
ANNUAL REPORT - The Centre Of Freshness | Perth Market
64
perthmarket.com.au 2020 ANNUAL REPORT for the year ended 30 June 2020
Transcript of ANNUAL REPORT - The Centre Of Freshness | Perth Market

perthmarket.com.au
2020 ANNUAL REPORT
for the year ended 30 June 2020

Page 2
Table of Contents
Vision, Purpose & Background 3
Performance overview 4
Chairman & CEO Report 6
Strategic Plan 9
Major Projects 10
Industry & Community Support 12
Summary of Historical Financial Results 13
Directors’ Report 16
Information on Directors 20
Auditors Independence Declaration 26
Consolidated Financial Statements 27
Directors’ Declaration 57
Independent Auditor’s Report 58
Corporate Governance Statement 60
Corporate Directory 63
PERTH MARKETS GROUP LIMITED

vision
Perth Markets and Market City – a developed, mixed use, destination precinct.
Purpose
Delivering shareholder value as a property owner, manager and developer, primarily serving the fresh produce industry.
ANNUAL REPORT 2020
Background
Perth Markets Group Limited (“PMG”) is an industry-based facility owner, manager and developer.
The Perth Markets and Market City site, owned by PMG, is a diverse cluster of businesses involved in wholesale fresh produce trading, supply chain logistics, retailing, professional services and weekend consumer markets.
The site not only plays a critical role in fresh produce supply, it makes a significant contribution to the State’s economy which impacts on local communities and families.
Perth Markets is the only Wholesale Fresh Produce Market in WA and with the retail and commercial areas of Market City is situated on 51 hectares of land in Canning Vale, 16 km south of the CBD of Perth, WA.
With more than 104 tenants, PMG is committed to ensuring Perth Markets is an efficient and safe market environment, connecting the grower to the consumer.
Page 4
PERTH MARKETS GROUP LIMITED
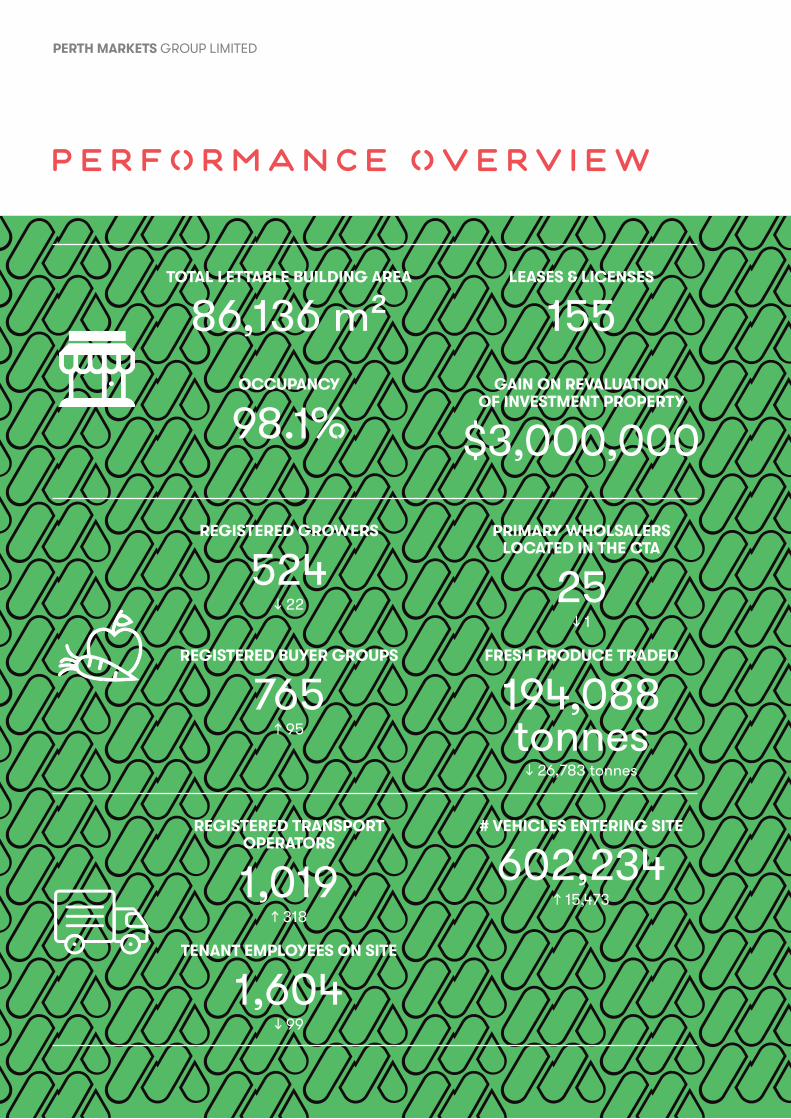
Performance overview
TOTAL LETTABLE BUILDING AREA
86,136 m²
LEASES & LICENSES
155
OCCUPANCY
98.1%
GAIN ON REVALUATION OF INVESTMENT PROPERTY
$3,000,000
REGISTERED GROWERS
524↓ 22
PRIMARY WHOLSALERS LOCATED IN THE CTA
25↓ 1
REGISTERED BUYER GROUPS
765↑ 95
FRESH PRODUCE TRADED
194,088 tonnes
↓ 26,783 tonnes
REGISTERED TRANSPORT OPERATORS
1,019↑ 318
# VEHICLES ENTERING SITE
602,234↑ 15,473
TENANT EMPLOYEES ON SITE
1,604↓ 99

Page 5
ANNUAL REPORT 2020
WATER CONSUMED
50,617 kL↓ 11,525 kL
WASTE VOLUME
1,995 tonnes↓ 527 tonnes
ELECTRICITY CONSUMED
24,483 MWh↓ 22 MWh
SATURDAYS CARS ATTENDING AVERAGE
1,032*↓ 122
SUNDAY PEOPLE ATTENDING AVERAGE
4,865*↓ 265
SUNDAY STALLS BOOKED AVERAGE
305*↓ 60 * Excludes Covid-19 closure period
TOTAL ASSETS
$193,024,000↑ $6,933,000
NET OPERATING PROFIT
$8,974,000↑ $103,000
NET ASSETS
$86,867,000↓ 6,422,000

Page 6
Chairman & CEO ReportWe are pleased to present the 2019/2020 Perth Markets Group Limited (“PMG”) Annual Report.
PERTH MARKETS GROUP LIMITED
This report covers our fourth full year of operations following the industry based bid to secure the Perth Markets and Market City site and operations upon its privatisation from the WA Government in March 2016.
In 2019/2020, PMG completed the process to move from a complex stapled security/trust structure to a simplified and more efficient corporate structure. The revised corporate restructure will streamline the administrative and operational expenses of the Perth Markets Group moving forward.
In July 2019, the Commonwealth Bank of Australia became the new banking partner for PMG supporting PMG with a revised financing structure to support the ongoing development of the Site.
The Board and Management Team completed a revised 5-year strategic plan in March 2020. The Strategic Plan is supported by strategic initiatives, and focuses on optimising current operations, facilitating future growth and identifying new opportunities for PMG. The Strategic Plan is supported by a 10-year financial model.
The future enhancement of the Site will be supported by the creation of a Site Master plan to be developed during 2021/22 after consultation and input from PMG’s relevant stakeholders.
New Branding for the Site’s two key areas, Perth Markets (Central Trading Area and Warehouses) and Market City (Retail, commercial and hospitality) has been adopted and will be rolled out across the Site in 2020/21.
Financial Results
The 2019/2020 Financial Year result confirms the positive operating results for the fourth full financial year following purchase of the Site from the State Government.
The consolidated operating profit before revaluation gain, finance costs and income tax of the group for the 2019/2020 financial year was $8.97M. (June 2019: $8.87M). An additional $3M of statutory profit was recognised following revaluation of the investment property as at 31 December 2019 resulting in PMG’s land and buildings being valued at $172M (December 2018: $169M).
Following the corporate restructure that occurred in October 2019, PMG recognised for the first time a deferred tax liability relating to the unrealised gains on the investment property that had been previously brought to account. The deferred tax liability represents a future tax obligation to PMG should it sell the site. As a result of the corporate restructure and the recognition of the deferred tax liability for the first time, PMG incurred a non-cash charge to the profit & loss account through income tax expense of $12.7M. As result of the recognition, in accordance with accounting standards, of this future obligation, PMG incurred a Net Loss after income tax for the full year of $5.2M (2019: Profit of $11.5M)
On 11 December 2019, a final distribution was paid under the old stapled security structure of $257,182. An interim dividend of 1.8c/share fully franked was paid under the new corporate structure on the 5th of March 2020 for the half year ended December 2019. Post 30 June 2020, the PMG Board resolved to pay a further distribution to shareholders who are registered as of 1 September 2020 of 2.8c/share fully franked with payments anticipated by 10 November 2020.
Subsequent Event - Change to Corporate Tax Rate
In the 2019 financial year the Group applied for and was granted a private tax ruling from the Australian Taxation Office (ATO) relating to the year to reduce the Corporate tax rate from 30% to 27.5%. The private tax ruling related to the 2019 year only. During the 2020 financial year PMG again applied for a private tax ruling for a reduction in the corporate tax rate to 27.5% from the ATO on the same basis as for the prior year.
In reasonable anticipation of a comparable ruling from the ATO, PMG prepared its 2020 financial statements using a corporate tax rate of 27.5%.
Subsequent to the end of the financial year end and after completion of the financial statements of PMG for the year ended 30 June 2020, the ATO indicated that a comparable ruling as before would not be forthcoming, although at the date of this report no formal communication has been received from the ATO to confirm that outcome.

Page 7
ANNUAL REPORT 2020
The impact of this outcome means that PMG will be required to recognise its tax liabilities at 30%, not 27.5%. This will necessitate the carrying value of the deferred tax liability arising from the revaluation gains of investment properties being restated in the December 2020 half year accounts by a further $2.25M and Income Tax Payable for the year ended 30 June 2020, by $114K, resulting in a negative adjustment to Shareholders equity of $2.36M.
However, it should also mean that shareholders should benefit by the final dividend for the 2020 year due for payment in November 2020 being fully franked to 30% rather than 27.5%.
COVID - 19
In 2020, COVID-19 had a significant impact on every business and person around Australia. In WA, a State of Emergency was declared in April 2020. PMG continued to provide services to its Tenants and maintained a full-time presence at the Markets throughout the lockdown period although the weekend markets were forced to close from April to the beginning of July 2020. The Site progressed to level 2A (according to PMG’s pandemic plan) during the lockdown and post June 30 remains a restricted access site to approved users only.
A National and State Code for support for Commercial Tenancies was introduced in April 2020 and PMG developed a Financial Hardship program in line with the State Code which saw a number of tenants make use of the assistance offered.
Property and Leasing
As at 30 June 2020 there were 155 leases and
licenses in place at the Perth Markets and Market City Site. Steady occupancy of 98.1% continued across the Site with 22 new leases and 13 extensions of existing leases finalised and approved.
Following a robust tender process Badge Construction was appointed as the preferred builder for a new 3500sqm cold chain warehouse with completion scheduled for December 2020. This is the first of 3 buildings approved in the 2019 development application for the SE Triangle and is the first new development on the Site in 6 years. The building was fully committed prior to the award of contract.
Site Operations Work Health and Safety
PMG treats matters of safety with the utmost importance and dedicates significant time and resources into adopting and upholding safe work practices, as well as educating site users and stakeholders.
A safety compliance audit was completed in October 2019 and PMG has worked closely with its insurer to ensure compliance obligations are met.
Site rules are in place to facilitate an effective, efficient, and safe business trading environment for all site users. A review of the existing site rules was undertaken and revised updated site rules are scheduled to be rolled out in late 2020.
A new safety framework was developed including a comprehensive Work Health and Safety Plan and supporting policies and documents. The Site Safety Committee was re-established to provide feedback to PMG from site users and to assist in increasing the level of education and communication concerning safety on the Site.

Page 8
PERTH MARKETS GROUP LIMITED
Site Infrastructure and Maintenance
The development of a 20-year strategic asset management plan was completed and the forecasted spend included in the 10-year financial plan.
Several site upgrades were completed during the year including:
• Generator controls upgrade, major service, and testing
• Exterior sprinklers introduced to Warehouse E6
• Market West refurbishment
• Upgrade to a Commercial Centre Tenants air-conditioning system
• Gutter replacement on Warehouse W1
• LED lighting installation in the CTA and Western Buyers Bay.
• Replacement of faulty isolation valves across the Site.
Weekend Markets
PMG values the contribution of the weekend markets to making the site a destination precinct.
From July to March 2020, Saturday Clearance Market average weekly attendance was 1,032 cars and Sunday Community Market attendance averaged 4,865 people.
The Saturday and Sunday Markets ceased operation in March 2020 for 3 months due to the Pandemic restrictions recommencing operations in July 2020.
Communications and Engagement
PMG is commited to increasing the level of communication and engagement with Tenants across the Site.
Over 2019/2020 this has included the introduction of fortnightly newsletters and updates, principal engagement sessions, 1:1 meetings with Tenants, feedback opportunities and also quarterly customer engagement meetings.
Going forward, PMG will continue working closely with Market West as the industry representative group for Perth Markets Tenants including collaborating on matters such as site safety and revision of the Site rules.
Acknowledgment and Thanks
The Board and management team remain focused on PMG’s strategic outlook, risk management, corporate performance, shareholder value delivery, stakeholder interests and improving governance systems and processes.
In closing, PMG recognises the contribution and support of the Board and the whole PMG management team for their contribution during the year.
Finally, with the ongoing support and combined efforts of PMG’s valued industry stakeholder, tenant and customer base, we look forward to pulling together to make Perth Markets and Market City a special place to come and do business.
Steven Cole Rebecca MooreChairman CEO

Page 9
ANNUAL REPORT 2020
Strategic Plan
Our Vision
To achieve our purpose of:
We will deliver:
Which is achieved by:
Through focusing on:
Perth Markets and Market City – a developed, mixed use, destination precinct
Delivering shareholder value as a property owner, manager and
developer, primarily serving the fresh produce industry
Sound sustainable returns to shareholders and a compelling value proposition to our customers
Optimise Current Operations (Improve it)
• Safe Site
• Efficient and Effective Site Management
• Customer Experience Focus
• Implement Strategic Asset Management Plan
• Organisational Capability and Systems
Future Sustainable Growth
(Develop it)
• Develop Site Master Plan
• Actively Develop S/E Triangle
• Develop Commercial/Retail Destination Precinct
• Diversify Tenant Mix/Product Offering (CTA and Non CTA)
New Opportunities
(Imagine It)
• Expand Complementary Services
• Identify Metronet Related Opportunities
• National Markets Collaboration
• Strategies Beyond Current Site
• Energy Efficiency

Page 10
PERTH MARKETS GROUP LIMITED
Major Projects
South East Triangle Development
Building 1 comprising a 3,945.5m² cold chain warehouse (3,555.7m2 ground floor and 389.8m2 mezzanine) is due for completion in December 2020. The building will be completed ahead of schedule and is expected to be delivered under the approved budget by Badge Construction. Tenants SJ Fresh, Brindle Group and Select Fresh Pty Ltd are expected to be operating from the new building by end of December 2020.
Early discussions have commenced with prospective tenants for Building 2 - a proposed 4,000m² cold chain warehouse.
Commercial Centre Upgrade
An upgrade to the Commercial Centre was completed in 2020 which included defitting vacant premises and upgrades to the ablutions, soffits and painting of the Building. The completed work has transformed the building, upgrading it to B grade office premises with a new Medical Centre to commence in January 2021.
Other capital works projects
• Loscam Driveway After four years in the planning a new driveway
and entrance for Loscam was completed under budget and on schedule. The new entrance has improved the flow of traffic through the Loscams site and reduced the risk of truck interactions.
• Baile Road Crossover A new crossover at the Baile Road entrance
was completed in 2019 to allow easier access for Road Trains. The changes to the entrance were to comply with DA requirements for the SE Triangle development.
• Planned Maintenance Upgrades PMG continued the focus on improving
planned maintenance schedules over reactive maintenance. Traffic Engineers were engaged to review the existing traffic management controls to improve movement around the site and safety with recommendations included in future works programs for 2020/21.
New Projects
The focus for 2020/21 will be on the following:
• Development of the Site Master Plan This will be a long term plan which will address
future development and usage of the Site. It is expected to take 12-18 months to complete and will require extensive consultation and engagement especially with the planned completion of the new Metronet Station in 2023.
• Site safety program During 2020/2021, PMG will roll out several
new safety initiatives including workshops and training sessions, annual induction and site safety refreshers for all site users, supporting Tenants to meet their obligations under safety laws and legislation.
• Revised Site Rules During 2020 PMG undertook consultation and
engagement to simplify and modernise the site rules. These will be rolled out with education and information sessions for site users and tenants, fact sheets and supporting information over an initial transition period.
• Strategic Asset Management Plan In 2020/21 a number of projects defined in
the strategic asset management plan will be delivered including road resurfacing, road marking, painting of various buildings on site and new signage as part of a new wayfinding and safety program.
• IT systems In 2020 PMG commenced a review of its IT
systems, security and record management processes and systems. In 2021 PMG anticipates being able to implement new systems that will greatly enhance the efficiency and productivity of staff and also the customer experience and interaction with PMG. This will be supported on ongoing work to improve processes and governance systems.

Page 11
ANNUAL REPORT 2020
• Wholesale Retail Centre Upgrade A new air conditioning system for the wholesale
retail centre is scheduled to be implemented in 2020. With new Tenants moving into the facility, and new signage and shade sails the upgrade will create a more welcoming environment for customers.
• Weekend Markets In collaboration with participating tenants and
stall-holders, PMG’s focus will be on growing the weekend markets and participation, offering add on activities and events to support the active use of the Site and creation as a destination precinct for the general public on the weekends.
• EnergyEfficiencyonSite Over 2020/2021 PMG will investigate future
energy efficiency options for the site both in the short and long term.
• StaffCultureandDevelopment Ongoing development of PMG staff will
continue in 2020/2021 with regular training and education and cultural enhancement initiatives to create a high performing team and an enjoyable place to work.

Page 12
Industry & Community Support
‘A Better Choice’
PMG continued to support ‘A Better Choice’ - a joint initiative by industry group Fresh Markets Australia (FMA) and the Central Markets Association of Australia (CMAA). The program supports more than 500 retailers across Australia and is designed to educate consumers about the quality, service and freshness of produce at their local fruit and vegetable shop. It presents an opportunity for consumers to come together to help create a positive future for business owners, produce wholesalers and local growers who supply them.
Market West
PMG works closely with Market West as the key industry representative organisation. Our commitments and support for Market West this year included Sponsorship for WA Retailer of the Year Awards, 2019 Market City 30th Year Ball, Market City Golf Day and the Cherry Auction.
PMG also provided funding again in 2019/20 for Market West to collate and publish Market Pricing Reports and Market Throughput Reports that are valuable to the industry and available to the industry on the Market West website.
Foodbank
PMG continues to proudly partner with Foodbank WA, helping them provide food relief to more than 43,000 people each month. Foodbank provides more than 70% of the food rescued for food relief organisations nation-wide and every $1 that is donated provides two meals to someone in need.
PMG’s support includes provision of a warehouse, where Foodbank collects and receives produce donated from PMG’s Tenants. Last year Tenants donated more than 82,000kg of produce that otherwise would have gone to Landfill. PMG also directly supports the School Breakfast Program which provides a nutritious breakfast to thousands of students across WA as well as the Food Sensations nutrition education and cooking program.
Shalom House
As part of PMG’s ongoing corporate and social responsibility program, PMG engages Shalom House to collect rubbish on the Site. In just one month 2.83 tonnes of waste was collected from across the Site. Shalom House is a residential rehabilitation centre located in Perth and runs a holistic rehabilitation program. Part of an individual’s participation and recovery is to undertake meaningful work in the community such as that at the Perth Markets’ site.
Other local community groups
In 2019/20 PMG contributed $22,203 to the Rotary Club of Willetton for its volunteer support on Saturday Market days. The money donated was used to support local and international programs including, student awards, youth exchange programme and Willetton Senior High School Wolf Pack Programme.

Page 13
PMG 2020
$’000
PML 2019
$’000
PML 2018
$’000
PML 2017
$’000
Revenue
Rental revenue 13,103 13,184 12,822 12,450
Provision of services revenue 9,868 9,591 9,428 8,440
Weekend markets revenue 675 1,052 1,106 1,118
Other revenue 581 438 398 566
Total revenue 24,227 24,265 23,754 22,574
Site operating expenses (14,821) (14,968) (14,499) (14,597)
EBITDA 9,406 9,297 9,255 7,977
Depreciation and amortisation expense (432) (426) (382) (370)
Gain on revaluation of investment properties 3,000 5,949 12,966 22,784
Fair value gain on financial assets through profit or loss
122 281 - -
Finance expenses (2,847) (2,856) (2,857) (2,858)
Acquisition related costs (490) (546) (641) (903)
NetProfitbeforeincometax 8,759 11,699 18,341 26,630
Less income tax expense attributable to operations (1,259) (187) (150) (30)
Less income tax expense from deferred tax liability due to revaluation of investment property
(12,716) - - -
NetProfit/(Loss)afterincometaxexpense (5,216) 11,512 18,191 26,600
Dividend/Distributions paid 3,258 3,765 3,648 3,470
Total assets 193,024 186,091 177,331 162,267
Total liabilities 106,157 92,802 88,079 85,902
Number of shares/units as at 30 June 58,840 58,840 58,840 58,840
Net tangible assets per share/unit ($) 1.48 1.59 1.52 1.30
Earnings per share excluding investment property valuation changes and abnormals (cents)
7.65 9.45 8.88 6.49
Summary of Historical Financial Results

Page 14

Page 15
PERTH MARKETS GROUP LIMITED ABN 25 633 346 184
FINANCIAL REPORT for the year ended 30 June 2020

Directors’ Report
Your directors present their report on the consolidated entity consisting of Perth Markets Group Limited (PMG) and the entities it controlled at the end of, or during, the year ended 30 June 2020, referred to throughout this report as the ‘Group’.
PMG was formed on 1 October 2019, following the approval of the Scheme of Arrangement by the securityholders of Perth Markets Limited, that resulted in PMG becoming the head entity of the Group.
InformationabouttheDirectorsandOfficers
The following persons were directors or officers of Perth Markets Group Limited during the year and up to the date of this report:
Name Role Date Appointed Date Resigned
DIRECTORS
Steven Cole Independent Non-Executive Chairman 22 May 2017 -
Patricia Skinner Non-Executive Deputy Chair 7 October 2015 -
Andrew Young Non-Executive Director 20 October 2015 -
Miro Lendich Non-Executive Director 26 February 2016 -
Frank Romano Non-Executive Director 12 April 2016 -
Richard Thomas Non-Executive Director 14 September 2018 -
James Ryan Non-Executive Director 1 November 2019 -
Tony Ceravolo Non-Executive Director 1 February 2020 -
Eric Smith Non-Executive Director 7 October 2015 7 August 2019
David Schirripa Non-Executive Director 26 February 2016 31 October 2019
OFFICERS
Rebecca Moore Chief Executive Officer 2 August 2019 -
Stephen Ward Chief Executive Officer 1 January 2017 2 August 2019
Mark Lindsay Company Secretary / CFO 5 May 2020 -
Paul Campbell Company Secretary/ CFO 27 February 2017 5 May 2020
PERTH MARKETS GROUP LIMITED
Page 16

Page 17
Principal Activities
During the year, the principal continuing activities of the consolidated entity consisted of the management and development of the Perth Markets Site and providing a marketing and distribution hub for fresh produce supply to the State of Western Australia.
The Perth Markets Site is home to a diverse cluster of businesses involved in wholesale trading, food retailing, business service providers and weekend consumer markets.
The Perth Markets Site was acquired on 31 March 2016 from the State Government and is WA’s primary trading centre for fruit and vegetables.
The Group generates income from its owned properties as well as income from services and activities provided to tenants at the Perth Markets site.
There has been no change in principal activities during the year.
Operating Results
The net operating profit/(loss) of the consolidated entity after income tax for the year ended 30 June 2020 was ($5,216k), 30 June 2019: PML $11,512k.
2020 2019 % change
$’000 $’000
PMGOperatingProfit 8,974 8,871 1.2%
Gain on revaluation of investment properties 3,000 5,949 (49.6%)
Fair value gain on financial assets through profit or loss 122 281 (56.6%)
Finance expenses (2,847) (2,856) (0.3%)
Acquisition related costs (490) (546) (10.3%)
NetProfitbeforeincometax 8,759 11,699 (25.1%)
Less income tax expense from operations (1,259) (187)
Less income tax expense from deferred tax liability due to revaluation of investment property
(12,716) -
NetProfit/(Loss)afterincometaxexpense (5,216) 11,512 (145.3%)
The net profit/(loss) after income tax includes the following material transactions for the year:
• Recognition of deferred tax liability for the first time following the Corporate Restructure on 1 October 2019, the majority of which is relating to the revaluation of Investment Properties since the date of acquisition of $12,310k. The deferred tax liability represents a future tax obligation payable on sale of Investment Properties should that occur.
• Recognition of corporate income tax payable for the first time following the Corporate Restructure on 1 October 2019. The removal of trusts as part of the corporate restructure resulted in additional income tax payable to the group for the year of $788k.
• Nonrecurring transaction costs associated with the Corporate Restructure of the Group for the year ended 30 June 2020 of $679k.
• The allowance for Tenant Support rental waiver associated with the COVID-19 Pandemic for the 3 months to June 2020 of $132k (2019: $nil).
• Government assistance support received in the form of PAYG cash boost and WA State payroll tax relief for the period 1 April to 30 June totalling $134k.
ANNUAL REPORT 2020

Page 18
PERTH MARKETS GROUP LIMITED
• The interest rate hedge was a condition of the original term debt facility with NAB and was assigned to the CBA as part of the facility change in July 2019. The hedge facility reduces interest rate variability during the hedge term. During the financial year ended 30 June 2020, variable interest rates reduced to their lowest levels in many years. The interest expense for the year included swap Interest charge of $1,140k being the difference between variable interest rate and the fixed interest hedge. At the balance date the interest rate hedge is “out of the money” by $5,676k (2019: $4,811k) which hedges 68% of the current debt facility (refer note 16).
While the COVID-19 Pandemic has had a fundamental and profound global impact, the underlying business model of the Group remains strong as the only wholesale fresh produce market in WA. Wholesale sales volumes were impacted by the government-imposed restrictions during the March to June period of 2020, however as the State continued to ease restrictions, volumes and activity improved for tenants overall. In compliance with government restrictions the weekend markets were closed from 21 March 2020 until 4 July 2020. PMG lost $160k in trading profit for the period.
During the Pandemic, the Group provided financial assistance to tenants who made formal requests. A total of 19 tenant requests were received and financial assistance in the form of rental waivers for the March to June period were granted totalling $132k.
The directors have reviewed and assessed the carrying value of Investment Properties and based on the overall trading activities of the business and its tenants to date, are of the opinion that there will be no negative impact due to COVID- 19 on the carrying value of the assets of the Group at this time.
During this period, the Group focused on retention of cash, restrictions to discretionary spending and reduction in non-essential staff. The Group qualified for COVID-19 based Government assistance support in the form of PAYG cash boost and WA State payroll tax relief for the period 1 April to 30 June totalling $134k.
Review of Operations
The consolidated Entity’s continued operational focus throughout the year remained unchanged in the management and development of the Perth Markets Site. The vacancy rate for the site at the end of June 2020 was 1.9%.
Two major undertakings this year were:
• Commencement of construction of the new Cold chain Warehouse (Building 1) on the vacant land of Market City Site. The new warehouse is 3,946 sqm in area and consists of 3 tenancies. At completion the new warehouse will be full tenanted.
• Capital works on the commercial centre continued throughout the year with $204k being invested on facility upgrades including painting and building refurbishments.
The land & buildings of Perth Markets Site was independently valued in December 2019 by Knight Frank and the financial accounts of the consolidated entity reflect the movement in the value of the asset, “Investment Properties”. The value of Investment Properties was increased by $3,000k following the completion of the valuation. The increase is an unrealised gain to the consolidated entity’s financial results, which is not included in the cashflow or dividend calculation for the financial year ended 30 June 2020.
Dividends and Distributions
Dividends paid to security holders and Shareholders during the year were as follows:
Paying Entity Payment Rate 2020 2019
PMG – (December 2019 Interim Dividend for FY 2019/20)
1.8 c/ share fully franked @ 27.5% Paid on 5 March 2020
$1,059,122 $-
Perth Markets Limited – Unit Trust (September 2019 Interim Distribution for FY 2019/20)
Unfranked Paid 11 Dec 2019
$257,182 $-
Perth Markets Limited – Unit Trust (Final distribution for FY 2018/19)
Unfranked Paid 11 Sept 2019
$- $1,941,724

Page 19
ANNUAL REPORT 2020
SignificantChangesintheStateofAffairs
On 19 September 2019, the Perth Markets Limited (PML) and its controlled entities entered into a Scheme of Arrangement through a corporate restructure, which resulted in the integration of the operations, assets and affairs of the various entities that formed PML into a more traditional corporate group structure. This Scheme was designed to create a more simplified and efficient structure through which the Group can further its objectives and operations in the best interests of security holders.
The Scheme involved:
(a) Unstapling the PML shares from the Perth Markets Land Trust (PMLT) units;
(b) Interposing, or “top hatting” Perth Markets Group Limited (PMG) (new company) as the new holding company of the Group; and
(c) PML Security holders exchanging their PML Securities for PMG shares on a one-for-one basis.
Immediately following the implementation of the Trust Scheme and Company Scheme, there was a consolidation of PMG shares on a 2 for 1 basis so each PML Securityholder held only one PMG share for every Stapled Security they held at the record date.
On 17 July 2019, PMG completed the refinancing of its core debt facility which was due to expire on 30 March 2020 from the National Australia Bank Limited to the Commonwealth Bank Limited. At the date of the refinancing the amount of debt refinanced was $75,112k for a term of 3 years at rates and conditions more favourable.
Other than the above there were no significant changes in the state of affairs of the Group during the financial year.
Events Since the End of the Financial Year
The COVID-19 pandemic (globally and within Australia) continues to provide a level of uncertainty that remains beyond the control of PMG. The Group remains focused on managing the Perth Markets site, in conjunction with its tenants, in a way that minimises the risks associated with the spread of COVID-19 across the operations of the Perth Markets site.
As at the date of this report, the directors of PMG are unable to determine what level of future restrictions may be imposed upon the Group through Government actions as a result of any further outbreak and the spread of COVID-19 in Western Australia and what financial impact any restrictions may have on PMG in future periods.
Other than the ongoing threat of the spread of COVID-19 throughout the community, there has been no matter or circumstance occurring subsequent to the end of the financial year that has significantly affected or may significantly affect the operations of the Group, the results of those operations, or the state of affairs of the Group in future financial years.
Likely Developments and Expected Results of Operations
The Group will continue to operate the Perth Markets business and aims to derive incrementally improving financial returns relative to prior trading periods through organic growth and improved efficiencies of operations. It remains the strategic goal of the directors to develop the vacant land on the Perth Markets site to its highest and best use through the construction of cold chain warehouses. The first stage of this development is well advanced with construction underway and due for completion by December 2020. The new building will be fully tenanted at handover.

Page 20
Information on Directors
Steven Cole – Independent Non-Executive Chair
Experience and Expertise
• Over 40 years of legal, business and corporate experience as well as a range of executive management and non-executive appointments. His extensive boardroom and board sub-committee experience includes ASX listed, statutory, proprietary and NFP organisations covering the industrial, financial, educational, professional services, health, agribusiness, local government and resources sectors.
• Mr Cole is also Chair of Neometals Limited (ASX listed), Director of Matrix Composites & Engineering Limited (ASX listed), and Chair of the Queen Elizabeth II Medical Centre Trust (statutory authority).
• From a general industry perspective, Mr Cole formerly was Vice President of the Chamber of Commerce & Industry (WA) and was previously WA State President and a national board member of the Australian Institute of Company Directors.
• Qualifications/Memberships: Llb(hons) and FAICD.
Patricia Skinner – Deputy Chair Experience and Expertise
• Over 30 years’ experience in fresh produce wholesaling industry began with the Sumich Group in 1989 to current position with Australian Produce Brokers, a leading fruit and vegetable wholesaler operating in the central trading area at Perth Markets for the past 20 years.
• President of Market West formerly The Chamber of Fruit and Vegetable Industries in Western Australia since 2011.
• Member of the Market West Management Committee and Director of FPAA Credit Service Pty Ltd since 2002.
• Director of Fresh Markets Australia since 2001.
• Industry representative on numerous industry committees including reviews of the Perth Markets Act and the Bylaws and two government reviews of the Mandatory Horticultural Code of Conduct.
James Ryan Experience and Expertise
• Background in Civil Engineering with managerial experience at a plant hire organisation.
• Extensive knowledge of the fresh produce industry and central markets having worked in both the Sydney & Perth Markets.
• Currently General Manager with Perfection Fresh, delivering shareholder value for Perfection Fresh’s WA division.
• Vice President of Market West formerly The Chamber of Fruit and Vegetable Industries in Western Australia since 2019.
• Member of the Market West Management Committee since 2011.
• Involvement and oversight of the Perth Markets privatisation process and the successful industry backed bid in 2016.
PERTH MARKETS GROUP LIMITED

Page 21
ANNUAL REPORT 2020
Tony Ceravolo
Experience and Expertise
• Director of South Australian Produce Market Limited Since 06/12/2007.
• Managing Director – R Ceravolo & Co Pty Ltd.
• Director and Founder – Ashton Valley Fresh Juices.
• Director – Ceravolo Orchards Pty Ltd.
• Director – LOT 100.
• Member of the Committee of Management – Apple & Pear Growers Association of SA.
• 35 years of orchard experience.
• 35 years of experience in wholesale of fruit and vegetables.
• Grower of Apples, Pears, Cherries and Strawberries.
Frank Romano
Experience and Expertise
• Independent Director and Chair of Master Planning Committee.
• 40-year history of establishing, owning and managing food franchise companies including Chicken Treat, Red Rooster and Oporto.
• Significant corporate transaction and expansion experience through multiple food franchise operations.
• Current owner of Olympic Fine Foods Pty Ltd, which specialises in snacks, nuts, cereal and confectionary.
• Other investments include sandalwood plantations, vineyards, and various commercial, retail, and residential property/property development interests.
• Director of Perth Children’s Hospital Foundation Ltd for over 10 years.
Miro Lendich
Experience and Expertise
• Current Chairman of United Crate, a grower-owned cooperative and the largest supplier of plastic crates and bins to Market City.
• Miro is also a grower based in the Swan Valley predominately growing table grapes, watermelons, honeydew melons and rock melons.

Page 22
Andrew Young
Experience and Expertise
• Current Chief Executive Officer of Brisbane Markets Limited, the entity which owns Brisbane’s wholesale fruit and vegetable market.
• Took on the role of Managing Director in January 2000, was appointed to Chief Executive Officer of BML on October 2002 and also retains the position of Chief Executive Officer of Brismark. Is a Director of Brisbane Markets Limited and an Executive Director of Fresh Markets Australia.
• Extensive managerial experience with tertiary qualifications in agricultural science, accounting and corporate management.
• Detailed knowledge of the operations of the fresh produce industry and central markets and relevant experience in property development and the construction of warehouses.
Richard Thomas
Experience and Expertise
• Independent, non-executive finance director and chair of the Audit, Finance & Risk Committee, who holds similar roles at Brightwater Care Group.
• Brings audit, risk, regulatory and financial expertise and experience, having been a partner with Deloitte for over 12 years, including leading the Risk Advisory practice in Perth since its foundation in 2010.
• Has worked in a variety of roles – external auditor, corporate regulator, internal auditor, management consultant, forensic accountant, investigator and risk practitioner – serving many industries and organisations in the public and private sectors.
• Achieved a first-class history degree at University College London and qualified as a chartered accountant with the ICAEW in 1988, before migrating to Perth in 1990, moving to Melbourne in 1994 and returning to WA in 2001.
Mark Lindsay – Company Secretary/Chief Financial Officer
Experience and Expertise
• Over 30 years of broad industry experience in retail, supply-chain, property, franchising, finance, mining, energy and QSR as CFO, CEO and Director.
• Highly experienced corporate transaction, advisory and expansion experience through multiple business and industry operations.
• Chair of Advisory Board of large national family business.
• Non-executive director & Chair of Audit & Risk committee of national franchised print business, and Building Technologies business.
• Advisor to private Aboriginal business.
• Contract CFO since February 2020, and appointed Company Secretary from May 2020.
• Member of AICD and CA.
PERTH MARKETS GROUP LIMITED

Page 23
Meetings of Directors
The number of meetings of the Company’s board of directors held during the year ended 30 June 2020, and the number of meetings attended by each director were:
No. of meetings eligible to attend
No. of meetings attended
S. Cole 16 16
P. Skinner 16 16
E. Smith 1 0
D. Schirripa 5 4
F. Romano 16 15
M. Lendich 15 15
A. Young 15 14
R. Thomas 15 14
J. Ryan 10 10
T. Ceravolo 8 5
Meetings of Audit, Finance and Risk Committee (AF&RC)
The number of meetings of the committee held during the year ended 30 June 2020, and the number of meetings attended by each member were:
No. of meetings eligible to attend
No. of meetings attended
R. Thomas 7 7
S. Cole 7 7
P. Skinner 7 5
A. Young 7 7
Meetings of Nominations & Remuneration Committee
The number of meetings of the committee held during the year ended 30 June 2020, and the number of meetings attended by each member were:
No. of meetings eligible to attend
No. of meetings attended
S. Cole 0 0
F. Romano 0 0
D. Schirripa 0 0
A. Young 0 0
The new structure of the Nominations and Remuneration Committee was only committed to early in 2019 and, although no formal Committee meetings occurred prior to the end of the reporting period, a number of informal meetings did take place in furtherance of the Committee’s functional remit.
ANNUAL REPORT 2020

Page 24
Meetings of Master Planning Committee
The number of meetings of the committee held during the year ended 30 June 2020, and the number of meetings attended by each member were:
No. of meetings eligible to attend
No. of meetings attended
F. Romano 6 6
A. Young 6 5
M. Lendich 6 6
S. Cole 6 6
E. Smith 1 0
J. Ryan 2 2
Shares under Option
(a) Unissued shares
There are no unissued shares under option in Perth Markets Group Limited on issue at the date of this report.
(b) Shares issued on the exercise of options
There are no shares in Perth Markets Group Limited issued on the exercise of options during the year ended 30 June 2020.
Environmental Regulation
The Group is subject to a number of environmental regulations as part of operating the Market City business, which the Group is committed to meeting. The Board is not aware of any significant or material breaches of environmental requirements during the period covered by this report.
PERTH MARKETS GROUP LIMITED

Page 25
ANNUAL REPORT 2020
InsuranceofOfficersandIndemnities
During the financial year, the Group paid a premium under a contract ensuring all Directors and Officers against liabilities incurred in that capacity. Disclosure of the nature of the liabilities insured and the premium is subject to a confidentiality clause under the contract of insurance.
No indemnities have been given or insurance premiums paid, during or since the end of the year, for any person who is or has been an auditor of the Group.
Proceedings on Behalf of the Company
No proceedings have been brought or intervened in on behalf of the Company with leave of the Court under section 237 of the Corporations Act 2001.
Auditor’s Independence Declaration
A copy of the auditor’s independence declaration as required under section 307C of the Corporations Act 2001 is set out on page 26.
Rounding of Amounts
The Company is of a kind referred to in ASIC Legislative Instruments 2016/191, relating to the ‘rounding off’ of amounts in the directors’ report. Amounts in the directors’ report have been rounded off in accordance with the instrument to the nearest thousand dollars ($k), or in certain cases, to the nearest dollar.
This report is made in accordance with a resolution of directors.
Steven Cole Patricia SkinnerChair Deputy Chair25 August 2020 25 August 2020
Page 26
PERTH MARKETS GROUP LIMITED
AUDITORS INDEPENDENCE DECLARATION
BDO Audit (WA) Pty Ltd ABN 79 112 284 787 is a member of a national association of independent entities which are all members of BDO Australia Ltd ABN 77 050 110 275,an Australian company limited by guarantee. BDO Audit (WA) Pty Ltd and BDO Australia Ltd are members of BDO International Ltd, a UK company limited by guarantee, andform part of the international BDO network of independent member firms. Liability limited by a scheme approved under Professional Standards Legislation.
Tel: +61 8 6382 4600Fax: +61 8 6382 4601www.bdo.com.au
38 Station StreetSubiaco, WA 6008PO Box 700 West Perth WA 6872Australia
DECLARATION OF INDEPENDENCE BY NEIL SMITH TO THE DIRECTORS OF PERTH MARKETS GROUP LIMITED
As lead auditor of Perth Markets Group Limited for the year ended 30 June 2020, I declare that, to thebest of my knowledge and belief, there have been:
1. No contraventions of the auditor independence requirements of the Corporations Act 2001 inrelation to the audit; and
2. No contraventions of any applicable code of professional conduct in relation to the audit.
This declaration is in respect of Perth Markets Group Limited and the entities it controlled during theperiod.
Neil Smith
Director
BDO Audit (WA) Pty Ltd
Perth, 25 August 2020

Page 27
ANNUAL REPORT 2020
For the year ended 30 June 2020
Note 2020 2019
$’000 $’000Continuing operations
Revenue 4a 23,646 23,827
Other income 4b 581 438
Total income 24,227 24,265
Operating expenses
Weekend markets expenses (364) (491)
Operational expenses 5 (5,036) (5,301)
Commercial site management expenses 6 (9,421) (9,176)
Depreciation and amortisation expenses (432) (426)
Operatingprofit 8,974 8,871
Gain on revaluation of investment properties 11 3,000 5,949
Fair value gain on financial assets through profit or loss 122 281
Finance expenses (2,847) (2,856)
Acquisition related costs (490) (546)
Profitbeforeincometax 8,759 11,699
Income tax expense 7 (13,975) (187)
Profit/(Loss)afterincometaxfortheyear (5,216) 11,512
Other comprehensive income
Items not reclassified subsequently to profit or loss:
Changes in the fair value of cash flow hedges (net of tax) 18b 553 (3,537)
Total other comprehensive (Loss)/Income 553 (3,537)
Total comprehensive (Loss)/Income for the Year (4,663) 7,975
Profit/(Loss)afterincometaxattributabletomembers
Perth Markets Group Limited (PMG) members (5,216) -
Perth Markets Limited (PML) members - 450
Perth Markets Land Trust (PMLT) members - 11,062
(5,216) 11,512
Total comprehensive (Loss)/Income attributable to members
Perth Markets Group Limited (PMG) members (4,663) -
Perth Markets Limited (PML) members - 450
Perth Markets Land Trust (PMLT) members - 7,525
(4,663) 7,975
The above consolidated statement of profit or loss and other comprehensive income should be read in conjunction with the accompanying notes.
Consolidated Statement of Profit or Loss and Other Comprehensive Income

Page 28
Consolidated Statement of Financial Position
As at 30 June 2020Note 2020 2019
Assets $’000 $’000
Current assets
Cash and cash equivalents 20a 7,357 5,925
Receivables 8 278 349
Other assets 9b 660 493
Total current assets 8,295 6,767
Non-current assets
Property, plant and equipment 10 7,318 5,166
Investment property 11 172,387 169,000
Deferred tax asset 7 - 180
Financial assets at fair value through profit or loss 9a 3,403 3,281
Other assets 9b 1,621 1,697
Total non-current assets 184,729 179,324
Total assets 193,024 186,091
Liabilities
Current liabilities
Borrowings 14 - 75,112
Payables 13 3,096 3,118
Employee benefit obligations 15 116 94
Other current liabilities 16 80 78
Total current liabilities 3,292 78,402
Non-current liabilities
Borrowings 14 76,331 131
Employee benefit obligations 15 28 34
Deferred tax liability 7 11,195 -
Other non-current liabilities 16 15,311 14,235
Total non-current liabilities 102,865 14,400
Total liabilities 106,157 92,802
Net assets 86,867 93,289
Equity
Contributed equity 18a 54,718 54,718
Reserves 18b (4,258) (4,811)
Retained earnings 18b 36,407 43,382
Total equity 86,867 93,289
The above consolidated statement of financial position should be read in conjunction with the accompanying notes.
PERTH MARKETS GROUP LIMITED

Page 29
Consolidated Statement of Changes in Equity
For the year ended 30 June 2020
Note Contributed equity
Cashflowhedge
reserve
Retained earnings
Total equity
Consolidated $’000 $’000 $’000 $’000
Balance at 30 June 2018 54,718 (1,274) 35,808 89,252
Profit for the year - - 11,512 11,512
Other comprehensive income 18b - (3,537) - (3,537)
Total comprehensive income for the year - (3,537) 11,512 7,975
Distributions to unit holders - - (3,938) (3,938)
Balance at 30 June 2019 54,718 (4,811) 43,382 93,289
Loss for the year - - (5,216) (5,216)
Other comprehensive income 18b - 553 - 553
Total comprehensive (Loss)/Income for the year - 553 (5,216) (4,663)
Dividends/Distributions to unit holders - - (1,759) (1,759)
Balance at 30 June 2020 54,718 (4,258) 36,407 86,867
The above consolidated statement of changes in equity should be read in conjunction with the accompanying notes.
ANNUAL REPORT 2020

Page 30
Consolidated Statement of Cash Flows
For the year ended 30 June 2020Note 2020 2019
$’000 $’000
Cashflowsfromoperatingactivities
Receipts and Payments
Receipts from customers 24,156 23,923
Payments to suppliers and employees (14,638) (14,935)
9,518 8,988
Interest income 4 132
Interest payments (2,773) (2,852)
Income tax (128) (216)
Netcashflowsfromoperatingactivities 20(b) 6,621 6,052
Cashflowfrominvestingactivities
Payment for property, plant, equipment and assets under construction (1,519) (844)
Payment for construction (cold chain warehouse) (1,485) -
Proceeds from sale of property, plant and equipment 19 -
Dividends received 154 76
Investment in Unlisted Securities - (3,000)
Receipt / (Payment) for fixed term deposits - 1,840
Netcashflowsusedininvestingactivities (2,831) (1,928)
Cashflowfromfinancingactivities
Proceeds from borrowings 1,031 92
Repayment of borrowings (131) (25)
Distribution/ Dividend paid 19 (3,258) (3,765)
Netcashflowusedinfinancingactivities (2,358) (3,698)
Net increase in cash and cash equivalents 1,432 426
Cash and cash equivalents at the beginning of the year 5,925 5,499
Cash and cash equivalents at the end of the year 20(a) 7,357 5,925
The above consolidated statement of cash flows should be read in conjunction with the accompanying notes.
PERTH MARKETS GROUP LIMITED

Page 31
ANNUAL REPORT 2020
1. Corporate information
The consolidated financial statements of Perth Markets Group Limited (PMG) and its subsidiaries (Group) for the year ended 30 June 2020 were authorised for issue in accordance with a resolution of the directors on 25 August 2020.
PMG is a public unlisted for-profit company limited by shares and incorporated and domiciled in Australia.
Further information on the nature of the operations and principal activities of the Group is provided in the directors’ report. Information on the Group’s structure is provided in Note 17. Information on other related party relationships of the Group is provided in Note 17.
These general purpose financial statements have been prepared in accordance with Australian Accounting Standards and Interpretations issued by the Australian Accounting Standard Board (‘AASB’) and the Corporations Act 2001, as appropriate for for-profit oriented entities. These financial statements also comply with International Financial Reporting Standards as issued by the International Accounting Standard Board (‘IASB’).
2.Significantaccountingpolicies
2.1 Basis of preparationThe financial report is a general purpose financial report, which has been prepared in accordance with the requirements of the Corporations Act 2001, Australian Accounting Standards and other authoritative pronouncements of the Australian Accounting Standards Board (AASB).
This financial report has been prepared on a historical cost basis, except for investment properties, derivative financial instruments, debt and equity financial assets, and contingent consideration that have been measured at fair value. The carrying values of recognised assets and liabilities that are designated as hedged items in fair value hedges that would otherwise be carried at amortised cost are adjusted to recognise changes in the fair values attributable to the risks that are being hedged in effective hedge relationships.
The financial report is presented in Australian dollars and all values are rounded to the nearest thousand ($k), except when otherwise indicated under the option available to the company under ASIC Corporations (Rounding in Financial/Directors’ Reports) Instrument 2016/191.
The consolidated financial statements provide comparative information in respect of the previous period of Perth Markets Limited and its controlled entities. The Scheme of Arrangement that was entered into on 1 October 2019 resulted in the creation of a new Corporate holding company Perth Markets Group Limited. The underlying nature and assets of the business remained the same during this period and no material impact has occurred to the operations of the Group from the Structure change.
2.2 Basis of consolidation The consolidated financial statements comprise the financial statements of the Company and each of its wholly owned subsidiaries as at 30 June 2020. Control is achieved when the Group is exposed, or has rights, to variable returns from its involvement with the investee and has the ability to affect those returns through its power over the investee. Specifically, the Group controls an investee if, and only if, the Group has:
• Power over the investee (i.e. existing rights that give it the current ability to direct the relevant activities of the investee)
• Exposure, or rights, to variable returns from its involvement with the investee
• The ability to use its power over the investee to affect its returns
Generally, there is a presumption that a majority of voting rights results in control.
Notes to the Consolidated Financial Statements

Page 32
The Group re-assesses whether or not it controls an investee if facts and circumstances indicate that there are changes to one or more of the three elements of control. Consolidation of a subsidiary begins when the Group obtains control over the subsidiary and ceases when the Group loses control of the subsidiary. Assets, liabilities, income and expenses of a subsidiary acquired or disposed of during the year are included in the consolidated financial statements from the date the Group gains control until the date the Group ceases to control the subsidiary.
All intra-group assets and liabilities, equity, income, expenses and cash flows relating to transactions between members of the Group are eliminated in full on consolidation.
2.3 SummaryofSignificantAccountingPolicies
(a) Currentversusnon-currentclassificationThe Group presents assets and liabilities in the statement of financial position based on current/non-current classification. An asset is current when it is:
• Expected to be realised or intended to be sold or consumed in the normal operating cycle,
• Held primarily for the purpose of trading,
• Expected to be realised within twelve months after the reporting period, or
• Cash or cash equivalent unless restricted from being exchanged or used to settle a liability for at least twelve months after the reporting period.
All other assets are classified as non-current.
A liability is current when:
• It is expected to be settled in the normal operating cycle
• It is held primarily for the purpose of trading
• It is due to be settled within twelve months after the reporting period, or
• There is no unconditional right to defer the settlement of the liability for at least twelve months after the reporting period.
The Group classifies all other liabilities as non-current.
Deferred tax assets and liabilities are classified as non-current assets and liabilities.
(b) Fair value measurementThe Group measures financial instruments such as derivatives, and non-financial assets such as investment properties, at fair value at each balance sheet date. Fair value is the price that would be received to sell an asset or paid to transfer a liability in an orderly transaction between market participants at the measurement date.
The fair value measurement is based on the presumption that the transaction to sell the asset or transfer the liability takes place either:
• In the principal market for the asset or liability, or
• In the absence of a principal market, in the most advantageous market for the asset or liability.
The principal or the most advantageous market must be accessible by the Group. The fair value of an asset or a liability is measured using the assumptions that market participants would use when pricing the asset or liability, assuming that market participants act in their economic best interest. A fair value measurement of a non-financial asset takes into account a market participant’s ability to generate economic benefits by using the asset in its highest and best use or by selling it to another market participant that would use the asset in its highest and best use.
PERTH MARKETS GROUP LIMITED

Page 33
ANNUAL REPORT 2020
The Group uses valuation techniques (including the engagement of an independent and qualified valuer) that are appropriate in the circumstances and for which sufficient data are available to measure fair value, maximising the use of relevant observable inputs and minimising the use of unobservable inputs.
For the purpose of fair value disclosures, the Group has determined classes of assets and liabilities on the basis of the nature, characteristics and risks of the asset or liability and the level of the fair value hierarchy, as explained above.
(c) Income Tax
Current income taxCurrent income tax assets and liabilities are measured at the amount expected to be recovered from or paid to the taxation authorities. The tax rates and tax laws used to compute the amount are those that are enacted or substantively enacted at the reporting date in the countries where the Group operates and generates taxable income.
Current income tax relating to items recognised directly in equity is recognised in equity and not in the statement of profit or loss. Management periodically evaluates positions taken in the tax returns with respect to situations in which applicable tax regulations are subject to interpretation and establishes provisions where appropriate.
Deferred taxDeferred tax is provided using the liability method on temporary differences between the tax bases of assets and liabilities and their carrying amounts for financial reporting purposes at the reporting date.
Deferred tax liabilities are recognised for all taxable temporary differences, except:
• When the deferred tax liability arises from the initial recognition of goodwill or an asset or liability in a transaction that is not a business combination and, at the time of the transaction, affects neither the accounting profit nor taxable profit or loss
• In respect of taxable temporary differences associated with investments in subsidiaries, associates and interests in joint arrangements, when the timing of the reversal of the temporary differences can be controlled and it is probable that the temporary differences will not reverse in the foreseeable future.
Deferred tax assets are recognised for all deductible temporary differences, the carry forward of unused tax credits and any unused tax losses. Deferred tax assets are recognised to the extent that it is probable that taxable profit will be available against which the deductible temporary differences, and the carry forward of unused tax credits and unused tax losses can be utilised.
Deferred tax assets and liabilities are measured at the tax rates that are expected to apply in the year when the asset is realised or the liability is settled, based on tax rates (and tax laws) that have been enacted or substantively enacted at the reporting date.
The Group offsets deferred tax assets and deferred tax liabilities if and only if it has a legally enforceable right to set off current tax assets and current tax liabilities and the deferred tax assets and deferred tax liabilities relate to income taxes levied by the same taxation authority on either the same taxable entity or different taxable entities which intend either to settle current tax liabilities and assets on a net basis, or to realise the assets and settle the liabilities simultaneously, in each future period in which significant amounts of deferred tax liabilities or assets are expected to be settled or recovered.
(d) Goods and services tax (GST)Revenues, expenses and assets are recognised net of the amount of GST, except:
• When the GST incurred on a sale or purchase of assets or services is not payable to or recoverable from the taxation authority, in which case the GST is recognised as part of the revenue or the expense item or as part of the cost of acquisition of the asset, as applicable, or
• When receivables and payables are stated with the amount of GST included.

Page 34
The net amount of GST recoverable from, or payable to, the taxation authority is included as part of receivables or payables in the statement of financial position. Commitments and contingencies are disclosed net of the amount of GST recoverable from, or payable to, the taxation authority.
Cash flows are included in the statement of cash flows on a gross basis and the GST component of cash flows arising from investing and financing activities, which is recoverable from, or payable to, the taxation authority is classified as part of operating cash flows.
(e) Property, plant and equipmentConstruction in progress is stated at cost, net of accumulated impairment losses, if any. Plant and equipment is stated at cost, net of accumulated depreciation and accumulated impairment losses, if any. Such cost includes the cost of replacing part of the plant and equipment and borrowing costs for long-term construction projects if the recognition criteria are met. When significant parts of plant and equipment are required to be replaced at intervals, the Group depreciates them separately based on their specific useful lives. Likewise, when a major inspection is performed, its cost is recognised in the carrying amount of the plant and equipment as a replacement if the recognition criteria are satisfied. All other repair and maintenance costs are recognised in profit or loss as incurred. The present value of the expected cost for the decommissioning of an asset after its use is included in the cost of the respective asset if the recognition criteria for a provision are met.
(f) Investment propertiesInvestment properties are measured initially at cost, including transaction costs. Subsequent to initial recognition, investment properties are stated at fair value, which reflects market conditions at the reporting date. Gains or losses arising from changes in the fair values of investment properties are included in profit or loss in the period in which they arise, including the corresponding tax effect. Fair values are determined based on an annual valuation performed by an accredited external independent valuer applying a valuation model recommended by the International Valuation Standards Committee.
Investment properties are derecognised either when they have been disposed of (i.e., at the date the recipient obtains control) or when they are permanently withdrawn from use and no future economic benefit is expected from their disposal. The difference between the net disposal proceeds and the carrying amount of the asset is recognised in profit or loss in the period of derecognition. In determining the amount of consideration from the derecognition of investment property, the Group considers the effects of variable consideration, existence of a significant financing component, non-cash consideration, and consideration payable to the buyer (if any).
Transfers are made to (or from) investment property only when there is a change in use. For a transfer from investment property to owner-occupied property, the deemed cost for subsequent accounting is the fair value at the date of change in use. If owner-occupied property becomes an investment property, the Group accounts for such property in accordance with the policy stated under property, plant and equipment up to the date of change in use.
(g) Borrowing costsBorrowing costs directly attributable to the acquisition, construction or production of an asset that necessarily takes a substantial period of time to get ready for its intended use or sale are capitalised as part of the cost of the asset.
All other borrowing costs are expensed in the period in which they occur.
(h) Derivativefinancialinstrumentsandhedgeaccounting
Initial recognition and subsequent measurementThe Group uses derivative financial instruments, such as interest rate swaps to hedge its interest rate risks. Such derivative financial instruments are initially recognised at fair value on the date on which a derivative contract is entered into and are subsequently remeasured at fair value. Derivatives are carried as financial assets when the fair value is positive and as financial liabilities when the fair value is negative.
PERTH MARKETS GROUP LIMITED
Page 35
For the purpose of hedge accounting, hedges are classified as:
• Fair value hedges when hedging the exposure to changes in the fair value of a recognised asset or liability or an unrecognised firm commitment,
• Cash flow hedges when hedging the exposure to variability in cash flows that is either attributable to a particular risk associated with a recognised asset or liability or a highly probable forecast transaction or the foreign currency risk in an unrecognised firm commitment.
At the inception of a hedge relationship, the Group formally designates and documents the hedge relationship to which it wishes to apply hedge accounting and the risk management objective and strategy for undertaking the hedge.
Fair value hedgesThe change in the fair value of a hedging instrument is recognised in the statement of profit or loss as other expense. The change in the fair value of the hedged item attributable to the risk hedged is recorded as part of the carrying value of the hedged item and is also recognised in the statement of profit or loss as other expense.
For fair value hedges relating to items carried at amortised cost, any adjustment to carrying value is amortised through profit or loss over the remaining term of the hedge using the Effective Interest Rate (EIR) method. The EIR amortisation may begin as soon as an adjustment exists and no later than when the hedged item ceases to be adjusted for changes in its fair value attributable to the risk being hedged.
If the hedged item is derecognised, the unamortised fair value is recognised immediately in profit or loss.
When an unrecognised firm commitment is designated as a hedged item, the subsequent cumulative change in the fair value of the firm commitment attributable to the hedged risk is recognised as an asset or liability with a corresponding gain or loss recognised in profit or loss.
(i) ProvisionsProvisions are liabilities of uncertain timing or amount and are recognised where there is a present legal or constructive obligation as a result of a past event and when the outflow of resources embodying economic benefits is probable and a reliable estimate can be made of the amount of the obligation. Provisions are reviewed at the end of each reporting period.
(j) Sick leaveLiabilities for sick leave are recognised when it is probable that sick leave paid in the future will be greater than the entitlement that will accrue in the future.
Past history indicates that on average, sick leave taken each reporting period is less than the entitlement accrued. This trend is expected to continue in future periods. Accordingly, it is unlikely that existing accumulated entitlements will be used by employees and no liability for unused sick leave entitlements is recognised. As sick leave is non-vesting, an expense is recognised in the profit or loss for this leave as it is taken.
(k) SuperannuationThe Group does not participate in any employer-sponsored defined benefit superannuation plans for its employees. All superannuation payments by the Group are in accordance with the relevant Superannuation Guarantee legislation.
(l) Employment on costsEmployment on-costs, including workers’ compensation insurance, are not employee benefits and are recognised separately as liabilities and expenses when the employment to which they relate has occurred. Employment on-costs are included as part of ‘Salaries and board fees’ and ‘staff costs’. The related liability is included in ‘Employee benefit obligations’ note 15.
ANNUAL REPORT 2020

Page 36
3.Significantaccountingjudgements,estimatesandassumptions
The preparation of the Group’s consolidated financial statements requires management to make judgements, estimates and assumptions that affect the reported amounts of revenues, expenses, assets and liabilities, and the accompanying disclosures, and the disclosure of contingent liabilities. Uncertainty about these assumptions and estimates could result in outcomes that require a material adjustment to the carrying amount of assets or liabilities affected in future periods.
JudgementsIn the process of applying the Group’s accounting policies, management has made the following judgements, which have the most significant effect on the amounts recognised in the consolidated financial statements.
Propertyleaseclassification–GroupaslessorThe Group has entered into commercial property leases on its investment property portfolio. The Group has determined, based on an evaluation of the terms and conditions of the arrangements, such as the lease term not constituting a major part of the economic life of the commercial property and the present value of the minimum lease payments not amounting to substantially all of the fair value of the commercial property, that it retains substantially all the significant risks and rewards incidental to ownership of these properties and accounts for the contracts as operating leases.
Estimates and assumptionsThe key assumptions concerning the future and other key sources of estimation uncertainty at the reporting date that have a significant risk of causing a material adjustment to the carrying amounts of assets and liabilities within the next financial year are described below. The Group based its assumptions and estimates on parameters available when the consolidated financial statements were prepared. Existing circumstances and assumptions about future developments, however, may change due to market changes or circumstances arising that are beyond the control of the Group. Such changes are reflected in the assumptions when they occur.
Revaluation of property, plant and equipment and investment propertiesThe Group carries its investment properties at fair value, with changes in fair value being recognised in the statement of profit or loss. For investment properties, a valuation methodology using a combination of methods including the discounted cash flow (DCF) method was used. The Group engaged an independent valuation specialist to assess the fair values as at 31 December 2019 for the investment properties.
The key assumptions used to determine the fair value of the investment properties and office properties and sensitivity analyses are provided in Notes 11 and 12.
4(a). Revenue
2020 2019
$’000 $’000
Rental revenue 13,103 13,184
Provision of services revenue 9,868 9,591
Weekend markets revenue 675 1,052
Total revenue 23,646 23,827
Revenue is recognised for the major business activities using the methods outlined below.
Rental revenueThe Group enters into contractual rental arrangements with tenants for its investment properties. These arrangements specify the duration of the lease, amount of the lease payable (usually on a monthly basis) and lease incentives (if any). Rental revenue from investment properties is recognised on a straight-line basis over the lease term based on contractual arrangements.
PERTH MARKETS GROUP LIMITED

Page 37
Revenue not received at the reporting date is reflected in the statement of financial position as a receivable or if paid in advance, as rent in advance (unearned income). Lease incentives granted are considered an integral part of the total rental revenue and are recognised as a reduction in rental income over the term of the lease, on a straight-line basis. Contingent rentals are recognised as income in the periods in which they are earned.
Provision of services revenue and Weekend markets revenueRevenue for services is recognised over time as those services are provided. These services are mainly provision of electricity and waste transfer. Invoices for these services are issued on a monthly basis and are usually payable within 30 days.
Under AASB 15, the total consideration in the service contracts is allocated to all services based on their relative stand-alone selling prices. The stand-alone selling price is determined based on the price at which the Group sells the services in separate transactions.
Revenue for weekend markets is recognised at the point in time when a fee is payable by the public to access the market during the weekend.
4(b). Other income
2020 2019
$’000 $’000
Interest revenue 19 132
Other revenue 562 306
Total other income 581 438
Interest revenueInterest revenue is recognised as the interest is earned.
Other revenueOther revenue is recognised when it is received or when the right to receive payment is established. Gain or loss on disposal of assets is calculated as the difference between the carrying amount of the asset at the date of disposal and the net proceeds from disposal and is included in the profit or loss in the year of disposal. Where the gain or loss is obtained from sale of properties, it is recognised when the control has transferred to the buyer, which is normally when legal title passes to the buyer.
5. Operational expenses
2020 2019
$’000 $’000
Information technology and telecommunications 211 248
Professional fees 566 596
Salaries and board fees (excl. contractors) 1,577 1,560
Legal fees 609 520
Land tax 1,043 1,317
Other 1,030 1,060
Total operational expenses 5,036 5,301
ANNUAL REPORT 2020

Page 38
6. Commercial site management expense
2020 2019
$’000 $’000
Rates and water consumption 2,327 2,069
Cleaning and waste removal 650 748
Electricity 3,343 3,212
Repairs and maintenance 570 735
Insurance 469 422
Staff costs 1,566 1,399
Other 496 591
Total commercial site management expenses 9,421 9,176
7.Incometaxexpense/(benefit)
Current tax expense
Current tax expense/(benefit) 1,259 248
Deferred tax expense/(benefit) (833) (83)
Under/(over) provision (24) 22
Previously unrecognised deferred taxes 13,573 -
Totalincometaxexpense/(benefit) 13,975 187
Numerical reconciliation of income tax expense to prima facie tax payable
Profit/(loss) before income tax expense/(benefit) 8,759 11,699
Income tax at the Australian tax rate of 27.5% 2,409 3,217
Unrecognised tax losses and other deferred tax assets
12,310 -
Tax effect amounts which are not deductible/(taxable)
(353) (3,052)
Timing differences not previously recognised (367) -
Under/(over) provision (24) 22
Totalincometaxexpense/(benefit) 13,975 187
Amounts recognised directly in other comprehensive income
Deferred tax expense/(benefit) relating to change in the fair value of cash flow hedges (1,419) -
PERTH MARKETS GROUP LIMITED

Page 39
ANNUAL REPORT 2020
2020 2019
$’000 $’000Deferred tax assets and liabilities comprise temporarydifferencesattributableto:
Land & properties (12,213) -
Deferred settlement consideration (493) -
Plant and equipment (105) -
Total deferred tax liabilities (12,811) -
Deferred tax assets
Interest rate swap 1,419 -
Other 197 180
Total deferred tax assets 1,616 180
Total deferred tax liabilities (12,811) -
Total deferred tax assets 1,616 180
Net deferred tax (liabilities)/assets (11,195) 180
Franking credits available for use in subsequent financial years 117 463
Recognition of deferred tax liability for the first time following the Corporate Restructure on 1 October 2019, the majority of which is relating to the revaluation of Investment Properties since the date of acquisition of $12,310k. The deferred tax liability represents a future tax obligation payable on sale of Investment Properties, should that occur.
Judgements and EstimatesThe Group has applied a 27.5% tax rate for year ended 2019/20 and the 2020/21 as the Group has an aggregated revenue threshold of less than $50 million from aggregated turnover from ordinary income and the ordinary income of any connected or affiliate entity. The Group received a private ruling from ATO for the 2018/2019 financial year to confirm that Brisbane Market Limited, while holding 41.73% of PMG, did not control PMG and therefore the aggregation of revenue rule did not apply. The tax rate applied to income tax for Perth Markets Limited for the 2018/2019 year was 27.5%.
PMG has applied to the ATO for a private tax ruling for the 2019/2020 year on the same basis that BML does not control PMG and therefore a tax rate of 27.5% can be applied by PMG to its taxable income for the current financial year. At the date of this report, the ATO tax ruling has not been received by PMG, however as the underlying business, operations and activities remain fundamentally the same as that which existed with Perth Markets Limited in the 2018/2019 year, we believe that there is a strong likelihood of the ATO providing a favourable tax ruling on the question of BML control of PMG. As such PMG has applied a tax rate of 27.5% for the 2019/2020 year against its taxable income.
Should the ATO provide a negative tax ruling, there will be a debt impact to the income tax expense in the profit and loss account of $2.36m, of which $2.24m will credit to the deferred tax liability and credit to the current tax liability (income tax payable) account of $114k. The deferred tax liability relates to the future tax payable arising from the increased Investment Property valuations taken to account since the Market City site was acquired, should the asset be sold in future periods.
The impact would result in shareholders receiving an amended dividend statement to show the dividend received during the year franked at 30% in lieu of 27.5%, providing a positive benefit to their income.

Page 40
PERTH MARKETS GROUP LIMITED
8. Receivables
2020 2019
$’000 $’000
Receivables 278 349
Total current receivables 278 349
ClassificationandmeasurementofreceivablesReceivables are recognised and carried at original invoice amount less an allowance for any uncollectible amounts (i.e. impairment). The collectability of receivables is reviewed on an ongoing basis and any receivables identified as uncollectible are written off against the allowance account. The carrying amount is equivalent to fair value as it is due for settlement within 30 days and therefore all classified as current.
In most cases the Group holds collateral as security or other credit enhancements relating to receivables for lease rentals.
These normally include a bank guarantee or cash security deposit held on trust.
9(a).Otherfinancialassets
2020 2019
$’000 $’000
Non-current
Share investment, fair value through profit or loss(a) 3,403 3,281
3,403 3,281
(a) The Group has purchased 937,500 shares in Brisbane Markets Limited (BML) for $3.20 per share (issue price). The shares were fully paid as at 30 June 2020. They have been assessed to have a fair value of $3.63 based on the average sale price of BML shares traded for the quarter ended 30 June 2020. This valuation resulted in a fair value gain of $122k for the year ended 30 June 2020.
9(b). Other assets
2020 2019
$’000 $’000
Current
Prepayments611 449
Inventories 49 44
Total current 660 493
Non-current
Receipts from customer security deposits 1,605 1,694
Software capitalisation 16 3
Total non-current 1,621 1,697

Page 41
ANNUAL REPORT 2020
Receipts from customer security depositsReceipts from customer security deposits are held as cash in a separate bank account and are not expected to be used for any other purpose than refunding or utilising the security deposit, which is shown as a liability in note 16. Amounts held as customer security deposits are therefore restricted and therefore not expected to be used to settle a liability for at least twelve months after the reporting date.
10. Property, plant and equipment
2020 2019
$’000 $’000
Plant and equipment comprises:
Fixed assets under construction2,866 519
Property, plant and equipment at cost 6,149 5,941
Less: Accumulated depreciation (1,697) (1,294)
7,318 5,166
Reconciliation:
Carrying amount at start of year 5,166 4,746
Additions 2,575 844
Disposals (20) -
Depreciation (403) (424)
Carrying amount at end of year 7,318 5,166
Measurement and recognition of property, plant and equipment
Initial recognition and measurementAll items of property, plant and equipment are initially recognised at cost.
For items of property, plant and equipment acquired at no cost or for nominal cost, the cost is the fair value at the date of acquisition.
Subsequent measurementSubsequent to initial recognition as an asset, items of property, plant and equipment are stated at historical cost less accumulated depreciation and accumulated impairment losses.
De-recognitionUpon disposal or de-recognition of an item of property, plant and equipment, any gain or loss is recognised in the consolidated statement of profit or loss.
DepreciationAll non-current assets having a limited useful life are systematically depreciated over their estimated useful lives in a manner that reflects the consumption of their future economic benefits.
Depreciation is calculated using the straight line method, using rates which are reviewed annually. Estimated useful lives for each class of depreciable assets are:
• Plant and equipment 3 to 20 years • Office equipment 5 to 10 years
Construction in progressProperty under construction held for future use as investment property is also carried at fair value unless fair value cannot yet be reliably determined. If fair value cannot yet be reliably determined, the property will be accounted for at cost until either the fair value can be reliably determined or when construction is complete.
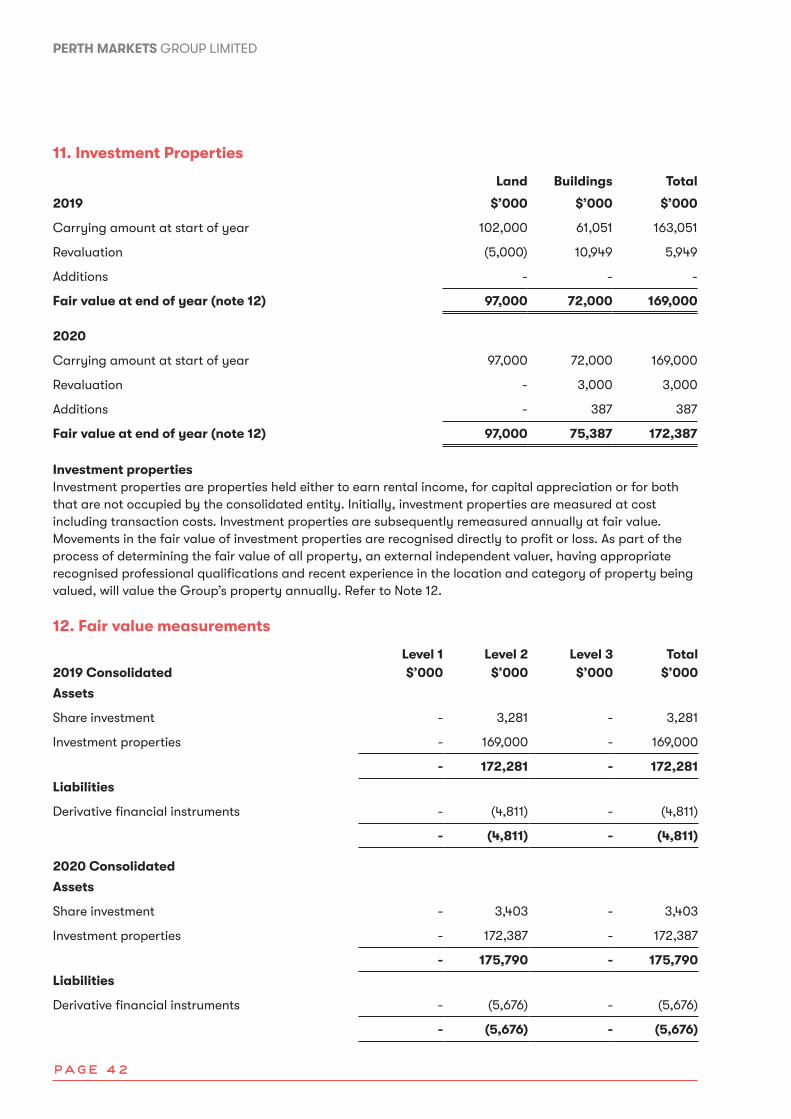
Page 42
PERTH MARKETS GROUP LIMITED
11. Investment Properties
Land Buildings Total
2019 $’000 $’000 $’000
Carrying amount at start of year 102,000 61,051 163,051
Revaluation (5,000) 10,949 5,949
Additions - - -
Fair value at end of year (note 12) 97,000 72,000 169,000
2020
Carrying amount at start of year 97,000 72,000 169,000
Revaluation - 3,000 3,000
Additions - 387 387
Fair value at end of year (note 12) 97,000 75,387 172,387
Investment propertiesInvestment properties are properties held either to earn rental income, for capital appreciation or for both that are not occupied by the consolidated entity. Initially, investment properties are measured at cost including transaction costs. Investment properties are subsequently remeasured annually at fair value. Movements in the fair value of investment properties are recognised directly to profit or loss. As part of the process of determining the fair value of all property, an external independent valuer, having appropriate recognised professional qualifications and recent experience in the location and category of property being valued, will value the Group’s property annually. Refer to Note 12.
12. Fair value measurements
Level 1 Level 2 Level 3 Total2019 Consolidated $’000 $’000 $’000 $’000
Assets
Share investment - 3,281 - 3,281
Investment properties - 169,000 - 169,000
- 172,281 - 172,281
Liabilities
Derivative financial instruments - (4,811) - (4,811)
- (4,811) - (4,811)
2020 Consolidated
Assets
Share investment - 3,403 - 3,403
Investment properties - 172,387 - 172,387
- 175,790 - 175,790
Liabilities
Derivative financial instruments - (5,676) - (5,676)
- (5,676) - (5,676)

Page 43
ANNUAL REPORT 2020
• Level 1: The fair value of financial instruments traded in active markets (such as publicly traded derivatives and equity securities) is based on quoted market prices at the end of the reporting period. The quoted market price used for financial assets held by the group is the current bid price. These instruments are included in level 1.
• Level 2: The fair value of financial instruments that are not traded in an active market (for example, over-the-counter derivatives) is determined using valuation techniques which maximise the use of observable market data and rely as little as possible on entity-specific estimates. If all significant inputs required to fair value an instrument are observable, the instrument is included in level 2.
• Level 3: If one or more of the significant inputs is not based on observable market data, the instrument is included in level 3.
There were no transfers between Levels 1, 2 or 3 during the current and previous period.
Valuation techniques to derive Level 2 fair valuesLevel 2 fair values are derived using the income-based approach to arrive at a market value type valuation. The cash flows associated with the asset are discounted using a discount rate that reflects the cost of capital risk and required return.
They are derived from market-based information, such as rental yields or interest rate forward curves. An independent valuation of the investment properties was completed as at 3 December 2019 by Knight Frank (FY19: Knight Frank), a qualified valuer with relevant experience in the type of property being valued.
The Share investment is in an unlisted public company that is thinly traded. The direct method of valuation has been adopted as the most appropriate valuation method. The value of the share trades is published. Trading of these shares is considered too infrequent to be classified as level 1 and so are disclosed as level 2.
13. Payables
2020 2019
$’000 $’000
Current
Accounts payable714 507
Sundry creditors 887 552
Employee salaries payable - 6
Interest payable 113 39
Net GST payable 216 380
Income tax payable/(receivable) 1,162 110
Corporate purchasing card 4 28
Unpaid distribution - 1,496
Total current payable 3,096 3,118
The change in income tax payable from prior year to current year is due to the corporate restructure that occurred on 1 October 2019 (refer to directors’ report and note 17 (1)).
Trade and other payablesTrade and other payables are recognised at the amounts payable when the Group becomes obliged to make future payments as a result of a purchase of assets or services. The carrying amount is equivalent to fair value, as they are generally settled within 30 days. Trade and other payables are unsecured.

Page 44
PERTH MARKETS GROUP LIMITED
14. Borrowings (Secured)
2020 2019
$’000 $’000
Current
Term loan (net of associated costs)- 75,112
Total current - 75,112
Non-current
Hire Purchase - 131
Term loan (net of associated costs) 76,331 -
Total non-current 76,331 131
Terms and conditions relating to the secured loan(a) The debt facility with the Commonwealth Bank Limited is $87,400k and will expire on 1 October 2022.
Interest rate risks associated with the liabilities are managed with interest rate swaps arrangements. As at 30 June 2020, the company had drawn $76,331k of this $87,400k facility.
(b) Loans are secured by a first registered mortgage over all current and future real property at the Perth Markets site and a general security interest over the assets and undertakings of the company. The carrying amount of the investment property at 30 June 2020 is $172,387k.
(c) Under the terms of the loan facility, there is a requirement to report financial undertaking to the Commonwealth Bank Limited on a 6-monthly basis. These undertakings include:
a. The loan to value ratio (ratio of the total debt to the property value) is not greater than 55% on each calculation date,
b. The interest cover ratio (ratio between EBITDA to interest expenses) is not less than 2.5 times on each calculation date occurring prior to and including 30 June 2020.
Borrowings (Secured)All borrowings are initially recognised at cost, being the fair value of the net proceeds received. Subsequent measurement is at amortised cost using the EIR method.
At the balance date the Group has the following undrawn facilities with the Commonwealth Bank Limited:
• Overdraft facility with a limit of $2,000,000
• Asset Finance Leasing facility with a limit of $500,000
• Construction facility $7,568,000
• Cash advance facility $901,000
These facilities form part of an overall 3-year financing facility with Commonwealth Bank Limited.
Terms of the borrowingsThe Group entered into a three-year, $84,800,000 revolving cash advance facility with the Commonwealth Bank Limited on 17 July 2019. The facility is interest bearing at a floating rate of interest linked to BBSY and was secured by the assets of the Group. The Group has in place an Interest Rate hedge against the term borrowing. Information on the Group’s management of interest rate risk is set out in note 23.

Page 45
ANNUAL REPORT 2020
Reconciliationofborrowingsarisingfromfinancingactivities:
2018 Cashflows Non-cash changes 2019
Addition Fair value changes
$’000 $’000 $’000 $’000 $’000
Hire Purchase 64 (15) - 82 131
Term loan (net of associated costs) 74,861 - - 251 75,112
Total non-current 74,925 (15) - 333 75,243
2019 Cashflows Non-cash changes 2020
Addition Fair value changes
$’000 $’000 $’000 $’000 $’000
Hire Purchase 131 (131) - - -
Term loan (net of associated costs) 75,112 - 1,219 - 76,331
Total non-current 75,243 (131) 1,219 - 76,331
15.Employeebenefitobligations
2020 2019
$’000 $’000
Current
Employee benefit obligations
Annual leave 116 94
Total current 116 94
Non-current
Employee benefit obligations
Long service leave 28 34
Total non-current 28 34
Current leave obligation expected to be settled after 12 months - -
Employeebenefitobligations
Annual leave and long service leave
The liability for annual and long service leave expected to be settled within 12 months after the reporting period is recognised and measured at the undiscounted amounts expected to be paid when the liabilities are settled.
Any annual leave that is not expected to be settled wholly within 12 months after the end of the reporting period is considered to be ‘other long-term employee benefits’.

Page 46
PERTH MARKETS GROUP LIMITED
Annual and long service leave expected to be settled more than 12 months after the reporting period is measured at the present value of amounts expected to be paid when the liabilities are settled. Leave liabilities are in respect of services provided by employees up to the end of the reporting period.
When assessing expected future payments, consideration is given to expectations of future wage and salary levels including non-salary components such as employer superannuation contributions. In addition, the long service leave liability also considers the experience of employee departures and periods of service.
The expected future payments are discounted using market yields at the end of the reporting period on national government bonds with terms to maturity that match, as closely as possible, the estimated future cash outflows.
Annual leave and unconditional long service leave provisions are classified as current liabilities when the Group does not have an unconditional right to defer settlement of the liability for at least 12 months after the reporting period.
16. Other Liabilities
2020 2019
$’000 $’000
Current
Deposit – magnetic access cards80 78
Total current 80 78
Non-current
Security deposits (Tenant leases) 1,605 1,695
Deferred settlement consideration 8,030 7,729
Derivative financial liabilities – Cash flow hedges 5,676 4,811
Total non-current 15,311 14,235
Deferred settlement considerationDeferred settlement consideration relates to $10 million payable to the Western Australian Government for the acquisition of Market City on 31 March 2026. The liability was initially recognised at its fair value and subsequently measured at amortised cost using the effective interest method. The amount is classified as non-current at the reporting date as the Group has an unconditional right to defer settlement of the liability until 31 March 2026.
DerivativesThe Group‘s accounting policy for its cash flow hedges is set out in note 2.3 (h). For information about the methods and assumptions used in determining the fair value of derivatives, please refer to note 3.
17. Related Party Disclosure
Parent EntityPerth Markets Group Limited (1)
SubsidiariesInterests in subsidiaries are set out below
The consolidated financial statements incorporate the assets, liabilities and results of the following wholly-owned subsidiaries in accordance with the accounting policy described in note 2.2.
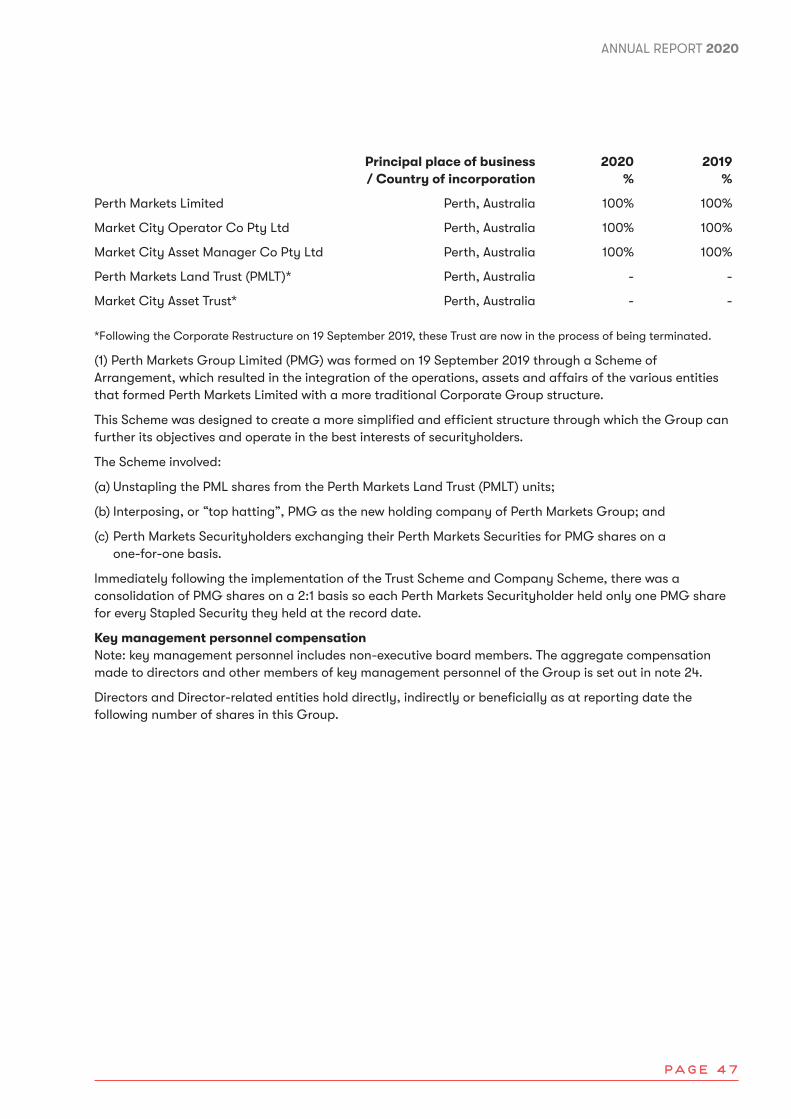
Page 47
ANNUAL REPORT 2020
Principal place of business / Country of incorporation
2020 %
2019 %
Perth Markets Limited Perth, Australia 100% 100%
Market City Operator Co Pty Ltd Perth, Australia 100% 100%
Market City Asset Manager Co Pty Ltd Perth, Australia 100% 100%
Perth Markets Land Trust (PMLT)* Perth, Australia - -
Market City Asset Trust* Perth, Australia - -
*Following the Corporate Restructure on 19 September 2019, these Trust are now in the process of being terminated.
(1) Perth Markets Group Limited (PMG) was formed on 19 September 2019 through a Scheme of Arrangement, which resulted in the integration of the operations, assets and affairs of the various entities that formed Perth Markets Limited with a more traditional Corporate Group structure.
This Scheme was designed to create a more simplified and efficient structure through which the Group can further its objectives and operate in the best interests of securityholders.
The Scheme involved:
(a) Unstapling the PML shares from the Perth Markets Land Trust (PMLT) units;
(b) Interposing, or “top hatting”, PMG as the new holding company of Perth Markets Group; and
(c) Perth Markets Securityholders exchanging their Perth Markets Securities for PMG shares on a one-for-one basis.
Immediately following the implementation of the Trust Scheme and Company Scheme, there was a consolidation of PMG shares on a 2:1 basis so each Perth Markets Securityholder held only one PMG share for every Stapled Security they held at the record date.
Key management personnel compensationNote: key management personnel includes non-executive board members. The aggregate compensation made to directors and other members of key management personnel of the Group is set out in note 24.
Directors and Director-related entities hold directly, indirectly or beneficially as at reporting date the following number of shares in this Group.
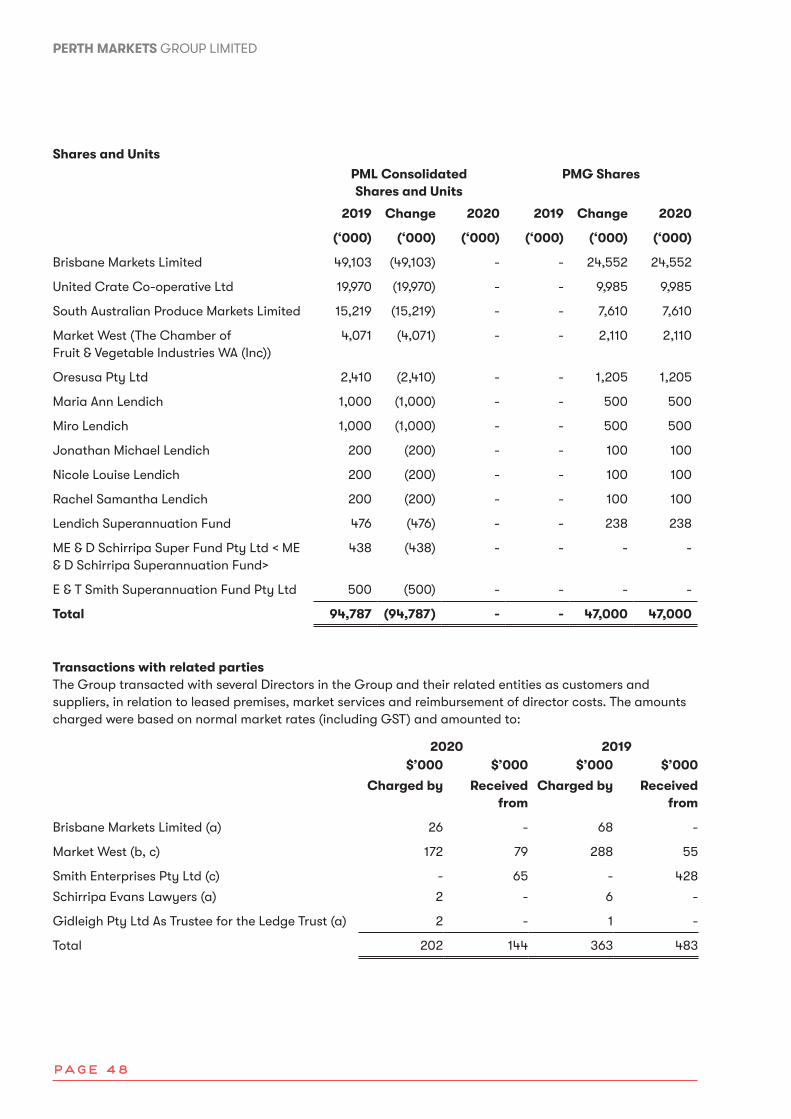
Page 48
PERTH MARKETS GROUP LIMITED
Shares and Units
PML Consolidated Shares and Units
PMG Shares
2019 Change 2020 2019 Change 2020
(‘000) (‘000) (‘000) (‘000) (‘000) (‘000)
Brisbane Markets Limited 49,103 (49,103) - - 24,552 24,552
United Crate Co-operative Ltd 19,970 (19,970) - - 9,985 9,985
South Australian Produce Markets Limited 15,219 (15,219) - - 7,610 7,610
Market West (The Chamber of Fruit & Vegetable Industries WA (Inc))
4,071 (4,071) - - 2,110 2,110
Oresusa Pty Ltd 2,410 (2,410) - - 1,205 1,205
Maria Ann Lendich 1,000 (1,000) - - 500 500
Miro Lendich 1,000 (1,000) - - 500 500
Jonathan Michael Lendich 200 (200) - - 100 100
Nicole Louise Lendich 200 (200) - - 100 100
Rachel Samantha Lendich 200 (200) - - 100 100
Lendich Superannuation Fund 476 (476) - - 238 238
ME & D Schirripa Super Fund Pty Ltd < ME & D Schirripa Superannuation Fund>
438 (438) - - - -
E & T Smith Superannuation Fund Pty Ltd 500 (500) - - - -
Total 94,787 (94,787) - - 47,000 47,000
Transactions with related partiesThe Group transacted with several Directors in the Group and their related entities as customers and suppliers, in relation to leased premises, market services and reimbursement of director costs. The amounts charged were based on normal market rates (including GST) and amounted to:
2020 2019$’000 $’000 $’000 $’000
Charged by Received from
Charged by Received from
Brisbane Markets Limited (a) 26 - 68 -
Market West (b, c) 172 79 288 55
Smith Enterprises Pty Ltd (c) - 65 - 428
Schirripa Evans Lawyers (a) 2 - 6 -
Gidleigh Pty Ltd As Trustee for the Ledge Trust (a) 2 - 1 -
Total 202 144 363 483

Page 49
ANNUAL REPORT 2020
Director Related entities
A. Young Brisbane Markets Limited
P. Skinner Market West (Chamber of Fruit & Vegetable Industries in Western Australia (Inc))
E. Smith (resigned) Smith Enterprises Pty Ltd
D. Schirripa (resigned) Schirripa Evans Lawyers
M. Lendich Miro Lendich family entities and United Crate Co-operative Ltd
S. Cole Gidleigh Pty Ltd as Trustee for the Ledge Trust
J. Ryan Market West (Chamber of Fruit & Vegetable Industries in Western Australia (Inc))
These amounts exclude any amount payable as a director fee as these are disclosed in Remuneration of members of the accountable Group and senior officers at note 24. These amounts are the total value of any amount receivable or payable from or to the related party and relate to:
(a) Reimbursement for travel expenses for Board representation at Board meetings.
(b) Acquisition of gas for forklift operations, for the Waste Transfer Facility (2020: $9k; 2019: $8k), Industry Market Subsidy (2020: $36k, 2019: $0k), Golf day (2020: $11k, 2019: $0k), contribution to the National Retailer Program (2020: $7k, 2019: $0k), contribution to the Market West Ball (2020: $6k; 2019: $72k), Market price reporting (2020: $51k; 2019: $50k), Retailer of the Year (2020: $37k, 2019: $19k), Produce Executive Program (2020: $0k, 2019: $16k), Great Green Grocer (2020: $0k, 2019: $110k) and rental income, utilities and other costs (2020: $15k, 2019: $1k).
(c) Rent and tenant outgoing expenses (2020: $127k; 2019: $385k), Utilities, waste disposal and other costs (2020: $17k; 2019: $43k).
18. Contributed Equity
(a) Issued CapitalPMG PML PMLT Consolidated
$’000 $’000 $’000 $’000
Stapled Securities - Balance as at 30 June 2019 - 3,344 51,374 54,718
Issued Shares – Balance as at 30 June 2020 54,718 - - 54,718
Terms and Conditions of Contributed Equity:During the year the Group undertook a capital restructure that resulted in the “transfer” of Stapled Securities of Unit Holders via a Scheme or arrangement to ordinary capital in a new holding company Perth Markets Group Limited (PMG). The transfer resulted in a dollar for dollar “swap” of units for shares in PMG.
Ordinary SharesOrdinary shares have the right to receive dividends as declared, and in the event of winding up the company, to participate in the proceeds from the sale of all surplus assets in portion to the number of, and the amount paid up on shares held. Ordinary shares entitle the holder to one vote, either in person or by proxy, at a meeting of the company.
Capital ManagementThe consolidated entity manages its capital to ensure that the Group will be able to continue as a going concern while maximising the return to stakeholders through optimisation of the debt and equity balance.
The capital structure of the Group consists of debt which includes borrowings disclosed in Note 14, cash and cash equivalents and equity attributable to equity holders of the parent, comprising issued capital, reserves and retained earnings as disclosed in Note 18.
Management effectively manages the consolidated entity’s capital by assessing the consolidated entity’s financial risks and adjusting its capital structure in response to changes in these risks and in the market.
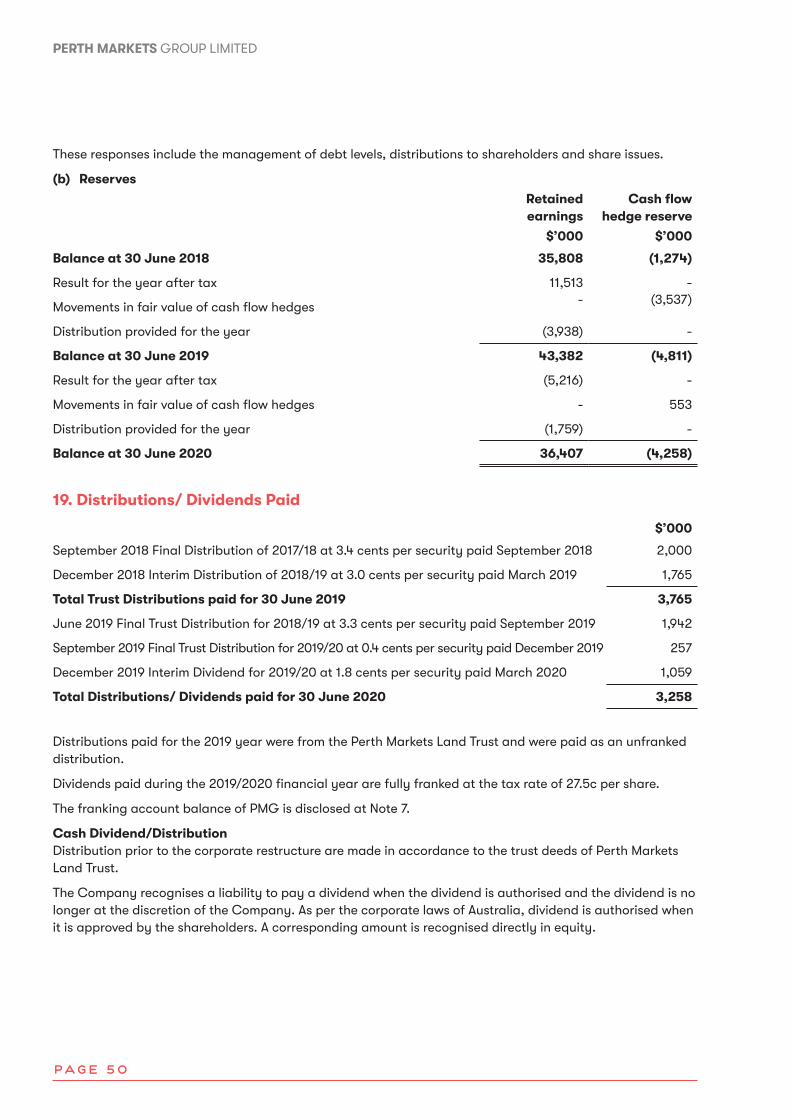
Page 50
These responses include the management of debt levels, distributions to shareholders and share issues.
(b) Reserves
Retained earnings
Cashflowhedge reserve
$’000 $’000
Balance at 30 June 2018 35,808 (1,274)
Result for the year after tax 11,513 -
Movements in fair value of cash flow hedges- (3,537)
Distribution provided for the year (3,938) -
Balance at 30 June 2019 43,382 (4,811)
Result for the year after tax (5,216) -
Movements in fair value of cash flow hedges - 553
Distribution provided for the year (1,759) -
Balance at 30 June 2020 36,407 (4,258)
19. Distributions/ Dividends Paid
$’000
September 2018 Final Distribution of 2017/18 at 3.4 cents per security paid September 2018 2,000
December 2018 Interim Distribution of 2018/19 at 3.0 cents per security paid March 2019 1,765
Total Trust Distributions paid for 30 June 2019 3,765
June 2019 Final Trust Distribution for 2018/19 at 3.3 cents per security paid September 2019 1,942
September 2019 Final Trust Distribution for 2019/20 at 0.4 cents per security paid December 2019 257
December 2019 Interim Dividend for 2019/20 at 1.8 cents per security paid March 2020 1,059
Total Distributions/ Dividends paid for 30 June 2020 3,258
Distributions paid for the 2019 year were from the Perth Markets Land Trust and were paid as an unfranked distribution.
Dividends paid during the 2019/2020 financial year are fully franked at the tax rate of 27.5c per share.
The franking account balance of PMG is disclosed at Note 7.
Cash Dividend/DistributionDistribution prior to the corporate restructure are made in accordance to the trust deeds of Perth Markets Land Trust.
The Company recognises a liability to pay a dividend when the dividend is authorised and the dividend is no longer at the discretion of the Company. As per the corporate laws of Australia, dividend is authorised when it is approved by the shareholders. A corresponding amount is recognised directly in equity.
PERTH MARKETS GROUP LIMITED

Page 51
ANNUAL REPORT 2020
20. Notes to the Statement of Cash Flows
(a) Reconciliation of cash
Cash at the end of the financial year as shown in the Statement of Cash Flows is reconciled to the related items in the Statement of Financial Position as follows:
2020 2019
$’000 $’000
Operating (*) 7,355 5,923
Cash Management 2 2
7,357 5,925
(*) This includes a working capital overdraft facility. In 2020 the account had a balance of $nil (2019: $nil)
(b)Reconciliationofprofitafterincometaxequivalenttonetcashflowsprovidedbyoperatingactivities
2020 2019
$’000 $’000
Profit/(loss) after income tax for the period (5,216) 11,512
Non-operating or non-cash items:
Depreciation and amortisation expense 432 426
Revaluation of investment properties (3,122) (6,230)
Unwind of discounting in interest expense 301 289
(Increase)/decrease in assets:
Receivables 71 (196)
Other assets (167) (42)
Deferred tax asset 13,975 (83)
Increase/(decrease) in liabilities:
Payables 331 378
Provisions 16 (2)
Net cash provided by operating activities 6,621 6,052
Cash and cash equivalentsFor the purpose of the Statement of Cash Flows, cash and cash equivalents (and restricted cash and cash equivalents) comprise cash on hand, net of bank overdrafts. Cash and cash equivalents includes cash on hand and deposits held at call with financial institutions which are subjected to an insignificant risk of changes in value. Bank overdrafts are shown within borrowings in current liabilities in the Statement of Financial Position.
Term deposits are presented as cash equivalents if they have a maturity of three months or less from the date of acquisition.

Page 52
PERTH MARKETS GROUP LIMITED
21. Commitments
Contractual & Operating Lease commitmentsCommitments in relation to operating leases contracted for at the end of the reporting period but not recognised in the financial statements are payable as follows:
2020 2019
$’000 $’000
Within 1 year - 28
Later than 1 year and not later than 5 years - 73
Later than 5 years - -
- 101
Representing:
Non-cancellable contractual & operating leases - 101
- 101
Commitments in relation to finance leases contracted for at the end of the reporting date are payables as follows:
2020 2019
$’000 $’000
Within 1 year - 15
Later than 1 year and not later than 5 years - 39
Later than 5 years - -
- 54
Capital project commitments
Payable not later than 1 year 6,834 -
22. Contingent Liabilities
In addition to the liabilities included in the financial statements, there are no contingent liabilities to be disclosed.

Page 53
ANNUAL REPORT 2020
23. Financial Instruments
The carrying amounts of each of the following categories of financial assets and financial liabilities at the end of the reporting period are as follows:
2020 2019
$’000 $’000
Financial Assets
Cash and cash equivalents 7,357 5,925
Security deposits 1,605 1,695
Receivables 278 349
Other financial assets - -
Share investment (FVTPL) 3,403 3,281
Totalfinancialassets 12,643 11,250
Financial Liabilities
Trade payables 3,096 3,118
Borrowings 76,331 75,243
Deferred consideration 8,030 7,729
Derivative financial instruments 5,676 4,811
Security deposits 1,605 1,695
Totalfinancialliabilities 94,738 92,596
Financial risk management objectives and policies Financial instruments held by the Group are cash and cash equivalents, restricted cash and cash equivalents, borrowings, receivables, and payables. The Group has limited exposure to financial risks. The Group’s overall risk management program focuses on managing the risks identified below.
Credit risk
Credit risk arises from the Group’s receivables and through the Group’s cash balances held by banking institutions.
The maximum exposure to credit risk at end of the reporting period in relation to each class of recognised financial assets is the gross carrying amount of those assets inclusive of any provisions for impairment.
The Group trades only with recognised, creditworthy third parties. The Group’s cash balances are held by Australian banks with investment grade credit ratings. The Group has policies in place to ensure that leases are made to tenants with an appropriate credit history. In addition, receivable balances are monitored on an ongoing basis with the result that the Group’s exposure to bad debts is minimal. At the reporting date, there are no significant concentrations of credit risk.
All tenants with outstanding balances exceeding 5 days are notified of their outstanding debt. If this is not paid within 10 days, another letter is provided and a due date for payment advised. Where the due date is missed, the tenant is sent a default notice.
The Group also has the capacity to charge interest on outstanding balances in accordance with the provisions of the lease.
The allowance for impairment of financial assets is calculated based on objective evidence, such as past experience and current and expected observable data indicating changes in client credit ratings. At reporting date, no impairment of financial assets was required and no amounts were overdue.

Page 54
Liquidity risk
Liquidity risk arises when the Group is unable to meet its financial obligations as they fall due. The Group is exposed to liquidity risk through its approach to capital management and its trading in the normal course of business.
The Group’s objective is to maintain a balance between continuity of funding and flexibility through the use of loans and finance leases. The Group has appropriate procedures to manage cash flows by monitoring forecast cash flows to ensure that sufficient funds are available to meet its commitments.
The Group manages its short term liquidity requirements through rigorous cash management and the availability of a $2 million overdraft facility of which $nil was utilised at reporting date (2019: $nil). The total facility for construction is $8,550k of which $7,568 is unutilised (refer note 14).
Contractual maturities
Carrying amount
Up to 3 months
3-12 months
1-2 years
2-5 years
More than 5 years
Total contractual cashflows
2019 $’000 $’000 $’000 $’000 $’000 $’000 $’000
Non-derivatives
Payables 3,118 3,118 - - - - 3,118
Hire purchase agreements 131 4 12 16 39 - 71
Term borrowings 75,112 642 77,226 - - - 77,868
Deferred consideration * 7,729 - - - - 10,000 10,000
Gross-settled Derivatives
Interest rate swaps – inflow - (201) (480) (518) (1,387) (1,221) (3,807)
Interest rate swaps – outflow 4,811 458 1,227 1,425 3,421 2,087 8,618
90,901 4,021 77,985 923 2,073 10,866 95,868
2020
Payables 3,096 3,096 - - - - 3,096
Hire purchase agreements - - - - - - -
Term borrowings 76,331 1,111 81,970 - - - 83,081
Deferred consideration * 8,030 - - - - 10,000 10,000
Gross-settled Derivatives
Interest rate swaps - inflow - (21) (81) (143) (452) (140) (837)
Interest rate swaps - outflow 5,676 397 1,179 1,586 2,887 495 6,544
93,133 4,583 83,068 1,443 2,435 10,355 101,884
PERTH MARKETS GROUP LIMITED
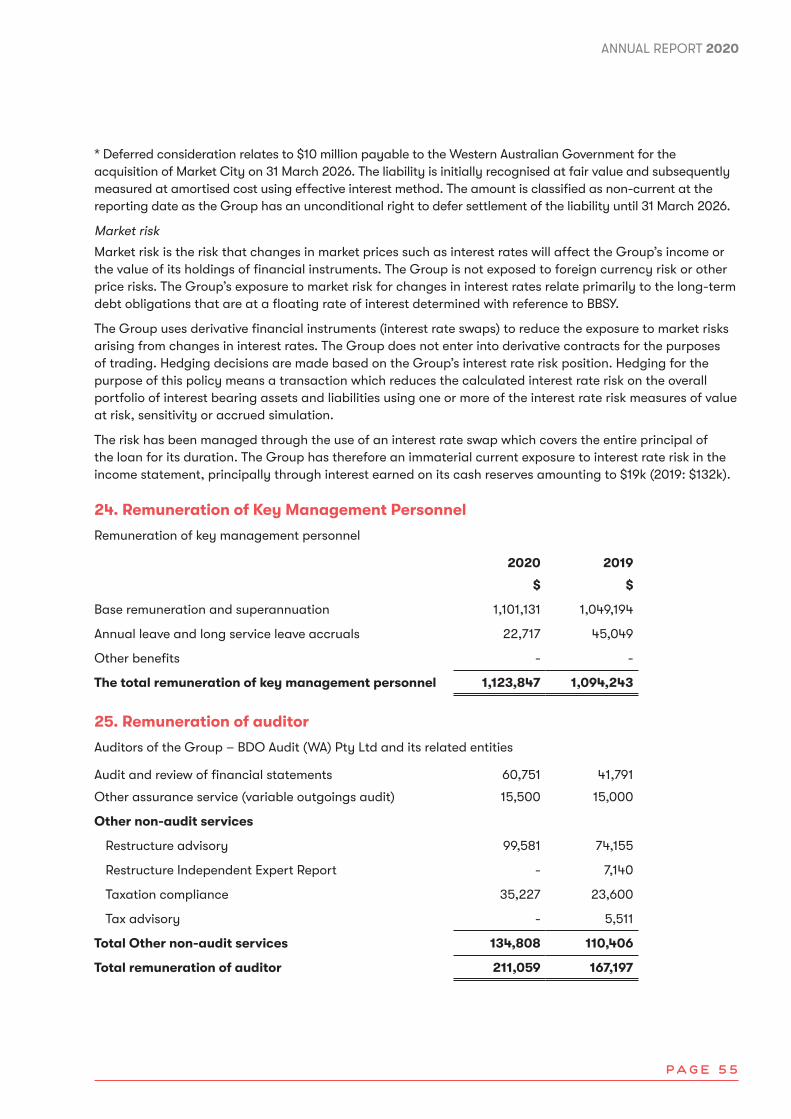
Page 55
ANNUAL REPORT 2020
* Deferred consideration relates to $10 million payable to the Western Australian Government for the acquisition of Market City on 31 March 2026. The liability is initially recognised at fair value and subsequently measured at amortised cost using effective interest method. The amount is classified as non-current at the reporting date as the Group has an unconditional right to defer settlement of the liability until 31 March 2026.
Market risk
Market risk is the risk that changes in market prices such as interest rates will affect the Group’s income or the value of its holdings of financial instruments. The Group is not exposed to foreign currency risk or other price risks. The Group’s exposure to market risk for changes in interest rates relate primarily to the long-term debt obligations that are at a floating rate of interest determined with reference to BBSY.
The Group uses derivative financial instruments (interest rate swaps) to reduce the exposure to market risks arising from changes in interest rates. The Group does not enter into derivative contracts for the purposes of trading. Hedging decisions are made based on the Group’s interest rate risk position. Hedging for the purpose of this policy means a transaction which reduces the calculated interest rate risk on the overall portfolio of interest bearing assets and liabilities using one or more of the interest rate risk measures of value at risk, sensitivity or accrued simulation.
The risk has been managed through the use of an interest rate swap which covers the entire principal of the loan for its duration. The Group has therefore an immaterial current exposure to interest rate risk in the income statement, principally through interest earned on its cash reserves amounting to $19k (2019: $132k).
24. Remuneration of Key Management Personnel
Remuneration of key management personnel
2020 2019
$ $
Base remuneration and superannuation 1,101,131 1,049,194
Annual leave and long service leave accruals 22,717 45,049
Other benefits - -
The total remuneration of key management personnel 1,123,847 1,094,243
25. Remuneration of auditor
Auditors of the Group – BDO Audit (WA) Pty Ltd and its related entities
Audit and review of financial statements 60,751 41,791
Other assurance service (variable outgoings audit) 15,500 15,000
Other non-audit services
Restructure advisory 99,581 74,155
Restructure Independent Expert Report - 7,140
Taxation compliance 35,227 23,600
Tax advisory - 5,511
Total Other non-audit services 134,808 110,406
Total remuneration of auditor 211,059 167,197
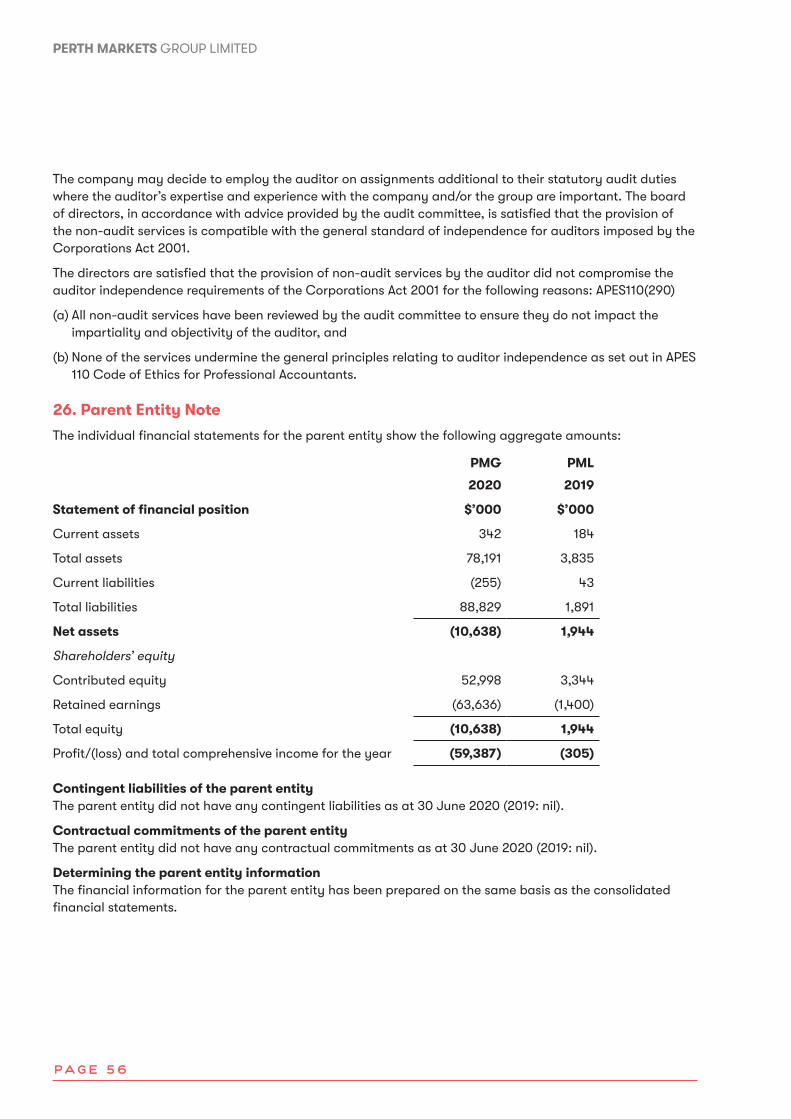
Page 56
PERTH MARKETS GROUP LIMITED
The company may decide to employ the auditor on assignments additional to their statutory audit duties where the auditor’s expertise and experience with the company and/or the group are important. The board of directors, in accordance with advice provided by the audit committee, is satisfied that the provision of the non-audit services is compatible with the general standard of independence for auditors imposed by the Corporations Act 2001.
The directors are satisfied that the provision of non-audit services by the auditor did not compromise the auditor independence requirements of the Corporations Act 2001 for the following reasons: APES110(290)
(a) All non-audit services have been reviewed by the audit committee to ensure they do not impact the impartiality and objectivity of the auditor, and
(b) None of the services undermine the general principles relating to auditor independence as set out in APES 110 Code of Ethics for Professional Accountants.
26. Parent Entity Note
The individual financial statements for the parent entity show the following aggregate amounts:
PMG PML
2020 2019
Statementoffinancialposition $’000 $’000
Current assets 342 184
Total assets 78,191 3,835
Current liabilities (255) 43
Total liabilities 88,829 1,891
Net assets (10,638) 1,944
Shareholders’ equity
Contributed equity 52,998 3,344
Retained earnings (63,636) (1,400)
Total equity (10,638) 1,944
Profit/(loss) and total comprehensive income for the year (59,387) (305)
Contingent liabilities of the parent entityThe parent entity did not have any contingent liabilities as at 30 June 2020 (2019: nil).
Contractual commitments of the parent entityThe parent entity did not have any contractual commitments as at 30 June 2020 (2019: nil).
Determining the parent entity informationThe financial information for the parent entity has been prepared on the same basis as the consolidated financial statements.

Page 57
ANNUAL REPORT 2020
In the directors’ opinion:(a) the financial statements and notes set out on pages 27 to 56 are in accordance with the Corporations
Act 2001, including:
(i) Complying with Accounting Standards, the Corporations Regulations 2001 and other mandatory professional reporting requirements, and
(ii) Giving a true and fair view of the consolidated entity’s financial position as at 30 June 2020 and of its performance for the year ended on that date, and
(b) there are reasonable grounds to believe that the Group will be able to pay its debts as and when they become due and payable.
Note 1 confirms that the financial statements also comply with International Financial Reporting Standards as issued by the International Accounting Standards Board.
This declaration is made in accordance with a resolution of the directors.
Dated: 25 August 2020
_________________________________ ___________________________________
Steven Cole Patricia Skinner Chair Deputy Chair
Directors’ Declaration

Page 58
PERTH MARKETS GROUP LIMITED
BDO Audit (WA) Pty Ltd ABN 79 112 284 787 is a member of a national association of independent entities which are all members of BDO Australia Ltd ABN 77 050 110 275,an Australian company limited by guarantee. BDO Audit (WA) Pty Ltd and BDO Australia Ltd are members of BDO International Ltd, a UK company limited by guarantee, andform part of the international BDO network of independent member firms. Liability limited by a scheme approved under Professional Standards Legislation.
Tel: +61 8 6382 4600Fax: +61 8 6382 4601www.bdo.com.au
38 Station StreetSubiaco, WA 6008PO Box 700 West Perth WA 6872Australia
INDEPENDENT AUDITOR'S REPORT
To the members of Perth Markets Group Limited
Report on the Audit of the Financial Report
Opinion
We have audited the financial report of Perth Markets Group Limited (the Company) and its subsidiaries(the Group), which comprises the consolidated statement of financial position as at 30 June 2020, theconsolidated statement of profit or loss and other comprehensive income, the consolidated statementof changes in equity and the consolidated statement of cash flows for the year then ended, and notesto the financial report, including a summary of significant accounting policies and the directors’declaration.
In our opinion the accompanying financial report of Perth Markets Group Limited, is in accordance withthe Corporations Act 2001, including:
(i) Giving a true and fair view of the Group’s financial position as at 30 June 2020 and of itsfinancial performance for the year ended on that date; and
(ii) Complying with Australian Accounting Standards and the Corporations Regulations 2001.
Basis for opinion
We conducted our audit in accordance with Australian Auditing Standards. Our responsibilities underthose standards are further described in the Auditor’s Responsibilities for the Audit of the FinancialReport section of our report. We are independent of the Group in accordance with the CorporationsAct 2001 and the ethical requirements of the Accounting Professional and Ethical Standards Board’sAPES 110 Code of Ethics for Professional Accountants (the Code) that are relevant to our audit of thefinancial report in Australia. We have also fulfilled our other ethical responsibilities in accordancewith the Code.
We confirm that the independence declaration required by the Corporations Act 2001, which has beengiven to the directors of the Company, would be in the same terms if given to the directors as at thetime of this auditor’s report.
We believe that the audit evidence we have obtained is sufficient and appropriate to provide a basisfor our opinion.
Other information
The directors are responsible for the other information. The other information obtained at the date ofthis auditor’s report is information included in the Directors’ Report, but does not include the financialreport and our auditor’s report thereon.
Our opinion on the financial report does not cover the other information and accordingly we do notexpress any form of assurance conclusion thereon.

Page 59
ANNUAL REPORT 2020
In connection with our audit of the financial report, our responsibility is to read the other informationand, in doing so, consider whether the other information is materially inconsistent with the financialreport or our knowledge obtained in the audit, or otherwise appears to be materially misstated.
If, based on the work we have performed on the other information obtained prior to the date of thisauditor’s report, we conclude that there is a material misstatement of this other information, we arerequired to report that fact. We have nothing to report in this regard.
Responsibilities of the directors for the Financial Report
The directors of the Company are responsible for the preparation of the financial report that gives atrue and fair view in accordance with Australian Accounting Standards and the Corporations Act 2001and for such internal control as the directors determine is necessary to enable the preparation of thefinancial report that gives a true and fair view and is free from material misstatement, whether due tofraud or error.
In preparing the financial report, the directors are responsible for assessing the ability of the group tocontinue as a going concern, disclosing, as applicable, matters related to going concern and using thegoing concern basis of accounting unless the directors either intend to liquidate the Group or to ceaseoperations, or has no realistic alternative but to do so.
Auditor’s responsibilities for the audit of the Financial Report
Our objectives are to obtain reasonable assurance about whether the financial report as a whole is freefrom material misstatement, whether due to fraud or error, and to issue an auditor’s report thatincludes our opinion. Reasonable assurance is a high level of assurance, but is not a guarantee that anaudit conducted in accordance with the Australian Auditing Standards will always detect a materialmisstatement when it exists. Misstatements can arise from fraud or error and are considered materialif, individually or in the aggregate, they could reasonably be expected to influence the economicdecisions of users taken on the basis of this financial report.
A further description of our responsibilities for the audit of the financial report is located at theAuditing and Assurance Standards Board website (http://www.auasb.gov.au/Home.aspx) at:
http://www.auasb.gov.au/auditors_responsibilities/ar3.pdf
This description forms part of our auditor’s report.
BDO Audit (WA) Pty Ltd
Neil Smith
Director
Perth, 25 August 2020

Page 60
corporate governance statement
PERTH MARKETS GROUP LIMITED
The Board of Directors is responsible on behalf of the shareholders for the overall corporate governance of the company, including direction and oversight of the company’s business and affairs.
Board composition
The Board comprises a material number of non-executive directors, including directors with independence of mind and decision making. The Board comprises Directors with a blend of skills, experience and attributes appropriate for the organisation, its strategies and its operations.
The Constitution of the Company states that unless otherwise determined by the Company in general meeting, the number of Directors is to be not less than three and not more than nine.
Market West as the Industry body (Chamber) has the right (but not obligation) to appoint up to two Directors for so long as the Chamber holds shares in PMG.
The board of Directors must use its best endeavours to ensure that at materially all times, there are at least two Directors who satisfy the criteria set out in the Constitution to act as Independent Directors.
Role of Directors
The Board has leadership responsibility for the overall management and strategic direction of the Organisation and for delivering accountable organisational performance in accordance with the Organisation’s goals and objectives. In performing its role, responsibilities reserved to the board include:
• providing strategic direction to the Organisation and deciding upon the Organisation’s strategies and objectives in conjunction with the CEO,
• monitoring the strategic direction of the Organisation and the attainment of its strategies and objectives in conjunction with the executive,
• monitoring the operational and financial position and performance of the Organisation generally,
• establishing an appropriate corporate culture and assuring a prudential and ethical base to the Organisation’s conduct and activities having regard to the relevant interests of its stakeholders,
• assuring the principal risks faced by the Organisation are identified and overseeing that appropriate control and monitoring systems are in place to manage and mitigate these risks,
• appointing and, where appropriate, removing the CEO, monitoring other executive appointments, and planning for executive succession,
• approving the Organisation’s budgets and business plans and monitoring major capital expenditures, acquisitions and divestitures, investments and capital management generally,
• ensuring that the Organisation’s financial results are appropriately and accurately reported on in a timely manner in accordance with regulatory requirements,
• ensuring that the Organisation’s affairs are conducted with prudential governance transparency and accountability, and
• overseeing the design and implementation of appropriate and effective policies, processes and codes of conduct for the Organisation (including with respect to ethics, values, conduct, employment, remuneration, diversity and otherwise) as well as monitoring and reviewing those policies, processes and codes of conduct from time to time.
Frequency of meetings and attendance
Subject to the Constitution, the Board should meet at least 8 times per annum, and as often as is necessary to effectively and efficiently fulfil its functions and discharge its responsibilities.
Page 61
ANNUAL REPORT 2020
PerformanceofDirectorsandChiefExecutiveOfficer
The performance of the Board (as a whole), each Board Committee, Board members (individually) and each senior executive should be periodically reviewed, desirably annually or thereabouts and at other times as decided upon by the Board, against measurable and qualitative benchmarks as may reasonably be determined from time to time by the Board having regard to generally accepted governance standards.
Governance Disclosure
The Organisation commits to compliance with any regulatory mandated disclosure requirements and to maintaining a current copy of this Charter on its website.
Independent professional advice
Each Director has the right to seek independent professional advice at the company’s cost, subject to the approval of the Chairman.
Committees of the Board
To assist in the execution of the Board’s corporate governance responsibilities, the Board has established three committees with a non-executive Director as Chairman of each.
The Chairman has a standing invitation to attend any or all meetings of Board Committees.
Audit, Finance and Risk Committee
The key areas dealt with by the Audit, Finance and Risk Committee include:
• The appointment and continuation of external auditors,
• The adequacy of existing external audit arrangements, with particular emphasis on the scope and quality of the audit,
• All areas of significant capital risk and the arrangements in place to contain those risk to acceptable levels,
• The effectiveness of management information or other systems of internal control,
• The application of accounting standards and policies to the company,
• The financial statements of the company with both management and external auditors.
The Audit, Finance and Risk Committee comprises four Directors, being Richard Thomas (Chair), Steven Cole, Patricia Skinner and Andrew Young.
Nomination & Remuneration Committee
The key areas dealt with by the Remuneration Committee include:
Board Membership• Board and Board Committee membership, succession planning and performance including through the
development and use of a board skills matrix (or like tool),
• Board Committee terms of reference review and recommendations including with respect to appointment to Board Committees,
• Development and implementation of a process for evaluation of Board, Committee and director performance,
• Board member induction and professional development.

Page 62
PERTH MARKETS GROUP LIMITED
CEO and Senior Executives• Periodic review of the job description and performance of the CEO according to agreed performance
parameters,
• Plans for succession planning for the CEO position,
• Involvement in complaints, grievance and disciplinary processes of senior executives.
Diversity• Diversity policy development, monitoring and review,
• Development, monitoring and review of strategies and programs to promote diversity in the Group consistent with such diversity policy,
• Monitoring the implementation by the Group of such diversity strategies and programs consistent with such diversity policy.
Generally• Reporting on these matters to the Board, with recommendations as appropriate,
• The Committee has the authority to access information and to consult with and interview Group personnel and to consult independent professional advisers it considers appropriate to provide advice on matters within the scope of its remit.
The Nomination & Remuneration Committee comprises three Directors, being Steven Cole (Chair), Frank Romano and Andrew Young.
Master Planning Committee
The key areas of responsibility for the Master Planning Committee include:
• Oversight and review of PMG’s Site Master Plan and ongoing development in accordance with the PMG Strategic Plan and agreed risk appetite. This includes review and consideration of expansion opportunities and Associated Business Plans,
• To review the development of the Site Master Plan developed by the PMG Executive (and consultants) and recommend it to the Board for adoption,
• Review progress against the Site Master Plan and report this progress to the PMG Board through the Committee Chairperson or other agreed representative of the Committee,
• Review management recommendations of the PMG Executive and consultants for approval to the Board,
• Review and assist the development of capital return benchmarks and alternatives of funding models and options,
• Continued development and refinement of the PMG Master Plan,
• Review of agreed capital management of PMG growth, operations, and balancing investor returns,
• Review of alternative capital funding options and developing anticipated return guidelines,
• Review of the engaging and directing of suitable external service providers to assist the PML with these objectives.
The Master Planning Committee comprises five Directors, being Frank Romano (Chair), Steven Cole, Andrew Young, Miro Lendich and James Ryan.
Ethical Standards
The company recognises the need for Directors and employees to observe the highest standards of behaviour and business ethics when engaging in corporate activity.
All Directors and employees are expected to act in accordance with the law and with the highest standards of propriety.

Page 63
Corporate Directory
Auditors and Independent AccountantBDO Audit (WA) Pty Ltd, ABN 79 112 284 78738 Station Street,Subiaco, WA 6008 AustraliaOffice +61 8 6382 4600Fax +61 8 6382 4601www.bdo.com.au
Legal ServicesLavan1 William Street,Perth WA 6000Tel: +61 8 9288 6928Fax: +61 8 9288 6001www.lavan.com.au
BankersCommonwealth Bank of Australia Limited 300 Murray Street, Perth WA 6000Tel: 131998www.commbank.com.au
Security RegistryOne Registry Services Pty Limited Level 11, 20 Hunter StreetSydney NSW 2000Tel: +61 2 81 88 110Fax: + 61 2 8580 5790www.oneregistryservices.com.au
Share Trading
PMG is an unlisted public company. A shares transfer register has been created by PMG that provides a facility whereby parties who wish to buy or sell shares can contact each other. It is up to the parties concerned to negotiate the price, prepare any documents required for the transaction, attend to the matters required to finalise any sale and or transfer and lodge the required documents with Perth Markets Group Ltd authorised share registry service.
The constitution of Perth Markets Group Ltd provides that its shareholders should be Australian residents and be an Exempt Investor. Please refer to section 708(8), 708(10) and 708(11) of the Corporations Act for guidance as to what is an Exempt Investor. Any sale of PMG shares through private treaty must be approved by the Board of Directors and under Clause 6.6 of the companies constitution, the Directors of PMG have the power to refuse to register a transfer of shares.
To register your interest in selling or buying shares in Perth Markets Group Ltd email [email protected].
ANNUAL REPORT 2020

Page 64
280 Bannister Road, Canning Vale WA 6155
(08) 9456 9200 perthmarket.com.au


![Perth City Farm the organic centre of town!members.iinet.net.au/~treeswa/images/cityfarm_newsletter01.pdf · Perth City Farm is a branch of Men Of The Trees [ Issue 1] May 2010 Perth](https://static.fdocuments.net/doc/165x107/5f105da97e708231d448c0bb/perth-city-farm-the-organic-centre-of-town-treeswaimagescityfarmnewsletter01pdf.jpg)


