Annual Report - SLI Systems · needs of our customers and our prospects, and outperform our...
60
2016 Annual Report
Transcript of Annual Report - SLI Systems · needs of our customers and our prospects, and outperform our...
2016Annual Report

Highlights
Chairman and Chief Executive’s Report
The Commerce Accelerator
SLI in the Spotlight
Proven Customer Success
SLI Connect
Board
Management
Corporate Governance
Shareholder and Statutory Information
Financial Statements
Directory
Financial Calendar
01
02
06
07
08
09
10
13
17
20
26
56
57
Contents

Highlights
ARR1 of
$31.2mdown 3% constant currency2
Gross margin
77%
Retention rate
84%by value
Net cash inflow
$1.2m
Growth of
24%in operating revenue to $35m v $28m in FY 15
Cash of
$6.8m
1. Annualised Recurring Revenue (ARR) is a non-GAAP financial performance measure used internally by SLI as a basis for its expected forward revenue. ARR is calculated based
on the subscription revenue from the existing customer base in the reference month and then annualised using exchange rates at the end of the reference month. ARR does not
account for changes in behaviour of customers. For the Site Champion component of ARR it is necessary to apply judgement to mitigate the effects of one-off events that impact
the reference month revenue of the calculation.
2. On a reported basis the reduction in ARR over the past 12 months was 10%.
SLI Systems Annual Report June 2016 | Highlights 1

Dear Shareholders,
As you know, financial year 2016 for SLI was a challenging
year, marked by the need to address business conditions
related primarily to our decelerating performance in the
North American region and our overall customer retention
rates. We are also mindful to improve efficiency within the
organisation to both deliver better value outcomes from our
model and to achieve cash flows such that we do not need to
raise additional capital.
We are pleased to report to you that we identified what we
believe to be the most significant issues. We have brought new
leadership and depth of experience including new staff to take
corrective actions in marketing, sales and customer success.
Our management team has led much change that we believe
will result in restoring our growth in North America to join the
solid performance of both our EMEA and APAC regions.
Equally important, we have substantial room for improvement
in positioning ourselves as the leader in the market. Internet
Retailer has validated SLI’s SaaS leadership position for the
past four years1 amongst the top 1,000 retailers. We have
launched new marketing strategies to clearly position SLI as
the thought leader and the superior provider of solutions that
drive traffic to e-commerce sites, convert more shoppers into
buyers and maximise order values.
At the core of our success is our ability to drive increased
revenue and profitability for our customers through our cloud-
based, machine learning platform. Our core competency is
applying machine learning to massive amounts of data. The
market is moving toward personalisation as merchants realise
that while the benefits of crowd or aggregate data is important,
knowing your individual customer can lead to improved
conversion rates. The SLI solution has been architected to
accept any data stream to ensure we will always lead the
market and provide the best predictions. We feel strongly that
our heritage is defined deeply in this capability, knowing that
customers adopt new technologies in step increments, as they
have done with SLI for the past 15 years. SLI is well positioned
to lead the market as it evolves.
Chairman and Chief Executive’s Report
2 SLI Systems Annual Report June 2016 | Chairman and Chief Executive’s Report
New and Upsells Growth FY16
Overall Global and Regional Sales PerformanceWe achieved year-over-year growth of 23% in new business
and upsells to existing customers’, excluding our Site Champion
product. Performance of new business and upsells compared to
respective beginning ARR across the regions was led by Japan
at a 575% increase, EMEA and Asia Pacific both at 32%, North
America at 19% and Latin America at 10%. New logo growth
remains our focus for both marketing and sales globally with
particular focus in North America and Asia Pacific. Japan’s
performance, while a small percentage of our overall business,
has improved significantly and continues to show promise for
continued growth.
580%
570%
40%
30%
20%
10%
0%
TOTA
L
NO
RT
H
AM
ER
ICA
EM
EA
JAPA
N
AS
IAPA
CIF
IC
LAT
IN
AM
ER
ICA
1. Internet Retailer (2015) Top 500 and Second 500 Update
SLI Systems Annual Report June 2016 | Chairman and Chief Executive’s Report 3
NZ
Dm
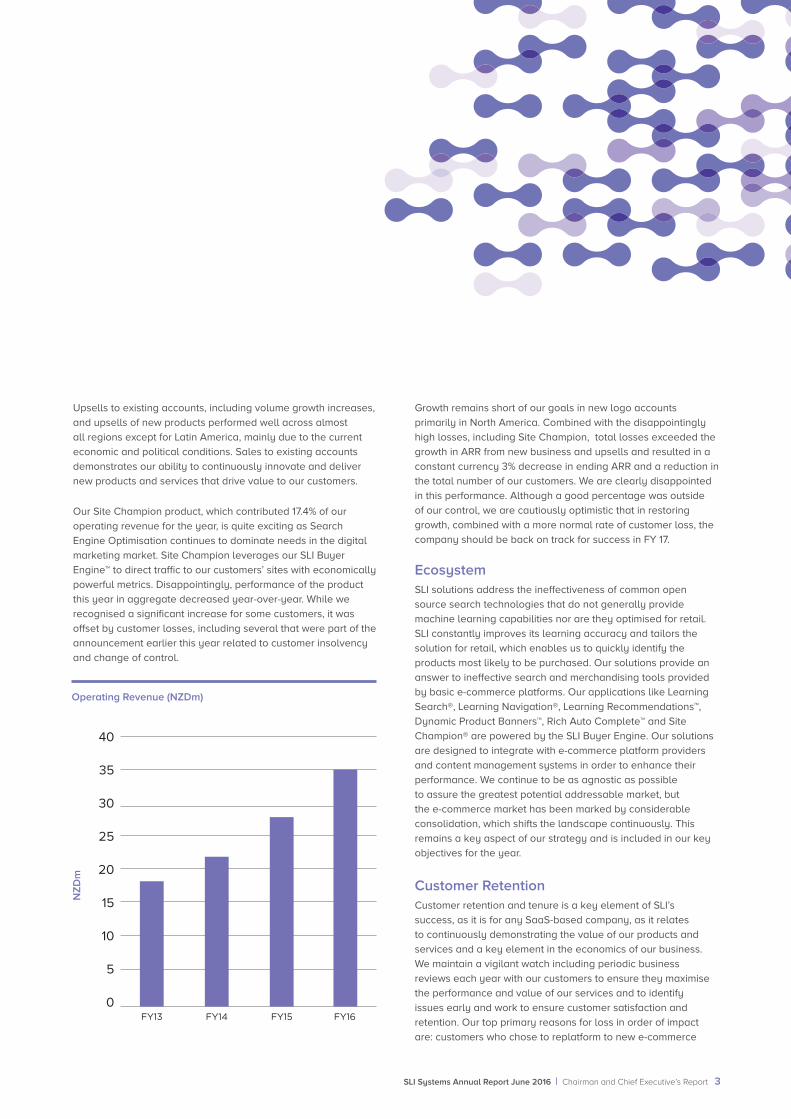
Operating Revenue (NZDm)
Upsells to existing accounts, including volume growth increases,
and upsells of new products performed well across almost
all regions except for Latin America, mainly due to the current
economic and political conditions. Sales to existing accounts
demonstrates our ability to continuously innovate and deliver
new products and services that drive value to our customers.
Our Site Champion product, which contributed 17.4% of our
operating revenue for the year, is quite exciting as Search
Engine Optimisation continues to dominate needs in the digital
marketing market. Site Champion leverages our SLI Buyer
Engine™ to direct traffic to our customers’ sites with economically
powerful metrics. Disappointingly, performance of the product
this year in aggregate decreased year-over-year. While we
recognised a significant increase for some customers, it was
offset by customer losses, including several that were part of the
announcement earlier this year related to customer insolvency
and change of control.
Growth remains short of our goals in new logo accounts
primarily in North America. Combined with the disappointingly
high losses, including Site Champion, total losses exceeded the
growth in ARR from new business and upsells and resulted in a
constant currency 3% decrease in ending ARR and a reduction in
the total number of our customers. We are clearly disappointed
in this performance. Although a good percentage was outside
of our control, we are cautiously optimistic that in restoring
growth, combined with a more normal rate of customer loss, the
company should be back on track for success in FY 17.
EcosystemSLI solutions address the ineffectiveness of common open
source search technologies that do not generally provide
machine learning capabilities nor are they optimised for retail.
SLI constantly improves its learning accuracy and tailors the
solution for retail, which enables us to quickly identify the
products most likely to be purchased. Our solutions provide an
answer to ineffective search and merchandising tools provided
by basic e-commerce platforms. Our applications like Learning
Search®, Learning Navigation®, Learning Recommendations™,
Dynamic Product Banners™, Rich Auto Complete™ and Site
Champion® are powered by the SLI Buyer Engine. Our solutions
are designed to integrate with e-commerce platform providers
and content management systems in order to enhance their
performance. We continue to be as agnostic as possible
to assure the greatest potential addressable market, but
the e-commerce market has been marked by considerable
consolidation, which shifts the landscape continuously. This
remains a key aspect of our strategy and is included in our key
objectives for the year.
Customer RetentionCustomer retention and tenure is a key element of SLI’s
success, as it is for any SaaS-based company, as it relates
to continuously demonstrating the value of our products and
services and a key element in the economics of our business.
We maintain a vigilant watch including periodic business
reviews each year with our customers to ensure they maximise
the performance and value of our services and to identify
issues early and work to ensure customer satisfaction and
retention. Our top primary reasons for loss in order of impact
are: customers who chose to replatform to new e-commerce
40
35
30
25
20
15
10
5
0FY13 FY14 FY15 FY16

4 SLI Systems Annual Report June 2016 | Chairman and Chief Executive’s Report
“At the core of our success is our ability to drive increased revenue and profitability for our customers through our cloud-based, machine learning platform.”
vendors, followed by business conditions, which includes
liquidation, company cost reductions, business in decline, etc.
and last, competition. When our customers do replatform, in many
cases, it still represents an opportunity to reacquire those lost
customers. As it relates to the prior year, our losses remained
within our expectations through our third quarter, but spiked
considerably in the fourth quarter. As announced in May 2016,
the spike was caused by large customers becoming insolvent
or being acquired by other companies that forced a termination
of services. While competition is increasing in North America,
in general, our loss from our customer base by competitors is
limited to only four primary competitors and the losses were
infrequent and immaterial. However, we have retrained our sales
organisation and put programs in place to combat challenges by
our competitors both for new business and existing customers as
we believe that we can prove superior performance.
ProductsOur products are the lifeblood of our company. We continue
to innovate to enhance performance and increase features of
the SLI Buyer Engine and all applications. Highlights of those
improvements during FY 16 include:
• Speed improvements to all our products
• A significant update to our popular Rich Auto Complete™
product
• A new version of our Learning Navigation® product
• A new dashboard to help customers monitor and manage
their businesses
• Plugin support for version 2 of the popular Magento
e-commerce platform
• The launch of our first customer in the Arabic language, and
new support for the Norwegian and Finnish languages
• Support for drag and drop merchandising of our Learning
Recommendations™ product
• Merchandising and analytics support for larger
businesses that have many sites, who need
merchandising controls and analytics at both the site
level and the corporate level
• A new way of implementing and maintaining our
customers, which relies more heavily on configuration of
standard components, and much less on writing custom
code per implementation
• A merchandising console in Spanish
Innovation and product development will always be a core
component of our strategy to ensure we meet or exceed the
needs of our customers and our prospects, and outperform
our competitor’s offerings. It is a leading indicator of our future
success.
StaffingHiring and retaining employees is essential to the success of
our business, as they are the heart and soul of the company.
We rely on our ability to attract and retain world class talent
to execute on our strategies and to propel the success of
our objectives and performance. The global market for
recruiting has heated up significantly and has made it difficult
to both retain and compete for new employees. In FY 16, we
experienced a rate of staff turnover greater than desired, some
of which was related to the prior spending control measures,
which has now been addressed, and some of the turnover was
related to the changes in our customer facing business models
in sales and customer success. Going forward we face a
highly competitive market and with open positions to hire, we
will be challenged to compete with richer compensation and
benefits package, particularly in the North American market.
Financial FocusWe remain committed to our shareholders as it relates to
achieving cash flow breakeven without an additional capital
raise. Our current plans call for measured and controlled
spending while we monitor our progress in restoring growth
in North America. As mentioned before, we must invest in our
people, but will limit discretionary spending where possible.
We look to growth and decreased losses to further invest in
our products to assure our ability to continuously innovate. We

SLI Systems Annual Report June 2016 | Chairman and Chief Executive’s Report 5
Cash inflow/(outflow)
Chris Brennan Chief Executive Officer
Greg Cross Chairman
will continue to invest in our current products and to build new
products that will meet or exceed the needs of our customers
and prospects, and to continuously outperform our competitor’s
offerings.
e-commerce businesses. We have a talented base of global
employees that are focused on our key initiatives, which will
enable our product development, sales and customer success
teams to succeed. We believe that we are capable of competing
effectively with our superior product suite powered by our SLI
Buyer Engine. While we continue to focus on the corrective
actions to restore our growth, we remain cautious not to over-
invest until such time as we begin to see improved results in
our internal and external operating metrics. We expect to see
those results appear in the second half of FY 17 and will monitor
closely to control our business in such a way as to assure our
commitment to cash.
The company celebrated its 15th year in business on August
1, 2016. While FY 16 was a hugely transformational year, FY 17
should see the effects of those changes and restore the growth
that reflects the market opportunity. We hope FY 17 will be
remembered as a pivotal year in the history of the company.
Summary SLI continues to operate in a very large e-commerce market,
characterised by an expected compounded growth rate of
greater than 10%. We estimate our total addressable market,
based upon data from Internet Retailer, eTail Insights and other
data sources to be approximately 50,000 global prospects in
both B2B and B2C markets, which based upon our estimated
average contract values, represents a total addressable
market of US$1.7B. With 576 customers as at 30 June 2016,
it’s clear there is a very big opportunity. Our products and our
extensible and patented technologies are well positioned to
take advantage of the current market opportunity. SLI is well
positioned to capture the emerging trends as customers look to
new personalised capabilities and beyond to accelerate their
Ca
sh in
flo
w/(
ou
tflo
w) N
ZD
00
0
2,000
1,000
0
(1,000)
(2,000)
(3,000)
(4,000)
(5,000)
(6,000)
(7,000)
FY14 FY15
FY16

6 SLI Systems Annual Report June 2016 | The Commerce Accelerator
TheCommerce
Accelerator
SLI continues to develop solutions with the future of e-commerce and the success of the company in mind. Highlights from the second half of the financial year include:
Empowering customers
Even though SLI delivers optimal results, some clients want
the ability to customise them. We’ve given clients more
power by expanding the control they have over SLI Learning
Recommendations™.
SLI released: Enhancements to Tune Recommendations
Control over which products are displayed for generic
strategies such as Top Sellers or Popular Products
Tuning capability can be added to any existing
recommendations
Ability to make tunings via a simple-to-use drag-and-drop
interface
Hosting & infrastructure changes
In order to support a significant growth in SLI’s customer base,
we have changed the implementation process to focus on
scalability, quality and efficiency.
SLI developed:
Standardised components for each SLI delivered element
Ability to quickly rollout new technology and universal fixes
Decreased deployment time
Supporting enterprise clients
Many enterprise clients manage multiple sites and need the
ability to monitor and control each entity.
SLI released: Ability to group sites
Reporting for all sites in a single instance allows overview of
entire business
Merchandising rules, such as synonyms, can be shared
across multiple sites, saving clients significant time
Expanding SLI’s global customer base
As e-commerce grows globally, we continue to expand
our support for new regions. SLI now supports search in
20 languages, and we have implemented our first Arabic
customer site.
SLI released: Support for Arabic, Finnish and Norwegian
languages

SLI Systems Annual Report June 2016 | SLI in the Spotlight 7
Virtual Reality: Coming Soon to a Clothing Store Near You
At the beginning of 2016, SLI Co-founder and Chief Innovation Officer Shaun Ryan was featured in Forbes magazine.
Shaun’s article focused on how virtual reality may impact the
shopping experience of the future.
“VR will transform how we shop, play and live. Imagine having
accurate 3D models of yourself and those you shop for, then
watching images of yourself walking running, surfing, skiing and
golfing while wearing that apparel – all in virtual reality.”
©2016 SLI SYSTEMS© 2016 SLI SYSTEMS
Retailers Who Transformed their Online Business Using SLI Systems
40
2016 Report
40 Retailers Who Transformed their Online Business using SLI_may2016_option2.indd 1 6/14/16 9:13 AM
SLI in the Spotlight
How 40 Retailers Transformed Their Businesses Using SLI Systems
SLI customers often brag about
the results from using our
solutions. We showcased these
stories and numbers in a new
report and infographic which
answers the question why site
search matters.
Platform Partnership Benefits SLI Customer
Chain Store Age spoke to Michael Schuler, e-commerce director of Schuler Shoes, about why the 10-store omnichannel chain chose SLI as a way to keep up with its larger competitors.
“SLI Learning Search Connect
easily plugged into our Magento
platform, quickly improving the
shopping experience and simplifying
merchandising and promotions.
With SLI site search, navigation and
refinements, we have seen 20% fewer
bounces and a
75%
increase
in the time visitors spend on the site,
indicating the solutions are helping
customers in the ‘pre-shop’ phase
before they buy from us in-store or
online.”

Proven Customer
Success
6xhigher conversions
“The search relevance, analytics and merchandising
controls are what sets SLI apart. I knew I could get SLI
up and running quickly and deliver benefits right away.
Even if I don’t touch it often, the solution is consistent
and performs well all the time.”
– Mike Ebert, E-commerce Director
3xhigher per-session value using search
“SLI solutions give us great insight into what our
customers want. SLI reports show us which items have
‘poor results,’ for example, so we can explore why
those products are performing poorly and pass that
information on to our buyers.”
– James Rigden, Co-founder and E-commerce Director
Retailers around the world partner with SLI Systems to grow sales and delight customers. See how retailers in North America, the United Kingdom, Australia and New Zealand have impacted their businesses.
30%
of site revenue attributed to SLI search
“We partnered with SLI Systems in 2010 because of its deep
commitment to customer service. The SLI Learning Search
Connect extension for Magento made it easy to implement and
the results speak for themselves. We know when shoppers use
search, we’ve got them!”
– Gareth Williams, E-commerce Manager
90%
increase in conversions
“SLI is easily one of the best among many technology partners
I’ve worked with. Along with seeing a rise in organic traffic, our
fully responsive mobile pages have seen conversions increase
by 90%.”
– Mark Hammond, Chief Operations Officer
8 SLI Systems Annual Report June 2016 | Proven Customer Success

SLI Connect is the place for retailer leaders to explore new ideas and learn from their peers. The one-day educational e-commerce summit is held annually in various locations around the globe.
2016 SLI Connect Events
SLI Connect UK15 March 2016 / Ham Yard Hotel, London
SLI Connect Australia6 April 2016 / Sydney Opera House, Sydney
SLI Connect North America15 September 2016 / Carnegie Hall, New York City
SLI Connect JapanNovember 2016 / New Zealand Embassy, Tokyo
This year, the London summit was
moderated by Kate Russell, reporter
and presenter on the BBC World
News technology programme Click.
In New York, Melissa Campanelli,
editor of Total Retail, is scheduled
to kick off the day and founder of
eShopportunity and previous category
manager at Amazon Fahim Naim
will be this year’s keynote speaker.
SLI Systems Annual Report June 2016 | SLI Connect 9
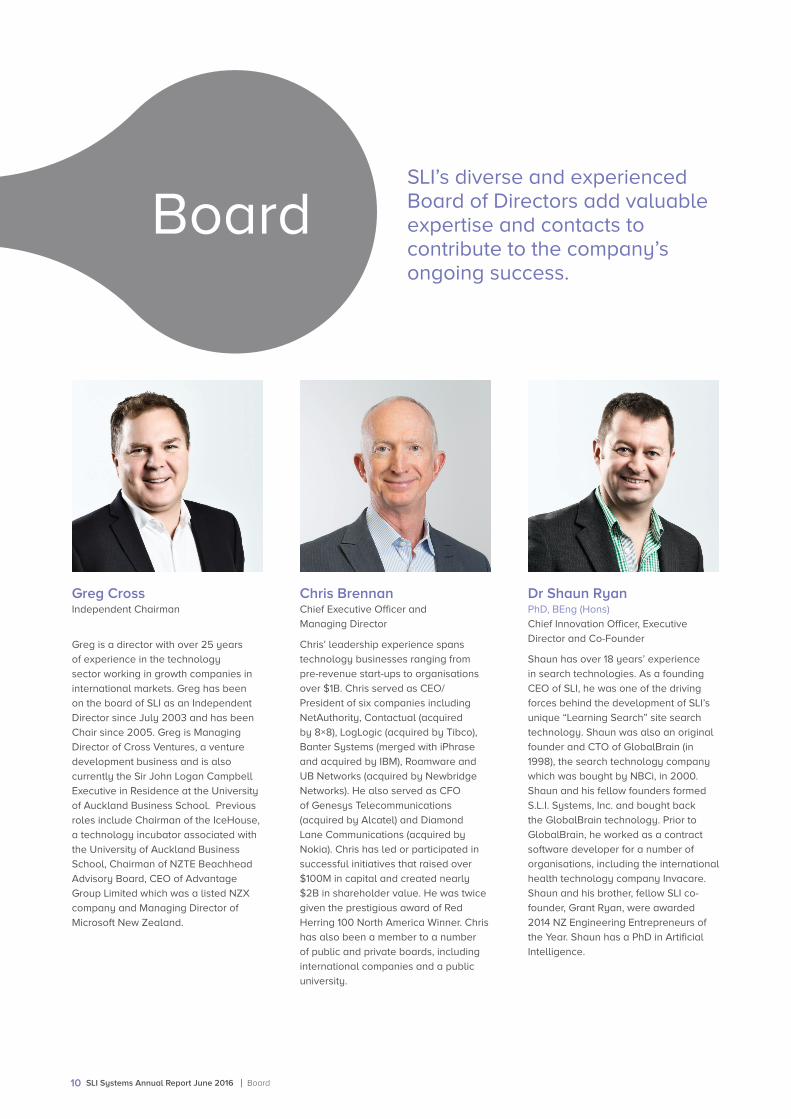
Greg CrossIndependent Chairman
Greg is a director with over 25 years
of experience in the technology
sector working in growth companies in
international markets. Greg has been
on the board of SLI as an Independent
Director since July 2003 and has been
Chair since 2005. Greg is Managing
Director of Cross Ventures, a venture
development business and is also
currently the Sir John Logan Campbell
Executive in Residence at the University
of Auckland Business School. Previous
roles include Chairman of the IceHouse,
a technology incubator associated with
the University of Auckland Business
School, Chairman of NZTE Beachhead
Advisory Board, CEO of Advantage
Group Limited which was a listed NZX
company and Managing Director of
Microsoft New Zealand.
Dr Shaun RyanPhD, BEng (Hons)
Chief Innovation Officer, Executive
Director and Co-Founder
Shaun has over 18 years’ experience
in search technologies. As a founding
CEO of SLI, he was one of the driving
forces behind the development of SLI’s
unique “Learning Search” site search
technology. Shaun was also an original
founder and CTO of GlobalBrain (in
1998), the search technology company
which was bought by NBCi, in 2000.
Shaun and his fellow founders formed
S.L.I. Systems, Inc. and bought back
the GlobalBrain technology. Prior to
GlobalBrain, he worked as a contract
software developer for a number of
organisations, including the international
health technology company Invacare.
Shaun and his brother, fellow SLI co-
founder, Grant Ryan, were awarded
2014 NZ Engineering Entrepreneurs of
the Year. Shaun has a PhD in Artificial
Intelligence.
Chris BrennanChief Executive Officer and
Managing Director
Chris’ leadership experience spans
technology businesses ranging from
pre-revenue start-ups to organisations
over $1B. Chris served as CEO/
President of six companies including
NetAuthority, Contactual (acquired
by 8×8), LogLogic (acquired by Tibco),
Banter Systems (merged with iPhrase
and acquired by IBM), Roamware and
UB Networks (acquired by Newbridge
Networks). He also served as CFO
of Genesys Telecommunications
(acquired by Alcatel) and Diamond
Lane Communications (acquired by
Nokia). Chris has led or participated in
successful initiatives that raised over
$100M in capital and created nearly
$2B in shareholder value. He was twice
given the prestigious award of Red
Herring 100 North America Winner. Chris
has also been a member to a number
of public and private boards, including
international companies and a public
university.
SLI’s diverse and experienced Board of Directors add valuable expertise and contacts to contribute to the company’s ongoing success.
Board
10 SLI Systems Annual Report June 2016 | Board

SLI Systems Annual Report June 2016 | Board 11
Andrew LarkIndependent Director
Andy is an internationally renowned
marketer and entrepreneur with 25
years’ experience running multi-billion
dollar e-commerce businesses and
building highly successful online and
marketing teams. Andy has served as
Chief Marketing and Online Officer at
Commonwealth Bank of Australia (CBA),
where he revitalized the CBA brand and
played a key role in establishing the
bank’s digital and online leadership.
Prior to this he was a Vice President
& General Manager at Dell, where he
was head of global marketing for the
computer manufacturer’s Enterprise
and Public group. He has led marketing
teams at LogLogic, Sun Microsystems
and Nortel Networks, and is a former
Senior Vice President and Partner at
Fleishman-Hillard. Today he is chief
marketing and revenue officer for Xero
- a leading global provider of software
solutions to small businesses. He also
chairs Group Lark, a consulting firm
accelerating digital and marketing
strategies for leading brands. His
achievements have earned him
recognition including the New Zealand
Government’s prestigious Worldclass
New Zealander Award. He is also a
member of the boards of Mighty River
Power, Fronde and SimpleHQ. Andy is
a native of Auckland and has received
accolades for his contributions to New
Zealand businesses.
Matthew HoutmanMMS
Non-Executive Director
Matthew is a co-founder and Managing
Director of Pioneer Capital, an investor
in New Zealand businesses that
are focussed on growth into large
international markets. In addition to
SLI, he has portfolio responsibilities
with Orion Health, Pukeko Pictures,
WhereScape and YikeBike. Before
joining Pioneer Capital, Matthew had
a career in investment banking; most
recently with UBS Investment Bank,
where he worked in the Auckland
then London offices. Activities
during this period included: mergers,
acquisitions, trade sales, balance sheet
recapitalisations, IPOs and debt funding.
Matthew has a Master of Management
Studies with distinction from the
University of Waikato.

Steven E MarderJD, BA
Non-Executive Director and Co-Founder
Silicon Valley-based Steven Marder has
over 25 years executive, advisory, and
investment experience in the global
technology, media and communications
sectors. In addition to serving as a
Co-Founder and Director at SLI, Steven
currently serves as a Director, Investment
Banking & Capital Markets for global
financial services firm BTIG, LLC. and on
the Board of Directors for Next Minute
Ltd. and Ingenious Ventures. Previously
he served as an Operating Partner for
the Technology, Media & Telco Group
at merchant bank, Morgan Joseph
TriArtisan. Prior, serving as an Operating
Partner for New York-based private
equity firm Avista Capital Partners,
Steven served as Director for portfolio
companies WideOpenWest (WOW!)
and InvestorPlace Media in addition to
serving as Director/co-founder of social
search company Eurekster. Steven also
co-founded and served as Managing
Director, North America for Gramercy
Venture Advisors, co-founded and served
as Chairman/CEO of eMemberDirect,
12 SLI Systems Annual Report June 2016 | Board
Inc. (FKA PetPlanet.com), served as
a Director for New Zealand based
technology company GlobalBrain and
as a senior executive at major media
companies EMI Music and Tribune
Company (Compton’s NewMedia). A
graduate of St. John’s School of Law,
Columbia College/Columbia University
and Horace Mann School, Steven is also
an attorney and member of the State
Bar of New York and California and an
investment banker holding FINRA Series
79, 62 and 63 licenses.
Sarah SmithBCom, CFInstD
Independent Director
Sarah has extensive business and
governance experience in both the
private and public sectors. She has held
key financial and business development
roles in a variety of businesses both
in New York and New Zealand. As an
independent director, Sarah has 20
years’ experience and is currently
Chairman of Ngai Tahu Tourism. Sarah
is also a Director of Christchurch City
Holdings, WhereScape Software,
and EcoCentral and is a Trustee for
several charitable organisations. She
is a Chartered Fellow of the Institute of
Directors.

SLI Systems Annual Report June 2016 | Management 13
Management
SLI’s seasoned management team brings the company extensive industry knowledge and experience in a breadth of disciplines including accounting and finance, software development, and marketing. The executive leadership team includes three original founders (Shaun Ryan, Wayne Munro, and Michael Grantham) and three PhD holders.
Dr Shaun RyanChief Innovation Officer and Co-Founder
Shaun has over 18 years’ experience
in search technologies. As a founding
CEO of SLI, he was one of the driving
forces behind the development of SLI’s
unique “Learning Search” site search
technology. Shaun was also an original
founder and CTO of GlobalBrain (in
1998), the search technology company
which was bought by NBCi, in 2000.
Shaun and his fellow founders formed
S.L.I. Systems, Inc. and bought back
the GlobalBrain technology. Prior to
GlobalBrain, he worked as a contract
software developer for a number of
organisations, including the international
health technology company Invacare.
Shaun and his brother, fellow SLI co-
founder, Grant Ryan, were awarded
2014 NZ Engineering Entrepreneurs of
the Year. Shaun has a PhD in Artificial
Intelligence.
Rod GarrettChief Financial Officer
Rod has over 20 years’ experience in
finance and related roles. He worked for
Pricewaterhouse in New Zealand and
London working mainly on Insolvency/
Corporate Recovery assignments before
moving into the commercial sector.
Before joining SLI in 2006, he was CFO
of Christchurch electronics developer
and manufacturer Eaton Power Quality
Ltd. Rod originally worked for New
Zealand owned Swichtec which was
acquired by British company Invensys
and, ultimately, by the Eaton group. He
has an honours degree in Accounting
and Finance from Otago University.
Chris BrennanChief Executive Officer and
Managing Director
Chris’ leadership experience spans
technology businesses ranging from
pre-revenue start-ups to organisations
over $1B. Chris served as CEO/
President of six companies including
NetAuthority, Contactual (acquired
by 8×8), LogLogic (acquired by Tibco),
Banter Systems (merged with iPhrase
and acquired by IBM), Roamware and
UB Networks (acquired by Newbridge
Networks). He also served as CFO
of Genesys Telecommunications
(acquired by Alcatel) and Diamond
Lane Communications (acquired by
Nokia). Chris has led or participated in
successful initiatives that raised over
$100M in capital and created nearly
$2B in shareholder value. He was twice
given the prestigious award of Red
Herring 100 North America Winner. Chris
has also been a member to a number
of public and private boards, including
international companies and a public
university.

14 SLI Systems Annual Report June 2016 | Management
Michael GranthamChief Information Officer
and Co-Founder
Michael is responsible for SLI’s global
technical infrastructure. As a co-founder
of SLI, he has helped design and
implement many of SLI’s products. Prior
to SLI, he gained valuable experience
in search and systems design at NBCi
and GlobalBrain, where he was a
lead developer and systems engineer.
Michael has also held lead developer
positions at Australia and New Zealand’s
largest banks. He holds a bachelor’s
degree in computer science from the
University of Canterbury.
Dr Blair CassidyChief Product Officer
Blair is responsible for product
management, strategy and pricing. He
has extensive experience leading high
performance technical teams, focusing
on the design, implementation and
usage of highly scalable IT systems.
Previously, he was VP of Engineering at
Eurekster, the pioneering social search
company. He spent several years at
PA Consulting Group, an international
management consultancy, living and
working throughout Asia and the US. He
also worked as the data engineer for the
search product at NBCi. Blair has held
research positions within New Zealand
and Japanese institutions, and holds a
PhD in Computational Modelling from
Lincoln University.
Dr Wayne MunroChief Technology Officer
and Co-Founder
Wayne leads SLI’s engineering team.
He is responsible for the production
and maintenance of the client searches
as well as the development of the SLI
products. Wayne is a co-founder of
SLI and has developed some of SLI’s
core algorithms as well as managing
and developing the internal processes
that have allowed the SLI engineering
team to grow efficiently. Before joining
the Company, he held senior technical
positions with NBCi and GlobalBrain,
specialising in software development
and theoretical research. Wayne also
worked as a research scientist for the
Wool Research Organisation of New
Zealand. He has a PhD in engineering
from the University of Canterbury in
New Zealand, where he developed
new numerical models for structural
simulation. Wayne has also published
papers in international journals.

SLI Systems Annual Report June 2016 | Management 15
Martin OnofrioChief Revenue Officer
Martin has more than 25 years’ sales
and executive leadership experience.
Before joining SLI, Martin was
Chief Revenue Officer at Attensity
Corporation, which provides test
analytics and intelligent data discovery
applications. He has also held executive
sales leadership positions at SAP,
Mobileum, Kana, Triple Point Technology
and e-commerce platform provider
Blue Martini Software. In these roles,
Martin consistently exceeded quota and
increased customer profitability. His
bachelor’s degree is from the University
of Texas in Dallas.
Chris BrubakerChief Marketing Officer
Chris is a 15 year veteran of Silicon
Valley where he has worked at numerous
start-ups including two Red Herring
Top 100 companies and one Fast
Company’s Fast 50. He led marketing at
Demandforce, which provided a turnkey
marketing automation solution for over
20,000 local businesses before being
acquired by Intuit. Most recently, Chris
led marketing at Upserve, a leading
restaurant technology company with
over 4,000 restaurant customers. He also
held marketing leadership positions at
Habeas (acquired by ReturnPath), Roost
(acquired by VerticalResponse) and
DudaMobile. Chris is a proud UCLA Bruin
and received his MBA in International
Management from the Monterey Institute
of International Studies.
Heather KinghornVice President of Human Resources
Heather has over 25 years’ experience
in building highly effective HR programs
in rapid-growth companies. She has
been with SLI since 2010 and leads
the company in its talent identification,
organisational development, and strategic
human resources planning. Prior to joining
SLI, Heather spent more than 15 years in
the consulting engineering industry, where
she specialised in acquisitional growth,
diversity management and conflict
resolution. Heather holds a bachelor’s
degree in industrial psychology and
industrial sociology.

16 SLI Systems Annual Report June 2016 | Management
Gary Schaumburg Vice President of Customer Success
Gary is responsible for leading the
company’s global customer success
teams and has more than 25 years of
leadership experience. Prior to joining
SLI, he was the VP of Client Services at
Attensity Corporation. He has also held
VP and leadership positions at Hughes
Electronics, Deloitte Consulting, Oracle,
Octane Software, Epiphany, Velosant,
Open Harbor and Infosys Edge. Gary
has been a successful leader in the
SaaS, CRM, social media, commerce,
communication and supply chain
spaces. He has a bachelor’s degree in
electrical engineering from UCLA and
a master’s degree from the Wharton
School of the University of Pennsylvania.

Best practice and governance
The Board has overall responsibility for ensuring that the
Company is properly managed and to enhance investor value
and confidence through good corporate governance. The Board
has adopted a corporate governance code (“Code”). A copy
of the Code is available on the Company’s website (www.sli-
systems.com).
The Board considers that the Company’s corporate governance
policies, practices and procedures materially comply with the
NZX Corporate Governance Best Practice Code.
The Company will continue to monitor best practice in the
governance area and update its policies to ensure it maintains
the most appropriate standards. The Company’s principal
governance statements are outlined in this report.
The role of the Board
The Board assumes accountability for the success of SLI Group
by taking responsibility for the direction and management of the
Company.
The main functions of the Board include:
• reviewing and approving the strategic, business and
financial plans prepared by management;
• ensuring the Company has appropriate management to
enable it to achieve its objectives;
• reviewing and approving individual investment and
divestment decisions which the Board has determined
should be referred to it before implementation;
• monitoring the Company’s performance against its
approved plans and overseeing the Company’s operating
results;
• ensuring the quality and independence of the Company’s
external audit process;
SLI Systems Annual Report June 2016 | Corporate Governance 17
• monitoring compliance and risk management;
• establishing and monitoring the Company’s health and
safety policies; and
• ensuring the ethical behaviour of the Company, the Board
and management.
Board and committee meetings
The Board formally met seven times during the period of 1 July
2015 to 30 June 2016. During this period, the Audit and Risk
Management Committee met four times and the Nominations
and Remuneration Committee met twice.
Board membership and composition
The Board is required to maintain at least a minimum number of
two Independent Directors or where the Board comprises eight
or more directors the number of Independent Directors must be
at least three or one-third of all directors (rounded down to the
nearest whole number of directors), whichever is the greater.
As at 30 June 2016, the Board has three Independent Directors
as noted below. In order for a director to be independent, the
Board has determined that he or she must not be an executive
of the Company and must have no disqualifying relationship as
defined in the Code and the NZX Main Board Listing Rules.
Each director of the Company is a skilled and experienced
business person and has been elected based on the value
they bring to the Board. Together they provide value by
making quality contributions to corporate governance matters,
conceptual thinking, strategic planning, policies and providing
guidance to management.
Corporate Governance

18 SLI Systems Annual Report June 2016 | Corporate Governance
As at 30 June 2016 the Board consisted of:
Greg Cross
Chairman and Independent Director
Chris Brennan
Managing Director
Steven Marder
Non-Executive Director
Matthew Houtman
Non-Executive Director
Shaun Ryan
Executive Director
Sarah Smith
Independent Director
Andrew Lark
Independent Director
Sam Knowles resigned from the Board on 16 October 2015.
Profiles of current board members are shown on pages 10 to 12.
As at 30 June 2016, six of the Company’s directors were male
and one was female (unchanged from 30 June 2015), and nine
of the Company’s ten key management personnel were male
and one, being the Vice President of Human Resources, was
female (30 June 2015 – six male, 1 female). The other nine key
management personnel as of 30 June 2016 were the CEO, the
Chief Financial Officer, the Chief Innovation Officer, the Chief
Technology Officer, the Chief Information Officer, the Chief
Revenue Officer, the Chief Product Officer, the Chief Marketing
Officer and the Vice President of Customer Success.
Nomination and appointment of directors
The Board is responsible for identifying and recommending
candidates. Directors may also be nominated by shareholders
under NZX Main Board Listing Rule 3.3.5.
A director may be appointed by ordinary resolution and all
directors are subject to removal by ordinary resolution.
The Board may at any time appoint additional directors. A
director appointed by the Board shall only hold office until the
next annual meeting of the Company, but shall be eligible for
election at that meeting.
One third of directors must retire from office at the annual
meeting each year but are eligible for reappointment by
shareholders at the annual meeting. The directors to retire shall
be those who have been longest in office since they were last
elected or deemed to be elected.
The number of elected directors and the procedure for their
retirement and re-election at annual meetings of shareholders
are set out in the Company’s Constitution.
Board committees
The Board uses committees to deal with issues requiring
detailed consideration by members of the Board with specialist
knowledge and experience, thereby enhancing the efficiency
and effectiveness of the Board. The committees examine
proposals and, where appropriate, make recommendations to
the Board. Committees do not take action or make decisions
on behalf of the Board unless specifically authorised to do so
by the Board. The two formally constituted committees are as
follows:

Audit and Risk Management Committee
The members of the Audit and Risk Management Committee are
Sarah Smith, Matthew Houtman and Greg Cross. The purpose of
the committee is to assist the Board in fulfilling its responsibilities
regarding external financial reporting, ensuring the quality and
independence of the Company’s external audit processes and
providing a formal forum for communication between the Board
and senior financial management staff.
A majority of the committee’s members must be independent
directors and at least one director must have a financial or
accounting background. The committee has adopted a written
charter.
Nominations and Remuneration Committee
The members of the Nominations and Remuneration Committee
are Greg Cross, Steven Marder and Andy Lark. This committee
is responsible for reviewing and making recommendations of
any changes to the Board, setting and reviewing the Company’s
remuneration policies including making remuneration
recommendations for directors and senior executives of the
Company. It also reviews any company-wide employee or
director incentive and share option schemes as required. The
committee has adopted a written charter.
Directors’ remuneration
Directors’ fees for the year ended 30 June 2016 were $60,000
per annum for the Chairman and $40,000 per annum for each
non-executive director1 (including the Independent Directors).
The actual aggregate amount of fees paid in the year ended
30 June 2016 was $231,917.
In November 2015, the board resolved to remunerate Greg Cross
with an additional services fee of $20,000 for Greg’s services
relating to the recruitment of the Company’s new Chief Executive
Officer.
To provide for flexibility, shareholder approval was obtained prior
to listing for aggregate non-executive directors’ fees of $250,000
which increased to $290,000 with the appointment of Andy Lark in
December 2013 as provided for under Listing Rule 3.5.
The directors are also entitled to be paid for all reasonable
travel, accommodation and other expenses incurred by them
in connection with their attendance at Board or shareholders’
meetings or otherwise in connection with the Company’s business.
Director and staff share dealings
The Company has adopted a securities trading policy which sets
out the procedure to be followed by directors and staff when
trading in the Company’s listed securities, to ensure that no trades
occur whilst that person is in possession of material information
which is not generally available to the market.
Directors’ indemnity and insurance
The Company has insured all of its directors and the directors of its
subsidiaries against liabilities to other parties (except the Company
or a related party of the Company) that may arise from their
position as directors. The insurance does not cover liabilities arising
from criminal actions. In addition, the Company has executed
a Deed of Indemnity, indemnifying all directors to the extent
permitted by section 162 of the Companies Act 1993.
Code of ethics
The Code includes a policy on business ethics which is designed
to govern the Board’s conduct. The Code addresses conflicts of
interest, receipt of gifts, confidentiality and fair business practices.
Disclosure
The Company adheres to the NZX continuous disclosure
requirements which govern the release of all material information
that may affect the value of Company’s listed shares.
1. Directors’ fees payable to Sam Knowles were prorated for his services as a director from 1 July 2015 to 16 October 2015.
SLI Systems Annual Report June 2016 | Corporate Governance 19

20 SLI Systems Annual Report June 2016 | Shareholder and Statutory Information
Stock Exchange Listing
The Company’s ordinary shares are quoted on the NZX Main Board licensed equity securities market operated by NZX Limited.
Twenty Largest Registered Shareholders
The table below shows the names and registered holdings of the 20 largest shareholders as at 31 July 2016.
Investor Name Total Shares %
Pioneer Capital I Nominees Limited 5,913,798 9.50
Custodial Services Limited 4,486,482 7.21
Premier Nominees Limited1 3,997,658 6.42
Grant James Ryan & Shaun William Ryan2 2,953,116 4.74
Wayne Alistair Munro 2,940,120 4.72
Lynnwood Holdings Limited 2,661,816 4.28
Shaun William Ryan & Katherine Louise Ryan3 2,430,000 3.90
Robert Van Nobelen & Bws Trustee (2005) Limited4 2,007,612 3.22
Michael Arthur Grantham 1,946,012 3.13
Accident Compensation Corporation1 1,843,190 2.96
Gareth Samuel Reuben Morgan & Gareth Huw Thomas Morgan & Charles Andrea Purcell5 1,795,843 2.88
JPMORGAN Chase Bank1 1,734,694 2.79
Kevin James Taylor & Anna Patricia Taylor6 1,492,928 2.40
Custodial Services Limited 1,333,929 2.14
Geoffrey Michael Brash 1,297,734 2.08
K One W One (No. 2) Limited 900,000 1.45
Jamie Glendinning Anstice 829,962 1.33
Shaun William Ryan 810,000 1.30
Warwick Desmond Croft & Elizabeth Prudence Croft 706,818 1.14
Michael James Chisholm 696,000 1.12
Shareholder and Statutory
Information
1. Held by New Zealand Central Securities Depository Limited as custodian
2. As trustees of the Grant James Ryan Family Trust
3. As trustees of the Shaun W Ryan Family Trust
4. As trustees of the Rob Van Nobelen Family Trust
5. As trustees of the Jasmine Investment Trust No.2
6. As trustees of the Anne and Kevin Taylor Family Trust
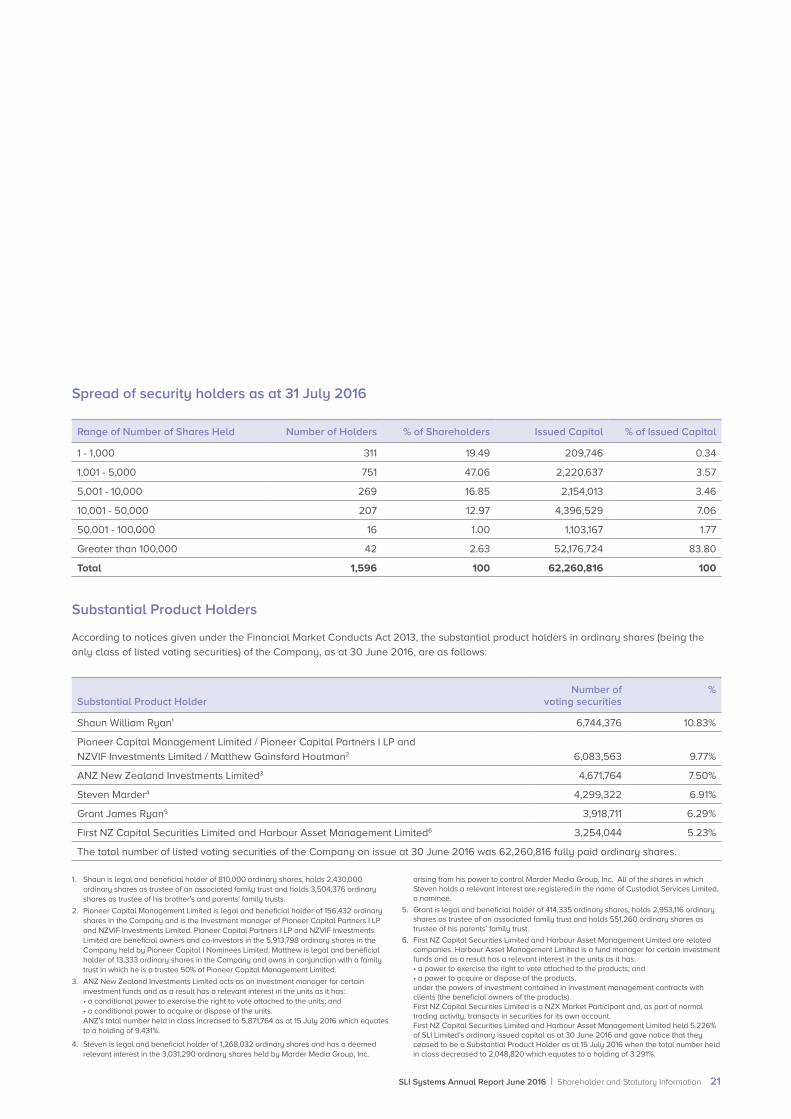
Spread of security holders as at 31 July 2016
Range of Number of Shares Held Number of Holders % of Shareholders Issued Capital % of Issued Capital
1 - 1,000 311 19.49 209,746 0.34
1,001 - 5,000 751 47.06 2,220,637 3.57
5,001 - 10,000 269 16.85 2,154,013 3.46
10,001 - 50,000 207 12.97 4,396,529 7.06
50,001 - 100,000 16 1.00 1,103,167 1.77
Greater than 100,000 42 2.63 52,176,724 83.80
Total 1,596 100 62,260,816 100
Substantial Product Holders
According to notices given under the Financial Market Conducts Act 2013, the substantial product holders in ordinary shares (being the
only class of listed voting securities) of the Company, as at 30 June 2016, are as follows:
Substantial Product HolderNumber of
voting securities%
Shaun William Ryan1 6,744,376 10.83%
Pioneer Capital Management Limited / Pioneer Capital Partners I LP and
NZVIF Investments Limited / Matthew Gainsford Houtman2 6,083,563 9.77%
ANZ New Zealand Investments Limited3 4,671,764 7.50%
Steven Marder4 4,299,322 6.91%
Grant James Ryan5 3,918,711 6.29%
First NZ Capital Securities Limited and Harbour Asset Management Limited6 3,254,044 5.23%
The total number of listed voting securities of the Company on issue at 30 June 2016 was 62,260,816 fully paid ordinary shares.
SLI Systems Annual Report June 2016 | Shareholder and Statutory Information 21
1. Shaun is legal and beneficial holder of 810,000 ordinary shares, holds 2,430,000 ordinary shares as trustee of an associated family trust and holds 3,504,376 ordinary shares as trustee of his brother’s and parents’ family trusts.
2. Pioneer Capital Management Limited is legal and beneficial holder of 156,432 ordinary shares in the Company and is the investment manager of Pioneer Capital Partners I LP and NZVIF Investments Limited. Pioneer Capital Partners I LP and NZVIF Investments Limited are beneficial owners and co-investors in the 5,913,798 ordinary shares in the Company held by Pioneer Capital I Nominees Limited. Matthew is legal and beneficial holder of 13,333 ordinary shares in the Company and owns in conjunction with a family trust in which he is a trustee 50% of Pioneer Capital Management Limited.
3. ANZ New Zealand Investments Limited acts as an investment manager for certain investment funds and as a result has a relevant interest in the units as it has: • a conditional power to exercise the right to vote attached to the units; and • a conditional power to acquire or dispose of the units. ANZ’s total number held in class increased to 5,871,764 as at 15 July 2016 which equates to a holding of 9.431%.
4. Steven is legal and beneficial holder of 1,268,032 ordinary shares and has a deemed relevant interest in the 3,031,290 ordinary shares held by Marder Media Group, Inc.
arising from his power to control Marder Media Group, Inc. All of the shares in which Steven holds a relevant interest are registered in the name of Custodial Services Limited, a nominee.
5. Grant is legal and beneficial holder of 414,335 ordinary shares, holds 2,953,116 ordinary shares as trustee of an associated family trust and holds 551,260 ordinary shares as trustee of his parents’ family trust.
6. First NZ Capital Securities Limited and Harbour Asset Management Limited are related companies. Harbour Asset Management Limited is a fund manager for certain investment funds and as a result has a relevant interest in the units as it has: • a power to exercise the right to vote attached to the products; and • a power to acquire or dispose of the products,under the powers of investment contained in investment management contracts with clients (the beneficial owners of the products).First NZ Capital Securities Limited is a NZX Market Participant and, as part of normal trading activity, transacts in securities for its own account. First NZ Capital Securities Limited and Harbour Asset Management Limited held 5.226% of SLI Limited’s ordinary issued capital as at 30 June 2016 and gave notice that they ceased to be a Substantial Product Holder as at 15 July 2016 when the total number held in class decreased to 2,048,820 which equates to a holding of 3.291%.

22 SLI Systems Annual Report June 2016 | Shareholder and Statutory Information
Statement of Directors’ relevant interests
Directors held the following relevant interests in equity securities in the Company as at 30 June 2016:
Director
Held as legal and beneficial
owner
Held as trustee of family trust
/ associated company
Held as trustee of trust not
established for benefit of director’s
immediate family Total
Greg Cross, Chairman
Unlisted redeemable shares 133,3331 133,333
Dr Shaun Ryan, Executive Director
Quoted Shares 810,000 2,430,000 3,504,376 6,744,376
Steven Marder, Non Executive Director
Quoted Shares 1,268,032 3,031,290 4,299,322
Matthew Houtman, Non Executive Director
Quoted Shares 13,333 6,070,230 6,083,563
Sarah Smith, Independent Director
Quoted Shares
Unlisted redeemable shares 133,3331
20,000 20,000
133,333
Sam Knowles, Independent Director
– Resigned from the Board as at 16 October 20152
Quoted Shares 66,667 66,667
Andy Lark, Independent Director
Unlisted redeemable shares 107,527 107,527
Directors also held the following relevant interests in securities that may convert to equity securities in the Company as at 30 June 2016:
• Greg Cross held 120,000 unlisted exercisable options as legal and beneficial owner
• Shaun Ryan held 249,260 unlisted exercisable options as legal and beneficial owner
• Chris Brennan held 1,839,249 unconditional share appreciation rights and 613,083 conditional share appreciation rights
Interest Register entries
The following represents the new entries in the Company’s Interests Register of the directors’ interests in other companies as disclosed to
the Company:
Shaun Ryan Vodafone Xone – Vodafone New Zealand Limited Mentor, Vodafone Xone 6 Dec 2015
Chris Brennan No interests recorded as at 30 June 2016.
1. In June 2016, the Board resolved to extend the repayment date of the limited recourse loans of Greg Cross and Sarah Smith to 31 December 2016.
2. Sam Knowles held 133,333 unlisted redeemable shares which were then redeemed by the Company on 30 June 2016.

Directors’ remuneration and other benefits
Directors’ fees have been fixed at $60,000 per annum for the Chairman, and $40,000 per annum for the non-executive directors (including
the Independent Directors).
Directors’ fees and other remuneration and benefits received or receivable from the Company during the accounting period ended 30
June 2016 are as follows:
$ Nature of Remuneration
Greg Cross 80,0001 Director Fees and other remuneration
Matthew Houtman 40,000 Director Fees
Steven Marder 40,000 Director Fees
Sam Knowles 11,917 Director Fees
Sarah Smith 40,000 Director Fees
Andy Lark 40,000 Director Fees
Chris Brennan 405,986 Salary and Entitlements
Shaun Ryan 307,599 Salary and Entitlements
The directors of each group company are also entitled to be paid for all reasonable travel, accommodation and other expenses incurred
by them in connection with their attendance at board or shareholders’ meetings or otherwise in connection with the Company’s business.
Director Share dealings
During the accounting period ended 30 June 2016 the following directors disclosed under section 148 of the Companies Act 1993 and
section 304 of the Financial Markets Conduct Act 2013 that they acquired or disposed of relevant interests in shares issued by the
Company:
DirectorShares in Company disposed during the year Nature of relevant interest
Consideration received
Date of acquisition or disposal
Shaun Ryan 200,000 Ordinary shares which were held by Shaun
Ryan as trustee of the J&I Ryan Family Trust
$188,000 25-May-16
Directors Indemnity Insurance
The Company entered into an indemnity in favour of its directors under an indemnity deed. The Company has insured all of its directors
against liabilities and costs referred to in section 162(5) of the Companies Act 1993.
SLI Systems Annual Report June 2016 | Shareholder and Statutory Information 23
1. $60,000 was paid to Greg Cross as Director Fees and $20,000 was paid to Greg Cross as other remuneration.

24 SLI Systems Annual Report June 2016 | Shareholder and Statutory Information
Employee Remuneration
The list below shows the number of employees of the SLI Group paid greater than $100,000 in the 12 months to 30 June 2016.
Remuneration range NZ$ No. of employees
100,000-109,999 11
110,000-119,999 14
120,000-129,999 6
130,000-139,999 8
140,000-149,999 3
150,000-159,999 2
160,000-169,999 3
170,000-179,999 2
180,000-189,999 2
200,000-209,999 1
210,000-219,999 1
220,000-229,999 1
230,000-239,999 1
240,000-249,999 2
250,000-259,999 1
280,000-289,999 1
290,000-299,999 2
300,000-309,999 1
350,000-359,999 1
380,000-389,999 1
400,000-409,999 2
560,000-569,999 1
NZX waivers obtained during the period to 30 June 2016
None were obtained.

SLI Systems Annual Report June 2016 | Shareholder and Statutory Information 25
Audit Fees
The amounts payable to PricewaterhouseCoopers as auditor of the SLI Group are as set out in the notes to the financial statements.
Donations
The SLI Group made no donations for the period ended 30 June 2016.
Dividends
As part of the SLI Group’s expansion and development plans, dividends are not currently paid, and will not be for the foreseeable future.
Subsidiary Company Directors
The following people held office as directors of subsidiary companies at 30 June 2016:
S.L.I. Systems, Inc.: Greg Cross, Chris Brennan, Shaun Ryan, Matthew Houtman, Sarah Smith, Steven Marder, Andy Lark
SLI Systems (UK) Limited: Shaun Ryan
SLI Systems (Japan) K.K: Terrie Lloyd

26 SLI Systems Annual Report June 2016 | Financial Statements
Independent Auditors’ Report
Directors’ Responsibility Statement
Consolidated Statement of Comprehensive Income
Consolidated Statement of Changes in Equity
Consolidated Balance Sheet
Consolidated Statement of Cash Flows
Notes to the Financial Statements
27
29
30
31
32
33
34
Financial Statements

SLI Systems Annual Report June 2016 | Financial Statements 27
Independent Auditors’ Report
PricewaterhouseCoopers, 5 Sir Gil Simpson Drive, Canterbury Technology Park, PO Box 13 244, Christchurch 8053, New Zealand; T: +64 (3) 374 3000, F: +64 (3) 374 3001, www.pwc.com/nz
Independent Auditors’ Report to the shareholders of SLI Systems Limited
Report on the Financial Statements We have audited the financial statements of SLI Systems Limited (“the Company”) on pages 6 to 36, which comprise the balance sheets as at 30 June 2014, the statements of comprehensive income and statements of changes in equity and statement of cash flows for the year then ended, and the notes to the financial statements that include a summary of significant accounting policies and other explanatory information for both the Company and the Group. The Group comprises the Company and the entities it controlled at 30 June 2014 or from time to time during the financial year.
Directors’ Responsibility for the Financial Statements The Directors are responsible for the preparation of these financial statements in accordance with generally accepted accounting practice in New Zealand and that give a true and fair view of the matters to which they relate and for such internal controls as the Directors determine are necessary to enable the preparation of financial statements that are free from material misstatement, whether due to fraud or error.
Auditors’ Responsibility Our responsibility is to express an opinion on these financial statements based on our audit. We conducted our audit in accordance with International Standards on Auditing (New Zealand) and International Standards on Auditing. These standards require that we comply with relevant ethical requirements and plan and perform the audit to obtain reasonable assurance about whether the financial statements are free from material misstatement.
An audit involves performing procedures to obtain audit evidence about the amounts and disclosures in the financial statements. The procedures selected depend on the auditors’ judgement, including the assessment of the risks of material misstatement of the financial statements, whether due to fraud or error. In making those risk assessments, the auditors consider the internal controls relevant to the Company and the Group’s preparation of financial statements that give a true and fair view of the matters to which they relate, in order to design audit procedures that are appropriate in the circumstances, but not for the purpose of expressing an opinion on the effectiveness of the Company and the Group’s internal control. An audit also includes evaluating the appropriateness of accounting policies used and the reasonableness of accounting estimates, as well as evaluating the overall presentation of the financial statements.
We believe that the audit evidence we have obtained is sufficient and appropriate to provide a basis for our audit opinion.
We have no relationship with, or interests in, SLI Systems Limited or any of its subsidiaries other than in our capacities as auditors and the provider of tax and other assurance services. These services have not impaired our independence as auditors of the Company and the Group.
to the shareholders of SLI Systems Limited
Report on the Financial Statements
We have audited the consolidated financial statements of SLI Systems Limited (“the Company”) on pages 30 to 55, which comprise
the consolidated balance sheet as at 30 June 2016, the consolidated statement of comprehensive income, the consolidated
statement of changes in equity and the consolidated statement of cash flows for the year then ended, and the notes to the financial
statements that include a summary of significant accounting policies and other explanatory information for the Group. The Group
comprises the Company and the entities it controlled at 30 June 2016 or from time to time during the financial year.
Directors’ Responsibility for the Consolidated Financial Statements
The Directors are responsible on behalf of the Company for the preparation and fair presentation of these consolidated financial
statements in accordance with New Zealand Equivalents to International Financial Reporting Standards and International
Financial Reporting Standards and for such internal controls as the Directors determine are necessary to enable the preparation of
consolidated financial statements that are free from material misstatement, whether due to fraud or error.
Auditors’ Responsibility
Our responsibility is to express an opinion on these consolidated financial statements based on our audit. We conducted our audit
in accordance with International Standards on Auditing (New Zealand) and International Standards on Auditing. These standards
require that we comply with relevant ethical requirements and plan and perform the audit to obtain reasonable assurance about
whether the consolidated financial statements are free from material misstatement.
An audit involves performing procedures to obtain audit evidence about the amounts and disclosures in the consolidated financial
statements. The procedures selected depend on the auditors’ judgement, including the assessment of the risks of material
misstatement of the consolidated financial statements, whether due to fraud or error. In making those risk assessments, the auditors
consider the internal controls relevant to the Company’s preparation and fair presentation of the consolidated financial statements
in order to design audit procedures that are appropriate in the circumstances, but not for the purpose of expressing an opinion on
the effectiveness of the Company’s internal control. An audit also includes evaluating the appropriateness of accounting policies
used and the reasonableness of accounting estimates, as well as evaluating the overall presentation of the consolidated financial
statements.
We believe that the audit evidence we have obtained is sufficient and appropriate to provide a basis for our audit opinion.
We are independent of the Group. Other than in our capacity as auditors, tax advisors and providers of other assurance related
services we have no relationship with, or interests in, the Group.

Independent Auditors’ Report SLI Systems Limited
Opinion In our opinion, the financial statements on pages 6 to 36:
(i) comply with generally accepted accounting practice in New Zealand; and
(ii) comply with International Financial Reporting Standards; and
(iii) give a true and fair view of the financial position of the Company and the Group as at 30 June 2014, and their financial performance and cash flows for the year then ended.
Report on Other Legal and Regulatory Requirements We also report in accordance with Sections 16(1)(d) and 16(1)(e) of the Financial Reporting Act 1993. In relation to our audit of the financial statements for the year ended 30 June 2014:
(i) we have obtained all the information and explanations that we have required; and
(ii) in our opinion, proper accounting records have been kept by the Company as far as appears from an examination of those records.
Restriction on Use of our Report This report is made solely to the Company’s shareholders, as a body, in accordance with Section 205(1) of the Companies Act 1993. Our audit work has been undertaken so that we might state to the Company’s shareholders those matters which we are required to state to them in an auditors’ report and for no other purpose. To the fullest extent permitted by law, we do not accept or assume responsibility to anyone other than the Company and the Company’s shareholders, as a body, for our audit work, for this report or for the opinions we have formed.
Chartered Accountants Christchurch 25 August 2014
28 SLI Systems Annual Report June 2016 | Financial Statements
PricewaterhouseCoopers, 5 Sir Gil Simpson Drive, Canterbury Technology Park, PO Box 13 244, Christchurch 8053, New Zealand; T: +64 (3) 374 3000, F: +64 (3) 374 3001, www.pwc.com/nz
Independent Auditors’ Report to the shareholders of SLI Systems Limited
Report on the Financial Statements We have audited the financial statements of SLI Systems Limited (“the Company”) on pages 6 to 36, which comprise the balance sheets as at 30 June 2014, the statements of comprehensive income and statements of changes in equity and statement of cash flows for the year then ended, and the notes to the financial statements that include a summary of significant accounting policies and other explanatory information for both the Company and the Group. The Group comprises the Company and the entities it controlled at 30 June 2014 or from time to time during the financial year.
Directors’ Responsibility for the Financial Statements The Directors are responsible for the preparation of these financial statements in accordance with generally accepted accounting practice in New Zealand and that give a true and fair view of the matters to which they relate and for such internal controls as the Directors determine are necessary to enable the preparation of financial statements that are free from material misstatement, whether due to fraud or error.
Auditors’ Responsibility Our responsibility is to express an opinion on these financial statements based on our audit. We conducted our audit in accordance with International Standards on Auditing (New Zealand) and International Standards on Auditing. These standards require that we comply with relevant ethical requirements and plan and perform the audit to obtain reasonable assurance about whether the financial statements are free from material misstatement.
An audit involves performing procedures to obtain audit evidence about the amounts and disclosures in the financial statements. The procedures selected depend on the auditors’ judgement, including the assessment of the risks of material misstatement of the financial statements, whether due to fraud or error. In making those risk assessments, the auditors consider the internal controls relevant to the Company and the Group’s preparation of financial statements that give a true and fair view of the matters to which they relate, in order to design audit procedures that are appropriate in the circumstances, but not for the purpose of expressing an opinion on the effectiveness of the Company and the Group’s internal control. An audit also includes evaluating the appropriateness of accounting policies used and the reasonableness of accounting estimates, as well as evaluating the overall presentation of the financial statements.
We believe that the audit evidence we have obtained is sufficient and appropriate to provide a basis for our audit opinion.
We have no relationship with, or interests in, SLI Systems Limited or any of its subsidiaries other than in our capacities as auditors and the provider of tax and other assurance services. These services have not impaired our independence as auditors of the Company and the Group.
Opinion
In our opinion, the consolidated financial statements on pages 30 to 55 present fairly, in all material respects, the financial position of
the Group as at 30 June 2016, and its financial performance and cash flows for the year then ended in accordance with New Zealand
Equivalents to International Financial Reporting Standards and International Financial Reporting Standards.
Restriction on Use of our Report
This report is made solely to the Company’s shareholders, as a body, in accordance with the Companies Act 1993. Our audit work has
been undertaken so that we might state those matters which we are required to state to them in an auditors’ report and for no other
purpose. To the fullest extent permitted by law, we do not accept or assume responsibility to anyone other than the Company and the
Company’s shareholders, as a body, for our audit work, for this report or for the opinions we have formed.
Chartered Accountants Christchurch
25 August 2016

SLI Systems Annual Report June 2016 | Financial Statements 29
Directors’ Responsibility Statement
The directors are responsible on behalf of the Company for presenting financial statements in accordance with New
Zealand law and generally accepted accounting practice, which present fairly a view of the financial position of the
Group as at 30 June 2016 and the results of the Group’s operations and cash flows for the year ended on that date.
The financial statements presented cover a period of 12 months from 1 July 2015 to 30 June 2016.
The directors believe that proper accounting records have been kept which enable with reasonable accuracy, the
determination of the financial position of the Group and facilitate compliance with Part 7 of the Financial Markets
Conduct Act 2013.
The directors consider that they have taken adequate steps to safeguard the assets of the Group, and to prevent
and detect fraud and other irregularities. Internal control procedures are also considered to be sufficient to provide a
reasonable assurance as to the integrity and reliability of the financial statements.
The Board of Directors of the Group authorised the financial statements presented for issue on 25 August 2016.
For and on behalf of the Board,
Greg Cross Sarah Smith Chairman of Board Chair of Audit and Risk Management Committee
30 SLI Systems Annual Report June 2016 | Financial Statements
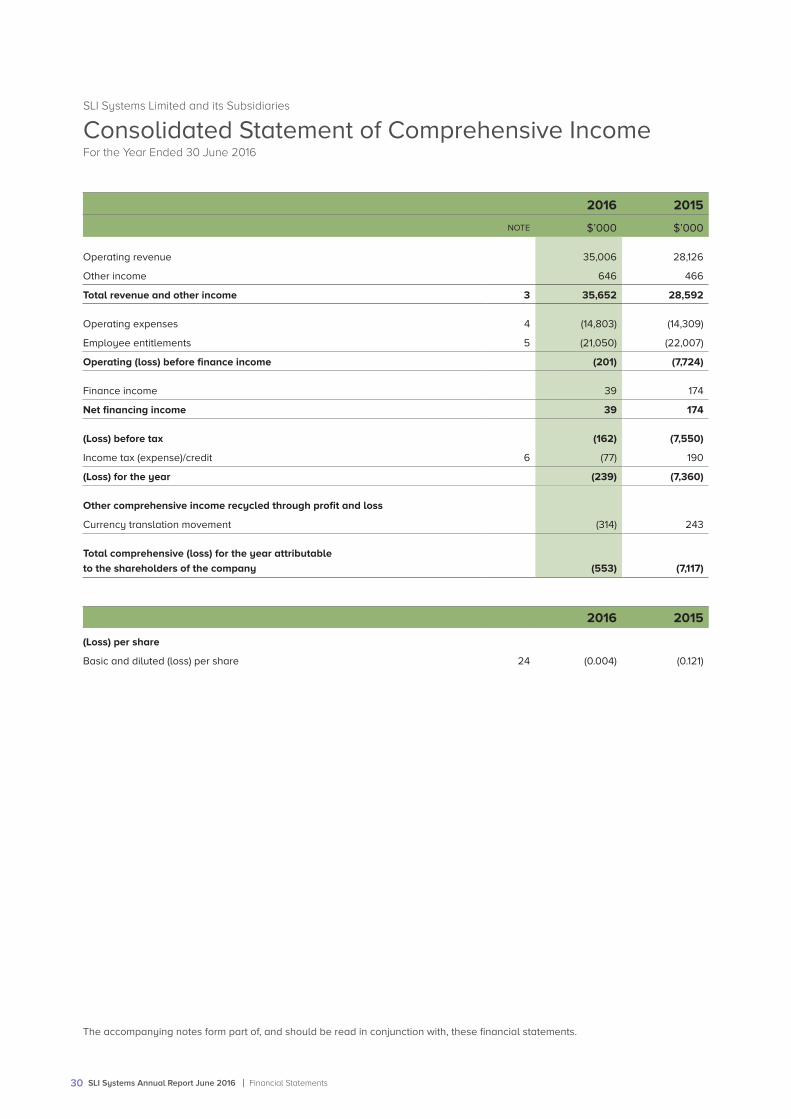
SLI Systems Limited and its Subsidiaries
Consolidated Statement of Comprehensive IncomeFor the Year Ended 30 June 2016
The accompanying notes form part of, and should be read in conjunction with, these financial statements.
2016 2015
NOTE $’000 $’000
Operating revenue 35,006 28,126
Other income 646 466
Total revenue and other income 3 35,652 28,592
Operating expenses 4 (14,803) (14,309)
Employee entitlements 5 (21,050) (22,007)
Operating (loss) before finance income (201) (7,724)
Finance income 39 174
Net financing income 39 174
(Loss) before tax (162) (7,550)
Income tax (expense)/credit 6 (77) 190
(Loss) for the year (239) (7,360)
Other comprehensive income recycled through profit and loss
Currency translation movement (314) 243
Total comprehensive (loss) for the year attributable
to the shareholders of the company (553) (7,117)
2016 2015
(Loss) per share
Basic and diluted (loss) per share 24 (0.004) (0.121)

SLI Systems Annual Report June 2016 | Financial Statements 31
SLI Systems Limited and its Subsidiaries
Consolidated Statement of Changes in EquityFor the Year Ended 30 June 2016
The accompanying notes form part of, and should be read in conjunction with, these financial statements.
Share
Capital
ShareOption
ReserveTranslation
ReserveAccumulated
LossesTotal
Equity
$’000 $’000 $’000 $’000 $’000
Opening balance at 1 July 2015 18,125 1,492 277 (14,504) 5,390
Prior period adjustment (note 2) - - - (478) (478)
Restated opening balance at 1 July 2015 18,125 1,492 277 (14,982) 4,912
(Loss) for the year - - - (239) (239)
Currency translation movement - - (314) - (314)
Total comprehensive income for the year - - (314) (239) (553)
Transactions with owners
Share Options
- Share options exercised during year 646 (108) - - 538
- Share option expense for the year - 888 - - 888
- Share options expired for the year - (424) - 424 -
Balance at 30 June 2016 18,771 1,848 (37) (14,797) 5,785
ShareCapital
ShareOption
ReserveTranslation
ReserveAccumulated
LossesTotal
Equity
$’000 $’000 $’000 $’000 $’000
Opening balance at 1 July 2014 17,674 1,216 34 (7,476) 11,448
Prior period adjustment (note 2) - - - (248) (248)
Restated opening balance at 1 July 2014 17,674 1,216 34 (7,724) 11,200
(Loss) for the year - - - (7,360) (7,360)
Currency translation movement - - 243 - 243
Total comprehensive income for the year - - 243 (7,360) (7,117)
Transactions with owners
Share Options
- Share options exercised during year 451 (148) - - 303
- Share option expense for the year - 526 - - 526
- Share options expired for the year - (102) - 102 -
Balance at 30 June 2015 18,125 1,492 277 (14,982) 4,912

32 SLI Systems Annual Report June 2016 | Financial Statements
2016 2015 2014
NOTE $’000 $’000 $’000
ASSETS
Current assets
Cash and cash equivalents 10 6,765 5,582 11,389
Trade and other receivables 11 5,876 6,631 4,972
Taxation receivable 6 - - 30
Total current assets 12,641 12,213 16,391
Non-current assets
Deferred tax assets 7 675 688 455
Property, plant and equipment 8 1,316 1,582 1,589
Intangible assets 9 65 99 115
Total non-current assets 2,056 2,369 2,159
Total assets 14,697 14,582 18,550
LIABILITIES
Current liabilities
Taxation payable 6 34 24 -
Trade and other payables 14 7,035 6,843 5,312
Employee benefits 15 1,801 2,774 1,966
Total current liabilities 8,870 9,641 7,278
Non-current liabilities
Employee benefits 15 29 17 57
Deferred tax liabilities 7 13 12 15
Total non-current liabilities 42 29 72
Total liabilities 8,912 9,670 7,350
Net assets 5,785 4,912 11,200
EQUITY
Share capital 13 18,771 18,125 17,674
Reserves 1,811 1,769 1,250
Accumulated losses (14,797) (14,982) (7,724)
Total equity 5,785 4,912 11,200
2016 2015 2014
Net tangible asset backing per ordinary security $0.09 $0.08 $0.18
The accompanying notes form part of, and should be read in conjunction with, these financial statements.
SLI Systems Limited and its Subsidiaries
Consolidated Balance SheetAs at 30 June 2016

SLI Systems Annual Report June 2016 | Financial Statements 33
The accompanying notes form part of, and should be read in conjunction with, these financial statements.
SLI Systems Limited and its Subsidiaries
Consolidated Statement of Cash FlowsFor the Year Ended 30 June 2016
2016 2015
NOTE $’000 $’000
Cash flows from operating activities
Cash was provided from:
Receipts from customers 36,148 27,938
Interest received 111 246
Net GST (paid) (23) (15)
Government grants 558 378
Cash was applied to:
Payments made to suppliers and employees (35,936) (34,193)
Income tax received / (paid) 6 (50) 8
Net cash inflow / (outflow) from operating activities 25 808 (5,638)
Cash flows from investing activities
Cash was provided from / (applied to):
Purchase of property, plant and equipment 8 (140) (433)
Sale of property, plant and equipment 8 - 1
Purchase of intangibles 9 (23) (40)
Net cash (outflow) from investing activities (163) (472)
Cash flows from financing activities
Cash was provided from / (applied to):
Cash received from share options exercised 538 303
Net cash inflow from financing activities 538 303
Net increase / (decrease) in cash and cash equivalents 1,183 (5,807)
Cash and cash equivalents at the beginning of the year 5,582 11,389
Cash and cash equivalents at the end of the year 10 6,765 5,582

34 SLI Systems Annual Report June 2016 | Financial Statements
SLI Systems Limited and its Subsidiaries
Notes to the Financial Statements
1. General informationSLI Systems Limited (the Company, SLI) and its subsidiaries S.L.I. Systems, Inc., SLI Systems (UK) Limited and SLI Systems (Japan) K.K
(together the Group) provide site search and navigation technologies to connect site visitors with products on e-commerce websites.
The Group has operations in New Zealand, the United States, Australia, the United Kingdom and Japan.
The consolidated financial statements for the Group for the year ended 30 June 2016 were authorised for issue in accordance with a
resolution of the Directors on 25 August 2016.
2. Summary of significant accounting policies
The consolidated financial statements of the group have been prepared in accordance with Generally Accepted Accounting Practice
in New Zealand (NZ GAAP). The group is a for-profit entity for the purposes of complying with NZ GAAP. The consolidated financial
statements comply with New Zealand equivalents to International Financial Reporting Standards (NZ IFRS), other New Zealand
accounting standards and authoritative notices that are applicable to entities that apply NZ IFRS. The consolidated financial
statements also comply with International Financial Reporting Standards (IFRS).
(a) Basis of preparation
The principal accounting policies adopted in the preparation of the financial statements are set out below. These policies have been
consistently applied to the period presented, unless otherwise stated.
The Group has adopted External Reporting Board Standard A1 Accounting Standards Framework (For-profit Entities Update) (XRB A1).
XRB A1 establishes a for-profit tier structure and outlines which suite of accounting standards entities in different tiers must follow. The
Group is a Tier 1 entity. There was no impact on the current or prior year financial statements.
Entities reporting
SLI Systems Limited is a company registered under the Companies Act 1993 and is an FMC reporting entity under Part 7 of the
Financial Markets Conduct Act 2013. The financial statements of the Group have been prepared in accordance with the requirements
of Part 7 of the Financial Markets Conduct Act 2013 and the NZX Main Board Listing Rules. In accordance with the Financial Markets
Conduct Act 2013, because Group financial statements are prepared and presented for SLI Systems Limited and its subsidiaries,
separate financial statements for SLI Systems Limited are no longer required to be prepared and presented.
The Group is designated as a for-profit entity for financial reporting purposes.
SLI is a limited company, incorporated in New Zealand and the registered office of the Company is 78-106 Manchester Street,
Christchurch, New Zealand.
There have been no significant changes in accounting policies during the period. These financial statements have been restated to
reflect a prior period adjustment as below:
During the year, the Company appointed a specialist indirect tax expert to evaluate previous advice on the Group’s US Sales Tax
position. The earlier advice and related treatment of US sales tax resulted in SLI under-returning sales taxes to the US authorities.
The Company has made a provision within Trade and other Payables of $664,000 for an estimate of additional sales tax cost, net of
expected credits, that relates to previous years.
As the amount relates to previous periods, as required by accounting standards, the amount has been adjusted against opening
retained earnings.
The impact of the restatement on these financial statements is as follows:
Year ended 30 June 2015 - $319,000 increase in operating expenses and loss for the year, a $664,000 increase in trade and other
payables, $186,000 increase in deferred tax asset and a $478,000 decrease in total equity. This equates to a $0.005 increase in loss
per share.
Year ended 30 June 2014 - $236,000 increase in operating expenses and loss for the year, a $345,000 increase in trade and other
payables, $97,000 increase in deferred tax asset and a $248,000 decrease in total equity. This equates to a $0.004 increase in loss
per share.

SLI Systems Annual Report June 2016 | Financial Statements 35
Historical cost convention
These financial statements have been prepared under the historical cost convention.
Critical accounting estimates and judgements
The preparation of financial statements requires management to make judgements, estimates and assumptions that affect the
application of accounting policies and reported amounts of assets, liabilities, income and expenses. The areas involving a higher
degree of judgement or complexity are in the determination of:
1. Research related costs from which Grant income is determined (note 5);
2. Share option expense whereby a level of judgement is required to determine the parameters of the Black-Scholes pricing model
(note 21);
3. Share appreciation rights being equity settled share option scheme (note 22);
4. US Sales tax provision as judgement has been used in determining the level of the provision (note 14);
5. The provision for doubtful debts in determining the level of receivables to provide (note 12).
(b) Principles of consolidation
Subsidiaries
The consolidated financial statements incorporate the assets and liabilities of the subsidiaries of SLI Systems Limited as at 30 June
2016 and the results of the subsidiaries for the year then ended. SLI Systems Limited and its subsidiaries together are referred to in
these financial statements as the Group or the consolidated entity.
Subsidiaries are entities over which the Group has the power to govern the financial and operating policies so as to obtain benefits
from its activities, generally accompanying a shareholding of more than one half of the voting rights. The existence and effect of
potential voting rights that are currently exercisable or convertible are considered when assessing whether the Group controls
another entity.
The financial statements of subsidiaries are included in the consolidated financial statements from the date that control commences
until the date that control ceases.
Inter-company transactions, balances and unrealised gains and losses on transactions between Group companies are eliminated.
(c) Foreign currency translation
(i) Functional and presentation currency
Items included in the financial statements of each subsidiary are measured using the currency of the primary economic
environment in which it operates. The consolidated financial statements are presented in New Zealand dollars, which is the
Company’s functional currency and the Group’s presentation currency.
(ii) Transactions and balances
Foreign currency transactions are translated into the functional currency using a monthly exchange rate set at the start of
each month as an estimate of the exchange rate prevailing at the dates of transactions. Foreign exchange gains and losses
resulting from the settlement of such transactions and from the translation at year end exchange rates of monetary assets and
liabilities denominated in foreign currencies are recognised in the statement of comprehensive income.
(iii) Foreign operations
The results and balance sheets of all foreign operations that have a currency different from New Zealand dollars are
translated into the presentation currency as follows:
• assets and liabilities for each balance sheet presented are translated at the closing rate at the date of that balance
sheet;
• income and expenses for each profit and loss component of the statement of comprehensive income are translated at
average exchange rates; and
• all resulting exchange differences are recognised as currency translation movement.

36 SLI Systems Annual Report June 2016 | Financial Statements
(d) Goods and Services Tax (GST)
The financial statements have been prepared so that all components are stated exclusive of GST with the exception of receivables
and payables, which are shown inclusive of GST.
(e) Segment reporting
An operating segment is a component of an entity that engages in business activities from which it may earn revenue and incur
expenses, whose operating results are regularly reviewed by the entity’s Chief Operating Decision-Maker to make decisions about
resources to be allocated to the segment and assess its performance, and for which discrete financial information is available. The
Chief Operating Decision-Maker, who is responsible for allocating resources and assessing performance of the Group, has been
identified as the CEO.
The Group currently operates in one operating segment providing website search services in New Zealand, United States, Australia,
the United Kingdom, Brazil and Japan. Discrete financial information is not produced on a geographical basis and the operating
results are reviewed on a group basis.
(f) Changes in accounting policy and disclosures
New standards and interpretations not yet adopted
A number of new standards and amendments to standards and interpretations are effective for annual periods beginning after 1 July
2017 and 2018, and have not been applied in preparing these consolidated financial statements. None of these are expected to have
a significant effect on the consolidated financial statements of the Group, except the following set out below:
IFRS 9, ‘Financial instruments’, addresses the classification, measurement and recognition of financial assets and financial liabilities.
IFRS 9 was issued in November 2009 and October 2010. It replaces the parts of IAS 39 that relate to the classification and
measurement of financial instruments. The standard is effective for accounting periods beginning on or after 1 January 2018. Early
adoption is permitted. The Group will apply this standard from 1 July 2018 and has yet to assess its full impact.
NZ IFRS 15, ‘Revenue from contracts with customers’ deals with revenue recognition and establishes principles for reporting useful
information to users of financial statements about the nature, amount, timing and uncertainty of revenue and cash flows arising from
an entity’s contracts with customers. Revenue is recognised when a customer obtains control of a good or service and thus has the
ability to direct the use and obtain the benefits from the good or service. The standard replaces NZ IAS 18 ‘Revenue’ and NZ IAS 11
‘Construction contracts’ and related interpretations. The standard is effective for annual periods beginning on or after 1 January 2018
and earlier application is permitted. The Group will apply this standard from 1 July 2018 and is currently assessing its full impact.
NZ IFRS 16, ‘Leases’ replaces the current guidance in NZ IAS 17. Under NZ IFRS 16, a contract is, or contains, a lease if the contract
conveys the right to control the use of an identified asset for a period of time in exchange for consideration. Under NZ IAS 17, a lessee
was required to make a distinction between a finance lease (on balance sheet) and an operating lease (off balance sheet). NZ IFRS
16 now requires a lessee to recognise a lease liability reflecting future lease payments and a ‘right-of-use asset’ for virtually all lease
contracts. Included is an optional exemption for certain short-term leases and leases of low-value assets; however, this exemption
can only be applied by lessees. The standard is effective for accounting periods beginning on or after 1 January 2019. The Group will
apply this standard from 1 July 2019 and has yet to assess its full impact.
(g) Accounting Policies disclosed in the Notes
The following accounting policies are disclosed separately alongside their relevant note:
Note
Revenue recognition 3
Income tax 7
Property, plant and equipment 8
Intangible assets 9
Cash and cash equivalents 10
Trade receivables 12
Contributed capital 13
Trade and other payables 14
Employee benefits 15
Leases 16
Equity settled share option plan 21
Financial assets 23
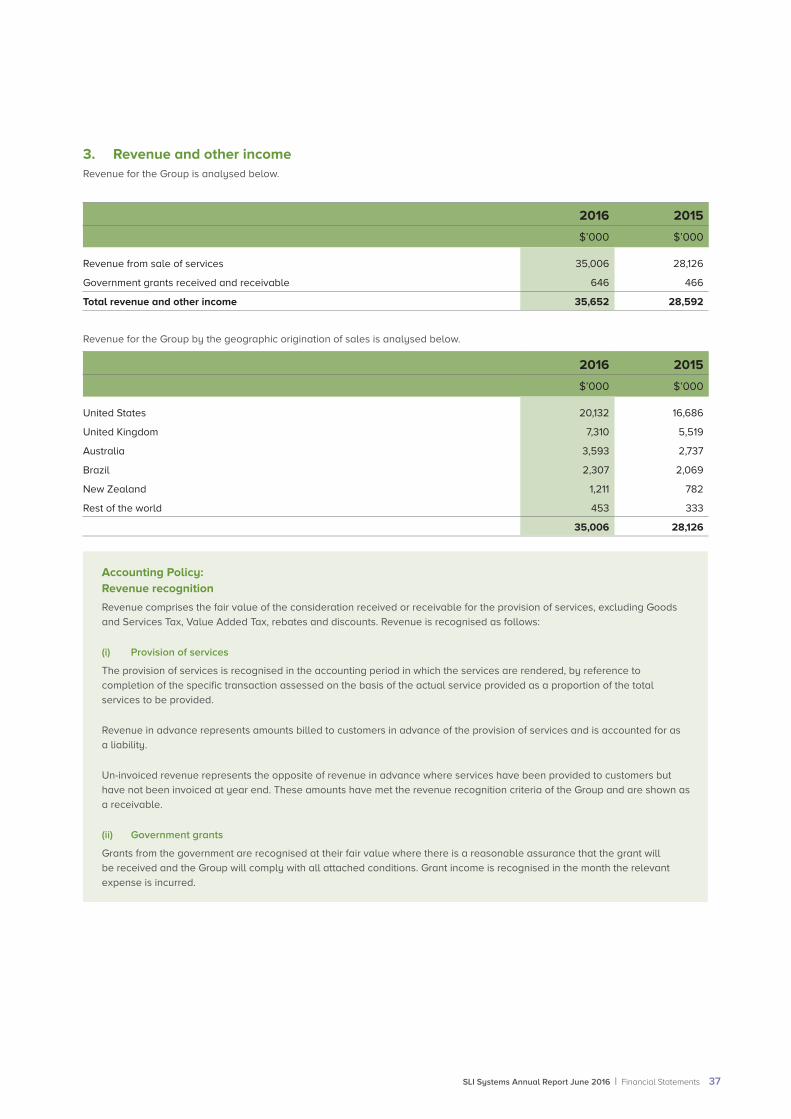
SLI Systems Annual Report June 2016 | Financial Statements 37
3. Revenue and other incomeRevenue for the Group is analysed below.
2016 2015
$’000 $’000
Revenue from sale of services 35,006 28,126
Government grants received and receivable 646 466
Total revenue and other income 35,652 28,592
Revenue for the Group by the geographic origination of sales is analysed below.
2016 2015
$’000 $’000
United States 20,132 16,686
United Kingdom 7,310 5,519
Australia 3,593 2,737
Brazil 2,307 2,069
New Zealand 1,211 782
Rest of the world 453 333
35,006 28,126
Accounting Policy: Revenue recognition
Revenue comprises the fair value of the consideration received or receivable for the provision of services, excluding Goods
and Services Tax, Value Added Tax, rebates and discounts. Revenue is recognised as follows:
(i) Provision of services
The provision of services is recognised in the accounting period in which the services are rendered, by reference to
completion of the specific transaction assessed on the basis of the actual service provided as a proportion of the total
services to be provided.
Revenue in advance represents amounts billed to customers in advance of the provision of services and is accounted for as
a liability.
Un-invoiced revenue represents the opposite of revenue in advance where services have been provided to customers but
have not been invoiced at year end. These amounts have met the revenue recognition criteria of the Group and are shown as
a receivable.
(ii) Government grants
Grants from the government are recognised at their fair value where there is a reasonable assurance that the grant will
be received and the Group will comply with all attached conditions. Grant income is recognised in the month the relevant
expense is incurred.

38 SLI Systems Annual Report June 2016 | Financial Statements
4. Operating expenses
2016 2015
$’000 $’000
Operating expenses include:
Amortisation of intangible assets 57 56
Bad debts written off 626 318
Movement in provision for doubtful debts 128 127
Depreciation on property, plant and equipment 392 458
Directors’ fees and other remuneration 252 260
Remuneration paid to auditors (Note 26) 128 141
Operating leases expenses 1,555 1,245
Loss / (gain) on foreign exchange transactions 289 (804)
5. Employee entitlements
2016 2015
$’000 $’000
Wages and salaries 19,877 21,199
Share option expense 888 526
Employer contribution to defined contribution plans 285 282
Total employee entitlements 21,050 22,007
Employee benefit costs incurred on research activities are included within employee entitlements disclosed above. The cost of
employee entitlements associated with research costs is $1,661,000 (30 June 2015 $843,000). Total amounts attributable to research
costs during the year is $2,092,000 (30 June 2015 $1,131,000). During the year there were no activities which met the definition of
development expenditure.
6. Taxation
2016 2015
$’000 $’000
(a) Income tax expense / (credit) can be reconciled to accounting (loss) as follows:
Accounting (loss) before tax (162) (7,550)
Tax at the Group’s effective income tax rate of 28% (45) (2,114)
Adjustments in respect of current income tax of previous years (15) (4)
Tax effect of non-deductible expenditure 273 182
Tax effect of deduction for share options exercised in UK (26) -
Unrecognised current year tax losses - 1,728
Tax effect of foreign jurisdictions 11 21
Tax losses brought forward utilised (201) (43)
Other 80 40
Aggregate income tax expense / (credit) 77 (190)

SLI Systems Annual Report June 2016 | Financial Statements 39
2016 2015
$’000 $’000
Comprising
Current tax
- Current year tax 81 50
- Prior year adjustment (15) (4)
Deferred tax 11 (236)
Income tax expense / (credit) 77 (190)
(b) Recognised tax (liability) / asset
Opening balance (24) 30
Charged to income (81) (50)
Tax paid / (refund) 50 (8)
Prior year adjustment 15 4
Other 6 -
Closing balance (34) (24)
(c) Imputation credit balance
There is no imputation credit balance at 30 June 2016 (30 June 2015 nil).
7. Deferred taxation
2016 2015
$’000 $’000
Deferred tax asset / (liability):
Opening balance 676 440
Credited to income 68 275
Prior year adjustment (79) (39)
Other (3) -
Closing balance 662 676
Deferred income tax at 30 June relates to the following:
Deferred tax assets:
Employee entitlements and other temporary differences 281 324
Provisions 285 266
Doubtful Debts 103 92
Other 6 6
Gross recognised deferred tax assets 675 688
Deferred tax liabilities:
Property, plant and equipment (13) (12)
Gross recognised deferred tax liabilities (13) (12)
Net recognised deferred tax asset 662 676
6. Taxation continued

40 SLI Systems Annual Report June 2016 | Financial Statements
It is not anticipated that deferred tax balances will be recovered within 12 months. The Company has unrecognised New Zealand tax
losses available to carry forward at 30 June 2016 of $11,043,000 (30 June 2015 $11,545,000) subject to shareholder continuity being
maintained as required by New Zealand tax legislation and subject to confirmation from the relevant tax authorities.
Accounting Policy: Income tax
Income tax expense comprises current and deferred tax. Income tax expense is recognised in the statement of
comprehensive income. Current tax is the expected tax payable on the taxable income for the year, using tax rates enacted
or substantially enacted at the reporting date, and any adjustment to tax payable in respect of previous years.
Deferred tax is recognised, using the liability method, on temporary differences arising between the tax bases of assets and
liabilities and their carrying amounts in the consolidated financial statements. Deferred income tax is determined using tax
rates (and laws) that have been enacted or substantially enacted by the reporting date and are expected to apply when the
related deferred income tax asset is realised or the deferred income tax liability is settled.
A deferred tax asset is recognised to the extent that it is probable that future taxable profits will be available against which
temporary differences can be utilised. Deferred tax assets are reviewed at each reporting date and are reduced to the extent
that it is no longer probable that the related benefits will be realised.
Deferred income tax assets and liabilities are offset when there is a legally enforceable right to offset current tax assets
against current tax liabilities and when the deferred income tax assets and liabilities relate to income tax levied by the same
taxation authority on either the same taxable entity or different entities where there is an intention to settle the balance on a
net basis.
8. Property, plant and equipment
Year ended 30 June 2016Computer
Equipment
Furniture, Equipment
& Other Total
$’000 $’000 $’000
Cost
Balance at 1 July 2015 1,352 1,724 3,076
Currency translation movement (31) (42) (73)
Additions 123 17 140
Disposals (12) - (12)
Balance at 30 June 2016 1,432 1,699 3,131
Depreciation
Balance at 1 July 2015 (961) (533) (1,494)
Currency translation movement 27 32 59
Depreciation expense (221) (171) (392)
Disposals 12 - 12
Balance at 30 June 2016 (1,143) (672) (1,815)
Net carrying amount 289 1,027 1,316

SLI Systems Annual Report June 2016 | Financial Statements 41
Year ended 30 June 2015Computer
Equipment
Furniture, Equipment
& Other Total
$’000 $’000 $’000
Cost
Balance at 1 July 2014 1,064 1,543 2,607
Currency translation movement 23 35 58
Additions 286 147 433
Disposals (21) (1) (22)
Balance at 30 June 2015 1,352 1,724 3,076
Depreciation
Balance at 1 July 2014 (695) (323) (1,018)
Currency translation movement (19) (20) (39)
Depreciation expense (267) (191) (458)
Disposals 20 1 21
Balance at 30 June 2015 (961) (533) (1,494)
Net carrying amount 391 1,191 1,582
The net carrying value at 30 June 2016 of property, plant and equipment held in New Zealand is $890,000 (30 June 2015
$1,049,000), within the United States $317,000 (30 June 2015 $336,000), within United Kingdom $86,000 (30 June 2015 $140,000),
within Australia $21,300 (30 June 2015 $25,000) and within Japan $1,200 (30 June 2015 $2,000).
Accounting Policy: Property, plant and equipment
All property, plant and equipment is stated at historical cost less depreciation and impairment. Historical cost includes
expenditure that is directly attributable to the acquisition of the items.
Subsequent costs are included in the asset’s carrying amount or recognised as a separate asset, as appropriate, only when
it is probable that future economic benefits associated with the item will flow to the Group and the cost of the item can be
measured reliably. All other costs are charged to the statement of comprehensive income during the financial period in which
they are incurred.
Depreciation of property, plant and equipment is calculated using diminishing value method so as to expense the cost of the
assets over their useful lives. The rates are as follows:
• Computer Equipment 30% - 67%
• Furniture, Equipment and Other 4% - 80%
An asset’s carrying amount is written down immediately to its recoverable amount if the asset’s carrying amount is greater
than its estimated recoverable amount.
Gains and losses on disposals are determined by comparing proceeds with carrying amount. These are included in the
statement of comprehensive income.

42 SLI Systems Annual Report June 2016 | Financial Statements
9. Intangible assets
Year ended 30 June 2016Patents &
Trademarks Software Total
$’000 $’000 $’000
Cost
Balance at 1 July 2015 503 140 643
Additions 13 10 23
Balance at 30 June 2016 516 150 666
Amortisation
Balance at 1 July 2015 (438) (106) (544)
Amortisation (37) (20) (57)
Balance at 30 June 2016 (475) (126) (601)
Net carrying value 41 24 65
Year ended 30 June 2015Patents &
Trademarks Software Total
$’000 $’000 $’000
Cost
Balance at 1 July 2014 486 117 603
Additions 17 23 40
Balance at 30 June 2015 503 140 643
Amortisation
Balance at 1 July 2014 (402) (86) (488)
Amortisation (36) (20) (56)
Balance at 30 June 2015 (438) (106) (544)
Net carrying value 65 34 99
Management assesses the costs incurred in developing software against the Accounting policy below (which is in accordance with
the recognition criteria set out in NZ IAS 38 Intangible Assets), and on the basis that certain aspects of the criteria have not been met
no development costs have been capitalised in the above numbers.
All intangible assets have been purchased from third parties.
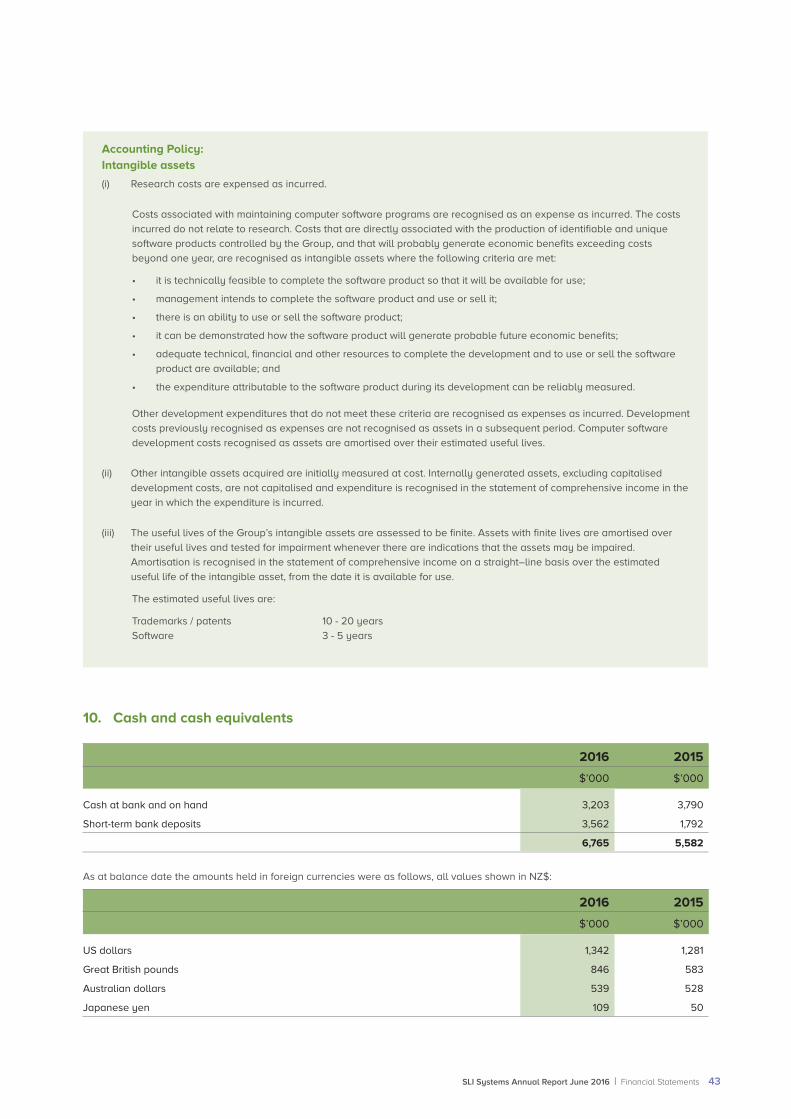
SLI Systems Annual Report June 2016 | Financial Statements 43
Accounting Policy: Intangible assets
(i) Research costs are expensed as incurred.
Costs associated with maintaining computer software programs are recognised as an expense as incurred. The costs
incurred do not relate to research. Costs that are directly associated with the production of identifiable and unique
software products controlled by the Group, and that will probably generate economic benefits exceeding costs
beyond one year, are recognised as intangible assets where the following criteria are met:
• it is technically feasible to complete the software product so that it will be available for use;
• management intends to complete the software product and use or sell it;
• there is an ability to use or sell the software product;
• it can be demonstrated how the software product will generate probable future economic benefits;
• adequate technical, financial and other resources to complete the development and to use or sell the software
product are available; and
• the expenditure attributable to the software product during its development can be reliably measured.
Other development expenditures that do not meet these criteria are recognised as expenses as incurred. Development
costs previously recognised as expenses are not recognised as assets in a subsequent period. Computer software
development costs recognised as assets are amortised over their estimated useful lives.
(ii) Other intangible assets acquired are initially measured at cost. Internally generated assets, excluding capitalised
development costs, are not capitalised and expenditure is recognised in the statement of comprehensive income in the
year in which the expenditure is incurred.
(iii) The useful lives of the Group’s intangible assets are assessed to be finite. Assets with finite lives are amortised over
their useful lives and tested for impairment whenever there are indications that the assets may be impaired.
Amortisation is recognised in the statement of comprehensive income on a straight–line basis over the estimated
useful life of the intangible asset, from the date it is available for use.
The estimated useful lives are:
Trademarks / patents 10 - 20 years
Software 3 - 5 years
10. Cash and cash equivalents
2016 2015
$’000 $’000
Cash at bank and on hand 3,203 3,790
Short-term bank deposits 3,562 1,792
6,765 5,582
As at balance date the amounts held in foreign currencies were as follows, all values shown in NZ$:
2016 2015
$’000 $’000
US dollars 1,342 1,281
Great British pounds 846 583
Australian dollars 539 528
Japanese yen 109 50

44 SLI Systems Annual Report June 2016 | Financial Statements
Accounting Policy: Cash and cash equivalents
Cash and cash equivalents includes cash on hand, deposits held at call with financial institutions and other short term, highly
liquid investments readily convertible to a known amount of cash and which are subject to an insignificant risk of changes in
value.
11. Trade and other receivables
2016 2015
$’000 $’000
Gross trade receivables 4,528 5,020
Provision for impairment of receivables (495) (367)
Net trade receivables 4,033 4,653
Un-invoiced revenue 926 1,368
Prepayments and other receivables 917 610
Total trade and other receivables 5,876 6,631
12. Trade receivables provisioning (a) Impaired receivables
As at 30 June 2016 trade receivables with a nominal value of $495,000 (30 June 2015 $367,000) were impaired in respect of the
Group. The ageing analysis of these trade receivables is as follows:
2016 2015
$’000 $’000
1-60 days overdue 87 88
61-90 days overdue 120 39
91+ days overdue 288 240
Impaired receivables 495 367
(b) Past due but not impaired
As at 30 June 2016 trade receivables of the Group of $241,000 (30 June 2015 $241,000) were past due but not impaired. These
relate to a number of independent customers for whom there is no recent history of default. The ageing analysis of these trade
receivables is as follows:
2016 2015
$’000 $’000
1-30 days overdue 173 23
Greater than 31 days overdue 68 218
241 241

SLI Systems Annual Report June 2016 | Financial Statements 45
(c) Provision for impairment of receivables
Movements in the provision for impairment of receivables are as follows:
2016 2015
$’000 $’000
Opening balance 367 240
Additional amounts provided 128 127
Unused amounts written back - -
Closing balance 495 367
(d) As at balance date the amounts receivable in foreign currency were as follows, all values shown in NZ$:
2016 2015
$’000 $’000
US dollars 3,587 4,186
Great British pounds 1,382 1,428
Australian dollars 376 553
Japanese yen 29 29
Accounting Policy: Trade receivables
Trade receivables are amounts due from customers for services performed in the ordinary course of business. If collection is
expected in one year or less they are classified as current assets. If not, they are presented as non-current assets.
Trade receivables are recognised at fair value, less provision for doubtful debts.
A provision for impairment of trade receivables is established when there is objective evidence that the Group will
not be able to collect all amounts due according to the original terms of the receivables. The carrying amount of the
asset is reduced through the use of an allowance account, and the amount of the loss is recognised in the statement of
comprehensive income within ‘operating expenses.’
When a trade receivable is uncollectible, it is written off against the statement of comprehensive income within ‘operating
expenses.’ Subsequent recoveries of amounts previously written off are credited against ‘operating expenses’ in the
statement of comprehensive income.
13. Contributed equity(a) Ordinary share capital
Number of Ordinary
Shares
Number of Ordinary
Shares
2016 2016$’000
2015 2015$’000
Opening balance 61,162,116 18,125 60,498,018 17,674
Share options exercised 1,098,700 646 664,098 451
Closing balance 62,260,816 18,771 61,162,116 18,125
The total number of ordinary shares on issue as at 30 June 2016 is 62,260,816 (30 June 2015: 61,162,116) shares. All shares are issued
and fully paid (no par value).

46 SLI Systems Annual Report June 2016 | Financial Statements
Accounting Policy: Contributed capital
Ordinary shares are classified as equity.
Incremental costs directly attributable to the issue of new shares are shown in equity as a deduction, net of tax, from the
proceeds.
(b) Redeemable shares
Redeemable shares have the same rights and terms and rank uniformly in all respects with the ordinary shares in the Company.
In satisfaction of the issue price of the redeemable shares, the Company provided loans to the redeemable shareholders. The loans
provided are interest free, have recourse only against the redeemable shares and are repayable in full on the third anniversary of
the issue date, or some other date under certain conditions. The substance of these transactions is similar in nature to the issuing of
share options and as such are valued in accordance with Note 21 using the Black-Scholes pricing model. As at 30 June 2016, no cash
has been exchanged in relation to these transactions and the loans are not recognised in the financial statements.
The redeemable shares vest immediately. Upon repayment of the loan, the redeemable shares automatically reclassify into ordinary
shares in the Company.
On 30 June 2016 the redeemable share issued to Sam Knowles were redeemed by SLI due to expiry of the limited recourse loan.
The loan was not repaid.
The Company’s board of directors agreed to extend the repayment date of the loan to 31 December 2016 in relation to the
redeemable shares issued to Greg Cross and Sarah Smith.
The unlisted redeemable shares as at 30 June 2016 are as follows:
Issuedate
Unlisted redeemable
shares Loan $
Greg Cross 31 May 2013 133,333 200,000
Sarah Smith 31 May 2013 133,333 200,000
Andrew Lark 20 Dec 2013 107,527 200,000
Sam Knowles (redeemed 30 Jun 16) 31 May 2013 - -
374,193 600,000
14. Trade and other payables
2016 2015
$’000 $’000
Trade payables 138 427
Revenue in advance 4,963 4,883
Other payables and accrued expenses 1,934 1,533
7,035 6,843

SLI Systems Annual Report June 2016 | Financial Statements 47
As at balance date the amounts payable (including revenue in advance and employee entitlements) in foreign currency were as
follows:
2016 2015
$’000 $’000
US dollars 5,749 5,637
Great British pounds 1,576 1,805
Australian dollars 686 953
Japanese yen 38 30
Accounting Policy: Trade and other payables
Trade payables are obligations to pay for goods or services that have been acquired in the ordinary course of business from
suppliers. Accounts payable are classified as current liabilities if payment is due within one year. If not, they are presented as
non-current liabilities. Trade payables are recognised initially at fair value and subsequently measured at cost.
15. Employee benefits
Current employee benefits
2016 2015
$’000 $’000
Liability for annual and long service leave 965 1,099
Other employee payables 836 1,675
1,801 2,774
Non-current employee benefits
2016 2015
$’000 $’000
Liability for long service leave 29 17
29 17
Accounting Policy: Employee benefits
Liabilities for wages and salaries, including non monetary benefits, long service leave and annual leave are recognised in
employee benefits in respect of employees’ services up to the reporting date. They are measured at the amounts expected
to be paid when the liabilities are settled. Cost for non-accumulating sick leave is recognised when the leave is taken and
measured at the rates paid or payable.

48 SLI Systems Annual Report June 2016 | Financial Statements
16. Operating lease commitmentNon-cancellable operating lease rentals are payable as follows:
2016 2015
$’000 $’000
Less than one year 1,471 1,432
Between one and five years 489 1,866
More than five years - -
1,960 3,298
Accounting Policy: Leases
Operating leases
The Group is the lessee. Leases in which a significant portion of the risks and rewards of ownership are retained by the lessor
are classified as operating leases. Payments made under operating leases (net of any incentives received from the lessor)
are charged to the statement of comprehensive income on a straight line basis over the period of the lease.
The Group leases properties. Operating leases held over certain properties give the Group the right to renew the lease
subject to a redetermination of the lease rental by the lessor, however potential commitments beyond the renewal dates
have not been included in the above commitments.
17. Capital commitmentsThere are no material contractual obligations to purchase plant and equipment at 30 June 2016 (30 June 2015 nil).
18. ContingenciesThere are no contingencies at 30 June 2016 (30 June 2015 nil).
19. Subsidiaries
NameCountry of
Incorporation Ownership Ownership
2016 2015
S.L.I. Systems, Inc. United States 100% 100%
SLI Systems (UK) Limited (owned 100% by S.L.I. Systems, Inc.) United Kingdom 100% 100%
SLI Systems (Japan) K.K. Japan 100% 100%
20. Related partiesParent and ultimate controlling party
The immediate parent and ultimate controlling party of the Group is SLI Systems Limited.
Related party transactions and balances
Directors’ holdings of options, SARs, preference shares and associated loans are disclosed in Notes 13, 21 and 22.
Marder Media Group, Inc. (of which Steven Marder is a director) is a shareholder of Delivery Agent, which is a customer of S.L.I.
Systems, Inc. Revenue recognised in the year $312,000 (2015 $239,000).

SLI Systems Annual Report June 2016 | Financial Statements 49
Key management personnel remuneration
Key management personnel are defined as those persons having authority and responsibility for planning, directing and controlling
the activities of the Group, directly or indirectly, and include the Chief Executive, his direct reports and Directors.
The following table summarises remuneration paid to key management personnel.
2016 2015
$’000 $’000
Directors’ fees and other remuneration 252 260
Employee entitlements 2,925 2,728
Share options (under Employee Share Options Scheme) and share appreciation rights 702 133
21. Share optionsOptions to subscribe for shares have been issued to certain directors, employees and some advisors of the Company.
Unless otherwise determined by the Board of Directors options shall be exercisable to the extent of 1/4 of the options as of the one
year anniversary after the grant date, then an additional 1/36th of the remaining balance on a monthly basis, so that the options
are fully exercisable on the fourth anniversary of the grant date. The options are no longer exercisable on the first to occur of i) the
10th anniversary of the grant date, ii) the last date for exercising the option following termination of the Optionee’s Service or iii) its
termination in connection with a change in control in the Company.
The functional and presentation currency of the financial statements is in New Zealand dollars (NZ$). However, a majority of the
options have an exercise price denominated in US dollars (US$) so the tables below are presented in US$ where appropriate.
Current Year
Reconciliation of outstanding options No. of optionsWeighted average exercise price US$
2016 2016
Balance at 1 July 2015 7,191,927 0.64
Expired during the year (1,873,283) 0.81
Exercised during the year (1,098,700) 0.33
Issued during the year 382,000 0.57
Balance at 30 June 2016 4,601,944 0.66
Exercisable at 30 June 2016 3,949,948 0.61
Prior Year
Reconciliation of outstanding options No. of optionsWeighted average exercise price US$
2015 2015
Balance at 1 July 2014 6,786,960 0.71
Expired during the year (519,837) 1.00
Exercised during the year (664,096) 0.37
Issued during the year 1,588,900 0.91
Balance at 30 June 2015 7,191,927 0.65
Exercisable at 30 June 2015 4,788,959 0.53

50 SLI Systems Annual Report June 2016 | Financial Statements
The weighted average exercise price of the total options at the end of the year is US $0.61 cents which equates to NZ $0.86 cents at
year end exchange rates.
The tables above includes the unlisted redeemable shares as detailed in note 13 (b).
Share options outstanding at the end of the year have the following characteristics:
Number of optionsExercise price
per shareWeighted average contractual
life at balance date 2016 (years)
340,000 US $0.29 - $0.33 0.9
1,834,348 US $0.3333 3.8
220,875 US $0.68 6.0
401,138 US $0.75 6.2
129,600 US $0.78 6.7
127,000 NZ $0.75 - $0.80 9.0
200,000 NZ $0.81 - $1.00 9.2
221,950 NZ $1.01 - $1.20 8.5
92,625 NZ $1.21 - $1.40 8.2
368,664 NZ $1.41 - $1.60 7.0
218,680 NZ $1.61 - $1.80 7.9
288,077 NZ $1.81 - $2.00 7.3
76,187 NZ $2.01 - $2.20 7.4
27,600 NZ $2.21 - $2.40 7.8
55,200 NZ $2.41 - $2.60 7.7
Measurement of fair value
The fair value of the options granted was measured based on the Black-Scholes pricing model. Expected volatility is estimated by
considering historic average share price volatility for both SLI and its peers.
The inputs used in the measurement of the fair values at grant date of the share based payment plans were as follows for US$
options:
US$ options 2016 2015
Share price at grant date (weighted average US$) 0.41 0.41
Exercise price (weighted average US$) 0.43 0.42
Expected volatility (weighted average) 20%-30% 20% to 30%
Expected life (weighted average) 4 4
Risk-free interest rate (weighted average) 3.0% 3.0%
Fair value at grant date (weighted average US$) 0.08 0.08
The inputs used in the measurement of the fair values at grant date of the share based payment plans were as follows for NZ$
options:
NZ$ options 2016 2015
Share price at grant date (weighted average NZ$) 1.50 1.44
Exercise price (weighted average NZ$) 1.49 1.43
Expected volatility (weighted average) 30% 30%
Expected life (weighted average) 4 4
Risk-free interest rate (weighted average) 3.5% 3.6%
Fair value at grant date (weighted average NZ$) 0.46 0.43

SLI Systems Annual Report June 2016 | Financial Statements 51
Directors
The following directors hold the following number of options as at balance date:
Exercise price
Shaun Ryan US $0.33 49,260
Shaun Ryan (issued in the current year) NZ $0.94 200,000
Greg Cross US $0.33 120,000
Accounting Policy: Equity settled share option plan
The Employee Share Option Plan allows employees to acquire shares of the Company. The fair value of options granted is
recognised as an employee expense in the statement of comprehensive income with a corresponding increase in the share
option reserve. The fair value is measured at grant date and spread over the vesting periods. The fair value of the options
granted is measured using the Black-Scholes pricing model, taking into account the terms and conditions upon which the
options are granted.
When options are exercised the amount in the share option reserve relating to those options, together with the exercise price
paid by the employee, is transferred to share capital.
When any vested options lapse, upon employee termination or unexercised options reaching maturity, the amount in the
share option reserve relating to those options is transferred to retained earnings.
22. Share Appreciation Rights Historically the company has operated a share option scheme for its employees in line with the terms set out in note 21 above.
During the current period the company has introduced a new share based payment plan based on Share Appreciation Rights (SARs).
The development of this new Long Term Incentive plan is for key US executives and provides the company with the flexibility to settle
any share appreciation in cash or shares. An appropriate Long Term Incentive plan is critical to attracting and retaining key executive
talent in the US market.
The terms and conditions, valuation basis and other required disclosures for these share based payments are set out below:
The SARs will vest to the extent of 1/4 of the SARs as of the one year anniversary after the grant date, then an additional 1/36th of the
remaining balance on a monthly basis, so that the SARs are fully vested on the fourth anniversary of the grant date. The SARs shall
be exercisable to the extent of 25% of the total number of SARs issued to the recipient at the one year anniversary of the grant date,
then an additional 25% of the initially issued number of SARs will be able to be exercised on each of the second, third and fourth
anniversaries of the base grant date. The SARs can only be exercised during the 30 day period commencing on the appropriate
anniversary date and if they are not exercised they will terminate after the expiry of the relevant 30 day period.
On the date on which the SARs are either (i) exercised or (ii) terminated, subject to Board approval, additional fully vested share
options will be issued equal to the number of such exercised or terminated SARs. The exercise price of the share options will be the
greater of the share price on the original grant date of the SARs and the share price on the day the share options are granted. The
options will expire on the 10th anniversary of the grant date of the SARs.
Upon exercise of SARs, the recipient will be entitled to receive a payment equal to the increase in share price between the grant date
and the exercise date. Such payment can be made either in cash or by the issue of SLI NZ ordinary shares, at market value, at the
discretion of the Board of Directors.
Whilst the share options linked to the SARs have not been issued, there is a constructive obligation to issue the additional options.
Therefore the share based payment expense including both the SARs and additional options, is required to be recognised from
the grant date of the SARs. Based on this choice of settlement and SLI’s ability and the likelihood to settle in shares, the SARs and
options are considered to be equity-settled share based payments.
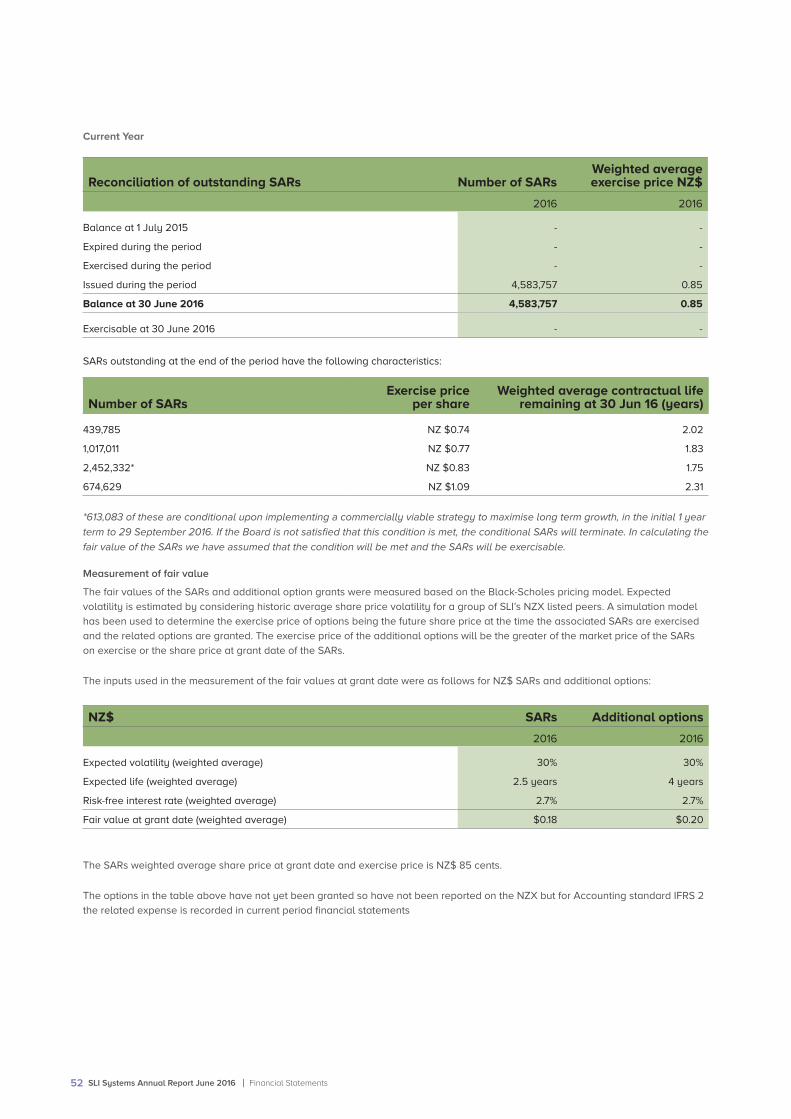
52 SLI Systems Annual Report June 2016 | Financial Statements
Current Year
Reconciliation of outstanding SARs Number of SARsWeighted average exercise price NZ$
2016 2016
Balance at 1 July 2015 - -
Expired during the period - -
Exercised during the period - -
Issued during the period 4,583,757 0.85
Balance at 30 June 2016 4,583,757 0.85
Exercisable at 30 June 2016 - -
SARs outstanding at the end of the period have the following characteristics:
Number of SARsExercise price
per shareWeighted average contractual life
remaining at 30 Jun 16 (years)
439,785 NZ $0.74 2.02
1,017,011 NZ $0.77 1.83
2,452,332* NZ $0.83 1.75
674,629 NZ $1.09 2.31
*613,083 of these are conditional upon implementing a commercially viable strategy to maximise long term growth, in the initial 1 year
term to 29 September 2016. If the Board is not satisfied that this condition is met, the conditional SARs will terminate. In calculating the
fair value of the SARs we have assumed that the condition will be met and the SARs will be exercisable.
Measurement of fair value
The fair values of the SARs and additional option grants were measured based on the Black-Scholes pricing model. Expected
volatility is estimated by considering historic average share price volatility for a group of SLI’s NZX listed peers. A simulation model
has been used to determine the exercise price of options being the future share price at the time the associated SARs are exercised
and the related options are granted. The exercise price of the additional options will be the greater of the market price of the SARs
on exercise or the share price at grant date of the SARs.
The inputs used in the measurement of the fair values at grant date were as follows for NZ$ SARs and additional options:
NZ$ SARs Additional options
2016 2016
Expected volatility (weighted average) 30% 30%
Expected life (weighted average) 2.5 years 4 years
Risk-free interest rate (weighted average) 2.7% 2.7%
Fair value at grant date (weighted average) $0.18 $0.20
The SARs weighted average share price at grant date and exercise price is NZ$ 85 cents.
The options in the table above have not yet been granted so have not been reported on the NZX but for Accounting standard IFRS 2
the related expense is recorded in current period financial statements

SLI Systems Annual Report June 2016 | Financial Statements 53
Directors
The following directors hold the following number of SARs as at 30 June 2016:
Exercise price
Christopher Brennan (issued in the current year) NZ $0.83 2,452,332
23. Financial risk management (i) Financial instrument classification
The Group’s loans and receivables comprise of ‘trade and other receivables’ and ‘cash and cash equivalents’ in the balance sheet.
‘Trade and other payables’ are recognised at fair value and subsequently at cost. ‘Employee benefits’ are recognised at the amounts
expected to be paid when the liabilities are settled.
Accounting Policy: Financial assets
Loans and receivables are classified as financial assets. The classification depends on the purpose for which the assets were
acquired. Management determines the classification of its assets at initial recognition and re-evaluates this designation at
every reporting date.
Classification
Loans and receivables are non derivative financial assets with fixed or determinable payments that are not quoted in an
active market. They are included in current assets, except for those with maturities greater than 12 months after the end of
the reporting period which are classified as non current assets.
Loans and receivables are subsequently carried at cost.
Offsetting financial instruments
Financial assets and liabilities are offset and the net amount reported in the balance sheet when there is a legally
enforceable right to offset the recognised amounts and there is an intention to settle on a net basis, or realise the asset and
settle the liability simultaneously.
(ii) Financial risk factors
The Group’s activities expose it to a variety of financial risks, market risks (including interest rate risk and currency risk), liquidity risk
and credit risk.
Interest rate risk
The Group’s interest rate risk arises from its cash balances. These are placed on deposit at variable rates that expose the Group to
cash flow interest rate risk. The Group does not enter into forward rate agreements or any interest rate hedges.
The Company’s management regularly reviews its banking arrangements to ensure that it achieves the best returns on its funds
while maintaining access to necessary cash levels to service the Group’s day-to-day activities.
Liquidity risk
Liquidity risk is the risk that the Company or Group cannot pay contractual liabilities as they fall due. The Group has no debt and
therefore management remains focused on growing sufficient revenue from sales to cover the on-going costs of operation and
continuously monitoring forecasts and actual cash flows.
Generally trade payables are settled with 30 days and the employee benefits (accrued wages and salaries, holiday pay and long
service leave) will be settled within 12 months with the exception of $29,000 at 30 June 2016 for long service leave that will be
settled after more than 12 months (30 June 2015: $17,000).
Credit risk
Where the Group has a receivable from another party, there is a credit risk in the event of non-performance by that other party.
Financial instruments that potentially subject the Group to credit risk principally consist of bank balances and receivables.

54 SLI Systems Annual Report June 2016 | Financial Statements
The Group manages its exposure to credit risk by monitoring the credit quality of the financial institutions that hold its cash balances.
The credit risk associated with trade receivables is small because of the inherently low individual transaction value and the spread
over many customers.
The maximum exposure to credit risk at balance date comprises ‘trade and other receivables’ and ‘cash and cash equivalents’ in the
balance sheet.
Foreign currency risk
The Group faces the risk of movements in foreign currency exchange rates against the New Zealand dollar. The Group operates in
three main currencies, being US dollars, British pounds, and Australian dollars. As a result the Group’s statement of comprehensive
income and balance sheet can be affected by movements in exchange rates.
There is a partial natural hedge in respect of the costs being incurred in each foreign jurisdiction. The Group does not use derivatives
to hedge its foreign currency risk.
The Group holds financial assets and liabilities denominated in foreign currency and the Group has subsidiaries whose reporting
currency is not New Zealand dollars. The potential impact on the Group’s results for the year ended 30 June 2016 if the New
Zealand dollar had changed to a closing rate of 10% higher / lower than other operating currencies, with all other variables remaining
constant, is set out below;
2016 2015
$’000 $’000
Appreciation of NZ$ against foreign currency (10%)
(Decrease) in profit before tax (15) (73)
(Decrease) in equity after tax (155) (161)
Depreciation of NZ$ against foreign currency (10%)
Increase in profit before tax 15 73
Increase in equity after tax 155 161
Capital risk management
The Group’s capital includes contributed equity, reserves and accumulated losses. The Group’s objectives when managing capital
are to safeguard the Group’s ability to continue as a going concern in order to provide returns for shareholders and benefits to other
stakeholders and to maintain an optimal capital structure.
Fair value
The carrying value for cash and cash equivalents, trade receivables, trade payables, and accruals is assumed to approximate their
fair values due to the short term maturity of these assets and liabilities.
24. Earnings per share
Basic earnings per share is calculated by dividing the profit attributable to equity holders of the Company by the weighted average
number of ordinary shares on issue during the year.
Diluted earnings per share is calculated by adjusting the weighted average number of shares outstanding to assume conversion of
all dilutive potential ordinary shares. The Group’s dilutive potential ordinary shares are in the form of share options / performance
rights. As the Group has made a loss during the current year, there are no dilutive potential ordinary shares and therefore basic and
diluted earnings per share are the same.
2016 2015
Net (loss) after tax ($239,000) ($7,360,000)
Ordinary shares on issue 62,260,816 61,162,116
Weighted average number of shares on issue 61,652,459 60,894,496
Basic and diluted (loss) per share (0.004) (0.121)

SLI Systems Annual Report June 2016 | Financial Statements 55
25. Reconciliation from the net (loss) after tax to the net cash from operating activities
2016 2015
$’000 $’000
Net (loss) after tax (239) (7,360)
Adjustments
Depreciation 392 458
Amortisation 57 56
(Loss) / gain on currency translation movement (300) 224
Share option expense 888 526
Changes in working capital items
Decrease / (Increase) in trade receivables and prepayments 835 (217)
(Decrease) / Increase in trade payables and accruals (864) 823
Decrease in GST 15 34
Decrease / (Increase) in tax 24 (182)
Net cash inflow / (outflow) from operating activities 808 (5,638)
26. Remuneration of auditorsDuring the year the following fees were paid or payable for services provided by the auditor of the Group
2016 2015
$’000 $’000
Audit of financial statements
Audit and review of financial statements (1) 98 71
Other services
Tax services (2) 12 21
Other services (3) 18 49
Total remuneration paid to auditors 128 141
1. The audit fee includes the fees for both annual audit of the Group and SLI Systems (UK) Limited financial statements and the compliance assurance engagement on the
Group interim financial statements.
2. Tax services relate to a peer review of the potential US sales tax on customer use agreements.
3. Other services as at 30 June 2016 include professional services rendered in relation to grant income and review of share appreciation right contracts and model.
27. Subsequent eventsThere have been no material subsequent events after 30 June 2016.

56 SLI Systems Annual Report June 2016 | Directory
Registered Office of the Company1st Floor, Epic Centre
78 - 106 Manchester Street
PO Box 13-841
Christchurch, 8011
Phone: 0800 754 797
Facsimile: +64 (3) 961 3262
Email: [email protected]
Website: www.sli-systems.com
Office DirectoryUSA333 West San Carlos, 12th Floor
San Jose, CA 95110
USA
Toll Free: (866) 240 2812
EuropeFifth Floor, Kemp House
152-160 City Road, London, EC1V 2NP
United Kingdom
Phone: +44 (0) 203 217 0321
AustraliaL5, Suite 3
189 Flinders Lane, Melbourne
VIC 3000
Australia
Phone: 1800 139 190
JapanTaiyo Seimei Shinagawa Building 28F
2-16-2 Konan, Minato-ku, Tokyo, Japan 108-0075
Phone: +81 03 5715-8052
New ZealandLevel 1, 78 – 106 Manchester Street
Christchurch 8011
New Zealand
Phone: 0800 754 797
SolicitorsChapman Tripp245 Blenheim Road
Riccarton
Christchurch 8011
AuditorPricewaterhouseCoopers5 Sir Gil Simpson Drive
Canterbury Technology Park
Christchurch
RegistrarLink Market Services LimitedLevel 11
Deloitte House
80 Queen Street
Auckland
Telephone: +64 (9) 375 5998
Facsimile: +64 (9) 375 5990
Email: [email protected]
Website: www.linkmarketservices.co.nz
Directory

SLI Systems Annual Report June 2016 | Financial Calendar 57
Financial Calendar
Annual Meeting
4 November 2016
Financial Year End
30 June