Annual Report - Sky
122
SKY NETWORK TELEVISION LIMITED Annual Report Silver Ferns celebrate their win at the Vitality Netball World Cup. ©Getty Images
Transcript of Annual Report - Sky

SKY NETWORK TELEVISION LIMITED
Annual Report
Silver Ferns celebrate their win at the Vitality Netball World Cup. ©Getty Images

Available now on Sky on DemandBohemian Rhapsody © 2018 Twentieth Century Fox Film Corporation. All rights reserved.
As a start up in Auckland, we set out to revolutionise
the way New Zealanders watched TV.
And we did just that.
We brought more entertainment, news, sport and choice to New Zealanders.
We led the way with the first all-digital and then high definition experience
available across the country.
We put customers in control through MySky, and pioneered online streaming for New Zealanders with Sky Go.
For nearly 30 years, we’ve helped to grow sport, from grassroots to the elite, and fuelled our nation of passionate sports fans.
We’ve brought the world’s stories to New Zealand, and New Zealand’s stories to the world.
/ 1
Today, we are proud to be New Zealand’s leading
entertainment company.
We operate in a world that is changing at pace so we’re
moving faster than ever before.
For our customers, our owners, our people, our partners and
New Zealand.
Sky / 2019 Annual Report

Kiwi Ferns in the lead up to their match against Fetu Samoa at Mt Smart Stadium. ©Photosport
/ 3
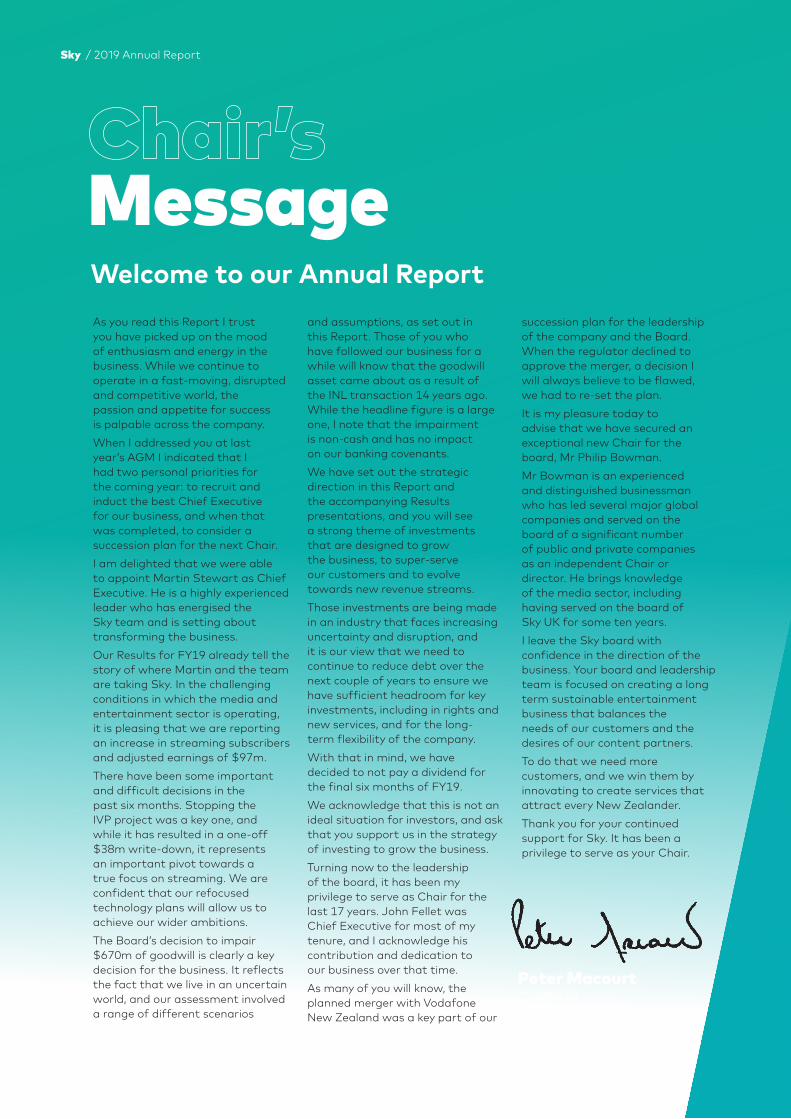
As you read this Report I trust you have picked up on the mood of enthusiasm and energy in the business. While we continue to operate in a fast-moving, disrupted and competitive world, the passion and appetite for success is palpable across the company.When I addressed you at last year’s AGM I indicated that I had two personal priorities for the coming year: to recruit and induct the best Chief Executive for our business, and when that was completed, to consider a succession plan for the next Chair.I am delighted that we were able to appoint Martin Stewart as Chief Executive. He is a highly experienced leader who has energised the Sky team and is setting about transforming the business.Our Results for FY19 already tell the story of where Martin and the team are taking Sky. In the challenging conditions in which the media and entertainment sector is operating, it is pleasing that we are reporting an increase in streaming subscribers and adjusted earnings of $97m.There have been some important and difficult decisions in the past six months. Stopping the IVP project was a key one, and while it has resulted in a one-off $38m write-down, it represents an important pivot towards a true focus on streaming. We are confident that our refocused technology plans will allow us to achieve our wider ambitions. The Board’s decision to impair $670m of goodwill is clearly a key decision for the business. It reflects the fact that we live in an uncertain world, and our assessment involved a range of different scenarios
and assumptions, as set out in this Report. Those of you who have followed our business for a while will know that the goodwill asset came about as a result of the INL transaction 14 years ago. While the headline figure is a large one, I note that the impairment is non-cash and has no impact on our banking covenants.We have set out the strategic direction in this Report and the accompanying Results presentations, and you will see a strong theme of investments that are designed to grow the business, to super-serve our customers and to evolve towards new revenue streams.Those investments are being made in an industry that faces increasing uncertainty and disruption, and it is our view that we need to continue to reduce debt over the next couple of years to ensure we have sufficient headroom for key investments, including in rights and new services, and for the long-term flexibility of the company.With that in mind, we have decided to not pay a dividend for the final six months of FY19.We acknowledge that this is not an ideal situation for investors, and ask that you support us in the strategy of investing to grow the business.Turning now to the leadership of the board, it has been my privilege to serve as Chair for the last 17 years. John Fellet was Chief Executive for most of my tenure, and I acknowledge his contribution and dedication to our business over that time.As many of you will know, the planned merger with Vodafone New Zealand was a key part of our
succession plan for the leadership of the company and the Board. When the regulator declined to approve the merger, a decision I will always believe to be flawed, we had to re-set the plan.It is my pleasure today to advise that we have secured an exceptional new Chair for the board, Mr Philip Bowman.Mr Bowman is an experienced and distinguished businessman who has led several major global companies and served on the board of a significant number of public and private companies as an independent Chair or director. He brings knowledge of the media sector, including having served on the board of Sky UK for some ten years.I leave the Sky board with confidence in the direction of the business. Your board and leadership team is focused on creating a long term sustainable entertainment business that balances the needs of our customers and the desires of our content partners.To do that we need more customers, and we win them by innovating to create services that attract every New Zealander.Thank you for your continued support for Sky. It has been a privilege to serve as your Chair.
Welcome to our Annual Report
Message
Peter Macourt CHAIRMAN
Sky / 2019 Annual Report
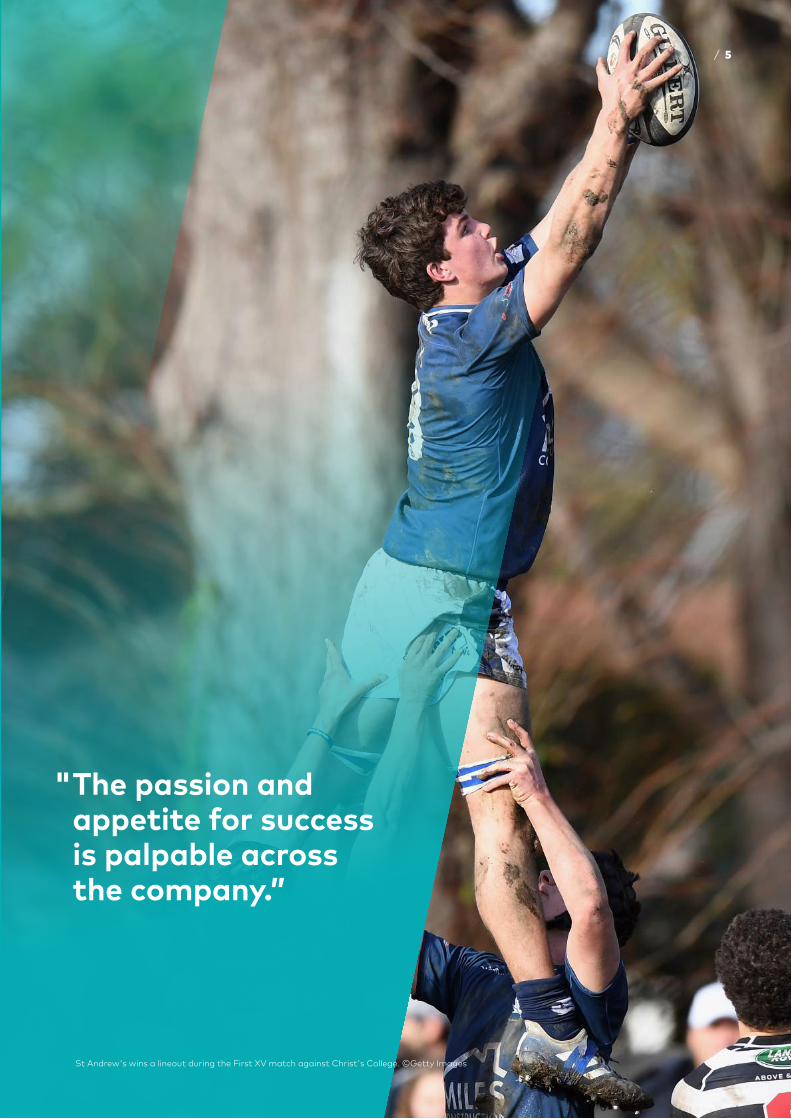
" The passion and appetite for success is palpable across the company.”
St Andrew's wins a lineout during the First XV match against Christ's College. ©Getty Images
/ 5
Chief Executive
Sky / 2019 Annual Report
It is six months today since I joined the Sky team, and it is my privilege to lead the business in this vital time.We have been hard at work transforming our business, and I’m pleased to share some of our progress with you.The world is changing, and so are we.
Our goal is to grow our business by accelerating our focus on streaming services while continuing to super-serve all Sky customers.
Our ambition is for Sky to be in the hands of every New Zealander, in ways that work for them.We are listening – to our customers, our people, and our partners - and moving much faster than ever before. In the last six months a significant amount of progress has been made, and it’s only the beginning. In the last month alone we launched the new Sky Sport Now app and the new Sky Sport News service, supercharged our Sky Sport offer with 12 HD channels, acquired key rights like the Cricket Australia deal, and announced the acquisition of global sports streaming business RugbyPass. We are pursuing opportunities to work with partners to offer Sky services to more customers, and are well on our way to achieving our goal of being in the hands of all New Zealanders. The Results we have released today demonstrate that we’re heading in the right direction.We are returning to growth by embracing streaming, and it is pleasing to see the 16% growth in streaming and commercial revenues as an early sign of success.
Our adjusted earnings of $97.4m are better than the guidance we provided in February, despite the disrupted market that we are operating in.We are continuing to observe good cost control as we rebalance to a streaming future.We made the clear decision to accelerate our focus on streaming when we decided to stop the IVP Project, and we are confident that our refocused technology plans will allow us to achieve our wider ambitions. One of my first priorities when I joined Sky was to build an outstanding leadership team. I believe we have managed to do that, and I am enjoying working with an excellent group of leaders and experts in their fields.We have a clear objective: Growth. It’s our main focus. And there are four pillars that we relentlessly focus on to achieve it: Our Customers, Our Content, Our People and Our Products. The following pages will give you a sense of what we’re doing to transform our business and deliver on our goals, and we look forward to sharing more with you as key milestones are reached throughout the year. I’m proud that we have revolutionised the viewing experience, allowing people to watch content whenever and wherever they want, live and on demand. Across DTH, free-to-air on Prime, Sky Go, Sky Sport Now and Neon, and through our partnership with Vodafone TV, we offer the broadest range of ways to watch.Last weekend over a million New Zealanders engaged with Sky to watch the Bledisloe Cup final, including 55,000 on our streaming services, with excellent delivery across the board.
People talk about streaming being the future. Well, the future is happening right now, and we are the premier sport streaming service in New Zealand. On the entertainment side of our business, Neon offers the biggest range of TV shows and movies of any New Zealand-based service – and we’ll be announcing some enhancements to it soon.Our laser focus on streaming, coupled with our commitment to super-serve all Sky customers, is the pathway to creating a long term sustainable entertainment business that balances the needs of our customers and the desires of our content partners, and delivers on behalf of our shareholders.We enter into FY20 with optimism and energy. On behalf of the talented, passionate, hardworking Sky crew I thank you for your support of our business.
Martin Stewart CHIEF EXECUTIVE
/ 7
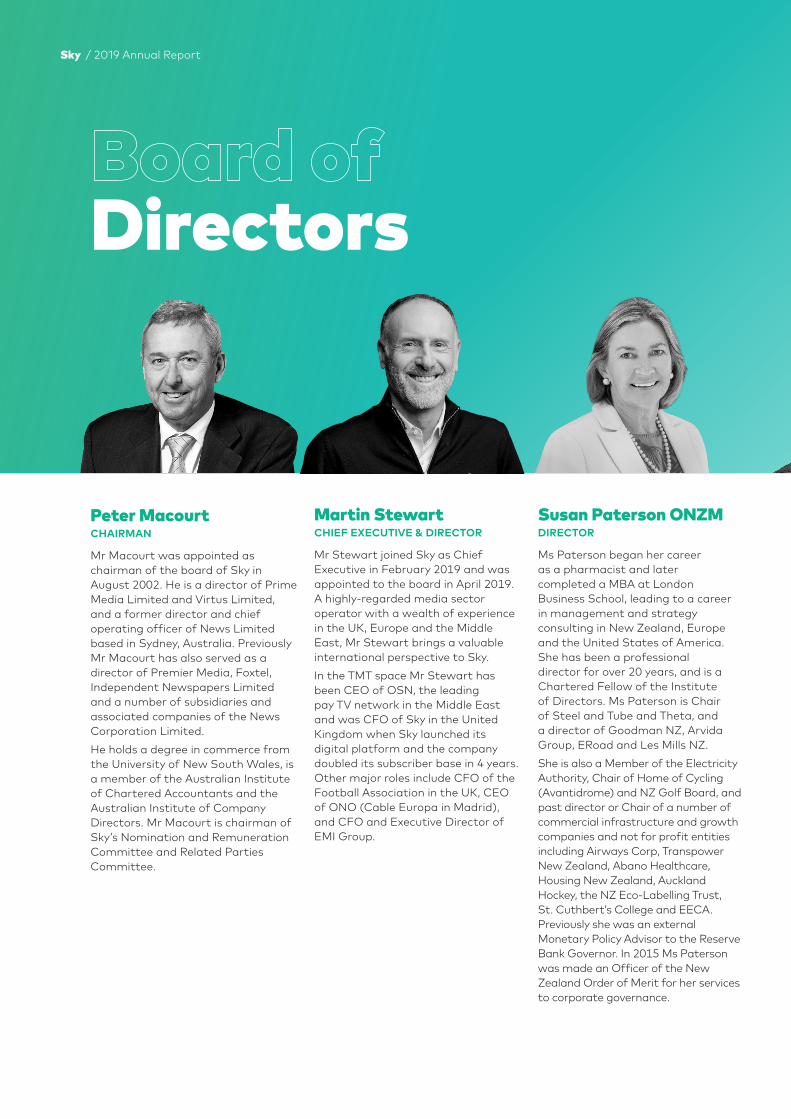
Peter Macourt CHAIRMAN
Mr Macourt was appointed as chairman of the board of Sky in August 2002. He is a director of Prime Media Limited and Virtus Limited, and a former director and chief operating officer of News Limited based in Sydney, Australia. Previously Mr Macourt has also served as a director of Premier Media, Foxtel, Independent Newspapers Limited and a number of subsidiaries and associated companies of the News Corporation Limited. He holds a degree in commerce from the University of New South Wales, is a member of the Australian Institute of Chartered Accountants and the Australian Institute of Company Directors. Mr Macourt is chairman of Sky’s Nomination and Remuneration Committee and Related Parties Committee.
Martin StewartCHIEF EXECUTIVE & DIRECTOR
Mr Stewart joined Sky as Chief Executive in February 2019 and was appointed to the board in April 2019. A highly-regarded media sector operator with a wealth of experience in the UK, Europe and the Middle East, Mr Stewart brings a valuable international perspective to Sky. In the TMT space Mr Stewart has been CEO of OSN, the leading pay TV network in the Middle East and was CFO of Sky in the United Kingdom when Sky launched its digital platform and the company doubled its subscriber base in 4 years. Other major roles include CFO of the Football Association in the UK, CEO of ONO (Cable Europa in Madrid), and CFO and Executive Director of EMI Group.
Susan Paterson ONZMDIRECTOR
Ms Paterson began her career as a pharmacist and later completed a MBA at London Business School, leading to a career in management and strategy consulting in New Zealand, Europe and the United States of America. She has been a professional director for over 20 years, and is a Chartered Fellow of the Institute of Directors. Ms Paterson is Chair of Steel and Tube and Theta, and a director of Goodman NZ, Arvida Group, ERoad and Les Mills NZ. She is also a Member of the Electricity Authority, Chair of Home of Cycling (Avantidrome) and NZ Golf Board, and past director or Chair of a number of commercial infrastructure and growth companies and not for profit entities including Airways Corp, Transpower New Zealand, Abano Healthcare, Housing New Zealand, Auckland Hockey, the NZ Eco-Labelling Trust, St. Cuthbert’s College and EECA. Previously she was an external Monetary Policy Advisor to the Reserve Bank Governor. In 2015 Ms Paterson was made an Officer of the New Zealand Order of Merit for her services to corporate governance.
Directors
Sky / 2019 Annual Report

Geraldine McBrideDIRECTOR
Ms McBride was appointed to the board in September 2013. A renowned Enterprise Business Technology and AI thought leader with a science background, Ms McBride’s global career spans 30 years, with senior executive roles in IBM, Dell and SAP. Her most recent roles were President & CEO of SAP North America and SAP Asia Pacific Japan. Geraldine is a Director of National Australia Bank, and Fisher and Paykel Healthcare. She is also CEO & Director of MyWave, a market leading Enterprise AI company focused on Intelligent Personalisation by putting the customer at the centre of business.
Derek HandleyDIRECTOR
Mr Handley was appointed to the board in September 2013. Mr Handley is an entrepreneur who created the Aera Foundation, a venture studio advancing new models that fuse social and financial goals. Before that he spent two years helping Sir Richard Branson set up the B Team, a global non-profit leadership collective. In 2001 at the age of 23, he co-founded The Hyperfactory, one of the first agencies in the world to recognise the power of mobile devices for connecting consumers, brands and mass media (acquired by NYSE-listed Meredith Corporation). Mr Handley has attended Massey University, MIT Sloan School of Management, Singularity University.
Mike DarceyDIRECTOR
With an extensive track record of strategy and delivery across television, publishing and technology, Mr Darcey was appointed to the board in September 2017. A New Zealander, he has lived and worked in the UK since 1989. Fifteen of those years were spent at Sky UK, initially as the Director of Strategy, then six years as Chief Operating Officer. He played a prominent role in most of Sky UK’s major strategic decisions and its major commercial and regulatory dealings during this period. From 2013 to 2015 Mr Darcey was CEO of News UK. Since 2015, Mr Darcey has had a series of non-executive roles and these currently include Chairman of M247 (a global connectivity and cloud services provider), Chairman of British Gymnastics, and director of Arqiva (the UK’s main independent provider of television broadcast and mobile infrastructure). He also provides strategic consulting services in the media sector.
/ 9
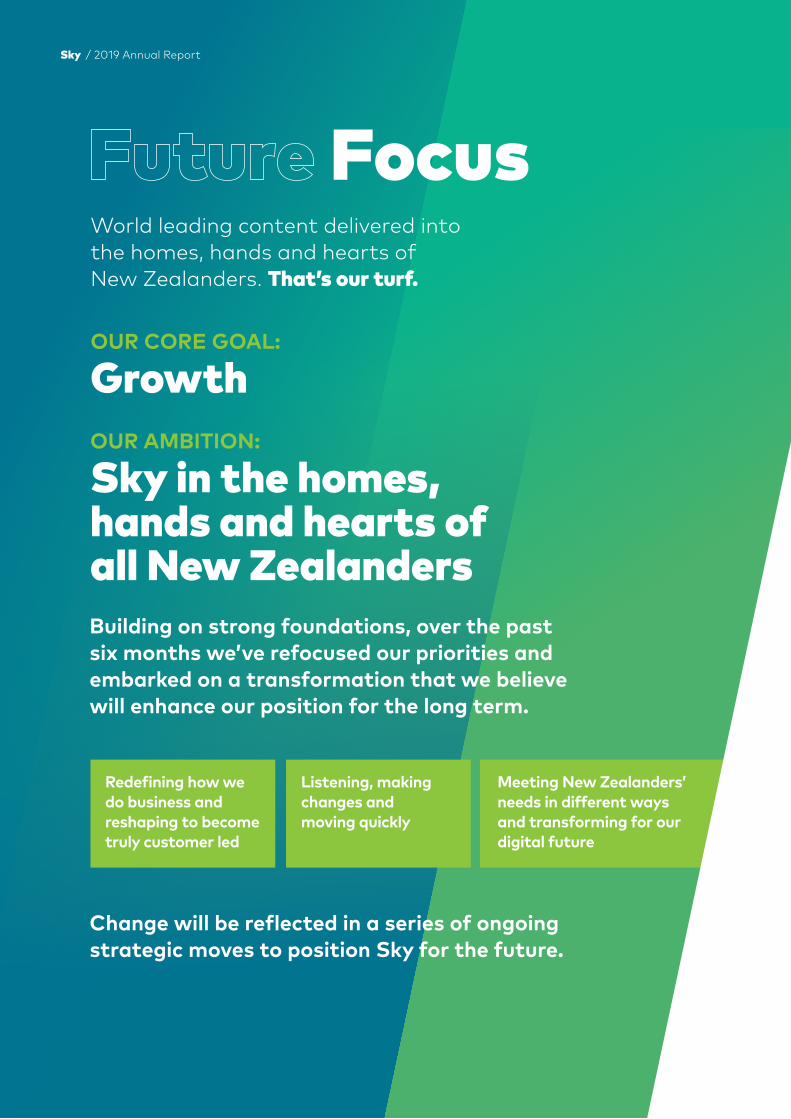
World leading content delivered into the homes, hands and hearts of New Zealanders. That’s our turf.
OUR CORE GOAL:
GrowthOUR AMBITION:
Sky in the homes, hands and hearts of all New ZealandersBuilding on strong foundations, over the past six months we’ve refocused our priorities and embarked on a transformation that we believe will enhance our position for the long term.
Change will be reflected in a series of ongoing strategic moves to position Sky for the future.
Meeting New Zealanders’ needs in different ways and transforming for our digital future
Listening, making changes and moving quickly
Redefining how we do business and reshaping to become truly customer led
FocusSky / 2019 Annual Report

WHAT MATTERS MOST:
Our Customers Being clear on our customer promise and delivering on it every time to rebuild trust and confidence in our brand. By being a truly customer and data led business we will deliver the content our customers want, when and where they want it.
Our Content We will continue to innovate in the way we deliver our partners’ great content and continue to develop our own. By building trusted partnerships and new complementary products we will improve our delivery of great sports, entertainment and original production to New Zealanders.
Our People Doing right by our people by focusing on our capability, capacity, culture and community. With an obsessive focus on delighting customers every day, our people and ways of working will meet the current and future needs of our customers and content providers.
Investing in Our Future By investing in our products and services, we’ll deliver our content in ways that work for all of our customers, now and in the future. That means continuing to provide premium quality broadcasting, and having a laser sharp focus on streaming to satisfy customer demand for greater flexibility. We’re investing in our future to build New Zealand’s leading streaming business in both sport and entertainment products.
/ 11
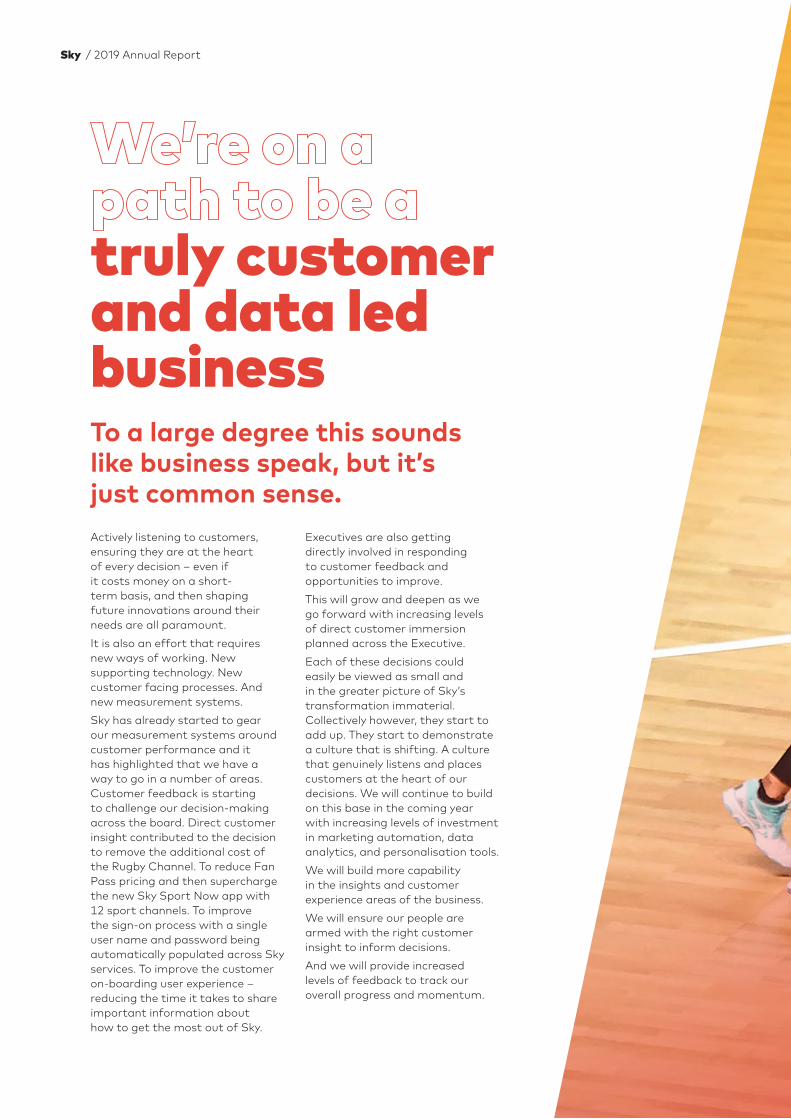
Actively listening to customers, ensuring they are at the heart of every decision – even if it costs money on a short-term basis, and then shaping future innovations around their needs are all paramount. It is also an effort that requires new ways of working. New supporting technology. New customer facing processes. And new measurement systems.Sky has already started to gear our measurement systems around customer performance and it has highlighted that we have a way to go in a number of areas. Customer feedback is starting to challenge our decision-making across the board. Direct customer insight contributed to the decision to remove the additional cost of the Rugby Channel. To reduce Fan Pass pricing and then supercharge the new Sky Sport Now app with 12 sport channels. To improve the sign-on process with a single user name and password being automatically populated across Sky services. To improve the customer on-boarding user experience – reducing the time it takes to share important information about how to get the most out of Sky.
Executives are also getting directly involved in responding to customer feedback and opportunities to improve. This will grow and deepen as we go forward with increasing levels of direct customer immersion planned across the Executive.Each of these decisions could easily be viewed as small and in the greater picture of Sky’s transformation immaterial. Collectively however, they start to add up. They start to demonstrate a culture that is shifting. A culture that genuinely listens and places customers at the heart of our decisions. We will continue to build on this base in the coming year with increasing levels of investment in marketing automation, data analytics, and personalisation tools. We will build more capability in the insights and customer experience areas of the business. We will ensure our people are armed with the right customer insight to inform decisions. And we will provide increased levels of feedback to track our overall progress and momentum.
To a large degree this sounds like business speak, but it’s just common sense.
truly customer and data led business
Sky / 2019 Annual Report

Silver Ferns celebrate their win at the Vitality Netball World Cup. ©Getty Images
/ 13

Moving fast and responding to customer needs.
The Past Six Months
All Blacks perform the Haka during the Bledisloe Cup final 2019 ©Getty Images
Sky / 2019 Annual Report
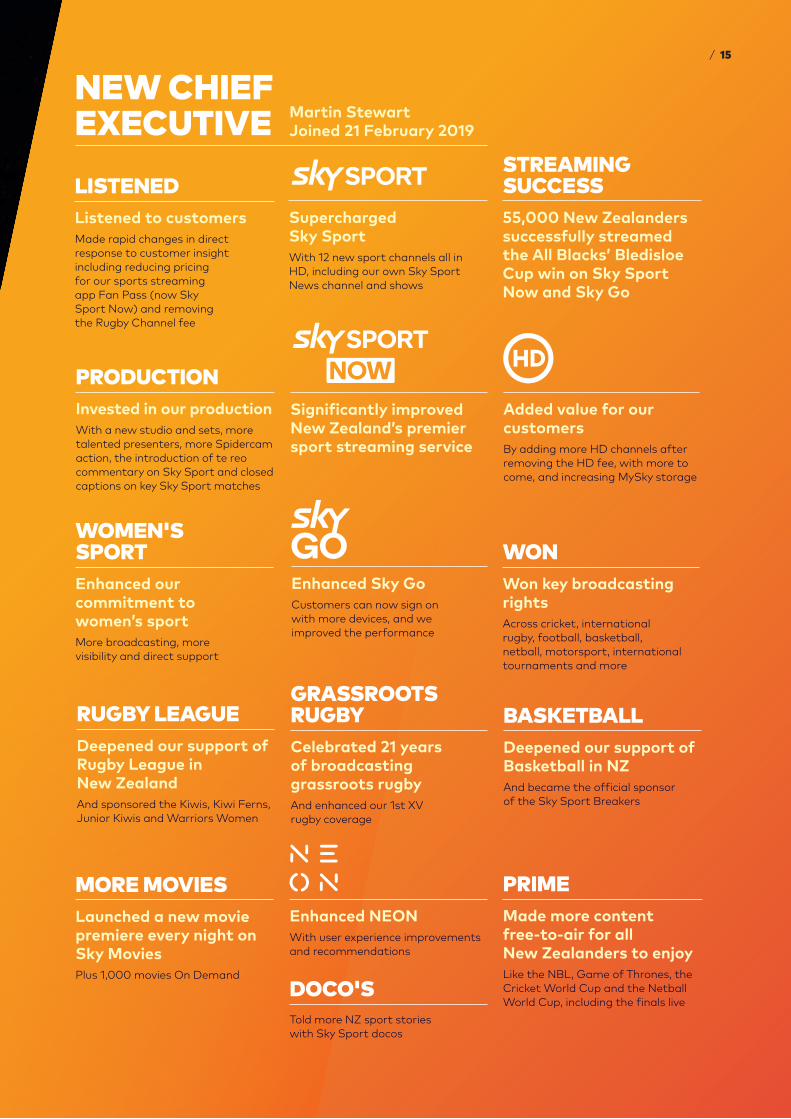
Enhanced Sky GoCustomers can now sign on with more devices, and we improved the performance
Supercharged Sky SportWith 12 new sport channels all in HD, including our own Sky Sport News channel and shows
Added value for our customersBy adding more HD channels after removing the HD fee, with more to come, and increasing MySky storage
STREAMING SUCCESS55,000 New Zealanders successfully streamed the All Blacks’ Bledisloe Cup win on Sky SportNow and Sky Go
PRODUCTIONInvested in our productionWith a new studio and sets, more talented presenters, more Spidercam action, the introduction of te reo commentary on Sky Sport and closed captions on key Sky Sport matches
WONWon key broadcasting rightsAcross cricket, international rugby, football, basketball, netball, motorsport, international tournaments and more
PRIMEMade more content free-to-air for all New Zealanders to enjoyLike the NBL, Game of Thrones, the Cricket World Cup and the Netball World Cup, including the finals live
WOMEN'S SPORTEnhanced our commitment to women’s sportMore broadcasting, more visibility and direct support
GRASSROOTS RUGBYCelebrated 21 years of broadcasting grassroots rugbyAnd enhanced our 1st XV rugby coverage
RUGBY LEAGUEDeepened our support of Rugby League in New ZealandAnd sponsored the Kiwis, Kiwi Ferns, Junior Kiwis and Warriors Women
Enhanced NEONWith user experience improvements and recommendations
MORE MOVIESLaunched a new movie premiere every night on Sky MoviesPlus 1,000 movies On Demand
DOCO'STold more NZ sport stories with Sky Sport docos
BASKETBALLDeepened our support of Basketball in NZAnd became the official sponsor of the Sky Sport Breakers
Significantly improved New Zealand’s premier sport streaming service
Martin Stewart Joined 21 February 2019
NEW CHIEF EXECUTIVELISTENEDListened to customersMade rapid changes in direct response to customer insight including reducing pricing for our sports streaming app Fan Pass (now SkySport Now) and removing the Rugby Channel fee
/ 15

© 2019 Image Reference Goes HereBlack Caps celebrate their win against West Indies at the ICC Cricket World Cup 2019. ©Photosport
Sky / 2019 Annual Report

Delighting New Zealanders with great entertainment experiences We know that we have a privileged role in our customers’ lives – we entertain them, we amuse them, we challenge and inspire them. Our customers choose Sky for great content – and we’re obsessed about delivering it in ways that best meet their needs.
It’s an exciting and dynamic time to be in the entertainment industry. The amount of content continues to trend upwards and in a world of seemingly limitless choice, people are watching more content, and valuing quality and curation more than ever.
Sky’s ability to offer the best and broadest range of content across sport, TV shows and movies is a key strength in a world where customers have more choices than ever before.
We bring a uniquely kiwi flavour to our content, as well as the best from across the world.
Across sport and entertainment, we are focused on fostering enduring partnerships, building on our great content, and delivering it in ways that work for all New Zealanders.
/ 17
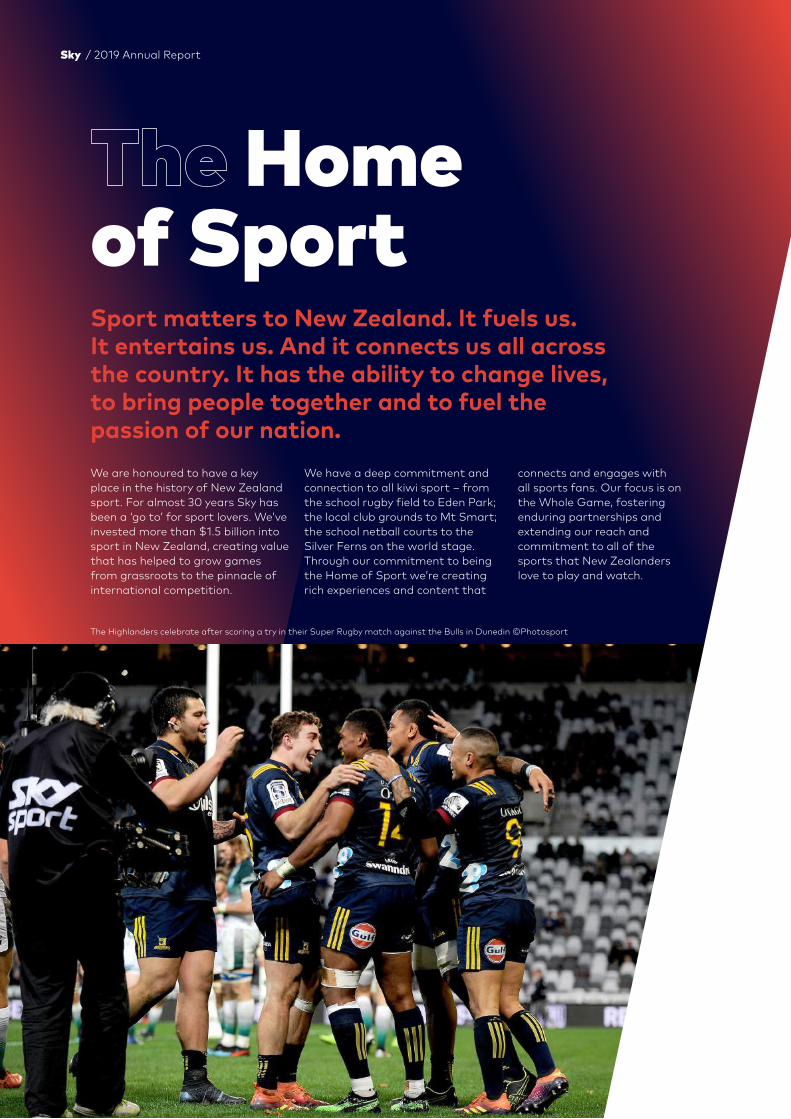
Home of Sport
We are honoured to have a key place in the history of New Zealand sport. For almost 30 years Sky has been a ‘go to’ for sport lovers. We’ve invested more than $1.5 billion into sport in New Zealand, creating value that has helped to grow games from grassroots to the pinnacle of international competition.
Sport matters to New Zealand. It fuels us. It entertains us. And it connects us all across the country. It has the ability to change lives, to bring people together and to fuel the passion of our nation.
We have a deep commitment and connection to all kiwi sport – from the school rugby field to Eden Park; the local club grounds to Mt Smart; the school netball courts to the Silver Ferns on the world stage. Through our commitment to being the Home of Sport we’re creating rich experiences and content that
connects and engages with all sports fans. Our focus is on the Whole Game, fostering enduring partnerships and extending our reach and commitment to all of the sports that New Zealanders love to play and watch.
The Highlanders celebrate after scoring a try in their Super Rugby match against the Bulls in Dunedin ©Photosport
Sky / 2019 Annual Report
Bringing sports fans more sport – and making it easier to find and enjoy.We’ve supercharged Sky Sport with 12 dedicated sport channels to bring customers the sport they love, and sport they didn’t know they loved too.
More sport than ever before, including dedicated channels for 24/7 coverage of rugby, cricket, golf and football – and channels that strongly feature netball, league and motorsport. Plus a better viewing experience with all 12 channels in High Definition.
We’ve also committed to delivering our customers more great features and documentaries, highlights through the Sky Sport Highlights app, and continued access to on demand sport via an enhanced and improved Sky Go. And we’ve kept the ability for additional pop-up channels for major events like the Australian Tennis Open and the Tokyo Olympic Games.
All in on Digital We’ve been working hard to truly meet the needs of sport fans who prefer to be digital-only.
Sky was the first company to bring sports streaming to New Zealand, first with Sky Go and then Fan Pass. Since it launched in February 2015 we’ve streamed four Sky Sport channels 24/7 – that’s a total of 156,788 hours of sport, with much of it live. We’ve evolved Fan Pass to become Sky Sport Now. More great sport content. More competitive. And more promotion so that more kiwis hear about it.
Sky Sport Now really is New Zealand’s premier sport streaming app.
Sky Sport News To keep New Zealanders up-to-date on all things sport around the country and the world, we’ve launched the Sky Sport News Channel. Drawing on the resources of our world-renowned Sky Sport crew, it features daily news from New Zealand and around the world, expert opinion and analysis, exclusive interviews, and a raft of features to keep every keen sports fan engaged.
Our local sport news shows begins 2 September with talented local broadcasters Kate King and Goran Paladin joining us as presenters.
Supercharging Sky Sport
Focused on the Whole GameWe’re committed to the Whole Game, and that means world class production with more coverage across multiple channels, new studio environments, and compelling, original content – always fresh and always on. It means backing all of the sports that New Zealanders love to play and watch. From grassroots and school sport to women’s leagues, we’re working with a wide range of sport partners and innovating beyond just broadcast, to in-stadium experience, social media and the community.
There every minute, every step of the wayThe depth and breadth of our sports offer is second to none, and we continue to add more. Week in week out, 365 days a year, we produce and broadcast some of New Zealand’s favourite sport including rugby, netball, cricket, basketball and rugby league.
Sky Sport Now– All 12 Sky Sport channels – The ability to link to a big screen – Access to replays, highlights,
features and documentaries on demand
– Flexible pricing options, including weekly, monthly and a special rate for customers who sign on for a year
– A new stats section with results, fixtures, tables and top performers
Fostering enduring partnershipsWe value our relationships with our sports partners. Fostering enduring partnerships and working together to help grow and nurture sport is a vital foundation for our business.
New Zealand is a nation of sports fans, but they are increasingly time poor, and young fans in particular are looking for a range of experiences. We want to help grow and engage New Zealand fans, delight our customers every day, and be in the hands of every New Zealander. We are committed to continuing to build great fan experiences and products that make sport accessible, exciting and appealing.
Backing through SponsorshipFunding is a struggle for many of our sports teams, and particularly women’s sports. It can be a challenge for athletes and teams to get the recognition that they deserve. We’re already committed to increasing airtime for women’s sport, and we’re also proud to be the new sponsors of the Kiwi Ferns and Warriors Women.
We’re also thrilled to have sponsored the Kiwis and Junior Kiwis, and to be the new naming sponsor of the Sky Sport Breakers when they take to the courts in October 2019.
Stronger Together
/ 19

A window into Sky through our free-to-air channel Prime
Prime is Sky’s hub for free-to-air sport and we’re showing more live and delayed games, highlights, and sports shows across the week and weekends than ever before.
Through Prime the whole country can access key sporting moments as well as school and growth sports that may not otherwise get the exposure that they need. We were delighted to be able to show the finals of the Cricket World Cup and Netball World Cup live and free on Prime. By making sport more accessible, we’re helping to build greater fan bases, attract sponsorships, and showcase our rich local talent. We’re nurturing sports fans, and most importantly future sports fans, driving engagement and giving non-customers a taste of what they can find on Sky Sport.
We’ve produced and broadcast women’s sport for years, and are committed to doing more. There are a number of areas where we are working to make a difference. Starting with more broadcasting of women’s sport. We love the pinnacle events like the Netball World Cup and the Black Ferns playing in the Rugby Super Series, but we are also focused on the Farah Palmer Cup, the ANZ Premiership,
Deepening Engagement with all New Zealanders
Supporting Women’s Sport
Social Media Kiwis don’t just watch sport, they follow every aspect of it. We’re connecting with fans on social more than ever before and ensuring they’re never short of great content from behind-the-scenes moments, to a glimpse of what athletes are doing outside of game time, and of course snippets from our knowledgeable and entertaining Sky crew.
Creating original content and telling sports stories Telling sports stories, particularly about our sports heroes and those special moments, is important to us. We know there’s nothing better than an original story of triumph, hard work and glory. Which is why we’re creating more than ever before of this rich content with the production of compelling, long-form documentaries.
Highlights include our three-part series Keeping the Faith – 25 Years with the Warriors, Greats of Super Rugby: Christian Cullen, Inside SailGP with Sir Russell Coutts and the Red Bull Ignite7 documentary.
the Women’s NRL, the Winter Games NZ and the White Ferns, as well as covering more women’s sport at grassroots level. We’ve enhanced our programme to support athletes during and after their sports careers in different ways across our business.
We’re working with colleagues in the media sector to increase visibility and news coverage of women’s sport. We’ll also give direct support to women’s teams where it is needed, starting with our sponsorship of the Kiwi Ferns and Warriors Women.
Warrior fans enjoying the game at Mt Smart Stadium. ©Photosport
Sky / 2019 Annual Report
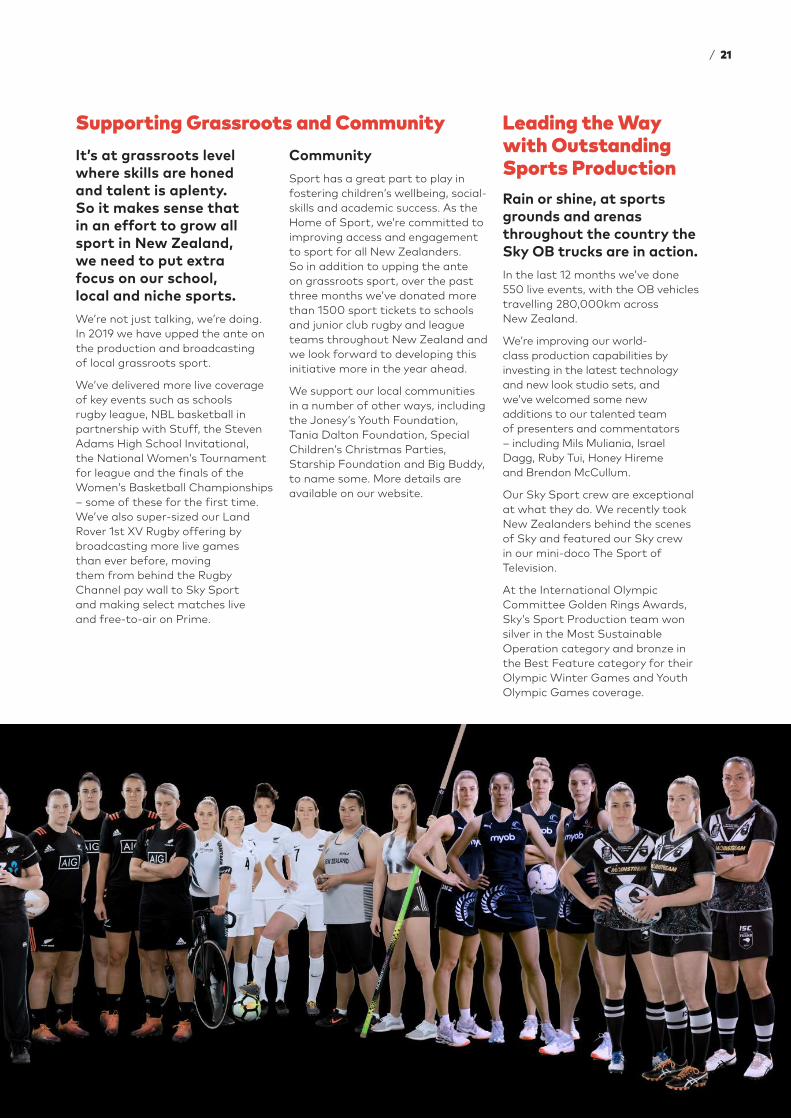
It’s at grassroots level where skills are honed and talent is aplenty. So it makes sense that in an effort to grow all sport in New Zealand, we need to put extra focus on our school, local and niche sports. We’re not just talking, we’re doing. In 2019 we have upped the ante on the production and broadcasting of local grassroots sport.
We’ve delivered more live coverage of key events such as schools rugby league, NBL basketball in partnership with Stuff, the Steven Adams High School Invitational, the National Women’s Tournament for league and the finals of the Women’s Basketball Championships – some of these for the first time. We’ve also super-sized our Land Rover 1st XV Rugby offering by broadcasting more live games than ever before, moving them from behind the Rugby Channel pay wall to Sky Sport and making select matches live and free-to-air on Prime.
Supporting Grassroots and Community
Rain or shine, at sports grounds and arenas throughout the country the Sky OB trucks are in action. In the last 12 months we’ve done 550 live events, with the OB vehicles travelling 280,000km across New Zealand.
We’re improving our world-class production capabilities by investing in the latest technology and new look studio sets, and we’ve welcomed some new additions to our talented team of presenters and commentators – including Mils Muliania, Israel Dagg, Ruby Tui, Honey Hireme and Brendon McCullum.
Our Sky Sport crew are exceptional at what they do. We recently took New Zealanders behind the scenes of Sky and featured our Sky crew in our mini-doco The Sport of Television.
At the International Olympic Committee Golden Rings Awards, Sky’s Sport Production team won silver in the Most Sustainable Operation category and bronze in the Best Feature category for their Olympic Winter Games and Youth Olympic Games coverage.
Leading the Way with Outstanding Sports Production
CommunitySport has a great part to play in fostering children’s wellbeing, social-skills and academic success. As the Home of Sport, we’re committed to improving access and engagement to sport for all New Zealanders. So in addition to upping the ante on grassroots sport, over the past three months we’ve donated more than 1500 sport tickets to schools and junior club rugby and league teams throughout New Zealand and we look forward to developing this initiative more in the year ahead.
We support our local communities in a number of other ways, including the Jonesy’s Youth Foundation, Tania Dalton Foundation, Special Children’s Christmas Parties, Starship Foundation and Big Buddy, to name some. More details are available on our website.
/ 21

Game of Thrones © 2019 Home Box Office, Inc. All rights reserved. HBO and all related programs are the property of Home Box Office, Inc.
Sky / 2019 Annual Report
Limitless World
ChoiceWith more choice than ever before, Sky’s entertainment offering has never been more exciting for fans.
Whether after escapism, action, tears - or even tears of laughter - our customers have access to the best and broadest range of content in New Zealand.
Flexibility
Sky’s proud of our partnerships
With some of the world’s top studios & content providers, such as Warner Media (HBO, Warner Movies, DC Series, CNN and Cartoon Network). NBC-Universal. Sony. MGM. Village Roadshow. Fox. FX Drama. Paramount. CBS. Showtime. BBC. Discovery Networks. Viacom: Comedy Central, MTV, Nickelodeon.
Key to this is our relationships with content providers across the globe. For nearly 30 years we’ve developed enduring partnerships, which have been a vital foundation for our business. Our close relationships with content creators and rights holders allow us to offer content that’s highly valued by our customers, and tailor our locally-produced channels to a variety of viewing preferences whether pure escapism, outstanding dramas and movies, light entertainment or riveting documentaries.
We’re also continuing to forge new relationships with content providers so kiwis have access to world class content, and look forward to including great new international titles to our line-up.
Armchair fans can always find something to watch with our in-home Sky box; whether they’re after a new movie every night, keen to catch a whole season at once, want to watch an episode of one of the most talked-about shows, or to choose from 1,000 movies On Demand.Customers who connect their Sky Box to their home Wi-Fi have access to a huge collection of shows, box sets and movies at the touch of a button.
We’re constantly adapting and refining ways to make it easier for our customers to find and access the content they love, whether via their TV or online.
For those on the go, we’ve added more streaming channels to Sky Go to complement the vast range of catch up, movies and box sets. And with an increasing list of download-to-go titles we’re making it even easier to watch a favourite show when offline. Our youngest TV fans are also well catered for with terrific age-appropriate content available on Nick Play, Nick Jr Play and Cartoon Network Watch ‘n Play Apps.
Content fans who prefer streaming-only for their entertainment are well catered for by NEON, giving instant access to a world of TV and Movies, including terrific exclusive content.
/ 23

Peaky Blinders © BBC
Hot Content
We have the shows that capture headlines and coffee break discussions around the country, whether it’s the runaway hit and highest rating show on IMBD Chernobyl, the drama of Big Little Lies or Euphoria, or the genuine thrill of returning cult favourites like Veronica Mars. We’ve the lion’s share of Emmy® nominated series compared to any other TV or streaming service in New Zealand with 225 nominations including Game of Thrones, Chernobyl, Barry, Pose and What We Do In The Shadows, The Daily Show, Who Do You Think You Are and Crazy Ex-Girlfriend.
Sky’s movie offering is second-to-none by way of breadth and quality of titles, with our ‘new movie every night’ promise and the ability to access a huge catalogue of new release and favourite titles through Sky On Demand (available for no extra charge for all Sky customers
who connect their Sky box to their home Wi-Fi).
New titles can also be purchased to view any time through Sky Box Office. And as a special treat at the moment, Quentin Tarantino has us on his hit list, personally curating and hosting a channel of classic films for us this year in a new evolution of our Sky Movies pop-up innovation.
We’ve also made sure there’s very little chance of anyone missing out on the latest series with more than 500 box sets ready and waiting for when the moment’s right on Sky On Demand, Sky Go and NEON.
We know our customers value new and distinguishable content and we’re committed to delivering it. It’s the content that fuels passion, true fanship and drives engagement and they expect to find it across our linear and streaming services. Best of all, they know that if it’s new and exciting we’ll find a way to get it to them as quickly as possible, utilising Sky On Demand and Sky Go to ensure that there’s no missing out.
If you’ve heard others talking about it, chances are you’ll find it on Sky.
Some of our favourite new content or returning series:
CompellingContent
– GAME OF THRONES PREQUEL – HIS DARK MATERIALS– WATCHMEN– TEMPLE– YOUR HONOR – YEARS AND YEARS– ALL NEW NANCY DREW– PEN 15– THE ROOK– LOOKING FOR ALASKA– MAYANS M.C.– HOMELAND – SHAMELESS– SUPERNATURAL– THE FLASH– RAY DONOVAN– BILLIONS– THE L WORD: GENERATION Q– VERONICA MARS – PEAKY BLINDERS– EUPHORIA
Sky / 2019 Annual Report
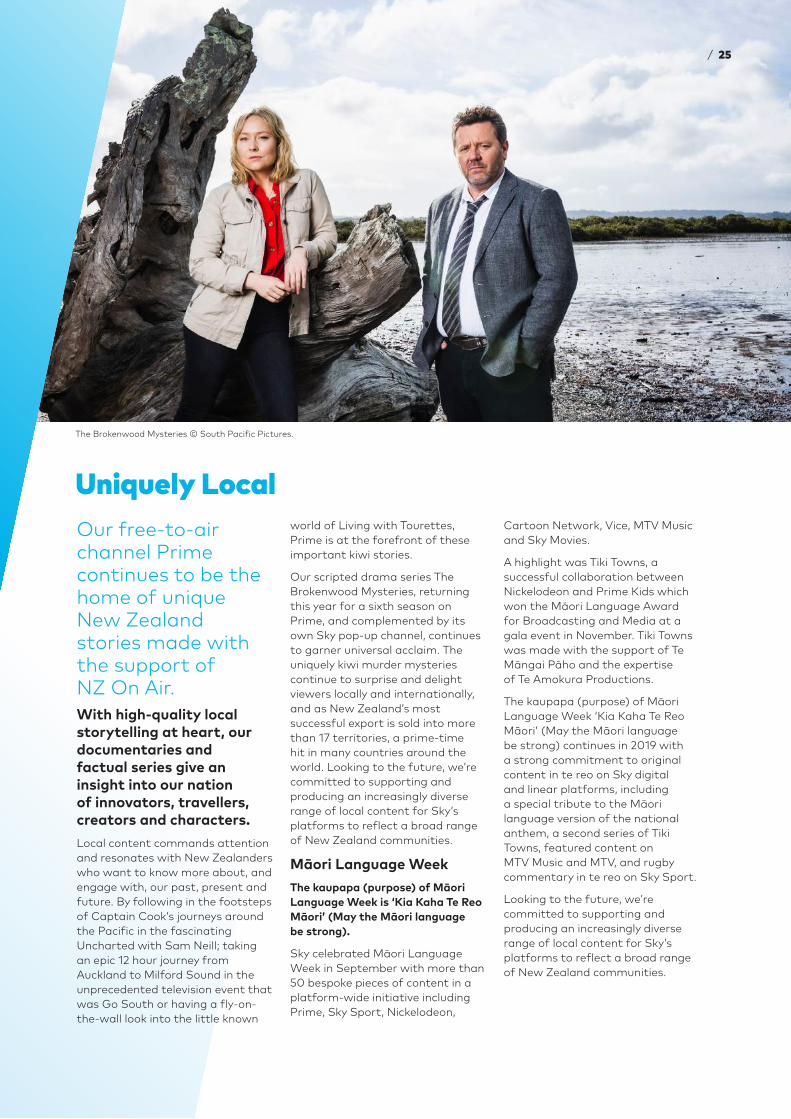
Our free-to-air channel Prime continues to be the home of unique New Zealand stories made with the support of NZ On Air. With high-quality local storytelling at heart, our documentaries and factual series give an insight into our nation of innovators, travellers, creators and characters. Local content commands attention and resonates with New Zealanders who want to know more about, and engage with, our past, present and future. By following in the footsteps of Captain Cook’s journeys around the Pacific in the fascinating Uncharted with Sam Neill; taking an epic 12 hour journey from Auckland to Milford Sound in the unprecedented television event that was Go South or having a fly-on-the-wall look into the little known
world of Living with Tourettes, Prime is at the forefront of these important kiwi stories.
Our scripted drama series The Brokenwood Mysteries, returning this year for a sixth season on Prime, and complemented by its own Sky pop-up channel, continues to garner universal acclaim. The uniquely kiwi murder mysteries continue to surprise and delight viewers locally and internationally, and as New Zealand’s most successful export is sold into more than 17 territories, a prime-time hit in many countries around the world. Looking to the future, we’re committed to supporting and producing an increasingly diverse range of local content for Sky’s platforms to reflect a broad range of New Zealand communities.
Māori Language WeekThe kaupapa (purpose) of Māori Language Week is ‘Kia Kaha Te Reo Māori’ (May the Māori language be strong).
Sky celebrated Māori Language Week in September with more than 50 bespoke pieces of content in a platform-wide initiative including Prime, Sky Sport, Nickelodeon,
Cartoon Network, Vice, MTV Music and Sky Movies.
A highlight was Tiki Towns, a successful collaboration between Nickelodeon and Prime Kids which won the Māori Language Award for Broadcasting and Media at a gala event in November. Tiki Towns was made with the support of Te Māngai Pāho and the expertise of Te Amokura Productions.
The kaupapa (purpose) of Māori Language Week ‘Kia Kaha Te Reo Māori’ (May the Māori language be strong) continues in 2019 with a strong commitment to original content in te reo on Sky digital and linear platforms, including a special tribute to the Māori language version of the national anthem, a second series of Tiki Towns, featured content on MTV Music and MTV, and rugby commentary in te reo on Sky Sport.
Looking to the future, we’re committed to supporting and producing an increasingly diverse range of local content for Sky’s platforms to reflect a broad range of New Zealand communities.
Uniquely Local
The Brokenwood Mysteries © South Pacific Pictures.
/ 25

Sky / 2019 Annual Report
For the year ended 30 June 2019
Financials
Financial overview .....................................................................................28
Financial trends ...........................................................................................34
Directors’ responsibility statement ...........................................37
Consolidated income statement .................................................38
Consolidated statement of comprehensive income ..39
Consolidated balance sheet .............................................................40
Consolidated statement of changes in equity ................41
Consolidated statement of cash flows .................................42
Notes to the financial statements .............................................43
Independent Auditor's report .........................................................88
/ 27
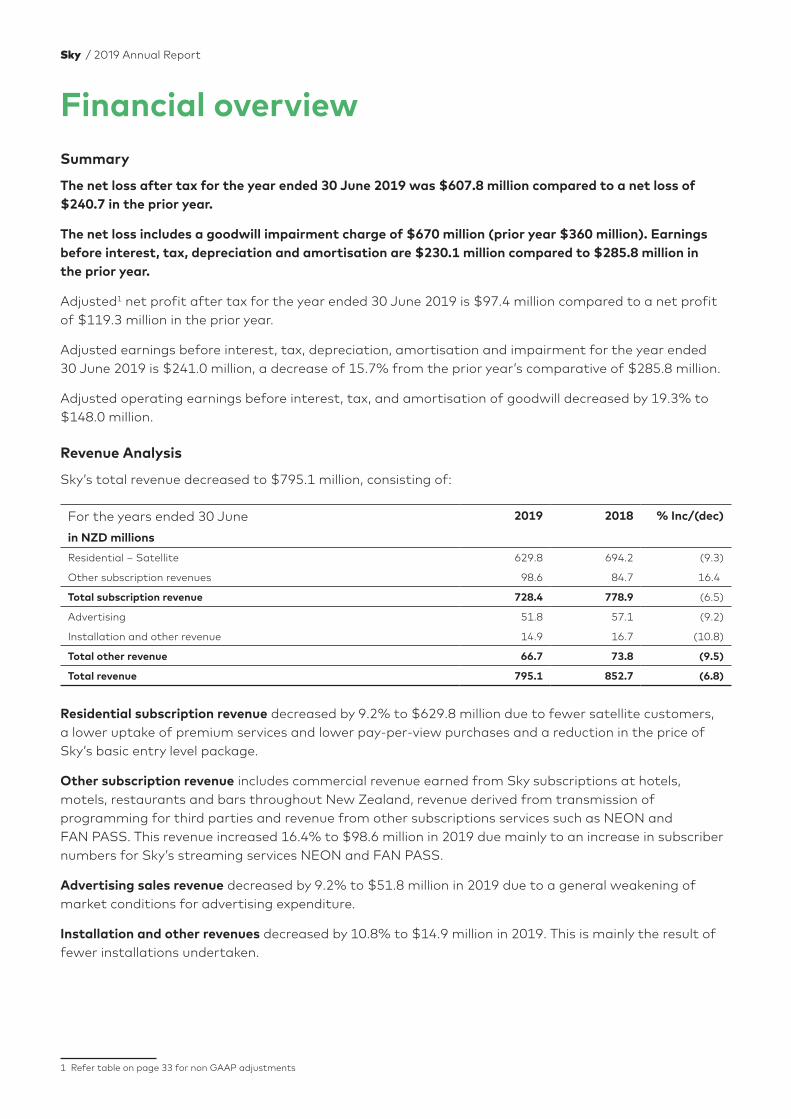
Financial overviewSummary
The net loss after tax for the year ended 30 June 2019 was $607.8 million compared to a net loss of $240.7 in the prior year.
The net loss includes a goodwill impairment charge of $670 million (prior year $360 million). Earnings before interest, tax, depreciation and amortisation are $230.1 million compared to $285.8 million in the prior year.
Adjusted1 net profit after tax for the year ended 30 June 2019 is $97.4 million compared to a net profit of $119.3 million in the prior year.
Adjusted earnings before interest, tax, depreciation, amortisation and impairment for the year ended 30 June 2019 is $241.0 million, a decrease of 15.7% from the prior year’s comparative of $285.8 million.
Adjusted operating earnings before interest, tax, and amortisation of goodwill decreased by 19.3% to $148.0 million.
Revenue Analysis
Sky’s total revenue decreased to $795.1 million, consisting of:
For the years ended 30 June 2019 2018 % Inc/(dec)
in NZD millions
Residential – Satellite 629.8 694.2 (9.3)
Other subscription revenues 98.6 84.7 16.4
Total subscription revenue 728.4 778.9 (6.5)
Advertising 51.8 57.1 (9.2)
Installation and other revenue 14.9 16.7 (10.8)
Total other revenue 66.7 73.8 (9.5)
Total revenue 795.1 852.7 (6.8)
Residential subscription revenue decreased by 9.2% to $629.8 million due to fewer satellite customers, a lower uptake of premium services and lower pay-per-view purchases and a reduction in the price of Sky’s basic entry level package.
Other subscription revenue includes commercial revenue earned from Sky subscriptions at hotels, motels, restaurants and bars throughout New Zealand, revenue derived from transmission of programming for third parties and revenue from other subscriptions services such as NEON and FAN PASS. This revenue increased 16.4% to $98.6 million in 2019 due mainly to an increase in subscriber numbers for Sky’s streaming services NEON and FAN PASS.
Advertising sales revenue decreased by 9.2% to $51.8 million in 2019 due to a general weakening of market conditions for advertising expenditure.
Installation and other revenues decreased by 10.8% to $14.9 million in 2019. This is mainly the result of fewer installations undertaken.
1 Refer table on page 33 for non GAAP adjustments
Sky / 2019 Annual Report

Revenue split
2019 2018
79%
2%
7%
12%
Residential satellite
Installation & other revenue
Advertising revenue
Other subscription revenue
81%
2%
7%
10%
Residential satellite
Installation & other revenue
Advertising revenue
Other subscription revenue
/ 29
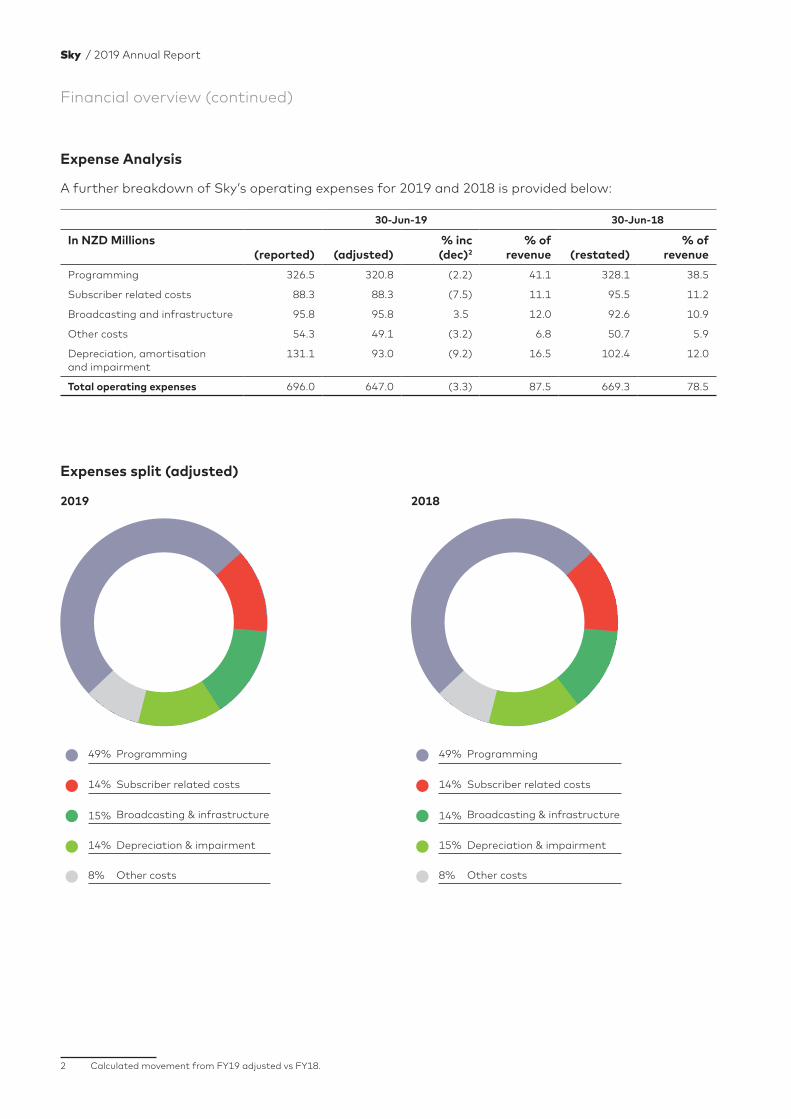
Expense Analysis
A further breakdown of Sky’s operating expenses for 2019 and 2018 is provided below:
30-Jun-19 30-Jun-18
In NZD Millions(reported) (adjusted)
% inc (dec)2
% of revenue
(restated)
% of revenue
Programming 326.5 320.8 (2.2) 41.1 328.1 38.5
Subscriber related costs 88.3 88.3 (7.5) 11.1 95.5 11.2
Broadcasting and infrastructure 95.8 95.8 3.5 12.0 92.6 10.9
Other costs 54.3 49.1 (3.2) 6.8 50.7 5.9
Depreciation, amortisation and impairment
131.1 93.0 (9.2) 16.5 102.4 12.0
Total operating expenses 696.0 647.0 (3.3) 87.5 669.3 78.5
2 Calculated movement from FY19 adjusted vs FY18.
Expenses split (adjusted)
2019 2018
49%
14%
8%
15%
14%
Programming
Depreciation & impairment
Other costs
Broadcasting & infrastructure
Subscriber related costs
49%
15%
8%
14%
14%
Programming
Depreciation & impairment
Other costs
Broadcasting & infrastructure
Subscriber related costs
Financial overview (continued)
Sky / 2019 Annual Report
Programming costs (adjusted) comprise both the costs of purchasing programme rights and also programme operating costs. Programme rights costs include the costs of sports rights, pass-through channel rights (e.g. Disney Channel, Living Channel, etc.), movies (including PPV) and music rights. Programme operating costs include the costs of producing live sports events, satellite and fibre linking costs and in-house studio produced shows.
Sky’s programming expenses (adjusted) have decreased by $7.3 million and equate to 40.3% of revenue in 2019, up from 38.5% in 2018. Adjustments include content costs of $5.7 million which were expensed as the result of a review of Sky’s content inventory.
A significant proportion of Sky’s programme rights costs are in Australian dollars (20% of rights costs) and United States dollars (52% of rights costs). This means the NZ dollar cost included in Sky’s accounts is affected by the strength of the NZ dollar during a particular year and by Sky’s hedging policy.
The board’s policy is to hedge a minimum of 85% of the forecast exposures over 0 to 12 months, up to 50% of variable exposures over 13 to 24 months and up to 30% over 25 to 36 months. Fixed price contracts denominated in foreign currencies are fully hedged at the time of signing the contract.
Subscriber related costs include the costs of servicing and monitoring equipment installed at subscribers’ homes, indirect installation costs, the costs of Sky’s customer service department, sales and marketing costs and general administrative costs associated with subscriber management.
In 2019, subscriber related costs decreased by 7.5% due to lower employee and contractor costs, lower trouble calls and decoder repair costs.
Broadcasting and infrastructure costs consist of transmission and linking costs for transmitting Sky and Prime’s television signals from its studios in Auckland to other locations in New Zealand and the costs of operating Sky’s television stations at Mt Wellington and Albany. The costs of leasing seven transponders on the Optus D1 satellite are included, as is the cost of high definition television broadcasting and management of Sky’s streaming platforms. Broadcasting and infrastructure costs have increased by 3.5% to $95.8 million due to increased internet delivery costs for on demand content and costs of supporting Sky’s streaming products (NEON, FANPASS).
Other costs (adjusted) include advertising costs, the overhead costs relating to corporate management and the affiliated businesses. These costs have decreased by 3.2% to $49.1 million. Reported cost of $54.3 million includes consultancy and employee costs of $5.0 million in relation to changes in strategic direction being implemented by the new executive team.
Depreciation and amortisation costs (adjusted) include depreciation charges for subscriber equipment including satellite dishes and decoders owned by Sky and fixed assets such as television station facilities. Depreciation and amortisation costs have decreased by 9.2% to $93 million for the current year due principally to an aging decoder base and fewer installations.
Unadjusted amortisation includes impairment of the infinite video platform (IVP) project and related assets of $38.2 million (refer note 11 in the financial statements).
/ 31
Finance costs, net have decreased from $17.5 million to $12.4 million. The reduction in interest is due to reduced levels of debt. During the year Sky refinanced its facility agreement with a new banking syndicate. This led to an increase in interest rates from the previous arrangement. Sky’s weighted average interest rates are as follows:
2019 2018
Borrowings 6.52% 5.58%
Bonds 6.13% 6.18%
Combined weight average 6.34% 5.79%
Capital expenditure
Sky’s capital expenditure over the last five years is summarised as follows:
In NZD Millions 2019 2018 2017 2016 2015
Subscriber equipment 7.3 9.2 19.7 63.8 22.8
Installation costs 15.5 18.8 29.3 32.6 29.7
Other 53.5 30.2 30.7 32.4 63.0
Total capital expenditure 76.3 58.2 79.7 128.8 115.5
Capital expenditure increased by $18.1 million in 2019 to $76.3 million.
The main increase was incurred in relation to the IVP project which was abandoned as a result of changes to Sky’s strategic plan. Costs of $38.2 million were written off as a consequence.
Non-GAAP Financial Information
Sky has used non-GAAP profit measures when discussing financial performance. The directors and management believe that these measures provide useful information on the underlying performance of the Group. They are used internally to evaluate performance, analyse trends and allocate resources. Non-GAAP financial measures are not prepared in accordance with NZ IFRS and are not uniformly defined and therefore should not be viewed in isolation nor considered as a substitute for measures reported in accordance with NZ IFRS.
Sky’s strategic direction has moved towards enhancing its streaming services. The costs adjusted in the following table have been incurred in relation to the changes in strategy being implemented by the Group’s new executive team and include the abandonment of the IVP project, content write-offs, redundancy and consultancy payments.
The Sky board is required to assess the fair value of intangible assets at each reporting period and if this is determined to be less than the book value, then the assets are impaired. The impairment charge reduces the net book value of Sky’s equity at 30 June 2019 to $352 million compared to $1,027 million in the prior year. This is a non-cash charge that has no impact on Sky’s 2019 cash flows or any of its bank covenants.
Financial overview (continued)
Sky / 2019 Annual Report
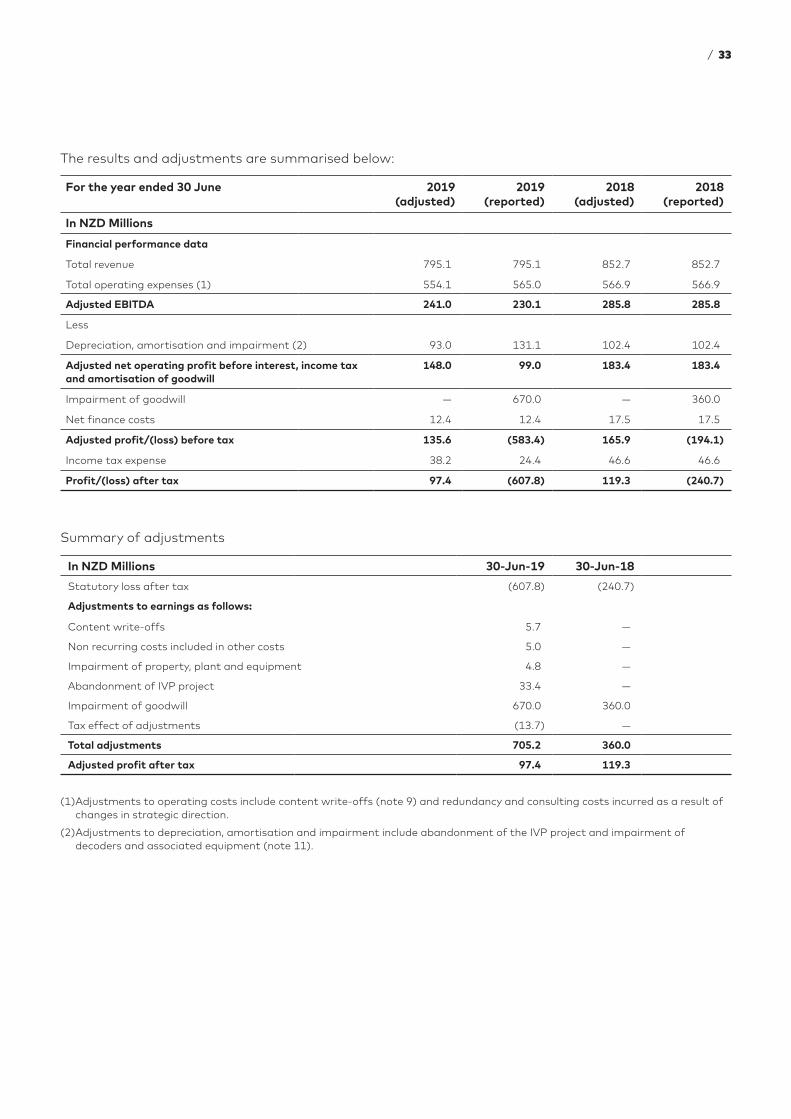
The results and adjustments are summarised below:
For the year ended 30 June 2019 (adjusted)
2019 (reported)
2018 (adjusted)
2018 (reported)
In NZD Millions
Financial performance data
Total revenue 795.1 795.1 852.7 852.7
Total operating expenses (1) 554.1 565.0 566.9 566.9
Adjusted EBITDA 241.0 230.1 285.8 285.8
Less
Depreciation, amortisation and impairment (2) 93.0 131.1 102.4 102.4
Adjusted net operating profit before interest, income tax and amortisation of goodwill
148.0 99.0 183.4 183.4
Impairment of goodwill — 670.0 — 360.0
Net finance costs 12.4 12.4 17.5 17.5
Adjusted profit/(loss) before tax 135.6 (583.4) 165.9 (194.1)
Income tax expense 38.2 24.4 46.6 46.6
Profit/(loss) after tax 97.4 (607.8) 119.3 (240.7)
Summary of adjustments
In NZD Millions 30-Jun-19 30-Jun-18
Statutory loss after tax (607.8) (240.7)
Adjustments to earnings as follows:
Content write-offs 5.7 —
Non recurring costs included in other costs 5.0 —
Impairment of property, plant and equipment 4.8 —
Abandonment of IVP project 33.4 —
Impairment of goodwill 670.0 360.0
Tax effect of adjustments (13.7) —
Total adjustments 705.2 360.0
Adjusted profit after tax 97.4 119.3
(1) Adjustments to operating costs include content write-offs (note 9) and redundancy and consulting costs incurred as a result of changes in strategic direction.
(2) Adjustments to depreciation, amortisation and impairment include abandonment of the IVP project and impairment of decoders and associated equipment (note 11).
/ 33
Financial trends
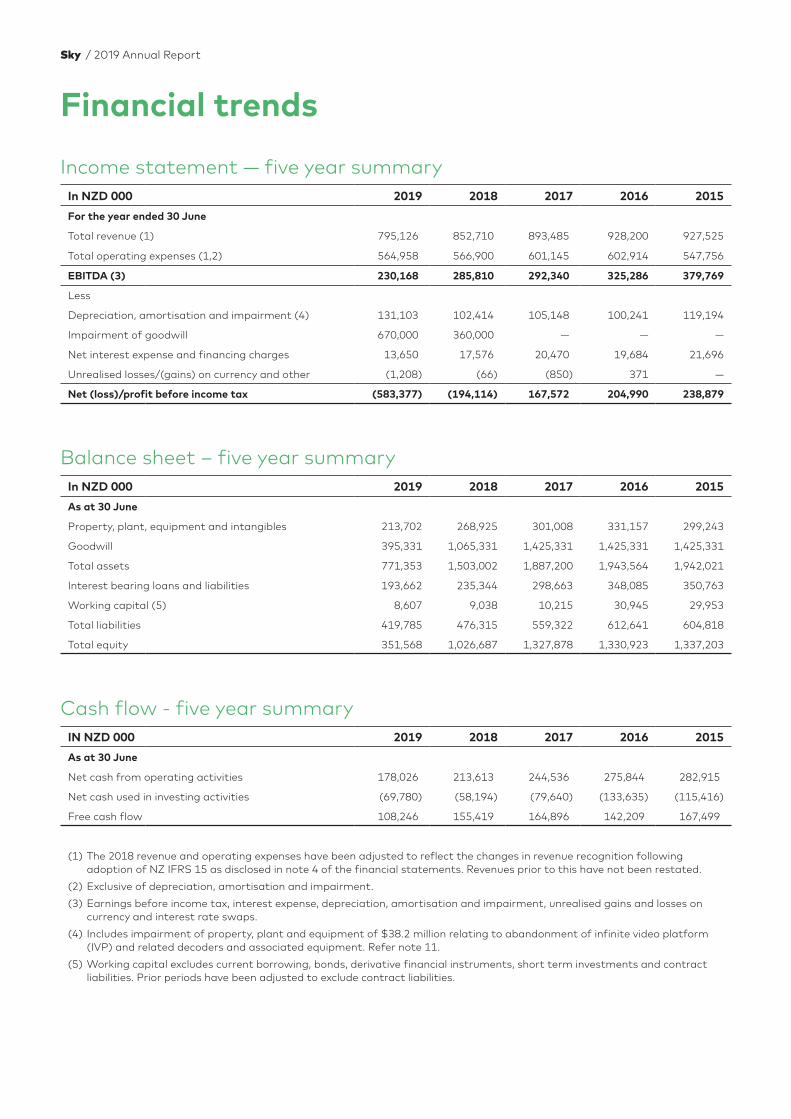
Income statement — five year summaryIn NZD 000 2019 2018 2017 2016 2015
For the year ended 30 June
Total revenue (1) 795,126 852,710 893,485 928,200 927,525
Total operating expenses (1,2) 564,958 566,900 601,145 602,914 547,756
EBITDA (3) 230,168 285,810 292,340 325,286 379,769
Less
Depreciation, amortisation and impairment (4) 131,103 102,414 105,148 100,241 119,194
Impairment of goodwill 670,000 360,000 — — —
Net interest expense and financing charges 13,650 17,576 20,470 19,684 21,696
Unrealised losses/(gains) on currency and other (1,208) (66) (850) 371 —
Net (loss)/profit before income tax (583,377) (194,114) 167,572 204,990 238,879
Balance sheet – five year summaryIn NZD 000 2019 2018 2017 2016 2015
As at 30 June
Property, plant, equipment and intangibles 213,702 268,925 301,008 331,157 299,243
Goodwill 395,331 1,065,331 1,425,331 1,425,331 1,425,331
Total assets 771,353 1,503,002 1,887,200 1,943,564 1,942,021
Interest bearing loans and liabilities 193,662 235,344 298,663 348,085 350,763
Working capital (5) 8,607 9,038 10,215 30,945 29,953
Total liabilities 419,785 476,315 559,322 612,641 604,818
Total equity 351,568 1,026,687 1,327,878 1,330,923 1,337,203
Cash flow - five year summaryIN NZD 000 2019 2018 2017 2016 2015
As at 30 June
Net cash from operating activities 178,026 213,613 244,536 275,844 282,915
Net cash used in investing activities (69,780) (58,194) (79,640) (133,635) (115,416)
Free cash flow 108,246 155,419 164,896 142,209 167,499
(1) The 2018 revenue and operating expenses have been adjusted to reflect the changes in revenue recognition following adoption of NZ IFRS 15 as disclosed in note 4 of the financial statements. Revenues prior to this have not been restated.
(2) Exclusive of depreciation, amortisation and impairment.
(3) Earnings before income tax, interest expense, depreciation, amortisation and impairment, unrealised gains and losses on currency and interest rate swaps.
(4) Includes impairment of property, plant and equipment of $38.2 million relating to abandonment of infinite video platform (IVP) and related decoders and associated equipment. Refer note 11.
(5) Working capital excludes current borrowing, bonds, derivative financial instruments, short term investments and contract liabilities. Prior periods have been adjusted to exclude contract liabilities.
Sky / 2019 Annual Report
/ 35
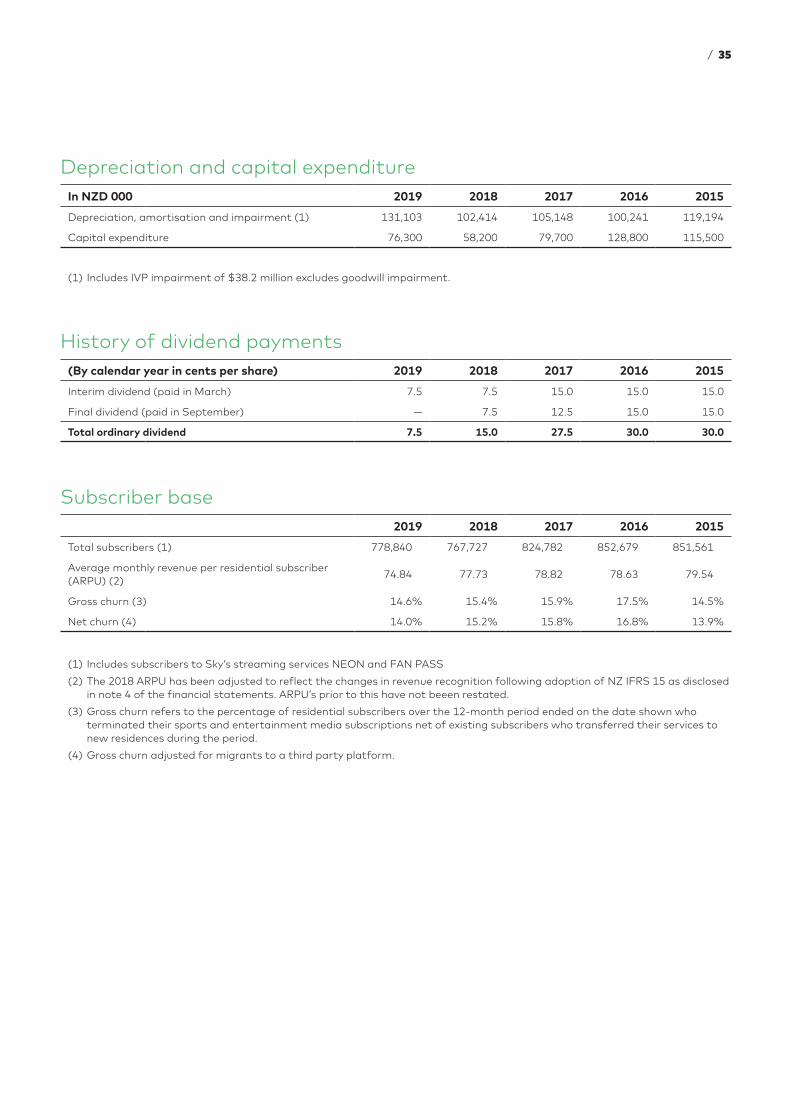
Depreciation and capital expenditureIn NZD 000 2019 2018 2017 2016 2015
Depreciation, amortisation and impairment (1) 131,103 102,414 105,148 100,241 119,194
Capital expenditure 76,300 58,200 79,700 128,800 115,500
(1) Includes IVP impairment of $38.2 million excludes goodwill impairment.
History of dividend payments(By calendar year in cents per share) 2019 2018 2017 2016 2015
Interim dividend (paid in March) 7.5 7.5 15.0 15.0 15.0
Final dividend (paid in September) — 7.5 12.5 15.0 15.0
Total ordinary dividend 7.5 15.0 27.5 30.0 30.0
Subscriber base2019 2018 2017 2016 2015
Total subscribers (1) 778,840 767,727 824,782 852,679 851,561
Average monthly revenue per residential subscriber (ARPU) (2)
74.84 77.73 78.82 78.63 79.54
Gross churn (3) 14.6% 15.4% 15.9% 17.5% 14.5%
Net churn (4) 14.0% 15.2% 15.8% 16.8% 13.9%
(1) Includes subscribers to Sky’s streaming services NEON and FAN PASS
(2) The 2018 ARPU has been adjusted to reflect the changes in revenue recognition following adoption of NZ IFRS 15 as disclosed in note 4 of the financial statements. ARPU’s prior to this have not beeen restated.
(3) Gross churn refers to the percentage of residential subscribers over the 12-month period ended on the date shown who terminated their sports and entertainment media subscriptions net of existing subscribers who transferred their services to new residences during the period.
(4) Gross churn adjusted for migrants to a third party platform.

Sky / 2019 Annual Report
The directors of Sky Network Television Limited (the Group) are responsible for ensuring that the consolidated financial statements of the Group present fairly the financial position of the Group as at 30 June 2019 and the results of its operations and cash flows for the year ended on that date.
The directors consider that the consolidated financial statements of the Group have been prepared using appropriate accounting policies, consistently applied and supported by reasonable judgements and estimates and that all relevant financial reporting and accounting standards have been followed.
The directors believe that proper accounting records have been kept which enable, with reasonable accuracy, the determination of the financial position of the Group and facilitate compliance of the consolidated financial statements with the Financial Markets Conduct Act 2013.
The directors consider they have taken adequate steps to safeguard the assets of the Group and to prevent and detect fraud and other irregularities.
The directors present the consolidated financial statements of the Group for the year ended 30 June 2019.
The board of directors of Sky Network Television Limited authorise these financial statements for issue on 21 August 2019.
For and on behalf of the board of directors
Peter Macourt Chairman
Susan Paterson Director
Date: 21 August 2019
Directors’ Responsibility Statement
/ 37
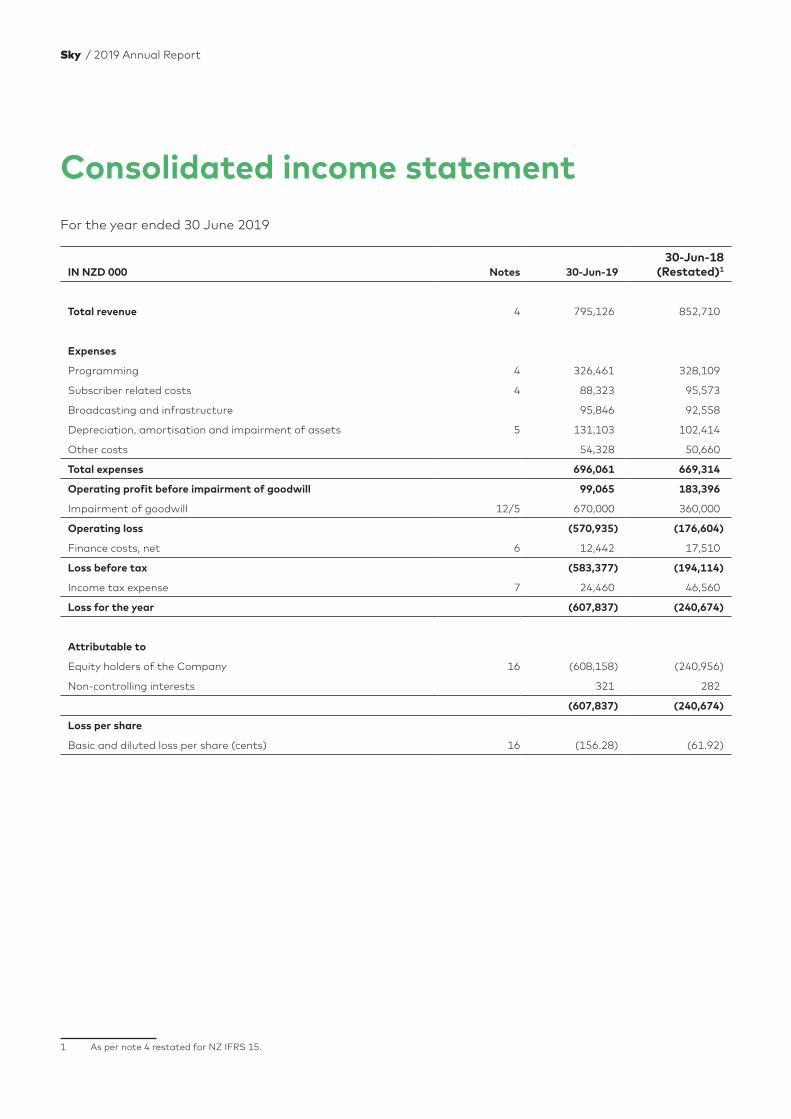
Consolidated income statementFor the year ended 30 June 2019
IN NZD 000 Notes 30-Jun-1930-Jun-18
(Restated)1
Total revenue 4 795,126 852,710
Expenses
Programming 4 326,461 328,109
Subscriber related costs 4 88,323 95,573
Broadcasting and infrastructure 95,846 92,558
Depreciation, amortisation and impairment of assets 5 131,103 102,414
Other costs 54,328 50,660
Total expenses 696,061 669,314
Operating profit before impairment of goodwill 99,065 183,396
Impairment of goodwill 12/5 670,000 360,000
Operating loss (570,935) (176,604)
Finance costs, net 6 12,442 17,510
Loss before tax (583,377) (194,114)
Income tax expense 7 24,460 46,560
Loss for the year (607,837) (240,674)
Attributable to
Equity holders of the Company 16 (608,158) (240,956)
Non-controlling interests 321 282
(607,837) (240,674)
Loss per share
Basic and diluted loss per share (cents) 16 (156.28) (61.92)
1 As per note 4 restated for NZ IFRS 15.
Sky / 2019 Annual Report
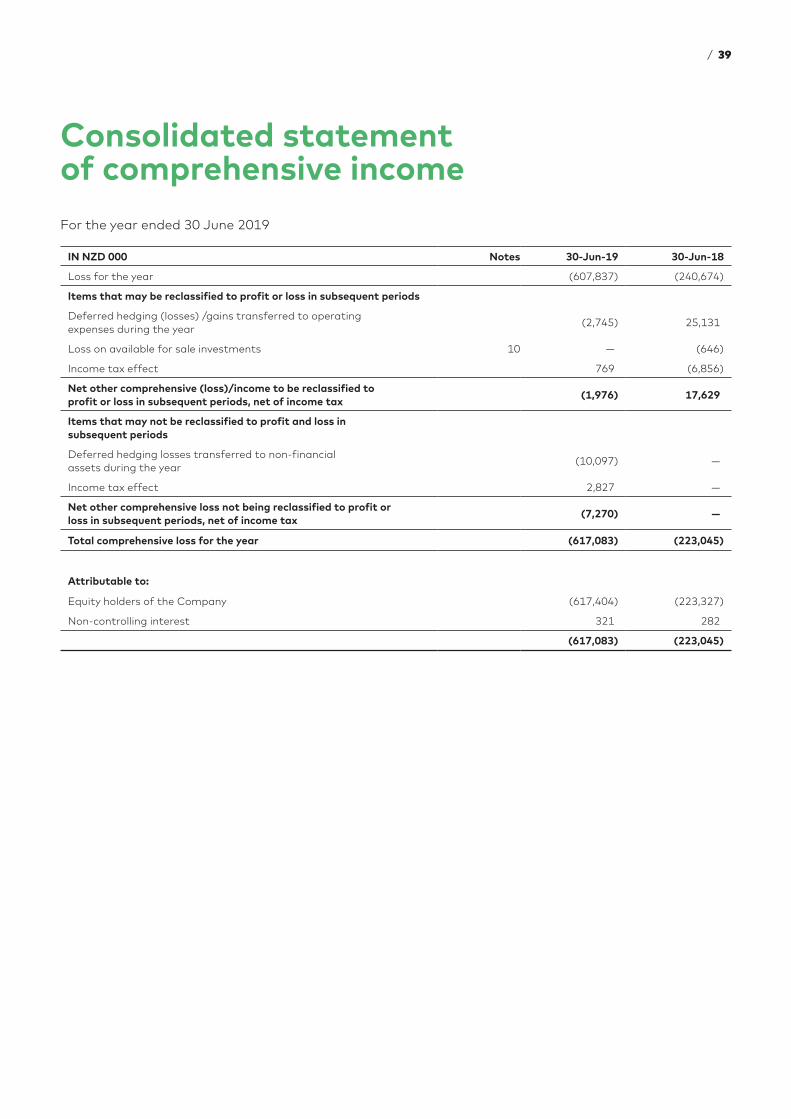
For the year ended 30 June 2019
Consolidated statement of comprehensive income
IN NZD 000 Notes 30-Jun-19 30-Jun-18
Loss for the year (607,837) (240,674)
Items that may be reclassified to profit or loss in subsequent periods
Deferred hedging (losses) /gains transferred to operating expenses during the year
(2,745) 25,131
Loss on available for sale investments 10 — (646)
Income tax effect 769 (6,856)
Net other comprehensive (loss)/income to be reclassified to profit or loss in subsequent periods, net of income tax
(1,976) 17,629
Items that may not be reclassified to profit and loss in subsequent periods
Deferred hedging losses transferred to non-financial assets during the year
(10,097) —
Income tax effect 2,827 —
Net other comprehensive loss not being reclassified to profit or loss in subsequent periods, net of income tax
(7,270) —
Total comprehensive loss for the year (617,083) (223,045)
Attributable to:
Equity holders of the Company (617,404) (223,327)
Non-controlling interest 321 282
(617,083) (223,045)
/ 39
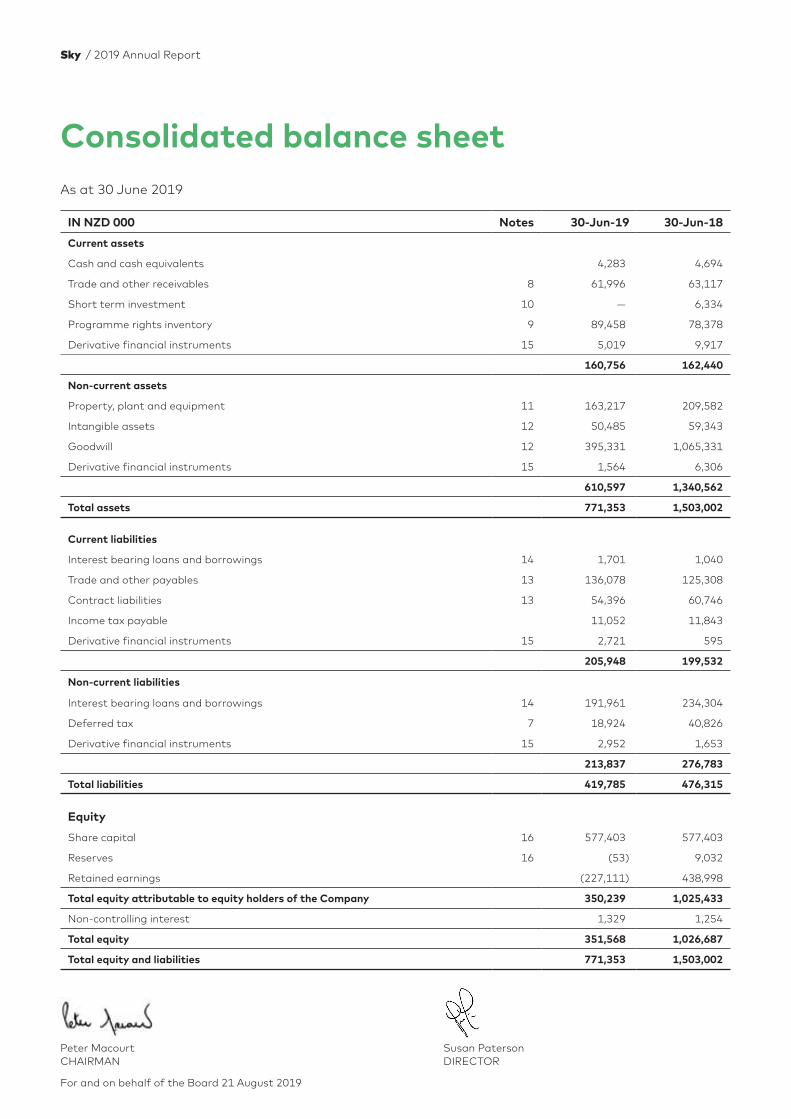
As at 30 June 2019
IN NZD 000 Notes 30-Jun-19 30-Jun-18
Current assets
Cash and cash equivalents 4,283 4,694
Trade and other receivables 8 61,996 63,117
Short term investment 10 — 6,334
Programme rights inventory 9 89,458 78,378
Derivative financial instruments 15 5,019 9,917
160,756 162,440
Non-current assets
Property, plant and equipment 11 163,217 209,582
Intangible assets 12 50,485 59,343
Goodwill 12 395,331 1,065,331
Derivative financial instruments 15 1,564 6,306
610,597 1,340,562
Total assets 771,353 1,503,002
Current liabilities
Interest bearing loans and borrowings 14 1,701 1,040
Trade and other payables 13 136,078 125,308
Contract liabilities 13 54,396 60,746
Income tax payable 11,052 11,843
Derivative financial instruments 15 2,721 595
205,948 199,532
Non-current liabilities
Interest bearing loans and borrowings 14 191,961 234,304
Deferred tax 7 18,924 40,826
Derivative financial instruments 15 2,952 1,653
213,837 276,783
Total liabilities 419,785 476,315
Equity
Share capital 16 577,403 577,403
Reserves 16 (53) 9,032
Retained earnings (227,111) 438,998
Total equity attributable to equity holders of the Company 350,239 1,025,433
Non-controlling interest 1,329 1,254
Total equity 351,568 1,026,687
Total equity and liabilities 771,353 1,503,002
Peter Macourt Susan Paterson CHAIRMAN DIRECTOR
For and on behalf of the Board 21 August 2019
Consolidated balance sheet
Sky / 2019 Annual Report
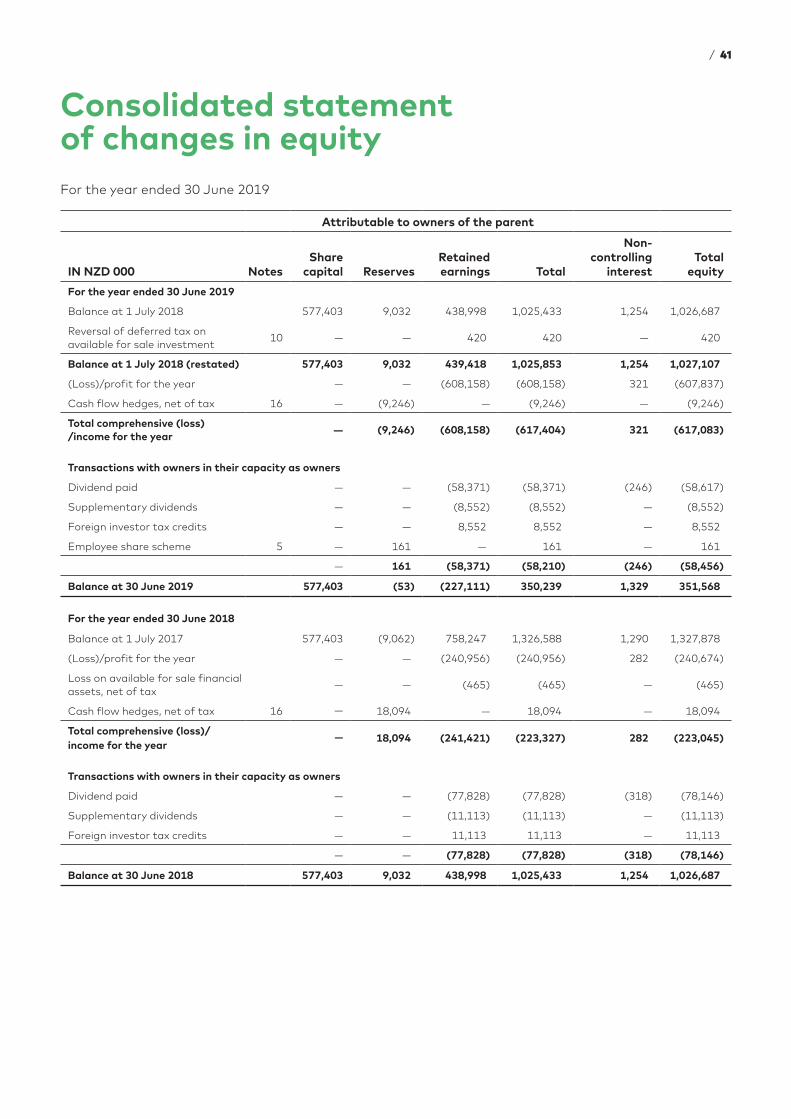
Consolidated statement of changes in equityFor the year ended 30 June 2019
Attributable to owners of the parent
IN NZD 000 NotesShare
capital ReservesRetained earnings Total
Non- controlling
interestTotal
equity
For the year ended 30 June 2019
Balance at 1 July 2018 577,403 9,032 438,998 1,025,433 1,254 1,026,687
Reversal of deferred tax on available for sale investment
10 — — 420 420 — 420
Balance at 1 July 2018 (restated) 577,403 9,032 439,418 1,025,853 1,254 1,027,107
(Loss)/profit for the year — — (608,158) (608,158) 321 (607,837)
Cash flow hedges, net of tax 16 — (9,246) — (9,246) — (9,246)
Total comprehensive (loss) /income for the year — (9,246) (608,158) (617,404) 321 (617,083)
Transactions with owners in their capacity as owners
Dividend paid — — (58,371) (58,371) (246) (58,617)
Supplementary dividends — — (8,552) (8,552) — (8,552)
Foreign investor tax credits — — 8,552 8,552 — 8,552
Employee share scheme 5 — 161 — 161 — 161
— 161 (58,371) (58,210) (246) (58,456)
Balance at 30 June 2019 577,403 (53) (227,111) 350,239 1,329 351,568
For the year ended 30 June 2018
Balance at 1 July 2017 577,403 (9,062) 758,247 1,326,588 1,290 1,327,878
(Loss)/profit for the year — — (240,956) (240,956) 282 (240,674)
Loss on available for sale financial assets, net of tax
— — (465) (465) — (465)
Cash flow hedges, net of tax 16 — 18,094 — 18,094 — 18,094
Total comprehensive (loss)/ income for the year — 18,094 (241,421) (223,327) 282 (223,045)
Transactions with owners in their capacity as owners
Dividend paid — — (77,828) (77,828) (318) (78,146)
Supplementary dividends — — (11,113) (11,113) — (11,113)
Foreign investor tax credits — — 11,113 11,113 — 11,113
— — (77,828) (77,828) (318) (78,146)
Balance at 30 June 2018 577,403 9,032 438,998 1,025,433 1,254 1,026,687
/ 41
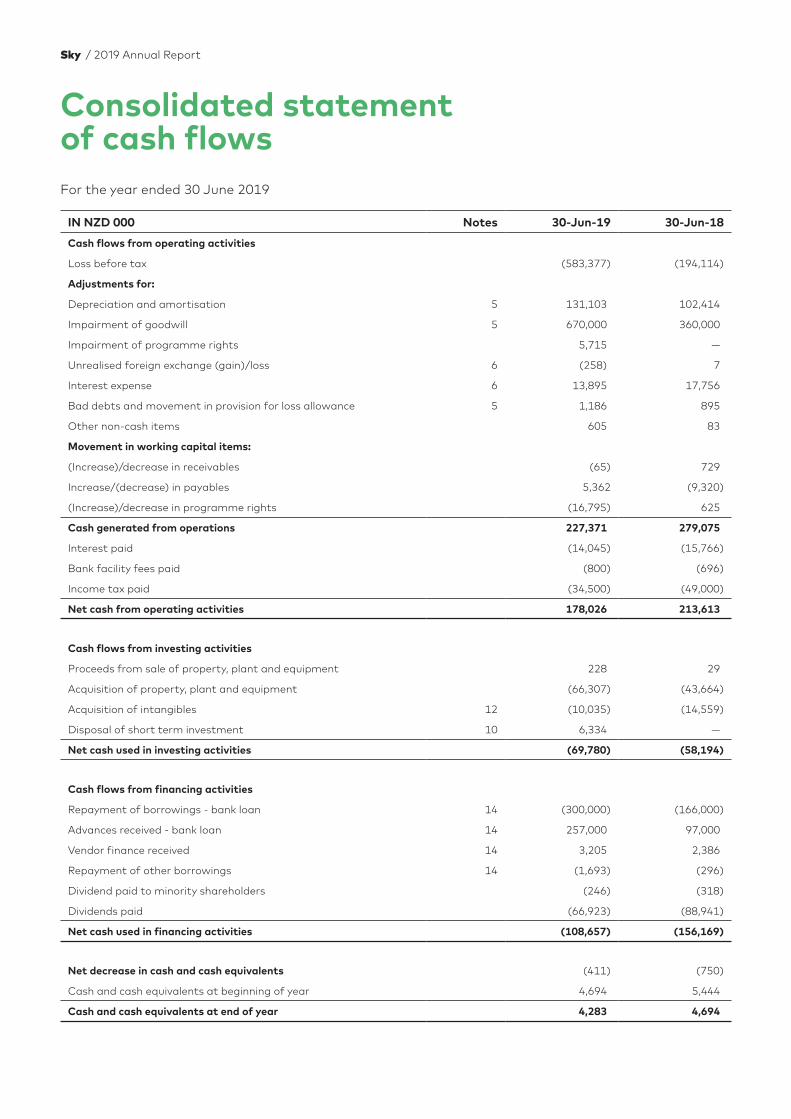
For the year ended 30 June 2019
IN NZD 000 Notes 30-Jun-19 30-Jun-18
Cash flows from operating activities
Loss before tax (583,377) (194,114)
Adjustments for:
Depreciation and amortisation 5 131,103 102,414
Impairment of goodwill 5 670,000 360,000
Impairment of programme rights 5,715 —
Unrealised foreign exchange (gain)/loss 6 (258) 7
Interest expense 6 13,895 17,756
Bad debts and movement in provision for loss allowance 5 1,186 895
Other non-cash items 605 83
Movement in working capital items:
(Increase)/decrease in receivables (65) 729
Increase/(decrease) in payables 5,362 (9,320)
(Increase)/decrease in programme rights (16,795) 625
Cash generated from operations 227,371 279,075
Interest paid (14,045) (15,766)
Bank facility fees paid (800) (696)
Income tax paid (34,500) (49,000)
Net cash from operating activities 178,026 213,613
Cash flows from investing activities
Proceeds from sale of property, plant and equipment 228 29
Acquisition of property, plant and equipment (66,307) (43,664)
Acquisition of intangibles 12 (10,035) (14,559)
Disposal of short term investment 10 6,334 —
Net cash used in investing activities (69,780) (58,194)
Cash flows from financing activities
Repayment of borrowings - bank loan 14 (300,000) (166,000)
Advances received - bank loan 14 257,000 97,000
Vendor finance received 14 3,205 2,386
Repayment of other borrowings 14 (1,693) (296)
Dividend paid to minority shareholders (246) (318)
Dividends paid (66,923) (88,941)
Net cash used in financing activities (108,657) (156,169)
Net decrease in cash and cash equivalents (411) (750)
Cash and cash equivalents at beginning of year 4,694 5,444
Cash and cash equivalents at end of year 4,283 4,694
Consolidated statement of cash flows
Sky / 2019 Annual Report
1. General information
This section sets out the Group’s accounting policies that relate to the consolidated financial statements as a whole. Where an accounting policy is specific to one note, the policy is described in the note to which it relates.
Sky Network Television Limited (Sky) is a company incorporated and domiciled in New Zealand. The address of its registered office is 10 Panorama Road, Mt Wellington, Auckland, New Zealand. The consolidated financial statements of the Group for the year ended 30 June 2019 comprise the Company, Sky Network Television Limited and its subsidiaries.
Sky is a company registered under the Companies Act 1993 and is a reporting entity under Part 7 of the Financial Markets Conduct Act 2013. The financial statements of the Group have been prepared in accordance with the requirements of the Financial Markets Conduct Act 2013 and the NZX Main Board Listing Rules.
The Group’s primary activity is to operate as a provider of sport and entertainment media services in New Zealand.
These consolidated financial statements were authorised for issue by the Board on 21 August 2019.
Basis of preparation
The consolidated financial statements of the Group have been prepared in accordance with Generally Accepted Accounting Practice in New Zealand (NZ GAAP). The Group is a for-profit entity for the purpose of complying with NZ GAAP. The consolidated financial statements comply with New Zealand equivalents to International Financial Reporting Standards (NZ IFRS), other New Zealand accounting standards and authoritative notices that are applicable to entities that apply NZ IFRS. The consolidated financial statements also comply with International Financial Reporting Standards (IFRS).
These consolidated financial statements are prepared on the basis of historical cost except where otherwise identified. The consolidated financial statements are presented in New Zealand dollars.
Notes to the Financial Statements
/ 43
Notes to the Financial Statements (continued)
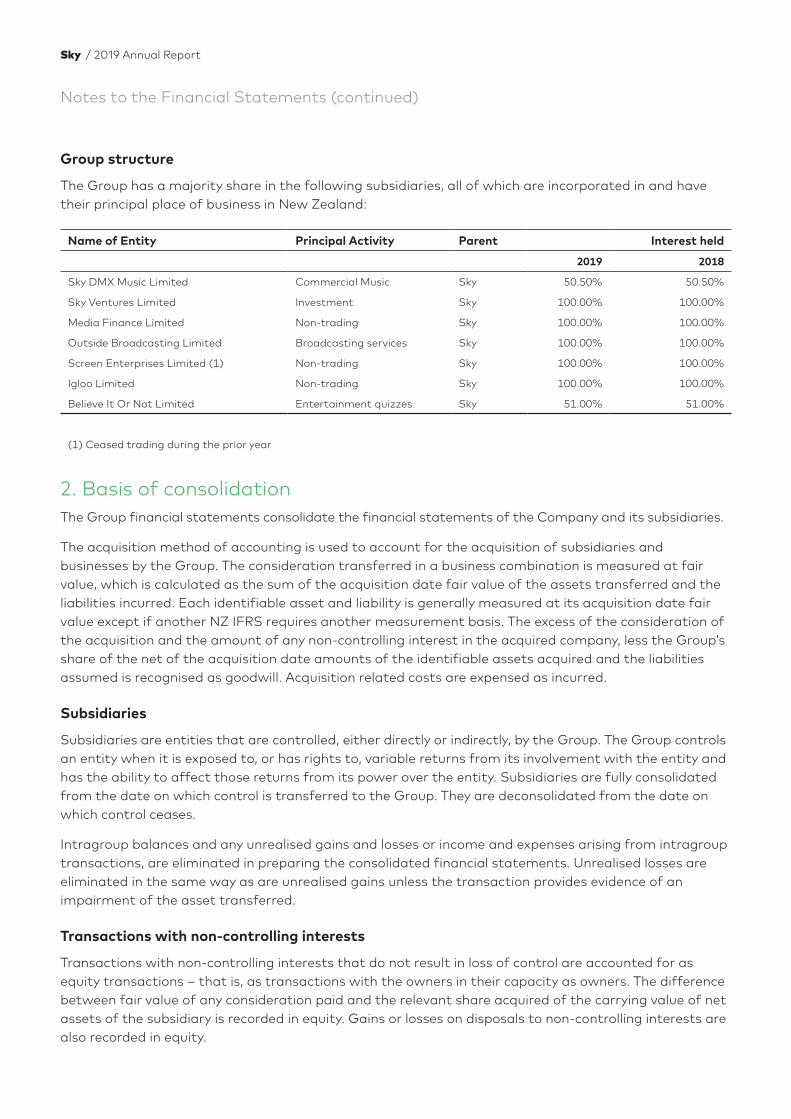
Group structure
The Group has a majority share in the following subsidiaries, all of which are incorporated in and have their principal place of business in New Zealand:
Name of Entity Principal Activity Parent Interest held
2019 2018
Sky DMX Music Limited Commercial Music Sky 50.50% 50.50%
Sky Ventures Limited Investment Sky 100.00% 100.00%
Media Finance Limited Non-trading Sky 100.00% 100.00%
Outside Broadcasting Limited Broadcasting services Sky 100.00% 100.00%
Screen Enterprises Limited (1) Non-trading Sky 100.00% 100.00%
Igloo Limited Non-trading Sky 100.00% 100.00%
Believe It Or Not Limited Entertainment quizzes Sky 51.00% 51.00%
(1) Ceased trading during the prior year
2. Basis of consolidationThe Group financial statements consolidate the financial statements of the Company and its subsidiaries.
The acquisition method of accounting is used to account for the acquisition of subsidiaries and businesses by the Group. The consideration transferred in a business combination is measured at fair value, which is calculated as the sum of the acquisition date fair value of the assets transferred and the liabilities incurred. Each identifiable asset and liability is generally measured at its acquisition date fair value except if another NZ IFRS requires another measurement basis. The excess of the consideration of the acquisition and the amount of any non-controlling interest in the acquired company, less the Group’s share of the net of the acquisition date amounts of the identifiable assets acquired and the liabilities assumed is recognised as goodwill. Acquisition related costs are expensed as incurred.
Subsidiaries
Subsidiaries are entities that are controlled, either directly or indirectly, by the Group. The Group controls an entity when it is exposed to, or has rights to, variable returns from its involvement with the entity and has the ability to affect those returns from its power over the entity. Subsidiaries are fully consolidated from the date on which control is transferred to the Group. They are deconsolidated from the date on which control ceases.
Intragroup balances and any unrealised gains and losses or income and expenses arising from intragroup transactions, are eliminated in preparing the consolidated financial statements. Unrealised losses are eliminated in the same way as are unrealised gains unless the transaction provides evidence of an impairment of the asset transferred.
Transactions with non-controlling interests
Transactions with non-controlling interests that do not result in loss of control are accounted for as equity transactions – that is, as transactions with the owners in their capacity as owners. The difference between fair value of any consideration paid and the relevant share acquired of the carrying value of net assets of the subsidiary is recorded in equity. Gains or losses on disposals to non-controlling interests are also recorded in equity.
Sky / 2019 Annual Report
3. Significant accounting policies and changesSky has applied NZ IFRS 9 Financial Instruments without restating comparative information and NZ IFRS 15 Revenue from Contracts with Customers using a full retrospective approach which requires restatement of comparatives of the 2018 financial year. The nature and effect of these changes are disclosed below.
NZ IFRS 9 Financial Instruments
NZ IFRS 9 replaces the provisions of NZ IAS 39 that relate to the recognition, classification and measurement of financial assets and financial liabilities, de-recognition of financial instruments, impairment of financial assets and hedge accounting.
NZ IFRS 9 was generally adopted without restating comparative information. No adjustments were made as a result of adoption of the new impairment rules.
The new impairment model requires the recognition of impairment provisions based on expected credit losses (ECL) rather than only incurred credit losses as was the case under NZ IAS 39. The standard applies to the Group in relation to financial assets classified at amortised cost, within the Group’s trade receivables. Based on the Group’s assessment of historical provision rates and forward-looking analysis, there is no material financial impact on the impairment provisions.
Classification and measurement
On 1 July 2018 (the date of initial application of NZ IFRS 9), the Group’s management has assessed which business models apply to financial assets held by the Group and has classified its financial instruments into the appropriate NZ IFRS 9 categories.
From 1 July 2018 the Group classifies its financial assets in the following measurement categories; − those to be measured subsequently at fair value (either through other comprehensive income
or through profit or loss), and
− those to be measured at amortised cost.
Except for cash and cash equivalents and trade receivables, under NZ IFRS 9, the Group initially measures a financial asset at its fair value, plus transaction costs where a financial asset is classified at fair value through other comprehensive income.
The only reclassification arising on transition to NZ IFRS 9 is for the investment in 90 Seconds Limited which under NZ IAS 39 was classified as an available for sale financial asset. At the date of initial application, this investment qualified as held for trading and therefore it was reclassified as a financial asset at fair value through profit of loss. Related fair value gains of $1,081,000 (net of tax) were transferred from the available-for-sale financial assets reserve to retained earnings on 1 July 2018. The value is combined in the retained earnings line in the consolidated statement of changes in equity. Subsequent changes in the fair value of financial assets at fair value through profit or loss are recognised in other gains/losses in profit or loss as applicable. The Group sold its investment in 90 Seconds Limited in July 2018 (Refer note 10).
/ 45
Notes to the Financial Statements (continued)
3. Significant accounting policies and changes (continued)The accounting for the Group’s financial liabilities remains the same as it was under NZ IAS 39.
Derivatives and hedging activities
The foreign currency forwards and interest rate swaps in place as at 1 July 2018 qualified as cash flow hedges under NZ IFRS 9. The Group’s risk management strategies and hedge documentation are aligned with the requirements of NZ IFRS 9 and these relationships are therefore treated as continuing hedges.
Sky applied hedge accounting prospectively. Consistent with prior periods Sky has continued to designate the change in fair value of the entire forward contract as a cash flow hedge relationship and as such, the adoption of the hedge accounting requirements of NZ IFRS 9 had no significant impact on Sky’s consolidated financial statements.
Under NZ IAS 39, all gains and losses arising from Sky’s cash flow hedging relationships were eligible to be subsequently reclassified to profit or loss. However, under NZ IFRS 9, gains or losses arising on cash flow hedges of forward purchases of non-financial assets need to be incorporated into the initial carrying amounts of the non-financial assets. This change was adopted by Sky on 1 July 2017 and consequently has no effect on Sky’s consolidated financial statements other than the reclassification described below.
Upon adoption of NZ IFRS 9 the portion of the net gain or loss on cash flow hedges relating to non-financial assets, ie programme rights and sports rights is presented as “Other comprehensive income not being reclassified to profit or loss in subsequent periods.” This change only applies prospectively from the date of initial application of NZ IFRS 9 and has no impact on the presentation of comparative figures.
NZ IFRS 15 Revenue from contracts with customers
NZ IFRS 15 supersedes NZ IAS 11 Construction Contracts, NZ IAS 18 Revenue and related interpretations and it applies to all revenue arising from contracts with customers, unless those contracts are in the scope of other standards. The new standard establishes a five-step model to account for revenue arising from contracts with customers. Under NZ IFRS 15, revenue is recognised at an amount that reflects the consideration to which an entity expects to be entitled in exchange for transferring goods or services to a customer.
The standard requires entities to exercise judgement, taking into consideration all of the relevant facts and circumstances when applying each step of the model to contracts with their customers. The standard also specifies the accounting for the incremental costs of obtaining a contract and the costs directly relating to fulfilling a contract.
Sky adopted NZ IFRS 15 for the first time on 1 July 2018, using the full retrospective approach. Sky did not identify any significant changes in the timing of revenue recognition as a result of the adoption of NZ IFRS 15 and accordingly there was no adjustment for the cumulative effect against opening retained earnings at 1 July 2018. Certain contracts where Sky has been identified as the principal, which historically were recognised net of expenses are now presented on a gross basis with expenses recognised in operating costs. As a result of the assessment made for adopting NZ IFRS 15, an adjustment was made which increased both revenue and expenses with no impact to net profit as referred to in note 4.
Sky / 2019 Annual Report
Presentation and disclosure requirements
As required by NZ IFRS 15 the Group disaggregated revenue recognised from contracts with customers into categories that depict how the nature, amount, timing and uncertainty of revenue and cash flows are affected by economic factors. Refer to note 4 for the disclosure on disaggregated revenue.
Under NZ IFRS 15 a contract liability is recognised for payments received from customers in advance and is recognised in revenue as services are provided. (Refer note 13). These payments were previously included in trade and other payables but are now presented separately on the balance sheet. Sky invoices customers in advance for both residential and commercial subscriptions.
The Group has identified certain transactions which are impacted by the adoption of NZ IFRS 15 but for which no adjustments have been made due to the immateriality of the amounts involved. These transactions which include installation revenue, customer acquisition costs, discounted services, and any new revenue streams will be monitored on an interim basis in order to ensure continued compliance with NZ IFRS 15.
Impact of standards issued but not yet applied by the entity
NZ IFRS 16 Leases (effective date: 1 January 2019)
NZ IFRS 16 will primarily change lease accounting for lessees; lease agreements will give rise to the recognition of an asset representing the right to use the leased item and a lease liability for future lease payables. Lease costs will be recognised in the form of depreciation of the right to use asset and interest must be recognised on the lease liability. The new standard will be substantively different for current operating leases where rental charges are currently recognised on a straight-line basis and no lease asset or lease obligation is recognised. The standard is effective for accounting periods beginning on or after 1 January 2019. The Group intends to adopt the standard from 1 July 2019.
The Group has assessed the impact of applying NZ IFRS 16 and determined that the adjustments to recognise right of use assets and corresponding lease liabilities are likely to be significant. Most of this value relates to the Optus transponder lease which is currently treated as an operating lease for accounting purposes.
/ 47
Notes to the Financial Statements (continued)
3. Significant accounting policies and changes (continued)The expenses for operating leases previously recorded within operating expense will now be moved to depreciation and finance expense. The impact on net income over the term of the lease will remain the same. However, a higher interest expense occurs in earlier years of the lease leading to higher costs in the initial lease period.
Sky has a large number of operating leases which will be recognised as “right of use assets” under NZ IFRS 16. These include:
Transponder Lease – The Optus transponder lease is the most significant of Sky’s operating leases and given its high value will have a material impact on “right of use assets” and lease liabilities on adoption of NZ IFRS 16.
Property – The Group has various rental properties throughout New Zealand which will also materially impact on “right of use assets” and lease liabilities after taking into account renewal rights which are reasonably certain to be exercised.
Motor Vehicles – The Group leases motor vehicles for use in field operations and vans for use in its installation activities.
Equipment – The Group has certain lease agreements for transmission networks, technology equipment and network infrastructure. These leases have been reviewed on an individual lease basis. The Group has utilised the recognition exemption for leases of low–value items where appropriate.
Adoption process
The Group has carried out a review of its lease contracts that could be impacted by adoption of NZ IFRS 16. In order to manage these lease contracts the Group has implemented an NZ IFRS 16 compliant lease management and accounting system.
Sky / 2019 Annual Report
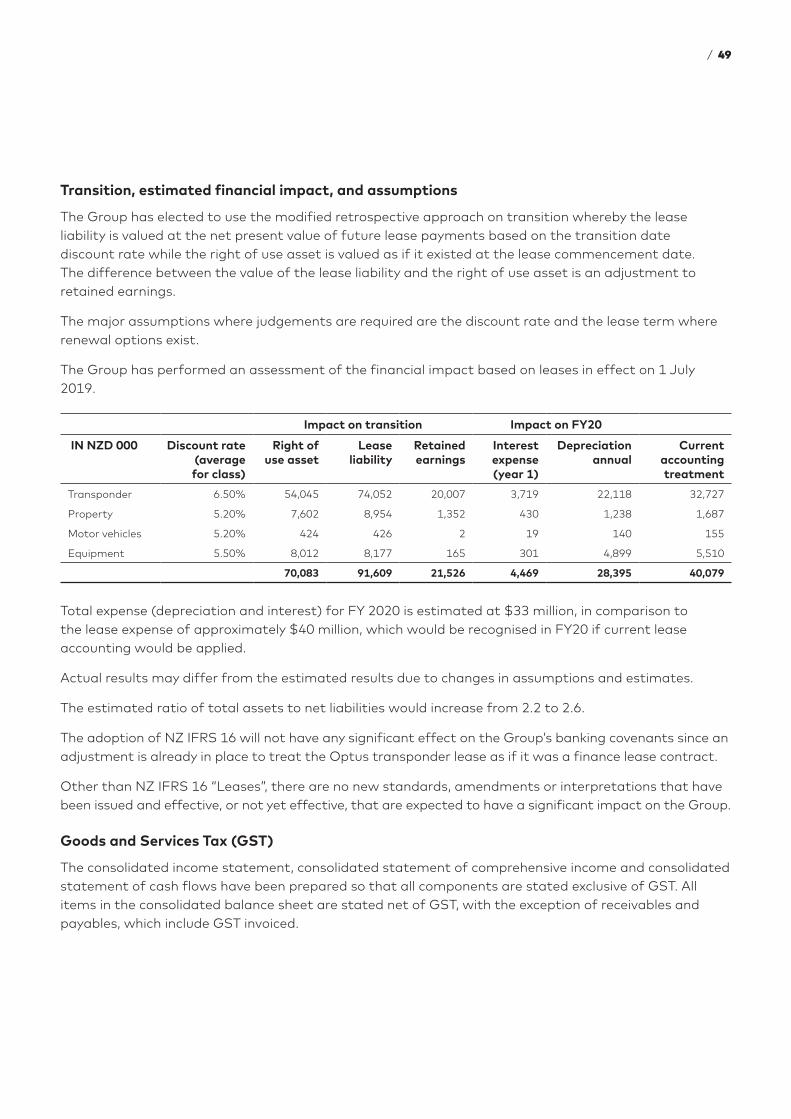
Transition, estimated financial impact, and assumptions
The Group has elected to use the modified retrospective approach on transition whereby the lease liability is valued at the net present value of future lease payments based on the transition date discount rate while the right of use asset is valued as if it existed at the lease commencement date. The difference between the value of the lease liability and the right of use asset is an adjustment to retained earnings.
The major assumptions where judgements are required are the discount rate and the lease term where renewal options exist.
The Group has performed an assessment of the financial impact based on leases in effect on 1 July 2019.
Impact on transition Impact on FY20
IN NZD 000 Discount rate (average for class)
Right of use asset
Lease liability
Retained earnings
Interest expense (year 1)
Depreciation annual
Current accounting treatment
Transponder 6.50% 54,045 74,052 20,007 3,719 22,118 32,727
Property 5.20% 7,602 8,954 1,352 430 1,238 1,687
Motor vehicles 5.20% 424 426 2 19 140 155
Equipment 5.50% 8,012 8,177 165 301 4,899 5,510
70,083 91,609 21,526 4,469 28,395 40,079
Total expense (depreciation and interest) for FY 2020 is estimated at $33 million, in comparison to the lease expense of approximately $40 million, which would be recognised in FY20 if current lease accounting would be applied.
Actual results may differ from the estimated results due to changes in assumptions and estimates.
The estimated ratio of total assets to net liabilities would increase from 2.2 to 2.6.
The adoption of NZ IFRS 16 will not have any significant effect on the Group’s banking covenants since an adjustment is already in place to treat the Optus transponder lease as if it was a finance lease contract.
Other than NZ IFRS 16 “Leases”, there are no new standards, amendments or interpretations that have been issued and effective, or not yet effective, that are expected to have a significant impact on the Group.
Goods and Services Tax (GST)
The consolidated income statement, consolidated statement of comprehensive income and consolidated statement of cash flows have been prepared so that all components are stated exclusive of GST. All items in the consolidated balance sheet are stated net of GST, with the exception of receivables and payables, which include GST invoiced.
/ 49
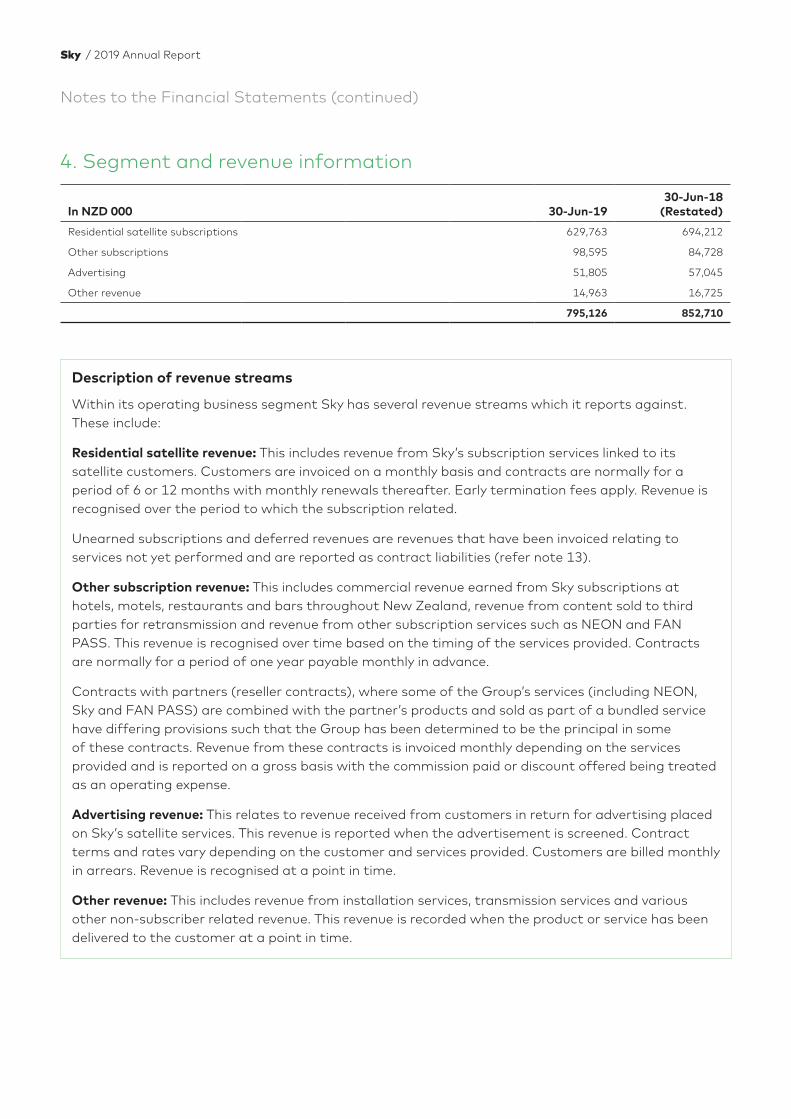
Notes to the Financial Statements (continued)
4. Segment and revenue information
In NZD 000 30-Jun-1930-Jun-18
(Restated)
Residential satellite subscriptions 629,763 694,212
Other subscriptions 98,595 84,728
Advertising 51,805 57,045
Other revenue 14,963 16,725
795,126 852,710
Description of revenue streams
Within its operating business segment Sky has several revenue streams which it reports against. These include:
Residential satellite revenue: This includes revenue from Sky’s subscription services linked to its satellite customers. Customers are invoiced on a monthly basis and contracts are normally for a period of 6 or 12 months with monthly renewals thereafter. Early termination fees apply. Revenue is recognised over the period to which the subscription related.
Unearned subscriptions and deferred revenues are revenues that have been invoiced relating to services not yet performed and are reported as contract liabilities (refer note 13).
Other subscription revenue: This includes commercial revenue earned from Sky subscriptions at hotels, motels, restaurants and bars throughout New Zealand, revenue from content sold to third parties for retransmission and revenue from other subscription services such as NEON and FAN PASS. This revenue is recognised over time based on the timing of the services provided. Contracts are normally for a period of one year payable monthly in advance.
Contracts with partners (reseller contracts), where some of the Group’s services (including NEON, Sky and FAN PASS) are combined with the partner’s products and sold as part of a bundled service have differing provisions such that the Group has been determined to be the principal in some of these contracts. Revenue from these contracts is invoiced monthly depending on the services provided and is reported on a gross basis with the commission paid or discount offered being treated as an operating expense.
Advertising revenue: This relates to revenue received from customers in return for advertising placed on Sky’s satellite services. This revenue is reported when the advertisement is screened. Contract terms and rates vary depending on the customer and services provided. Customers are billed monthly in arrears. Revenue is recognised at a point in time.
Other revenue: This includes revenue from installation services, transmission services and various other non-subscriber related revenue. This revenue is recorded when the product or service has been delivered to the customer at a point in time.
Sky / 2019 Annual Report
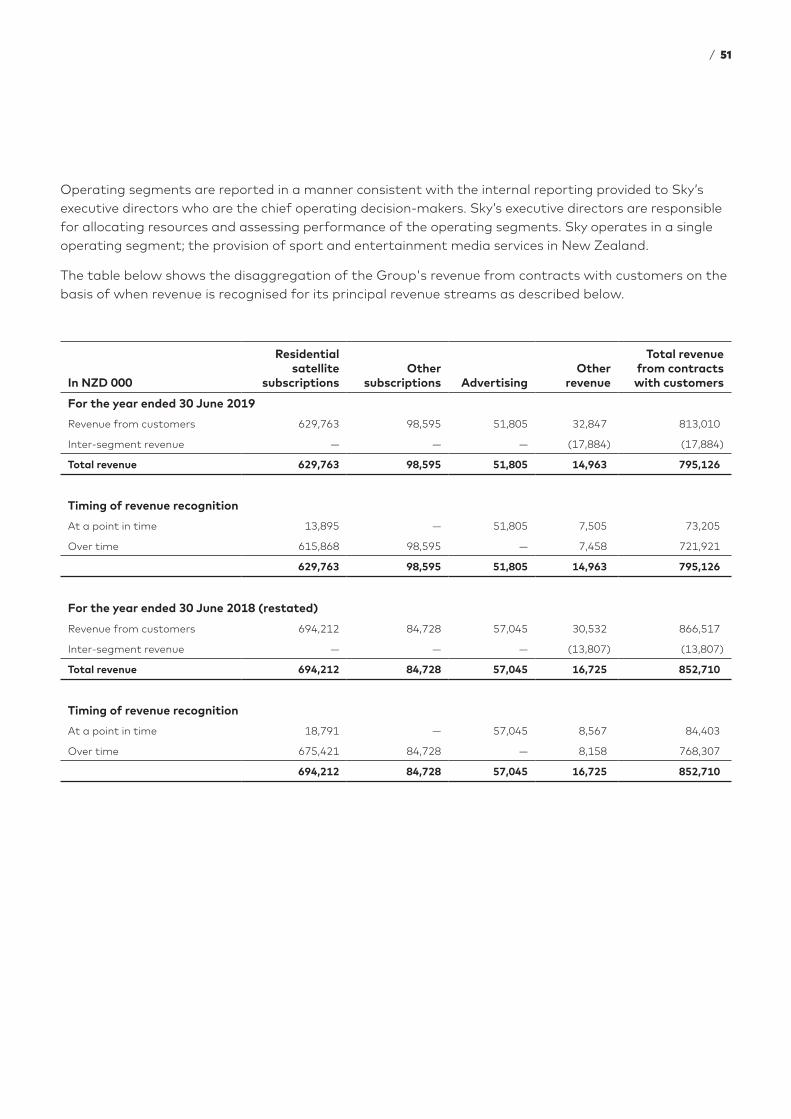
Operating segments are reported in a manner consistent with the internal reporting provided to Sky’s executive directors who are the chief operating decision-makers. Sky’s executive directors are responsible for allocating resources and assessing performance of the operating segments. Sky operates in a single operating segment; the provision of sport and entertainment media services in New Zealand.
The table below shows the disaggregation of the Group's revenue from contracts with customers on the basis of when revenue is recognised for its principal revenue streams as described below.
In NZD 000
Residential satellite
subscriptionsOther
subscriptions AdvertisingOther
revenue
Total revenue from contracts with customers
For the year ended 30 June 2019
Revenue from customers 629,763 98,595 51,805 32,847 813,010
Inter-segment revenue — — — (17,884) (17,884)
Total revenue 629,763 98,595 51,805 14,963 795,126
Timing of revenue recognition
At a point in time 13,895 — 51,805 7,505 73,205
Over time 615,868 98,595 — 7,458 721,921
629,763 98,595 51,805 14,963 795,126
For the year ended 30 June 2018 (restated)
Revenue from customers 694,212 84,728 57,045 30,532 866,517
Inter-segment revenue — — — (13,807) (13,807)
Total revenue 694,212 84,728 57,045 16,725 852,710
Timing of revenue recognition
At a point in time 18,791 — 57,045 8,567 84,403
Over time 675,421 84,728 — 8,158 768,307
694,212 84,728 57,045 16,725 852,710
/ 51
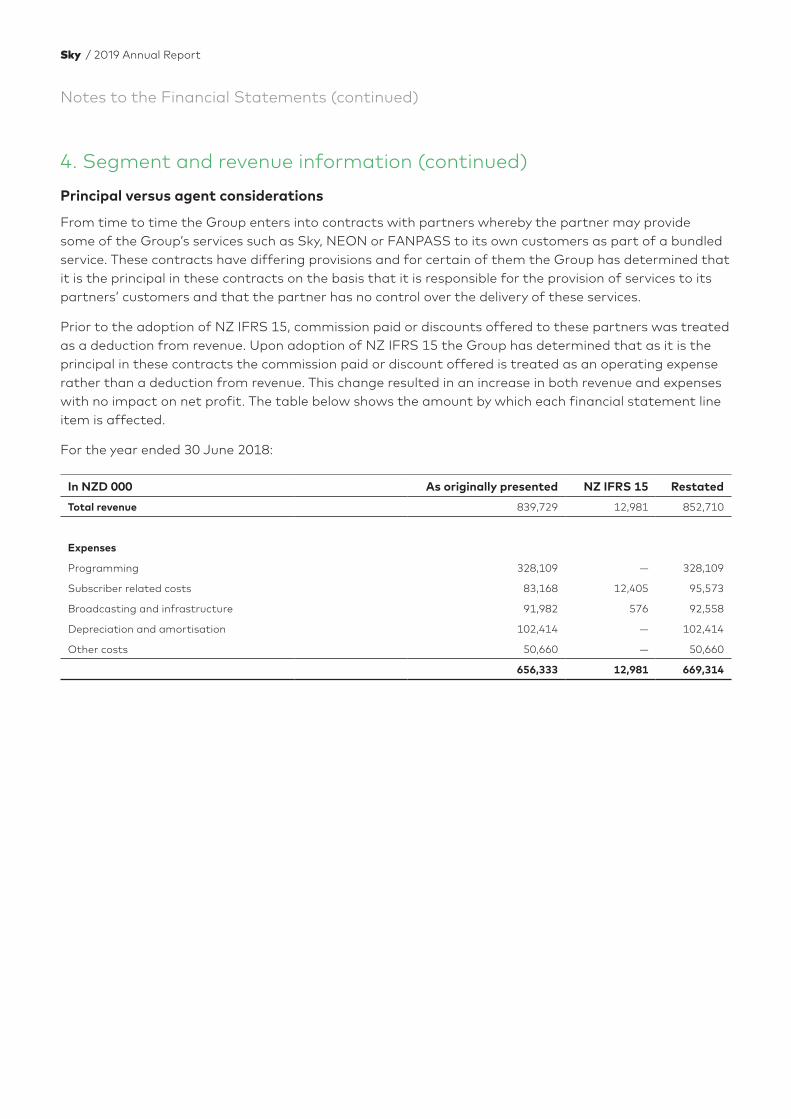
Notes to the Financial Statements (continued)
4. Segment and revenue information (continued)
Principal versus agent considerations
From time to time the Group enters into contracts with partners whereby the partner may provide some of the Group’s services such as Sky, NEON or FANPASS to its own customers as part of a bundled service. These contracts have differing provisions and for certain of them the Group has determined that it is the principal in these contracts on the basis that it is responsible for the provision of services to its partners’ customers and that the partner has no control over the delivery of these services.
Prior to the adoption of NZ IFRS 15, commission paid or discounts offered to these partners was treated as a deduction from revenue. Upon adoption of NZ IFRS 15 the Group has determined that as it is the principal in these contracts the commission paid or discount offered is treated as an operating expense rather than a deduction from revenue. This change resulted in an increase in both revenue and expenses with no impact on net profit. The table below shows the amount by which each financial statement line item is affected.
For the year ended 30 June 2018:
In NZD 000 As originally presented NZ IFRS 15 Restated
Total revenue 839,729 12,981 852,710
Expenses
Programming 328,109 — 328,109
Subscriber related costs 83,168 12,405 95,573
Broadcasting and infrastructure 91,982 576 92,558
Depreciation and amortisation 102,414 — 102,414
Other costs 50,660 — 50,660
656,333 12,981 669,314
Sky / 2019 Annual Report
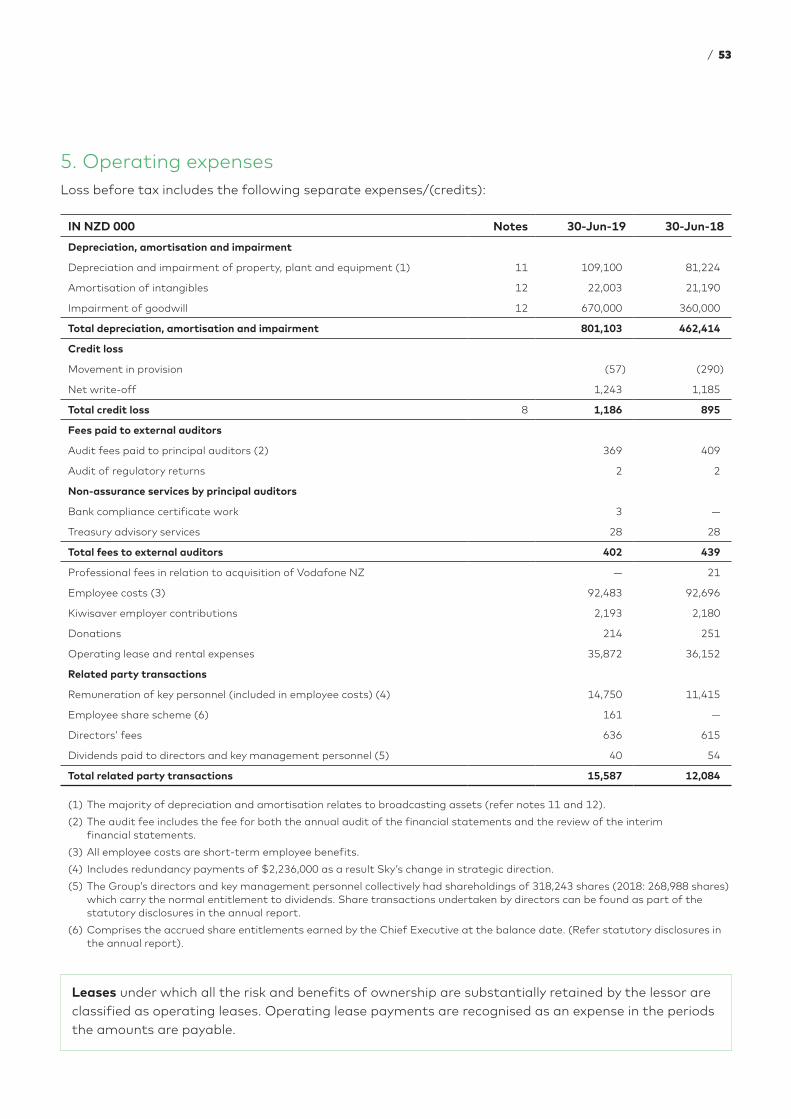
5. Operating expensesLoss before tax includes the following separate expenses/(credits):
IN NZD 000 Notes 30-Jun-19 30-Jun-18
Depreciation, amortisation and impairment
Depreciation and impairment of property, plant and equipment (1) 11 109,100 81,224
Amortisation of intangibles 12 22,003 21,190
Impairment of goodwill 12 670,000 360,000
Total depreciation, amortisation and impairment 801,103 462,414
Credit loss
Movement in provision (57) (290)
Net write-off 1,243 1,185
Total credit loss 8 1,186 895
Fees paid to external auditors
Audit fees paid to principal auditors (2) 369 409
Audit of regulatory returns 2 2
Non-assurance services by principal auditors
Bank compliance certificate work 3 —
Treasury advisory services 28 28
Total fees to external auditors 402 439
Professional fees in relation to acquisition of Vodafone NZ — 21
Employee costs (3) 92,483 92,696
Kiwisaver employer contributions 2,193 2,180
Donations 214 251
Operating lease and rental expenses 35,872 36,152
Related party transactions
Remuneration of key personnel (included in employee costs) (4) 14,750 11,415
Employee share scheme (6) 161 —
Directors’ fees 636 615
Dividends paid to directors and key management personnel (5) 40 54
Total related party transactions 15,587 12,084
(1) The majority of depreciation and amortisation relates to broadcasting assets (refer notes 11 and 12).
(2) The audit fee includes the fee for both the annual audit of the financial statements and the review of the interim financial statements.
(3) All employee costs are short-term employee benefits.
(4) Includes redundancy payments of $2,236,000 as a result Sky’s change in strategic direction.
(5) The Group’s directors and key management personnel collectively had shareholdings of 318,243 shares (2018: 268,988 shares) which carry the normal entitlement to dividends. Share transactions undertaken by directors can be found as part of the statutory disclosures in the annual report.
(6) Comprises the accrued share entitlements earned by the Chief Executive at the balance date. (Refer statutory disclosures in the annual report).
Leases under which all the risk and benefits of ownership are substantially retained by the lessor are classified as operating leases. Operating lease payments are recognised as an expense in the periods the amounts are payable.
/ 53
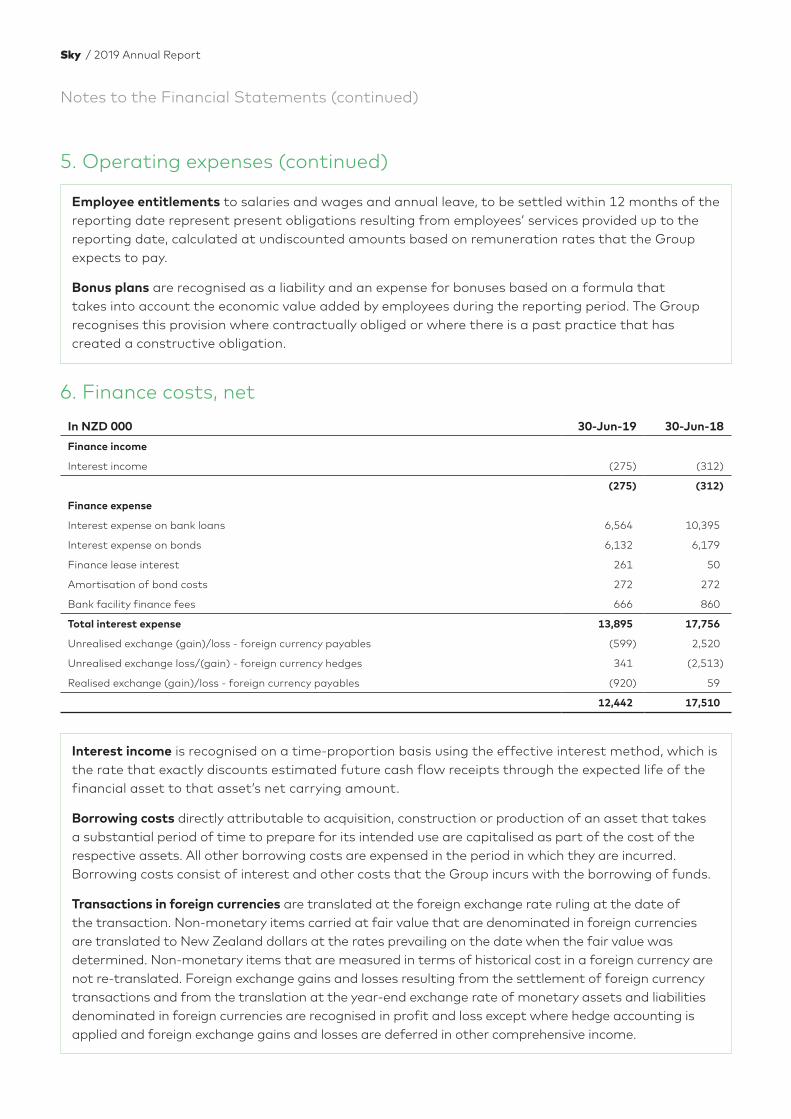
Notes to the Financial Statements (continued)
Interest income is recognised on a time-proportion basis using the effective interest method, which is the rate that exactly discounts estimated future cash flow receipts through the expected life of the financial asset to that asset’s net carrying amount.
Borrowing costs directly attributable to acquisition, construction or production of an asset that takes a substantial period of time to prepare for its intended use are capitalised as part of the cost of the respective assets. All other borrowing costs are expensed in the period in which they are incurred. Borrowing costs consist of interest and other costs that the Group incurs with the borrowing of funds.
Transactions in foreign currencies are translated at the foreign exchange rate ruling at the date of the transaction. Non-monetary items carried at fair value that are denominated in foreign currencies are translated to New Zealand dollars at the rates prevailing on the date when the fair value was determined. Non-monetary items that are measured in terms of historical cost in a foreign currency are not re-translated. Foreign exchange gains and losses resulting from the settlement of foreign currency transactions and from the translation at the year-end exchange rate of monetary assets and liabilities denominated in foreign currencies are recognised in profit and loss except where hedge accounting is applied and foreign exchange gains and losses are deferred in other comprehensive income.
6. Finance costs, net
In NZD 000 30-Jun-19 30-Jun-18
Finance income
Interest income (275) (312)
(275) (312)
Finance expense
Interest expense on bank loans 6,564 10,395
Interest expense on bonds 6,132 6,179
Finance lease interest 261 50
Amortisation of bond costs 272 272
Bank facility finance fees 666 860
Total interest expense 13,895 17,756
Unrealised exchange (gain)/loss - foreign currency payables (599) 2,520
Unrealised exchange loss/(gain) - foreign currency hedges 341 (2,513)
Realised exchange (gain)/loss - foreign currency payables (920) 59
12,442 17,510
Employee entitlements to salaries and wages and annual leave, to be settled within 12 months of the reporting date represent present obligations resulting from employees’ services provided up to the reporting date, calculated at undiscounted amounts based on remuneration rates that the Group expects to pay.
Bonus plans are recognised as a liability and an expense for bonuses based on a formula that takes into account the economic value added by employees during the reporting period. The Group recognises this provision where contractually obliged or where there is a past practice that has created a constructive obligation.
5. Operating expenses (continued)
Sky / 2019 Annual Report
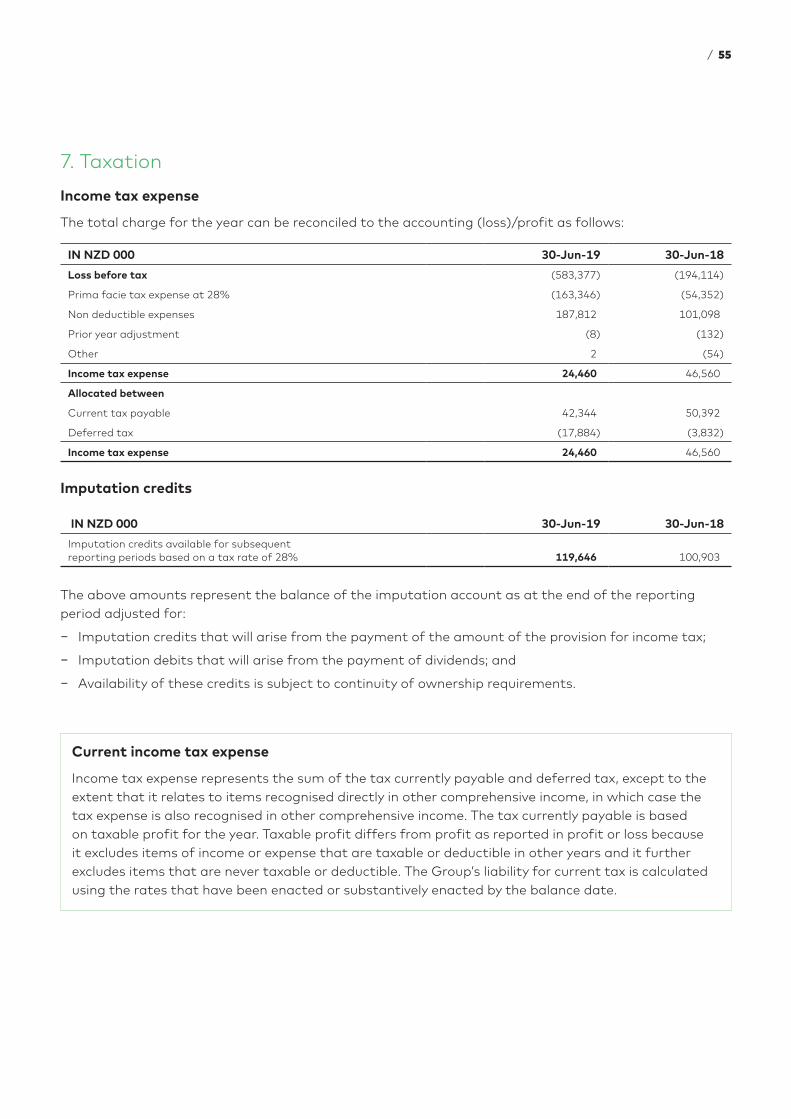
7. Taxation
Income tax expense
The total charge for the year can be reconciled to the accounting (loss)/profit as follows:
IN NZD 000 30-Jun-19 30-Jun-18
Loss before tax (583,377) (194,114)
Prima facie tax expense at 28% (163,346) (54,352)
Non deductible expenses 187,812 101,098
Prior year adjustment (8) (132)
Other 2 (54)
Income tax expense 24,460 46,560
Allocated between
Current tax payable 42,344 50,392
Deferred tax (17,884) (3,832)
Income tax expense 24,460 46,560
Imputation credits
IN NZD 000 30-Jun-19 30-Jun-18
Imputation credits available for subsequent reporting periods based on a tax rate of 28% 119,646 100,903
The above amounts represent the balance of the imputation account as at the end of the reporting period adjusted for:
− Imputation credits that will arise from the payment of the amount of the provision for income tax;
− Imputation debits that will arise from the payment of dividends; and
− Availability of these credits is subject to continuity of ownership requirements.
Current income tax expense
Income tax expense represents the sum of the tax currently payable and deferred tax, except to the extent that it relates to items recognised directly in other comprehensive income, in which case the tax expense is also recognised in other comprehensive income. The tax currently payable is based on taxable profit for the year. Taxable profit differs from profit as reported in profit or loss because it excludes items of income or expense that are taxable or deductible in other years and it further excludes items that are never taxable or deductible. The Group’s liability for current tax is calculated using the rates that have been enacted or substantively enacted by the balance date.
/ 55
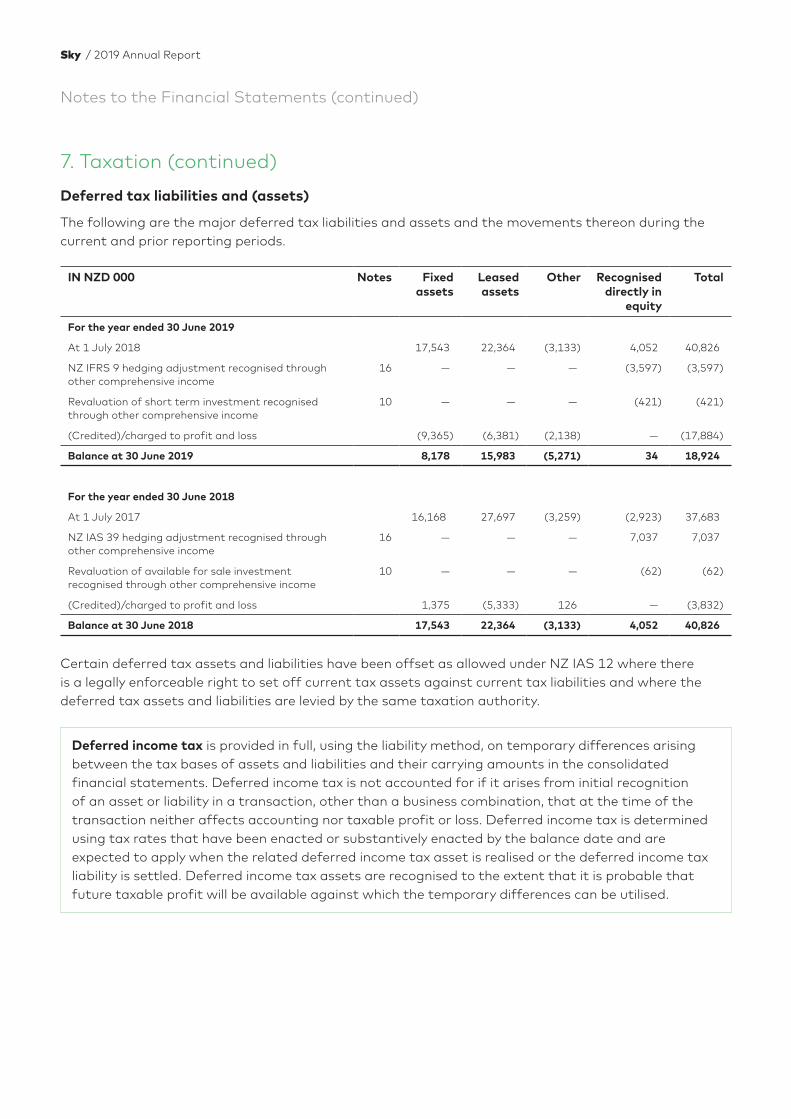
Notes to the Financial Statements (continued)
Deferred income tax is provided in full, using the liability method, on temporary differences arising between the tax bases of assets and liabilities and their carrying amounts in the consolidated financial statements. Deferred income tax is not accounted for if it arises from initial recognition of an asset or liability in a transaction, other than a business combination, that at the time of the transaction neither affects accounting nor taxable profit or loss. Deferred income tax is determined using tax rates that have been enacted or substantively enacted by the balance date and are expected to apply when the related deferred income tax asset is realised or the deferred income tax liability is settled. Deferred income tax assets are recognised to the extent that it is probable that future taxable profit will be available against which the temporary differences can be utilised.
7. Taxation (continued)
Deferred tax liabilities and (assets)
The following are the major deferred tax liabilities and assets and the movements thereon during the current and prior reporting periods.
IN NZD 000 Notes Fixed assets
Leased assets
Other Recognised directly in
equity
Total
For the year ended 30 June 2019
At 1 July 2018 17,543 22,364 (3,133) 4,052 40,826
NZ IFRS 9 hedging adjustment recognised through other comprehensive income
16 — — — (3,597) (3,597)
Revaluation of short term investment recognised through other comprehensive income
10 — — — (421) (421)
(Credited)/charged to profit and loss (9,365) (6,381) (2,138) — (17,884)
Balance at 30 June 2019 8,178 15,983 (5,271) 34 18,924
For the year ended 30 June 2018
At 1 July 2017 16,168 27,697 (3,259) (2,923) 37,683
NZ IAS 39 hedging adjustment recognised through other comprehensive income
16 — — — 7,037 7,037
Revaluation of available for sale investment recognised through other comprehensive income
10 — — — (62) (62)
(Credited)/charged to profit and loss 1,375 (5,333) 126 — (3,832)
Balance at 30 June 2018 17,543 22,364 (3,133) 4,052 40,826
Certain deferred tax assets and liabilities have been offset as allowed under NZ IAS 12 where there is a legally enforceable right to set off current tax assets against current tax liabilities and where the deferred tax assets and liabilities are levied by the same taxation authority.
Sky / 2019 Annual Report
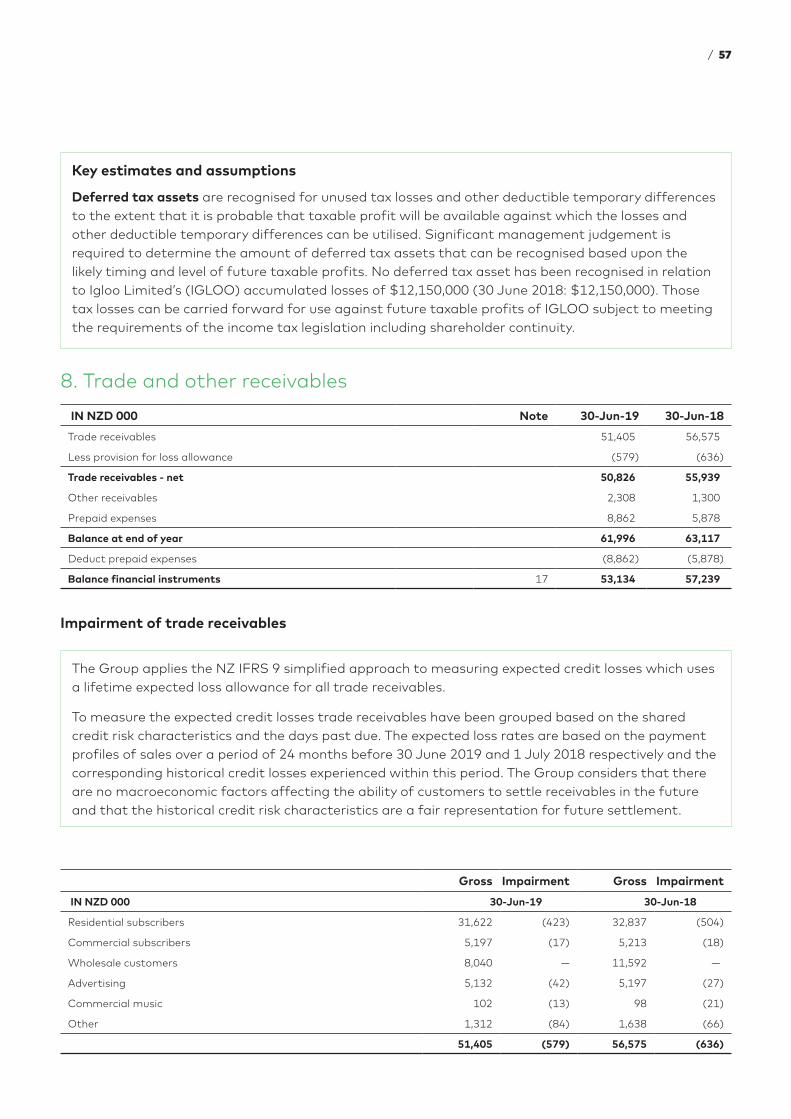
Key estimates and assumptions
Deferred tax assets are recognised for unused tax losses and other deductible temporary differences to the extent that it is probable that taxable profit will be available against which the losses and other deductible temporary differences can be utilised. Significant management judgement is required to determine the amount of deferred tax assets that can be recognised based upon the likely timing and level of future taxable profits. No deferred tax asset has been recognised in relation to Igloo Limited’s (IGLOO) accumulated losses of $12,150,000 (30 June 2018: $12,150,000). Those tax losses can be carried forward for use against future taxable profits of IGLOO subject to meeting the requirements of the income tax legislation including shareholder continuity.
8. Trade and other receivables
IN NZD 000 Note 30-Jun-19 30-Jun-18
Trade receivables 51,405 56,575
Less provision for loss allowance (579) (636)
Trade receivables - net 50,826 55,939
Other receivables 2,308 1,300
Prepaid expenses 8,862 5,878
Balance at end of year 61,996 63,117
Deduct prepaid expenses (8,862) (5,878)
Balance financial instruments 17 53,134 57,239
Impairment of trade receivables
The Group applies the NZ IFRS 9 simplified approach to measuring expected credit losses which uses a lifetime expected loss allowance for all trade receivables.
To measure the expected credit losses trade receivables have been grouped based on the shared credit risk characteristics and the days past due. The expected loss rates are based on the payment profiles of sales over a period of 24 months before 30 June 2019 and 1 July 2018 respectively and the corresponding historical credit losses experienced within this period. The Group considers that there are no macroeconomic factors affecting the ability of customers to settle receivables in the future and that the historical credit risk characteristics are a fair representation for future settlement.
Gross Impairment Gross Impairment
IN NZD 000 30-Jun-19 30-Jun-18
Residential subscribers 31,622 (423) 32,837 (504)
Commercial subscribers 5,197 (17) 5,213 (18)
Wholesale customers 8,040 — 11,592 —
Advertising 5,132 (42) 5,197 (27)
Commercial music 102 (13) 98 (21)
Other 1,312 (84) 1,638 (66)
51,405 (579) 56,575 (636)
/ 57
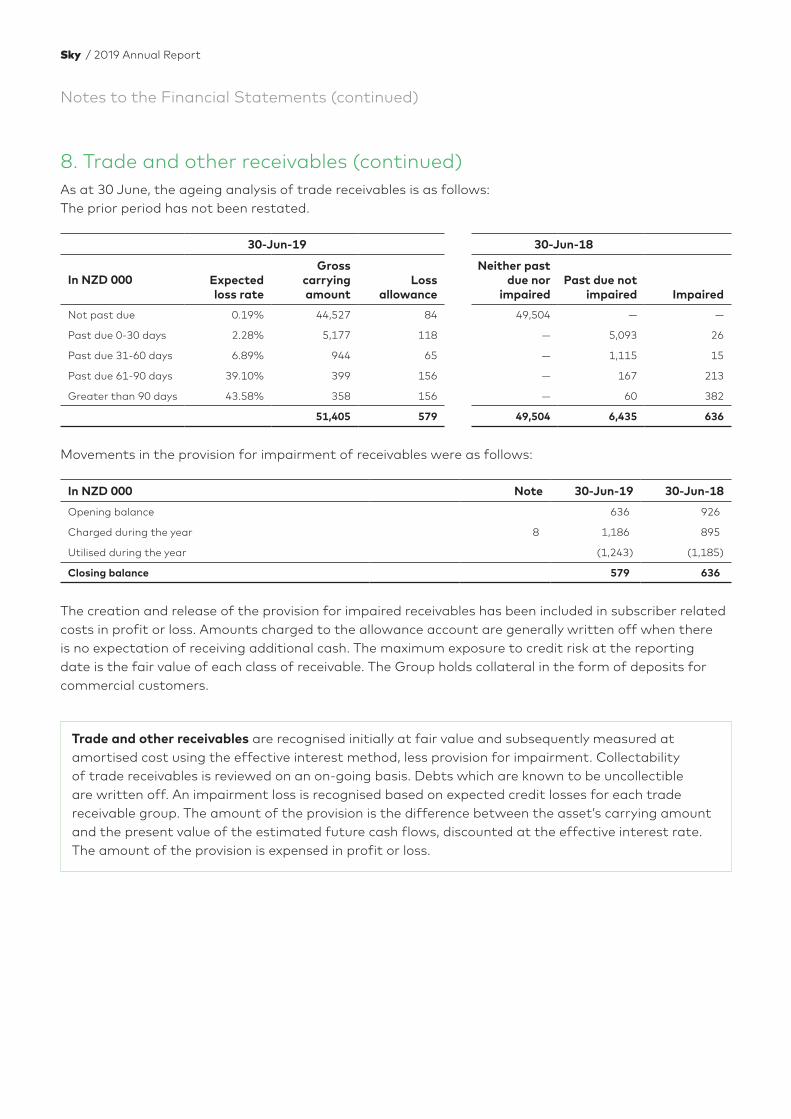
Notes to the Financial Statements (continued)
As at 30 June, the ageing analysis of trade receivables is as follows: The prior period has not been restated.
30-Jun-19 30-Jun-18
In NZD 000 Expected loss rate
Gross carrying amount
Loss allowance
Neither past due nor
impairedPast due not
impaired Impaired
Not past due 0.19% 44,527 84 49,504 — —
Past due 0-30 days 2.28% 5,177 118 — 5,093 26
Past due 31-60 days 6.89% 944 65 — 1,115 15
Past due 61-90 days 39.10% 399 156 — 167 213
Greater than 90 days 43.58% 358 156 — 60 382
51,405 579 49,504 6,435 636
Movements in the provision for impairment of receivables were as follows:
In NZD 000 Note 30-Jun-19 30-Jun-18
Opening balance 636 926
Charged during the year 8 1,186 895
Utilised during the year (1,243) (1,185)
Closing balance 579 636
The creation and release of the provision for impaired receivables has been included in subscriber related costs in profit or loss. Amounts charged to the allowance account are generally written off when there is no expectation of receiving additional cash. The maximum exposure to credit risk at the reporting date is the fair value of each class of receivable. The Group holds collateral in the form of deposits for commercial customers.
Trade and other receivables are recognised initially at fair value and subsequently measured at amortised cost using the effective interest method, less provision for impairment. Collectability of trade receivables is reviewed on an on-going basis. Debts which are known to be uncollectible are written off. An impairment loss is recognised based on expected credit losses for each trade receivable group. The amount of the provision is the difference between the asset’s carrying amount and the present value of the estimated future cash flows, discounted at the effective interest rate. The amount of the provision is expensed in profit or loss.
8. Trade and other receivables (continued)
Sky / 2019 Annual Report
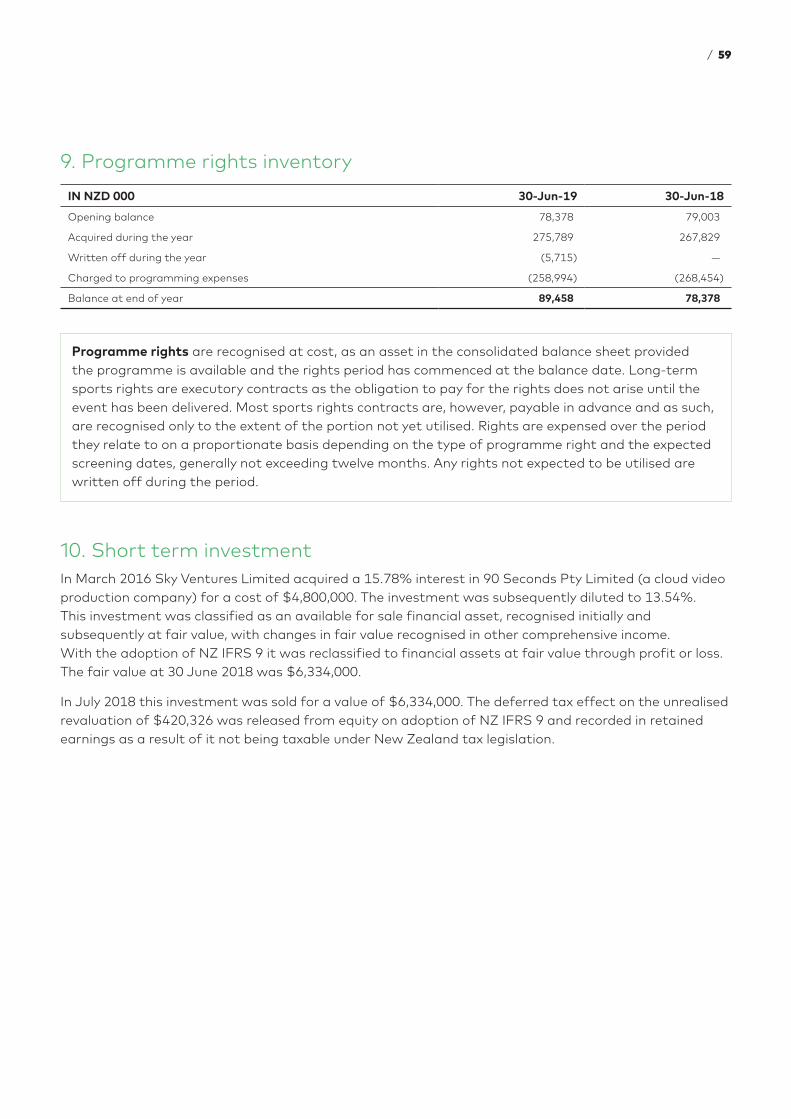
9. Programme rights inventory
IN NZD 000 30-Jun-19 30-Jun-18
Opening balance 78,378 79,003
Acquired during the year 275,789 267,829
Written off during the year (5,715) —
Charged to programming expenses (258,994) (268,454)
Balance at end of year 89,458 78,378
10. Short term investmentIn March 2016 Sky Ventures Limited acquired a 15.78% interest in 90 Seconds Pty Limited (a cloud video production company) for a cost of $4,800,000. The investment was subsequently diluted to 13.54%. This investment was classified as an available for sale financial asset, recognised initially and subsequently at fair value, with changes in fair value recognised in other comprehensive income. With the adoption of NZ IFRS 9 it was reclassified to financial assets at fair value through profit or loss. The fair value at 30 June 2018 was $6,334,000.
In July 2018 this investment was sold for a value of $6,334,000. The deferred tax effect on the unrealised revaluation of $420,326 was released from equity on adoption of NZ IFRS 9 and recorded in retained earnings as a result of it not being taxable under New Zealand tax legislation.
Programme rights are recognised at cost, as an asset in the consolidated balance sheet provided the programme is available and the rights period has commenced at the balance date. Long-term sports rights are executory contracts as the obligation to pay for the rights does not arise until the event has been delivered. Most sports rights contracts are, however, payable in advance and as such, are recognised only to the extent of the portion not yet utilised. Rights are expensed over the period they relate to on a proportionate basis depending on the type of programme right and the expected screening dates, generally not exceeding twelve months. Any rights not expected to be utilised are written off during the period.
/ 59
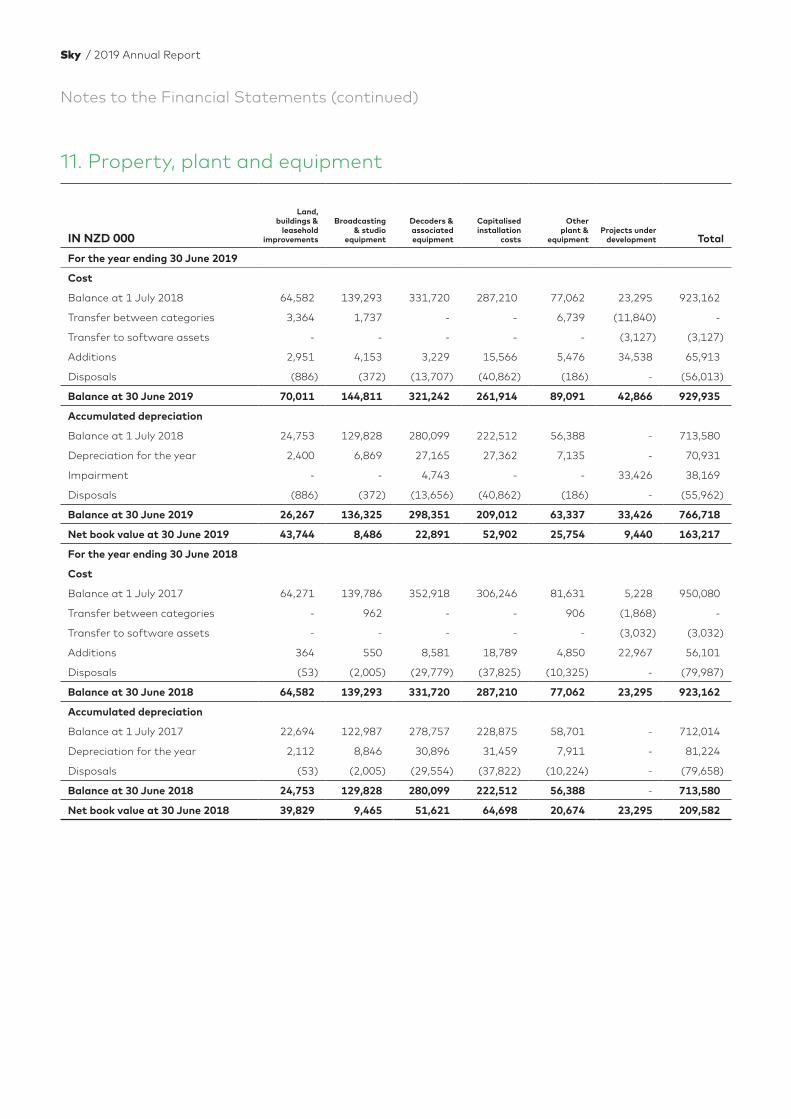
Notes to the Financial Statements (continued)
11. Property, plant and equipment
IN NZD 000
Land, buildings &
leasehold improvements
Broadcasting & studio
equipment
Decoders & associated equipment
Capitalised installation
costs
Other plant &
equipmentProjects under
development Total
For the year ending 30 June 2019
Cost
Balance at 1 July 2018 64,582 139,293 331,720 287,210 77,062 23,295 923,162
Transfer between categories 3,364 1,737 - - 6,739 (11,840) -
Transfer to software assets - - - - - (3,127) (3,127)
Additions 2,951 4,153 3,229 15,566 5,476 34,538 65,913
Disposals (886) (372) (13,707) (40,862) (186) - (56,013)
Balance at 30 June 2019 70,011 144,811 321,242 261,914 89,091 42,866 929,935
Accumulated depreciation
Balance at 1 July 2018 24,753 129,828 280,099 222,512 56,388 - 713,580
Depreciation for the year 2,400 6,869 27,165 27,362 7,135 - 70,931
Impairment - - 4,743 - - 33,426 38,169
Disposals (886) (372) (13,656) (40,862) (186) - (55,962)
Balance at 30 June 2019 26,267 136,325 298,351 209,012 63,337 33,426 766,718
Net book value at 30 June 2019 43,744 8,486 22,891 52,902 25,754 9,440 163,217
For the year ending 30 June 2018
Cost
Balance at 1 July 2017 64,271 139,786 352,918 306,246 81,631 5,228 950,080
Transfer between categories - 962 - - 906 (1,868) -
Transfer to software assets - - - - - (3,032) (3,032)
Additions 364 550 8,581 18,789 4,850 22,967 56,101
Disposals (53) (2,005) (29,779) (37,825) (10,325) - (79,987)
Balance at 30 June 2018 64,582 139,293 331,720 287,210 77,062 23,295 923,162
Accumulated depreciation
Balance at 1 July 2017 22,694 122,987 278,757 228,875 58,701 - 712,014
Depreciation for the year 2,112 8,846 30,896 31,459 7,911 - 81,224
Disposals (53) (2,005) (29,554) (37,822) (10,224) - (79,658)
Balance at 30 June 2018 24,753 129,828 280,099 222,512 56,388 - 713,580
Net book value at 30 June 2018 39,829 9,465 51,621 64,698 20,674 23,295 209,582
Sky / 2019 Annual Report

Land, buildings and leasehold improvements at 30 June 2019 includes land with a cost of $8,820,000 (30 June 2018: $8,820,000).
Depreciation related to broadcasting assets (including decoders and capitalised installation costs) of $61,396,000 (30 June 2018: $71,201,000) accounts for the majority of the total depreciation charge. Due to immateriality of the remaining depreciation, no allocation of deprecation has been made across expense categories in the consolidated income statement.
In addition, an impairment charge of $38,169,000 was incurred in relation to the closure of the infinite video platform (IVP) project and impairment of decoders and associated equipment.
The net book value of assets subject to finance leases totals $2,361,000 (30 June 2018: $3,050,000).
Property, plant and equipment are stated at cost less accumulated depreciation and impairment losses except land which is shown at cost less impairment. Cost includes expenditure that is directly attributable to the acquisition of the items. Capitalised installation costs are represented by the cost of satellite dishes, installation costs and direct labour costs. Where parts of an item of property, plant and equipment have different useful lives, they are accounted for as separate items of property, plant and equipment.
Subsequent costs are included in the asset’s carrying amount or recognised as a separate asset, as appropriate, only when it is probable that the future economic benefits embodied within the item will flow to the Group and the cost of the item can be measured reliably. The cost of additions to plant and other assets constructed by the Group consist of all appropriate costs of development, construction and installation, comprising material, labour, direct overhead and transport costs. For qualifying assets directly attributable interest costs incurred during the period required to complete and prepare the asset for its intended use are capitalised as part of the total cost. All other costs are recognised in profit or loss as an expense as incurred. Additions in the current year include $746,000 of capitalised labour costs (30 June 2018: $110,000).
Projects under development comprise expenditure on partially completed assets. The projects include items of property, plant and equipment and intangible assets. At completion of the project the costs are allocated to the appropriate asset categories and depreciation or amortisation commences.
Costs may also include transfers from equity of any gains or losses on qualifying cash flow hedges of foreign currency purchases of property, plant and equipment.
Gains and losses on disposals are determined by comparing the proceeds with the carrying amount and recognised in other costs in profit or loss.
/ 61

Notes to the Financial Statements (continued)
Depreciation
Property, plant and equipment are depreciated using the straight-line method so as to allocate the costs of assets to their residual values over their estimated useful lives as follows:
ASSETS Time
Land Nil
Leasehold improvements 5 — 50 years
Buildings 50 years
Broadcasting and studio equipment 5 — 10 years
Decoders and associated equipment 4 — 5 years
Other plant and equipment 3 — 10 years
Capitalised installation cost 5 years
The assets’ residual values and useful lives are reviewed, and adjusted if appropriate, at each balance date.
Key estimates and assumptions
The estimated life of technical assets such as decoders and other broadcasting assets is based on management’s best estimates. Changes in technology may result in the economic life of these assets being different from that estimated previously. The board and management regularly review economic life assumptions of these assets as part of management reporting procedures.
11. Property, plant and equipment (continued)
Sky / 2019 Annual Report

12. Intangible assets and goodwill
Intangible assets
IN NZD 000 Software Broadcasting rights
Other intangibles
Total
For the year ending 30 June 2019
Cost
Balance at 1 July 2018 138,883 — 1,083 139,966
Transfer from projects under development 3,127 — — 3,127
Additions 10,035 — — 10,035
Disposals (156) — — (156)
Balance at 30 June 2019 151,889 — 1,083 152,972
Accumulated amortisation
Balance at 1 July 2018 79,573 — 1,050 80,623
Amortisation for the year 21,990 — 13 22,003
Disposals (139) — — (139)
Balance at 30 June 2019 101,424 — 1,063 102,487
Net book value at 30 June 2019 50,465 — 20 50,485
For the year ending 30 June 2018
Cost
Balance at 1 July 2017 135,690 2,185 3,167 141,042
Transfer from projects under development 3,032 — — 3,032
Additions 14,559 — — 14,559
Disposals (14,398) (2,185) (2,084) (18,667)
Balance at 30 June 2018 138,883 — 1,083 139,966
Accumulated amortisation
Balance at 1 July 2017 72,837 2,185 3,078 78,100
Amortisation for the year 21,134 — 56 21,190
Disposals (14,398) (2,185) (2,084) (18,667)
Balance at 30 June 2018 79,573 — 1,050 80,623
Net book value at 30 June 2018 59,310 — 33 59,343
/ 63
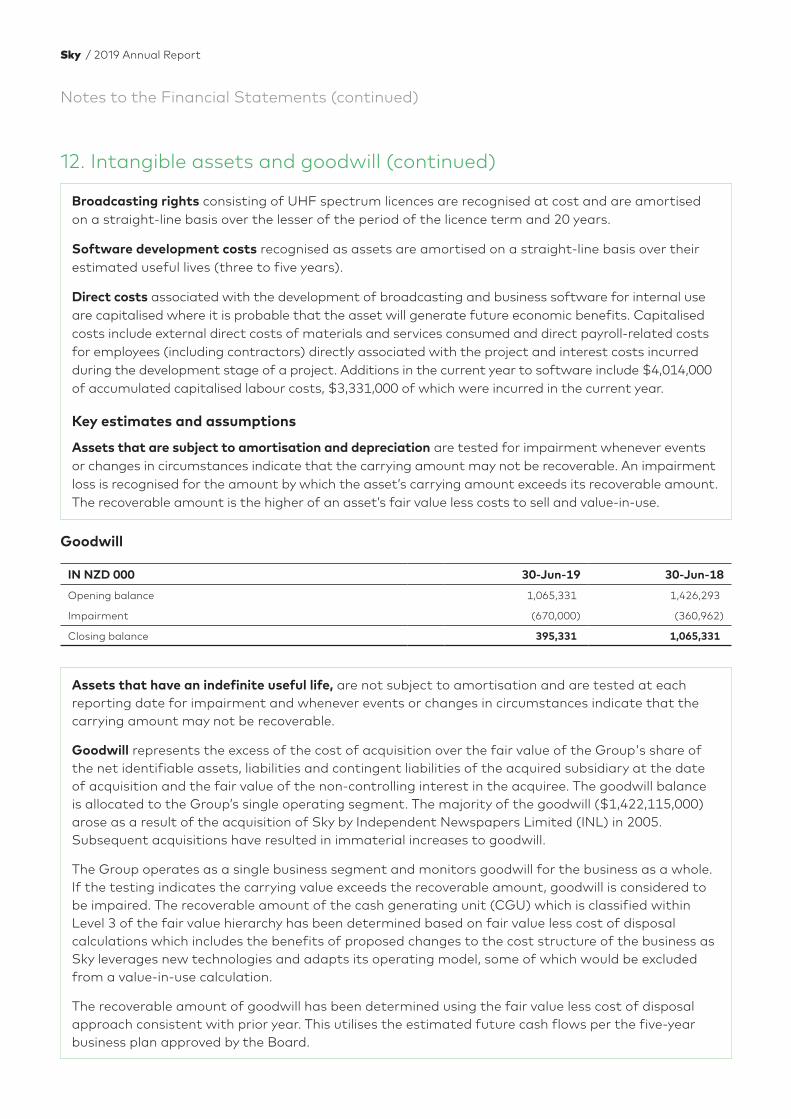
Notes to the Financial Statements (continued)
12. Intangible assets and goodwill (continued)
Assets that have an indefinite useful life, are not subject to amortisation and are tested at each reporting date for impairment and whenever events or changes in circumstances indicate that the carrying amount may not be recoverable.
Goodwill represents the excess of the cost of acquisition over the fair value of the Group's share of the net identifiable assets, liabilities and contingent liabilities of the acquired subsidiary at the date of acquisition and the fair value of the non-controlling interest in the acquiree. The goodwill balance is allocated to the Group’s single operating segment. The majority of the goodwill ($1,422,115,000) arose as a result of the acquisition of Sky by Independent Newspapers Limited (INL) in 2005. Subsequent acquisitions have resulted in immaterial increases to goodwill.
The Group operates as a single business segment and monitors goodwill for the business as a whole. If the testing indicates the carrying value exceeds the recoverable amount, goodwill is considered to be impaired. The recoverable amount of the cash generating unit (CGU) which is classified within Level 3 of the fair value hierarchy has been determined based on fair value less cost of disposal calculations which includes the benefits of proposed changes to the cost structure of the business as Sky leverages new technologies and adapts its operating model, some of which would be excluded from a value-in-use calculation.
The recoverable amount of goodwill has been determined using the fair value less cost of disposal approach consistent with prior year. This utilises the estimated future cash flows per the five-year business plan approved by the Board.
Goodwill
IN NZD 000 30-Jun-19 30-Jun-18
Opening balance 1,065,331 1,426,293
Impairment (670,000) (360,962)
Closing balance 395,331 1,065,331
Broadcasting rights consisting of UHF spectrum licences are recognised at cost and are amortised on a straight-line basis over the lesser of the period of the licence term and 20 years.
Software development costs recognised as assets are amortised on a straight-line basis over their estimated useful lives (three to five years).
Direct costs associated with the development of broadcasting and business software for internal use are capitalised where it is probable that the asset will generate future economic benefits. Capitalised costs include external direct costs of materials and services consumed and direct payroll-related costs for employees (including contractors) directly associated with the project and interest costs incurred during the development stage of a project. Additions in the current year to software include $4,014,000 of accumulated capitalised labour costs, $3,331,000 of which were incurred in the current year.
Key estimates and assumptions
Assets that are subject to amortisation and depreciation are tested for impairment whenever events or changes in circumstances indicate that the carrying amount may not be recoverable. An impairment loss is recognised for the amount by which the asset’s carrying amount exceeds its recoverable amount. The recoverable amount is the higher of an asset’s fair value less costs to sell and value-in-use.
Sky / 2019 Annual Report
A pre-tax discount rate of 12.5% (2018:12.5%) and a terminal growth rate of 0% (2018: 0%) have been applied to the cash flows to calculate the recoverable amount.
During the current year, the Group’s market capitalisation fell significantly below the value of net assets and average revenue per user (ARPU) decreased from the prior year. Following the appointment of a new Chief Executive Officer in February 2019, a new strategy has been developed and a five-year business plan was approved by the Board in June 2019. In a highly competitive streaming environment margins are expected to be lower which results in a lower ARPU than previously assumed. While the Group expects to have increased customer relationships as a result of the focus on streaming, it is unclear whether the increased number of customer relationships will offset the margin declines arising from the loss of residential satellite subscribers. Significant enhancements to product offerings and pricing options are also planned such as the new Sky Sport Now service.
The key assumptions used within the modelling of future cash flows are: net subscriber numbers, ARPU and programming costs. These assumptions are heavily dependent on the retention of key programming rights, in particular sporting rights. The model assumes that all key programming rights are retained.
Due to the increased competitive environment and the inclusion of new products and offerings in the business plan, there is an increased level of uncertainty around the future level of subscriber numbers, ARPU and programming costs than was the case in prior year forecasts. Management have considered a number of alternative scenarios in the modelling of future cash flows that show a wide range of reasonably possible outcomes. In addition to modelling of cash flows, management performed a cross check against other valuation techniques; for example if the recoverable amounts was determined based on the Company’s share price at 30 June, an impairment of approximately $572 million would be required.
The table below illustrates the sensitivity of the impairment assessment to the changes in key assumptions over the five year forecast period used in the model (prior to the impairment charge in the current year).
NZD (million) Impairment
Increase/decrease of 10% in subscriber numbers 419m–921m
Increase/decrease of 10% in ARPU 329m–1,011m
Decrease/increase of 10% in programming costs 405m–935m
Based on the business plan and taking into account the volatility and uncertainty inherent in the cash flow forecast, an impairment of $670 million has been recognised in the current year.
/ 65
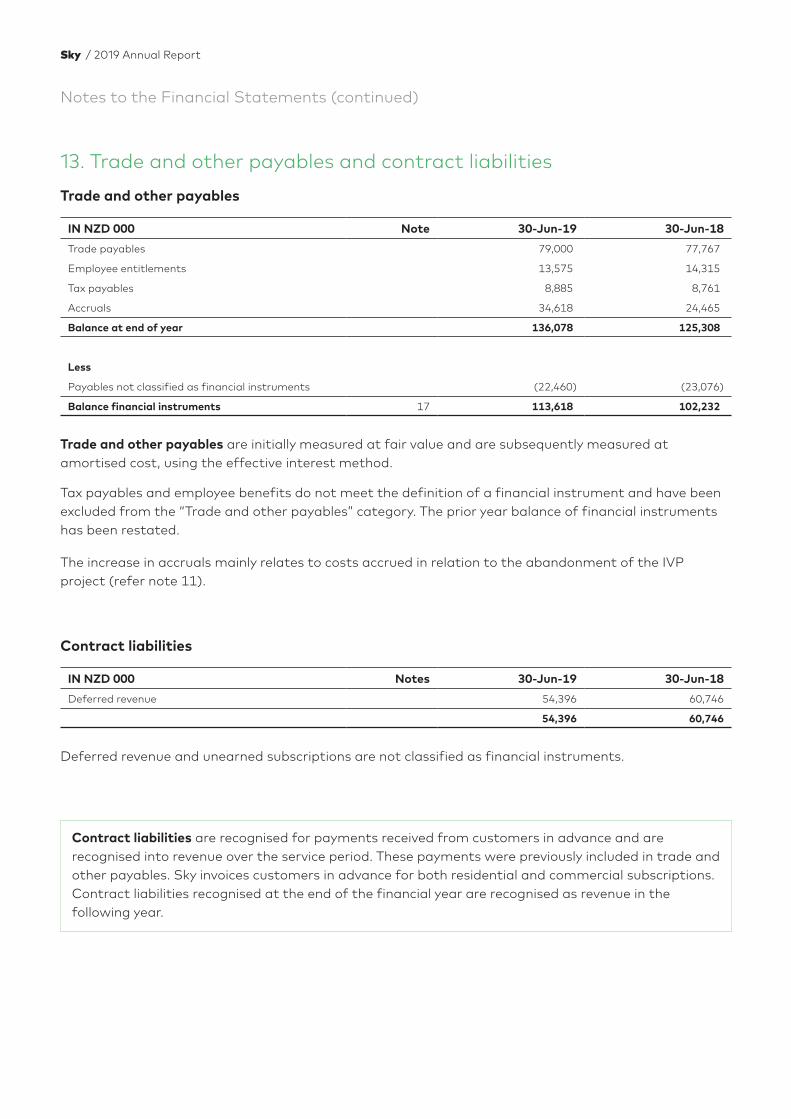
Notes to the Financial Statements (continued)
Contract liabilities are recognised for payments received from customers in advance and are recognised into revenue over the service period. These payments were previously included in trade and other payables. Sky invoices customers in advance for both residential and commercial subscriptions. Contract liabilities recognised at the end of the financial year are recognised as revenue in the following year.
13. Trade and other payables and contract liabilities
Trade and other payables
IN NZD 000 Note 30-Jun-19 30-Jun-18
Trade payables 79,000 77,767
Employee entitlements 13,575 14,315
Tax payables 8,885 8,761
Accruals 34,618 24,465
Balance at end of year 136,078 125,308
Less
Payables not classified as financial instruments (22,460) (23,076)
Balance financial instruments 17 113,618 102,232
Trade and other payables are initially measured at fair value and are subsequently measured at amortised cost, using the effective interest method.
Tax payables and employee benefits do not meet the definition of a financial instrument and have been excluded from the “Trade and other payables” category. The prior year balance of financial instruments has been restated.
The increase in accruals mainly relates to costs accrued in relation to the abandonment of the IVP project (refer note 11).
Contract liabilities
IN NZD 000 Notes 30-Jun-19 30-Jun-18
Deferred revenue 54,396 60,746
54,396 60,746
Deferred revenue and unearned subscriptions are not classified as financial instruments.
Sky / 2019 Annual Report

14. Borrowings
30-Jun-19 30-Jun-18
IN NZD 000 Current Non- current
Total Current Non- current
Total
Borrowings 1,093 90,643 91,736 458 132,625 133,083
Finance lease 608 1,796 2,404 582 2,429 3,011
Bonds — 99,522 99,522 — 99,250 99,250
1,701 191,961 193,662 1,040 234,304 235,344
Repayment terms
IN NZD 000 30-Jun-19 30-Jun-18
Less than one year 1,701 1,040
Between one and five years 191,961 234,304
193,662 235,344
Bank Loans
In October 2018 the Group refinanced its bank facility with a syndicate of banks comprising Bank of New Zealand, Commonwealth Bank of Australia and Westpac Bank for a value of $200 million expiring in 22 July 2022 with the facility reducing to $150 million by July 2021. This facility refinanced the Group’s $300 million revolving credit bank facility scheduled to expire in July 2020 provided by a syndicate of banks comprising ANZ National Bank Limited, Bank of New Zealand, Commonwealth Bank of Australia and Westpac Bank.
The new facility arrangements (together with certain hedging arrangements and the existing $100 million bond) take the benefit of shared security granted by certain members of the Group, including (i) a general security deed granted by each of Sky Network Television Limited and Outside Broadcasting Limited; (ii) real property mortgages granted over certain real property interests of Sky Network Television Limited; and (iii) a spectrum mortgage granted over certain spectrum. The loan facility is subject to certain covenant clauses whereby the Group is required to meet certain key financial ratios. These ratios are subject to change depending on certain conditions being met. These financial ratios are calculated in accordance with the new strategy and business plan. Future compliance with the covenants, including any changes in the ratios, is dependent on and sensitive to the timing and execution of the Group’s strategy which affects the level of operating cash flows, capital investments and disposals that are key inputs to the financial ratio calculation. There have been no breaches of covenant clauses and no breaches are anticipated within the next 12 months.
Bank overdrafts of $6,780,000 (30 June 2018: $3,307,000) have been set off against cash balances.
Interest-bearing borrowings are recognised initially at fair value less attributable transaction costs. Subsequent to initial recognition, interest-bearing borrowings are stated at amortised cost with any difference between cost and redemption value being recognised in profit or loss over the period of the borrowings, using the effective interest method. Arrangement fees are amortised over the term of the loan facility. Borrowings are classified as current liabilities unless the Group has an unconditional right to defer settlement of the liability for at least 12 months after the balance date.
/ 67
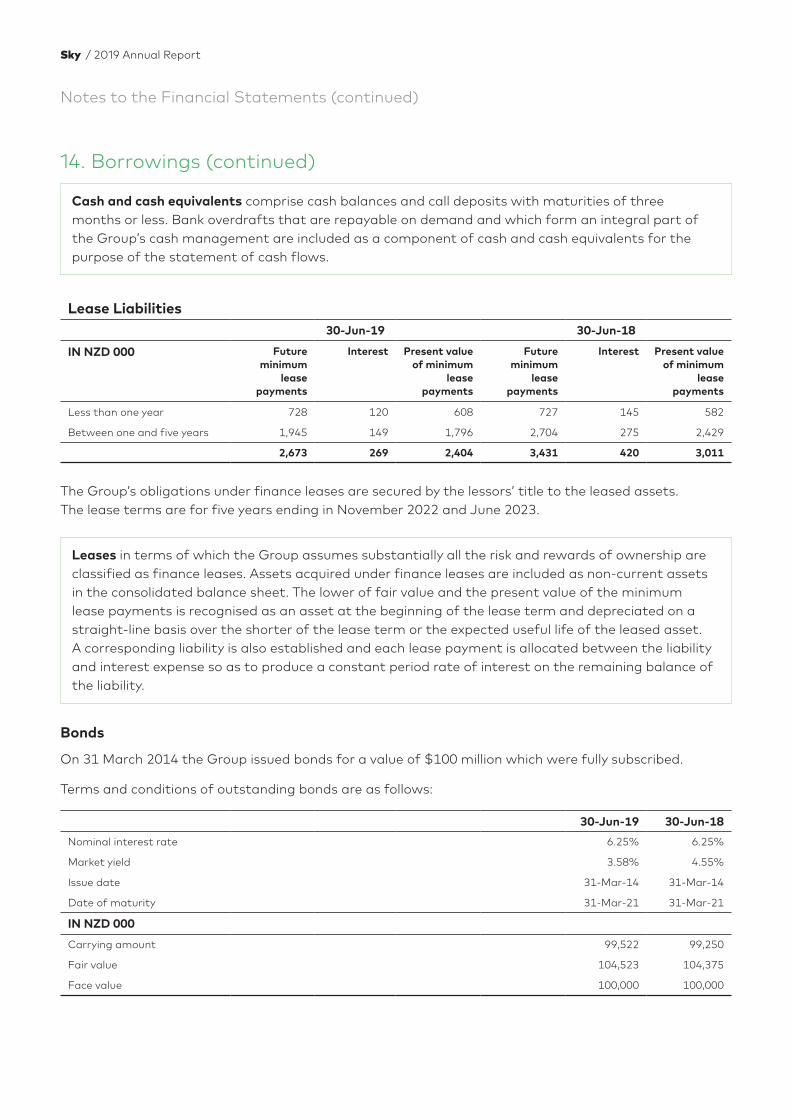
Notes to the Financial Statements (continued)
Cash and cash equivalents comprise cash balances and call deposits with maturities of three months or less. Bank overdrafts that are repayable on demand and which form an integral part of the Group’s cash management are included as a component of cash and cash equivalents for the purpose of the statement of cash flows.
Leases in terms of which the Group assumes substantially all the risk and rewards of ownership are classified as finance leases. Assets acquired under finance leases are included as non-current assets in the consolidated balance sheet. The lower of fair value and the present value of the minimum lease payments is recognised as an asset at the beginning of the lease term and depreciated on a straight-line basis over the shorter of the lease term or the expected useful life of the leased asset. A corresponding liability is also established and each lease payment is allocated between the liability and interest expense so as to produce a constant period rate of interest on the remaining balance of the liability.
Bonds
On 31 March 2014 the Group issued bonds for a value of $100 million which were fully subscribed.
Terms and conditions of outstanding bonds are as follows:
30-Jun-19 30-Jun-18
Nominal interest rate 6.25% 6.25%
Market yield 3.58% 4.55%
Issue date 31-Mar-14 31-Mar-14
Date of maturity 31-Mar-21 31-Mar-21
IN NZD 000
Carrying amount 99,522 99,250
Fair value 104,523 104,375
Face value 100,000 100,000
14. Borrowings (continued)
Lease Liabilities30-Jun-19 30-Jun-18
IN NZD 000 Future minimum
lease payments
Interest Present value of minimum
lease payments
Future minimum
lease payments
Interest Present value of minimum
lease payments
Less than one year 728 120 608 727 145 582
Between one and five years 1,945 149 1,796 2,704 275 2,429
2,673 269 2,404 3,431 420 3,011
The Group’s obligations under finance leases are secured by the lessors’ title to the leased assets. The lease terms are for five years ending in November 2022 and June 2023.
Sky / 2019 Annual Report
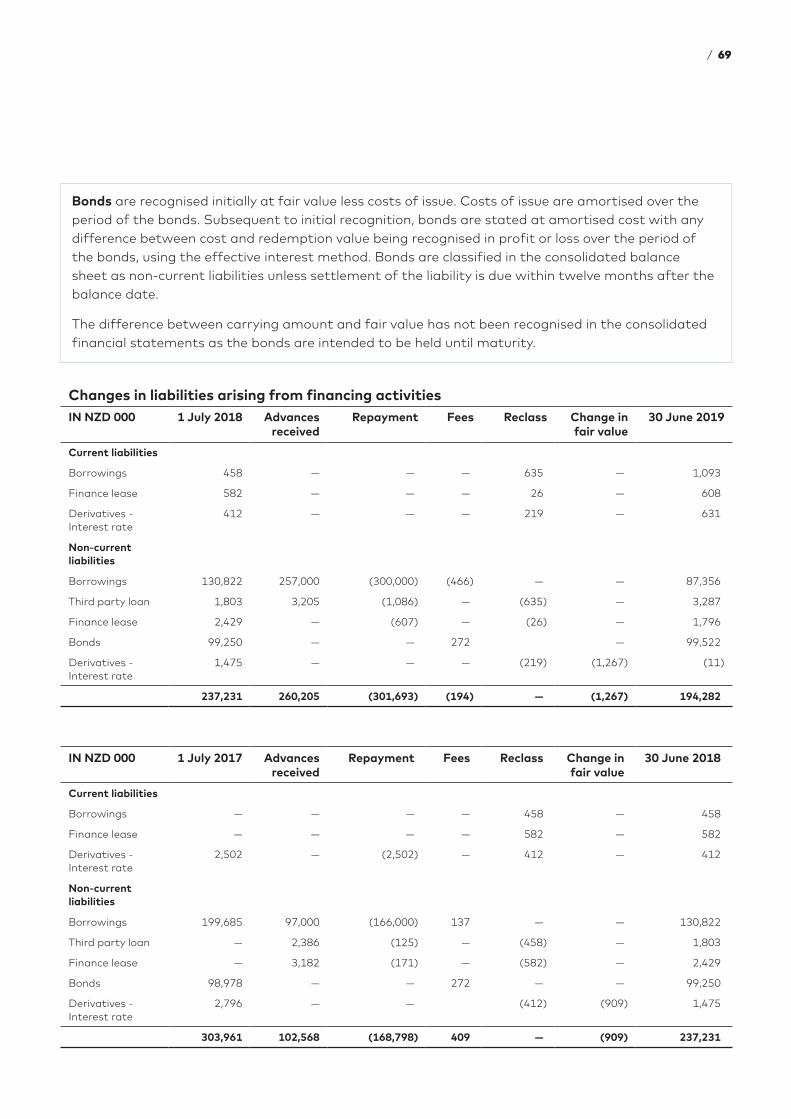
Bonds are recognised initially at fair value less costs of issue. Costs of issue are amortised over the period of the bonds. Subsequent to initial recognition, bonds are stated at amortised cost with any difference between cost and redemption value being recognised in profit or loss over the period of the bonds, using the effective interest method. Bonds are classified in the consolidated balance sheet as non-current liabilities unless settlement of the liability is due within twelve months after the balance date.
The difference between carrying amount and fair value has not been recognised in the consolidated financial statements as the bonds are intended to be held until maturity.
Changes in liabilities arising from financing activitiesIN NZD 000 1 July 2018 Advances
receivedRepayment Fees Reclass Change in
fair value 30 June 2019
Current liabilities
Borrowings 458 — — — 635 — 1,093
Finance lease 582 — — — 26 — 608
Derivatives - Interest rate
412 — — — 219 — 631
Non-current liabilities
Borrowings 130,822 257,000 (300,000) (466) — — 87,356
Third party loan 1,803 3,205 (1,086) — (635) — 3,287
Finance lease 2,429 — (607) — (26) — 1,796
Bonds 99,250 — — 272 — 99,522
Derivatives - Interest rate
1,475 — — — (219) (1,267) (11)
237,231 260,205 (301,693) (194) — (1,267) 194,282
IN NZD 000 1 July 2017 Advances received
Repayment Fees Reclass Change in fair value
30 June 2018
Current liabilities
Borrowings — — — — 458 — 458
Finance lease — — — — 582 — 582
Derivatives - Interest rate
2,502 — (2,502) — 412 — 412
Non-current liabilities
Borrowings 199,685 97,000 (166,000) 137 — — 130,822
Third party loan — 2,386 (125) — (458) — 1,803
Finance lease — 3,182 (171) — (582) — 2,429
Bonds 98,978 — — 272 — — 99,250
Derivatives - Interest rate
2,796 — — (412) (909) 1,475
303,961 102,568 (168,798) 409 — (909) 237,231
/ 69
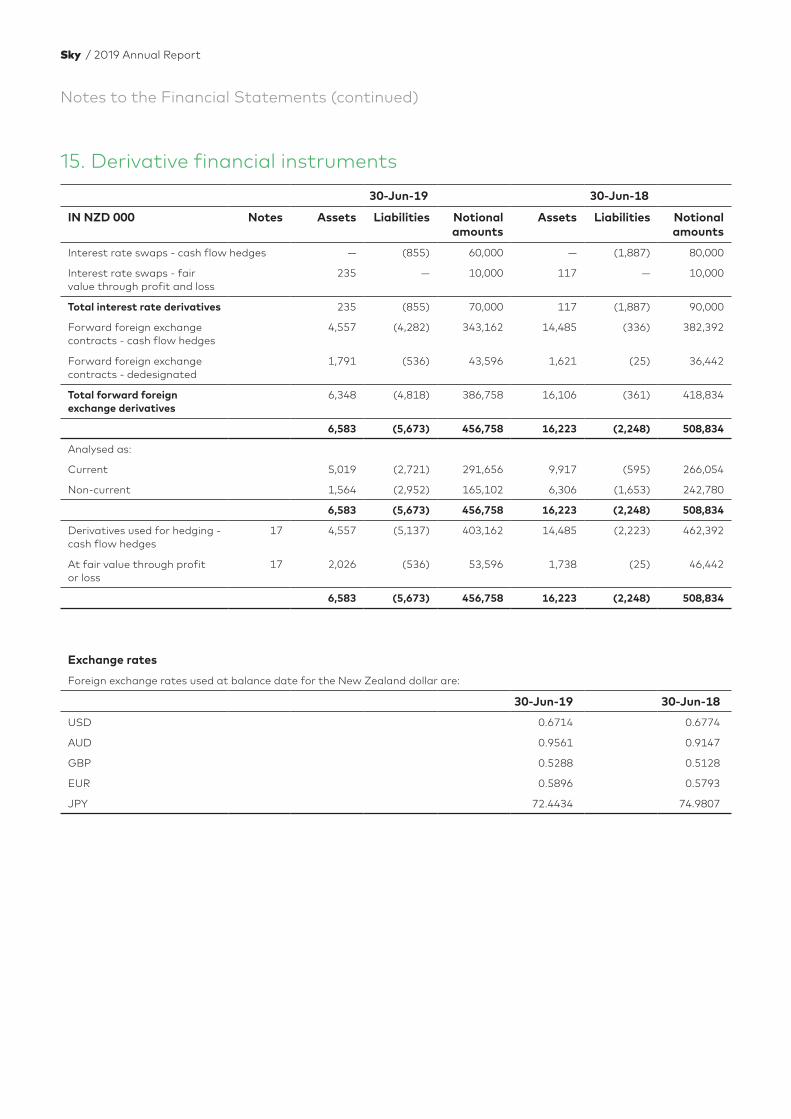
Notes to the Financial Statements (continued)
15. Derivative financial instruments
30-Jun-19 30-Jun-18
IN NZD 000 Notes Assets Liabilities Notional amounts
Assets Liabilities Notional amounts
Interest rate swaps - cash flow hedges — (855) 60,000 — (1,887) 80,000
Interest rate swaps - fair value through profit and loss
235 — 10,000 117 — 10,000
Total interest rate derivatives 235 (855) 70,000 117 (1,887) 90,000
Forward foreign exchange contracts - cash flow hedges
4,557 (4,282) 343,162 14,485 (336) 382,392
Forward foreign exchange contracts - dedesignated
1,791 (536) 43,596 1,621 (25) 36,442
Total forward foreign exchange derivatives
6,348 (4,818) 386,758 16,106 (361) 418,834
6,583 (5,673) 456,758 16,223 (2,248) 508,834
Analysed as:
Current 5,019 (2,721) 291,656 9,917 (595) 266,054
Non-current 1,564 (2,952) 165,102 6,306 (1,653) 242,780
6,583 (5,673) 456,758 16,223 (2,248) 508,834
Derivatives used for hedging - cash flow hedges
17 4,557 (5,137) 403,162 14,485 (2,223) 462,392
At fair value through profit or loss
17 2,026 (536) 53,596 1,738 (25) 46,442
6,583 (5,673) 456,758 16,223 (2,248) 508,834
Exchange rates
Foreign exchange rates used at balance date for the New Zealand dollar are:
30-Jun-19 30-Jun-18
USD 0.6714 0.6774
AUD 0.9561 0.9147
GBP 0.5288 0.5128
EUR 0.5896 0.5793
JPY 72.4434 74.9807
Sky / 2019 Annual Report

Credit risk – derivative financial instruments
The maximum exposure to credit risk on the derivative financial instruments is the value of the derivative assets’ receivable portion of $6,583,000 (2018: $16,233,000).
Exposure to currency risk
The Group’s exposure to foreign currency risk that has been covered by forward foreign exchange contracts is as follows:
30-Jun-19 30-Jun-18
IN NZD 000 USD AUD Other USD AUD Other
Foreign currency payables (25,672) (22,631) (487) (27,787) (20,058) (882)
Dedesignated forward exchange contracts 24,731 18,865 — 21,592 14,850 —
Net balance sheet exposure (941) (3,766) (487) (6,195) (5,208) (882)
Forward exchange contracts (for forecasted transactions)
138,500 204,662 — 223,652 158,740 —
Total forward exchange contracts 163,231 223,527 — 245,244 173,590 —
/ 71
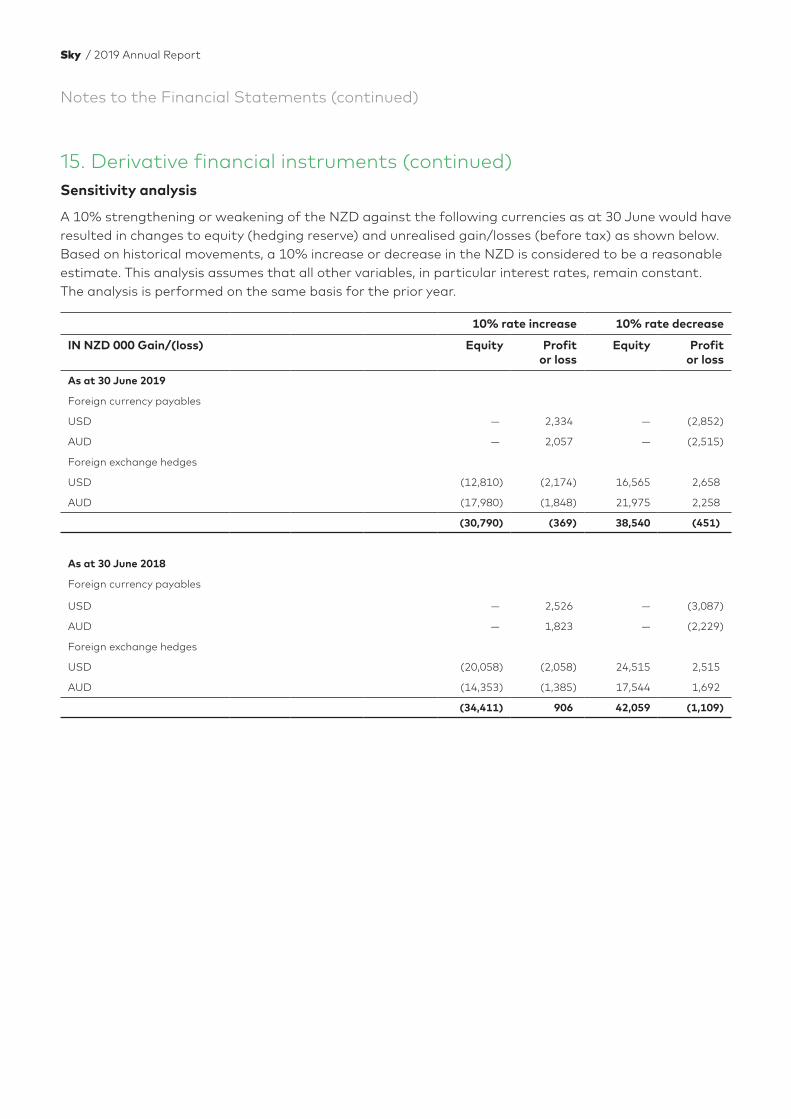
Notes to the Financial Statements (continued)
Sensitivity analysis
A 10% strengthening or weakening of the NZD against the following currencies as at 30 June would have resulted in changes to equity (hedging reserve) and unrealised gain/losses (before tax) as shown below. Based on historical movements, a 10% increase or decrease in the NZD is considered to be a reasonable estimate. This analysis assumes that all other variables, in particular interest rates, remain constant. The analysis is performed on the same basis for the prior year.
10% rate increase 10% rate decrease
IN NZD 000 Gain/(loss) Equity Profit or loss
Equity Profit or loss
As at 30 June 2019
Foreign currency payables
USD — 2,334 — (2,852)
AUD — 2,057 — (2,515)
Foreign exchange hedges
USD (12,810) (2,174) 16,565 2,658
AUD (17,980) (1,848) 21,975 2,258
(30,790) (369) 38,540 (451)
As at 30 June 2018
Foreign currency payables
USD — 2,526 — (3,087)
AUD — 1,823 — (2,229)
Foreign exchange hedges
USD (20,058) (2,058) 24,515 2,515
AUD (14,353) (1,385) 17,544 1,692
(34,411) 906 42,059 (1,109)
15. Derivative financial instruments (continued)
Sky / 2019 Annual Report

Interest rates
During the year ended 30 June 2019, interest rates on borrowings varied in the range of 3.2% to 6.5% (2018: 3.3% to 6.5%).
The Group’s interest rate structure is as follows:
30-Jun-19 30-Jun-18
IN NZD 000 Notes Effective interest
rate
Current Non- current
Effective interest
rate
Current Non- current
Assets
Cash and cash equivalents 3.01% 4,283 — 3.87% 4,694 —
Liabilities
Borrowings 14 6.52% (1,093) (90,643) 5.58% (458) (132,625)
Financial leases 14 6.58% (608) (1,796) 6.15% (582) (2,429)
Bonds 14 6.13% — (99,522) 6.18% — (99,250)
Derivatives
Floating to fixed interest rate swaps
50,000 10,000 20,000 60,000
Fixed to floating interest rate swaps
— 10,000 — 10,000
52,582 (171,961) 23,654 (164,304)
Gains and losses recognised in the hedging reserve in equity (note 16) on interest rate hedges as at 30 June 2019 will be continuously released to profit or loss within finance cost until the repayment of the bank borrowings.
Sensitivity analysis for interest-bearing instruments
A change of 100 basis points in interest rates on the reporting date, would have increased/(decreased) equity (hedging reserve) and profit or loss (before tax) by the amounts shown below. Based on historical movements a 100 basis point movement is considered to be a reasonably possible estimate. The analysis is performed on the same basis for the prior year. This analysis assumes that all other variables remain constant.
100 BP Increase 100 BP decrease
IN NZD 000 Gain/(loss) Equity Profit or loss
Equity Profit or loss
As at 30 June 2019
Variable rate instruments - bank loans — (880) — 880
Interest rate hedges - cash flow 204 — (204) —
204 (880) (204) 880
As at 30 June 2018
Variable rate instruments - bank loans — (1,260) — 1,260
Interest rate hedges - cash flow 698 — (709) —
698 (1,260) (709) 1,260
/ 73
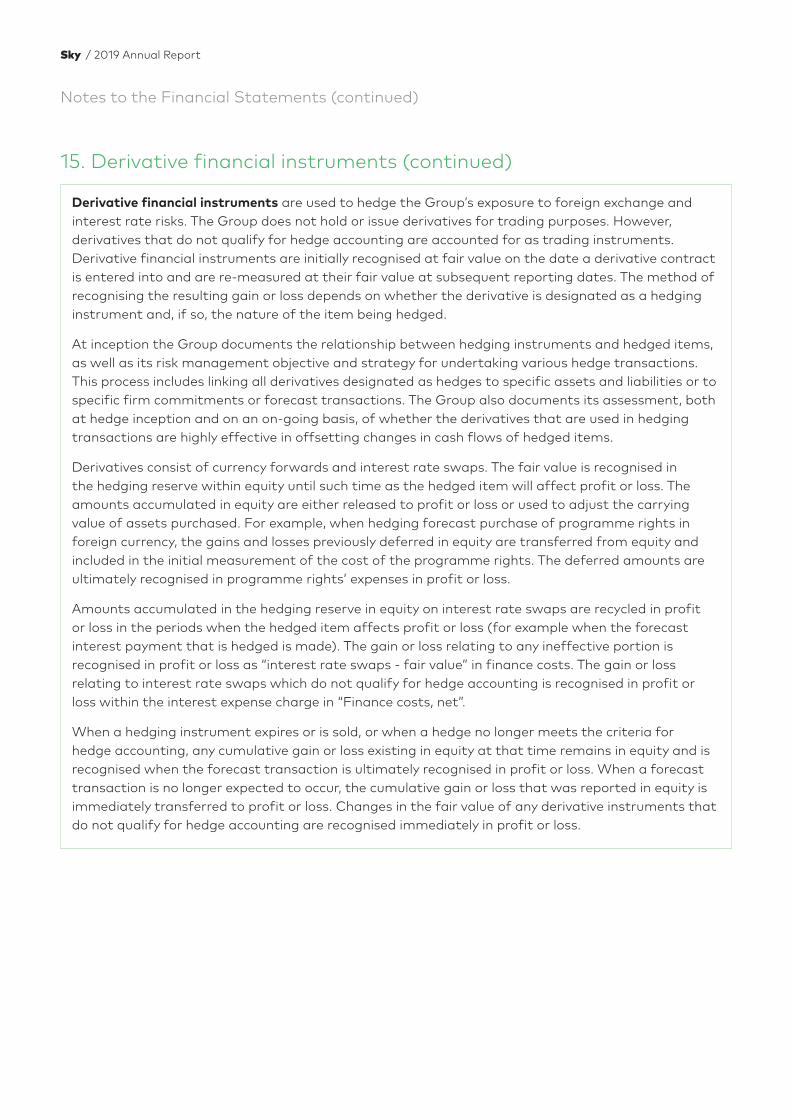
Notes to the Financial Statements (continued)
Derivative financial instruments are used to hedge the Group’s exposure to foreign exchange and interest rate risks. The Group does not hold or issue derivatives for trading purposes. However, derivatives that do not qualify for hedge accounting are accounted for as trading instruments. Derivative financial instruments are initially recognised at fair value on the date a derivative contract is entered into and are re-measured at their fair value at subsequent reporting dates. The method of recognising the resulting gain or loss depends on whether the derivative is designated as a hedging instrument and, if so, the nature of the item being hedged.
At inception the Group documents the relationship between hedging instruments and hedged items, as well as its risk management objective and strategy for undertaking various hedge transactions. This process includes linking all derivatives designated as hedges to specific assets and liabilities or to specific firm commitments or forecast transactions. The Group also documents its assessment, both at hedge inception and on an on-going basis, of whether the derivatives that are used in hedging transactions are highly effective in offsetting changes in cash flows of hedged items.
Derivatives consist of currency forwards and interest rate swaps. The fair value is recognised in the hedging reserve within equity until such time as the hedged item will affect profit or loss. The amounts accumulated in equity are either released to profit or loss or used to adjust the carrying value of assets purchased. For example, when hedging forecast purchase of programme rights in foreign currency, the gains and losses previously deferred in equity are transferred from equity and included in the initial measurement of the cost of the programme rights. The deferred amounts are ultimately recognised in programme rights’ expenses in profit or loss.
Amounts accumulated in the hedging reserve in equity on interest rate swaps are recycled in profit or loss in the periods when the hedged item affects profit or loss (for example when the forecast interest payment that is hedged is made). The gain or loss relating to any ineffective portion is recognised in profit or loss as “interest rate swaps - fair value” in finance costs. The gain or loss relating to interest rate swaps which do not qualify for hedge accounting is recognised in profit or loss within the interest expense charge in “Finance costs, net”.
When a hedging instrument expires or is sold, or when a hedge no longer meets the criteria for hedge accounting, any cumulative gain or loss existing in equity at that time remains in equity and is recognised when the forecast transaction is ultimately recognised in profit or loss. When a forecast transaction is no longer expected to occur, the cumulative gain or loss that was reported in equity is immediately transferred to profit or loss. Changes in the fair value of any derivative instruments that do not qualify for hedge accounting are recognised immediately in profit or loss.
15. Derivative financial instruments (continued)
Sky / 2019 Annual Report
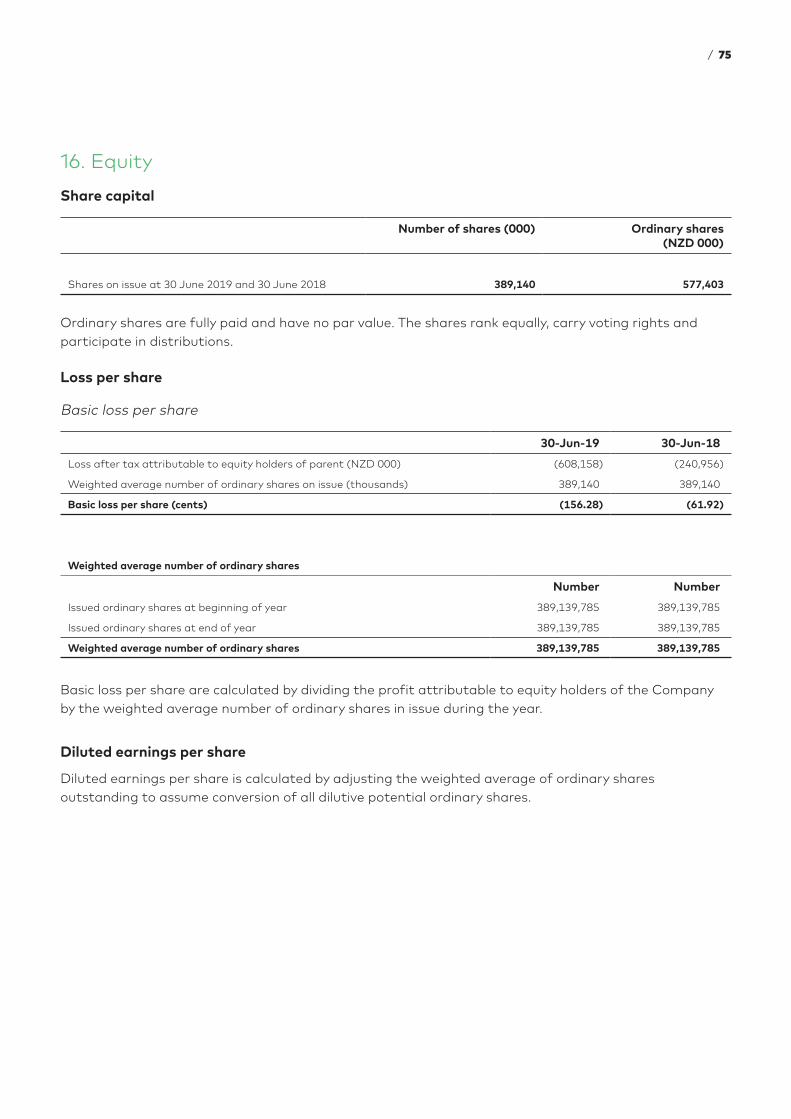
16. Equity
Share capital
Number of shares (000) Ordinary shares (NZD 000)
Shares on issue at 30 June 2019 and 30 June 2018 389,140 577,403
Ordinary shares are fully paid and have no par value. The shares rank equally, carry voting rights and participate in distributions.
Loss per share
Basic loss per share
30-Jun-19 30-Jun-18
Loss after tax attributable to equity holders of parent (NZD 000) (608,158) (240,956)
Weighted average number of ordinary shares on issue (thousands) 389,140 389,140
Basic loss per share (cents) (156.28) (61.92)
Weighted average number of ordinary shares
Number Number
Issued ordinary shares at beginning of year 389,139,785 389,139,785
Issued ordinary shares at end of year 389,139,785 389,139,785
Weighted average number of ordinary shares 389,139,785 389,139,785
Basic loss per share are calculated by dividing the profit attributable to equity holders of the Company by the weighted average number of ordinary shares in issue during the year.
Diluted earnings per share
Diluted earnings per share is calculated by adjusting the weighted average of ordinary shares outstanding to assume conversion of all dilutive potential ordinary shares.
/ 75
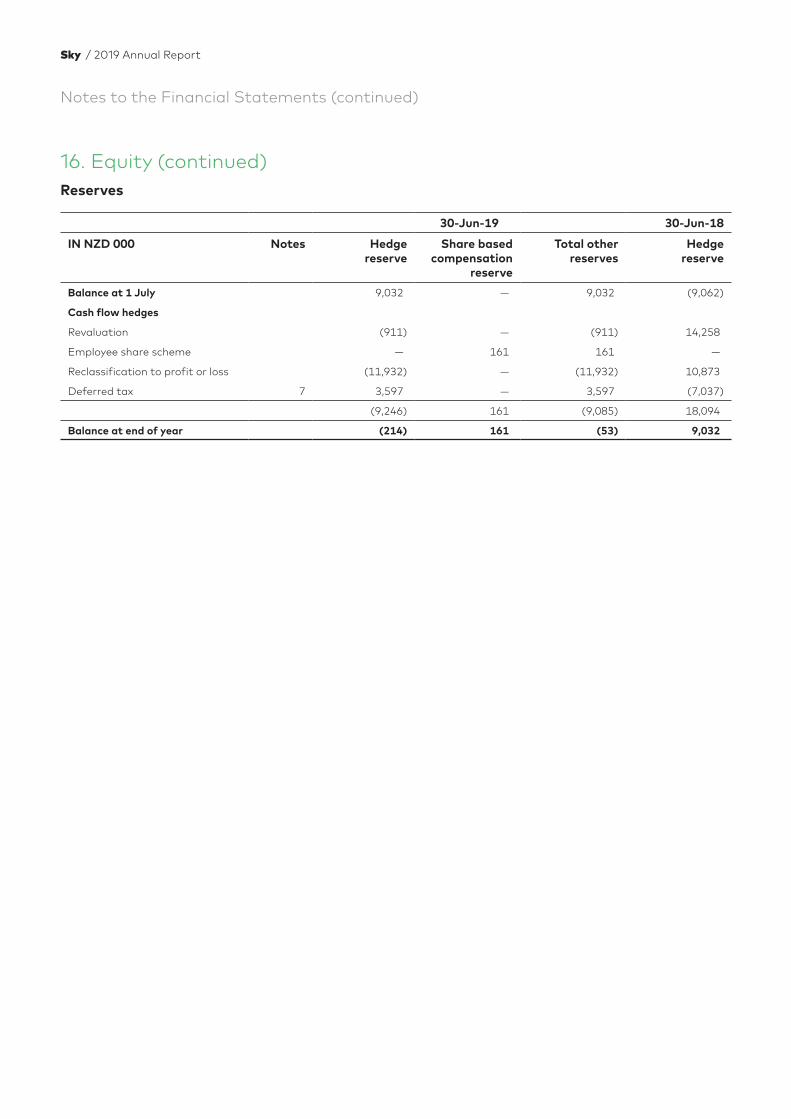
Notes to the Financial Statements (continued)
Reserves
30-Jun-19 30-Jun-18
IN NZD 000 Notes Hedge reserve
Share based compensation
reserve
Total other reserves
Hedge reserve
Balance at 1 July 9,032 — 9,032 (9,062)
Cash flow hedges
Revaluation (911) — (911) 14,258
Employee share scheme — 161 161 —
Reclassification to profit or loss (11,932) — (11,932) 10,873
Deferred tax 7 3,597 — 3,597 (7,037)
(9,246) 161 (9,085) 18,094
Balance at end of year (214) 161 (53) 9,032
16. Equity (continued)
Sky / 2019 Annual Report
17. Financial risk management
Financial risk management objectives
The Group undertakes transactions in a range of financial instruments which include cash and cash equivalents, receivables, payables, derivatives and various forms of borrowings including bonds and bank loans.
These activities result in exposure to financial risks that include market risk (currency risk, fair value interest rate risk, cash flow interest rate risk and price risk), credit risk and liquidity risk.
The Group seeks to minimise the effects of currency and interest rate risks by using derivative financial instruments to hedge these risk exposures. The use of financial derivatives is governed by the Group’s policies approved by the board of directors, which provides written principles on foreign exchange risk, interest rate risk, credit risk, the use of financial derivatives and non-derivative financial instruments, and the investment of excess liquidity. The Group does not enter into or trade financial instruments, including derivative financial instruments, for speculative purposes.
The Corporate Treasury function reports monthly to the board of directors. The board has an audit and risk committee which is responsible for developing and monitoring the Group’s risk management policies.
Market risk
Market risk is the risk that changes in market prices, such as foreign exchange rates and interest rates will affect the Group’s income or the value of its holdings of financial instruments. The objective of market risk management is to manage and control market risk exposures within acceptable parameters, while optimising the return on risk.
The Group buys and sells derivatives in the ordinary course of business, and also incurs financial liabilities, in order to manage market risks. All such transactions are carried out within the guidelines set by the board. Generally the Group seeks to apply hedge accounting in order to manage income statement volatility.
a) Foreign exchange risk
The Group is exposed to foreign exchange risk arising from various currency exposures primarily with respect to the Australian dollar and the United States dollar in relation to purchases of programme rights and the lease of transponders on the satellite. Foreign exchange risk arises when purchases are denominated in a currency that is not the entity’s functional currency. The net position in each foreign currency is managed by using forward currency contracts and foreign currency options and collars to limit the Group’s exposure to currency risk.
The Group’s risk management policy is to hedge foreign capital expenditure (Capex) and foreign operating expenditure (Opex) in accordance with the following parameters. Approximately 90% of anticipated transactions in each major currency qualify as ‘highly probable’ forecast transactions for hedge accounting purposes.
/ 77
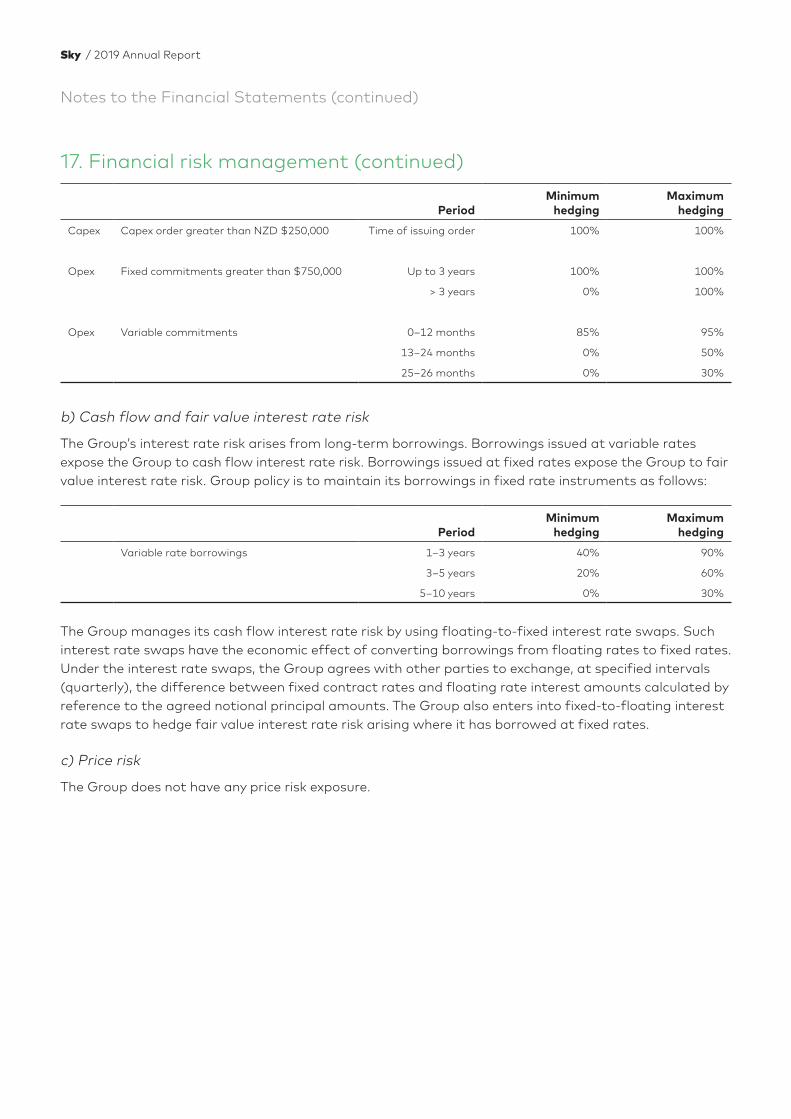
Notes to the Financial Statements (continued)
17. Financial risk management (continued)
PeriodMinimum
hedgingMaximum
hedging
Capex Capex order greater than NZD $250,000 Time of issuing order 100% 100%
Opex Fixed commitments greater than $750,000 Up to 3 years 100% 100%
> 3 years 0% 100%
Opex Variable commitments 0–12 months 85% 95%
13–24 months 0% 50%
25–26 months 0% 30%
b) Cash flow and fair value interest rate risk
The Group’s interest rate risk arises from long-term borrowings. Borrowings issued at variable rates expose the Group to cash flow interest rate risk. Borrowings issued at fixed rates expose the Group to fair value interest rate risk. Group policy is to maintain its borrowings in fixed rate instruments as follows:
PeriodMinimum
hedgingMaximum
hedging
Variable rate borrowings 1–3 years 40% 90%
3–5 years 20% 60%
5–10 years 0% 30%
The Group manages its cash flow interest rate risk by using floating-to-fixed interest rate swaps. Such interest rate swaps have the economic effect of converting borrowings from floating rates to fixed rates. Under the interest rate swaps, the Group agrees with other parties to exchange, at specified intervals (quarterly), the difference between fixed contract rates and floating rate interest amounts calculated by reference to the agreed notional principal amounts. The Group also enters into fixed-to-floating interest rate swaps to hedge fair value interest rate risk arising where it has borrowed at fixed rates.
c) Price risk
The Group does not have any price risk exposure.
Sky / 2019 Annual Report
Credit risk
Credit risk is the risk of financial loss to the Group if a customer or counterparty to a financial instrument fails to meet its contractual obligations and arises from cash and cash equivalents, deposits with banks, derivative financial instruments and the Group’s receivables from customers.
The Group has no significant concentrations of credit risk.
Credit risk with respect to trade receivables is limited due to the large number of subscribers included in the Group’s subscriber base. In addition, receivables balances are monitored on an on-going basis with the result that the Group’s exposure to bad debts is not significant. The Group establishes an impairment loss that represents its estimate of expected credit losses in respect of trade receivables. The main component of the impairment loss is based on a collective loss component established for groups of similar assets in respect of losses that have been incurred but not yet identified. The collective loss allowance is determined based on historical data of payment statistics for similar financial assets. The maximum exposure is the carrying amount as disclosed in note 8.
Derivative counterparties and cash transactions are limited to high credit quality financial institutions. The Group has policies that limit the amount of credit exposure to any one financial institution.
Liquidity risk
Liquidity risk is the risk that the Group will not be able to meet its financial obligations as they fall due. Prudent liquidity risk management implies maintaining sufficient cash and cash equivalents, the availability of funding through an adequate amount of committed credit facilities and the ability to close out market positions. The Group aims to maintain flexibility in funding by keeping committed credit lines available.
Management monitors the Group’s cash requirements on a daily basis against expected cash flows based on a rolling daily cash flow forecast for at least 90 days in advance. In addition the Group compares actual cash flow reserves against forecast and budget on a monthly basis.
The Group had an undrawn facility balance of $112,000,000 (June 2018: $169,000,000) that can be drawn down to meet short-term working capital requirements. The facility limit at 30 June 2019 is $200,000,000 (30 June 2018: $300,000,000).
The table below analyses the Group’s financial liabilities into relevant maturity groupings based on the remaining period from the balance date to the contractual maturity date. The amounts disclosed in the table are the contractual undiscounted cash flows, including interest payments in respect of financial liabilities and the net settled interest rate derivatives that are in a loss position at balance date. Balances due within 12 months equal their carrying value as the impact of discounting is not significant.
/ 79
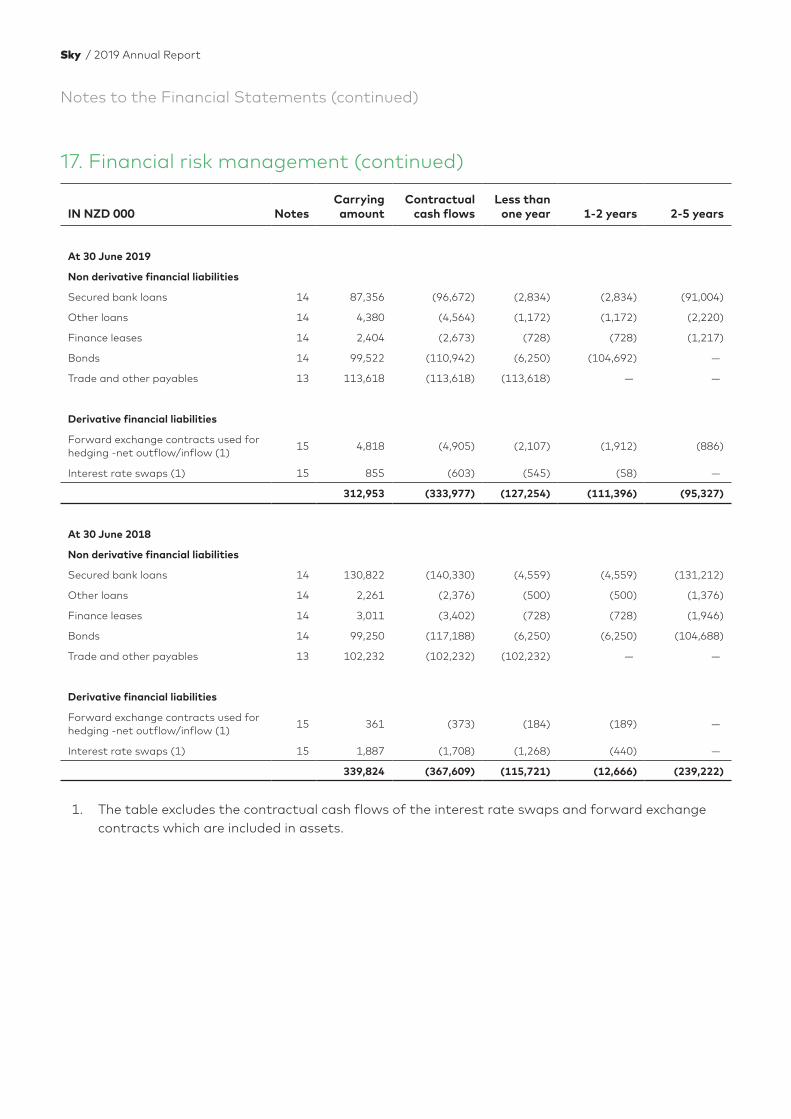
Notes to the Financial Statements (continued)
17. Financial risk management (continued)
IN NZD 000 NotesCarrying amount
Contractual cash flows
Less than one year 1-2 years 2-5 years
At 30 June 2019
Non derivative financial liabilities
Secured bank loans 14 87,356 (96,672) (2,834) (2,834) (91,004)
Other loans 14 4,380 (4,564) (1,172) (1,172) (2,220)
Finance leases 14 2,404 (2,673) (728) (728) (1,217)
Bonds 14 99,522 (110,942) (6,250) (104,692) —
Trade and other payables 13 113,618 (113,618) (113,618) — —
Derivative financial liabilities
Forward exchange contracts used for hedging -net outflow/inflow (1)
15 4,818 (4,905) (2,107) (1,912) (886)
Interest rate swaps (1) 15 855 (603) (545) (58) —
312,953 (333,977) (127,254) (111,396) (95,327)
At 30 June 2018
Non derivative financial liabilities
Secured bank loans 14 130,822 (140,330) (4,559) (4,559) (131,212)
Other loans 14 2,261 (2,376) (500) (500) (1,376)
Finance leases 14 3,011 (3,402) (728) (728) (1,946)
Bonds 14 99,250 (117,188) (6,250) (6,250) (104,688)
Trade and other payables 13 102,232 (102,232) (102,232) — —
Derivative financial liabilities
Forward exchange contracts used for hedging -net outflow/inflow (1)
15 361 (373) (184) (189) —
Interest rate swaps (1) 15 1,887 (1,708) (1,268) (440) —
339,824 (367,609) (115,721) (12,666) (239,222)
1. The table excludes the contractual cash flows of the interest rate swaps and forward exchange contracts which are included in assets.
Sky / 2019 Annual Report
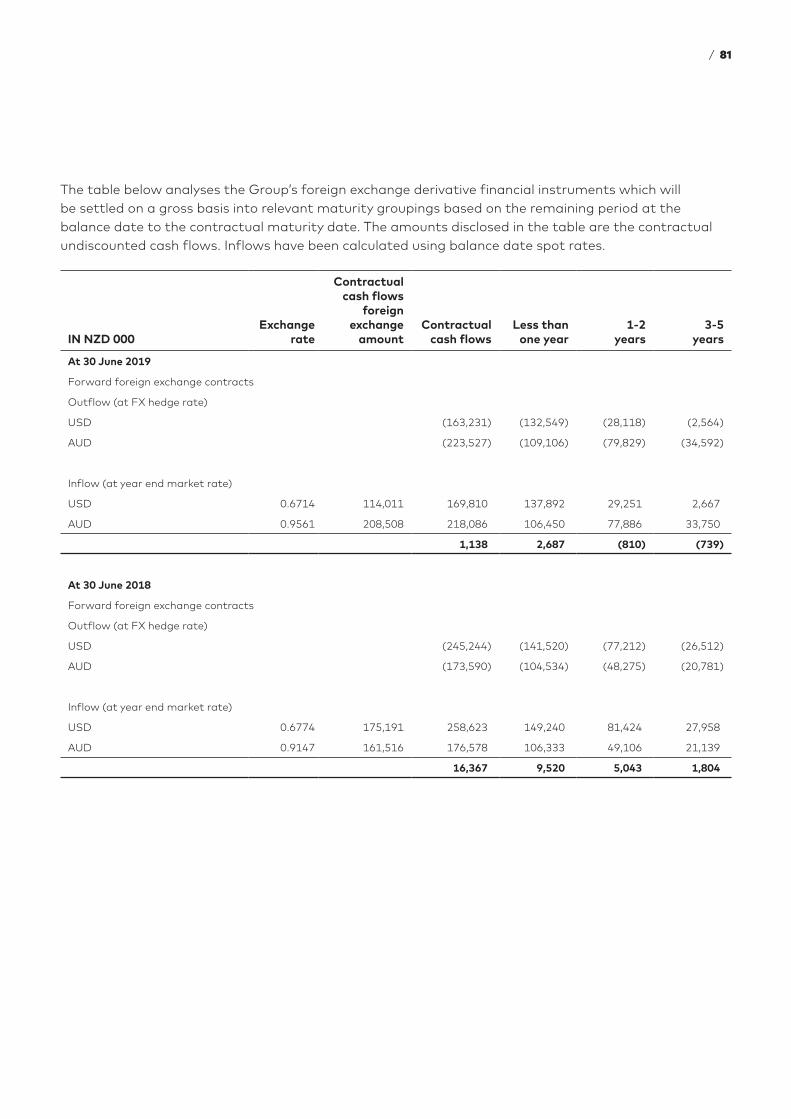
The table below analyses the Group’s foreign exchange derivative financial instruments which will be settled on a gross basis into relevant maturity groupings based on the remaining period at the balance date to the contractual maturity date. The amounts disclosed in the table are the contractual undiscounted cash flows. Inflows have been calculated using balance date spot rates.
IN NZD 000Exchange
rate
Contractual cash flows
foreign exchange
amountContractual
cash flowsLess than
one year1-2
years3-5
years
At 30 June 2019
Forward foreign exchange contracts
Outflow (at FX hedge rate)
USD (163,231) (132,549) (28,118) (2,564)
AUD (223,527) (109,106) (79,829) (34,592)
Inflow (at year end market rate)
USD 0.6714 114,011 169,810 137,892 29,251 2,667
AUD 0.9561 208,508 218,086 106,450 77,886 33,750
1,138 2,687 (810) (739)
At 30 June 2018
Forward foreign exchange contracts
Outflow (at FX hedge rate)
USD (245,244) (141,520) (77,212) (26,512)
AUD (173,590) (104,534) (48,275) (20,781)
Inflow (at year end market rate)
USD 0.6774 175,191 258,623 149,240 81,424 27,958
AUD 0.9147 161,516 176,578 106,333 49,106 21,139
16,367 9,520 5,043 1,804
/ 81
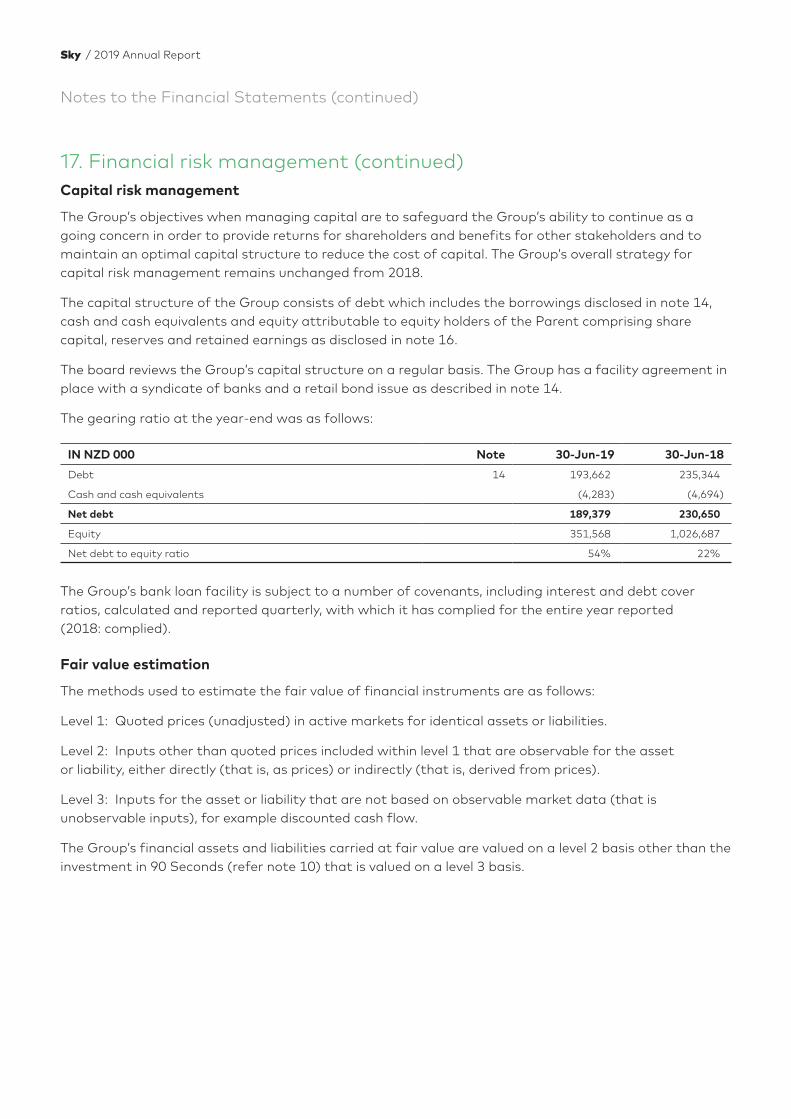
Notes to the Financial Statements (continued)
Capital risk management
The Group’s objectives when managing capital are to safeguard the Group’s ability to continue as a going concern in order to provide returns for shareholders and benefits for other stakeholders and to maintain an optimal capital structure to reduce the cost of capital. The Group’s overall strategy for capital risk management remains unchanged from 2018.
The capital structure of the Group consists of debt which includes the borrowings disclosed in note 14, cash and cash equivalents and equity attributable to equity holders of the Parent comprising share capital, reserves and retained earnings as disclosed in note 16.
The board reviews the Group’s capital structure on a regular basis. The Group has a facility agreement in place with a syndicate of banks and a retail bond issue as described in note 14.
The gearing ratio at the year-end was as follows:
IN NZD 000 Note 30-Jun-19 30-Jun-18
Debt 14 193,662 235,344
Cash and cash equivalents (4,283) (4,694)
Net debt 189,379 230,650
Equity 351,568 1,026,687
Net debt to equity ratio 54% 22%
The Group’s bank loan facility is subject to a number of covenants, including interest and debt cover ratios, calculated and reported quarterly, with which it has complied for the entire year reported (2018: complied).
Fair value estimation
The methods used to estimate the fair value of financial instruments are as follows:
Level 1: Quoted prices (unadjusted) in active markets for identical assets or liabilities.
Level 2: Inputs other than quoted prices included within level 1 that are observable for the asset or liability, either directly (that is, as prices) or indirectly (that is, derived from prices).
Level 3: Inputs for the asset or liability that are not based on observable market data (that is unobservable inputs), for example discounted cash flow.
The Group’s financial assets and liabilities carried at fair value are valued on a level 2 basis other than the investment in 90 Seconds (refer note 10) that is valued on a level 3 basis.
17. Financial risk management (continued)
Sky / 2019 Annual Report
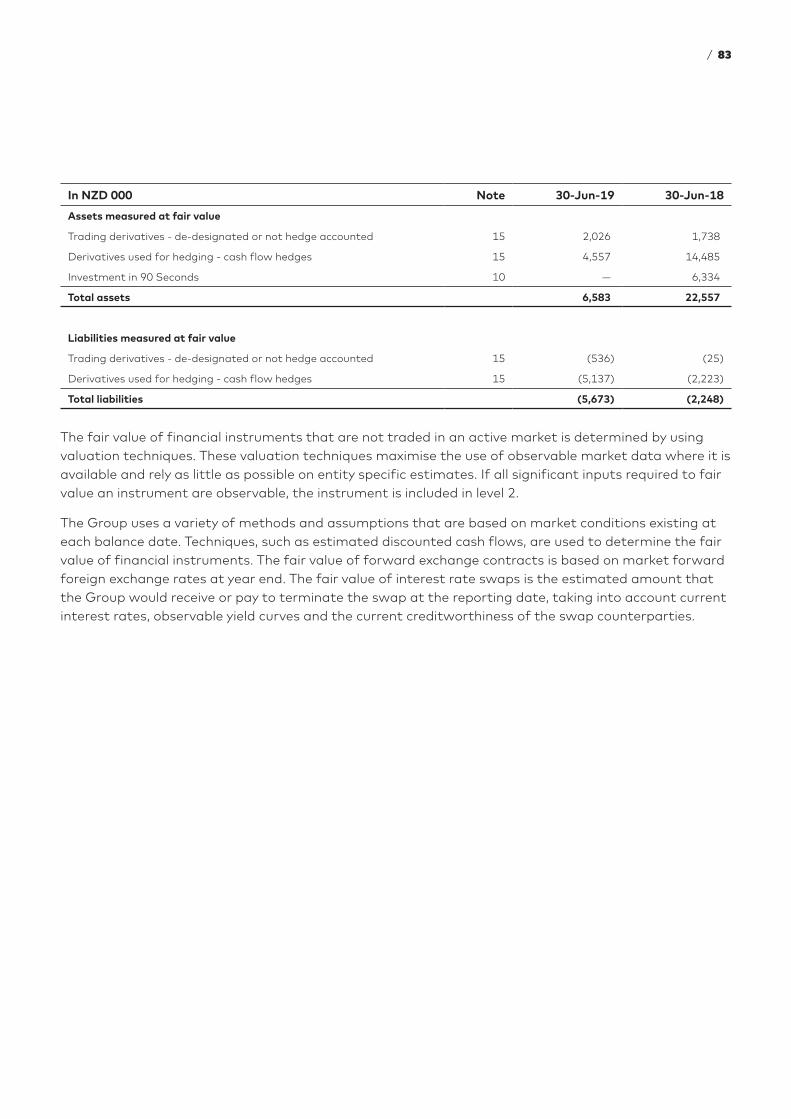
In NZD 000 Note 30-Jun-19 30-Jun-18
Assets measured at fair value
Trading derivatives - de-designated or not hedge accounted 15 2,026 1,738
Derivatives used for hedging - cash flow hedges 15 4,557 14,485
Investment in 90 Seconds 10 — 6,334
Total assets 6,583 22,557
Liabilities measured at fair value
Trading derivatives - de-designated or not hedge accounted 15 (536) (25)
Derivatives used for hedging - cash flow hedges 15 (5,137) (2,223)
Total liabilities (5,673) (2,248)
The fair value of financial instruments that are not traded in an active market is determined by using valuation techniques. These valuation techniques maximise the use of observable market data where it is available and rely as little as possible on entity specific estimates. If all significant inputs required to fair value an instrument are observable, the instrument is included in level 2.
The Group uses a variety of methods and assumptions that are based on market conditions existing at each balance date. Techniques, such as estimated discounted cash flows, are used to determine the fair value of financial instruments. The fair value of forward exchange contracts is based on market forward foreign exchange rates at year end. The fair value of interest rate swaps is the estimated amount that the Group would receive or pay to terminate the swap at the reporting date, taking into account current interest rates, observable yield curves and the current creditworthiness of the swap counterparties.
/ 83
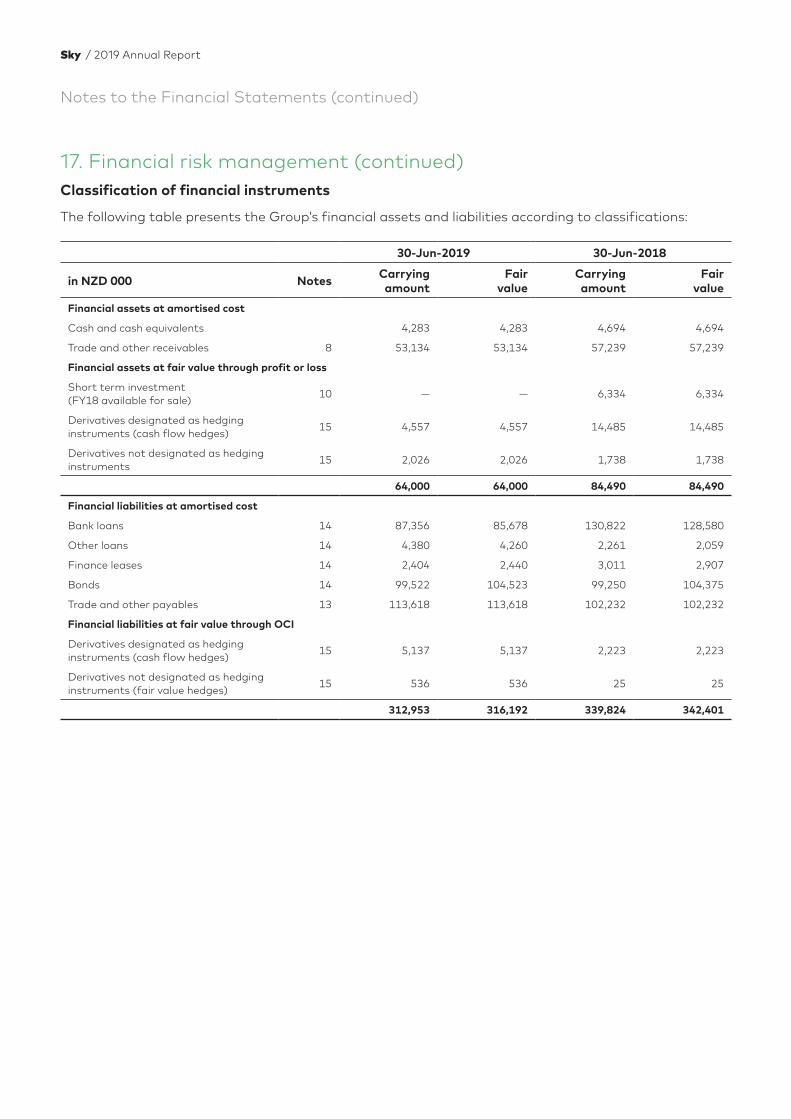
Notes to the Financial Statements (continued)
Classification of financial instruments
The following table presents the Group’s financial assets and liabilities according to classifications:
30-Jun-2019 30-Jun-2018
in NZD 000 Notes Carrying amount
Fair value
Carrying amount
Fair value
Financial assets at amortised cost
Cash and cash equivalents 4,283 4,283 4,694 4,694
Trade and other receivables 8 53,134 53,134 57,239 57,239
Financial assets at fair value through profit or loss
Short term investment (FY18 available for sale)
10 — — 6,334 6,334
Derivatives designated as hedging instruments (cash flow hedges)
15 4,557 4,557 14,485 14,485
Derivatives not designated as hedging instruments
15 2,026 2,026 1,738 1,738
64,000 64,000 84,490 84,490
Financial liabilities at amortised cost
Bank loans 14 87,356 85,678 130,822 128,580
Other loans 14 4,380 4,260 2,261 2,059
Finance leases 14 2,404 2,440 3,011 2,907
Bonds 14 99,522 104,523 99,250 104,375
Trade and other payables 13 113,618 113,618 102,232 102,232
Financial liabilities at fair value through OCI
Derivatives designated as hedging instruments (cash flow hedges)
15 5,137 5,137 2,223 2,223
Derivatives not designated as hedging instruments (fair value hedges)
15 536 536 25 25
312,953 316,192 339,824 342,401
17. Financial risk management (continued)
Sky / 2019 Annual Report
Prepaid expenses, contract liabilities, unearned subscriptions, tax payables and employee benefits do not meet the definition of a financial instrument and have been excluded from the “Trade and other receivables” and Trade and other payables” categories above.
The fair values of financial assets and financial liabilities are determined as follows:
Cash and short-term deposits, trade and other receivables carried at amortised cost, trade and other payables, and other current liabilities approximate their carrying amounts largely due to the short-term maturities of these instruments.
The fair value of quoted notes and bonds is based on price quotations at the reporting date being a level 1 basis. The fair value of loans from banks and lease liabilities is estimated on a level 3 basis by discounting future cash flows using rates currently available for debt on similar terms, credit risk and remaining maturities. The fair value of related party receivables is estimated on a level 3 basis by discounting future cash flows using rates currently available for deposits on similar terms.
Classification
Financial assets are classified in the following categories: those to be measured subsequently at fair value through other comprehensive income or profit or loss, and those to be measured at amortised cost. The classification depends on the purpose for which the financial assets were acquired. Management determines the classification of its financial assets at initial recognition and re-evaluates this designation at each reporting date.
For assets measured at fair value, gains and losses will either be recorded in profit or loss or other comprehensive income.
Regular way purchases and sales of financial assets are recognised on trade-date, the date on which the Group commits to purchase or sell the asset. Financial assets are derecognised when the rights to receive cash flows from the financial assets have expired or have been transferred and the Group has transferred substantially all the risk and rewards of ownership.
At initial recognition, the Group measures a financial asset at its fair value plus, in the case of a financial asset not at fair value through profit or loss, transaction costs that are directly attributable to the acquisition of the financial assets. Transaction costs of financial assets carried at fair value through profit or loss are expensed in profit or loss.
Impairment of financial assets
From 1 July 2018, the Group assess on a forward looking basis the expected credit losses associated with its debt instruments carried at amortised costs and fair value through other comprehensive income. The impairment methodology applied depends on whether there has been a significant increase in credit risk.
For trade receivables, the Group applies the simplified approach permitted by NZ IFRS 9, which requires expected lifetime losses to be recognised from initial recognition of the receivables (refer note 8 for further details).
/ 85
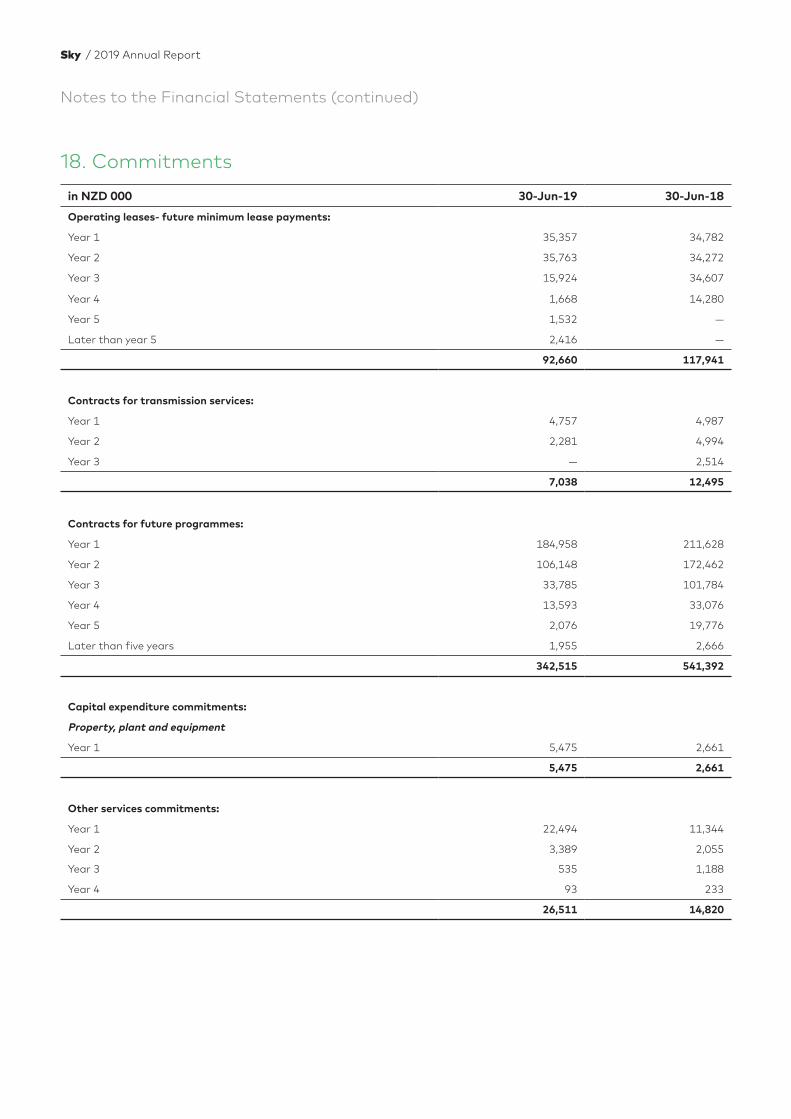
Notes to the Financial Statements (continued)
18. Commitments
in NZD 000 30-Jun-19 30-Jun-18
Operating leases- future minimum lease payments:
Year 1 35,357 34,782
Year 2 35,763 34,272
Year 3 15,924 34,607
Year 4 1,668 14,280
Year 5 1,532 —
Later than year 5 2,416 —
92,660 117,941
Contracts for transmission services:
Year 1 4,757 4,987
Year 2 2,281 4,994
Year 3 — 2,514
7,038 12,495
Contracts for future programmes:
Year 1 184,958 211,628
Year 2 106,148 172,462
Year 3 33,785 101,784
Year 4 13,593 33,076
Year 5 2,076 19,776
Later than five years 1,955 2,666
342,515 541,392
Capital expenditure commitments:
Property, plant and equipment
Year 1 5,475 2,661
5,475 2,661
Other services commitments:
Year 1 22,494 11,344
Year 2 3,389 2,055
Year 3 535 1,188
Year 4 93 233
26,511 14,820
Sky / 2019 Annual Report
The Group has entered into a contract with Optus Networks Pty Limited (Optus) to lease transponders on the D1 satellite which was launched in October 2006 and commissioned in November 2006. The contract is for a period of 15 years from the time of commissioning with monthly payments in Australian dollars. This contract is accounted for as an operating lease. Non-cancellable operating lease payments, including Optus lease payments, are included in operating leases above.
Sky is currently utilising seven transponders, six of which are on a long-term lease. Access to the seventh transponder was negotiated, effective from 1 April 2011.
In December 2018, Sky entered into a satellite service agreement with Optus for ten years to 2031. The deal is conditional on Optus procuring fleet enhancements, including the successful launch of a new satellite to replace the existing D1 satellite.
19. Contingent liabilitiesThe Group has undrawn letters of credit at 30 June 2019 of $650,000 (30 June 2018: $650,000), relating to Datacom Employer Services for Sky executive payroll liabilities in the current year.
The Group is subject to litigation incidental to their business, none of which is expected to be material. No provision has been made in the Group’s financial statements in relation to any current litigation and the directors believe that such litigation will not have a significant effect on the Group’s financial position, results of operations or cash flows.
20. Subsequent eventsSky acquired 100% of RugbyPass, on 19 August 2019.
RugbyPass is the world’s largest digital rugby platform combining live streamed broadcasting with unique and engaging video content and stories for rugby fans around the globe.
RugbyPass was owned by US-based RugbyPass Investors LLC, which is majority owned by private investment company Cooper and Company.
The purchase price is US$40m, with consideration made up of US$10m cash and issuance of new Sky shares of US$20m at completion, and the remaining US$10m payable in cash during an agreed earn out period.
RugbyPass will operate as a wholly owned subsidiary of Sky.
The accounting for the acquisition is not yet complete and a fair value assessment is still to be carried out.
/ 87
Independent auditor’s report To the shareholders of Sky Network Television Limited
We have audited the consolidated financial statements which comprise:
− the consolidated balance sheet as at 30 June 2019;
− the consolidated income statement for the year then ended;
− the consolidated statement of comprehensive income for the year then ended;
− the consolidated statement of changes in equity for the year then ended;
− the consolidated statement of cash flows for the year then ended; and
− the notes to the financial statements, which include significant accounting policies.
Our opinion
In our opinion, the accompanying consolidated financial statements of Sky Network Television Limited (the Company), including its subsidiaries (the Group), present fairly, in all material respects, the financial position of the Group as at 30 June 2019, its financial performance and its cash flows for the year then ended in accordance with New Zealand Equivalents to International Financial Reporting Standards (NZ IFRS) and International Financial Reporting Standards (IFRS).
Basis for opinion We conducted our audit in accordance with International Standards on Auditing (New Zealand) (ISAs (NZ)) and International Standards on Auditing (ISAs). Our responsibilities under those standards are further described in the Auditor’s responsibilities for the audit of the consolidated financial statements section of our report.
We believe that the audit evidence we have obtained is sufficient and appropriate to provide a basis for our opinion.
We are independent of the Group in accordance with Professional and Ethical Standard 1 (Revised) Code of Ethics for Assurance Practitioners (PES 1) issued by the New Zealand Auditing and Assurance Standards Board and the International Ethics Standards Board for Accountants’ Code of Ethics for Professional Accountants (IESBA Code), and we have fulfilled our other ethical responsibilities in accordance with these requirements.
Our firm carries out other services for the Group in the areas of providing treasury related financial markets risk analysis and commentary, agreed upon procedures on the bank compliance certificate and regulatory reporting. In addition, certain partners and employees of our firm may subscribe to Sky services on normal terms within the ordinary course of the trading activities of the Group. These relationships and other services have not impaired our independence as auditor of the Group.
PricewaterhouseCoopers, 188 Quay Street, Private Bag 92162, Auckland 1142, New ZealandT: +64 9 355 8000, F: +64 9 355 8001, pwc.co.nz
Sky / 2019 Annual Report
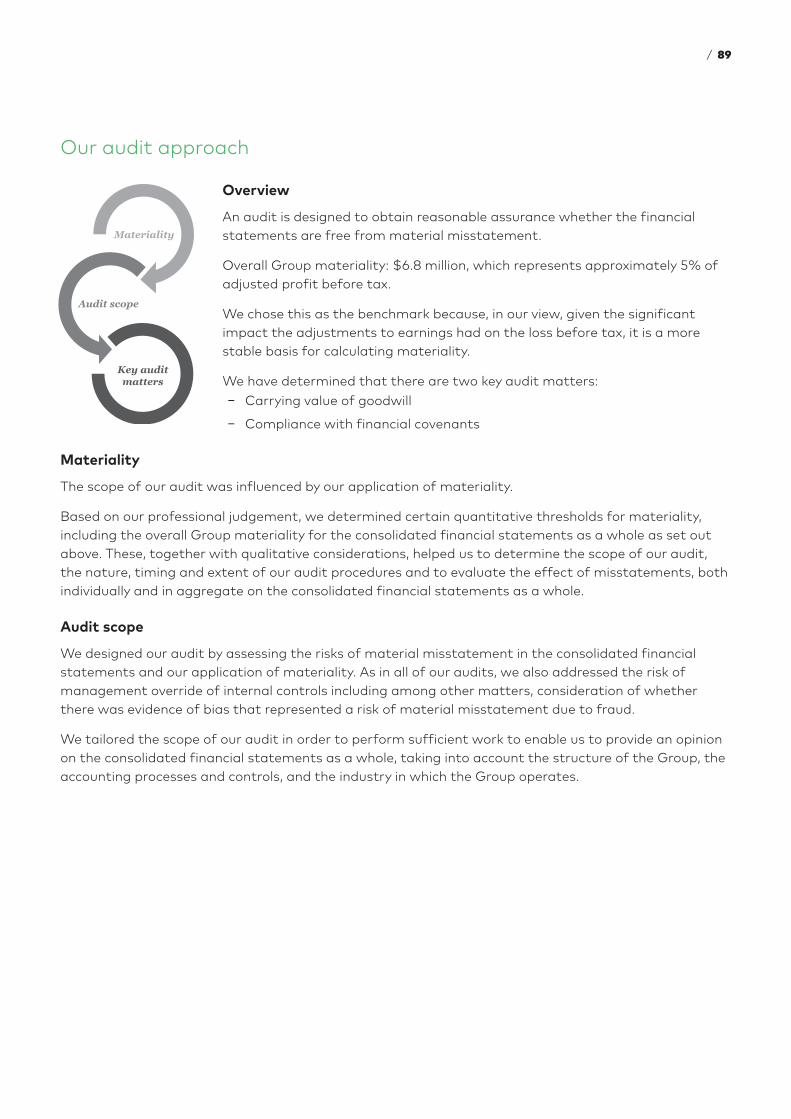
Our audit approach
Overview
An audit is designed to obtain reasonable assurance whether the financial statements are free from material misstatement.
Overall Group materiality: $6.8 million, which represents approximately 5% of adjusted profit before tax.
We chose this as the benchmark because, in our view, given the significant impact the adjustments to earnings had on the loss before tax, it is a more stable basis for calculating materiality.
We have determined that there are two key audit matters: − Carrying value of goodwill
− Compliance with financial covenants
Materiality
The scope of our audit was influenced by our application of materiality.
Based on our professional judgement, we determined certain quantitative thresholds for materiality, including the overall Group materiality for the consolidated financial statements as a whole as set out above. These, together with qualitative considerations, helped us to determine the scope of our audit, the nature, timing and extent of our audit procedures and to evaluate the effect of misstatements, both individually and in aggregate on the consolidated financial statements as a whole.
Audit scope
We designed our audit by assessing the risks of material misstatement in the consolidated financial statements and our application of materiality. As in all of our audits, we also addressed the risk of management override of internal controls including among other matters, consideration of whether there was evidence of bias that represented a risk of material misstatement due to fraud.
We tailored the scope of our audit in order to perform sufficient work to enable us to provide an opinion on the consolidated financial statements as a whole, taking into account the structure of the Group, the accounting processes and controls, and the industry in which the Group operates.
/ 89
Key audit matters Key audit matters are those matters that, in our professional judgment, were of most significance in our audit of the consolidated financial statements of the current year. These matters were addressed in the context of our audit of the consolidated financial statements as a whole, and in forming our opinion thereon, and we do not provide a separate opinion on these matters.
Key audit matter How our audit addressed the key audit matter
Carrying value of goodwill
As at 30 June 2019, the carrying amount of goodwill amounted to $0.4 billion (30 June 2018: $1.1 billion) after an impairment charge of $670 million has been recorded against this balance during the year.
The carrying value of goodwill is an area of focus for the audit as it is dependent on future cash flows and there is risk that if these cash flows do not meet the Group’s expectations then goodwill may be further impaired.
The forecasts in the model include future expected changes in Sky’s business in response to the disruption in the marketplace and increased competition, some of which would be excluded under a value in use methodology. Consequently, at 30 June 2019 management considered the recoverable amount using the fair value less costs of disposal methodology as being the most appropriate approach to assess whether or not there is an impairment in the carrying value of goodwill.
The estimated future cash flows used in the model were prepared based on the approved budget for the next financial year and forecast cash flows for the following four years assuming that all key programming rights, in particular, sports rights are retained.
Management determined that the model was most sensitive to changes in the assumptions relating to subscriber numbers, average monthly revenue per residential subscriber (ARPU) and programming costs. Adverse changes in these assumptions might lead to a further impairment in the carrying value of goodwill.
We obtained management’s fair value less costs of disposal model used to assess the carrying value of goodwill at 30 June 2019.
Our audit procedures included the following:
− Assessing management’s processes and controls over preparing the model.
− Assessing the appropriateness of using a fair value less costs of disposal approach against the applicable accounting standard.
− Testing the calculation of the valuation model, including the inputs and the mathematical accuracy and comparing the resulting balances to the relevant net assets of the business.
− Performing the following procedures to assess the following estimates and assumptions made by management:
− Ensured that the impairment model used by management to assess the impairment of goodwill was approved by the Board.
− Considered the reasonableness of assumptions, including movements in subscriber numbers, ARPU, foreign exchange rates, expected revenue and costs in the next five years, the on-going level of capex and the long-term growth rate with reference to Sky’s performance historically, particularly in recent periods, analysis of subscriber tenure and churn, key initiatives being taken and comparison to available broker reports.
Sky / 2019 Annual Report
Independent auditor’s report (continued)
Key audit matter How our audit addressed the key audit matter
Management also considered the NZX market capitalisation at balance date.
As a result of the impairment review, the Directors identified an impairment in the carrying value of goodwill at 30 June 2019. Reasonably possible changes in key assumptions that could result in further impairment are disclosed in note 12.
− Considered the appropriateness of changes in assumptions from the previous year by performing a lookback procedure against the actual FY19 results and understanding the key elements of the new five-year business plan approved by the Board versus the prior year.
− Engaged our own expert to review the structure of the model, to recalculate the weighted average cost of capital used as the discount rate in the model and to review external evidence for the rate used for cost of disposal. The rates used by management were within a reasonable range given estimation uncertainty.
− Reviewed management’s assessment of fair value less costs of disposal based on market capitalisation at balance date.
− Obtained and evaluated management’s sensitivity analysis to ascertain the impact of reasonably possible changes and also considered alternative possible scenarios and their potential impact.
We reviewed the disclosures in note 12 to the financial statements to ensure they are compliant with the requirements of the accounting standards.
We have no matters to report.
/ 91
Key audit matter How our audit addressed the key audit matter
Compliance with financial covenants
As disclosed in note 14, the Group refinanced its bank facility in October 2018. The bank facility is subject to financial covenants where the Group is required to meet certain key financial ratios.
The Group disclosed that they have complied with all covenants during the year. The Group notes that the financial covenants are subject to change if certain conditions are not met. It is the considered view of the Directors that the Group will be able to comply with the financial covenants.
Due to the sensitivity of the cash flows that impact the calculation of the key financial ratios and the effect that a change in the financial ratios could have on covenant compliance, this is an area of focus for the audit.
We obtained an understanding of the relevant covenants and any conditions included in the bank facility agreement that may result in a change in the financial ratios.
We obtained the Group’s forecast compliance assessment and:
− agreed the FY20 budget to that approved by the Board
− recalculated compliance with financial covenants at each compliance date, and
− performed sensitivity analysis to assess the level of forecasting risk.
We also assessed the Group’s ability to meet the financial covenants assuming a change in the financial ratios if certain conditions were not met by performing sensitivity analysis on the cash flows that impact the calculation.
We have no matters to report.
Information other than the consolidated financial statements and auditor’s reportThe Directors are responsible for the annual report. Our opinion on the consolidated financial statements does not cover the other information included in the annual report and we do not express any form of assurance conclusion on the other information.
In connection with our audit of the consolidated financial statements, our responsibility is to read the other information and, in doing so, consider whether the other information is materially inconsistent with the consolidated financial statements or our knowledge obtained in the audit, or otherwise appears to be materially misstated. If, based on the work we have performed on the other information that we obtained prior to the date of this auditor’s report, we conclude that there is a material misstatement of this other information, we are required to report that fact. We have nothing to report in this regard.
Sky / 2019 Annual Report
Independent auditor’s report (continued)
Key audit matters (continued)
Responsibilities of the Directors for the consolidated financial statementsThe Directors are responsible, on behalf of the Company, for the preparation and fair presentation of the consolidated financial statements in accordance with NZ IFRS and IFRS, and for such internal control as the Directors determine is necessary to enable the preparation of consolidated financial statements that are free from material misstatement, whether due to fraud or error.
In preparing the consolidated financial statements, the Directors are responsible for assessing the Group’s ability to continue as a going concern, disclosing, as applicable, matters related to going concern and using the going concern basis of accounting unless the Directors either intend to liquidate the Group or to cease operations, or have no realistic alternative but to do so.
Auditor’s responsibilities for the audit of the consolidated financial statementsOur objectives are to obtain reasonable assurance about whether the consolidated financial statements, as a whole, are free from material misstatement, whether due to fraud or error, and to issue an auditor’s report that includes our opinion. Reasonable assurance is a high level of assurance, but is not a guarantee that an audit conducted in accordance with ISAs (NZ) and ISAs will always detect a material misstatement when it exists. Misstatements can arise from fraud or error and are considered material if, individually or in the aggregate, they could reasonably be expected to influence the economic decisions of users taken on the basis of these consolidated financial statements.
A further description of our responsibilities for the audit of the financial statements is located at the External Reporting Board’s website at:
https://www.xrb.govt.nz/assurance-standards/auditors-responsibilities/audit-report-1
This description forms part of our auditor’s report.
Who we report toThis report is made solely to the Company’s shareholders, as a body. Our audit work has been undertaken so that we might state those matters which we are required to state to them in an auditor’s report and for no other purpose. To the fullest extent permitted by law, we do not accept or assume responsibility to anyone other than the Company and the Company’s shareholders, as a body, for our audit work, for this report or for the opinions we have formed.
The engagement partner on the audit resulting in this independent auditor’s report is Leopino Foliaki.
For and on behalf of:
Chartered Accountants
21 August 2019 Auckland
/ 93

Sky / 2019 Annual Report
InformationCorporate governance ..........................................................................97
Interests register .....................................................................................100
Company and bondholder information ..............................102
Waivers and information .................................................................112
Share market and other information ...................................115
Directory .........................................................................................................116
/ 95

Sky / 2019 Annual Report
Board of directors
Committees
The board operates two permanent board committees, namely the audit and risk committee and the nomination and remuneration committee. The members of both committees are Susan Paterson (Chair), Peter Macourt and Derek Handley.
Independent and Executive DirectorsAt 30 June 2019 all of the directors of Sky other than Martin Stewart were considered to be independent directors. Martin Stewart is currently the only executive director on the board, and is not considered independent as he is also Sky’s Chief Executive. In determining independence, the board applies the materiality thresholds set out in the NZX and ASX Listing Rules. All directors other than Martin Stewart are considered independent because they do not have any “Disqualifying Relationship” (as defined by the NZX Listing Rules), and none of the factors in NZX Recommendation 2.4 or ASX Recommendation 2.3 apply to materially diminish independence.
Diversity Diversity of gender, skill, age, ethnicity, experience and beliefs are valued by Sky. Sky recognises the value of diversity and the organisational strength, problem solving ability and innovative approach that it brings. The provision of equal opportunities for all employees is fundamental to the way in which Sky functions as a business. Sky established a diversity policy during 2012 (updated in 2015) and has posted this on Sky’s website at www.sky.co.nz/investor-relations. The board acknowledges there is a lot of focus on gender diversity both on boards and within companies, and as noted
1 These figures do not include one female officer and three male officers, which as at 30 June 2019, no longer report to the Chief Executive but were still contractually employed by Sky.
in Sky’s diversity policy, this is one of the diversity characteristics that is considered when evaluating new director candidates.
As at 30 June 2019, Sky’s board had two female directors and four male directors (no overall change from 30 June 2018).
Sky’s officers (a person who reports to the board or to a person who reports to the board) include two female officers and seven male officers1 (30 June 2018 three female officers and ten male officers).
Sky takes a holistic approach to diversity. Sky’s measurable objectives for achieving diversity are that:
− Each year, the board actively considers the composition of the board and any opportunities for new directors to join the board with diversity (including gender diversity) being one of the key criteria when considering new appointments.
− Each year the board compares the number of female and male employees at Sky to the previous financial year’s figures to ensure that Sky is maintaining a strong level of female participation at all levels of the organisation.
− Each year the board considers the extent of age diversification at Sky by comparing the number of employees aged over and under 45 years to the previous financial year’s figures, in order to ensure Sky is benefiting from a mix of experience and new ways of thinking.
For the year ended 30 June 2019, the board is satisfied that Sky achieved its gender diversity objectives and other measurable diversity objectives as follows:
− The board considered opportunities for new directors to join the board with diversity (including gender diversity) in mind for new appointments.
Corporate governanceThis section includes the corporate governance information which Sky is required to disclose in its annual report. Sky has a more detailed corporate governance statement available online at https://www.sky.co.nz/investor-relations, which provides the required disclosures under the ASX Corporate Governance Principles and Recommendations and the NZX Corporate Governance Best Practice Code as at 21 August 2019. That corporate governance statement has been approved by the board.
/ 97
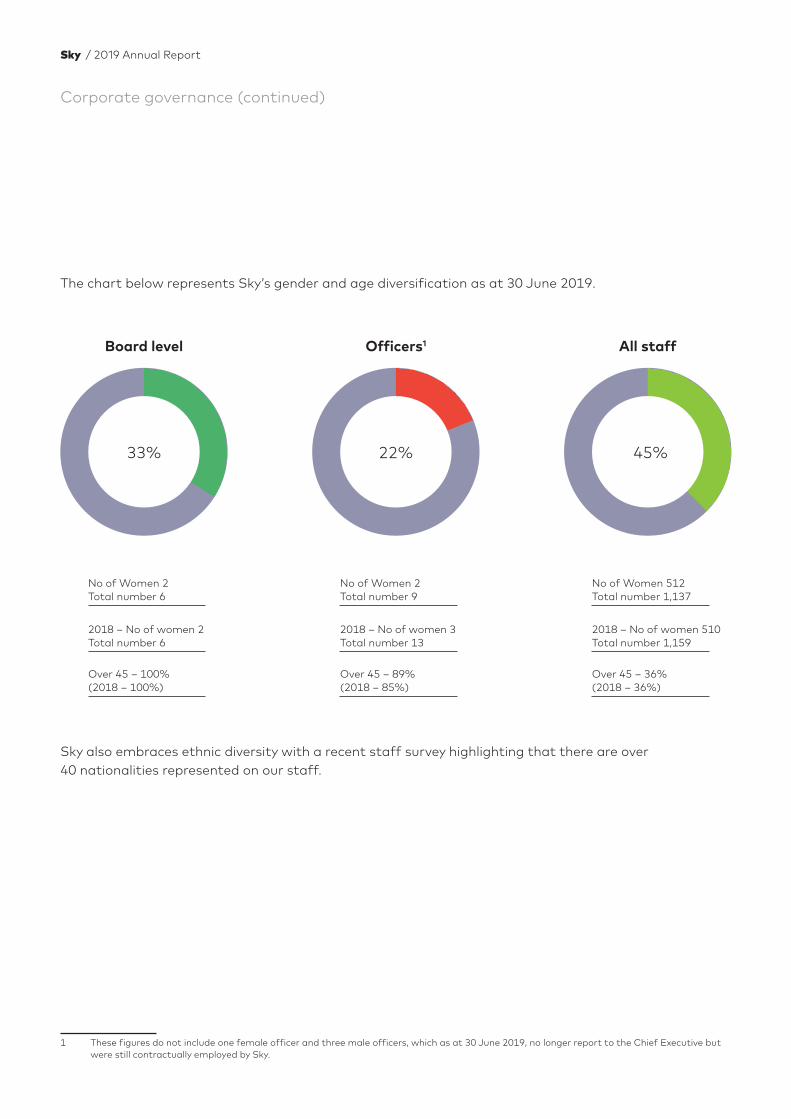
Corporate governance (continued)
33% 22% 45%
The chart below represents Sky’s gender and age diversification as at 30 June 2019.
Sky also embraces ethnic diversity with a recent staff survey highlighting that there are over 40 nationalities represented on our staff.
Board level
No of Women 2
2018 – No of women 2
Over 45 – 100%
Total number 6
Total number 6
(2018 – 100%)
Officers1
No of Women 2
2018 – No of women 3
Over 45 – 89%
Total number 9
Total number 13
(2018 – 85%)
All staff
No of Women 512
2018 – No of women 510
Over 45 – 36%
Total number 1,137
Total number 1,159
(2018 – 36%)
1
1 These figures do not include one female officer and three male officers, which as at 30 June 2019, no longer report to the Chief Executive but were still contractually employed by Sky.
Sky / 2019 Annual Report
Risk managementSky’s risk framework is overseen and monitored by both the board and the audit and risk committee. Sky maintains a risk register and the audit and risk committee in conjunction with management regularly report to the board on the effectiveness of the management of Sky’s business risks and whether the risk management framework and systems of internal compliance and control are operating efficiently and effectively in all material respects.
Sky has a Risk Management Policy which provides an overview of its risk management process. The policy outlines Sky’s strategic risk management objectives and guidelines and provides a framework to identify, manage and report on risks both financial and non-financial. The audit and risk committee reviews the Risk Management Policy annually. The board reviewed Sky’s risk management framework during the reporting period to 30 June 2019 and is satisfied that Sky has in place a robust risk assessment process.
Sky’s internal audit function is contracted out to an independent third party. An annual internal audit plan is presented and approved by the audit and risk committee and the audit and risk committee receives internal audit reports during the year and monitors completion of action items that arise.
Material exposure to economic environmental and social sustainability risksSky identifies and assesses material exposure to economic, environmental and social sustainability risks on an annual basis and like all media companies Sky is exposed to industry disruption and ongoing structural changes in the way it carries out its business. A summary of Sky’s risk management policy, the key economic, environmental and social sustainability risks it faces, and how Sky intends to manage those risks is available on Sky’s website.
Principal risks that could affect results and performance include:
− Regulatory environment;
− Competition;
− Content protection;
− Business continuity – Interruption to business;
− Investment strategy – Adoption of new technology;
− Financial risks;
− Reputational risks and brand perception;
− Business transformation; and
− Customer value proposition.
/ 99
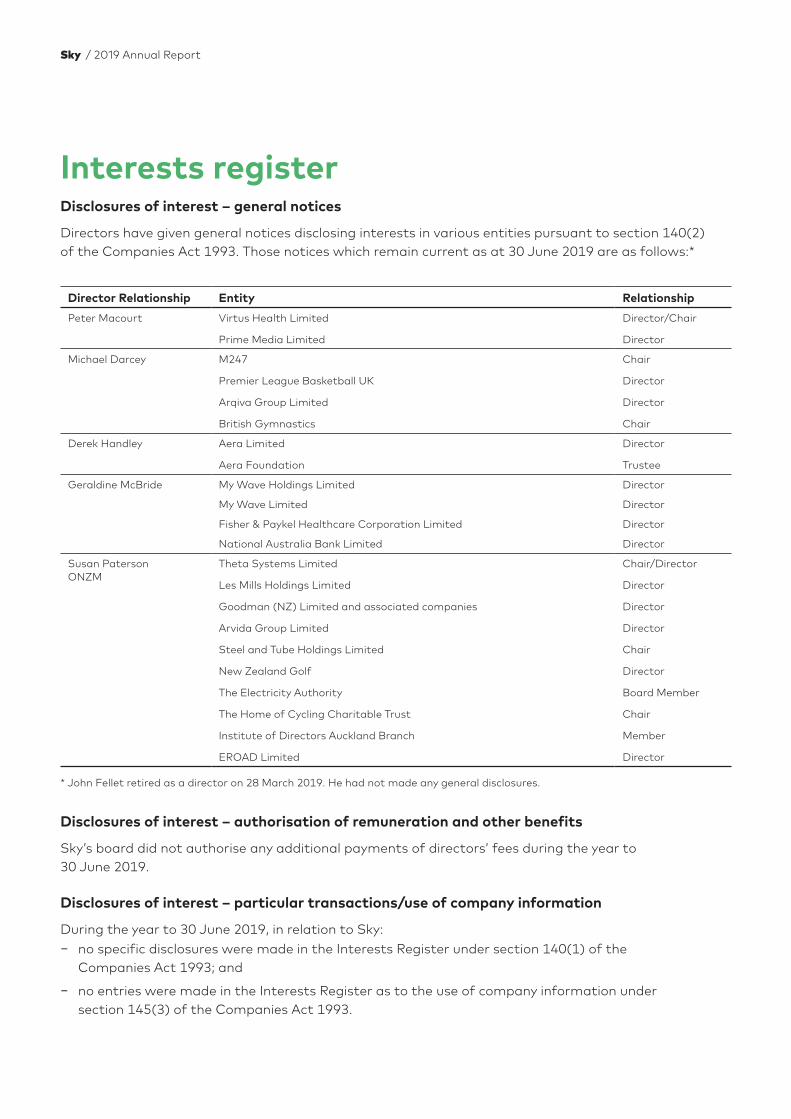
Interests registerDisclosures of interest – general notices
Directors have given general notices disclosing interests in various entities pursuant to section 140(2) of the Companies Act 1993. Those notices which remain current as at 30 June 2019 are as follows:*
Director Relationship Entity Relationship
Peter Macourt Virtus Health Limited
Prime Media Limited
Director/Chair
Director
Michael Darcey M247
Premier League Basketball UK
Arqiva Group Limited
British Gymnastics
Chair
Director
Director
Chair
Derek Handley Aera Limited
Aera Foundation
Director
Trustee
Geraldine McBride My Wave Holdings Limited Director
My Wave Limited Director
Fisher & Paykel Healthcare Corporation Limited Director
National Australia Bank Limited Director
Susan Paterson ONZM
Theta Systems Limited
Les Mills Holdings Limited
Goodman (NZ) Limited and associated companies
Arvida Group Limited
Steel and Tube Holdings Limited
New Zealand Golf
The Electricity Authority
The Home of Cycling Charitable Trust
Institute of Directors Auckland Branch
EROAD Limited
Chair/Director
Director
Director
Director
Chair
Director
Board Member
Chair
Member
Director
* John Fellet retired as a director on 28 March 2019. He had not made any general disclosures.
Disclosures of interest – authorisation of remuneration and other benefits
Sky’s board did not authorise any additional payments of directors’ fees during the year to 30 June 2019.
Disclosures of interest – particular transactions/use of company information
During the year to 30 June 2019, in relation to Sky: − no specific disclosures were made in the Interests Register under section 140(1) of the
Companies Act 1993; and
− no entries were made in the Interests Register as to the use of company information under section 145(3) of the Companies Act 1993.
Sky / 2019 Annual Report
Disclosures of relevant interests in securities
During the year to 30 June 2019, in relation to Sky’s directors, one disclosure was made in the Interests Register as to acquiring a relevant interest in Sky’s shares under section 148 of the Companies Act 1993:
− Martin Stewart made one disclosure regarding a contractual entitlement to receive a total of 800,000 ordinary shares in instalments of 200,000 on each of the first four anniversaries of commencement of employment, with the shares vesting if Sky exercises its no fault termination right or if there is a change of control and Mr Stewart is no longer Chief Executive.
Insurance and indemnities Sky has in place directors’ and officers’ liability insurance to cover risks normally covered by such policies arising out of acts or omissions of Sky directors or employees in that capacity.
Sky has entered into a deed of indemnity pursuant to which it has agreed to indemnify directors, senior management and officers of Sky against liability incurred from acts or omissions of such directors, senior management or officers, subject to certain exceptions which are normal in such indemnities.
Sky subsidiaries’ interests registers The directors of Sky’s subsidiaries have given notices disclosing interests in the various entities pursuant to section 140 of the Companies Act 1993. Those notices which remain current as at 30 June 2019 are set out below:*
Screen Enterprises Limited: George McFarlane had given a general notice disclosing interests arising from being an employee of Sky.
Sky DMX Music Limited: Martin Wrigley and Grant McKenzie have each given a general disclosure notice disclosing interests arising from being senior employees of Sky and, in Martin Wrigley’s case, a shareholder of Sky.
Believe It Or Not Limited: Grant McKenzie has given notice disclosing interests arising from being an employee of Sky. Brendan Lochead has given a general notice disclosing his interest arising from being a shareholder of Believe It Or Not Limited and a director and shareholder of Mad If You Don’t Limited. Annabelle Lochead has given a general notice disclosing her interest arising from being the wife of Brendan Lochead (who is a shareholder of Believe It Or Not Limited) and a director and shareholder of Mad If You Don’t Limited.* John Fellet retired as a director of Outside Broadcasting Limited,
Igloo Limited and Sky Ventures Limited on 21 March 2019. Jason Hollingworth retired as a director of Screen Enterprises Limited, Outside Broadcasting Limited, Igloo Limited and Sky Ventures Limited on 23 April 2019. Michael Watson retired as a director of Igloo Limited on 21 February 2019. Eric Van Der Plank retired as a director of Believe It Or Not Limited on 13 June 2019. Mr Fellet, Mr Hollingworth, Mr Watson and Mr Van Der Plank had each disclosed interests arising as employees of Sky, and in Mr Fellet’s case, a director of Sky.
/ 101
Company and bondholder informationDirectors holding and ceasing office
− Peter Macourt (Chair)
− Michael Darcey
− John Fellet (ceased 28 March 2019)
− Derek Handley
− Geraldine McBride
− Susan Paterson, ONZM
− Martin Stewart (appointed 18 April 2019)
Statement of directors’ interests For the purposes of NZX Listing Rule 3.7.1(d), the following table sets out the quoted financial products in which each director had a relevant interest as at 30 June 2019*:
Relevant interests Shares
Peter Macourt —
Mike Darcey —
Derek Handley 4,000
Geraldine McBride —
Susan Paterson 10,000
Martin Stewart 800,000**
* John Fellet retired from the board on 28 March 2019. On retirement, Mr Fellet held a relevant interest in 246,400 ordinary shares in Sky. ** Power to control the acquisition/disposal of 800,000 ordinary shares as a result of a contractual entitlement to receive such shares in instalments
of 200,000 on each of the first four anniversaries of commencement of employment, with the shares vesting if Sky exercises its no fault termination right or if there is a change of control and Mr Stewart is no longer Chief Executive.
Sky / 2019 Annual Report
Subsidiaries At 30 June 2019, Sky had the following subsidiary companies:
Sky DMX Music Limited, Screen Enterprises Limited, Outside Broadcasting Limited, Igloo Limited, Believe It Or Not Limited, Sky Ventures Limited and Media Finance Limited. During the year to 30 June 2019, Sky DMX Music Limited operated the Sky DMX music business. Outside Broadcasting Limited provided mobile on-site broadcasting facilities and services, Believe It Or Not Limited provided quizzes for the hotel entertainment industry, and Sky Ventures Limited provided investment and sponsorship in the field of information and broadcast technology, by holding a 13.54% investment in 90 Seconds Pty Limited (a cloud video production company). This investment was sold in July 2018. Media Finance Limited, Igloo Limited and Screen Enterprises Limited did not trade during the year.
Directors of subsidiaries
Subsidiary Director
Sky DMX Music Limited Grant McKenzie
Martin Wrigley
Steven Hughes
Kenneth Eissing Jr
Screen Enterprises Limited George MacFarlane
Jason Hollingworth (retired 23 April 2019)
Outside Broadcasting Limited Martin Stewart (appointed 21 February 2019)
Jason Hollingworth (retired 23 April 2019)
John Fellet (retired 21 February 2019)
Igloo Limited Martin Stewart (appointed 21 February 2019)
Jason Hollingworth (retired 23 April 2019)
John Fellet (retired 21 February 2019)
Michael Watson (retired 21 February 2019)
Believe It Or Not Limited Anabelle Lochead
Brendan Lochead
Grant McKenzie
Christopher Shaw (appointed 13 June 2019)
Eric Van Der Plank (retired 13 June 2019)
Sky Ventures Limited (previously Cricket Max Limited)
Martin Stewart (appointed 21 February 2019)
Jason Hollingworth (retired 23 April 2019)
John Fellet (retired 21 February 2019)
Media Finance Limited Martin Stewart (appointed 21 February 2019)
John Fellet (retired 21 February 2019)
The remuneration of Sky’s employees acting as directors of subsidiary companies is disclosed in the relevant banding for employee remuneration or in the case of John Fellet and Martin Stewart, their remuneration is disclosed below under the heading of “Remuneration of Directors”.
No director of any subsidiary company received directors’ fees or extra benefits by virtue of the fact that they are acting as directors of subsidiary companies.
/ 103
Company and bondholder information (continued)
Remuneration of directors The total remuneration and value of other benefits received by directors of Sky during the year 1 July 2018 to 30 June 2019 was as follows:
Name Board FeesAudit and Risk
Committee
Nomination and Remuneration
Committee OtherTotal
Remuneration
John Fellet (ceased 28 March 2019) — — — 1,478,946 1,478,946
Martin Stewart (appointed 18 April 2019) — — — 625,000 625,000
Derek Handley 100,000 12,000 5,000 — 117,000
Peter Macourt (Chair) 170,000 12,000 5,000 — 187,000
Geraldine McBride 100,000 — — — 100,000
Susan Paterson 100,000 20,000 12,000 — 132,000
Mike Darcey 100,000 — — — 100,000
570,000 44,000 22,000 2,103,946 2,739,946
The current fees paid to Sky directors are set out in the table above. Directors do not receive any performance or equity based remuneration or superannuation or retirement benefits. This reflects the role of the directors which is to provide oversight and guide strategy, whereas the role of management is to operate the business and execute Sky’s strategy.
Chief executive remunerationMartin Stewart was appointed as CEO of Sky on 21 February 2019. He was also appointed as a director on 18 April 2019.
John Fellet who was an employee of Sky for 26 years and the CEO of Sky for 17 years retired from his position as CEO on 21 February 2019. He retired as a director on 28 March 2019.
The CEO remuneration is a mix of base salary, bonus and share entitlements and is externally benchmarked annually.
Details for the past five years are as follows:
2019 2018 2017 2016 2015
Martin Stewart John Fellet John Fellet John Fellet John Fellet John Fellet
Base salary 625,000 911,050 1,413,057 1,406,130 1,375,262 1,333,750
STI — 178,133 156,249 144,743 204,243 227,579
LTI — 389,763 405,694 414,868 423,745 347,767
Total Remuneration 625,000 1,478,946 1,975,000 1,965,741 2,003,250 1,909,096
The CEO shares in a bonus pool (with other senior executives who participate in the scheme) which is designed to drive long-term value creation. The proportion of the bonus pool attributable to the CEO depends on the board’s assessment of his performance against a range of KPI’s including development of the long term strategy, leadership, product offerings and pricing, supplier arrangements, organisational efficiencies, and subscriber numbers.
Sky / 2019 Annual Report
The bonus is paid in cash in September each year. A bonus amount is calculated based on financial performance for the prior financial year ended 30 June and this is added to a pool of deferred bonus payments, with one third of the total bonus pool paid being out in the year, and two thirds of the pool being deferred. This deferral of part of the annual bonus is to provide a long-term component to the scheme as the extent to which it is paid will be dependent on the future performance of the business. There is no entitlement to the deferred bonus on resignation or retirement of an executive. The board may consider the individual circumstances in determining how much if any of the deferred bonus will be paid on retirement.
The annual bonus calculation is based on two factors:
− the absolute rate of return on capital employed; and
− the year on year movement in the rate of return on capital employed.
The absolute rate of return on capital employed is calculated as earnings before interest, tax and depreciation (EBITDA) divided by the cumulative capital investment over the previous five years. The scheme also looks at the year on year change in this rate of return and a fixed dollar amount is paid for each percentage point change in the rate of return. This fixed dollar amount is two times the dollar amount paid in the rate of return calculation. If the rate of return decreases compared to the previous year this element of the calculation will result in a negative value being deducted from the bonus pool causing the pool to reduce and the bonus payments to reduce. The pool was reweighted down by $528,000 in 2018 due to a reduced number of participants.
Both Martin Stewart and John Fellet participated in this bonus scheme during the year to 30 June 2019. Mr Stewart’s overall on-target bonus is 50% of his base salary. Mr Stewart is also entitled to 800,000 shares in Sky, in instalments of 200,000 on each of the first four anniversaries of commencement of his employment, with the shares vesting if Sky exercises its no fault termination right or if there is a change of control and Mr Stewart is no longer Chief Executive.
Sky’s executive bonus scheme is currently under review with assistance from external advisers, and Sky intends to implement a new or revised STI and LTI scheme in the 2020 financial year.
/ 105
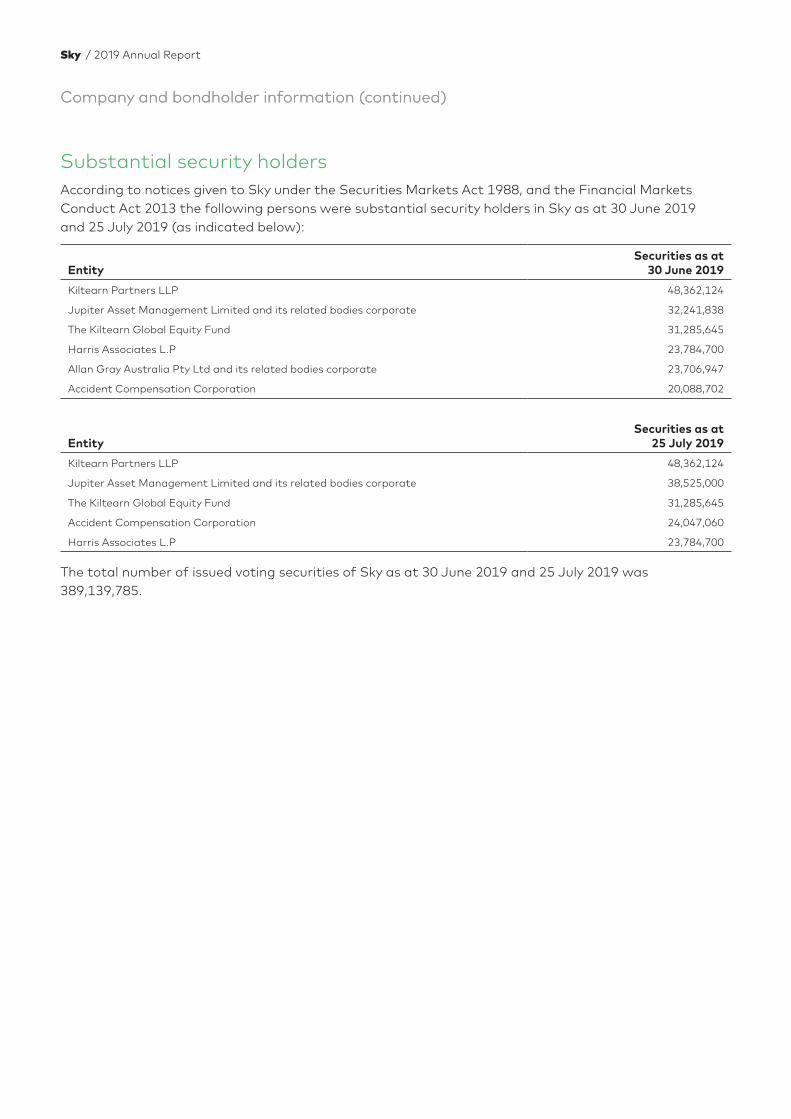
Company and bondholder information (continued)
Substantial security holdersAccording to notices given to Sky under the Securities Markets Act 1988, and the Financial Markets Conduct Act 2013 the following persons were substantial security holders in Sky as at 30 June 2019 and 25 July 2019 (as indicated below):
EntitySecurities as at
30 June 2019
Kiltearn Partners LLP 48,362,124
Jupiter Asset Management Limited and its related bodies corporate 32,241,838
The Kiltearn Global Equity Fund 31,285,645
Harris Associates L.P 23,784,700
Allan Gray Australia Pty Ltd and its related bodies corporate 23,706,947
Accident Compensation Corporation 20,088,702
EntitySecurities as at
25 July 2019
Kiltearn Partners LLP 48,362,124
Jupiter Asset Management Limited and its related bodies corporate 38,525,000
The Kiltearn Global Equity Fund 31,285,645
Accident Compensation Corporation 24,047,060
Harris Associates L.P 23,784,700
The total number of issued voting securities of Sky as at 30 June 2019 and 25 July 2019 was 389,139,785.
Company and bondholder information (continued)
Sky / 2019 Annual Report
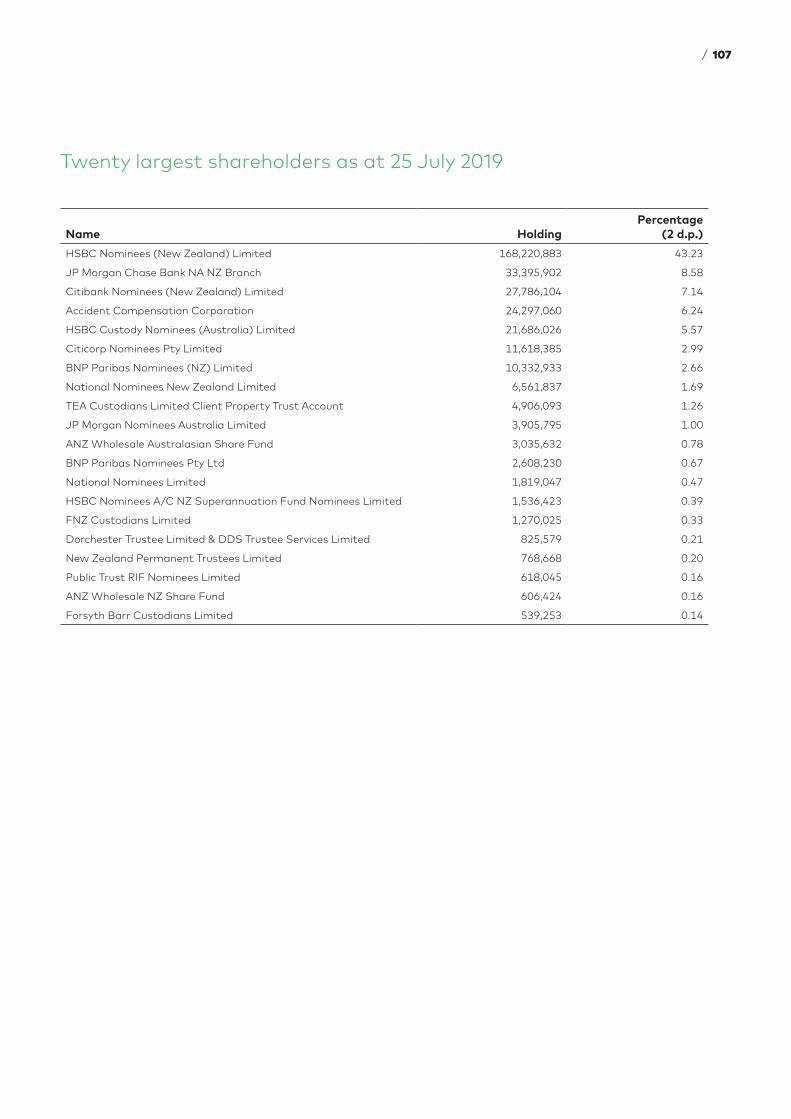
Twenty largest shareholders as at 25 July 2019
Name HoldingPercentage
(2 d.p.)
HSBC Nominees (New Zealand) Limited 168,220,883 43.23
JP Morgan Chase Bank NA NZ Branch 33,395,902 8.58
Citibank Nominees (New Zealand) Limited 27,786,104 7.14
Accident Compensation Corporation 24,297,060 6.24
HSBC Custody Nominees (Australia) Limited 21,686,026 5.57
Citicorp Nominees Pty Limited 11,618,385 2.99
BNP Paribas Nominees (NZ) Limited 10,332,933 2.66
National Nominees New Zealand Limited 6,561,837 1.69
TEA Custodians Limited Client Property Trust Account 4,906,093 1.26
JP Morgan Nominees Australia Limited 3,905,795 1.00
ANZ Wholesale Australasian Share Fund 3,035,632 0.78
BNP Paribas Nominees Pty Ltd 2,608,230 0.67
National Nominees Limited 1,819,047 0.47
HSBC Nominees A/C NZ Superannuation Fund Nominees Limited 1,536,423 0.39
FNZ Custodians Limited 1,270,025 0.33
Dorchester Trustee Limited & DDS Trustee Services Limited 825,579 0.21
New Zealand Permanent Trustees Limited 768,668 0.20
Public Trust RIF Nominees Limited 618,045 0.16
ANZ Wholesale NZ Share Fund 606,424 0.16
Forsyth Barr Custodians Limited 539,253 0.14
/ 107
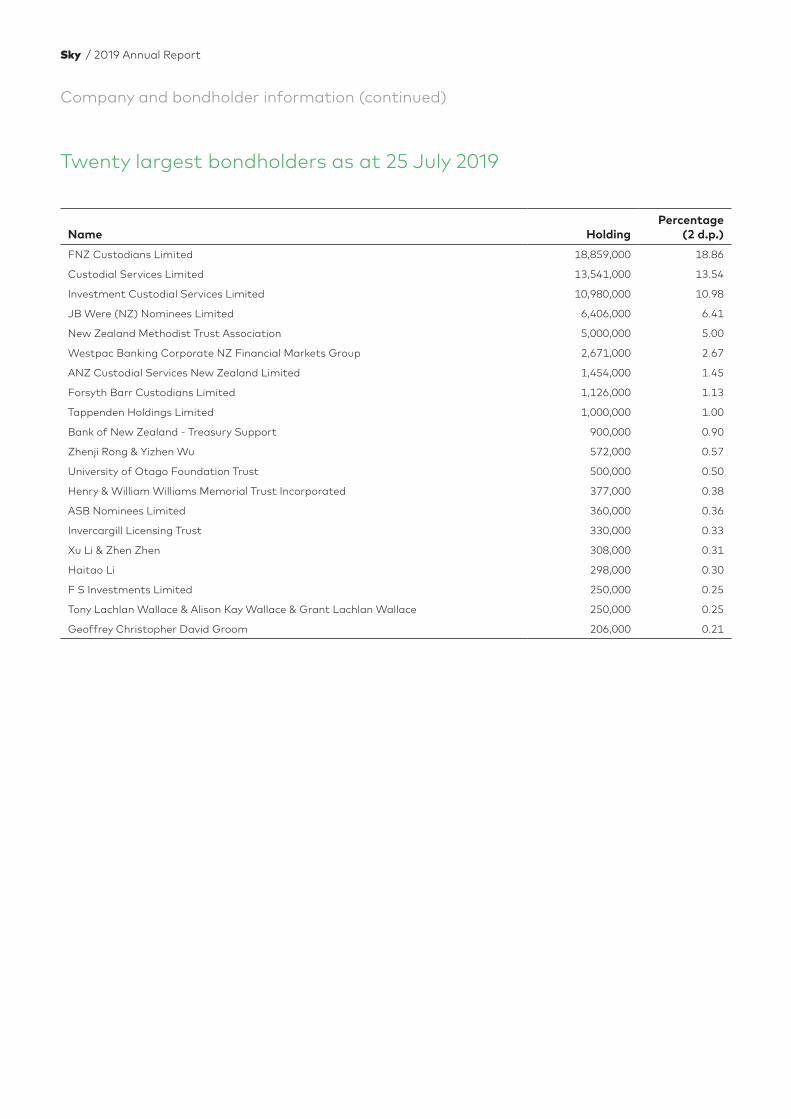
Company and bondholder information (continued)
Twenty largest bondholders as at 25 July 2019
Name HoldingPercentage
(2 d.p.)
FNZ Custodians Limited 18,859,000 18.86
Custodial Services Limited 13,541,000 13.54
Investment Custodial Services Limited 10,980,000 10.98
JB Were (NZ) Nominees Limited 6,406,000 6.41
New Zealand Methodist Trust Association 5,000,000 5.00
Westpac Banking Corporate NZ Financial Markets Group 2,671,000 2.67
ANZ Custodial Services New Zealand Limited 1,454,000 1.45
Forsyth Barr Custodians Limited 1,126,000 1.13
Tappenden Holdings Limited 1,000,000 1.00
Bank of New Zealand - Treasury Support 900,000 0.90
Zhenji Rong & Yizhen Wu 572,000 0.57
University of Otago Foundation Trust 500,000 0.50
Henry & William Williams Memorial Trust Incorporated 377,000 0.38
ASB Nominees Limited 360,000 0.36
Invercargill Licensing Trust 330,000 0.33
Xu Li & Zhen Zhen 308,000 0.31
Haitao Li 298,000 0.30
F S Investments Limited 250,000 0.25
Tony Lachlan Wallace & Alison Kay Wallace & Grant Lachlan Wallace 250,000 0.25
Geoffrey Christopher David Groom 206,000 0.21
Sky / 2019 Annual Report
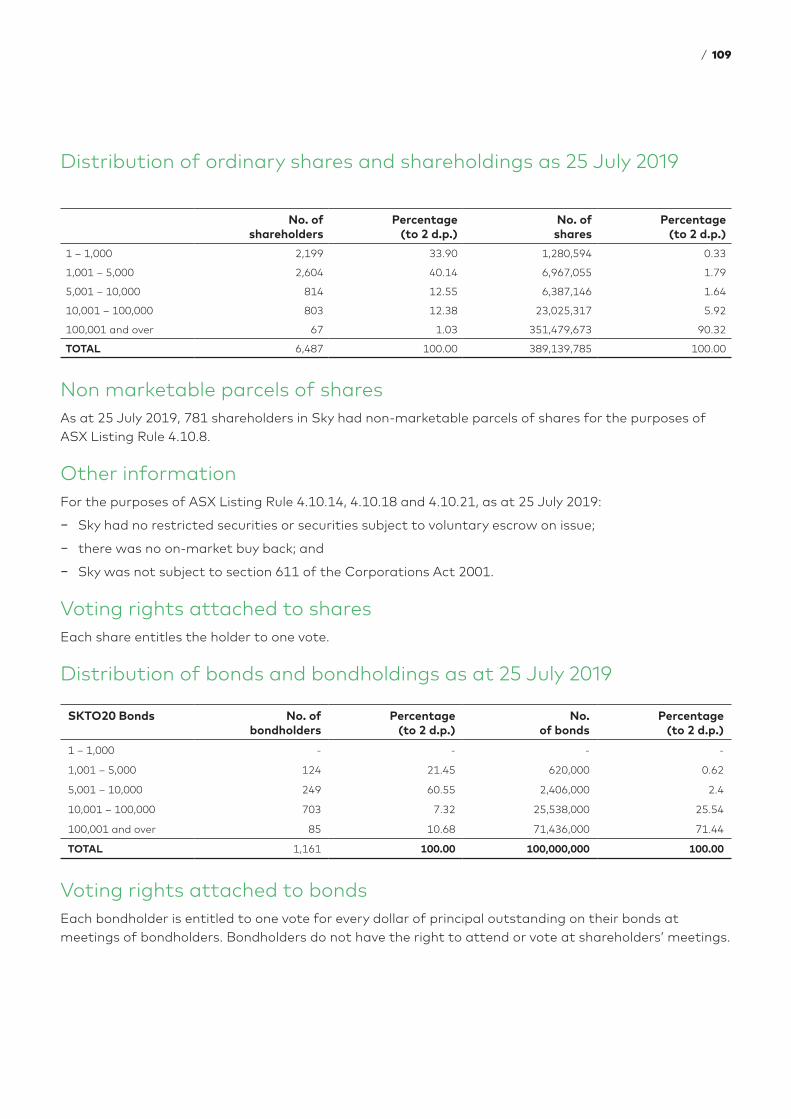
Distribution of ordinary shares and shareholdings as 25 July 2019
No. of shareholders
Percentage (to 2 d.p.)
No. of shares
Percentage (to 2 d.p.)
1 – 1,000 2,199 33.90 1,280,594 0.33
1,001 – 5,000 2,604 40.14 6,967,055 1.79
5,001 – 10,000 814 12.55 6,387,146 1.64
10,001 – 100,000 803 12.38 23,025,317 5.92
100,001 and over 67 1.03 351,479,673 90.32
TOTAL 6,487 100.00 389,139,785 100.00
Non marketable parcels of shares As at 25 July 2019, 781 shareholders in Sky had non-marketable parcels of shares for the purposes of ASX Listing Rule 4.10.8.
Other information For the purposes of ASX Listing Rule 4.10.14, 4.10.18 and 4.10.21, as at 25 July 2019:
− Sky had no restricted securities or securities subject to voluntary escrow on issue;
− there was no on-market buy back; and
− Sky was not subject to section 611 of the Corporations Act 2001.
Voting rights attached to shares Each share entitles the holder to one vote.
Distribution of bonds and bondholdings as at 25 July 2019
SKTO20 Bonds No. of bondholders
Percentage (to 2 d.p.)
No. of bonds
Percentage (to 2 d.p.)
1 – 1,000 - - - -
1,001 – 5,000 124 21.45 620,000 0.62
5,001 – 10,000 249 60.55 2,406,000 2.4
10,001 – 100,000 703 7.32 25,538,000 25.54
100,001 and over 85 10.68 71,436,000 71.44
TOTAL 1,161 100.00 100,000,000 100.00
Voting rights attached to bonds Each bondholder is entitled to one vote for every dollar of principal outstanding on their bonds at meetings of bondholders. Bondholders do not have the right to attend or vote at shareholders’ meetings.
/ 109
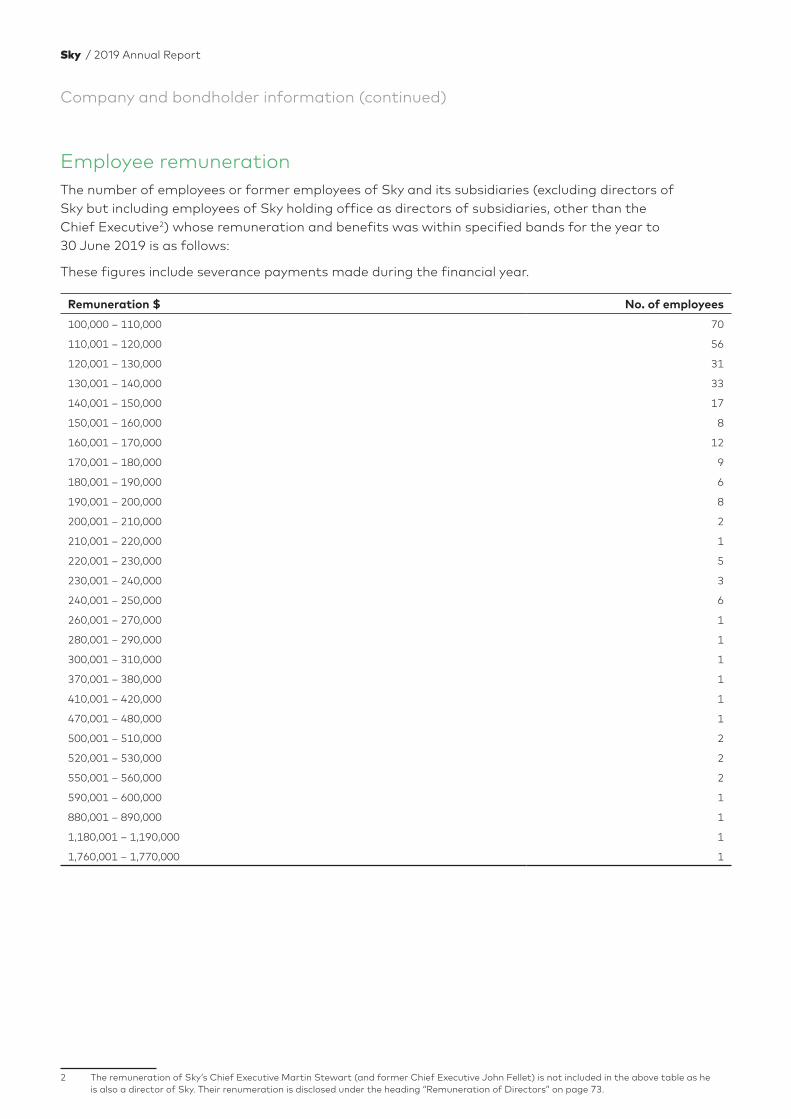
Company and bondholder information (continued)
Employee remuneration The number of employees or former employees of Sky and its subsidiaries (excluding directors of Sky but including employees of Sky holding office as directors of subsidiaries, other than the Chief Executive2) whose remuneration and benefits was within specified bands for the year to 30 June 2019 is as follows:
These figures include severance payments made during the financial year.
Remuneration $ No. of employees
100,000 – 110,000 70
110,001 – 120,000 56
120,001 – 130,000 31
130,001 – 140,000 33
140,001 – 150,000 17
150,001 – 160,000 8
160,001 – 170,000 12
170,001 – 180,000 9
180,001 – 190,000 6
190,001 – 200,000 8
200,001 – 210,000 2
210,001 – 220,000 1
220,001 – 230,000 5
230,001 – 240,000 3
240,001 – 250,000 6
260,001 – 270,000 1
280,001 – 290,000 1
300,001 – 310,000 1
370,001 – 380,000 1
410,001 – 420,000 1
470,001 – 480,000 1
500,001 – 510,000 2
520,001 – 530,000 2
550,001 – 560,000 2
590,001 – 600,000 1
880,001 – 890,000 1
1,180,001 – 1,190,000 1
1,760,001 – 1,770,000 1
2 The remuneration of Sky’s Chief Executive Martin Stewart (and former Chief Executive John Fellet) is not included in the above table as he is also a director of Sky. Their renumeration is disclosed under the heading “Remuneration of Directors” on page 73.
Sky / 2019 Annual Report
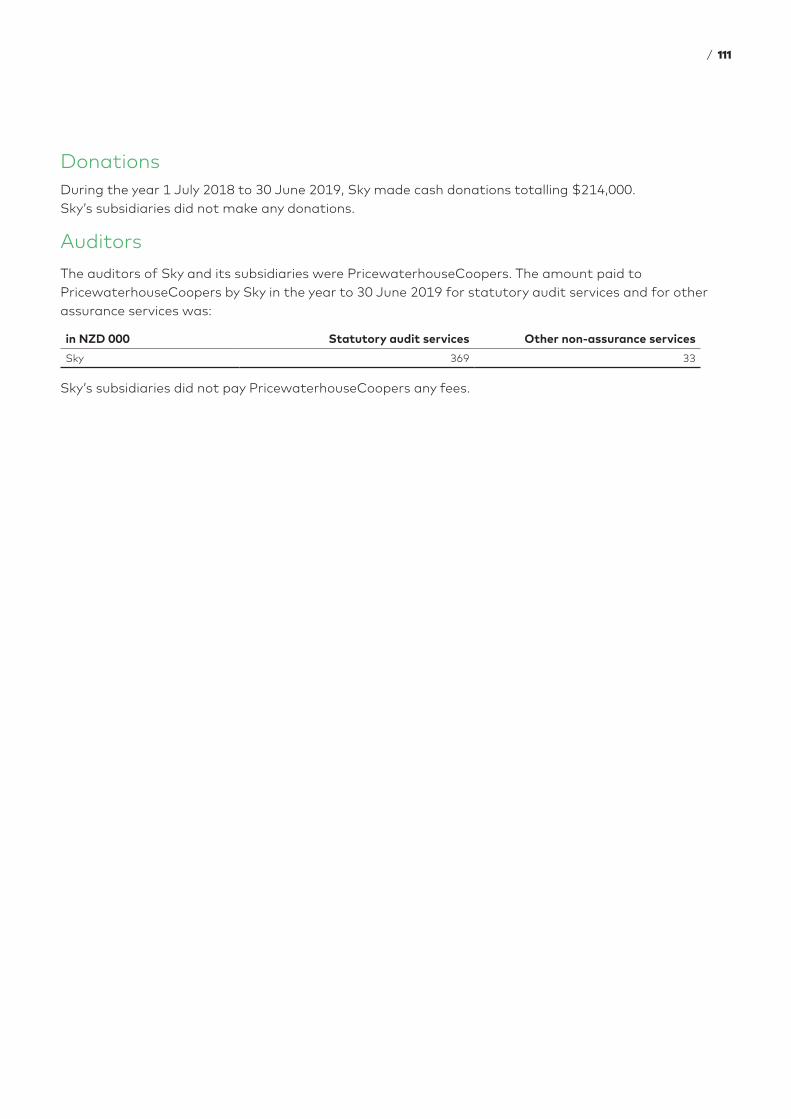
Donations During the year 1 July 2018 to 30 June 2019, Sky made cash donations totalling $214,000. Sky’s subsidiaries did not make any donations.
Auditors
The auditors of Sky and its subsidiaries were PricewaterhouseCoopers. The amount paid to PricewaterhouseCoopers by Sky in the year to 30 June 2019 for statutory audit services and for other assurance services was:
in NZD 000 Statutory audit services Other non-assurance services
Sky 369 33
Sky’s subsidiaries did not pay PricewaterhouseCoopers any fees.
/ 111
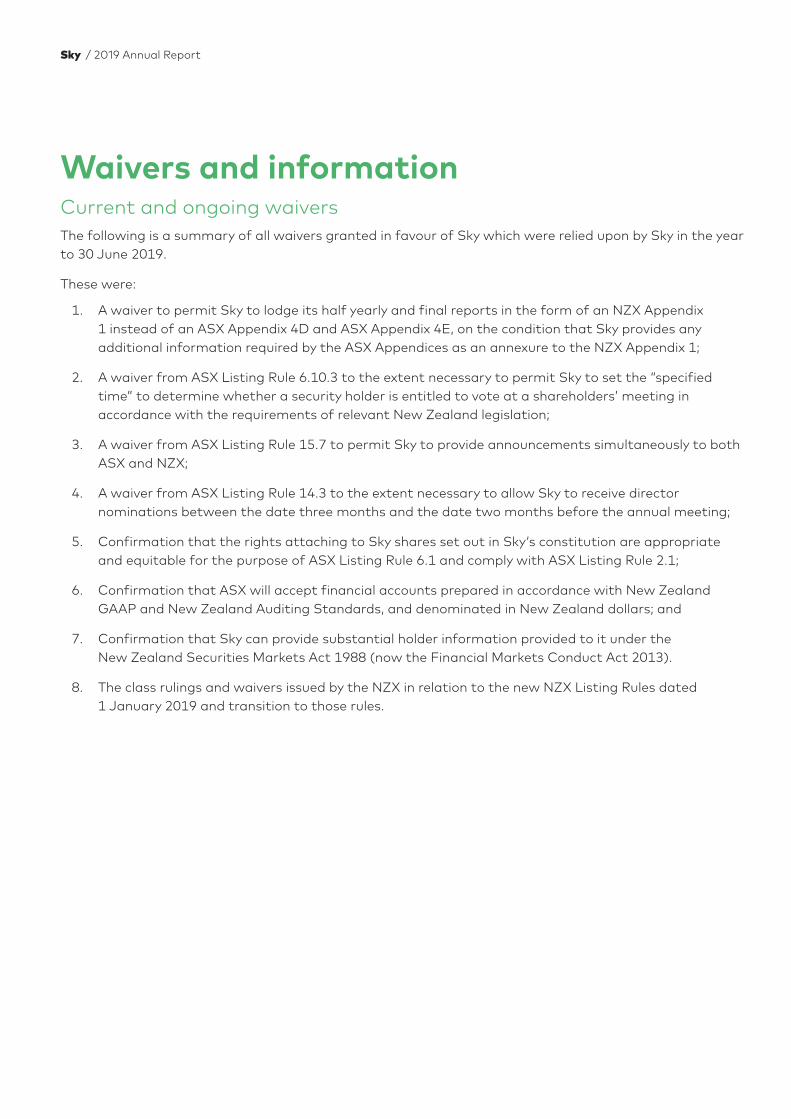
Waivers and informationCurrent and ongoing waivers The following is a summary of all waivers granted in favour of Sky which were relied upon by Sky in the year to 30 June 2019.
These were:
1. A waiver to permit Sky to lodge its half yearly and final reports in the form of an NZX Appendix 1 instead of an ASX Appendix 4D and ASX Appendix 4E, on the condition that Sky provides any additional information required by the ASX Appendices as an annexure to the NZX Appendix 1;
2. A waiver from ASX Listing Rule 6.10.3 to the extent necessary to permit Sky to set the “specified time” to determine whether a security holder is entitled to vote at a shareholders’ meeting in accordance with the requirements of relevant New Zealand legislation;
3. A waiver from ASX Listing Rule 15.7 to permit Sky to provide announcements simultaneously to both ASX and NZX;
4. A waiver from ASX Listing Rule 14.3 to the extent necessary to allow Sky to receive director nominations between the date three months and the date two months before the annual meeting;
5. Confirmation that the rights attaching to Sky shares set out in Sky‘s constitution are appropriate and equitable for the purpose of ASX Listing Rule 6.1 and comply with ASX Listing Rule 2.1;
6. Confirmation that ASX will accept financial accounts prepared in accordance with New Zealand GAAP and New Zealand Auditing Standards, and denominated in New Zealand dollars; and
7. Confirmation that Sky can provide substantial holder information provided to it under the New Zealand Securities Markets Act 1988 (now the Financial Markets Conduct Act 2013).
8. The class rulings and waivers issued by the NZX in relation to the new NZX Listing Rules dated 1 January 2019 and transition to those rules.
Sky / 2019 Annual Report
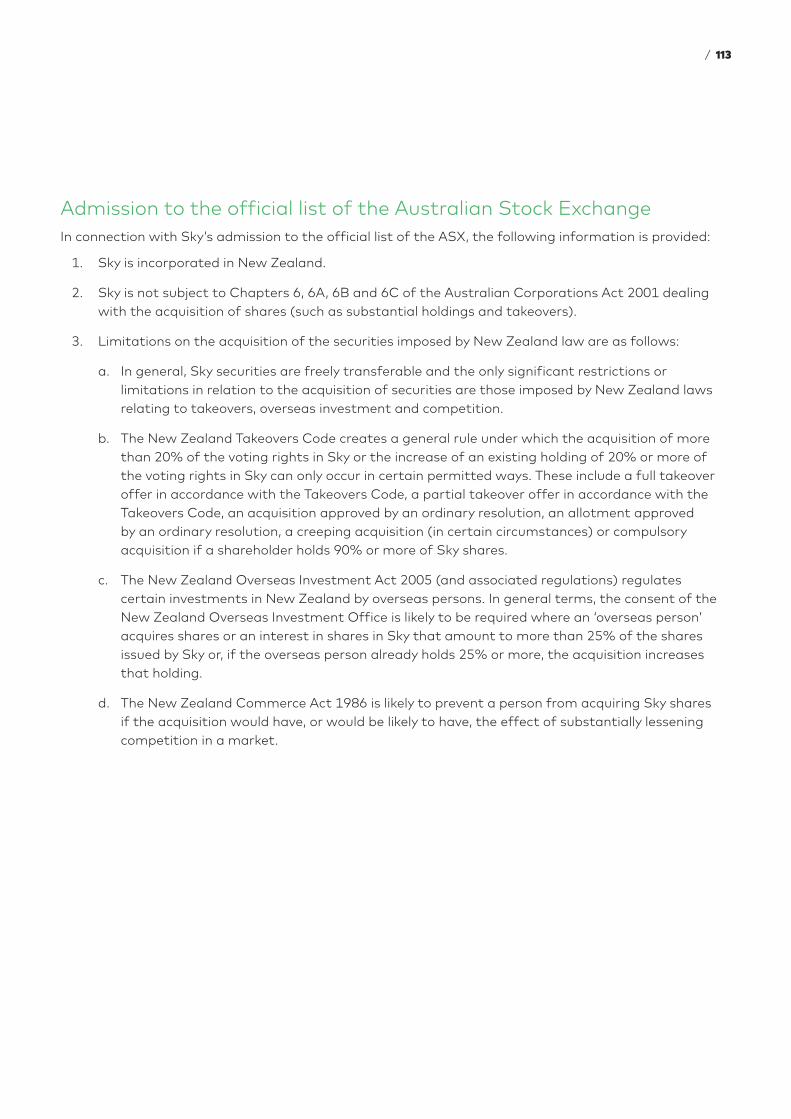
Admission to the official list of the Australian Stock ExchangeIn connection with Sky’s admission to the official list of the ASX, the following information is provided:
1. Sky is incorporated in New Zealand.
2. Sky is not subject to Chapters 6, 6A, 6B and 6C of the Australian Corporations Act 2001 dealing with the acquisition of shares (such as substantial holdings and takeovers).
3. Limitations on the acquisition of the securities imposed by New Zealand law are as follows:
a. In general, Sky securities are freely transferable and the only significant restrictions or limitations in relation to the acquisition of securities are those imposed by New Zealand laws relating to takeovers, overseas investment and competition.
b. The New Zealand Takeovers Code creates a general rule under which the acquisition of more than 20% of the voting rights in Sky or the increase of an existing holding of 20% or more of the voting rights in Sky can only occur in certain permitted ways. These include a full takeover offer in accordance with the Takeovers Code, a partial takeover offer in accordance with the Takeovers Code, an acquisition approved by an ordinary resolution, an allotment approved by an ordinary resolution, a creeping acquisition (in certain circumstances) or compulsory acquisition if a shareholder holds 90% or more of Sky shares.
c. The New Zealand Overseas Investment Act 2005 (and associated regulations) regulates certain investments in New Zealand by overseas persons. In general terms, the consent of the New Zealand Overseas Investment Office is likely to be required where an ‘overseas person’ acquires shares or an interest in shares in Sky that amount to more than 25% of the shares issued by Sky or, if the overseas person already holds 25% or more, the acquisition increases that holding.
d. The New Zealand Commerce Act 1986 is likely to prevent a person from acquiring Sky shares if the acquisition would have, or would be likely to have, the effect of substantially lessening competition in a market.
/ 113

Sky / 2019 Annual Report
Share market and other informationNew ZealandSky’s ordinary shares are listed on the main board of the NZX and trade under the symbol SKT. Sky’s bonds are listed on the NZDX and trade under the symbol SKT020. Sky’s International Security Identification Number issued for the Company by the NZX is NZSKTE0001S6.
NZX Limited
Level 1, NZX Centre 11 Cable Street Wellington 6011, New Zealand
Mailing address:
PO Box 2959 Wellington 6140, New Zealand Tel: +64 4 472 7599 Fax: +64 4 496 2893 Website: nzx.com
AustraliaSky’s ordinary shares are also listed on the ASX and trade under the symbol SKT.
ASX Limited
Exchange Centre 20 Bridge Street, Sydney NSW 2000, Australia
Mailing address:
PO Box H224Australia Square, SydneyNSW 1215, AustraliaTel: +61 2 9338 0000 Fax: +61 2 9227 0885Website: asx.com.au
Annual meeting The next annual meeting of Sky Network Television Limited will be held at The Generator, 12 Madden Street, Auckland, on Thursday 17 October 2019, commencing at 10.30 am.
/ 115
DirectoryRegistrars
Shareholders should address questions relating to share certificates, notify changes of address or address any administrative questions to Sky’s share registrar as follows:
New Zealand ordinary share registrar
Computershare Investor Services Limited Level 2, 159 Hurstmere Road Takapuna, North Shore City 0622 New Zealand
Mailing address:
Private Bag 92119 Auckland Mail Centre Auckland 1142, New Zealand Tel: +64 9 488 8700 Fax: +64 9 488 8787 Email: [email protected]
Australian branch register
Computershare Investor Services Pty Limited
Yarra Falls, 452 Johnston Street Abbotsford, VIC 3067 GPO Box 2975 Melbourne VIC 3000, Australia
Freephone: 1800 501 366 (within Australia) Tel 61 3 9415 5000 (outside Australia) Fax +61 3 9473 2500 Email: [email protected]
Bondholder trustee
The New Zealand Guardian Trust Company Limited Level 6, 191 Queen Street Auckland 1010, New Zealand
Mailing address:
PO Box 274, Shortland Street Auckland 1140, New Zealand Tel: 0800 683 909 Fax: +64 9 377 7470 Email: [email protected]
Sky / 2019 Annual Report
Directors
Peter Macourt, Chair
Michael Darcey
Derek Handley
Geraldine McBride
Susan Paterson ONZM
Martin Stewart (appointed 18 April 2019), Chief Executive
Officers
Martin Stewart Director and Chief Executive Officer
Sophie Moloney Chief Legal, People and Partnerships Officer and Company Secretary
Blair Woodbury Chief Financial Officer
Steve Bayliss Chief Marketing Officer
Travis Dunbar Director of Entertainment Programming
Chris Major Director of External Affairs
Tex Teixeira Director of Sport and Broadcasting
Grant Frear Interim Chief of Technology
Martin Wrigley Director of Operations
New Zealand registered office
10 Panorama Road, Mt Wellington, Auckland 1060, New Zealand Tel: +64 9 579 9999 Fax: +64 9 579 8324 Website: sky.co.nz
Australian registered office
c/- Allens Arthur Robinson Corporate Pty Limited Level 4, Deutsche Bank Place, 126 Philip Street, Sydney, NSW 2000, Australia Tel: +61 2 9230 4000 Fax: +61 2 9230 5333
Auditors to Sky
PricewaterhouseCoopers PricewaterhouseCoopers Tower, 188 Quay Street, Auckland 1010, New Zealand Tel: +64 9 355 8000 Fax: +64 9 355 8001
Solicitors to Sky
Buddle Findlay PricewaterhouseCoopers Tower, 188 Quay Street, Auckland 1010, New Zealand Tel: +64 9 358 2555 Fax: +64 9 358 2055
/ 117

Sky / 2019 Annual Report