Annual Report - Phillip...
57
Phillip Investment Funds Annual Report For the year ended 31 December 2014
Transcript of Annual Report - Phillip...

Phillip Investment Funds
Annual ReportFor the year ended 31 December 2014

1
Phillip Investment Funds
MANAGER
Phillip Capital Management (S) Ltd250 North Bridge Road #06-00Raffles City TowerSingapore 179101
DIRECTORS OF THE MANAGER
Lim Hua MinLoh Hoon SunJeffrey Lee Chay KhiongLinus Lim Wen SheongLee Ken Hoon
TRUSTEE
Citicorp Trustee (Singapore) Limited8 Marina View #21-00Asia Square Tower 1Singapore 018960
CUSTODIAN
Citibank N.A. Singapore Branch8 Marina View #21-00Asia Square Tower 1Singapore 018960
REGISTRAR
Boardroom Corporate & Advisory Services Pte Ltd50 Raffles Place#32-01 Singapore Land TowerSingapore 048623

2
AUDITORS
KPMG LLP16 Raffles Quay #22-00Hong Leong BuildingSingapore 048581
SOLICITORS TO THE MANAGER
Chan & Goh LLP50 Craig Road #03-01Singapore 089688
SOLICITORS TO THE TRUSTEE
Drew & Napier LLP10 Collyer Quay, #10-01Ocean Financial CentreSingapore 049315

3
CONTENTS Page
MANAGER’S REPORT 4-19
FINANCIAL STATEMENTS
REPORT OF THE TRUSTEE 20
STATEMENT BY THE MANAGER 21
INDEPENDENT AUDITORS’ REPORT 22– 23
Statements of Total Return FS1
Statements of Financial Position FS2
Statements of Movements of Unitholders’ Funds FS3-FS4
Statements of Portfolio FS5 – FS17
Notes to the Financial Statements FS18 –FS33

4
Phillip Money Market Fund
MANAGER’S REPORT
The fund generated a net return of 0.44% for the year ended 31 December 2014. Thereturn outperformed the corresponding 3-month SGD Interbank Offer rate (“SIBOR”)average at 0.29%.
As at 31 December 2014, the portfolio’s Weighted Average Maturity (“WAM’) stood at89 days. The bond portfolio has an average credit rating of A, and is well-diversified insector and geographical holdings. As at 31 December 2014, Singapore and China comprise21% and 13% of the fund’s allocation respectively. The fund is mainly invested in Asianfixed rate issues and deposits with banks.
Singapore’s GDP grew by 2.9% in 2014 compared with 4.4% in 2013, weighed down by aslowdown in services and construction. The services industry grew by 3.2 percent in 2014,easing from the 6.1 percent growth in 2013. This was due to a drag in transportation &storage and wholesale & retail trade. Growth in the construction sector declined from 6.3%in 2013 to 3% in 2014. Private construction activities is expected to remain a drag in 2015given tepid market sentiments. On the other hand, manufacturing output posted a modestrecovery from 1.7% in 2013 to 2.6% in 2014, supported by biomedical and chemicalssector.
The Monetary Authority of Singapore (“MAS”) core inflation eased from 2% in 2013 tojust 1.5% in 2014. This is primarily driven by lower transport costs given the drop inpetrol pump prices, and a soft housing market..
SGD Singapore Swap Offer Rate (“SOR”) 1 month and 3 months yields increased from0.18% and 0.25% in October 2014 to 0.62% and 0.74% respectively as at end December2014. The SGD Inter-Bank Offer Rate (“SIBOR”) 1-month rate and 3-month rate alsoincreased by 0.47% during the year. The increase in short-term interest rates couldcontinue to increase as 2015 progresses, with the market anticipating a Fed rate hike.
OUTLOOK
The Singapore economy is expected to grow at 2-4% in 2015, with uneven growthrecovery and downside risks in the Fed tightening policy, China’s growth slowdown andthe Eurozone crisis. Core inflation is expected to rise slower at -0.5% to 0.5%. With theinflationary environment expected to look fairly benign in 2015, MAS announced inJanuary that it will reduce the slope of the S$NEER policy band in order to slow theappreciation of the SGD. MAS said it remains vigilant over external developments suchas the Russia-Ukraine crisis and East Asia territorial disputes and their impact on thedomestic economy.
Our strategy remains to buy and hold high quality securities to maturity and manageinterest rate risk with a portfolio of staggered maturities. In addition, we maintain prudentmanagement of concentration and liquidity risks with a wide diversification of issuers andbanks for the portfolio.

5
Disclosures on the Fund1
a) I Investment Classified by Geography
Fair Valueas at
Percentage ofNet Assets
Attributable toUnitholders as at
31/12/2014 31/12/2014S$ %
By Geography (Summary)Australia 5,602,791 0.70China / Hong Kong 102,110,414 12.84Italy 23,918,136 3.01Japan 9,985,000 1.26Netherlands 2,751,224 0.35New Zealand 6,304,895 0.79Singapore 167,785,489 21.11South Korea 5,349,026 0.68Accrued interest on debt securities 2,014,395 0.25Portfolio of investments 325,821,370 40.99Other net assets 469,143,211 59.01Net assets attributable to unitholders 794,964,581 100.00
a) II Investment Classified by Industry
Fair Valueas at
Percentage ofNet Assets
Attributable toUnitholders as at
31/12/2014 31/12/2014S$ %
By Industry (Summary)Airline 10,377,971 1.31Banks & financials 156,021,486 19.63Commercial services 14,870,360 1.87Government agency 41,413,590 5.21Hotel and property 62,238,142 7.83Media 31,816,993 4.00Transportation & logistics 3,020,700 0.38Utilities 4,047,733 0.51Accrued interest on debt securities 2,014,395 0.25Portfolio of investments 325,821,370 40.99Other net assets 469,143,211 59.01Net assets attributable to unitholders 794,964,581 100.00
1 As required by the Code on Collective Investment Schemes

6
a) III Asset Class
Fair Valueas at
31/12/2014
Percentage ofNet Assets
Attributable toUnitholders as at
31/12/2014S$ %
Debt Securities 325,821,370 40.99Other net assets (17,113,028) (2.15)Term deposits 432,080,372 54.35Cash and Bank Balances 54,175,867 6.81Net assets attributable to unitholders 794,964,581 100.00
a) IV Credit Rating of Non-Deposit Investments
Fair Valueas at
31/12/2014
Percentage ofNet Assets
Attributable toUnitholders as at
31/12/2014S$ %
A 9,575,581 1.21AA 7,903,070 0.99AA * 2,782,604 0.35A ** 64,476,458 8.11Aa ** 2,280,764 0.29Unrated 238,802,892 30.04Portfolio of investments 325,821,370 40.99
Source of the credit rating is from Standard & Poor’s except for the following:* Credit rating is from Fitch.** Credit rating is from Moody’s.
Type of Non-Deposit Investments
Fair Valueas at
31/12/2014
Percentage ofNet Assets
Attributable toUnitholders as
at31/12/2014
S$ %Certificates of Deposit 136,013,550 17.12Fixed Rate Bonds 187,793,424 23.62Accrued interest on debt securities 2,014,396 0.25Portfolio of investments 325,821,370 40.99

7
Maturity Profile of Underlying Investments
Fair Valueas at
31/12/2014
Percentage ofNet Assets
Attributable toUnitholders as at
31/12/2014S$ %
Up to 30 days 177,852,111 22.3731 to 60 days 55,743,162 7.0161 to 90 days 104,133,534 13.1191 to 120 days 97,179,517 12.22121 to 180 days 112,518,642 14.15181 to 365 days 164,921,721 20.75366 to 681 days 43,538,659 5.48Accrued interest on debt securities 2,014,396 0.25
757,901,742 95.34
b) Top Ten Holdings
10 Largest Holdings as at 31 December 2014
Fair Valueas at
31/12/2014S$
Percentage ofNet Assets
Attributable toUnitholders as at
31/12/2014%
Industrial & Commercial Bank of China 1.00%Due 8 September 2015 34,961,500 4.40
Hong Kong Land Treasury Service 3.65%Due 5 October 2015 33,141,875 4.17
Singapore Press Holdings 2.81%Due 2 March 2015 31,816,993 4.00
Agriculture Bank of China 1.00%Due 22 September 2015 19,998,000 2.52
Bank of China (Singapore)1.15%Due 8 April 2015 14,980,335 1.88
Agriculture Bank of China 1.18%Due 28 April 2015 14,971,545 1.88
Bank of China (Singapore)1.10%Due 6 August 2015 14,949,510 1.88
PSA Corporation Ltd 2.83%Due 6 July 2015 14,870,360 1.87
Intesa SanPaolo London 1.06%Due 15 May 2015 13,938,526 1.75
Land Transport Authority 1.675%Due 27 May 2015 13,028,600 1.64
8
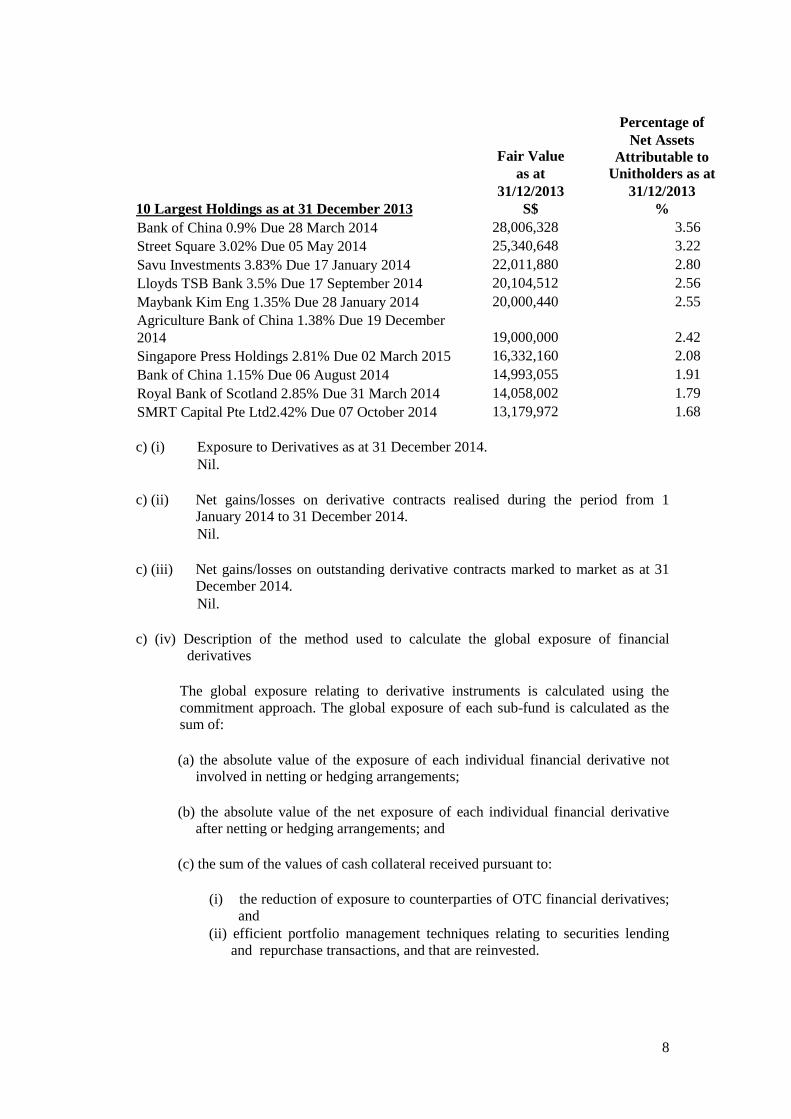
10 Largest Holdings as at 31 December 2013
Fair Valueas at
31/12/2013S$
Percentage ofNet Assets
Attributable toUnitholders as at
31/12/2013%
Bank of China 0.9% Due 28 March 2014 28,006,328 3.56Street Square 3.02% Due 05 May 2014 25,340,648 3.22Savu Investments 3.83% Due 17 January 2014 22,011,880 2.80Lloyds TSB Bank 3.5% Due 17 September 2014 20,104,512 2.56Maybank Kim Eng 1.35% Due 28 January 2014 20,000,440 2.55Agriculture Bank of China 1.38% Due 19 December2014 19,000,000 2.42Singapore Press Holdings 2.81% Due 02 March 2015 16,332,160 2.08Bank of China 1.15% Due 06 August 2014 14,993,055 1.91Royal Bank of Scotland 2.85% Due 31 March 2014 14,058,002 1.79SMRT Capital Pte Ltd2.42% Due 07 October 2014 13,179,972 1.68
c) (i) Exposure to Derivatives as at 31 December 2014.Nil.
c) (ii) Net gains/losses on derivative contracts realised during the period from 1January 2014 to 31 December 2014.Nil.
c) (iii) Net gains/losses on outstanding derivative contracts marked to market as at 31December 2014.Nil.
c) (iv) Description of the method used to calculate the global exposure of financialderivatives
The global exposure relating to derivative instruments is calculated using thecommitment approach. The global exposure of each sub-fund is calculated as thesum of:
(a) the absolute value of the exposure of each individual financial derivative notinvolved in netting or hedging arrangements;
(b) the absolute value of the net exposure of each individual financial derivativeafter netting or hedging arrangements; and
(c) the sum of the values of cash collateral received pursuant to:
(i) the reduction of exposure to counterparties of OTC financial derivatives;and
(ii) efficient portfolio management techniques relating to securities lendingand repurchase transactions, and that are reinvested.

9
d) Amount and percentage of total fund size invested in other unit trusts, mutual fundsand collective investment schemes as at 31 December 2014.Nil
e) Amount and percentage of borrowings of total fund size as at 31 December 2014.Nil
f) Amount of redemptions and subscriptions for the period 1 January 2014 to 31December 2014.Total amount of redemptions S$ 2,441,266,897Total amount of subscriptions S$ 2,447,621,271
g) Related party transactionsTerm deposits, cash and bank balances held with
related parties of the trustee S$24,796,752
h) Performance of the Fund as at 31 December 2014
Note: Cumulative returns are calculated in Singapore dollars on a bid to bid basis, with netdividends reinvested.
Source: Bloomberg
3months
6months
1year
3years
5years
10years
Inception(on 16 Apr2001)
Cumulativereturns (%)
0.13 0.23 0.44 1.48 2.72 11.99 16.31
Annualisedreturns (%)
- - 0.44 0.49 0.54 1.14 1.11
i) Expense Ratio 31 December 2014 31 December 2013Without performance fee 0.49% 0.50%With performance fee 0.49% 0.50%
The expense ratio is computed in accordance with IMAS’ guidelines. The expensesused in the calculation of the expense ratio do not include brokerage and othertransaction costs, performance fee (where applicable), foreign exchange gains orlosses, front or back end loads arising from the purchase or sale of other schemes andtax deducted at source or arising out of income received.
j) Turnover Ratio 31 December 2014 31 December 2013_ 28.24%
The portfolio turnover ratio is calculated in accordance with the formula stated in theCode on Collective Investment Schemes. The calculation of the portfolio turnoverratio is based on the total value of purchases (or sales) of the underlying investmentsdivided by the weighted average daily net asset value. Total value of purchases (or sales)does not include brokerage and other transaction costs. The total value of bonds maturedduring the year is not included in the computation of portfolio turnover ratio.

10
k) Any material information that will adversely impact the valuation of the scheme suchas contingent liabilities of open contracts.Nil.
l) For schemes which invest more than 30% of their deposited property in anotherscheme, the following key information on the second-mentioned scheme (‘theunderlying scheme”) should be disclosed as well.
(i) Top 10 holdings at market value and as percentage of NAV as at 31 December2014 and 31 December 2013.Not applicable.
(ii) Expense ratios for the period 31 December 2014 and 31 December 2013.Not applicable.
(iii) Turnover ratios for the period 31 December 2014 and 31 December 2013Not applicable.
m) Soft dollar arrangements
The Manager shall be entitled to and intends to receive or enter into soft-dollarcommissions or arrangements. The Manager will comply with applicable regulatoryand industry standards on soft-dollars. The soft-dollar commissions which theManager may receive include research and advisory services, economic and politicalanalyses, portfolio analyses including valuation and performance measurements,market analyses, data and quotation services, computer hardware and software or anyother information facilities to the extent that they are used to support the investmentdecision making process, the giving of advice, or the conduct of research or analysis inrelation to the investments managed for clients. The soft dollar credits utilised are notallocated on a specific client basis. The brokers also execute trades for other fundsmanaged by the Manager.
The Manager will not accept or enter into soft dollar commissions or arrangementsunless such soft-dollar commissions/arrangements would, in the opinion of theManager, assist the Manager in its management of clients’ funds, provided that theManager shall ensure at all times that transactions are executed on the best availableterms taking into account the relevant market at the time for transactions of the kindand size concerned, and that no unnecessary trades are entered into in order to qualifyfor such soft-dollar commissions or arrangements.
The Manager does not, and is not entitled to retain cash rebates for its own account inrespect of rebates earned when transacting in securities for account of clients’ funds.
The Manager did not receive any soft dollar services in respect of the fund during theyear.

11
Phillip Income Fund
MANAGER’S REPORT
For the year ended 31 December 2014, the fund generated a return of 5.9% (on a bid-to-bid basis), outperforming its benchmark’s return of 4.6%. Careful management of thedividend income and coupon income received by the portfolio allowed the fund to pay itsinvestors semi-annual distributions amounting to a 4.5% yield in 2014. Since its inceptionon 16 April 2001, the fund is up by 27.7%.
As at 31 December 2014, the portfolio is invested 47% in debt securities and 45% inequities. The fund has a bias toward financials, real estate as well as key utility sub-sectors. In particular focus was the Singapore REIT market in which the REITs offeredsteady income backed by high quality properties. With regards to the fixed incomeholdings, the Fund benefited not only from the selection of high quality bonds for itsportfolio but also from currency appreciation on its USD and RMB-denominated bondinvestments. One such example is a 5-year bond issued by Finansbank AS, a mid-sizedTurkish bank enjoying strong profitability and robust growth. Its positive growth outlookled to a decline in credit spread, contributing a significant gain for the fund after a 6-monthholding period. China Travel Services Corp Ltd 10-year bond issue was another topperformer. The company is one of the largest state-owned travel enterprises with presencein 11 countries, and which has benefited from the burgeoning tourism industry in China.
OUTLOOK
Global economic growth is expected to be supported by lower oil prices. The World Bankprojects growth of 3% in 2015 and 3.3% through 2017 respectively. Developed marketssuch as the US are expected to drive the engines of global growth. Despite inflationarypressures staying muted, the US unemployment rate has continued to improve. Moreover,lower oil prices is expected to support the country’s domestic demand and with a moremoderate fiscal adjustment. The appreciation of the USD partly reflects a strengtheningdomestic economy. The Eurozone continues to show a contrasting outlook from the US,with the risk of slipping back into a recession.
In Asia, Japan pulled out of a technical recession in the last quarter of 2014, with softspending by businesses and consumers. Prime Minister Abe faces the challenge ofattempting to balance the increase in prices and wages. Policy responses in the form ofadditional quantitative and qualitative monetary easing and the Yen depreciation shouldstrengthen growth to above trend in 2015-2016. China is expected to see a slowdown ingrowth to below 7% in 2015 as the Chinese government intends to rebalance and reorientthe economy towards consumption and away from property related sectors and shadowbanking.
Looking ahead to 2015, it is widely expected that the US Federal Reserve will raiseinterest rates most probably in the latter half of the year. A US rate hike has worldwideimplications since the USD is a global reserve currency and several countries are holdingon to US treasuries. We expect the short-end of the yield curve to move up as the US Fedstarts to increase interest rates. This will likely lead to a re-pricing of risk assets especiallyshort duration bonds. As such, we continue to closely monitor and manage interest rate(duration) risk on our bond allocations.

12
The fund has a global mandate but we continue to stay positive in key Asian markets inboth equity and fixed income allocations. Asia continues to benefit from the vast amountof liquidity as a result of easy monetary policies maintained by major central banks whilstunderpinning Asian corporates is the rise of the Asian middle class with its ever increasingconsumption levels. The fund will continue its preference for high dividend-yield Asianequities and quality Asian bonds in 2015. We believe Asian credit spreads still offer valueas opposed to US domestic bonds.
The portfolio intends to maintain a balanced allocation to equities and fixed income. Fixedincome provides diversification, a steady stream of income and lower volatility over time.With the expected rise in interest rates, we continue to stay in the short end of the yield,buy floating rate notes as its coupon resets to market changes, and invest in higher couponsecurities which have shorter durations.
Our strategy is to balance the risk and reward of the fund through active management ofasset allocation, security selection and bond duration. The portfolio is diversifiedgeographically across developed and emerging markets.

13
Disclosures on the Fund 2
a) I Investment Classified by Geography
Fair Valueas at
Percentage ofNet Assets
Attributable toUnitholders as at
31/12/2014 31/12/2014By Geography (Summary) S$ %Australia 320,139 2.68Bermuda 210,873 1.77British Virgin Islands 216,347 1.81Cayman Islands 1,029,570 8.63China / Hong Kong 996,856 8.35France 581,812 4.88Indonesia 535,568 4.49Italy 238,419 2.00Japan 749,807 6.28Malaysia 256,831 2.15Philippines 298,218 2.51Singapore 3,636,781 30.47South Korea 309,661 2.59Taiwan 151,106 1.27Thailand 160,662 1.35United Kingdom 697,100 5.84United States 656,886 5.50Accrued interest on debt securities 39,106 0.32Portfolio of investments 11,085,742 92.89Other net assets 848,027 7.11Net assets attributable to unitholders 11,933,769 100.00
2 As required by the Code on Collective Investment Schemes

14
a) II Investment Classified by Industry
Fair Valueas at
31/12/2014
Percentage ofNet Assets
Attributable toUnitholders as at
31/12/2014By Industry (Summary) S$ %Airline 216,347 1.81Automotive 420,649 3.52Banks & financials 2,498,208 20.93Bond funds 718,674 6.02Chemicals 160,662 1.35Country funds 248,055 2.08Electronics 496,720 4.16Food & beverage 579,728 4.86Government agency 1,187,886 9.95Holding company 117,267 0.98Insurance 132,475 1.11Internet 469,186 3.93Iron & steel 83,089 0.70Leisure 275,107 2.31Mining 104,574 0.88Multi industry 40,240 0.34Oil & gas 134,149 1.12Pharmaceuticals 226,479 1.90Real estate 1,312,534 11.00REITS 127,890 1.07Retail 158,701 1.33Software 305,995 2.56Telecommunications 369,413 3.11Toy & games 165,762 1.39Transportation 496,846 4.16Accrued interest on debt securities 39,106 0.32Portfolio of investments 11,085,742 92.89Other net assets 848,027 7.11Net assets attributable to unitholders 11,933,769 100.00
a) III Asset Class
Fair Valueas at
31/12/2014
Percentage ofNet Assets
Attributable toUnitholders as at
31/12/2014S$ %
Debt Securities 5,666,6661 47.48Equities / Equities Fund 5,039,641 42.23REITs 379,440 3.18Cash and Bank Balances 1,613,008 13.51

15
Other net assets (764,981) (6.41)Net assets attributable to unitholders 11,933,769 100.00
a) IV Credit Rating of Debt Securities
Fair Valueas at
31/12/2014
Percentage ofNet Assets
Attributable toUnitholders as at
31/12/2014S$ %
A 524,900 4.40AAA 657,703 5.51BB 481,848 4.04BBB 430,487 3.60Unrated 3,571,723 29.93Portfolio of investments 5,666,661 47.48
Source of the credit rating is from Standard & Poor’s.
b) Top Ten Holdings
10 Largest Holdings as at 31 December 2014
Fair Valueas at
31/12/2014
Percentage ofNet Assets
Attributable toUnitholders as at
31/12/2014S$ %
Phillip SP Real Estate I-IIS 718,674 6.02US Treasury N/B T 1.50% Due 30 November 2019 656,886 5.50Societe Generale Due 4 February 2016 581,813 4.87Singapore Government SIGB3.0% Due 1 September 2024 531,000 4.45Kingsoft Corp Lt Kinsf 1.25% Due 11 April 2019 305,995 2.56King Power Cap Chitra 5.625% Due 3 November 2024 275,107 2.31Bnkea FRN Due 20 November 2024 262,602 2.20Alibaba Group 3.60% Due 28 November 2024 262,150 2.20Competition Team Honhai 2.125%
Due 13 December 2017 261,639 2.19Filinvest Development Cayman Island 4.25%
Due 2 April 2020 254,389 2.13

16
10 Largest Holdings as at 31 December 2013
Fair Valueas at
31/12/2013
Percentage ofNet Assets
Attributable toUnitholders asat 31/12/2013
S$ %Hyundai Capital 4.5% Due 16 May 2017 336,173 2.53China Shanshui 10% Due 27 April 2017 275,399 2.07Vodafone Group Plc 272,720 2.05Nam Cheong 6% Due 05 November 2015 258,612 1.94Texhong Texttile 6. 5% Due 18 January 2019 257,977 1.94Courta 4.75% Due 02 May 2016 257,031 1.93Keppel Telecom & Transport 2.625% Due 13 August
2019 254,435 1.91China Mengniu 3.5% Due 27 November 2018 251,594 1.89Biosensors Investment 4.875% Due 23 January 2017 251,175 1.89Neptune Orient Lines 4.65% Due 09 September 2020 250,926 1.89
c) (i) Exposure to derivatives as at 31 December 2014:
Fair valueasset
31 December2014S$
Fair valueLiabilities
31 December2014S$
Percentage of totalnet asset
attributable tounitholders
%Forward foreign exchange
contracts 11,526 - 0.10
c) (ii) Net losses on derivative contracts realized for the period from 1 January 2014 to31 December 2014.S$ 5,751
c) (iii) Net gains/(losses) on outstanding derivative contracts marked to market as at 31December 2014.S$11,526
c) (iv) Description of the method used to calculate the global exposure of financialderivatives
The global exposure relating to derivative instruments is calculated using thecommitment approach. The global exposure of each sub-fund is calculated as thesum of:
(a) the absolute value of the exposure of each individual financial derivative notinvolved in netting or hedging arrangements;

17
(b) the absolute value of the net exposure of each individual financial derivativeafter netting or hedging arrangements; and
(c) the sum of the values of cash collateral received pursuant to:
(i) the reduction of exposure to counterparties of OTC financial derivatives;and
(ii) efficient portfolio management techniques relating to securities lendingand repurchase transactions, and that are reinvested.
d) Amount and percentage of total fund size invested in other unit trusts, mutual fundsand collective investment schemes as at 31 December 2014.$ 1,388,911 (11.64%)
e) Amount and percentage of borrowings of total fund size as at 31 December 2014.Nil
f) Amount of redemptions and subscriptions for the period 1 January 2014 to 31December 2014.
Class A SGD Class I SGDS$ S$
Total amount of redemptions 91,880 2,142,003Total amount of subscriptions 75,173 547,241
g) Related party transactions
Brokerage paid to related parties of the Manager S$4,162
Interest income received from related parties of the Manager S$7
Interest income received from related parties of the Trustee S$158
Cash and bank balances held withrelated parties of the trustee S$1,373,967
Amounts held with related parties of the Manager S$215,381Investment into other funds managed by the Manager S$718,674
h) Performance of the Fund
Phillip Income Fund A
3months
6months
1year
3years
5years
10years
Inception
Class A SGDcumulative (%)
0.65 0.74 5.86 17.00 15.27 7.32 27.66
Class A SGDannualised (%)
- - 5.86 5.37 2.88 0.71 1.80
Benchmarkcumulative (%)
2.09 2.28 4.60 13.65 13.56 16.63 36.52
Benchmark annualised(%)
- - 4.60 4.36 2.58 1.55 2.30

18
Phillip Income Fund I
Note: Cumulative returns are calculated in Singapore dollars on a bid to bid basis,with net dividends reinvested. Inception dates for Class A SGD and Class I SGDwere 16 April 2001 and 28 September 2012 respectively.Source: Bloomberg & Phillip Capital Management (S) Ltd
Benchmark: 30% Citigroup World Government Bond Index (SGD Unhedged) + 40%Citigroup World Money Index SGD 3 Mth Euro Deposit (SGD) + 30% MSCI WorldFree Index (SGD) with effect from 27 February 2005
i) Expense Ratio31 December 2014 31 December 2013
Class ASGD
Class ISGD
Class ASGD
Class ISGD
% % % %Without performance fee 1.83 1.61 1.72 1.51With performance fee 1.83 1.61 1.72 1.51
The expense ratio is computed in accordance with IMAS’ guidelines. The expensesused in the calculation of the expense ratio do not include brokerage and othertransaction costs, performance fee (where applicable), foreign exchange gains orlosses, front or back end loads arising from the purchase or sale of other schemes andtax deducted at source or arising out of income received.
j) Turnover Ratio 31 December 2014 31 December 2013146.98% 124.30%
The portfolio turnover ratio is calculated in accordance with the formula stated in theCode on Collective Investment Schemes. The calculation of the portfolio turnoverratio was based on the total value of purchases (or sales) of the underlying investmentsdivided by the weighted average daily net asset value. The total value of bondsmatured during the year is not included in the computation of portfolio turnover ratio.
k) Any material information that will adversely impact the valuation of the scheme suchas contingent liabilities of open contracts.Nil
3months
6months
1year
3years
5years
10years
Inception
Class I SGDCumulative (%)
0.71 0.85 6.04 - - - 12.57
Class I SGDAnnualised (%)
- - 6.04 - - - 5.38
Benchmarkcumulative (%)
2.09 2.28 4.60 - - - 12.55
Benchmark annualised(%)
- - 4.60 - - - 5.38

19
l) For schemes which invest more than 30% of their deposited property in anotherscheme, the following key information on the second-mentioned scheme (‘theunderlying scheme”) should be disclosed as well.
(i) Top 10 holdings at market value and as percentage of NAV as at 31 December2014 and 31 December 2013.
Not applicable.
(ii) Expense ratios for the period 31 December 2014 and 31 December 2013.
Not applicable.
(iii) Turnover ratios for the period 31 December 2014 and 31 December 2013
Not applicable.
m) Soft dollar arrangements
The Manager shall be entitled to and intends to receive or enter into soft-dollarcommissions or arrangements. The Manager will comply with applicable regulatoryand industry standards on soft-dollars. The soft-dollar commissions which theManager may receive include research and advisory services, economic and politicalanalyses, portfolio analyses including valuation and performance measurements,market analyses, data and quotation services, computer hardware and software or anyother information facilities to the extent that they are used to support the investmentdecision making process, the giving of advice, or the conduct of research or analysisand custodial services in relation to the investments managed for clients. The softdollar credits utilised are not allocated on a specific client basis. The brokers alsoexecute trades for other funds managed by the Manager.
The Manager will not accept or enter into soft dollar commissions/arrangementsunless such soft-dollar commissions/arrangements would, in the opinion of theManager, assist the Manager in its management of clients’ funds, provided that theManager shall ensure at all times that transactions are executed on the best availableterms taking into account the relevant market at the time for transactions of the kindand size concerned, and that no unnecessary trades are entered into in order to qualifyfor such soft-dollar commissions/ arrangements.
The Manager does not, and is not entitled to retain cash rebates for its own account inrespect of rebates earned when transacting in securities for account of clients’ funds.
During the year, soft dollar services received from each broker were investmentresearch and publications, data and quotation services. Soft dollars were received fromthe Manager’s panel of brokers which executed transactions for the fund and otherfunds managed by the Manager.

Phillip Investment FundsReport of the Trustee
Year ended 31 December 2014
20
Report of the Trustee
The Trustee is under a duty to take into custody and hold the assets of Phillip Investment Fundsin trust for the unitholders. In accordance with the Securities and Futures Act (Chapter 289), itssubsidiary legislation and the Code on Collective Investment Schemes, the Trustee shallmonitor the activities of the Manager for compliance with the limitations imposed on theinvestment and borrowing powers as set out in the Trust Deed in each annual accounting periodand report thereon to unitholders in an annual report.
To the best knowledge of the Trustee, the Manager has, in all material respects, managed PhillipInvestment Funds during the period covered by these financial statements, set out on pages FS1to FS33, in accordance with the limitations imposed on the investment and borrowing powersset out in the Trust Deed.
For and on behalf of the TrusteeCiticorp Trustee (Singapore) Limited
────────────────────Director
30 March 2015

Phillip Investment FundsStatement by the Manager
Year ended 31 December 2014
21
Statement by the Manager
In the opinion of the directors of Phillip Capital Management (S) Ltd, the accompanyingfinancial statements set out on pages FS1 to FS33, comprising the Statements of Total Return,Statements of Financial Position, Statements of Movements of Unitholders’ Funds, Statementsof Portfolio and Notes to the Financial Statements are drawn up so as to present fairly, in allmaterial respects, the financial position of Phillip Investment Funds as at 31 December 2014,and the total return and movements in unitholders’ funds for the year then ended in accordancewith the recommendations of Statement of Recommended Accounting Practice 7 “ReportingFramework for Unit Trusts” issued by the Institute of Singapore Chartered Accountants. At thedate of this statement, there are reasonable grounds to believe that Phillip Investment Funds willbe able to meet its financial obligations as and when they materialise.
For and on behalf of Directors ofPhillip Capital Management (S) Ltd
────────────────Jeffrey Lee Chay KhiongDirector
30 March 2015
22
KPMG LLP16 Raffles Quay #22-00Hong Leong BuildingSingapore 048581
Telephone +65 6213 3388Fax +65 6225 0984Internet www.kpmg.com.sg
KPMG LLP (Registration No. T08LL1267L) an accounting limitedliability partnership registered in Singapore under the LimitedLiability Partnership Act (Chapter 163A) and a member firm of theKPMG network of independent member firms affiliated with KPMGInternational Cooperative (“KPMG International”), a Swiss entity.
Independent auditors’ report
Auditors’ Report to the unitholders ofPhillip Investment Funds(Constituted under a Trust Deed in the Republic of Singapore)
We have audited the financial statements of Phillip Investment Funds (the “Fund”), whichcomprise the Statements of Financial Position and Statements of Portfolio as at 31 December2014, the Statements of Total Return and Statements of Movements of Unitholders’ Funds forthe year then ended, and a summary of significant accounting policies and other explanatoryinformation, as set out on pages FS1 to FS33.
Manager’s responsibility for the financial statements
The Fund’s Manager (the “Manager”) is responsible for the preparation and fair presentation ofthese financial statements in accordance with the recommendations of Statement ofRecommended Accounting Practice 7 “Reporting Framework for Unit Trusts” issued by theInstitute of Singapore Chartered Accountants, and for such internal control as the Managerdetermines is necessary to enable the preparation of financial statements that are free frommaterial misstatement, whether due to fraud or error.
Auditors’ responsibility
Our responsibility is to express an opinion on these financial statements based on our audit. Weconducted our audit in accordance with Singapore Standards on Auditing. Those standardsrequire that we comply with ethical requirements and plan and perform the audit to obtainreasonable assurance about whether the financial statements are free from materialmisstatement.
An audit involves performing procedures to obtain audit evidence about the amounts anddisclosures in the financial statements. The procedures selected depend on the auditor’sjudgement, including the assessment of the risks of material misstatement of the financialstatements, whether due to fraud or error. In making those risk assessments, the auditorconsiders internal control relevant to the Fund’s preparation and fair presentation of thefinancial statements in order to design audit procedures that are appropriate in thecircumstances, but not for the purpose of expressing an opinion on the effectiveness of theFund’s internal control. An audit also includes evaluating the appropriateness of accountingpolicies used and the reasonableness of accounting estimates made by the Manager, as well asevaluating the overall presentation of the financial statements.
We believe that the audit evidence we have obtained is sufficient and appropriate to provide abasis for our audit opinion.

Phillip Investment FundsIndependent auditors’ report
Year ended 31 December 2014
23
Opinion
In our opinion, the financial statements present fairly, in all material respects, the financialposition of the Fund as at 31 December 2014 and the total return and movements in unitholders’funds for the year then ended in accordance with the recommendations of Statement ofRecommended Accounting Practice 7 “Reporting Framework for Unit Trusts” issued by theInstitute of Singapore Chartered Accountants.
KPMG LLPPublic Accountants andChartered Accountants
Singapore
30 March 2015
Phillip Investment FundsFinancial statements
Year ended 31 December 2014
FS1
The accompanying notes form an integral part of these financial statements.
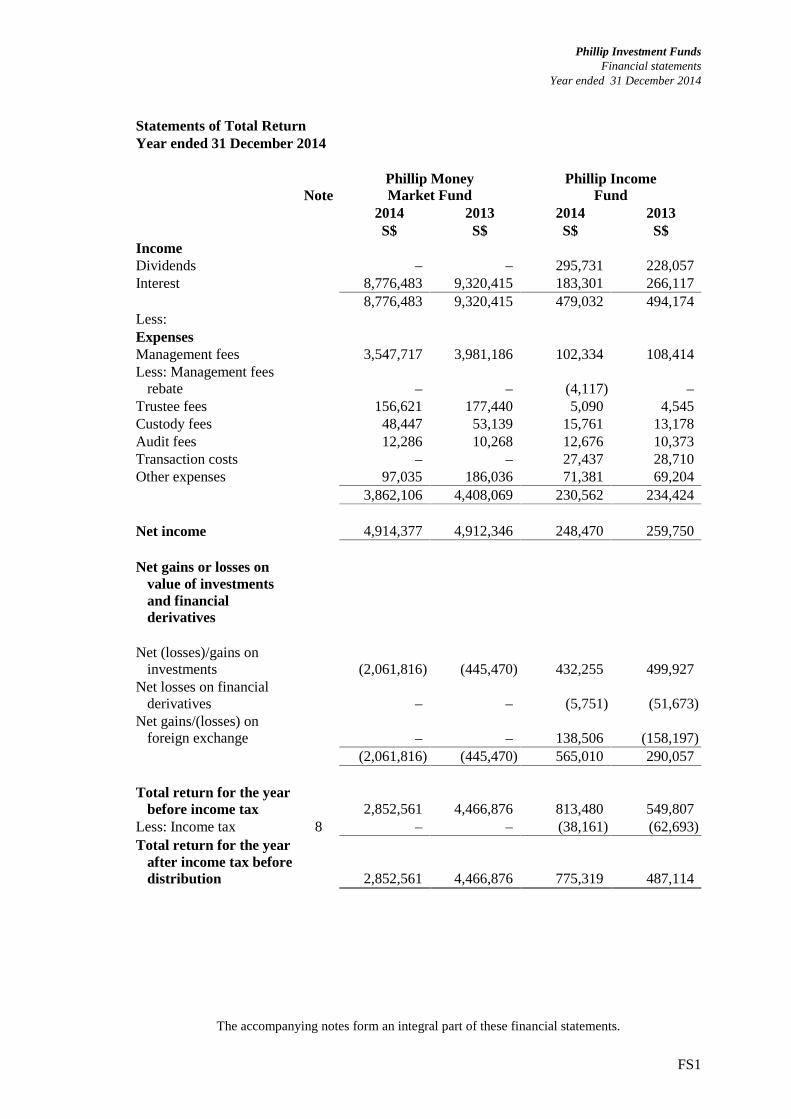
Statements of Total ReturnYear ended 31 December 2014
NotePhillip MoneyMarket Fund
Phillip IncomeFund
2014 2013 2014 2013S$ S$ S$ S$
IncomeDividends – – 295,731 228,057Interest 8,776,483 9,320,415 183,301 266,117
8,776,483 9,320,415 479,032 494,174Less:ExpensesManagement fees 3,547,717 3,981,186 102,334 108,414Less: Management fees
rebate – – (4,117) –Trustee fees 156,621 177,440 5,090 4,545Custody fees 48,447 53,139 15,761 13,178Audit fees 12,286 10,268 12,676 10,373Transaction costs – – 27,437 28,710Other expenses 97,035 186,036 71,381 69,204
3,862,106 4,408,069 230,562 234,424
Net income 4,914,377 4,912,346 248,470 259,750
Net gains or losses onvalue of investmentsand financialderivatives
Net (losses)/gains oninvestments (2,061,816) (445,470) 432,255 499,927
Net losses on financialderivatives – – (5,751) (51,673)
Net gains/(losses) onforeign exchange – – 138,506 (158,197)
(2,061,816) (445,470) 565,010 290,057
Total return for the yearbefore income tax 2,852,561 4,466,876 813,480 549,807
Less: Income tax 8 – – (38,161) (62,693)Total return for the year
after income tax beforedistribution 2,852,561 4,466,876 775,319 487,114

Phillip Investment FundsFinancial statements
Year ended 31 December 2014
FS2
The accompanying notes form an integral part of these financial statements.
Statements of Financial PositionAs at 31 December 2014
Phillip MoneyMarket Fund
Phillip IncomeFund
Note 2014 2013 2014 2013S$ S$ S$ S$
AssetsPortfolio of investments 325,821,370 341,936,746 11,085,742 12,722,344Receivables 3 1,485,922 1,003,685 292,017 10,781Cash and cash equivalents 4 486,256,239 443,913,511 1,613,008 1,173,642Financial derivatives at
fair value 6 – – 11,526 –Total assets 813,563,531 786,853,942 13,002,293 13,906,767
LiabilitiesPayables 5 1,237,135 1,096,297 154,550 65,081Purchases awaiting
settlement 17,361,815 – 913,974 531,817Total liabilities 18,598,950 1,096,297 1,068,524 596,898
Equity
Net assets attributable tounitholders 7 794,964,581 785,757,645 11,933,769 13,309,869

Phillip Investment FundsFinancial statements
Year ended 31 December 2014
FS3
The accompanying notes form an integral part of these financial statements.
Statements of Movements of Unitholders’ FundsYear ended 31 December 2014
Phillip MoneyMarket Fund
2014 2013S$ S$
Net assets attributable to unitholders at thebeginning of financial year 785,757,645 857,300,881
Operations
Changes in net assets attributable to unitholdersresulting from operations 2, 2,852,561 4,466,876
Unitholders’ contributions/(withdrawals)
Creation of units 2,447,621,272 2,852,473,846Cancellation of units (2,441,266,897) (2,928,483,958)Change in net assets attributable to unitholders
resulting from net creation and cancellationof units 6,354,375 (76,010,112)
Distribution – –
Total increase/(decrease) in net assets attributableto unitholders 9,206,936 (71,543,236)
Net assets attributable to unitholders at the endof financial year 794,964,581 785,757,645

Phillip Investment FundsFinancial statements
Year ended 31 December 2014
FS4
The accompanying notes form an integral part of these financial statements.
Phillip Income Fund2014 2013
Note Class A Class I Class I Total Class A Class I Class I TotalSGD SGD USD SGD SGD USDS$ S$ S$ S$ S$ S$ S$ S$
Net assets attributable tounitholders at the beginningof financial year 1,412,608 11,897,261 – 13,309,869 1,368,980 11,866,398 – 13,235,378
OperationsChanges in net assets attributable
to unitholders resulting fromoperations 79,928 695,391 – 775,319 48,578 438,536 – 487,114
Unitholders’ contributions/(withdrawals)
Creation of units 75,173 547,242 – 622,415 89,557 86,768 – 176,325Cancellation of units (91,880) (2,142,003) – (2,233,883) (35,840) – – (35,840)Change in net assets attributable
to unitholders resulting fromnet creation and cancellationof units (16,707) (1,594,761) – (1,611,468) 53,717 86,768 – 140,485
Distribution 9 (62,389) (477,562) – (539,951) (58,667) (494,441) – (553,108)
Total increase/(decrease) in netassets attributable tounitholders 832 (1,376,932) – (1,376,100) 43,628 30,863 – 74,491
Net assets attributable tounitholders at the end offinancial year 1,413,440 10,520,329 – 11,933,769 1,412,608 11,897,261 – 13,309,869

Phillip Investment FundsFinancial statements
Year ended 31 December 2014
FS5
The accompanying notes form an integral part of these financial statements.
Statements of PortfolioYear ended 31 December 2014
Holdingsas at
Fair valueas at
Percentage oftotal net assetsattributable to
unitholdersas at
31/12/2014 31/12/2014 31/12/2014S$ %
Phillip Money Market FundBy Industry (Primary)
Quoted securities
AirlineFixed Rate BondsSingapore Airlines 2.15%
Due 30 September 2015 10,300,000 10,377,971 1.31Total Airline 10,377,971 1.31
Banks & financialsCertificates of DepositAgriculture Bank of China 1.00%
Due 22 September 2015 20,000,000 19,998,000 2.52Agriculture Bank of China 1.15%
Due 16 January 2015 1,250,000 1,249,776 0.16Agriculture Bank of China 1.18%
Due 28 April 2015 15,000,000 14,971,545 1.88Bank of China (Singapore)1.00%
Due 15 January 2015 1,000,000 999,748 0.13Bank of China (Singapore)1.15%
Due 8 April 2015 15,000,000 14,980,335 1.88Bank of China (Singapore)1.10%
Due 6 August 2015 15,000,000 14,949,510 1.88Industrial & Commercial Bank of China 1.00%
Due 8 September 2015 35,000,000 34,961,500 4.40Intesa SanPaolo London 1.06%
Due 15 May 2015 14,000,000 13,938,526 1.75Intesa SanPaolo London 1.15%
Due 10 March 2015 10,000,000 9,979,610 1.26Sumitomo Mitsui BKG/SG1.10%
Due 22 June 2016 10,000,000 9,985,000 1.26136,013,550 17.12
Fixed Rate BondsANZ New Zealand INTL 2.95 %
Due 27 July 2015 5,500,000 5,554,340 0.70Commonwealth Bank of Australia 2.875%
Due 28 January 2015 1,500,000 1,502,096 0.19Macquarie Bank 3.28%
Due 11 April 2016 500,000 512,534 0.06Carried forward 7,568,970 0.95

Phillip Investment FundsFinancial statements
Year ended 31 December 2014
FS6
The accompanying notes form an integral part of these financial statements.
Holdingsas at
Fair valueas at
Percentage oftotal net assetsattributable to
unitholdersas at
31/12/2014 31/12/2014 31/12/2014S$ %
Phillip Money Market FundBy Industry (Primary)
Banks & financialsFixed Rate BondsBrought forward 7,568,970 0.95
Macquarie Bank 3.3%Due 8 April 2016 3,500,000 3,588,162 0.45
Rabo Bank 2.45%Due 13 January 2015 2,750,000 2,751,224 0.35
Shinhan Bank 3.94%Due 15 January 2016 5,250,000 5,349,025 0.67
Westpac Securities NZ LT 3.06%Due 12 February 2015 750,000 750,555 0.09
20,007,936 2.51
Total Banks & financials 156,021,486 19.63
Commercial ServicesFixed Rate BondsPSA Corporation Ltd 2.83%
Due 6 July 2015 14,750,000 14,870,360 1.87Total Commercial Services 14,870,360 1.87
Government agencyFixed Rate BondsHousing & Development Board 1.87%
Due 25 March 2015 2,000,000 2,002,660 0.25Housing & Development Board 0.76%
Due 2 November 2015 2,500,000 2,490,525 0.31Housing & Development Board 1.685%
Due 8 June 2016 3,000,000 3,014,190 0.38Housing & Development Board 3.2%
Due 12 October 2015 3,500,000 3,554,355 0.45Housing & Development Board 0.943%
Due 21 March 2016 4,500,000 4,482,585 0.57Carried forward 15,544,315 1.96

Phillip Investment FundsFinancial statements
Year ended 31 December 2014
FS7
The accompanying notes form an integral part of these financial statements.
Holdingsas at
Fair valueas at
Percentage oftotal net assetsattributable to
unitholdersas at
31/12/2014 31/12/2014 31/12/2014S$ %
Phillip Money Market FundBy Industry (Primary)
Government agencyFixed Rate BondsBrought forward 15,544,315 1.96Housing & Development Board 2.0225%
Due 22 February 2016 5,000,000 5,044,950 0.63Housing & Development Board 3.375%
Due 21 April 2015 7,750,000 7,795,725 0.98Land Transport Authority 1.675%
Due 27 May 2015 13,000,000 13,028,600 1.64Total Government agency 41,413,590 5.21
Hotel & propertyFixed Rate BondsAscott Capital 3.80%
Due 10 November 2016 4,000,000 4,138,276 0.52City Development 3.22%
Due 8 April 2015 3,750,000 3,763,688 0.48Henderson Land MTN Singapore 3.65%
Due 15 February 2016 6,000,000 6,127,200 0.77Henderson Land MTN Singapore 3.865%
Due 11 November 2016 1,250,000 1,296,737 0.16Hong Kong Land Treasury Service 3.65%
Due 5 October 2015 32,500,000 33,141,875 4.17Keppel Land Ltd 3.51%
Due 3 February 2015 6,750,000 6,756,750 0.85UOL Group Ltd 2.493%
Due 8 May 2015 3,750,000 3,751,789 0.47Wing Tai Holdings 3.3%
Due 26 May 2015 3,250,000 3,261,827 0.41Total Hotel & property 62,238,142 7.83
MediaFixed Rate BondsSingapore Press Holdings 2.81%
Due 2 March 2015 31,750,000 31,816,993 4.00Total Media 31,816,993 4.00
Phillip Investment FundsFinancial statements
Year ended 31 December 2014
FS8
The accompanying notes form an integral part of these financial statements.
Holdingsas at
Fair valueas at
Percentage oftotal net assetsattributable to
unitholdersas at
31/12/2014 31/12/2014 31/12/2014S$ %
Phillip Money Market FundBy Industry (Primary)
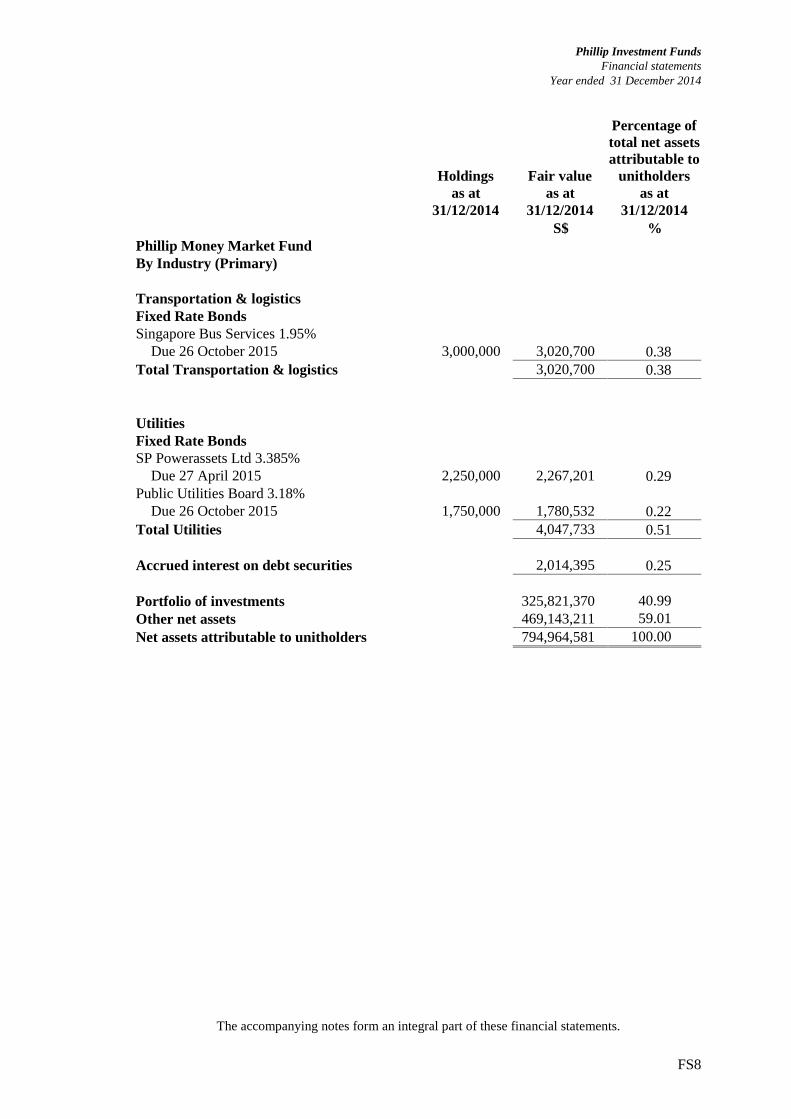
Transportation & logisticsFixed Rate BondsSingapore Bus Services 1.95%
Due 26 October 2015 3,000,000 3,020,700 0.38Total Transportation & logistics 3,020,700 0.38
UtilitiesFixed Rate BondsSP Powerassets Ltd 3.385%
Due 27 April 2015 2,250,000 2,267,201 0.29Public Utilities Board 3.18%
Due 26 October 2015 1,750,000 1,780,532 0.22Total Utilities 4,047,733 0.51
Accrued interest on debt securities 2,014,395 0.25
Portfolio of investments 325,821,370 40.99Other net assets 469,143,211 59.01Net assets attributable to unitholders 794,964,581 100.00

Phillip Investment FundsFinancial statements
Year ended 31 December 2014
FS9
The accompanying notes form an integral part of these financial statements.
Fair valueas at
Percentage oftotal net assetsattributable to
unitholdersas at
Percentage oftotal net assetsattributable to
unitholdersas at
31/12/2014 31/12/2014 31/12/2013S$ % %
Phillip Money Market FundBy Industry (Primary)
Airline 10,377,971 1.31 0.03Banks & financials 156,021,486 19.63 20.44Commercial services 14,870,360 1.87 Engineering & construction 0.06Government agency 41,413,590 5.21 6.74Hotel and property 62,238,142 7.83 7.85Industrials 0.99Investment companies 2.80Media 31,816,993 4.00 2.08REITS 0.07Supranational 0.20Transportation & logistics 3,020,700 0.38 1.68Utilities 4,047,733 0.51 0.30Accrued interest on debt securities 2,014,395 0.25 0.28Portfolio of investments 325,821,370 40.99 43.52Other net assets 469,143,211 59.01 56.48Net assets attributable to unitholders 794,964,581 100.00 100.00
Phillip Money Market Fund
By Geography (Secondary)Australia 5,602,791 0.70 0.19China / Hong Kong 102,110,414 12.84 9.16Italy 23,918,136 3.01 1.53Japan 9,985,000 1.26 Netherlands 2,751,224 0.35 0.36New Zealand 6,304,895 0.79 0.39Singapore 167,785,489 21.11 20.29South Korea 5,349,026 0.68 6.67Supranational 0.20United Kingdom 4.39United States 0.06Accrued interest on debt securities 2,014,395 0.25 0.28Portfolio of investments 325,821,370 40.99 43.52Other net assets 469,143,211 59.01 56.48Net assets attributable to unitholders 794,964,581 100.00 100.00

Phillip Investment FundsFinancial statements
Year ended 31 December 2014
FS10
The accompanying notes form an integral part of these financial statements.
Holdingsas at
Fair valueas at
Percentage oftotal net assetsattributable to
unitholdersas at
31/12/2014 31/12/2014 31/12/2014S$ %
Phillip Income FundBy Industry (Primary)
Quoted securities
AirlineFixed Rate BondsHong Kong Aviation 7.5%
Due 4 November 2016 1,000,000 216,347 1.81Total Airline 216,347 1.81
AutomotiveEquitiesHonda Motor Co Ltd 3,300 128,512 1.08Hyundai Motor Co 710 143,933 1.20Nissan Motor Co Ltd 12,700 148,204 1.24Total Automotive 420,649 3.52
Banks & financialsEquitiesChina Construction Bank 114,000 123,441 1.03HSBC Holdings PLC 14,918 187,990 1.58Mega Financial Holding Co 148,000 151,106 1.27Mitsubishi UFJ Financial Group 20,000 146,755 1.23Mizuho Financial Group 53,800 120,333 1.01Singapore Exchange Ltd 15,000 117,150 0.98Standard Chartered Plc 7,500 148,482 1.24
995,257 8.34

Phillip Investment FundsFinancial statements
Year ended 31 December 2014
FS11
The accompanying notes form an integral part of these financial statements.
Holdingsas at
Fair valueas at
Percentage oftotal net assetsattributable to
unitholdersas at
31/12/2014 31/12/2014 31/12/2014S$ %
Phillip Income FundBy Industry (Primary)
Banks & financialsFixed Rate BondsFilinvest Development Cayman Island 4.25%
Due 2 April 2020 200,000 254,389 2.13Hyundai Capital 4.5%
Due 16 May 2017 150,000 165,728 1.39420,117 3.52
Floating Rate NotesBnkea FRN
Due 20 November 2024 250,000 262,602 2.20Unicredit SPA 5.5%
Due 30 July 2023 250,000 238,419 2.00501,021 4.20
Zero Rate BondsSociete Generale
Due 4 February 2016 500,000 581,813 4.87581,813 4.87
Total Banks & financials 2,498,208 20.93
Bond FundsInvestment FundsPhillip SP Real Estate I-IIS 540,682 718,674 6.02Total Bond Funds 718,674 6.02
ChemicalsEquitiesPtt Global Chemical PCL 78,000 160,662 1.35Total Chemicals 160,662 1.35
Country FundsFixed Rates BondsRickmers Trust Ricksp 8.45%
Due 15 May 2017 250,000 248,055 2.08Total Country Fund 248,055 2.08

Phillip Investment FundsFinancial statements
Year ended 31 December 2014
FS12
The accompanying notes form an integral part of these financial statements.
Holdingsas at
Fair valueas at
Percentage oftotal net assetsattributable to
unitholdersas at
31/12/2014 31/12/2014 31/12/2014S$ %
Phillip Income FundBy Industry (Primary)
ElectronicsFixed Rate BondsPerush Listrik Negara 5.25%
Due 24 October 2042 200,000 235,081 1.97Competition Team Honhai 2.125%
Due 13 December 2017 200,000 261,639 2.19Total Electronics 496,720 4.16
Food & beverageEquitiesGuinness Anchor Bhd 30,000 139,563 1.17Indofood Suksex Makmur Tbk P 198,000 141,947 1.19Pepsi-Cola Products Philippine Php0.15 1,147,000 139,065 1.17San Miguel Pure Foods Co Php10 26,000 159,153 1.33Total Food & beverage 579,728 4.86
Government agencyFixed Rate BondsSingapore Government SIGB 3.00%
Due 1 September 2024 500,000 531,000 4.45US Treasury N/B T 1.50%
Due 30 November 2019 500,000 656,886 5.50Total government agency 1,187,886 9.95
Holding companyEquitiesYTL Corporation Berhad 195,000 117,267 0.98Total Holding company 117,267 0.98
InsuranceEquitiesQBE Insurance Group Ltd 11,000 132,475 1.11Total Insurance 132,475 1.11

Phillip Investment FundsFinancial statements
Year ended 31 December 2014
FS13
The accompanying notes form an integral part of these financial statements.
Holdingsas at
Fair valueas at
Percentage oftotal net assetsattributable to
unitholdersas at
31/12/2014 31/12/2014 31/12/2014S$ %
Phillip Income FundBy Industry (Primary)
InternetFixed Rate Bonds21Vianet Group Vnet 6.875%
Due 26 June 2017 1,000,000 207,036 1.73Alibaba Group 3.60%
Due 28 November 2024 200,000 262,150 2.20Total Internet 469,186 3.93
Iron & steelEquitiesFortescue Metals Group Ltd NPV 28,000 83,089 0.70Total Iron & steel 83,089 0.70
LeisureFixed Rate BondsKing Power Cap Chitra 5.625%
Due 3 November 2024 200,000 275,107 2.31Total Leisure 275,107 2.31
MiningEquitiesBHP Ltd 3,300 104,574 0.88Total Mining 104,574 0.88
Multi industryEquitiesNippon Prologis 14 40,240 0.34Total Multi industry 40,240 0.34
Oil & gasEquitiesBP Plc SHS 15,880 134,149 1.12Total Oil & gas 134,149 1.12

Phillip Investment FundsFinancial statements
Year ended 31 December 2014
FS14
The accompanying notes form an integral part of these financial statements.
Holdingsas at
Fair valueas at
Percentage oftotal net assetsattributable to
unitholdersas at
31/12/2014 31/12/2014 31/12/2014S$ %
Phillip Income FundBy Industry (Primary)
PharmaceuticalsEquitiesGlaxosmithkline Plc ORD 8,000 226,479 1.90Total Pharmaceuticals 226,479 1.90
Real estateFixed Rate BondsGlob Logst Prop GLPSP 3.275%
Due 11 May 2016 1,000,000 210,598 1.76Chip Eng Seng Chipen 4.25%
Due 17 October 2017 250,000 250,673 2.11461,271 3.87
EquitiesAIMS AMP Capital Industrial Re 81,600 115,056 0.96Capitaland Ltd 45,000 148,950 1.25Cheung Kong Holdings Ltd 7,000 155,294 1.30China Overseas Land & Investment 46,000 180,412 1.51Frasers Hospitality Trust 115,000 101,200 0.85Keppel DC REIT 155,000 150,351 1.26
851,263 7.13
Total Real estate 1,312,534 11.00
REITSREITSCapitamall Trust 63,000 127,890 1.07Total REITS 127,890 1.07
RetailEquitiesSheng Siong Group Ltd 230,000 158,701 1.33Total Retail 158,701 1.33
SoftwareConvertible BondsKingsoft Corp Lt Kinsf 1.25%
Due 11 April 2019 2,000,000 305,995 2.56Total Software 305,995 2.56

Phillip Investment FundsFinancial statements
Year ended 31 December 2014
FS15
The accompanying notes form an integral part of these financial statements.
Holdingsas at
Fair valueas at
Percentage oftotal net assetsattributable to
unitholdersas at
31/12/2014 31/12/2014 31/12/2014S$ %
Phillip Income FundBy Industry (Primary)
TelecommunicationsEquitiesTelekomunikasi Indonesia Per 520,000 158,540 1.34
158,540 1.34Fixed Rate BondsChina Electronic CHELCP 4.70%
Due 16 January 2017 1,000,000 210,873 1.77210,873 1.77
Total Telecommunications 369,413 3.11
Toy & gamesEquitiesSanrio Co Ltd NPV 5,000 165,762 1.39Total Toy & games 165,762 1.39
TransportationEquitiesSMRT Corp Ltd 43,000 67,940 0.57
67,940 0.57Investment FundsHutchison Port Holdings 194,000 175,740 1.47
175,740 1.47Fixed Rate BondsKeppel Telecom & Transport 2.625%
Due 13 August 2019 250,000 253,166 2.12253,166 2.12
Total Transportation 496,846 4.16
Accrued interest on debt securities 39,106 0.32
Portfolio of investments 11,085,742 92.89Other net assets 848,027 7.11Net assets attributable to unitholders 11,933,769 100.00

Phillip Investment FundsFinancial statements
Year ended 31 December 2014
FS16
The accompanying notes form an integral part of these financial statements.
Fair valueas at
Percentage oftotal net assetsattributable to
unitholdersas at
Percentage oftotal net assetsattributable to
unitholdersas at
31/12/2014 31/12/2014 31/12/2013S$ % %
Phillip Income FundBy Industry (Primary)
Airline 216,347 1.81 1.48Apparel – – 1.94Automotive 420,649 3.52 2.98Banks & financials 2,498,208 20.93 18.72Bond funds 718,674 6.02 –Chemicals 160,662 1.35 1.10Country funds 248,055 2.08 –Distribution & wholesale – – 1.50Engineering & construction – – 0.66Electronics 496,720 4.16 –Exchange traded fund – – 1.23Food & beverage 579,728 4.86 7.84Government agency 1,187,886 9.95 –Healthcare – – 1.89Holding company 117,267 0.98 –Home builders – – 1.84Hotel and property – – 5.55Insurance 132,475 1.11 –Internet 469,186 3.93 –Iron & steel 83,089 0.70 –Leisure 275,107 2.31 –Materials – – 2.07Mining 104,574 0.88 1.68Multi industry 40,240 0.34 –Oil & gas 134,149 1.12 1.87Pharmaceuticals 226,479 1.90 3.07Real estate 1,312,534 11.00 –REITS 127,890 1.07 10.73Retail 158,701 1.33 3.26Semiconductors – – 3.51Shipbuilding – – 1.94Software 305,995 2.56 –Telecommunications 369,413 3.11 12.66Toy & games 165,762 1.39 –Transportation 496,846 4.16 7.62Accrued interest on debt securities 39,106 0.32 0.45Portfolio of investments 11,085,742 92.89 95.59Other net assets 848,027 7.11 4.41Net assets attributable to unitholders 11,933,769 100.00 100.00
Phillip Investment FundsFinancial statements
Year ended 31 December 2014
FS17
The accompanying notes form an integral part of these financial statements.
Fair valueas at
Percentage oftotal net assetsattributable to
unitholdersas at
Percentage oftotal net assetsattributable to
unitholdersas at
31/12/2014 31/12/2014 31/12/2013S$ % %
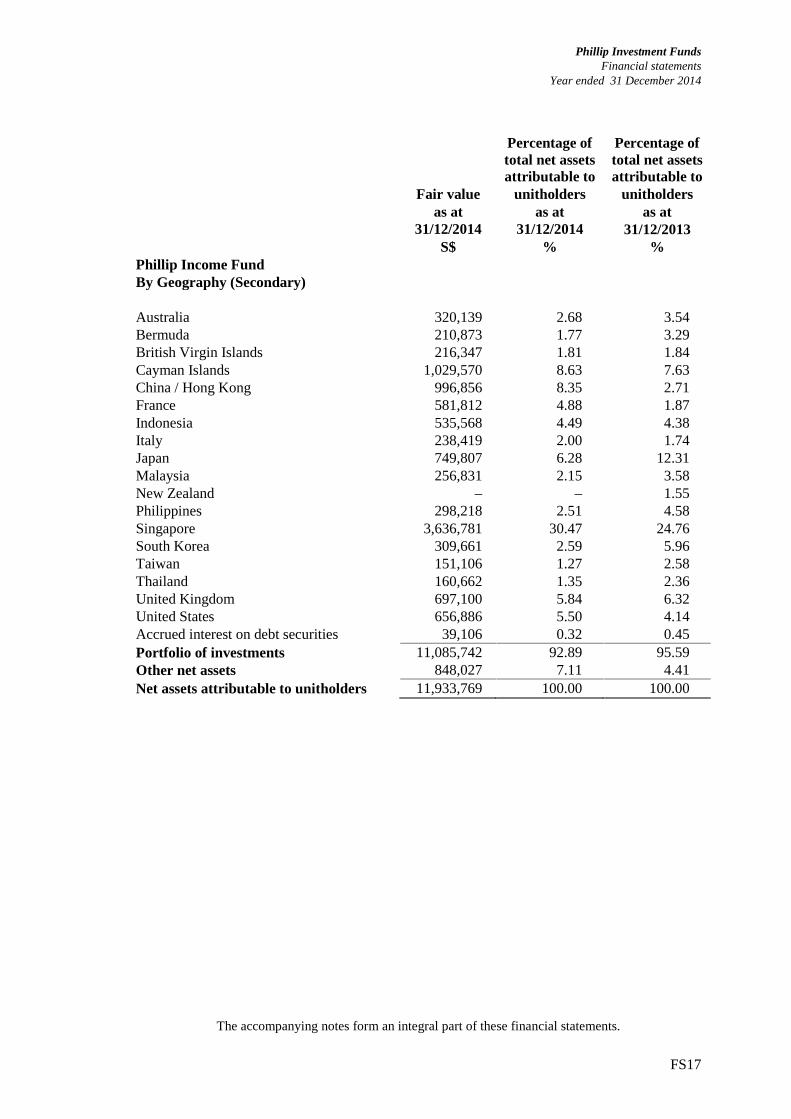
Phillip Income FundBy Geography (Secondary)
Australia 320,139 2.68 3.54Bermuda 210,873 1.77 3.29British Virgin Islands 216,347 1.81 1.84Cayman Islands 1,029,570 8.63 7.63China / Hong Kong 996,856 8.35 2.71France 581,812 4.88 1.87Indonesia 535,568 4.49 4.38Italy 238,419 2.00 1.74Japan 749,807 6.28 12.31Malaysia 256,831 2.15 3.58New Zealand – – 1.55Philippines 298,218 2.51 4.58Singapore 3,636,781 30.47 24.76South Korea 309,661 2.59 5.96Taiwan 151,106 1.27 2.58Thailand 160,662 1.35 2.36United Kingdom 697,100 5.84 6.32United States 656,886 5.50 4.14Accrued interest on debt securities 39,106 0.32 0.45Portfolio of investments 11,085,742 92.89 95.59Other net assets 848,027 7.11 4.41Net assets attributable to unitholders 11,933,769 100.00 100.00
Phillip Investment FundsFinancial statements
Year ended 31 December 2014
FS18
Notes to the Financial Statements
These notes form an integral part of the financial statements.
1 Domicile and activities
Phillip Investment Funds (the “Fund") is an open ended umbrella unit trust constituted pursuantto a Trust Deed dated 26 February 2001 together with its Amending and Restating Deeds and itsSupplemental Deed thereon (thereafter referred to as the “Trust Deed”) between Phillip CapitalManagement (S) Ltd (the “Manager") and Citicorp Trustee (Singapore) Limited (the “Trustee").The Trust Deed is governed by and construed in accordance with the laws of the Republic ofSingapore.
The Fund offers a series of sub-funds (the “Sub-Funds”); these were first offered for sale inSingapore on the following launch dates:
Sub-Fund Launch date
Phillip Money Market Fund 1 March 2001Phillip Income Fund 1 March 2001
Phillip Money Market Fund
The investment objective of the Phillip Money Market Fund is to aim to preserve principalvalue and maintain a high degree of liquidity while producing returns comparable to that ofSingapore dollar savings deposits. The Sub-Fund invests primarily in short term, high qualitymoney market instruments and debt securities. Such investments may include government andcorporate bonds, commercial bills and deposits with financial institutions. The Money MarketFunds Investment Guidelines in Appendix 2 of the Code on Collective Investment Schemesapply to this Sub-Fund. The Phillip Money Market Fund is relatively low risk and its objectiveis targeted at achieving absolute returns. There is no benchmark for the Phillip Money MarketFund as the Sub-Fund maintains an orientation towards positive rather than relative returnsagainst a benchmark.
Phillip Income Fund
The investment objective of the Phillip Income Fund is to aim to achieve medium to long termcapital appreciation through investing substantially all of the assets in a diversified portfolio ofhigh quality bonds, high yield stocks and other interest bearing securities across various sectorsand regions. The Sub-Fund intends to offer regular dividends through semi-annual distributions.However such distribution is not guaranteed and is subject to all times to the discretion of theManager.
Benchmark: 30% Citigroup World Government Bond Index (SGD Unhedged) + 40% CitigroupWorld Money Market Index SGD 3 month Euro Deposit (SGD) + 30% MSCI World Free Index(SGD) with effect from 27 February 2005.

Phillip Investment FundsFinancial statements
Year ended 31 December 2014
FS19
2 Significant accounting policies
2.1 Basis of preparation
The financial statements, expressed in Singapore dollars, have been prepared under thehistorical cost basis, as modified by the revaluation of investments, and in accordance with theStatement of Recommended Accounting Practice 7 “Reporting Framework for Unit Trusts”issued by the Institute of Singapore Chartered Accountants.
For the purposes of preparation of these financial statements, the basis used for calculating theexpense ratio and turnover ratio are in accordance with the guidelines issued by the InvestmentManagement Association of Singapore (“IMAS”) and the Code on Collective InvestmentSchemes under the Securities and Futures Act (Cap 289) respectively.
2.2 Basis of valuation of investments
Quoted investments are stated at fair value based on the bid prices at the reporting date.Unrealised gains/losses on investments are represented by the difference between the fair valueand the carrying value of investments and are recognised in the Statements of Total Return.Realised gains and losses upon disposal of investments are computed on the basis of thedifference between the carrying value and the selling price of investments on trade date and aretaken to the Statements of Total Return.
2.3 Financial derivatives
Derivatives are recognised initially at fair value; attributable transaction costs are recognised inthe Statements of Total Return when incurred. Subsequent to initial recognition, derivatives aremeasured at fair value, and changes in fair value therein are recognised in the Statements ofTotal Return.
2.4 Recognition of income
Dividend income is recognised when declared and is stated gross of tax credits.
Interest income is recognised using the effective interest method.
2.5 Foreign currency translation
Transactions in foreign currencies are translated at the exchange rate at the date of transaction.Monetary assets and liabilities denominated in foreign currencies at the reporting date aretranslated at exchange rates at the reporting date. All exchange differences are recognised in theStatements of Total Return.
2.6 Income tax expense
The Fund was approved for the Enhanced-Tier Fund Tax Incentive Scheme under Section 13Xof the Income Tax Act by the Monetary Authority of Singapore (“MAS”) with effect from 12December 2011. The tax exemption status will be for the life of the Fund, provided the Fundcontinues to meet all the terms and conditions set out by MAS and the relevant Income Taxlegislations.

Phillip Investment FundsFinancial statements
Year ended 31 December 2014
FS20
2.7 Cash and cash equivalents
Cash and cash equivalents comprise term deposits, cash and bank balances and amounts heldwith brokers. Cash equivalents are short-term highly liquid investments that are readilyconvertible to known amounts of cash and are subject to an insignificant risk of changes invalue.
2.8 Net assets attributable to unitholders
Net assets attributable to unitholders are classified as equity.
3 ReceivablesPhillip MoneyMarket Fund
Phillip IncomeFund
2014 2013 2014 2013S$ S$ S$ S$
Receivable from unitholders forcreation of units 273,194 78,502 4,220 10,369
Accrued interest receivable 1,212,711 903,358 Other receivable 17 21,825 287,797 412
1,485,922 1,003,685 292,017 10,781
4 Cash and cash equivalentsPhillip MoneyMarket Fund
Phillip IncomeFund
2014 2013 2014 2013S$ S$ S$ S$
Term deposits 432,080,372 427,670,503 Cash and bank balances 54,175,867 16,243,008 1,373,967 1,012,851Amounts held with brokers 239,041 160,791
486,256,239 443,913,511 1,613,008 1,173,642
5 PayablesPhillip MoneyMarket Fund
Phillip IncomeFund
2014 2013 2014 2013S$ S$ S$ S$
Payable to unitholders forcancellation of units 181,447 335,975
Accrued expenses 1,055,688 760,322 154,550 65,0811,237,135 1,096,297 154,550 65,081

Phillip Investment FundsFinancial statements
Year ended 31 December 2014
FS21
6 Financial derivatives at fair value
Financial derivative contracts comprise forward foreign exchange contracts due for settlementwithin 1 year (2013: Nil) from the reporting date. The contract or underlying principal amountsof these financial derivatives and their corresponding gross fair values at the reporting date areanalysed below.
Phillip Income Fund2014
Notionalamount
Fair valueassets
Fair valueliabilities
S$ S$ S$
Forward foreign exchange contracts 3,476,381 11,526 3,476,381 11,526
2013Notionalamount
Fair valueassets
Fair valueliabilities
S$ S$ S$
Forward foreign exchange contracts
7 Units in issue
During the year the number of shares issued, redeemed and outstanding were as follows:
Phillip Money Market Fund2014 2013
Units at beginning of the year 678,476,094 744,006,950Units created 2,109,352,851 2,469,050,471Units cancelled (2,103,904,710) (2,534,581,327)Units at end of the year 683,924,235 678,476,094
Net assets attributable to unitholders – S$ 794,964,581 785,757,645
Net asset value per unit – S$ 1.1624 1.1581

Phillip Investment FundsFinancial statements
Year ended 31 December 2014
FS22
Phillip Income Fund2014
Class A SGD Class I SGD Class I USD Total
Units at beginning of the year 1,315,440 11,047,888 12,363,328Units created 68,024 495,479 563,503Units cancelled (85,382) (1,930,955) (2,016,337)Units at end of the year 1,298,082 9,612,412 10,910,494
Net assets attributable tounitholders – S$ 1,413,440 10,520,329 11,933,769
Net asset value per unit – S$ 1.0889 1.0945
2013Class A SGD Class I SGD Class I USD Total
Units at beginning of the year 1,266,095 10,968,051 12,234,146Units created 81,803 79,837 161,640Units cancelled (32,458) (32,458)Units at end of the year 1,315,440 11,047,888 12,363,328
Net assets attributable tounitholders – S$ 1,412,608 11,897,261 13,309,869
Net asset value per unit – S$ 1.0739 1.0769
Class A SGD Units are offered to investors who invest SGD500 and above. Class I SGD Unitsare offered to investors who invest SGD500,000 and above. Class I USD Units are offered toinvestors who invest USD500,000 and above. All classes constitute the Sub-Fund and are notseparate sub-funds. Any expense, income and/or gain which is attributable to a particular classis deducted from or added to (as the case may be) the value of the sub-fund which is attributableto that class. A separate net asset value per unit is calculated for each class.
For subscriptions and redemptions and for various fee calculations, investments are stated at thelast traded price/amortised cost on the valuation day for the purpose of determining net assetvalue per unit while for reporting purpose the investments are valued at the relevant bid marketprices as at the reporting date.

Phillip Investment FundsFinancial statements
Year ended 31 December 2014
FS23
The effect of bid market prices/amortised cost in the net assets attributable to unitholders is asfollows:
Phillip Money Market Fund2014 2013S$ S$
Net assets attributable to unitholders per financial statements 794,964,581 785,757,645Effect of adopting bid prices at fair value/amortised cost 579,418 (64,126)Net assets attributable to unitholders for issuing/redeeming 795,543,999 785,693,519
Phillip Income Fund2014
Class A SGD Class I SGD Class I USD TotalS$ S$ S$ S$
Net assets attributable tounitholders per financialstatements 1,413,440 10,520,329 11,933,769
Effect of adopting bid pricesat fair value/amortised cost 2,676 19,914 22,590
Net assets attributable tounitholders for issuing/redeeming 1,416,116 10,540,243 11,956,359
2013Class A SGD Class I SGD Class I USD Total
S$ S$ S$ S$Net assets attributable to
unitholders per financialstatements 1,412,608 11,897,261 13,309,869
Effect of adopting bid pricesat fair value/amortised cost 3,838 32,322 36,160
Net assets attributable tounitholders for issuing/redeeming 1,416,446 11,929,583 13,346,029
8 Income taxPhillip MoneyMarket Fund
Phillip IncomeFund
2014 2013 2014 2013S$ S$ S$ S$
Singapore income tax – – 2,241 7,162Overseas income tax – – 35,920 55,531Total income tax – – 38,161 62,693
The income tax charge relates to tax deducted at source and withholding tax suffered ondividend income and interest income.

Phillip Investment FundsFinancial statements
Year ended 31 December 2014
FS24
9 Distribution
Phillip Income FundEntitlement cut off
dateDistribution
amountS$
2014
Distribution at 2.25 cents per unit 6 March 2014 278,192Distribution at 2.50 cents per unit 11 September 2014 261,759
539,951
2013
Distribution at 2.25 cents per unit 8 March 2013 276,055Distribution at 2.25 cents per unit 13 September 2013 277,053
553,108
The Manager has not proposed any distribution for Phillip Money Market Fund (2013: nil).
10 Financial risk management
The Sub-Funds’ activities expose them to a variety of market risks (including price risk, interestrate risk and currency risk), liquidity risk and credit risk. The Sub-Funds’ overall riskmanagement programme seeks to minimise potential adverse effects on the Sub-Funds’financial performance. The Sub-Funds may use futures contracts, options contracts and/orcurrency forward contracts subject to the terms of the Trust Deed to moderate certain riskexposures. Specific guidelines on exposures to individual securities and certain industries are inplace for the Sub-Funds at any time as part of the overall financial risk management to reducethe Sub-Funds’ risk exposures.
a) Market risk
Market risk is the risk of potential adverse change to the value of financial instruments becauseof changes in market conditions such as interest rate movements and volatility in securities’prices. The Manager manages each Sub-Fund’s exposure to market risk through the use of riskmanagement strategies and various analytical monitoring techniques.
i. Price risk
Price risk is the risk that the fair values of equities or future cash flows of a financialinstrument will fluctuate because of changes in market prices (other than those arising frominterest rate risk or currency risk).
The investments of the Sub-Funds are subject to normal market fluctuations and the risksinherent in investing in securities markets and there can be no assurance that appreciationwill occur. It is the policy of the Manager to maintain a diversified portfolio of investmentsso as to minimise the risk.

Phillip Investment FundsFinancial statements
Year ended 31 December 2014
FS25
ii. Interest rate risk
Interest rate risk is the risk that the value of a financial instrument will fluctuate due tochanges in market interest rates.
The table below summarises the Sub-Funds’ exposure to interest rate risks. They include theSub-Funds’ assets and trading liabilities at fair value, categorised by interest rate types.
Phillip Money Market Fund
Variablerates
Fixedrates
Non-interestbearing Total
S$ S$ S$ S$2014
AssetsPortfolio of investments 325,821,370 325,821,370Receivables 1,485,922 1,485,922Cash and cash equivalents 29,379,115 432,080,372 24,796,752 486,256,239
29,379,115 757,901,742 26,282,674 813,563,531
LiabilitiesPayables 1,237,135 1,237,135Purchases awaiting
settlement 17,361,815 17,361,815 18,598,950 18,598,950
2013
AssetsPortfolio of investments 249,311 341,687,435 341,936,746Receivables 1,003,685 1,003,685Cash and cash equivalents 266,289 427,670,503 15,976,719 443,913,511
515,600 769,357,938 16,980,404 786,853,942
LiabilitiesPayables 1,096,297 1,096,297

Phillip Investment FundsFinancial statements
Year ended 31 December 2014
FS26
Phillip Income Fund
Variablerates Fixed rates
Non-interestbearing Total
S$ S$ S$ S$2014
AssetsPortfolio of investments 508,071 4,269,848 6,307,823 11,085,742Receivables 292,017 292,017Cash and cash equivalents 239,041 1,373,967 1,613,008Financial derivatives at fair
value 11,526 11,526508,071 4,508,889 7,985,333 13,002,293
LiabilitiesPayables 154,550 154,550Purchases awaiting
settlement 913,974 913,974 1,068,524 1,068,524
2013
AssetsPortfolio of investments 463,076 4,458,838 7,800,430 12,722,344Receivables 10,781 10,781Cash and cash equivalents 160,791 1,012,851 1,173,642
463,076 4,619,629 8,824,062 13,906,767
LiabilitiesPayables 65,081 65,081Purchases awaiting
settlement 531,817 531,817 596,898 596,898
Phillip Investment FundsFinancial statements
Year ended 31 December 2014
FS27
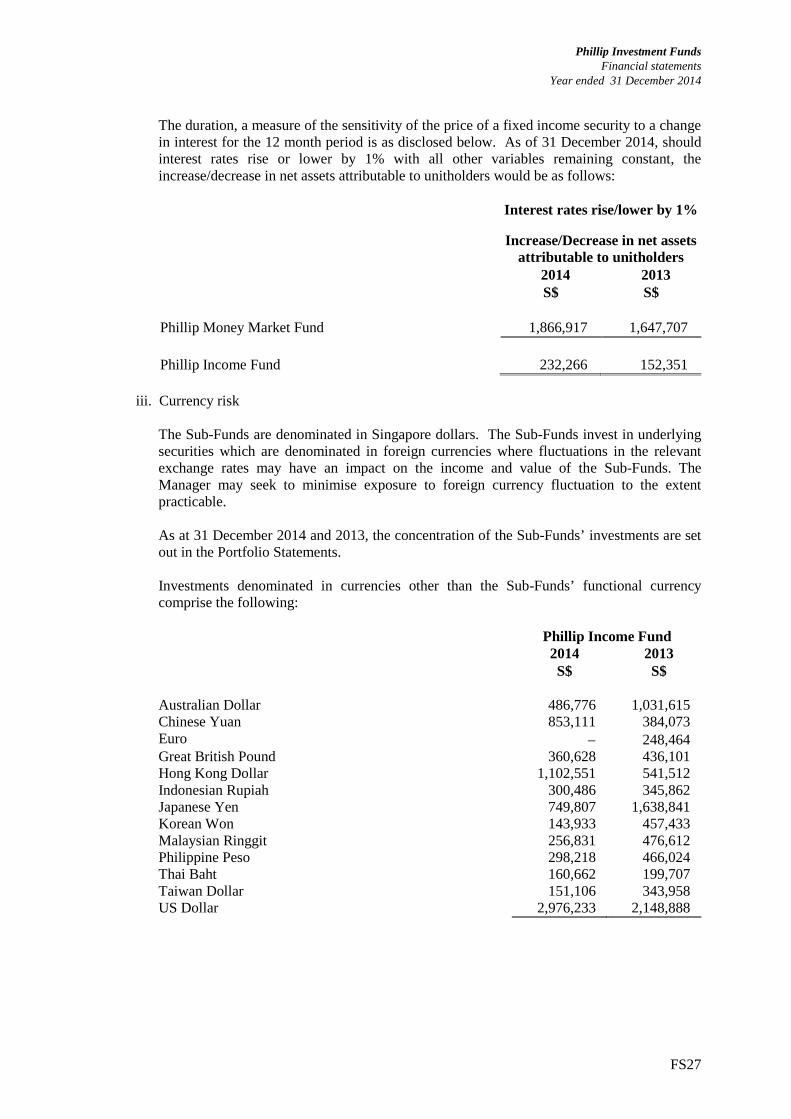
The duration, a measure of the sensitivity of the price of a fixed income security to a changein interest for the 12 month period is as disclosed below. As of 31 December 2014, shouldinterest rates rise or lower by 1% with all other variables remaining constant, theincrease/decrease in net assets attributable to unitholders would be as follows:
Interest rates rise/lower by 1%
Increase/Decrease in net assetsattributable to unitholders
2014 2013S$ S$
Phillip Money Market Fund 1,866,917 1,647,707
Phillip Income Fund 232,266 152,351
iii. Currency risk
The Sub-Funds are denominated in Singapore dollars. The Sub-Funds invest in underlyingsecurities which are denominated in foreign currencies where fluctuations in the relevantexchange rates may have an impact on the income and value of the Sub-Funds. TheManager may seek to minimise exposure to foreign currency fluctuation to the extentpracticable.
As at 31 December 2014 and 2013, the concentration of the Sub-Funds’ investments are setout in the Portfolio Statements.
Investments denominated in currencies other than the Sub-Funds’ functional currencycomprise the following:
Phillip Income Fund2014 2013S$ S$
Australian Dollar 486,776 1,031,615Chinese Yuan 853,111 384,073Euro 248,464Great British Pound 360,628 436,101Hong Kong Dollar 1,102,551 541,512Indonesian Rupiah 300,486 345,862Japanese Yen 749,807 1,638,841Korean Won 143,933 457,433Malaysian Ringgit 256,831 476,612Philippine Peso 298,218 466,024Thai Baht 160,662 199,707Taiwan Dollar 151,106 343,958US Dollar 2,976,233 2,148,888

Phillip Investment FundsFinancial statements
Year ended 31 December 2014
FS28
Cash and cash equivalents denominated in currencies other than the Sub-Funds’ functionalcurrency comprise the following:
Phillip Income Fund2014 2013S$ S$
Chinese Yuan 7,454 7,732Hong Kong Dollar 377,881 95,156Indonesian Rupee 145,639Philippine Peso 479Taiwan Dollar 57,530Thai Baht 49 US Dollar 168,167 327,849
Investments and cash and cash equivalents of Phillip Money Market Fund are denominatedin the Sub-Fund’s functional currency.
Investments are exposed to both currency risk and price risk. Hence, no sensitivity analysishas been performed to analyse currency risk.
As at 31 December 2014 and 2013, with respect to the cash and cash equivalents of the Sub-Fund, had the Singapore Dollar increased/(decreased) by 2% against foreign currencies,with all other variables remaining constant, the increase or decrease in net assets attributableto unitholders would be as follows:
Currency rate rise/lower by 2%
Increase/(Decrease) in net assetsattributable to unitholders
2014 2013S$ S$
Phillip Income Fund
Chinese Yuan (149) (155)Hong Kong Dollar (7,558) (1,903)Indonesian Rupee (2,913)Philippine Peso (10)Taiwan Dollar (1,151)Thai Baht (1) US Dollar (3,363) (6,557)
b) Liquidity risk
The Sub-Funds are exposed to daily redemption of units in the Sub-Funds. Therefore themajority of its assets are invested in investments that are traded in an active market and can bereadily disposed of.

Phillip Investment FundsFinancial statements
Year ended 31 December 2014
FS29
c) Credit risk
Credit risk is the risk that a counterparty will fail to its perform contractual obligations, either inwhole or in part, under a contract.
The main credit risk to which the Sub-Funds are exposed arise from the Sub-Funds’ investmentsin debt securities. The Sub-Funds are also exposed to counterparty credit risk on tradingderivative products, cash and cash equivalents, amounts due from brokers and other receivablebalances.
All transactions in listed securities are settled/paid upon delivery using approved brokers. Therisk of default is considered minimal, as delivery of securities is only made once the broker hasreceived payment. Payment is made on a purchase once the securities have been received by thebroker. The trade will fail if either party fails to meet its obligation.
The Sub-Funds may also enter into derivatives to manage exposures to currency risk and pricerisk, including foreign exchange forward contracts and options. Hence, the Sub-Funds are alsoexposed to the risk that derivatives held with counterparties may not be recoverable in the eventof any default by the parties concerned.
The table below analyses the Sub-Funds’ debt investments by credit ratings.
Phillip Money Market Fund
Debt securities by rating category
Percentage of total netassets attributable to
unitholders
Percentage of total netassets attributable to
unitholders2014 2013% %
A 1.21 8.60AA 0.99 0.92AA * 0.35 2.37AAA * 0.20A ** 8.11 Aa ** 0.29 0.10Unrated 30.04 31.33Total debt securities 40.99 43.52
Source of the credit rating is from Standard & Poor’s except for the following:
* Credit rating is from Fitch** Credit rating is from Moody’s

Phillip Investment FundsFinancial statements
Year ended 31 December 2014
FS30
Phillip Income Fund
Debt securities by rating category
Percentage of total netassets attributable tounitholders
Percentage of total netassets attributable to
unitholders2014 2013% %
A 4.40 5.14AAA 5.51 BB 4.04 5.89BBB 3.60 4.33Unrated 29.93 21.62Total debt securities 47.48 36.98
Derivatives risk
The Manager may use financial derivative instruments solely for the purposes of hedgingexisting positions in a portfolio or for efficient portfolio management, and such financialderivative instruments are not used to gear the overall portfolio.
d) Fair value estimation
Except for investments which are measured at fair value, at 31 December 2014 and 2013,the fair values of assets and liabilities approximate their carrying values on the Statementsof Financial Position.
The fair value of financial assets and liabilities traded in active markets (such as publiclytraded derivatives and trading securities) are based on quoted market prices at the close oftrading on the reporting date. The quoted market price used for financial assets held by theSub-Funds is the current bid price; the appropriate quoted market price for financialliabilities is the current asking price. When the Sub-Funds hold derivatives with offsettingmarket risks, mid-market prices are used as a basis for establishing fair values for theoffsetting risk positions and bid or asking price are applied to the net open position, asappropriate.
The Sub-Funds classify fair value measurements using a fair value hierarchy that reflectsthe significance of the inputs used in making the measurements. The fair value hierarchyhas the following levels:
Quoted prices (unadjusted) in active markets for identical assets or liabilities (Level 1).
Inputs other than quoted prices included within level 1 that are observable for the assetor liability, either directly (that is, as prices) or indirectly (that is, derived from prices)(Level 2).
Inputs for the asset or liability that are not based on observable market data (that is,unobservable inputs) (Level 3).

Phillip Investment FundsFinancial statements
Year ended 31 December 2014
FS31
The following table analyses within the fair value hierarchy the Sub-Funds’ financialassets and liabilities (by class) measured at fair value at 31 December 2014 and 2013:
Phillip Money Market Fund
Level 1 Level 2 Level 3 TotalS$ S$ S$ S$
2014
AssetsDebt securities 325,821,370 – – 325,821,370
325,821,370 – – 325,821,370
2013
AssetsDebt securities 341,936,746 – – 341,936,746
341,936,746 – – 341,936,746
Phillip Income Fund
Level 1 Level 2 Level 3 TotalS$ S$ S$ S$
2014
AssetsEquity securities and
investment funds 5,419,081 – – 5,419,081Debt securities 5,666,661 – – 5,666,661
11,085,742 – – 11,085,742
2013
AssetsEquity securities and
investment funds 7,800,431 – – 7,800,431Debt securities 4,921,913 – – 4,921,913
12,722,344 – – 12,722,344
Investments whose values are based on quoted market prices in active markets, andtherefore classified within level 1, include active listed equities and exchange tradedderivative. The Sub-Funds do not adjust the quoted price for these instruments.
Financial instruments that trade in markets that are not considered to be active but arevalued based on quoted market prices, dealer quotations or alternative pricing sourcessupported by observable inputs are classified within level 2.
Investments classified within level 3 have significant unobservable inputs, as they tradeinfrequently.

Phillip Investment FundsFinancial statements
Year ended 31 December 2014
FS32
11 Related parties
In the normal course of the business of the Sub-Funds, management fees and trustee feeshave been paid or are payable to the Manager and the Trustee respectively as noted in theStatements of Total Return.
In addition, the bank holding company and related parties of the Trustee have alsoprovided custodian, banking, foreign exchange, fund administration and brokerageservices to the Sub-Funds in the normal course of business at terms agreed between theparties and within the provisions of the Trust Deed.
Except as disclosed elsewhere in the financial statements, the following significanttransactions took place between the Sub-Funds and its related parties during the year:
Phillip MoneyMarket Fund
Phillip IncomeFund
2014 2013 2014 2013S$ S$ S$ S$
Brokerage fee paid to:- a related party of the Manager 4,162 819- a related party of the Trustee 31Interest income received from:- a related party of the Manager 7 28- a related party of the Trustee 158 171
Cash and bank balances held witha related party of the Trustee 24,796,752 15,976,719 1,373,967 1,012,851
Amounts held with a related partyof the Manager 215,381 160,791
Investment into other fundsmanaged by the Manager 718,674
The Manager may also use the services of related parties to carry out transactionsinvolving the purchase and sale of securities.

Phillip Investment FundsFinancial statements
Year ended 31 December 2014
FS33
12 Financial ratios
Phillip MoneyMarket Fund Phillip Income Fund2014 2013 2014 2013
Class ASGD
Class ISGD
Class IUSD
Class ASGD
Class ISGD
Class IUSD
% % % % % % % %
Expense ratios (Note 1) 0.49 0.50 1.83 1.61 1.72 1.51
Phillip MoneyMarket Fund
Phillip IncomeFund
2014 2013 2014 2013% % % %
Turnover ratios (Note 2) 28.24 146.98 124.30
Note 1 The expense ratio has been computed based on the guidelines laid down by the IMAS.The calculation of the expense ratio is based on total operating expenses divided by theaverage net asset value for the year. The total operating expenses do not include (whereapplicable) brokerage and other transaction costs, performance fees, interest expenses,distributions paid out to unitholders, foreign exchange gains/losses, front or back endloads arising from the purchase or sale of other funds and tax deducted at source orarising out of income received. The Sub-Funds do not pay performance fee. The averagenet asset value is based on the daily balances.
Note 2 The portfolio turnover ratio is calculated in accordance with the formula stated in theCode on Collective Investment Schemes. The calculation of the portfolio turnover ratiois based on the total value of purchases (or sales) of the underlying investments dividedby the weighted average daily net asset value. Total value of purchases (or sales) do notinclude brokerage and other transaction costs. The total value of bonds matured duringthe year is not included in the computation of portfolio turnover ratio.
Total operating expenses, average daily net asset values and total values of purchases (orsales) used in the calculation of the expense and turnover ratios are disclosed below
Phillip MoneyMarket Fund Phillip Income Fund
2014 2013 2014 2013Class A
SGD Class I SGDClass IUSD Total
Class ASGD Class I SGD
Class IUSD Total
S$ S$ S$ S$ S$ S$ S$ S$ S$ S$
Total operatingexpenses (asper note 1) 3,861,916 4,406,915 25,856 177,080 – 202,936 24,491 180,953 – 205,444
Total value ofpurchases (orsales) of theunderlyinginvestments – 250,675,822 – – – 18,271,981 – – – 16,699,774
Average netasset value 784,304,032 887,562,189 1,414,541 11,017,044 – 12,431,585 1,423,761 12,010,840 – 13,434,601