
ANNUAL REPORT FOR THE YEAR ENDED 30TH JUNE,...
102
ANNUAL REPORT FOR THE YEAR ENDED 30 TH JUNE, 2015
Transcript of ANNUAL REPORT FOR THE YEAR ENDED 30TH JUNE,...

ANNUAL REPORT FOR THE YEAR ENDED 30TH JUNE, 2015

THE UNITED REPUBLIC OF TANZANIA
9THANNUAL REPORT FOR THE YEAR ENDED 30TH JUNE, 2015
January, 2016
Energy and Water Utilities Regulatory Authority (EWURA)7TH Floor, LAPF Pension Fund Tower, Opposite Makumbusho Village, Kijitonyama
P.O. Box 72175, Dar es Salaam, Tanzania
Tel: +255 (0)22 2923513 -18, Fax: +255 (0)22 2923519,
E-mail: [email protected] • Website: www.ewura.go.tz

iv
9THANNUAL REPORT FOR THE YEAR ENDED 30TH JUNE, 2015
ABBREVIATIONS
ACL : Armstone Company LimitedAFUR : African Forum for Utility RegulatorsBOD : Biochemical Oxygen DemandCOD : Chemical Oxygen DemandDTWSSA : District and Township Water Supply and Sanitation AuthorityEPP : Emergency Power ProducerEWURA : Energy and Water Utilities Regulatory AuthorityFCT : Fair Competition TribunalFOB : Free On BoardGEPF : Government Employees Provident FundGIZ : Deutsche Gesellschaft für Internationale ZusammenarbeitGPA : Group Personal AccidentGWh : Giga Watt hourHIV/AIDS : Human Immunodefi ciency Virus/Acquired Immune Defi ciency SyndromeHFO : Heavy Furnace OilIAS : International Accounting StandardsIASB : International Accounting Standards BoardICT : Information and Communication TechnologyIDA : International Development AssociationIFRS : International Financial Reporting StandardsIK : Illuminating KeroseneIPP : Independent Power ProducerISA : International Standards on AuditingISO : International Standardization OrganizationKASHWASA : Kahama Shinyanga Water Supply and Sanitation AuthorityLAPF : Local Authorities Pensions FundLOIS : Licensing and Order Information SystemMajIs : Water Utilities Information SystemMEM : Ministry of Energy and MineralsMT : Metric TonnesMW : Mega WattNPWSSA : National Project Water Supply and Sanitation AuthorityNSSF : National Social Security FundPAA : Public Audit Act 2008PICL : Petroleum Importers Coordinators LtdPPF : Parastatal Pension FundPPSDP : Privatization and Private Sector Development ProjectPSPF : Public Service Pensions FundRERA : Regional Electricity Regulators AssociationRWSSA : Regional Water Supply and Sanitation AuthoritySPP : Small Power ProducerTANESCO : Tanzania Electric Supply CompanyTBS : Tanzania Bureau of StandardsTZS : Tanzania ShillingsWSSA : Water Supply and Sanitation AuthorityZECO : Zanzibar Electric CompanyZESCO : Zambia Electricity Corporation

v
9THANNUAL REPORT FOR THE YEAR ENDED 30TH JUNE, 2015
LETTER OF TRANSMITTAL
Hon. Gerson Lwenge (MP),Minister for Water,Ministry of Water,426 Morogoro Road,14473 Dar es Salaam.
Honourable Minister,
I have the honour to submit to you the Annual Report and Audited Accounts of the Energy and Water Utilities Regulatory Authority (EWURA) for the fi nancial year ended 30th June, 2015 as per Section 48 of the EWURA Act, Cap 414.
The report outlines the major activities accomplished by the Authority during the year under review.
I submit.
Prof. Eng. Jamidu KatimaChairman, EWURA Board of DirectorsJanuary 2016

vi
9THANNUAL REPORT FOR THE YEAR ENDED 30TH JUNE, 2015
VISION, MISSION AND CORE VALUES
Vision: To be a world class regulator of energy and water services.
Mission: To regulate the energy and water services in a transparent, effective and effi cient manner that promotes investments and enhances the socio-economic welfare of the Tanzanian society.
Core Values:
(a) Transparency EWURA operates in a fully transparent manner. All regulatory decisions are conducted without prejudice,
with respect for the interests of all stakeholders and in a fair and completely transparent manner. Information on regulatory decisions is openly communicated to all stakeholders using various media.
(b) Integrity EWURA Board members and staff are not allowed to solicit or accept gifts, favours or inducements, fi nancial
or otherwise, in the course of discharging their duties. In addition, EWURA Board members and staff shall not offer gifts, improper favors or inducements.
(c) Courtesy EWURA Board members and staff treat their clients and colleagues with courtesy and regard themselves
as servants of the people; and will be particularly considerate when dealing with vulnerable members of the public such as the elderly, the poor, the sick and people with disabilities and disadvantaged groups in society.
(d) Accountability EWURA Board members and staff discharge duties including making decisions with which they are bound
and answerable. Their conduct is in a manner that shows readiness to take full liability and responsibility for the outcome of their decisions.
(e) Professionalism EWURA Board members and staff attend to their duties with the highest degree of professionalism.
(f) Equity EWURA Board members and staff treat all stakeholders with impartiality and fairness. The duty of EWURA
as a regulator is to set a level playing fi eld and balance interests of all stakeholders. The conduct of all staff and their individual decisions as well as those of the Authority at all times should refl ect this value.
Strategic Objectives
The Authority is determined to increase its contribution to national economic development and improve the welfare of the Tanzanian society through delivery of regulated services. It is within this drive that the Authority set out fi ve objectives in its Strategic Plan (2012/13 - 2016/17) with a view to enabling it to address imminent and medium-term regulatory challenges in all the sectors it regulates. These strategic objectives are:
(a) least cost investments in the regulated sectors promoted; (b) quality and access of regulated services improved;(c) public knowledge, awareness and understanding of regulatory functions in the regulated sectors enhanced;(d) EWURA functions effectively and effi ciently managed; and(e) interventions against HIV/AIDS enhanced.

vii
9THANNUAL REPORT FOR THE YEAR ENDED 30TH JUNE, 2015
TABLE OF CONTENTS
ABBREVIATIONS ..................................................................................................................................................iv
LETTER OF TRANSMITTAL .....................................................................................................................................v
VISION, MISSION AND CORE VALUES ...............................................................................................................vi
INTRODUCTION ..................................................................................................................................................1
CHAIRMAN’S STATEMENT ....................................................................................................................................2
DIRECTOR GENERAL’S STATEMENT ......................................................................................................................7
Board of Directors ..................................................................................................................................................8Board Committees ..................................................................................................................................................8Director General ....................................................................................................................................................8Internal Monitoring System .....................................................................................................................................8Litigation ................................................................................................................................................................8Finance and Budget Administration ........................................................................................................................8Procurement Management ......................................................................................................................................9Code of Conduct ....................................................................................................................................................9Internal Audit and Risk Management ......................................................................................................................9
1.0 GENERAL INSTITUTIONAL PERFORMANCE REVIEW ...........................................................................101.1 Staffi ng and Institutional Capacity Building .............................................................................................101.2 Regional Co-operation and Collaboration ...............................................................................................101.3 Information and Communication Technology (ICT) .................................................................................111.4 Public Register ........................................................................................................................................111.5 Financial Performance Review ................................................................................................................111.6 Key Achievements and Challenges ..........................................................................................................12
2.0 ELECTRICITY SECTOR PERFORMANCE AND REGULATION .................................................................142.1 Overview ................................................................................................................................................142.2 Performance Monitoring .........................................................................................................................152.3 Tariff and Power Purchase Agreement .....................................................................................................172.4 Regulatory ..............................................................................................................................................182.5 Complaints and Dispute Resolutions .......................................................................................................182.6 Litigation ................................................................................................................................................182.7 Health, Safety and Environmental Matters ...............................................................................................182.8 Key Achievements and Challenges ..........................................................................................................19
3.0 PETROLEUM SECTOR PERFORMANCE AND REGULATION .................................................................203.1 Overview ................................................................................................................................................203.2 Performance Monitoring .........................................................................................................................203.3 Petroleum Products Quality Monitoring ..................................................................................................293.4 Monitoring adherence to Health, Safety and Environmental (HSE) requirements .....................................323.5 Licensing Activities .................................................................................................................................343.6 Legislative Regulatory Tools ....................................................................................................................343.7 Complaints Handling and Dispute Resolution .........................................................................................35
viii
9THANNUAL REPORT FOR THE YEAR ENDED 30TH JUNE, 2015
3.8 Litigation ................................................................................................................................................353.9 Key Challenges and Achievements ..........................................................................................................35
4.0 NATURAL GAS SECTOR PERFORMANCE AND REGULATION ..............................................................364.1 Overview ................................................................................................................................................364.2 Performance Monitoring .........................................................................................................................364.3 Level of Investment in Gas Infrastructure Development ...........................................................................394.4 Health, Safety and Environment ..............................................................................................................404.5 Licensing ................................................................................................................................................404.6 Determination of Rates and Charges .......................................................................................................404.7 Legislative Matters ..................................................................................................................................404.8 Disputes and Complaints ........................................................................................................................414.9 Litigation ................................................................................................................................................414.10 Achievements and Challenges ................................................................................................................41
5.0 WATER SUPPLY AND SANITATION SERVICES REGULATION ...............................................................425.1 Overview ................................................................................................................................................425.2 Performance Monitoring .........................................................................................................................425.3 Review of WSSAs’ Business Plans ...........................................................................................................435.4 Review of WSSAs’ Client Service Charters ..............................................................................................435.5 Water Utilities Performance Review Report .............................................................................................435.6 Licensing ................................................................................................................................................435.7 Determination of Rates and Charges .......................................................................................................445.8 Complaints Handling and Dispute Resolution .........................................................................................445.9 Litigation ................................................................................................................................................455.10 Health, Safety and Environmental Matters ...............................................................................................455.11 Capacity Building ...................................................................................................................................455.12 Other Interventions in the Water Sector ..................................................................................................455.13 Key Achievements and Challenges ..........................................................................................................46
6.0 COMMUNICATIONS AND PUBLIC AWARENESS PROGRAMME ..........................................................476.1 Overview ................................................................................................................................................476.2 Public Awareness Campaign ...................................................................................................................476.3 Press Conferences and Media Coverage ..................................................................................................476.4 Advertisements .......................................................................................................................................476.5 Publicity Materials ..................................................................................................................................476.6 Exhibitions ..............................................................................................................................................486.7 Impact of Public Awareness Campaigns ..................................................................................................486.8 Donations and Contributions ..................................................................................................................486.9 Key Achievement and Challenges ...........................................................................................................48
7.0 STAKEHOLDERS CONSULTATIONS .......................................................................................................49
8.0 DECLARATION OF CONFLICT OF INTEREST ........................................................................................49
9.0 CONCLUSION AND FUTURE OUTLOOK .............................................................................................49
10.0 REPORT FROM THE CONTROLLER AND AUDITOR GENERAL .............................................................51

1
9THANNUAL REPORT FOR THE YEAR ENDED 30TH JUNE, 2015
INTRODUCTION
This is the 9th Annual report that presents the performance of the Energy and Water Utilities Regulatory Authority (EWURA) for the year that ended on 30th June, 2015. The report summarizes the executed activities, challenges encountered and achievements attained during the period under review.
The Authority was established under the EWURA Act, Cap. 414 of the Laws of Tanzania, and started its operations in June 2006 as a multi-sector regulatory authority. The Authority carries out economic and technical regulation of the energy (electricity, petroleum, and natural gas) and water sectors. The functions of the Authority as spelt out in the Act are to: (a) perform all functions conferred on it by sector legislation and Cap. 414;(b) issue, renew and cancel licences;(c) establish standards for goods and services;(d) establish standards for terms and conditions of supply of goods and services;(e) regulate rates and charges;(f) make rules;(g) monitor performance of regulated sectors in relation to availability, quality, standards of services, cost of
services, effi ciency of production, investment levels and distribution of services; (h) facilitate resolution of complaints and disputes; and(i) disseminate information about matters relevant to its functions.
Further, Section 6 of the EWURA Act requires the Authority to assume the following duties in the course of carrying out its functions:(a) promote effective competition and economic effi ciency;(b) promote the interests of consumers;(c) protect the fi nancial viability of effi cient suppliers;(d) promote the availability of regulated services to all consumers, including low income, rural and disadvantaged
consumers;(e) enhance public knowledge, awareness and understanding of the regulated sectors including the rights and
obligations of consumers and regulated suppliers, the ways in which complaints and disputes may be initiated and resolved, and the duties, functions and activities of the Authority; and
(f) take into account the need to protect and preserve the environment.
Objectives of the ReportThis annual report for 2014/15 fulfi ls the following objectives:(a) to comply to the requirements of Section 48 of EWURA Act, Cap. 414;(b) to inform the public on the Authority’s performance in regulation of energy and water sectors;(c) to educate stakeholders of regulated sectors and the general public on regulatory matters; and(d) to provide a source of credible information on the regulated sectors.
2
9THANNUAL REPORT FOR THE YEAR ENDED 30TH JUNE, 2015
CHAIRMAN’S STATEMENT
On behalf of the Board of Directors of the Energy and Water Utilities Regulatory Authority (EWURA), I am pleased to give a brief overview of EWURA’s performance for the Financial Year ending June 30th 2015, which is the 9th Annual Report since the commencement of the Authority’s operations way back in 2006.
For the fi nancial year 2014/2015, EWURA has proved its stability by demonstrating a strong performance in its regulatory activities to the sectors that fall under its mandate and jurisdiction. Such sectors are Energy (Electricity, Petroleum, Natural Gas) and Water and Sanitation.
During the period under review, the Authority received many awards; but one of them is a famous award that the Authority won as the best Energy Regulator in Africa at the Africa Energy Forum held in June,2015 in Dubai, thus proving the Authority’s ability to regulate the sectors that it regulates.
Although there are still some challenges in the quality of service, especially in Water and Electricity, the Authority has managed to put more efforts in making sure that it accelerates the development of services in terms of availability and quality of services. The Authority has continued to protect the interests of the consumers and the service providers.
During the fi nancial year 2014/2015, the Authority monitored the fl uctuations of petroleum products prices in the world market and translated its effects in Tanzania, where the country experienced lowest prices during the period between September 2014 and March 2015.
This was the last fi nancial year for the founding Board Chairman, Mr. Simon Sayore who completed his 8 years tenure on 26th June 2015 as stipulated in the EWURA Act Cap. 414. I am pleased to note that Mr. Sayore has left behind a powerful institution which stands fi rm in implementing and defending various regulatory principles and values, through which the Authority steers towards the right direction in attaining its objectives.
I wish to extend my sincere appreciation to the Government of Tanzania, and especially to His Excellence, Dr. Jakaya Mrisho Kikwete, the President of the United Republic of Tanzania, who has pioneered the operationalization of EWURA and leaving his legacy of founding the Authority that has achieved a lot.
I also wish to extend my appreciation to the Minister for Water, Hon. Prof. Jumanne Maghembe and the Minister for Energy and Minerals, Hon. George Simbachawene for supporting the Authority in achieving its intended goals. Finally, let me take this opportunity to congratulate EWURA Board Members, Management and Staff for their unwavering commitment, dedication and hardworking during the year under review.
Mr. Omar Shane BenderaDeputy Chairman

3
9THANNUAL REPORT FOR THE YEAR ENDED 30TH JUNE, 2015
BOARD AND MANAGEMENT STRUCTURE
The Authority has a cost-effective organisation structure that facilitates effi cient regulation of the energy (electricity, petroleum, natural gas) and water sectors; good corporate governance; and effi cient provision of cross-cutting services. The structure has the Board of Directors as the top decision-making body, the Director General as the overall overseer of the day to day activities of the Authority and eight Divisions headed by Directors. There are also heads of units who report directly to the Director General, namely, Manager Procurement Management and Manager, Communications and Public Relations. The organisation structure is as shown in FIGURE 1.
Board of DirectorsEWURA is governed by a Board of Directors which is the highest decision-making organ of the Authority established under section 8 of the EWURA Act. The Board consists of the non-executive Chairman appointed by the President of the United Republic of Tanzania, fi ve (5) non-executive members and the Director General who are appointed by the Minister responsible for EWURA after consultation with the Minister for Energy and Minerals.
In order to fulfi l its oversight responsibilities, the Board has established fi ve (5) Board Committees based on sectoral and cross-cutting issues. These are Audit, Legal and Corporate Affairs, Electricity and Natural Gas, Petroleum, and Water Board Committees.
Director GeneralThe Director General is appointed under section 14 of the EWURA Act and is responsible for the day-to-day operations of the Authority, subject to the directions of the Board of Directors.
Divisional DirectorsThe Director General is assisted by seven (7) Divisional Directors, namely Director of Electricity, Director of Petroleum, Director of Natural Gas, Director of Water and Sanitation, Director of Regulatory Economics, Director of Legal Services and Director of Corporate Affairs. The Director of Internal Audit reports to the Board’s Audit Committee on audit functions and to the Director General on administrative matters. Communications and Public Relations, and Procurement Management are functions headed by managers under the Director General’s Offi ce.
Offi ce of the AuthorityThe offi ce of the Authority is currently located at 7th Floor, LAPF Pension Fund Tower, Opposite Makumbusho Village, Kijitonyama in Dar es Salaam. The Authority also operates one zonal offi ce in Mwanza.

4
9THANNUAL REPORT FOR THE YEAR ENDED 30TH JUNE, 2015
Dir
ec
tor
of
Co
rpo
rate
Aff
air
s
Bo
ard
of
Dir
ec
tors
Dir
ec
tor
of
Inte
rna
l A
ud
it
Dir
ec
tor
Ge
ne
ral
Ma
na
ge
r
Co
mm
un
ica
tio
n a
nd
Pu
blic
Re
lati
on
s
Ma
na
ge
r
Pro
cu
rem
en
t
Ma
na
ge
me
nt
Fin
an
ce
an
d
Ad
min
istr
ati
on
Ma
na
ge
r
Info
rma
tio
n a
nd
Co
mm
un
ica
tio
n
Te
ch
no
log
y M
an
ag
er
Hu
ma
n R
eso
urc
es
Ma
na
ge
r
Zo
na
l M
an
ag
er
Ma
na
ge
r G
as
Dis
trib
uti
on
Te
ch
nic
al
Ma
na
ge
r
Te
ch
nic
al
Ma
na
ge
r
Te
ch
nic
al
Ma
na
ge
r
Ma
na
ge
r F
ina
nc
ial
An
aly
sis
an
d
Mo
de
llin
g
Ma
na
ge
r L
ice
nsin
g
an
d E
nfo
rce
me
nt
Ma
na
ge
r G
as
Tra
nsm
issio
n
Co
mm
erc
ial
Ma
na
ge
r
Co
mm
erc
ial
Ma
na
ge
rC
om
me
rcia
l
Ma
na
ge
r
Ma
na
ge
r E
co
no
mic
An
aly
sis
an
d
Re
se
arc
h
Ma
na
ge
r L
eg
al
Se
rvic
es
Dir
ec
tor
of
Na
tura
l G
as
Dir
ec
tor
of
Pe
tro
leu
m
Dir
ec
tor
of
Wa
ter
an
d S
ew
era
ge
Dir
ec
tor
of
Ele
ctr
icit
y
Dir
ec
tor
of
Re
gu
lato
ry
Ec
on
om
ics
Dir
ec
tor
of
Le
ga
l
Se
rvic
es
Figu
re 1
: Org
aniz
atio
n St
ruct
ure

5
9THANNUAL REPORT FOR THE YEAR ENDED 30TH JUNE, 2015
BOARD OF DIRECTORS
Mr. Simon F. Sayore Chairman
Mr. Richard M. KayomboMember
Mr. Omar S. BenderaDeputy Chairman
Mr. Ahmed S.K. KilimaMember
Mr. Oswald R. MutaitinaMember
Ms Juliana A. MwalongoMember up to October,
2014
Mr. Nicholas H.MbwanjiMember
Mr. Felix M. NgamlagosiMember

6
9THANNUAL REPORT FOR THE YEAR ENDED 30TH JUNE, 2015
MANAGEMENT
Mr. Felix M. NgamlagosiDirector General
Ms. Miriam G. Mahanyu
Director of Legal Services
Eng. Anastas MbawalaDirector of Electricity
Ms. Naiungishu S. MollelDirector of Corporate
Affairs
Eng. Mutaekulwa Mutegeki
Director of Water and Sanitation
Eng. Godwin SamwelDirector of Petroleum
Eng. Charles OmujuniDirector of Natural Gas
Mr. George KabelwaAg. Director of
Regulatory Economics
Mr. Giniva SangaAg. Director of Internal Audit
Mr. Deogratius KumalijaManager Procurement
Management
Mr. Titus KaguoManager
Communications and Public Relations

7
9THANNUAL REPORT FOR THE YEAR ENDED 30TH JUNE, 2015
DIRECTOR GENERAL’S STATEMENT
On behalf of Management and Members of staff of the Energy and Water Utilities Regulatory Authority (EWURA), I am honoured to present EWURA’s Annual Report for the Financial Year 2014/2015. This is the ninth year of operation since the Authority was established. The report contains details on achievements made from the efforts and commitments of the Authority’s Board of Directors, Management, members of staff and stakeholders. Furthermore, the report contains the challenges that were encountered during the reporting period.
Before I proceed, let me fi rst congratulate the founding Board Chairman, Mr. Simon Sayore, whose 8 years tenure with the Authority, as the Board Chairman, ended effectively on 26th June 2015. Mr Sayore has served as the Board Chairman for eight years since 2006, bringing the Authority to new heights of professional performance that transcended to global levels. During his leadership, EWURA registered notable success, for instance emerging as the best energy regulator of Africa for the year 2015 namely the Energy Regulator of the Year 2015, Award for Excellence 2015.
I would like to recognise and applaud the noble leadership of the Deputy Chairman Mr. Omar Shane Bendera during the time under review. Also, would like to welcome and congratulate, the new Board Chairman, Professor Eng. Jamidu Katima, who has just been appointed by His Excellency, the President of the United Republic of Tanzania, Dr. Jakaya Mrisho Kikwete. On behalf of EWURA Board, Management and staff, I wish him all the best in his new responsibilities and assure him of our continued cooperation.
During the fi nancial year 2014/2015, the Authority continued to discharge its mandate in the regulation of energy and water sectors. Specifi cally, the Authority registered notable successes in the regulation of tariffs and charges for regulated goods and services by, inter alia, focusing on the value for money and the quality of services offered.
Furthermore, the Authority participated in the preparation of Model Power Purchase Agreements for seven energy technologies which are hydro, natural gas, oil, coal, geothermal, solar and wind, for use in negotiating power projects in Mainland Tanzania. These models will be applicable for power projects of above 10MW. These models have been approved by the Ministry of Energy and Minerals and will be used in negotiations between project developers and power off-takers in a bid to attract investments in the electricity sector. Likewise, during the period under review the second generation Small Power Producers Framework has been developed for hydro generation of electricity and biomass technologies for generating electricity.
For the fi nancial year 2014/15 the Authority participated in the drafting of the Petroleum Act 2015. The Petroleum Act, which was passed by the Parliament of Tanzania in July 2015 and assented by H.E President of the United Republic of Tanzania, once enacted will facilitate management and regulation of petroleum and natural gas sub-sectors in Tanzania.
Last but not least, I would like to thank the EWURA Board of Directors, Management, staff and all our stakeholders for the highest commitment and support extended to us during the fi nancial year 2014/2015.
Felix M. NgamlagosiDirector General

8
9THANNUAL REPORT FOR THE YEAR ENDED 30TH JUNE, 2015
CORPORATE GOVERNANCE
Board of DirectorsThe Board of Directors of EWURA as the highest decision making organ, is established under Section 8 of the EWURA Act, Cap 414. The Board consists of six (6) non-executive members including the Chairman and one (1) executive member who is also the Director General. The Chairman is appointed by the President of the United Republic of Tanzania while the remaining fi ve (5) non-executive members and the Director General are appointed by the Minister responsible for EWURA after consultation with the relevant sector Ministers. During the year under review a total of 32 Board Meetings were conducted, out of which 12 were ordinary and 20 were extraordinary.
Board CommitteesThe committees of the Board of Directors are established in accordance with Section 21 of the EWURA Act, Cap 414 to fulfi l its oversight responsibilities. The Board has fi ve (5) Committees based on sectoral and cross-cutting issues. These are Audit, Legal and Corporate Affairs, Electricity and Natural Gas, Petroleum, and Water Committees. During the period under review, eighteen (18) meetings were conducted by these Committees as shown in Table 1.
Table 1: Board Committees Meetings
S/N Board Committee Number of Meetings
1 Audit 7
2 Legal and Corporate Affairs 5
3 Electricity and Natural Gas 4
4 Petroleum 1
5 Water 1
Total 18
Director GeneralThe Director General of the Authority is appointed by the Minister responsible for EWURA as per section 14 of the EWURA Act, Cap 414 and shall discharge day-to-day operations of the Authority, subject to the directions of the Board of Directors.
Internal Monitoring SystemThe Authority has established an Internal Monitoring System in line with relevant public sector legislation, regulations, rules and procedures. The internal administrative monitoring system is achieved through, among other things, fi nancial controls, and the Code of Conduct and Internal Audit functions.
LitigationDuring the year under review, in relation to Corporate Governance, the Authority was a party to one labour dispute at the Commission of Mediation and Arbitration (CMA). In this dispute, one former employee of the Authority is challenging EWURA’s decision not to confi rm him to the post. Hearing of the matter is still pending. Furthermore, the Authority was a party to two Civil Suits at the Resident Magistrate Court of Dar es Salaam at Kisutu. The nature of the Suit was on recovery of unpaid regulatory levy by some regulated suppliers.
Finance and Budget AdministrationThe fi nancial matters of the Authority are governed by the Public Finance Act, 2002 and international fi nancial best practices. The Authority’s Annual Plan and Budget are prepared in accordance with the fi ve years strategic plan (2012/13 – 2016/17) of the Authority.

9
9THANNUAL REPORT FOR THE YEAR ENDED 30TH JUNE, 2015
Pursuant to Section 21 of the Budget Act, 2014, the Authority is required to prepare budget estimates and submit to the Permanent Secretary of the Ministry of Finance for scrutiny and approval. After being approved the budget is submitted to the Minister responsible for EWURA in line with the provisions of section 49 of the EWURA Act. Resources used to implement the Annual Budget are derived from regulatory levies and fees collected from regulated utilities and consumers. The outcome of the implementation of annual budget is presented to the Minister responsible for the Authority through an Annual Report and Accounts in line with the provisions of section 48 of the EWURA Act.
Procurement ManagementThe Authority has a Tender Board and a Procurement Management Unit (PMU) established in accordance with the Public Procurement Act Cap 410. In order to comply with the requirements of the Public Procurement Act and its related Regulations, members of the Tender Board, Staff of the Procurement Management Unit and user departments attend various training courses being conducted by the Public Procurement Regulatory Authority (PPRA).
During the audit on the implementation of the system for checking and monitoring procurement activities conducted by the Public Procurement Regulatory Authority in February 2015, the Authority was assessed to have performed very well with a compliance level of 88.5%.
Code of ConductThe Authority’s Code of Conduct binds both Members of the Board of Directors and Staff. The Code of Conduct explicitly underlines that the Authority has zero tolerance to fraud and corruption. All incidents of fraud and corruption are reported to appropriate Authorities. During the year under review, the Authority did not encounter any incident of fraud or corruption.
Internal Audit and Risk ManagementThe Internal Audit functions that entail giving assurance on risk management, control processes and governance processes, were carried out in accordance with the Internal Audit Charter, Annual Audit Plan and International Standards for Professional Practices of Internal Auditing.
During the period under review, the Authority witnessed a smooth running of various processes under the guidance of the oversight bodies which include the Board of Directors and its committees. The Internal Audit activity continued to assist the Board and Management in ensuring that there is improvement in the effectiveness of risk management, control and governance processes.

10
9THANNUAL REPORT FOR THE YEAR ENDED 30TH JUNE, 2015
1.0 GENERAL INSTITUTIONAL PERFORMANCE REVIEW
During the period under review, the Authority performed various activities related to regulatory matters as summarised below:
1.1 Staffi ng and Institutional Capacity Building 1.1.1 Recruitment The Authority maintained its recruitment policy by providing equal opportunity to all. In so doing, the
Authority recruited the most appropriate candidates available in the market in a competitive and transparent manner in order to ensure that the functions and duties of the Authority are performed effi ciently and effectively.
During the period under review, the Authority’s workforce was further strengthened. A total of 11 staff were recruited thus bringing the number of staff to 104 out of 113 in the approved establishment. Staff gender structure is as indicated in Table 2 below:
Table 2: Staff as at 30th June 2015
Item Male Female Total
Staff Compliment 70 34 104
Proportion 67% 33% 100%
1.1.2 Capacity Building EWURA believes in having well educated and motivated staff. The Authority encourages distance learning,
development and growth of its staff. The learning and development programmes support the retention initiatives of the Authority that aims at ensuring that the Authority has adequate professional and skilled staff.
During the year under review, the Authority enhanced knowledge of its staff in relevant regulatory, managerial and operational competencies. The new senior staff attended general courses on Public Utility Regulation and Strategy. Also, several staff attended local training on general management courses, professional courses, secretarial practices and advanced drivers and offi ce attendants courses in order to improve their performance. Additionally the Authority in collaboration with Public Service College and Tanzania Fire and Rescue Force Unit conducted awareness training on HIV/ AIDS and working life skills, and fi re- fi ghting and protection respectively to all the Authority staff.
1.2 Regional Co-operation and Collaboration The Authority subscribed and participated in the activities of fi ve Regional Associations namely, Regional
Electricity Regulators Association (RERA), African Forum for Utility Regulators (AFUR), Energy Regulators Association of East Africa (EREA), Eastern and Southern Africa Water and Sanitation Regulators Association (ESAWAS) and African Refi ners Association (ARA). The main objective is to exchange regulatory experiences within the International and Regional setting, and allow the Authority to have access to information necessary for regulation and performance benchmarking. Furthermore, the Authority has participated in various meetings convened to establish the regional power pool regulatory body, the Eastern Africa Power Pool Independent Regulatory Body (EAPP-IRB).

11
9THANNUAL REPORT FOR THE YEAR ENDED 30TH JUNE, 2015
1.3 Information and Communication Technology (ICT)
1.3.1 Regulatory and Management Information Systems The Authority’s Information Communication and Technology (ICT) System continued to support regulatory
functions. It is the Authority’s policy to ensure that the public is provided with timely and accurate information. The Authority’s website provides access to regulatory information including publications of all decisions made by the Board.
Pursuant to the Petroleum Act, 2008, the Authority continued with testing and training on the National Petroleum Information System (NPIS). The system consist of an integrated and centralized information system using modern data processing technology and covering all petroleum supply operations and installations, the principal market activities and statistics of the country as well as international reference data. In ensuring that the system works well and meets the expectations of all users, the Authority conducted training to Oil Marketing Companies (OMCs) on the use of NPIS.
The Authority continued to monitor the performance of Water Supply and Sanitation Authorities (WSSA) by using the Water Utilities Information System (MajIs). MajIs serves to improve accessibility to data and information for monitoring, planning and decision-making.
Likewise, the Authority maintained the Electricity Regulatory Information System (ERIS) and Asset Register (AR). The system is used to collect information from electricity service providers.
Furthermore, the Authority was in the fi nal stages of commissioning the Licensing and Order Information System (LOIS) under the support of GIZ. LOIS has been designed to facilitate online application, issuing, revocation and transfer of licences.
Finance and accounting activities of the Authority are managed through EPICOR accounting software which provides accurate data and timely reporting. A remote data recovery centre has been improved to strengthen the security of the Authority’s data in the event of a disaster to ensure business continuity.
1.4 Public Register Public Register is maintained by the Authority for public inspection at all times during business hours
at the Head Quarters in Dar es Salaam. Some of the information from the public access registry can be obtained from the Authority’s website. The register provides access to the Code of Conduct adopted by the Authority, regulatory information and all regulatory decisions made by the Authority and published in the Government Gazette such as rules, tariff Orders, awards and licences. The public has the right to get correct and accurate information from the Authority relating to the regulated entities. The main objective of the Public Registry is to ensure transparency and provision of timely information to all stakeholders on the Authority’s regulatory activities.
1.5 Financial Performance Review The Authority’s operations are fi nanced mainly through collection of levies from regulated service
providers in the energy, (electricity, petroleum, natural gas) and water and sanitation sectors. Other sources of fi nancing include licence fees, application fees, penalties and interest income from fi xed deposits.
Total operating revenue in 2014/15 amounted to TZS 38.7 billion indicating an increase of 15.7% when compared to the previous year as shown in Table 3

12
9THANNUAL REPORT FOR THE YEAR ENDED 30TH JUNE, 2015
Table 3: Summary of Financial Performance
Item Amount for the Year Ended 30th June, 2015
Amount for the Year Ended 30th June, 2014
%Increase Over Previous Year
TZS’000 TZS’000 %
Income from Levy and Licences 34,823,343 30,077,848 15.8
Other Income 4,866,718 3,076,257 58.2
Total Income 38,690,061 33,154,105 16.7
Re-current Expenditure 27,490,594 25,347,854 8.5
Capital Expenditure 1,243,174 612,443 103.0
Total Expenditure 28,733,768 25,960,297 10.7
1.6 Key Achievements and Challenges Key achievements made and challenges experienced by the Authority during the year under review are
discussed below.
1.6.1 Key Achievements During the year under review, the key achievements of the Authority included: (a) The Authority continued to sustain fi nancial self-suffi ciency to run its operations without depending
on grants from the Government or Development Partners. (b) In a bid to bring regulatory services closer to consumers, the Authority’s Zonal Offi ce in Mwanza
for the Lake Zone has started its operations. (c) The Authority continued with petroleum products marking system which has signifi cantly reduced
adulteration and dumping of transit petroleum products. This has improved the quality of petroleum products and competition in the sector. In addition the system has reduced tax evasion on transit petroleum products.
(d) The standard of retail outlets infrastructure, quality of service and compliance to Health Safety and Environment (HSE) throughout the country has signifi cantly improved because of compliance monitoring, enforcement and measures taken by the Authority.
(e) The Authority prepared and disseminated the fi rst Downstream Petroleum Sub-Sector Performance Review Report. The report covers performance of the sector between years 2007 to 2014.
(f) The Authority participated in the preparation of Petroleum Act, 2015 which enables the Authority to regulate the mid and downstream of the petroleum and natural gas sectors
(g) In a bid to promote investments in the power sector, the Authority participated in the preparation of technology based Model Power Purchase Agreements for hydro, natural gas, oil, coal, geothermal, solar and wind.
(h) The Authority conducted training on the use of Water Utilities Information System (MajIs) to District, Township and National Project Water Supply and Sanitation Authorities (WSSAs). As a result, additional 60 water utilities started reporting through MajIs.
(i) The Authority prepared Licensing and Order Information System (LOIS) under the support of GIZ to facilitate online application, issuing, revocation and transfer of licences.
(j) The Authority developed regulatory tools which include 19 rules, guidelines, codes and licence templates.
(k) The Authority issued Water Quality Monitoring Guidelines, 2014 which provide guidance to water utilities in developing own quality monitoring programs for water supply and wastewater disposal.
(l) The Authority developed and implemented a Communication Policy and Strategy.

13
9THANNUAL REPORT FOR THE YEAR ENDED 30TH JUNE, 2015
(m) The Authority continued to conduct public awareness campaigns and seminars on the roles and responsibilities of the Authority, rights and obligations of the service providers and consumers and complaints handling mechanism, for editors and journalists of Dar es Salaam based media houses. A similar training was conducted to TANESCO employees in Dar es Salaam, Coast, Lindi, Mtwara, Tabora, Kigoma, Kagera, Shinyanga, Mwanza and Mara regions.
1.6.2 Key Challenges The key challenges and their respective mitigation measures are as outlined below. (a) The Authority is faced with offi ce accommodation challenges which include frequent increases in
rent and insuffi cient space. However, efforts are under way to enable the Authority to construct its own offi ce building.
(b) Insuffi cient knowledge by the general public and key stakeholders in understanding the concept of regulation. This causes some of the key stakeholders to misunderstand the Authority’s decision making process. The Authority shall continue to implement its Public Awareness Programme to address this challenge.
(c) The delay in making regulatory decisions to some crosscutting issues that require approval from other Government Institutions like land use and environmental requirements.
14
9THANNUAL REPORT FOR THE YEAR ENDED 30TH JUNE, 2015
2.0 ELECTRICITY SECTOR PERFORMANCE AND REGULATION
2.1 Overview Regulatory activities performed by the Authority in the electricity supply industry include, among other
things, issuing licences, tariff setting and compliance monitoring of operations and regulated infrastructure to ensure quality and reliability of services. The regulated infrastructure include power generating plants, power transmission lines, distribution substations and distributions lines, which are operated by private and public entities.
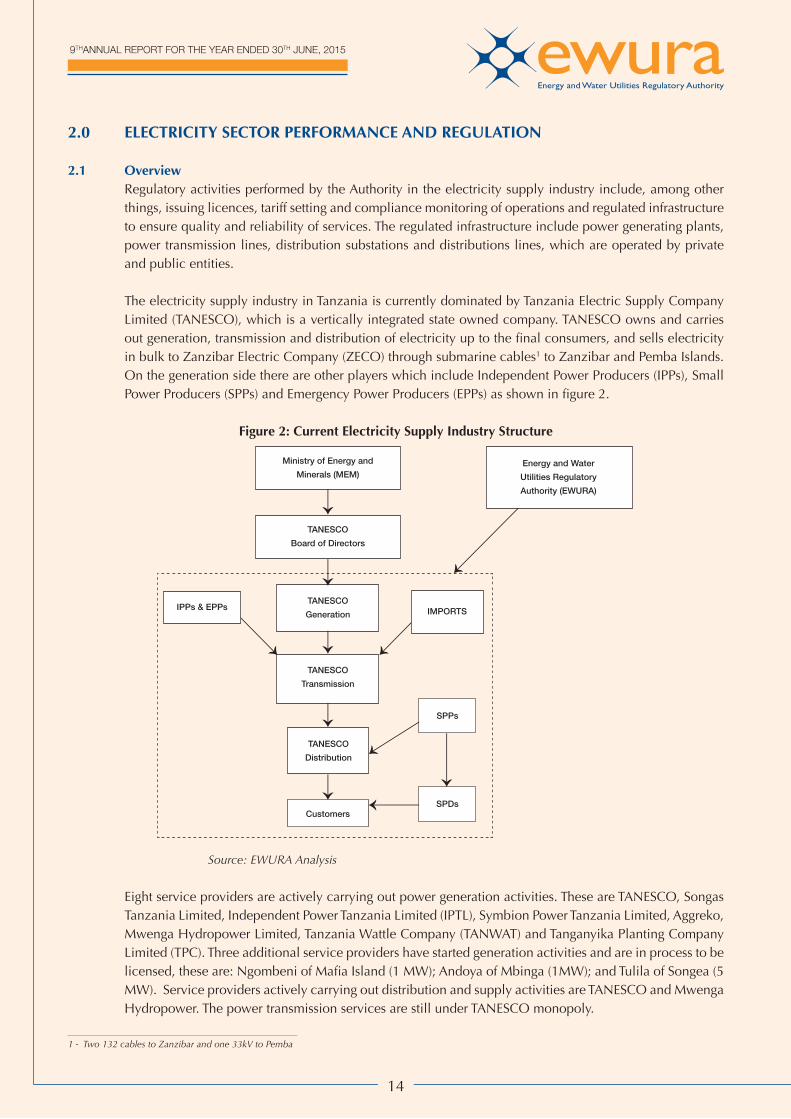
The electricity supply industry in Tanzania is currently dominated by Tanzania Electric Supply Company Limited (TANESCO), which is a vertically integrated state owned company. TANESCO owns and carries out generation, transmission and distribution of electricity up to the final consumers, and sells electricity in bulk to Zanzibar Electric Company (ZECO) through submarine cables1 to Zanzibar and Pemba Islands. On the generation side there are other players which include Independent Power Producers (IPPs), Small Power Producers (SPPs) and Emergency Power Producers (EPPs) as shown in fi gure 2.
Figure 2: Current Electricity Supply Industry Structure
Source: EWURA Analysis
Eight service providers are actively carrying out power generation activities. These are TANESCO, Songas Tanzania Limited, Independent Power Tanzania Limited (IPTL), Symbion Power Tanzania Limited, Aggreko, Mwenga Hydropower Limited, Tanzania Wattle Company (TANWAT) and Tanganyika Planting Company Limited (TPC). Three additional service providers have started generation activities and are in process to be licensed, these are: Ngombeni of Mafi a Island (1 MW); Andoya of Mbinga (1MW); and Tulila of Songea (5 MW). Service providers actively carrying out distribution and supply activities are TANESCO and Mwenga Hydropower. The power transmission services are still under TANESCO monopoly.
Ministry of Energy and
Minerals (MEM)
Energy and Water
Utilities Regulatory
Authority (EWURA)
TANESCO
Board of Directors
TANESCO
Generation
TANESCO
Transmission
IPPs & EPPsIMPORTS
SPPs
TANESCO
Distribution
CustomersSPDs
1 - Two 132 cables to Zanzibar and one 33kV to Pemba

15
9THANNUAL REPORT FOR THE YEAR ENDED 30TH JUNE, 2015
2.2 Performance Monitoring
2.2.1 Reporting System Pursuant to Section 15(4) of the Electricity Act, 2008, every electricity service provider is required to
submit to the Authority, data and information relating to performance of its functions. During the period under review, the Authority continued to receive and maintain periodic data submitted by licensed power utilities and suppliers directly and through the Electricity Regulatory Information System (ERIS). Also, daily system reports were submitted by TANESCO through email distribution list.
2.2.2 Monitoring and Inspection During the period under review the Authority conducted routine inspection on Low Voltage (LV) and
Medium Voltage (MV) distribution networks. The inspections were conducted for Electricity Distribution infrastructure’s in nine Regions namely Arusha, Mwanza, Kagera, Morogoro, Dodoma, Tabora, Kigoma, Mara and Iringa. Among the defects found during inspection were leaning and rotten poles, defective switchgears, leaning insulators, transformer oil leakages and unrated fuse wires. Also some areas were observed to have low voltage caused by lines extended beyond the standard limit and overloaded transformers. The Authority instructed TANESCO to rectify the anomalies as detailed in the inspection reports given to them.
2.2.3 Quality and Standard of Services The Authority continued to monitor quality of service with reference to the quality of supply and services
standards with a focus on system disturbances such as unacceptable frequencies and voltage fl uctuations, power outages and load shedding. It was revealed that the system experienced voltages and frequencies fluctuations because of aged equipment and lack of maintenance. In this regard, the Authority has started planned utility infrastructure inspections through which identifi ed anomalies are communicated to the utility operators for rectifi cation. Furthermore, the Authority allows funds through the multi-year tariff order for capital investment projects to address such problems.
2.2.4 Generation Capacity The installed capacity in the Isolated Grid was 78 MW, while installed capacity in the main grid was 1,261
MW. The Maximum Demand attained was 934.62 MW, recorded on 12th December 2014. During the period under review, a total of 6,164 GWh as were available for sale as shown in Table 4, which implies a 1.3% increase as compared to 6,085.92 GWh reported during the previous year. These units were received from TANESCO plants, IPPs, SPPs and imports from neighbouring countries.
Table 4: Electricity Generation and Imports
S/N Utility GWh: 2014-2015 Contribution (%)1 TANESCO 4,028,567 65.4%
2 Songas 1,358,260 22.0%
3 IPTL 588,244 9.5%
4 Aggreko 125,672 2.0%
5 SPPs 34,230 0.6%
6 Symbion 0 0.0%
7 Imports 63,345.82 1.0%
Total 6,164,089 100.0%
Source: EWURA

16
9THANNUAL REPORT FOR THE YEAR ENDED 30TH JUNE, 2015
2.2.5 Generation Mix During the reporting period, the electricity generation mix consisted of hydropower 42%, natural gas 41%
and liquid fuel 17% as shown in Figure 3. In comparison to the previous years there is an increase of hydropower contribution in the generation mix. This increase was mainly due to improved rainfall in the catchment areas during rainy season of 2014, which resulted in having suffi cient water for the dry season of 2014 (August to November). During the review period, the Authority ensured that, the utility operates the available generation resources while adhering to least-cost merit order in order to minimize the cost of energy generation.
In 2014/15 thermal power plants including the emergency ones had dispatched less due to insuffi cient fund for fuel and good water level in the reservoirs. The emergency plants of 105 MW (Symbion Arusha and Dodoma) and 30 MW of Aggreko Tegeta had were decommissioned. Furthermore, there has been reduction of natural gas generation from 47% to 41%. After decommissioning of the emergency power plants, the remaining generating plants were able to fulfi l demand requirements up to the end of the review period. The new gas pipeline from Mtwara was expected to be completed in September 2015.
Figure 3: Electricity Generation Mix 2014-15
Source: EWURA
2.2.6 Customer Base During the year under review, the number of connected TANESCO customers was 1,502,474 as compared
to 1,298,468 customers recorded the previous year. The growth in customer connections was on record high due to an extensive grid extension of the distribution network funded by the Rural Energy Fund. This has increased access to electricity to about 36%, surpassing the Government target of 30% access by end of 2015.
2.2.7 Licensing
2.2.7.1 Power Supply Licensing During the period under review the Authority approved six generation licences (4 provisional and 2
operational) with potential generation capacity of up to 164MW as shown in Table 5 below. There were no transmission and distribution licences issued during the period under review.

17
9THANNUAL REPORT FOR THE YEAR ENDED 30TH JUNE, 2015
Table 5: New Electricity Generation Licences
S/N Licensee Project Area
Capacity [MW]
Use Duration - Months
Date Issued
1 Dangote Industries Ltd Mtwara 75.00 Own Use 12 19-Mar-15
2 Aggreko Ubungo & Tegeta 70.00 Supply 6 16-May-15
3 East Coast Oils Kurasini 10.00 Supply 12 10-Feb-15
4 TEXPOL Development Co. Ltd Ilungu Ward Mbeya 6.20 Supply 36 4-Jun-15
5 Ulaya Hydro and Windmill Technology Ltd - Uzia Small Hydro Power
Uzia - Sumbawanga
1.12 Supply 36 16-Jun-15
6 Ulaya Hydro and Windmill Technology Ltd - Kalumbaleza Small Hydro Power
Kalumbaleza - Sumbawanga
1.20 Supply 36 16-May-15
Total 163.52Source: EWURA
2.2.8 Electrical Installation Contractors and Wiremen During the year under review, the Authority received a total of 209 licence applications for wiremen
and electrical contractors. Table 6 shows that 203 licences were issued to successful applicants while six licence applications were rejected mainly due to insuffi cient qualifi cations. Furthermore, in order to bring awareness on the Electricity Act, 2008 on licensing matters, the Authority conducted one Electrical Installation Contractors and Wiremen seminar in Dodoma which was attended by 83 registered contractors and wiremen from Singida, Morogoro, Dodoma, and Tabora. EWURA in collaboration with TANESCO continued to require electrical installation personnel to be licensed and refrain from doing work in breach of the law.
Table 6: Electrical Contractors and Wiremen license applied and issued
S/N CLASSNUMBER OF
APPLICATIONSLICENCESISSUED
REJECTEDAPPLICATION
1 A 14 14 0
2 B 26 24 2
3 C 60 58 2
4 D 56 55 1
5 W 53 52 1
TOTAL LICENCES ISSUED 209 203 6Source: EWURA
2.3 Tariff and Power Purchase Agreement
2.3.1 Tariff Review During the period under review, the Authority reviewed and approved Tariff Application from Armstone
Company Limited (ACL) for provision of electricity distribution services at Kyerwa District in Kagera region. The approved ACL’s interim tariff is shown in the Table 7.

18
9THANNUAL REPORT FOR THE YEAR ENDED 30TH JUNE, 2015
Table 7: Approved ACL’s Interim Tariff
Customer Category ParticularsRequested Tariff
(in TZS)
Approved Tariff
(in TZS)
ST – Schools and Hospital Basic Monthly Charge - - Energy Charge per kWh 252 309
T1 – Household Customers Basic Monthly Charge 5,400 5,400
Energy Charge per kWh 342 235
T2 – Small, Middle and Large Entities
Monthly Charge 12,600 12,600
Energy Charge per kWh 342 267
Monthly Demand Charge per KVA 13,500 13,500
Source: EWURA
2.3.2 Power Purchase Agreements The Authority reviewed and approved the following PPAs between: (a) TANESCO and Aggreko International Projects Limited for a 50MW emergency power plant and an
additional capacity of 20 MW located at Ubungo and Tegeta in Dar es Salaam, respectively. (b) TANESCO and Geo Wind Power Limited for 50MW Singida wind power project was reviewed and
approved by the Board in August 2014. Furthermore, EWURA has completed review of a PPA between TANESCO and Zambia Electricity
Corporation (ZESCO), and the parties have been instructed to work on comments before signing the contract. The PPA is for electricity supply to the border town of Sumbawanga through the 66 kV Mbala - Sumbawanga Interconnector Transmission Line.
2.4 Regulatory Tools During the period under review, the Authority developed the Electricity (Development of Small Power
Projects) Rules, 2015 – GN No. 321 of 2015 and Electricity (Electrical Installation Services) Rules, 2015, - GN No. 404 of 2015. These rules were approved by the Authority and published in the Government Gazette. Also during the same period the Authority worked on the draft Electricity (Accident Reporting) Rules 2015 and Electricity Distribution Code. These documents are being reviewed and be circulated to stakeholders’ for comments.
2.5 Complaints and Dispute Resolutions A total of 88 complaints were brought forward from the previous fi nancial year while the number of
complaints received during the fi nancial year 2014/2015 were 51, resolving 59 complaints, and the remaining 80 are in progress.
2.6 Litigation During the period under review, the Authority was a party in six appeals in the electricity sub-sector all
of which were pending at the Fair Competition Tribunal. All appeals were against the decisions of the Authority in the complaints which were fi led by consumers to EWURA against TANESCO. Judgements for four out of six appeals were made in favour of the Authority while two are pending determination.
2.7 Health, Safety and Environmental Matters The Authority continued to sensitize electricity service providers on the need to keep their power supply
facilities and workplaces at highest level of safety. Furthermore, the service providers were reminded to disseminate information to the public on the dangers of electricity, and safe ways of using electricity, and have their workers maintain a high level of safety when working in the field. The Authority carried out

19
9THANNUAL REPORT FOR THE YEAR ENDED 30TH JUNE, 2015
inspection of the power supply facilities, including power stations, substations, and distribution lines and service line entries, in order to check safety and environmental issues. Several challenges were noted, including old equipment, low hanging distribution lines, unprotected transformers, and unsatisfactory dangerous clearance of electricity conductors from building structures thus posing risk of electrocutions. The findings of the Authority during inspections were forwarded to the service providers for rectification. During the period under review there were no fatal accidents recorded, however there was one fi re incident recorded whereby a grid transformer at Mufi ndi was destroyed, causing power interruptions for a period of more than one month.
2.8 Key Achievements and Challenges
2.8.1 Achievements The achievements made by the Authority during the period under review include the following: (a) Development of Second Generation SPP Framework which included technology based Renewable
Feed-in Tariffs (REFITs) for Small Power Projects meant to attract investments in renewable energy. Solar and wind projects will be procured through competitive bidding process that is being developed and be available for use beginning 2016.
(b) Development of technology based Model Power Purchase Agreements(MPPAs) (c) Increased level of awareness of the need for licence for electrical installation personnel.
2.8.2 Challenges The major challenges that the Authority faced in the electricity sector during the year under review were; (a) Delay in decision making by other institutions than EWURA. The Authority experienced the delay in
the approval of model PPA and the Electricity (Approval of Power Purchase Agreements) Regulations, 2015. Also delay in gazetting the Electricity (Small Power Projects) Rules, 2015. The Authority will continue to make close follow up on issues submitted other institutions.
(b) TANESCO late payments to SPPs currently in operation has made it diffi cult to operate and new projects have diffi culty in getting fi nance. The Authority is working on a possibility to establish liquidity support facility in collaboration with World Bank.
(c) Unreliable electricity supply due to infrastructure related problems and lack of generation reserves. The Authority is carrying out regular infrastructure inspections and advise TANESCO to take corrective measures to improve the network. The Authority will also continue to take measures to improve the investment climate so as to attract more investments in electricity generation especially by private sector.
(d) Despite the fact that the Authority has developed regulatory tools to attract private investment, the pace of private investment in the electricity sector is not suffi cient to meet the rapid growing demand of electricity in the country. The Authority, in collaboration with the Government, is working on strategies developed under the Big Results Now initiatives to enable increased electrification and increased involvement of the private sector.

20
9THANNUAL REPORT FOR THE YEAR ENDED 30TH JUNE, 2015
3.0 PETROLEUM SECTOR PERFORMANCE AND REGULATION
3.1 Overview The Authority continued to regulate the downstream petroleum sub-sector in Mainland Tanzania, covering
technical and commercial aspects. The regulated service providers include Oil Marketing Companies, Retail Outlets, Lubricants and Liquefi ed Petroleum Gas (LPG) Wholesalers.
EWURA is committed to continuously improve standards of petroleum products and facilities. Furthermore, the Authority continued with its efforts to ensure that there is all times, adequate and stable supplies of petroleum products in the country, and that these products are not sold above the monthly published cap prices.
3.2 Performance Monitoring
3.2.1 Petroleum Products Supply and Consumption Monitoring
(a) Petroleum Products Supply All Oil Marketing Companies (OMCs) submitted to the Authority their stocks on weekly basis as required.
This was done to ensure that there was at all times adequate supplies of petroleum products in the country. The Authority continued to prepare weekly stock reports which were shared with various key stakeholders such as the Ministry of Energy and Minerals, PICL inter alia.
Throughout the period under review, there was no critical stock out, except for few incidents of which some operators were hoarding stocks in anticipation of price increase. The Authority responded by taking punitive measures to all those who caused such artifi cial shortages.
During the period under review, a total of 4.60 billion litres of petroleum products were imported into the country through Dar es Salaam port and Sirari border. That included 2.99 billion litres for the local market and 1.61 billion litres as transit to neighbouring countries. Total imported volume for the fi nancial year 2014/15 decreased by two percent (2%) when compared to 4.71 billion litres which were imported in the previous fi nancial year of 2013/14.
On the other hand, the total imported volume for local consumption was 2.99 billion litres, an increase of one percent (1%) when compared to 2.97 billion litres imported in the previous fi nancial year 2013/14. As for the transit products, imported volume was 1,61 billion litres, a decrease of eight percent (8%) when compared to 1.74 billion litres imported in the previous fi nancial year 2013/14.
Dar es Salaam port continued to be the main entry point of petroleum products and accommodated 99% of all imports, leaving the remaining 1% to Sirari border. Table 8 and Table 9 show the volume of petroleum products imported for the local and transit markets respectively, under 2014/15 fi nancial year.
It is clear from the tables that local market petroleum products imports were 65% of the total imported petroleum products and the remaining 35% were imported for the transit market (Zambia, Democratic Republic of Congo, Rwanda, Malawi and Burundi).

21
9THANNUAL REPORT FOR THE YEAR ENDED 30TH JUNE, 2015
Table 8: Petroleum Products Imports for the Local Market (Litres)
Month Diesel Petrol IK Jet A1 HFO TotalJul-14 104,786,808 74,541,954 4,245,527 13,133,375 12,501,797 209,209,461
Aug-14 117,068,219 73,401,147 5,333,889 13,959,038 12,893,044 222,655,337
Sep-14 112,070,244 70,882,584 1,545,590 13,919,977 21,370,493 219,788,888
Oct-14 103,309,470 85,479,929 1,915,867 27,862,603 - 218,567,869
Nov-14 101,995,448 46,174,386 2,090,095 28,057,185 30,160,444 208,477,558
Dec-14 80,762,196 56,668,921 3,084,276 15,751,045 30,827,758 187,094,196
Jan-15 92,315,101 48,446,376 2,077,751 26,739,386 - 169,578,614
Feb-15 97,150,812 25,705,755 2,254,423 16,498,531 14,530,516 156,140,037
Mar-15 107,133,807 68,338,677 1,621,533 14,173,368 - 191,267,386
Apr-15 97,061,973 48,640,231 1,337,819 12,117,285 36,733,130 195,890,439
May-15 127,004,653 73,273,833 611,430 12,572,769 6,880,626 220,343,311
Jun-15 124,252,829 62,443,068 2,082,846 12,879,658 32,422,880 234,081,281
Add localized-Jul-2014 to May 2015 321,232,388 197,871,368 12,606,598 - 27,959,772 559,670,126
Total 1,586,143,949 931,868,231 40,807,644 207,664,220 226,280,459 2,992,764,502
Source: EWURA
Table 9: Transit Petroleum Products Imports (Litres)
Month Diesel Petrol IK HFO TotalJul-14 78,418,458 68,931,510 4,206,193 - 151,556,161
Aug-14 132,484,057 80,929,699 7,375,995 508,258 221,298,009
Sep-14 92,509,330 75,462,606 4,902,782 - 172,874,718
Oct-14 85,108,875 69,966,370 5,935,722 - 161,010,967
Nov-14 123,007,591 56,017,114 4,759,925 1,039,327 184,823,957
Dec-14 123,871,331 54,313,496 6,319,670 8,135,096 192,639,593
Jan-15 92,574,434 45,229,139 5,870,114 - 143,673,687
Feb-15 123,886,590 42,117,569 5,127,659 - 171,131,818
Mar-15 98,120,090 88,111,352 6,342,209 - 192,573,650
Apr-15 98,257,512 73,959,658 4,913,481 11,381,774 188,512,424
May-15 93,445,929 89,942,056 4,137,172 - 187,525,156
Jun-15 120,179,563 71,974,861 4,671,014 3,115,716 199,941,154
Less localized (Jul-2014 to May-2015) (298,313,605) (220,790,151) (12,606,598) (27,959,772) (559,670,126)
Total 963,550,154 596,165,278 51,955,337 (3,779,600) 1,607,891,169
Source: EWURA
Furthermore, during the year under review, a total of 69,148 MT of LPG were imported into the country as compared to 69,257 MT which was imported in the previous fi nancial year of 2013/14. The noted decrease of 0.2% in the LPG imports was because of a substantial decrease in the re-exported volume. It may be noted that consumption of the product in the local market is increasing.
(b) Petroleum Products Consumption During the fi nancial year 2014/15, the industry recorded sales of 3.1billion litres of petroleum products, an
increase of 5% when compared to previous fi nancial year performance which was 2,938,896,450 litres. The petroleum market in the country is competitive and fairy distributed among different oil marketing

22
9THANNUAL REPORT FOR THE YEAR ENDED 30TH JUNE, 2015
companies, as shown in Figure 4. There are only two companies with market shares of above 10%, namely PUMA Energy (12%) and Oryx Energies (12%), the rest have market shares below 10% (Figure 4). Companies that attained market shares of less than 10% but higher than 5% are Camel Oil (9%), Total (9%), Star Oil (8%), Oil Com (8%), GBP(6%) Gapco (6%) and Lake Oil (5%).
Figure 4: OMCs Market Shares
Source: EWURA
In terms of consumption, as it can be seen in Figure 5 Diesel outperformed all other products by registering 54% of total annual consumption, followed by Petrol (31%), Jet A1(7%), Fuel Oil(7%) and Kerosene(1%). The overall fuel consumption for petroleum products went up by 5% during the period under review when compared to the previous fi nancial year. Diesel dropped by 4% and this was attributed by improved power supply from hydro and natural gas that was used for power generation.
Petrol consumption increased signifi cantly during the period under review and this was probably because of increased number of vehicles using petrol in the country as well as the motorcycles commonly known as (boda boda). Kerosene continued to drop, possibly due to progressive measures exercised by the Authority to curb fuel adulteration, but also increased number of households connected to the supply of electricity, particularly in rural areas under the REA (Rural Energy Agency) scheme.
Figure 5: Local Consumption by Product
Source: EWURA
23
9THANNUAL REPORT FOR THE YEAR ENDED 30TH JUNE, 2015
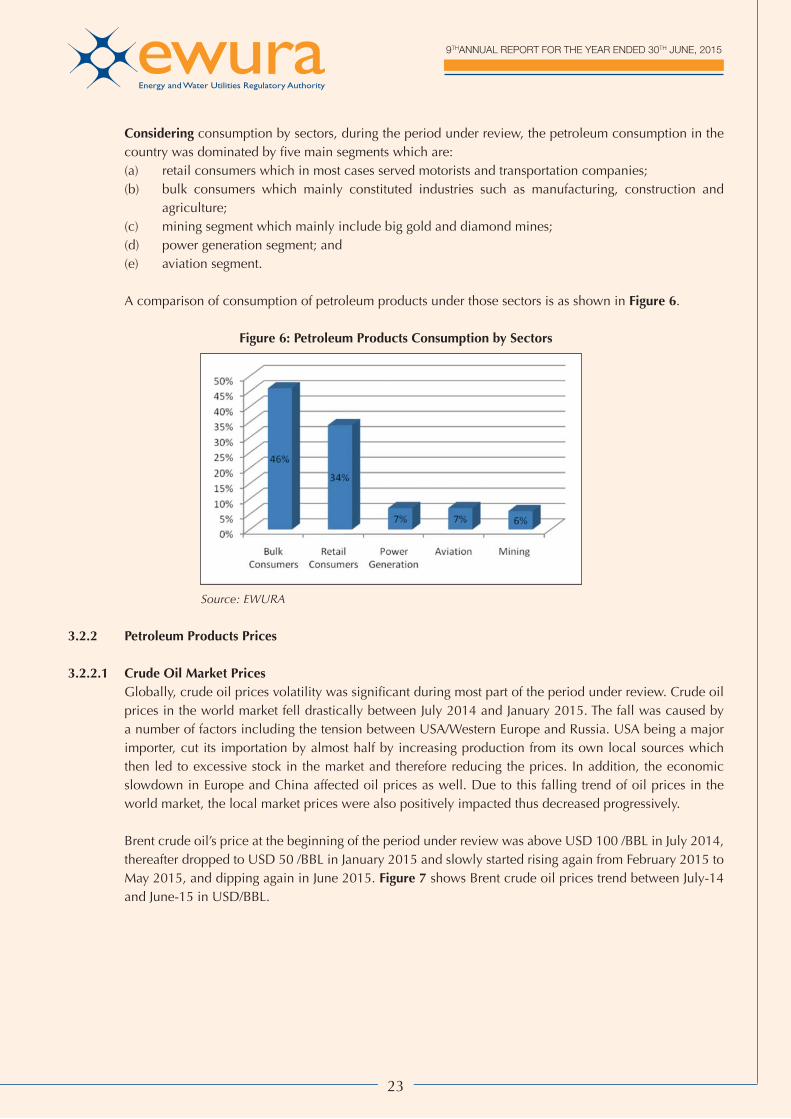
Considering consumption by sectors, during the period under review, the petroleum consumption in the country was dominated by fi ve main segments which are:
(a) retail consumers which in most cases served motorists and transportation companies; (b) bulk consumers which mainly constituted industries such as manufacturing, construction and
agriculture; (c) mining segment which mainly include big gold and diamond mines; (d) power generation segment; and (e) aviation segment.
A comparison of consumption of petroleum products under those sectors is as shown in Figure 6.
Figure 6: Petroleum Products Consumption by Sectors
Source: EWURA
3.2.2 Petroleum Products Prices
3.2.2.1 Crude Oil Market Prices Globally, crude oil prices volatility was signifi cant during most part of the period under review. Crude oil
prices in the world market fell drastically between July 2014 and January 2015. The fall was caused by a number of factors including the tension between USA/Western Europe and Russia. USA being a major importer, cut its importation by almost half by increasing production from its own local sources which then led to excessive stock in the market and therefore reducing the prices. In addition, the economic slowdown in Europe and China affected oil prices as well. Due to this falling trend of oil prices in the world market, the local market prices were also positively impacted thus decreased progressively.
Brent crude oil’s price at the beginning of the period under review was above USD 100 /BBL in July 2014, thereafter dropped to USD 50 /BBL in January 2015 and slowly started rising again from February 2015 to May 2015, and dipping again in June 2015. Figure 7 shows Brent crude oil prices trend between July-14 and June-15 in USD/BBL.

24
9THANNUAL REPORT FOR THE YEAR ENDED 30TH JUNE, 2015
Figure 7: Crude Price trend from Jul-14 to Jun-15 in USD/BBL
Source: PLATTS Arab Gulf
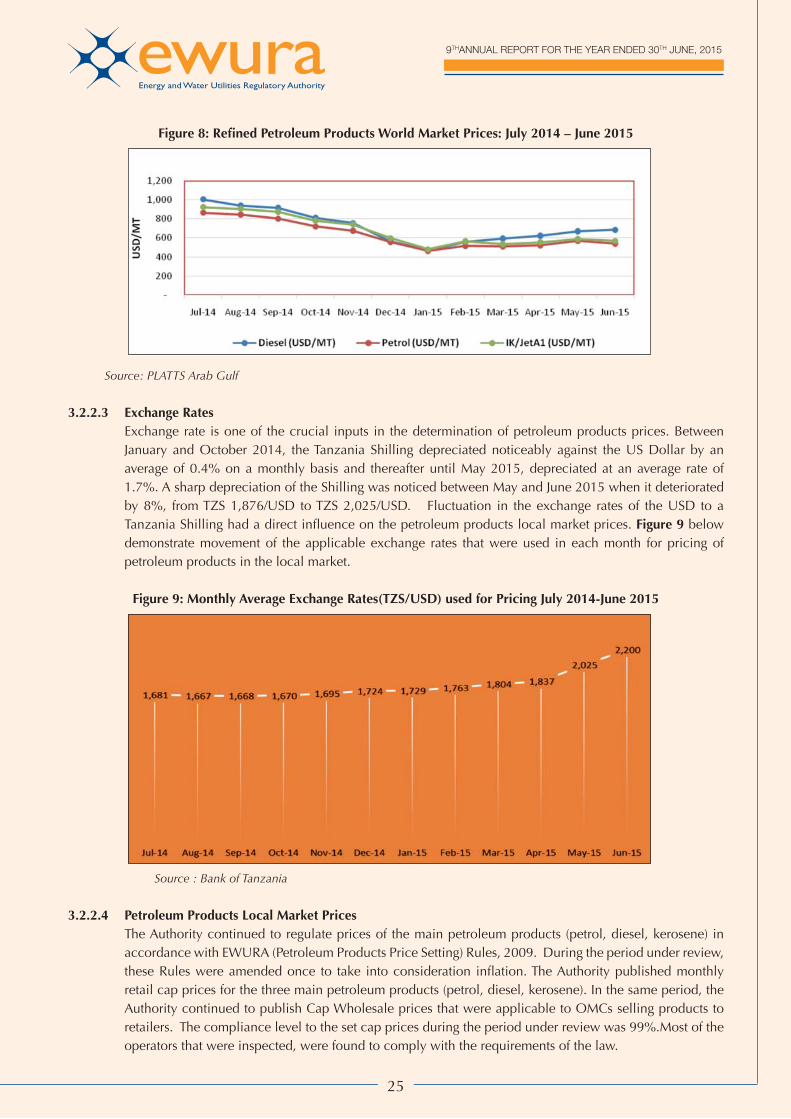
3.2.2.2 Refi ned Petroleum Products Prices in the World Market During the period under review, average monthly prices of refi ned petroleum products in the world market
ranged between USD 1,004/MT and USD 468/MT. This was a very volatile trend that was caused by falling crude oil prices in the market. Lowest prices were recorded in January 2015, thereafter a slight upward trend was experienced through June 2015. Monthly average World Market FOB prices are shown in Table 10 Error! Reference source not found.and Figure 8 below.
Table 10: Refi ned Petroleum Products World Market Prices from July 2014- June 2015
Month Diesel (USD/MT) Petrol (USD/MT) IK/JetA1 (USD/MT)
Jul-14 1,004 865 923
Aug-14 938 847 907
Sep-14 914 803 875
Oct-14 809 721 783
Nov-14 755 676 744
Dec-14 564 561 600
Jan-15 468 465 483
Feb-15 556 517 567
Mar-15 592 511 537
Apr-15 622 522 556
May-15 669 570 590
Jun-15 683 544 571
Avg 2014/15 715 633 678
Avg 2013/14 894 979 952
% Change -20% -35% -29%
Source: PLATTS Arab Gulf
25
9THANNUAL REPORT FOR THE YEAR ENDED 30TH JUNE, 2015
Figure 8: Refi ned Petroleum Products World Market Prices: July 2014 – June 2015
Source: PLATTS Arab Gulf
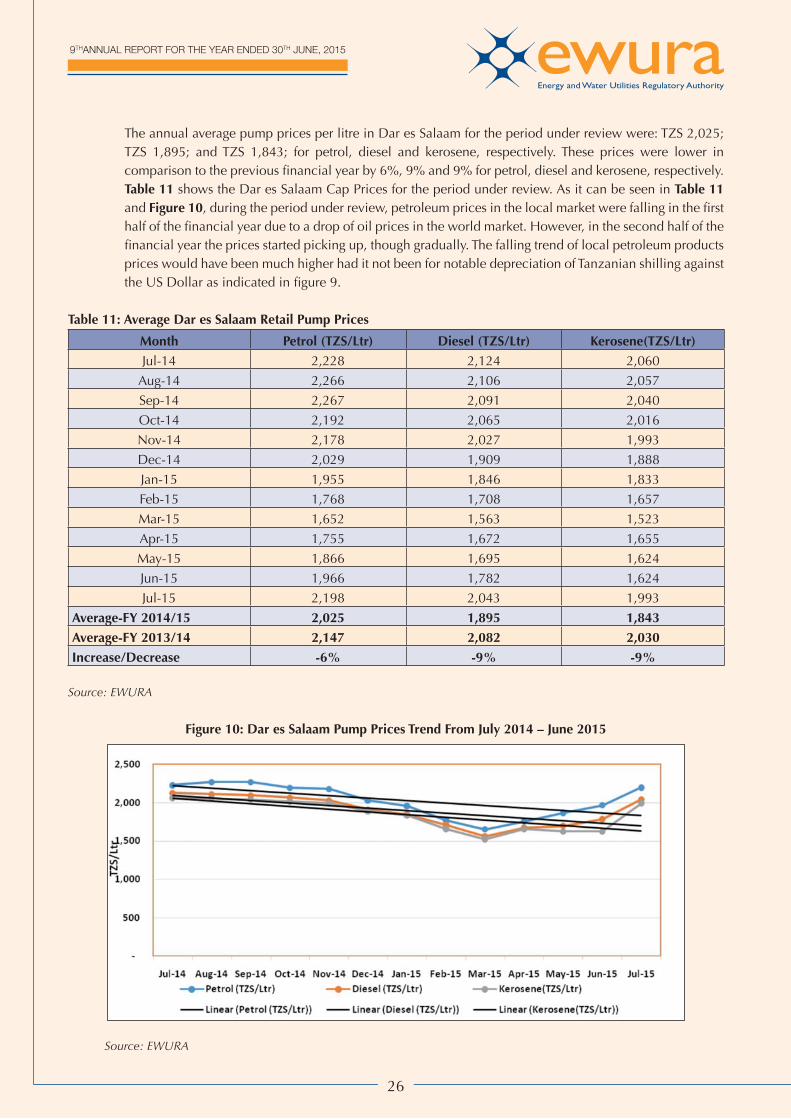
3.2.2.3 Exchange Rates Exchange rate is one of the crucial inputs in the determination of petroleum products prices. Between
January and October 2014, the Tanzania Shilling depreciated noticeably against the US Dollar by an average of 0.4% on a monthly basis and thereafter until May 2015, depreciated at an average rate of 1.7%. A sharp depreciation of the Shilling was noticed between May and June 2015 when it deteriorated by 8%, from TZS 1,876/USD to TZS 2,025/USD. Fluctuation in the exchange rates of the USD to a Tanzania Shilling had a direct infl uence on the petroleum products local market prices. Figure 9 below demonstrate movement of the applicable exchange rates that were used in each month for pricing of petroleum products in the local market.
Figure 9: Monthly Average Exchange Rates(TZS/USD) used for Pricing July 2014-June 2015
Source : Bank of Tanzania
3.2.2.4 Petroleum Products Local Market Prices The Authority continued to regulate prices of the main petroleum products (petrol, diesel, kerosene) in
accordance with EWURA (Petroleum Products Price Setting) Rules, 2009. During the period under review, these Rules were amended once to take into consideration infl ation. The Authority published monthly retail cap prices for the three main petroleum products (petrol, diesel, kerosene). In the same period, the Authority continued to publish Cap Wholesale prices that were applicable to OMCs selling products to retailers. The compliance level to the set cap prices during the period under review was 99%.Most of the operators that were inspected, were found to comply with the requirements of the law.
26
9THANNUAL REPORT FOR THE YEAR ENDED 30TH JUNE, 2015
The annual average pump prices per litre in Dar es Salaam for the period under review were: TZS 2,025; TZS 1,895; and TZS 1,843; for petrol, diesel and kerosene, respectively. These prices were lower in comparison to the previous fi nancial year by 6%, 9% and 9% for petrol, diesel and kerosene, respectively. Table 11 shows the Dar es Salaam Cap Prices for the period under review. As it can be seen in Table 11 and Figure 10, during the period under review, petroleum prices in the local market were falling in the fi rst half of the fi nancial year due to a drop of oil prices in the world market. However, in the second half of the fi nancial year the prices started picking up, though gradually. The falling trend of local petroleum products prices would have been much higher had it not been for notable depreciation of Tanzanian shilling against the US Dollar as indicated in fi gure 9.
Table 11: Average Dar es Salaam Retail Pump Prices
Month Petrol (TZS/Ltr) Diesel (TZS/Ltr) Kerosene(TZS/Ltr)Jul-14 2,228 2,124 2,060
Aug-14 2,266 2,106 2,057
Sep-14 2,267 2,091 2,040
Oct-14 2,192 2,065 2,016
Nov-14 2,178 2,027 1,993
Dec-14 2,029 1,909 1,888
Jan-15 1,955 1,846 1,833
Feb-15 1,768 1,708 1,657
Mar-15 1,652 1,563 1,523
Apr-15 1,755 1,672 1,655
May-15 1,866 1,695 1,624
Jun-15 1,966 1,782 1,624
Jul-15 2,198 2,043 1,993
Average-FY 2014/15 2,025 1,895 1,843Average-FY 2013/14 2,147 2,082 2,030Increase/Decrease -6% -9% -9%
Source: EWURA
Figure 10: Dar es Salaam Pump Prices Trend From July 2014 – June 2015
Source: EWURA

27
9THANNUAL REPORT FOR THE YEAR ENDED 30TH JUNE, 2015
3.2.2.5 Regulated Petroleum Products Price Parameters During the year under review, pricing structure of the main regulated petroleum products (Diesel, Petrol
and Kerosene) continued being formulated using six main parameters including exchange rates movement. These main parameters were:
(a) Cost, Insurance and Freight(CIF), which is a combination of FOB prices and Premium; (b) Local charges; (c) Government taxes; (d) OMCs margin; (e) Retailers margin; and (f) Transport cost.
The main parameters which affected prices of the main petroleum products(diesel, petrol and kerosene) during the period under review were CIF cost - which was between47% and 52% of the total fuel cost and Government taxes – which were about 32% and 37% of the total cost. Examples of composition of pricing structures for the three main products are as shown in Figure 11, Figure 12 and Figure 13. Based on that, EWURA made an effort to closely monitor and analyse FOB prices and Premiums quoted by petroleum products suppliers to ensure that these two costs are competitive and refl ect the world market trends.
Figure 11: Pricing Parameters composition(%) for Diesel
Source: EWURA
Figure 12: Parameters composition (%) for Petrol
Source: EWURA

28
9THANNUAL REPORT FOR THE YEAR ENDED 30TH JUNE, 2015
Figure 13: Pricing Parameters composition(%) for Kerosene
Source: EWURA
3.2.3 Bulk Procurement System (BPS) All along the period under review, the Petroleum Importation Coordinator Limited (PICL) continued to
coordinate importation of all petroleum products into the country through the BPS, and the Authority monitored closely the whole process. That is in accordance with the BPS Regulations 2011 and the subsequent amendment(s) which took effect in March 2013.
During the fi nancial year 2014/15, 35 oil traders were prequalifi ed by PICL for participation in the BPS tenders and the process was done under International Competitive Bidding (ICB) providing an opportunity for both local and international oil companies and traders to participate. The validity of prequalifi ed parties was for a period of one year. Under the same period, a total of twelve (12) tenders were opened and awarded to successful bidders through ICB to supply petroleum products into the country.
In accordance with the BPS Regulations all petroleum products for the local market are required to be procured through the BPS. Pursuant to Regulation 5(1) of the BPS Regulations, transit petroleum products importers can optionally import through the BPS. During year 2014/15, Addax Energy SA won fi ve (5) tenders, Augusta Energy SA won three (3) tenders, whereas ENOC Africa Limited won two (2) and Gapco (Kenya) Limited and Sahara Energy DMCC won one (1) tender each. Table 12 and Figure 14 below provide a summary of weighted average premiums for the period under review.
During the period under review, the highest weighted premium quoted was 52USD/MT in the month of
January 2015, while the lowest weighted average premium was 34USD/MT quoted in the month June 2015. The average premium was 43.23 USD/MT which was a decrease of 0.25% when compared to average premium of 43.34USD/MT in the previous fi nancial year.

29
9THANNUAL REPORT FOR THE YEAR ENDED 30TH JUNE, 2015
Table 12: Weighted Average Premiums (Revise Table, alignment, CAPS)
BPS Tender NumberMonth of Supply
WinningSupplierWT.Average Premium
USD/MTT23 Jul-14 Enoc Africa 40.57
T24 Aug-14 Augusta Energy SA 43.66
T25 Sep-14 Addax EnergySA 43.76
T26 Oct-14 Enoc Africa 45.77
T27 Nov-14 Augusta Energy SA 38.29
T28 Dec-14 Addax Energy SA 43.26
T29 Jan-15 Addax Energy SA 51.51
T30 Feb-15 Augusta Energy SA 47.20
T31 Mar-15 Addax Energy SA 40.03
T32 Apr-15 Sahara EnergyDMCC 49.08
T33 May-15 Addax Energy SA 41.53
T34 Jun-15 Gapco Kenya Ltd. 34.16
Average FY 2014/15 43.23Average FY 2013/14 43.34
Source: PICL
Figure 14: Weighted Average Premiums for Tenders No. 23 to 34
Source: PICL
3.3 Petroleum Products Quality Monitoring
3.3.1 Sampling for Quality Testing During the year under review, the Authority continued with its role of monitoring quality of petroleum
products so as to ensure the quality of petroleum products sold to consumers is at the required standards. Sampling of petroleum products was carried out from various facilities including petrol stations, road tankers and storage depots. The samples tested were from Arusha, Coast, Dodoma, Dar es Salaam, Kilimanjaro and Tanga regions.
A total of 371 samples of petroleum products were collected from the above mentioned facilities for laboratory testing. Only 28 samples (equivalent to 8%) did not conform to TBS specifi cations. Pursuant to the Petroleum (Sampling and Testing) Rules, 2010, punitive measures were taken against operators

30
9THANNUAL REPORT FOR THE YEAR ENDED 30TH JUNE, 2015
of the facilities that were found with products that failed to conform to the TBS specifi cations. There is a continued improvement in compliance by operators by selling petroleum products which conform to standards. This trend is a clear indication that the Authority is performing well by ensuring that petroleum products offered for sale to consumers are of the right quality.
During the same period, samples of lubricants were collected from 22 different lubricants retail outlets in Dar es Salaam, Tanga, Kilimajaro, Arusha and Mwanza Regions. The aim of the exercise was to check the quality of lubricants offered for sale in the market and to identify substandard products. A total of 64 samples were collected for laboratory analysis. Out of 64 samples of lubricants collected for analysis, 12 (equivalent to 18.75%) samples were found to be out of TBS specifi cations. The standards used included TZS 647:2001 ICS 75.100 “Tanzania Standard for Engine Oils - Minimum Performance – Specifi cation and TZS 675:2001 ICS 75.100 “Tanzania Standard for Multipurpose Automotive Gear Lubricant – Specifi cation.
This inspection round was aimed at assessing the general quality of lubricants in the local market, to enable the Authority strategize and implement regular countrywide inspection exercises and taking punitive measures to defaulters. The Authority plans to intensify compliance monitoring efforts in the 2015/16 fi nancial year to ensure compliance in the lubricant business segment, in accordance with the Lubricants (Testing and Sampling) Rules, 2010.
3.3.2 Fuel Marking Program During the year under review, the Authority continued to implement the fuel marking program which
is done by the Contractor, M/S Global Fluids International Tanzania Limited (GFI). The objectives of the program is to curb dumping of untaxed petroleum products into the local market and fuel adulteration malpractices and ensuring that there is a fair competition among operators in the downstream sub sector.
A total of 2.46 billion litres of petroleum products (diesel, petrol and kerosene) were marked during the period under review as compared to 2.41 billion litres marked during the last fi nancial year. Marked petrol increased by 18% as compared to the quantity marked last year whereas the marked kerosene and diesel quantities decreased by 44% and 5%, respectively. A pronounced decrease of the marked Kerosene refl ects the fact that unscrupulous traders do not import kerosene for use as an adulterant as it was before commencement of the fuel marking program. Table 13 presents quantities of petroleum products marked in the period under review.
From commencement of the fuel marking program in September 2010 to June 2015, 10.50 billion litres of petroleum products have been marked, AGO scoring the highest quantity followed by MSP. While MSP and AGO have been increasing on the contrary IK has been decreasing considerably.
Table 13: Marked Volume of Petroleum Products from July 2014 - June 2015
Period MSP (LT) AGO (LT) IK (LT) Total (LT)14-Jul 77,071,040 121,709,728 2,926,868 207,563,450
14-Aug 77,166,031 124,418,153 3,085,550 215,426,22014-Sep 76,177,324 125,083,757 2,412,300 204,508,28014-Oct 80,739,650 126,699,037 3,795,750 216,321,91014-Nov 74,621,110 115,641,949 3,121,100 218,999,83014-Dec 88,679,116 127,017,182 1,759,600 219,742,21015-Jan 78,963,329 118,874,887 2,097,500 209,990,07015-Feb 75,048,779 111,212,766 3,332,000 183,415,42015-Mar 81,308,363 119,847,853 2,018,300 183,744,120

31
9THANNUAL REPORT FOR THE YEAR ENDED 30TH JUNE, 2015
Period MSP (LT) AGO (LT) IK (LT) Total (LT)15-Apr 84,363,507 122,944,835 3,455,500 176,569,38015-May 81,688,676 113,324,618 4,994,786 186,447,07015-Jun 85,321,603 133,756,938 3,568,850 189,602,100Total 961,148,518 1,460,531,703 36,568,104 2,459,244,678
Total Marked Volume FY 2013/14 (LT)
815,905,940 1,530,817,790 65,606,330 2,412,330,060
Increase/Decrease -5% 18% -44% 2%
Source: EWURA
3.3.2.1 Number of Facilities Tested During the year under review, samples of petroleum products from 622 petroleum facilities including
retail outlets, depots and road trucks, were collected and tested for level of marker concentration. Out of these, 80 facilities which is equivalent to 13% were found with petroleum products that failed the marker tests. Most of the markers failure tests were because of dumping of transit petroleum products in the local market. Operators whose facilities were found with petroleum products that failed the marker tests were subjected to punitive measures in accordance with the Petroleum (Marking and Quality Control) Rules, 2010.
3.3.2.2 Benefi ts of Fuel Marking Program The fuel marking program that was introduced and implemented by the Authority effective September
2010 has resulted to a number of benefi ts to the public. These include: (a) The public is currently enjoying good quality petroleum products through reduction of adulteration
malpractices which was the order of the day prior to introduction of the program. (b) Reduction in dumping of transit products into the local market hence assuring Government revenue
collection increase. (c) Reduction in smuggling of petroleum products malpractices creating a level playing fi eld amongst
petroleum operators and thus promoting fair competition in the petroleum downstream sub sector. (d) Transit cargo through Tanzania has increased due to the trust neighbouring countries have in the
country’s system of monitoring quality of petroleum products.
3.3.3 Compliance Monitoring During the year under review, the Authority continued to undertake monitoring programs to ensure
compliance to the applicable laws and standards along the petroleum supply chain. The following sections cover highlights of the compliance monitoring activities which were carried out in year under review.
3.3.3.1 Licence Conditions Monitoring During the period under review, the Authority continued with regular inspection rounds in order to ensure
that all licensed retail outlets comply with the licence conditions. A total of 532 petrol stations were inspected to monitor compliance to the licence conditions. Out of these, 250 petrol stations equivalent to 46.99% were found fully meeting the licensing conditions. On the other hand, 204 petrol stations equivalent to 38.35% were at least above 50% compliant to the licence conditions. However, punitive measures were taken against all petrol stations that did not fully meet the licence conditions.
The Authority will continue executing periodic and surprise inspections to retail outlets to ensure that the petrol stations are upgraded accordingly to fully meet the licensing conditions.

32
9THANNUAL REPORT FOR THE YEAR ENDED 30TH JUNE, 2015
3.3.3.2 Petrol Stations operating without licences Section 7 of the Petroleum Act, 2008 requires that all petroleum operators in the country should be
licensed by the Authority. During the period under review, the Authority continued to monitor petrol stations that are operating without a licence. A total of 202 petrol stations were found operating without EWURA licences. These petrol stations were ordered to stop operating until they are meeting licensing requirements and be licensed accordingly. Out of these, 101 petrol stations fully met the licensing requirements and were licensed.
3.3.3.3 Petroleum Facilities constructed without construction approvals In accordance with Section 13 (1) of the Petroleum Act, 2008 any person intending to construct a
petroleum installation is required to apply and obtain a construction approval from the Authority prior to starting construction of the facility. During the period under review, the Authority continued with regular inspections to ensure that all new petroleum installations have relevant construction approvals. A total of seventy one (71) petroleum facilities mostly petrol stations were found being constructed without construction approvals from the Authority. Punitive measures were taken against defaulters.
3.3.3.4 Monitoring compliance to the price Setting Rules During the year under review, the Authority continued to monitor compliance to the price setting Rules. A
total of 817 petrol stations were inspected. Out of these, only three (3), equivalent to 0.37% were found selling petroleum products above cap prices. Punitive measures were taken against the defaulters.
3.3.3.5 Monitoring of Supply of Petroleum Products During the year under review, the Authority continued to monitor the supply of petroleum products in order
to ensure availability of products in the market. In this period, there were some rumours on the scarcity of petroleum products towards the end of the month of March and June due to anticipated price changes. The Authority deployed inspectors to monitor the situation including confi rming the stocks of petroleum products at the petroleum facilities (i.e. depots and retail outlets). Generally, in both instances the supply of petroleum products in the country was at the normal level. However, the Authority issued fourteen (14) compliance orders to operators that were alleged to have caused artifi cial shortage of petroleum products in the market.
3.4 Monitoring adherence to Health, Safety and Environmental (HSE) requirements
3.4.1 Facilities closed due to contravening HSE Requirements All operators of petroleum products installations are required to operate in a manner that their operations
do not pose serious threat to the public health, safety and the environment. During the period under review, seven (7) petroleum facilities were found operating in a manner that jeopardized HSE. Punitive measures were taken against these defaulters including ordering them to stop operating until the Authority is satisfi ed that all anomalies are rectifi ed and that their operations are carried out in accordance with the good petroleum industry practice.
3.4.2 Incident Investigation In response to incidents occurring in the petroleum downstream sector operations, the Authority continued
with its obligation of investigating incidents to underscore their causes, establish and recommend corrective actions so as to prevent recurrence of similar incidents in future. During the period under review fi ve (5) incidents were investigated. Table 14 summarizes incidents that were investigated during the period under review.

33
9THANNUAL REPORT FOR THE YEAR ENDED 30TH JUNE, 2015
Table 14: Summary of incidents that were investigated from July 2014- June 2015
No. Incident Date of Incident
Place Root Cause Incident Impact
Corrective Actions
1 Spiked crude oil spill
18th August 2014
8” High Pressure Tazama Pipeline, Gongo la mboto-Dar es Salaam
Absence of marker post to indicate that a pipeline crosses the work area
Loss of Product and Environmental Pollution
a) Put marker posts and warning signs at all potentially dangerous areas.
b) Cover the pipeline exposed parts to avoid any pipeline intentional drilling.
c) Pipeline surveillance.
2 Fire 2nd September 2014
SOPCO Filling Station, Masaki- Dar es Salaam
Electricity overload
Burnt Generator House & Electricity Outage
a) Avoid electrical overloads at the petrol station.
b) Training of staff on the use of fi refi ghting equipment and ensure equipment are available at all times.
c) Relocation of the generator exhaust away from the neighbouring houses.
3 Fire 13th October 2014
Mbagala Rangi Tatu
Truck overturn Loss of products & people’s lives (seven, 7)
a) Adhere to Transportation Rules.
b) Public awareness campaigns.
c) Periodic inspection of road tankers to ensure their road worthiness.
4 Fire 29th October 2014
Burnt Semi-trailer T 689 CES/T950 AUZ carrying 40,000 lts MSP; Kimara Korogwe
RHS tyre burst Loss of all product & burnt semi-trailer
a) Periodic inspection of road tankers to ensure their road worthiness.
b) Drivers to be accompanied by turn boys for security and safety reasons.
5 Spiked crude oil spill
5th March 2015
8” Tazama Pipeline, Kibada area, Kigamboni-Dar es Salaam
Vandalism Loss of Product and Environmental Pollution
c) Strengthening security of the pipeline.
d) Clean up and rehabilitation of the affected area.
Source: EWURA

34
9THANNUAL REPORT FOR THE YEAR ENDED 30TH JUNE, 2015
3.4.3 Environmental Impact Assessment and Audit (EIA & EA) Studies Reviews During the period under review, a total of 99 Environmental Impact Assessment (EIA) and Environmental
Audit (EA) studies submitted by NEMC for proposed, new and existing petroleum facilities respectively, as per the Environmental Management Act, 2004 requirements were reviewed. 85 reports were for EIA whereas fourteen (14) reports were for EA. The EIA and EA reports were for construction and operating petrol stations, LPG Storage and Filling plants. The Authority actively participated in site verifi cations and Technical Advisory Committee (TAC) meetings coordinated by NEMC to review the EIA and EA studies prepared by various environmental experts on behalf of the project proponents.
3.5 Licensing Activities During the year under review, one hundred seventy (170) petroleum facilities were issued with operating
licences in Mainland Tanzania. Out of these licenses, 12 were for wholesale business, 149 for Retail, 2 for LPG Wholesale business, 5 for consumer installations, 1 for Bunkering business and 1 for Lubricants Wholesale business. During the same period, 16 construction approvals were issued to proponents of various downstream petroleum facilities construction projects. Table 15 summarizes Licenses and Construction Approvals issued by the Authority during the period under review.
Table 15: Petroleum Products Licences/Approvals issued by the Authority
Type of Licence/Approval Licences/construction approvals issued
New Renewal TotalWholesale 7 5 12
Retail 126 23 149
LPG Wholesale 2 0 2
Lubricant Wholesale 1 0 1
Bunkering 1 0 1
Consumer Installation 5 0 5
Construction Approval 16 0 16
Total 158 28 186
Source: EWURA
3.6 Legislative Regulatory Tools Legislative tools are important instruments to improve on governance and regulation of the downstream
petroleum sub sector in the country. During the year under review the Authority prepared/amended ten (10) legislative tools as shown hereunder:
(a) The Petroleum (Wholesale Operations) Rules, 2014; (b) The Petroleum (Retail Operations) Rules, 2014; (c) The Petroleum (Retail Operations in Townships and Villages) Rules, 2014; (d) The Petroleum (Consumer Installation Operations) Rules, 2014; (e) The Petroleum (Pipeline Operations) Rules, 2014; (f) Petroleum Pipeline Transportation Licence Template; (g) The Petroleum (Refi nery Operations) Rules; (h) The Petroleum (Bitumen and Petcoke Operations) Rules; (i) The Petroleum (Aviation Fuel Operations) Rules; and (j) The Petroleum (Marine Loading & Offl oading Operations) Rules.

35
9THANNUAL REPORT FOR THE YEAR ENDED 30TH JUNE, 2015
3.7 Complaints Handling and Dispute Resolution During the year under review, 18 complaints were registered from consumers of petroleum goods and
services, out of which 2 were carried forward from the previous fi nancial year and 16 were new complaints. Out of 18 complaints, 10(56%) were resolved and 8 (44%) were in progress.
3.8 Litigation During the year under review, the Authority was involved in 11 cases out of which three (3) were in the
nature of appeal at the Fair Competition Tribunal (FCT). The Authority was also a party to seven (7) contempt charges in the High Court of Tanzania at Tanga, Arusha, Dar es Salaam, Dodoma and Mwanza Registries. Furthermore, the Authority is a party to the Constitutional Petition lodged at the High Court of Tanzania, Dar es Salaam Main Registry by one of the regulated supplier. In that petition, the petitioner is challenging powers of the Authority in issuing Compliance Orders. Hearing of the matter is still pending. Additionally, the Authority is the Respondent in the Civil Case at the Resident Magistrate Court of Shinyanga. Hearing of the suit is still pending.
3.9 Key Challenges and Achievements
3.9.1 Achievements During the year under review, the Authority recorded a number of achievements in the downstream
petroleum sub-sector as outlined hereunder: (a) Continued improvement in the quality of petroleum products that are sold in the local market; (b) Petroleum products pricing was monitored and controlled enabling competitive and stable prices to
consumers; (c) Petroleum products supply in the country was stable as there were no shortages recorded in the
period under review; (d) Regulatory measures that were taken by the Authority resulted in increased revenue to the
Government in terms of taxes; (e) Seven regulatory tools that were absent before are now in place and others are under preparation; (f) The standards of retail outlets in the country signifi cantly improved because of compliance
monitoring enforcement and the measures taken by the Authority; and (g) The Authority continued enabling a level playing fi eld in the petroleum sub-sector through
enforcement on compliance by all service providers, to the relevant Rules and Standards applicable in the sub sector.
3.9.2 Challenges The Authority strived to meet its regulatory roles in the downstream petroleum sub-sector in Tanzania.
However, the Authority faced the following challenges during discharging regulatory roles. (a) Inadequate Supply of petroleum products in rural areas: In some rural areas there were no reliable
supplies of petroleum products, supply of petroleum products to these areas were done by illegal vendors that pause imminent danger to HSE, including fi re explosion incidents. To deal with this challenge, the Authority has put in place standards of petrol stations for rural areas which require lesser investment, though not compromising HSE requirements.
(b) Continuation of violation of rules/regulations by operators especially in construction of facilities without necessary approvals from the Authority as required by law. The Authority will intensify awareness to investors in this sub sector, to the requirements of the Law, through different mechanisms, including liaison with local government Authorities for information dissemination.
(c) Lack of Technical Know-How and Expertise: Many operators still lack technical know-how and expertise in petroleum downstream operations. The Authority is dealing with this challenge through continuous education and awareness campaigns to stakeholders, especially in the retail segment.

36
9THANNUAL REPORT FOR THE YEAR ENDED 30TH JUNE, 2015
4.0 NATURAL GAS SECTOR PERFORMANCE AND REGULATION
4.1 Overview Pursuant to Section 7(1) (c) of EWURA Act (Cap 414), the Authority is responsible for regulating mid
and downstream natural gas activities involving processing plants, transportation, storage and distribution of natural gas in the Mainland Tanzania. The regulated infrastructures comprised of processing plants, transmission and distribution pipeline and storage facilities which are still a natural monopoly.
Four companies namely Tanzania Petroleum Development Corporation (TPDC); Songas Limited (Songas); Pan African Energy Tanzania Limited (PAET); and Maurel & Prom (M&P) are actively carrying out midstream and downstream natural gas activities. In the upstream fi ve exploration companies namely Ophir Energy Plc, BG Group Plc, Statoil, Exon Mobil and Aminex are actively exploring in offshore and onshore of Main Land Tanzania. As of 30th June 2015 the Ministry of Energy and Minerals confi rmed the quantity of discovered gas (Gas in place) amounting to 55.08 Trillion Standard Cubic Feet (Tcf).
4.2 Performance Monitoring During the period under review the Authority carried out six fi eld inspections of natural gas infrastructures
at Songas gas facilities in Lindi, Maurel & Prom gas facilities in Mtwara, the construction of TPDC Mtwara to Dar es Salaam gas pipeline project as well as low pressure gas distribution network operated by PAET and TPDC in Dar es Salaam.
The Authority observed that at the time of visiting the infrastructure it was revealed that they were being operated in the required standards.
4.2.1 Natural Gas Production During the period under review, the overall gas production from both gas fi elds Songo Songo Island (SSI)
and Mnazi Bay was 33,069MMscf compared with gas production of 34,764MMscf in the previous year. This indicates a signifi cant decrease in gas production as shown in Figure 15 below. Over the period under review, the quantity of natural gas produced at Songo Songo gas plant was 32,260 MMscf compared to 34,055 MMscf produced during 2013/14 which shows a decrease of about 5.3%. The decrease in production of natural gas at SSI was attributed to failure of some wells to produce natural gas due to technical damages on their tubings. PAET was undertaking repairs of the wells to bring them back to production.
During the period under review, Mnazi Bay gas fi eld increased its production to 809.99 MMscf compared to 708.99 MMscf recorded in the previous year. Without storage, whatever is produced, it should be consumed. This is an increase of natural gas consumption by 14.24% which indicates a growing demand of electricity in Mtwara and Lindi regions.

37
9THANNUAL REPORT FOR THE YEAR ENDED 30TH JUNE, 2015
Figure 15: Periodic Monthly Natural Gas Production of SSI and M&P Gas Plants
Source: TPDC, M&P and PAET
4.2.2 The Demand –Supply Balance of Natural Gas During the period under review, the natural gas processing capacities at Mnazi Bay and Songo Songo
gas fi elds remained the same. The average processing capacities for both plants remained at 91MMscfd, an amount that can generate about 455 MW of electricity. The average demand of natural gas was 131.23 MMscfd, which indicates the unmet demand of about 40.23 MMscfd. It is expected that once the Government through TPDC fi nalizes and commission the Mtwara-Dar es Salaam Gas Transportation Pipeline Project it will increase the supply of natural gas suffi cient to meet the demand.
4.2.3 Trend of Cost of Services During the period under review, the average monthly natural gas price for thermal power plants that
were supplied with protected gas was USD 4.2 /Mcf while the prices for thermal power plants supplied additional gas, remained at USD3.45/Mcf . The price for Mnazi Bay gas was USD 5.4/Mcf and average natural gas prices for industrial customers in the country was USD7.93/Mcf compared to USD 8.49/Mcf of the previous year. The Authority benchmarked the natural gas prices for thermal power generation in Tanzanian market to US market as shown in Figure 16 and Figure 17 below. The average USA prices for power generation is USD 4.11 /Mcf.

38
9THANNUAL REPORT FOR THE YEAR ENDED 30TH JUNE, 2015
Figure 16: Natural Gas Price Trends Ffor Power Generation for FY 2014/15
Source: TPDC and PAET
The natural gas price for industrial customers during the period under review indicated a decreasing trend towards the second quarter and sharp increase towards the end of third quarter as compared to similar period in fi nancial year 2013/14. The industrial customers’ gas prices in the country benchmarked to USA’s natural gas industrial price is as shown in fi gure 17 below.
Figure 17: Natural gas price trends for industrial for FY 2014/15
Source: PAET and US EIA

39
9THANNUAL REPORT FOR THE YEAR ENDED 30TH JUNE, 2015
4.2.4 The Impact of Natural Gas Import Substitution on the Economy During the period under review 28,346.58MMscf of natural gas was consumed by the gas-based thermal
power generation plant which is equivalent to 882.325 million litres of oil equivalent, mainly Jet A-1 and 6,280.428MMscf of natural gas for industries which is equivalent to 149.933 million litres of oil equivalent, mainly Heavy Fuel Oil. This refl ects to a total savings (cost avoided) estimated to be USD 843.9 million during the period under review by not using Jet A1.
4.2.5 Natural Gas Quality and Standard of Services The Authority continued carrying out monitoring of quality and standard of the regulated services rendered
by the service providers. The natural gas extracted at Songo Songo and Mnazi Bay gas reservoirs is a dry gas with no existence of hydrogen sulphide or signifi cant volumes of carbon dioxide or substantial volumes of condensate and other associated elements. Monitoring the natural gas quality specifi cation of regulated services involved monitoring the quality of the commodity (natural gas) and adherence by the service providers and their customers, to the specifi ed standard. The principal components of natural gas are methane and ethane with varying amounts of heavier hydrocarbons including propane, butane, pentane, hexane, heptane and octane as well as carbon dioxide, oxygen and water vapour. Typical Natural Gas from Songo Songo and Mnazi Bay compositions are shown inTable 16.
Table 16: Typical Songo Songo Gas Composition (in % Mole)
Natural Gas Component Reference Quality of Natural Gas
Quality of Natural Gas
Songo Songo Mnazi Bay
Methane (CH4) 87.0 to 97.0 97.35 98.19
Ethane (C2H6) 1.50 to 7.00 0.91 1.01
Propane (C3H8) 0.10 to 1.50 0.27 0.21
iso-Butane (C4H10) 0.01 to 0.30 0.06 0.05
n-Butane (C4H10) 0.01 to 0.30 0.07 0.04
iso-Pentane (C5H12) trace to 0.04 0.02 0.01
n-Pentane (C5H12) trace to 0.04 0.02 0.01
Hexanes (C6H14) trace to 0.06 0.02 0.01
Moisture (ppm) trace to 5.00 4.00 4.00
Carbon Dioxide (CO2) 0.10 to 1.00 0.49 0.26
Nitrogen (N2) 1.30 to 5.60 0.60 0.20
Hydrogen Sulphide (H2S) trace to 0.02 Nil Nil
Total 100.00 100.00 100.00
Specifi c Gravity 0.57 to 0.62 0.585 0.576
Gross Heating Value (MJ/m3) 36.0 to 40.2 37.4 38.08
Source: www.uniongas.com, PAET and M&P
The natural gas produced from Songo Songo and Mnazi Bay reservoirs has the best quality, with 97.23% Methane. No signifi cant changes in gas composition were observed and reported during the period under review, for both gas fi elds. Most parameters monitored by the Authority were observed to be within the best industry standards.
4.3 Level of Investment in Gas Infrastructure Development TPDC continued with pre-commissioning of Mtwara – Dar es Salaam Gas Pipeline Project. The pre-
commissioning and commissioning of a 25 km, 24 inches natural gas pipeline from Songo Songo to Somanga Fungu and a 532 km, 36 inches pipeline from Mtwara to Dar es Salaam was in progress at the time of reporting. The Contractor was fi nalizing the installation works of two gas processing plants at

40
9THANNUAL REPORT FOR THE YEAR ENDED 30TH JUNE, 2015
Madimba in Mtwara and Songo Songo Island in Lindi. The combined capacity of two processing plants is 350MMscfd. Also, TPDC had commissioned the low pressure gas distribution pipeline from Ubungo to Mikocheni light industrial area and TPDC staff accommodation which replace transportation of natural gas by trucks (virtual).
4.4 Health, Safety and Environment The Authority carried out health, safety and environmental monitoring of transmission and distribution
activities in the natural gas sub-sector on quarterly basis. The inspection involved technical inspection of natural gas infrastructure on the following:-
(a) the critical pipeline valves on both Songas and M&P pipelines, corrosion, leakage survey, damage prevention, compaction and restoration of degraded land falls.;
(b) construction works along Mtwara-Dar es Salaam pipeline project; (c) the integrity of gas pipelines and way leave between the landfall areas to the market with great
emphasis on security of facilities along the pipelines; (d) the physical appearance of gas processing plants and gas wells; and (e) the status of the Dar es Salaam ring main serving about 40 industries and the way leave operated by
PAET.
Both processing plants at Songo Songo and Mnazi Bay achieved no Lost Time Injuries (LTI). There was no “Near Miss Accident” or Major Accident to be reported. During the period under review, the Authority observed a trend of potential hydrogen (pH) ranging between 6.53 to 7.6 and oil in water content ranging from 1 to 7 ppm, which were within acceptable range. The allowable pH standard is between 6 to 8 while allowable oil in water content should not exceed 29 ppm (parts per million). In conclusion, handling of produced water at both plants complied with Health, Safety and Environment (HSE) standards and the World Health Organization (WHO) standards.
4.5 Licensing In the absence of natural gas sub-sector legislation, no license was issued in the mid and downstream
for the period under review. The sector legislation (Petroleum Act, 2015) was expected to be enacted by the Parliament. That will allow the Authority to start licencing the operations of regulated activities in the natural gas sub-sector starting in year 2015/16.
4.6 Determination of Rates and Charges In September 2014 TPDC submitted the Natural Gas Processing and Transportation Tariff Application
covering all quantities of natural gas to be processed and transported by TPDC for the Mtwara to Dar es Salaam Natural Gas Infrastructure Project. The Board of Directors, approved, among others, the following
(a) a twenty (20) year, Multi-Year Tariff Adjustment Methodology for Natural Gas Processing and Transportation up to year 2034 to be reviewed after every fi ve (5) years;
(b) an Interim (Natural Gas Processing and Transportation) Tariff of USD2.14/MMBtu with effect from 1st April 2015; and
(c) the project return of 4.58% and a debt-equity ratio of 75:25; However, the Capital Cost (USD1,331.51 million) in respect to the Mtwara-Dar es Salaam Gas Project is
not yet fi nalised, thence the decision above will remain indicative until such time a new tariff is determined following Capital Costs Determination Date.
4.7 Legislative Matters During the period under review the Authority participated in review process of the draft Petroleum Bill,
2015. After the enactment of the specifi c sector legislation, the Authority is looking forward to develop different rules as per demand of the industry based on regulations set by the responsible Minister for Natural Gas Sector.

41
9THANNUAL REPORT FOR THE YEAR ENDED 30TH JUNE, 2015
4.8 Disputes and Complaints There were no disputes or complaints brought to the attention of the Authority during the period under
review.
4.9 Litigation There was no litigation involving the Authority, the service providers, or other stakeholders during the
period under review.
4.10 Achievements and Challenges
4.10.1 Achievements The Authority directly and indirectly attained the following achievements- (a) through performance monitoring and quarterly inspections the Authority ensured the natural gas
supply infrastructures were well operated and maintained by the service providers; (b) fi nalised the interim tariff in favour of TPDC with regard to natural gas processing and transportation
from Madimba and Songo Songo from 1st April to 31st December 2015; and (c) harmoniously and smoothly regulated the constructed newly installed pipeline capable of delivering
784 MMscfd and the natural gas processing plants at Madimba and Songo Songo, capable of processing 350 MMscfd, of which by 30th June 2015the construction work was 95% complete;
4.10.2 Challenges The following are key challenges encountered so far, and the way forward being pursued by the Authority
and other stakeholders- (a) during the year under review, it was diffi cult to regulate the subsector without legislation. However,
the sector legislation (Petroleum Act, 2015) has been enacted, paving way to the Authority to start regulating the natural gas activities;
(b) limited infrastructures of Compressed Natural Gas (CNG) dispensing units have resulted into very low rate for vehicle conversion to natural gas usage among prospective car owners; and
(c) the natural gas infrastructure ends in Dar es Salaam, but more investments are required to extend the pipelines to Tanga and Morogoro within the reasonable timeframe. The fi rst and fast measures call for establishment of “Virtual Pipeline” Project, where CNG could be transported consistently to both municipalities to pave the way for new markets. Since Mozambique have been successful on Virtual Pipeline Project, it can work also in Tanzania.

42
9THANNUAL REPORT FOR THE YEAR ENDED 30TH JUNE, 2015
5.0 WATER SUPPLY AND SANITATION SERVICES REGULATION
5.1 Overview The Authority is responsible for regulating water utilities established under Section 9 of the Water Supply
and Sanitation Act, 2009 and DAWASA Act, Cap 273. As of 30th June 2015, there were 130 regulated water utilities. These included the Dar es Salaam Water and Sewerage Authority (DAWASA), Dar es Salaam Water Supply Corporation (DAWASCO), 23 Regional Water Supply and Sanitation Authorities (RWSSAs), 97 District and Township Water Supply and Sanitation Authorities (DTWSSAs) and eight National Projects Water Supply and Sanitation Authorities (NPWSSAs).
The RWSSAs, DTWSSAs and NPWSSAs were established under the Water Supply and Sanitation Act (2009) and are responsible for provision of Water and Sanitation Services in their designated areas according to the licences issued by EWURA. DAWASA was established by the DAWASA Act, Cap. 273. DAWASA is the owner of the assets for water supply and sewerage services in Dar es Salaam region and part of Kibaha and Bagamoyo Districts. It is responsible for planning, procurement and implementation of strategic capital works. DAWASCO is a public corporation responsible for providing water supply and sewerage services in the DAWASA designated area through a lease contract.
5.2 Performance Monitoring
5.2.1 Performance Data Reporting The Authority maintains a web based software for reporting namely Water Utilities Information System
(MajIs). Through MajIs, WSSAs are obliged to submit electronically their monthly and annual performance data. During the period under review, the Authority conducted training on MajIs reporting to DTWSSAs and NPWSSAs. As a result, MajIs database was updated such that besides the 23 Regional WSSAs, additional 60 water utilities started reporting through MajIs.
5.2.2 Site Inspections and Data Verifi cation The Authority conducted site inspections to all the 23 RWSSAs, DAWASA, DAWASCO and 30 DTWSSAs
(Bariadi, Misungwi, Magu, Mugumu, Bunda, Nansio, Sengerema, Gairo, Mpwapwa, Kondoa, Nzega, Igunga, Tunduru, Ludewa, Makete, Vwawa, Itumba-Isongole and Rujewa, Songe and Orkesumet). Major activities conducted, during site inspections were water and wastewater quality testing, follow up on implementation of WSSAs’ Business Plans, follow up on compliance to licensing requirements and verifi cation of data for review of tariff applications.
Special performance monitoring inspections were carried out to two water utilities that poorly performed in terms of Non-Revenue Water (NRW) as per Water Utilities Performance Review Report of 2013/14. The utilities were Mwanza and Bukoba WSSAs. During the inspections, the Authority investigated the reasons behind poor performance and gave directives for improvements.
Verifi cation of data during the tariff review application process was done for Korogwe, Songea, Tanga Tabora, Singida, Mtwara, Dodoma, Shinyanga, Ngudu, Kiomboi and Moshi WSSAs; Kahama Shinyanga Water Supply and Sanitation Authority (KASHWASA) and DAWASA which applied for tariff reviews.
During site inspections it was observed that WSSAs need to improve on their strategies for reduction of Non Revenue Water (NRW). Among other things, WSSAs need to improve the data management systems on meter readings, recording and storage so as to provide reliable data on NRW.
Also, WSSAs need to conduct studies to establish the source of NRW in their utilities and design appropriate measures for reduction of NRW instead of relying on generic approaches. Regarding implementation of

43
9THANNUAL REPORT FOR THE YEAR ENDED 30TH JUNE, 2015
Business Plans, it was observed that some of the planned investment projects were not implemented mainly due to failure by WSSAs in achieving targeted revenue collections.
5.3 Review of WSSAs’ Business Plans WSSAs are required to prepare their business plans according to EWURA Business Planning Guidelines
for Water Supply and Sanitation Authorities, 2011 and submit them to EWURA for review. Among other things, WSSAs’ business plans serve as essential tools for operational management and budgeting and securing fi nance for investments. Also, the business plans are among the key documents used by EWURA to set WSSAs’ tariffs and are a basis for EWURA to measure and monitor the performance of the WSSAs in achieving their desired objectives and targets.
During the year under review, the Authority revised business plans from 20 WSSAs namely Dodoma, KASHWASA, Mwanza, Singida, Bukoba, Iringa, Shinyanga, Moshi, Arusha, Njombe, Babati, Chalinze, Mbinga, Masasi Nachingwea, Tukuyu, Kiomboi, Ifakara, Ngudu and Biharamulo. Generally, it was noted WSSAs have continued to improve the level of compliance to the EWURA Business Planning Guidelines for Water Supply and Sanitation Authorities, 2011 in terms of structure and contents. The revised business plans were used to set tariffs for the WSSAs which applied for tariff review.
5.4 Review of WSSAs’ Client Service Charters During the year under review, the Authority adopted the President’s Offi ce-Public Service Management’s
(PO-PSM) Guidelines for preparation of Client Service Charters for use by WSSAs. As a result, EWURA received and reviewed client service charters submitted by 43 WSSAs namely Biharamulo, Bunda, Geita, Isaka, Kisarawe, Ruangwa, KASHWASA, Kahama, Karagwe, Kasulu and Maswa.
Others were Misungwi, Muleba, Mwanhuzi, Ngara Chunya, KilwaMasoko, Liwale, Kilolo, Kyela, Ludewa and Mafi nga. In the list there were also Makete, Mbinga, Namtumbo, Tukuyu, Tunduma, Vwawa, Ilula, Makambako, Mbalizi, Tunduma, Handeni, Pangani, Korogwe, Monduli, Chalinze, Same, Magugu, Mombo, Muheza, Kilindoni and Handeni Trunk Main. Generally, EWURA’s comments on the submitted Client Service Charters focused on requiring the WSSAs to commit themselves on improving the quality of services provided to their clients.
5.5 Water Utilities Performance Review Report Pursuant to Section 28(1) of the Water Supply and Sanitation Act, 2009, the Authority prepared the
Water Utilities Performance Report for the fi nancial year 2013/2014. The report revealed the overall and individual performance of regulated water utilities during the fi nancial year 2013/2014 as compared to the previous two fi nancial years of 2012/2013 and 2011/2012.
Despite showing improvement in metering ratio, number of water and sewerage connections, revenue collection and staff per 1000 connections; the report shows that determination of future water sources and unsatisfactory performance in NRW reduction as key issues to be addressed by water utilities. The report was prepared in two volumes, the fi rst for DTWSSAs and the second for RWSSAs, DAWASCO and NPWSSAs. The fi rst volume was launched on 12th November, 2014 while the second volume was launched on 19th December, 2014. During launching of the reports, best performing utilities for year 2013/14 were awarded certifi cates and/or trophies.
5.6 Licensing The Authority issues three classes of licences to WSSAs namely Class I (highest), Class II, and Class III.
The licence classes are issued based on fulfi lment of managerial, technical and fi nancial requirements. The Authority reviewed licence applications and issued Class III licences to six WSSAs of Utete, Loliondo, Gallapo, Chalinze, Wanging’ombe and Usa River. Also, the Authority continued to monitor and verify

44
9THANNUAL REPORT FOR THE YEAR ENDED 30TH JUNE, 2015
fulfi lment of conditions set out for upgrading WSSAs to Class II or Class I licences. None of the regulated utilities qualifi ed for promotion to a higher class and hence, all regulated water utilities maintained Class III licence.
5.7 Determination of Rates and Charges The Authority received 20 applications for tariff reviews, out of which ten were approved, three were
referred back and the seven were in progress. Those which were referred back were resubmitted and approved. Table 17 below shows Water Supply Tariff Applications and their status.
Table 17: Tariff Reviews
S/N
Reg
ulat
ed E
ntit
y
App
licat
ion
Dat
e
Exis
ting
Ave
rage
M
eter
ed T
ariff
(T
ZS/
m3)
Approved Average Metered Tariff (TZS/m3)
Dat
e of
A
ppro
val
Stat
us/E
ffec
tive
date
2014/15 2015/16 2016/17
1 Dodoma WSSA 10-Jul-14 910 Referred back
2 Singida WSSA 15-Aug-14 811 Referred back
3 Tabora WSSA 22-Aug-14 843 1,124 1,202 1,211 25-Feb-15 1-Feb-15
4 Dodoma WSSA 7-Nov-14 910 1,150 1,183.85 12-May-15 1-Jun-15
5 Mbinga WSSA 17-Nov-14 395 Referred Back
6 Mtwara WSSA 24-Dec-14 764 1,105 1,323 30-Apr-15 1-Jun-15
7 Singida WSSA 30-Jan-15 811 1,067 1,202 30-Apr-15 1-Jun-15
8 Iringa WSSA 26-May-15 970 In progress
9 Babati WSSA 26-May-15 960 1,281 1,287 1,287 28-Aug-15 1-Nov-15
10 Ngudu WSSA 24-Mar-15 735 1,144 1,221 1,283 3-Aug-15 1-Sep-15
11 Ifakara WSSA 25-Mar-15 646 1,008 1,053 3-Aug-15 1-Sep-15
12 Shinyanga WSSA 26-Mar-15 650 976 1,067 1,133 28-Aug-15 1-Sep-15
13 DAWASA 25-May-15 970 In progress
14 Moshi WSSA 24-Apr-15 561 704 728 791 3-Aug-15 1-Sep-15
15 KASHWASA 18-May-15 561 704 728 791 3-Aug-15 1-Sep-15
16 Njombe WSSA 3-Jun-15 506 In progress
17 Mpwapwa WSSA 3-Jun-15 665 In progress
18 Bukoba WSSA 4-Jun-15 729 In progress
19 Arusha WSSA 5-Jun-15 759 In progress
20 Kahama WSSA 30-Jun-15 1,257 In progress
Source: EWURA
5.8 Complaints Handling and Dispute Resolution During the year under review, 68 complaints were registered from consumers of water and sanitation
services, out of which 50 were carried forward from the previous fi nancial year and 18 were new complaints. Out of 68 complaints, 17 were resolved and 51 were in progress.

45
9THANNUAL REPORT FOR THE YEAR ENDED 30TH JUNE, 2015
5.9 Litigation During the year under review, the Authority was involved in a carried forward case between EWURA and
the CEO of DAWASCO. The judgment in this case was delivered in favour of the CEO of DAWASCO.
5.10 Health, Safety and Environmental Matters
5.10.1 Water and Wastewater Quality Tests During the year under review the Authority conducted spot water and/or waste water quality checks in the
service areas of 52 water utilities including Tanga, Moshi, Arusha Babati, Handeni Trunk Main, Korogwe, Pangani and Monduli. The tests were also conducted to Katesh, Mbulu, Mwanza Bukoba, Shinyanga, Musoma, Kigoma Bariadi, Geita, and Tarime WSSAs. Others were Mugango-Kiabakari, Karagwe,Bunda, Misungwi, KASHWASA, Kahama, Maswa, Iringa, Njombe, Songea, Mbeya and Sumbawanga WSSAs. Also, the tests included WSSAs of Mpanda, Wanging’ombe, Ilula, Kilolo, Tukuyu, Kyela, Mbalizi, Tunduma, Masasi-Nachingwea, Chalinze, Makonde, Mtwara, Lindi, Utete, Gairo, Mpwapwa, Kondoa, Igunga, Tabora, Singida, Dodoma and Morogoro.
The water quality tests were carried out by the Authority through Regional Water Laboratories of the Ministry of Water. The spot tests were conducted to verify the physical, bacteriological and chemical water and wastewater quality data reported by the utilities. Also, the tests were carried out to chek whether water supplied and effl uent from waste water systems comply with standards issued by the Tanzania Bureau of Standards (TBS). Quality Parameters tested are pH, turbidity, residual chlorine and faecal coliforms (E-Coli) for drinking water and BOD5 and COD for waste water. Generally, results of the tests showed good compliance to pH and turbidity standards. However, compliance to E-Coli requirements in some of the utilities was found not satisfactory mainly due to failure to maintain the required amount of residual chlorine in their distribution systems. With regard to wastewater, compliance to BOD5 and COD standards was not attained by some of the utilities. As a result of the fi ndings of the water and wastewater quality tests, each utility was given directives for remedial measures whose implementation will be followed up as part of the Authority’s regular monitoring of the performance of water utilities.
5.10.2 Water and Wastewater Quality Monitoring Guidelines, 2014 In December 2014, the Authority issued Water and Wastewater Quality Monitoring Guidelines, 2014. The
overall objective of the Guidelines is to provide guidance to water utilities in developing their own water quality monitoring programmes for water supply and wastewater effl uent discharges. The Guidelines are applicable to all licensed Water Supply and Sanitation Authorities including DAWASA and DAWASCO. During dissemination, a total of 97 water utilities confi rmed receipt of the Guidelines and will incorporate the implementation thereof during the fi nancial year 2015/16.
5.11 Capacity Building In a bid to improve performance of regulated water utilities, the Authority continued to implement capacity
building measures to water utilities. During the year under review, the Authority participated in training sessions for 83 DTWSSAs and NPWSSAs that were organized by GIZ. The training sessions were aimed at imparting technical, commercial and managerial skills for the DTWSSAs and NPWSSAs. During the training sessions EWURA’s intervention was mainly on preparation of business plans, asset management plans, tariff setting and application, and MajIs reporting.
5.12 Other Interventions in the Water Sector (a) Water Sector Development Programme During the year under review, the Authority collaborated with the Ministry of Water (MoW) and
other stakeholders to improve service delivery in WSSAs. This included participation in the Water Sector Development Programme (WSDP) thematic working group on urban water supply. The

46
9THANNUAL REPORT FOR THE YEAR ENDED 30TH JUNE, 2015
activities of the urban water supply thematic group include, setting indicators for monitoring, carrying out joint inspection and evaluation of WSDP projects implemented by WSSAs. During the reporting period, the Authority participated in two Thematic Working Group Meetings and the Joint Water Sector Review Meeting. During the meetings, the Authority provided inputs to MoW on Performance achievement by Regional WSSAs and DAWASCO.
(b) Loan fi nancing to WSSAs In order to promote investments in the water sector, the Authority provided technical, commercial
and fi nancial inputs to the establishment of the KfW Output Based Aid (OBA) and AfDB Pilot Loan schemes. The schemes’ aim is to provide investment loans to WSSAs at favourable conditions. The Authority was given an observer’s status by the MoW in the implementation of the OBA programme. Also, the Authority participated in a workshop organised by GIZ to raise awareness to banks on the available business opportunities of providing loans to WSSAs.
5.13 Key Achievements and Challenges
5.13.1 Achievements The achievements made by the Authority during the period under review included the following: (a) through routine inspections the Authority has managed to follow up on all regional WSSAs and
some DTWSSAs so as to ensure compliance with water quality standards; (b) there has been a continuous improvement in terms of quality of the WSSAs’ Business Plans submitted
to the Authority for review; and (c) the Authority has provided guidance to WSSAs on planned strategies for reduction of Non-Revenue
Water (NRW) and extension of water distribution systems while reviewing their Business Plans, Tariff Applications and during special site inspections
5.13.2 Challenges The main challenges facing the Authority in regulating the water sector are described below: (a) Overall compliance to various regulatory directives from District and Township WSSAs is still a
challenge to EWURA. This is due to lack of skills and manpower in WSSAs. To address this challenge, the Authority is collaborating with MoW and PMORALG to conduct capacity building workshops to the DNSPs Board Members and skills on technical, commercial and managerial matters to WSSAs staff.
(b) A good number of DTWSSAs have not started reporting through MajIs mainly due to capacity challenges. The Authority will continue to implement capacity development measures and regular follow up so as to ensure that all DST WSSAs are actively reporting through MajIs.
(c) Promotion of investment in the water sector remains a challenge to the Authority. This is because, investment funds earmarked for WSSAs under the WSDP for various expansion and rehabilitation projects have not been suffi cient to meet increasing demand. To address the challenge, the Authority has prepared comprehensive business plan guidelines for water utilities to use in preparation of plans towards attaining cost recovery tariffs and use the business plans to access funds.
(d) Lack of Board and Management with required qualifi cations.

47
9THANNUAL REPORT FOR THE YEAR ENDED 30TH JUNE, 2015
6.0 COMMUNICATIONS AND PUBLIC AWARENESS PROGRAMME
6.1 Overview The Authority continued with its obligation to implement public awareness and outreach programmes aimed
at informing the public on various activities conducted by EWURA on consumers’ rights and obligations. The programme was also geared at enhancing public knowledge, awareness and understanding of the regulated sectors as stipulated under Section 6(e) of the EWURA Act, Cap. 414.
Public awareness activities performed during the period under review, aimed at enlightening stakeholders on their rights and obligations, complaints handling procedures and instilling positive perception to the public on the role and functions of the Authority.
During the period under review, direct communication with stakeholders by way of electronic, print media, meetings, public hearings and consultations was accorded preference in order to enhance public awareness programme.
6.2 Public Awareness Campaign During the fi nancial year 2014/2015, the Authority produced the Information, Education and
Communications Policy and Strategy to ensure a smooth and proper fl ow of information, both within and outside the organization; and in conformity with the EWURA Act. With the policy in use, the Authority broadened its public awareness activities. Under the period in review, the Authority aired 70 weekly TV programmes on TBC1, ITV, Channel 10 and Star TV under the brand name “EWURA NA UCHUMI,” that covered various topics on areas that the Authority regulates.
The Authority also featured in news headlines on television stations of TBC1, ITV, EATV, TV1, Star TV, Channel Ten, Azam TV and Sibuka TV. Also, EWURA offi cials took part on the ITV’s Kipimajoto live programme to clarify petroleum price issues.
For radios, the Authority featured in news headlines and live interviews on Radio One, TBC Taifa, Uhuru, Clouds, Radio Free Africa, EFM Radio, Tumaini Radio, Wapo FM, East Africa Radio and Ebony Radio especially on issues of petroleum pricing and tariffs of various regulated entities.
During the same period, EWURA conducted public awareness seminars to offi cials of the Tanzania Police Force, members of the Fair Competition Tribunal, Editors Forum and TANESCO employees. Furthermore, the Authority continued to update its website, (www.ewura.go.tz), to make it more informative tool for public education and source of information.
6.3 Press Conferences and Media Coverage During the period under review, press conferences were held on matters related to regulatory functions
and specifi cally on issues of tariffs and prices, public hearings, electricity and petroleum supply and licensing.
6.4 Advertisements During the period under review the Unit managed to handle all advertisements at any given time to meet
the required deadlines by every user Division. Print media was the most benefi ciary of the advertisements.
6.5 Publicity Materials The Authority printed Newsletters, Annual Reports, Water Sector Annual Performance Report, diaries,
calendars and brochures. For the fi rst time, the Authority published a Downstream Petroleum Sub Sector Performance Review Report which covered details of the executed activities, challenges encountered

48
9THANNUAL REPORT FOR THE YEAR ENDED 30TH JUNE, 2015
and achievements attained from the year 2012 to 2014 and also summarised the activities executed in between year 2007 and 2011. These materials are good tools for the promotion of the Authority’s image and regulatory activities.
6.6 Exhibitions During the period under review, the Authority participated at Saba Saba exhibition, at the Dar es Salaam
International Trade Fair (DITF). The information disseminated at the exhibition dwelt on the duties and functions of the Authority, rights and obligations of various stakeholders, complaint resolution and the Authority’s achievement and challenges faced.
6.7 Impact of Public Awareness Campaigns There was a general trend of increased recognition of the Authority’s activities by the public and regulated
suppliers. Through public awareness campaigns regulated suppliers are becoming compliant with the licensing conditions as is evidenced by the decrease of the number of complaints during the year under review.
The outcome of such awareness programs has been that the Authority has also witnessed the increased number of inquiries and consultations on issues related to regulations, from both consumers as well as potential investors.
6.8 Donations and Contributions During the year under review, the Authority sponsored a number of students who were undertaking
practical training and also supported various activities in education, capacity building, environmental matters and Maji Week exhibitions.
6.9 Key Achievement and Challenges
6.9.1 Key Achievements (a) The Authority has successfully managed to cultivate and maintain good rapport with its stakeholders,
including its peers, Government offi cials, politicians, regulated entities, the media and the general public.
(b) Various programmes targeting increased public awareness have been implemented as scheduled, thereby increasing the public knowledge and understanding the regulated sectors.
(c) The Authority has prepared a comprehensive Communication Policy and Strategy to facilitate implementation of public awareness program as stipulated in the EWURA Act, Cap 414. The Authority has established and maintained good communication channels with its stakeholders that have helped to improve and smoothen communication.
6.9.2 Key Challenges (a) The high cost of newspapers, radio and television media of communication makes public awareness
a costly activity, therefore limiting the Authority from effectively extending its plans on public awareness campaigns.
(b) The geographical size of the country, coupled with poor infrastructure that makes logistical issues diffi cult, have a negative impact in that television and radio coverage becomes limited. In order to contain the problem, the Authority is exploring ways of reaching the rural public using local rural network and EWURA zonal offi ces.
(c) Diversifi cation of communication channels resulting from technological development such as that of social media has further disintegrated the audience, thus making it diffi cult for the Authority to rely on main media stream alone. The Authority is working on how it can fully participate in social media channels.

49
9THANNUAL REPORT FOR THE YEAR ENDED 30TH JUNE, 2015
7.0 STAKEHOLDERS CONSULTATIONS
The Authority conducted various stakeholders’ consultations during the year under review as they are a crucial part in the decision making process. Stakeholders involved during this fi nancial year included the Consumer Consultative Council (CCC), Government Consultative Council (GCC), Ministries and Government Departments, regulated entities, media and the public at large.
During the period under review, the Authority developed 18 regulatory tools of which stakeholders were fully involved through consultations. The Authority also conducted 12 public inquiry meetings of which six related to water, one to electricity, four to petroleum and one to Natural Gas operations.
8.0 DECLARATION OF CONFLICT OF INTEREST
The Authority did not register any incident of confl ict of interest from Board Members and staff while discharging their duties during the year under review.
9.0 CONCLUSION AND FUTURE OUTLOOK
The regulatory decisions made by the Authority continued to support the Government’s efforts to eradicate poverty and strive to attract investments in the regulated sectors and enhance the socio-economic welfare of the Tanzanian society through delivery of quality services.
The Authority aims at taking measures to achieve the necessary impact as listed below: (a) To continue to implement the Strategic Plan 2012/13-2016/17 that guides the Authority’s operations
for the remaining two years. (b) To develop more regulatory tools as and when required in order for consumers and regulated
suppliers to comply with issues of standards on the one hand and enhancing transparency and predictability to all stakeholders on the other hand.
(c) To make sure the Authority continues to be the best centre for attracting investments in the regulated sectors by creating an enabling environment to all investors.
(d) To ensure that there is the highest level of compliance by all regulated operators. (e) To continue with the capacity building activities for the Authority’s staff in technical, managerial as
well as regulatory skills, in order to execute regulatory duties effectively and effi ciently; (f) To strengthen working relationships with Government institutions and other stakeholders. (g) To continue supporting the Government in implementing the recently passed Petroleum Act 2015
for the benefi ts of the nation. (h) To continue strengthening efforts to implement a public awareness and outreach programme for the
benefi t of consumers, regulated operators, Government offi cials and the public at large. (i) To relocate to new offi ce accommodation with conducive working environment with affordable
rental charges. (j) To start constructing EWURA offi ce building at the Authority’s plot located at Ubungo Maji. (k) To strengthen the Authority operations by improving the zonal offi ce operations in Lake Zone Offi ce
in Mwanza and opening other offi ces in various zones. (l) Continue improving service delivery to the public by implementing the EWURA Client Service
Charter, quality standards under ISO certifi cation and the Open Performance Review and Appraisal System (OPRAS).
50
9THANNUAL REPORT FOR THE YEAR ENDED 30TH JUNE, 2015

51
9THANNUAL REPORT FOR THE YEAR ENDED 30TH JUNE, 2015
10.0 REPORT FROM THE CONTROLLER AND AUDITOR GENERAL
THE UNITED REPUBLIC OF TANZANIA
NATIONAL AUDIT OFFICE
REPORT OF THE CONTROLLER AND AUDITOR GENERAL
ON THEFINANCIAL STATEMENTS OF ENERGY AND
WATER UTILITIES REGULATORY AUTHORITY
FOR THE YEAR ENDED 30TH JUNE, 2015
The Controller and Auditor General,National Audit Offi ce,Samora Avenue/Ohio Street,P.O. Box 9080,Tel: 255 (022) 2115157/8,Fax: 255 (022) 2117527E-mail: [email protected]: www.nao.go.tzDar es Salaam.
December, 2015 AR/PA/2014/2015

52
9THANNUAL REPORT FOR THE YEAR ENDED 30TH JUNE, 2015
TABLE OF CONTENTS
Offi ce of the Controller and Auditor General ........................................................................................................53
Vision, Mission............................................................................................................... ......................................53
Defi nition of Terms and Abbreviations ..................................................................................................................54
REPORT OF THE DIRECTORS ..............................................................................................................................55
STATEMENT OF DIRECTORS’ RESPONSIBILITIES ................................................................................................68
AUDIT REPORT ON FINANCIAL STATEMENTS ...................................................................................................69
STATEMENT OF FINANCIAL POSITION ...............................................................................................................71
STATEMENT OF COMPREHENSIVE INCOME ......................................................................................................72
STATEMENT OF CHANGES IN EQUITY ...............................................................................................................73
STATEMENT OF CASH FLOW ..............................................................................................................................74
NOTES TO THE FINANCIAL STATEMENTS ...........................................................................................................75

53
9THANNUAL REPORT FOR THE YEAR ENDED 30TH JUNE, 2015
Offi ce of the Controller and Auditor General
National Audit Offi ce
The United Republic of Tanzania
(Established under Article 143 of the Constitution of the URT)
The statutory duties and responsibilities of the controller and Auditor General are enshrined under Article 143 of the Constitution of the URT of 1977 and further amplifi ed under Sect. 10 of the Public Audit Act No. 11 of 2008.
VisionTo be a Centre of excellence in public sector auditing.
MissionTo provide effi cient audit services in order to enhance accountability and value for money in the collection and use of public resources.
In providing quality services, NAO is guided by the following Core Values:ü Objectivity: We are an impartial organization, offering services to our clients in an objective and unbiased
manner;ü Excellence: We are professionals providing high quality audit services based on best practices;ü Integrity: We observe and maintain high standards of ethical behavior and the rule of law;ü People focus: We focus on stakeholders’ needs building a culture of good customer care having competent and
motivated work force;ü Innovation: We are a creative organization that constantly promotes a culture of developing and accepting new
ideas from inside and outside the organization; and ü Best resource utilization: We are an organization that values and uses public resources entrusted to it in
effi cient, economic and effective manner.
We do this by: -· Contributing to better stewardship of public funds by ensuring that our clients are accountable for the resources
entrusted to them;· Helping to improve the quality of public services by supporting innovation on the use of public resources;· Providing technical advice to our clients on operational gaps in their operating systems;· Systematically involve our clients in the audit process and audit cycles; and· Providing audit staff with adequate working process tools and facilities that promote independence.
© This audit report is intended for use by the EWURA Management. However, upon adoption of the report by the EWURA this report becomes a matter of public record and its distribution may not be limited.

54
9THANNUAL REPORT FOR THE YEAR ENDED 30TH JUNE, 2015
DEFINITION OF TERMS AND ABBREVIATIONS
AFUR : African Forum for Utility RegulatorsARA : African Refi ners AssociationCAG : Controller and Auditor GeneralEREA : Energy Regulators Association of East AfricaESAWAS : Eastern and Southern Africa Water and Sanitation Regulators AssociationESI : Electricity Sector IndustryEWURA : Energy and Water Utilities Regulatory AuthorityFCT : Fair Competition TribunalGEPF : Government Employees Provident FundGPA : Group Personal AccidentHIV/AIDS : Human Immunodefi ciency Virus/Acquired Immune Defi ciency SyndromeIAS : International Accounting StandardsIASB : International Accounting Standards BoardIDA : International Development AssociationIFRS : International Financial Reporting StandardsISA : International Standards on AuditingISSAIs : International Standards of Supreme Audit InstitutionsLAPF : Local Authorities Pensions FundLPG : Liquefi ed Petroleum GasNAO : National Audit Offi ceNSSF : National Social Security FundPAA : Public Audit Act 2008PPA : Public Procurement Act, 2011PPF : Parastatal Pension FundPPP : Public Private PartnershipPPSDP : Privatization and Private Sector Development ProjectPSPF : Public Service Pensions FundReg. : RegulationRERA : Regional Electricity Regulators AssociationSect. : SectionTBS : Tanzania Bureau of StandardsTZS : Tanzania ShillingsURT : United Republic of TanzaniaWSSAs : Water, Sanitation and Sewerage Authorities

55
9THANNUAL REPORT FOR THE YEAR ENDED 30TH JUNE, 2015
REPORT OF THE DIRECTORS FOR THE YEAR ENDED 30TH JUNE, 2015
1.0 INTRODUCTION The Directors hereby submit their report together with the audited fi nancial statements for the year ended
30th June, 2015 which disclose the state of affairs of the Energy and Water Utilities Regulatory Authority.
2.0 ESTABLISHMENT The Energy and Water Utilities Regulatory Authority (EWURA) is an autonomous statutory body established
under the Energy and Water Utilities Regulatory Authority Act, Cap 414 of the Laws of Tanzania (EWURA Act). Although EWURA was established in November, 2005 through Government Notice No. 19 of February, 2006, it became operational in June, 2006 when the Board of Directors was fully constituted.
3.0 VISION To be a world class Regulator of Energy and Water services.
4.0 MISSION To regulate the energy and water services in a transparent, effective and effi cient manner that promotes
investments and enhances the socio economic welfare of the Tanzanian society.
5.0 PRINCIPAL ACTIVITIES EWURA is a regulatory Authority responsible for the technical and economic regulation of the electricity,
downstream petroleum, natural gas and water and sanitation sectors in Tanzania. The functions of the Authority include, among others, licensing, tariff review, monitoring performance and standards with regard to quality, safety, health and environmental issues of the regulated suppliers.
6.0 COMPOSITION OF THE BOARD OF DIRECTORS The Board of Directors consists of seven members; six of them are non-executive Directors and one
Executive Director who is the Director General. The Board members who served the Authority during the year are as follows:
S/N Name Position Qualifi cation Nationality Date of Appointment/Retired
Age
1. *Mr. Simon F. Sayore
Chairman MSc(Fin),FCCA Tanzanian Re- appointed 27th June, 2011 to 26th June 2015
67
2. Mr. Omary S. Bendera
Member M.A. (Dev. Economics) Tanzanian Re-appointed 1st March, 2014
66
3. Mr. Nicholas H. Mbwanji
Member B.Sc (Physics & Maths) M.A.(Human Resource Management)
Tanzanian Appointed 1st March, 2011
66
4. Mr. Felix M. Ngamlagosi
Director General
MSc.(Economics) Tanzanian Appointed 1stFebruary, 2014
49
5. *Ms. Juliana A. Mwalongo
Member LLM,MA (Development Studies)
Tanzanian Appointed 1st March,2011 to 24th October,2014
58
6. Mr. Richard M. Kayombo
Member MBA (Marketing) Tanzanian Appointed 20th October 2014
46
7. Mr. Ahmed S.K.Kilima
Member MBA (Marketing) Tanzanian Appointed 20th October 2014
62
8. Mr. Oswald R. Mutaitina
Member MSc. (Finance) Tanzanian Appointed 1st April 2015 50

56
9THANNUAL REPORT FOR THE YEAR ENDED 30TH JUNE, 2015
* Directors who served the Authority in the fi nancial year 2014/15 and their tenure expired on the dates indicated above.
7.0 CORPORATE GOVERNANCE The overall responsibilities of the Board of Directors, among other things, include general oversight of
the Authority’s operations, identifying key risk areas, monitoring investment decisions and reviewing the performance of management business plans and budgets. The Board is also responsible for ensuring that comprehensive system of internal control policies and procedures are operative and are in compliance with sound corporate governance principles.
The Board is required to meet at least once a month and as when there is business to transact. The Board delegates the day to day management of the Authority to the Director General assisted by Senior Management members. The Authority is committed to the principles of effective corporate governance namely integrity, transparency and accountability.
During the year under review 12 Ordinary Meetings and 20 Extra Ordinary Board Meetings were held.
8.0 BOARD COMMITTEES In streamlining the business transactions the Board has constituted sector specifi c and cross-cutting issues
Board Committees. During the year under review, the Audit Committee, Legal and Corporate Affairs Committee, Petroleum Committee, Electricity and Natural Gas Committee and Water and Sanitation Committee, met regularly pursuant to section 21 of the EWURA Act. During the period under review a total of 18 meetings were conducted by these committees as shown below.
Board Committee Meetings
S/N Board Committee Number of Meetings1. Audit 7
2. Legal and Corporate Affairs 5
3. Electricity and Natural Gas 4
4. Petroleum 1
5. Water 1
Total 18
Constitution of Board Committees is as follows:
Board’s Audit Committee
S/N Name Position Qualifi cation Nationality1. Mr. Omary S. Bendera Chairman M.A. (Dev. Economics) Tanzanian
2. Mr. Oswald R. Mutaitina Member MSc. (Finance) Tanzanian
3. *Ms. Juliana A. Mwalongo Member LLM,MA (Development Studies) Tanzanian
4. Mr. Richard M. Kayombo Member MBA (Marketing) Tanzanian
5. Mr. Peter L. Machunde Co-opted Member CPA(T) Tanzanian

57
9THANNUAL REPORT FOR THE YEAR ENDED 30TH JUNE, 2015
Board’s Legal and Corporate Affairs Committee
S/N Name Position Qualifi cation Nationality1. Mr. Richard M. Kayombo Chairman MBA (Marketing) Tanzanian
2. *Mr. Simon F. Sayore Member MSc(Fin),FCCA Tanzanian
3. *Ms. Juliana A. Mwalongo Member LLM,MA (Development Studies)
Tanzanian
4. Mr. Nicholas H. Mbwanji Member B.Sc (Physics & Maths) MM.A.(Human Resource Management)
Tanzanian
5. Mr. Felix M. Ngamlagosi Director General MSc.(Economics) Tanzanian
Board’s Electricity and Natural Gas Committee
S/N Name Position Qualifi cation Nationality1. Mr. Nicholas H.
Mbwanji
Chairman B.Sc (Physics & Maths) MM.A.(Human Resource Management)
Tanzanian
2. *Mr. Simon F. Sayore Member MSc(Fin),FCCA Tanzanian
3. Mr. Felix M. Ngamlagosi Director General MSc.(Economics) Tanzanian
4. Mr. Ahmed S. K.Kilima Member MBA (Marketing) Tanzanian
5. Mr. Oswald R. Mutaitina Member MSc. (Finance) Tanzanian
Board’s Petroleum Committee
S/N Name Position Qualifi cation Nationality1. Mr. Omary S. Bendera Chairman M.A. (Dev. Economics) Tanzanian
2. *Mr. Simon F. Sayore Member MSc(Fin),FCCA Tanzanian
3. Mr. Felix M. Ngamlagosi Director General MSc.(Economics) Tanzanian
4. Mr. Ahmed S.K.Kilima Member MBA (Marketing) Tanzanian
Board’s Water Committee
S/N Name Position Qualifi cation Nationality1. Mr. Ahmed S.K.Kilima Chairman MBA (Marketing) Tanzanian
2. Mr. Omary S. Bendera Member M.A. (Dev. Economics) Tanzanian
3. *Ms. Juliana A. Mwalongo Member LLM,MA (Development Studies)
Tanzanian
4. *Mr. Simon F. Sayore Member MSc(Fin),FCCA Tanzanian
5. Mr. Felix M. Ngamlagosi Director General MSc.(Economics) Tanzanian
*Directors who served the Authority in the fi nancial year 2014/15 and their tenure have expired.
9.0 RELATED PARTY TRANSACTIONS The related party transactions during the year are disclosed in Note 17 of these fi nancial statements.

58
9THANNUAL REPORT FOR THE YEAR ENDED 30TH JUNE, 2015
10.0 MANAGEMENT The Management of the Authority is under the Director General and is structured in the following eight
Directorates and two Units; (a) Directorate of Corporate Affairs; (b) Directorate of Natural Gas; (c) Directorate of Water and Sewerage; (d) Directorate of Legal Services; (e) Directorate of Internal Audit; (f) Directorate of Petroleum; (g) Directorate of Electricity; (h) Directorate of Regulatory Economics (i) Communication and Public Relations Unit; and (j) Procurement Management Unit.
11.0 OPERATIONAL AND FINANCIAL PERFORMANCE During the year under review, EWURA focused on the implementation of its strategic objectives which
guide the Authority in achieving its vision and mission, championing good governance and facilitating the attainment of vibrant and thriving energy and water sectors in Tanzania.
The Strategic Objectives are as follows: (a) To have a Least - Cost Investments framework for electricity, natural gas, water and petroleum
regulated sectors; (b) To ensure EWURA’s functions are effi ciently and effectively managed; (c) To have public knowledge, awareness and understanding of the regulatory functions and the
regulated sectors enhanced; (d) To have quality service standards and codes of regulated sectors of electricity, water and petroleum
enforced; and (e) To have an effective intervention strategy against HIV/AIDS for enhanced productivity.
During the year under review, the Authority continued implementing its Strategic Plan for year 2012/13 – 2016/17 that guides the Authority’s operations in fi ve years period.
11.1 Achievements During the year under review, the Authority witnessed signifi cant achievements in mobilization of fi nancial
and non-fi nancial resources, reviewed and developed Rules, Information Monitoring Systems, service standards and codes governing the regulation of the regulated sectors; continued to implement the Bulk Procurement System of petroleum products and facilitated its operations; ensured a fair competition in the petroleum sub-sector; continued executing periodic and unscheduled inspections; provided public knowledge, awareness and understanding of the regulatory functions in the regulated sectors; the Authority was in the fi nal stages of getting ISO certifi cation; started developing the Client Service Charter, developed the
Water Supply and Sanitation (Quality of Service) Rules and Initiated the development of Disaster Recovery Manual. The year also saw the Authority being the winner in the Regulator of the Year Award for Excellence 2015 Competition which was organized by the Africa Energy Forum and was held in Dubai in the United Arab Emirates on 8th to 11th June, 2015.

59
9THANNUAL REPORT FOR THE YEAR ENDED 30TH JUNE, 2015
11.2 Financing The Authority’s operations are fi nanced mainly through collection of levies from regulated service providers
in the electricity, petroleum, natural gas and water and sanitation sectors. Other sources of fi nancing include licence fees, application fees, penalties and interest income from fi xed deposits.
During the year under review total revenue amounting to TZS 38.7 billion was collected indicating an increase of 17% compared to the previous year as shown below.
Description 30.06.2015
TZS’000
30.06.2014
TZS’000
Increase/
(Decrease) %
Income from Regulatory Levy and Licenses 34,823,343 30,077,847 16
Other Income 4,866,718 3,076,258 26
Total Revenue 38,690,061 33,154,105 17
11.3 Legal Framework The EWURA Act, Cap 414 together with sector legislation, govern the conduct of the activities of the
Authority. The sector legislation includes the Electricity Act, Cap 131, Water and Sanitation Act, Cap 272, the Petroleum Act Cap 392 and DAWASA Act, Cap 273. The Authority continued to play a key role in supporting the Government in the development of the Natural Gas Supply Bill.
11.4 Licensing During the year under review, the Authority prepared and issued licenses to some regulated suppliers
operating in the regulated sectors. EWURA also continued to license personnel that are qualifi ed to carry out electrical installation works as required by the Electricity Act, Cap. 131. During the year under review, three hundred thirty (330) applicants were issued with new licenses as follows; petroleum 122 licenses (whole sale 14, Retail 107 and LPG 1), Electricity 208 licenses (Generation 8, Distribution 2 and wiremen contractors 198).
Licences under the natural gas sector are still issued by the Ministry of Energy and Minerals under the Petroleum (Exploration and Production) Act, Cap 328.
11.5 Development of Regulatory Tools The Authority continued with the task of fi nalizing the preparation and issuing of the regulatory tools
initiated during the previous year and developing new ones. The process of developing regulatory tools is governed by principles of good governance which require the collection of comments from interested stakeholders and holding hearings and workshops. The process of developing regulatory tools and procedures is an ongoing one.
During the year under review, the following Regulatory tools were completed: (a) The Petroleum (Pipeline Operations), Rules, 2015; (b) The Petroleum (Lubricants Sampling & Testing) Rules, 2015; (c) The Petroleum (Lubricants Operations) Rules, 2015; (d) Petroleum (Retail Operations in Townships & Villages), Rules, 2015. (e) The Petroleum (Retail Operations), Rules, 2015; (f) The Licence Template for LPG Storage; (g) The Licence Template for LPG Wholesale;

60
9THANNUAL REPORT FOR THE YEAR ENDED 30TH JUNE, 2015
(h) The Licence template for LPG Distribution; (i) Water and Waste Water Quality Monitoring Guidelines,2014 (j) Water Supply and Sanitation (Quality of Services) Rules,2014 (k) Water Meter Guidelines, 2015 (l) Performance Inspection Guidelines (m) Water Supply and Sanitation (Regulation of Water Tankers and Private Boreholes) Rules, 2014. (n) The Petroleum (Wholesale Operation) Rules, 2015 (Revised); (o) The Petroleum (Retail Operations) Rules, 2015 (Revised); (p) The Petroleum (Liquefi ed Petroleum Gas) Rules, 2015 (Revised); (q) Petroleum (Pipeline Operations) Rules ,2015; (r) Petroleum (Consumer Installations Operations) Rules, 2015 (Revised) and (s) Petroleum (Village and Township Retail Outlet Operations) Rules, 2015
11.6 Standards and Codes The Authority continued with the process of developing new codes and standards by taking into
consideration the existing local and international standards applicable to regulated sectors. This process involves the Tanzania Bureau of Standards (TBS), service providers, Sector Ministries academic institutions and other stakeholders.
The Authority also approved the Distribution Codes (TANESCO Distribution Engineering Instruction Manual). The Manual will also be the Authority’s standard code for inspection of distribution infrastructure.
EWURA in collaboration with the Ministry of Water (MoW) has set the minimum quality of service standards which are included in the Memorandum of Understanding (MoU) that is signed between the Ministry of Water and the WSSAs. EWURA has ensured that the quality of service standards are included in Water Sanitation and Sewerage Authorities (WSSAs) Business Plans, and follow up is always made to ensure their implementation.
The Authority also in collaboration with Tanzania Bureau of Standards (TBS) facilitated the development of several standards including Water Meters Standards, Standards for Petroleum Product Outlets TZS 1115:2009, Standards for Installation of Underground Storage Tanks, Pump/Dispensers and Pipe-Work at Service Stations and Consumer Installations TZS 1079:2009 and Standards for the Petroleum Products Storage Depots TZS 1113:2009.
11.7 Tariff Review The Authority carried out Public Inquiries and Public Hearings meetings to determine several tariff review matters fi led by regulated suppliers. Summary of Public Inquiries and Tariff Reviews conducted during the year is shown below:
Regulated Sectors
Applications Brought Forward
Applications Received During the Period
Total Applications Reviewed
Approved Referred Back
Withdrawn Under Review at the End of the Period
Electricity 1 - 1 1 - - -
Natural Gas - 1 1 1 - - -
Water &
Sewerage
2 13 15 5 1 2 13
TOTAL 3 14 17 7 1 2 13

61
9THANNUAL REPORT FOR THE YEAR ENDED 30TH JUNE, 2015
The above table does not include tariffs and/or charges that has been initiated by EWURA either by its own motive or when the need arises. The status of tariffs and charges that were initiated by EWURA are indicated in the table below;
Regulated Sector Applications initiated by
EWURA
Application
Approved
Applications under review at the
end of the year Electricity 3 3 -
Petroleum 3 3 1
Total 6 6 1
In all cases, the legal requirement of taking the views of both consumers and service providers into account was respected when determining the new tariffs. In this regard, the Authority conducted public hearings as summarized below.
Regulated Sector No. of Public Hearings Concluded as of 30.06.2015Electricity 1 1
Natural Gas 1 1
Petroleum 4 4
Water & Sewerage 6 6
Total 12 12
During the period under review, the Authority undertook a review of the small power projects framework through the support of USAID, where a consultant, namely Nexant, from the USA established technology specifi c Renewable Energy Feed-in Tariffs (REFITs) for mini-hydro and biomass whereas REFITs for solar and wind shall be undertaken through competitive bidding.
The Authority made two amendments to the Petroleum Pricing Formula. The fi rst amendment involved combining the retailer’s margin charged by Oil Marketing Companies (OMCs) of TZS 92 per litre. The second amendment refl ected the annual adjustment of the retailers and wholesalers Margins based on infl ation from TZS 92 per liter to TZS 95 per litre effective from March, 2015.
11.8 Sector Monitoring and Inspection During the year under review, the Authority conducted performance monitoring in the activities of
regulated service providers in all of the regulated sectors, both at the time that the licensee applies for a tariff revision and at regular intervals. Key objectives for sector monitoring include the following:
(a) to promote effective competition and economic effi ciency; (b) to protect the interest of the consumers and fi nancial viability of effi cient service providers; (c) to promote the availability of regulated services to all consumers including low income, rural and
disadvantaged consumers; and (d) to protect and preserve the environment.
The Authority continued executing periodic and unscheduled inspections to the petroleum facilities to ensure that there is continuous compliance to Standards that are in place. During the period under review the following petroleum facilities and installations were inspected:-
(a) Conducted pre-licensing inspection to 205 petroleum facilities. Out of these, 180 facilities met licensing requirements and hence recommended for license.
(b) Inspected 190 petrol stations to monitor compliance to the license conditions. 118 petrol station equivalents to 62.1% were found 100% meeting the license conditions.
(c) Inspected 555 petrol stations to monitor compliance to the Price Setting Rules. Only three (3) petrol stations (0.54%) were found defaulting the Rules and appropriate legal actions were taken.

62
9THANNUAL REPORT FOR THE YEAR ENDED 30TH JUNE, 2015
The Authority also continued to ensure that petroleum products of the right quality were offered for sale to consumers by carrying out frequent and random sampling for quality and marker tests. Punitive measures were taken against operators of the facilities that were found with products that failed the quality and marker tests in accordance with the Petroleum (Sampling and Testing) Rules, 2010 and the petroleum (Marking and Quality Control) Rules, 2010.
(a) Conducted fuel marker detection to 539 facilities in order to curb dumping of untaxed petroleum products into local market and adulteration. 74 facilities (13.73%) were found with non-conforming products. Appropriate legal actions were taken against the defaulters.
(b) A total of 227 samples of petroleum products were taken from petroleum facilities in order to monitor compliance to the TBS specifi cation. Eighteen (18) samples equivalent to 7.93% were found not conforming to TBS specifi cations. Appropriate legal actions were taken against the defaulters.
The Authority continued to ensure sustainability of quality improvement by monitoring the Key Performance Indicators (KPIs) that were set in December 2010 during TANESCO Tariff adjustment. Furthermore, the Authority continued to observe Electricity Reliability Indices which were set in 2003 by the East African Community (EAC).
In the year under review, Authority conducted nine inspections on utility’s Electricity Distribution Infrastructure and fi ve pre licensing inspections.
The electricity distribution inspections were conducted in Arusha, Mwanza, Kagera, Mara, Tabora, Kigoma, Morogoro and Dodoma. Pre-licensing inspections were conducted to new project developers such as KIUPA small hydropower ltd, Ludewa clean Energy, Kalumbaleza SHP, Uzia SHP and Lupali mini hydropower project.
All fi ndings observed during distribution infrastructure inspection were submitted to TANESCO for
rectifi cation and there after normally EWURA makes follow up to ensure compliance to standards. Pre licensing inspection were done to verify what was submitted by the applicant fulfi lls the respective application requirement to enable EWURA’s Board management to make a fi nal decision on license awarding.
The Authority has hired two electrical inspections for more enforcement on licensing matters and will further hire one for Mwanza Zone and three to the rest of the other zone to ensure inspection activities on utilities infrastructure are covered in large . It is believed that through inspection is when power quality problems on utility infrastructure will be minimized, that is why Authority strengthened its efforts in monitoring and Inspection.
Inspections for monitoring and verifi cation of data and information reported by WSSAs were also conducted in Kigoma, Kahama, Kilwa Masoko, Iringa, Mbeya, Sumbawanga WSSAs and DAWASCO.
The Authority prepared two Water Utilities Performance Review Reports for 2013/14 for Regional Water Utilities, National Water Projects and DAWASCO and District and small Towns Water Supply and Sanitation Authorities respectively. The reports covered among other things the technical, commercial and fi nancial performance of regulated water utilities. During the launching of the report best performing utilities were recognized by awarding them with certifi cates and trophies.
The Authority has ensured that the Key Performance Indicators targets are included in the WSSAs’ Business Plans and follow up is regularly made to ensure their implementation. Implementation of KPIs is being monitored monthly through the Water Utilities Information System (MaJIs) and Quarterly Performance Reports from Water Utilities.

63
9THANNUAL REPORT FOR THE YEAR ENDED 30TH JUNE, 2015
During the year, the Authority revised Business Plans from 20 WSSAs of Dodoma, KASHWASHA, Mwanza, Singida, Bukoba, Iringa, Shinyanga, Moshi, Arusha, Njombe, Babati, Chalinze, Mbinga, Masasi, Nachingwea, Tukuyu, Kiomboi, Ifakara, Ngudu and Biharamulo. The Authority ensured that the Water Utilities prepare and operate in accordance with their business plans.
As part of monitoring, the Authority also conducted training to regional and District Water Supply and Sanitation Authorities on the use of the MajIs software. A total of 30 Water Utilities were trained and are capable of submitting their information using the software.
Water quality monitoring was conducted to 56 water utilities including DAWASCO. The Authority carried out water and waste water quality monitoring in order to establish whether water supplied and effl uent from waste water systems comply with TBS Standards.
The Authority carried out quarterly fi eld inspections to the natural gas infrastructures for High Pressure Transmission Pipeline and Dar es Salaam Natural Gas Distribution Network to ascertain the infrastructure integrity and its safety. During the fi eld inspections, the Authority had an opportunity to verify the information received from the regulated service providers based on daily, weekly and monthly reports which form part of the basis of monitoring the performance. However, in the absence of sector Regulations and Rules the Authority could not carry out enforcement but advised the service providers to take safety precautionary measures to ensure the public are not at any risk associated with natural gas activities.
11.9 Public Awareness During the period under review, the Authority produced the Information, Education and Communications
Policy and Strategy document to ensure a smooth and proper fl ow of information, both within and outside the organization, and in conformity with the EWURA Act. The production of the policy is also a requirement of the EWURA Strategic Plan 2012/13-2016/17. With the policy in use, the Authority broadened its public awareness activities and continued to air 70 weekly TV programmes on “EWURA NA UCHUMI” covered various topics such as electricity tariffs and petroleum price caps on TBC1, ITV, Channel 10 and Star TV.
The Authority also dominated news headlines on television stations of TBC1, ITV, EATV, TV1, Star TV, Radio One, Uhuru Radio and Radio Free Africa especially on issues of petroleum pricing and TANESCO tariffs. EWURA offi cials also took part on the ITV aired Kipimajoto debate program to clarify petroleum price issues.
During this period EWURA conducted Public Awareness seminars to the Tanzanian Police Force, the Fair Competition Tribunal, Journalists and TANESCO employees in Southern Zone.
11.10 Complaints and Disputes The Authority attended to complaints against suppliers of regulated goods or services in relation to any matter connected with the supply, possible supply or proposed supply of goods or services. A summary of complaints received and settled in each sector is shown below.
Regulated Sector Complaints
Received
Complaints
Settled
Complaints Settlement %
Petroleum 16 13 81
Electricity 48 27 56
Water Supply and Sewerage 16 10 62
Total 80 50 62

64
9THANNUAL REPORT FOR THE YEAR ENDED 30TH JUNE, 2015
At the end of the fi nancial year a number of unresolved complaints were at various stages of mediation and hearing.
11.11 Regional Cooperation Meetings The Authority continued to participate in the activities of four Regional Associations namely, Regional
Electricity Regulators Association (RERA), African Forum for Utility Regulators (AFUR), Energy Regulators Association of East Africa (EREA),African Refi ners Association (ARA) and the Eastern and Southern Africa Water and Sanitation Regulators Association (ESAWAS). The main objective is to exchange regulatory experiences within the International and Regional settings, and allow EWURA to have access to information necessary for regulation and performance benchmarking.
Furthermore, EWURA has participated in various meetings convened to establish the regional power pool, the Eastern Africa Power Pool Regulatory Body (EAPP-IRB) . EAPP-IRB members include Libya, Egypt, Sudan, Ethiopia, Kenya, Tanzania, Uganda, Rwanda, Burundi and the Democratic Republic of Congo.
12.0 RECRUITMENT The Authority’s recruitment policy is to provide equal opportunity for all. The Authority recruits the most
appropriate candidates available in the market in a competitive and transparent manner to ensure that the public continues to receive quality service.
In the year under review, the Authority recruited 11 employees thus bringing the total number of staff to 104 out of 113 that were required during the year. Staff gender structure is as indicated below:
Item Male Female TotalStaff Compliment 70 34 104Percentage 67 33 100
The Authority has a staff complement of highly qualifi ed and motivated professionals, thus bringing into the Authority a wide variety of experiences.
13.0 RISK MANAGEMENT AND CONTROL The Board assumes fi nal responsibility for the risk management and internal control system of the Authority.
It is the task of the Board to ensure that adequate internal fi nancial and operational control systems are developed, improved and maintained on an ongoing basis in order to provide reasonable assurance regarding:
(a) the effectiveness and effi ciency of operations; (b) the safeguarding of the Authority’s assets; (c) compliance with the applicable laws and regulations; (d) reliability of accounting records; (e) business suitability under normal as well as adverse conditions; and (f) responsible behaviors towards stakeholders.
14.0 STAFF WELFARE
14.1 Staff Relations Good relationship between employees and management of the Authority was observed and maintained
during the year under review.

65
9THANNUAL REPORT FOR THE YEAR ENDED 30TH JUNE, 2015
14.2 Capacity Building The Authority’s policy is to equip its staff with relevant regulatory, managerial and operational competencies
to enhance their service delivery to the public. During the year under review, new senior staff attended general courses on Public Utility Regulation and Strategy. Several Staff also attended international and local training on general management courses, secretarial practices and advanced drivers and offi ce attendants training courses in order to improve their performance.
14.3 Medical Services The Authority provides free medical care to all staff, spouses and up to four legal children not exceeding 18
years of age. The Authority commits suffi cient funds to cater for evacuation of staff and overseas treatment, where necessary. During the year under review, there were two cases which required overseas treatment and therefore, the Authority incurred medical costs for both local and overseas treatment.
14.4 HIV/AIDS Intervention During the period under review, the Authority conducted a seminar to all staff on HIV/AIDS. This involved
awareness on HIV/AIDS related issues, training on causes and prevention measures and testing.
15.0 EMPLOYEE BENEFIT PLAN The Authority pays contributions to publicly administered pension funds on a mandatory basis.
16.0 GENDER PARITY The Authority had 104 employees, out of whom 70 were male and 34 were female. The Authority is an
equal opportunity employer.
17.0 POLITICAL DONATIONS The Authority did not make any donations during the year under review.
18.0 CORPORATE SOCIAL RESPONSIBILITY The Authority makes contributions to different organisations to support activities of national interest. In
this regard the Authority supported various organisations including Town Planners Association’s General Meeting, Institute of Internal Auditors during good governance workshop, Rukwa Regional Administrative Secretary to support investment forum in Lake Tanganyika zone, ENOCSS to support a project on strengthening community awareness on participation on environment conservation and Ministry of Water to support Maji Week Commemoration.
The involvement of the Authority in corporate social responsibilities enhances its value and improves its image to the public.
19.0 ENVIRONMENTAL CONTROL PROGRAMME The Authority, in collaboration with the National Environmental Management Council (NEMC) and other
stakeholders, continued to participate in compliance monitoring on matters related to protection of environment. In considering any application for a license or construction approval, the authority takes into account the need to protect and preserve the environment as required by the Environmental Management Act, 2004.
20.0 PERSONS WITH DISABILITIES The Authority gives equal opportunities to persons with disabilities.

66
9THANNUAL REPORT FOR THE YEAR ENDED 30TH JUNE, 2015
21.0 KEY CHALLENGES AND THE WAY FORWARD The Authority encountered various challenges in the course of discharging its functions during the year
under review. Key challenges encountered included the following; (a) The Authority faces a challenge of the growing demand of its services given the vast nature of the
country. The Authority plans to open more zonal offi ces in additional to the one in Lake zone in Mwanza commensurate to fi nancial availability.
(b) Given the enactment of the Petroleum Act, 2015 and a limitation of expertise especially in oil and gas as there is an increasing demand of the professional which the local market cannot support right now. The Authority trains its staff in foreign countries in short term courses, conferences and attachments. These courses are expensive hence very few staff get this opportunity.
(c) Hidden ineffi ciencies in the electricity sector due to the vertically integrated structure of the Electricity Supply Industry in Tanzania. However, the Government in June 2014 announced Electricity Sector Industry (ESI) whereby the unbundling process of TANESCO into generation, transmission and distribution over started in July, 2014 and will be carried out until 2025 in alignment with Tanzania Development Vision, 2025.
(d) WSSAs are many and diverse in size, capability and capacity. There are about 130 WSSAs in the country. Generally, WSSAs at district and small town level have weak managerial, fi nancial and technical capacity. The Authority will continue to utilize its available resources to conduct capacity building activities, inspections and monitoring. The Authority will also support the clustering of the WSSAs.
(e) Inadequate capacity of the WSSAs to prepare Business Plans which is compliant to the EWURA Business Plan Guidelines continues to be a challenge. The Authority has considered continuing with capacity building to WSSAs and is committed to set aside funds for the capacity building in the future years’ budgets.
(f) Low investments in Water Supply and Sanitation which results into a slow pace towards moving to 100% service coverage (currently, it is around 86% in urban areas). EWURA has prepared Business Planning guidelines which assist WSSAs to plan towards cost recovery tariffs. EWURA approves a three year tariff corresponding to the Business Plan. In addition, EWURA is cooperating with the Mow and DPs to put in place incentives for WSSAs to involve PPP’s and to acquire loans for investments.
(g) The Authority is also faced with offi ce accommodation challenges which include increase in rent cost and insuffi cient space. The Authority plans to construct its own offi ce building on the plot provided by the Ministry of Water at Ubungo, Dar-Es-Salaam. The Authority continues with efforts of securing a title deed from the Ministry of Lands and Human Settlement Development to enable the construction start as soon as possible.
(h) Insuffi cient public knowledge in the understanding of rights and obligations of consumers and the regulated suppliers due to limited fi nancial resources. The Authority shall continue to strengthen the
implementation of Public Awareness Programme to address this challenge.
22.0 SOLVENCY Since its establishment, the Authority has managed to fi nance its operations through sources specifi ed
under the EWURA Act. The Directors consider the Authority to be solvent on the strength of its fi nancial position as at 30th June, 2015 as set out in pages 71 to 74 of these fi nancial statements and the Notes thereon.

67
9THANNUAL REPORT FOR THE YEAR ENDED 30TH JUNE, 2015
23.0 AUDIT MANDATE By virtue of the provision of Article 143 of the Constitution of the United Republic of Tanzania, and as
amplifi ed in Sect. 10 of the Public Audit Act, No. 11 of 2008, the Controller and Auditor General (CAG) has appointed BDO East Africa to carry out the audit of EWURA fi nancial statements on his behalf for three years from the fi nancial year 2013/14.
…………………………… ….………………………………. OMAR S. BENDERA FELIX NGAMLAGOSI DEPUTY CHAIRMAN DIRECTOR GENERAL
Date ---------------------------- Date ---------------------------

68
9THANNUAL REPORT FOR THE YEAR ENDED 30TH JUNE, 2015
STATEMENT OF DIRECTORS’ RESPONSIBILITIES
These fi nancial statements have been prepared by the management of the Energy and Water Utilities Regulatory Authority in accordance with the provisions of section 46 of the EWURA Act and section 25(4) of the Public Finance Act, Cap 348 of 2008.
The Directors of EWURA are responsible for establishing and maintaining a system of effective internal control designed to give reasonable assurance that the transactions recorded in the fi nancial statements are within the statutory requirement and that they contain the receipts and use of resources by the Authority.
The Directors of EWURA are responsible for keeping proper accounting records which disclose with reasonable accuracy at any time the fi nancial position of the Authority, and which enable them to ensure that the fi nancial statements comply with the EWURA Act. They are also responsible for safeguarding the assets of EWURA and hence for taking reasonable steps for the prevention and detection of fraud, error and other irregularities.
The Directors confi rm that suitable accounting policies have been used and applied consistently, and reasonable and prudent judgment and estimates have been made in the preparation of the fi nancial statements for the year ended 30th June, 2015. The Directors also confi rm that International Financial Reporting Standards have been followed and that the fi nancial statements have been prepared on the going concern basis.To the best of the Directors knowledge, the internal control system has operated adequately throughout the reporting period and the accounting and underlying records provide a reasonable basis for the preparation of the fi nancial statements for the year ended 30th June, 2015.
Directors accept responsibility for the integrity of the Financial Statements, the information they contain and their compliance with International Financial Reporting Standards. Nothing has come to the attention of the Directors to indicate that EWURA will not remain a going concern for at least the next twelve months from the date of the Statement.
Approved by the Board of Directors on 1st December, 2015 and signed on its behalf by:
…………………………… ….……………………………….OMAR S. BENDERA FELIX NGAMLAGOSIDEPUTY CHAIRMAN DIRECTOR GENERAL
Date ------------------------ Date ----------------------

69
9THANNUAL REPORT FOR THE YEAR ENDED 30TH JUNE, 2015
AUDIT REPORT ON FINANCIAL STATEMENTS
To: Deputy Chairman of the Board, Energy and Water Utilities Regulatory Authority, P.O. Box 72175, DAR ES SALAAM.
RE: REPORT OF THE CONTROLLER AND AUDITOR GENERAL ON THE FINANCIAL STATEMENTS OF ENERGY AND WATER UTILITIES REGULATORY AUTHORITY (EWURA) FOR THE YEAR ENDED 30TH JUNE, 2015
Introduction
I have audited the fi nancial statements of Energy and Water Utilities Regulatory Authority for the fi nancial year ended 30th June, 2015, which comprises statement of fi nancial position, statement of comprehensive income, statement of changes in equity and statement of cash fl ows for the year then ended, and a summary of signifi cant accounting policies and other explanatory notes set out from pages 75 to 91 of this report.
Director’s Responsibilities for the fi nancial statements
The Board of Directors of the Energy and Water Utilities Regulatory Authority is responsible for the preparation and fair presentation of these fi nancial statements in accordance with International Financial Reporting Standards. This responsibility includes designing, implementing and maintaining internal control relevant to the preparation and fair presentation of fi nancial statements that are free from material misstatement, whether due to fraud or error, selecting and applying appropriate accounting policies and making accounting estimates that are reasonable in the circumstances.
Responsibilities of the Controller and Auditor General
My responsibility as an auditor is to express an independent opinion on the fi nancial statements based on the audit. The audit was conducted in accordance with International Standards on Auditing (ISA) and such other audit procedures I considered necessary in the circumstances. These standards require that I comply with ethical requirements and plan and perform the audit to obtain reasonable assurance about whether the fi nancial statements are free from material misstatement.
An audit involves performing procedures to obtain audit evidence about the amounts and disclosures in the fi nancial statements. The procedures selected depend on the auditor’s judgment, including the assessment of the risks of material misstatement of the fi nancial statements, whether due to fraud or error. In making those risk assessments, the auditor considers internal control relevant to EWURA’s preparation and fair presentation of the fi nancial Statements in order to design audit procedures that are appropriate in the circumstances, but not for the purpose of expressing an opinion on the effectiveness of EWURA’s internal control. An audit also includes evaluating the appropriateness of accounting policies used and the reasonableness of accounting estimates made by management, as well as evaluating the overall presentation of the fi nancial statements.
In addition, Sect. 10 (2) of the PAA No. 11 of 2008 requires me to satisfy myself that the accounts have been prepared in accordance with the appropriate accounting standards and that; reasonable precautions have been taken to safeguard the collection of revenue, receipt, custody, disposal, issue and proper use of public property, and that the law, directions and instructions applicable thereto have been duly observed and expenditures of public monies have been properly authorized.

70
9THANNUAL REPORT FOR THE YEAR ENDED 30TH JUNE, 2015
Further, Sect. 48(3) of the Public Procurement Act No. 7 of 2011 and Reg. No. 31 of the Public Procurement (Goods, Works, Non-consultant services and Disposal of Public Assets by Tender) Regulations of 2013 requires me to state in my annual audit report whether or not the auditee has complied with the provisions of the Law and its Regulations.
I believe that the audit evidence I have obtained is suffi cient and appropriate to provide a basis for my audit opinion.
Unqualifi ed opinion
In my opinion, the fi nancial statements present fairly, in all material respects, the fi nancial position of Energy and Water Utilities Regulatory Authority (EWURA) as at 30th June, 2015 and of its fi nancial performance and its cash fl ows for the year then ended in accordance with International Financial Reporting Standards and the Energy and Water Utilities Regulatory Authority Act, Cap 414.
Report on Compliance with Procurement Legislation
Compliance with Public Procurement Act
In view of my responsibility on the procurement legislation, and taking into consideration the procurement transactions and processes I have reviewed as part of this audit, I state that Energy and Water Utilities Regulatory Authority procurement has generally complied with the requirements of the Public Procurement Act, 2011 and its related Regulations of 2013.
Prof. Mussa Juma AssadCONTROLLER AND AUDITOR GENERAL
National Audit Offi ceDAR ES SALAAM
14th December, 2015
Procurement Act, 2011

71
9THANNUAL REPORT FOR THE YEAR ENDED 30TH JUNE, 2015
STATEMENT OF FINANCIAL POSITION AS AT 30TH JUNE, 2015
NOTES 30.06.2015 30.06.2014
TZS’000 TZS’000
ASSETS
Non-Current Assets
Property and Equipment 9 3,301,352 2,934,246
Intangible Assets 10 32,602 91,525
Total Non-Current Assets 3,333,954 3,025,771
Current Assets
Stocks and Consumables 122,021 102,220
Trade and Other Receivables 11 9,263,481 6,082,535
Financial Assets 12 26,435,645 16,035,302
Cash and Bank Balances 13 2,217,113 4,175,382
Total Current Assets 38,038,260 26,395,439
TOTAL ASSETS 41,372,214 29,421,210
EQUITY AND LIABILITIES
Capital and Reserves
Retained Surplus 16,009,834 10,810,367
Building Fund 21,850,000 15,850,000
Total Capital and Reserves 37,859,834 26,660,367
Non-Current Liabilities
Gratuity Payable 15 1,739,370 1,641,590
Current Liabilities
Trade and Other Payables 16 1,773,010 1,119,253
Total Liabilities 3,512,380 2,760,843
TOTAL EQUITY AND LIABILITIES 41,372,214 29,421,210
The accounting policies and the notes on pages 75 to 91 form an integral part of these fi nancial statements.
--------------------------------------- -------------------------------------OMAR S. BENDERA FELIX NGAMLAGOSIDEPUTY CHAIRMAN DIRECTOR GENERAL
Date --------------------------------------- Date -------------------------

72
9THANNUAL REPORT FOR THE YEAR ENDED 30TH JUNE, 2015
STATEMENT OF COMPREHENSIVE INCOME FOR THE YEAR ENDED 30TH JUNE, 2015
NOTES 30.06.2015 30.06.2014
TZS’000 TZS’000
Revenue
Operating Revenue 1 34,823,343 30,077,848
Other Income 2 1,369,450 1,345,503
Finance Income 3 2,497,268 1,730,754
Total Revenue 38,690,061 33,154,105
Expenditure
Staff Costs 4 9,423,966 8,313,571
Operating Expenditure 5 9,728,758 9,520,541
Contribution to Other Government Entities 5,086,043 4,609,935
Administration Costs 6 2,386,774 2,180,807
Other Charges 7 195,303 181,400
Depreciation on Property and Equipment 9 575,281 393,342
Amortisation of Intangible Assets 10 94,469 148,798
Total Expenditure 27,490,594 25,347,854
Net Operating (Defi cit)/Surplus for the Year 11,199,467 7,806,251
Add: Retained Surplus Brought Forward 10,810,367 10,804,116
Total Surplus Before Appropriation22,009,834 18,610,367
Appropriation:
Transfer to Building Fund (6,000,000) (7,800,000)
Retained Surplus Carried Forward 16,009,834 10,810,367
The accounting policies and the notes on pages 75 to 91 form an integral part of these fi nancial statements.
--------------------------------------- -------------------------------------OMAR S. BENDERA FELIX NGAMLAGOSIDEPUTY CHAIRMAN DIRECTOR GENERAL
Date --------------------------------------- Date -------------------------

73
9THANNUAL REPORT FOR THE YEAR ENDED 30TH JUNE, 2015
STATEMENT OF CHANGES IN EQUITY FOR THE YEAR ENDED 30TH JUNE, 2015
Capital Fund Building Fund Retained Surplus Total
TZS’000 TZS’000 TZS’000 TZS’000
Opening Balance at 1st July, 2014 - 15,850,000 10,810,367 26,660,367
Net Operating surplus for the Year 11,199,467 11,199,467
Transfer to Building Fund 6,000,000 (6,000,000) -
Grant Amortisation
Balance at 30th June, 2015 - 21,850,000 16,009,834 37,859,834
Year Ended 30th June, 2014
Item Capital Fund Building Fund Retained Surplus Total
TZS’000 TZS’000 TZS’000 TZS’000
Balance at 1 July, 2013 24,982 8,050,000 10,804,116 18,879,098
Net Operating Surplus for the Year - 7,806,251 7,806,251
Transfer to Building Fund - 7,800,000 (7,800,000) -
Grant Amortisation (24,982) - - (24,982)
-
Balance as at 30 June, 2014 - 15,850,000 10,810,367 26,660,367
Note: The building fund balance of TZS 21.9 billion as at 30th June, 2015, represents the amount appropriated to the Building Fund as a special fund established by the Authority to be used for construction of offi ce building for its own use.
The accounting policies and the notes on pages 75 to 91 form an integral part of these fi nancial statements.

74
9THANNUAL REPORT FOR THE YEAR ENDED 30TH JUNE, 2015
STATEMENT OF CASH FLOW FOR THE YEAR ENDED 30TH JUNE, 2015
NOTES 30.06.2015 30.06. 2014
TZS’000 TZS’000
Cash Generated From (Used in) Operations
Net Operating Surplus for the Year 11,199,467 7,806,251
Adjustments for:
Depreciation on Property and Equipment 9 575,281 393,342
Amortization of Intangible Assets 10 94,469 148,798
Gain on Insurance Claim - (21,329)
Gain on Disposal of NCA (750) -
Net Foreign Exchange (gain)/loss (1,155) (8,901)
Grant Amortization 14 - (24,982)
Operating Surplus Before Working Capital Changes 11,867,312 8,293,179
Changes in Working Capital Items:
(Increase)/ Decrease in Stocks and Consumables (19,801) (23,254)
(Increase)/ Decrease in Trade and Other Receivables (3,180,946) 63,913
Increase/ (Decrease) in Trade and Other Payables 653,758 531,471
Net Cash Generated from Operations (A) 9,320,323 8,865,309
Investing Activities
Purchase of Property and equipment 9 (1,207,628) (184,912)
Purchase of Intangible Assets 10 (35,546) -
Proceeds/Adjustments from Disposal of Property and Equipment 265,990 -
Purchase of Financial Assets - Maturity after 91 days (19,281,908) (13,535,393)
Proceed from Financial Assets - Maturity after 91 days 8,980,500 5,430,150
Net Cash Used in Investing Activities (B) (11,278,592) (8,290,155
Financing Activities
Net Cash Generated from Financing Activities (C) - -
Increase in Cash and Cash Equivalents (A+B+C) (1,958,269) 575,154
Movement in Cash and Cash Equivalent
At Start of Year 4,175,382 3,600,228
At end of the year 2,217,113 4,175,382
The accounting policies and the notes on pages 75 to 91 form an integral part of these fi nancial statements.

75
9THANNUAL REPORT FOR THE YEAR ENDED 30TH JUNE, 2015
NOTES TO THE FINANCIAL STATEMENTS FOR THE YEAR ENDED 30TH JUNE, 2015
1. GENERAL INFORMATION The Energy and Water Utilities Regulatory Authority (EWURA) was established under the Energy and
Water Utilities Regulatory Authority Act Cap 414 of the Laws of Tanzania (EWURA Act). Although EWURA was established in November, 2005 through Government Notice No. 19 of February, 2006, it became operational in June, 2006 when the Board of Directors was fully established. The address of its registered offi ce is:
7th Floor, LAPF Pension Fund Tower, Opposite Makumbusho Village, Kijitonyama P.O. Box 72175, Dar es Salaam, Tanzania
2. PRINCIPAL ACCOUNTING POLICIES The principal accounting policies adopted in the preparation of these fi nancial statements are set out
below. These policies have been consistently applied to all the years presented unless otherwise stated.
(a) Basis of Preparation The fi nancial statements are prepared in accordance with International Financial Reporting Standards
(IFRS). The measurement basis used is the historical cost basis except where otherwise stated in the accounting policies below. The fi nancial statements have been prepared on a going concern basis which assumes that the Authority will continue in operational existence for the foreseeable future.
The preparation of fi nancial statements in conformity with IFRS requires the use of certain critical accounting estimates and assumptions. It also requires management to exercise its judgment in the process of applying the Authority’s accounting policies. The areas involving a higher degree of judgment or complexity, or where assumptions and estimates are signifi cant to the fi nancial statements are disclosed in accounting policy (b).
(i) Standards, amendments and interpretations to the Authority’s operations IAS1 on ‘Presentation of Financial Statements’ which became effective on 1st January 2010
provides clarifi cation that the potential settlement of a liability by the issue of equity is not relevant to its classifi cation as current or non-current. By amending the defi nition of current liability, this standard permits a liability to be classifi ed as non-current (provided that the entity has an unconditional right to defer settlement by transfer of cash or other assets for at least 12 months after the accounting period) notwithstanding the fact that the entity could be required by the counterparty to settle in shares at any time. The adoption of this standard does not have any material impact on the fi nancial statements.
IAS 7 on ‘Cash Flow Statement’ requires that only expenditures that result in a recognized asset in the statement of fi nancial position can be classifi ed as investing activities. It is not expected to have a material impact on the Authority’s fi nancial statements.
IAS 17 on ‘Leases’ (effective on or after 1st January, 2010). Leasehold land can now be classifi ed either as an operating or fi nance lease.
(ii) The following standards, amendments and interpretations of existing published standards are also relevant to the Authority’s operations.

76
9THANNUAL REPORT FOR THE YEAR ENDED 30TH JUNE, 2015
In November 2009, the IASB issued amendments to IAS 24 “Related Party Disclosures”. This standard provides a partial exemption from the disclosure requirements for government-related entities and clarifi es the defi nition of a related party.
In May 2010, the IASB issued amendments to IFRS resulting from the IASB’s annual improvement project. These amendments have been effective since January 1, 2011. The amendments primarily comprise clarifi cation to presentation, disclosure and measurement provisions related to several IFRS standards.
In November 2009, as part of the phased project to replace IAS 39 “Financial Instruments: Recognition and Measurement”, the IASB issued IFRS 9 “Financial Instruments” which reconsiders the classifi cation and measurement of fi nancial assets. IFRS 9 will be effective for reporting periods beginning on or after January 1st, 2015 (revised), with earlier adoption permitted.
(b) Critical Accounting Estimates, Judgments and Assumptions In the process of applying the Authority’s accounting policies, the Authority’s management makes
certain estimates, judgments and assumptions. These are based on the management’s past experience and other determinants that under the circumstances are deemed to be reasonable. In practice, the estimated and assumed results would differ from the actual results.
Property and Equipment Critical estimates are made by the directors in determining depreciation rates for property, plant and
equipment. The rates used are set out in the accounting policy under property, plant and equipment.
(c) Revenue Recognition
The Annual Levy Policy Revenue comprises of infl ows of economic benefi ts received and receivable by the reporting entity,
which represents an increase in net assets/equity, other than increases relating to contributions from owners.
The Authority recognizes revenue when the amount of revenue can be reliably measured, it is probable that future economic benefi ts will fl ow to the entity and when the specifi c criteria have been met for each of the Authority’s activities as described below. The amount of revenue is not considered to be reliably measured until all contingencies relating to the levy have been resolved. The Authority bases its estimates on historical results, taking into consideration the type of regulated supplier, type of transaction and specifi cs of each arrangement.
(i) Revenue from Levies is recognized upon regulated supplier’s acceptance of demand note. (ii) Interest income is accounted for in the period in which it is earned. (iii) Other sources of revenue are recognized and accounted for as income to the Authority on
receipt basis.
Donor and Government Funds Funds from the World Bank and Government Funds are reported as Government Grants and
recognized when there is reasonable assurance that the Authority will comply with the conditions attached to them and the grants will be received in order to comply with the disclosure requirements of International Accounting Standard (IAS) 20.

77
9THANNUAL REPORT FOR THE YEAR ENDED 30TH JUNE, 2015
(i) Operating Grant This is normally in the form of cash and is recognized as income in the year it is received.
(ii) Grant Related to Assets Government grants related to assets, including non-monetary grants (such as land or other
resources) are recorded at fair value. The grant is recognized in the Statement of Comprehensive Income over the useful life of a depreciable asset.
(d) Property and Equipment All property and equipment is recorded at cost and thereafter stated at historical cost less
depreciation. Historical cost comprises expenditure initially incurred to bring the asset to its location and condition ready for its intended use.
Subsequent costs are included in the asset’s carrying amount or recognized as a separate asset, as appropriate, only when it is probable that future economic benefi ts associated with the item will fl ow to the Authority and the cost can be reliably measured. The carrying amount of the replaced part is derecognized.
All other repairs and maintenance costs are charged to the statement of comprehensive income during the fi nancial year in which they are incurred.
Depreciation is calculated on the straight line basis to write down the cost of each asset, to its residual value over its estimated useful life. Full year depreciation is charged to the asset in the year of acquisition irrespective of the date of acquisition, while no depreciation is charged during the year of disposal. The following annual rates are applied:
Category of Assets Rate (%)Leasehold Improvement 20
Technical Equipment 12.5
Motor Vehicles 20
Furniture and Fittings 12.5
Offi ce Equipment 12.5
Computers 33.33
The assets residual values and useful lives are reviewed, and adjusted if appropriate, at each
statement of fi nancial position date.
An asset’s carrying amount is written down immediately to its recoverable amount if the asset’s carrying amount is greater than its estimated recoverable amount.
Gains and losses on disposal of property and equipment are determined by comparing the proceeds with the carrying amount and are taken into account in determining operating profi t.
(e) Intangible Assets Computer software licenses are capitalized on the basis of the costs incurred to acquire and bring
to use the specifi c software. These costs are amortized over their estimated useful lives which are estimated to be 3 years.

78
9THANNUAL REPORT FOR THE YEAR ENDED 30TH JUNE, 2015
(f) Financial Instruments Classifi cation The Authority classifi es fi nancial assets and fi nancial liabilities into the following categories:
v Held-to-maturity investment v Loans and receivables v Financial liabilities measured at amortized cost
Classifi cation depends on the purpose for which the fi nancial instruments were obtained / incurred and takes place at initial recognition.
Initial Recognition and Measurement Financial instruments are recognized initially when the Authority becomes a party to the contractual
provisions of the instruments.
The Authority classifi es fi nancial instruments, or their component parts, on initial recognition as a fi nancial asset, a fi nancial liability or an equity instrument in accordance with the substance of the contractual arrangement.
Financial instruments are measured initially at fair value, except for equity investments for which a fair value is not determinable, which are measured at cost and are classifi ed as available-for-sale fi nancial assets.
For fi nancial instruments which are not at fair value through profi t or loss, transaction costs are included in the initial measurement of the instrument.
Transaction costs on fi nancial instruments at fair value through profi t or loss are recognized in profi t or loss.
Subsequent Measurement Loans and receivables are subsequently measured at amortized cost, using the effective interest
method, less accumulated impairment losses.
Held-to-maturity investments are subsequently measured at amortized cost, using the effective interest method, less accumulated impairment losses.
Gains and losses arising from changes in fair value are recognized in other comprehensive income and accumulated in equity until the asset is disposed of or determined to be impaired.
Financial liabilities at amortized cost are subsequently measured at amortized cost, using the effective interest method.
Derecognition Financial assets are derecognized when the rights to receive cash fl ows from the investments have
expired or have been transferred and the Authority has transferred substantially all risks and rewards of ownership.
Impairment of Financial Assets At each reporting date the Authority assesses all fi nancial assets, other than those at fair value
through profi t or loss, to determine whether there is objective evidence that a fi nancial asset or

79
9THANNUAL REPORT FOR THE YEAR ENDED 30TH JUNE, 2015
group of fi nancial assets has been impaired. For amounts due to the Authority, signifi cant fi nancial diffi culties of the debtor, probability that the debtor will enter bankruptcy and default of payments are all considered to be indicators of impairment. Impairment losses are recognized in profi t or loss.
Impairment losses are reversed when an increase in the fi nancial asset’s recoverable amount can be related objectively to an event occurring after the impairment was recognized, subject to the restriction that the carrying amount of the fi nancial asset at the date that the impairment is reversed shall not exceed what the carrying amount would have been had the impairment not been recognized.
Reversals of impairment losses are recognized in profi t or loss except for equity investments classifi ed as available-for-sale.
Where fi nancial assets are impaired through use of an allowance account, the amount of the loss is recognized in profi t or loss within operating expenses. When such assets are written off, the write off is made against the relevant allowance account. Subsequent recoveries of amounts previously written off are credited against operating expenses.
Loans to Staff These fi nancial assets are classifi ed as loans and receivables.
Trade and Other Receivables Trade receivables are measured at initial recognition at fair value, and are subsequently measured
at amortized cost using the effective interest rate method. Appropriate allowances for estimated irrecoverable amounts are recognized in profi t or loss when there is objective evidence that the asset is impaired. The allowance recognized is measured as the difference between the asset’s carrying amount and the present value of estimated future cash fl ows discounted at the effective interest rate computed at initial recognition.
The carrying amount of the asset is reduced through the use of an allowance account, and the amount of the loss is recognized in profi t or loss within operating expenses. When a trade receivable is uncollectable, it is written off against the allowance account for trade receivables. Subsequent recoveries of amounts previously written off are credited against operating expenses in profi t or loss.
Trade and other receivables are classifi ed as loans and receivables.
Trade and Other Payables Trade payables are initially measured at fair value, and are subsequently measured at amortized
cost, using the effective interest rate method.
Cash and Cash Equivalents Cash and cash equivalents comprise cash on hand and demand deposits and other short-term
highly liquid investments that are readily convertible to a known amount of cash and are subject to an insignifi cant risk of changes in value. These are initially and subsequently recorded at fair value.
Held to Maturity These fi nancial assets are initially measured at fair value plus transaction costs. At subsequent reporting dates these are measured at amortized cost using the effective interest
rate method, less any impairment loss recognized to refl ect irrecoverable amounts. An impairment loss is recognized in profi t or loss when there is objective evidence that the asset is impaired, and

80
9THANNUAL REPORT FOR THE YEAR ENDED 30TH JUNE, 2015
is measured as the difference between the investment’s carrying amount and the present value of estimated future cash fl ows discounted at the effective interest rate computed at initial recognition. Impairment losses are reversed in subsequent periods when an increase in the investment’s recoverable amount can be related objectively to an event occurring after the impairment was recognized, subject to the restriction that the carrying amount of the investment at the date the impairment is reversed shall not exceed what the amortized cost would have been had the impairment not been recognized.
Financial assets that the Authority has the positive intention and ability to hold to maturity are classifi ed as held to maturity.
(g) Translation of Foreign Currencies Transactions in foreign currencies during the year are converted into Tanzania Shillings (functional
currency), at rates ruling at the transaction dates. Monetary assets and liabilities at the Statement of Financial Position date which are expressed in foreign currencies are translated into Tanzania Shillings at rates ruling at that date. Non-monetary items that are measured in terms of historical cost in a foreign currency are not retranslated. The resulting differences from conversion and translation are dealt with in the Statement of Comprehensive Income in the period in which they arise.
(h) Employee Entitlements Employee entitlements to gratuity and long-term service awards are recognized when they accrue to
employees. A provision is made for the estimated liability for such entitlements as result of services rendered by employees up to the Statement of Financial Position date.
The estimated monetary liability for employees’ accrued annual leave entitlement at the Statement of Financial Position date is recognized as an expense accrual.
(i) Retirement Benefi t Obligation
(i) Approved Pension Scheme The Authority contributes to statutory defi ned pension contribution plans for its employees
at the rate of 15% of basic salary to either Parastatal Pension Fund (PPF) or National Social Security Fund (NSSF) or Government Employees Provident Fund (GEPF) or Public Service Pensions Fund (PSPF) or Local Authorities Pensions Fund (LAPF).
(ii) Gratuity In addition to pension scheme, the Authority sets aside 15% of employee’s last basic salary
as gratuity payable at the end of the contract. The contract period is normally fi ve (5) years. A provision is made for the estimated gratuity liability as a result of service rendered by the employees up to the Statement of Financial Position date.
(j) Accounting for Leases Leases of assets under which a signifi cant portion of the risks and rewards of ownership are effectively
retained by the lessor are classifi ed as operating leases. Payments made under operating leases are charged to the Statement of Comprehensive Income on a straight line basis over the period of the lease.
(k) Comparatives Comparative fi gures have been adjusted to conform to changes in presentation in the current year
where necessary.

81
9THANNUAL REPORT FOR THE YEAR ENDED 30TH JUNE, 2015
1. OPERATING REVENUE
30.06.2015 30.06.2014TZS’000 TZS’000
Regulatory LevyElectricity 12,774,108 11,245,801
Petroleum 18,042,799 15,783,619
Natural Gas 1,590,125 1,672,236
Water and Sewerage 1,738,376 893,902
Total Regulatory Levy Revenue 34,145,408 29,595,558
Licence FeesElectricity 96,975 60,216
Electricity Contractors and Wiremen 36,803 40,252
Petroleum 421,995 296,935
Total License Fees Revenue 555,773 397,403
Application FeesElectricity 28,591 19,288
Petroleum 93,572 65,599
Total Application fees revenue 122,162 84,887
Total Operating Revenue 34,823,343 30,077,848
2. OTHER INCOME
Sale of Tender Documents 1,600 -
Grant Amortization - 24,982
Penalties from Petroleum Adulteration 1,367,100 1,299,192
Profi t on Disposal of Property and Equipment 750 -
Gain on Insurance Claim - 21,329
Total Other Income 1,369,450 1,345,503
3. FINANCE INCOME/(COSTS)
Interest Income on Fixed Deposits 2,420,233 1,702,239
Foreign Exchange Gain 1,155 8,901
Interest Received on Current Account 75,881 19,614
Total Finance Income/(Cost) 2,497,268 1,730,754

82
9THANNUAL REPORT FOR THE YEAR ENDED 30TH JUNE, 2015
4. STAFF COSTS
30.06.2015 TZS’000
30.06.2014 TZS’000
Salaries 5,813,115 4,945,592
Gratuity Expenses 984,887 868,738
Pension Employer’s Contribution 803,494 684,952
Skills and Development Levy 267,446 227,800
Medical Expenses 182,177 341,807
Other Staff Costs (Schedule 1) 1,372,847 1,244,682
TOTAL 9,423,966 8,313,571
5. OPERATING EXPENSES
30.06.2015 30.06.2014TZS’000 TZS’000
Capacity Building (Schedule 2) 1,220,785 1,552,140
Regulatory Tools Development Expenses 787,647 322,505
Field and Inspection Expenses 1,268,704 2,556,825
Public Inquiries 320,778 189,528
Complaints and Dispute Resolution 420,885 141,711
Government Delegation Participation costs 405,263 -
Public Awareness Programmes 988,884 493,221
Advertisement Expenses 345,651 373,862
Consultancy Expenses 209,503 694,493
Membership Contribution, Books and Periodicals 185,793 155,280
Library General Expenses - 750
International Conference Expenses 1,351,880 1,289,957
Regional Cooperation Meetings 857,370 574,646
Local Travel and Conference Expenses 183,985 142,248
Stakeholders Consultative Meetings 87,222 93,683
Motor Vehicle Fuel Expenses 82,198 96,789
Motor Vehicle Repairs and Maintenance 194,324 201,293
Car Hiring Expenses 10,105 19,075
Maintenance of Computer Hardware 37,685 17,443
Maintenance of Computer Software 57,959 27,883
Maintenance of Other Offi ce Equipment 6,416 6,189
Wiremen Licensing Activities 32,672 33,925
Directors Fees 24,167 26,059
Public Awareness Programme- Staff Relations 83,011 -
Board Expenses 566,874 511,036
TOTAL OPERATING EXPENSES 9,728,758 9,520,541

83
9THANNUAL REPORT FOR THE YEAR ENDED 30TH JUNE, 2015
b) CONTRIBUTION TO GOVERNMENT ENTITIES
Government Consultative Council Expenses 194,355 210,298
Consumer Consultative Council Expenses 1,511,874 1,416,369
Fair Competition Tribunal Subvention 358,196 381,003
Fair Competition Commission Subvention 771,617 601,725
Treasury Contribution 2,250,000 2,000,000
TOTAL CONTRIBUTIONS 5,086,043 4,609,395
6. ADMINISTRATION COSTS
30.06.2015 30.06.2014TZS’000 TZS’000
Offi ce Rent 1,399,993 1,347,117
Telephone, Fax and Internet 264,907 223,029
Stamps and Postages 4,536 2,043
Printing and Stationery 310,519 306,354
Maintenance of Leasehold Property 29,680 26,244
Offi ce General Expenses 128,209 69,969
Entertainment Expenses 12,890 25,823
Corporate Social Responsibilities 70,370 43,970
Audit Fees 84,200 58,017
Tender Board Expenses 68,197 58,160
Editorial Board Expenses 13,272 20,081
TOTAL 2,386,774 2,180,807
7. OTHER CHARGES
Insurance Charges 14,709 25,931
Legal Fees -
Data Storage Charges 140,474 137,462
Bank Charges 40,121 18,007
Foreign Exchange Loss -
TOTAL 195,303 181,400
8. SURPLUS FUNDS In case of any surplus funds during the year, the surplus fund shall be deposited to a Special Account as per requirement of Section 44 (1) of EWURA Act. In accordance with the Act, funds in the Special Account shall be used only for one or more of the following purposes: consumer education or information projects, special non-recurring projects, budgeted capital expenditure, or major rate regulating inquiries.

84
9THANNUAL REPORT FOR THE YEAR ENDED 30TH JUNE, 2015
9. P
RO
PERT
Y A
ND
EQ
UIP
MEN
T
Year
End
ed 3
0th
June
, 201
5 WIP
EW
UR
A
Hou
se
WIP
La
bora
tory
B
uild
ing
WIP
Tec
hnic
al
Equi
pmen
tLe
aseh
old
Impr
ovem
ent
Tech
nica
l Eq
uipm
ent
Mot
or
Veh
icle
s
Furn
itur
e an
d Fi
ttin
gs
Offi
ce
Equi
pmen
tC
ompu
ters
Tot
al
Cos
t:TZ
S 00
0TZ
S ‘0
00TZ
S ‘0
00TZ
S ‘0
00TZ
S ‘0
00TZ
S ‘0
00TZ
S ‘0
00TZ
S ‘0
00TZ
S ‘0
00TZ
S ‘0
00
At 1
July
, 201
440
7,89
622
,451
1,86
5,24
854
1,99
06,
190
1,31
5,24
113
2,18
544
4,99
474
7,21
15,
483,
406
Add
ition
s40
,020
--
32,5
07-
970,
477
38,3
0476
,097
50,2
231,
207,
628
Di
sp
os
al
s/
Adj
ustm
ents
--
(262
,999
)-
-(4
,920
)(7
,016
)(4
4,54
5)(3
19,4
80)
At
30 Ju
ne, 2
015
447,
915
22,4
511,
602,
248
574,
497
6,19
02,
285,
719
165,
569
514,
074
752,
890
6,37
1,55
3
Dep
reci
atio
n:
At 1
July
, 201
4-
--
504,
778
5,52
31,
069,
436
62,1
5826
2,95
464
4,31
12,
549,
160
Cha
rges
fo
r th
e Ye
ar26
,749
668
387,
569
20,5
1157
,450
82,3
3457
5,28
1
Dis
posa
l-
--
--
-(4
,035
)(5
,660
)(4
4,54
5)(5
4,24
0)
At
30 Ju
ne, 2
015
--
-53
1,52
76,
190
1,45
7,00
478
,634
314,
744
682,
100
3,07
0,20
1
Net
B
ook
Val
ue
30 Ju
ne 2
015
447,
915
22,4
511,
602,
248
42,9
700
828,
714
86,9
3419
9,33
070
,789
3,30
1,35
2

85
9THANNUAL REPORT FOR THE YEAR ENDED 30TH JUNE, 2015
Year
End
ed 3
0th
June
, 201
4
WIP
EW
UR
A
Hou
se
WIP
Lab
Eq
uipm
ent
WIP
Te
chni
cal
Equi
pmen
t
Leas
ehol
d Im
prov
emen
tTe
chni
cal
Equi
pmen
tM
otor
V
ehic
les
Furn
itur
e an
d Fi
ttin
gs
Offi
ce
Equi
pmen
tC
ompu
ters
Tota
l
TZS’
000
TZS’
000
TZS’
000
TZS’
000
TZS’
000
TZS’
000
TZS’
000
TZS’
000
TZS’
000
TZS’
000
Cos
t:
At 1
st Ju
ly, 2
013
407,
896
22,4
511,
865,
248
513,
716
6,19
01,
315,
241
98,4
5343
3,98
363
5,31
55,
298,
493
Add
ition
s-
--
28,2
7433
,732
11,0
1011
1,89
618
4,91
2
Adj
ustm
ents
--
--
--
--
--
At
30th
June
, 201
440
7,89
622
,451
1,86
5,24
854
1,99
06,
190
1,31
5,24
113
2,18
544
4,99
474
7,21
15,
483,
406
Dep
reci
atio
n:
At 1
st Ju
ly, 2
013
--
-46
3,77
14,
749
857,
962
45,6
3520
7,33
057
6,37
22,
155,
818
Cha
rge
for
the
Year
-
--
41,0
0777
421
1,47
416
,523
55,6
2467
,939
393,
342
Adj
ustm
ents
--
--
--
--
--
At
30th
June
, 201
4-
--
504,
778
5,52
31,
069,
436
62,1
5826
2,95
464
4,31
12,
549,
160
Net
Boo
k V
alue
30th
June
, 201
440
7,89
622
,451
1,86
5,24
837
,212
668
245,
806
70,0
2618
2,04
010
2,90
02,
934,
246
In th
e op
inio
n of
the
dire
ctor
s, th
ere
is n
o im
pair
men
t in
the
valu
e of
pro
pert
y an
d eq
uipm
ent.

86
9THANNUAL REPORT FOR THE YEAR ENDED 30TH JUNE, 2015
10. INTANGIBLE ASSETS – SOFTWARE COSTS
30.06.2015 30.06.2014
Cost TZS’000 TZS’000
At Start of Year 600,946 600,946
Additions 35,546 -
At End of Year 636,492 600,946
Amortization
At Start of Year 509,421 360,622
Charge for the Year 94,469 148,798
At End of Year 603,890 509,421
Net Book Value 32,602 91,525
11. TRADE AND OTHER RECEIVABLES
30.06.2015 30.06.2014
TZS’000 TZS’000
Trade Receivables 6,044,224 2,990,773
Prepayments (Note 11.1) 1,028,971 1,298,063
ESCB Account (54,096) -
Other Receivables 106,653 121,724
Interest Receivable 1,388,585 1,062,256
Staff Loans and Advances (Note 17 B) 749,144 609,719
TOTAL 9,263,481 6,082,535
In the opinion of the directors, the carrying amounts of Trade and Other Receivables approximate to their fair value.The carrying amounts of the Authority’s Trade and Other Receivables are denominated in the following currencies.
Carrying Amount of Trade and Receivables
Tanzania Shillings 9,263,481 6,082,535
US Dollars - -
TOTAL 9,263,481 6,082,535
The trade and other receivables do not contain impaired assets.
11.1 PREPAYMENTS
Prepayments
Prepaid Offi ce Rent 917,646 784,496
Prepaid Insurance 11,631 13,860
Prepayments – Others 99,694 499,707
TOTAL PREPAYMENTS 1,028,971 1,298,063

87
9THANNUAL REPORT FOR THE YEAR ENDED 30TH JUNE, 2015
Prepayments for other expenses comprise of advance payments in respect of Motor Vehicle, Platt’s, ARA Membership, International Energy Agency (IEA) and AFUR membership subscriptions.
12. FINANCIAL ASSETSFinancial assets comprise the following:
Fixed deposits
30.06.2015 30.06.2014
TZS’000 TZS’000
At Start of Year 16,035,302 7,499,899
Additions 18,091,653 12,740,583
Deposits Redeemed at Maturity (7,691,310) (4,205,180)
At End of Year 26,435,645 16,035,302
Analysis of Held-to-Maturity Investments follows:
Maturing within 91 days 5,692,412 7,054,803
Maturing after 91 days 20,743,233 8,980,500
26,435,645 16,035,303
13. CASH AND CASH EQUIVALENTSFor the purpose of the cash fl ow statement, the year-end cash and cash equivalents comprise the following:
30.06.2015 30.06.2014
TZS’000 TZS’000
Cash and Bank Balances 2,217,113 4,175,382
maturing within 91 days (Note 12) 5,692,412 7,054,803
TOTAL 7,909,525 11,230,185
The Authority is not exposed to credit risk on cash and bank balances because these are held with sound fi nancial institutions.The carrying amounts of the Authority’s cash and cash equivalents are denominated in the following currencies:
30.06.2015 30.06.2014
TZS’000 TZS’000
NBC Account 10,891 4,393
CRDB Main Account 134,010 1,794,984
CRDB Revolving Fund Account 85,446 65,883
CRDB Surplus Account 10,368 553
Bank ABC Gratuity Account 783,622 242,966
Bank ABC Building Fund 618,775 1,579,436
Bank ABC Sinking Fund 270,629 136,626
BOT-Energy Sector Capacity Building Project 54,503 -
CRDB USD 248,869 350,541
TOTAL 2,217,113 4,175,382

88
9THANNUAL REPORT FOR THE YEAR ENDED 30TH JUNE, 2015
14. GOVERNMENT GRANTGovernment Grant stated at nil balance at the statement of fi nancial position date represents the fully amortised grant in the form of assets received from Privatization and Private Sector Development Project (PPSDP), IDA Credit.
30.06.2015 30.06.2014
TZS’000 TZS’000
At Start of Year - 24,983
Grant Amortization - (24,983)
At End of Year -
15. GRATUITY PAYABLENon-current liabilities portion at the statement of fi nancial position date amounted to TZS 1,739,371,065. This is part of gratuity provision amounting to TZS.2, 667,360,165 as analyzed below;
30.06.2015 30.06.2014
TZS’000 TZS’000
Charge for the Year 984,887 868,738
Released During the Year (351,027) (496,500)
At End of Year 2,667,360 2,033,500
Categorized As:
Current Liabilities (Note 16) 927,989 391,910
Non-Current Liabilities 1,739,371 1,641,590
TOTAL 2,667,360 2,033,500
16. TRADE AND OTHER PAYABLES
30.06.2015 30.06.2014
TZS’000 TZS’000
Trade Payables 3,886 74,788
Gratuity Payable (Note 15) within the year 927,989 391,910
Audit Fees 58,036 58,036
Annual Leave Payable 25,489 -
Withholding Tax (19,949) -
GPA Sinking Fund 269,955 136,626
EREA Fund 30,263 -
Other Payables and Accruals 477,342 457,893
TOTAL 1,773,011 1,119,253
In the opinion of the directors, the carrying amount of Trade and Other Payables is approximate to their fair value.

89
9THANNUAL REPORT FOR THE YEAR ENDED 30TH JUNE, 2015
17. RELATED PARTY TRANSACTIONSThe following transactions were carried out with related parties:
A. Key Management Compensation 30.06.2015 30.06.2014
TZS’000 TZS’000
Salaries and other emoluments 1,738,649 1,535,846
Directors Fees 24,167 26,059
Employees Post-employment Benefi ts:
- Pension - Employer’s Contribution 803,494 684,951
- Gratuity (Note 15) paid during the year 351,027 496,500
2,919,337 2,743,356
Directors FeesDirectors Fees are paid to the Members of the Board of Directors as approved by the Minister that is TZS 4,500,000 for Chairman and TZS 4,000,000 each for other six (6) Members per annum.
Employees Post-employment Benefi tsThe Authority contributes to the approved pension contribution plans for its employees to different Pension Funds including Parastatal Pension Fund (PPF), Public Service Pension Fund (PSPF), Government Employees Provident Fund (GEPF) or Local Authorities Pensions Fund (LAPF) and National Social Security Fund (NSSF). The Authority’s contribution during the year ended 30th June, 2015 amounted to TZS 803,493,758. Contributions to these funds are recognized as an expense in the period the employees render services to the Authority.
The Authority also charges gratuity expense of 15% of employee’s last basic monthly salary on statement of comprehensive income and maintains gratuity payable account for future payment to staff. For the year ended 30th June, 2015 TZS 351,027,465 were released to staff whose contract came to an end.
B. Staff Loans and Advances (Note 11) 30.06.2015 30.06.2014
TZS’000 TZS’000
Staff Revolving Loans 373,703 426,483
Salary Advances 232,428 148,505
Imprest 143,013 34,731
TOTAL 749,144 609,719
The Authority set up the Staff Revolving Loans Fund for the purpose of extending loans to staff for the purchase of motor vehicles and other amenities. These loans are interest free, repayable within a period of three years and are taxed in accordance with the requirements of the Income Tax Act of 2004. For the year ended 30th June, 2015 loans amounting to TZS 373,703,000 were outstanding.

90
9THANNUAL REPORT FOR THE YEAR ENDED 30TH JUNE, 2015
18. COMMITMENTS
Capital commitmentsCapital expenditure contracted for or tenders are in progress at the statement of fi nancial position date is as follows:
30.06.2015 30.06.2014
TZS’000 TZS’000
Property and Equipment
Subtotal
Other commitments
Consultancy Services 81,600 132,720
Total commitments 81,600 132,720
Commitment relates to the contracts entered into but goods or services had not been delivered. In some other cases contracts have not been entered into but respective tenders were in progress in accordance with the requirement of the Public Procurement Act No. 7 of 2011.The above amount represent value of work committed but not yet paid.
19. FINANCIAL RISK MANAGEMENT
(a) Interest Rate Risk The Authority’s interest income and operating cash fl ows are affected by changes in market interest rates. The
Authority mitigates the risks by investing in the less risky investments mainly risk-free fi xed deposits maturing within a period of one year.
(b) Credit Risk The Authority’s regulatory levy which is the main source of its income is not tied to a single regulated supplier.
This mitigates credit risk associated with its operations.
(c) Liquidity Risk The Authority ensures suffi cient liquidity is maintained to meet short-term maturing obligations and it also
ensures that all excess cash is invested in less risky investments.
(d) Foreign Exchange Risk The Authority minimizes foreign exchange risk by maintaining foreign currency account. The Authority does
not engage in foreign currency swaps or speculations. The risks are also managed by ensuring that the services value are negotiated and fi xed in the local currency whenever possible.
20. CONTINGENT LIABILITIESThere are pending Court cases to which EWURA is a party at various registries of the High Court, FCT and Resident Magistrate Courts. In the opinion of the directors, the outcome of these cases shall not give rise to any signifi cant loss and therefore, no provisions have been made in these fi nancial statements.

91
9THANNUAL REPORT FOR THE YEAR ENDED 30TH JUNE, 2015
SCHEDULE OF OTHER EXPENDITURE
1. OTHER STAFF COSTS
30.06.2015 30.06.2014
TZS’000 TZS’000
Staff Insurance – GPA 148,629 136,626
Transport Allowances 554,059 502,565
Annual Leave Package 110,400 135,697
Acting Allowance 107,914 86,500
Outfi t Allowance 30,313 30,887
Funeral Expenses 16,256 36,794
Recruitment Costs 84,136 137,014
Compensation Allowance 260,777 158,269
Staff Relocation Costs 46,252 14,052
Staff Welfare Expenses 14,111 6,194
TOTAL 1,372,847 1,244,682
2. CAPACITY BUILDING
Technical Exposure - 353,523
Overseas Training 826,676 887,657
Local Training 394,108 310,960
TOTAL 1,220,784 1,552,140

92
9THANNUAL REPORT FOR THE YEAR ENDED 30TH JUNE, 2015


