ANNUAL REPORT - Foot Locker, Inc.
124
INSPIRE & EMPOWER ANNUAL REPORT 2020
Transcript of ANNUAL REPORT - Foot Locker, Inc.

INSPIRE & EMPOWER
A N N U A L
R E P O R T
2 0 2 0
1
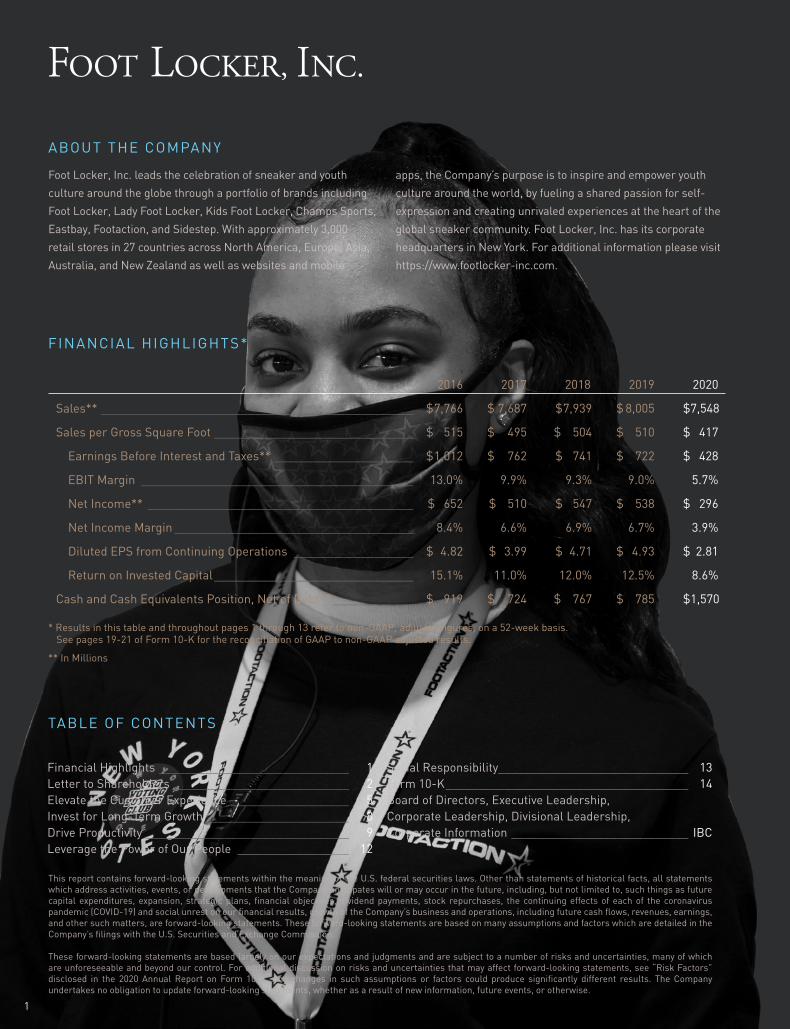
Foot Locker, Inc. leads the celebration of sneaker and youth
culture around the globe through a portfolio of brands including
Foot Locker, Lady Foot Locker, Kids Foot Locker, Champs Sports,
Eastbay, Footaction, and Sidestep. With approximately 3,000
retail stores in 27 countries across North America, Europe, Asia,
Australia, and New Zealand as well as websites and mobile
apps, the Company’s purpose is to inspire and empower youth
culture around the world, by fueling a shared passion for self-
expression and creating unrivaled experiences at the heart of the
global sneaker community. Foot Locker, Inc. has its corporate
headquarters in New York. For additional information please visit
https://www.footlocker-inc.com.
This report contains forward-looking statements within the meaning of the U.S. federal securities laws. Other than statements of historical facts, all statements which address activities, events, or developments that the Company anticipates will or may occur in the future, including, but not limited to, such things as future capital expenditures, expansion, strategic plans, financial objectives, dividend payments, stock repurchases, the continuing effects of each of the coronavirus pandemic (COVID-19) and social unrest on our financial results, growth of the Company’s business and operations, including future cash flows, revenues, earnings, and other such matters, are forward-looking statements. These forward-looking statements are based on many assumptions and factors which are detailed in the Company’s filings with the U.S. Securities and Exchange Commission.
These forward-looking statements are based largely on our expectations and judgments and are subject to a number of risks and uncertainties, many of which are unforeseeable and beyond our control. For additional discussion on risks and uncertainties that may affect forward-looking statements, see “Risk Factors” disclosed in the 2020 Annual Report on Form 10-K. Any changes in such assumptions or factors could produce significantly different results. The Company undertakes no obligation to update forward-looking statements, whether as a result of new information, future events, or otherwise.
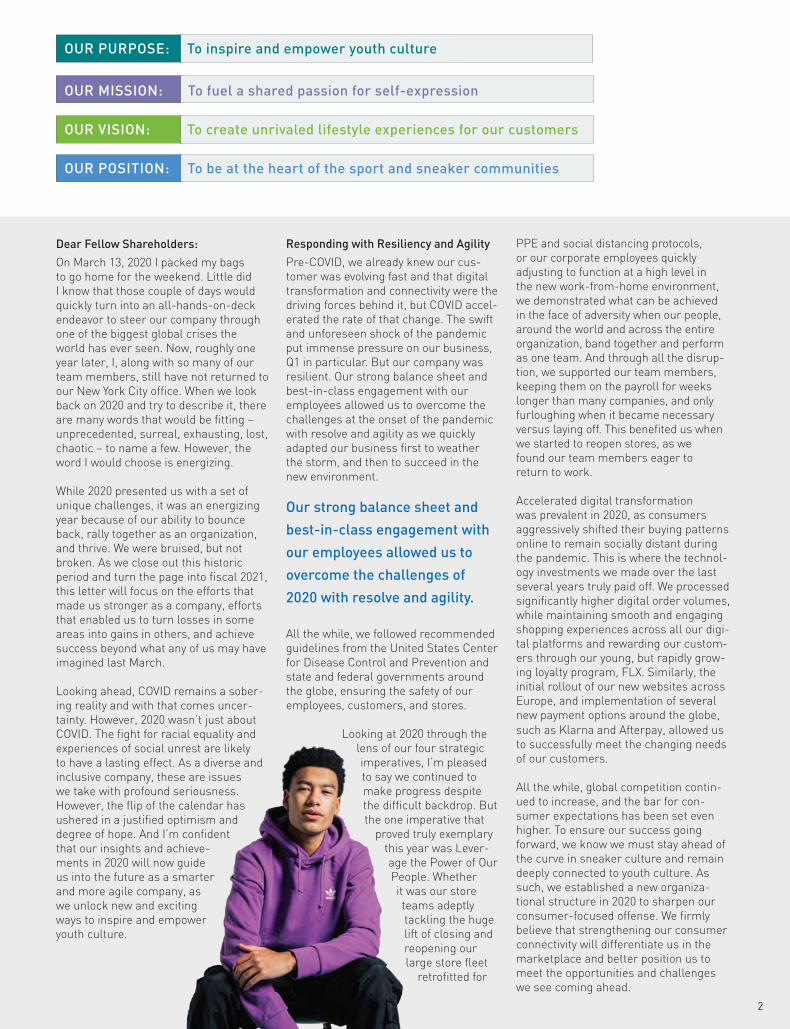
2016 2017 2018 2019 2020
Sales** _______________________________________________ $ 7,766 $ 7,687 $ 7,939 $ 8,005 $ 7,548
Sales per Gross Square Foot ______________________________ $ 515 $ 495 $ 504 $ 510 $ 417
Earnings Before Interest and Taxes** _____________________ $ 1,012 $ 762 $ 741 $ 722 $ 428
EBIT Margin _________________________________________ 13.0% 9.9% 9.3% 9.0% 5.7%
Net Income** ________________________________________ $ 652 $ 510 $ 547 $ 538 $ 296
Net Income Margin ____________________________________ 8.4% 6.6% 6.9% 6.7% 3.9%
Diluted EPS from Continuing Operations __________________ $ 4.82 $ 3.99 $ 4.71 $ 4.93 $ 2.81
Return on Invested Capital ______________________________ 15.1% 11.0% 12.0% 12.5% 8.6%
Cash and Cash Equivalents Position, Net of Debt** ____________ $ 919 $ 724 $ 767 $ 785 $ 1,570
* Results in this table and throughout pages 1 through 13 refer to non-GAAP, adjusted figures, on a 52-week basis. See pages 19-21 of Form 10-K for the reconciliation of GAAP to non-GAAP adjusted results.
** In Millions
FINANCIAL HIGHLIGHTS*
TABLE OF CONTENTS
ABOUT THE COMPANY
Financial Highlights _____________________________ 1 Letter to Shareholders ___________________________ 2Elevate the Customer Experience __________________ 5Invest for Long-Term Growth ______________________ 8Drive Productivity _______________________________ 9Leverage the Power of Our People _________________ 12
Social Responsibility _____________________________ 13Form 10-K _____________________________________ 14Board of Directors, Executive Leadership, Corporate Leadership, Divisional Leadership, Corporate Information ___________________________ IBC
Dear Fellow Shareholders:
On March 13, 2020 I packed my bags to go home for the weekend. Little did I know that those couple of days would quickly turn into an all-hands-on-deck endeavor to steer our company through one of the biggest global crises the world has ever seen. Now, roughly one year later, I, along with so many of our team members, still have not returned to our New York City office. When we look back on 2020 and try to describe it, there are many words that would be fitting – unprecedented, surreal, exhausting, lost, chaotic – to name a few. However, the word I would choose is energizing.
While 2020 presented us with a set of unique challenges, it was an energizing year because of our ability to bounce back, rally together as an organization, and thrive. We were bruised, but not broken. As we close out this historic period and turn the page into fiscal 2021, this letter will focus on the efforts that made us stronger as a company, efforts that enabled us to turn losses in some areas into gains in others, and achieve success beyond what any of us may have imagined last March.
Looking ahead, COVID remains a sober-ing reality and with that comes uncer-tainty. However, 2020 wasn’t just about COVID. The fight for racial equality and experiences of social unrest are likely to have a lasting effect. As a diverse and inclusive company, these are issues we take with profound seriousness. However, the flip of the calendar has ushered in a justified optimism and degree of hope. And I’m confident that our insights and achieve-ments in 2020 will now guide us into the future as a smarter and more agile company, as we unlock new and exciting ways to inspire and empower youth culture.
Responding with Resiliency and Agility
Pre-COVID, we already knew our cus-tomer was evolving fast and that digital transformation and connectivity were the driving forces behind it, but COVID accel-erated the rate of that change. The swift and unforeseen shock of the pandemic put immense pressure on our business, Q1 in particular. But our company was resilient. Our strong balance sheet and best-in-class engagement with our employees allowed us to overcome the challenges at the onset of the pandemic with resolve and agility as we quickly adapted our business first to weather the storm, and then to succeed in the new environment.
All the while, we followed recommended guidelines from the United States Center for Disease Control and Prevention and state and federal governments around the globe, ensuring the safety of our employees, customers, and stores.
Looking at 2020 through the lens of our four strategic imperatives, I’m pleased to say we continued to make progress despite the difficult backdrop. But the one imperative that
proved truly exemplary this year was Lever-age the Power of Our People. Whether it was our store teams adeptly tackling the huge lift of closing and reopening our large store fleet
retrofitted for
PPE and social distancing protocols, or our corporate employees quickly adjusting to function at a high level in the new work-from-home environment, we demonstrated what can be achieved in the face of adversity when our people, around the world and across the entire organization, band together and perform as one team. And through all the disrup-tion, we supported our team members, keeping them on the payroll for weeks longer than many companies, and only furloughing when it became necessary versus laying off. This benefited us when we started to reopen stores, as we found our team members eager to return to work.
Accelerated digital transformation was prevalent in 2020, as consumers aggressively shifted their buying patterns online to remain socially distant during the pandemic. This is where the technol-ogy investments we made over the last several years truly paid off. We processed significantly higher digital order volumes, while maintaining smooth and engaging shopping experiences across all our digi-tal platforms and rewarding our custom-ers through our young, but rapidly grow-ing loyalty program, FLX. Similarly, the initial rollout of our new websites across Europe, and implementation of several new payment options around the globe, such as Klarna and Afterpay, allowed us to successfully meet the changing needs of our customers.
All the while, global competition contin-ued to increase, and the bar for con-sumer expectations has been set even higher. To ensure our success going forward, we know we must stay ahead of the curve in sneaker culture and remain deeply connected to youth culture. As such, we established a new organiza-tional structure in 2020 to sharpen our consumer-focused offense. We firmly believe that strengthening our consumer connectivity will differentiate us in the marketplace and better position us to meet the opportunities and challenges we see coming ahead.
2
OUR PURPOSE: To inspire and empower youth culture
OUR MISSION: To fuel a shared passion for self-expression
OUR VISION: To create unrivaled lifestyle experiences for our customers
OUR POSITION: To be at the heart of the sport and sneaker communities
Our strong balance sheet and
best-in-class engagement with
our employees allowed us to
overcome the challenges of
2020 with resolve and agility.
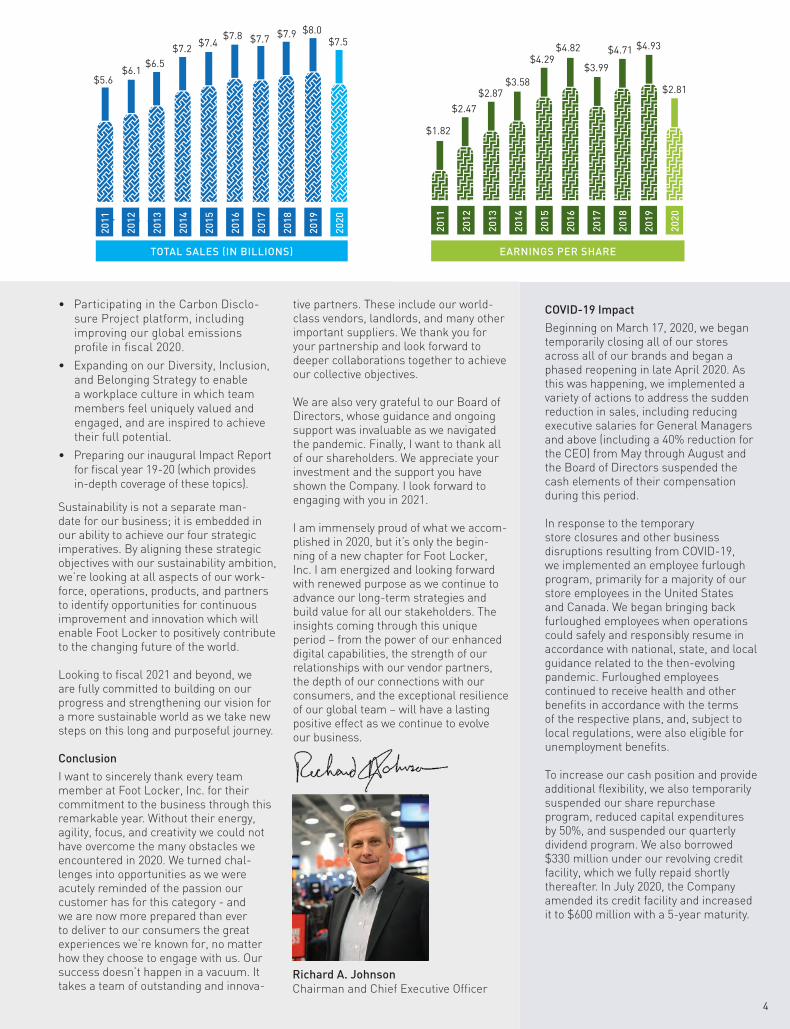
Highlights of our 2020 Financial ResultsTotal sales decreased to $7.5 billion, reflecting a full-year comparable-store sales decrease of 5.9 percent, largely due to the disruption beginning in Q1. However, following Q1, we saw a sharp rebound in sales through Q2 and the back-to-school season, as one thing COVID could not infect was the health of the sneaker category, where the cul-ture of basketball remained prevalent across genders, borders, and brands (led by Nike and Jordan, but bolstered by offerings from Puma, Reebok, and New Balance). This helped to drive strong performances across men’s, women’s, and kids’ footwear for the better part of the year. Additionally, we saw apparel results strengthen as consumers fully embraced the stay-at-home comfort trend. While Q4 was impacted by COVID-man-dated store closures and inventory delays at U.S. ports, a robust product pipeline and strong footwear trends are setting us up for momentum into 2021.
Even with the setback of a tough Q1, several of our banners posted full-year comp gains. Foot Locker Pacific led the way with a double-digit gain, followed by Footaction (up mid-single digits), and Kids Foot Locker (up low-single digits). Our digital business had an exceptional year, generating sales growth of 64% to over $2 billion, and representing a record 28% of our total sales.
Earnings on an adjusted basis fell to $2.81 per share. While a meaningful decline from last year, it largely reflects the pressure on our merchandise mar-gins, as we used promotions to strategi-cally manage inventory through the pan-demic and effectively clear aged goods. As a result, we entered fiscal 2021 with clean inventories and we should begin to see receipt flows gradually normalize as we move through the year.
We invested $159 million into the busi-ness in 2020, which was lower than our plan coming into the year as we exer-cised strong fiscal discipline since the onset of the pandemic.
2020 was also a strong first year for FLX, as our loyalty program gained meaning-ful traction, surpassing 17 million mem-bers globally. Engagement is encour-aging as well, with members spending more on average than non-members and generating a higher number of average orders per customer.
While COVID impacted store traffic, it didn’t prevent us from opening exciting new Power Stores, including locations in
Compton, California, and Vancouver, Canada. We also took Foot
Locker to exciting new markets, opening our first stores in Macau and South Korea. We
recognize the passion for sneaker culture that
exists in these markets and our stores offer a premium
expression of our retail experience, including exclusive product, custom store artwork, and activation spaces that will host community events for the sneaker-obsessed as the world finds its new normal.
Rebuilding our Approach to Capital Allocation
Foot Locker, Inc.’s balance sheet remains our strong foundation. Our quick and diligent efforts to preserve cash provided adequate liquidity to success-fully navigate the most challenging period of the crisis. As a result, we were able to quickly repay the draw down on our credit facility, we renegotiated a new revolver (extended to 2025 and expanded to $600 million), and we exited fiscal 2020 with nearly $1.7 billion in cash and minimal debt – the strongest financial position in our history.
Despite the headwind to sales and mar-gins, we nonetheless delivered healthy profitability in 2020, which, combined with a lower level of capital expenditures, allowed us to generate almost $900
million of free cash flow. Shareholder returns were prudently suspended during the early months of the pan-demic, but in August 2020 our Board of Directors reinstated the dividend at a cautiously appropriate rate of 15 cents per share, and we also returned to the market to opportunistically repurchase shares, albeit at a modest pace. Our Board recently raised the dividend to 20 cents per share, underscoring the health of our financial position.
In the coming year, we will continue to invest our capital in areas that we expect to drive long-term improvement in our performance metrics, including investing in digital capabilities and data analytics, opening new community-based Power Stores, elevating core stores, and expanding our supply chain capabilities. Additionally, we will continually seek to return capital to shareholders in 2021, but also continue to exercise fiscal dis-cipline and maintain flexibility to guard against the lingering unknowns.
Taking the LEED: Deepening Our CSR Programming Commitments
COVID captured most of the headlines in 2020, but we can’t ignore the impact social unrest had on our society last year and the call to action it spurred across the country and within our company. Our youth culture customers are keenly focused on the issues of social action, responsibility, and sustainability. As an organization deeply connected to that consumer, we must lead with a com-mitment to reshaping the future for the better. We are doing just that, and I’m proud to share some of the initiatives and campaigns that highlight those efforts, which include:
• Committing to investing $200 million over the next five years to support our Black workforce and communi-ties through our Leading in Edu-cation and Economic Development (LEED) initiative.
3
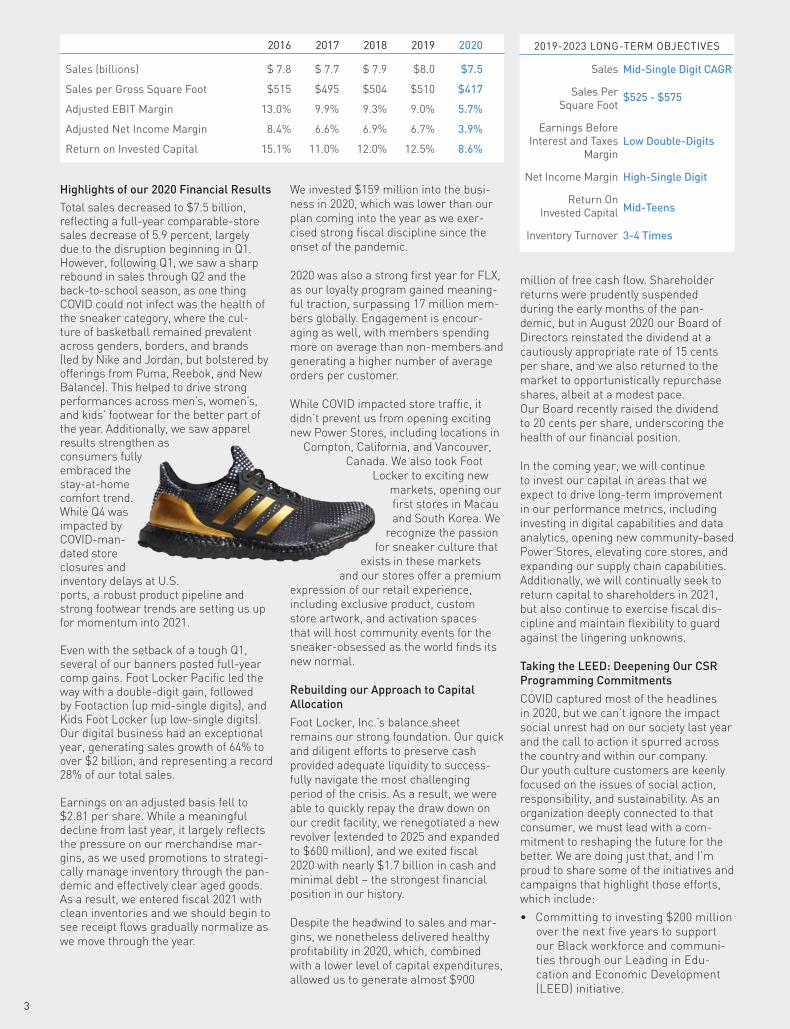
2016 2017 2018 2019 2020
Sales (billions) $ 7.8 $ 7.7 $ 7.9 $8.0 $7.5
Sales per Gross Square Foot $515 $495 $504 $510 $417
Adjusted EBIT Margin 13.0% 9.9% 9.3% 9.0% 5.7%
Adjusted Net Income Margin 8.4% 6.6% 6.9% 6.7% 3.9%
Return on Invested Capital 15.1% 11.0% 12.0% 12.5% 8.6%
2019-2023 LONG-TERM OBJECTIVES
Sales
Sales Per Square Foot
Earnings Before Interest and Taxes
Margin
Net Income Margin
Return On Invested Capital
Inventory Turnover
Mid-Single Digit CAGR
$525 - $575
Low Double-Digits
High-Single Digit
Mid-Teens
3-4 Times
• Participating in the Carbon Disclo-sure Project platform, including improving our global emissions profile in fiscal 2020.
• Expanding on our Diversity, Inclusion, and Belonging Strategy to enable a workplace culture in which team members feel uniquely valued and engaged, and are inspired to achieve their full potential.
• Preparing our inaugural Impact Report for fiscal year 19-20 (which provides in-depth coverage of these topics).
Sustainability is not a separate man-date for our business; it is embedded in our ability to achieve our four strategic imperatives. By aligning these strategic objectives with our sustainability ambition, we’re looking at all aspects of our work-force, operations, products, and partners to identify opportunities for continuous improvement and innovation which will enable Foot Locker to positively contribute to the changing future of the world.
Looking to fiscal 2021 and beyond, we are fully committed to building on our progress and strengthening our vision for a more sustainable world as we take new steps on this long and purposeful journey.
ConclusionI want to sincerely thank every team member at Foot Locker, Inc. for their commitment to the business through this remarkable year. Without their energy, agility, focus, and creativity we could not have overcome the many obstacles we encountered in 2020. We turned chal-lenges into opportunities as we were acutely reminded of the passion our customer has for this category - and we are now more prepared than ever to deliver to our consumers the great experiences we’re known for, no matter how they choose to engage with us. Our success doesn’t happen in a vacuum. It takes a team of outstanding and innova-
tive partners. These include our world-class vendors, landlords, and many other important suppliers. We thank you for your partnership and look forward to deeper collaborations together to achieve our collective objectives.
We are also very grateful to our Board of Directors, whose guidance and ongoing support was invaluable as we navigated the pandemic. Finally, I want to thank all of our shareholders. We appreciate your investment and the support you have shown the Company. I look forward to engaging with you in 2021.
I am immensely proud of what we accom-plished in 2020, but it’s only the begin-ning of a new chapter for Foot Locker, Inc. I am energized and looking forward with renewed purpose as we continue to advance our long-term strategies and build value for all our stakeholders. The insights coming through this unique period – from the power of our enhanced digital capabilities, the strength of our relationships with our vendor partners, the depth of our connections with our consumers, and the exceptional resilience of our global team – will have a lasting positive effect as we continue to evolve our business.
TOTAL SALES (IN BILLIONS)
$5.6$6.1
$6.5$7.2 $7.4
$7.8 $7.7 $7.9 $8.0$7.5
2011
2012
2013
2014
2015
2016
2017
2018
2019
2020
Richard A. JohnsonChairman and Chief Executive Officer
COVID-19 ImpactBeginning on March 17, 2020, we began temporarily closing all of our stores across all of our brands and began a phased reopening in late April 2020. As this was happening, we implemented a variety of actions to address the sudden reduction in sales, including reducing executive salaries for General Managers and above (including a 40% reduction for the CEO) from May through August and the Board of Directors suspended the cash elements of their compensation during this period.
In response to the temporary store closures and other business disruptions resulting from COVID-19, we implemented an employee furlough program, primarily for a majority of our store employees in the United States and Canada. We began bringing back furloughed employees when operations could safely and responsibly resume in accordance with national, state, and local guidance related to the then-evolving pandemic. Furloughed employees continued to receive health and other benefits in accordance with the terms of the respective plans, and, subject to local regulations, were also eligible for unemployment benefits.
To increase our cash position and provide additional flexibility, we also temporarily suspended our share repurchase program, reduced capital expenditures by 50%, and suspended our quarterly dividend program. We also borrowed $330 million under our revolving credit facility, which we fully repaid shortly thereafter. In July 2020, the Company amended its credit facility and increased it to $600 million with a 5-year maturity.
$1.82
$2.47
$2.87 $3.58
$4.29 $4.82
$3.99
$4.71
$2.81
$4.93
2011
2012
2013
2014
2015
2016
2017
2018
2019
2020
EARNINGS PER SHARE
4
5
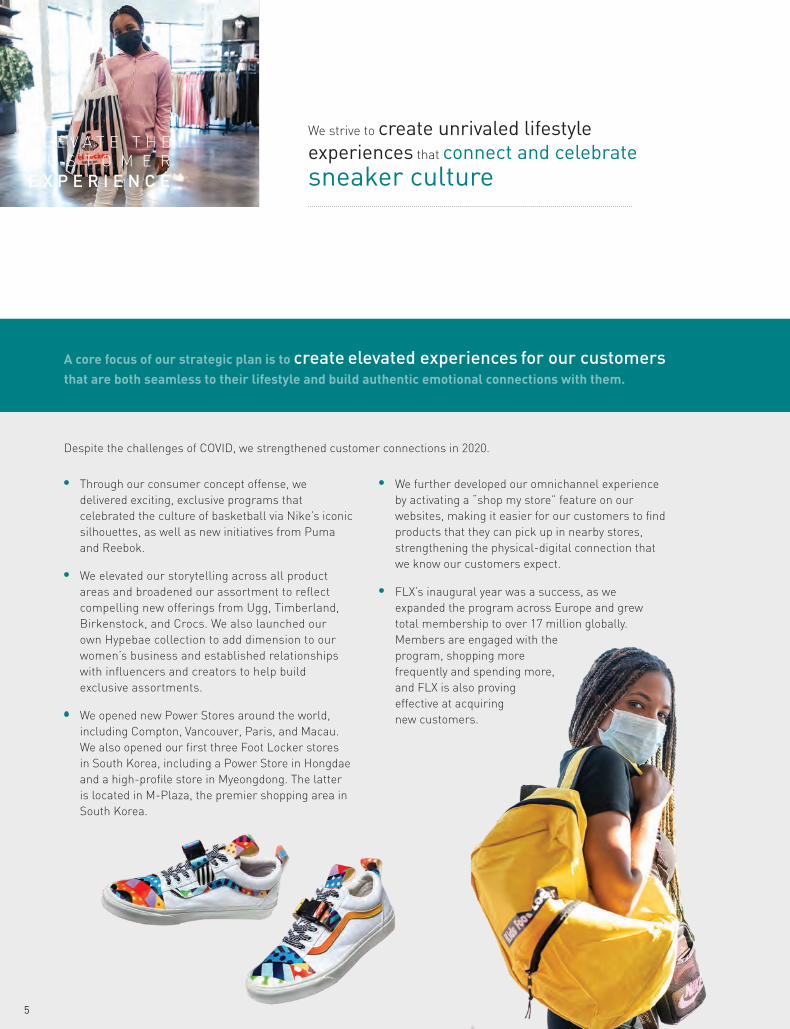
Through our consumer concept offense, we delivered exciting, exclusive programs that celebrated the culture of basketball via Nike’s iconic silhouettes, as well as new initiatives from Puma and Reebok.
We elevated our storytelling across all product areas and broadened our assortment to reflect compelling new offerings from Ugg, Timberland, Birkenstock, and Crocs. We also launched our own Hypebae collection to add dimension to our women’s business and established relationships with influencers and creators to help build exclusive assortments.
We opened new Power Stores around the world, including Compton, Vancouver, Paris, and Macau. We also opened our first three Foot Locker stores in South Korea, including a Power Store in Hongdae and a high-profile store in Myeongdong. The latter is located in M-Plaza, the premier shopping area in South Korea.
We further developed our omnichannel experience by activating a “shop my store” feature on our websites, making it easier for our customers to find products that they can pick up in nearby stores, strengthening the physical-digital connection that we know our customers expect.
FLX’s inaugural year was a success, as we expanded the program across Europe and grew total membership to over 17 million globally. Members are engaged with the program, shopping more frequently and spending more, and FLX is also proving effective at acquiring new customers.
We strive to create unrivaled lifestyle experiences that connect and celebrate sneaker culture
A core focus of our strategic plan is to create elevated experiences for our customers that are both seamless to their lifestyle and build authentic emotional connections with them.
E L E V A T E T H E C U S T O M E R E X P E R I E N C E
Despite the challenges of COVID, we strengthened customer connections in 2020.

6

MACAU
SINGAPORE
MELROSE
COMPTON
7
SEOUL
8
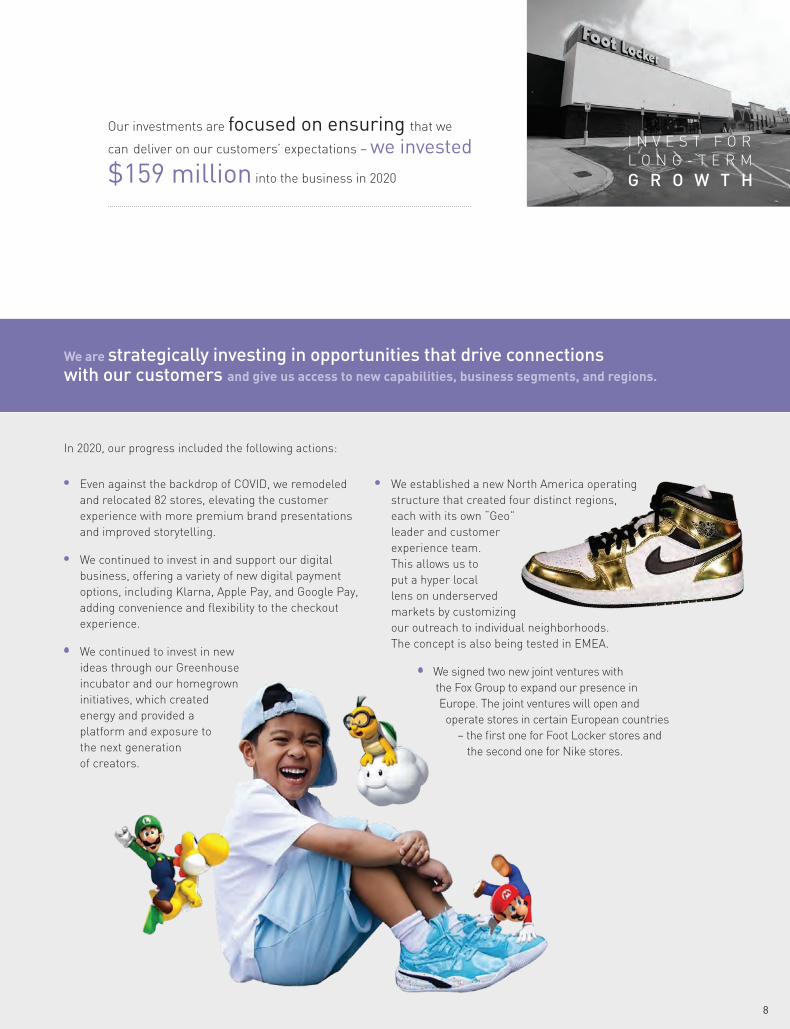
Even against the backdrop of COVID, we remodeled and relocated 82 stores, elevating the customer experience with more premium brand presentations and improved storytelling.
We continued to invest in and support our digital business, offering a variety of new digital payment options, including Klarna, Apple Pay, and Google Pay, adding convenience and flexibility to the checkout experience.
We continued to invest in new ideas through our Greenhouse incubator and our homegrown initiatives, which created energy and provided a platform and exposure to the next generation of creators.
We established a new North America operating structure that created four distinct regions, each with its own “Geo” leader and customer experience team. This allows us to put a hyper local lens on underserved markets by customizing our outreach to individual neighborhoods. The concept is also being tested in EMEA.
We signed two new joint ventures with the Fox Group to expand our presence in
Europe. The joint ventures will open and operate stores in certain European countries
– the first one for Foot Locker stores and the second one for Nike stores.
We are strategically investing in opportunities that drive connections with our customers and give us access to new capabilities, business segments, and regions.
I N V E S T F O R L O N G - T E R M G R O W T H
In 2020, our progress included the following actions:
Our investments are focused on ensuring that we
can deliver on our customers’ expectations – we invested $159 million into the business in 2020

9
We continued to drive increased efficiency in our digital marketing and media efforts, increasing automation and machine learning, personalization, and triggered messaging to drive improved return on spend through enhanced audience targeting and relevancy.
We opened a U.K.-based 3PL facility to better serve customers and stores in the U.K., which proved extremely valuable during the period when stores were closed in December and January due to COVID.
We continued to upgrade our Point-of-Sale systems, including adding support for more countries and languages, and activating contactless payment options on handheld POS devices in many of our stores. This not only helped us maintain social distancing and keep register queues down during the holiday season but it also added speed and convenience for customers and team members.
We launched a pilot drop ship program with Nike to activate additional inventory on our sites that is not held in our stores or distribution centers. While only in its infancy, the program aims to provide more of the right product at the right time to better satisfy customer demand and shorten lead times.
We completed the shut down of the Runners Point business in Europe, closing the remaining stores and consolidating the digital team into our other European operations.
We are committed to continually
improving our operating efficiencyD R I V E P R O D U C T I V I T Y
This past year, in order to become more productive:
At the same time as we focus on elevating the customer experience and investing for long-term growth,
driving higher productivity is key to delivering on our long-term objectives.
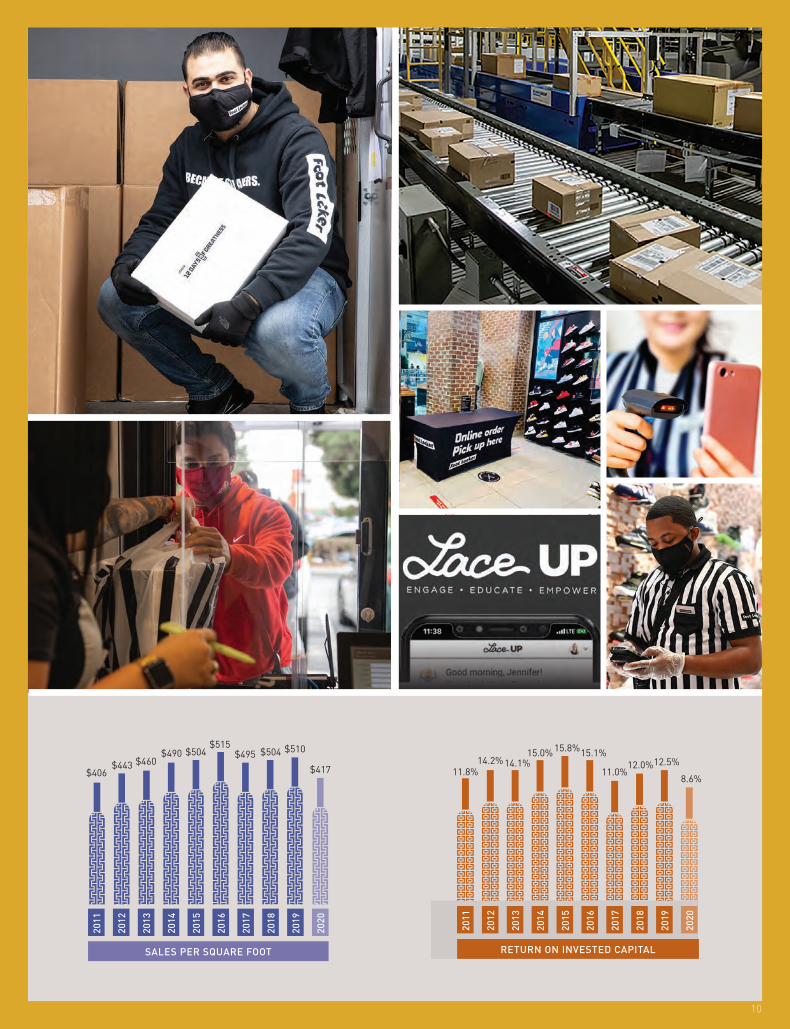
$406$443 $460
$490 $504$515
$495 $504 $510
$417
2011
2012
2013
2014
2015
2016
2017
2018
2019
2020
SALES PER SQUARE FOOT
10
11.8%14.2% 14.1%
15.0% 15.8%15.1%
11.0%12.0%12.5%
8.6%
2011
2012
2013
2014
2015
2016
2017
2018
2019
2020
RETURN ON INVESTED CAPITAL

11
12
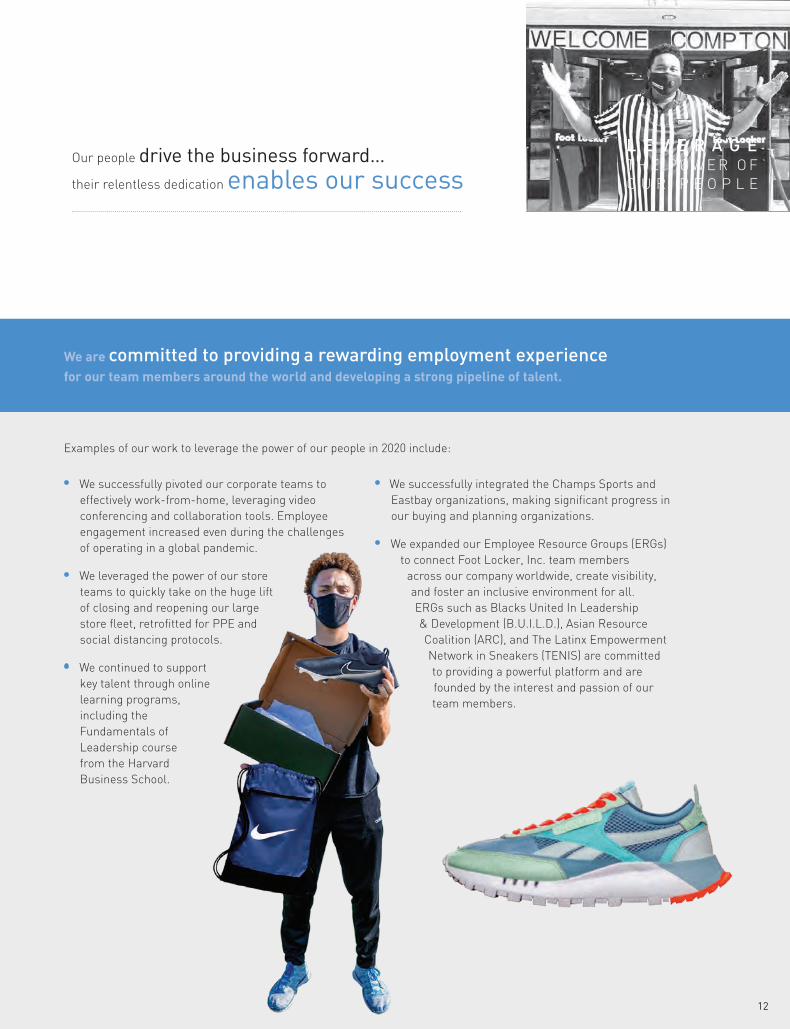
We successfully pivoted our corporate teams to effectively work-from-home, leveraging video conferencing and collaboration tools. Employee engagement increased even during the challenges of operating in a global pandemic.
We leveraged the power of our store teams to quickly take on the huge lift of closing and reopening our large store fleet, retrofitted for PPE and social distancing protocols.
We continued to support key talent through online learning programs, including the Fundamentals of Leadership course from the Harvard Business School.
We successfully integrated the Champs Sports and Eastbay organizations, making significant progress in our buying and planning organizations.
We expanded our Employee Resource Groups (ERGs) to connect Foot Locker, Inc. team members
across our company worldwide, create visibility, and foster an inclusive environment for all. ERGs such as Blacks United In Leadership & Development (B.U.I.L.D.), Asian Resource Coalition (ARC), and The Latinx Empowerment Network in Sneakers (TENIS) are committed to providing a powerful platform and are founded by the interest and passion of our team members.
We are committed to providing a rewarding employment experience for our team members around the world and developing a strong pipeline of talent.
Our people drive the business forward…
their relentless dedication enables our success
Examples of our work to leverage the power of our people in 2020 include:
913
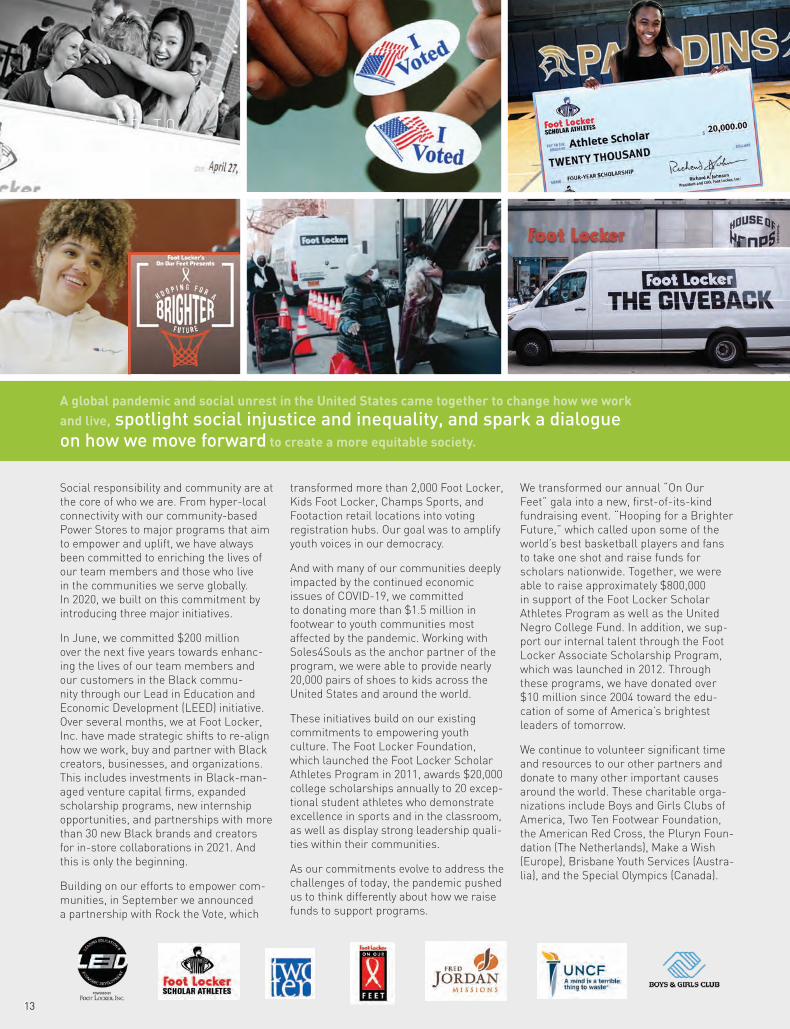
Social responsibility and community are at the core of who we are. From hyper-local connectivity with our community-based Power Stores to major programs that aim to empower and uplift, we have always been committed to enriching the lives of our team members and those who live in the communities we serve globally. In 2020, we built on this commitment by introducing three major initiatives.
In June, we committed $200 million over the next five years towards enhanc-ing the lives of our team members and our customers in the Black commu-nity through our Lead in Education and Economic Development (LEED) initiative. Over several months, we at Foot Locker, Inc. have made strategic shifts to re-align how we work, buy and partner with Black creators, businesses, and organizations. This includes investments in Black-man-aged venture capital firms, expanded scholarship programs, new internship opportunities, and partnerships with more than 30 new Black brands and creators for in-store collaborations in 2021. And this is only the beginning.
Building on our efforts to empower com-munities, in September we announced a partnership with Rock the Vote, which
transformed more than 2,000 Foot Locker, Kids Foot Locker, Champs Sports, and Footaction retail locations into voting registration hubs. Our goal was to amplify youth voices in our democracy.
And with many of our communities deeply impacted by the continued economic issues of COVID-19, we committed to donating more than $1.5 million in footwear to youth communities most affected by the pandemic. Working with Soles4Souls as the anchor partner of the program, we were able to provide nearly 20,000 pairs of shoes to kids across the United States and around the world.
These initiatives build on our existing commitments to empowering youth culture. The Foot Locker Foundation, which launched the Foot Locker Scholar Athletes Program in 2011, awards $20,000 college scholarships annually to 20 excep-tional student athletes who demonstrate excellence in sports and in the classroom, as well as display strong leadership quali-ties within their communities.
As our commitments evolve to address the challenges of today, the pandemic pushed us to think differently about how we raise funds to support programs.
We transformed our annual “On Our Feet” gala into a new, first-of-its-kind fundraising event. “Hooping for a Brighter Future,” which called upon some of the world’s best basketball players and fans to take one shot and raise funds for scholars nationwide. Together, we were able to raise approximately $800,000 in support of the Foot Locker Scholar Athletes Program as well as the United Negro College Fund. In addition, we sup-port our internal talent through the Foot Locker Associate Scholarship Program, which was launched in 2012. Through these programs, we have donated over $10 million since 2004 toward the edu-cation of some of America’s brightest leaders of tomorrow.
We continue to volunteer significant time and resources to our other partners and donate to many other important causes around the world. These charitable orga-nizations include Boys and Girls Clubs of America, Two Ten Footwear Foundation, the American Red Cross, the Pluryn Foun-dation (The Netherlands), Make a Wish (Europe), Brisbane Youth Services (Austra-lia), and the Special Olympics (Canada).
Lorem ipsum dolor sit amet, consectetur adipiscing elit. Cras tincidunt pellentesque nunc ut frin-gilla. In ac pretium dolor. Vivamus eu viverra quam. Proin id massa nec massa varius tincidunt. A global pandemic and social unrest in the United States came together to change how we work
and live, spotlight social injustice and inequality, and spark a dialogue on how we move forward to create a more equitable society.

1 0 - K
14

c
UNITED STATES SECURITIES AND EXCHANGE COMMISSION
Washington, D.C. 20549
FORM 10-K (Mark One) ☒ ANNUAL REPORT PURSUANT TO SECTION 13 OR 15(d) OF THE SECURITIES EXCHANGE ACT OF 1934
For the fiscal year ended January 30, 2021
OR
☐ TRANSITION REPORT PURSUANT TO SECTION 13 OR 15(d) OF THE SECURITIES EXCHANGE ACT OF 1934
For the transition period from to
Commission File No. 1-10299
(Exact name of registrant as specified in its charter)
New York 13-3513936 (State or other jurisdiction of (I.R.S. Employer Identification No.) incorporation or organization)
330 West 34th Street, New York, New York 10001 (Address of principal executive offices) (Zip Code)
Registrant’s telephone number, including area code: (212) 720-3700
Securities registered pursuant to Section 12(b) of the Act:
Title of each class Trading
Symbol(s) Name of each exchange on which registered Common Stock, par value $0.01 FL New York Stock Exchange Preferred Stock Purchase Rights New York Stock Exchange
Securities registered pursuant to Section 12(g) of the Act: None
Indicate by check mark if the registrant is a well-known seasoned issuer, as defined in Rule 405 of the Securities Act. Yes x No ¨
Indicate by check mark if the registrant is not required to file reports pursuant to Section 13 or Section 15(d) of the Act. Yes ¨ No x
Indicate by check mark whether the registrant (1) has filed all reports required to be filed by Section 13 or 15(d) of the Securities Exchange Act of 1934 during the preceding 12 months (or for such shorter period that the Registrant was required to file such reports), and (2) has been subject to such filing requirements for the past 90 days. Yes x No ¨
Indicate by check mark whether the registrant has submitted electronically every Interactive Data File required to be submitted pursuant to Rule 405 of Regulation S-T (§ 232.405 of this chapter) during the preceding 12 months (or for such shorter period that the registrant was required to submit such files). Yes x No ¨
Indicate by check mark whether the registrant is a large accelerated filer, an accelerated filer, a non-accelerated filer, smaller reporting company, or an emerging growth company. See the definitions of “large accelerated filer,” “accelerated filer,” “smaller reporting company,” and “emerging growth company” in Rule 12b-2 of the Exchange Act.
Large accelerated filer x Accelerated filer ¨ Non-accelerated filer ¨ Smaller reporting company ☐Emerging growth company ☐ If an emerging growth company, indicate by check mark if the registrant has elected not to use the extended transition period for complying with any new or revised financial accounting standards pursuant to Section 13(a) of the Exchange Act. ¨
Indicate by check mark whether the registrant has filed a report on and attestation to its management’s assessment of the effectiveness of its internal control over financial reporting under Section 404(b) of the Sarbanes-Oxley Act (15 U.S.C. 7262(b)) by the registered public accounting firm that prepared or issued its audit report.☒
Indicate by check mark whether the registrant is a shell company (as defined in Rule 12b-2 of the Act). Yes ☐ No ☒
The number of shares of the registrant’s Common Stock, par value $0.01 per share, outstanding as of March 22, 2021: 103,278,201 The aggregate market value of voting stock held by non-affiliates of the registrant computed by reference to the closing price as of the last business day of the Registrant’s most recently completed second fiscal quarter, July 31, 2020 was approximately: $1,727,775,209* * For purposes of this calculation only (a) all non-employee directors plus six executive officers and owners of five percent or more of the registrant are deemed
to be affiliates of the registrant and (b) shares deemed to be “held” by such persons include only outstanding shares of the registrant’s voting stock with respect to which such persons had, on such date, voting or investment power.
DOCUMENTS INCORPORATED BY REFERENCE
Portions of the registrant’s definitive Proxy Statement (the “Proxy Statement”) to be filed in connection with the Annual Meeting of Shareholders to be held on May 19, 2021: Parts III and IV.
TABLE OF CONTENTS
PART I Item 1. Business 1 Item 1A. Risk Factors 3 Item 1B. Unresolved Staff Comments 13 Item 2. Properties 13 Item 3. Legal Proceedings 13 Item 4. Mine Safety Disclosures 14 Item 4A. Information about our Executive Officers 14 PART II Item 5.
Market for the Company’s Common Equity, Related Stockholder Matters and Issuer Purchases of Equity Securities 15
Item 6. Selected Financial Data 17 Item 7. Management’s Discussion and Analysis of Financial Condition and Results of Operations 18 Item 7A. Quantitative and Qualitative Disclosures About Market Risk 33 Item 8. Consolidated Financial Statements and Supplementary Data 33 Item 9. Changes in and Disagreements with Accountants on Accounting and Financial Disclosure 73 Item 9A. Controls and Procedures 73 Item 9B. Other Information 75 PART III Item 10. Directors, Executive Officers and Corporate Governance 75 Item 11. Executive Compensation 75 Item 12.
Security Ownership of Certain Beneficial Owners and Management and Related Stockholder Matters 75
Item 13. Certain Relationships and Related Transactions, and Director Independence 75 Item 14. Principal Accounting Fees and Services 75 PART IV Item 15. Exhibits and Financial Statement Schedules 76 Item 16. Form 10-K Summary 76 INDEX OF EXHIBITS 77 SIGNATURES 81

CAUTIONARY NOTE REGARDING FORWARD-LOOKING STATEMENTS
This Annual Report on Form 10-K (“Annual Report”) includes “forward-looking” statements within the meaning of the Private Securities Litigation Reform Act of 1995. Forward-looking statements can be identified by the fact that they do not relate strictly to historical or current facts. They often include words such as “believes,” “expects,” “anticipates,” “estimates,” “intends,” “plans,” “seeks,” “continues,” “feels,” “forecasts,” or words of similar meaning, or future or conditional verbs, such as “will,” “should,” “could,” “may,” “aims,” “intends,” or “projects.” These statements include statements relating to trends in or expectations relating to the expected effects of our initiatives, strategies and plans, as well as trends in or expectations regarding our financial results and long-term growth model and drivers, tax rates, business opportunities and expansion, strategic acquisitions or investments, expenses, dividends, share repurchases, and our mitigation strategies, liquidity, cash flow from operations, use of cash and cash requirements, investments, borrowing capacity and use of proceeds, repatriation of cash to the U.S., and the continuing effects of each of the coronavirus pandemic (COVID-19) and social unrest on our financial results. A forward-looking statement is neither a prediction nor a guarantee of future events or circumstances, and those future events or circumstances may not occur. You should not place undue reliance on forward-looking statements, which speak to our views only as of the date of this Annual Report. These forward-looking statements are all based on currently available operating, financial, and competitive information and are subject to various risks and uncertainties, many of which are unforeseeable and beyond our control, such as the developing situation, and uncertainty caused by and, related to the COVID-19 pandemic and social unrest. Additional risks and uncertainties that we do not presently know about or that we currently consider to be insignificant may also affect our business operations and financial performance.
Our actual future results and trends may differ materially depending on a variety of factors, including, but not limited to, the risks and uncertainties discussed under “Risk Factors” and “Management’s Discussion and Analysis of Financial Condition and Results of Operations.” Given these risks and uncertainties, you should not rely on forward-looking statements as a prediction of actual results. Any or all of the forward-looking statements contained in this Annual Report or any other public statement made by us, including by our management, may turn out to be incorrect. We are including this cautionary note to make applicable and take advantage of the safe harbor provisions of the Private Securities Litigation Reform Act of 1995 for forward-looking statements. We expressly disclaim any obligation to update or revise any forward-looking statements, whether as a result of new information, future events or otherwise.
2020 Form 10-K Page 1
PART I
Item 1. Business
General
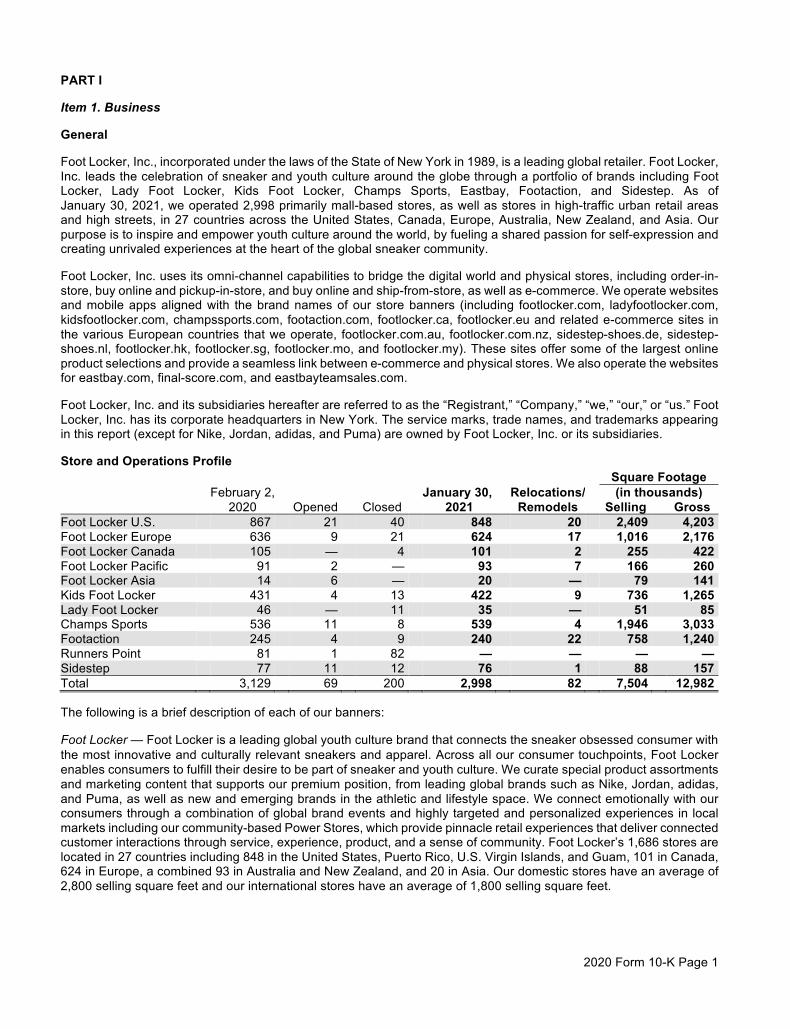
Foot Locker, Inc., incorporated under the laws of the State of New York in 1989, is a leading global retailer. Foot Locker, Inc. leads the celebration of sneaker and youth culture around the globe through a portfolio of brands including Foot Locker, Lady Foot Locker, Kids Foot Locker, Champs Sports, Eastbay, Footaction, and Sidestep. As of January 30, 2021, we operated 2,998 primarily mall-based stores, as well as stores in high-traffic urban retail areas and high streets, in 27 countries across the United States, Canada, Europe, Australia, New Zealand, and Asia. Our purpose is to inspire and empower youth culture around the world, by fueling a shared passion for self-expression and creating unrivaled experiences at the heart of the global sneaker community.
Foot Locker, Inc. uses its omni-channel capabilities to bridge the digital world and physical stores, including order-in-store, buy online and pickup-in-store, and buy online and ship-from-store, as well as e-commerce. We operate websites and mobile apps aligned with the brand names of our store banners (including footlocker.com, ladyfootlocker.com, kidsfootlocker.com, champssports.com, footaction.com, footlocker.ca, footlocker.eu and related e-commerce sites in the various European countries that we operate, footlocker.com.au, footlocker.com.nz, sidestep-shoes.de, sidestep-shoes.nl, footlocker.hk, footlocker.sg, footlocker.mo, and footlocker.my). These sites offer some of the largest online product selections and provide a seamless link between e-commerce and physical stores. We also operate the websites for eastbay.com, final-score.com, and eastbayteamsales.com.
Foot Locker, Inc. and its subsidiaries hereafter are referred to as the “Registrant,” “Company,” “we,” “our,” or “us.” Foot Locker, Inc. has its corporate headquarters in New York. The service marks, trade names, and trademarks appearing in this report (except for Nike, Jordan, adidas, and Puma) are owned by Foot Locker, Inc. or its subsidiaries.
Store and Operations Profile
Square Footage February 2, January 30, Relocations/ (in thousands) 2020 Opened Closed 2021 Remodels Selling Gross Foot Locker U.S. 867 21 40 848 20 2,409 4,203 Foot Locker Europe 636 9 21 624 17 1,016 2,176 Foot Locker Canada 105 — 4 101 2 255 422 Foot Locker Pacific 91 2 — 93 7 166 260 Foot Locker Asia 14 6 — 20 — 79 141 Kids Foot Locker 431 4 13 422 9 736 1,265 Lady Foot Locker 46 — 11 35 — 51 85 Champs Sports 536 11 8 539 4 1,946 3,033 Footaction 245 4 9 240 22 758 1,240 Runners Point 81 1 82 — — — — Sidestep 77 11 12 76 1 88 157 Total 3,129 69 200 2,998 82 7,504 12,982
The following is a brief description of each of our banners:
Foot Locker — Foot Locker is a leading global youth culture brand that connects the sneaker obsessed consumer with the most innovative and culturally relevant sneakers and apparel. Across all our consumer touchpoints, Foot Locker enables consumers to fulfill their desire to be part of sneaker and youth culture. We curate special product assortments and marketing content that supports our premium position, from leading global brands such as Nike, Jordan, adidas, and Puma, as well as new and emerging brands in the athletic and lifestyle space. We connect emotionally with our consumers through a combination of global brand events and highly targeted and personalized experiences in local markets including our community-based Power Stores, which provide pinnacle retail experiences that deliver connected customer interactions through service, experience, product, and a sense of community. Foot Locker’s 1,686 stores are located in 27 countries including 848 in the United States, Puerto Rico, U.S. Virgin Islands, and Guam, 101 in Canada, 624 in Europe, a combined 93 in Australia and New Zealand, and 20 in Asia. Our domestic stores have an average of 2,800 selling square feet and our international stores have an average of 1,800 selling square feet.
2020 Form 10-K Page 2
Kids Foot Locker — Kids Foot Locker offers the largest selection of premium brand-name athletic footwear, apparel, and accessories for children. Kids Foot Locker enables youth of all ages to participate in sneaker culture and helps their parents shop in a curated environment with only the best assortment in stores and online. Of our 422 stores, 373 are located in the United States, and Puerto Rico, 31 in Europe, 16 in Canada, 1 in Australia, and 1 in New Zealand. These stores have an average of 1,700 selling square feet.
Lady Foot Locker — Lady Foot Locker is a U.S. retailer of athletic footwear, apparel, and accessories dedicated to sneaker-obsessed young women. Our stores provide premium sneakers and apparel, carefully selected to reflect the latest styles. Lady Foot Locker operates 35 stores that are located in the United States and Puerto Rico. These stores have an average of 1,500 selling square feet.
Champs Sports — Champs Sports is one of the largest mall-based specialty athletic footwear and apparel retailers in North America. With a focus on the lifestyle expression of sport, Champs Sports’ product categories include athletic footwear and apparel, and sport-lifestyle inspired accessories. This assortment allows Champs Sports to offer the best head-to-toe fashion stories representing the most powerful athletic brands, sports teams, and athletes in North America. Of our 539 stores, 506 are located in the United States, Puerto Rico, and the U.S. Virgin Islands and 33 in Canada. The Champs Sports stores have an average of 3,600 selling square feet.
Footaction — Footaction is a North American athletic footwear and apparel retailer that offers the freshest, best edited selection of athletic lifestyle brands and looks. This banner is uniquely positioned at the intersection of sport and style, with a focus on authentic, premium product. Of our 240 stores, 235 are located in the United States and Puerto Rico and 5 are in Canada. The Footaction stores have an average of 3,200 selling square feet.
Runners Point — We closed our Runners Point banner during 2020.
Sidestep — Sidestep is a predominantly athletic fashion footwear banner. Our 76 stores are located in Germany, Netherlands, and Switzerland. Sidestep caters to a more discerning, fashion forward consumer. Sidestep stores have an average of 1,200 selling square feet.
Eastbay
Eastbay is a sporting goods direct marketer operating in the United States, providing high school and other athletes with a complete sports solution including athletic footwear, apparel, equipment, and team licensed merchandise for a broad range of sports. With over 100 sales professionals, Eastbay Team Sales connects directly with thousands of high school coaches and athletic directors in the United States in offering the best performance product and a premium service level.
Franchise Operations
We have a total of 127 franchised Foot Locker stores located within the Middle East as of January 30, 2021, of which 58 are in Israel. These amounts are not included in the store counts in the table on the prior page.
Competition
The athletic footwear and apparel industry is highly competitive. We compete primarily with athletic footwear specialty stores, sporting goods stores, department stores, traditional shoe stores, mass merchandisers, and online retailers, some of which are our suppliers.
Merchandise Purchases
Financial information concerning merchandise purchases is contained under the “Liquidity” section in “Item 7. Management’s Discussion and Analysis of Financial Condition and Results of Operations” and under the “Business Risk” section in the Financial Instruments and Risk Management note in “Item 8. Consolidated Financial Statements and Supplementary Data.”
Human Capital
Our purpose is to inspire and empower youth culture around the world, by fueling a shared passion for self-expression and creating unrivaled experiences at the heart of the global sneaker community. We believe the strength of our workforce is a significant contributor to our success as a global brand that leads with purpose. We seek to be a great place to work by cultivating and celebrating a culture that promotes diversity, inclusion, and belonging. Our “Live Well. Work Well.” framework enables us to provide support and resources for a variety of needs to help our team members reach their fullest potential.

2020 Form 10-K Page 3
Our People Strategy includes actions around “Uniting our Communities of Talent” around the world to achieve focus and drive results as a more agile and dynamic organization. By creating a Diversity, Inclusion, and Belonging Strategy (DIBs) as part of our people processes, we are able to attract, select, hire, grow, develop, promote, and retain valued team members with diverse backgrounds, perspectives, and experiences. We are relentless in creating a work environment that celebrates the differences that make us even stronger. We provide career growth and professional development through formal learning and on-the-job experiences to advance our team members capability, confidence, and contribution.
We offer competitive compensation (including salary, incentive bonus, and equity) and benefits packages in each of our locations around the globe. Our compensation program is designed to attract and reward talented individuals who possess the skills necessary to lead and support our business objectives, ensure the achievement of our strategic goals, and create long-term value for our shareholders. To support our team members, we provide competitive compensation and benefits, including:
• Health and wellness benefits (medical, dental, vision, and behavioral health coverage) • Financial benefits (401(k) Plan with Company matching contribution, life and disability coverage, Employee
Stock Purchase Plan at a 15 percent discount, and commuter benefits) • Work-life balance and lifestyle benefits (such as paid time off for full-time team members and Employee
Discount Program for all team members) • Tuition reimbursement in the United States and EMEA only • Outside the United States, we may offer supplemental Health and Wellness benefits, as well as Retirement
benefits, based on local competitive practices.
Through our listening session communication strategy, we are committed to listening to and learning from our team members. For many years, we have tracked engagement and leadership effectiveness through our engagement surveys. We have improved our overall engagement, with 80 percent overall favorable rating and 85 percent response rate in 2020. We use insights from these surveys to assess our culture, evaluate our leaders, adjust our plans, and evolve our culture.
We had 15,791 full-time and 35,461 part-time employees as of January 30, 2021 and we consider employee relations to be satisfactory.
We are committed to engaging in corporate social responsibility and sustainability initiatives that support our communities and help us develop trusted relationships with our stakeholders. Our Corporate Social Responsibility disclosure is available to investors on the investor relations tab of our corporate website under the heading “Responsibility.”
Available Information
We maintain a corporate website at www.footlocker-inc.com. Our filings with the U.S. Securities and Exchange Commission (the “SEC”), including our annual report on Form 10-K, quarterly reports on Form 10-Q, current reports on Form 8-K, and all amendments to those reports are available free of charge through this website as soon as reasonably practicable after they are filed with or furnished to the SEC. The Corporate Governance section of our corporate website contains our Corporate Governance Guidelines, Committee Charters, and the Code of Business Conduct for directors, officers and employees, including the Chief Executive Officer, Chief Financial Officer, and Chief Accounting Officer. Copies of these documents may also be obtained free of charge upon written request to our Corporate Secretary at 330 West 34th Street, New York, N.Y. 10001.
Item 1A. Risk Factors
Risks Related to Our Business and Industry
Our inability to implement our long-range strategic plan may adversely affect our future results.
Our ability to successfully implement and execute our long-range strategic plan is dependent on many factors. Our strategies may require significant capital investment and management attention. Additionally, any new initiative is subject to certain risks including customer acceptance of our products and renovated store designs, competition, product differentiation, the ability to attract and retain qualified personnel, and our ability to successfully implement technological initiatives. If we cannot successfully execute our strategic growth initiatives or if the long-range plan does not adequately address the challenges or opportunities we face, our financial condition and results of operations may be adversely affected. Additionally, failure to meet shareholder expectations, particularly with respect to sales, operating margins, and earnings per share, would likely result in volatility in the market value of our stock.
2020 Form 10-K Page 4
The retail athletic footwear and apparel business is highly competitive.
Our athletic footwear and apparel operations compete primarily with athletic footwear specialty stores, sporting goods stores, department stores, traditional shoe stores, mass merchandisers, and online retailers, many of which are units of national or regional chains that have significant financial and marketing resources. The principal competitive factors in our markets are selection of merchandise, customer experience, reputation, store location, advertising, and price. We cannot assure that we will continue to be able to compete successfully against existing or future competitors. Our expansion into markets served by our competitors, and entry of new competitors or expansion of existing competitors into our markets, could have a material adverse effect on our business, financial condition, and results of operations.
Although we sell an increasing proportion of our merchandise online, a significantly faster shift in customer buying patterns to purchasing athletic footwear, athletic apparel, and sporting goods online could have a material adverse effect on our business results. In addition, all of our significant suppliers operate retail stores and distribute products directly through the internet and others may follow. Should this continue to occur or accelerate, and if our customers decide to purchase directly from our suppliers, it could have a material adverse effect on our business, financial condition, and results of operations.
A change in the relationship with any of our key suppliers or the unavailability of key products at competitive prices could affect our financial health.
Our business is dependent to a significant degree upon our ability to obtain premium product and the ability to purchase brand-name merchandise at competitive prices from a limited number of suppliers. In addition, we have negotiated volume discounts, cooperative advertising, and markdown allowances with our suppliers, as well as the ability to cancel orders and return excess or unneeded merchandise. We cannot be certain that such terms with our suppliers will continue in the future.
We purchased approximately 91 percent of our merchandise in 2020 from our top five suppliers and we expect to continue to obtain a significant percentage of our athletic product from these suppliers in future periods. Approximately 75 percent of all merchandise purchased in 2020 was purchased from one supplier — Nike, Inc. (“Nike”). Each of our operating divisions is highly dependent on Nike. Individually they purchased between 47 to 82 percent of their merchandise from Nike during the year. Merchandise that is high profile and in high demand is allocated by our suppliers based upon their internal criteria. Although we have generally been able to purchase sufficient quantities of this merchandise in the past, we cannot be certain that our suppliers will continue to allocate sufficient amounts to us in the future or whether our suppliers will choose to sell such merchandise in their online business. Our inability to obtain merchandise in a timely manner from major suppliers as a result of business decisions by our suppliers, or any disruption in the supply chain, could have a material adverse effect on our business, financial condition, and results of operations. Because of the high proportion of purchases from Nike, any adverse development in Nike’s reputation, financial condition or results of operations or the inability of Nike to develop and manufacture products that appeal to our target customers could also have an adverse effect on our business, financial condition, and results of operations. We cannot be certain that we will be able to acquire merchandise at competitive prices or on competitive terms in the future. These risks could have a material adverse effect on our business, financial condition, and results of operations.
The industry in which we operate is dependent upon fashion trends, customer preferences, product innovations, and other fashion-related factors.
The athletic footwear and apparel industry, especially at the premium end of the price spectrum, in which we operate, is subject to changing fashion trends and customer preferences. In addition, retailers in the athletic industry rely on their suppliers to maintain innovation in the products they develop. We cannot guarantee that our merchandise selection will accurately reflect customer preferences when it is offered for sale or that we will be able to identify and respond quickly to fashion changes, particularly given the long lead times for ordering much of our merchandise from suppliers. A substantial portion of our highest margin sales are to young males (ages 12–25), many of whom we believe purchase athletic footwear and athletic apparel as a fashion statement and are frequent purchasers. Our failure to anticipate, identify or react appropriately in a timely manner to changes in fashion trends that would make athletic footwear or athletic apparel less attractive to our customers could have a material adverse effect on our business, financial condition, and results of operations.
2020 Form 10-K Page 5
If we do not successfully manage our inventory levels, our operating results will be adversely affected.
We must maintain sufficient inventory levels to operate our business successfully. However, we also must guard against accumulating excess inventory. For example, we order most of our athletic footwear four to six months prior to delivery to us. If we fail to anticipate accurately either the market for the merchandise or our customers’ purchasing habits, we may be forced to rely on markdowns or promotional sales to dispose of excess or slow-moving inventory, which could have a material adverse effect on our business, financial condition, and results of operations.
The COVID-19 pandemic has disrupted and is expected to continue to disrupt our business, which could have a material adverse effect on our results of operations, liquidity, and financial condition for an extended period of time.
In December 2019, a novel strain of coronavirus (COVID-19) was reported to have surfaced in Wuhan, China. In March 2020, the World Health Organization designated COVID-19 a pandemic. As a result of COVID-19, we temporarily closed all of our stores across all of our brands in North America, Europe Middle East and Africa (“EMEA”), and Asia Pacific for various periods throughout the year. We continue to monitor COVID-19, as well as new strains of the virus, and other closures, capacity limitations, social distancing requirements, and reduced operating hours may be required to help ensure the health and safety of our team members and our customers. We are also continuing to communicate with our suppliers regarding the flow of product. To the extent one or more of our suppliers is negatively affected by COVID-19, including due to the closure of their distribution centers or manufacturing facilities, we may be unable to maintain adequate inventory in our stores or distribution centers. COVID-19 has also caused disruption in transportation, such as shipping port congestion, which has adversely affected our ability to receive merchandise on a timely basis. Given the dynamic nature of these circumstances, the duration of business disruption, reduced customer traffic, and related financial affects cannot be reasonably estimated at this time but are expected to materially affect our business for 2021. The extent to which COVID-19 affects our results, or those of our suppliers, will depend on future developments, which are highly uncertain and cannot be predicted, including new information which may emerge concerning the severity of COVID-19 and the actions and related costs to contain or treat it, among others.
We are affected by mall traffic and our ability to secure suitable store locations.
Many of our stores, especially in North America, are located primarily in enclosed regional and neighborhood malls. Our sales are affected, in part, by the volume of mall traffic. Mall traffic may be adversely affected by, among other factors, economic downturns, the closing or continued decline of anchor department stores and/or specialty stores, and a decline in the popularity of mall shopping among our target customers. Further, any terrorist act, natural disaster, public health issue, such as COVID-19, flu or other pandemics, or safety concern that decreases the level of mall traffic, or that affects our ability to open and operate stores in such locations, could have a material adverse effect on our business.
To take advantage of customer traffic and the shopping preferences of our customers, we need to maintain or acquire stores in desirable locations such as in regional and neighborhood malls, as well as high-traffic urban retail areas and high streets. We cannot be certain that desirable locations will continue to be available at favorable rates. Some traditional enclosed malls are experiencing significantly lower levels of customer traffic, driven by economic conditions, public health issues, the closure of certain mall anchor tenants, and changes in customer shopping preferences, such as online shopping. Further, some malls have closed, and others may close in the future. While we seek to obtain suitable locations off-mall there is no guarantee that we will be able to secure such locations.
Several large landlords dominate the ownership of prime malls and because of our dependence upon these landlords for a substantial number of our locations, any significant erosion of their financial condition or our relationships with them could negatively affect our ability to obtain and retain store locations. Additionally, further landlord consolidation may negatively affect our ability to negotiate favorable lease terms.
Our future growth may depend on our ability to expand operations in international markets.
Our future growth will depend, in part, on our ability to expand our business in additional international markets. As we expand into new international markets, we may have only limited experience in operating our business in such markets. In other instances, we may have to rely on the efforts and abilities of foreign business partners in such markets. In addition, business practices in these new international markets may be unlike those in the other markets we serve, and we may face increased exposure to certain risks. Our future growth may be materially adversely affected if we are unsuccessful in our international expansion efforts. Our inability to expand in international markets could have a material adverse effect on our business.
2020 Form 10-K Page 6
We may experience fluctuations in, and cyclicality of, our comparable-store sales results.
Our comparable-store sales have fluctuated significantly in the past, on both an annual and a quarterly basis, and we expect them to continue to fluctuate in the future. A variety of factors affect our comparable-store sales results, including, among others, fashion trends, product innovation, promotional events, the highly competitive retail sales environment, economic conditions, timing of income tax refunds, changes in our merchandise mix, calendar shifts of holiday periods, declines in foot traffic, supply chain disruptions, and weather conditions.
Many of our products represent discretionary purchases. Accordingly, customer demand for these products could decline in an economic downturn or if our customers develop other priorities for their discretionary spending. These risks could have a material adverse effect on our business, financial condition, and results of operations.
The effects of natural disasters, terrorism, acts of war, acts of violence, and public health issues may adversely affect our business.
Natural disasters, including earthquakes, hurricanes, floods, and tornadoes may affect store and distribution center operations. In addition, acts of terrorism, acts of war, and military action both in the United States and abroad can have a significant effect on economic conditions and may negatively affect our ability to purchase merchandise from suppliers for sale to our customers. Any act of violence, including active shooter situations and terrorist activities, that are targeted at or threatened against shopping malls, our stores, offices or distribution centers, could result in restricted access to our stores and/or store closures in the short-term and, in the long-term, may cause our customers and employees to avoid visiting our stores.
Public health issues, such as COVID-19, flu or other pandemics, whether occurring in the United States or abroad, could disrupt our operations and result in a significant part of our workforce being unable to operate or maintain our infrastructure or perform other tasks necessary to conduct our business. Additionally, public health issues may disrupt, or have an adverse effect on, our suppliers’ operations, our operations, our customers, or result in significantly lower traffic to or closure of our stores, or customer demand.
Our ability to mitigate the adverse effect of these events depends, in part, upon the effectiveness of our disaster preparedness and response planning as well as business continuity planning. However, we cannot be certain that our plans will be adequate or implemented properly in the event of an actual disaster.
Any significant declines in public safety or uncertainties regarding future economic prospects that affect customer spending habits could have a material adverse effect on customer purchases of our products. We may be required to suspend operations in some or all of our locations and incur significant costs to remediate concerns which could have a material adverse effect on our business, financial condition, and results of operations.
Riots, vandalism, and other crimes and acts of violence may affect the markets in which we operate, our customers, delivery of our products and customer service, and could have a material adverse effect on our business, results of operations, or financial condition.
Our business may be adversely affected by instability, disruption, or destruction, regardless of cause, including riots, civil insurrection or social unrest, and manmade disasters or crimes. Such events may result in property damage and loss and may also cause customers to suspend their decisions to shop in our stores, interrupt our supply chain, and cause restrictions, postponements, and cancellations of events that attract large crowds and public gatherings, such as store marketing events.
Additional risks and uncertainties not currently known to us or that we currently deem to be immaterial also may adversely affect our business, financial condition or operating results.
Risks Related to Technology, Data Security, and Privacy
We are subject to technology risks including failures, security breaches, and cybersecurity risks that could harm our business, damage our reputation, and increase our costs in an effort to protect against these risks.
Information technology is a critical part of our business operations. We depend on information systems to process transactions, make operational decisions, manage inventory, operate our websites, purchase, sell and ship goods on a timely basis, and maintain cost-efficient operations. There is a risk that we could experience a business interruption, theft of information, or reputational damage as a result of a cyber-attack, such as an infiltration of a data center or data leakage of confidential information, either internally or at our third-party providers.
2020 Form 10-K Page 7
We may experience operational problems with our information systems as a result of system failures, system implementation issues, viruses, malicious hackers, sabotage, or other causes. We invest in security technology to protect the data stored by us, including our data and business processes, against the risk of data security breaches and cyber-attacks. Our data security management program includes enforcement of standard data protection policies such as Payment Card Industry compliance. Additionally, we evaluate our major technology suppliers and any outsourced services through accepted security assessment measures. We maintain and routinely test backup systems and disaster recovery, along with external network security penetration testing by an independent third party as part of our business continuity preparedness.
While we believe that our security technology and processes follow appropriate practices in the prevention of security breaches and the mitigation of cybersecurity risks, given the ever-increasing abilities of those intent on breaching cybersecurity measures and given the necessity of our reliance on the security procedures of third-party vendors, the total security effort at any point in time may not be completely effective.
Any security breaches and cyber incidents could adversely affect our business. Failure of our systems, either internally or at our third-party providers, including failures due to cyber-attacks that would prevent the ability of systems to function as intended, could cause transaction errors, loss of customers and sales, and negative consequences to us, our employees, and those with whom we do business. Any security breach involving the misappropriation, loss, or other unauthorized disclosure of confidential information by us could also severely damage our reputation, expose us to the risks of litigation and liability, increase operating costs associated with remediation, and harm our business. While we carry insurance that would mitigate the losses, insurance may be insufficient to compensate us fully for potentially significant losses.
Risks associated with digital operations.
Our digital operations are subject to numerous risks, including risks related to the failure of the computer systems that operate our websites, mobile sites, and apps and their related support systems, computer viruses, cybersecurity risks, telecommunications failures, denial of service attacks, bot attacks, and similar disruptions. Also, to sustain, keep current, or grow our digital commerce business we will need to make additional investments. Risks related to digital commerce include those associated with credit card fraud, the need to keep pace with rapid technological change, governmental regulation, and legal uncertainties with respect to internet regulatory compliance. If any of these risks materialize, it could have a material adverse effect on our business.
Privacy and data security concerns and regulation could result in additional costs and liabilities.
The protection of customer, employee, and Company data is critical. The regulatory environment surrounding information security and privacy is demanding, with the frequent imposition of new and changing requirements. In addition, customers appear increasingly to have a high expectation that we will adequately protect their personal information. Any actual or perceived misappropriation or breach involving this data could attract negative media attention, cause harm to our reputation or result in liability (including but not limited to fines, penalties or lawsuits), any of which could have a material adverse effect on our business, operational results, financial position, and cash flows.
The European Union (“E.U.”) adopted a comprehensive General Data Privacy Regulation (the “GDPR”), which requires companies to satisfy new requirements regarding the handling of personal and sensitive data, including its use, protection, and the ability of persons whose data is stored to correct or delete data about themselves. Failure to comply with GDPR requirements could result in penalties of up to 4 percent of worldwide revenue. In addition, the State of California adopted the California Consumer Protection Act of 2018 ("CCPA"). The CCPA requires companies that process information on California residents to make new disclosures to consumers about their data collection, use and sharing practices, allows consumers to opt out of certain data sharing with third parties, and provides a new cause of action for data breaches. It remains unclear how the CCPA will be interpreted and the extent of its effect on our business. Some observers have noted that the CCPA could mark the beginning of a trend toward more stringent privacy legislation in the United States, which could increase our potential liability and adversely affect our business.
GDPR, CCPA and other similar laws and regulations, as well as any associated inquiries or investigations or any other government actions, may be costly to comply with, result in negative publicity, increase our operating costs, require significant management time and attention, and subject us to remedies that may harm our business, including fines or demands or orders that we modify or cease existing business practices. The laws and regulations relating to privacy and data security are evolving, can be subject to significant change and may result in ever-increasing regulatory and public scrutiny and escalating levels of enforcement and sanctions.
2020 Form 10-K Page 8
The technology enablement of omni-channel in our business is complex.
We continue to invest in initiatives designed to deliver a high-quality, coordinated shopping experience online, in stores, and on mobile devices, which requires substantial investment in technology, information systems, and employee training, as well as significant management time and resources. Our omni-channel retailing efforts include the integration and implementation of new technology, software, and processes to be able to fulfill orders from any point within our system of stores and distribution centers, which is extremely complex and may not meet customer expectations for timely and accurate deliveries. These efforts involve substantial risk, including risk of implementation delays, cost overruns, technology interruptions, supply and distribution delays, and other issues that can affect the successful implementation and operation of our omni-channel initiatives. If our omni-channel initiatives are not successful, or we do not realize the return on our omni-channel investments that we anticipate, our financial performance and future growth could be materially adversely affected.
Risks Related to our Operations and Supply Chain
Complications in our distribution centers and other factors affecting the distribution of merchandise may affect our business.
We operate multiple distribution centers worldwide to support our businesses. In addition to the distribution centers that we operate, we have third-party arrangements to support our operations in the United States, Canada, England, Australia, and New Zealand. If complications arise with any facility or third-party arrangements, or if any facility is severely damaged or destroyed, our other distribution centers may be unable to support the resulting additional distribution demands. We also may be affected by disruptions in the global transportation network caused by events including delays caused by the COVID-19 pandemic, port disruption, port strikes, weather conditions, work stoppages, or other labor unrest. These factors may adversely affect our ability to deliver inventory on a timely basis. We depend upon third-party carriers for shipment of merchandise. Any interruption in service by these carriers for any reason could cause disruptions in our business, a loss of sales and profits, and other material adverse effects.
Manufacturer compliance with our social compliance program requirements.
We require our independent manufacturers to comply with our policies and procedures, which cover many areas including human rights policy, labor, health and safety, and environmental standards. We monitor compliance with our policies and procedures using internal resources, as well as third-party monitoring firms. Although we monitor their compliance with these policies and procedures, we do not control the manufacturers or their practices. Any failure of our independent manufacturers to comply with our policies and procedures or local laws in the country of manufacture could disrupt the shipment of merchandise to us, force us to locate alternate manufacturing sources, reduce demand for our merchandise, or damage our reputation.
Our reliance on key management.
Future performance will depend upon our ability to attract, retain, and motivate our executive and senior management teams. Our executive and senior management teams have substantial experience and expertise in our business and have made significant contributions to our success. Our future performance depends, to a significant extent, both upon the continued services of our current executive and senior management teams, as well as our ability to attract, hire, motivate, and retain additional qualified management in the future. While we believe that we have adequate succession planning and executive development programs, competition for key executives in the retail industry is intense, and our operations could be adversely affected if we cannot retain and attract qualified executives.
Risks associated with attracting and retaining store and field team members.
Our success depends, in part, upon our ability to attract, develop, and retain a sufficient number of qualified store and field team members. The turnover rate in the retail industry is generally high. If we are unable to attract and retain quality team members, our ability to meet our growth goals or to sustain expected levels of profitability may be compromised. Our ability to meet our labor needs while controlling costs is subject to external factors such as unemployment levels, prevailing wage rates, minimum wage legislation, and overtime regulations.
2020 Form 10-K Page 9
Risks Related to our Investments
If our long-lived tangible assets and operating lease right-of-use assets, or goodwill become impaired, we may need to record significant non-cash impairment charges.
We review our long-lived tangible assets and operating lease right-of-use assets, and goodwill when events indicate that the carrying value of such assets may be impaired. Goodwill is reviewed for impairment if impairment indicators arise and, at a minimum, annually. Goodwill is not amortized but is subject to an impairment test, which consists of either a qualitative assessment on a reporting unit level, or a quantitative impairment test, if necessary. The determination of impairment charges is significantly affected by estimates of future operating cash flows and estimates of fair value. Our estimates of future operating cash flows are identified from our long-range strategic plans, which are based upon our experience, knowledge, and expectations; however, these estimates can be affected by factors such as our future operating results, future store profitability, and future economic conditions, all of which are difficult to predict accurately. Any significant deterioration in macroeconomic conditions could affect the fair value of our long-lived assets, including our operating lease right-of-use assets, and goodwill and could result in future impairment charges, which would adversely affect our results of operations.
We do not have the ability to exert control over our minority investments, and therefore, we are dependent on others in order to realize their potential benefits.
We currently hold $337 million of non-controlling minority investments in various entities and we may make additional strategic minority investments in the future. Such minority investments inherently involve a lesser degree of control over business operations, thereby potentially increasing the financial, legal, operational, and compliance risks associated with the investments. Other investors in these entities may have business goals and interests that are not aligned with ours or may exercise their rights in a manner in which we do not approve. These circumstances could lead to delayed decisions or disputes and litigation with those other investors, all of which could have a material adverse impact on our reputation, business, financial condition, and results of operations.
If our investees seek additional financing to fund their growth strategies, these financing transactions may result in further dilution of our ownership stakes and these transactions may occur at lower valuations than the investment transactions through which we acquired such interests, which could significantly decrease the fair values of our investments in those entities. Additionally, if our investees are unable to obtain additional financing, those entities could need to significantly reduce their spending in order to fund their operations or result in their insolvency. These actions likely would result in reduced growth forecasts, which also could significantly decrease the fair values of our investments in those entities.
Risks Related to Shareholder Activism, Geopolitics, Regulations, and Other External Risks
We may face risks associated with shareholder activism.
Publicly traded companies are subject to campaigns by shareholders advocating corporate actions related to matters such as corporate governance, operational practices, and strategic direction. We may become subject in the future to such shareholder activity and demands. Such activities could interfere with our ability to execute our business plans, be costly and time-consuming, disrupt our operations, and divert the attention of management, any of which could have an adverse effect on our business or stock price.
Our shareholder rights plan could impede or discourage a takeover or change of control.
In December 2020, our Board of Directors adopted a short-term rights plan. The rights plan is intended to protect the interests of all the Company’s shareholders by reducing the likelihood that any person would gain control of the Company through open market accumulation or other tactics without appropriately compensating the Company's shareholders for such control. The rights plan is not intended to prevent or deter any action or offer that the Board of Directors determines to be in the best interests of shareholders. However, the overall effect of the rights plan may render it more difficult or discourage a merger, tender offer or other business combination involving the Company that may be considered beneficial by some shareholders but is not supported by our Board of Directors.
2020 Form 10-K Page 10
Economic or political conditions in other countries, including fluctuations in foreign currency exchange rates and tax rates may adversely affect our operations.
A significant portion of our sales and operating income for 2020 was attributable to our operations outside of the United States. As a result, our business is subject to the risks associated with doing business outside of the United States such as local customer product preferences, political unrest, disruptions or delays in shipments, changes in economic conditions in countries in which we operate, foreign currency fluctuations, real estate costs, and labor and employment practices in non-U.S. jurisdictions that may differ significantly from those that prevail in the United States. In addition, because our suppliers manufacture a substantial amount of our products in foreign countries, our ability to obtain sufficient quantities of merchandise on favorable terms may be affected by governmental regulations, trade restrictions, labor, and other conditions in the countries from which our suppliers obtain their product.
Fluctuations in the value of the euro and the British Pound may affect the value of our European earnings when translated into U.S. dollars. Similarly, our earnings in other jurisdictions may be affected by the value of currencies when translated into U.S. dollars.
Except for our business in the United Kingdom (the “U.K.”), our international subsidiaries conduct most of their business in their local currency. Inventory purchases for our U.K. business are generally denominated in euros, which could result in foreign currency transaction gains or losses.
Our products are subject to import and excise duties and/or sales or value-added taxes in many jurisdictions. Fluctuations in tax rates and duties and changes in tax legislation or regulation could have a material adverse effect on our results of operations and financial condition.
Significant developments stemming from the U.K.’s withdrawal from the E.U. could have a material adverse effect on the Company.
The U.K. formally exited the European Union on January 31, 2020 (commonly referred to as “Brexit”) and entered into a new trade agreement with the European Union on December 24, 2020. Despite the U.K.’s December 2020 trade agreement, many potential future effects of Brexit remain unclear and could adversely affect certain areas of our business, including, but not limited to, an increase in duties and delays in the delivery of products, and adverse effects to our suppliers. We have significant operations in both the U.K. and the E.U., and we are highly dependent on the free flow of labor and goods in those regions. In response to Brexit, in February 2020 we engaged with a third-party logistics provider within England to mitigate supply chain risks. Uncertainty surrounding Brexit could cause a slowdown in economic activity in the U.K., Europe or globally, which could adversely affect our operating results and growth prospects. In addition, Brexit could lead to legal uncertainty and potentially divergent national laws and regulations as the U.K. determines which E.U. laws to replace or replicate, including data protection regulation. Compliance with any new laws and regulations may be cumbersome, difficult, or costly. There remains substantial uncertainty surrounding the ultimate effect of Brexit and outcomes could disrupt the markets we serve and the tax jurisdictions in which we operate. This uncertainty creates challenges (particularly in the near term) with respect to trading relationships between our U.K. subsidiary and other E.U. nations. These possible effects of Brexit could adversely affect our business, results of operations, and financial condition. Imposition of tariffs and export controls on the products we buy may have a material adverse effect on our business.
A significant portion of the products that we purchase, including the portion purchased from U.S.-based suppliers, as well as most of our private brand merchandise, is manufactured abroad. We may be affected by potential changes in international trade agreements or tariffs, such as new tariffs imposed on certain Chinese-made goods imported into the U.S. Furthermore, China or other countries may institute retaliatory trade measures in response to existing or future tariffs imposed by the U.S. that could have a negative effect on our business. If any of these events occur as described, we may be obligated to seek alternative suppliers for our private brand merchandise, raise prices, or make changes to our operations, any of which could have a material adverse effect on our sales and profitability, results of operations and financial condition.
2020 Form 10-K Page 11
Macroeconomic developments may adversely affect our business.
Our performance is subject to global economic conditions and the related effects on consumer spending levels. Continued uncertainty about global economic conditions, including the COVID-19 pandemic, poses a risk as consumers and businesses may postpone spending in response to tighter credit, unemployment, negative financial news, and/or declines in income or asset values, which could have a material negative effect on demand for our products.
As a retailer that is dependent upon consumer discretionary spending, our results of operations are sensitive to changes in macroeconomic conditions. Our customers may have less money for discretionary purchases as a result of job losses, foreclosures, bankruptcies, increased fuel and energy costs, higher interest rates, higher taxes, reduced access to credit, and lower home values. These and other economic factors could adversely affect demand for our products, which could adversely affect our financial condition and operating results.
Instability in the financial markets may adversely affect our business.
During 2020, uncertainty surrounding the potential effects of the COVID-19 pandemic helped create volatility in financial markets around the world. This volatility may affect our future access to the credit and debt security markets, leading to higher borrowing costs, or, in some cases, the inability to obtain additional financing. On November 30, 2020, ICE Benchmark Administration (“IBA”), the administrator of LIBOR, with the support of the United States Federal Reserve and the United Kingdom’s Financial Conduct Authority, announced plans to consult on ceasing publication of USD LIBOR on December 31, 2021, for only the one week and two month USD LIBOR tenors, and on June 30, 2023, for all other USD Libor tenors. While this announcement extends the transition period to June 2023, the United States Federal Reserve concurrently issued a statement advising banks to stop new USD LIBOR issuances by the end of 2021. In light of these recent announcements, the future of LIBOR at this time is uncertain and any changes in the methods by which LIBOR is determined or regulatory activity related to LIBOR’s phaseout could cause LIBOR to perform differently than in the past or cease to exist. Our 2020 Credit Agreement provides for alternative methods of calculating the interest rate payable on indebtedness thereunder.
Instability in the global financial markets could reduce availability of credit to our business. Although we currently have a revolving credit agreement in place until July 14, 2025, tightening of credit markets could make it more difficult for us to access funds, refinance our existing indebtedness, enter into agreements for new indebtedness, or obtain funding through the issuance of the Company’s securities.
Material changes in the market value of the securities we hold may adversely affect our results of operations and financial condition.
At January 30, 2021 our cash and cash equivalents totaled $1,680 million. The majority of our investments were short-term deposits in highly-rated banking institutions. We regularly monitor our counterparty credit risk and mitigate our exposure by making short-term investments only in highly-rated institutions and by limiting the amount we invest in any one institution. We continually monitor the creditworthiness of our counterparties. At January 30, 2021, all investments were in investment grade institutions. Despite an investment grade rating, it is possible that the value or liquidity of our investments may decline due to any number of factors, including general market conditions and bank-specific credit issues.
Our U.S. pension plan trust holds assets totaling $666 million at January 30, 2021. The fair values of these assets held in the trust are compared to the plan’s projected benefit obligation to determine the pension funding liability. We attempt to mitigate funding risk through asset diversification, and we regularly monitor investment risk of our portfolio through quarterly investment portfolio reviews and periodic asset and liability studies. Despite these measures, it is possible that the value of our portfolio may decline in the future due to any number of factors, including general market conditions and credit issues. Such declines could affect the funded status of our pension plan and future funding requirements.
Our financial results may be adversely affected by tax rates or exposure to additional tax liabilities.
We are a U.S. based multinational company subject to tax in multiple U.S. and foreign tax jurisdictions. Our provision for income taxes is based on a jurisdictional mix of earnings, statutory rates, and enacted tax rules, including transfer pricing. Significant judgment is required in determining our provision for income taxes and in evaluating our tax positions on a worldwide basis. President Biden has proposed raising the highest U.S. federal income tax rate applicable to corporations. Our effective tax rate could be adversely affected by a number of factors, including shifts in the mix of pretax results by tax jurisdiction, changes in tax laws or related interpretations in the jurisdictions in which we operate, and tax assessments and related interest and penalties resulting from income tax audits.
2020 Form 10-K Page 12
Changes in employment laws or regulation could harm our performance.
Various foreign and domestic labor laws govern our relationship with our employees and affect our operating costs. These laws include minimum wage requirements, overtime and sick pay, paid time off, work scheduling, healthcare reform and the Patient Protection and Affordable Care Act, unemployment tax rates, workers’ compensation rates, European works council requirements, and union organization.
A number of factors could adversely affect our operating results, including additional government-imposed increases in minimum wages, overtime and sick pay, paid leaves of absence, mandated health benefits, and changing regulations from the National Labor Relations Board or other agencies. Complying with any new legislation or reversing changes implemented under existing law could be time-intensive and expensive and may affect our business.
Legislative or regulatory initiatives related to climate change concerns may negatively affect our business.
Greenhouse gases may have an adverse effect on global temperatures, weather patterns, and the frequency and severity of extreme weather and natural disasters. Global climate change could result in certain types of natural disasters occurring more frequently or with more intense effects. Such events could make it difficult or impossible for us to deliver products to our customers, create delays, and inefficiencies in our supply chain. Following an interruption to our business, we could require substantial recovery time, experience significant expenditures to resume operations, and lose significant sales. Concern over climate change may result in new or additional legal, legislative, and regulatory requirements to reduce or mitigate the effects of climate change on the environment, which could result in future tax, transportation, and utility increases, which could adversely affect our business. There is also increased focus, including by investors, customers, and other stakeholders, on these and other sustainability matters, such as worker safety, the use of plastic, energy consumption, and waste.
Increasing scrutiny and changing expectations from investors and our customers with respect to our Corporate Social Responsibility (“CSR”) may impose additional costs on us or expose us to new or additional risks.
Our reputation could be damaged if we do not (or are perceived not to) act responsibly with respect to sustainability matters, which could adversely affect our business, results of operations, cash flows, and financial condition. Increasing attention to CSR matters may affect our business and some institutional investors may be discouraged from investing in us.
Companies across all industries are facing increasing scrutiny from stakeholders related to their CSR practices. Investor advocacy groups, certain institutional investors, investment funds, and other influential investors are also increasingly focused on CSR practices and in recent years have placed increasing importance on the implications and social cost of their investments. Regardless of the industry, investors’ increased focus and activism related to CSR and similar matters may hinder access to capital, as investors may decide to reallocate capital or to not commit capital as a result of their assessment of a company’s CSR practices. Companies which do not adapt to or comply with investor or stakeholder expectations and standards, which are evolving, or which are perceived to have not responded appropriately to the growing concern for CSR issues, regardless of whether there is a legal requirement to do so, may suffer from reputational damage and the business, financial condition, and/or stock price of such a company could be materially and adversely affected.
In addition, the importance of CSR scoring evaluations is becoming more broadly accepted by shareholders. Certain organizations that provide corporate governance and other corporate risk information to shareholders have developed scores and ratings to evaluate companies based upon CSR metrics. Many shareholders focus on positive CSR business practices and scores when making investments and may consider a company’s score as a reputational or other factor in making an investment decision. In addition, investors, particularly institutional investors, use these scores to benchmark companies against their peers and if a company is perceived as lagging, these investors may engage with companies to require improved CSR disclosure or performance. We may face reputational damage in the event our CSR procedures or standards do not meet the standards set by various constituencies. A low score could result in a negative perception of us, or exclusion of our common stock from consideration by certain investors who may elect to invest with our competition instead. In addition, the cost of compliance to receive high CSR scores may be considerable.
2020 Form 10-K Page 13
We may be adversely affected by regulatory and litigation developments.
We are exposed to the risk that federal or state legislation may negatively affect our operations. Changes in federal or state wage requirements, employee rights, health care, social welfare or entitlement programs, including health insurance, paid leave programs, or other changes in workplace regulation could increase our cost of doing business or otherwise adversely affect our operations. Additionally, we are regularly involved in litigation, including commercial, tort, intellectual property, customer, employment, wage and hour, data privacy, anti-corruption, and other claims, including purported class action lawsuits. The cost of defending against these types of claims against us or the ultimate resolution of such claims, whether by settlement or adverse court decision, may harm our business.
We operate in many different jurisdictions and we could be adversely affected by violations of the U.S. Foreign Corrupt Practices Act and similar worldwide anti-corruption laws.
The U.S. Foreign Corrupt Practices Act (“FCPA”) and similar worldwide anti-corruption laws, including the U.K. Bribery Act of 2010, which is broader in scope than the FCPA, generally prohibit companies and their intermediaries from making improper payments to government officials for the purpose of obtaining or retaining business. Our internal policies mandate compliance with these anti-corruption laws. Despite our training and compliance programs, we cannot be assured that our internal control policies and procedures will always protect us from reckless or criminal acts committed by our employees or agents. Our continued expansion outside the United States, including in developing countries, could increase the risk of FCPA violations in the future. Violations of these laws, or allegations of such violations, could have a material adverse effect on our results of operations or financial condition.
Failure to fully comply with Section 404 of the Sarbanes-Oxley Act of 2002 could negatively affect our business, market confidence in our reported financial information, and the price of our common stock.
We continue to document, test, and monitor our internal control over financial reporting in order to satisfy the requirements of Section 404 of the Sarbanes-Oxley Act of 2002. However, we cannot be assured that our disclosure controls and procedures and our internal control over financial reporting will prove to be completely adequate in the future. Failure to fully comply with Section 404 of the Sarbanes-Oxley Act of 2002 could negatively affect our business, market confidence in our reported financial information, and the price of our common stock.
International intellectual property protection can be uncertain and costly.
Uncertainty in intellectual property protection can result from conducting business outside the United States, particularly in jurisdictions that do not have comparable levels of protection for our assets such as intellectual property, copyrights, and trademarks. Continuing to operate in such foreign jurisdictions where the ability to enforce intellectual property rights is limited increases our exposure to risk.
Item 1B. Unresolved Staff Comments
None
Item 2. Properties
Our properties consist of land, leased stores, administrative facilities, and distribution centers. Gross square footage and total selling area for our store locations at the end of 2020 were approximately 12.98 and 7.50 million square feet, respectively. These properties, which are primarily leased, are located in the United States and its territories, Canada, various European countries, Asia, Australia, and New Zealand.
We currently operate five distribution centers, of which two are owned and three are leased, occupying an aggregate of 3.0 million square feet. Three of these distribution centers are located in the United States, one in Canada, and one in the Netherlands. We also own a cross-dock and manufacturing facility, and operate a leased warehouse in the United States, both of which support our Team Edition apparel business.
We believe that all leases of properties that are material to our operations may be renewed, or that alternative properties are available, on terms similar to existing leases.
Item 3. Legal Proceedings
Information regarding the Company’s legal proceedings is contained in the Legal Proceedings note under “Item 8. Consolidated Financial Statements and Supplementary Data.”
2020 Form 10-K Page 14
Item 4. Mine Safety Disclosures
Not applicable.
Item 4A. Information about our Executive Officers The following table provides information with respect to all persons serving as executive officers as of March 25, 2021, including business experience for the last five years.
Chairman, President and Chief Executive Officer Richard A. Johnson Executive Vice President and Chief Executive Officer — North America Frank Bracken Executive Vice President and Chief Commercial Officer Andrew Gray Executive Vice President and Chief Executive Officer — Asia Pacific and Chief Strategy
Officer W. Scott Martin Executive Vice President and Chief Financial Officer Lauren B. Peters Executive Vice President and Chief Executive Officer — EMEA Vijay Talwar Senior Vice President and Chief Accounting Officer Giovanna Cipriano Senior Vice President, General Counsel and Secretary Sheilagh M. Clarke Senior Vice President — Global Supply Chain Todd Greener Senior Vice President and Chief Human Resources Officer Elizabeth S. Norberg Senior Vice President and Chief Information Officer Himanshu Parikh Vice President, Treasurer John A. Maurer
Richard A. Johnson, age 63, has served as Chairman of the Board since May 2016 and President and Chief Executive Officer since December 2014.
Frank Bracken, age 48, has served as Executive Vice President and Chief Executive Officer — North America since July 22, 2020. He previously served as Senior Vice President and General Manager Foot Locker, Lady Foot Locker, and Kids Foot Locker from October 2017 through July 2020. Mr. Bracken previously served as the General Manager of Foot Locker Canada from February 2016 through October 2017. From January 2014 through February 2016, Mr. Bracken served as Vice President, Divisional Merchandise Manager of Footwear for Champs Sports.
Andrew Gray, age 43, has served as Executive Vice President and Chief Commercial Officer since July 22, 2020. Mr. Gray previously served as Vice President and Chief Merchandising Officer — North America from October 2017 through July 2020 and Vice President and General Manager of U.S. Foot Locker and Lady Foot Locker from April 2016 to October 2017. Mr. Gray previously served as Vice President and General Merchandising Manager from July 2013 to April 2016.
W. Scott Martin, age 53, has served as Executive Vice President and Chief Executive Officer — Asia Pacific and Chief Strategy Officer since July 22, 2020. He previously served as Senior Vice President, Chief Strategy and Development Officer from March 2019 to July 2020. Previously he served as Senior Vice President — Strategy and Store Development from October 2017 to March 2019 and as Senior Vice President — Real Estate from June 2016 to September 2017. Mr. Martin previously served as Vice President, Store Development – Asia Pacific with Gap Inc. from June 2014 to June 2016.
Lauren B. Peters, age 59, has served as Executive Vice President and Chief Financial Officer since July 2011.
Vijay Talwar, age 49, has served as Executive Vice President and Chief Executive Officer — EMEA since February 2019. Mr. Talwar previously served as President — Digital from March 2018 to February 2019 and President — Digital/Footlocker.com/Eastbay from September 2016 to March 2018. Mr. Talwar served as President, Gifts and Special Occasions at Sears Holdings Corporation from 2014 to September 2016.
Giovanna Cipriano, age 51, has served as Senior Vice President and Chief Accounting Officer since May 2009.
Sheilagh M. Clarke, age 61, has served as Senior Vice President, General Counsel and Secretary since June 2014.
Todd Greener, age 50, has served as Senior Vice President — Global Supply Chain since October 2018. Mr. Greener previously served as Senior Vice President — Supply Chain at Advance Auto Parts from March 2015 to October 2018 and General Manager — Appliance Distribution Operations at General Electric Company from September 2012 to February 2015.
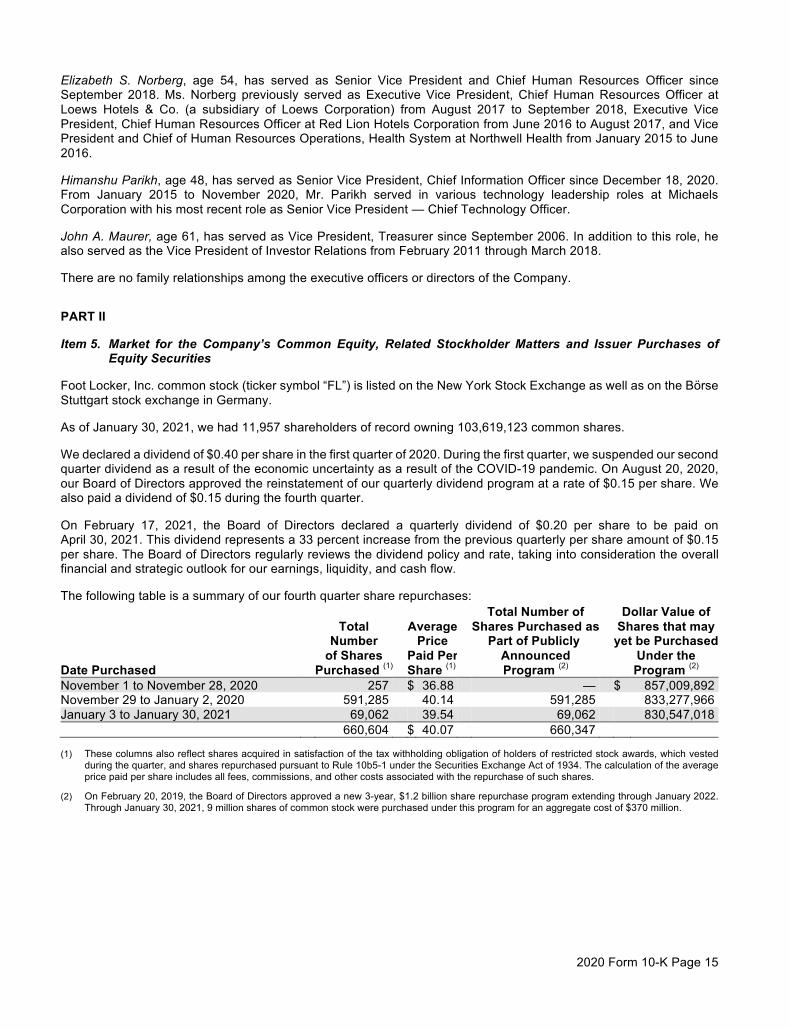
2020 Form 10-K Page 15
Elizabeth S. Norberg, age 54, has served as Senior Vice President and Chief Human Resources Officer since September 2018. Ms. Norberg previously served as Executive Vice President, Chief Human Resources Officer at Loews Hotels & Co. (a subsidiary of Loews Corporation) from August 2017 to September 2018, Executive Vice President, Chief Human Resources Officer at Red Lion Hotels Corporation from June 2016 to August 2017, and Vice President and Chief of Human Resources Operations, Health System at Northwell Health from January 2015 to June 2016.
Himanshu Parikh, age 48, has served as Senior Vice President, Chief Information Officer since December 18, 2020. From January 2015 to November 2020, Mr. Parikh served in various technology leadership roles at Michaels Corporation with his most recent role as Senior Vice President — Chief Technology Officer.
John A. Maurer, age 61, has served as Vice President, Treasurer since September 2006. In addition to this role, he also served as the Vice President of Investor Relations from February 2011 through March 2018.
There are no family relationships among the executive officers or directors of the Company.
PART II
Item 5. Market for the Company’s Common Equity, Related Stockholder Matters and Issuer Purchases of Equity Securities
Foot Locker, Inc. common stock (ticker symbol “FL”) is listed on the New York Stock Exchange as well as on the Börse Stuttgart stock exchange in Germany.
As of January 30, 2021, we had 11,957 shareholders of record owning 103,619,123 common shares.
We declared a dividend of $0.40 per share in the first quarter of 2020. During the first quarter, we suspended our second quarter dividend as a result of the economic uncertainty as a result of the COVID-19 pandemic. On August 20, 2020, our Board of Directors approved the reinstatement of our quarterly dividend program at a rate of $0.15 per share. We also paid a dividend of $0.15 during the fourth quarter.
On February 17, 2021, the Board of Directors declared a quarterly dividend of $0.20 per share to be paid on April 30, 2021. This dividend represents a 33 percent increase from the previous quarterly per share amount of $0.15 per share. The Board of Directors regularly reviews the dividend policy and rate, taking into consideration the overall financial and strategic outlook for our earnings, liquidity, and cash flow.
The following table is a summary of our fourth quarter share repurchases:
Total Number of Dollar Value of Total Average Shares Purchased as Shares that may Number Price Part of Publicly yet be Purchased of Shares Paid Per Announced Under the Date Purchased Purchased (1) Share (1) Program (2) Program (2) November 1 to November 28, 2020 257 $ 36.88 — $ 857,009,892 November 29 to January 2, 2020 591,285 40.14 591,285 833,277,966 January 3 to January 30, 2021 69,062 39.54 69,062 830,547,018 660,604 $ 40.07 660,347 (1) These columns also reflect shares acquired in satisfaction of the tax withholding obligation of holders of restricted stock awards, which vested
during the quarter, and shares repurchased pursuant to Rule 10b5-1 under the Securities Exchange Act of 1934. The calculation of the average price paid per share includes all fees, commissions, and other costs associated with the repurchase of such shares.
(2) On February 20, 2019, the Board of Directors approved a new 3-year, $1.2 billion share repurchase program extending through January 2022. Through January 30, 2021, 9 million shares of common stock were purchased under this program for an aggregate cost of $370 million.
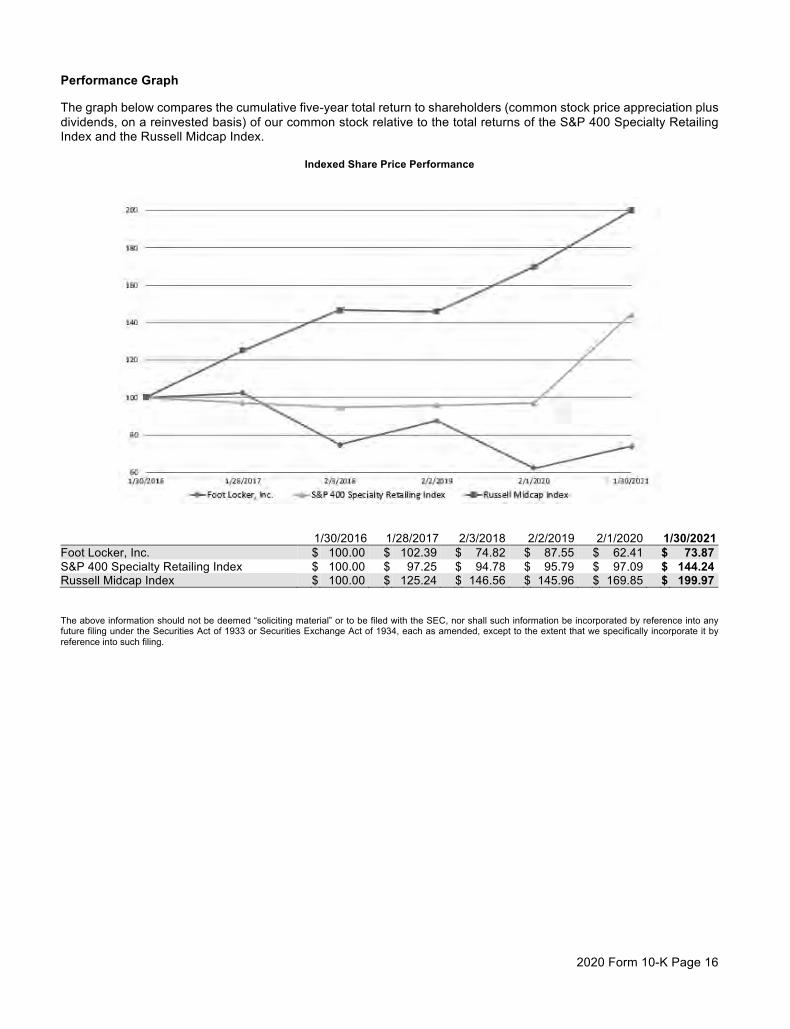
2020 Form 10-K Page 16
Performance Graph
The graph below compares the cumulative five-year total return to shareholders (common stock price appreciation plus dividends, on a reinvested basis) of our common stock relative to the total returns of the S&P 400 Specialty Retailing Index and the Russell Midcap Index.
Indexed Share Price Performance
1/30/2016 1/28/2017 2/3/2018 2/2/2019 2/1/2020 1/30/2021 Foot Locker, Inc. $ 100.00 $ 102.39 $ 74.82 $ 87.55 $ 62.41 $ 73.87 S&P 400 Specialty Retailing Index $ 100.00 $ 97.25 $ 94.78 $ 95.79 $ 97.09 $ 144.24 Russell Midcap Index $ 100.00 $ 125.24 $ 146.56 $ 145.96 $ 169.85 $ 199.97
The above information should not be deemed “soliciting material” or to be filed with the SEC, nor shall such information be incorporated by reference into any future filing under the Securities Act of 1933 or Securities Exchange Act of 1934, each as amended, except to the extent that we specifically incorporate it by reference into such filing.
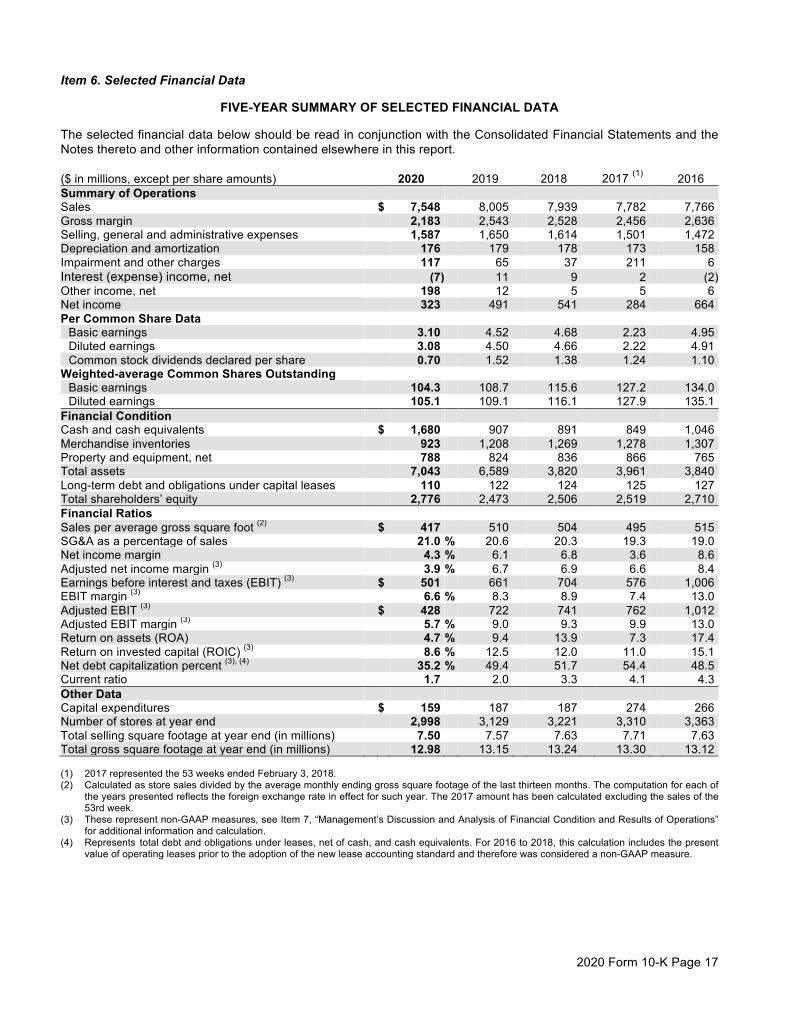
2020 Form 10-K Page 17
Item 6. Selected Financial Data
FIVE-YEAR SUMMARY OF SELECTED FINANCIAL DATA
The selected financial data below should be read in conjunction with the Consolidated Financial Statements and the Notes thereto and other information contained elsewhere in this report.
($ in millions, except per share amounts) 2020 2019 2018 2017 (1) 2016 Summary of Operations Sales $ 7,548 8,005 7,939 7,782 7,766 Gross margin 2,183 2,543 2,528 2,456 2,636 Selling, general and administrative expenses 1,587 1,650 1,614 1,501 1,472 Depreciation and amortization 176 179 178 173 158 Impairment and other charges 117 65 37 211 6 Interest (expense) income, net (7) 11 9 2 (2) Other income, net 198 12 5 5 6 Net income 323 491 541 284 664 Per Common Share Data
Basic earnings 3.10 4.52 4.68 2.23 4.95 Diluted earnings 3.08 4.50 4.66 2.22 4.91 Common stock dividends declared per share 0.70 1.52 1.38 1.24 1.10
Weighted-average Common Shares Outstanding Basic earnings 104.3 108.7 115.6 127.2 134.0 Diluted earnings 105.1 109.1 116.1 127.9 135.1
Financial Condition Cash and cash equivalents $ 1,680 907 891 849 1,046 Merchandise inventories 923 1,208 1,269 1,278 1,307 Property and equipment, net 788 824 836 866 765 Total assets 7,043 6,589 3,820 3,961 3,840 Long-term debt and obligations under capital leases 110 122 124 125 127 Total shareholders’ equity 2,776 2,473 2,506 2,519 2,710 Financial Ratios Sales per average gross square foot (2) $ 417 510 504 495 515 SG&A as a percentage of sales 21.0 % 20.6 20.3 19.3 19.0 Net income margin 4.3 % 6.1 6.8 3.6 8.6 Adjusted net income margin (3) 3.9 % 6.7 6.9 6.6 8.4 Earnings before interest and taxes (EBIT) (3) $ 501 661 704 576 1,006 EBIT margin (3) 6.6 % 8.3 8.9 7.4 13.0 Adjusted EBIT (3) $ 428 722 741 762 1,012 Adjusted EBIT margin (3) 5.7 % 9.0 9.3 9.9 13.0 Return on assets (ROA) 4.7 % 9.4 13.9 7.3 17.4 Return on invested capital (ROIC) (3) 8.6 % 12.5 12.0 11.0 15.1 Net debt capitalization percent (3), (4) 35.2 % 49.4 51.7 54.4 48.5 Current ratio 1.7 2.0 3.3 4.1 4.3 Other Data Capital expenditures $ 159 187 187 274 266 Number of stores at year end 2,998 3,129 3,221 3,310 3,363 Total selling square footage at year end (in millions) 7.50 7.57 7.63 7.71 7.63 Total gross square footage at year end (in millions) 12.98 13.15 13.24 13.30 13.12 (1) 2017 represented the 53 weeks ended February 3, 2018. (2) Calculated as store sales divided by the average monthly ending gross square footage of the last thirteen months. The computation for each of
the years presented reflects the foreign exchange rate in effect for such year. The 2017 amount has been calculated excluding the sales of the 53rd week.
(3) These represent non-GAAP measures, see Item 7, “Management’s Discussion and Analysis of Financial Condition and Results of Operations” for additional information and calculation.
(4) Represents total debt and obligations under leases, net of cash, and cash equivalents. For 2016 to 2018, this calculation includes the present value of operating leases prior to the adoption of the new lease accounting standard and therefore was considered a non-GAAP measure.
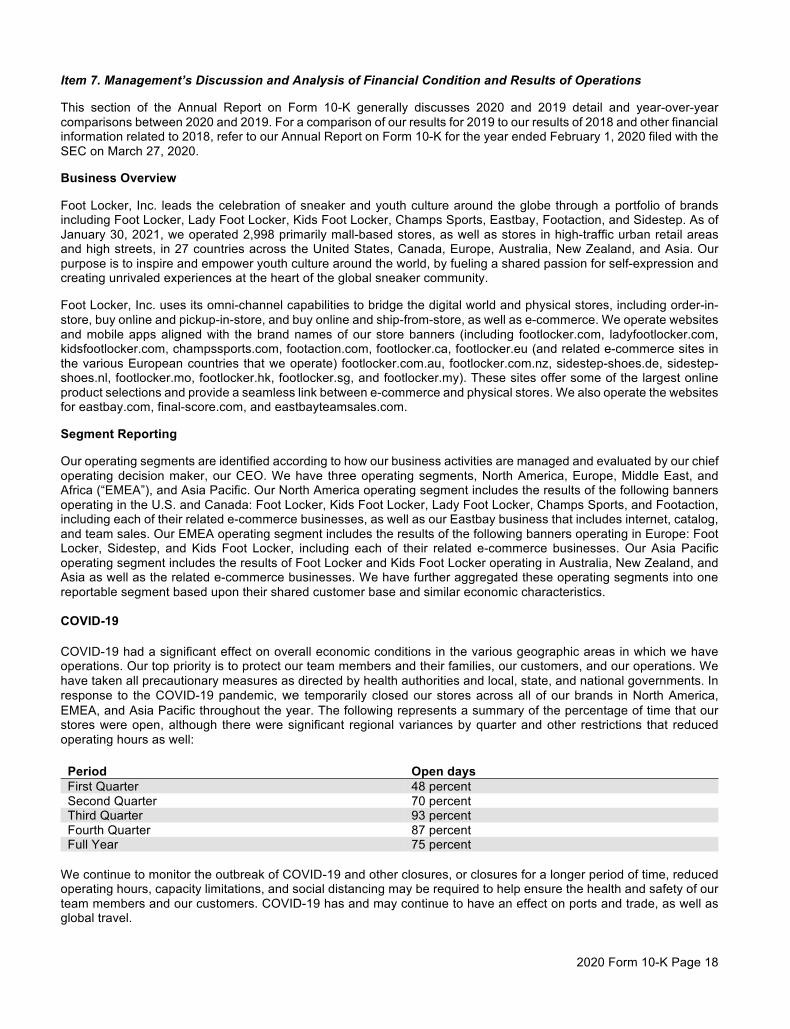
2020 Form 10-K Page 18
Item 7. Management’s Discussion and Analysis of Financial Condition and Results of Operations
This section of the Annual Report on Form 10-K generally discusses 2020 and 2019 detail and year-over-year comparisons between 2020 and 2019. For a comparison of our results for 2019 to our results of 2018 and other financial information related to 2018, refer to our Annual Report on Form 10-K for the year ended February 1, 2020 filed with the SEC on March 27, 2020.
Business Overview
Foot Locker, Inc. leads the celebration of sneaker and youth culture around the globe through a portfolio of brands including Foot Locker, Lady Foot Locker, Kids Foot Locker, Champs Sports, Eastbay, Footaction, and Sidestep. As of January 30, 2021, we operated 2,998 primarily mall-based stores, as well as stores in high-traffic urban retail areas and high streets, in 27 countries across the United States, Canada, Europe, Australia, New Zealand, and Asia. Our purpose is to inspire and empower youth culture around the world, by fueling a shared passion for self-expression and creating unrivaled experiences at the heart of the global sneaker community.
Foot Locker, Inc. uses its omni-channel capabilities to bridge the digital world and physical stores, including order-in-store, buy online and pickup-in-store, and buy online and ship-from-store, as well as e-commerce. We operate websites and mobile apps aligned with the brand names of our store banners (including footlocker.com, ladyfootlocker.com, kidsfootlocker.com, champssports.com, footaction.com, footlocker.ca, footlocker.eu (and related e-commerce sites in the various European countries that we operate) footlocker.com.au, footlocker.com.nz, sidestep-shoes.de, sidestep-shoes.nl, footlocker.mo, footlocker.hk, footlocker.sg, and footlocker.my). These sites offer some of the largest online product selections and provide a seamless link between e-commerce and physical stores. We also operate the websites for eastbay.com, final-score.com, and eastbayteamsales.com.
Segment Reporting
Our operating segments are identified according to how our business activities are managed and evaluated by our chief operating decision maker, our CEO. We have three operating segments, North America, Europe, Middle East, and Africa (“EMEA”), and Asia Pacific. Our North America operating segment includes the results of the following banners operating in the U.S. and Canada: Foot Locker, Kids Foot Locker, Lady Foot Locker, Champs Sports, and Footaction, including each of their related e-commerce businesses, as well as our Eastbay business that includes internet, catalog, and team sales. Our EMEA operating segment includes the results of the following banners operating in Europe: Foot Locker, Sidestep, and Kids Foot Locker, including each of their related e-commerce businesses. Our Asia Pacific operating segment includes the results of Foot Locker and Kids Foot Locker operating in Australia, New Zealand, and Asia as well as the related e-commerce businesses. We have further aggregated these operating segments into one reportable segment based upon their shared customer base and similar economic characteristics. COVID-19
COVID-19 had a significant effect on overall economic conditions in the various geographic areas in which we have operations. Our top priority is to protect our team members and their families, our customers, and our operations. We have taken all precautionary measures as directed by health authorities and local, state, and national governments. In response to the COVID-19 pandemic, we temporarily closed our stores across all of our brands in North America, EMEA, and Asia Pacific throughout the year. The following represents a summary of the percentage of time that our stores were open, although there were significant regional variances by quarter and other restrictions that reduced operating hours as well:
Period Open days First Quarter 48 percent Second Quarter 70 percent Third Quarter 93 percent Fourth Quarter 87 percent Full Year 75 percent
We continue to monitor the outbreak of COVID-19 and other closures, or closures for a longer period of time, reduced operating hours, capacity limitations, and social distancing may be required to help ensure the health and safety of our team members and our customers. COVID-19 has and may continue to have an effect on ports and trade, as well as global travel.
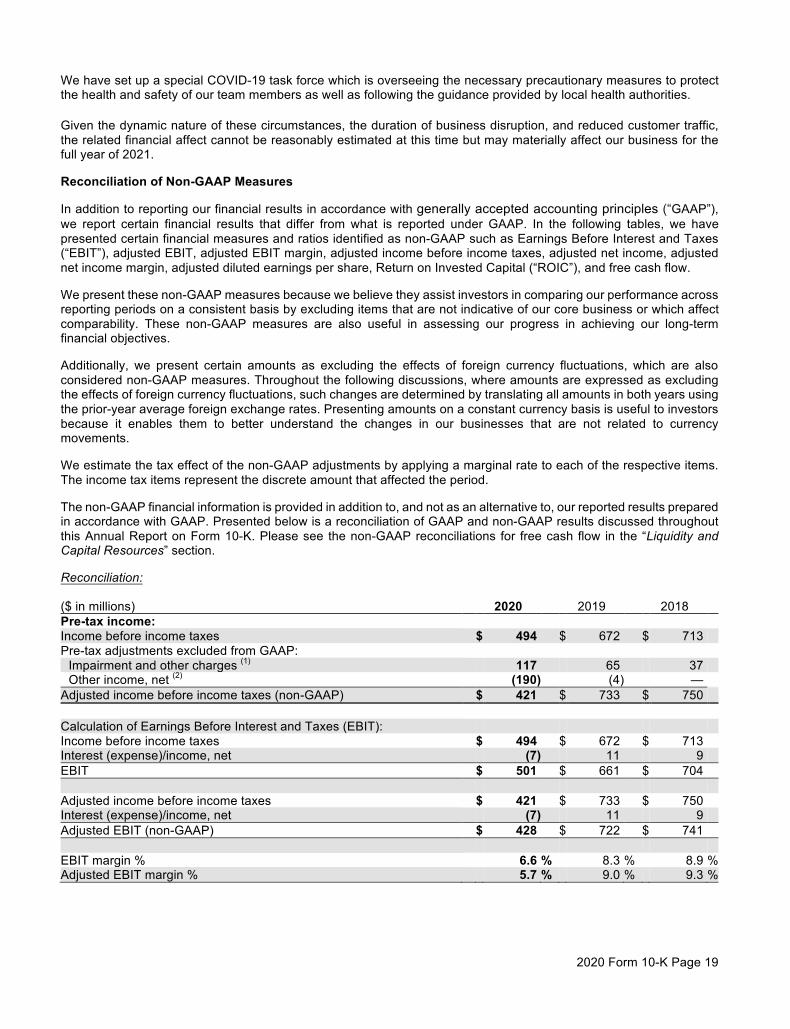
2020 Form 10-K Page 19
We have set up a special COVID-19 task force which is overseeing the necessary precautionary measures to protect the health and safety of our team members as well as following the guidance provided by local health authorities.
Given the dynamic nature of these circumstances, the duration of business disruption, and reduced customer traffic, the related financial affect cannot be reasonably estimated at this time but may materially affect our business for the full year of 2021.
Reconciliation of Non-GAAP Measures
In addition to reporting our financial results in accordance with generally accepted accounting principles (“GAAP”), we report certain financial results that differ from what is reported under GAAP. In the following tables, we have presented certain financial measures and ratios identified as non-GAAP such as Earnings Before Interest and Taxes (“EBIT”), adjusted EBIT, adjusted EBIT margin, adjusted income before income taxes, adjusted net income, adjusted net income margin, adjusted diluted earnings per share, Return on Invested Capital (“ROIC”), and free cash flow.
We present these non-GAAP measures because we believe they assist investors in comparing our performance across reporting periods on a consistent basis by excluding items that are not indicative of our core business or which affect comparability. These non-GAAP measures are also useful in assessing our progress in achieving our long-term financial objectives.
Additionally, we present certain amounts as excluding the effects of foreign currency fluctuations, which are also considered non-GAAP measures. Throughout the following discussions, where amounts are expressed as excluding the effects of foreign currency fluctuations, such changes are determined by translating all amounts in both years using the prior-year average foreign exchange rates. Presenting amounts on a constant currency basis is useful to investors because it enables them to better understand the changes in our businesses that are not related to currency movements.
We estimate the tax effect of the non-GAAP adjustments by applying a marginal rate to each of the respective items. The income tax items represent the discrete amount that affected the period.
The non-GAAP financial information is provided in addition to, and not as an alternative to, our reported results prepared in accordance with GAAP. Presented below is a reconciliation of GAAP and non-GAAP results discussed throughout this Annual Report on Form 10-K. Please see the non-GAAP reconciliations for free cash flow in the “Liquidity and Capital Resources” section.
Reconciliation:
($ in millions) 2020 2019 2018 Pre-tax income: Income before income taxes $ 494 $ 672 $ 713 Pre-tax adjustments excluded from GAAP:
Impairment and other charges (1) 117 65 37 Other income, net (2) (190) (4) —
Adjusted income before income taxes (non-GAAP) $ 421 $ 733 $ 750 Calculation of Earnings Before Interest and Taxes (EBIT): Income before income taxes $ 494 $ 672 $ 713 Interest (expense)/income, net (7) 11 9 EBIT $ 501 $ 661 $ 704 Adjusted income before income taxes $ 421 $ 733 $ 750 Interest (expense)/income, net (7) 11 9 Adjusted EBIT (non-GAAP) $ 428 $ 722 $ 741 EBIT margin % 6.6 % 8.3 % 8.9 % Adjusted EBIT margin % 5.7 % 9.0 % 9.3 %
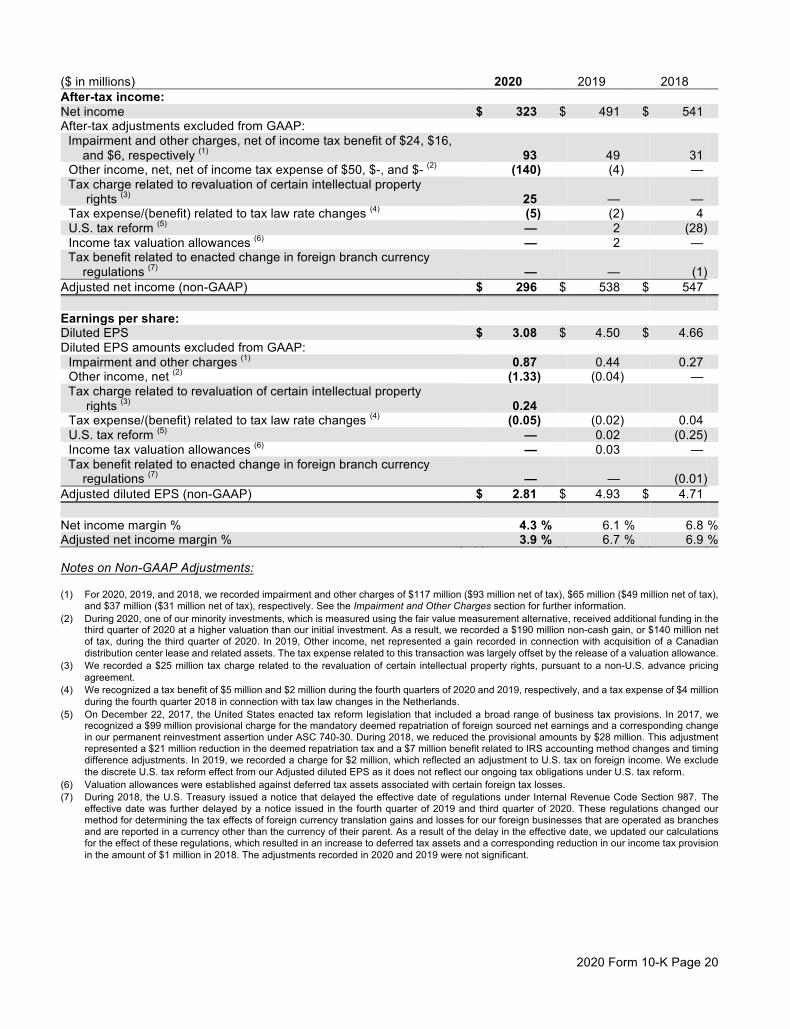
2020 Form 10-K Page 20
($ in millions) 2020 2019 2018 After-tax income: Net income $ 323 $ 491 $ 541 After-tax adjustments excluded from GAAP:
Impairment and other charges, net of income tax benefit of $24, $16, and $6, respectively (1) 93 49 31
Other income, net, net of income tax expense of $50, $-, and $- (2) (140) (4) — Tax charge related to revaluation of certain intellectual property
rights (3) 25 — — Tax expense/(benefit) related to tax law rate changes (4) (5) (2) 4 U.S. tax reform (5) — 2 (28) Income tax valuation allowances (6) — 2 — Tax benefit related to enacted change in foreign branch currency
regulations (7) — — (1) Adjusted net income (non-GAAP) $ 296 $ 538 $ 547 Earnings per share: Diluted EPS $ 3.08 $ 4.50 $ 4.66 Diluted EPS amounts excluded from GAAP:
Impairment and other charges (1) 0.87 0.44 0.27 Other income, net (2) (1.33) (0.04) — Tax charge related to revaluation of certain intellectual property
rights (3) 0.24 Tax expense/(benefit) related to tax law rate changes (4) (0.05) (0.02) 0.04 U.S. tax reform (5) — 0.02 (0.25) Income tax valuation allowances (6) — 0.03 — Tax benefit related to enacted change in foreign branch currency
regulations (7) — — (0.01) Adjusted diluted EPS (non-GAAP) $ 2.81 $ 4.93 $ 4.71 Net income margin % 4.3 % 6.1 % 6.8 % Adjusted net income margin % 3.9 % 6.7 % 6.9 %
Notes on Non-GAAP Adjustments: (1) For 2020, 2019, and 2018, we recorded impairment and other charges of $117 million ($93 million net of tax), $65 million ($49 million net of tax),
and $37 million ($31 million net of tax), respectively. See the Impairment and Other Charges section for further information. (2) During 2020, one of our minority investments, which is measured using the fair value measurement alternative, received additional funding in the
third quarter of 2020 at a higher valuation than our initial investment. As a result, we recorded a $190 million non-cash gain, or $140 million net of tax, during the third quarter of 2020. In 2019, Other income, net represented a gain recorded in connection with acquisition of a Canadian distribution center lease and related assets. The tax expense related to this transaction was largely offset by the release of a valuation allowance.
(3) We recorded a $25 million tax charge related to the revaluation of certain intellectual property rights, pursuant to a non-U.S. advance pricing agreement.
(4) We recognized a tax benefit of $5 million and $2 million during the fourth quarters of 2020 and 2019, respectively, and a tax expense of $4 million during the fourth quarter 2018 in connection with tax law changes in the Netherlands.
(5) On December 22, 2017, the United States enacted tax reform legislation that included a broad range of business tax provisions. In 2017, we recognized a $99 million provisional charge for the mandatory deemed repatriation of foreign sourced net earnings and a corresponding change in our permanent reinvestment assertion under ASC 740-30. During 2018, we reduced the provisional amounts by $28 million. This adjustment represented a $21 million reduction in the deemed repatriation tax and a $7 million benefit related to IRS accounting method changes and timing difference adjustments. In 2019, we recorded a charge for $2 million, which reflected an adjustment to U.S. tax on foreign income. We exclude the discrete U.S. tax reform effect from our Adjusted diluted EPS as it does not reflect our ongoing tax obligations under U.S. tax reform.
(6) Valuation allowances were established against deferred tax assets associated with certain foreign tax losses. (7) During 2018, the U.S. Treasury issued a notice that delayed the effective date of regulations under Internal Revenue Code Section 987. The
effective date was further delayed by a notice issued in the fourth quarter of 2019 and third quarter of 2020. These regulations changed our method for determining the tax effects of foreign currency translation gains and losses for our foreign businesses that are operated as branches and are reported in a currency other than the currency of their parent. As a result of the delay in the effective date, we updated our calculations for the effect of these regulations, which resulted in an increase to deferred tax assets and a corresponding reduction in our income tax provision in the amount of $1 million in 2018. The adjustments recorded in 2020 and 2019 were not significant.
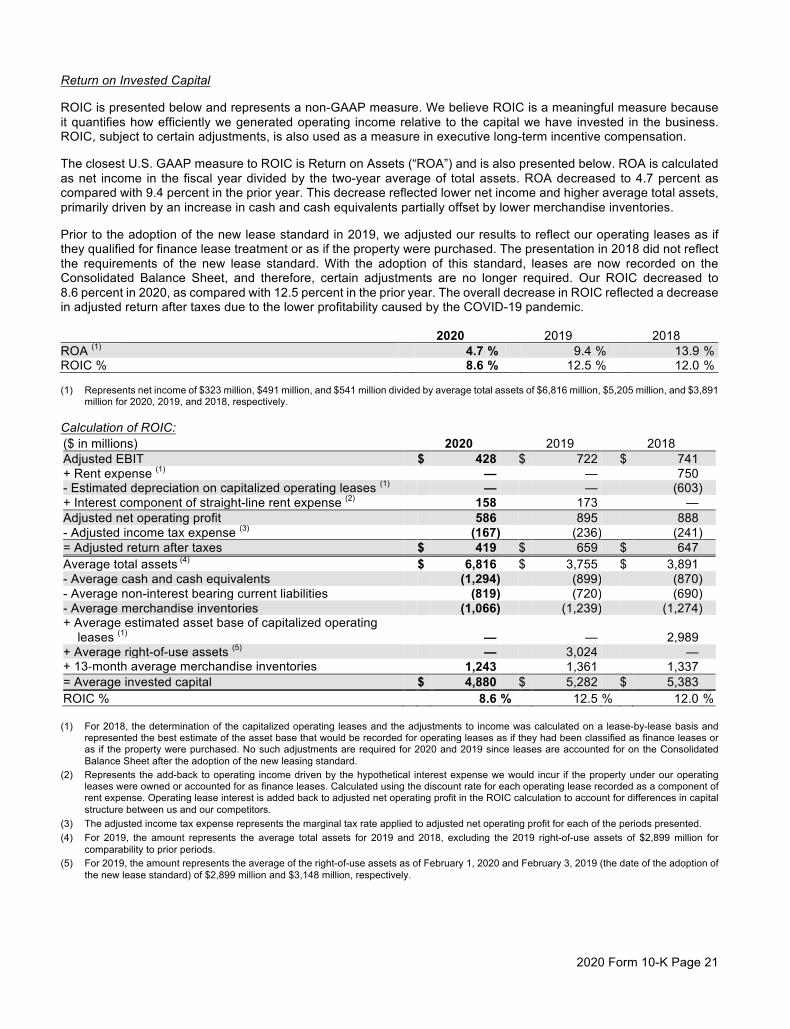
2020 Form 10-K Page 21
Return on Invested Capital
ROIC is presented below and represents a non-GAAP measure. We believe ROIC is a meaningful measure because it quantifies how efficiently we generated operating income relative to the capital we have invested in the business. ROIC, subject to certain adjustments, is also used as a measure in executive long-term incentive compensation.
The closest U.S. GAAP measure to ROIC is Return on Assets (“ROA”) and is also presented below. ROA is calculated as net income in the fiscal year divided by the two-year average of total assets. ROA decreased to 4.7 percent as compared with 9.4 percent in the prior year. This decrease reflected lower net income and higher average total assets, primarily driven by an increase in cash and cash equivalents partially offset by lower merchandise inventories.
Prior to the adoption of the new lease standard in 2019, we adjusted our results to reflect our operating leases as if they qualified for finance lease treatment or as if the property were purchased. The presentation in 2018 did not reflect the requirements of the new lease standard. With the adoption of this standard, leases are now recorded on the Consolidated Balance Sheet, and therefore, certain adjustments are no longer required. Our ROIC decreased to 8.6 percent in 2020, as compared with 12.5 percent in the prior year. The overall decrease in ROIC reflected a decrease in adjusted return after taxes due to the lower profitability caused by the COVID-19 pandemic.
2020 2019 2018 ROA (1) 4.7 % 9.4 % 13.9 % ROIC % 8.6 % 12.5 % 12.0 % (1) Represents net income of $323 million, $491 million, and $541 million divided by average total assets of $6,816 million, $5,205 million, and $3,891
million for 2020, 2019, and 2018, respectively.
Calculation of ROIC:
($ in millions) 2020 2019 2018 Adjusted EBIT $ 428 $ 722 $ 741 + Rent expense (1) — — 750 - Estimated depreciation on capitalized operating leases (1) — — (603) + Interest component of straight-line rent expense (2) 158 173 — Adjusted net operating profit 586 895 888 - Adjusted income tax expense (3) (167) (236) (241) = Adjusted return after taxes $ 419 $ 659 $ 647 Average total assets (4) $ 6,816 $ 3,755 $ 3,891 - Average cash and cash equivalents (1,294) (899) (870) - Average non-interest bearing current liabilities (819) (720) (690) - Average merchandise inventories (1,066) (1,239) (1,274) + Average estimated asset base of capitalized operating
leases (1) — — 2,989 + Average right-of-use assets (5) — 3,024 — + 13-month average merchandise inventories 1,243 1,361 1,337 = Average invested capital $ 4,880 $ 5,282 $ 5,383 ROIC % 8.6 % 12.5 % 12.0 %
(1) For 2018, the determination of the capitalized operating leases and the adjustments to income was calculated on a lease-by-lease basis and
represented the best estimate of the asset base that would be recorded for operating leases as if they had been classified as finance leases or as if the property were purchased. No such adjustments are required for 2020 and 2019 since leases are accounted for on the Consolidated Balance Sheet after the adoption of the new leasing standard.
(2) Represents the add-back to operating income driven by the hypothetical interest expense we would incur if the property under our operating leases were owned or accounted for as finance leases. Calculated using the discount rate for each operating lease recorded as a component of rent expense. Operating lease interest is added back to adjusted net operating profit in the ROIC calculation to account for differences in capital structure between us and our competitors.
(3) The adjusted income tax expense represents the marginal tax rate applied to adjusted net operating profit for each of the periods presented. (4) For 2019, the amount represents the average total assets for 2019 and 2018, excluding the 2019 right-of-use assets of $2,899 million for
comparability to prior periods. (5) For 2019, the amount represents the average of the right-of-use assets as of February 1, 2020 and February 3, 2019 (the date of the adoption of
the new lease standard) of $2,899 million and $3,148 million, respectively.
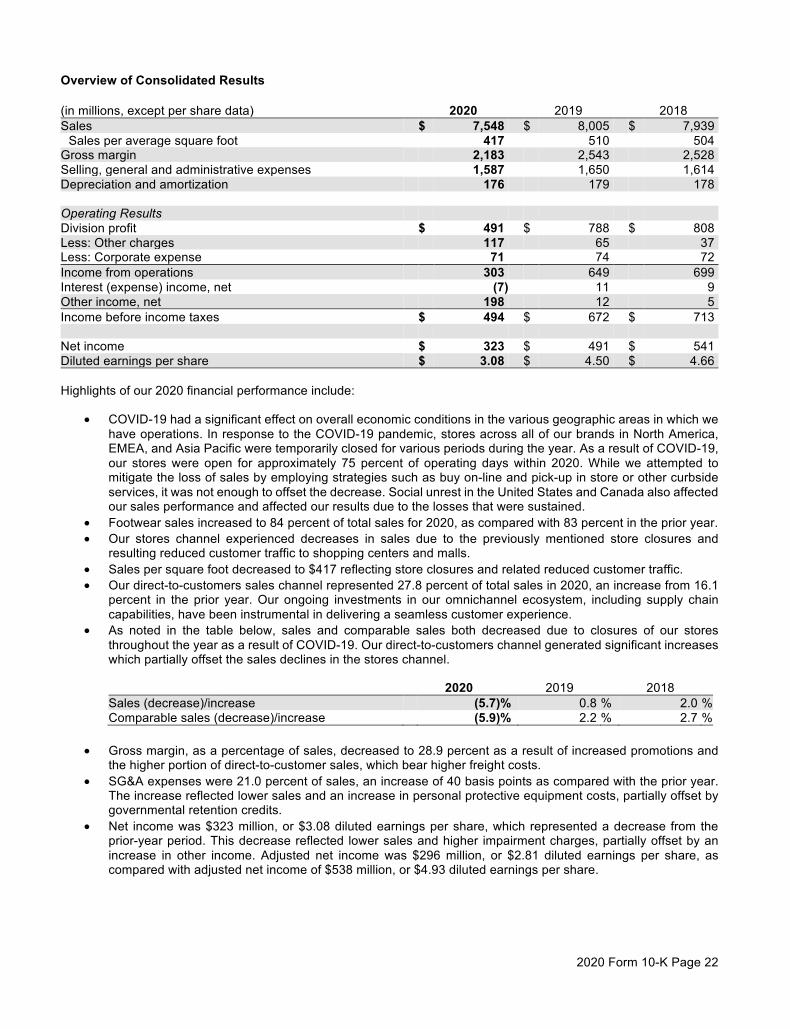
2020 Form 10-K Page 22
Overview of Consolidated Results
(in millions, except per share data) 2020 2019 2018 Sales $ 7,548 $ 8,005 $ 7,939
Sales per average square foot 417 510 504 Gross margin 2,183 2,543 2,528 Selling, general and administrative expenses 1,587 1,650 1,614 Depreciation and amortization 176 179 178 Operating Results Division profit $ 491 $ 788 $ 808 Less: Other charges 117 65 37 Less: Corporate expense 71 74 72 Income from operations 303 649 699 Interest (expense) income, net (7) 11 9 Other income, net 198 12 5 Income before income taxes $ 494 $ 672 $ 713 Net income $ 323 $ 491 $ 541 Diluted earnings per share $ 3.08 $ 4.50 $ 4.66 Highlights of our 2020 financial performance include:
• COVID-19 had a significant effect on overall economic conditions in the various geographic areas in which we have operations. In response to the COVID-19 pandemic, stores across all of our brands in North America, EMEA, and Asia Pacific were temporarily closed for various periods during the year. As a result of COVID-19, our stores were open for approximately 75 percent of operating days within 2020. While we attempted to mitigate the loss of sales by employing strategies such as buy on-line and pick-up in store or other curbside services, it was not enough to offset the decrease. Social unrest in the United States and Canada also affected our sales performance and affected our results due to the losses that were sustained.
• Footwear sales increased to 84 percent of total sales for 2020, as compared with 83 percent in the prior year. • Our stores channel experienced decreases in sales due to the previously mentioned store closures and
resulting reduced customer traffic to shopping centers and malls. • Sales per square foot decreased to $417 reflecting store closures and related reduced customer traffic. • Our direct-to-customers sales channel represented 27.8 percent of total sales in 2020, an increase from 16.1
percent in the prior year. Our ongoing investments in our omnichannel ecosystem, including supply chain capabilities, have been instrumental in delivering a seamless customer experience.
• As noted in the table below, sales and comparable sales both decreased due to closures of our stores throughout the year as a result of COVID-19. Our direct-to-customers channel generated significant increases which partially offset the sales declines in the stores channel.
2020 2019 2018 Sales (decrease)/increase (5.7) % 0.8 % 2.0 % Comparable sales (decrease)/increase (5.9) % 2.2 % 2.7 %
• Gross margin, as a percentage of sales, decreased to 28.9 percent as a result of increased promotions and the higher portion of direct-to-customer sales, which bear higher freight costs.
• SG&A expenses were 21.0 percent of sales, an increase of 40 basis points as compared with the prior year. The increase reflected lower sales and an increase in personal protective equipment costs, partially offset by governmental retention credits.
• Net income was $323 million, or $3.08 diluted earnings per share, which represented a decrease from the prior-year period. This decrease reflected lower sales and higher impairment charges, partially offset by an increase in other income. Adjusted net income was $296 million, or $2.81 diluted earnings per share, as compared with adjusted net income of $538 million, or $4.93 diluted earnings per share.
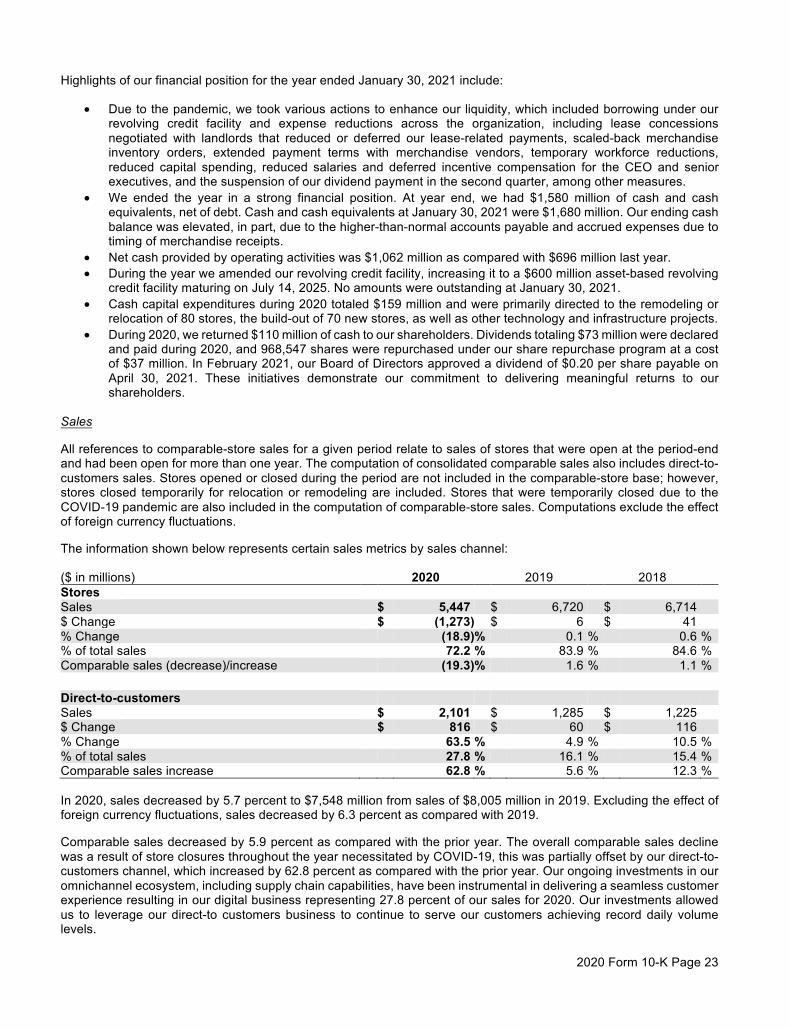
2020 Form 10-K Page 23
Highlights of our financial position for the year ended January 30, 2021 include:
• Due to the pandemic, we took various actions to enhance our liquidity, which included borrowing under our revolving credit facility and expense reductions across the organization, including lease concessions negotiated with landlords that reduced or deferred our lease-related payments, scaled-back merchandise inventory orders, extended payment terms with merchandise vendors, temporary workforce reductions, reduced capital spending, reduced salaries and deferred incentive compensation for the CEO and senior executives, and the suspension of our dividend payment in the second quarter, among other measures.
• We ended the year in a strong financial position. At year end, we had $1,580 million of cash and cash equivalents, net of debt. Cash and cash equivalents at January 30, 2021 were $1,680 million. Our ending cash balance was elevated, in part, due to the higher-than-normal accounts payable and accrued expenses due to timing of merchandise receipts.
• Net cash provided by operating activities was $1,062 million as compared with $696 million last year. • During the year we amended our revolving credit facility, increasing it to a $600 million asset-based revolving
credit facility maturing on July 14, 2025. No amounts were outstanding at January 30, 2021. • Cash capital expenditures during 2020 totaled $159 million and were primarily directed to the remodeling or
relocation of 80 stores, the build-out of 70 new stores, as well as other technology and infrastructure projects. • During 2020, we returned $110 million of cash to our shareholders. Dividends totaling $73 million were declared
and paid during 2020, and 968,547 shares were repurchased under our share repurchase program at a cost of $37 million. In February 2021, our Board of Directors approved a dividend of $0.20 per share payable on April 30, 2021. These initiatives demonstrate our commitment to delivering meaningful returns to our shareholders.
Sales
All references to comparable-store sales for a given period relate to sales of stores that were open at the period-end and had been open for more than one year. The computation of consolidated comparable sales also includes direct-to-customers sales. Stores opened or closed during the period are not included in the comparable-store base; however, stores closed temporarily for relocation or remodeling are included. Stores that were temporarily closed due to the COVID-19 pandemic are also included in the computation of comparable-store sales. Computations exclude the effect of foreign currency fluctuations.
The information shown below represents certain sales metrics by sales channel:
($ in millions) 2020 2019 2018 Stores Sales $ 5,447 $ 6,720 $ 6,714 $ Change $ (1,273) $ 6 $ 41 % Change (18.9) % 0.1 % 0.6 % % of total sales 72.2 % 83.9 % 84.6 % Comparable sales (decrease)/increase (19.3) % 1.6 % 1.1 % Direct-to-customers Sales $ 2,101 $ 1,285 $ 1,225 $ Change $ 816 $ 60 $ 116 % Change 63.5 % 4.9 % 10.5 % % of total sales 27.8 % 16.1 % 15.4 % Comparable sales increase 62.8 % 5.6 % 12.3 %
In 2020, sales decreased by 5.7 percent to $7,548 million from sales of $8,005 million in 2019. Excluding the effect of foreign currency fluctuations, sales decreased by 6.3 percent as compared with 2019.
Comparable sales decreased by 5.9 percent as compared with the prior year. The overall comparable sales decline was a result of store closures throughout the year necessitated by COVID-19, this was partially offset by our direct-to-customers channel, which increased by 62.8 percent as compared with the prior year. Our ongoing investments in our omnichannel ecosystem, including supply chain capabilities, have been instrumental in delivering a seamless customer experience resulting in our digital business representing 27.8 percent of our sales for 2020. Our investments allowed us to leverage our direct-to customers business to continue to serve our customers achieving record daily volume levels.
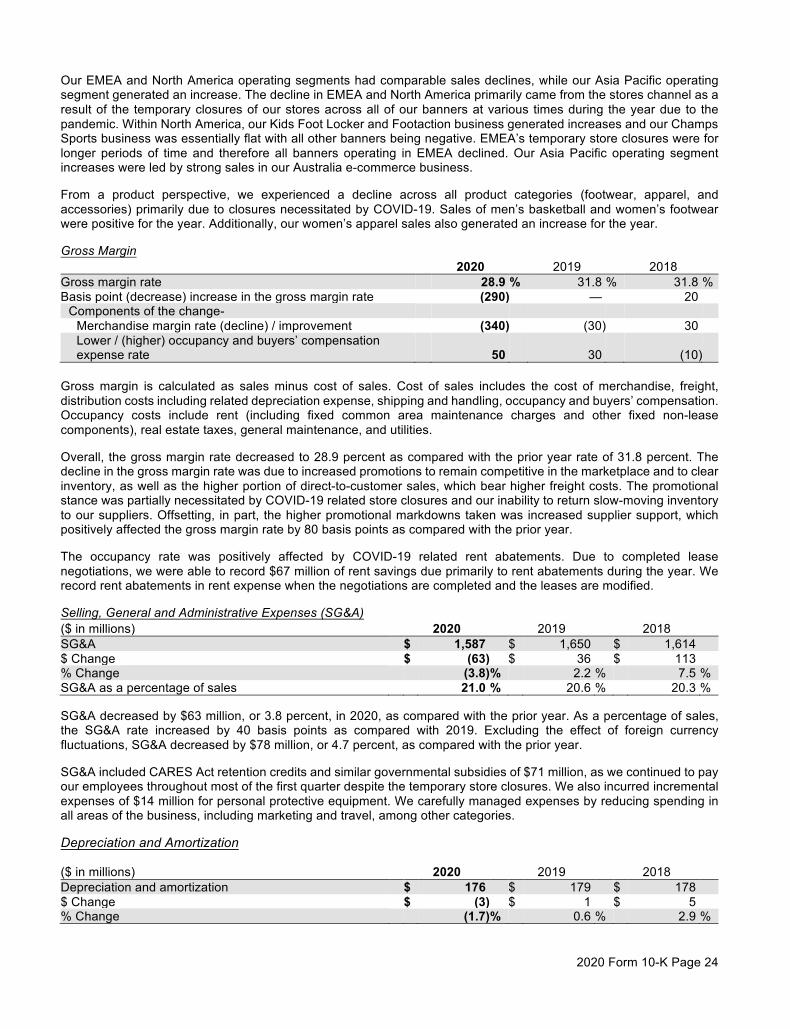
2020 Form 10-K Page 24
Our EMEA and North America operating segments had comparable sales declines, while our Asia Pacific operating segment generated an increase. The decline in EMEA and North America primarily came from the stores channel as a result of the temporary closures of our stores across all of our banners at various times during the year due to the pandemic. Within North America, our Kids Foot Locker and Footaction business generated increases and our Champs Sports business was essentially flat with all other banners being negative. EMEA’s temporary store closures were for longer periods of time and therefore all banners operating in EMEA declined. Our Asia Pacific operating segment increases were led by strong sales in our Australia e-commerce business.
From a product perspective, we experienced a decline across all product categories (footwear, apparel, and accessories) primarily due to closures necessitated by COVID-19. Sales of men’s basketball and women’s footwear were positive for the year. Additionally, our women’s apparel sales also generated an increase for the year.
Gross Margin
2020 2019 2018 Gross margin rate 28.9 % 31.8 % 31.8 % Basis point (decrease) increase in the gross margin rate (290) — 20
Components of the change- Merchandise margin rate (decline) / improvement (340) (30) 30 Lower / (higher) occupancy and buyers’ compensation expense rate 50 30 (10)
Gross margin is calculated as sales minus cost of sales. Cost of sales includes the cost of merchandise, freight, distribution costs including related depreciation expense, shipping and handling, occupancy and buyers’ compensation. Occupancy costs include rent (including fixed common area maintenance charges and other fixed non-lease components), real estate taxes, general maintenance, and utilities.
Overall, the gross margin rate decreased to 28.9 percent as compared with the prior year rate of 31.8 percent. The decline in the gross margin rate was due to increased promotions to remain competitive in the marketplace and to clear inventory, as well as the higher portion of direct-to-customer sales, which bear higher freight costs. The promotional stance was partially necessitated by COVID-19 related store closures and our inability to return slow-moving inventory to our suppliers. Offsetting, in part, the higher promotional markdowns taken was increased supplier support, which positively affected the gross margin rate by 80 basis points as compared with the prior year.
The occupancy rate was positively affected by COVID-19 related rent abatements. Due to completed lease negotiations, we were able to record $67 million of rent savings due primarily to rent abatements during the year. We record rent abatements in rent expense when the negotiations are completed and the leases are modified.
Selling, General and Administrative Expenses (SG&A)
($ in millions) 2020 2019 2018 SG&A $ 1,587 $ 1,650 $ 1,614 $ Change $ (63) $ 36 $ 113 % Change (3.8) % 2.2 % 7.5 % SG&A as a percentage of sales 21.0 % 20.6 % 20.3 %
SG&A decreased by $63 million, or 3.8 percent, in 2020, as compared with the prior year. As a percentage of sales, the SG&A rate increased by 40 basis points as compared with 2019. Excluding the effect of foreign currency fluctuations, SG&A decreased by $78 million, or 4.7 percent, as compared with the prior year.
SG&A included CARES Act retention credits and similar governmental subsidies of $71 million, as we continued to pay our employees throughout most of the first quarter despite the temporary store closures. We also incurred incremental expenses of $14 million for personal protective equipment. We carefully managed expenses by reducing spending in all areas of the business, including marketing and travel, among other categories.
Depreciation and Amortization
($ in millions) 2020 2019 2018 Depreciation and amortization $ 176 $ 179 $ 178 $ Change $ (3) $ 1 $ 5 % Change (1.7) % 0.6 % 2.9 %
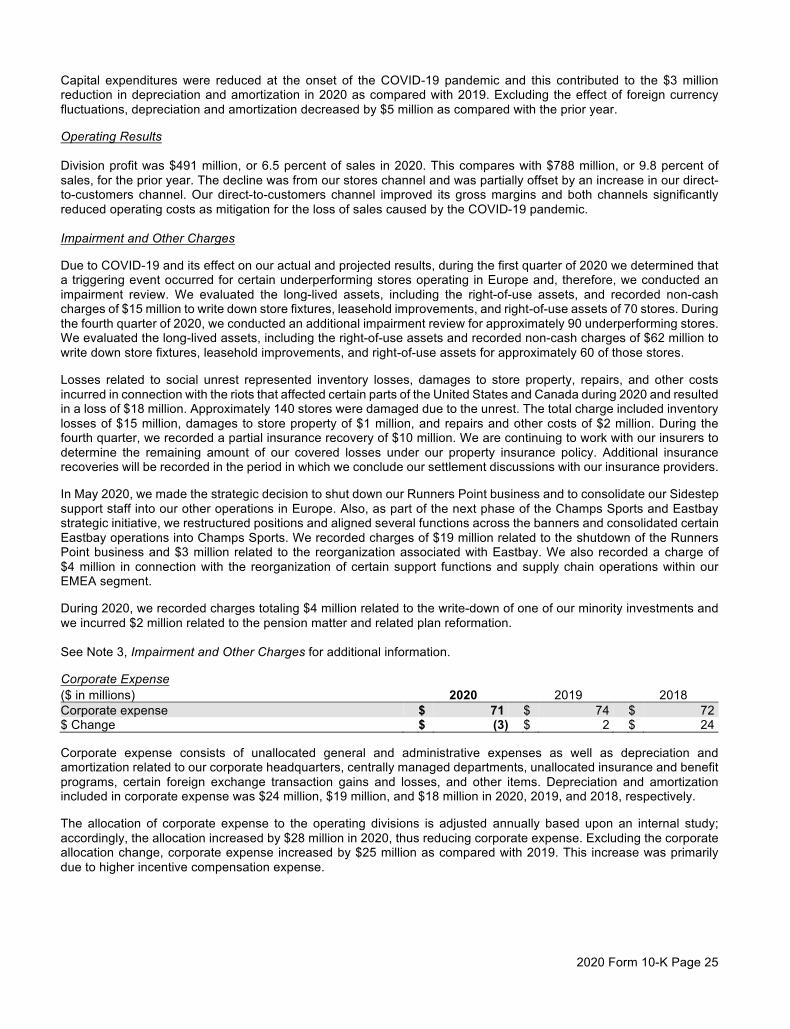
2020 Form 10-K Page 25
Capital expenditures were reduced at the onset of the COVID-19 pandemic and this contributed to the $3 million reduction in depreciation and amortization in 2020 as compared with 2019. Excluding the effect of foreign currency fluctuations, depreciation and amortization decreased by $5 million as compared with the prior year.
Operating Results Division profit was $491 million, or 6.5 percent of sales in 2020. This compares with $788 million, or 9.8 percent of sales, for the prior year. The decline was from our stores channel and was partially offset by an increase in our direct-to-customers channel. Our direct-to-customers channel improved its gross margins and both channels significantly reduced operating costs as mitigation for the loss of sales caused by the COVID-19 pandemic. Impairment and Other Charges
Due to COVID-19 and its effect on our actual and projected results, during the first quarter of 2020 we determined that a triggering event occurred for certain underperforming stores operating in Europe and, therefore, we conducted an impairment review. We evaluated the long-lived assets, including the right-of-use assets, and recorded non-cash charges of $15 million to write down store fixtures, leasehold improvements, and right-of-use assets of 70 stores. During the fourth quarter of 2020, we conducted an additional impairment review for approximately 90 underperforming stores. We evaluated the long-lived assets, including the right-of-use assets and recorded non-cash charges of $62 million to write down store fixtures, leasehold improvements, and right-of-use assets for approximately 60 of those stores.
Losses related to social unrest represented inventory losses, damages to store property, repairs, and other costs incurred in connection with the riots that affected certain parts of the United States and Canada during 2020 and resulted in a loss of $18 million. Approximately 140 stores were damaged due to the unrest. The total charge included inventory losses of $15 million, damages to store property of $1 million, and repairs and other costs of $2 million. During the fourth quarter, we recorded a partial insurance recovery of $10 million. We are continuing to work with our insurers to determine the remaining amount of our covered losses under our property insurance policy. Additional insurance recoveries will be recorded in the period in which we conclude our settlement discussions with our insurance providers.
In May 2020, we made the strategic decision to shut down our Runners Point business and to consolidate our Sidestep support staff into our other operations in Europe. Also, as part of the next phase of the Champs Sports and Eastbay strategic initiative, we restructured positions and aligned several functions across the banners and consolidated certain Eastbay operations into Champs Sports. We recorded charges of $19 million related to the shutdown of the Runners Point business and $3 million related to the reorganization associated with Eastbay. We also recorded a charge of $4 million in connection with the reorganization of certain support functions and supply chain operations within our EMEA segment.
During 2020, we recorded charges totaling $4 million related to the write-down of one of our minority investments and we incurred $2 million related to the pension matter and related plan reformation. See Note 3, Impairment and Other Charges for additional information.
Corporate Expense
($ in millions) 2020 2019 2018 Corporate expense $ 71 $ 74 $ 72 $ Change $ (3) $ 2 $ 24
Corporate expense consists of unallocated general and administrative expenses as well as depreciation and amortization related to our corporate headquarters, centrally managed departments, unallocated insurance and benefit programs, certain foreign exchange transaction gains and losses, and other items. Depreciation and amortization included in corporate expense was $24 million, $19 million, and $18 million in 2020, 2019, and 2018, respectively.
The allocation of corporate expense to the operating divisions is adjusted annually based upon an internal study; accordingly, the allocation increased by $28 million in 2020, thus reducing corporate expense. Excluding the corporate allocation change, corporate expense increased by $25 million as compared with 2019. This increase was primarily due to higher incentive compensation expense.
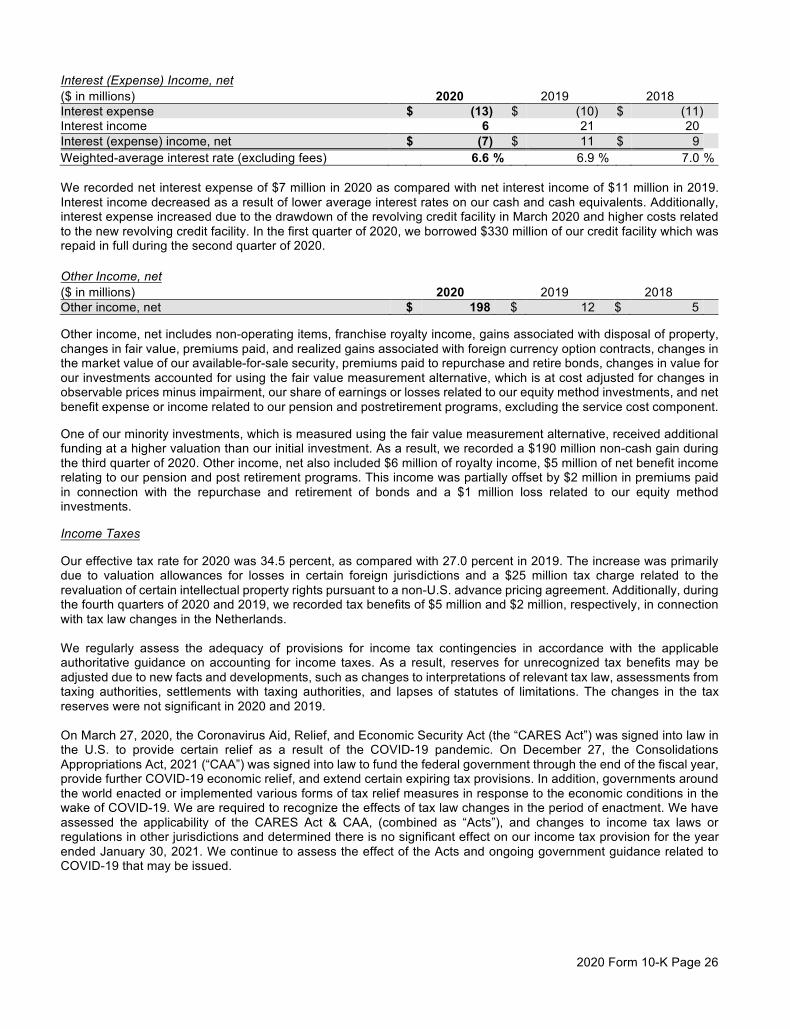
2020 Form 10-K Page 26
Interest (Expense) Income, net
($ in millions) 2020 2019 2018 Interest expense $ (13) $ (10) $ (11) Interest income 6 21 20 Interest (expense) income, net $ (7) $ 11 $ 9 Weighted-average interest rate (excluding fees) 6.6 % 6.9 % 7.0 % We recorded net interest expense of $7 million in 2020 as compared with net interest income of $11 million in 2019. Interest income decreased as a result of lower average interest rates on our cash and cash equivalents. Additionally, interest expense increased due to the drawdown of the revolving credit facility in March 2020 and higher costs related to the new revolving credit facility. In the first quarter of 2020, we borrowed $330 million of our credit facility which was repaid in full during the second quarter of 2020.
Other Income, net
($ in millions) 2020 2019 2018 Other income, net $ 198 $ 12 $ 5 Other income, net includes non-operating items, franchise royalty income, gains associated with disposal of property, changes in fair value, premiums paid, and realized gains associated with foreign currency option contracts, changes in the market value of our available-for-sale security, premiums paid to repurchase and retire bonds, changes in value for our investments accounted for using the fair value measurement alternative, which is at cost adjusted for changes in observable prices minus impairment, our share of earnings or losses related to our equity method investments, and net benefit expense or income related to our pension and postretirement programs, excluding the service cost component.
One of our minority investments, which is measured using the fair value measurement alternative, received additional funding at a higher valuation than our initial investment. As a result, we recorded a $190 million non-cash gain during the third quarter of 2020. Other income, net also included $6 million of royalty income, $5 million of net benefit income relating to our pension and post retirement programs. This income was partially offset by $2 million in premiums paid in connection with the repurchase and retirement of bonds and a $1 million loss related to our equity method investments.
Income Taxes
Our effective tax rate for 2020 was 34.5 percent, as compared with 27.0 percent in 2019. The increase was primarily due to valuation allowances for losses in certain foreign jurisdictions and a $25 million tax charge related to the revaluation of certain intellectual property rights pursuant to a non-U.S. advance pricing agreement. Additionally, during the fourth quarters of 2020 and 2019, we recorded tax benefits of $5 million and $2 million, respectively, in connection with tax law changes in the Netherlands. We regularly assess the adequacy of provisions for income tax contingencies in accordance with the applicable authoritative guidance on accounting for income taxes. As a result, reserves for unrecognized tax benefits may be adjusted due to new facts and developments, such as changes to interpretations of relevant tax law, assessments from taxing authorities, settlements with taxing authorities, and lapses of statutes of limitations. The changes in the tax reserves were not significant in 2020 and 2019. On March 27, 2020, the Coronavirus Aid, Relief, and Economic Security Act (the “CARES Act”) was signed into law in the U.S. to provide certain relief as a result of the COVID-19 pandemic. On December 27, the Consolidations Appropriations Act, 2021 (“CAA”) was signed into law to fund the federal government through the end of the fiscal year, provide further COVID-19 economic relief, and extend certain expiring tax provisions. In addition, governments around the world enacted or implemented various forms of tax relief measures in response to the economic conditions in the wake of COVID-19. We are required to recognize the effects of tax law changes in the period of enactment. We have assessed the applicability of the CARES Act & CAA, (combined as “Acts”), and changes to income tax laws or regulations in other jurisdictions and determined there is no significant effect on our income tax provision for the year ended January 30, 2021. We continue to assess the effect of the Acts and ongoing government guidance related to COVID-19 that may be issued.
2020 Form 10-K Page 27
Liquidity and Capital Resources
Liquidity
Our primary source of liquidity has been cash flow from operations, while the principal uses of cash have been to fund inventory and other working capital requirements; finance capital expenditures related to store openings, store remodelings, internet and mobile sites, information systems, and other support facilities; make retirement plan contributions, quarterly dividend payments, and interest payments; and fund other cash requirements to support the development of our short-term and long-term operating strategies. We generally finance real estate with operating leases. We believe our cash, cash equivalents, future cash flow from operations, and amounts available under our credit agreement will be adequate to fund these requirements.
We may also repurchase our common stock through open market purchases, privately negotiated transactions, or otherwise. Such repurchases if any, will depend on prevailing market conditions, liquidity requirements, contractual restrictions, and other factors. The amounts involved may be material. As of January 30, 2021, approximately $830 million remained available under our current $1.2 billion share repurchase program.
In February 2021, the Board of Directors declared a quarterly dividend of $0.20 per share to be paid on April 30, 2021, representing a 33 percent increase over the previous quarterly per share amount.
In January 2022, we will repay the $98 million principal outstanding of our 8.5 percent debentures.
Any material adverse change in customer demand, fashion trends, competitive market forces, or customer acceptance of our merchandise mix and retail locations, uncertainties related to the effect of competitive products and pricing, our reliance on a few key suppliers for a significant portion of our merchandise purchases and risks associated with global product sourcing, economic conditions worldwide, the effects of currency fluctuations, uncertainties caused by COVID-19, as well as other factors listed under the heading “Disclosure Regarding Forward-Looking Statements,” could affect our ability to continue to fund our liquidity needs from business operations.
Maintaining access to merchandise that we consider appropriate for our business may be subject to the policies and practices of our key suppliers. Therefore, we believe that it is critical to continue to maintain satisfactory relationships with these key suppliers. We purchased approximately 91 percent of our merchandise from our top five suppliers in both 2020 and 2019 and expect to continue to obtain a significant percentage of our athletic product from these suppliers in future periods. Approximately 75 percent and 71 percent was purchased from one supplier, Nike, Inc., in 2020 and 2019, respectively.
Planned capital expenditures in 2021 are $275 million. Included in the planned amount is $160 million dedicated to real estate projects designed to elevate our customers’ in-store experience. The real estate total includes the remodeling or expansion of approximately 130 existing stores, as well as the planned opening of approximately 100 new stores, including the continued expansion of our off-mall community-based and “power” store formats, which provide pinnacle retail experiences that deliver connected customer interactions through service, experience, product, and a sense of community. The real estate total also includes continued expansion in Asia. Finally, the capital plan for 2021 also includes $115 million for digital and supply chain initiatives. As shown in 2020, we have the ability to revise and reschedule much of the anticipated capital expenditure program should our financial position require it.
Operating Activities
($ in millions) 2020 2019 2018 Net cash provided by operating activities $ 1,062 $ 696 $ 781 $ Change $ 366 $ (85) $ (32) The amount provided by operating activities reflects income adjusted for non-cash items and working capital changes. Adjustments to net income for non-cash items include non-cash gains, non-cash impairment and other charges, depreciation and amortization, deferred income taxes, and share-based compensation expense.
The increase in cash provided by operating activities in 2020 compared with the prior year reflected higher inflows associated with working capital changes, partially offset by lower net income and a non-cash gain. In response to the COVID-19 pandemic we carefully managed our inventory levels. We were also affected by lack of available inventory caused, in part, by slowdowns in the supply chain environment. During 2020, we did not make any contributions to our U.S. qualified pension plan, as compared with $55 million made in 2019. No U.S. qualified pension plan contributions were required during 2020 due to the strong funded position of the plan. The amounts and timing of pension contributions are dependent on several factors, including asset performance.
2020 Form 10-K Page 28
As of January 30, 2021, we have withheld approximately $24 million of lease and lease-related payments as we continue to negotiate rent deferrals or abatements with our landlords for the period that our stores were closed due to the COVID-19 pandemic.
Cash paid for income taxes was $100 million, $201 million, and $184 million for 2020, 2019, and 2018, respectively.
Investing Activities
($ in millions) 2020 2019 2018 Net cash used in investing activities $ 168 $ 235 $ 274 $ Change $ (67) $ (39) $ (15)
Capital expenditures in 2020 decreased to $159 from $187 in the prior year. During 2020, we completed the remodeling or relocation of 82 existing stores and opened 69 new stores.
Investing activities for 2020 included cash outflows of $9 million related to various minority investments as compared with $50 million in 2019. Also included in 2019 is a $2 million inflow related to the sale of a building.
Financing Activities
($ in millions) 2020 2019 2018 Net cash used in financing activities $ 126 $ 493 $ 527 $ Change $ (367) $ (34) $ (89) Cash used in financing activities consisted primarily of our return to shareholders initiatives, including our share repurchase program and cash dividend payments, as follows:
($ in millions) 2020 2019 2018 Share repurchases $ 37 $ 335 $ 375 Dividends paid on common stock 73 164 158 Total returned to shareholders $ 110 $ 499 $ 533 During 2020, we repurchased 968,547 shares of our common stock under our share repurchase programs for $37 million. Additionally, we declared and paid dividends of $73 million, representing an annual rate of $0.70 per share in 2020.
In the first quarter of 2020, we borrowed $330 million of our then-existing revolving credit facility, which was repaid in full during the second quarter of 2020. In July 2020, we entered into a new $600 million revolving credit agreement and in connection with this transaction we paid fees of $4 million. During the year, we purchased and retired $20 million of our outstanding bonds for $22 million. Additionally, we paid $1 million in connection with our finance lease obligations.
During the year, we entered into an agreement with one of our franchisors to operate a limited number of Foot Locker stores in Europe. We have operational control of the new entity and have continued to consolidate the results of the joint venture. We received contributions of $6 million in connection with this agreement.
During 2020, we paid $1 million to satisfy tax withholding obligations relating to the vesting of share-based equity awards. Offsetting the amounts above were proceeds received from the issuance of common stock and treasury stock in connection with the employee stock programs of $6 million for 2020.
Free Cash Flow (non-GAAP measure)
In addition to net cash provided by operating activities, we use free cash flow as a useful measure of performance and as an indication of our financial strength and our ability to generate cash. We define free cash flow as net cash provided by operating activities less capital expenditures (which is classified as an investing activity). We believe the presentation of free cash flow is relevant and useful for investors because it allows investors to evaluate the cash generated from underlying operations in a manner similar to the method used by management. Free cash flow is not defined under U.S. GAAP. Therefore, it should not be considered a substitute for income or cash flow data prepared in accordance with U.S. GAAP and may not be comparable to similarly titled measures used by other companies. It should not be inferred that the entire free cash flow amount is available for discretionary expenditures.

2020 Form 10-K Page 29
The following table presents a reconciliation of net cash flow provided by operating activities, the most directly comparable U.S. GAAP financial measure, to free cash flow.
($ in millions) 2020 2019 2018 Net cash provided by operating activities $ 1,062 $ 696 $ 781 Capital expenditures (159) (187) (187) Free cash flow $ 903 $ 509 $ 594 Capital Structure
On July 14, 2020, we amended our then-existing revolving credit agreement to provide for a $600 million asset-based revolving credit facility that is scheduled to mature on July 14, 2025 (as amended, “2020 Credit Agreement”). Under the 2020 Credit Agreement interest is determined, at our option, by either (1) the eurodollar rate, which is determined by reference to LIBOR, plus a margin of 1.75 percent to 2.25 percent per annum, or (2) the base rate, which is determined by reference to the federal funds rate, plus a margin of 0.75 percent to 1.25 percent, in each case. In addition, we are paying a commitment fee of 0.50 percent per annum on the unused portion of the commitments under the 2020 Credit Agreement. The 2020 Credit Agreement provides for a security interest in certain of our and the Guarantors’ (as defined in the 2020 Credit Agreement) domestic assets, including inventory, accounts receivable, cash deposits, and certain insurance proceeds. If certain specified events of default have occurred and are continuing, or if availability under the 2020 Credit Agreement is less than or equal to the greater of $60 million and 10 percent of the Loan Cap (as defined in the 2020 Credit Agreement), we are required to test compliance with a minimum consolidated fixed charge coverage ratio of 1.00 to 1.00 as of the end of each fiscal quarter. No events of default occurred during 2020. As long as certain payment conditions are satisfied, including (a) the absence of any default or event of default has occurred availability under the 2020 Credit Agreement is not less than 15 percent of the lesser of the aggregate amount of the commitments and (b) the Borrowing Base (as defined in the 2020 Credit Agreement), determined as of the preceding fiscal month and on a proforma basis for the following six fiscal months, we may make investments, pay dividends, and repurchase our shares without restriction.
Credit Rating
As of March 25, 2021, our corporate credit ratings from Standard & Poor’s and Moody’s Investors Service are BB+ and Ba1, respectively. In addition, Moody’s Investors Service has rated our senior unsecured notes Ba2.
Debt Capitalization and Equity
($ in millions) 2020 2019 Long-term debt and obligations under finance leases $ 110 $ 122 Operating lease liability 3,079 3,196
Total debt including finance and operating leases 3,189 3,318 Less: Cash and cash equivalents 1,680 907
Total net debt including the present value of finance and operating leases 1,509 2,411 Shareholders’ equity 2,776 2,473 Total capitalization $ 4,285 $ 4,884 Total net debt capitalization percent including finance and operating leases 35.2 % 49.4 % Net debt capitalization percent decreased to 35.2 percent as compared with 49.4 percent in the prior year, primarily reflecting higher cash and cash equivalents.
Off-Balance Sheet Arrangements
We have not entered into any transactions with unconsolidated entities that expose us to material continuing risks, contingent liabilities, or any other obligation under a variable interest in an unconsolidated entity. Also, our financial policies prohibit the use of derivatives for which there is no underlying exposure.
2020 Form 10-K Page 30
In connection with the sale of various businesses and assets, we may be obligated for certain lease commitments transferred to third parties and pursuant to certain normal representations, warranties, or indemnifications entered into with the purchasers of such businesses or assets. Although the maximum potential amounts for such obligations cannot be readily determined, we believe that the resolution of such contingencies will not significantly affect our consolidated financial position, liquidity, or results of operations.
We also operate certain stores for which lease agreements are in the process of being negotiated with landlords. Although there is no contractual commitment to make these payments, it is likely that leases will be executed.
Critical Accounting Policies
Our responsibility for integrity and objectivity in the preparation and presentation of the financial statements requires application of appropriate accounting policies. Generally, our accounting policies and methods are those specifically required by U.S. GAAP. Included in the Summary of Significant Accounting Policies note in “Item 8. Consolidated Financial Statements and Supplementary Data” is a summary of the most significant accounting policies. In some cases, we are required to calculate amounts based on estimates for matters that are inherently uncertain. We believe the following to be the most critical of those accounting policies that necessitate subjective judgments.
Merchandise Inventories and Cost of Sales
Merchandise inventories for our stores are valued at the lower of cost or market using the retail inventory method (“RIM”). The RIM is used by retail companies to value inventories at cost and calculate gross margins due to its practicality. Under the RIM, cost is determined by applying a cost-to-retail percentage across groupings of similar items, known as departments. The cost-to-retail percentage is applied to ending inventory at its current owned retail valuation to determine the cost of ending inventory on a department basis.
The RIM is a system of averages that requires estimates and assumptions regarding markups, markdowns and shrink, among others, and as such, could result in distortions of inventory amounts. Judgment is required for these estimates and assumptions, as well as to differentiate between promotional and other markdowns that may be required to correctly reflect merchandise inventories at the lower of cost or market. Reserves are established based on current selling prices when the inventory has not been marked down to market. The failure to take permanent markdowns on a timely basis may result in an overstatement of cost under the retail inventory method. The decision to take permanent markdowns includes many factors, including the current retail environment, inventory levels, and the age of the item. We believe this method and its related assumptions, which have been consistently applied, to be reasonable.
Leases
We determine if an arrangement is a lease at inception. Right-of-use assets and liabilities are recognized at the commencement date based on the present value of lease payments over the lease term for those arrangements where there is an identified asset and the contract conveys the right to control its use. Our lease term includes options to extend or terminate a lease only when it is reasonably certain that we will exercise that option.
As most of our leases do not provide an implicit interest rate, we use our incremental borrowing rates based on the remaining lease term to determine the present value of future lease payments. Our incremental borrowing rate for a lease is the rate of interest we would have to pay on a collateralized basis to borrow an amount equal to the lease payments under similar terms. Our incremental borrowing rate is calculated as the weighted average risk-free (sovereign) rate plus a spread to reflect our current unsecured credit rating plus the fees to borrow under our credit facility. The weighted average risk-free (sovereign) rates were based on the Treasury BVAL rates curve in Bloomberg. In the regions that we have stores, rates were developed for 3, 5, 7, 10, and 15 years. The weighting given to each region was determined by the number of stores in each region.
The spread to reflect our current credit rating represented the spread between U.S. Treasury rates and Bloomberg’s USD BVAL curve for non-financial companies with the Company’s credit rating. The fees to borrow represent the facility fees paid on the Company’s revolving credit facility.
2020 Form 10-K Page 31
Impairment of Long-Lived Tangible Assets and Right-of-Use Assets
We perform an impairment review when circumstances indicate that the carrying value of long-lived tangible assets and right-of-use assets may not be recoverable (“a triggering event”). Our policy for determining whether a triggering event exists comprises the evaluation of measurable operating performance criteria and qualitative measures at the lowest level for which identifiable cash flows are largely independent of cash flows of other assets and liabilities, which is generally at the store level. We also evaluate for triggering events at the banner level. If an impairment review is necessitated by the identification of a triggering event, we determine the fair value of the asset using assumptions predominately identified from our historical performance and our long-range strategic plans. To determine if an impairment exists, we compare the carrying amount of the asset with the estimated future undiscounted cash flows expected to result from the use of the asset group. If the carrying amount of the asset exceeds the estimated undiscounted future cash flows, we measure the amount of the impairment by comparing the carrying amount of the asset group with its estimated fair value.
The estimation of fair value is measured by discounting expected future cash flows using a risk adjusted discount rate and by using a market approach to determine current lease rates. Future expected cash flows are based upon estimates that, if not achieved, may result in significantly different results. During 2020, due to the COVID-19 pandemic and its effect on our actual and projected results, during the first quarter of 2020, we determined that a triggering event occurred for certain underperforming stores operating in Europe and, therefore, we conducted an impairment review. We evaluated the long-lived assets, including the right-of-use assets, and recorded non-cash charges of $15 million to write down store fixtures, leasehold improvements, and right-of-use assets of 70 stores. Additionally, we performed an impairment review for certain underperforming stores during the fourth quarter and recorded non-cash impairment charges totaling $62 million for approximately 60 stores. Recoverability of Goodwill
We review goodwill for impairment annually during the first quarter of each fiscal year or more frequently if impairment indicators arise. The review of impairment consists of either using a qualitative approach to determine whether it is more likely than not that the fair value of the assets is less than their respective carrying values or a one-step qualitative impairment test. In performing the qualitative assessment, we consider many factors in evaluating whether the carrying value of goodwill may not be recoverable, including declines in our stock price and market capitalization in relation to the book value of the Company and macroeconomic conditions affecting retail. If, based on the results of the qualitative assessment, it is concluded that it is not more likely than not that the fair value of a reporting unit exceeds its carrying value, additional quantitative impairment testing is performed. The quantitative test requires that the carrying value of each reporting unit be compared with its estimated fair value. If the carrying value of a reporting unit is greater than its fair value, a goodwill impairment charge will be recorded for the difference (up to the carrying value of goodwill). We use a discounted cash flow approach to determine the fair value of a reporting unit. The determination of discounted cash flows of the reporting units and assets and liabilities within the reporting units requires significant estimates and assumptions. These estimates and assumptions primarily include, but are not limited to, the discount rate, terminal growth rates, earnings before depreciation and amortization, and capital expenditures forecasts. Due to the inherent uncertainty involved in making these estimates, actual results could differ from those estimates. We evaluate the merits of each significant assumption, both individually and in the aggregate, used to determine the fair value of the reporting units, as well as the fair values of the corresponding assets and liabilities within the reporting units.
In addition to performing our qualitative assessment as of the beginning of the year, we performed an additional quantitative assessment during the first quarter due to the COVID-19 pandemic and its effect on our results and stock price. Neither assessment resulted in the recognition of impairment.
2020 Form 10-K Page 32
Pension and Postretirement Liabilities
We review all assumptions used to determine our obligations for pension and postretirement liabilities annually with our independent actuaries, taking into consideration existing and future economic conditions and our intentions with regard to the plans. The assumptions used are:
Long-Term Rate of Return
The expected rate of return on plan assets is the long-term rate of return expected to be earned on the plans’ assets and is recognized as a component of pension expense. The rate is based on the plans’ weighted-average target asset allocation, as well as historical and future expected performance of those assets. The target asset allocation is selected to obtain an investment return that is sufficient to cover the expected benefit payments and to reduce the variability of future contributions. The expected rate of return on plan assets is reviewed annually and revised, as necessary, to reflect changes in the financial markets and our investment strategy. The weighted-average long-term rate of return used to determine 2020 pension expense was 5.5 percent.
A decrease of 50 basis points in the weighted-average expected long-term rate of return would
have increased 2020 pension expense by approximately $3 million. The actual return on plan assets in a given year typically differs from the expected long-term rate of return, and the resulting gain or loss is deferred and amortized into expense over the average life expectancy of the inactive participants.
Discount Rate An assumed discount rate is used to measure the present value of future cash flow obligations
of the plans and the interest cost component of pension expense and postretirement income. The cash flows are then discounted to their present value and an overall discount rate is determined. The discount rate for our U.S. plans are determined by reference to the Bond:Link interest rate model based upon a portfolio of highly-rated U.S. corporate bonds with individual bonds that are theoretically purchased to settle the plan’s anticipated cash outflows. The discount rate selected to measure the present value of our Canadian benefit obligations is similar to the approach used for the U.S. plan and was determined by reference to the Canadian Rate:Link interest rate model. The weighted-average discount rates used to determine the 2020 benefit obligations related to our pension and postretirement plans was 2.5 percent and 2.8 percent, respectively.
Changing the weighted-average discount rate by 50 basis points would have changed the accumulated benefit obligation of the pension plans at January 30, 2021 by approximately $42 million and $35 million, depending on if the change was an increase or decrease, respectively. A decrease of 50 basis points in the weighted-average discount rate would have increased or decreased the accumulated benefit obligation on the postretirement plan by approximately $1 million depending on if the change was an increase or decrease, respectively.
Trend Rate We maintain two postretirement medical plans, one covering certain executive officers and key
employees (“SERP Medical Plan”), and the other covering all other team members. With respect to the SERP Medical Plan, a 100-basis point change in the assumed health care cost trend rate would not significantly change this plan’s accumulated benefit obligation. With respect to the postretirement medical plan covering all other team members, there is limited risk to us for increases in health care costs since, beginning in 2001, new retirees have assumed the full expected costs and then-existing retirees have assumed all increases in such costs.
2020 Form 10-K Page 33
Mortality Assumptions
The mortality assumption used to value our 2020 U.S. pension obligations was the Pri-2012 mortality table with generational projection using MP-2020 for both males and females, while in the prior year the obligation was valued using the Pri-2012 mortality table with generational projection using MP-2019. We used the 2014 CPM Private Sector mortality table projected generationally with Scale CPM-B for both males and females to value our Canadian pension obligations for 2020.
For the SERP Medical Plan, the mortality assumption used to value the 2019 obligation was updated to the PriH-2012 table with generational projection using MP-2020. Each year we update this assumption to the most recent study from the Society of Actuaries.
Income Taxes
Deferred tax assets are reduced by a valuation allowance, which is established when it is more likely than not that some portion or all of the deferred tax assets will not be realized. We are required to estimate taxable income for future years by taxing jurisdiction and to use our judgment to determine whether to record a valuation allowance for part or all of a deferred tax asset. Estimates of taxable income are based upon our long-range strategic plans. A one percent change in the overall statutory tax rate for 2020 would have resulted in a change of $2 million to the carrying value of the net deferred tax asset and a corresponding charge or credit to income tax expense depending on whether the tax rate change was a decrease or an increase. We have operations in multiple taxing jurisdictions, and we are subject to audit in these jurisdictions. Tax audits by their nature are often complex and can require several years to resolve. Accruals of tax contingencies require us to make estimates and judgments with respect to the ultimate outcome of tax audits. Actual results could vary from these estimates. Excluding the effect of any nonrecurring items that may occur, we expect the effective tax rate for 2021 to be in the range of 29.6% to 30.6%. The actual tax rate will depend on the level and geographic mix of income and losses, as well as the limits to tax benefits for losses in certain foreign jurisdictions. Our actual tax rate will also depend on the enactment of a corporate tax rate increase, as proposed by the Biden Administration. Recent Accounting Pronouncements
Descriptions of the recently issued accounting principles, and the accounting principles adopted by us during the year ended January 30, 2021 are included in the Summary of Significant Accounting Policies note in “Item 8. Consolidated Financial Statements and Supplementary Data.”
Item 7A. Quantitative and Qualitative Disclosures About Market Risk
Information regarding foreign exchange risk management is included in the Financial Instruments and Risk Management note under “Item 8. Consolidated Financial Statements and Supplementary Data.”
Item 8. Consolidated Financial Statements and Supplementary Data The following Consolidated Financial Statements of the Company are included as part of this Report:
• Consolidated Statements of Operations for the fiscal years ended:
• January 30, 2021, February 1, 2020, and February 2, 2019 • Consolidated Statements of Comprehensive Income for the fiscal years ended:
• January 30, 2021, February 1, 2020, and February 2, 2019 • Consolidated Balance Sheets as of:
• January 30, 2021 and February 1, 2020 • Consolidated Statements of Changes in Shareholders’ Equity for the fiscal years ended:
• January 30, 2021, February 1, 2020, and February 2, 2019 • Consolidated Statements of Cash Flows for the fiscal years ended:
• January 30, 2021, February 1, 2020, and February 2, 2019 • Notes to the Consolidated Financial Statements.
2020 Form 10-K Page 34
REPORT OF INDEPENDENT REGISTERED PUBLIC ACCOUNTING FIRM To the Shareholders and Board of Directors Foot Locker, Inc.:
Opinion on the Consolidated Financial Statements
We have audited the accompanying consolidated balance sheets of Foot Locker, Inc. and subsidiaries (the Company) as of January 30, 2021 and February 1, 2020, the related consolidated statements of operations, comprehensive income, changes in shareholders’ equity, and cash flows for each of the years in the three-year period ended January 30, 2021 and the related notes (collectively, the consolidated financial statements). In our opinion, the consolidated financial statements present fairly, in all material respects, the financial position of the Company as of January 30, 2021 and February 1, 2020, and the results of its operations and its cash flows for each of the years in the three-year period ended January 30, 2021, in conformity with U.S. generally accepted accounting principles.
We also have audited, in accordance with the standards of the Public Company Accounting Oversight Board (United States) (PCAOB), the Company’s internal control over financial reporting as of January 30, 2021, based on criteria established in Internal Control – Integrated Framework (2013) issued by the Committee of Sponsoring Organizations of the Treadway Commission, and our report dated March 25, 2021 expressed an unqualified opinion on the effectiveness of the Company’s internal control over financial reporting.
Change in Accounting Principle
As discussed in Note 1 to the consolidated financial statements, the Company changed its method of accounting for leases effective February 3, 2019 due to the adoption of Financial Accounting Standards Board Accounting Standards Codification (ASC) Topic 842, Leases.
Basis for Opinion
These consolidated financial statements are the responsibility of the Company’s management. Our responsibility is to express an opinion on these consolidated financial statements based on our audits. We are a public accounting firm registered with the PCAOB and are required to be independent with respect to the Company in accordance with the U.S. federal securities laws and the applicable rules and regulations of the Securities and Exchange Commission and the PCAOB.
We conducted our audits in accordance with the standards of the PCAOB. Those standards require that we plan and perform the audit to obtain reasonable assurance about whether the consolidated financial statements are free of material misstatement, whether due to error or fraud. Our audits included performing procedures to assess the risks of material misstatement of the consolidated financial statements, whether due to error or fraud, and performing procedures that respond to those risks. Such procedures included examining, on a test basis, evidence regarding the amounts and disclosures in the consolidated financial statements. Our audits also included evaluating the accounting principles used and significant estimates made by management, as well as evaluating the overall presentation of the consolidated financial statements. We believe that our audits provide a reasonable basis for our opinion.
Critical Audit Matter
The critical audit matter communicated below is a matter arising from the current period audit of the consolidated financial statements that were communicated or required to be communicated to the audit committee and that: (1) relate to accounts or disclosures that are material to the consolidated financial statements and (2) involved our especially challenging, subjective, or complex judgments. The communication of the critical audit matter does not alter in any way our opinion on the consolidated financial statements, taken as a whole, and we are not, by communicating the critical audit matter below, providing separate opinions on the critical audit matter or on the accounts or disclosures to which it relates.
2020 Form 10-K Page 35
Fair value of asset group related to certain underperforming stores
As discussed in Notes 1 and 3 to the consolidated financial statements, the Company performs an impairment review when circumstances indicate that the carrying amount of long-lived tangible assets and right-of-use assets may not be recoverable. The long-lived tangible assets and the right-of-use assets of the Company as of January 30, 2021 were $788 million and $2,716 million, respectively. If a triggering event is identified, the Company compares the carrying amount of the asset group with the estimated future cash flows expected to result from the use of the asset group. If the carrying amount of the asset group exceeds the estimated undiscounted future cash flows, the Company measures the amount of the impairment by comparing the carrying amount of the asset group with its estimated fair value. The estimation of fair value of the asset group is measured by discounting expected future cash flows using a risk adjusted discount rate and current market-based information for right-of-use assets. During the year ended January 30, 2021, the Company recorded impairment charges of $77 million related to certain underperforming stores.
We identified the evaluation of the fair value of the asset group related to certain underperforming stores as a critical audit matter. The market-based assumptions used to estimate the fair value of the asset group included market rent estimates for comparable stores that required a high degree of auditor judgment to evaluate and were challenging to test in the current economic environment, as the COVID-19 shutdowns impacted the retail real estate market significantly. Changes in the selection of the market rent estimates could have had a significant effect on the determination of the fair value of the asset group, which impacted the measurement and allocation of the impairment loss within the asset group.
The following are the primary procedures we performed to address this critical audit matter. We evaluated the design and tested the operating effectiveness of certain internal controls over the Company’s long-lived tangible asset and right-of-use asset impairment assessment process, including controls related to the estimate of the fair value of the asset group. We involved valuation professionals with specialized skills and knowledge, who assisted in:
• evaluating the market rent estimates by assessing comparable retail leasing activity applicable to each location • assessing historic leasing activity of the Company in relation to historical store sales performance
/s/ KPMG LLP
We have served as the Company’s auditor since 1995.
New York, New York March 25, 2021
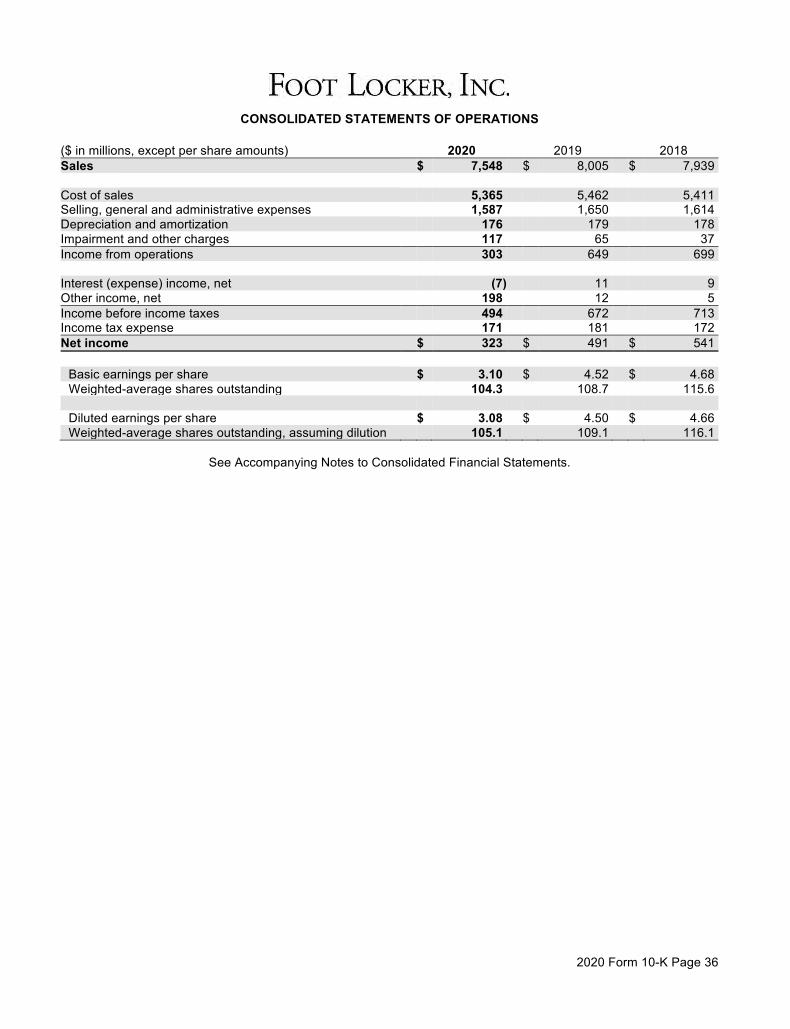
2020 Form 10-K Page 36
CONSOLIDATED STATEMENTS OF OPERATIONS
($ in millions, except per share amounts) 2020 2019 2018 Sales $ 7,548 $ 8,005 $ 7,939 Cost of sales 5,365 5,462 5,411 Selling, general and administrative expenses 1,587 1,650 1,614 Depreciation and amortization 176 179 178 Impairment and other charges 117 65 37 Income from operations 303 649 699 Interest (expense) income, net (7) 11 9 Other income, net 198 12 5 Income before income taxes 494 672 713 Income tax expense 171 181 172 Net income $ 323 $ 491 $ 541
Basic earnings per share $ 3.10 $ 4.52 $ 4.68 Weighted-average shares outstanding 104.3 108.7 115.6
Diluted earnings per share $ 3.08 $ 4.50 $ 4.66 Weighted-average shares outstanding, assuming dilution 105.1 109.1 116.1
See Accompanying Notes to Consolidated Financial Statements.
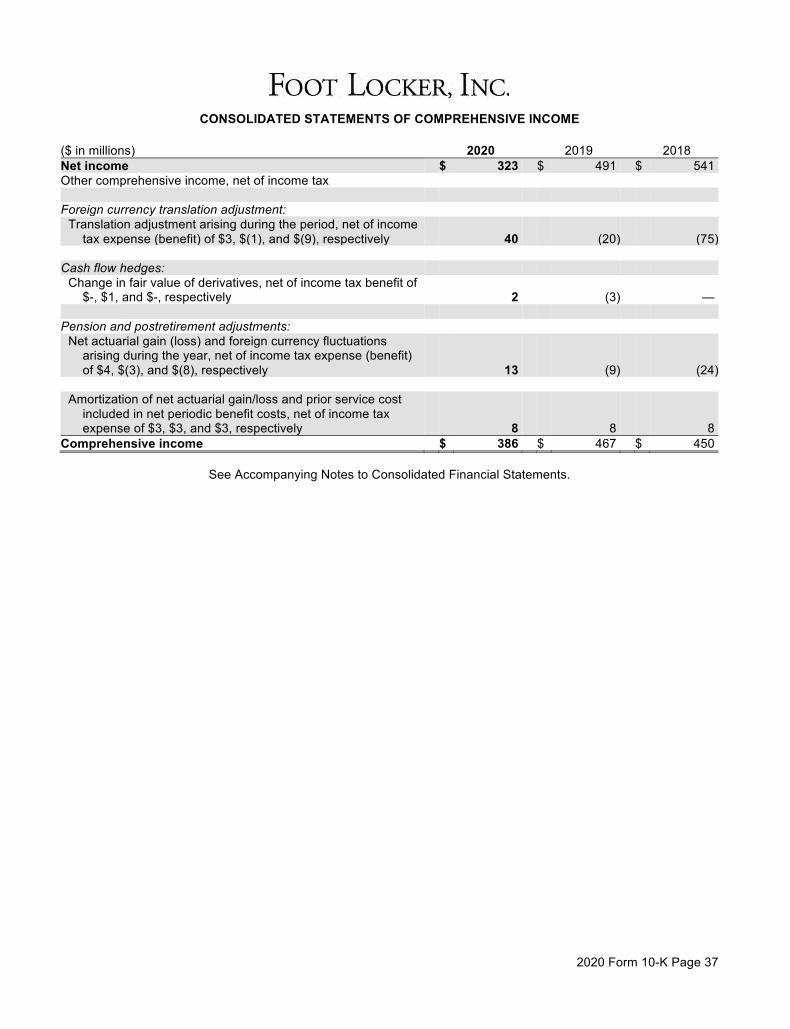
2020 Form 10-K Page 37
CONSOLIDATED STATEMENTS OF COMPREHENSIVE INCOME
($ in millions) 2020 2019 2018 Net income $ 323 $ 491 $ 541 Other comprehensive income, net of income tax Foreign currency translation adjustment:
Translation adjustment arising during the period, net of income tax expense (benefit) of $3, $(1), and $(9), respectively 40 (20) (75)
Cash flow hedges:
Change in fair value of derivatives, net of income tax benefit of $-, $1, and $-, respectively 2 (3) —
Pension and postretirement adjustments:
Net actuarial gain (loss) and foreign currency fluctuations arising during the year, net of income tax expense (benefit) of $4, $(3), and $(8), respectively 13 (9) (24)
Amortization of net actuarial gain/loss and prior service cost
included in net periodic benefit costs, net of income tax expense of $3, $3, and $3, respectively 8 8 8
Comprehensive income $ 386 $ 467 $ 450
See Accompanying Notes to Consolidated Financial Statements.
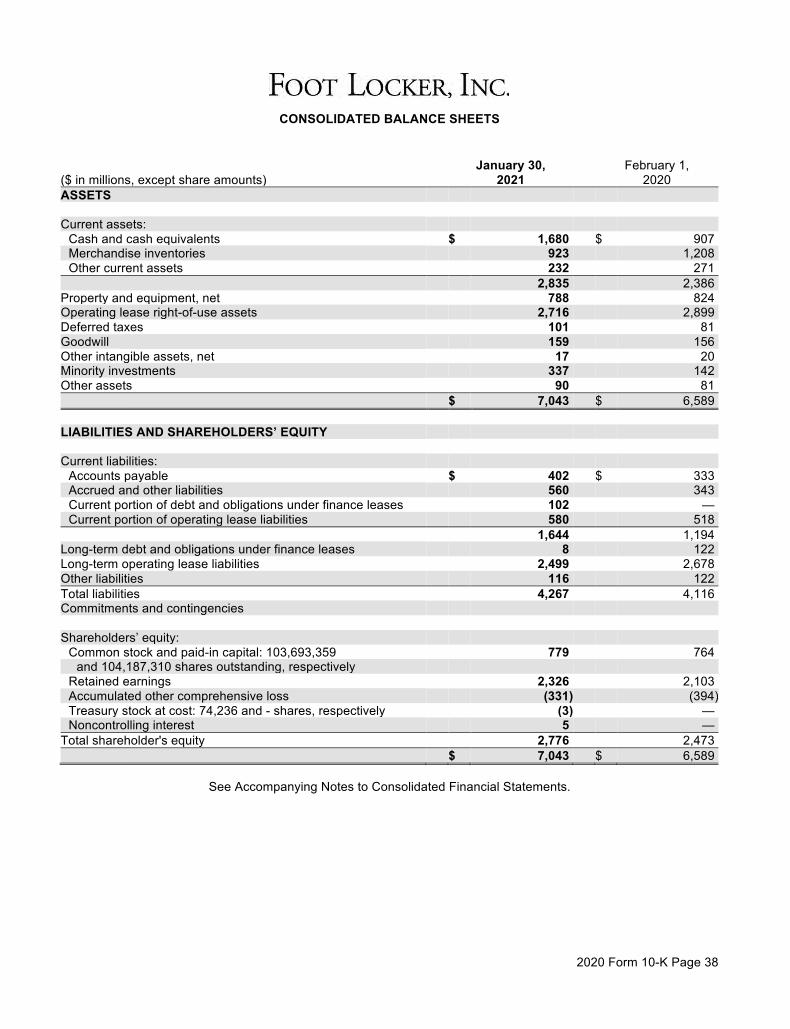
2020 Form 10-K Page 38
CONSOLIDATED BALANCE SHEETS
($ in millions, except share amounts) January 30,
2021 February 1,
2020 ASSETS Current assets:
Cash and cash equivalents $ 1,680 $ 907 Merchandise inventories 923 1,208 Other current assets 232 271
2,835 2,386 Property and equipment, net 788 824 Operating lease right-of-use assets 2,716 2,899 Deferred taxes 101 81 Goodwill 159 156 Other intangible assets, net 17 20 Minority investments 337 142 Other assets 90 81 $ 7,043 $ 6,589 LIABILITIES AND SHAREHOLDERS’ EQUITY Current liabilities:
Accounts payable $ 402 $ 333 Accrued and other liabilities 560 343 Current portion of debt and obligations under finance leases 102 — Current portion of operating lease liabilities 580 518
1,644 1,194 Long-term debt and obligations under finance leases 8 122 Long-term operating lease liabilities 2,499 2,678 Other liabilities 116 122 Total liabilities 4,267 4,116 Commitments and contingencies Shareholders’ equity:
Common stock and paid-in capital: 103,693,359 779 764 and 104,187,310 shares outstanding, respectively
Retained earnings 2,326 2,103 Accumulated other comprehensive loss (331) (394) Treasury stock at cost: 74,236 and - shares, respectively (3) — Noncontrolling interest 5 —
Total shareholder's equity 2,776 2,473 $ 7,043 $ 6,589
See Accompanying Notes to Consolidated Financial Statements.
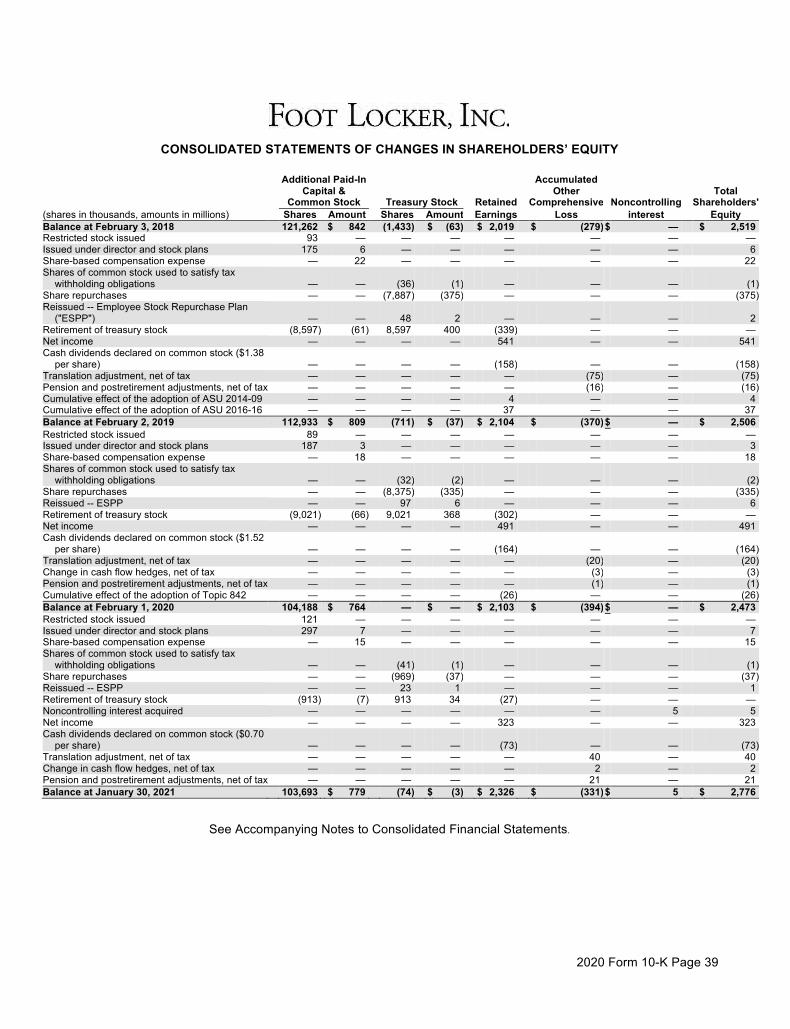
2020 Form 10-K Page 39
CONSOLIDATED STATEMENTS OF CHANGES IN SHAREHOLDERS’ EQUITY
Additional Paid-In Accumulated Capital & Other Total Common Stock Treasury Stock Retained Comprehensive Noncontrolling Shareholders' (shares in thousands, amounts in millions) Shares Amount Shares Amount Earnings Loss interest Equity Balance at February 3, 2018 121,262 $ 842 (1,433) $ (63) $ 2,019 $ (279) $ — $ 2,519 Restricted stock issued 93 — — — — — — — Issued under director and stock plans 175 6 — — — — — 6 Share-based compensation expense — 22 — — — — — 22 Shares of common stock used to satisfy tax
withholding obligations — — (36) (1) — — — (1) Share repurchases — — (7,887) (375) — — — (375) Reissued -- Employee Stock Repurchase Plan
("ESPP") — — 48 2 — — — 2 Retirement of treasury stock (8,597) (61) 8,597 400 (339) — — — Net income — — — — 541 — — 541 Cash dividends declared on common stock ($1.38
per share) — — — — (158) — — (158) Translation adjustment, net of tax — — — — — (75) — (75) Pension and postretirement adjustments, net of tax — — — — — (16) — (16) Cumulative effect of the adoption of ASU 2014-09 — — — — 4 — — 4 Cumulative effect of the adoption of ASU 2016-16 — — — — 37 — — 37 Balance at February 2, 2019 112,933 $ 809 (711) $ (37) $ 2,104 $ (370) $ — $ 2,506 Restricted stock issued 89 — — — — — — — Issued under director and stock plans 187 3 — — — — — 3 Share-based compensation expense — 18 — — — — — 18 Shares of common stock used to satisfy tax
withholding obligations — — (32) (2) — — — (2) Share repurchases — — (8,375) (335) — — — (335) Reissued -- ESPP — — 97 6 — — — 6 Retirement of treasury stock (9,021) (66) 9,021 368 (302) — — — Net income — — — — 491 — — 491 Cash dividends declared on common stock ($1.52
per share) — — — — (164) — — (164) Translation adjustment, net of tax — — — — — (20) — (20) Change in cash flow hedges, net of tax — — — — — (3) — (3) Pension and postretirement adjustments, net of tax — — — — — (1) — (1) Cumulative effect of the adoption of Topic 842 — — — — (26) — — (26) Balance at February 1, 2020 104,188 $ 764 — $ — $ 2,103 $ (394) $ — $ 2,473 Restricted stock issued 121 — — — — — — — Issued under director and stock plans 297 7 — — — — — 7 Share-based compensation expense — 15 — — — — — 15 Shares of common stock used to satisfy tax
withholding obligations — — (41) (1) — — — (1) Share repurchases — — (969) (37) — — — (37) Reissued -- ESPP — — 23 1 — — — 1 Retirement of treasury stock (913) (7) 913 34 (27) — — — Noncontrolling interest acquired — — — — — — 5 5 Net income — — — — 323 — — 323 Cash dividends declared on common stock ($0.70
per share) — — — — (73) — — (73) Translation adjustment, net of tax — — — — — 40 — 40 Change in cash flow hedges, net of tax — — — — — 2 — 2 Pension and postretirement adjustments, net of tax — — — — — 21 — 21 Balance at January 30, 2021 103,693 $ 779 (74) $ (3) $ 2,326 $ (331) $ 5 $ 2,776
See Accompanying Notes to Consolidated Financial Statements.
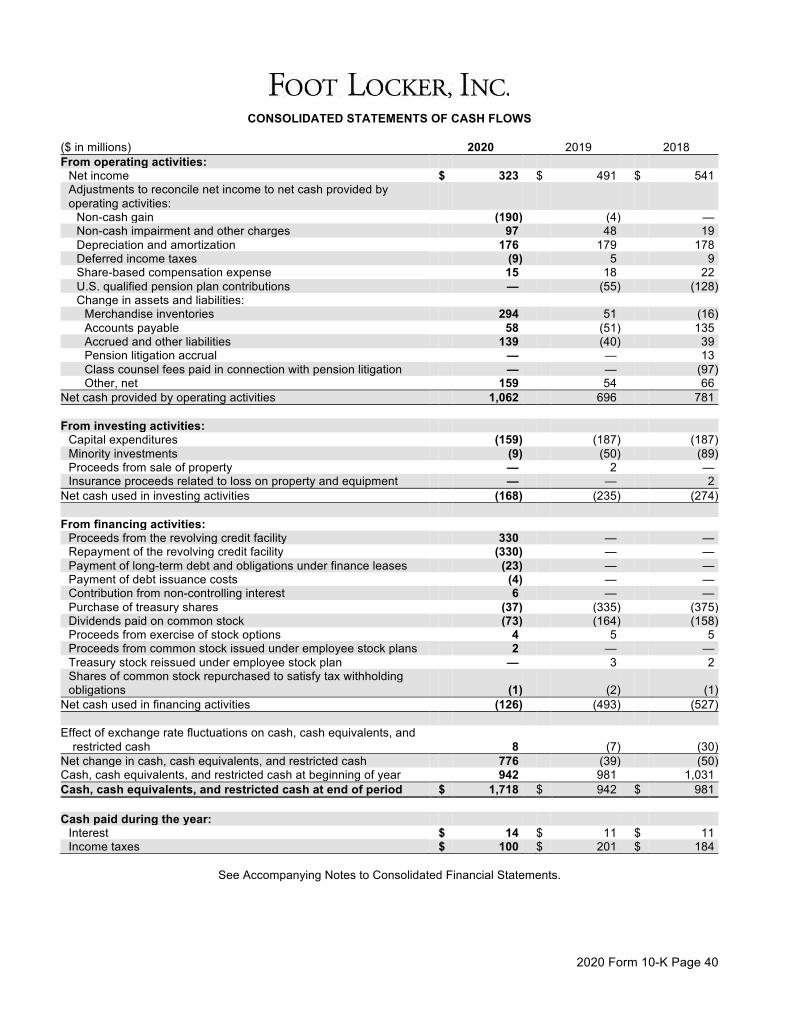
2020 Form 10-K Page 40
CONSOLIDATED STATEMENTS OF CASH FLOWS ($ in millions) 2020 2019 2018 From operating activities:
Net income $ 323 $ 491 $ 541 Adjustments to reconcile net income to net cash provided by operating activities:
Non-cash gain (190) (4) — Non-cash impairment and other charges 97 48 19 Depreciation and amortization 176 179 178 Deferred income taxes (9) 5 9 Share-based compensation expense 15 18 22 U.S. qualified pension plan contributions — (55) (128) Change in assets and liabilities:
Merchandise inventories 294 51 (16) Accounts payable 58 (51) 135 Accrued and other liabilities 139 (40) 39 Pension litigation accrual — — 13 Class counsel fees paid in connection with pension litigation — — (97) Other, net 159 54 66
Net cash provided by operating activities 1,062 696 781 From investing activities:
Capital expenditures (159) (187) (187) Minority investments (9) (50) (89) Proceeds from sale of property — 2 — Insurance proceeds related to loss on property and equipment — — 2
Net cash used in investing activities (168) (235) (274) From financing activities:
Proceeds from the revolving credit facility 330 — — Repayment of the revolving credit facility (330) — — Payment of long-term debt and obligations under finance leases (23) — — Payment of debt issuance costs (4) — — Contribution from non-controlling interest 6 — — Purchase of treasury shares (37) (335) (375) Dividends paid on common stock (73) (164) (158) Proceeds from exercise of stock options 4 5 5 Proceeds from common stock issued under employee stock plans 2 — — Treasury stock reissued under employee stock plan — 3 2 Shares of common stock repurchased to satisfy tax withholding obligations (1) (2) (1)
Net cash used in financing activities (126) (493) (527) Effect of exchange rate fluctuations on cash, cash equivalents, and
restricted cash 8 (7) (30) Net change in cash, cash equivalents, and restricted cash 776 (39) (50) Cash, cash equivalents, and restricted cash at beginning of year 942 981 1,031 Cash, cash equivalents, and restricted cash at end of period $ 1,718 $ 942 $ 981 Cash paid during the year:
Interest $ 14 $ 11 $ 11 Income taxes $ 100 $ 201 $ 184
See Accompanying Notes to Consolidated Financial Statements.
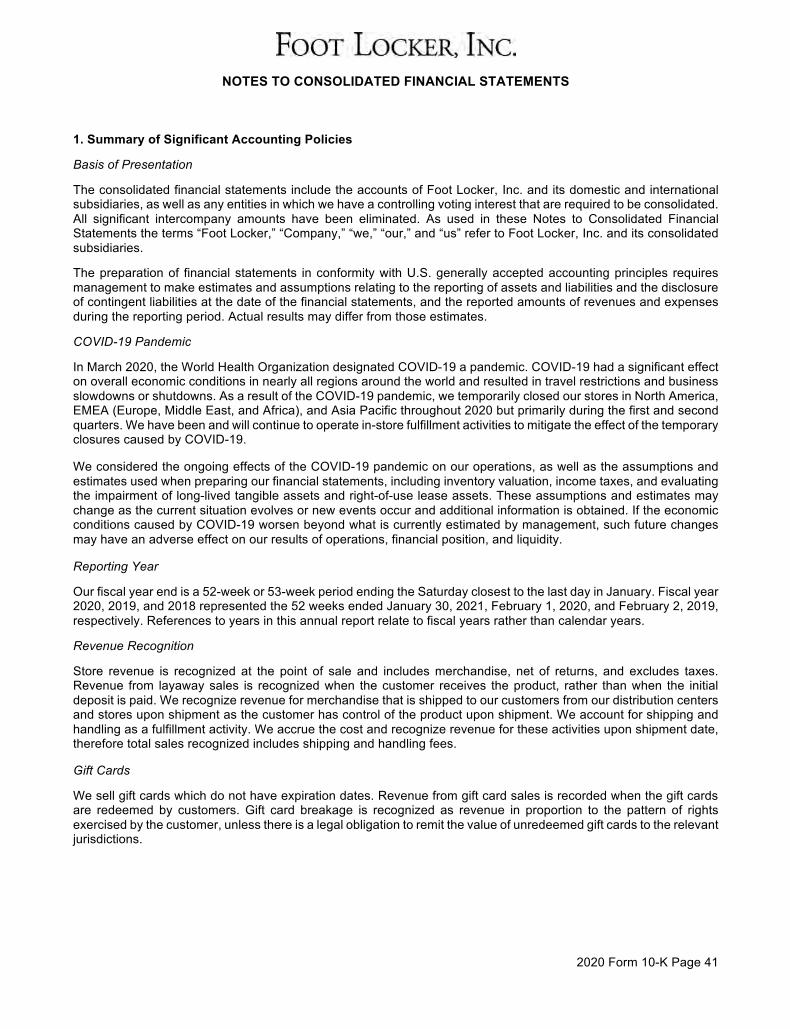
NOTES TO CONSOLIDATED FINANCIAL STATEMENTS
2020 Form 10-K Page 41
1. Summary of Significant Accounting Policies
Basis of Presentation
The consolidated financial statements include the accounts of Foot Locker, Inc. and its domestic and international subsidiaries, as well as any entities in which we have a controlling voting interest that are required to be consolidated. All significant intercompany amounts have been eliminated. As used in these Notes to Consolidated Financial Statements the terms “Foot Locker,” “Company,” “we,” “our,” and “us” refer to Foot Locker, Inc. and its consolidated subsidiaries.
The preparation of financial statements in conformity with U.S. generally accepted accounting principles requires management to make estimates and assumptions relating to the reporting of assets and liabilities and the disclosure of contingent liabilities at the date of the financial statements, and the reported amounts of revenues and expenses during the reporting period. Actual results may differ from those estimates.
COVID-19 Pandemic
In March 2020, the World Health Organization designated COVID-19 a pandemic. COVID-19 had a significant effect on overall economic conditions in nearly all regions around the world and resulted in travel restrictions and business slowdowns or shutdowns. As a result of the COVID-19 pandemic, we temporarily closed our stores in North America, EMEA (Europe, Middle East, and Africa), and Asia Pacific throughout 2020 but primarily during the first and second quarters. We have been and will continue to operate in-store fulfillment activities to mitigate the effect of the temporary closures caused by COVID-19.
We considered the ongoing effects of the COVID-19 pandemic on our operations, as well as the assumptions and estimates used when preparing our financial statements, including inventory valuation, income taxes, and evaluating the impairment of long-lived tangible assets and right-of-use lease assets. These assumptions and estimates may change as the current situation evolves or new events occur and additional information is obtained. If the economic conditions caused by COVID-19 worsen beyond what is currently estimated by management, such future changes may have an adverse effect on our results of operations, financial position, and liquidity.
Reporting Year
Our fiscal year end is a 52-week or 53-week period ending the Saturday closest to the last day in January. Fiscal year 2020, 2019, and 2018 represented the 52 weeks ended January 30, 2021, February 1, 2020, and February 2, 2019, respectively. References to years in this annual report relate to fiscal years rather than calendar years.
Revenue Recognition
Store revenue is recognized at the point of sale and includes merchandise, net of returns, and excludes taxes. Revenue from layaway sales is recognized when the customer receives the product, rather than when the initial deposit is paid. We recognize revenue for merchandise that is shipped to our customers from our distribution centers and stores upon shipment as the customer has control of the product upon shipment. We account for shipping and handling as a fulfillment activity. We accrue the cost and recognize revenue for these activities upon shipment date, therefore total sales recognized includes shipping and handling fees. Gift Cards
We sell gift cards which do not have expiration dates. Revenue from gift card sales is recorded when the gift cards are redeemed by customers. Gift card breakage is recognized as revenue in proportion to the pattern of rights exercised by the customer, unless there is a legal obligation to remit the value of unredeemed gift cards to the relevant jurisdictions.
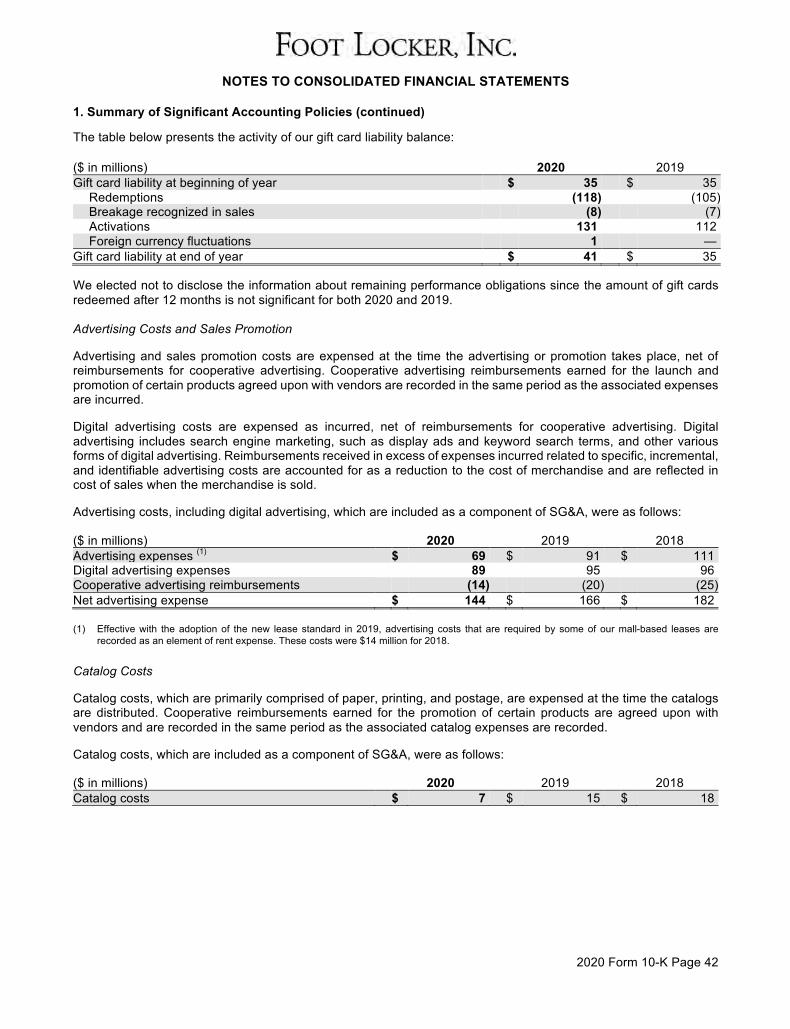
NOTES TO CONSOLIDATED FINANCIAL STATEMENTS
2020 Form 10-K Page 42
1. Summary of Significant Accounting Policies (continued)
The table below presents the activity of our gift card liability balance:
($ in millions) 2020 2019 Gift card liability at beginning of year $ 35 $ 35
Redemptions (118) (105) Breakage recognized in sales (8) (7) Activations 131 112 Foreign currency fluctuations 1 —
Gift card liability at end of year $ 41 $ 35 We elected not to disclose the information about remaining performance obligations since the amount of gift cards redeemed after 12 months is not significant for both 2020 and 2019. Advertising Costs and Sales Promotion
Advertising and sales promotion costs are expensed at the time the advertising or promotion takes place, net of reimbursements for cooperative advertising. Cooperative advertising reimbursements earned for the launch and promotion of certain products agreed upon with vendors are recorded in the same period as the associated expenses are incurred.
Digital advertising costs are expensed as incurred, net of reimbursements for cooperative advertising. Digital advertising includes search engine marketing, such as display ads and keyword search terms, and other various forms of digital advertising. Reimbursements received in excess of expenses incurred related to specific, incremental, and identifiable advertising costs are accounted for as a reduction to the cost of merchandise and are reflected in cost of sales when the merchandise is sold.
Advertising costs, including digital advertising, which are included as a component of SG&A, were as follows:
($ in millions) 2020 2019 2018 Advertising expenses (1) $ 69 $ 91 $ 111 Digital advertising expenses 89 95 96 Cooperative advertising reimbursements (14) (20) (25) Net advertising expense $ 144 $ 166 $ 182 (1) Effective with the adoption of the new lease standard in 2019, advertising costs that are required by some of our mall-based leases are
recorded as an element of rent expense. These costs were $14 million for 2018. Catalog Costs
Catalog costs, which are primarily comprised of paper, printing, and postage, are expensed at the time the catalogs are distributed. Cooperative reimbursements earned for the promotion of certain products are agreed upon with vendors and are recorded in the same period as the associated catalog expenses are recorded.
Catalog costs, which are included as a component of SG&A, were as follows:
($ in millions) 2020 2019 2018 Catalog costs $ 7 $ 15 $ 18
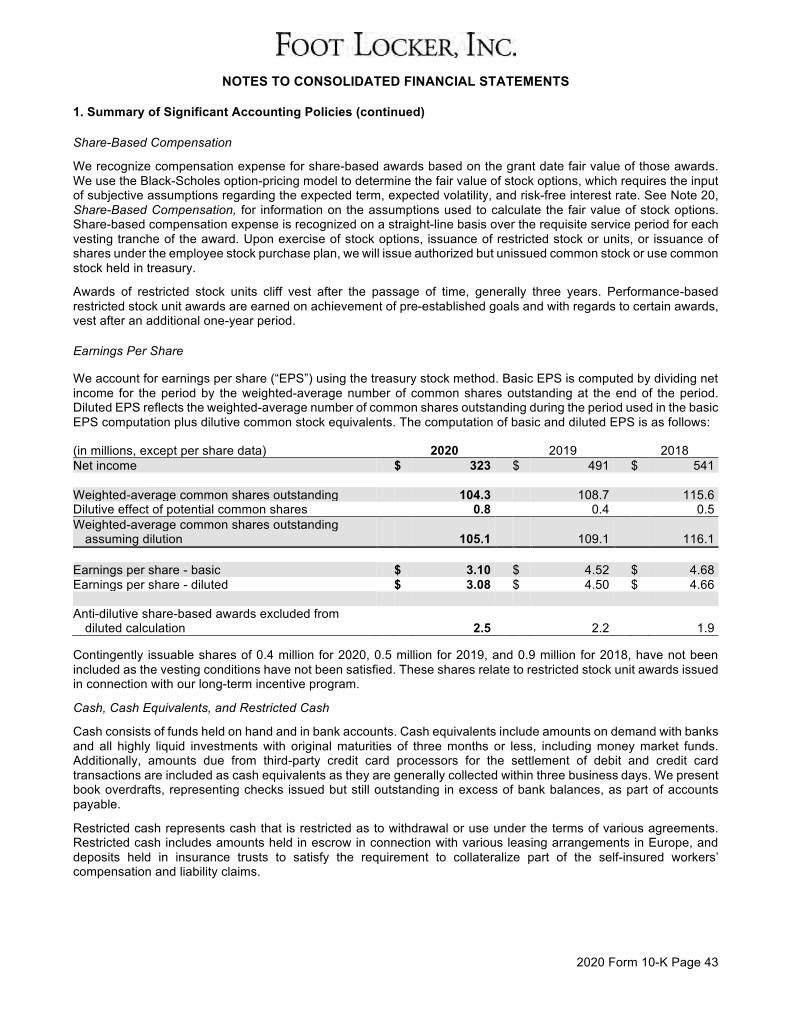
NOTES TO CONSOLIDATED FINANCIAL STATEMENTS
2020 Form 10-K Page 43
1. Summary of Significant Accounting Policies (continued)
Share-Based Compensation
We recognize compensation expense for share-based awards based on the grant date fair value of those awards. We use the Black-Scholes option-pricing model to determine the fair value of stock options, which requires the input of subjective assumptions regarding the expected term, expected volatility, and risk-free interest rate. See Note 20, Share-Based Compensation, for information on the assumptions used to calculate the fair value of stock options. Share-based compensation expense is recognized on a straight-line basis over the requisite service period for each vesting tranche of the award. Upon exercise of stock options, issuance of restricted stock or units, or issuance of shares under the employee stock purchase plan, we will issue authorized but unissued common stock or use common stock held in treasury.
Awards of restricted stock units cliff vest after the passage of time, generally three years. Performance-based restricted stock unit awards are earned on achievement of pre-established goals and with regards to certain awards, vest after an additional one-year period.
Earnings Per Share
We account for earnings per share (“EPS”) using the treasury stock method. Basic EPS is computed by dividing net income for the period by the weighted-average number of common shares outstanding at the end of the period. Diluted EPS reflects the weighted-average number of common shares outstanding during the period used in the basic EPS computation plus dilutive common stock equivalents. The computation of basic and diluted EPS is as follows:
(in millions, except per share data) 2020 2019 2018 Net income $ 323 $ 491 $ 541 Weighted-average common shares outstanding 104.3 108.7 115.6 Dilutive effect of potential common shares 0.8 0.4 0.5 Weighted-average common shares outstanding
assuming dilution 105.1 109.1 116.1 Earnings per share - basic $ 3.10 $ 4.52 $ 4.68 Earnings per share - diluted $ 3.08 $ 4.50 $ 4.66 Anti-dilutive share-based awards excluded from
diluted calculation 2.5 2.2 1.9 Contingently issuable shares of 0.4 million for 2020, 0.5 million for 2019, and 0.9 million for 2018, have not been included as the vesting conditions have not been satisfied. These shares relate to restricted stock unit awards issued in connection with our long-term incentive program.
Cash, Cash Equivalents, and Restricted Cash
Cash consists of funds held on hand and in bank accounts. Cash equivalents include amounts on demand with banks and all highly liquid investments with original maturities of three months or less, including money market funds. Additionally, amounts due from third-party credit card processors for the settlement of debit and credit card transactions are included as cash equivalents as they are generally collected within three business days. We present book overdrafts, representing checks issued but still outstanding in excess of bank balances, as part of accounts payable.
Restricted cash represents cash that is restricted as to withdrawal or use under the terms of various agreements. Restricted cash includes amounts held in escrow in connection with various leasing arrangements in Europe, and deposits held in insurance trusts to satisfy the requirement to collateralize part of the self-insured workers’ compensation and liability claims.
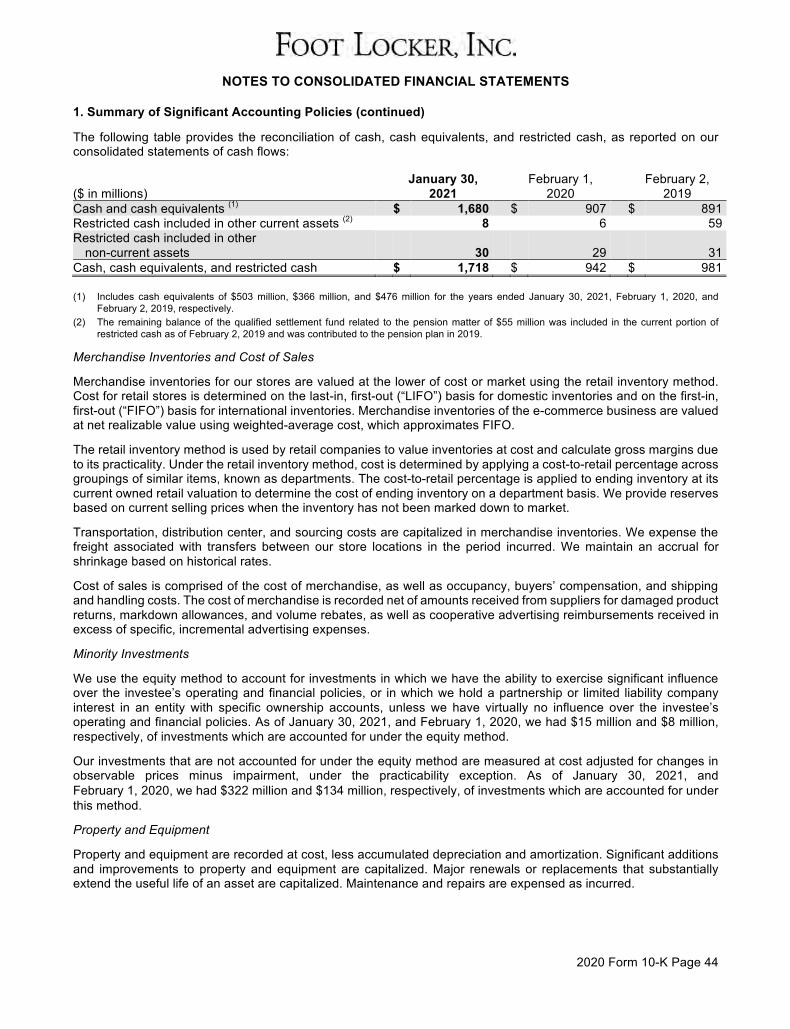
NOTES TO CONSOLIDATED FINANCIAL STATEMENTS
2020 Form 10-K Page 44
1. Summary of Significant Accounting Policies (continued)
The following table provides the reconciliation of cash, cash equivalents, and restricted cash, as reported on our consolidated statements of cash flows:
January 30, February 1, February 2, ($ in millions) 2021 2020 2019 Cash and cash equivalents (1) $ 1,680 $ 907 $ 891 Restricted cash included in other current assets (2) 8 6 59 Restricted cash included in other
non-current assets 30 29 31 Cash, cash equivalents, and restricted cash $ 1,718 $ 942 $ 981 (1) Includes cash equivalents of $503 million, $366 million, and $476 million for the years ended January 30, 2021, February 1, 2020, and
February 2, 2019, respectively. (2) The remaining balance of the qualified settlement fund related to the pension matter of $55 million was included in the current portion of
restricted cash as of February 2, 2019 and was contributed to the pension plan in 2019.
Merchandise Inventories and Cost of Sales
Merchandise inventories for our stores are valued at the lower of cost or market using the retail inventory method. Cost for retail stores is determined on the last-in, first-out (“LIFO”) basis for domestic inventories and on the first-in, first-out (“FIFO”) basis for international inventories. Merchandise inventories of the e-commerce business are valued at net realizable value using weighted-average cost, which approximates FIFO.
The retail inventory method is used by retail companies to value inventories at cost and calculate gross margins due to its practicality. Under the retail inventory method, cost is determined by applying a cost-to-retail percentage across groupings of similar items, known as departments. The cost-to-retail percentage is applied to ending inventory at its current owned retail valuation to determine the cost of ending inventory on a department basis. We provide reserves based on current selling prices when the inventory has not been marked down to market.
Transportation, distribution center, and sourcing costs are capitalized in merchandise inventories. We expense the freight associated with transfers between our store locations in the period incurred. We maintain an accrual for shrinkage based on historical rates.
Cost of sales is comprised of the cost of merchandise, as well as occupancy, buyers’ compensation, and shipping and handling costs. The cost of merchandise is recorded net of amounts received from suppliers for damaged product returns, markdown allowances, and volume rebates, as well as cooperative advertising reimbursements received in excess of specific, incremental advertising expenses.
Minority Investments
We use the equity method to account for investments in which we have the ability to exercise significant influence over the investee’s operating and financial policies, or in which we hold a partnership or limited liability company interest in an entity with specific ownership accounts, unless we have virtually no influence over the investee’s operating and financial policies. As of January 30, 2021, and February 1, 2020, we had $15 million and $8 million, respectively, of investments which are accounted for under the equity method.
Our investments that are not accounted for under the equity method are measured at cost adjusted for changes in observable prices minus impairment, under the practicability exception. As of January 30, 2021, and February 1, 2020, we had $322 million and $134 million, respectively, of investments which are accounted for under this method.
Property and Equipment
Property and equipment are recorded at cost, less accumulated depreciation and amortization. Significant additions and improvements to property and equipment are capitalized. Major renewals or replacements that substantially extend the useful life of an asset are capitalized. Maintenance and repairs are expensed as incurred.
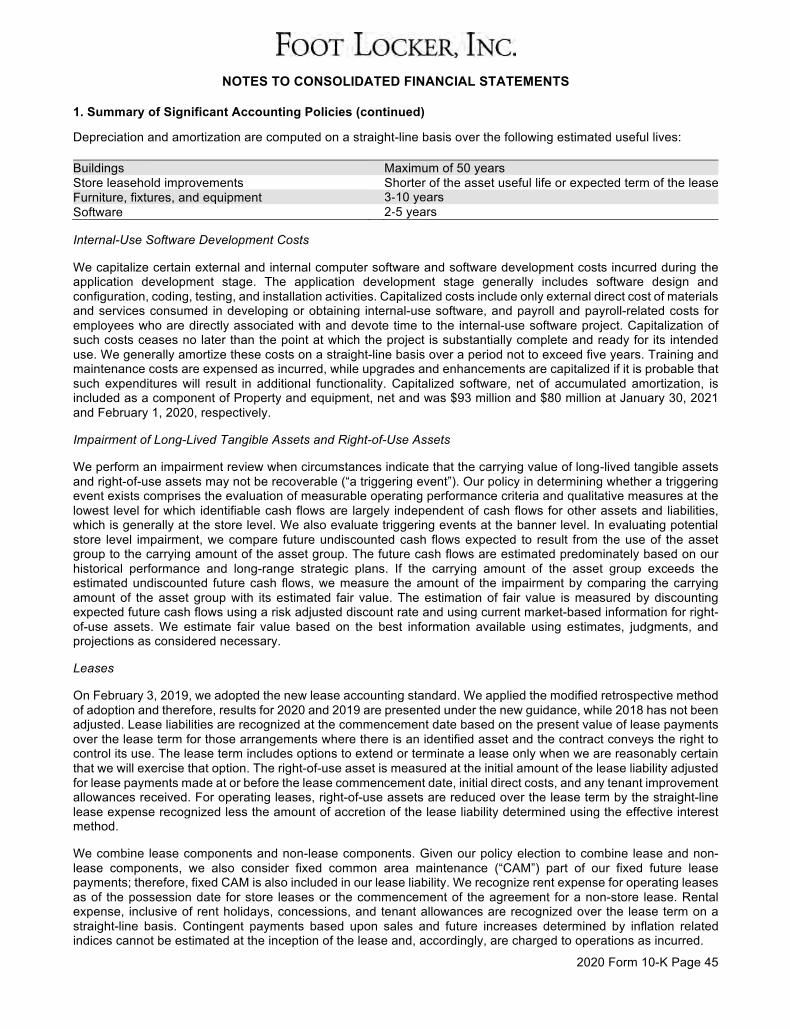
NOTES TO CONSOLIDATED FINANCIAL STATEMENTS
2020 Form 10-K Page 45
1. Summary of Significant Accounting Policies (continued)
Depreciation and amortization are computed on a straight-line basis over the following estimated useful lives:
Buildings Maximum of 50 years Store leasehold improvements Shorter of the asset useful life or expected term of the lease Furniture, fixtures, and equipment 3-10 years Software 2-5 years
Internal-Use Software Development Costs
We capitalize certain external and internal computer software and software development costs incurred during the application development stage. The application development stage generally includes software design and configuration, coding, testing, and installation activities. Capitalized costs include only external direct cost of materials and services consumed in developing or obtaining internal-use software, and payroll and payroll-related costs for employees who are directly associated with and devote time to the internal-use software project. Capitalization of such costs ceases no later than the point at which the project is substantially complete and ready for its intended use. We generally amortize these costs on a straight-line basis over a period not to exceed five years. Training and maintenance costs are expensed as incurred, while upgrades and enhancements are capitalized if it is probable that such expenditures will result in additional functionality. Capitalized software, net of accumulated amortization, is included as a component of Property and equipment, net and was $93 million and $80 million at January 30, 2021 and February 1, 2020, respectively.
Impairment of Long-Lived Tangible Assets and Right-of-Use Assets
We perform an impairment review when circumstances indicate that the carrying value of long-lived tangible assets and right-of-use assets may not be recoverable (“a triggering event”). Our policy in determining whether a triggering event exists comprises the evaluation of measurable operating performance criteria and qualitative measures at the lowest level for which identifiable cash flows are largely independent of cash flows for other assets and liabilities, which is generally at the store level. We also evaluate triggering events at the banner level. In evaluating potential store level impairment, we compare future undiscounted cash flows expected to result from the use of the asset group to the carrying amount of the asset group. The future cash flows are estimated predominately based on our historical performance and long-range strategic plans. If the carrying amount of the asset group exceeds the estimated undiscounted future cash flows, we measure the amount of the impairment by comparing the carrying amount of the asset group with its estimated fair value. The estimation of fair value is measured by discounting expected future cash flows using a risk adjusted discount rate and using current market-based information for right-of-use assets. We estimate fair value based on the best information available using estimates, judgments, and projections as considered necessary.
Leases
On February 3, 2019, we adopted the new lease accounting standard. We applied the modified retrospective method of adoption and therefore, results for 2020 and 2019 are presented under the new guidance, while 2018 has not been adjusted. Lease liabilities are recognized at the commencement date based on the present value of lease payments over the lease term for those arrangements where there is an identified asset and the contract conveys the right to control its use. The lease term includes options to extend or terminate a lease only when we are reasonably certain that we will exercise that option. The right-of-use asset is measured at the initial amount of the lease liability adjusted for lease payments made at or before the lease commencement date, initial direct costs, and any tenant improvement allowances received. For operating leases, right-of-use assets are reduced over the lease term by the straight-line lease expense recognized less the amount of accretion of the lease liability determined using the effective interest method.
We combine lease components and non-lease components. Given our policy election to combine lease and non-lease components, we also consider fixed common area maintenance (“CAM”) part of our fixed future lease payments; therefore, fixed CAM is also included in our lease liability. We recognize rent expense for operating leases as of the possession date for store leases or the commencement of the agreement for a non-store lease. Rental expense, inclusive of rent holidays, concessions, and tenant allowances are recognized over the lease term on a straight-line basis. Contingent payments based upon sales and future increases determined by inflation related indices cannot be estimated at the inception of the lease and, accordingly, are charged to operations as incurred.
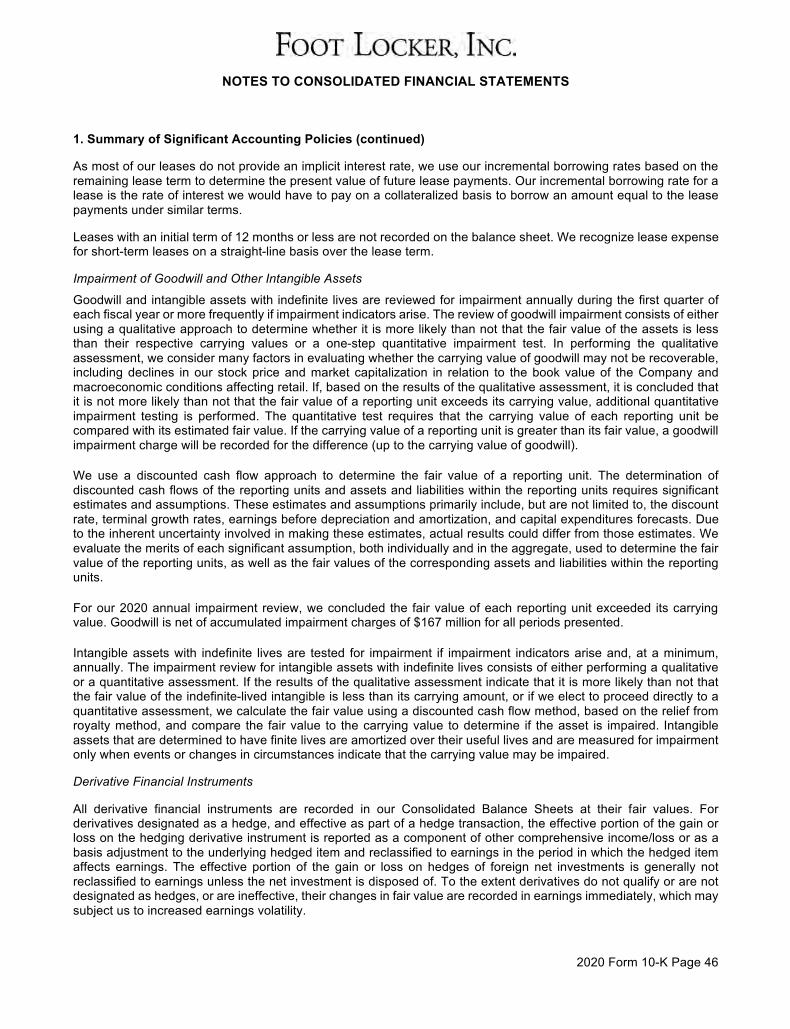
NOTES TO CONSOLIDATED FINANCIAL STATEMENTS
2020 Form 10-K Page 46
1. Summary of Significant Accounting Policies (continued)
As most of our leases do not provide an implicit interest rate, we use our incremental borrowing rates based on the remaining lease term to determine the present value of future lease payments. Our incremental borrowing rate for a lease is the rate of interest we would have to pay on a collateralized basis to borrow an amount equal to the lease payments under similar terms.
Leases with an initial term of 12 months or less are not recorded on the balance sheet. We recognize lease expense for short-term leases on a straight-line basis over the lease term.
Impairment of Goodwill and Other Intangible Assets
Goodwill and intangible assets with indefinite lives are reviewed for impairment annually during the first quarter of each fiscal year or more frequently if impairment indicators arise. The review of goodwill impairment consists of either using a qualitative approach to determine whether it is more likely than not that the fair value of the assets is less than their respective carrying values or a one-step quantitative impairment test. In performing the qualitative assessment, we consider many factors in evaluating whether the carrying value of goodwill may not be recoverable, including declines in our stock price and market capitalization in relation to the book value of the Company and macroeconomic conditions affecting retail. If, based on the results of the qualitative assessment, it is concluded that it is not more likely than not that the fair value of a reporting unit exceeds its carrying value, additional quantitative impairment testing is performed. The quantitative test requires that the carrying value of each reporting unit be compared with its estimated fair value. If the carrying value of a reporting unit is greater than its fair value, a goodwill impairment charge will be recorded for the difference (up to the carrying value of goodwill).
We use a discounted cash flow approach to determine the fair value of a reporting unit. The determination of discounted cash flows of the reporting units and assets and liabilities within the reporting units requires significant estimates and assumptions. These estimates and assumptions primarily include, but are not limited to, the discount rate, terminal growth rates, earnings before depreciation and amortization, and capital expenditures forecasts. Due to the inherent uncertainty involved in making these estimates, actual results could differ from those estimates. We evaluate the merits of each significant assumption, both individually and in the aggregate, used to determine the fair value of the reporting units, as well as the fair values of the corresponding assets and liabilities within the reporting units.
For our 2020 annual impairment review, we concluded the fair value of each reporting unit exceeded its carrying value. Goodwill is net of accumulated impairment charges of $167 million for all periods presented.
Intangible assets with indefinite lives are tested for impairment if impairment indicators arise and, at a minimum, annually. The impairment review for intangible assets with indefinite lives consists of either performing a qualitative or a quantitative assessment. If the results of the qualitative assessment indicate that it is more likely than not that the fair value of the indefinite-lived intangible is less than its carrying amount, or if we elect to proceed directly to a quantitative assessment, we calculate the fair value using a discounted cash flow method, based on the relief from royalty method, and compare the fair value to the carrying value to determine if the asset is impaired. Intangible assets that are determined to have finite lives are amortized over their useful lives and are measured for impairment only when events or changes in circumstances indicate that the carrying value may be impaired.
Derivative Financial Instruments
All derivative financial instruments are recorded in our Consolidated Balance Sheets at their fair values. For derivatives designated as a hedge, and effective as part of a hedge transaction, the effective portion of the gain or loss on the hedging derivative instrument is reported as a component of other comprehensive income/loss or as a basis adjustment to the underlying hedged item and reclassified to earnings in the period in which the hedged item affects earnings. The effective portion of the gain or loss on hedges of foreign net investments is generally not reclassified to earnings unless the net investment is disposed of. To the extent derivatives do not qualify or are not designated as hedges, or are ineffective, their changes in fair value are recorded in earnings immediately, which may subject us to increased earnings volatility.
NOTES TO CONSOLIDATED FINANCIAL STATEMENTS
2020 Form 10-K Page 47
1. Summary of Significant Accounting Policies (continued)
Income Taxes
We account for our income taxes under the asset and liability method, which requires the recognition of deferred tax assets and liabilities for the expected future tax consequences of events that have been included in the financial statements. Under this method, deferred tax assets and liabilities are determined on the basis of the differences between the financial statements and the tax basis of assets and liabilities, using enacted tax rates in effect for the year in which the differences are expected to reverse. Deferred tax assets are recognized for tax credits and net operating loss carryforwards, reduced by a valuation allowance, which is established when it is more likely than not that some portion or all of the deferred tax assets will not be realized. The effect of a change in tax rates on deferred tax assets and liabilities is recognized in income in the period that includes the enactment date.
We recognize net deferred tax assets to the extent that we believe these assets are more likely than not to be realized. In making such a determination, we consider all available positive and negative evidence, including future reversals of existing taxable temporary differences, projected future taxable income, tax-planning strategies, and results of recent operations. If we determine that we would be able to realize our deferred tax assets in the future in excess of their net recorded amount, we would make an adjustment to the deferred tax asset valuation allowance, which would reduce the provision for income taxes.
A taxing authority may challenge positions that we adopted in our income tax filings. Accordingly, we may apply different tax treatments for transactions in filing our income tax returns than for income tax financial reporting. We regularly assess our tax positions for such transactions and record reserves for those differences when considered necessary. Tax positions are recognized only when it is more likely than not, based on technical merits, that the positions will be sustained upon examination. Tax positions that meet the more-likely-than-not threshold are measured using a probability weighted approach as the largest amount of tax benefit that is greater than fifty percent likely of being realized upon settlement. Whether the more-likely-than-not recognition threshold is met for a tax position is a matter of judgment based on the individual facts and circumstances of that position evaluated in light of all available evidence. We recognize interest and penalties related to unrecognized tax benefits within income tax expense in the accompanying Consolidated Statement of Operations. Accrued interest and penalties are included within the related tax liability line in the Consolidated Balance Sheet.
Pension and Postretirement Obligations
Pension benefit obligations and net periodic pension costs are calculated using actuarial assumptions. Two key assumptions used in accounting for pension liabilities and expenses are the discount rate and expected rate of return on plan assets. The discount rate for the U.S. plans is determined by reference to the Bond:Link interest rate model based upon a portfolio of highly-rated U.S. corporate bonds with individual bonds that are theoretically purchased to settle the plan’s anticipated cash outflows. The cash flows are discounted to their present value and an overall discount rate is determined. The discount rate selected to measure the present value of the Canadian benefit obligations was developed by using that plan’s bond portfolio indices, which match the benefit obligations. We measure our plan assets and benefit obligations using the month-end date that is closest to our fiscal year end. The expected return on plan assets assumption is derived using the current and expected asset allocation of the pension plan assets and considering historical as well as expected performance of those assets.
Insurance Liabilities
We are primarily self-insured for health care, workers’ compensation, and general liability costs. Accordingly, provisions are made for actuarially determined estimates of discounted future claim costs for such risks, for the aggregate of claims reported, and claims incurred but not yet reported. Self-insured liabilities totaled $13 million and $12 million for January 30, 2021 and February 1, 2020, respectively. Workers’ compensation and general liability reserves are discounted using a risk-free interest rate. Imputed interest expense related to these liabilities was not significant for any of the periods presented.
NOTES TO CONSOLIDATED FINANCIAL STATEMENTS
2020 Form 10-K Page 48
1. Summary of Significant Accounting Policies (continued)
Treasury Stock Retirement
We periodically retire treasury shares that we acquire through share repurchases and return those shares to the status of authorized but unissued. We account for treasury stock transactions under the cost method. For each reacquisition of common stock, the number of shares and the acquisition price for those shares is added to the existing treasury stock count and total value. When treasury shares are retired, our policy is to allocate the excess of the repurchase price over the par value of shares acquired to both retained earnings and additional paid-in capital. The portion allocated to additional paid-in capital is determined by applying a percentage, which is determined by dividing the number of shares to be retired by the number of shares issued, to the balance of additional paid-in capital as of the retirement date.
We retired 913,095 and 9,021,244 shares of our common stock held in treasury during 2020 and 2019, respectively. The shares were returned to the status of authorized but unissued. As a result, treasury stock decreased by $34 million and $368 million as of January 30, 2021 and February 1, 2020, respectively.
Foreign Currency Translation
The functional currency of our international operations is the applicable local currency. The translation of the applicable foreign currency into U.S. dollars is performed for balance sheet accounts using current exchange rates in effect at the balance sheet date and for revenue and expense accounts using the weighted-average rates of exchange prevailing during the year. The unearned gains and losses resulting from such translation are included as a separate component of accumulated other comprehensive loss (“AOCL”) within shareholders’ equity.
Recently Adopted Accounting Pronouncements On February 2, 2020, we adopted Financial Accounting Standards Board (“FASB”) guidance on the accounting for implementation costs of a cloud computing arrangement that is considered to be a service contract, that requires companies to follow the guidance for internal-use software to determine which costs to capitalize in a cloud computing arrangement that is a service contract. Under this guidance, such implementation costs will be capitalized in Other assets on the Consolidated Balance Sheet, with the related amortization presented in Selling, general and administrative expenses on the Consolidated Statement of Operations. This guidance was applied prospectively to implementation costs incurred after February 2, 2020. The adoption of this guidance did not have a significant effect on our consolidated financial statements. On February 2, 2020, we adopted FASB’s updated guidance on the accounting for performing goodwill impairment tests. This update eliminates the requirement to perform a hypothetical purchase price allocation to measure goodwill impairment. In testing goodwill for impairment, an entity may elect to utilize a qualitative assessment to evaluate whether it is more likely than not that the fair value of a reporting unit is less than its carrying amount. If the qualitative assessment indicates that goodwill impairment is more likely than not, an entity should perform its goodwill impairment test by comparing the fair value of a reporting unit to its carrying amount and recognize an impairment charge for the amount by which the carrying amount exceeds the reporting unit's fair value, not to exceed the total amount of goodwill allocated to the reporting unit. In January 2021, we adopted FASB’s amended guidance that eliminates, adds, and clarifies certain disclosure requirements for defined benefit pension or other postretirement plans. The eliminated disclosures include the amounts in accumulated other comprehensive income expected to be recognized in net periodic benefit costs over the next fiscal year and the effects of a one-percentage-point change in assumed health care cost trend rates on the aggregate of the service and interest cost components of net periodic benefit costs and the benefit obligation for postretirement health care benefits. The new disclosures require an explanation of significant gains and losses related to changes in benefit obligations. This standard is effective for fiscal years beginning after December 15, 2020 and allows for early adoption. The amendments are required to be applied retrospectively. The adoption of this guidance did not have a significant effect on our consolidated financial statements. Other recently issued accounting pronouncements did not, or are not believed by management to, have a material effect on our present or future consolidated financial statements.
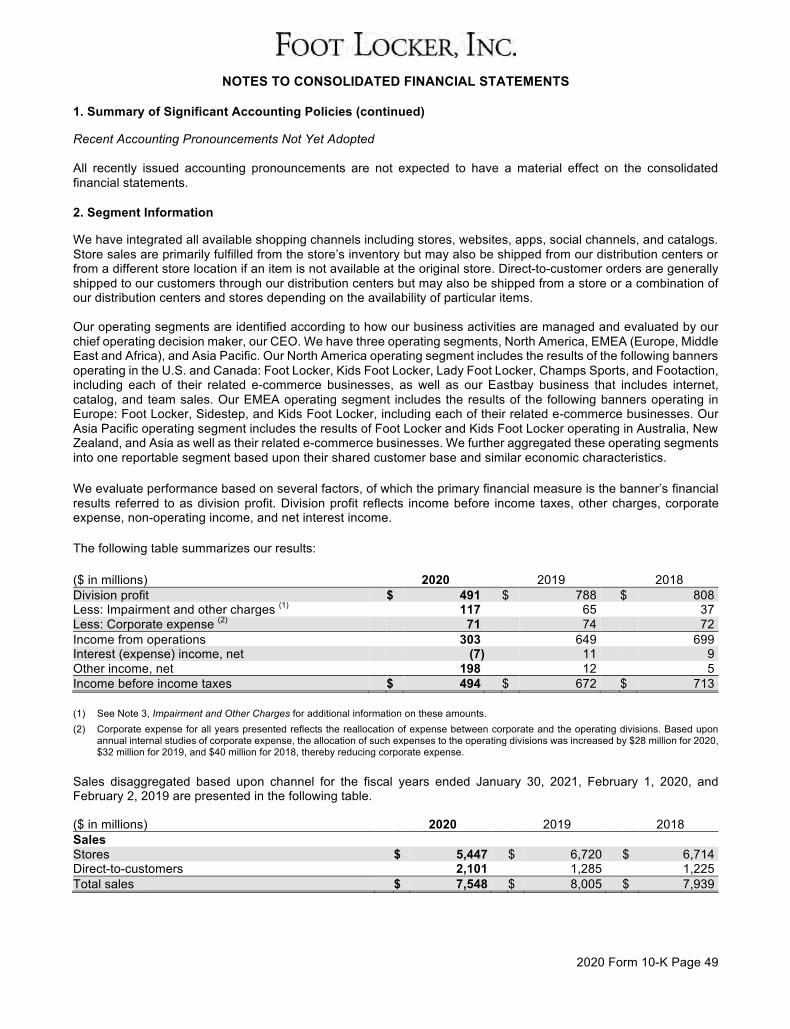
NOTES TO CONSOLIDATED FINANCIAL STATEMENTS
2020 Form 10-K Page 49
1. Summary of Significant Accounting Policies (continued)
Recent Accounting Pronouncements Not Yet Adopted All recently issued accounting pronouncements are not expected to have a material effect on the consolidated financial statements. 2. Segment Information
We have integrated all available shopping channels including stores, websites, apps, social channels, and catalogs. Store sales are primarily fulfilled from the store’s inventory but may also be shipped from our distribution centers or from a different store location if an item is not available at the original store. Direct-to-customer orders are generally shipped to our customers through our distribution centers but may also be shipped from a store or a combination of our distribution centers and stores depending on the availability of particular items. Our operating segments are identified according to how our business activities are managed and evaluated by our chief operating decision maker, our CEO. We have three operating segments, North America, EMEA (Europe, Middle East and Africa), and Asia Pacific. Our North America operating segment includes the results of the following banners operating in the U.S. and Canada: Foot Locker, Kids Foot Locker, Lady Foot Locker, Champs Sports, and Footaction, including each of their related e-commerce businesses, as well as our Eastbay business that includes internet, catalog, and team sales. Our EMEA operating segment includes the results of the following banners operating in Europe: Foot Locker, Sidestep, and Kids Foot Locker, including each of their related e-commerce businesses. Our Asia Pacific operating segment includes the results of Foot Locker and Kids Foot Locker operating in Australia, New Zealand, and Asia as well as their related e-commerce businesses. We further aggregated these operating segments into one reportable segment based upon their shared customer base and similar economic characteristics. We evaluate performance based on several factors, of which the primary financial measure is the banner’s financial results referred to as division profit. Division profit reflects income before income taxes, other charges, corporate expense, non-operating income, and net interest income.
The following table summarizes our results:
($ in millions) 2020 2019 2018 Division profit $ 491 $ 788 $ 808 Less: Impairment and other charges (1) 117 65 37 Less: Corporate expense (2) 71 74 72 Income from operations 303 649 699 Interest (expense) income, net (7) 11 9 Other income, net 198 12 5 Income before income taxes $ 494 $ 672 $ 713 (1) See Note 3, Impairment and Other Charges for additional information on these amounts. (2) Corporate expense for all years presented reflects the reallocation of expense between corporate and the operating divisions. Based upon
annual internal studies of corporate expense, the allocation of such expenses to the operating divisions was increased by $28 million for 2020, $32 million for 2019, and $40 million for 2018, thereby reducing corporate expense.
Sales disaggregated based upon channel for the fiscal years ended January 30, 2021, February 1, 2020, and February 2, 2019 are presented in the following table.
($ in millions) 2020 2019 2018 Sales Stores $ 5,447 $ 6,720 $ 6,714 Direct-to-customers 2,101 1,285 1,225 Total sales $ 7,548 $ 8,005 $ 7,939
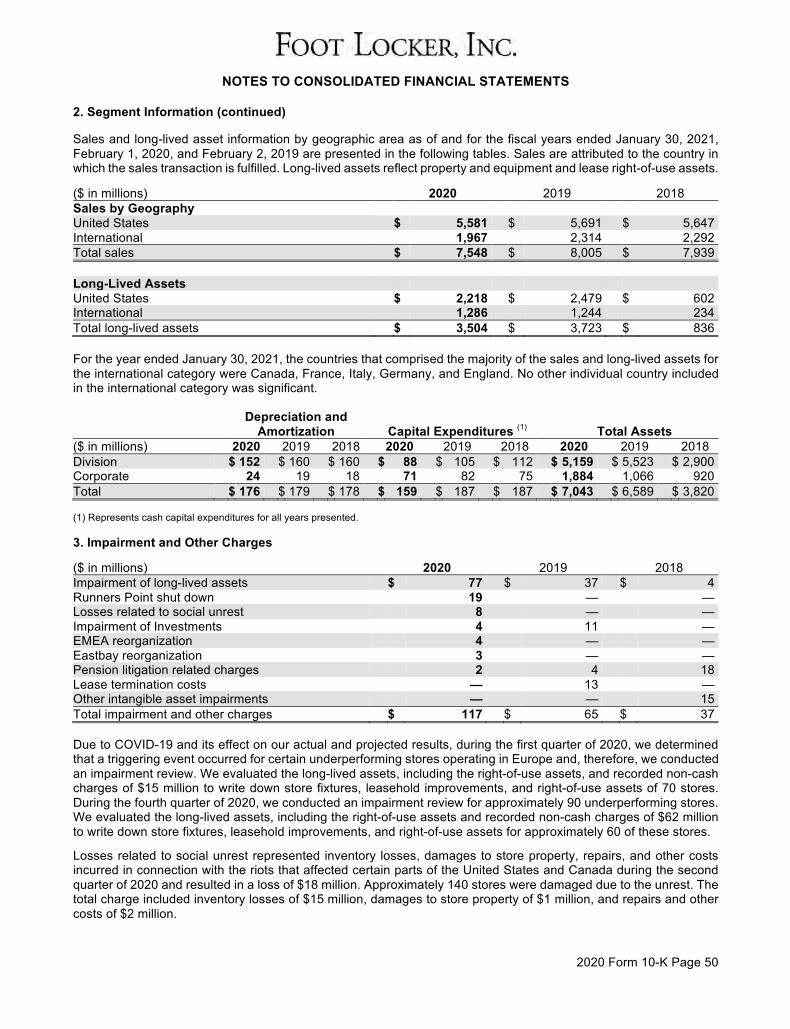
NOTES TO CONSOLIDATED FINANCIAL STATEMENTS
2020 Form 10-K Page 50
2. Segment Information (continued)
Sales and long-lived asset information by geographic area as of and for the fiscal years ended January 30, 2021, February 1, 2020, and February 2, 2019 are presented in the following tables. Sales are attributed to the country in which the sales transaction is fulfilled. Long-lived assets reflect property and equipment and lease right-of-use assets.
($ in millions) 2020 2019 2018 Sales by Geography United States $ 5,581 $ 5,691 $ 5,647 International 1,967 2,314 2,292 Total sales $ 7,548 $ 8,005 $ 7,939 Long-Lived Assets United States $ 2,218 $ 2,479 $ 602 International 1,286 1,244 234 Total long-lived assets $ 3,504 $ 3,723 $ 836 For the year ended January 30, 2021, the countries that comprised the majority of the sales and long-lived assets for the international category were Canada, France, Italy, Germany, and England. No other individual country included in the international category was significant.
Depreciation and Amortization Capital Expenditures (1) Total Assets ($ in millions) 2020 2019 2018 2020 2019 2018 2020 2019 2018 Division $ 152 $ 160 $ 160 $ 88 $ 105 $ 112 $ 5,159 $ 5,523 $ 2,900 Corporate 24 19 18 71 82 75 1,884 1,066 920 Total $ 176 $ 179 $ 178 $ 159 $ 187 $ 187 $ 7,043 $ 6,589 $ 3,820 (1) Represents cash capital expenditures for all years presented. 3. Impairment and Other Charges
($ in millions) 2020 2019 2018 Impairment of long-lived assets $ 77 $ 37 $ 4 Runners Point shut down 19 — — Losses related to social unrest 8 — — Impairment of Investments 4 11 — EMEA reorganization 4 — — Eastbay reorganization 3 — — Pension litigation related charges 2 4 18 Lease termination costs — 13 — Other intangible asset impairments — — 15 Total impairment and other charges $ 117 $ 65 $ 37 Due to COVID-19 and its effect on our actual and projected results, during the first quarter of 2020, we determined that a triggering event occurred for certain underperforming stores operating in Europe and, therefore, we conducted an impairment review. We evaluated the long-lived assets, including the right-of-use assets, and recorded non-cash charges of $15 million to write down store fixtures, leasehold improvements, and right-of-use assets of 70 stores. During the fourth quarter of 2020, we conducted an impairment review for approximately 90 underperforming stores. We evaluated the long-lived assets, including the right-of-use assets and recorded non-cash charges of $62 million to write down store fixtures, leasehold improvements, and right-of-use assets for approximately 60 of these stores.
Losses related to social unrest represented inventory losses, damages to store property, repairs, and other costs incurred in connection with the riots that affected certain parts of the United States and Canada during the second quarter of 2020 and resulted in a loss of $18 million. Approximately 140 stores were damaged due to the unrest. The total charge included inventory losses of $15 million, damages to store property of $1 million, and repairs and other costs of $2 million.
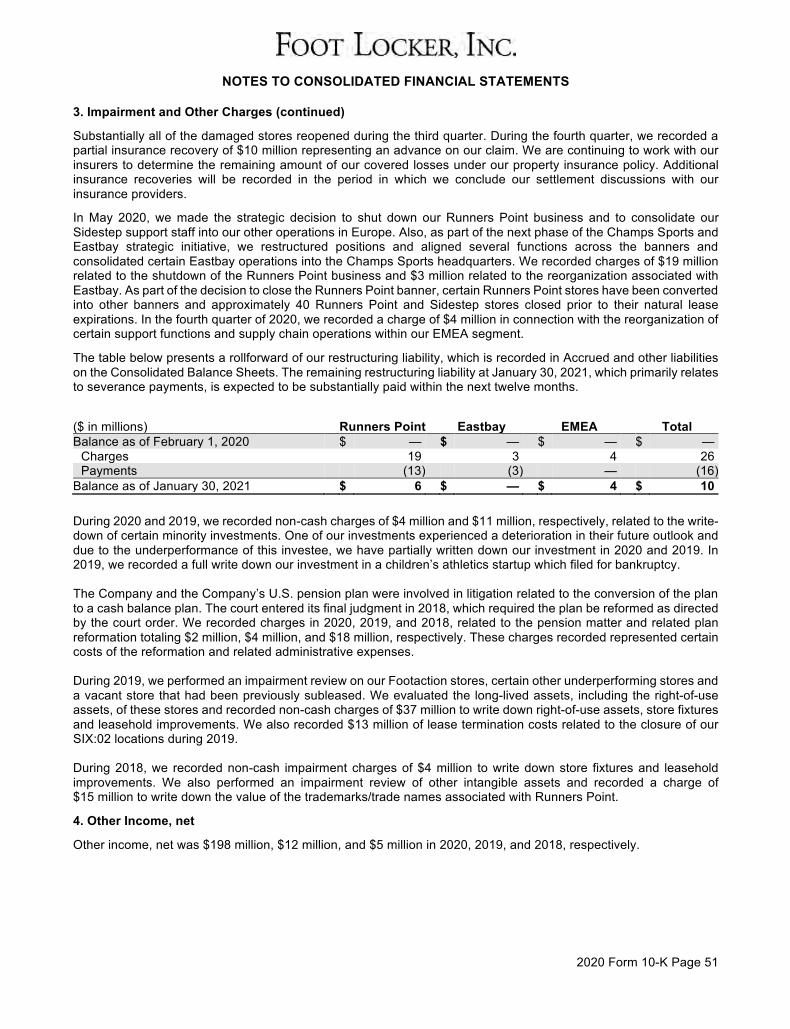
NOTES TO CONSOLIDATED FINANCIAL STATEMENTS
2020 Form 10-K Page 51
3. Impairment and Other Charges (continued)
Substantially all of the damaged stores reopened during the third quarter. During the fourth quarter, we recorded a partial insurance recovery of $10 million representing an advance on our claim. We are continuing to work with our insurers to determine the remaining amount of our covered losses under our property insurance policy. Additional insurance recoveries will be recorded in the period in which we conclude our settlement discussions with our insurance providers.
In May 2020, we made the strategic decision to shut down our Runners Point business and to consolidate our Sidestep support staff into our other operations in Europe. Also, as part of the next phase of the Champs Sports and Eastbay strategic initiative, we restructured positions and aligned several functions across the banners and consolidated certain Eastbay operations into the Champs Sports headquarters. We recorded charges of $19 million related to the shutdown of the Runners Point business and $3 million related to the reorganization associated with Eastbay. As part of the decision to close the Runners Point banner, certain Runners Point stores have been converted into other banners and approximately 40 Runners Point and Sidestep stores closed prior to their natural lease expirations. In the fourth quarter of 2020, we recorded a charge of $4 million in connection with the reorganization of certain support functions and supply chain operations within our EMEA segment.
The table below presents a rollforward of our restructuring liability, which is recorded in Accrued and other liabilities on the Consolidated Balance Sheets. The remaining restructuring liability at January 30, 2021, which primarily relates to severance payments, is expected to be substantially paid within the next twelve months.
($ in millions) Runners Point Eastbay EMEA Total Balance as of February 1, 2020 $ — $ — $ — $ —
Charges 19 3 4 26 Payments (13) (3) — (16)
Balance as of January 30, 2021 $ 6 $ — $ 4 $ 10 During 2020 and 2019, we recorded non-cash charges of $4 million and $11 million, respectively, related to the write-down of certain minority investments. One of our investments experienced a deterioration in their future outlook and due to the underperformance of this investee, we have partially written down our investment in 2020 and 2019. In 2019, we recorded a full write down our investment in a children’s athletics startup which filed for bankruptcy. The Company and the Company’s U.S. pension plan were involved in litigation related to the conversion of the plan to a cash balance plan. The court entered its final judgment in 2018, which required the plan be reformed as directed by the court order. We recorded charges in 2020, 2019, and 2018, related to the pension matter and related plan reformation totaling $2 million, $4 million, and $18 million, respectively. These charges recorded represented certain costs of the reformation and related administrative expenses. During 2019, we performed an impairment review on our Footaction stores, certain other underperforming stores and a vacant store that had been previously subleased. We evaluated the long-lived assets, including the right-of-use assets, of these stores and recorded non-cash charges of $37 million to write down right-of-use assets, store fixtures and leasehold improvements. We also recorded $13 million of lease termination costs related to the closure of our SIX:02 locations during 2019. During 2018, we recorded non-cash impairment charges of $4 million to write down store fixtures and leasehold improvements. We also performed an impairment review of other intangible assets and recorded a charge of $15 million to write down the value of the trademarks/trade names associated with Runners Point.
4. Other Income, net
Other income, net was $198 million, $12 million, and $5 million in 2020, 2019, and 2018, respectively.
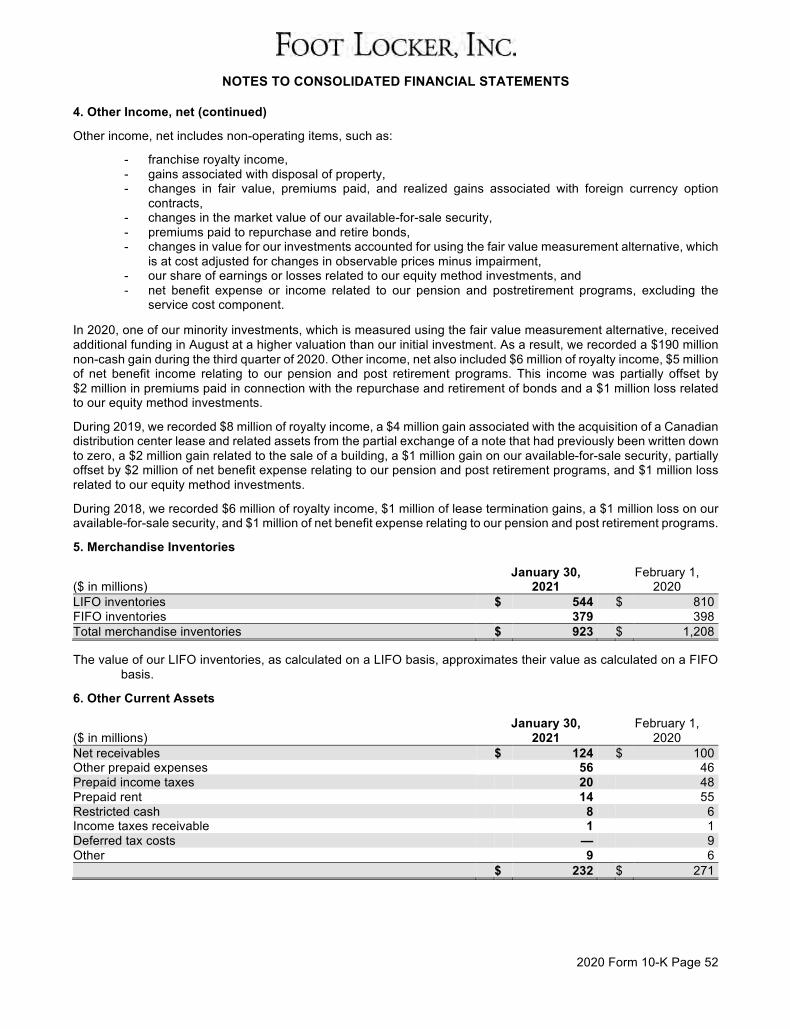
NOTES TO CONSOLIDATED FINANCIAL STATEMENTS
2020 Form 10-K Page 52
4. Other Income, net (continued)
Other income, net includes non-operating items, such as:
- franchise royalty income, - gains associated with disposal of property, - changes in fair value, premiums paid, and realized gains associated with foreign currency option
contracts, - changes in the market value of our available-for-sale security, - premiums paid to repurchase and retire bonds, - changes in value for our investments accounted for using the fair value measurement alternative, which
is at cost adjusted for changes in observable prices minus impairment, - our share of earnings or losses related to our equity method investments, and - net benefit expense or income related to our pension and postretirement programs, excluding the
service cost component.
In 2020, one of our minority investments, which is measured using the fair value measurement alternative, received additional funding in August at a higher valuation than our initial investment. As a result, we recorded a $190 million non-cash gain during the third quarter of 2020. Other income, net also included $6 million of royalty income, $5 million of net benefit income relating to our pension and post retirement programs. This income was partially offset by $2 million in premiums paid in connection with the repurchase and retirement of bonds and a $1 million loss related to our equity method investments.
During 2019, we recorded $8 million of royalty income, a $4 million gain associated with the acquisition of a Canadian distribution center lease and related assets from the partial exchange of a note that had previously been written down to zero, a $2 million gain related to the sale of a building, a $1 million gain on our available-for-sale security, partially offset by $2 million of net benefit expense relating to our pension and post retirement programs, and $1 million loss related to our equity method investments.
During 2018, we recorded $6 million of royalty income, $1 million of lease termination gains, a $1 million loss on our available-for-sale security, and $1 million of net benefit expense relating to our pension and post retirement programs.
5. Merchandise Inventories
($ in millions) January 30,
2021 February 1,
2020 LIFO inventories $ 544 $ 810 FIFO inventories 379 398 Total merchandise inventories $ 923 $ 1,208 The value of our LIFO inventories, as calculated on a LIFO basis, approximates their value as calculated on a FIFO
basis.
6. Other Current Assets
($ in millions) January 30,
2021 February 1,
2020 Net receivables $ 124 $ 100 Other prepaid expenses 56 46 Prepaid income taxes 20 48 Prepaid rent 14 55 Restricted cash 8 6 Income taxes receivable 1 1 Deferred tax costs — 9 Other 9 6 $ 232 $ 271
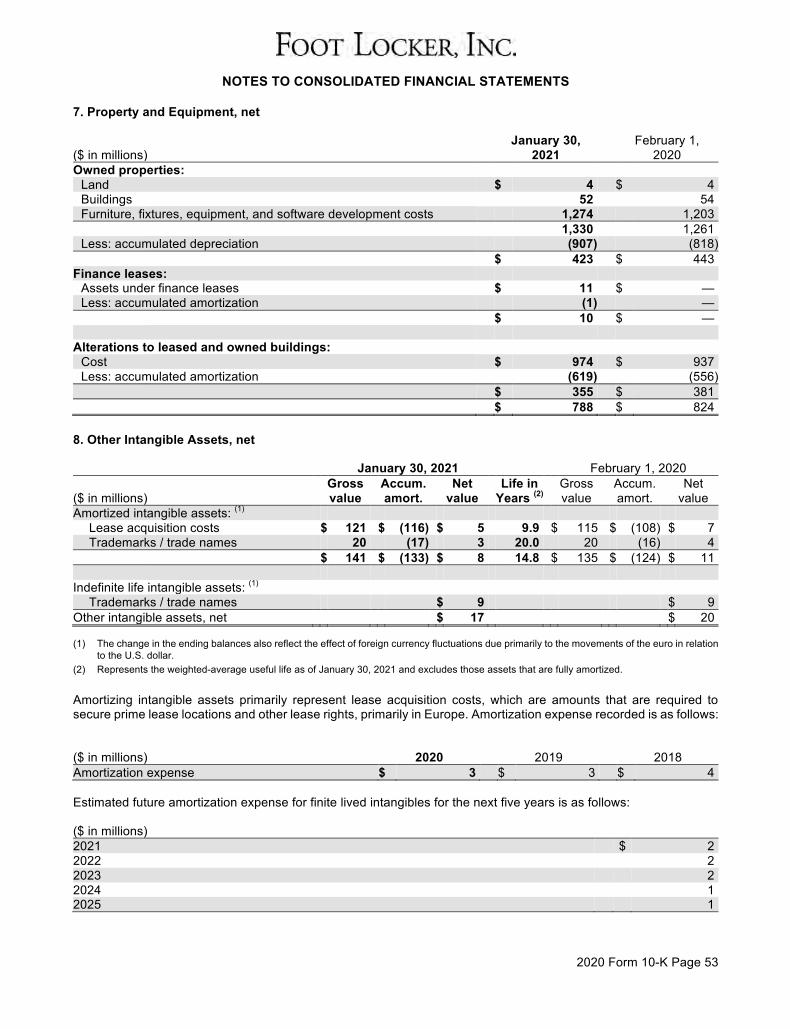
NOTES TO CONSOLIDATED FINANCIAL STATEMENTS
2020 Form 10-K Page 53
7. Property and Equipment, net
($ in millions) January 30,
2021 February 1,
2020 Owned properties:
Land $ 4 $ 4 Buildings 52 54 Furniture, fixtures, equipment, and software development costs 1,274 1,203
1,330 1,261 Less: accumulated depreciation (907) (818)
$ 423 $ 443 Finance leases:
Assets under finance leases $ 11 $ — Less: accumulated amortization (1) —
$ 10 $ — Alterations to leased and owned buildings:
Cost $ 974 $ 937 Less: accumulated amortization (619) (556)
$ 355 $ 381 $ 788 $ 824
8. Other Intangible Assets, net
January 30, 2021 February 1, 2020 Gross Accum. Net Life in Gross Accum. Net ($ in millions) value amort. value Years (2) value amort. value Amortized intangible assets: (1)
Lease acquisition costs $ 121 $ (116) $ 5 9.9 $ 115 $ (108) $ 7 Trademarks / trade names 20 (17) 3 20.0 20 (16) 4
$ 141 $ (133) $ 8 14.8 $ 135 $ (124) $ 11 Indefinite life intangible assets: (1)
Trademarks / trade names $ 9 $ 9 Other intangible assets, net $ 17 $ 20 (1) The change in the ending balances also reflect the effect of foreign currency fluctuations due primarily to the movements of the euro in relation
to the U.S. dollar. (2) Represents the weighted-average useful life as of January 30, 2021 and excludes those assets that are fully amortized. Amortizing intangible assets primarily represent lease acquisition costs, which are amounts that are required to secure prime lease locations and other lease rights, primarily in Europe. Amortization expense recorded is as follows:
($ in millions) 2020 2019 2018 Amortization expense $ 3 $ 3 $ 4 Estimated future amortization expense for finite lived intangibles for the next five years is as follows:
($ in millions) 2021 $ 2 2022 2 2023 2 2024 1 2025 1
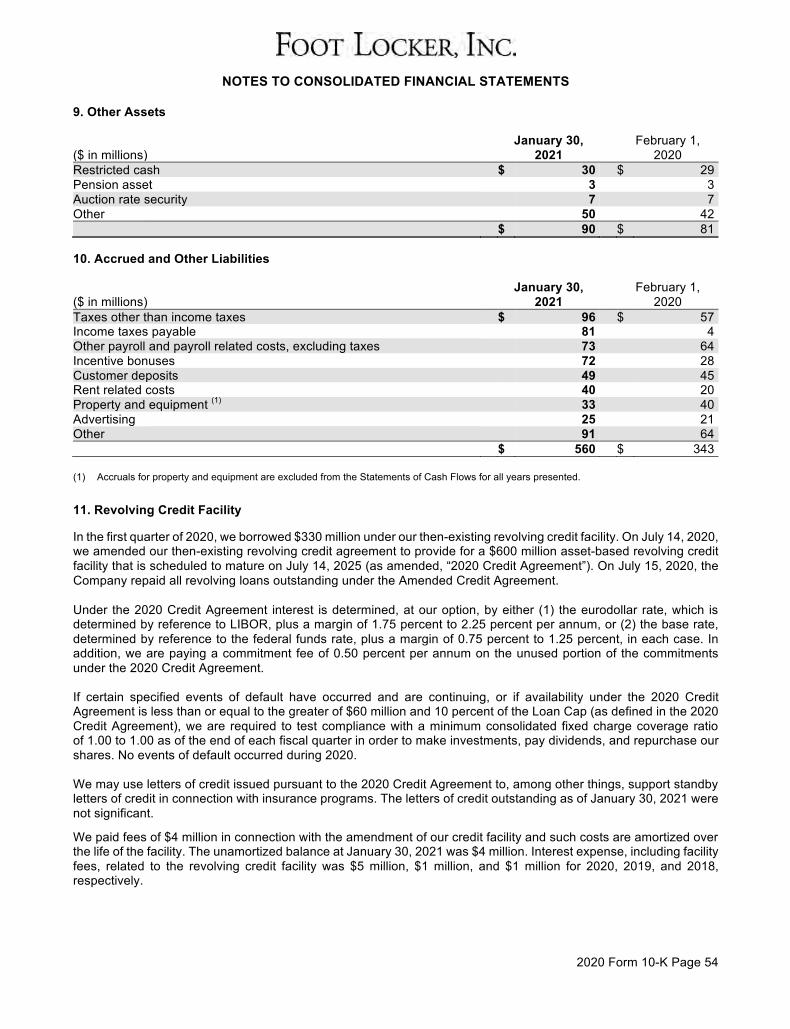
NOTES TO CONSOLIDATED FINANCIAL STATEMENTS
2020 Form 10-K Page 54
9. Other Assets
($ in millions) January 30,
2021 February 1,
2020 Restricted cash $ 30 $ 29 Pension asset 3 3 Auction rate security 7 7 Other 50 42 $ 90 $ 81
10. Accrued and Other Liabilities
($ in millions) January 30,
2021 February 1,
2020 Taxes other than income taxes $ 96 $ 57 Income taxes payable 81 4 Other payroll and payroll related costs, excluding taxes 73 64 Incentive bonuses 72 28 Customer deposits 49 45 Rent related costs 40 20 Property and equipment (1) 33 40 Advertising 25 21 Other 91 64 $ 560 $ 343
(1) Accruals for property and equipment are excluded from the Statements of Cash Flows for all years presented.
11. Revolving Credit Facility
In the first quarter of 2020, we borrowed $330 million under our then-existing revolving credit facility. On July 14, 2020, we amended our then-existing revolving credit agreement to provide for a $600 million asset-based revolving credit facility that is scheduled to mature on July 14, 2025 (as amended, “2020 Credit Agreement”). On July 15, 2020, the Company repaid all revolving loans outstanding under the Amended Credit Agreement. Under the 2020 Credit Agreement interest is determined, at our option, by either (1) the eurodollar rate, which is determined by reference to LIBOR, plus a margin of 1.75 percent to 2.25 percent per annum, or (2) the base rate, determined by reference to the federal funds rate, plus a margin of 0.75 percent to 1.25 percent, in each case. In addition, we are paying a commitment fee of 0.50 percent per annum on the unused portion of the commitments under the 2020 Credit Agreement. If certain specified events of default have occurred and are continuing, or if availability under the 2020 Credit Agreement is less than or equal to the greater of $60 million and 10 percent of the Loan Cap (as defined in the 2020 Credit Agreement), we are required to test compliance with a minimum consolidated fixed charge coverage ratio of 1.00 to 1.00 as of the end of each fiscal quarter in order to make investments, pay dividends, and repurchase our shares. No events of default occurred during 2020. We may use letters of credit issued pursuant to the 2020 Credit Agreement to, among other things, support standby letters of credit in connection with insurance programs. The letters of credit outstanding as of January 30, 2021 were not significant.
We paid fees of $4 million in connection with the amendment of our credit facility and such costs are amortized over the life of the facility. The unamortized balance at January 30, 2021 was $4 million. Interest expense, including facility fees, related to the revolving credit facility was $5 million, $1 million, and $1 million for 2020, 2019, and 2018, respectively.
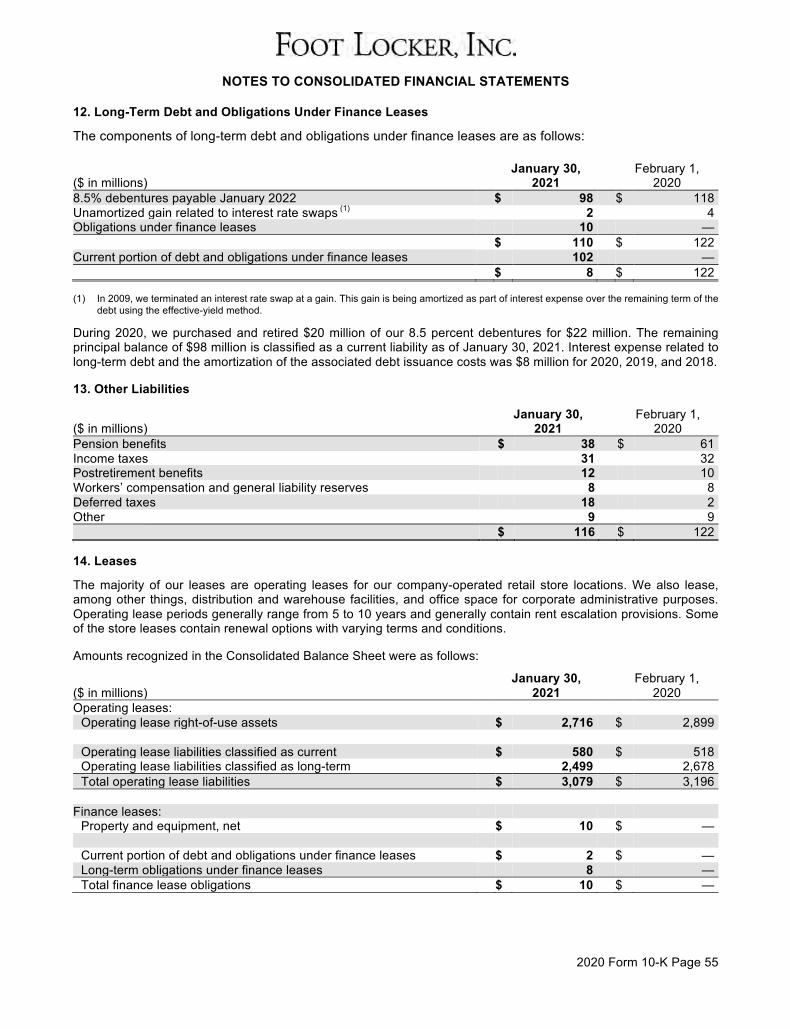
NOTES TO CONSOLIDATED FINANCIAL STATEMENTS
2020 Form 10-K Page 55
12. Long-Term Debt and Obligations Under Finance Leases
The components of long-term debt and obligations under finance leases are as follows:
($ in millions) January 30,
2021 February 1,
2020 8.5% debentures payable January 2022 $ 98 $ 118 Unamortized gain related to interest rate swaps (1) 2 4 Obligations under finance leases 10 — $ 110 $ 122 Current portion of debt and obligations under finance leases 102 — $ 8 $ 122 (1) In 2009, we terminated an interest rate swap at a gain. This gain is being amortized as part of interest expense over the remaining term of the
debt using the effective-yield method.
During 2020, we purchased and retired $20 million of our 8.5 percent debentures for $22 million. The remaining principal balance of $98 million is classified as a current liability as of January 30, 2021. Interest expense related to long-term debt and the amortization of the associated debt issuance costs was $8 million for 2020, 2019, and 2018.
13. Other Liabilities
($ in millions) January 30,
2021 February 1,
2020 Pension benefits $ 38 $ 61 Income taxes 31 32 Postretirement benefits 12 10 Workers’ compensation and general liability reserves 8 8 Deferred taxes 18 2 Other 9 9 $ 116 $ 122 \
14. Leases
The majority of our leases are operating leases for our company-operated retail store locations. We also lease, among other things, distribution and warehouse facilities, and office space for corporate administrative purposes. Operating lease periods generally range from 5 to 10 years and generally contain rent escalation provisions. Some of the store leases contain renewal options with varying terms and conditions.
Amounts recognized in the Consolidated Balance Sheet were as follows:
($ in millions) January 30,
2021 February 1,
2020 Operating leases:
Operating lease right-of-use assets $ 2,716 $ 2,899 Operating lease liabilities classified as current $ 580 $ 518 Operating lease liabilities classified as long-term 2,499 2,678 Total operating lease liabilities $ 3,079 $ 3,196
Finance leases:
Property and equipment, net $ 10 $ — Current portion of debt and obligations under finance leases $ 2 $ — Long-term obligations under finance leases 8 — Total finance lease obligations $ 10 $ —
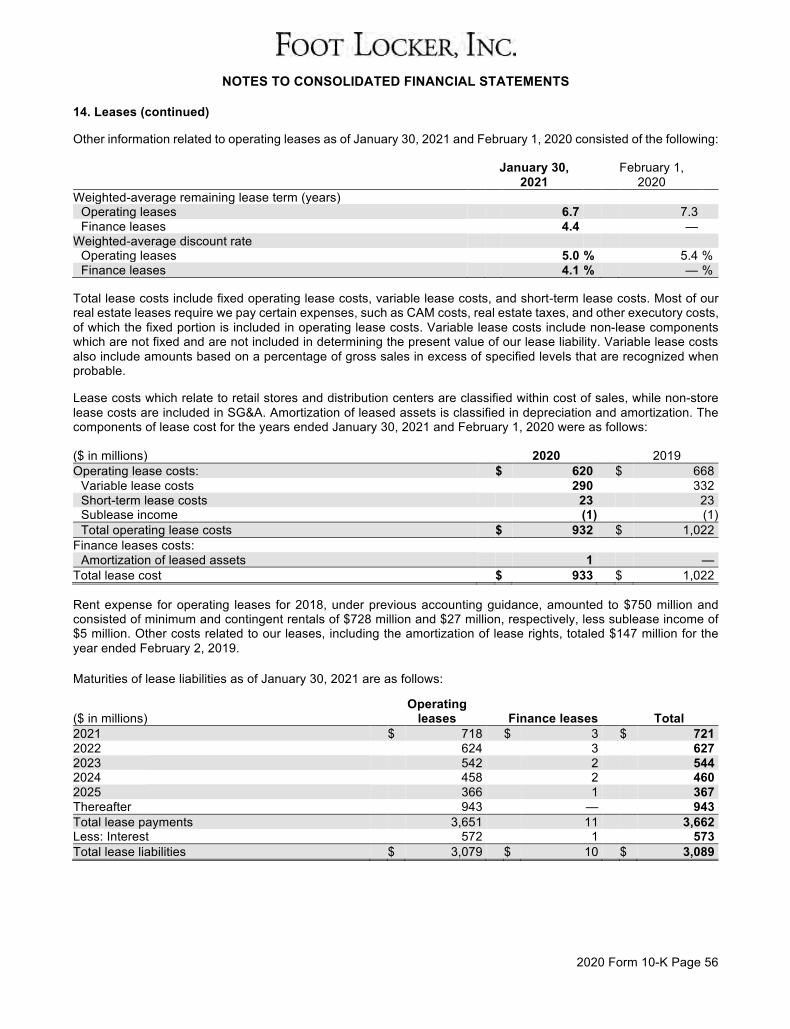
NOTES TO CONSOLIDATED FINANCIAL STATEMENTS
2020 Form 10-K Page 56
14. Leases (continued)
Other information related to operating leases as of January 30, 2021 and February 1, 2020 consisted of the following:
January 30,
2021 February 1,
2020 Weighted-average remaining lease term (years)
Operating leases 6.7 7.3 Finance leases 4.4 —
Weighted-average discount rate Operating leases 5.0 % 5.4 % Finance leases 4.1 % — %
Total lease costs include fixed operating lease costs, variable lease costs, and short-term lease costs. Most of our real estate leases require we pay certain expenses, such as CAM costs, real estate taxes, and other executory costs, of which the fixed portion is included in operating lease costs. Variable lease costs include non-lease components which are not fixed and are not included in determining the present value of our lease liability. Variable lease costs also include amounts based on a percentage of gross sales in excess of specified levels that are recognized when probable.
Lease costs which relate to retail stores and distribution centers are classified within cost of sales, while non-store lease costs are included in SG&A. Amortization of leased assets is classified in depreciation and amortization. The components of lease cost for the years ended January 30, 2021 and February 1, 2020 were as follows:
($ in millions) 2020 2019 Operating lease costs: $ 620 $ 668
Variable lease costs 290 332 Short-term lease costs 23 23 Sublease income (1) (1) Total operating lease costs $ 932 $ 1,022
Finance leases costs: Amortization of leased assets 1 —
Total lease cost $ 933 $ 1,022
Rent expense for operating leases for 2018, under previous accounting guidance, amounted to $750 million and consisted of minimum and contingent rentals of $728 million and $27 million, respectively, less sublease income of $5 million. Other costs related to our leases, including the amortization of lease rights, totaled $147 million for the year ended February 2, 2019.
Maturities of lease liabilities as of January 30, 2021 are as follows:
($ in millions) Operating
leases Finance leases Total 2021 $ 718 $ 3 $ 721 2022 624 3 627 2023 542 2 544 2024 458 2 460 2025 366 1 367 Thereafter 943 — 943 Total lease payments 3,651 11 3,662 Less: Interest 572 1 573 Total lease liabilities $ 3,079 $ 10 $ 3,089
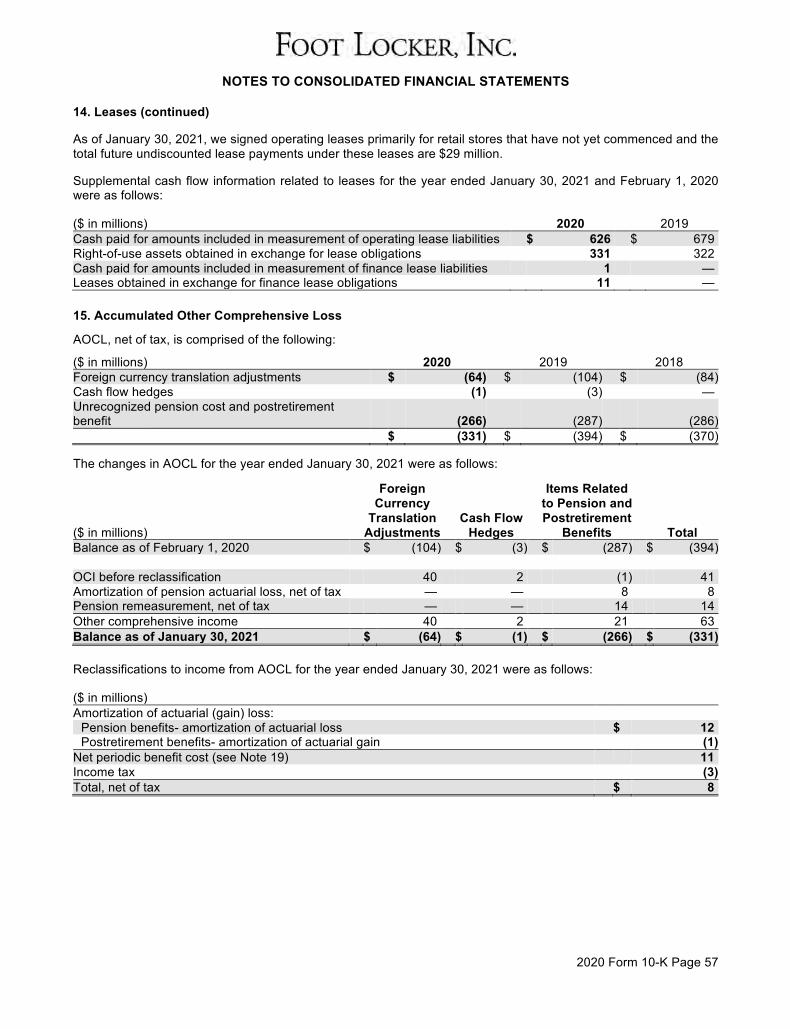
NOTES TO CONSOLIDATED FINANCIAL STATEMENTS
2020 Form 10-K Page 57
14. Leases (continued)
As of January 30, 2021, we signed operating leases primarily for retail stores that have not yet commenced and the total future undiscounted lease payments under these leases are $29 million.
Supplemental cash flow information related to leases for the year ended January 30, 2021 and February 1, 2020 were as follows:
($ in millions) 2020 2019 Cash paid for amounts included in measurement of operating lease liabilities $ 626 $ 679 Right-of-use assets obtained in exchange for lease obligations 331 322 Cash paid for amounts included in measurement of finance lease liabilities 1 — Leases obtained in exchange for finance lease obligations 11 —
15. Accumulated Other Comprehensive Loss
AOCL, net of tax, is comprised of the following:
($ in millions) 2020 2019 2018 Foreign currency translation adjustments $ (64) $ (104) $ (84) Cash flow hedges (1) (3) — Unrecognized pension cost and postretirement benefit (266) (287) (286) $ (331) $ (394) $ (370) The changes in AOCL for the year ended January 30, 2021 were as follows:
Foreign Items Related Currency to Pension and Translation Cash Flow Postretirement ($ in millions) Adjustments Hedges Benefits Total Balance as of February 1, 2020 $ (104) $ (3) $ (287) $ (394) OCI before reclassification 40 2 (1) 41 Amortization of pension actuarial loss, net of tax — — 8 8 Pension remeasurement, net of tax — — 14 14 Other comprehensive income 40 2 21 63 Balance as of January 30, 2021 $ (64) $ (1) $ (266) $ (331)
Reclassifications to income from AOCL for the year ended January 30, 2021 were as follows:
($ in millions) Amortization of actuarial (gain) loss:
Pension benefits- amortization of actuarial loss $ 12 Postretirement benefits- amortization of actuarial gain (1)
Net periodic benefit cost (see Note 19) 11 Income tax (3) Total, net of tax $ 8
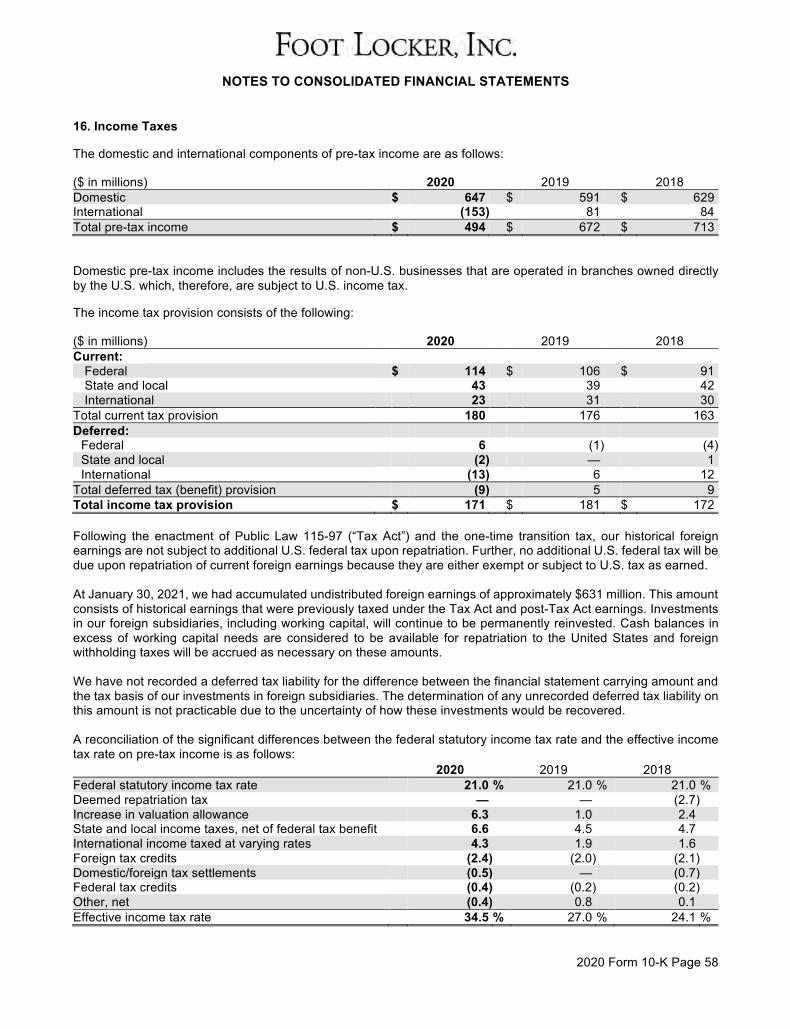
NOTES TO CONSOLIDATED FINANCIAL STATEMENTS
2020 Form 10-K Page 58
16. Income Taxes
The domestic and international components of pre-tax income are as follows:
($ in millions) 2020 2019 2018 Domestic $ 647 $ 591 $ 629 International (153) 81 84 Total pre-tax income $ 494 $ 672 $ 713
Domestic pre-tax income includes the results of non-U.S. businesses that are operated in branches owned directly by the U.S. which, therefore, are subject to U.S. income tax.
The income tax provision consists of the following:
($ in millions) 2020 2019 2018 Current:
Federal $ 114 $ 106 $ 91 State and local 43 39 42 International 23 31 30
Total current tax provision 180 176 163 Deferred:
Federal 6 (1) (4) State and local (2) — 1 International (13) 6 12
Total deferred tax (benefit) provision (9) 5 9 Total income tax provision $ 171 $ 181 $ 172 Following the enactment of Public Law 115-97 (“Tax Act”) and the one-time transition tax, our historical foreign earnings are not subject to additional U.S. federal tax upon repatriation. Further, no additional U.S. federal tax will be due upon repatriation of current foreign earnings because they are either exempt or subject to U.S. tax as earned. At January 30, 2021, we had accumulated undistributed foreign earnings of approximately $631 million. This amount consists of historical earnings that were previously taxed under the Tax Act and post-Tax Act earnings. Investments in our foreign subsidiaries, including working capital, will continue to be permanently reinvested. Cash balances in excess of working capital needs are considered to be available for repatriation to the United States and foreign withholding taxes will be accrued as necessary on these amounts. We have not recorded a deferred tax liability for the difference between the financial statement carrying amount and the tax basis of our investments in foreign subsidiaries. The determination of any unrecorded deferred tax liability on this amount is not practicable due to the uncertainty of how these investments would be recovered. A reconciliation of the significant differences between the federal statutory income tax rate and the effective income tax rate on pre-tax income is as follows:
2020 2019 2018 Federal statutory income tax rate 21.0 % 21.0 % 21.0 % Deemed repatriation tax — — (2.7) Increase in valuation allowance 6.3 1.0 2.4 State and local income taxes, net of federal tax benefit 6.6 4.5 4.7 International income taxed at varying rates 4.3 1.9 1.6 Foreign tax credits (2.4) (2.0) (2.1) Domestic/foreign tax settlements (0.5) — (0.7) Federal tax credits (0.4) (0.2) (0.2) Other, net (0.4) 0.8 0.1 Effective income tax rate 34.5 % 27.0 % 24.1 %
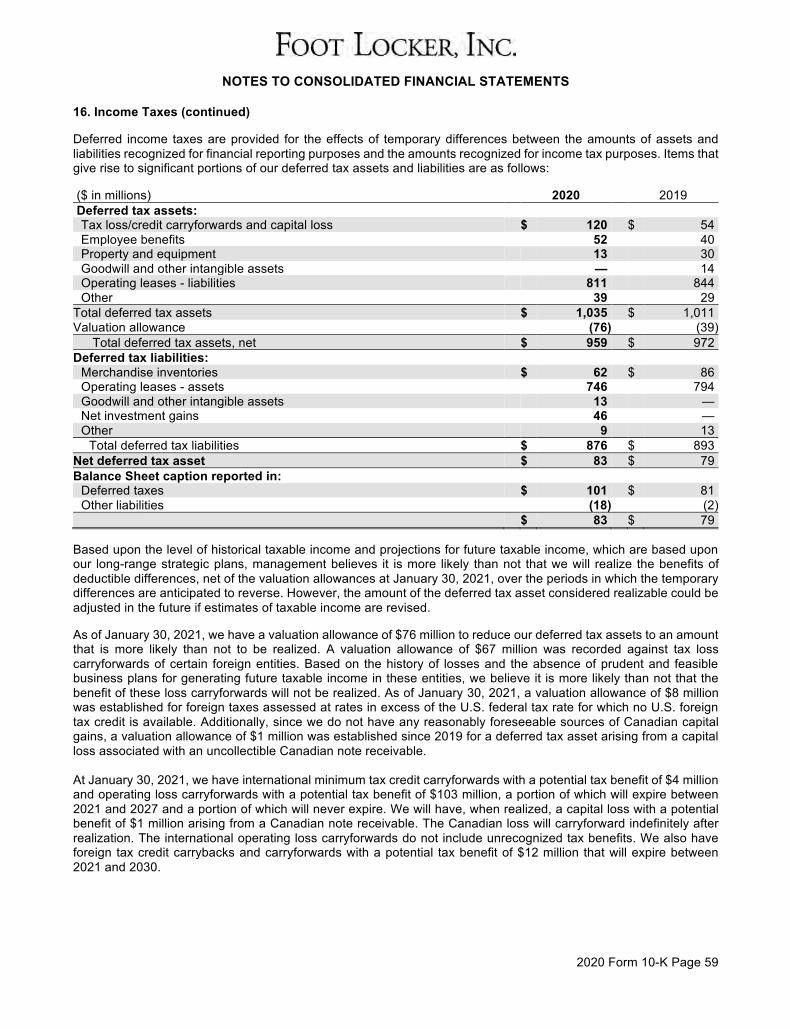
NOTES TO CONSOLIDATED FINANCIAL STATEMENTS
2020 Form 10-K Page 59
16. Income Taxes (continued)
Deferred income taxes are provided for the effects of temporary differences between the amounts of assets and liabilities recognized for financial reporting purposes and the amounts recognized for income tax purposes. Items that give rise to significant portions of our deferred tax assets and liabilities are as follows:
($ in millions) 2020 2019 Deferred tax assets:
Tax loss/credit carryforwards and capital loss $ 120 $ 54 Employee benefits 52 40 Property and equipment 13 30 Goodwill and other intangible assets — 14 Operating leases - liabilities 811 844 Other 39 29
Total deferred tax assets $ 1,035 $ 1,011 Valuation allowance (76) (39)
Total deferred tax assets, net $ 959 $ 972 Deferred tax liabilities:
Merchandise inventories $ 62 $ 86 Operating leases - assets 746 794 Goodwill and other intangible assets 13 — Net investment gains 46 — Other 9 13
Total deferred tax liabilities $ 876 $ 893 Net deferred tax asset $ 83 $ 79 Balance Sheet caption reported in:
Deferred taxes $ 101 $ 81 Other liabilities (18) (2)
$ 83 $ 79
Based upon the level of historical taxable income and projections for future taxable income, which are based upon our long-range strategic plans, management believes it is more likely than not that we will realize the benefits of deductible differences, net of the valuation allowances at January 30, 2021, over the periods in which the temporary differences are anticipated to reverse. However, the amount of the deferred tax asset considered realizable could be adjusted in the future if estimates of taxable income are revised.
As of January 30, 2021, we have a valuation allowance of $76 million to reduce our deferred tax assets to an amount that is more likely than not to be realized. A valuation allowance of $67 million was recorded against tax loss carryforwards of certain foreign entities. Based on the history of losses and the absence of prudent and feasible business plans for generating future taxable income in these entities, we believe it is more likely than not that the benefit of these loss carryforwards will not be realized. As of January 30, 2021, a valuation allowance of $8 million was established for foreign taxes assessed at rates in excess of the U.S. federal tax rate for which no U.S. foreign tax credit is available. Additionally, since we do not have any reasonably foreseeable sources of Canadian capital gains, a valuation allowance of $1 million was established since 2019 for a deferred tax asset arising from a capital loss associated with an uncollectible Canadian note receivable. At January 30, 2021, we have international minimum tax credit carryforwards with a potential tax benefit of $4 million and operating loss carryforwards with a potential tax benefit of $103 million, a portion of which will expire between 2021 and 2027 and a portion of which will never expire. We will have, when realized, a capital loss with a potential benefit of $1 million arising from a Canadian note receivable. The Canadian loss will carryforward indefinitely after realization. The international operating loss carryforwards do not include unrecognized tax benefits. We also have foreign tax credit carrybacks and carryforwards with a potential tax benefit of $12 million that will expire between 2021 and 2030.
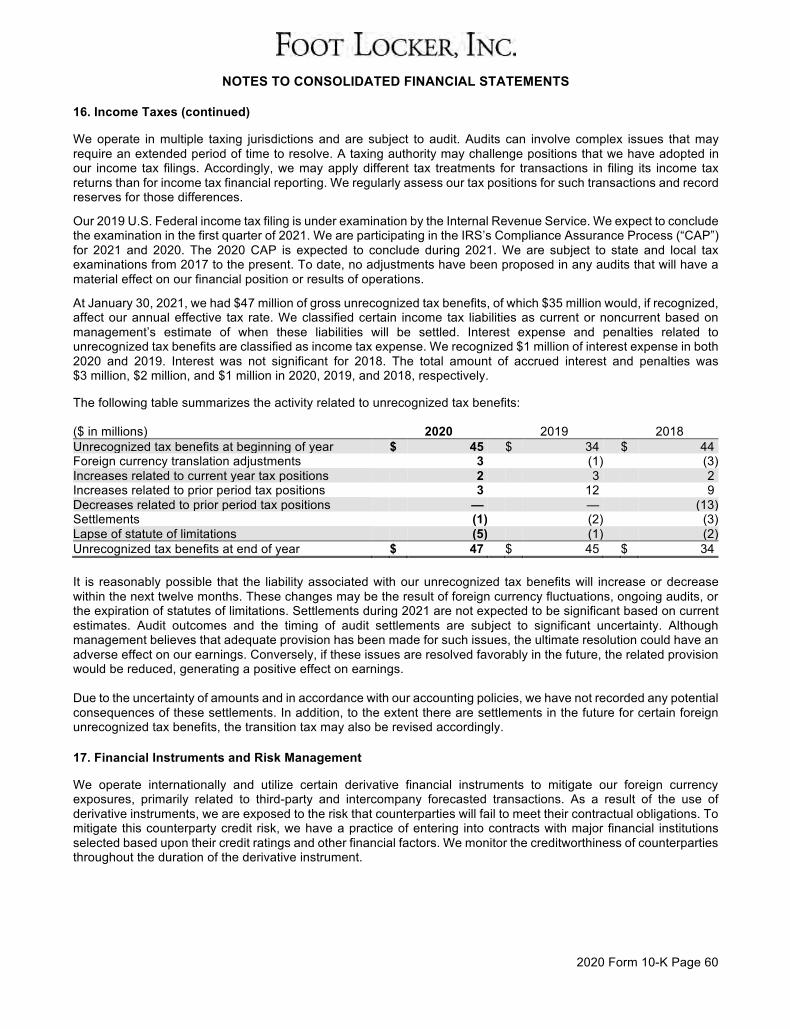
NOTES TO CONSOLIDATED FINANCIAL STATEMENTS
2020 Form 10-K Page 60
16. Income Taxes (continued)
We operate in multiple taxing jurisdictions and are subject to audit. Audits can involve complex issues that may require an extended period of time to resolve. A taxing authority may challenge positions that we have adopted in our income tax filings. Accordingly, we may apply different tax treatments for transactions in filing its income tax returns than for income tax financial reporting. We regularly assess our tax positions for such transactions and record reserves for those differences.
Our 2019 U.S. Federal income tax filing is under examination by the Internal Revenue Service. We expect to conclude the examination in the first quarter of 2021. We are participating in the IRS’s Compliance Assurance Process (“CAP”) for 2021 and 2020. The 2020 CAP is expected to conclude during 2021. We are subject to state and local tax examinations from 2017 to the present. To date, no adjustments have been proposed in any audits that will have a material effect on our financial position or results of operations.
At January 30, 2021, we had $47 million of gross unrecognized tax benefits, of which $35 million would, if recognized, affect our annual effective tax rate. We classified certain income tax liabilities as current or noncurrent based on management’s estimate of when these liabilities will be settled. Interest expense and penalties related to unrecognized tax benefits are classified as income tax expense. We recognized $1 million of interest expense in both 2020 and 2019. Interest was not significant for 2018. The total amount of accrued interest and penalties was $3 million, $2 million, and $1 million in 2020, 2019, and 2018, respectively.
The following table summarizes the activity related to unrecognized tax benefits:
($ in millions) 2020 2019 2018 Unrecognized tax benefits at beginning of year $ 45 $ 34 $ 44 Foreign currency translation adjustments 3 (1) (3) Increases related to current year tax positions 2 3 2 Increases related to prior period tax positions 3 12 9 Decreases related to prior period tax positions — — (13) Settlements (1) (2) (3) Lapse of statute of limitations (5) (1) (2) Unrecognized tax benefits at end of year $ 47 $ 45 $ 34 It is reasonably possible that the liability associated with our unrecognized tax benefits will increase or decrease within the next twelve months. These changes may be the result of foreign currency fluctuations, ongoing audits, or the expiration of statutes of limitations. Settlements during 2021 are not expected to be significant based on current estimates. Audit outcomes and the timing of audit settlements are subject to significant uncertainty. Although management believes that adequate provision has been made for such issues, the ultimate resolution could have an adverse effect on our earnings. Conversely, if these issues are resolved favorably in the future, the related provision would be reduced, generating a positive effect on earnings. Due to the uncertainty of amounts and in accordance with our accounting policies, we have not recorded any potential consequences of these settlements. In addition, to the extent there are settlements in the future for certain foreign unrecognized tax benefits, the transition tax may also be revised accordingly.
17. Financial Instruments and Risk Management
We operate internationally and utilize certain derivative financial instruments to mitigate our foreign currency exposures, primarily related to third-party and intercompany forecasted transactions. As a result of the use of derivative instruments, we are exposed to the risk that counterparties will fail to meet their contractual obligations. To mitigate this counterparty credit risk, we have a practice of entering into contracts with major financial institutions selected based upon their credit ratings and other financial factors. We monitor the creditworthiness of counterparties throughout the duration of the derivative instrument.
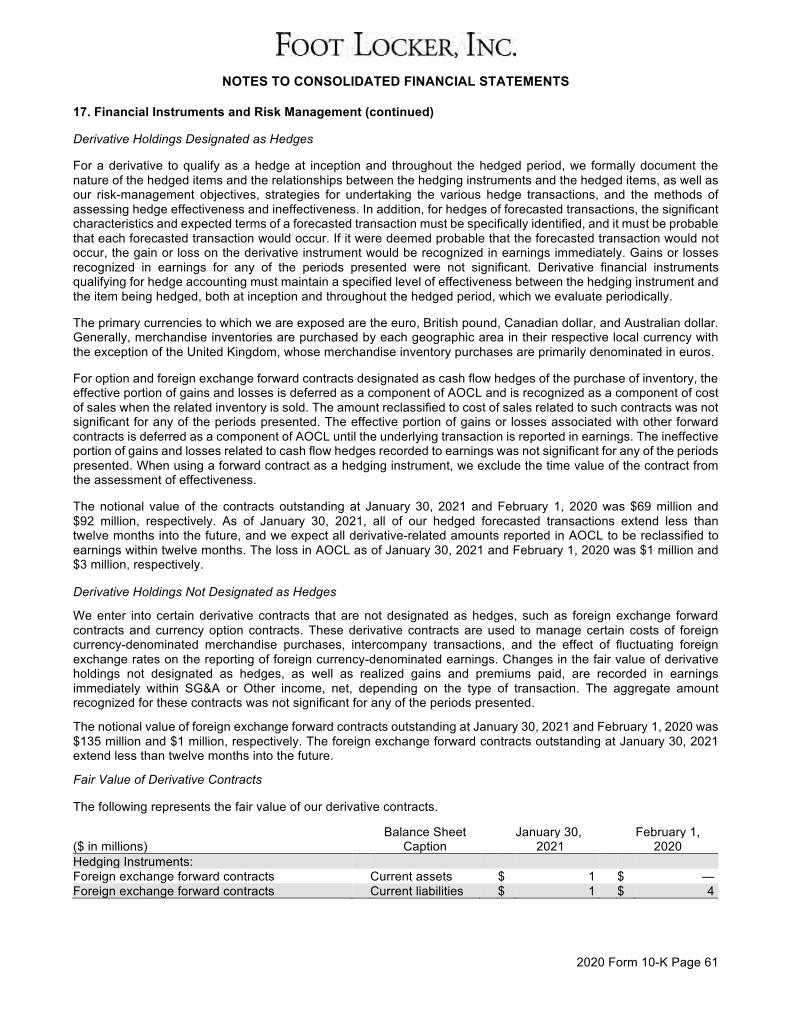
NOTES TO CONSOLIDATED FINANCIAL STATEMENTS
2020 Form 10-K Page 61
17. Financial Instruments and Risk Management (continued)
Derivative Holdings Designated as Hedges
For a derivative to qualify as a hedge at inception and throughout the hedged period, we formally document the nature of the hedged items and the relationships between the hedging instruments and the hedged items, as well as our risk-management objectives, strategies for undertaking the various hedge transactions, and the methods of assessing hedge effectiveness and ineffectiveness. In addition, for hedges of forecasted transactions, the significant characteristics and expected terms of a forecasted transaction must be specifically identified, and it must be probable that each forecasted transaction would occur. If it were deemed probable that the forecasted transaction would not occur, the gain or loss on the derivative instrument would be recognized in earnings immediately. Gains or losses recognized in earnings for any of the periods presented were not significant. Derivative financial instruments qualifying for hedge accounting must maintain a specified level of effectiveness between the hedging instrument and the item being hedged, both at inception and throughout the hedged period, which we evaluate periodically.
The primary currencies to which we are exposed are the euro, British pound, Canadian dollar, and Australian dollar. Generally, merchandise inventories are purchased by each geographic area in their respective local currency with the exception of the United Kingdom, whose merchandise inventory purchases are primarily denominated in euros.
For option and foreign exchange forward contracts designated as cash flow hedges of the purchase of inventory, the effective portion of gains and losses is deferred as a component of AOCL and is recognized as a component of cost of sales when the related inventory is sold. The amount reclassified to cost of sales related to such contracts was not significant for any of the periods presented. The effective portion of gains or losses associated with other forward contracts is deferred as a component of AOCL until the underlying transaction is reported in earnings. The ineffective portion of gains and losses related to cash flow hedges recorded to earnings was not significant for any of the periods presented. When using a forward contract as a hedging instrument, we exclude the time value of the contract from the assessment of effectiveness.
The notional value of the contracts outstanding at January 30, 2021 and February 1, 2020 was $69 million and $92 million, respectively. As of January 30, 2021, all of our hedged forecasted transactions extend less than twelve months into the future, and we expect all derivative-related amounts reported in AOCL to be reclassified to earnings within twelve months. The loss in AOCL as of January 30, 2021 and February 1, 2020 was $1 million and $3 million, respectively.
Derivative Holdings Not Designated as Hedges
We enter into certain derivative contracts that are not designated as hedges, such as foreign exchange forward contracts and currency option contracts. These derivative contracts are used to manage certain costs of foreign currency-denominated merchandise purchases, intercompany transactions, and the effect of fluctuating foreign exchange rates on the reporting of foreign currency-denominated earnings. Changes in the fair value of derivative holdings not designated as hedges, as well as realized gains and premiums paid, are recorded in earnings immediately within SG&A or Other income, net, depending on the type of transaction. The aggregate amount recognized for these contracts was not significant for any of the periods presented.
The notional value of foreign exchange forward contracts outstanding at January 30, 2021 and February 1, 2020 was $135 million and $1 million, respectively. The foreign exchange forward contracts outstanding at January 30, 2021 extend less than twelve months into the future.
Fair Value of Derivative Contracts
The following represents the fair value of our derivative contracts.
Balance Sheet January 30, February 1, ($ in millions) Caption 2021 2020 Hedging Instruments: Foreign exchange forward contracts Current assets $ 1 $ — Foreign exchange forward contracts Current liabilities $ 1 $ 4
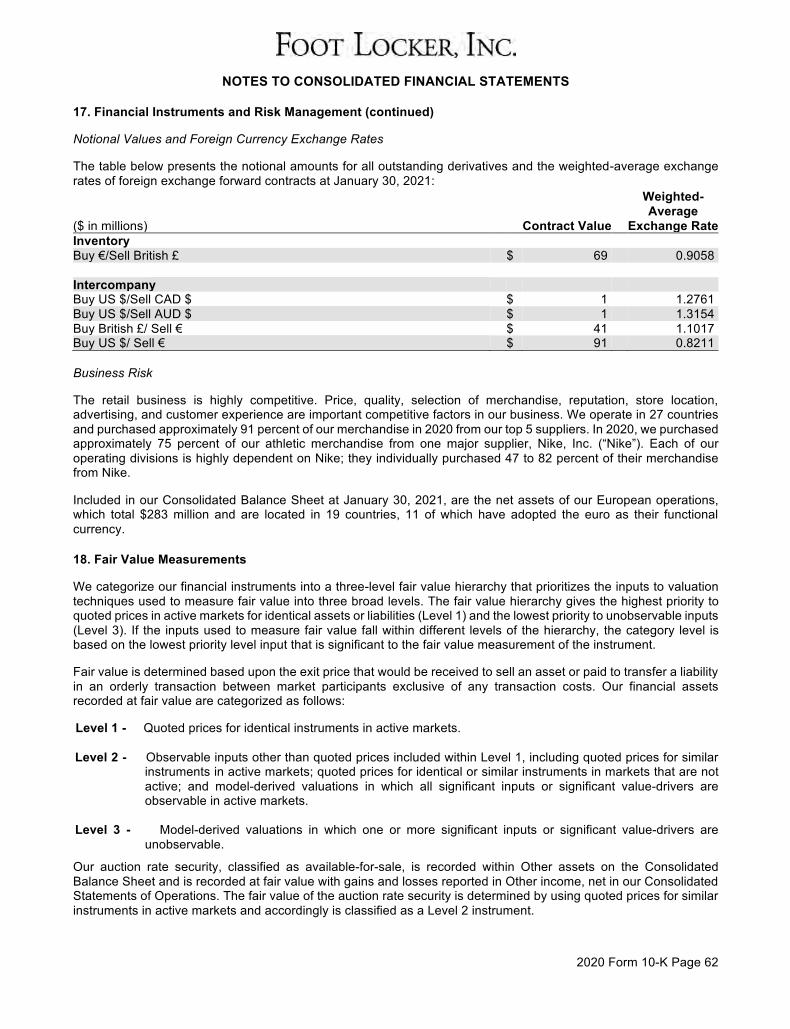
NOTES TO CONSOLIDATED FINANCIAL STATEMENTS
2020 Form 10-K Page 62
17. Financial Instruments and Risk Management (continued)
Notional Values and Foreign Currency Exchange Rates
The table below presents the notional amounts for all outstanding derivatives and the weighted-average exchange rates of foreign exchange forward contracts at January 30, 2021:
Weighted-Average
($ in millions) Contract Value Exchange Rate Inventory Buy €/Sell British £ $ 69 0.9058 Intercompany Buy US $/Sell CAD $ $ 1 1.2761 Buy US $/Sell AUD $ $ 1 1.3154 Buy British £/ Sell € $ 41 1.1017 Buy US $/ Sell € $ 91 0.8211 Business Risk
The retail business is highly competitive. Price, quality, selection of merchandise, reputation, store location, advertising, and customer experience are important competitive factors in our business. We operate in 27 countries and purchased approximately 91 percent of our merchandise in 2020 from our top 5 suppliers. In 2020, we purchased approximately 75 percent of our athletic merchandise from one major supplier, Nike, Inc. (“Nike”). Each of our operating divisions is highly dependent on Nike; they individually purchased 47 to 82 percent of their merchandise from Nike.
Included in our Consolidated Balance Sheet at January 30, 2021, are the net assets of our European operations, which total $283 million and are located in 19 countries, 11 of which have adopted the euro as their functional currency.
18. Fair Value Measurements
We categorize our financial instruments into a three-level fair value hierarchy that prioritizes the inputs to valuation techniques used to measure fair value into three broad levels. The fair value hierarchy gives the highest priority to quoted prices in active markets for identical assets or liabilities (Level 1) and the lowest priority to unobservable inputs (Level 3). If the inputs used to measure fair value fall within different levels of the hierarchy, the category level is based on the lowest priority level input that is significant to the fair value measurement of the instrument.
Fair value is determined based upon the exit price that would be received to sell an asset or paid to transfer a liability in an orderly transaction between market participants exclusive of any transaction costs. Our financial assets recorded at fair value are categorized as follows:
Level 1 - Quoted prices for identical instruments in active markets. Level 2 - Observable inputs other than quoted prices included within Level 1, including quoted prices for similar
instruments in active markets; quoted prices for identical or similar instruments in markets that are not active; and model-derived valuations in which all significant inputs or significant value-drivers are observable in active markets.
Level 3 - Model-derived valuations in which one or more significant inputs or significant value-drivers are
unobservable.
Our auction rate security, classified as available-for-sale, is recorded within Other assets on the Consolidated Balance Sheet and is recorded at fair value with gains and losses reported in Other income, net in our Consolidated Statements of Operations. The fair value of the auction rate security is determined by using quoted prices for similar instruments in active markets and accordingly is classified as a Level 2 instrument.
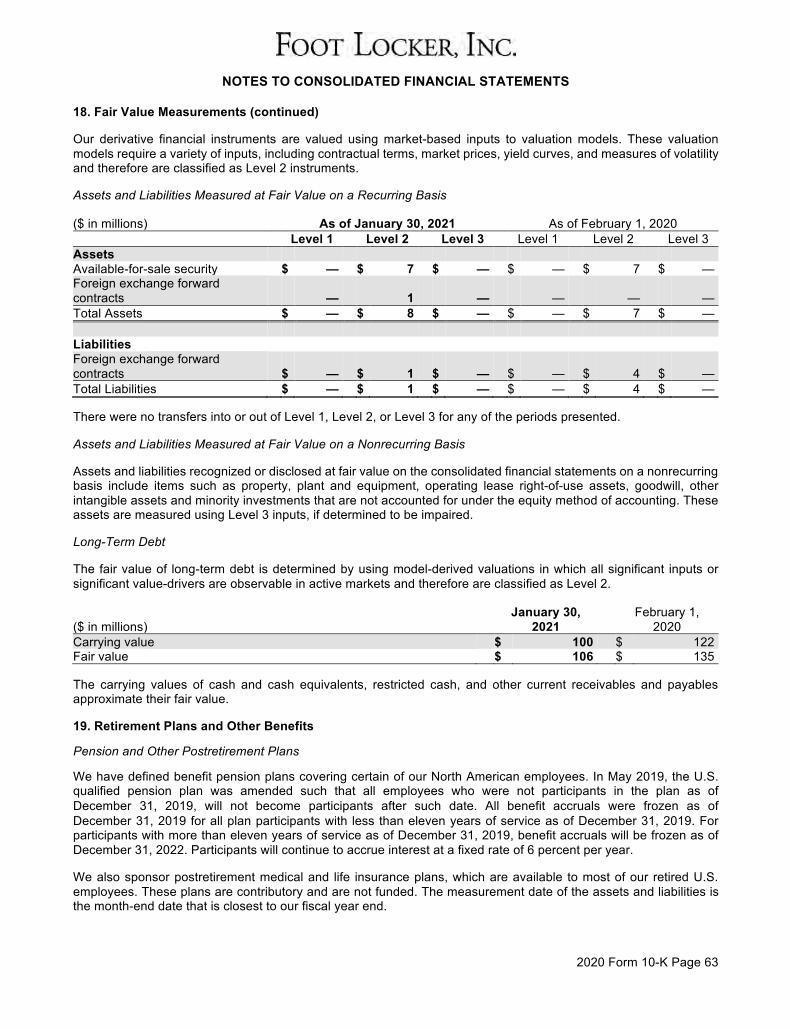
NOTES TO CONSOLIDATED FINANCIAL STATEMENTS
2020 Form 10-K Page 63
18. Fair Value Measurements (continued)
Our derivative financial instruments are valued using market-based inputs to valuation models. These valuation models require a variety of inputs, including contractual terms, market prices, yield curves, and measures of volatility and therefore are classified as Level 2 instruments.
Assets and Liabilities Measured at Fair Value on a Recurring Basis
($ in millions) As of January 30, 2021 As of February 1, 2020 Level 1 Level 2 Level 3 Level 1 Level 2 Level 3 Assets Available-for-sale security $ — $ 7 $ — $ — $ 7 $ — Foreign exchange forward contracts — 1 — — — — Total Assets $ — $ 8 $ — $ — $ 7 $ — Liabilities Foreign exchange forward contracts $ — $ 1 $ — $ — $ 4 $ — Total Liabilities $ — $ 1 $ — $ — $ 4 $ — There were no transfers into or out of Level 1, Level 2, or Level 3 for any of the periods presented.
Assets and Liabilities Measured at Fair Value on a Nonrecurring Basis
Assets and liabilities recognized or disclosed at fair value on the consolidated financial statements on a nonrecurring basis include items such as property, plant and equipment, operating lease right-of-use assets, goodwill, other intangible assets and minority investments that are not accounted for under the equity method of accounting. These assets are measured using Level 3 inputs, if determined to be impaired.
Long-Term Debt
The fair value of long-term debt is determined by using model-derived valuations in which all significant inputs or significant value-drivers are observable in active markets and therefore are classified as Level 2.
($ in millions) January 30,
2021 February 1,
2020 Carrying value $ 100 $ 122 Fair value $ 106 $ 135
The carrying values of cash and cash equivalents, restricted cash, and other current receivables and payables approximate their fair value.
19. Retirement Plans and Other Benefits
Pension and Other Postretirement Plans
We have defined benefit pension plans covering certain of our North American employees. In May 2019, the U.S. qualified pension plan was amended such that all employees who were not participants in the plan as of December 31, 2019, will not become participants after such date. All benefit accruals were frozen as of December 31, 2019 for all plan participants with less than eleven years of service as of December 31, 2019. For participants with more than eleven years of service as of December 31, 2019, benefit accruals will be frozen as of December 31, 2022. Participants will continue to accrue interest at a fixed rate of 6 percent per year.
We also sponsor postretirement medical and life insurance plans, which are available to most of our retired U.S. employees. These plans are contributory and are not funded. The measurement date of the assets and liabilities is the month-end date that is closest to our fiscal year end.
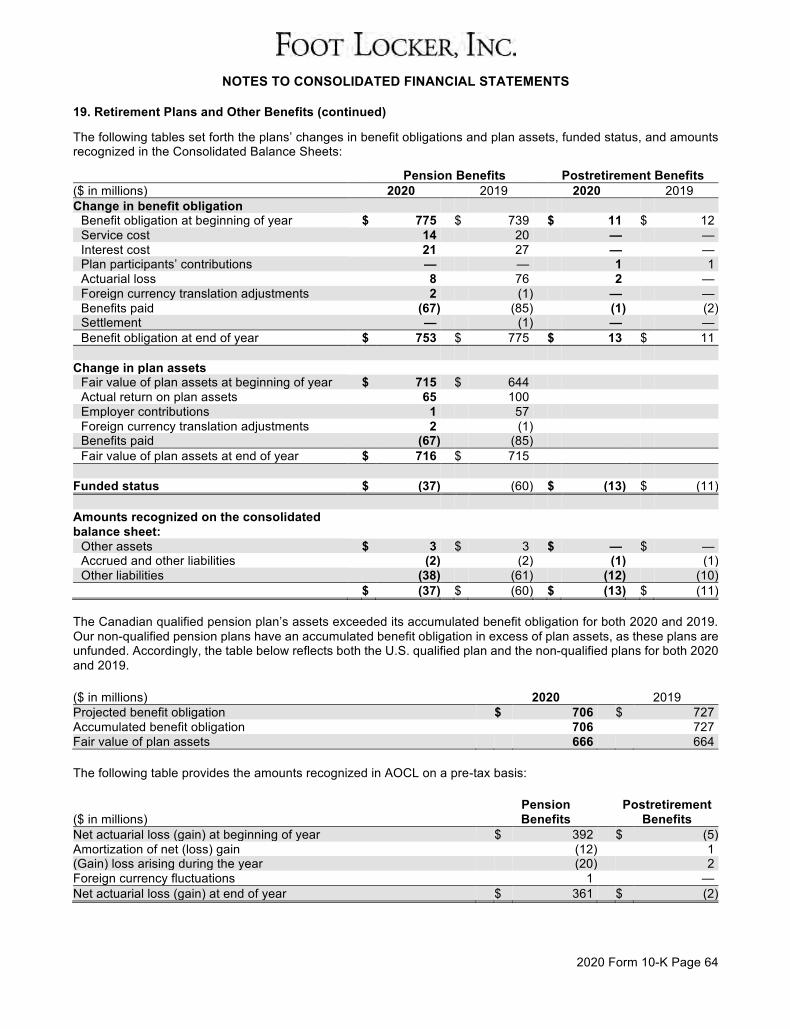
NOTES TO CONSOLIDATED FINANCIAL STATEMENTS
2020 Form 10-K Page 64
19. Retirement Plans and Other Benefits (continued)
The following tables set forth the plans’ changes in benefit obligations and plan assets, funded status, and amounts recognized in the Consolidated Balance Sheets:
Pension Benefits Postretirement Benefits ($ in millions) 2020 2019 2020 2019 Change in benefit obligation
Benefit obligation at beginning of year $ 775 $ 739 $ 11 $ 12 Service cost 14 20 — — Interest cost 21 27 — — Plan participants’ contributions — — 1 1 Actuarial loss 8 76 2 — Foreign currency translation adjustments 2 (1) — — Benefits paid (67) (85) (1) (2) Settlement — (1) — — Benefit obligation at end of year $ 753 $ 775 $ 13 $ 11
Change in plan assets
Fair value of plan assets at beginning of year $ 715 $ 644 Actual return on plan assets 65 100 Employer contributions 1 57 Foreign currency translation adjustments 2 (1) Benefits paid (67) (85) Fair value of plan assets at end of year $ 716 $ 715
Funded status $ (37) (60) $ (13) $ (11) Amounts recognized on the consolidated balance sheet:
Other assets $ 3 $ 3 $ — $ — Accrued and other liabilities (2) (2) (1) (1) Other liabilities (38) (61) (12) (10)
$ (37) $ (60) $ (13) $ (11) The Canadian qualified pension plan’s assets exceeded its accumulated benefit obligation for both 2020 and 2019. Our non-qualified pension plans have an accumulated benefit obligation in excess of plan assets, as these plans are unfunded. Accordingly, the table below reflects both the U.S. qualified plan and the non-qualified plans for both 2020 and 2019.
($ in millions) 2020 2019 Projected benefit obligation $ 706 $ 727 Accumulated benefit obligation 706 727 Fair value of plan assets 666 664
The following table provides the amounts recognized in AOCL on a pre-tax basis:
Pension Postretirement ($ in millions) Benefits Benefits Net actuarial loss (gain) at beginning of year $ 392 $ (5) Amortization of net (loss) gain (12) 1 (Gain) loss arising during the year (20) 2 Foreign currency fluctuations 1 — Net actuarial loss (gain) at end of year $ 361 $ (2)
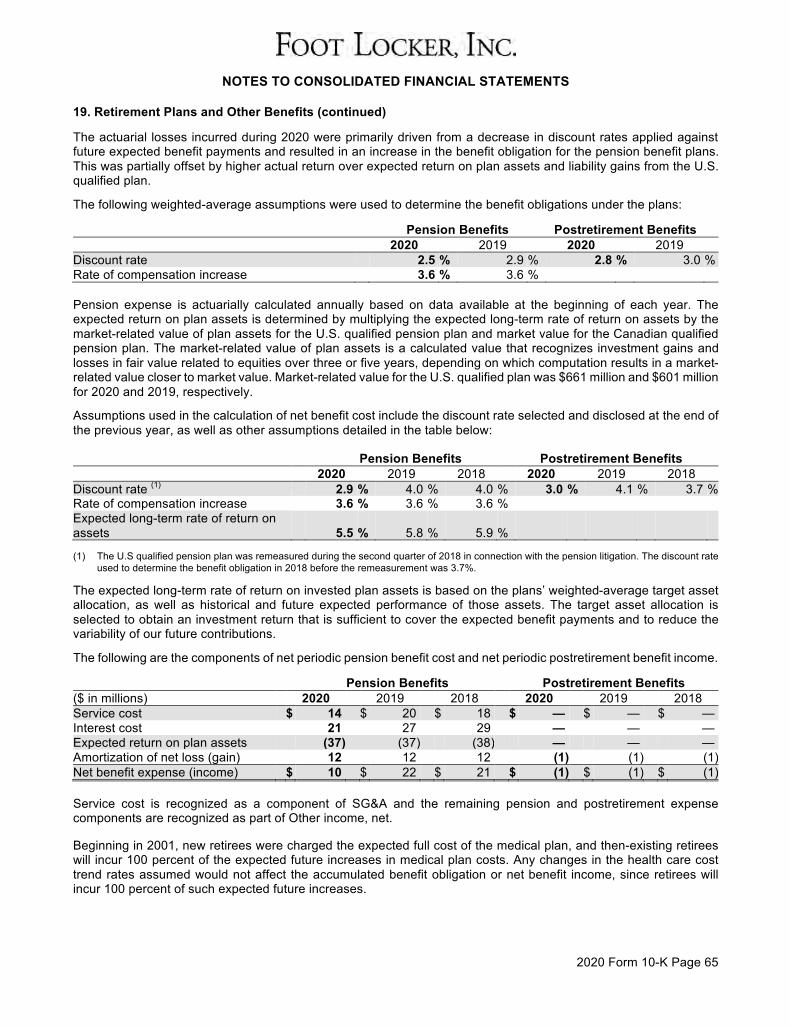
NOTES TO CONSOLIDATED FINANCIAL STATEMENTS
2020 Form 10-K Page 65
19. Retirement Plans and Other Benefits (continued)
The actuarial losses incurred during 2020 were primarily driven from a decrease in discount rates applied against future expected benefit payments and resulted in an increase in the benefit obligation for the pension benefit plans. This was partially offset by higher actual return over expected return on plan assets and liability gains from the U.S. qualified plan.
The following weighted-average assumptions were used to determine the benefit obligations under the plans:
Pension Benefits Postretirement Benefits 2020 2019 2020 2019 Discount rate 2.5 % 2.9 % 2.8 % 3.0 % Rate of compensation increase 3.6 % 3.6 % Pension expense is actuarially calculated annually based on data available at the beginning of each year. The expected return on plan assets is determined by multiplying the expected long-term rate of return on assets by the market-related value of plan assets for the U.S. qualified pension plan and market value for the Canadian qualified pension plan. The market-related value of plan assets is a calculated value that recognizes investment gains and losses in fair value related to equities over three or five years, depending on which computation results in a market-related value closer to market value. Market-related value for the U.S. qualified plan was $661 million and $601 million for 2020 and 2019, respectively.
Assumptions used in the calculation of net benefit cost include the discount rate selected and disclosed at the end of the previous year, as well as other assumptions detailed in the table below:
Pension Benefits Postretirement Benefits 2020 2019 2018 2020 2019 2018 Discount rate (1) 2.9 % 4.0 % 4.0 % 3.0 % 4.1 % 3.7 % Rate of compensation increase 3.6 % 3.6 % 3.6 % Expected long-term rate of return on assets 5.5 % 5.8 % 5.9 %
(1) The U.S qualified pension plan was remeasured during the second quarter of 2018 in connection with the pension litigation. The discount rate used to determine the benefit obligation in 2018 before the remeasurement was 3.7%.
The expected long-term rate of return on invested plan assets is based on the plans’ weighted-average target asset allocation, as well as historical and future expected performance of those assets. The target asset allocation is selected to obtain an investment return that is sufficient to cover the expected benefit payments and to reduce the variability of our future contributions.
The following are the components of net periodic pension benefit cost and net periodic postretirement benefit income.
Pension Benefits Postretirement Benefits ($ in millions) 2020 2019 2018 2020 2019 2018 Service cost $ 14 $ 20 $ 18 $ — $ — $ — Interest cost 21 27 29 — — — Expected return on plan assets (37) (37) (38) — — — Amortization of net loss (gain) 12 12 12 (1) (1) (1) Net benefit expense (income) $ 10 $ 22 $ 21 $ (1) $ (1) $ (1) Service cost is recognized as a component of SG&A and the remaining pension and postretirement expense components are recognized as part of Other income, net.
Beginning in 2001, new retirees were charged the expected full cost of the medical plan, and then-existing retirees will incur 100 percent of the expected future increases in medical plan costs. Any changes in the health care cost trend rates assumed would not affect the accumulated benefit obligation or net benefit income, since retirees will incur 100 percent of such expected future increases.
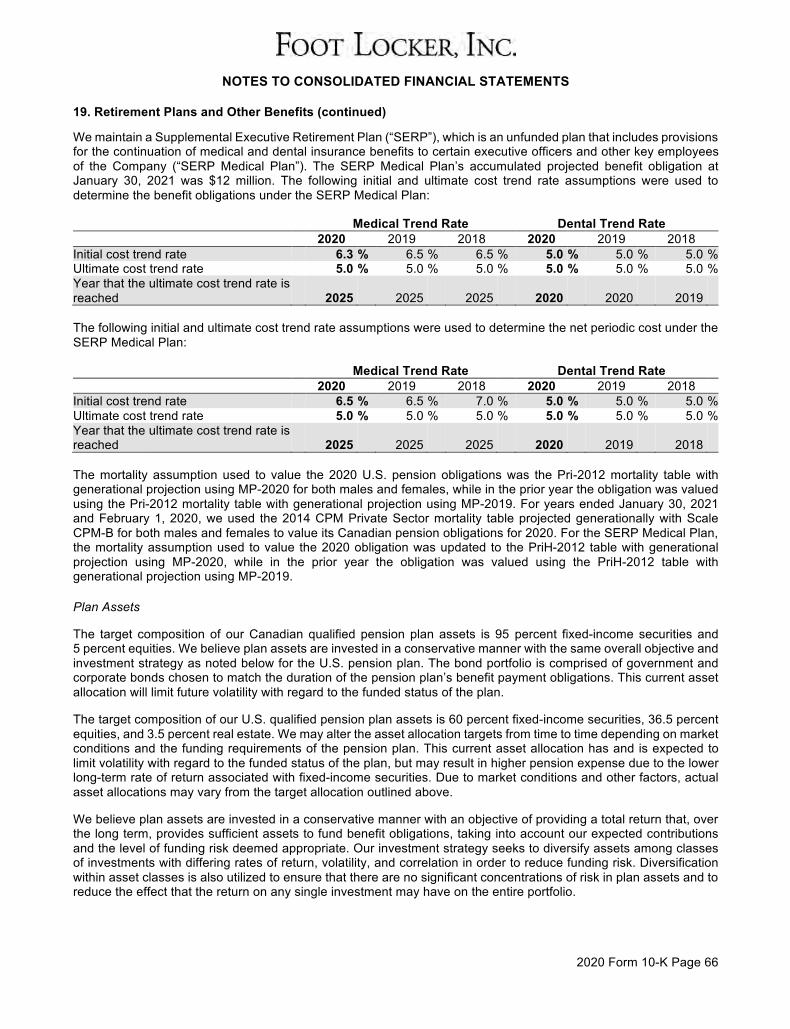
NOTES TO CONSOLIDATED FINANCIAL STATEMENTS
2020 Form 10-K Page 66
19. Retirement Plans and Other Benefits (continued)
We maintain a Supplemental Executive Retirement Plan (“SERP”), which is an unfunded plan that includes provisions for the continuation of medical and dental insurance benefits to certain executive officers and other key employees of the Company (“SERP Medical Plan”). The SERP Medical Plan’s accumulated projected benefit obligation at January 30, 2021 was $12 million. The following initial and ultimate cost trend rate assumptions were used to determine the benefit obligations under the SERP Medical Plan:
Medical Trend Rate Dental Trend Rate 2020 2019 2018 2020 2019 2018 Initial cost trend rate 6.3 % 6.5 % 6.5 % 5.0 % 5.0 % 5.0 % Ultimate cost trend rate 5.0 % 5.0 % 5.0 % 5.0 % 5.0 % 5.0 % Year that the ultimate cost trend rate is reached 2025 2025 2025 2020 2020 2019 The following initial and ultimate cost trend rate assumptions were used to determine the net periodic cost under the SERP Medical Plan:
Medical Trend Rate Dental Trend Rate 2020 2019 2018 2020 2019 2018 Initial cost trend rate 6.5 % 6.5 % 7.0 % 5.0 % 5.0 % 5.0 % Ultimate cost trend rate 5.0 % 5.0 % 5.0 % 5.0 % 5.0 % 5.0 % Year that the ultimate cost trend rate is reached 2025 2025 2025 2020 2019 2018 The mortality assumption used to value the 2020 U.S. pension obligations was the Pri-2012 mortality table with generational projection using MP-2020 for both males and females, while in the prior year the obligation was valued using the Pri-2012 mortality table with generational projection using MP-2019. For years ended January 30, 2021 and February 1, 2020, we used the 2014 CPM Private Sector mortality table projected generationally with Scale CPM-B for both males and females to value its Canadian pension obligations for 2020. For the SERP Medical Plan, the mortality assumption used to value the 2020 obligation was updated to the PriH-2012 table with generational projection using MP-2020, while in the prior year the obligation was valued using the PriH-2012 table with generational projection using MP-2019.
Plan Assets
The target composition of our Canadian qualified pension plan assets is 95 percent fixed-income securities and 5 percent equities. We believe plan assets are invested in a conservative manner with the same overall objective and investment strategy as noted below for the U.S. pension plan. The bond portfolio is comprised of government and corporate bonds chosen to match the duration of the pension plan’s benefit payment obligations. This current asset allocation will limit future volatility with regard to the funded status of the plan.
The target composition of our U.S. qualified pension plan assets is 60 percent fixed-income securities, 36.5 percent equities, and 3.5 percent real estate. We may alter the asset allocation targets from time to time depending on market conditions and the funding requirements of the pension plan. This current asset allocation has and is expected to limit volatility with regard to the funded status of the plan, but may result in higher pension expense due to the lower long-term rate of return associated with fixed-income securities. Due to market conditions and other factors, actual asset allocations may vary from the target allocation outlined above.
We believe plan assets are invested in a conservative manner with an objective of providing a total return that, over the long term, provides sufficient assets to fund benefit obligations, taking into account our expected contributions and the level of funding risk deemed appropriate. Our investment strategy seeks to diversify assets among classes of investments with differing rates of return, volatility, and correlation in order to reduce funding risk. Diversification within asset classes is also utilized to ensure that there are no significant concentrations of risk in plan assets and to reduce the effect that the return on any single investment may have on the entire portfolio.
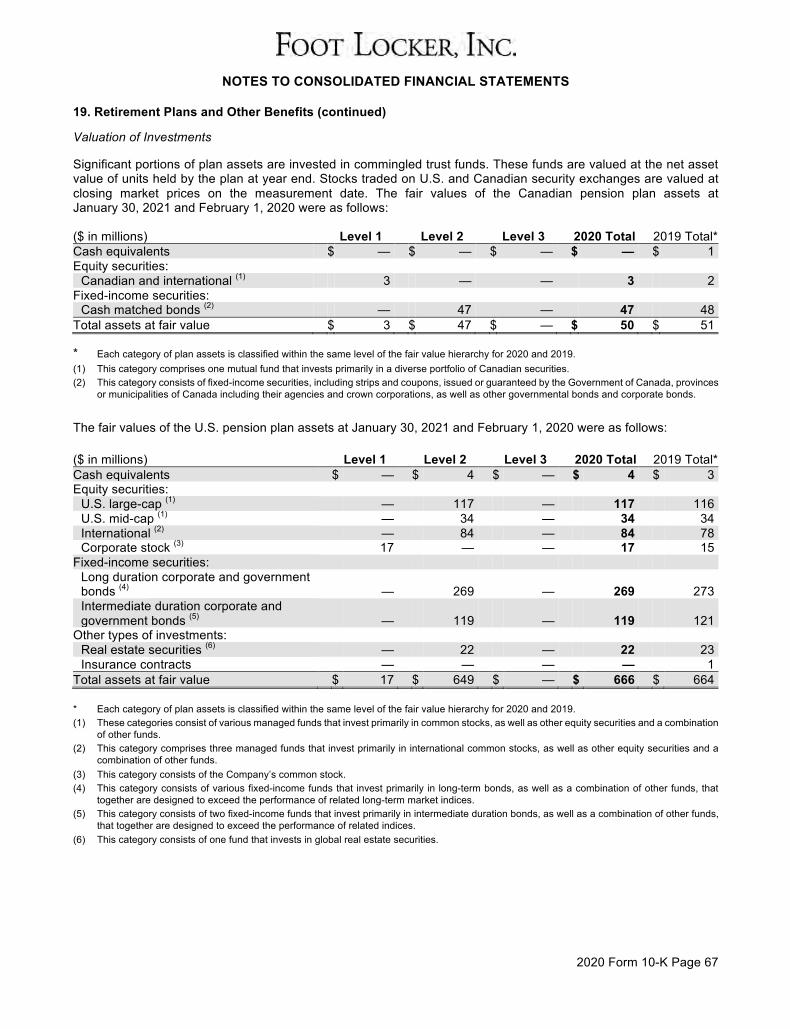
NOTES TO CONSOLIDATED FINANCIAL STATEMENTS
2020 Form 10-K Page 67
19. Retirement Plans and Other Benefits (continued)
Valuation of Investments
Significant portions of plan assets are invested in commingled trust funds. These funds are valued at the net asset value of units held by the plan at year end. Stocks traded on U.S. and Canadian security exchanges are valued at closing market prices on the measurement date. The fair values of the Canadian pension plan assets at January 30, 2021 and February 1, 2020 were as follows:
($ in millions) Level 1 Level 2 Level 3 2020 Total 2019 Total* Cash equivalents $ — $ — $ — $ — $ 1 Equity securities:
Canadian and international (1) 3 — — 3 2 Fixed-income securities:
Cash matched bonds (2) — 47 — 47 48 Total assets at fair value $ 3 $ 47 $ — $ 50 $ 51 * Each category of plan assets is classified within the same level of the fair value hierarchy for 2020 and 2019. (1) This category comprises one mutual fund that invests primarily in a diverse portfolio of Canadian securities. (2) This category consists of fixed-income securities, including strips and coupons, issued or guaranteed by the Government of Canada, provinces
or municipalities of Canada including their agencies and crown corporations, as well as other governmental bonds and corporate bonds.
The fair values of the U.S. pension plan assets at January 30, 2021 and February 1, 2020 were as follows:
($ in millions) Level 1 Level 2 Level 3 2020 Total 2019 Total* Cash equivalents $ — $ 4 $ — $ 4 $ 3 Equity securities:
U.S. large-cap (1) — 117 — 117 116 U.S. mid-cap (1) — 34 — 34 34 International (2) — 84 — 84 78 Corporate stock (3) 17 — — 17 15
Fixed-income securities: Long duration corporate and government bonds (4) — 269 — 269 273 Intermediate duration corporate and government bonds (5) — 119 — 119 121
Other types of investments: Real estate securities (6) — 22 — 22 23 Insurance contracts — — — — 1
Total assets at fair value $ 17 $ 649 $ — $ 666 $ 664 * Each category of plan assets is classified within the same level of the fair value hierarchy for 2020 and 2019. (1) These categories consist of various managed funds that invest primarily in common stocks, as well as other equity securities and a combination
of other funds. (2) This category comprises three managed funds that invest primarily in international common stocks, as well as other equity securities and a
combination of other funds. (3) This category consists of the Company’s common stock. (4) This category consists of various fixed-income funds that invest primarily in long-term bonds, as well as a combination of other funds, that
together are designed to exceed the performance of related long-term market indices. (5) This category consists of two fixed-income funds that invest primarily in intermediate duration bonds, as well as a combination of other funds,
that together are designed to exceed the performance of related indices. (6) This category consists of one fund that invests in global real estate securities.
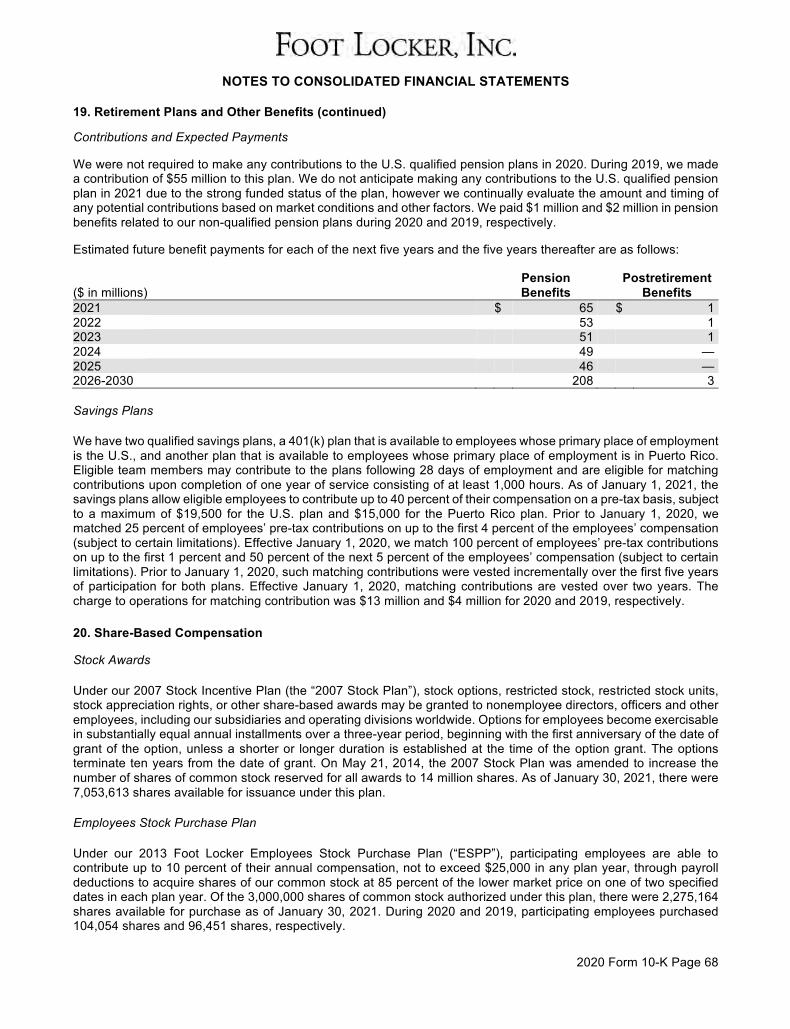
NOTES TO CONSOLIDATED FINANCIAL STATEMENTS
2020 Form 10-K Page 68
19. Retirement Plans and Other Benefits (continued)
Contributions and Expected Payments
We were not required to make any contributions to the U.S. qualified pension plans in 2020. During 2019, we made a contribution of $55 million to this plan. We do not anticipate making any contributions to the U.S. qualified pension plan in 2021 due to the strong funded status of the plan, however we continually evaluate the amount and timing of any potential contributions based on market conditions and other factors. We paid $1 million and $2 million in pension benefits related to our non-qualified pension plans during 2020 and 2019, respectively.
Estimated future benefit payments for each of the next five years and the five years thereafter are as follows:
Pension Postretirement ($ in millions) Benefits Benefits 2021 $ 65 $ 1 2022 53 1 2023 51 1 2024 49 — 2025 46 — 2026-2030 208 3 Savings Plans
We have two qualified savings plans, a 401(k) plan that is available to employees whose primary place of employment is the U.S., and another plan that is available to employees whose primary place of employment is in Puerto Rico. Eligible team members may contribute to the plans following 28 days of employment and are eligible for matching contributions upon completion of one year of service consisting of at least 1,000 hours. As of January 1, 2021, the savings plans allow eligible employees to contribute up to 40 percent of their compensation on a pre-tax basis, subject to a maximum of $19,500 for the U.S. plan and $15,000 for the Puerto Rico plan. Prior to January 1, 2020, we matched 25 percent of employees’ pre-tax contributions on up to the first 4 percent of the employees’ compensation (subject to certain limitations). Effective January 1, 2020, we match 100 percent of employees’ pre-tax contributions on up to the first 1 percent and 50 percent of the next 5 percent of the employees’ compensation (subject to certain limitations). Prior to January 1, 2020, such matching contributions were vested incrementally over the first five years of participation for both plans. Effective January 1, 2020, matching contributions are vested over two years. The charge to operations for matching contribution was $13 million and $4 million for 2020 and 2019, respectively.
20. Share-Based Compensation
Stock Awards
Under our 2007 Stock Incentive Plan (the “2007 Stock Plan”), stock options, restricted stock, restricted stock units, stock appreciation rights, or other share-based awards may be granted to nonemployee directors, officers and other employees, including our subsidiaries and operating divisions worldwide. Options for employees become exercisable in substantially equal annual installments over a three-year period, beginning with the first anniversary of the date of grant of the option, unless a shorter or longer duration is established at the time of the option grant. The options terminate ten years from the date of grant. On May 21, 2014, the 2007 Stock Plan was amended to increase the number of shares of common stock reserved for all awards to 14 million shares. As of January 30, 2021, there were 7,053,613 shares available for issuance under this plan.
Employees Stock Purchase Plan
Under our 2013 Foot Locker Employees Stock Purchase Plan (“ESPP”), participating employees are able to contribute up to 10 percent of their annual compensation, not to exceed $25,000 in any plan year, through payroll deductions to acquire shares of our common stock at 85 percent of the lower market price on one of two specified dates in each plan year. Of the 3,000,000 shares of common stock authorized under this plan, there were 2,275,164 shares available for purchase as of January 30, 2021. During 2020 and 2019, participating employees purchased 104,054 shares and 96,451 shares, respectively.
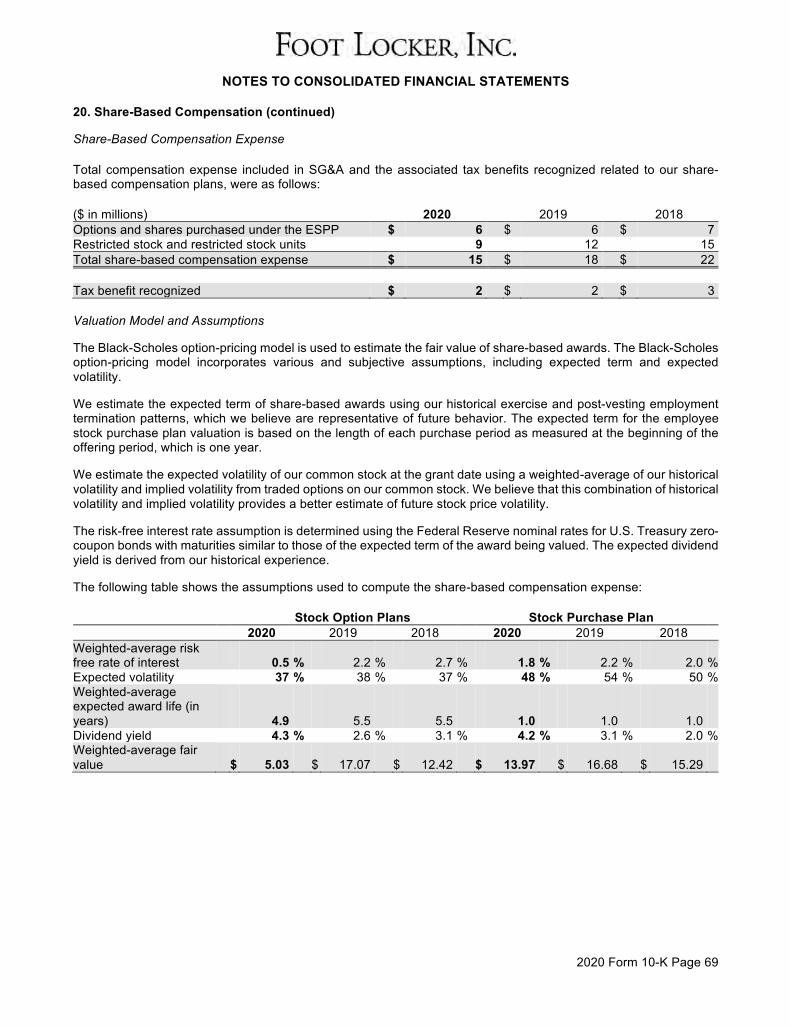
NOTES TO CONSOLIDATED FINANCIAL STATEMENTS
2020 Form 10-K Page 69
20. Share-Based Compensation (continued)
Share-Based Compensation Expense
Total compensation expense included in SG&A and the associated tax benefits recognized related to our share-based compensation plans, were as follows:
($ in millions) 2020 2019 2018 Options and shares purchased under the ESPP $ 6 $ 6 $ 7 Restricted stock and restricted stock units 9 12 15 Total share-based compensation expense $ 15 $ 18 $ 22 Tax benefit recognized $ 2 $ 2 $ 3 Valuation Model and Assumptions
The Black-Scholes option-pricing model is used to estimate the fair value of share-based awards. The Black-Scholes option-pricing model incorporates various and subjective assumptions, including expected term and expected volatility.
We estimate the expected term of share-based awards using our historical exercise and post-vesting employment termination patterns, which we believe are representative of future behavior. The expected term for the employee stock purchase plan valuation is based on the length of each purchase period as measured at the beginning of the offering period, which is one year.
We estimate the expected volatility of our common stock at the grant date using a weighted-average of our historical volatility and implied volatility from traded options on our common stock. We believe that this combination of historical volatility and implied volatility provides a better estimate of future stock price volatility.
The risk-free interest rate assumption is determined using the Federal Reserve nominal rates for U.S. Treasury zero-coupon bonds with maturities similar to those of the expected term of the award being valued. The expected dividend yield is derived from our historical experience.
The following table shows the assumptions used to compute the share-based compensation expense:
Stock Option Plans Stock Purchase Plan 2020 2019 2018 2020 2019 2018 Weighted-average risk free rate of interest 0.5 % 2.2 % 2.7 % 1.8 % 2.2 % 2.0 % Expected volatility 37 % 38 % 37 % 48 % 54 % 50 % Weighted-average expected award life (in years) 4.9 5.5 5.5 1.0 1.0 1.0 Dividend yield 4.3 % 2.6 % 3.1 % 4.2 % 3.1 % 2.0 % Weighted-average fair value $ 5.03 $ 17.07 $ 12.42 $ 13.97 $ 16.68 $ 15.29
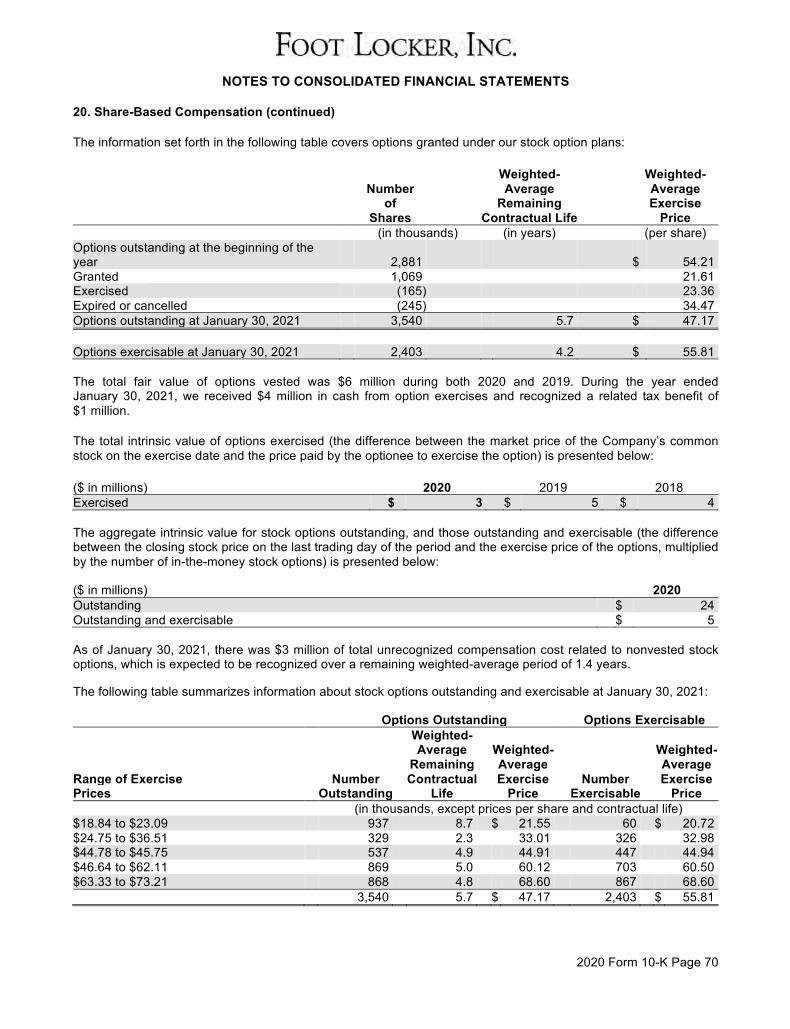
NOTES TO CONSOLIDATED FINANCIAL STATEMENTS
2020 Form 10-K Page 70
20. Share-Based Compensation (continued)
The information set forth in the following table covers options granted under our stock option plans:
Weighted- Weighted- Number Average Average of Remaining Exercise Shares Contractual Life Price (in thousands) (in years) (per share) Options outstanding at the beginning of the year 2,881 $ 54.21 Granted 1,069 21.61 Exercised (165) 23.36 Expired or cancelled (245) 34.47 Options outstanding at January 30, 2021 3,540 5.7 $ 47.17 Options exercisable at January 30, 2021 2,403 4.2 $ 55.81 The total fair value of options vested was $6 million during both 2020 and 2019. During the year ended January 30, 2021, we received $4 million in cash from option exercises and recognized a related tax benefit of $1 million.
The total intrinsic value of options exercised (the difference between the market price of the Company’s common stock on the exercise date and the price paid by the optionee to exercise the option) is presented below:
($ in millions) 2020 2019 2018 Exercised $ 3 $ 5 $ 4 The aggregate intrinsic value for stock options outstanding, and those outstanding and exercisable (the difference between the closing stock price on the last trading day of the period and the exercise price of the options, multiplied by the number of in-the-money stock options) is presented below:
($ in millions) 2020 Outstanding $ 24 Outstanding and exercisable $ 5 As of January 30, 2021, there was $3 million of total unrecognized compensation cost related to nonvested stock options, which is expected to be recognized over a remaining weighted-average period of 1.4 years.
The following table summarizes information about stock options outstanding and exercisable at January 30, 2021:
Options Outstanding Options Exercisable Weighted- Average Weighted- Weighted- Remaining Average Average Range of Exercise Number Contractual Exercise Number Exercise Prices Outstanding Life Price Exercisable Price (in thousands, except prices per share and contractual life) $18.84 to $23.09 937 8.7 $ 21.55 60 $ 20.72 $24.75 to $36.51 329 2.3 33.01 326 32.98 $44.78 to $45.75 537 4.9 44.91 447 44.94 $46.64 to $62.11 869 5.0 60.12 703 60.50 $63.33 to $73.21 868 4.8 68.60 867 68.60 3,540 5.7 $ 47.17 2,403 $ 55.81
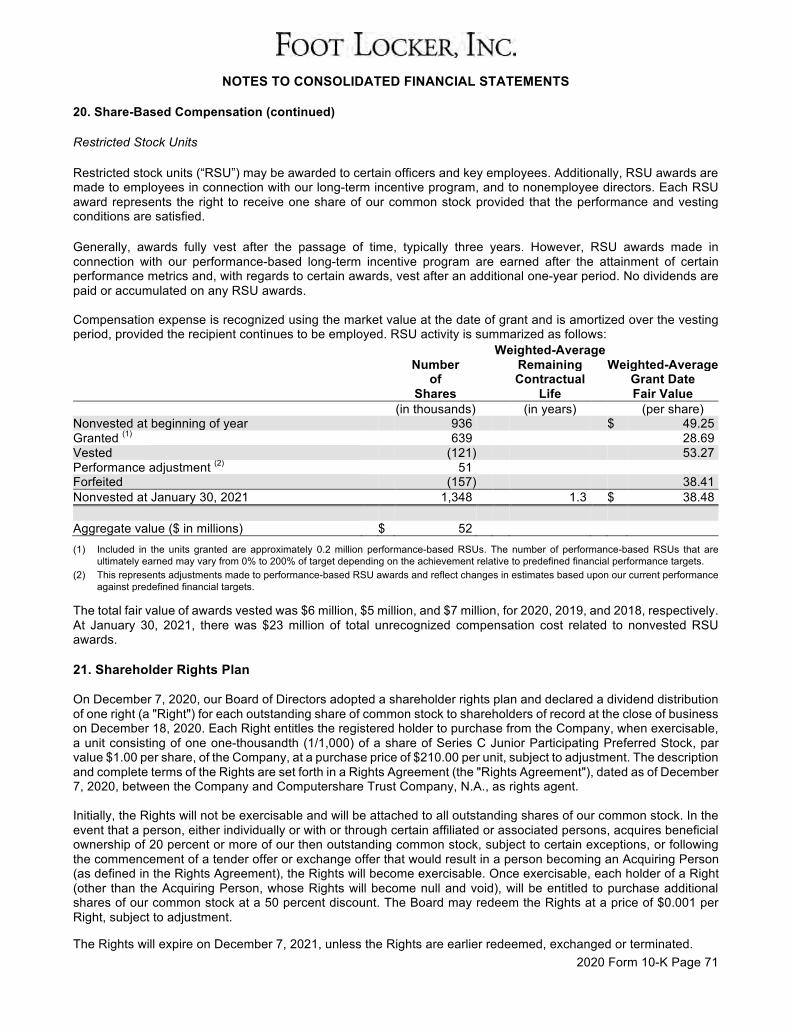
NOTES TO CONSOLIDATED FINANCIAL STATEMENTS
2020 Form 10-K Page 71
20. Share-Based Compensation (continued)
Restricted Stock Units
Restricted stock units (“RSU”) may be awarded to certain officers and key employees. Additionally, RSU awards are made to employees in connection with our long-term incentive program, and to nonemployee directors. Each RSU award represents the right to receive one share of our common stock provided that the performance and vesting conditions are satisfied.
Generally, awards fully vest after the passage of time, typically three years. However, RSU awards made in connection with our performance-based long-term incentive program are earned after the attainment of certain performance metrics and, with regards to certain awards, vest after an additional one-year period. No dividends are paid or accumulated on any RSU awards. Compensation expense is recognized using the market value at the date of grant and is amortized over the vesting period, provided the recipient continues to be employed. RSU activity is summarized as follows:
Weighted-Average Number Remaining Weighted-Average of Contractual Grant Date Shares Life Fair Value (in thousands) (in years) (per share) Nonvested at beginning of year 936 $ 49.25 Granted (1) 639 28.69 Vested (121) 53.27 Performance adjustment (2) 51 Forfeited (157) 38.41 Nonvested at January 30, 2021 1,348 1.3 $ 38.48 Aggregate value ($ in millions) $ 52
(1) Included in the units granted are approximately 0.2 million performance-based RSUs. The number of performance-based RSUs that are ultimately earned may vary from 0% to 200% of target depending on the achievement relative to predefined financial performance targets.
(2) This represents adjustments made to performance-based RSU awards and reflect changes in estimates based upon our current performance against predefined financial targets.
The total fair value of awards vested was $6 million, $5 million, and $7 million, for 2020, 2019, and 2018, respectively. At January 30, 2021, there was $23 million of total unrecognized compensation cost related to nonvested RSU awards. 21. Shareholder Rights Plan On December 7, 2020, our Board of Directors adopted a shareholder rights plan and declared a dividend distribution of one right (a "Right") for each outstanding share of common stock to shareholders of record at the close of business on December 18, 2020. Each Right entitles the registered holder to purchase from the Company, when exercisable, a unit consisting of one one-thousandth (1/1,000) of a share of Series C Junior Participating Preferred Stock, par value $1.00 per share, of the Company, at a purchase price of $210.00 per unit, subject to adjustment. The description and complete terms of the Rights are set forth in a Rights Agreement (the "Rights Agreement"), dated as of December 7, 2020, between the Company and Computershare Trust Company, N.A., as rights agent. Initially, the Rights will not be exercisable and will be attached to all outstanding shares of our common stock. In the event that a person, either individually or with or through certain affiliated or associated persons, acquires beneficial ownership of 20 percent or more of our then outstanding common stock, subject to certain exceptions, or following the commencement of a tender offer or exchange offer that would result in a person becoming an Acquiring Person (as defined in the Rights Agreement), the Rights will become exercisable. Once exercisable, each holder of a Right (other than the Acquiring Person, whose Rights will become null and void), will be entitled to purchase additional shares of our common stock at a 50 percent discount. The Board may redeem the Rights at a price of $0.001 per Right, subject to adjustment. The Rights will expire on December 7, 2021, unless the Rights are earlier redeemed, exchanged or terminated.
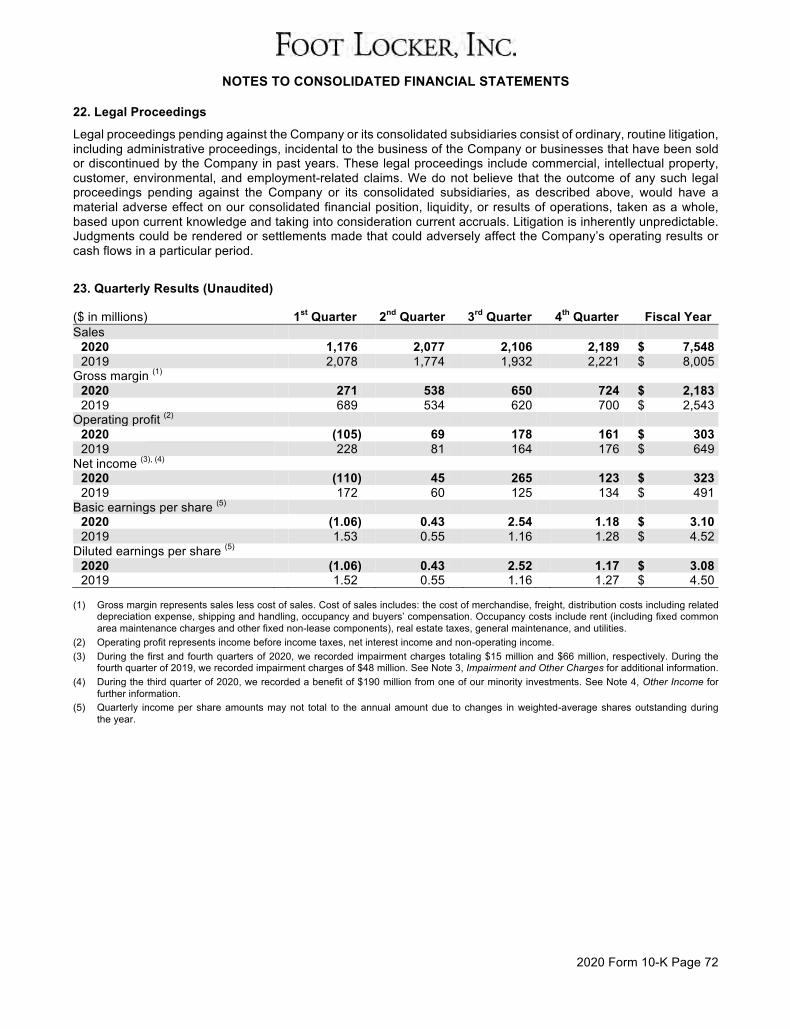
NOTES TO CONSOLIDATED FINANCIAL STATEMENTS
2020 Form 10-K Page 72
22. Legal Proceedings
Legal proceedings pending against the Company or its consolidated subsidiaries consist of ordinary, routine litigation, including administrative proceedings, incidental to the business of the Company or businesses that have been sold or discontinued by the Company in past years. These legal proceedings include commercial, intellectual property, customer, environmental, and employment-related claims. We do not believe that the outcome of any such legal proceedings pending against the Company or its consolidated subsidiaries, as described above, would have a material adverse effect on our consolidated financial position, liquidity, or results of operations, taken as a whole, based upon current knowledge and taking into consideration current accruals. Litigation is inherently unpredictable. Judgments could be rendered or settlements made that could adversely affect the Company’s operating results or cash flows in a particular period.
23. Quarterly Results (Unaudited)
($ in millions) 1st Quarter 2nd Quarter 3rd Quarter 4th Quarter Fiscal Year Sales
2020 1,176 2,077 2,106 2,189 $ 7,548 2019 2,078 1,774 1,932 2,221 $ 8,005
Gross margin (1) 2020 271 538 650 724 $ 2,183 2019 689 534 620 700 $ 2,543
Operating profit (2) 2020 (105) 69 178 161 $ 303 2019 228 81 164 176 $ 649
Net income (3), (4) 2020 (110) 45 265 123 $ 323 2019 172 60 125 134 $ 491
Basic earnings per share (5) 2020 (1.06) 0.43 2.54 1.18 $ 3.10 2019 1.53 0.55 1.16 1.28 $ 4.52
Diluted earnings per share (5) 2020 (1.06) 0.43 2.52 1.17 $ 3.08 2019 1.52 0.55 1.16 1.27 $ 4.50
(1) Gross margin represents sales less cost of sales. Cost of sales includes: the cost of merchandise, freight, distribution costs including related
depreciation expense, shipping and handling, occupancy and buyers’ compensation. Occupancy costs include rent (including fixed common area maintenance charges and other fixed non-lease components), real estate taxes, general maintenance, and utilities.
(2) Operating profit represents income before income taxes, net interest income and non-operating income. (3) During the first and fourth quarters of 2020, we recorded impairment charges totaling $15 million and $66 million, respectively. During the
fourth quarter of 2019, we recorded impairment charges of $48 million. See Note 3, Impairment and Other Charges for additional information. (4) During the third quarter of 2020, we recorded a benefit of $190 million from one of our minority investments. See Note 4, Other Income for
further information. (5) Quarterly income per share amounts may not total to the annual amount due to changes in weighted-average shares outstanding during
the year.
2020 Form 10-K Page 73
Item 9. Changes in and Disagreements with Accountants on Accounting and Financial Disclosure
There were no disagreements between the Company and its independent registered public accounting firm on matters of accounting principles or practices.
Item 9A. Controls and Procedures
(a) Evaluation of Disclosure Controls and Procedures.
The Company’s management performed an evaluation, under the supervision and with the participation of the Company’s Chief Executive Officer (“CEO”) and Chief Financial Officer (“CFO”), of the effectiveness of the design and operation of the Company’s disclosure controls and procedures (as that term is defined in Rules 13a-15(e) and 15d-15(e) under the Securities Exchange Act of 1934, as amended (the “Exchange Act”)) as of January 30, 2021. Based on that evaluation, the Company’s CEO and CFO concluded that the Company’s disclosure controls and procedures were effective to ensure that information relating to the Company that is required to be disclosed in the reports that we file or submit under the Exchange Act is recorded, processed, summarized, and reported within the time periods specified in the SEC rules and forms, and is accumulated and communicated to management, including the CEO and CFO, as appropriate to allow timely decisions regarding required disclosure.
(b) Management’s Annual Report on Internal Control over Financial Reporting.
The Company’s management is responsible for establishing and maintaining adequate internal control over financial reporting (as that term is defined in Exchange Act Rules 13a-15(f) and 15d-15(f)). To evaluate the effectiveness of the Company’s internal control over financial reporting, the Company uses the framework in Internal Control-Integrated Framework (2013) issued by the Committee of Sponsoring Organizations of the Treadway Commission (the “2013 COSO Framework”). Using the 2013 COSO Framework, the Company’s management, including the CEO and CFO, evaluated the Company’s internal control over financial reporting and concluded that the Company’s internal control over financial reporting was effective as of January 30, 2021. KPMG LLP, the independent registered public accounting firm that audits the Company’s consolidated financial statements included in this annual report, has issued an attestation report on the Company’s effectiveness of internal control over financial reporting, which is included in Item 9A(d).
(c) Changes in Internal Control over Financial Reporting.
We are currently migrating our e-commerce order management system. All North American e-commerce websites and apps were live on the new system as of January 30, 2021. In connection with this implementation and resulting business process changes, we may make changes to the design and operation of our internal control over financial reporting.
During the Company’s last fiscal quarter there were no changes in internal control over financial reporting, other than the implementation of our e-commerce order management system noted above, that materially affected, or are reasonably likely to materially affect, the Company’s internal control over financial reporting.
(d) Report of Independent Registered Public Accounting Firm on Internal Control Over Financial Reporting- the report appears on the following page.
2020 Form 10-K Page 74
REPORT OF INDEPENDENT REGISTERED PUBLIC ACCOUNTING FIRM
To the Shareholders and Board of Directors Foot Locker, Inc.:
Opinion on Internal Control Over Financial Reporting
We have audited Foot Locker, Inc.’s and subsidiaries (the “Company”) internal control over financial reporting as of January 30, 2021, based on criteria established in Internal Control – Integrated Framework (2013) issued by the Committee of Sponsoring Organizations of the Treadway Commission. In our opinion, the Company maintained, in all material respects, effective internal control over financial reporting as of January 30, 2021, based on criteria established in Internal Control – Integrated Framework (2013) issued by the Committee of Sponsoring Organizations of the Treadway Commission.
We also have audited, in accordance with the standards of the Public Company Accounting Oversight Board (United States) (PCAOB), the consolidated balance sheets of the Company as of January 30, 2021 and February 1, 2020, the related consolidated statements of operations, comprehensive income, changes in shareholders’ equity, and cash flows for each of the years in the three-year period ended January 30, 2021, and the related notes (collectively, the “consolidated financial statements”), and our report dated March 25, 2021 expressed an unqualified opinion on those consolidated financial statements.
Basis for Opinion
The Company’s management is responsible for maintaining effective internal control over financial reporting and for its assessment of the effectiveness of internal control over financial reporting, included in the accompanying Management’s Annual Report on Internal Control over Financial Reporting. Our responsibility is to express an opinion on the Company’s internal control over financial reporting based on our audit. We are a public accounting firm registered with the PCAOB and are required to be independent with respect to the Company in accordance with the U.S. federal securities laws and the applicable rules and regulations of the Securities and Exchange Commission and the PCAOB.
We conducted our audit in accordance with the standards of the PCAOB. Those standards require that we plan and perform the audit to obtain reasonable assurance about whether effective internal control over financial reporting was maintained in all material respects. Our audit of internal control over financial reporting included obtaining an understanding of internal control over financial reporting, assessing the risk that a material weakness exists, and testing and evaluating the design and operating effectiveness of internal control based on the assessed risk. Our audit also included performing such other procedures as we considered necessary in the circumstances. We believe that our audit provides a reasonable basis for our opinion.
Definition and Limitations of Internal Control Over Financial Reporting
A company’s internal control over financial reporting is a process designed to provide reasonable assurance regarding the reliability of financial reporting and the preparation of financial statements for external purposes in accordance with generally accepted accounting principles. A company’s internal control over financial reporting includes those policies and procedures that (1) pertain to the maintenance of records that, in reasonable detail, accurately and fairly reflect the transactions and dispositions of the assets of the company; (2) provide reasonable assurance that transactions are recorded as necessary to permit preparation of financial statements in accordance with generally accepted accounting principles, and that receipts and expenditures of the company are being made only in accordance with authorizations of management and directors of the company; and (3) provide reasonable assurance regarding prevention or timely detection of unauthorized acquisition, use, or disposition of the company’s assets that could have a material effect on the financial statements. Because of its inherent limitations, internal control over financial reporting may not prevent or detect misstatements. Also, projections of any evaluation of effectiveness to future periods are subject to the risk that controls may become inadequate because of changes in conditions, or that the degree of compliance with the policies or procedures may deteriorate.
/s/ KPMG LLP New York, New York March 25, 2021
2020 Form 10-K Page 75
Item 9B. Other Information None.
PART III
Item 10. Directors, Executive Officers and Corporate Governance
(a) Directors of the Company
Information relative to directors of the Company will be set forth under the section captioned “Proposal 1-Election of Directors” in the Proxy Statement and is incorporated herein by reference.
(b) Executive Officers of the Company
Information with respect to executive officers of the Company will be set forth in Item 4A in Part I.
(c) Information with respect to compliance with Section 16(a) of the Securities Exchange Act of 1934 will be set forth under the section captioned “Section 16(a) Beneficial Ownership Reporting Compliance” in the Proxy Statement and is incorporated herein by reference.
(d) Information on our audit committee and the audit committee financial expert will be contained in the Proxy Statement under the section captioned “Committees of the Board” and is incorporated herein by reference.
(e) Information about the Code of Business Conduct governing our employees, including our Chief Executive Officer, Chief Financial Officer, Chief Accounting Officer, and the Board of Directors, will be set forth under the heading “Code of Business Conduct” under the Corporate Governance section of the Proxy Statement and is incorporated herein by reference.
Item 11. Executive Compensation
Information set forth in the Proxy Statement beginning with the section captioned “Director Compensation” through and including the section captioned “Pension Benefits” is incorporated herein by reference, and information set forth in the Proxy Statement under the heading “Compensation Committee Interlocks and Insider Participation” is incorporated herein by reference.
Item 12. Security Ownership of Certain Beneficial Owners and Management and Related Stockholder Matters
Information set forth in the Proxy Statement under the sections captioned “Equity Compensation Plan Information” and “Beneficial Ownership of the Company’s Stock” is incorporated herein by reference.
Item 13. Certain Relationships and Related Transactions, and Director Independence
Information set forth in the Proxy Statement under the section captioned “Directors’ Independence” is incorporated herein by reference.
Item 14. Principal Accounting Fees and Services
Information about the principal accounting fees and services is set forth under the section captioned “Proposal 3: Ratification of the Appointment of our Independent Registered Public Accounting Firm — Audit and Non-Audit Fees” in the Proxy Statement and is incorporated herein by reference. Information about the Audit Committee’s preapproval policies and procedures is set forth in the section captioned “Proposal 3: Ratification of the Appointment of our Independent Registered Public Accounting Firm — Audit Committee Preapproval Policies and Procedures” in the Proxy Statement and is incorporated herein by reference.
2020 Form 10-K Page 76
PART IV
Item 15. Exhibits and Financial Statement Schedules
(a)(1) and (2) Financial Statements
The list of financial statements required by this item is set forth in Item 8. “Consolidated Financial Statements and Supplementary Data.” All other schedules specified under Regulation S-X have been omitted because they are not applicable, because they are not required, or because the information required is included in the financial statements or notes thereto.
(a)(3) and (c) Exhibits
An index of the exhibits which are required by this item and which are included or incorporated herein by reference in this report appears on pages 77 through 80.
Item 16. Form 10-K Summary
None.
2020 Form 10-K Page 77
FOOT LOCKER, INC.
INDEX OF EXHIBITS
Exhibit No. Description 3.1
Certificate of Incorporation of the Registrant, as filed by the Department of State of the State of New York on April 7, 1989 (incorporated herein by reference to Exhibit 3(i)(a) to the Quarterly Report on Form 10-Q for the quarterly period ended July 26, 1997 filed on September 4, 1997 (the “July 26, 1997 Form 10-Q”)), as amended by Certificates of Amendment of the Certificate of Incorporation of the Registrant, as filed by the Department of State of the State of New York on (a) July 20, 1989, (b) July 24, 1990, (c) July 9, 1997 (incorporated herein by reference to Exhibit 3(i)(b) to the July 26, 1997 Form 10-Q), (d) June 11, 1998 (incorporated herein by reference to Exhibit 4.2(a) to the Registration Statement on Form S-8 (Registration No. 333-62425) (the “1998 Form S-8”)), (e) November 1, 2001 (incorporated herein by reference to Exhibit 4.2 to the Registration Statement on Form S-8 (Registration No. 333-74688) (the “2001 Form S-8”)), (f) May 28, 2014 (incorporated herein by reference to Exhibit 3.1 to the Current Report on Form 8-K dated May 21, 2014 filed on May 28, 2014), and (g) December 8, 2020 (incorporated herein by reference to Exhibit 3.1 to the Current Report on Form 8-K dated December 7, 2020 filed on December 8, 2020).
3.2 By-Laws of the Registrant, as amended (incorporated herein by reference to Exhibit 3.1 to the
Current Report on Form 8-K dated February 20, 2018 filed on February 22, 2018).
3.3
Rights Agreement, dated as of December 7, 2020, between the Registrant and Computershare Trust Company, N.A., as Rights Agent (incorporated herein by reference to Exhibit 3.1 to the Current Report on Form 8-K dated December 7, 2020 filed on December 8, 2020).
4.1
Indenture, dated as of October 10, 1991 (incorporated herein by reference to Exhibit 4.1 to the Registration Statement on Form S-3 (Registration No. 33-43334)).
4.2
Form of 8-1/2 % Debentures due 2022 (incorporated herein by reference to Exhibit 4 to the Current Report on Form 8-K dated January 16, 1992).
4.3* Description of Registrant’s Securities.
10.1
Credit Agreement, dated as of May 19, 2016, among Foot Locker, Inc., a New York corporation, the guarantors party thereto, the lenders party thereto and Wells Fargo, National Association, as agent, letter of credit issuer and swing line lender (incorporated herein by reference to Exhibit 10.1 to the Current Report on Form 8-K dated May 19, 2016 filed on May 19, 2016).
10.2
Amendment No. 1 to Credit Agreement, dated as of July 14, 2020, among Foot Locker, Inc., a New York corporation, the guarantors party thereto, the lenders party thereto, and Wells Fargo, National Association, as administrative agent, letter of credit issuer, and swing line lender (incorporated herein by reference to Exhibit 10.1 to the Current Report on Form 8-K dated July 14, 2020 filed on July 16, 2020).
10.3†
Foot Locker 2007 Stock Incentive Plan, amended and restated as of May 21, 2014 (incorporated herein by reference to Exhibit 10.3 to the Current Report on Form 8-K dated December 23, 2014 filed on December 31, 2014.
10.4†
Amendment Number One to the Foot Locker 2007 Stock Incentive Plan, amended and restated as of May 21, 2014 (incorporated herein by reference to Exhibit 10.5 to the Annual Report on Form 10-K for the fiscal year ended January 28, 2017 filed on March 23, 2017).
10.5†
Foot Locker Long-Term Incentive Compensation Plan, as amended and restated (incorporated herein by reference to Exhibit 10.3 to the Current Report on Form 8-K dated March 23, 2016 filed on March 29, 2016) (the “March 23, 2016 Form 8-K”).
2020 Form 10-K Page 78
Exhibit No. Description 10.6†
Foot Locker Executive Incentive Cash Compensation Plan (incorporated by reference to Exhibit 10.1 to the Current Report on Form 8-K dated March 28, 2018 filed on April 3, 2018).
10.7†
Form of Nonstatutory Stock Option Award Agreement for Executive Officers (incorporated herein by reference to Exhibit 10.40 to the Annual Report on Form 10-K for the fiscal year ended January 28, 2006 filed on March 27, 2006).
10.8†
Form of Nonstatutory Stock Option Award Agreement for Executive Officers (incorporated herein by reference to Exhibit 10.1 to the March 26, 2014 Form 8-K).
10.9†
Form of Time-Based Restricted Stock Unit Award Agreement (incorporated herein by reference to Exhibit 10.3 to the March 28, 2013 Form 8-K).
10.10†
Form of Time-Based Restricted Stock Unit Award Agreement (incorporated herein by reference to Exhibit 10.2 to March 23, 2016 Form 8-K).
10.11†
Form of Time-Based Restricted Stock Unit Award Agreement for new hires (incorporated herein by reference to Exhibit 10.1 to the Quarterly Report on Form 10-Q for the quarterly period ended July 30, 2016 filed on September 7, 2016).
10.12†
Form of Performance Restricted Stock Unit Award Agreement for Long-Term Incentive Compensation Plan (incorporated herein by reference to Exhibit 10.1 to the March 23, 2016 Form 8-K).
10.13†
Form of Accelerate Future Growth Award Agreement (incorporated herein by reference to Exhibit 10.1 to the Current Report on Form 8-K, dated April 12, 2018 filed on April 18, 2018.)
10.14†
Executive Supplemental Retirement Plan (incorporated herein by reference to Exhibit 10(d) to the Registration Statement on Form 8-B filed on August 7, 1989 (Registration No. 1-10299) (the “8-B Registration Statement”)).
10.15†
Amendment to the Executive Supplemental Retirement Plan (incorporated herein by reference to Exhibit 10(c)(i) to the Annual Report on Form 10-K for the fiscal year ended January 28, 1995 filed on April 24, 1995).
10.16†
Amendment to the Executive Supplemental Retirement Plan (incorporated herein by reference to Exhibit 10(d)(ii) to the Annual Report on Form 10-K for the fiscal year ended January 27, 1996 filed on April 26, 1996).
10.17†
Supplemental Executive Retirement Plan, as amended and restated (incorporated herein by reference to Exhibit 10.1 to the Current Report on Form 8-K dated August 13, 2007 filed on August 17, 2007).
10.18†
Amendment to the Foot Locker Supplemental Executive Retirement Plan (incorporated herein by reference to Exhibit 10.1 to the Current Report on Form 8-K dated May 25, 2011 filed on May 27, 2011).
10.19†
Amendment Number Two to the Foot Locker Supplemental Executive Retirement Plan (incorporated herein by reference to Exhibit 10.3 to the Current Report on Form 8-K dated March 26, 2014 filed on April 1, 2014 (the “March 26, 2014 Form 8-K”)).
10.20†
Amendment Number Three to the Foot Locker Supplemental Executive Retirement Plan (incorporated herein by reference to Exhibit 10.1 to the Current Report on Form 8-K dated May 22, 2019 filed on May 28, 2019 (the “May 22, 2019 Form 8-K”)).
2020 Form 10-K Page 79
Exhibit No. Description 10.21†
Amendment Number Four to the Foot Locker Supplemental Executive Retirement Plan (incorporated herein by reference to Exhibit 10.1 to the Quarterly Report on Form 10-Q for the quarterly period ended August 3, 2019 filed on September 11, 2019).
10.22†
Foot Locker Directors’ Retirement Plan, as amended (incorporated herein by reference to Exhibit 10(k) to the 8-B Registration Statement).
10.23†
Amendments to the Foot Locker Directors’ Retirement Plan (incorporated herein by reference to Exhibit 10(c) to the Quarterly Report on Form 10-Q for the quarterly period ended October 28, 1995 filed on December 11, 1995).
10.24†
Foot Locker, Inc. Excess Cash Balance Plan (incorporated herein by reference to Exhibit 10.22 to the Annual Report on Form 10-K for the fiscal year ended January 31, 2009 filed on March 30, 2009 (the “2008 Form 10-K”)).
10.25†* Foot Locker Excess Savings Plan.
10.26†
Automobile Expense Reimbursement Program for Senior Executives (incorporated herein by reference to Exhibit 10.26 to the 2008 Form 10-K).
10.27†
Executive Medical Expense Allowance Program for Senior Executives (incorporated herein by reference to Exhibit 10.27 to the 2008 Form 10-K).
10.28†
Financial Planning Allowance Program for Senior Executives (incorporated herein by reference to Exhibit 10.28 to the 2008 Form 10-K).
10.29†
Long-Term Disability Program for Senior Executives (incorporated herein by reference to Exhibit 10.32 to the 2008 Form 10-K).
10.30
Form of indemnification agreement, as amended (incorporated herein by reference to Exhibit 10(g) to the 8-B Registration Statement).
10.31
Amendment to form of indemnification agreement (incorporated herein by reference to Exhibit 10.5 to the Quarterly Report on Form 10-Q for the quarterly period ended May 5, 2001 filed on June 13, 2001 (the “May 5, 2001 Form 10-Q”)).
10.32
Trust Agreement dated as of November 12, 1987 (“Trust Agreement”), between F.W. Woolworth Co. and The Bank of New York, as amended and assumed by the Registrant (incorporated herein by reference to Exhibit 10(j) to the 8-B Registration Statement).
10.33
Amendment to Trust Agreement made as of April 11, 2001 (incorporated herein by reference to Exhibit 10.4 to the May 5, 2001 Form 10-Q).
10.34†
Employment Agreement, dated November 6, 2014, by and between Richard A. Johnson and the Company (incorporated herein by reference to Exhibit 10.2 to the Current Report on Form 8-K dated November 3, 2014 filed on November 7, 2014).
10.35†
Form of Senior Executive Employment Agreement (incorporated herein by reference to Exhibit 10.1 to the Current Report on Form 8-K dated April 20, 2015 filed on April 20, 2015).
10.36†
Form of Executive Employment Agreement (incorporated herein by reference to Exhibit 10.19 to the Annual Report on Form 10-K for the fiscal year ended January 30, 2016 filed on March 24, 2016).
10.37†
Agreement, dated July 28, 2020, between the Registrant and Stephen D. Jacobs (incorporated herein by reference to Exhibit 99.1 to the Current Report on Form 8-K dated September 1, 2020 filed September 4, 2020).
2020 Form 10-K Page 80
Exhibit No. Description 21* Subsidiaries of the Registrant.
23* Consent of Independent Registered Public Accounting Firm.
31.1* Certification of Chief Executive Officer Pursuant to Section 302 of the Sarbanes-Oxley Act of 2002.
31.2* Certification of Chief Financial Officer Pursuant to Section 302 of the Sarbanes-Oxley Act of 2002.
32**
Certification of Chief Executive Officer and Chief Financial Officer Pursuant to 18 U.S.C. Section 1350, as adopted pursuant to Section 906 of the Sarbanes-Oxley Act of 2002.
101.INS* XBRL Instance Document.
101.SCH* XBRL Taxonomy Extension Schema.
101.CAL* XBRL Taxonomy Extension Calculation Linkbase.
101.DEF* XBRL Taxonomy Extension Definition Linkbase.
101.LAB* XBRL Taxonomy Extension Label Linkbase.
101.PRE*
104
XBRL Taxonomy Extension Presentation Linkbase. Cover Page Interactive Data File (formatted as Inline XBRL and contained in Exhibit 10.1).
† Management contract or compensatory plan or arrangement.
* Filed herewith
** Furnished herewith
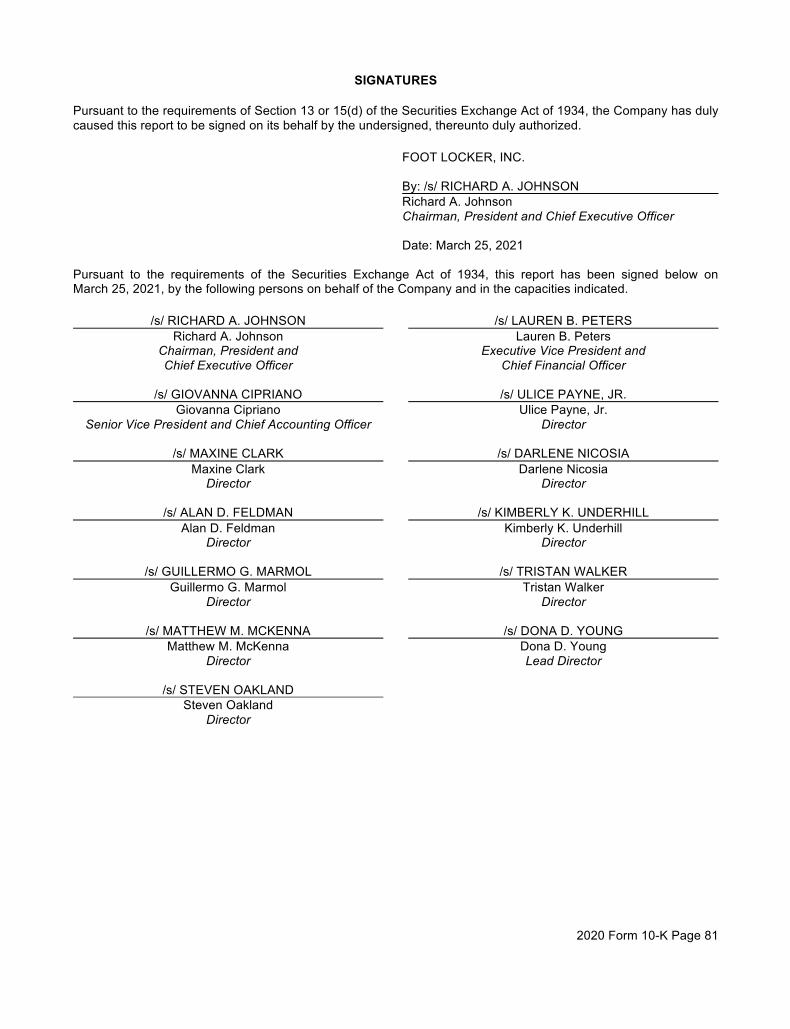
2020 Form 10-K Page 81
SIGNATURES
Pursuant to the requirements of Section 13 or 15(d) of the Securities Exchange Act of 1934, the Company has duly caused this report to be signed on its behalf by the undersigned, thereunto duly authorized.
FOOT LOCKER, INC. By: /s/ RICHARD A. JOHNSON
Richard A. Johnson Chairman, President and Chief Executive Officer
Date: March 25, 2021 Pursuant to the requirements of the Securities Exchange Act of 1934, this report has been signed below on March 25, 2021, by the following persons on behalf of the Company and in the capacities indicated.
/s/ RICHARD A. JOHNSON /s/ LAUREN B. PETERS Richard A. Johnson Lauren B. Peters
Chairman, President and Executive Vice President and Chief Executive Officer Chief Financial Officer
/s/ GIOVANNA CIPRIANO /s/ ULICE PAYNE, JR.
Giovanna Cipriano Ulice Payne, Jr. Senior Vice President and Chief Accounting Officer Director
/s/ MAXINE CLARK /s/ DARLENE NICOSIA
Maxine Clark Darlene Nicosia Director Director
/s/ ALAN D. FELDMAN /s/ KIMBERLY K. UNDERHILL
Alan D. Feldman Kimberly K. Underhill Director Director
/s/ GUILLERMO G. MARMOL /s/ TRISTAN WALKER
Guillermo G. Marmol Tristan Walker Director Director
/s/ MATTHEW M. MCKENNA /s/ DONA D. YOUNG
Matthew M. McKenna Dona D. Young Director Lead Director
/s/ STEVEN OAKLAND
Steven Oakland Director
Exhibit 4.3
DESCRIPTION OF THE REGISTRANT’S SECURITIES REGISTERED PURSUANT TO SECTION 12 OF THE SECURITIES
EXCHANGE ACT OF 1934
The following description of the common stock of Foot Locker, Inc. (“Foot Locker,” the “Company,” “we,” “us” and “our”) is based on our Certificate of Incorporation, as amended (our “Certificate of Incorporation”) and our Bylaws (our “Bylaws”). This description is summarized from, and qualified in its entirety by reference to the New York Business Corporation Law and the complete text of our Certificate of Incorporation and our Bylaws, which are filed as Exhibits 3.1 and 3.2, respectively, to our Annual Report on Form 10-K.
DESCRIPTION OF COMMON STOCK
Authorized Shares of Capital Stock
Our authorized capital stock consists of:
• 500,000,000 shares of common stock, $0.01 par value per share; and
• 7,000,000 shares of preferred stock, $1.00 par value per share.
Voting Rights
The holders of our common stock are entitled to one vote for each share of stock held by such shareholder which has voting power upon the matter in question, including the election of directors. Except as otherwise provided by law, our Certificate of Incorporation or our Bylaws, matters will generally be decided by the holders of a majority of shares entitled to vote thereon. Our Bylaws provide that directors must be elected by a majority of the votes cast in elections for which the number of nominees for election does not exceed the number of directors to be elected. A plurality vote standard applies to contested elections where the number of nominees exceeds the number of directors to be elected. Our Corporate Governance Guidelines provide that any incumbent director who does not receive a majority of the votes cast in an uncontested election is required to tender his or her resignation for consideration by the Nominating and Corporate Governance Committee. The Nominating and Corporate Governance Committee will make a recommendation to the Board of Directors (“Board”) whether to accept or reject the resignation, or whether other action should be taken. The director who tenders his or her resignation will not participate in the Committee’s or the Board’s decision. In determining its recommendation to the Board, the Nominating and Corporate Governance Committee will consider all factors that it deems relevant. Following such determination, the Company will promptly disclose publicly the Board’s decision, including, if applicable, the reasons for rejecting the tendered resignation.
Dividends
Subject to preferences that may apply to any preferred stock outstanding, holders of common stock are entitled to receive dividends out of assets legally available at the time and in the amounts that the Board may determine from time to time.
Liquidation Rights
In the event of a liquidation, dissolution or winding-up of Foot Locker, the holders of common stock are entitled to share equally and ratably in the assets of Foot Locker, if any, remaining after the payment of all debts and liabilities of Foot Locker and the liquidation preference of any outstanding preferred stock.
Other Rights and Preferences
Our common stock has no sinking fund, redemption provisions, or preemptive, conversion, or exchange rights.
Listing
Our common stock is listed on The New York Stock Exchange under the trading symbol “FL.”
Transfer Agent and Registrar
The transfer agent and registrar for our common stock is Computershare Shareholder Services.
Preferred Stock Purchase Rights
On December 7, 2020, the Board of Foot Locker, authorized and declared a dividend distribution of one right (a “Right”) for each outstanding share of common stock, par value $0.01 per share, of the Company (the “Common Stock”) to shareholders of record at the close of business on December 18, 2020 (the “Record Date”).
Each Right entitles the registered holder to purchase from the Company, when exercisable and subject to adjustment, a unit consisting of one one-thousandth (1/1,000) of a share (a “Unit”) of Series C Junior Participating Preferred Stock, par value $1.00 per share, of the Company (the “Preferred Stock”), at a purchase price of $210.00 per Unit, subject to adjustment (the “Purchase Price”). The description and complete terms of the Rights are set forth in a Rights Agreement (the “Rights Agreement”), dated as of December 7, 2020, between the Company and Computershare Trust Company, N.A., as rights agent (the “Rights Agent”).
The full text of the Rights Agreement is filed as Exhibit 4.1 to the Current Report on Form 8-K filed on December 8, 2020. A copy of the Rights Agreement is available free of charge from the Rights Agent. The following is a summary of the material terms of the Rights Agreement.
Rights Certificates; Exercise Period; Term
Initially, the Rights will be attached to all outstanding shares of Common Stock, and no separate rights certificates (“Rights Certificates”) will be distributed. Subject to certain exceptions specified in the Rights Agreement, the Rights will separate from the Common Stock and a distribution date for the Rights (“Distribution Date”) will occur upon the earlier of (i) the tenth (10th) business day following a public announcement that a person (an “Acquiring Person”), either individually or with or through certain affiliated or associated persons, has acquired beneficial ownership of twenty percent (20%) or more of the outstanding shares of Common Stock (the “Stock Acquisition Date”), other than as a result of (a) pre-existing beneficial ownership in excess of the applicable threshold (in which case such person shall become an Acquiring Person upon acquisition of an additional one-half of one percent (0.5%) of the outstanding shares of Common Stock), (b) repurchases of stock by the Company, or (c) certain inadvertent actions by shareholders and (ii) the tenth (10th) business day (or such later date as the Board of the Company shall determine) following the commencement of a tender offer or exchange offer that would result in a person becoming an Acquiring Person. For purposes of the Rights Agreement, beneficial ownership is defined to include any securities with respect to which a person constitutes a “beneficial owner” as defined in Section 912 of the New York Business Corporation Law, subject to certain exceptions.
Until the Distribution Date, (i) the Rights will be evidenced by the Common Stock certificates (or, for book entry shares, by notations in the respective accounts for the Common Stock) and will be transferred with and only with such Common Stock, (ii) new Common Stock certificates issued after the Record Date will contain a notation incorporating the Rights Agreement by reference (and for book entry shares, the account statement will contain a notation advising the holders of the Rights Agreement) and (iii) the surrender for transfer of any certificates for shares of Common Stock (or book entry shares) outstanding will also constitute the transfer of the Rights associated with the Common Stock represented by such certificates (or book entry shares). Pursuant to the Rights Agreement, the Company reserves the right to require prior to the occurrence of a Triggering Event (as defined below) that, upon any exercise of Rights, a number of Rights be exercised so that only whole shares of Preferred Stock will be issued.
The Rights are not exercisable until the Distribution Date and will expire on the first (1st) anniversary date of the Rights Agreement (the “Expiration Date”), unless the Rights are earlier redeemed, exchanged or terminated.
As soon as practicable after the Distribution Date, Rights Certificates will be sent by such means as may be selected by the Company to holders of record of the Common Stock as of the close of business on the Distribution Date and, thereafter, the separate Rights Certificates alone will represent the Rights. Except as otherwise determined by the Board of the Company, only shares of Common Stock issued prior to the earlier of the Distribution Date and the Expiration Date will be issued with the Rights.
Flip-in Trigger
In the event that any person becomes an Acquiring Person (unless the event causing such person to become an Acquiring Person is a transaction described under “Flip-over Trigger,” below), each holder of a Right will thereafter have the right to receive, upon exercise, Common Stock (or, in certain circumstances, cash, property or other securities of the Company) having a value equal to two times the exercise price of the Right. Notwithstanding any of the foregoing, following the occurrence of any of the events set forth in this paragraph, all Rights that are, or (under certain circumstances specified in the Rights Agreement) were, beneficially owned by any Acquiring Person will be null and void and any holder of any such Rights (including any purported transferees or subsequent holders) will be unable to exercise or transfer any such Rights. However, Rights are not exercisable following the occurrence of the event set forth above until such time as the Rights are no longer redeemable by the Board of the Company as set forth below.
Flip-over Trigger
In the event that, at any time following the Stock Acquisition Date, (i) the Company engages in a merger or other business combination transaction in which the Company is not the surviving corporation, (ii) the Company engages in a merger or other business combination transaction in which the Company is the surviving corporation and the Common Stock of the Company is changed or exchanged, or (iii) fifty percent (50%) or more of the Company’s assets, cash flow or earning power is sold or transferred, each holder of a Right (except Rights which have previously been voided as set forth above) shall thereafter have the right to receive, upon exercise, in accordance with the terms of the Rights Agreement, common stock of the acquiring company having a value equal to two times the exercise price of the Right. The events set forth in this paragraph and in the preceding paragraph are referred to as the “Triggering Events.”
Exchange Feature
At any time after any person becomes an Acquiring Person and prior to the acquisition by such person of fifty percent (50%) or more of the outstanding shares of Common Stock, the Board of the Company may exchange the Rights (other than Rights beneficially owned by such Acquiring Person, which will have become null and void), in whole or in part, at an exchange ratio of one share of Common Stock, or one one-thousandth (1/1,000) of a share of Preferred Stock (or of a share of a class or series of the Company’s preferred stock having equivalent rights, preferences and privileges), per Right (subject to adjustment).
Equitable Adjustments
The Purchase Price payable, and the number of Units of Preferred Stock or other securities or property issuable, upon exercise of the Rights are subject to adjustment from time to time to prevent dilution (i) in the event of a stock dividend on, or a subdivision, combination, consolidation or reclassification of, the Preferred Stock, (ii) if holders of the Preferred Stock are granted certain rights or warrants to subscribe for Preferred Stock or convertible securities at less than the then-current market price of the Preferred Stock, or (iii) upon the distribution to holders of the Preferred Stock of evidences of indebtedness, assets or cash (excluding regular quarterly cash dividends or dividends payable in Preferred Stock) or of subscription rights or warrants (other than those referred to above).
The number of outstanding Rights is subject to adjustment in the event of a stock dividend on outstanding Common Stock payable in shares of Common Stock or subdivisions, consolidations or combinations of the Common Stock occurring, in any such case, prior to the Distribution Date.
With certain exceptions, no adjustment in the Purchase Price will be required until cumulative adjustments amount to at least one percent (1%) of the Purchase Price. No fractional Units will be issued and, in lieu thereof, an adjustment in cash will be made based on the market price of the Preferred Stock on the last trading day prior to the date of exercise.
Redemption Rights
At any time prior to the earlier to occur of (i) ten (10) business days following the Stock Acquisition Date and (ii) the Expiration Date, the Board of the Company may redeem the Rights in whole, but not in part, at a price of $0.001 per Right (as such amount may be adjusted pursuant to the Rights Agreement), payable in cash, Common Stock or other consideration deemed appropriate by the Board of the Company. Immediately upon the action of the Board of the Company ordering redemption of the Rights (or if such action states that the redemption will not be effective until the occurrence of a specified future time or event, upon the occurrence of such future time or event), the Rights will terminate and the only right of the holders of Rights will be to receive the $0.001 redemption price.
Amendment of Rights
Any of the provisions of the Rights Agreement may be amended by the Board of the Company so long as the Rights are then redeemable. At any time when the Rights are no longer redeemable, the provisions of the Rights Agreement may be amended by the Board of the Company for any reason, including to shorten or lengthen any time period under the Rights Agreement, except that no amendment may be made at such time as the Rights are not redeemable that may (a) adversely affect the interests of the holders of the Rights as such, (b) cause the Rights Agreement to become amendable other than as already provided in the Rights Agreement and (c) cause the Rights to again become redeemable. Notwithstanding the foregoing, no supplement or amendment may be made that changes the redemption price.
Anti-Takeover Effects
The Rights may have certain anti-takeover effects. The Rights may cause substantial dilution to any person or group that attempts to acquire the Company without the approval of its Board. As a result, the overall effect of the Rights may be to render more difficult or discourage a merger, tender offer or other business combination involving the Company that is not supported by its Board.
Miscellaneous
Until a Right is exercised or exchanged, the holder thereof, as such, will have no separate rights as a shareholder of the Company, including the right to vote or to receive dividends in respect of the Rights. While the distribution of the Rights will not be taxable to shareholders or to the Company, shareholders may, depending upon the circumstances, recognize taxable income in the event that the Rights become exercisable for Common Stock (or such other consideration as the Board of the Company may elect) or for common stock of an acquiring company or in the event of the redemption of the Rights as set forth above.
The foregoing description of the Rights Agreement and the Rights does not purport to be complete and is qualified in its entirety by reference to the Certificate of Amendment of the Certificate of Incorporation of the Company and the Rights Agreement, copies of which were filed as Exhibits 3.1 and 4.1, respectively, to the Current Report on Form 8-K filed by the Company on December 8, 2020.
ANTI-TAKEOVER EFFECTS OF CERTAIN PROVISIONS OF OUR CERTIFICATE OF INCORPORATION AND BYLAWS
Certain Effects of Authorized but Unissued Stock
Our Board may create and issue series of preferred stock with rights, privileges or restrictions, having the effect of discriminating against an existing or prospective holder of such securities as a result of such security holder beneficially owning or commencing a tender offer for a substantial amount of common stock. One of the effects of authorized but unissued and unreserved shares of capital stock may be to render more difficult or discourage an attempt by a potential acquiror to obtain control of Foot Locker by means of a merger, tender offer, proxy contest or otherwise, and thereby protect the continuity of Foot Locker’s management.
Advance Notice for Shareholder Proposals and Nominations
Our Bylaws contain advance notice provisions with respect to shareholder nominations of candidates for election as directors and any other business that the shareholder intends to bring at a meeting of shareholders.
No Cumulative Voting
Our Bylaws do not provide for cumulative voting in the election of directors. The absence of cumulative voting may make it more difficult for shareholders owning less than a majority of our common stock to elect any directors to our Board.
Power of Shareholders to Call Special Shareholders Meeting
Our Bylaws provide that special meetings of shareholders may be called only by the Chairman of our Board, the Chief Executive Officer, a Vice Chairman of the Board, the President or our Board pursuant to a resolution adopted by a majority of the total number of authorized directors.
Anti-Greenmail Provision
Our Certificate of Incorporation includes an “anti-greenmail” provision that prohibits us from repurchasing any shares of our capital stock at a price above the fair market value of such shares at the time of such repurchase from an Interested Shareholder (defined as any person, with certain exceptions, who is, or who has announced or publicly disclosed a plan or intention to become, a beneficial owner of five percent or more of our voting stock) or certain related parties who have not beneficially owned all of their shares for at least two years, unless such repurchase is approved by a majority vote of shareholders other than such Interested Shareholder and related parties.
Exhibit 10.25
FOOT LOCKER EXCESS SAVINGS PLAN
(Effective January 1, 2020)
1. Purpose.
The purpose of this Plan is to provide supplemental benefits for a select group of management and key employees of the Employer who contribute to the Qualified Plan and whose compensation for purposes of the Qualified Plan is limited by the Compensation Limit. It is intended that the Plan shall at all times be maintained on an unfunded basis for federal income tax purposes under the Code, and administered as a “top hat” plan exempt from the substantive requirements of ERISA. The Plan is intended to comply with the requirements of Section 409A of the Code. The Plan as set forth below is effective January 1, 2020. 2. Definitions.
Unless the context requires otherwise, the following words as used in the Plan shall have the meanings ascribed to each below:
(a) “Account” shall mean the separate recordkeeping account maintained for each Participant, which consists of the Excess Savings Credit credited to the Participant’s Account, plus interest credited in accordance with Section 3 of the Plan, in each case, as of any Accounting Date.
(b) “Accounting Date” shall mean each business day or such other dates as the Committee may determine in accordance with its rules and procedures.
(c) “Affiliate” shall mean the Company and any entity affiliated with the Company within the
meaning of Code Section 414(b) with respect to controlled group of corporations, Code Section 414(c) with respect to trades or businesses under common control with the Company, Code Section 414(m) with respect to affiliated service groups, and any other entity required to be aggregated with the Company under Code Section 414(o). No entity shall be treated as an Affiliate for any period during which it is not part of the controlled group, under common control or otherwise required to be aggregated under Code Section 414, except as may otherwise be determined by the Board and set forth in resolutions of the Board.
(d) “Beneficiary” shall mean the Participant’s beneficiary under the Qualified Plan and
determined in accordance with the Qualified Plan and any rules or procedures established thereunder.
(e) “Board” shall mean the Board of Directors of the Company.
(f) “Code” shall mean the Internal Revenue Code of 1986, as amended. All references to any
section of the Code shall be deemed to refer not only to such section, but also to (i) any amendment thereto, (ii) any successor statutory provision, and (iii) any regulations issued thereunder.
(g) “Committee” shall mean the Retirement Plan Committee of the Company (including any successor committee) or such other committee as designated by the Board.
(h) “Company” shall mean Foot Locker, Inc., a New York corporation, and any successor by
merger, consolidation or transfer of assets. (i) “Compensation Limit” shall mean, for any Plan Year, the limitation on compensation
applicable under Code Section 401(a)(17) for the Plan Year.
(j) “Control Group” shall mean the Company and its Affiliates.
(k) “Employee” shall mean any officer, member of senior management or other key employee employed by an Employer, as determined by the Committee in accordance with its rules and procedures.
(l) “Employer” shall mean the Company and any Participating Employer.
(m) “ERISA” shall mean the Employee Retirement Income Security Act of 1974, as amended. All
references to any section of ERISA shall be deemed to refer not only to such section, but also to (i) any amendment thereto, (ii) any successor statutory provision, and (iii) any regulations issued thereunder.
(n) “Excess Savings Credit” shall mean the amount(s) credited to a Participant’s Account in
accordance with Section 3 hereof. (o) “Match Percentage” shall mean, for any Plan Year, the amount of the QP Matching
Contributions that a Participant receives under the Qualified Plan with respect to the Plan Year, expressed as a percentage of the Participant’s compensation taken into account under the Qualified Plan for the Plan Year.
(p) “Participant” shall mean any Employee who (i) contributes to the Qualified Plan for a Plan
Year, (ii) receives Total Compensation for the same Plan Year that exceeds the Compensation Limit for the Plan Year, and (iii) is ineligible to accrue any Compensation Credits (as defined in the Retirement Plan) under the Retirement Plan with respect to the Plan Year.
(q) “Participating Employer” shall mean any Affiliate which has adopted the Plan by action of
its board of directors and is approved by the Board.
(r) “Plan” shall mean the Foot Locker Excess Savings Plan, as amended from time to time. (s) “Plan Year” shall mean a period of twelve (12) months beginning on January 1st and ending
on the following December 31st. (t) “QP Matching Contributions” shall mean “Matching Contributions,” as such term is defined
under the Qualified Plan.

(u) “Qualified Plan” shall mean the Foot Locker 401(k) Plan, as amended and restated as of January 1, 2017, and as further amended from time to time.
(v) “Retirement Plan” shall mean the Foot Locker Retirement Plan, as amended and restated as
of January 1, 2017, and as further amended from time to time. (w) “Specified Employee” shall have the meaning set forth in Section 409A of the Code on the
date of Termination of Employment in accordance with procedures established by the Company and consistent with Section 409A of the Code.
(x) “Termination of Employment” shall mean a termination of employment or other separation
from service with the Control Group in accordance with Section 409A of the Code for any reason, including, without limitation, retirement, death, disability, resignation, or dismissal with or without Cause; provided, however, that if an Employer is no longer a member of the Control Group and the Participant is transferred in connection with the sale of the assets of an Employer and the successor assumed the obligations hereunder in accordance with Section 14 hereof, a Termination of Employment shall not occur until the Participant terminates employment with the successor’s controlled group.
(y) “Total Compensation” shall mean the compensation otherwise taken into account under the
Qualified Plan, determined in accordance with the provisions of the Qualified Plan, but without regard to the limitation on compensation otherwise required under Code Section 401(a)(17).
3. Excess Savings Credits and Interest. An Excess Savings Credit shall be credited to each Participant’s Account within the first two months following each Plan Year in which the Participant’s Total Compensation exceeds the Compensation Limit, provided that the Participant is employed by an Employer on the last business day of the Plan Year. The Excess Savings Credit for a Plan Year (if any) shall equal the product of (i) the Match Percentage and (ii) the amount by which the Participant’s Total Compensation exceeds the Compensation Limit. Notwithstanding the foregoing, in no event shall the Excess Savings Credit for a Plan Year exceed the QP Matching Contributions that the Participant could have received under the Qualified Plan for the Plan Year but for the Qualified Plan’s restrictions based on the compensation and deferral limitations applicable to the Qualified Plan under the Code. Each Participant’s Account shall be credited with simple interest per annum on any amounts credited thereto through the date on which the Account is distributed at a rate of one hundred twenty percent (120%) of the annually compounded long-term applicable federal rate determined in accordance with Code Section 1274(d), as published by the Internal Revenue Service as of the December of the prior Plan Year. For the avoidance of doubt, no Excess Savings Credit shall be credited to a Participant’s Account for any Plan Year in which the Participant does not contribute to the Qualified Plan. 4. Vesting.
Subject to the Company’s right to terminate the Plan under Section 16 hereof, the Excess Savings Credits credited to a Participant’s Account shall vest to the same extent that the Participant’s QP Matching
Contributions are vested under the Qualified Plan. 5. Payment.
The vested portion of a Participant’s Account shall be paid to the Participant in a lump sum on the first payroll date of the month occurring thirty (30) days after the date of the Participant’s Termination of Employment with an Employer. Notwithstanding the foregoing, amounts payable pursuant to this Section 5 to a Participant who is a Specified Employee during the first six (6) months following such Participant’s Termination of Employment shall be delayed during the six (6) month period following such Participant’s Termination of Employment and shall be paid to the Participant on the first payroll date of the month following the end of such six (6) month period.
6. Death of Participant.
Notwithstanding Section 5 hereof, in the event of the death of a Participant, the vested portion of the Participant’s Account shall be paid to the Participant’s Beneficiary no later than December 31 of the year following the year in which the Participant death occurs. 7. Claims Procedure.
Any claim by a Participant or Beneficiary (“Claimant”) with respect to eligibility, participation, benefits, or other aspects of the operation of the Plan shall be made in writing to the Secretary of the Company or such other person designated by the Committee from time to time for such purpose. If the designated person receiving a claim believes, following consultation with the Chairman of the Committee, that the claim should be denied, he or she shall notify the Claimant in writing of the denial of the claim within ninety (90) days after his or her receipt thereof (this period may be extended an additional ninety (90) days in special circumstances and, in such event, the Claimant shall be notified in writing of the extension). Such notice shall (a) set forth the specific reason or reasons for the denial making reference to the pertinent provisions of the Plan or of Plan documents on which the denial is based, (b) describe any additional material or information necessary to perfect the claim, and explain why such material or information, if any, is necessary, and (c) inform the Claimant of his or her right pursuant to this Section 7 to request review of the decision. A Claimant may appeal the denial of a claim by submitting a written request for review to the Committee, within sixty (60) days after the date on which such denial is received. Such period may be extended by the Committee for good cause shown. The claim shall then be reviewed by the Committee. A Claimant or his or her duly authorized representative may discuss any issues relevant to the claim, may review pertinent documents and may submit issues and comments in writing. If the Committee deems it appropriate, it may hold a hearing as to a claim. If a hearing is held, the Claimant shall be entitled to be represented by counsel. The Committee shall decide whether or not to grant the claim within sixty (60) days after receipt of the request for review, but this period may be extended by the Committee for up to an additional sixty (60) days in special circumstances. Written notice of any such special circumstances shall be sent to the Claimant. Any claim not decided upon in the required time period shall be deemed denied. All interpretations, determinations and decisions of the Committee with respect to any claim shall be made in its sole discretion based on the Plan and other relevant documents and shall be final, conclusive, and binding on all persons. A Claimant must exhaust all administrative remedies available to the Claimant under the Plan before the Claimant may seek any judicial review.
8. Construction of Plan.
Nothing contained in this Plan and no action taken pursuant to the provisions of this Plan shall create or be construed to create a trust of any kind, or a fiduciary relationship between the Employer and the Participants, their Beneficiaries or any other person. Any funds which may be invested under the provisions of this Plan shall continue for all purposes to be part of the general funds of the Employer and no person other than the Employer shall by virtue of the provisions of this Plan have any interest in such funds. To the extent that any person acquires a right to receive payments from the Employer under this Plan, such right shall be no greater than the right of any unsecured general creditor of the Employer. If the Company decides to establish any advance accrued reserve on its books against the future expense of benefits payable hereunder, or if the Company is required to fund a trust under this Plan, such reserve or trust shall not under any circumstances be deemed to be an asset of the Plan. In no event shall any Participant or Beneficiary be entitled to receive any payment for any amount due under the Plan from any trust maintained for the Qualified Plan. 9. Minors and Incompetents.
In the event that the Committee finds that a Participant is unable to care for his or her affairs because of illness or accident, then benefits payable hereunder, unless claim has been made therefor by a duly appointed guardian, committee, or other legal representative, may be paid in such manner as the Committee shall determine, and the payment of any benefits hereunder and the application thereof shall be a complete discharge of all liability for any payments or benefits to which such Participant was or would have been otherwise entitled under this Plan. Any payments to a minor from this Plan may be paid by the Committee in its sole and absolute discretion (a) directly to such minor; (b) to the legal or natural guardian of such minor; or (c) to any other person, whether or not appointed guardian of the minor, who shall have the care and custody of such minor. The receipt by such individual shall be a complete discharge of all liability under the Plan therefor. 10. Administration.
The Plan shall be administered by the Committee. The Committee (or its delegate) shall have the exclusive right, power, and authority, in its sole and absolute discretion, to administer, apply and interpret the Plan and any other Plan documents and to decide all matters arising in connection with the operation or administration of the Plan. Without limiting the generality of the foregoing, the Committee shall have the sole and absolute discretionary authority: (a) to take all actions and make all decisions with respect to the eligibility for, and the amount of, benefits payable under the Plan; (b) to formulate, interpret and apply rules, regulations and policies necessary to administer the Plan in accordance with its terms; (c) to decide questions, including legal or factual questions, relating to the calculation and payment of benefits under the Plan; (d) to resolve and/or clarify any ambiguities, inconsistencies and omissions arising under the Plan or other Plan documents; (e) to decide for purposes of paying benefits hereunder, whether, based on the terms of the Plan, a termination of employment has occurred; and (f) except as specifically provided to the contrary in Section 7 hereof, to process and approve or deny benefit claims and rule on any benefit exclusions. All determinations made by the Committee (or any delegate) with respect to any matter arising under the Plan and any other Plan documents shall be final, binding and conclusive on all parties.
Decisions of the Committee shall be made by a majority of its members attending a meeting at which a quorum is present (which meeting may be held telephonically), or by written action in accordance with applicable law. All decisions of the Committee on any question concerning the interpretation and administration of the Plan shall be final, conclusive and binding upon all parties.
No member of the Committee and no officer, director or employee of the Company or any other
Affiliate shall be liable for any action or inaction with respect to his or her functions under the Plan unless such action or inaction is adjudged to be due to gross negligence, willful misconduct or fraud. Further, no such person shall be personally liable merely by virtue of any instrument executed by him or her or on his or her behalf in connection with the Plan.
Each Employer shall indemnify, to the full extent permitted by law and its Certificate of Incorporation and By-laws (but only to the extent not covered by insurance) its officers and directors (and any employee involved in carrying out the functions of such Employer under the Plan) and each member of the Committee against any expenses, including amounts paid in settlement of a liability, which are reasonably incurred in connection with any legal action to which such person is a party by reason of his or her duties or responsibilities with respect to the Plan (other than as a Participant), except with regard to matters as to which he or she shall be adjudged in such action to be liable for gross negligence, willful misconduct or fraud in the performance of his or her duties. 11. Limitation of Rights.
Nothing contained herein shall be construed as conferring upon an Employee the right to continue in the employ of the Employer as a Participant or in any other capacity or to interfere with the Employer’s right to discharge him or her at any time for any reason whatsoever. 12. Payment Not Salary.
Any Excess Savings Credit payable under this Plan shall not be deemed salary or other compensation to the Employee for the purposes of computing benefits to which he or she may be entitled under any pension plan or other arrangement of the Employer for the benefit of its employees, except as otherwise provided in such plan or arrangement. 13. Withholding.
The Employer shall have the right to make such provisions as it deems necessary or appropriate to
satisfy any obligations it may have to withhold federal, state or local income or other taxes incurred by reason of payments or accrual pursuant to this Plan. In lieu thereof, the Employer shall have the right to withhold the amount of such taxes from any other sums due or to become due from the Employer to the Participant upon such terms and conditions as the Committee may prescribe. 14. Assignment.
This Plan shall be binding upon and inure to the benefit of the Employer, its successors and assigns and the Participants and their heirs, executors, administrators and legal representatives. In addition to any obligations imposed by law upon any successor of the Employer, the Employer shall require any successor (whether direct or indirect, by purchase, merger, consolidation or otherwise) to all or substantially all of the business and/or assets of the Employer to expressly assume and agree in writing to assume the obligations under this Plan to the same extent that the Employer would be responsible if no such succession had taken place. In the event that the Employer sells all or substantially all of the assets of its business and the acquiror of such assets assumes the obligations hereunder, the Employer shall be released from any liability imposed
herein and shall have no obligation to provide any benefits payable hereunder. 15. Non-Alienation of Benefits.
The benefits payable under this Plan shall not be subject to alienation, transfer, assignment, garnishment, execution or levy of any kind, and any attempt to cause any benefits to be so subjected shall not be recognized. 16. Amendment or Termination of Plan.
The Board may amend this Plan from time to time in any respect, and may at any time terminate the Plan in its entirety. In the event of such termination, Participants shall receive no additional benefits hereunder and the vested portion of a Participant’s Account (if any) shall be paid in accordance with Section 5 hereof or in any other manner permitted by Section 409A of the Code as determined by the Board in its discretion, including, without limitation, as provided under Treasury Regulation Section 1.409A-3(j)(4)(ix). Any such action by the Board with respect to the Plan shall be binding on the Employer and Employee. Except as otherwise specifically provided herein, in no event shall any termination, amendment, or change to the Plan reduce the vested portion of a Participant’s Account (if any) as of the date of such termination, amendment, or change. 17. Non-Exclusivity.
The adoption of the Plan by the Employer shall not be construed as creating any limitations on the power of the Employer to adopt such other supplemental benefit arrangements as it deems desirable, and such arrangements may be either generally applicable or limited in application. 18. Severability.
Should any provisions of the Plan be deemed or held to be unlawful or invalid for any reason, such fact shall not adversely affect the other provisions of the Plan unless such determination shall render impossible or impracticable the functioning of the Plan, and in such case, an appropriate provision or provisions shall be adopted so that the Plan may continue to function properly. 19. Headings and Captions.
The headings and captions herein are provided for reference and convenience only. They shall not be considered part of the Plan and shall not be employed in the construction of the Plan. 20. Governing Law.
This Plan shall be construed, interpreted and governed by ERISA. To the extent not governed by ERISA, this Plan shall be governed by the laws of the State of New York, (without regard to conflict of law provisions).
21. Accounts and Records of the Plan. The Accounts and records of the Plan shall be maintained by the Committee and shall accurately reflect the value and status of the Account of each Participant in the Plan. Each Participant shall be advised from time to time as to the status of the Participant’s Account.
22. Section 409A of the Code.
(a) General. Although there is no guarantee of the tax treatment relating to participation in the Plan or payment of a Participant’s Account, it is intended that the provisions of this Plan comply with, or be exempt from, Section 409A of the Code, and all provisions of this Plan shall be construed in a manner consistent with the requirements for avoiding taxes or penalties under Section 409A of the Code (including, but not limited to, any correction under Section 409A of the Code that the Company, in its sole discretion, determines is necessary to effectuate such intent). Accordingly, the Company reserves the right to amend the provisions of the Plan in its sole discretion at any time in order to avoid the imposition of an excise tax under Section 409A of the Code on any payments to be made hereunder, but shall be under no obligation to do so. Notwithstanding the foregoing, neither the Company nor any Employer shall have any liability with regard to any failure to comply with Section 409A of the Code, and in no event shall the Company or any Employer be liable for any additional tax, interest, or penalty that may be imposed on a Participant by Section 409A of the Code.
(b) Payment Timing. Whenever the Plan specifies a payment period with reference to a number of days, the actual date of payment within the specified period shall be within the sole discretion of the Company.
(c) Separation from Service. Notwithstanding any provision to the contrary in this Plan, no amount deemed deferred compensation subject to Section 409A of the Code shall be payable pursuant to a Termination of Employment unless Participant’s Termination of Employment constitutes a “separation from service” within the meaning of Section 409A of the Code.

IN WITNESS WHEREOF, the Company has caused this document to be executed this 23 day of May, 2019.
FOOT LOCKER, INC. By: /s/ Caryn Steinert . Caryn Steinert, VP – Global Total Rewards
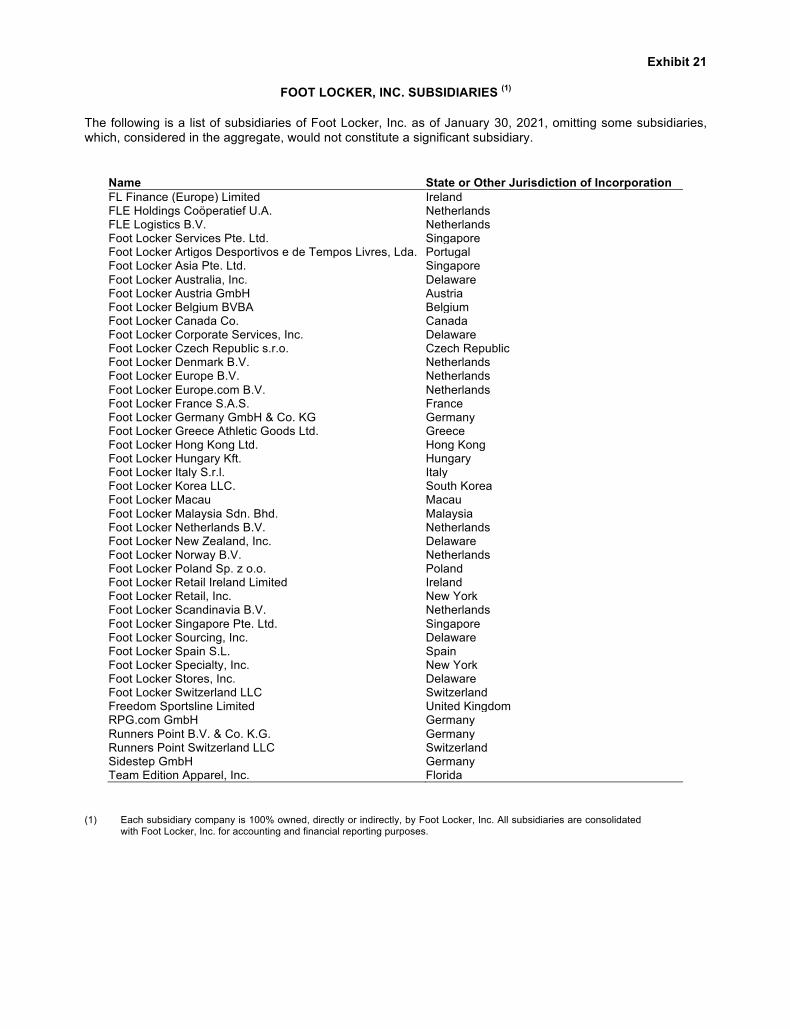
Exhibit 21
FOOT LOCKER, INC. SUBSIDIARIES (1)
The following is a list of subsidiaries of Foot Locker, Inc. as of January 30, 2021, omitting some subsidiaries, which, considered in the aggregate, would not constitute a significant subsidiary.
Name State or Other Jurisdiction of Incorporation FL Finance (Europe) Limited Ireland FLE Holdings Coöperatief U.A. Netherlands FLE Logistics B.V. Netherlands Foot Locker Services Pte. Ltd. Singapore Foot Locker Artigos Desportivos e de Tempos Livres, Lda. Portugal Foot Locker Asia Pte. Ltd. Singapore Foot Locker Australia, Inc. Delaware Foot Locker Austria GmbH Austria Foot Locker Belgium BVBA Belgium Foot Locker Canada Co. Canada Foot Locker Corporate Services, Inc. Delaware Foot Locker Czech Republic s.r.o. Czech Republic Foot Locker Denmark B.V. Netherlands Foot Locker Europe B.V. Netherlands Foot Locker Europe.com B.V. Netherlands Foot Locker France S.A.S. France Foot Locker Germany GmbH & Co. KG Germany Foot Locker Greece Athletic Goods Ltd. Greece Foot Locker Hong Kong Ltd. Hong Kong Foot Locker Hungary Kft. Hungary Foot Locker Italy S.r.l. Italy Foot Locker Korea LLC. South Korea Foot Locker Macau Macau Foot Locker Malaysia Sdn. Bhd. Malaysia Foot Locker Netherlands B.V. Netherlands Foot Locker New Zealand, Inc. Delaware Foot Locker Norway B.V. Netherlands Foot Locker Poland Sp. z o.o. Poland Foot Locker Retail Ireland Limited Ireland Foot Locker Retail, Inc. New York Foot Locker Scandinavia B.V. Netherlands Foot Locker Singapore Pte. Ltd. Singapore Foot Locker Sourcing, Inc. Delaware Foot Locker Spain S.L. Spain Foot Locker Specialty, Inc. New York Foot Locker Stores, Inc. Delaware Foot Locker Switzerland LLC Switzerland Freedom Sportsline Limited United Kingdom RPG.com GmbH Germany Runners Point B.V. & Co. K.G. Germany Runners Point Switzerland LLC Switzerland Sidestep GmbH Germany Team Edition Apparel, Inc. Florida
(1) Each subsidiary company is 100% owned, directly or indirectly, by Foot Locker, Inc. All subsidiaries are consolidated with Foot Locker, Inc. for accounting and financial reporting purposes.
Exhibit 23
CONSENT OF INDEPENDENT REGISTERED PUBLIC ACCOUNTING FIRM
The Board of Directors Foot Locker, Inc.:
We consent to the incorporation by reference in the following registration statements of Foot Locker, Inc. and subsidiaries of our reports dated March 25, 2021, with respect to the consolidated balance sheets of Foot Locker, Inc. and subsidiaries as of January 30, 2021 and February 1, 2020, and the related consolidated statements of operations, comprehensive income, changes in shareholders’ equity, and cash flows for each of the years in the three-year period ended January 30, 2021, and the related notes, and the effectiveness of internal control over financial reporting as of January 30, 2021, which reports appear in the January 30, 2021 annual report on Form 10-K of Foot Locker, Inc.
Form S-8 No. 33-10783 Form S-8 No. 33-91888 Form S-8 No. 33-91886 Form S-8 No. 33-97832 Form S-8 No. 333-07215 Form S-8 No. 333-21131 Form S-8 No. 333-62425 Form S-8 No. 333-33120 Form S-8 No. 333-41056 Form S-8 No. 333-41058 Form S-8 No. 333-74688 Form S-8 No. 333-99829 Form S-8 No. 333-111222 Form S-8 No. 333-121515 Form S-8 No. 333-144044 Form S-8 No. 333-149803 Form S-3 No. 33-43334 Form S-3 No. 33-86300 Form S-3 No. 333-64930 Form S-8 No. 333-167066 Form S-8 No. 333-171523 Form S-8 No. 333-190680 Form S-8 No. 333-196899
Our report on the consolidated financial statements refers to a change in the Company’s method of accounting for leases due to the adoption of Financial Accounting Standards Board Accounting Standards Codification Topic 842, Leases.
/s/ KPMG LLP
New York, New York March 25, 2021
Exhibit 31.1
CERTIFICATION
I, Richard A. Johnson, certify that:
1. I have reviewed this Annual Report on Form 10-K of Foot Locker, Inc. (the “Registrant”); 2. Based on my knowledge, this report does not contain any untrue statement of a material fact or omit to state a
material fact necessary to make the statements made, in light of the circumstances under which such statements were made, not misleading with respect to the period covered by this report;
3. Based on my knowledge, the financial statements, and other financial information included in this report, fairly
present in all material respects the financial condition, results of operations and cash flows of the Registrant as of, and for, the periods presented in this report;
4. The Registrant’s other certifying officer(s) and I are responsible for establishing and maintaining disclosure
controls and procedures (as defined in Exchange Act Rules 13a-15(e) and 15d-15(e)) and internal control over financial reporting (as defined in Exchange Act Rules 13a-15(f) and 15d-15(f)) for the Registrant and have:
a) designed such disclosure controls and procedures, or caused such disclosure controls and
procedures to be designed under our supervision, to ensure that material information relating to the Registrant, including its consolidated subsidiaries, is made known to us by others within those entities, particularly during the period in which this report is being prepared;
b) designed such internal control over financial reporting, or caused such internal control over
financial reporting to be designed under our supervision, to provide reasonable assurance regarding the reliability of financial reporting and the preparation of financial statements for external purposes in accordance with generally accepted accounting principles;
c) evaluated the effectiveness of the Registrant’s disclosure controls and procedures and presented
in this report our conclusions about the effectiveness of the disclosure controls and procedures, as of the end of the period covered by this report based on such evaluation; and
d) disclosed in this report any change in the Registrant’s internal control over financial reporting that
occurred during the Registrant’s most recent fiscal quarter (the Registrant’s fourth fiscal quarter in the case of an annual report) that has materially affected, or is reasonably likely to materially affect, the Registrant’s internal control over financial reporting; and
5. The Registrant’s other certifying officer(s) and I have disclosed, based on our most recent evaluation of
internal control over financial reporting, to the Registrant’s auditors and the Audit Committee of the Registrant’s Board of Directors:
a) all significant deficiencies and material weaknesses in the design or operation of internal control
over financial reporting which are reasonably likely to adversely affect the Registrant’s ability to record, process, summarize and report financial information; and
b) any fraud, whether or not material, that involves management or other employees who have a
significant role in the Registrant’s internal control over financial reporting.
March 25, 2021
/s/ RICHARD A. JOHNSON Chief Executive Officer
Exhibit 31.2
CERTIFICATION
I, Lauren B. Peters, certify that:
1. I have reviewed this Annual Report on Form 10-K of Foot Locker, Inc. (the “Registrant”); 2. Based on my knowledge, this report does not contain any untrue statement of a material fact or omit to state a
material fact necessary to make the statements made, in light of the circumstances under which such statements were made, not misleading with respect to the period covered by this report;
3. Based on my knowledge, the financial statements, and other financial information included in this report, fairly
present in all material respects the financial condition, results of operations and cash flows of the Registrant as of, and for, the periods presented in this report;
4. The Registrant’s other certifying officer(s) and I are responsible for establishing and maintaining disclosure
controls and procedures (as defined in Exchange Act Rules 13a-15(e) and 15d-15(e)) and internal control over financial reporting (as defined in Exchange Act Rules 13a-15(f) and 15d-15(f)) for the Registrant and have:
a) designed such disclosure controls and procedures, or caused such disclosure controls and
procedures to be designed under our supervision, to ensure that material information relating to the Registrant, including its consolidated subsidiaries, is made known to us by others within those entities, particularly during the period in which this report is being prepared;
b) designed such internal control over financial reporting, or caused such internal control over
financial reporting to be designed under our supervision, to provide reasonable assurance regarding the reliability of financial reporting and the preparation of financial statements for external purposes in accordance with generally accepted accounting principles;
c) evaluated the effectiveness of the Registrant’s disclosure controls and procedures and presented
in this report our conclusions about the effectiveness of the disclosure controls and procedures, as of the end of the period covered by this report based on such evaluation; and
d) disclosed in this report any change in the Registrant’s internal control over financial reporting that
occurred during the Registrant’s most recent fiscal quarter (the Registrant’s fourth fiscal quarter in the case of an annual report) that has materially affected, or is reasonably likely to materially affect, the Registrant’s internal control over financial reporting; and
5. The Registrant’s other certifying officer(s) and I have disclosed, based on our most recent evaluation of
internal control over financial reporting, to the Registrant’s auditors and the Audit Committee of the Registrant’s Board of Directors:
a) all significant deficiencies and material weaknesses in the design or operation of internal control
over financial reporting which are reasonably likely to adversely affect the Registrant’s ability to record, process, summarize and report financial information; and
b) any fraud, whether or not material, that involves management or other employees who have a
significant role in the Registrant’s internal control over financial reporting.
March 25, 2021
/s/ LAUREN B. PETERS Chief Financial Officer
Exhibit 32
FOOT LOCKER, INC.
CERTIFICATION PURSUANT TO 18 U.S.C. SECTION 1350
AS ADOPTED PURSUANT TO SECTION 906 OF THE SARBANES-OXLEY ACT OF 2002
In connection with the Annual Report on Form 10-K of Foot Locker, Inc. (the “Registrant”) for the period ended January 30, 2021, as filed with the Securities and Exchange Commission on the date hereof (the “Report”), Richard A. Johnson, as Chief Executive Officer of the Registrant and Lauren B. Peters, as Chief Financial Officer of the Registrant, each hereby certify, pursuant to 18 U.S.C. Section 1350, that:
(1) the Report fully complies with the requirements of Section 13(a) or 15(d) of the Securities Exchange Act
of 1934; and (2) the information contained in the Report fairly presents, in all material respects, the financial condition
and results of operations of the Registrant.
Dated: March 25, 2021
/s/ RICHARD A. JOHNSON Richard A. Johnson Chief Executive Officer /s/ LAUREN B. PETERS Lauren B. Peters Chief Financial Officer
The foregoing certification is being furnished solely pursuant to 18 U.S.C. § 1350 and is not being filed as part of the Report or as a separate disclosure document. Such certification will not be deemed to be incorporated by reference into any filing under the Securities Act of 1933, as amended, or the Securities Exchange Act of 1934, as amended, except to the extent that the company specifically incorporates it by reference.

This page intentionally left blank.


BOARD OF DIRECTORS
Richard A. Johnson 1
Chairman, President and Chief Executive Officer
Maxine Clark 3, 5
Founder and Retired Chief Executive Bear Build-A-Bear Workshop, Inc.
Alan D. Feldman 3, 5
Retired Chairman, President and Chief Executive OfficerMidas, Inc.
Guillermo G. Marmol 1, 2, 3
President Marmol & Associates
Matthew M. McKenna 1, 2, 5
Executive in Residence Georgetown University, McDonough School of Business; General Partner Open Prairie Rural Opportunities Fund, L.P.
Darlene Nicosia 2, 3
President, Canada and Northeast U.S., North America Operating Unit, The Coca-Cola Company
Steven Oakland 1, 4, 5
Chief Executive Officer and PresidentTreeHouse Foods, Inc.
Ulice Payne, Jr. 2, 4 President and Managing Member Addison-Clifton, LLC Kimberly K. Underhill 1, 3, 4
President, North America ConsumerKimberly-Clark Corporation
Tristan Walker 4, 5
Founder and Chief Executive OfficerWalker and Company Brands, Inc.
Dona D. Young 1, 2, 4 Lead DirectorRetired Chairman, President and Chief Executive OfficerThe Phoenix Companies, Inc.
EXECUTIVE LEADERSHIP
Richard A. Johnson Chairman, President and Chief Executive Officer
Lauren B. Peters Executive Vice President and Chief Financial Officer
Andrew Gray Executive Vice President and Chief Commercial Officer
Franklin R. BrackenExecutive Vice President and Chief Executive Officer – North America
Vijay TalwarExecutive Vice President and Chief Executive Officer – EMEA
W. Scott MartinExecutive Vice President and Chief Executive Officer – Asia Pacificand Chief Strategy & Development Officer
Giovanna CiprianoSenior Vice President andChief Accounting Officer
Sheilagh M. Clarke Senior Vice President, General Counsel and Secretary
Todd Greener Senior Vice President – Global Supply Chain
Elizabeth S. NorbergSenior Vice President andChief Human Resources Officer
Himanshu ParikhSenior Vice President andChief Information Officer
CORPORATE LEADERSHIP
James R. Lance Vice President, Corporate Finance and Investor Relations
John A. Maurer Vice President, Treasurer
Dennis E. SheehanVice President andDeputy General Counsel
DIVISIONAL LEADERSHIP
Bryon MilburnSenior Vice President and General Manager, Foot Locker and Kids Foot Locker
Guy M. HarklessSenior Vice President and General Manager, Champs Sports & Eastbay
Patrick Walsh Vice President and General Manager, Footaction
Richard McLeodVice President and General Manager, Foot Locker Canada
Susie Kuhn Vice President and General Manager, Foot Locker Europe
Kick van der StaakVice President and General Manager, Sidestep
Natalie Ellis Vice President and General Manager, Foot Locker Pacific
Tomas Petersson Vice President and General Manager, Foot Locker Asia
CORPORATE INFORMATION
Corporate Headquarters330 West 34th Street New York, New York 10001 (212) 720-3700
Transfer Agent and Registrar ComputershareP.O. Box 505000Louisville, Kentucky 40233 (866) 857-2216 (201) 680-6578 Outside U.S. and Canada (800) 952-9245 Hearing Impaired -TTY Phone www.computershare.com/investor Overnight correspondence should be sent to: 462 South 4th Street, Suite 1600Louisville, Kentucky 40202
Independent Registered Public Accounting Firm KPMG LLP345 Park AvenueNew York, New York 10154(212) 758-9700
Dividend Reinvestment Dividends on Foot Locker, Inc. common stock may be reinvested through participation in the Dividend Reinvestment Program. Participating shareowners may also make optional cash purchases of Foot Locker, Inc. common stock. Please contact our Transfer Agent.
Service Marks and TrademarksThe service marks and tradmarks Foot Locker, Footaction, Lady Foot Locker, Kids Foot Locker, Champs Sports, footlocker.com, Eastbay, Team Edition, and Sidestep are owned by Foot Locker, Inc. or it’s affiliates.
Investor Information Investor inquiries should be directed to the Investor Relations Department at (212) 720-4600.
Worldwide Website Our website at www.footlocker-inc.com offers information about our Company, as well as online versions of our Form 10-K, SEC reports, quarterly results, press releases, and corporate gover-nance documents.
1 Member of Executive Committee
2 Member of Audit Committee
3 Member of Compensation and Management Resources Committee
4 Member of Nominating and Corporate Governance Committee
5 Member of Finance and Investment Oversight Committee

330 West 34th StreetNew York, NY 10001
footlocker-inc.com
INSPIRE & EMPOWER