Annual Report - Fatima Group | Home...
81
Annual Report Annual Report
Transcript of Annual Report - Fatima Group | Home...
Annual R e p o r tAnnual R e p o r t

2 Core Values2 Our Vision and Mission3 Code of Conduct4 Company Information5 CompanyProfile6 ProfileoftheDirectors8 Board Structure and Committees10 ProfileoftheKeyManagement13 OrganizationChart14 Notice of 43rdAnnualGeneralMeeting15 FinancialHighlights16 HorizontalAnalysis-BalanceSheet17 VerticalAnalysis-BalanceSheet18 HorizontalAnalysis-ProfitandLoss19 VerticalAnalysis-ProfitandLoss20 Directors’ReporttotheMembers27 StatementofCompliancewiththeCodeof Corporate Governance Financial Statements
30 ReviewReporttotheMembersonStatementof Compliance
31 Auditors’ReporttotheMembers32 BalanceSheet34 ProfitandLossAccount35 StatementofComprehensiveIncome36 StatementofChangesinEquity37 CashFlowStatement38 NotestoandformingpartoftheFinancialStatements
Consolidated Financial Statements
91 Auditors’ReporttotheMembers92 ConsolidatedBalanceSheet94 ConsolidatedProfitandLossAccount95 ConsolidatedStatementofComprehensiveIncome96 ConsolidatedStatementofChangesinEquity97 ConsolidatedCashFlowStatement98 NotestoandformingpartoftheConsolidatedFinancialStatements152 PatternofShareholding154 Financial Calendar Form of Proxy
Contents
1

Our Vision and Mission
Code of Conduct
VisionTobeaworldclassmanufactureroffertilizersandancillaryproducts,withafocusonsafety,qualityandcontributionto nationaleconomicgrowthanddevelopment.Wewillcarefortheenvironmentandthecommunitiesweworkinwhilecontinuingtocreateshareholders’value.
Mission• Tobethepreferredfertilizercompanyforfarmers,businessassociatesandsuppliersthroughqualityandservice.
• Toprovideemployeesanexciting,enablingandsupportiveenvironmenttoexcelin,beinnovative,entrepreneurialinanethicalandsafeworkingplacebasedonmeritocracyandequalopportunity.
• Tobearesponsiblecorporatecitizenwithaconcernfortheenvironmentandthecommunitieswedealwith.
“Acommitmenttohonesty,ethicalconductandintegrityisthesupremeobjectiveoftheCompany.Toassistemployeesinachievingthisobjectiveandimplementitscommitment,theCompanyhasdevelopedacomprehensiveCodeofConductwhichguidesthebehaviorofdirectors,officersandemployeesoftheCompanyandisreproducedintheformofaPolicyStatementofEthicsandBusinessPractices.”
IntegrityOuractionsaredrivenbyhonesty,ethics,fairnessandtransparency
InnovationWeencouragecreativityandrecognizenewideas
TeamworkWeworkcollectivelytowardsacommongoal
Safety, Health, Environment & CSRWecareforourpeopleandthecommunitiesaroundus
Customer FocusWebelieveinlisteningtoourcustomersanddeliveringvalueinourproducts and services
ExcellenceWestrivetoexcelineverythingwedo
Valuing PeopleWevalueourpeopleasourgreatestresource
Core Values
PakarabFertilizersLimitedconductsitsbusinesswiththehighestethicalstandardsinfullcompliancewithallapplicablelaws.Honestyandintegritytakeprecedenceinallrelationshipsincludingthosewithcustomers,suppliers,employeesandotherstakeholders.
Ethics and Business PracticesWEbelieveinconductingtheCompany’sbusinessinamannerthatrespects,protectsandimprovestheenvironmentandprovidesemployeeswithasafeandhealthyworkplace.Weconductourbusinessinanenvironmentallyresponsibleandsustainablemanner.Employeesmustbecompletelyfamiliarwiththepermits,HealthSafetyandEnvironmentPolicy,locallawsandregulationsthatapplytotheirwork.
Allemployeesareexpectedtounderstandthelawsandbusinessregulationsrelatedtotheirworkandcomplyfullysothatourshareholders,employees,customers,suppliers,stakeholdersandtheGovernmenthavecompletefaithinthewayweoperateandthatourbusinessdecisionsaremadeethicallyandinthebestinterestsoftheCompany.
EmployeesareobligatedtoactinaccordancewiththeCompany’scodeofEthicsandBusinessConductandarerestrictedtousingonlylegitimatepracticesincommercialoperationsandinpromotingtheCompany’spositiononissuesbeforegovernmentalauthorities.Inducementsintendedtorewardfavorabledecisionsandgovernmentalactionsareunacceptableandprohibited.
Employeesareprohibitedfromusingtheirpositions,Companypropertyorinformationforpersonalgain,andfromcompetingwiththeCompany.EmployeesarealsoprohibitedfromtakingadvantagefromopportunitiesthatbecomeavailablethroughtheuseofCompanyinformation,propertyortheirposition.
Assets and Proprietary InformationWEconsiderourCompany’sassets,bothphysicalandintellectual,veryvaluable.Wehave,thereforeanobligationtoprotecttheseassetsintheinterestoftheCompanyanditsshareholders.
ProtectionoftheCompany’sinformationisimportantforourbusiness.Allemployeesareexpectedtoknowwhatinformationisproprietaryandwhichmustnotbedisclosedtounauthorizedsources.EmployeesareresponsibleforapplyingallavailabletoolstomanagetheCompany’sinformationresourcesandrecords.
Relations with Business PartnersWEseektodobusinesswithsuppliers,vendors,contractorsandotherindependentbusinesseswhodemonstratehighstandardsofethicalbusinessbehavior.OurCompanywillnotknowinglydobusinesswithanypersonsorbusinessesthatoperateinviolationofapplicablelawsandregulations,includingemployment,health,safetyandenvironmentallaws.Weshalltakestepstoassurethatoursuppliers,vendorsandcontractorsunderstandthestandardsweapplytoourselves,andexpectthesamefromthem.
Our EmployeesWEbelievethathighlyengagedemployeesarethekeyingredientinprofessionaldevelopmentandbusinesssuccess.Therefore,weinviteouremployeestocontributetheirbestandtoavailtheopportunitiesforimprovementandgrowth.Weareanequalopportunityemployerandpromotegenderdiversity,self-developmentandinnovation.Weprovideemployeeswithtools,techniques,andtrainingtomastertheircurrentjobs,broadentheirskills,andadvancetheircareergoals.
TheAuditcommitteeoftheBoardensuresthecomplianceofaboveprinciples.
2
ANNUAL REPORT 2015
3

Company Information Company Profile
PakarabFertilizersLimitedwasestablishedasaresultofprotocolconcludedandsignedonNovember15,1972bytheGovernmentofPakistantofurtherstrengthenanddevelopfraternaltiesbetweenIslamicRepublicofPakistanandstateofAbuDhabi.
AMemorandumofUnderstandingwasconcludedbetweenPakistanIndustrialDevelopmentCorporation(PIDC)andAbuDhabiNationalOilCompanyLimited(ADNOC)onMarch7,1973.AparticipationagreementemergedonNovember1,1973toestablishajointventurefortheexpansionandmodernizationoftheoldNaturalGasFertilizerFactory(NGFF)atMultan.
TheCompanywasincorporatedonNovember12,1973.Subsequently,PIDCassigned52%ofitssharestoNationalFertilizerCorporation(NFC)ofPakistanandADNOCassigned48%ofitsshareto International Petroleum Investment Company,withapaidupcapitalofRs.743.061million.
UndertheprivatizationpolicyofGovernmentofPakistan,PakarabFertilizersLimitedwasprivatizedonJuly14,2005atacostofRs.14.125billion.ItwasacquiredbytheconsortiumofFatimaGroupandArifHabibGroup.
Underthenewmanagement,PakarabFertilizersLimitedhasundergoneextensivemodernizationandnewimprovedprocesseshavebeenintroducedtomaximizetheoutputwhileminimizingthenegativeimpactsontheenvironment.ForthisaCleanDevelopmentMechanism(CDM)plantwasinstalled,whichisthefirstprojectofitskindinPakistan.BasicaimofthisprojectistheabatementofN2O and NOXemissionsfromthestackgasesofNitricAcidplant.Thereductionofgreenhouseeffectofthesegasesshowsthenewmanagement’scommitmenttowardsacleanerenvironment.
PakarabFertilizersLimitedislocatedatKhanewalRoad,Multan.Thesiteareacomprises302acres,whichincludesareaforthefactoryandthehousingcolonywithallamenitiesincludingmedicalcentre,school,managementandstaffclubsforrecreationofemployeesandtheirfamilies,etc.
Board of DirectorsMr.ArifHabibChairman
Mr.FawadAhmedMukhtarChiefExecutiveOfficer
Mr.FazalAhmedSheikhExecutiveDirector
Mr.FaisalAhmedMukhtarNon-ExecutiveDirector
Mr.NasimBegNon-ExecutiveDirector
Mr.RehmanNaseemNon-ExecutiveDirector
Mr.Abdus SamadNon-ExecutiveDirector
Mr.MuhammadKashifHabibNon-ExecutiveDirector
Audit CommitteeMr.NasimBegChairman
Mr.FazalAhmedSheikhMember
Mr.Rehman NaseemMember
Mr.MuhammadKashifHabibMember
Human Resource andRemuneration CommitteeMr.NasimBegChairman
Mr.AbdusSamadMember
Mr.FaisalAhmedMukhtarMember
Mr.Rehman NaseemMember
Chief Financial OfficerMr.ArifHamidDar
Company SecretaryMr.AusafAliQureshi
Key ManagementMr.M.AbadKhanAdvisortoCEO
Mr.ArifUrRehmanChiefManufacturingOfficer
Mr.QadeerAhmedKhanDirectorSpecialProjects
Mr.AhsenUdDinDirectorTechnologyDivision
Mr.HaroonWaheedGroupHeadofHumanResource
Mr.IftikharMahmoodBaigDirectorBusinessDevelopment
Mr.FuadImranKhanChiefInformationOfficer
Mr.JavedAkbarHead of Procurement
Mr.KashifMustafaKhanInchargeofInternalAudit
Brig.(Retd)AdeebAzamGeneralManagerAdministration
Legal AdvisorsM/s.Chima&IbrahimAdvocates1-A/245,TufailRoad,LahoreCantt.
AuditorsA.F.Ferguson&Co.,CharteredAccountants23-C,AzizAvenue,CanalBank,GulbergV,Lahore-54660.Tel:04235715864-71F-04235715872
Cost AuditorsErnst&YoungFordRhodesSidatHyder&CoCharteredAccountants96-B-1, 4th Floor, PaceMall Building,M.M.AlamRoad,Gulberg-IILahore.Tel:+924235778402-11Fax:[email protected]/pk
BankersAlliedBankLimitedAl-BarakaBank(Pakistan)LimitedAskariBankLimitedBankIslamiPakistanLimitedBankAlfalahLimitedBurjBankLimitedCitibank,N.A.DubaiIslamicBankPakistanLimitedFaysalBankLimitedHabibBankLimitedHabibMetropolitanBankLimitedMCBBankLimitedMeezanBankLimitedNationalBankofPakistanPakOmanInvestmentCompanyLimitedPakistanKuwaitInvestmentCompany(Private)LimitedPAIRInvestmentCompanyLimitedSindhBankLimitedStandardCharteredBank(Pakistan)LimitedSummitBankLimitedSoneriBankLimitedUnitedBankLimitedZaraiTaraqiatiBankLimited
Registered / Head OfficeE-110,Khayaban-e-Jinnah,LahoreCantt.,Pakistan.UAN:111-FATIMA(111-328-462)Fax:042-36621389E-mail:[email protected]:www.fatima-group.com
Plant SiteKhanewalRoad,MultanTel: 061 9220022Fax: 061 9220021
4
ANNUAL REPORT 2015
5

Profile of the Directors
Mr. Arif HabibChairman/Non-ExecutiveDirector
Mr. Fawad Ahmed MukhtarChiefExecutiveOfficer/Director
Mr. Fazal Ahmed SheikhExecutiveDirector
Mr. Rehman NaseemNon-ExecutiveDirector
Mr.ArifHabibistheChairmanofPakarabFertilizersLimited.HeisalsotheChiefExecutiveOfficerofArifHabibCorporationLimited,directorofPakarabEnergyLimitedandChairmanofFatimafertLimited,FatimaFertilizerCompanyLimited,AishaSteelMillsLimitedandJavedanCorporationLimited.Mr.ArifHabibremainedtheelectedPresident/ChairmanofKarachiStockExchangeforsixtimesinthepastandwasaFoundingMemberandChairmanoftheCentralDepositoryCompanyofPakistanLimited.HehasservedasaMemberofthePrivatizationCommission,BoardofInvestment,TariffReformsCommissionandSecurities&ExchangeOrdinanceReviewCommittee.OvertheyearshehasbeennominatedontheBoardofDirectorsofanumberofcompaniesbytheGovernmentofPakistan.Presently,heisaDirectorontheBoardsofPakistanInternationalAirlinesandSuiNorthernGasPipelinesLimited.Mr.Habibparticipatessignificantlyinwelfareactivities.HeisoneofthetrusteesofFatimidFoundationandMemonHealth&EducationFoundationaswellasadirectorofPakistanCentreforPhilanthropyandKarachiEducationInitiative.
Mr.FawadAhmedMukhtaristheChiefExecutiveOfficerandDirectoroftheCompany.Hehasrichexperienceofmanufacturingandindustrialmanagement,andinadditiontobeingasuccessfulbusinessleader,heisalsoarenownedphilanthropist.Followinghisgraduation,hehasspent30yearsindevelopinghisfamilybusinessintoasizableconglomerate.
Mr.FawadMukhtarleadsseveralcommunityserviceinitiativesofhisgroupincludingtheFatimaFertilizerTrustandWelfareHospital,FatimaFertilizerEducationSocietyandSchool,MukhtarA.SheikhWelfareTrustetc.HeisalsotheChairmanofRelianceWeavingMillsLimited,FatimaEnergyLimited,RelianceCommodities(Private)Limited,FatimaSugarMillsLimited,FatimaHoldingLimited,AirOne(Private)Limited,andisalsotheCEOofFatimaFertilizerCompanyLimitedandFatimafertLimited.HeisalsotheDirectorofFatimaTransmissionCompanyLimitedandPakarabEnergyLimited.Inaddition,heismemberBoardofDirectorsof“TheNationalManagementFund”–aparentbodyofLahoreUniversityofManagementSciences(LUMS).
Mr.RehmanNaseemisaDirectoroftheCompany.HeobtainedaBachelorofEconomicsDegreefromColumbiaUniversity,NewYork.HeistheChiefExecutiveofAhmedFineTextileMillsLimitedandRehmanAmirFabricsLimited.HeisalsodirectorofFazalClothMillsLimited,FazalWeavingMillsLimited,FazalRehmanFabricsLimited,ZafarNasirOilExtractionLimited,HussainGinneriesLimited,AmirFineExports(PVT)Limited,FazalFarms(Pvt)LimitedandFatimaEnergyLimited.
Mr.FazalAhmedSheikhisaDirectoroftheCompany.HeholdsadegreeinEconomicsfromtheUniversityofMichigan,AnnArbor,USA.HehasplayedastrategicroleinFatimaGroup’sexpansionandsuccess.HeistheCEOofRelianceWeavingMillsLimited,FatimaEnergyLimited,FatimaElectricCompanyLimited,FatimaTransmissionCompanyLimited,PakarabEnergyLimitedandAirOne(Private)Limited.Inaddition,heisalsothememberBoardofDirectorsatFatimaFertilizerCompanyLimited,FatimafertLimited,RelianceCommodities(Private)Limited,FatimaSugarMillsLimited,FatimaHoldingLimitedandFazalClothMillsLimited.
Mr. Faisal Ahmed Mukhtar Non-ExecutiveDirector
Mr. Nasim BegNon-ExecutiveDirector
Mr. Abdus SamadNon-ExecutiveDirector
Mr. Muhammad Kashif HabibNon-ExecutiveDirector
Mr.FaisalAhmedMukhtarisaDirectoroftheCompany.HeholdsaLawdegreefromBahauddinZakariyaUniversity,Multan.HeistheformerMayorandCityDistrictNazimofMultan,andcontinuestoleadwelfareeffortsinthecity.HeisalsotheChairmanofWorkersWelfareBoardatPakarabFertilizersLimitedandismemberBoardofDirectorsatFatimaFertilizerCompanyLimited,FatimafertLimited,FatimaSugarMillsLimited,FatimaHoldingLimited,FatimaEnergyLimited,FatimaElectricCompanyLimited,PakarabEnergyLimited,RelianceWeavingMillsLimited,RelianceCommodities(Private)Limited,FazalClothMillsLimited,andAirOne(Private)Limited.AdditionallyhewasalsoamemberintheProvincialFinanceCommission(Punjab),SteeringCommitteeofSouthernPunjabDevelopmentProjectandDecentralizationSupportProgram.
Mr.NasimBegisaDirectoroftheCompany.HequalifiedasaCharteredAccountantin1970;healsoholdsaBachelor’sdegreeinCommercefromtheKarachiUniversity.HeisthefounderChiefExecutiveofArifHabibConsultancyandwasthefounderChiefExecutive(nowViceChairman)ofMCB-ArifHabibSavings&InvestmentsLtd(formerlyArifHabibInvestmentsLimited),aleadingAssetManagementCompanyofPakistan.NasimBegservesonontheBoardsofseveralArifHabibGroupcompanies,aswellassomeothers.HechairstheBoardsofArifHabibDolmenREITManagementLimitedandPowerCementLimited.Hehasexperienceofoverforty-fiveyearsinindustryandthefinancialservicessector,inboththedomesticandinternationalmarkets.HewasapartofataskforcesetupbytheSecurities&ExchangeCommissionofPakistan(SECP),whichdevelopedandintroducedtheVoluntaryPensionSystem.HewasthefounderChairmanoftheSECPsponsoredInstituteofCapitalMarketsandhasalsobeenaMemberofthePrimeMinister’sEconomicAdvisoryCouncil.
Mr.MuhammadKashifHabibisaDirectoroftheCompany.HeisaCharteredAccountantfromtheInstituteofCharteredAccountantsofPakistan(ICAP)andhascompletedhismandatoryArticleswithM/s.A.F.Ferguson&Co.CharteredAccountants.
HeistheCEOofPowerCementLimitedandSafeMixConcreteLimited.HeisalsoDirectorofArif HabibCorporationLimited,FatimaFertilizerCompanyLimited,FatimafertLimited,BubberSher(Pvt.)Limited,RelianceSacksLimited,JavedanCorporationLimited,AishaSteelMillsLimited,ArifHabibDolmenREITManagementLimited,RotocastEngineeringCompany(Pvt.)LimitedandMemonHealth&EducationFoundation.
Mr.AbdusSamadisaDirectoroftheCompany.HeholdsaMaster’sdegreeinBusinessAdministrationandhasmorethan15yearsofexperience,including9yearsofworkinginthefinancialservicesindustryinvariousseniormanagementroles.HebeganhiscareerwithArifHabibCorporationLimited(theholdingcompanyofArifHabibgroup)andhasservedthecompanyinvariousexecutivepositionsincludingExecutiveSalesandBusinessPromotions,CompanySecretary,HeadofMarketing,etc.InSeptember2004,hewasappointedtheChairmanandChiefExecutiveofArifHabibLimited.AsChairmanhewasresponsibleforthestrategicdirectionofthecompanyandwasactivelyinvolvedincapitalmarketoperationsandcorporatefinanceactivitiessuchasservingcorporateclients,institutionalclients,highnetworthindividuals,andraisingfundsforclientsthroughIPO’s,privateplacementsetc.HeresignedfromthatpositioninJanuary2011.Mr.SamadA.HabibistheChiefExecutiveofJavedanCorporationLimitedanddirectorofArifHabibCorporationLimited,ArifHabibEquity(Pvt.)Limited,ArifHabibDolmenREITManagementLimited,MCB-ArifHabibSavings&InvestmentsLimited,InternationalComplexProjectsLimited,NooriabadSpinningMills(Pvt.)Limited,PakarabFertilizersLimited,PakistanOpportunitiesLimited,PowerCementLimited,RealEstateModarabaManagementCompanyLimited,RotocastEngineeringCompany(Pvt.)LimitedandSafemixConcreteLimited.
6
ANNUAL REPORT 2015
7

Board Structure and Committees
Board StructurePFL’sBoardiscomprisedofeightdirectorswhohavebeenelectedbytheshareholdersforatermofthreeyearsexpiringonDecember31,2018.OtherthantheChiefExecutiveOfficer(CEO),thereisoneexecutivedirectorandsixnon-executivedirectorsontheBoard.TheChairmanoftheBoardisanon-executivedirector. TheBoardprovidesleadershipandstrategicguidancetotheCompany,overseestheconductofbusinessandpromotestheinterestsofallstockholders.Itreviewscorporatepolicies,overallperformance,accountingandreportingstandardsandothersignificantareasofmanagement,corporategovernanceandregulatorycompliance. TheBoardisheadedbytheChairmanwhomanagestheBoard’sbusinessandactsasitsfacilitatorandguide.TheBoardisassistedbyanAuditCommitteeandaHumanResourceandRemunerationCommitteewhiletheCEOcarriesresponsibilityforday-to-dayoperationsoftheCompanyandexecutionofBoardpolicies.
Board CommitteesThestandingcommitteesoftheBoardare:
Audit Committee
Composition
TheAuditCommitteeconsistsoffourmembersoftheBoard.MajorityofthemembersoftheAuditCommitteearenon-executiveincludingtheChairman.Themembersare:
1.Mr.NasimBeg-Chairman2.Mr.FazalAhmedSheikh-Member3.Mr.RehmanNaseem-Member4.Mr.MuhammedKashifHabib-Member
Terms of Reference
Inadditiontoanyotherresponsibilitieswhichmaybeassignedfromtimeto
timebytheBoard,themainpurposeoftheAuditComitteeistoassisttheBoardbyperformingthefollowingmainfunctions:
• tomonitorthequalityandintegrityoftheCompany’saccountingandreportingpractices;
• tooverseetheperformanceofCompany’sinternalauditfunction;
• toreviewtheexternalauditor’squalification;independence,performanceandcompetence;and
• tocomplywiththelegalandregulatoryrequirements,Company’sby-lawsandinternalregulations.
TheTermsofReferenceoftheAuditCommitteehavebeendrawnupandapprovedbytheBoardofDirectorsincompliancewiththeCodeofCorporateGovernance.InadditiontocompliancewithCodeofCorporateGovernance,theAuditCommitteecarriesoutthefollowingdutiesandresponsibilitiesfortheCompanyasperitsTermsofReference:
a)determinationofappropriatemeasurestosafeguardtheCompany’sassets;
b)reviewofpreliminaryannouncementsofresultspriortopublication;
c)reviewofquarterly,half-yearlyandannualfinancialstatementsoftheCompany,priortotheirapprovalbytheBoardofDirectors,focusingon:
• majorjudgmentalareas;
• significantadjustmentsresultingfromtheaudit;
• thegoing-concernassumption;
• anychangesinaccountingpoliciesandpractices;
• compliancewithapplicableaccountingstandards;and
• compliancewithlistingregulationsandotherstatutoryandregulatoryrequirements.
d)facilitatingtheexternalauditanddiscussionwithexternalauditorsof
majorobservationsarisingfrominterimandfinalauditsandanymatterthattheauditorsmaywishtohighlight(intheabsenceofmanagement,wherenecessary);
e)reviewofmanagementletterissuedbyexternalauditorsandmanagement’sresponsethereto;
f) ensuringcoordinationbetweentheinternalandexternalauditorsoftheCompany;
g)reviewofthescopeandextentofinternalauditandensuringthattheinternalauditfunctionhasadequateresources and is appropriately placed withintheCompany;
h)considerationofmajorfindingsofinternalinvestigationsandmanagement’sresponsethereto;
i) ascertainingthattheinternalcontrolsystemincludingfinancialandoperationalcontrols,accountingsystemandreportingstructureareadequateandeffective;
j) reviewoftheCompany’sstatementon internal control systems prior toendorsementbytheBoardofDirectors;
k) institutingspecialprojects,valueformoneystudiesorotherinvestigationsonanymatterspecifiedbytheBoardofDirectors,inconsultationwiththeChiefExecutiveandtoconsiderremittanceofanymattertotheexternalauditorsortoanyotherexternalbody;
l) determinationofcompliancewithrelevantstatutoryrequirements;
m)monitoringcompliancewiththebestpracticesofcorporategovernanceandidentificationofsignificantviolationsthereof;and
n)considerationofanyotherissueormatterasmaybeassignedbytheBoardofDirectors.
Human Resource and Remuneration Committee
Composition
TheHumanResourceandRemunerationCommitteeconsistsoffourmembersoftheBoard.AllthemembersoftheCommitteearenon-executivedirectorsincludingtheChairman.
Themembersare:
1.Mr.NasimBeg-Chairman2.Mr.AbdusSamad-Member3.Mr.FaisalAhmedMukhtar-Member4.Mr.RehmanNaseem-Member
Terms of Reference
TheHumanResourceCommitteeisameansbywhichtheBoardprovidesguidanceonhumanresourcesexcellence.Thespecificresponsibilities,authoritiesandpowersthattheCommitteecarriesoutonbehalfoftheBoard are as follows:
1. Duties and Responsibilities
TheCommitteeshallcarryoutthedutiesbelowfortheCompany:
1.1 toreviewandrecommendtheannualCompensationstrategywithfocusontheannualbudgetforHeadcountandSalariesandwages;
1.2 toreviewandrecommendtheannualBonusandIncentiveplan;
1.3 toreviewandrecommendthecompensationoftheChiefExecutiveandExecutiveDirectors;
1.4 toassisttheBoardinreviewingandmonitoringthesuccessionplansofkeypositionsintheCompany;
1.5 toreviewandmonitorprocessesandinitiativesrelatedtoworkenvironmentandculture;
1.6 toperformsuchotherdutiesandresponsibilitiesasmaybeassignedtimetotimebytheBoardofDirectors.
2. Reporting Responsibilities
2.1 TheCommitteeChairmanshallreportformallytotheBoardonitsproceedingsaftereachmeetingonallmatterswithinitsdutiesandresponsibilities;
2.2 TheCommitteeshallmakewhateverrecommendationstotheBoarditdeems appropriate on any area withinitsremitwhereactionorimprovementisneeded;
2.3 TheCommitteeshall,ifrequestedbytheBoard,compileareporttoshareholdersonitsactivitiestobeincludedintheCompany’sAnnualReport.
3. Authorities and Powers
TheCommitteeisauthorisedandempowered:
3.1 ToseekanyinformationitrequiresfromanyemployeeoftheCompanyinordertoperformitsduties;
3.2 Toobtain,attheCompany’sexpense,outsidelegalorotherprofessional advice on any matter withinitstermsofreference;and
3.3 TocallanyemployeetobequestionedatameetingoftheCommitteeasandwhenrequired.
8
ANNUAL REPORT 2015
9

Profile of the Key Management
Mr. M. Abad KhanAdvisortoCEO
Mr. Arif Hamid DarChiefFinancialOfficer
Mr Arif Ur RehmanChiefManufacturingOfficer
Mr. Haroon WaheedGroupHeadofHR
Mr. Qadeer Ahmed KhanDirectorSpecialProjects
Mr. Iftikhar Mahmood BaigDirectorBusinessDevelopment
Mr. Ausaf Ali QureshiCompany Secretary
Mr. Fuad Imran KhanChiefInformationOfficer
Mr.M.AbadKhangraduatedinMechanicalEngineeringfromUETLahoreandreceivedextensivetraininginFertilizermanufacturingfromabroad.Overthelast55yearsofhiscareer,heremainedpartofthegrowthoffertilizerindustryinPakistan.
HewaspartoftheteamthatcommissionedPakistan’sfirstUreaPlantundertheaegisofPIDC.HeservedExxonChemicalPakistanLtd.for15yearsmostlyatseniormanagementpositionsinmanufacturing.HeledFaujiFertilizerCo.manufacturingfor14yearsasGeneralManagerPlant.Duringthisperiod,Plantoperated par excellence and itsdesigncapacityincreasedtomorethandouble.In2001,whenFFBLfacedseriouschallenges,hetookresponsibilityasheadofthemanufacturingandwasinstrumentalinamajorrevampwhichimprovedthecapacityby25%.
HehasbeenwithFatimaGroupforthelast10yearsandplayedasignificantroleinestablishmentandprogressofFatimaFertilizerplantand operational improvements in PakarabFertilizers.
Duringthecourseofalongcareer,hehadextensiveinternationalexposuresthroughseminars,symposiumsandtrainingsincludingtheoneatHarvardBusinessSchool.
HeisalsoDirectorofseveralotherGroup Companies namely Fatima EnergyLtd,PakarabEnergyLtd,FatimafertLtd,BubberSher(Pvt)Ltd,FatimaVentures(Pvt)LtdandFatimaElectricCoLtd.
Mr.ArifHamidDarisafellowmemberoftheInstituteofCharteredAccountantsofPakistanandgottrainingwithA.F.Ferguson&Co.CharteredAccountant.Hehas14yearsofdiversifiedexperienceofhandlingfinance,businessplanning,aftersalesservicesfunctionswithHondaAtlasCars(Pakistan)Ltd,asubsidiaryofHondaMotorCompany,Japan.HehasjoinedtheCompanyinearly2010.
Mr.QadeerAhmedKhanhasdonehisMSinPetrochemicalsandHydrocarbonsfromtheInstituteofScienceandTechnology,UniversityofManchester,England.Hehasavastexperienceofworkinginchemicalsandfertilizerindustries.Hehasover32yearsofexperienceatEngroChemicalsandEngroPolymers,whereheheldvariousseniormanagementpositions.
IftikharMahmoodBaigisDirectorBusinessDevelopmentofFatimaGroup.HeisaFellowMemberofInstituteofCharteredSecretariesandManagersofPakistan.Hehas32yearsofFinancial&Commercialexperience.OverthecourseofhistenurewithFatimaGroup,heplayedaninstrumentalroleinobtainingnaturalgasallocationof110MMCFDin2004andsuccessfullyachievingFinancialCloseofthelargestrupeesyndicationofRs.23billionin2006forthegreenfieldfertilizermanufacturingcomplexofFatimaFertilizerCompanyLimited(InvestmentUS$750million).HealsoplayedapivotalroleintheacquisitionofPakarabFertilizersLimitedin2005.HewasassociatedwithFatimaEnergyLimitedfromconceptualstageuntilitsimplementation.IftikhariscurrentlyengagedinGasmanagementandLNGsourcingforFertilizerPlants,GovernmentRegulations/RegulatoryApprovals and development of NewVenturesinPowerSectors.
Mr.Arif-ur-Rehmanisachemicalengineerandhasover34yearsofexperienceinthefertilizerandpetrochemicalindustries.Hehasbeenapartofnumberofsuccessfulprojectsfromconstructiontocommissioning.TheseincludeFaujiFertilizerCompany,FaujiFertilizerBinQasimandICI(PTAPlant).Healsoworkedonvariousforeignassignments.
Mr.HaroonWaheedhasdonehisLLMfromMonashUniversity,Melbourne,Australia.Hehasover 21 years of national and internationalbroadbasedfunctionalbusinessexperiencewithUnilever,andhasbeenassociatedwithPakistanSocietyofHRManagementasPresident.HaroonalsorepresentsintheHR,managementandleadershipdevelopment conferences atnationallevel.HewontheInternationalHRLeadershipAwardinLondonandTalentManagementAwardinSingaporein2010.
Mr.AusafAliQureshiisaFellowMemberofInstituteofCharteredAccountantsofPakistan.HejoinedtheGroupin May 2010 as Company Secretarywithadditionalresponsibilityforinvestorrelations.Hehasover33yearsofexperiencewithFaujiFertilizer,PakistanInternationalAirlines(Holdings)andBristol-MyersSquibb(BMS).Inhis20years’pluscareeratBMS,heheldvariousseniormanagementpositionsinPakistan,SouthKorea,EgyptandSingaporeintheareasofnance,corporatecomplianceandstrategicprojectplanning.
Dr.FuadImranKhanholdsaPh.D.DegreeinComputerInformation and Control EngineeringandaMaster’sdegreeinElectricalandComputerEngineeringfromUniversityofMichigan,USAandhasaBachelor’sdegreeinElectricalEngineeringfromMassachusettsInstituteofTechnology.HehasworkedasHeadofInformationTechnologyatRoshanAfghanistanandPTCL.Dr.Fuad’slastassignmentwaswithWaridTelecomastheirChiefInformationOfficer.
10
ANNUAL REPORT 2015
11
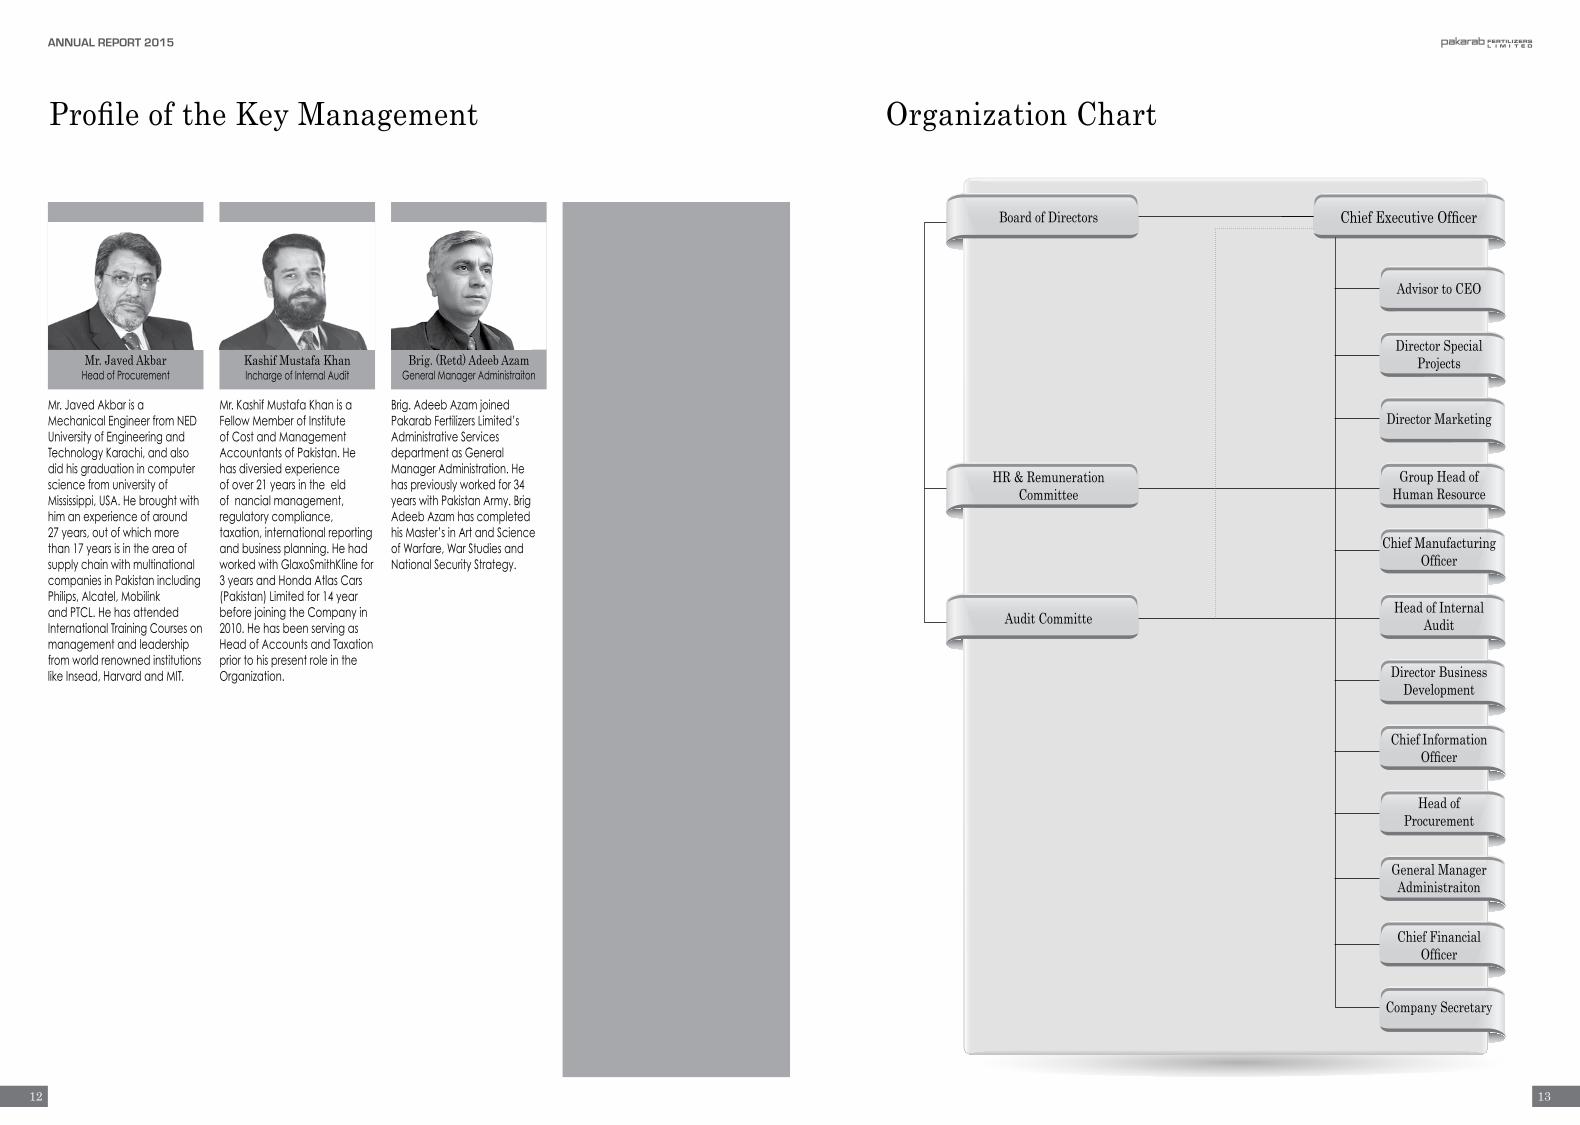
Profile of the Key Management Organization Chart
Board of Directors
HR & RemunerationCommittee
Audit Committe
Advisor to CEO
Director Special Projects
Director Marketing
Group Head of Human Resource
Chief Manufacturing Officer
Head of InternalAudit
Director BusinessDevelopment
Chief Information Officer
Head of Procurement
General Manager Administraiton
Chief FinancialOfficer
Company Secretary
Chief Executive Officer
Mr. Javed AkbarHead of Procurement
Kashif Mustafa Khan InchargeofInternalAudit
Brig. (Retd) Adeeb AzamGeneralManagerAdministraiton
Mr.JavedAkbarisaMechanicalEngineerfromNEDUniversityofEngineeringandTechnologyKarachi,andalsodidhisgraduationincomputerscience from university of Mississippi,USA.Hebroughtwithhimanexperienceofaround27years,outofwhichmorethan17yearsisintheareaofsupplychainwithmultinationalcompaniesinPakistanincludingPhilips,Alcatel,MobilinkandPTCL.HehasattendedInternationalTrainingCoursesonmanagementandleadershipfrom world renowned institutions likeInsead,HarvardandMIT.
Brig.AdeebAzamjoinedPakarabFertilizersLimited’sAdministrative Services department as General ManagerAdministration.Hehaspreviouslyworkedfor34yearswithPakistanArmy.BrigAdeebAzamhascompletedhisMaster’sinArtandScienceofWarfare,WarStudiesandNationalSecurityStrategy.
Mr.KashifMustafaKhanisaFellowMemberofInstituteofCostandManagementAccountantsofPakistan.Hehasdiversiedexperienceofover21yearsintheeldofnancialmanagement,regulatorycompliance,taxation,internationalreportingandbusinessplanning.HehadworkedwithGlaxoSmithKlinefor3 years and Honda Atlas Cars (Pakistan)Limitedfor14yearbeforejoiningtheCompanyin2010.HehasbeenservingasHead of Accounts and Taxation priortohispresentroleintheOrganization.
12
ANNUAL REPORT 2015
13

Noticeof the 43rd Annual General Meeting
Notice is hereby given that the 43rd Annual General Meeting of the shareholders of PAKARAB FERTILIZERS LIMITED (the‘Company’or‘PFL’)willbeheldonSaturday,April30,2016at12:30p.m.atE-110,Khayaban-e-Jinnah,LahoreCantt.,totransactthefollowingbusiness:
Ordinary Business
1. ToconfirmminutesoftheExtraordinaryGeneralMeetingheldonDecember31,2015.
2. Toreceive,considerandadopttheauditedfinancialstatementsoftheCompanytogetherwiththeDirectors’andAuditors’ReportsthereonfortheyearendedDecember31,2015togetherwiththeauditedconsolidatedfinancial statements of Pakarab Fertilizers Limited and subsidiary Reliance Sacks Limited for the year endedDecember31,2015andtheAuditors’Reportsthereon.
3. ToappointAuditorsfortheyearendingDecember31,2016andtofixtheirremuneration.TheAuditCommitteeandtheBoardofDirectorshaverecommendedforreappointmentofM/sA.F.Ferguson&Co.,CharteredAccountantsasexternalauditors.
Other Business
4. TotransactanyotherbusinesswiththepermissionoftheChair.
ByorderoftheBoard
AusafAliQureshi
Lahore;April09,2016 Company Secretary
Notes:
1. ThesharetransferbooksoftheCompanywillremainclosedfromApril24,2016toApril30,2016(bothdaysinclu-sive).TransfersreceivedinorderattheregisteredofficeoftheCompanybythecloseofbusinessonApril23,2016willbetreatedintime.
2. Amemberentitledtoattendandvoteatthemeetingmayappointanothermemberashis/herproxywhoshallhavesuchrightsasrespectsattending,speakingandvotingatthemeetingasareavailabletoamember.
3. ProxiesinordertobeeffectivemustbereceivedbytheCompanyattheRegisteredOfficenotlaterthan48hoursbeforethetimeforholdingmeeting,dulysignedandstampedandwitnessedbytwopersonswiththeirnames,address,NICnumberandsignatures.
4. Shareholdersarerequestedtoimmediatelynotifythechangeoftheiraddress,ifany.
Financial HighlightsSix years at a glance (Rs. in millions except share data and ratios)
Dec31, Dec31, Dec31, Dec31, Dec31, Dec31, 2010 2011 2012 2013 2014 2015Income Statement
Turnover Rs. 18,248 16,701 8,136 7,428 14,248 21,920CostofGoodsSold Rs. (9,051) (7,188) (6,221) (7,143) (12,264) (17,353)GrossProfit Rs. 9,197 9,513 1,915 286 1,984 4,568AdminCost Rs. (780) (969) (1,165) (888) (731) (879)DistributionCost Rs. (994) (829) (299) (495) (686) (897)FinancialCost Rs. (3,589) (3,472) (2,610) (1,579) (1,626) (1,677)OtherExpenses Rs. (386) (510) (218) (382) (1) (333)InterestIncome Rs. 543 736 685 63 OtherIncome Rs. 866 1,119 843 198 1,036 333Re-measurementgain/(loss) Rs. (121) 741 (47) - - -Sharegain/(loss)ofassociatedcompany Rs. (39) (18) - - - -ProfitbeforeTax Rs. 4,697 6,311 (896) (2,798) (25) 1,114ProfitafterTax Rs. 3,232 4,590 (240) (1,825) (45) 2,460EBITDA Rs. 8,943 10,665 2,929 (745) 2,041 3,555
Balance Sheet
PaidupCapital Rs. 4,500 4,500 4,500 4,500 4,500 4,500Shareholder’sEquityincludingrevaluationreserve Rs. 10,224 17,856 15,396 13,584 16,273 19,411Longtermborrowings Rs. 13,372 8,484 4,559 1,466 1,891 4,203Capitalemployed Rs. 33,989 43,754 37,077 31,518 32,303 36,264Deferredliabilities Rs. 5,631 11,058 11,038 10,059 10,303 8,105Property,plant&equipment Rs. 21,916 37,937 37,290 37,114 39,909 39,194Longtermassets Rs. 33,178 46,336 41,188 40,945 43,735 43,027Netcurrentassets/Workingcapital Rs. 811 (2,456) (4,111) (10,188) (9,620) (6,762)TotalAssets Rs. 50,637 65,341 54,636 48,148 52,727 65,680
Cash Flows:
Operatingactivities Rs. 4,109 4,023 (1,179) (682) 2,797 (10,603)Investingactivities Rs. (2,989) (710) 5,870 2,790 345 50Financingactivities Rs. (316) (2,643) (5,665) (1,864) (1,789) (857)Changesincash&cashequivalents Rs. 804 669 (973) 244 1,352 (11,410)Cash&cashequivalents-Yearend Rs. (4,517) (3,847) (4,820) (4,576) (3,224) (14,634)
Key Indicators:
Operating: GrossProfitMargin % 50.40 56.96 23.54 3.84 13.92 20.84Pretaxmargin % 25.74 37.79 (11.01) (37.67) (0.17) 5.08Netprofitmargin % 17.71 27.48 (2.95) (24.57) (0.31) 11.22EBITDA%agetosale % 49.01 63.86 36.00 (10.04) 14.33 16.12Earningpershare(Rs.)Basic Rs. 7.18 10.20 (0.53) (4.06) (0.10) 5.47
Performance:
BookValuepershare(Excludingrevaluationsurplus) Rs. 27.22 23.14 17.63 13.78 13.96 19.75BookValuepershare(Includingrevaluationsurplus) Rs. 32.72 49.68 44.21 40.19 46.16 53.14Returnonassets % 6.38 7.02 (0.44) (3.79) (0.08) 3.74TotalAssetsTurnover Times 0.36 0.26 0.15 0.15 0.27 0.33FixedAssetsTurnover Times 0.82 0.44 0.22 0.20 0.36 0.56Debtorsturnover Times 11.13 12.19 11.14 20.52 83.57 15.59Debtorsturnover Days 33 29.95 33 18 4 23Inventoryturnover Times 1.82 1.45 1.32 1.40 3.07 2.39Inventoryturnover Days 200 251 276 261 119 153ReturnonShareCapital % 71.82 102.00 (5.33) (40.56) (0.99) 54.66ReturnonEquity(excludingrevaluationsurplus) % 26.39 44.08 (3.03) (29.44) (0.71) 27.67
Leverage:
Debt:Equity 59:41 59:41 54:46 43:57 36:64 49:51Interestcover 1.31 1.82 (0.66) (0.77) (0.02) 0.66
Liquidity:
CurrentRatio 1.05 0.89 0.77 0.41 0.48 0.77Quickratio 0.73 0.67 0.49 0.20 0.30 0.42
Valuation
Earningspershare(beforetax) Rs. 10.44 14.02 (1.99) (6.22) (0.05) 2.48Earningspershare(aftertax) Rs. 7.18 10.20 (0.53) (4.06) (0.10) 5.47EarningsGrowth % (31.79) 42.02 (105.23) 660.45 97.55 5,608Cashdividend % – – – – – –Bonusdividend % – – – – – –Speciedividend % 130 148 49 – – –
14
ANNUAL REPORT 2015
15

Rupees(Million) %Change
Dec31, Dec31, Dec31, Dec31, Dec31, Dec31, 2010vs 2011vs 2012vs 2013vs 2014vs 2015vs 2010 2011 2012 2013 2014 2015 2009 2010 2011 2012 2013 2014
Issued,subscribedandpaidupcapital 4,500 4,500 4,500 4,500 4,500 4,500 8.89 6.89 8.24 9.35 8.53 6.85
Reserves 7,548 5,714 3,432 1,700 1,782 4,389 14.91 8.74 6.28 3.53 3.38 6.68
Sharedepositmoney 200 200 – – – – 0.39 0.31 – – – –
Revaluationreserve 2,476 11,942 11,964 11,884 14,491 15,023 4.89 18.28 21.90 24.68 27.48 22.87
14,724 22,356 19,896 18,084 20,773 23,911 29.08 34.21 36.42 37.56 39.40 36.41
Non-Current LiabilitiesLongtermfinances 13,372 8,484 4,559 1,466 1,891 4,203 26.41 12.98 8.34 3.04 3.59 6.40
Supplier’scredit-secured – 1,796 1,488 1,100 1,100 – – 2.75 2.72 2.28 2.09 –
Liabilitiesagainstassetssubjecttofinancelease 218 138 50 – – – 0.43 0.21 0.09 – – –
Payableagainstminingrights – – – – – – – – – – – –
Longtermdeposits 44 48 46 47 48 45 0.09 0.07 0.08 0.10 0.09 0.07
Deferredliabilities 57 91 115 126 116 133 0.11 0.14 0.21 0.26 0.22 0.20
Deferredtaxation 5,574 10,967 10,923 9,933 10,187 7,972 11.01 16.78 19.99 20.63 19.32 12.14
19,265 21,524 17,181 12,672 13,342 12,353 38.05 32.94 31.45 26.32 25.30 18.81
Current Liabilities Currentportionoflongtermliabilities 4,009 6,335 4,878 3,132 901 1,072 7.92 9.70 8.93 6.51 1.71 1.63
Financesundermarkuparrangements-secured 4,702 4,644 5,814 4,736 4,637 15,152 9.29 7.11 10.64 9.84 8.80 23.07
Derivativefinancialinstruments – – – – – – – – – – – –
PayabletoPrivatizationCommissionofPakistan 2,198 2,198 2,198 2,198 2,198 2,198 4.34 3.36 4.02 4.56 4.17 3.35
Shorttermloanfromrelatedparty-secured – – – 3,000 3,000 2,200 – – – 6.23 5.69 3.35
Tradeandotherpayables 4,458 3,121 3,225 3,989 7,555 8,345 8.80 4.78 5.90 8.28 14.33 12.71
Accruedfinancecost 650 677 366 337 320 449 1.28 1.04 0.67 0.70 0.61 0.68
Dividendpayable – 3,755 1,078 – – – – 5.75 1.97 – – –
Provisionfortaxation 631 731 – – – – 1.25 1.12 – – – –
16,648 21,461 17,559 17,391 18,611 29,416 32.88 32.84 32.14 36.12 35.30 44.79
50,637 65,341 54,636 48,148 52,727 65,680 100.00 100.00 100.00 100.00 100.00 100.00
Rupees(Million) %Change Dec31, Dec31, Dec31, Dec31, Dec31, Dec31, 2010vs 2011vs 2012vs 2013vs 2014vs 2015vs 2010 2011 2012 2013 2014 2015 2009 2010 2011 2012 2013 2014Non-Current Assets Property,plantandequipment 21,916 37,937 37,290 37,114 39,909 39,194 43.28 58.06 68.25 77.08 75.69 59.67
Assetssubjecttofinancelease 283 230 121 51 – – 0.56 0.35 0.22 0.11 – –
Intangibles 183 161 149 144 125 94 0.36 0.25 0.27 0.30 0.24 0.14
Goodwill 3,305 3,305 3,305 3,305 3,305 3,305 6.53 5.06 6.05 6.86 6.27 5.03
Investments-relatedparty 2,930 130 262 295 361 405 5.79 0.20 0.48 0.61 0.68 0.62
Loantosubsidiary 4,516 4,516 – – – – 8.92 6.91 – – – –
Securitydeposits 45 57 61 36 35 29 0.09 0.09 0.11 0.08 0.07 0.04
33,178 46,336 41,188 40,945 43,735 43,027 65.52 70.91 75.39 85.04 82.95 65.51
Current Assets Storesandspareparts 2,310 2,583 3,023 2,904 2,631 2,561 4.56 3.95 5.53 6.03 4.99 3.90
Stock-in-trade 2,947 2,058 1,734 812 829 7,661 5.82 3.15 3.17 1.69 1.57 11.66
Tradedebts 1,851 890 571 153 188 2,624 3.66 1.36 1.05 0.32 0.36 4.00
Otherreceivables 3,583 5,300 6,042 3,174 3,930 9,290 7.08 8.11 11.06 6.59 7.45 14.14
Derivativefinancialinstruments 69 19 – – – – 0.14 0.03 – – – –
Investments 6,513 7,359 1,084 – – – 12.86 11.26 1.98 – – –
Cashandbankbalances 186 796 994 160 1,413 517 0.37 1.22 1.82 0.33 2.68 0.79
17,459 19,005 13,448 7,203 8,992 22,654 34.48 29.09 24.61 14.96 17.05 34.49
50,637 65,341 54,636 48,148 52,727 65,680 100.00 100.00 100.00 100.00 100.00 100.00
Horizontal AnalysisBalance Sheet
Vertical AnalysisBalance Sheet
Rupees(Million) %Change
Dec31, Dec31, Dec31, Dec31, Dec31, Dec31, 2010vs 2011vs 2012vs 2013vs 2014vs 2015vs 2010 2011 2012 2013 2014 2015 2009 2010 2011 2012 2013 2014
Issued,subscribedandpaidupcapital 4,500 4,500 4,500 4,500 4,500 4,500 – – – – – –
Reserves 7,548 5,714 3,432 1,700 1,782 4,389 (25.61) (24.30) (39.94) (50.47) 4.85 146.23
Sharedepositmoney 200 200 – – – – – – (100.00) – – –
Revaluationreserve 2,476 11,942 11,964 11,884 14,491 15,023 – 382.31 0.18 (0.67) 21.93 3.67
14,724 22,356 19,896 18,084 20,773 23,911 (15.00) 51.83 (11.00) (9.11) 14.87 15.11
Non-Current LiabilitiesLongtermfinances 13,372 8,484 4,559 1,466 1,891 4,203 (17.41) (36.55) (46.26) (67.84) 28.97 122.29
Supplier’scredit-secured – – 1,796 1,488 1,100 1,100 – 100.00 (17.15) (26.08) – (100.00
Liabilitiesagainstassetssubjecttofinancelease 218 138 50 – – – 103.74 (36.70) (63.77) (100.00) – –
Payableagainstminingrights – – – – – (100.00) – – – – –
Longtermdeposits 44 48 46 47 48 45 (93.99) 9.09 (4.17) 2.49 1.96 (6.68)
Deferredliabilities 57 91 115 126 116 133 24.57 59.65 26.37 9.98 (8.45) 14.85
Deferredtaxation 5,574 10,967 10,923 9,933 10,187 7,972 12.04 96.75 (0.40) (9.07) 2.56 (21.74)
19,265 21,524 17,181 12,672 13,342 12,353 (12.84) 11.73 (20.18) (26.24) 5.28 (7.41
Current LiabilitiesCurrentportionoflongtermliabilities 4,009 6,335 4,878 3,132 901 1,072 199.40 58.02 (23.00) (35.79) (71.23) 18.96
Financesundermarkuparrangements-secured 4,702 4,644 5,814 4,736 4,637 15,152 (15.37) (1.23) 25.19 (18.54) (2.08) 226.72
PayabletoPrivatizationCommissionofPakistan 2,198 2,198 2,198 2,198 2,198 2,198 – – – (0.00) – –
Shorttermloanfromrelatedparty-secured – – – 3,000 3,000 2,200 – – – – – (26.67)
Tradeandotherpayables 4,458 3,121 3,225 3,989 7,555 8,345 78.96 (29.99) 3.33 23.68 89.42 10.46
Accruedfinancecost 650 677 366 337 320 449 (34.28) 4.15 (45.94) (8.04) (5.07) 40.65
Dividendpayable – 3,755 1,078 – – – – – – (100.00) – –
Provisionfortaxation 631 731 – – – – 396.85 15.85 (100.00) – – –
16,648 21,461 17,559 17,391 18,611 29,416 31.09 28.91 (18.18) (0.95) 7.01 58.06
50,637 65,341 54,636 48,148 52,727 65,680 (2.86) 29.04 (16.38) (11.88) 9.51 24.57
Rupees(Million) %Change
Dec31, Dec31, Dec31, Dec31, Dec31, Dec31, 2010vs 2011vs 2012vs 2013vs 2014vs 2015vs 2010 2011 2012 2013 2014 2015 2009 2010 2011 2012 2013 2014Non-Current AssetsProperty,plantandequipment 21,916 37,937 37,290 37,114 39,909 39,194 2.96 73.10 (1.71) (0.47) 7.53 (1.79)
Assetssubjecttofinancelease 283 230 121 51 – – 91.22 (18.73) (47.39) (58.16) (100.00) –
Intangibles 183 161 149 144 125 94 (11.17) (12.02) (7.45) (3.08) (13.16) (24.81)
Goodwill 3,305 3,305 3,305 3,305 3,305 3,305 – – – 0.00 – –
Investments-relatedparty 2,930 130 262 295 361 405 (62.83) (95.56) 101.54 12.42 22.56 12.09
Loantosubsidiary 4,516 4,516 – – – – 105.65 – (100.00) – – –
Securitydeposits 45 57 61 36.22 35 28.55 164.71 26.67 7.02 (40.63) (4.65) (17.32)
33,178 46,336 41,188 40,945 43,735 43,027 (5.31) 39.66 (11.11) (0.59) 6.81 (1.62)
Current AssetsStoresandspareparts 2,310 2,583 3,023 2,904 2,631 2,561 22.87 11.82 17.03 (3.92) (9.41) (2.66)
Stock-in-trade 2,947 2,058 1,734 812 829 7,661 5.51 (30.17) (15.74) (53.19) 2.18 823.72
Tradedebts 1,851 890 571 153 188 2,624 29.71 (51.92) (35.84) (73.18) 22.62 1,297.23
otherreceivables 3,583 5,300 6,042 3,174 3,930 9,290 (47.42) 47.92 14.00 (47.47) 23.82 136.40
Derivative 69 19 – – – – 762.50 (72.46) (100.00) – – –
Investments 6,513 7,359 1,084 – – – 65.73 12.99 (85.27) (100.00) – –
Cashandbankbalances 186 796 994 160 1,413 517 (20.85) 327.96 24.87 (83.92) 784.32 (63.39)
17,459 19,005 13,448 7,203 8,992 22,654 2.18 8.86 (29.24) (46.44) 24.83 151.94
50,637 65,341 54,636 48,148 52,727 65,680 (2.86) 29.04 (16.38) (11.88) 9.51 24.57
16
ANNUAL REPORT 2015
17

Horizontal AnalysisProfit & Loss
Rupees(Million) %Change
Dec31, Dec31, Dec31, Dec31, Dec31, Dec31, 2010vs 2011vs 2012vs 2013vs 2014vs 2015vs 2010 2011 2012 2013 2014 2015 2009 2010 2011 2012 2013 2014
Sales 18,248 16,701 8,136 7,428 14,248 21,920 9.23 (8.48) (51.28) (8.70) 91.81 53.85
CostofSales (9,051) (7,188) (6,221) (7,143) (12,264) (17,353) (7.61) (20.58) (13.45) 14.82 71.70 41.49
Gross Profit 9,197 9,513 1,915 286 1,984 4,568 33.10 3.44 (79.87) (85.09) 594.68 130.24
AdministrativeExpenses (780) (969) (1,165) (888) (731) (879) 27.87 24.23 20.23 (23.82) (17.67) 20.35
Selling&DistributionExpenses (994) (829) (299) (495) (686) (897) 10.69 (16.60) (63.93) 65.69 38.52 30.65
FinanceCost (3,589) (3,472) (2,610) (1,579) (1,626) (1,677) 13.61 (3.26) (24.83) (39.49) 2.94 3.15
OtherOperatingExpenses (387) (510) (218) (382) (1) (333) 58.61 31.78 (57.25) 75.08 (99.63) 23,190
OtherOperatingIncome 1,409 1,855 1,528 261 1,036 333 311.99 31.65 (17.63) (82.95) 297.47 (67.88)
Operating Profit 4,856 5,588 (849) (2,798) (25) 1,114 107.43 15.07 (115.19) 229.55 (99.12) (4,627.66)
Shareofprofit/(loss)ofassociatedco. (39) (18) – – – – 54.72 (53.85) (100.00) – – –
Re-measurementgain/(loss) (121) 741 (47) – – – (104.22) (712.40) (106.34) (100.00) – –
Profit before Taxation 4,696 6,311 (896) (2,798) (25) 1,114 (9.38) 34.39 (114.20) 212.26 (99.12) (4,627.66)
Taxation (1,464) (1,721) 656 973 (20) 1,345 229.73 17.55 (138.12) 48.29 (102.06) (6,810.44)
Profit after Taxation 3,232 4,590 (240) (1,825) (45) 2,460 (31.79) 42.02 (105.23) 660.45 (97.55) (5,607.61)
Vertical AnalysisProfit & Loss
Rupees(Million) %Change
Dec31, Dec31, Dec31, Dec31, Dec31, Dec31, 2010vs 2011vs 2012vs 2013vs 2014vs 2015vs 2010 2011 2012 2013 2014 2015 2009 2010 2011 2012 2013 2014
Sales 18,248 16,701 8,136 7,428 14,248 21,920 100.00 100.00 100.00 100.00 100.00 100.00
CostofSales (9,051) (7,188) (6,221) (7,143) (12,264) (17,353) (49.60) (43.04) (76.46) (96.16) (86.08) (79.16)
Gross Profit 9,197 9,513 1,915 286 1,984 4,568 50.40 56.96 23.54 3.84 13.92 20.84
AdministrativeExpenses (780) (969) (1,165) (888) (731) (879) (4.27) (5.80) (14.32) (11.95) (5.13) (4.01)
Selling&DistributionExpenses (994) (829) (299) (495) (686) (897) (5.45) (4.96) (3.68) (6.67) (4.82) (4.09)
FinanceCost (3,589) (3,472) (2,610) (1,579) (1,626) (1,677) (19.67) (20.79) (32.08) (21.26) (11.41) (7.65)
OtherOperatingExpenses (387) (510) (218) (382) (1) (333) (2.12) (3.05) (2.68) (5.14) (0.01) (1.52)
OtherOperatingIncome 1,409 1,855 1,528 261 1,036 333 7.72 11.11 18.78 3.51 7.27 1.52
Operating Profit 4,856 5,588 (849) (2,798) (25) 1,114 26.61 33.46 (10.44) (37.67) (0.17) 5.08
Shareofprofit/(loss)ofassociatedco. (39) (18) – – – – (0.21) (0.11) – – – –
Re-measurementgain/(loss) (121) 741 (47) – – – (0.66) 4.44 (0.58) – – –
Profit before Taxation 4,696 6,311 (896) (2,798) (25) 1,114 25.73 37.79 (11.01) (37.67) (0.17) 5.08
Taxation (1,464) (1,721) 656 973 (20) 1,345 (8.02) (10.30) 8.06 13.10 (0.14) 6.14
Profit after Taxation 3,232 4,590 (240) (1,825) (45) 2,460 17.71 27.48 (2.95) (24.57) (0.31) 11.22
18
ANNUAL REPORT 2015
19

Directors’ Report To The Members
OnbehalfoftheBoardofDirectorsofPakarabFertilizersLimited,IpresentherewiththeAnnualReportofyourCompanyandtheauditedfinancialstatementsfortheyearendedDecember31,2015togetherwithauditors’reportthereonandabriefoverviewoffinancialandoperationalperformanceoftheCompany.
Company performance
Year2015wasabetteryearcomparedto2014fortheCompanyduetoRegasifiedLiquefiedNaturalGas(RLNG)suppliesinthecountry.ThefirstLNGcargoimportedinthecountrywaspurchasedbyPFL.RLNGsupplytoPFL’splantwasstartedonApril1,2015andcontinuedtotheendoftheyearresultinginoperationsof267 days in 2015 as compared to 42 daysin2014.TheProductionofCANandNPasapercentageofannualdesignedcapacitywas74%and101%respectively.
ManagementcontinueditsstrategyofdiversifyingtheCompany’srevenuestream.93,285MTofimportedDAPwassoldduringtheyear-2015whichalsocontributedsignificantlytoimprovingthefinancialpositionoftheCompany.
Asummaryoffinancialresultsfortheyear2015comparedwithyear2014isasunder: Rupeesinmillion
Year2015 Year2014
Sales 21,920 14,248GrossProfit 4,568 1,984OtherOperatingIncome 3331,036ProfitfromOperations 3,124 1,601FinanceCost (1,677)(1,626)Profit/(Loss)aftertax 2,460 (45)
Asummaryofconsolidatedfinancialresultsfortheyear2015comparedwithyear 2014 is as under : Rupeesinmillion Year2015Year2014
Sales 23,022 15,656GrossProfit 4,789 2,236FinanceCost (1,713) (1,684)OtherIncome 3331,040Profitaftertax 2,604 77
Appropriationsduringtheyearwereasfollows: Rupeesinmillion FairValue General Un-Appropriated Reserve Reserve Profit/ (accumulatedloss)
Balance as atDecember31,2014 66 2,098 (382)Othercomprehensiveincomefortheyear2015 34 – 113Profitfortheyear2015 – – 2,460 100 2,098 2,191
Performance of wholly owned subsidiary company-Reliance Sacks Limited (RSL)
RelianceSacksLimitedisawhollyownedsubsidiaryofPakarabFertilizersLimited(PFL).Itisprincipallyengagedinthemanufacturingandsaleofpolypropylenesacks,polypropyleneclothandliners.
Thiswasanotheryearwhenpricesof commodities remained volatile especiallythoselinkedwithoilproducts.Thepricesofthepolypropylenegranulesshoweddecreasingtrendandremainedintherangeof1,450US$/MTto960US$/MT.Thisdecreasingtrendwasdue to low oil prices in international market.AverageannualrequirementofPolypropyleneWoven(PPW)bagsofcorporate/organizedsectoris773millionwhereasannualproductioncapacityofPPWsuppliersis1,885million.However,RSLmainlyfocusedonfertilizersectorandselectedsugar,textileandothercompanies.
70%
60%
50%
40%
30%
20%
10%
0%
10%
-20%
-30%
50% 49%
64%
36%
-0.3%
16%14%
11%
-25%
-10%
2009 2010 2011 2012 2013 2014 2015
Profit to sale EBITDA margin
-3%
27%18%
28%
Net Profit & EBITDA Margin
Earning Per Share(Rupeesinmillion)
10.53
7.18
10.2
5.47
(4.15)
(0.53) (0.10)
FY 2009 FY 2010 FY 2011 FY 2012 FY 2013 FY 2014 FY 2015
FinancialresultsofRelianceSacksLimitedfortheyearendedDecember31,2015havebeensummarizedbelow: Rupeesinmillion
Description Yearended Yearended December31, December31, 2015 2014
SalesexcludingGST 1,492 1,584Costofsales (1,271) (1,330)Grossprofit 221 253Adminandsellingexpenses (27) (25)FinancialCharges (36) (58)OtherExpenses (15) (12)Otherincome - 5Profitbeforetaxation 143 163Taxation 2 (41)Profitaftertaxation 145 122
20
ANNUAL REPORT 2015
21

Directors’ Report To The Members
ThesalesintermsofRupeesremainedlowduetodecreaseinthePolypropyleneGranules(PPG)prices,howeverintermsofkgsitincreasedfrom5.084millionKgsto5.268millionKgs.DecreaseingrossprofitismainlyattributedtohigherelectricitycostwhichincreasedbyRs.25million.Financialchargesdecreasedduetopaymentoflongtermfinanceandreductionindiscountrate.Taxationchargeadjustedwithreversalofdeferredtaxprovisionandclubbingofassessmentwithholdingcompanyasasinglefiscalunit.
Manufacturing OverviewPlant Operation with RLNG
Aftersustainingaperiodofmorethanthreeyearsoflowcapacityutilizationandproductivity,PakarabfertilizersbecamethefirstfertilizercompanyinPakistantobeabletostartoperationsonRe-gasifiedLiquidNaturalGas(RLNG).PakarabtakesprideinworkingwiththeGOPinimportofthefirstRLNGshipinMarch2015andresumingitsmanufacturingoperationswitheffect from 1stApril,2015.In2015PFLconsumedthreeLNGships.TheRLNG,duetoeconomicreasons,wasusedinproductionofNPandCANfertilizersalone.
TheplantoperationsweremaintainedsmoothlywithrestrainedcostsandmanninginviewofthehighcostofRLNGascomparedtodomesticgas.
NitrateFertilizersproductionremainedunderpressureduetodamagedNitricAcidlineCrotorwhich,beingveryoldandun-availabilityofspares,hadlongtermfailure.ItisundermaintenanceandwillbeavailabletousagainatendofMarchforfurtheroperations.
PlantsitewitnessedlargeoperationsofproducthandlingduetolowCANfertilizersales/shipments.Tocopewiththissituation,exportofCANfertilizerisbeingexplored.Toenableexports,projectsforalignmentofCANproductqualityhavebeentakenup.CANGranulationprojectisalsounderconsiderationforthispurpose.
Energy Conservation Projects at Pakarab
Sincerawmaterialpriceisveryhighascomparedtodomesticgas,thereisadireneedtotakeupconservationstepstominimizeoperationalcosts.Severalshorttermenergyandwaterconservationprojectswereinitiatedandcompleted.
Completed projects
• UseofsteamcoilsinCNmelttankat NP plant instead of live steam to conservesteam.
• Recoveryofcondensate/heatfromairheater40-2110atNPPlant-Steamconservation
• Partial conversion of vacuum pumps installedatNPplantfromDMWtoRW-Waterconservation
• FueloptimizationatFurnaceofAmmoniaplant-Gasoptimization
• Ammonia Process condensate recoveryproject-Steamconservation
• PGRUexchangerE-102tubebundlereplacement-Ammoniaproductlossreduction
Byimplementationofaboveprojects,therewillbeanetsavingofPKR75millionperannumwithin2016alone.Furthermore,followinglonger/mediumtermCAPEXprojectsarebeingtakenupfor 2016:
a. FeedgaspreheatcoilinAmmoniaPrimary reformer convection section
b. LTStrimcoolerinstallation/upgradeexisting104-Cwithimprovedsizeandmetallurgy.
Raw water quality at site
Overthepastfewyears,aregulardepletioninsubsoilwaterqualitywasexperienced.Tocopewiththisissue,new raw water well was installed at an appropriatelocation.Theinvestmenthasalreadypaidbackinareasonabletimeastheconductivityinrawwatertankdroppedfrom950uS/cmto610uS/
cmonaveragebasiswhichwillreduceoperatingcostofPKR27.34millionperannum.
Manufacturing Overview-Reliance Sacks Limited
RelianceSacksLimitedproduced5.332millionKgs(2014:5.194millionKgs)intapelinesectionandachieved92.10%(2014:89.71%)ofthestandardcapacity.Thecompanyproduced53.28millionbags(2014:55.27millionbags)duringtheyearwhichisinlinewithexpectationsanditvariesaccordingtosizeandweightofbags.Further,thecompanyproduced1.788millionkgsofliners(2014:1.483millionkgs)duringtheyearwhichis87.07%ofthecapacity(2014:90.26%ofcapacity).Duringtheyear,anotherlinermachinewasaddedwithcapacityof1,000kgsperday.
Employee Engagement Activities
TheannualTownHallmeetingwasheldatPakarabFertilizersLimitedandallthe
ManagementEmployeesatPFLwereinvited.ThemainobjectiveoftheTownHallmeetingwastoenabletheseniorleadershiptokeepyoungengineersinformed,engagedandinsyncwithbusinesschallengesandgoals.
Social/CSR Activities
TheCompany and employees donated fundstohelpthefloodvictims.ThisdonationwashandedovertoPakistanArmyforfinaldispersal.AfterthefloodsinandaroundMultan,afreemedicalcampwassetupatShujaAbad,HeadMohammadWallaandMahniSiyalareasnearMultan.About550patientsweretreatedinthesecamps.
Hunar Foundation School
Aspartofitsefforttohelpcommunity,PFLengagedwithHunarFoundation,KarachitobuildatechnicalschoolforlocalpopulationwithinPFLpremises.NecessaryapprovalshavebeenobtainedforthisschoolanditisgoingtobefunctionalfromJuly2016.TheschoolcharterandsyllabuswillbecertifiedbyCity&GuildUK/TEVTA.
Blood Donation Camp
A blooddonationcampwasarrangedwiththesupportofFatimidfoundationandPFLmedicalCentre.Morethan70Employeesdonatedbloodforthechildrensufferingfromthalassemiainthiscamp.
Free Medical Camps
Twofreemedicalcamps(Dental&EyesCheckup)werearrangedforemployeesandtheirfamiliesduringsafetyweek.Employeesandtheirfamilies’participationinthesefreecampswasveryencouraging.Approximately70patientswerecheckedbyDentalsurgeonand67patientswerecheckedbyaneyespecialist.Besidethesefreemedicalcamps,medicalcenteralsoarrangedmanyawarenesscampaigns relatedtohealthofemployees.
600,000
500,000
400,000
300,000
200,000
100,000
0
NP CAN Urea TotalActual
265,3
49
275,5
69
287,9
54
305,1
45
553,3
03
580,7
14
0 0
Budgeted
300
250
200
150
100
50
0
258
00
NP CAN UreaPlanned Actual
266 259265
Production Statistics (MeT)-2015
No of Operating Days-2015
22
ANNUAL REPORT 2015
23

Directors’ Report To The Members
LahoreApril08,2016
Arif HabibChairman
Health Safety and Environment Achievements – 2015.
Completion of 15.0 million Safe Man Hours.
PFLhascompleted15.0millioncombinedsafemanhoursinDecember2015.ThisisthehighestlandmarkeverachievedinPFLhistory.PFLdistributedsafetyawardsforcompletionof14.0millioncombinedsafehoursforallregularandcontractoremployees.
Safety Week Celebration
PFLorganized1steversafetyweekofitshistoryinOctober2015.Theobjectiveofthesafetyweekwastoensureemployees’engagementandownershipinCompanyHealth,safetyandenvironmentprogram.Safetyawareness of employees was raised throughdifferentinteractingsessionslikePPEsawareness,housekeepingdrive,SCBAdonning,SafetyCommitmentBoard,MSDS,PSMquiz,SafetyGalaetc.Responseofthesafetyweekwasveryencouragingastherewerenoinjuriesafterthatin2015.RepresentativesfromCorporateHSEandsistercompaniesofFatimagroupalsoparticipatedinsafetyweekandappraisedtheevent.
IFA Protect and sustainable product Stewardship Award
PFLhasreceivedprotectandsustainableproductstewardshipawardbyIFAbyscoring74%marks.It’samatterofgreathonorthatPFListhe1st ever company underFatimagrouptoachieveIFAcertificationinASIA.IFAauditwasconductedbyM/SSGS.PFLarranged1st,2ndpartyauditsbeforefinalaudit.
Green Office Certification
PFLhassuccessfullyachievedgreenofficecertificationbyscoring75%scoreinopeningaudit.ThisisthehighestscoreachievedbyanycompanyinopeningauditinPakistan.PFLselectedthreeKPIs(Paper,ElectricityandMixedwastereduction)andreductiontargetof5%wassetfor2015.SuccessfulauditwasconductedbyWWFPakistaninDecember2015.
British Safety Council Award
PFLreceivedtheBritishsafetycouncilawardin2015again.Thisisthe5th consecutiveBritishsafetycouncilawardwonbyPFLwhichdepictsdedication,devotionandcommitmentofPFLtopmanagementandstafffornourishinghealth,safetyandenvironmentculture.PFLachieved56marksoutof60.
GO Live - SMIS Modules
FivemodulesofSafetymanagementinformationsystem(SMIS)includingManagementsafetyaudit,weeklyfiredrill,quarterlyemergencydrill,SOCMOMsandIncidentinvestigationand recommendation module were launchedatsite.Trainingsessionswerearrangedforallemployeesbeforelaunch.
IFA Hard Hat campaign
PFLparticipatedinhardhatcampaignorganizedbyinternationalfertilizerassociation(IFA)inApril2015.Awarenessdrivewasinitiatedatsite.HardhatsnapwasalsopastedonIFAsite.
Code of Corporate Governance
TheBoardandmanagementarecommittedtoensurethattherequirementsoftheCodeofCorporateGovernancearefullymet.Thoughitisnotapplicablebeinganon-listedcompanybuttheCompanyisvoluntarilycomplyingtheCode.TheCompanyhasadoptedgoodCorporateGovernancepracticeswithanaimtoenhancetheaccuracy,comprehensivenessandtransparencyoffinancialandnon-financialinformation.Pursuanttoandinvoluntarilycompliancewithclause(xvi)oftheCodeofCorporateGovernance,theDirectorsarepleasedtoreportthat:
a) Thefinancialstatements,preparedbythemanagementoftheCompany,presentitsstateofaffairsfairly,theresultofitsoperations,cashflowsandchangesinequity;
b) ProperbooksofaccountoftheCompanyhavebeenmaintained;
c) Appropriateaccountingpolicieshavebeenconsistentlyappliedinpreparationoffinancialstatementsandaccountingestimatesarebasedonreasonableandprudentjudgment;
d) InternationalFinancialReportingStandards,asapplicableinPakistan,havebeenfollowedinthepreparationoffinancialstatements;
e) Thesystemofinternalcontrolissoundindesignandhasbeeneffectively implemented and monitored;and
f) TherearenosignificantdoubtsupontheCompany’sabilitytocontinueasagoingconcern.
Board and Committees’ Meetings and Attendance
Duringtheyearunderreview,sixmeetingsoftheBoardofDirectorsandfourmeetingsoftheAuditCommitteewereheldfromJanuary01,2015toDecember31,2015.TheattendanceoftheBoardandCommitteememberswasas follows:
NameofDirector Board Audit Meetings Committee Meetings
Mr.ArifHabib 5 N/AMr.FawadAhmedMukhtar 6 N/AMr.FazalAhmedSheikh 5 3Mr.FaisalAhmedMukhtar 1 N/AMr.RehmanNaseem 5 3Mr.AbdusSamad 3 N/AMr.MuhammadKashifHabib 4 4Mr.NasimBeg 3 4
TheleaveofabsencewasgrantedtothemembersnotattendingtheBoardandCommitteemeetings.
Pattern of Shareholding
ThedetailedpatternoftheshareholdingandcategoriesofshareholdersoftheCompanyasatDecember31,2015havebeenAnnexedherewith.
Trading in Shares of the Company by Directors and Executives
ThesharesoftheCompanyarenotlistedonanystockexchangesotheDirectors,CEO,CFO,CompanySecretaryandtheirspousesandminorchildrendidnotcarryoutanytradeinthesharesoftheCompany.
Financial Highlights
KeyoperatingandfinancialdataofpreviousyearshasbeenAnnexedherewith.
Post Balance Sheet Events
Therehavebeennomaterialpostbalancesheeteventsthatwouldrequiredisclosureoradjustmenttothesefinancialstatements.
Contribution to National Exchequer and Economy
TheCompany’scontributiontotheNationalExchequerbywayoftaxes,levies,excisedutyandsalestaxamountstoRs.3,144millionasagainstRs.3,150millionlastyear.
Statement as to the Value of Investments of Provident and Gratuity Funds
ThefundedretirementbenefitsoftheemployeesoftheCompanyareauditedatregularintervalsandareadequatelycoveredbyappropriateinvestments.ThevalueoftheinvestmentsofthetwoprovidentfundsandgratuityfundaggregatedtoRs.400.696Millions.Accordingtoactuarialvaluation,fairvalueoftheassetsofthefundeddefinedbenefitgratuityplanforbothmanagementandnon-managementstaffisRs.136.175Millionason31st December2015.
Audit Committee
TheAuditCommitteeoftheBoardcontinued to perform its duties and responsibilitieseffectivelyasperitstermsofreferencedulyapprovedbytheBoard.Thecommitteecompositionanditstermsofreferencehavealsobeenattachedtothisreport.
Code of Conduct
AspertheCorporateGovernanceguidelines,theCompanyhasprepareda Code of Conduct and communicated throughouttheCompanyapartfromplacingitontheCompany’swebsite.
Auditors
M/sA.F.Ferguson&CompanyCharteredAccountantsLahore,retiringauditorsoftheCompany,beingeligibleofferthemselvesforre-appointment.TheBoardAuditCommitteeandtheBoardofDirectorshaverecommendedtheirre-appointmentbytheshareholdersatthe43rdAnnualGeneralMeeting,asauditorsoftheCompanyfortheyearendingDecember31,2016atafeetobemutuallyagreed.
Future Outlook
GiventheGovernment’scommitmenttoimportLNG,PFLexpectstobeabletocontinueitsoperationsonRLNGfortheforeseeablefuture.LNGpricesareexpectedtoreducein2016whichwilltranslatedirectlytobottomlineoftheCompany.ImprovedperformancecanbeexpectedgiventhedeclineinpricesintheinternationalmarketforLNG.
Acknowledgements
TheBoardplacesonrecorditsgratitudeforthehardworkanddedicationofeveryemployeeoftheCompany.TheBoardalsoappreciatesandacknowledgestheassistance,guidanceandcooperationofallstakeholdersincludingtheGovernmentofPakistan,financialinstitutions,commercialbanks,businessassociates,customersandallotherswhoseeffortsandcontributionsstrengthenedtheCompany.
ForandonbehalfofBoard
24
ANNUAL REPORT 2015
25

Statement of Compliancewith the code of corporate Governance for the year ended December 31, 2015
Attachment to The Directors’ Reportto all members of the Company
ThisstatementisbeingpresentedtovoluntarilycomplywiththeCodeofCorporateGovernance(CCG)forthepurposeofestablishingaframeworkofgoodgovernance,wherebyalistedcompanyismanagedincompliancewiththebestpracticesofcorporategovernance.
TheCompanyhasappliedtheprinciplescontainedintheCCGinthefollowingmanner:
1. TheCompanyencouragestherepresentationofindependentnon-executive directors and directors representingminorityinterestsonitsboardofdirectors.CurrentlythereisnoindependentdirectorontheBoardastheCompanyisvoluntarilycomplyingwiththeCCG.TheCompanyhasalsoconductedannualevaluationoftheBoard’sownperformance.Atpresenttheboardincludes:
Category Names
ExecutiveDirectors 1.MrFawadAhmedMukhtar 2.MrFazalAhmedSheikhNon-ExecutiveDirectors 1.MrArifHabib 2.MrNasimBeg 3.MrFaisalAhmedMukhtar 4.RehmanNaseem 5.MrMuhammadKashifHabib 6.MrAbdusSamad
2. Thedirectorshaveconfirmedthatnoneofthemisservingasadirectoronmorethansevenlistedcompanies.
3. AlltheresidentdirectorsoftheCompanyareregisteredastaxpayersandnoneofthemhasdefaultedinpaymentofanyloantoabankingCompany,aDFIoranNBFIor,beingamemberofastockexchange,hasbeendeclaredasadefaulterbythatstockexchange.
4. NocasualvacancyoccurredontheBoardduringtheyear.
5. TheCompanyhasprepareda“CodeofConduct”andhasensuredthatappropriatestepshavebeentakentodisseminateitthroughouttheCompanyalongwithitssupportingpoliciesandprocedures.
Place:LahoreDate:April08,2016
Fawad Ahmed MukhtarChiefExecutiveOfficer
DearSir/Madam,
ABSTRACT OF THE TERMS OF APPOINTMENT UNDER SECTION 218 OF THE COMPANIES ORDINANCE, 1984
Inpursuanceofsection218oftheCompaniesOrdinance,1984,thisistoinformyouthattheBoardofDirectorsoftheCompanyonDecember31,2015hasreappointedMr.FawadAhmedMukhtarasChiefExecutiveOfficeroftheCompanyforthenextthreeyearscommencingfromJanuary01,2016toDecember31,2018withoutanyremuneration.TheChiefExecutiveOfficershallbeentitledtoalltherightsandprivilegesandsubjecttoalltheliabilitiesoftheofficeoftheChiefExecutive.TheChiefExecutiveshallcarryonthedaytodaybusinessandaffairsoftheCompanyinconsultationwiththeBoardofDirectorsinaccordancewiththeprovisionsoftheMemorandumandArticlesofAssociationoftheCompany.
MEMORANDUM UNDER SECTION 218 OF THE COMPANIES ORDINANCE, 1984
Mr.FawadAhmedMukhtarisconcerned/interestedinhisappointmenttotheextentmentionedaboveanduptotheextentofhisshareholding/directorshipinPakarabFertilizersLimited.Nootherdirectorsareconcerned/interestedinthisrespect.
6. Theboardhasdevelopedavision/missionstatement,overallcorporatestrategyandsignificantpoliciesoftheCompany.A complete record of particulars of significantpoliciesalongwiththedatesonwhichtheywereapprovedoramendedhasbeenmaintained.
7. Allthepowersoftheboardhavebeendulyexercisedanddecisionsonmaterialtransactions,includingappointment and determination of remuneration and terms and conditions of employmentoftheCEO,otherexecutiveandnon-executivedirectors,havebeentakenbytheboard.
8. ThemeetingsoftheboardwerepresidedoverbytheChairmanandtheboardmetatleastonceineveryquarter.Writtennoticesoftheboardmeetings,alongwithagendaandworkingpapers,were circulated at least seven days beforethemeetingsexceptinthecaseofanemergencymeetingheldonJune24,2015inwhichcasethenoticeperiodisreduced.Theminutesofthemeetingswere appropriately recorded and circulated.
9. Theboardarrangedin-houseonetrainingprogramforitsdirectorsduringtheyeartoacquaintthemwiththeCode.
10. TheBoardhasapprovedappointmentofChiefFinancialOfficer(CFO),CompanySecretary and Head of Internal Audit includingtheirremunerationandtermsandconditionsofemployement.ThereisnonewappointmentofCFO,CompanySecretary and Head of Internal Audit duringtheyear.
11. Thedirectors’reportforthisyearhasbeenpreparedincompliancewiththerequirementsoftheCCGandfullydescribesthesalientmattersrequiredtobedisclosed.
12. ThefinancialstatementsoftheCompanyweredulyendorsedbyCEOandCFObeforeapprovaloftheboard.
13. Thedirectors,CEOandexecutivesdonotholdanyinterestinthesharesoftheCompanyotherthanthatdisclosedinthepatternofshareholding.
14. TheCompanyhascompliedwithallthecorporateandfinancialreportingrequirementsoftheCCG.
15. TheboardhasformedanAuditCommittee.Itcomprisesfourmembers,ofwhomthreearenon-executivedirectorsandthechairmanofthecommitteeisanon-executivedirector.
16. ThemeetingsoftheauditcommitteewereheldatleastonceeveryquarterpriortoapprovalofinterimandfinalresultsoftheCompanyandasrequiredbytheCCG.Thetermsofreferenceofthecommitteehavebeenformedandadvisedtothecommitteeforcompliance.
17. TheboardhasformedanHRandRemunerationCommittee.Itcomprisesfourmembers,allofwhomarenon-executivedirectorsandthechairmanofthecommitteeisanon-executivedirector.
18. TheboardhassetupaneffectiveinternalauditfunctionwhichisconsideredsuitablyqualifiedandexperiencedforthepurposeandareconversantwiththepoliciesandproceduresoftheCompany.
19. ThestatutoryauditorsoftheCompanyhaveconfirmedthattheyhavebeengivenasatisfactoryratingunderthequalitycontrolreviewprogramoftheICAP,thattheyoranyofthepartnersofthefirm,theirspousesandminorchildrendonotholdsharesoftheCompanyandthatthefirmandallitspartnersareincompliancewithInternationalFederationofAccountants(IFAC)guidelinesoncodeofethicsasadoptedbytheICAP.
20. ThestatutoryauditorsorthepersonsassociatedwiththemhavenotbeenappointedtoprovideotherservicesexceptinaccordancewiththelistingregulationsandtheauditorshaveconfirmedthattheyhaveobservedIFACguidelinesinthisregard.
21. WeconfirmthatallothermaterialprinciplesenshrinedintheCCGhavebeencompliedwith.
26
ANNUAL REPORT 2015
27

FINANCIALSTATEMENTSOF
fortheyearendedDecember31,2015
Thepageisleftintentionallyblank
28
ANNUAL REPORT 2015

Review Report To The MembersOn Statement of Compliance with Best Practices of Code of Corporate Governance
Wehave reviewed the StatementofCompliancewith thebestpracticescontained in theCodeofCorporateGovernancepreparedbytheBoardofDirectorsofPakarabFertilizersLimited(the‘company’)tovoluntarilycomplywiththeListingRegulationNo.35oftheKarachiStockExchangeLimited,wherethecompanywaspreviouslylisted.
The responsibility forcompliancewith theCodeofCorporateGovernance (the ‘Code’) is thatof theBoardofDirectorsofthecompany.Ourresponsibilityistoreview,totheextentwheresuchcompliancecanbeobjectivelyverified,whethertheStatementofCompliancereflectsthestatusofthecompany’scompliancewiththeprovisionsof theCodeofCorporateGovernanceand report if itdoesnot.A review is limitedprimarily to inquiriesof thecompanypersonnelandreviewofvariousdocumentspreparedbythecompanytocomplywiththeCode.
Aspartofourauditoffinancial statementsweare requiredtoobtainanunderstandingof theaccountingandinternalcontrolsystemssufficienttoplantheauditanddevelopaneffectiveauditapproach.WearenotrequiredtoconsiderwhethertheBoard’sstatementoninternalcontrolcoversallrisksandcontrols,ortoformanopinionontheeffectivenessofsuchinternalcontrols,thecompany’scorporategovernanceproceduresandrisks.
TheCoderequiresthecompanytoplacebeforetheBoardofDirectorsfortheirconsiderationandapprovalrelatedpartytransactionsdistinguishingbetweentransactionscarriedoutontermsequivalenttothosethatprevailinarm’slengthtransactionsandtransactionswhicharenotexecutedatarm’s lengthpricerecordingproper justificationforusingsuchalternatepricingmechanism.Further,allsuchtransactionsarealsorequiredtobeseparatelyplacedbeforetheauditcommittee.WeareonlyrequiredandhaveensuredcomplianceofrequirementtotheextentofapprovalofrelatedpartytransactionsbytheBoardofDirectorsandplacementofsuchtransactionsbeforetheauditcommittee.Wehavenotcarriedoutanyprocedurestodeterminewhethertherelatedpartytransactionswereundertakenatarm’slengthpriceornot.
Based on our review, nothing has come to our attention which causes us to believe that the Statement ofCompliance does not appropriately reflect the company’s compliance, in all material respects, with the bestpracticescontained in theCodeofCorporateGovernanceasapplicable to thecompany for theyearendedDecember31,2015.
Further,wehighlighttheinstanceofnon-compliancewiththerequirementoftheCodeasreflectedintheparagraph1ofthestatementofcompliancewhichstatesthat:
1. ThecompanydoesnothaveanindependentdirectorontheBoardasit isvoluntarilycomplyingwiththeCode;and
2. Thecompanyis intheprocessofannualevaluationoftheBoard’sownperformanceasthesamehasnotbeenconductedduringtheyear.
A.F.Ferguson&Co.CharteredAccountants
Lahore,April08,2016
EngagementPartner:MuhammadMasood
Auditors’ Report to the Members
WehaveauditedtheannexedbalancesheetofPakarabFertilizersLimited(Company)asatDecember31,2015,andtherelatedprofitandlossaccount,statementofcomprehensiveincome,cashflowstatementandstatementofchanges inequity togetherwith thenotes formingpart thereof, for theyear thenendedandwe state thatwehaveobtainedall the informationandexplanationswhich, to thebestofour knowledgeandbelief,werenecessaryofthepurposesofouraudit.
It istheresponsibilityofthecompany’smanagementtoestablishandmaintainasystemof internalcontrolandprepareandpresenttheabovesaidstatementsinconformitywiththeapprovedaccountingstandardsandtherequirementsoftheCompaniesOrdinance.1984.
Ourresponsibilityistoexpressanopiniononthestatementsbasedonouraudit.
Weconductedouraudit inaccordancewith theauditing standardsasapplicable inPakistan These standardsrequire that we plan and perform the audit to obtain reasonable assurance about whether the above saidstatementarefreeofanymaterialmisstatement.
An audit includes examining on a test basis, evidence supporting the amounts and disclosures in the abovesaid statements. An audit also includes assessing the accounting policies and significant estimates made bymanagement,aswellas,evaluatingtheoverallpresentationoftheabovesaidstatements.Webelievethatourauditprovidesareasonablebasisforouropinionand,afterdueverification,wereportthat:
(a) Inouropinionproperbooksofaccounthavebeenkeptbythecompanyasrequiredbythecompaniesordinance,1984.
(b) In our opinion:
(i) The balance sheet and profit and loss account togetherwith the notes thereon have been drawn up inconformitywiththecompaniesordinance,1984,andareinagreementwiththebooksofaccountandarefurtherinaccordancewithaccountingpoliciesconsistentlyapplied;
(ii) Theexpenditureincurredduringtheyearwasforthepurposeofthecompany’sbusiness;and
(iii) Thebusinessconducted,investmentsmadeandtheexpenditureincurredduringtheyearwereinaccordancewiththeobjectsofthecompany;
(c) Inouropinionandtothebestofourinformationandaccordingtotheexplanationsgiventous,thebalancesheet,profitandlossaccount,statementofcomprehensiveincome,cashflowstatementandstatementofchangesinequitytogetherwiththenotesformingpartthereofconformwithapprovedaccountingstandardsasapplicableinPakistan,andgivetheinformationrequiredbytheCompaniesOrdinance,1984,inthemannersorequiredandrespectivelygiveatrueandfairviewofthestateofthecompany’saffairsasatDecember31,2015andoftheloss,totalcomprehensiveloss,itscashflowsandchangesinequityfortheyearthenended;and
(d) Inouropinion,noZakatwasdeductibleatsourceundertheZakatandUshrOrdinance,1980(XVIIIof1980)
A.F.Ferguson&Co.
CharteredAccountants
Lahore,April08,2016
EngagementPartner:MuhammadMasood
30
ANNUAL REPORT 2015
31

Note 2015 2014 (Rupeesinthousand)
EQUITY AND LIABILITIES
SHARE CAPITAL AND RESERVES Authorisedsharecapital 1,000,000,000(2014:1,000,000,000) ordinarysharesofRs10each 10,000,000 10,000,000
Issued,subscribedandpaidupsharecapital 450,000,000(2014:450,000,000) ordinarysharesofRs10each 5 4,500,000 4,500,000Reserves 6 4,388,510 1,782,308
8,888,510 6,282,308
SURPLUS ON REVALUATION OF OPERATING FIXED ASSETS 7 15,022,831 14,491,103 NON-CURRENT LIABILITIES Longtermfinances-secured 8 1,970,139 1,064,882Longtermloansfromrelatedparties-unsecured 9 2,232,952 825,968Importbillpayable-secured 10 – 1,100,000Longtermdeposits 11 44,860 48,070Deferredliabilities 12 132,980 115,789Deferredtaxation 13 7,972,085 10,187,240
12,353,016 13,341,949CURRENT LIABILITIESCurrentportionoflongtermloans 8 1,072,022 901,189Shorttermborrowingfromrelatedparty-secured 14 2,200,000 3,000,000Shorttermborrowings-secured 15 15,151,614 4,637,446PayabletoPrivatizationCommissionofPakistan 16 2,197,901 2,197,901Tradeandotherpayables 17 8,345,123 7,555,283Accruedfinancecost 18 449,423 319,531 29,416,083 18,611,350 CONTINGENCIES AND COMMITMENTS 19 65,680,440 52,726,710
Theannexednotes1to46formanintegralpartofthesefinancialstatements.
Balance Sheetas at December 31, 2015
ChiefExecutive Director
Note 2015 2014 (Rupeesinthousand)
ASSETS
NON-CURRENT ASSETS
Property,plantandequipment 20 39,194,084 39,908,940Assetssubjecttofinancelease 21 – –Intangibleassets 22 94,289 125,399Goodwill 23 3,305,163 3,305,163Longterminvestments 24 404,630 360,998Securitydeposits 28,554 34,534
43,026,720 43,735,034
CURRENT ASSETS
Storesandspareparts 25 2,560,963 2,631,027Stock-in-trade 26 7,660,745 829,332Tradedebts 27 2,624,200 187,814Advances,deposits,prepaymentsandotherreceivables 28 9,290,354 3,930,048Cashandbankbalances 29 517,458 1,413,455 22,653,720 8,991,676
65,680,440 52,726,710
32
ANNUAL REPORT 2015
33
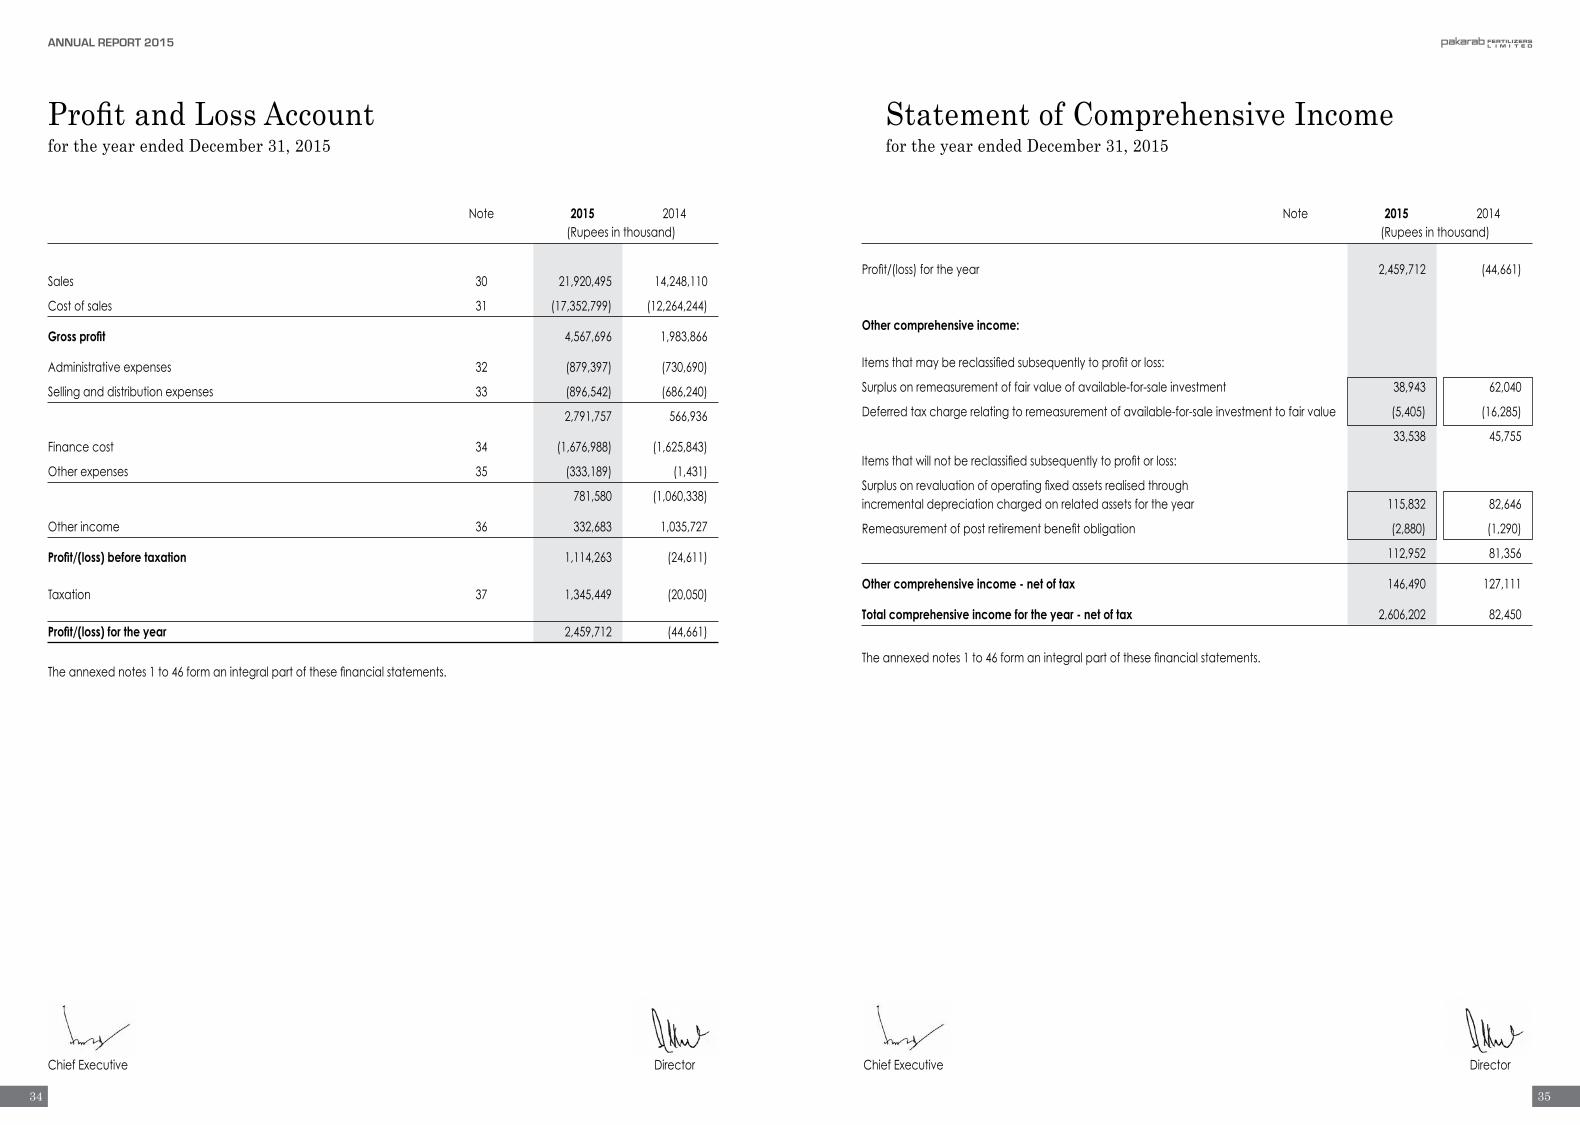
Profit and Loss Accountfor the year ended December 31, 2015
Statement of Comprehensive Incomefor the year ended December 31, 2015
ChiefExecutive Director ChiefExecutive Director
Note 2015 2014 (Rupeesinthousand)
Sales 30 21,920,495 14,248,110
Costofsales 31 (17,352,799) (12,264,244)
Gross profit 4,567,696 1,983,866
Administrativeexpenses 32 (879,397) (730,690)
Sellinganddistributionexpenses 33 (896,542) (686,240)
2,791,757 566,936
Financecost 34 (1,676,988) (1,625,843)
Otherexpenses 35 (333,189) (1,431)
781,580 (1,060,338)
Otherincome 36 332,683 1,035,727
Profit/(loss) before taxation 1,114,263 (24,611)
Taxation 37 1,345,449 (20,050)
Profit/(loss) for the year 2,459,712 (44,661)
Theannexednotes1to46formanintegralpartofthesefinancialstatements.
Note 2015 2014 (Rupeesinthousand)
Profit/(loss)fortheyear 2,459,712 (44,661)
Other comprehensive income:
Itemsthatmaybereclassifiedsubsequentlytoprofitorloss:
Surplusonremeasurementoffairvalueofavailable-for-saleinvestment 38,943 62,040
Deferredtaxchargerelatingtoremeasurementofavailable-for-saleinvestmenttofairvalue (5,405) (16,285)
33,538 45,755
Itemsthatwillnotbereclassifiedsubsequentlytoprofitorloss:
Surplusonrevaluationofoperatingfixedassetsrealisedthroughincrementaldepreciationchargedonrelatedassetsfortheyear 115,832 82,646
Remeasurementofpostretirementbenefitobligation (2,880) (1,290)
112,952 81,356
Other comprehensive income - net of tax 146,490 127,111
Total comprehensive income for the year - net of tax 2,606,202 82,450
Theannexednotes1to46formanintegralpartofthesefinancialstatements.
34
ANNUAL REPORT 2015
35

Statement of Changes In Equityfor the year ended December 31, 2015
(Rupees in thousand)
Capital Revenue reserves reserve
(Accumulated loss) / un Share Fair value General appropriated capital reserve reserve profit Total
Balance as on January 1, 2014 4,500,000 20,284 2,098,313 (418,739) 6,199,858
Lossfortheyear – – – (44,661) (44,661)
Othercomprehensiveincomefortheyear-netoftax – 45,755 – 81,356 127,111
Total comprehensive income for the year – 45,755 – 36,695 82,450
Balance as on December 31, 2014 4,500,000 66,039 2,098,313 (382,044) 6,282,308
Profitfortheyear – – – 2,459,712 2,459,712
Othercomprehensiveincomefortheyear-netoftax – 33,538 – 112,952 146,490
Total comprehensive income for the year – 33,538 – 2,572,664 2,606,202
Balance as on December 31, 2015 4,500,000 99,577 2,098,313 2,190,620 8,888,510 Theannexednotes1to46formanintegralpartofthesefinancialstatements.
ChiefExecutive Director ChiefExecutive Director
Cash Flow Statementfor the year ended December 31, 2015
Note 2015 2014 (Rupeesinthousand)
Cash flows from operating activities
Cash(usedin)/generatedfromoperations 38 (8,122,881) 4,920,789Financecostpaid (1,546,614) (1,510,738)Taxespaid (892,265) (549,182)Retirementbenefitspaid (43,661) (49,587)Securitydeposits-net 2,770 (14,600)
Net cash (outflow)/inflow from operating activities (10,602,651) 2,796,682
Cash flows from investing activities
Purchaseofproperty,plantandequipment (38,600) (42,476)Purchaseofintangibleassets (607) (10,654)Saleproceedsofproperty,plantandequipmentdisposed 26,602 373,027Investmentsmade – (227)Profitonbankdepositsreceived 62,299 24,857
Net cash inflow from investing activities 49,694 344,527
Cash flows from financing activities
Repaymentofredeemablecapital – (1,625,000)Proceedsfromlongtermloansacquired 2,000,000 500,000Proceedsfromlongtermloansacquiredfromrelatedparties 2,003,707 825,968Proceedsfromshorttermborrowingacquiredfromrelatedparty 500,000 –Repaymentoflongtermloans (901,192) (1,468,206)Repaymentoflongtermloansfromrelatedparties (596,723) –Paymentofimportbillpayable (2,539,800) –Paymentoffinanceleaseliabilities – (21,602)Repaymentofshorttermborrowingfromrelatedparty (1,300,000) –Paymentofinitialtransactioncostonlongtermloanacquired (23,200) –
Net cash outflow from financing activities (857,208) (1,788,840)
Net (decrease)/increase in cash and cash equivalents (11,410,165) 1,352,369
Cash and cash equivalents at the beginning of the year (3,223,991) (4,576,360)Cash and cash equivalents at the end of the year 39 (14,634,156) (3,223,991)
Theannexednotes1to46formanintegralpartofthesefinancialstatements.
36
ANNUAL REPORT 2015
37

Notesto and forming part of the Financial Statements for the year ended December 31, 2015
1. The company and its activities
PakarabFertilizersLimited(‘company’)wasincorporatedasaprivatelimitedcompanyinPakistanundertheCompaniesAct,1913,(nowCompaniesOrdinance,1984).Thecompany’sstatuschangedtoanon-listedpubliccompanyfromJune7,2007.Thecompany’sTermFinanceCertificateswerelistedattheKarachiStockExchangeLimited(nowmergedasPakistanStockExchangeLimited)duringtheperiodfromMarch2008toMarch2013.Thereafterthecompanyisanon-listedpubliccompany.ItisprincipallyengagedinthemanufacturingandsaleofchemicalfertilizersandgenerationandsaleofCertifiedEmissionReductions(‘CERs’).TheaddressoftheregisteredofficeofthecompanyisE-110,Khayaban-e-Jinnah,LahoreCanttwhileitsmanufacturingfacilityislocatedinMultan.
Thesefinancialstatementsaretheseparatefinancialstatementsofthecompany.Consolidatedfinancialstatementsarepreparedseparately.
2. Basis of preparation
2.1 These financial statements havebeenprepared in accordancewith approvedaccounting standards as applicable in Pakistan.Approvedaccounting standards compriseof such International Financial Reporting Standards (‘IFRS’) issuedby the InternationalAccountingStandardsBoard(‘IASB’)andIslamicFinancialAccountingStandards(‘IFAS’)issuedbyInstituteofCharteredAccountantsofPakistanasarenotifiedundertheCompaniesOrdinance,1984,provisionsofanddirectivesissuedundertheCompaniesOrdinance,1984.WherevertherequirementsoftheCompaniesOrdinance,1984ordirectivesissuedbySecuritiesandExchangeCommissionofPakistan(‘SECP’)differwiththerequirementsofIFRSorIFAS,therequirementsoftheCompaniesOrdinance,1984ortherequirementsofthesaiddirectivesprevail.
2.2 Duringtheyear,SECPhasmadeamendmentsintheFifthScheduletotheCompaniesOrdinance,1984,throughSRO928(I)/2015datedSeptember10,2015.Theseamendmentsrelatetothechangesmadeintheclassificationofnon-listedcompaniesforthepurposeofpreparationoftheirfinancialstatements.Undertheseamendments,thecompanyfallsunderthedefinitionofa‘LargeSizedCompany’.Further,throughSRO929(I)/2015datedSeptember10,2015,SECPhasdirectedlargesizedcompaniesasclassifiedundertheamendedFifthScheduletotheCompaniesOrdinance,1984,tofollowapplicablefinancialandaccountingreportingstandards.Asaresultoftheseamendments,thecompanyisrequiredtofollowIFRSsasissuedbyIASBandasnotifiedbySECPforannualaccountingperiodsbeginningonorafterJanuary01,2015i.e.fromthestartofcurrentfinancialyear.However,suchamendmentsdonothaveanyimpactonthecompany’sfinancialstatementsasthecompanywasalreadyfollowingtherequiredframework.
2.3 Initial application of standards, amendments or an interpretation to existing standards
The followingamendments toexistingstandardshavebeenpublishedthatareapplicable to thecompany’sfinancial statementscoveringannualperiods,beginningonorafterthefollowingdates:
2.3.1 Standards, amendments and interpretations to approved accounting standards that are effective in current year
Certain standards, amendments and interpretations to approved accounting standards are effective for accounting periodsbeginningonJanuary1,2015butareconsiderednottoberelevantortohaveanysignificanteffectonthecompany’soperationsandare,therefore,notdetailedinthesefinancialstatements,exceptforthefollowing:
-IFRS13‘Fairvaluemeasurement’.Thestandardaimstoimproveconsistencyandreducecomplexitybyprovidingaprecisedefinitionof fairvalueandasinglesourceof fairvaluemeasurementanddisclosure requirements foruseacross IFRSs. The requirementsdonotextendtheuseoffairvalueaccountingbutprovideguidanceonhowitshouldbeappliedwhereitsuseisalreadyrequiredorpermittedbyotherstandardswithinIFRSs.Thestandardonlyaffectsthedisclosuresinthecompany’sfinancialstatments.
- IAS27 (revised) ‘Separatefinancial statements’. This standard replaces thecurrent IAS27 ‘ConsolidatedandSeparateFinancialStatements’(asamendedin2008)andincludestheprovisionsonseparatefinancialstatementsthatareleftafterthecontrolprovisionsofIAS27havebeenincludedinthenewIFRS10.Thecompany’scurrentaccountingtreatmentisalreadyinlinewiththerequirementsofthisstandard.
2.3.2 Standards, amendments and interpretations to existing standards that are not yet effective and have not been early adopted by the company
There are certain standards, amendments to the approved accounting standards and interpretations that are mandatory forcompanieshavingaccountingperiodsbeginningonorafterJanuary1,2016butareconsiderednottoberelevantortohaveanysignificanteffectonthecompany’soperationsandare,therefore,notdetailedinthesefinancialstatements,exceptforthefollowing:
-IAS27(Amendments),‘Separatefinancialstatements’areapplicableonaccountingperiodsbeginningonorafterJanuary1,2016.Theseprovideentitiestheoptiontousetheequitymethodtoaccountfor investments insubsidiaries, jointventuresandassociatesintheirseparatefinancialstatements.ThecompanyshallapplytheseamendmentsfromJanuary1,2016andhasnotyetevaluatedwhetheritshallchangeitsaccountingpolicytoavailthisoption.
3. Basis of measurement
3.1 Thesefinancialstatementshavebeenpreparedunderthehistoricalcostconventionasmodifiedbytherevaluationofoperatingfixedassetsandcertainfinancialinstrumentsatfairvalueandrecognitionofcertainemployeeretirementbenefitsatpresentvalue.
3.2 Critical accounting estimates and judgments
Thecompany’ssignificantaccountingpoliciesarestatedinnote4.Notallofthesesignificantpoliciesrequirethemanagementtomakedifficult,subjectiveorcomplexjudgmentorestimates.Thefollowingisintendedtoprovideanunderstandingofthepoliciesthemanagementconsiderscriticalbecauseoftheircomplexity, judgmentofestimation involvedintheirapplicationandtheir impactonthesefinancialstatements.Estimatesandjudgmentsarecontinuallyevaluatedandarebasedonhistoricalexperience,includingexpectationsoffutureeventsthatarebelievedtobereasonableunderthecircumstances.Thesejudgmentsinvolveassumptionsorestimatesinrespectoffutureeventsandtheactualresultsmaydifferfromtheseestimates.
a) Employee retirement benefits
Thecompanyusesthevaluationperformedbyanindependentactuaryasthepresentvalueofitsretirementbenefit obligations.Thevaluationisbasedonassumptionsasmentionedinnote4.2.
b) Provision for taxation
Thecompanytakesintoaccountthecurrentincometaxlawandthedecisionstakenbyappellateauthorities.Instanceswherethecompany’sviewdiffersfromtheviewtakenbytheincometaxdepartmentattheassessmentstageandwherethecompanyconsidersthatitsviewsonitemsofmaterialnatureisinaccordancewithlaw,theamountsareshownascontingentliabilities.
c) Useful lives and residual values of property, plant and equipment
Thecompanyreviewstheuseful livesandresidualvaluesofproperty,plantandequipmentonregularbasis.Anychangeinestimates infutureyearsmightaffectthecarryingamountsoftherespectiveitemsofproperty,plantandequipmentwithacorrespondingeffectonthedepreciationchargeandimpairment.
d) Estimated impairment of goodwill
Thecompanytestsannuallywhethergoodwillhassufferedanyimpairment,inaccordancewiththeaccountingpolicystatedinnote4.7.Therecoverableamountsofcash-generatingunitshavebeendeterminedbasedonvalue-in-usecalculations.Thesecalculationsrequiretheuseofestimates(note23).
e) Revaluation surplus on operating fixed assets
Certain operating fixed assets are carried under the revaluation model as per International Accounting Standard (‘IAS’)16 ‘Property,PlantandEquipment’as stated innote4.3.1.Revaluation iscarriedoutwithsufficient regularity toensure thatthecarryingamountofassetsdoesnotdiffermateriallyfromtheir fairvalue.Revaluedamounthasbeendeterminedbyanindependentprofessionalvalueronthebasisofpresentmarketvalue(note7).
f) Fair value of investment in subsidiary
Thefairvalueofinvestmentinsubsidiaryisdeterminedbyusingvaluationtechniques.Thecompanyusesitsjudgmenttoselectavarietyofmethodsandmakeassumptionsthataremainlybasedonmarketconditionsexistingattheendofeachreportingperiod.Thecompanyhasuseddiscountedcashflowanalysisforthispurpose(note24.1).
4. Significant accounting policies
Thesignificantaccountingpoliciesadoptedinthepreparationofthesefinancialstatementsaresetoutbelow.Thesepolicieshavebeenconsistentlyappliedtoallyearspresented.
4.1 Taxation
Incometaxcomprisescurrentanddeferredtax.Incometaxisrecognizedintheprofitandlossaccountexcepttotheextentthatitrelatestoitemsrecognizeddirectlyinequity,inwhichcaseitisrecognizeddirectlyinequity.
38
ANNUAL REPORT 2015
39

Current
Provisionofcurrenttaxisbasedonthetaxableincomefortheyeardeterminedinaccordancewiththeprevailinglawfortaxationofincome.Thechargeforcurrenttaxiscalculatedusingprevailingtaxratesortaxratesexpectedtoapplytotheprofitfortheyearifenacted.Thechargeforcurrenttaxalsoincludesadjustments,whereconsiderednecessary,toprovisionfortaxmadeinpreviousyearsarisingfromassessmentsframedduringtheyearforsuchyears.
Thecompanyanditssubsidiary,RelianceSacksLimited(together‘theGroup’)haveoptedforGrouptaxationundersection59AAoftheIncomeTaxOrdinance,2001.
Deferred
Deferredtaxisaccountedforusingthebalancesheetliabilitymethodinrespectofalltemporarydifferencesarisingfromdifferencesbetween the carrying amount of assets and liabilities in the financial statements and the corresponding tax bases used in thecomputationofthetaxableprofit.However,thedeferredtaxisnotaccountedforifitarisesfrominitialrecognitionofanassetorliabilityinatransactionotherthanabusinesscombinationthatatthetimeoftransactionneitheraffectsaccountingnortaxableprofitorloss.Deferredtaxliabilitiesaregenerallyrecognizedforalltaxabletemporarydifferencesanddeferredtaxassetsarerecognizedtotheextentthatitisprobablethattaxableprofitswillbeavailableagainstwhichthedeductibletemporarydifferences,unusedtaxlossesandtaxcreditscanbeutilised.
Deferredtaxliabilitiesareprovidedontaxabletemporarydifferencesarisingfrominvestmentsinsubsidiaries,exceptfordeferredtax
liabilitywherethetimingofthereversalofthetemporarydifferenceiscontrolledbythecompanyanditisprobablethatthetemporarydifferencewillnotreverseintheforeseeablefuture.Deferredtaxassetsarerecognisedondeductibletemporarydifferencesarisingfrominvestments insubsidiariesonlytotheextentthatit isprobablethetemporarydifferencewill reverseinthefutureandthereissufficienttaxableprofitavailableagainstwhichthetemporarydifferencecanbeutilised.
Deferredtaxiscalculatedattheratesthatareexpectedtoapplytotheperiodwhenthedifferencesreversebasedontaxratesthat
havebeenenactedorsubstantivelyenactedbythebalancesheetdate.Deferredtaxischargedorcreditedintheprofitandlossaccount,exceptinthecaseofitemscreditedorchargedtoothercomprehensiveincomeorequityinwhichcaseitisincludedinothercomprehensiveincomeorequity.
4.2 Employee retirement benefits
Themainfeaturesoftheschemesoperatedbythecompanyforitsemployeesareasfollows:
(a) Defined benefit plan - Gratuity
Thecompanyoperatesanapprovedfundeddefinedbenefitgratuityplanforallpermanentemployeeshavingaserviceperiodofmorethanthreeyearsforexecutivesandsixmonthsforworkersandotherstaff.Provisionsaremadeinthefinancialstatementstocoverobligationsonthebasisofactuarialvaluationscarriedoutannually.ThemostrecentvaluationwascarriedoutasatDecember31,2015usingthe“ProjectedUnitCreditMethod”.
Theactualreturnonplanassetsrepresentsthedifferencebetweenthefairvalueofplanassetsatthebeginningoftheyearandasat
theendoftheyearafteradjustmentsforcontributionsmadebythecompanyasreducedbybenefitspaidduringtheyear.
Theamountrecognizedinbalancesheetrepresentsthepresentvalueofthedefinedbenefitobligationasreducedbythefairvalueoftheplanassets.
Actuarialgainsand lossesarising fromexperienceadjustmentsandchanges inactuarialassumptionsarechargedorcredited toequityinothercomprehensiveincomeintheyearinwhichtheyarise.Pastservicecostsarerecognizedimmediatelyintheprofitandlossaccount.
Thefuturecontributionrateoftheplanincludesallowancesfordeficitandsurplus.ProjectedUnitCreditMethod,usingthefollowingsignificantassumptions,isusedforvaluationofthisscheme:
Discountrate 9%p.a. Expectedrateofincreaseinsalarylevelperannum 8%p.a. Durationofplan(years) 9 Expectedmortalityrate SLIC(2001-2005)mortality table(setback1year)
(b) Defined contribution plan - Provident Fund
Thereisanapproveddefinedcontributoryprovidentfundforallpermanentemployees.Equalmonthlycontributionsaremadebothbythecompanyandemployeestothefundattherateof8.33percentofsalaryfortheexecutivesand10percentofsalaryfortheworkers.
(c) Accumulating compensated absences
Thecompanyprovidesforaccumulatingcompensatedabsences,whentheemployeesrenderservicesthatincreasetheirentitlementtofuturecompensatedabsences.Undertheservicerules,workersandnormalstaffmembersareentitledto18daysleaveperyear.Theleavepolicyformanagementemployeesisasfollows:
Service in the company Annual Leaves Lessthan5Years 18 Lessthan5Years(WorkingonShiftDuties) 22 Morethan5Years 25 Morethan5Years(WorkingonShiftDuties) 29
TheunutilizedAnnualLeavecanbeaccumulateduptoamaximumof2yearsofAnnualLeaves.Anemployeewillbeentitledtoencashtheaccumulatedannualleavesatthetimeofleavingcompanyservice.
Provisionsaremadeannuallytocovertheobligationforaccumulatingcompensatedabsencesbasedonactuarialvaluationandarechargedtoprofitandlossaccount.ThemostrecentvaluationwascarriedoutasatDecember31,2015usingthe“ProjectedUnitCreditMethod”.
Theamountrecognisedinthebalancesheetrepresentsthepresentvalueofthedefinedbenefitobligation.Actuarialgainsandlossesarechargedtotheprofitandlossaccountimmediatelyintheperiodwhentheseoccur.
Projectedunitcreditmethod,usingthefollowingsignificantassumptions,hasbeenusedforvaluationofaccumulatingcompensatedabsences:
Discountrate 9%p.a. Expectedrateofincreaseinsalarylevelperannum 8%p.a. Expectedmortalityrate SLIC(2001-2005)mortality table(setback1year)
4.3 Property, plant and equipment
4.3.1 Operating fixed assets
Operatingfixedassetsexcept freehold land,buildingson freehold land, railway siding,plantandmachineryand toolsandotherequipmentarestatedatcostlessaccumulateddepreciationandanyidentifiedimpairmentloss.Freeholdlandisstatedatrevaluedamountlessanyidentifiedimpairmentlosswhilebuildingsonfreeholdland,railwaysiding,plantandmachineryandtoolsandotherequipmentarestatedatrevaluedamountlessaccumulateddepreciationandanyidentifiedimpairmentloss.Revaluationiscarriedoutwith sufficient regularity toensure that thecarryingamountofassetsdoesnotdiffermaterially fromtheir fairvalue.Revaluedamounthasbeendeterminedbyanindependentprofessionalvaluer.Anyaccumulateddepreciationatthedateofrevaluationiseliminatedagainstthegrosscarryingamountoftheasset,andthenetamountisrestatedtotherevaluedamountoftheasset.Costinrelationtootheroperatingfixedassetssignifieshistoricalcost,gainsandlossestransferredfromothercomprehensiveincomeonqualifyingcashflowhedgesasreferredtoinnote4.12.
Notesto and forming part of the Financial Statements for the year ended December 31, 2015
40
ANNUAL REPORT 2015
41

Increasesinthecarryingamountsarisingonrevaluationofoperatingfixedassetsarecreditedtosurplusonrevaluationofoperatingfixedassets.Decreases thatoffsetprevious increasesof the sameassetsarechargedagainst this surplus,allotherdecreasesarechargedtoprofitor loss.Eachyear thedifferencebetweendepreciationbasedon revaluedcarryingamountsof theassets (thedepreciationchargedtotheprofitorloss)anddepreciationbasedontheassets’originalcostistransferredfromsurplusonrevaluationofoperatingfixedassetstoothercomprehensiveincome.Alltransfersto/fromsurplusonrevaluationofoperatingfixedassetsarenetofapplicabledeferredtaxation.
Depreciationonoperatingfixedassetsischargedtoprofitorlossonthefollowingmethodsandratessoastowriteoffthedepreciableamountofanassetoveritsestimatedusefullifeaftertakingintoaccounttheirresidualvalues:
Asset category Annual depreciation rate Buildingsonfreeholdland Straightline 3.99to5.13% Buildingsonleaseholdland -do- 10% Railwaysiding -do- 26% Aircraft -do- 10%to10.08% Furnitureandfixtures -do- 10%to26.09% Toolsandotherequipment(otherthanfactoryequipment) -do- 10%to50% Vehicles -do- 20% Plantandmachinery Unitsofproduction Toolsandotherequipment(factoryequipment) -do- Catalyst -do-
The assets’ residual values and useful lives are reviewed, at each financial year end, andadjusted if impact on depreciation issignificant.
Anasset’scarryingamountiswrittendownimmediatelytoitsrecoverableamountiftheasset’scarryingamountisgreaterthanitsestimatedrecoverableamount(note4.5).
Subsequentcostsare included in theasset’s carryingamountor recognisedasa separateasset,asappropriate, onlywhen it isprobablethatfutureeconomicbenefitsassociatedwiththeitemwillflowtothecompanyandthecostoftheitemcanbemeasuredreliably.Allotherrepairandmaintenancecostsarechargedtoincomeduringtheperiodinwhichtheyareincurred.
Thegainor lossondisposalor retirementofanasset representedby thedifferencebetweenthesaleproceedsandthecarryingamountoftheassetisrecognisedasanincomeorexpense.
4.3.2 Capital work-in-progress
Capitalwork-in-progressisstatedatcostlessanyidentifiedimpairmentloss.Allexpenditureconnectedwithspecificassetsincurredduringinstallationandconstructionperiodarecarriedundercapitalwork-in-progress.Thesearetransferredtooperatingfixedassetsasandwhentheseareavailableforuse.
4.3.3 Major spare parts and stand-by equipment
Majorsparepartsandstand-byequipmentqualifyasproperty,plantandequipmentwhenanentityexpectstousethemduringmorethanoneyear.Transfersaremadetooperatingassetscategoryasandwhensuchitemsareavailableforuse.
4.4 Intangible assets
4.4.1 Computer software
Expenditureincurredtoacquirecomputersoftwareiscapitalisedasintangibleassetandstatedatcostlessaccumulatedamortisationandanyidentifiedimpairmentloss.Computersoftwareisamortisedusingthestraightlinemethodoveraperiodoffouryears.
Anasset’scarryingamountiswrittendownimmediatelytoitsrecoverableamountiftheasset’scarryingamountisgreaterthanitsestimatedrecoverableamount(note4.5).
4.4.2 Mining rights
Expenditureincurredtoacquireminingrightsiscapitalisedasintangibleassetandstatedatcostlessaccumulatedamortisationandanyidentifiedimpairmentloss.Miningrightsareamortisedusingthestraightlinemethodoveraperiodoftenyears.
Anasset’scarryingamountiswrittendownimmediatelytoitsrecoverableamountiftheasset’scarryingamountisgreaterthanitsestimatedrecoverableamount(note4.5).
4.5 Impairment of non-financial assets
Assetsthathaveanindefiniteusefullife-forexample,goodwillorintangibleassetsnotreadytouse-arenotsubjecttoamortisationandaretestedannuallyforimpairment.Assetsthataresubjecttoamortisationarereviewedforimpairmentwhenevereventsorchangesincircumstancesindicatethatthecarryingamountmaynotberecoverable.Animpairmentlossisrecognisedfortheamountbywhichtheasset’scarryingamountexceedsitsrecoverableamount.Therecoverableamountisthehigherofanasset’sfairvaluelesscoststosellandvalueinuse.Forthepurposesofassessingimpairment,assetsaregroupedatthelowestlevelsforwhichthereareseparatelyidentifiablecashflows(cash-generatingunits).Non-financialassetsotherthangoodwillthatsufferedanimpairmentarereviewedforpossiblereversaloftheimpairmentateachreportingdate.
4.6 Leases
Thecompanyisthelessee.
4.6.1 Finance leases
Leaseswherethecompanyhassubstantiallyalltherisksandrewardsofownershipareclassifiedasfinanceleases.Atinceptionfinanceleasesarecapitalisedatthelowerofpresentvalueofminimumleasepaymentsundertheleaseagreementsandthefairvalueoftheassets.
Therelatedrentalobligations,netoffinancecharges,areincludedinliabilitiesagainstassetssubjecttofinancelease.Theliabilitiesareclassifiedascurrentandlongtermdependinguponthetimingofthepayment.
Each lease payment is allocated between the liability and finance charges so as to achieve a constant rate on the balanceoutstanding.Theinterestelementoftherentalischargedtoprofitorlossovertheleaseterm.
Assetsacquiredunderafinanceleasearedepreciatedovertheusefullifeoftheassetonastraight-linemethodattheratesgiveninnote21.Depreciationofleasedassetsischargedtoprofitorloss.
4.6.2 Operating leases
Leaseswhereasignificantportionoftherisksandrewardsofownershipareretainedbythelessorareclassifiedasoperatingleases.Paymentsmadeunderoperatingleases(netofanyincentivesreceivedfromthelessor)arechargedtoprofitorlossonastraight-linebasisovertheleaseterm.
4.7 Goodwill
Goodwillrepresentstheexcessofthecostofacquisitionoverthefairvalueoftheidentifiableassetsandliabilitiesofthecompany,byRelianceExports(Private)Limitedatthedateofacquisitioni.e.July14,2005.
GoodwillistestedannuallyforimpairmentandcarriedatitscarryingvalueasatJune30,2007lessanyidentifiedimpairmentlosses.Impairmentlossesongoodwillarenotreversed.
4.8 Investments
Investmentsintendedtobeheldforlessthantwelvemonthsfromthebalancesheetdateortobesoldtoraiseoperatingcapital,areincludedincurrentassets,allotherinvestmentsareclassifiedasnon-current.Managementdeterminestheappropriateclassificationofitsinvestmentsatthetimeofthepurchaseandre-evaluatessuchdesignationonaregularbasis.
4.8.1 Investment in equity instruments of subsidiary
Investmentsinequityinstrumentsofsubsidiaryaredesignateduponinitialrecognitionas‘financialassetsatfairvaluethroughprofitorloss’or‘available-for-salefinancialassets’.Incaseoffinancialassetsatfairvaluethroughprofitorloss,theseareinitiallyrecognizedat fair valuewhile incaseofavailable-for-sale financialassets, theseare initially recognizedat fair valueandassociateddirectlyattributableacquisitioncosts.Subsequently,thesearemeasuredatfairvalueunlessincaseofavailable-for-salefinancialassetswhosefairvaluecannotbemeasuredreliably,thesearecarriedatcost.Forinvestmentshavingquotedpriceinactivemarket,thequotedpricerepresentsthefairvalue.Inothercases,fairvalueismeasuredusingappropriatevaluationmethodology.
Notesto and forming part of the Financial Statements for the year ended December 31, 2015
42
ANNUAL REPORT 2015
43

Notesto and forming part of the Financial Statements for the year ended December 31, 2015
Gainsandlossesonsubsequentre-measurementsoffinancialassetsatfairvaluethroughprofitorlossareincludedintheprofitandlossaccountwhilethoseonre-measurementofavailable-for-salefinancialassetsareincludedinothercomprehensiveincome.Wheninvestmentsclassifiedasavailable-for-saleare soldor impaired, theaccumulated fairvalueadjustments recognized inequityareincludedintheprofitandlossaccount.
ThecompanyisrequiredtoissueconsolidatedfinancialstatementsalongwithitsseparatefinancialstatementsinaccordancewiththerequirementsofIAS27‘ConsolidatedandSeparateFinancialStatements’.
Ateachbalancesheetdate,thecompanyreviewsthecarryingamountsoftheinvestmentsinsubsidiariestoassesswhetherthereisanyindicationthatsuchinvestmentshavesufferedanimpairmentloss.Ifanysuchindicationexists,therecoverableamountisestimatedinordertodeterminetheextentoftheimpairmentloss,ifany.Inmakinganestimateofrecoverableamountoftheseinvestments,themanagementconsidersfuturedividendstreamandanestimateoftheterminalvalueoftheseinvestments.Impairmentlossesarerecognisedasexpenseintheprofitandlossaccount.
Investments in subsidiaries, that sufferedan impairment,are reviewed forpossible reversalof impairmentateach reportingdate.Impairment lossesrecognisedintheprofitandlossaccountoninvestments insubsidiariesandassociatesarereversedthroughtheprofitandlossaccount.
4.8.2 Investments in equity instruments of associate Investments inassociateswherethecompanyhassignificant influencearemeasuredatcost inthecompany’sseparatefinancial
statements.
Thecompanyisrequiredtoissueconsolidatedfinancialstatementsalongwithitsseparatefinancialstatements,inaccordancewiththerequirementsofIAS27‘ConsolidatedandSeparateFinancialStatements’.Investmentsinassociates,intheconsolidatedfinancialstatements,arebeingaccountedforusingtheequitymethod.
Ateachbalancesheetdate,thecompanyreviewsthecarryingamountsoftheinvestmentsinassociatestoassesswhetherthereisanyindicationthatsuchinvestmentshavesufferedanimpairmentloss.Ifanysuchindicationexists,therecoverableamountisestimatedinordertodeterminetheextentoftheimpairmentloss,ifany.Inmakinganestimateofrecoverableamountoftheseinvestments,themanagementconsidersfuturestreamofcashflowsandanestimateoftheterminalvalueoftheseinvestments.Impairmentlossesarerecognisedasexpenseintheprofitandlossaccount.
4.9 Financial assets
4.9.1 Classification
Thecompanyclassifiesitsfinancialassetsinthefollowingcategories:atfairvaluethroughprofitorloss,loansandreceivables,available-for-saleandheldtomaturity.Theclassificationdependsonthepurposeforwhichthefinancialassetswereacquired.Managementdeterminestheclassificationofitsfinancialassetsatthetimeofinitialrecognition.
a) Financial assets at fair value through profit or loss
Financialassetsat fairvalue throughprofitor lossarefinancialassetsheld for tradingandfinancialassetsdesignatedupon initialrecognitionasatfairvaluethroughprofitorloss.Derivativesarealsocategorisedasheldfortradingunlesstheyaredesignatedashedges.Afinancialassetisclassifiedasheldfortradingifacquiredprincipallyforthepurposeofsellingintheshortterm.Assetsinthiscategoryareclassifiedascurrentassetsifexpectedtobesettledwithintwelvemonths,otherwise,theyareclassifiedasnon-current.
b) Loans and receivables
Loansand receivablesarenon-derivative financialassetswith fixedordeterminablepayments thatarenotquoted inanactivemarket.Theyareincludedincurrentassets,exceptformaturitiesgreaterthantwelvemonthsafterthebalancesheetdate,whichareclassifiedasnon-currentassets.Loansandreceivablescomprisesecuritydeposits,tradedebts,loans,advances,depositsandotherreceivablesandcashandcashequivalentsinthebalancesheet.
c) Available-for-sale financial assets
Available-for-salefinancialassetsarenon-derivativesthatareeitherdesignatedinthiscategoryornotclassifiedinanyoftheothercategories.Theyareincludedinnon-currentassetsunlessmanagementintendstodisposeoftheinvestmentswithintwelvemonthsfromthebalancesheetdate.
d) Held to maturity
Financialassetswithfixedordeterminablepaymentsandfixedmaturity,wheremanagementhastheintentionandabilitytoholdtillmaturityareclassifiedasheldtomaturityandarestatedatamortisedcost.
4.9.2 Recognition and measurement
Allfinancialassetsarerecognisedatthetimewhenthecompanybecomesapartytothecontractualprovisionsoftheinstrument.Regularpurchasesandsalesofinvestmentsarerecognisedontrade-date–thedateonwhichthecompanycommitstopurchaseorselltheasset.Financialassetsareinitiallyrecognisedatfairvalueplustransactioncostsforallfinancialassetsnotcarriedatfairvaluethroughprofitorloss.Financialassetscarriedatfairvaluethroughprofitorlossareinitiallyrecognisedatfairvalueandtransactioncostsareexpensedintheprofitandlossaccount.Financialassetsarederecognisedwhentherightstoreceivecashflowsfromtheassetshaveexpiredorhavebeentransferredandthecompanyhastransferredsubstantiallyalltherisksandrewardsofownership.Available-for-salefinancialassetsandfinancialassetsat fairvaluethroughprofitor lossaresubsequentlycarriedat fairvalue.Available-for-salefinancialassetsarecarriedatcostincasefairvaluecannotbemeasuredreliably.Loansandreceivablesandheld-to-maturityinvestmentsarecarriedatamortisedcostusingtheeffectiveinterestratemethod.
Gainsorlossesarisingfromchangesinthefairvalueofthe‘financialassetsatfairvaluethroughprofitorloss’categoryarepresentedintheprofitandlossaccountintheperiodinwhichtheyarise.Dividendincomefromfinancialassetsatfairvaluethroughprofitorlossisrecognisedintheprofitandlossaccountaspartofotherincomewhenthecompany’srighttoreceivepaymentsisestablished.
Changesinthefairvalueofsecuritiesclassifiedasavailable-for-salearerecognisedinothercomprehensiveincome.Whensecuritiesclassifiedasavailable-for-salearesoldorimpaired,theaccumulatedfairvalueadjustmentsrecognisedinequityareincludedintheprofitand lossaccountasgainsand losses from investmentsecurities. Interestonavailable-for-salesecuritiescalculatedusing theeffectiveinterestmethodisrecognisedintheprofitandlossaccount.Dividendsonavailable-for-saleequityinstrumentsarerecognisedintheprofitandlossaccountwhenthecompany’srighttoreceivepaymentsisestablished.
Thecompanyassessesateachbalancesheetdatewhetherthereisobjectiveevidencethatafinancialassetoragroupoffinancialassetsis impaired.Ifanysuchevidenceexistsforavailable-for-salefinancialassets,thecumulativelossisremovedfromequityandrecognisedintheprofitandlossaccount.Impairmentlossesrecognisedintheprofitandlossaccountonequityinstrumentsarenotreversedthroughtheprofitandlossaccount.Impairmenttestingoftradedebtsandotherreceivablesisdescribedinnote4.15.
4.10 Financial liabilities
Allfinancialliabilitiesarerecognisedatthetimewhenthecompanybecomesapartytothecontractualprovisionsoftheinstrument.
Afinancial liability isderecognisedwhentheobligationundertheliability isdischargedorcancelledorexpired.Whereanexistingfinancialliabilityisreplacedbyanotherfromthesamelenderonsubstantiallydifferentterms,orthetermsofanexistingliabilityaresubstantiallymodified,suchanexchangeormodificationistreatedasaderecognitionoftheoriginalliabilityandtherecognitionofanewliability,andthedifferenceinrespectivecarryingamountsisrecognisedintheprofitandlossaccount.
4.11 Offsetting of financial assets and financial liabilities
Financialassetsandfinancialliabilitiesareoffsetandthenetamountisreportedinthefinancialstatementsonlywhenthereisalegallyenforceablerighttosetofftherecognizedamountandthecompanyintendseithertosettleonanetbasisortorealizetheassetsandtosettletheliabilitiessimultaneously.
4.12 Derivative financial instruments
Theseareinitiallyrecordedatcostonthedateaderivativecontractisenteredintoandareremeasuredtofairvalueatsubsequentreportingdates.Themethodofrecognizingtheresultinggainorlossdependsonwhetherthederivativeisdesignatedasahedginginstrument,andifso,thenatureoftheitembeinghedged.Thecompanydesignatescertainderivativesascashflowhedges.
Thecompanydocumentsattheinceptionofthetransactiontherelationshipbetweenthehedginginstrumentsandhedgeditems,aswellasitsriskmanagementobjectiveandstrategyforundertakingvarioushedgetransactions.Thecompanyalsodocumentsitsassessment,bothathedgeinceptionandonanongoingbasis,ofwhetherthederivativesthatareusedinhedgingtransactionsarehighlyeffectiveinoffsettingchangesincashflowofhedgeditems.
Theeffectiveportionofchangesinthefairvalueofderivativesthataredesignatedandqualifyascashflowhedgesisrecognizedinothercomprehensive income.Thegainor loss relatingtothe ineffectiveportion is recognized immediately intheprofitand lossaccount.
Amountsaccumulatedinothercomprehensiveincomearerecognisedinprofitandlossaccountintheperiodswhenthehedgeditemwillaffectprofitorloss.However,whentheforecasthedgedtransactionresultsintherecognitionofanon-financialassetoraliability,thegainsandlossespreviouslydeferredinothercomprehensiveincomearetransferredfromothercomprehensiveincomeandincludedintheinitialmeasurementofthecostoftheassetorliability.Thechangesinfairvaluere-measurementofderivativeswhichthecompanyhasnotdesignatedasahedginginstrumentarerecognisedintheprofitandlossaccount.Tradingderivativesareclassifiedasacurrentassetorliability.
44
ANNUAL REPORT 2015
45

Notesto and forming part of the Financial Statements for the year ended December 31, 2015
4.13 Stores and spare parts
Thesearevaluedatweightedaveragecostexcept for items in transitwhicharestatedat invoicevalueplusotherchargespaidthereontillthebalancesheetdate.Foritemswhichareslowmovingand/oridentifiedasobsolete,adequateprovisionismadeforanyexcessbookvalueoverestimatedrealisablevalue.Thecompanyreviewsthecarryingamountofstoresandsparesonaregularbasisandprovisionismadeforobsolescence.
4.14 Stock-in-trade
Allstocksarevaluedatthelowerofcostandnetrealizablevalue.Costinrelationtorawandpackingmaterialsandgoodspurchasedforresale,exceptforthoseintransit,signifiesweightedaveragecostandthatrelatingtomidproductsandownmanufacturedfinishedgoods,annualaveragecostcomprisingcostofdirectmaterials,labourandappropriatemanufacturingoverheads.
Materialsintransitarestatedatcostcomprisinginvoicevalueplusotherchargesincurredthereon.
Netrealizablevaluesignifiestheestimatedsellingpriceintheordinarycourseofbusinesslesscostsnecessarilytobeincurredinordertomakethesale.Provisionismadeinthefinancialstatementsforobsoleteandslowmovingstock-in-tradebasedonmanagementestimate.
4.15 Trade debts and other receivables
Tradedebtsandotherreceivablesarerecognisedinitiallyatinvoicevalue,whichapproximatesfairvalue,andsubsequentlymeasuredatamortisedcostusingtheeffectiveinterestmethod,lessprovisionfordoubtfuldebts.Aprovisionfordoubtfuldebtsisestablishedwhenthereisobjectiveevidencethatthecompanywillnotbeabletocollectalltheamountdueaccordingtotheoriginaltermsofthereceivable.Significantfinancialdifficultiesofthedebtors,probabilitythatthedebtorwillenterbankruptcyorfinancialreorganisation,anddefaultordelinquencyinpaymentsareconsideredindicatorsthatthetradedebtisimpaired.Theprovisionisrecognisedintheprofitandlossaccount.Whenatradedebtisuncollectible,itiswrittenoffagainsttheprovision.Subsequentrecoveriesofamountspreviouslywrittenoffarecreditedtotheprofitandlossaccount.
4.16 Cash and cash equivalents
Cashandcashequivalents includescash inhand,depositsheldatcallwithbanks,other short-termhighly liquid investmentswithoriginalmaturitiesofthreemonthsorless,andbankoverdrafts/shorttermborrowings.
4.17 Borrowings
Borrowingsarerecognisedinitiallyatfairvalue,netoftransactioncostsincurred.Borrowingsaresubsequentlystatedatamortisedcost,anydifferencebetweentheproceeds(netoftransactioncosts)andtheredemptionvalueisrecognisedintheprofitandlossaccountovertheperiodoftheborrowingsusingtheeffectiveinterestmethod.Financecostsareaccountedforonanaccrualbasisandarereportedunderaccruedfinancecoststotheextentoftheamountremainingunpaid.
Borrowingsareclassifiedascurrentliabilitiesunlessthecompanyhasanunconditionalrighttodefersettlementoftheliabilityforatleasttwelvemonthsafterthebalancesheetdate.
4.18 Trade and other payables
Tradeandotherpayablesare recognised initiallyat fair valueand subsequentlymeasuredatamortisedcostusing theeffectiveinterestmethod.Exchangegainsandlossesarisingontranslationinrespectofliabilitiesinforeigncurrencyareaddedtothecarryingamountoftherespectiveliabilities.
4.19 Provisions
Provisionsarerecognizedwhenthecompanyhasapresentlegalorconstructiveobligationasaresultofpastevents,itisprobablethatanoutflowofresourcesembodyingeconomicbenefitswillberequiredtosettletheobligationandareliableestimateoftheamountcanbemade.Provisionsarenotrecognisedforfutureoperatinglosses.
Where there are a number of similar obligations, the likelihood that an outflow shall be required in settlement is determined byconsideringtheclassofobligationsasawhole.Aprovisionisrecognisedevenifthelikelihoodofanoutflowwithrespecttoanyoneitemincludedinthesameclassofobligationsmaybesmall.
Provisionsaremeasuredatthepresentvalueoftheexpendituresexpectedtoberequiredtosettletheobligationusingapre-taxratethatreflectscurrentmarketassessmentsofthetimevalueofmoneyandtherisksspecifictotheobligation.Theincreaseintheprovisionduetopassageoftimeisrecognisedasinterestexpense.
4.20 Foreign currency transactions and translation
a) Functional and presentation currency
Itemsincludedinthefinancialstatementsofthecompanyaremeasuredusingthecurrencyoftheprimaryeconomicenvironmentinwhichthecompanyoperates(thefunctionalcurrency).ThefinancialstatementsarepresentedinPakRupees,whichisthecompany’sfunctionalandpresentationcurrency.
b) Transactions and balances
Allmonetaryassetsandliabilities inforeigncurrenciesaretranslatedintoPakRupeesatexchangeratesprevailingatthebalancesheetdate.TransactionsinforeigncurrenciesaretranslatedintoPakRupeesatexchangeratesprevailingatthedateoftransaction.Non-monetaryassetsandliabilitiesthataremeasuredintermsofhistoricalcostinaforeigncurrencyaretranslatedintoPakRupeesatexchangeratesprevailingatthedateoftransaction.Non-monetaryassetsand liabilitiesdenominated in foreigncurrencythatarestatedatfairvaluearetranslatedintoPakRupeesatexchangeratesprevailingatthedatewhenfairvaluesaredetermined.Exchangegainsandlossesareincludedinprofitandlossaccount.
4.21 Borrowing Costs
Generalandspecificborrowingcostsdirectlyattributabletotheacquisition,constructionorproductionofqualifyingassets,whichareassetsthatnecessarilytakeasubstantialperiodoftimetogetreadyfortheirintendeduseorsale,areaddedtothecostofthoseassets,untilsuchtimeastheassetsaresubstantiallyreadyfortheirintendeduseorsale.Investmentincomeearnedonthetemporaryinvestmentof specificborrowingspending theirexpenditureonqualifyingassets isdeducted fromtheborrowingcostseligible forcapitalisation.Allotherborrowingcostsarerecognisedinprofitorlossintheperiodinwhichtheyareincurred.
4.22 Revenue recognition
Revenueisrecognisedwhenitisprobablethattheeconomicbenefitswillflowtothecompanyandtherevenuecanbemeasuredreliably.Revenueismeasuredatthefairvalueoftheconsiderationreceivedorreceivableonthefollowingbasis:
-Revenuefromsaleoffertilizerproductsisrecognizedondispatchtocustomers.
-RevenuefromsaleofCERsisrecognisedonthegenerationoftheEmissionReductionswhenafirmcommitmentforsaleofCERsexistswithabuyer.
-Returnondepositsisaccruedonatimeproportionbasisbyreferencetotheprincipaloutstandingandtheapplicablerateofreturn.
-Dividend incomeandentitlementofbonus sharesare recognisedwhen the right to receive suchdividendandbonus shares isestablished.
-Governmentsubsidyonsaleoffertilizerisrecognisedwhentherighttoreceivesuchsubsidyhasbeenestablishedandtheunderlyingconditionsaremet.
4.23 Share capital
Ordinarysharesareclassifiedasequityandrecognisedattheirfacevalue.Incrementalcostsdirectlyattributabletotheissueofnewsharesareshowninequityasadeduction,netoftax.
4.24 Dividend
Dividenddistributiontothecompany’smembersisrecognisedasaliabilityintheperiodinwhichthedividendsareapproved.
46
ANNUAL REPORT 2015
47
Notesto and forming part of the Financial Statements for the year ended December 31, 2015
2015 2014 (Rupeesinthousand)
Openingbalance-netoftax 14,491,103 11,884,336 Revaluationsurplusduringtheyear -note20.1 – 3,055,295 Deferredtaxonrevaluationsurplus -note13 647,560 (365,882) Surplustransferredtoothercomprehensiveincomeforthe yearonaccountofincrementaldepreciation-netoftax (115,832) (82,646)
Closingbalance-netoftax -note7.1 15,022,831 14,491,103
7.1 IncludessurplusonrevaluationoffreeholdlandamountingtoRs5,865.66million(2014:Rs5,865.66million).
2015 2014 (Rupeesinthousand)
8. Long term finances - secured Redeemablecapital -note8.1 – – Longtermloans -note8.2 3,042,161 1,966,071 3,042,161 1,966,071 Currentportionshownundercurrentliabilities -notes8.1&8.2 (1,072,022) (901,189) 1,970,139 1,064,882
8.1 Redeemable capital ThisrepresentsPrivatelyPlacedTermFinanceCertificates(‘PPTFCs’)thatwereredeemedlastyear.
2015 2014 (Rupeesinthousand)
Opening balance – 1,625,000 Redeemedduringtheyear – (1,625,000) Currentportionshownundercurrentliabilities – – – –
2015 2014 (Rupeesinthousand)
8.2 Long term loans Thesehavebeenobtainedfromthefollowingfinancialinstitutions StandardCharteredBank(Pakistan)Limited-Loan1 -note8.2.1 – 166,667 StandardCharteredBank(Pakistan)Limited-Loan2 -note8.2.2 333,332 500,000 FaysalBankLimited -note8.2.3 250,000 416,667 PakistanKuwaitInvestmentCompany(Private)Limited -note8.2.4 62,500 187,500 PAIRInvestmentCompanyLimited -note8.2.5 285,714 428,571 SoneriBankLimited -note8.2.6 133,333 266,666 AlliedBankLimited -note8.2.7 1,977,282 –
3,042,161 1,966,071 Currentportionshownundercurrentliabilities (1,072,022) (901,189)
1,970,139 1,064,882
5. Issued, subscribed and paid up share capital
2015 2014 2015 2014 (Numberofshares) (Rupeesinthousand)
2,791,260 2,791,260 OrdinarysharesofRs10eachfullypaidincash 27,913 27,913 447,208,740 447,208,740 OrdinarysharesofRs10eachissuedasfullypaidbonusshares 4,472,087 4,472,087 450,000,000 450,000,000 4,500,000 4,500,000
2015 2014 (Numberofshares)
Ordinarysharesofthecompanyheldbyassociated undertakingsasatyearendareasfollows: RelianceCommodities(Private)Limited 7,136,613 7,136,613 FatimaSugarMillsLimited 84,145,872 71,250,558 FazalClothMillsLimited – 25,790,610 ArifHabibCorporationLimited 135,000,000 135,000,000 AmirFineExports(Private)Limited 12,895,296 –
239,177,781 239,177,781
2015 2014 (Rupeesinthousand)
6. Reserves Capital: -Fairvaluereserve 99,577 66,039 Revenue: -Generalreserve 2,098,313 2,098,313 -Un-appropriatedprofit/(accumulatedloss) 2,190,620 (382,044)
4,288,933 1,716,269
4,388,510 1,782,308
7. Surplus on revaluation of operating fixed assets Thisrepresentssurplusoverbookvalueresultingfromtherevaluationoffreeholdland,buildingsonfreeholdland,plantand
machinery,railwaysidingandtoolsandotherequipment,adjustedbyincrementaldepreciationarisingoutofrevaluationofabovementionedassetsexceptfreeholdland.Thevaluationwascarriedoutbyanindependentvaluer,M/sPirsonsChemicalEngineering (Private) Limited, on August 31, 2014. Surplus on revaluation of operating fixed assets can be utilized by thecompanyonlyforthepurposesspecifiedinsection235oftheCompaniesOrdinance,1984.
Therevaluationsurplusrelatingtoabovementionedoperatingfixedassetsexcludingfreeholdlandisnetofapplicabledeferredincometaxes.Incrementaldepreciationrepresentsthedifferencebetweentheactualdepreciationontheabovementionedassetsexcludingfreeholdlandandtheequivalentdepreciationbasedonthehistoricalcostoftheseassets.Themovementinrevaluation surplus is as follows:
48
ANNUAL REPORT 2015
49

Notesto and forming part of the Financial Statements for the year ended December 31, 2015
8.2.1 Thishasbeenrepaidduringtheyear.Themarkupratechargedduringtheyearontheoutstandingbalancerangesfrom9.21%to11.59%perannum.
8.2.2Thisrepresentstermloanfacilityforbalancesheetrestructuring.Itisrepayableinfoursemi-annualinstallmentsofRs83.333millioneachendingonDecember31, 2017.Markup ispayablemonthlyat the rateof threemonthsKarachi Inter-BankOfferedRate(‘KIBOR’)plus1.50%perannum.Themarkupratechargedduringtheyearontheoutstandingbalancerangesfrom8.07%to11.13%perannum.Theloanissecuredbyfirstparipassuchargeoverthepresentandfuturecurrentassetsofthecompany.
8.2.3 Thisrepresentsatermfinancefacilityobtainedtofinancethecompany’scapitalexpenditurerequirements.Itisrepayableinthreesemi-annualinstallmentsofRs83.333millioneachendingonJune14,2017andcarriesmarkupattherateofsixmonthsKIBORplus1.70%perannum,payablesemi-annually.Themarkupratechargedduringtheyearontheoutstandingbalancerangesfrom8.22%to11.37%perannum.ItissecuredbyaparipassuchargeonallpresentandfuturefixedassetsexcludingtheassetscomprisingofAmmoniaConverterBasket,theLamontBoilerforNitricAcid,theBombardierChallengeraircraft,theassetscomprisingoftheCleanDevelopmentMechanism(‘CDM’)project,thecompletecarbondioxiderecoveryplant/liquefactionplantandthelandandbuildingsoftheexcludedassets.
8.2.4 Thisrepresentstermfinancefacilitytofinancethecompany’scapacityexpansion.ItisrepayableonJune29,2016andcarriesmarkupattherateofsixmonthsKIBORplus2.25%perannum,payablesemi-annually.Themarkupratechargedduringtheyearontheoutstandingbalancerangesfrom8.76%to11.09%perannum.It issecuredbyafirstparipassuchargeonallpresentandfuturefixedassetsexcludingtheassetscomprisingofAmmoniaConverterBasket,theLamontBoilerforNitricAcid,theassetscomprisingoftheCDMproject,thecompletecarbondioxiderecoveryplant/liquefactionplantalongwithcarbondioxidestaticstoragetank,toolsanditsspares,toolsandaccessories.
8.2.5 This representstermfinancefacility forbalancesheet restructuringandcompany’scapitalexpenditurerequirements. It isrepayableinfoursemi-annualinstallmentsofRs71.429millioneachendingonAugust27,2017andcarriesmarkupattherateofsixmonthsKIBORplus2.25%perannum,payablesemi-annually.Themarkupratechargedduringtheyearontheoutstandingbalancerangesfrom9.32%to12.44%perannum.Itissecuredbyafirstparipassuchargeonthecompany’spresentandfuturefixedassets.
8.2.6 Thisrepresentstermfinancefacilitytomeetthecompany’scapitalexpenditure/repaymentofexpensivedebt.Itisrepayableintwosemi-annual installmentsofRs66.667millioneachendingNovember2,2016andcarriesmarkupattherateofsixmonthsKIBORplus1.75%perannum,payablesemi-annually.Themarkupratechargedduringtheyearontheoutstandingbalancerangesfrom8.22%to11.91%perannum.Itissecuredbyafirstparipassuchargeonthecompany’spresentandfuturefixedassetsincludinglandandbuildingandmachineryexcludingtheassetscomprisingofAmmoniaConverterBasket,theLamontBoilerforNitricAcid,theassetscomprisingoftheCDMproject,thecompletecarbondioxiderecoveryplant/liquefactionplantalongwithcarbondioxidestaticstoragetank,toolsanditsspares,toolsandaccessoriesandthelandandbuildingsrelatedtotheseassets.
8.2.7 Thisrepresentstermfinancefacilitytomeetcompany’srepaymentofimportbillpayable.Itisrepayableintensemi-annualinstallmentsofRs200millioneachcommencingfromMay24,2016andcarriesmarkupattherateofsixmonthsKIBORplus2%perannum,payablesemi-annualy.Themarkupratechargedduringtheyearontheoutstandingbalanceis8.52%perannum.ItissecuredbyafirstparipassuchargeoverallpresentandfutureplantandmachineryofthecompanyexcludingassetscomprisingofAmmoniaConverterBasket,theLamontboilerforNitricAcid,theassetscomprisingoftheCDMproject,the complete carbon dioxide recovery plant/liquefaction plant along with carbon dioxide static storage tank and anexclusivechargeovertheBombardierChallengeraircraft.Thereconciliationofthecarryingamountofloanisasfollows:
2015 2014 (Rupeesinthousand)
Receipt 2,000,000 – Initialtransactioncost (23,200) –
1,976,800 –
Amortizationofinitialtransactioncost -note34 482 –
1,977,282 – Currentmaturity (400,000) –
1,577,282 –
9. Long term loans from related parties - unsecured
Thesehavebeenobtainedfromthefollowingrelatedparties: FatimaHoldingsLimited(associatedcompany) – 442,287 RelianceCommodities(Private)Limited(associatedcompany) 877,982 34,292 MemberandChairman’sspouse 371,491 313,032 Chairman’schildren 116,914 – Directors 866,565 36,357
-note9.1 2,232,952 825,968
9.1 This is repayable in a period of two years commencing from January 1, 2017 on terms that are to bemutually agreedbetweentheparties.Markupispayablesemi-annuallyatarateofsixmonthsKIBORplus1.5%perannum.Themarkupratechargedduringtheyearontheoutstandingbalancerangesfrom7.98%to8.51%perannum.
10. Import bill payable - secured
ThishasbeenpaidduringtheyearthroughproceedsofloanacquiredfromAlliedBankLimitedasreferredtoinnote8.2.7tothesefinancialstatements.
11. Long term deposits
Theserepresentinterestfreesecuritydepositsfromcustomersandcarriagecontractorsandarerepayableoncancellation/withdrawalofthedealershiporoncessationofthebusinesswiththecompanyrespectively.
2015 2014 (Rupeesinthousand)
12. Deferred liabilities
Accumulatingcompensatedabsences -note12.1 97,166 80,812 Retirementbenefits-gratuityfund -note12.2 35,814 34,977
132,980 115,789
12.1 Accumulating compensated absences Openingliability 80,812 86,320 Chargetoprofitandlossaccount -note12.1.2 25,038 3,925
105,850 90,245 Paymentsmadeduringtheyear (8,684) (9,433)
Liabilityasatyearend 97,166 80,812
50
ANNUAL REPORT 2015
51
Notesto and forming part of the Financial Statements for the year ended December 31, 2015
2015 2014 (Rupeesinthousand)
12.1.1 Movement in liability for accumulating compensated Absences Openingpresentvalueofaccumulatingcompensatedabsences 80,812 86,320 Currentservicecost 15,971 11,830 Interestcost 8,029 5,741 Benefitspaidduringtheyear (8,684) (9,433) Remeasurementduringtheyear 1,038 (13,646)
Closingpresentvalueofaccumulatingcompensatedabsences 97,166 80,812
12.1.2 Charge for the year
Currentservicecost 15,971 11,830 Interestcost 8,029 5,741 Remeasurementduringtheyear 1,038 (13,646)
Expensechargedtotheprofitandlossaccount 25,038 3,925
Amountsforcurrentperiodandpreviousfourannualperiodsofaccumulatingcompensatedabsencesareasfollows: 2015 2014 2013 2012 2011
AsatDecember31 (Rupeesinthousand) Presentvalueofaccumulating compensatedabsences 97,166 80,812 86,320 84,150 66,001
Experienceadjustmentarisingonobligation 1,038 (13,646) – – –
Theaveragenumberofleavesaccumulatedperannumistendaysforexecutivesandfivedaysforworkersandotherstaff.
2015 2014 (Rupeesinthousand)
12.2 Gratuity fund Theamountsrecognisedinthebalancesheetareasfollows: Presentvalueofdefinedbenefitobligation 171,990 149,293 Fairvalueofplanassets (136,176) (114,316)
Liabilityasatyearend 35,814 34,977
Openingnetliability 34,977 40,152 Chargetoprofitandlossaccount 24,630 24,449 Chargetorelatedparty 8,304 9,240 Netremeasurementsfortheyear 2,880 1,290 Contributionbythecompany (34,977) (40,154)
Liabilityasatyearend 35,814 34,977
2015 2014 (Rupeesinthousand)
Themovementinthepresentvalueofdefinedbenefitobligationisasfollows: Openingpresentvalueofdefinedbenefitobligation 149,293 129,962 Currentservicecost 31,098 31,179 Interestcost 14,620 14,762 Benefitspaidtoout-goingmembersduringtheyear (20,104) (23,738) Remeasurementsonobligation (2,917) (2,872)
Presentvalueofdefinedbenefitobligationasatyearend 171,990 149,293
Themovementinfairvalueofplanassetsisasfollows: Openingfairvalue 114,316 89,810 Expectedreturnonplanassets 12,784 12,252 Companycontributions 34,977 40,154 Benefitspaidtoout-goingmembersduringtheyear (20,104) (23,738) Remeasurementsonfairvalueofplanassets (5,797) (4,162) Fairvalueasatyearend 136,176 114,316
Plan assets are comprised as follows: Mixedfunds 104,574 76,086 Cash 31,602 38,230 136,176 114,316
ThecompanyisexpectedtocontributeRs30.258milliontothegratuityfundinthenextyear. Thepresentvalueofdefinedbenefitobligation,thefairvalueofplanassetsandthesurplusordeficitofgratuityfundisas follows: 2015 2014 2013 2012 2011
(Rupeesinthousand) Presentvalueofdefinedbenefitobligation (171,990) (149,293) (129,962) (115,230) (88,126) Fairvalueofplanassets 136,176 114,316 89,810 82,105 64,824
Loss (35,814) (34,977) (40,152) (33,125) (23,302)
Experienceadjustmentonobligation -2% -2% 5% 3% 6% Experienceadjustmentonplanassets -4.26% -3.64% -1.44% -0.95% 0.89%
Thesensitivityofthedefinedbenefitobligationtochangesintheweightedprincipalassumptionsis:
Impact on defined benefit obligation Change in Increase in Decrease in assumptions assumption assumption (Rupeesinthousand)
Discountrate 1% 157,335 189,091 Salarygrowthrate 1% 189,344 156,856
52
ANNUAL REPORT 2015
53
Notesto and forming part of the Financial Statements for the year ended December 31, 2015
2015 2014 (Rupeesinthousand)
13. Deferred taxation
Liability/(asset)fordeferredtaxationcomprisestemporarydifferencesrelatingto: Acceleratedtaxdepreciation 8,842,825 10,408,173 Accumulatingcompensatedabsences (29,150) (28,284) Provisionfordoubtfulreceivable (2,673) (3,119) Postretirementmedicalbenefitsandotherallowancespayable (3,454) (4,030) Interestreceivable 6,982 6,752 Unrealisedrecoveryofchemicalcatalyst 48,820 56,957 Transactioncostonlongtermloans 6,815 – Investmentinsubsidiary 28,910 23,505 Goodwill 991,549 1,092,676 Unusedtaxlosses (1,455,557) (1,108,744) Unusedtaxcredits (462,982) (256,646)
7,972,085 10,187,240
Deferredtaxasseton tax lossesavailable forcarry forwardandthose representingminimumtaxpaidavailable forcarryforwardundersection113oftheIncomeTaxOrdinance,2001arerecognizedtotheextentthattherealisationofrelatedtaxbenefitsthroughfuturetaxableprofitsisprobable.
Thegrossmovementinnetdeferredtaxliabilityduringtheyearisasfollows: 2015 2014 (Rupeesinthousand)
Openingbalance 10,187,240 9,932,611 Deferredtaxonrevaluationsurplus -note7 (647,560) 365,882 Chargedtoothercomprehensiveincome 5,405 16,285 Creditedtoprofitandlossaccount -note37 (1,573,000) (127,538)
Closingbalance 7,972,085 10,187,240
14. Short term borrowing from related party - secured
Asofthebalancesheetdate,thisrepresentsarenewablelimit,inthenatureofrunningfinancefacility,ofRs3billionavailablefromFatimaFertilizerCompanyLimited(‘FATIMA’),arelatedparty(associatedcompany).Duringtheyear,thisfacilitywaschangedfromShortTermLoantoarenewablelimit,inthenatureofrunningfinancefacility,afterthechangeintermsoftheloanwereapprovedbythemembersofFATIMAintheirAnnualGeneralMeetingheldonApril30,2015.MarkupispayablequarterlyattherateofsixmonthsKIBORplus2.12%.Therateofmarkupcharged,duringtheyear,rangesfrom8.63%to11.75%perannum.Thisfacilityissecuredagainstrankingchargeonallpresentandfuturefixedassetsofthecompany.Aspertheterms,thefacilitywasrepayablebyDecember31,2015.
However,inDecember2015,thecompanysentacommunicationtoFATIMA,requestingittorenewthefacilityforafurther
periodofoneyearonthesametermsandconditionsasalreadyagreedbetweenthetwocompanies.
Basedonthecommunicationfromthecompany,consideringitaviableinvestment,theBoardofDirectorsofFATIMA,initsmeetingheldonDecember29,2015,agreedtorenewthisfacilityforafurtherperiodofoneyearthatwillbepresentedformembers’approvalintheupcomingAnnualGeneralMeetingofFATIMA.
2015 2014 (Rupeesinthousand)
15. Short term borrowings - secured Runningfinances -note15.1 10,290,326 2,892,453 Termfinances -note15.2 4,861,288 1,744,993 15,151,614 4,637,446
15.1 Running finances
Short term runningfinance facilitiesavailable fromcommercialbanksundermark-uparrangementsamount toRs13,279million(2014:Rs4,244million).Theratesofmarkuprangefrom7.26%to12.40%ontheoutstandingbalanceorpartthereof.Theaggregate runningfinancesare securedagainstpledgeof stock-in-tradeas referred to innote26.1and registeredhypothecation charge on current and fixed assets of the company including the Lamont Boiler for Nitiric Acid, assetscomprisingCDMprojectand thecompletecarbondioxide recoveryplant/liquefactionplantalongwithcarbondioxidestaticstoragetankofthecompany.IncludedintheaboveisarunningfinanceofRs385.504million(2014:Rs376.199million)[availablelimit:Rs400million(2014:Rs400million)]fromSummitBankLimited,arelatedparty(associatedcompany).
15.2 Term finances
TermfinancefacilitiesavailablefromvariouscommercialbanksunderprofitarrangementsamounttoRs5,509million(2014:Rs1,845million).Theratesofprofitrangefrom7.64%to12.13%ontheoutstandingbalanceorpartthereof.Theaggregatetermfinancesaresecuredagainstfirstparipassuchargeoverallcurrentandfixedassetsof thecompany includingtheLamontBoiler,AmmoniaConverterBasket,assetscomprisingCDMprojectandthecompletecarbondioxiderecoveryplant/liquefactionplantalongwithcarbondioxidestaticstoragetankofthecompany.
15.3 Letters of credit and guarantees
OftheaggregatefacilityofRs4,690million(2014:Rs4,542million)foropeninglettersofcreditandRs18million(2014:Rs18million)forguarantees,theamountutilisedatDecember31,2015was2,030million(2014:1,326million)andRs17million(2014:Rs17million)respectively.Thefacilityforopeninglettersofcreditissecuredagainstimportdocumentsandregisteredjointparipassuchargeovercurrentassetswhereasfacilityforguaranteesissecuredagainstregisteredjointparipassuchargeovercurrentassets.
16. Payable to Privatization Commission of Pakistan
RelianceExports(Private)Limited(‘REL’),underthetermsandconditionsstatedinthe‘SharePurchaseAgreement’(‘theAgreement’),acquired100%sharesinthecompanyonJuly14,2005throughtheprocessofprivatization.UnderthetermsoftheAgreement,thepurchaseconsideration,inadditiontolumpsumcashpayment,includedafurtherpaymentequivalentto90%ofthecompany’sclaimoftaxrefundaggregatingtoRs2,814.511millionfortheassessmentyears1993-94,1995-96through2002-2003andtaxyears2003and2004.TheamountispayabletothePrivatizationCommissionintheeventofandatthetimeofcashreceiptoftherefundfromtheconcernedtaxauthorities.
Theamount recognized in thesefinancial statementsaspayable toPrivatizationCommission isnetoffRs 240.119million
which,accordingtothemanagementofthecompany,hasalreadybeenwithdrawnbythePreviousMembersaspartofthedividenddistribution for theyearendedJune30,2005.Themanagementof thecompany feels that theAgreementaspresentlyworded,ifexecuted,wouldresultintodoublepaymentofthesameamounttothePrivatizationCommission/PreviousMembers,firstly,aspartoftheprofitsfortheyearendedJune30,2005(computedwithoutrecognitionofthetaxexpensefortheyearsforwhichwhentherefundisissued,anamountequivalentto90%wouldbetherightofthePrivatizationCommission/PreviousMembers)andsecondly,atthetimetherefundisreceivedfromthetaxauthoritieswhenanamountequivalentto90%ofsuchrefundispaidofftothePrivatizationCommission,asagreed.ThemanagementofthecompanyfeelsthatsuchdoublepaymentisneithertheintentionnorwarrantedunderthespecificprovisionsoftheAgreement.
54
ANNUAL REPORT 2015
55
Notesto and forming part of the Financial Statements for the year ended December 31, 2015
UpondissolutionofRELanditsamalgamationwiththecompanyonJuly14,2005,thisliabilitywasrecognisedinthebooksofthecompanybeingthesurvivingentityuponREL’samalgamationwiththecompanyinaccordancewiththeSchemeofArrangementforAmalgamation.
2015 2014 (Rupeesinthousand)
17. Trade and other payables
Tradecreditors -note17.1 2,674,413 3,617,238 Suigasbillpayable -note17.2 – 6,147 Securitydeposits 32,105 16,652 Accruedliabilities -notes17.3&17.4 2,387,327 1,581,095 Workers’profitparticipationfund -note17.5 717,710 702,148 Workers’welfarefund 266,787 244,046 Customers’balances 184,712 1,246,120 Bankguaranteesdiscounted 1,987,767 76,100 Duetorelatedparty – 16,838 Duetoemployees’providentfundtrust 1,312 177 Withholdingtaxpayable 61,095 11,043 Excisedutypayable 1,724 1,724 Salestaxpayable – 13,397 Electricitydutypayable 30,171 22,558
8,345,123 7,555,283
17.1 IncludesanamountofRs76.389million(2014:Rs24.092million)payabletoRelianceSacksLimited(‘RSL’),arelatedparty(subsidiary).
17.2 This amount is payable to Sui NorthernGas Pipelines Limited (‘SNGPL’), a related party (associated company) againstpurchaseofgas.
17.3 AccruedliabilitiesincludeRs1,071million(2014:Rs1,061million)onaccountofGasInfrastructureDevelopmentCess(‘GIDC’).Duringtheyear,theParliamentpassedtheGIDCAct2015 inMay2015whichseeksto imposeGIDClevysince2011.ThecompanyhaschallengedthevalidityandpromulgationofGIDCAct,2015beforetheHonorableSindhHighCourt,whereintheCourtpassedinterimorders,therebyrestrainingSNGPLfromchargingorrecoveringGIDC.
17.4 IncludesbonusofRs7.5million(2014:Rs7.5million)payabletotheDirectorsofthecompany.
2015 2014 (Rupeesinthousand)
17.5 Workers’profitparticipationfund Openingbalance 702,148 727,628 Provisionfortheyear -note35 59,843 –
761,991 727,628
Paymentsmadeduringtheyear (44,281) (25,480)
Closingbalance 717,710 702,148
ThecompanyhasanagreementwiththeWorkersWelfareFund(‘WWF’),MinistryofLabourandManpower,GovernmentofPakistanwherebythebalanceamountofWorkers’ProfitParticipationFund(‘WPPF’)remainingafterdeductingtheworkers’portionofWPPFthatisrequiredtobedepositedintheWWF,wouldbeusedforestablishingahospitalfortheworkersasperthemechanismdefinedinthatagreement.
2015 2014 (Rupeesinthousand)
18. Accrued finance cost Accruedmarkupon: -longtermloans-secured 38,259 26,828 -longtermloansfromrelatedparties-unsecured -note18.1 97,712 – -shorttermborrowingfromrelatedparty-secured -note18.2 97,701 176,641 -shorttermborrowings-secured -note18.3 215,751 116,062
449,423 319,531
18.1 Thisamountispayabletothefollowingrelatedparties: RelianceCommodities(Private)Limited(associatedcompany) 39,152 – MemberandChairman’sspouse 16,015 – Chairman’schildren 5,067 – Directors 37,478 – 97,712 –
18.2 ThisamountispayabletoFATIMA,arelatedparty(associatedcompany).
18.3 IncludesanamountofRs8.314million(2014:11.574million)payabletoSummitBankLimited,arelatedparty(associated company).
19. Contingencies and commitments
19.1 Contingencies
(i) ThecompanyhasnettedoffanamountofRs240.119millionfromtheamountpayabletothePrivatizationCommission,aspartofpurchaseconsideration,atthetimeandintheeventtherefundisreceivedfromthetaxauthorities.Incase,thecompany’scontention relating topossibledoublepayment isnotaccededtoby theotherparty to theSharePurchaseAgreement,thecompanyiscontingently liabletotheaforesaidamountofRs240.119million. Incase,theamountbecomespayable,thecorrespondingeffectwouldbereflectedinthecomputationofgoodwill.
(ii) Thecompanyhasissuedfollowingguaranteesinfavourof:
-SNGPLagainstgassaleamountingtoRs10million(2014:Rs10million). -PakistanStateOilCompanyLimited(‘PSO’)againstfuelforaircraftamountingtoRs7million(2014:Rs7million). -MeezanBankLimitedassecurityagainstfinanceobtainedbyitssubsidiary,RSL.
(iii) As at June 30, 2004, the company had investment of 140,000 ordinary shares of Rs 10 each valuing Rs 100,000 inNationalFertilizerMarketingLimited,beingtheassociatedcompanyonthatdate.OnMay20,2005,this investmentwastransferredtoNationalFertilizerCorporationofPakistan(Private)Limitedbythemanagementofthecompany.However, the new buyer, REL filed an application before PrivatizationCommission challenging this transfer on thegroundsthatsuchtransferhadbeencarriedoutagainstthetermsandconditionsofthebiddocuments.Incaseofapositiveoutcometotheapplication,thisinvestmentwouldbere-instated.
56
ANNUAL REPORT 2015
57

Notesto and forming part of the Financial Statements for the year ended December 31, 2015
(iv) AnamountofRs 129.169millionwaswithdrawnby thepreviousmembersof thecompanyaspartofdividend fortheyearendedJune30,2005undertheSharePurchaseAgreement.Outoftheaggregateamount,Rs89.39millionrepresents thevalueofcertaincatalysts recovered inconsequenceofcleandownoperationsof theplantprior toundertakingtheprocessofprivatization,whichwasaccountedforasincomeinthefinancialstatementsfortheyearendedJune30,2005inthelightofapplicablefinancialreportingframework.
Themanagementofthecompanyfeelsthatnotwithstandingtheapplicabilityofthefinancialreportingframework,onthefinancialstatementsfortheyearendedJune30,2005,theamountwasnotdistributableaspartofdividendforthatyearinviewoftheclearunderstandingbehindtheexecutionoftheAgreementascategoricallyconfirmed,inwriting,bythePrivatizationCommissionpriortosigningoftheAgreement.Similarly,thebalanceamountofRs39.779millionisconsideredtobedividenddistributionoutofthethenavailablereserveswhichwasalsonotdistributabletothepreviousmembersintermsofothercovenantsoftheAgreement.
Thecompanyhasfiledaclaimfortherecoveryoftheaforesaidaggregateamountonthegroundsthatinthepresentform,thedistributionhasbeenmadeoutoftheaccumulatedreserves,fortheyearsuptoJune30,2004,which,underthespecificprovisionsoftheAgreementwerenotdistributabletothepreviousmembersofthecompany.Incaseofapositiveoutcometothecompany’sclaim,theexcessdividendwithdrawnbythepreviousmembersofthecompanywouldberecovered.
(v) Throughashowcausenotice,thedepartmentraisedtheissueofshortpaymentofoutputsalestaxonsuppliesofthecompany’sfertilizerproduct,CalciumAmmoniumNitrate(‘CAN’)fortheperiodfromApril18,2011toDecember31,2011involvingaprincipalsalestaxdemandofRs500million.SuchissuewasraisedonthegroundsthatnotificationSRO15(I)/2006,providingforlevyofsalestaxonthebasisof‘notifiedprice’ofCAN,waswithdrawnthroughnotificationSRO313(I)/2011datedApril18,2011andhence,companywaslegallyrequiredtorecoveroutputsalestaxonsuppliesofCANonthebasisofactualconsideration receivedthereagainst.CompanyhadalreadyapproachedtheFederalBoardofRevenue(‘FBR’)ontheissueforcondonationintermsofsection65oftheSalesTaxAct,1990,whichwasnotentertained.CompanyhasassailedsuchorderthroughinstitutionofawritpetitionbeforetheLahoreHighCourtonthegroundsthatrelevantpowershavebeenexercisedinanarbitrarymannerwithoutreferringthemattertocompetentauthorityasrequiredunderthelaw.Whilesuchconstitutionalpetitionhasnotyetbeendisposed,sincemanagementconsidersthatcompany’sstanceisbasedonmeritoriousgroundsandhencereliefwouldbesecuredfromtheCourt,noprovisiononthisaccounthasbeenmadeinthesefinancialstatements.
(vi) Forassessmentyears1993-94and1995-96through2002-2003andfor taxyears2003through2005, thecompany, inviewofthepositiontakenbythetaxauthoritiesthattheincomeofthecompanyischargeabletotaxonthebasisof‘netincome’,hadprovidedforinthefinancialstatementsthetaxliabilityonnetincomebasiswhichaggregatedtoRs5,223.343million.Taxliabilitiesadmittedinrespectivereturnsoftotalincomeinrespectoftheseassessment/taxyears,however,aggregated toRs1,947.671millionbeing the liabilities leviableunder thePresumptiveTaxRegime(‘PTR’),consideredbythemanagementtobeapplicableinrespectofcompany’sincomefromsaleofownmanufacturedfertilizerproducts.
TheAppellateTribunal InlandRevenue(‘ATIR’)throughitsseparateordersfortheassessmentyears1993-94,1995-96through 2002-03 upheld the company’s position as taken in respective returns of total incomeand consequently,managementreversedtheexcessprovisionsaggregatingtoRs3,275.673milliononthestrengthofsuch judgments.ATIR’sdecisionsinrespectofcertainassessmentyearshavealsobeenupheldbytheLahoreHighCourtwhiledisposingdepartmentalappealsagainstrespectiveordersofATIR.IncometaxdepartmenthasstatedlyagitatedtheissuefurtherbeforeSupremeCourtofPakistan,whichispendingadjudication.
InviewofthefavorabledisposalofthematteruptothelevelofHighCourt,managementofthecompanyfeelsthatthedecisionoftheapexcourtwouldalsobeinthefavorofthecompanyandhenceinthesefinancialstatements,taxliabilitiesinrespectofabovereferredassessment/taxyearshavebeenprovidedonthebasisthatcompany’sincomeduringsuchyearswastaxableunderPTR.Incase,theapexcourtdecidesthematterotherwise,amountaggregatingtoRs3,275.673millionwillhavetoberecognizedastaxexpenseinrespectofsuchassessment/taxyears.
(vii) IncludedintradedebtsisanamountofRs18.877million(2014:Rs18.877million)whichhasnotbeenacknowledgedasdebtsbyitscustomersduetoadisputeregardingthediscountontheproduct’sprice.Thecompany’scustomershadcollectivelyfiledanappealregardingthepricedisputebeforetheCivilCourt,Multan,whichdecidedthecaseinfavorofthecompany’scustomers.ThecompanypreferredanappealbeforetheDistrictandSessionsCourt,MultanwhichsetasidetheorderoftheCivilCourt.Thecompany’scustomersfiledarevisedpetitionbeforetheLahoreHighCourtagainsttheorderoftheDistrictandSessionsCourt,whichispendingforadjudication.Basedontheadviceofthecompany’slegalcounsel,thecompany’smanagementconsidersthattherearemeritoriousgroundstodefendthecompany’sstanceandhence,noprovisionhasbeenmadeinthesefinancialstatementsonthisaccount.
(viii) Duringtheyear,throughashowcausenotice,thedepartmentraisedtheissueofnon-paymentofoutputsalestaxonstockoffertilizerproducttransferredtovariouswarehousesofthecompanyinvolvingaprincipalsalestaxdemandofRs909.125million(notincludingdefaultsurchargewhichwillbecalculatedatthetimeofdeposit)alongwithapenaltyequal to100%of theprincipal sales taxdemand.Such issuewas raisedonthegroundsthat theabovementionedtransfers constitute ‘supply’ in terms of section 2(44) of the Sales TaxAct, 1990, and hence, the samehavebeenmadewithoutpaymentofsalestax.ThemanagementhasassailedthesubjectorderinusualappellatecoursebeforeCommissionerInlandRevenue(Appeals)[‘CIR(A)’]whichispendingadjudication.Furthermore,arestraintorderdatedNovember23,2015waspassedbytheLahoreHighCourtstayingtherecoveryof thisdemandfromthecompany.Managementconsidersthattherearestronggroundstosupportthecompany’sstanceandthusnoprovisionhasbeenmadeinthesefinancialstatementsfortheabovementionedamount.
(ix) OnJuly5,2006,PakistanNationalShippingCorporation(‘PNSC’)filedarecoverysuit forUSD1.5millionagainst thecompanybeforetheCivilCourt,Lahoreclaimingthat ithadsufferedlossesasthecompanyunilaterallyterminatedtheCharterPartyAgreement(‘CPA’)betweenthePNSCandthecompany.AsperthetermsoftheCPA,PNSCwastotransport300,000metrictonsofrockphosphateforthecompanybetweenFebruary1,2005toMay31,2006atarateofUSD41permetrictonfromCasablancaporttoKarachiport.However,PNSCclaimedthatthecompanyhadunilaterallyterminatedCPAafteritsprivatizationin2005.ThecompanyalsofiledacountersuitagainstPNSCclaimingthat it had violated the termsof theCPAbydiverting ships carryingcompany’s cargo toother ports causing thecompany’scargotoarrivelaterthanexpectedresultinginlosstothecompany.TheCourtreferredthemattertothearbitratorwhothrough itsawarddatedApril22,2010decidedthematter inPNSC’s favourandconfirmed itsclaimatUSD1.3million(equivalenttoRs80.009million)andmarkupattherateof14%tobecalculatedfromthedateofawardtillthetimeofdeposit.ThecompanybeingaggrievedhasfiledanapplicationagainsttheawardofarbitratorbeforetheCivilCourt,Lahorewhichispendingadjudication.Basedontheadviceofthecompany’slegalcounsel,themanagementconsidersthatcompany’sstanceisbasedonmeritoriousgroundsandhencereliefwouldbesecuredfromtheCourt,noprovisiononthisaccounthasbeenmadeinthesefinancialstatements.
(x) During the year, thecompanypurchased LiquefiedNaturalGas (‘LNG’) fromPakistan StateOilCompany Limited(‘PSO’)underthevariousdirectivesofMinistryofPetroleumandNaturalResources(‘MP&NR’),GovernmentofPakistan.IncludedinthecostbookedduringtheyearrelatingtoLNGareprovisionalchargesofSuiSouthernGasCompanyLimited (‘SSGC’) and Sui NorthernGas Pipelines Limited (‘SNGPL’) (hereinafter collectively referred to as the ‘GasCompanies’) that are based on the abovementionedGovernment directives and determination ofOil andGasRegulatoryAuthority(‘OGRA’)forotherconsumersthroughitsdecisiondatedMarch18,2016.Basedontheadviceof thecompany’s legalcounsel,managementstronglybelieves that theamountsclaimedby theGasCompaniesfromthecompanywouldeventuallybein linewiththeabovebasis.Consequently,noprovisionhasbeenmadeinthesefinancialstatementsforthedifferentialamountofRs448.950millionbasedontheadviceofthecompany’slegalcounselthattherearemeritoriousgroundstofollowtheabovebasis. 58
ANNUAL REPORT 2015
59

Notesto and forming part of the Financial Statements for the year ended December 31, 2015
19.2 Commitments in respect of(i) LettersofcreditotherthanforcapitalexpenditureRs66.821million(2014:Nil).(i1) Theamountoffuturepaymentsunderoperatingleasesandtheperiodinwhichthesepaymentswillbecomedueare
as follows: 2015 2014 (Rupeesinthousand) Notlaterthanoneyear 59,854 40,258 Laterthanoneyearandnotlaterthanfiveyears 120,096 31,637 179,950 71,895
20. Property, plant and equipment Operatingfixedassets -note20.1 39,126,732 39,822,111 Capitalwork-in-progress -note20.2 11,588 12,408 Capitalstoresandstand-byequipment -note20.3 55,764 74,421 39,194,084 39,908,940
20.1 Operating fixed assets
(Rupees in thousand)
Freehold land Buildings on Buildings on Railway Plant and Aircrafts Furniture Tools and Vehicles Catalyst Total freehold leasehold siding machinery and other land fixtures equipment
COST BalanceasatJanuary01,2014 4,767,634 2,057,264 – 36,800 28,652,792 2,783,209 70,459 721,110 206,370 217,312 39,512,950 Additionsduringtheyear – 4,853 31,400 – 29,334 7,372 122 6,516 – – 79,597 Revaluation 2,009,966 45,022 – 1,000 996,197 – – 3,110 – – 3,055,295 Transfersinfromassetssubjecttofinancelease – – – – – – – – 161,879 – 161,879 Disposalsduringtheyear – – – – – (505,796) – (60) (57,690) – (563,546) Eliminationofaccumulateddepreciation againstcostonrevaluation – (313,061) – (28,800) (1,053,736) – (23,957) (179,094) – – (1,598,648) BalanceasatDecember31,2014 6,777,600 1,794,078 31,400 9,000 28,624,587 2,284,785 46,624 551,582 310,559 217,312 40,647,527
BalanceasatJanuary01,2015 6,777,600 1,794,078 31,400 9,000 28,624,587 2,284,785 46,624 551,582 310,559 217,312 40,647,527 Additionsduringtheyear – 6,960 3,519 – – – 234 27,706 – 19,658 58,077 Disposalsduringtheyear – – – – – – – (19,123) (59,887) – (79,010) BalanceasatDecember31,2015 6,777,600 1,801,038 34,919 9,000 28,624,587 2,284,785 46,858 560,165 250,672 236,970 40,626,594
DEPRECIATION BalanceasatJanuary01,2014 – 242,137 – 22,401 996,367 768,557 18,369 148,434 189,853 74,694 2,460,812 Chargefortheyear-note20.1.3 – 107,400 262 9,475 80,283 111,620 8,306 49,617 10,883 2,483 380,329 Transfersinfromassetssubjecttofinancelease – – – – – – – – 140,676 – 140,676 Chargeondisposals – – – – – (505,796) – (49) (51,908) – (557,753) Eliminationofaccumulateddepreciation – (313,061) – (28,800) (1,053,736) - (23,957) (179,094) – – (1,598,648) BalanceasatDecember31,2014 – 36,476 262 3,076 22,914 374,381 2,718 18,908 289,504 77,177 825,416
BalanceasatJanuary01,2015 – 36,476 262 3,076 22,914 374,381 2,718 18,908 289,504 77,177 825,416 Chargefortheyear-note20.1.3 – 109,518 3,522 5,924 413,878 112,480 8,122 48,906 15,696 14,387 732,433 Chargeondisposals – – – – – – – (677) (57,310) – (57,987) BalanceasatDecember31,2015 – 145,994 3,784 9,000 436,792 486,861 10,840 67,137 247,890 91,564 1,499,862
BookvalueasatDecember31,2014 6,777,600 1,757,602 31,138 5,924 28,601,673 1,910,404 43,906 532,674 21,055 140,135 39,822,111
BookvalueasatDecember31,2015 6,777,600 1,655,044 31,135 – 28,187,795 1,797,924 36,018 493,028 2,782 145,406 39,126,732
20.1.1 Freeholdland,buildingsonfreeholdland,railwaysiding,plantandmachineryandtoolsandotherequipmentwererevaluedbyanindependentvaluerM/sPirsonsChemicalEngineering(Private)LimitedonAugust31,2014.Therevaluationsurplusnetofdeferredtaxwascreditedtosurplusonrevaluationofoperatingfixedassets.Hadtherebeennorevaluation,thecarryingamountsofthefollowingclassesofassetswouldhavebeenasfollows:
2015 2014 (Rupeesinthousand)
Freeholdland 911,940 911,940 Buildingsonfreeholdland 1,252,700 1,336,110 Plantandmachinery 15,896,051 16,185,267 Toolsandotherequipment 334,285 322,717
18,394,976 18,756,034
20.1.2 IncludedinplantandmachineryareassetshavingcarryingamountofRs47.989millionthatareinstalledatthemanufacturingfacilitiesofthecompany’scustomersnamelyIcebergGasCompany,Coca-ColaBeveragesPakistanLimitedandPepsiColaInternational(Private)Limitedastheseassetsareusedforsalestothesecustomers.
2015 2014 (Rupeesinthousand)
20.1.3Thedepreciationchargefortheyearhasbeenallocatedasfollows:
Costofsales -note31 528,302 181,794 Administrativeexpenses -note32 194,648 194,127 Sellinganddistributionexpenses -note33 9,483 4,408 732,433 380,329
20.1.4 Fair value estimation
Fairvalueistheamountforwhichanassetcouldbeexchanged,orliabilitysettled,betweenknowledgeablewillingpartiesinanarm’slengthtransaction.Underlyingthedefinitionoffairvalueisthepresumptionthatthecompanyisagoingconcernwithoutanyintentionorrequirementtocurtailmateriallythescaleofitsoperationsortoundertakeatransactiononadverseterms.Fairvalueisdeterminedonthebasisofobjectiveevidenceateachreportingdate.
Thetablesbelowanalyzethenon-financialassetscarriedatfairvalueasatDecember31,2015andDecember31,2014.
Thedifferentlevelshavebeendefinedasfollows:
- Quotedprices(unadjusted)inactivemarketsforidenticalassetsorliabilities(level1).
- Inputsotherthanquotedpricesincludedwithinlevel1thatareobservablefortheassetorliability,eitherdirectly(thatis,asprices)orindirectly(thatis,derivedfromprices)(level2).
- Inputsfortheassetorliabilitythatarenotbasedonobservablemarketdata(thatis,unobservableinputs)(level3).
Thefollowingtablepresentsthecompany’snon-financialassetsthataremeasuredatfairvalueatDecember31,2015.
60
ANNUAL REPORT 2015
61

Notesto and forming part of the Financial Statements for the year ended December 31, 2015
(Rupees in thousand)
Level 1 Level 2 Level 3 Total Recurring fair value measurements of certain items of operating fixed assets Freeholdland – 6,777,600 – 6,777,600 Buildingsonfreeholdland – – 1,655,044 1,655,044 Railwaysiding – – – – Plantandmachinery – – 28,187,795 28,187,795 Toolsandotherequipment – – 493,028 493,028 – 6,777,600 30,335,867 37,113,467 Thefollowingtablepresentsthecompany’snon-financialassetsthataremeasuredatfairvalueatDecember31,2014.
(Rupees in thousand)
Level 1 Level 2 Level 3 Total Recurring fair value measurements of certain items of operating fixed assets Freeholdland – 6,777,600 – 6,777,600 Buildingsonfreeholdland – – 1,757,602 1,757,602 Railwaysiding – – 5,924 5,924 Plantandmachinery – – 28,601,673 28,601,673 Toolsandotherequipment – – 532,674 532,674 – 6,777,600 30,897,873 37,675,473
Movementsoftheabovementionedassetsandsurplusonrevaluationoftheseassetshavebeendisclosedinnote20.1andnote7respectivelytothesefinancialstatements.Thecompany’spolicyistorecognisetransfersintoandtransfersoutoffairvaluehierarchylevelsasattheendofthereportingperiod.TherewerenotransfersbetweenLevels1and2&Levels2and3duringtheyearandtherewerenochangesinvaluationtechniquesduringtheyears.
Valuation techniques used to determine level 2 and level 3 fair values
The company obtains independent valuations for its freehold land, building on freehold land, railway siding, plant andmachinery,andtoolsandequipments(classifiedasproperty,plantandequipment)atleasteverythreeyears.Attheendofeachreportingperiod,themanagementupdatesitsassessmentofthefairvalueofeachassetmentionedabove,takingintoaccount themost recent independent valuation. Themanagement determines anasset’s valuewithin a rangeofreasonablefairvalueestimates.Level2fairvalueoffreeholdlandhasbeenderivedusingasalescomparisonapproach.Salepricesofcomparablelandincloseproximityareadjustedfordifferencesinkeyattributessuchaslocationandsizeoftheproperty.Themostsignificantinputintothisvaluationapproachispricepersquarefoot.Level3fairvalueofbuildingonfreeholdlandhasbeendeterminedusingadepreciatedreplacementcostapproach,whereby,currentcostofconstructionofasimilarbuilding inasimilar locationhasbeenadjustedusingasuitabledepreciationratetoarriveatpresentmarketvalue.Level3fairvalueofrailwaysiding,plantandmachinery,andtoolsandequipmentshavebeendeterminedusingadepreciatedreplacementcostapproach,whereby,thecurrentreplacementcostofrailwaysiding,plantandmachinery,andtoolsandequipmentsofsimilarmake/origin,capacityand leveloftechnologyhasbeenadjustedusingasuitabledepreciationrateonaccountofnormalwearandtear.
Valuation inputs and relationship to fair value
Thefollowingtablesummarisesthequantitativeandqualitativeinformationaboutthesignificantunobservableinputsusedinrecurringlevel3fairvaluemeasurements.Seeparagraphaboveforthevaluationtechniquesadopted.
Fair value at
Significant Quantitative Data / Range Description Unobservable and relationship to the
2015 2014 inputs fair value
Buildingsonfreeholdland 1,655,044 1,757,602 “Costofconstruction Themarketvaluehasbeen ofanewsimilarbuilding. determinedbyusingadepreciation factorofapproximately10%-15%on Suitabledepreciationrate costofconstructingasimilarnew toarriveatdepreciated building.Higher,theestimatedcost replacementvalue.” ofconstructionofanewbuilding,
higherthefairvalue.Further,higher thedepreciationrate,thelowerthe fairvalueofthebuilding.
Railwaysiding – 5,924 “Costofacquisition Themarketvaluehasbeen ofsimilarrailwaysiding determinedbyusingcostof withsimilarlevelof acquisitionofsimilarrailwaysiding technology. withsimilarleveloftechnologyand applyingasuitabledepreciation Suitabledepreciationrate factorbasedonremaininguseful toarriveatdepreciated lifeofrailwaysiding.Remaining replacementvalue“ usefullifehasbeenestimatedto benil.Thehigherthecostof acquisitionofsimilarrailwaysiding, higherthefairvalueofrailway siding.Further,higherthe depreciationrate,thelowerthefair valueofrailwaysiding.
Plantandmachinery 28,187,795 28,601,673 “Costofacquisitionof Themarketvaluehasbeen similar plant andmachinery determinedbyusingcostof withsimilarlevelof acquisitionofsimilarplantand technology. machinerywithsimilarlevelof echnologyandapplyingasuitablet Suitabledepreciationrate depreciationfactorbasedon toarriveatdepreciated remainingusefullivesofplantand replacementvalue“ machinery.Remainingusefullives havebeenestimatedfrom20to 25years.Thehigherthecostof acquisitionofsimilarplantand machinery,higherthefairvalueof plantandmachinery.Further,higher thedepreciationrate,thelowerthe fairvalueofplantandmachinery.
Toolsandotherequipment 493,028 532,674 “Costofacquisitionof Themarketvaluehasbeen similartoolsandequipmentdeterminedbyusingcostof withsimilarlevelof acquisitionofsimilartoolsand technology. equipmentwithsimilarlevelof technologyandapplyingasuitable Suitabledepreciationrate depreciationfactorbasedon toarriveatdepreciated remainingusefullivesoftoolsand replacementvalue.” equipment.Remainingusefullives havebeenestimatedfrom4to25 years.Thehigherthecostof acquisitionofsimilartoolsand equipment,higherthefairvalueof toolsandequipment.Further,higher thedepreciationrate,thelowerthe fairvalueoftoolsandequipment.
62
ANNUAL REPORT 2015
63

Notesto and forming part of the Financial Statements for the year ended December 31, 2015
2015 2014 (Rupeesinthousand)
20.2 Capital work-in-progress
Plantandmachinery 9,468 9,320 Civilworks 295 295 Advancesagainstpurchaseofplantandmachinery-consideredgood 1,825 2,010 Others – 783
11,588 12,408
20.2.1Thereconciliationofthecarryingamountisasfollows: Openingbalance 12,408 61,718 Additionsduringtheyear 21,383 53,130
33,791 114,848 Transfersduringtheyear (22,203) (102,440)
Closingbalance 11,588 12,408
20.3 Capital stores and stand-by equipment
Openingbalance 74,421 – Additionsduringtheyear 19,378 74,421 93,799 74,421 Transfersduringtheyear (38,035) –
Closingbalance 55,764 74,421 21. Assets subject to finance lease
Theserepresentvehiclesleasedbythecompany. COST Openingbalance – 161,879 Transfertooperatingfixedassetsduringtheyear – (161,879)
Closingbalance – –
DEPRECIATION
Openingbalance – 111,248 Chargefortheyear -note21.1 – 29,428 Transfertooperatingfixedassetsduringtheyear – (140,676)
Closingbalance – –
Closingbookvalue – –
Annualdepreciationrate% – 20
21.1 Thedepreciationchargefortheyearhasbeenallocatedasfollows:
Costofsales -note31 – 4,540 Administrativeexpenses -note32 – 13,840 Sellinganddistributionexpenses -note33 – 11,048
– 29,428
(Rupees in thousand) Computer Mining rights Total software22. Intangible assets COST BalanceasatJanuary01,2014 33,586 210,000 243,586 Additionsduringtheyear 10,654 – 10,654 BalanceasatDecember31,2014 44,240 210,000 254,240 BalanceasatJanuary01,2015 44,240 210,000 254,240 Additionsduringtheyear 607 – 607 BalanceasatDecember31,2015 44,847 210,000 254,847
AMORTIZATION BalanceasatJanuary01,2014 8,179 91,000 99,179 Chargefortheyear -note22.2 8,662 21,000 29,662 BalanceasatDecember31,2014 16,841 112,000 128,841
BalanceasatJanuary01,2015 16,841 112,000 128,841 Chargefortheyear -note22.2 10,717 21,000 31,717 BalanceasatDecember31,2015 27,558 133,000 160,558
BookvalueasatDecember31,2014 27,399 98,000 125,399
BookvalueasatDecember31,2015 17,289 77,000 94,289
Annualamortizationrate% 25 10
22.1 MiningrightsrepresentrightsacquiredforextractionofrockphosphatefromablockofareainDistrictAbbottabadforatenyearsperiodendingonAugust11,2019.TheaforesaidareaisinthepossessionandcontrolofPakistanMiningCompanyLimited(‘PMCL’),arelatedparty(associatedcompany),whichprovidesrockphosphateextractionservicestothecompanyaspertheServicesAgreement.
2015 2014 (Rupeesinthousand)
22.2 Theamortizationchargefortheyearhasbeenallocatedasfollows: Costofsales(includedinrawmaterialsconsumed) 21,000 21,000 Administrativeexpenses -note32 10,717 8,662
31,717 29,662
23. Goodwill
ThisrepresentsgoodwillonamalgamationofRELandthecompany.
Impairmenttestingofgoodwillhasbeencarriedoutbyallocatingtheamountofgoodwilltorespectiveassetsonwhichitarose.TherecoverableamountoftheCashGeneratingUnithasbeendeterminedbasedonavalueinusecalculation.Thiscalculationusescashflowprojectionsbasedonfinancialbudgetsapprovedbymanagementcoveringafive-yearperiodthathavebeendiscountedusingadiscountrateof14.21%.Thecashflowsbeyondthefive-yearperiodareextrapolatedusinganestimatedgrowthrateof4%whichisconsistentwiththelong-termaveragegrowthrateforthefertilizerindustry.TherecoverableamountcalculatedbasedonvalueinuseexceededcarryingvaluebyRs23,841million.Alongterm/terminalgrowthrateof-5.50%orariseindiscountrateto21.13%would,allchangestakeninisolation,resultintherecoverableamountbeingequaltothecarryingamount.
64
ANNUAL REPORT 2015
65

Notesto and forming part of the Financial Statements for the year ended December 31, 2015
Theabovecashflowprojectionsareprincipallybasedontheassumptionthatgassupplywouldcontinuetothecompany.Duringthepreviousthreeyears,thecompanyhasfacedgasshortagesthatresultedinlosses.However,duringthecurrentyear,thecompanystartedpurchasingRegasifiedLiquefiedNaturalGas(‘RLNG’)fromPSOduetowhichitsplantoperatedfor273days resulting inprofit for thecurrentyear.PSOhad importedsuchLiquefiedNaturalGas(‘LNG’) fromQatargas.Management’sassumptionofcontinuity ingas supply to thecompany’splant isbasedon the long termagreement forimportofLNGsignedbetweentheGovernmentofPakistanandQatargas.
2015 2014 (Rupeesinthousand)
24. Long term investments
Subsidiary - unquoted - available for sale (not intended to be sold within next twelve months):
RelianceSacksLimited(incorporatedinPakistan) 16,863,273(2014:16,863,273)fully paidordinarysharesofRs10each Equityheld100%(2014:100%) BookvaluepershareRs26.949(2014:Rs18.412) -note24.1 297,120 258,177
Associate - unquoted - at cost:
MultanRealEstateCompany(Private)Limited 642,321(2014:642,321)fully paidordinarysharesofRs100each Equityheld29.55%(2014:29.55%) BookvaluepershareRs100.04(2014:Rs99.83) -note24.2 64,232 64,232 Held to maturity (not due to mature within next twelve months):
-Other -note24.3 43,278 38,589
404,630 360,998
24.1 Investment in Reliance Sacks Limited - at fair value
Atcost 168,633 168,633 Cumulativefairvaluegainrecognised 128,487 89,544
-note24.1.1 297,120 258,177
This represents investment in the ordinary shares of RSL which is principally engaged in themanufacturing and sale ofpolypropylenesacks,polypropyleneclothandlinerstobeusedinpackingoffertilizers.SinceRSL’sordinarysharesarenotlisted,an investmentadvisor engagedby thecompanyhasestimateda fair valueof Rs 17.62perordinary shareasatDecember31,2015throughavaluationtechniquebasedondiscountedcashflowanalysisofRSL,hence,hasbeenclassifiedunderlevel3offairvaluehierarchyasfurtherexplainedinnote44.2tothesefinancialstatements.
Themainlevel3inputsusedbythecompanyarederivedandevaluatedasfollows:
-Discount rate isdeterminedusingacapitalassetpricingmodel tocalculateapre-tax ratethat reflectscurrentmarketassessmentsofthetimevalueofmoneyandtheriskspecifictoRSL.
-EarninggrowthfactorisestimatedbasedonhistoricalperformanceofRSLandcurrentmarketinformationforsimilartype
ofcompanies.
Thesignificantassumptionusedinthisvaluationtechniqueareasfollows:
-Discountrate19.80%perannum.
-Earninggrowthfactor2%perannum. Sensitivity analysis
Sensitivityanalysisofthesignificantassumptionusedinthevaluationtechniqueareasfollows:
Ifthediscountrateincreasesby1%withallothervariablesheldconstant,theimpactonfairvalueasatDecember31,2015wouldbeRs30.483millionlower.
Iftheearninggrowthfactordecreasesby1%withallothervariablesheldconstant,theimpactonfairvalueasatDecember31,2015wouldbeRs15.579millionlower.
2015 2014 (Rupeesinthousand)
24.1.1Thereconciliationofthecarryingamountisasfollows:
Openingbalance 258,177 196,137 Surplus on remeasurement of fair value ofavailable-for-saleinvestmentrecognized asothercomprehensiveincome 38,943 62,040
Closingbalance 297,120 258,177
24.2 Associate - unquoted - at cost
ThisrepresentsinvestmentintheordinarysharesofMultanRealEstateCompany(Private)Limited(‘MREC’).ThemainbusinessofMRECisestablishinganddesigninghousingandcommercialschemes,tocarryonbusinessofcivilengineersforconstructionofprivateandgovernmentalbuildingsandinfrastructureandprovisionoflaborandbuildingmaterial.
24.3 Investment - Other
ThisrepresentsDefenceSavingCertificatesissuedforaperiodoftenyears,whichwillmatureonSeptember11,2019.Yieldtomaturityonthesecertificatesis12.15%.ThesecertificateshavebeenpledgedassecuritywiththeDirectorGeneral,Mines&Minerals,GovernmentofKhyberPakhtunkhwaasperthetermsoftheminingagreement.
2015 2014 (Rupeesinthousand)
25. Stores and spare parts
Chemicalsandcatalysts -note25.1 845,155 890,927 Stores 114,625 121,376 Spareparts[includingintransitRs37.598million (2014:Rs23.112million)] 1,677,407 1,694,948
2,637,187 2,707,251 Provisionforobsoleteitems (76,224) (76,224)
2,560,963 2,631,027
25.1 Includedinchemicalsandcatalystsisplatinum,rhodiumandpalladiumofRs80.327million(2014:Rs57.042million)heldbyJohnsonMattheyPublicLimitedCompany,UnitedKingdomonbehalfofthecompanyforrefiningpurposes.
66
ANNUAL REPORT 2015
67

Notesto and forming part of the Financial Statements for the year ended December 31, 2015
2015 2014 (Rupeesinthousand)
26. Stock-in-trade Rawmaterials -note26.2 539,316 426,502 Packingmaterials 40,044 37,508 Midproducts 154,189 19,709 Finishedgoods: -Ownmanufactured: Fertilizers -note26.3 4,733,699 8,909 Emissionreductions -note26.4 – 317 4,733,699 9,226 -Fertilizerpurchasedforresale 2,193,497 336,387
7,660,745 829,332
26.1 RawmaterialsandfinishedgoodsamountingtoRs4,521.267million(2014:Rs423.610million)arepledgedwith lendersassecurityagainstshorttermborrowingsasreferredtoinnote15.1.
26.2 IncludesrockphosphateamountingtoRs64.396million(2014:Rs52.546million)whichisinthepossessionofPMCL(relatedparty-associatedcompany).TherockphosphateinpossessionofPMCLisduetothereasonexplainedinnote22.1tothesefinancialstatements.
26.3 Includescompany’sfertilizerproduct,NitroPhosphate(‘NP’),amountingtoRs5.748million(2014:Nil)whichisinpossessionofFATIMA,arelatedparty(associatedcompany),forstoragepurposeasthetwocompaniessharestoragespaceincertainareas.
26.4 This representsemission reductionscostingRs 37.137million (2014: Rs 37.137million)carriedat theirNetRealizableValue(‘NRV’)amountingtoNil(2014:Rs0.317million).TheNRVwritedownexpenseofRs0.317million(2014:Rs36.820million)hasbeenchargedtocostofsales.
2015 2014 (Rupeesinthousand)
27. Trade debts
Consideredgood: -Secured(bywayofbankguaranteesandsecuritydeposits) -note27.1 2,507,978 85,878 -Unsecured 116,222 101,936
2,624,200 187,814
27.1Theseareinthenormalcourseofbusinessandcertaindebtscarryinterestrangingfrom9.02%to12.52%perannum.
2015 2014 (Rupeesinthousand)
28. Advances, deposits, prepayments and other receivables Advances - considered good:
-Toemployees -note28.1 11,022 11,740 -Tosuppliers -note28.2 1,707,632 80,742 Tradedeposits – 100 Prepayments 163,712 5,986 Interestreceivableonbankdeposits 992 1,702 Balanceswithstatutoryauthorities: -Salestax -consideredgood -note28.5 2,206,858 – -considereddoubtful 8,911 8,911 2,215,769 8,911 -Incometaxrecoverable 3,765,575 3,100,861 -Customdutyrecoverable 9,812 9,812 Lettersofcredit-margins,deposits,openingchargesetc. 248 – Securitydeposits -note28.3 18,157 637,995 ReceivablefromGovernmentofPakistan -note28.4 1,302,429 – Otherreceivables-consideredgood 103,917 81,110 9,299,265 3,938,959 Provisionfordoubtfulreceivable (8,911) (8,911)
9,290,354 3,930,048 28.1 IncludedinadvancestoemployeesareamountsduefromexecutivesofRs7.503million(2014:Rs7.845million).
28.2 IncludesanamountofRs26.741million(2014:Rs27.684million)andRs5.895million(2014:Nil)asadvancestorelatedparties,PMCL(associatedcompany)andSNGPL(associatedcompany)respectively.
28.3 IncludesanamountofNil(2014:Rs630million)depositedwithSindhHighCourt,inrespectofsuitfiledbythecompanyinrelationtoproposedacquisitionofDHFertilizersLimited(‘DHFL’,nowFatimafertLimited).
DuringtheyearendedDecember31,2012,thecompanysignedaMemorandumofUnderstanding(MoU)withDawoodHerculesCorporationLimited(‘DHCorp’)forthepurchaseofitsentireshareholding(100millionordinarysharesofRs10each)initswhollyownedsubsidiary,DHFL.However,theBoardofDirectorsofDHCorpintheirmeetingheldonDecember10,2012decidedthat itdidnot intendtopursue the transaction forcommercial reasons.Subsequently, thecompanyfiledasuitagainstDHCorpinSindhHighCourt(the‘Court’)fortheenforcementofthesaidMoU.
Duringtheyear,thecompanyandDHCorpreachedanoutofcourtsettlementforthesaidsuitwherebyDHCorpagreedtofulfilitsobligationaspertheMoUbysellingitsentireshareholdinginDHFLtothecompany.Consequently,thecompanyfiledanapplicationfordismissaloftheaforesaidsuitwhichwasdulyacceptedbytheCourtvideitsorderdatedJune18,2015andthecompleteamountofdepositwasrefundedtothecompany.Furthermore,asperthesettlement,thecompanyandDHCorpenteredintoa‘SharePurchaseAgreement’foracquisitionofentireshareholdingofDHFLonJune15,2015.However,owingtothecompany’sfinancialposition,itsBoardofDirectorsassignedtheacquisitionrights,benefitsandobligationsundertheSharePurchaseAgreementtoFATIMA,arelatedparty(associatedcompany).
28.4 During the year, theGovernmentof Pakistannotified thepaymentof subsidyat the rateof Rs 500per 50 kgbagofDiAmmoniumPhosphate(‘DAP’)andRs217per50kgbagofNPsold.TheamountofsubsidywillbepaidtothecompanyuponverificationbytheFederalBoardofRevenue.
68
ANNUAL REPORT 2015
69

Notesto and forming part of the Financial Statements for the year ended December 31, 2015
28.5 IncludesRs134.022millionwhichprimarilyrepresentstheinputsalestaxpaidbythecompanyinrespectofrawmaterialsacquiredbeforeJune11,2008onwhichdatefertilizerproductsmanufacturedbythecompanywereexemptedfromlevyofsalestaxthroughnotificationSRO535(I)/2008.Theamountstoodrefundabletothecompanytherebeingnooutputsalestaxliabilityremainingpayableonfertilizerproductsmanufacturedbythecompanyagainstwhichsuchinputsalestaxwasadjustable.Thecompany’sclaimofrefundonthisaccountwasnotentertainedbyFederalBoardofRevenue(‘FBR’)onthepremisethatsincesubjectrawmaterialsweresubsequentlyconsumedinmanufactureofaproductexemptfromlevyofsalestax,claimwasnotinaccordancewiththerelevantprovisionsoftheSalesTaxAct,1990.
Company’smanagementbeingaggrievedwiththeinterpretationadvancedbyFBRontheissuehaspreferredawritpetitionbeforetheLahoreHighCourt,whichhasnotyetbeendisposedoff.Sincecompany’smanagementconsidersthatclaimofrefundiscompletelyinaccordancewithrelevantstatutoryframeworkandexpectsrelieffromappellateauthoritiesonthisaccount,itconsidersthatthereceivableamountwasunimpairedatthebalancesheetdate.
2015 2014 (Rupeesinthousand)
29. Cash and bank balances
Atbankson: -Savingaccounts -notes29.1&29.2 382,090 1,314,132 -Currentaccounts -note29.2 130,399 94,178
512,489 1,408,310 Inhand 4,969 5,145
517,458 1,413,455
29.1 Profitonbalancesinsavingaccountsrangesfrom4%to9%perannum.
29.2 IncludedinsavingaccountsisanamountofRs217.379million(2014:Rs274.314million)whichbearsmarkupattherateof5.75%perannumandincludedincurrentaccountsisanamountofRs2.698million(2014:Rs3.019million),bothplacedwithSummitBankLimited,arelatedparty(associatedcompany).
2015 2014 (Rupeesinthousand)
30. Sales Fertilizerproducts: -Ownmanufactured 16,193,646 5,790,966 -Purchasedforresale 6,307,780 10,794,959
22,501,426 16,585,925
SubsidyfromGovernmentofPakistan -note28.4 1,302,429 – Midproducts 542,280 287,264 Rockphosphate 40,107 85,695
1,884,816 372,959
24,386,242 16,958,884 Less: Salestax 2,081,415 2,523,392 Salesincentive 384,332 187,382 2,465,747 2,710,774
21,920,495 14,248,110
2015 2014 (Rupeesinthousand)
31. Cost of sales Rawmaterialconsumed -notes31.1&31.2 11,898,039 1,901,383 Packingmaterialconsumed 339,559 75,845
12,237,598 1,977,228 Salaries,wagesandotherbenefits -note31.3 638,150 475,852 Fuelandpower -notes31.4 2,461,501 710,373 Chemicalsandcatalystsconsumed 408,497 7,950 Sparepartsconsumed 151,981 100,621 Storesconsumed 45,723 20,707 Repairsandmaintenance 73,713 141,524 Insurance 128,412 154,920 Depreciationonoperatingfixedassets -note20.1.3 528,302 181,794 Depreciationonassetssubjecttofinancelease -note21.1 – 4,540 Tollmanufacturingchargesandfreight -note31.5 723,838 978,864 Others -note31.6 40,310 29,635
17,438,025 4,784,008 Openingstockofmidproducts 19,709 40,519 Closingstockofmidproducts (180,135) (19,709)
(160,426) 20,810
Costofgoodsmanufactured 17,277,599 4,804,818 Openingstockoffinishedgoods 9,226 20,391 Closingstockoffinishedgoods (4,707,754) (9,226)
(4,698,528) 11,165 Costofgoodssold-ownmanufactured 12,579,071 4,815,983 Costofgoodssold-purchasedforresale 4,773,728 7,448,261
17,352,799 12,264,244
31.1 IncludesfeedgasconsumedofNil(2014:Rs745.024million)purchasedfromSNGPL,arelatedparty(associatedcompany).
31.2 IncludesexpensesofRs43.459million(2014:Rs81.529million) forextractionof rockphosphatebyPMCL,a relatedparty(associatedcompany),asexplainedinnote22.1tothesefinancialstatements.
2015 2014 (Rupeesinthousand)
31.3 Salaries, wages and other benefits Salaries,wagesandotherbenefitsincludethefollowingin respectofretirementbenefits:
Gratuity Currentservicecost 15,792 15,969 Interestcostfortheyear 7,425 7,560 Expectedreturnonplanassets (6,492) (6,274)
16,725 17,255
Accumulating compensated absences Currentservicecost 8,059 2,487 Interestcostfortheyear 4,052 1,207 Remeasurements 524 (2,868)
12,635 826
70
ANNUAL REPORT 2015
71

Notesto and forming part of the Financial Statements for the year ended December 31, 2015
Inadditiontotheabove,salaries,wagesandotherbenefitsincludeRs13.215million(2014:Rs12.332million)inrespectofprovidentfundcontributionbythecompany.
31.4 IncludesfuelgasconsumedofRs46.907million(2014:Rs644.746million)purchasedfromSNGPL,arelatedparty(associatedcompany).
31.5ThisincludesprocessingservicesofRs658.842million(2014:Rs976.416million)availedfromFATIMA,arelatedparty(associatedcompany).
31.6IncludesoperatingleaserentalsamountingtoRs15.224million(2014:Rs13.671million).
2015 2014 (Rupeesinthousand)
32. Administrative expenses
Salaries,wagesandotherbenefits -note32.1 301,435 201,411 Travellingandconveyance 15,546 13,205 Telephone,telexandpostage 14,521 14,024 Stationery,printingandperiodicals 5,194 7,763 Rent,ratesandtaxes -note32.2 59,738 38,747 Repairsandmaintenance 50,130 28,768 Aircraftoperatingexpenses -note32.3 123,161 111,764 Insurance 13,540 17,950 Legalandprofessionalcharges 23,126 13,956 Vehiclerunningexpenses 2,785 1,644 Entertainment 7,765 3,435 Advertisement 352 462 Depreciationonoperatingfixedassets -note20.1.3 194,648 194,127 Depreciationonassetssubjecttofinancelease -note21.1 – 13,840 Amortizationonintangibleassets -note22.2 10,717 8,662 Other 56,739 60,932
-note32.4 879,397 730,690
32.1 Salaries, wages and other benefits
Salaries,wagesandotherbenefitsincludethe followinginrespectofretirementbenefits: Gratuity Currentservicecost 5,325 5,466 Interestcostfortheyear 2,503 2,589 Expectedreturnonplanassets (2,189) (2,148) Amountchargedtorelatedparty (1,108) (1,055) 4,531 4,852 Accumulatingcompensatedabsences Currentservicecost 3,060 1,338 Interestcostfortheyear 1,539 649 Remeasurements 199 (1,544) 4,798 443
Inaddition to theabove, salaries,wagesandotherbenefits includeRs5.302million (2014:Rs5.222million) in respectofprovidentfundcontributionbythecompany.
32.2 IncludesoperatingleaserentalsamountingtoRs19.289million(2014:Rs18.563million).
32.3 IncludesexpensesofRs35.120million(2014:Rs31.090million)forflyingandmaintenanceservicesofthecompany’saircraftbyAirOne(Private)Limited,arelatedparty(associatedcompany)aspertheServicesAgreement.
32.4 IncludesamountofRs187.733million(2014:Rs103.959million)whichrepresentscommoncostschargedtothecompanybyFATIMA,a relatedparty (associatedcompany)asper theExpenseSharingAgreement.Also, theamount isnetofRs81.111million(2014:Rs74.205million)whichrepresentscommoncostschargedbythecompanytoFATIMA,arelatedparty(associatedcompany)aspertheExpenseSharingAgreement.
2015 2014 (Rupeesinthousand)
33. Selling and distribution expenses
Salaries,wagesandotherbenefits -note33.1 117,712 14,428 Travellingandconveyance 9,655 1,491 Telephone,telexandpostage 6,772 750 Stationery,printingandperiodicals 1,745 184 Rent,ratesandtaxes -note33.2 40,662 3,273 Repairsandmaintenance 5,007 995 Insurance 3,153 846 Vehiclerunningexpenses 7,436 1,985 Entertainment 3,966 523 Advertisementandsalepromotion 148,982 15,566 Depreciationonoperatingfixedassets -note20.1.3 9,483 4,408 Depreciationonassetssubjecttofinancelease -note21.1 – 11,048 Transportationandfreight 533,238 630,288 Utilities 1,066 236 Technicalservices – 93 Others 7,665 126
-note33.3 896,542 686,240
33.1 Salaries, wages and other benefits
Salaries,wagesandotherbenefitsincludethe followinginrespectofretirementbenefits:
Gratuity Currentservicecost 9,981 9,744 Interestcostfortheyear 4,692 4,613 Expectedreturnonplanassets (4,103) (3,830) Amountchargedtorelatedparty (7,196) (8,185)
3,374 2,342
Accumulating compensated absences Currentservicecost 4,851 8,005 Interestcostfortheyear 2,439 3,885 Remeasurements 315 (9,234)
7,605 2,656
Inaddition to theabove, salaries,wagesandotherbenefits includeRs9.901million (2014:Rs8.815million) in respectofprovidentfundcontributionbythecompany.
72
ANNUAL REPORT 2015
73
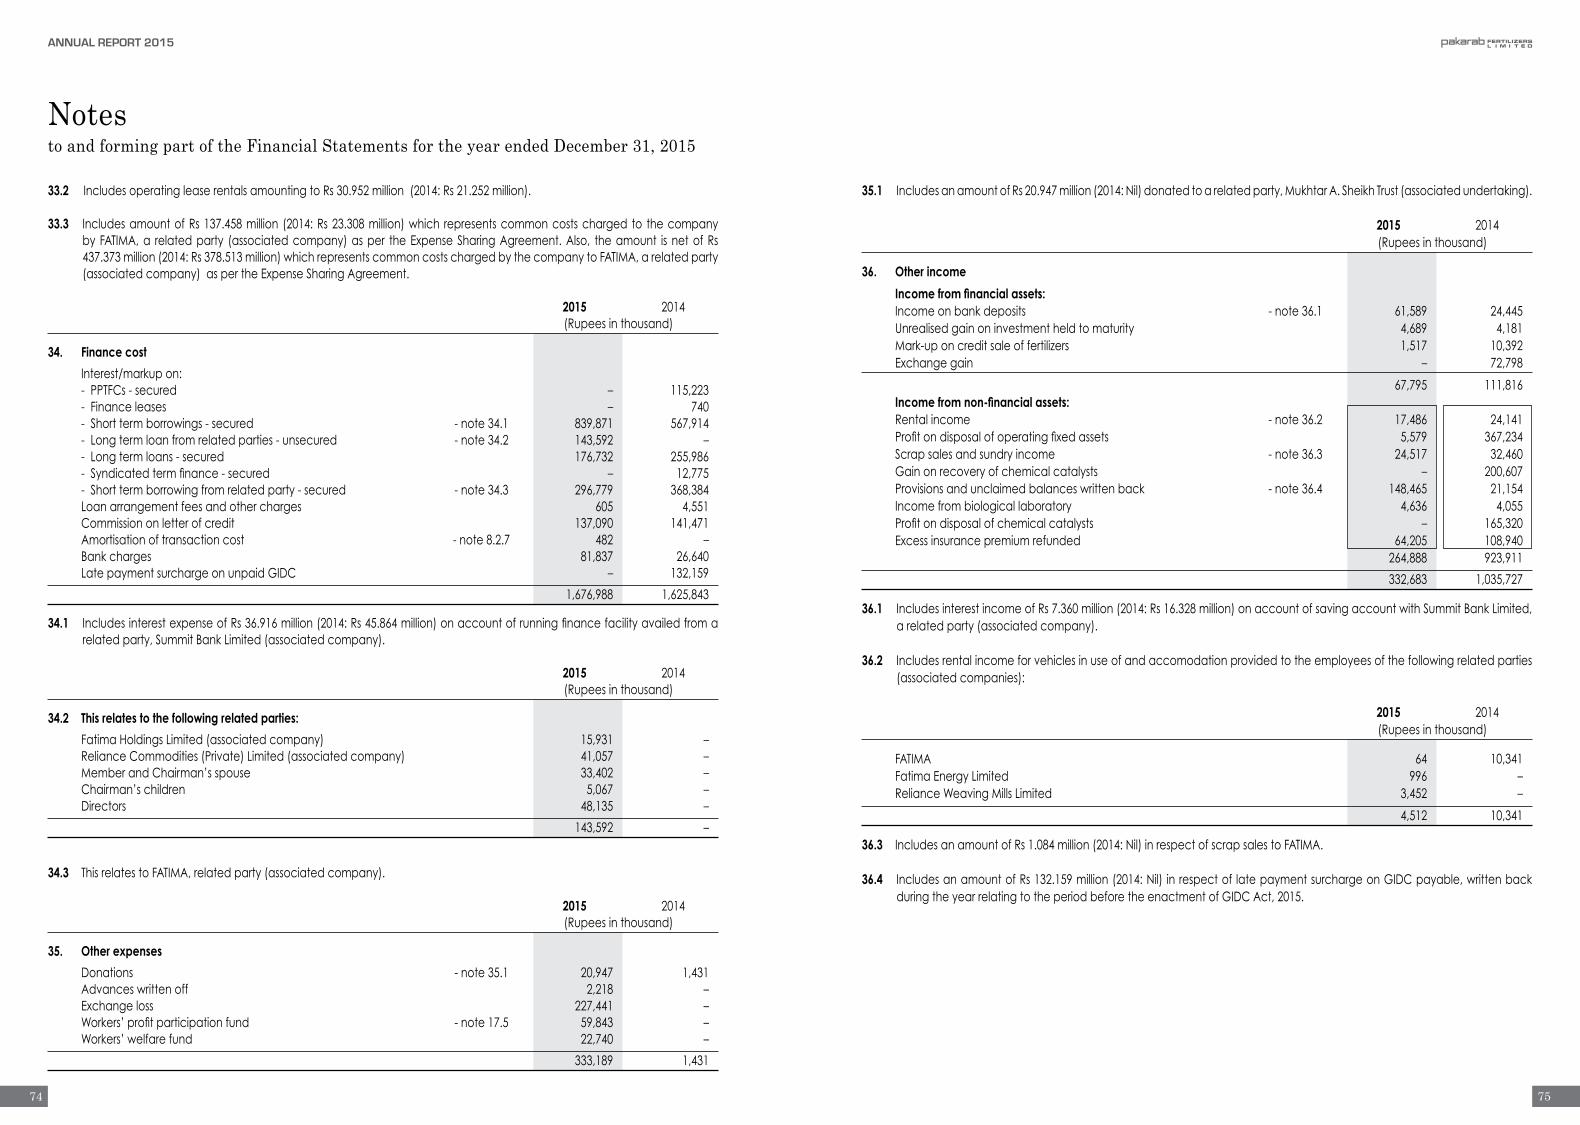
Notesto and forming part of the Financial Statements for the year ended December 31, 2015
33.2 IncludesoperatingleaserentalsamountingtoRs30.952million(2014:Rs21.252million).
33.3 IncludesamountofRs137.458million (2014:Rs23.308million)which representscommoncostscharged to thecompanybyFATIMA,a relatedparty (associatedcompany)asper theExpenseSharingAgreement.Also, theamount isnetofRs437.373million(2014:Rs378.513million)whichrepresentscommoncostschargedbythecompanytoFATIMA,arelatedparty(associatedcompany)aspertheExpenseSharingAgreement.
2015 2014 (Rupeesinthousand)
34. Finance cost
Interest/markupon: -PPTFCs-secured – 115,223 -Financeleases – 740 -Shorttermborrowings-secured -note34.1 839,871 567,914 -Longtermloanfromrelatedparties-unsecured -note34.2 143,592 – -Longtermloans-secured 176,732 255,986 -Syndicatedtermfinance-secured – 12,775 -Shorttermborrowingfromrelatedparty-secured -note34.3 296,779 368,384 Loanarrangementfeesandothercharges 605 4,551 Commissiononletterofcredit 137,090 141,471 Amortisationoftransactioncost -note8.2.7 482 – Bankcharges 81,837 26,640 LatepaymentsurchargeonunpaidGIDC – 132,159
1,676,988 1,625,843
34.1 IncludesinterestexpenseofRs36.916million(2014:Rs45.864million)onaccountofrunningfinancefacilityavailedfromarelatedparty,SummitBankLimited(associatedcompany).
2015 2014 (Rupeesinthousand)
34.2 This relates to the following related parties:
FatimaHoldingsLimited(associatedcompany) 15,931 – RelianceCommodities(Private)Limited(associatedcompany) 41,057 – MemberandChairman’sspouse 33,402 – Chairman’schildren 5,067 – Directors 48,135 –
143,592 –
34.3 ThisrelatestoFATIMA,relatedparty(associatedcompany).
2015 2014 (Rupeesinthousand)
35. Other expenses
Donations -note35.1 20,947 1,431 Advanceswrittenoff 2,218 – Exchangeloss 227,441 – Workers’profitparticipationfund -note17.5 59,843 – Workers’welfarefund 22,740 –
333,189 1,431
35.1 IncludesanamountofRs20.947million(2014:Nil)donatedtoarelatedparty,MukhtarA.SheikhTrust(associatedundertaking).
2015 2014 (Rupeesinthousand)
36. Other income
Income from financial assets: Incomeonbankdeposits -note36.1 61,589 24,445 Unrealisedgainoninvestmentheldtomaturity 4,689 4,181 Mark-uponcreditsaleoffertilizers 1,517 10,392 Exchangegain – 72,798
67,795 111,816 Income from non-financial assets: Rentalincome -note36.2 17,486 24,141 Profitondisposalofoperatingfixedassets 5,579 367,234 Scrapsalesandsundryincome -note36.3 24,517 32,460 Gainonrecoveryofchemicalcatalysts – 200,607 Provisionsandunclaimedbalanceswrittenback -note36.4 148,465 21,154 Incomefrombiologicallaboratory 4,636 4,055 Profitondisposalofchemicalcatalysts – 165,320 Excessinsurancepremiumrefunded 64,205 108,940 264,888 923,911
332,683 1,035,727
36.1 IncludesinterestincomeofRs7.360million(2014:Rs16.328million)onaccountofsavingaccountwithSummitBankLimited,arelatedparty(associatedcompany).
36.2 Includesrentalincomeforvehiclesinuseofandaccomodationprovidedtotheemployeesofthefollowingrelatedparties(associatedcompanies):
2015 2014 (Rupeesinthousand)
FATIMA 64 10,341 FatimaEnergyLimited 996 – RelianceWeavingMillsLimited 3,452 –
4,512 10,341
36.3 IncludesanamountofRs1.084million(2014:Nil)inrespectofscrapsalestoFATIMA.
36.4 IncludesanamountofRs132.159million(2014:Nil) inrespectof latepaymentsurchargeonGIDCpayable,writtenbackduringtheyearrelatingtotheperiodbeforetheenactmentofGIDCAct,2015.
74
ANNUAL REPORT 2015
75

Notesto and forming part of the Financial Statements for the year ended December 31, 2015
2015 2014 (Rupeesinthousand)
37. Taxation
Current tax -Fortheyear 206,336 147,588 -Prioryears 21,215 – 227,551 147,588 Deferredtax -note13 (1,573,000) (127,538)
(1,345,449) 20,050
37.1 Asexplainedinnote4.1,thecompany’sprovisionfortaxation(currentanddeferred)isbasedontheconsolidatedresultsoftheGroup. 2015 2014
%age %age
37.2 Tax charge reconciliation Numericalreconciliationbetweentheaverageeffectivetaxrate andtheapplicabletaxrate Applicabletaxrate 32.00 33.00 Taxeffectofamountsthatare: Notdeductiblefortaxpurposes 3.18 (40.46) Incomeexemptfromtax (37.39) – Allowableastaxcredit – 11.92 WithinGrouptaxationasexplainedinnote4.1 1.86 (55.61) Effectofchangeintaxrate (75.49) 1.00 Effectofchangeinprioryears’tax (44.91) (31.32)
(152.75) (114.47)
Averageeffectivetaxrate (120.75) (81.47)
2015 2014 (Rupeesinthousand)
38. Cash (used in)/generated from operations Profit/(loss)beforetaxation 1,114,263 (24,611) Adjustmentsfornon-cashchargesandotheritems: -Depreciationonoperatingfixedassets 732,433 380,329 -Depreciationonleasedassets – 29,428 -Advanceswrittenoff 2,218 – -Amortizationonintangibleassets 31,717 29,662 -Retirementbenefitsaccrued 57,972 37,614 -Profitondisposalofoperatingfixedassets (5,579) (367,234) -Provisionsandunclaimedbalanceswrittenback (148,465) (21,154) -Financecost 1,676,988 1,625,843 -Incomeonbankdeposits (61,589) (24,445) -Unrealisedgainoninvestmentheldtomaturity (4,689) (4,181) -Exchangeloss/(gain) 227,440 (72,798) -Gainonrecoveryofchemicalcatalysts – (200,607)
Profitbeforeworkingcapitalchanges 3,622,709 1,387,846
Effectoncashflowduetoworkingcapitalchanges -Decreaseinstoresandspareparts 70,064 411,698 -Increaseinstock-in-trade (6,947,585) (17,673) -Increaseintradedebts (2,436,386) (34,651) -Increaseinadvances,deposits prepaymentsandotherreceivables (4,698,520) (555,664) -Increaseintradeandotherpayables 2,266,837 3,729,233 (11,745,590) 3,532,943 (8,122,881) 4,920,789
2015 2014 (Rupeesinthousand)
39. Cash and cash equivalents Shorttermborrowings -note15 (15,151,614) (4,637,446) Cashandbankbalances -note29 517,458 1,413,455 (14,634,156) (3,223,991)
40. Transactions with related parties
The relatedpartiescomprise subsidiary,associatedundertakings,other relatedparties, keymanagementpersonnelandpostemploymentbenefitplans.Thecompanyinthenormalcourseofbusinesscarriesouttransactionswithvariousrelatedparties.Amountsduefromandduetorelatedpartiesareshownunderreceivablesandpayablesandremunerationofthekeymanagementpersonnelisdisclosedinnote41.Significantrelatedpartytransactionshavebeendisclosedinrespectivenotesinthesefinancialstatementsexceptforthefollowing:
2015 2014 (Rupeesinthousand)
Relationship with the company Nature of transactions
i.Subsidiary Purchaseofgoods 457,094 204,480 ii.Associatedundertakings Saleofgoodsandservices – 170,321 Purchaseofgoods 88,986 13,247 iii.Postemploymentbenefitplans Expensechargedinrespectof 61,335 60,058 retirementbenefitplans
41. Remuneration of Chief Executive, Directors and Executives
41.1 Theaggregateamountchargedinthefinancialstatementsfortheyearforremuneration,includingcertainbenefits,totheChiefExecutive,DirectorsandExecutivesofthecompanyisasfollows:
ChiefExecutive ExecutiveDirectors Non-ExecutiveDirectors Executives
2015 2014 2015 2014 2015 2014 2015 2014 (Rupeesinthousand)
Short term employee benefits
Managerialremuneration – – – – 5,673 6,000 320,673 283,252 Housingrent – – – – – – 109,327 97,177 Utilities – – – – – – 24,295 21,595 Conveyance – – – – – 240 24,295 21,595 Medicalexpenses – – – – 567 – 9,868 16,428 Leavepassage – – – – 945 1,000 38,169 35,031 Others – – – – – – 15,875 7,320
– – – – 7,185 7,240 542,502 482,398 Post employment benefits
Contributiontoprovidentand gratuityfunds – – – – – – 42,155 36,985
Other long term benefits
Accumulatingcompensatedabsences – – – – – – 44,358 37,286
– – – – 7,185 7,240 629,015 556,669
Number of persons 1 1 1 1 6 6 231 208
41.2 Thecompanyalsoprovidesthechiefexecutive,directorsandsomeofitsexecutiveswithcompanymaintainedcars,travelfacilitiesandclubmembership.
76
ANNUAL REPORT 2015
77

Notesto and forming part of the Financial Statements for the year ended December 31, 2015
2015 2014
42. Capacity and production
Urea Ratedproductioncapacity M.Tons 92,400 92,400 Actualureaproduced M.Tons – 6,789
NilproductionofUREAisattributabletohighcostofproductionascomapredtootherfertilizerproductsofthecompany.ThecompanyintendstoresumeproductionofUREAnextyearasitexpectsthatthepriceofRLNGwilldecreaseinfuture.
Nitro Phosphate (NP)
Ratedproductioncapacity M.Tons 304,500 304,500 ActualNPproduced M.Tons 265,349 44,684
ThelowproductionofNPisduetoshortageoffeedgasandperiodicalmaintenance.
Calcium Ammonium Nitrate (CAN)
Ratedproductioncapacity M.Tons 450,000 450,000 ActualCANproduced M.Tons 287,954 55,432 ThelowproductionofCANisduetoshortageoffeedgasandperiodicalmaintenance.
43. Disclosures relating to Provident Fund
Thecompanyoperatestwoprovidentfunds:
(i) Employees’ProvidentFundTrustLahore(ii) Employees’ProvidentFundTrustMultan
ThefollowinginformationisbasedontheauditedfinancialstatementsoftheFundsasatJune30,2015and2014:
2015 2014 (Rupeesinthousand)
SizeoftheFunds-totalassets 350,297 315,758 Costofinvestmentsmade 270,528 225,735 Percentageofinvestmentsmade 86% 79% Fairvalueofinvestments 300,566 249,102
Break up of investments
Specialaccountsinascheduledbank 199,028 207,735 Mutualfunds-listed 101,539 41,367
2015 2014 %ageofsizeoftheFund
Break up of investments
Specialaccountsinascheduledbank 57% 66% Mutualfunds-listed 29% 13% InvestmentsoutofProvidentFundshavebeenmadeinaccordancewiththeprovisionsofsection227oftheCompanies
Ordinance,1984andtherulesformulatedforthispurpose.
44. Financial risk management
44.1 Financial risk factors Thecompanyisexposedtoavarietyoffinancialrisks:marketrisk(includingcurrencyrisk,otherpriceriskandinterestraterisk),
creditriskandliquidityrisk.Thecompany’soverallriskmanagementprogrammefocusesontheunpredictabilityoffinancialmarketsandseekstominimisepotentialadverseeffectsonthefinancialperformance.
Riskmanagement iscarriedoutby thecompany’sBoardofDirectors (‘theBoard’). Thecompany’sfinancedepartmentevaluatesandhedgesfinancial risks.TheBoardprovideswrittenprinciplesforoverall riskmanagement,aswellaswrittenpolicies covering specific areas, such as foreign exchange risk, interest rate risk, credit risk, use of derivative financialinstrumentsandnon-derivativefinancialinstruments,andinvestmentofexcessliquidity.
Thecompany’soverallriskmanagementprocedurestominimizepotentialadverseeffectoffinancialmarketoncompanyare as follows:
a) Market risk
i) Currency risk
Currencyriskistheriskthatthefairvalueorfuturecashflowsofafinancialinstrumentwillfluctuatebecauseofchangesinforeignexchangerates.Currencyriskarisesmainlyfromfuturecommercialtransactionsorreceivablesandpayablesthatexistduetotransactionsinforeigncurrencies.
Thecompanyisexposedtocurrencyriskarisingfromvariouscurrencyexposures,primarilywithrespecttotheUnitedStatesDollar(USD)andEuro.Currently,thecompany’sforeignexchangeriskexposureisrestrictedtobankbalancesandamountsreceivablefrom/payabletotheforeignentities.
2015 2014
Amountpayable-USD 19,596,344 42,557,215 Cashandbankbalances-USD (11,627) (151,586) Netliabilityexposure-USD 19,584,717 42,405,629
Cashandbankbalances-Euro (5,095) (364,906) Netassetexposure-Euro (5,095) (364,906)
AtDecember31,2015iftheRupeehadweakened/strengthenedby5%againsttheUSDwithallothervariablesheldconstant,theimpactonpretaxprofitfortheyearwouldhavebeenRs100.863million(2014:Rs214.572million)lower/higher,mainlyasaresultofexchangelosses/gainsontranslationofUSDdenominatedfinancialinstruments.
At December 31, 2015 if the Rupee hadweakened/strengthened by 5% against the Euro with all other variables held
constant,theimpactonpretaxprofitfortheyearwouldhavebeenNil(2014:Rs2.456million)higher/lower,mainlyasaresultofexchangegains/lossesontranslationofEurodenominatedfinancialinstruments.
78
ANNUAL REPORT 2015
79

Notesto and forming part of the Financial Statements for the year ended December 31, 2015
ii) Other price risk
Otherpriceriskrepresentstheriskthatthefairvalueorfuturecashflowsofafinancialinstrumentwillfluctuatebecauseofchangesinmarketprices(otherthanthosearisingfrominterestrateriskorcurrencyrisk),whetherthosechangesarecausedbyfactorsspecifictotheindividualfinancialinstrumentoritsissuer,orfactorsaffectingallsimilarfinancialinstrumentstradedinthemarket.Thecompanyisnotmateriallyexposedtoequitypricerisksincetherearenosignificantinvestmentsinequityinstrumentstradedinthemarketeitherclassifiedasavailable-for-saleoratfairvaluethroughprofitorlossatthereportingdate.Thecompany isalsonotexposedtocommoditypricerisksince itdoesnotholdanyfinancial instrumentbasedoncommodityprices.
iii) Interest rate risk
Interestrateriskrepresentstheriskthatthefairvalueorfuturecashflowsofafinancialinstrumentwillfluctuatebecauseofchangesinmarketinterestrates.
Thecompany’sinterestrateriskarisesfromlongtermfinances/loansandshorttermborrowings.Borrowingsobtainedandloansprovidedatvariableratesexposethecompanytocashflowinterestraterisk.
Atthebalancesheetdate,theinterestrateprofileofthecompany’ssignificantinterestbearingfinancialinstrumentswas:
2015 2014 (Rupeesinthousand)
Fixed rate instruments: Financial assets Investment 43,278 38,589 Tradedebts 2,510,370 121,369 Bankbalances-savingaccounts 382,090 1,314,132 2,935,738 1,474,090
Financial liabilities – – Net exposure 2,935,738 1,474,090
Floating rate instruments: Financial assets – – Financial liabilities
Longtermloansfromrelatedparties 2,232,952 825,968 Longtermfinances 3,042,161 1,966,071 Shorttermborrowingfromrelatedparty 2,200,000 3,000,000 Shorttermborrowings 15,151,614 4,637,446 22,626,727 10,429,485 Netexposure (22,626,727) (10,429,485)
Fair value sensitivity analysis for fixed rate instruments
Thecompanydoesnotaccountforanyfixedratefinancialassetsandliabilitiesatfairvaluethroughprofitorloss.Therefore,achangeininterestrateatthebalancesheetdatewouldnotaffectprofitorlossofthecompany.
Cash flow sensitivity analysis for variable rate instruments
If interest ratesonvariable rate financial instruments,at the yearenddate, fluctuatesby 1%higher/lowerwithall othervariablesheldconstant,pretaxprofitfortheyearwouldhavebeenRs226.306million(2014:Rs96.035million)lower/higher,mainlyasaresultofhigher/lowerinterestexpenseonfloatingrateinstruments.
b) Credit risk
Creditriskrepresentstheriskoffinanciallossbeingcausedifcounterpartyfailstodischargeanobligation.
Creditriskofthecompanyarisesfromcashandcashequivalentsanddepositswithbanksandfinancialinstitutions,aswellascreditexposurestocustomers,includingoutstandingreceivablesandcommittedtransactions.Themanagementassessesthecreditqualityofthecustomers,takingintoaccounttheirfinancialposition,pastexperienceandotherfactors.IndividualrisklimitsaresetbasedoninternalorexternalratingsinaccordancewithlimitssetbytheBoard.Theutilisationofcreditlimitsisregularlymonitoredandmajorsalestocustomersaresettledincash.Forbanksandfinancialinstitutions,onlyindependentlyratedpartieswithastrongcreditratingareaccepted.
Thecompanymonitorsthecreditqualityofitsfinancialassetswithreferencetohistoricalperformanceofsuchassetsandavailableexternalcreditratings.Thecarryingvaluesoffinancialassetswhichareneitherpastduenorimpairedareasunder:
2015 2014 (Rupeesinthousand)
Longterminvestments 404,630 360,998 Securitydeposits 28,554 34,534 Tradedebts 1,922,564 142,968 Advances,depositsandotherreceivables 123,066 720,807 Cashandbankbalances 512,489 1,408,310 2,991,303 2,667,617
Thecompany’sexposuretocreditriskislimitedtothecarryingamountofunsecuredtradereceivablesandbankbalances.
Theageinganalysisoftradereceivablebalancesisasfollows:
2015 2014 (Rupeesinthousand)
Neitherpastduenorimpaired 1,922,564 142,968 Pastduebutnotimpaired: 1to90days 223,613 7,700 91to180days 167,710 10,834 181to270days 192,816 1,240 above270days 117,497 25,072 701,636 44,846 2,624,200 187,814
Themanagementestimatestherecoverabilityoftradereceivablesonthebasisoffinancialpositionandpasthistoryofitscustomersbasedontheobjectiveevidencethatitwillnotreceivetheamountduefromtheparticularcustomer.Aprovisionfordoubtfuldebtsisestablishedwhenthereisobjectiveevidencethatthecompanywillnotbeabletocollectalltheamountdueaccording to theoriginal termsof the receivable. Significantfinancialdifficultiesof thedebtors,probability that thedebtorwillenterbankruptcyorfinancialreorganisation,anddefaultordelinquencyinpaymentsareconsideredindicatorsthatthetradedebtisimpaired.Theprovisionisrecognisedintheprofitandlossaccount.Theprovisioniswrittenoffbythecompanywhenitexpectsthatitcannotrecoverthebalancedue.Anysubsequentrepaymentsinrelationtoamountwrittenoff,arecrediteddirectlytoprofitandlossaccount.
80
ANNUAL REPORT 2015
81

Notesto and forming part of the Financial Statements for the year ended December 31, 2015
Thecreditqualityofcompany’sbankbalancescanbeassessedwithreferencetoexternalcreditratingsasfollows:
Rating Rating 2015 2014 Shortterm Longterm Agency (Rupeesinthousand)
AlBarakaIslamicBankLimited A1 A PACRA 6,973 11,038 AlliedBankLimited A1+ AA+ PACRA 70 76 SummitBankLimited A-1 A JCR-VIS 220,076 277,332 BankAlfalahLimited A1+ AA PACRA 45,042 444,136 DeutscheBankAG A-2 BBB+ Standard&Poor 1,738 0.1 DubaiIslamicBankLimited A-1 A+ JCR-VIS 2 2 FaysalBankLimited A1+ AA PACRA 3,701 7,253 HabibBankLimited A-1+ AAA JCR-VIS 100,686 60,973 HabibMetropolitanBankLimited A1+ AA+ PACRA 99 558,166 MCBBankLimited A1+ AAA PACRA 5,387 2,127 MeezanBankLimited A-1+ AA JCR-VIS 726 4,444 NationalBankofPakistan A-1+ AAA JCR-VIS 202 3,508 StandardCharteredBank(Pakistan)Limited A1+ AAA PACRA 21,443 4,250 UnitedBankLimited A-1+ AA+ JCR-VIS 90,501 15,302 ZaraiTaraqiatiBankLimited A-1+ AAA JCR-VIS 59 58 BankIslamiPakistanLimited A1 A+ PACRA 10,633 12,180 SindhBankLimited A-1+ AA JCR-VIS 4,879 6,922 BurjBankLimited A-2 A- JCR-VIS 271 543 CitibankN.A. P-1 A2 MOODY’S 0.3 0.3 512,489 1,408,310
Duetothecompany’slongstandingbusinessrelationshipswiththesecounterpartiesandaftergivingdueconsiderationtotheirstrongfinancialstanding,managementdoesnotexpectnon-performancebythesecounterpartiesontheirobligationstothecompany.Accordingly,thecreditriskisminimal.
c) Liquidity risk Liquidityriskistheriskthatanentitywillencounterdifficultyinmeetingobligationsassociatedwithfinancialliabilities.
Thecompany’sapproachtomanagingliquidityistoensurethat,asfaraspossible,italwayshassufficientliquiditytomeetitsliabilitieswhendue,underbothnormalandstressedconditions,withoutincurringunacceptablelossorriskingdamagetothecompany’sreputation.
ThefollowingarethecontractualmaturitiesoffinancialliabilitiesasatDecember31,2015andDecember31,2014:
At December 31, 2015 (Rupeesinthousand) Carrying Lessthan Oneto Morethanfive
amount oneyear fiveyears years
Longtermfinances 3,042,161 1,072,022 1,970,139 – Longtermloanfromrelatedparties 2,232,952 – 2,232,952 – Longtermdeposits 44,860 – – 44,860 Shorttermborrowingfromrelatedparty 2,200,000 2,200,000 – – Shorttermborrowings 15,151,614 15,151,614 – – Tradeandotherpayables 7,266,324 7,266,324 – – Accruedfinancecost 449,423 449,423 – – 30,387,334 26,139,383 4,203,091 44,860
At December 31, 2014 (Rupeesinthousand) Carrying Lessthan Oneto Morethanfive
amount oneyear fiveyears years
Longtermfinances 1,966,071 901,189 1,064,882 – Longtermloanfromrelatedparties 825,968 – 825,968 – Importbillpayable 2,414,400 1,314,400 1,100,000 – Longtermdeposits 48,070 – – 48,070 Shorttermborrowingfromrelatedparty 3,000,000 3,000,000 – – Shorttermborrowings 4,637,446 4,637,446 – – Tradeandotherpayables 6,560,190 6,560,190 – – Accruedfinancecost 319,531 319,531 – – 19,771,676 16,732,756 2,990,850 48,070
44.2 Fair value estimation
Fairvalueistheamountforwhichanassetcouldbeexchanged,orliabilitysettled,betweenknowledgeablewillingpartiesinanarm’slengthtransaction.Underlyingthedefinitionoffairvalueisthepresumptionthatthecompanyisagoingconcernwithoutanyintentionorrequirementtocurtailmateriallythescaleofitsoperationsortoundertakeatransactiononadverseterms.Thecarryingvaluesofallfinancialassetsandliabilitiesreflectedinthesefinancialstatementsapproximatetheirfairvalues.Fairvalueisdeterminedonthebasisofobjectiveevidenceateachreportingdate.Thetablebelowanalysesfinancialinstrumentscarriedatfairvalue,byvaluationmethod.Thedifferentlevelshavebeendefinedasfollows:
- Quotedprices(unadjusted)inactivemarketsforidenticalassetsorliabilities(level1).
- Inputsotherthanquotedpricesincludedwithinlevel1thatareobservablefortheassetorliability,eitherdirectly(thatis,asprices)orindirectly(thatis,derivedfromprices)(level2).
- Inputsfortheassetorliabilitythatarenotbasedonobservablemarketdata(thatis,unobservableinputs)(level3).
82
ANNUAL REPORT 2015
83
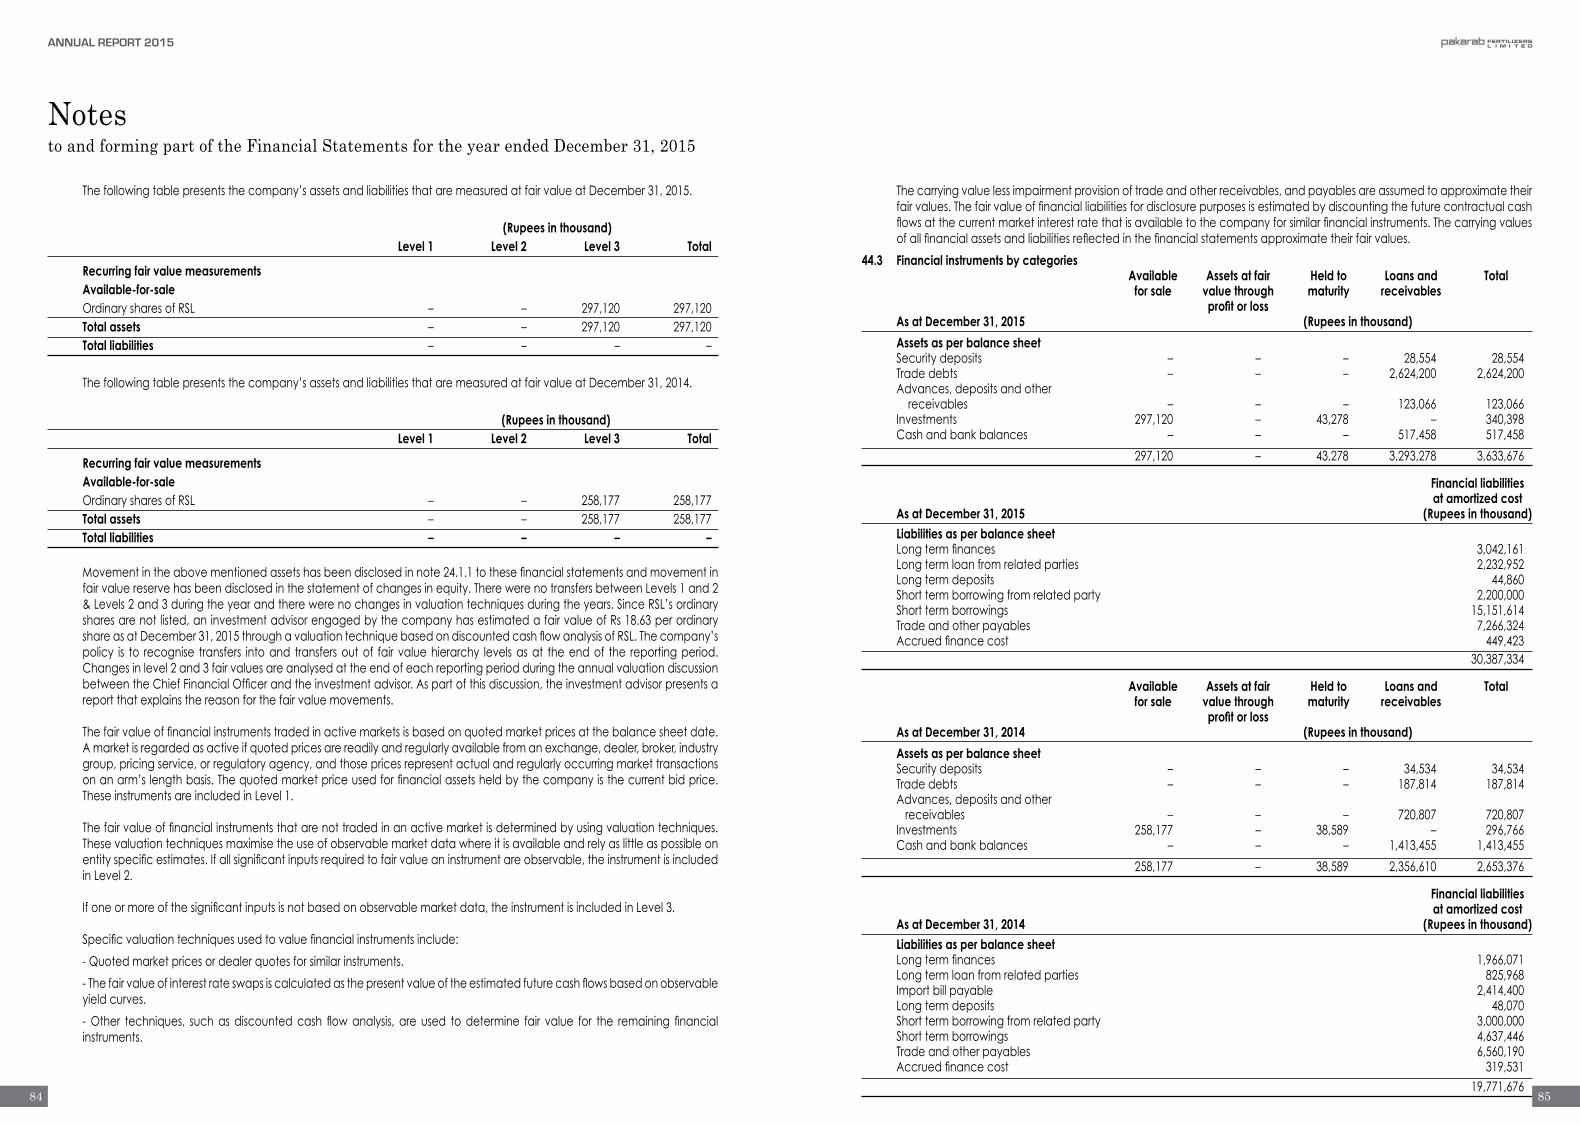
Notesto and forming part of the Financial Statements for the year ended December 31, 2015
Thefollowingtablepresentsthecompany’sassetsandliabilitiesthataremeasuredatfairvalueatDecember31,2015. (Rupees in thousand)
Level 1 Level 2 Level 3 Total
Recurring fair value measurements Available-for-sale OrdinarysharesofRSL – – 297,120 297,120 Total assets – – 297,120 297,120 Total liabilities – – – – Thefollowingtablepresentsthecompany’sassetsandliabilitiesthataremeasuredatfairvalueatDecember31,2014.
(Rupees in thousand) Level 1 Level 2 Level 3 Total
Recurring fair value measurements Available-for-sale OrdinarysharesofRSL – – 258,177 258,177 Total assets – – 258,177 258,177 Total liabilities – – – –
Movementintheabovementionedassetshasbeendisclosedinnote24.1.1tothesefinancialstatementsandmovementinfairvaluereservehasbeendisclosedinthestatementofchangesinequity.TherewerenotransfersbetweenLevels1and2&Levels2and3duringtheyearandtherewerenochangesinvaluationtechniquesduringtheyears.SinceRSL’sordinarysharesarenotlisted,aninvestmentadvisorengagedbythecompanyhasestimatedafairvalueofRs18.63perordinaryshareasatDecember31,2015throughavaluationtechniquebasedondiscountedcashflowanalysisofRSL.Thecompany’spolicy is to recognise transfers intoand transfersoutof fair valuehierarchy levelsasat theendof the reportingperiod.Changesinlevel2and3fairvaluesareanalysedattheendofeachreportingperiodduringtheannualvaluationdiscussionbetweentheChiefFinancialOfficerandtheinvestmentadvisor.Aspartofthisdiscussion,theinvestmentadvisorpresentsareportthatexplainsthereasonforthefairvaluemovements.
Thefairvalueoffinancialinstrumentstradedinactivemarketsisbasedonquotedmarketpricesatthebalancesheetdate.Amarketisregardedasactiveifquotedpricesarereadilyandregularlyavailablefromanexchange,dealer,broker,industrygroup,pricingservice,orregulatoryagency,andthosepricesrepresentactualandregularlyoccurringmarkettransactionsonanarm’slengthbasis.Thequotedmarketpriceusedforfinancialassetsheldbythecompanyisthecurrentbidprice.TheseinstrumentsareincludedinLevel1.
Thefairvalueoffinancialinstrumentsthatarenottradedinanactivemarketisdeterminedbyusingvaluationtechniques.Thesevaluationtechniquesmaximisetheuseofobservablemarketdatawhereitisavailableandrelyaslittleaspossibleonentityspecificestimates.Ifallsignificantinputsrequiredtofairvalueaninstrumentareobservable,theinstrumentisincludedinLevel2.
Ifoneormoreofthesignificantinputsisnotbasedonobservablemarketdata,theinstrumentisincludedinLevel3.
Specificvaluationtechniquesusedtovaluefinancialinstrumentsinclude:
-Quotedmarketpricesordealerquotesforsimilarinstruments.
-Thefairvalueofinterestrateswapsiscalculatedasthepresentvalueoftheestimatedfuturecashflowsbasedonobservableyieldcurves.
-Other techniques, suchas discountedcash flowanalysis, are used todetermine fair value for the remaining financialinstruments.
Thecarryingvaluelessimpairmentprovisionoftradeandotherreceivables,andpayablesareassumedtoapproximatetheirfairvalues.Thefairvalueoffinancialliabilitiesfordisclosurepurposesisestimatedbydiscountingthefuturecontractualcashflowsatthecurrentmarketinterestratethatisavailabletothecompanyforsimilarfinancialinstruments.Thecarryingvaluesofallfinancialassetsandliabilitiesreflectedinthefinancialstatementsapproximatetheirfairvalues.
44.3 Financial instruments by categories Available Assets at fair Held to Loans and Total for sale value through maturity receivables profit or loss As at December 31, 2015 (Rupees in thousand)
Assets as per balance sheet Securitydeposits – – – 28,554 28,554
Tradedebts – – – 2,624,200 2,624,200 Advances,depositsandother receivables – – – 123,066 123,066 Investments 297,120 – 43,278 – 340,398 Cashandbankbalances – – – 517,458 517,458
297,120 – 43,278 3,293,278 3,633,676
Financial liabilities at amortized cost As at December 31, 2015 (Rupees in thousand) Liabilities as per balance sheet Longtermfinances 3,042,161 Longtermloanfromrelatedparties 2,232,952 Longtermdeposits 44,860 Shorttermborrowingfromrelatedparty 2,200,000 Shorttermborrowings 15,151,614 Tradeandotherpayables 7,266,324 Accruedfinancecost 449,423 30,387,334
Available Assets at fair Held to Loans and Total for sale value through maturity receivables profit or loss As at December 31, 2014 (Rupees in thousand)
Assets as per balance sheet Securitydeposits – – – 34,534 34,534 Tradedebts – – – 187,814 187,814 Advances,depositsandother receivables – – – 720,807 720,807 Investments 258,177 – 38,589 – 296,766 Cashandbankbalances – – – 1,413,455 1,413,455
258,177 – 38,589 2,356,610 2,653,376
Financial liabilities at amortized cost As at December 31, 2014 (Rupees in thousand) Liabilities as per balance sheet Longtermfinances 1,966,071 Longtermloanfromrelatedparties 825,968 Importbillpayable 2,414,400 Longtermdeposits 48,070 Shorttermborrowingfromrelatedparty 3,000,000 Shorttermborrowings 4,637,446 Tradeandotherpayables 6,560,190 Accruedfinancecost 319,531 19,771,676
84
ANNUAL REPORT 2015
85

Notesto and forming part of the Financial Statements for the year ended December 31, 2015
44.4 Offsetting financial assets and financial liabilities
(a) Financial assets
Thefollowingfinancialassetsaresubjecttooffsetting,enforceablemasternettingarrangementsandsimilaragreements:
Gross amounts Gross amount Net amount of Related Net amount Financial assets of recognized of recognized financial assets amounts not not in scope of financial assets financial liabilities presented in the off set in the off setting off set in the balance sheet balance sheet disclosures balance sheet (Rupees in thousand)
Asat31December2015 A B C=A+B D E=C+D Securitydeposits – – – – – 28,554 Tradedebts – – – – – 2,624,200 Advances,depositsandother receivables – – – – – 123,066 Investments – – – – – 404,630 Cashandbankbalances – – – – – 517,458 – – – – –
Gross amounts Gross amount Net amount of Related Net amount Financial assets of recognized of recognized financial assets amounts not not in scope of financial assets financial liabilities presented in the off set in the off setting off set in the balance sheet balance sheet disclosures balance sheet (Rupees in thousand)
Asat31December2014 A B C=A+B D E=C+D Securitydeposits – – – – – 34,534 Tradedebts – – – – – 187,814 Advances,depositsandother receivables – – – – – 720,807 Investments – – – – – 360,998 Cashandbankbalances – – – – – 1,413,455 – – – – –
(b) Financial liabilities Thefollowingfinancialliabilitiesaresubjecttooffsetting,enforceablemasternettingarrangementsandsimilaragreements:
Gross amounts Gross amount Net amount of Related Net amount Financial liabilites of recognized of recognized financial liabilites amounts not not in scope of
financial financial assets presented in the off set in the off setting liabilites off set in the balance sheet balance sheet disclosures balance sheet (Rupees in thousand)
Asat31December2015 A B C=A+B D E=C+D Longtermfinances – – – – – 3,042,161 Longtermloanfromrelatedparties – – – – – 2,232,952 Importbillpayable – – – – – – Longtermdeposits – – – – – 44,860 Shorttermborrowingfromrelatedparty – – – – – 2,200,000 Shorttermborrowings – – – – – 15,151,614 Tradeandotherpayables – – – – – 7,266,324 Accruedfinancecost – – – – – 449,423 – – – – –
Gross amounts Gross amount Net amount of Related Net amount Financial liabilites of recognized of recognized financial liabilites amounts not not in scope of
financial financial assets presented in the off set in the off setting liabilites off set in the balance sheet balance sheet disclosures balance sheet (Rupees in thousand)
Asat31December2014 A B C=A+B D E=C+D Longtermfinances – – – – – 1,966,071 Importbillpayable – – – – – 2,414,400 Longtermloanfromrelatedparty – – – – – 825,968 Longtermdeposits – – – – – 48,070 Shorttermborrowingfromrelatedparty – – – – – 3,000,000 Shorttermborrowings – – – – – 4,637,446 Tradeandotherpayables – – – – – 6,560,190 Accruedfinancecost – – – – – 319,531 – – – – –
44.5 Capital management
Thecompany’sobjectiveswhenmanagingcapitalaretosafeguardthecompany’sabilitytocontinueasagoingconcerninordertoprovidereturnsforshareholdersandbenefitsforotherstakeholdersandtomaintainanoptimalcapitalstructuretoreducethecostofcapital.Inordertomaintainoradjustthecapitalstructure,thecompanymayadjusttheamountofdividendspaidtoshareholders,returncapitaltoshareholdersthroughrepurchaseofshares,issuenewsharesorsellassetstoreducedebt.Consistentwithothersintheindustryandtherequirementsofthelenders,thecompanymonitorsthecapitalstructureonthebasisofgearingratio.This ratio iscalculatedasnetdebtdividedbytotalcapitalemployed.Netdebt iscalculatedastotalborrowings(includingcurrentandnon-currentborrowings)lesscashandcashequivalents.Totalcapitalincludesequityasshowninthebalancesheetplusnetdebt.Thecompanyisnotsubjecttoanyexternallyimposedcapitalrequirements.
ThegearingratiosasatDecember31,2015and2014wereasfollows:
2015 2014 (Rupeesinthousand)
Borrowings-notes8,9and14 7,475,113 5,792,039 Less:Cashandcashequivalents -note39 (14,634,156) (3,223,991) Netdebt 22,109,269 9,016,030
Totalequity(includessurplusonrevaluationofoperatingfixedassets) 23,911,341 20,773,411 Gearingratio Percentage 48% 30%
2015 2014
45. Number of employees TotalnumberofemployeesasatDecember31 811 730 Averagenumberofemployeesduringtheyear 741 752
46. Date of authorization for issue ThesefinancialstatementswereauthorizedforissueonApril08,2016bytheBoardofDirectorsofthecompany.
ChiefExecutive Director
86
ANNUAL REPORT 2015
87
CONSOLIDATEDFINANCIALSTATEMENTSOF
fortheyearendedDecember31,2015
88
ANNUAL REPORT 2015
Thepageisleftintentionallyblank
Auditors’ Report to the Members
Thepageisleftintentionallyblank
Wehaveaudited theannexedconsolidated financial statementscomprisingconsolidatedbalance sheetof Pakarab Fertilizer
Limited(theholdingcompany)anditssubsidiarycompany(hereinafterreferredtoas‘theGroup’)asatDecember31,2015and
therelatedconsolidatedprofitandlossaccount,consolidatedstatementofcomprehensiveincome,consolidatedstatementof
changesinequityandconsolidatedcashflowstatementtogetherwiththenotesformingpartthereof,fortheyearthenended.We
havealsoexpressedseparateopinionsonthefinancialstatementsofPakarabFertilizersLimitedanditssubsidiarycompany.These
financialstatementaretheresponsibilityoftheholdingcompany’smanagement.Ourresponsibilityistoexpressanopiniononthese
financialstatementbasedonouraudit.
Ourauditwasconducted inaccordancewith the International StandardsonAuditingandaccordingly included such testsof
accountingrecordsandsuchotherauditingproceduresasweconsiderednecessaryinthecircumstances.
Inouropinion,theconsolidatedfinancialstatementspresentfairlythefinancialpositionofPakarabFertilizerLimitedanditssubsidiary
company(theGroup)asatDecember31,2015andtheresultsoftheiroperationsfortheyearthenended.
A.F.Ferguson&Co.CharteredAccountantsLahore.April08,2016
EngagementPartner:MuhammadMasood
90
ANNUAL REPORT 2015
91
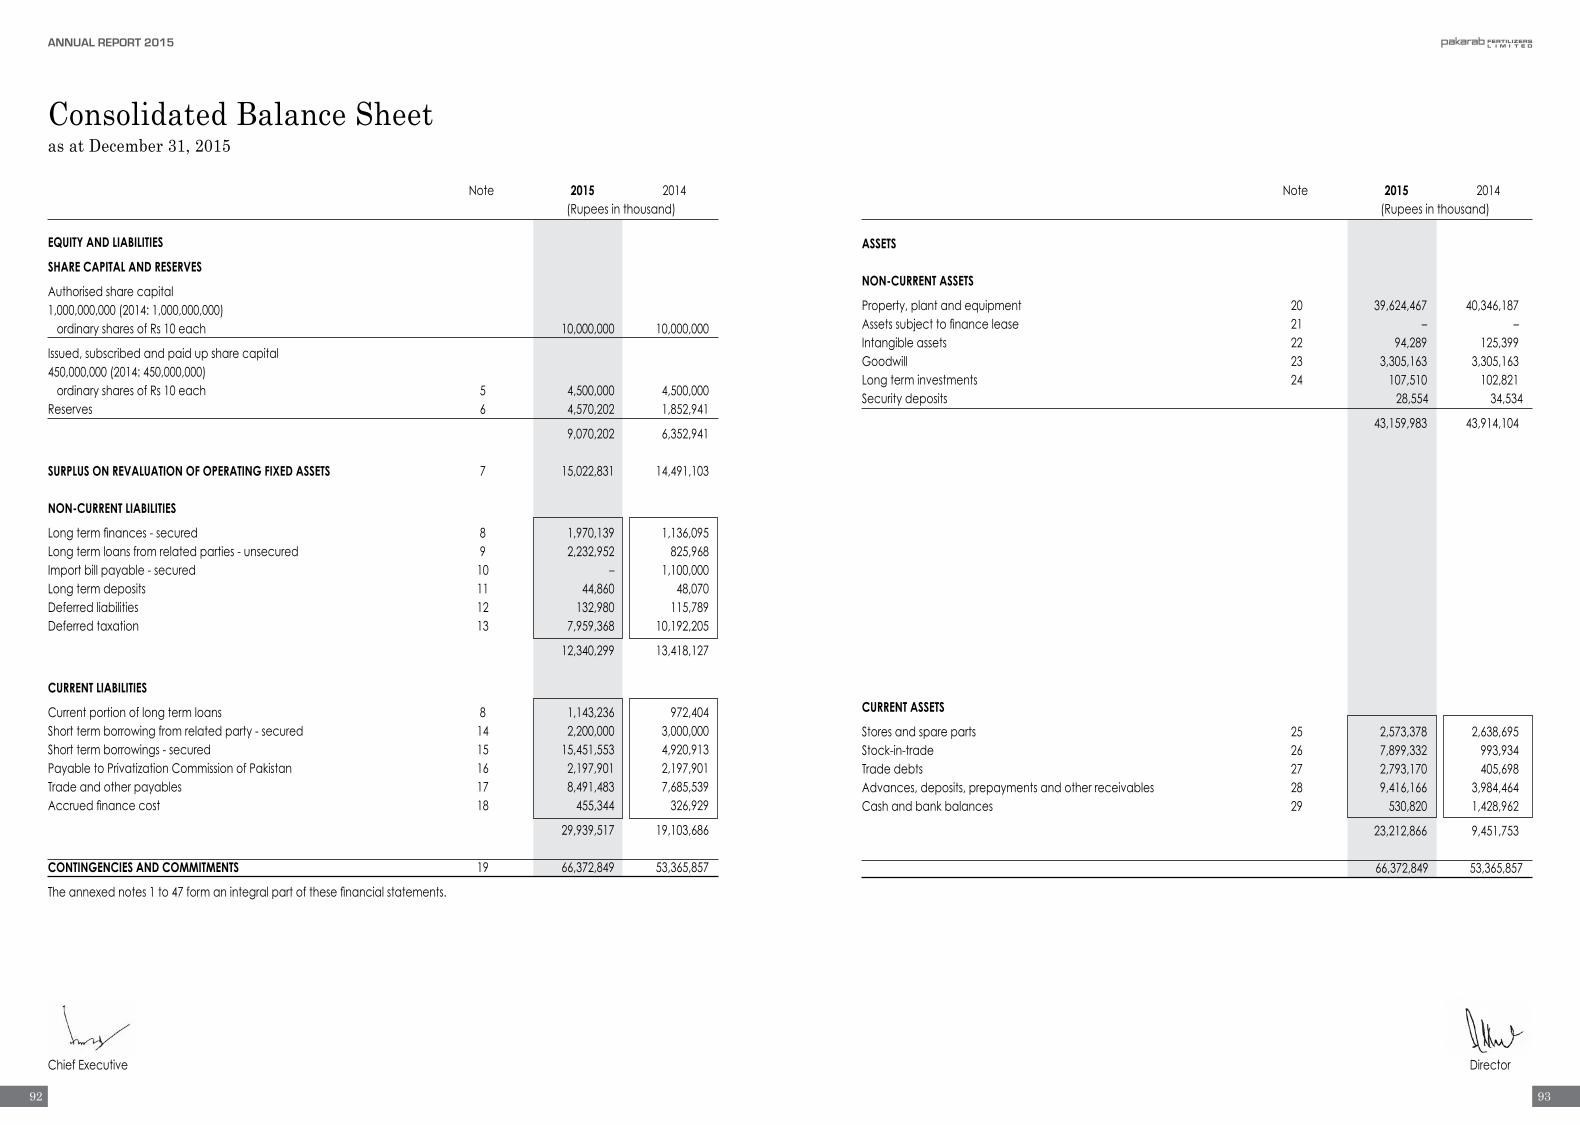
ChiefExecutive Director
Consolidated Balance Sheetas at December 31, 2015
Note 2015 2014 (Rupeesinthousand)
EQUITY AND LIABILITIES
SHARE CAPITAL AND RESERVES
Authorisedsharecapital1,000,000,000(2014:1,000,000,000)ordinarysharesofRs10each 10,000,000 10,000,000
Issued,subscribedandpaidupsharecapital450,000,000(2014:450,000,000)ordinarysharesofRs10each 5 4,500,000 4,500,000Reserves 6 4,570,202 1,852,941
9,070,202 6,352,941
SURPLUS ON REVALUATION OF OPERATING FIXED ASSETS 7 15,022,831 14,491,103
NON-CURRENT LIABILITIES
Longtermfinances-secured 8 1,970,139 1,136,095Longtermloansfromrelatedparties-unsecured 9 2,232,952 825,968Importbillpayable-secured 10 – 1,100,000Longtermdeposits 11 44,860 48,070Deferredliabilities 12 132,980 115,789Deferredtaxation 13 7,959,368 10,192,205
12,340,299 13,418,127
CURRENT LIABILITIES
Currentportionoflongtermloans 8 1,143,236 972,404Shorttermborrowingfromrelatedparty-secured 14 2,200,000 3,000,000Shorttermborrowings-secured 15 15,451,553 4,920,913PayabletoPrivatizationCommissionofPakistan 16 2,197,901 2,197,901Tradeandotherpayables 17 8,491,483 7,685,539Accruedfinancecost 18 455,344 326,929
29,939,517 19,103,686
CONTINGENCIES AND COMMITMENTS 19 66,372,849 53,365,857
Theannexednotes1to47formanintegralpartofthesefinancialstatements.
Note 2015 2014 (Rupeesinthousand)
ASSETS
NON-CURRENT ASSETS
Property,plantandequipment 20 39,624,467 40,346,187Assetssubjecttofinancelease 21 – –Intangibleassets 22 94,289 125,399Goodwill 23 3,305,163 3,305,163Longterminvestments 24 107,510 102,821Securitydeposits 28,554 34,534
43,159,983 43,914,104
CURRENT ASSETS
Storesandspareparts 25 2,573,378 2,638,695Stock-in-trade 26 7,899,332 993,934Tradedebts 27 2,793,170 405,698Advances,deposits,prepaymentsandotherreceivables 28 9,416,166 3,984,464Cashandbankbalances 29 530,820 1,428,962
23,212,866 9,451,753
66,372,849 53,365,857
92
ANNUAL REPORT 2015
93

ChiefExecutive Director ChiefExecutive Director
Consolidated Profit and Loss Accountfor the year ended December 31, 2015
Consolidated Statement of Comprehensive Incomefor the year ended December 31, 2015
Note 2015 2014 (Rupeesinthousand)
Sales 30 23,021,808 15,655,993
Costofsales 31 (18,232,840) (13,419,947)
Gross profit 4,788,968 2,236,046
Administrativeexpenses 32 (893,150) (741,373)
Sellinganddistributionexpenses 33 (909,689) (700,157)
2,986,129 794,516
Financecost 34 (1,713,275) (1,683,907)
Otherexpenses 35 (347,879) (13,522)
924,975 (902,913)
Otherincome 36 332,683 1,040,410
Profit before taxation 1,257,658 137,497
Taxation 37 1,346,651 (60,978)
Profit for the year 2,604,309 76,519
Profitattributabletoownersoftheparent 2,604,309 76,519
Theannexednotes1to47formanintegralpartofthesefinancialstatements.
Note 2015 2014 (Rupeesinthousand)
Profitfortheyear 2,604,309 76,519
Other comprehensive income:
Itemsthatmaybereclassifiedsubsequentlytoprofitorloss
Itemsthatwillnotbereclassifiedsubsequentlytoprofitorloss:
Surplusonrevaluationofoperatingfixedassetsrealisedthrough
incrementaldepreciationchargedonrelatedassetsfortheyear 115,832 82,646
Remeasurementofpostretirementbenefitobligation (2,880) (1,290)
112,952 81,356
Other comprehensive income - net of tax 112,952 81,356
Total comprehensive income for the year - net of tax 2,717,261 157,875
Attributabletoownersoftheparent 2,717,261 157,875
Theannexednotes1to47formanintegralpartofthesefinancialstatements.
94
ANNUAL REPORT 2015
95

ChiefExecutive Director
Consolidated Statement of Changes In Equityfor the year ended December 31, 2015
(Rupees in thousand) Attributable to the owners of the parent
Revenue reserves
(Accumulated loss) / un Share General appropriated capital reserve profit Total
Balance as on January 1, 2014 4,500,000 2,098,313 (403,247) 6,195,066
Profitfortheyear – – 76,519 76,519
Othercomprehensiveincomefortheyear-netoftax – – 81,356 81,356
Total comprehensive income for the year – – 157,875 157,875
Balance as on December 31, 2014 4,500,000 2,098,313 (245,372) 6,352,941
Profitfortheyear – – 2,604,309 2,604,309
Othercomprehensiveincomefortheyear-netoftax – – 112,952 112,952
Totalcomprehensiveincomefortheyear – – 2,717,261 2,717,261
Balance as on December 31, 2015 4,500,000 2,098,313 2,471,889 9,070,202
Theannexednotes1to47formanintegralpartofthesefinancialstatements.
ChiefExecutive Director
Consolidated Cash Flow Statementfor the year ended December 31, 2015
Note 2015 2014 (Rupeesinthousand)
Cash flows from operating activities
Cash(usedin)/generatedfromoperations 38 (7,943,316) 5,171,593Financecostpaid (1,584,378) (1,570,850)Taxespaid (966,852) (564,569)Retirementbenefitspaid (43,661) (49,587)Securitydeposits-net 2,770 (14,600)
Net cash (outflow)/inflow from operating activities (10,535,437) 2,971,987
Cash flows from investing activities
Purchaseofproperty,plantandequipment (53,221) (59,727)Purchaseofintangibleassets (607) (10,654)Saleproceedsofproperty,plantandequipmentdisposed 26,606 373,052Investmentsmade – (227)Profitonbankdepositsreceived 62,299 24,857
Net cash inflow from investing activities 35,077 327,301
Cash flows from financing activities
Repaymentofredeemablecapital – (1,625,000)Proceedsfromlongtermloansacquired 2,000,000 500,000Proceedsfromlongtermloansacquiredfromrelatedparties 2,003,707 825,968Repaymentoflongtermloans (972,406) (1,539,421)Repaymentoflongtermloansfromrelatedparties (596,723) –Paymentofimportbillpayable (2,539,800) –Proceedsfromshorttermborrowingacquiredfromrelatedparty 500,000 –Paymentofinitialtransactioncostonlongtermloanacquired (23,200) –Repaymentofshorttermborrowingfromrelatedparty (1,300,000) –Paymentoffinanceleaseliabilities – (21,602)
Net cash outflow from financing activities (928,422) (1,860,055)
Net (decrease)/increase in cash and cash equivalents (11,428,782) 1,439,233
Cash and cash equivalents at the beginning of the year (3,491,951) (4,931,184)Cash and cash equivalents at the end of the year 39 (14,920,733) (3,491,951)
Theannexednotes1to47formanintegralpartofthesefinancialstatements.
96
ANNUAL REPORT 2015
97

Notesto and forming part of the Consolidated Financial Statements for the year ended December 31, 2015
1. Legal status and nature of business
Pakarab Fertilizers Limited (the ‘parentcompany’)onApril 12, 2011, incorporatedawhollyowned subsidiarycompany,RelianceSacksLimited(together,the‘group’).Theparentcompanyisprincipallyengagedinthemanufacturingandsaleofchemicalfertilizers(hereinafteralsoreferredtoasthe‘fertilizeroperations’)whilethesubsidiarycompanyisprincipallyengagedinthemanufacturingandsaleofpolypropylenesacks,clothandliners(hereinafteralsoreferredtoasthe‘sacksoperations’).
2. Basis of preparation
2.1 Theseconsolidatedfinancialstatementshavebeenprepared inaccordancewithapprovedaccountingstandardsasapplicablein Pakistan. Approved accounting standards comprise of such International Financial Reporting Standards (‘IFRS’) issued by theInternational Accounting Standards Board and Islamic Financial Accounting Standards (‘IFAS’) issued by Institute of CharteredAccountants of Pakistan as are notified under the Companies Ordinance, 1984, provisions of and directives issued under theCompaniesOrdinance,1984.WherevertherequirementsoftheCompaniesOrdinance,1984ordirectives issuedbySecuritiesandExchangeCommissionofPakistandifferwiththerequirementsofIFRSorIFAS,therequirementsoftheCompaniesOrdinance,1984ortherequirementsofthesaiddirectivesprevail.
2.2 Initial application of standards, amendments or an interpretation to existing standards
Thefollowingamendmentstoexistingstandardshavebeenpublishedthatareapplicabletothegroup’sfinancialstatementscoveringannualperiods,beginningonorafterthefollowingdates:
2.2.1 Standards, amendments and interpretations to approved accounting standards that are effective in current year
Certain standards, amendments and interpretations to approved accounting standards are effective for accounting periodsbeginningonJanuary1,2015butareconsiderednottoberelevantortohaveanysignificanteffectonthegroup’soperationsandare,therefore,notdetailedinthesefinancialstatements,exceptforthefollowing:
-IFRS13‘Fairvaluemeasurement’.Thestandardaimstoimproveconsistencyandreducecomplexitybyprovidingaprecisedefinitionof fairvalueandasinglesourceof fairvaluemeasurementanddisclosure requirements foruseacross IFRSs. The requirementsdonotextendtheuseoffairvalueaccountingbutprovideguidanceonhowitshouldbeappliedwhereitsuseisalreadyrequiredorpermittedbyotherstandardswithinIFRSs.Thestandardonlyaffectsthedisclosuresinthegroup’sfinancialstatments.
2.2.2 Standards, amendments and interpretations to existing standards that are not yet effective and have not been early adopted by the group
Therearecertainstandards,amendmentstotheapprovedaccountingstandardsandinterpretationsthataremandatoryforgroupshavingaccountingperiodsbeginningonorafterJanuary1,2016butareconsiderednottoberelevantortohaveanysignificanteffectonthegroup’soperationsandare,therefore,notdetailedinthesefinancialstatements.
3. Basis of measurement
3.1 Thesefinancialstatementshavebeenpreparedunderthehistoricalcostconventionasmodifiedbytherevaluationofcertainoperatingfixedassetsandcertainfinancialinstrumentsatfairvalueandrecognitionofcertainemployeeretirementbenefitsatpresentvalue.
3.2 Critical accounting estimates and judgments
Thegroup’ssignificantaccountingpoliciesarestatedinnote4.Notallofthesesignificantpoliciesrequirethemanagementtomakedifficult, subjective or complex judgment or estimates. The following is intended to providean understanding of the policies themanagementconsiderscriticalbecauseoftheircomplexity, judgmentofestimation involvedintheirapplicationandtheir impactonthesefinancialstatements.Estimatesandjudgmentsarecontinuallyevaluatedandarebasedonhistoricalexperience,includingexpectationsoffutureeventsthatarebelievedtobereasonableunderthecircumstances.Thesejudgmentsinvolveassumptionsorestimatesinrespectoffutureeventsandtheactualresultsmaydifferfromtheseestimates.
a) Employee retirement benefits
Thegroupusesthevaluationperformedbyanindependentactuaryasthepresentvalueofitsretirementbenefitobligations.Thevaluationisbasedonassumptionsasmentionedinnote4.3.
b) Provision for taxation
Thegrouptakesintoaccountthecurrentincometaxlawandthedecisionstakenbyappellateauthorities.Instanceswherethegroup’sviewdiffersfromtheviewtakenbytheincometaxdepartmentattheassessmentstageandwherethegroupconsidersthatitsviewsonitemsofmaterialnatureisinaccordancewithlaw,theamountsareshownascontingentliabilities.
c) Useful lives and residual values of property, plant and equipment
Thegroupreviewstheusefullivesandresidualvaluesofproperty,plantandequipmentonregularbasis.Anychangeinestimatesinfutureyearsmightaffectthecarryingamountsoftherespectiveitemsofproperty,plantandequipmentwithacorrespondingeffectonthedepreciationchargeandimpairment.
d) Estimated impairment of goodwill
Thegrouptestsannuallywhethergoodwillhassufferedanyimpairment,inaccordancewiththeaccountingpolicystatedinnote4.8.Therecoverableamountsofcash-generatingunitshavebeendeterminedbasedonvalue-in-usecalculations.Thesecalculationsrequiretheuseofestimates(note23).
e) Revaluation surplus on operating fixed assets
Certain operating fixed assets are carried under the revaluation model as per International Accounting Standard (‘IAS’)16 ‘Property,PlantandEquipment’asstated innote4.4.1.Revaluation iscarriedoutwithsufficient regularity toensurethatthecarryingamountofassetsdoesnotdiffermateriallyfromtheir fairvalue.Revaluedamounthasbeendeterminedbyanindependentprofessionalvalueronthebasisofpresentmarketvalue(note7).
4. Significant accounting policies
Thesignificantaccountingpoliciesadoptedinthepreparationofthesefinancialstatementsaresetoutbelow.Thesepolicieshavebeenconsistentlyappliedtoallyearspresented.
4.1 Principles of consolidation
a) Subsidiaries
Subsidiariesareallentities(includingspecialpurposeentities)overwhichthegrouphasthepowertogovernthefinancialandoperatingpoliciesgenerallyaccompanyingashareholdingofmorethanonehalfofthevotingrights.Theexistenceandeffectofpotentialvotingrightsthatarecurrentlyexercisableorconvertibleareconsideredwhenassessingwhetherthegroupcontrolsanotherentity.Thegroupalsoassessesexistenceofcontrolwhereitdoesnothavemorethan50%ofthevotingpowerbutisabletogovernthefinancialandoperatingpoliciesbyvirtueofde-factocontrol.De-factocontrolmayariseincircumstanceswherethesizeofthegroup’svotingrightsrelativetothesizeanddispersionofholdingsofothershareholdersgivethegroupthepowertogovernthefinancialandoperatingpolicies,etc.
Subsidiariesarefullyconsolidatedfromthedateonwhichcontrolistransferredtothegroup.Theyaredeconsolidatedfromthe
datethatcontrolceases.
Thegroupappliestheacquisitionmethodtoaccountforbusinesscombinations.Theconsiderationtransferredfortheacquisitionofasubsidiaryisthefairvaluesoftheassetstransferred,theliabilities incurredtotheformerownersoftheacquireeandtheequityinterestsissuedbythegroup.Theconsiderationtransferredincludesthefairvalueofanyassetorliabilityresultingfromacontingentconsiderationarrangement.Identifiableassetsacquiredandliabilitiesandcontingentliabilitiesassumedinabusinesscombinationaremeasuredinitiallyattheirfairvaluesattheacquisitiondate.Thegrouprecognisesanynon-controllinginterestintheacquireeonanacquisition-by-acquisitionbasis,eitheratfairvalueoratthenon-controllinginterest’sproportionateshareoftherecognisedamountsofacquiree’sidentifiablenetassets.
98
ANNUAL REPORT 2015
99
Notesto and forming part of the Consolidated Financial Statements for the year ended December 31, 2015
Acquisition-relatedcostsareexpensedasincurred.
Ifthebusinesscombinationisachievedinstages,theacquisitiondatefairvalueoftheacquirer’spreviouslyheldequityinterestintheacquireeisremeasuredtofairvalueattheacquisitiondatethroughprofitorloss.
Anycontingentconsiderationtobetransferredbythegroupis recognisedatfairvalueattheacquisitiondate.SubsequentchangestothefairvalueofthecontingentconsiderationthatisdeemedtobeanassetorliabilityisrecognisedinaccordancewithIAS39eitherinprofitorlossorasachangetoothercomprehensiveincome.Contingentconsiderationthatisclassifiedasequityisnotremeasured,anditssubsequentsettlementisaccountedforwithinequity.
Goodwillisinitiallymeasuredastheexcessoftheaggregateoftheconsiderationtransferredandthefairvalueofnon-controllinginterestoverthenetidentifiableassetsacquiredandliabilitiesassumed.Ifthisconsiderationislowerthanthefairvalueofthenetassetsofthesubsidiaryacquired,thedifferenceisrecognisedinprofitorloss.
“Inter-company transactions, balances, incomeand expenses on transactions between group companies are eliminated.Profitsandlossesresultingfrominter-companytransactionsthatarerecognisedinassetsarealsoeliminated.Accountingpoliciesofsubsidiarieshavebeenchangedwherenecessarytoensureconsistencywiththepoliciesadoptedbythegroup.
b) Changes in ownership interests in subsidiaries without change of control
Transactionswithnon-controllingintereststhatdonotresultinlossofcontrolareaccountedforasequitytransactions–thatis,astransactionswiththeownersintheircapacityasowners.Thedifferencebetweenfairvalueofanyconsiderationpaidandtherelevantshareacquiredofthecarryingvalueofnetassetsofthesubsidiaryisrecordedinequity.Gainsorlossesondisposalstonon-controllinginterestsarealsorecordedinequity.
c) Disposal of subsidiaries
Whenthegroupceasestohavecontrolanyretainedinterestintheentityisre-measuredtoitsfairvalueatthedatewhencontrolislost,withthechangeincarryingamountrecognisedinprofitorloss.Thefairvalueistheinitialcarryingamountforthepurposesofsubsequentaccountingfortheretainedinterestasanassociate, jointventureorfinancialasset. Inaddition,anyamountspreviouslyrecognisedinothercomprehensiveincomeinrespectofthatentityareaccountedforasifthegrouphaddirectlydisposedoftherelatedassetsorliabilities.Thismaymeanthatamountspreviouslyrecognisedinothercomprehensiveincomearereclassifiedtoprofitorloss.
d) Associates
Associatesareallentitiesoverwhichthegrouphassignificantinfluencebutnotcontrol,generallyaccompanyingashareholdingofbetween20%and50%ofthevotingrights.Investmentsinassociatesareaccountedforusingtheequitymethodofaccounting.Under theequitymethod, the investment is initially recognisedatcost,andthecarryingamount is increasedordecreasedto recognise the investor’s shareof theprofitor lossof the investeeafter thedateofacquisition. Thegroup’s investment inassociatesincludesgoodwillidentifiedonacquisition.
Iftheownershipinterestinanassociateisreducedbutsignificantinfluenceisretained,onlyaproportionateshareoftheamountspreviouslyrecognisedinothercomprehensiveincomeisreclassifiedtoconsolidatedprofitandlossaccountwhereappropriate.
Thegroup’sshareofpost-acquisitionprofitorlossisrecognisedintheconsolidatedprofitandlossaccount,anditsshareofpost-acquisitionmovements inothercomprehensive incomeis recognised inothercomprehensive incomewithacorrespondingadjustmenttothecarryingamountoftheinvestment.Whenthegroup’sshareoflossesinanassociateequalsorexceedsitsinterestintheassociate,includinganyotherunsecuredreceivables,thegroupdoesnotrecognisefurtherlosses,unlessithasincurredlegalorconstructiveobligationsormadepaymentsonbehalfoftheassociate.
Thegroupdeterminesateachreportingdatewhetherthere isanyobjectiveevidencethatthe investment intheassociateis impaired. If this is thecase, thegroupcalculates theamountof impairmentas thedifferencebetween the recoverableamountoftheassociateanditscarryingvalueandrecognisestheamountadjacenttoshareofprofit/(loss)ofassociatesintheconsolidatedprofitandlossaccount.
Profitsandlossesresultingfromupstreamanddownstreamtransactionsbetweenthegroupanditsassociatearerecognisedin thegroup’sfinancial statementsonly to theextentofunrelated investor’s interests in theassociates.Unrealised lossesareeliminatedunlessthetransactionprovidesevidenceofanimpairmentoftheassettransferred.Accountingpoliciesofassociateshavebeenchangedwherenecessarytoensureconsistencywiththepoliciesadoptedbythegroup.
Dilutiongainsandlossesarisingininvestmentsinassociatesarerecognisedintheconsolidatedprofitandlossaccount.
4.2 Taxation
Incometaxcomprisescurrentanddeferredtax.Incometaxisrecognizedintheprofitandlossaccountexcepttotheextentthatitrelatestoitemsrecognizeddirectlyinequity,inwhichcaseitisrecognizeddirectlyinequity.
Current
Provisionofcurrenttaxisbasedonthetaxableincomefortheyeardeterminedinaccordancewiththeprevailinglawfortaxationofincome.Thechargeforcurrenttaxiscalculatedusingprevailingtaxratesortaxratesexpectedtoapplytotheprofitfortheyearifenacted.Thechargeforcurrenttaxalsoincludesadjustments,whereconsiderednecessary,toprovisionfortaxmadeinpreviousyearsarisingfromassessmentsframedduringtheyearforsuchyears.
ThegrouphasoptedforGrouptaxationundersection59AAoftheIncomeTaxOrdinance,2001.
Deferred
Deferredtaxisaccountedforusingthebalancesheetliabilitymethodinrespectofalltemporarydifferencesarisingfromdifferencesbetween the carrying amount of assets and liabilities in the financial statements and the corresponding tax bases used in thecomputationofthetaxableprofit.However,thedeferredtaxisnotaccountedforifitarisesfrominitialrecognitionofanassetorliabilityinatransactionotherthanabusinesscombinationthatatthetimeoftransactionneitheraffectsaccountingnortaxableprofitorloss.Deferredtaxliabilitiesaregenerallyrecognizedforalltaxabletemporarydifferencesanddeferredtaxassetsarerecognizedtotheextentthatitisprobablethattaxableprofitswillbeavailableagainstwhichthedeductibletemporarydifferences,unusedtaxlossesandtaxcreditscanbeutilised.
Deferredtaxiscalculatedattheratesthatareexpectedtoapplytotheperiodwhenthedifferencesreversebasedontaxratesthathavebeenenactedorsubstantivelyenactedbythebalancesheetdate.Deferredtaxischargedorcreditedintheprofitandlossaccount,exceptinthecaseofitemscreditedorchargedtoothercomprehensiveincomeorequityinwhichcaseitisincludedinothercomprehensiveincomeorequity.
4.3 Employee retirement benefits
Themainfeaturesoftheschemesoperatedbythegroupforitsemployeesareasfollows:
(a) Defined benefit plan - Gratuity
Thegroupoperatesanapprovedfundeddefinedbenefitgratuityplanforallpermanentemployeesofthefertilizeroperationshavingaserviceperiodofmorethanthreeyearsforexecutivesandsixmonthsforworkersandotherstaff.Provisionsaremadeinthefinancialstatementstocoverobligationsonthebasisofactuarialvaluationscarriedoutannually.ThemostrecentvaluationwascarriedoutasatDecember31,2015usingthe“ProjectedUnitCreditMethod”.
Theactualreturnonplanassetsrepresentsthedifferencebetweenthefairvalueofplanassetsatthebeginningoftheyearand
asattheendoftheyearafteradjustmentsforcontributionsmadebythegroupasreducedbybenefitspaidduringtheyear.
Theamountrecognizedinbalancesheetrepresentsthepresentvalueofthedefinedbenefitobligationasreducedbythefairvalueoftheplanassets.
Actuarialgainsandlossesarisingfromexperienceadjustmentsandchangesinactuarialassumptionsarechargedorcreditedtoequityinothercomprehensiveincomeintheyearinwhichtheyarise.Pastservicecostsarerecognizedimmediatelyintheprofitandlossaccount.
100
ANNUAL REPORT 2015
101

Notesto and forming part of the Consolidated Financial Statements for the year ended December 31, 2015
The futurecontribution rateof theplan includesallowances fordeficitandsurplus.ProjectedUnitCreditMethod,using thefollowingsignificantassumptions,isusedforvaluationofthisscheme:
Discountrate 9%p.a. Expectedrateofincreaseinsalarylevelperannum 8%p.a. Durationofplan(years) 9 Expectedmortalityrate SLIC(2001-2005)mortality table(setback1year)
(b) Defined contribution plan - Provident Fund
Thereisanapproveddefinedcontributoryprovidentfundforallpermanentemployeesofthefertilizeroperations.Equalmonthlycontributionsaremadebothbythegroupandemployeestothefundattherateof8.33percentofsalaryfortheexecutivesand10percentofsalaryfortheworkers.
(c) Accumulating compensated absences
Thefertilizeroperationsprovidesforaccumulatingcompensatedabsences,whentheemployeesrenderservicesthatincreasetheirentitlementtofuturecompensatedabsences.Undertheservicerules,workersandnormalstaffmembersareentitledto18daysleaveperyear.Theleavepolicyformanagementemployeesisasfollows:
Service in the company Annual Leaves Lessthan05Years 18 Lessthan05Years(WorkingonShiftDuties) 22 Morethan05Years 25 Morethan05Years(WorkingonShiftDuties) 29
TheunutilizedAnnualLeavecanbeaccumulateduptoamaximumof2yearsofAnnualLeaves.Anemployeewillbeentitled
toencashtheaccumulatedannualleavesatthetimeofleavingcompanyservice.
Provisionsaremadeannuallytocovertheobligationforaccumulatingcompensatedabsencesbasedonactuarialvaluationandarechargedtoprofitand lossaccount.Themost recentvaluationwascarriedoutasatDecember31,2015usingthe“ProjectedUnitCreditMethod”.
Theamountrecognisedinthebalancesheetrepresentsthepresentvalueofthedefinedbenefitobligation.Actuarialgainsandlossesarechargedtotheprofitandlossaccountimmediatelyintheperiodwhentheseoccur.
Projected unit credit method, using the following significant assumptions, has been used for valuation of accumulatingcompensatedabsences:
Discountrate 9%p.a. Expectedrateofincreaseinsalarylevelperannum 8%p.a. Expectedmortalityrate SLIC(2001-2005)mortality table(setback1year)
4.4 Property, plant and equipment
4.4.1 Operating fixed assets
Operatingfixedassetsexcept freehold land,buildingson freehold land, railway siding,plantandmachineryand toolsandotherequipmentarestatedatcostlessaccumulateddepreciationandanyidentifiedimpairmentloss.Freeholdlandisstatedatrevaluedamountlessanyidentifiedimpairmentlosswhilebuildingsonfreeholdland,railwaysiding,plantandmachineryandtoolsandotherequipmentarestatedatrevaluedamountlessaccumulateddepreciationandanyidentifiedimpairmentloss.Revaluationiscarriedoutwithsufficientregularitytoensurethatthecarryingamountofassetsdoesnotdiffermateriallyfromtheirfairvalue.Anyaccumulateddepreciationatthedateofrevaluationiseliminatedagainstthegrosscarryingamountoftheasset,andthenetamountisrestatedtotherevaluedamountoftheasset.Costinrelationtootheroperatingfixedassetssignifieshistoricalcost,gainsandlossestransferredfromothercomprehensiveincomeonqualifyingcashflowhedgesasreferredtoinnote4.13.
Increasesinthecarryingamountarisingonrevaluationofoperatingfixedassetsarecreditedtosurplusonrevaluationofoperatingfixedassets.Decreases thatoffsetprevious increasesof the sameassetsarechargedagainst this surplus,allotherdecreasesarechargedtoprofitor loss.Eachyear thedifferencebetweendepreciationbasedon revaluedcarryingamountsof theassets (thedepreciationchargedtotheprofitorloss)anddepreciationbasedontheassets’originalcostistransferredfromsurplusonrevaluationofoperatingfixedassetstoothercomprehensiveincome.Alltransfersto/fromsurplusonrevaluationofoperatingfixedassetsarenetofapplicabledeferredtaxation.
Depreciationonoperatingfixedassetsischargedtoprofitorlossonthefollowingmethodsandratessoastowriteoffthedepreciableamountofanassetoveritsestimatedusefullifeaftertakingintoaccounttheirresidualvalues:
Asset category Depreciation method Annual depreciation rate
Buildingsonfreeholdland Straightline 3.99%to5.31% Buildingsonleaseholdland -do- 4%to10% Railwaysiding -do- 26% Aircrafts -do- 10%to10.08% Furnitureandfixtures -do- 10%to26.09% Toolsandotherequipment(otherthanfactoryequipment) -do- 10%to50% Vehicles -do- 20% Plantandmachinery-Sacksoperations -do- 4.35%to4.76% Plantandmachinery-Fertilizeroperations Unitsofproduction Toolsandotherequipment(factoryequipment) -do- Catalyst -do-
The assets’ residual values and useful lives are reviewed, at each financial year end, andadjusted if impact on depreciation issignificant.
Anasset’scarryingamountiswrittendownimmediatelytoitsrecoverableamountiftheasset’scarryingamountisgreaterthanitsestimatedrecoverableamount(note4.6).
Subsequentcostsare included in theasset’s carryingamountor recognisedasa separateasset,asappropriate, onlywhen it isprobablethatfutureeconomicbenefitsassociatedwiththeitemwillflowtothegroupandthecostoftheitemcanbemeasuredreliably.Allotherrepairandmaintenancecostsarechargedtoincomeduringtheperiodinwhichtheyareincurred.
Thegainor lossondisposalor retirementofanasset representedby thedifferencebetweenthesaleproceedsandthecarryingamountoftheassetisrecognisedasanincomeorexpense.
4.4.2 Capital work-in-progress
Capitalwork-in-progressisstatedatcostlessanyidentifiedimpairmentloss.Allexpenditureconnectedwithspecificassetsincurredduringinstallationandconstructionperiodarecarriedundercapitalwork-in-progress.Thesearetransferredtooperatingfixedassetsasandwhentheseareavailableforuse.
4.4.3 Major spare parts and stand-by equipment
Majorsparepartsandstand-byequipmentqualifyasproperty,plantandequipmentwhenanentityexpectstousethemduringmorethanoneyear.Transfersaremadetooperatingassetscategoryasandwhensuchitemsareavailableforuse.
4.5 Intangible assets
4.5.1 Computer software
Expenditureincurredtoacquirecomputersoftwareiscapitalisedasintangibleassetandstatedatcostlessaccumulatedamortisationandanyidentifiedimpairmentloss.Computersoftwareisamortisedusingthestraightlinemethodoveraperiodoffouryears.
Anasset’scarryingamountiswrittendownimmediatelytoitsrecoverableamountiftheasset’scarryingamountisgreaterthanitsestimatedrecoverableamount(note4.6).
102
ANNUAL REPORT 2015
103
Notesto and forming part of the Consolidated Financial Statements for the year ended December 31, 2015
4.5.2 Mining rights
Expenditureincurredtoacquireminingrightsiscapitalisedasintangibleassetandstatedatcostlessaccumulatedamortisationandanyidentifiedimpairmentloss.Miningrightsareamortisedusingthestraightlinemethodoveraperiodoftenyears.
Anasset’scarryingamountiswrittendownimmediatelytoitsrecoverableamountiftheasset’scarryingamountisgreaterthanitsestimatedrecoverableamount(note4.6).
4.6 Impairment of non-financial assets
Assetsthathaveanindefiniteusefullife-forexample,goodwillorintangibleassetsnotreadytouse-arenotsubjecttoamortisationandaretestedannuallyforimpairment.Assetsthataresubjecttoamortisationarereviewedforimpairmentwhenevereventsorchangesincircumstancesindicatethatthecarryingamountmaynotberecoverable.Animpairmentlossisrecognisedfortheamountbywhichtheasset’scarryingamountexceedsitsrecoverableamount.Therecoverableamountisthehigherofanasset’sfairvaluelesscoststosellandvalueinuse.Forthepurposesofassessingimpairment,assetsaregroupedatthelowestlevelsforwhichthereareseparatelyidentifiablecashflows(cash-generatingunits).Non-financialassetsotherthangoodwillthatsufferedanimpairmentarereviewedforpossiblereversaloftheimpairmentateachreportingdate.
4.7 Leases
Thegroupisthelessee.
4.7.1 Finance leases
Leaseswherethegrouphassubstantiallyalltherisksandrewardsofownershipareclassifiedasfinanceleases.Atinceptionfinanceleasesarecapitalisedatthelowerofpresentvalueofminimumleasepaymentsundertheleaseagreementsandthefairvalueoftheassets.
Therelatedrentalobligations,netoffinancecharges,areincludedinliabilitiesagainstassetssubjecttofinancelease.Theliabilitiesareclassifiedascurrentandlongtermdependinguponthetimingofthepayment.
Each lease payment is allocated between the liability and finance charges so as to achieve a constant rate on the balanceoutstanding.Theinterestelementoftherentalischargedtoprofitorlossovertheleaseterm.
Assetsacquiredunderafinanceleasearedepreciatedovertheusefullifeoftheassetonastraight-linemethodattheratesgiveninnote21.Depreciationofleasedassetsischargedtoprofitorloss.
4.7.2 Operating leases
Leaseswhereasignificantportionoftherisksandrewardsofownershipareretainedbythelessorareclassifiedasoperatingleases.Paymentsmadeunderoperatingleases(netofanyincentivesreceivedfromthelessor)arechargedtoprofitorlossonastraight-linebasisovertheleaseterm.
4.8 Goodwill
Goodwillrepresentstheexcessofthecostofanacquisitionoverthefairvalueofthegroup’sshareofthenetidentifiableassetsoftheacquiredsubsidiary/associateatthedateofacquisition.Goodwillonacquisitionsofsubsidiariesisincludedin‘intangibleassets’.Goodwillonacquisitionsofassociates is included in ‘investments inassociates’and is tested for impairmentaspartof theoverallbalance.Separatelyrecognisedgoodwillistestedannuallyforimpairmentandcarriedatcostlessaccumulatedimpairmentlosses.Impairmentlossesongoodwillarenotreversed.Gainsandlossesonthedisposalofanentityincludethecarryingamountofgoodwillrelatingtotheentitysold.
4.9 Investments
Investmentsintendedtobeheldforlessthantwelvemonthsfromthebalancesheetdateortobesoldtoraiseoperatingcapital,areincludedincurrentassets,allotherinvestmentsareclassifiedasnon-current.Managementdeterminestheappropriateclassificationofitsinvestmentsatthetimeofthepurchaseandre-evaluatessuchdesignationonaregularbasis.
4.9.1 Investments in equity instruments of associate
Investmentsinequityinstrumentsofassociatesareaccountedforusingtheequitymethodofaccountingandareinitiallyrecognisedatcost.Thegroup’sinvestmentinassociatesincludesgoodwill(netofanyaccumulatedimpairmentloss) identifiedonacquisition.Thegroup’sshareofitsassociates’post-acquisitionprofitsorlossesisrecognisedintheconsolidatedprofitandlossaccount,anditsshareofpost-acquisitionmovementsinreservesisrecognisedinreserves.Thecumulativepost-acquisitionmovementsareadjustedagainstthecarryingamountoftheinvestment.Whenthegroup’sshareoflossesinanassociateequalsorexceedsitsinterestintheassociate,includinganyotherunsecuredreceivables,thegroupdoesnotrecognisefurtherlosses,unlessithasincurredobligationsormadepaymentsonbehalfoftheassociate.Unrealisedgainsontransactionsbetweenthegroupanditsassociatesareeliminatedtotheextentofthegroup’sinterestintheassociates.Unrealisedlossesarealsoeliminatedunlessthetransactionprovidesevidenceofanimpairmentoftheassettransferred.
4.10 Financial assets
4.10.1 Classification
Thegroupclassifiesitsfinancialassetsinthefollowingcategories:atfairvaluethroughprofitorloss,loansandreceivables,availableforsaleandheldtomaturity.Theclassificationdependsonthepurposeforwhichthefinancialassetswereacquired.Managementdeterminestheclassificationofitsfinancialassetsatthetimeofinitialrecognition.
a) Financial assets at fair value through profit or loss
Financialassetsatfairvaluethroughprofitorlossarefinancialassetsheldfortradingandfinancialassetsdesignateduponinitialrecognitionasatfairvaluethroughprofitorloss.Derivativesarealsocategorisedasheldfortradingunlesstheyaredesignatedashedges.Afinancialassetisclassifiedasheldfortradingifacquiredprincipallyforthepurposeofsellingintheshortterm.Assetsinthiscategoryareclassifiedascurrentassetsifexpectedtobesettledwithintwelvemonths,otherwise,theyareclassifiedasnon-current.
b) Loans and receivables
Loansandreceivablesarenon-derivativefinancialassetswithfixedordeterminablepaymentsthatarenotquotedinanactivemarket.Theyare includedincurrentassets,exceptformaturitiesgreaterthantwelvemonthsafterthebalancesheetdate,whichareclassifiedasnon-currentassets.Loansandreceivablescompriseloans,advances,depositsandotherreceivablesandcashandcashequivalentsinthebalancesheet.
c) Available-for-sale financial assets
Available-for-salefinancialassetsarenon-derivativesthatareeitherdesignatedinthiscategoryornotclassifiedinanyoftheother categories. Theyare included in non-current assets unlessmanagement intends todisposeof the investmentswithintwelvemonthsfromthebalancesheetdate.
d) Held to maturity
Financialassetswithfixedordeterminablepaymentsandfixedmaturity,wheremanagementhastheintentionandabilitytoholdtillmaturityareclassifiedasheldtomaturityandarestatedatamortisedcost.
4.10.2 Recognition and measurement
Allfinancialassetsarerecognisedatthetimewhenthegroupbecomesapartytothecontractualprovisionsoftheinstrument.Regularpurchasesandsalesofinvestmentsarerecognisedontrade-date–thedateonwhichthegroupcommitstopurchaseorselltheasset.Financialassetsareinitiallyrecognisedatfairvalueplustransactioncostsforallfinancialassetsnotcarriedatfairvaluethroughprofitorloss.Financialassetscarriedatfairvaluethroughprofitorlossareinitiallyrecognisedatfairvalueandtransactioncostsareexpensedintheprofitandlossaccount.Financialassetsarederecognisedwhentherightstoreceivecashflowsfromtheassetshaveexpiredorhavebeentransferredandthegrouphastransferredsubstantiallyalltherisksandrewardsofownership.Available-for-salefinancialassetsandfinancialassetsatfairvaluethroughprofitorlossaresubsequentlycarriedatfairvalue.Available-for-salefinancialassetsarecarriedatcostincasefairvaluecannotbemeasuredreliably.Loansandreceivablesandheld-to-maturityinvestmentsarecarriedatamortisedcostusingtheeffectiveinterestratemethod.
104
ANNUAL REPORT 2015
105

Notesto and forming part of the Consolidated Financial Statements for the year ended December 31, 2015
Gainsorlossesarisingfromchangesinthefairvalueofthe‘financialassetsatfairvaluethroughprofitorloss’categoryarepresentedintheprofitandlossaccountintheperiodinwhichtheyarise.Dividendincomefromfinancialassetsatfairvaluethroughprofitorlossisrecognisedintheprofitandlossaccountaspartofotherincomewhenthegroup’srighttoreceivepaymentsisestablished.
Changesinthefairvalueofsecuritiesclassifiedasavailable-for-salearerecognisedinothercomprehensiveincome.Whensecuritiesclassifiedasavailable-for-salearesoldorimpaired,theaccumulatedfairvalueadjustmentsrecognisedinequityareincludedintheprofitand lossaccountasgainsand losses from investmentsecurities. Interestonavailable-for-salesecuritiescalculatedusing theeffectiveinterestmethodisrecognisedintheprofitandlossaccount.Dividendsonavailable-for-saleequityinstrumentsarerecognisedintheprofitandlossaccountwhenthegroup’srighttoreceivepaymentsisestablished.
Thefairvaluesofquotedinvestmentsarebasedoncurrentprices. If themarketforafinancialasset isnotactive(andforunlistedsecurities),thegroupmeasurestheinvestmentsatcostlessimpairmentinvalue,ifany.
Thegroupassessesateachbalancesheetdatewhetherthere isobjectiveevidencethatafinancialassetoragroupoffinancialassetsis impaired.Ifanysuchevidenceexistsforavailable-for-salefinancialassets,thecumulativelossisremovedfromequityandrecognisedintheprofitandlossaccount.Impairmentlossesrecognisedintheprofitandlossaccountonequityinstrumentsarenotreversedthroughtheprofitandlossaccount.Impairmenttestingoftradedebtsandotherreceivablesisdescribedinnote4.16.
4.11 Financial liabilities
Allfinancialliabilitiesarerecognisedatthetimewhenthegroupbecomesapartytothecontractualprovisionsoftheinstrument. Afinancial liability isderecognisedwhentheobligationundertheliability isdischargedorcancelledorexpired.Whereanexisting
financialliabilityisreplacedbyanotherfromthesamelenderonsubstantiallydifferentterms,orthetermsofanexistingliabilityaresubstantiallymodified,suchanexchangeormodificationistreatedasaderecognitionoftheoriginalliabilityandtherecognitionofanewliability,andthedifferenceinrespectivecarryingamountsisrecognisedintheprofitandlossaccount.
4.12 Offsetting of financial assets and financial liabilities
Financialassetsandfinancialliabilitiesareoffsetandthenetamountisreportedinthefinancialstatementsonlywhenthereisalegallyenforceablerighttosetofftherecognizedamountandthegroupintendseithertosettleonanetbasisortorealizetheassetsandtosettletheliabilitiessimultaneously.
4.13 Derivative financial instruments
Theseareinitiallyrecordedatcostonthedateaderivativecontractisenteredintoandareremeasuredtofairvalueatsubsequentreportingdates.Themethodofrecognizingtheresultinggainorlossdependsonwhetherthederivativeisdesignatedasahedginginstrument,andifso,thenatureoftheitembeinghedged.Thegroupdesignatescertainderivativesascashflowhedges.
Thegroupdocumentsattheinceptionofthetransactiontherelationshipbetweenthehedginginstrumentsandhedgeditems,aswellasitsriskmanagementobjectiveandstrategyforundertakingvarioushedgetransactions.Thegroupalsodocumentsitsassessment,bothathedgeinceptionandonanongoingbasis,ofwhetherthederivativesthatareusedinhedgingtransactionsarehighlyeffectiveinoffsettingchangesincashflowofhedgeditems.
Theeffectiveportionofchangesinthefairvalueofderivativesthataredesignatedandqualifyascashflowhedgesisrecognized
inothercomprehensive income.Thegainor loss relatingtothe ineffectiveportion is recognized immediately intheprofitand lossaccount.
Amountsaccumulatedinothercomprehensiveincomearerecognisedinprofitandlossaccountintheperiodswhenthehedgeditemwillaffectprofitorloss.However,whentheforecasthedgedtransactionresultsintherecognitionofanon-financialassetoraliability,thegainsandlossespreviouslydeferredinothercomprehensiveincomearetransferredfromothercomprehensiveincomeandincludedintheinitialmeasurementofthecostoftheassetorliability.Thechangesinfairvaluere-measurementofderivativeswhichthegrouphasnotdesignatedasahedginginstrumentarerecognisedintheprofitandlossaccount.Tradingderivativesareclassifiedasacurrentassetorliability.
4.14 Stores and spare parts
Thesearevaluedatweightedaveragecostexcept for items in transitwhicharestatedat invoicevalueplusotherchargespaidthereontillthebalancesheetdate.Foritemswhichareslowmovingand/oridentifiedasobsolete,adequateprovisionismadeforanyexcessbookvalueoverestimatedrealisablevalue.Thegroupreviewsthecarryingamountofstoresandsparesonaregularbasisandprovisionismadeforobsolescence.
4.15 Stock-in-trade
Allstocksarevaluedatthelowerofcostandnetrealizablevalue.Costinrelationtorawandpackingmaterialsandgoodspurchasedforresale,exceptforthoseintransit,signifiesweightedaveragecostandthatrelatingtomidproductsandownmanufacturedfinishedgoods,annualaveragecostcomprisingcostofdirectmaterials,labourandappropriatemanufacturingoverheads.
Materialsintransitarestatedatcostcomprisinginvoicevalueplusotherchargesincurredthereon.
Netrealizablevaluesignifiestheestimatedsellingpriceintheordinarycourseofbusinesslesscostsnecessarilytobeincurredinordertomakethesale.Provisionismadeinthefinancialstatementsforobsoleteandslowmovingstock-in-tradebasedonmanagementestimate.
4.16 Trade debts and other receivables
Tradedebtsandotherreceivablesarerecognisedinitiallyatinvoicevalue,whichapproximatesfairvalue,andsubsequentlymeasuredatamortisedcostusingtheeffectiveinterestmethod, lessprovisionfordoubtfuldebts.Aprovisionfordoubtfuldebts isestablishedwhenthereisobjectiveevidencethatthegroupwillnotbeabletocollectalltheamountdueaccordingtotheoriginaltermsofthereceivable.Significantfinancialdifficultiesofthedebtors,probabilitythatthedebtorwillenterbankruptcyorfinancialreorganisation,anddefaultordelinquencyinpaymentsareconsideredindicatorsthatthetradedebtisimpaired.Theprovisionisrecognisedintheprofitandlossaccount.Whenatradedebtisuncollectible,itiswrittenoffagainsttheprovision.Subsequentrecoveriesofamountspreviouslywrittenoffarecreditedtotheprofitandlossaccount.
4.17 Cash and cash equivalents
Cashandcashequivalents includescash inhand,depositsheldatcallwithbanks,other short-termhighly liquid investmentswithoriginalmaturitiesof threemonthsor less, andbankoverdrafts / short termborrowings. Bankoverdraftsare shownwithincurrentliabilitiesonthebalancesheet.
4.18 Borrowings
Borrowingsarerecognisedinitiallyatfairvalue,netoftransactioncostsincurred.Borrowingsaresubsequentlystatedatamortisedcost,anydifferencebetweentheproceeds(netoftransactioncosts)andtheredemptionvalueisrecognisedintheprofitandlossaccountovertheperiodoftheborrowingsusingtheeffectiveinterestmethod.Financecostsareaccountedforonanaccrualbasisandarereportedunderaccruedfinancecoststotheextentoftheamountremainingunpaid.
Borrowingsareclassifiedascurrentliabilitiesunlessthegrouphasanunconditionalrighttodefersettlementoftheliabilityforatleasttwelvemonthsafterthebalancesheetdate.
4.19 Trade and other payables
Tradeandotherpayablesare recognised initiallyat fair valueand subsequentlymeasuredatamortisedcostusing theeffectiveinterestmethod.Exchangegainsandlossesarisingontranslationinrespectofliabilitiesinforeigncurrencyareaddedtothecarryingamountoftherespectiveliabilities.
106
ANNUAL REPORT 2015
107

Notesto and forming part of the Consolidated Financial Statements for the year ended December 31, 2015
4.20 Provisions
Provisionsarerecognizedwhenthegrouphasapresentlegalorconstructiveobligationasaresultofpastevents,itisprobablethatanoutflowofresourcesembodyingeconomicbenefitswillberequiredtosettletheobligationandareliableestimateoftheamountcanbemade.Provisionsarenotrecognisedforfutureoperatinglosses.
Where there are a number of similar obligations, the likelihood that an outflow shall be required in settlement is determined byconsideringtheclassofobligationsasawhole.Aprovisionisrecognisedevenifthelikelihoodofanoutflowwithrespecttoanyoneitemincludedinthesameclassofobligationsmaybesmall.
Provisionsaremeasuredatthepresentvalueoftheexpendituresexpectedtoberequiredtosettletheobligationusingapre-taxrate
thatreflectscurrentmarketassessmentsofthetimevalueofmoneyandtherisksspecifictotheobligation.Theincreaseintheprovisionduetopassageoftimeisrecognisedasinterestexpense.
4.21 Foreign currency transactions and translation
a) Functional and presentation currency
Itemsincludedinthefinancialstatementsofthegrouparemeasuredusingthecurrencyoftheprimaryeconomicenvironmentinwhich thegroupoperates (the functionalcurrency). The financial statementsarepresented in PakRupees,which is thegroup’sfunctionalandpresentationcurrency.
b) Transactions and balances
Allmonetary assets and liabilities in foreign currencies are translated into Pak Rupees at exchange rates prevailing at thebalancesheetdate.TransactionsinforeigncurrenciesaretranslatedintoPakRupeesatexchangeratesprevailingatthedateoftransaction.Non-monetaryassetsandliabilitiesthataremeasuredintermsofhistoricalcostinaforeigncurrencyaretranslatedintoPakRupeesatexchangeratesprevailingatthedateoftransaction.Non-monetaryassetsandliabilitiesdenominatedinforeigncurrencythatarestatedatfairvaluearetranslatedintoPakRupeesatexchangeratesprevailingatthedatewhenfairvaluesaredetermined.Exchangegainsandlossesareincludedinprofitandlossaccount.
4.22 Borrowing costs
Generalandspecificborrowingcostsdirectlyattributabletotheacquisition,constructionorproductionofqualifyingassets,whichareassetsthatnecessarilytakeasubstantialperiodoftimetogetreadyfortheirintendeduseorsale,areaddedtothecostofthoseassets,untilsuchtimeastheassetsaresubstantiallyreadyfortheirintendeduseorsale.Investmentincomeearnedonthetemporaryinvestmentof specificborrowingspending theirexpenditureonqualifyingassets isdeducted fromtheborrowingcostseligible forcapitalisation.Allotherborrowingcostsarerecognisedinprofitorlossintheperiodinwhichtheyareincurred.
4.23 Revenue recognition
Revenue is recognisedwhen it isprobable that theeconomicbenefitswill flow to thegroupand the revenuecanbemeasuredreliably.Revenueismeasuredatthefairvalueoftheconsiderationreceivedorreceivableonthefollowingbasis:
-Revenuefromsaleofgoodsandexportrebateisrecognizedondispatchtocustomers.
-RevenuefromsaleofCertifiedEmissionReductions(‘CERs’)isrecognisedonthegenerationoftheEmissionReductionswhenafirmcommitmentforsaleofCERsexistswithabuyer.
-Returnondepositsisaccruedonatimeproportionbasisbyreferencetotheprincipaloutstandingandtheapplicablerateofreturn.
-Dividend incomeandentitlement of bonus shares are recognisedwhen the right to receive suchdividendandbonus shares isestablished.
-Governmentsubsidyonsaleoffertilizerisrecognisedwhentherighttoreceivesuchsubsidyhasbeenestablishedandtheunderlyingconditionsaremet.
4.24 Share capital
Ordinarysharesareclassifiedasequityandrecognisedattheirfacevalue.Incrementalcostsdirectlyattributabletotheissueofnewsharesareshowninequityasadeduction,netoftax.
4.25 Dividend
Dividenddistributiontothemembersisrecognisedasaliabilityintheperiodinwhichthedividendsareapproved.
5. Issued, subscribed and paid up share capital
2015 2014 2015 2014 (Numberofshares) (Rupeesinthousand)
2,791,260 2,791,260 OrdinarysharesofRs10eachfullypaidincash 27,913 27,913 447,208,740 447,208,740 OrdinarysharesofRs10eachissuedasfullypaidbonusshares 4,472,087 4,472,087
450,000,000 450,000,000 4,500,000 4,500,000
2015 2014 (Numberofshares)
Ordinarysharesoftheparentcompanyheldbyassociated undertakingsasatyearendareasfollows: RelianceCommodities(Private)Limited 7,136,613 7,136,613 FatimaSugarMillsLimited 84,145,872 71,250,558 FazalClothMillsLimited – 25,790,610 ArifHabibCorporationLimited 135,000,000 135,000,000 AmirFineExports(Private)Limited 12,895,296 – 239,177,781 239,177,781
2015 2014 (Numberofshares)
6. Reserves Revenue: -Generalreserve 2,098,313 2,098,313 -Un-appropriatedprofit/(accumulatedloss) 2,471,889 (245,372)
4,570,202 1,852,941
7. Surplus on revaluation of operating fixed assets
Thisrepresentssurplusoverbookvalueresultingfromtherevaluationoffreeholdland,buildingsonfreeholdland,plantandmachinery,railwaysidingandtoolsandotherequipment,adjustedbyincrementaldepreciationarisingoutofrevaluationoftheabovementionedassetsexceptfreeholdland.Thevaluationoftheassetswascarriedoutbyanindependentvaluer,M/sPirsonsChemicalEngineering(Private)Limited,onAugust31,2014.Surplusonrevaluationofoperatingfixedassetscanbeutilizedbythegrouponlyforthepurposesspecifiedinsection235oftheCompaniesOrdinance,1984.
Therevaluationsurplusrelatingtoabovementionedoperatingfixedassetsexcludingfreeholdlandisnetofapplicabledeferredin-come taxes. Incrementaldepreciation represents thedifferencebetween theactualdepreciationon theabovementionedassetsexcludingfreeholdlandandtheequivalentdepreciationbasedonthehistoricalcostoftheseassets.Themovementinrevaluationsurplus is as follows:
108
ANNUAL REPORT 2015
109

Notesto and forming part of the Consolidated Financial Statements for the year ended December 31, 2015
2015 2014 (Rupeesinthousand)
Openingbalance-netoftax 14,491,103 11,884,336 Revaluationsurplusduringtheyear -note20.1 – 3,055,295 Deferredtaxonrevaluationsurplus -note13 647,560 (365,882) Surplustransferredtoothercomprehensiveincomefortheyear onaccountofincrementaldepreciation-netoftax (115,832) (82,646)
Closingbalance-netoftax -note7.1 15,022,831 14,491,103
7.1 IncludessurplusonrevaluationoffreeholdlandamountingtoRs5,865.66million(2014:Rs5,865.66million).
2015 2014 (Numberofshares)
8. Long term finances - secured
Redeemablecapital -note8.1 – – Longtermloans -note8.2 3,113,375 2,108,499 3,113,375 2,108,499 Currentportionshownundercurrentliabilities (1,143,236) (972,404)
1,970,139 1,136,095
8.1 Redeemable capital
ThisrepresentsPrivatelyPlacedTermFinanceCertificates(‘PPTFCs’).Thesewereredeemedlastyear.
2015 2014 (Rupeesinthousand)
Openingbalance – 1,625,000 Redeemedduringtheyear – (1,625,000) Currentportionshownundercurrentliabilities – – – –
– –
8.2 Long term loans
Thesehavebeenobtainedfromthefollowingfinancialinstitutions: StandardCharteredBank(Pakistan)Limited-Loan1 -note8.2.1 – 166,667 StandardCharteredBank(Pakistan)Limited-Loan2 -note8.2.2 333,332 500,000 FaysalBankLimited -note8.2.3 250,000 416,667 PakistanKuwaitInvestmentCompany(Private)Limited -note8.2.4 62,500 187,500 PAIRInvestmentCompanyLimited -note8.2.5 285,714 428,571 SoneriBankLimited -note8.2.6 133,333 266,666 AlliedBankLimited -note8.2.7 1,977,282 – MeezanBankLimited -note8.2.8 71,214 142,428
3,113,375 2,108,499 Currentportionshownundercurrentliabilities (1,143,236) (972,404)
1,970,139 1,136,095
8.2.1Thishasbeenrepaidduringtheyear.Themarkupratechargedduringtheyearontheoutstandingbalancerangesfrom9.21%to11.59%perannum.
8.2.2 Thisrepresentstermloanfacilityforbalancesheetrestructuring.Itisrepayableinfoursemi-annualinstallmentsofRs83.333millioneachendingonDecember31,2017.MarkupispayablemonthlyattherateofthreemonthsKarachiInter-BankOfferedRate(‘KIBOR’)plus1.50%perannum.Themarkupratechargedduringtheyearontheoutstandingbalancerangesfrom8.07%to11.13%perannum.Theloanissecuredbyfirstparipassuchargeoverthepresentandfuturecurrentassetsofthefertilizeroperations.
8.2.3 Thisrepresentsatermfinancefacilityobtainedtofinancethegroup’scapitalexpenditurerequirements.Itisrepayableinthreesemi-annual installments of Rs 83.333millioneachendingon June 14, 2017andcarriesmark upat the rateof sixmonths KIBORplus1.70%perannum,payablesemi-annually.Themarkupratechargedduringtheyearontheoutstandingbalancerangesfrom8.22%to11.37%perannum. It is securedbyaparipassuchargeonallpresentand future fixedassetsexcluding theassetscomprisingofAmmoniaConverterBasket, the LamontBoiler forNitricAcid, theBombardierChallengeraircraft, theassetscomprisingof theCleanDevelopmentMechanism(‘CDM’)project,thecompletecarbondioxiderecoveryplant/liquefactionplantandthelandandbuildingsoftheexcludedassets.
8.2.4 This represents termfinance facility tofinance thegroup’scapacityexpansion. It is repayableonJune29,2016andcarriesmarkupattherateofsixmonthsKIBORplus2.25%perannum,payablesemi-annually.Themarkupratechargedduringtheyearontheoutstandingbalancerangesfrom8.76%to11.09%perannum.ItissecuredbyafirstparipassuchargeonallpresentandfuturefixedassetsexcludingtheassetscomprisingofAmmoniaConverterBasket,theLamontBoilerforNitricAcid,theassetscomprisingoftheCDMproject,thecompletecarbondioxiderecoveryplant/liquefactionplantalongwithcarbondioxidestaticstoragetank,toolsanditsspares,toolsandaccessories.
8.2.5 Thisrepresentstermfinancefacilityforbalancesheetrestructuringandgroup’scapitalexpenditurerequirements.Itisrepayableinfoursemi-annualinstallmentsofRs71.429millioneachendingonAugust27,2017andcarriesmarkupattherateofsixmonthsKIBORplus2.25%perannum,payablesemi-annually.Themarkupratechargedduringtheyearontheoutstandingbalancerangesfrom9.32%to12.44%perannum.Itissecuredbyafirstparipassuchargeonthepresentandfuturefixedassetsoffertilizeroperations.
8.2.6 This represents termfinance facility tomeet thegroup’scapitalexpenditure/repaymentofexpensivedebt. It is repayable in twosemi-annualinstallmentsofRs66.667millioneachendingNovember2,2016andcarriesmarkupattherateofsixmonthsKIBORplus1.75%perannum,payablesemi-annually.Themarkupratechargedduringtheyearontheoutstandingbalancerangesfrom8.22%to11.91%perannum.ItissecuredbyafirstparipassuchargeonthepresentandfuturefixedassetsoffertilizeroperationsincludinglandandbuildingandmachineryexcludingtheassetscomprisingofAmmoniaConverterBasket,theLamontBoilerforNitricAcid,theassetscomprisingoftheCDMproject,thecompletecarbondioxiderecoveryplant/liquefactionplantalongwithcarbondioxidestaticstoragetank,toolsanditsspares,toolsandaccessoriesandthelandandbuildingsrelatedtotheseassets.
8.2.7 Thisrepresentstermfinancefacilitytomeetgroup’srepaymentofimportbillpayable.Itisrepayableintensemi-annualinstallmentsofRs200millioneachcommencingfromMay24,2016andcarriesmarkupattherateofsixmonthsKIBORplus2%perannum,payablesemi-annualy.Themarkupratechargedduringtheyearontheoutstandingbalanceis8.52%perannum.ItissecuredbyafirstparipassuchargeoverallpresentandfutureplantandmachineryfertilizeroperationsexcludingassetscomprisingofAmmoniaConverterBasket, theLamontboiler forNitricAcid, theassetscomprisingof theCDMproject, thecompletecarbondioxide recoveryplant/liquefactionplantalongwithcarbondioxidestaticstoragetankandanexclusivechargeovertheBombardierChallengeraircraft.Thereconciliationofthecarryingamountofloanisasfollows:
2015 2014 (Rupeesinthousand)
Receipt 2,000,000 – Initialtransactioncost (23,200) –
1,976,800 – Amortizationofinitialtransactioncost -note34 482 –
1,977,282 – Currentmaturity (400,000) –
1,577,764 –
110
ANNUAL REPORT 2015
111

Notesto and forming part of the Consolidated Financial Statements for the year ended December 31, 2015
8.2.8 ThisrepresentsdiminishingmusharikafacilityofRs250millionforfinancingthepurchaseofbothlocalandimportedplantandmachinery.AsofDecember31,2015,theprincipalisrepayableinfourquarterlyinstallmentsofRs17.804millioneachendingonDecember15,2016andcarriesmarkupattherateofsixmonthsKIBORplus1.6%perannumwithafloorof8%andacapof25%.Themarkupratechargedduringtheyearontheoutstandingbalancerangesfrom6.52%to9.66%perannum.ThefacilityissecuredbyaregisteredmortgageofRs100millionoverthebuilding/superstructureonthesacksoperation’slease-holdland,anexclusivehypothecationchargeonplantandmachinery,aguaranteefromthegroupandundertakingfromtherelatedparty(associatedcompany),FatimaFertilizerCompanyLimited(‘FATIMA’),nottomortgageunencumberedlandonwhichthesacksoperation’sprojecthasbeenbuilt.
2015 2014 (Rupeesinthousand)
9. Long term loans from related parties - unsecured
Thesehavebeenobtainedfromthefollowingrelatedparties: FatimaHoldingsLimited(associatedcompany) – 442,287 RelianceCommodities(Private)Limited(associatedcompany) 877,982 34,292 MemberandChairman’sspouse 371,491 313,032 Chairman’schildren 116,914 – Directors 866,565 36,357
-note9.1 2,232,952 825,968
9.1 ThisisrepayableinaperiodoftwoyearscommencingfromJanuary1,2017ontermsthataretobemutuallyagreedbetweentheparties.Markupispayablesemi-annuallyatarateofsixmonthsKIBORplus1.5%perannum.Themarkupratechargedduringtheyearontheoutstandingbalancerangesfrom7.98%to8.51%perannum.
10. Import bill payable - secured
ThishasbeenpaidduringtheyearthroughproceedsofloanacquiredfromAlliedBankLimitedasreferredtoinnote8.2.7tothesefinancialstatements.
11. Long term deposits
Theserepresentinterestfreesecuritydepositsfromcustomersandcarriagecontractorsandarerepayableoncancellation/withdrawalofthedealershiporoncessationofthebusinesswiththegrouprespectively.
2015 2014 (Rupeesinthousand)
12. Deferred liabilities
Accumulatingcompensatedabsences -note12.1 97,166 80,812 Retirementbenefits-gratuityfund -note12.2 35,814 34,977
132,980 115,789
12.1 Accumulating compensated absences
Openingbalance 80,812 86,320 Chargetoprofitandlossaccount -note12.1.2 25,038 3,925 105,850 90,245 Paymentsmadeduringtheyear (8,684) (9,433)
Liabilityasatyearend 97,166 80,812
2015 2014 (Rupeesinthousand)
12.1.1 Movement in liability for accumulating compensated absences
Openingpresentvalueofaccumulatingcompensatedabsences 80,812 86,320 Currentservicecost 15,971 11,830 Interestcost 8,029 5,741 Benefitspaidduringtheyear (8,684) (9,433) Remeasurementduringtheyear 1,038 (13,646)
Closingpresentvalueofaccumulatingcompensatedabsences 97,166 80,812
12.1.2 Charge for the year
Currentservicecost 15,971 11,830 Interestcost 8,029 5,741 Remeasurementduringtheyear 1,038 (13,646)
Expensechargedtotheprofitandlossaccount 25,038 3,925
Amountsforcurrentperiodandpreviousfourannualperiodsofaccumulatingcompensatedabsencesareasfollows:
2015 2014 2013 2012 2011
As at December 31 (Rupeesinthousand)
Presentvalueofaccumulating compensatedabsences 97,166 80,812 86,320 84,150 66,001
Experienceadjustmentarisingonobligation 1,038 (13,646) – – –
Theaveragenumberofleavesaccumulatedperannumistendaysforexecutivesandfivedaysforworkersandotherstaff.
2015 2014 (Rupeesinthousand)
12.2 Gratuity fund
Theamountsrecognisedinthebalancesheetareasfollows: Presentvalueofdefinedbenefitobligation 171,990 149,293 Fairvalueofplanassets (136,176) (114,316)
Liabilityasatyearend 35,814 34,977
Openingnetliability 34,977 40,152 Chargetoprofitandlossaccount 24,630 24,449 Chargetorelatedparty 8,304 9,240 Netremeasurementsfortheyear 2,880 1,290 Contributionbythecompany (34,977) (40,154)
Liabilityasatyearend 35,814 34,977
Themovementinthepresentvalueofdefinedbenefitobligationisasfollows: Openingpresentvalueofdefinedbenefitobligation 149,293 129,962 Currentservicecost 31,098 31,179 Interestcost 14,620 14,762 Benefitspaidtoout-goingmembersduringtheyear (20,104) (23,738) Remeasurementsonobligation (2,917) (2,872)
Presentvalueofdefinedbenefitobligationasatyearend 171,990 149,293
112
ANNUAL REPORT 2015
113
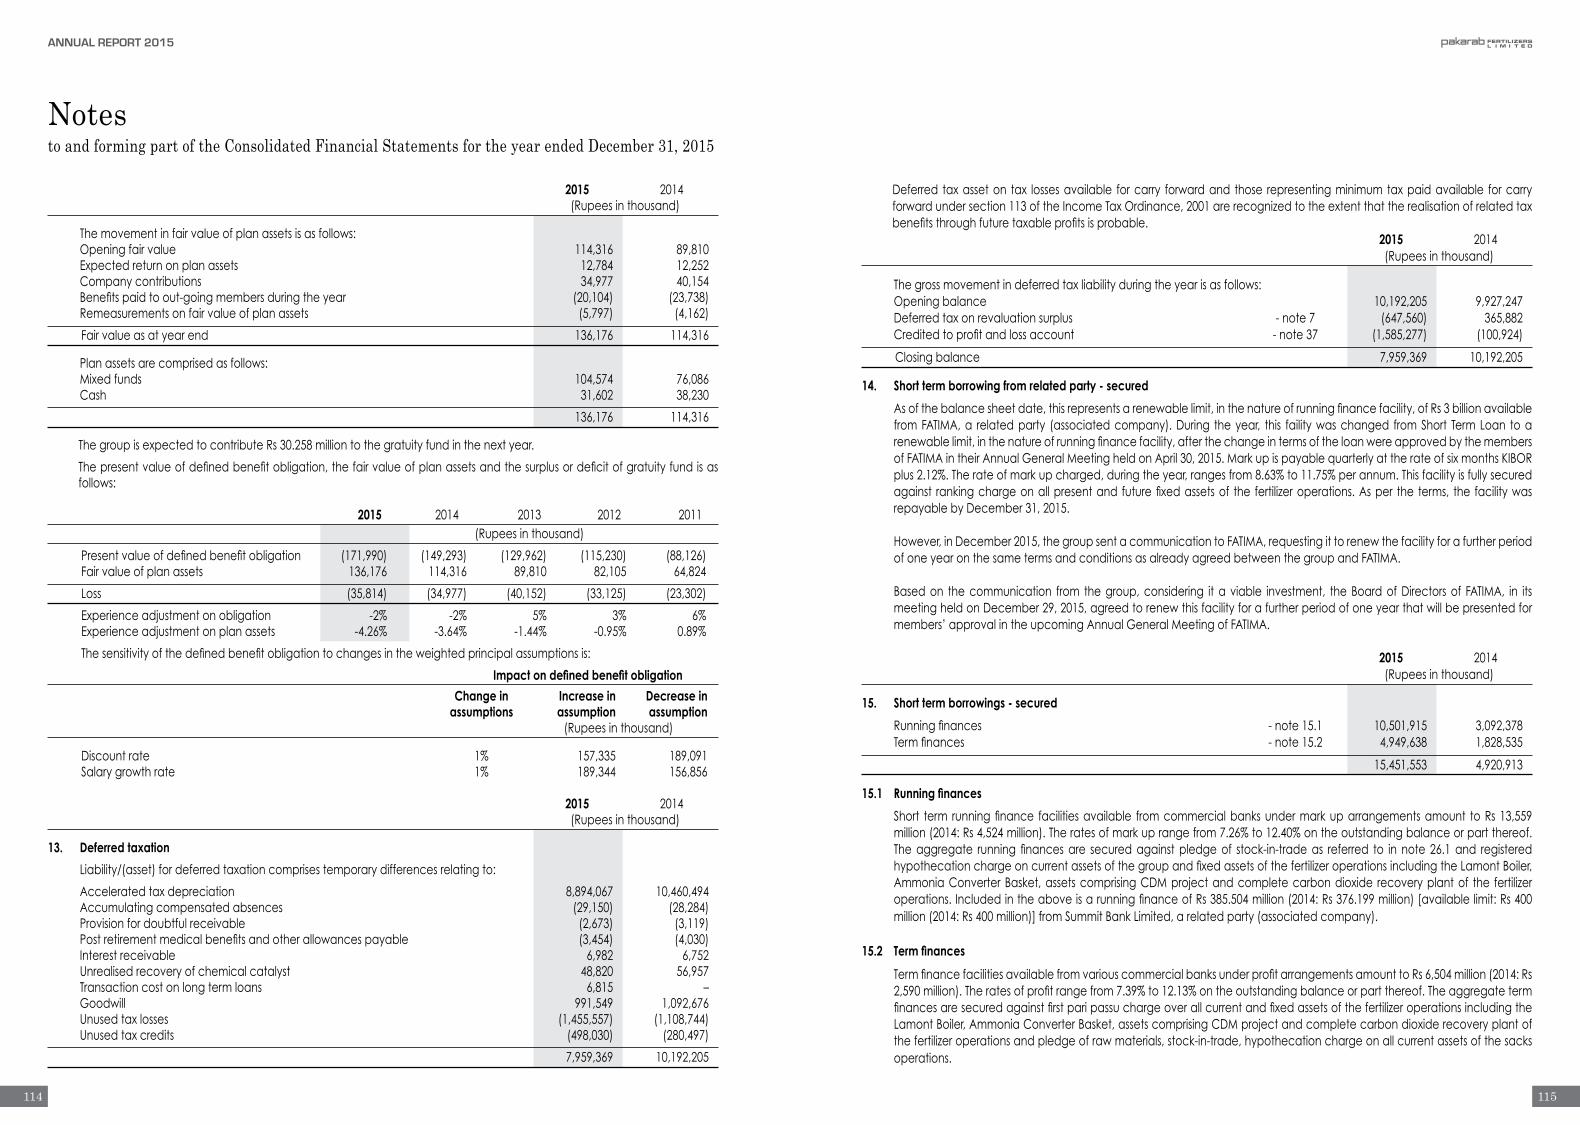
Notesto and forming part of the Consolidated Financial Statements for the year ended December 31, 2015
2015 2014 (Rupeesinthousand)
Themovementinfairvalueofplanassetsisasfollows: Openingfairvalue 114,316 89,810 Expectedreturnonplanassets 12,784 12,252 Companycontributions 34,977 40,154 Benefitspaidtoout-goingmembersduringtheyear (20,104) (23,738) Remeasurementsonfairvalueofplanassets (5,797) (4,162)
Fairvalueasatyearend 136,176 114,316
Plan assets are comprised as follows: Mixedfunds 104,574 76,086 Cash 31,602 38,230
136,176 114,316
ThegroupisexpectedtocontributeRs30.258milliontothegratuityfundinthenextyear.
Thepresentvalueofdefinedbenefitobligation,thefairvalueofplanassetsandthesurplusordeficitofgratuityfundisasfollows:
2015 2014 2013 2012 2011 (Rupeesinthousand)
Presentvalueofdefinedbenefitobligation (171,990) (149,293) (129,962) (115,230) (88,126) Fairvalueofplanassets 136,176 114,316 89,810 82,105 64,824
Loss (35,814) (34,977) (40,152) (33,125) (23,302)
Experienceadjustmentonobligation -2% -2% 5% 3% 6% Experienceadjustmentonplanassets -4.26% -3.64% -1.44% -0.95% 0.89%
Thesensitivityofthedefinedbenefitobligationtochangesintheweightedprincipalassumptionsis:
Impact on defined benefit obligation
Change in Increase in Decrease in assumptions assumption assumption (Rupeesinthousand)
Discountrate 1% 157,335 189,091 Salarygrowthrate 1% 189,344 156,856
2015 2014 (Rupeesinthousand)
13. Deferred taxation
Liability/(asset)fordeferredtaxationcomprisestemporarydifferencesrelatingto:
Acceleratedtaxdepreciation 8,894,067 10,460,494 Accumulatingcompensatedabsences (29,150) (28,284) Provisionfordoubtfulreceivable (2,673) (3,119) Postretirementmedicalbenefitsandotherallowancespayable (3,454) (4,030) Interestreceivable 6,982 6,752 Unrealisedrecoveryofchemicalcatalyst 48,820 56,957 Transactioncostonlongtermloans 6,815 – Goodwill 991,549 1,092,676 Unusedtaxlosses (1,455,557) (1,108,744) Unusedtaxcredits (498,030) (280,497)
7,959,369 10,192,205
Deferred taxasseton tax lossesavailable forcarry forwardand those representingminimumtaxpaidavailable forcarryforwardundersection113oftheIncomeTaxOrdinance,2001arerecognizedtotheextentthattherealisationofrelatedtaxbenefitsthroughfuturetaxableprofitsisprobable.
2015 2014 (Rupeesinthousand)
Thegrossmovementindeferredtaxliabilityduringtheyearisasfollows: Openingbalance 10,192,205 9,927,247 Deferredtaxonrevaluationsurplus -note7 (647,560) 365,882 Creditedtoprofitandlossaccount -note37 (1,585,277) (100,924)
Closingbalance 7,959,369 10,192,205
14. Short term borrowing from related party - secured
Asofthebalancesheetdate,thisrepresentsarenewablelimit,inthenatureofrunningfinancefacility,ofRs3billionavailablefromFATIMA,a relatedparty (associatedcompany).During theyear, this failitywaschanged fromShort TermLoan toarenewablelimit,inthenatureofrunningfinancefacility,afterthechangeintermsoftheloanwereapprovedbythemembersofFATIMAintheirAnnualGeneralMeetingheldonApril30,2015.MarkupispayablequarterlyattherateofsixmonthsKIBORplus2.12%.Therateofmarkupcharged,duringtheyear,rangesfrom8.63%to11.75%perannum.Thisfacilityisfullysecuredagainst rankingchargeonallpresentand futurefixedassetsof the fertilizeroperations.Asper the terms, the facilitywasrepayablebyDecember31,2015.
However,inDecember2015,thegroupsentacommunicationtoFATIMA,requestingittorenewthefacilityforafurtherperiod
ofoneyearonthesametermsandconditionsasalreadyagreedbetweenthegroupandFATIMA.
Basedon thecommunication from thegroup,considering ita viable investment, theBoardofDirectorsof FATIMA, in itsmeetingheldonDecember29,2015,agreedtorenewthisfacilityforafurtherperiodofoneyearthatwillbepresentedformembers’approvalintheupcomingAnnualGeneralMeetingofFATIMA.
2015 2014 (Rupeesinthousand)
15. Short term borrowings - secured
Runningfinances -note15.1 10,501,915 3,092,378 Termfinances -note15.2 4,949,638 1,828,535
15,451,553 4,920,913
15.1 Running finances
Short term runningfinance facilitiesavailable fromcommercialbanksundermarkuparrangementsamount toRs13,559million(2014:Rs4,524million).Theratesofmarkuprangefrom7.26%to12.40%ontheoutstandingbalanceorpartthereof.Theaggregate running financesare securedagainstpledgeof stock-in-tradeas referred to in note 26.1and registeredhypothecationchargeoncurrentassetsofthegroupandfixedassetsofthefertilizeroperationsincludingtheLamontBoiler,AmmoniaConverterBasket,assetscomprisingCDMprojectandcompletecarbondioxide recoveryplantof the fertilizeroperations.IncludedintheaboveisarunningfinanceofRs385.504million(2014:Rs376.199million)[availablelimit:Rs400million(2014:Rs400million)]fromSummitBankLimited,arelatedparty(associatedcompany).
15.2 Term finances
TermfinancefacilitiesavailablefromvariouscommercialbanksunderprofitarrangementsamounttoRs6,504million(2014:Rs2,590million).Theratesofprofitrangefrom7.39%to12.13%ontheoutstandingbalanceorpartthereof.TheaggregatetermfinancesaresecuredagainstfirstparipassuchargeoverallcurrentandfixedassetsofthefertilizeroperationsincludingtheLamontBoiler,AmmoniaConverterBasket,assetscomprisingCDMprojectandcompletecarbondioxiderecoveryplantofthefertilizeroperationsandpledgeofrawmaterials,stock-in-trade,hypothecationchargeonallcurrentassetsofthesacksoperations.
114
ANNUAL REPORT 2015
115

Notesto and forming part of the Consolidated Financial Statements for the year ended December 31, 2015
15.3 Letters of credit and guarantees
OftheaggregatefacilityofRs5,405million(2014:Rs5,417million)foropeninglettersofcreditandRs288million(2014:Rs88million)forguarantees,theamountutilisedatDecember31,2015wasRs2,240million(2014:1,426million)andRs17million(2014:Rs17million)respectively.Thefacilityforopeninglettersofcreditissecuredagainstimportdocumentsandregisteredjointparipassuchargeovercurrentassetswhereasfacilityforguaranteesissecuredagainstregisteredjointparipassuchargeovercurrentassets.
16. Payable to Privatization Commission of Pakistan
RelianceExports (Private)Limited(‘REL’),under thetermsandconditionsstated in the‘SharePurchaseAgreement’ (‘theAgreement’),acquired100%sharesintheparentcompanyonJuly14,2005throughtheprocessofprivatization.UnderthetermsoftheAgreement,thepurchaseconsideration, inadditiontolumpsumcashpayment, includedafurtherpaymentequivalentto90%ofthegroup’sclaimoftaxrefundaggregatingtoRs2,814.511millionfortheassessmentyears1993-94,1995-96through2002-2003andtaxyears2003and2004.TheamountispayabletothePrivatizationCommissionintheeventofandatthetimeofcashreceiptoftherefundfromtheconcernedtaxauthorities.
TheamountrecognizedinthesefinancialstatementsaspayabletoPrivatizationCommissionisnetoffRs240.119millionwhich,
accordingtothemanagementofthegroup,hasalreadybeenwithdrawnbythePreviousMembersaspartofthedividenddistributionfortheyearendedJune30,2005.ThemanagementofthegroupfeelsthattheAgreementaspresentlyworded,ifexecuted,wouldresultintodoublepaymentofthesameamounttothePrivatizationCommission/PreviousMembers,firstly,aspartoftheprofitsfortheyearendedJune30,2005(computedwithoutrecognitionofthetaxexpensefortheyearsforwhichwhentherefundisissued,anamountequivalentto90%wouldbetherightofthePrivatizationCommission/PreviousMembers)andsecondly,atthetimetherefundisreceivedfromthetaxauthoritieswhenanamountequivalentto90%ofsuchrefundispaidofftothePrivatizationCommission,asagreed.ThemanagementofthegroupfeelsthatsuchdoublepaymentisneithertheintentionnorwarrantedunderthespecificprovisionsoftheAgreement.
UpondissolutionofRELanditsamalgamationwiththeparentcompanyonJuly14,2005,thisliabilitywasrecognisedinthebooksoftheparentcompanybeingthesurvivingentityuponREL’samalgamationwiththeparentcompanyinaccordancewiththeSchemeofArrangementforAmalgamation.
2015 2014 (Rupeesinthousand)
17. Trade and other payables
Tradecreditors 2,785,913 3,720,662 Suigasbillpayable -note17.1 – 6,147 Securitydeposits 32,105 16,652 Accruedliabilities -notes17.2&17.3 2,400,261 1,587,607 Workers’profitparticipationfund -note17.4 731,012 711,097 Workers’welfarefund 273,040 247,374 Customers’balances 186,333 1,249,938 Bankguaranteesdiscounted 1,987,767 76,100 Duetorelatedparty – 16,838 Duetoemployees’providentfundtrust 1,312 177 Withholdingtaxpayable 61,540 11,193 Excisedutypayable 1,724 1,724 Salestaxpayable – 17,081 Electricitydutypayable 30,171 22,558 Retentionmoney 245 342 Duetoemployees 60 49
8,491,483 7,685,539
17.1 This amount is payable to Sui Northern Gas Pipelines Limited (‘SNGPL’), a related party (associated company) againstpurchaseofgas.
17.2 AccruedliabilitiesincludeRs1,071million(2014:Rs1,061million)onaccountofGasInfrastructureDevelopmentCess(‘GIDC’).Duringtheyear,theParliamentpassedtheGIDCAct2015inMay2015whichseekstoimposeGIDClevysince2011.ThegrouphaschallengedthevalidityandpromulgationofGIDCAct,2015beforetheHonorableSindhHighCourt,whereintheCourtpassedinterimorders,therebyrestrainingSNGPLfromchargingorrecoveringGIDC.
17.3 IncludesbonusofRs7.5million(2014:Rs7.5million)payabletothedirectors.
2015 2014 (Rupeesinthousand)
17.4 Workers’ profit participation fund
Openingbalance 711,097 730,152 Provisionfortheyear -note35 67,543 8,763 Interestfortheyear -note34 695 186
779,335 739,101 Paymentsmadeduringtheyear (48,323) (28,004)
Closingbalance 731,012 711,097
TheparentcompanyhasanagreementwiththeWorkersWelfareFund(‘WWF’),MinistryofLabourandManpower,GovernmentofPakistanwherebythebalanceamountofWorkers’ProfitParticipationFund(‘WPPF’)remainingafterdeductingtheworkers’portionofWPPFthatisrequiredtobedepositedintheWWF,wouldbeusedforestablishingahospitalfortheworkersasperthemechanismdefinedinthatagreement.
2015 2014 (Rupeesinthousand)
18. Accrued finance cost
Accruedmarkupon: -longtermloans-secured 38,593 27,519 -longtermloansfromrelatedparties-unsecured -note18.1 97,712 – -shorttermborrowingfromrelatedparty-secured -note18.2 97,701 176,641 -shorttermborrowings-secured -note18.3 221,338 122,769
455,344 326,929
18.1 Thisamountispayabletothefollowingrelatedparties:
RelianceCommodities(Private)Limited(associatedcompany) 39,152 – MemberandChairman’sspouse 16,015 – Chairman’schildren 5,067 – Directors 37,478 –
97,712 –
18.2 ThisamountispayabletoFATIMA,arelatedparty(associatedcompany).
18.3 IncludesanamountofRs8.314million(2014:Rs11.574million)payabletoSummitBankLimited,arelatedparty(associatedcompany).
116
ANNUAL REPORT 2015
117

Notesto and forming part of the Consolidated Financial Statements for the year ended December 31, 2015
19. Contingencies and commitments
19.1 Contingencies
(i) ThegrouphasnettedoffanamountofRs240.119millionfromtheamountpayabletothePrivatizationCommission,aspartofpurchaseconsideration,atthetimeandintheeventtherefundisreceivedfromthetaxauthorities.Incase,thegroup’scontentionrelatingtopossibledoublepaymentisnotaccededtobytheotherpartytotheSharePurchaseAgreement,thegroupiscontingentlyliabletotheaforesaidamountofRs240.119million.Incase,theamountbecomespayable,thecorrespondingeffectwouldbereflectedinthecomputationofgoodwill.
(ii) Thegrouphasissuedfollowingguaranteesinfavourof:
-SNGPLagainstgassaleamountingtoRs10million(2014:Rs10million).
-PakistanStateOilCompanyLimited(‘PSO’)againstfuelforaircraftamountingtoRs7million(2014:Rs7million).
-MeezanBankLimitedassecurityagainstfinanceobtainedbyitssacksoperations.
(iii) AsatJune30,2004,thegrouphadinvestmentof140,000ordinarysharesofRs10eachvaluingRs100,000inNationalFertilizer Marketing Limited, being the associated company on that date. On May 20, 2005, this investment wastransferredtoNationalFertilizerCorporationofPakistan(Private)Limitedbythemanagementofthegroup.However,thenewbuyer,RelianceExports(Private)LimitedfiledanapplicationbeforePrivatizationCommissionchallengingthistransferonthegroundsthatsuchtransferhadbeencarriedoutagainstthetermsandconditionsofthebiddocuments.Incaseofapositiveoutcometotheapplication,thisinvestmentwouldbere-instated.
(iv) AnamountofRs129.169millionwaswithdrawnbythepreviousmembersoftheparentcompanyaspartofdividendfortheyearendedJune30,2005undertheSharePurchaseAgreement.Outoftheaggregateamount,Rs89.39millionrepresents thevalueofcertaincatalysts recovered inconsequenceofcleandownoperationssof theplantprior toundertakingtheprocessofprivatization,whichwasaccountedforasincomeinthefinancialstatementsfortheyearendedJune30,2005inthelightofapplicablefinancialreportingframework.
Themanagementofthegroupfeelsthatnotwithstandingtheapplicabilityofthefinancialreportingframework,onthefinancialstatementsfortheyearendedJune30,2005,theamountwasnotdistributableaspartofdividendforthatyearinviewoftheclearunderstandingbehindtheexecutionoftheAgreementascategoricallyconfirmed,inwriting,bythePrivatizationCommissionpriortosigningoftheAgreement.Similarly,thebalanceamountofRs39.779millionisconsideredtobedividenddistributionoutofthethenavailablereserveswhichwasalsonotdistributabletothepreviousmembersintermsofothercovenantsoftheAgreement.
Thegrouphasfiledaclaimfortherecoveryoftheaforesaidaggregateamountonthegroundsthatinthepresentform,thedistributionhasbeenmadeoutoftheaccumulatedreserves,fortheyearsuptoJune30,2004,which,underthespecificprovisionsoftheAgreementwerenotdistributabletothepreviousmembersoftheparentcompany.Incaseofapositiveoutcometothegroup’sclaim, theexcessdividendwithdrawnbythepreviousmembersof theparentcompanywouldberecovered.
(v) Throughashowcausenotice,thedepartmentraisedtheissueofshortpaymentofoutputsalestaxonsuppliesofthegroup’sfertilizerproduct,CalciumAmmoniumNitrate(‘CAN’)fortheperiodfromApril18,2011toDecember31,2011involvingaprincipal sales taxdemandofRs500million. Such issuewas raisedon thegrounds thatnotificationSRO15(I)/2006,providing for levyof sales taxon thebasisof ‘notifiedprice’ofCAN,waswithdrawnthroughnotificationSRO313(I)/2011datedApril18,2011andhence,thegroupwaslegallyrequiredtorecoveroutputsalestaxonsuppliesofCANonthebasisofactualconsiderationreceivedthereagainst.ThegrouphadalreadyapproachedtheFederalBoardofRevenue(‘FBR’)ontheissueforcondonationintermsofsection65oftheSalesTaxAct,1990,whichwasnotentertained.ThegrouphasassailedsuchorderthroughinstitutionofawritpetitionbeforeHighCourtonthegroundsthatrelevantpowershavebeenexercisedinanarbitrarymannerwithoutreferringthemattertocompetentauthorityasrequiredunderthelaw.Whilesuchconstitutionalpetitionhasnotyetbeendisposed,sincemanagementconsidersthatgroup’sstanceisbasedonmeritoriousgroundsandhencereliefwouldbesecuredfromtheCourt,noprovisiononthisaccounthasbeenmadeinthesefinancialstatements.
(vi) Forassessmentyears1993-94and1995-96through2002-2003andfortaxyears2003through2005,thegroup,inviewofthepositiontakenbythetaxauthoritiesthattheincomeofthegroupischargeabletotaxonthebasisof‘netincome’,hadprovided for in thefinancial statements the tax liabilityonnet incomebasiswhichaggregated toRs5,223.343million.Taxliabilitiesadmittedinrespectivereturnsoftotalincomeinrespectoftheseassessment/taxyears,however,aggregatedtoRs1,947.671millionbeingtheliabilitiesleviableunderthePresumptiveTaxRegime(‘PTR’),consideredbythemanagementtobeapplicableinrespectofgroup’sincomefromsaleofownmanufacturedfertilizerproducts.
The Appellate Tribunal Inland Revenue (‘ATIR’) through its separate orders for the assessment years 1993-94, 1995-96 through 2002-03 upheld the group’s position as taken in respective returns of total income and consequently,management reversed theexcessprovisionsaggregating toRs3,275.673millionon the strengthof such judgments.ATIR’sdecisionsinrespectofcertainassessmentyearshavealsobeenupheldbytheLahoreHighCourtwhiledisposingdepartmentalappealsagainstrespectiveordersofATIR.IncometaxdepartmenthasstatedlyagitatedtheissuefurtherbeforeSupremeCourtofPakistan,whichispendingadjudication.
InviewofthefavourabledisposalofthematteruptothelevelofHighCourt,managementofthegroupfeelsthatthedecisionoftheapexcourtwouldalsobeinthefavourofthegroupandhenceinthesefinancialstatements,taxliabilitiesinrespectofabovereferredassessment/taxyearshavebeenprovidedonthebasisthatgroup’sincomeduringsuchyearswastaxableunderPTR.Incase,theapexcourtdecidesthematterotherwise,amountaggregatingtoRs3,275.673millionwillhavetoberecognizedastaxexpenseinrespectofsuchassessment/taxyears.
(vii) IncludedintradedebtsisanamountofRs18.877million(2014:Rs18.877million)whichhasnotbeenacknowledgedasdebtsbyitscustomersduetoadisputeregardingthediscountontheproduct’sprice.Thegroup’scustomershadcollectivelyfiledanappealregardingthepricedisputebeforetheCivilCourt,Multan,whichdecidedthecaseinfavourofthegroup’scustomers.ThegrouppreferredanappealbeforetheDistrictandSessionsCourt,MultanwhichsetasidetheorderoftheCivilCourt.Thegroup’scustomersfiledarevisedpetitionbeforetheLahoreHighCourtagainsttheorderoftheDistrictandSessionsCourt,whichispendingforadjudication.Basedontheadviceofthegroup’slegalcounsel,thegroup’smanagementconsidersthattherearemeritoriousgroundstodefendthegroup’sstanceandhence,noprovisionhasbeenmadeinthesefinancialstatementsonthisaccount.
(viii) Duringtheyear,throughashowcausenotice,thedepartmentraisedtheissueofnon-paymentofoutputsalestaxonstockoffertilizerproducttransferredtovariouswarehousesofthegroupinvolvingaprincipalsalestaxdemandofRs909.125million(notincludingdefaultsurchargewhichwillbecalculatedatthetimeofdeposit)alongwithapenaltyequal to100%of theprincipal sales taxdemand.Such issuewas raisedon thegrounds that theabovementionedtransfers are sales under section 2(44) of the Sales TaxAct, 1990, and hence, the same havebeenmadewithoutpaymentofsalestax.ThemanagementhasassailedthesubjectorderinusualappellatecoursebeforeCommissionerInlandRevenue(Appeals)[‘CIR(A)’]whichispendingadjudication.Furthermore,arestraintorderdatedNovember23,2015waspassedbytheLahoreHighCourtstayingtherecoveryofthisdemandfromthegroup.Managementconsidersthattherearestronggroundstosupportthegroup’sstanceandishopefulofafavorabledecision.Consequently,noprovisionhasbeenmadeinthesefinancialstatementsfortheabovementionedamount.
(ix) OnJuly5,2006,PakistanNationalShippingCorporation (‘PNSC’)fileda recovery suit forUSD1.5millionagainst thegroupbeforetheCivilCourt,LahoreclaimingthatithadsufferedlossesasthegroupunilaterallyterminatedtheCharterPartyAgreement(‘CPA’)betweenthePNSCandthegroup.AsperthetermsoftheCPA,PNSCwastotransport300,000metrictonsofrockphosphateforthegroupbetweenFebruary1,2005toMay31,2006atarateofUSD41permetricton fromCasablancaport toKarachiport.However,PNSCclaimedthat thegrouphadunilaterally terminatedCPAaftertheprivatizationoftheparentcompanyin2005.ThegroupalsofiledacountersuitagainstPNSCclaimingthatithadviolatedthetermsoftheCPAbydivertingshipscarryinggroup’scargotootherportscausingthegroup’scargotoarrivelaterthanexpectedresultinginlosstothegroup.TheCourtreferredthemattertothearbitratorwhothroughitsawarddatedApril22,2010decidedthematterinPNSC’sfavourandconfirmingitsclaimatUSD1.3millionandmarkupattherateof14%tobecalculatedfromthedateofawardtillthetimeofdeposit.ThegroupbeingaggrievedhasfiledanapplicationagainsttheawardofarbitratorbeforetheCivilCourt,Lahorewhichispendingadjudication.Basedontheadviceofthegroup’slegalcounsel,themanagementconsidersthatgroup’sstanceisbasedonmeritoriousgroundsandhence reliefwouldbesecured fromtheCourt,noprovisionon thisaccounthasbeenmade in thesefinancialstatements.
(x) Duringtheyear,thegrouppurchasedLiquefiedNaturalGas(‘LNG’)fromPakistanStateOilCompanyLimited(‘PSO’)underthevariousdirectivesofMinistryofPetroleumandNaturalResources(‘MP&NR’),GovernmentofPakistan.Includedin the cost bookedduring the year relating to LNGareprovisional charges of Sui SouthernGasCompany Limited(‘SSGC’)andSuiNorthernGasPipelinesLimited(‘SNGPL’)(hereinaftercollectivelyreferredtoasthe‘GasCompanies’)thatarebasedontheabovementionedGovernmentdirectivesanddeterminationofOilandGasRegulatoryAuthority(‘OGRA’) forotherconsumers through itsdecisiondatedMarch18,2016.Basedon theadviceof thegroup’s legalcounsel, management strongly believes that the amounts claimed by theGas Companies from the groupwouldeventuallybeinlinewiththeabovebasis.Consequently,noprovisionhasbeenmadeinthesefinancialstatementsforthedifferentialamountofRs448.950millionbasedontheadviceofthegroup’slegalcounselthattherearemeritoriousgroundstofollowtheabovebasis.
118
ANNUAL REPORT 2015
119

Notesto and forming part of the Consolidated Financial Statements for the year ended December 31, 2015
19.2 Commitments in respect of
(i) LettersofcreditotherthanforcapitalexpenditureRs98.022million(2014:Rs107.317million).
(ii) Theamountoffuturepaymentsunderoperatingleasesandtheperiodinwhichthesepaymentswillbecomedueareas follows:
2015 2014 (Rupeesinthousand)
Notlaterthanoneyear 61,932 42,265 Laterthanoneyearandnotlaterthanfiveyears 122,178 34,108
184,110 76,373
20. Property, plant and equipment
Operatingfixedassets -note20.1 39,538,136 40,233,289 Capitalwork-in-progress -note20.2 30,567 38,477 Capitalstoresandstand-byequipment -note20.3 55,764 74,421
39,624,467 40,346,187
20.1 Operating fixed assets
(Rupees in thousand)
Freehold land Buildings on Buildings on Railway Plant and Aircrafts Furniture Tools and Vehicles Catalyst Total freehold leasehold siding machinery and other land fixtures equipment
COST BalanceasatJanuary01,2014 4,767,634 2,057,264 132,812 36,800 28,955,826 2,783,209 73,312 722,729 212,406 217,312 39,959,304 Additionsduringtheyear – 4,853 33,555 – 33,590 7,372 907 8,394 6 – 88,677 Revaluation 2,009,966 45,022 – 1,000 996,197 – – 3,110 – – 3,055,295 Transfersinfromassetssubjecttofinancelease – – – – – – – – 161,879 – 161,879 Disposalsduringtheyear – – – – – (505,796) – (127) (57,690) – (563,613) Adjustmentsduringtheyear – – (2,345) – – – – – – – (2,345) againstcostonrevaluation – (313,061) – (28,800) (1,053,736) – (23,957) (179,094) – – (1,598,648)
BalanceasatDecember31,2014 6,777,600 1,794,078 164,022 9,000 28,931,877 2,284,785 50,262 555,012 316,601 217,312 41,100,549
BalanceasatJanuary01,2015 6,777,600 1,794,078 164,022 9,000 28,931,877 2,284,785 50,262 555,012 316,601 217,312 41,100,549 Additionsduringtheyear – 6,960 22,828 – 1,440 – 678 28,017 207 19,658 79,788 Disposalsduringtheyear – – – – – – – (19,138) (59,887) – (79,025) BalanceasatDecember31,2015 6,777,600 1,801,038 186,850 9,000 28,933,317 2,284,785 50,940 563,890 256,921 236,970 41,101,311
DEPRECIATION BalanceasatJanuary01,2014 – 242,137 5,064 22,401 1,009,317 768,557 18,654 149,220 191,508 74,694 2,481,552 Chargefortheyear-note20.1.3 – 107,401 5,588 9,475 93,617 111,620 8,618 50,580 12,091 2,483 401,473 Transfersinfromassetssubjecttofinancelease – – – – – – – – 140,676 – 140,676 Chargeondisposals – – – – – (505,796) – (89) (51,908) – (557,793) Eliminationofaccumulateddepreciation againstcostonrevaluation – (313,061) – (28,800) (1,053,736) – (23,957) (179,094) – – (1,598,648) BalanceasatDecember31,2014 – 36,477 10,652 3,076 49,198 374,381 3,315 20,617 292,367 77,177 867,260
BalanceasatJanuary01,2015 – 36,477 10,652 3,076 49,198 374,381 3,315 20,617 292,367 77,177 867,260 Chargefortheyear-note21.1.3 – 109,518 8,984 5,924 427,317 112,480 8,513 49,872 16,917 14,387 753,912 Chargeondisposals – – – – – – – (688) (57,310) – (57,998) BalanceasatDecember31,2015 – 145,995 19,636 9,000 476,515 486,861 11,828 69,801 251,974 91,564 1,563,174
BookvalueasatDecember31,2014 6,777,600 1,757,601 153,370 5,924 28,882,679 1,910,404 46,947 534,395 24,234 140,135 40,233,289
BookvalueasatDecember31,2015 6,777,600 1,655,043 167,214 – 28,456,801 1,797,924 39,112 494,089 4,947 145,406 39,538,136
20.1.1 Freeholdland,buildingsonfreeholdland,railwaysiding,plantandmachineryandtoolsandotherequipmentwererevaluedbyanindependentvaluerM/sPirsonsChemicalEngineering(Private)LimitedonAugust31,2014.Therevaluationsurplusnetofdeferredtaxwascreditedtosurplusonrevaluationofoperatingfixedassets.Hadtherebeennorevaluation,thecarryingamountsofthefollowingclassesofassetswouldhavebeenasfollows:
2015 2014 (Rupeesinthousand)
Freeholdland 911,940 911,940 Buildingsonfreeholdland 1,252,700 1,336,110 Plantandmachinery 15,896,051 16,185,267 Toolsandotherequipment 334,285 322,717
18,394,976 18,756,034
20.1.2 IncludedinplantandmachineryareassetshavingcarryingamountofRs47.989millionthatareinstalledatthemanufacturingfacilitiesofthegroup’scustomersnamelyIcebergGasCompany,Coca-ColaBeveragesPakistanLimitedandPepsiCoalaInternational(Private)Limitedastheseassetsareusedforsalestothesecustomers.
20.1.3 Thedepreciationchargefortheyearhasbeenallocatedasfollows:
2015 2014 (Rupeesinthousand)
Costofsales -note31 549,012 202,204 Administrativeexpenses -note32 195,203 194,635 Sellinganddistributionexpenses -note33 9,697 4,634
753,912 401,473
120
ANNUAL REPORT 2015
121

Notesto and forming part of the Consolidated Financial Statements for the year ended December 31, 2015
20.1.4 Disposal of operating fixed assets 2015 (Rupees in thousand) Accumulated
Particulars Sold to Cost depreciation Book value Sale proceeds Mode of disposal
Vehicles Ex - employees
SagheerAhmaed 899 764 135 131 AsperCompany Policy SyedBilalHassan 903 768 135 184 -do- AdnanAshraf 530 432 98 117 -do- MuhammadKamran 914 777 137 160 -do- SajidFarid 881 837 44 9 -do- QaiserAbbasKhan 914 807 107 117 -do- HafizAtta-ur-Mustafa 716 633 83 307 -do- BilalButt 1,256 1,256 – – -do- AdnanKashifUmar 934 840 94 123 -do- AbdulGhaffar 898 868 30 5 -do- AbdulKhaliqueShaukat 934 871 63 123 -do- BabarJamil 934 871 63 79 -do- ShahidMunir 942 942 – 87 -do- SadiaSharif 552 506 46 219 -do- TahirMasud 1,145 1,145 – – -do- Employees
ArifHameedDar (ChiefFinancialOfficer) 1,913 1,817 96 13 -do- MuhammadTahirSherazi 1,477 1,231 246 290 -do- M.QadeerAli 949 838 111 214 -do- MumtazAliNasir 1,125 1,125 – 18 -do- MohsanRazaHaiderHashmi 825 825 – 7 -do- SyedSaeedHasanShah 1,125 1,125 – 12 -do- TayyabAminMalik 1,297 1,297 – 12 -do- MuhammadAbidSaeed 1,297 1,297 – – -do- IqbalAwan 1,125 1,125 – – -do-
AnwarHussain 655 655 – 126 -do- Ch.M.MunirAhmad 1,297 1,297 – – -do- MArshadAshraf 825 825 – 7 -do-
FarrukhNadeemAbid 1,297 1,297 – – -do- MuhammadJamil 876 861 15 184 -do- M.Aqeel 832 832 – – -do- MuhammadZahir (DirectorMarketing) 1,940 1,908 32 – -do- IftikharMahmoodBaig (DirectorBusinessDevelopment) 1,958 1,893 65 – -do- Mati-ur-RabSiddiqui 1,481 1,481 – – -do- M.AbadKhan (AdvisortoChiefExecutiveOfficer) 1,937 1,937 – – -do-
C/F 37,584 35,983 1,600 2,544
2015 (Rupees in thousand) Accumulated
Particulars Sold to Cost depreciation Book value Sale proceeds Mode of disposal
B/F 37,584 35,983 1,600 2,544
AsadAhmadJan 1,481 1,432 49 – AsperCompanyPolicy
HaqNawaz 876 876 – 13 -do-
YousafImranKhan 893 849 44 18 -do-
GhulamRasool 927 866 61 128 -do-
M.ImranHussain 893 878 15 – -do-
MuhammadYasin 899 899 – 16 -do-
AfzalHussain 899 899 – 7 -do-
MahmudShah 1,348 1,348 – 13 -do-
DanishAmanMirza 893 893 – 7 -do-
AbdulNasir 1,414 1,414 – – -do-
AusafA.Qureshi(CompanySecretary) 1,886 1,886 – – -do-
NaseerullahKhan 1,297 1,297 – 11 -do-
IftikharAhmedMalik 1,138 1,138 – 10 -do-
Employees of associated
company and related party (FATIMA)
AbdulGhani 1,478 1,256 222 188 -do-
M.TariqJaved 1,858 1,517 341 733 -do-
ShakeelAhmad 572 458 114 – -do-
MuhammadAmjad 864 864 – 180 -do-
Outside Party
Mrs.ZahiaShafqat 1,975 1,843 132 1,215 Auction
AminHafeez 715 715 – 525 Auction
Tools and other equipment
FirstHabibModaraba 18,376 – 18,376 20,604 Transferagreement
Other assets with book value less than Rs 50,000 763 689 73 394
79,028 57,998 21,027 26,606
122
ANNUAL REPORT 2015
123

Notesto and forming part of the Consolidated Financial Statements for the year ended December 31, 2015
2014 (Rupees in thousand) Accumulated
Particulars Sold to Cost depreciation Book value Sale proceeds Mode of disposal
Vehicles Ex - employees
MuhammadSaddiqueAkbar 930 744 186 575 Aspercompanypolicy BabarShahid 899 749 150 298 -do- AdnanAnjum 1,313 1,116 197 893 -do- GhultamRazaJallaalani 1,483 1,360 123 455 -do-
C/F 4,625 3,969 656 2,221
2014 (Rupees in thousand) Accumulated
Particulars Sold to Cost depreciation Book value Sale proceeds Mode of disposal
B/F 4,625 3,969 656 2,221 MuhammadMusharafKhan 1,702 1,475 227 495 Aspercompanypolicy MohsinAzizSyed 899 749 150 211 -do- AsadMurad 2,078 1,593 485 425 -do- AsifSirhindi 1,918 1,822 96 27 -do-
Employees M.AmirShahzad 708 614 94 301 -do- MuneebHussain 716 620 96 306 -do- M.FarazArshad 899 779 120 496 -do- HafizAtta-Ur-Rehman 737 638 99 332 -do-
Employeesofassociated companyandrelatedparty(FATIMA) RafaqatAli 871 813 58 464 -do- GhulamAbbas 864 807 57 461 -do- MuhammadMazharHussain 864 807 57 460 -do- NaveedBashir 1,283 1,176 107 888 -do- JavedIqbal 1,922 1,794 128 744 -do- JaffarNazir 554 498 56 147 -do- AbdulGhaffar 714 619 95 303 -do- ZarrinAlam 547 465 82 138 -do- MuhammadSarfraz 708 602 106 303 -do- SohailAhmed 737 651 86 335 -do- ImranKhalid 554 498 56 149 -do- MuhammadImtiaz 708 637 71 308 -do- M.UmarCh 883 795 88 487 -do- ZaheerAbbas 951 840 111 332 -do- SyedUsmanKhalid 737 639 98 339 -do- MuhammadNasir 1,473 1,228 245 388 -do- Lt.Col(R)SarfarazKhan 881 778 103 178 -do- UsmanSohail 729 595 134 329 -do- MuhammadAmin 1,388 1,110 278 284 -do- MuhammadAsif 1,391 1,113 278 989 -do- KashifMustafaKhan 1,476 1,230 246 308 -do- M.Atique-Ur-Rehman 929 728 201 322 -do- TofiqueAhmed 1,541 1,233 308 434 -do-
Outside Party MianNoorHayat 1,478 1,232 246 1,200 Auction
Other assets with book value less than Rs 50,000 525,150 524,646 504 357,951
563,615 557,793 5,822 373,055
20.1.5 Fair value estimation
Fairvalueistheamountforwhichanassetcouldbeexchanged,orliabilitysettled,betweenknowledgeablewillingpartiesinanarm’slengthtransaction.Underlyingthedefinitionoffairvalueisthepresumptionthatthegroupisagoingconcernwithoutanyintentionorrequirementtocurtailmateriallythescaleofitsoperationsortoundertakeatransactiononadverseterms.Fairvalueisdeterminedonthebasisofobjectiveevidenceateachreportingdate.
Thetablesbelowanalyzethenon-financialassetscarriedatfairvalueasatDecember31,2015andDecember31,2014.
Thedifferentlevelshavebeendefinedasfollows:- Quotedprices(unadjusted)inactivemarketsforidenticalassetsorliabilities(level1).
- Inputsotherthanquotedpricesincludedwithinlevel1thatareobservablefortheassetorliability,eitherdirectly(thatis,asprices)orindirectly(thatis,derivedfromprices)(level2).
- Inputsfortheassetorliabilitythatarenotbasedonobservablemarketdata(thatis,unobservableinputs)(level3).
Thefollowingtablepresentsthegroup’snon-financialassetsthataremeasuredatfairvalueatDecember31,2015.
(Rupees in thousand)
Level 1 Level 2 Level 3 Total Recurring fair value measurements of certain items of operating fixed assets Freeholdland – 6,777,600 – 6,777,600 Buildingsonfreeholdland – – 1,655,043 1,655,043 Railwaysiding – – – – Plantandmachinery – – 28,456,802 28,456,802 Toolsandequipment – – 494,089 494,089 – 6,777,600 30,605,934 37,383,534 Thefollowingtablepresentsthegroup’snon-financialassetsthataremeasuredatfairvalueatDecember31,2014.
(Rupees in thousand)
Level 1 Level 2 Level 3 Total Recurringfairvaluemeasurementsof certainitemsofoperatingfixedassets Freeholdland – 6,777,600 – 6,777,600 Buildingsonfreeholdland – – 1,757,601 1,757,601 Railwaysiding – – 5,924 5,924 Plantandmachinery – – 28,882,679 28,882,679 Toolsandequipment – – 534,395 534,395 – 6,777,600 31,180,599 37,958,199
Movementsoftheabovementionedassetsandsurplusonrevaluationoftheseassetshavebeendisclosedinnote20.1andnote7respectivelytothesefinancialstatements.Thegroup’spolicyistorecognisetransfersintoandtransfersoutoffairvaluehierarchylevelsasattheendofthereportingperiod.TherewerenotransfersbetweenLevels1and2&Levels2and3duringtheyearandtherewerenochangesinvaluationtechniquesduringtheyears.
Valuation techniques used to determine level 2 and level 3 fair values
Thegroupobtainsindependentvaluationsforitsfreeholdland,buildingonfreeholdland,railwaysiding,plantandmachinery,and toolsandequipments (classifiedasproperty,plantandequipment)at leastevery threeyears.At theendofeachreportingperiod, themanagementupdates itsassessmentof the fairvalueofeachassetmentionedabove, taking intoaccountthemostrecentindependentvaluation.Themanagementdeterminesanasset’svaluewithinarangeofreasonablefairvalueestimates.Level2fairvalueoffreeholdlandhasbeenderivedusingasalescomparisonapproach.Salepricesofcomparablelandincloseproximityareadjustedfordifferencesinkeyattributessuchaslocationandsizeoftheproperty.Themostsignificantinputintothisvaluationapproachispricepersquarefoot.Level3fairvalueofbuildingonfreeholdlandhasbeendeterminedusingadepreciatedreplacementcostapproach,whereby,currentcostofconstructionofasimilarbuildinginasimilarlocationhasbeenadjustedusingasuitabledepreciationratetoarriveatpresentmarketvalue.Level3fairvalueofrailwaysiding,plantandmachinery,andtoolsandequipmentshavebeendeterminedusingadepreciatedreplacementcostapproach,whereby,thecurrentreplacementcostofrailwaysiding,plantandmachinery,andtoolsandequipmentsofsimilarmake/origin,capacityandleveloftechnologyhasbeenadjustedusingasuitabledepreciationrateonaccountofnormalwearandtear.
124
ANNUAL REPORT 2015
125
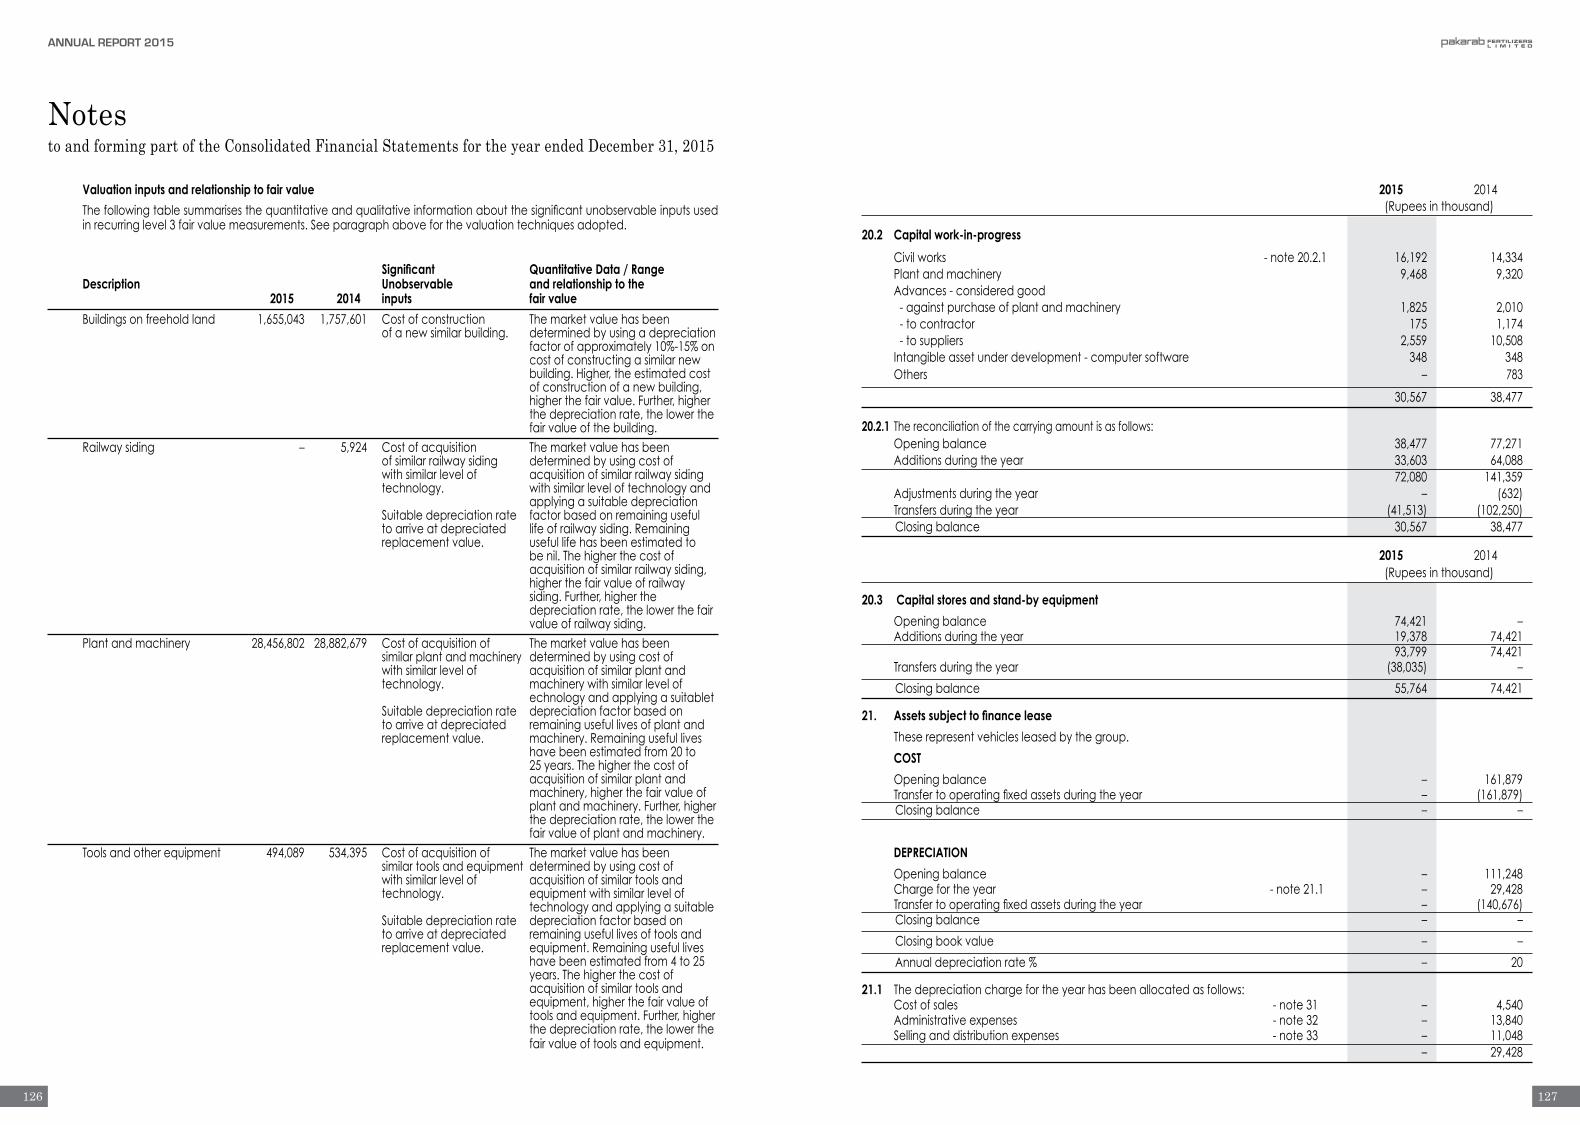
Notesto and forming part of the Consolidated Financial Statements for the year ended December 31, 2015
2015 2014 (Rupeesinthousand)
20.2 Capital work-in-progress
Civilworks -note20.2.1 16,192 14,334 Plantandmachinery 9,468 9,320 Advances-consideredgood -againstpurchaseofplantandmachinery 1,825 2,010 -tocontractor 175 1,174 -tosuppliers 2,559 10,508 Intangibleassetunderdevelopment-computersoftware 348 348 Others – 783
30,567 38,477
20.2.1 Thereconciliationofthecarryingamountisasfollows: Openingbalance 38,477 77,271 Additionsduringtheyear 33,603 64,088 72,080 141,359 Adjustmentsduringtheyear – (632) Transfersduringtheyear (41,513) (102,250) Closingbalance 30,567 38,477
2015 2014 (Rupeesinthousand)
20.3 Capital stores and stand-by equipment
Openingbalance 74,421 – Additionsduringtheyear 19,378 74,421
93,799 74,421 Transfersduringtheyear (38,035) –
Closingbalance 55,764 74,421
21. Assets subject to finance lease
Theserepresentvehiclesleasedbythegroup.
COST
Openingbalance – 161,879 Transfertooperatingfixedassetsduringtheyear – (161,879) Closingbalance – –
DEPRECIATION
Openingbalance – 111,248 Chargefortheyear -note21.1 – 29,428 Transfertooperatingfixedassetsduringtheyear – (140,676) Closingbalance – –
Closingbookvalue – –
Annualdepreciationrate% – 20
21.1 Thedepreciationchargefortheyearhasbeenallocatedasfollows: Costofsales -note31 – 4,540 Administrativeexpenses -note32 – 13,840 Sellinganddistributionexpenses -note33 – 11,048 – 29,428
Valuation inputs and relationship to fair value
Thefollowingtablesummarisesthequantitativeandqualitativeinformationaboutthesignificantunobservableinputsusedinrecurringlevel3fairvaluemeasurements.Seeparagraphaboveforthevaluationtechniquesadopted.
Significant Quantitative Data / Range Description Unobservable and relationship to the
2015 2014 inputs fair value
Buildingsonfreeholdland 1,655,043 1,757,601 Costofconstruction Themarketvaluehasbeen ofanewsimilarbuilding. determinedbyusingadepreciation factorofapproximately10%-15%on costofconstructingasimilarnew building.Higher,theestimatedcost ofconstructionofanewbuilding,
higherthefairvalue.Further,higher thedepreciationrate,thelowerthe fairvalueofthebuilding.
Railwaysiding – 5,924 Costofacquisition Themarketvaluehasbeen ofsimilarrailwaysiding determinedbyusingcostof withsimilarlevelof acquisitionofsimilarrailwaysiding technology. withsimilarleveloftechnologyand applyingasuitabledepreciation Suitabledepreciationrate factorbasedonremaininguseful toarriveatdepreciated lifeofrailwaysiding.Remaining replacementvalue. usefullifehasbeenestimatedto benil.Thehigherthecostof acquisitionofsimilarrailwaysiding, higherthefairvalueofrailway siding.Further,higherthe depreciationrate,thelowerthefair valueofrailwaysiding. Plantandmachinery 28,456,802 28,882,679 Costofacquisitionof Themarketvaluehasbeen similar plant andmachinery determinedbyusingcostof withsimilarlevelof acquisitionofsimilarplantand technology. machinerywithsimilarlevelof echnologyandapplyingasuitablet Suitabledepreciationrate depreciationfactorbasedon toarriveatdepreciated remainingusefullivesofplantand replacementvalue. machinery.Remainingusefullives havebeenestimatedfrom20to 25years.Thehigherthecostof acquisitionofsimilarplantand machinery,higherthefairvalueof plantandmachinery.Further,higher thedepreciationrate,thelowerthe fairvalueofplantandmachinery. Toolsandotherequipment 494,089 534,395 Costofacquisitionof Themarketvaluehasbeen similartoolsandequipmentdeterminedbyusingcostof withsimilarlevelof acquisitionofsimilartoolsand technology. equipmentwithsimilarlevelof technologyandapplyingasuitable Suitabledepreciationrate depreciationfactorbasedon toarriveatdepreciated remainingusefullivesoftoolsand replacementvalue. equipment.Remainingusefullives havebeenestimatedfrom4to25 years.Thehigherthecostof acquisitionofsimilartoolsand equipment,higherthefairvalueof toolsandequipment.Further,higher thedepreciationrate,thelowerthe fairvalueoftoolsandequipment.
126
ANNUAL REPORT 2015
127

Notesto and forming part of the Consolidated Financial Statements for the year ended December 31, 2015
(Rupees in thousand) Computer Mining rights Total software 22. Intangible assets COST BalanceasatJanuary01,2014 33,586 210,000 243,586 Additionsduringtheyear 10,654 – 10,654 BalanceasatDecember31,2014 44,240 210,000 254,240 BalanceasatJanuary01,2015 44,240 210,000 254,240 Additionsduringtheyear 607 – 607 BalanceasatDecember31,2015 44,847 210,000 254,847 AMORTIZATION BalanceasatJanuary01,2014 8,179 91,000 99,179 Chargefortheyear -note22.2 8,662 21,000 29,662 BalanceasatDecember31,2014 16,841 112,000 128,841 BalanceasatJanuary01,2015 16,841 112,000 128,841 Chargefortheyear -note22.2 10,717 21,000 31,717 BalanceasatDecember31,2015 27,558 133,000 160,558 BookvalueasatDecember31,2014 27,399 98,000 125,399 BookvalueasatDecember31,2015 17,289 77,000 94,289 Annualamortizationrate% 25 10
22.1 MiningrightsrepresentrightsacquiredforextractionofrockphosphatefromablockofareainDistrictAbbottabadforatenyearsperiodendingonAugust11,2019.TheaforesaidareaisinthepossessionandcontrolofPakistanMiningCompanyLimited(‘PMCL’),arelatedparty(associatedcompany),whichprovidesrockphosphateextractionservicestothegroupaspertheServicesAgreement.
2015 2014 (Rupeesinthousand)
22.2 Theamortizationchargefortheyearhasbeenallocatedasfollows:
Costofsales(includedinrawmaterialsconsumed) 21,000 21,000 Administrativeexpenses -note32 10,717 8,662
31,717 29,662
23. Goodwill
Thisrepresentsgoodwillonamalgamationasreferredtoinnote16tothesefinancialstatements.
Impairmenttestingofgoodwillhasbeencarriedoutbyallocatingtheamountofgoodwilltorespectiveassetsonwhichitarose.TherecoverableamountoftheCashGeneratingUnithasbeendeterminedbasedonavalueinusecalculation.Thiscalculationusescashflowprojectionsbasedonfinancialbudgetsapprovedbymanagementcoveringafive-yearperiodthathavebeendiscountedusingadiscountrateof14.21%.Thecashflowsbeyondthefive-yearperiodareextrapolatedusinganestimatedgrowthrateof4%whichisconsistentwiththelong-termaveragegrowthrateforthefertilizerindustry.TherecoverableamountcalculatedbasedonvalueinuseexceededcarryingvaluebyRs23,841million.Alongterm/terminalgrowthrateof-5.50%orariseindiscountrateto21.13%would,allchangestakeninisolation,resultintherecoverableamountbeingequaltothecarryingamount.
Theabovecashflowprojectionsareprincipallybasedontheassumptionthatgassupplywouldcontinuetothegroup.During
thepreviousthreeyears,thefertilizeroperationshasfacedgasshortagesthatresultedinlosses.However,duringthecurrentyear, thegroup startedpurchasingRegasified LiquefiedNaturalGas (‘RLNG’) fromPSOdue towhich itsplantoperatedfor273days resulting inprofit for thecurrentyear.PSOhad imported suchLiquefiedNaturalGas (‘LNG’) fromQatargas.
Management’sassumptionofcontinuityingassupplytothefertilizeroperations’plantisbasedonthelongtermagreementforimportofLNGsignedbetweentheGovernmentofPakistanandQatargas.
2015 2014 (Rupeesinthousand)
24. Long term investments
Held to maturity (not due to mature within next twelve months): -Other -note24.1 43,278 38,589 Associate - unquoted: MultanRealEstateCompany(Private)Limited 642,321(2014:642,321)fullypaidordinarysharesofRs100each Equityheld29.55%(2014:29.55%) BookvaluepershareRs100.04(2014:Rs99.8) -note24.2 64,232 64,232
107,510 102,821
24.1 Investment - Other
ThisrepresentsDefenceSavingCertificatesissuedforaperiodoftenyears,whichwillmatureonSeptember11,2019.Yieldtomaturityonthesecertificatesis12.15%.ThesecertificateshavebeenpledgedassecuritywiththeDirectorGeneral,Mines&Minerals,GovernmentofKhyberPakhtunkhwaasperthetermsoftheminingagreement.
24.2 Associate - unquoted
ThisrepresentsinvestmentintheordinarysharesofMultanRealEstateCompany(Private)Limited(‘MREC’).ThemainbusinessofMRECisestablishinganddesigninghousingandcommercialschemes,tocarryonbusinessofcivilengineersforconstructionofprivateandgovernmentalbuildingsandinfrastructureandprovisionoflaborandbuildingmaterial
Theinvestmentismeasuredatcostastheassociatehasnotyetstarteditscommercialoperationsandthebreakupvalueforthepurposesofequitymethodisnotsignificantlydifferentfromcost.
Thegroup’sshareof theresultof itsassociate,which is incorporated inPakistan,and its shareof theassets, liabilitiesand
revenuebasedonun-auditedfinancialstatementsasatDecember31,2015isasfollows:
Percentage (Rupees in thousand) Name interest held Assets Liabilities Revenue Loss MultanRealEstateCompany (Private)Limited 29.55% 217,542 105 – 154
2015 2014 (Rupeesinthousand)
25. Stores and spare parts
Chemicalsandcatalysts -note25.1 857,570 898,595 Stores 114,625 121,376 Spareparts[includingintransitRs37.598million (2014:Rs23.112million)] 1,677,407 1,694,948 2,649,602 2,714,919 Provisionforobsoleteitems (76,224) (76,224)
2,573,378 2,638,695
128
ANNUAL REPORT 2015
129

Notesto and forming part of the Consolidated Financial Statements for the year ended December 31, 2015
25.1 Includedinchemicalsandcatalystsisplatinum,rhodiumandpalladiumofRs80.327million(2014:Rs57.042million)heldbyJohnsonMattheyPublicLimitedCompany,UnitedKingdomonbehalfofthegroupforrefiningpurposes.
2015 2014 (Rupeesinthousand)
26. Stock-in-trade
Rawmaterials[includingintransitofRs24.197million (2014:Rs16.972million)] -note26.2 753,458 557,403 Packingmaterials 34,895 32,335 Midproducts 154,189 19,709 Work-in-process 25,664 34,023 Finishedgoods: -Ownmanufactured: Fertilizers -note26.3 4,733,699 8,909 Emissionreductions -note26.4 – 317 Polypropylenesacksandcloth 3,930 4,851 4,737,629 14,077 -Fertilizerpurchasedforresale 2,193,497 336,387
7,899,332 993,934
26.1 RawmaterialsandfinishedgoodsamountingtoRs4,521.267million(2014:Rs423.610million)arepledgedwith lendersassecurityagainstshorttermborrowingsasreferredtoinnote15.1.
26.2 IncludesrockphosphateamountingtoRs64.396million(2014:Rs52.546million)whichisinthepossessionofPMCL(relatedparty-associatedcompany).TherockphosphateinpossessionofPMCLisduetothereasonexplainedinnote22.1tothesefinancialstatements.
26.3 Includesgroup’sfertilizerproduct,NitroPhosphate(‘NP’),amountingtoRs5.748million(2014:Nil)whichis inpossessionofFATIMA,arelatedparty(associatedcompany),forstoragepurposeasitsharesstoragespaceincertainareas.
26.4 ThisrepresentsemissionreductionscostingRs37.137million(2014:Rs37.137million)carriedattheirNetRealizableValue(‘NRV’)amountingtoNil(2014:Rs0.317million).TheNRVwritedownexpenseofRs0.317million(2014:Rs36.820million)hasbeenchargedtocostofsales.
2015 2014 (Rupeesinthousand)
27. Trade debts
Consideredgood: -Secured(bywayofbankguaranteesandsecuritydeposits) -note27.1 2,507,978 85,878 -Unsecured -note27.2 285,192 319,820
2,793,170 405,698
27.1 Theseareinthenormalcourseofbusinessandcertaindebtscarryinterestrangingfrom9.02%to12.52%perannum.
27.2Includethefollowingamountsduefromrelatedparties(associatedcompanies):
2015 2014 (Rupeesinthousand)
FatimaFertilizerCompanyLimited 64,343 49,278 FatimaSugarMillsLimited 23,270 22,519 RelianceWeavingMillsLimited 3,262 872 RelianceCommodities(Private)Limited 14,018 30,359 FazalClothMillsLimited 43 957 FazalRehmanFabricsLimited 8 8 FatimafertLimited(previouslyDHFertilizersLimited) 466 – 105,410 103,993
Theageanalysisoftradedebtsduefromrelatedpartiesisasfollows: Neitherpastduenorimpaired 80,396 69,676 Pastduebutnotimpaired: 1to30days 21,701 25,389 31to60days – 8,920 Above60days 3,313 8 105,410 103,993
2015 2014 (Rupeesinthousand)
28. Advances, deposits, prepayments and other receivables
Advances-consideredgood: -Toemployees -note28.1 11,054 11,753 -Tosuppliers -note28.2 1,716,123 88,953 Tradedeposits – 100 Prepayments 165,948 9,719 Interestreceivableonbankdeposits 992 1,702 Balanceswithstatutoryauthorities: -Salestax -consideredgood -note28.3 2,216,408 – -considereddoubtful 8,911 8,911
2,225,319 8,911 -Incometaxrecoverable 3,861,925 3,133,699 -Customdutyrecoverable 9,812 9,812 -Exportrebaterecoverable 1,663 1,497 Lettersofcredit-margins,deposits,openingchargesetc. 248 – Securitydeposits -note28.4 23,662 644,134 ReceivablefromGovernmentofPakistan -note28.5 1,302,429 – Otherreceivables-consideredgood 105,902 83,095
9,425,077 3,993,375 Provisionfordoubtfulreceivable (8,911) (8,911)
9,416,166 3,984,464
28.1 IncludedinadvancestoemployeesareamountsduefromexecutivesofRs7.503million(2014:Rs7.845million).
28.2 IncludesanamountofRs26.741million(2014:Rs27.684million)andRs5.895million(2014:Nil)asadvancestorelatedparties,PMCL(associatedcompany)andSNGPL(associatedcompany)respectively.
130
ANNUAL REPORT 2015
131

Notesto and forming part of the Consolidated Financial Statements for the year ended December 31, 2015
28.3 IncludesRs134.022millionwhichprimarilyrepresentstheinputsalestaxpaidbythegroupinrespectofrawmaterialsacquiredbeforeJune11,2008onwhichdatefertilizerproductsmanufacturedbythegroupwereexemptedfromlevyofsalestaxthroughnotification SRO535(I)/2008. Theamount stood refundable to thegroup therebeingnooutput sales tax liabilityremainingpayableonfertilizerproductsmanufacturedbythegroupagainstwhichsuchinputsalestaxwasadjustable.Thegroup’sclaimofrefundonthisaccountwasnotentertainedbyFederalBoardofRevenue(‘FBR’)onthepremisethatsincesubjectrawmaterialsweresubsequentlyconsumedinmanufactureofaproductexemptfromlevyofsalestax,claimwasnotinaccordancewiththerelevantprovisionsoftheSalesTaxAct,1990.
Group’smanagementbeingaggrievedwiththeinterpretationadvancedbyFBRontheissuehaspreferredawritpetitionbefore theLahoreHighCourt,whichhasnotyetbeendisposedoff. Sincegroup’smanagementconsiders thatclaimofrefundiscompletelyinaccordancewithrelevantstatutoryframeworkandexpectsrelieffromappellateauthoritiesonthisaccount,itconsidersthatthereceivableamountwasunimpairedatthebalancesheetdate.
28.4 IncludesanamountofNil(2014:Rs630million)depositedwithSindhHighCourt,inrespectofsuitfiledbythegroupinrelationtoproposedacquisitionofDHFertilizersLimited(‘DHFL’,nowFatimafertLimited).
DuringtheyearendedDecember31,2012,thegroupsignedaMemorandumofUnderstanding(MoU)withDawoodHercules
CorporationLimited(‘DHCorp’)forthepurchaseof itsentireshareholding(100millionordinarysharesofRs10each)initswhollyownedsubsidiary,DHFL.However, theBoardofDirectorsofDHCorp in theirmeetingheldonDecember10,2012decidedthatitdidnotintendtopursuethetransactionforcommercialreasons.Subsequently,thegroupfiledasuitagainstDHCorpinSindhHighCourt(the‘Court’)fortheenforcementofthesaidMoU.
Duringtheyear,thegroupandDHCorpreachedanoutofcourtsettlementforthesaidsuitwherebyDHCorpagreedtofulfil itsobligationaspertheMoUbyselling itsentireshareholding inDHFLtothegroup.Consequently, thegroupfiledanapplicationfordismissaloftheaforesaidsuitwhichwasdulyacceptedbytheCourtvideitsorderdatedJune18,2015andthecompleteamountofdepositwasrefundedtothegroup.Furthermore,asperthesettlement,thegroupandDHCorpenteredintoa‘SharePurchaseAgreement’foracquisitionofentireshareholdingofDHFLonJune15,2015.However,owingtothegroup’sfinancialposition,itsBoardofDirectorsassignedtheacquisitionrights,benefitsandobligationsundertheSharePurchaseAgreementtoFATIMA,arelatedparty(associatedcompany).
28.5 During the year, theGovernmentof Pakistan notified thepaymentof subsidyat the rateof Rs 500per 50 kgbagofDiAmmoniumPhosphate(‘DAP’)andRs217per50kgbagofNPsold.TheamountofsubsidywillbepaidtothegroupuponverificationbytheFederalBoardofRevenue.
2015 2014 (Rupeesinthousand)
29. Cash and bank balances
Atbankson: -Savingaccounts -notes29.1&29.2 382,090 1,314,132 -Currentaccounts -note29.2 143,758 109,665 525,848 1,423,797 Inhand 4,972 5,165
530,820 1,428,962
29.1 Profitonbalancesinsavingaccountsrangesfrom4%to9%perannum.
29.2 IncludedinsavingaccountsisanamountofRs217.379million(2014:Rs274.314million)whichbearsmarkupattherateof5.75%perannumandincludedincurrentaccountsisanamountofRs7.158million(2014:Rs5.473million),bothplacedwithSummitBankLimited,arelatedparty(associatedcompany).
2015 2014 (Rupeesinthousand)
30. Sales
Fertilizerproducts: -Ownmanufactured 16,193,646 5,790,966 -Purchasedforresale 6,307,780 10,794,959
22,501,426 16,585,925
SubsidyfromGovernmentofPakistan -note28.5 1,302,429 – Midproducts 542,280 287,264 Rockphosphate 40,107 85,695 1,884,816 372,959
Salesoffertilizeroperations 24,386,242 16,958,884
Polypropylenesacksandcloth -note30.1 1,283,617 1,594,130 Exportsales 2,177 37,869 Exportrebate 232 1,128 Salesofsacksoperations 1,286,026 1,633,127
25,672,268 18,592,011 Less: Salestax 2,266,129 2,748,636 Salesincentive 384,331 187,382 2,650,460 2,936,018
23,021,808 15,655,993
2015 2014 (Rupeesinthousand)
30.1 Includessalestothefollowingrelatedparties(associatedcompanies): FatimaFertilizerCompanyLimited 639,731 785,895 FatimaSugarMillsLimited 55,401 45,083 RelianceWeavingMillsLimited 4,591 9,461 RelianceCommodities(Private)Limited 18,749 34,846 FazalClothMillsLimited 2,486 2,845 FazalRehmanFabricsLimited – 239 FatimafertLimited(previouslyDHFertilizersLimited) 27,418 –
748,376 878,369
132
ANNUAL REPORT 2015
133

Notesto and forming part of the Consolidated Financial Statements for the year ended December 31, 2015
2015 2014 (Rupeesinthousand)
31. Cost of sales
Rawmaterialconsumed -note31.1&31.2 12,652,716 2,781,465 Packingmaterialconsumed 4,817 4,429 Linersconsumed 290,050 273,923 Linerinsertioncost 21,747 15,653
12,969,330 3,075,470 Salaries,wagesandotherbenefits -note31.3 703,527 538,324 Fuelandpower -note31.4 2,461,501 710,373 Chemicalsandcatalystsconsumed 408,497 7,950 Sparepartsconsumed 151,981 100,621 Storesconsumed 55,782 30,775 Travellingandconveyance 2,133 2,143 Telephone,telexandpostage 182 199 Stationery,printingandperiodicals 336 7 Repairsandmaintenance 73,714 141,524 Rent,ratesandtaxes -note31.5 2,587 2,178 Insurance 132,438 158,279 Vehiclerunningexpenses 1,700 1,390 Entertainment 1,870 278 Depreciationonoperatingfixedassets -note20.1.3 549,012 202,204 Depreciationonassetssubjecttofinancelease -note21.1 – 4,540 Tollmanufacturingchargesandfreight -note31.6 726,671 982,880 Utilities -note31.5 81,486 56,421 Feesandsubscription 1,475 273 Others -note31.7 40,522 29,746
18,364,744 6,045,575
Openingstockofmidproductsandwork-in-process 53,732 72,006 Closingstockofmidproductsandwork-in-process (179,853) (53,732)
(126,121) 18,274
Costofgoodsmanufactured 18,238,623 6,063,849
Openingstockoffinishedgoods 14,077 25,133 Closingstockoffinishedgoods (4,737,629) (14,077)
(4,723,552) 11,056
Costofgoodssold-ownmanufactured 13,515,071 6,074,905 Costofgoodssold-purchasedforresale 4,717,769 7,345,042
18,232,840 13,419,947
31.1 IncludesfeedgasconsumedofNil(2014:Rs745.024million)purchasedfromSNGPL,arelatedparty(associatedcompany).
31.2 IncludesexpensesofRs43.459million(2014:Rs81.529million)forextractionofrockphosphatebyPMCL,arelatedparty(associatedcompany),asexplainedinnote22.1tothesefinancialstatements.
2015 2014 (Rupeesinthousand)
31.3 Salaries, wages and other benefits
Salaries,wagesandotherbenefitsincludethefollowinginrespectofretirementbenefits:
Gratuity
Currentservicecost 15,792 15,969 Interestcostfortheyear 7,425 7,560 Expectedreturnonplanassets (6,492) (6,274)
16,725 17,255
Accumulating compensated absences Currentservicecost 8,059 2,487 Interestcostfortheyear 4,052 1,207 Remeasurements 524 (2,868)
12,635 826
Inadditiontotheabove,salaries,wagesandotherbenefits includeRs13.215million(2014:Rs12.332million) inrespectofprovidentfundcontributionbythegroup.
31.4 IncludesfuelgasconsumedofRs46.907million(2014:Rs644.746million)purchasedfromSNGPL,arelatedparty(associatedcompany).
31.5 IncludesexpenseschargedbyFATIMA,arelatedparty(associatedcompany): 2015 2014 (Rupeesinthousand)
Rentagainstleaseofland 699 639 Utilities 81,486 56,421
82,185 57,060
31.6 This includes processing services of Rs 658.842million (2014: Rs 976.416million) availed from FATIMA, a related party (associatedcompany).
31.7 IncludesoperatingleaserentalsamountingtoRs15.224million(2014:Rs13.671million).
134
ANNUAL REPORT 2015
135

Notesto and forming part of the Consolidated Financial Statements for the year ended December 31, 2015
2015 2014 (Rupeesinthousand)
32. Administrative expenses
Salaries,wagesandotherbenefits -note32.1 310,436 208,035 Travellingandconveyance 15,647 13,274 Telephone,telexandpostage 14,634 14,144 Stationery,printingandperiodicals 5,323 7,898 Rent,ratesandtaxes -note32.2 60,405 39,476 Feeandsubscription 493 87 Repairsandmaintenance 50,130 28,768 Aircraftoperatingexpenses -note32.3 123,160 111,764 Insurance 13,764 18,036 Legalandprofessionalcharges -note32.4 24,128 14,931 Vehiclerunningexpenses 3,441 2,302 Entertainment 7,765 3,678 Advertisement 635 462 Depreciationonoperatingfixedassets -note20.1.3 195,203 194,635
Depreciationonassetssubjecttofinancelease -note21.1 – 13,840 Amortizationonintangibleassets -note22.2 10,717 8,662 Others 57,269 61,381 -note32.5 893,150 741,373
2015 2014 (Rupeesinthousand)
32.1 Salaries, wages and other benefits
Salaries,wagesandotherbenefitsincludefollowinginrespectofgratuity:
Gratuity
Currentservicecost 5,325 5,466 Interestcostfortheyear 2,503 2,589 Expectedreturnonplanassets (2,189) (2,148) Amountchargedtorelatedparty (1,108) (1,055)
4,531 4,852
Accumulating compensated absences
Currentservicecost 3,060 1,338 Interestcostfortheyear 1,539 649 Remeasurements 199 (1,544)
4,798 443
Inaddition to theabove, salaries,wagesandotherbenefits includeRs 5.302million (2014: Rs 5.222million) in respectofprovidentfundcontributionbythegroup.
32.2 IncludesoperatingleaserentalsamountingtoRs19.289million(2014:Rs18.563million).
32.3 IncludesexpensesofRs35.120million(2014:Rs31.090million)forflyingandmaintenanceservicesofthegroup’saircraftbyAirOne(Private)Limited,arelatedparty(associatedcompany)aspertheServicesAgreement.
2015 2014 (Rupeesinthousand)
32.4 Professional services
Thechargesforprofessionalservicesincludethefollowing inrespectofauditors’servicesfor: -Statutoryaudit 3,470 3,385 -Taxservices 16,529 625 -Assuranceandothercertificationservices – 160 -Outofpocketexpenses 179 285
20,178 4,455
32.5 IncludesamountofRs189.383million (2014:Rs105.187million)which representscommoncostschargedto thegroupbyFATIMA,arelatedparty(associatedcompany)aspertheExpenseSharingAgreement.Also,theamountisnetofRs81.111million(2014:Rs74.205million)whichrepresentscommoncostschargedbythegrouptoFATIMA,arelatedparty(associatedcompany)aspertheExpenseSharingAgreement.
2015 2014 (Rupeesinthousand)
33. Selling and distribution expenses
Salaries,wagesandotherbenefits -note33.1 120,228 16,576 Travellingandconveyance 10,824 2,616 Telephone,telexandpostage 6,806 782 Stationery,printingandperiodicals 1,745 184 Rent,ratesandtaxes -note33.2 40,662 3,273 Repairsandmaintenance 5,007 995 Insurance 3,190 846 Vehiclerunningexpenses 7,705 2,300 Entertainment 3,966 523 Advertisementandsalepromotion 148,982 15,566 Depreciationonoperatingfixedassets -note20.1.3 9,697 4,634 Depreciationonassetssubjecttofinancelease -note21.1 – 11,048 Transportationandfreight 542,016 640,234 Feesandsubscription 130 125 Utilities 1,066 236 Technicalservices – 93 Others 7,665 126
-note33.3 909,689 700,157
33.1 Salaries, wages and other benefits
Salaries,wagesandotherbenefitsincludethefollowinginrespectofretirementbenefits:
Gratuity
Currentservicecost 9,981 9,744 Interestcostfortheyear 4,692 4,613 Expectedreturnonplanassets (4,103) (3,830) Amountchargedtorelatedparty (7,196) (8,185)
3,374 2,342
Accumulating compensated absences
Currentservicecost 4,851 8,005 Interestcostfortheyear 2,439 3,885 Remeasurements 315 (9,234)
7,605 2,656
Inaddition to theabove, salaries,wagesandotherbenefits includeRs 9.901million (2014: Rs 8.815million) in respectofprovidentfundcontributionbythegroup.
136
ANNUAL REPORT 2015
137
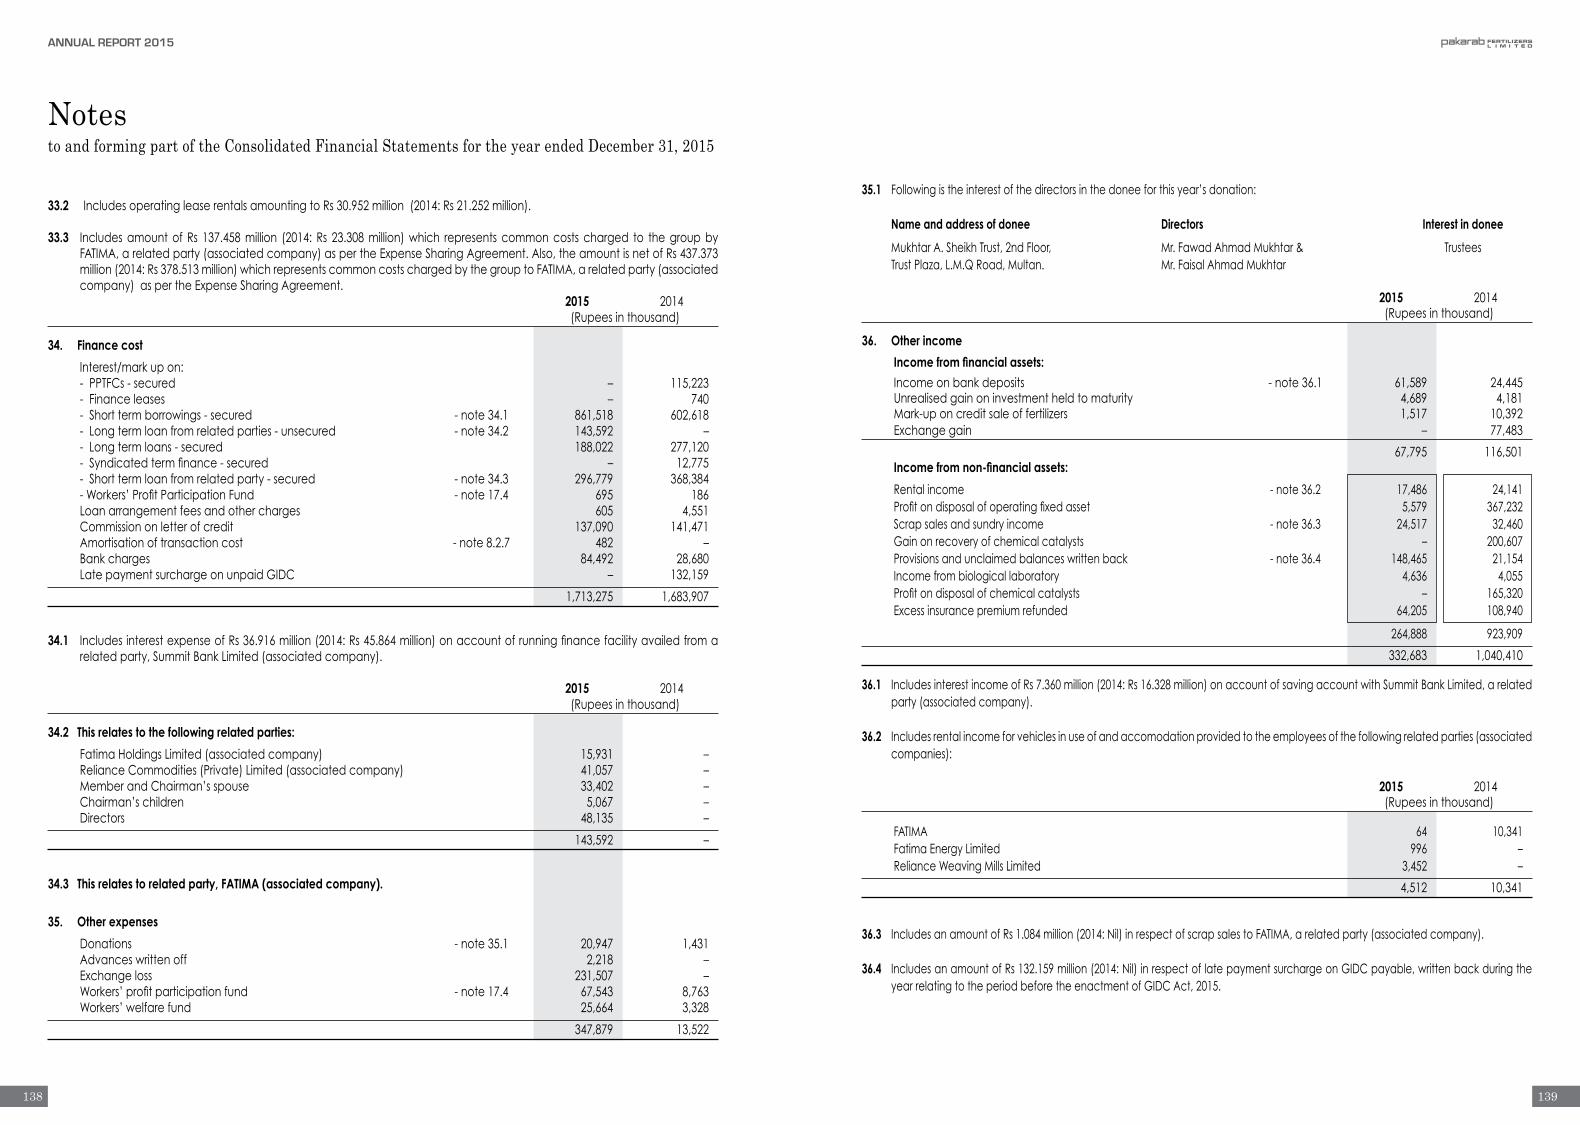
Notesto and forming part of the Consolidated Financial Statements for the year ended December 31, 2015
33.2 IncludesoperatingleaserentalsamountingtoRs30.952million(2014:Rs21.252million).
33.3 Includesamountof Rs 137.458million (2014: Rs 23.308million)which representscommoncostscharged to thegroupbyFATIMA,arelatedparty(associatedcompany)aspertheExpenseSharingAgreement.Also,theamountisnetofRs437.373million(2014:Rs378.513million)whichrepresentscommoncostschargedbythegrouptoFATIMA,arelatedparty(associatedcompany)aspertheExpenseSharingAgreement.
2015 2014 (Rupeesinthousand)
34. Finance cost
Interest/markupon: -PPTFCs-secured – 115,223 -Financeleases – 740 -Shorttermborrowings-secured -note34.1 861,518 602,618 -Longtermloanfromrelatedparties-unsecured -note34.2 143,592 – -Longtermloans-secured 188,022 277,120 -Syndicatedtermfinance-secured – 12,775 -Shorttermloanfromrelatedparty-secured -note34.3 296,779 368,384 -Workers’ProfitParticipationFund -note17.4 695 186 Loanarrangementfeesandothercharges 605 4,551 Commissiononletterofcredit 137,090 141,471 Amortisationoftransactioncost -note8.2.7 482 – Bankcharges 84,492 28,680 LatepaymentsurchargeonunpaidGIDC – 132,159
1,713,275 1,683,907
34.1 IncludesinterestexpenseofRs36.916million(2014:Rs45.864million)onaccountofrunningfinancefacilityavailedfromarelatedparty,SummitBankLimited(associatedcompany).
2015 2014 (Rupeesinthousand)
34.2 This relates to the following related parties:
FatimaHoldingsLimited(associatedcompany) 15,931 – RelianceCommodities(Private)Limited(associatedcompany) 41,057 – MemberandChairman’sspouse 33,402 – Chairman’schildren 5,067 – Directors 48,135 –
143,592 –
34.3 This relates to related party, FATIMA (associated company).
35. Other expenses
Donations -note35.1 20,947 1,431 Advanceswrittenoff 2,218 – Exchangeloss 231,507 – Workers’profitparticipationfund -note17.4 67,543 8,763 Workers’welfarefund 25,664 3,328
347,879 13,522
35.1 Followingistheinterestofthedirectorsinthedoneeforthisyear’sdonation: Name and address of donee Directors Interest in donee
MukhtarA.SheikhTrust,2ndFloor, Mr.FawadAhmadMukhtar& Trustees TrustPlaza,L.M.QRoad,Multan. Mr.FaisalAhmadMukhtar
2015 2014 (Rupeesinthousand)
36. Other income
Income from financial assets:
Incomeonbankdeposits -note36.1 61,589 24,445 Unrealisedgainoninvestmentheldtomaturity 4,689 4,181 Mark-uponcreditsaleoffertilizers 1,517 10,392 Exchangegain – 77,483
67,795 116,501 Income from non-financial assets:
Rentalincome -note36.2 17,486 24,141 Profitondisposalofoperatingfixedasset 5,579 367,232 Scrapsalesandsundryincome -note36.3 24,517 32,460 Gainonrecoveryofchemicalcatalysts – 200,607 Provisionsandunclaimedbalanceswrittenback -note36.4 148,465 21,154 Incomefrombiologicallaboratory 4,636 4,055 Profitondisposalofchemicalcatalysts – 165,320 Excessinsurancepremiumrefunded 64,205 108,940
264,888 923,909
332,683 1,040,410
36.1 IncludesinterestincomeofRs7.360million(2014:Rs16.328million)onaccountofsavingaccountwithSummitBankLimited,arelatedparty(associatedcompany).
36.2 Includesrentalincomeforvehiclesinuseofandaccomodationprovidedtotheemployeesofthefollowingrelatedparties(associatedcompanies):
2015 2014 (Rupeesinthousand)
FATIMA 64 10,341 FatimaEnergyLimited 996 –
RelianceWeavingMillsLimited 3,452 –
4,512 10,341
36.3 IncludesanamountofRs1.084million(2014:Nil)inrespectofscrapsalestoFATIMA,arelatedparty(associatedcompany).
36.4 IncludesanamountofRs132.159million(2014:Nil)inrespectoflatepaymentsurchargeonGIDCpayable,writtenbackduringtheyearrelatingtotheperiodbeforetheenactmentofGIDCAct,2015.
138
ANNUAL REPORT 2015
139
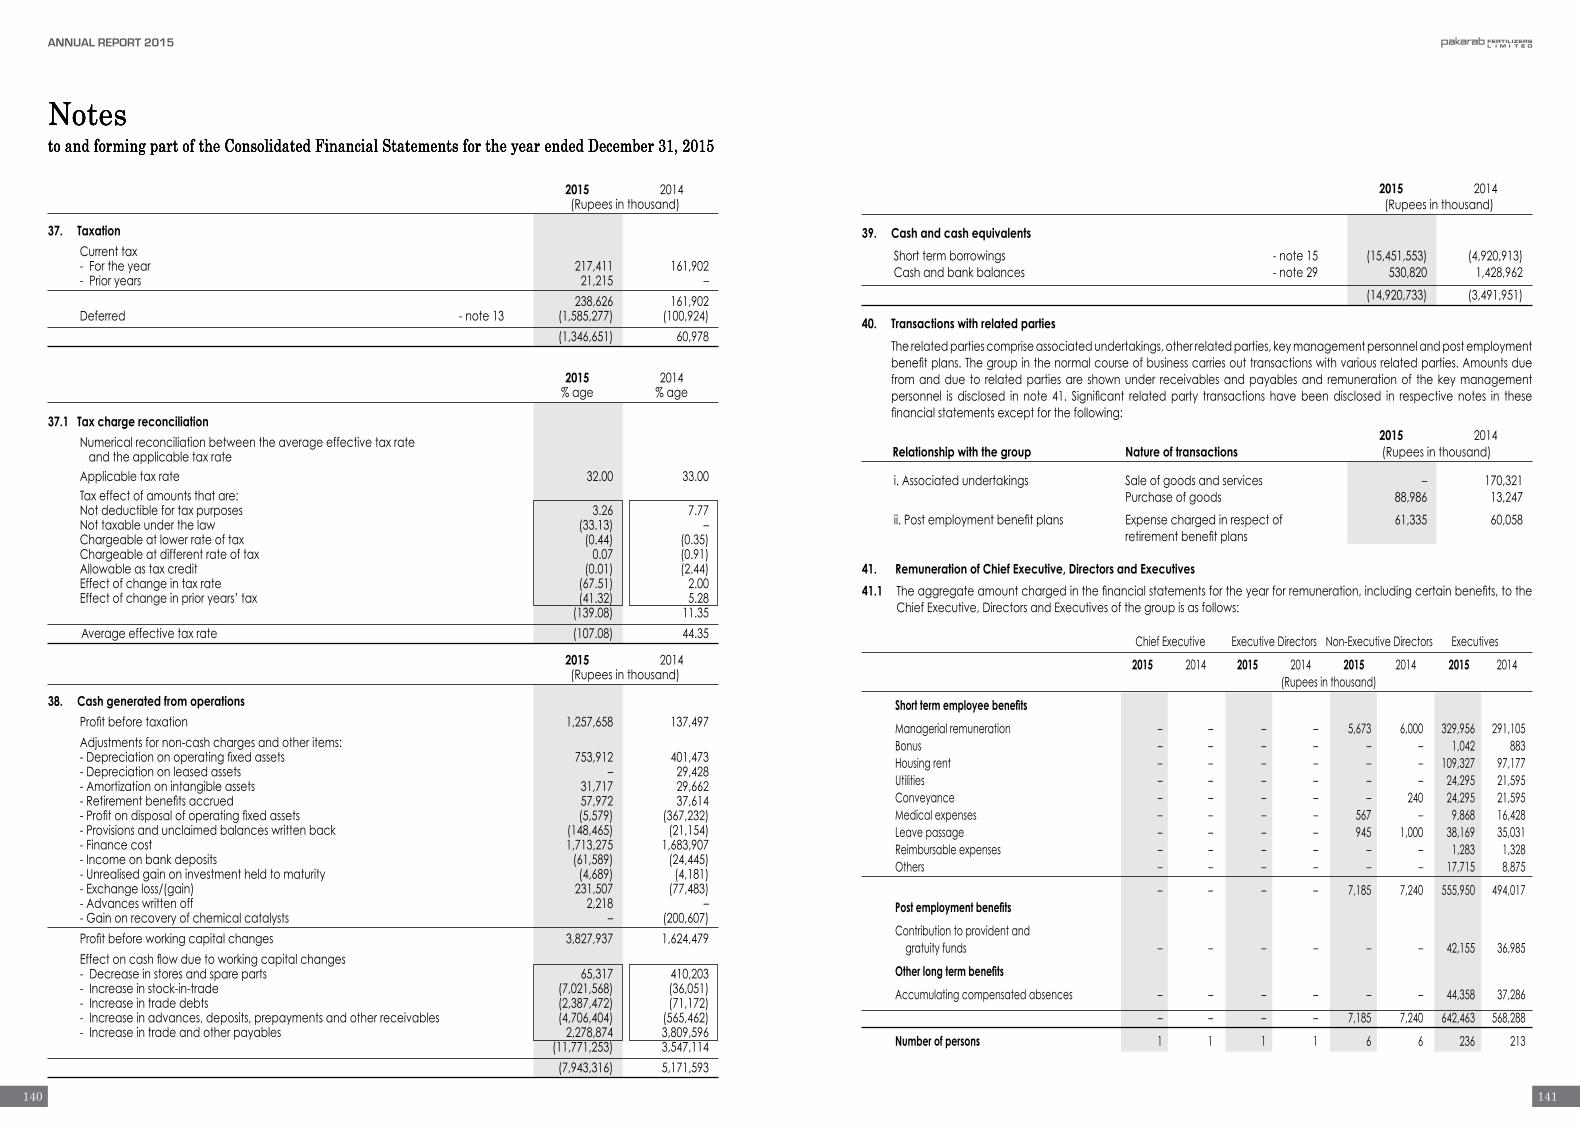
Notesto and forming part of the Consolidated Financial Statements for the year ended December 31, 2015
2015 2014 (Rupeesinthousand)
37. Taxation
Current tax -Fortheyear 217,411 161,902 -Prioryears 21,215 –
238,626 161,902 Deferred -note13 (1,585,277) (100,924)
(1,346,651) 60,978
2015 2014 %age %age
37.1 Tax charge reconciliation
Numericalreconciliationbetweentheaverageeffectivetaxrate andtheapplicabletaxrate Applicabletaxrate 32.00 33.00 Taxeffectofamountsthatare: Notdeductiblefortaxpurposes 3.26 7.77 Nottaxableunderthelaw (33.13) – Chargeableatlowerrateoftax (0.44) (0.35) Chargeableatdifferentrateoftax 0.07 (0.91) Allowableastaxcredit (0.01) (2.44) Effectofchangeintaxrate (67.51) 2.00 Effectofchangeinprioryears’tax (41.32) 5.28 (139.08) 11.35
Averageeffectivetaxrate (107.08) 44.35
2015 2014 (Rupeesinthousand)
38. Cash generated from operations
Profitbeforetaxation 1,257,658 137,497
Adjustmentsfornon-cashchargesandotheritems: -Depreciationonoperatingfixedassets 753,912 401,473 -Depreciationonleasedassets – 29,428 -Amortizationonintangibleassets 31,717 29,662 -Retirementbenefitsaccrued 57,972 37,614 -Profitondisposalofoperatingfixedassets (5,579) (367,232) -Provisionsandunclaimedbalanceswrittenback (148,465) (21,154) -Financecost 1,713,275 1,683,907 -Incomeonbankdeposits (61,589) (24,445) -Unrealisedgainoninvestmentheldtomaturity (4,689) (4,181) -Exchangeloss/(gain) 231,507 (77,483) -Advanceswrittenoff 2,218 – -Gainonrecoveryofchemicalcatalysts – (200,607)
Profitbeforeworkingcapitalchanges 3,827,937 1,624,479
Effectoncashflowduetoworkingcapitalchanges -Decreaseinstoresandspareparts 65,317 410,203 -Increaseinstock-in-trade (7,021,568) (36,051) -Increaseintradedebts (2,387,472) (71,172) -Increaseinadvances,deposits,prepaymentsandotherreceivables (4,706,404) (565,462) -Increaseintradeandotherpayables 2,278,874 3,809,596 (11,771,253) 3,547,114
(7,943,316) 5,171,593
2015 2014 (Rupeesinthousand)
39. Cash and cash equivalents
Shorttermborrowings -note15 (15,451,553) (4,920,913) Cashandbankbalances -note29 530,820 1,428,962
(14,920,733) (3,491,951)
40. Transactions with related parties
Therelatedpartiescompriseassociatedundertakings,otherrelatedparties,keymanagementpersonnelandpostemploymentbenefitplans.Thegroupinthenormalcourseofbusinesscarriesouttransactionswithvariousrelatedparties.Amountsduefromanddue to relatedpartiesare shownunder receivablesandpayablesand remunerationof the keymanagementpersonnel is disclosed in note 41. Significant related party transactions have beendisclosed in respective notes in thesefinancialstatementsexceptforthefollowing:
2015 2014 Relationship with the group Nature of transactions (Rupeesinthousand)
i.Associatedundertakings Saleofgoodsandservices – 170,321 Purchaseofgoods 88,986 13,247
ii.Postemploymentbenefitplans Expensechargedinrespectof 61,335 60,058 retirementbenefitplans
41. Remuneration of Chief Executive, Directors and Executives
41.1 Theaggregateamountchargedinthefinancialstatementsfortheyearforremuneration,includingcertainbenefits,totheChiefExecutive,DirectorsandExecutivesofthegroupisasfollows:
ChiefExecutive ExecutiveDirectors Non-ExecutiveDirectors Executives
2015 2014 2015 2014 2015 2014 2015 2014 (Rupeesinthousand)
Short term employee benefits
Managerialremuneration – – – – 5,673 6,000 329,956 291,105 Bonus – – – – – – 1,042 883 Housingrent – – – – – – 109,327 97,177 Utilities – – – – – – 24,295 21,595 Conveyance – – – – – 240 24,295 21,595 Medicalexpenses – – – – 567 – 9,868 16,428 Leavepassage – – – – 945 1,000 38,169 35,031 Reimbursableexpenses – – – – – – 1,283 1,328 Others – – – – – – 17,715 8,875
– – – – 7,185 7,240 555,950 494,017 Post employment benefits
Contributiontoprovidentand gratuityfunds – – – – – – 42,155 36,985
Other long term benefits
Accumulatingcompensatedabsences – – – – – – 44,358 37,286
– – – – 7,185 7,240 642,463 568,288
Number of persons 1 1 1 1 6 6 236 213
Notesto and forming part of the Consolidated Financial Statements for the year ended December 31, 2015Notesto and forming part of the Consolidated Financial Statements for the year ended December 31, 2015Notesto and forming part of the Consolidated Financial Statements for the year ended December 31, 2015
140
ANNUAL REPORT 2015
141

Notesto and forming part of the Consolidated Financial Statements for the year ended December 31, 2015
41.2 Thegroupalsoprovides thechiefexecutive,directorsand someof itsexecutiveswithcompanymaintainedcars, travelfacilitiesandclubmembership.
2015 2014
42. Capacity and production
Urea Ratedproductioncapacity M.Tons 92,400 92,400 Actualureaproduced M.Tons – 6,789 NilproductionofUREAisattributabletohighcostofproductionas comapredtootherfertilizerproducts.Thegroupintendstoresume productionofUREAnextyearasitexpectsthatthepriceofRLNG willdecreaseinfuture. Nitro Phosphate (NP)
Ratedproductioncapacity M.Tons 304,500 304,500 ActualNPproduced M.Tons 265,349 44,684
ThelowproductionofNPisduetoshortageoffeedgasand periodicalmaintenance. CalciumAmmoniumNitrate(CAN) Ratedproductioncapacity M.Tons 450,000 450,000 ActualCANproduced M.Tons 287,954 55,432 ThelowproductionofCANisduetoshortageoffeedgasand periodicalmaintenance. Polypropylenesacks Ratedproductioncapacity Kilograms 5,280,000 5,280,000 Actualproduction Kilograms 5,154,779 5,041,442 Thelowproductionofpolypropylenesacksisduetotheproductmix.
43. Disclosures relating to Provident Fund
Thegroupoperatestwoprovidentfunds:
(i) Employees’ProvidentFundTrustLahore
(ii) Employees’ProvidentFundTrustMultan ThefollowinginformationisbasedontheauditedfinancialstatementsoftheFundsasatJune30,2015and2014:
2015 2014 (Rupeesinthousand)
SizeoftheFund-totalassets 350,297 315,758 Costofinvestmentsmade 270,528 225,735 Percentageofinvestmentsmade 86% 79% Fairvalueofinvestments 300,566 249,102 Break up of investments Specialaccountsinascheduledbank 199,028 207,735 Mutualfunds-listed 101,539 41,367
2015 2014 %ageofsizeoftheFund
Break up of investments Specialaccountsinascheduledbank 57% 66% Mutualfunds-listed 29% 13% InvestmentsoutofProvidentFundshavebeenmadeinaccordancewiththeprovisionsofsection227oftheCompaniesOrdinance,
1984andtherulesformulatedforthispurpose.
44. Financial risk management
44.1 Financial risk factors
Thegroupisexposedtoavarietyoffinancialrisks:marketrisk(includingcurrencyrisk,otherpriceriskandinterestraterisk),credit risk and liquidity risk. Thegroup’s overall riskmanagement programme focuses on the unpredictability of financialmarketsandseekstominimisepotentialadverseeffectsonthefinancialperformance.
Riskmanagementiscarriedoutbythegroup’sBoardofDirectors(theBoard).Thegroup’sfinancedepartmentevaluatesand
hedgesfinancialrisks.TheBoardprovideswrittenprinciplesforoverallriskmanagement,aswellaswrittenpoliciescoveringspecificareas, suchas foreignexchange risk, interest rate risk,credit risk, useofderivative financial instrumentsandnon-derivativefinancialinstruments,andinvestmentofexcessliquidity.
a) Market risk i) Currency risk
Currencyriskistheriskthatthefairvalueorfuturecashflowsofafinancialinstrumentwillfluctuatebecauseofchangesinforeignexchangerates.Currencyriskarisesmainlyfromfuturecommercialtransactionsorreceivablesandpayablesthatexistduetotransactionsinforeigncurrencies.
Thegroupisexposedtocurrencyriskarisingfromvariouscurrencyexposures,primarilywithrespecttotheUnitedStatesDollar
(USD)andEuro.Currently,thegroup’sforeignexchangeriskexposureisrestrictedtobankbalancesandamountsreceivablefrom/payabletotheforeignentities.
2015 2014 (Rupeesinthousand)
Amountpayable-USD 19,601,027 42,583,465 Cashandbankbalances-USD (11,627) (151,586) Netliabilityexposure-USD 19,589,400 42,431,879
Amountpayable-Euro – – Cashandbankbalances-Euro (5,095) (364,906) Netassetexposure-Euro (5,095) (364,906)
AtDecember31,2015iftheRupeehadweakened/strengthenedby5%againsttheUSDwithallothervariablesheldconstant,theimpactonpretaxprofitfortheyearwouldhavebeenRs100.885million(2014:Rs214.705million)lower/higher,mainlyasaresultofexchangelosses/gainsontranslationofUSDdenominatedfinancialinstruments.
AtDecember31,2015iftheRupeehadweakened/strengthenedby5%againsttheEurowithallothervariablesheldconstant,
theimpactonpretaxprofitfortheyearwouldhavebeenRs0.029million(2014:Rs2.456million)higher/lower,mainlyasaresultofexchangegains/lossesontranslationofEurodenominatedfinancialinstruments.
142
ANNUAL REPORT 2015
143

Notesto and forming part of the Consolidated Financial Statements for the year ended December 31, 2015
ii) Other price risk
Otherprice risk represents the risk that the fair valueor futurecash flowsofa financial instrumentwill fluctuatebecauseofchanges inmarketprices (other than thosearising from interest rate riskorcurrency risk),whether thosechangesarecausedbyfactorsspecifictotheindividualfinancialinstrumentoritsissuer,orfactorsaffectingallsimilarfinancialinstrumentstraded in themarket.Thegroup isnotmateriallyexposedtoequityprice risksincetherearenosignificant investments inequity instruments traded in themarket either classifiedas available-for-sale or at fair value throughprofit or loss at thereportingdate.Thegroupisalsonotexposedtocommoditypricerisksinceitdoesnotholdanyfinancialinstrumentbasedoncommodityprices.
iii) Interest rate risk
Interestrateriskrepresentstheriskthatthefairvalueorfuturecashflowsofafinancialinstrumentwillfluctuatebecauseofchangesinmarketinterestrates.
The group’s interest rate risk arises from long term finances/loans, lease liabilities and short term borrowings. Borrowingsobtainedandloansprovidedatvariableratesexposethegrouptocashflowinterestraterisk.
Atthebalancesheetdate,theinterestrateprofileofthegroup’ssignificantinterestbearingfinancialinstrumentswas:
2015 2014 (Rupeesinthousand)
Fixed rate instruments:
Financial assets
Investment 43,278 38,589 Tradedebts 2,510,370 121,369 Bankbalances-savingaccounts 382,090 1,314,132
2,935,738 1,474,090
Financial liabilities – –
Net exposure 2,935,738 1,474,090
Floating rate instruments:
Financial assets – –
Financial liabilities
Longtermloansfromrelatedparties 2,232,952 825,968 Longtermfinances 3,113,375 2,108,499 Shorttermborrowingfromrelatedparty 2,200,000 3,000,000 Shorttermborrowings 15,451,553 4,920,913
22,997,880 10,855,380
Net exposure (22,997,880) (10,855,380)
Fair value sensitivity analysis for fixed rate instruments
Thegroupdoesnotaccountforanyfixedratefinancialassetsandliabilitiesatfairvaluethroughprofitorloss.Therefore,achangeininterestrateatthebalancesheetdatewouldnotaffectprofitorlossofthegroup.
Cash flow sensitivity analysis for variable rate instruments
If interest rates on variable rate financial instruments, at the year enddate, fluctuatesby 1%higher/lowerwithall othervariablesheldconstant,pretaxprofitfortheyearwouldhavebeenRs230.056million(2014:Rs100.284million)lower/higher,mainlyasaresultofhigher/lowerinterestexpenseonfloatingrateinstruments.
b) Credit risk
Creditriskrepresentstheriskoffinanciallossbeingcausedifcounterpartyfailstodischargeanobligation.
Creditriskofthegrouparisesfromcashandcashequivalentsanddepositswithbanksandfinancialinstitutions,aswellascreditexposurestocustomers, includingoutstandingreceivablesandcommittedtransactions.Themanagementassessesthecreditqualityofthecustomers,takingintoaccounttheirfinancialposition,pastexperienceandotherfactors.IndividualrisklimitsaresetbasedoninternalorexternalratingsinaccordancewithlimitssetbytheBoard.Theutilisationofcreditlimitsisregularlymonitoredandmajorsalestocustomersaresettledincash.Forbanksandfinancialinstitutions,onlyindependentlyratedpartieswithastrongcreditratingareaccepted.
Thegroupmonitorsthecreditqualityofitsfinancialassetswithreferencetohistoricalperformanceofsuchassetsandavailableexternalcreditratings.Thecarryingvaluesoffinancialassetswhichareneitherpastduenorimpairedareasunder:
2015 2014 (Rupeesinthousand)
Longterminvestments 107,510 102,821 Securitydeposits 28,554 34,534 Tradedebts 2,004,830 277,162 Advances,depositsandotherreceivables 130,556 728,931 Cashandbankbalances 530,820 1,428,962
2,802,270 2,572,410
Thegroup’sexposuretocreditriskislimitedtothecarryingamountofunsecuredtradereceivablesandbankbalances.Theageinganalysisoftradereceivablebalancesisasfollows:
2015 2014 (Rupeesinthousand)
Neitherpastduenorimpaired 2,004,830 277,162 Pastduebutnotimpaired:
1to90days 271,405 76,900 91to180days 176,205 13,419 181to270days 223,171 1,240 above270days 117,559 36,977
788,340 128,536
2,793,170 405,698
Themanagementestimatestherecoverabilityoftradereceivablesonthebasisoffinancialpositionandpasthistoryof itscustomersbasedontheobjectiveevidencethatitwillnotreceivetheamountduefromtheparticularcustomer.Aprovisionfordoubtfuldebtsisestablishedwhenthereisobjectiveevidencethatthegroupwillnotbeabletocollectalltheamountdueaccordingtotheoriginaltermsofthereceivable.Significantfinancialdifficultiesofthedebtors,probabilitythatthedebtorwillenterbankruptcyorfinancialreorganisation,anddefaultordelinquencyinpaymentsareconsideredindicatorsthatthetradedebtisimpaired.Theprovisionisrecognisedintheprofitandlossaccount.Theprovisioniswrittenoffbythegroupwhenitexpectsthatitcannotrecoverthebalancedue.Anysubsequentrepaymentsinrelationtoamountwrittenoff,arecrediteddirectlytoprofitandlossaccount.
144
ANNUAL REPORT 2015
145

Notesto and forming part of the Consolidated Financial Statements for the year ended December 31, 2015
Thecreditqualityofgroup’sbankbalancescanbeassessedwithreferencetoexternalcreditratingsasfollows:
Rating Rating 2015 2014 Short term Long term Agency (Rupees in thousand)
AlBarakaIslamicBankLimited A1 A PACRA 6,973 11,038 AlliedBankLimited A1+ AA+ PACRA 70 76 SummitBankLimited A-1 A JCR-VIS 224,536 279,786 BankAlfalahLimited A1+ AA PACRA 45,042 444,136 DeutscheBankAG A-2 BBB+ Standard&Poor’s 1,738 0.1 DubaiIslamicBankLimited A-1 A+ JCR-VIS 2 2 FaysalBankLimited A1+ AA PACRA 3,701 7,253 HabibBankLimited A-1+ AAA JCR-VIS 100,690 61,332 HabibMetropolitanBankLimited A1+ AA+ PACRA 99 558,166 MCBBankLimited A1+ AAA PACRA 5,387 2,127 MeezanBankLimited A-1+ AA JCR-VIS 1,865 12,208 NationalBankofPakistan A-1+ AAA JCR-VIS 605 5,166 StandardCharteredBank(Pakistan)Limited A1+ AAA PACRA 21,443 4,250 UnitedBankLimited A-1+ AA+ JCR-VIS 90,577 15,577 ZaraiTaraqiatiBankLimited A-1+ AAA JCR-VIS 59 58 BankIslamiPakistanLimited A1 A+ PACRA 10,701 12,180 SindhBankLimited A-1+ AA JCR-VIS 4,879 6,922 BurjBankLimited A-2 A- JCR-VIS 271 543 CitibankN.A. P-1 A2 MOODY’S 0.3 0.3 TheBankofPunjab A1+ AA- PACRA 7,210 2,315 KASBBankLimited A3 BBB JCR-VIS – 662
525,848 1,423,797
Duetothegroup’slongstandingbusinessrelationshipswiththesecounterpartiesandaftergivingdueconsiderationtotheirstrongfinancialstanding,managementdoesnotexpectnon-performancebythesecounterpartiesontheirobligationstothegroup.Accordingly,thecreditriskisminimal.
c) Liquidity risk
Liquidityriskistheriskthatanentitywillencounterdifficultyinmeetingobligationsassociatedwithfinancialliabilities.
Thegroup’sapproachtomanagingliquidityistoensurethat,asfaraspossible, italwayshassufficientliquiditytomeetitsliabilitieswhendue,underbothnormalandstressedconditions,withoutincurringunacceptablelossorriskingdamagetothegroup’sreputation.
ThefollowingarethecontractualmaturitiesoffinancialliabilitiesasatDecember31,2015andDecember31,2014:
Carrying Less than One to More than amount one year five years five years As at December 31, 2015 (Rupees in thousand)
Longtermfinances 3,113,375 1,143,236 1,970,139 – Longtermloansfromrelatedparties 2,232,952 – 2,232,952 – Longtermdeposits 44,860 – – 44,860 Shorttermborrowingfromrelatedparty 2,200,000 2,200,000 – – Shorttermborrowings 15,451,553 15,451,553 – – Tradeandotherpayables 7,392,684 7,392,684 – – Accruedfinancecost 455,344 455,344 – –
30,890,768 26,642,817 4,203,091 44,860
Carrying Less than One to More than amount one year five years five years As at December 31, 2014 (Rupees in thousand)
Longtermfinances 2,108,499 972,404 1,136,095 – Longtermloansfromrelatedparties 825,968 – 825,968 – Importbillpayable 2,414,400 1,314,400 1,100,000 – Longtermdeposits 48,070 – – 48,070 Shorttermborrowingfromrelatedparty 3,000,000 3,000,000 – – Shorttermborrowings 4,920,913 4,920,913 – – Tradeandotherpayables 6,674,335 6,674,335 – – Accruedfinancecost 326,929 326,929 – –
20,319,114 17,208,981 3,062,063 48,070
44.2 Fair value estimation
Thecarryingvaluelessimpairmentprovisionoftradeandotherreceivables,andpayablesareassumedtoapproximatetheirfairvalues.Thefairvalueoffinancialliabilitiesfordisclosurepurposesisestimatedbydiscountingthefuturecontractualcashflowsatthecurrentmarketinterestratethatisavailabletothegroupforsimilarfinancialinstruments.Thecarryingvaluesofallfinancialassetsandliabilitiesreflectedinthefinancialstatementsapproximatetheirfairvalues.
44.3 Financial instruments by categories
Held to Loans and Total maturity receivables As at December 31, 2015 (Rupees in thousand)
Assetsasperbalancesheet Securitydeposits – 28,554 28,554 Tradedebts – 2,793,170 2,793,170 Advances,depositsandotherreceivables – 130,556 130,556 Investments 43,278 – 43,278 Cashandbankbalances – 530,820 530,820
43,278 3,483,100 3,526,378
146
ANNUAL REPORT 2015
147
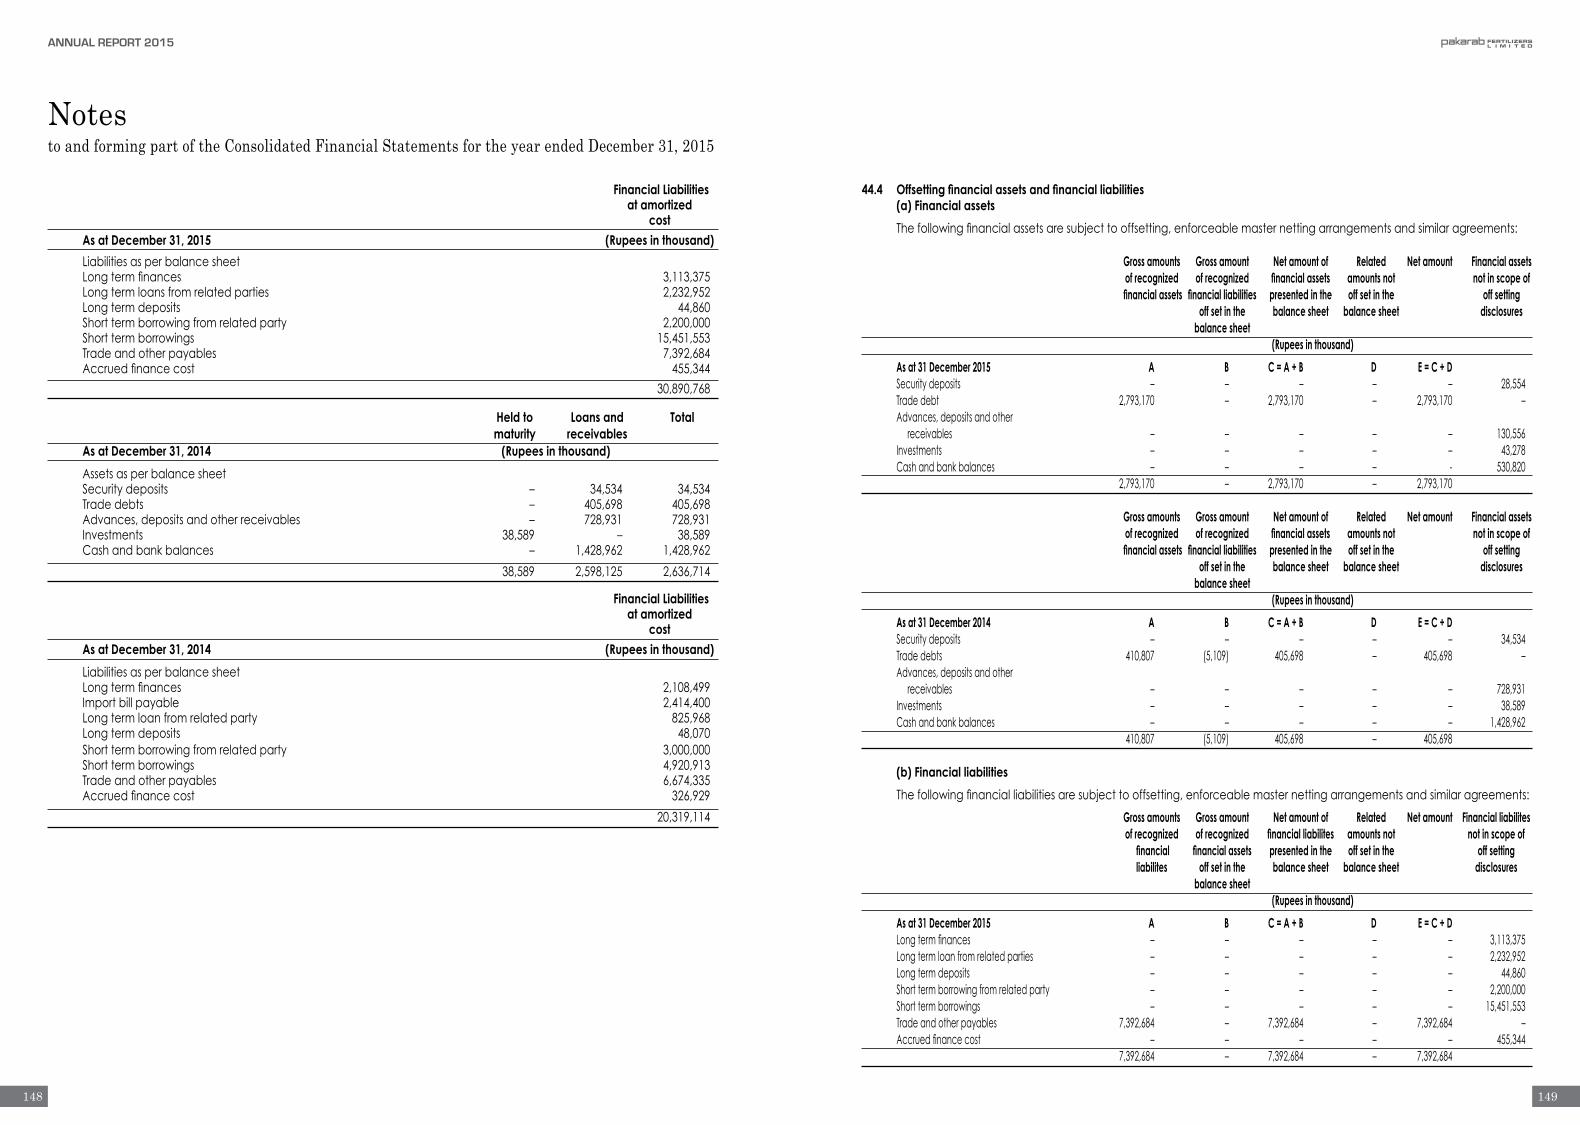
Notesto and forming part of the Consolidated Financial Statements for the year ended December 31, 2015
Financial Liabilities at amortized cost As at December 31, 2015 (Rupees in thousand)
Liabilitiesasperbalancesheet Longtermfinances 3,113,375 Longtermloansfromrelatedparties 2,232,952 Longtermdeposits 44,860 Shorttermborrowingfromrelatedparty 2,200,000 Shorttermborrowings 15,451,553 Tradeandotherpayables 7,392,684 Accruedfinancecost 455,344
30,890,768
Held to Loans and Total maturity receivables As at December 31, 2014 (Rupees in thousand)
Assetsasperbalancesheet Securitydeposits – 34,534 34,534 Tradedebts – 405,698 405,698 Advances,depositsandotherreceivables – 728,931 728,931 Investments 38,589 – 38,589 Cashandbankbalances – 1,428,962 1,428,962
38,589 2,598,125 2,636,714
Financial Liabilities at amortized cost As at December 31, 2014 (Rupees in thousand)
Liabilitiesasperbalancesheet Longtermfinances 2,108,499 Importbillpayable 2,414,400 Longtermloanfromrelatedparty 825,968 Longtermdeposits 48,070 Shorttermborrowingfromrelatedparty 3,000,000 Shorttermborrowings 4,920,913 Tradeandotherpayables 6,674,335 Accruedfinancecost 326,929
20,319,114
44.4 Offsetting financial assets and financial liabilities (a) Financial assets
Thefollowingfinancialassetsaresubjecttooffsetting,enforceablemasternettingarrangementsandsimilaragreements:
Gross amounts Gross amount Net amount of Related Net amount Financial assets of recognized of recognized financial assets amounts not not in scope of financial assets financial liabilities presented in the off set in the off setting off set in the balance sheet balance sheet disclosures balance sheet (Rupees in thousand)
As at 31 December 2015 A B C = A + B D E = C + D Securitydeposits – – – – – 28,554 Tradedebt 2,793,170 – 2,793,170 – 2,793,170 – Advances,depositsandother receivables – – – – – 130,556 Investments – – – – – 43,278 Cashandbankbalances – – – – - 530,820 2,793,170 – 2,793,170 – 2,793,170
Gross amounts Gross amount Net amount of Related Net amount Financial assets of recognized of recognized financial assets amounts not not in scope of financial assets financial liabilities presented in the off set in the off setting off set in the balance sheet balance sheet disclosures balance sheet (Rupees in thousand)
As at 31 December 2014 A B C = A + B D E = C + D Securitydeposits – – – – – 34,534 Tradedebts 410,807 (5,109) 405,698 – 405,698 – Advances,depositsandother receivables – – – – – 728,931 Investments – – – – – 38,589 Cashandbankbalances – – – – – 1,428,962 410,807 (5,109) 405,698 – 405,698 (b) Financial liabilities
Thefollowingfinancialliabilitiesaresubjecttooffsetting,enforceablemasternettingarrangementsandsimilaragreements:
Gross amounts Gross amount Net amount of Related Net amount Financial liabilites of recognized of recognized financial liabilites amounts not not in scope of
financial financial assets presented in the off set in the off setting liabilites off set in the balance sheet balance sheet disclosures balance sheet (Rupees in thousand)
As at 31 December 2015 A B C = A + B D E = C + D Longtermfinances – – – – – 3,113,375 Longtermloanfromrelatedparties – – – – – 2,232,952 Longtermdeposits – – – – – 44,860 Shorttermborrowingfromrelatedparty – – – – – 2,200,000 Shorttermborrowings – – – – – 15,451,553 Tradeandotherpayables 7,392,684 – 7,392,684 – 7,392,684 – Accruedfinancecost – – – – – 455,344 7,392,684 – 7,392,684 – 7,392,684
148
ANNUAL REPORT 2015
149

Gross amounts Gross amount Net amount of Related Net amount Financial liabilites of recognized of recognized financial liabilites amounts not not in scope of
financial financial assets presented in the off set in the off setting liabilites off set in the balance sheet balance sheet disclosures balance sheet (Rupees in thousand)
As at 31 December 2014 A B C = A + B D E = C + D Longtermfinances – – – – – 2,108,499 Longtermloanfromrelatedparties – – – – – 825,968 Importbillpayable – – – – – 2,414,400 Longtermdeposits – – – – – 48,070 Shorttermborrowingfromrelatedparty – – – – – 3,000,000 Shorttermborrowings – – – – – 4,920,913 Tradeandotherpayables 6,679,444 (5,109) 6,674,335 – 6,674,335 – Accruedfinancecost – – – – – 326,929 6,679,444 (5,109) 6,674,335 – 6,674,335
44.5 Capital management
Thegroup’sobjectiveswhenmanagingcapitalaretosafeguardthegroup’sabilitytocontinueasagoingconcerninordertoprovidereturnsforshareholdersandbenefitsforotherstakeholdersandtomaintainanoptimalcapitalstructuretoreducethecostofcapital.Inordertomaintainoradjustthecapitalstructure,thegroupmayadjusttheamountofdividendspaidtoshareholders,returncapitaltoshareholdersthroughrepurchaseofshares,issuenewsharesorsellassetstoreducedebt.Consistentwithothers in the industryandthe requirementsof the lenders, thegroupmonitors thecapital structureonthebasisofgearingratio.Thisratioiscalculatedasnetdebtdividedbytotalcapitalemployed.Netdebtiscalculatedastotalborrowings(includingcurrentandnon-currentborrowings) lesscashandcashequivalents.Totalcapital includesequityasshown in thebalancesheetplusnetdebt. Thegroup isnotexposedtoanyexternally imposedcapital requirements. ThegearingratiosasatDecember31,2015and2014wereasfollows:
ChiefExecutive Director
Notesto and forming part of the Consolidated Financial Statements for the year ended December 31, 2015
2015 2014 (Rupeesinthousand)
Borrowings-note8,9,14&15 7,546,327 5,934,467 Cashandcashequivalents-note39 (14,920,733) (3,491,951)
Netdebt 22,467,060 9,426,418
Totalequity(includessurplusonrevaluationofoperatingfixedassets) 24,093,033 18,079,402 Gearingratio Percentage 48% 34%
2015 2014
45. Number of employees
TotalnumberofemployeesasatDecember31 1,065 983
Averagenumberofemployeesduringtheyear 995 1,006
46. Details of subsidiary
Nameofsubsidiary Accountingyearend Percentageofholding Countryofincorporation RelianceSacksLimited December31,2015 100% Pakistan
47. Date of authorization for issue ThesefinancialstatementswereauthorizedforissueonApril08,2016bytheBoardofDirectors.
150
ANNUAL REPORT 2015
151

Pattern of Shareholding as at December 31, 2015Disclosure requirement under the code of corporate governance
Pattern of shareholding as at December 31, 2015 Category-Wise
Details of holding as on December 31, 2015: Shares held
1. Associated Companies, Undertakings and Related Parties RelianceCommodities(Pvt)Limited 7,136,613
AmirFineExports(Pvt)Limited 12,895,296 FatimaHoldingLimited 84,145,872 ArifHabibCorporationLimited 135,000,000
2. Mutual Funds –3. Directors and their spouse(s) and minor children
Mr.ArifHabib-Chairman 50,624,877 Mr.FawadAhmedMukhtar-CEO 12,499,995 Mr.RehmanNaseem 13,820,522 Mr.FazalAhmedShekih 30,943,236 Mr.FaisalAhmedMukhtar 30,943,236 Mr.NasimBeg 1 Mr.AbdusSamad 1 Mr.MuhammadKashif 1 Mrs.ZetunArif 39,375,120 Mrs.AmbreenFawad 3,577,410 MissMerajFatima 4,030,431 4. Executives –
5. Public Sector companies and corporations –
6. Banks, Development Finance Institutions, Non-Banking Finance Companies, Insurance Companies, Takaful, Modarabas and Pension Funds –
7. Shareholders holding five percent or more voting rights ArifHabibCorporationLimited 135,000,000
FatimaHoldingLimited 84,145,872 Mr.ArifHabib 50,624,877 Mrs.ZetunArif 39,375,120 Mr.FaisalAhmedMukhtar 30,943,236 Mr.FazalAhmedSheikh 30,943,236
Shareholding No. of Shareholders Total Shares held Percentage
From To
1 100 3 3 0.00
3,575,001 3,580,000 1 3,577,410 0.79
4,030,001 4,035,000 4 16,121,724 3.58
6,455,001 6,460,000 2 12,916,096 2.87
7,135,001 7,140,000 1 7,136,613 1.59
12,495,001 12,500,000 1 12,499,995 2.78
12,895,001 12,900,000 1 12,895,296 2.87
13,820,001 13,825,000 1 13,820,522 3.07
30,940,001 30,945,000 2 61,886,472 13.75
39,375,001 39,380,000 1 39,375,120 8.75
50,620,001 50,625,000 1 50,624,877 11.25
84,145,001 84,150,000 1 84,145,872 18.70
134,995,001 135,000,000 1 135,000,000 30.0
Total 20 450,000,000 100
CategoriesofShareholders SharesHeld Percentage
Directors,ChiefExecutiveOfficer,andtheirspouseandminorchildren 185,814,830 41.29
AssociatedCompanies,undertakingsandrelatedparties 239,177,781 53.15
Executives – –
PublicSectorCompaniesandCorporation – –
Banks,DevelopmentFinancialInstitutions,NonBankingFinancialInstitutions,
InsuranceCompanies,Takaful,ModarabasandPensionFunds – –
MutualFunds – –
GeneralPublic
a.Local – –
b.Foreign – –
Others 25,007,389 5.56
Total 450,000,000 100.00
152
ANNUAL REPORT 2015
153

Financial Calendar
Thefinancialresultswillbeannouncedasperthefollowingtentativeschedule:
43rd Annual General Meeting
43rd 30, 2016
2016.
AnnualGeneralMeeting April30,2016
1stQuarterendingMarch31,2016 ThirdweekofApril,2016
2nd QuarterendingJune30,2016 ThirdweekofAugust,2016
3rdQuarterendingSeptembt30,2016 LastweekofOctober,2016
YearendingDecember31,2016 FourthweekofJanuary,2017
154
ANNUAL REPORT 2015

The Company Secretary
HIGHNOON LABORATORIES LIMITED
17.5 Kilometer, Multan Road,
Lahore - 53700 Pakistan.
AFFIXCORRECTPOSTAGE
Annual R e p o r tAnnual R e p o r t