Annual Report & Audited Financial Statements - Aviva · PDF fileAnnual Report & Audited...
99
Baring Global Umbrella Fund Annual Report & Audited Financial Statements for the year ended 30 April 2017
Transcript of Annual Report & Audited Financial Statements - Aviva · PDF fileAnnual Report & Audited...

Baring Global Umbrella Fund
Annual Report & Audited Financial Statements for the year ended 30 April 2017

Table of Contents
Management and administration ...................................................................................................... 1
Introduction ...................................................................................................................................... 3
Independent Auditors’ report to the unitholders of the Funds of Baring Global Umbrella Fund ........ 7
Statement of Manager’s responsibilities ........................................................................................... 9
Manager’s statement ...................................................................................................................... 10
Report of the Depositary to the unitholders for the year ended 30 April 2017 ................................ 11
Key changes during the year.......................................................................................................... 12
This below section includes the following:
- Investment Manager's report - Unaudited
- Balance sheet
- Statement of changes in net assets attributable to holders of redeemable participating units
- Profit and loss account
Baring Developed and Emerging Markets High Yield Bond Fund (formerly Baring High Yield Bond Fund) .............................................................................................................................................. 13
Baring Eastern Europe Fund ......................................................................................................... 17
Baring Global Leaders Fund ......................................................................................................... 21
Baring Global Resources Fund ..................................................................................................... 25
Notes to the financial statements ................................................................................................... 29
Portfolio Statements ....................................................................................................................... 53
Information for investors in Switzerland - Unaudited ...................................................................... 70
Information for investors in Germany - Unaudited .......................................................................... 78
General information - Unaudited .................................................................................................... 79
Appendix 1 - additional information Hong Kong Code - Unaudited ................................................ 81
Appendix 2 - significant portfolio movements - Unaudited ............................................................. 90
Appendix 3 - securities financing transaction regulation - Unaudited ............................................. 94
Appendix 4 - remuneration disclosure - Unaudited ....................................................................... 95

1
Management and administration
Manager
Baring International Fund Managers (Ireland)
Limited
Registered Office
Georges Court
54-62 Townsend Street
Dublin 2
Ireland
Telephone: + 353 1 542 2930
Facsimile: + 353 1 670 1185
Investment Manager*
Baring Asset Management Limited
155 Bishopsgate
London EC2M 3XY
United Kingdom
Telephone: + 44 207 628 6000
Facsimile: + 44 207 638 7928
* Both Barings LLC and Barings (U.K.) Limited have each been
appointed as sub-investment manager for the Baring Developed
and Emerging Markets High Yield Bond Fund and provide the
Investment Manager with discretionary investment management
and advisory services in relation to the Fund.
Depositary
Northern Trust Fiduciary Services (Ireland) Limited
Georges Court
54-62 Townsend Street
Dublin 2
Ireland
Administrator and Registrar
Northern Trust International Fund Administration
Services (Ireland) Limited
Georges Court
54-62 Townsend Street
Dublin 2
Ireland
Independent Auditors
PricewaterhouseCoopers
One Spencer Dock
North Wall Quay
Dublin 1
Ireland
Sponsoring Broker & Legal Advisers
Dillon Eustace
33 Sir John Rogerson’s Quay
Dublin 2
Ireland
Directors of the Manager
Oliver Burgel* (German)
John Burns* (British)
Jim Cleary*† (Irish)
David Conway† (Irish)
Nicola Hayes* (British)
Barbara Healy*† (Irish)
Michel Schulz* (German)
Timothy Schulze* (United States)
Julian Swayne* (British)
Mark Thorne*† (Irish)
* Oliver Burgel was appointed as Director of the Manager with effect from
29 November 2016.
John Burns has resigned from his position as Director of the Manager
with effect from 9 December 2016.
Nicola Hayes has resigned from her position as Director of the Manager
with effect from 18 December 2016.
Barbara Healy was appointed as Director of the Manager with effect
from 9 February 2017.
Julian Swayne was appointed as Director of the Manager with effect
from 9 February 2017.
Jim Cleary was appointed as Director of the Manager with effect from 18
May 2017.
Michel Schulz has resigned from his position as a Director of the
Manager with effect from 18 May 2017.
Timothy Schulze was appointed as Director of the Manager with effect
18 May 2017.
Mark Thorne has resigned from his position as Director of the Manager
with effect from 18 May 2017.
† Non-executive Directors independent of the Investment Manager.

2
Management and administration (continued)
Paying Agents
UniCredit Bank Austria AG
Schottengasse 6-8
1010 Vienna
Austria
BNP Paribas Securities Services
9 Rue du Débarcadère
93500 Pantin Cedex
France
Deutsche Bank AG
Global Transaction Banking
Issuer Services - Global Securities Services
Post IPO Services
Taunusanlage 12
60325 Frankfurt am Main
Germany
S.E. Banken
Skandinaviska Enskilda Banken AB (publ)
Transaction Banking
KB BV, SE-106 40
Stockholm
Sweden
BNP Paribas Securities Services, Paris
Succursale de Zurich
Selnaustrasse 16
8002 Zurich
Switzerland

3
Introduction
Baring Global Umbrella Fund (“the Trust”) is managed by Baring International Fund Managers (Ireland) Limited
(“the Manager”). The Trust was established pursuant to the Unit Trusts Act, 1990 and a Trust Deed dated 21
June 1993 (as supplemented or amended from time to time) (“the Trust Deed”) made between the Manager and
Northern Trust Fiduciary Services (Ireland) Limited (“the Depositary”) and authorised by the Central Bank of
Ireland (“the CBI”) pursuant to the European Communities (Undertakings for Collective Investment in
Transferable Securities) Regulations 2011 (as amended) (“the UCITS Regulations”). It has been authorised by
the Securities and Futures Commission in Hong Kong.
The Trust is organised in the form of an Umbrella Fund. The Trust Deed provides that the Trust may offer
separate series of units, each representing interest in a Trust Fund (“a Fund”) comprised of a distinct portfolio of
investments. A separate Fund is maintained for each series of units and is invested in accordance with the
investment objective applicable to such Fund to date. Each Fund may create more than one class of units in
relation to a Fund (“a class”) and these separate classes of units may be denominated in different currencies. A
unit represents a beneficial interest in the Fund (“a unit”).
The trade receipt and valuation deadline for the annual accounts was 12pm on 28 April 2017, the last business
day of the year
The following Funds have been approved by the Central Bank of Ireland:
Fund Fund launch date
Baring Developed and Emerging Markets High Yield Bond Fund (formerly Baring High Yield Bond Fund)
19/07/1993
Baring Eastern Europe Fund 30/09/1996
Baring Global Leaders Fund 26/02/2001
Baring Global Resources Fund 12/12/1994
Baring Developed and Emerging Markets High Yield Bond Fund (formerly Baring High Yield Bond Fund)
Investment objective and policy
The primary investment objective of the Baring Developed and Emerging Markets High Yield Bond Fund (“the
Fund”) is to produce a high level of current yield in US dollar terms, commensurate with an acceptable level of
risk as determined by the Manager in its reasonable discretion. Any capital appreciation will be incidental. The
Fund will seek to achieve its primary investment objective by investing at least 70% of its total assets at any one
time in a combination of debt and loan securities (including credit-linked securities) of corporations and
governments (including any agency of government or central bank) of any member state of the Organisation for
Economic Co-operation and Development (“OECD”) and of any developing or emerging markets. Please refer to
the Prospectus for the full investment objective and policy.
How the Fund is managed
The Manager of the Trust, Baring International Fund Managers (Ireland) Limited, has appointed Baring Asset
Management Limited as the Investment Manager of the Fund. Under the terms of the Sub-Investment
Management Agreement, dated 22 February 2017, the Investment Manager appointed both Barings LLC and
Barings (U.K.) Limited as Sub-Investment Manager to provide discretionary investment management and
advisory services to the Fund. Barings LLC and Barings (U.K.) Limited each have extensive investment expertise
in high yield securities, which supports the Fund’s strategy and enables the Fund’s investors to benefit from their
extensive investment platforms, resources and experience across high yield investment capabilities.

4
Introduction (continued)
Baring Developed and Emerging Markets High Yield Bond Fund (formerly Baring High Yield Bond Fund)
(continued)
How the Fund is managed (continued)
The Fund invests in high yield bonds in both emerging and developed markets. When investing the Fund’s
assets, the strategy will seek to take advantage of inefficiencies between geographic regions. For example, the
Fund will seek to take advantage of differences in pricing between secured or unsecured, and, either senior or
subordinated debt of an issuer denominated in U.S. dollars and substantially similar debt of the same issuer
denominated in Euros or other currencies, potentially allowing the Fund to achieve a higher relative return for the
same credit risk exposure. In addition, relative value decisions for geographic allocations across the high yield
bond market will be determined using top-down, macro views based upon country economic growth, index
market caps, and country specific risk. Once geographic allocations have been determined, portfolio managers
rely on Barings’ global team of research analysts to select individual bonds based on its fundamental bottom-up
approach to credit.
Risk profile
Changes in exchange rates can have the effect of increasing or decreasing the value of the Fund and any
income generated.
There is no guarantee that a bond issuer will pay the interest due or repay the loan. Bond values are likely to fall
if interest rates rise.
Where a bond market has a low number of buyers and/or a high number of sellers, it may be harder to sell fund
investments at an anticipated price or in a timely manner. This could have a negative impact on the value of your
investment. In extreme conditions, this could affect the Fund’s ability to meet investors’ redemption requests.
Derivative instruments can make a profit or a loss and there is no guarantee that a financial derivative contract
will achieve its intended outcome. The use of derivatives can increase the amount by which the Fund’s value
rises and falls and could expose the Fund to losses that are significantly greater than the cost of the derivative as
a relatively small movement may have a larger impact on derivatives than the underlying assets.
Emerging market countries may have less developed regulation and face more political, economic or structural
challenges than developed countries. This means your money is at greater risk.
The fees and expenses are paid out of capital. This will constrain capital growth and may erode capital.
Losses may occur if an organisation through which we buy an asset (such as a bank) fails to meet its obligations.
Please refer to the Prospectus for the full risk profile.
Baring Eastern Europe Fund
Investment objective and policy
The investment objective of the Baring Eastern Europe Fund (“the Fund”) is to achieve long-term capital
appreciation through investment in a diversified portfolio of securities of issuers located in or with a significant
exposure to the emerging markets of Europe. The Fund will seek to achieve its investment objective by investing
at least 70% of its total assets at any one time in equities and equity-related securities, such as convertible
bonds and warrants, of companies incorporated in, or exercising the predominant part of their economic activity
in, Armenia, Azerbaijan, Belarus, Kazakhstan, Kyrgyzstan, Moldova, Russia, Tajikistan, Turkmenistan, Ukraine
and Uzbekistan (“Commonwealth of Independent States”) and in other emerging European countries such as
Albania, Bulgaria, Bosnia and Herzegovina, Croatia, the Czech Republic, Estonia, Georgia, Hungary, Kosovo,
Latvia, Lithuania, Macedonia, Montenegro, Poland, Romania, Serbia, Slovenia, Slovakia and Turkey. Please
refer to the Prospectus for the full investment objective and policy.

5
Introduction (continued)
Baring Eastern Europe Fund (continued)
How the Fund is managed
The Manager of the Trust, Baring International Fund Managers (Ireland) Limited, has appointed Baring Asset
Management Limited as the Investment Manager of the Fund.
The equity investment teams at Baring Asset Management Limited share a philosophy of Growth at a
Reasonable Price (“GARP”), founded on a rigorous research discipline which they believe gives an advantage
over opportunistic styles. Fundamental company research is focused on identifying long-term growth
opportunities which are reasonably priced. Individual investments are then combined to construct a disciplined
and relatively concentrated portfolio of the most attractive companies.
Risk profile
Changes in exchange rates between the currency of the Fund and the currencies in which the assets of the Fund
are valued can have the effect of increasing or decreasing the value of the Fund and any income generated.
Derivative instruments can make a profit or a loss and there is no guarantee that a financial derivative contract
will achieve its intended outcome. The use of derivatives can increase the amount by which the Fund’s value
rises and falls and could expose the Fund to losses that are significantly greater than the cost of the derivative as
a relatively small movement may have a larger impact on derivatives than the underlying assets.
Emerging markets or less developed countries may face more political, economic or structural challenges than
developed countries. Coupled with less developed regulation, this means your money is at greater risk.
Regional Funds have a narrower focus than those which invest broadly across markets and are therefore
considered to be more risky.
Losses may occur if an organisation through which we buy an asset (such as a bank) fails to meet its obligations.
Please refer to the Prospectus for the full risk profile.
Baring Global Leaders Fund
Investment objective and policy
The investment objective of the Baring Global Leaders Fund (“the Fund”) is to achieve long-term capital growth
by investing in equities listed or traded on a wide range of international markets. The Fund will seek to achieve
its investment objective by investing at least 70% of its total assets at any one time in equities and equity-related
securities listed or traded on a wide range of international markets. Please refer to the Prospectus for the full
investment objective and policy.
How the Fund is managed
The Manager of the Trust, Baring International Fund Managers (Ireland) Limited, has appointed Baring Asset
Management Limited as the Investment Manager of the Fund.
The Baring Global Leaders Fund comprises Barings’ Global Sector and Regional Research Teams’ best ideas
from all around the world. The expertise of Barings’ Strategic Policy Group is also drawn on in allocating
investments by region and industry sector.
Risk profile
Changes in exchange rates between the currency of the Fund and the currencies in which the assets of the Fund
are valued can have the effect of increasing or decreasing the value of the Fund and any income generated.
Derivative instruments can make a profit or a loss and there is no guarantee that a financial derivative contract
will achieve its intended outcome. The use of derivatives can increase the amount by which the Fund’s value
rises and falls and could expose the Fund to losses that are significantly greater than the cost of the derivative as
a relatively small movement may have a larger impact on derivatives than the underlying assets.
Emerging markets or less developed countries may face more political, economic or structural challenges than
developed countries. Coupled with less developed regulation, this means your money is at greater risk.

6
Introduction (continued)
Baring Global Leaders Fund (continued)
Risk profile (continued)
The Fund can hold smaller company shares which can be more difficult to buy and sell as they may trade
infrequently and in small volumes, so their share prices may fluctuate more than those of larger companies.
Losses may occur if an organisation through which we buy an asset (such as a bank) fails to meet its obligations.
Please refer to the Prospectus for the full risk profile.
Baring Global Resources Fund
Investment objective and policy
The investment objective of the Baring Global Resources Fund (“the Fund”) is to achieve long-term capital
appreciation through investment in a diversified portfolio of the securities of commodity producers, being
companies engaged in the extraction, production, processing and/or trading of commodities e.g. oil, gold,
aluminium, coffee and sugar. Baring Asset Management Limited (“the Investment Manager”) will identify
worldwide commodities experiencing, or expected to experience, strong demand growth, and select appropriate
companies for analysis and possible investment. Please refer to the Prospectus for the full investment objective
and policy.
How the Fund is managed
The Manager of the Trust, Baring International Fund Managers (Ireland) Limited, has appointed Baring Asset
Management Limited as the Investment Manager of the Fund.
At Barings, a philosophy of Growth at a Reasonable Price (“GARP”) investing is followed. This philosophy seeks
to discover unrecognised growth investments that are believed to deliver positive earnings surprises over a 2-3
year investment horizon. This flexible approach, sensitive to the stage of the economic cycle and the conditions
prevailing in the markets at any given time, leads to superior long-term results. A consistent qualitative and
quantitative research approach is followed in order to identify companies and sectors that are likely to produce
above-average investment performance. This fundamental research framework encompasses three broad
factors which help identify the key drivers of investment performance, namely quality (of franchise, of
management and of balance sheet), growth (historic and longer-term forward) and valuation (relative and
absolute). Each of these factors is assessed by specialists at the company level in order to identify the most
attractive investment opportunities, which are scored to reflect the conviction of the specialists. Careful risk
management and portfolio construction is also an integral part of the process. Barings’ proprietary risk analysis
system goes beyond tracking errors and stock and sector limits, to consider style factor exposures with Value at
Risk (“VaR”) analysis.
Risk profile
Changes in exchange rates between the currency of the Fund and the currencies in which the assets of the Fund
are valued can have the effect of increasing or decreasing the value of the Fund and any income generated.
Derivative instruments can make a profit or a loss and there is no guarantee that a financial derivative contract
will achieve its intended outcome. The use of derivatives can increase the amount by which the Fund’s value
rises and falls and could expose the Fund to losses that are significantly greater than the cost of the derivative as
a relatively small movement may have a larger impact on derivatives than the underlying assets.
Emerging markets or less developed countries may face more political, economic or structural challenges than
developed countries. Coupled with less developed regulation, this means your money is at greater risk.
The Fund can hold smaller company shares which can be more difficult to buy and sell as they may trade
infrequently and in small volumes, so their share prices may fluctuate more than those of larger companies.
The value of commodities and the companies involved can be significantly affected by world events, trade
controls, political and economic conditions, international energy conservation, the success of explorations
projects, tax and other government regulations.
Losses may occur if an organisation through which we buy an asset (such as a bank) fails to meet its obligations.
Please refer to the Prospectus for the full risk profile.

7
Independent Auditors’ report to the unitholders of the Funds of Baring Global Umbrella
Fund
Report on the financial statements
Our opinion
In our opinion, Baring Global Umbrella Fund’s financial statements (the “financial statements”):
• give a true and fair view of the Funds’ assets, liabilities and financial position as at 30 April 2017 and of their
results for the year then ended;
• have been properly prepared in accordance with Generally Accepted Accounting Practice in Ireland; and
• have been properly prepared in accordance with the requirements of the European Communities
(Undertakings for Collective Investment in Transferable Securities) Regulations 2011 (as amended).
What we have audited
The financial statements, included within the Annual Report and Audited Financial Statements, comprise:
• the Balance sheet as at 30 April 2017;
• the Profit and loss account for the year then ended;
• the Statement of changes in net assets attributable to holders of redeemable participating units for the year
then ended;
• the Portfolio statement for each of the Funds as at 30 April 2017; and
• the notes to the financial statements for each of its Funds which include a summary of significant accounting
policies and other explanatory information.
The financial reporting framework that has been applied in the preparation of the financial statements is Irish law
and accounting standards issued by the Financial Reporting Council and promulgated by the Institute of
Chartered Accountants in Ireland (Generally Accepted Accounting Practice in Ireland), including FRS 102 “The
Financial Reporting Standard applicable in the UK and Republic of Ireland”.
In applying the financial reporting framework, the manager has made a number of subjective judgements, for
example in respect of significant accounting estimates. In making such estimates, the manager has made
assumptions and considered future events.
Responsibilities for the financial statements and the audit
Our responsibilities and those of the manager
As explained more fully in the Statement of Manager's responsibilities set out on page 9 the manager is
responsible for the preparation of the financial statements giving a true and fair view.
Our responsibility is to audit and express an opinion on the financial statements in accordance with Irish law and
International Standards on Auditing (UK and Ireland). Those standards require us to comply with the Auditing
Practices Board’s Ethical Standards for Auditors.
This report, including the opinion, has been prepared for and only for the unitholders of each of the Funds as a
body and for no other purpose. We do not, in giving this opinion, accept or assume responsibility for any other
purpose or to any other person to whom this report is shown or into whose hands it may come save where
expressly agreed by our prior consent in writing.

8
Independent Auditors’ report to the unitholders of the Funds of Baring Global Umbrella
Fund (continued)
What an audit of financial statements involves
We conducted our audit in accordance with International Standards on Auditing (UK and Ireland). An audit
involves obtaining evidence about the amounts and disclosures in the financial statements sufficient to give
reasonable assurance that the financial statements are free from material misstatement, whether caused by
fraud or error. This includes an assessment of:
• whether the accounting policies are appropriate to the Funds’ circumstances and have been consistently
applied and adequately disclosed;
• the reasonableness of significant accounting estimates made by the manager; and
• the overall presentation of the financial statements.
We primarily focus our work in these areas by assessing the manager’s judgements against available evidence,
forming our own judgements, and evaluating the disclosures in the financial statements.
We test and examine information, using sampling and other auditing techniques, to the extent we consider
necessary to provide a reasonable basis for us to draw conclusions. We obtain audit evidence through testing
the effectiveness of controls, substantive procedures or a combination of both.
In addition, we read all the financial and non-financial information in the Annual Report and Audited Financial
Statements to identify material inconsistencies with the audited financial statements and to identify any
information that is apparently materially incorrect based on, or materially inconsistent with, the knowledge
acquired by us in the course of performing the audit. If we become aware of any apparent material
misstatements or inconsistencies we consider the implications for our report.
Pat Candon
for and on behalf of PricewaterhouseCoopers
Chartered Accountants and Statutory Audit Firm
Dublin
21 August 2017

9
Statement of Manager’s responsibilities
Baring International Fund Managers (Ireland) Limited (“the Manager”) is required by the European Communities
(Undertakings for Collective Investment in Transferable Securities) Regulations 2011 (as amended) (“the UCITS
Regulations”) to prepare financial statements for each financial year. The Manager has elected to prepare these
financial statements in accordance with Financial Reporting Standard 102 (“FRS 102”), the financial reporting
standard applicable in the UK and Republic of Ireland to give a true and fair view of the state of affairs of the
Baring Global Umbrella Fund (“the Trust”) at the year end, and of the results and movements in net assets for
the year then ended. In preparing these financial statements, the Manager must:
select and consistently apply suitable accounting policies;
make judgements and estimates that are reasonable and prudent; and
prepare the financial statements on the going concern basis unless it is inappropriate to presume that the
Trust will continue in operation.
The financial statements must comply with the disclosure requirements of the UCITS Regulations. The Manager
is responsible for keeping adequate accounting records which disclose with reasonable accuracy at any time the
financial position of the Trust and enable it to ensure that the financial statements comply with the UCITS
Regulations. The Manager is also responsible for taking reasonable steps for the prevention and detection of
fraud and other irregularities.
The financial statements are published at www.barings.com. The Directors together with the Manager and
Investment Manager are responsible for the maintenance and integrity of the website as far as it relates to
Barings funds. Legislation in the Republic of Ireland governing the presentation and dissemination of the
financial statements may differ from legislation in other jurisdictions.
Transactions with connected persons
Any transaction carried out with the Trust by a management company or Depositary to the Trust, the delegates
or sub-delegates of the management company or Depositary, and any associate or group of such a
management company, Depositary, delegate or sub-delegate (“connected persons”) must be carried out as if
negotiated at arm’s length. Transactions must be in the best interests of the unitholders.
The Directors of the Manager are satisfied that there are arrangements (evidenced by written procedures) in
place to ensure that the obligations set out in Regulation 41(1) of the Central Bank UCITS Regulations are
applied to all transactions with connected persons, and are satisfied that transactions with connected persons
entered into during the year complied with the obligations set out in Regulation 41(1) of the Central Bank UCITS
Regulations.
Remuneration code
The UCITS V provisions require Management Companies to establish and apply remuneration policies and
practices that promote sound and effective risk management, and do not encourage risk taking which is
inconsistent with the risk profile of the UCITS.
The Manager has a Remuneration Policy in place, details of which are available on the Barings website at
www.baring.com/remuneration.
The purpose of the Manager’s remuneration policy is to seek to ensure that the remuneration arrangements of
“Identified Staff”:
(i) are consistent with and promote sound and effective risk management and do not encourage risk-taking
which is inconsistent with the risk profile, rules or instruments of incorporation of the Manager or any fund
which the Manager is the manager of; and
(ii) are consistent with the Manager’s business strategy, objectives, values and interests and include
measures to avoid conflicts of interest.
The Manager has a business model, policies and procedures which by their nature do not promote excessive
risk taking and which take account of the nature, scale and complexity of the Manager and any of the Funds.
Please see the remuneration disclosure in Appendix 4.

10
Manager’s statement
The financial statements were approved by the Directors of the Manager, Baring International Fund Managers
(Ireland) Limited, on 21 August 2017 and signed on its behalf by:
Directors
David Conway Barbara Healy 21 August 2017

11
Report of the Depositary to the unitholders for the year ended 30 April 2017
We, Northern Trust Fiduciary Services (Ireland) Limited, appointed Depositary to Baring Global Umbrella Fund
(“the Trust”) provide this report solely in favour of the unitholders of the Fund for the year ended 30 April 2017,
(“the Annual Accounting Period”). This report is provided in accordance with the UCITS Regulations – European
Communities (Undertakings for Collective Investment in Transferable Securities) Regulations 2011 (SI No 352 of
2011), which implemented Directive 2009/65/EU into Irish Law (“the Regulations”). We do not, in the provision of
this report, accept nor assume responsibility for any other purpose or person to whom this report is shown.
In accordance with our Depositary obligation as provided for under the Regulations, we have enquired into the
conduct of the Trust for this Annual Accounting Period and we hereby report thereon to the unitholders of the
Trust as follows:
Opinion
We are of the opinion that the Trust has been managed during the Annual Accounting Period, in all material
respects:
(i) in accordance with the limitations imposed on the investment and borrowing powers of the Depositary by the
constitutional documents and by the Regulations; and
(ii) otherwise in accordance with the provisions of the constitutional document and the Regulations.
__________________________________________
For and on behalf of 21 August 2017
Northern Trust Fiduciary Services (Ireland) Limited
Georges Court
54-62 Townsend Street
Dublin 2
Ireland

12
Key changes during the year
Baring High Yield Bond Fund changed its name to Baring Developed and Emerging Markets High Yield Bond
Fund with effect from 23 February 2017 and appointed Barings LLC and Barings (U.K.) Limited as the Sub-
Investment Manager.
Oliver Burgel was appointed Director of Baring International Fund Managers (Ireland) Limited (“the Manager”)
with effect from 29 November 2016.
John Burns has resigned from his position as Director of the Manager with effect from 9 December 2016.
Nicola Hayes has resigned from her position as Director of the Manager with effect from 18 December 2016.
Barbara Healy was appointed Director of the Manager with effect from 9 February 2017.
Julian Swayne was appointed Director of the Manager with effect from 9 February 2017.
From 1 April 2017 the Funds currently listed will transfer their Irish Stock Exchange (“ISE”) listing from the ISE
Main Securities Market (“MSM”) to be listed on the ISE Global Exchange Market.

13
Baring Developed and Emerging Markets High Yield Bond Fund (formerly Baring High Yield
Bond Fund) - Investment Manager’s report - Unaudited
Performance
The Fund’s positive returns during the period were driven by strong outperformance in the Energy and Metals &
Mining sectors and lower rated credits. While we remain selective within the commodity dependent industries,
we have increased our allocation to Energy in both the developed and emerging markets over the period as the
sector has surged from its early 2016 lows. In addition, we have increased our allocation to emerging markets as
a whole by opportunistically adding to favoured issuers during periods of weakness, particularly during the first
quarter of 2017. Notable positions we have built in the emerging markets space include Petrobras, a semi-public
Brazilian multinational petroleum corporation and our largest emerging markets allocation at approximately 2% of
the Fund, as well as other large energy-focused issuers like Kosmos Energy, Tullow Oil, and Topaz Marine.
From a ratings perspective, we continue to favour single-B and triple-C rated credits over double-B rated credits,
finishing the period with larger allocations relative to the market in single-B’s and triple-C’s and less exposure to
double-B’s relative to the market, a strategy that has proven well placed to capture the market’s shift toward risk
that dominated the period. For context, the market saw returns for double-B’s of approximately 9.5% over the
period, returns for single-B’s of approximately 14.1%, and returns for triple-C’s of approximately 24.5%. While
lower-rated credits rallied largely indiscriminately for much of 2016 and early 2017, producing outsized returns
for the performance comparator, we remain particularly selective further down the ratings hierarchy, a strategy
that protects the Fund from much of the downside during periods when lower-rated bonds experience weakness,
as was the case in March.
Market outlook
Going forward, we expect geopolitical news, oil price volatility, and rates to remain key inflection points for the
market. Thus far, the market has digested multiple major and unprecedented political events without
experiencing any material correction. The market’s first curve ball over the period came when the United
Kingdom delivered a surprise vote to leave the European Union, creating significant uncertainty throughout
Europe and prompting currency volatility in the days following the vote. While much remains unknown about the
final terms of the Brexit agreement, markets have handled the announcement better than most expected and
remained orderly following the news. The market’s second major shock came in November with the surprise
election of Donald Trump as the next President of the United States and a Republican sweep of both houses of
Congress. Here again the market has remained undeterred by the hostile and chaotic political environment that
has marked the early months of the administration, choosing instead to focus on the prospects of a more
business-friendly regulatory and tax policy.
Outside of the political sphere, the fundamental picture for risk assets also steadily improved over the period with
data around corporate earnings, unemployment, consumer sentiment, and oil prices all showing strength,
despite increased volatility in oil in recent days. In addition, the improving economic picture coupled with rising
markets and hawkish rhetoric out of the Federal Reserve point to an end to the record low interest rates in the
U.S. that have become the norm around the globe. Despite action from the Federal Reserve, the European
Central Bank is expected to continue its accommodative policies in the near term, creating a divergence in
monetary policy between the developed markets. Outside of the developed world, issuers in emerging markets
remain a case-by-case situation with few distinct macro trends shaping the broader story. Despite political
uncertainty around the world, corporate fundamentals remain sound, we expect default volume to continue to
decrease over the year, and view any pullback or volatility in the markets as an opportunity to add to high
conviction issuers and sectors.
Barings LLC and Barings (U.K.) Limited appointed as Sub-Investment Manager by Baring Asset Management Limited. May 2017
Baring Asset Management Limited (“the Investment Manager”) gives its portfolio managers full authority to manage their funds as they see fit, within the established guidelines set down. This includes the views that managers may take of the markets and sectors they invest in, which may differ from the views of other Barings portfolio managers.
14
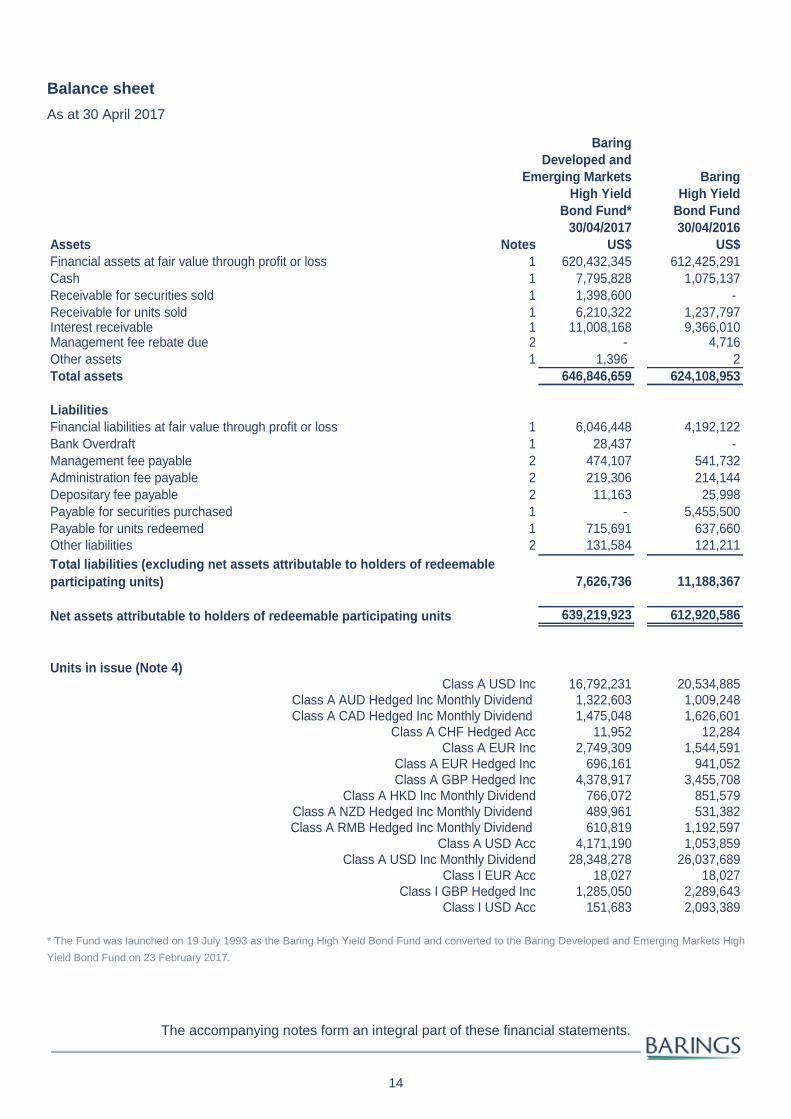
Balance sheet
As at 30 April 2017
Baring
Developed and
Emerging Markets Baring
High Yield High Yield
Bond Fund* Bond Fund
30/04/2017 30/04/2016
Assets Notes US$ US$
Financial assets at fair value through profit or loss 1 620,432,345 612,425,291
Cash 1 7,795,828 1,075,137
Receivable for securities sold 1 1,398,600 -
Receivable for units sold 1 6,210,322 1,237,797Interest receivable 1 11,008,168 9,366,010Management fee rebate due 2 - 4,716
Other assets 1 1,396 2
Total assets 646,846,659 624,108,953
Liabilities
Financial liabilities at fair value through profit or loss 1 6,046,448 4,192,122
Bank Overdraft 1 28,437 -
Management fee payable 2 474,107 541,732
Administration fee payable 2 219,306 214,144
Depositary fee payable 2 11,163 25,998
Payable for securities purchased 1 - 5,455,500
Payable for units redeemed 1 715,691 637,660
Other liabilities 2 131,584 121,211
Total liabilities (excluding net assets attributable to holders of redeemable
participating units) 7,626,736 11,188,367
Net assets attributable to holders of redeemable participating units 639,219,923 612,920,586
Units in issue (Note 4)
16,792,231 20,534,8851,322,603 1,009,2481,475,048 1,626,601
11,952 12,2842,749,309 1,544,591
696,161 941,0524,378,917 3,455,708
766,072 851,579489,961 531,382610,819 1,192,597
4,171,190 1,053,85928,348,278 26,037,689
18,027 18,0271,285,050 2,289,643
151,683 2,093,389
Class A USD IncClass A AUD Hedged Inc Monthly Dividend Class A CAD Hedged Inc Monthly Dividend
Class A CHF Hedged AccClass A EUR Inc
Class I GBP Hedged IncClass I USD Acc
Class A EUR Hedged Inc
Class I EUR Acc
Class A GBP Hedged IncClass A HKD Inc Monthly Dividend
Class A NZD Hedged Inc Monthly Dividend
Class A USD AccClass A USD Inc Monthly Dividend
Class A RMB Hedged Inc Monthly Dividend
* The Fund was launched on 19 July 1993 as the Baring High Yield Bond Fund and converted to the Baring Developed and Emerging Markets High
Yield Bond Fund on 23 February 2017.
The accompanying notes form an integral part of these financial statements.

15
Statement of changes in net assets attributable to holders of redeemable participating units
For the year ended 30 April 2017
Baring
Developed and
Emerging Markets Baring
High Yield High Yield
Bond Fund* Bond Fund
30/04/2017 30/04/2016
Note US$ US$
Net assets attributable to holders of redeemable participating units at the
beginning of the year 612,920,586 881,780,483
Increase/(decrease) in assets for the year from operations attributable to holders
of redeemable participating units 22,141,857 (91,168,050)
Issue of redeemable participating units for the year 313,288,400 347,500,824
Redemption of redeemable participating units for the year (309,189,989) (523,935,210)
Income equalisation 3 59,069 (1,257,461) Net assets attributable to holders of redeemable participating units at the
end of the year 639,219,923 612,920,586
* The Fund was launched on 19 July 1993 as the Baring High Yield Bond Fund and converted to the Baring Developed and Emerging Markets High
Yield Bond Fund on 23 February 2017.
The accompanying notes form an integral part of these financial statements.

16
Profit and loss account
For the year ended 30 April 2017
Baring
Developed and
Emerging Markets Baring
High Yield High Yield
Bond Fund* Bond Fund
30/04/2017 30/04/2016
Investment income Notes US$ US$
Interest income 1 36,549,403 43,862,877
Net fair value gain/(loss) on financial assets and at fair value through profit or
loss 1 26,355,512 (81,073,354)
Management fee rebate 2 18,178 28,712
Total investment income/(expense) 62,923,093 (37,181,765)
Expenses
Management fees 2 6,013,250 6,824,808
Administration fees 2 2,777,244 3,157,083
Depositary fees 2 140,319 171,667
General expenses 2 155,070 132,814
Total operating expenses 9,085,883 10,286,372
Net income/(expense) before finance costs 53,837,210 (47,468,137)
Finance costs
Distributions 3 (31,692,649) (43,696,432)
Bank interest expense (2,704) (3,481)
Total finance costs (31,695,353) (43,699,913)
Increase/(decrease) in net assets for the period attributable to holders of
redeemable participating units 22,141,857 (91,168,050)
Gains and losses arose solely from continuing operations. There were no gains or losses other than those dealt with in the profit and loss account.
* The Fund was launched on 19 July 1993 as the Baring High Yield Bond Fund and converted to the Baring Developed and Emerging Markets High
Yield Bond Fund on 23 February 2017.
The accompanying notes form an integral part of these financial statements.

17
Baring Eastern Europe Fund – Investment Manager’s report
Performance
From a global perspective, emerging markets had to come to terms with the implications that the Trump victory
in the US presidential elections cast over global trade relations. While the fear of a more pronounced
protectionist global framework was counterbalanced by the fiscally reflationary approach pursued by key policy
makers in the new US cabinet, the implication for emerging European stock markets, and specifically for Russia,
were more politically charged. The assumption that a Trump administration would opt for a more lenient policy
approach towards Russia galvanised the stock market in the immediate aftermath of the US election results,
propelling the Moscow Index up by more than 20% in USD terms in the seven weeks from US elections to year
end. The Turkish equity market, on the other hand, suffered from a rapid devaluation of the Turkish lira as global
markets started to price rising inflation expectations and interest rates.
While Baring Eastern Europe Fund’s (“the Fund’s”) portfolio has been benefiting from diversification effects,
keeping overall volatility low, emerging European markets did not feel tranquil to most participants. The reason
being, key currencies such as the Polish zloty, the Turkish lira and the Russian rouble fluctuated considerably
over the period and contributed or detracted the lion’s share of the relevant USD performance. In the case of the
Russian rouble, markets remained impressed by the strictly orthodox policy stance of the Russian Central Bank
under Governor Nabiullina, who, determined to anchor inflation expectations, kept monetary policy tight even as
the macroeconomic recovery only started to improve slowly. The subsequent double-digit rouble appreciation set
the tone for Russian assets over the course of last year, thereby generating a substantial part of the overall
performance of the Russian stock market. In contrast, Murat Centinkaya’s first year of tenure as Governor of the
Central Bank of Turkey (“CBoT”) proved to be an especially testing period as political interference in the run-up
to the presidential referendum in April 2017 had markets question the CBoT’s very mandate. Only when the
CBoT started to act decisively by tightening liquidity and hiking rates in January did the Turkish lira gain footing,
paving the way for a substantial rebound in asset prices in the Turkish market.
A bit surprisingly, international investors’ attitude towards the Polish equity market changed dramatically over the
period of the last year, mainly on the back of a tremendous performance in the first quarter of 2017. Indeed, the
Warsaw Stock Exchange’s sudden change of fortune serves as a reminder of how fast emerging European
equity markets can rise (or fall) in the investors’ appreciation. Previously scorned for the heavy-handed approach
of ruling right-wing party PiS, it took only a somewhat softer regulatory approach together with the first signs of
market consolidation in the Banking sector to shift investors’ attention back to what remains one of the most
successful European economies with vibrant domestic demand and a booming export sector.
Market outlook
The economic backdrop in most emerging European economies strengthened recently and makes us look
optimistically towards 2017. Sentiment indicators such Purchasing Managers’ Indices both in Central Europe and
Russia improved on the back of healthy growth in Western European markets and stable oil prices. Turkey, on
the other side, has seen a substantial adjustment in asset prices over the last quarter of 2016, which sets the bar
for positive economic and political surprises relatively low, especially after the political uncertainty related to the
presidential referendum in April will be out of the way. Further, we sense that the trend of improving corporate
governance standards in emerging European equity markets are here to stay, a view that is supported by
increasing payout ratios. Also, we note that the successful share price performance over the last quarter seems
fully driven by rising earnings and dividends – in other words, emerging European equity valuations remain
attractive on a relative comparison and, as we think, offer further upside.
Baring Asset Management Limited.
May 2017
Baring Asset Management Limited (“the Investment Manager”) gives its portfolio managers full authority to manage their funds as they see fit, within
the established guidelines set down. This includes the views that managers may take of the markets and sectors they invest in, which may differ
from the views of other Barings portfolio managers.

18
Balance sheet
As at 30 April 2017
Baring Baring
Eastern Eastern
Europe Fund Europe Fund
30/04/2017 30/04/2016
Assets Notes US$ US$
Financial assets at fair value through profit or loss 1 1,045,221,688 975,788,161
Cash 1 2,334,699 279,162
Receivable for securities sold 1 1,586,290 51,500
Receivable for units sold 1 830,486 272,175
Dividends and interest receivable 1 2,254,198 1,689,711
Management fee rebate due 2 12,148 10,230
Other assets 1 1,427 4,219
Total assets 1,052,240,936 978,095,158
Liabilities
Management fee payable 2 1,164,198 1,114,790
Administration fee payable 2 350,087 334,809
Depositary fee payable 2 16,420 38,691
Payable for securities purchased 1 - 2,024,017
Payable for units redeemed 1 1,420,685 867,710
Other liabilities 2 252,639 402,170
Total liabilities (excluding net assets attributable to holders of
redeemable participating units) 3,204,029 4,782,187
Net assets attributable to holders of redeemable participating units 1,049,036,907 973,312,971
- 0
Units in issue (Note 4)
Class A USD Inc 9,811,188 11,390,750
Class A EUR Inc 2,435,107 2,615,772
Class A GBP Inc 16,264 19,529
Class A USD Acc 604,783 4,614
Class I EUR Acc 10 10
Class I GBP Acc 34,316 9,359
Class I USD Acc 14,937 15,082
Class I EUR Inc 10 190
Class I GBP Inc 7,770 169
Class I USD Inc 686 686
The accompanying notes form an integral part of these financial statements.

19
Statement of changes in net assets attributable to holders of redeemable participating units
For the year ended 30 April 2017
Baring Baring
Eastern EasternEurope Fund Europe Fund
30/04/2017 30/04/2016
Note US$ US$
Net assets attributable to holders of redeemable participating units at the
beginning of the year 973,312,971 1,108,111,158Increase/(decrease) in net assets for the year from operations attributable to
holders of redeemable participating units 156,787,651 (92,483,823)
Issue of redeemable participating units for the year 158,387,458 135,524,453
Redemption of redeemable participating units for the year (238,741,731) (177,414,665)
Income equalisation 3 (709,442) (424,152)Net assets attributable to holders of redeemable participating units at the
end of the year 1,049,036,907 973,312,971
The accompanying notes form an integral part of these financial statements.

20
Profit and loss account
For the year ended 30 April 2017
Baring Baring
Eastern Eastern
Europe Fund Europe Fund
30/04/2017 30/04/2016
Investment income Notes US$ US$
Interest income 1 1,981 2,258
Dividend income 1 36,183,443 34,573,599
Net profit/(loss) on financial assets at fair value through profit or loss 1 154,138,069 (87,975,955)
Management fee rebate due 2 37,536 28,588
Total investment income/(expense) 190,361,029 (53,371,510)
Expenses
Management fees 2 14,563,661 13,631,598
Administration fees 2 4,375,925 4,094,156
Depositary fees 2 200,531 212,184
General expenses 2 162,072 181,677
Total operating expenses 19,302,189 18,119,615
Net income/(expense) before finance costs and tax 171,058,840 (71,491,125)
Finance costs
Distributions 3 (10,648,252) (16,619,776)
Bank interest expense 1 (2,168) (1,665)
Total finance costs (10,650,420) (16,621,441)
Profit/(loss) for the financial year before tax 160,408,420 (88,112,566)
Tax
Withholding tax on dividends and other investment income (3,620,769) (4,371,257)
Total tax (3,620,769) (4,371,257)
156,787,651 (92,483,823)
Increase/(decrease) in net assets for the year from operations attributable to
holders of redeemable participating units
Gains and losses arose solely from continuing operations. There were no gains or losses other than those dealt
with in the profit and loss account.
The accompanying notes form an integral part of these financial statements.

21
Baring Global Leaders Fund – Investment Manager’s report - Unaudited
Performance
Global equities rose strongly during the period under review, and though Baring Global Leaders Fund (“the Fund”)
also rose strongly, it underperformed somewhat relative to the performance comparator.
Our Information Technology investments were amongst the strongest contributors to overall performance,
delivering strong positive returns over the year. Israeli automobile vision systems company Mobileye, Dutch
semiconductor equipment manufacturer ASML and German electronic payments provider Wirecard all delivered
strong positive returns over the year. We also had good positive returns from US regional bank SVB Financial
Group.
These positive areas in the portfolio were offset somewhat by some of our other investments. US drug store and
pharmaceutical benefits provider CVS Corporation, UK listed hospital operator Mediclinic, US retailer Tractor
Supply Company and US medical clinic operator Acadia Healthcare were the weakest contributors to our portfolio.
Market outlook
The strength of the markets over the past year was the triumph of reasonable valuations and moderate economic
growth over political risk.
The United States’ equity market performance was influenced by the incoming Trump administration as the market
digested the implications of his agenda. His pro-business policies of lower taxation, lower regulation and
infrastructure spending were initially good for equities; however, as the year has progressed, and with President
Trump's failure to enact healthcare reform, questions have arisen over his ability to deliver this agenda.
Political risk continues to attract much commentary, and for good reason. How events unfold with regard to Syria,
the Korean peninsula, Brexit discussions, various elections, the Russian hacking claims and the Trump presidency
can have an impact on investor sentiment and markets.
However, these political events are difficult to predict and, moreover, even if you could predict them, their impact
on equity markets often cannot be determined. So, we are not ignoring politics, but instead trying to avoid portfolio
holdings where political risk is not priced in or where the share price performance is too dependent on a given
political outcome.
Our view is that economic growth has remained weak throughout the recovery post the global financial crisis.
Thankfully, inflation has been low, with the effect that weak economic growth has been met with ultra-low interest
rates resulting in a rising equity market. It would be rising inflation without a corresponding rise in real growth that
we would fear most of all.
Fortunately, the best way to mitigate that risk is to own companies with pricing power, and that is very much what
our focus on seeking companies with good end markets is about. This focus has the added benefit of often
identifying good investments regardless of the economic environment.
It has been a good year for global equities, but despite the share price movements to date we continue to find
companies that meet our investment criteria of quality, growth and reasonable prices.
Baring Asset Management Limited.
May 2017
Baring Asset Management Limited (“the Investment Manager”) gives its portfolio managers full authority to manage their funds as they see fit, within
the established guidelines set down. This includes the views that managers may take of the markets and sectors they invest in, which may differ from
the views of other Barings portfolio managers.

22
Balance sheet
As at 30 April 2017
Baring Baring
Global Global
Leaders Leaders
Fund Fund
30/04/2017 30/04/2016
Assets Notes US$ US$
Financial assets at fair value through profit or loss 1 54,407,043 48,368,978
Cash 1 223,975 43,781
Receivable for units sold 1 - 266
Dividends and interest receivable 1 66,627 119,059
Other assets 1 6,720 6,985
Total assets 54,704,365 48,539,069
Liabilities
Management fee payable 2 58,793 56,619
Administration fee payable 2 18,275 16,374
Depositary fee payable 2 954 1,658
Payable for units redeemed 1 6,138 263,819
Other liabilities 2 39,808 38,692 Total liabilities (excluding net assets attributable to holders of
redeemable units) 123,968 377,162
Net assets attributable to holders of redeemable participating
units 54,580,397 48,161,907
Units in issue (Note 4) Class A USD Inc 2,437,251 2,402,207
Class A EUR Inc 336,169 365,946
Class A GBP Inc 113,473 135,476
Class I USD Acc 209,552 220,550
The accompanying notes form an integral part of these financial statements.

23
Statement of changes in net assets attributable to holders of redeemable participating units
For the year ended 30 April 2017
Baring Baring
Global Global
Leaders Leaders
Fund Fund
30/04/2017 30/04/2016
US$ US$
Net assets attributable to holders of redeemable participating units at
the beginning of the year 48,161,907 50,194,985
Increase/(decrease) in net assets for the year from operations
attributable to holders of redeemable participating units 6,908,461 (4,747,998)
Issue of redeemable participating units for the year 7,518,152 16,451,364
Redemption of redeemable participating units for the year (8,008,157) (13,736,445)
Income equalisation 34 1 Net assets attributable to holders of redeemable participating
units at the end of the year 54,580,397 48,161,907
The accompanying notes form an integral part of these financial statements.

24
Profit and loss account
For the year ended 30 April 2017
Baring Baring
Global Global
Leaders Leaders
Fund Fund
30/04/2017 30/04/2016
Notes US$ US$
Investment income
Bank interest income 1 1,015 76
Dividend income 1 698,020 771,241
Net fair value gain/(loss) on financial assets at fair value through profit
or loss 1 7,351,834 (4,388,177)
Total investment income/(expense) 8,050,869 (3,616,860)
Expenses
Management fees 2 705,886 695,510
Administration fees 2 223,699 215,821
Depositary fees 2 10,509 10,493
General expenses 2 80,461 73,656
Total operating expenses 1,020,555 995,480
Net income/(expense) before finance costs and tax 7,030,314 (4,612,340)
Finance costs
Bank interest expense 1 (149) (71)
Total finance costs (149) (71)
Profit/(loss) for the financial year before tax 7,030,165 (4,612,411)
Tax
Withholding tax on dividends and other investment income (121,704) (135,587)
Total tax (121,704) (135,587)Increase/(decrease) in net assets for the year from operations
attributable to holders of redeemable participating units 6,908,461 (4,747,998)
Gains and losses arose solely from continuing operations. There were no gains or losses other than those dealt with in the profit and loss account.
The accompanying notes form an integral part of these financial statements.

25
Baring Global Resources Fund – Investment Manager’s report - Unaudited
Performance
The Baring Global Resources Fund (“the Fund”) performed well in absolute terms but underperformed the
performance comparator over the reference period. The first half of the reference period saw the majority of the
relative underperformance as the deep value stocks rallied sharply; low price-to-book mining companies were a
particular detractor at the sector level. 2017 has proved to be a better period of relative performance as stock
selection has been positive, most notably in Energy.
At the stock level, Vopak, the European Energy, chemicals logistics and storage company has been the largest
detractor of returns. A pullback in Energy prices has led some to question the longer-term growth prospects of the
business. We continue to believe that structural demand growth in China and Asia coupled with supply growth in
North America and the Middle East will underpin earnings growth in the industry and Vopak should be positioned
to capitalise on this trend. Tupras, the Turkish oil refining company, was also a detractor to relative returns.
Operational issues drove a poor set of results for the company and, with a deteriorating outlook for the company’s
margins and emerging risks to the dividend, we exited the position in Q3 2016.
On the positive side, Albemarle, the US specialty chemicals company, continues to perform well. Ongoing pricing
strength in the lithium market, coupled with the announced sale of the Chemetall Surface Treatment business to
BASF for $3.2 billion, were positives for the share price. In addition, the company provided a comprehensive and
positive outlook for the lithium market which was well received.
Market outlook
While macro events still appear to contribute to day-to-day sector volatility, the deep value rally we saw in 2016,
most notably in Mining, appears to be abating as 2017 progresses. We identify several positive trends over the
Commodity, Consumer and Next Generation Resources areas.
Within the Commodity Resources sectors, Base Metals and Energy prices consolidated after a strong end to 2016
as concerns of tightening fiscal policy in China unwound some of the speculative long positions in these
commodities. However, we see several sectors where equity valuations are already discounting a negative outlook
for pricing and supply-demand balances may be tightening in the future. North American timber, Asian
petrochemicals, potash fertiliser and oil and gas are the main areas where the Fund has exposure in this regard.
Within the Consumer Resources sector there are also varied drivers of earnings growth. Agricultural equipment
appear to be at an inflection point after four years of a down cycle. Building materials in both Europe and the US
also appear to see demand returning while supply may be limited by a combination of permitting issues and
industry discipline. Similarly, the containerboard market in Europe and the US is poised to see margins improve in
2017 and beyond in our opinion.
Within the next generation group of companies the Fund invests in, share prices continue to be volatile and the
Fund has sized positions accordingly. Having modelled new supply on a project-by-project basis, we remain
comfortable with the lithium market fundamentally tightening over the next several years and we do not share
recent market concern that new supply will hurt pricing.
Baring Asset Management Limited.
May 2017
Baring Asset Management Limited (“the Investment Manager”) gives its portfolio managers full authority to manage their funds as they see fit, within
the established guidelines set down. This includes the views that managers may take of the markets and sectors they invest in, which may differ from
the views of other Barings portfolio managers.

26
Balance sheet
As at 30 April 2017
Baring Baring
Global Global
Resources Resources
Fund Fund
30/04/2017 30/04/2016
Assets Notes US$ US$
Financial assets at fair value through profit or loss 1 415,848,346 385,638,120
Cash 1 36,825 -
Receivable for units sold 1 385,457 99,140
Dividends and interest receivable 1 678,811 137,256
Other assets 1 4,627 226
Total assets 416,954,066 385,874,742
Liabilities
Bank overdraft 1 7,597,598 4,754,906
Management fee payable 2 456,458 427,415
Administration fee payable 2 141,129 130,593
Depositary fee payable 2 7,370 15,296
Payable for securities purchased 1 2,016,403 -
Payable for units redeemed 1 267,530 278,494
Other liabilities 2 67,722 68,986
Total liabilities (excluding net assets attributable to holders of
redeemable participating units) 10,554,210 5,675,690
Net assets attributable to holders of redeemable participating
units 406,399,856 380,199,052
Units in issue (Note 4) Class A USD Inc 17,908,230 18,460,610
Class A EUR Inc 2,887,165 2,971,149
Class A GBP Inc 78,066 70,586
Class I GBP Acc 1,301,908 819,013
Class I USD Acc 6,610 10
The accompanying notes form an integral part of these financial statements.

27
Statement of changes in net assets attributable to holders of redeemable participating units
For the year ended 30 April 2017
Baring Baring
Global Global
Resources Resources
Fund Fund
30/04/2017 30/04/2016
Note US$ US$
Net assets attributable to holders of redeemable participating units at the
beginning of the year 380,199,052 468,276,948
Increase/(decrease) in net assets for the year from operations attributable
to holders of redeemable participating units 28,113,720 (82,171,237)
Issue of redeemable participating units for the year 55,589,427 72,441,751
Redemption of redeemable participating units for the year (57,483,621) (78,347,931)
Income equalisation 3 (18,722) (479)Net assets attributable to holders of redeemable participating units at
the end of the year 406,399,856 380,199,052
The accompanying notes form an integral part of these financial statements.
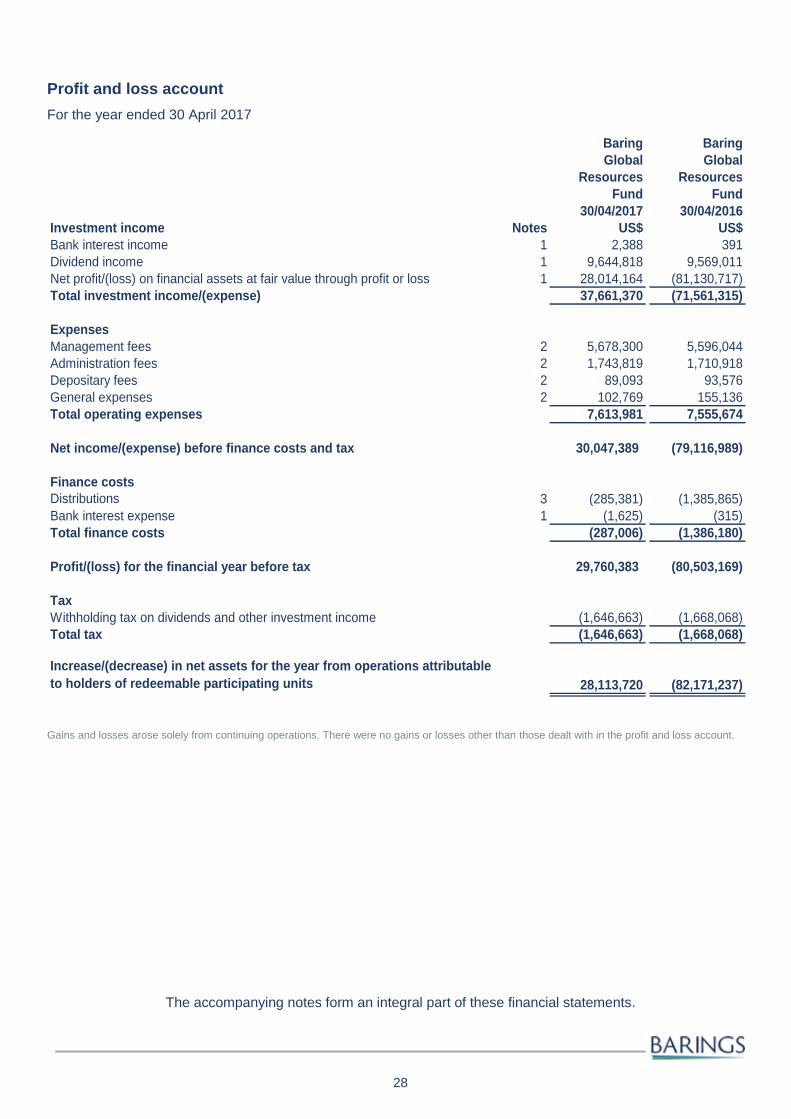
28
Profit and loss account
For the year ended 30 April 2017
Baring Baring
Global Global
Resources Resources
Fund Fund
30/04/2017 30/04/2016
Investment income Notes US$ US$
Bank interest income 1 2,388 391
Dividend income 1 9,644,818 9,569,011
Net profit/(loss) on financial assets at fair value through profit or loss 1 28,014,164 (81,130,717)
Total investment income/(expense) 37,661,370 (71,561,315)
Expenses
Management fees 2 5,678,300 5,596,044
Administration fees 2 1,743,819 1,710,918
Depositary fees 2 89,093 93,576
General expenses 2 102,769 155,136
Total operating expenses 7,613,981 7,555,674
Net income/(expense) before finance costs and tax 30,047,389 (79,116,989)
Finance costs
Distributions 3 (285,381) (1,385,865)
Bank interest expense 1 (1,625) (315)
Total finance costs (287,006) (1,386,180)
Profit/(loss) for the financial year before tax 29,760,383 (80,503,169)
Tax
Withholding tax on dividends and other investment income (1,646,663) (1,668,068)
Total tax (1,646,663) (1,668,068)
Increase/(decrease) in net assets for the year from operations attributable
to holders of redeemable participating units 28,113,720 (82,171,237)
Gains and losses arose solely from continuing operations. There were no gains or losses other than those dealt with in the profit and loss account.
The accompanying notes form an integral part of these financial statements.

29
Notes to the financial statements
1. Principal accounting policies
The principal accounting policies adopted by Baring Global Umbrella Fund (“the Trust”) are as follows:
Basis of preparation
In preparing the financial statements for the year ended 30 April 2017, the Directors of Baring International
Fund Managers (Ireland) Limited (“the Manager”) have applied Financial Reporting Standard 102 ‘The
Financial Reporting Standard applicable in the UK and Republic of Ireland’ (“FRS 102”), and these financial
statements comply with that standard.
These financial statements have been prepared in accordance with FRS 102 and certain provisions of the
European Communities (Undertakings for Collective Investment in Transferable Securities) Regulations 2011
(“the UCITS Regulations”). Accounting standards generally accepted in Ireland in preparing financial
statements giving a true and fair view are those promulgated by the Institute of Chartered Accountants in
Ireland and issued by the Financial Reporting Council (“FRC”).
The preparation of financial statements requires management to make judgements, estimates and
assumptions that affect the application of policies and the reported amounts of assets, liabilities, income and
expenses. The estimates and associated assumptions are based on historical experience and various other
factors that are believed to be reasonable under the circumstances, the results of which form the basis of the
judgements made about carrying values of assets and liabilities that are not readily apparent from other
sources. Actual results may differ from these estimates.
The Trust has availed of the exemption under Section 7 of FRS 102 not to prepare a cash flow statement.
Historical cost convention
The financial statements have been prepared under the historical cost convention as modified by the
revaluation of financial assets and financial liabilities, including derivative financial instruments held at fair
value through profit or loss. The financial statements are prepared on a going concern basis.
Fair value measurement
By fully adopting FRS 102, in accounting for its financial instruments, a reporting entity is required to apply
either a) the full requirements of FRS 102 relating to Basic Financial Instruments and Other Financial
Instruments, b) the recognition and measurement provisions of IAS 39 Financial Instruments: Recognition and
only the disclosure requirements of FRS 102 relating to Basic Financial Instruments and Other Financial
Instruments, or c) the recognition and measurement provisions of IFRS 9 Financial Instruments and only the
disclosure requirements of FRS 102 relating to Basic Financial Instruments and Other Financial Instruments.
The Trust has chosen to implement (b) the recognition and measurement provisions of IAS 39 Financial
Instruments: Recognition and only the disclosure requirements of FRS 102 relating to Basic Financial
Instruments and Other Financial Instruments.
The use of IAS 39 recognition and measurement provisions is in line with the pricing policy set out in the Trust
Deed which outlines that the fair value of financial assets and financial liabilities be valued at the last traded
prices.
Foreign exchange translation
(a) Functional and presentation currency
Items included in the financial statements of the separate Funds of Baring Global Umbrella Fund (“the Funds”)
are measured using the currency of the primary economic environment in which they operate (“the functional
currency”). The functional and presentation currency of the Funds is the US dollar, as the majority of classes
in the Funds are subscribed in US dollars.

30
Notes to the financial statements (continued)
1. Principal accounting policies (continued)
Foreign exchange translation (continued)
(b) Transactions and balances
Foreign currency transactions are translated into the functional currency using the exchange rates prevailing
at the dates of the transactions. Foreign exchange gains and losses resulting from the settlement of such
transactions and from the translation at year-end exchange rates of monetary assets and liabilities
denominated in foreign currencies are recognised in the profit and loss account.
Proceeds from subscriptions and amounts paid on redemption of redeemable participating units are
translated into the functional currency using the exchange rates prevailing at the dates of the transactions.
Financial assets and liabilities at fair value through profit or loss
(a) Classification
The Funds classify their investments as financial assets or financial liabilities at fair value through profit or
loss. These financial assets and financial liabilities are classified as held for trading or designated by the
Directors of the Manager at fair value through profit or loss at inception.
Financial assets or financial liabilities held for trading are those acquired or incurred principally for the
purposes of selling or repurchasing in the short term. Financial assets and financial liabilities designated at
fair value through profit or loss at inception are those that are managed and whose performance is evaluated
on a fair value basis in accordance with the Funds’ documented investment strategies. The Funds’ policy is
for Baring Asset Management Limited (“the Investment Manager”) and the Directors of the Manager to
evaluate the information about these financial assets on a fair value basis together with other related financial
information. These financial assets are expected to be realised within 12 months of the balance sheet date.
(b) Recognition/derecognition
Purchases and sales of investments are recognised on the trade date – the date on which the Funds commit
to purchasing or selling the investment. The financial statements include all the trades received up until the
valuation point for each Fund as disclosed on page 3. Any trades received subsequent to these points are not
reflected in the financial statements.
Investments are de-recognised when the rights to receive cash flows from the investments have expired or
the Funds have transferred substantially all risks and rewards of ownership. Realised gains and losses on
disposals of financial assets and financial liabilities classified as at fair value through profit or loss are
calculated using the First In First Out (“FIFO”) method. They represent the difference between an instrument's
initial carrying amount and disposal amount, or cash payments or receipts made on derivative contracts
(excluding payments or receipts on collateral margin accounts for such instruments).
(c) Measurement
Financial assets and financial liabilities at fair value through profit or loss are initially recognised at fair value.
Transaction costs are included in the net fair value gain/(loss) on financial assets at fair value through profit or
loss in the profit and loss account for each individual Fund. Subsequent to initial recognition, all financial
assets and financial liabilities at fair value through profit or loss are measured at fair value at the relevant
valuation point for each Fund as disclosed on page 3. Gains and losses arising from changes in the fair value
of the financial assets or financial liabilities at fair value through profit or loss category are presented in the
profit and loss account in the year in which they arise.

31
Notes to the financial statements (continued)
1. Principal accounting policies (continued)
Financial assets and liabilities at fair value through profit or loss (continued)
(d) Fair value estimation
Fair value is the price that would be received to sell an asset or paid to transfer a liability in an orderly
transaction between market participants at the measurement date. As a result of the Trust’s decision to
implement the recognition and measurement provisions of IAS 39 Financial Instruments: Recognition and
Measurement, the fair value of financial assets and liabilities traded in active markets (such as publicly traded
derivatives and trading securities) is based on quoted market prices at the Funds valuation point on the
reporting date. The Trust’s fair valuation input utilises the last traded market price for both financial assets and
financial liabilities where the last traded price falls within the bid-ask spread. In circumstances where the last
traded is not within the bid-ask spread, management will determine the point within the bid-ask spread that is
most representative of the fair value.
Fair value pricing (“FVP”) is the application of the Manager’s best estimate of the amount a Fund might
receive on a sale, or expect to pay on a purchase, of one or more securities or even an entire portfolio of
securities, at the time of a Fund's Valuation Point, with the intention of producing a fairer dealing price,
thereby protecting ongoing, incoming and outgoing investors. In the opinion of the Manager, where market
conditions may be such that the last applicable real time quoted price or the Valuation Point does not capture
the best reflection of the buying and selling price of a stock, FVP may be applied.
Due to the time differences between the closing of the relevant securities exchanges and the time of a Fund's
valuation point, a Fund may fair value its investments more frequently than it does other securities and on
some Funds this may occur on a daily basis. The Manager has determined that movements in relevant
indices or other appropriate market indicators, after the close of the securities exchanges, may demonstrate
that market quotations are unreliable and may trigger fair value pricing for certain securities. Therefore the fair
values assigned to a Fund's investments may not be the quoted or published prices of the investments on
their primary markets or exchanges.
The Investment Manager instructed that a fair value reduction be included in the Net Asset Value of Baring
Global Leaders Fund in respect of all Japanese securities held by the Fund at 30 April 2016.
The fair value of financial instruments that are not traded in an active market (for example, over-the-counter
derivatives) is determined by using valuation techniques. The Funds use a variety of methods and make
assumptions that are based on market conditions existing at each balance sheet date. Unquoted investments
are valued in accordance with the most recent valuation made by the Manager. In the absence of a price
being available for a security, the Manager can determine such a valuation where appropriate. Valuation
techniques used include the use of comparable recent arm’s length transactions, discounted cash flow
analysis, option pricing models and other valuation techniques commonly used by market participants.
(e) Forward foreign currency transactions
Forward foreign currency transactions (“FFCTs”) are measured at fair value based on the closing prices of the
FFCTs contract rates on the relevant foreign exchange market on a daily basis. Realised and unrealised
gains and/or losses are reported in the profit and loss account.
Income from investments and interest expense
Interest income and expense are recognised in the profit and loss account for all debt instruments and cash
using the effective interest method. The effective interest method is a method of calculating the amortised
cost of a financial asset or financial liability and of allocating the interest income or interest expense over the
relevant year.
The effective interest rate is the rate that exactly discounts estimated future cash payments or receipts
throughout the expected life of the financial instrument, or a shorter period where appropriate, to the net
carrying amount of the financial asset or financial liability.

32
Notes to the financial statements (continued)
1. Principal accounting policies (continued)
Income from investments and interest expense (continued)
Once a financial asset or a group of similar financial assets has been written down as a result of an
impairment loss, interest income is recognised using the rate of interest used to discount the future cash flows
for the purpose of measuring the impairment loss.
Dividends are credited to the profit and loss account on the dates on which the relevant securities are listed
as "ex-dividend". Dividend income is shown gross of any irrecoverable withholding taxes, which are disclosed
separately in the profit and loss account, and net of any tax credits.
Operating expenses
The Trust is responsible for all normal operating expenses, including audit fees, stamp and other duties and
charges incurred on the acquisition and realisation of investments. These are accounted for on an accruals
basis. The Manager meets all other expenses incurred by the Trust in connection with its services.
Transaction costs
Transaction costs are costs incurred to acquire financial assets or liabilities at fair value through profit or loss.
They include fees and commissions paid to agents, advisers, brokers or dealers. Transaction costs are
included in the ‘net fair value gain/(loss) on financial assets at fair value through profit or loss’ in the profit and
loss account for each individual Fund. See Note 2, ‘Fees and related party disclosures’, for further information
on transaction costs.
Distributions
Note 3 discloses all distributions declared and paid during the year. Distributions in respect of the Baring
Eastern Europe Fund, Baring Global Resources Fund and Baring Global Leaders Fund are normally paid
annually no later than 30 June each year.
Distributions in respect of Baring Developed and Emerging Markets High Yield Bond Fund monthly income
classes are paid monthly no later than the last business day in each month, quarterly income classes are paid
quarterly no later than 28 February, 31 May, 31 August and 30 November, with Baring Developed and
Emerging Markets High Yield Bond Fund Class A EUR Hedged Inc paying annually no later than 30 June
each year. Distributions may be declared from net income and net fair value gains on financial assets.
Unitholders should note that all distributions below US$100/£50/€100 are automatically reinvested. The
distributions on these units are recognised in the profit and loss account as finance costs on an ex-date basis.
Cash and bank overdraft
Cash and bank overdrafts are valued at their face value together with interest accrued, where applicable.
Receivables
Receivables are non-derivative financial assets with fixed or determinable payments that are not quoted in an
active market. Receivables are recognised initially at fair value plus transaction costs that are directly
attributable to their acquisition origination. They are subsequently measured at amortised cost using the
effective interest method, less provision for impairment.

33
Notes to the financial statements (continued)
1. Principal accounting policies (continued)
Payables
Payables are recognised initially at fair value and subsequently stated at amortised cost using the effective
interest method. The difference between the proceeds and the amounts payable is recognised over the year
of the payable using the effective interest method.
Redeemable participating units
Redeemable participating units are redeemable at the unitholder’s option and are classified as financial
liabilities.
The participating unit can be put back into the Trust on any business day of the Fund, for cash equal to a
proportionate unit of the Fund’s Net Asset Value. The participating unit is carried at the redemption amount
that is payable at the balance sheet date if the unitholder exercised their right to put the unit back into the
Trust.
In accordance with the provisions of the Trust Deed, listed investments and investments with prices quoted in
over-the-counter markets or by market makers are stated at the last traded price on the valuation day for the
purpose of determining the Net Asset Value per unit for subscriptions and redemptions, and for various fee
calculations.
Net assets attributable to holders of redeemable participating units represent a liability in the balance sheet,
carried at the redemption amount that would be payable at the balance sheet date if the unitholder exercised
the right to redeem the unit to the Fund.
Net income equalisation
Net income equalisation is accrued net income included in the price of units purchased and redeemed during
the accounting year. The subscription price of units is deemed to include an equalisation payment calculated
by reference to the accrued net income of the relevant Fund, and the first distribution in respect of any unit will
include a payment of income usually equal to the amount of such equalisation payment. The redemption
price of each unit will also include an equalisation payment in respect of the accrued net income of the
relevant Fund up to the date of redemption. Income equalisation is detailed on the statement of changes in
net assets of each Fund where applicable.

34
Notes to the financial statements (continued)
2. Fees and related party disclosures
Management fees
The Manager currently charges a management fee in respect of each Fund at the following percentage rate
per annum of the Net Asset Value of the Fund:
Baring Eastern Europe Fund - Class A USD Inc 1.50% Baring Developed and Emerging Markets High
Baring Eastern Europe Fund - Class A EUR Inc 1.50% Yield Bond Fund - Class A CHF Hedged Acc 1.00%
Baring Eastern Europe Fund - Class A GBP Inc 1.50% Baring Developed and Emerging Markets High
Baring Eastern Europe Fund - Class A USD Acc 1.50% Yield Bond Fund - Class A EUR Inc 1.00%
Baring Eastern Europe Fund - Class I GBP Acc 0.75% Baring Developed and Emerging Markets High
Baring Eastern Europe Fund - Class I USD Acc 0.75% Yield Bond Fund - Class A EUR Hedged Inc 1.00%
Baring Eastern Europe Fund - Class I EUR Acc 0.75% Baring Developed and Emerging Markets High
Baring Eastern Europe Fund - Class I EUR Inc 0.75% Yield Bond Fund - Class A GBP Hedged Inc 1.00%
Baring Eastern Europe Fund - Class I GBP Inc 0.75% Baring Developed and Emerging Markets High
Baring Eastern Europe Fund - Class I USD Inc 0.75% Yield Bond Fund - Class A HKD Inc Monthly 1.00%
Baring Global Leaders Fund - Class A USD Inc 1.50% Baring Developed and Emerging Markets High
Baring Global Leaders Fund - Class A EUR Inc 1.50% Yield Bond Fund - Class A NZD Hedged Inc 1.00%
Baring Global Leaders Fund - Class A GBP Inc 1.50% Baring Developed and Emerging Markets High
Baring Global Leaders Fund - Class I USD Acc 0.75% Yield Bond Fund - Class A RMB Hedged Inc 1.00%
Baring Global Resources Fund - Class A USD Inc 1.50% Baring Developed and Emerging Markets High
Baring Global Resources Fund - Class A EUR Inc 1.50% Yield Bond Fund - Class A USD Acc 1.00%
Baring Global Resources Fund - Class A GBP Inc 1.50% Baring Developed and Emerging Markets High
Baring Global Resources Fund - Class I GBP Acc 0.75% Yield Bond Fund - Class A USD Inc Monthly 1.00%
Baring Developed and Emerging Markets High Yield
Bond Fund - Class A USD Inc 1.00%
Baring Developed and Emerging Markets High
Yield Bond Fund - Class I EUR Acc 0.75%
Baring Developed and Emerging Markets High
1.00% Yield Bond Fund - Class I GBP Hedged Inc 0.75%
Baring Developed and Emerging Markets High
1.00% Yield Bond Fund - Class I USD Acc 0.75%
Baring Developed and Emerging Markets High Yield
Bond Fund - Class A AUD Hedged Inc Monthly
Baring Developed and Emerging Markets High Yield
Bond Fund - Class A CAD Hedged Inc Monthly
The Trust is managed by Baring International Fund Managers (Ireland) Limited (“the Manager”). Oliver
Burgel*, John Burns*, Nicola Hayes*, Michel Schulz and Julian Swayne* are/were connected to the Manager
through employment with Baring Asset Management Limited (“Investment Manager”) and its subsidiaries.
The Manager will discharge the fees and expenses of the Investment Manager out of its own fee. The
Investment Manager is an investment management company incorporated in London on 6 April 1994. The
Investment Manager is part of the Barings LLC group and is a wholly-owned subsidiary of Massachusetts
Mutual Life Insurance Company (“MassMutual”). The outstanding amounts payable as at the end of the year
for management fees are disclosed on each Fund’s balance sheet. Parties are considered to be related if one
party has the ability to control the other party or exercise significant influence over the other party in making
financial or operational decisions.
* Oliver Burgel was appointed as Director of the Manager with effect from 29 November 2016.
John Burns has resigned from his position as Director of the Manager with effect from 9 December 2016.
Nicola Hayes has resigned from her position as Director of the Manager with effect from 18 December 2016.
Julian Swayne was appointed as Director of the Manager with effect from 9 February 2017.
The management fee is payable monthly in arrears and is calculated by reference to the Net Asset Value of
each Fund as at each day on which the value of the net assets of the relevant Fund is calculated. The
foregoing charges may be increased up to the relevant amount specified in the Prospectus on giving no less
than three months’ notice to unitholders.

35
Notes to the financial statements (continued)
2. Fees and related party disclosures (continued)
Management fees (continued)
Where the Net Asset Value of any Fund includes interests in any investment fund managed by a subsidiary of
the parent company (“a Barings Fund”), the fee payable to the Manager relating to the holding will be reduced
by the percentage rate (if any) charged to the Barings Fund for comparable management services.
Baring Developed and Emerging Markets High Yield Bond Fund received a management rebate in relation to
its investment in the Baring China Bond Fund and Baring Eastern Europe Fund received a management
rebate in relation to its investment in the Baring Russia Fund. The management fee rates have not changed
from the previous year.
Administration fees
The Administrator shall be entitled to receive an administration fee in respect of each Fund at the rate of
0.45% per annum of the Net Asset Value of each Fund calculated by reference to the daily calculation of
asset values and subject to a monthly minimum fee of £2,500. Out of these fees the Manager will pay
Northern Trust International Fund Administration Services (Ireland) Limited (“the Administrator”). With respect
to the Baring Developed and Emerging Markets High Yield Bond Fund – Euro Hedged and Sterling Hedged
classes, the Manager is entitled under the Trust Deed to charge an additional £500 per month. Such fees are
paid monthly in arrears and are also payable out of the assets of the Trust. The rates have not changed
during the year.
Depositary fees
Northern Trust Fiduciary Services (Ireland) Limited (“the Depositary”) was entitled to the following:
• 0.0235% of the Net Asset Value of the Trust on the first £500 million;
• 0.0175% of the Net Asset Value of the Trust on the next £500 million*; and
• 0.0105% of the Net Asset Value of the Trust thereafter**.
In addition, the Depositary will receive a charge of £150 per transaction in respect of single line assets and on
annual active accounts a charge of £3,000 per fund. These fees are payable monthly in arrears. The
Depositary is entitled to be reimbursed for all fees and charges of depositaries and sub-custodians appointed
by it and all other expenses incurred by it.
* This fee changed from 0.015% to 0.0175% on 18 August 2016.
** This fee changed from 0.008% to 0.0105% on 18 August 2016.
Legal fee
Mark Thorne is a partner of the Legal Adviser and a Director of the Manager. The fees paid to Dillon Eustace
during the year amounted to US$24,110 (30 April 2016: US$10,609).
Other expenses
The Depositary pays out of the assets of the Trust the above fees and expenses, stamp duties, taxes,
brokerage or other expenses of acquiring and disposing of investments, the fees and expenses of the
auditors, listing fees and legal expenses of the Manager. The costs of printing and distributing reports,
accounts and any Prospectuses, as well as publishing prices and any costs incurred as a result of a change
in law or the introduction of any new law (including any costs incurred as a result of compliance with any code
relating to trusts, whether or not having the force of law), are also paid out of the assets of the Trust.
Expenses are charged to the Fund in respect of which they are incurred or, where an expense is not
considered by the Depositary to be attributable to any one Fund, the expense will normally be allocated by the
Depositary to all Funds pro rata to the value of the net assets of the relevant Funds.
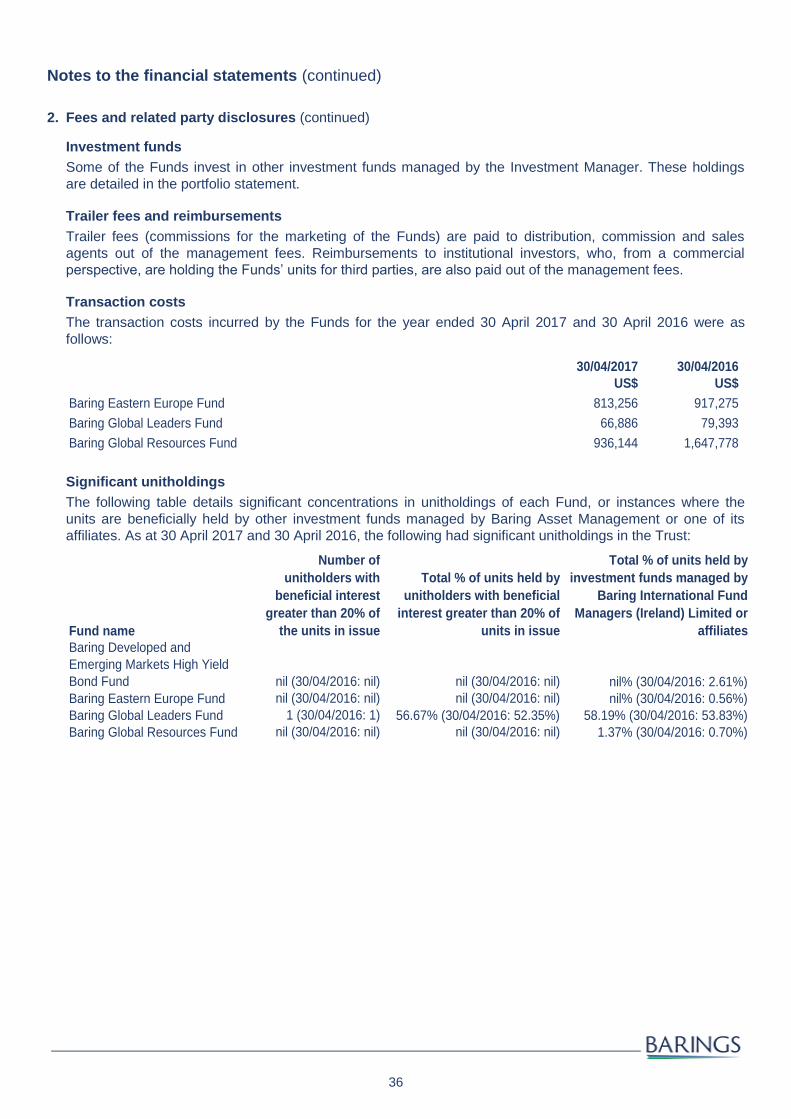
36
Notes to the financial statements (continued)
2. Fees and related party disclosures (continued)
Investment funds
Some of the Funds invest in other investment funds managed by the Investment Manager. These holdings
are detailed in the portfolio statement.
Trailer fees and reimbursements
Trailer fees (commissions for the marketing of the Funds) are paid to distribution, commission and sales
agents out of the management fees. Reimbursements to institutional investors, who, from a commercial
perspective, are holding the Funds’ units for third parties, are also paid out of the management fees.
Transaction costs
The transaction costs incurred by the Funds for the year ended 30 April 2017 and 30 April 2016 were as
follows:
30/04/2017 30/04/2016
US$ US$
Baring Eastern Europe Fund 813,256 917,275
Baring Global Leaders Fund 66,886 79,393
Baring Global Resources Fund 936,144 1,647,778 Significant unitholdings
The following table details significant concentrations in unitholdings of each Fund, or instances where the
units are beneficially held by other investment funds managed by Baring Asset Management or one of its
affiliates. As at 30 April 2017 and 30 April 2016, the following had significant unitholdings in the Trust:
Fund name
Number of
unitholders with
beneficial interest
greater than 20% of
the units in issue
Total % of units held by
unitholders with beneficial
interest greater than 20% of
units in issue
Total % of units held by
investment funds managed by
Baring International Fund
Managers (Ireland) Limited or
affiliates
Baring Developed and
Emerging Markets High Yield
Bond Fund nil (30/04/2016: nil) nil (30/04/2016: nil) nil% (30/04/2016: 2.61%)
Baring Eastern Europe Fund nil (30/04/2016: nil) nil (30/04/2016: nil) nil% (30/04/2016: 0.56%)
Baring Global Leaders Fund 1 (30/04/2016: 1) 56.67% (30/04/2016: 52.35%) 58.19% (30/04/2016: 53.83%)
Baring Global Resources Fund nil (30/04/2016: nil) nil (30/04/2016: nil) 1.37% (30/04/2016: 0.70%)

37
Notes to the financial statements (continued)
3. Distributions (continued)
As at 30/04/2017 (continued)
Baring Developed and Emerging Markets High Yield Bond Fund (continued)
Distribution
frequency
Income
available for
distribution
Distributed
amount*
Income
equalisation**
Baring Developed and Emerging Markets High Yield Bond Fund AU$ AU$ AU$
Class A AUD Hedged Inc - Monthly Dividend Monthly 1,460,222 (650,676) 32,190
CA$ CA$ CA$
Class A CAD Hedged Inc - Monthly Dividend Monthly 1,931,346 (855,294) (9,521)
€ € €
Class A EUR Hedged Inc Annually 558,390 (568,596) 97,317
Class A EUR Inc Quarterly 925,679 (930,513) (64,534)
£ £ £
Class A GBP Hedged Inc - Quarterly Dividend Quarterly 1,369,495 (1,386,850) 49,804
Class I GBP Hedged Inc - Quarterly Dividend Quarterly 938,982 (624,478) (48,731)
HK$ HK$ HK$
Class A HKD Inc - Monthly Dividend Monthly 7,177,208 (3,536,382) (43,877)
NZ$ NZ$ NZ$
Class A NZD Hedged Inc - Monthly Dividend Monthly 823,819 (407,573) (4,633)
US$ US$ US$
Class A USD Inc - Monthly Dividend Monthly 30,293,375 (14,771,746) 242,580
Class A USD Inc - Quarterly Dividend Quarterly 10,288,896 (10,284,972) (194,547)
CNH CNH CNH
Class A RMB Hedged Inc - Monthly Dividend Monthly 5,824,236 (3,501,090) (231,057)
US$ US$ US$
Total distribution for the Baring Developed and
Emerging Markets High Yield Bond Fund 144,453,272 (31,692,649) 59,069
Distribution
frequency
Income
available for
distribution
Distributed
amount
paid*
Income
equalisation**
US$ US$ US$Total distribution for the Baring Eastern Europe Fund Annually 10,665,407 (10,648,252) (709,442)
US$ US$ US$Total distribution for the Baring Global Resources Fund Annually 285,792 (285,381) (18,722)
* Includes distributions with an ex-date of 1 May 2016 which were paid during the current financial year. These distributions with an ex-date of 1
May 2016 reflect the undistributed income on the Fund as at 30 April 2016.
** Income equalisation relates to the dealing activity of distributing classes for the year from 1 May 2016 to 30 April 2017. The income
equalisation of the distributing classes is disclosed separately in the statement of changes in net assets attributable to holders of redeemable
participating units for the year ended 30 April 2017.

38
Notes to the financial statements (continued)
3. Distributions (continued)
Comparative as at 30/04/2016
Distribution
frequency
Income
available for
distribution
Distributed
amount
paid*
Income
equalisation**
US$ US$ US$Total distribution for the Baring Eastern Europe Fund Annually 16,639,268 (16,619,776) (424,152)
US$ US$ US$
Total distribution for the Baring Global Resources Fund* Annually 1,387,217 (1,385,865) (479)
Income
available for
distribution
Distributed
amount
Income
equalisation
Baring High Yield Bond Fund AU$ AU$ AU$
Class A AUD Hedged Inc - Monthly Dividend Monthly 1,164,248 (557,407) 22,335
CA$ CA$ CA$
Class A CAD Hedged Inc - Monthly Dividend Monthly 2,441,422 (1,177,630) (42,837)
€ € €
Class A EUR Hedged Inc - Quarterly Dividend Quarterly 933,979 (934,224) (6,051)
Class A EUR Inc Annually 658,317 (659,521) (62,163)
£ £ £
Class A GBP Hedged Inc - Quarterly Dividend Quarterly 1,734,304 (1,734,304) (50,605)
Class I GBP Hedged Inc - Quarterly Dividend Quarterly 1,595,891 (1,595,106) (100,368)
HK$ HK$ HK$
Class A HKD Inc - Monthly Dividend Monthly 10,290,218 (5,624,405) (350,601)
NZ$ NZ$ NZ$
Class A NZD Hedged Inc - Monthly Dividend Monthly 1,118,188 (572,666) (39,386)
US$ US$ US$
Class A USD Inc - Monthly Dividend Monthly 32,216,959 (17,452,147) (336,842)
Class A USD Inc - Quarterly Dividend Quarterly 16,071,578 (16,050,305) (475,756)
CNH CNH CNH
Class A RMB Hedged Inc - Monthly Dividend Monthly 9,174,859 (5,936,287) (347,327)
Total distribution for the Baring Developed and US$ US$ US$
Emerging Markets High Yield Bond Fund*** 61,274,667 (43,696,432) (1,257,461)
* Includes distributions with an ex-date of 1 May 2015 which were paid during the current financial year. These distributions with an ex-date of 1
May 2015 reflect the undistributed income on the Fund as at 30 April 2015.
** Income equalisation relates to the dealing activity of distributing classes for the year from 1 May 2015 to 30 April 2016. The income
equalisation of the distributing classes is disclosed separately in the statement of changes in net assets attributable to holders of redeemable
participating units for the year ended 30 April 2016.
*** The Fund was launched on 19 July 1993 as the Baring High Yield Bond Fund and converted to the Baring Developed and Emerging Markets
High Yield Bond Fund on 23 February 2017.

39
Notes to the financial statements (continued)
4. Units issued and redeemed
As at 30/04/2017
Baring Developed and Emerging Markets High Yield Bond Fund
By units:
Class A USD
Inc units
Class A AUD
Hedged Inc
Monthly
Dividend units
Class A CAD
Hedged Inc
Monthly
Dividend units
Class A CHF
Hedged Acc
units
Class A EUR
Inc units
Units in issue as at 01/05/2016 20,534,885 1,009,248 1,626,601 12,284 1,544,591
Units issued during the year 7,174,120 882,512 514,226 - 1,653,086
Units redeemed during the year (10,916,774) (569,157) (665,779) (332) (448,368)
Units in issue as at 30/04/2017 16,792,231 1,322,603 1,475,048 11,952 2,749,309
By units:
Class A EUR
Hedged Inc
units
Class A GBP
Hedged Inc
units
Class A HKD
Inc Monthly
Dividend units
Class A NZD
Hedged Inc
Monthly
Dividend units
Class A RMB
Hedged Inc
Monthly
Dividend units
Units in issue as at 01/05/2016 941,052 3,455,708 851,579 531,382 1,192,597
Units issued during the year 1,950,852 2,430,377 71,854 145,523 63,106
Units redeemed during the year (2,195,743) (1,507,168) (157,361) (186,945) (644,884)
Units in issue as at 30/04/2017 696,161 4,378,917 766,072 489,960 610,819
By units:
Class A USD
Acc units
Class A USD
Inc Monthly
Dividend units
Class I EUR
Acc units
Class I GBP
Hedged Inc
units
Class I USD
Acc units
Units in issue as at 01/05/2016 1,053,859 26,037,689 18,027 2,289,643 2,093,389
Units issued during the year 3,603,921 12,240,192 - 311,361 396,858
Units redeemed during the year (486,590) (9,929,603) - (1,315,954) (2,338,564)Units in issue as at 30/04/2017 4,171,190 28,348,278 18,027 1,285,050 151,683
Baring Eastern Europe Fund
Class A Class A Class A Class A Class I
By units: USD Inc units EUR Inc units GBP Inc units USD Acc units EUR Acc unitsUnits in issue as at 01/05/2016 11,390,750 2,615,772 19,529 4,614 10
Units issued during the year 1,089,437 393,580 19,382 665,609 - Units redeemed during the year (2,668,999) (574,245) (22,647) (65,440) -
Units in issue as at 30/04/2017 9,811,188 2,435,107 16,264 604,783 10

40
Notes to the financial statements (continued)
4. Units issued and redeemed (continued)
As at 30/04/2017 (continued)
Baring Eastern Europe Fund
(continued)
Class I Class I Class I Class I Class I
By units: GBP Acc units USD Acc units EUR Inc units GBP Inc units USD Inc units
Units in issue as at 01/05/2016 9,359 15,082 190 169 686
Units issued during the year 53,921 - - 18,683 -
Units redeemed during the year (28,964) (145) (180) (11,082) -
Units in issue as at 30/04/2017 34,316 14,937 10 7,770 686
Baring Global Leaders Fund
By units:
Class A USD
Inc units
Class A EUR
Inc units
Class A GBP
Inc units
Class I USD
Acc units
Units in issue as at 01/05/2016 2,402,207 365,946 135,476 220,550
Units issued during the year 405,097 45,072 4,119 20,752
Units redeemed during the year (370,053) (74,849) (26,122) (31,750)
Units in issue as at 30/04/2017 2,437,251 336,169 113,473 209,552
Baring Global Resources Fund
By units:
Class A USD
Inc units
Class A EUR
Inc units
Class A GBP
Inc units
Class I GBP
Acc units
Class I USD
Acc units
Units in issue as at 01/05/2016 18,460,610 2,971,149 70,586 819,013 10
Units issued during the year 2,012,947 253,910 25,578 840,149 6,600
Units redeemed during the year (2,565,327) (337,894) (18,098) (357,254) -
Units in issue as at 30/04/2017 17,908,230 2,887,165 78,066 1,301,908 6,610

41
Notes to the financial statements (continued)
4. Units issued and redeemed (continued)
Comparative as at 30/04/2016
Baring Developed and Emerging Markets High Yield Bond Fund (formerly Baring High Yield Bond Fund)
By units:
Class A USD
Inc units
Class A AUD
Hedged Inc
Monthly
Dividend units
Class A CAD
Hedged Inc
Monthly
Dividend units
Class A CHF
Hedged Acc
units
Class A EUR
Inc units
Units in issue as at 01/05/2015 26,289,303 770,258 2,094,911 21,644 1,630,313
Units issued during the year 22,421,051 666,798 267,871 - 482,703
Units redeemed during the year (28,175,469) (427,808) (736,181) (9,360) (568,425)
Units in issue as at 30/04/2016 20,534,885 1,009,248 1,626,601 12,284 1,544,591
By units:
Class A EUR
Hedged Inc
units
Class A GBP
Hedged Inc
units
Class A HKD
Inc Monthly
Dividend units
Class A NZD
Hedged Inc
Monthly
Dividend units
Class A RMB
Hedged Inc
Monthly
Dividend units
Units in issue as at 01/05/2015 931,496 4,498,311 1,498,823 884,064 2,179,163
Units issued during the year 2,224,475 214,257 48,849 96,187 61,712
Units redeemed during the year (2,214,919) (1,256,860) (696,093) (448,869) (1,048,278)
Units in issue as at 30/04/2016 941,052 3,455,708 851,579 531,382 1,192,597
By units:
Class A USD
Acc units
Class A USD
Inc Monthly
Dividend units
Class I EUR
Acc units
Class I GBP
Hedged Inc
units
Class I USD
Acc units
Units in issue as at 01/05/2015 887,284 32,082,956 775 4,335,531 2,920,251
Units issued during the year 541,207 7,071,876 18,027 615,142 273,194
Units redeemed during the year (374,632) (13,117,143) (775) (2,661,030) (1,100,056)Units in issue as at 30/04/2016 1,053,859 26,037,689 18,027 2,289,643 2,093,389
Baring Eastern Europe Fund
Class A Class A Class A Class A Class I
By units: USD Inc units EUR Inc units GBP Inc units USD Acc units EUR Acc unitsUnits in issue as at 01/05/2015 11,954,757 2,746,764 23,652 5,444 -
Units issued during the year 1,684,974 419,259 3,699 179 10 Units redeemed during the year (2,248,981) (550,251) (7,822) (1,009) -
Units in issue as at 30/04/2016 11,390,750 2,615,772 19,529 4,614 10
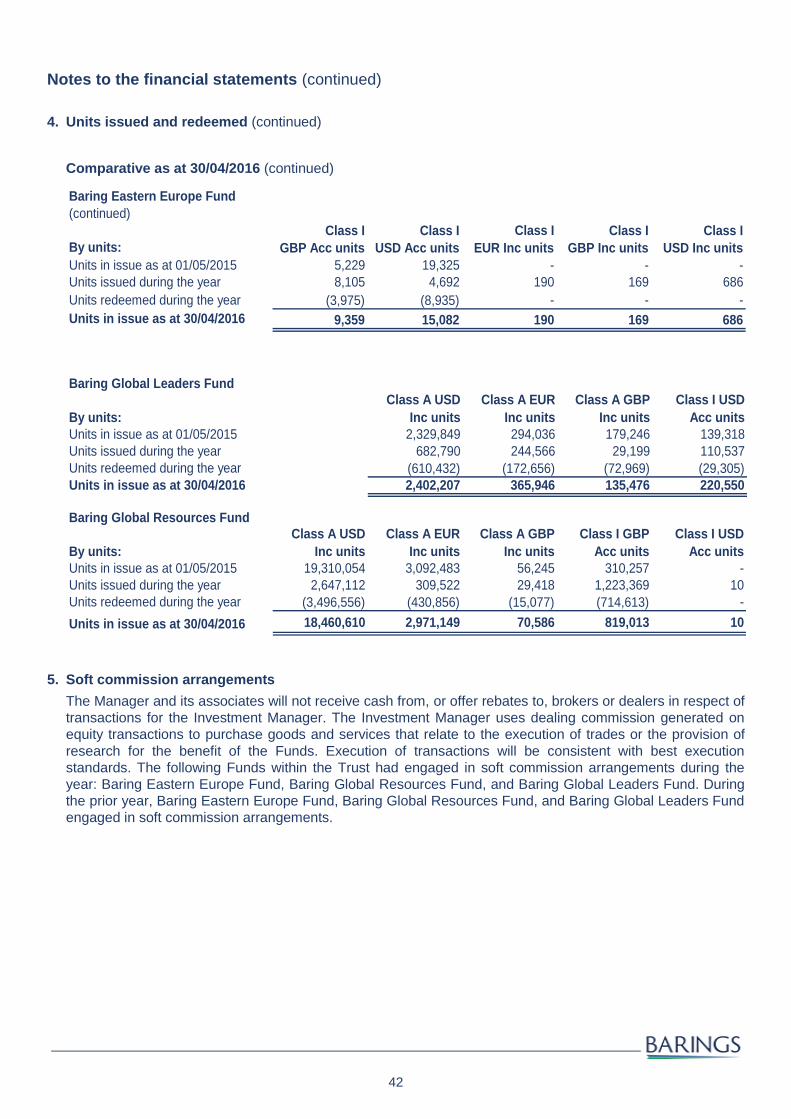
42
Notes to the financial statements (continued)
4. Units issued and redeemed (continued)
Comparative as at 30/04/2016 (continued)
Baring Eastern Europe Fund
(continued)
Class I Class I Class I Class I Class I
By units: GBP Acc units USD Acc units EUR Inc units GBP Inc units USD Inc units
Units in issue as at 01/05/2015 5,229 19,325 - - -
Units issued during the year 8,105 4,692 190 169 686
Units redeemed during the year (3,975) (8,935) - - -
Units in issue as at 30/04/2016 9,359 15,082 190 169 686
Baring Global Leaders Fund
By units:
Class A USD
Inc units
Class A EUR
Inc units
Class A GBP
Inc units
Class I USD
Acc units
Units in issue as at 01/05/2015 2,329,849 294,036 179,246 139,318
Units issued during the year 682,790 244,566 29,199 110,537
Units redeemed during the year (610,432) (172,656) (72,969) (29,305)
Units in issue as at 30/04/2016 2,402,207 365,946 135,476 220,550
Baring Global Resources Fund
By units:
Class A USD
Inc units
Class A EUR
Inc units
Class A GBP
Inc units
Class I GBP
Acc units
Class I USD
Acc units
Units in issue as at 01/05/2015 19,310,054 3,092,483 56,245 310,257 -
Units issued during the year 2,647,112 309,522 29,418 1,223,369 10
Units redeemed during the year (3,496,556) (430,856) (15,077) (714,613) -
Units in issue as at 30/04/2016 18,460,610 2,971,149 70,586 819,013 10
5. Soft commission arrangements
The Manager and its associates will not receive cash from, or offer rebates to, brokers or dealers in respect of
transactions for the Investment Manager. The Investment Manager uses dealing commission generated on
equity transactions to purchase goods and services that relate to the execution of trades or the provision of
research for the benefit of the Funds. Execution of transactions will be consistent with best execution
standards. The following Funds within the Trust had engaged in soft commission arrangements during the
year: Baring Eastern Europe Fund, Baring Global Resources Fund, and Baring Global Leaders Fund. During
the prior year, Baring Eastern Europe Fund, Baring Global Resources Fund, and Baring Global Leaders Fund
engaged in soft commission arrangements.

43
Notes to the financial statements (continued)
6. Comparative statistics
As at As at As at
30/04/2017 30/04/2016 30/04/2015Total Net Asset Value
Baring Developed and Emerging Markets High Yield Bond
Fund US$639,219,923 US$612,920,586 US$881,780,483
Net Asset Value per unitBaring Developed and Emerging Markets High Yield Bond
Fund - Class A USD Inc US$10.13 US$9.70 US$10.87Baring Developed and Emerging Markets High Yield Bond
Fund - Class A AUD Hedged Inc Monthly Dividend AU$10.90 AU$10.33 AU$11.34Baring Developed and Emerging Markets High Yield Bond
Fund - Class A CAD Hedged Inc Monthly Dividend CA$10.36 CA$9.93 CA$11.10Baring Developed and Emerging Markets High Yield Bond
Fund - Class A CHF Hedged Acc CHF12.91 CHF11.91 CHF12.67Baring Developed and Emerging Markets High Yield Bond
Fund - Class A EUR Inc €9.23 €8.48 €9.70Baring Developed and Emerging Markets High Yield Bond
Fund - Class A EUR Hedged Inc €9.98 €9.76 €10.99Baring Developed and Emerging Markets High Yield Bond
Fund - Class A GBP Hedged Inc £6.46 £6.24 £7.01Baring Developed and Emerging Markets High Yield Bond
Fund - Class A HKD Inc Monthly Dividend HK$79.04 HK$75.43 HK$84.33Baring Developed and Emerging Markets High Yield Bond
Fund - Class A NZD Hedged Inc Monthly Dividend NZ$14.25 NZ$13.44 NZ$14.65Baring Developed and Emerging Markets High Yield Bond
Fund - Class A RMB Hedged Inc ¥68.01 ¥63.07 ¥68.03Baring Developed and Emerging Markets High Yield Bond
Fund - Class A USD Acc US$14.28 US$12.91 US$13.57Baring Developed and Emerging Markets High Yield Bond
Fund - Class A USD Inc Monthly Dividend US$10.01 US$9.57 US$10.71Baring Developed and Emerging Markets High Yield Bond
Fund - Class I EUR Acc €12.81 €11.09 €12.44Baring Developed and Emerging Markets High Yield Bond
Fund - Class I GBP Hedged Inc £6.50 £6.27 £7.00Baring Developed and Emerging Markets High Yield Bond
Fund - Class I USD Acc US$14.06 US$12.67 US$13.23
Total Net Asset Value
Baring Eastern Europe Fund US$1,049,036,907 US$973,312,971 US$1,108,111,15
Net Asset Value per unit
Baring Eastern Europe Fund - Class A USD Inc US$80.92 US$69.23 US$75.09
Baring Eastern Europe Fund - Class A EUR Inc €73.97 €60.74 €67.08
Baring Eastern Europe Fund - Class A GBP Inc £62.53 £47.38 £48.67
Baring Eastern Europe Fund - Class A USD Acc US$85.59 US$72.41 US$77.35
Baring Eastern Europe Fund - Class I EUR Acc* €75.74 £61.00 -
Baring Eastern Europe Fund - Class I GBP Acc £66.58 £49.51 £49.73
Baring Eastern Europe Fund - Class I USD Acc US$88.85 US$74.60 US$78.93
Baring Eastern Europe Fund - Class I EUR Inc* €75.27 £61.00 -
Baring Eastern Europe Fund - Class I GBP Inc* £63.66 £47.55 -
Baring Eastern Europe Fund - Class I USD Inc* US$82.34 US$69.50 - * The Class I EUR Inc, Class I GBP Inc and Class I USD Inc unit classes were launched on 29 October 2015. The Class I EUR Acc unit class was launched on 20 January 2016.

44
Notes to the financial statements (continued)
6. Comparative statistics (continued)
Total Net Asset Value
Baring Global Leaders Fund US$54,580,397 US$48,161,907 US$50,194,985
Net Asset Value per unit
Baring Global Leaders Fund - Class A USD Inc US$17.59 US$15.39 US$17.05
Baring Global Leaders Fund - Class A EUR Inc €16.08 €13.50 €15.23
Baring Global Leaders Fund - Class A GBP Inc £13.60 £10.53 £11.05
Baring Global Leaders Fund - Class I USD Acc US$18.16 US$15.71 US$17.21
Total Net Asset Value
Baring Global Resources Fund US$406,399,856 US$380,199,052 US$468,276,948
Net Asset Value per unit
Baring Global Resources Fund - Class A USD Inc US$18.29 US$17.02 US$20.56
Baring Global Resources Fund - Class A EUR Inc €16.73 €14.93 €18.37
Baring Global Resources Fund - Class A GBP Inc £14.14 £11.65 £13.33
Baring Global Resources Fund - Class I GBP Acc £14.45 £11.80 £13.37
Baring Global Resources Fund - Class I USD Acc* US$18.79 US$17.29 - * The Class I USD Acc unit class was launched on 20 January 2016.
7. Exchange rates
As at 30/04/2017Exchange rate to US$ Exchange rate to US$
Australian dollar 1.3383 Norwegian Krone 8.5308
Canadian dollar 1.3651 Polish zloty 3.8590
Chinese Yuan 6.8981 Pound sterling 0.7727
Euro 0.9142 South African rand 13.2775
Hong Kong dollar 7.7783 South Korean won 1,137.9000
Hungarian forint 285.6340 Swedish krona 8.8118
Indonesian rupiah 13,329.0000 Swiss franc 0.9904
Japanese yen 111.4600 Taiwan dollar 30.1710
Mexican peso 19.0388 Turkish lira 3.5428
New Zealand dollar 1.4565
ComparativeAs at 30/04/2016
Exchange rate to US$ Exchange rate to US$
Australian dollar 1.3094 Pound sterling 0.6842
Canadian dollar 1.2504 South African rand 14.1913
Euro 0.8775 South Korean won 1,139.4000
Hong Kong dollar 7.7576 Swedish krona 8.0461
Hungarian forint 273.6937 Swiss franc 0.9624
Indonesian rupiah 13,188.0000 Taiwan dollar 32.2530
Japanese yen 107.0250 Turkish lira 2.8047
Mexican peso 17.1663
New Zealand dollar 1.4318
Polish zloty 3.8678

45
Notes to the financial statements (continued)
8. Financial Risk Management
Strategy in using financial instruments
The Funds of the Trust are exposed to a variety of financial risks in pursuing their stated investment objective
and policy. These risks include, but are not limited to, credit risk, liquidity risk and market risk (which in turn
includes foreign currency risk, interest rate risk and market price risk). The Funds assume exposure to these
risks to generate investment returns on their portfolios, although these risks can also potentially result in a
reduction in the Funds’ net assets. The Investment Manager will use its best endeavours to minimise the
potentially adverse effects of these risks on the Funds’ performance where it can do so, while still managing
the investments of the Funds in a way that is consistent with the Funds’ investment objectives and policies.
The investment objective of the Funds is disclosed in the Prospectus and in the introduction to the financial
statements. The risks, and the measures adopted by the Funds for managing these risks, are detailed below.
The Manager reviews and agrees policies for managing each of these risks and they are summarised below.
These policies have remained substantially unchanged since the beginning of the year to which these
financial statements relate.
(a) Market price risk
Market price risk is defined in FRS 102 as “the risk that the fair value of a financial instrument or its future
cash flows will fluctuate because of changes in market prices”.
The Baring Eastern Europe Fund, Baring Global Leaders Fund and Baring Global Resources Fund consist
principally of equity instruments. Baring Developed and Emerging Markets High Yield Bond Fund (formerly
Baring High Yield Bond Fund) consists principally of bond instruments. The values of these instruments are
determined by market forces and accordingly there is a risk that market prices can change in a way that is
adverse to the Funds’ performance. The Funds have adopted a number of investment restrictions which are
set out in the Trust’s Prospectus which limit the exposure of the Funds to adverse changes in the price of any
individual financial asset. In accordance with the Funds’ policies, the Investment Manager monitors the
Funds’ positions on a daily basis and reports regularly to the Directors of the Manager, which review the
information on the Funds’ overall market exposures provided by the Investment Manager at its periodic
meetings.
The Investment Manager uses three techniques to help in the risk management process: monitoring of
compliance and quantitative limits, prevention of limit breaches and trade monitoring. These techniques allow
the Investment Manager to ensure that the Funds remain in compliance with the restrictions in the Prospectus
and the UCITS regulations, as amended, by which the Funds are governed.
In addition, the Investment Manager manages the exposure of the portfolio to the risk of adverse changes in
the general level of market prices through adhering to its formal risk management process, which includes the
use of systems and technology to monitor overall market and position risk on a daily basis. The maximum risk
arising from an investment is determined by the fair value of the financial instruments. The overall market
exposures and concentration of risk can be seen on the portfolio statement and balance sheet of each Fund.
The Funds’ market price risk is affected by two main components: changes in market prices and currency
exchange rates. The Funds’ exposure to market risk is disclosed in the portfolio statements.
The method used to determine the global exposure is Value at Risk (“VaR”). VaR is calculated daily using
Risk Metrics (one of the leading suppliers of risk management software).
For relative VaR: The Funds’ VaR is shown as a percentage of the VaR of the performance comparator or
reference portfolio to ensure that the relative figure is within an internal limit. This limit is set lower than a
multiple of two (or 200%) of the performance comparison or reference portfolio VaR.
For absolute VaR: The Funds’ VaR is shown as a percentage of the Funds’ Net Asset Value and is monitored
against an internal limit. This limit is set lower than 20%.
For data prior to 01/07/2016:
The VaR calculation uses a historic methodology and utilises a 99% confidence interval, 20-day holding
period and uses three years of daily returns. The VaR Calculations are both absolute and relative (depending
if the specific fund has a risk benchmark).

46
Notes to the financial statements (continued)
8. Financial Risk Management (continued)
Strategy in using financial instruments (continued)
For data post 01/07/2016:
The VaR calculation uses a Monte Carlo methodology and utilises a 99% confidence interval, 10-day holding
period, one year of daily returns and an 11-day half-life.
Fund namePerformance comparator or
reference portfolio
30/04/2017 30/04/2016 Lowest Highest Mean
Baring Developed and
Emerging Markets High
Yield Bond Fund*
96.61% 44.08% 38.43% 113.78% 65.08%Merrill Lynch Global High Yield BB-B
Rated USD Hedged
Baring Eastern Europe
Fund79.06% 84.07% 63.82% 96.01% 81.42% MSCI Emerging Europe 10/40
Baring Global Leaders
Fund101.43% 102.64% 94.29% 139.87% 110.11% MSCI ACWI
Baring Global Resources
Fund91.56% 90.73% 86.04% 113.89% 98.34%
60% MSCI AC World Energy, 40%
MSCI AC World Materials
Fund relative VaR over the past financial year.
Fund name
30/04/2017 30/04/2016 Lowest Highest Mean
Baring Developed and Emerging Markets High Yield Bond
Fund*1.08% 1.21% 0.62% 1.50% 1.04%
Merrill Lynch Global High Yield BB-B Rated USD Hedged 1.12% 2.75% 0.81% 2.95% 1.74%
Baring Eastern Europe Fund 6.22% 10.10% 4.02% 12.01% 6.82%
MSCI Emerging Europe 10/40 7.87% 12.01% 5.05% 14.18% 8.35%
Baring Global Leaders Fund 3.67% 6.52% 2.19% 11.68% 4.70%
MSCI ACWI 3.62% 6.36% 2.02% 9.80% 4.32%
Baring Global Resources Fund 4.49% 8.08% 3.59% 12.20% 6.15%
60% MSCI AC World Energy, 40% MSCI AC World
Materials4.91% 8.90% 3.55% 11.74% 6.28%
Absolute VaR over the past financial year.
Some limitations of VaR analysis are:
the methodology is based on historical data and cannot take account of the fact that future market price
movements, correlations between markets and levels of market liquidity in conditions of market stress may
bear no relation to historical patterns; and
the VaR is a point-in-time calculation, and does not necessarily reflect the risk position of the Funds at any
time other than the date and time at which it is calculated.
(b) Foreign currency risk
Currency risk is defined in FRS 102 as “the risk that the fair value or future cash flows of a financial
instrument will fluctuate because of changes in foreign exchange rates”. The Funds are exposed to currency
risk as assets and liabilities of the Funds may be denominated in a currency other than the functional
currency of the Funds, which is the US dollar.
* The Fund was launched on 19 July 1993 as the Baring High Yield Bond Fund and converted to the Baring Developed and Emerging Markets
High Yield Bond Fund on 23 February 2017.

47
Notes to the financial statements (continued)
8. Financial risk management (continued)
(b) Foreign currency risk (continued) The fluctuations in the rate of exchange between the currency in which the asset or liability is denominated and the functional currency could result in an appreciation or depreciation in the fair value of those assets and liabilities. The Investment Manager is permitted but not obliged to use hedging techniques to attempt to offset market and currency risk.
In accordance with the Trust’s policy, the Investment Manager monitors the Funds’ currency exposures on a
daily basis and reports regularly to the Directors of the Manager, which reviews the information provided by
the Investment Manager on any significant exposures at its periodic meetings.
The Investment Manager may have used FFCTs on Funds as a tool and technique to hedge their currency
exposure.
The Funds’ sensitivity to changes in foreign currency rates is included in the VaR risk analysis above. The
Funds’ portfolio statement details the currency, and therefore currency risk, of the underlying investments.
Foreign exchange transactions and other currency contracts may also be used to provide protection against
exchange risks or to actively overlay currency views onto the Funds’ currency exposure resulting from
investing in foreign markets. Such contracts may, at the discretion of the Investment Manager, be used to
hedge some or all of the exchange risk/currency risk arising as a result of the fluctuation between the
denominated currency of the Funds and the currencies in which the Funds’ investments are denominated, or
to pursue an active currency overlay strategy.
A Fund may (but is not obliged to) enter into certain currency-related transactions in order to hedge the
currency exposure of the assets of a Fund attributable to a particular class into the currency of denomination
of the relevant class. Any financial instruments used to implement such strategies with respect to one or more
classes shall be assets/liabilities of a Fund as a whole but will be attributable to the relevant class(es), and the
gains/losses on, and costs of, the relevant financial instruments will accrue solely to the relevant class. Any
currency exposure of a class may not be combined with or offset against that of any other class of a Fund.
The currency exposure of the assets attributable to a class may not be allocated to other classes. A class will
not be leveraged as a result of currency hedging transactions so that the use of such hedging instruments
shall in no case exceed 100% of the Net Asset Value attributable to the relevant class of a Fund.
(c) Interest rate risk
This risk is defined in FRS 102 as “the risk that the fair value or future cash flows of a financial instrument will
fluctuate because of changes in market interest rates”.
Baring Developed and Emerging Markets High Yield Bond Fund, which holds fixed interest rate debt
securities, is exposed to interest rate risk where the value of these securities may fluctuate as a result of a
change in market interest rates.
All other financial assets and financial liabilities, with the exception of cash at bank balances and overdrawn
cash, held by the Funds are not directly exposed to interest rate risk. The Funds are exposed to interest rate
risk on the interest earned on their cash and bank balances, and paid on overdrawn cash. This exposure is
not considered to be significant.
Interest rate risks are managed by the Investment Manager, whose management of interest rate risk is
monitored through regular performance reviews with senior managers as well as through monthly peer
reviews of positioning held with senior managers. Individual managers are authorised to initiate fixed income
trades within pre-set limits. Baring Developed and Emerging Markets High Yield Bond Fund’s sensitivity to
changes in interest rates is included in the VaR analysis on pages 45 and 46.
(d) Liquidity risk Liquidity risk is defined in FRS 102 as “the risk that an entity will encounter difficulty in meeting obligations associated with financial liabilities as they fall due”.
The Funds are exposed to daily cash redemptions of units. However, the Manager is entitled, with the
approval of the Depositary, to limit the number of units of any class realised on any dealing day to 10% of the
total number of units of that class in issue. There are also a number of circumstances where the Manager
may, with the approval of the Depositary, temporarily suspend the right of unitholders to require the realisation
of units of any class and/or may delay the payment of any monies in respect of any such realisation.

48
Notes to the financial statements (continued)
8. Financial risk management (continued)
(d) Liquidity risk (continued)
The Funds invest the majority of their assets in securities and other instruments that are traded on an active
market and which are considered to be liquid as they can be readily disposed of in the event that cash needs
to be raised to meet redemptions or to pay expenses.
In accordance with the Funds’ policies, the Investment Manager monitors the Funds’ liquidity on a daily basis
and reports regularly to the Directors of the Manager, which reviews the information provided by the
Investment Manager on significant exposures at its periodic meetings. The Funds have an agreed temporary
overdraft facility (if required) with the Depositary to allow for temporary timing/matching differences on trades,
subscriptions and redemptions. During the year ended 30 April 2017, Baring Developed and Emerging
Markets High Yield Bond Fund, Baring Eastern Europe Fund Baring Global Leaders Fund and Baring Global
Resources Fund had drawn down on this facility. At 30 April 2017 and 30 April 2016, the Funds’ liabilities, as
disclosed on the balance sheet, were all due within one month with the exception of forward foreign currency
contracts which are due within one to three months.
The table below analyses the Funds’ financial derivative instruments that will be settled on a gross basis into relevant maturity groupings based on the remaining period at the balance sheet date to the contractual maturity date.
Baring Developed and Emerging Markets High
Yield Bond Fund < 1 month 1-3 Months < 1 month 1-3 Months
30/04/2017 30/04/2017 30/04/2016 30/04/2016
Forward foreign currency exchange contracts US$ US$ US$ US$
Inflow 225,845,164 - 121,431,645 148,424,470
Outflow (229,593,823) - (124,273,734) (148,422,353) (e) Credit risk
Credit risk is defined in FRS 102 as “the risk that one party to a financial instrument will cause a financial loss
for the other party by failing to discharge an obligation”.
The Baring Global Resources Fund, Baring Eastern Europe Fund and Baring Global Leaders Fund consist
principally of equity instruments and are not directly exposed to credit risk from these positions. The Baring
Developed and Emerging Markets High Yield Bond Fund consists of bonds and is directly exposed to credit
risk.
However, the Funds will be exposed to credit risk on parties with whom they trade and will bear the risk of settlement default. All transactions in listed securities are settled/paid for upon delivery using approved brokers. The risk of default is considered minimal, as delivery of securities sold is only made once the broker has received payment. Payment is made on a purchase once the securities have been received by the broker. The trade will fail if either party fails to meet its obligation. The Funds are exposed to credit risk on cash and investment balances held with the Depositary.
Substantially, all of the cash assets are held with The Northern Trust Company (“TNTC”). Cash deposited with TNTC is deposited as banker and is held on its statement of financial position. Accordingly, in accordance with usual banking practice, the Bank’s liability to the Funds in respect of such cash deposits shall be that of debtor and the Funds will rank as a general creditor of TNTC. The financial instruments held in custody are held with the Depositary, Northern Trust Fiduciary Services (Ireland) Limited. These assets are held distinct and separately from the proprietary assets of the Depositary. Securities are clearly recorded to ensure they are held on behalf of the Funds. Bankruptcy or insolvency of the Depositary and or one of its agents or affiliates may cause the Funds rights with respect to the securities held by the Depositary to be delayed.
Both the Depositary and TNTC are wholly-owned subsidiaries of Northern Trust Corporation. As at 30.04.2017 Northern Trust Corporation had a long term rating from Standard & Poor’s of A+ (30 April 2016 A+).
Risk is managed by monitoring the credit quality and financial positions of the Depositary the Funds use.
Northern Trust acts as its own sub-custodian in the U.S., the U.K., Ireland and Canada. In all other markets,
Northern Trust appoints a local sub-custodian. Northern Trust continually reviews its sub-custodian network to
ensure that clients have access to the most efficient, creditworthy and cost-effective provider in each market.

49
Notes to the financial statements (continued)
8. Financial risk management (continued)
(e) Credit risk (continued)
The Investment Manager reviews concentrations of credit risk on a fortnightly basis. All exposures to
counterparty credit risk are monitored by the Baring Asset Management Limited Counterparty Credit
Committee and are subject to Baring Asset Management Limited’s Counterparty Credit Policy (“CCP”). Baring
Asset Management Limited requires a minimum credit rating of Dunn and Bradstreet (“D&B”) 3, but also
actively avoids exposure to entities having an S&P rating of less than AA-, even where the D&B rating is 3 or
better. Adherence to the CCP is very rigidly enforced.
Any changes to ratings which cause divergence from the CCP are acted on immediately without exception.
Application for initial public offerings, for example, is subject to the credit rating of the entity to whose balance
sheet the application will expose the investing fund. Where no satisfactory rating is applied, Baring Asset
Management Limited insists that monies are paid into a ring-fenced 'Client Money' account, hence avoiding
exposure not permitted by the CCP. The Funds minimise concentrations of credit risk by undertaking
transactions with a large number of regulated counterparties on recognised and reputable exchanges.
Credit risk arising from receivables relating to unsettled trades is considered small due to the short settlement
period involved. The maximum exposure related to unsettled trades equals the amounts shown on the
balance sheet. There were no past due or impaired assets as of 30 April 2017 (2016: none).
As at 30 April 2017 and 30 April 2016, the Baring Developed and Emerging Markets High Yield Bond Fund’s
exposure to portfolio credit risk was as follows:
Portfolio by rating category
Rating 30/04/2017 30/04/2016
Investment grade 2.23% 7.53%
Non investment grade 95.44% 88.43%
Non rated 2.33% 4.04%
100.00% 100.00%
For investments held at 30 April 2017 and 30 April 2016, investments held above S&P rating BBB- were
considered investment grade
(f) Fair value hierarchy
FRS 102 (as amended) requires the Funds to classify fair value measurements using a fair value hierarchy
that reflects the significance of the inputs used in making the measurements. The fair value hierarchy has the
following levels:
Level 1: Quoted prices (unadjusted) in active markets for identical assets or liabilities;
Level 2: Inputs other than quoted prices included within level 1 that are observable for the asset or
liability, either directly (that is, as prices) or indirectly (that is, derived from prices);
Level 3: Inputs for the assets or liabilities that are not based on observable market data (that is,
unobservable inputs).
The level in the fair value hierarchy within which the fair value measurement is categorised in its entirety is
determined on the basis of the lowest input that is significant to the fair value measurement in its entirety. For
this purpose, the significance of an input is assessed against the fair value measurement in its entirety. If a
fair value measurement uses observable inputs that require significant adjustment based on unobservable
inputs, that measurement is a level 3 measurement. Assessing the significance of a particular input to the fair
value measurement in its entirety requires judgement, taking into consideration factors specific to the asset or
liability.
The determination of what constitutes ‘observable’ requires significant judgement by the Manager. The
Manager considers observable data to be market data that is readily available, regularly distributed or
updated, reliable and verifiable, not proprietary, and provided by independent sources that are actively
involved in the relevant market.

50
Notes to the financial statements (continued)
8. Financial risk management (continued)
(f) Fair value hierarchy (continued)
The following table analyses, within the fair value hierarchy, the Funds’ financial assets and liabilities
measured at fair value as at 30 April 2017 and 30 April 2016.
Financial assets and liabilities at fair value through profit or loss
30/04/2017
Baring Developed and Emerging Markets Total Level 1 Level 2 Level 3
High Yield Bond Fund US$ US$ US$ US$
Financial Assets
Fixed interest 612,597,422 - 612,597,422 -
Forward foreign currency exchange contracts 2,297,790 - 2,297,790 -
Investment Funds 5,537,133 - 5,537,133 -
620,432,345 - 620,432,345 -
Financial liabilities
Forward foreign currency exchange contracts (6,046,448) - (6,046,448) -
(6,046,448) - (6,046,448) -
Total 614,385,897 - 614,385,897 -
30/04/2016 Total Level 1 Level 2 Level 3
Baring High Yield Bond Fund US$ US$ US$ US$
Financial Assets
Fixed interest 572,726,017 - 572,726,017 -
Forward foreign currency exchange contracts 1,352,150 - 1,352,150 -
Investment Funds 38,347,124 - 38,347,124 -
612,425,291 - 612,425,291 -
Financial liabilities
Forward foreign currency exchange contracts (4,192,122) - (4,192,122) -
(4,192,122) - (4,192,122) -
Total 608,233,169 - 608,233,169 -
30/04/2017 Total Level 1 Level 2 Level 3
Baring Eastern Europe Fund US$ US$ US$ US$
Financial Assets
Equities 1,026,037,837 1,026,037,837 - -
Investment Funds 19,183,851 - 19,183,851 -
Total 1,045,221,688 1,026,037,837 19,183,851 -
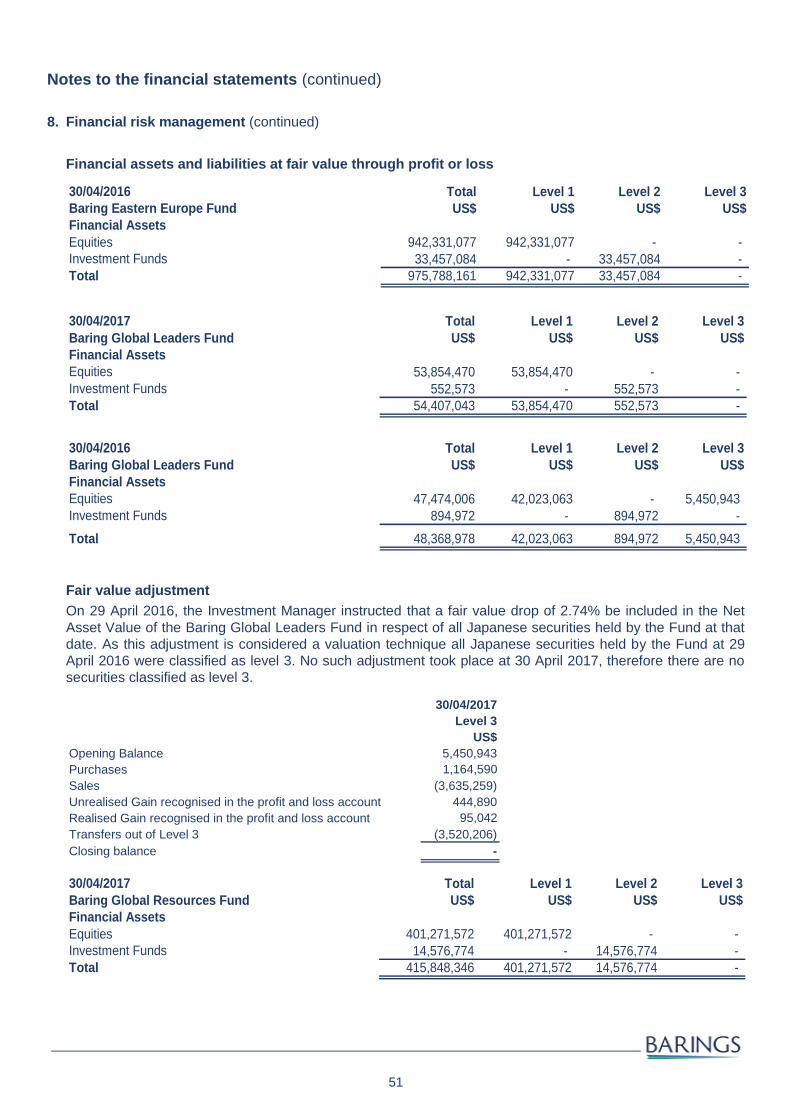
51
Notes to the financial statements (continued)
8. Financial risk management (continued)
Financial assets and liabilities at fair value through profit or loss
30/04/2016 Total Level 1 Level 2 Level 3
Baring Eastern Europe Fund US$ US$ US$ US$
Financial Assets
Equities 942,331,077 942,331,077 - -
Investment Funds 33,457,084 - 33,457,084 -
Total 975,788,161 942,331,077 33,457,084 -
30/04/2017 Total Level 1 Level 2 Level 3
Baring Global Leaders Fund US$ US$ US$ US$
Financial Assets
Equities 53,854,470 53,854,470 - -
Investment Funds 552,573 - 552,573 -
Total 54,407,043 53,854,470 552,573 -
30/04/2016 Total Level 1 Level 2 Level 3
Baring Global Leaders Fund US$ US$ US$ US$
Financial Assets
Equities 47,474,006 42,023,063 - 5,450,943
Investment Funds 894,972 - 894,972 -
Total 48,368,978 42,023,063 894,972 5,450,943
Fair value adjustment
On 29 April 2016, the Investment Manager instructed that a fair value drop of 2.74% be included in the Net
Asset Value of the Baring Global Leaders Fund in respect of all Japanese securities held by the Fund at that
date. As this adjustment is considered a valuation technique all Japanese securities held by the Fund at 29
April 2016 were classified as level 3. No such adjustment took place at 30 April 2017, therefore there are no
securities classified as level 3.
30/04/2017
Level 3
US$
Opening Balance 5,450,943
Purchases 1,164,590
Sales (3,635,259)
Unrealised Gain recognised in the profit and loss account 444,890
Realised Gain recognised in the profit and loss account 95,042
Transfers out of Level 3 (3,520,206)
Closing balance -
30/04/2017 Total Level 1 Level 2 Level 3
Baring Global Resources Fund US$ US$ US$ US$
Financial Assets
Equities 401,271,572 401,271,572 - -
Investment Funds 14,576,774 - 14,576,774 -
Total 415,848,346 401,271,572 14,576,774 -

52
Notes to the financial statements (continued)
8. Financial risk management (continued)
Financial assets and liabilities at fair value through profit or loss
30/04/2016 Total Level 1 Level 2 Level 3
Baring Global Resources Fund US$ US$ US$ US$
Financial Assets
Equities 377,045,450 377,045,450 - -
Investment Funds 8,592,670 - 8,592,670 -
Total 385,638,120 377,045,450 8,592,670 -
9. Bank Facilities
There is a bank overdraft facility in place with the Northern Trust Company (“NTC”). An “uncommitted” multi-
currency loan facility has been made available by NTC to the Funds. As at 30 April 2017, Baring Developed
and Emerging Markets High Yield Bond Fund, Baring Eastern Europe Fund, Baring Global Leaders Fund and
Baring Global Resources Fund were the funds that had drawn down on this facility (30 April 2016: Baring
Developed and Emerging Markets High Yield Bond Fund (formerly Baring High Yield Bond Fund), Baring
Eastern Europe Fund, Baring Global Leaders Fund and Baring Global Resources Fund).
10. Taxation
Under current law and practice, the Trust qualifies as an investment undertaking as defined in Section 739B
of the Taxes Consolidation Act, 1997, as amended (“the TCA”).
On that basis, it is not chargeable to Irish tax on its income or capital gains. However, Irish tax can arise on
the happening of a chargeable event in the Trust.
A chargeable event includes any distribution payments to unitholders or any encashment, redemption,
transfer or cancellation of units and any deemed disposal of units for Irish tax purposes arising as a result of
holding units in the Trust for a period of eight years or more.
No Irish tax will arise in respect of chargeable events for a unitholder who is an Exempt Irish Investor (as
defined in Section 739D of the TCA) or who is neither an Irish resident nor ordinarily resident in Ireland for tax
purposes at the time of the chargeable event, provided, in each case, that an appropriate valid declaration in
accordance with Schedule 2B of the TCA is held by the Trust or where the Trust has been authorised by Irish
Revenue to make gross payments in absence of appropriate declarations.
Capital gains, dividends and interest received on investments made by the Trust may be subject to
withholding taxes imposed by the country of origin and such taxes may not be recoverable by the Trust or its
unitholders.
11. Subsequent Events
Jim Cleary was appointed as Director of the Manager with effect from 18 May 2017.
Michel Schulz has resigned from his position as Director of the Manager with effect from 18 May 2017.
Timothy Schulze was appointed as Director of the Manager with effect from 18 May 2017.
Mark Thorne has resigned from his position as Director of the Manager with effect from 18 May 2017.
There have been no other events subsequent to the year-end which, in the opinion of the Directors of the
Manager, may have had a material impact on these financial statements.
12. Approval of financial statements
The financial statements were approved by the Directors of the Manager on 21 August 2017.

53
Portfolio statements
As at 30 April 2017
Baring Developed and Emerging Markets High Yield Bond Fund
Financial assets at fair value through profit or loss
Nominal Fair value % of
Investment Funds 0.87% (2016: 6.26%) Currency holdings US$ NAV
Euro: 0.00% (2016: 1.73%)
Northern Trust Global Funds - Euro Liquidity Fund EUR 1 1 -
1 -
Pound sterling: 0.09% (2016: 0.32%)
Northern Trust Global Funds - Sterling Fund GBP 439,000 568,132 0.09
568,132 0.09
US dollar: 0.78% (2016: 4.21%)
Northern Trust Global Funds - US Dollar Fund USD 4,969,000 4,969,000 0.78
4,969,000 0.78
Total Investment Funds 5,537,133 0.87
Fixed Interest: 95.84% (2016: 93.44%)
Euro: 11.86% (2016: 18.82%)
Altice Luxembourg 6.25% Bonds 15/02/2025 EUR 2,575,000 3,059,571 0.48
Ardagh Packaging Finance 6.75% Bonds 15/05/2024 EUR 5,500,000 6,631,331 1.04
Boing Group Financing 6.63% Bonds 15/07/2019 EUR 1,500,000 1,669,877 0.26
Bormioli Rocco Holdings 10.00% Bonds 01/08/2018 EUR 300,000 336,984 0.05
Carlson Travel Holdings FRN 15/06/2023 EUR 100,000 109,557 0.02
Constellium 7.00% Bonds 15/01/2023 EUR 3,500,000 4,000,606 0.63
eircom Finance DAC 4.50% Bonds 31/05/2022 EUR 5,650,000 6,475,649 1.01
Horizon Holdings I SAS 7.25% Bonds 01/08/2023 EUR 2,700,000 3,171,633 0.50
INEOS Group Holdings 5.38% Bonds 01/08/2024 EUR 1,300,000 1,514,357 0.24
Infor US 5.75% Bonds 15/05/2022 EUR 3,100,000 3,512,830 0.55
Loxam SAS 6.00% Bonds 15/04/2025 EUR 1,200,000 1,379,818 0.22
LSF9 Balta Issuer 7.75% Bonds 15/09/2022 EUR 3,800,000 4,574,173 0.72
Monitchem HoldCo 2 6.88% Bonds 15/06/2022 EUR 1,750,000 1,911,614 0.30
Petrobras Global Finance 4.75% Bonds 14/01/2025 EUR 2,000,000 2,290,152 0.36
SIG Combibloc 7.75% Bonds 15/02/2023 EUR 6,000,000 7,057,788 1.10
Spectrum Brands 4.00% Bonds 01/10/2026 EUR 2,900,000 3,315,143 0.52
Takko Luxembourg 2 9.88% Bonds 15/04/2019 EUR 2,100,000 1,917,363 0.30
Takko Luxembourg 2 FRN 15/04/2019 EUR 775,000 674,530 0.11
Thomas Cook 6.25% Bonds 15/06/2022 EUR 2,500,000 2,985,702 0.47
Unitymedia Hessen GmbHKG 6.25% Bonds 15/01/2029 EUR 4,250,000 5,316,450 0.83
UPCB Finance IV 4.00% Bonds 15/01/2027 EUR 2,050,000 2,329,257 0.36
WFS Global SAS 9.50% Bonds 15/07/2022 EUR 6,095,000 7,246,817 1.12
WMG Acquisition 4.13% Bonds 01/11/2024 EUR 1,300,000 1,497,313 0.23
Ziggo Secured Finance 4.25% Bonds 15/01/2027 EUR 2,450,000 2,836,645 0.44
75,815,160 11.86
The accompanying notes form an integral part of these financial statements.

54
Portfolio statements (continued)
As at 30 April 2017
Baring Developed and Emerging Markets High Yield Bond Fund (continued)
Financial assets at fair value through profit or loss
Nominal Fair value % of
Fixed Interest: 95.84% (2016: 93.44%) Currency holdings US$ NAV
(continued)
Pound sterling: 11.34% (2016: 7.90%)
AA Bond 5.50% Bonds 31/07/2022 GBP 4,800,000 6,457,166 1.01
AMC Entertainment Holdings 6.38% Bonds 15/11/2024 GBP 1,300,000 1,799,905 0.28
Arrow Global Finance 5.13% Bonds 15/09/2024 GBP 1,700,000 2,315,558 0.36
Boparan Finance 5.25% Bonds 15/07/2019 GBP 750,000 984,447 0.15
Boparan Finance 5.50% Bonds 15/07/2021 GBP 1,750,000 2,276,086 0.36
Cabot Financial Luxembourg 7.50% Bonds 01/10/2023 GBP 950,000 1,331,089 0.21
Cognita Financing 7.75% Bonds 15/08/2021 GBP 500,000 683,538 0.11
CPUK Finance 7.00% Bonds 28/08/2020 GBP 2,300,000 3,132,814 0.49
Galaxy Finco 7.88% Bonds 15/11/2021 GBP 2,750,000 3,632,852 0.57
Garfunkelux Holdco 3 8.50% Bonds 01/11/2022 GBP 6,900,000 9,662,240 1.51
HSS Financing 6.75% Bonds 01/08/2019 GBP 2,040,000 2,665,094 0.42
IDH Finance 6.25% Bonds 15/08/2022 GBP 2,350,000 2,950,276 0.46
Iron Mountain Europe 6.13% Bonds 15/09/2022 GBP 2,000,000 2,746,833 0.43
Jerrold Finco 6.13% Bonds 15/01/2024 GBP 2,000,000 2,616,637 0.41
Keystone Financing 9.50% Bonds 15/10/2019 GBP 2,800,000 3,810,236 0.60
Marlin Intermediate 10.50% Bonds 01/08/2020 GBP 450,000 630,704 0.10
Perform Group Financing 8.50% Bonds 15/11/2020 GBP 2,250,000 3,083,636 0.48
Pizzaexpress Financing 2 6.63% Bonds 01/08/2021 GBP 3,500,000 4,711,866 0.74
Premier Foods Finance 6.50% Bonds 15/03/2021 GBP 2,230,000 2,958,681 0.46
Travelex Financing 8.00% Bonds 01/08/2018 GBP 2,500,000 3,300,487 0.52
TVL Finance 8.50% Bonds 15/05/2023 GBP 4,500,000 6,410,014 1.00
Virgin Media Secured Finance 5.50% Bonds 15/01/2025 GBP 3,150,000 4,320,352 0.67
72,480,511 11.34
US dollar: 72.64% (2016: 66.72%)
A Schulman 6.88% Bonds 01/06/2023 USD 7,000,000 7,455,000 1.17
Aeropuertos Argentina 2000 Bonds 6.88% 01/02/2027 USD 780,000 823,484 0.13
Aircastle 4.13% Bonds 01/05/2024 USD 4,522,000 4,623,745 0.72
Aleris International 7.88% Bonds 01/11/2020 USD 4,008,000 3,987,960 0.62
Allegheny Technologies 5.95% Bonds 15/01/2021 USD 6,105,000 6,074,475 0.95
Alliance & Leicester 7.50% Bonds 01/05/2025 USD 1,487,000 1,555,774 0.24
Allison Transmission 5.00% Bonds 01/10/2024 USD 1,000,000 1,022,500 0.16
Alpha Star III 6.25% Bonds 20/04/2022 USD 2,000,000 2,061,374 0.32
Altice Financing 7.50% Bonds 15/05/2026 USD 4,650,000 5,033,625 0.79
Apex Tool 7.00% Bonds 01/02/2021 USD 100,000 93,250 0.01
Appvion 9.00% Bonds 01/06/2020 USD 1,267,000 741,195 0.12
Arcos Dorados 5.88% Bonds 04/04/2027 USD 1,100,000 1,103,839 0.17
Arcos Dorados 6.63% Bonds 27/09/2023 USD 1,000,000 1,076,590 0.17
The accompanying notes form an integral part of these financial statements.

55
Portfolio statements (continued)
As at 30 April 2017
Baring Developed and Emerging Markets High Yield Bond Fund (continued)
Financial assets at fair value through profit or loss
Nominal Fair value % of
Fixed Interest: 95.84% (2016: 93.44%) Currency holdings US$ NAV
(continued)
US dollar: 72.64% (2016: 66.72%) (continued)
Ardagh Packaging Finance 6.00% Bonds 15/02/2025 USD 4,056,000 4,190,355 0.66
Banco do Brasil FRN 31/12/2049 USD 3,000,000 3,158,400 0.49
Borets Finance DAC 6.50% Bonds 07/04/2022 USD 1,900,000 1,973,625 0.31
Carlson Travel Holdings 6.75% Bonds 15/12/2023 USD 500,000 517,810 0.08
Carlson Travel Holdings 9.50% Bonds 15/12/2024 USD 3,728,000 3,858,480 0.60
CCO Holdings 5.13% Bonds 01/05/2027 USD 6,030,000 6,150,600 0.96
Cemex 7.75% Bonds 16/04/2026 USD 3,000,000 3,435,000 0.54
Cemex Finance 6.00% Bonds 01/04/2024 USD 3,000,000 3,187,500 0.50
Cequel Communications I 6.38% Bonds 15/09/2020 USD 2,796,000 2,886,870 0.45
Change Healthcare Holdings 5.75% Bonds 01/03/2025 USD 2,923,000 3,010,690 0.47
Chesapeake Energy 8.00% Bonds 15/12/2022 USD 2,933,000 3,108,188 0.49
Citgo Holding 10.75% Bonds 15/02/2020 USD 6,284,000 6,755,300 1.06
Clear Channel Worldwide Holdings 7.63% Bonds 15/03/2020 USD 4,900,000 4,887,750 0.76
Community Health Systems 6.25% Bonds 31/03/2023 USD 1,244,000 1,270,435 0.20
Community Health Systems 6.88% Bonds 01/02/2022 USD 1,500,000 1,245,000 0.19
Consolidated Energy Finance 6.75% Bonds 15/10/2019 USD 8,000,000 8,200,000 1.28
Constellium 7.88% Bonds 01/04/2021 USD 250,000 269,063 0.04
Coveris Holdings 7.88% Bonds 01/11/2019 USD 12,000,000 11,926,920 1.87
Deck Chassis Acquisition 10.00% Bonds 15/06/2023 USD 5,000,000 5,487,500 0.86
Diamond 1 Finance/ Diamond 2 Finance 7.13% Bonds 15/06/2024 USD 8,000,000 8,823,256 1.38
Digicel 6.00% Bonds 15/04/2021 USD 3,000,000 2,870,010 0.45
DISH DBS 7.75% Bonds 01/07/2026 USD 3,214,000 3,744,310 0.59
Endo DAC 5.88% Bonds 15/10/2024 USD 632,000 646,220 0.10
Energy Transfer Partners FRN 01/11/2066 USD 10,500,000 9,108,750 1.42
EnPro Industries 5.88% Bonds 15/09/2022 USD 4,418,000 4,660,990 0.73
Envision Healthcare 5.63% Bonds 15/07/2022 USD 2,190,000 2,258,438 0.35
EP Energy 8.00% Bonds 15/02/2025 USD 7,000,000 6,282,500 0.98
EP Energy 8.00% Bonds 29/11/2024 USD 5,000,000 5,231,250 0.82
Evraz 5.375% Bonds 20/03/2023 USD 3,000,000 3,015,750 0.47
Exterran Energy Solutions 8.13% Bonds 01/05/2025 USD 1,090,000 1,122,700 0.18
Ferrellgas Partners 6.75% Bonds15/01/2022 USD 5,000,000 4,862,500 0.76
Ferrellgas Partners 8.63% Bonds 15/06/2020 USD 2,321,000 2,265,876 0.35
First Quantum Minerals 7.25% Bonds 15/05/2022 USD 2,000,000 2,062,500 0.32
Frontier Communications 7.13% Bonds 15/03/2019 USD 4,228,000 4,481,680 0.70
Frontier Communications 8.88% Bonds 15/09/2020 USD 3,000,000 3,176,250 0.50
Gardner Denver 6.88% Bonds 15/08/2021 USD 5,000,000 5,187,500 0.81
Gartner 5.13% Bonds 01/04/2025 USD 967,000 1,004,471 0.16
Ghana Government International Bond 10.75% 14/10/2030 USD 1,000,000 1,206,450 0.19
The accompanying notes form an integral part of these financial statements.

56
Portfolio statements (continued)
As at 30 April 2017
Baring Developed and Emerging Markets High Yield Bond Fund (continued)
Financial assets at fair value through profit or loss
Nominal Fair value % of
Fixed Interest: 95.84% (2016: 93.44%) Currency holdings US$ NAV
(continued)
US dollar: 72.64% (2016: 66.72%) (continued)
Goodyear Tire & Rubber 5.00% Bonds 31/05/2026 USD 5,050,000 5,207,813 0.81
GTH Finance 7.25% Bonds 26/04/2023 USD 3,000,000 3,293,061 0.52
GTL Trade Finance 5.89% Bonds 29/04/2024 USD 2,000,000 2,044,600 0.32
HCA 5.88% Bonds 15/03/2022 USD 6,600,000 7,326,000 1.15
Hertz Corp 5.88% Bonds 15/10/2020 USD 8,000,000 7,560,000 1.18
Hughes Satellite Systems 5.25% Bonds 01/08/2026 USD 4,000,000 4,060,000 0.64
Hughes Satellite Systems 6.63% Bonds 01/08/2026 USD 2,977,000 3,070,031 0.48
Icahn Enterprises 6.25% Bonds 01/02/2022 USD 3,085,000 3,216,113 0.50
Icahn Enterprises 6.75% Bonds 01/02/2024 USD 3,144,000 3,285,480 0.51
Jupiter Resources 8.50% Bonds 01/10/2022 USD 8,750,000 7,175,000 1.12
KCA Deutag UK Finance 9.88% Bonds 01/04/2022 USD 600,000 619,500 0.10
KCA Deutag UK Finance 9.88% Bonds 01/04/2022 USD 350,000 361,375 0.06
Kinross Gold 6.88% Bonds 01/09/2041 USD 2,000,000 2,087,500 0.33
Kissner Holdings 8.38% Bonds 01/12/2022 USD 1,675,000 1,739,906 0.27
Kosmos Energy 7.88% Bonds 01/08/2021 USD 4,000,000 4,110,000 0.64
Kosmos Energy 7.88% Bonds 01/08/2021 USD 6,000,000 6,165,000 0.96
Laredo Petroleum 5.63% Bonds 15/01/2022 USD 5,500,000 5,527,500 0.87
Liberty Interactive 8.25% Bonds 01/02/2030 USD 8,200,000 8,825,250 1.39
LPL Holdings 5.75% Bonds 15/09/2025 USD 5,000,000 5,087,500 0.80
Mallinckrodt International Finance 5.75% Bonds 01/08/2022 USD 5,277,000 5,211,037 0.82
MPT Operating Partnership 5.25% Bonds 01/08/2026 USD 250,000 257,187 0.04
Netflix 5.38% Bonds 01/02/2021 USD 4,000,000 4,300,000 0.67
New Albertsons 7.45% Bonds 01/08/2029 USD 6,000,000 5,700,000 0.89
NRG Energy 6.63% Bonds 15/01/2027 USD 2,000,000 1,980,000 0.31
NRG Energy 7.25% Bonds 15/05/2026 USD 4,119,000 4,252,868 0.67
Numericable SFR 6.00% Bonds 15/05/2022 USD 5,383,000 5,637,347 0.88
NuStar Logistics 5.63% Bonds 28/04/2027 USD 1,077,000 1,112,003 0.17
Ortho-Clinical Diagnostics 6.63% Bonds 15/05/2022 USD 3,288,000 3,033,180 0.47
Pampa Energia 7.50% Bonds 24/01/2027 USD 2,000,000 2,132,500 0.33
Parker Drilling 6.75% Bonds 15/07/2022 USD 5,037,000 4,470,338 0.70
Peabody Energy 6.00% Bonds 31/03/2022 USD 576,000 589,680 0.09
Peabody Energy 6.38% Bonds 31/03/2025 USD 2,803,000 2,852,473 0.45
Petra 7.25% Bonds 01/05/2022 USD 1,950,000 2,044,614 0.32
Petrobras Global Finance 8.38% Bonds 23/05/2021 USD 1,500,000 1,696,500 0.27
Petrobras Global Finance 8.75% Bonds 23/05/2026 USD 2,000,000 2,343,500 0.37
Polyus Gold 5.25% Bonds 07/02/2023 USD 2,000,000 2,045,000 0.32
Post Holdings 5.50% Bonds 01/03/2025 USD 1,656,000 1,734,660 0.27
Post Holdings 5.75% Bonds 01/03/2027 USD 2,048,000 2,137,600 0.33
Prime Security Services Borrower 9.25% Bonds 15/05/2023 USD 4,000,000 4,375,000 0.68
Province of Santa Fe 6.90% Bonds 01/11/2027 USD 1,850,000 1,829,521 0.29
The accompanying notes form an integral part of these financial statements.

57
Portfolio statements (continued)
As at 30 April 2017
Baring Developed and Emerging Markets High Yield Bond Fund (continued)
Financial assets at fair value through profit or loss
Nominal Fair value % of
Fixed Interest: 95.84% (2016: 93.44%) Currency holdings US$ NAV
(continued)
US dollar: 72.64% (2016: 66.72%) (continued)
Provincia de Cordoba 7.13% Bonds 10/06/2021 USD 2,000,000 2,121,040 0.33
RegionalCare Hospital Partners 8.25% Bonds 01/05/2023 USD 3,760,000 4,023,200 0.63
ServiceMaster 5.13% Bonds 15/11/2024 USD 4,000,000 4,137,500 0.65
Signode Industrial US 6.38% Bonds 01/05/2022 USD 7,305,000 7,524,150 1.18
Sirius XM Radio 4.25% Bonds 15/05/2020 USD 5,500,000 5,561,875 0.87
Sprint 7.88% Bonds 15/09/2023 USD 1,432,000 1,611,000 0.25
Sprint Capital 6.88% Bonds 15/11/2028 USD 10,000,000 10,809,400 1.69
State Bank of India FRN 29/09/2049 USD 3,000,000 3,076,500 0.48
Suburban Propane Partners 5.88% Bonds 01/03/2027 USD 4,543,000 4,531,643 0.71
SunCoke Energy Partners 7.38% Bonds 01/02/2020 USD 4,000,000 4,110,000 0.64
Sunoco 6.25% Bonds 15/04/2021 USD 3,436,000 3,624,980 0.57
Symantec 5.00% Bonds 15/04/2025 USD 3,959,000 4,090,142 0.64
Tenet Healthcare 6.88% Bonds 15/11/2031 USD 4,200,000 3,625,860 0.57
TIBCO Software 11.38% Bonds 01/12/2021 USD 2,750,000 3,045,625 0.48
Topaz Marine 8.63% Bonds 01/11/2018 USD 8,500,000 8,541,948 1.34
TransDigm 5.50% Bonds 15/10/2020 USD 3,318,000 3,388,508 0.53
TransDigm 6.38% Bonds 15/06/2026 USD 5,280,000 5,346,000 0.84
Trinseo Materials Operating 6.75% Bonds 01/05/2022 USD 2,500,000 2,643,750 0.41
Tronox Finance 7.50% Bonds 15/03/2022 USD 4,150,000 4,367,875 0.68
Tullow Oil 6.00% Bonds 01/11/2020 USD 8,545,000 8,406,571 1.32
UPCB Finance IV 5.38% Bonds 15/01/2025 USD 2,000,000 2,037,500 0.32
USIS Merger Sub 6.88% Bonds 01/05/2025 USD 4,769,000 4,876,303 0.76
Valeant Pharmaceuticals International 6.13% Bonds 15/04/2025 USD 10,000,000 7,412,500 1.16
Valeant Pharmaceuticals International 6.50% Bonds 15/03/2022 USD 865,000 889,869 0.14
Valeant Pharmaceuticals International 7.00% Bonds 15/03/2024 USD 1,512,000 1,547,910 0.24
Vedanta Resources 6.38% Bonds 30/07/2022 USD 2,000,000 2,041,400 0.32
Virgin Media Finance 5.75% Bonds 15/01/2025 USD 4,200,000 4,310,250 0.67
VTR Finance 6.88% Bonds 15/01/2024 USD 4,000,000 4,270,000 0.67
Welltec 8.00% Bonds 01/02/2019 USD 1,105,000 1,125,719 0.18
West 5.38% Bonds 15/07/2022 USD 5,500,000 5,500,000 0.86
Wind Acquisition Finance 7.38% Bonds 23/04/2021 USD 6,500,000 6,776,250 1.06
XPO Logistics 6.13% Bonds 01/09/2023 USD 750,000 790,313 0.12
Zachry Holdings 7.50% Bonds 01/02/2020 USD 3,000,000 3,112,500 0.49
Zayo Capital 5.75% Bonds 15/01/2027 USD 244,000 258,335 0.04
Zayo Capital 6.38% Bonds 15/05/2025 USD 1,000,000 1,085,000 0.17
464,301,751 72.64
Total fixed interest 612,597,422 95.84
The accompanying notes form an integral part of these financial statements.

58
Portfolio statements (continued)
As at 30 April 2017
Baring Developed and Emerging Markets High Yield Bond Fund (continued)
Financial assets at fair value through profit or loss
Open forward foreign currency transactions 0.36% (2016: 0.22%)
Currency Currency Currency Maturity Unrealised % of
sold bought rate Counterparty date gain US$ NAV
US$ 34,045,886 £27,380,731 1.2434 Barclays 15/05/2017 1,402,650 0.22
US$ 10,057,796 £8,088,784 1.2434 Barclays 15/05/2017 414,368 0.07
US$ 5,233,845 € 4,915,798 1.0647 Barclays 15/05/2017 147,168 0.02
US$ 2,915,837 € 2,739,843 1.0642 State Street 15/05/2017 83,296 0.01
US$ 2,920,225 € 2,736,979 1.0670 State Street 15/05/2017 75,772 0.01
US$ 1,120,123 £893,527 1.2536 State Street 15/05/2017 36,684 0.01
US$ 1,529,063 € 1,426,356 1.0720 State Street 15/05/2017 32,278 0.01
US$ 3,418,266 £2,664,461 1.2829 State Street 15/05/2017 31,285 -
US$ 633,365 £509,455 1.2432 Barclays 15/05/2017 26,203 -
US$ 2,380,563 € 2,190,712 1.0867 Barclays 15/05/2017 17,470 -
US$ 194,224 £156,227 1.2432 Barclays 15/05/2017 8,035 -
US$ 369,668 £288,956 1.2793 Barclays 15/05/2017 4,429 -
US$ 96,017 € 90,185 1.0647 Barclays 15/05/2017 2,703 -
US$ 149,798 CHF 150,332 0.9965 Barclays 15/05/2017 2,124 -
US$ 6,226,208 CNH 43,023,719 0.1447 State Street 15/05/2017 1,982 -
US$ 182,475 £142,468 1.2808 Barclays 15/05/2017 1,972 -
US$ 132,318 £103,157 1.2827 Barclays 15/05/2017 1,235 -
US$ 120,994 £94,290 1.2832 Barclays 15/05/2017 1,079 -
US$ 29,977 £23,971 1.2505 Barclays 15/05/2017 1,057 -
CA$ 51,464 US$ 38,650 0.7510 Barclays 15/05/2017 942 -
AU$ 67,761 US$ 51,335 0.7576 State Street 15/05/2017 717 -
AU$ 127,710 US$ 96,066 0.7522 State Street 15/05/2017 664 -
US$ 54,493 £42,490 1.2825 Barclays 15/05/2017 517 -
US$ 81,112 € 74,472 1.0892 Barclays 15/05/2017 408 -
US$ 12,940 € 12,157 1.0644 Barclays 15/05/2017 368 -
US$ 60,756 € 55,803 1.0888 Barclays 15/05/2017 328 -
CA$ 51,515 US$ 37,977 0.7372 Barclays 15/05/2017 232 -
US$ 6,872 € 6,486 1.0595 Barclays 15/05/2017 228 -
US$ 4,967 £4,000 1.2416 Barclays 15/05/2017 212 -
NZ$ 27,408 US$ 19,020 0.6940 State Street 15/05/2017 208 -
NZ$ 17,485 US$ 12,166 0.6958 State Street 15/05/2017 165 -
US$ 7,470 £5,897 1.2668 Barclays 15/05/2017 164 -
US$ 13,017 £10,170 1.2800 Barclays 15/05/2017 149 -
US$ 11,006 £8,581 1.2825 Barclays 15/05/2017 104 -
CNH 379,394 US$ 55,025 0.1450 State Street 15/05/2017 103 -
US$ 25,192 £19,523 1.2904 Barclays 15/05/2017 83 -
CA$ 6,188 US$ 4,610 0.7451 Barclays 15/05/2017 77 -
US$ 1,272 £1,023 1.2435 Barclays 15/05/2017 52 -
US$ 14,350 £11,121 1.2904 Barclays 15/05/2017 47 -
NZ$ 3,411 US$ 2,387 0.6997 State Street 15/05/2017 46 -
The accompanying notes form an integral part of these financial statements.
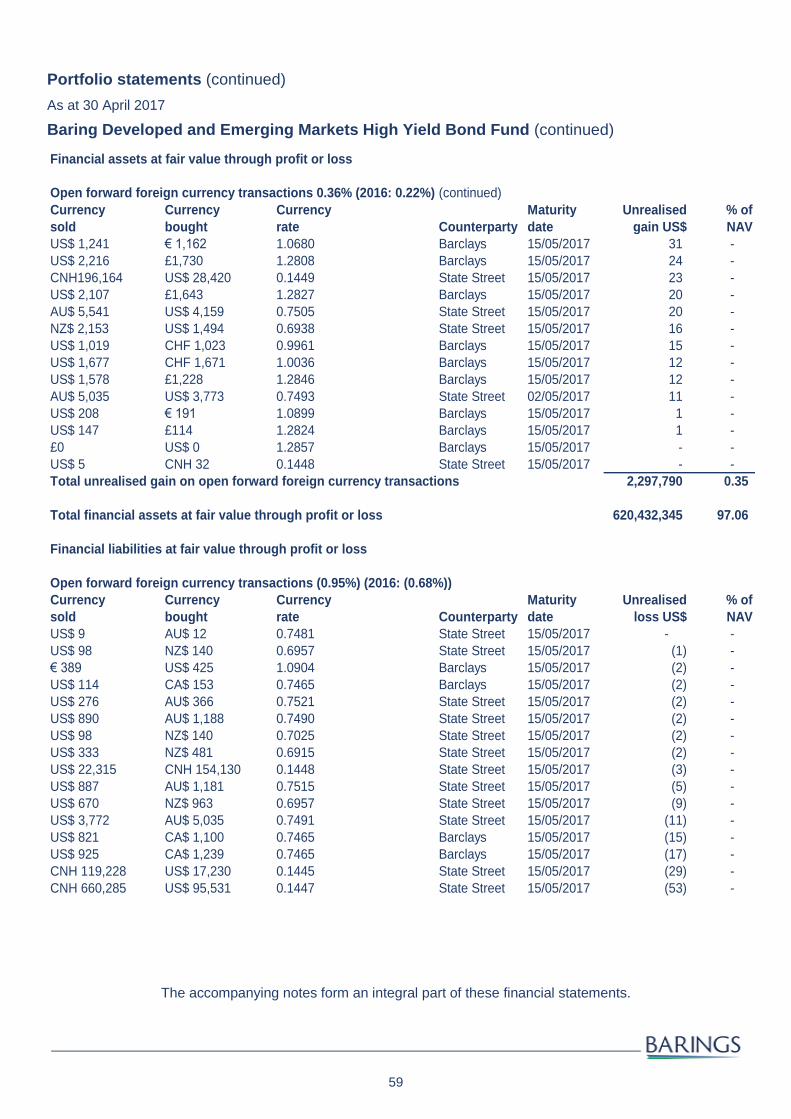
59
Portfolio statements (continued)
As at 30 April 2017
Baring Developed and Emerging Markets High Yield Bond Fund (continued)
Financial assets at fair value through profit or loss
Open forward foreign currency transactions 0.36% (2016: 0.22%) (continued)
Currency Currency Currency Maturity Unrealised % of
sold bought rate Counterparty date gain US$ NAV
US$ 1,241 € 1,162 1.0680 Barclays 15/05/2017 31 -
US$ 2,216 £1,730 1.2808 Barclays 15/05/2017 24 -
CNH196,164 US$ 28,420 0.1449 State Street 15/05/2017 23 -
US$ 2,107 £1,643 1.2827 Barclays 15/05/2017 20 -
AU$ 5,541 US$ 4,159 0.7505 State Street 15/05/2017 20 -
NZ$ 2,153 US$ 1,494 0.6938 State Street 15/05/2017 16 -
US$ 1,019 CHF 1,023 0.9961 Barclays 15/05/2017 15 -
US$ 1,677 CHF 1,671 1.0036 Barclays 15/05/2017 12 -
US$ 1,578 £1,228 1.2846 Barclays 15/05/2017 12 -
AU$ 5,035 US$ 3,773 0.7493 State Street 02/05/2017 11 -
US$ 208 € 191 1.0899 Barclays 15/05/2017 1 -
US$ 147 £114 1.2824 Barclays 15/05/2017 1 -
£0 US$ 0 1.2857 Barclays 15/05/2017 - -
US$ 5 CNH 32 0.1448 State Street 15/05/2017 - -
Total unrealised gain on open forward foreign currency transactions 2,297,790 0.35
Total financial assets at fair value through profit or loss 620,432,345 97.06
Financial liabilities at fair value through profit or loss
Open forward foreign currency transactions (0.95%) (2016: (0.68%))
Currency Currency Currency Maturity Unrealised % of
sold bought rate Counterparty date loss US$ NAV
US$ 9 AU$ 12 0.7481 State Street 15/05/2017 - -
US$ 98 NZ$ 140 0.6957 State Street 15/05/2017 (1) -
€ 389 US$ 425 1.0904 Barclays 15/05/2017 (2) -
US$ 114 CA$ 153 0.7465 Barclays 15/05/2017 (2) -
US$ 276 AU$ 366 0.7521 State Street 15/05/2017 (2) -
US$ 890 AU$ 1,188 0.7490 State Street 15/05/2017 (2) -
US$ 98 NZ$ 140 0.7025 State Street 15/05/2017 (2) -
US$ 333 NZ$ 481 0.6915 State Street 15/05/2017 (2) -
US$ 22,315 CNH 154,130 0.1448 State Street 15/05/2017 (3) -
US$ 887 AU$ 1,181 0.7515 State Street 15/05/2017 (5) -
US$ 670 NZ$ 963 0.6957 State Street 15/05/2017 (9) -
US$ 3,772 AU$ 5,035 0.7491 State Street 15/05/2017 (11) -
US$ 821 CA$ 1,100 0.7465 Barclays 15/05/2017 (15) -
US$ 925 CA$ 1,239 0.7465 Barclays 15/05/2017 (17) -
CNH 119,228 US$ 17,230 0.1445 State Street 15/05/2017 (29) -
CNH 660,285 US$ 95,531 0.1447 State Street 15/05/2017 (53) -
The accompanying notes form an integral part of these financial statements.

60
Portfolio statements (continued)
As at 30 April 2017
Baring Developed and Emerging Markets High Yield Bond Fund (continued)
Financial liabilities at fair value through profit or loss
Open forward foreign currency transactions (0.95%) (2016: (0.68%)) (continued)
Currency Currency Currency Maturity Unrealised % of
sold bought rate Counterparty date loss US$ NAV
€ 5,504 US$ 7,058 1.2824 Barclays 15/05/2017 (67) -
US$ 7,660 CA$ 10,332 0.7414 Barclays 15/05/2017 (90) -
US$ 13,059 AU$ 17,351 0.7526 State Street 15/05/2017 (97) -
US$ 5,665 NZ$ 8,093 0.7001 State Street 15/05/2017 (111) -
£3,148 US$ 3,950 1.2549 Barclays 15/05/2017 (125) -
US$ 6,109 NZ$ 8,708 0.7015 State Street 15/05/2017 (132) -
£3,291 US$ 4,116 1.2505 Barclays 15/05/2017 (145) -
US$ 66,927 CNH 461,220 0.1451 State Street 15/05/2017 (160) -
US$ 29,816 NZ$ 43,200 0.6902 State Street 15/05/2017 (165) -
US$ 12,558 CA$ 16,855 0.7451 Barclays 15/05/2017 (208) -
US$ 9,437 NZ$ 13,430 0.7027 State Street 15/05/2017 (219) -
US$ 25,539 AU$ 33,882 0.7538 State Street 15/05/2017 (228) -
US$ 33,018 AU$ 43,893 0.7522 State Street 15/05/2017 (229) -
US$ 12,032 CA$ 16,107 0.7470 Barclays 15/05/2017 (232) -
US$ 35,160 AU$ 46,748 0.7521 State Street 15/05/2017 (238) -
CNH 889,061 US$ 128,389 0.1444 State Street 15/05/2017 (313) -
US$ 63,124 CA$ 85,702 0.7366 Barclays 15/05/2017 (330) -
US$ 16,299 CA$ 21,700 0.7511 Barclays 15/05/2017 (399) -
US$ 19,971 NZ$ 28,475 0.7013 State Street 15/05/2017 (427) -
US$ 96,191 CA$ 130,575 0.7367 Barclays 15/05/2017 (517) -
US$ 40,906 AU$ 53,994 0.7576 State Street 15/05/2017 (571) -
US$ 27,098 CA$ 36,183 0.7489 Barclays 15/05/2017 (587) -
£14,322 US$ 17,782 1.2416 Barclays 15/05/2017 (759) -
£85,558 US$ 109,911 1.2846 Barclays 15/05/2017 (857) -
US$ 129,789 AU$ 172,575 0.7521 State Street 15/05/2017 (873) -
US$ 116,387 AU$ 154,562 0.7530 State Street 15/05/2017 (927) -
US$ 53,391 NZ$ 76,156 0.7011 State Street 15/05/2017 (1,120) -
US$ 37,766 CA$ 50,000 0.7553 Barclays 15/05/2017 (1,130) -
US$ 127,046 CA$ 171,600 0.7404 Barclays 15/05/2017 (1,314) -
US$ 138,459 CA$ 186,383 0.7429 Barclays 15/05/2017 (1,896) -
£71,743 US$ 90,883 1.2668 Barclays 15/05/2017 (1,999) -
£48,622 US$ 60,454 1.2433 Barclays 15/05/2017 (2,494) -
£54,562 US$ 67,840 1.2433 Barclays 15/05/2017 (2,799) -
£320,188 US$ 409,924 1.2803 State Street 15/05/2017 (4,608) -
£136,096 US$ 170,791 1.2549 Barclays 15/05/2017 (5,405) -
£106,188 US$ 132,052 1.2436 State Street 15/05/2017 (5,425) -
€ 402,003 US$ 431,626 1.0737 Barclays 15/05/2017 (8,421) (0.01)
US$ 4,732,729 NZ$ 6,802,889 0.6957 State Street 15/05/2017 (63,457) (0.01)
US$ 10,491,469 AU$ 13,949,195 0.7521 State Street 15/05/2017 (71,169) (0.01)
The accompanying notes form an integral part of these financial statements.

61
Portfolio statements (continued)
As at 30 April 2017
Baring Developed and Emerging Markets High Yield Bond Fund (continued)
Financial liabilities at fair value through profit or loss (continued)
Open forward foreign currency transactions (0.95%) (2016: (0.68%)) (continued)
Currency Currency Currency Maturity Unrealised % of
sold bought rate Counterparty date loss US$ NAV
US$ 10,887,909 CA$ 14,584,158 0.7466 Barclays 15/05/2017 (201,967) (0.03)
€ 78,543,525 US$ 83,578,950 1.0641 State Street 15/05/2017 (2,397,673) (0.38)
£60,246,235 US$ 74,731,539 1.2404 State Street 15/05/2017 (3,266,410) (0.51)
Total unrealised loss on open forward foreign currency transactions (6,046,448) (0.95)
Total financial liabilities at fair value through profit or loss (6,046,448) (0.95)
Total financial assets and liabilities at fair value through profit or loss 614,385,897 96.11
Cash 7,767,391 1.22
Other net assets 17,066,635 2.67
Total net assets attributable to holders of redeemable participating units 639,219,923 100.00
Analysis of portfolio
UCITS and Non-UCITS Collective Investment Schemes 0.86
Transferable securities admitted to an official stock exchange listing or traded on a recognised market** 94.71
OTC Financial derivatives instruments 0.36
Other assets 4.07
100.00
% of total assets*
* Calculation based on the total assets of the Fund (excluding liabilities). This summary is a UCITS requirement.
** Transferable securities admitted to an official stock exchange listing or traded on a recognised market.
Comparative figures shown in brackets relate to 30 April 2016.
The accompanying notes form an integral part of these financial statements.

62
Portfolio statements (continued)
As at 30 April 2017
Baring Eastern Europe Fund
Financial assets at fair value through profit or loss
Nominal Fair value % of
Investment Funds: 1.83% (2016: 3.43%) Currency holdings US$ NAV
Ireland: 1.56% (2016: 3.22%)
Northern Trust Global Fund - Euro Liquidity Fund EUR - - -
Northern Trust Global Fund - US Dollar Fund USD 16,323,000 16,323,000 1.56
16,323,000 1.56
Russian Federation: 0.27% (2016: 0.21%)
Baring Russia Fund USD 48,489 2,860,851 0.27
2,860,851 0.27
Total Investment Funds 19,183,851 1.83
Equities: 97.81% (2016: 96.82%)
Czech Republic: 1.51% (2016: 1.08%)
Moneta Money Bank CZK 4,925,681 15,789,776 1.51
15,789,776 1.51
Europe: 0.00% (2016: 0.35%)
Greece: 2.57% (2016: 2.13%)
JUMBO EUR 628,932 9,838,238 0.94
OPAP EUR 1,729,315 17,119,864 1.63
26,958,102 2.57
Hungary: 5.70% (2016: 5.35%)
MOL Hungarian Oil & Gas HUF 100,195 7,611,949 0.73
OTP Bank HUF 1,424,272 40,638,778 3.87
Richter Gedeon HUF 473,619 11,512,414 1.10
59,763,141 5.70
Kazakhstan: 0.00% (2016: 0.15%)
Poland: 12.07% (2016: 10.39%)
Bank Zachodn PLN 286,575 27,124,001 2.59
CCC PLN 386,779 22,546,239 2.15
Cyfrowy Polsat PLN 1,453,411 9,204,811 0.88
Powszechny Zaklad Ubezpieczen PLN 6,069,415 67,693,087 6.45
126,568,138 12.07
Romania: 1.46% (2016: 1.13%)
Banca Transilvania RON 4,969,538 3,273,022 0.31
SC Electrica RON 2,192,753 7,607,095 0.73
SC Fondul Proprietatea RON 20,633,237 4,455,133 0.42
15,335,250 1.46
The accompanying notes form an integral part of these financial statements.
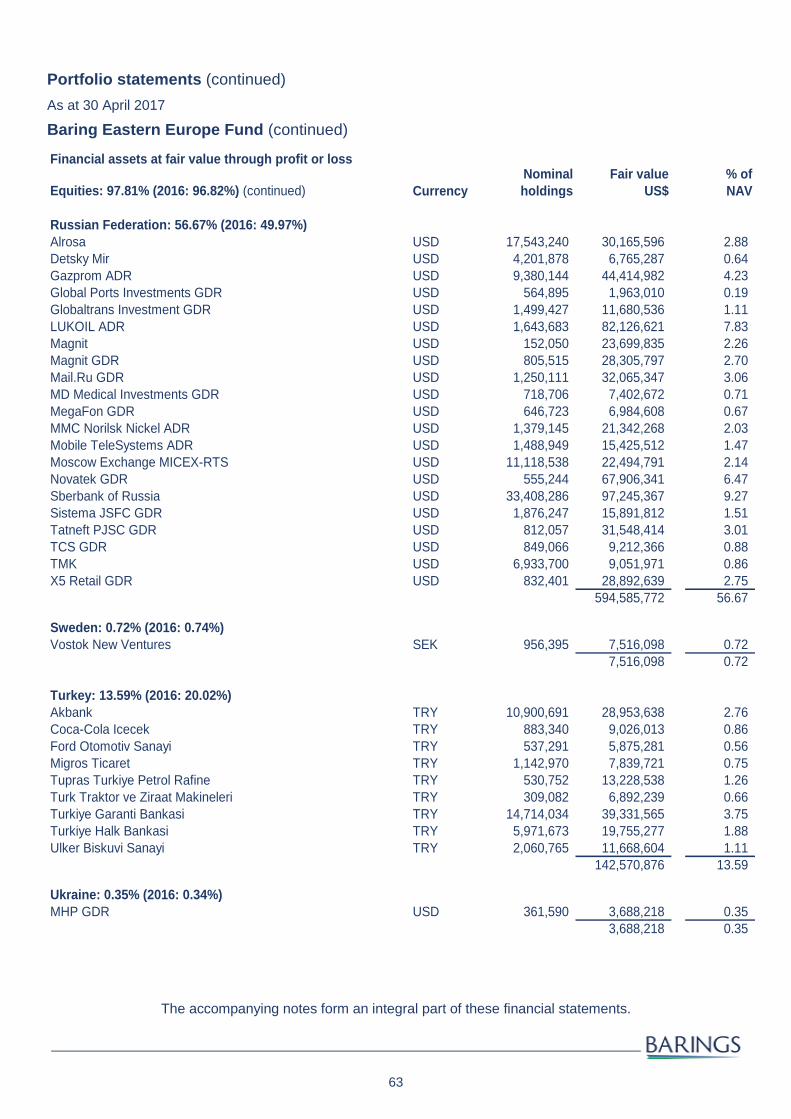
63
Portfolio statements (continued)
As at 30 April 2017
Baring Eastern Europe Fund (continued)
Financial assets at fair value through profit or lossNominal Fair value % of
Equities: 97.81% (2016: 96.82%) (continued) Currency holdings US$ NAV
Russian Federation: 56.67% (2016: 49.97%)
Alrosa USD 17,543,240 30,165,596 2.88
Detsky Mir USD 4,201,878 6,765,287 0.64
Gazprom ADR USD 9,380,144 44,414,982 4.23
Global Ports Investments GDR USD 564,895 1,963,010 0.19
Globaltrans Investment GDR USD 1,499,427 11,680,536 1.11
LUKOIL ADR USD 1,643,683 82,126,621 7.83
Magnit USD 152,050 23,699,835 2.26
Magnit GDR USD 805,515 28,305,797 2.70
Mail.Ru GDR USD 1,250,111 32,065,347 3.06
MD Medical Investments GDR USD 718,706 7,402,672 0.71
MegaFon GDR USD 646,723 6,984,608 0.67
MMC Norilsk Nickel ADR USD 1,379,145 21,342,268 2.03
Mobile TeleSystems ADR USD 1,488,949 15,425,512 1.47
Moscow Exchange MICEX-RTS USD 11,118,538 22,494,791 2.14
Novatek GDR USD 555,244 67,906,341 6.47
Sberbank of Russia USD 33,408,286 97,245,367 9.27
Sistema JSFC GDR USD 1,876,247 15,891,812 1.51
Tatneft PJSC GDR USD 812,057 31,548,414 3.01
TCS GDR USD 849,066 9,212,366 0.88
TMK USD 6,933,700 9,051,971 0.86
X5 Retail GDR USD 832,401 28,892,639 2.75
594,585,772 56.67
Sweden: 0.72% (2016: 0.74%)
Vostok New Ventures SEK 956,395 7,516,098 0.72
7,516,098 0.72
Turkey: 13.59% (2016: 20.02%)
Akbank TRY 10,900,691 28,953,638 2.76
Coca-Cola Icecek TRY 883,340 9,026,013 0.86
Ford Otomotiv Sanayi TRY 537,291 5,875,281 0.56
Migros Ticaret TRY 1,142,970 7,839,721 0.75
Tupras Turkiye Petrol Rafine TRY 530,752 13,228,538 1.26
Turk Traktor ve Ziraat Makineleri TRY 309,082 6,892,239 0.66
Turkiye Garanti Bankasi TRY 14,714,034 39,331,565 3.75
Turkiye Halk Bankasi TRY 5,971,673 19,755,277 1.88
Ulker Biskuvi Sanayi TRY 2,060,765 11,668,604 1.11
142,570,876 13.59
Ukraine: 0.35% (2016: 0.34%)
MHP GDR USD 361,590 3,688,218 0.35
3,688,218 0.35
The accompanying notes form an integral part of these financial statements.

64
Portfolio statements (continued)
As at 30 April 2017
Baring Eastern Europe Fund (continued)
Financial assets at fair value through profit or loss
Nominal Fair value % of
Equities: 97.81% (2016: 96.82%) (continued) Currency holdings US$ NAV
United Kingdom: 0.65% (2016: 1.14%)
BGEO GBP 145,852 6,785,719 0.65
6,785,719 0.65
United States: 2.52% (2016: 4.03%)
EPAM Systems USD 139,233 10,740,434 1.02
Yandex USD 574,318 15,736,313 1.50
26,476,747 2.52
Total equities 1,026,037,837 97.81
Total financial assets at fair value through profit or loss 1,045,221,688 99.64
Cash 2,334,699 0.22
Other net assets 1,480,520 0.14
Total net assets attributable to holders of redeemable
participating units 1,049,036,907 100.00
Analysis of portfolio % of Total assets*
UCITS and Non-UCITS Collective Investment Schemes 1.82
Transferable securities admitted to an official stock exchange listing or traded on a recognised market** 97.52
Other assets 0.66
100.00
* Calculation based on the total assets of the Fund (excluding liabilities). This summary is a UCITS requirement.
** Transferable securities admitted to an official stock exchange listing or traded on a recognised market.
Comparative figures shown in brackets relate to 30 April 2016.
The accompanying notes form an integral part of these financial statements.

65
Portfolio statements (continued)
As at 30 April 2017
Baring Global Leaders Fund
Financial assets at fair value through profit or loss
Nominal Fair value % of
Currency holdings US$ NAV
Investment Funds: 1.01% (2016: 1.86%)
Northern Trust Global Funds - Euro Liquidity Fund EUR 26,080 28,213 0.05
Northern Trust Global Funds - Sterling Fund GBP 229,000 296,360 0.54
Northern Trust Global Funds - US Dollar Fund USD 228,000 228,000 0.42
Total Investment Funds 552,573 1.01
Equities 98.67% (2016: 98.57%)
Consumer Discretionary: 16.29% (2016: 15.77%)
Amazon.com USD 965 886,237 1.62
Dollarama CAD 6,795 599,581 1.10
Merlin Entertainments GBP 153,626 1,003,917 1.84
Naspers ZAR 8,164 1,572,382 2.88
Pandora DKK 7,971 862,756 1.58
Priceline Group USD 337 618,688 1.13
Samsonite International HKD 188,700 729,012 1.34
Sony JPY 51,000 1,719,980 3.15
Starbucks USD 14,688 900,374 1.65
8,892,927 16.29
Consumer Staples: 13.94% (2016: 15.14%)
Alimentation Couche CAD 29,778 1,354,031 2.48
CVS Health USD 14,250 1,179,758 2.16
Koninklijke Ahold Delhaize EUR 64,504 1,351,595 2.48
LG Household & Health Care KRW 1,230 936,093 1.71
Ontex EUR 33,076 1,105,355 2.03
Tate & Lyle GBP 87,691 859,084 1.57
Unilever GBP 16,004 822,250 1.51
7,608,166 13.94
Energy: 6.46% (2016: 2.53%)
EOG Resources USD 6,690 622,170 1.14
Royal Dutch Shell GBP 25,993 692,624 1.27
Schlumberger USD 11,324 824,840 1.51
Suncor Energy USD 36,333 1,114,696 2.04
TGS Nopec Geophysical NOK 12,395 270,399 0.50
3,524,729 6.46
Financials: 8.23% (2016: 11.85%)
AIA HKD 173,400 1,200,474 2.20
Deutsche Boerse EUR 13,471 1,322,844 2.42
Mitsubishi UFJ Financial JPY 112,900 718,362 1.32
Prudential GBP 55,890 1,247,693 2.29
4,489,373 8.23
The accompanying notes form an integral part of these financial statements.
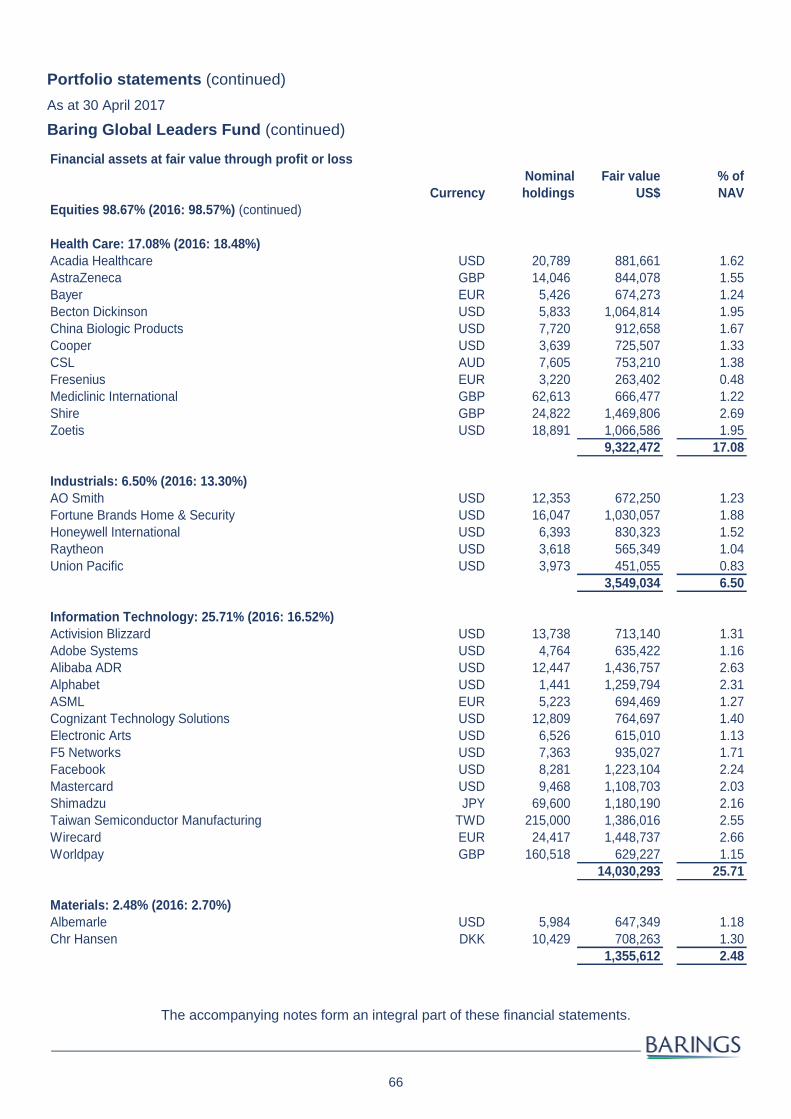
66
Portfolio statements (continued)
As at 30 April 2017
Baring Global Leaders Fund (continued)
Financial assets at fair value through profit or loss
Nominal Fair value % of
Currency holdings US$ NAV
Equities 98.67% (2016: 98.57%) (continued)
Health Care: 17.08% (2016: 18.48%)
Acadia Healthcare USD 20,789 881,661 1.62
AstraZeneca GBP 14,046 844,078 1.55
Bayer EUR 5,426 674,273 1.24
Becton Dickinson USD 5,833 1,064,814 1.95
China Biologic Products USD 7,720 912,658 1.67
Cooper USD 3,639 725,507 1.33
CSL AUD 7,605 753,210 1.38
Fresenius EUR 3,220 263,402 0.48
Mediclinic International GBP 62,613 666,477 1.22
Shire GBP 24,822 1,469,806 2.69
Zoetis USD 18,891 1,066,586 1.95
9,322,472 17.08
Industrials: 6.50% (2016: 13.30%)
AO Smith USD 12,353 672,250 1.23
Fortune Brands Home & Security USD 16,047 1,030,057 1.88
Honeywell International USD 6,393 830,323 1.52
Raytheon USD 3,618 565,349 1.04
Union Pacific USD 3,973 451,055 0.83
3,549,034 6.50
Information Technology: 25.71% (2016: 16.52%)
Activision Blizzard USD 13,738 713,140 1.31
Adobe Systems USD 4,764 635,422 1.16
Alibaba ADR USD 12,447 1,436,757 2.63
Alphabet USD 1,441 1,259,794 2.31
ASML EUR 5,223 694,469 1.27
Cognizant Technology Solutions USD 12,809 764,697 1.40
Electronic Arts USD 6,526 615,010 1.13
F5 Networks USD 7,363 935,027 1.71
Facebook USD 8,281 1,223,104 2.24
Mastercard USD 9,468 1,108,703 2.03
Shimadzu JPY 69,600 1,180,190 2.16
Taiwan Semiconductor Manufacturing TWD 215,000 1,386,016 2.55
Wirecard EUR 24,417 1,448,737 2.66
Worldpay GBP 160,518 629,227 1.15
14,030,293 25.71
Materials: 2.48% (2016: 2.70%)
Albemarle USD 5,984 647,349 1.18
Chr Hansen DKK 10,429 708,263 1.30
1,355,612 2.48
The accompanying notes form an integral part of these financial statements.
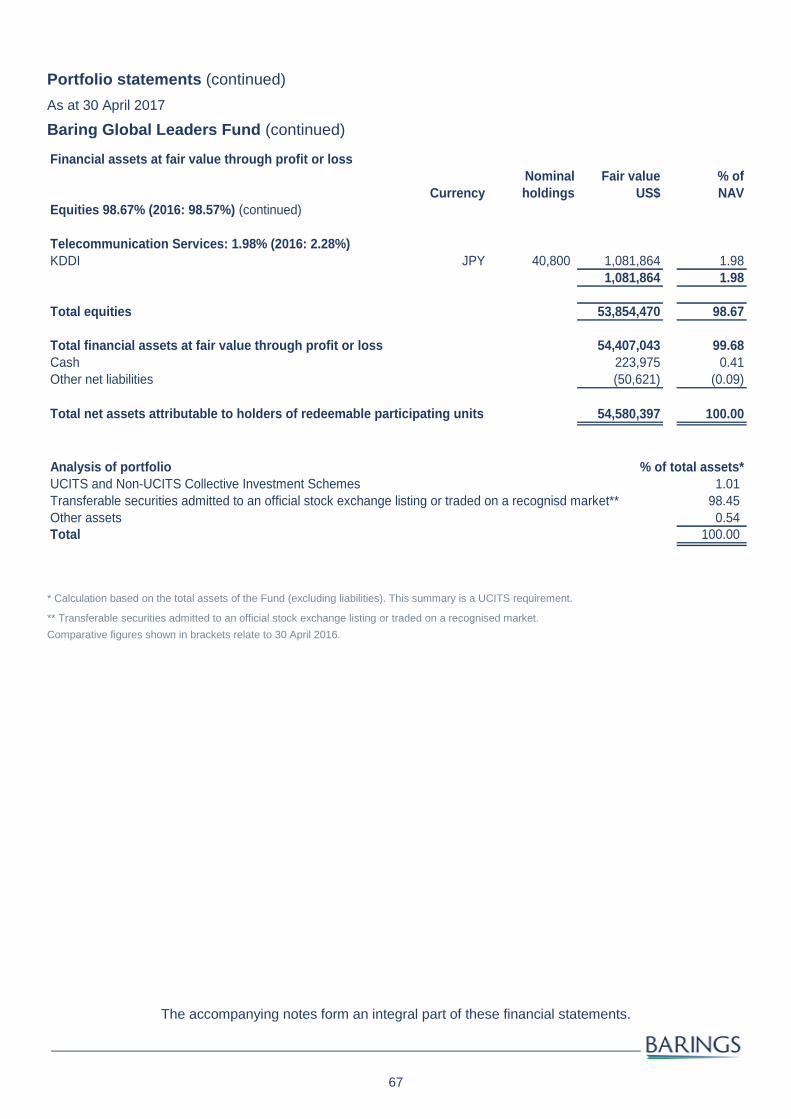
67
Portfolio statements (continued)
As at 30 April 2017
Baring Global Leaders Fund (continued)
Financial assets at fair value through profit or loss
Nominal Fair value % of
Currency holdings US$ NAV
Equities 98.67% (2016: 98.57%) (continued)
Telecommunication Services: 1.98% (2016: 2.28%)
KDDI JPY 40,800 1,081,864 1.98
1,081,864 1.98
Total equities 53,854,470 98.67
Total financial assets at fair value through profit or loss 54,407,043 99.68
Cash 223,975 0.41
Other net liabilities (50,621) (0.09)
54,580,397 100.00
Analysis of portfolio % of total assets*
UCITS and Non-UCITS Collective Investment Schemes 1.01
Transferable securities admitted to an official stock exchange listing or traded on a recognisd market** 98.45
Other assets 0.54
Total 100.00
Total net assets attributable to holders of redeemable participating units
* Calculation based on the total assets of the Fund (excluding liabilities). This summary is a UCITS requirement.
** Transferable securities admitted to an official stock exchange listing or traded on a recognised market.
Comparative figures shown in brackets relate to 30 April 2016.
The accompanying notes form an integral part of these financial statements.

68
Portfolio statements (continued)
As at 30 April 2017
Baring Global Resources Fund
Financial assets at fair value through profit or loss
Nominal Fair value % of
Currency holdings US$ NAV
Investment Funds: 3.59% (2016: 2.26%)
Baring Global Mining Fund USD 450,000 2,236,500 0.55
Northern Trust Global Funds - Euro Liquidity Fund EUR 136,143 147,274 0.04
Northern Trust Global Funds - US Dollar Fund USD 12,193,000 12,193,000 3.00
Total Investment Funds 14,576,774 3.59
Equities: 98.74% (2016: 99.17%)
Consumer Staples: 5.89% (2016: 2.59%)
Adecoagro USD 417,136 4,500,897 1.11
Tate & Lyle GBP 1,162,633 11,389,985 2.80
Tyson Foods USD 124,466 8,041,748 1.98
23,932,630 5.89
Energy: 43.88% (2016: 41.39%)
Cabot Oil & Gas USD 657,449 15,857,670 3.90
Canadian Natural Resources CAD 322,243 10,252,382 2.52
Chevron USD 59,921 6,319,868 1.55
CNOOC HKD 6,872,000 8,013,247 1.97
EOG Resources USD 168,445 15,665,385 3.85
Forum Energy Technologies USD 407,196 7,370,248 1.81
Galp Energia EUR 1,000,471 15,595,417 3.84
Halliburton USD 373,771 17,342,974 4.27
Koninklijke Vopak EUR 187,418 8,443,607 2.08
National Oilwell Varco USD 114,634 4,009,897 0.99
PlainsLP USD 61,698 1,837,983 0.45
Schlumberger USD 285,856 20,821,751 5.12
Sinopec Kantons HKD 5,828,000 2,974,597 0.73
SK Innovation KRW 28,305 4,253,586 1.05
Suncor Energy CAD 669,618 20,480,240 5.04
TMK USD 3,721,985 4,859,065 1.20
Total EUR 273,621 14,247,347 3.51
178,345,264 43.88
Industrials: 4.15% (2016: 0.95%)
AGCO USD 129,864 8,326,880 2.05
Ceres Power GBP 6,121,000 667,782 0.17
Deere USD 37,778 4,200,158 1.03
Leclanche CHF 1,448,190 3,670,191 0.90
16,865,011 4.15
The accompanying notes form an integral part of these financial statements.

69
Portfolio statements (continued)
As at 30 April 2017
Baring Global Resources Fund (continued) Financial assets at fair value through profit or loss
Nominal Fair value % of
Currency holdings US$ NAV
Equities: 98.74% (2016: 99.17%) (continued)
Materials: 44.82% (2016: 53.44%)
Agnico Eagle Mines CAD 164,485 7,114,168 1.75
Albemarle USD 163,701 17,709,174 4.36
Alpek MXN 1,720,429 2,036,818 0.50
Anglo American GBP 879,672 12,613,777 3.10
Avery Dennison USD 119,863 10,013,355 2.46
BASF EUR 103,619 10,140,186 2.50
Boliden SEK 282,315 8,147,337 2.00
China Resources Cement HKD 3,640,000 1,993,559 0.49
CRH EUR 237,008 8,722,905 2.15
Galaxy Resources AUD 9,635,009 3,059,693 0.75
Gemfields GBP 1,595,145 851,547 0.21
Interfor CAD 310,581 4,550,471 1.12
Johnson Matthey GBP 204,263 7,933,052 1.95
LG Chem KRW 40,560 9,766,623 2.40
Lotte Chemical KRW 13,075 3,929,739 0.97
Mondi GBP 547,691 14,338,909 3.53
Orocobre AUD 2,640,560 6,215,033 1.53
Potash Corp of Saskatchewan USD 721,053 12,272,322 3.02
Praxair USD 73,582 9,233,069 2.27
Randgold Resources GBP 113,388 9,905,023 2.44
Reliance Steel & Aluminum USD 62,055 4,997,289 1.23
RPC GBP 589,785 6,155,775 1.52
Wienerberger EUR 437,022 10,428,843 2.57
182,128,667 44.82
Utilities: 0.00% (2016: 0.80%)
Total equities 401,271,572 98.74
Total financial assets at fair value through profit or loss 415,848,346 102.33
Bank overdraft (7,560,773) (1.87)
Other net liabilities (1,887,717) (0.46)
Total net assets attributable to holders of redeemable participating units 406,399,856 100.00
Analysis of portfolio % of total assets*
UCITS and Non-UCITS Collective Investment Schemes 3.50
Transferable securities admitted to an official stock exchange listing or traded on a recognised market** 96.25
Other assets 0.25
Total 100.00
* Calculation based on the total assets of the Fund (excluding liabilities). This summary is a UCITS requirement.
** Transferable securities admitted to an official stock exchange listing or traded on a recognised market.
Comparative figures shown in brackets relate to 30 April 2016.
The accompanying notes form an integral part of these financial statements.

70
Information for investors in Switzerland - Unaudited
Baring International Fund Managers (Ireland) Limited (“the Manager”) has appointed BNP Paribas Securities
Services, Paris, Succursale de Zurich, Selnaustrasse 16, CH-8002, Zurich, Switzerland, as representative and
paying agent for Switzerland. Units are distributed in Switzerland by BNP Paribas Securities Services, Paris at
the above address. Investors can obtain, free of charge, the Prospectus, the Key Investor Information
Document(s) (“KIID(s)”), the last annual and interim reports, the Unit Trusts Act, 1990, as well as a list of the
purchases and sales made on behalf of the Funds, in French, from the representative at the above address.
Official publications for the Funds are found on the Internet at www.fundinfo.com and in the Swiss Official Trade
Gazette. Units prices (Net Asset Value with the words "plus commissions") are published daily on the Internet at
www.fundinfo.com.
All the information appearing in these reports and accounts is solely with respect to those Funds of the Trust
which are licensed for public offer and marketing in or from Switzerland, namely: Baring Developed and
Emerging Markets High Yield Bond Fund, Baring Eastern Europe Fund, Baring Global Resources Fund and
Baring Global Leaders Fund.
Representative and Paying Agent for Switzerland
BNP Paribas Securities Services, Paris
Succursale de Zurich
Selnaustrasse 16
CH-8002
Zurich
Switzerland
Performance
Following a guideline from the Swiss Funds and Asset Management Association (“the SFAMA”) dated 16 May
2008, the Directors of the Manager are supplying performance data in conformity with the said guideline. This
data can be found below and under each of the Funds’ reports on pages 56 - 60. Furthermore, the Directors of
the Manager are required to provide the below additional information on performance.
There is no appropriate performance comparator for the Funds. The following comparative indices are used as,
in the Directors’ opinion, and in the light of the investment policy of the relevant Fund, they are the most
appropriate selection for comparison.
Baring Developed and Emerging Markets High Yield Bond Fund
Merrill Lynch Global High Yield BB-B Rated USD Hedged.
Baring Eastern Europe Fund
MSCI Emerging Europe 10/40 Index.
Baring Global Leaders Fund
MSCI ACWI Index.
Baring Global Resources Fund
60% MSCI AC World Energy Index/40% MSCI AC World Materials Index.
Investors should contact the Swiss representative at the above address should they require additional
information e.g. on performance including the composition of the relevant indices where applicable.

71
Information for investors in Switzerland - Unaudited (continued)
Total expense ratio
Pursuant to a guideline from the SFAMA dated 16 May 2008, the Funds are required to publish a total expense
ratio (“TER”) for the year ended 30 April 2017.
The TERs for each Fund for the year ended 30 April 2017 and year ended 30 April 2016 are as follows:
Name of Fund 30/04/2017 30/04/2016 TER in % TER in % Baring Developed and Emerging Markets High Yield Bond Fund -Class A USD Inc
1.51 1.50
Baring Developed and Emerging Markets High Yield Bond Fund -Class A AUD Hedged Inc Monthly Dividend
1.51 1.50
Baring Developed and Emerging Markets High Yield Bond Fund -Class A CAD Hedged Inc Monthly Dividend
1.51 1.50
Baring Developed and Emerging Markets High Yield Bond Fund -Class A CHF Hedged Acc
1.51 1.50
Baring Developed and Emerging Markets High Yield Bond Fund - Class A EUR Inc
1.51 1.50
Baring Developed and Emerging Markets High Yield Bond Fund -Class A EUR Hedged Inc
1.59 1.50
Baring Developed and Emerging Markets High Yield Bond Fund -Class A GBP Hedged Inc
1.53 1.50
Baring Developed and Emerging Markets High Yield Bond Fund -Class A HKD Inc Monthly Dividend
1.51 1.50
Baring Developed and Emerging Markets High Yield Bond Fund -Class A NZD Hedged Inc Monthly Dividend
1.51 1.50
Baring Developed and Emerging Markets High Yield Bond Fund- Class A RMB Hedged Inc Monthly Dividend
1.51 1.50
Baring Developed and Emerging Markets High Yield Bond Fund- Class A USD Acc
1.51 1.50
Baring Developed and Emerging Markets High Yield Bond Fund -Class A USD Inc Monthly Dividend
1.51 1.50
Baring Developed and Emerging Markets High Yield Bond Fund -Class I EUR Acc
1.26 1.25
Baring Developed and Emerging Markets High Yield Bond Fund -Class I GBP Hedged Inc
1.26 1.25
Baring Developed and Emerging Markets High Yield Bond Fund -Class I USD Acc
1.26 0.90
Baring Eastern Europe Fund -Class A 2.09 1.99 Baring Eastern Europe Fund -Class I GBP Acc 1.34 1.24 Baring Eastern Europe Fund -Class I USD Acc 1.34 1.24 Baring Eastern Europe Fund -Class I EUR Acc 1.34 1.24 Baring Eastern Europe Fund -Class I EUR Inc 1.34 1.24 Baring Eastern Europe Fund- Class I GBP Inc 1.34 1.24 Baring Eastern Europe Fund -Class I USD Inc 1.34 1.24 Baring Global Leaders -Class A 2.16 2.15 Baring Global Leaders -Class I USD Acc 1.00 1.00 Baring Global Resources Fund -Class A 2.01 2.00 Baring Global Resources Fund -Class I GBP 1.26 1.25 Baring Global Resources Fund -Class I USD Acc 1.26 1.25
This information was established by the Manager, Baring International Fund Managers (Ireland) Limited, based
on the data contained in the profit and loss account for the above reference period (Fund management fees,
administration fees, depositary fees, taxes and duties, all other commissions and expenses appearing as per the
breakdown of the profit and loss account and not already included in any of the foregoing categories). The TER
is calculated using the average daily Net Asset Value for the year.

72
Information for investors in Switzerland - Unaudited (continued)
Trailer fees and reimbursements
Trailer fees (Bestandespflegekommissionen) may only be paid to the sales agents/partners indicated below:
authorised sales agents(distributors) within the meaning of Article 19, Para 1, Collective Investments Scheme
Act (“CISA”);
sales agents (distributors)exempted from the authorisation requirement within the meaning of Article 19, Para
4 CISA and Article 8 Collective Investment Scheme Ordinance (“CISO”);
sales partners who place Fundunits exclusively with institutional investors with professional treasury facilities;
and/or
sales partners who place Fundunits with their clients exclusively on the basis of a written commission-based
asset management mandate.
Reimbursements (Rückvergütungen) may only be paid to the institutional investors detailed below who, from a
commercial perspective, are holding the Fund units for third parties:
life insurance companies (inrespect of Fund units held for the account of insured persons or to cover
obligations towards insured persons);
pension funds and other retirement provision institutions (in respect of Fund units held for the account of
beneficiaries);
investment foundations (in respectof Fund units held for the account of in-house funds);
Swiss fund management companies(in respect of Fund units held for the account of the funds managed);
foreign fund management companies and providers (in respect of Fund units held for the account of managed
funds and investing unitholders); and/or
investment companies (in respectof the investment of the company assets).
Taxation
Please refer to the paragraph headed "European Union Taxation of Savings Income Directive" on pages 62 and
63. The attention of investors is drawn to the fact that Switzerland and the European Union have entered into a
bilateral agreement effective from 1 July 2005, based on which measures have been enacted in Switzerland
which correspond to the European Union Taxation of Savings Income Directive. Generally, these measures
require tax to be withheld on interest payments made by paying agents to EU residents.

73
Information for investors in Switzerland - Unaudited (continued)
Performance Data
Baring Developed and Emerging Markets High Yield Bond Fund (including distribution payments where
applicable)
01/05/2016
- 30/04/2017 %
01/05/2015 - 30/04/2016
%
01/05/2014 - 30/04/2015
%
01/05/2013 - 30/04/2014
%
01/05/2012 - 30/04/2013
%
Baring Developed and Emerging
Markets High Yield Bond Fund -
Class A AUD Hedged Inc Monthly
Dividend (AUD terms)*
11.63 (2.98) 2.60 7.81 13.28
Baring Developed and Emerging
Markets High Yield Bond Fund -
Class A CAD Hedged Inc Monthly
Dividend (CAD terms)*
10.38 (4.72) 0.95 5.86 11.56
Baring Developed and Emerging
Markets High Yield Bond Fund -
Class A CHF Hedged Acc (CHF
terms)*
8.40 (6.00) (0.47) 4.34 0.58
Baring Developed and Emerging
Markets High Yield Bond Fund -
Class A EUR Inc (EUR terms)
15.39 (6.68) 23.29 (0.73) 12.80
Baring Developed and Emerging
Markets High Yield Bond Fund -
Class A EUR Hedged Inc (EUR
terms)
8.86 (5.09) (0.04) 4.79 11.35
Baring Developed and Emerging
Markets High Yield Bond Fund -
Class A GBP Hedged Inc (GBP
terms)
9.85 (4.80) 0.51 5.15 11.87
Baring Developed and Emerging
Markets High Yield Bond Fund -
Class A HKD Inc Monthly Dividend
(HKD terms)
10.86 (4.73) 0.08 4.80 11.71
Baring Developed and Emerging
Markets High Yield Bond Fund -
Class A NZD Hedged Inc Monthly
Dividend (NZD terms)*
12.17 (2.29) 3.63 7.59 13.55
Baring Developed and Emerging
Markets High Yield Bond Fund -
Class A RMB Hedged Inc Monthly
Dividend (CNY terms)*
14.08 (1.26) 3.23 1.55 N/A
Baring Developed and Emerging
Markets High Yield Bond Fund -
Class A USD Acc (USD terms)
10.61 (4.86) 0.22 4.88 11.68

74
Information for investors in Switzerland - Unaudited (continued)
Performance Data
Baring Developed and Emerging Markets High Yield Bond Fund (including distribution payments where
applicable) (continued)
01/05/2016
- 30/04/2017 %
01/05/2015 - 30/04/2016
%
01/05/2014 - 30/04/2015
%
01/05/2013 - 30/04/2014
%
01/05/2012 - 30/04/2013
%
Baring Developed and Emerging
Markets High Yield Bond Fund -
Class A USD Inc Monthly Dividend
(USD terms)
10.66 (4.83) 0.15 4.93 11.57
Baring Developed and Emerging
Markets High Yield Bond Fund -
Class I EUR Acc (EUR terms)**
15.51 (0.54) 24.03 (0.59) 13.24
Baring Developed and Emerging
Markets High Yield Bond Fund -
Class I GBP Hedged Inc (GBP
terms)
10.00 (4.48) 0.79 5.41 11.99
Baring Developed and Emerging
Markets High Yield Bond Fund -
Class I USD Acc (USD terms)
10.97 (4.23) 0.76 5.46 12.36
Performance figures are shown net of fees and charges, on a NAV per unit basis, gross income reinvested.
Source: Morningstar/Barings/Merrill Lynch.
For data sourced from Morningstar: © Morningstar. All Rights Reserved. The information contained herein: (1) is
proprietary to Morningstar and/or its content providers; (2) may not be copied or distributed; and (3) is not
warranted to be accurate, complete or timely. Neither Morningstar nor its content providers are responsible for
any damages or losses arising from any use of this information.
*The Class A AUD Hedged Inc Monthly Dividend unit class was launched on 16 July 2012.
The Class A CAD Hedged Inc Monthly Dividend unit class was launched on 16 July 2012.
The Class A NZD Hedged Inc Monthly Dividend unit class was launched on 16 July 2012.
The Class A CHF Hedged Acc unit class was launched on 24 April 2013.
The Class A RMB Hedged Inc Monthly Dividend unit class was launched on 13 February 2014.
** The Class I EUR Acc unit class was launched on 19 May 2011. A full redemption was received on 30 June 2015 and the unit class was
relaunched on 17 September 2015.
The performance comparator of Baring High Yield Bond Fund changed from Merrill Lynch Global High Yield BB-B Rated to the Merrill Lynch
Global High Yield BB-B Rated USD Hedged on 5 February 2015. Performance figures have been backdated to 1 June 2009.
The Fund was launched on 19 July 1993 as the Baring High Yield Bond Fund and converted to the Baring Developed and Emerging Markets
High Yield Bond Fund on 23 February 2017.
Past performance is no indication of current or future performance. The performance data does not take
account of the commissions and costs incurred on the issue and redemption of units. Please note that
changes in the rates of exchange may have an adverse effect on the value, price or income of an
investment.

75
Information for investors in Switzerland - Unaudited (continued)
Performance Data
Baring Eastern Europe Fund (including distribution payments where applicable)
01/05/2016 - 30/04/2017
%
01/05/2015 - 30/04/2016
%
01/05/2014 - 30/04/2015
%
01/05/2013 - 30/04/2014
%
01/05/2012 - 30/04/2013
%
Baring Eastern Europe Fund - Class A USD Inc (USD terms) 18.20 (6.39) (11.45) (13.02) 3.46
MSCI Emerging Europe 10/40 Total, Net Return (USD terms)
12.61 (11.53) (11.72) (10.38) 5.98
Baring Eastern Europe Fund - Class A EUR Inc (EUR terms)
23.17 (8.05) 9.42 (17.76) 4.61
Baring Eastern Europe Fund - Class A GBP Inc (GBP terms)
33.50 (1.17) (3.47) (19.89) 8.63
Baring Eastern Europe Fund - Class A USD Acc (USD terms)
18.21 (6.39) (11.46) (12.92) 3.48
Baring Eastern Europe Fund - Class I EUR Acc (USD terms)*
24.16 31.78 N/A N/A N/A
Baring Eastern Europe Fund - Class I GBP Acc (GBP terms)*
34.48 (0.44) (2.76) (20.16) N/A
Baring Eastern Europe Fund - Class I USD Acc (USD terms)*
19.10 (5.49) (10.55) (12.25) 0.56
Baring Eastern Europe Fund - Class I EUR Inc (EUR terms)*
23.95 5.70 N/A N/A N/A
Baring Eastern Europe Fund - Class I GBP Inc (USD terms)*
34.57 14.72 N/A N/A N/A
Baring Eastern Europe Fund - Class I USD Inc (USD terms)*
19.09 9.88 N/A N/A N/A
Performance figures are shown net of fees and charges, on a NAV per unit basis, with gross income reinvested.
Source: Morningstar/Barings/MSCI.
For data sourced from Morningstar: © Morningstar. All Rights Reserved. The information contained herein: (1) is
proprietary to Morningstar and/or its content providers; (2) may not be copied or distributed; and (3) is not
warranted to be accurate, complete or timely. Neither Morningstar nor its content providers are responsible for
any damages or losses arising from any use of this information.
The MSCI data is for Barings’ use only and may not be redistributed or used in connection with creating or
offering any securities, financial products or indices.
The Fund was launched on 30 September 1996.
* The Class I USD Acc unit class was launched on 4 January 2013.
The Class I GBP Acc unit class was launched on 2 May 2013.
The Class I EUR Inc, Class I GBP Inc and Class I USD Inc unit classes were launched on 29 October 2015.
The Class I EUR Acc unit class was launched on 20 January 2016.
Past performance is no indication of current or future performance. The performance data does not take
account of the commissions and costs incurred on the issue and redemption of units. Please note that
changes in the rates of exchange may have an adverse effect on the value, price or income of an
investment.

76
Information for investors in Switzerland - Unaudited (continued)
Performance Data
Baring Global Leaders Fund (including distribution payments where applicable)
01/05/2016
- 30/04/2017 %
01/05/2015 - 30/04/2016
%
01/05/2014 - 30/04/2015
%
01/05/2013 - 30/04/2014
%
01/05/2012 - 30/04/2013
%
Baring Global Leaders Fund -
Class A USD Inc (USD terms) 14.29 (9.74) 11.95 6.73 6.25
MSCI ACWI Total, Gross Return
(USD terms) 15.77 (5.13) 8.02 14.98 15.69
Baring Global Leaders Fund -
Class A EUR Inc (EUR terms) 19.11 (11.36) 38.33 0.92 7.38
Baring Global Leaders Fund -
Class A GBP Inc (GBP terms) 29.15 (4.71) 21.96 (1.63) 11.50
Baring Global Leaders Fund -
Class I USD Acc (USD terms)* 15.60 (8.72) 6.70 N/A N/A
Performance figures are shown net of fees and charges, on a NAV per unit basis, with gross income reinvested.
Source: Morningstar/Barings/MSCI.
For data sourced from Morningstar: © Morningstar. All Rights Reserved. The information contained herein: (1) is
proprietary to Morningstar and/or its content providers; (2) may not be copied or distributed; and (3) is not
warranted to be accurate, complete or timely. Neither Morningstar nor its content providers are responsible for
any damages or losses arising from any use of this information.
The MSCI data is for Barings’ use only and may not be redistributed or used in connection with creating or
offering any securities, financial products or indices.
The Fund was launched on 26 February 2001 as the Baring Global Select Fund and converted to the Baring
Global Leaders Fund on 28 January 2016.
* The Class I USD Acc unit class was launched on 20 June 2014.
Past performance is no indication of current or future performance. The performance data does not take
account of the commissions and costs incurred on the issue and redemption of units. Please note that
changes in the rates of exchange may have an adverse effect on the value, price or income of an
investment.

77
Information for investors in Switzerland - Unaudited (continued)
Performance Data
Baring Global Resources Fund (including distribution payments where applicable)
01/05/2016
- 31/10/2017 %
01/05/2015 - 30/04/2016
%
01/05/2014 - 30/04/2015
%
01/05/2013 - 30/04/2014
%
01/05/2012 - 30/04/2013
%
Baring Global Resources Fund -
Class A USD Inc (USD terms) 7.60 (16.97) (8.46) 10.07 (18.79)
60% MSCI AC World Energy
Index/40% MSCI AC World
Materials Index Total, Gross
Return (USD terms)**
10.53 (12.65) (9.26) 10.33 (11.18)
Baring Global Resources Fund -
Class A EUR Inc (EUR terms) 12.14 (18.48) 13.13 4.07 (17.89)
Baring Global Resources Fund -
Class A GBP Inc (GBP terms) 21.50 (12.34) (0.21) 1.43 (14.74)
Baring Global Resources Fund -
Class I GBP Acc (GBP terms)* 22.46 (11.74) (2.62) N/A N/A
Baring Global Resources Fund -
Class I USD Acc (USD terms)* 8.68 25.84 N/A N/A N/A
Performance figures are shown net of fees and charges, on a NAV per unit basis, with gross income reinvested.
Source: Morningstar/Barings/MSCI.
For data sourced from Morningstar: © Morningstar. All Rights Reserved. The information contained herein: (1) is
proprietary to Morningstar and/or its content providers; (2) may not be copied or distributed; and (3) is not
warranted to be accurate, complete or timely. Neither Morningstar nor its content providers are responsible for
any damages or losses arising from any use of this information.
The MSCI data is comprised of a custom index calculated by MSCI. The MSCI data is for Barings’ use only and
may not be redistributed or used in connection with creating or offering any securities, financial products or
indices.
The Baring Global Resources Fund was launched on 12 December 1994.
* The Class I GBP Acc unit class was launched on 25 July 2014.
The Class I USD Acc unit class was launched on 20 January 2016.
** The current performance comparator was effective from 3 March 2014. Prior to this date, the Fund was shown against the 60% MSCI AC
World Metals & Mining Index / 40% MSCI AC World Energy Index Total.
Past performance is no indication of current or future performance. The performance data does not take
account of the commissions and costs incurred on the issue and redemption of units. Please note that
changes in the rates of exchange may have an adverse effect on the value, price or income of an
investment.

78
Information for investors in Germany - Unaudited
The Prospectus, the Key Investor Information Document(s) (“KIID(s)”), a list of portfolio changes, the Unit Trusts
Act, 1990, as well as the annual and the interim reports are available free of charge in hard copy at the office of
the German Paying and Information Agent and the Further German Information Agent.
German Paying and Information Agent
Deutsche Bank AG
Global Transaction Banking
Issuer Services - Global Securities Services
Post IPO Services
Taunusanlage 12
60325 Frankfurt am Main
Germany
Further German Information Agent
Baring Asset Management GmbH
Ulmenstraße 37-39
60325 Frankfurt
Germany
Special risks resulting from tax publication requirements in Germany
Foreign investment companies (such as Baring International Fund Managers (Ireland) Limited (“the Manager”))
must provide documentation to the German fiscal authorities upon request, e.g. in order to verify the accuracy of
the published tax information. The basis upon which such figures are calculated is open to interpretation and it
cannot be guaranteed that the German fiscal authorities will accept the Manager’s calculation methodology in
every material respect. In addition, if it transpires that these publications are incorrect, any subsequent correction
will, as a general rule, not have retrospective effect and will, as a general rule, only take effect during the current
financial year. Consequently, the correction may positively or negatively affect the investors who receive a
distribution or an attribution of deemed income distributions in the current year.

79
General information - Unaudited
Market timing
Repeatedly purchasing and selling units in the Funds in response to short-term market fluctuations – known as
‘market timing’ – can disrupt Baring Asset Management Limited’s (“the Investment Manager’s”) investment
strategy and increase the Funds’ expenses to the prejudice of all unitholders. The Funds are not intended for
market timing or excessive trading. To deter these activities, the Directors of Baring International Fund Managers
(Ireland) Limited (“the Manager”) may refuse to accept an application for units from persons that it reasonably
believes are engaged in market timing or are otherwise excessive or potentially disruptive to the Funds.
The Directors of the Manager reserve the right to redeem units from a unitholder, on the basis of the
circumstances of the unitholder concerned, or if they have reasonable grounds to believe that the unitholder is
engaging in any activity which might result in the Funds or their unitholders as a whole suffering any legal,
regulatory, reputational or other material disadvantage which the Funds or their unitholders as a whole might not
otherwise have suffered.
UK reporting fund status
Applications were made with effect from the accounting year commencing from 1 May 2011 for UK reporting
fund status for those unit classes in the Funds which previously had UK distributor status while further
applications are being made from time to time for certain new unit classes when they are launched. Applications
may also be made from time to time for UK reporting fund status in respect of unit classes which did not
previously have UK distributor status. UK taxable investors in UK reporting funds are subject to tax on their share
of the UK reporting funds’ income attributable to their holdings in the Funds, whether or not distributed, while
typically any gains on disposal of their holdings are subject to capital gains tax.
Details of the unit classes which currently have UK reporting fund status are available at the Her Majesty’s
Revenue and Customs (“HMRC”) Collective Investment Schemes Centre website:
http://www.hmrc.gov.uk/cisc/offshore-funds.htm.
As stated above, UK tax payers should note that for each unit class with reporting fund status their share of any
amounts of income, if any, that have not been distributed will be subject to tax. Further details will be made
available on the Baring Asset Management Limited website: www.barings.com/uk.
European Union Taxation of Savings Income Directive
On 3 June 2003, the European Commission published a new directive regarding the taxation of savings income
(“the Directive”). From 1 July 2005, member states have been required to provide to the tax authorities of
another member state details of payments of interest or other similar income paid by a person within its
jurisdiction to an individual resident in that other member state, subject to the right of certain member states to
opt instead for a withholding tax system in relation to such payments. For the purposes of the Directive, interest
payments include distributions made by certain collective investment funds to the extent that any relevant fund
has invested more than 15% of its assets directly or indirectly in interest-bearing securities and income realised
upon the sale, refund or redemption of Fund units to the extent that the Fund has invested more than currently
25% directly or indirectly in interest-bearing securities.
Accordingly, Northern Trust Fiduciary Services (Ireland) Limited (“the Depositary”), Northern Trust International
Fund Administrative Services (Ireland) Limited (“the Administrator”), the paying agent or such other entity
considered a “paying agent” (for the purposes of the Directive, a “paying agent” is the economic operator who
pays interest to or secures the payment of interest for the immediate benefit of the beneficial owner) for the
purposes of the Directive may be required to disclose details of, or withhold tax on, distributions and/or
realisation payments by the Funds to unitholders who are individuals or residual entities (located in another EU
member state) to the taxation authority in the home jurisdiction of the paying agent who will pass such details or
tax to the member state where the investor resides.

80
General information - Unaudited (continued)
European Union Taxation of Savings Income Directive (continued)
As Ireland has opted for exchange of information rather than a withholding tax system, since the Directive
became effective, the principal consequence for unitholders will be that details of relevant savings income are
disclosed to the EU member states in which unitholders are resident. The Directive has now been enacted into
Irish legislation and the reporting of any relevant payments of interest made by the Trust, together with various
specified information relating to recipients who are individuals or residual entities resident in EU states other than
Ireland, applied with effect from 1 July 2005.
Set out below are those Funds subject to disclosure and the disclosure to which they are currently and are
expected to remain subject under the Directive.
Fund Disclosure of distribution to
the tax authorities of the
underlying unitholder (15%
rule)
Disclosure of redemption
proceeds to the tax
authorities of the underlying
unitholder (25% rule)
Baring Developed and Emerging Markets
High Yield Bond Fund

81
Appendix 1 - additional information Hong Kong Code - Unaudited
Baring Developed and Emerging Markets High Yield Bond Fund
Highest issue and lowest redemption prices
Highest issue prices during the year*
30/04/2017 30/04/2016 30/04/2015 30/04/2014 30/04/2013
Class A USD Inc 10.12 10.70 11.62 11.63 11.67
Class A AUD Hedged Inc Monthly
Dividend 10.84 11.34 11.89 11.79 11.54
Class A CAD Hedged Inc Monthly
Dividend 9.93 11.09 11.80 11.76 11.69
Class A CHF Hedged Acc 12.90 12.72 12.98 12.73 12.20
Class A EUR Inc 9.26 9.82 10.30 9.02 9.08
Class A EUR Hedged Inc 9.76 10.32 11.70 11.66 11.79
Class A GBP Hedged Inc 6.22 6.92 7.45 7.45 7.47
Class A HKD Inc Monthly Dividend 79.03 84.24 90.28 90.94 90.48
Class A NZD Hedged Inc Monthly
Dividend 13.87 14.67 15.21 15.08 14.79
Class A RMB Hedged Inc Monthly
Dividend 67.57 68.05 70.74 70.31 0.00
Class A USD Acc 14.27 13.62 13.81 13.54 12.91
Class A USD Inc Monthly Dividend 10.00 10.70 11.47 11.53 11.47
Class I EUR Acc 12.85 12.83 13.19 10.32 10.19
Class I GBP Hedged Inc 6.24 6.91 7.45 7.44 7.46
Class I USD Acc 14.06 13.29 13.41 13.13 12.45
30/04/2012 30/04/2011 30/04/2010 30/04/2009 30/04/2008
Class A USD Inc 11.55 11.71 11.22 10.96 11.71
Class A AUD Hedged Inc Monthly
Dividend - - - - -
Class A CAD Hedged Inc Monthly
Dividend - - - - -
Class A CHF Hedged Acc - - - - -
Class A EUR Inc 8.54 8.83 8.48 7.44 8.53
Class A EUR Hedged Inc 11.36 11.92 11.42 11.10 11.90
Class A GBP Hedged Inc 7.38 7.48 7.16 7.02 7.45
Class A HKD Inc Monthly Dividend 90.61 91.80 87.16 - -
Class A NZD Hedged Inc Monthly
Dividend - - - - -
Class A RMB Hedged Inc Monthly
Dividend - - - - -
Class A USD Acc 11.57 - - - -
Class A USD Inc Monthly Dividend 11.47 11.49 11.00 10.81 11.57
Class I EUR Acc 9.01 - - - -
Class I GBP Hedged Inc 11.08 - - - -
Class I USD Acc - - - - -

82
Appendix 1 - additional information Hong Kong Code-Unaudited (continued)
Baring Developed and Emerging Markets High Yield Bond Fund (continued)
Highest issue and lowest redemption prices (continued)
Lowest redemption prices during the year*
30/04/2017 30/04/2016 30/04/2015 30/04/2014 30/04/2013
Class A USD Inc 9.51 9.70 10.27 11.08 10.60
Class A AUD Hedged Inc Monthly
Dividend 10.27 9.62 10.66 11.05 10.54
Class A CAD Hedged Inc Monthly
Dividend 9.91 9.28 10.50 11.15 10.92
Class A CHF Hedged Acc 11.87 11.05 11.84 11.72 12.13
Class A EUR Inc 8.55 7.93 8.22 8.24 8.28
Class A EUR Hedged Inc 9.65 9.03 10.22 10.69 10.25
Class A GBP Hedged Inc 6.16 5.77 6.61 7.09 6.78
Class A HKD Inc Monthly Dividend 74.26 70.77 79.97 86.17 82.40
Class A NZD Hedged Inc Monthly
Dividend 13.31 12.51 13.70 14.15 13.58
Class A RMB Hedged Inc Monthly
Dividend 64.28 58.35 63.42 69.74 0.00
Class A USD Acc 12.84 11.94 12.60 12.41 11.19
Class A USD Inc Monthly Dividend 9.43 8.94 10.16 10.93 10.45
Class I EUR Acc 11.34 10.36 9.99 9.68 8.90
Class I GBP Hedged Inc 6.19 5.79 6.60 7.08 6.77
Class I USD Acc 12.61 11.70 12.26 11.98 10.73
30/04/2012 30/04/2011 30/04/2010 30/04/2009 30/04/2008
Class A USD Inc 9.68 10.39 8.44 7.53 10.86Class A AUD Hedged Inc Monthly
Dividend - - - - - Class A CAD Hedged Inc Monthly
Dividend - - - - -
Class A CHF Hedged Acc - - - - -
Class A EUR Inc 7.24 7.91 6.34 5.66 6.09
Class A EUR Hedged Inc 9.52 10.03 8.12 7.89 10.98
Class A GBP Hedged Inc 6.19 6.63 5.40 4.82 6.94
Class A HKD Inc Monthly Dividend 75.12 81.67 83.43 - - Class A NZD Hedged Inc Monthly
Dividend - - - - - Class A RMB Hedged Inc Monthly
Dividend - - - - -
Class A USD Acc 10.24 - - - -
Class A USD Inc Monthly Dividend 9.53 10.28 8.41 7.47 10.69
Class I EUR Acc 7.34 - - - -
Class I GBP Hedged Inc 6.88 - - - -
Class I USD Acc 10.81 - - - -

83
Appendix 1 - additional information Hong Kong Code - Unaudited (continued)
Baring High Yield Bond Fund (continued)
Statement of movements in portfolio holdings
30/04/2017 30/04/2016 30/04/2015 30/04/2014
% of NAV* % of NAV* % of NAV* % of NAV*
Euro 11.85 18.82 14.45 15.95
Pound sterling 11.34 7.90 6.50 5.99
US dollar 72.64 66.72 74.42 70.88
Investment Funds 0.87 6.26 2.92 5.38
Open forwards (0.59) (0.46) (0.35) (0.17)
Total investments 96.11 99.24 97.94 98.03
Cash/(overdraft) 1.22 0.17 (0.05) 0.50
Other net assets 2.67 0.59 2.11 1.47
Total net assets 100.00 100.00 100.00 100.00
* Movement in portfolio holdings have been analysed above based on a percentage of Net Asset Value invested in each currency. The movement in
each currency position between years has to be inferred.
Portfolio information
Top ten holdings % of NAV
Coveris Holdings 7.88% Bonds 01/11/2019 1.87
Sprint Capital 6.88% Bonds 15/11/2028 1.69
Garfunkelux Holdco 3 8.50% Bonds 01/11/2022 1.51
Energy Transfer Partners FRN 01/11/2066 1.42
Liberty Interactive 8.25% Bonds 01/02/2030 1.38
Diamond 1 Finance/ Diamond 2 Finance 7.13%
Bonds 15/06/20241.38
Topaz Marine 8.63% Bonds 01/11/2018 1.34
Tullow Oil 6.00% Bonds 01/11/2020 1.32
Consolidated Energy Finance 6.75% Bonds
15/10/20191.28
Hertz Corp 5.88% Bonds 15/10/2020 1.18

84
Appendix 1 - additional information Hong Kong Code - Unaudited (continued)
Baring Eastern Europe Fund
Highest issue and lowest redemption prices
Highest issue prices during the year*
30/04/2017 30/04/2016 30/04/2015 30/04/2014 30/04/2013
Class A USD Inc 80.92 76.97 98.41 106.06 109.16
Class A EUR Inc 73.96 67.80 72.22 80.69 81.26
Class A GBP Inc 62.52 49.10 58.54 69.14 70.48
Class A USD Acc 85.59 80.51 101.39 108.46 109.41
Class I USD Acc 75.73 82.18 102.52 109.17 109.46
Class I GBP Acc 66.58 50.95 59.42 69.16 -
Class I EUR Acc 88.84 61.00 - - -
Class I EUR Inc 82.34 61.00 - - -
Class I GBP Inc 63.47 48.15 - - -
Class I USD Inc 75.27 69.50 - - -
Class A USD Inc 30/04/2012 30/04/2011 30/04/2010 30/04/2009 30/04/2008
Class A EUR Inc 131.09 136.22 120.14 172.94 172.99
Class A GBP Inc 88.77 94.66 88.75 111.02 117.89
Class A USD Acc 79.53 83.31 77.96 - -
Class I USD Acc 100.83 - - - -
Class I GBP Acc - - - - -
Class I EUR Acc - - - - -
Class I EUR Inc - - - - -
Class I GBP Inc - - - - -
Class I USD Inc - - - - -
Lowest redemption prices during the year*
30/04/2017 30/04/2016 30/04/2015 30/04/2014 30/04/2013
Class A USD Inc 63.23 49.75 60.02 78.55 78.65
Class A EUR Inc 57.42 45.61 47.85 56.57 63.81
Class A GBP Inc 47.87 35.26 38.14 47.35 51.33
Class A USD Acc 66.88 52.04 61.83 80.40 78.83
Class I USD Acc 58.17 53.48 62.86 81.17 97.19
Class I GBP Acc 50.65 36.77 38.87 47.67 -
Class I EUR Acc 68.99 45.70 - - -
Class I EUR Inc 63.94 45.71 - - -
Class I GBP Inc 63.66 35.32 - - -
Class I USD Inc 58.12 49.84 - - -
30/04/2012 30/04/2011 30/04/2010 30/04/2009 30/04/2008
Class A USD Inc 78.94 90.43 62.45 39.52 124.95
Class A EUR Inc 59.25 74.13 46.82 31.30 92.07
Class A GBP Inc 51.14 61.54 58.84 - -
Class A USD Acc 94.50 - - - -
Class I USD Acc - - - - -
Class I GBP Acc - - - - -
Class I EUR Acc - - - - -
Class I EUR Inc - - - - -
Class I GBP Inc - - - - -
Class I USD Inc - - - - - * The above highest issue prices and lowest redemption prices during the year are quoted in their respective unit classes’ denomination currency.

85
Appendix 1 - additional information Hong Kong Code - Unaudited (continued)
Baring Eastern Europe Fund (continued)
Statement of movements in portfolio holdings
30/04/2017 30/04/2016 30/04/2015 30/04/2014
% of NAV* % of NAV* % of NAV* % of NAV*
Czech Republic 1.51 1.08 - -
Europe - 0.35 1.31 -
Greece 2.57 2.13 1.99 3.02
Hungary 5.70 5.35 3.10 3.1
Kazakhstan - 0.15 0.35 -
Poland 12.07 10.39 13.81 15.38
Romania 1.46 1.13 0.6 -
Russia 56.67 49.97 52.37 54.9
Sweden 0.72 0.74 0.58 -
Turkey 13.59 20.02 20.96 21.80
Ukraine 0.35 0.34 0.37 0.23
United Kingdom 0.65 1.14 1.94 -
United States 2.52 4.03 - -
Investment Funds 1.83 3.43 2.61 2.02
Total investments 97.81 100.25 99.99 100.45
Cash/(bank overdraft) 0.22 0.03 0.27 (0.58)
Other net assets/(liabilities) 0.14 (0.28) (0.26) 0.13
Total net assets 100.00 100.00 100.00 100.00
* Movement in portfolio holdings have been analysed above based on a percentage of Net Asset Value invested in each geographic location. The
movement in each country’s position between years has to be inferred.
Portfolio information
Top ten holdings % of NAV
Sberbank of Russia 9.27
LUKOIL ADR 7.83
Novatek GDR 6.47
Powszechny Zaklad Ubezpieczen 6.45
Gazprom ADR 4.23
OTP Bank 3.87
Turkiye Garanti Bankasi 3.75
Mail.Ru GDR 3.06
Tatneft PJSC GDR 3.01
Alrosa 2.88
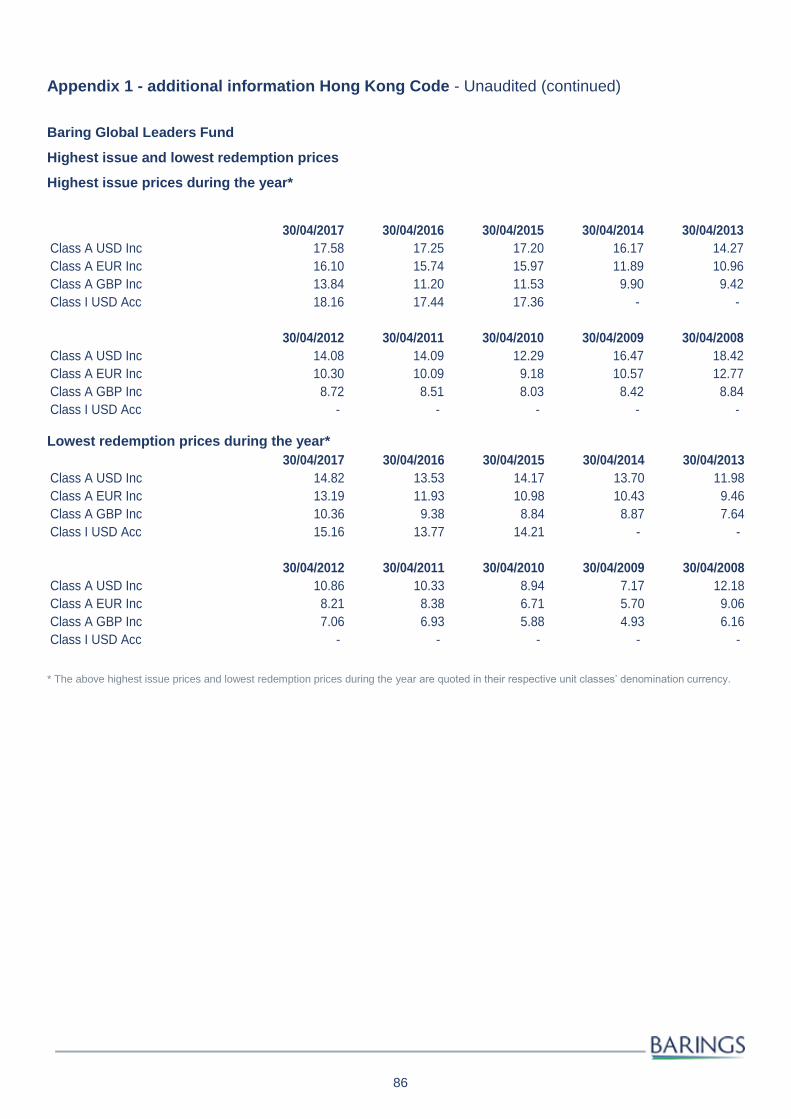
86
Appendix 1 - additional information Hong Kong Code - Unaudited (continued)
Baring Global Leaders Fund
Highest issue and lowest redemption prices
Highest issue prices during the year*
30/04/2017 30/04/2016 30/04/2015 30/04/2014 30/04/2013
Class A USD Inc 17.58 17.25 17.20 16.17 14.27
Class A EUR Inc 16.10 15.74 15.97 11.89 10.96
Class A GBP Inc 13.84 11.20 11.53 9.90 9.42
Class I USD Acc 18.16 17.44 17.36 - -
30/04/2012 30/04/2011 30/04/2010 30/04/2009 30/04/2008
Class A USD Inc 14.08 14.09 12.29 16.47 18.42
Class A EUR Inc 10.30 10.09 9.18 10.57 12.77
Class A GBP Inc 8.72 8.51 8.03 8.42 8.84
Class I USD Acc - - - - -
Lowest redemption prices during the year*
30/04/2017 30/04/2016 30/04/2015 30/04/2014 30/04/2013
Class A USD Inc 14.82 13.53 14.17 13.70 11.98
Class A EUR Inc 13.19 11.93 10.98 10.43 9.46
Class A GBP Inc 10.36 9.38 8.84 8.87 7.64
Class I USD Acc 15.16 13.77 14.21 - -
30/04/2012 30/04/2011 30/04/2010 30/04/2009 30/04/2008
Class A USD Inc 10.86 10.33 8.94 7.17 12.18
Class A EUR Inc 8.21 8.38 6.71 5.70 9.06
Class A GBP Inc 7.06 6.93 5.88 4.93 6.16
Class I USD Acc - - - - -
* The above highest issue prices and lowest redemption prices during the year are quoted in their respective unit classes’ denomination currency.
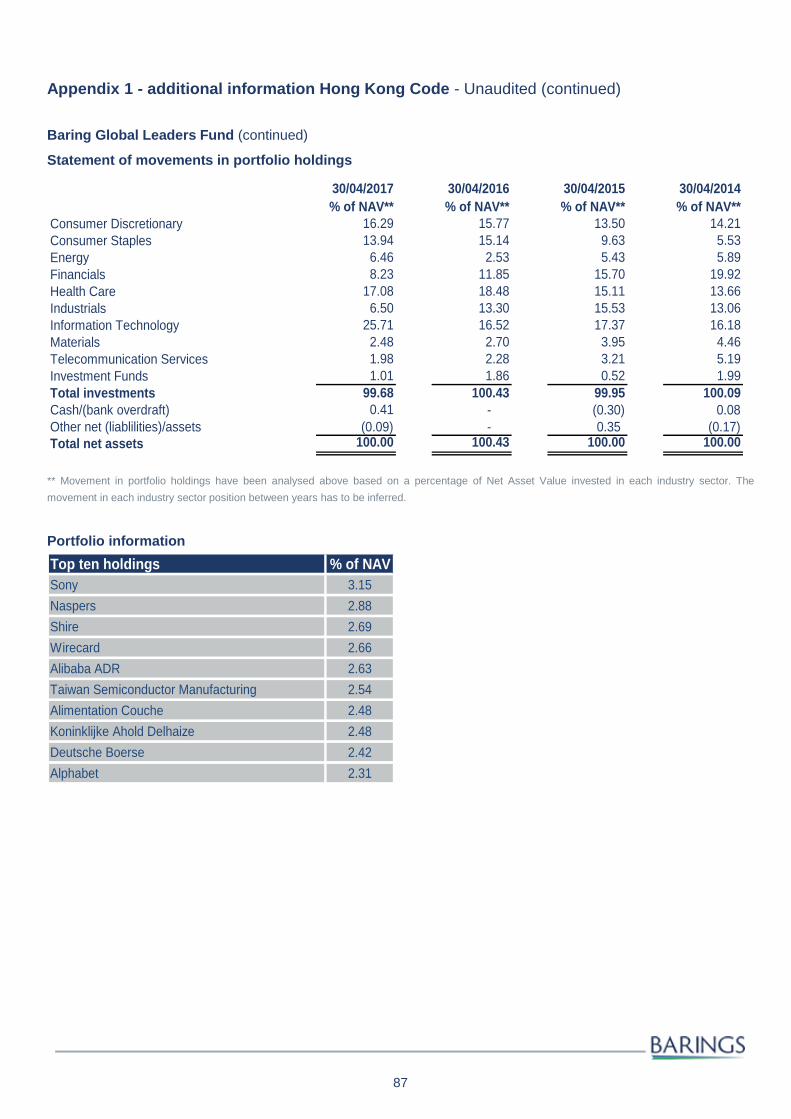
87
Appendix 1 - additional information Hong Kong Code - Unaudited (continued)
Baring Global Leaders Fund (continued)
Statement of movements in portfolio holdings
30/04/2017 30/04/2016 30/04/2015 30/04/2014
% of NAV** % of NAV** % of NAV** % of NAV**
Consumer Discretionary 16.29 15.77 13.50 14.21
Consumer Staples 13.94 15.14 9.63 5.53
Energy 6.46 2.53 5.43 5.89
Financials 8.23 11.85 15.70 19.92
Health Care 17.08 18.48 15.11 13.66
Industrials 6.50 13.30 15.53 13.06
Information Technology 25.71 16.52 17.37 16.18
Materials 2.48 2.70 3.95 4.46
Telecommunication Services 1.98 2.28 3.21 5.19
Investment Funds 1.01 1.86 0.52 1.99
Total investments 99.68 100.43 99.95 100.09
Cash/(bank overdraft) 0.41 - (0.30) 0.08
Other net (liablilities)/assets (0.09) - 0.35 (0.17)
Total net assets 100.00 100.43 100.00 100.00
** Movement in portfolio holdings have been analysed above based on a percentage of Net Asset Value invested in each industry sector. The
movement in each industry sector position between years has to be inferred.
Portfolio information
Top ten holdings % of NAV
Sony 3.15
Naspers 2.88
Shire 2.69
Wirecard 2.66
Alibaba ADR 2.63
Taiwan Semiconductor Manufacturing 2.54
Alimentation Couche 2.48
Koninklijke Ahold Delhaize 2.48
Deutsche Boerse 2.42
Alphabet 2.31

88
Appendix 1 - additional information Hong Kong Code - Unaudited (continued)
Baring Global Resources Fund
Highest issue and lowest redemption prices
Highest issue prices during the year*
30/04/2017 30/04/2016 30/04/2015 30/04/2014 30/04/2013
Class A USD Inc 18.95 20.56 23.55 22.53 25.25
Class A EUR Inc 17.66 18.37 17.33 16.45 19.23
Class A GBP Inc 15.04 13.33 13.73 14.08 15.61
Class I GBP Acc 15.35 13.66 13.68 - -
Class I USD Acc** 19.43 17.34 - - -
30/04/2012 30/04/2011 30/04/2010 30/04/2009 30/04/2008
Class A USD Inc 32.74 33.54 28.65 51.14 47.99
Class A EUR Inc 22.66 24.73 21.36 32.83 31.74
Class A GBP Inc 20.00 20.74 18.85 - -
Class I GBP Acc - - - - -
Class I USD Acc** - - - - -
Lowest redemption prices during the year*
30/04/2017 30/04/2016 30/04/2015 30/04/2014 30/04/2013
Class A USD Inc 15.87 13.58 18.38 18.86 19.48
Class A EUR Inc 14.31 12.45 15.72 14.36 14.92
Class A GBP Inc 11.89 9.59 12.07 12.20 12.77
Class I GBP Acc 12.08 9.70 12.08 - -
Class I USD Acc** 16.16 13.74 - - -
30/04/2012 30/04/2011 30/04/2010 30/04/2009 30/04/2008
Class A USD Inc 21.73 21.55 18.75 13.85 29.93
Class A EUR Inc 16.48 17.44 13.65 11.01 22.25
Class A GBP Inc 14.13 14.47 14.97 - -
Class I GBP Acc - - - - -
Class I USD Acc** - - - - -
* The above highest issue prices and lowest redemption prices during the year are quoted in their respective unit classes’ denomination currency.
** The Class I USD Acc unit class was launched on 20 January 2016.

89
Appendix 1 - additional information Hong Kong Code-Unaudited (continued)
Baring Global Resources Fund (continued)
Statement of movements in portfolio holdings
30/04/2017 30/04/2016 30/04/2015 30/04/2014
% of NAV*** % of NAV*** % of NAV*** % of NAV***
Consumer Staples 5.89 2.59 2.37 -
Energy 43.88 41.39 46.08 53.75
Industrial 4.15 0.95 - -
Materials 44.82 53.44 47.49 39.91
Utilities 0.00 0.8 - -
Investment Funds 3.59 2.26 3.34 5.47
Total investments 102.33 101.43 99.28 99.13
(Bank overdraft)/cash (1.87) (1.25) 0.75 (0.45)
Other net assets/(liabilities) (0.46) (0.18) (0.03) 1.32
Total net assets 100.00 100.00 100.00 100.00
*** Movement in portfolio holdings have been analysed above based on a percentage of Net Asset Value invested in each currency. The movement
in each currency position between years has to be inferred.
Portfolio information
Top ten holdings % of NAV
Schlumberger 5.12
Suncor Energy 5.04
Albemarle 4.36
Halliburton 4.27
Cabot Oil & Gas 3.90
EOG Resources 3.85
Galp Energia 3.84
Mondi 3.53
Total 3.51
Anglo American 3.10

90
Appendix 2 - significant portfolio movements-Unaudited
Baring Developed and Emerging Markets High Yield Bond Fund
Purchases Cost Sales Proceeds
US$'000 US$'000
Northern Trust Global Funds - US Dollar Fund 227,400 Northern Trust Global Funds - US Dollar Fund 243,776
Northern Trust Global Funds - Euro Liquidity Fund 103,213 Northern Trust Global Funds - Euro Liquidity Fund 113,506
Northern Trust Global Funds - Sterling Fund 46,653 Northern Trust Global Funds - Sterling Fund 48,003
Coveris Holdings 7.88% Bonds 01/11/2019 11,940
United States Treasury Bill 0.00% Bonds
26/05/2016 18,000
Garfunkelux Holdco 3 8.50% Bonds 01/11/2022 9,082 Wind Acquisition Finance 7.00% Bonds 23/04/2021 11,304
Topaz Marine 8.63% Bonds 01/11/2018 8,340 Agile Property Holdings 8.88% Bonds 28/04/2017 9,000
Diamond 1 Finance/ Diamond 2 Finance 7.13%
Bonds 15/06/2024 8,099 Sabine Pass Liquefaction 5.63% Bonds 01/02/2021 8,690
Consolidated Energy Finance 6.75% Bonds
15/10/2019 8,080 Telecom Italia 5.30% Bonds 30/05/2024 8,638
Valeant Pharmaceuticals International 6.13% Bonds
15/04/2025 7,934 Vedanta Resources 6.75% Bonds 07/06/2016 8,500
Jupiter Resources 8.50% Bonds 01/10/2022 7,306 Unitymedia KabelBW 6.125% Bonds 15/01/2025 8,335
A Schulman 6.88% Bonds 01/06/2023 7,079
Cirsa Funding Luxembourg 5.88% Bonds
15/05/2023 8,247
EP Energy 8.00% Bonds 15/02/2025 7,002
Ardagh Packaging Finance 9.25% Bonds
15/10/2020 8,221
Wind Acquisition Finance 7.38% Bonds 23/04/2021 6,706 TA MFG. 3.63% Bonds 15/04/2023 7,850
HCA 5.88% Bonds 15/03/2022 6,559 Freescale Semiconductor 5.00% Bonds 15/05/2021 7,781
WFS Global SAS 9.50% Bonds 15/07/2022 6,497 Cemex 5.88% Bonds 25/03/2019 7,720
Citgo Holding 10.75% Bonds 15/02/2020 6,470 CSC 6.75% Bonds 15/11/2021 7,622
eircom Finance DAC 4.50% Bonds 31/05/2022 6,413 MTS International Funding 5.00% Bonds 30/05/2023 7,462
Ardagh Packaging Finance 6.75% Bonds
15/05/2024 6,311
MGM Resorts International 6.63% Bonds
15/12/2021 7,199
AA Bond 5.50% Bonds 31/07/2022 6,242 Nielsen Finance 4.50% Bonds 01/10/2020 7,158
Level 3 Financing 5.38% Bonds 15/08/2022 6,135 Selecta 6.50% Bonds 15/06/2020 7,155
The Fund was launched on 19 July 1993 as the Baring High Yield Bond Fund and converted to the Baring
Developed and Emerging Markets High Yield Bond Fund on 23 February 2017.

91
Appendix 2 - significant portfolio movements - Unaudited (continued)
Baring Eastern Europe Fund
Purchases Cost Sales Proceeds
US$'000 US$'000
Northern Trust Global Fund - US Dollar Fund 236,815 Northern Trust Global Fund - US Dollar Fund 251,879
Alrosa 24,116 Sberbank of Russia 38,965
Powszechny Zaklad Ubezpieczen 22,204 Yandex 31,342
Turkiye Garanti Bankasi 21,110 LUKOIL ADR 16,325
Moneta Money Bank 18,144 Novatek GDR 15,170
Gazprom ADR 11,405 Phosagro GDR 13,799
Emlak Konut Gayrim 10,189 Komercni Banka 13,135
Mobile TeleSystems ADR 10,081 Powszechna Kasa Oszczednosci Bank Polski 12,865
EPAM Systems 9,332 Bim Birlesik Magazalar 12,502
TMK 8,766 Tupras Turkiye Petrol Rafine 11,631
OPAP 7,128 Alior Bank 9,677
Moscow Exchange MICEX-RTS 6,959 Emlak Konut Gayrim 9,596
MegaFon GDR 6,893 Powszechny Zaklad Ubezpieczen 7,840
MOL Hungarian Oil & Gas 6,510 Alrosa 7,568
Detsky Mir 6,048 Turk Traktor ve Ziraat Makineleri 7,131
Magnit GDR 5,335 Turk Telekomunikasyon 7,119
Ulker Biskuvi Sanayi 4,733 BGEO 7,034
Migros Ticaret 4,344 JUMBO 5,418
X5 Retail GDR 4,216 Magnit 5,307
Sistema JSFC GDR 4,210 OTP Bank 5,033

92
Appendix 2 - significant portfolio movements - Unaudited (continued)
Baring Global Leaders Fund
Purchases Cost Sales Proceeds
US$'000 US$'000
Northern Trust Global Funds - US Dollar Fund 15,585 Northern Trust Global Funds - US Dollar Fund 16,132
Northern Trust Global Funds - Sterling Fund 2,223 Northern Trust Global Funds - Sterling Fund 1,917
Alibaba ADR 1,216 Mobileye 1,667
Mobileye 1,177 SVB Financial 1,484
Suncor Energy 1,155 Northern Trust Global Funds - Euro Liquidity Fund 1,095
Shimadzu 1,108 ARM 920
F5 Networks 1,055 Pigeon 907
Northern Trust Global Funds - Euro Liquidity Fund 1,040 Altria 895
Facebook 1,011 ServiceInternational/US 826
Shire 1,009 Dollarama 797
LG Household & Health Care 1,008 BlackRock 777
Pandora 970 AO Smith 762
Schlumberger 967 Amgen 711
Merlin Entertainments 948 Hain Celestial Group 707
Adobe Systems 893 PPG Industries 699
Albemarle 842 Hoya 686
China Biologic Products 796 TUI 615
Amazon.com 793 Hitachi Metals 607
Unilever 768 Mitsui Fudosan 594
Tate & Lyle 753 Tractor Supply 580
Chr Hansen 631 Sunny Optical Technology 576
KDDI 628 Reckitt Benckiser 565
Samsonite International 596 Adobe Systems 543
Wirecard 473 Fresenius 528
Koninklijke Ahold Delhaize 470 Airbus 525
Assa Abloy 518
Toyota Motor 510
Activision Blizzard 499
China Mengniu Dairy 468
Sensata Technologies 463

93
Appendix 2 - significant portfolio movements - Unaudited (continued)
Baring Global Resources Fund
Baring Global Resources Fund
Purchases Cost Sales Proceeds
US$'000 US$'000
Northern Trust Global Funds - US Dollar Fund 158,773 Northern Trust Global Funds - US Dollar Fund 153,026
Schlumberger 23,064 BHP Billiton 21,154
Tyson Foods 17,562 Julius Baer Multistock 20,557
Anglo American 15,081 PPG Industries 12,414
Cabot Oil & Gas 15,073 Tyson Foods 12,260
Potash Corp of Saskatchewan 12,324 Eastman Chemical 12,238
Mondi 11,383 Covestro 11,345
Johnson Matthey 10,191 Symrise 11,236
Forum Energy Technologies 9,826 Exxon Mobil 11,084
Deere 9,392 Arkema 11,012
LG Chem 8,965 Valero Energy 10,418
CNOOC 8,462 Forum Energy Technologies 10,268
Boliden 8,033 LyondellBasell Industries 10,246
Wienerberger 7,334 Deere 7,481
Monsanto 7,328 Monsanto 7,284
Agnico Eagle Mines 6,821 Woodside Petroleum 7,248
Total 6,513 Total 6,796
Lotte Chemical 5,900 Tupras Turkiye Petrol Rafinerileri 6,368
SK Innovation 5,847 Chevron 6,315
RPC 5,752 Occidental Petroleum 6,229
Tate & Lyle 5,697 Albemarle 5,811
Suncor Energy 5,568 Asahi Kasei 5,703
Interfor 5,175 BASF 5,538
Reliance Steel & Aluminum 4,838 Praxair 5,534
TMK 4,746 Galp Energia 4,586
National Oilwell Varco 4,585 ENN Energy 4,506
Adecoagro 4,486
Fortescue Metals Group 4,420

94
Appendix 3 - securities financing transactions regulation - Unaudited
The Securities Financing Transactions Regulation requires the manager of Undertakings for Collective Investment
in Transferable Securities (“UCITS”) Fund to comply with a series of obligations. In particular, Baring International
Fund Managers (Ireland) Limited (“the Manager”) is required to provide investors with information on the use of
securities financial transactions (“SFTs”) and total return swaps (“TRS”) by Baring Global Umbrella Fund (“the
Trust”) in all interim and annual report published from 13 January 2017.
During the year 1 May 2016 to 30 April 2017, the Fund did not enter into SFTs and TRSs. Should this change in
the future, the interim and annual reports for the Fund will disclose all required information of the use of SFTs and
TRSs.

95
Appendix 4 - remuneration disclosure - Unaudited
Baring Global Umbrella Fund Remuneration
The Manager of the Baring Global Umbrella Fund (“the Fund”) is Baring International Fund Managers Ireland (“the
Manager”), authorised by the Central Bank of Ireland as a UCITS Management Company under the European
Communities (Undertakings for Collective Investment in Transferable Securities) Regulation 2011 (S.I. No 352 of
2011) as amended (“UCITS”).
The Manager’s Remuneration Policy ensures that the remuneration arrangements of “Identified Staff” as defined
in the European Securities and Market Authority’s(“ESMA”) “Guidelines on sound remuneration policies under the
UCITS directive” (the “ESMA Guidelines”), as amended, are:
(i) consistent with and promote sound and effective risk management and do not encourage risk-taking which
is inconsistent with the risk profile, rules or instruments of incorporation of BIFMI or the Fund; and
(ii) consistent with the Manager’s business strategy, objectives, values and interests and includes measures
to avoid conflicts of interest.
The Manager must comply with the UCITS remuneration principles in a way and to the extent that is appropriate to
its size and business.
Remuneration Committee
Due to the size and nature of the Manager, the Board considers it appropriate to disapply the requirement to
appoint a remuneration committee.
Baring Asset Management Limited (“the Investment Manager”) employs and remunerates staff that carry out
activities on behalf of the Manager. The Investment Manager is also the appointed delegate to carry out
investment management and is authorised in the UK by the Financial Conduct Authority (“FCA”).
Barings has an HR and Salaries Committee as well as a Remuneration Committee to ensure the fair and
proportionate application of the remuneration rules and requirements across the Barings group, which includes the
Investment Manager. The Committees ensure that potential conflicts arising from remuneration are managed and
mitigated appropriately. All the Investment Manager staff are subject to the Barings Performance Management
Review process, which includes both financial and non-financial criteria as appropriate.
UCITS Remuneration Identified Staff
The Manager must determine its Identified Staff. Identified Staff consists of staff whose professional activities have
a material impact on the risk profiles of the Manager or the Fund, which includes senior managers, controlled
functions and risk takers. The Manager has a year end of 31 December and remuneration is based on the
Manager year end of 31 December 2016.
(a) Senior Managers and controlled functions
(i) Two independent directors received a fixed director’s fee (they did not receive any variable
remuneration or performance-based pay). The other directors, employed and remunerated by the
Investment Manager, waived their entitlement to receive a director’s fee from the Manager.
(ii) Designated persons perform the managerial functions of risk management and monitoring investment
performance. The Designated Persons were seconded from Duff & Phelps Financial Services
(Ireland) Limited, were not employed by the Manager and did not receive a salary from the Manager.
There were no other controlled functions, senior management or identified staff employed by the Manager.
(b) Risk takers
Investment Managers: the Manager has delegated investment management to the Investment Manager and
accordingly the investment manager was remunerated by Barings under an equivalent remuneration regime (the
Investment Manager and its subsidiaries are subject to remuneration rules contained in the Capital Requirements
Directive (“CRD”) and these are considered to be equally as effective as those contained in the UCITS directive).

96
Appendix 4 - remuneration disclosure - Unaudited (continued)
Remuneration Disclosure: Baring Global Umbrella Fund
The table below summarises the fixed and variable remuneration paid to Identified Staff as well as other Barings’
staff (remunerated by the Investment Manager) that carried out activities for the Manager for the financial year
ending 31 December 2016. The disclosures below show remuneration relevant to the Funds, apportioned using
total Barings Assets under Management (“AUM”).
Number of beneficiaries
Total Fixed Remuneration for the period
Total Variable Remuneration for
the period
Total remuneration
Baring Global Resources Fund
Staff 336 €362,068 €218,635 €544,703
Identified Staff 7 €108,479 €124,205 €232,685
Baring Global Leaders Fund
Staff 336 €42,531 €28,518 €71,048
Identified Staff 7 €45,222 €84,225 €129,447
Baring Developed and Emerging Markets High Yield Bond Fund
Staff 336 €513,202 €344,113 €857,315
Identified Staff 7 €34,311 €37,836 €72,148
Baring Eastern Europe Fund
Staff 336 €842,105 €564,650 €1,406,755
Identified Staff 7 €96,287 €264,714 €361,001
Notes:
1. The disclosures assume all UK staff employed by the Investment Manager (and global investment managers
managing the Manager funds) carry out some activities on behalf of the Manager. Remuneration is
apportioned based on the relevant AUM. Other than the Identified Staff noted above, none of the staff were
considered to be senior managers or others whose actions may have a material impact on the risk profile of
the Fund.
2. Identified Staff: these are as defined in the Manager’s Remuneration Policy; no direct payments from the
Manager are received by Identified Staff (excluding the independent directors). Remuneration is paid by the
Investment Manager and is apportioned on an AUM basis.
3. Variable remuneration consists of cash bonus and deferred awards awarded in the period.
4. The Fund does not pay either performance-related fees or carried interests to any person.

Address:
Baring International Fund Managers (Ireland) Limited
Georges Court
Townsend Street
Dublin 2
Ireland
Contact:
Tel: +353 1 542 2930
Fax: +353 1 670 1185
www.barings.com
Important information: This document is approved and issued by Baring International Fund Managers (Ireland) Limited. Disclosure: Baring International Fund Managers (Ireland) Limited Authorised and Regulated by the Central Bank of Ireland Georges Court, Townsend Street, Dublin 2, Ireland