"Annual Report and Financial Statements 2016" · PDF fileAnnual Report and Financial...
122
Annual Report and Financial Statements 2016
Transcript of "Annual Report and Financial Statements 2016" · PDF fileAnnual Report and Financial...

Home ReTAIL GRoUP PLCAvebury489–499 Avebury BoulevardMilton KeynesMK9 2NWTel: 0845 603 6677
www.homeretailgroup.com
Visit our 2016 annual report and corporate responsibility report at www.homeretailgroup.com
Ho
me ReTA
IL GRo
UP PLC
Annual Report and Financial Statem
ents 2016
Annual Report and Financial Statements
2016
01_Cover_v7.indd 1-3 20/05/2016 17:56
Designmslgroup.com
Board photographyIain CrockartJames JohnsonBen NormingtonLucy Cheveralls
PaperThis has been printed on Cocoon Offset paper. The paper has been awarded the NAPM 100% Recycled Mark. Produced at a mill that is certified with the ISO14001 environmental management standard. FSC® Recycled Product supporting responsible use of forest resources. The fibre source is 100% de inked post consumer waste. The pulp is bleached using a totally chlorine free (TCF) process and the inks used are all vegetable oil based.
PrintPrinted by CPI Colour
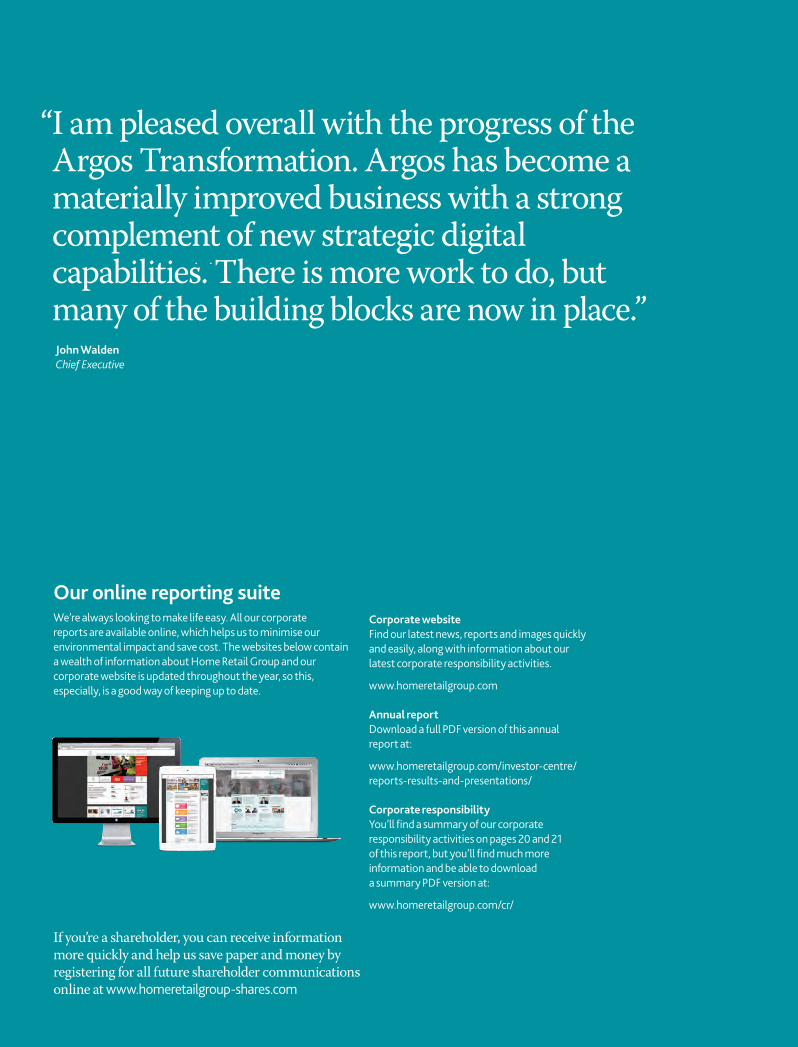
our online reporting suiteWe’re always looking to make life easy. All our corporate reports are available online, which helps us to minimise our environmental impact and save cost. The websites below contain a wealth of information about Home Retail Group and our corporate website is updated throughout the year, so this, especially, is a good way of keeping up to date.
“ I am pleased overall with the progress of the Argos Transformation. Argos has become a materially improved business with a strong complement of new strategic digital capabilities. There is more work to do, but many of the building blocks are now in place.”John WaldenChief Executive
If you’re a shareholder, you can receive information more quickly and help us save paper and money by registering for all future shareholder communications online at www.homeretailgroup-shares.com
Corporate websiteFind our latest news, reports and images quickly and easily, along with information about our latest corporate responsibility activities.
www.homeretailgroup.com
Annual reportDownload a full PDF version of this annual report at:
www.homeretailgroup.com/investor-centre/reports-results-and-presentations/
Corporate responsibilityYou’ll find a summary of our corporate responsibility activities on pages 20 and 21 of this report, but you’ll find much more information and be able to download a summary PDF version at:
www.homeretailgroup.com/cr/
01_Cover_v7.indd 4-6 20/05/2016 17:56

Strategic rePOrt 04 Our business model 05 Our strategy 07 Chairman’s statement 08 Chief Executive’s statement 10 Group performance 12 Argos business review 16 Financial Services business review 18 Homebase - discontinued operation 20 Responsible retailing 22 Principal risks and uncertainties 24 Financial summary 25 Group financial review
gOvernance 30 Board of Directors 31 Corporate governance 36 Nomination Committee report 37 Group Audit and Risk Committee report 41 Directors’ remuneration report 53 Directors’ report 56 Statement of directors’ responsibilities
Financial StatementS 57 Independent auditors’ report – Group 63 Consolidated income statement 64 Consolidated statement of
comprehensive income 65 Consolidated balance sheet 66 Consolidated statement of changes in equity 67 Consolidated statement of cash flows 68 Analysis of net cash/(debt) 69 Notes to the financial statements 108 Independent auditors’ report – Parent 110 Parent Company balance sheet 111 Parent Company statement of changes
in equity 111 Parent Company statement of cash flows 112 Notes to the Parent Company
financial statements 115 Group five-year summary
additiOnal inFOrmatiOn 117 Shareholder information 119 Index
MSL_HRG_RA2016_FINAL_2005.indb 3 20/05/2016 17:58

Our business model
We aim to provide outstanding value and convenience for our customers by building an infrastructure of market-leading retail capabilities, which can be employed by Argos to provide leading customer offers across multiple channels. Customers are at the heart of our business, with around 120m transactions during the year. We use the insight that our many customers provide to add value to our business model.
Following the sale of Homebase, our business model relates only to our retained businesses, which are Argos and Financial Services.
Building market-leading retail capabilitiesSourcing and distributionWe source our products both locally and globally. The sourcing scale of Argos allows us to offer great choice and value to our customers. We have a strong supply chain which, together with our logistics infrastructure, enables us to provide products for our customers cost-effectively through a national distribution network.
ProductsWe offer a comprehensive range of over 57,000 products across home and general merchandise. We support our offer of well-known product brands with a portfolio of own and exclusive brands such as Habitat, Heart of House, Bush, Alba and Chad Valley.
technology infrastructureMany modern and innovative retail capabilities depend on new technologies. Technology is central to our multi-channel business model, where information of interest to customers must be maintained securely and be available whenever and wherever a customer needs it.
engaged colleaguesOur ability to deliver our business model is underpinned by our 30,000 dedicated colleagues who serve our customers every day and we are committed to their ongoing training and development.
Financial ServicesArgos is supported by an in-house financial services offer, which provides a range of credit products for our customers.
Financial strengthThe Group has strong operational cash-generating characteristics and is in a strong financial position, with £623m of cash. This supports our strategy for growth.
digital developmentThe internet has inspired a revolution in the way customers shop, with digital channels such as online and mobile representing a growing share of business. Our business model prioritises the rapid development of customer features on these digital channels.
delivering leading multi-channel convenience Argos is one of the UK’s leading general merchandise retailers. We are a
multi-channel retailer in that we offer our customers a number of convenient ways in which they can both purchase and physically obtain their products.
We are taking advantage of developments in digital technology that have brought about a fundamental and permanent shift in the way our customers shop. Our successful online and mobile channels help make us a market leader in multi-channel retailing. This is supported with a national network of 845 Argos stores across a range of formats. Our store network can offer not only a selection of shopping options, but also a leading Click & Collect service for customers who order a product on a digital channel and collect it in-store.
In October 2015, Argos introduced Fast Track, a market-leading nationwide proposition offering c.20,000 products for immediate store collection or same-day home delivery to c.95% of UK mainland households. In addition to this, Argos offers an express two-man home delivery service offering leading large item delivery across a broad range of products and contact centres to provide our customers with personalised service.
Increasingly, we are entering into partnerships to help us access new customers online or through store concessions.
Sourcing &distribution
engaged colleagues
digitaldevelopment
Financialservices
Financialstrength
Buildingmarket-leading
retailcapabilities
Products
Online
mobile devices
Storeformats
Partnerships
Delivering leading
multi-channel convenience
click & collect contact
centres
technologyinfrastructure
4 Home Retail GroupAnnual Report 2016
MSL_HRG_RA2016_FINAL_2005.indb 4 20/05/2016 17:58

Home Retail Group’s strategy is to create long-term value by offering leadership in convenience and choice for customers in an emerging digital age.
Our strategy
The strategy positions Argos to build contemporary, market-leading retail capabilities and a leading customer offer across the many ways customers shop, purchase and obtain goods – including digital (online and mobile), store formats and home delivery.
The Group strategy is built around five elements of a competitively advantaged and differentiated customer proposition: Product choice; Digital: Convenience; Human; and Financial Services.
Product choiceThe scale and strength of our business drives market leadership in general merchandise product categories. The Group offers over 57,000 products through its Argos brand, including a substantial element of exclusive and own-brand lines such as Habitat, and is continually expanding its offer to build credibility, choice and differentiation. We utilise our scale advantage to source products for our customers, enabling us to offer them a broad choice of products at competitive prices.
digitalRetail has seen technology drive a fundamental and permanent shift in the way customers shop. Increasingly customers choose to shop online or on the move through mobile devices. The Group strives to develop digital customer experiences that are intuitive, inspiring and consistent across many devices, and provide information to customers that is helpful in their purchase decision such as an up-to-the-minute view of stocking levels for each product. Multi-channel experiences are core to what we do, and the reason we have an ongoing focus on developing our successful internet and mobile commerce channels.
convenienceIn a digital world, convenience is being redefined to mean the ability for customers to obtain our products at the location and the time they desire. The presence of a local store remains critical for many customers, to meet traditional shopping needs and as locations from which to ‘click & collect’ items previously ordered online.
Home delivery options are equally important to customers. Argos operates a nationwide distribution network across multiple distribution centres and 845 stores.
Our logistics network is based on a well-developed infrastructure that allows us to continue to focus on improving the speed at which products can be delivered to our customers, through whichever channel they choose to shop with us.
In October 2015, Argos introduced Fast Track; market-leading nationwide propositions offering c.20,000 products for immediate store collection or same-day home delivery to c.95% of UK mainland households. Argos also offers an express two-man home delivery service offering leading large item delivery across a broad range of products.
HumanOur 30,000 colleagues working in stores, home delivery, distribution, contact centres and central functions are fundamental to how our customers experience our brands. They are a key factor in building trust with customers, particularly in an increasingly technology-driven environment.
Financial ServicesArgos is supported by an in-house financial services offer. Our Financial Services business offers a range of credit products which make it easy for our customers to buy the products they want, when they want.
argos transformation PlanThe Group strategy is underpinned by a comprehensive Argos strategy. In 2012 Argos announced its five-year Transformation Plan to reinvent itself as a ‘digital retail leader’.
This plan has four principal components: � More choice available faster
– Provide high levels of availability to our customers
– Exploit the strategic advantage of having efficient distribution and collection points in local markets across a variety of different formats
– Introduce market-leading fulfilment options to complement the immediacy of in-store collection
� Reposition channels for a digital future – Create market-leading digital customer
experiences – Invest in systems to drive online sales
growth – Innovation of the store experience,
including Fast Track Collection and tablet browsers
– Shift the paper catalogue in Argos to a supporting role for the digital offer, and develop a market-leading digital catalogue
� Universal customer appeal – Ensure competitive pricing and value – Extend product ranges to build both
authority and choice – Strengthen both exclusive and
own-brand offer through fewer, cross-category own brands
– Enhance product quality and design to meet the needs of new customer segments
– Reposition brand and customer experiences
– Expand customer reach and build loyalty – Develop large-scale customer data
collection, insight and personalisation capabilities
� Maintain a lean and flexible cost base
GovernanceFinancial StatementS
additional inFormationStrategic report
Home Retail Groupannual report 2016 5
MSL_HRG_RA2016_FINAL_2005.indb 5 20/05/2016 17:58
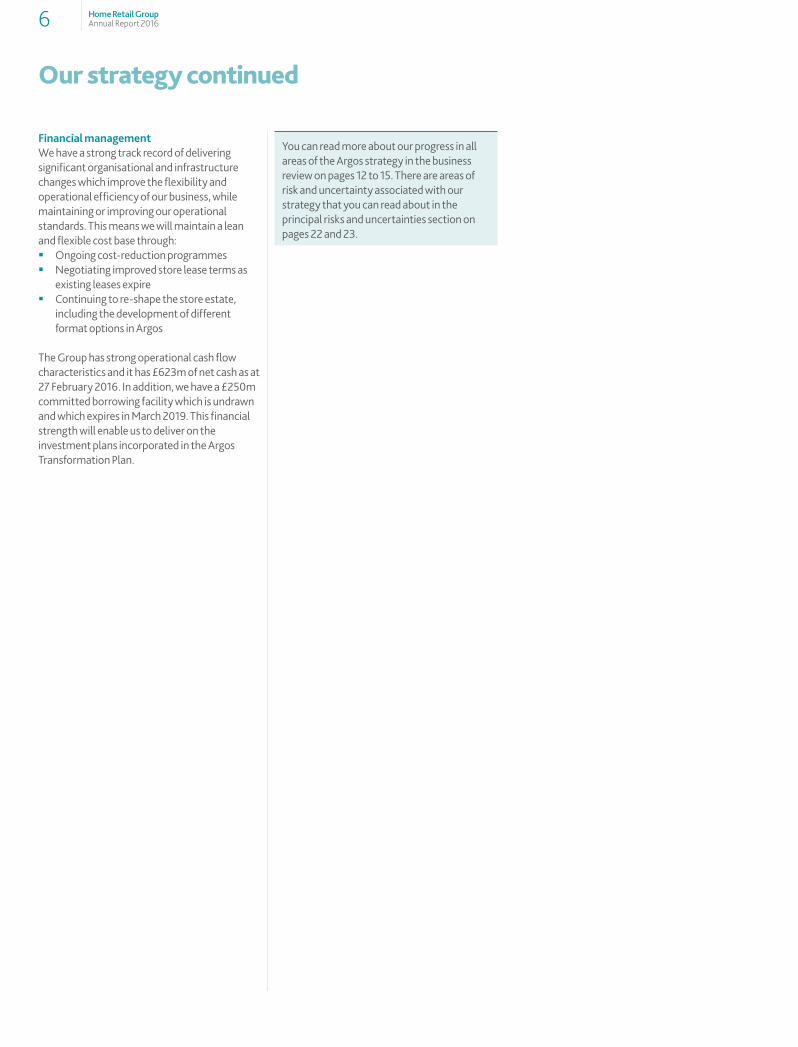
Financial managementWe have a strong track record of delivering significant organisational and infrastructure changes which improve the flexibility and operational efficiency of our business, while maintaining or improving our operational standards. This means we will maintain a lean and flexible cost base through: � Ongoing cost-reduction programmes � Negotiating improved store lease terms as
existing leases expire � Continuing to re-shape the store estate,
including the development of different format options in Argos
The Group has strong operational cash flow characteristics and it has £623m of net cash as at 27 February 2016. In addition, we have a £250m committed borrowing facility which is undrawn and which expires in March 2019. This financial strength will enable us to deliver on the investment plans incorporated in the Argos Transformation Plan.
You can read more about our progress in all areas of the Argos strategy in the business review on pages 12 to 15. There are areas of risk and uncertainty associated with our strategy that you can read about in the principal risks and uncertainties section on pages 22 and 23.
Our strategy continued
6 Home Retail GroupAnnual Report 2016
MSL_HRG_RA2016_FINAL_2005.indb 6 20/05/2016 17:58

Chairman’s statement
In this annual statement to shareholders, which is likely to be the last one, I had hoped to report a third year of increased profits. I regret that this has not been the case and the reasons why are discussed later in this report. In brief, Homebase performed broadly in line with our expectations but Argos did not. However, some notable improvements were made to Argos’ customer service capabilities ahead of the critical Christmas peak period in line with the aspirations of the Transformation Plan. These improvements will serve Argos well in the future.
Shareholders will be aware that this has been a year of two halves. To September 2015 all our focus was on running the businesses and trying to improve its performance. From September that business focus continued but in addition, we became increasingly involved in corporate activity as a result of a proposal made to purchase Homebase. This involvement was then compounded by proposed offers from both J Sainsbury plc and Steinhoff for Home Retail Group, although Steinhoff subsequently decided not to proceed with a confirmed offer.
Mindful of the need to deliver shareholder value, the Board responded to all three proposals with urgency and diligence.
In summary, following approval by shareholders, the sale of Homebase was completed on 27 February 2016 and, on 1 April 2016, your Board announced that it recommended acceptance of the offer from J Sainsbury plc for the whole of Home Retail Group, which included a return of cash in respect of the Homebase sale and a further payment of 2.8 pence per share in lieu of the FY16 final dividend. There are still regulatory hurdles to be overcome, but assuming these are settled satisfactorily we currently expect the takeover to be completed in the second half of the calendar year. Shareholders will be kept informed of progress.
In the meantime, the Board and executive management and other colleagues remain responsible for delivering the best possible performance from both the Argos and Financial Services businesses. We do this in a commercial environment made more challenging by the introduction of the living wage legislation and the absence of any relief on business rates which last year amounted to a charge against profits of approximately £140 million. We also have to navigate a period of potential integration, with its attendant anxieties for some and new opportunities for others. We are committed to doing this fairly and successfully.
I have previously reported on the magnificent efforts made by colleagues on behalf of charitable causes. This last year has been no different and Macmillan Cancer Support has benefitted from cash raised of approximately £1.5 million. This is in addition to assistance given by colleagues to many local charities around the country.
My closing words in this statement are reserved for colleagues. Special mention goes to all those who worked for Homebase while it was owned by Home Retail Group. I would like to thank them for their loyalty and hard work and wish them well for the future. Special mention also goes to those executives and other colleagues in the Group who, in addition to their regular workload, took on the challenges of handling, initially the offer for Homebase and subsequently, the two offers for the Group as a whole. The level of commitment was quite extraordinary and was maintained throughout the second half of the year and beyond. Finally, I would like to thank my non-executive colleagues who contributed their time and wisdom to many more meetings than they could have expected at the beginning of the year.
John coombe Chairman
GovernanceFinancial StatementS
additional inFormationStrategic report
Home Retail Groupannual report 2016 7
MSL_HRG_RA2016_FINAL_2005.indb 7 20/05/2016 17:58

Chief Executive’s statement
� Proven digital store model, including small formats and concessions, which require lower capital outlay and provide customers with fast access to an expanded product range regardless of store stocking capacity. In FY16, Argos expanded its number of concessions, demonstrating both the rapid scalability and the success of this model.
� digital development and digital channel capabilities. Although the internet is now central to most businesses, the market has both broad variation in digital standards and a shortage of sufficient digital leadership capability. Argos has developed teams with strong digital capabilities, and it has aggressively shifted the business from a catalogue retailer to a digital specialist. In FY16, internet transactions accounted for 49% of total Argos sales, including mobile commerce which grew by 10% to represent 28% of total Argos sales.
� more universally appealing offer, including expanded ranges and marketing communications that are beginning to reposition the Argos brand among consumers as being more dynamic, while preserving its strong heritage. In FY16, this was supported by the introduction of eight new brands such as Nespresso and Bang & Olufsen.
� a more flexible store cost base. As at the end of FY16, Argos has significantly reduced the average lease term of Argos stores such that they are now below five years. When combined with new options for store locations presented by small-format stores and concessions, Argos now has the flexibility to add, eliminate and relocate stores to minimise costs and meet previously unaddressed consumer demand.
Although Argos’ financial performance in FY16 was disappointing, I am pleased overall with the progress of the Argos Transformation. From 2012, Argos has become a materially improved business with a strong complement of new strategic digital capabilities. There is more work to do, but many of the building blocks are now in place.
Homebase saleOn 27 February 2016 we completed the sale of Homebase to Wesfarmers Limited, for a cash consideration of £340m. This transaction realised good value for Home Retail Group shareholders and enables the Retained Group to focus on the ongoing Transformation Plan at Argos.
The sale followed a review of the Homebase business in 2014, initiated by the Board and myself as the then new Chief Executive. Following the completion of the review, the Board introduced a three-year Productivity Plan that included improving store productivity, closing approximately 25% of the store estate, strengthening customer propositions and accelerating Homebase’s digital capabilities. Significant progress was made against the Productivity Plan in the intervening period, including: � The substantial completion of the
programme to close underperforming stores; � Improvements to both pricing structures and
promotional effectiveness; � A range of improvements to drive an
improved trading performance; � Significant growth in digital sales; and � An energised new leadership.
The Board was cognisant of the value created in Homebase over a short period through the successful progress made in relation to the Productivity Plan, as well as the investment, management attention and other resources required to help grow Homebase further. The Productivity Plan preserved the option to sell Homebase in the event that circumstances proved appropriate.
Progress with argos’ transformationIn October 2012, we outlined a five-year Transformation Plan to reinvent Argos as a digital retail leader, transforming it from a catalogue-led business to a digitally-led business. We have made meaningful progress in developing new strategic capabilities since the introduction of the Transformation Plan, including: � a national ‘hub & spoke’ distribution
network which currently supports c.20,000 products in local hubs, making them available for faster fulfilment via home delivery or store collection. In FY16 Argos further extended this concept to a regional hub trial, with the potential to hold substantially more products, including third-party products, for same-day fulfilment.
� introduction of Fast track delivery and Fast track collection. Launched in FY16, these market-leading same-day home delivery and store collection propositions leverage 845 Argos store locations, the ‘hub & spoke’ model and a newly established national home delivery network, offering c.20,000 products for immediate store collection or same-day home delivery to c.95% of UK mainland households. Argos has also introduced an express two-man home delivery service offering leading large item delivery across a broad range of products.
8 Home Retail GroupAnnual Report 2016
MSL_HRG_RA2016_FINAL_2005.indb 8 20/05/2016 17:58

The Board believed that the transaction was highly compelling for the following reasons: � The level of consideration was attractive and
fairly reflected the business improvements achieved to date. It allowed shareholders to realise a significant part of Homebase’s future growth potential whilst also de-risking the future execution of the Productivity Plan;
� It allows £200 million of cash to be available for return to shareholders; and
� It resulted in significant improvements to the Group’s overall financial position by removing gross lease liabilities valued at £1.4 billion (as at 28 February 2015) from the Group.
As a result of the factors set out above, the Board unanimously decided that the transaction was in the best interests of shareholders. The transaction was duly approved by shareholders on 25 February and it was completed on 27 February 2016.
Offer for the groupThe Board continues to believe that execution of the Argos Transformation Plan would create a leading digital retailer in the UK and deliver future shareholder value. The Board and I further believe that the progress that has been made to date on the plan, together with the sale of Homebase, led to interest from potential acquirers of the Retained Group. Post the year-end, on 1 April 2016, the Board recommended an offer from J Sainsbury plc for the purchase of Home Retail Group plc.
For Home Retail Group, there will be significant business benefits in the combination with Sainsbury’s, including benefits of scale and opportunity to accelerate the work begun under the Transformation Plan, creating opportunities for our employees and other stakeholders. In addition, the Sainsbury’s share component of the purchase will enable Home Retail Group shareholders to benefit from the value creation expected to arise through the combination, including significant synergies. However, as a result of the recommended offer, we have
recorded an exceptional charge of around £850m in respect of an impairment of the goodwill that arose on the acquisition of Argos in 1998. This charge is a non-cash item and therefore it has had no impact on the Group’s year-end cash balance of £623m, which was significantly stronger than previously anticipated.
As announced as a part of the offer from J Sainsbury plc, the FY16 final dividend will be replaced by a payment of 2.8 pence per Home Retail Group share in lieu of the final dividend as part of the proposed capital returns, which also incorporates the £200m return to shareholders in respect of the Homebase sale. For further information about the offer, a copy of the full announcement can be found on Home Retail Group’s website at www.homeretailgroup.com/investor-centre/sainsburys-offer.
I would like to thank Home Retail Group colleagues for their significant contributions during FY16. In addition to a challenging trading environment, our colleagues have faced the uncertain effects of the various corporate activities that occurred during the year. Maintaining focus in this environment has been difficult, but our colleagues have demonstrated both resilience and optimism, which I very much appreciate.
John Walden Chief Executive
GovernanceFinancial StatementS
additional inFormationStrategic report
Home Retail Groupannual report 2016 9
MSL_HRG_RA2016_FINAL_2005.indb 9 20/05/2016 17:58

Group performance
argos operating highlights � Completed the national roll-out of market leading Fast Track
propositions for both same-day home delivery and store collection � Opened 94 digital concessions and collection points, taking the total
number to 114 � Total of 177 digital stores, representing 21% of the Argos store estate � Internet transactions accounted for 49% of total Argos sales, including
mobile commerce which grew by 10% to represent 28% of total sales
group financial highlights � Sales down 1% to £5,668m; flat at Argos, down 3% at Homebase � Cash gross margin down 3% to £1,978m � Operating and distribution costs decreased by £21m to £1,887m, Argos
costs increased by £22m, Homebase costs decreased by £44m � Benchmark profit before tax decreased by 28% to £94.7m � Basic benchmark earnings per share decreased by 28% to 9.3p � The recommended offer from J Sainsbury plc for the purchase of Home
Retail Group plc resulted in an exceptional goodwill impairment charge of £852m, leading to a total loss after tax of £808m
� Year-end cash balance of £623m
corporate developments � Sale of Homebase for £340m successfully completed on 27 February
2016, with £337m received in FY16 and the balance received in FY17 � Post the year-end, on 1 April 2016, the Board recommended an offer
from J Sainsbury plc for the purchase of Home Retail Group plc: – Under the terms of the offer, Home Retail Group shareholders will be
entitled to receive the following for each Home Retail Group share; – 0.321 new Sainsbury’s shares; and – 55.0 pence in cash
– In addition, Home Retail Group shareholders will also be entitled to the following payments, which together form the proposed capital returns; – 25.0 pence per share, reflecting the £200m return to
shareholders in respect of the Homebase sale; and – 2.8 pence per share in lieu of a final dividend in respect of the
financial year ended 27 February 2016. As a result, a final dividend will not be paid
*Refer to page 75 for definitions of benchmark measures
10 Home Retail GroupAnnual Report 2016
MSL_HRG_RA2016_FINAL_2005.indb 10 20/05/2016 17:58

Group key performance indicators
For all charts, FY12 is on a 52-week pro forma basis except ‘net cash’, which is on a 53-week basis ending 3 March 2012.
Total Group sales (including both continuing and discontinued operations) decreased by 1% to £5,668m. Argos accounted for 72% of Group sales and remained broadly flat with a £1m decrease in the year. Homebase accounted for 25% of Group sales and decreased by 3% or £46m in the year. Financial Services accounted for the remaining 3% of Group sales and increased by 3% or £4m in the year.definition: Income received for goods and services from both continuing and discontinued operations.Source: Audited financial statements.
Basic benchmark EPS decreased by 28% to 9.3p per share, principally as a result of the lower benchmark PBT reported for the year.definition: Refer to page 75 for definitions of benchmark measures.Source: Audited financial statements.
Total Group benchmark PBT decreased 28% to £95m. Argos benchmark operating profit decreased by 36% or £46m, Homebase benchmark operating profit increased 18% or £4m, Financial Services benchmark operating profit was maintained at £7m and the cost of Central Activities decreased by 15% or £4m.definition: Refer to page 75 for definitions of benchmark measures.Source: Audited financial statements.
The Group’s financing net cash position at 27 February 2016 was £623m, an increase of £314m over the year. The principal driver to this increase was the sale proceeds received in respect of the sale of the Homebase business. definition: Year-end balance sheet financing net cash.
Source: Audited financial statements.
total group sales
Basic benchmark earnings per share (ePS)
total group benchmark profit before tax (PBt)
net cash
5,492 5,475 5,663 5,710 5,668
FY12 FY13 FY14 FY15 FY16
6,000
5,000
4,000
3,000
2,000
1,000
0
£m
Argos Homebase Financial Services
91102
115
132
95
FY12 FY13 FY14 FY15 FY16
£m
Argos Homebase Financial ServicesCentral Activities
160
120
40
80
0
FY12 FY13 FY14 FY15 FY16
9.38.7
7.7
10.4
13.0
15
10
5
0
Pence
FY12 FY13 FY14 FY15 FY16
194
396
331309
623
700
600
500
400
300
200
100
0
£m
Home Retail Group600p
500p
400p
300p
200p
100p
0p
FTSE 350 Index of General Retailers
Share price performance
February 2011 February 2012 March 2013 March 2014 February 2015 27 February 2016
GovernanceFinancial StatementS
additional inFormationStrategic report
Home Retail Groupannual report 2016 11
MSL_HRG_RA2016_FINAL_2005.indb 11 20/05/2016 17:58

Argos business review
Argos has an outstanding offer of convenience, choice and value to meet customer needs, selling products through its 845 stores, website and mobile apps.
Highlights
845 storesGiving access to c.20,000 products for same-day home delivery or store collection
£4,095mSales broadly flat year-on-year
49%Of total sales are internet-led, including mobile commerce52 WeeKS tO 27 FEBRUARY 2016 28 FEBRUARY 2015
Sales (£m) 4,095.3 4,096.0
Benchmark operating profit (£m) 83.1 129.2
Benchmark operating margin 2.0% 3.2%
Like-for-like sales change (2.6%) 0.6%
Net space sales change 2.6% 0.5%
Total sales change 0.0% 1.1%
Gross margin rate movement Down (c.50bps) Up c.25bps
Benchmark operating profit change (36%) 15%
Number of stores at year-end 845 755
Of which are digital format 177 60
Argos has spent the last two and a half years enhancing the systems and operational capabilities that underpin its product fulfilment, including improving its real-time stock visibility and stock picking systems, and implementing its ‘hub & spoke’ distribution network on a national scale.
12 Home Retail GroupAnnual Report 2016
MSL_HRG_RA2016_FINAL_2005.indb 12 20/05/2016 17:59

Argos key facts
94
FY12 FY13 FY14 FY15 FY16
FY12 FY13 FY14 FY15 FY16
FY12 FY13 FY14 FY15 FY16
3,873 3,931 4,051 4,096 4,095
£m
FY12 FY13 FY14 FY15 FY16
FY12 FY13 FY14 FY15 FY16
33.9 34.0
43.3
53.757.1
748 737 734 755
845
FY12 FY13 FY14 FY15 FY16
Thousand
100112
129
83
51 53 54 55
£m %
2.4 2.6 2.83.1
2.0
%
%
(7.7%)+1.5%
+3.0%
+1.1%0.0%
5,000
4,000
3,000
2,000
1,000
0
60
50
40
20
30
10
0
1,000
600
800
400
200
0
60
48
36
24
12
0
160
120
80
40
0
8
6
4
2
0
Sales Number of stores
Sales trends Total number of lines offered in catalogue and online
Space Like-for-like Catalogue Total online only
Benchmark operating profit and benchmark operating profit margin Multi-channel sales
Margin
Total
Check & Reserve (internet) Home delivery (internet)Check & Reserve (phone) Home delivery (phone)Home delivery (store)
0
-5
-10
5
48
Argos sales were broadly flat at £4,095m. Net space increased sales by 2.6% with the store estate increasing by a net 90 stores to 845. Like-for-like sales declined by 2.6% principally driven by a decline in sales of electrical products, such as TVs, tablets and white goods, partially offset by growth in mobiles. The decline in electrical sales were partially offset by growth in toys, general sports and furniture.definition: Income received from goods and services.Source: Audited financial statements.
Like-for-like sales decreased by 2.6% in the year. Net new space increased sales by 2.6%.definition: Annual percentage change in sales. Like-for-like sales are calculated on stores that have been open for more than a year; the contribution to sales from net new space is the sales performances for the first 52 weeks trading of any newly opened stores less the sales performances for the last 52 weeks of any stores that have been closed.Source: Audited financial statements/measured internally.
Benchmark operating profit declined by 36% or £46m, to £83m as a result of broadly flat sales, combined with reduced gross margin and cost investments in new strategic and customer-focused initiatives such as Fast Track.definition: Refer to page 75 for definitions of benchmark measures.Source: Audited financial statements.
During the year, a net 90 stores were opened, increasing the store portfolio to 845. There are now 177 digital stores across three formats; conversions, concessions and small format . The increase in stores is principally driven by digital concessions and collection points opened during the year, of which 81 were within Homebase stores, and 13 were within Sainsbury’s stores.definition: Total number of stores at year-end. Source: Measured internally.
Our spring/summer catalogue featured more than 21,000 lines and, combined with our online exclusive range, this was increased to 57,100 lines.definition: Total number of product lines offered in the main spring/summer catalogue and online.Source: Measured internally.
Multi-channel sales grew to 55% or £2.3bn of Argos sales. Internet sales grew 7% during FY16 and represented 49% of total sales, up from 46% last year. Within this, mobile commerce sales grew by 10% to represent 28% of total Argos sales, up from 25% in the prior year.definition: Percentage of sales across more than one channel. There are three ordering channels: the internet, phone or store and two fulfilment channels: store or home delivery. Mobile channel are sales accessed via mobile devices through either our mobitised website or through our apps. Source: Measured internally.
GovernanceFinancial StatementS
additional inFormationStrategic report
Home Retail Groupannual report 2016 13
MSL_HRG_RA2016_FINAL_2005.indb 13 20/05/2016 17:59

In October 2012 Argos outlined a five-year Transformation Plan to reinvent itself as a digital retail leader, transforming from a catalogue-led business to a digitally-led business. The Plan is designed to address competitive challenges, exploit emerging market opportunities and restore sustainable growth.
There are four key strategic elements to the Transformation Plan:1. Provide more product choice, available to
customers faster;2. Reposition Argos’ channels for a digital future;3. Develop a customer offer that has universal
appeal; and4. Operate a lean and flexible cost base.
Operational reviewdigital fulfilment propositions Argos has spent the last two and a half years enhancing the systems and operational capabilities that underpin its product fulfilment, including improving its real-time stock visibility and stock picking systems, and implementing its ‘hub & spoke’ distribution network on a national scale. In the first half of FY16, Argos further evolved ‘hub & spoke’ to improve stock availability and during the second half, Fast Track Delivery and Fast Track Collection were successfully introduced.
Internet sales grew 7% during FY16 and represented 49% of total sales, up from 46% last year. Within this, mobile commerce sales grew by 10% to represent 28% of total sales, up from 25% in the prior year.
Fast Track Delivery offers customers c.20,000 products for same-day home delivery, with the choice of four time slots per day. Orders can be placed until 6pm for same-day delivery by
10pm, seven days per week, at a standard cost of £3.95. To make this offer available to customers throughout the UK, Argos currently employs c.2,300 colleagues as customer fulfilment drivers for its dedicated fleet of c.500 vans. At peak, our drivers and vans increased to c.3,000 and c.800 respectively in order to meet the increased demand.
Fast Track Collection enables customers to choose from the same c.20,000 products, pay online and collect their products from their local store on the same-day, from a dedicated Fast Track counter, in as little as 60 seconds. This service is free of charge.
The launch of the market-leading Fast Track propositions was a key milestone in Argos’ migration to digital channels. Since the launch of both Fast Track Delivery and Fast Track Collection early in the second half, internet sales grew 13% compared to the same months last year, and represented 54% of total Argos sales, up from 49% over the same period last year. There was a strong take up of the Fast Track Delivery offer, such that total one-man home delivery grew 79% for these months versus the prior year. Fast Track Delivery also achieved the highest customer satisfaction scores of any Argos channel with a delivery success rate of 98%. Fast Track Collection has seen collection rates at c.95% which, in-line with expectation, is higher than the traditional check and reserve collection rate.
The market for large item delivery is increasingly competitive and Argos is focused on improving its proposition, such that during the first half of FY16, it implemented new capability in order for it to launch an express next day proposition during the second half. As a result,
Argos’ most popular large products can now be delivered on a next day basis, seven days a week, including the option of new evening slots. This service is a market-leading service across a range of product categories such as furniture, beds and large sports equipment.
Argos has continued to grow its extensive registered customer database, such that it now holds c.18m customer records. It is utilising this data through e-mail programmes which support improved add-on sales, higher levels of cross-category purchases and enable a better understanding of customers.
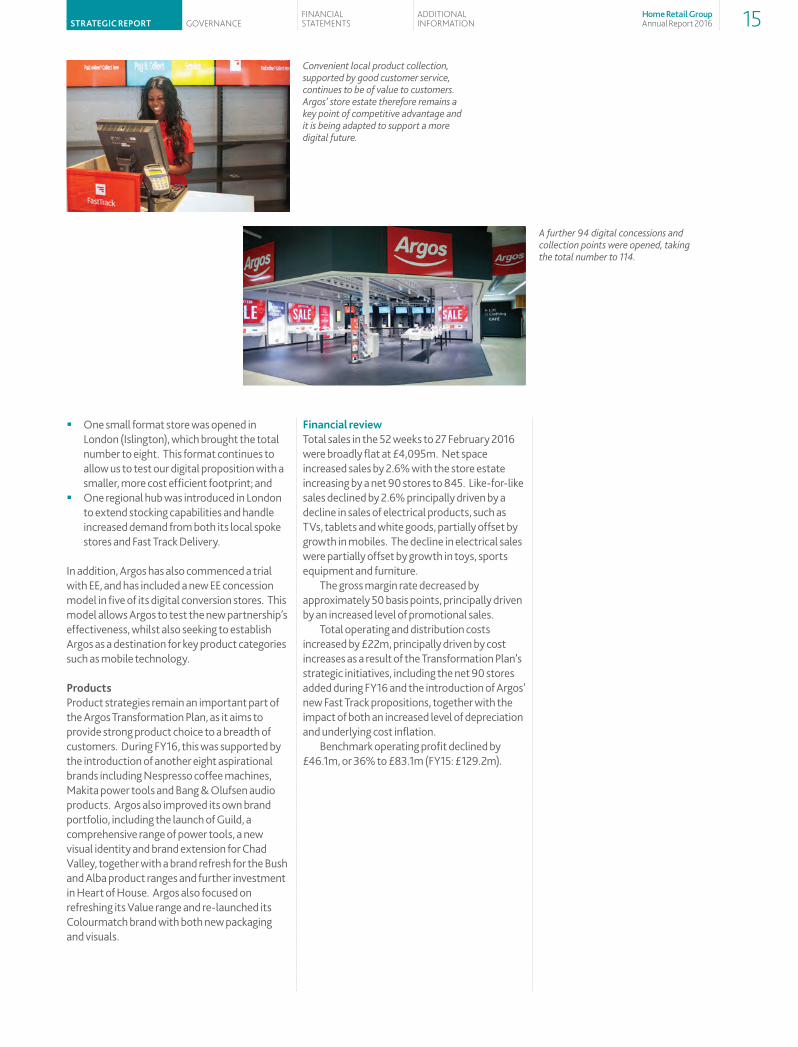
digital storesConvenient local product collection, supported by good customer service, continues to be of increasing value to customers. Argos’ store estate therefore remains a key point of competitive advantage and it is being adapted to support a more digital future. Facilitated by the ‘hub & spoke’ distribution model, during FY16 Argos continued to increase its number of collection points through its now proven digital concession store model; � There were 22 conversions of existing stores
to a digital format, 18 of which were based on a new, lower cost version of the digital format;
� A further 94 digital concessions and collection points were opened, taking the total number to 114, of which 101 were within Homebase stores, and 13 within Sainsbury’s stores;
Fast Track Collection enables customers to choose from c.20,000 products, pay online and collect their products from their local store on the same-day, from a dedicated Fast Track counter, in as little as 60 seconds.
14 Home Retail GroupAnnual Report 2016
MSL_HRG_RA2016_FINAL_2005.indb 14 20/05/2016 17:59
� One small format store was opened in London (Islington), which brought the total number to eight. This format continues to allow us to test our digital proposition with a smaller, more cost efficient footprint; and
� One regional hub was introduced in London to extend stocking capabilities and handle increased demand from both its local spoke stores and Fast Track Delivery.
In addition, Argos has also commenced a trial with EE, and has included a new EE concession model in five of its digital conversion stores. This model allows Argos to test the new partnership’s effectiveness, whilst also seeking to establish Argos as a destination for key product categories such as mobile technology.
ProductsProduct strategies remain an important part of the Argos Transformation Plan, as it aims to provide strong product choice to a breadth of customers. During FY16, this was supported by the introduction of another eight aspirational brands including Nespresso coffee machines, Makita power tools and Bang & Olufsen audio products. Argos also improved its own brand portfolio, including the launch of Guild, a comprehensive range of power tools, a new visual identity and brand extension for Chad Valley, together with a brand refresh for the Bush and Alba product ranges and further investment in Heart of House. Argos also focused on refreshing its Value range and re-launched its Colourmatch brand with both new packaging and visuals.
Financial reviewTotal sales in the 52 weeks to 27 February 2016 were broadly flat at £4,095m. Net space increased sales by 2.6% with the store estate increasing by a net 90 stores to 845. Like-for-like sales declined by 2.6% principally driven by a decline in sales of electrical products, such as TVs, tablets and white goods, partially offset by growth in mobiles. The decline in electrical sales were partially offset by growth in toys, sports equipment and furniture.
The gross margin rate decreased by approximately 50 basis points, principally driven by an increased level of promotional sales.
Total operating and distribution costs increased by £22m, principally driven by cost increases as a result of the Transformation Plan’s strategic initiatives, including the net 90 stores added during FY16 and the introduction of Argos’ new Fast Track propositions, together with the impact of both an increased level of depreciation and underlying cost inflation.
Benchmark operating profit declined by £46.1m, or 36% to £83.1m (FY15: £129.2m).
A further 94 digital concessions and collection points were opened, taking the total number to 114.
Convenient local product collection, supported by good customer service, continues to be of value to customers. Argos’ store estate therefore remains a key point of competitive advantage and it is being adapted to support a more digital future.
GovernanceFinancial StatementS
additional inFormationStrategic report
Home Retail Groupannual report 2016 15
MSL_HRG_RA2016_FINAL_2005.indb 15 20/05/2016 17:59

Highlights
Financial Services business review
Financial Services works in conjunction with Argos and, up until the point of its disposal, with Homebase to provide their customers with the most appropriate credit offers to drive retail sales and ensure fair customer outcomes.
£35mIncrease in store card net receivables, to £614m
4%Increase of in-house store card credit sales, representing 11.3% of Group retail sales
In doing so, it aims to achieve a return on equity on the revolving element of its loan book that is typical of the financial service industry norm and in addition, to recover its costs on the promotional element of its loan book. The profit earned by Financial Services over and above this amount accrues to the retail companies, which is where both the transactions and the customer relationships originate.
Operational and financial reviewConsistent with the wider consumer credit industry, Financial Services is currently managing the change in regulation of consumer credit activity from the Office of Fair Trading to the Financial Conduct Authority (‘FCA’). During FY16 a number of internal reviews were completed to ensure processes, agreements and training are in accordance with requirements. In addition, new FCA related governance models have been implemented across the business. Argos, Homebase and Habitat all secured the required retail authorisations and the process is progressing well towards authorisation for the Financial Services business.
In-house store card credit sales were 4% higher at £739m (FY15: £711m) which represented 11.3% (FY15: 10.7%) of Group retail sales. This increased level of credit sales was principally as a result of an increase in credit penetration across most product categories. In
addition to credit sales on the Group’s own store cards, credit offers for purchases at Homebase, up until the point of its sale, which were greater than £1,000, were principally provided through product loans from a third-party provider. Including these product loans, total credit sales increased by 4% to £832m (FY15: £800m) resulting in total credit sales penetration increasing to 12.7% (FY15: 12.1%) of Group retail sales.
Store card net receivables grew by £35m versus FY15 to £614m, principally as a result of the increase in in-house credit sales. The Group finances these receivables internally with no third-party debt being required.
Total sales in the 52 weeks to 27 February 2016 increased by 3% to £139m. While delinquency rates continued their downward trend of the last few years, this reduction was at a slower rate than the prior year which, along with an increased loan book, resulted in a marginal increase in the bad debt cost. Financing costs were slightly higher than last year due to the growth in the loan book, with a corresponding credit for this internal financing cost recharge being recognised in Group net interest income. Overall, the improved sales performance was offset by the increased bad debt cost and an increase in operating costs. Benchmark operating profit was in line with last year at £7.0m (FY15: £7.0m).
52 WeeKS tO 27 FEBRUARY 2016 28 FEBRUARY 2015
Sales (£m) 139.4 135.1
Benchmark operating profit before financing costs (£m) 11.1 10.9
Financing costs (£m) (4.1) (3.9)
Benchmark operating profit (£m) 7.0 7.0
aS at 27 FEBRUARY 2016 28 FEBRUARY 2015
Store card gross receivables (£m) 677.0 644.1
Provision (£m) (62.9) (64.6)
Store card net receivables (£m) 614.1 579.5
Provisions % of gross receivables 9.3% 10.0%
16 Home Retail GroupAnnual Report 2016
MSL_HRG_RA2016_FINAL_2005.indb 16 20/05/2016 17:59
Financial Services key facts
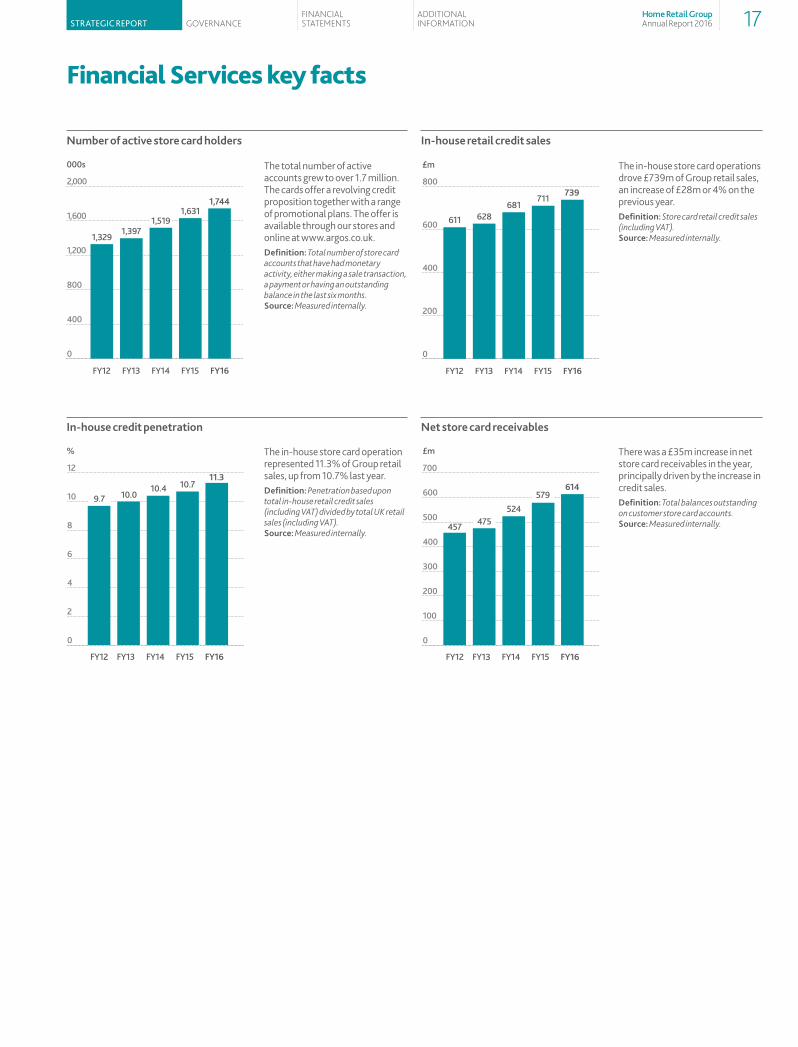
The total number of active accounts grew to over 1.7 million. The cards offer a revolving credit proposition together with a range of promotional plans. The offer is available through our stores and online at www.argos.co.uk.definition: Total number of store card accounts that have had monetary activity, either making a sale transaction, a payment or having an outstanding balance in the last six months.Source: Measured internally.
The in-house store card operation represented 11.3% of Group retail sales, up from 10.7% last year.definition: Penetration based upon total in-house retail credit sales (including VAT) divided by total UK retail sales (including VAT).Source: Measured internally.
There was a £35m increase in net store card receivables in the year, principally driven by the increase in credit sales.definition: Total balances outstanding on customer store card accounts.Source: Measured internally.
The in-house store card operations drove £739m of Group retail sales, an increase of £28m or 4% on the previous year.definition: Store card retail credit sales (including VAT).Source: Measured internally.
number of active store card holders
in-house credit penetration
in-house retail credit sales
net store card receivables
000s
FY12 FY13 FY14 FY15 FY16
1,3291,397
1,5191,631
1,744
2,000
1,600
1,200
800
400
0
£m
FY12 FY13 FY14 FY15 FY16
611 628681
711739
800
600
400
200
0
%
FY12 FY13 FY14 FY15 FY16
9.7 10.010.4 10.7
11.312
10
8
6
4
2
0
£m
FY12 FY13 FY14 FY15 FY16
457 475524
579614
700
600
500
400
300
200
100
0
GovernanceFinancial StatementS
additional inFormationStrategic report
Home Retail Groupannual report 2016 17
MSL_HRG_RA2016_FINAL_2005.indb 17 20/05/2016 17:59
Homebase – discontinued operation
Home Retail Group plc completed the sale of Homebase to Wesfarmers Limited on 27 February 2016 for a cash consideration of £340m.
52 WEEKS TO 27 FEBRUARY 2016 28 FEBRUARY 2015
Sales (£m) 1,433.1 1,479.3
Benchmark operating profit (£m) 23.5 19.8
Benchmark operating margin 1.6% 1.3%
Like-for-like sales change 5.2% 2.3%
Net space sales change (8.3%) (3.0%)
Total sales change (3.1%) (0.7%)
Gross margin rate movement Down (c.125bps) Down (c.100bps)
Benchmark operating profit change 19% 5%
Homebase saleHome Retail Group plc completed the sale of Homebase to Wesfarmers Limited on 27 February 2016 for a cash consideration of £340m. A Transitional Services Agreement was entered into on 17 January 2016 and has been implemented to govern the provision of the transitional services. The key components of the Transitional Services Agreement are set out as follows: � The Retained Group will continue to charge
Homebase, under its new ownership, for the provision of services by the Retained Group’s shared functions. These services relate to items such as large product item home delivery, call centres and information technology. During the financial year ended 27 February 2016, the Retained Group charged Homebase approximately £70 million for the provision of these services;
� The Retained Group will continue to provide the transitional services for a range of periods of time not likely to exceed 18 months;
� As the components of the Transitional Services Agreement expire, the Retained Group will undertake a cost reduction programme to eliminate, as much as possible, any excess costs remaining after Homebase no longer requires certain services from the Retained Group; and
� After this cost reduction programme, approximately £10 million of overhead costs from providing services under the Transitional Services Agreement is expected to be reabsorbed by the Retained Group, assuming that this capacity cannot be utilised through internal growth or otherwise.
Over a period of approximately 18 months, Wesfarmers Limited will require the removal of the Argos digital concessions from Homebase stores, which, in the absence of alternative locations, would result in an anticipated reduction in Argos’ benchmark operating profit of approximately £10 million.
Financial reviewTotal sales in the 52 weeks to 27 February 2016 declined by 3.1% to £1,433m. Net space reduced sales by 8.3% as a result of the planned reduction in the store estate by a net 34 stores during the year. Like-for-like sales increased by 5.2% with growth broadly across all product categories, but in particular in big ticket. The gross margin rate decreased by approximately 125 basis points.
Total operating and distribution costs decreased by £44m principally driven by cost reductions as a result of the store closure programme, partially offset by the impact of underlying cost inflation.
Benchmark operating profit increased by £3.7m, or 19% to £23.5m (FY15: £19.8m).
18 Home Retail GroupAnnual Report 2016
07_Homebase_v19.indd 18 20/05/2016 19:29
Homebase key facts
Sales Benchmark operating profit and benchmark operating profit margin
FY12 FY13 FY14 FY15 FY16 FY12 FY13 FY14 FY15 FY16
1,5101,431
1,489 1,479 1,433
£m
23
11
1920
24
£m %
1.5
0.8
1.3 1.3
1.6
1,600
1,280
960
640
320
0
30
20
10
0
3
2
1
0
Margin
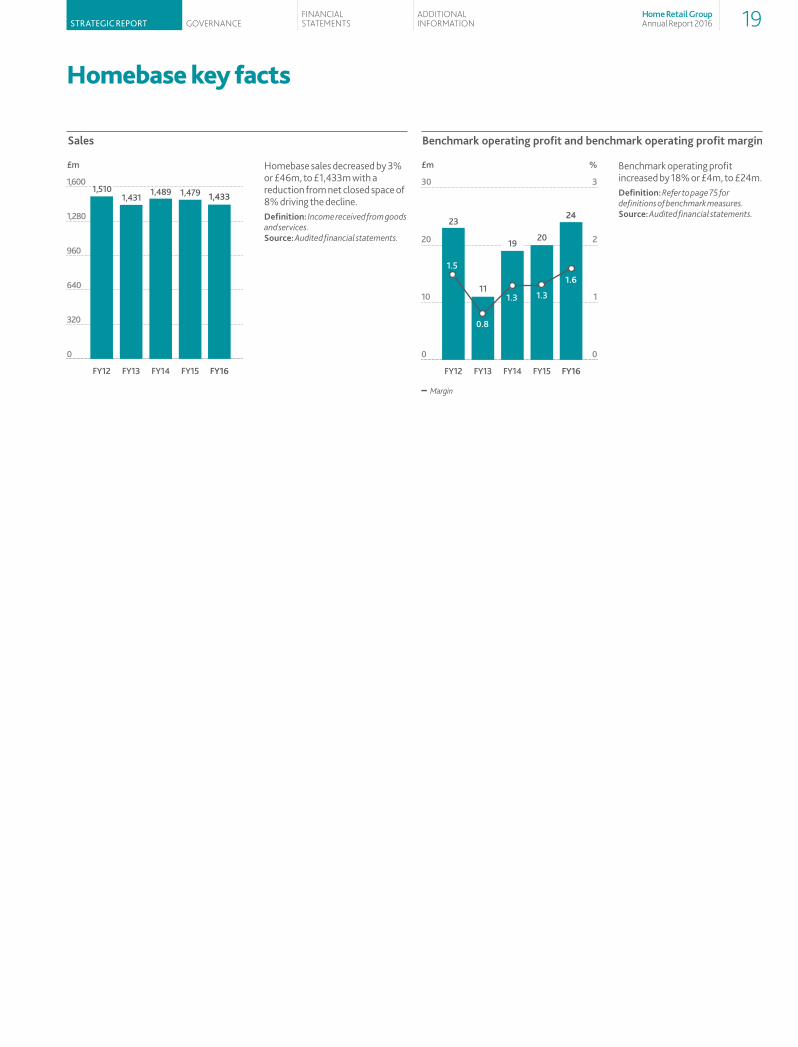
Homebase sales decreased by 3% or £46m, to £1,433m with a reduction from net closed space of 8% driving the decline.definition: Income received from goods and services.Source: Audited financial statements.
Benchmark operating profit increased by 18% or £4m, to £24m.definition: Refer to page 75 for definitions of benchmark measures.Source: Audited financial statements.
GovernanceFinancial StatementS
additional inFormationStrategic report
Home Retail Groupannual report 2016 19
MSL_HRG_RA2016_FINAL_2005.indb 19 20/05/2016 17:59
Responsible retailing
Our responsible approach to social, ethical and environmental issues is about creating an excellent shopping experience for our customers, a great place to work for our colleagues and a business which helps our communities. Here are some highlights of our achievements from the last year.
We use five good business principles to communicate our strategic objectives: � Shopping for tomorrow � Building a great place to work � Being a good neighbour � Keeping clean and green � Sourcing with care
Shopping for tomorrowWe build partnerships and develop activities that support the strategies of our businesses while also creating a benefit to society for today and for the future. � Argos is a retail leader in a digital age. John
Walden is chair of the Digital High Street Advisory Board which, in March 2015, published recommendations of strategies to reinvigorate our high streets in the context of a digital future
� Argos is a board member of Go ON UK, working in partnership with leading businesses and charities to empower everyone in the UK to reach their digital potential
� Argos piloted a beginner’s internet workshop with the Group’s charity partner – Macmillan Cancer Support
� Homebase partnered with Macmillan at the RHS Chelsea Flower Show in May 2015 and won a prestigious gold medal for the fourth consecutive year. The show garden – ‘Urban Retreat Garden’ – was an urban setting in which the local community and wildlife could flourish
Building a great place to workWe support colleagues to reach their full potential, whether they work five or thirty-five hours a week, in whatever capacity. � Over 450 store colleagues from Argos and
Homebase completed internal apprenticeship programmes or City & Guilds accredited training programmes
� Homebase Garden Academy continued into its third year, with 37 colleagues enrolled to develop their knowledge of horticulture and provide expert advice to our customers. Homebase Design and Decorating Academy completed its first year with 11 colleagues completing the programme
Being a good neighbourWe look to create charity partnerships that deliver value, engage our colleagues and customers and create opportunities to support those who need help to move into employment. We team up with a national charity partner as well as supporting our colleagues in their charity and community activity. � We raised approximately £1.5m in
fundraising for Macmillan during the first year of our partnership
� Over £225k of volunteering time was donated to enable our colleagues to volunteer in their local communities
� We partnered with Remploy, Ready for Work, Gingerbread and The Prince’s Trust to provide over 250 two-week work placements in Argos and Homebase stores
� The Argos Barnardo’s Toy Exchange raised over £550k in the fourth year of its partnership and £2.5m cumulatively
Keeping clean and greenWe work to minimise the impact of our activity on the environment through reduced landfill waste, increased recycling rates and implementation of energy-efficiency measures. � We continued the great work in reducing our
footprint with a 34% reduction in CO2 emissions per square foot compared to 2006 and retained the Carbon Trust Standard, demonstrating a commitment to ongoing improvements in carbon management
� 94% of our Group operational waste was recycled
Sourcing with careWe work with our suppliers to embed the process and principles of responsible sourcing, allowing us to source our products with care for the environment and for human rights. � We have carried out over 1,000 ethical audits
and 100% of all own-brand direct-source suppliers have a current ethical audit
� Both Argos and Homebase were members of WWF-GFTN (World Wildlife Fund – Global Forest Trade Network)
You can find out more about our corporate responsibility activities in the corporate responsibility section of our corporate website homeretailgroup.com/cr/
20 Home Retail GroupAnnual Report 2016
MSL_HRG_RA2016_FINAL_2005.indb 20 20/05/2016 17:59

Responsible retailing key facts
In FY16, 94% of operational waste was diverted from landfill (FY15: 93%) and total waste tonnage reduced by 8%. We will continue to focus on our objectives of both minimising the total waste we produce and putting what waste we do produce to positive use wherever possible.
Our total carbon emissions have reduced year on year, resulting in a 2% reduction per square foot.
In FY16, our greenhouse gas footprint reduced by 9%, principally due to a 7% reduction in selling space.We have reported on all the emission sources required under the Companies Act 2006 (Strategic Report and Directors’ Report) Regulations 2013. These sources fall within the activities for which we have operational control. The data has been prepared in accordance with the UK Government’s Environmental Reporting Guidance (2013).
For FY16: Scope 1 emissions = 89,232 tonnes (includes Buildings Gas CO2e and Transport CO2e)
Scope 2 emissions = 132,672 tonnes (includes Buildings Electricity CO2e)
There has been an 8% reduction in total energy consumption in buildings which has been driven primarily by the 7% reduction in selling space meaning that the energy intensity has remained broadly flat at 33kw/sq ft.
We are members of the Carbon Disclosure Project.
We continue to meet globally recognised standards in environmental, social and governance criteria.
FOR MORE INFORMATION ON OUR APPROACH TO CORPORATE RESPONSIBILITY VISIT:
homeretailgroup.com/cr/
Waste management
carbon emissions
greenhouse gas footprint
Building energy use
Recycle
k tonnes
Landfill
FY12 FY13 FY14 FY15 FY16
47.152.6
48.6 49.8 51.3
60
50
40
30
20
10
0
Scope 1 Scope 2
FY12 FY13 FY14 FY15 FY16
263 259245 244
222
k tonnes
300
250
200
100
150
50
0
kg/sq ft
FY12 FY13 FY14 FY15 FY16
18.2 18.0 18.217.518.5
20
15
10
5
0
FY12 FY13 FY14 FY15 FY16
34 35 3533 33
kWh/sq ft
40
30
20
10
0
GovernanceFinancial StatementS
additional inFormationStrategic report
Home Retail Groupannual report 2016 21
MSL_HRG_RA2016_FINAL_2005.indb 21 20/05/2016 17:59

We outline below the principal risks and uncertainties to achieving the Group’s strategic priorities together with the approach the Group takes to managing them. We have also included the principal transitional risks which arise following the disposal of Homebase and the risks associated with the proposed purchase of the Retained Group by J Sainsbury plc.For further information on how we manage risk, see page 34 and 35 within the corporate governance section for an overview of our risk management process.
riSKS and UncertaintieS riSK management aPPrOacH
Business strategyImpact on shareholder value•Inappropriate strategies•Poor investment decisions•Inadequate execution
Our strategic report on pages 5 and 6 details how Argos continues to progress towards retail digital leadership whilst maintaining its heritage and mass-market appeal by evolving the role of the traditional catalogue. Balancing the investment in Argos’ Transformation and delivering shareholder value is of paramount importance to the Board.
Strategic issues, including risks and opportunities, are discussed at every Board meeting. All material investments are evaluated and monitored at both the Group Executive Board and the Board.
Programme governance structures are in place, supported by an established project management environment, with selected projects reviewed by Internal Audit. Considerable time is dedicated to strategic review, with regular performance reviews of strategic KPIs at various executive meetings.
We strive to effectively communicate with key stakeholders such as investors, colleagues and suppliers.
Trading environmentImpact on sales, gross margins, costs, profit and cash of:•Economic and market conditions•Cost of products/services/utilities•Competitor activity•Seasonality and/or weather•UK-centric store network
The Argos business review (pages 12 to 15) summarises trading performance.
We operate in a highly competitive and diverse marketplace which demands both strategic and tactical risk management approaches. Commercial advantage is gained through breadth and depth of product ranges however this also attracts a broad set of competitors all with different dynamics.
The universal customer appeal strategy (pages 5 and 14) within Argos aims to broaden customer appeal. Furthermore, price tracking versus our competition and dynamic pricing aims to ensure that price competitiveness is maintained. This, coupled with a planning process which supports the business through new product launches, seasonal changes, extreme weather variations and a programme of promotional activity, seeks to reduce trading risk from increased competitive pressures.
Sales in Argos are supported by our in-house Financial Services business, providing the option to promote on price and/or credit.
Cash generation is a key management objective (see remuneration scheme metrics on pages 41 to 52) and we maintain good relationships with our banks and credit insurers.
We have a well-established operational improvement programme which constantly reviews and challenges the Group’s cost base to maintain our low-cost operating model.
Infrastructure/ development projectsImpact on costs and future capabilities•Delay or failure to manage and
implement major business and infrastructure projects effectively
•Reliance on third-party service providers
The Group’s strategy is outlined on pages 5 and 6. Our governance framework is instrumental in ensuring the delivery of all aspects of the strategic plan.
Detailed planning, including review of any pilot learnings occurs prior to any subsequent roll-out. The Group Executive Board and the Board receive regular progress updates on all major change programmes. Post completion, major investments are subject to a post-investment review at various levels within the management structure.
Argos is investing in the recruitment of digital engineers and specialists to deliver the transformation agenda. Our in-house colleagues work alongside leading technology partners to enhance innovation and build the knowledge infrastructure for a sustainable digital future in addition to managing the day-to-day IT operations.
Our colleaguesImpact on service quality, innovation and costs•Reliance on key personnel•Availability of specialist skills•Pension obligations
The Group values its colleagues and their contribution to the success of the organisation. Competitive remuneration packages, with oversight from the Remuneration Committee, in parallel with active succession planning, a strong focus on learning and development and both A-Level and Graduate recruitment programmes enable the Group to both attract and retain an engaged workforce.
We regularly review remuneration, benefits and employment policies to ensure we are able to retain and attract talented individuals.
In line with our strategy, colleagues continue to invest time in digital up-skilling which is also an enabler for workplace flexibility.
We are committed to open communications with colleagues at all times and monitor employee satisfaction through listening groups and employee forums.
A defined contribution pension scheme is accessible to all colleagues. We have a good relationship with the Trustees of the Group’s closed defined benefit pension scheme which helps to ensure that we manage the scheme’s obligations as efficiently as possible.
Principal risks and uncertainties
22 Home Retail GroupAnnual Report 2016
MSL_HRG_RA2016_FINAL_2005.indb 22 20/05/2016 17:59
riSKS and UncertaintieS riSK management aPPrOacH
Our customersImpact on sales, profit and growth potential•Failing to meet customers’ existing
and future expectations•Consumer preferences•Changing demographics and
behaviours
Understanding our customers is essential to the success of our strategy. We are investing to better understand our different customers so as to provide insight to enable us to improve our customer offering and Argos has introduced the Net Promoter Score (NPS) as a measure of customer satisfaction. This measure has been included in the FY17 broadband bonus scheme (see remuneration scheme metrics on page 45). We continuously engage with our customers, increasingly via social media, to gather feedback.The launch of Argos Fast Track Delivery and Fast Track Collection, plus the expansion of our eBay partnership demonstrate how we are responding to the increasing needs of customers by providing convenience options for greater choice in how they shop.The Group supports the Government’s ‘Go ON UK’ initiative, which aims to improve digital inclusion across society.
OperationsImpact on costs and proposition delivery of a failure to ensure appropriate processes are in place to manage the complexity of operations, including supply chain, multi-channel and customer service
Argos’ significant change agenda puts pressure on day-to-day operations. Retaining our core competencies for competitive advantage is being achieved through executive oversight and cross-functional working parties.Product availability remains a key priority. We mitigate complex supply chain risks through robust processes and new initiatives to enable product immediacy for customers on a wide range of products.As we continue to invest in our digital capabilities our focus is also on the supporting infrastructure to ensure a leading-edge, multi-channel proposition is maintained.
Sourcing, product quality and safetyImpact on customers, costs and reputation•Product failures•Purchase of products whose cost
base of manufacture is in currencies other than sterling, principally the US dollar
The Group has strong global sourcing capabilities and established buying operations in Asia and seeks further opportunities for sourcing efficiencies to control the cost of goods sold which thereby benefits customers.The Group takes seriously the safety and quality of its products. We have a robust risk-based approach to assurance and are members of Sedex, a global audit data platform. All of our own-brand direct-source factories are audited against our ethical standards using an accredited scheme. We build successful partnership across our supply chain so that when issues are identified we can work collaboratively to drive improvements in productivity and benefit customers.With over a third of products imported, the volatility of the global economy exposes the Group to both currency fluctuations, particularly the US dollar, and changes in freight costs. We hedge currency exposures and forward-buy freight commitments where possible.
Regulatory environmentImpact on costs and reputation• Changes to/breach of UK
and overseas legislation and regulation, eg consumer protection, environmental regulation
• Changes in UK fiscal/employment policy, eg National Living Wage
•Changes to/breach of FCA requirements
Good governance practices are important to the Group, demonstrated through membership of industry representation groups, including the British Retail Consortium and ongoing engagement with regulatory bodies such as the Financial Conduct Authority (FCA).We have specialists that ensure robust controls are in place to manage risks such as consumer law, health and safety, advertising standards, data protection and cyber security. We have also complied with the requirements of the National Living Wage legislation and we maintain compliance with other existing regulations and also monitor future developments through pro-active engagement with government and regulators.As a leading retailer, the Group encourages diversity and equality.Our financial services products are regulated by the FCA and through our retail credit accreditation the Group has made significant progress during the year in developing the robust mechanisms which are in place to manage all risks, including the approval of new products and its conduct towards customers, ensuring fair customer outcomes.
Business interruptionImpact on sales, costs and reputation•Cyber-attack/terrorism/acts of nature•Failure or unavailability of operational
and/or IT infrastructure, eg website•Delay or interruption in products or
services provided by third-party suppliers
A major incident could impact the ability of the Group to continue trading. We manage this risk by maintaining and testing our business continuity plans regularly, investing in incident management training and establishing remote IT disaster recovery capabilities. The Argos website is a critical asset which is continuously monitored to maintain availability supported by incident management.Cyber security is of paramount importance to Argos given the volume of customer data that is handled on a daily basis. Specialist teams identify threats and potential vulnerabilities and deploy a variety of controls on a continuous and risk-based approach to mitigate the risks.The Group has robust contractual arrangements and comprehensive supplier management, particularly for key service partners. We actively monitor the supply base to identify exposures and identify suitable contingency solutions, working towards a sustainable outcome for all parties when issues arise.
Transactional risks arising from the disposal of Homebase•Complex separation•Smaller and less diverse Retained
Group•Increased costs
The process of separating Homebase from the Group is complex, involving the separation of significant business systems and operations. We entered into a Transitional Services Agreement which identifies how services will be provided during the transition period.The disposal of Homebase necessitates a significant cost reduction programme for the Retained Group. There is a risk that this cost reduction program takes longer than anticipated, which would have an adverse impact on profit. We have already commenced this exercise and have a detailed plan to achieve the required savings in an appropriate period of time.The reduction in size and diversification of the Group may increase the challenge of attracting and retaining talented colleagues.The purchasing power of the Group may be reduced going forward. Although we have robust commercial relationships which we will leverage, the disposal of Homebase could prompt suppliers to seek to renegotiate supply arrangements.Our exposure to seasonality risk has increased with the disposal of Homebase. Argos sales are highest in the Christmas trading period, whilst Homebase was typically strongest in the summer trading period as a result of external DIY and garden categories. The Group will no longer fully benefit from this seasonal diversification.
Risks arising from the proposed purchase of the Retained Group by J Sainsbury plc •Complex transaction•Increased costs
The proposed purchase of the Retained Group by J Sainsbury plc will be complex and will create uncertainty which could increase the challenge of attracting and retaining talented colleagues, lead to an increase in costs, increase the difficulty of providing services to customers or disrupt relationships with suppliers. There could also be a risk of lower levels of focus on delivering the Group’s strategy in the period up to the possible transaction.
GovernanceFinancial StatementS
additional inFormationStrategic report
Home Retail Groupannual report 2016 23
MSL_HRG_RA2016_FINAL_2005.indb 23 20/05/2016 17:59
£m52 WeeKS tO
27 FeBrUarY 201652 WeeKS tO
28 FeBrUarY 2015
Argos 4,095.3 4,096.0
Homebase 1,433.1 1,479.3
Financial Services 139.4 135.1
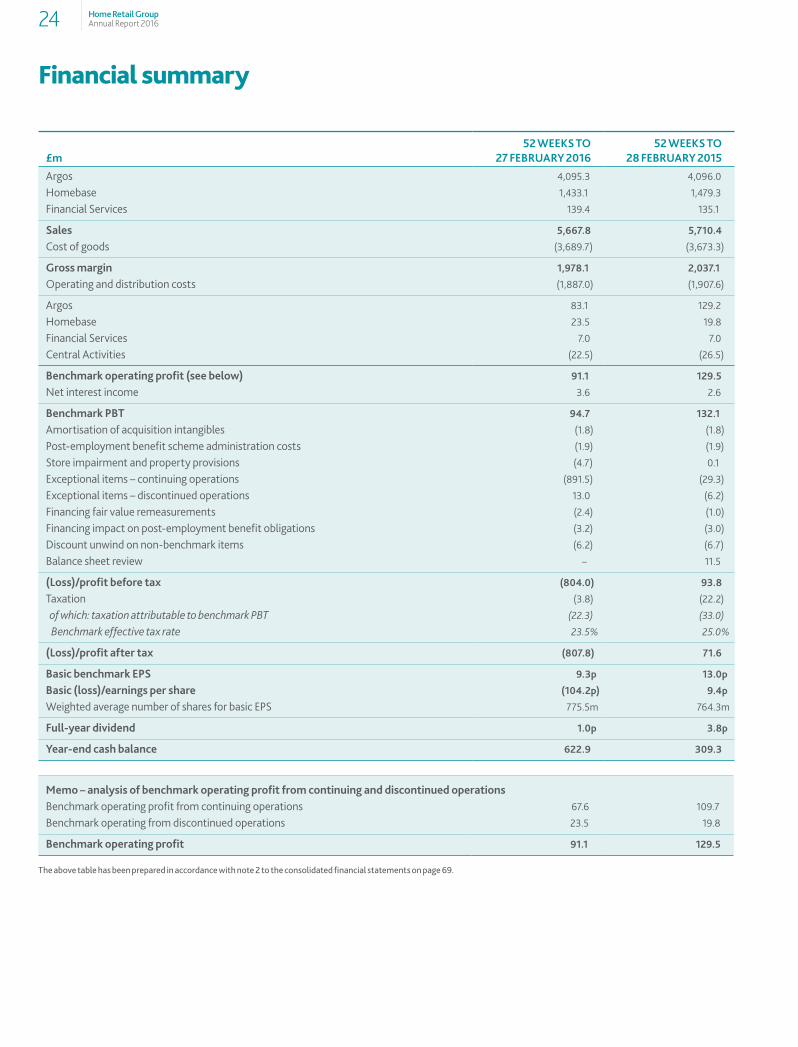
Sales 5,667.8 5,710.4
Cost of goods (3,689.7) (3,673.3)
gross margin 1,978.1 2,037.1
Operating and distribution costs (1,887.0) (1,907.6)
Argos 83.1 129.2
Homebase 23.5 19.8
Financial Services 7.0 7.0
Central Activities (22.5) (26.5)
Benchmark operating profit (see below) 91.1 129.5
Net interest income 3.6 2.6
Benchmark PBt 94.7 132.1
Amortisation of acquisition intangibles (1.8) (1.8)
Post-employment benefit scheme administration costs (1.9) (1.9)
Store impairment and property provisions (4.7) 0.1
Exceptional items – continuing operations (891.5) (29.3)
Exceptional items – discontinued operations 13.0 (6.2)
Financing fair value remeasurements (2.4) (1.0)
Financing impact on post-employment benefit obligations (3.2) (3.0)
Discount unwind on non-benchmark items (6.2) (6.7)
Balance sheet review – 11.5
(loss)/profit before tax (804.0) 93.8
Taxation (3.8) (22.2)
of which: taxation attributable to benchmark PBT (22.3) (33.0)
Benchmark effective tax rate 23.5% 25.0%
(loss)/profit after tax (807.8) 71.6
Basic benchmark ePS 9.3p 13.0p
Basic (loss)/earnings per share (104.2p) 9.4p
Weighted average number of shares for basic EPS 775.5m 764.3m
Full-year dividend 1.0p 3.8p
Year-end cash balance 622.9 309.3
memo – analysis of benchmark operating profit from continuing and discontinued operationsBenchmark operating profit from continuing operations 67.6 109.7
Benchmark operating from discontinued operations 23.5 19.8
Benchmark operating profit 91.1 129.5
The above table has been prepared in accordance with note 2 to the consolidated financial statements on page 69.
Financial summary
Home Retail GroupAnnual Report 201624
MSL_HRG_RA2016_FINAL_2005.indb 24 20/05/2016 17:59
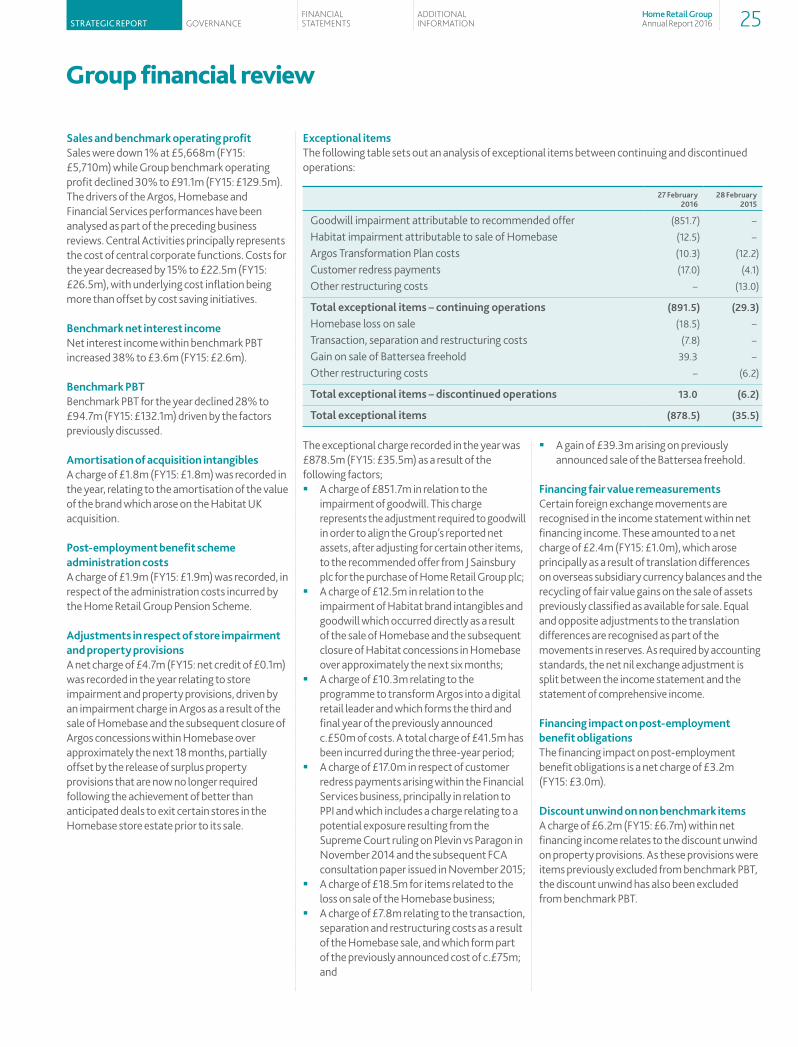
Group financial review
Sales and benchmark operating profitSales were down 1% at £5,668m (FY15: £5,710m) while Group benchmark operating profit declined 30% to £91.1m (FY15: £129.5m). The drivers of the Argos, Homebase and Financial Services performances have been analysed as part of the preceding business reviews. Central Activities principally represents the cost of central corporate functions. Costs for the year decreased by 15% to £22.5m (FY15: £26.5m), with underlying cost inflation being more than offset by cost saving initiatives.
Benchmark net interest incomeNet interest income within benchmark PBT increased 38% to £3.6m (FY15: £2.6m).
Benchmark PBtBenchmark PBT for the year declined 28% to £94.7m (FY15: £132.1m) driven by the factors previously discussed.
amortisation of acquisition intangiblesA charge of £1.8m (FY15: £1.8m) was recorded in the year, relating to the amortisation of the value of the brand which arose on the Habitat UK acquisition.
Post-employment benefit scheme administration costsA charge of £1.9m (FY15: £1.9m) was recorded, in respect of the administration costs incurred by the Home Retail Group Pension Scheme.
adjustments in respect of store impairment and property provisionsA net charge of £4.7m (FY15: net credit of £0.1m) was recorded in the year relating to store impairment and property provisions, driven by an impairment charge in Argos as a result of the sale of Homebase and the subsequent closure of Argos concessions within Homebase over approximately the next 18 months, partially offset by the release of surplus property provisions that are now no longer required following the achievement of better than anticipated deals to exit certain stores in the Homebase store estate prior to its sale.
exceptional itemsThe following table sets out an analysis of exceptional items between continuing and discontinued operations:
27 February2016
28 February2015
Goodwill impairment attributable to recommended offer (851.7) –
Habitat impairment attributable to sale of Homebase (12.5) –
Argos Transformation Plan costs (10.3) (12.2)
Customer redress payments (17.0) (4.1)
Other restructuring costs – (13.0)
total exceptional items – continuing operations (891.5) (29.3)
Homebase loss on sale (18.5) –
Transaction, separation and restructuring costs (7.8) –
Gain on sale of Battersea freehold 39.3 –
Other restructuring costs – (6.2)
total exceptional items – discontinued operations 13.0 (6.2)
total exceptional items (878.5) (35.5)
The exceptional charge recorded in the year was £878.5m (FY15: £35.5m) as a result of the following factors; � A charge of £851.7m in relation to the
impairment of goodwill. This charge represents the adjustment required to goodwill in order to align the Group’s reported net assets, after adjusting for certain other items, to the recommended offer from J Sainsbury plc for the purchase of Home Retail Group plc;
� A charge of £12.5m in relation to the impairment of Habitat brand intangibles and goodwill which occurred directly as a result of the sale of Homebase and the subsequent closure of Habitat concessions in Homebase over approximately the next six months;
� A charge of £10.3m relating to the programme to transform Argos into a digital retail leader and which forms the third and final year of the previously announced c.£50m of costs. A total charge of £41.5m has been incurred during the three-year period;
� A charge of £17.0m in respect of customer redress payments arising within the Financial Services business, principally in relation to PPI and which includes a charge relating to a potential exposure resulting from the Supreme Court ruling on Plevin vs Paragon in November 2014 and the subsequent FCA consultation paper issued in November 2015;
� A charge of £18.5m for items related to the loss on sale of the Homebase business;
� A charge of £7.8m relating to the transaction, separation and restructuring costs as a result of the Homebase sale, and which form part of the previously announced cost of c.£75m; and
� A gain of £39.3m arising on previously announced sale of the Battersea freehold.
Financing fair value remeasurementsCertain foreign exchange movements are recognised in the income statement within net financing income. These amounted to a net charge of £2.4m (FY15: £1.0m), which arose principally as a result of translation differences on overseas subsidiary currency balances and the recycling of fair value gains on the sale of assets previously classified as available for sale. Equal and opposite adjustments to the translation differences are recognised as part of the movements in reserves. As required by accounting standards, the net nil exchange adjustment is split between the income statement and the statement of comprehensive income.
Financing impact on post-employment benefit obligationsThe financing impact on post-employment benefit obligations is a net charge of £3.2m (FY15: £3.0m).
discount unwind on non benchmark itemsA charge of £6.2m (FY15: £6.7m) within net financing income relates to the discount unwind on property provisions. As these provisions were items previously excluded from benchmark PBT, the discount unwind has also been excluded from benchmark PBT.
GovernanceFinancial StatementS
additional inFormationStrategic report
Home Retail Groupannual report 2016 25
MSL_HRG_RA2016_FINAL_2005.indb 25 20/05/2016 17:59

net interest reconciliationThe following table illustrates both the benchmark and non-benchmark impact of net financing items within the income statement.
52 weeks to£m
27 February2016
28 February2015
net interest income within benchmark PBt 3.6 2.6
Financing fair value remeasurements (2.4) (1.0)
Financing impact on post-employment benefit obligations (3.2) (3.0)
Discount unwind on non-benchmark items (6.2) (6.7)
income statement net financing charge (8.2) (8.1)
(loss)/profit before taxThe loss before tax for the year was £804.0m (FY15: profit before tax of £93.8m).
taxationTaxation attributable to benchmark PBT was £22.3m (FY15: £33.0m), representing an effective tax rate of 23.5% (FY15: 25.0%). The lower effective tax rate principally reflects two elements: a 1% reduction in the UK corporation tax rate together with a small reduction in the level of disallowable expenditure for tax purposes. Taxation attributable to non-benchmark items amounted to a credit of £18.5m (FY15: £10.8m). The total tax expense for the year was therefore £3.8m (FY15: £22.2m).
number of shares and (loss)/earnings per shareThe number of shares for the purpose of calculating basic EPS was 775.5m (FY15: 764.3m), representing the weighted average number of issued ordinary shares of 813.4m (FY15: 813.4m), less an adjustment of 37.9m (FY15: 49.1m) representing shares held in Group share trusts net of vested but unexercised share awards. The calculation of diluted EPS reflects the potential dilutive effect of employee share incentive schemes. This increases the number of shares for diluted EPS purposes by 25.0m (FY15: 36.0m) to 800.5m (FY15: 800.3m). Basic benchmark EPS is 9.3p (FY15: 13.0p), with diluted benchmark EPS of 9.0p (FY15: 12.4p). Reported basic loss per share is (104.2p) (FY15: earnings per share 9.4p), with reported diluted loss per share (104.2p) (FY15: earnings per share 8.9p).
Group financial review continued
Home Retail GroupAnnual Report 201626
MSL_HRG_RA2016_FINAL_2005.indb 26 20/05/2016 17:59
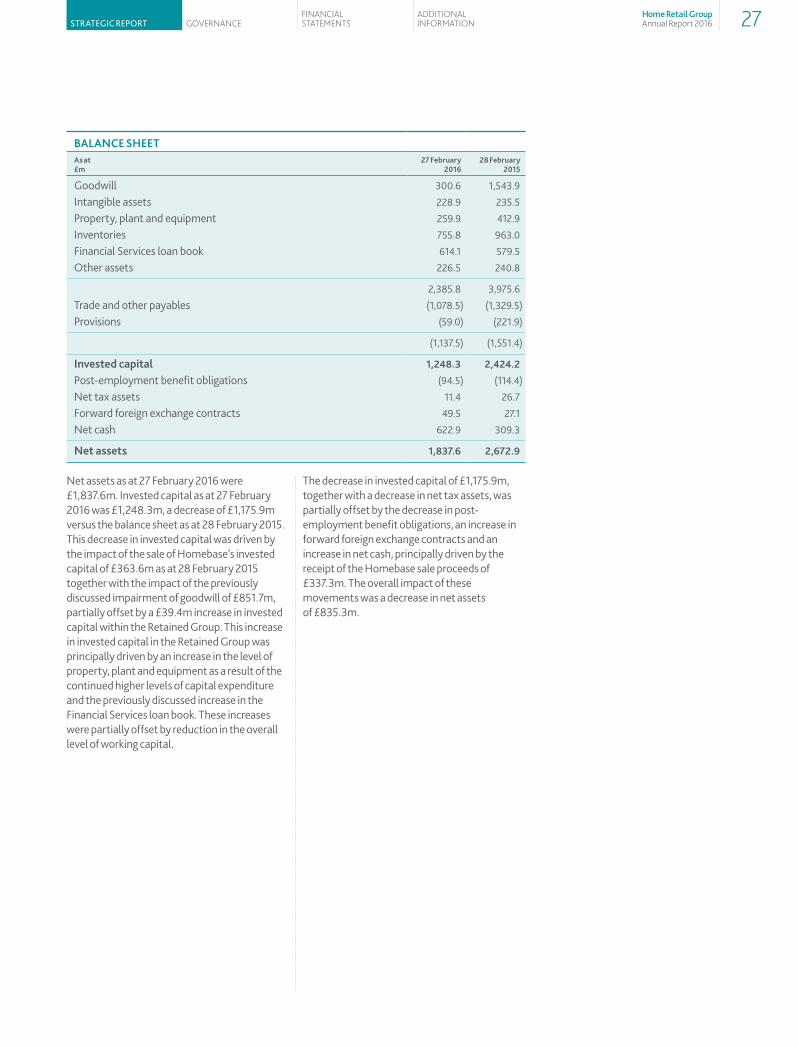
Balance SHeetas at£m
27 February2016
28 February2015
Goodwill 300.6 1,543.9
Intangible assets 228.9 235.5
Property, plant and equipment 259.9 412.9
Inventories 755.8 963.0
Financial Services loan book 614.1 579.5
Other assets 226.5 240.8
2,385.8 3,975.6
Trade and other payables (1,078.5) (1,329.5)
Provisions (59.0) (221.9)
(1,137.5) (1,551.4)
invested capital 1,248.3 2,424.2
Post-employment benefit obligations (94.5) (114.4)
Net tax assets 11.4 26.7
Forward foreign exchange contracts 49.5 27.1
Net cash 622.9 309.3
net assets 1,837.6 2,672.9
Net assets as at 27 February 2016 were £1,837.6m. Invested capital as at 27 February 2016 was £1,248.3m, a decrease of £1,175.9m versus the balance sheet as at 28 February 2015. This decrease in invested capital was driven by the impact of the sale of Homebase’s invested capital of £363.6m as at 28 February 2015 together with the impact of the previously discussed impairment of goodwill of £851.7m, partially offset by a £39.4m increase in invested capital within the Retained Group. This increase in invested capital in the Retained Group was principally driven by an increase in the level of property, plant and equipment as a result of the continued higher levels of capital expenditure and the previously discussed increase in the Financial Services loan book. These increases were partially offset by reduction in the overall level of working capital.
The decrease in invested capital of £1,175.9m, together with a decrease in net tax assets, was partially offset by the decrease in post-employment benefit obligations, an increase in forward foreign exchange contracts and an increase in net cash, principally driven by the receipt of the Homebase sale proceeds of £337.3m. The overall impact of these movements was a decrease in net assets of £835.3m.
GovernanceFinancial StatementS
additional inFormationStrategic report
Home Retail Groupannual report 2016 27
MSL_HRG_RA2016_FINAL_2005.indb 27 20/05/2016 17:59

Group financial review continued
caSH FlOW and net caSH POSitiOn52 weeks to£m
27 February2016
28 February2015
Benchmark operating profit 91.1 129.5
Exceptional items (878.5) (35.5)
Post-employment benefit scheme administration costs (1.9) (1.9)
Amortisation of acquisition intangibles (1.8) (1.8)
Adjustments in respect of store impairment and property provisions (4.7) 0.1
Balance Sheet review – 11.5
Total operating (loss)/profit (795.8) 101.9
Depreciation and amortisation 140.6 136.0
Movement in trade working capital 52.9 36.6
Movement in Financial Services loan book (34.6) (55.4)
Cash impact of restructuring charges (25.8) (22.8)
Cash impact of customer redress payments (34.5) (8.8)
Pension scheme deficit recovery payment (22.0) (22.0)
Pension scheme payment in respect of Homebase sale (26.0) –
Financing costs charged to Financial Services 4.1 3.9
Movement in post-employment benefit obligations 1.2 1.2
Disposal of Homebase leasehold properties (13.2) (9.0)
Homebase loss on sale 18.5 –
Profit on sale of Battersea freehold (39.3) –
Goodwill impairment attributable to recommended offer 851.7 –
Habitat impairment attributable to sale of Homebase 12.5 –
Other operating items 31.1 41.2
cash flows from operating activities 121.4 202.8
Net capital expenditure (168.5) (167.8)
Proceeds from sale of Battersea freehold 27.7 30.0
Taxation 13.1 (12.1)
Net interest (2.3) 0.7
Cash proceeds from sale of Homebase 337.3 –
cash inflow before financing activities 328.7 53.6
Dividends paid (29.0) (25.3)
Sale/(purchase) of own shares for Employee Share Trust 13.3 (48.5)
increase/(decrease) in cash and cash equivalents 313.0 (20.2)
Effect of foreign exchange rate changes 0.6 (1.5)
increase/(decrease) in financing net cash 313.6 (21.7)
Opening financing net cash 309.3 331.0
closing financing net cash 622.9 309.3
Cash flows from operating activities were £121.4m (FY15: £202.8m). This £81.4m decrease was principally attributable to the lower level of benchmark operating profit, together with the impact of an additional pension scheme payment agreed with the Trustee as a result of the sale of Homebase and a higher level of customer redress payments principally in respect of PPI, partially offset by a decrease in the cash outflow in respect of the Financial Services loan book and an increase in the cash inflow from trade working capital.
Net capital expenditure was £168.5m (FY15: £167.8m), representing the continued higher level of investment in strategic initiatives across the Group. Proceeds from the sale of the Battersea freehold were £27.7m (FY15: £30.0m), representing the final payment received in respect of the sale of the freehold relating to Homebase’s Battersea store for a total consideration of £57.7m. Taxation was a net cash inflow of £13.1m (FY15 outflow: £12.1m)representing a normal cash tax payment level which was more than offset by the receipt of £27m in respect of historical outstanding tax items for which the Group had previously paid in full and which have recently been agreed and settled by HMRC.
The Group received £337.3m (FY15: £nil) in respect of the sale of the Homebase business, which represents the proceeds of £340m less a timing adjustment for the Homebase closing net cash position which occurred due to the transaction completing on Saturday 27 February 2016. The balance of the total sale proceeds has been received in FY17.
Dividends paid to Shareholders amounted to £29.0m (FY15: £25.3m). Cash of £13.3m was received, principally in respect of the exercise of a Save As You Earn scheme, available to all employees. (FY15 outflow: £48.5m).
The Group’s financing net cash position at 27 February 2016 was £622.9m, an increase of £313.6m over the year. The underlying financing net cash position, excluding the impact of the Homebase transaction was broadly flat year-on-year.
Home Retail GroupAnnual Report 201628
MSL_HRG_RA2016_FINAL_2005.indb 28 20/05/2016 17:59
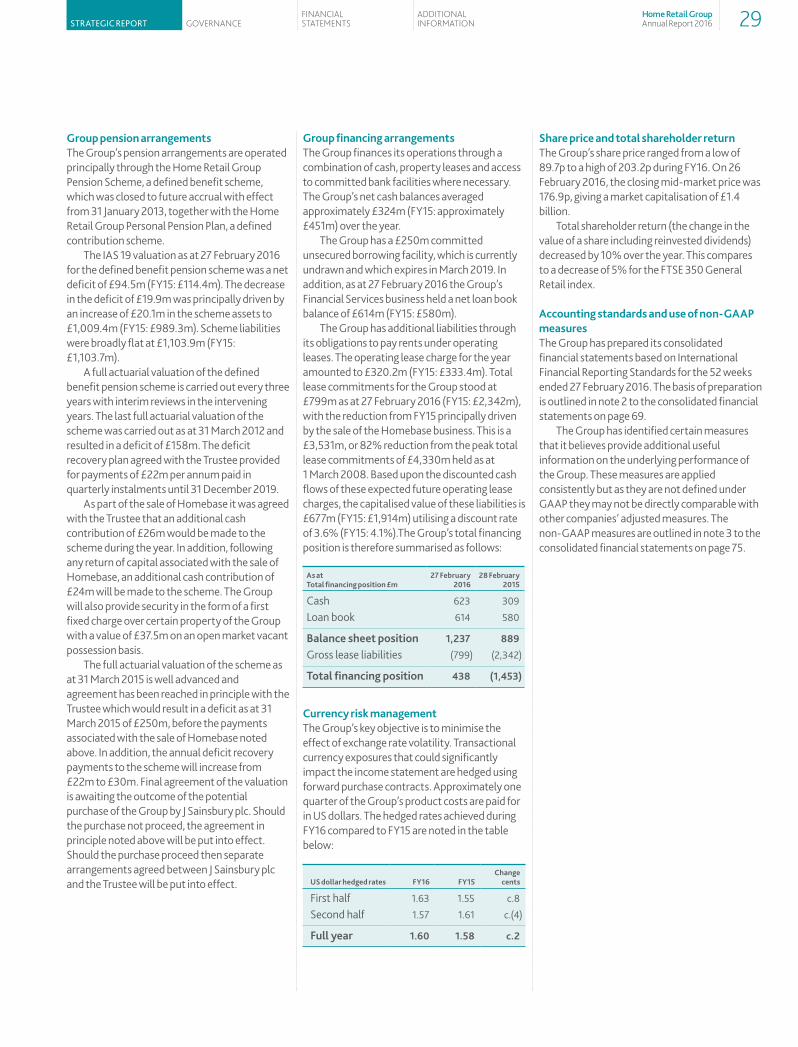
group pension arrangementsThe Group’s pension arrangements are operated principally through the Home Retail Group Pension Scheme, a defined benefit scheme, which was closed to future accrual with effect from 31 January 2013, together with the Home Retail Group Personal Pension Plan, a defined contribution scheme.
The IAS 19 valuation as at 27 February 2016 for the defined benefit pension scheme was a net deficit of £94.5m (FY15: £114.4m). The decrease in the deficit of £19.9m was principally driven by an increase of £20.1m in the scheme assets to £1,009.4m (FY15: £989.3m). Scheme liabilities were broadly flat at £1,103.9m (FY15: £1,103.7m).
A full actuarial valuation of the defined benefit pension scheme is carried out every three years with interim reviews in the intervening years. The last full actuarial valuation of the scheme was carried out as at 31 March 2012 and resulted in a deficit of £158m. The deficit recovery plan agreed with the Trustee provided for payments of £22m per annum paid in quarterly instalments until 31 December 2019.
As part of the sale of Homebase it was agreed with the Trustee that an additional cash contribution of £26m would be made to the scheme during the year. In addition, following any return of capital associated with the sale of Homebase, an additional cash contribution of £24m will be made to the scheme. The Group will also provide security in the form of a first fixed charge over certain property of the Group with a value of £37.5m on an open market vacant possession basis.
The full actuarial valuation of the scheme as at 31 March 2015 is well advanced and agreement has been reached in principle with the Trustee which would result in a deficit as at 31 March 2015 of £250m, before the payments associated with the sale of Homebase noted above. In addition, the annual deficit recovery payments to the scheme will increase from £22m to £30m. Final agreement of the valuation is awaiting the outcome of the potential purchase of the Group by J Sainsbury plc. Should the purchase not proceed, the agreement in principle noted above will be put into effect. Should the purchase proceed then separate arrangements agreed between J Sainsbury plc and the Trustee will be put into effect.
group financing arrangementsThe Group finances its operations through a combination of cash, property leases and access to committed bank facilities where necessary. The Group’s net cash balances averaged approximately £324m (FY15: approximately £451m) over the year.
The Group has a £250m committed unsecured borrowing facility, which is currently undrawn and which expires in March 2019. In addition, as at 27 February 2016 the Group’s Financial Services business held a net loan book balance of £614m (FY15: £580m).
The Group has additional liabilities through its obligations to pay rents under operating leases. The operating lease charge for the year amounted to £320.2m (FY15: £333.4m). Total lease commitments for the Group stood at £799m as at 27 February 2016 (FY15: £2,342m), with the reduction from FY15 principally driven by the sale of the Homebase business. This is a £3,531m, or 82% reduction from the peak total lease commitments of £4,330m held as at 1 March 2008. Based upon the discounted cash flows of these expected future operating lease charges, the capitalised value of these liabilities is £677m (FY15: £1,914m) utilising a discount rate of 3.6% (FY15: 4.1%).The Group’s total financing position is therefore summarised as follows:
as at total financing position £m
27 February2016
28 February2015
Cash 623 309
Loan book 614 580
Balance sheet position 1,237 889
Gross lease liabilities (799) (2,342)
total financing position 438 (1,453)
currency risk managementThe Group’s key objective is to minimise the effect of exchange rate volatility. Transactional currency exposures that could significantly impact the income statement are hedged using forward purchase contracts. Approximately one quarter of the Group’s product costs are paid for in US dollars. The hedged rates achieved during FY16 compared to FY15 are noted in the table below:
US dollar hedged rates FY16 FY15change
cents
First half 1.63 1.55 c.8
Second half 1.57 1.61 c.(4)
Full year 1.60 1.58 c.2
Share price and total shareholder returnThe Group’s share price ranged from a low of 89.7p to a high of 203.2p during FY16. On 26 February 2016, the closing mid-market price was 176.9p, giving a market capitalisation of £1.4 billion.
Total shareholder return (the change in the value of a share including reinvested dividends) decreased by 10% over the year. This compares to a decrease of 5% for the FTSE 350 General Retail index.
accounting standards and use of non-gaaP measuresThe Group has prepared its consolidated financial statements based on International Financial Reporting Standards for the 52 weeks ended 27 February 2016. The basis of preparation is outlined in note 2 to the consolidated financial statements on page 69.
The Group has identified certain measures that it believes provide additional useful information on the underlying performance of the Group. These measures are applied consistently but as they are not defined under GAAP they may not be directly comparable with other companies’ adjusted measures. The non-GAAP measures are outlined in note 3 to the consolidated financial statements on page 75.
GovernanceFinancial StatementS
additional inFormationStrategic report
Home Retail Groupannual report 2016 29
MSL_HRG_RA2016_FINAL_2005.indb 29 20/05/2016 17:59
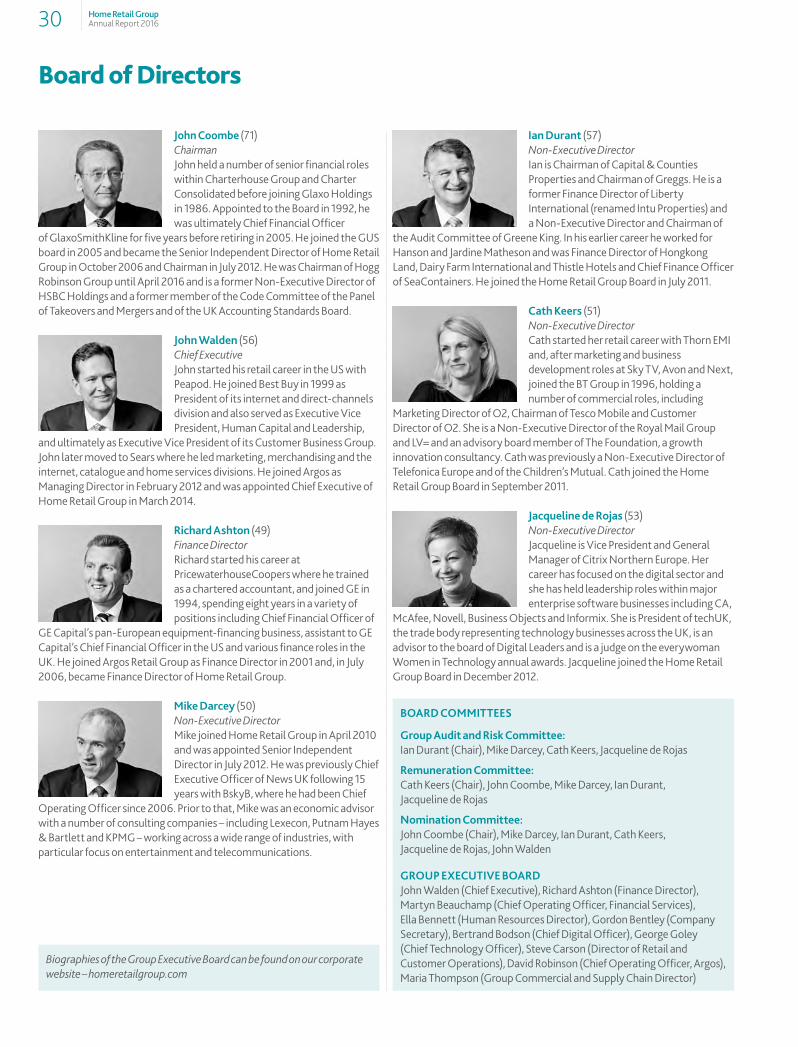
John coombe (71) Chairman John held a number of senior financial roles within Charterhouse Group and Charter Consolidated before joining Glaxo Holdings in 1986. Appointed to the Board in 1992, he was ultimately Chief Financial Officer
of GlaxoSmithKline for five years before retiring in 2005. He joined the GUS board in 2005 and became the Senior Independent Director of Home Retail Group in October 2006 and Chairman in July 2012. He was Chairman of Hogg Robinson Group until April 2016 and is a former Non-Executive Director of HSBC Holdings and a former member of the Code Committee of the Panel of Takeovers and Mergers and of the UK Accounting Standards Board.
John Walden (56) Chief Executive John started his retail career in the US with Peapod. He joined Best Buy in 1999 as President of its internet and direct-channels division and also served as Executive Vice President, Human Capital and Leadership,
and ultimately as Executive Vice President of its Customer Business Group. John later moved to Sears where he led marketing, merchandising and the internet, catalogue and home services divisions. He joined Argos as Managing Director in February 2012 and was appointed Chief Executive of Home Retail Group in March 2014.
richard ashton (49) Finance Director Richard started his career at PricewaterhouseCoopers where he trained as a chartered accountant, and joined GE in 1994, spending eight years in a variety of positions including Chief Financial Officer of
GE Capital’s pan-European equipment-financing business, assistant to GE Capital’s Chief Financial Officer in the US and various finance roles in the UK. He joined Argos Retail Group as Finance Director in 2001 and, in July 2006, became Finance Director of Home Retail Group.
mike darcey (50) Non-Executive Director Mike joined Home Retail Group in April 2010 and was appointed Senior Independent Director in July 2012. He was previously Chief Executive Officer of News UK following 15 years with BskyB, where he had been Chief
Operating Officer since 2006. Prior to that, Mike was an economic advisor with a number of consulting companies – including Lexecon, Putnam Hayes & Bartlett and KPMG – working across a wide range of industries, with particular focus on entertainment and telecommunications.
ian durant (57) Non-Executive Director Ian is Chairman of Capital & Counties Properties and Chairman of Greggs. He is a former Finance Director of Liberty International (renamed Intu Properties) and a Non-Executive Director and Chairman of
the Audit Committee of Greene King. In his earlier career he worked for Hanson and Jardine Matheson and was Finance Director of Hongkong Land, Dairy Farm International and Thistle Hotels and Chief Finance Officer of SeaContainers. He joined the Home Retail Group Board in July 2011.
cath Keers (51) Non-Executive Director Cath started her retail career with Thorn EMI and, after marketing and business development roles at Sky TV, Avon and Next, joined the BT Group in 1996, holding a number of commercial roles, including
Marketing Director of O2, Chairman of Tesco Mobile and Customer Director of O2. She is a Non-Executive Director of the Royal Mail Group and LV= and an advisory board member of The Foundation, a growth innovation consultancy. Cath was previously a Non-Executive Director of Telefonica Europe and of the Children’s Mutual. Cath joined the Home Retail Group Board in September 2011.
Jacqueline de rojas (53) Non-Executive Director Jacqueline is Vice President and General Manager of Citrix Northern Europe. Her career has focused on the digital sector and she has held leadership roles within major enterprise software businesses including CA,
McAfee, Novell, Business Objects and Informix. She is President of techUK, the trade body representing technology businesses across the UK, is an advisor to the board of Digital Leaders and is a judge on the everywoman Women in Technology annual awards. Jacqueline joined the Home Retail Group Board in December 2012.
Board of Directors
Biographies of the Group Executive Board can be found on our corporate website – homeretailgroup.com
BOard cOmmitteeS
group audit and risk committee:Ian Durant (Chair), Mike Darcey, Cath Keers, Jacqueline de Rojas
remuneration committee:Cath Keers (Chair), John Coombe, Mike Darcey, Ian Durant, Jacqueline de Rojas
nomination committee:John Coombe (Chair), Mike Darcey, Ian Durant, Cath Keers, Jacqueline de Rojas, John Walden
grOUP eXecUtive BOardJohn Walden (Chief Executive), Richard Ashton (Finance Director), Martyn Beauchamp (Chief Operating Officer, Financial Services), Ella Bennett (Human Resources Director), Gordon Bentley (Company Secretary), Bertrand Bodson (Chief Digital Officer), George Goley (Chief Technology Officer), Steve Carson (Director of Retail and Customer Operations), David Robinson (Chief Operating Officer, Argos), Maria Thompson (Group Commercial and Supply Chain Director)
30 Home Retail GroupAnnual Report 2016
MSL_HRG_RA2016_FINAL_2005.indb 30 20/05/2016 17:59
Corporate governance
chairman’s introduction
The Board is collectively responsible for the governance and long-term success of the Group. In this corporate governance section my aim is to provide insight into how the Board fulfils its responsibilities.
This has been an unusual year for the Group, highlighting not only the role of the Board in approving the Group’s strategic plans, monitoring performance and managing risk, but also its stewardship responsibilities during a period of unprecedented corporate activity. These activities emphasise the importance of the Board and its committees having the right balance of skills, experience, independence and knowledge of the Group to enable them to discharge their respective duties. However, there are two further elements that are also essential for effective governance. First, individual board members must be prepared to devote the time required of their roles to keep pace with developments affecting the business, to understand how the business is performing against its strategic objectives and to assess how risk is being managed. As may be expected during a period of intense corporate activity, there was a significant increase in the number of Board meetings convened in the past year which were all well attended. This time commitment was not only reflected in participation in board and committee meetings but also in the range of informal individual meetings and workshops that took place with members of senior management and their teams outside the boardroom including the induction of new Group Executive Board members appointed during the year. Secondly, the Board must foster a culture of openness, challenge and debate with senior management supported by constructive relations between executive and non-executive directors. I am grateful to my Board colleagues and senior management for their contribution and commitment to this culture.
This year we report against the 2014 UK Corporate Governance Code (the ‘Code’), taking into account the FRC’s Guidance on Risk Management, Internal Control and Related Financial and Business Reporting. I support the view, as set out in the FRC Guidance, that risk management and internal control should be incorporated within normal management and governance processes and not treated as a separate compliance exercise. During the year a key initiative for the Board was the design and implementation of a revised risk management system for Financial Services which reflects that principle. Such experience is helping to inform our ongoing monitoring and enhancement of our risk management and internal control systems.
In line with the Code requirements, for the first time, we have included a ‘viability statement’ in the Directors’ Report. In the unusual circumstances of the proximity in time of the Homebase sale and the proposed takeover of the Group by J Sainsbury plc and in the light of the significant and detailed work on working capital carried out as part of the Homebase sale, the Board concluded that, for this year’s report, it was appropriate that the assessment of the prospects of the Group should be for a period of two years.
John coombe Chairman
For the period under review, Home Retail Group plc has complied fully with the main and supporting principles set out in the Code.
This statement, together with the Directors’ Report and the Directors’ Remuneration Report, provide a summary of the Group’s procedures for applying the principles of the Code and the extent to which such principles have been applied.
the role and effectiveness of the BoardThe Board is responsible for the long-term success of the Group by creating and delivering sustainable shareholder value. The Board seeks to achieve this through approving the Group’s strategic aims, monitoring performance against strategic objectives and providing oversight of the implementation of plans by management. By monitoring its strategy and management of risk, the Board considers the impact of decisions on wider stakeholders, including employees, the pension scheme trustee, suppliers and the environment.
The Board consists of the Chairman, John Coombe; Chief Executive, John Walden; Finance Director, Richard Ashton; and four non-executive directors: Mike Darcey (the Senior Independent Director), Ian Durant, Cath Keers and Jacqueline de Rojas.
In order for any board to discharge its duties and responsibilities effectively, it must comprise the right balance of skills, experience and knowledge ideally gained in a diverse range of backgrounds. In addition, directors must exhibit independence of mind, integrity and the courage to challenge constructively when appropriate. � John Coombe, appointed to the Board in 2006 and as Chairman in
2012, has an in-depth understanding of the Group and its businesses and exceptional experience at both board level of listed companies in a range of industries and as a former member of the UK Accounting Standards Board.
� Mike Darcey, appointed in 2010, has worked across many industries, including telecommunications and entertainment, and has wide-ranging experience of media and digital technology.
� Ian Durant, appointed in 2011, has strong financial and accounting experience combined with extensive knowledge of the retail sector and property investment and development.
� Cath Keers, appointed in 2011, has significant marketing and business development experience, with particular emphasis on mobile applications and e-commerce.
� Jacqueline de Rojas, appointed in 2012, has worked extensively in the digital sector and has wide-ranging experience in software technology businesses.
The non-executive directors are determined by the Board to be independent and there are no relationships or circumstances which could affect, or appear to affect, a non-executive director’s judgement. The Group has in place formal procedures regarding conflicts of interest, which are reviewed on an annual basis.
GovernanceFinancial StatementS
additional inFormationStrategic report 31Home Retail Group
Annual Report 2016
MSL_HRG_RA2016_FINAL_2005.indb 31 20/05/2016 17:59

Corporate governance continued
There is a clear division of responsibilities between the Chairman and the Chief Executive.
The Chairman’s responsibilities include: � providing leadership for and ensuring the effective operation of the
Board in conformity with the highest standards of corporate governance;
� supporting the Chief Executive in the development of strategy; � promoting and facilitating effective relationships and communications
between non-executive and executive directors and members of senior management;
� ensuring effective communication with the Group’s stakeholders, including shareholders; and
� chairing the Nomination Committee and building an effective and complementary Board, initiating change and planning succession for both Board and senior management appointments.
The Chief Executive’s responsibilities include: � developing the strategy of the Group in conjunction with the Chairman
and the Board and being responsible to the Board for the performance of the business, consistent with agreed plans, strategies and policies;
� developing and maintaining an effective framework of internal controls over risk in relation to all business activities;
� leading the Group Executive Board and senior management team in the day-to-day running of the business;
� ensuring that robust management succession and management development plans are in place; and
� ensuring that financial results, business strategies and, where appropriate, targets and milestones are communicated to the investment community.
In fulfilling his responsibilities, the Chief Executive is supported by the members of the Group Executive Board.
The Board has a programme of scheduled meetings and telephone conferences each year and meets more frequently as required. During the period under review, the Chairman met with the non-executive directors without the executive directors present and arrangements are in place for regular informal meetings with the non-executive directors. The Board met informally the evening before most scheduled Board meetings and members of the Group Executive Board were invited to join these discussions on a regular basis and to provide updates on their areas of responsibility.
A number of informal meetings took place during the year to provide non-executive directors with the opportunity to provide input on the development of strategy and to monitor progress on strategic initiatives. In addition, the Board held a full-day meeting to discuss strategy, including sessions with management teams on plans for the next phase of the Argos Transformation.
Arrangements to ensure that the non-executive directors are fully informed about the business are kept under review. Upon appointment, non-executive directors undertake a full induction programme, meeting the management team and visiting stores, distribution centres and contact centres across the United Kingdom. Board members continue to spend time seeing the business in operation, hearing the views of colleagues from across the business, attending management conferences and monitoring developments both in the market and with the Group’s competitors. During the year, non-executive directors had the opportunity to participate in workshops with the Group’s digital development teams to gain insight on digital innovation and progress on the Group’s digital initiatives.
Each of the non-executive directors serves on the three main Board committees: Group Audit and Risk; Remuneration; and Nomination. This not only facilitates the provision of information to the Board and better communication, but it also enables Board members to have direct involvement in the key areas of governance and to take full account of the relationships between the activities of these committees.
Certain matters are specifically reserved for the Board’s approval and are not delegated to management. These include matters relating to the Group’s strategy; approval of any major acquisition; disposals; significant capital expenditure; financial results; and overseeing the Group’s systems of internal control, governance and risk management.
BoardStrategic leadership
Monitoring of performance against strategic objectivesMonitoring management of risk
group audit and risk committeeThe committee supports the Board in carrying out its responsibilities in relation to financial reporting, risk management and assessing internal controls. It oversees internal audit and the relationship with the external auditor, including the effectiveness of the external audit and the provision of non-audit services by the external auditor.
remuneration committeeThe committee is responsible for making recommendations to the Board on remuneration policy for executive directors and other members of the Group Executive Board as well as the specific remuneration packages for these executives.
nomination committeeThe committee’s focus is on strengthening, balancing and understanding the range of skills, experience and diversity of the Board and key roles below Board level. It is responsible for making recommendations to the Board on the composition of the Board and its committees, on retirements, appointments of additional and replacement directors and on succession planning.
32 Home Retail GroupAnnual Report 2016
MSL_HRG_RA2016_FINAL_2005.indb 32 20/05/2016 17:59

A formal schedule of matters reserved for the Board is reviewed annually and the following specific responsibilities have remained unchanged this year: � The overall management of the Group, approval of the Group’s
long-term objectives and commercial strategy, and the review of performance.
� Determining the nature and extent of significant risks the Board is willing for the Group to take in achieving its strategic objectives.
� The approval of trading statements, announcements of half-year and full-year results, including dividends, and the Annual Report and Financial Statements.
� The approval of documentation to be put forward to shareholders at general meetings and all circulars and prospectuses other than routine documents.
� The approval of all appointments to the Board and of the Company Secretary and ensuring adequate succession planning for the Board and senior management.
Each month the Board received a management information pack that provided detailed information on the performance of the Group’s businesses and a report on the progress of the Argos Transformation Plan. At each scheduled meeting the Board received an update on trading and financial performance and, in addition at five of these meetings, the Board received a management report that covered the trading and operational performance of each of the Group’s businesses, the Group’s financial performance, current market expectations of financial performance and any significant developments.
During the period under review, the Board has focused on: � The ongoing development and implementation of the Argos
Transformation Plan, including the systems, infrastructure and management resources required to deliver the plan, together with the associated risks and opportunities. More information on the progress being made is set out in the Argos business review on pages 12 to 15.
� The development of IT infrastructure and service management to complement and support the Group’s strategic plans.
� Prior to the sale of Homebase, the development and implementation of the Homebase Productivity Plan including improvements in store productivity, strengthening of customer propositions and acceleration of digital capabilities.
� The development of Financial Services to support the Group’s retail propositions including its regulatory business plan taking into account regulatory changes and the transition of consumer credit regulatory responsibility to the FCA. More information on the progress being made is set out in the Financial Services business review on pages 16 and 17.
� The financial performance of the Group and its operating companies, including financial planning, variances to forecasts and the provision of appropriate financial resources to support the Group’s strategic plans. The development of IT infrastructure and service management to complement and support the Group’s strategic plans.
� The sale of Homebase to Wesfarmers Limited, which completed on 27 February 2016.
� The possible offers for the Group announced by J Sainsbury plc and Steinhoff respectively.
Other matters considered by the Board included health and safety and the development of the Group’s corporate responsibility strategy. In relation to human rights, the Group maintains and applies appropriate policies in relevant areas of its businesses including its supply chain and in relation to its employees.
The Board continued to monitor progress on diversity and inclusion, gender diversity in senior management and the work taking place to develop and maintain a diverse colleague base, including training in unconscious bias and balanced and diverse short-lists for roles.
As at February 2016, 15,998 (53%) of a total colleague number of 30,468 were women (FY15: 53%) and 28% of 81 senior executives were women (FY15: 29%).If statutory directors of corporate entities whose financial information is included in the Group financial statements are aggregated with senior executives, 26 (29%) of the total number of 89 are women (FY15: 30%). Two of seven members of the Board (29%) are women. The Group will continue to support and encourage increased diversity across all parts of its business and at every management level of the organisation. More information on our approach in these areas is set out in the corporate responsibility section of the Group’s website, homeretailgroup.com/cr/.
The Company Secretary ensures that the Board receives regular briefings on corporate governance matters and company legislation.
In 2016, a review of the performance of the Board and its committees was externally facilitated by Independent Audit Limited using their online assessment service, Thinking Board. A questionnaire in relation to Board and committee performance was provided to each Board member. The responses to the questionnaire were reviewed and analysed by Independent Audit and used as the basis for a report setting out findings and key points for further discussion. The report was reviewed by the Chairman and discussed at a Board meeting. The overall conclusion was that the Board and its committees were functioning well. The Board discussed items where there may be scope for the Board to enhance its effectiveness and actions were agreed and are being addressed including the further development of risk management and internal control systems and focus on organisational changes and culture following the sale of Homebase.
Individual appraisals of directors have been undertaken by the Chairman. Under the leadership of the senior independent director, the non-executive directors met without the Chairman present to appraise the Chairman’s performance, taking account of any views expressed by the executive directors. In line with the requirements of the Code, all directors are required to submit themselves for re-election each year.
Board committeesThe Board has appointed the following committees: Group Audit and Risk Committee, Remuneration Committee and Nomination Committee. The terms of reference of each of these committees are available on the Group’s website at homeretailgroup.com. For information on the work of the Group Audit and Risk Committee see pages 37 to 40, the Remuneration Committee see pages 41 to 52 and the Nomination Committee see page 36. The attendance of directors at meetings of the Board and the committees during the period under review is set out on the next page:
GovernanceFinancial StatementS
additional inFormationStrategic report 33Home Retail Group
Annual Report 2016
MSL_HRG_RA2016_FINAL_2005.indb 33 20/05/2016 17:59

Corporate governance continued
BOard and cOmmittee attendance
Board memberBoard
meetings
group audit and risk
committeeremuneration
committeenomination committee
John Walden 24/24 – – 2/2
Richard Ashton 24/24 – – –
John Coombe 24/24 – 7/7 2/2
Mike Darcey 22/24 5/5 7/7 2/2
Ian Durant 23/24 5/5 7/7 2/2
Cath Keers 22/24 5/5 7/7 2/2
Jacqueline de Rojas 23/24 5/5 7/7 2/2
Notes: The last scheduled meetings in respect of FY16 took place on 29 February and 1 March 2016.John Coombe, John Walden and Richard Ashton attended every meeting of the Group Audit and Risk Committee at the invitation of the Committee Chair.Non-attendance at meetings was due to prior business commitments, travel schedules and the short notice at which a meeting may have had to be convened. In each case where the directors have not been able to attend a Board meeting they have reviewed the papers distributed for that meeting and provided their comments directly to the Chairman as appropriate.
internal control The Board has ultimate responsibility for the Group’s risk management and internal control systems. The systems are designed to safeguard the assets of the Group and help ensure the reliability of internal and external financial reporting. The purpose of the systems is to help manage and control risk rather than eliminate it. The Board has reviewed the effectiveness of the risk management and internal control systems.
The Board confirms there is in place an ongoing process for identifying, evaluating and managing the significant risks faced by the Group, including risks relating to environmental, social and governance matters. This process was in place throughout the period under review and up to the date of approval of this annual report. This process is overseen by a risk committee which supports the Group Executive Board in managing and controlling risk. The risk committee is chaired by the Finance Director and comprises all the divisional finance directors, the director of Group treasury and taxation, the Company Secretary, the risk assurance manager and the head of internal audit. The risk committee met five times in the period under review.
The Board reviewed and approved a revised risk management system for Financial Services, taking into account regulatory changes and the transition of consumer credit regulatory responsibility to the FCA, including processes for defining risk appetite, setting key performance indicator limits and tolerances and establishing key risk indicators. Revised arrangements for reporting by the management of Financial Services to the Group Audit and Risk Committee and to the Board were also approved and implemented.
The Group Audit and Risk Committee reassessed the Group’s approach to risk management and internal control taking into account the FRC guidance entitled ‘Guidance on Risk Management, Internal Control and Related Financial and Business Reporting’ including the setting of risk appetite and the identification and evaluation of the Group’s principal risks.
The Group Audit and Risk Committee has kept under review the effectiveness of the risk management and internal control systems and has reported regularly to the Board. As part of the process that the Group has in place to review the effectiveness of the risk management and internal control systems there are procedures designed to capture and evaluate failings and weaknesses, and to ensure that necessary action is taken to remedy any failings that may be categorised by the Board as significant.
The key procedures which were operational in the period under review were as follows.
risk assessment � The Board considered and reviewed the Group’s strategy, including the
Argos Transformation Plan and Homebase Productivity Plan, taking into account the risks it was willing for the Group to take in achieving its strategic objectives.
� New risk management software that provides improved real time visibility of risk information to management has been deployed in Financial Services.
� Current and longer-term emerging risks in relation to the Group’s strategy and the delivery of the strategy (including any risks that could threaten the Group’s solvency or liquidity) were discussed and reviewed by management on the basis of the likelihood and impact of these risks materialising.
� Following the risks identified through this process being reviewed by the risk committee, they were then reported to the Group Audit and Risk Committee, with particular focus on those risks classified as principal risks by management. The schedule of principal risks was used as the basis for the programme of internal audit and assurance and is outlined in the principal risks and uncertainties on pages 22 and 23.
� The Group Audit and Risk Committee has delegated responsibility from the Board for considering operational, financial and compliance risks on a regular basis and received its annual report on the controls over these risks. This included risks arising from environmental, social and governance matters.
34 Home Retail GroupAnnual Report 2016
MSL_HRG_RA2016_FINAL_2005.indb 34 20/05/2016 17:59

control environment and control activities � The Group has established procedures for delegating authority which
ensure that decisions that are significant, either because of their value or their impact on other parts of the Group, are taken at an appropriate level.
� The Group has implemented appropriate strategies to deal with each significant risk that has been identified. These strategies include internal controls, insurance and foreign currency hedging.
� The Group sets out principles, policies and standards to be adhered to. These include risk identification, management and reporting standards, ethical principles and practice, appropriate reward systems and accounting policies. Data consolidated into the Group’s financial statements is reconciled to the underlying financial systems. A review of the consolidated data is undertaken by management to ensure that the true position and results of the Group are reflected through compliance with approved accounting policies.
information and communication � The Group has a comprehensive system of budgetary control, including
monthly performance reviews by the Group Executive Board. The Group Executive Board also reviews a range of financial and non-financial performance indicators. These indicators were regularly reviewed to ensure that they remain relevant and reliable.
� The Group has whistleblowing procedures in place for employees to report any suspected improprieties.
monitoring � A range of procedures was used to monitor the effective application of
internal controls in the Group, including management assurance through confirmation of compliance with standards, and independent assurance through internal audit reviews and review by specialist third parties.
� The internal audit department’s responsibilities include reporting to the Group Audit and Risk Committee on the effectiveness of internal control systems, with a particular focus on those areas identified as being the greatest risk to the Group.
� Follow-up processes were used to ensure there was an appropriate response to changes and developments in risks and the control environment.
relations with shareholdersThe Board recognises the importance of communicating with its shareholders and does so in a number of ways, including the provision of information in the annual report and on the Group’s website, the Annual General Meeting and the processes described below.
Although the majority of shareholder contact is with the Chief Executive and the Finance Director, supported by management specialising in investor relations, it is the responsibility of the Board as a whole, led by the Chairman, to ensure that a satisfactory dialogue with shareholders takes place. Meetings with investors have been held throughout the year with roadshow activity following the half-year and full-year results announcements. John Coombe has held meetings with a number of shareholders during the period under review. Cath Keers, as chair of the Remuneration Committee, has also engaged with larger shareholders on remuneration matters.
Through these processes the Board is kept abreast of key issues. Shareholders have a direct line of communication to the Chairman, particularly if there are areas for concern, whether it be about performance, strategy or governance. The senior independent director is also available should shareholders have concerns which contact through the normal channels of the Chairman, the Chief Executive and the Finance Director has failed to resolve, or for which such contact is inappropriate.
All directors, including the chairs of the Group Audit and Risk, Remuneration and Nomination Committees, intend to be present at the Annual General Meeting and be available to answer shareholders’ questions. Voting by members present at the Annual General Meeting will be by way of a poll. Proxies lodged prior to the meeting showing the balance for and against each resolution and the number of votes withheld will be displayed at the meeting. The results of voting at the Annual General Meeting will also be available on the Group’s website at homeretailgroup.com as soon as possible after the meeting.
GovernanceFinancial StatementS
additional inFormationStrategic report 35Home Retail Group
Annual Report 2016
MSL_HRG_RA2016_FINAL_2005.indb 35 20/05/2016 17:59
membershipThe Nomination Committee is chaired by John Coombe and its other members are Mike Darcey, Ian Durant, Cath Keers, Jacqueline de Rojas and John Walden.
meetingsThe committee met twice during the year and attendance at those meetings is shown on page 34 within the corporate governance section.
main activitiesThe committee’s focus is on strengthening, balancing and understanding the range of skills, experience and diversity of the Board and key roles below Board level. The Nomination Committee is responsible for making recommendations to the Board on the composition of the Board and its committees, on retirements, appointments of additional and replacement directors and on succession planning. Following the sale of Homebase and in the context of the possible takeover bids for the Company, the committee considered succession planning in relation to key senior management roles.
Board succession planningDuring the year the committee completed a review of Board succession. The committee considered the balance of skills and experience that were most appropriate for the Group, taking into account its strategy and risk profile; developments and trends in the market; regulatory developments, including the regulation of consumer credit by the FCA and the importance of the role of the Board in supporting creativity and innovation. The committee considered the length of service of the non-executive directors and the size of the Board and agreed the approach to be adopted towards refreshing the skills and experience represented on the Board, while maintaining an appropriate degree of continuity through a period of significant change in the Group.
chairman succession planningThe committee considered the conclusions of a review undertaken by the senior independent director in consultation with the non-executive directors and taking into account the views of the executive directors and agreed the approach to be adopted towards succession planning for the Chairman’s role.
.
Nomination Committee report
36 Home Retail GroupAnnual Report 2016
MSL_HRG_RA2016_FINAL_2005.indb 36 20/05/2016 17:59

membershipThe Group Audit and Risk Committee is comprised of the independent non-executive directors and is chaired by Ian Durant, whom the Board considers has both recent and relevant financial experience. Ian Durant is a Chartered Accountant and a former Finance Director of Liberty International (renamed Intu Properties) and other companies. Further biographical details of Ian Durant are shown in the Board of Directors’ profiles on page 30.
meetingsThe committee met five times during the year and attendance at those meetings is shown on page 34 within the corporate governance section. At the invitation of the committee chair, the Board Chairman, Chief Executive and Finance Director attended all committee meetings. The Group head of internal audit and the external auditors also attended all meetings of the committee at the invitation of the committee chair except for an additional meeting in January 2016 that considered external auditor rotation. After each of the other four meetings the committee met with the external auditors and the Group head of internal audit, in each case without the presence of executive directors or management.
main activitiesThe committee supports the Board in carrying out its responsibilities in relation to financial reporting, risk management and assessing internal controls. It oversees internal audit and the relationship with the external auditors, including the effectiveness of the external audit and the provision of non-audit services by the external auditors. The committee has a structured annual programme developed from its terms of reference and linked to the Group’s financial calendar. The programme includes standing items the committee considers at each meeting as well as topical items on which the committee has chosen to focus. The committee’s terms of reference are reviewed each year and were last reviewed in April 2016. They can be found on the Group’s website, homeretailgroup.com. Specific issues considered by the committee included the implications for financial reporting and risk management of the sale of Homebase; the development and implementation of the risk management framework for Financial Services; the Group’s response to risks arising in relation to information and cyber security; development of the Group’s risk management processes taking into account the changes to the Code and related FRC Guidance; proposed arrangements for the tendering of the external audit; and the goodwill implications and risks arising from the offer for the Group from J Sainsbury plc.
At each of the four regular meetings, the committee considered reports from the Group head of internal audit and reports on any material or potential litigation involving Group companies. During the period under review, the committee also reviewed management of fraud risk and incidences of fraud including the Group’s anti-bribery arrangements; reviewed arrangements by which Group employees may, in confidence, raise concerns about possible improprieties in financial reporting, dishonesty, corruption, breaches of business principles and other matters and reviewed the statement in the annual report on the system of internal control (see page 34 within the corporate governance section).
Fair, balanced and understandableThe Board asked the committee to advise it on whether the Annual Report and Financial Statements, taken as a whole, were fair, balanced and understandable and provided the information necessary for shareholders to assess the Group’s business model, strategy and position and performance. The committee reviewed the process for preparing the Annual Report and
Group Audit and Risk Committee report
chair’s introduction
The Group Audit and Risk Committee has a key role to play in supporting the Board in carrying out its responsibilities in relation to financial reporting, assessing risk management and internal controls and ensuring high standards of quality and effectiveness in the external audit process. This report summarises the committee’s activities in these areas.
The changes to the UK Corporate Governance Code (the ‘Code’) and the related FRC guidance highlight the importance of effective risk management and internal control systems. This year we have made good progress in designing and implementing revised risk management systems for Financial Services. Effective risk management systems should support better decision-making and not inhibit sensible risk-taking that is essential for growth. With that goal in mind, our risk management processes are kept under review.
In relation to financial reporting, I have sought to ensure that clear explanations are provided in this report on the approach we have taken in reaching conclusions on key judgements and estimates.
The work of the Group Audit and Risk Committee relies on frank, open working relationships with the Board, management and internal and external auditors and particularly between the Committee Chair and the Board Chairman, the Chief Executive and the Finance Director. I am grateful to all my colleagues for their contribution to these relationships.
ian durant Chair – Group Audit and Risk Committee
GovernanceFinancial StatementS
additional inFormationStrategic report 37Home Retail Group
Annual Report 2016
MSL_HRG_RA2016_FINAL_2005.indb 37 20/05/2016 17:59

Group Audit and Risk Committee report continued
Financial Statements and the basis for substantiating that the content provided a fair, balanced and understandable view of the year under review.
The committee reviewed the Annual Report and Financial Statements and has confirmed to the Board that, in the opinion of the committee, it is fair, balanced and understandable.
Financial reportingThe committee reviewed the full-year and half-year results announcement, the Annual Report and Financial Statements and considered reports from the external auditors identifying any accounting or judgemental issues requiring its attention.
To inform the Board’s assessment of whether it was appropriate for the Group to adopt the going concern basis in preparing financial statements at the half year, the committee considered a detailed review based on the Group’s financial plans in relation to liquidity and solvency, taking into consideration the Group’s cash position, bank facilities and Financial Services loan book together with a range of sensitivities.
The primary areas of accounting judgements and issues considered by the committee in relation to the FY16 financial statements and how these were addressed are set out below.
commercial incomeThe committee reviewed the different types of commercial income within the Group, and the accounting policies and estimates applied in recognising this income. The committee concurred with the additional disclosure which continues to be included in the consolidated financial statements. This disclosure can be found in the Group’s accounting policies on page 71 and in note 21 on page 94.
goodwill impairment assessmentThe committee reviewed management’s assessment of the carrying value of the Group’s goodwill. In doing so the committee reviewed the judgements required to calculate the recoverable amount of goodwill. In light of the recommended offer received from J Sainsbury plc on 1 April 2016, the committee concurred with management’s assessment that it was appropriate to recognise an impairment charge of £851.7m against the carrying value of Argos’ goodwill.
In addition, in light of the sale of Homebase and the announcement that Habitat concessions in Homebase will be closed as part of this sale, the committee also concurred with management’s assessment that it was appropriate to recognise an impairment charge of £12.5m to fully write down the Habitat goodwill and brand intangible asset.
impairment of store card receivablesStore card receivables of £614m represent a significant asset on the Group’s balance sheet. The provision for impairment has been established on a portfolio basis, taking into account the level of arrears, past loss experience and defaults based on portfolio trends, and also judgements made by management to assess the appropriateness of the provision. The committee concurred with management’s assessment and judgements and agreed that the provisioning level was appropriate. Further details of provisions against receivables are disclosed in note 21 to the consolidated financial statements on page 94.
inventory provisionsInventory of £755.8m represents a significant asset on the Group’s balance sheet and is carried at the lower of cost and net realisable value. Net realisable value takes into account slow moving, obsolete and defective
inventory. Provision is also made against inventory losses arising, for example, due to theft. The committee considered and concurred with management’s assessment of the net realisable value of inventory because the methodology used in calculating provisions against inventory has been consistently applied by management, taking into account previous experience of impairment or inventory losses.
exceptional itemsArgos Transformation PlanGiven the scale of the Argos Transformation Plan, the committee considered the judgements made by management when assessing the items to be reported as exceptional. The committee agreed with management’s assessment that the exceptional items in respect of the Argos Transformation Plan have been calculated and reported in accordance with the policy set out in note 3. These items have been reported in note 9 to the consolidated financial statements and amounted to £10.3m.
Financial Services customer redressThe committee reviewed additional customer redress charges, principally relating to customer redress in respect of Payment Protection Insurance (PPI) which was historically provided by Financial Services. An increase to these provisions of £17.0m was charged to exceptional items in FY16 and redress payments have continued to be made to customers resulting in the partial utilisation of this provision during FY16. The provision continues to represent management’s best estimate of the liability for future customer redress payments at the balance sheet date. The committee agreed with the judgements made and conclusions drawn by management, and therefore concluded that the accounting for these provisions was appropriate.
Gain on sale of freehold propertyThe committee has reviewed the gain on sale of freehold property which represents the gain following the sale of the Group’s freehold located in Battersea, London. The gain of £39.3m represents cash proceeds of £57.7m less net book value and costs of sale of £18.4m.
discontinued operationsThe committee has reviewed the classification, presentation and disclosure of Homebase as a discontinued operation in the financial statements. The committee has also reviewed the calculation of the loss on disposal of £18.5m and the transaction, separation and restructuring costs of £7.8m incurred as part of the transaction. This disclosure can be found in note 14.
38 Home Retail GroupAnnual Report 2016
MSL_HRG_RA2016_FINAL_2005.indb 38 20/05/2016 17:59

external auditOne of the primary responsibilities of the Group Audit and Risk Committee is to assess the effectiveness of the external audit process and make recommendations to the Board in relation to the appointment, re-appointment and removal of the external auditors. The committee took a number of factors into account in its assessment, including but not limited to: � the quality and scope of the planning of the audit. In September 2015,
the external auditors presented their strategy for FY16 to the committee. The committee reviewed and agreed with the external auditors’ assessment of risks. The committee also reviewed the audit approach including how the external auditors’ planned to evolve the audit to respond to changes in the business, including the Transformation Plan in Argos, and the external auditors’ approach to assessing materiality for the Group;
� the quality of reports provided to the committee and the Board and the quality of advice given;
� the level of understanding demonstrated of the Group’s businesses and the retail sector;
� the objectivity of the external auditors’ views on the controls around the Group and the robustness of challenge and findings on areas which required management judgement; and
� the key messages highlighted in the FRC’s Audit Quality Inspection Report on PricewaterhouseCoopers for 2014/15 and the FRC’s Audit Quality Inspections Annual Report for 2014/15.
In addition, a review was undertaken by the Group’s internal audit department of the effectiveness of the external audit for the previous financial year. Effectiveness was assessed in relation to three areas: robustness of audit; quality of audit; and quality of people and service. A questionnaire was completed by stakeholders within management including members of the risk committee, divisional finance directors and those colleagues who were involved on a daily basis with the external auditors. Respondents were required to ‘score’ the external auditors’ performance against a range of criteria and were also given the opportunity to provide comments and explanations. The results evidenced a positive evaluation of the work of the external auditors and that high standards had been maintained. The committee reviewed and discussed the findings of the report with the head of internal audit and the lead audit engagement partner after taking into account all of the above factors, the committee concluded that the external auditors were effective.
Taking into consideration the audit strategy and proposed areas of work and the assessment of the effectiveness of the external audit for the previous financial year, the Group Audit and Risk Committee discussed and approved the external auditors’ audit fee proposal. Further details of the audit fee can be found in note 7 on page 82.
independenceExternal auditor independence is an essential part of the audit framework and the assurance it provides. The committee reviews the independence of the external auditor when considering their reappointment. The committee has established control procedures to safeguard the objectivity and independence of the external auditors and to ensure that the independence of the audit work undertaken by the external auditors is not compromised. These procedures include a policy on the provision of non-audit services overseen by the Finance Director in consultation with the committee chair; annual confirmation of independence in writing by the external auditors following a review of relevant areas including relationships and investment, services provided to the Group and gifts and hospitality; consideration of the external auditors’ confirmation at a committee meeting; and half-yearly reports to the committee providing details of any assignments and related fees carried out by the external auditors in addition to their normal work. These control procedures are in addition to the Group’s anti-bribery and gifts and hospitality policies. Audit partner rotation forms part of the arrangements that support independence and objectivity.
external auditor rotationThe current external auditors, PricewaterhouseCoopers LLP, were appointed in 2006 and since that time the external audit has not been tendered formally. As reported last year, it had been proposed to undertake a tender process for the FY17 audit. However in view of the uncertainty arising from the proposed takeover of the Group , the committee intend to consult with the Competition and Markets Authority in relation to the external audit , to confirm whether , in the circumstances, it is allowable to recommend the reappointment of PricewaterhouseCoopers LLP as the Group’s auditors for FY17 and to undertake a competitive tender process for the FY18 audit should it be required in the event that the acquisition of the Group by J Sainsbury plc does not take place. The Company has complied with the provisions of the Competition and Markets Authority’s Order for the financial year under review.
GovernanceFinancial StatementS
additional inFormationStrategic report 39Home Retail Group
Annual Report 2016
MSL_HRG_RA2016_FINAL_2005.indb 39 20/05/2016 17:59

non-audit servicesThe Group’s policy on the provision of non-audit services is that the external auditors may only provide such services provided these do not conflict with their statutory responsibilities and ethical guidance. These services are: � Further assurance services – where the external auditors’ knowledge of
the Group’s affairs means that they may be best placed to carry out such work. This may include, but is not restricted to, shareholder and other circulars, regulatory reports and work in connection with acquisitions and divestments.
� Taxation services – where the external auditors’ knowledge of the Group’s affairs may provide support to the Group’s tax position. Where this is not the case, the work is put out to tender.
� General – in other circumstances, the external auditors may provide services, provided that proposed assignments which exceed financial limits set out in the policy are put out to tender and decisions to award work are taken on the basis of demonstrable competence and cost effectiveness.
However, certain areas of work are specifically prohibited, including work related to accounting records and financial statements that will ultimately be subject to external audit and management of, or significant involvement in, internal audit services. The committee chair’s approval is required before the Group uses any non-audit services that exceed £50,000.
Owing to the exceptional circumstances that applied for the period under review, total non-audit fees paid to the Group’s auditors, PricewaterhouseCoopers LLP, were more than the audit fee. The major proportion of these fees were incurred in connection with the significant amount of work required in relation to the Homebase disposal, including reporting responsibilities relating to the class 1 circular sent to shareholders. Other non-audit services provided by the external auditors were principally taxation services. The external auditors were engaged to undertake these assignments after discussion with the committee chair because of their knowledge of the Group’s affairs, their past experience in delivering similar services to the Group and their cost effectiveness. In addition, in the case of the Homebase disposal, the very limited time available to complete the necessary work precluded the undertaking of a tender process. The fees in respect of assignments carried out by the external auditor in addition to their normal work in the period under review were:
£m
Taxation services 0.2
Deal-related services 1.2
internal audit and control The Group has an internal audit department and the Group head of internal audit reports jointly to the chair of the committee and to the Finance Director. The committee agreed the audit plan to be undertaken by the internal audit team at its first meeting at the start of the financial year and at each meeting throughout the year progress against this plan was reviewed. The plan was assessed on the basis of providing appropriate coverage over the internal control environment to provide the committee with a balanced overview across the Group, taking into account the level of risk and previous coverage. Additional areas of review were added to the plan as required where circumstances gave rise to an increased level of risk and any changes to the agreed audit plan were reviewed by the committee. At each meeting, except the additional January 2016 meeting, the committee considered reports from the Group head of internal audit on the results of all internal audit reviews, significant findings and progress on management actions agreed from previous audits. A review of the effectiveness of internal audit was carried out during the year by way of a questionnaire to stakeholders. Having considered the results of this survey and a number of other factors, including the quality of reporting to the committee and impartiality of the internal auditors, the committee concluded that internal audit was effective.
risk managementThe committee has delegated responsibility from the Board for considering operational, financial and compliance risks on a regular basis. Information on the Group’s approach to risk management and internal control is set out in the corporate governance section. A summary of the principal risks and uncertainties that could impact the Group’s performance can be found on pages 22 and 23. The committee is overseeing the development of the Group’s risk management framework. During the year, a new risk management framework policy and risk appetite framework was approved for Financial Services and a new risk management software system was deployed in Financial Services. This risk management software system that provides improved real time visibility of risk information to management is now being introduced across the Group.
Group Audit and Risk Committee report continued
40 Home Retail GroupAnnual Report 2016
MSL_HRG_RA2016_FINAL_2005.indb 40 20/05/2016 17:59
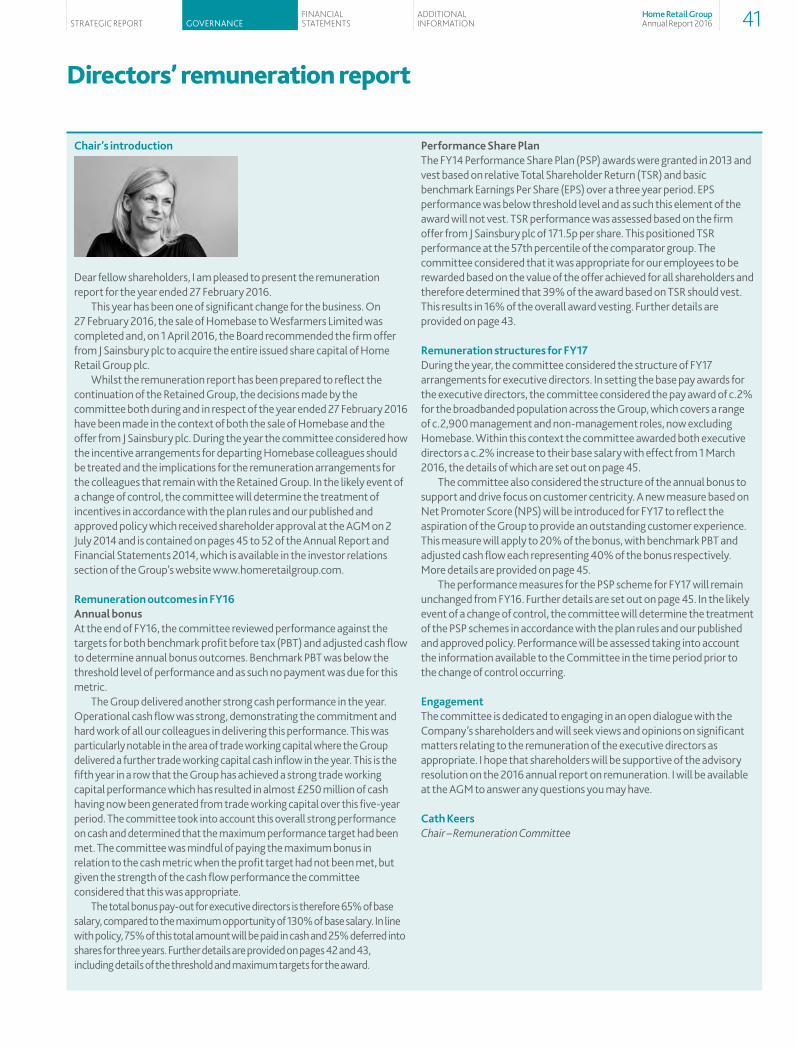
chair’s introduction
Dear fellow shareholders, I am pleased to present the remuneration report for the year ended 27 February 2016.
This year has been one of significant change for the business. On 27 February 2016, the sale of Homebase to Wesfarmers Limited was completed and, on 1 April 2016, the Board recommended the firm offer from J Sainsbury plc to acquire the entire issued share capital of Home Retail Group plc.
Whilst the remuneration report has been prepared to reflect the continuation of the Retained Group, the decisions made by the committee both during and in respect of the year ended 27 February 2016 have been made in the context of both the sale of Homebase and the offer from J Sainsbury plc. During the year the committee considered how the incentive arrangements for departing Homebase colleagues should be treated and the implications for the remuneration arrangements for the colleagues that remain with the Retained Group. In the likely event of a change of control, the committee will determine the treatment of incentives in accordance with the plan rules and our published and approved policy which received shareholder approval at the AGM on 2 July 2014 and is contained on pages 45 to 52 of the Annual Report and Financial Statements 2014, which is available in the investor relations section of the Group’s website www.homeretailgroup.com.
remuneration outcomes in FY16annual bonusAt the end of FY16, the committee reviewed performance against the targets for both benchmark profit before tax (PBT) and adjusted cash flow to determine annual bonus outcomes. Benchmark PBT was below the threshold level of performance and as such no payment was due for this metric.
The Group delivered another strong cash performance in the year. Operational cash flow was strong, demonstrating the commitment and hard work of all our colleagues in delivering this performance. This was particularly notable in the area of trade working capital where the Group delivered a further trade working capital cash inflow in the year. This is the fifth year in a row that the Group has achieved a strong trade working capital performance which has resulted in almost £250 million of cash having now been generated from trade working capital over this five-year period. The committee took into account this overall strong performance on cash and determined that the maximum performance target had been met. The committee was mindful of paying the maximum bonus in relation to the cash metric when the profit target had not been met, but given the strength of the cash flow performance the committee considered that this was appropriate.
The total bonus pay-out for executive directors is therefore 65% of base salary, compared to the maximum opportunity of 130% of base salary. In line with policy, 75% of this total amount will be paid in cash and 25% deferred into shares for three years. Further details are provided on pages 42 and 43, including details of the threshold and maximum targets for the award.
Performance Share PlanThe FY14 Performance Share Plan (PSP) awards were granted in 2013 and vest based on relative Total Shareholder Return (TSR) and basic benchmark Earnings Per Share (EPS) over a three year period. EPS performance was below threshold level and as such this element of the award will not vest. TSR performance was assessed based on the firm offer from J Sainsbury plc of 171.5p per share. This positioned TSR performance at the 57th percentile of the comparator group. The committee considered that it was appropriate for our employees to be rewarded based on the value of the offer achieved for all shareholders and therefore determined that 39% of the award based on TSR should vest. This results in 16% of the overall award vesting. Further details are provided on page 43.
remuneration structures for FY17During the year, the committee considered the structure of FY17 arrangements for executive directors. In setting the base pay awards for the executive directors, the committee considered the pay award of c.2% for the broadbanded population across the Group, which covers a range of c.2,900 management and non-management roles, now excluding Homebase. Within this context the committee awarded both executive directors a c.2% increase to their base salary with effect from 1 March 2016, the details of which are set out on page 45.
The committee also considered the structure of the annual bonus to support and drive focus on customer centricity. A new measure based on Net Promoter Score (NPS) will be introduced for FY17 to reflect the aspiration of the Group to provide an outstanding customer experience. This measure will apply to 20% of the bonus, with benchmark PBT and adjusted cash flow each representing 40% of the bonus respectively. More details are provided on page 45.
The performance measures for the PSP scheme for FY17 will remain unchanged from FY16. Further details are set out on page 45. In the likely event of a change of control, the committee will determine the treatment of the PSP schemes in accordance with the plan rules and our published and approved policy. Performance will be assessed taking into account the information available to the Committee in the time period prior to the change of control occurring.
engagementThe committee is dedicated to engaging in an open dialogue with the Company’s shareholders and will seek views and opinions on significant matters relating to the remuneration of the executive directors as appropriate. I hope that shareholders will be supportive of the advisory resolution on the 2016 annual report on remuneration. I will be available at the AGM to answer any questions you may have.
cath KeersChair – Remuneration Committee
Directors’ remuneration report
GovernanceFinancial StatementS
additional inFormationStrategic report 41Home Retail Group
Annual Report 2016
MSL_HRG_RA2016_FINAL_2005.indb 41 20/05/2016 17:59

Directors’ remuneration report continued
directors’ remuneration report for the year ended 27 February 2016The directors’ remuneration report has been prepared in accordance with the relevant provisions of the Listing Rules and Schedule 8 of the Large and Medium-sized Companies and Groups (Accounts and Reports) Regulations 2008 (as amended). The report is subject to an advisory shareholder vote at the 2016 AGM.
As last year, and in line with reporting regulations, this report is split into two sections: � The annual report on remuneration (pages 42 to 50), which provides
details on how executive directors were paid in FY16 and how we intend to implement the remuneration policy in FY17.
� The summary policy report (pages 51 to 52). The full policy report received shareholder approval at the AGM on 2 July 2014 and is contained on pages 45 to 52 of the Annual Report and Financial Statements 2014, which is available in the investor relations section of the Group’s website www.homeretailgroup.com. It is intended that this will last three years until the AGM in 2017 when a new policy will be presented for shareholder approval.
executive directors – single total figure of remuneration (audited)The following table sets out the single-figure for total remuneration for executive directors for FY16 and FY15.
£000 Salary Benefits Bonus ltiP Pension total
executive directors
John Walden1
FY16 663 50 431 205 199 1,548
FY15 623 46 449 1,1792,3 187 2,484
RichardAshton
FY16 490 13 318 179 122 1,122
FY15 480 13 346 1,7452 120 2,704
Notes: 1. John Walden was appointed as Chief Executive with effect from 14 March 2014 and was
not an executive director prior to this date.2. The value of awards in the FY15 single-figure table were calculated using a share price of
£1.99 and included dividend-equivalent amounts. The share price used was the average of the price for the three months preceding 28 February 2015. Awards were released to participants on 23 May 2015, a Saturday. The share price on the preceding trading day was £1.64. The value in the single figure table above has been updated to reflect the value at the date of release.
3. In addition to the LTIP shown above, in March and May 2012, upon the appointment of John Walden as Managing Director of Argos, the Company made awards under the terms of the Company’s PSP scheme. The awards were subject, in part, to performance conditions that were fully satisfied in prior years. As disclosed in the FY15 report, the first of these was released on 1 March 2015 and had a value of £1,062,000 based on the share price at the date of release. The second of these awards was released on 23 May 2015. The value of this award, based on the share price at the release date was £1,148,312. Further details are available on page 47.
notes to the single-figure table and remuneration outcomes (audited)BenefitsBenefits include values relating to all-employee share schemes including Save As You Earn (SAYE), private medical insurance, life assurance and company car cash allowance. The value of the SAYE benefit has been calculated as £250 × 12 × discount received (%) to reflect the value of the share price discount which applies, based on directors saving the maximum amount over the course of the year. John Walden was also provided with certain travel benefits, including a cash allowance to cover certain flights to and from the US and US private health cover.
FY16 annual bonusThe payment of the FY16 bonus was subject to the achievement of targets based on two equally-weighted measures: benchmark PBT and adjusted cash flow. The table on the next page sets out the performance achieved against each metric and corresponding bonus pay-out. Benchmark PBT performance was below threshold and as such no bonus is payable for that metric.
The Group delivered another strong cash performance in the year. Operational cash flow was strong, demonstrating the commitment and hard work of all our colleagues in delivering this performance. This was particularly notable in the area of trade working capital where the Group delivered a further trade working capital cash inflow in the year. This is the fifth year in a row that the Group has achieved a strong trade working capital performance which has resulted in almost £250 million of cash having now been generated from trade working capital over this five year period. The committee took into account this overall strong performance on cash and determined that the maximum performance target had been met. The committee was mindful of paying the maximum bonus in relation to the cash metric when the profit target had not been met, but given the strength of the cash flow performance the committee considered that this was appropriate.
annual report on remunerationThis section provides information about the Remuneration Committee, how executive directors were paid in FY16 and how the committee intends to implement the remuneration policy, as set out on pages 45 to 46, in FY17.
The following directors were members of the committee during FY16: � Cath Keers (Chair) � John Coombe � Mike Darcey
� Ian Durant � Jacqueline de Rojas
At the invitation of the committee, John Walden, the Chief Executive, attended the meetings to give background information on remuneration matters. The committee was also advised by Richard Ashton, Finance Director; Julie Elder, Human Resources Director (until 13/07/15); Ella Bennett, Human Resources Director (from 02/08/15) and Louise Baker, Head of Reward. The secretary to the committee was Gordon Bentley, Company Secretary.
Deloitte LLP continued to act as advisors to the committee. During the year they have advised the committee on a number of executive remuneration matters including developments in market practice and governance and reward benchmarking data. Total fees for advice provided to the committee during the year under review, on a time-spent basis, amounted to £49,200. Deloitte LLP are members of the Remuneration Consultants Group and the committee is satisfied that their advice is independent. The committee is comfortable that the Deloitte LLP engagement partner and team that provide remuneration advice to the committee do not have connections with the Company that may impair their independence. Deloitte LLP also provided other services to Home Retail Group in relation to broader remuneration matters. Separate teams within Deloitte also provided risk advisory and general tax advice.
The terms of reference of the committee can be found on the Group’s website www.homeretailgroup.com.
The details over the following pages show the implementation of policy, first looking back to FY16 and second looking forward to FY17.
42 Home Retail GroupAnnual Report 2016
MSL_HRG_RA2016_FINAL_2005.indb 42 20/05/2016 17:59
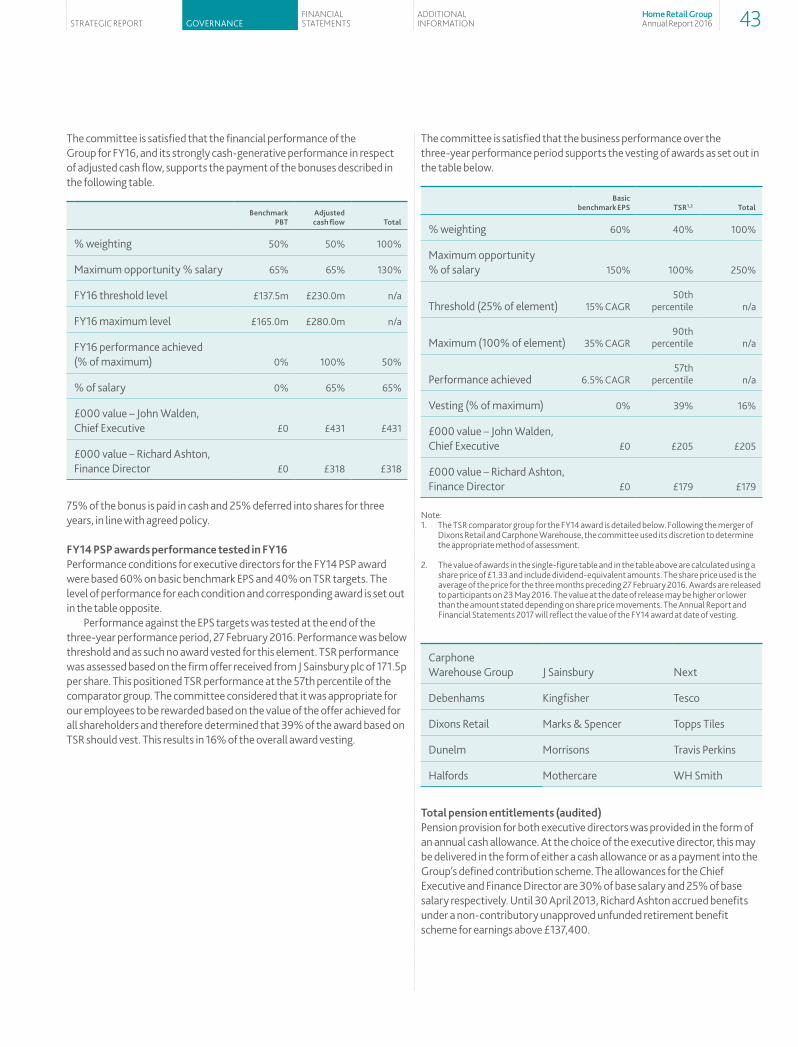
The committee is satisfied that the financial performance of the Group for FY16, and its strongly cash-generative performance in respect of adjusted cash flow, supports the payment of the bonuses described in the following table.
Benchmark PBt
adjustedcash flow total
% weighting 50% 50% 100%
Maximum opportunity % salary 65% 65% 130%
FY16 threshold level £137.5m £230.0m n/a
FY16 maximum level £165.0m £280.0m n/a
FY16 performance achieved (% of maximum) 0% 100% 50%
% of salary 0% 65% 65%
£000 value – John Walden,Chief Executive £0 £431 £431
£000 value – Richard Ashton, Finance Director £0 £318 £318
75% of the bonus is paid in cash and 25% deferred into shares for three years, in line with agreed policy.
FY14 PSP awards performance tested in FY16Performance conditions for executive directors for the FY14 PSP award were based 60% on basic benchmark EPS and 40% on TSR targets. The level of performance for each condition and corresponding award is set out in the table opposite.
Performance against the EPS targets was tested at the end of the three-year performance period, 27 February 2016. Performance was below threshold and as such no award vested for this element. TSR performance was assessed based on the firm offer received from J Sainsbury plc of 171.5p per share. This positioned TSR performance at the 57th percentile of the comparator group. The committee considered that it was appropriate for our employees to be rewarded based on the value of the offer achieved for all shareholders and therefore determined that 39% of the award based on TSR should vest. This results in 16% of the overall award vesting.
The committee is satisfied that the business performance over the three-year performance period supports the vesting of awards as set out in the table below.
Basic benchmark ePS tSr1,2 total
% weighting 60% 40% 100%
Maximum opportunity % of salary 150% 100% 250%
Threshold (25% of element) 15% CAGR50th
percentile n/a
Maximum (100% of element) 35% CAGR90th
percentile n/a
Performance achieved 6.5% CAGR57th
percentile n/a
Vesting (% of maximum) 0% 39% 16%
£000 value – John Walden, Chief Executive £0 £205 £205
£000 value – Richard Ashton, Finance Director £0 £179 £179
Note: 1. The TSR comparator group for the FY14 award is detailed below. Following the merger of
Dixons Retail and Carphone Warehouse, the committee used its discretion to determine the appropriate method of assessment.
2. The value of awards in the single-figure table and in the table above are calculated using a share price of £1.33 and include dividend-equivalent amounts. The share price used is the average of the price for the three months preceding 27 February 2016. Awards are released to participants on 23 May 2016. The value at the date of release may be higher or lower than the amount stated depending on share price movements. The Annual Report and Financial Statements 2017 will reflect the value of the FY14 award at date of vesting.
Carphone Warehouse Group J Sainsbury Next
Debenhams Kingfisher Tesco
Dixons Retail Marks & Spencer Topps Tiles
Dunelm Morrisons Travis Perkins
Halfords Mothercare WH Smith
total pension entitlements (audited)Pension provision for both executive directors was provided in the form of an annual cash allowance. At the choice of the executive director, this may be delivered in the form of either a cash allowance or as a payment into the Group’s defined contribution scheme. The allowances for the Chief Executive and Finance Director are 30% of base salary and 25% of base salary respectively. Until 30 April 2013, Richard Ashton accrued benefits under a non-contributory unapproved unfunded retirement benefit scheme for earnings above £137,400.
GovernanceFinancial StatementS
additional inFormationStrategic report 43Home Retail Group
Annual Report 2016
MSL_HRG_RA2016_FINAL_2005.indb 43 20/05/2016 17:59
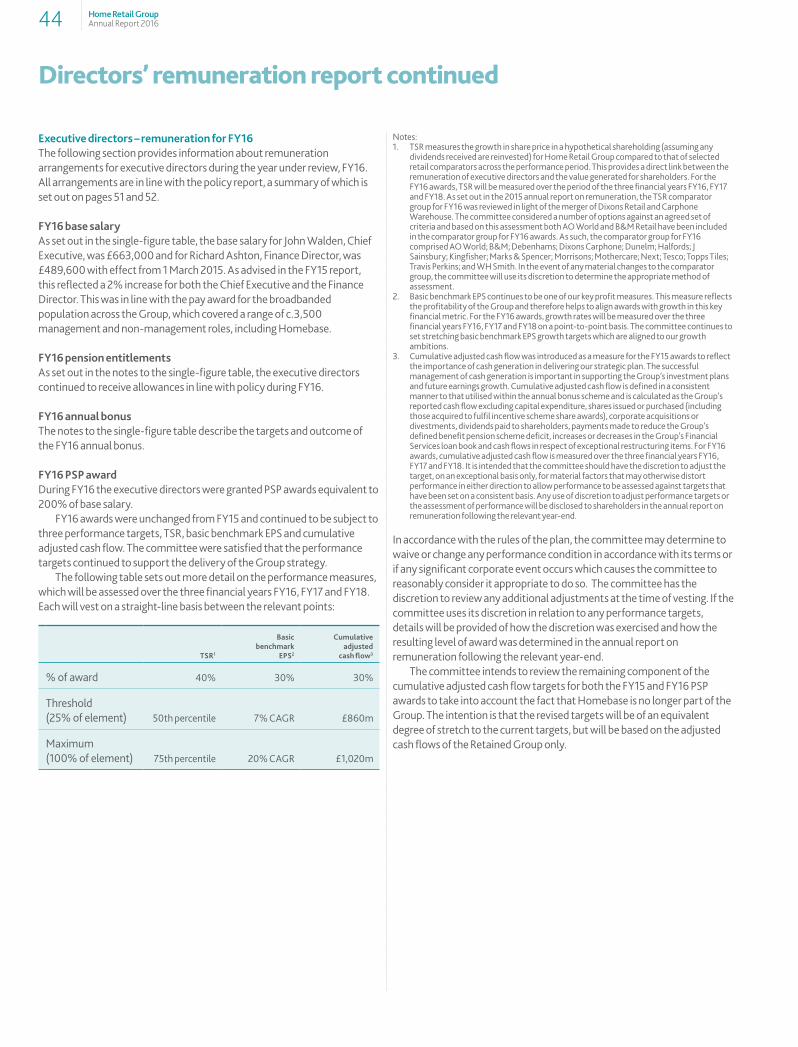
Directors’ remuneration report continued
executive directors – remuneration for FY16The following section provides information about remuneration arrangements for executive directors during the year under review, FY16. All arrangements are in line with the policy report, a summary of which is set out on pages 51 and 52.
FY16 base salaryAs set out in the single-figure table, the base salary for John Walden, Chief Executive, was £663,000 and for Richard Ashton, Finance Director, was £489,600 with effect from 1 March 2015. As advised in the FY15 report, this reflected a 2% increase for both the Chief Executive and the Finance Director. This was in line with the pay award for the broadbanded population across the Group, which covered a range of c.3,500 management and non-management roles, including Homebase.
FY16 pension entitlementsAs set out in the notes to the single-figure table, the executive directors continued to receive allowances in line with policy during FY16.
FY16 annual bonusThe notes to the single-figure table describe the targets and outcome of the FY16 annual bonus.
FY16 PSP awardDuring FY16 the executive directors were granted PSP awards equivalent to 200% of base salary.
FY16 awards were unchanged from FY15 and continued to be subject to three performance targets, TSR, basic benchmark EPS and cumulative adjusted cash flow. The committee were satisfied that the performance targets continued to support the delivery of the Group strategy.
The following table sets out more detail on the performance measures, which will be assessed over the three financial years FY16, FY17 and FY18. Each will vest on a straight-line basis between the relevant points:
tSr1
Basic benchmark
ePS2
cumulative adjusted
cash flow3
% of award 40% 30% 30%
Threshold (25% of element) 50th percentile 7% CAGR £860m
Maximum (100% of element) 75th percentile 20% CAGR £1,020m
Notes: 1. TSR measures the growth in share price in a hypothetical shareholding (assuming any
dividends received are reinvested) for Home Retail Group compared to that of selected retail comparators across the performance period. This provides a direct link between the remuneration of executive directors and the value generated for shareholders. For the FY16 awards, TSR will be measured over the period of the three financial years FY16, FY17 and FY18. As set out in the 2015 annual report on remuneration, the TSR comparator group for FY16 was reviewed in light of the merger of Dixons Retail and Carphone Warehouse. The committee considered a number of options against an agreed set of criteria and based on this assessment both AO World and B&M Retail have been included in the comparator group for FY16 awards. As such, the comparator group for FY16 comprised AO World; B&M; Debenhams; Dixons Carphone; Dunelm; Halfords; J Sainsbury; Kingfisher; Marks & Spencer; Morrisons; Mothercare; Next; Tesco; Topps Tiles; Travis Perkins; and WH Smith. In the event of any material changes to the comparator group, the committee will use its discretion to determine the appropriate method of assessment.
2. Basic benchmark EPS continues to be one of our key profit measures. This measure reflects the profitability of the Group and therefore helps to align awards with growth in this key financial metric. For the FY16 awards, growth rates will be measured over the three financial years FY16, FY17 and FY18 on a point-to-point basis. The committee continues to set stretching basic benchmark EPS growth targets which are aligned to our growth ambitions.
3. Cumulative adjusted cash flow was introduced as a measure for the FY15 awards to reflect the importance of cash generation in delivering our strategic plan. The successful management of cash generation is important in supporting the Group’s investment plans and future earnings growth. Cumulative adjusted cash flow is defined in a consistent manner to that utilised within the annual bonus scheme and is calculated as the Group’s reported cash flow excluding capital expenditure, shares issued or purchased (including those acquired to fulfil incentive scheme share awards), corporate acquisitions or divestments, dividends paid to shareholders, payments made to reduce the Group’s defined benefit pension scheme deficit, increases or decreases in the Group’s Financial Services loan book and cash flows in respect of exceptional restructuring items. For FY16 awards, cumulative adjusted cash flow is measured over the three financial years FY16, FY17 and FY18. It is intended that the committee should have the discretion to adjust the target, on an exceptional basis only, for material factors that may otherwise distort performance in either direction to allow performance to be assessed against targets that have been set on a consistent basis. Any use of discretion to adjust performance targets or the assessment of performance will be disclosed to shareholders in the annual report on remuneration following the relevant year-end.
In accordance with the rules of the plan, the committee may determine to waive or change any performance condition in accordance with its terms or if any significant corporate event occurs which causes the committee to reasonably consider it appropriate to do so. The committee has the discretion to review any additional adjustments at the time of vesting. If the committee uses its discretion in relation to any performance targets, details will be provided of how the discretion was exercised and how the resulting level of award was determined in the annual report on remuneration following the relevant year-end.
The committee intends to review the remaining component of the cumulative adjusted cash flow targets for both the FY15 and FY16 PSP awards to take into account the fact that Homebase is no longer part of the Group. The intention is that the revised targets will be of an equivalent degree of stretch to the current targets, but will be based on the adjusted cash flows of the Retained Group only.
44 Home Retail GroupAnnual Report 2016
MSL_HRG_RA2016_FINAL_2005.indb 44 20/05/2016 17:59

executive directors – implementation of our remuneration policy for FY17 (non-audited)The committee has applied the approved policy for FY17 for the executive directors as set out below:
FY17 base salaryIn line with policy, salary increases for broadbanded colleagues as well as relevant market data and individual performance, are taken into consideration when determining increases for the executive directors. Based on these considerations, the salaries for the Chief Executive and Finance Director have been increased for FY17 in line with the increase for the broadbanded population across the Group of c.2%.
FY17base salary1
FY16 base salary increase
John Walden, Chief Executive £676,500 £663,000 2%
Richard Ashton, Finance Director £500,000 £489,600 2%
Note:1. Effective from 1 March 2016.
Pension entitlements Pension arrangements for the executive directors are unchanged from FY16.
FY17 annual bonus As reflected in the agreed policy and consistent with the approach taken in FY16, the maximum annual bonus opportunity for executive directors will continue to be 130% of salary with 75% of any bonus payment paid in cash and 25% deferred into shares for three years.
To support the Group’s business model, as set out on page 4, which is based on providing outstanding value and convenience for customers, the committee has considered the structure of the annual bonus for FY17 and has introduced a new target based on NPS. This target is in addition to the existing financial targets based on benchmark PBT and adjusted cash flow. The introduction of a non-financial target with the weighting as set out opposite is in line with the agreed policy.
The table below provides details of the targets and the weightings for FY17.
Metrics
Benchmark PBt
adjusted cash flow nPS
Threshold to maximum as a range around target
£2.5m below target to £15m
above target
£10m below target to £20m
above target
2.5% above current performance to
20% above current performance
Weighting
Benchmark PBt
adjusted cash flow nPS
John Walden, Chief Executive 40% 40% 20%
Richard Ashton, Finance Director 40% 40% 20%
The committee continues to set stretching targets for the annual bonus financial metrics that support year-on-year improvement of the Group’s financial performance. The threshold to maximum ranges around target recognise the growth ambitions of the Group and have been set to continue to incentivise executive directors to deliver the business performance expected by shareholders. The targets for NPS recognise the Group’s business model and its aspiration to deliver outstanding customer experience.
Due to the competitive nature of the retail sector, the targets for FY17 have not been disclosed in this report as they are considered by the Board to be commercially sensitive information and as such could be damaging to the Group’s and shareholders’ interests. The committee will disclose targets retrospectively in the 2017 annual report on remuneration to the extent that these are no longer considered to be commercially sensitive. Details of targets in respect of the FY16 annual bonus are provided in a table on page 43.
FY17 awards under the PSP As reflected in the policy and consistent with the approach taken in FY16, awards under the PSP for the executive directors will continue to be 200% of base salary.
The performance measures for the PSP scheme for FY17 will remain unchanged from FY16. In the likely event of a change of control the committee will determine the treatment of the PSP schemes in accordance with the plan rules and our published and approved policy. Performance will be assessed taking into account the information available to the committee at the point of the change of control.
tSr
Basic benchmark
ePS
cumulative adjusted
cash flow
% of award 40% 30% 30%
Threshold (25% of element) 50th percentile 7% CAGR £485m
Maximum (100% of element) 75th percentile 20% CAGR £575m
The FY17 awards will continue to vest on a straight-line basis between the relevant points.
GovernanceFinancial StatementS
additional inFormationStrategic report 45Home Retail Group
Annual Report 2016
MSL_HRG_RA2016_FINAL_2005.indb 45 20/05/2016 17:59

Directors’ remuneration report continued
tSrThe targets for TSR are set out in the previous table and all other aspects of the measurement and definition of TSR are unchanged from FY16. The full comparator group is set out in the table below.
AO World Dunelm Marks & Spencer Tesco
B&M Retail Halfords Morrisons Topps Tiles
Debenhams J Sainsbury Mothercare Travis Perkins
Dixons Carphone Kingfisher Next WH Smith
Basic benchmark ePSThe committee has reviewed basic benchmark EPS growth targets and is satisfied that they continue to be aligned to the growth ambitions of the Retained Group and are stretching for the FY17 awards. For the FY17 awards, growth rates will be measured over the three financial years FY17, FY18 and FY19 on a point-to-point basis. The targets are set out in the table on the previous page and all other aspects of the measurement and the definition of basic benchmark EPS are unchanged from FY16.
cumulative adjusted cash flowThe committee also reviewed the approach to the cumulative adjusted cash flow target. The committee is satisfied that the target continues to support the delivery of the cash generation needed to deliver the Retained Group’s long-term plans. For FY17 awards, cumulative adjusted cash flow is measured over the three financial years FY17, FY18 and FY19. The targets are set out in the table on the previous page and all other aspects of the measurement and definition of cumulative adjusted cash flow, together with committee’s discretion to adjust targets where appropriate, are unchanged from FY16.
malus and claw-backAs set out in the FY15 report, both malus and claw-back provisions will apply to annual bonus and PSP awards with effect from FY16 (ie from FY16 awards onwards). The committee has developed an approach that sets out the considerations and process for the recovery of amounts that were paid in error following identification of a misstatement of results, an error in the calculation of an award and/or gross misconduct resulting in misstatement of results or a revised calculation of the award. Details will be provided should such events occur which lead to this policy being applied.
non-executive directors – single total figure of remuneration (audited)As outlined in the summary policy table on pages 51 and 52, non-executive director fees should be broadly in line with market levels, set to reflect the responsibilities undertaken and be sufficient to attract and retain high calibre non-executives. The following table sets out the single figure for total remuneration for non-executive directors for FY16 and FY15. The fees shown include the element used to purchase shares. Non-executive directors did not receive any performance-related payments or benefits in either year.
FY16£000
FY15£000
John Coombe 250 250
Mike Darcey 87 87
Ian Durant 100 100
Cath Keers 92 92
Jacqueline de Rojas 77 77
non-executive directors – arrangements for FY17 (non-audited) The table below provides information on the Group’s forward-looking arrangements for non-executive directors in relation to FY17. Following a review in February 2016, fees will be held at their current level for FY17.
cash element
of fee£000
element of fee to be used to
purchase shares1
£000total£000
Chairman 200 50 250
Non-executive director base fee 50 27 77
Senior independent director fee 10 – 10
Audit Committee chair fee 22.5 – 22.5
Remuneration Committee chair fee 15 – 15
Note: 1. This element of the fee must be used to purchase Group shares after the payment of tax.
Shares purchased must be retained until retirement from the Board.
46 Home Retail GroupAnnual Report 2016
MSL_HRG_RA2016_FINAL_2005.indb 46 20/05/2016 17:59
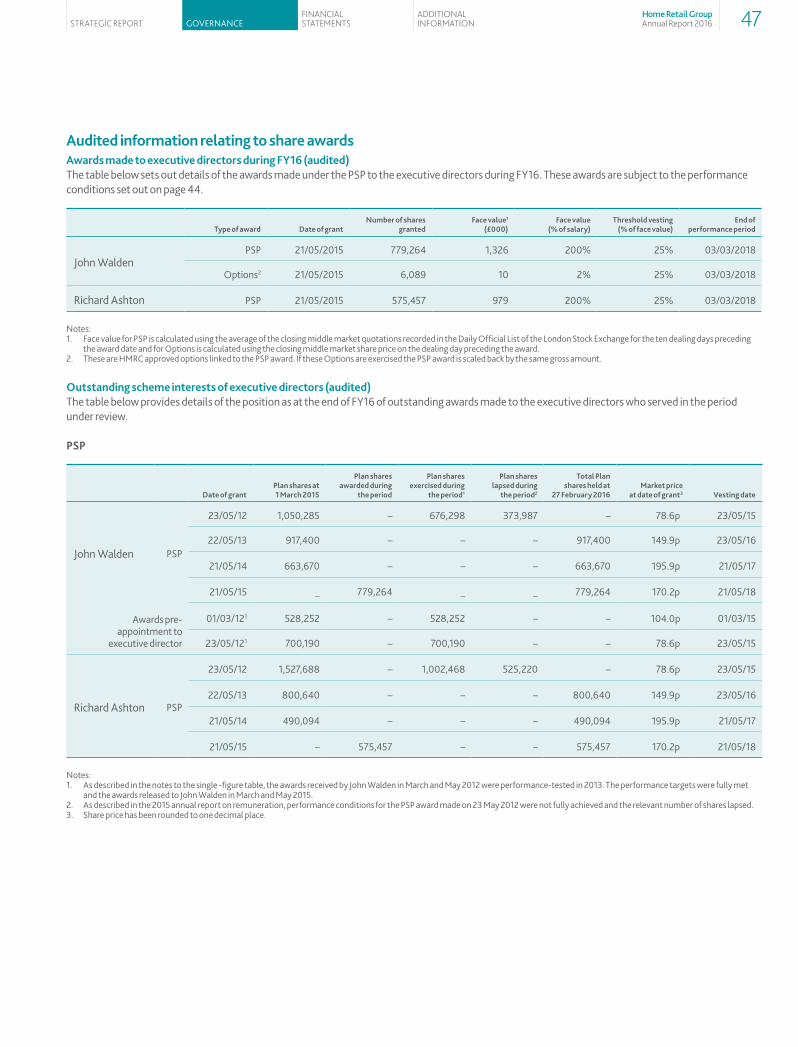
audited information relating to share awardsawards made to executive directors during FY16 (audited)The table below sets out details of the awards made under the PSP to the executive directors during FY16. These awards are subject to the performance conditions set out on page 44.
type of award date of grantnumber of shares
grantedFace value1
(£000)Face value
(% of salary)threshold vesting
(% of face value)end of
performance period
John WaldenPSP 21/05/2015 779,264 1,326 200% 25% 03/03/2018
Options2 21/05/2015 6,089 10 2% 25% 03/03/2018
Richard Ashton PSP 21/05/2015 575,457 979 200% 25% 03/03/2018
Notes:1. Face value for PSP is calculated using the average of the closing middle market quotations recorded in the Daily Official List of the London Stock Exchange for the ten dealing days preceding
the award date and for Options is calculated using the closing middle market share price on the dealing day preceding the award. 2. These are HMRC approved options linked to the PSP award. If these Options are exercised the PSP award is scaled back by the same gross amount.
Outstanding scheme interests of executive directors (audited)The table below provides details of the position as at the end of FY16 of outstanding awards made to the executive directors who served in the period under review.
PSP
date of grantPlan shares at 1 march 2015
Plan shares awarded during
the period
Plan shares exercised during
the period1
Plan shares lapsed during
the period2
total Plan shares held at
27 February 2016market price
at date of grant3 vesting date
John Walden PSP
23/05/12 1,050,285 – 676,298 373,987 – 78.6p 23/05/15
22/05/13 917,400 – – – 917,400 149.9p 23/05/16
21/05/14 663,670 – – – 663,670 195.9p 21/05/17
21/05/15 _ 779,264 _ _ 779,264 170.2p 21/05/18
Awards pre- appointment to
executive director
01/03/121 528,252 – 528,252 – – 104.0p 01/03/15
23/05/121 700,190 – 700,190 – – 78.6p 23/05/15
Richard Ashton PSP
23/05/12 1,527,688 – 1,002,468 525,220 – 78.6p 23/05/15
22/05/13 800,640 – – – 800,640 149.9p 23/05/16
21/05/14 490,094 – – – 490,094 195.9p 21/05/17
21/05/15 – 575,457 – – 575,457 170.2p 21/05/18
Notes:1. As described in the notes to the single -figure table, the awards received by John Walden in March and May 2012 were performance-tested in 2013. The performance targets were fully met
and the awards released to John Walden in March and May 2015.2. As described in the 2015 annual report on remuneration, performance conditions for the PSP award made on 23 May 2012 were not fully achieved and the relevant number of shares lapsed.3. Share price has been rounded to one decimal place.
GovernanceFinancial StatementS
additional inFormationStrategic report 47Home Retail Group
Annual Report 2016
MSL_HRG_RA2016_FINAL_2005.indb 47 20/05/2016 17:59
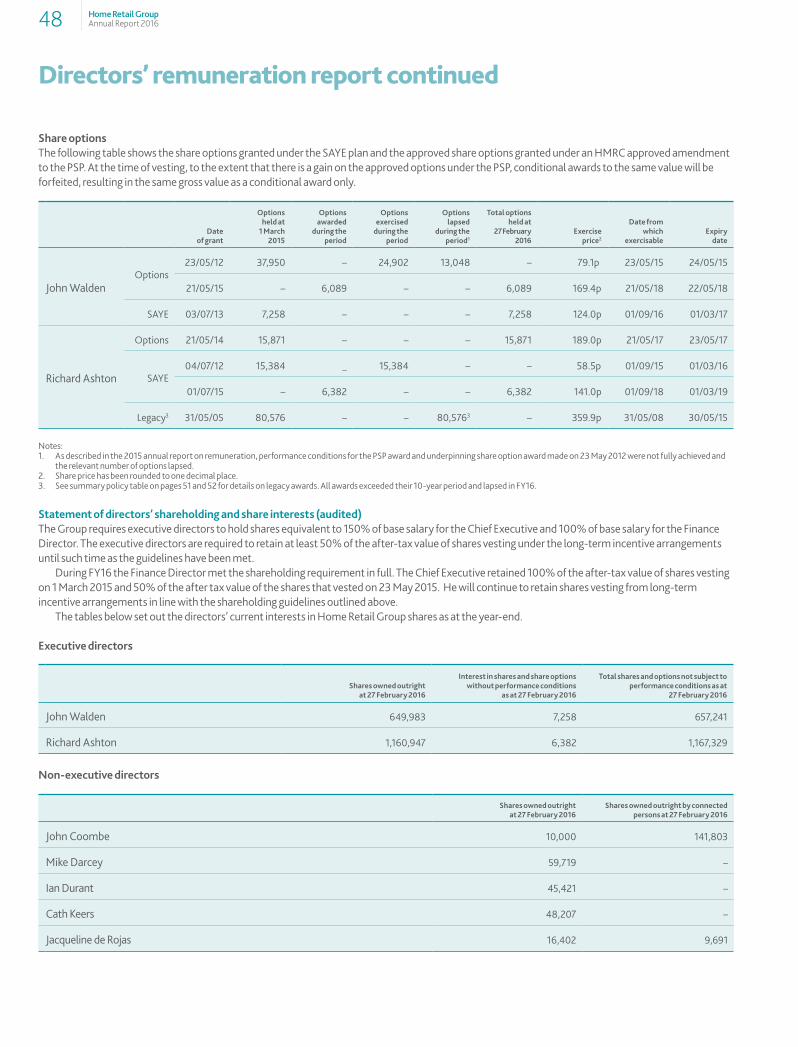
Directors’ remuneration report continued
Share optionsThe following table shows the share options granted under the SAYE plan and the approved share options granted under an HMRC approved amendment to the PSP. At the time of vesting, to the extent that there is a gain on the approved options under the PSP, conditional awards to the same value will be forfeited, resulting in the same gross value as a conditional award only.
date of grant
Options held at
1 march 2015
Options awarded
during the period
Options exercised
during the period
Options lapsed
during the period1
total options held at
27 February 2016
exercise price2
date from which
exercisableexpiry
date
John WaldenOptions
23/05/12 37,950 – 24,902 13,048 – 79.1p 23/05/15 24/05/15
21/05/15 – 6,089 – – 6,089 169.4p 21/05/18 22/05/18
SAYE 03/07/13 7,258 – – – 7,258 124.0p 01/09/16 01/03/17
Richard Ashton
Options 21/05/14 15,871 – – – 15,871 189.0p 21/05/17 23/05/17
SAYE04/07/12 15,384 _ 15,384 – – 58.5p 01/09/15 01/03/16
01/07/15 – 6,382 – – 6,382 141.0p 01/09/18 01/03/19
Legacy3 31/05/05 80,576 – – 80,5763 – 359.9p 31/05/08 30/05/15
Notes:1. As described in the 2015 annual report on remuneration, performance conditions for the PSP award and underpinning share option award made on 23 May 2012 were not fully achieved and
the relevant number of options lapsed. 2. Share price has been rounded to one decimal place.3. See summary policy table on pages 51 and 52 for details on legacy awards. All awards exceeded their 10-year period and lapsed in FY16.
Statement of directors’ shareholding and share interests (audited)The Group requires executive directors to hold shares equivalent to 150% of base salary for the Chief Executive and 100% of base salary for the Finance Director. The executive directors are required to retain at least 50% of the after-tax value of shares vesting under the long-term incentive arrangements until such time as the guidelines have been met.
During FY16 the Finance Director met the shareholding requirement in full. The Chief Executive retained 100% of the after-tax value of shares vesting on 1 March 2015 and 50% of the after tax value of the shares that vested on 23 May 2015. He will continue to retain shares vesting from long-term incentive arrangements in line with the shareholding guidelines outlined above.
The tables below set out the directors’ current interests in Home Retail Group shares as at the year-end.
executive directors
Shares owned outright at 27 February 2016
interest in shares and share options without performance conditions
as at 27 February 2016
total shares and options not subject to performance conditions as at
27 February 2016
John Walden 649,983 7,258 657,241
Richard Ashton 1,160,947 6,382 1,167,329
non-executive directors
Shares owned outright at 27 February 2016
Shares owned outright by connected persons at 27 February 2016
John Coombe 10,000 141,803
Mike Darcey 59,719 –
Ian Durant 45,421 –
Cath Keers 48,207 –
Jacqueline de Rojas 16,402 9,691
48 Home Retail GroupAnnual Report 2016
MSL_HRG_RA2016_FINAL_2005.indb 48 20/05/2016 17:59

external appointmentsExecutive directors and members of senior management may be invited to become non-executive directors of other companies subject to the agreement of the Group. These appointments provide an opportunity to gain broader experience outside Home Retail Group and therefore benefit the Group. Providing that appointments are not likely to lead to a conflict of interest, executive directors may accept non-executive appointments and retain the fees received. Individuals are limited to holding one external plc board appointment, other than at the discretion of the committee. Other external appointments, such as school governor appointments or appointments to the boards of charities, are at the discretion of the committee. Neither John Walden nor Richard Ashton held any external appointments during FY16.
Payments made to past directors (audited)No payments were made during FY16.
Payments for loss of office (audited)No payments were made during FY16.
Percentage change in remuneration (non-audited)The table below illustrates the percentage change in salary, benefits and annual bonus for the Chief Executive (based on the single-figure table) compared with that of colleagues in the broadbanded population and senior management colleagues across the Group. Remuneration for broadbanded colleagues is not subject to union negotiations and, as for previous years, the committee believes this provides the most reasonable comparator group.
% changein base salary (FY15-FY16)
% changein benefits (FY15-FY16)
% changein annual bonus (FY15-FY16)
Chief Executive1 1% increase 4% increase 4% decrease
All broadbanded colleagues2 2% increase 20% decrease 127% decrease
Senior management colleagues3 2% increase 34% decrease 21% decrease
Notes:1. Figures for the Chief Executive relate to John Walden for FY16 and both Terry Duddy and John Walden for FY15. a. John Walden received an increase of 2% to base salary during FY16. The increase in the table above is reflective of the inclusion of base salary for Terry Duddy during his period as Chief
Executive in FY15. b. Whilst there has been a decrease in cost of some benefits, the increase shown above is due to an increase in cost of healthcare benefits in the US. c. Bonus for FY15 reflects only the 50 week period as Chief Executive for John Walden from his appointment on 14 March 2014. Terry Duddy did not receive any bonus in respect of FY15.
Bonus payments reflect business performance as set out on page 43.2. The following is relevant for the whole broadbanded population: a. Salary increases are based on an overall pay review budget of c.2%. b. The comparison for benefits is based on data excluding Homebase. Benefit cost decreases relate to a change in company car policy. c. Whilst bonus structure for senior management colleagues in the broadbanded population mirrors that of the executive directors, other colleagues in the broadbanded population are
bonused on benchmark PBT only and as such are not eligible for a bonus payment in respect of FY16. The decrease in average bonus reflects the impact of this.3. The following is relevant for senior management colleagues: a. Salary and benefit changes are as all broadbanded colleagues. b. The decrease in bonus is for those senior management colleagues with the same bonus structure as the executive directors.
GovernanceFinancial StatementS
additional inFormationStrategic report 49Home Retail Group
Annual Report 2016
MSL_HRG_RA2016_FINAL_2005.indb 49 20/05/2016 17:59

Directors’ remuneration report continued
Historic tSr performance (non-audited)The graph below compares the TSR of Home Retail Group against the FTSE 350 Index of General Retailers for a seven-year period. The FTSE 350 Index of General Retailers is considered the most appropriate choice of index as it is a relevant comparator group for a retail business.
chief executive remuneration outcomes (non-audited) The table below illustrates the Chief Executive single-figure for total remuneration, annual bonus pay-out and PSP vesting as a percentage of maximum opportunity for the same seven-year period.
chief executive single figure of remuneration
(£000)
annual bonus pay-out
(% of maximum)ltiP vesting
(% of maximum)
FY16 John Walden 1,548 50% 16%
FY15 John Walden 2,484 55% 66%
FY14 Terry Duddy 1,983 64% 0%
FY13 Terry Duddy 2,134 53% 0%
FY12 Terry Duddy 1,732 17% 0%
FY11 Terry Duddy 1,709 25% 0%
FY10 Terry Duddy 4,6761 100% 62%
Note:1. The FY10 single figure includes vesting from a number of legacy award schemes from GUS
plc, as well as bonus and LTIP pay-out for that year.
relative importance of spend on pay (non-audited)The table below illustrates the year-on-year change in total remuneration compared to benchmark profit after tax and distributions to shareholders for FY16 and FY15.
FY16 £m
FY15 £m
Percentage change year-on-year note
Total remuneration 645.0 643.2 0.3% increase 8
Benchmark profit after tax 72.4 99.1 26.9% decrease 13
Shareholder distributions1 7.8 28.7 72.8% decrease 12
Note:1. Shareholder distributions refer to dividends paid or declared in respect of the financial year. An
interim dividend of 1.0p per ordinary share was paid on 21 January 2016. The final dividend has not been declared as a result of the 2.8p element of the proposed capital return component of the Board-recommended offer by J Sainsbury plc, which reflects a payment in lieu of the FY16 final dividend. The full-year dividend is therefore represented by the interim dividend of 1.0p per ordinary share. Including this payment in lieu of the FY16 final dividend, the total charge would have been £29.9m.
Shareholder voting (non-audited)The table below sets out the results of the vote on the FY15 remuneration report at the 2015 AGM:
votes %
votes in favour 573,173,898 99.56%
votes against 2,560,028 0.44%
total votes 575,679,926 100.00%
votes withheld 10,090,789 n/a
The committee was pleased with the level of shareholder support for the FY15 remuneration report and is committed to ongoing dialogue with shareholders.
Home Retail Group
£275
£300
£325
£350
£175
£200
£225
£250
£25
£50
£75
£125
£150
£100
28 February 2009
Value of £100 invested on 28 February 2009
27 February 2010
26 February 2011
3 March 2012
2 March 2013
27 February 2016
28 February 2015
1 March 2014
FTSE 350 Index of General Retailers
50 Home Retail GroupAnnual Report 2016
MSL_HRG_RA2016_FINAL_2005.indb 50 20/05/2016 17:59
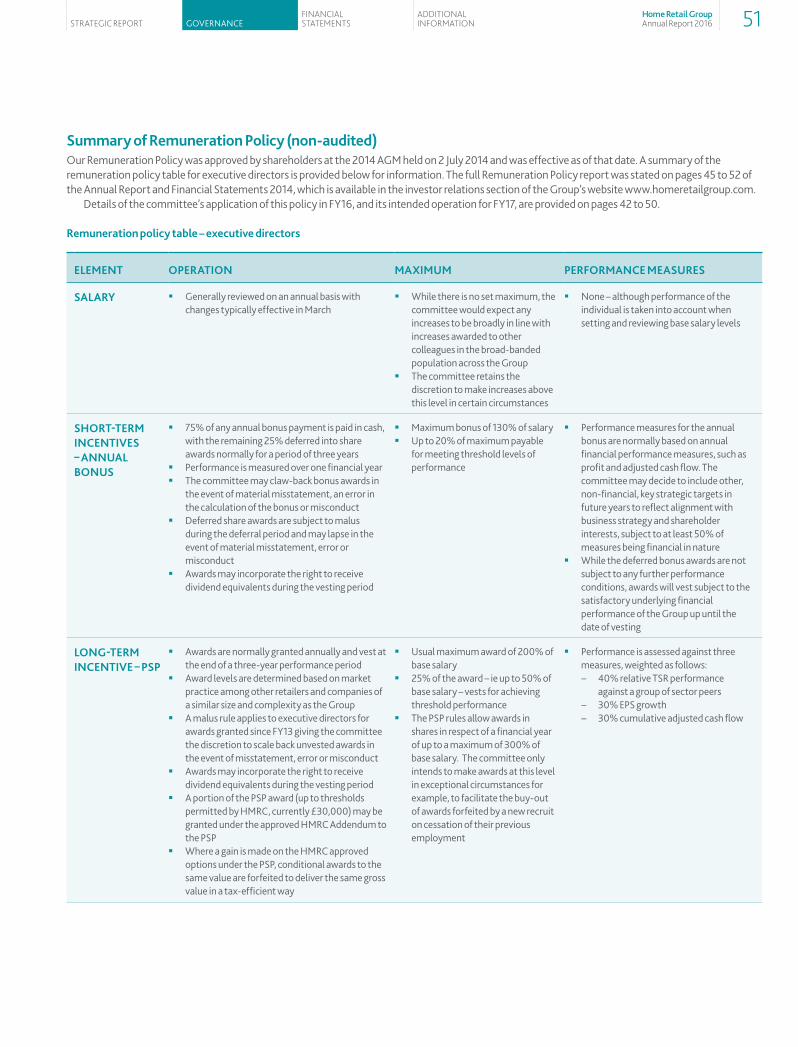
Summary of remuneration Policy (non-audited) Our Remuneration Policy was approved by shareholders at the 2014 AGM held on 2 July 2014 and was effective as of that date. A summary of the remuneration policy table for executive directors is provided below for information. The full Remuneration Policy report was stated on pages 45 to 52 of the Annual Report and Financial Statements 2014, which is available in the investor relations section of the Group’s website www.homeretailgroup.com.
Details of the committee’s application of this policy in FY16, and its intended operation for FY17, are provided on pages 42 to 50.
remuneration policy table – executive directors
element OPeratiOn maXimUm PerFOrmance meaSUreS
SalarY � Generally reviewed on an annual basis with changes typically effective in March
� While there is no set maximum, the committee would expect any increases to be broadly in line with increases awarded to other colleagues in the broad-banded population across the Group
� The committee retains the discretion to make increases above this level in certain circumstances
� None – although performance of the individual is taken into account when setting and reviewing base salary levels
SHOrt-term incentiveS – annUal BOnUS
� 75% of any annual bonus payment is paid in cash, with the remaining 25% deferred into share awards normally for a period of three years
� Performance is measured over one financial year � The committee may claw-back bonus awards in
the event of material misstatement, an error in the calculation of the bonus or misconduct
� Deferred share awards are subject to malus during the deferral period and may lapse in the event of material misstatement, error or misconduct
� Awards may incorporate the right to receive dividend equivalents during the vesting period
� Maximum bonus of 130% of salary � Up to 20% of maximum payable
for meeting threshold levels of performance
� Performance measures for the annual bonus are normally based on annual financial performance measures, such as profit and adjusted cash flow. The committee may decide to include other, non-financial, key strategic targets in future years to reflect alignment with business strategy and shareholder interests, subject to at least 50% of measures being financial in nature
� While the deferred bonus awards are not subject to any further performance conditions, awards will vest subject to the satisfactory underlying financial performance of the Group up until the date of vesting
lOng-term incentive – PSP
� Awards are normally granted annually and vest at the end of a three-year performance period
� Award levels are determined based on market practice among other retailers and companies of a similar size and complexity as the Group
� A malus rule applies to executive directors for awards granted since FY13 giving the committee the discretion to scale back unvested awards in the event of misstatement, error or misconduct
� Awards may incorporate the right to receive dividend equivalents during the vesting period
� A portion of the PSP award (up to thresholds permitted by HMRC, currently £30,000) may be granted under the approved HMRC Addendum to the PSP
� Where a gain is made on the HMRC approved options under the PSP, conditional awards to the same value are forfeited to deliver the same gross value in a tax-efficient way
� Usual maximum award of 200% of base salary
� 25% of the award – ie up to 50% of base salary – vests for achieving threshold performance
� The PSP rules allow awards in shares in respect of a financial year of up to a maximum of 300% of base salary. The committee only intends to make awards at this level in exceptional circumstances for example, to facilitate the buy-out of awards forfeited by a new recruit on cessation of their previous employment
� Performance is assessed against three measures, weighted as follows:
− 40% relative TSR performance against a group of sector peers
− 30% EPS growth − 30% cumulative adjusted cash flow
GovernanceFinancial StatementS
additional inFormationStrategic report 51Home Retail Group
Annual Report 2016
MSL_HRG_RA2016_FINAL_2005.indb 51 20/05/2016 17:59

element OPeratiOn maXimUm PerFOrmance meaSUreS
BeneFitS � The benefits provided take into account market practice and may include, but are not limited to, the following:
− Car benefits, including a driver − Private medical insurance and US healthcare
for the executive director’s family − Relocation − Life insurance − Limited personal travel and home office
expenses − Subscription to professional bodies − Participation in all-employee share schemes
in line with other employees in the Group. The Group currently operates a SAYE scheme.
� There is no maximum. The value of benefits will vary year-on-year depending on the cost of providing these benefits.
� Set at an appropriate market level in the context of the market/role/individual
� None
retirement BeneFitS
� Executive directors are provided with retirement benefits which, at the choice of the executive director, may be delivered in the form of either a cash allowance or as a payment into the Group’s defined contribution scheme
� The maximum employer contribution in respect of a financial year for any director is 30% of base salary
� None
The elements of remuneration for executive directors apply to a significant number of employees within the Group. Award levels and participation vary depending upon seniority and market factors.
Service contracts and letters of appointmentexecutive directors – service contractsJohn Walden was appointed as an executive director on 14 March 2014 following his promotion to the Board as Chief Executive. John Walden has a contract dated 15 January 2014. Richard Ashton was appointed as executive director on 5 July 2006 and his contract is dated 1 March 2005.
non-executive directors – letters of appointmentThe non-executive directors, including the Chairman, are appointed via letters of appointment. Non-executive directors are initially appointed for a three-year term and are typically expected to serve up to a maximum of three, three-year terms subject to review by the Board every three years.
Signed on behalf of the Board
cath KeersChair – Remuneration Committee27 April 2016
Directors’ remuneration report continued
52 Home Retail GroupAnnual Report 2016
MSL_HRG_RA2016_FINAL_2005.indb 52 20/05/2016 17:59

Directors’ report
The directors present their report and the audited consolidated financial statements for the 52 weeks ended 27 February 2016 (the ‘year’).
Home Retail Group plc (the ‘Company’) is the ultimate parent company of Home Retail Group (the ‘Group’), which operates in the UK and the Republic of Ireland.
Sections required to be included in this Annual Report and Financial Statements in accordance with the Companies Act 2006 are set out below. This section (together with sections of the Annual Report incorporated by reference) form part of the directors’ report which is presented in accordance with, and with reliance upon, applicable English company law. The liabilities of the directors in connection with that report shall be subject to the limitations and restrictions provided by such law.
In accordance with s.414C(11) of the Companies Act 2006, the Company has chosen to include certain information in the strategic report as follows: � Particulars of important events affecting the Group since the last
financial year. � Indication of likely future development of the business of the Group.
Other information, which forms part of the directors’ report, can be found in the following sections and locations within this annual report:
information Page no’s/note
Group Audit and Risk Committee report Page 37
Board and committee membership Page 30
Chairman’s statement Page 7
Corporate governance Page 31
Corporate responsibility, including greenhouse gas emissions Page 20 and 21
Directors’ biographies Page 30
Directors’ responsibilities statement Page 56
Diversity Page 33
Financial results and dividends Pages 24 and 86
Nomination Committee report Page 36
Post balance sheet events (Financial Statements) Note 36 on page 107
Risk management (Principal risks and uncertainties) Pages 22 and 23
Strategic report Pages 4 to 29
Publication of unaudited financial information (Group financial review) Pages 25 to 29
Details of long-term incentive schemes (Directors’ remuneration report) Pages 41 to 52
Shareholder waiver of dividends (Financial Statements) Note 28 on page 101
Shareholder waiver of future dividends (Financial Statements) Note 28 on page 101
Viability statement Page 55
Interest capitalised and tax relief Not applicable
Profit forecast disclosure Page 54
Profit and dividendsThe Group’s consolidated income statement on page 63 shows a loss for the year of (£807.8m). An interim dividend of 1.0p per ordinary share was paid on 21 January 2016. The final dividend has not been declared as a result of the 2.8p element of the proposed capital return component of the Board-recommended offer by J Sainsbury plc, which reflects a payment in lieu of the FY16 final dividend. The full-year dividend is therefore represented by the interim dividend of 1.0p per ordinary share.
directorsThe names and biographical details of the directors are shown in the Board of Directors section on page 30. Particulars of directors’ remuneration are shown in the remuneration report on pages 41 to 52.
During the year and up to the date of this report, the Group maintained liability insurance and third-party indemnification provisions for its directors, under which the Company has agreed to indemnify the directors to the extent permitted by law in respect of all liabilities to third parties arising out of, or in connection with, the execution of their powers, duties and responsibilities as directors of the Company and any of its associated companies. These indemnities are Qualifying Third-Party Indemnity Provisions as defined in Section 234 of the Companies Act 2006 and copies are available for inspection at the registered office of the Company during business hours on any weekday except public holidays.
Shareholder rights, appointment, removal of directors and directors’ powersThe internal regulation of the Company is set out in its Articles of Association which cover such matters as the rights of shareholders, the appointment or removal of directors and the conduct of the Board and general meetings. Copies are available upon request and are displayed on the Group’s website at homeretailgroup.com. In accordance with the Articles of Association, directors can be appointed or removed by the Board or shareholders in general meeting. Subject to company law and the Articles of Association, the directors may exercise all the powers of the Company and may delegate authorities to committees. Details of the principal Board committees can be found in the corporate governance section on page 32. The Company’s Articles of Association can be amended by a special resolution of the Company’s shareholders.
Share capital and controlAs at 27 April 2016, the Company’s issued share capital comprised a single class of shares, referred to as ordinary shares. Details of the ordinary share capital can be found in note 27 to the financial statements on page 101. Each share carries the right to one vote at general meetings of the Company and ordinary rights to dividends.
GovernanceFinancial StatementS
additional inFormationStrategic report 53Home Retail Group
Annual Report 2016
MSL_HRG_RA2016_FINAL_2005.indb 53 20/05/2016 17:59

Directors’ report continued
The rights and obligations attached to the shares are more fully set out in the Articles of Association of the Company. There are no restrictions on the transfer of ordinary shares in the Company other than the following: � Certain restrictions may, from time to time, be imposed by laws and
regulations (such as insider trading laws). � Pursuant to the Listing Rules of the FCA, the Company requires certain
employees to seek the Company’s permission to deal in the Company’s ordinary shares.
The Company is not aware of any agreements between shareholders which may result in restrictions on the transfer of securities and/or voting rights. There are no shareholdings which carry special rights relating to control of the Company. A change of control of the Company following a takeover bid may cause a number of agreements to which the Company or its trading subsidiaries is party to take effect, alter or terminate.
Purchase of own sharesAt the Annual General Meeting of the Company held on 1 July 2015, authority was given for the Company to purchase, in the market, up to 81,000,000 ordinary shares of 10p each. At the Annual General Meeting to be held on 29 June 2016, shareholders will be asked to give the Company authority to purchase, in the market, up 81,000,000 ordinary shares of 10p each, details of which are contained in the Notice of Meeting.
Details of the Company’s interests in its own shares are set out in note 28 to the financial statements on page 101.
Substantial shareholdingsAs at 27 April 2016, the Company had been notified under Rule 5 of the FCA’s Disclosure and Transparency Rules of the following holdings of voting rights in the issued share capital of the Company:
total number of voting rights
(ordinary shares)
Percentage of total voting
rights (%)
Schroders plc 146,324,734 17.99
Sanderson Asset Management LLP 59,246,016 7.28
RBC cees Trustee Limited 28,049,821 3.45
Norges Bank 24,613,598 3.03
employeesThe Group has in place measures to provide its employees with information on matters of concern to them as employees, including consulting employees or their representatives on a regular basis so that the views of employees can be taken into account in making decisions which are likely to affect their interests. Various communication routes are made available to employees to give them awareness of the financial and economic factors affecting the performance of the Group and employees are also encouraged to be involved in the Group’s performance through a SAYE share scheme.
The Group has a policy in place for giving full and fair consideration to applications for employment made by disabled persons, having regard to their particular aptitudes and abilities, and for continuing the employment of, and for arranging appropriate training for, employees of the Group who have become disabled persons during the period when they were employed by the Group. The policy also covers the training, career development and promotion of disabled persons employed by the Group.
employee share plansSome of the Company’s employee share plans include restrictions on the transfer of shares while the shares are subject to the plan. As described in the directors’ remuneration report, non-executive directors use part of their fees to purchase shares, which may not normally be transferred during a director’s period of office.
Where, under an employee share plan operated by the Company, participants are the beneficial owners of the shares but are not the registered owners, the voting rights are normally exercised by the registered owner, at the direction of the participant.
All of the Company’s share plans contain provisions relating to a change of control. Outstanding awards and options would normally vest and become exercisable on a change of control, subject to the satisfaction of any performance conditions at that time.
Financial risk managementThe financial risk management objectives and policies of the Group and the exposure of the Group to price, credit, liquidity and cash flow risk are set out in note 4 to the consolidated financial statements.
Political donationsThe Group has made no political donations and incurred no items of political expenditure during the year.
Homebase sale-related profit forecast On 2 February 2016 the Group issued a circular to shareholders in respect of the sale of Homebase. This circular included the following statement: On 14 January 2016, the Company released its Trading Statement for the 18 weeks from 30 August 2015 to 2 January 2016 which updated the statement it made on 21 October 2015 to state that the Group expects that Group benchmark profit before tax for the financial year ending 27 February 2016 will be around the bottom of the current range of market expectations of £92 million to £118 million. This statement constituted a profit forecast for the purposes of the Listing Rules.
The actual results for the 52 weeks ended 27 February 2016 were consistent with this profit forecast as benchmark profit before tax was £94.7m.
relevant audit informationAs at 27 April 2016, so far as each director is aware, there is no relevant audit information of which the Company’s auditors are unaware and each director has taken all steps that he or she ought to have taken as a director in order to make himself or herself aware of any relevant audit information and to ensure that the auditors are aware of that information.
54 Home Retail GroupAnnual Report 2016
MSL_HRG_RA2016_FINAL_2005.indb 54 20/05/2016 17:59
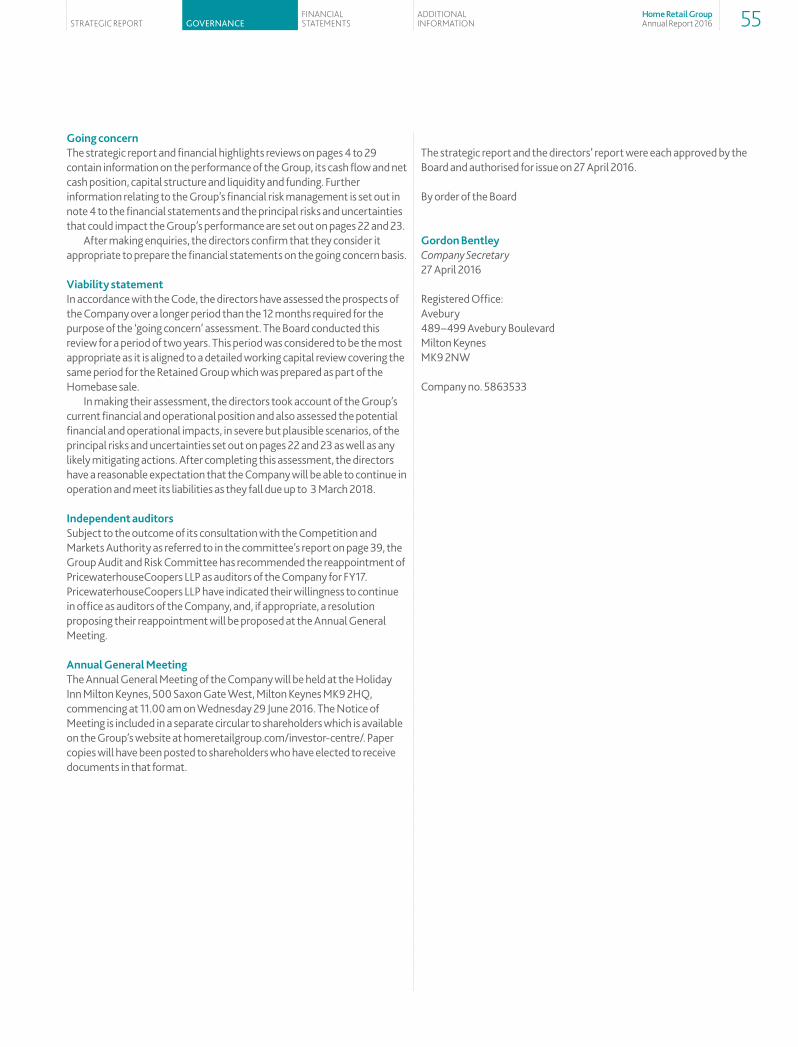
going concernThe strategic report and financial highlights reviews on pages 4 to 29 contain information on the performance of the Group, its cash flow and net cash position, capital structure and liquidity and funding. Further information relating to the Group’s financial risk management is set out in note 4 to the financial statements and the principal risks and uncertainties that could impact the Group’s performance are set out on pages 22 and 23.
After making enquiries, the directors confirm that they consider it appropriate to prepare the financial statements on the going concern basis.
viability statementIn accordance with the Code, the directors have assessed the prospects of the Company over a longer period than the 12 months required for the purpose of the ‘going concern’ assessment. The Board conducted this review for a period of two years. This period was considered to be the most appropriate as it is aligned to a detailed working capital review covering the same period for the Retained Group which was prepared as part of the Homebase sale. In making their assessment, the directors took account of the Group’s current financial and operational position and also assessed the potential financial and operational impacts, in severe but plausible scenarios, of the principal risks and uncertainties set out on pages 22 and 23 as well as any likely mitigating actions. After completing this assessment, the directors have a reasonable expectation that the Company will be able to continue in operation and meet its liabilities as they fall due up to 3 March 2018.
independent auditorsSubject to the outcome of its consultation with the Competition and Markets Authority as referred to in the committee’s report on page 39, the Group Audit and Risk Committee has recommended the reappointment of PricewaterhouseCoopers LLP as auditors of the Company for FY17. PricewaterhouseCoopers LLP have indicated their willingness to continue in office as auditors of the Company, and, if appropriate, a resolution proposing their reappointment will be proposed at the Annual General Meeting.
annual general meetingThe Annual General Meeting of the Company will be held at the Holiday Inn Milton Keynes, 500 Saxon Gate West, Milton Keynes MK9 2HQ, commencing at 11.00 am on Wednesday 29 June 2016. The Notice of Meeting is included in a separate circular to shareholders which is available on the Group’s website at homeretailgroup.com/investor-centre/. Paper copies will have been posted to shareholders who have elected to receive documents in that format.
The strategic report and the directors’ report were each approved by the Board and authorised for issue on 27 April 2016.
By order of the Board
gordon Bentley Company Secretary27 April 2016
Registered Office:Avebury489–499 Avebury BoulevardMilton KeynesMK9 2NW
Company no. 5863533
GovernanceFinancial StatementS
additional inFormationStrategic report 55Home Retail Group
Annual Report 2016
MSL_HRG_RA2016_FINAL_2005.indb 55 20/05/2016 17:59
Statement of directors’ responsibilities
The directors are responsible for preparing the annual report, the directors’ remuneration report and the financial statements in accordance with applicable law and regulations.
Company law requires the directors to prepare financial statements for each financial year. Under that law the directors have prepared the Group and Parent Company financial statements in accordance with International Financial Reporting Standards (IFRSs) as adopted by the European Union. Under company law the directors must not approve the financial statements unless they are satisfied that they give a true and fair view of the state of affairs of the Group and the Company and of the profit or loss of the Group for that period.
In preparing these financial statements, the directors are required to: � select suitable accounting policies and then apply them consistently; � make judgements and accounting estimates that are reasonable and
prudent; � state whether applicable IFRSs as adopted by the European Union have
been followed, subject to any material departures disclosed and explained in the financial statements; and
� prepare the Group financial statements on the going concern basis unless it is inappropriate to presume that the Company will continue in business.
The directors are responsible for keeping adequate accounting records that are sufficient to show and explain the Company’s transactions and disclose with reasonable accuracy, at any time, the financial position of the Company and enable them to ensure that the financial statements and the directors’ remuneration report comply with the Companies Act 2006 and, as regards the Group financial statements, Article 4 of the IAS Regulation. They are also responsible for safeguarding the assets of the Company and hence for taking reasonable steps for the prevention and detection of fraud and other irregularities.
The directors are responsible for the maintenance and integrity of information on the Group’s website. Legislation in the United Kingdom governing the preparation and dissemination of financial statements may differ from legislation in other jurisdictions.
Having taken advice from the Group Audit and Risk Committee, the directors consider that the Annual Report and Financial Statements, taken as a whole, is fair, balanced and understandable and provides the information necessary for shareholders to assess the Company’s position and performance, business model and strategy.
Each of the directors, whose names and functions are listed in the Board of Directors section on page 30 confirm that, to the best of their knowledge: � the Group financial statements, which have been prepared in
accordance with IFRSs as adopted by the EU, give a true and fair view of the assets, liabilities, financial position and profit of the Group; and
� the management report contained in the strategic report and the directors’ report includes a fair review of the development and performance of the business and the position of the Group, together with a description of the principal risks and uncertainties that it faces.
By order of the Board
John Walden Chief Executive27 April 2016
richard ashton Finance Director27 April 2016
56 Home Retail GroupAnnual Report 2016
MSL_HRG_RA2016_FINAL_2005.indb 56 20/05/2016 17:59

Independent auditors’ report to the members of Home Retail Group plc - Groupreport on the group financial statementsOur opinionIn our opinion, Home Retail Group plc’s Group financial statements (the ‘financial statements’): � give a true and fair view of the state of the Group’s affairs as at 27 February 2016 and of its loss and cash flows for the 52-week period (the ‘period’)
then ended; � have been properly prepared in accordance with International Financial Reporting Standards (‘IFRSs’) as adopted by the European Union; and � have been prepared in accordance with the requirements of the Companies Act 2006 and Article 4 of the IAS Regulation.
What we have auditedThe financial statements included within the Annual Report and Financial Statements (the ‘Annual Report’) comprise: � the Consolidated balance sheet as at 27 February 2016; � the Consolidated income statement and Consolidated statement of comprehensive income for the period then ended; � the Consolidated statement of cash flows for the period then ended; � the Consolidated statement of changes in equity for the period then ended; and � the notes to the financial statements, which include a summary of significant accounting policies and other explanatory information.
Certain required disclosures have been presented elsewhere in the Annual Report rather than in the notes to the financial statements. These are cross-referenced from the financial statements and are identified as audited. The financial reporting framework that has been applied in the preparation of the financial statements is IFRSs as adopted by the European Union and applicable law.
Our audit approachContextOn 17 January 2016 the Group signed a share purchase agreement with Bunnings (UK & I) Holdings Limited to sell Homebase and the deal completed on 27 February 2016. In light of the disposal we included the accounting for discontinued operations as an area of audit focus. In addition, as announced on 1 April 2016, the boards of Home Retail Group plc and J Sainsbury plc have reached agreement on the terms of a recommended offer for Home Retail Group plc. Notwithstanding this offer, we determined there was no additional risk or impact to our planned audit approach for Home Retail Group as a standalone Group in the current year.
OverviewMateriality: � Overall Group materiality of £8.0 million, which was based on applying professional judgement, gives regard to benchmark profit before tax
(including discontinued operations) in the current year as well as the overall scale of the business.
Audit scope: � We conducted an audit of the complete financial information of the largest operating segment, Argos, due to its significance to the Group, and of the
Financial Services segment due to the increased inherent risk associated with certain activities within that segment. � We have performed an audit of the income statement of Homebase, which is considered to be a financially significant segment as although it has been
disposed of at the year end, a full year trading activity contributes to the overall Group profit/(loss). We have also audited the loss on disposal of the segment. � Additional audit procedures we performed at a Group level, including testing of certain central expenses in the fourth operating segment, Central
Activities, and over the Group consolidation.
Areas of focus: � Commercial income. � Goodwill impairment assessment. � Provisions for customer redress in respect of Financial Services products. � Exceptional items. � Accounting for discontinued operations.
The scope of our audit and our areas of focusWe conducted our audit in accordance with International Standards on Auditing (UK and Ireland) (‘ISAs (UK & Ireland)’).
We designed our audit by determining materiality and assessing the risks of material misstatement in the financial statements. In particular, we looked at where the directors made subjective judgements, for example in respect of significant accounting estimates that involved making assumptions and considering future events that are inherently uncertain. As in all of our audits, we also addressed the risk of management override of internal controls, including evaluating whether there was evidence of bias by the directors that represented a risk of material misstatement due to fraud.
The risks of material misstatement that had the greatest effect on our audit, including the allocation of our resources and effort, are identified as ‘areas of focus’ in the table below. We have also set out how we tailored our audit to address these specific areas in order to provide an opinion on the financial statements as a whole, and any comments we make on the results of our procedures should be read in this context. This is not a complete list of all risks identified by our audit.
GovernanceFinancial StatementS
additional informationStrateGic report 57Home Retail Group
Annual Report 2016
MSL_HRG_RA2016_FINAL_2005.indb 57 20/05/2016 17:59

Independent auditors’ report to the members of Home Retail Group plc continuedarea of focus How our audit addressed the area of focuscommercial incomeAs described in the Group Audit and Risk Committee Report on page 38 and in note 3 to the accounts on page 71, the Group has two main streams of commercial income: volume-based rebates and marketing and advertising funding.
Commercial income is an area of focus due to the quantum of the income recorded under these arrangements and its significance in relation to the result for the year, and the application of management judgement in recording either amounts receivable or amounts deferred at the balance sheet date.
Volume-based rebatesVolume-based rebates are earned both on purchases of product from suppliers and also on sales to customers and are driven by the Group achieving certain purchase or sales volume targets set by individual suppliers for specific products over a pre-determined period.
There is, therefore, judgement involved in estimating the volume of purchases or sales, particularly where rebate agreements span a financial year end. In instances where the rebate agreement does not fully coincide with the year end the key judgement that we focused on was the estimate of rebate income to be accrued at the year end, in particular, the judgement over whether required contractual volumes were expected to be received.
Marketing and advertising fundingMarketing and advertising funding is recognised in the income statement over the period of time to which the funding relates depending on the nature of the specific arrangement. This is a complex area given the varied types of funding in place (such as funding relating to specific marketing campaigns, funding related to specific Argos catalogues or general marketing support), and management’s manual methodology of tracking and recording this income on spreadsheets.
Our focus was therefore on assessing whether there was evidence that a funding agreement was in place, whether the relevant marketing activity had taken place and whether the income recognised was recorded in the correct year, with particular focus on testing the manual processes in place.
Volume-based rebatesOur approach to auditing volume-based rebates on purchases was largely substantive in nature due to the manual process for tracking such amounts. In addition, we have tested key system controls, including those used to determine the amount of items purchased under the terms of volume-based rebate agreements.
We tested the rebate purchase arrangements entered into the rebate system or onto the sales rebate spreadsheet by testing a sample of data to contracts and agreeing the contractual terms had been recorded correctly. In the absence of a contract, we agreed the terms of the arrangement to other evidence from the supplier. We also tested any post year-end reversal of debit notes recorded at the balance sheet date for evidence and found no such amounts.
We additionally re-performed the system calculation of rebate income to confirm the accuracy of the income recorded, and reconciled the total value of volume-based rebate income recorded in the rebate system or on the rebate spreadsheet to the total value recorded in the general ledger and found no material reconciling items.
We also independently confirmed the terms of a sample of individual commercial income agreements, covering both the duration of the arrangement and rebate value ranges based upon the volume of purchases or sales directly with a range of suppliers. In addition, we independently obtained confirmation of a sample of debit notes raised in the year within the associated agreement period.
Based on the testing detailed above, we concluded there were no material errors in volume based rebates.
Marketing and advertising fundingMarketing and advertising funding is tracked on spreadsheets and therefore our audit procedures focused on obtaining evidence over the amount of the marketing funding entered onto these spreadsheets and whether the funding was recognised in the correct period.
We traced a sample of funding arrangements included on the spreadsheet tracker to evidence from the supplier that they had agreed to the arrangement. We additionally tested the remittance of cash through the supplier’s account.
We tested whether marketing funding had been allocated to the correct year by testing a sample of deals logged on the spreadsheet tracker raised after the year end across all types of funding to ensure that, where income related to pre- year-end funding, that funding had been recorded.
In the Argos business, we traced a sample of adverts viewed on television, online and in print media in the period to the spreadsheet trackers to check the income had been recognised in the correct period.
In the Homebase business, for a sample of marketing funding deals we independently confirmed with the suppliers the income to be recognised in the period.
We reconciled the total value of funding income recorded in the spreadsheet trackers to the total value recorded in the general ledger and found no material reconciling items.
Based on the testing detailed above, we concluded there were no material errors in marketing and advertising funding.
goodwill impairment assessmentRefer to the Group Audit and Risk Committee Report on page 38, the critical accounting estimates and judgements in note 2 to the accounts on page 70, and note 15 for goodwill.
Management has recorded a charge of £851.7m to impair goodwill in order to align the Group’s reported net assets, after adjusting for certain other items, to the recommended offer from J Sainsbury plc for the purchase of Home Retail Group.
We focused on this area because of the materiality of the amounts involved.
We assessed and challenged the appropriate methodology to assess the carrying value of the Argos goodwill in light of the recommended offer from J Sainsbury plc.
We obtained and understood management’s impairment calculation which assesses the difference between the carrying value of the Group’s net assets, including goodwill, and the value of the recommended offer having adjusted for certain items inherent in the valuation. We tested the calculation for mathematical accuracy.
We evaluated the nature of the adjustments made by management to the offer price used in the impairment calculation. We obtained supporting evidence to verify these adjustments and corroborate the reasonableness of the amounts.
We concluded that the impairment recorded was appropriate and the corresponding disclosures are reasonable.
58 Home Retail GroupAnnual Report 2016
MSL_HRG_RA2016_FINAL_2005.indb 58 20/05/2016 17:59

area of focus How our audit addressed the area of focusProvisions for customer redress in respect of Financial Services productsRefer to the Group Audit and Risk Committee Report on page 38, the critical accounting estimates and judgements in note 2 to the accounts on page 70, and note 24 for provisions on page 95.
The Group’s Financial Services division offers Payment Protection Insurance (‘PPI’) to customers for which a provision is recognised in respect of estimated future customer redress.
Management uses a model to calculate estimated provisions. This is a key area of focus due to the extent of judgement incorporated in the assessment and inherent uncertainty in assessing factors such as customer response rates to mailing campaigns, uphold rates on future complaints and the operational cost of administering these claims.
We evaluated controls around the PPI redress program and tested the internal quality review process over the calculation of PPI redress payments and determined it to be effective.
We tested the completeness of the customer account population and the premiums paid to date by obtaining, and re-performing the data scripts used to extract data from management systems.
Using our expertise in the financial services sector, we understood and challenged the provisioning calculation and underlying assumptions used by management. We have reviewed historic data of response rates and pay-out rates, being key assumptions in the calculation. For those assumptions based on historic information, we challenged whether this was appropriate for future experience. We also independently performed sensitivity analysis on the key assumptions to quantify the range of possible outcomes for the provision and concluded the provision was reasonable.
We evaluated disclosures made in the financial statements. We found the disclosures made to be appropriate.
exceptional itemsRefer to note 9 on page 84 and note 14(iv) on page 89 for exceptional items.
The financial statements include certain items which are disclosed as exceptional. In continuing operations these comprise Argos goodwill impairment of £851.7m, Argos transformation of £10.3m, customer redress provisions of £17.0m and impairment of the Habitat brand and goodwill of £12.5m. In discontinuing operations exceptional items comprise gain on disposal of freehold property of £39.3m, loss on disposal of £18.5m and disposal related transaction, separation and restructuring costs of £7.8m.
We focused on this area because items classified as exceptional require judgement by the directors as to whether the items meet the definition in the Group’s accounting policy.
Consistency in identifying and disclosing items as exceptional is important to maintain comparability of the results with previous years.
We assessed the appropriateness of the Group’s accounting policy for exceptional items with reference to the applicable accounting standards.
We evaluated whether each of the items disclosed as exceptional met the criteria set out in the accounting policy and with the treatment adopted in previous accounting years, and confirmed that they were.
We agreed a sample of Argos transformation costs incurred to supplier invoices or other form of evidence such as payroll records to confirm the accuracy of the amounts without exception.
We agreed a sample of transaction, separation and restructuring costs incurred to either supplier invoices to confirm the accuracy of the amounts or assessed the reasonableness of assumptions in management’s calculation of costs. All costs recorded were supportable.
We considered the impact of the closure of the Habitat concessions which are required to close as result of the sale Homebase and concluded that based on management’s forecast of future profitability the Habitat brand and goodwill is impaired.
We reviewed the calculation of the gain on disposal of freehold property and agreed amounts to supporting evidence such as the sale and purchase agreement, property deeds and the bank statement.
Argos goodwill, customer redress and the loss on disposal are considered in other sections of our opinion.
accounting for discontinued operationsRefer to the Group Audit and Risk Committee Report on page 38 and note 14 on pages 88 and 89 for disposal of Homebase.
The results of the Homebase segment are disclosed as discontinued operations in the consolidated income statement, and a loss on disposal of £18.5m has been recognised in the year.
This has been an area of focus given the significance of disposing of a major operating segment, and the complexity and judgement in accounting for this disposal and providing the required disclosures in the Annual Report.
We have reviewed the share purchase agreement for the sale of Homebase and tested management’s calculation of the loss on disposal;
• We have agreed the sale proceeds received to the share purchase agreement and cash received;
• We have tested the mathematical accuracy of management’s calculation;
• We have performed analytical procedures on the net assets disposed and agreed the closing net asset position to the share purchase agreement;
• We have reviewed the completion accounts prepared under the terms of the share purchase agreement.
We concluded that the loss on disposal and the disclosures made in Annual Report are appropriate.
How we tailored the audit scopeWe tailored the scope of our audit to ensure that we performed enough work to be able to give an opinion on the financial statements as a whole, taking into account the geographic structure of the Group, the accounting processes and controls, and the industry in which the Group operates.
The Group is structured along four operating segments being Argos, Financial Services, Central Activities and Homebase, which although presented as a discontinued operation, continues to be a financially significant segment as a full-year trading activity which contributes to the overall Group profit/(loss).
GovernanceFinancial StatementS
additional informationStrateGic report 59Home Retail Group
Annual Report 2016
MSL_HRG_RA2016_FINAL_2005.indb 59 20/05/2016 17:59

We conducted an audit of the complete financial information of the largest operating segment, Argos, due to its significance to the Group, and of the Financial Services segment due to the increased inherent risk associated with certain activities within that segment. We have performed an audit of the income statement of Homebase and have also audited the loss on disposal of the segment.
The group engagement partner led the audit of the Argos segment and we engaged component auditors within PwC UK to perform the Homebase and Financial Services segment audits. All audits are conducted at a single location, which enabled the group engagement team to be actively involved in understanding and evaluating the work of the component auditors.
This, together with additional procedures performed at the Group level including testing certain central expenses within the Central Activities segment and with respect to goodwill impairment testing and the Group consolidation, gave us the evidence we needed for our opinion on the Group financial statements as a whole.
MaterialityThe scope of our audit was influenced by our application of materiality. We set certain quantitative thresholds for materiality. These, together with qualitative considerations, helped us to determine the scope of our audit and the nature, timing and extent of our audit procedures on the individual financial statement line items and disclosures and in evaluating the effect of misstatements, both individually and on the financial statements as a whole.
Based on our professional judgement, we determined materiality for the financial statements as a whole as follows:
Overall group materiality £8.0 million (2015: £8.6 million).
How we determined it Applying professional judgement, giving consideration to benchmark profit before tax (including discontinued operations) in the current year as well the overall scale of the business.
rationale for benchmark applied We believe that benchmark profit before tax (which excludes exceptional and other non-core items) is the primary profit measure used by shareholders to assess the Group’s performance. This provides us with a consistent year on year basis for determining materiality. We had regard to benchmark profit before tax, as well as the overall scale of the business, because in our view, this is appropriate for a business that has had relatively stable volumes but volatile profits. There has been no significant change in the business in the year, however as trading performance is lower than anticipated, we have reduced our materiality level to reflect this.
component materiality For each component in our audit scope, we allocated a materiality that is less than our overall Group materiality. The range of materiality allocated across components was between £2.4 million and £7.6 million.
We agreed with the Group Audit and Risk Committee that we would report to them misstatements identified during our audit above £0.4 million (2015: £0.5 million) as well as misstatements below that amount that, in our view, warranted reporting for qualitative reasons.
going concernUnder the Listing Rules we are required to review the directors’ statement, set out on page 55, in relation to going concern. We have nothing to report having performed our review.
Under ISAs (UK & Ireland) we are required to report to you if we have anything material to add or to draw attention to in relation to the directors’ statement about whether they considered it appropriate to adopt the going concern basis in preparing the financial statements. We have nothing material to add or to draw attention to.
As noted in the directors’ statement, the directors have concluded that it is appropriate to adopt the going concern basis in preparing the financial statements. The going concern basis presumes that the Group has adequate resources to remain in operation, and that the directors intend it to do so, for at least one year from the date the financial statements were signed. As part of our audit we have concluded that the directors’ use of the going concern basis is appropriate. However, because not all future events or conditions can be predicted, these statements are not a guarantee as to the Group’s ability to continue as a going concern.
Independent auditors’ report to the members of Home Retail Group plc continued
60 Home Retail GroupAnnual Report 2016
MSL_HRG_RA2016_FINAL_2005.indb 60 20/05/2016 17:59
Other required reportingconsistency of other information
Companies Act 2006 opinionIn our opinion, the information given in the Strategic Report and the Directors’ Report for the financial period for which the financial statements are prepared is consistent with the financial statements.
ISAs (UK & Ireland) reportingUnder ISAs (UK & Ireland) we are required to report to you if, in our opinion:
� information in the Annual Report is: – materially inconsistent with the information in the audited financial statements; or – apparently materially incorrect based on, or materially inconsistent with, our knowledge of the
Group acquired in the course of performing our audit; or – otherwise misleading.
We have no exceptions to report.
� the statement given by the directors on page 56, in accordance with provision C.1.1 of the UK Corporate Governance Code (‘the Code’), that they consider the Annual Report taken as a whole to be fair, balanced and understandable and provides the information necessary for members to assess the Group’s and Parent Company’s position and performance, business model and strategy is materially inconsistent with our knowledge of the Group and Parent Company acquired in the course of performing our audit.
We have no exceptions to report.
� the section of the Annual Report on page 37, as required by provision C.3.8 of the Code, describing the work of the Group Audit and Risk Committee does not appropriately address matters communicated by us to the Group Audit and Risk Committee.
We have no exceptions to report.
the directors’ assessment of the prospects of the group and of the principal risks that would threaten the solvency or liquidity of the group
Under ISAs (UK & Ireland) we are required to report to you if we have anything material to add or to draw attention to in relation to:
� the directors’ confirmation on page 34 of the Annual Report, in accordance with provision C.2.1 of the Code, that they have carried out a robust assessment of the principal risks facing the Group, including those that would threaten its business model, future performance, solvency or liquidity.
We have nothing material to add or to draw attention to.
� the disclosures in the Annual Report that describe those risks and explain how they are being managed or mitigated.
We have nothing material to add or to draw attention to.
� the directors’ explanation on page 55 of the Annual Report, in accordance with provision C.2.2 of the Code, as to how they have assessed the prospects of the Group, over what period they have done so and why they consider that period to be appropriate, and their statement as to whether they have a reasonable expectation that the Group will be able to continue in operation and meet its liabilities as they fall due over the period of their assessment, including any related disclosures drawing attention to any necessary qualifications or assumptions.
We have nothing material to add or to draw attention to.
Under the Listing Rules we are required to review the directors’ statement that they have carried out a robust assessment of the principal risks facing the Group and the directors’ statement in relation to the longer-term viability of the Group. Our review was substantially less in scope than an audit and only consisted of making inquiries and considering the directors’ process supporting their statements; checking that the statements are in alignment with the relevant provisions of the Code; and considering whether the statements are consistent with the knowledge acquired by us in the course of performing our audit. We have nothing to report having performed our review.
adequacy of information and explanations receivedUnder the Companies Act 2006 we are required to report to you if, in our opinion, we have not received all the information and explanations we require for our audit. We have no exceptions to report arising from this responsibility.
directors’ remunerationUnder the Companies Act 2006 we are required to report to you if, in our opinion, certain disclosures of directors’ remuneration specified by law are not made. We have no exceptions to report arising from this responsibility.
corporate governance statementUnder the Listing Rules we are required to review the part of the Corporate Governance Statement relating to ten further provisions of the Code. We have nothing to report having performed our review.
GovernanceFinancial StatementS
additional informationStrateGic report 61Home Retail Group
Annual Report 2016
MSL_HRG_RA2016_FINAL_2005.indb 61 20/05/2016 17:59
responsibilities for the financial statements and the auditOur responsibilities and those of the directorsAs explained more fully in the Statement of Directors’ Responsibilities set out on page 56, the directors are responsible for the preparation of the financial statements and for being satisfied that they give a true and fair view.
Our responsibility is to audit and express an opinion on the financial statements in accordance with applicable law and ISAs (UK & Ireland). Those standards require us to comply with the Auditing Practices Board’s Ethical Standards for Auditors.
This report, including the opinions, has been prepared for and only for the Parent Company’s members as a body in accordance with Chapter 3 of Part 16 of the Companies Act 2006 and for no other purpose. We do not, in giving these opinions, accept or assume responsibility for any other purpose or to any other person to whom this report is shown or into whose hands it may come save where expressly agreed by our prior consent in writing.
What an audit of financial statements involvesAn audit involves obtaining evidence about the amounts and disclosures in the financial statements sufficient to give reasonable assurance that the financial statements are free from material misstatement, whether caused by fraud or error. This includes an assessment of: � whether the accounting policies are appropriate to the Group’s circumstances and have been consistently applied and adequately disclosed; � the reasonableness of significant accounting estimates made by the directors; and � the overall presentation of the financial statements.
We primarily focus our work in these areas by assessing the directors’ judgements against available evidence, forming our own judgements, and evaluating the disclosures in the financial statements.
We test and examine information, using sampling and other auditing techniques, to the extent we consider necessary to provide a reasonable basis for us to draw conclusions. We obtain audit evidence through testing the effectiveness of controls, substantive procedures or a combination of both. In addition, we read all the financial and non-financial information in the Annual Report to identify material inconsistencies with the audited financial statements and to identify any information that is apparently materially incorrect based on, or materially inconsistent with, the knowledge acquired by us in the course of performing the audit. If we become aware of any apparent material misstatements or inconsistencies we consider the implications for our report.
Other matterWe have reported separately on the Parent Company financial statements of Home Retail Group plc for the 52-week period ended 27 February 2016 and on the information in the Directors’ Remuneration Report that is described as having been audited.
neil grimesSenior Statutory Auditorfor and on behalf of PricewaterhouseCoopers LLPChartered Accountants and Statutory AuditorsLondon27 April 2016
Independent auditors’ report to the members of Home Retail Group plc continued
62 Home Retail GroupAnnual Report 2016
MSL_HRG_RA2016_FINAL_2005.indb 62 20/05/2016 17:59
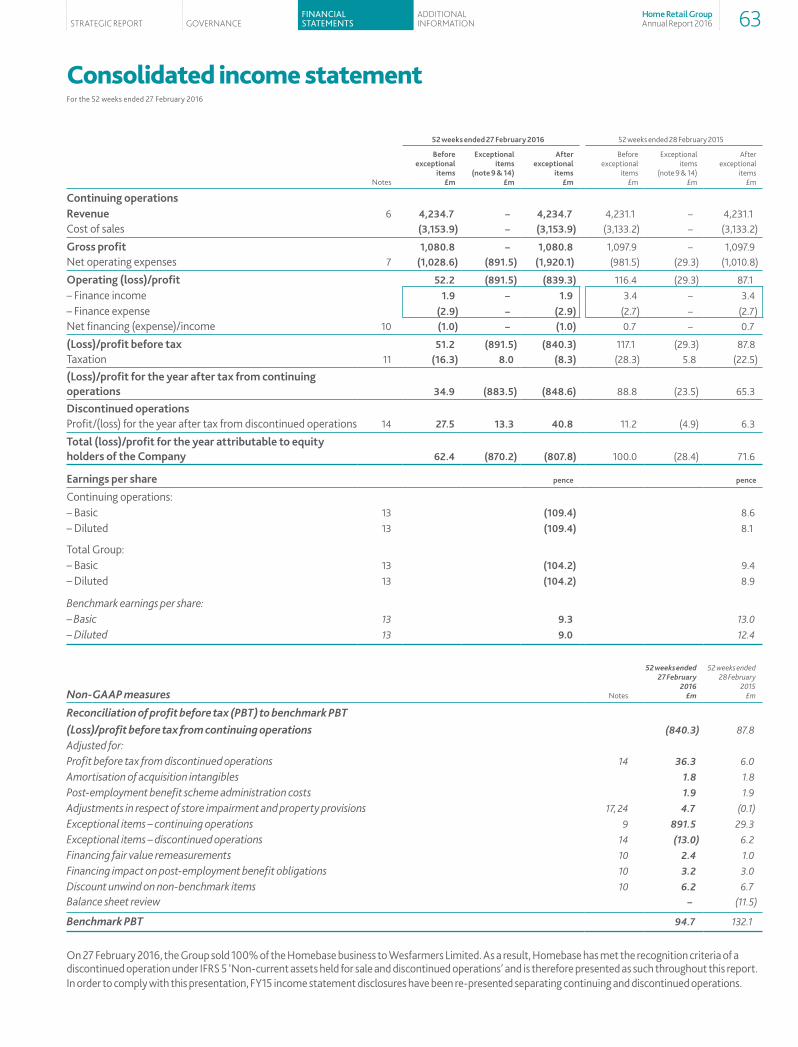
Consolidated income statementFor the 52 weeks ended 27 February 2016
52 weeks ended 27 February 2016 52 weeks ended 28 February 2015
Notes
Before exceptional
items £m
exceptional items
(note 9 & 14) £m
after exceptional
items £m
Before exceptional
items £m
Exceptional items
(note 9 & 14) £m
After exceptional
items £m
continuing operationsrevenue 6 4,234.7 – 4,234.7 4,231.1 – 4,231.1Cost of sales (3,153.9) – (3,153.9) (3,133.2) – (3,133.2)
gross profit 1,080.8 – 1,080.8 1,097.9 – 1,097.9Net operating expenses 7 (1,028.6) (891.5) (1,920.1) (981.5) (29.3) (1,010.8)
Operating (loss)/profit 52.2 (891.5) (839.3) 116.4 (29.3) 87.1– Finance income 1.9 – 1.9 3.4 – 3.4– Finance expense (2.9) – (2.9) (2.7) – (2.7)Net financing (expense)/income 10 (1.0) – (1.0) 0.7 – 0.7
(loss)/profit before tax 51.2 (891.5) (840.3) 117.1 (29.3) 87.8Taxation 11 (16.3) 8.0 (8.3) (28.3) 5.8 (22.5)
(loss)/profit for the year after tax from continuing operations 34.9 (883.5) (848.6) 88.8 (23.5) 65.3
discontinued operations Profit/(loss) for the year after tax from discontinued operations 14 27.5 13.3 40.8 11.2 (4.9) 6.3
total (loss)/profit for the year attributable to equity holders of the company 62.4 (870.2) (807.8) 100.0 (28.4) 71.6
earnings per share pence pence
Continuing operations:– Basic 13 (109.4) 8.6– Diluted 13 (109.4) 8.1
Total Group:– Basic 13 (104.2) 9.4– Diluted 13 (104.2) 8.9
Benchmark earnings per share:– Basic 13 9.3 13.0– Diluted 13 9.0 12.4
Non-GAAP measures Notes
52 weeks ended 27 February
2016£m
52 weeks ended 28 February
2015£m
Reconciliation of profit before tax (PBT) to benchmark PBT(Loss)/profit before tax from continuing operations (840.3) 87.8Adjusted for:Profit before tax from discontinued operations 14 36.3 6.0Amortisation of acquisition intangibles 1.8 1.8Post-employment benefit scheme administration costs 1.9 1.9Adjustments in respect of store impairment and property provisions 17, 24 4.7 (0.1)Exceptional items – continuing operations 9 891.5 29.3Exceptional items – discontinued operations 14 (13.0) 6.2Financing fair value remeasurements 10 2.4 1.0Financing impact on post-employment benefit obligations 10 3.2 3.0Discount unwind on non-benchmark items 10 6.2 6.7Balance sheet review – (11.5)
Benchmark PBT 94.7 132.1
On 27 February 2016, the Group sold 100% of the Homebase business to Wesfarmers Limited. As a result, Homebase has met the recognition criteria of a discontinued operation under IFRS 5 ‘Non-current assets held for sale and discontinued operations’ and is therefore presented as such throughout this report. In order to comply with this presentation, FY15 income statement disclosures have been re-presented separating continuing and discontinued operations.
GovernanceFinancial StatementS
additional informationStrateGic report 63Home Retail Group
Annual Report 2016
MSL_HRG_RA2016_FINAL_2005.indb 63 20/05/2016 17:59

Consolidated statement of comprehensive incomeFor the 52 weeks ended 27 February 2016
Notes
52 weeks ended
27 February 2016
£m
52 weeks ended
28 February 2015
£m
(loss)/profit for the year attributable to equity holders of the company (807.8) 71.6
items that may be reclassified subsequently to profit or loss:Net change in fair value of cash flow hedges– Foreign currency forward exchange contracts 72.0 49.1
Net change in fair value of cash flow hedges transferred to inventory– Foreign currency forward exchange contracts (44.4) (3.3)
Fair value movements on available-for-sale financial assets (0.3) 0.7
Currency translation differences 2.9 (1.5)
Tax (charge) in respect of items that will be or have been recycled 11 (5.1) (9.1)
Items recycled from other reserves (13.1) -
12.0 35.9
items that will not be reclassified subsequently to profit or loss:Remeasurement of the net defined benefit liability 25 (24.7) (55.6)
Tax credit in respect of items not recycled 11 3.9 11.1
(20.8) (44.5)
Other comprehensive (expense)/income for the year, net of tax (8.8) (8.6)
total comprehensive (expense)/income for the year attributable to equity holders of the company (816.6) 63.0
Continuing operations (849.4) 32.4
Discontinued operations 32.8 30.6
total comprehensive (expense)/income for the year attributable to equity holders of the company (816.6) 63.0
64 Home Retail GroupAnnual Report 2016
MSL_HRG_RA2016_FINAL_2005.indb 64 20/05/2016 17:59
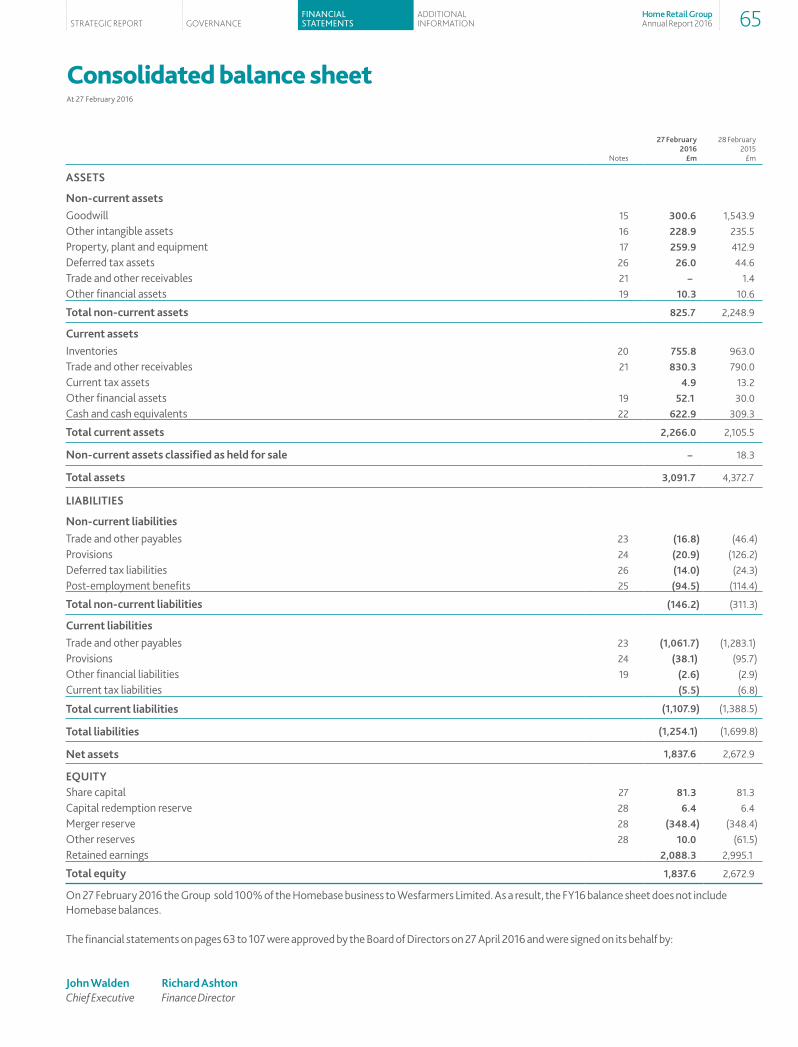
Consolidated balance sheetAt 27 February 2016
Notes
27 February 2016
£m
28 February 2015
£m
aSSetS
non-current assetsGoodwill 15 300.6 1,543.9Other intangible assets 16 228.9 235.5Property, plant and equipment 17 259.9 412.9Deferred tax assets 26 26.0 44.6Trade and other receivables 21 – 1.4Other financial assets 19 10.3 10.6
total non-current assets 825.7 2,248.9
current assetsInventories 20 755.8 963.0Trade and other receivables 21 830.3 790.0Current tax assets 4.9 13.2Other financial assets 19 52.1 30.0Cash and cash equivalents 22 622.9 309.3
total current assets 2,266.0 2,105.5
non-current assets classified as held for sale – 18.3
total assets 3,091.7 4,372.7
liaBilitieS
non-current liabilitiesTrade and other payables 23 (16.8) (46.4)Provisions 24 (20.9) (126.2)Deferred tax liabilities 26 (14.0) (24.3)Post-employment benefits 25 (94.5) (114.4)
total non-current liabilities (146.2) (311.3)
current liabilitiesTrade and other payables 23 (1,061.7) (1,283.1)Provisions 24 (38.1) (95.7)Other financial liabilities 19 (2.6) (2.9)Current tax liabilities (5.5) (6.8)
total current liabilities (1,107.9) (1,388.5)
total liabilities (1,254.1) (1,699.8)
net assets 1,837.6 2,672.9
eQUitYShare capital 27 81.3 81.3Capital redemption reserve 28 6.4 6.4Merger reserve 28 (348.4) (348.4)Other reserves 28 10.0 (61.5)Retained earnings 2,088.3 2,995.1
total equity 1,837.6 2,672.9
On 27 February 2016 the Group sold 100% of the Homebase business to Wesfarmers Limited. As a result, the FY16 balance sheet does not include Homebase balances.
The financial statements on pages 63 to 107 were approved by the Board of Directors on 27 April 2016 and were signed on its behalf by:
John Walden richard ashton Chief Executive Finance Director
GovernanceFinancial StatementS
additional informationStrateGic report 65Home Retail Group
Annual Report 2016
MSL_HRG_RA2016_FINAL_2005.indb 65 20/05/2016 17:59
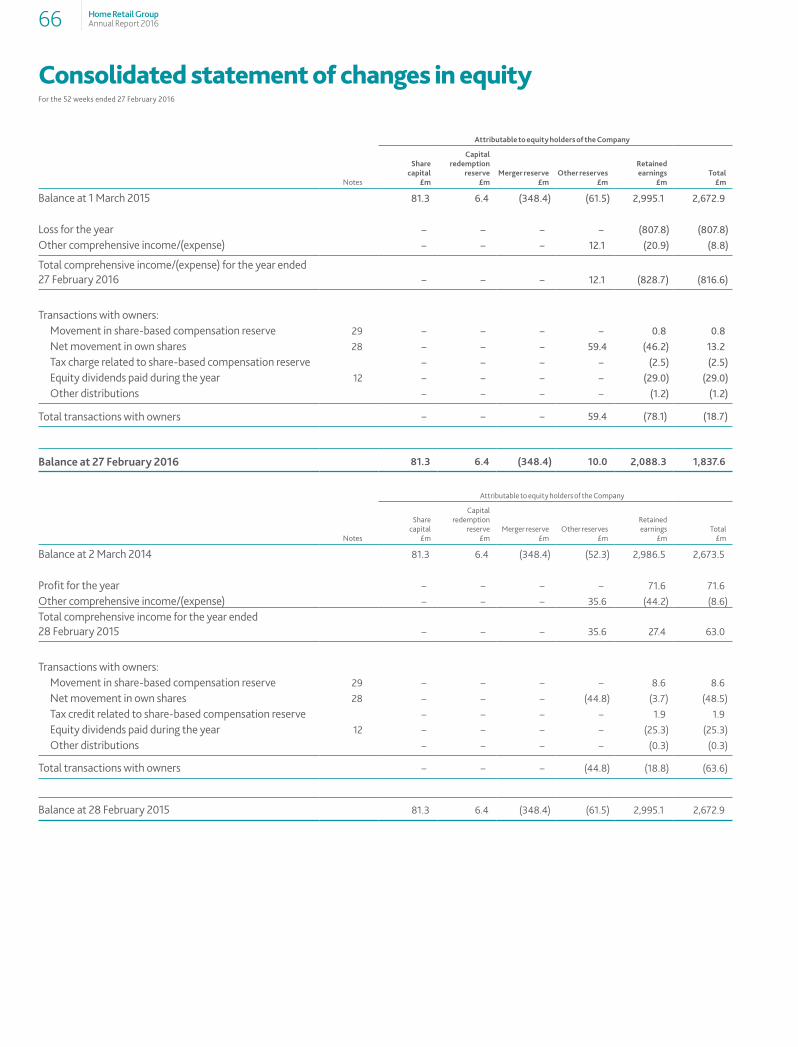
Consolidated statement of changes in equityFor the 52 weeks ended 27 February 2016
attributable to equity holders of the company
Notes
Share capital
£m
capital redemption
reserve£m
merger reserve£m
Other reserves£m
retained earnings
£mtotal
£m
Balance at 1 March 2015 81.3 6.4 (348.4) (61.5) 2,995.1 2,672.9
Loss for the year – – – – (807.8) (807.8)Other comprehensive income/(expense) – – – 12.1 (20.9) (8.8)
Total comprehensive income/(expense) for the year ended 27 February 2016 – – – 12.1 (828.7) (816.6)
Transactions with owners: Movement in share-based compensation reserve 29 – – – – 0.8 0.8 Net movement in own shares 28 – – – 59.4 (46.2) 13.2 Tax charge related to share-based compensation reserve – – – – (2.5) (2.5) Equity dividends paid during the year 12 – – – – (29.0) (29.0) Other distributions – – – – (1.2) (1.2)
Total transactions with owners – – – 59.4 (78.1) (18.7)
Balance at 27 February 2016 81.3 6.4 (348.4) 10.0 2,088.3 1,837.6
Attributable to equity holders of the Company
Notes
Share capital
£m
Capital redemption
reserve£m
Merger reserve£m
Other reserves£m
Retained earnings
£mTotal
£m
Balance at 2 March 2014 81.3 6.4 (348.4) (52.3) 2,986.5 2,673.5
Profit for the year – – – – 71.6 71.6Other comprehensive income/(expense) – – – 35.6 (44.2) (8.6)Total comprehensive income for the year ended 28 February 2015 – – – 35.6 27.4 63.0
Transactions with owners: Movement in share-based compensation reserve 29 – – – – 8.6 8.6 Net movement in own shares 28 – – – (44.8) (3.7) (48.5) Tax credit related to share-based compensation reserve – – – – 1.9 1.9 Equity dividends paid during the year 12 – – – – (25.3) (25.3) Other distributions – – – – (0.3) (0.3)
Total transactions with owners – – – (44.8) (18.8) (63.6)
Balance at 28 February 2015 81.3 6.4 (348.4) (61.5) 2,995.1 2,672.9
66 Home Retail GroupAnnual Report 2016
MSL_HRG_RA2016_FINAL_2005.indb 66 20/05/2016 17:59

Consolidated statement of cash flows For the 52 weeks ended 27 February 2016
Notes
52 weeks ended
27 February 2016
£m
52 weeks ended
28 February 2015
£m
cash flows from operating activities
Cash generated from operations 33 134.6 211.8Tax received/(paid) 13.1 (12.1)Disposal of leasehold property (13.2) (9.0)
cash flows from operating activities 134.5 190.7
Purchase of property, plant and equipment (65.5) (81.2)Purchase of other intangible assets (107.3) (93.3)Proceeds from the disposal of property, plant and equipment – freehold property 27.7 30.0Proceeds from the disposal of property, plant and equipment – other 4.3 6.7Sale of Homebase – discontinued operations 14 (v) 337.3 –Interest and other financing fees (paid)/received (2.3) 0.7
net cash generated/(used) in investing activities 194.2 (137.1)
cash flows from financing activities
Purchase of shares for Employee Share Trust – (50.0)Proceeds from disposal of shares held by Employee Share Trust 13.3 1.5Dividends paid 12 (29.0) (25.3)
net cash used in financing activities (15.7) (73.8)
net increase/(decrease) in cash and cash equivalents 313.0 (20.2)
movement in cash and cash equivalents
Cash and cash equivalents at the beginning of the year 22 309.3 331.0Effect of foreign exchange rate changes 0.6 (1.5)Net increase/(decrease) in cash and cash equivalents 313.0 (20.2)
cash and cash equivalents at the end of the year 22 622.9 309.3
GovernanceFinancial StatementS
additional informationStrateGic report 67Home Retail Group
Annual Report 2016
MSL_HRG_RA2016_FINAL_2005.indb 67 20/05/2016 17:59

Analysis of net cash/(debt)At 27 February 2016
Non-GAAP measures Notes
27 February 2016
£m
28 February 2015
£m
Financing net cash:
Cash and cash equivalents 22 622.9 309.3
Total financing net cash 622.9 309.3
Operating net debt:
Off balance sheet operating leases (676.9) (1,914.4)
Total operating net debt (676.9) (1,914.4)
Total net debt (54.0) (1,605.1)
The Group uses the term ‘total net debt’ to highlight the Group’s aggregate net indebtedness to banks and other financial institutions together with debt-like liabilities, notably operating leases. The gross lease commitments are £798.9m (2015: £2,342.2m), the discounted value of these leases is £676.9m (2015: £1,914.4m) based upon discounting the existing lease commitments at the Group’s estimated long-term cost of borrowing of 3.6% (2015: 4.1%).
68 Home Retail GroupAnnual Report 2016
MSL_HRG_RA2016_FINAL_2005.indb 68 20/05/2016 17:59

Notes to the financial statementsFor the 52 weeks ended 27 February 2016
1. general inFOrmatiOnHome Retail Group plc (the Company), which is the ultimate parent company of Home Retail Group (the Group), is a public limited company incorporated and domiciled in the United Kingdom under the Companies Act 2006 and listed on the London Stock Exchange. The Group is a home and general merchandise retailer. These consolidated financial statements were authorised for issue by the Board of Directors on 27 April 2016. The financial year represents the 52 weeks to 27 February 2016 (prior financial year represents the 52 weeks to 28 February 2015).
Statement of compliance The consolidated financial statements of the Company have been prepared in accordance with International Financial Reporting Standards (IFRSs) and International Financial Reporting Interpretations Committee Interpretations (IFRICs) as adopted by the European Union. They also comply with those parts of the Companies Act 2006 applicable to companies reporting under IFRSs.
2. BaSiS OF PreParatiOnThe Group consolidated financial statements are presented in sterling, rounded to the nearest hundred thousand. They are prepared on a going concern basis and under the historic cost basis modified for the revaluation of certain financial instruments, share-based payments and post-employment benefits. The principal accounting policies applied in the preparation of these consolidated financial statements are set out in note 3. Unless otherwise stated, these policies have been consistently applied to all the periods presented.
On 27 February 2016 the Group sold 100% of the Homebase business to Wesfarmers Limited. As a result, Homebase has met the recognition criteria of a discontinued operation under IFRS 5 ‘Non-current assets held for sale and discontinued operations’ and is therefore presented as such throughout this report. In order to comply with this presentation, FY15 income statement disclosures have been re-presented separating continuing and discontinued operations.
Basis of consolidationThe Group financial statements consist of the financial statements of the ultimate parent company (Home Retail Group plc), entities controlled by the Company (its subsidiaries) and the Group’s share of its interests in associates. The accounting policies of subsidiaries are consistent with the policies adopted by the Group for the purposes of the Group’s consolidation.
SubsidiariesA subsidiary is an entity whose operating and financing policies are controlled by the Group. Subsidiaries are consolidated from the date on which control was transferred to the Group. Subsidiaries cease to be consolidated from the date that the Group no longer has control. Intercompany transactions, balances and unrealised gains on transactions between Home Retail Group companies have been eliminated on consolidation.
Business combinationsUnder the requirements of IFRS 3, all business combinations are accounted for using the acquisition method. The cost of business acquisitions is the aggregate of fair values, at the date of exchange, of assets given, liabilities incurred or assumed and equity instruments issued by the acquirer. The cost of a business combination is allocated at the acquisition date by recognising the acquiree’s identifiable assets, liabilities and contingent liabilities that satisfy the recognition criteria at their fair values at that date. The acquisition date is the date on which the acquirer effectively obtains control of the acquiree. Intangible assets are recognised if they meet the definition of an intangible asset contained in IAS 38 and its fair value can be measured reliably. The excess of the cost of acquisition over the fair value of the Group’s share of the identifiable net assets acquired is recognised as goodwill.
changes in accounting standardsThere are no new standards, amendments to existing standards or interpretations which are effective for the first time during the year ended 27 February 2016 that have a material impact on the Group. At the balance sheet date there are a number of new standards and amendments to existing standards in issue but not yet effective, including IFRS 15 ‘Revenue from contracts with customers’ and IFRS 9 ‘Financial Instruments’, which are both effective for periods beginning on or after 1 January 2018. IFRS 16 ‘Leases’ was published during the year and will come into effect on periods beginning on or after 1 January 2019. The Group has not early-adopted any of these new standards or amendments to existing standards and the Group will assess their full impact in due course. There are no other new standards, amendments to existing standards or interpretations that are not yet effective that would be expected to have a material impact on the Group.
critical accounting estimates and assumptionsThe preparation of financial statements requires management to make estimates and assumptions that affect the reported amount of revenues, expenses, assets and liabilities and the disclosure of contingent liabilities. The resulting accounting estimates, which are based on management’s best judgement at the date of the financial statements, will, by definition, seldom equal the related actual results. The estimates and underlying assumptions are reviewed on an ongoing basis, with revisions recognised in the period in which the estimates are revised and future periods where appropriate. The estimates and assumptions that have a significant risk of causing a material adjustment to the carrying amounts of assets and liabilities within the next financial year are discussed below:
GovernanceFinancial StatementS
additional informationStrateGic report 69Home Retail Group
Annual Report 2016
MSL_HRG_RA2016_FINAL_2005.indb 69 20/05/2016 17:59
Notes to the financial statements continuedFor the 52 weeks ended 28 February 2016
2. BaSiS OF PreParatiOn CONTINUEDImpairment of goodwillGoodwill is allocated to cash-generating units (CGUs) at the level of each business segment. The Group is required to assess whether goodwill has suffered any impairment loss on an annual basis, based on the recoverable amount, being the higher of the CGU’s fair value less costs to sell and its value-in-use. The calculations of recoverable amounts require the use of estimates as disclosed in note 15.
Impairment of assetsAssets are subject to impairment reviews whenever changes in events or circumstances indicate that an impairment may have occurred. If such an indicator exists, the recoverable amount of the asset is estimated in order to determine the extent of any impairment loss. Where the asset does not generate cash flows that are independent from other assets, the Group estimates the recoverable amount of the CGU to which the asset belongs. In the case of store assets, a CGU may represent a single store or a group of stores.
Assets (or CGUs) are written down to their recoverable amount, which is the higher of fair value less costs to sell and value-in-use. Value-in-use is calculated by discounting the expected cash flows from the asset at an appropriate discount rate for the risks associated with that asset. This includes the expected future cash flows based on management’s assumptions and estimates of the future performance of the asset and an appropriate discount rate. Differences between expectations and the actual cash flows will result in differences in the level of impairment required. The calculations of impairment charges are disclosed in notes 16 and 17.
A previously recognised impairment loss is reversed if there has been a significant change in the underlying assumptions used to determine the recoverable amount, however not to an amount higher than the carrying amount that would have been determined, net of amortisation or depreciation, if no impairment loss had been recognised in prior years.
Impairment of trade receivablesA trade receivable is impaired when there is objective evidence that events since the receivable was established have affected the expected cash flows from the receivable. The Group’s impairment provision against trade receivables is established on a portfolio basis, taking into account the level of arrears, past loss experience and defaults based on portfolio trends. The future credit quality of the trade receivable portfolio is subject to uncertainties that could cause actual credit losses to differ materially from the reported impairment provision against trade receivables. These uncertainties include the economic environment, notably the unemployment level, payment behaviour and bankruptcy trends.
Post-employment benefitsThe present value of the defined benefit obligations depends on a number of factors that are determined on an actuarial basis using a number of assumptions. The main assumption used in determining the defined benefit obligations and net pension costs is the discount rate. Any changes in these assumptions may impact the amounts disclosed in the Group’s balance sheet and income statement. The Group determines the appropriate discount rate at the end of each year. This is the interest rate used to determine the present value of estimated future cash outflows expected to be required to settle the defined benefit obligations. In determining the appropriate discount rate, the Group considers the market yields of high-quality corporate bonds that are denominated in the currency in which the benefits will be paid, and that have terms to maturity consistent with the estimated average term of the related pension liability. Other key assumptions for defined benefit obligations and pension costs are based in part on market conditions at the relevant year-ends and additional information is disclosed in note 25.
ProvisionsProvisions have been estimated for property, insurance, restructuring, customer redress principally in respect of Payment Protection Insurance and other liabilities. These provisions represent the best estimate of the liability at the balance sheet date, the actual liability being dependent on future events such as trading conditions at a particular store, including expected costs or income associated with store closures, the incidence of insurance claims against the Group or the anticipated costs of related customer contact and redress. Expectations will be revised each period until the actual liability arises, with any difference accounted for in the period in which the revision is made. The calculations of the provisions and additional information are disclosed in note 24.
Inventory provisionsInventory is carried at the lower of cost and net realisable value, which requires the estimation of the eventual sales price of goods to customers in the future as disclosed in note 20. Cost includes the impact of discounts received from suppliers which is directly linked to the purchase of stock. Net realisable value takes into account slow moving, obsolete and defective inventory. Any difference between the expected and the actual sales price achieved will be accounted for in the period in which the sale is made.
70 Home Retail GroupAnnual Report 2016
MSL_HRG_RA2016_FINAL_2005.indb 70 20/05/2016 17:59

3. SUmmarY OF PrinciPal accOUnting POlicieSrevenue recognitionRevenue comprises the fair value of the consideration received or receivable for the sale of goods and services to external customers, net of value added tax, rebates, discounts and expected returns. Revenue is recognised as follows:
Sale of goodsRevenue is recognised when the significant risks and rewards of ownership of the goods have passed to the buyer and the amount of revenue can be measured reliably. Revenue on goods to be delivered is recognised when the customer receives delivery of the goods. The Group operates a variety of sales promotion schemes that give rise to goods being sold at a discount to the standard retail price. Commissions receivable on the sale of services for which the Group acts as agent are included within revenue.
Interest incomeInterest income on customer store card accounts is recognised as revenue using the effective interest method.
commercial incomeCommercial income is recognised such that income which relates to product costs is recognised within cost of sales and income related to activities where the costs are recognised within net operating expenses, such as catalogue and other advertising costs, are recognised within net operating expenses. Commercial income is recognised based on the expected entitlement that has been earned up to the balance sheet date. The Group only recognises commercial income where there is documented evidence of an agreement with a supplier. The types of commercial income recognised by the Group are:
type of commercial income description accounting policy
Marketing and advertising income Examples include contributions to the cost of the catalogue, funding for other advertising and short-term product promotions.
Income which is directly linked to the cost of producing the catalogue is recognised once agreed with the supplier and when the catalogue is made available to the Group which is the point at which the catalogue costs are recognised.
Other marketing and advertising income is recognised once agreed with a supplier and over the period as set out in the specific supplier agreement.
Volume-based rebates Income earned by achieving specific volume targets agreed with the supplier for specific products.
Income is recognised through the year based on forecasts for expected sales or purchase volumes, informed by current performance, trends, and the terms of the supplier agreement. Income is invoiced throughout the year in accordance with the specific supplier terms. The majority of these arrangements run for one calendar year.
Commercial income related to inventory held on the balance sheet is deferred within inventory as a cost price reduction. Commercial income earned but not collected at the balance sheet date is recognised within trade and other receivables. There are no significant amounts of collected and deferred commercial income within trade and other payables at the 27 February 2016 balance sheet date.
There are certain other types of funding which are collected from suppliers, for example discounts received on settlement of creditor balances and cost recoveries from suppliers for product quality issues which have been excluded from commercial income disclosure principally because they are not judgemental.
Foreign currency translationFunctional and presentation currencyThe consolidated financial information is presented in sterling, which is the Company’s functional and the Group’s presentation currency. Items included in the financial statements of each of the Group’s entities are measured using the currency of the primary economic environment in which the entity operates (the functional currency).
Transactions and balancesTransactions in foreign currencies are recorded at the exchange rate prevailing on the date of the transaction. At each balance sheet date, monetary assets and liabilities denominated in foreign currencies are retranslated at the exchange rate prevailing at the balance sheet date. Translation differences on monetary items are taken to the income statement with the exception of differences on transactions that are subject to effective cash flow hedges. Translation differences on non-monetary items are reported as part of the fair value gain or loss and are included in either equity or the income statement as appropriate.
Group companiesThe results and financial position of overseas Home Retail Group entities are translated into sterling as follows: � assets and liabilities are translated at the closing rate at the date of that balance sheet; � income and expenses are translated at the average exchange rate for the period; and � all resulting exchange differences are recognised as a separate component of equity.
GovernanceFinancial StatementS
additional informationStrateGic report 71Home Retail Group
Annual Report 2016
MSL_HRG_RA2016_FINAL_2005.indb 71 20/05/2016 17:59
Notes to the financial statements continuedFor the 52 weeks ended 28 February 2016
3. SUmmarY OF PrinciPal accOUnting POlicieS CONTINUEDOn consolidation, exchange differences arising from the translation of the net investment in foreign entities are taken to equity. Tax charges and credits attributable to those exchange differences are taken directly to equity. Goodwill and fair value adjustments arising on the acquisition of a foreign entity are treated as assets and liabilities of the foreign entity and are translated at the closing rate.
Segmental reportingOperating segments are reported in a manner consistent with the internal reporting provided to the chief operating decision-maker. The chief operating decision-maker, who is responsible for allocating resources and assessing performance of the operating segments, has been identified as the Board of Directors and Group Executive Board.
goodwillGoodwill is the excess of the fair value of the consideration payable for an acquisition over the fair value of the Group’s share of identifiable net assets of a subsidiary or associate acquired at the date of acquisition. Fair values are attributed to the identifiable assets, liabilities and contingent liabilities that existed at the date of acquisition, reflecting their condition at that date. Adjustments are made where necessary to bring the accounting policies of acquired businesses into alignment with those of the Group. Goodwill is stated at cost less any provision for impairment. Goodwill is not amortised and is tested at least annually for impairment. An impairment charge is recognised where the carrying value of goodwill exceeds its recoverable amount, being the higher of its fair value less costs to sell and its value-in-use. Value-in-use calculations are performed using cash flow projections discounted at a rate taking account of the specific risks inherent within the Group’s retail businesses. Gains and losses on the disposal of an entity include the carrying amount of goodwill relating to the entity sold, allocated where necessary on the basis of relative fair value.
Other intangible assetsIntangible assets acquired as part of an acquisition of a business are capitalised separately from goodwill, if those assets are separable and their fair value can be measured reliably. Intangible assets acquired separately from the acquisition of a business are capitalised at cost. Certain costs incurred in the developmental phase of an internal project are capitalised as intangible assets provided that a number of criteria are satisfied. These include the technical feasibility of completing the asset so that it is available for use or sale, the availability of adequate resources to complete the development and how the asset will generate probable future economic benefit.
The cost of other intangible assets with finite useful economic lives is amortised over that period. The carrying values of intangible assets are reviewed for impairment when events or changes in circumstances indicate that the carrying values may not be recoverable. If impaired, they are written down to the higher of fair value less costs to sell and value-in-use.
BrandsAcquired brands have a finite useful life and are initially recognised at fair value at the date of acquisition and subsequently held at cost less accumulated amortisation. Amortisation is calculated to spread the cost of the brands over their estimated useful lives of 10 years on a straight-line basis. This amortisation method reflects the pattern in which the asset’s future economic benefits are expected to be consumed.
Computer softwareAcquired computer software licences are capitalised on the basis of the costs incurred to acquire and bring to use the specific software. Computer software licences are held at cost and are amortised on a straight-line basis over three to five years. Costs that are directly associated with the production of identifiable and unique software products controlled by the Group, and that will generate economic benefits beyond one year, are recognised as intangible assets. Computer software development costs recognised as assets are amortised on a straight-line basis over three to ten years. Costs associated with maintaining computer software programs are recognised as an expense as incurred.
The residual values and useful lives of assets are reviewed, and adjusted if appropriate, at each balance sheet date.
Property, plant and equipmentProperty, plant and equipment are held at cost, being the purchase price and other costs directly attributable to bringing the asset into use less accumulated depreciation and any impairment in value. The carrying values of property, plant and equipment are reviewed for impairment when events or changes in circumstances indicate that the carrying values may not be recoverable. An impairment charge is recognised where the carrying value of the asset (or CGU to which the asset belongs) exceeds its recoverable amount, being the higher of the asset’s fair value less costs to sell and its value-in-use. Value-in-use calculations are performed using cash flow projections discounted at a rate taking account of the specific risks inherent within the Group’s businesses.
Depreciation is charged on a straight-line basis as follows: � freehold properties are depreciated over 50 years; � leasehold premises are depreciated over the period of the lease; � plant and equipment are depreciated over 2 to 10 years according to the estimated life of the asset; � land is not depreciated; and � assets under the course of construction are not depreciated.
The residual values and useful lives of assets are reviewed, and adjusted if appropriate, at each balance sheet date.
72 Home Retail GroupAnnual Report 2016
MSL_HRG_RA2016_FINAL_2005.indb 72 20/05/2016 17:59
non-current assets classified as held for saleWhere the carrying value of a non-current asset is expected to be principally recovered through its sale, the asset is classified as held for sale if it also meets the following: � The asset is available for sale in its current condition; � The sale is highly probable; and � The sale is expected to occur within one year.
Once classified as held for sale, the asset is held at the lower of its carrying value and the fair value less cost to sell and is no longer depreciated.
discontinued operationsOperations are classified as discontinued when they are either disposed of or are part of a single coordinated plan to dispose, and represent a major line of business or geographical area of operation.
trade receivablesTrade receivables are recognised initially at fair value and subsequently measured at amortised cost, less provision for impairment. A provision for impairment of trade receivables is established when there is objective evidence that the Group will not be able to collect all amounts due according to the original terms of receivables. The amount of the provision is recognised in the balance sheet, with the cost of unrecoverable trade receivables recognised in the income statement immediately.
inventoriesInventories are stated at the lower of cost and net realisable value. The cost base in use within the Group are general retail goods valued on a standard cost basis which approximates to actual cost. Commercial income received in respect of specific inventory is treated as a reduction in the cost of this inventory. Net realisable value is the estimated selling price in the ordinary course of business, less applicable variable selling expenses. Costs of inventory include the transfer from equity of any gains or losses on qualifying cash flow hedges relating to their purchase.
cash and cash equivalentsCash and cash equivalents includes cash in hand, deposits held at call with banks, other short-term highly liquid investments with original maturities of three months or less and bank overdrafts.
trade payablesTrade payables are obligations to pay for goods or services that have been acquired in the ordinary course of business from suppliers. They are classified as current liabilities if payment is due within 12 months of the balance sheet date. They are recognised initially at fair value and subsequently remeasured at amortised cost.
corporation taxCorporation tax is based on taxable profit for the year. Taxable profit differs from profit before tax as reported in the income statement because it excludes items of income or expense that are taxable or deductible in other years and it further excludes items that are never taxable or deductible. Corporation tax is the expected tax payable on the taxable income for the year, using tax rates enacted or substantively enacted by the balance sheet date. Tax expense is recognised in the consolidated income statement except to the extent that it relates to items recognised in the consolidated statement of comprehensive income or directly in the consolidated statement of changes in equity, in which case it is recognised in the consolidated statement of comprehensive income or directly in the consolidated statement of changes in equity, respectively.
deferred taxDeferred tax is provided in full on temporary differences arising between the tax bases of assets and liabilities and their carrying amounts. However, if the deferred tax arises from initial recognition of an asset or liability in a transaction other than a business combination that at the time of the transaction affects neither accounting nor taxable profit or loss, it is not accounted for. Deferred tax assets and liabilities are calculated at the tax rates that are expected to apply to the period when the asset is realised or the liability is settled, based on the tax rates and laws that have been enacted or substantively enacted by the balance sheet date. Deferred tax assets are recognised to the extent that it is probable that future taxable profit will be available against which the temporary differences can be utilised. Deferred tax is provided on temporary differences arising on investments in subsidiaries, except where the timing of the reversal of the temporary difference is controlled by the Group and it is probable that the temporary difference will not reverse in the foreseeable future. Deferred tax assets and liabilities are offset when there is a legally enforceable right to offset current tax assets against current tax liabilities and when the deferred tax assets and liabilities relate to taxes levied by the same taxation authority on either the taxable entity or different taxable entities where there is an intention to settle the balances on a net basis.
ProvisionsProvisions are recognised when: � the Group has a present legal or constructive obligation as a result of past events; � it is more likely than not that an outflow of resources will be required to settle the obligation; and � the amount has been reliably estimated.
GovernanceFinancial StatementS
additional informationStrateGic report 73Home Retail Group
Annual Report 2016
MSL_HRG_RA2016_FINAL_2005.indb 73 20/05/2016 17:59

Notes to the financial statements continuedFor the 52 weeks ended 28 February 2016
3. SUmmarY OF PrinciPal accOUnting POlicieS CONTINUEDProvisions are not recognised for future operating losses. Where there are a number of similar obligations, the likelihood that an outflow will be required in settlement is determined by considering the class of obligations as a whole. A provision is recognised even if the likelihood of an outflow with respect to any one item included in the same class of obligations may be small. If the effect of the time value of money is material, provisions are determined by discounting the expected future cash flows at a pre-tax rate that reflects current market assessments of the time value of money and, where appropriate, the risks specific to the liability. Where discounting is used, the increase in the provision due to the passage of time is recognised as an interest expense. Where the Group expects a provision to be reimbursed, the reimbursement is recognised as a separate asset when the reimbursement is virtually certain.
Provisions are made for property provisions, including onerous lease contracts for stores that have closed or where a decision to close has been announced, and for those stores where the projected future trading income is insufficient to cover the lower of exit cost or cost of continuing to trade the store. Provisions for other costs and income on store closures are recognised where such an outflow or inflow is probable.
Provisions are made for Financial Services to cover claims made by customers, including estimated redress payments, and specific costs incurred in remediation.
Provisions are also made for legal claims, the estimated cost of insurance claims incurred by the Group but not settled at the balance sheet date, restructuring costs and other liabilities.
insuranceThe Group self-insures some risks and the liabilities associated with these risks are retained within the Group. The Group accounts for all insurance costs as part of operating costs in these financial statements. Insurance premiums in respect of insurance placed with third parties are charged to the income statement in the period to which they relate.
Operating leasesLeases in which a significant portion of the risks and rewards of ownership are retained by the lessor are classified as operating leases. Payments made under operating leases are charged to the income statement on a straight-line basis over the period of the lease. Incentives from lessors are recognised as a systematic reduction of the charge over the life of the lease.
Post-employment benefitsThe liability recognised in the balance sheet in respect of defined benefit pension plans is the present value of the defined benefit obligations at the balance sheet date less the fair value of plan assets, together with adjustments for unrecognised past service costs. The defined benefit obligations are calculated annually by independent actuaries using the projected-unit credit method. The present value of the defined benefit obligations is determined by discounting the estimated future cash outflows using interest rates of high-quality corporate bonds that are denominated in the currency in which the benefits will be paid, and that have terms to maturity approximating to the terms of the related pension liability. Actuarial gains and losses arising from experience adjustments and changes in actuarial assumptions are recognised in the consolidated statement of comprehensive income.
For defined contribution pension plans the Group and employees pay contributions into an independently administered fund. The cost of providing these benefits, recognised in the income statement, comprises the amount of contributions payable to the schemes in respect of the year.
catalogue costsCosts incurred during the production of the Group’s catalogues are deferred on the balance sheet net of any associated advertising revenue and marketing support until the catalogue is made available to the Group, at which point the net deferred cost is charged to the income statement.
dividendsDividends proposed by the Board of Directors and unpaid at the year-end are not recognised in the financial statements until they have been approved by the shareholders at the Annual General Meeting. Interim dividends are recognised in the financial statements when they are paid.
Financial instrumentsThe Group classifies its financial instruments in the following categories: financial assets and liabilities at fair value through profit or loss, loans and receivables and available-for-sale financial assets. The classification depends on the purpose for which the financial instruments were acquired. Management determines the classification of its financial instruments at initial recognition.
Other financial assetsOther financial assets are non-derivatives that are either designated in this category or not classified in any of the other categories. Other financial assets are measured at fair value or, where fair value cannot be reliably measured, at cost less impairment. They are included in non-current assets unless management intends to dispose of the investment within 12 months of the balance sheet date. The movements in fair value are recognised in other comprehensive income until the financial asset is derecognised or impaired at which time the cumulative gain or loss previously recognised in other comprehensive income is recognised in the income statement.
74 Home Retail GroupAnnual Report 2016
MSL_HRG_RA2016_FINAL_2005.indb 74 20/05/2016 17:59

accounting for derivative financial instruments and hedging activitiesDerivatives are recognised at fair value on the date a contract is entered into and are subsequently remeasured at their fair value. The method of recognising the resulting gain or loss depends on whether the derivative is designated as a hedging instrument, and if so, the nature of the item being hedged. The Group designates its derivatives as cash flow hedges.
The Group documents the relationship between hedging instruments and hedged items at the hedge inception, as well as its risk management objective and strategy for undertaking various hedge transactions. The Group also documents its assessment, both at hedge inception and on an ongoing basis, of whether the derivatives that are used in hedging transactions are highly effective in offsetting changes in cash flows of hedged items. Movements on the hedging reserve in equity are shown in the Group statement of comprehensive income.
Cash flow hedgesThe cash flow hedges are intended to hedge the foreign currency exposures of future purchases of inventory. The effective portion of changes in the fair value of derivatives that are designated and qualify as cash flow hedges is recognised in equity. Any gain or loss relating to the ineffective portion would be recognised immediately in the income statement. The hedged cash flow is expected to occur up to 14 months into the future and will be transferred to the consolidated income statement via inventory carrying value as applicable.
Fair value estimationThe fair value of financial instruments traded in organised active financial markets is based on quoted market prices at the close of business on the balance sheet date. The quoted market price used for financial assets held by the Group is the current bid price; the appropriate quoted market price for financial liabilities is the current offer price. The fair value of financial instruments for which there is no quoted market price is determined by a variety of methods incorporating assumptions that are based on market conditions existing at each balance sheet date. Quoted market prices or dealer quotes for similar instruments are used for long-term debt. Other techniques, such as estimated discounted cash flows, are used to determine fair value for the remaining financial instruments.
The fair value of forward foreign exchange contracts is determined using forward exchange market rates at the balance sheet date. The nominal value less estimated credit adjustments of trade receivables and payables are assumed to approximate to their fair values. The fair value of financial liabilities is estimated by discounting the future contractual cash flows at the current market interest rate that is available to the Group for similar financial instruments.
Share-based paymentsThe Group operates a number of equity-settled, share-based compensation plans. The fair value of the shares granted is recognised as an expense after taking into account the best estimate of the number of awards expected to vest. The Group revisits the vesting estimate at each balance sheet date. Non-market performance conditions are included in the vesting estimate. Expenses are incurred over the vesting period. Fair value is measured at the date of grant using whichever of the Black-Scholes or Monte Carlo models, or closing market price that is most appropriate to the award. Market-based performance conditions are included in the fair value measurement on grant date and are not revisited for actual performance.
non-gaaP financial informationHome Retail Group has identified certain measures that it believes will assist the understanding of the performance of the business. The measures are not defined under IFRS and they may not be directly comparable with other companies’ adjusted measures. The non-GAAP measures are not intended to be a substitute for, or superior to, any IFRS measures of performance but Home Retail Group has included them as it considers them to be important comparables and key measures used within the business for assessing performance. The following are the key non-GAAP measures identified by Home Retail Group:
Exceptional itemsItems which are both non-recurring and material in either size or nature are presented as exceptional items within their relevant income statement line. The separate reporting of exceptional items helps provide a better indication of underlying performance of the Group. Examples of items which may be recorded as exceptional items are restructuring costs and the profits and/or losses on the disposal of businesses.
Benchmark measuresThe Group uses the following terms as measures which are not formally recognised under IFRS: � Benchmark operating profit is defined as operating profit from all operations (both continuing and discontinued) before amortisation of acquisition
intangibles, post-employment benefit scheme administration costs, store impairment and onerous lease charges or releases and costs or income associated with store closures and exceptional items.
� Benchmark profit before tax (benchmark PBT) is defined as profit from all operations (both continuing and discontinued) before amortisation of acquisition intangibles, post-employment benefit scheme administration costs, store impairment and onerous lease charges or releases and costs or income associated with store closures, exceptional items, financing fair value remeasurements, financing impact on post-employment benefit obligations, the discount unwind on non-benchmark items and taxation.
� Basic benchmark earnings per share (benchmark EPS) is defined as benchmark PBT less taxation attributable to benchmark PBT, divided by the weighted average number of shares in issue (excluding shares held in Home Retail Group’s share trusts net of vested but unexercised share awards).
GovernanceFinancial StatementS
additional informationStrateGic report 75Home Retail Group
Annual Report 2016
MSL_HRG_RA2016_FINAL_2005.indb 75 20/05/2016 17:59

Notes to the financial statements continuedFor the 52 weeks ended 28 February 2016
3. SUmmarY OF PrinciPal accOUnting POlicieS CONTINUEDThese measures are considered useful in that they provide investors with an alternative means to evaluate the underlying performance of the Group’s operations.
Total net debtThe Group uses the term ‘total net debt’ which is considered useful in that it highlights the Group’s aggregate net indebtedness to banks and other financial institutions together with debt-like liabilities, notably operating leases.
4. Financial riSK managementFinancial risk factorsThere are a number of financial risks and uncertainties which could impact the performance of the Group, being market risk (foreign exchange and interest rate risk), credit risk and liquidity risk. The Group operates a structured risk management process which identifies, evaluates and prioritises risks and uncertainties. Further details of the principal risks and uncertainties that could impact the Group’s performance, and the Group’s mitigating activities, are set out in the principal risks and uncertainties section of the review of the business on pages 22 and 23.
The Group’s treasury function seeks to reduce exposures to foreign exchange, interest rate and other financial risks, and to ensure sufficient liquidity is available to meet foreseeable needs and to invest cash assets safely and profitably. Policies and procedures are subject to review and approval by the Board of Directors.
Market risk – foreign exchange riskThe Group is subject to foreign exchange risk arising from various currency exposures, primarily with respect to the US dollar and the euro. Foreign exchange risk arises from future commercial transactions, recognised assets and liabilities and net investments in foreign operations. To manage the foreign exchange risk arising from future commercial transactions and recognised assets and liabilities, entities in the Group use forward contracts, transacted with external banks. Foreign exchange risk arises when future commercial transactions or recognised assets or liabilities are denominated in a currency that is not the entity’s functional currency.
Group Treasury is responsible for managing the net position in each foreign currency by using external forward currency contracts. The key objective of the Group’s foreign exchange transaction exposure management is to minimise potential volatility in profits which could arise as a result of exchange rate fluctuations whilst maintaining an appropriate relative position versus the Group’s retail peers. To achieve the above objectives, the Group will initially seek to hedge up to 90% of any foreign exchange transaction risks expected to arise as a result of uncertain, but probable, foreign currency cash flows up to 14 months forward. This subsequently increases to 100% as cash flows become certain. Each subsidiary designates contracts as fair value hedges or cash flow hedges, as appropriate. External foreign exchange contracts are designated as hedges of foreign exchange risk on specific assets, liabilities or future transactions on a gross basis.
The cash flow hedges are intended to hedge the foreign currency exposure of future purchases of inventory. The hedged cash flows are expected to occur up to 14 months into the future and will be transferred to the consolidated income statement or inventory carrying value as applicable. The Group has foreign operations whose net assets are exposed to foreign currency translation risk. Currency exposure arising from the net assets of the Group’s foreign operations is not hedged.
If on 27 February 2016, the last day of the financial year, sterling had been 5 cents, or approximately 3% (2015: approximately 3%), weaker/stronger against the US dollar, with all other variables held constant, post-tax profit would have been £0.2m lower/higher(2015: £0.3m lower/higher) mainly as a result of foreign exchange losses/gains arising on retranslation of US dollar denominated balances in subsidiary companies with a sterling functional currency. Equity would have been £12.9m higher/lower (2015: £10.3m higher/lower), arising mainly from the revaluation of US dollar forward currency contracts.
If on 27 February 2016, the last day of the financial year, sterling had been 5 cents, or approximately 4% (2015: approximately 4%), weaker/stronger against the euro, with all other variables held constant, post-tax profit would have been £0.3m lower/higher (2015: £0.4m lower/higher), mainly as a result of foreign exchange losses/gains on retranslation of sterling denominated cash balances in subsidiary companies with a euro functional currency. Equity would have been £1.2m lower/higher (2015: £1.0m lower/higher), arising mainly from the revaluation of euro forward currency contracts net of foreign exchange gains or losses on retranslation of euro-denominated net assets held by subsidiary companies with a euro functional currency.
Market risk – cash flow and fair value interest rate riskWhilst the Group’s Financial Services business has gross instalment receivable balances (‘Financial Services loan book’) on fixed interest rates and floating rates, the Group’s income and operating cash flows are still considered to be substantially independent of changes in market interest rates.
The Group currently holds a net cash position and has undrawn committed borrowing facilities.
The Group’s interest rate risk arises from the variance in market rate when deposits are made. This risk is managed by combining overnight deposits with term deposits. The principal objective of the Group’s interest rate risk management is to manage the trade-off between obtaining the most beneficial effective rates of interest whilst minimising the impact of interest rate volatility on profits before tax.
The Group had no borrowings at any point during the year.
76 Home Retail GroupAnnual Report 2016
MSL_HRG_RA2016_FINAL_2005.indb 76 20/05/2016 17:59

Credit riskThe Group has no significant concentrations of credit risk within its Financial Services loan book. It has policies in place to ensure that sales of financial services products are made to customers with an appropriate credit history. Customers are credit scored using data from an external credit agency and a credit risk provision is held which is based on historic default experience (note 21). Sales to retail customers are made in cash, via major debit and credit cards or via in-house or third party operated financial products.
The Group’s exposure to credit risk with regard to treasury transactions is managed by dealing only with major banks and financial institutions. Dealing activity is closely controlled and counterparty positions are monitored on a regular basis. Foreign exchange counterparty limits are set for each organisation on a scale based on credit rating and maturity period.
The Group’s cash management policy, which was updated and approved by the Board of Directors during the year, requires: � for a term deposit of up to £50m for up to 3 months a bank must have a minimum long-term rating of A- or better; � for an additional 3 month term deposit of up to £50m a bank must have a minimum long-term rating of A+, or a minimum long-term rating of A if the
UK Government holds a minimum shareholding of 25%; � for a term deposit of up to £50m for a period of up to 12 months, a bank must have a minimum long-term rating of A+, or a minimum long-term rating
of A if the UK Government holds a minimum shareholding of 25%; � for instant access on demand accounts of up to £75m a bank must have a minimum short-term rating of B; � for instant access on demand accounts of up to £150m a bank must have a minimum short-term rating of A-1; and � for a deposit of up to £150m in a money market fund, the fund must have a long-term rating of AAA.
Each deposit made by the Group during the year was compliant with the policy that was effective at the date the deposit was made. Where a term deposit has been made and the counterparty ratings have subsequently reduced, each relevant position has been reviewed and any decision to maintain a position until the normal maturity date has been approved by the Board of Directors.
The credit quality of financial assets that are neither past due nor impaired can be assessed by reference to external credit ratings as follows:
cash and term deposits
Bank and institution long-term rating at transaction date
Bank and institution long-term rating at 27 February 2016
cash and short-term
cash deposits £m
A A 519.4A- A- 42.3BBB- BBB- 61.2
622.9
Bank and institution long-term rating at transaction date
Bank and institution long-term rating at 28 February 2015
Cash and short-term cash
deposits £m
AAA AAA 207.8A A 50.0A- A- 25.4BB+ BB+ 26.1
309.3
marked to market forward foreign exchange contracts
Bank and institution rating at year-end2016
£m2015
£m
AA- 7.9 -A 22.2 19.0A- 9.4 6.2BBB+ 11.1 -BBB- (1.9) –BB+ 0.8 1.9
49.5 27.1
GovernanceFinancial StatementS
additional informationStrateGic report 77Home Retail Group
Annual Report 2016
MSL_HRG_RA2016_FINAL_2005.indb 77 20/05/2016 17:59

Notes to the financial statements continuedFor the 52 weeks ended 28 February 2016
4. Financial riSK management CONTINUEDLiquidity riskHome Retail Group manages its cash and committed borrowing facilities to maintain liquidity and funding flexibility. Liquidity is achieved through arranging funding ahead of requirements and maintaining sufficient undrawn committed facilities to meet short-term needs, and facilities are in place for this purpose. At 27 February 2016, the Group had an undrawn committed borrowing facility available of £250m. This facility, which was unsecured, included a covenant related to adjusted benchmark earnings before interest, tax, depreciation, amortisation and rent and also included a covenant related to net balance sheet debt. The Group has not drawn down on its borrowing facilities and has been in compliance with the requirements of the covenants throughout the year.
Trade and other payables of £828.6m (2015: £828.6m) all have contractual maturity dates of less than three months at the balance sheet date.
When a forward foreign exchange contract matures, this requires an outflow of the currency being sold and an inflow of the currency being bought. The table below analyses the Group’s outflow and inflow from derivative financial instruments into relevant maturity groupings based on the remaining period at the balance sheet date to the contractual maturity date. The amounts disclosed in the table are the contractual undiscounted cash flows.
at 27 February 2016
less than 3 months
£m
3–6 months
£m
6–9 months
£m
9–12 months
£m total
£m
Forward foreign exchange contracts – outflow (251.8) (141.5) (160.9) (98.7) (652.9)
– inflow 272.5 154.4 172.1 103.4 702.4
At 28 February 2015
Less than 3 months
£m
3–6 months
£m
6–9 months
£m
9–12 months
£m Total
£m
Forward foreign exchange contracts – outflow (237.1) (191.9) (203.6) (87.9) (720.5)
– inflow 252.0 202.4 205.9 87.3 747.6
capital risk managementThe Group’s objectives when managing capital are to safeguard the Group’s ability to continue as a going concern in order to provide returns for shareholders and benefits for other stakeholders and to maintain an optimal and efficient capital structure. In order to maintain or adjust the capital structure, the Group may adjust the amount of dividends paid to shareholders, return capital to shareholders or issue new shares. The Group finances its operations through a combination of cash, property leases and borrowing facilities where necessary. The Group has significant commitments through its obligations to pay rents under property leases. The Group, in common with the credit rating agencies, treats its lease liabilities as debt when evaluating financial risk and investment returns. In addition, the Group’s Financial Services business holds a net loan book balance of £614m (2015: £580m) as at 27 February 2016. The Group’s net debt varies throughout the year due to trading seasonality, and the position as at 27 February 2016 is set out in the analysis of net cash/(debt) on page 68.
Foreign currencyThe principal exchange rates used were as follows:
Average Closing
52 weeks ended
27 February2016
52 weeks ended
28 February2015
27 February
201628 February
2015
US dollar 1.51 1.63 1.39 1.54Euro 1.37 1.26 1.27 1.38
78 Home Retail GroupAnnual Report 2016
MSL_HRG_RA2016_FINAL_2005.indb 78 20/05/2016 17:59

Fair value estimationIFRS 13 requires disclosure of fair value measurements by level of the following measurement hierarchy:Level 1 – quoted prices (unadjusted) in active markets for identical assets or liabilities;Level 2 – inputs other than quoted prices included within level 1 that are observable for the asset or liability, either directly (that is, as prices) or indirectly (that is, derived from prices); andLevel 3 – inputs for the asset or liability that are not based on observable market data (that is, unobservable inputs).
level 1£m
level 2£m
level 3£m
total£m
assetsOther Financial Assets – Forward foreign exchange contracts – 52.1 – 52.1Other Financial Assets 10.2 – 0.1 10.3
total assets 10.2 52.1 0.1 62.4
liabilitiesOther Financial Liabilities – Forward foreign exchange contracts – (2.6) – (2.6)
total liabilities – (2.6) – (2.6)
The fair value of financial instruments traded in active markets is based on quoted market prices at the close of business on the balance sheet date. A market is regarded as active if quoted prices are readily and regularly available from an exchange, dealer, broker, industry group, pricing service, or regulatory agency, and those prices represent actual and regularly occurring market transactions on an arm’s length basis. The quoted market price used for financial assets held by the Group is the current bid price. These instruments are included in level 1 and comprise investments in quoted managed indexed funds. As at 27 February 2016, these instruments, which are classified as other financial assets, had a carrying value of £10.2m (2015: £10.5m).
The fair value of financial instruments that are not traded in an active market (for example, over-the-counter derivatives) is determined by using valuation techniques. The valuation techniques maximise the use of observable market data where it is available and rely as little as possible on entity specific estimates. If all significant inputs required to fair value an instrument are observable, the instrument is included in level 2. The fair value of forward foreign exchange contracts is determined using forward exchange rates at the balance sheet date. As at 27 February 2016, the fair value of derivative instruments used for hedging purposes was a net asset of £49.5m (2015: £27.1m).
If one or more of the significant inputs is not based on observable market data, the instrument is included in level 3. The available-for-sale financial asset within the level 3 hierarchy is measured at cost less impairment. The impairment has been calculated to write down the asset to its recoverable value based on the actual financial position of the Group’s associate. The fair value measurement is therefore not sensitive to changes in inputs.
There have been no movements in level 3 financial assets during the period and there have been no transfers of assets or liabilities between levels of the fair value hierarchy.
GovernanceFinancial StatementS
additional informationStrateGic report 79Home Retail Group
Annual Report 2016
MSL_HRG_RA2016_FINAL_2005.indb 79 20/05/2016 17:59

Notes to the financial statements continuedFor the 52 weeks ended 28 February 2016
5. Segmental inFOrmatiOnThe Board of Directors and Group Executive Board review the Group’s internal reporting in order to assess performance and allocate resources. Management has determined the operating segments based on these reports, which reflect the distinct retail brands and different risks associated with the different businesses. On 27 February 2016 the Group disposed of 100% of the Homebase segment and therefore it has been disclosed as a discontinued operation. The Retained Group is organised into two main business segments: Argos and Financial Services together with Central Activities. The Board of Directors and Group Executive Board assess the performance of the operating segments based on a combination of revenue and benchmark operating profit. Benchmark operating profit is defined within note 3.
52 weeks ended
27 February 2016
£m
52 weeks ended
28 February 2015
£m
revenueArgos 4,095.3 4,096.0Financial Services 139.4 135.1
revenue from continuing operations 4,234.7 4,231.1
Discontinued operations 1,433.1 1,479.3
total revenue 5,667.8 5,710.4
Benchmark operating profitArgos 83.1 129.2
Financial Services 7.0 7.0Central Activities (22.5) (26.5)
Benchmark operating profit from continuing operations 67.6 109.7
Benchmark operating profit from discontinued operations 23.5 19.8
total benchmark operating profit 91.1 129.5
Benchmark net financing income 3.6 2.6
total Benchmark profit before tax 94.7 132.1
Amortisation of acquisition intangibles (1.8) (1.8)
Post-employment benefit scheme administration costs (1.9) (1.9)
Adjustments in respect of store impairment and property provisions (4.7) 0.1
Exceptional items – continuing operations (891.5) (29.3)
Exceptional items – discontinued operations 13.0 (6.2)
Financing fair value remeasurements (2.4) (1.0)
Financing impact on post-employment benefit obligations (3.2) (3.0)
Discount unwind on non-benchmark items (6.2) (6.7)Balance sheet review – 11.5
total profit before tax (804.0) 93.8
Total taxation (3.8) (22.2)
total profit for the year attributable to equity holders of the company (807.8) 71.6
Of which:
Profit for the year from continuing operations (848.6) 65.3
Profit for the year from discontinued operations 40.8 6.3
80 Home Retail GroupAnnual Report 2016
MSL_HRG_RA2016_FINAL_2005.indb 80 20/05/2016 17:59

2016 £m
2015 £m
Segment assetsArgos 1,631.1 2,395.9Financial Services 645.2 622.8Central Activities 161.6 71.5
total segment assets – continuing operations 2,437.9 3,090.2
Tax assets 30.9 57.8
Cash and cash equivalents 622.9 309.3
total assets – continuing operations 3,091.7 3,457.3
Total assets discontinued operations – 915.4
total assets per balance sheet 3,091.7 4,372.7
Segment assets include goodwill and other intangible assets, property, plant and equipment, inventories, trade and other receivables and other financial assets. Tax assets and cash and cash equivalents are not allocated to segments.
2016 £m
2015 £m
Segment liabilitiesArgos (952.4) (841.4)
Financial Services (41.1) (56.3)
Central Activities (146.6) (108.5)
total segment liabilities – continuing operations (1,140.1) (1,006.2)
Tax liabilities (19.5) (31.1)
Post-employment benefit obligations (94.5) (114.4)
total liabilities – continuing operations (1,254.1) (1,151.7)
Total liabilities – discontinued operations – (548.1)
total liabilities per balance sheet (1,254.1) (1,699.8)
Segment liabilities include trade and other payables, provisions and other financial liabilities. Tax liabilities and post-employment benefit obligations are not allocated to segments.
52 weeks ended 27 February 2016
Other segment items Notesargos
£m
Financial Services
£m
central activities
£m
continuing operations
£m
discontinued operations
£m total
£m
Depreciation and impairment of property, plant and equipment 17 (65.1) – – (65.1) (24.4) (89.5)
Amortisation and impairment of intangible assets 16 (48.0) (0.4) (11.4) (59.8) (12.2) (72.0)
Goodwill impairment 15 (851.7) - (2.9) (854.6) - (854.6)
Additions to property, plant and equipment 17 43.8 0.1 – 43.9 21.6 65.5Additions to other intangible assets 16 92.8 0.1 – 92.9 14.4 107.3
52 weeks ended 28 February 2015
Other segment items NotesArgos
£m
Financial Services
£m
Central Activities
£m
Continuing operations
£m
Discontinued operations
£m Total
£m
Depreciation and impairment of property, plant and equipment 17 (53.4) – (3.5) (56.9) (44.5) (101.4)
Amortisation of intangible assets 16 (37.0) (0.4) (2.2) (39.6) (10.8) (50.4)
Additions to property, plant and equipment 17 42.3 – 2.1 44.4 36.8 81.2Additions to other intangible assets 16 70.5 – – 70.5 22.8 93.3
geographical segmentsThe Group trades predominantly in the UK and the Republic of Ireland and consequently the majority of revenues, capital expenditure and segment net assets arise there. The profits, turnover and assets of the businesses in the Republic of Ireland are not significant to the Group.
GovernanceFinancial StatementS
additional informationStrateGic report 81Home Retail Group
Annual Report 2016
MSL_HRG_RA2016_FINAL_2005.indb 81 20/05/2016 17:59

Notes to the financial statements continuedFor the 52 weeks ended 28 February 2016
6. analYSiS OF revenUe BY categOrY52 weeks
ended 27 February
2016 £m
52 weeks ended
28 February 2015
£m
continuing operationsSale of goods 4,095.3 4,096.0
Provision of services by Financial Services 139.4 135.1
total continuing operations 4,234.7 4,231.1
Discontinued operations 1,433.1 1,479.3
total 5,667.8 5,710.4
All revenue from discontinued operations in FY16 and FY15 relate to the sale of goods.
7. net OPerating eXPenSeS52 weeks ended 27 February 2016 52 weeks ended 28 February 2015
expenses by function
continuing operations
£m
discontinued operations
£m
Continuing operations
£m
Discontinued operations
£m
Selling costs (778.1) (519.9) (739.1) (578.4)
Administrative costs (1,142.0) (67.9) (271.7) (81.9)
total net operating expenses (1,920.1) (587.8) (1,010.8) (660.3)
Included within administrative expenses for continuing operations is £891.5m (FY15: £29.3m) of exceptional costs. Included within administrative expenses for discontinued operations is £13.0m of exceptional income (FY15: £6.2m of exceptional costs).
continuing operations Notes
52 weeks ended
27 February 2016
£m
52 weeks ended
28 February 2015
£m
(Loss)/profit before tax is stated after (charging)/crediting:Operating lease rental expense (167.1) (161.5)
Cost of inventories and other direct expenses recognised in cost of sales (3,042.5) (3,030.5)
Write down of inventories (108.9) (100.1)
Profit on sale of property, plant and equipment and other intangible assets 1.1 1.4
Depreciation of property, plant and equipment 17 (53.8) (59.6)
Impairment charges - Goodwill 15 (854.6) –
Impairment charges - Other assets 16,17 (20.9) –
Amortisation of intangible assets 16 (50.2) (42.8)
Employee benefit costs 8 (455.3) (431.8)
auditors’ remuneration
52 weeks ended
27 February 2016
£m
52 weeks ended
28 February2015
£m
Audit services:
Fees payable for the audit of the Company and the consolidated financial statements (0.9) (1.1)
Audit of the Company’s subsidiaries pursuant to legislation (0.1) (0.1)
(1.0) (1.2)
Other services:Fees payable to the Company’s auditors and its associates for other services– other assurance services (1.2) –
– services relating to taxation (0.2) (0.1)
total fees payable to Pricewaterhousecoopers llP (2.4) (1.3)
Other assurance services relate to services provided in respect of the sale of Homebase. Further details of these fees are included on page 40 within the Group Audit and Risk Committee report.
82 Home Retail GroupAnnual Report 2016
MSL_HRG_RA2016_FINAL_2005.indb 82 20/05/2016 17:59

8. emPlOYee BeneFit cOStS and emPlOYee nUmBerS
employee costs Notes
52 weeks ended
27 February 2016
£m
52 weeks ended
28 February2015
£m
continuing operationsWages and salaries (420.4) (387.0)
Social security costs (24.8) (26.7)
Other pension costs 25 (11.2) (10.7)
Share-based payments 29 1.1 (7.4)
(455.3) (431.8)
discontinued operations Wages and salaries (173.2) (194.2)
Social security costs (11.5) (12.4)
Other pension costs 25 (3.1) (3.6)
Share-based payments 29 (1.9) (1.2)
(189.7) (211.4)
52 weeks ended 27 February 2016 52 weeks ended 28 February 2015
average number of employeesnumber of employees
Full time equivalent
Number of employees
Full time equivalent
continuing operationsArgos 29,565 15,627 28,791 14,726
Financial Services 865 786 734 665
Central Activities 59 58 58 58
total continuing operations 30,489 16,471 29,583 15,449
discontinued operations 14,885 8,057 17,006 8,944
45,374 24,528 46,589 24,393
Key management compensation
52 weeks ended
27 February 2016
£m
52 weeks ended
28 February2015
£m
Short-term employee benefits (3.6) (4.1)
Share-based payments 0.3 (1.8)
(3.3) (5.9)
Key management consists of the members of the Home Retail Group plc Board of Directors and the managing director of Homebase. The directors’ remuneration is set out on pages 41 to 52.
GovernanceFinancial StatementS
additional informationStrateGic report 83Home Retail Group
Annual Report 2016
MSL_HRG_RA2016_FINAL_2005.indb 83 20/05/2016 17:59
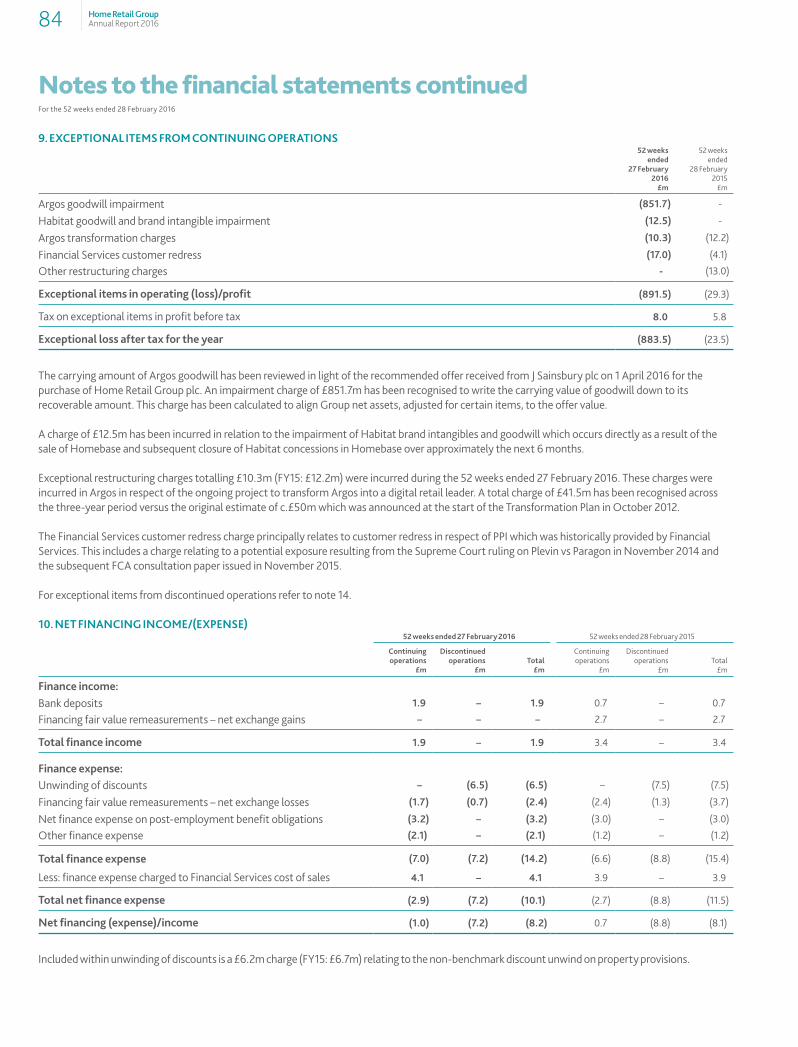
Notes to the financial statements continuedFor the 52 weeks ended 28 February 2016
9. eXcePtiOnal itemS FrOm cOntinUing OPeratiOnS
52 weeks ended
27 February 2016
£m
52 weeks ended
28 February 2015
£m
Argos goodwill impairment (851.7) -
Habitat goodwill and brand intangible impairment (12.5) -
Argos transformation charges (10.3) (12.2)
Financial Services customer redress (17.0) (4.1)
Other restructuring charges - (13.0)
exceptional items in operating (loss)/profit (891.5) (29.3)
Tax on exceptional items in profit before tax 8.0 5.8
exceptional loss after tax for the year (883.5) (23.5)
The carrying amount of Argos goodwill has been reviewed in light of the recommended offer received from J Sainsbury plc on 1 April 2016 for the purchase of Home Retail Group plc. An impairment charge of £851.7m has been recognised to write the carrying value of goodwill down to its recoverable amount. This charge has been calculated to align Group net assets, adjusted for certain items, to the offer value.
A charge of £12.5m has been incurred in relation to the impairment of Habitat brand intangibles and goodwill which occurs directly as a result of the sale of Homebase and subsequent closure of Habitat concessions in Homebase over approximately the next 6 months.
Exceptional restructuring charges totalling £10.3m (FY15: £12.2m) were incurred during the 52 weeks ended 27 February 2016. These charges were incurred in Argos in respect of the ongoing project to transform Argos into a digital retail leader. A total charge of £41.5m has been recognised across the three-year period versus the original estimate of c.£50m which was announced at the start of the Transformation Plan in October 2012.
The Financial Services customer redress charge principally relates to customer redress in respect of PPI which was historically provided by Financial Services. This includes a charge relating to a potential exposure resulting from the Supreme Court ruling on Plevin vs Paragon in November 2014 and the subsequent FCA consultation paper issued in November 2015.
For exceptional items from discontinued operations refer to note 14.
10. net Financing incOme/(eXPenSe)52 weeks ended 27 February 2016 52 weeks ended 28 February 2015
continuing operations
£m
discontinued operations
£mtotal
£m
Continuing operations
£m
Discontinued operations
£mTotal
£m
Finance income:
Bank deposits 1.9 – 1.9 0.7 – 0.7
Financing fair value remeasurements – net exchange gains – – – 2.7 – 2.7
total finance income 1.9 – 1.9 3.4 – 3.4
Finance expense:Unwinding of discounts – (6.5) (6.5) – (7.5) (7.5)
Financing fair value remeasurements – net exchange losses (1.7) (0.7) (2.4) (2.4) (1.3) (3.7)
Net finance expense on post-employment benefit obligations (3.2) – (3.2) (3.0) – (3.0)
Other finance expense (2.1) – (2.1) (1.2) – (1.2)
total finance expense (7.0) (7.2) (14.2) (6.6) (8.8) (15.4)
Less: finance expense charged to Financial Services cost of sales 4.1 – 4.1 3.9 – 3.9
total net finance expense (2.9) (7.2) (10.1) (2.7) (8.8) (11.5)
net financing (expense)/income (1.0) (7.2) (8.2) 0.7 (8.8) (8.1)
Included within unwinding of discounts is a £6.2m charge (FY15: £6.7m) relating to the non-benchmark discount unwind on property provisions.
84 Home Retail GroupAnnual Report 2016
MSL_HRG_RA2016_FINAL_2005.indb 84 20/05/2016 17:59

11. taXatiOn
analysis of charge in year
52 weeks ended
27 February 2016
£m
52 weeks ended
28 February 2015
£m
Current tax:UK corporation tax (2.2) (17.6)
Adjustments in respect of prior years (0.9) 8.7
Total current UK tax charge (3.1) (8.9)
Overseas tax (1.1) (1.0)
Total current tax charge (4.2) (9.9)
Deferred tax:Origination and reversal of temporary differences (7.1) (3.9)
Adjustments in respect of prior years 3.0 (8.7)
total tax charge in income statement – continuing operations (8.3) (22.5)
total tax charge in income statement – discontinued operations 4.5 0.3
total tax charge in income statement (3.8) (22.2)
tax included in other comprehensive income
52 weeks ended
27 February 2016
£m
52 weeks ended
28 February 2015
£m
items that may be reclassified subsequently to profit and loss:Cash flow hedges (5.5) (9.1)
Rate change impact 0.4 –
(5.1) (9.1)
items that will not be reclassified subsequently to profit and loss:Post-employment benefit obligations 4.8 11.8Rate change impact (0.9) (0.7)
3.9 11.1
total tax (charge)/credit in other comprehensive income (1.2) 2.0
GovernanceFinancial StatementS
additional informationStrateGic report 85Home Retail Group
Annual Report 2016
MSL_HRG_RA2016_FINAL_2005.indb 85 20/05/2016 17:59

Notes to the financial statements continuedFor the 52 weeks ended 28 February 2016
11. taXatiOn CONTINUEDFactors affecting the tax chargeThe effective tax rate for the year of (0.5% ) (FY15: 23.7%), is lower than (FY15: higher than) the standard rate of corporation tax in the UK of 20.0% (FY15: 21.0%). This is analysed below:
52 weeks ended 27 February 2016 52 weeks ended 28 February 2015
continuing operations
£m
discontinued operations
£mtotal
£m
Continuing operations
£m
Discontinued operations
£mTotal
£m
Profit before tax (840.3) 36.3 (804.0) 87.8 6.0 93.8
Profit before tax multiplied by the standard rate of corporation tax in the UK 168.1 (7.3) 160.8 (18.4) (1.3) (19.7)
Effects of:Benchmark income/(expenses) not deductible for tax purposes (7.1) 3.8 (3.3) (5.5) (0.3) (5.8)
Non-benchmark income/(expenses) not deductible for tax purposes (171.4) 3.2 (168.2) 0.9 (1.1) (0.2)
Differences in effective tax rates on overseas earnings – – – 0.5 – 0.5Tax charge on non-benchmark items (11.1) (0.5) (11.6) (5.5) (2.3) (7.8)
Benchmark tax expense (21.5) (0.8) (22.3) (28.0) (5.0) (33.0)
Non-benchmark:
Tax credit on exceptional items 8.0 0.3 8.3 5.8 1.3 7.1
Tax credit/(charge) on non-benchmark items 3.1 – 3.1 (0.3) 1.0 0.7
Adjustments in respect of prior years 2.1 4.8 6.9 – 3.0 3.0
Corporation tax on chargeable gain – – – – 6.7 6.7
Utilisation of unprovided capital losses – – – – (6.7) (6.7)Rate change impact – 0.2 0.2 – – –
total tax (charge)/credit in income statement (8.3) 4.5 (3.8) (22.5) 0.3 (22.2)
Factors that may affect future tax chargesThe income tax expense for the year is based on the UK statutory rate of corporation tax for the period of 20.0% (FY15: 21.0%). Overseas tax is calculated at the rates prevailing in the respective jurisdictions. The impact of the changes in statutory rates relates to the reduction of the UK corporation tax rate from 20.0% to 19.0% from 1 April 2017 the substantively enacted rate, and has a £0.2m impact to the income statement and £0.5m impact to the consolidated statement of comprehensive income. The 2016 Budget announced that corporation tax would be reduced further from 1 April 2020 to 17.0%, this differs from the substantively enacted rate of 18.0%. The estimated impact of this is a £1.2m deferred tax credit, of which £0.2m would be credited to the income statement and £1.0m to the consolidated statement of comprehensive income at the balance sheet date.
12. dividendS52 weeks
ended 27 February
2016 £m
52 weeks ended
28 February2015
£m
amounts recognised as distributions to equity holders
Final dividend of 2.8p per share (2015: 2.3p) for the prior year (21.2) (17.8)Interim dividend of 1.0p per share (2015: 1.0p) for the current year (7.8) (7.5)
Ordinary dividends on equity shares (29.0) (25.3)
On 1 April 2016, the Board recommended an offer from J Sainsbury plc for the purchase of Home Retail Group plc, the details of which are set out in note 36. As a result of the 2.8p element of the proposed capital return component of the offer, which reflects a payment in lieu of the FY16 final dividend, no final dividend is proposed for FY16.
86 Home Retail GroupAnnual Report 2016
MSL_HRG_RA2016_FINAL_2005.indb 86 20/05/2016 17:59

13. BaSic and dilUted earningS Per SHare (ePS)Basic EPS is calculated by dividing the profit attributable to the equity holders of the Company by the weighted average number of ordinary shares in issue during the year, excluding ordinary shares held in Home Retail Group’s share trusts, net of vested but unexercised share awards. Diluted EPS is calculated by adjusting the weighted average number of ordinary shares outstanding to assume conversion of all potential dilutive ordinary shares.
earnings
Notes
52 weeks ended
27 February 2016
£m
52 weeks ended
28 February2015
£m
(Loss)/profit after tax for continuing operations (848.6) 65.3Profit after tax for discontinued operations 40.8 6.3
total (loss)/profit after tax for the financial year (807.8) 71.6Adjusted for:Amortisation of acquisition intangibles 1.8 1.8Post-employment benefit scheme administration costs 1.9 1.9Adjustments in respect of store impairment and property provisions 4.7 (0.1)Exceptional items – continuing operations 9 891.5 29.3Exceptional items – discontinued operations 14 (13.0) 6.2Financing fair value remeasurements 10 2.4 1.0Financing impact on post-employment benefit obligations 10 3.2 3.0Discount unwind on non-benchmark items 10 6.2 6.7Balance sheet review – (11.5)Attributable taxation credit (11.4) (7.8)Non-benchmark tax credit in respect of prior years (6.9) (3.0)Tax rate change (0.2) –
Benchmark profit after tax for the financial year 72.4 99.1
Continuing operations 50.0 85.1
Discontinued operations 22.4 14.0
Weighted average number of shares millions millions
Number of ordinary shares for the purpose of basic EPS 775.5 764.3Dilutive effect of share incentive awards 25.0 36.0
number of ordinary shares for the purpose of diluted ePS 800.5 800.3
ePS
52 weeks ended
27 February 2016
pence
52 weeks ended
28 February 2015
pence
EPS from continuing operations:– Basic (109.4) 8.6– Diluted* (109.4) 8.1
EPS from discontinued operations: – Basic 5.3 0.8– Diluted 5.1 0.8
EPS for total Group– Basic (104.2) 9.4– Diluted* (104.2) 8.9
Total Basic benchmark EPS 9.3 13.0– Continuing operations 6.4 11.2– Discontinued operations 2.9 1.8
Diluted benchmark EPS 9.0 12.4– Continuing operations 6.2 10.6– Discontinued operations 2.8 1.8
*EPS from continuing operations and EPS for total Group are losses per share for FY16. As such, in line with the requirements of IAS 33 ‘Earnings per share’ these diluted EPS calculations are based on the basic number of shares.
GovernanceFinancial StatementS
additional informationStrateGic report 87Home Retail Group
Annual Report 2016
MSL_HRG_RA2016_FINAL_2005.indb 87 20/05/2016 17:59

Notes to the financial statements continuedFor the 52 weeks ended 28 February 2016
14. diScOntinUed OPeratiOnSOn 27 February 2016 the Group sold 100% of the Homebase business to Wesfarmers Limited. As a result, Homebase has met the recognition criteria of a discontinued operation under IFRS 5 ‘Non-current assets held for sale and discontinued operations’ and is therefore presented as such throughout this report. A summary of the consolidated income statement, exceptional items and the loss on disposal, with respect to discontinued operations are set out below.
(i) consolidated income statement
Notes
52 weeks ended
27 February 2016
£m
52 weeks ended
28 February 2015
£m
revenue 1,433.1 1,479.3Cost of sales (801.8) (804.2)
gross profit 631.3 675.1Net operating expenses 14 (iii) (600.8) (654.1)
Operating profit before exceptional items 30.5 21.0Exceptional items 14 (iv) 13.0 (6.2)
Operating profit 43.5 14.8Finance expense (7.2) (8.8)
Profit before tax from discontinued operations 36.3 6.0Taxation 4.5 0.3
Profit after tax from discontinued operations 40.8 6.3
(ii) Benchmark PBt reconciliation
Non–GAAP measures Notes
52 weeks ended
27 February 2016
£m
52 weeks ended
28 February 2015
£m
Reconciliation of PBT to benchmark PBTPBT from discontinued operations 36.3 6.0
Adjusted for:Adjustments in respect of store impairment and property provisions 17, 24 (7.0) (1.2)
Exceptional items 14 (iv) (13.0) 6.2
Financing fair value remeasurements 10 0.7 1.3Discount unwind on non–benchmark items 10 6.2 6.7
Benchmark PBT from discontinued operations 23.2 19.0Benchmark net financing expense 0.3 0.8
Benchmark operating profit from discontinued operations 23.5 19.8
(iii) net operating expenses
Notes
52 weeks ended
27 February 2016
£m
52 weeks ended
28 February 2015
£m
Profit before tax is stated after (charging)/crediting:Operating lease rental expense (153.1) (171.9)
Cost of inventories and other direct expenses recognised in cost of sales (787.7) (790.1)
Write down of inventories (14.1) (14.1)
Profit on sale of property, plant and equipment and other intangible assets (0.4) 0.1
Depreciation of property, plant and equipment 17 (24.4) (26.0)
Impairment charges 17 – (15.8)
Amortisation of intangible assets 16 (12.2) (7.6)Employee benefit costs 8 (189.7) (211.4)
88 Home Retail GroupAnnual Report 2016
MSL_HRG_RA2016_FINAL_2005.indb 88 20/05/2016 17:59
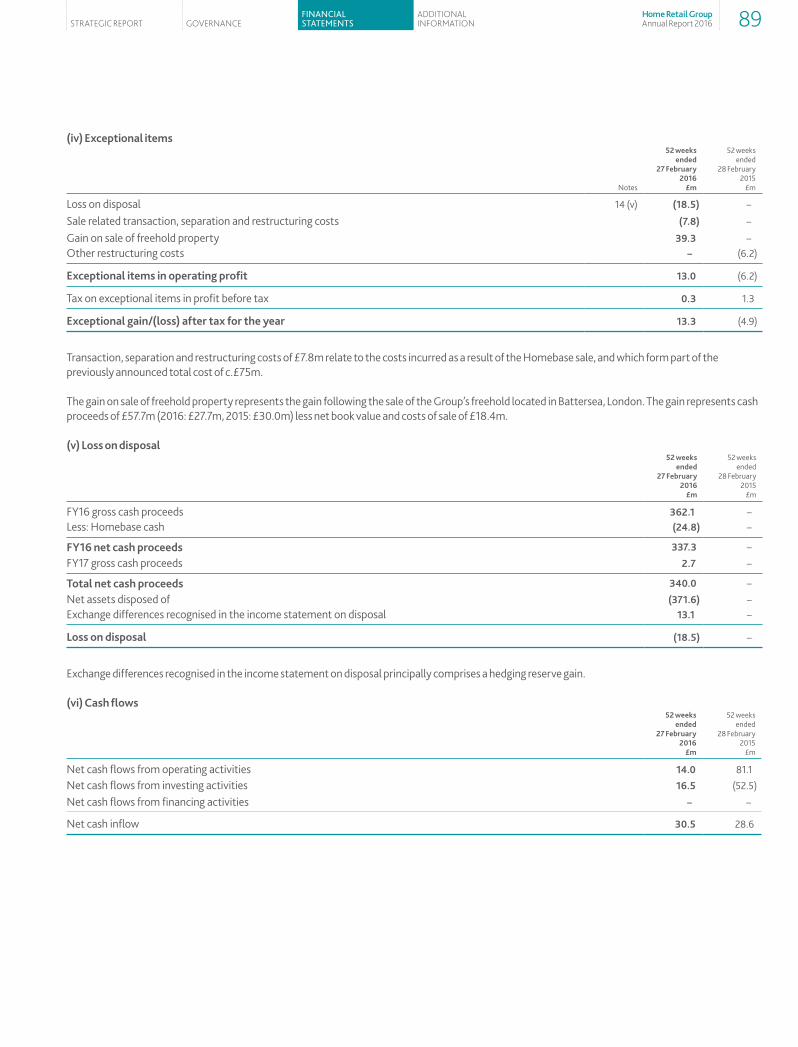
(iv) exceptional items
Notes
52 weeks ended
27 February 2016
£m
52 weeks ended
28 February 2015
£m
Loss on disposal 14 (v) (18.5) –
Sale related transaction, separation and restructuring costs (7.8) –
Gain on sale of freehold property 39.3 –Other restructuring costs – (6.2)
exceptional items in operating profit 13.0 (6.2)
Tax on exceptional items in profit before tax 0.3 1.3
exceptional gain/(loss) after tax for the year 13.3 (4.9)
Transaction, separation and restructuring costs of £7.8m relate to the costs incurred as a result of the Homebase sale, and which form part of the previously announced total cost of c.£75m.
The gain on sale of freehold property represents the gain following the sale of the Group’s freehold located in Battersea, London. The gain represents cash proceeds of £57.7m (2016: £27.7m, 2015: £30.0m) less net book value and costs of sale of £18.4m.
(v) loss on disposal52 weeks
ended 27 February
2016£m
52 weeks ended
28 February 2015
£m
FY16 gross cash proceeds 362.1 –Less: Homebase cash (24.8) –
FY16 net cash proceeds 337.3 –
FY17 gross cash proceeds 2.7 –
total net cash proceeds 340.0 –
Net assets disposed of (371.6) –Exchange differences recognised in the income statement on disposal 13.1 –
loss on disposal (18.5) –
Exchange differences recognised in the income statement on disposal principally comprises a hedging reserve gain.
(vi) cash flows52 weeks
ended 27 February
2016£m
52 weeks ended
28 February 2015
£m
Net cash flows from operating activities 14.0 81.1
Net cash flows from investing activities 16.5 (52.5)
Net cash flows from financing activities – –
Net cash inflow 30.5 28.6
GovernanceFinancial StatementS
additional informationStrateGic report 89Home Retail Group
Annual Report 2016
MSL_HRG_RA2016_FINAL_2005.indb 89 20/05/2016 17:59

Notes to the financial statements continuedFor the 52 weeks ended 28 February 2016
15. gOOdWill
argos £m
Homebase £m
central activities
£mtotal
£m
CostAt 1 March 2015 1,152.3 770.4 2.9 1,925.6
Disposal – (770.4) – (770.4)
at 27 February 2016 1,152.3 – 2.9 1,155.2
Accumulated impairmentAt 1 March 2015 – (381.7) – (381.7)
Impairment (851.7) – (2.9) (854.6)
Disposal – 381.7 – 381.7
at 27 February 2016 (851.7) – (2.9) (854.6)
net book value at 27 February 2016 300.6 – – 300.6
argos £m
Homebase £m
central
activities£m
total £m
CostAt March 2014 and 28 February 2015 1,152.3 770.4 2.9 1,925.6
Accumulated impairmentAt 3 March 2014 and 28 February 2015 – (381.7) – (381.7)
Net book value at 28 February 2015 1,152.3 388.7 2.9 1,543.9
Goodwill has been allocated for impairment testing purposes to two individual cash-generating units (CGUs) being the business segments of Argos and Habitat which is included within Central Activities. The goodwill in respect of Homebase has been incorporated in the disposal of the business (note 14).
The carrying amount of Argos goodwill has been reviewed in light of the recommended offer received from J Sainsbury plc on 1 April 2016 for the purchase of Home Retail Group plc. An impairment charge of £851.7m has been recognised, such that after this charge the carrying amount of Argos goodwill is £300.6m. This charge has been calculated to align Group net assets, adjusted for certain items, to the offer value.
The carrying value of Habitat goodwill was reviewed in light of the sale of Homebase. An impairment charge of £2.9m has been recognised, which fully writes down the Habitat goodwill. This has arisen directly as a result of the sale of Homebase and subsequent closure of Habitat concessions in Homebase over approximately the next 6 months.
In the prior year the recoverable amount of goodwill was determined based on the value-in-use calculation. The key assumptions used for the Argos business were; compound annual increase in sales of 3.4%, long term growth beyond five years of 2.0% and a post tax discount rate of 8.5%.
90 Home Retail GroupAnnual Report 2016
MSL_HRG_RA2016_FINAL_2005.indb 90 20/05/2016 17:59

16. OtHer intangiBle aSSetScomputer
software £m
Brands £m
total £m
CostAt 1 March 2015 458.3 40.5 498.8
Additions 107.3 – 107.3
Disposals (9.2) – (9.2)
Disposal of business (80.0) – (80.0)
at 27 February 2016 476.4 40.5 516.9
Accumulated amortisationAt 1 March 2015 (243.1) (20.2) (263.3)
Charge for the year (58.3) (4.1) (62.4)
Impairment – (9.6) (9.6)
Disposals 9.3 – 9.3
Disposal of business 38.0 – 38.0
at 27 February 2016 (254.1) (33.9) (288.0)
net book value at 27 February 2016 222.3 6.6 228.9
Assets in the course of construction included above at 27 February 2016 19.0 – 19.0
computer software
£m Brands
£mtotal
£m
CostAt 2 March 2014 368.8 40.5 409.3
Additions 93.3 – 93.3
Disposals (3.8) – (3.8)
At 28 February 2015 458.3 40.5 498.8
Accumulated amortisationAt 2 March 2014 (199.5) (16.2) (215.7)
Charge for the year (46.4) (4.0) (50.4)
Disposals 2.8 – 2.8
At 28 February 2015 (243.1) (20.2) (263.3)
Net book value at 28 February 2015 215.2 20.3 235.5
Net book value at 1 March 2014 169.3 24.3 193.6
Assets in the course of construction included above at 28 February 2015 25.2 – 25.2
Amortisation of £2.5m (2015: £2.6m) is included in cost of sales in the income statement and £59.9m (2015: £47.8m) in net operating expenses.
The impairment of Habitat brand intangibles has arisen directly as a result of the sale of Homebase and subsequent closure of Habitat concessions in Homebase over approximately the next 6 months.
GovernanceFinancial StatementS
additional informationStrateGic report 91Home Retail Group
Annual Report 2016
MSL_HRG_RA2016_FINAL_2005.indb 91 20/05/2016 17:59
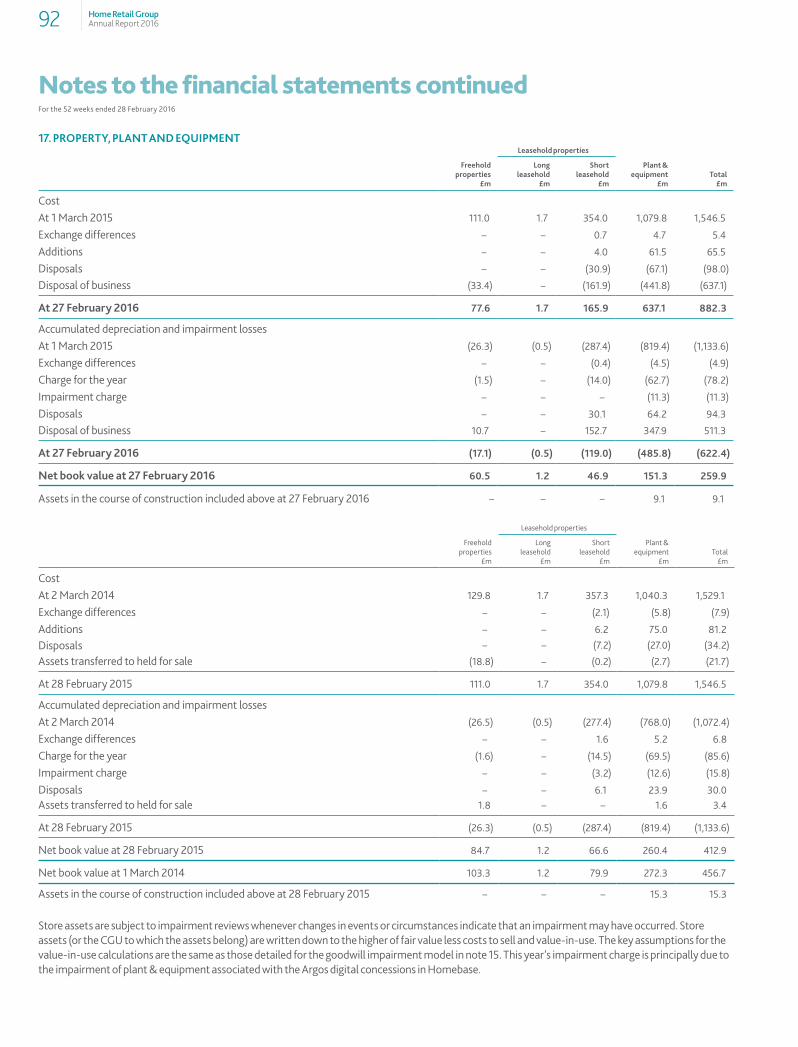
Notes to the financial statements continuedFor the 52 weeks ended 28 February 2016
17. PrOPertY, Plant and eQUiPmentleasehold properties
Freehold properties
£m
long leasehold
£m
Short leasehold
£m
Plant & equipment
£m total
£m
CostAt 1 March 2015 111.0 1.7 354.0 1,079.8 1,546.5
Exchange differences – – 0.7 4.7 5.4
Additions – – 4.0 61.5 65.5
Disposals – – (30.9) (67.1) (98.0)
Disposal of business (33.4) – (161.9) (441.8) (637.1)
at 27 February 2016 77.6 1.7 165.9 637.1 882.3
Accumulated depreciation and impairment lossesAt 1 March 2015 (26.3) (0.5) (287.4) (819.4) (1,133.6)
Exchange differences – – (0.4) (4.5) (4.9)
Charge for the year (1.5) – (14.0) (62.7) (78.2)
Impairment charge – – – (11.3) (11.3)
Disposals – – 30.1 64.2 94.3
Disposal of business 10.7 – 152.7 347.9 511.3
at 27 February 2016 (17.1) (0.5) (119.0) (485.8) (622.4)
net book value at 27 February 2016 60.5 1.2 46.9 151.3 259.9
Assets in the course of construction included above at 27 February 2016 – – – 9.1 9.1
Leasehold properties
Freehold properties
£m
Long leasehold
£m
Short leasehold
£m
Plant & equipment
£m Total
£m
CostAt 2 March 2014 129.8 1.7 357.3 1,040.3 1,529.1
Exchange differences – – (2.1) (5.8) (7.9)
Additions – – 6.2 75.0 81.2
Disposals – – (7.2) (27.0) (34.2)
Assets transferred to held for sale (18.8) – (0.2) (2.7) (21.7)
At 28 February 2015 111.0 1.7 354.0 1,079.8 1,546.5
Accumulated depreciation and impairment lossesAt 2 March 2014 (26.5) (0.5) (277.4) (768.0) (1,072.4)
Exchange differences – – 1.6 5.2 6.8
Charge for the year (1.6) – (14.5) (69.5) (85.6)
Impairment charge – – (3.2) (12.6) (15.8)
Disposals – – 6.1 23.9 30.0Assets transferred to held for sale 1.8 – – 1.6 3.4
At 28 February 2015 (26.3) (0.5) (287.4) (819.4) (1,133.6)
Net book value at 28 February 2015 84.7 1.2 66.6 260.4 412.9
Net book value at 1 March 2014 103.3 1.2 79.9 272.3 456.7
Assets in the course of construction included above at 28 February 2015 – – – 15.3 15.3
Store assets are subject to impairment reviews whenever changes in events or circumstances indicate that an impairment may have occurred. Store assets (or the CGU to which the assets belong) are written down to the higher of fair value less costs to sell and value-in-use. The key assumptions for the value-in-use calculations are the same as those detailed for the goodwill impairment model in note 15. This year’s impairment charge is principally due to the impairment of plant & equipment associated with the Argos digital concessions in Homebase.
92 Home Retail GroupAnnual Report 2016
MSL_HRG_RA2016_FINAL_2005.indb 92 20/05/2016 17:59
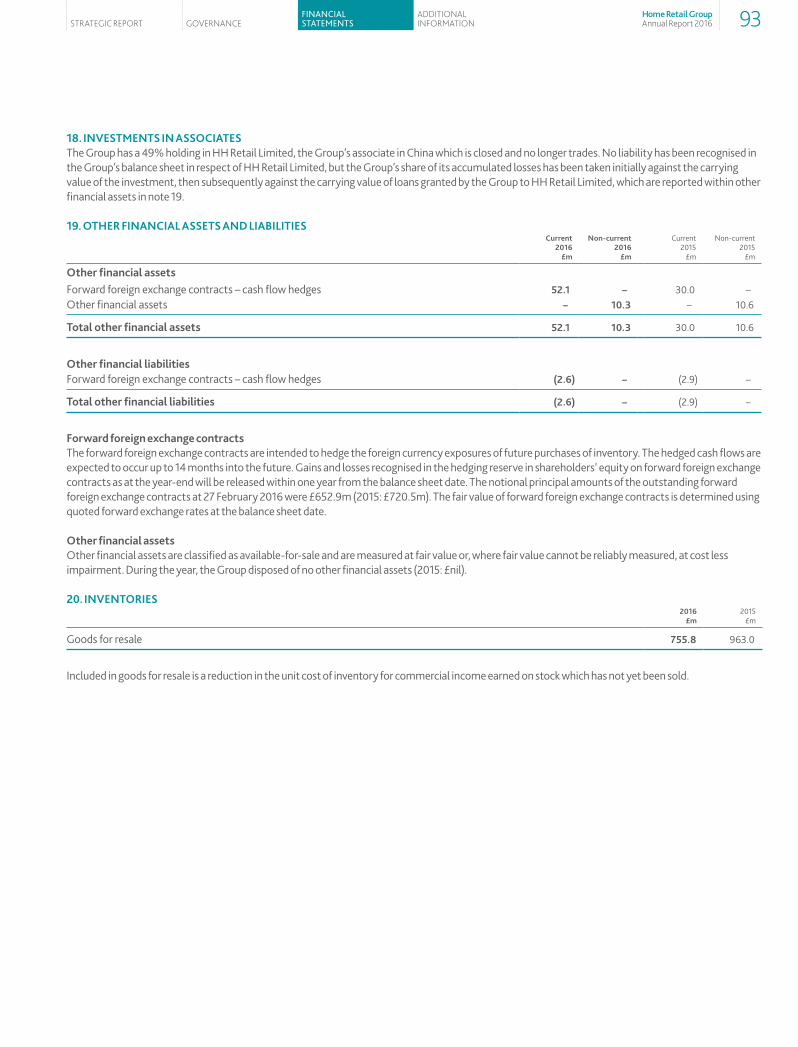
18. inveStmentS in aSSOciateSThe Group has a 49% holding in HH Retail Limited, the Group’s associate in China which is closed and no longer trades. No liability has been recognised in the Group’s balance sheet in respect of HH Retail Limited, but the Group’s share of its accumulated losses has been taken initially against the carrying value of the investment, then subsequently against the carrying value of loans granted by the Group to HH Retail Limited, which are reported within other financial assets in note 19.
19. OtHer Financial aSSetS and liaBilitieS
current 2016
£m
non-current 2016
£m
Current 2015
£m
Non-current 2015
£m
Other financial assetsForward foreign exchange contracts – cash flow hedges 52.1 – 30.0 –Other financial assets – 10.3 – 10.6
total other financial assets 52.1 10.3 30.0 10.6
Other financial liabilitiesForward foreign exchange contracts – cash flow hedges (2.6) – (2.9) –
total other financial liabilities (2.6) – (2.9) –
Forward foreign exchange contractsThe forward foreign exchange contracts are intended to hedge the foreign currency exposures of future purchases of inventory. The hedged cash flows are expected to occur up to 14 months into the future. Gains and losses recognised in the hedging reserve in shareholders’ equity on forward foreign exchange contracts as at the year-end will be released within one year from the balance sheet date. The notional principal amounts of the outstanding forward foreign exchange contracts at 27 February 2016 were £652.9m (2015: £720.5m). The fair value of forward foreign exchange contracts is determined using quoted forward exchange rates at the balance sheet date.
Other financial assetsOther financial assets are classified as available-for-sale and are measured at fair value or, where fair value cannot be reliably measured, at cost less impairment. During the year, the Group disposed of no other financial assets (2015: £nil).
20. inventOrieS2016
£m2015
£m
Goods for resale 755.8 963.0
Included in goods for resale is a reduction in the unit cost of inventory for commercial income earned on stock which has not yet been sold.
GovernanceFinancial StatementS
additional informationStrateGic report 93Home Retail Group
Annual Report 2016
MSL_HRG_RA2016_FINAL_2005.indb 93 20/05/2016 17:59

Notes to the financial statements continuedFor the 52 weeks ended 28 February 2016
21. trade and OtHer receivaBleScurrent
2016 £m
non-current 2016
£m
Current 2015
£m
Non-current 2015
£m
Trade receivables:– Financial Services loan book 677.0 – 644.1 –– Other trade receivables 58.9 – 62.8 –
735.9 – 706.9 –Less: provision for impairment of receivables (65.3) – (68.4) –
670.6 – 638.5 –
Other receivables 120.3 – 98.8 1.4Prepayments and accrued income 39.4 – 52.7 –
830.3 – 790.0 1.4
The carrying values of current trade and other receivables are a reasonable approximation of their fair values due to their short-term nature. Long-term receivables have been discounted where the time value of money is material. All receivables due after more than one year are due within five years from the balance sheet date. There is no concentration of credit risk with respect to trade receivables, as the Group has a broad customer base. The maximum exposure to credit risk at the reporting date is the fair value of each class of receivable mentioned above. The Group does not hold any collateral as security.
Included in other receivables is £13.0m (2015: £23.0m) of commercial income balances which have been earned during FY16 and principally relate to contractually agreed volume-based rebates which are expected to be collected in Q1 FY17.
As at 27 February 2016, trade receivables of £66.8m (2015: £62.1m) were individually determined to be impaired. The impaired receivables mainly relate to store cardholder balances on customer accounts on which indications of possible default have been identified. Provision for impairment of trade receivables is also made on a portfolio basis against trade receivables which are not individually determined to be impaired.
Movements in the provision for impairment of trade receivables are as follows:2016
£m2015
£m
At 28 February 2015 (68.4) (73.1)
Charge for the year (17.3) (16.2)
Utilised 20.4 20.9
at 27 February 2016 (65.3) (68.4)
As at 27 February 2016, trade receivables of £10.2m (2015: £8.0m) were past due but not impaired. These mainly relate to other trade receivable balances. The ageing analysis of these trade receivables is as follows:
2016 £m
2015 £m
Less than 3 months 9.0 4.1
3 to 6 months 1.2 3.7
6 to 9 months – 0.2
10.2 8.0
The other classes within trade and other receivables do not contain impaired assets.
22. caSH and caSH eQUivalentS2016
£m2015
£m
Cash at bank and in hand 622.9 309.3
The effective interest rate during the year ended 27 February 2016 for cash and cash equivalents was 0.6% (2015: 0.6%). The Group has provided letters of credit totalling £12.5m (2015: £12.5m) to AIG Europe Limited as part of their re-insurance agreement. These letters are secured by cash deposits.
94 Home Retail GroupAnnual Report 2016
MSL_HRG_RA2016_FINAL_2005.indb 94 20/05/2016 17:59

23. trade and OtHer PaYaBleScurrent
2016 £m
non-current 2016
£m
Current 2015
£m
Non-current 2015
£m
Trade payables (678.1) – (687.8) –
Social security costs and other taxes (48.6) – (80.4) –
Accruals (114.9) – (193.3) –
Deferred income (69.6) (16.8) (180.8) (46.4)
Other payables (150.5) – (140.8) –
(1,061.7) (16.8) (1,283.1) (46.4)
Trade and other payables are non-interest bearing and the fair values are not considered to differ materially from the recognised book values. Long-term payables have been discounted where the time value of money is material.
24. PrOviSiOnS
Property £m
insurance £m
restructuring £m
FScustomer
redress £m
Other £m
total £m
At 1 March 2015 (130.7) (35.5) (20.8) (29.0) (5.9) (221.9)
Charged to the income statement (8.0) (4.3) (19.0) (17.0) (5.7) (54.0)
Released to the income statement 14.6 3.2 – – – 17.8
Utilised during the year – cash 18.3 4.9 25.8 34.5 5.8 89.3
Utilised during the year – non cash 0.7 – 1.2 – – 1.9
Transfer from accruals (1.3) – (0.2) – – (1.5)
Exchange differences (1.6) – – – – (1.6)
Discount unwind (6.7) - - - - (6.7)
Impact of business disposal 112.9 2.3 0.2 – 2.3 117.7
at 27 February 2016 (1.8) (29.4) (12.8) (11.5) (3.5) (59.0)
analysed as:
2016 £m
2015 £m
Current (38.1) (95.7)
Non-current (20.9) (126.2)
(59.0) (221.9)
Property provisions comprise obligations in respect of onerous leases together with other costs or income associated with store closures. In respect of onerous leases, provision is made for onerous lease contracts on stores that have either closed, or where projected future trading income is insufficient to cover the lower of exit cost or cost of continuing to trade the store. Where the cost of continuing to trade the store is lower, the provision is based on the present value of expected future cash flows relating to rents, rates and other property costs to the end of the lease terms net of expected trading or sublet income.
Provision is made for the estimated costs of insurance claims incurred by the Group which have not been settled at the balance sheet date, including the costs of claims that have arisen but have not yet been reported to the Group. The estimated cost of claims includes operational costs to be incurred in administering future claims.
The restructuring provision principally relates to the restructuring charges incurred following the sale of Homebase.
The Financial Services customer redress provision principally relates to customer redress in respect of PPI and includes a charge relating to a potential exposure resulting from the Supreme Court ruling on Plevin vs Paragon in November 2014 and the subsequent FCA consultation paper issued in November 2015. The customer redress provision comprises the estimated cost of making redress payments to customers in respect of past sales of PPI policies, including the related operational costs of administering these claims. The eventual cost is dependent upon response rates, uphold rates, redress costs, claim handling costs and costs associated with claims that are subsequently referred to the Financial Ombudsman Service. The provision represents management’s best estimate of future costs and will remain under review.
GovernanceFinancial StatementS
additional informationStrateGic report 95Home Retail Group
Annual Report 2016
MSL_HRG_RA2016_FINAL_2005.indb 95 20/05/2016 17:59

Notes to the financial statements continuedFor the 52 weeks ended 28 February 2016
25. POSt-emPlOYment BeneFitSDuring the year, the Group operated both defined benefit and defined contribution schemes. A defined benefit scheme is a pension scheme that defines an amount of pension benefit that an employee will receive on retirement, usually dependent on one or more factors such as age, years of service and compensation. A defined contribution scheme is a pension scheme under which both the Group and employees pay contributions into an independently administered fund. The defined benefit scheme is closed to future accrual. The cost of providing the benefits under the defined contribution schemes, recognised in the income statement, comprises the amount of contributions payable to the schemes in respect of the year.
Pension arrangements for UK employees were provided principally through a defined benefit scheme (the Home Retail Group Pension Scheme), until it was closed to future accrual during FY13, and a defined contribution scheme (the Home Retail Group Personal Pension Plan), which continues to be operated. In other countries, benefits are determined in accordance with local practice and regulations and funding is provided accordingly.
defined benefit schemesThe Home Retail Group Pension SchemeThe scheme has rules which specify the benefits to be paid and is financed accordingly with assets being held in independently administered funds. A full actuarial valuation of the scheme is carried out every three years with interim reviews in the intervening years. The last full actuarial valuation of the scheme was carried out as at 31 March 2012 by independent, qualified actuaries, Towers Watson, using the projected unit method and resulted in a deficit of £158m. The deficit recovery plan agreed with the Trustee provides for payments of £22m per annum paid in quarterly instalments until 31 December 2019.
As part of the sale of Homebase it was agreed with the Trustee that an additional cash contribution of £26m would be made to the scheme at the time that the sale process was completed, which was 27 February 2016. In addition, following any return of capital associated with the sale, an additional cash contribution of £24m will be made to the scheme. The Group will also provide security in the form of a first fixed charge over certain freehold property of the Group with a value of £37.5m on an open market vacant possession basis.
The full actuarial valuation of the scheme as at 31 March 2015 is well advanced and agreement has been reached in principal with the Trustee which would result in: � A deficit as at 31 March 2015 of £250m, before the payments associated with the sale of Homebase noted above; and � Annual deficit recovery payments to the scheme increasing from £22m to £30m.
Final agreement of the valuation is awaiting the outcome of the potential acquisition of the Group by J Sainsbury plc. Should the acquisition not proceed, the agreement in principal as set out above will be put into effect. Should the acquisition proceed, then separate arrangements agreed between J Sainsbury plc and the Trustee will be put into effect.
Unfunded defined benefit schemeThe Group has in place arrangements which secure unfunded pension benefit arrangements for certain directors and senior managers by granting charges to an independent Trustee over an independently managed portfolio of marketable securities owned by the Group. The amount of assets charged in this way is adjusted annually to keep the ratio of assets charged to the discounted value of the accrued benefits secured in this way as close as possible to the corresponding ratio in the Home Retail Group Pension Scheme. The total value of the assets charged in this way at 27 February 2016 was £10.2m (2015: £10.5m). The Group’s unfunded defined benefit arrangement closed to future accrual with effect from 30 April 2013. Further details of the pension arrangements for directors appear in the audited part of the directors’ remuneration report.
IAS 19 valuationsThe valuations used for IAS 19 have been based on the most recent actuarial funding valuations and have been updated by KPMG to take account of the requirements of IAS 19 in order to assess the liabilities of the schemes at the year-end. As required by IAS 19, the value of the defined benefit obligations at the year-end has been measured using the projected unit method. The movements during the year in the net deficit recognised in the balance sheet were as follows:
2016
£m2015
£m
at 1 march 2015 (114.4) (76.6)Total net charge recognised in the consolidated income statement (5.1) (4.9)Remeasurement of the net defined benefit liability recognised in the consolidated statement of comprehensive income (24.7) (55.6)Impact of business disposal 1.0 –Contributions paid by the Group – annual deficit recovery payment 22.0 22.0 – Homebase sale related payment 26.0 – – other 0.7 0.7
at 27 February 2016 (94.5) (114.4)
During the year, the Group has paid contributions totalling £48.7m (2015: £22.7m) to the Home Retail Group Pension Scheme including £22.0m (2015: £22.0m) as part of the deficit recovery plan agreed with the scheme Trustee following the completion of the 31 March 2012 actuarial valuation and £26.0m of additional contributions following the sale of Homebase.
96 Home Retail GroupAnnual Report 2016
MSL_HRG_RA2016_FINAL_2005.indb 96 20/05/2016 17:59

The defined benefit obligations consist of a combination of both insured liabilities (whereby the Trustee has entered an insurance contract with a regulated insurer, to take over the financial responsibility for meeting the cost of the pension promise made by the Group to those members covered by the premium) and non-insured liabilities (where the Group has responsibility for meeting the costs of the pension promise). The risks associated with defined benefit funding for the insured liabilities have therefore been passed to the insurance company (although the Group retains ultimate responsibility for the insured liabilities if the insurance company should fail). Recognising this transfer of risk, the sensitivities described below relate to the non-insured defined benefit obligations only. The amounts recognised in the consolidated balance sheet are determined as follows:
2016
£m2015
£m
Fair value of scheme assets 1,009.4 989.3Present value of insured funded obligations (323.0) (315.4)Present value of non-insured funded liabilities (769.0) (776.2)
Deficit in the funded scheme (82.6) (102.3)Present value of unfunded pension arrangements (11.9) (12.1)
Post-employment benefits recognised in the balance sheet (94.5) (114.4)
The weighted average duration to payment of the schemes’ expected non-insured cash flows is 28 years (2015: 27 years).
The amounts recognised in the consolidated income statement were as follows:
Notes2016
£m2015
£m
Post-employment benefit scheme administration costs (1.9) (1.9)Net finance expense on post-employment benefit obligations 10 (3.2) (3.0)
total net charge recognised in the consolidated income statement (5.1) (4.9)
Contributions to the Group’s defined contribution pension arrangements are in addition to those set out in this note and are charged directly to the income statement.
The principal actuarial assumptions used to calculate the present value of the defined benefit obligations were as follows:
2016
%2015
%
Rate of inflation 3.1 3.0Rate of increase for pensions in payment 2.9 2.9Rate of increase for deferred pensions 2.9 2.9Discount rate 3.8 3.5Life expectancy: at age 65 for a male currently aged 65 23.1 years 22.4 years at age 65 for a female currently aged 65 25.5 years 24.8 years at age 65 for a male currently aged 50 24.6 years 24.0 years at age 65 for a female currently aged 50 27.2 years 26.6 years
The discount rate is based on market yields on high-quality corporate bonds of equivalent currency and term to the defined benefit obligations. The sensitivity of the defined benefit obligations to changes in the material assumptions is detailed below. Changes in the ‘insured’ defined obligations are matched by changes in the fair value of the insurance contract and therefore the sensitivities below relate to the non-insured defined benefit obligations only. The impact of changing material assumptions is as follows:
Increase/ decrease in
assumptions
2016indicative effect
on non-insured defined benefit
obligations £m
2015Indicative effect on non-insured defined benefit
obligations £m
Rate of inflation 0.5% +/- 89 +/- 103Rate of increase for pensions in payment 0.5% +/- 45 +/- 47Rate of increase for deferred pensions 0.5% +/- 50 +/- 53Discount rate 0.5% -/+ 95 -/+ 96Life expectancy 1 year +/- 27 +/- 22
GovernanceFinancial StatementS
additional informationStrateGic report 97Home Retail Group
Annual Report 2016
MSL_HRG_RA2016_FINAL_2005.indb 97 20/05/2016 17:59

Notes to the financial statements continuedFor the 52 weeks ended 28 February 2016
25. POSt-emPlOYment BeneFitS CONTINUEDFollowing closure of the scheme to future accrual during FY13, the present value of the defined benefit obligations is no longer impacted by increases in salaries. The calculations in this section have been carried out using the same method and data as the Group’s pensions and accounting figures with each assumption adjusted as shown above. Each assumption has been varied individually and a combination of changes in assumptions could produce a different result.
The assets of the Home Retail Group Pension Scheme are summarised as follows:2016 2015
Fair value of quoted
assets £m
Fair value of unquoted
assets£m
Percentage of scheme
assets %
Fair value of quoted
assets £m
Fair value of unquoted
assets£m
Percentage of scheme
assets %
Insurance policy – 323.0 32 – 315.4 32
Equities 153.2 – 15 260.8 – 26
Fund of hedge funds1 – 91.9 9 – 99.7 10
Diversified growth fund2 128.6 – 13 139.8 – 14
Property funds 55.7 58.3 11 49.4 58.2 11
Corporate bonds 104.5 53.2 16 – – –
Index linked government bonds 5.2 – 1 6.2 – 1
Cash and cash equivalents (8.4) – (1) 8.6 – 1
Other – 44.2 4 – 51.2 5
Fair value of scheme assets 438.8 570.6 100 464.8 524.5 100
1 The fund of hedge funds holds a portfolio of other hedge funds and is designed to achieve greater diversification of assets whilst maximising return and minimising risk to the scheme. There are many different types of hedge fund, however they typically aim to produce absolute returns rather than relative returns, they use short as well as long-term investments and are typically traded more actively than traditional assets.
2 A diversified growth fund (DGF) invests in a broad range of asset classes and is designed to produce less volatile returns than equities, which, if achieved, should help pension schemes to better maintain their funding level in volatile markets. DGFs generally aim to achieve positive return or a real return ahead of inflation, have a wide exposure to a range of asset classes and are a low governance solution to the problem of diversifying a scheme’s assets. The DGF, Standard Life Global Absolute Return Strategies, aims to provide positive investment returns in all market conditions over the medium and long term and invests mainly in derivatives, fixed income assets and equities.
Investment strategyInvestment risk is managed by diversifying the assets across asset classes whose return patterns are not highly correlated. The assets include an insurance contract which matches approximately one-third of the scheme’s pension benefits and therefore helps to significantly reduce the Group’s defined benefit pension risks. Changes in the present value of the defined benefit liabilities are as follows:
2016
£m2015
£m
Opening defined benefit liabilities (1,103.7) (968.4)
Finance expense (38.2) (42.2)
Remeasurements due to:Changes in financial assumptions (44.9) (134.5)
Experience on benefit liabilities 43.4 20.6
(1.5) (113.9)
Liabilities disposed through the sale of Homebase 15.1 –
Benefits paid 24.4 20.8
closing defined benefit liabilities (1,103.9) (1,103.7)
98 Home Retail GroupAnnual Report 2016
MSL_HRG_RA2016_FINAL_2005.indb 98 20/05/2016 17:59
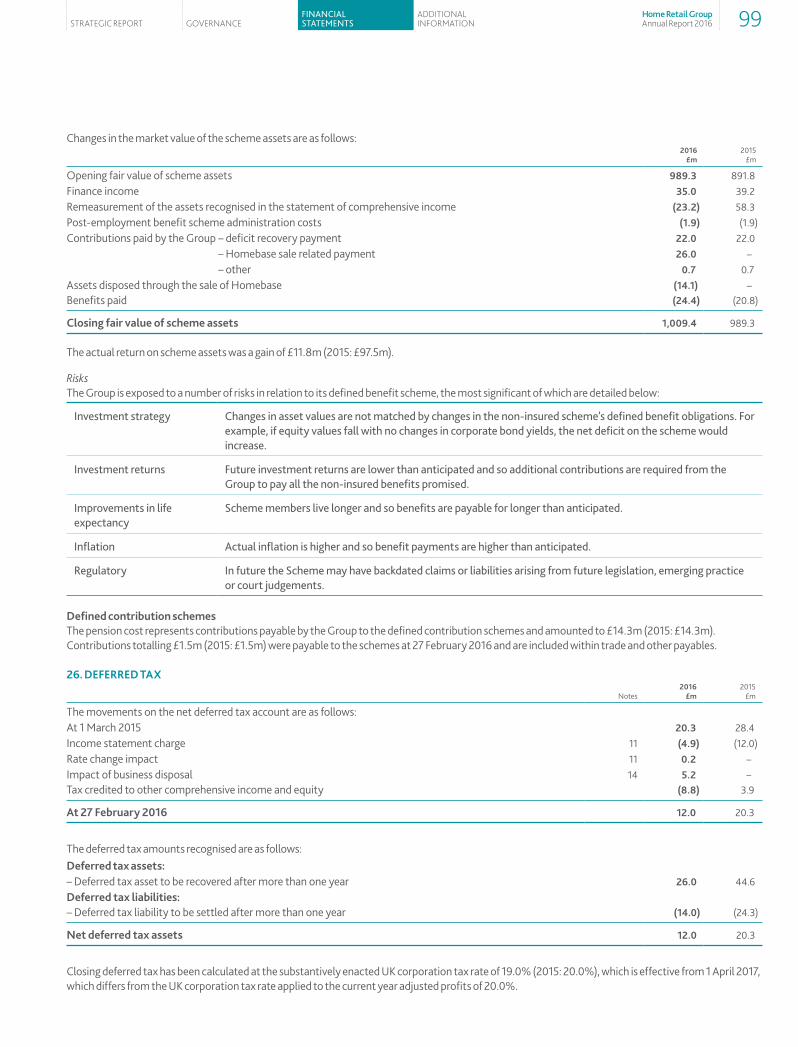
Changes in the market value of the scheme assets are as follows:
2016
£m2015
£m
Opening fair value of scheme assets 989.3 891.8Finance income 35.0 39.2Remeasurement of the assets recognised in the statement of comprehensive income (23.2) 58.3Post-employment benefit scheme administration costs (1.9) (1.9)Contributions paid by the Group – deficit recovery payment 22.0 22.0 – Homebase sale related payment 26.0 – – other 0.7 0.7Assets disposed through the sale of Homebase (14.1) –Benefits paid (24.4) (20.8)
closing fair value of scheme assets 1,009.4 989.3
The actual return on scheme assets was a gain of £11.8m (2015: £97.5m).
RisksThe Group is exposed to a number of risks in relation to its defined benefit scheme, the most significant of which are detailed below:
Investment strategy Changes in asset values are not matched by changes in the non-insured scheme’s defined benefit obligations. For example, if equity values fall with no changes in corporate bond yields, the net deficit on the scheme would increase.
Investment returns Future investment returns are lower than anticipated and so additional contributions are required from the Group to pay all the non-insured benefits promised.
Improvements in life expectancy
Scheme members live longer and so benefits are payable for longer than anticipated.
Inflation Actual inflation is higher and so benefit payments are higher than anticipated.
Regulatory In future the Scheme may have backdated claims or liabilities arising from future legislation, emerging practice or court judgements.
defined contribution schemesThe pension cost represents contributions payable by the Group to the defined contribution schemes and amounted to £14.3m (2015: £14.3m). Contributions totalling £1.5m (2015: £1.5m) were payable to the schemes at 27 February 2016 and are included within trade and other payables.
26. deFerred taX
Notes2016
£m2015
£m
The movements on the net deferred tax account are as follows:At 1 March 2015 20.3 28.4Income statement charge 11 (4.9) (12.0)Rate change impact 11 0.2 –Impact of business disposal 14 5.2 –Tax credited to other comprehensive income and equity (8.8) 3.9
at 27 February 2016 12.0 20.3
The deferred tax amounts recognised are as follows:deferred tax assets:– Deferred tax asset to be recovered after more than one year 26.0 44.6deferred tax liabilities:– Deferred tax liability to be settled after more than one year (14.0) (24.3)
net deferred tax assets 12.0 20.3
Closing deferred tax has been calculated at the substantively enacted UK corporation tax rate of 19.0% (2015: 20.0%), which is effective from 1 April 2017, which differs from the UK corporation tax rate applied to the current year adjusted profits of 20.0%.
GovernanceFinancial StatementS
additional informationStrateGic report 99Home Retail Group
Annual Report 2016
MSL_HRG_RA2016_FINAL_2005.indb 99 20/05/2016 17:59

Notes to the financial statements continuedFor the 52 weeks ended 28 February 2016
26. deFerred taX CONTINUEDThe movement in deferred tax assets and liabilities during the year, without taking into consideration the offsetting of balances within the same tax jurisdiction, is as follows:
deferred tax assets Notes
asset provisions
£m
Post- employment
benefit£m
Other£m
total £m
At 1 March 2015 21.8 22.8 – 44.6
Income statement (charge) (4.2) (8.5) – (12.7)
Impact of disposal – Homebase 14 (1.7) – – (1.7)
Tax credited to other comprehensive income and equity (7.6) 3.9 - (3.7)
Rate change (0.5) – – (0.5)
at 27 February 2016 7.8 18.2 – 26.0
Deferred tax assets
Asset provisions
£m
Post- employment
benefit£m
Other£m
Total £m
At 2 March 2014 19.6 15.5 6.2 41.3
Income statement credit/(charge) 0.3 (3.8) – (3.5)
Tax credited to other comprehensive income and equity 1.9 11.1 – 13.0
Transfer to deferred tax liabilities – – (6.2) (6.2)
At 28 February 2015 21.8 22.8 – 44.6
deferred tax liabilities Notes
Property valuations
£m
accelerated tax
depreciation£m
Other£m
total £m
At 1 March 2015 (9.1) (12.3) (2.9) (24.3)
Income statement credit 1.2 6.6 – 7.8
Impact of disposal – Homebase 14 5.3 (0.4) 2.0 6.9
Tax credited to other comprehensive income and equity – – (5.1) (5.1)
Rate change 0.4 0.3 – 0.7
at 27 February 2016 (2.2) (5.8) (6.0) (14.0)
Deferred tax liabilities
Property valuations
£m
Accelerated tax
depreciation£m
Other£m
Total £m
At 2 March 2014 (9.8) (3.1) – (12.9)
Income statement credit/(charge) 0.7 (9.2) – (8.5)
Tax credited to other comprehensive income and equity – – (9.1) (9.1)
Transfer from deferred tax assets – – 6.2 6.2
At 28 February 2015 (9.1) (12.3) (2.9) (24.3)
Deferred tax assets are recognised for tax loss carry-forwards and other temporary differences to the extent that the realisation of the related tax benefit through the future taxable profits is probable.
The Group has not recognised deferred tax assets of £12.7m (2015: £12.9m) in respect of capital losses, which total £66.9m (2015: £64.7m) that can be carried forward against future taxable gains. These losses are available indefinitely.
100 Home Retail GroupAnnual Report 2016
MSL_HRG_RA2016_FINAL_2005.indb 100 20/05/2016 17:59

27. SHare caPital
2016 number of shares
2016 £m
2015 Number of shares
2015 £m
allotted, called-up and fully paidOrdinary share capital of 10p each 813,445,001 81.3 813,445,001 81.3
28. nOteS tO tHe cOnSOlidated Statement OF cHangeS in eQUitYcapital redemption reserveThe capital redemption reserve arose as a result of the share buy-back programme that was undertaken during the year ended 26 February 2011.
merger reserveThe merger reserve arose on the demerger of the Group from GUS plc during 2006.
Other reservestreasury
shares£m
Hedging reserve
£m
translation reserve
£m
total other reserves
£m
Balance at 1 March 2015 (103.1) 13.3 28.3 (61.5)
Other comprehensive income – 22.5 2.7 25.2
Net movement in own shares 59.4 – – 59.4
Discontinued operations – (8.5) (4.6) (13.1)
Balance at 27 February 2016 (43.7) 27.3 26.4 10.0
Treasury shares
£m
Hedging reserve
£m
Translation reserve
£m
Total other reserves
£m
Balance at 2 March 2014 (58.3) (23.3) 29.3 (52.3)
Other comprehensive income – 36.6 (1.0) 35.6
Net movement in own shares (44.8) – – (44.8)
Balance at 28 February 2015 (103.1) 13.3 28.3 (61.5)
The net credit arising on the movement in own shares of £59.4m (2015: debit of £44.8m) represents the purchase, and subsequent utilisation, of shares held for the purpose of satisfying obligations arising from the Group’s share-based compensation schemes. Shares in Home Retail Group plc are held in the following trusts:
Home Retail Group Employee Share Trust (EST)The EST provides for the issue of shares to Group employees under share option and share grant schemes (with the exception of the Share Incentive Plan). At 27 February 2016, the EST held 23,595,286 (2015: 57,975,907) shares with a market value of £41.7m (2015: £117.3m). The shares in the EST are held within equity of the Group at a cost of £41.6m (2015: £100.8m). No additional shares were purchased during the year (2015: £50.0m). Dividends on these shares are waived.
Home Retail Group Share Incentive Scheme TrustThe Home Retail Group Share Incentive Scheme Trust provides for the issue of shares to Group employees under the Share Incentive Plan. At 27 February 2016, the Trust held 513,063 (2015: 557,938) shares with a market value of £0.9m (2015: £1.1m). These shares are held within equity of the Group at a cost of £2.1m (2015: £2.3m). No additional shares were purchased during the year (2015: nil).
GovernanceFinancial StatementS
additional informationStrateGic report 101Home Retail Group
Annual Report 2016
MSL_HRG_RA2016_FINAL_2005.indb 101 20/05/2016 17:59

Notes to the financial statements continuedFor the 52 weeks ended 28 February 2016
29. SHare-BaSed PaYment arrangementSSummary of the total cost of share-based compensation in respect of ordinary shares in the company
52 weeks ended
27 February 2016
£m
52 weeks ended
28 February 2015
£m
Share option awards (1.4) (1.9)
Share grant awards 0.6 (6.7)
Total expense recognised (all equity-settled) (0.8) (8.6)
Summary of share option and share award arrangementsDuring the year ended 27 February 2016, Home Retail Group plc had a number of share option and share award arrangements for its employees, all of which are equity-settled. Details of these arrangements are as follows:
Share optionsthe Home retail group plc save-as-you-earn (SaYe) plan permits the grant to employees of options over the Company’s shares linked to a building society save-as-you-earn contract for a term of three or five years with contributions from employees of between £5 and £250 per month. Options are normally capable of being exercised at the end of the three or five-year period at an exercise price calculated at a 10% or 20% discount (dependent upon the date of grant) to market price over the three dealing days preceding invitation to participants. Options must be exercised within six months of the end of the three or five-year SAYE contract.
the Home retail group approved option plan. Options are granted at an exercise price equal to the market price of the shares over the ten dealing days preceding grant. For those awards with performance conditions, the percentage of the options exercisable by participants is determined either by ranking TSR relative to a comparator group or by reference to performance against other specific targets, such as EPS growth, or cumulative adjusted cash flow. The TSR target is considered a market-based performance condition under IFRS 2, and the options with this performance condition have been valued using a Monte Carlo simulation with historic volatilities and correlations measured over the three-year period preceding valuation. The other targets are non market-based performance conditions, and the options with these performance conditions have been valued by reference to the share price at the date of grant.
Share awardsthe Performance Share Plan (PSP). Awards made under this plan will normally vest three years after the date of grant for nil consideration. For all awards under this plan, vesting is conditional on participants’ continued service. For those awards with performance conditions, the percentage of the award distributed to participants is determined either by ranking TSR relative to a comparator group or by reference to performance against other specific targets, such as EPS growth, or cumulative adjusted cash flow. The TSR target is considered a market-based performance condition under IFRS 2, and the awards with this performance condition have been valued using a Monte Carlo simulation with historic volatilities and correlations measured over the three-year period preceding valuation. The other targets are non market-based performance conditions, and the awards with these performance conditions have been valued by reference to the share price at the date of grant. The plan was amended in 2010 to add an HM Revenue & Customs approved option to the share awards at no additional cost. The approved option is over the same number of shares as awarded under the normal PSP award, up to a maximum share value of £30,000. The value of the award delivered under the approved share option is deducted from the PSP award, such that the two awards together give participants the same gross value as the normal PSP award.
the share incentive plan was a one-off free share grant to all employees at the time of the demerger. The shares were acquired by a trust on behalf of participants and were normally forfeited if a participant’s employment with the Group ceased within three years of the grant date. All awards under this plan vested after this initial three-year period in November 2009, at which point participants were able to withdraw their shares, and since November 2011 shares can be withdrawn free of tax. The shares continue to be held by the trust until they are either withdrawn by participants or the awards lapse.
information relating to share option valuation techniquesThe weighted average fair value of options granted during the year over the Company’s shares under the Group’s option plans, determined using the Black-Scholes option pricing model, was £0.19 (2015: £0.31) per option. The significant inputs into the option pricing model were as follows:
Weighted average:
52 weeks ended
27 February 2016
52 weeks ended
28 February2015
Share price on grant date (£) 1.57 1.89Exercise price (£) 1.42 1.71Expected volatility 33.9% 45.3%Expected dividend yield 2.6% 1.9%Risk free interest rate 1.4% 1.5%Expected option life to exercise 3.2 years 3.3 years
102 Home Retail GroupAnnual Report 2016
MSL_HRG_RA2016_FINAL_2005.indb 102 20/05/2016 17:59
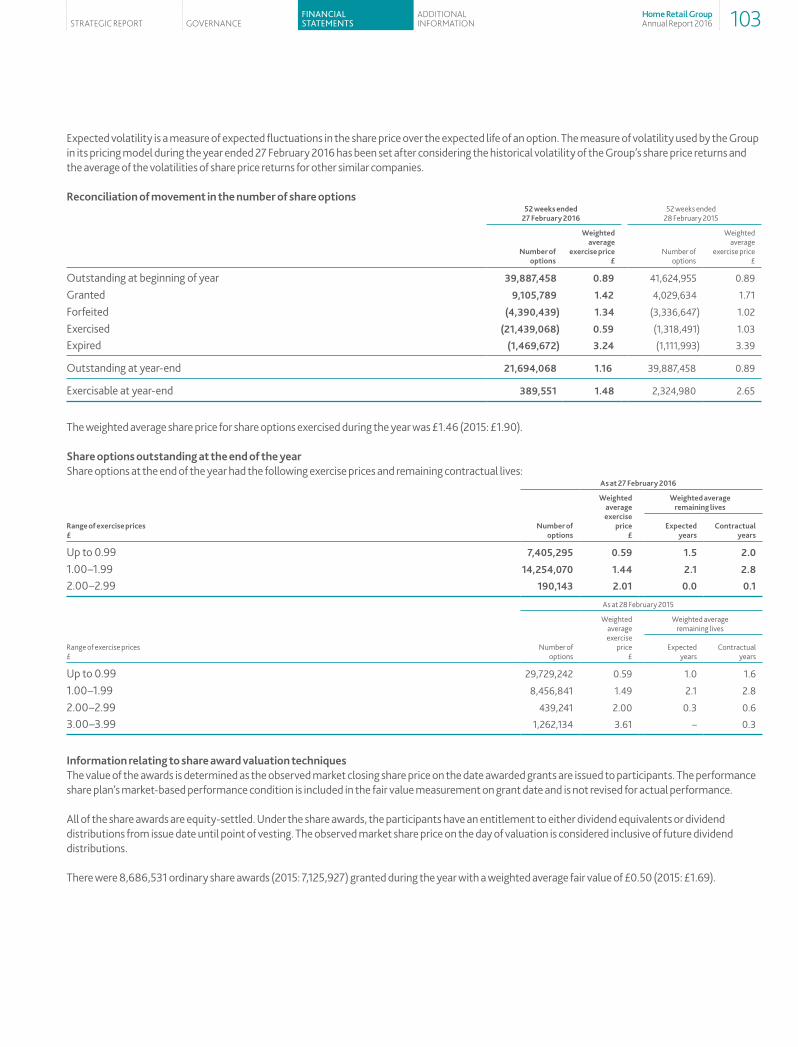
Expected volatility is a measure of expected fluctuations in the share price over the expected life of an option. The measure of volatility used by the Group in its pricing model during the year ended 27 February 2016 has been set after considering the historical volatility of the Group’s share price returns and the average of the volatilities of share price returns for other similar companies.
reconciliation of movement in the number of share options
52 weeks ended
27 February 201652 weeks ended
28 February 2015
number of
options
Weighted average
exercise price £
Number of options
Weighted average
exercise price £
Outstanding at beginning of year 39,887,458 0.89 41,624,955 0.89
Granted 9,105,789 1.42 4,029,634 1.71
Forfeited (4,390,439) 1.34 (3,336,647) 1.02
Exercised (21,439,068) 0.59 (1,318,491) 1.03
Expired (1,469,672) 3.24 (1,111,993) 3.39
Outstanding at year-end 21,694,068 1.16 39,887,458 0.89
Exercisable at year-end 389,551 1.48 2,324,980 2.65
The weighted average share price for share options exercised during the year was £1.46 (2015: £1.90).
Share options outstanding at the end of the yearShare options at the end of the year had the following exercise prices and remaining contractual lives:
as at 27 February 2016
range of exercise prices £
number of options
Weighted average exercise
price £
Weighted average remaining lives
expected years
contractual years
Up to 0.99 7,405,295 0.59 1.5 2.0
1.00–1.99 14,254,070 1.44 2.1 2.8
2.00–2.99 190,143 2.01 0.0 0.1
As at 28 February 2015
Range of exercise prices £
Number of options
Weighted average exercise
price £
Weighted average remaining lives
Expected years
Contractual years
Up to 0.99 29,729,242 0.59 1.0 1.6
1.00–1.99 8,456,841 1.49 2.1 2.8
2.00–2.99 439,241 2.00 0.3 0.6
3.00–3.99 1,262,134 3.61 – 0.3
information relating to share award valuation techniquesThe value of the awards is determined as the observed market closing share price on the date awarded grants are issued to participants. The performance share plan’s market-based performance condition is included in the fair value measurement on grant date and is not revised for actual performance.
All of the share awards are equity-settled. Under the share awards, the participants have an entitlement to either dividend equivalents or dividend distributions from issue date until point of vesting. The observed market share price on the day of valuation is considered inclusive of future dividend distributions.
There were 8,686,531 ordinary share awards (2015: 7,125,927) granted during the year with a weighted average fair value of £0.50 (2015: £1.69).
GovernanceFinancial StatementS
additional informationStrateGic report 103Home Retail Group
Annual Report 2016
MSL_HRG_RA2016_FINAL_2005.indb 103 20/05/2016 17:59
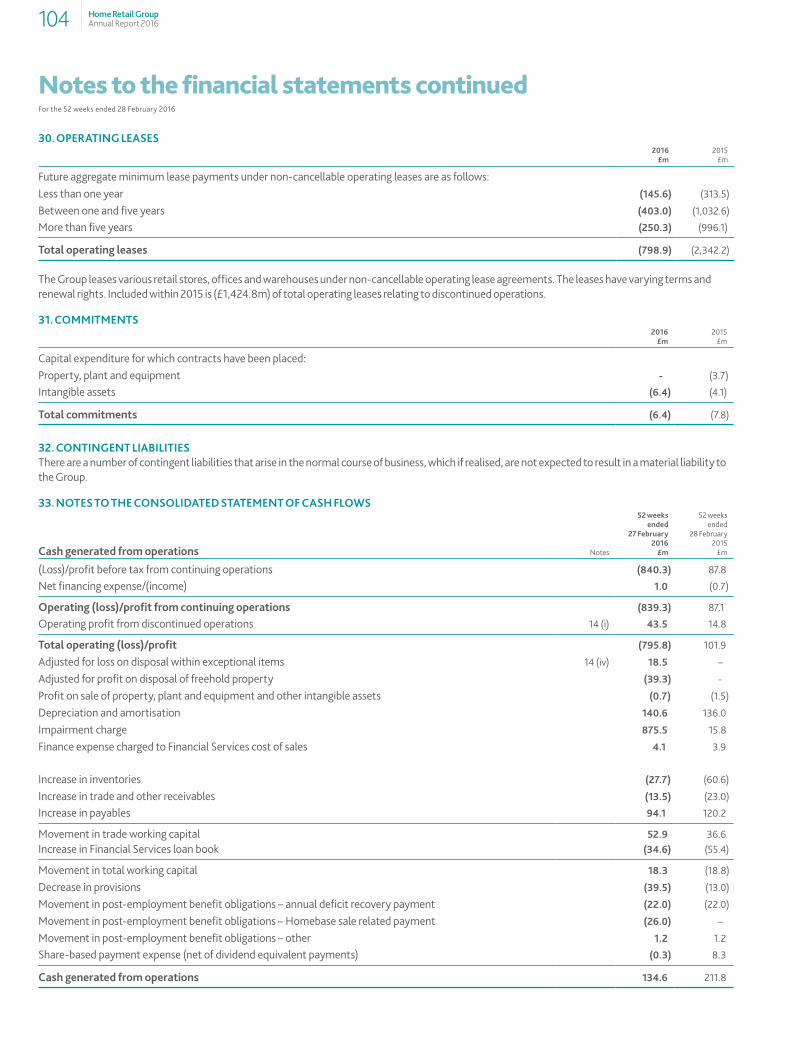
Notes to the financial statements continuedFor the 52 weeks ended 28 February 2016
30. OPerating leaSeS
2016
£m2015
£m
Future aggregate minimum lease payments under non-cancellable operating leases are as follows: Less than one year (145.6) (313.5)
Between one and five years (403.0) (1,032.6)
More than five years (250.3) (996.1)
total operating leases (798.9) (2,342.2)
The Group leases various retail stores, offices and warehouses under non-cancellable operating lease agreements. The leases have varying terms and renewal rights. Included within 2015 is (£1,424.8m) of total operating leases relating to discontinued operations.
31. cOmmitmentS
2016
£m2015
£m
Capital expenditure for which contracts have been placed:
Property, plant and equipment - (3.7)
Intangible assets (6.4) (4.1)
total commitments (6.4) (7.8)
32. cOntingent liaBilitieSThere are a number of contingent liabilities that arise in the normal course of business, which if realised, are not expected to result in a material liability to the Group.
33. nOteS tO tHe cOnSOlidated Statement OF caSH FlOWS
cash generated from operations Notes
52 weeks ended
27 February 2016
£m
52 weeks ended
28 February 2015
£m
(Loss)/profit before tax from continuing operations (840.3) 87.8
Net financing expense/(income) 1.0 (0.7)
Operating (loss)/profit from continuing operations (839.3) 87.1
Operating profit from discontinued operations 14 (i) 43.5 14.8
total operating (loss)/profit (795.8) 101.9
Adjusted for loss on disposal within exceptional items 14 (iv) 18.5 –
Adjusted for profit on disposal of freehold property (39.3) -
Profit on sale of property, plant and equipment and other intangible assets (0.7) (1.5)
Depreciation and amortisation 140.6 136.0
Impairment charge 875.5 15.8
Finance expense charged to Financial Services cost of sales 4.1 3.9
Increase in inventories (27.7) (60.6)
Increase in trade and other receivables (13.5) (23.0)
Increase in payables 94.1 120.2
Movement in trade working capital 52.9 36.6Increase in Financial Services loan book (34.6) (55.4)
Movement in total working capital 18.3 (18.8)
Decrease in provisions (39.5) (13.0)
Movement in post-employment benefit obligations – annual deficit recovery payment (22.0) (22.0)
Movement in post-employment benefit obligations – Homebase sale related payment (26.0) –
Movement in post-employment benefit obligations – other 1.2 1.2
Share-based payment expense (net of dividend equivalent payments) (0.3) 8.3
cash generated from operations 134.6 211.8
104 Home Retail GroupAnnual Report 2016
MSL_HRG_RA2016_FINAL_2005.indb 104 20/05/2016 17:59
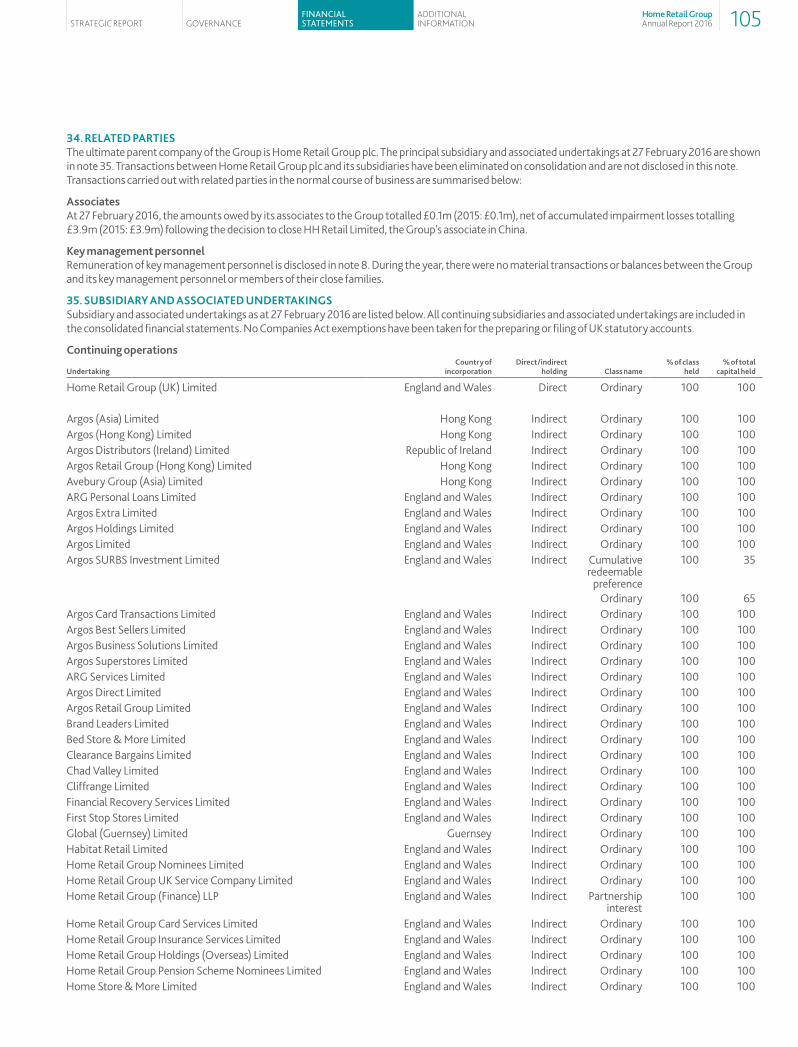
34. related PartieSThe ultimate parent company of the Group is Home Retail Group plc. The principal subsidiary and associated undertakings at 27 February 2016 are shown in note 35. Transactions between Home Retail Group plc and its subsidiaries have been eliminated on consolidation and are not disclosed in this note. Transactions carried out with related parties in the normal course of business are summarised below:
associatesAt 27 February 2016, the amounts owed by its associates to the Group totalled £0.1m (2015: £0.1m), net of accumulated impairment losses totalling £3.9m (2015: £3.9m) following the decision to close HH Retail Limited, the Group’s associate in China.
Key management personnelRemuneration of key management personnel is disclosed in note 8. During the year, there were no material transactions or balances between the Group and its key management personnel or members of their close families.
35. SUBSidiarY and aSSOciated UndertaKingSSubsidiary and associated undertakings as at 27 February 2016 are listed below. All continuing subsidiaries and associated undertakings are included in the consolidated financial statements. No Companies Act exemptions have been taken for the preparing or filing of UK statutory accounts.
continuing operations
Undertakingcountry of
incorporationdirect/indirect
holding class name% of class
held% of total
capital held
Home Retail Group (UK) Limited England and Wales Direct Ordinary 100 100
Argos (Asia) Limited Hong Kong Indirect Ordinary 100 100Argos (Hong Kong) Limited Hong Kong Indirect Ordinary 100 100Argos Distributors (Ireland) Limited Republic of Ireland Indirect Ordinary 100 100Argos Retail Group (Hong Kong) Limited Hong Kong Indirect Ordinary 100 100Avebury Group (Asia) Limited Hong Kong Indirect Ordinary 100 100ARG Personal Loans Limited England and Wales Indirect Ordinary 100 100Argos Extra Limited England and Wales Indirect Ordinary 100 100Argos Holdings Limited England and Wales Indirect Ordinary 100 100Argos Limited England and Wales Indirect Ordinary 100 100Argos SURBS Investment Limited England and Wales Indirect Cumulative
redeemable preference
Ordinary
100
100
35
65Argos Card Transactions Limited England and Wales Indirect Ordinary 100 100Argos Best Sellers Limited England and Wales Indirect Ordinary 100 100Argos Business Solutions Limited England and Wales Indirect Ordinary 100 100Argos Superstores Limited England and Wales Indirect Ordinary 100 100ARG Services Limited England and Wales Indirect Ordinary 100 100Argos Direct Limited England and Wales Indirect Ordinary 100 100Argos Retail Group Limited England and Wales Indirect Ordinary 100 100Brand Leaders Limited England and Wales Indirect Ordinary 100 100Bed Store & More Limited England and Wales Indirect Ordinary 100 100Clearance Bargains Limited England and Wales Indirect Ordinary 100 100Chad Valley Limited England and Wales Indirect Ordinary 100 100Cliffrange Limited England and Wales Indirect Ordinary 100 100Financial Recovery Services Limited England and Wales Indirect Ordinary 100 100First Stop Stores Limited England and Wales Indirect Ordinary 100 100Global (Guernsey) Limited Guernsey Indirect Ordinary 100 100Habitat Retail Limited England and Wales Indirect Ordinary 100 100Home Retail Group Nominees Limited England and Wales Indirect Ordinary 100 100Home Retail Group UK Service Company Limited England and Wales Indirect Ordinary 100 100Home Retail Group (Finance) LLP England and Wales Indirect Partnership
interest100 100
Home Retail Group Card Services Limited England and Wales Indirect Ordinary 100 100Home Retail Group Insurance Services Limited England and Wales Indirect Ordinary 100 100Home Retail Group Holdings (Overseas) Limited England and Wales Indirect Ordinary 100 100Home Retail Group Pension Scheme Nominees Limited England and Wales Indirect Ordinary 100 100Home Store & More Limited England and Wales Indirect Ordinary 100 100
GovernanceFinancial StatementS
additional informationStrateGic report 105Home Retail Group
Annual Report 2016
MSL_HRG_RA2016_FINAL_2005.indb 105 20/05/2016 17:59

Notes to the financial statements continuedFor the 52 weeks ended 28 February 2016
Undertakingcountry of
incorporationdirect/indirect
holding class name% of class
held% of total
capital held
Home Retail Group Procurement Consultancy (Shanghai) Limited
China Indirect Registered capital
100 100
Home Retail Group (Cyprus) Limited Cyprus Indirect Ordinary 100 100Home Retail Group (Guernsey) LP Guernsey Indirect Partnership
interest100 100
HH Retail Limited Hong Kong Unit 3513, 35/F, The
Centre, 99 Queens Road Central, Hong Kong
Indirect Ordinary 100 49
Home Retail Group (Asia) Limited Hong Kong Indirect Ordinary 100 100Home Retail Group (Hong Kong) Limited Hong Kong Indirect Ordinary 100 100Argos Retail Group (Asia) Limited Hong Kong Indirect Ordinary 100 100Home Retail (Hong Kong) Limited Hong Kong Indirect Ordinary 100 100Home Retail (Asia) Limited Hong Kong Indirect Ordinary 100 100Home Retail Group Private (India) Limited India Indirect Ordinary 100 100Home Retail Group (Jersey) Limited Jersey Indirect Ordinary 100 100Jungle.com Holdings Limited England and Wales Indirect Ordinary 100 100Jungle.com Limited England and Wales Indirect Ordinary 100 100Jungle Online England and Wales Indirect Ordinary 50 50Premier Incentives Limited England and Wales Indirect Ordinary 100 100Stanhope Finance Limited England and Wales Indirect Ordinary 100 100Software Warehouse Holdings Limited England and Wales Indirect Ordinary 100 100Shanghai HH Retail Co Limited China
Room 1402, No 2 Building, 14th Floor, No 355
Guoding Road, Yangpu District, Shanghai, China
Indirect Ordinary 100 49
The below subsidiaries and associated undertakings were disposed of as part of the Homebase sale on 27 February 2016 and therefore have been consolidated in the income statement up to the point of disposal but excluded from the balance sheet as at 27 February 2016.
discontinued operations
Undertakingaddress of the
undertakingdirect/indirect
holding class name% of class
held % of capital
Beddington House (No.4) Limited England and Wales Indirect Ordinary 100 100Beddington House Holdings Limited England and Wales Indirect Ordinary 100 100Fifthgrange Limited England and Wales Indirect Ordinary 100 100Focal Point (Lighting) Limited England and Wales Indirect Ordinary 100 100Hampden Group Limited England and Wales Indirect Ordinary 100 100Homebase Card Handling Services Limited England and Wales Indirect Ordinary 100 100Homebase Limited England and Wales Indirect Ordinary 100 100Homebase House & Garden Centre Limited Republic of Ireland Indirect Deferred
Ordinary100100
793
Iconford Limited England and Wales Indirect Ordinary 100 100Index Limited England and Wales Indirect Ordinary 100 100Homebase Spend & Save Limited England and Wales Indirect Ordinary 100 100Homebase (NI) Limited Northern Ireland Indirect Ordinary 100 100Homebase Group Limited England and Wales Indirect Ordinary-A
Ordinary-BOrdinary-COrdinary-DOrdinary-E
7.571.217.83.00.5
7711831
Homebase Group (2000) Limited England and Wales Indirect Ordinary 100 100Homebase Holdings Limited England and Wales Indirect Ordinary
Preference100100
1000
Home Charm Group Limited England and Wales Indirect Ordinary 100 100Home Charm Group Trustees Limited England and Wales Indirect Ordinary 100 100Homebase Direct Limited England and Wales Indirect Ordinary 100 100
35. SUBSidiarY and aSSOciated UndertaKingS CONTINUED
106 Home Retail GroupAnnual Report 2016
MSL_HRG_RA2016_FINAL_2005.indb 106 20/05/2016 17:59
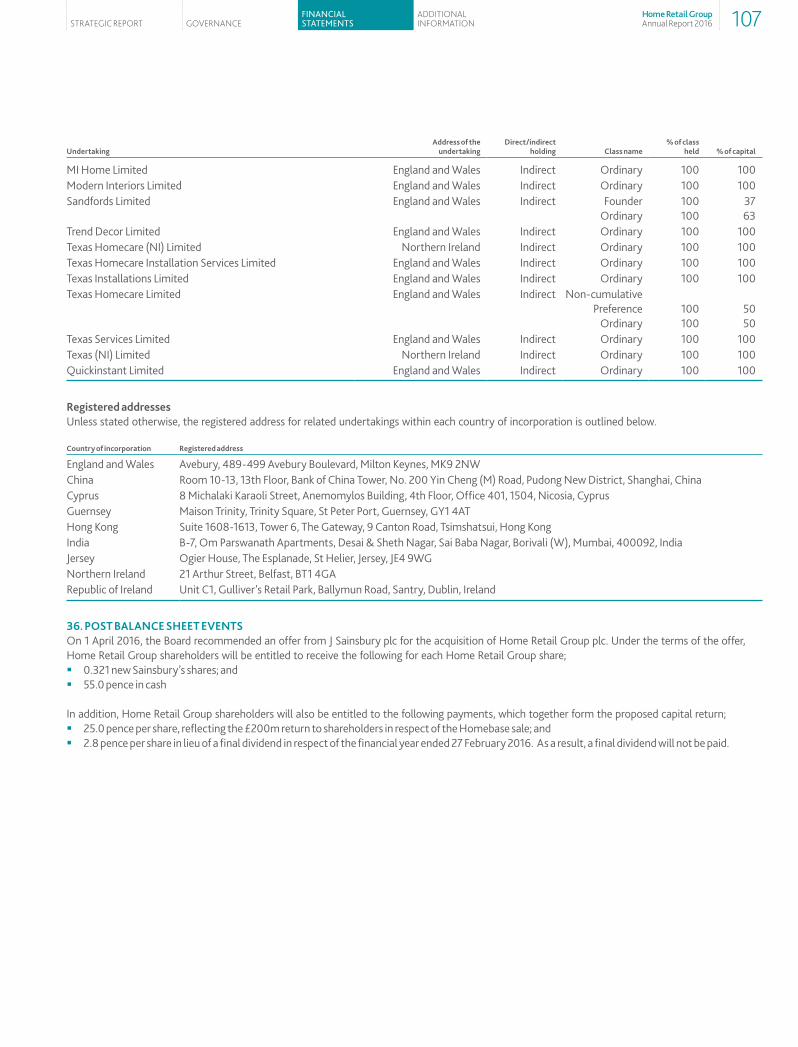
Undertakingaddress of the
undertakingdirect/indirect
holding class name% of class
held % of capital
MI Home Limited England and Wales Indirect Ordinary 100 100Modern Interiors Limited England and Wales Indirect Ordinary 100 100Sandfords Limited England and Wales Indirect Founder
Ordinary100100
3763
Trend Decor Limited England and Wales Indirect Ordinary 100 100Texas Homecare (NI) Limited Northern Ireland Indirect Ordinary 100 100Texas Homecare Installation Services Limited England and Wales Indirect Ordinary 100 100Texas Installations Limited England and Wales Indirect Ordinary 100 100Texas Homecare Limited England and Wales Indirect Non-cumulative
PreferenceOrdinary
100100
5050
Texas Services Limited England and Wales Indirect Ordinary 100 100Texas (NI) Limited Northern Ireland Indirect Ordinary 100 100Quickinstant Limited England and Wales Indirect Ordinary 100 100
registered addresses Unless stated otherwise, the registered address for related undertakings within each country of incorporation is outlined below.
country of incorporation registered address
England and Wales Avebury, 489-499 Avebury Boulevard, Milton Keynes, MK9 2NWChina Room 10-13, 13th Floor, Bank of China Tower, No. 200 Yin Cheng (M) Road, Pudong New District, Shanghai, ChinaCyprus 8 Michalaki Karaoli Street, Anemomylos Building, 4th Floor, Office 401, 1504, Nicosia, CyprusGuernsey Maison Trinity, Trinity Square, St Peter Port, Guernsey, GY1 4AT Hong Kong Suite 1608-1613, Tower 6, The Gateway, 9 Canton Road, Tsimshatsui, Hong KongIndia B-7, Om Parswanath Apartments, Desai & Sheth Nagar, Sai Baba Nagar, Borivali (W), Mumbai, 400092, IndiaJersey Ogier House, The Esplanade, St Helier, Jersey, JE4 9WGNorthern Ireland 21 Arthur Street, Belfast, BT1 4GARepublic of Ireland Unit C1, Gulliver’s Retail Park, Ballymun Road, Santry, Dublin, Ireland
36. POSt Balance SHeet eventSOn 1 April 2016, the Board recommended an offer from J Sainsbury plc for the acquisition of Home Retail Group plc. Under the terms of the offer, Home Retail Group shareholders will be entitled to receive the following for each Home Retail Group share; � 0.321 new Sainsbury’s shares; and � 55.0 pence in cash
In addition, Home Retail Group shareholders will also be entitled to the following payments, which together form the proposed capital return; � 25.0 pence per share, reflecting the £200m return to shareholders in respect of the Homebase sale; and � 2.8 pence per share in lieu of a final dividend in respect of the financial year ended 27 February 2016. As a result, a final dividend will not be paid.
GovernanceFinancial StatementS
additional informationStrateGic report 107Home Retail Group
Annual Report 2016
MSL_HRG_RA2016_FINAL_2005.indb 107 20/05/2016 17:59

Independent auditors’ report to the members of Home Retail Group plc - Parentreport on the Parent company financial statementsOur opinionIn our opinion, Home Retail Group plc’s Parent Company financial statements (the ‘financial statements’): � give a true and fair view of the state of the Parent Company’s affairs as at 27 February 2016 and of its cash flows for the 52 week period (the ‘period’)
then ended; � have been properly prepared in accordance with International Financial Reporting Standards (‘IFRSs’) as adopted by the European Union and as
applied in accordance with the provisions of the Companies Act 2006; and � have been prepared in accordance with the requirements of the Companies Act 2006.
What we have auditedThe financial statements, included within the Annual Report and Financial Statements (the ‘Annual Report’), comprise: � the Parent Company balance sheet as at 27 February 2016; � the Parent Company statement of cash flows for the period then ended; � the Parent Company statement of changes in equity for the period then ended; and � the notes to the financial statements, which include a summary of significant accounting policies and other explanatory information.
The financial reporting framework that has been applied in the preparation of the financial statements is IFRSs as adopted by the European Union, and applicable law, and as applied in accordance with the provisions of the Companies Act 2006.
Other required reportingconsistency of other informationCompanies Act 2006 opinionIn our opinion, the information given in the Strategic Report and the Directors’ Report for the financial period for which the financial statements are prepared is consistent with the financial statements.
ISAs (UK & Ireland) reportingUnder International Standards on Auditing (UK and Ireland) (‘ISAs (UK & Ireland)’) we are required to report to you if, in our opinion, information in the Annual Report is: � materially inconsistent with the information in the audited financial statements; or � apparently materially incorrect based on, or materially inconsistent with, our knowledge of the Parent Company acquired in the course of performing
our audit; or � otherwise misleading.
We have no exceptions to report arising from this responsibility.
adequacy of accounting records and information and explanations receivedUnder the Companies Act 2006 we are required to report to you if, in our opinion: � we have not received all the information and explanations we require for our audit; or � adequate accounting records have not been kept by the Parent Company, or returns adequate for our audit have not been received from branches
not visited by us; or � the financial statements and the part of the Directors’ Remuneration Report to be audited are not in agreement with the accounting records
and returns.
We have no exceptions to report arising from this responsibility.
directors’ remunerationDirectors’ remuneration report - Companies Act 2006 opinionIn our opinion, the part of the Directors’ Remuneration Report to be audited has been properly prepared in accordance with the Companies Act 2006.
Other Companies Act 2006 reportingUnder the Companies Act 2006 we are required to report to you if, in our opinion, certain disclosures of directors’ remuneration specified by law are not made. We have no exceptions to report arising from this responsibility.
108 Home Retail GroupAnnual Report 2016
MSL_HRG_RA2016_FINAL_2005.indb 108 20/05/2016 17:59

responsibilities for the financial statements and the auditOur responsibilities and those of the directorsAs explained more fully in the Statement of Directors’ Responsibilities set out on page 56, the directors are responsible for the preparation of the financial statements and for being satisfied that they give a true and fair view.
Our responsibility is to audit and express an opinion on the financial statements in accordance with applicable law and ISAs (UK & Ireland). Those standards require us to comply with the Auditing Practices Board’s Ethical Standards for Auditors.
This report, including the opinions, has been prepared for and only for the Parent Company’s members as a body in accordance with Chapter 3 of Part 16 of the Companies Act 2006 and for no other purpose. We do not, in giving these opinions, accept or assume responsibility for any other purpose or to any other person to whom this report is shown or into whose hands it may come save where expressly agreed by our prior consent in writing.
What an audit of financial statements involvesWe conducted our audit in accordance with ISAs (UK & Ireland). An audit involves obtaining evidence about the amounts and disclosures in the financial statements sufficient to give reasonable assurance that the financial statements are free from material misstatement, whether caused by fraud or error. This includes an assessment of: � whether the accounting policies are appropriate to the Parent Company’s circumstances and have been consistently applied and adequately
disclosed; � the reasonableness of significant accounting estimates made by the directors; and � the overall presentation of the financial statements.
We primarily focus our work in these areas by assessing the directors’ judgements against available evidence, forming our own judgements, and evaluating the disclosures in the financial statements.
We test and examine information, using sampling and other auditing techniques, to the extent we consider necessary to provide a reasonable basis for us to draw conclusions. We obtain audit evidence through testing the effectiveness of controls, substantive procedures or a combination of both.
In addition, we read all the financial and non-financial information in the Annual Report to identify material inconsistencies with the audited financial statements and to identify any information that is apparently materially incorrect based on, or materially inconsistent with, the knowledge acquired by us in the course of performing the audit. If we become aware of any apparent material misstatements or inconsistencies we consider the implications for our report.
Other matterWe have reported separately on the Group financial statements of Home Retail Group plc for the 52-week period ended 27 February 2016.
neil grimesSenior Statutory Auditorfor and on behalf of PricewaterhouseCoopers LLPChartered Accountants and Statutory AuditorsLondon27 April 2016
GovernanceFinancial StatementS
additional informationStrateGic report 109Home Retail Group
Annual Report 2016
MSL_HRG_RA2016_FINAL_2005.indb 109 20/05/2016 17:59

Notes
27 February2016
£m
28 February2015
£m
aSSetSnon-current assetsInvestment in subsidiary 6 2,702.0 2,895.6
total non-current assets 2,702.0 2,895.6
current assetsTrade and other receivables 7 28.4 72.2
total current assets 28.4 72.2
total assets 2,730.4 2,967.8
liaBilitieScurrent liabilitiesTrade and other payables 8 (892.8) (876.6)
total current liabilities (892.8) (876.6)
total liabilities (892.8) (876.6)
net assets 1,837.6 2,091.2
eQUitYShare capital 9 81.3 81.3
Capital redemption reserve 6.4 6.4
Retained earnings 1,749.9 2,003.5
total equity 1,837.6 2,091.2
The financial statements on pages 110 to 114 were approved by the Board of Directors on 27 April 2016 and were signed on its behalf by:
John Walden richard ashtonChief Executive Finance Director
Parent Company balance sheet At 27 February 2016
110 Home Retail GroupAnnual Report 2016
MSL_HRG_RA2016_FINAL_2005.indb 110 20/05/2016 17:59

Parent Company statement of changes in equityFor the 52 weeks ended 27 February 2016
attributable to equity holders of the company
Notes
Sharecapital
£m
capital redemption
reserve£m
retainedearnings
£m
total
£m
Balance at 1 March 2015 81.3 6.4 2,003.5 2,091.2
Loss for the year 4 – - (224.2) (224.2)
Total comprehensive income for the year ended 27 February 2016 – - (224.2) (224.2)
Transactions with owners: Movement in share-based compensation reserve 3 – – 0.8 0.8
Equity dividends paid during the year 5 – – (29.0) (29.0)
Other distributions – – (1.2) (1.2)
Total transactions with owners – – (29.4) (29.4)
Balance at 27 February 2016 81.3 6.4 1,749.9 1,837.6
Attributable to equity holders of the Company
Notes
Sharecapital
£m
Capital redemption
reserve£m
Retainedearnings
£m
Total
£m
Balance at 2 March 2014 81.3 6.4 2,020.8 2,108.5
Loss for the year 4 – – (0.3) (0.3)
Total comprehensive income for the year ended 28 February 2015 – – (0.3) (0.3)
Transactions with owners: Movement in share-based compensation reserve 3 – – 8.6 8.6
Equity dividends paid during the year 5 – – (25.3) (25.3)
Other distributions – – (0.3) (0.3)
Total transactions with owners – – (17.0) (17.0)
Balance at 28 February 2015 81.3 6.4 2,003.5 2,091.2
Parent Company statement of cash flowsFor the 52 weeks ended 27 February 2016
There were no cash movements during the year for the Company as any cash transactions were executed by other members of the Home Retail Group on behalf of the Company. As a result no statement of cash flows has been presented in these financial statements.
GovernanceFinancial StatementS
additional informationStrateGic report 111Home Retail Group
Annual Report 2016
MSL_HRG_RA2016_FINAL_2005.indb 111 20/05/2016 17:59
1. general inFOrmatiOnHome Retail Group plc (the Company) is a public limited company incorporated and domiciled in the United Kingdom under the Companies Act 2006 (the Act) and listed on the London Stock Exchange. The Company’s registered number is 5863533 and the registered office of the Company is Avebury, 489 – 499 Avebury Boulevard, Milton Keynes MK9 2NW.
Statement of compliance The financial statements of the Company have been prepared in accordance with International Financial Reporting Standards (IFRSs) and International Financial Reporting Interpretations Committee Interpretations (IFRICs) as adopted by the European Union. They also comply with those parts of the Companies Act 2006 applicable to companies reporting under IFRSs.
2. BaSiS OF PreParatiOnThese separate financial statements of the Company are presented in sterling, rounded to the nearest hundred thousand. They are prepared on a going concern basis and under the historic cost basis modified for the revaluation of certain financial instruments and share-based payments.
The Company is the ultimate parent entity of Home Retail Group (the Group). The Company’s financial statements are included in Home Retail Group plc’s consolidated financial statements for the 52 weeks ended 27 February 2016. As permitted by section 408 of the Act, the Company has not presented its own income statement or statement of comprehensive income.
The investment in Home Retail Group (UK) Limited has been recorded under UK GAAP at the nominal value of shares issued, under the provisions of section 615 of the Act. When transitioned to IFRS, the Company used the exemption available under IFRS 1 for measuring its cost of investment in Home Retail Group (UK) Limited at its deemed cost (previous GAAP carrying amount at the date of transition to IFRS).
3. SUmmarY OF PrinciPal accOUnting POlicieSThe Company’s principal accounting policies are the same as those set out in note 3 of the Group financial statements, with the addition of those noted below. Unless otherwise stated, these policies have been consistently applied to all the periods presented.
investmentsInvestments are included in the balance sheet at their cost of acquisition. Where appropriate, a provision is made for any impairment in their value.
loans and other payablesLoans from other Group undertakings and all other payables are initially recorded at fair value, which represents the proceeds received. They are then subsequently carried at amortised cost, less any provision for impairment as appropriate.
Share-based paymentsThe Company operates a number of equity-settled, share-based compensation plans. Awards are granted to employees of the Company’s subsidiaries, and the Company is reimbursed by its subsidiaries for the fair value of the shares granted over the vesting period. Fair value is measured at the date of grant using whichever of the Black-Scholes or Monte Carlo models, or closing market price that is most appropriate to the award. Market based performance conditions are included in the fair value measurement on grant date and are not revisited for actual performance. Further details of the Company’s share-based compensation plans are set out in note 29 to the Group financial statements.
4. incOme Statement diSclOSUreSThe Company’s loss for the financial year attributable to owners of the parent was £224.2m (2015: £0.3m).
The Company had no employees in either year, other than the Company directors. No directors received any remuneration from the Company during either year. Further information on directors’ remuneration, which forms part of the audited Group financial statements, can be found in the directors’ remuneration report on pages 41 to 52.
There were no non-audit services provided by the Company’s auditors PricewaterhouseCoopers LLP.
Notes to the Parent Company financial statementsFor the 52 weeks ended 27 February 2016
112 Home Retail GroupAnnual Report 2016
MSL_HRG_RA2016_FINAL_2005.indb 112 20/05/2016 17:59

5. dividendS
amounts recognised as distributions to equity holders
52 weeks ended
27 February 2016
£m
52 weeks ended
28 February 2015
£m
Final dividend of 2.8p per share (2015: 2.3p) for the prior year (21.2) (17.8)
Interim dividend of 1.0p per share (2015: 1.0p) for the current year (7.8) (7.5)
Ordinary dividends on equity shares (29.0) (25.3)
On 1 April 2016, the Board recommended an offer from J Sainsbury plc for the acquisition of Home Retail Group plc, the details of which are set out in note 36 of the Group financial statements. As a result of the 2.8p element of the proposed capital return component of the offer, which reflects a payment in lieu of the FY16 final dividend, no final dividend is proposed for FY16.
6. inveStment in SUBSidiarY2016
£m2015
£m
CostAt beginning of the year 2,895.6 2,895.6
Impairment (193.6) -
At the end of the year 2,702.0 2,895.6
The Company’s sole investment is in Home Retail Group (UK) Limited, which is a 100% owned subsidiary incorporated within the UK and is a Group holding company. The impairment charge for the year of £193.6m has been recognised to write down the carrying value of investments to their recoverable amount. This charge has been calculated on a consistent basis to the goodwill impairment charge, as disclosed in note 15 of the Group financial statements. Details of indirectly held subsidiaries and associates are disclosed in note 35 of the Group financial statements.
7. trade and OtHer receivaBleS
current2016
£m
Current2015
£m
Amount owed by related party (note 11) 28.4 72.2
The amount owed by a related party is unsecured, repayable on demand and non-interest bearing. No balance owed by a related party is past due. The maximum exposure to credit risk at the reporting date is the fair value of each class of receivable mentioned above.
The amount owed by a related party of £28.4m (2015: £72.2m) is due from the Home Retail Group Employee Share Trust (EST). The Company advances funds to the EST by way of a loan, in order that the EST may acquire shares for the purpose of satisfying obligations arising from the Group’s share-based compensation schemes. As the shares acquired by the EST are utilised to satisfy these obligations, at times for nil cash consideration, the EST will be unable to repay the loan in full. It is therefore disclosed net of a provision for impairment of £81.3m (2015: £50.7m).
Movements in the provision for impairment are as follows: £m
At 28 February 2015 (50.7)
Charge for the year (30.6)
at 27 February 2016 (81.3)
GovernanceFinancial StatementS
additional informationStrateGic report 113Home Retail Group
Annual Report 2016
MSL_HRG_RA2016_FINAL_2005.indb 113 20/05/2016 17:59

Notes to the Parent Company financial statements continuedFor the 52 weeks ended 27 February 2016
8. trade and OtHer PaYaBleS
current2016
£m
Current2015
£m
Amounts owed to Group companies (note 11) (892.2) (876.0)
Other payables (0.6) (0.6)
(892.8) (876.6)
All amounts owed to Group companies are unsecured, non-interest bearing and repayable on demand. The fair values of trade and other payables balances are not considered to differ materially from the recognised book values.
9. SHare caPital
2016 number of shares
2016 £m
2015 Number of shares
2015 £m
allotted, called-up and fully paid
Ordinary share capital of 10p each 813,445,001 81.3 813,445,001 81.3
10. cOmmitmentSOn 26 March 2015, Home Retail Group (UK) Limited, a subsidiary of the Company, entered into a new unsecured multi-currency revolving credit facility of £250m with a syndicate of banks. This facility is for a minimum term of four years. On the same day, the Group cancelled its existing £165m facility which was due to expire on 27 March 2016. The Company is a borrower and a guarantor to this facility.
There are no capital or operating lease commitments.
11. related PartY tranSactiOnSThe principal subsidiary undertakings of the Company are shown in note 35 of the Group financial statements. Transactions between the Company and its subsidiaries and the Home Retail Group Employee Share Trust (EST) are shown below. All transactions carried out with related parties are in the normal course of business.
2016 £m
2015 £m
transactions with subsidiary undertakingsRecharge of costs 0.8 8.6
Transfer of cash to the EST by subsidiary undertakings on behalf of the Company – 50.0
Settlement of liabilities by subsidiary undertakings on behalf of the Company 30.2 25.6
Amounts owed to subsidiary undertakings (892.2) (876.0)
transactions with other related parties
Amount owed by other related party – EST (note 7) 28.4 72.2
114 Home Retail GroupAnnual Report 2016
MSL_HRG_RA2016_FINAL_2005.indb 114 20/05/2016 17:59

Group five-year summary
income statement
52-week period to
27 February 2016
£m
52-week period to
28 February 2015
£m
52-week period to
1 March 2014
£m
52-week period to
2 March 2013
£m
52-week pro forma to 25 February
2012 £m
continuing operationsArgos 4,095.3 4,096.0 4,051.1 3,931.3 3,872.6
Financial Services 139.4 135.1 122.7 113.4 109.1
total continuing operations 4,234.7 4,231.1 4,173.8 4,044.7 3,981.7
Discontinued operations – Homebase 1,433.1 1,479.3 1,489.2 1,430.7 1,509.8
total sales 5,667.8 5,710.4 5,663.0 5,475.4 5,491.5
continuing operationsArgos 83.1 129.2 112.3 100.3 94.2
Financial Services 7.0 7.0 6.0 6.0 6.0
Central Activities (22.5) (26.5) (24.2) (24.0) (25.3)
total continuing operations 67.6 109.7 94.1 82.3 74.9Discontinued operations – Homebase 23.5 19.8 18.9 11.0 22.8
Benchmark operating profit 91.1 129.5 113.0 93.3 97.7
Net financing income 3.6 2.6 2.4 3.8 3.4
Share of post-tax (loss)/profit of joint ventures and associates – – – (6.0) 0.5
Benchmark PBt 94.7 132.1 115.4 91.1 101.6
Statistics
argos
52-week period to
27 February 2016
52-week period to
28 February 2015
52-week period to
1 March 2014
52-week period to 2 March
2013
52-week pro forma to 25 February
2012
Like-for-like change in sales (2.6%) 0.6% 3.3% 2.1% (8.9%)
Net space contribution to sales change 2.6% 0.5% (0.3%) (0.6%) 1.2%
Total sales change 0.0% 1.1% 3.0% 1.5% (7.7%)
Number of stores at year-end 845 755 734 737 748
discontinued operations – Homebase
Like-for-like change in sales 5.2% 2.3% 5.9% (4.9%) (2.0%)
Net space contribution to sales change (8.3%) (3.0%) (1.8%) (0.3%) (0.6%)
Total sales change (3.1%) (0.7%) 4.1% (5.2%) (2.6%)
Number of stores at year-end – 296 323 336 341
Of which contain a mezzanine floor – 179 184 186 187
Financial Services
27 February2016
£m
28 February2015
£m
1 March2014
£m
2 March 2013
£m
3 March 2012
£m
Store card net receivables 614 580 524 475 457
GovernanceFinancial StatementS
AdditionAl informAtionStrateGic report 115Home Retail Group
Annual Report 2016
MSL_HRG_RA2016_FINAL_2005.indb 115 20/05/2016 17:59

Balance sheet
27 February 2016
£m
28 February 2015
£m
1 march 2014
£m
2 march 2013
£m
3 march 2012
£m
Invested capital 1,248.3 2,424.2 2,421.6 2,376.8 2,518.6
Post-employment benefit obligations (94.5) (114.4) (76.6) (85.1) (115.3)
Net tax assets 11.4 26.7 33.0 10.7 24.7
Forward foreign exchange contracts 49.5 27.1 (35.5) 34.1 3.1
Financing net cash 622.9 309.3 331.0 396.0 194.3
Reported net assets 1,837.6 2,672.9 2,673.5 2,732.5 2,625.4
earnings and dividends
52-week period to
27 February 2016
52-week period to
28 February 2015
52-week period to
1 March 2014
52-week period to 2 March
2013
52-week pro forma to 25 February
2012
Basic benchmark EPS 9.3p 13.0p 10.4p 7.7p 8.7p
Dividends per share (interim paid and final proposed) 1.0p 3.8p 3.3p 3.0p 4.7p
Dividend cover 9.30x 3.42x 3.15x 2.57x 1.85x
The statutory 53-week period to 3 March 2012 comprises reported results that are non-comparable to the 52-week periods reported for other years. To assist with analysis and comparison, certain pro forma 52-week information has therefore been provided in respect of the Group’s FY12 financial year to eliminate the distortion of a 53rd week on the performance of the Group.
In June 2011, the IASB issued amendments to IAS 19 ‘Employee Benefits’ (IAS 19 (revised)). The revised standard was effective for the first time during the 52 weeks to 28 February 2015 and is required to be applied retrospectively. There has been no change to the Group five-year summary as the adjustments to the income statement resulting from adoption of IAS 19 (revised) relate only to items previously excluded from the Group’s reported benchmark profit before tax. There has been no change to the Group’s net assets as a result of the adoption of IAS 19 (revised), so no restatement of the balance sheet was required.
Group five-year summary continued
116 Home Retail GroupAnnual Report 2016
MSL_HRG_RA2016_FINAL_2005.indb 116 20/05/2016 17:59

Shareholder information
Who are the group’s shareholders?The Group had 25,898 ordinary shareholders at 27 February 2016, comprising a mix of corporate shareholders and individuals. Their holdings can be analysed as follows:
Number of shareholders
Percentage of total number
of shareholders Number of
ordinary shares Percentage of
ordinary shares
Over 1,000,000 82 0.3% 703,086,552 86.4%
100,001–1,000,000 171 0.7% 68,067,952 8.4%
10,001–100,000 629 2.4% 15,539,992 1.9%
5,001–10,000 1,030 4.0% 7,269,997 0.9%
2,001–5,000 2,618 10.1% 8,084,590 1.0%
1–2,000 21,368 82.5% 11,395,918 1.4%
25,898 100.0% 813,445,001 100.0%
Number of shareholders
Percentage of total number
of shareholders Number of
ordinary shares Percentage of
ordinary shares
Corporate shareholders 1,570 6.1% 778,431,740 95.7%
Individuals* 24,328 93.9% 35,013,261 4.3%
25,898 100.0% 813,445,001 100.0%
* Employee shareholdings under the Group’s share schemes are held in trust and are not therefore reflected in the number of individual shareholders.
i have an enquiry or want to update my details. Who should i contact?For all enquiries and shareholder administration, please contact Capita Asset Services: � Email: [email protected] � Telephone: +44 (0) 371 664 0437* � Fax number: +44 (0) 1484 600 914 � Postal address: Capita Asset Services, The Registry, 34 Beckenham Road, Beckenham, Kent, BR3 4TU
* Calls are charged at the standard geographic rate and will vary by provider. Calls outside the United Kingdom will be charged at the applicable international rate. Capita Asset Services are open between 9:00am – 5:30pm Monday to Friday, excluding public holidays in England and Wales.
duplicate share register accountsIf you are receiving more than one copy of our report, it means your shares are registered in two or more accounts on our register of members. If that was not your intention, please contact Capita Asset Services, who will be pleased to merge your accounts.
can i choose to receive information by email?Shareholders can register to receive reports and notifications by email, browse shareholder information and submit voting instructions at www.homeretailgroup-shares.com. This service is provided by Capita Asset Services.
does the group have an investor relations website?Investor relations information, such as webcasts of results presentations to analysts and investors and accompanying slides, is available at www.homeretailgroup.com.
Where can i find the group’s share price?In the Investor Centre on our website at www.homeretailgroup.com
GovernanceFinancial StatementS
AdditionAl informAtionStrateGic report 117Home Retail Group
Annual Report 2016
MSL_HRG_RA2016_FINAL_2005.indb 117 20/05/2016 17:59

does the group provide a share dealing facility?Investors can buy or sell shares through Capita Deal Services. Go to www.capitadeal.com or telephone +44 (0) 371 664 0445. Calls are charged at the standard geographic rate and will vary by provider. Calls outside the United Kingdom will be charged at the applicable international rate. Capita Deal Services are open between 8:00am – 4:30pm Monday to Friday, excluding public holidays in England and Wales.
When are the next major events for shareholders?First quarter trading statement: 9 June 2016Annual General Meeting : 29 June 2016
Where is the next annual general meeting?The AGM will be held at 11:00am on Wednesday, 29 June 2016 at the Holiday Inn Milton Keynes, 500 Saxon Gate West, Milton Keynes, MK9 2HQ.
Where is the registered office?The registered office address is Home Retail Group plc, Avebury, 489-499 Avebury Boulevard, Milton Keynes MK9 2NW. The Company is registered in England and Wales, No 5863533.
Shareholder information continued
118 Home Retail GroupAnnual Report 2016
MSL_HRG_RA2016_FINAL_2005.indb 118 20/05/2016 17:59

Index
Strategic rePOrtOur business model ................................................................................... 04Our strategy .................................................................................................05chairman’s statement ................................................................................07chief executive’s statement .................................................................... 08group performance ....................................................................................10 Argos operating highlights ................................................................................10 Group financial highlights .................................................................................10 Corporate developments ................................................................................. 10 Group key performance indicators............................................................. 11argos business review ................................................................................ 12 Argos key facts ....................................................................................................13 Argos operational review ...................................................................................14 Argos financial review .........................................................................................15Financial Services business review .......................................................... 16 Financial Services operational and financial review ...................................16 Financial Services key facts ............................................................................... 17Homebase - discontinued operation ......................................................18 Homebase financial review..............................................................................18 Homebase key facts...........................................................................................19responsible retailing ..................................................................................20 Responsible retailing key facts ........................................................................21Principal risks and uncertainties .............................................................22Financial summary ......................................................................................24group financial review ...............................................................................25
gOvernanceBoard of directors .......................................................................................30corporate governance ................................................................................ 31 Chairman’s introduction ...................................................................................31 The role and effectiveness of the Board .........................................................31 Board committees .............................................................................................. 33 Internal control ................................................................................................... 34 Relations with shareholders .............................................................................35nomination committee report ...............................................................36 Membership ......................................................................................................... 36 Meetings ............................................................................................................... 36 Main activities ..................................................................................................... 36 Board succession planning ............................................................................... 36 Chairman succession planning........................................................................ 36group audit and risk committee report ..............................................37 Chair’s introduction ............................................................................................37 Membership ..........................................................................................................37 Meetings ................................................................................................................37 Main activities ......................................................................................................37 Fair, balanced and understandable .................................................................37 Financial reporting ............................................................................................. 38 External audit ...................................................................................................... 39 Independence ...................................................................................................... 39 External auditor rotation .................................................................................. 39 Non-audit services .............................................................................................40 Internal audit and control .................................................................................40 Risk management ...............................................................................................40directors’ remuneration report ................................................................ 41 Chair’s introduction ............................................................................................41 Annual report on remuneration ..................................................................... 42 Summary of remuneration policy ...................................................................51directors’ report ..........................................................................................53 Profit and dividends ........................................................................................... 53 Directors ............................................................................................................... 53 Shareholder rights, appointments, removal of directors and directors’ powers ........................................................................................ 53 Share capital and control .................................................................................. 53 Purchase of own shares ..................................................................................... 54 Substantial shareholdings ................................................................................ 54 Employees ............................................................................................................ 54 Employee share plans ........................................................................................ 54 Financial risk management .............................................................................. 54 Political donations .............................................................................................. 54 Homebase sale-related profit forecast......................................................... 54 Relevant audit information .............................................................................. 54 Going concern ......................................................................................................55 Viability statement .............................................................................................55 Independent auditors .........................................................................................55 Annual General Meeting....................................................................................55Statement of directors’ responsibilities ................................................56
GovernanceFinancial StatementS
AdditionAl informAtionStrateGic report 119Home Retail Group
Annual Report 2016
MSL_HRG_RA2016_FINAL_2005.indb 119 20/05/2016 17:59

Financial StatementSindependent auditors’ report – group ...................................................57consolidated income statement .............................................................63consolidated statement of comprehensive income.......................... 64consolidated balance sheet......................................................................65consolidated statement of changes in equity .....................................66consolidated statement of cash flows ..................................................67analysis of net cash/(debt) ...................................................................... 68notes to the financial statements ..........................................................69 1 General information ....................................................................................... 69 2 Basis of preparation ........................................................................................ 69 3 Summary of principal accounting policies ................................................. 71 4 Financial risk management ............................................................................76 5 Segmental information .................................................................................80 6 Analysis of revenue by category .................................................................. 82 7 Net operating expenses ................................................................................. 82 8 Employee benefit costs and employee numbers .................................... 83 9 Exceptional items from continuing operations .......................................84 10 Net financing income/(expense) ..............................................................84 11 Taxation ............................................................................................................ 85 12 Dividends .........................................................................................................86 13 Basic and diluted earnings per share .........................................................87 14 Discontinued operations .............................................................................88 15 Goodwill ..........................................................................................................90 16 Other intangible assets .................................................................................91 17 Property, plant and equipment .................................................................. 92 18 Investments in associates ........................................................................... 93 19 Other financial assets and liabilities ......................................................... 93 20 Inventories ...................................................................................................... 93 21 Trade and other receivables ........................................................................ 94 22 Cash and cash equivalents ..........................................................................94 23 Trade and other payables ............................................................................ 95 24 Provisions ........................................................................................................ 95 25 Post-employment benefits ........................................................................ 96 26 Deferred tax ................................................................................................... 99 27 Share capital ..................................................................................................101 28 Notes to the consolidated statement of changes in equity .....................................................................................101 29 Share-based payment arrangements ................................................... 102 30 Operating leases .........................................................................................104 31 Commitments .............................................................................................104 32 Contingent liabilities ..................................................................................104 33 Notes to the consolidated statement of cash flows ..........................104 34 Related parties............................................................................................. 105 35 Subsidiary and associated undertakings ............................................... 105 36 Post balance sheet events .........................................................................107
independent auditors’ report – Parent ............................................... 108Parent company balance sheet ............................................................. 110Parent company statement of changes in equity .............................111Parent company statement of cash flows ..........................................111notes to the Parent company financial statements ....................... 112 1 General information ...................................................................................... 112 2 Basis of preparation ....................................................................................... 112 3 Summary of principal accounting policies ............................................... 112 4 Income statement disclosures .................................................................... 112 5 Dividends ..........................................................................................................113 6 Investment in subsidiary ..............................................................................113 7 Trade and other receivables .........................................................................113 8 Trade and other payables .............................................................................114 9 Share capital ....................................................................................................114 10 Commitments ..............................................................................................114 11 Related party transactions .........................................................................114group five-year summary ....................................................................... 115
additiOnal inFOrmatiOnShareholder information ..........................................................................117index ............................................................................................................. 119
Index continued
120 Home Retail GroupAnnual Report 2016
MSL_HRG_RA2016_FINAL_2005.indb 120 20/05/2016 17:59

Designmslgroup.com
Board photographyIain CrockartJames JohnsonBen NormingtonLucy Cheveralls
PaperThis has been printed on Cocoon Offset paper. The paper has been awarded the NAPM 100% Recycled Mark. Produced at a mill that is certified with the ISO14001 environmental management standard. FSC® Recycled Product supporting responsible use of forest resources. The fibre source is 100% de inked post consumer waste. The pulp is bleached using a totally chlorine free (TCF) process and the inks used are all vegetable oil based.
PrintPrinted by CPI Colour
our online reporting suiteWe’re always looking to make life easy. All our corporate reports are available online, which helps us to minimise our environmental impact and save cost. The websites below contain a wealth of information about Home Retail Group and our corporate website is updated throughout the year, so this, especially, is a good way of keeping up to date.
“ I am pleased overall with the progress of the Argos Transformation. Argos has become a materially improved business with a strong complement of new strategic digital capabilities. There is more work to do, but many of the building blocks are now in place.”John WaldenChief Executive
If you’re a shareholder, you can receive information more quickly and help us save paper and money by registering for all future shareholder communications online at www.homeretailgroup-shares.com
Corporate websiteFind our latest news, reports and images quickly and easily, along with information about our latest corporate responsibility activities.
www.homeretailgroup.com
Annual reportDownload a full PDF version of this annual report at:
www.homeretailgroup.com/investor-centre/reports-results-and-presentations/
Corporate responsibilityYou’ll find a summary of our corporate responsibility activities on pages 20 and 21 of this report, but you’ll find much more information and be able to download a summary PDF version at:
www.homeretailgroup.com/cr/
01_Cover_v7.indd 4-6 20/05/2016 17:56
Home ReTAIL GRoUP PLCAvebury489–499 Avebury BoulevardMilton KeynesMK9 2NWTel: 0845 603 6677
www.homeretailgroup.com
Visit our 2016 annual report and corporate responsibility report at www.homeretailgroup.com
Ho
me ReTA
IL GRo
UP PLC
Annual Report and Financial Statem
ents 2016
Annual Report and Financial Statements
2016
01_Cover_v7.indd 1-3 20/05/2016 17:56