Annual Report and Accounts for the 14 months ended 30...
116
RM plc Annual Report and Accounts for the 14 months ended 30 November 2011
Transcript of Annual Report and Accounts for the 14 months ended 30...

21269-04 02/02/2012 Proof 1
RM plcAnnual Report and Accounts for the 14 months ended 30 November 2011
RM plc A
nnual Report and Accounts 2011

21269-04 02/02/2012 Proof 1
01 Executive Chairman’s Statement07 Group Financial Performance & Chief Financial
Officer’s Review
09 Directors’ Bigraphies10 Report of the Directors10 Directors’ Responsibilities
Statement11 Principal risks17 Corporate Governance Report24 Audit Committee Report26 Remuneration Report
38 Independent Auditors’ Report40 Consolidated income statement41 Consolidated statement of
comprehensive income42 Consolidated balance sheet43 Company balance sheet44 Consolidated cash
flow statement45 Group net funds45 Company cash flow statement46 Consolidated statement
of changes in equity47 Company statement of changes
in equity48 Notes to the report and accounts104 Appendix to the financial statements 111 Shareholder Information
Contents
Board of Directors
Martyn RatcliffeExecutive Chairman
Iain McIntoshChief Financial Officer
Lord Andrew AdonisIndependent Non-Executive Director
Sir Bryan CarsbergIndependent Non-Executive Director
Jo Connell DLIndependent Non-Executive Director
Deena MattarIndependent Non-Executive Director
Sir Mike TomlinsonIndependent Non-Executive Director
BuSIneSS RevIew GoveRnAnCe fInAnCIAL STATeMenTS
See pAGe 09 foR fuLL DIReCToR BIoGRAphIeS

stock code: RM.RM plc Annual Report 2011 01www.rmeducation.com
21269-04 28/01/2012 Proof 1
Busi
nes
s Re
view
Go
veRn
an
ceFi
na
nci
al
stat
emen
ts
Executive Chairman’s StatementThe past year has been challenging for RM resulting in significant changes throughout the Group. The impact of the market environment, reversing from an extended period of increasing expenditure on education to a severe tightening of public sector budgets, became very apparent during this time. In recent years, while recognising that the market was changing, the severity of the changes was not fully appreciated by the business, exacerbated by the continuing positive effect of the Building Schools for the Future (“BSF”) programme which mitigated the effects of the slow down. This situation was compounded by an unsuccessful international expansion programme and a lack of innovation in recent years, whereby few new growth opportunities in the core UK market were created to offset the foreseeable decline in BSF.
Consequently a strategic review was undertaken during the summer of 2011 which concluded that RM should concentrate on its core UK education market, restructure into four operating divisions, dispose of a number of business operations and integrate the remaining activities more fully. In addition, it became apparent that a greater emphasis on working capital management was required in some areas and a significant cost reduction programme was necessary. The resulting actions were primarily undertaken during the autumn, including the disposal of the Group’s US hardware business and the Australian operations before the period end, followed by the sale of the DACTA/Lego and AMI (Easytrace) businesses since the period end. The ISIS business is currently held for sale and the Group will, in due course, seek to realise its 25% holding in Inclusive. All of the operations to be exited were either loss-making or of marginal profitability during 2011 and, together with the redundancy/restructuring programme and a general tightening of cost controls, a substantial reduction in the Group’s cost base has been achieved. The restructuring resulted in a number of charges being incurred in the 2011 financial year, including the cost of the redundancy programme, an onerous property provision arising from the closure and consolidation of a number of office facilities and impairment of goodwill, intangibles and investments. In addition, provisions relating to overdue debtors and slow-moving inventory have been reviewed in light of the current market conditions.
Despite this challenging environment, RM’s underlying business remains profitable, reporting £10.0 million of adjusted operating profit for the 14 month period (2010: £22.6 million for the 12 month period) and generating cash from operations of £24.8 million (2010: £23.7 million). The increased focus on working capital, together with the disposal programme, have resulted in a significant improvement in the Group’s cash position, such that cash and cash equivalents at 30 November 2011 were £24.5 million (30 September 2010: £13.8 million) with net funds less deferred consideration of £11.3 million (30 September 2010: £0.5 million), the highest period end level since 2008.
Reflecting the operating performance and the difficult market conditions, the Board is recommending a reduction in the final dividend to 1.53 pence per share, making a total of 3.00 pence per share for the period (2010: total of 6.64 pence). Subject to shareholder approval, the final dividend will be payable on 13 April 2012 to shareholders on the register at the close of business on 16 March 2012.
The actions taken have stabilised the Group and have established a stronger platform for the future. Furthermore, despite the market environment and the internal organisational changes, RM has maintained its unparalleled position in the UK education market which is a reflection of the resilience and commitment of the management and staff throughout the Group. Looking to the future, there are already several innovative new opportunities being evaluated which, in the medium term, provide potential to leverage the unique relationship between RM and its customer base. Such creativity and innovation, based on a more robust foundation and a leading market position, offers an exciting opportunity for the future.
Review of OperationsIn order to provide maximum transparency for shareholders, the review of operations below provides information on both the three division structure under which the Group operated in 2011, on a 14 month basis and a comparative 12 month basis, in accordance with statutory reporting, together with the new four division structure which became effective on 1 December 2011, the start of the 2012 financial year. An explanation of the changes to the business structure is also provided.

stock code: RM.RM plc Annual Report 201102
21269-04 28/01/2012 Proof 1
BUSINESS REVIEW
Learning TechnologiesThe Learning Technologies division was severely affected by the market conditions and experienced a very difficult year with revenue falling in all categories. Overall revenue declined by 21.1% from November 2010 to November 2011, comprising a decline of 16.6% in the UK and a 67.6% decline in the USA.
For the 14 month period to 30 November 2011, the Learning Technologies division reported an adjusted operating profit of £5.4 million on revenue of £243.0 million (2010: adjusted operating profit of £10.5 million on revenue of £274.0 million for the 12 month period to 30 September 2010). For the 12 month period to 30 November 2011, the Learning Technologies division reported an adjusted operating profit of £8.7 million on revenue of £214.4 million compared to the 12 month period to 30 November 2010 when operating profit was £9.7 million on revenue of £271.8 million. Included in the 2011 results are the losses associated with the USA, Australian and AMI businesses and an increased provision for overdue debtors, partially offset by reductions in warranty and related provisions in the first half of the year. In addition, due to its relative size, the Learning Technologies division was the major beneficiary of the Group not paying senior management and other profit related bonuses for the period.
The operations of the Learning Technologies division comprised:
zz RM-branded and third-party computing products, together with maintenance and warranty and other third-party classroom equipment, all of which transferred to the new Education Technology division. In 2011, these activities experienced difficult market conditions with revenue declining by approximately 11% on a comparable basis (November 2010 to November 2011);
zz Network Solutions, Internet Hosting and related services, which also transferred to the new Education Technology division, suffered from the market conditions and declined by approximately 13% on a comparable basis;
zz The Group’s BSF and managed service contracts reported a revenue decline of approximately 18% on a comparable basis due to the scheduled roll-out of BSF implementations. These activities operate under a different business model with long term contract accounting and therefore, following the strategic review, a new Managed Services division was established through which this business will be reported for FY 12;
zz The School Management Systems and Learning Platform software businesses, which transferred to the new Education Software division, declined by approximately 14% on a comparable basis; and
zz The USA hardware and Australian business operations were sold in October and November 2011 respectively, with AMI (Easytrace) being sold in January 2012. The USA software business and the AMI Ranger network management business are being retained by the Group, with the former transferring to the new Software division and the latter transferring to the Network Solutions business within the Education Technology division.
Education ResourcesThe Education Resources division comprised a diversity of businesses which operated as independent business units in 2011. Although the TTS business has dominated the results of this division for a number of years, the weaker performance of some of the smaller operations has been an impediment to the reported figures for the division and the success of TTS has not therefore been recognised historically. In fact, despite the deteriorating market environment, TTS reported growth in revenue of approximately 4% on a comparable basis. However inventory and supply chain management require further improvement and increasing return on capital is a key focus for 2012.
For the 14 month period to 30 November 2011, the Education Resources division reported an adjusted operating profit of £3.0 million on revenue of £83.9 million (2010: adjusted operating profit of £9.2 million on revenue of £83.3 million for the 12 month period to 30 September 2010). For the 12 month period to 30 November 2011, the Education Resources division reported an adjusted operating profit of £3.9 million on revenue of £74.4 million compared to the 12 month period to 30 November 2010 when adjusted operating profit was £8.8 million on revenue of £81.6 million. Included in the 2011 results are the losses associated with the DACTA business, an increased provision against slow-moving inventory and provisions taken against some OEM partner software contracts where payment for licence royalties was not received in 2011 or is considered to be at risk. In the light of greater payment risks in the current market, the Board has now adopted a more conservative approach to revenue recognition on such contracts.
Executive Chairman’s Statement continued

stock code: RM.RM plc Annual Report 2011 03www.rmeducation.com
21269-04 28/01/2012 Proof 1
Busi
nes
s Re
view
Go
veRn
an
ceFi
na
nci
al
stat
emen
ts
Following the period end, in January 2012, the DACTA business and the Group’s investment in Lego Education Europe were sold. In addition, a sale process for Isis, which provides classroom furniture, is currently underway. The Lightbox business, providing software publishing and contract services, was included in the Education Resources division in 2011 but transferred to the new Education Software division in the new structure. As a result, the new Education Resources division retains TTS and RM-Spacekraft, a small, specialist business which supplies products and services for Special Educational Needs environments.
Assessment and DataThe Assessment and Data division had a mixed performance in the period, with the Assessment Services business experiencing only a modest decline in revenue and winning a number of new contracts for e-marking services. However the Data Solutions activities experienced a more challenging period when compared to the prior year which benefited from some large one-off projects.
For the 14 month period to 30 November 2011, the Assessment and Data division reported an adjusted operating profit of £1.6 million on revenue of £23.9 million (2010: adjusted operating profit of £3.0 million on revenue of £22.9 million for the 12 month period to 30 September 2010). For the 12 month period to 30 November 2011, the division reported an adjusted operating profit of £1.6 million on revenue of £21.3 million compared to the 12 month period to 30 November 2010 when adjusted operating profit was £2.9 million on revenue of £22.7 million. Included within the 2011 results is a £1.4 million write-off associated with development work undertaken on a partnership basis which had previously been included in work in progress.
RM IndiaThe Group’s operation in Trivandrum, India, RM Education Solutions India (“RMESI”), was established in 2003 and had 476 employees at period end. For the 14 month period ending 30 November 2011, the total cost of RMESI was £6.2 million.
RMESI provides services solely to RM Group companies. Approximately 55% of RMESI employees are engaged in software development for the operating divisions, and 18% in customer and operational support with the remainder providing back office shared service support (e.g. customer order entry, IT, finance and HR) and administration.
2012 Organisation StructureAs RM enters the new year, the Group has been restructured into four operating divisions, each with a Managing Director and management team. Wherever appropriate, staff functions are provided by a central service in order to benefit from economies of scale and consistency across the Group. In addition approximately 20% of the Group headcount is based in RMESI in India, providing support services and software development to the operating divisions.
In order to provide an understanding of the Group in the new structure, the following commentary and figures reflect the twelve month period to 30 November 2011 (“Nov-2011”), not the 14 month statutory period. The figures stated below provide a proforma estimate and do not reflect the organisation structures in place during the period, since the new organisation was introduced at the start of the 2012 financial year.
Education TechnologyThe Education Technology division is a UK-focused business supplying IT hardware, networks, internet services and related installation and support. In the Nov-2011 financial year, on a pro-forma basis, the division’s continuing operations would have reported revenue of £125.7 million. In FY12, revenue from the division is anticipated to decline as budget reductions continue to impact negatively on IT expenditure in schools. Margins are also anticipated to remain under pressure. In terms of seasonality, the Education Technology hardware and network businesses, together with related services, operate at a broadly consistent level throughout three-quarters of the year with a significant seasonal increase over the summer, while the internet hosting business is relatively constant throughout the year.
The Education Technology division comprises four main operating areas, namely Hardware, Network Solutions, Internet Hosting and Support services.

stock code: RM.RM plc Annual Report 201104
21269-04 28/01/2012 Proof 1
BUSINESS REVIEW
zz Revenue derived from Hardware (RM-branded and third-party computing products, together with maintenance and warranty and other third-party classroom equipment) would have accounted for approximately 62% of the division’s revenue in Nov-2011. The RM-branded computer product shipments continue to decline, partially offset by growth in third-party products, which due to the lower margin on third-party products has an impact on overall gross margins. In the current market, both revenue and gross margins for hardware products are anticipated to remain under pressure in the year ahead.
zz Network Solutions, which provides network management software to approximately 5,700 schools, would have contributed approximately 10% of the division’s revenue in Nov-2011 and revenue is anticipated to decline in FY12. While gross margins in this business in FY12 should benefit from BSF projects coming on stream, underlying gross margins may experience continued pressure.
zz The Internet Hosting Group, where RM has a strong position as a service provider to approximately 8,000 schools, would have contributed 16% of the Education Technology division revenue in Nov-2011 and is anticipated to be broadly flat in the year ahead but with pressure on margins consistent with market trends for internet services.
zz The remaining revenue of the Education Technology division is derived from associated support services.
While the Education Technology division is anticipated to have the lowest operating margins in the new Group structure, at rates comparable to other UK hardware-oriented businesses, the division has a greater strategic importance to the RM Group as the major sales channel to UK schools and provides products and services to the Managed Services division.
Managed ServicesThe Managed Services division comprises implementation, management and support of IT infrastructure within schools and colleges, including the BSF contracts. In the Nov-2011 financial year, on a pro-forma basis, the division would have reported revenue of £61.5 million. This division has a service-based revenue stream which, excluding BSF, should be less sensitive to market variability and seasonality than product-based businesses. However, the BSF programme drives a substantial summer seasonality due to the requirement for school installations during the summer holidays and is subject to long term project accounting.
The division has approximately 30 contracts covering over 750 schools and colleges, including BSF and PFI contracts, which consist of multi-year support arrangements. Resources are geographically aligned to the schools, often with permanent on-site staff. The BSF contracts provide milestone receipts for the implementation of capital equipment followed by typically five years of managed service fees. The PFI contracts consist of capital investment in equipment and software, typically combined with a five year managed service. The division also services a number of smaller contracts which vary in duration from single year extensions to contracts of five years or more.
Following another successful summer implementation period, BSF contract activities would have accounted for approximately 65% of the division’s revenue in Nov-2011 and is therefore a material influence on near term performance. Due to the contract roll-out schedule, it is anticipated that BSF revenue will peak in 2012 but will decline significantly thereafter with only modest revenue from BSF implementations after 2014. In cash terms however, a cash inflow is anticipated in 2013 and 2014 due to the working capital profile of the BSF implementations, although this is partially offset by contractual obligations for provision of technology refresh programmes.
While the completion of the BSF programme creates challenges for the Managed Services division in the future, BSF has enabled RM to establish an efficient infrastructure to be able to offer competitive outsourced IT support services to schools, which could partially offset the reduction in future years as BSF revenues decline.
Education ResourcesFollowing the restructuring of the Group and the disposals, the Education Resources division now comprises just two operating businesses: TTS and RM-Spacekraft. In the Nov-2011 financial year, on a pro-forma basis, the division would have reported revenue of £58.0 million, of which TTS would have accounted for approximately 91%.
Executive Chairman’s Statement continued

stock code: RM.RM plc Annual Report 2011 05www.rmeducation.com
21269-04 28/01/2012 Proof 1
Busi
nes
s Re
view
Go
veRn
an
ceFi
na
nci
al
stat
emen
ts
TTS is a value-added distribution business offering a wide range of curriculum products and materials to schools for both general and departmental use. TTS has excellent market penetration supplying products to approximately 90% of all primary schools and 45% of secondary schools. Despite being a distribution-oriented business, TTS is a very profitable operation with an outstanding customer base, although in the past, inventory and supply chain management have not received adequate focus with a corresponding impact on return on capital. Actions are currently in process to improve these areas with satisfactory progress being made. TTS experiences two seasonal cycles in the year with peaks in February/March and August/September.
RM-Spacekraft is a modest business, supplying products and installation services for the Special Educational Needs market. The new management team appointed in 2010 has made good progress in improving the financial performance of the business over the past year, although better inventory management offers the potential to improve return on capital in this business. The RM-Spacekraft business seasonality peaks in February and March with its low period over the summer.
Education SoftwareThe Education Software division comprises Assessment Services, Data Solutions, School Management Systems (“SMS”), Learning Platforms, Software Publishing (including Easiteach and RM Easimaths) and other software (excluding network-related software which is within the Education Technology division). Distribution for the Education Software division’s offerings is through direct and indirect sales channels and also via the Group’s other divisional sales operations. In the Nov-2011 financial year, on a pro-forma basis, the division would have reported revenue of £38.5 million. The underlying business is less seasonal than other RM businesses and actions have also been taken to reduce the revenue volatility of Easiteach, although the education market for software is anticipated to remain challenging in the year ahead.
The largest contributor of revenue to the division (approximately 36%) is the Assessment Services business, providing e-marking and e-testing solutions and services for examining boards where RM has established a strong position in the UK and is now building an international presence to offset the limited future growth in the UK market. The first international contract was signed during the past year, although it is anticipated that international opportunities will evolve more as a software rather than service-oriented activity.
Data Solutions provides database-oriented consultancy solutions and services to public sector organisations primarily, but not exclusively, in the education sector. Data Solutions experienced a difficult year compared to 2010 when the business benefited from some large data migration projects. The business is also very dependent on one public sector customer and the renewal of this contract (tender anticipated in 2012) is critical to the future of this activity.
RM is the second largest provider of School Management Systems in the UK, although its market share is modest. In recent years RM has migrated the SMS software to a software-as-a-service (“SaaS”) model and this approach offers schools a cost-effective solution with the ability for new customers to be operational in a very short period of time.
Learning Platforms, providing on-line teaching and learning environments for a school or education authority, were previously considered to be a growth area enabling school-parent-pupil interaction. However, with tightening of education budgets the product category has proven to be subject to budget cuts with a major existing customer in Scotland indicating that it will not re-procure the existing service after the end of the current contract in September 2012. Furthermore, where Learning Platforms are being retained, the revenue per pupil is under significant pressure.
RM Easiteach products are typically bundled with interactive whiteboards or similar devices such as projectors with a current installed base of approximately 350,000. Since the UK education sector has a high penetration of interactive whiteboards in schools, the primary market opportunity for Easiteach is for distribution on a licence royalty model through third-party suppliers of interactive hardware in the international market. The timing and recognition of such licence contracts has historically exacerbated the seasonality of the Group’s profitability and collectability of licence royalty payments has sometimes been difficult. As a result, a more conservative approach has now been adopted.
The next generation of the division’s maths product, RM Easimaths, was launched in January as a hosted service for schools and is being promoted as the upgrade to the current RM Maths product which is currently installed in approximately 4,000 schools. In parallel, the remaining portfolio of curriculum software products has been reviewed and a number of minor product lines are being phased out in the year ahead.

stock code: RM.RM plc Annual Report 201106
21269-04 28/01/2012 Proof 1
BUSINESS REVIEW
Executive Chairman’s Statement continued
Non-Recurring ChargesAs indicated in the strategic review, the Group has incurred a number of significant, non-recurring costs including:
zz The impairment of goodwill, acquisition related intangible assets, other intangible assets and investments principally arising from the disposal programme (£12.4 million);
zz Loss on sale of operations (£4.4 million);zz Provisions for dilapidations on leased properties and onerous
lease contracts on surplus property (£6.0 million); andzz Restructuring costs largely relating to the redundancy
programmes during the period (£8.8 million).
Board ChangesJohn Leighfield retired in May after 17 years as Chairman and I was appointed Non-Executive Chairman from 1 June 2011. John Windeler and Sir Tim Brighouse retired in October 2011 and November 2011 respectively each having completed nine years as Non-Executive Directors of RM. Sir Bryan Carsberg has also advised the Board that he will not be standing for re-election at the forthcoming annual general meeting, having been a Non-Executive Director and Chairman of the Audit Committee for over nine years.
Following the strategic review and after 13 years with RM, in October 2011, Terry Sweeney resigned as Chief Executive Officer to pursue his career outside of the Group. Subsequent to the period end, after 21 years with the Group, Rob Sirs decided that it was now the right time for him to leave the Group.
The Board would like to acknowledge the contribution of all of these Directors and thank them for their long service to RM.
In addition to my appointment as Chairman (subsequently becoming Executive Chairman in October 2011), Deena Mattar was appointed a Non-Executive Director in June 2011 and will take over the chair of the Audit Committee following the annual general meeting, and Lord Andrew Adonis was appointed a Non-Executive Director in October 2011.
SummaryIn summary, 2011 has been a difficult period for the Group. Nevertheless, it is a credit to RM management and staff that they have shown resilience and commitment to the restructuring and recovery programme and the Group is now looking to the future.
The operational restructuring of the Group is now almost complete and provides a more balanced structure with each division being more focused and having a clear strategy. While the Board anticipates that the difficult market conditions will continue for the foreseeable future, the Group’s BSF contract profile provides some resilience in 2012, although the anticipated decline in 2013 and 2014 is material. However, the leaner organisation and reduced cost base provide a more robust platform to manage the challenges ahead, supported by a strong cash position and increased emphasis on working capital management.
Notwithstanding all of the challenges, RM retains an unparalleled market position in the UK education sector and this brand presence offers considerable opportunities for the Group. RM is now moving forward and is actively pursuing new initiatives to restore growth in the medium term. While cautious regarding near-term expectations, particularly in the ongoing public sector climate, the Board remains optimistic and ambitious for the future of RM.
Martyn Ratcliffe Executive Chairman6 February 2012

stock code: RM.RM plc Annual Report 2011 07www.rmeducation.com
21269-04 28/01/2012 Proof 1
Busi
nes
s Re
view
Go
veRn
an
ceFi
na
nci
al
stat
emen
ts
As previously announced, RM has changed its financial year end from 30 September to 30 November. This separates both annual financial year planning and financial year end activity from the busiest operational period of the Group’s year. As a result, the financial statements are for the 14 month period to 30 November 2011. However to aid year-on-year comparisons, proforma information for the 12 months to 30 November 2010 and 2011 is also provided.
To provide a better guide to underlying business performance, the income statement amortisation charges relating to acquisition related intangible assets, goodwill and other asset impairment charges, exceptional pension credits, redundancy costs, share-based payment charges and movements in property related provisions have been disclosed in the adjustments column in the income statement to give ‘Adjusted’ results. In previous years, share-based payment charges and redundancy costs (except those incurred as part of a major exceptional programme as with the end of BSF) had been included in adjusted operating profits. The comparative figures have therefore been restated on a consistent basis.
Group revenues for the 14 months to 30 November 2011 were £350.8 million (2010: £380.1 million). Proforma revenues were £310.1 million for the 12 months to 30 November 2011 a decline of 17.6% from the corresponding period in 2010.
The Group incurred an unadjusted loss before tax of £23.4 million for the 14 months to 30 November 2011 (2010: profit of £23.9 million). This loss was after significant non-recurring costs, most of which derived from the implementation of the strategic review set out in the Executive Chairman’s statement, including a £12.4 million charge for the impairment of the value of goodwill and intangible assets, a £4.4 million loss on the sale of operations, £6.0 million increase in property related provisions and £8.8 million of restructuring costs, principally related to redundancy payments.
Adjusted operating profit for the 14 months to 30 November 2011 was £10.0 million. Adjusted operating profit for the 12 months to 30 November declined to £14.1 million from £21.4 million in the corresponding period in 2010. Adjusted operating profit margins decreased from 5.7% in the year to 30 November 2010 to 4.6% in the year to 30 November 2011.
The total tax credit for the 14 months to 30 November 2011 was £0.3 million (2010: charge of £5.8 million). The Group’s tax credit for the 14 months to 30 November 2011, measured as a percentage of profit/loss before tax, was 1% (2010: 24% tax charge). This tax rate has been below the standard UK corporation tax rate for a number of years, principally due to the benefit the Group gains from enhanced tax deductions on qualifying research & development activities. In addition many of the losses incurred as a result of actions following the strategic review, such as goodwill impairments, are not tax deductible and some tax losses in overseas jurisdictions have not been recognised.
Adjusted basic and diluted earnings per share declined to 7.3p for the 14 months to 30 November 2011 (2010: 18.8p). Reflecting the deterioration in the market and trading performance, total dividend (paid and proposed) has been reduced to 3.00p per share (2010: 6.64p). This comprises an already paid interim dividend of 1.47p per share, and, subject to shareholder approval, a proposed final dividend of 1.53p per share. The estimated total cost of dividends paid and proposed for 2011 is £2.7 million (2010: £6.1 million).
Average Group headcount for the 14 month period was 2,799 (2010: 2,864). At 30 November 2011 headcount was 2,358 a 17% reduction from 2,855 on 30 November 2010. The November 2011 headcount comprises 2,113 permanent and 245 temporary or contract staff, of which 1,865 were located in the UK, 476 in India and 17 in other locations.
Group Financial Performance & Chief Financial Officer’s Report

stock code: RM.RM plc Annual Report 201108
21269-04 28/01/2012 Proof 1
BUSINESS REVIEW
Despite challenging trading conditions, cash generated by operations for the 14 months to 30 November 2011 was £24.8 million (2010: £23.7 million). In addition, proceeds from the US and Australian businesses sold in the period totalled £3.8 million. As a result, cash and cash equivalents at 30 November 2011 improved significantly to £24.5 million (30 September 2010: £13.8m) and net funds less deferred consideration at 30 November 2011 were £11.3 million, compared to £0.5 million at 30 September 2010 and £(15.7) million at 30 November 2010. Seasonal cash flows reach a low point over the peak summer period and the maximum bank overdraft reached £11.8 million in the period (2010: £26.8 million).
In order to strengthen the Group’s financing structure, in January, the Group signed a £30 million unsecured revolving credit facility with Barclays bank, committed until 27 March 2015. Together with an existing £3 million annual Barclays overdraft these facilities will replace the uncommitted US $39.5 million HSBC sterling dealing line and committed £25 million acquisition facility (of which £13 million had been drawn at 30 November 2011). The principal financial covenants remain at 2.5 times Net Debt/Earnings before Interest, Taxation, Depreciation and Amortisation (‘EBITDA’) and 4.0 times interest cover. The interest rate over LIBOR is 2.75%, which can reduce to 2.5% after 12 months whenever Net Debt/EBITDA falls below 0.5 times.
Regarding the RM defined benefit pension scheme, this was closed to new entrants in 2003 and a number of actions have been taken in recent years to mitigate the Group’s exposure to the pension liabilities, including increasing member contributions and introducing pensionable salary caps. Following a review with the Group’s pension advisors, and in order to mitigate the growth in future liabilities and to manage the risk associated with the Scheme, the Board has entered into discussions with the Scheme Trustees regarding the potential closure of the Scheme to future accrual of benefits. At 30 November 2011 the IAS 19 scheme deficit (pre tax) was £21.2 million (30 September 2010: £12.4 million), the increased deficit being primarily due to the impact of lower corporate bond yields used in the calculation of the Scheme’s liabilities. The next triennial valuation of the Scheme’s position is due at 31 May 2012.
Iain McIntoshChief Financial Officer6 February 2012
Group Financial Performance & Chief Financial Officer’s Report continued

stock code: RM.RM plc Annual Report 2011 09www.rmeducation.com
21269-04 28/01/2012 Proof 1
Busi
nes
s Re
view
Go
veRn
an
ceFi
na
nci
al
stat
emen
tsBu
sin
ess
Revi
ewG
ove
Rna
nce
Fin
an
cia
l st
atem
ents
Martyn Ratcliffe – Executive Chairman (n)Martyn Ratcliffe (50) was appointed Non-Executive Chairman of RM plc on 1 June 2011 and Executive Chairman on 25 October 2011. He is also Chairman of the Nominations Committee of the Board. Mr Ratcliffe has been Chairman of Microgen plc since 1998 and Chairman of Sagentia Group plc since April 2010. Prior to joining Microgen, he was the senior vice-president of Dell Computer Corporation, responsible for the Europe, Middle East and Africa Region.
Iain McIntosh – Chief Financial OfficerIain McIntosh FCA (48) joined RM on 30 November 2009 and was appointed to the Board as a Director on 1 April 2010. Before joining RM, he held equivalent positions in listed and private equity backed IT and service companies, most recently as CFO of FTSE 250 listed Axon Group plc. Mr McIntosh initially qualified as a Chartered Accountant and then spent four years as a management consultant with McKinsey & Co.
Lord Andrew Adonis – Independent Non-Executive Director (a) (r) (n)Lord Andrew Adonis (48) joined the RM Board on 1 October 2011. He served 12 years in government as a Minister and special adviser, including Secretary of State for Transport, Minister for Schools, Head of the No.10 Policy Unit, and senior No.10 adviser on education, public services and constitutional reform. Before joining government, he was Public Policy Editor of the Financial Times. Lord Adonis is also a Non-Executive Director of Dods (Group) plc and a number of charitable organisations.
Sir Bryan Carsberg – Independent Non-Executive Director (a) (r) (n)Sir Bryan Carsberg (72) was appointed to the Board as a Non-Executive Director in September 2002. He is a Non-Executive Director of Novae Group plc, a Non-Executive Director of Inmarsat plc, an independent member of the Equality of Access Board of BT Group plc, a former Director General of OFTEL, a former Director General of Fair Trading and is Chairman of Council and Senior Pro-Chancellor of Loughborough University. He served as Secretary General of the International Accounting Standards Committee from 1996 to 2001, is a Chartered Accountant and has been a professor of accounting at the University of Manchester and the London School of Economics. Sir Bryan is retiring from the Board at the forthcoming annual general meeting.
Jo Connell OBE, DL – Senior Independent Non-Executive Director (a) (r) (n)Jo Connell (63) was appointed to the Board as a Non-Executive Director in December 2007. Until 2003, she was Managing Director of Xansa plc, the outsourcing and technology company, having served on the Board since 1991. Ms Connell is Chair of Governors and Pro-Chancellor of the University of Hertfordshire, Chairman of Ofcom’s Advisory Committee for Older and Disabled People, a former Non-Executive Director of THUS plc and Synstar plc.
Deena Mattar – Independent Non-Executive Director (a) (r) (n)Deena Mattar FCA (46) joined the Board on 1 June 2011 as a Non-Executive Director and is to be appointed Chairman of the Audit Committee after the next annual general meeting. She served as Group Finance Director of Kier Group plc from 2001 to 2010, having joined the Group in 1998 as Finance Director of Kier National. Prior to this she held senior positions at KPMG. Ms Mattar is also a Non-Executive Director of Invensys plc.
Sir Mike Tomlinson – Independent Non-Executive Director (a) (r) (n)Sir Mike Tomlinson (69) was appointed to the Board as a Non-Executive Director in February 2004 and is also Chairman of the Remuneration Committee. He is one of the UK’s leading educationalists and formerly chaired the Department for Education and Skills Working Group on educational reform for 14 to 19-year olds and was Her Majesty’s Chief Inspector for Schools from December 2000 until April 2002, during which time he was responsible for the work of Ofsted. He is Chair of Myscience, responsible for the National and Regional Science Learning Centres and the National STEM Centre.
Committee membership as at the date of this report.
(a) Audit Committee Member(r) Remuneration Committee Member(n) Nominations Committee Member
Directors’ Biographies

stock code: RM.RM plc Annual Report 201110
21269-04 28/01/2012 Proof 1
GOVERNANCE
Report of the Directors
The Directors submit their report together with the audited consolidated and Company financial statements for the 14 months ended 30 November 2011.
Results and DividendsThe results for the period are set out in the financial statements and notes that appear on pages 40 to 102. As explained in the Executive Chairman’s Statement, the Directors propose the payment of a final dividend of 1.53 pence per share, making a total of 3.00 pence per share for the period (2010: 6.64 pence).
Principal ActivitiesThe Group’s principal activitiy is the provision of products and services to the UK and international education markets. In the period covered by this report the Group’s products and services were provided through three segments: Learning Technologies, Education Resources and Assessment & Data. The scope of these divisions is set out in the financial statements. Following the strategic review announced in September 2011, from 1 December 2011 the Group is organised in four operating divisions as follows:
Education Technology: a UK-focused business supplying IT hardware, network, internet services and related installation and support;
Managed Services: a UK-focused business providing implementation, management and support of IT infrastructure in schools and colleges, including Building Schools for the Future (”BSF”) contracts;
Education Resources: a UK and international added-value distribution business offering a wide range of curriculum products and materials to schools, including special educational needs environments; and
Education Software: a UK and international business providing assessment, data solutions, school management systems (“SMS”), learning platforms and other software.
Review of the BusinessThe information that fulfils the requirements of the Business Review can be found in the Executive Chairman’s Statement, the Chief Financial Officer’s Report, the Audit Committee Report and the Remuneration Committee Report which are incorporated into this report by reference.
The Corporate Governance Report is incorporated into this Report of the Directors by reference.
Principal Risks and UncertaintiesThe management of the business and the execution of the Group’s strategy are subject to a number of risks. Risks are reviewed by the Board and appropriate processes put in place to monitor and mitigate them. The key business risks for the Group are set out in the table on pages 11 to 13.
Directors’ Responsibilities StatementThe Directors are responsible for preparing the Annual Report, the Remuneration Report and the financial statements in accordance with applicable UK law and regulations.
UK Company law requires the Directors to prepare financial statements for each financial year. Under that law the Directors are required to prepare the Group financial statements in accordance with International Financial Reporting Standards (IFRSs) as adopted by the European Union and have elected to prepare the Company financial statements on the same basis. Under company law the Directors must not approve the financial statements unless they are satisfied that they give a true and fair view of the state of affairs of the Company and the Group and of the profit or loss of the Group for that period.
In preparing those financial statements, the Directors are required to:
zz select suitable accounting policies and then apply them consistently;
zz make judgements and estimates that are reasonable and prudent;
zz state whether applicable IFRSs as adopted by the European Union have been followed, subject to any material departures disclosed and explained in the financial statements; and
zz prepare the financial statements on a going concern basis unless it is inappropriate to presume that the Group and the Company will continue in business.
The Directors are responsible for keeping proper accounting records that are sufficient to show and explain the Company’s transactions and disclose with reasonable accuracy at any time the financial position of the Company and to enable them to ensure that the financial statements comply with the Companies Act 2006. They are also responsible for safeguarding the assets of the Group and hence for taking reasonable steps for the prevention and detection of fraud and other irregularities.

stock code: RM.RM plc Annual Report 2011 11www.rmeducation.com
21269-04 28/01/2012 Proof 1
Busi
nes
s Re
view
Go
veRn
an
ceFi
na
nci
al
stat
emen
tsBu
sin
ess
Revi
ewG
ove
Rna
nce
Fin
an
cia
l st
atem
ents
Under applicable law and regulations, the Directors are also responsible for preparing a Directors’ Report, Remuneration Report and Corporate Governance Report that complies with that law and those regulations.
Each of the Directors, whose names and functions are listed at the front of this report confirm that, to the best of their knowledge:
zz the Group financial statements, which have been prepared in accordance with IFRSs, as adopted by the EU, give a true and fair view of the assets, liabilities, financial position and performance of the Group; and
zz the information contained in pages 01 to 08 of this Annual Report includes a fair review of the development and performance of the business and the position of the Group, together with a description of the principal risks and uncertainties that it faces.
A copy of the Group’s financial statements is posted on the Group’s website www.rmeducation.com. The Directors are responsible for the maintenance and integrity of the Company’s website and the financial information included in the website. Information published on the website is accessible in many countries with differing legal requirements but only legislation in the United Kingdom governing the preparation and dissemination of financial statements applies to the Group.
Principal Risks and Uncertainties Table
Risk Mitigation
Public Policy The majority of RM’s business is funded from government sources. Changes in political administration, or changes in policy priorities, might result in a reduction in education spending.
Global economic conditions might result in a reduction in budgets available for public spending generally and education spending specifically.
The Group seeks to understand the education policy environment by regular monitoring of policy positions and by building relationships with education policy makers.
The Group seeks to increase the diversity of its revenue streams by developing a broad product and service portfolio.
Education practice Educational practices and priorities may change and, as a result, RM’s products and services may no longer meet customer requirements.
The Group seeks to maintain a deep level of knowledge of current education practice and priorities by maintaining close relationships with customers.
Competition in IT markets and international supply chain
The IT hardware market is subject to intense global competition. RM has to react to continual average selling price reductions and margin pressures, as well as to US Dollar rate fluctuations.
The Group seeks to reduce its exposure to commodity hardware sales and has a programme of foreign exchange hedging activity.
Operational Execution RM provides sophisticated products and services, which require a high level of technical expertise to develop and support, and on which its customers place a high level of reliance.
RM is engaged in the delivery of large, multi-year education projects, typically involving the development and integration of complex ICT systems, and may have liability for failure to deliver on time.
The Group invests in maintaining a high level of technical expertise. The Group has in place a range of customer satisfaction programmes, which includes management processes designed to address the causes of customers’ dissatisfaction.
Internal management control processes are in place to govern the delivery of education projects, including regular reviews by Operating and Group Boards.

stock code: RM.RM plc Annual Report 201112
21269-04 28/01/2012 Proof 1
GOVERNANCE
Risk Mitigation
Product Safety RM is involved in the supply of electrical goods, physical education resources and other products that will be used by children of all ages and abilities.
The Group’s product development processes take account of international safety regulations.
Data and Business Continuity RM is engaged in storing and processing sensitive data (for example, exam papers and scripts, and school and pupil records), where accuracy, privacy and security are very important.
The Group would be significantly impacted if as a result of a disaster one of its major buildings, systems or infrastructure components could not function for a long period of time.
The Group’s IS function has invested in developing secure Data Centres, and has been successfully certified to ISO/IEC 27001:2005 for the provision of systems, information and hosting services.
The Group has established an Information Security Committee to oversee the security aspects of the Group’s information systems. This covers data integrity and protection, defence against external threats and disaster recovery.
The Group has made significant investments in protecting itself against the consequences of a disaster and has plans for dealing with a disaster.
The Group has comprehensive property insurance covering all of its properties.
People RM’s business depends on highly skilled employees.
The high rate of external and internal change experienced by the Group has increased the risk of higher staff turnover.
The Group seeks to be an excellent employer and regularly monitors the engagement of its employees. The Group has active talent management, career planning and succession planning programmes.
Innovation The IT market is subject to rapid, and often unpredictable, change. As a result of inappropriate technology choices, the Group’s products and services might become unattractive to its customer base. The Group’s continued success depends on developing and/or sourcing a continuous stream of innovative and effective products for the education market.
The Group closely monitors technology developments, invests continually in keeping its products up to date and maintains relationships with key technology providers.
The Group works closely with teachers and educators to understand opportunities and requirements.
Report of the Directors continued

stock code: RM.RM plc Annual Report 2011 13www.rmeducation.com
21269-04 28/01/2012 Proof 1
Busi
nes
s Re
view
Go
veRn
an
ceFi
na
nci
al
stat
emen
tsBu
sin
ess
Revi
ewG
ove
Rna
nce
Fin
an
cia
l st
atem
ents
Risk Mitigation
Financial – Foreign Exchange The Group is exposed to foreign currency risk with respect to purchases of goods in US Dollars and from its operations in India.The Group is exposed to counterparty risk on liquid assets.
The Group enters into US Dollar and Indian Rupee denominated hedging contracts with approved banking organisations.
Cash and cash reserves are spread across a number of highly rated banks.
Financial – Capital Changes in the banking environment increase the risk of the Group failing to obtain adequate banking facilities to support its financing requirements.
The Group has agreed a 3 year £30 million committed revolving credit facility with Barclays bank.
Pension The Group operates a defined benefits pension scheme in the UK, which is in deficit.
The Group’s ability to pay dividends to shareholders depends on having sufficient distributable reserves in the holding company, RM plc. Losses incurred as a result of significant increases in the pension scheme deficit could impair the ability of RM Education plc to pay dividends up to RM plc.
The Scheme was closed to new entrants in 2003.
The financial position of the scheme is reviewed at least bi-annually, when management meets with the scheme actuary.
The Group has actively managed its exposure to pension risk by agreeing changes to the scheme with members.
The Group has entered into consultation with the trustees to close the scheme to future accrual of benefits.
Acquisitions Acquisitions do not realise the value originally expected.
The Group carries out analysis of potential acquisitions. Prior to any acquisition an integration plan will be developed and reviewed regularly following completion of the acquisition.

stock code: RM.RM plc Annual Report 201114
21269-04 28/01/2012 Proof 1
GOVERNANCE
Going ConcernThe Directors, having made appropriate enquiries, consider that the Company and the Group have adequate resources to continue in operational existence for the foreseeable future and that therefore it is appropriate to adopt the going concern basis in preparing the financial statements.
Employment PoliciesThe Group is committed to offering equal employment opportunities and its policies are designed to attract, retain and motivate the best staff regardless of sex, race, religion, age or disability. The Group gives proper consideration to applications for employment when these are received from disabled persons and will employ them in posts whenever suitable vacancies arise. Employees who become disabled will be retained whenever possible through retraining, use of appropriate technology and making available suitable alternative employment. The Group encourages the participation of all employees in the operation and development of the business and has a policy of regular communications. The Group incentivises employees and senior management through the payment of bonuses linked to performance objectives, together with the other components of remuneration detailed in the Remuneration Report. The Group has a wide range of other written policies, designed to ensure that it operates in a legal and ethical manner. These include policies related to health and safety, ‘whistle blowing’, anti bribery and corruption, grievance, career planning, parental leave, sabbatical, systems and network security. All of RM’s employment policies are published internally.
Environmental PolicyThe Group has recycling facilities in its principal offices and use of waste paper is minimised by promoting a paperless process and downloadable software products. The Group recognises that its activities should be carried out in an environmentally friendly
manner and therefore aims to:zz comply with relevant environmental legislation;zz reduce waste and, where practicable, reuse and recycle
consumables;zz dispose of non-recyclable items in an environmentally
friendly manner;zz minimise the consumption of energy and resources in the
Group’s operations; andzz reduce the environmental impact of the Group’s activities and
where possible increase the procurement of environmentally friendly products.
Health and SafetyThe Group adopts a health and safety policy which is designed to provide and maintain safe and healthy working conditions for all employees. Appropriate information, training and supervision are provided by the Group to support this policy.
DonationsThe Group made various charitable donations totalling £126,000 (2010: £75,000) which includes the sponsorship of the Tipton RSA Academy amounting to £50,000 (2010: £66,000) to enable it to utilise the Academy for marketing purposes. This arrangement is explained in more detail in note 29 to the financial statements. A further £12,000 was given to locally based community support projects (2010: £14,000).
No political donations have been made.
Articles of AssociationThe Company’s Articles of Association are available from Companies House in the UK, or by writing to the Company Secretary. Amendments to the Articles of Association can only be made by means of a Special Resolution at a general meeting of the shareholders of the Company.
Substantial ShareholdingsOn 2 February 2012 the Company had received notifications that the following parties were interested in accordance with DTR 5:
ShareholderNo. of
shares
Percentageof Issued
Share Capitalas at 2 Feb
No. ofsharesDirect
No. of shares Indirect
Schroders Investment Management 13,704,816 14.66% - 13,704,816Aberforth Partners Ltd 9,679,273 10.36% - 9,679,273Aviva plc 6,805,165 7.28% 3,021,689 3,783,476Standard Life Investments Ltd 5,291,557 5.66% 5,277,383 14,174Invesco Ltd 5,288,535 5.66% - 5,288,535Legal & General Investment Management 3,440,664 3.68% 3,123,951 316,713
Report of the Directors continued

stock code: RM.RM plc Annual Report 2011 15www.rmeducation.com
21269-04 28/01/2012 Proof 1
Busi
nes
s Re
view
Go
veRn
an
ceFi
na
nci
al
stat
emen
tsBu
sin
ess
Revi
ewG
ove
Rna
nce
Fin
an
cia
l st
atem
ents
The Takeovers DirectiveThe Company has one class of share capital, ordinary shares. All the shares rank pari passu. There are no special control rights in relation to the Company’s shares. As at 30 November 2011 the RM plc Employee Share Trust owned 1,942,557 ordinary shares in the Company (2.08 per cent of the issued share capital); any voting or other similar decisions relating to those shares would be taken by the trustees, who may take account of any recommendation of the Board of the Company.
Share options granted to the Executive Chairman under the 2004 RM plc share option plan vest if there is a general offer for the Company under Rule 9.1 of the Plan or a compulsory acquisition under Rule 9.2 of the Plan and the offer price exceeds 100p whether in cash or any other form of consideration for a period of 20 consecutive trading days between the date of grant and 30 November 2016.
The Group enters into long-term contracts to supply ICT products and services to its customers. Wherever possible, these contracts do not have change of control provisions. Where they do, the change of control provisions are limited to giving the customer the right to terminate the contract without cost to the Group.
In January 2012 the Group entered into a £30 million revolving credit facility with Barclays bank. This facility has a change of control provision and is subject to termination in the event of change of control of the Company.
Repurchase of own sharesAt the General Meeting held on 17 January 2011 members renewed the authority under section 701 of the Companies Act 2006 to make market purchases on the London Stock Exchange of up to 9,342,005 ordinary shares of 2p each, being 10% of the issued share capital of the Company. The minimum price which may be paid for each share is the nominal value. The maximum price which may be paid for a share is an amount equal to the higher of (1) 5% above the average of the middle market quotations of the Company’s ordinary shares as derived from the London Stock Exchange Daily Official List for the 5 business days immediately preceding the day on which such share is contracted to be purchased and (2) the amount stipulated by Article 5(1) of the Buy-back and Stabilisation Regulation 2003. The Directors will seek to renew this authority at the next annual general meeting scheduled for 26 March 2012.
Significant ContractsThere did not exist at any time during the period any contract involving the Company or any of its subsidiaries in which a Director of the Company was or is materially interested or any contract which was either a contract of significance with a controlling shareholder or a contract for the provision of service by a controlling shareholder, save for one exception as set out in the related parties section (note 29) of the financial statements.
DirectorsDetails of Directors who have held office during the period and up to the date of signing these financial statements are given below:
Lord Andrew AdonisProfessor Sir Tim BrighouseSir Bryan CarsbergJo ConnellJohn LeighfieldIain McIntoshDeena MattarMartyn RatcliffeRob SirsTerry SweeneySir Mike TomlinsonJohn Windeler
Mr Leighfield retired on 31 May 2011. Mr Windeler retired on 1 October 2011. Professor Sir Tim Brighouse retired on 30 November 2011. Mr Sweeney resigned as a Director, by mutual agreement, on 24 October 2011. Mr Sirs resigned as a Director for personal reasons on 31 January 2012.
Mr Ratcliffe and Ms Mattar were appointed on 1 June 2011 and Lord Andrew Adonis was appointed with effect from 1 October 2011.
Sir Bryan Carsberg has completed over nine years as a Director and Chairman of the Audit Committee and, accordingly, has advised the Board that he does not intend to seek re-election at the next annual general meeting. Ms Mattar is to be appointed Chairman of the Audit Committee following the annual general meeting.

stock code: RM.RM plc Annual Report 201116
21269-04 28/01/2012 Proof 1
GOVERNANCE
Biographical details of the current Directors are given on page 09. As stated at the last annual general meeting, at the forthcoming annual general meeting all continuing Directors will stand for re-election in accordance with best practice and guidance set out in The UK Corporate Governance Code 2010 as issued by the Financial Reporting Council in June 2010 (“UK Corporate Governance Code 2010”). The Directors who are proposed for re-election or election have either a letter of appointment or a service contract, details of which can be found in the Remuneration Report.
The Company has purchased and maintained throughout the year Directors’ and officers’ liability insurance in respect of itself and its Directors. The Directors also have the benefit of a Deed of Indemnity in respect of liabilities which may attach to them in their capacity as Directors of the Company. These provisions are qualifying third party indemnity provisions as defined by section 234 of the Companies Act 2006.
Treasury and Foreign ExchangeThe Group has in place appropriate treasury policies and procedures, which are approved by the Board. The treasury function manages interest rates for both borrowings and cash deposits for the Group and is also responsible for ensuring there is sufficient headroom against any banking covenants contained within its credit facilities, and for ensuring there are appropriate facilities available to meet the Group’s strategic plans.
In order to mitigate and manage exchange rate risk, the Group routinely enters into forward contracts and continues to monitor exchange rate risk in respect of foreign currency exposures.
In order to mitigate and manage interest rate risk the Group has in place an interest rate hedge to manage exposure on borrowings. Interest rate swaps are used as cash flow hedges of future interest payments, which have the effect of increasing the proportion of fixed interest debt.
All these treasury policies and procedures are regularly monitored and reviewed. It is the Group’s policy not to undertake speculative transactions which create additional exposures over and above those arising from normal trading activity.
Creditor Payment PolicyThe Group agrees terms and conditions for its business transactions with suppliers. Payment is then generally made in line with these terms, subject to the terms and conditions being met by suppliers.
Independent Auditor and Disclosure of Information to AuditorAs far as the Directors are aware, there is no relevant audit information (as defined by section 418(3) of the Companies Act 2006) of which the Company’s auditor is unaware and each of the Directors have taken all the steps that they ought to have taken as Directors in order to make themselves aware of any relevant audit information and to establish that the Company’s auditor is aware of that information.
The auditor, KPMG Audit Plc who was appointed during the period, has indicated its willingness to continue in office, and a resolution that it be re-appointed will be proposed at the annual general meeting.
Annual General MeetingThe forthcoming annual general meeting will be held on 26 March 2012 at 140 Milton Park, Abingdon, Oxfordshire OX14 4SE, at a time set out in the annual general meeting notice. The notice of the annual general meeting contains the full text of resolutions to be proposed.
By Order of the Board
Andy RobsonCompany Secretary6 February 2012
Report of the Directors continued

stock code: RM.RM plc Annual Report 2011 17www.rmeducation.com
21269-04 28/01/2012 Proof 1
Busi
nes
s Re
view
Go
veRn
an
ceFi
na
nci
al
stat
emen
tsBu
sin
ess
Revi
ewG
ove
Rna
nce
Fin
an
cia
l st
atem
ents
Corporate Governance Report
Statement of ComplianceThe Group has applied the principles set out in the UK Corporate Governance Code 2010. The Company has complied with the UK Corporate Governance Code 2010 throughout the 14 month period ended 30 November 2011, other than the limited exceptions which are noted in the table below.
Compliance with the UK Corporate Governance Code 2010Code of Best Practice – Principles RM Compliance Statement
A DIRECTORS
1 The Role of the BoardEvery company should be headed by an effective board, which is collectively responsible for the success of the company.
The Directors’ responsibilities are outlined in the Report of the Directors. The Board meets regularly on a formal basis plus additional ad hoc meetings as necessary.
2 Division of ResponsibilitiesThere should be a clear division of responsibilities at the head of the company between the running of the board and the executive responsibility for the running of the company’s business. No one individual should have unfettered powers of decision.
The role of Chairman and Chief Executive was exercised by the same individual from 25 October 2011, namely, Mr. Ratcliffe. We recognise that this is out of line with best practice. The Board is composed of a majority of independent Non-Executive Directors. The Board will ensure that robust governance structures are in place while benefiting from Mr. Ratcliffe being at the helm. Executive responsibility is split between the Executive Chairman and the Divisional Managing Directors. The Executive Chairman is primarily responsible for strategy, corporate development and running the Board. The Divisional Managing Directors have specific responsibility for the Group’s operating businesses.
3 The ChairmanThe chairman is responsible for the leadership of the board and ensuring its effectiveness on all aspects of its role.
The Executive Chairman sets the Board’s agenda and ensures that adequate time is available for the discussion of all agenda items. The Executive Chairman promotes a culture of openness and debate. He also ensures constructive relations between the Executive Directors and the Non-Executive Directors. The Executive Chairman ensures effective communication with shareholders.
On appointment the Executive Chairman met the independence criteria.

stock code: RM.RM plc Annual Report 201118
21269-04 28/01/2012 Proof 1
GOVERNANCE
Code of Best Practice – Principles RM Compliance Statement
4 Non-Executive DirectorsAs part of their role as members of a unitary board, Non-executive directors should constructively challenge and help develop proposals on strategy.
The Non-Executive Directors scrutinise the performance of management and monitor the reporting of performance. Ms. Connell has been appointed as Senior Independent Director and she is available to shareholders if they have concerns which contact through the normal channels has failed to resolve.
The Executive Chairman holds meetings with the Non-Executive Directors without the other Executive Director(s) present where considered appropriate. The Senior Independent Director meets with the Non-Executive Directors without the Executive Chairman being present on such occassions as she considers appropriate.
B EFFECTIVENESS
1 The Composition of the BoardThe board and its committees should have the appropriate balance of skills, experience, independence and knowledge of the company to enable them to discharge their respective duties and responsibilities effectively.
The Board consists of the Executive Chairman and Chief Financial Officer plus, currently, five Non-Executive Directors. All of the Non-Executive Directors are considered by the Board to be independent of the management of the Company and free from any business or other relationship which could materially interfere with the exercise of their independent judgement. The Directors have a combination of business and educational expertise which is suited to the nature of the Company.
2 Appointments to the BoardThere should be a formal, rigorous and transparent procedure for the appointment of new directors to the board.
A separate Nominations Committee comprised of all of the Non-Executive Directors and the Executive Chairman, is responsible for identifying and nominating candidates to fill Board vacancies.
The Board is committed to the changes to the UK Corporate Governance Code 2010 in relation to board diversity announced by the Financial Reporting Council in October 2011. These changes do not apply until the next financial year. The Board intends to set measureable objectives and monitor progress on diversity (including gender).
3 CommitmentAll directors should be able to allocate sufficient time to the company to discharge their reponsibilities effectively.
The Board ensures that on appointment and thereafter all Directors have sufficient time to carry out their duties.
Corporate Governance Report continued

stock code: RM.RM plc Annual Report 2011 19www.rmeducation.com
21269-04 28/01/2012 Proof 1
Busi
nes
s Re
view
Go
veRn
an
ceFi
na
nci
al
stat
emen
tsBu
sin
ess
Revi
ewG
ove
Rna
nce
Fin
an
cia
l st
atem
ents
Code of Best Practice – Principles RM Compliance Statement
4 DevelopmentAll directors should receive induction on joining the board and should regularly update and refresh their skills and knowledge.
All Non-Executive Directors receive an induction on joining the Board. All Non-Executive Directors have extensive experience and possess relevant and updated skills and knowledge to perform their duties.
5 Information and SupportThe board should be supplied in a timely manor with information in a form and of a quality appropriate to enable it to discharge its duties.
The Board is supplied with management accounts and detailed operational reviews prior to each meeting.
All Directors have access to the advice and services of the Company Secretary or suitably qualified alternative, and all the Directors are able to take independent professional advice, if necessary, at the Company’s expense.
6 EvaluationThe board should undertake a formal and rigorous evaluation of its own performance and that of its committees and individual directors.
Evaluation is an ongoing process. A performance evaluation is undertaken for all Directors from time to time. The Chief Financial Officer receives an annual performance appraisal as part of the Senior Management Bonus Scheme. The performace of each Board Committee is reviewed on an annual basis. The performance of the Executive Chairman is assessed by the Non-Executive Directors led by the Senior Independent Director. The performance of the Chief Financial Officer is assessed by the Executive Chairman.
7 Re-electionAll directors should be submitted for re-election at regular intervals, subject to continued satisfactory performance.
Non-Executive Directors are appointed for specific terms subject to annual re-election.
C ACCOUNTABILITY
1 Financial and Business ReportingThe board should present a balanced and understandable assessment of the company’s position and prospects.
In preparing the annual report to shareholders the Directors seek to present a summarised but balanced and easily understood assessment of the Group’s performance and provide guidance on its future prospects.
2 Risk Management and Internal ControlThe board is responsible for determining the nature and extent of the significant risks it is willing to take in achieving its strategic objectives. The board should maintain sound risk management and internal control systems.
The Company operates a risk management and internal control process which is reviewed at least on an annual basis by the Audit Committee and endorsed by the Board.
3 Audit Committee and AuditorThe board should establish formal and transparent arrangements for considering how they should apply the corporate reporting and risk management and internal control principles and for maintaining an appropriate relationship with the company’s auditor.
Effective October 2011 the Audit Committee is comprised of Non-Executive Directors and meets at least three times a year. The Executive Chairman and Chief Financial Officer are invited to attend. The Audit Committee meets separately with the Company’s auditor without the other Directors present. Further details are set out in the Audit Committee Report.

stock code: RM.RM plc Annual Report 201120
21269-04 28/01/2012 Proof 1
GOVERNANCE
Code of Best Practice – Principles RM Compliance Statement
D REMUNERATION
1 The Level and Components of RemunerationLevels of remuneration should be sufficient to attract, retain and motivate directors of the quality required to run the company successfully, but a company should avoid paying more than is necessary for this purpose. A significant proportion of executive directors’ remuneration should be structured so as to link rewards to corporate and individual performance.
The Chief Financial Officer’s remuneration consists of basic salary and a variable annual bonus. Basic salaries are reviewed annually in the light of individual performance and market comparisons for similar jobs. Annual bonus may be paid, at the sole discretion of the Remuneration Committee, at a target level of up to 50% with an overall cap of 100% of basic salary. The annual bonus payment is determined on the basis of individual and Company performance. In addition there are long term incentive schemes in place as detailed in the Remuneration Report. These long term incentive schemes include the Performance Share Plan and Share Option Plans.
The remuneration of the Executive Chairman’s comprises a base salary and share options only. His remuneration is reviewed annually by the Remuneration Committee in light of performance and market comparisons. The Executive Chairman does not receive any other benefits or participate in the annual bonus scheme. Any bonus is entirely at the discretion of the Remuneration Committee and would only apply in exceptional circumstances. The Executive Chairman was granted share options as set out in the Report of the Directors.
As at 30 November 2011 the Chief Financial Officer did not hold Non-Executive positions with other companies for which he receives remuneration.
2 ProcedureThere should be a formal and transparent procedure for developing policy on executive remuneration and for fixing the remuneration packages of individual directors. No director should be involved in deciding his or her own remuneration.
Remuneration packages for individual Directors are set by the Remuneration Committee after, if required, receiving information from independent sources and the Company’s Human Resources function. The Executive Chairman and Chief Financial Officer may be invited to attend the Committee’s meetings.
E RELATIONS WITH SHAREHOLDERS
1 Dialogue with ShareholdersThere should be a dialogue with shareholders based on the mutual understanding of objectives. The board as a whole has responsibility for ensuring that a satisfactory dialogue with shareholders takes place.
The Executive Directors meet on a regular basis with the Company’s major shareholders. Non-Executive Directors are available to meet institutional shareholders on an ad hoc basis.
Corporate Governance Report continued

stock code: RM.RM plc Annual Report 2011 21www.rmeducation.com
21269-04 28/01/2012 Proof 1
Busi
nes
s Re
view
Go
veRn
an
ceFi
na
nci
al
stat
emen
tsBu
sin
ess
Revi
ewG
ove
Rna
nce
Fin
an
cia
l st
atem
ents
Code of Best Practice – Principles RM Compliance Statement 2 Constructive Use of the AGM
The board should use the annual general meeting to communicate with investors and to encourage their participation.
All Directors make themselves available at the annual general meeting to respond to any questions raised by the investors in attendance.
Board of DirectorsThe Board of Directors meets regularly to review strategic, operational and financial matters, including proposed acquisitions and divestments, and has a formal schedule of matters reserved to it for decision. It approves the interim and annual financial statements, the annual financial plan, significant contracts and capital investment in addition to reviewing the effectiveness of the internal control systems and business risks faced by the Group. Where appropriate, it has delegated authority to committees of Directors.
Board CommitteesThere are four Board committees: Audit, Remuneration, Nominations and Transactions; each of which, apart from the Nominations Committee and Transactions Committee, comprises only Non-Executive Directors.
During the period, the Audit Committee was chaired by Sir Bryan Carsberg and was comprised solely of independent Non-Executive Directors. From 1 October 2011 all Non-Executive Directors were appointed to the Audit Committee. The Audit Committee meets at least three times a year. The Company’s external auditor, the Executive Chairman, Chief Financial Officer, Group Financial Controller and the Head of Internal Audit normally attend part of these meetings. The Audit Committee is responsible for reviewing the accounting policies, internal control assessment and the financial information contained in the annual and interim reports. It provides an opportunity for the Non-Executive Directors to make independent judgements and contributions thus furthering the effectiveness of RM’s internal financial controls. Further details of the Audit Committee’s activities are given in the Audit Committee Report. The terms of reference for the Audit Committee are published on www.rmeducation.com.
During the period the Remuneration Committee was chaired by Sir Mike Tomlinson and comprised solely independent Non-Executive Directors. From 1 October 2011 all Non-Executive Directors were appointed to the Remuneration Committee. The Remuneration Committee meets at least four times a year. Executive Directors and senior managers may be invited to attend Committee meetings, but will not be present during any discussion of their own pay arrangements. The Remuneration Committee sets the remuneration of the Executive Directors and senior management. It also considers grants and performance conditions under RM’s share-based payment schemes and reviews RM’s employment strategy generally. Further details of the Remuneration Committee’s activities are given in the Remuneration Report. The terms of reference for the Remuneration Committee are published on www.rmeducation.com.
The Nominations Committee is chaired by the Chairman and included all of the independent Non-Executive Directors. The Nominations Committee recommends to the Board candidates for appointment as Directors. It meets at least once a year, with more frequent meetings when the Group is actively selecting Directors. The terms of reference for the Nominations Committee are published on www.rmeducation.com
During the period, the Transactions Committee was chaired by the Executive Chairman plus any one independent Non-Executive Director and any one Executive Director. The Transactions Committee meets at such times as the Chairman of the Committee requires. The Transactions Committee approves, enters into and authorises the execution of all deeds and documents and does everything that is necessary to give effect to any ‘substantial transaction’ that has already been approved in principle by the Board. The terms of reference for the Transactions Committee are published on www.rmeducation.com.

stock code: RM.RM plc Annual Report 201122
21269-04 28/01/2012 Proof 1
GOVERNANCE
Board AttendanceDetails of the number of normal meetings of the Board, including sub-committees and individual attendances by Directors are set out in the table below.
BoardMeetings
AuditCommittee
RemunerationCommittee
NominationCommittee
Number of Meetings held in the Period 13 4 5 2 Lord Andrew Adonis 2*1 - 1*1 - Professor Sir TimBrighouse 10*2 - - 2 Sir Bryan Carsberg 13 4 5 2 Jo Connell 13 4 5 2 John Leighfield 7*3 2*7 2*7 1*3 Deena Mattar 6*4 1*4 3*4 1*4 Iain McIntosh 13 4*7 3*7 - Martyn Ratcliffe 6*4 1*4*7 3*4*7 1*4 Rob Sirs 12 - 1*7 - Terry Sweeney 12*6 - 4*6*7 -
Sir Mike Tomlinson 13 - 5 2 John Windeler 11*5 2*5 2*5 2*5 *1 Appointed 1 October 2011
*2 Retired 30 November 2011
*3 Retired 31 May 2011
*4 Appointed 1 June 2011
*5 Retired 1 October 2011
*6 Resigned by mutual agreement on 24 October 2011
*7 Attendance by invitation
Rob Sirs resigned as a Director for personal reasons on 31 January 2012.
The above table details attendance at scheduled meetings. In addition ten ad hoc meetings were held.
Operating BoardThe Operating Board was introduced in January 2012. It is chaired by the Executive Chairman and also comprises the Chief Financial Officer and other senior managers within the Group. The Operating Board normally meets on a monthly basis to discuss policy and operational issues. Those issues outside the delegated authority levels are referred to the Group Board for its decision. All Non-Executive Directors are invited to attend the Operating Board.
Relations with ShareholdersIn order to maintain dialogue with institutional shareholders the Executive Directors meet with them following interim and final results announcements, or as appropriate, with other Directors available to meet institutional shareholders on request. Where practicable the Annual Report is sent to shareholders at least 20 working days before the annual general meeting and each issue for consideration at the annual general meeting is proposed as a separate resolution. All Directors generally attend the annual general meeting.
Social, Ethical and Environmental RisksThe Board takes regular account of the significance of social, environmental and ethical (“SEE”) matters to the Group’s business of providing IT services and solutions (including software, managed services and consultancy) to educational institutions.
The Board considers that it has received adequate information to enable it to assess any significant risks to the Company’s short and long-term value arising from SEE matters and has concluded that the risks associated with SEE matters are minimal. The Board will continue to monitor those risks on an ongoing basis and will implement appropriate policies and procedures if those risks become significant.
Internal ControlThe Group maintains an ongoing process in respect of internal control to safeguard the shareholders’ investment and the Group’s assets and to facilitate the effective and efficient operation of the Group.
These processes enable the Group to respond appropriately, and in a timely fashion, to significant business, operational, financial, compliance and other risks, in line with the UK Corporate Governance Code 2010, which may otherwise prevent the achievement of the Group’s objectives.
The Group recognises that it operates in a highly competitive market that can be affected by factors and events outside its control. Details of the risks faced by the Group are set out in the table in the Report of the Directors. It is committed to minimising risks arising wherever possible and accepts that internal controls, rigorously applied and monitored, are an essential tool in achieving this objective.
Corporate Governance Report continued

stock code: RM.RM plc Annual Report 2011 23www.rmeducation.com
21269-04 28/01/2012 Proof 1
Busi
nes
s Re
view
Go
veRn
an
ceFi
na
nci
al
stat
emen
tsBu
sin
ess
Revi
ewG
ove
Rna
nce
Fin
an
cia
l st
atem
ents
The key elements of Group internal control, which have been effective during 2011 and up to the date of approval of these financial statements, are set out below:
zz the existence of a clear organisational structure with defined lines of responsibility and delegation of authority from the Board to its Executive Directors and operating divisions;
zz a procedure for the regular review of reporting business issues and risks by operating divisions;
zz regular review meetings with the operating management;zz a planning and management reporting system operated by
each division and the Executive Directors; andzz the establishment of prudent operating and financial policies.
The Directors have overall responsibility for establishing financial and other reporting procedures to provide them with a reasonable basis on which to make proper judgements as to the financial position and prospects of the Group, and have responsibility for establishing the Group’s system of internal control and for monitoring its effectiveness. The Group’s systems are designed to provide Directors with reasonable assurance that physical and financial assets are safeguarded, transactions are authorised and properly recorded and material errors and irregularities are either prevented or detected with the minimum delay. However, systems of internal financial control can provide only reasonable and not absolute assurance against material misstatement or loss.
The key features of the systems of internal financial control include:
zz a financial planning process with an annual financial plan approved by the Board. The plan is regularly updated providing an updated forecast for the year;
zz monthly comparison of actual results against plan;zz written procedures detailing operational and financial internal
control policies which are reviewed on a regular basis;zz regular reporting to the Board on treasury and legal matters;zz defined investment control guidelines and procedures; andzz periodic reviews by the Audit Committee of the Group’s
systems and procedures.
The majority of the Group’s financial and management information is processed and stored on computer systems. The Group is dependent on systems that require sophisticated computer networks. The Group has established controls and procedures over the security of data held on such systems, including business continuity arrangements.
On behalf of the Board, the Audit Committee has reviewed the operation and effectiveness of this framework of internal control for the period, and up to the date of approval of the Annual Report.

stock code: RM.RM plc Annual Report 201124
21269-04 28/01/2012 Proof 1
GOVERNANCE
The Audit Committee operates under terms of reference approved by the Board, with the purposes of:
zz appointing the Group’s internal and external auditors;zz reviewing the performance of and relationship with the
Group’s external auditor (including considering fee levels and the provision of non-audit work);
zz reviewing the performance of the Group’s internal audit function;
zz reviewing the Group’s financial reporting and internal control processes;
zz monitoring the integrity of the Group’s financial statements and announcements regarding performance; and
zz ensuring that a system is operated for the assessment and management of key risks.
Composition and qualifications of the Audit CommitteeDuring the period the Audit Committee comprised Sir Bryan Carsberg MSc(Econ), FCA (Chair), John Windeler (until 1 October 2011), Jo Connell, Deena Mattar BSc (Econ), FCA (from 1 June 2011), Sir Mike Tomlinson (from 1 October 2011) and Lord Andrew Adonis (from 1 October 2011) all of whom are independent Non-Executive Directors. The Group considers that Sir Bryan Carsberg, as a previous Secretary General of the International Accounting Standards Committee and a former Professor of Accounting and Deena Mattar as an FCA and former FTSE250 Finance Director both have significant recent technical accounting experience. Sir Bryan Carsberg has completed over nine years as a Director and Chair of the Audit Committee and, accordingly, has advised the Board that he does not intend to seek re-election at the next annual general meeting. Deena Mattar is to be appointed Chair of the Audit Committee following the annual general meeting.
John Leighfield (Chairman until 24 May 2011), Martyn Ratcliffe (Chairman from 1 June 2011), Iain McIntosh MA, FCA, Douglas Muir BSc, FCA (Group Financial Controller) and Edward Warwick MEng, ACA (Head of Internal Audit) are invited to attend Audit Committee meetings.
Schedule of meetingsThe Audit Committee met four times during the period. Three of these meetings were part of the regular schedule of meetings set out in the Committee’s terms of reference.
Audit Committee meetings have formal agendas, which cover all of the areas of responsibility set out in the Committee’s terms of reference. These agendas include meetings with the external
auditor without Executive Directors or managers of the Company present.
Appointment of external auditorThe Audit Committee recommended, and shareholders approved at the Group’s AGM on 17 January 2011, the reappointment of Deloitte LLP as the Group’s external auditor. During the subsequent period the Audit Committee conducted a market tender for the provision of external audit services to the Group. Following this process on 17 March 2011 the Committee resolved to appoint KPMG Audit Plc as Group external auditor. A resolution proposing that KPMG Audit Plc be reappointed as auditor of the Company will be proposed at the next AGM.
There are no contractual obligations restricting the Group’s choice of external auditor.
Oversight of external auditThe Audit Committee has reviewed the scope and results of the audit services, and the cost effectiveness and independence and objectivity of the external auditor.
Internal auditThe Audit Committee has approved the appointment of RM’s Group Chief Accountant Edward Warwick MEng, ACA as Head of Internal Audit. For the purposes of this role, the Group Chief Accountant reports directly to the Chair of the Audit Committee. The Audit Committee, with the advice and support of the Head of Internal Audit, sets an internal audit plan. The Head of Internal Audit reports on progress against this plan at Audit Committee meetings.
Policy on non-audit workThe Audit Committee has considered the issue of the provision of non-audit work by the external auditor and, in March 2003, has agreed a policy intended to ensure that the objectivity of the external auditor is not compromised. The policy sets a limit for fees for non-audit work and states that non-audit work should only be undertaken by the external auditor where there is a clear commercial benefit in doing so. Any significant activity must be approved, in advance, by at least two Audit Committee Members.
The Audit Committee has revised the policy to include a cap on fees for non-audit work of 25% of the annual audit fee. This fee incorporates a review of the Group’s interim results and the provision of an opinion on compliance with banking covenants.
Audit Committee Report

stock code: RM.RM plc Annual Report 2011 25www.rmeducation.com
21269-04 28/01/2012 Proof 1
Busi
nes
s Re
view
Go
veRn
an
ceFi
na
nci
al
stat
emen
tsBu
sin
ess
Revi
ewG
ove
Rna
nce
Fin
an
cia
l st
atem
ents
In light of the appointment of KPMG Audit Plc as external auditor during the period the Committee reviewed the existing non-audit services being provided by KPMG Audit Plc, including pensions advisory services. The Committee approved the exceeding of the cap of 25% on non-audit work as a consequence of these ongoing relationships. This target has therefore been revised to exclude pensions advisory work from the 25% cap as the Committee believes the value of continuity of pension advice currently exceeds the benefits of keeping within the 25% cap. Fees for non-audit work in the year period were 48% of the annual audit fee.
Internal controlControl environment – The Board has put in place an organisational structure with clearly defined lines of responsibility and delegation of authority to Executive management. Individuals are formally made aware of their level of authority and their budgetary responsibility which enables them to identify and monitor financial performance. There are established policies and procedures, which are subject to regular review. The Boards of the operating companies work within strict terms of reference and any matters outside those terms or the agreed business plan are referred to the Group Board for approval. The Group’s selection and recruitment procedures are set to exacting criteria and the performance management process is supportive of these same criteria.
Identification and evaluation of business risks and control objectives – The Board has the primary responsibility for identifying the principal business risks facing the Group and developing appropriate policies to manage those risks. It delegates responsibility for operational risks to the Group Operating Board which meets monthly.
Management Information – Executive managers are required to produce a business plan for approval at the beginning of each financial year and detailed financial forecasts are formally compiled quarterly and reviewed by the Board. Consolidated management accounts are produced each month and results measured against plan and previous year to identify any significant variations.
Main control procedures – The financial systems and procedures established lead the Board to a high level of confidence in the completeness and accuracy of the recording of financial transactions. The well established processes in place and the level of analytical detail given within the management accounts facilitate the identification of unreliable data. The Group’s treasury activities are operated within a defined policy designed to control the Group’s cash and to minimise its exposure to foreign exchange risk.
Monitoring – The Audit Committee meets periodically to review reports from management and the external auditor so as to derive reasonable assurance on behalf of the Board that financial control procedures are in place and operate effectively. An internal audit function reports directly to the Audit Committee and has annual plans agreed by the Audit Committee.
‘Whistle blowing’ policyThe Group has adopted a formal ‘whistle blowing’ policy, which allows staff to raise concerns about possible improprieties. No concerns were raised during the year.
Anti-BriberyRM conducts all its business in an honest and ethical manner and seeks to ensure that all associates and business partners do the same.
The Bribery Act 2010 sets clear standards of behaviour, which govern our operations. We have implemented robust policies and procedures to ensure we are transparent and ethical in all our business dealings. We have an anti-corruption and anti-bribery policy which sets out the legal standards we enforce as part of our ongoing commitment to implement adequate procedures to guard against illegal practices.
Statement of risksAs with any business, RM is exposed to risks as an inherent part of creating value for shareholders. As described above, the Group has put in place processes designed to identify these principal risks and to manage and mitigate the effect of them. The Audit Committee is responsible for ensuring that risks are properly considered and the Board is responsible for deciding what risks should be taken and how best to manage and mitigate the risks.
The Audit Committee is satisfied that the Group’s risk management and internal control processes provide a high level of confidence that Executive management has identified and addressed the principal risks affecting RM.
The most significant risks the Group is exposed to are set out in the Report of the Directors.
Sir Bryan CarsbergChairman, Audit Committee6 February 2012

stock code: RM.RM plc Annual Report 201126
21269-04 28/01/2012 Proof 1
GOVERNANCE
This report by the Remuneration Committee for the 14 months ended 30 November 2011 has been approved by the Board for submission to shareholders for their approval at the forthcoming annual general meeting.
1. Membership of the CommitteeThe membership of the Remuneration Committee during the 14 months ended 30 November 2011 comprised Sir Mike Tomlinson (Chair), Sir Bryan Carsberg, Jo Connell, John Windeler (until 1 October 2011), Deena Mattar (from 1 June 2011) and Lord Andrew Adonis (from 1 October 2011) all of whom are independent Non-Executive Directors.
2. Remuneration PolicyThe Remuneration Committee is responsible for the remuneration of Senior Executives, which term includes Executive Directors.
RM’s remuneration policy is designed to attract, retain and motivate Senior Executives, both to achieve the Group’s business objectives and to deliver outstanding shareholder returns, and alignment of interest between Senior Executives and shareholders. To achieve this, RM’s remuneration policy aims to provide ‘median’ reward compared to RM’s comparator group when acceptable levels of performance have been delivered. For the achievement of outstanding performance, it aims to deliver ‘upper quartile’ remuneration compared to the comparator group. The maximum incentive awards are made only when improved business performance, customer satisfaction and superior shareholder returns have been realised.
Under these arrangements, the package is designed to be focused on performance. In the event that the Group has not met the targets set none of the variable elements are earned. If outstanding performance is achieved, the value of the total package could double in comparison with an on-target performance. These increases are derived entirely from the incentive arrangements so that Senior Executives have the opportunity to earn high levels of reward, but only if they enhance shareholder returns by meeting the Group’s short-term and long-term targets. The remuneration policy therefore seeks to ensure that the Senior Executives are focused on the achievement of key Company objectives as well as developing a significant shareholding. The Remuneration Committee is satisfied that this model provides appropriate alignment with Group performance and shareholder returns and therefore acts as a real motivator to the Senior Executives.
The Remuneration Committee has reviewed the level of risk inherent in the remuneration policy and is satisfied that there is an appropriate balance between encouraging entrepreneurial behaviour from Senior Executives, whilst at the same time ensuring that there are no areas of the policy which encourage undue risk taking. In relation to the target setting process and other matters arising in relation to the operation of the annual bonus and long-term incentive plans, the Remuneration Committee keeps in mind that the structure should not encourage excessive risk taking.
The remuneration of the Executive Chairman comprises a base salary and share options only. The Executive Chairman does not receive any other benefits or participate in the annual bonus scheme. Any bonus payable is entirely at the discretion of the Remuneration Committee and would only apply in exceptional circumstances. The Executive Chairman waived all remuneration from his appointment on 1 June 2011 until 30 November 2011.
3. Components of Remuneration for Executive Directorsa) Base salariesThe policy of the Remuneration Committee is that base salary is only one element of the entire package and should be considered within this context. The leverage and alignment (with the strategy and investors’ interests) of the package comes entirely from the bonus and long-term incentives. The Remuneration Committee aims to set base salaries at median in the market to achieve the desired leverage.
b) Annual bonusThe annual bonus potential is up to 100% of base salary.
The bonus payment made to the Senior Executives depends on the performance conditions, set by the Remuneration Committee at the beginning of the year, being met. The performance targets reflect the factors that we believe to be critical to RM’s business success and the Remuneration Committee is satisfied that the targets set are stretching and aligned with shareholders’ interests.
Bonus outcomes for 2011As relevant Group performance bonus targets were not met, no Executive Director received any bonus in respect of their 2011 performance. Personal bonus entitlements were waived.
Remuneration Report

stock code: RM.RM plc Annual Report 2011 27www.rmeducation.com
21269-04 28/01/2012 Proof 1
Busi
nes
s Re
view
Go
veRn
an
ceFi
na
nci
al
stat
emen
tsBu
sin
ess
Revi
ewG
ove
Rna
nce
Fin
an
cia
l st
atem
ents
c) Long-term incentivesThe RM plc Performance Share Plan (PSP) provides a competitive long-term incentive which will target exceptional improvement in returns to shareholders. Senior Executives may receive an award of shares worth up to 120%, or even up to 150% in exceptional circumstances, of salary in any one year, which will vest subject to performance at the end of three years.
d) BenefitsBenefits comprise principally of the provision of a company car and fuel allowance, pension and private health insurance.
The Executive Chairman is not eligible for any of these benefits.
4. Directors’ Service Contracts and Letters of AppointmentThe Remuneration Committee’s policy on Executive Directors’ service contracts is for them to contain a maximum notice period of one year. Each service contract expires at the respective normal retirement date of the Executive Director, but is subject to earlier termination for cause or if notice is given under the contract. The contracts are designed to allow for flexibility to deal with each case on its own particular merits in accordance with the law and policy as they have developed at the relevant time. In the event that the Company wishes to terminate the employment of an Executive Director, it will take into account the Executive Director’s obligations to mitigate their own losses when deciding on an appropriate level of compensation.
Details of the Directors’ service contracts and/or letters of appointment who served for all or part of the 14 months ended 30 November 2011 are shown in the table below:
Initial agreementdate
Expiry date ofcurrent agreement
Notice tobe given by
employer
Notice tobe given by
individualCurrent Directors*Lord Andrew Adonis 1 October 2011 30 September 2014 3 months 3 monthsSir Bryan Carsberg§ 1 September 2002 1 September 2014 3 months 3 monthsJo Connell 20 December 2007 20 December 2013 3 months 3 monthsIain McIntosh 22 October 2009 Indefinite 12 months 12 monthsDeena Mattar 1 June 2011 31 May 2014 3 months 3 monthsMartyn Ratcliffe** 1 June 2011 Indefinite 6 months 6 monthsSir Mike Tomlinson 2 February 2004 28 January 2013 3 months 3 monthsPast Directors*Sir Tim Brighouse 20 May 2004 1 February 2013 3 months 3 monthsJohn Leighfield 3 November 1993 31 May 2011 3 months 3 monthsRob Sirs 13 February 2002 Indefinite 12 months 6 monthsTerry Sweeney 11 August 2008 Indefinite 12 months 6 monthsJohn Windeler 1 October 2002 1 October 2011 3 months 3 months
* As at the date of this Report.** On 24 October 2011 Mr Ratcliffe was appointed Executive Chairman.§ Sir Bryan Carsberg has indicated he will not seek re-election at the annual general meeting in March 2012.

stock code: RM.RM plc Annual Report 201128
21269-04 28/01/2012 Proof 1
GOVERNANCE
Audited Information5. Directors’ RemunerationThe total amounts for Directors’ remuneration and other benefits were as follows:
14 months to 30 November
2011£’000
12 months to 30 September
2010£’000
Emoluments 1,546 1,415Gains on exercise of share options 10 211Amounts receivable under long-term incentive schemes 60 128
1,616 1,754
Directors’ emoluments in respect of the Directors of the Company who served during the 14 months ended 30 November 2011 were as follows:
Name
Salariesandfees
£’000
Taxablebenefits
£’000
Annualbonuses
£’000
Terminationpayments
£’000
14 months to 30 November
2011Total
£’000
12 months to 30 September
2010Total
£’000
ExecutiveMike Greig (until 31/03/10) – – – – – 99Iain McIntosh (from 01/04/10) 227 13 – – 240 165Martyn Ratcliffe (from 01/06/11) – – – – – –Rob Sirs 275 13 – – 288 389Terry Sweeney (until 24/10/11) 336 13 – 365 714 470
Non-ExecutiveLord Andrew Adonis (from 01/10/11) 6 – – – 6 –Sir Tim Brighouse (until 30/11/11) 39 – – – 39 33Sir Bryan Carsberg 50 – – – 50 43Jo Connell 43 – – – 43 36John Leighfield (until 31/05/11) 52 18 – – 70 104Deena Mattar (from 01/06/11) 17 – – – 17 –Sir Mike Tomlinson 45 – – – 45 42John Windeler (until 01/10/11) 34 – – – 34 34
1,124 57 – 365 1,546 1,415
Martyn Ratcliffe waived his salary entitlement of £125,000 for the period from 1 June 2011 to 30 November 2011.
Terry Sweeney, Iain McIntosh and Rob Sirs waived their right to any entitlement linked to the achievement of personal objectives. The on-target bonus payable if all personal targets were achieved for each individual would have amounted to £30,500, £21,000 and £25,000 respectively.
The 2010 Remuneration Report stated that Executive Directors salaries would be increased by 2% from 1 November 2010. The Executive Directors serving at the time waived all or part of their entitlements. Iain McIntosh and Rob Sirs agreed to waive all of their entitlement for the period being £3,900 and £4,643 respectively. Iain McIntosh has confirmed that he has waived the increase permanently. Terry Sweeney agreed to waive £2,614 of his entitlement.
Remuneration Report continued
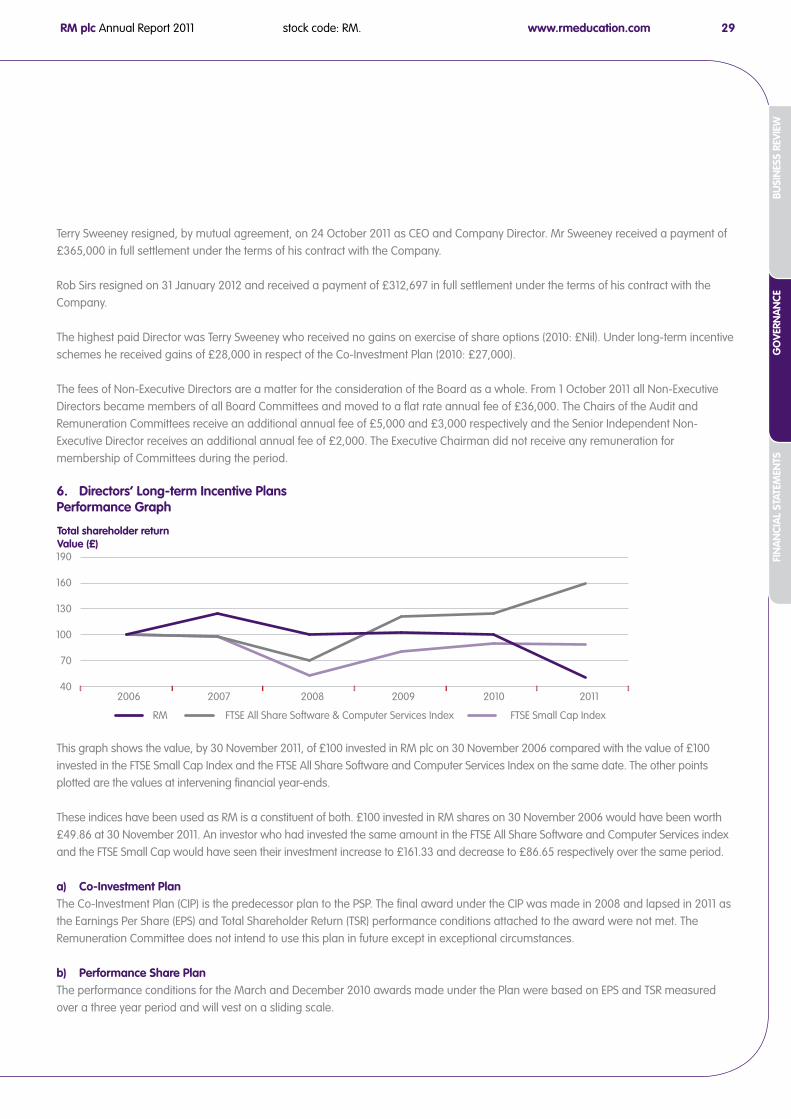
stock code: RM.RM plc Annual Report 2011 29www.rmeducation.com
21269-04 28/01/2012 Proof 1
Busi
nes
s Re
view
Go
veRn
an
ceFi
na
nci
al
stat
emen
tsBu
sin
ess
Revi
ewG
ove
Rna
nce
Fin
an
cia
l st
atem
ents
Terry Sweeney resigned, by mutual agreement, on 24 October 2011 as CEO and Company Director. Mr Sweeney received a payment of £365,000 in full settlement under the terms of his contract with the Company.
Rob Sirs resigned on 31 January 2012 and received a payment of £312,697 in full settlement under the terms of his contract with the Company.
The highest paid Director was Terry Sweeney who received no gains on exercise of share options (2010: £Nil). Under long-term incentive schemes he received gains of £28,000 in respect of the Co-Investment Plan (2010: £27,000).
The fees of Non-Executive Directors are a matter for the consideration of the Board as a whole. From 1 October 2011 all Non-Executive Directors became members of all Board Committees and moved to a flat rate annual fee of £36,000. The Chairs of the Audit and Remuneration Committees receive an additional annual fee of £5,000 and £3,000 respectively and the Senior Independent Non-Executive Director receives an additional annual fee of £2,000. The Executive Chairman did not receive any remuneration for membership of Committees during the period.
6. Directors’ Long-term Incentive PlansPerformance Graph
This graph shows the value, by 30 November 2011, of £100 invested in RM plc on 30 November 2006 compared with the value of £100 invested in the FTSE Small Cap Index and the FTSE All Share Software and Computer Services Index on the same date. The other points plotted are the values at intervening financial year-ends.
These indices have been used as RM is a constituent of both. £100 invested in RM shares on 30 November 2006 would have been worth £49.86 at 30 November 2011. An investor who had invested the same amount in the FTSE All Share Software and Computer Services index and the FTSE Small Cap would have seen their investment increase to £161.33 and decrease to £86.65 respectively over the same period.
a) Co-Investment PlanThe Co-Investment Plan (CIP) is the predecessor plan to the PSP. The final award under the CIP was made in 2008 and lapsed in 2011 as the Earnings Per Share (EPS) and Total Shareholder Return (TSR) performance conditions attached to the award were not met. The Remuneration Committee does not intend to use this plan in future except in exceptional circumstances.
b) Performance Share PlanThe performance conditions for the March and December 2010 awards made under the Plan were based on EPS and TSR measured over a three year period and will vest on a sliding scale.
40
70
100
130
160
190
2006 2007 2008 2009 2010 2011
RM FTSE Small Cap IndexFTSE All Share Software & Computer Services Index
Total shareholder returnValue (£)

stock code: RM.RM plc Annual Report 201130
21269-04 28/01/2012 Proof 1
GOVERNANCE
March 2010EPS TSR
Annualcompound growth
Proportion ofaward vesting
Position relative toFTSE Small Cap
Proportion ofaward vesting
Less than RPI + 3% Nil Below median NilThreshold RPI + 3% 12.5% At median 12.5%
Maximum RPI + 8.5% 50% Upper quartile 50%
December 2010
EPS TSR
Less than 17.5p
Proportion ofaward vesting
Nil
Position relative toFTSE Small CapBelow median
Proportion ofaward vesting
NilThreshold 17.5p 25% At median 25%
Maximum Between 17.5p and 20p 25% to 100%Between median and
upper quartile 25% to 100%
At the time of these awards the Remuneration Committee considered that the mix of EPS and TSR performance conditions remained appropriate measures for the following reasons:
zz The TSR condition provided a balance to the EPS condition by rewarding relative share price performance and ensured that there was a share price based discipline in the package
zz The EPS target rewards sustained increases in earnings and profitability
For the TSR performance condition the TSR comparator group remained the FTSE Small Cap index as at the date of grant.
The Remuneration Committee considered carefully the EPS range to be attached to awards, taking account of the Government Spending Review and based on analyst forecasts available at the time. The Remuneration Committee considered that the range was equivalently demanding to the EPS growth range set in previous years.
December 2011The performance conditions for the December 2011 award made to other Senior Executives (including the Chief Financial Officer but excluding the Executive Chairman) under the PSP were based on share price, namely 50% of the shares awarded will vest if the share price is £1.00 or better for 20 consecutive trading days at any point between the date of grant and 30 November 2015. A further 50% of the shares awarded will vest if the share price is £1.25 or higher for 20 consecutive trading days at any point between the date of grant and 30 November 2016. No award can vest before 2 December 2014. If either or both performance conditions are met before that date, then vesting shall take place on 2 December 2014. If either or both performance conditions are met after 2 December 2014 but before 1 December 2016, then vesting shall take place within 90 days of the performance condition being achieved at the absolute discretion of the Board.
The Remuneration Committee considers that the share price targets are appropriate measures and are clearly in shareholders’ interests for the following reasons:
zz For the first 50% of shares to vest an increase of 36% in the value of the share price from the date of grant is requiredzz For the second 50% of shares to vest an increase of 70% in the value of the share price from the date of grant is required
Remuneration Report continued

stock code: RM.RM plc Annual Report 2011 31www.rmeducation.com
21269-04 28/01/2012 Proof 1
Busi
nes
s Re
view
Go
veRn
an
ceFi
na
nci
al
stat
emen
tsBu
sin
ess
Revi
ewG
ove
Rna
nce
Fin
an
cia
l st
atem
ents
c) Deferred Bonus PlanUnder this plan 40% of any annual cash bonus payable to the Senior Executives was deferred in ordinary shares for a period of three years and vested at the expiry of the same period. If a Senior Executive ceases to be an employee of the Group and is deemed not to be a ‘good leaver’ under the rules of this Plan then any shares held will lapse on the leave date. Following a review by the Remuneration Committee during the year it was decided to make no further awards under this plan.
Terry Sweeney and Rob Sirs were good leavers in accordance with the rules.
d) Audited InformationThe Directors’ interests in the Co-Investment Plan, Performance Share Plan and Deferred Bonus Plan are listed below:
Co-Investment Plan
Dateof award
Maximumnumber ofmatching
shares*at 01/10/10
Marketprice on
awarddate
Performanceperiod formatching
shares
Numberof
matchingshares
releasedRelease
date
Marketprice onrelease
date
Maximumnumber ofmatching
shares*at 30/11/11
Rob Sirs14/12/07 103,950 200p 01/10/07 – 30/09/10 20,790 14/12/10 154p –16/12/08 167,229 148p 01/10/08 – 30/09/11 – – – 167,229
Terry Sweeney14/12/07 44,670 200p 01/10/07 – 30/09/10 17,868 14/12/10 154p –16/12/08 126,915 148p 01/10/08 – 30/09/11 – – – 126,915*The number of matching shares is the maximum (a match of 3 for 1) that could be received by the Executive Director if performance conditions are fully met.
Awards made in December 2008 lapsed during the year as described earlier in the Report.
Performance Share Plan
Dateof award
Maximumnumber of
awardedshares*
at 01/10/10
Marketprice on
awarddate
Performanceperiod forawarded
shares
Numberof
awardedshares
releasedRelease
date
Marketprice onrelease
date
Maximumnumber of
awardedshares*
at 30/11/11Iain McIntosh04/03/10 140,349 171p 01/10/09 – 30/09/12 – – – 140,34910/12/10 – 151p 01/10/10 – 30/11/13 – – – 139,072
Rob Sirs04/03/10 154,020 171p 01/10/09 – 30/09/12 – – – 154,02010/12/10 – 151p 01/10/10 – 30/11/13 – – – 165,562
Terry Sweeney*04/03/10 195,904 171p 01/10/09 – 30/09/12 – – – 114,27710/12/10 – 151p 01/10/10 – 30/11/13 – – – 63,785*Following Terry Sweeney’s resignation by mutual agreement the maximum number of awarded shares was reduced on a pro-rated basis.

stock code: RM.RM plc Annual Report 201132
21269-04 28/01/2012 Proof 1
GOVERNANCE
Deferred Bonus Plan
Dateof award
Totalshares
deferredat 01/10/10
Marketprice on
awarddate
Deferredperiod for
shares
Numberof
deferredshares
releasedRelease
date
Marketprice onrelease
date
Totalshares
deferredat 30/11/11
Iain McIntosh15/12/10 - 160p 01/10/10 – 30/09/13 – – – 25,151
Rob Sirs14/12/07 28,961 201p 01/10/07 – 30/09/10 28,961 15/12/10 154p –16/12/08 33,211 147p 01/10/08 – 30/09/11 33,21115/12/09 28,737 159p 01/10/09 – 30/09/12 – – – 28,73715/12/10 - 160p 01/10/10 – 30/09/13 – – – 36,567
Terry Sweeney15/12/09 35,807 159p 01/10/09 – 30/09/12 35,807 30/11/11 72p –15/12/10 - 160p 01/10/10 – 30/09/13 43,835 30/11/11 72p –
e) On 9 January 2009, Rob Sirs was granted a restricted stock award over 137,363 2p ordinary shares in RM plc. The number of shares awarded was equivalent to 100% of his salary at 182p per share, the closing price on 15 September 2008, the date on which the award was confirmed by the Remuneration Committee. The awarded shares were released on 3 October 2011 with a market price on that date of 72p.
7. Directors’ Share OptionsThe Remuneration Committee has determined that Senior Executives will not be granted share options, except in exceptional circumstances. Senior Executives have been granted options in previous years and an exceptional share option grant was made to the Executive Chairman on 26 October 2011.
a) The Company currently operates two executive share option schemes: the RM plc 2001 Executive Share Option Scheme (2001 Scheme); and the RM plc 2004 Executive Share Option Scheme (2004 Scheme). RM share options are not offered at a discount.
2001 SchemeUnder the 2001 Scheme, options were granted at the market value at the time of grant and were exercisable three years after the date of the grant, provided performance conditions were met. The performance conditions related to the Group’s EPS (set under UKGAAP excluding goodwill and before exceptional charges) growth relative to RPI, with the number of options exercisable varying on a sliding scale depending on the extent to which EPS growth exceeds RPI. The 2001 Scheme had a life of three years, and closed in 2004.
2004 SchemeShareholder approval was obtained in January 2004 for an extension of the 2001 Scheme with a reduced overall dilution limit of 13% (down from 15% in the 2001 Scheme). RM has also committed to keep future years’ annual option grants to less than 1% pa dilution. Maximum grants under the scheme are 200% of basic salary. Neither of these provisions applies to the Executive Chairman’s October 2011 Share Option grant (subject to shareholder approval).
It is intended that the 2004 Scheme will only be used at Director level in exceptional circumstances (for example, appointment of Executive Chairman). There will be no re-testing of performance conditions.
Remuneration Report continued

stock code: RM.RM plc Annual Report 2011 33www.rmeducation.com
21269-04 28/01/2012 Proof 1
Busi
nes
s Re
view
Go
veRn
an
ceFi
na
nci
al
stat
emen
tsBu
sin
ess
Revi
ewG
ove
Rna
nce
Fin
an
cia
l st
atem
ents
Audited Informationb) The Directors’ interests in share options are listed below:
At01/10/10
Grantedin
year
Exercisedin
year
Lapsedin
yearAt
30/11/11Exercise
price
Marketprice atdate of
exercise
Date fromwhich
exercisableExpiry
dateMartyn Ratcliffe– 1,000,000 – – 1,000,000 £0.511 – 26/10/14 26/10/21
Rob Sirs10,350 Nil 10,350 Nil Nil £0.735 £1.655 05/03/05 05/03/1212,000 Nil Nil Nil 12,000 £1.445 – 01/12/06 31/01/13
22,350 Nil 10,350 Nil 12,000
Terry Sweeney100,000 Nil Nil Nil 100,000 £1.973 – 28/11/10 18/11/12
The performance conditions for share options granted to Directors which were unexpired during the year are as follows:
2001 SchemeGrant date Performance condition % of options vesting (with sliding scale)December 2002 3-year growth EPS
RPI + 3% 25%RPI + 22% 100%
December 2003 3-year growth EPSRPI + 7.5% 33%RPI + 17.5% 100%
2004 SchemeGrant date Performance condition % of Options vesting28 November 2007 3-year growth EPS
RPI + 3%*100% (no sliding scale)
26 October 2011** Closing mid-market share price must exceed 100 pence per share, in 20 consecutive trading days, prior to 30 November 2015 and for each two share options awarded Martyn Ratcliffe must have purchased five RM shares prior to 30 November 2012.
On a sliding scale up to 100% depending on the number of shares purchased by Martyn Ratcliffe.
* The gain on the option will be restricted to 2.5 times the exercise price of the option.** Due to the nature of this share option grant and the share purchase matching conditions, the Board intends to request shareholder
approval at the next AGM to exclude this share option grant from the ABI guidelines. Any future share option grants to Martyn Ratcliffe will be subject to specific shareholder approval.
The total number of options currently outstanding is 4,291,417 which represents 4.59% of RM’s shares in issue at 30 November 2011.
stock code: RM.RM plc Annual Report 201134
21269-04 28/01/2012 Proof 1
GOVERNANCE
The gains on exercise of options were as follows:
Rob Sirs £9,520
The market price of the ordinary shares at 30 November 2011 was 72p per share and the range during the period was 41.5p to 178p per share.
8. Directors’ ShareholdingsThe beneficial interests of the Directors in the ordinary shares of RM plc as at 30 November 2011 were:
30 November2011
30 September2010
Lord Andrew Adonis – –Sir Bryan Carsberg – –Jo Connell 35,000 –Iain McIntosh 50,151 –Deena Mattar 20,495 –Martyn Ratcliffe 1,527,267 –Rob Sirs 246,271 180,482Sir Mike Tomlinson – –
No changes to the Directors’ shareholdings or share options took place between 1 December 2011 and the date of this Report.
9. Directors’ Pensionsa) Rob Sirs and Terry Sweeney were active members of the Group’s defined benefit pension scheme, the Research Machines plc 1988 Pension Scheme during the period. This scheme provides a pension of 1/60ths of a member’s final pensionable salary for each year of service, subject to HMRC limits. Only base salary is pensionable.
Normal retirement age is 60 in respect of benefits accrued prior to 1 May 2002. For benefits accrued after 1 May 2002 normal retirement age is 65, but members were able to choose to maintain the normal retirement age at 60 subject to paying a higher rate of contributions:
Member contributions % salaryNormal retirement age
(Pre 1 May 2002 benefits)Normal retirement age
(Post 1 May 2002 benefits)8.3% 60 6514.1% 60 60
Terry Sweeney paid contributions at the higher rate whilst Rob Sirs paid at the lower rate.
The scheme also provides life insurance cover and dependant pensions. Member contributions are notionally held in individual accounts that are increased in line with the fund’s investment returns. Benefits received under the scheme are guaranteed to have a value at least as high as the value of these individual accounts at retirement.
b) Iain McIntosh is a member of the Group’s main UK defined contribution pension scheme.
Remuneration Report continued

stock code: RM.RM plc Annual Report 2011 35www.rmeducation.com
21269-04 28/01/2012 Proof 1
Busi
nes
s Re
view
Go
veRn
an
ceFi
na
nci
al
stat
emen
tsBu
sin
ess
Revi
ewG
ove
Rna
nce
Fin
an
cia
l st
atem
ents
Audited Informationc) The table below shows at the period end; the accrued pension had the Directors left employment at 30 November 2011; the increase in the accrued pension during the period; the increase excluding inflation, and the transfer value of that increase less member contributions and any increase/(decrease) in this value assessed on the transfer value basis of the scheme. Transfer values have been calculated in accordance with the Occupational Pension Schemes (Transfer Value) Regulations 1996.
Rob Sirs(age 50)
£’000
Terry Sweeney(age 44)
£’000Accrued annual pension at 30 September 2010 70 25Increase in accrued pension during the period 5 2
Accrued annual pension at 30 November 2011 75 27
Increase in accrued pension (net of inflation) 1 1
Transfer value of accrued pension at 30 September 2010 1,007 343Increase in transfer value (net of Director’s contributions) 191 100
Transfer value of accrued pension at 30 November 2011 1,198 443
Transfer value of increase (net of inflation and Director’s contributions) 9 11
Terry Sweeney ceased pensionable service under the scheme on 2 June 2011. This has been reflected in his calculations.
Subsequent to 31 January 2012 Rob Sirs ceased pensionable service.
All Executive Directors, except for the Executive Chairman, were members of the SMART Scheme (pension salary sacrifice) and as such did not make employee contributions.
Payments of £54,320 (£36,750 Employers contribution and £17,570 personal contribution under SMART) were paid by the Company to a defined contribution pension scheme, in respect of Iain McIntosh, during the period.
10. Compliance with RegulationsThis Report has been prepared in accordance with Schedule 8 of the Large and Medium-Sized Companies and Group (Accounts and Reports) Regulations 2008. The Report also meets the relevant requirements of the Listing Rules of the UK Listing Authority and illustrates how the principles of the UK Corporate Governance Code relating to Directors’ remuneration are applied by the Company.
The Group’s auditor is required to comment on whether certain parts of the Group’s Remuneration Report have been prepared in accordance with Schedule 8 of the Large and Medium-Sized Companies and Group (Accounts and Reports) Regulations 2008. Accordingly, sections 5, 6(d), 7(b) and 9(c) have been audited by KPMG Audit Plc.

stock code: RM.RM plc Annual Report 201136
21269-04 28/01/2012 Proof 1
GOVERNANCE
11. Remuneration CommitteeThe Remuneration Committee operates under terms of reference approved by the Board with the purposes of determining, on behalf of the Board and shareholders, the fee level for the Executive Chairman and all elements of the remuneration of the Company’s Senior Executives and their direct reports and of overseeing major changes to the overall reward policy structure throughout the Group. In particular, the Committee keeps under review incentive plans operated throughout the Company so as to ensure that these plans are structured appropriately and that the incentive arrangements for all Senior Executives are coherent. The Remuneration Committee’s terms of reference can be found on the Group’s web site at www.rmeducation.com/investors. The Remuneration Committee undertakes an annual appraisal of remuneration policy and addresses any areas that have been highlighted for improvement.
None of the members of the Remuneration Committee has any personal financial interest in the Company other than through fees received or as a shareholder. They are not involved in the day-to-day running of the business and have no personal conflicts of interest which could materially interfere with the exercise of their independent judgement.
As and when required, Hewitt New Bridge Street provided advice on the Executive Directors’ remuneration and information on market practice. They provided no other services to the Company.
The Remuneration Committee believes in dialogue with shareholders on remuneration matters and actively consults with leading shareholders about aspects of the Company’s reward programmes.
By Order of the Board
Sir Mike TomlinsonChair, Remuneration Committee6 February 2012
Remuneration Report continued

stock code: RM.RM plc Annual Report 2011 37www.rmeducation.com
21269-04 28/01/2012 Proof 1
Busi
nes
s Re
view
Go
veRn
an
ceFi
na
nci
al
stat
emen
tsBu
sin
ess
Revi
ewG
ove
Rna
nce
Fin
an
cia
l st
atem
ents

stock code: RM.RM plc Annual Report 201138
21269-04 28/01/2012 Proof 1
RM Plc Annual Report 2011
FINANCIAL STATEMENTS
We have audited the financial statements of RM plc for the 14 months ended 30 November 2011 set out on pages 40 to 102. The financial reporting framework that has been applied in their preparation is applicable law and International Financial Reporting Standards (IFRSs) as adopted by the EU and as regards the parent Company financial statements, as applied in accordance with the provisions of the Companies Act 2006.
This report is made solely to the Company’s members, as a body, in accordance with Chapter 3 of Part 16 of the Companies Act 2006. Our audit work has been undertaken so that we might state to the Company’s members those matters we are required to state to them in an auditor’s report and for no other purpose. To the fullest extent permitted by law, we do not accept or assume responsibility to anyone other than the Company and the Company’s members, as a body, for our audit work, for this report, or for the opinions we have formed.
Respective responsibilities of Directors and auditorAs explained more fully in the Directors’ Responsibilities Statement set out on pages 10 and 11, the Directors are responsible for the preparation of the financial statements and for being satisfied that they give a true and fair view. Our responsibility is to audit, and express an opinion on, the financial statements in accordance with applicable law and International Standards on Auditing (UK and Ireland). Those standards require us to comply with the Auditing Practices Board’s (APB’s) Ethical Standards for Auditors.
Scope of the audit of the financial statementsA description of the scope of an audit of financial statements is provided on the APB’s web site at www.frc.org.uk/apb/private.cfm.
Opinion on financial statementsIn our opinion:
zz the financial statements give a true and fair view of the state of the Group’s and of the parent Company’s affairs as at 30 November 2011 and of the Group’s loss for the 14 month period then ended;
zz the Group financial statements have been properly prepared in accordance with IFRSs as adopted by the EU;
zz the parent Company financial statements have been properly prepared in accordance with IFRSs as adopted by the EU and as applied in accordance with the provisions of the Companies Act 2006; and
zz the financial statements have been prepared in accordance with the requirements of the Companies Act 2006 and, as regards the Group financial statements, Article 4 of the IAS Regulation.
Opinion on other matters prescribed by the Companies Act 2006In our opinion:
zz the part of the Directors’ Remuneration Report to be audited has been properly prepared in accordance with the Companies Act 2006;
zz the information given in the Report of the Directors for the financial period for which the financial statements are prepared is consistent with the financial statements; and
zz information given in the Corporate Governance Report set out on pages 17 to 23 with respect to internal control and risk management systems in relation to financial reporting processes and about share capital structures is consistent with the financial statements.
Independent Auditor’s Report
stock code: RM.RM plc Annual Report 2011 39www.rmeducation.com
21269-04 28/01/2012 Proof 1
Busi
nes
s Re
view
Go
veRn
an
ceFi
na
nci
al
stat
emen
tsBu
sin
ess
Revi
ewG
ove
Rna
nce
Fin
an
cia
l st
atem
ents
Matters on which we are required to report by exceptionWe have nothing to report in respect of the following:
Under the Companies Act 2006 we are required to report to you if, in our opinion:
zz adequate accounting records have not been kept by the parent Company, or returns adequate for our audit have not been received from branches not visited by us; or
zz the parent Company financial statements and the part of the Directors’ Remuneration Report to be audited are not in agreement with the accounting records and returns; or
zz certain disclosures of Directors’ remuneration specified by law are not made; or
zz we have not received all the information and explanations we require for our audit; or
zz a Corporate Governance Report has not been prepared by the Company.
Under the Listing Rules we are required to review:
zz the Directors’ statement, set out on page 14, in relation to going concern;
zz the part of the Corporate Governance Report on page 19 relating to the Company’s compliance with the nine provisions of the UK Corporate Governance Code specified for our review; and
zz certain elements of the report to shareholders by the Board on Directors’ remuneration.
Tudor Aw(Senior Statutory Auditor)for and on behalf of KPMG Audit Plc, Statutory Auditor
Chartered AccountantsArlington Business Park, Theale,Reading, RG7 4SD, United Kingdom6 February 2012

stock code: RM.RM plc Annual Report 201140
21269-04 28/01/2012 Proof 1
FINANCIAL STATEMENTS
Consolidated income statementfor the 14 months ended 30 November 2011
NotesAdjusted
£’000Adjustments
£’000
14 monthsended
30 November2011Total
£’000
Adjusted £’000
(Restated)
Adjustments £’000
(Restated)
Year ended 30 September
2010Total
£’000 (Restated)
Revenue 3 350,785 – 350,785 380,124 – 380,124Cost of sales (260,113) – (260,113) (279,537) – (279,537)Gross profit 90,672 – 90,672 100,587 – 100,587Operating expenses 5 (80,655) – (80,655) (78,025) – (78,025)– Amortisation of acquisition related
intangible assets – (728) (728) – (1,273) (1,273)
– Impairment of goodwill, acquisition related intangible assets, other intangible assets and investments – (12,370) (12,370) – – –
– Loss on sale of operations – (4,391) (4,391) – – –– Share-based payment charges – (1,378) (1,378) – (1,417) (1,417)– Restructuring costs – (8,773) (8,773) – (1,344) (1,344)– Increase in provision for dilapidations
on leased properties and onerous lease contracts – (5,986) (5,986) – – –
– Exceptional costs relating to curtailment of Building Schools for the Future programme – – – – (1,474) (1,474)
– Exceptional pension credit – – – – 7,056 7,056Share of results of associate and joint venture 32 (32) – 67 (28) 39
(80,623) (33,658) (114,281) (77,958) 1,520 (76,438)
Profit/(loss) from operations 5 10,049 (33,658) (23,609) 22,629 1,520 24,149Investment income 3 & 7 1,079 – 1,079 1,091 – 1,091Finance costs 8 (850) – (850) (1,321) – (1,321)
Profit/(loss) before tax 10,278 (33,658) (23,380) 22,399 1,520 23,919Tax 9 (3,616) 3,887 271 (5,086) (674) (5,760)
Profit/(loss) for the period attributable to equity holders of the parent 6,662 (29,771) (23,109) 17,313 846 18,159
Earnings/(loss) per ordinary share: 10Basic 7.3p (32.6)p (25.3)p 18.8p 0.9p 19.7pDiluted 7.3p (32.6)p (25.3)p 18.8p 0.9p 19.7pPaid and proposed dividends per share: 11Interim 1.47p 1.39pFinal 1.53p 5.25p
Results for the year to 2010 have been restated to reflect current period treatment of restructuring costs and share-based payment charges as adjustments with costs of £1,344,000 and £1,417,000 being reallocated respectively. These costs had previously been allocated to adjusted cost of sales (£866,000) or adjusted operating expenses (£1,895,000) according to the employee’s role. The restatement is a reallocation only and there is no change to profit from operations, profit before tax or profit attributable to equity holders of the parent as a result. Adjustments to profit have been presented to give a better guide to business performance.
All activities relate to continuing operations. Although there have been businesses exited in the period and held for sale (note 24) at 30 November 2011 these have been determined to not meet the International Financial Reporting Standards definition of discontinued operations.
The accompanying notes are an integral part of this consolidated income statement.

stock code: RM.RM plc Annual Report 2011 41www.rmeducation.com
21269-04 28/01/2012 Proof 1
Busi
nes
s Re
view
Go
veRn
an
ceFi
na
nci
al
stat
emen
tsBu
sin
ess
Revi
ewG
ove
Rna
nce
Fin
an
cia
l st
atem
ents
Consolidated statement of comprehensive incomefor the 14 months ended 30 November 2011
Notes
14 monthsended
30 November 2011
£’000
Year ended30 September
2010£’000
(Loss)/profit for the period (23,109) 18,159
Exchange differences on translation of foreign operations (105) 505Transfer of exchange reserves to income statement on sale of foreign operations 24a (1,409) -Actuarial gains and (losses) on defined benefit pension scheme 28 (10,215) (7,913)Fair value gain/(loss) on interest rate swap 145 (128)Current tax on items taken directly to equity (67) (9)Deferred tax on items taken directly to equity 9 2,049 2,218
Other comprehensive income/(expense) for the period (9,602) (5,327)
Total comprehensive (expense)/income for the period attributable to equity holders of the parent (32,711) 12,832
Total tax credited to equity in the period was £1,982,000 (2010: credit of £2,209,000).
The Company has no other recognised income and expense other than the loss for the 14 months ended 30 November 2011 as shown in the statement of changes in equity, consequently a Company statement of comprehensive income has not been prepared.

stock code: RM.RM plc Annual Report 201142
21269-04 28/01/2012 Proof 1
FINANCIAL STATEMENTS
Consolidated balance sheetas at 30 November 2011
Notes
At30 November
2011£’000
At30 September
2010£’000
Non-current assetsGoodwill 12 17,349 34,220Acquisition related intangible assets 13 1,202 3,690Other intangible assets 13 3,607 3,186Property, plant and equipment 14 16,600 21,054Interest in associate 316 1,013Other receivables 18 2,590 –Deferred tax assets 9c 6,973 4,859
48,637 68,022Current assetsInventories 16 18,827 25,079Trade and other receivables 18 62,270 97,838Tax assets 9d 2,058 877Cash and cash equivalents 20 24,529 13,814Assets held for sale 24b 6,791 –
114,475 137,608Total assets 163,112 205,630Current liabilitiesTrade and other payables 19 (77,781) (106,554)Provisions 21 (7,752) (536)Tax liabilities 9d – (1,878)Liabilities directly associated with assets held for sale 24b (2,914) –
(88,447) (108,968)Net current assets 26,028 28,640Non-current liabilitiesRetirement benefit obligation 28 (21,174) (12,380)Bank loans 20 (13,026) (11,507)Deferred tax liabilities 9c – (34)Other payables 19 (6,286) (5,918)Provisions 21 (5,661) (678)
(46,147) (30,517)Total liabilities (134,594) (139,485)Net assets 28,518 66,145Equity attributable to equity holders of the parentShare capital 22 1,869 1,868Share premium account 26,963 26,918Own shares 23 (3,202) (3,805)Capital redemption reserve 94 94Hedging reserve (44) (189)Translation reserve 115 1,629Retained earnings 2,723 39,630Total equity 28,518 66,145
These financial statements of RM plc, registered number 01749877, were approved and authorised for issue by the Board of Directors on 6 February 2012.
Martyn Ratcliffe Iain McIntosh Director Director
The accompanying notes form an integral part of this consolidated balance sheet.

stock code: RM.RM plc Annual Report 2011 43www.rmeducation.com
21269-04 28/01/2012 Proof 1
Busi
nes
s Re
view
Go
veRn
an
ceFi
na
nci
al
stat
emen
tsBu
sin
ess
Revi
ewG
ove
Rna
nce
Fin
an
cia
l st
atem
ents
Company balance sheetas at 30 November 2011
Notes
At30 November
2011£’000
At30 September
2010£’000
Non-current assetsInvestments 15 58,735 55,640Trade and other receivables 18 712 –
59,447 55,640Current assetsTrade and other receivables 18 31 10,108Tax assets 48 28
79 10,136
Total assets 59,526 65,776
Current liabilitiesTrade and other payables 19 (4,700) (686)
(4,700) (686)
Net current (liabilities)/assets (4,621) 9,450
Non-current liabilitiesOther payables 19 – (195)Provisions (126) –
(126) (195)
Total liabilities (4,826) (881)
Net assets 54,700 64,895
Equity attributable to equity holders of the parentShare capital 22 1,869 1,868Share premium account 26,963 26,918Own shares 23 (3,202) (3,805)Capital redemption reserve 94 94Retained earnings 28,976 39,820
Total equity 54,700 64,895
These financial statements of RM plc, registered number 01749877, were approved and authorised for issue by the Board of Directors on 6 February 2012.
Martyn Ratcliffe Iain McIntoshDirector Director
The accompanying notes form an integral part of this Company balance sheet.
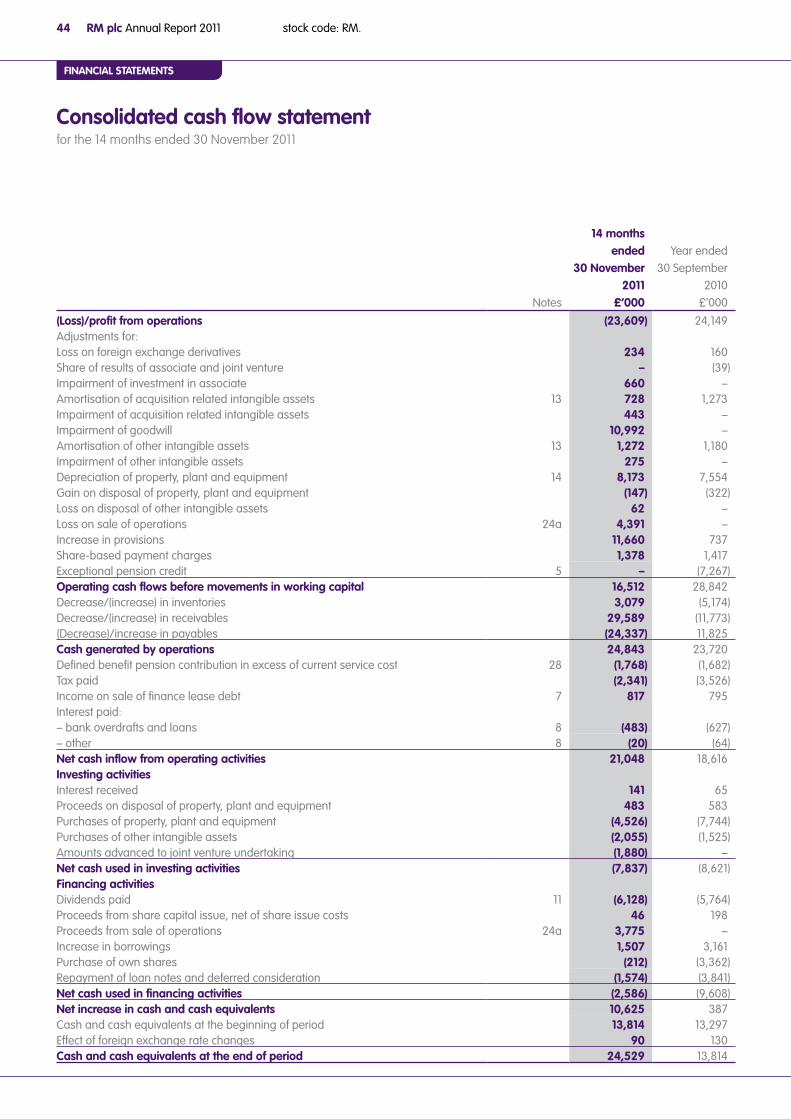
stock code: RM.RM plc Annual Report 201144
21269-04 28/01/2012 Proof 1
FINANCIAL STATEMENTS
Consolidated cash flow statementfor the 14 months ended 30 November 2011
Notes
14 monthsended
30 November 2011
£’000
Year ended30 September
2010£’000
(Loss)/profit from operations (23,609) 24,149Adjustments for:Loss on foreign exchange derivatives 234 160Share of results of associate and joint venture – (39)Impairment of investment in associate 660 –Amortisation of acquisition related intangible assets 13 728 1,273Impairment of acquisition related intangible assets 443 –Impairment of goodwill 10,992 –Amortisation of other intangible assets 13 1,272 1,180Impairment of other intangible assets 275 –Depreciation of property, plant and equipment 14 8,173 7,554Gain on disposal of property, plant and equipment (147) (322)Loss on disposal of other intangible assets 62 –Loss on sale of operations 24a 4,391 –Increase in provisions 11,660 737Share-based payment charges 1,378 1,417Exceptional pension credit 5 – (7,267)Operating cash flows before movements in working capital 16,512 28,842Decrease/(increase) in inventories 3,079 (5,174)Decrease/(increase) in receivables 29,589 (11,773)(Decrease)/increase in payables (24,337) 11,825Cash generated by operations 24,843 23,720Defined benefit pension contribution in excess of current service cost 28 (1,768) (1,682)Tax paid (2,341) (3,526)Income on sale of finance lease debt 7 817 795Interest paid:– bank overdrafts and loans 8 (483) (627)– other 8 (20) (64)Net cash inflow from operating activities 21,048 18,616Investing activitiesInterest received 141 65Proceeds on disposal of property, plant and equipment 483 583Purchases of property, plant and equipment (4,526) (7,744)Purchases of other intangible assets (2,055) (1,525)Amounts advanced to joint venture undertaking (1,880) –Net cash used in investing activities (7,837) (8,621)Financing activitiesDividends paid 11 (6,128) (5,764)Proceeds from share capital issue, net of share issue costs 46 198Proceeds from sale of operations 24a 3,775 –Increase in borrowings 1,507 3,161Purchase of own shares (212) (3,362)Repayment of loan notes and deferred consideration (1,574) (3,841)Net cash used in financing activities (2,586) (9,608)Net increase in cash and cash equivalents 10,625 387Cash and cash equivalents at the beginning of period 13,814 13,297Effect of foreign exchange rate changes 90 130Cash and cash equivalents at the end of period 24,529 13,814
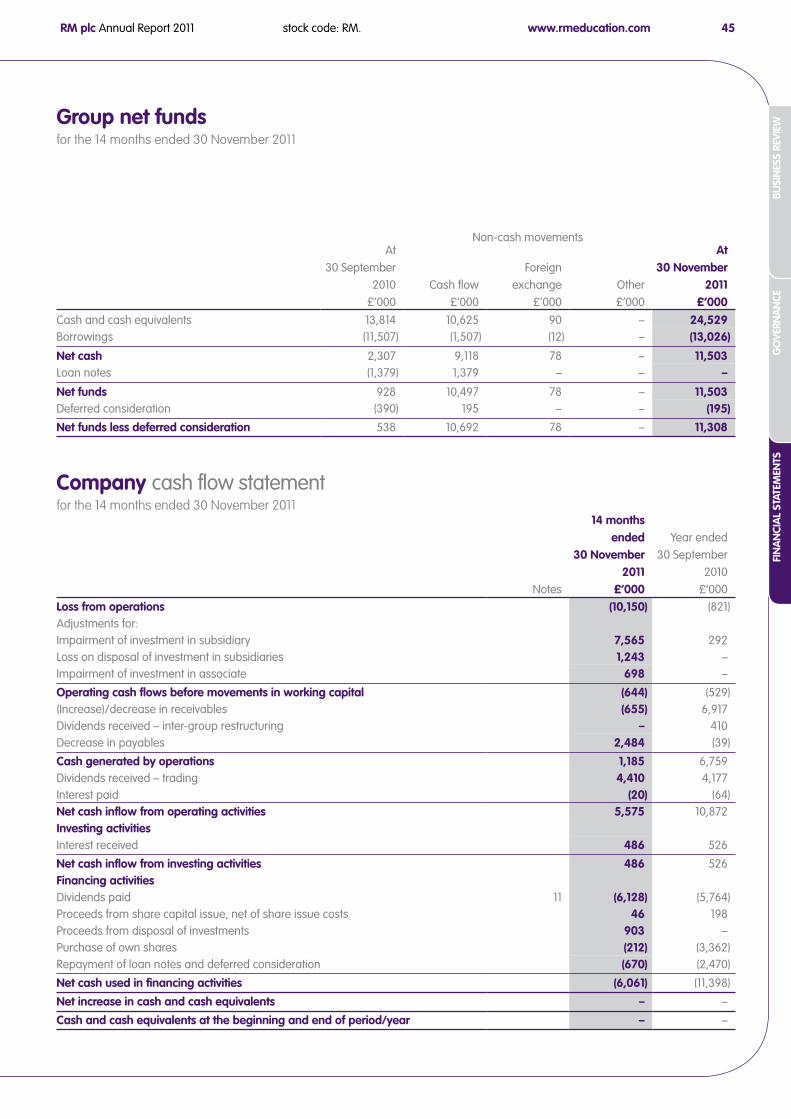
stock code: RM.RM plc Annual Report 2011 45www.rmeducation.com
21269-04 28/01/2012 Proof 1
Busi
nes
s Re
view
Go
veRn
an
ceFi
na
nci
al
stat
emen
tsBu
sin
ess
Revi
ewG
ove
Rna
nce
Fin
an
cia
l st
atem
ents
Group net fundsfor the 14 months ended 30 November 2011
Company cash flow statementfor the 14 months ended 30 November 2011
Notes
14 monthsended
30 November 2011
£’000
Year ended30 September
2010£’000
Loss from operations (10,150) (821)Adjustments for:Impairment of investment in subsidiary 7,565 292Loss on disposal of investment in subsidiaries 1,243 –Impairment of investment in associate 698 –
Operating cash flows before movements in working capital (644) (529)(Increase)/decrease in receivables (655) 6,917Dividends received – inter-group restructuring – 410Decrease in payables 2,484 (39)
Cash generated by operations 1,185 6,759Dividends received – trading 4,410 4,177Interest paid (20) (64)Net cash inflow from operating activities 5,575 10,872Investing activitiesInterest received 486 526
Net cash inflow from investing activities 486 526Financing activitiesDividends paid 11 (6,128) (5,764)Proceeds from share capital issue, net of share issue costs 46 198Proceeds from disposal of investments 903 –Purchase of own shares (212) (3,362)Repayment of loan notes and deferred consideration (670) (2,470)
Net cash used in financing activities (6,061) (11,398)
Net increase in cash and cash equivalents – –
Cash and cash equivalents at the beginning and end of period/year – –
Non-cash movementsAt
30 September 2010
£’000Cash flow
£’000
Foreignexchange
£’000Other£’000
At30 November
2011£’000
Cash and cash equivalents 13,814 10,625 90 – 24,529Borrowings (11,507) (1,507) (12) – (13,026)
Net cash 2,307 9,118 78 – 11,503Loan notes (1,379) 1,379 – – –
Net funds 928 10,497 78 – 11,503Deferred consideration (390) 195 – – (195)Net funds less deferred consideration 538 10,692 78 – 11,308

stock code: RM.RM plc Annual Report 201146
21269-04 28/01/2012 Proof 1
FINANCIAL STATEMENTS
Consolidated statement of changes in equityfor the 14 months ended 30 November 2011
Notes
Share capital£’000
Sharepremiumaccount
£’000
Ownshares £’000
Capitalredemption
reserve£’000
Hedgingreserve
£’000
Translationreserve
£’000
Retainedearnings
£’000
Totalequity£’000
GroupAt 1 October 2009 1,863 26,725 (1,246) 94 (61) 1,124 32,325 60,824
Profit for the year – – – – – – 18,159 18,159
Other comprehensive incomeExchange differences on translation of foreign operations – – – – – 505 – 505Actuarial gains and (losses) on defined benefit scheme – – – – – – (7,913) (7,913)Fair value loss on interest rate swap – – – – (128) – – (128)Tax credit on items taken directly to equity – – – – – – 2,209 2,209Total other comprehensive income/(expense) – – – – (128) 505 (5,704) (5,327)
Transactions with owners of the CompanyPurchase of shares 23 – – (3,213) – – – – (3,213)Share issues 5 193 – – – – – 198Share-based payment awards exercised in year – – 654 – – – (803) (149)Share-based payment fair value charges 6 – – – – – – 1,417 1,417Dividends paid 11 – – – – – – (5,764) (5,764)At 1 October 2010 1,868 26,918 (3,805) 94 (189) 1,629 39,630 66,145Loss for the period – – – – – – (23,109) (23,109)Other comprehensive incomeExchange differences on translation of foreign operations – – – – – (105) – (105)Transfer of exchange reserves to income statement on sale of foreign operations – – – – – (1,409) – (1,409)Actuarial gains and (losses) on defined benefit scheme – – – – – – (10,215) (10,215)
Fair value gain/(loss) on interest rate swap – – – – 145 – – 145Tax credit on items taken directly to equity – – – – – – 1,982 1,982Total other comprehensive income/(expense) – – – – 145 (1,514) (8,233) (9,602)
Transactions with owners of the CompanyPurchase of shares 23 – – (212) – – – – (212)Share issues 1 45 – – – – – 46Share-based payment awards exercised in period – – 815 – – – (815) –Share-based payment fair value charges 6 – – – – – – 1,378 1,378Dividends paid 11 – – – – – – (6,128) (6,128)At 30 November 2011 1,869 26,963 (3,202) 94 (44) 115 2,723 28,518

stock code: RM.RM plc Annual Report 2011 47www.rmeducation.com
21269-04 28/01/2012 Proof 1
Busi
nes
s Re
view
Go
veRn
an
ceFi
na
nci
al
stat
emen
tsBu
sin
ess
Revi
ewG
ove
Rna
nce
Fin
an
cia
l st
atem
ents
Company statement of changes in equityfor the 14 months ended 30 November 2011
Notes
Share capital£’000
Sharepremiumaccount
£’000
Ownshares £’000
Capitalredemption
reserve£’000
Retainedearnings
£’000
Totalequity£’000
CompanyAt 1 October 2009 1,863 26,725 (1,246) 94 40,567 68,003Profit for the year – – – – 4,403 4,403
Total other comprehensive income – – – – – –
Transactions with owners of the CompanyPurchase of shares 23 – – (3,213) – – (3,213)Share issues 5 193 – – – 198Share-based payment awards exercised in year – – 654 – (803) (149)Share-based payment fair value charges 6 – – – – 1,417 1,417Dividends paid 11 – – – – (5,764) (5,764)
At 1 October 2010 1,868 26,918 (3,805) 94 39,820 64,895Loss for the period – – – – (5,279) (5,279)
Total other comprehensive income – – – – – –
Transactions with owners of the CompanyPurchase of shares 23 – – (212) – – (212)Share issues 1 45 – – – 46Share-based payment awards exercised in the period – – 815 – (815) –Share-based payment fair value charges 6 – – – – 1,378 1,378Dividends paid 11 – – – – (6,128) (6,128)At 30 November 2011 1,869 26,963 (3,202) 94 28,976 54,700
As permitted by section 408 of the Companies Act 2006, no separate income statement is presented in respect of the parent Company. The Company made a loss for the 14 months ended 30 November 2011 amounting to £5.3m (year ended 30 September 2010: profit of £4.4m).

stock code: RM.RM plc Annual Report 201148
21269-04 28/01/2012 Proof 1
FINANCIAL STATEMENTS
Notes to the report and accounts
1. General informationRM plc is a company incorporated in the United Kingdom under the Companies Act 2006. It is the parent company of a group of companies, the nature of whose operations and its principal activities are set out in the Report of the Directors.
The financial year end of the Company and its subsidiaries has changed from 30 September to 30 November. Following the change of accounting reference date, these audited accounts disclose the financial performance and cash flows for the 14 months ended 30 November 2011 and the financial position as at 30 November 2011. As a result, the comparative financial information which is for the year to 30 September 2010 covers an indirectly comparable time period. Proforma financial information for the comparable year ended 30 November 2011 and the year ended 30 November 2010 has been included within an appendix to this Report and Accounts and is unaudited. The decision to change the financial year end was made in order to separate both the annual financial year planning and financial year end activity from the busiest operational period of the Group’s year.
The accounting policies are drawn up in accordance with those International Accounting Standards (IAS) and International Financial Reporting Standards (IFRS) issued by the International Accounting Standards Board (IASB) and adopted for use in the EU and therefore comply with Article 4 of the EU IAS Regulation applied in accordance with the provisions of the Companies Act 2006.
Income statement presentationThe income statement is presented in three columns. This presentation is intended to give a better guide to business performance by separately identifying: the amortisation of acquisition related intangible assets; the impairment of goodwill, acquisition related intangible assets, other intangible assets and investments; the loss on sale of operations; share-based payment charges; restructuring costs; and the increase in provision for dilapidations on leased properties and onerous lease contracts. In the prior year exceptional costs relating to curtailment of Building Schools for the Future programme; and an exceptional pension credit on the Group’s defined benefit pension scheme were also separately identified. The columns extend down the income statement to allow the tax and earnings per share impacts of these transactions to be understood.
Adoption of new and revised International Financial Reporting StandardsThe IFRIC interpretations, amendments to existing standards and new standards that are mandatory and relevant for the Group’s accounting periods beginning on or after 1 October 2010 have been adopted. The following new standards and interpretations have been adopted in the current period but have not impacted the reported results or the financial position:
zz IFRS 3 Business Combinations;zz IFRS 7 Financial Instruments: Disclosures;zz IAS 27 Consolidated and Separate Financial Statements; andzz Improvements to IFRSs 2010.

stock code: RM.RM plc Annual Report 2011 49www.rmeducation.com
21269-04 28/01/2012 Proof 1
Busi
nes
s Re
view
Go
veRn
an
ceFi
na
nci
al
stat
emen
tsBu
sin
ess
Revi
ewG
ove
Rna
nce
Fin
an
cia
l st
atem
ents
1. General information continued
New standards and interpretations not yet adoptedAt the date of authorisation of these financial statements, the following Standards and Interpretations which have not been applied in these financial statements were in issue but not yet effective (and in some cases had not yet been adopted by the EU):
zz IFRS 7 (amended) Disclosures - Transfers of Financial Assets;zz IFRS 9 Financial Instruments;zz IFRS 10 Consolidated Financial Statements;zz IFRS 11 Joint Arrangements;zz IFRS 12 Disclosure of Interests in Other Entities;zz IFRS 13 Fair Value Measurement;zz IAS 1 (amended) Presentation of Items of Other Comprehensive Income;zz IAS 12 (amended) Deferred Tax: Recovery of Underlying Assets;zz IAS 19 (revised) Employee Benefits;zz IAS 24 (2009) Related Party Disclosures ;zz IAS 27 (revised) Separate Financial Statements; andzz IAS 34 Interim Financial Reporting – Significant events and transactions.
The Directors are finalising their analysis and do not anticipate that the adoption of these standards and interpretations will have a material impact on the financial statements of the Group in future periods, except as follows:
zz IFRS 9 will impact both the measurement and disclosures of Financial Instruments;zz IFRS 13 will impact the measurement of fair value for certain assets and liabilities as well as the associated disclosures; andzz IAS 19 (revised) will impact the measurement of the various components representing movements in the defined benefit pension
obligation and associated disclosures, but not the Group’s total obligation. It is likely that following the replacement of expected returns on plan assets with a net finance cost in the income statement, the profit for the period will be reduced and accordingly other comprehensive income increased.
Beyond the information above, it is not practicable to provide a reasonable estimate of the effect of these standards until a detailed review has been completed.
The principal IFRS accounting policies adopted by the Group are listed below.

stock code: RM.RM plc Annual Report 201150
21269-04 28/01/2012 Proof 1
FINANCIAL STATEMENTS
Notes to the report and accounts continued
2. Principal accounting policiesBasis of preparationThe financial statements have been prepared on the historical cost basis except for certain financial instruments, share-based payments and pension assets and liabilities which are measured at fair value and disposal groups held for sale which are measured at the lower of their carrying amount and fair value less costs to sell. The preparation of financial statements, in conformity with generally accepted accounting principles, requires the use of estimates and assumptions that affect the reported amounts of assets and liabilities and disclosure of contingent assets and liabilities at the date of the financial statements and the reported amounts of revenues and expenses during the reporting period. Although these estimates are based on the Directors’ best knowledge of current events and actions, actual results ultimately may differ from those estimates.
The Group’s business activities, together with the factors likely to affect its future development, performance and position are set out in the Business Review. The financial position of the Group, its cash flows and borrowing facilities are described in the Chief Financial Officer’s Report and the Report of the Directors. The Group’s risk management policies are outlined in the Report of the Directors: Principal Risks and Uncertainties table and notes 18, 19 and 20 to the financial statements outline the Group’s financial assets and liabilities, including details of its financial instruments and hedging activities; and its exposures to credit risk and liquidity risk.
The Directors have assessed forecast future cash flows for the foreseeable future, being a period of at least a year following the approval of the Accounts, and are satisfied that the Group’s agreed working capital facilities are sufficient to meet these cash flows. Given the Group’s continued seasonality and long term education project contractual commitments, cash flows are forecast to be at their highest outflow between July and September.
Considering the above and following the September 2011 Strategic Review, the Directors believe that the Group is well placed to manage its business risks successfully despite the continued current uncertain economic outlook and have a reasonable expectation that the Group has adequate resources to continue in operational existence for the foreseeable future. Therefore, they continue to adopt the going concern basis of accounting in preparing the annual financial statements.
ConsolidationThe Group financial statements incorporate the financial statements of the Company and all its subsidiaries for the periods during which they were members of the Group.
Inter-company balances and transactions between Group companies are eliminated on consolidation. On acquisition, assets and liabilities of subsidiaries are measured at their fair values at the date of acquisition with any excess of the cost of acquisition over this value being capitalised as goodwill.
Investment in subsidiariesIn the Company accounts, investments in subsidiaries are stated at cost less any provision for impairment where appropriate.
Business combinationsThe acquisition of subsidiaries is accounted for using the purchase method. The cost of the acquisition is measured at the aggregate of the fair values, at the date of exchange, of assets given and liabilities incurred or assumed in exchange for control. The acquired company’s identifiable assets, liabilities and contingent liabilities that meet the conditions for recognition under IFRS 3 Business Combinations are recognised at their fair value at the acquisition date.

stock code: RM.RM plc Annual Report 2011 51www.rmeducation.com
21269-04 28/01/2012 Proof 1
Busi
nes
s Re
view
Go
veRn
an
ceFi
na
nci
al
stat
emen
tsBu
sin
ess
Revi
ewG
ove
Rna
nce
Fin
an
cia
l st
atem
ents
2. Principal accounting policies continued
Assets held for saleNon-current assets, or disposal groups comprising assets and liabilities, that are expected to be recovered primarily through sale rather than through continuing use, are classified as held for sale. This condition is regarded as met only when the sale is highly probable and the asset (or disposal group) is available for immediate sale in its present condition. The identification of disposal groups includes the allocation of goodwill from the relevant cash generating unit subject to the transaction.
Immediately before classification as held for sale, the assets, or components of a disposal group, are re-measured in accordance with the Group’s accounting policies. Thereafter generally the assets, or disposal group, are measured at the lower of their carrying amount and fair value less costs to sell. Any impairment loss on a disposal group first is allocated to goodwill, and then to remaining assets and liabilities on a pro rata basis, except that no loss is allocated to inventories, financial assets, deferred tax assets or employee benefit assets, which continue to be measured in accordance with the Group’s accounting policies. Impairment losses on initial classification as held for sale and subsequent gains and losses on re-measurement are recognised in profit or loss. Gains are not recognised in excess of any cumulative impairment loss.
Intangible assets and property, plant and equipment once classified as held for sale are not amortised or depreciated.
RevenueRevenue represents amounts receivable for goods supplied and services provided to third-parties net of VAT and other sales-related taxes.
Revenue from the sale of goods and services is recognised upon transfer to the customer of the significant risks and rewards of ownership. This is generally when goods are despatched to, or services performed for, customers. Revenue on hardware and perpetual software licences is recognised on shipment providing there are no unfulfilled obligations that are essential to the functionality of the delivered product and with consideration of any significant credit risk uncertainty. If such obligations exist, revenue is recognised as they are fulfilled. Revenue from term licences is spread over the period of the licence, reflecting the Group’s obligation to support the relevant software products or update their content over the term of the licence. Revenue from contracts for maintenance, support and annually and other periodically contracted products and services is recognised on a pro-rata basis over the contract period. Revenue from installation, consultancy and other services is recognised when the service has been provided. For multiple element arrangements revenue is allocated to each element on a fair value basis. The portion of the revenue allocated to an element is recognised when the revenue recognition criteria for that element have been met. Appropriate provisions for returns, trade discounts and other allowances are deducted from revenue.
Investment income is recognised in the income statement in the period in which it arises.
Revenue on long-term contracts is recognised while contracts are in progress. Revenue is recognised proportionally to the stage of completion of the contract, based on the fair value of goods and services provided to date, taking into account the sign-off of milestone delivery by customers.

stock code: RM.RM plc Annual Report 201152
21269-04 28/01/2012 Proof 1
FINANCIAL STATEMENTS
Notes to the report and accounts continued
2. Principal accounting policies continued
Long-term contractsLong-term contracts represent those accounted for in accordance with the principles of IAS 18 Revenue and related linkage with IAS 11 Construction Contracts.
Profit on long-term contracts is recognised when the outcome of the contract can be assessed with reasonable certainty, including assessment of contingent and uncertain future expenses. Thereafter profit is recognised based upon the expected outcome of the contract and the revenue recognised at the balance sheet date as a proportion of total contract revenue.
If the outcome of a long-term contract cannot be assessed with reasonable certainty, no profit is recognised. Any expected loss on a contract as a whole, is recognised as soon as it is foreseen. The loss is calculated using a discounted cash flow model utilising a discount rate that reflects an estimate of the market’s assessment of the time value of money and the risks specific to the liability. Any unwinding of the discount is included in the income statement in finance costs.
Where the cumulative fair value of goods and services provided exceeds amounts invoiced the balance is included within trade and other receivables as long-term contract balances. Where amounts invoiced exceed the fair value of goods and services provided the excess is first set off against long-term contract balances and then included in amounts due to long-term contract customers within trade and other payables.
Pre-contract costs are expensed until the awarding of the contract to the Group is considered to be virtually certain which is not before the Group has been appointed sole preferred bidder. Once virtual certainty has been established and the contract is expected to be awarded within a reasonable timescale and pre-contract costs are expected to be recovered from the contract’s net cash flows, then pre-contract costs are recognised as an asset and accounted for as long-term contract costs.
Intangible assetsAll intangible assets, except goodwill, are stated at cost less accumulated amortisation and any accumulated impairment losses.
GoodwillGoodwill represents the amount by which the fair value of the cost of a business combination exceeds the fair value of net assets acquired. Goodwill is not amortised and is stated at cost less any accumulated impairment losses. For business combinations occurring before 1 October 2004, the Group’s transition date to IFRS, the cost of goodwill is deemed to be the UK GAAP net book value at this date.
The recoverable amount of goodwill is tested for impairment annually or when events or changes in circumstance indicate that it might be impaired. Impairment charges are deducted from the carrying value and recognised immediately in profit or loss. For the purpose of impairment testing, goodwill is allocated to each of the Group’s cash generating units expected to benefit from the synergies of the combination. Cash generating units to which goodwill has been allocated are tested for impairment annually, or more frequently when there is an indication that the unit may be impaired. If the recoverable amount of the cash generating unit is less than the carrying amount of the unit, the impairment loss is allocated first to reduce the carrying amount of any goodwill allocated to the unit and then to the other assets of the unit pro-rata on the basis of the carrying amount of each asset in the unit. An impairment loss recognised for goodwill is not reversed in a subsequent period.

stock code: RM.RM plc Annual Report 2011 53www.rmeducation.com
21269-04 28/01/2012 Proof 1
Busi
nes
s Re
view
Go
veRn
an
ceFi
na
nci
al
stat
emen
tsBu
sin
ess
Revi
ewG
ove
Rna
nce
Fin
an
cia
l st
atem
ents
2. Principal accounting policies continued
Research and development costsResearch and development costs associated with the development of software products or enhancements and their related intellectual property rights are expensed as incurred until all of the following criteria can be demonstrated, in which case they are capitalised as an intangible asset:
zz the technical feasibility of completing the intangible asset so that it will be available for use or sale;zz an intention to complete the intangible asset and use or sell it;zz ability to use or sell the intangible asset;zz how the intangible asset will generate probable future economic benefits. Among other things, the Group can demonstrate the
existence of a market for the output of the intangible asset or the intangible asset itself or, if it is to be used internally, the usefulness of the intangible asset;
zz the availability of adequate technical, financial and other resources to complete the development and to use or sell the intangible asset; and
zz an ability to measure reliably the expenditure attributable to the intangible asset during its development.
The technological feasibility for the Group’s software products is assessed on an individual basis and is generally reached shortly before the products are released to manufacturing, and late in the development cycle. Capitalised development costs are amortised on a straight-line basis over their useful lives, once the product is available for use. Useful lives are assessed on a project-by-project basis.
Other intangible assetsIntangible assets purchased separately, such as software licences that do not form an integral part of hardware and the costs of internally generated software for the Group’s use, are capitalised at cost and amortised over their useful lives of 2-8 years.
For business combinations occurring after 1 October 2004, net assets acquired includes an assessment of the fair value of separately identifiable acquisition related intangible assets, in addition to other assets, liabilities and contingent liabilities purchased. These are amortised over their useful lives which are individually assessed.
Property, plant and equipmentProperty, plant and equipment assets are stated at cost, less depreciation and provision for impairment where appropriate.
Property, plant and equipment are depreciated by equal annual instalments to write down the assets to their estimated disposal value at the end of their useful lives as follows:
Freehold property Up to 50 yearsLeasehold building improvements Up to 25 yearsPlant and equipment 3 - 10 yearsComputer equipment 2 - 5 yearsVehicles 2 - 4 years
Computer units produced by the Group which are used for the purposes of administration, research and development and customer demonstrations are capitalised and carried at cost less accumulated depreciation.
stock code: RM.RM plc Annual Report 201154
21269-04 28/01/2012 Proof 1
FINANCIAL STATEMENTS
Notes to the report and accounts continued
2. Principal accounting policies continuedImpairment of tangible and intangible assets excluding goodwillAt each balance sheet date, the Group reviews the carrying amounts of its tangible and intangible assets to determine whether there is any indication that those assets have suffered an impairment loss. If any such indication exists, the recoverable amount of the asset is estimated in order to determine the extent of any impairment loss. Where the asset does not generate cash flows that are independent from other assets, the Group estimates the recoverable amount of the cash generating unit to which the asset belongs.
Recoverable amount is the higher of fair value less costs to sell and value in use. In assessing value in use, the estimated future cash flows are discounted to their present value using a pre-tax discount rate that reflects current market assessments of the time value of money and the risks specific to the asset for which the estimates of future cash flows have not been adjusted.
If the recoverable amount of an asset (or cash generating unit) is estimated to be less than its carrying amount, the carrying amount of the asset (or cash generating unit) is reduced to its recoverable amount. An impairment loss is recognised as an expense immediately.
Where an impairment loss subsequently reverses, the carrying amount of the asset (or cash generating unit) is increased to the revised estimate of its recoverable amount, but so that the increased carrying amount does not exceed the carrying amount that would have been determined had no impairment loss been recognised for the asset (or cash generating unit) in prior periods. A reversal of an impairment loss is recognised as income immediately.
Financial instrumentsTrade and other receivablesTrade and other receivables are not interest bearing and are stated at their original invoiced value reduced by appropriate allowances for estimated irrecoverable amounts.
Cash and cash equivalentsCash and cash equivalents comprise cash at bank and in hand and short-term deposits with a maturity of three months or less. Bank overdrafts are included in cash and cash equivalents only to the extent that the Group has the right of set-off.
Trade and other payablesTrade payables on normal terms are not interest bearing and are stated at original invoiced amount.
Derivative financial instrumentsThe Group holds derivative financial instruments to hedge its foreign currency and interest rate risk exposures.
On initial designation of the derivative as the hedging instrument, the Group formally documents the relationship between the hedging instrument and hedged item, including the risk management objectives and strategy in undertaking the hedge transaction and the hedged risk, together with the methods that will be used to assess the effectiveness of the hedging relationship. The Group makes an assessment, both at the inception of the hedge relationship as well as on an ongoing basis, of whether the hedging instruments are expected to be “highly effective” in offsetting the changes in the fair value or cash flows of the respective hedged items attributable to the hedged risk, and whether the actual results of each hedge are within a range of 80 – 125 percent. For a cash flow hedge of a forecast transaction, the transaction should be highly probable to occur and should present an exposure to variations in cash flows that could ultimately affect reported profit or loss.
Derivatives are recognised initially at fair value and attributable transaction costs are recognised in profit or loss as incurred. Subsequent to initial recognition, derivatives are measured at fair value, and changes therein are accounted for as described below.

stock code: RM.RM plc Annual Report 2011 55www.rmeducation.com
21269-04 28/01/2012 Proof 1
Busi
nes
s Re
view
Go
veRn
an
ceFi
na
nci
al
stat
emen
tsBu
sin
ess
Revi
ewG
ove
Rna
nce
Fin
an
cia
l st
atem
ents
2. Principal accounting policies continued
Cash flow hedgesWhen a derivative is designated as the hedging instrument in a hedge of the variability in cash flows attributable to a particular risk associated with a recognised asset or liability or a highly probable forecast transaction that could affect profit or loss, the effective portion of changes in the fair value of the derivative is recognised in other comprehensive income and presented in the hedging reserve in equity. Any ineffective portion of changes in the fair value of the derivative is recognised immediately in profit or loss.
When the hedged item is a non-financial asset, the amount accumulated in equity is included in the carrying amount of the asset when the asset is recognised. In other cases the amount accumulated in equity is reclassified to profit or loss in the same period that the hedged item affects profit or loss. If the hedging instrument no longer meets the criteria for hedge accounting, expires or is sold, terminated or exercised, or the designation is revoked, then hedge accounting is discontinued prospectively. If the forecast transaction is no longer expected to occur, then the balance in equity is reclassified in profit or loss.
Other non-trading derivativesWhen a derivative financial instrument is not designated in a hedge relationship that qualifies for hedge accounting, all changes in its fair value are recognised immediately in profit or loss.
InventoriesFinished goods and work-in-progress are valued at cost on a first in first out basis, including appropriate labour costs and other overheads. Raw materials and bought in finished goods are valued at purchase price. All inventories are reduced to net realisable value where lower than cost. Provision is made for obsolete, slow moving and defective items where appropriate.
ProvisionsA provision is recognised if, as a result of a past event, the Group has a present legal or constructive obligation that can be estimated reliably, and it is probable that an outflow of economic benefits will be required to settle the obligation. Provisions are determined by discounting the expected future cash flows at a pre-tax rate that reflects current market assessments of the time value of money and the risks specific to the liability. The unwinding of the discount is recognised as finance cost.
RestructuringA provision for restructuring is recognised when the Group has approved a detailed and formal restructuring plan, and the restructuring either has commenced or has been announced publicly. Future operating losses are not provided for.
Onerous contractsA provision for onerous contracts is recognised when the expected benefits to be derived by the Group from a contract are lower than the unavoidable cost of meeting its obligations under the contract. The provision is measured at the present value of the lower of the expected cost of terminating the contract and the expected net cost of continuing with the contract. Before a provision is established, the Group recognises any impairment loss on the assets associated with that contract.
Dilapidations provisionA dilapidations provision is recognised when the Group has an obligation to rectify, repair or reinstate a leased premises to a certain condition in accordance with the lease agreement. The provision is measured at the present value of the estimated cost of rectifying, repairing or reinstating the leased premises at a specified future date. To the extent that future economic benefits associated with leasehold improvements are expected to flow to the Group, this cost is capitalised within the leasehold improvement category of property, plant and equipment and is depreciated over its useful economic life.

stock code: RM.RM plc Annual Report 201156
21269-04 28/01/2012 Proof 1
FINANCIAL STATEMENTS
Notes to the report and accounts continued
2. Principal accounting policies continued
Leasing activityThe Group offers customers the option to finance lease assets. Where these transactions are entered into, the lease debt is subsequently sold to a finance institution. At this stage profit on sale of the lease debt is recognised as a financing item within investment income.
Operating leasesRentals under operating leases are charged to profit on a straight-line basis over the lease term.
Share-based paymentsThe Group operates a number of Executive and employee share schemes. For all grants of share-based payments, the fair value as at the date of grant is calculated using a pricing model and the corresponding expense is recognised over the vesting period. At vesting the cumulative expense is adjusted to take into account the number of awards actually vesting as a result of survivorship and where this reflects non-market-based performance conditions.
Employee benefitsThe Group has both defined benefit and defined contribution pension schemes. For the defined benefit plan, based on the advice of a qualified independent actuary at each balance sheet date and using the projected unit method, the employers’ portion of past and current service cost is charged to operating profit, with the interest cost, net of expected return on assets in the plan, reported as a financing item. Actuarial gains or losses are recognised directly in equity such that the balance sheet reflects the scheme’s surplus or deficit as at the balance sheet date.
Contributions to defined contribution plans are charged to operating profit as they become payable. An accrual is maintained for paid holiday entitlements which have been accrued by employees during a period but not taken during that period.
Employee share trustsEmployee share trusts, which hold ordinary shares of the Company in connection with certain share schemes, are consolidated into the financial statements where the Company controls the trust. Any consideration paid to the trusts for the purchase of the Company’s own shares is shown as a movement in shareholders’ equity.
TaxationCurrent tax, including UK corporation tax and foreign tax, is provided at amounts expected to be paid (or recovered) using the tax rates and laws that have been enacted or substantively enacted by the balance sheet date.
Deferred taxation is accounted for using the balance sheet liability method in respect of temporary differences arising from differences between the carrying amount of assets and liabilities in the financial statements and the corresponding tax bases used in computation of taxable profit. Deferred tax liabilities are recognised for all taxable temporary differences except in respect of investments in subsidiaries where the Group is able to control the reversal of the temporary difference and it is probable that the temporary difference will not reverse in the foreseeable future.
Deferred tax assets are recognised to the extent that it is probable that future taxable profit will be available against which the temporary difference can be utilised. Their carrying amount is reviewed at each balance sheet date on the same basis.
Deferred tax is measured on an undiscounted basis, and at the tax rates that are expected to apply in the periods in which the asset or liability is settled. It is recognised in the income statement except when it relates to items credited or charged directly to equity, in which case the deferred tax is also dealt with in equity. Deferred tax assets and liabilities are offset when they relate to income taxes levied by the same taxation authority and when the Group intends to settle its current tax assets and liabilities on a net basis.

stock code: RM.RM plc Annual Report 2011 57www.rmeducation.com
21269-04 28/01/2012 Proof 1
Busi
nes
s Re
view
Go
veRn
an
ceFi
na
nci
al
stat
emen
tsBu
sin
ess
Revi
ewG
ove
Rna
nce
Fin
an
cia
l st
atem
ents
2. Principal accounting policies continued
Foreign currenciesThe Group presents its financial statements in Sterling because this is the currency in its primary operating environment. Balance sheet items of subsidiary undertakings whose functional currency is not Sterling are translated into Sterling at the period-end rates of exchange. Income statement items and the cash flows of subsidiary undertakings are translated at the average rates for the period. Exchange differences on the translation of subsidiary opening net assets at closing rates of exchange and the differences arising between the translation of profits at average and closing exchange rates are recorded as movements in the currency translation reserve.
Transactions denominated in foreign currencies are translated into Sterling at rates prevailing at the dates of the individual transactions. Foreign currency monetary assets and liabilities are translated at the rates prevailing at the balance sheet date. Exchange gains and losses arising are charged or credited to the income statement within operating costs. Foreign currency non-monetary amounts are translated at rates prevailing at the time of establishing the fair value of the asset or liability.
DividendsDividends are recognised as a liability in the period in which the shareholders’ right to receive payment has been established.
Key sources of estimation uncertainty and critical accounting judgementsIn applying the Group’s accounting policies the Directors are required to make judgements, estimates and assumptions. Actual results may differ from these estimates. The Group’s key risks are set out in the Report of the Directors and give rise to the following estimations and judgements which are disclosed within the relevant note to the Report and Accounts:
zz Goodwill valuation and impairment – see note 12;zz Long-term contract outcome – see note 17;zz Retirement benefit scheme valuation – see note 28;zz Onerous lease provision – see note 21; andzz Held for sale asset valuation – see note 24b.
3. RevenueAn analysis of transactions accounted for under IAS 18 Revenue is shown below:
14 months2011
£’000
12 months 2010
£’000Revenue from supply of products 184,460 213,410Revenue from rendering of services 140,768 135,446Revenue from the sale of licences and receipt of royalties 25,557 31,268Investment income 1,079 1,091
Total revenue per IAS 18 Revenue 351,864 381,215

stock code: RM.RM plc Annual Report 201158
21269-04 28/01/2012 Proof 1
FINANCIAL STATEMENTS
Notes to the report and accounts continued
4. Operating segmentsThe Group’s business is supplying products and services to the UK and international education markets.
For the period covered by these financial statements, the Group has operated Learning Technologies (which includes US and Asia-Pacific operations), Education Resources and Assessment and Data divisions and this is the basis under which segmental information has been presented to the chief operating decision maker, via Group consolidated management accounts. These are the segments that the Group has determined are its reportable segments.
The nature of the products/services sold within each segment is explained below:
zz Learning Technologies – provides schools with classroom technology (including learning platforms, computer systems and interactive teaching equipment) and infrastructure (including networking, MIS software, access control and cashless catering) and managed services;
zz Education Resources – provides schools with curriculum focused classroom resources including teaching equipment and materials, furniture and educational software; and
zz Assessment and Data – provides systems, platforms and outsourcing for testing and qualifications, and performs the collection, analysis and distribution of educational performance data.
The following disclosure shows the result and total assets of these segments:
Segmental resultLearning
Technologies£’000
EducationResources
£’000
Assessment and Data
£’000Total
£’00014 months ended 30 November 2011Revenue 242,986 83,936 23,863 350,785Adjusted operating profit* 5,444 3,041 1,564 10,049
Investment income (note 7) 1,079Finance costs (note 8) (850)
Adjusted profit before tax* 10,278Adjustments* (33,658)Loss before tax (23,380)
Group loss before tax (23,380)Share of associate result –Loss before tax (23,380)
* Refer to note 1 for an explanation of adjustments to profit.

stock code: RM.RM plc Annual Report 2011 59www.rmeducation.com
21269-04 28/01/2012 Proof 1
Busi
nes
s Re
view
Go
veRn
an
ceFi
na
nci
al
stat
emen
tsBu
sin
ess
Revi
ewG
ove
Rna
nce
Fin
an
cia
l st
atem
ents
4. Operating segments continuedLearning
Technologies£’000
(Restated)
EducationResources
£’000(Restated)
Assessment and Data
£’000(Restated)
Total£’000
(Restated)Year ended 30 September 2010Revenue 273,950 83,288 22,886 380,124
Adjusted operating profit* 10,454 9,186 2,989 22,629
Investment income (note 7) 1,091Finance costs (note 8) (1,321)
Adjusted profit before tax* 22,399Adjustments* 1,520
Profit before tax 23,919
Group profit before tax 23,880Share of associate result 39
Profit before tax 23,919
* Refer to note 1 for an explanation of adjustments to profit.
Results for the year to September 2010 have been restated to reflect current period treatment of restructuring costs and share-based payment charges as adjustments with costs of £1,344,000 and £1,417,000 being reallocated respectively. These costs had previously been allocated to adjusted operating profit according to the employee’s role. The restatement has resulted in a corresponding change to adjusted operating profit. As a reallocation only there is no change to profit before tax.
Inter-segment revenue has been eliminated in the segment in which it is generated hence the revenue disclosed above are those earned by the Group from third parties.

stock code: RM.RM plc Annual Report 201160
21269-04 28/01/2012 Proof 1
FINANCIAL STATEMENTS
Notes to the report and accounts continued
4. Operating segments continued
Segmental assetsSegmental assets include all assets except for tax balances, balance due from joint venture and investment undertakings and cash and cash equivalents which are shown as non-segmental balances:
LearningTechnologies
£’000
EducationResources
£’000
Assessment and Data
£’000Total
£’000At 30 November 2011Total assets– Segmental 69,111 49,809 8,005 126,925– Other 36,187
163,112
At 30 September 2010Total assets– Segmental 111,146 63,579 11,355 186,080– Other 19,550
205,630
The Group’s operations are predominately located in the United Kingdom, with operations also in the United States of America and India. The Group sells to the markets of these countries and also the European, North American, Asian and Australasian continents. Revenues of £30.2m (2010: £49.6m) were earned on non–UK sales and include RM Learning Technologies sales of £18.4m (2010: £34.0m) largely in the United States of America, £9.6m (2010: £14.3m) of RM Education Resources sales largely in Europe and £2.2m (2010: £1.3m) of RM Assessment and Data sales largely in Europe.
Included within the disclosed segmental assets are non current assets (excluding financial instruments, deferred tax assets and other financial assets) of £41.3m (2010: £57.0m) located in the United Kingdom, £1.0m (2010: £0.7m) located in India, £nil (2010: £2.8m) in the United States of America and £nil (2010: £2.7m) in Australasia.
Following the September 2011 Strategic Review, from 1 December 2011 the Group was restructured into four operating divisions: Education Technology, Managed Services, Education Resources and Education Software. For results after 1 December 2011 the Group has moved to this basis of responsibility and reporting and segmental information for the Group will be reported on this basis in the future. Proforma information contained within the Appendix to these financial statements gives derived segmental performance under this new basis. The Strategic Review identified a number of businesses to be exited by the Group and these have either been sold at the balance sheet date or identified as held for sale. The results of exited businesses are included above within the division in which they have been historically reported. Proforma segmental information, within the Appendix, separately identifies the performance of these exited businesses.

stock code: RM.RM plc Annual Report 2011 61www.rmeducation.com
21269-04 28/01/2012 Proof 1
Busi
nes
s Re
view
Go
veRn
an
ceFi
na
nci
al
stat
emen
tsBu
sin
ess
Revi
ewG
ove
Rna
nce
Fin
an
cia
l st
atem
ents
5. Profit from operationsProfit is stated after charging/(crediting):
14 months2011
£’000
12 months 2010
£’000(Restated)
Depreciation of property, plant and equipment:– charged in cost of sales 3,885 4,271– charged in operating expenses 4,288 3,283
8,173 7,554Amortisation:– other intangible assets 1,272 1,180– acquisition related intangible assets – associate 32 28– acquisition related intangible assets 728 1,273
2,032 2,481Impairment:– goodwill 10,992 –– acquisition related intangible assets 443 –– other intangible assets 275 –– investment in associate 660 –
12,370 –
Selling and distribution costs 46,815 45,282Research and development costs 13,452 12,230Administrative expenses – adjusted 20,388 20,513Operating expenses 80,655 78,025
Administrative expenses - adjusted 20,388 20,513Amortisation of acquisition related intangible assets 728 1,273Impairment of goodwill, acquisition related intangible assets, other intangible assets and investments 12,370 –Loss on sale of operations 4,391 –Share-based payment charges 1,378 1,417Restructuring costs 8,773 1,344Increase in provision for dilapidations on leased properties and onerous lease contracts 5,986 –Exceptional costs relating to curtailment of BSF programme:– Restructuring costs – 1,097– Write off of capitalised bid costs – 377
– 1,474Exceptional pension credit – (7,056)Total administrative expense 54,014 18,965
Profit on sale of property, plant and equipment (147) (322)Loss on disposal of other intangible assets 62 –Staff costs (see note 6) 128,874 119,931Operating lease expense 6,986 6,586Foreign exchange loss 35 64Amount of inventories recognised as an expense 141,146 147,810Increase in stock obsolescence provision 563 297Increase in trade receivables impairment provision 1,734 585
Results for the year to 2010 have been restated to reflect current period treatment of restructuring costs and share-based payment charges as adjustments to operating expenses. Historically these costs were included within adjusted operating expenses within the income statement. The restatement reduces cost of sales by £866,000, selling and distribution costs by £510,000, research and development costs by £174,000 and adjusted administrative expenses by £1,211,000.

stock code: RM.RM plc Annual Report 201162
21269-04 28/01/2012 Proof 1
FINANCIAL STATEMENTS
Notes to the report and accounts continued
5. Profit from operations continued
The Group undertakes a programme of research and development, in which advancement of technical knowledge and innovative solutions are used to substantially improve the performance of product areas, to develop new products related to existing markets and to enhance access to potential new markets. During the periods reported the Group has reviewed its research and development expenditure against the criteria outlined in the Accounting Policies. No material expenditure is considered to have met the capitalisation criteria. Consequently capitalised research and development expenditure is £nil (2010: £nil).
Auditor’s remuneration:14 months
2011£’000
12 months 2010
£’000Fees payable to the Company’s auditor and its associates for:– The audit of the Company’s annual accounts 8 9– The audit of the Company’s subsidiaries, pursuant to legislation 211 273
219 282Fees payable to the Company’s auditor and its associates for other non-audit services:– Review of the interim financial statements 14 18– Other services pursuant to legislation 20 33– Corporate pensions advisory 93 –
127 51Fees payable in respect of the audit of the defined benefit pension scheme – 7
346 340
A description of the work of the Audit Committee is set out in their report and includes an explanation of how auditor objectivity and independence is safeguarded when non-audit services are provided by the auditors. As explained within this report, the external audit was subject to tender in the period with the fees shown in the above table being payable to the incumbent auditor: to KPMG Audit Plc while incumbent auditors in the 14 months ended November 2011 and to Deloitte LLP for the year to September 2010.

stock code: RM.RM plc Annual Report 2011 63www.rmeducation.com
21269-04 28/01/2012 Proof 1
Busi
nes
s Re
view
Go
veRn
an
ceFi
na
nci
al
stat
emen
tsBu
sin
ess
Revi
ewG
ove
Rna
nce
Fin
an
cia
l st
atem
ents
6. Staff costsThe average monthly number of persons (including Executive Directors, temporary employees and contractors) employed by the Group during the period was as follows:
14 months2011
NumberEmployed
12 months 2010
NumberEmployed
Research and development, products and services 2,131 2,156Marketing and sales 389 381Corporate services 279 327
2,799 2,864
Their aggregate employment costs comprised:14 months
2011£’000
12 months 2010
£’000Wages and salaries 110,126 102,706Social security costs 8,960 8,497Other pension costs 8,410 7,311Share-based payment charge – equity settled 1,378 1,417
128,874 119,931
There are no staff (2010: nil) employed by the Company.
Information in relation to the Directors’ remuneration is shown in the Remuneration Report.
Note 27 contains details of the share-based payment awards to employees.
7. Investment income14 months
2011£’000
12 months 2010
£’000Bank interest 141 92Income from sale of finance lease debt 817 795Other finance income 121 204
1,079 1,091

stock code: RM.RM plc Annual Report 201164
21269-04 28/01/2012 Proof 1
FINANCIAL STATEMENTS
Notes to the report and accounts continued
8. Finance costs14 months
2011£’000
12 months 2010
£’000Interest on bank overdrafts and loans 483 627Interest on loan notes 20 64Net finance costs on defined benefit pension scheme 347 630
850 1,321
9. Taxa) Income statementAnalysis of tax charged in income statement:
14 months2011
£’000
12 months 2010
£’000Current taxationUK corporation tax (489) 4,185Adjustment in respect of prior years (194) (620)Overseas tax – current period 184 (374)
Total current tax (credit)/charge (499) 3,191
Deferred taxationTemporary differences 189 2,491Adjustment in respect of prior years (175) 78Overseas tax – current period 214 –
Total deferred tax charge 228 2,569
Total income statement tax (credit)/charge (271) 5,760
In addition to the amount charged to the income statement, £1,982,000 of tax has been credited to equity through the statement of comprehensive income (2010: £2,209,000). The amount comprises a tax charge on the equity component of share-based payments of £284,000 (2010: credit of £57,000), a tax charge on a net investment hedge of £73,000 (2010: £66,000) and a tax credit on actuarial gains and losses of £2,339,000 (2010: £2,216,000).
Further analysis of the Group’s deferred tax assets and liabilities is shown below.

stock code: RM.RM plc Annual Report 2011 65www.rmeducation.com
21269-04 28/01/2012 Proof 1
Busi
nes
s Re
view
Go
veRn
an
ceFi
na
nci
al
stat
emen
tsBu
sin
ess
Revi
ewG
ove
Rna
nce
Fin
an
cia
l st
atem
ents
9. Tax continued
b) Reconciliation to standard UK tax rateThe difference between the total tax shown above and the amount calculated by applying the standard rate of UK corporation tax to the profit/(loss) before tax is as follows:
Adjusted£’000
Adjustments£’000
Total£’000
14 months ended 30 November 2011Profit/(loss) before tax 10,278 (33,658) (23,380)
Tax at 26.86% thereon: 2,761 (9,041) (6,280)
Effects of:– impact of change in tax rate on carried forward deferred tax asset 145 (42) 103– other expenses not deductible for tax purposes 228 150 378– temporary differences unrecognised for deferred tax 1,388 191 1,579– other temporary timing differences 54 367 421– research and development tax credit – current period (775) – (775)– research and development tax credit – prior period adjustment (76) – (76)– effect of profits/losses in various overseas tax jurisdictions 184 – 184– impairments – 3,215 3,215– loss on sale of operations - 1,273 1,273– prior period adjustments – other (293) – (293)Tax charge/(credit) 3,616 (3,887) (271)Effective tax rate 35.2% 11.5% 1.2%
Adjusted£’000
(Restated)
Adjustments£’000
(Restated)
Total£’000
Year ended 30 September 2010Profit before tax 22,399 1,520 23,919
Tax at 28% thereon: 6,271 426 6,697
Effects of:– impact of change in tax rate on carried forward deferred tax asset 195 (30) 165– other expenses not deductible for tax purposes 340 – 340– other temporary timing differences 63 272 335– research and development tax credit – current period (890) – (890)– research and development tax credit – prior period adjustment (548) – (548)– effect of profits/losses in various overseas tax jurisdictions (345) – (345)– prior period adjustments – other – 6 6
Tax charge 5,086 674 5,760
Effective tax rate 22.7% 44.3% 24.1%
As explained within the income statement, results for the year to 30 September 2010 have been restated to reflect the current period treatment of restructuring costs and share-based payments as adjustments. The related tax credit has also been restated. There is no change to the tax charge as a result of this reallocation.
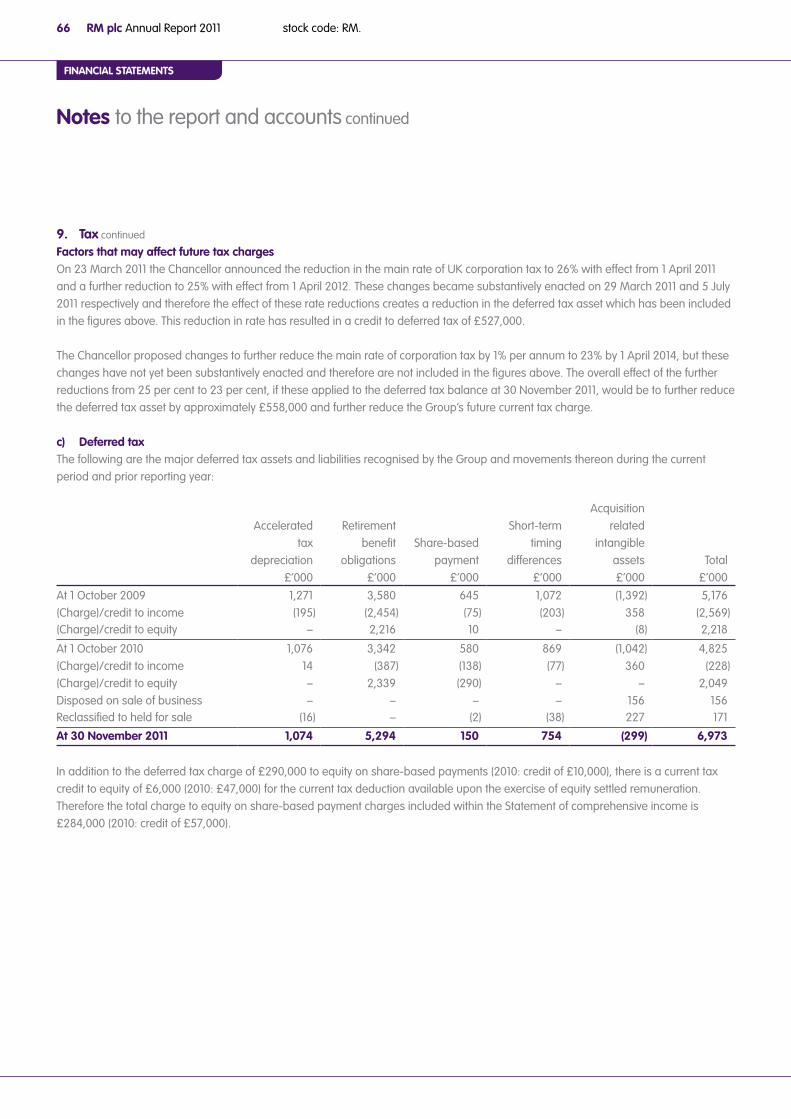
stock code: RM.RM plc Annual Report 201166
21269-04 28/01/2012 Proof 1
FINANCIAL STATEMENTS
Notes to the report and accounts continued
9. Tax continued
Factors that may affect future tax chargesOn 23 March 2011 the Chancellor announced the reduction in the main rate of UK corporation tax to 26% with effect from 1 April 2011 and a further reduction to 25% with effect from 1 April 2012. These changes became substantively enacted on 29 March 2011 and 5 July 2011 respectively and therefore the effect of these rate reductions creates a reduction in the deferred tax asset which has been included in the figures above. This reduction in rate has resulted in a credit to deferred tax of £527,000.
The Chancellor proposed changes to further reduce the main rate of corporation tax by 1% per annum to 23% by 1 April 2014, but these changes have not yet been substantively enacted and therefore are not included in the figures above. The overall effect of the further reductions from 25 per cent to 23 per cent, if these applied to the deferred tax balance at 30 November 2011, would be to further reduce the deferred tax asset by approximately £558,000 and further reduce the Group’s future current tax charge.
c) Deferred taxThe following are the major deferred tax assets and liabilities recognised by the Group and movements thereon during the current period and prior reporting year:
Acceleratedtax
depreciation£’000
Retirementbenefit
obligations£’000
Share-based payment
£’000
Short-termtiming
differences£’000
Acquisitionrelated
intangibleassets£’000
Total£’000
At 1 October 2009 1,271 3,580 645 1,072 (1,392) 5,176(Charge)/credit to income (195) (2,454) (75) (203) 358 (2,569)(Charge)/credit to equity – 2,216 10 – (8) 2,218
At 1 October 2010 1,076 3,342 580 869 (1,042) 4,825(Charge)/credit to income 14 (387) (138) (77) 360 (228)(Charge)/credit to equity – 2,339 (290) – – 2,049Disposed on sale of business – – – – 156 156Reclassified to held for sale (16) – (2) (38) 227 171
At 30 November 2011 1,074 5,294 150 754 (299) 6,973
In addition to the deferred tax charge of £290,000 to equity on share-based payments (2010: credit of £10,000), there is a current tax credit to equity of £6,000 (2010: £47,000) for the current tax deduction available upon the exercise of equity settled remuneration. Therefore the total charge to equity on share-based payment charges included within the Statement of comprehensive income is £284,000 (2010: credit of £57,000).

stock code: RM.RM plc Annual Report 2011 67www.rmeducation.com
21269-04 28/01/2012 Proof 1
Busi
nes
s Re
view
Go
veRn
an
ceFi
na
nci
al
stat
emen
tsBu
sin
ess
Revi
ewG
ove
Rna
nce
Fin
an
cia
l st
atem
ents
9. Tax continued
Certain deferred tax assets and liabilities have been offset above. The following analysis shows the deferred tax balances before offset, as shown in the balance sheet:
At30 November
2011£’000
At30 September
2010£’000
Deferred tax assets 6,973 4,859Deferred tax liabilities – (34)
6,973 4,825
The Group has recognised deferred tax assets in jurisdictions where these are expected to be recoverable against profits in future periods. At the balance sheet date, the Group has an unrecognised gross deferred tax asset of £2.3m (2010: £0.3m) which is available for offset against future profits within the United States of America. Included within this balance are unrecognised tax losses of £1.8m (2010: £0.3m). A deferred tax asset has not been recognised in respect of any of this amount due to uncertainty surrounding the future use of these losses (2010: £nil).
No deferred tax liability is recognised on temporary differences of £343,000 (2010: £390,000) relating to the unremitted earnings of overseas subsidiaries as the Group is able to control the timings of the reversal of these temporary differences and it is probable that they will not reverse in the foreseeable future.
d) Tax assets/liabilitiesCorporation tax balances are offset when there is a legally enforceable right to set off current tax assets against current tax liabilities. The following is an analysis of the current tax assets and liabilities for financial reporting purposes:
At30 November
2011£’000
At30 September
2010£’000
Current tax assets 2,058 877Current tax liabilities – (1,878)
2,058 (1,001)
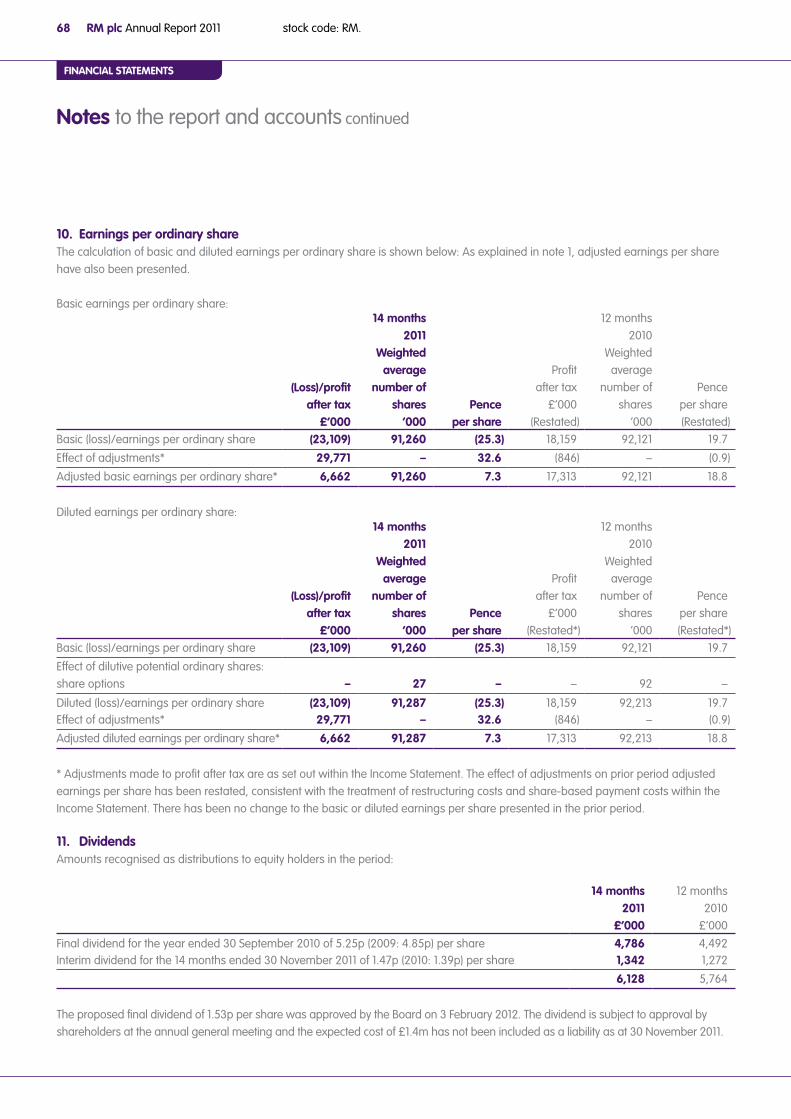
stock code: RM.RM plc Annual Report 201168
21269-04 28/01/2012 Proof 1
FINANCIAL STATEMENTS
Notes to the report and accounts continued
10. Earnings per ordinary shareThe calculation of basic and diluted earnings per ordinary share is shown below: As explained in note 1, adjusted earnings per share have also been presented.
Basic earnings per ordinary share:
(Loss)/profit after tax
£’000
14 months2011
Weighted average
number of shares
‘000Pence
per share
Profitafter tax
£’000 (Restated)
12 months2010
Weightedaverage
number ofshares
‘000
Penceper share(Restated)
Basic (loss)/earnings per ordinary share (23,109) 91,260 (25.3) 18,159 92,121 19.7
Effect of adjustments* 29,771 – 32.6 (846) – (0.9)
Adjusted basic earnings per ordinary share* 6,662 91,260 7.3 17,313 92,121 18.8
Diluted earnings per ordinary share:
(Loss)/profit after tax
£’000
14 months2011
Weighted average
number of shares
‘000Pence
per share
Profitafter tax
£’000 (Restated*)
12 months2010
Weightedaverage
number ofshares
‘000
Penceper share(Restated*)
Basic (loss)/earnings per ordinary share (23,109) 91,260 (25.3) 18,159 92,121 19.7
Effect of dilutive potential ordinary shares: share options – 27 – – 92 –
Diluted (loss)/earnings per ordinary share (23,109) 91,287 (25.3) 18,159 92,213 19.7Effect of adjustments* 29,771 – 32.6 (846) – (0.9)
Adjusted diluted earnings per ordinary share* 6,662 91,287 7.3 17,313 92,213 18.8
* Adjustments made to profit after tax are as set out within the Income Statement. The effect of adjustments on prior period adjusted earnings per share has been restated, consistent with the treatment of restructuring costs and share-based payment costs within the Income Statement. There has been no change to the basic or diluted earnings per share presented in the prior period.
11. DividendsAmounts recognised as distributions to equity holders in the period:
14 months2011
£’000
12 months 2010
£’000Final dividend for the year ended 30 September 2010 of 5.25p (2009: 4.85p) per share 4,786 4,492Interim dividend for the 14 months ended 30 November 2011 of 1.47p (2010: 1.39p) per share 1,342 1,272
6,128 5,764
The proposed final dividend of 1.53p per share was approved by the Board on 3 February 2012. The dividend is subject to approval by shareholders at the annual general meeting and the expected cost of £1.4m has not been included as a liability as at 30 November 2011.

stock code: RM.RM plc Annual Report 2011 69www.rmeducation.com
21269-04 28/01/2012 Proof 1
Busi
nes
s Re
view
Go
veRn
an
ceFi
na
nci
al
stat
emen
tsBu
sin
ess
Revi
ewG
ove
Rna
nce
Fin
an
cia
l st
atem
ents
12. Goodwill
£’000CostAt 1 October 2009 36,287Exchange differences 270Change in estimated deferred consideration payable 132
At 1 October 2010 36,689Exchange differences 176Derecognised on disposal of operations (4,103)Derecognised on dissolution of subsidiary (1,247)Assets reclassified as held for sale (6,532)
At 30 November 2011 24,983
Accumulated impairment lossesAt 1 October 2009 and 1 October 2010 (2,469)Impairment losses in the period (10,992)Derecognised on dissolution of subsidiary 1,247Assets reclassified as held for sale 4,580
At 30 November 2011 (7,634)
Carrying amount
At 30 November 2011 17,349At 30 September 2010 34,220
Goodwill acquired in a business combination is allocated, at acquisition, to the cash-generating units (‘CGUs’) that are expected to benefit from that business combination. As explained within note 4, for the period to 30 November 2011 the Group has operated under Learning Technologies, Assessment and Data and Education Resources segments.
Over the course of the period and with developments in the Group’s ability to allocate net assets to sub-segmental level, the Group’s CGUs have been lowered to sub-segment Business Unit level and it is this level to which goodwill has been allocated. This was reinforced in the Group’s September 2011 Strategic Review where certain operations were identified as being non-core to the Group’s continuing strategy and an active disposal programme was initiated, with a number of subsidiaries and businesses being sold in the period to 30 November 2011 and others identified as held for sale and hence transferred to this category. Goodwill attaching to the relevant CGUs has been allocated to the subsidiary or business being sold.

stock code: RM.RM plc Annual Report 201170
21269-04 28/01/2012 Proof 1
FINANCIAL STATEMENTS
Notes to the report and accounts continued
12. Goodwill continued
The carrying amount of goodwill has been allocated as follows:
Pre-taxdiscount rate
At30 November
2011£’000
Assessment and Data:– RM Data Solutions 13.8% 2,956Education Resources:– RM Education – RM Software 13.8% 1,550– TTS Group 13.5% 11,111– RM-SpaceKraft 13.4% 1,732
17,349
Pre-taxdiscount rate
At30 September
2010£’000
Learning Technologies 15.6% 9,904Assessment and Data 15.6% 2,956Education Resources 15.6% 21,360
34,220
The Group tests goodwill annually for impairment or more frequently if there are indications that goodwill might be impaired. This includes assessment following the Group’s September 2011 Strategic Review, where impairment indicators were evident. The Review was performed in response to recent unpredictability within the Education market, with the Group’s performance being dependent upon the UK macro-economic environment and particularly public sector spending on Education. This suggested that operating results were anticipated to be below analyst forecasts at the time. The following impairments have been recognised in the period:
Learning Technologieszz In advance of the balance sheet date the hardware element of the Group’s US business was sold to Troxell Communications Inc
and the Group’s Australian subsidiary was sold to Civica Pty Ltd. Goodwill relating to these businesses of £1.7m and £2.4m respectively was included within the loss on sale;
zz On 1 December 2011, certain trade and assets of AMI Education Solutions Ltd, representing the Ranger business were transferred to RM Education plc. Following an assessment of the likely future cash flows from these assets an impairment charge of £4.2m was recognised on goodwill allocated to the Ranger business; and
zz The remaining trade of AMI Education Solutions Ltd being the Easytrace business was sold to Jonas Computing (UK) Ltd on 19 January 2012. This business was recorded as held for sale at the balance sheet date (refer to note 24b). A goodwill impairment of £1.7m, reflecting the ultimate sales price of this business, has been recognised. As a result the goodwill relating to Easytrace is fully impaired.
Assessment and Datazz The goodwill within this segment relates to Group subsidiary RM Data Solutions Ltd. After considering the likely future cash flows of
this business it was determined that no impairment was required. The business is heavily reliant on one public sector contract and it is likely that, in the event thi scontract is not renewed a goodwill impairment charge will be recorded.

stock code: RM.RM plc Annual Report 2011 71www.rmeducation.com
21269-04 28/01/2012 Proof 1
Busi
nes
s Re
view
Go
veRn
an
ceFi
na
nci
al
stat
emen
tsBu
sin
ess
Revi
ewG
ove
Rna
nce
Fin
an
cia
l st
atem
ents
12. Goodwill continued
Education Resourceszz An impairment of £2.3m, representing full impairment, has been recognised in relation to goodwill allocated to the Isis Concepts
Ltd business, which is being actively marketed for sale. This reflects an assessment of the estimated sales proceeds;zz Following a review of forecast future cash flows the goodwill on RM Education plc’s Software business and on SpaceKraft Ltd
subsidiary related goodwill has been impaired by £1.1m and £1.0m respectively;zz Since the balance sheet date, the Group’s 49% investment in Lego Education Europe Ltd and associated support provided through
Group subsidiary DACTA Ltd has been sold to Lego A/S. The business is recorded within held for sale at the balance sheet date. A goodwill impairment of £0.5m reflecting the ultimate sales price of the business has been recognised. The remaining goodwill on the DACTA business of £2.0m has been transferred to assets held for sale (refer to note 24b); and
zz Following a review of the forecast future cash flows, no impairment was required on Group subsidiary TTS Group Ltd.
The total impact of the items identified above is an impairment charge on the carrying value of goodwill of £11.0m (2010: £nil), which has been recognised in the period within operating expenses in the consolidated income statement.
The recoverable amounts of the CGUs are determined from value in use calculations or, where assets are classified as held for sale, the estimated sales proceeds. The key assumptions for the value in use calculations are those regarding the discount rates and growth rates.
The Group monitors its post-tax Weighted Average Cost of Capital and those of its competitors using market data. This measure has been subject to downward pressure as a result of reduced yields on UK Government Gilts and, for RM specifically, reductions in RM plc’s equity beta. In considering the discount rates applying to CGUs, the Directors have considered the relative sizes, risks and the inter-dependencies of its CGUs and their relatively narrow operation within the Education products and services market. The impairment reviews use a discount rate adjusted for pre-tax cash flows. Analysis of the sensitivity of the resultant impairment reviews to changes in the discount rate is included below.
The Group prepares cash flow forecasts derived from the most recent financial plan approved by the Board and extrapolates cash flows for the following two years based on forecast growth rates of the CGUs. The growth rates are based on internal growth forecasts of between -7% and 3% (2010: 3% and 8%). The terminal rates used for the value in use calculation are between 0% and 3% (2010: 3%).
SensitivityThe table below shows the sensitivity of the impairment reviews to the discount rate used:
£’000
Carryingamount at
30 November2011
£’000
Reduction incarryingamountfrom 1%
increase in discount rate
£’000
Increasein carrying
amountfrom 1%
decrease in discount rate
£’000Assessment and Data:– RM Data Solutions 2,956 – –Education Resources:– RM Education – RM Software 1,550 (99) 114– TTS Group 11,111 – –– RM-SpaceKraft 1,732 (277) 344
17,349 (376) 458

stock code: RM.RM plc Annual Report 201172
21269-04 28/01/2012 Proof 1
FINANCIAL STATEMENTS
Notes to the report and accounts continued
13. Intangible assetsAcquisition related intangible assets
Customerrelationships
£’000Brands
£’000
Intellectual property &
databaseassets£’000
Sub-total £’000
Other software
assets* £’000
Total£’000
GroupCostAt 1 October 2009 5,171 1,465 1,487 8,123 19,301 27,424Additions – – 8 8 1,517 1,525Transfer from property, plant and equipment – – – – 277 277Exchange differences 21 3 - 24 20 44Change in estimated deferred consideration payable (50) – – (50) – (50)Disposals – – – – (30) (30)
At 1 October 2010 5,142 1,468 1,495 8,105 21,085 29,190Additions – – – – 2,055 2,055Exchange differences – – – – (29) (29)Disposals – – – – (10,377) (10,377)Disposal on sale of operations (1,053) (288) (265) (1,606) – (1,606)Assets reclassified as held for sale (2,490) (616) (905) (4,011) (84) (4,095)
At 30 November 2011 1,599 564 325 2,488 12,650 15,138
Accumulated amortisation and impairmentAt 1 October 2009 2,203 433 506 3,142 16,647 19,789Charge for the year 862 183 228 1,273 1,180 2,453Transfer from property, plant and equipment – – – – 89 89Exchange differences – – – – 13 13On disposals – – – – (30) (30)
At 1 October 2010 3,065 616 734 4,415 17,899 22,314Charge for the period 404 118 206 728 1,272 2,000Impairment loss 109 86 248 443 275 718Exchange differences – – – – (28) (28)Disposals – – – – (10,315) (10,315)Disposal on sale of operations (782) (189) (224) (1,195) – (1,195)Assets reclassified as held for sale (1,952) (511) (642) (3,105) (60) (3,165)
At 30 November 2011 844 120 322 1,286 9,043 10,329
Carrying amountAt 30 November 2011 755 444 3 1,202 3,607 4,809At 30 September 2010 2,077 852 761 3,690 3,186 6,876
* Purchased and internally developed software assets amounted to net book values of £0.6m and £3.0m respectively (2010: £0.9m and £2.3m). This included respective additions of £0.2m and £1.8m (2010: £0.4m and £1.1m).

stock code: RM.RM plc Annual Report 2011 73www.rmeducation.com
21269-04 28/01/2012 Proof 1
Busi
nes
s Re
view
Go
veRn
an
ceFi
na
nci
al
stat
emen
tsBu
sin
ess
Revi
ewG
ove
Rna
nce
Fin
an
cia
l st
atem
ents
13. Intangible assets continued
An impairment loss on acquisition related intangible assets of £443,000 (2010: £nil) and an impairment loss on other software assets of £275,000 (2010: £nil) have been recognised in the period within operating expenses in the consolidated income statement. These arose following the Group’s September 2011 Strategic Review where certain operations were identified as being non-core to the Group’s continuing strategy and an active disposal programme was initiated, with a number of subsidiaries and businesses being sold at 30 November 2011 and others identified as held for sale. The acquisition intangible assets were impaired under the requirements of IFRS 5 Non-current Assets Held for Sale and Discontinued Operations. Refer to note 12 for further information on the impairment reviews performed and calculation of recoverable amount. The other software assets were fully impaired following the disposal of businesses that benefitted from the assets’ use. The impairments are allocated to the segmental assets as follows: Learning Technologies £436,000, Education Resources £282,000.
14. Property, plant and equipmentThe movement in the period was as follows:
Freeholdland andbuildings
£’000
Shortleasehold
improvements£’000
Plant andequipment
£’000
Computerequipment
£’000Vehicles
£’000Total
£’000GroupCostAt 1 October 2009 2,803 2,972 8,366 38,675 7,205 60,021Additions 14 937 1,256 3,490 2,103 7,800Transfer to intangible assets – – – (277) – (277)Exchange differences – 31 (49) 161 24 167Disposals – – (224) (221) (1,444) (1,889)At 1 October 2010 2,817 3,940 9,349 41,828 7,888 65,822Additions 97 1,046 1,265 2,010 995 5,413Exchange differences – (41) (103) (82) (31) (257)Transfer between categories (134) – 17 117 – –Disposals – (79) (887) (4,524) (1,963) (7,453)Disposal on sale of operations – (165) (366) (1,090) (120) (1,741)Assets reclassified as held for sale – (79) (92) (211) (484) (866)At 30 November 2011 2,780 4,622 9,183 38,048 6,285 60,918
Accumulated depreciationAt 1 October 2009 337 1,887 6,010 27,392 3,074 38,700Charge for the year 121 296 851 4,341 1,945 7,554Transfer to intangible assets – – – (89) – (89)Exchange differences – 24 84 132 (9) 231Eliminated on disposals – – (212) (168) (1,248) (1,628)At 1 October 2010 458 2,207 6,733 31,608 3,762 44,768Charge for the period 112 383 911 4,859 1,908 8,173Exchange differences – (8) (60) (52) (17) (137)Transfers between categories 119 – (46) (73) – –Disposals – (50) (901) (4,007) (1,633) (6,591)Disposal on sale of operations – (111) (234) (908) (95) (1,348)Assets reclassified as held for sale – – (77) (175) (295) (547)At 30 November 2011 689 2,421 6,326 31,252 3,630 44,318
Carrying amountAt 30 November 2011 2,091 2,201 2,857 6,796 2,655 16,600At 30 September 2010 2,359 1,733 2,616 10,220 4,126 21,054

stock code: RM.RM plc Annual Report 201174
21269-04 28/01/2012 Proof 1
FINANCIAL STATEMENTS
Notes to the report and accounts continued
15. Investment in subsidiary undertakingsAll principal subsidiaries of the Group are involved in the education market and are consolidated into the financial statements. At 30 November 2011 these were as follows:
Principal activityCountry of
incorporationClass of
share
Proportionof voting
rights and shares held
AMI Education Solutions Ltd ** Software, services and systems England Ordinary 100%DACTA Ltd ** Resource supply England Ordinary 100%Isis Concepts Ltd ** Resource supply England Ordinary 100%RM Group US LLC (formerly Computrac LLC) * Software, services and systems USA Ordinary 100%RM Data Solutions Ltd Data analysis and reporting England Ordinary 100%RM Education plc Software, services and systems England Ordinary 100%RM Education Solutions India Pvt Ltd * Software and Corporate Services India Ordinary 100%SpaceKraft Ltd Resource supply England Ordinary 100%
TTS Group Ltd Resource supply England Ordinary 100%* Held through subsidiary undertaking** Subsidiaries classified as held for sale at 30 November 2011, see note 24b for further information.
In the Company, equity investments in subsidiary undertakings are held at cost less provision for impairment:
Investmentin share
capital£’000
Capitalcontribution –Share-based
payments£’000
Quasi-equity Loan
£’000Total
£’000CompanyCostAt 1 October 2009 45,481 5,719 7,077 58,277Repayment of capital following inter-group restructuring (410) – – (410)Decrease in fair value of issuable loan notes and deferred consideration 132 – – 132Share-based payments – 1,417 – 1,417At 1 October 2010 45,203 7,136 7,077 59,416Increase in investment in subsidiary 12,000 – – 12,000Disposal of investments (2,020) – – (2,020)Share-based payments – 1,378 – 1,378At 30 November 2011 55,183 8,514 7,077 70,774
ImpairmentAt 1 October 2009 (3,484) – – (3,484)Impairment in cost of investment of subsidiary (292) – – (292)At 1 October 2010 (3,776) – – (3,776)Impairment in cost of investment of subsidiaries (7,565) – – (7,565)Impairment in cost of investment in associate (698) – – (698)At 30 November 2011 (12,039) – – (12,039)
Carrying value At 30 November 2011 43,144 8,514 7,077 58,735At 30 September 2010 41,427 7,136 7,077 55,640

stock code: RM.RM plc Annual Report 2011 75www.rmeducation.com
21269-04 28/01/2012 Proof 1
Busi
nes
s Re
view
Go
veRn
an
ceFi
na
nci
al
stat
emen
tsBu
sin
ess
Revi
ewG
ove
Rna
nce
Fin
an
cia
l st
atem
ents
15. Investment in subsidiary undertakings continued
Loans to subsidiary undertakings are not repayable in the foreseeable future and are considered to form part of the Company’s investment.
An impairment loss on the investment in subsidiaries of £7.6m (2010: £nil) and £0.7m (2010: £nil) on the investment in an associate has been recognised in the period within operating expenses in the parent company income statement. This arose following the Group’s September 2011 Strategic Review where certain operations were identified as being non-core to the Group’s continuing strategy and an active disposal programme was initiated, with a number of subsidiaries and businesses being sold at 30 November 2011 and others identified as held for sale.
Refer to note 12 for further information on the impairment reviews performed and calculation of recoverable amount.
A further investment of £12.0m was made during the period in Group subsidiary RM Education plc in order to maintain RM Education’s capital position which had been impacted by impairments to loans to Group companies and businesses sold or identified as held for sale.
16. Inventories
At30 November
2011£’000
At30 September
2010£’000
(Restated)GroupComponents 4,840 9,461Work in progress 165 193Finished goods 13,822 15,425
18,827 25,079
17. Long-term contractsThe following disclosure relates to long-term contracts accounted for under the principles of IAS 18 Revenue and related linkage to IAS 11 Construction Contracts. These contracts do not represent the Group’s only long-duration business.
At30 November
2011£’000
At30 September
2010£’000
(Restated)GroupContracts in progress at the balance sheet date:Contract cost incurred plus recognised profits less recognised losses to date 321,597 376,768Less: progress billings (319,085) (368,800)
2,512 7,968
Amounts due from contract customers included in trade and other receivables 9,407 13,856Amounts due from contract customers included in trade and other payables (6,895) (5,888)
2,512 7,968
Within the prior year comparators, an amount of £5.3m has been reclassified from accruals to long-term contract balances reflecting the nature of the balance. This is shown above within amounts due from contract customers included within trade and other payables in the comparative period.

stock code: RM.RM plc Annual Report 201176
21269-04 28/01/2012 Proof 1
FINANCIAL STATEMENTS
Notes to the report and accounts continued
17. Long-term contracts continued
Further, contract cost incurred plus recognised profits less recognised losses to date and progress billings have been restated by £18.3m and £23.6m respectively to include certain contracts that were in progress at the balance sheet date but had been omitted.
Total revenue recognised from long-term contracts amounted to £101.1m (2010: £90.5m).
Long-term contract outcome – estimation uncertaintyThe Group’s long-term contracts represent a significant part of the Group’s business. As a result of the accounting for these contracts, as outlined in note 2 it is necessary for the Directors to assess the outcome of each contract and also estimate future costs and contracted revenues to establish ultimate contract profitability. Key judgements include performance indicator outcomes, future inflation rates and implementation/software development costs. Profit is then recognised based on these judgements and therefore, depending on the maturity of the contract portfolio, a greater or lesser proportion of Group profit will arise from long-term contracts.
18. Trade and other receivablesGroup CompanyAt
30 November 2011
£’000
At 30 September
2010£’000
At30 November
2011£’000
At30 September
2010£’000
CurrentFinancial assets:Trade receivables 43,938 75,076 – –Long-term contract balances (Note 17) 9,407 13,856 – –Other receivables 2,046 1,914 31 88Derivative financial instruments: forward foreign exchange contracts 67 73 – –Accrued income 782 1,636 – –Amounts owed by subsidiary undertakings – – – 10,020
56,240 92,555 31 10,108Non financial assets:Prepayments 6,030 5,283 – –
62,270 97,838 31 10,108
Non-currentFinancial assets:Other receivables – amount owed by joint venture undertaking 1,878 – – –Other receivables – other 712 – 712 –
2,590 – 712 –
Subsequent to the balance sheet date, the loan of £1,878,000 to joint venture undertaking Lego Education Europe Ltd was repaid on 3 January 2012 on the sale of the investment – refer to note 29b for further details.
Other non-current receivables includes £712,000 of gross amounts receivable from Newham Learning Partnership (PSP) Ltd and Essex Schools (Holdings) Ltd where amounts have been lent to the Group’s equity investments in BSF delivery companies.

stock code: RM.RM plc Annual Report 2011 77www.rmeducation.com
21269-04 28/01/2012 Proof 1
Busi
nes
s Re
view
Go
veRn
an
ceFi
na
nci
al
stat
emen
tsBu
sin
ess
Revi
ewG
ove
Rna
nce
Fin
an
cia
l st
atem
ents
18. Trade and other receivables continued
The currency profile of receivables is shown below:At
30 November 2011
£’000
At 30 September
2010£’000
At30 November
2011£’000
At30 September
2010£’000
Currency profile of receivables:Sterling 61,746 88,899 743 10,108US Dollar 941 5,110 – –Euro 1,878 1,870 – –Australian Dollar – 1,154 – –Danish Kroner – 455 – –Indian Rupee 295 350 – –
64,860 97,838 743 10,108
The Directors consider that the carrying amount of trade and other receivables approximates their fair value.
The average credit period on sales of goods is 62 days (2010: 46 days). An allowance has been made for estimated irrecoverable amounts of trade receivables of £2.2m (2010: £1.0m) based on management’s knowledge of the customer, externally available information and expected payment likelihood. This allowance has been determined by reference to specific receivable balances and past default experience. New customers are subject to credit checks, using third-party databases prior to orders being accepted. Analysis of type of customer:
Group
At30 November
2011£’000
At30 September
2010£’000
Government customers 23,974 56,251Commercial customers 19,964 18,825
43,938 75,076

stock code: RM.RM plc Annual Report 201178
21269-04 28/01/2012 Proof 1
FINANCIAL STATEMENTS
Notes to the report and accounts continued
18. Trade and other receivables continued
Analysis of allowance for estimated irrecoverable amounts of trade receivables:At
30 November2011
£’000
At30 September
2010£’000
GroupAt start of period 1,024 523Charge to income statement 1,734 585Utilised (421) (84)Transfer to held for sale (143) –
At end of period 2,194 1,024
Ageing of trade receivables:At
30 November2011
£’000
At30 September
2010£’000
GroupNeither impaired nor past due 19,839 45,632Not impaired but overdue by less than 60 days 15,520 23,801Not impaired but overdue by between 60 and 90 days 4,320 2,753Not impaired but overdue by more than 90 days 4,695 3,885Impaired 1,758 29Allowance for estimated irrecoverable amounts (2,194) (1,024)
43,938 75,076
Included within trade receivables are £0.6m (2010: £0.7m) of receivables relating to finance lease debt awaiting sale to a financial institution, which completed shortly after the balance sheet date. Upon sale the margin implicit will be recognised as a financing item within investment income.
All impaired receivables are overdue by more than 90 days.

stock code: RM.RM plc Annual Report 2011 79www.rmeducation.com
21269-04 28/01/2012 Proof 1
Busi
nes
s Re
view
Go
veRn
an
ceFi
na
nci
al
stat
emen
tsBu
sin
ess
Revi
ewG
ove
Rna
nce
Fin
an
cia
l st
atem
ents
19. Trade and other payablesGroup Company
At30 November
2011£’000
At 30 September
2010£’000
(Restated)
At30 November
2011£’000
At30 September
2010£’000
CurrentFinancial liabilities:Trade payables 16,206 34,379 – –Amounts due to subsidiary undertakings – – 4,505 10Other taxation and social security 5,307 12,341 – –Other payables – other 2,628 2,780 – –Derivative financial instruments:– Forward foreign exchange contracts 273 73 – –– Interest rate swap 72 189 – –Accruals 22,327 25,276 – 6Long-term contract balances (note 17) 6,895 5,888 – –Loan notes – 1,379 – 475Deferred consideration 195 195 195 195
53,903 82,500 4,700 686Non financial liabilities:Deferred income 23,878 24,054 – –
77,781 106,554 4,700 686
Non-currentFinancial liabilities:Other payables – deferred consideration – 195 – 195
– 195 – 195Non financial liabilities:Deferred income:– due after one year but within two years 3,627 3,014 – –– due after two years but within five years 2,576 2,633 – –– due after five years 83 76 – –
6,286 5,918 – 195
As explained in note 17, within the prior year comparators, an amount of £5.3m has been reclassified from accruals to long-term contract balances reflecting the nature of the balance.

stock code: RM.RM plc Annual Report 201180
21269-04 28/01/2012 Proof 1
FINANCIAL STATEMENTS
Notes to the report and accounts continued
19. Trade and other payables continued
The currency profile of payables is shown below:
Group CompanyAt
30 November 2011
£’000
At 30 September
2010£’000
At30 November
2011£’000
At30 September
2010£’000
Currency profile of payables:Sterling 81,258 99,595 4,700 881US Dollar 2,005 8,799 – –Australian Dollar – 1,328 – –Euro 20 2,371 – –New Zealand Dollar – 22 – –Indian Rupee 784 357 – –
84,067 112,472 4,700 881
Trade payables and accruals principally comprise amounts outstanding for trade purchases and ongoing costs. The average credit period taken for trade purchases is 35 days (2010: 40 days). The Companies Act 2006 requires creditor days to be calculated using the period end trade creditors balance as a ratio of expenditure in the period. However due to the Group’s seasonality, average creditor days are considered by management to give a better reflection of the Group’s payment profile. Creditor days calculated in accordance with the Companies Act 2006 is 28 days (2010: 49 days).
The Directors consider that the carrying amount of trade and other payables approximates to their fair value.
Following the re-estimation of amounts payable, calculated based on the performance of historic acquisitions, the Group settled £1,379,000 (2010: £2,161,000) of loan notes and £195,000 (2010: £1,680,000) of deferred consideration during the period. Loan notes are not secured on assets of the Group and are repayable subject to the performance conditions relating to the acquisition being met.
The maturity profile of payables is presented below:
Group CompanyAt
30 November 2011
£’000
At 30 September
2010£’000
At30 November
2011£’000
At30 September
2010£’000
Maturity profile of payables:– due within one year 77,781 106,554 4,700 686– due after one year but within two years 3,627 3,209 – 195– due after two years but within five years 2,576 2,633 – –– due after five years 83 76 – –
84,067 112,472 4,700 881

stock code: RM.RM plc Annual Report 2011 81www.rmeducation.com
21269-04 28/01/2012 Proof 1
Busi
nes
s Re
view
Go
veRn
an
ceFi
na
nci
al
stat
emen
tsBu
sin
ess
Revi
ewG
ove
Rna
nce
Fin
an
cia
l st
atem
ents
20. Financial instrumentsCarrying of financial assets and financial liabilities:
Group Company
Notes
At30 November
2011£’000
At 30 September
2010£’000
At30 November
2011£’000
At30 September
2010£’000
Financial assetsTrade and other receivables (current) 18 56,240 92,555 31 10,108Trade and other receivables (non-current) 18 2,590 – 712 –Assets held for sale (current) 24b 6,791 – – –Cash and cash equivalents 24,529 13,814 – –
90,150 106,369 743 10,108
All financial assets are classified as loans and receivables except for the forward foreign exchange contract of £67,000 (2010: £73,000) which is classified as at fair value through profit or loss.
The Directors consider that the carrying amount of financial assets approximates their fair value.
Group Company
Notes
At30 November
2011£’000
At 30 September
2010£’000
(Restated)
At30 November
2011£’000
At30 September
2010£’000
Financial liabilitiesTrade and other payables (current) 19 53,903 82,500 4,700 686Trade and other payables (non-current) 19 – 195 – 195Liabilities directly associated with assets classified as held-for-sale 24b 2,914 – – –Provisions (current) 21 7,752 536 126 –Provisions (non-current) 21 5,661 678 – –Bank loans 13,026 11,507 – –
83,256 95,416 4,826 881
All liabilities classified as financial liabilities are held at amortised cost except for forward foreign exchange contracts of £273,000 (2010: £73,000) which are classified at fair value through profit or loss and the interest rate swap of £72,000 (2010: £189,000) which is designated and effective as a cash flow hedge.
Group financial liabilities for the period to 30 September 2010 have been restated to include the Group’s provisions which are considered financial in nature.
The main risks arising from the Group’s financial assets and liabilities are market risk (foreign currency risk and interest rate risk), credit risk and liquidity risk. The Board reviews and agrees policies on a regular basis for managing the risks associated with these assets and liabilities.
It is, and has been throughout the period under review, the Group’s policy that no trading in financial instruments shall be undertaken and the Group does not hold or issue derivative financial instruments for speculative purposes.

stock code: RM.RM plc Annual Report 201182
21269-04 28/01/2012 Proof 1
FINANCIAL STATEMENTS
Notes to the report and accounts continued
20. Financial instruments continued
Foreign currency riska) TranslationDuring the period the Group has held operations in the United States of America, Australia and India and trades within Europe, hence exposing the Group to foreign exchange risk on non-Sterling assets, liabilities and cash flows. The Group’s acquisition borrowing facility includes an amount of £6,580,000 ($10,350,000) denominated in US Dollars and also long-term inter-group loans of £10,178,000 ($16,009,000) denominated in US Dollars and the Group applies net investment hedging to the balances.
The Group also maintains foreign currency denominated cash accounts, but only holds balances required to settle its payables.
b) TransactionOperations are also subject to foreign exchange risk from transactions in currencies other than their functional currency, and once recognised, the revaluation of foreign currency denominated assets and liabilities. Principally, this relates to transactions arising in US Dollars and Indian Rupees. Specifically, the Group purchases significant amounts of its components in US Dollars and operating costs in the Group’s subsidiary RM Education Solutions India are in Indian Rupees.
In order to manage these risks the Group enters into derivative transactions in the form of forward foreign currency contracts. To manage the US Dollar to Sterling risk, the forward foreign currency contracts are designed to cover 80-90% of forecast currency denominated purchases and the contracts are renewed on a revolving basis of approximately three months. To manage the Indian Rupee to Sterling risk, the contracts are designed to cover 70% of forecast Rupee costs and are renewed on a revolving basis of approximately eleven to twelve months.
At the balance sheet date, total notional amount of outstanding forward foreign exchange contracts that the Group has committed to are as below:
At 30 November 2011 At 30 September 2010Nominal
value£’000
Fair value£’000
Nominalvalue£’000
Fair value£’000
Forward foreign currency exchange contracts 14,300 (206) 10,709 –
The fair value of the derivative financial instruments is estimated by discounting the future contracted cash flow, using readily available market data and represents a level 2 measurement in the fair value hierarchy under IFRS 7. These fair value gains/(losses) are included within trade and other receivables and trade and other payables respectively.
Of these, forward foreign currency exchange contracts with a nominal value of £9.8m (2010: £nil) have been designated as effective hedges in accordance with IAS 39 Financial Instruments: Recognition and Measurement. The movement in fair value of hedged derivative financial instruments was a credit of £27,000 (2010: £nil) which has been recognised in other comprehensive income and presented in the hedging reserve in equity.
The remaining forward foreign currency exchange contracts with a nominal value of £4.5m (2010: £10.7m) have not been designated as effective hedges in accordance with IAS 39 Financial Instruments: Recognition and Measurement. The movement in the fair value of these instruments of £232,000 (2010: £160,000) have therefore been charged to income.
Commercially effective hedges may continue to lead to income statement volatility in the future.

stock code: RM.RM plc Annual Report 2011 83www.rmeducation.com
21269-04 28/01/2012 Proof 1
Busi
nes
s Re
view
Go
veRn
an
ceFi
na
nci
al
stat
emen
tsBu
sin
ess
Revi
ewG
ove
Rna
nce
Fin
an
cia
l st
atem
ents
20. Financial instruments continued
c) Foreign exchange rate sensitivityThe following table details how the Group’s income and equity would increase/(decrease) if there was a 10% increase in the amount of the respective currency which could be purchased with £1 Sterling (assuming all other variables remain constant), for example from $1.57:£1 to $1.73:£1 at the balance sheet date. The sensitivity analysis includes only outstanding foreign currency denominated monetary items and adjusts their translation at the period end for a 10% change in foreign currency rates and is shown after considering the impact of the Group’s foreign exchange forward contracts and net investment hedge positions. A positive number indicates an increase in profit and equity where Sterling strengthens 10% against the relevant currency. For a 10% weakening of Sterling against the relevant currency, there would be a comparable impact on the profit and equity and the balances below would be negative.
14 months to30 November
2011Income
sensitivity£’000
At30 November
2011Equity
sensitivity£’000
12 months to30 September
2010Income
sensitivity£’000
At30 September
2010Equity
sensitivity£’000
10% increase in foreign exchange rates against SterlingUS Dollar 94 844 335 432Australian Dollar – – 16 (80)Indian Rupee 66 (154) 1 (356)Euro (169) (165) 46 (108)Other – – (39) (33)
In management’s opinion, the sensitivity analysis is unrepresentative of the inherent foreign exchange risk as the year end exposure does not reflect the exposure during the period, as the analysis does not reflect management’s proactive monitoring of the exchange risk.
Interest rate risk The only significant interest bearing financial assets held by the Group are cash and cash equivalents which comprise cash held by the Group and Company and short-term bank deposits with an original maturity of three months or less. Surplus sterling balances are invested in the money market, or with financial institutions on maturing terms from within 24 hours up to a period of three months with interest earned based on the relevant national inter-bank rates available at the time of investing. During the period, average cash and cash equivalents were £6.1m (2010: £0.7m), and the maximum bank overdraft was £11.8m (2010: £26.8m), excluding amounts drawn under the acquisition facility. The interest and currency profile of cash and cash equivalents is shown below:
At 30 November 2011 At 30 September 2010Floating rate
£’000Interest free
£’000Total
£’000Floating rate
£’000Interest free
£’000Total
£’000Sterling 18,761 1,189 19,950 2,405 5,830 8,235US Dollar 1 3,931 3,932 455 2,976 3,431Australian Dollar – – – 26 910 936Euro – 180 180 325 350 675Danish Kroner – 16 16 – 99 99Indian Rupee 74 369 443 201 221 422New Zealand Dollar – – – – 16 16Polish Zloty – 8 8 – – –
18,836 5,693 24,529 3,412 10,402 13,814
The Group’s main interest bearing financial liability is an acquisition facility. A working capital overdraft facility has been used during the period but was not drawn-down at 30 November 2011 (2010: £Nil).

stock code: RM.RM plc Annual Report 201184
21269-04 28/01/2012 Proof 1
FINANCIAL STATEMENTS
20. Financial instruments continued
Interest payable on the acquisition facility is linked, normally on a quarterly basis, to either national inter-bank rates or HSBC base rates, with the chosen rate being at the Group’s discretion. On 13 July 2009 the Group entered into a US$10,000,000 interest rate swap contract maturing in July 2012 to sell a proportion of this floating rate liability in exchange for a quarterly settled fixed rate liability of 2.03%. The liability fair value of this contract at 30 November 2011 has been designated as an effective hedge against outstanding US Dollar borrowings on the acquisition facility. The fair value of the interest rate swap is estimated by using readily available market data and represents a level 2 measurement in the fair value hierarchy under IFRS 7. The loss arising of £117,000 (2010: £128,000) has been included in the hedging reserve.
In addition a commitment fee and £49,000 arrangement fee are also payable, spread on a quarterly basis over the duration of the facility.
The weighted average effective interest rates at the balance sheet date were as follows:
At 30 November 2011 At 30 September 2010
Floating rate£’000
Weightedaverage
interest rate%
Floating rate£’000
Weightedaverage
interest rate%
Financial assets:Cash and cash equivalents 18,836 0.27 13,814 0.30Trade and other receivables (non-current) 2,590 5.77 - -
Financial liabilities:Bank loans (13,026) 1.24 (11,507) 1.25Issued loan notes – – (1,379) 5.12
Deferred consideration (195) – (390) –
Interest rate risk sensitivity (assuming all other variables remain constant):
14 months to30 November
2011Income
sensitivity£’000
At30 November
2011Equity
sensitivity£’000
12 months to30 September
2010Income
sensitivity£’000
At30 September
2010Equity
sensitivity£’000
1% increase in interest rates 51 51 34 341% decrease in interest rates (51) (51) (34) (34)
Notes to the report and accounts continued

stock code: RM.RM plc Annual Report 2011 85www.rmeducation.com
21269-04 28/01/2012 Proof 1
Busi
nes
s Re
view
Go
veRn
an
ceFi
na
nci
al
stat
emen
tsBu
sin
ess
Revi
ewG
ove
Rna
nce
Fin
an
cia
l st
atem
ents
20. Financial instruments continued
Credit riskThe Group’s principal financial assets are bank balances and trade and other receivables. The Group’s credit risk is primarily attributable to its trade receivables. Credit checks are performed on new customers and before credit limits are increased. The amounts presented in the balance sheet are net of allowances for doubtful receivables.
The credit risk on liquid funds and derivative financial instruments is limited because the counterparties are banks with high credit-ratings assigned by international credit-rating agencies. The Group has no significant concentration of credit risk, with exposure spread over a large number of counterparties and customers and a large proportion are ultimately backed by the UK Government.
The Group’s maximum exposure to credit risk at 30 November 2011 is £83.4m (2010: £106.4m). The Group does not hold any collateral.
Liquidity riskCash is managed to ensure that sufficient liquid funds are available with a variety of counterparties, through short-, medium- and long-term cash flow forecasting.
The Group meets its seasonal working capital requirements through overdraft facilities. At 30 November 2011 none of these facilities were drawn-down (2010: £nil). At the balance sheet date, the Group has an annual unsecured overdraft facility of $39.5m (set at a minimum of £25m) with HSBC. In addition to the HSBC working capital facilities, the Group also has a £3m working capital facility with Barclays bank which is reviewed annually each March. These facilities combined gave £28m of working capital funding capacity during the period.
At the balance sheet date, the Group also has a committed acquisition borrowing facility of £25m with HSBC with a scheduled expiry in July 2013. At 30 November 2011 £13.0m of this facility was drawn down (30 September 2010: £11.5m), with the increase in the period being used to fund the payment of loan notes and deferred consideration (note 20). The facility can be repaid before expiry, at the discretion of the Group. Subsequent to the balance sheet date, on 27 January 2012 a £30m three year committed revolving credit facility was agreed with Barclays bank which will replace both the HSBC overdraft facility and acquisition borrowing facilities. The £3m Barclays overdraft facility will be retained. See note 30 for further details.
Capital risk managementThe Group manages capital employed as shareholders’ equity less net funds less deferred consideration:
At30 November
2011£’000
At30 September
2010£’000
GroupShareholders’ equity 28,518 66,145Less: net funds less deferred consideration (11,308) (538)
Capital employed 17,210 65,607
At the balance sheet date, the Group had borrowings under the acquisition facility. During the period the Group also utilised facilities to finance its seasonal working capital requirements although none were drawn at 30 November 2011. The financial covenants relating to the HSBC acquisition facility were all comfortably met during the period to 30 November 2011 and in the period to the signing of the accounts. The covenants under the Group’s new facility, agreed with Barclays bank subsequent to the balance sheet date (note 30) are very similar to the HSBC requirements, containing measurements against net debt, which is to be less than 2.5 times earnings before interest, tax, depreciation and amortisation (EBITDA) and net debt interest, which is to be less than 0.25 times EBITDA. Based on the results for 2011 and management’s plan for 2012 and subsequent years, there is adequate headroom over these covenant measures.
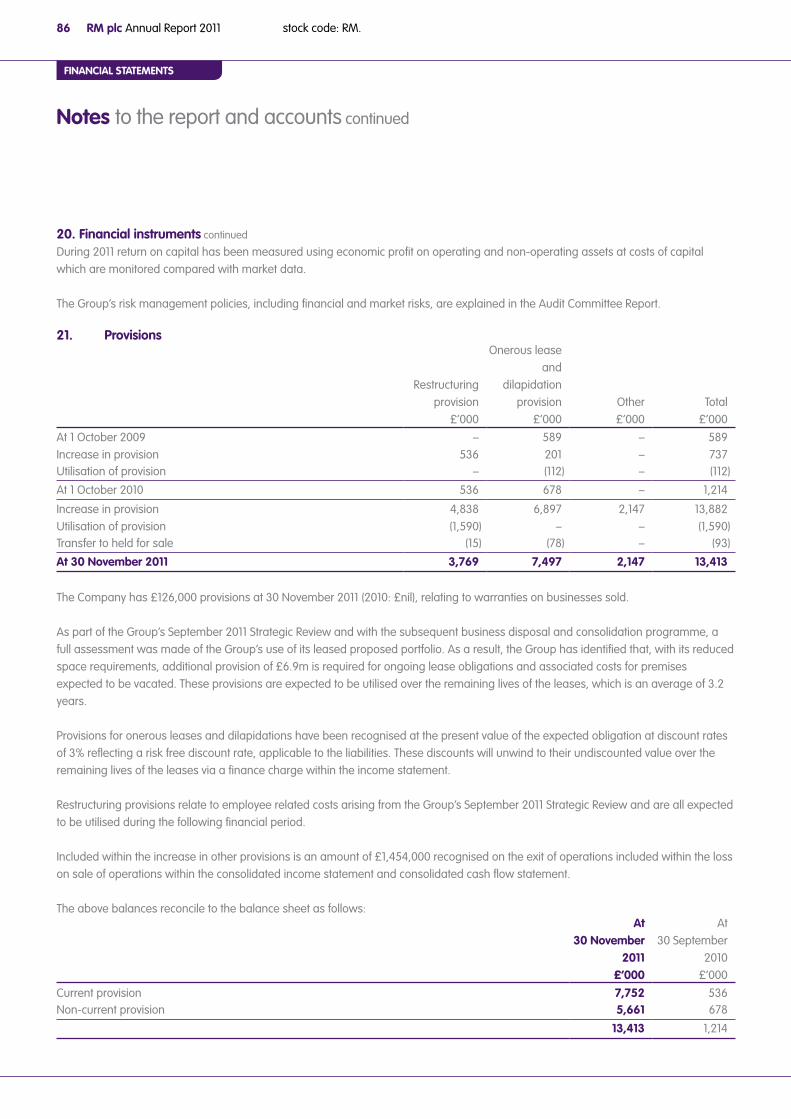
stock code: RM.RM plc Annual Report 201186
21269-04 28/01/2012 Proof 1
FINANCIAL STATEMENTS
20. Financial instruments continued
During 2011 return on capital has been measured using economic profit on operating and non-operating assets at costs of capital which are monitored compared with market data.
The Group’s risk management policies, including financial and market risks, are explained in the Audit Committee Report.
21. Provisions
Restructuringprovision
£’000
Onerous leaseand
dilapidationprovision
£’000Other£’000
Total£’000
At 1 October 2009 – 589 – 589Increase in provision 536 201 – 737Utilisation of provision – (112) – (112)
At 1 October 2010 536 678 – 1,214
Increase in provision 4,838 6,897 2,147 13,882Utilisation of provision (1,590) – – (1,590)Transfer to held for sale (15) (78) – (93)
At 30 November 2011 3,769 7,497 2,147 13,413
The Company has £126,000 provisions at 30 November 2011 (2010: £nil), relating to warranties on businesses sold.
As part of the Group’s September 2011 Strategic Review and with the subsequent business disposal and consolidation programme, a full assessment was made of the Group’s use of its leased proposed portfolio. As a result, the Group has identified that, with its reduced space requirements, additional provision of £6.9m is required for ongoing lease obligations and associated costs for premises expected to be vacated. These provisions are expected to be utilised over the remaining lives of the leases, which is an average of 3.2 years.
Provisions for onerous leases and dilapidations have been recognised at the present value of the expected obligation at discount rates of 3% reflecting a risk free discount rate, applicable to the liabilities. These discounts will unwind to their undiscounted value over the remaining lives of the leases via a finance charge within the income statement.
Restructuring provisions relate to employee related costs arising from the Group’s September 2011 Strategic Review and are all expected to be utilised during the following financial period.
Included within the increase in other provisions is an amount of £1,454,000 recognised on the exit of operations included within the loss on sale of operations within the consolidated income statement and consolidated cash flow statement.
The above balances reconcile to the balance sheet as follows:At
30 November2011
£’000
At30 September
2010£’000
Current provision 7,752 536Non-current provision 5,661 678
13,413 1,214
Notes to the report and accounts continued

stock code: RM.RM plc Annual Report 2011 87www.rmeducation.com
21269-04 28/01/2012 Proof 1
Busi
nes
s Re
view
Go
veRn
an
ceFi
na
nci
al
stat
emen
tsBu
sin
ess
Revi
ewG
ove
Rna
nce
Fin
an
cia
l st
atem
ents
22. Share capitalAllotted, called-up and fully paid ordinary shares of 2p each:
Number’000 £’000
At 1 October 2009 93,172 1,863Issued on options 248 5
At 1 October 2010 93,420 1,868Issued on options 48 1
At 30 November 2011 93,468 1,869
47,750 (2010: 248,439) ordinary shares of 2p each were allotted in the period, for consideration of £46,000 (2010: £198,000). The Company has the authority to repurchase 9,342,005 shares (2010: 9,317,161) and repurchased nil shares during the period (2010: nil).
The Company has one class of ordinary shares which carries no right to fixed income.
23. Own sharesThe RM plc Employee Share Trust (EST) was established in March 2003 to hedge the future obligations of the Group in respect of shares awarded under the RM plc Co-Investment Plan, RM plc Performance Share Plan and Deferred bonus plan. The trustee of the EST, Computershare Trustees (C.I.) Ltd, purchases the Company’s ordinary shares in the open market with financing provided by the Company, as required, on the basis of regular reviews of the anticipated share-based payment liabilities of the Group. The EST has waived any entitlement to the receipt of dividends in respect of all of its holding of the Company’s ordinary shares. The EST’s waiver of dividends may be revoked or varied at any time.
NumberCost
£’000At 1 October 2009 773,679 1,246Acquired in period 1,941,697 3,213Disposed on exercise of co-investment plan and deferred bonus plan (409,026) (654)
At 1 October 2010 2,306,350 3,805Acquired in period 136,609 212Disposed on exercise of co-investment plan and deferred bonus plan (500,402) (815)
At 30 November 2011 1,942,557 3,202
These shares are shown at weighted average cost within equity in the Group and Company balance sheets.
24. Held for sale and exited businessesAs a result of the September 2011 Strategic Review, the Board concluded that several Group subsidiaries and businesses would be disposed. These have been determined to not meet the IFRS 5 Non-Current Assets Held for Sale and Discontinued Operations definition of discontinued operations

stock code: RM.RM plc Annual Report 201188
21269-04 28/01/2012 Proof 1
FINANCIAL STATEMENTS
24. Held for sale and exited businesses continued
a) Loss on disposalsOn 21 October 2011, the Group entered into a sale agreement to dispose of the hardware element of its US business for a cash consideration of £2,872,000. On 8 November 2011, the Group entered into a sale agreement to dispose of its subsidiary RM Asia-Pacific for a cash consideration of £903,000. The net assets disposed and the impact on the income statement of these disposals are detailed below:
RM Asia Pacific£’000
US hardware£’000
Total£’000
14 months to 30 November 2011Goodwill 2,382 1,721 4,103Other intangible assets – 411 411Property, plant and equipment 280 113 393Deferred tax liabilities – (156) (156)Inventories 26 2,031 2,057Trade and other receivables 1,966 379 2,375Trade and other payables (2,171) (83) (2,254)
Net assets disposed 2,513 4,416 6,929
Other exit costs 127 2,519 2,646Foreign exchange reserve – reclassified to income (1,217) (192) (1,409)
Total consideration 903 2,872 3,775Loss on disposal (520) (3,871) (4,391)
Other exit costs principally relate to asset impairments, and termination and exit costs and provisions.
b) Held for sale operationsAt the balance sheet date certain businesses identified for disposal were being actively marketed for sale but had not been disposed. These are recorded as held for sale:
Investment in joint ventureAt the balance sheet date the Group held a 49% equity holding with equivalent voting power in Lego Education Europe Ltd, a joint venture incorporated in the United Kingdom. The joint venture was incorporated on 9 September 2010 with a financial year end of 31 December. The joint venture commenced trading on 1 January 2011 and the results for the 11 months ended 30 November 2011 have been equity accounted in the consolidated financial statements.
Following the Group’s September 2011 Strategic Review, it was concluded that the investment in joint venture was non-core to the Group’s continuing strategy and an active disposal programme was initiated. At 30 November 2011, the investment in joint venture was classified as held for sale and was subsequently disposed on 3 January 2012.
Notes to the report and accounts continued

stock code: RM.RM plc Annual Report 2011 89www.rmeducation.com
21269-04 28/01/2012 Proof 1
Busi
nes
s Re
view
Go
veRn
an
ceFi
na
nci
al
stat
emen
tsBu
sin
ess
Revi
ewG
ove
Rna
nce
Fin
an
cia
l st
atem
ents
24. Held for sale and exited businesses continued
Investment in subsidiariesThe following subsidiaries were identified as held-for-sale at 30 November 2011:
Principal activity Type of sale
Proportion of voting rightsand shares held
at 30 November 2011AMI Education Solutions Ltd Software, services and systems Sale of shares 100%Isis Concepts Ltd Resource supply n/a 100%DACTA Ltd Resource supply Sale of trade and assets 100%
These operations, which are anticipated to be sold within 12 months, have been classified as a disposal group held for sale and presented separately in the balance sheet. The estimated proceeds on disposal are expected to be lower than the book value of the related net assets and accordingly an impairment of £5.0m has been recognised to goodwill and acquisition related intangible assets on the classification of these operations as held for sale.
The major classes of assets and liabilities comprising the operations classified as held for sale are as follows:
Net assetsbefore
impairment onclassification to
held-for-sale£’000
Impairment onclassification to
held-for-sale £’000
Net assetsheld-for-sale
at30 November
2011Total
£’000Goodwill 6,532 (4,580) 1,952Intangible assets 1,373 (443) 930Property, plant and equipment 319 – 319Deferred tax assets 33 – 33Investment in joint venture 37 – 37Inventories 727 – 727Trade and other receivables 2,793 – 2,793
Total assets held-for-sale 11,814 (5,023) 6,791
Trade and other payables (2,617) – (2,617)Provisions (93) – (93)Deferred tax liabilities (204) – (204)Total liabilities directly associated with assets held-for-sale (2,914) – (2,914)Net assets of disposal group 8,900 (5,023) 3,877

stock code: RM.RM plc Annual Report 201190
21269-04 28/01/2012 Proof 1
FINANCIAL STATEMENTS
25. Commitmentsa) Operating leasesThe Group leases certain assets under operating leases and recognised expenses in the period of:
14 months to 30 November
2011£’000
12 months to30 September
2010£’000
Minimum lease payments under operating leases recognised as an expense in the period/year 6,986 6,586
At the balance sheet date, the Group had outstanding commitments for future minimum lease payments under non-cancellable operating leases, which fall due as follows:
At30 November
2011£’000
At30 September
2010£’000
Within one year 2,984 4,560In the second to fifth years inclusive 9,289 13,182After five years 6,308 7,034
Operating lease payments represent rentals payable by the Group for certain of its office properties and include the period up to the earliest commercial exit date which is normally the first break clause of the lease. The balances disclosed above exclude commitments of £3.1m which have been included within onerous lease provisions at the balance sheet date. Minimum expected sub-lease payments receivable, until earliest termination, are £nil (2010: £nil). The terms of these leases are subject to renegotiation on an average term of 3.3 years (2010: 3.7 years) and rentals are fixed for an average of 3.6 years (2010: 4.9 years). If all rights of renewals within the operating leases are included, the leases have an average term of 12.5 years (2010: 11.2 years). Minimum expected sub-lease payments receivable, until earliest termination, are £nil (2010: £nil).
b) Capital commitmentsThe Group has the following capital expenditure commitments:
At30 November
2011£’000
At30 September
2010£’000
Contracted for but not provided for 1,257 3,518
26. Guarantees and contingent liabilitiesa) GuaranteesThe Company has entered into guarantees relating to the performance and liabilities of its subsidiaries’ major contracts. The Directors are not aware of any circumstances that have given rise to any liability under such guarantees and consider the possibility of any arising to be remote. A fair value of £nil (2010: £nil) has been applied to these guarantees.
b) Contingent liabilitiesThe Group has provided performance guarantees and indemnities relating to performance bonds and letters of credit issued by its banks on its behalf, in the ordinary course of business. The Directors are not aware of any circumstances that have given rise to any liability under such guarantees and indemnities and consider the possibility of any arising to be remote. A fair value of £nil (2010: £nil) has been applied to these guarantees and indemnities.
Notes to the report and accounts continued

stock code: RM.RM plc Annual Report 2011 91www.rmeducation.com
21269-04 28/01/2012 Proof 1
Busi
nes
s Re
view
Go
veRn
an
ceFi
na
nci
al
stat
emen
tsBu
sin
ess
Revi
ewG
ove
Rna
nce
Fin
an
cia
l st
atem
ents
27. Share-based paymentsThe Group operates a number of executive and employee equity settled share-based payment schemes including co-investment plans, performance share plans, deferred bonus plans, share options and staff share schemes. The fair values of these schemes have been assessed using Black-Scholes and Monte-Carlo models, as appropriate to the scheme, at the date of grant. The fair values of the schemes are expensed over the period between grant and vesting.
Share-based payment awards exercised in the period disclosed in the statement of changes in equity represents the impact on Retained earnings of releasing the fair value charge accrued under IFRS 2 Share-based payment, which for the co-investment scheme and deferred bonus scheme is partially matched by the release of own-shares held.
a) Employee share option schemesThe Group has in place share option schemes which issue options over shares in the Company. There are various performance conditions attaching to share option grants which are yet to vest, including EPS, share-price and share purchase conditions. Options are forfeited if the employee leaves the Group before the options vest
Details of share options outstanding during the period/year are as follows:
Number of shareoptions
Weighted averageexercise price
£
Weighted averageexercise price at exercise
£
Exercise price range
£Outstanding at 1 October 2009 4,469,403 2.53 0.72 - 7.62Granted during the period 647,000 1.65Lapsed during the period (1,042,764) 5.34Exercised during the period (248,439) 0.80 1.67
Outstanding at 1 October 2010 3,825,200 1.72 0.79 - 2.05Granted during the period 1,000,000 0.51Lapsed during the period (486,033) 1.72Exercised during the period (47,750) 0.96 1.54
Outstanding at 30 November 2011 4,291,417 1.45 0.51 - 2.05
Included within the total outstanding options at 30 November 2011 are 2,286,750 (1 October 2010: 1,615,200) options which are exercisable.
The options outstanding at 30 November 2011 had a weighted average contractual life of 6.7 years (2010: 6.9 years).
Included within the above balances are options over 37,650 shares (2010: 62,700 shares) for which a charge has not been recognised in accordance with IFRS 2 as the options were granted on or before 7 November 2002.
In the 14 months ended 30 November 2011, the only option grant made was on 26 October 2011 to Martyn Ratcliffe on his appointment as Executive Chairman. The options are exercisable at a price equal to the mid-market close price on 25 October 2011. The estimated fair value of the options granted is £0.16 per option, determined using a Monte-Carlo model owing to the share-price and share purchase performance conditions within the award. It has been assumed that the share purchase condition will be met. The fair value calculation is sensitive to the share-price volatility input assumption, with a 10% increase or decrease in this assumption giving rise to a respective increase or decrease of £0.04 per option. In the prior period an Employee award was made on 2 December 2009 with an estimated fair value of £0.29 per option determined using a Black-Scholes model. Fair values are charged to income evenly over the vesting period. Inputs to the models are as follows:

stock code: RM.RM plc Annual Report 201192
21269-04 28/01/2012 Proof 1
FINANCIAL STATEMENTS
27. Share-based payments continued
26 October2011
Executive Chairman
award
2 December2009
Employeeaward
Share price at grant 0.59 1.72Exercise price 0.51 1.65Expected volatility 45% 23%Expected life 3 years 5 yearsRisk free rate 0.9% 2.7%Expected dividends 4.4% 3.6%
Expected volatility was determined by calculating the historic volatility of the Company’s share price over the previous five years. The expected life used in the model has been adjusted based on management’s best estimate, for the effects of non-transferability, exercise restrictions and behavioural considerations.
b) Co-investment plansThe Group has in place co-investment plans for the remuneration of senior management. In the period to 30 November 2011, no co-investment rights were granted (2010: none). Details of co-investment plan maximum matching share commitments are included below:
Maximumnumber ofmatching
sharesOutstanding at 1 October 2009 2,805,564Lapsed during the period (946,206)Exercised during the period (284,928)
Outstanding at 1 October 2010 1,574,430Lapsed during the period (466,282)Exercised during the period (243,098)
Outstanding at 30 November 2011 865,050
The weighted average market price at the date of vesting of co-investment matching shares during the period was £1.54 (2010: £1.59). The plans outstanding at 30 November 2011 had a weighted average contractual life of 16 days (2010: 0.9 years). All of the above instruments lapsed on 16 December 2011 owing to the non-achievement of the plan performance conditions.
In November 2010, the Remuneration Committee used its discretion to waive the share price underpin performance condition in relation to the EPS proportion of the Co-investment Plans maturing in December 2010 and December 2011 (subsequently moved to February 2012 owing to year-end change). Under IFRS 2 Share-based Payment, this has been treated as a modification of the award and an additional fair value has been added to the charges for these plans. The additional fair values were calculated using Monte-Carlo models and the resultant charges recorded to income in the period.
In March 2003 the Company established the RM plc Share Trust to hedge the future obligations of the Group in respect of shares awarded under the RM plc Co-Investment Plan. The trustees periodically purchase shares on the open market using funds provided by the Group. These shares are used to hedge the estimated liability but until vesting represent own shares held – see note 23.
Notes to the report and accounts continued

stock code: RM.RM plc Annual Report 2011 93www.rmeducation.com
21269-04 28/01/2012 Proof 1
Busi
nes
s Re
view
Go
veRn
an
ceFi
na
nci
al
stat
emen
tsBu
sin
ess
Revi
ewG
ove
Rna
nce
Fin
an
cia
l st
atem
ents
27. Share-based payments continued
c) Performance share plansThe Group uses performance share plans for the remuneration of senior management. Executive Management and Business Unit Directors participating within the plan are normally awarded shares worth up to 100% of their base salary which are subject to various vesting conditions, including EPS and total shareholder return conditions. Other senior management are awarded between 3,000 and 10,000 shares which are subject to EPS vesting conditions. The vesting period for the plan is three years. If the vesting conditions are not met or the participants leave the Group’s employment then the award lapses. Details of performance share plan shares during the period are included below:
Maximumnumber of
awarded shares
Marketprice on
grantOutstanding at 1 October 2009 –Granted during the period 1,704,728 1.71Lapsed during the period (150,583)
Outstanding at 1 October 2010 1,554,145Granted during the period 2,333,269 1.51Lapsed during the period (907,674)Exercised during the period (7,248)
Outstanding at 30 November 2011 2,972,492
The plan outstanding at 30 November 2011 had a weighted average contractual life of 1.8 years (2010: 2.4 years).
In the period to 30 November 2011 performance share plan rights were granted on 10 December 2010 (2010: 4 March 2010). The fair values are determined using Monte-Carlo models which give £1.29 per share for EPS vesting conditions and for TSR vesting conditions, £0.86 per share (2010: £0.63 per share for EPS vesting conditions and £0.96 per share for TSR vesting conditions) and are charged to income evenly over the vesting period with adjustments made for non-market based vesting conditions. Inputs to the models are as follows:
10 December 2010 4 March 2010EPS TSR EPS TSR
Share price at grant 1.51 1.51 1.71 1.71Exercise price Nil Nil Nil NilExpected life 3 years 3 years 3 years 3 yearsExpected dividends 4.3% 4.3% 3.6% 3.6%
The expected life used in the model has been adjusted based on management’s best estimate, for the effects of non-transferability and exercise restrictions.
Comparator company volatility is assessed using annualised, daily historic TSR growth assessed over a period prior to the date of grant that corresponds to the performance period of three years. The company correlation uses historic pairwise correlations of the companies over a three year period. The fair value of the TSR element is based on a large number of stochastic projections of Company and comparator TSR.
In November 2010, the Remuneration Committee used its discretion to waive the share price underpin performance condition in relation to the EPS proportion of the Performance Share Plan maturing in March 2012. Under IFRS 2 Share-based Payment, this has been treated as a modification of the award and an additional fair value has been added to the charges for these plans. The additional fair values were calculated using Monte-Carlo models and the resultant charges recorded to income in the period.

stock code: RM.RM plc Annual Report 201194
21269-04 28/01/2012 Proof 1
FINANCIAL STATEMENTS
27. Share-based payments continued
In order to hedge the Group’s liability to provide shares in the Company under the performance share plans the trustees periodically purchase shares on the open market using funds provided by the Group. These shares are used to hedge the estimated liability but until vesting represent own shares held – see note 23.
d) Deferred bonus planThe Group has in place a deferred bonus plan for the remuneration of Executive Directors. This plan was not used for the period ended 30 November 2011. Under historic plans 40% of the Directors’ annual cash bonus was deferred in ordinary shares for a period of three years and vested at the expiry of the same period. Any unvested shares lapse immediately if the Executive Director ceases to be an employee of the Group in circumstances where they would not be considered to be a “good leaver” under the rules of the plan.Details of deferred bonus grants outstanding during the year are as follows:
Numberof bonus
shares
Market priceon setting
entitlementMarket price
on grantOutstanding at 1 October 2009 356,914Granted during the period in relation to 2009 87,533 £1.63 £1.59Released during the period (124,098)Lapsed during the period (470)
Outstanding at 1 October 2010 319,879Granted during the period in relation to 2010 120,476 £1.57 £1.60Released during the period (250,056)Lapsed during the period (3,690)
Outstanding at 30 November 2011 186,609
The number of shares outstanding at 30 November 2011 had a weighted average contractual life of 1.1 years (2010: 1.2 years).
In the 14 months ended 30 November 2011 an award was granted under the deferred bonus plan on 15 December 2010 (2010: 15 December 2009). The estimated fair value of the grant is £1.52 per bonus share (2010: £1.51 per bonus share). This fair value is determined using a Black–Scholes model and charged to income evenly over the vesting period adjusted for expected survivorship. Inputs to the model are as follows:
15 December2010
15 December2009
Share price at grant £1.60 £1.59Exercise price Nil NilExpected life 3 years 3 yearsRisk free rate 0.9% 2.0%Expected dividends 4.0% 3.9%
The expected life used in the model has been adjusted based on management’s best estimate, for the effects of non-transferability, exercise restrictions and behavioural considerations.
In order to hedge the Group’s liability to provide shares in the Company under the deferred bonus plans the trustees periodically purchase shares on the open market using funds provided by the Group. These shares are used to hedge the estimated liability but until vesting represent own shares held – see note 23.
Notes to the report and accounts continued

stock code: RM.RM plc Annual Report 2011 95www.rmeducation.com
21269-04 28/01/2012 Proof 1
Busi
nes
s Re
view
Go
veRn
an
ceFi
na
nci
al
stat
emen
tsBu
sin
ess
Revi
ewG
ove
Rna
nce
Fin
an
cia
l st
atem
ents
27. Share-based payments continued
e) Staff share schemesThe RM plc 2002 Staff Share Scheme has historically made annual grants shares in RM plc to almost all employees. No award was made in the period to 30 November 2011. The shares vest to the employees after a minimum of three years, but normally after five years. The scheme is an HMRC approved employee share scheme constituted under a trust deed and was introduced to replace the RML Staff Share Scheme.
At grant, the Trustees of the scheme purchase shares on the open market and hold these in trust on behalf of the employees. The schemes hold the following shares in RM plc:
Numberof shares
Weighted average cost
£’000RM plc 2002 Staff Share Scheme 477,619 796RML Staff Share Scheme 1,361 1
At 1 October 2009 478,980 797
Purchased 86,510 149Vested (41,856) (89)
RM plc 2002 Staff Share Scheme 522,273 856RML Staff Share Scheme 1,361 1
At 1 October 2010 523,634 857
Purchased – –Vested (67,064) (110)
RM plc 2002 Staff Share Scheme 455,209 747RML Staff Share Scheme 1,361 1
At 30 November 2011 456,570 748
These shares are held for the benefit of staff and are therefore not consolidated into the Group or Company balance sheets.
Performance conditions – estimation uncertaintyAssigning a fair value charge to share-based payments requires estimation of the projected share price, the number of instruments which are likely to vest and, for non-market based performance conditions, continuing reassessment of these estimates.
28. Retirement benefit schemesDefined contribution schemesThe Group operates or contributes to a number of defined contribution schemes for the benefit of qualifying employees in its subsidiary companies. The assets of these schemes are held separately from those of the Group. The total cost charged to income of £5.1m (2010: £4.3m) represents contributions payable to these schemes by the Group at rates specified in employment contracts. As at 30 November 2011 £0.3m (2010: £0.4m) due in respect of the current reporting period had not been paid over to the schemes.
Local Government Pension SchemesThrough its long-term contract portfolio the Group has TUPE employees who retain membership of Local Government Pension schemes. The Group makes payments to these schemes for current service costs in accordance with its contractual obligations which are capped and collared. The Group has insignificant deficit risk for these schemes.

stock code: RM.RM plc Annual Report 201196
21269-04 28/01/2012 Proof 1
FINANCIAL STATEMENTS
28. Retirement benefit schemes continued
Defined benefit schemeThe Group operates one defined benefit pension scheme, the Research Machines plc 1988 Pension Scheme. The scheme provides benefits to qualifying employees and former employees of RM Education plc, 3T Productions Ltd and Softease Ltd, but was closed to new members with effect from 1 January 2003. RM Education plc is the only company currently with qualifying employees. Under the scheme, employees are entitled to retirement benefits of 1/60th of final pensionable salary for each qualifying year on attainment of retirement age of 60 or 65 years and additional benefits based on the value of individual accounts. No other post-retirement benefits are provided. The scheme is a funded scheme.
The assets of the scheme are held separately from those of the Group in a trustee-administered fund.
The most recent actuarial valuation of plan assets and the present value of the defined benefit obligation were carried out for statutory funding purposes at 31 May 2009 by a qualified independent actuary. IAS 19 Employee Benefits liabilities have been rolled forward based on this valuation’s base data. Plan assets are measured at bid-price at 30 November 2011. The present value of the defined benefit obligation and the related current service cost was measured using the projected unit credit method.
As at 31 May 2009, the triennial valuation for statutory funding purposes showed a deficit of £16.6m (31 May 2006: £12.7m). The Group agreed with the Scheme Trustees to repay this amount via deficit catch up payments of £1.7m per annum until 31 May 2017.
The cost of future provision, on a valuation basis as a percentage of pension contribution salary, is 19.0% for Normal Retirement Age 60 (2009: 20.9%, 2006: 21.4%, 2003: 20.4%) and 13.0% for Normal Retirement Age 65 (2009: 15.1%, 2006: 15.3%, 2003: 13.1%). The costs post 2006 and pre 2010 take into account the benefit of the implementation of a contribution salary cap at 5% per annum and from 2010 the lowering of the cap to 2.5%.
During the period, following the UK Government’s publication and application, the statutory inflation rate applying to increases in pensions in payment and for revaluing deferred benefits changed from the Retail Prices Index to the Consumer Prices Index. The impact of the change, being a £4.7m actuarial gain on liabilities, has been recognised in the Statement of Other Comprehensive Income.
The Group announced in its September 2011 Strategic Review that it had begun discussing with Scheme Trustees the potential closure of the Scheme to future accrual, with the objectives of long-term risk reduction and the provision of equal benefits to employees. These discussions are ongoing.
IAS 19 valuationDefined benefit pension scheme charges/(credits) recognised in income are as follows:
14 months2011
£’000
12 months 2010
£’000Current service cost, recognised within operating profit 3,122 3,247Curtailment gain – (7,267)
Operating (income)/charge 3,122 (4,020)
Interest cost 7,137 5,716Expected return on scheme assets (6,790) (5,086)
Expense recognised within finance cost 347 630
3,469 (3,390)
Notes to the report and accounts continued

stock code: RM.RM plc Annual Report 2011 97www.rmeducation.com
21269-04 28/01/2012 Proof 1
Busi
nes
s Re
view
Go
veRn
an
ceFi
na
nci
al
stat
emen
tsBu
sin
ess
Revi
ewG
ove
Rna
nce
Fin
an
cia
l st
atem
ents
28. Retirement benefit schemes continued
Of the £3.1m (2010: £3.2m) current service cost, £1.6m (2010: £1.7m) is included in cost of sales and £1.5m (2010: £1.5m) in operating expenses.
The amount included within the balance sheet arising from the Group’s obligations in respect of its defined benefit scheme, and the expected rate of return on scheme assets are as follows:
At 30 November 2011 At 30 September 2010% £’000 % £’000
Equities 6.5% 54,594 7.20% 51,109Bonds, gilts and cash 3.4% 56,821 3.90% 51,183
Total fair value of scheme assets 111,415 102,292Present value of defined benefit obligations (132,589) (114,672)
Deficit in scheme and liability recognised in balance sheet (21,174) (12,380)Related deferred tax asset 5,294 3,342
Net pension deficit (15,880) (9,038)
The actual return on scheme assets in the year was a gain of £5.9m (2010: gain of £8.8m). The expected return on scheme equity assets is based upon the expected out-performance of equities over government bonds over the long term and includes an allowance for future expenses. The bond rate is based on the addition of a risk loading to the long term risk free rate of return and also includes an allowance for future expenses.
Amounts recognised directly in equity in respect of the defined benefit pension scheme are as follows:
14 months2011
£’000
12 months 2010
£’000Actuarial gains and (losses) (10,215) (7,913)Experience gains and (losses) – –
(10,215) (7,913)
Cumulative actuarial gains and losses recognised in the statement of recognised income and expense since 1 October 2004 are losses of £32.9m (2010: losses of £22.7m).
Key assumptions used:At
30 November2011
At30 September
2010Rate of increase in salaries 2.4% 2.4%Rate of increase of pensions(pre 6 April 1997, pre 1 June 2005, post 31 May 2005) 1.3%, 2.9%, 2.0% 1.3%, 3.2%, 2.3%Discount rate 4.8% 5.3%Inflation assumption:– CPI 2.3% n/a– RPI 3.0% 3.3%
Mortality assumptions align with those used in the triennial valuation and are the SAPS 03 Normal year of birth, medium cohort tables with a 1% mortality improvement underpin. These give average life expectancies as follows:

stock code: RM.RM plc Annual Report 201198
21269-04 28/01/2012 Proof 1
FINANCIAL STATEMENTS
28. Retirement benefit schemes continued
At 30 November 2011 At 30 September 2010Male Female Male Female
Pensioner member age 65 (current life expectancy) 21.3 24.1 21.3 24.1Non-pensioner member age 45 (life expectancy at 65) 23.2 26.0 23.2 26.0
Movements in fair value of scheme assets were as follows:2011
£’0002010
£’000At start of period 102,292 89,880Expected return on scheme assets 6,790 5,086Actuarial gains and (losses) – actual return less expected return (927) 3,695Contributions from sponsoring companies:– In respect of current service cost 3,122 3,247– In excess of current service cost 1,768 1,682
4,890 4,929
Contributions from scheme members 36 18Benefits paid (1,666) (1,316)
At end of period 111,415 102,292
Movements in fair value of defined benefit obligations were as follows:2011
£’0002010
£’000At start of period 114,672 102,666Current service costs 3,122 3,247Curtailment gain – exceptional credit from lowering inflation cap to 2.5% per annum – (7,267)Interest cost 7,137 5,716Contributions from scheme members 36 18Actuarial (gains) and losses:– Movement from RPI to CPI (4,714) –– Other 14,002 11,608
9,288 11,608
Benefits paid (1,666) (1,316)
At end of period 132,589 114,672
Notes to the report and accounts continued

stock code: RM.RM plc Annual Report 2011 99www.rmeducation.com
21269-04 28/01/2012 Proof 1
Busi
nes
s Re
view
Go
veRn
an
ceFi
na
nci
al
stat
emen
tsBu
sin
ess
Revi
ewG
ove
Rna
nce
Fin
an
cia
l st
atem
ents
28. Retirement benefit schemes continued
The history of experience adjustments is as follows:14 months
201112 months
201012 months
200912 months
200812 months
2007Difference between expected and actual return on scheme assets:– amount (£’000) (927) 3,695 4,540 (15,189) 1,102– as a percentage of scheme assets (1)% 4% 5% (20)% 1%Experience gains and (losses) on scheme liabilities:– amount (£’000) – – (1,100) – –– as a percentage of scheme liabilities – – (1)% – –
The amount of contributions expected to be paid to the Scheme during the year to 30 November 2012 are contingent upon the ongoing discussions with the Scheme Trustees over the potential closure of the Scheme to future accrual, the timing of any closure and the up-coming triennial valuation of the Scheme as at 31 May 2012. The Company is committed via the Scheme’s current Schedule of Contributions to make deficit reduction payments of £1.7m per annum on a funding basis of valuing liabilities to May 2017.
Defined benefit pension parametersThe defined benefit pension scheme accounting entries require a number of estimates to be made including the discount rate applied to liabilities, the current and past service costs and appropriate mortality assumptions. The financial position and performance of the scheme are sensitive to these parameters owing to the long duration of the liabilities.
Sensitivity to these assumptions is shown in the table below:
Current assumption
Increase/(decrease)in pre-tax
deficit£’000
Discount rate increase of 0.1% 4.80% (3,421)Inflation increase of 0.1% 3.0% 3,485
1 year additional life expectancy
SAPS normalwith 1% mortality
improvementunderpin 2,142
If the above assumptions were decreased by 0.1%, this would result in an approximately equal and opposite effect on the pre-tax deficit.
Risk of deficit increase on distributable reservesRM plc Company has distributable reserves of £29m, representing approximately nine years of dividend payments at the current proposed levels. RM plc has direct investment in TTS Group Ltd and SpaceKraft Ltd and these investments are expected to continue to remit dividends to RM plc. RM plc’s main operating subsidiary RM Education plc, which is also a direct investment, is the principal employer to the Research Machines plc 1988 Pension Scheme. At the balance sheet date RM Education plc has negative distributable reserves of £25m and as a consequence is blocked from paying dividends to RM plc. There is a risk that, despite continuing to trade profitably and generate cash, increases in the value of the deficit in the pension scheme may mean that RM Education plc remains blocked from paying dividends to RM plc and there is a remote risk that this block may ultimately restrict RM plc’s ability to pay dividends to shareholders.

stock code: RM.RM plc Annual Report 2011100
21269-04 28/01/2012 Proof 1
FINANCIAL STATEMENTS
29. Related party transactionsBalances and transactions between the Company and its subsidiaries have been eliminated on consolidation and are not included in this note. Transactions between the Group and its joint venture are disclosed below.
a) Remuneration of key management personnelThe remuneration of the key management personnel of the Group, recognised in the income statement, is set out below in aggregate. Key management are defined as the Executive and Non-Executive Directors of the Company and other persons classified as “persons discharging management responsibility under the rules of the Financial Services Authority”. Further information about the remuneration of individual Directors, including waived remuneration, is provided in the audited part of the Remuneration Report.
14 months2011
£’000
12 months2010
£’000Short-term employee benefits 2,716 3,280Post-employment benefits 392 283Termination payments 365 –Share-based payments 694 701
4,167 4,264
Share-based payments includes charges made under the long-term incentive deferred bonus, performance share, co-investment and share option plans. There are no other long-term incentive plans.
b) Transactions between the Group and Joint ventureThe Group provided services of £1.5m (2010: £nil) to its joint venture undertaking Lego Education Europe Ltd and at 30 November 2011, a trading balance of £0.1m was receivable from the joint venture (2010: £nil). The Group also provided financing of £1.9m to the joint venture on which interest was charged at an effective interest rate of 3.13%. The balances are unsecured, will be settled in cash and at the balance sheet date, are due for repayment by the joint venture on 31 December 2015 with the ability to extend the payment date to 31 December 2020. At 30 November 2011, the Group loan to the joint venture of £1.9m (2010: £nil) is included in non-current financial assets within other receivables in line with the contractual commitments detailed above. Subsequent to the balance sheet date, as detailed in note 24b, the joint venture was sold and, as part of the terms of sale, the loan was repaid on 3 January 2012. Total interest income from the joint venture in the period was £30,000 (2010: £nil).
c) Transactions between the Company and its subsidiariesA list of the Company’s principal subsidiaries is set out in note 15. Transactions with subsidiaries relate principally to management recharges, intra-group dividends and interest. The table below shows transactions between the Company and its subsidiaries impacting profit for the period:
14 months2011
£’000
12 months2010
£’000Management recharges (626) (515)Net intercompany interest 474 525Dividends received 4,410 4,177
Total outstanding balances held with subsidiaries are listed in notes 18 and 19.
The Company also operates several share-based payment schemes for the benefit of employees of Group companies. A fair value charge of £1.4m (2010: £1.4m) for these schemes has been recharged to the employing Group company.
Notes to the report and accounts continued

stock code: RM.RM plc Annual Report 2011 101www.rmeducation.com
21269-04 28/01/2012 Proof 1
Busi
nes
s Re
view
Go
veRn
an
ceFi
na
nci
al
stat
emen
tsBu
sin
ess
Revi
ewG
ove
Rna
nce
Fin
an
cia
l st
atem
ents
29. Related party transactions continued
d) Sponsorship and donationsRSA and RSA Tipton AcademyIn 2008 the Group agreed to support the building costs of the RSA Tipton Academy (“Academy”) via an agreement with the Royal Society of Arts (“RSA”). In total £100,000 has been paid to the RSA for this purpose. During the period, the Group has also supported the Academy directly, with products and services, at an approximate cost to the Group of £70,000. The Group’s outstanding commitments to the Academy are not anticipated to exceed a further cost of £100,000.
RM Board Director Sir Mike Tomlinson became Chair of Governors at the Academy in 2008 (a non-fee earning position), after the initial arrangements with the Academy were negotiated. He did not participate in any of these negotiations.
21st Century Learning TrustOver the period to 30 November 2011 the Group undertook three teacher fellowship sponsorships of £3,000 each through 21st Century Learning, a trust in respect of which Board Directors Professor Sir Tim Brighouse and Sir Mike Tomlinson are Trustees (in non-fee earning positions).
The Transformation TrustOver the period to 30 November 2011 the Group contributed £10,000 to The Transformation Trust where RM Board Director Professor Sir Tim Brighouse is a Trustee (in a non-fee earning position).
Cabot Learning FederationRM Board Director Rob Sirs is a Director of the Cabot Learning Federation, an Academy provider. Cabot Academies have purchased products and services from RM of approximately £65,000 in the period to 30 November 2011, with these being at arms-length prices and following competitive tendering.
Teach FirstThe Group contributed products and services to the value of approximately £10,000 in the period to 30 November 2011 to Teach First Trust where RM Board Director Lord Andrew Adonis is a Trustee (in a non-fee earning position).
City & GuildsRM Board Director Sir Mike Tomlinson is Chair of the Quality & Standards Committee of City & Guilds. City & Guilds has a contract with the Group, through which it has purchased £158,000 of services in the period to 30 November 2011.
Microgen plcIn the post balance sheet period the Group has engaged Microgen plc to perform certain accounting software development services. RM Executive Chairman, Martyn Ratcliffe, is Chairman of and equity holder in Microgen. The estimated cost of software and services to be provided to the Group by Microgen is £157,000. Martyn Ratcliffe did not participate in the negotiation of this contract.
Dods plcRM Board Director Lord Andrew Adonis is a Director of Dods plc. The Group has purchased products and services from Dods of approximately £1,000 in the period to 30 November 2011, with these being at arms-length prices.

stock code: RM.RM plc Annual Report 2011102
21269-04 28/01/2012 Proof 1
FINANCIAL STATEMENTS
Notes to the report and accounts continued
29. Related party transactions continued
PricewaterhouseCoopers LLPThe Group uses PricewaterhouseCoopers LLP to provide certain consultancy and assurance services, but excluding external audit services. RM Board Director Iain McIntosh’s wife is an equity partner in PricewaterhouseCoopers. She has not been involved in any services provided to the Group.
The Group encourages its Directors and employees to be Governors, Trustees or equivalent of educational establishments. The Group trades with these establishments in the normal course of its business.
30. Subsequent events disclosureIn the period between the balance sheet date and the date of signing the accounts the Group has sold two operations which were held for sale at the balance sheet date. These were: the Group’s 49% stake in Lego Education Europe and the business assets and employees of Dacta to Lego A/S for €4.36m; and 100% of the equity of AMI Education Solutions Ltd, containing the Easytrace trade to Jonas Computing (UK) Ltd for £0.65m plus working capital. Note 24b contains details of the assets held for sale. There were no significant differences between the assumed sales proceeds within these calculations and the considerations obtained.
RM Board director Rob Sirs resigned from the Company effective 31 January 2012. The Report of the Directors contains further information.
Subsequent to the balance sheet date, on 27 January 2012 the Group signed a £30m committed revolving credit facility with Barclays bank which runs until March 2015. Together with an existing £3m annual Barclays overdraft facility these will replace the $39.5m uncommitted HSBC sterling dealing line and £25m committed acquisition facility (of which £13.0m had been drawn at 30 November 2011). Details of the covenant requirements, which are very similar to the Group’s previous HSBC requirements, are set out in note 20.

stock code: RM.RM plc Annual Report 2011 103www.rmeducation.com
21269-04 28/01/2012 Proof 1
Busi
nes
s Re
view
Go
veRn
an
ceFi
na
nci
al
stat
emen
tsBu
sin
ess
Revi
ewG
ove
Rna
nce
Fin
an
cia
l st
atem
ents

stock code: RM.RM plc Annual Report 2011104
21269-04 28/01/2012 Proof 1
FINANCIAL STATEMENTS Appendix to the financial statements
On 20 October 2010 following a detailed review and consultation with major shareholders, the Board agreed to change the Company and Group’s year end to 30 November. As explained in the Business Review: Finance within the 2010 Annual Report and Accounts, the change of year end means that 2011 is a fourteen month period from 1 October 2010 to 30 November 2011.
In order to present data for comparable time periods, proforma financial information showing the Group’s financial performance and cash flows for the year ending 30 November 2011 and the financial position at 30 November 2011 is presented below with comparative financial information for the year ending 30 November 2010. This data has been prepared as if the Group had always had a 30 November year end.
This proforma financial information is unaudited.
Proforma financial informationfor the year ended 30 November 2011

stock code: RM.RM plc Annual Report 2011 105www.rmeducation.com
21269-04 28/01/2012 Proof 1
Busi
nes
s Re
view
Go
veRn
an
ceFi
na
nci
al
stat
emen
tsBu
sin
ess
Revi
ewG
ove
Rna
nce
Fin
an
cia
l st
atem
ents
Proforma consolidated income statementfor the year ended 30 November 2011
NotesAdjusted
£’000Adjustments
£’000
Year ended 30 November
2011Total
£’000
Adjusted£’000
(Restated)
Adjustments£’000
(Restated)
Year ended30 November
2010Total
£’000(Restated)
Revenue 310,055 - 310,055 376,105 - 376,105Cost of sales (228,686) - (228,686) (276,916) - (276,916)
Gross profit 81,369 - 81,369 99,189 - 99,189
Operating expenses (67,264) - (67,264) (77,806) - (77,806)– Amortisation of acquisition related
intangible assets - (604) (604) - (1,114) (1,114)– Impairment of goodwill, acquisition related
intangible assets, other intangible assets and investments - (12,370) (12,370) - - -
– Loss on sale of operations - (4,391) (4,391) - - -– Share-based payment charges - (1,087) (1,087) - (1,501) (1,501)– Restructuring costs - (8,576) (8,576) - (1,286) (1,286)– Increase in provision for dilapidations
on leased properties and onerous lease contracts - (5,986) (5,986) - - -
– Exceptional costs relating to curtailment of Building Schools for the Future programme - - - - (1,474) (1,474)
– Exceptional pension credit - - - - 7,056 7,056Share of results of associate and joint venture 37 (28) 9 63 (28) 35
(67,227) (33,042) (100,269) (77,743) 1,653 (76,090)
Profit/(loss) from operations 14,142 (33,042) (18,900) 21,446 1,653 23,099Investment income 940 - 940 984 - 984Finance costs (510) - (510) (1,579) - (1,579)
Profit/(loss) before tax 14,572 (33,042) (18,470) 20,851 1,653 22,504Tax 33 (4,724) 3,868 (856) (4,830) (752) (5,582)
Profit/(loss) for the year attributable to equity holders of the parent 9,848 (29,174) (19,326) 16,021 901 16,922
Earnings/(loss) per ordinary share:Basic 10.8p (32.0)p (21.2)p 17.6p 1.0p 18.6pDiluted 10.8p (32.0)p (21.2)p 17.4p 1.0p 18.4p
On 16 May 2011 within the Group’s interim results publication, proforma information was presented showing the profit for the year to 30 November 2010. To ensure consistency with the Income Statement presentation for the 14 months to 30 November 2011, this comparative data has been restated with share-based payment charges and restructuring costs, of £1,501,000 and £1,286,000 respectively, being reallocated from adjusted profit to adjustments, along with their related tax position. There is no change to the profit from operations, profit before tax or profit attributable to equity holders of the parent from this reallocation.

stock code: RM.RM plc Annual Report 2011106
21269-04 28/01/2012 Proof 1
FINANCIAL STATEMENTS
Proforma consolidated balance sheetas at 30 November 2011
Notes
As at30 November
2011£’000
As at30 November
2010£’000
Non-current assetsGoodwill 17,349 34,255Acquisition related intangible assets 1,202 3,573Other intangible assets 3,607 3,499Property, plant and equipment 16,600 20,365Interest in associate 316 1,004Other receivables 34 2,590 –Deferred tax assets 6,973 3,897
48,637 66,593Current assetsInventories 18,827 25,461Trade and other receivables 34 62,270 77,866Tax assets 2,058 1,143Cash and cash equivalents 24,529 3,669Assets held-for-sale 6,791 –
114,475 108,139
Total assets 163,112 174,732
Current liabilitiesBank overdraft – (6,083)Trade and other payables 35 (77,781) (75,019)Provisions (7,752) (220)Tax liabilities – (523)Liabilities directly associated with assets held for sale (2,914) –
(88,447) (81,845)
Net current assets 26,028 26,294
Non-current liabilitiesRetirement benefit obligation (21,174) (8,575)Bank loans (13,026) (12,419)Deferred tax liabilities – (32)Other payables 35 (6,286) (5,556)Provisions (5,661) (678)
(46,147) (27,260)
Total liabilities (134,594) (109,105)
Net assets 28,518 65,627
Equity attributable to equity holders of the parentShare capital 1,869 1,868Share premium account 26,963 26,918Own shares (3,202) (3,805)Capital redemption reserve 94 94Hedging reserve (44) (156)Translation reserve 115 1,613Retained earnings 2,723 39,095
Total equity 28,518 65,627

stock code: RM.RM plc Annual Report 2011 107www.rmeducation.com
21269-04 28/01/2012 Proof 1
Busi
nes
s Re
view
Go
veRn
an
ceFi
na
nci
al
stat
emen
tsBu
sin
ess
Revi
ewG
ove
Rna
nce
Fin
an
cia
l st
atem
ents
Proforma consolidated cash flow statementfor the year ended 30 November 2011
Year ended30 November
2011£’000
Year ended30 November
2010£’000
(Loss)/profit from operations (18,900) 23,099 Adjustments for:Loss/(gain) on foreign exchange derivatives 607 (498)Share of results of associate and joint venture (9) (35)Impairment of investment in associate 660 -Amortisation of acquisition related intangible assets 604 1,114 Impairment of acquisition related intangible assets 443 -Impairment of goodwill 10,992 -Amortisation of other intangible assets 1,114 1,150 Impairment of other intangible assets 275 -Depreciation of property, plant and equipment 7,051 7,408 Gain on disposal of property, plant and equipment (125) (372)Loss on disposal of other intangible assets 62 -Loss on sale on operations 4,391 -Increase in provisions 11,660 737 Share-based payment charge 1,087 1,501 Exceptional pension credit - (7,267)Operating cash flows before movements in working capital 19,912 26,837 Decrease/(increase) in inventories 3,461 (4,533)Decrease/(increase) in receivables 9,316 (1,161)Increase/(decrease) in payables 6,801 (6,961)Cash generated by operations 39,490 14,182 Defined benefit pension contribution in excess of current service cost (1,638) (1,730)Tax paid (1,698) (4,477)Income on sale of finance lease debt 683 705 Interest paid:– bank overdrafts and loans (396) (627)– other (12) (64)Net cash inflow from operating activities 36,429 7,989
Investing activitiesInterest received 136 48 Proceeds on disposal of property, plant and equipment 412 675 Purchases of property, plant and equipment (4,055) (6,894)Purchases of other intangible assets (1,579) (1,891)Amounts advanced to joint venture undertaking (1,880) -Net cash used in investing activities (6,966) (8,062)
Financing activitiesDividends paid (6,128) (5,764)Proceeds from share capital issue, net of share issue costs 46 198 Proceeds from sale of operations 3,775 -Increase in borrowings 670 4,019 Purchase of own shares (212) (3,214)Repayment of loan notes and deferred consideration (670) (4,386)Net cash used in financing activities (2,519) (9,147)Net increase/(decrease) in cash and cash equivalents 26,944 (9,220)
Cash and cash equivalents at the beginning of year (2,414) 6,620 Effect of foreign exchange rate changes (1) 186 Cash and cash equivalents at the end of year 24,529 (2,414)

stock code: RM.RM plc Annual Report 2011108
21269-04 28/01/2012 Proof 1
FINANCIAL STATEMENTS
Proforma group net fundsfor the year ended 30 November 2011
Non-cash movementsAs at
30 November2010
£’000Cash flow
£’000
Foreignexchange
£’000Other£’000
As at30 November
2011£’000
Cash at bank 3,669 20,861 (1) – 24,529Bank overdraft (6,083) 6,083 – – –
Cash and cash equivalents (2,414) 26,944 (1) – 24,529Borrowings (12,419) (670) 63 (13,026)
Net cash (14,833) 26,274 62 – 11,503Loan notes (475) 475 – – –
Net funds (15,308) 26,749 62 – 11,503Deferred consideration (390) 195 – – (195)Net funds less deferred consideration (15,698) 26,944 62 – 11,308

stock code: RM.RM plc Annual Report 2011 109www.rmeducation.com
21269-04 28/01/2012 Proof 1
Busi
nes
s Re
view
Go
veRn
an
ceFi
na
nci
al
stat
emen
tsBu
sin
ess
Revi
ewG
ove
Rna
nce
Fin
an
cia
l st
atem
ents
Notes to the proforma financial statements
31. General informationThe proforma financial information for the year ended 30 November 2011 does not constitute statutory accounts as defined in section 434 of the Companies Act 2006.
The annual financial statements of the Group are prepared in accordance with International Financial Reporting Standards (IFRSs) as adopted by the European Union. The proforma financial information has been prepared applying the accounting policies and presentation that were applied in the preparation of the Group’s published consolidated financial statements for the 14 months ended 30 November 2011.
32. Operating segmentsSegmental results within this proforma statement are presented in accordance with the Group’s revised management structure which applies from 1 December 2011 and as explained within note 4 is a different basis of presentation from the statutory segmental information:
Segmental result
Year ended 30 November 2011
EducationTechnology
£’000
ManagedServices
£’000
EducationResources
£’000
EducationSoftware
£’000
CorporateServices
£’000
Exitedoperations**
£’000Total
£’000Revenue 125,712 61,487 57,961 38,538 – 26,357 310,055Adjusted operating profit/(loss)* 8,303 6,137 5,415 3,229 (3,420) (5,522) 14,142
Investment income 940Finance costs (510)Adjusted profit before tax* 14,572Adjustments* (33,042)Loss before tax (18,470)
* Adjustments to profit are as stated within the income statement.** Exited operations represent the results from operations sold or classified as held for sale at 30 November 2011.
33. TaxThe effective tax rate for the 12 months ended 30 November 2011 is shown below:
Adjusted£’000
Adjustments£’000
Year ended30 November
2011Total
£’000 Adjusted*
£’000Adjustments*
£’000
Year ended30 November
2010Total
£’000Profit/(loss) before tax 14,572 (33,042) (18,470) 20,851 1,653 22,504Tax (charge)/credit (4,724) 3,868 (856) (4,830) (752) (5,582)
Effective tax rate 32.4% 11.7% 4.6% 23.2% 45.5% 24.8%
* Adjustments and their related tax impact for the year to 30 November 2010 have been restated from the amounts disclosed within the Group’s 16 May 2010 interim results announcement, as explained within the note to the proforma Income Statement. There has been no change to the total tax charge as a result of this reallocation.

stock code: RM.RM plc Annual Report 2011110
21269-04 28/01/2012 Proof 1
FINANCIAL STATEMENTS
34. Trade and other receivablesAs at
30 November2011
£’000
As at 30 November
2010£’000
CurrentTrade receivables 43,938 51,972Long-term contract balances 9,407 13,869Other receivables 2,046 2,045Derivative financial instruments: forward foreign exchange contracts 67 373Accrued income 782 2,247Prepayments 6,030 7,360
62,270 77,866
Non-currentOther receivables – amount owed by joint venture undertaking 1,878 –Other receivables – other 712 –
2,590 –
35. Trade and other payablesAs at
30 November2011
£’000
As at 30 November
2010£’000
CurrentTrade payables 16,206 16,309Other taxation and social security 5,307 7,342Other payables – other 2,628 2,627Derivative financial instruments:– Forward foreign exchange contracts 273 –– Interest rate swap 72 153Accruals 22,327 21,036Long-term contract balances 6,895 6,485Loan notes – 475Deferred consideration 195 195Deferred income 23,878 20,397
77,781 75,019
Non-currentOther payables – deferred consideration – 195Deferred income:– due after one year but within two years 3,627 3,042– due after two years but within five years 2,576 2,319– due after five years 83 –
6,286 5,556
Notes to the proforma financial statements continued
stock code: RM.RM plc Annual Report 2011 111www.rmeducation.com
21269-04 28/01/2012 Proof 1
Busi
nes
s Re
view
Go
veRn
an
ceFi
na
nci
al
stat
emen
tsBu
sin
ess
Revi
ewG
ove
Rna
nce
Fin
an
cia
l st
atem
ents
Shareholder Information
Financial calendarEx-dividend date for 2011 final dividend 14 March 2012Record date for 2011 final dividend 16 March 2012Annual general meeting 26 March 2012Payment of 2011 final dividend 13 April 2012Announcement of 2012 interim results July 2012Preliminary announcementof 2012 results January/February 2013
Corporate websiteInformation about the Group’s activities is available from RM at www.rmeducation.com.
Investor informationInformation for investors is available at www.rmeducation.com/investors. Enquiries can be directed to Andy Robson, Company Secretary, at the Group head office address or [email protected].
Registrars and shareholding informationShareholders can access the details of their holdings in RM plc via the Shareholder Services option within the investor section of the corporate Web site at www.rmeducation.com/investors. Shareholders can also make changes to their address details and dividend mandates online.
All enquiries about individual shareholder matters should be made to the Registrars either via email at [email protected] or telephone: 0871 664 0300 (calls cost 10p per minute plus network extras; lines are open 8.30am to 5.30pm, Monday to Friday). To help shareholders, the Capita Web site at www.capitaregistrars.com contains a shareholders’ frequently asked questions section.
Electronic communicationShareholders are able to receive company communication via email. By registering your email address, you will receive emails with a web link to information posted on our Web site. This can include our report and accounts, notice of meetings and other information we communicate to our shareholders.
Electronic communication brings numerous benefits including:
zz Environmental: helping us reduce our impact on the environment
zz Security: your documents cannot be lost in the post or read by others
zz Faster notification of information and updateszz Easy access: check your shareholding and account
transactions online at any timezz Convenience: change your name, address or dividend
mandate details online
To sign-up to receive e-communications simply go to Capita Registrars’ Share Portal at www.capitashareportal.com and follow the instructions.
Beneficial shareholders with ‘information rights’Please note that beneficial owners of shares who have been nominated by the registered holders of those shares to receive information rights under section 146 of the Companies Act 2006 are required to direct all communications to the registered holder of their shares rather than to Capita Registrars, or to the Company directly.
Multiple accounts on the shareholder registerIf you have received two or more copies of this document, it may be because there is more than one account in your name on the shareholder register. This may be due to either your name or address appearing on each account in a slightly different way. For security reasons, Capita will not amalgamate the accounts without your written consent. If you would like to amalgamate your multiple accounts into one account, please write to Capita Registrars.

stock code: RM.RM plc Annual Report 2011112
21269-04 28/01/2012 Proof 1
FINANCIAL STATEMENTS
Shareholder Information continued
Company SecretaryAndy Robson
Group head office and registered officeNew Mill House183 Milton ParkAbingdonOxfordshire OX14 4SEUnited KingdomTelephone: +44 (0) 8450 700300Fax: +44 (0) 8450 700400
Registered NumberRM plc’s registered number is 1749877
BankersBarclays Bank PLCTechnology & Telecoms Team, Barclays CorporateUnited Kingdom House7th Floor, 180 Oxford StreetLondon W1D 1EA
HSBC Bank PLCThames Valley Corporate Banking CentreApex PlazaReading RG1 1AX
Independent AuditorKPMG Audit PlcArlington Business ParkThealeReading RG7 4SD
Financial Advisors and StockbrokerNumis Securities Ltd10 Paternoster SquareLondon EC4M 7LT
Financial Public RelationsFTI Consulting LtdHolborn Gate 26 Southampton Buildings London WC2A 1PB
RegistrarsCapita RegistrarsThe Registry34 Beckenham RoadBeckenhamKent BR3 4TU
Legal AdvisersAllen & Overy LLPOne Bishops SquareLondon E1 6AD

21269-04 02/02/2012 Proof 1
perfect Image is a white uncoated paper and board, made from FSC® certified pulp.

21269-04 02/02/2012 Proof 1
RM plcNew Mill House183 Milton ParkAbingdonOxfordshireOX14 4SETelephone: 08450 700300www.rm.com
Stock code: RM.
RM plc A
nnual Report and Accounts 2011