Annual Report - ADXfunding, ADX listed both the National Investor and Manazel Real Estate in the...
88
Annual Report 2014 www.adx.ae
Transcript of Annual Report - ADXfunding, ADX listed both the National Investor and Manazel Real Estate in the...

Annual Report2014
www.adx.ae
…ƒ
``æ°ù
`dG
ô``j
ô`≤
à`dG
Ann
ual R
epor
t 2
014

Abu Dhabi Securities Exchange (ADX)
Al Ghaith Tower, Hamdan Street, Abu Dhabi P.O.Box 54500, Abu Dhabi, United Arab Emirates Phone: +971 2 6277777 Fax: +971 2 6128728 Toll-free: 800-239Email: [email protected]
Website: www.adx.ae
Branches Phone NumbersAl Ain: +971 3 7044040, +971 3 7044005, +971 3 7044003Fujairah: +971 9 2055115, +971 9 2055111
Madinat Zayed: +971 2 8945407, +971 2 8945408Ras Al-Khaimah: +971 7 2264011, +971 7 2260693Sharjah: +971 6 5374574, +971 6 5374572, +971 6 5375513
Trading Times Sunday -Thursday 09:30 A.M. - 10:00 A.M. Pre-opening Session10:00 A.M.- 02:00 P.M. Continuous Trading

www.adx.ae


His Highness the late Sheikh Zayed bin Sultan Al NahyanThe founder of the United Arab Emirates


His Highness Sheikh Khalifa bin Zayed Al NahyanPresident of the United Arab Emirates


His Highness Sheikh Mohammed bin Zayed Al NahyanCrown Prince of Abu Dhabi and Deputy Supreme Commander of the Armed Forces

Annual Report2014التقرير السنوي
10
Disclaimer
All information contained in this report is for informational purposes only. Nothing herein constitutes an offer, solicitation or recommendation
to invest or conduct any transaction in any kind of securities listed on Abu Dhabi Securities Exchange (ADX).
ADX is not liable for any claims or losses or damages of any nature, arising directly or indirectly from the use of the data found in this report.
ADX endeavors to ensure that the data and other materials found in this report are correct and complete, but does not accept liability or
responsibility for any error made or omission in this report.
All material contained in this report, including the data, information, and content are the property of Abu Dhabi Securities Exchange (ADX).

Annual Report2014التقرير السنوي
11
Vision
ADX aspires to become the Exchange of choice
Mission
To develop the capital market through legal environment that ensures disclosure, transparency and integrity.
Values
IntegrityWe will endeavor to enforce the Law and commit to the highest legal and ethical standards.
Professionalism We will adopt the highest profession standards by benchmarking against international best practice and being dedicated to best serve our customers needs and by adopting courtesy and respect.
TransparencyWe will endeavor to enhance disclosure standards and disseminate sensitive data in a timely fashion.
FairnessWe will ensure that all of our customers and employees receive relevant information and treatment without bias, dishonesty, or injustice.
InnovationWe will strive to be innovative in our industry by introducing entrepreneurial solutions to the challenges and maintain continuous improvements to our organization and processes.
EfficiencyWe will make the best use of our resources in terms of time, efforts and expenses to maximize the services provided to our clients.
Cost EffectiveneWe will provide our customers with acceptable level of quality and cost.


ADX Board of Directors
H.E. Nasser Ahmed Al SuwaidiChairman
H.E. Abdul Hamid Mohamed SaeedBoard Member
H.E. Hamad Abdulla Al ShamsiVice Chairman
H.E. Abu baker Seddiq Al KhouryBoard Member
H.E. Mubarak Al MansouriBoard Member
H.E. Khalifa Sultan Al SuwaidiBoard Member
H.E. Suhail Faris Al MazrouieBoard Member
13

Annual Report2014التقرير السنوي

Annual Report2014التقرير السنوي
ADX Organizational Chart
Board of Directors
Executive Committee
BusinessDevelopment
Advisor
Strategy Media
Finance &Management Affairs
Human Resources
CSD & RegistryServices
Market Operations& Surveillance
I.T. Services
Listed Companies
Legal AdvisorAssisstant Chief
Executive for SupportServices
Deputy Chief Executivefor Operations Affairs
Chief Executive
Internal Auditors
Audit Committee

Annual Report2014التقرير السنوي

Annual Report2014التقرير السنوي
Table of Contents
Message from the Chairman
Message from the CEO
Economic Brief on The Emirate of Abu Dhabi
ADX Strategy (2013-2016)
ADX Achievements in 2014
ADX Performance in 2014
Clearing, Settlement & Depository
Statistical Appendix
Trading Activities in 2014
GCC Stock Markets Performance in 2014
Companies Listed on ADX
Activity Report Brokerage
ADX Annual Trading Activity in 2014
Definitions & Terminology
Financial Indicators
19
21
22
23
24
32
33
34
Investor Numbers issued in 2014
Foreign Investment
Market Performance in Sectoral Trading Contribution
36
36
38
44
45
55
67
75
81
85

Annual Report2014التقرير السنوي
18
H.E. Nasser Ahmed Al SuwaidiChairman

Annual Report2014التقرير السنوي
Chairman Message
I have the pleasure to present to you the Annual Report of Abu Dhabi Securities Exchange (ADX) for 2014. The Report provides a detailed portrayal of the market performance during the year and provides the members details as well as investors’ activities as well as beneficial information about the listed companies as we believe in the importance of the role played by transparency in enabling investors to take educated investment decisions.
In 2014 we continued our efforts towards implementing our strategy which its four pillars are Securities Market with best standards, diversification of products, institutional participation in investment and projects financing, and high performing organization. Through these pillars, we aim at developing various aspects of activity in the Exchange in a way that would make it more capable of realization of its main objectives hence contributing positively and effectively to the support and prosperity of the economy of the Emirate of Abu Dhabi within the Emirate’s 2030 Vision.
Within our efforts of creating a Securities Market with best standards, we launched a new trading system, X-Stream Trading, developed by NASDAQ OMX. X-Stream Trading provides a proven, functionally rich, multi-asset trading platform that complies with international standards and policies. The new platform will improve ADX’s trading performance and transparency, and ensure low latency in pre- and post-trade or “at trade” risk management checks. The platform will support Market Making activity as well as transactions of fixed income and ETF instruments, and allow ADX to handle an unlimited number of indices
At the same level, ADX launched its smart application, which provides a market summary on the indices, and ADX’s listed companies’ activities, as well as providing multiple watch lists to keep track of investors’ preferred stocks. The smart app enables investors to create a portfolio tracking which includes tracking error index and provide daily investor portfolio gains and losses daily and overall.
In our endeavors to diversify financial products, we had the first listing of government bonds in a step towards building a bond market operating under the best standards as with international financial markets. The total amount of the bonds listed is USD 1.5 billion, with a maturity date in 2019. Also in 2014, ADX applied Rights Issue trading when approving Eshraq Properties capital increase through a rights issue of the amounts of AED 600 million. The Rights Issue was covered by 137%.
ADX upgrade to emerging market status, by both Morgan Stanley Capital International (MSCI) and S & P Dow Jones coming into effect last year, has come to represent recognition by the international institutions of the achievements of our market during the past years including development of the structure of the local market and strengthening our continuous efforts to enhance the investment institutional contribution as the market has polarized a net foreign investment of 3.5 billion Dirhams in 2014 compared with 2 billion Dirhams in 2013.
Our endeavors continued to build performance high performing organization through participation in many career fairs across the UAE as well as internally organizing appreciation ceremonies for our employees, work teams and committees where we recognize their hard work and dedication.
We continue to execute our strategy in driving future growth for our stakeholders. Our social capital and marketing capabilities, both internal and external, continue to strengthen. The long-term growth strategy we have been carrying out is still very much the right one, given the financial environment in which ADX will be operating in the years ahead. In light of the challenges we face, we are continuing to look for additional ways to implement that strategy to further enhance ADX’s growth.In conclusion, I wish to thank my fellow board members for their efforts and valuable suggestions and I would like to thank our dedicated team of employees, who every day contributes to the success of this great establishment in so many ways. Their quick recognition of issues, the precision of action plans to resolve those issues and the quality of their results, achieved in such a short period, all confirm their standards and their skill.

Annual Report2014التقرير السنويAnnual Report2014التقرير السنوي
20
H.E. Rashed Al BaloushiChief Executive Officer

Annual Report2014التقرير السنوي
21
Annual Report2014التقرير السنوي
ADX CEO’s Message
ADX continued its endeavors aiming at achieving its long-term objectives last year and shall continue on gradually to achieve our goals in the years to come. On the top of those objectives is to further diversify financial products, elevate the transparency level, and lead the development process of stock markets in the region.
By the end of 2014, ADX index has gone up by 6%. Moreover, ADX achieved a significant increase in terms of trading value and volume last year including trading value increase by 70 percent compared to that of 2013 whereas the volume trading increased by15 percent compared to that of 2013. Market Capitalization for ADX listed companies exceeded 464 billion Dirhams at the end of 2014 whereas the Market Capitalization amounted to approximately 449 billion Dirhams at the end of 2013.
In our drive for regulatory framework based on international best practices, ADX set out rules and procedures of Market Maker while also fulfilling all the technical requirements. Market Making shall commence its activity in the first quarter of 2015. Furthermore, within our endeavors to develop ADX services to accommodate customer’s needs, we have developed an e-service designed to receive Investor Numbers requests from the brokerage firms directly, thus eliminating human error and allowing for maximum time allocation.
As ensuring efficiency and integration of the main processes lies within the strategic objectives of ADX, we therefore applied circuit breaker system, which aims to give traders enough time to re-consider their investments, and double check any news that are resulting in the tumbling of share prices.
In order to realize ADX strategic objective of activating AD Capital market role as investment and financing channel, ADX continued its international roadshows which aim to engage with potential new investors, fund managers, asset management and investment management companies, as well as high end investors to demonstrate the range of opportunities, as well as to provide an insight into the operations and future development of ADX. Roadshows for 2014 included the Far East, UK in addition to the USA whereby increasing the number of foreign investment institutions registered in ADX to 1106 at the end of 2014 compared to 380 institutions in 2013.
Furthermore, ADX upgrade to emerging markets status by both MSCI and S&P Dow Jones confirms our success in activating AD Capital Market as key financier for expansion & growth particularly with the rise of net foreign investment to 3.5 billion Dirhams in 2014 compared to 2 billion in 2013.
In order to attract savings to be directed for investment in AD market and to activate ADX role as a center for projects funding, ADX listed both the National Investor and Manazel Real Estate in the sector of Private Joint Stock Companies on the Secondary Market Platform launched by H.H. Sheikh Mohammed Bin Rashid Al Maktoum, Vice President, Prime Minister of the UAE, Ruler of Dubai. It is worth noting that ADX isthe first exchange in the region to develop a trading platform for private companies.
In pursuance of our objective towards attracting, developing and retaining skilled workforce ADX has continued its cooperation with Abu Dhabi Tawteen Council and Absher Initiative. ADX’s efforts in retaining Emirati work force is evident in the high Emiratisation level which reached 86% at the end of 2014 noting that 100% of senior and supervisory positions are held by Emirati nationals.
In 2014, ADX signed a number of cooperation agreements with various universities as we aim to build an organization culture based on commitment to social responsibilities where we facilitate mutual cooperation in the fields of research, institutional development and training within the framework of ADX›s commitment to support educational initiatives and to encourage and promote professional investment skills across the UAE, to the very highest international standards Moreover, ADX has visited more than thirty universities and schools in UAE during last year for the purpose of increasing investment awareness and spreading terms of financial culture among students of various age groups.
Undoubtedly, ADX stands as an exemplary of excellence among its counterparts of stock markets and in the business domain at large.
Finally, I would like to express my utmost thanks to ADX employees and staff for their hard and fruitful work. ADX, indeed, is an active and vital institution that reflects determination of our staff, all of whom have been vital in enabling the exchange to support the financial sector in Abu Dhabi and the economy of the United Arab Emirates.

Annual Report2014التقرير السنوي
22
Economic Brief
Economic indicators for 2014 evidenced the ongoing consolidation of the momentum of economic growth in the UAE in general, and in Abu Dhabi in particular.At the national level, the Ministry of Economy announced that UAE's GDP is projected to increase to more than AED1.54 trillion in 2014, compared to AED1.47 trillion in 2013, which is a percentage increase of 4.8%. The International Monetary Fund and others reported that the projected GDP will increase by 4.3%. The UAE benefited in particular from the policy of economic diversification whereby various sectors contributed to driving economic growth, giving the UAE a leading position among Arab as well as other economies around the world.
A number of reputable international institutes have acknowledged the strides that have been made by the UAE in developing its economy, ranking it 12th out of 148 global economies in the Global Competitiveness Report 2014/2015, and 23rd in the Ease of Doing Business report issued by the World Bank and the International Finance Corporation.
The UAE Country Report issued by the International Monetary Fund in 2014 acknowledged that the UAE had benefited from political stability, increased confidence, and the strength of the tourism sector, as well as increased capital inflows due to increased global liquidity. Additionally, Abu Dhabi ranked in the 19th place out of 83 financial centers according to the Global Financial Centers Index September 2014, (GFCI) which tracks competitiveness among international financial hubs solidifying Abu Dhabi’s position as it takes its rightful place on the international stage leaping from 32nd place in GFCI March 2014 rankings.
One of the most important drivers of economic growth during the period 2014-2017 is expected to be government support for infrastructural and social development which is already taking place at a rapid pace with a budget of almost AED 368 billion on developing infrastructure which will help to meet the aspirations of citizens in creating a high quality of life and a value added society. The economic development of Abu Dhabi has been characterized in recent years by focusing on large investments in non-oil activities, which in turn diversifies the economic base and sources of income to meet this objective.

Annual Report2014التقرير السنوي
23
High Performing Organization
Securities Market withBest Standard
Diversification ofproductsInstitutional participation
in investment and Projectsfinancing
ADX Strategy (2012-2016)
Through its strategic plan Abu Dhabi Securities Exchange (ADX) seeks to achieve the Abu Dhabi government’s ambition to become a regional center for capital markets. ADX supports the Abu Dhabi’s Economic Vision 2030 which identifies capital markets as a major contributor for the growth of the economy by attracting institutional investment and providing the necessary funding. ADX’s strategic plan is based on four pillars:
Securities Market with Best Standards Diversification of products Institutional participation in investment and Projects financing High Performing Organization
Since its strategic plan 2012-2016 was launched, ADX has attained many achievements and has taken the necessary steps towards accomplishing these strategic pillars.

Annual Report2014التقرير السنوي
24
Abu Dhabi Securities Exchange Strategies2014 Achievements
Strategic Core
“Securities Market with Best Practice”
Objective/PriorityCreation of a statutory framework in compliance with international best practice.
Strategic Initiative: Market Making
The ADX set out rules and procedures for the introduction of “market makers” and fulfilled all the technical requirements to ensure that the market maker function operates smoothly.
Completion Phases/Findings
- February 2014: The ADX held a conference on market making.- May 2014: Rules for market makers were issued by the ADX Board of Directors.- November 2014: ADX issued a resolution related to commissions due for market making negotiation activities.- October 2014: An experimental linkage between the ADX and market maker NBAD and a test of the market maker’s negotiation platform were completed.
Strategic Initiative: Rules for Securities Lending
The ADX set out rules and procedures for securities lending and borrowing and fulfilled all the technical requirements for the registration of securities lending and borrowing transactions.
Completion Phases/Findings
- 2014 Internal tests of the set-off system for securities lending and borrowing transactions were conducted on the electronic system of the Department of Setting-off and Depository.- May 2014: Rules for securities lending and borrowing at the ADX were prepared and approved by the ADX Board of Directors.

Annual Report2014التقرير السنوي
25
Objective/PriorityDevelopment of market services to facilitate customer activity.
Strategic Initiative: Smart services
The ADX developed smart services to improve the customer experience, particularly by introducing an ADX smartphone application (app).
Completion Phases/Findings
- October 2014: The ADX applied for inclusion of its smartphone app in the Apple and Android app stores. The smartphone app was launched during the GITEX2014 trade fair and conference.
Strategic Initiative: Electronic Services
The ADX is developing its electronic services to improve the customer experience. These services now include the application for, and approval of, investor numbers for brokerage companies.
Completion Phases/Findings
- February 2014: The ADX Board of Directors set out its “technical perception” and the executive procedures necessary to enable brokerage companies to apply for investor numbers electronically.- March 2014: Development of an electronic window for processing investor number applications within the E-Service System was completed.- April 2014: The ADX held workshops to train brokerage companies on the application process through the electronic system.- May 2014: The service was launched on the ADX website.
Objective/PriorityRaising the efficiency and integration of the ADX’s main operations
Strategic Initiative: X-stream
The ADX introduced X-stream, the latest electronic trading system provided by NASDAQ OMX. The project was delivered in good time and to budget.
Completion Phases/Findings
- February 2014: Completion of the design stage for the X-stream electronic dealing system, following launch of the project in 2013.- March 2014: Completion of system testing with all mediators and users.- April 2014: Successful commissioning of the electronic dealing system.

Annual Report2014التقرير السنوي
26
Strategic Initiative: Business Continuity
The ADX designed and adopted a new business continuity management plan in line with international best practice.
Completion Phases/Findings
- May 2014: The ADX formed a team on business continuity in the market, which was entrusted with the task of building a comprehensive program for business continuity and setting up an effective implementation plan. The team is entrusted with the application of the NCEMA7000 standard.- November 2014: A strategy for business continuity was completed and a business continuity management program was established.
Strategic Initiative: Circuit Breaker System
The ADX researched and introduced a circuit breaker system in order to strengthen investor confidence in the market in the case of high price volatility for listed securities. The circuit breaker aims to alleviate the impact of sharp and sudden price moves, with negotiation of any security that falls by 5% during a single session suspended for between 5 and 15 minutes.
Completion Phases/Findings
- August 2014: The ADX prepared a study on circuit breakers and market volatility, including market comparison to assess international best practice.- October 2014: The ADX issues a manual on circuit breaker procedures.- November 2014: A test of the ADX system using an experimental negotiation system was completed.- December 2014: The circuit breaker system was activated.
Strategic Initiative: Negotiation by Margin
The ADX activated negotiation by margin in order to help increase liquidity in the market.
Completion Phases/Findings
- May 2014: The ADX established procedures necessary for putting into force a system for negotiation by margin.- August 2014: The electronic models for operations of negotiation by margin were set out.- November 2014: A system for the issuance of electronic reports on operations of negotiation by margin was launched.
Strategic Core
“Diversification of Products”
Objective/ PriorityOffering new investment tools for negotiation

Annual Report2014التقرير السنوي
27
Strategic Initiatives: Rights issues
The ADX set out rules and procedures for the listing and negotiation of rights issues. Eshraq Properties became the first company to have its rights traded on the ADX.
Completion Phases/Findings
- 2013: A rights issue negotiation system was prepared by the Securities and Commodities Authority (SCA) following consultation with the ADX.- May 2014: The SCA issued a resolution concerning the fees due on the listing and negotiation of rights issues. The ADX took part in the preparation of the resolution.- September 2014: The ADX set out internal procedures for the listing and negotiation of rights as well as procedures for the registration of rights holders.- November 2014: ADX becomes the first market in the UAE to implement the negotiation of rights when Eshraq Properties launches a rights issue to increase capital. The ADX and Eshraq held an information session for brokers and media organizations.
Strategic Initiative: Listing government bonds
Completion Phases/Findings
- June 2014: The ADX signed an agreement with the National Bank of Abu Dhabi (NBAD) for the bank to operate as the securities account manager on the Euroclear platform.- July 2014: The ADX prepared and published on its website an investor manual document related to securities registered in the International Central Securities Depository. - October 2014: Abu Dhabi Government bonds, with an issue size of USD 1.5 billion and maturing in 2019, were dual listed on the ADX and the London Stock Exchange.
Strategic Core
“ Institutional Participation in Investment & Projects financing”
Objective/PriorityPromotion of Abu Dhabi Securities Exchange as a center for project funding.
Strategic Initiative: Trading in Private Companies
The ADX launched negotiation of shares in private joint stock companies in order to support funding of projects and growth companies.

Annual Report2014التقرير السنوي
28
Completion Phases/Findings
- February 2014: The Securities and Commodities Authority (SCA) issued a regulation on the listing of Private Joint Stock Companies and a related negotiation system. The ADX participated in the preparation of the document.- September 2014: HH Sheikh Mohammed Bin Rashid Al Maktoum launched “The Second Securities Exchange,” dedicated to the listing and negotiation of shares in Private Joint Stock Companies in UAE markets.- November 2014: ADX has listed its first two Private Joint Stock Companies on the Second Securities Exchange, namely Manazel Real Estates Company and The National Investor Company.
Strategic Initiative: More Listed Companies
One of the missions of the ADX is the promotion of listing on the exchange as a means for companies to raise capital.
Completion Phases/Findings
- During 2014: Meetings were held with nine companies on the potential opportunities and challenges involved in converting into Public Joint Stock Companies and listing on the Abu Dhabi Securities Exchange. - During 2014: Meetings were held with seven private companies on the possibility of listing on the “Second Securities Exchange” dedicated to negotiation of shares in Private Joint Stock Companies. Two companies subsequently listed during the year, namely Manazel Real Estates Company and The National Investor Company.- During 2014: Fourteen official meetings were held between the ADX and the Securities and Commodities Authority to discuss applications submitted by companies intending to be converted into Public Joint Stock Companies or to be listed on the Abu Dhabi Securities Exchange as Private Joint Stock Companies.
Objective/PriorityPolarisation of funds and orienting them towards investment in the capital market.
Strategic Initiative: Enhance Institutional Investor Participation
The ADX carried out several promotional campaigns on investment opportunities in the market with the aim of enhancing institutional investor participation in the market.
Completion Phases/Findings
- During 2014: The ADX led promotional campaigns in New York (March), London (June), Hong Kong (November) and Singapore (November), which involved the participation of a number of listed companies.
Strategic Initiative: Raising Investor Awareness
The ADX carried out several activities to raise awareness of the investment opportunities in the market and of new initiatives undertaken by the exchange to enhance the customer experience.

Annual Report2014التقرير السنوي
29
Completion Phases/Findings
- April 2014: The ADX launched the Virtual Securities Exchange in Abu Dhabi University.- June 2014: A lecture was organized for officers of the Abu Dhabi Police College. - October 2014: The ADX participated in the GITEX Exhibition 2014.- December 2014: The ADX sponsored a “Business Challenge” contest at the New York Institute of Technology Abu Dhabi.
Strategic Core
“High Performance Organization”
Objective/PriorityAttraction, development and maintenance of a skilled labour force.
Strategic Initiative: Recruitment
The ADX aims to attract talented university and college students and to help employees develop rewarding, long-term careers at the exchange. During the year, the ADX undertook a number of recruitment activities, including participation in university exhibitions, and has been awarded several certificates of recognition and appreciation for this work.
Completion Phases/Findings
- April 2014: The ADX participated in separate recruitment exhibitions, one aimed at female students and another aimed at male students, at Zayed University, Abu Dhabi.- May 2014: The ADX participated in a recruitment exhibition aimed at female students from the Higher Colleges of Technology.- June 2014: The ADX participated in the “Abu Dhabi Jobs” electronic recruitment exhibition.
Strategic Initiative: Promoting Emirati talent
Under its “Absher Initiative”, the ADX aims to continually increase the proportion of UAE nationals among its employee base.
Completion Phases/Findings
- Fourth quarter of 2014: The “Emiratisation ratio” at the ADX stood at 87% of total employees, compared to 83% in 2013.- End of 2014: The ADX recruited seven new employees under the “Absher Initiative” in the 2012-2014 period, surpassing the original target of three.

Annual Report2014التقرير السنوي
30
Strategic Initiative: Rewarding Excellent Performance
The ADX is committed to showing appreciation for outstanding performance, granting its “Teslam” award for excellence to honour employees, work teams and committees that show dedication and innovation.
Completion Phases/Findings
- During 2014: Eight employees were honoured within the categories of “excellent employee,” “excellence in customer service,” and “academic achievement.”
Strategic Initiative: Training and Development
The ADX seeks to continually increase capacity by investing in the training and development of its employees.
Completion Phases/Findings
- End of 2014: The total number of man-hours of employee training in 2014 amounted to 4115.
Objective/PriorityCommitment to social responsibility.
Strategic Initiative: Student Sponsorship
The ADX seeks to play a positive role in society beyond its main function, and has chosen student sponsorship in order to promote education among the local community.
Completion Phases/Findings
- End of 2014: One student specializing in “Applied Sciences” was nominated for a four-year sponsorship program. A total of five students have benefitted from the program since 2010 -- in line with the target.

Annual Report2014التقرير السنوي
31

Annual Report2014التقرير السنوي
32
ADX Performance in 2014:
Index Performance:
Abu Dhabi Securities Exchange (ADX) General Index increased 238 points during 2014, closing at 4528 points, an increase of 6% compared to 2013 when the index closed at 4290 points. ADX index witnessed a continuous rise during the first and second quarters of the year 2014, reaching its highest during the second quarter of 2014 at 5253 points.
The figure below shows ADX index on a monthly basis in the years 2013 -2014:
0
1,000
2,000
3,000
4,000
5,000
6,000
Janu
ary
Febr
uary
Mar
ch
Apr
il
May
June
July
Aug
ust
Sep
tem
ber
octo
ber
Nov
embe
r
Dec
embe
r
20132014
7,000
6,500
6,000
5,500
5,000
4,500
4,000
3,500
Opening4,290.30 Lowest Point
3,892.08
Highest Point5,253.41 Closing
4,528.93
ADX ends 2014 with 5.6% increase at 4528.93 points

Annual Report2014التقرير السنوي
33
GCC Stock Markets Performance in 2014 Reports on GCC Stock Markets performance in 2014 have shown various changes in index performance during 2104. Qatar Exchange led the GCC markets with a percentage increase of 18.4%, followed by Bahrain Exchange with 13.9%, Dubai Financial Market with 12%, and ADX with 5.6%. The Saudi Exchange declined the most among GCC markets with 1.5% followed by Muscat Exchange with 7% and the Kuwaiti exchange with 13.8%. GCC Stock Markets Performance in 2014
-5%
-10%
-15%
-20%
0%
5%
10%
15%
20%18.4%
13.9%12.0%
5.6%
-1.5%
-7.0%
-13.8%
KuwaitMuscatSaudi ArabiaAbu DhabiDubaiBahrainCountry

Annual Report2014التقرير السنوي
34
Trading Value:
Total trading value in ADX increased significantly during 2014 amounting to around AED 145 billion, compared to about AED 85 billion in 2013, an increase of about 70%. January was the highest month in terms of traded value, with about AED 23 billion worth of shares traded.
Average daily trading value in 2014 reached AED 579 million, compared to AED 339 million in 2013, an increase of 70%.
The figure below shows the monthly trading values in the years 2013 -2014:
Trading Volume:
Total trading volume in ADX also witnessed an increase amounting to around 58 billion shares compared with about 51.5 billion shares in 2013, an increase of about 13%. January was the highest month in terms of share traded volume, with 10 billion shares traded.Average daily trading volume in 2014 reached 233 billion shares, compared to 206 billion shares in 2013, an increase of around 13%.
0.0
5.0
10.0
15.0
20.0
25.0
Janu
ary
Febr
uary
Mar
ch
Apr
il
May
June
July
Aug
ust
Sep
tem
ber
Oct
ober
Nov
embe
r
Dec
embe
r20132014
Bill
ion
Dir
ham
s

Annual Report2014التقرير السنوي
35
The figure below shows the monthly trading volumes in the years 2013 -2014:
Market Capitalization:
The market capitalization of all listed companies on the exchange reached more than AED 464 billion at the end of 2014, of which about AED 417 billion was for local listed companies. The month of May topped the monthly market capitalization for the year. As for the year 2013, the market capitalization of all listed companies in the exchange reached about AED 449 billion, of which AED 402 billion was for local listed companies.
The figure below shows the monthly market capitalization in the years 2013 -2014:
0.0
5.0
10.0
15.0
Janu
ary
Febr
uary
Mar
ch
Apr
il
May
June
July
Aug
ust
Sep
tem
ber
Oct
ober
Nov
embe
r
Dec
embe
r
20132014
Bill
ion
0.0
100
600
500
400
300
200
Janu
ary
Febr
uary
Mar
ch
Apr
il
May
June
July
Aug
ust
Sep
tem
ber
Oct
ober
Nov
embe
r
Dec
embe
r
20132014
Bill
ion
Dir
ham
s

Annual Report2014التقرير السنوي
36
Investor Numbers (INs):
The total Investor Numbers issued by the Abu Dhabi Securities Exchange since inception and up to the end of 2014 was around 951 thousand numbers.
19,251 Investor Numbers were issued in 2014 compared with 15, 856 issued in 2013. The Investor Numbers issued in 2014 were distributed among 17,942 individuals, 1304 institutions, and five government agencies.
As for the distribution of Investor Numbers by nationality, UAE nationals accounted for 5946, while GCC nationals accounted for 929, other Arab nationals for 6548, while 5828 numbers were issued for other nationalities.
The figure below shows the distribution of Investor Numbers issued in 2014 compared to 2013:
Foreign Investment:
Net foreign investment in Abu Dhabi Securities Exchange increased in 2014 to reach around AED 3.5 billion, compared to AED 2 billion at the end of 2013, an increase of 75%.
The total number of shares bought by foreign investors, non UAE nationals, amounted to approximately 23 billion shares with a value of AED 61.5 billion, with shares sold amounting to approximately 22 billion shares, worth an estimated of AED 58 billion.
UAE
GCC
ARABS
OTHERS
2014
4,855
994
5,545
4,091
5,946
929
6,548
5,828
20130
5,000
10,000
15,000
20,000

Annual Report2014التقرير السنوي
37
Foreign Net Investment Based on Nationality
The number of foreign institutional investors registered in Abu Dhabi Securities Exchange also increased to reach 1106 institutions in 2014, compared with 380 in 2013, an increase of about 191%. This increase brings the number of foreign institutional investors registered in ADX since its inception to more than 3500 institutions.
UAE
GCC
ARABS
OTHERS
Mill
ion
Dir
ham
s
3,5003,0002,5002,0001,5001,000
5000
-500-1,000-1,500
-2,500
-3,500
-2,000
-3,000
-4,000
3,091.25
-3,588.04
537.57
-40.79
201420130
10,500
20,500
30,500
40,50034,130
37,219
9%
Bill
ion
Dir
ham
s

Annual Report2014التقرير السنوي
38
Market Performance in Sectoral Trading Contribution
The below charts illustrate the value, volume, and trading percentage in ADX listed companies for the year 2014 according to the sectors they operate in. The charts also show the number of executed trades in each sector.
Shares Index 2014
ADX listed companies operated in 9 sectors: Banking, Industrial, Energy, Consumer Staples, Investment and Financial Services, Services, Insurance, Real-estate, and Telecommunications. The Real-estate sector came first in the number of trading value in 2014, with a percentage of 55.97% of the overall total trading value. Trading value in the sector exceeded AED 81.32 billion and the number of executed trades reached 451,132 thousand deals, which represents 52.28% of the overall number of trades executed on the exchange.
0.00
10,000.00
9,000.00
8,000.00
7,000.00
6,000.00
5,000.00
4,000.00
3,000.00
2,000.00
1,000.00
9,087.03
4,203.753,906.24
3,195.08
2,466.97 2,465.25 2,387.44 2,299.63
1,138.70
Services
Investment and financial services
Real Estate
Banks
Insurance
Industrial
Communications
Consumer Staples
Energy

Annual Report2014التقرير السنوي
39
Sectoral Distribution of Trading Volume in 2014
Yet, the Real-estate sector index declined to 4,203.75 points which is a percentage of -9.95% in comparison to the same period in 2013. The Banking sector came second in the number of trading value in 2014 with AED 30 billion, and yet it was in third place right after Real-estate and Industrial sectors in the number of volume traded. The number of shares traded in the banking sector exceeded 3.7 billion shares while the banking sector took the second place in regards to the overall executed trades on the exchange which exceeded 154,750 thousand deals in 2014, representing a percentage 17.93% of the total trades registered on the exchange. Banking Index also increased to reach 9,087.03 representing 14.8% increase in comparison to the same period in 2013.
Services
Investment
Real Estate
Banks
Communications
Consumer Staples
0.23%0.41%1.70%
1.72%
63.65%
14.79%
6.38%
5.86%
5.27%

Annual Report2014التقرير السنوي
40
Sectoral Distribution of Trading Value in 2014:
The Investment and Financial Services sector, landed in the third place for trading value with the value of shares traded in the sector reaching AED 9 billion a percentage of 6.20% of the overall sectors trading value. While the number of executed trades in the sector rising to 47,124 thousand trades, a percentage of 5.46% of the overall executed deals on the exchange. The Investment and Financial Services sector index increased by 31.38% compared to the same period in 2013.
It is worth noting that the highest increase in sectoral indices occurred in the Investment and Financial Services sector with a percentage increase of 31.38% when compared to the year 2013, followed by the Banking sector that witnessed an increase of 14.08% as previously mentioned. They were followed by the Services sector which witnessed an index increase of 16.54% compared to eh same period in 2013. The rest of the sectors, Consumer Staples, Insurance, Energy, Industrial, Real-estate, and telecommunication contributed to around AED 104.6 billion of the overall total traded value in the index, whereas the overall increase in the aforementioned sectors reached around 51.4 billion in trading volume.
As for the number of executed trades, the 6 sectors contributed to around 659,960 thousand trades of the overall trades.
Services
Investment
Real Estate
Banks
Communications
Consumer Staples
0.48%0.68%1.13%
55.97%
21.09%
6.20%
5.06%
4.80%
4.58%

Annual Report2014التقرير السنوي
41
Sectoral Distribution of Number of Trades in 2014
Services
Investment
Real Estate
Banks
Customer Staples
0.13%2.01%
17.93%
52.28%
8.03%
7.70%
5.71%
5.46%
0.74%

Annual Report2014التقرير السنوي
42
Most Active Companies in Trading Value
The below chart identified the 10 most active listed companies in trading value for the year 2014.
Al Dar Properties achieved the highest trading value with AED 43.8 billion, a percentage of 30.1% of the overall trading value on the exchange. Al Dar also took the second place in the number of traded shares on the exchange representing 20% of the overall number of shares traded.
Most Active Shares by Value
Al Dar also headed the list of companies most active in regards to executed trades with 216,918 thousand trades, a percentage of 25.1% of the overall total of trades executed on the exchange. Eshraq Properties came in second in the list of companies with most active in traded value where its value of trades reached AED 28.23 Billion, a percentage of 19.4% of the overall value traded on the exchange. Eshraq Properties headed the list of companies that are most active in the number of shares traded reaching 12.47 billion shares, a percentage of 21.3% of the overall shares traded on the exchange. Eshraq Properties came in second in regards to the number of executed trades with 158,764 thousand trades, a percentage of 18.4% of the overall trades executed on ADX.
1.9%2.4%
ALDAR
ESHRAQ
FGB
RAKPROP
WAHA
DANA
ETISALAT
ADCB
NBAD
ADIB
OTHERS
19.4%
30.1%
8.4%
6.3%
6.2%
4.8%
4.3%
4.2%
12.0%

Annual Report2014التقرير السنوي
43
Most Active Shares by Volume
First Gulf Bank landed the third place in the list of the ten most active companies as for value of shares trades with a total trading value of AED 12.178 billion, a percentage of 8.4% of the overall trading value on the exchange in 2014. As for executed trades, the number of First Gulf Bank executed trades reached 59,335 thousand trades, a percentage of 6.9% of the overall executed number of trades. RAK Properties achieved the fourth place in the list of the most active companies in regards to trading value with AED 9.19 billion, a percentage of 6.3% of the overall trading value on the exchange in 2014. RAK Properties also achieved the fourth place in the number of shares trades with 6.7 billion shares, a percentage of 11.5% of the overall number of shares traded on the exchange. RAK Properties took the third place in the number of executed trades with 70,841 thousand, a percentage of 8.2% of the overall executed number of trades on ADX. Emirates Telecommunication Company (Etisalat) acquired the highest cut in regards to Market Capitalization which exceeded AED 86.57 billion at the end of 2014, followed by National Bank of Abu Dhabi with AED 66.30 billion. Etisalat reached the seventh place in terms of value traded with 4.3% of the overall total of the value traded amounting to AED 6.3 billion. The rest of ADX listed companies represented a percentage of 35.76% of the overall total of value of shares traded, where the number of shares reached 58 billion, as for the overall number of trades executed on the exchange, it reached 864,066 thousand trades in 2014.
0.9%1.8%
ESHRAQ
ALDAR
DANA
RAKPROP
WAHA
RAKCC
ESRI14
ADCB
METHAQ
FGB
OTHERS
20.0%
21.3%
11.8%11.5%
4.7%
4.5%
3.4%2.4%
17.7%

Annual Report2014التقرير السنوي
44
Most Active Companies in Domestic Market Cap
Clearing, Settlement & Depository The number of issue right certificates deposited in 2014 has gone up to 1,171 whereas the number of shares representing those certificates exceeded 2,197 billion shares whereby strengthening the ambition of ADX to establish an electronic platform free from paper works for the purpose of environment preservation.
2014 marked issue of 19,251 investors’ numbers as compared to 15,856 in 2013.The investors’ numbers issued in 2014 have been distributed as follows: 17,942 of them for individuals, 1034 for institutions and 5 governmental entities.The total number of executed transactions amounted to 5,979 which would represent about one billion shares. These transactions comprise operations of ownership transfer out of the trading hall related to legacy, family affairs and mortgage operations.
However, as regards distribution of issue of investors’ numbers according to nationality the numbers of UAE national investors amounted to 5,946 whereas those of Gulf nationals amounted to 929 and the investor’s numbers of other Arab nationalities amounted to 6,548 and the remaining numbers have been issued for other nationalities.
1.5%1.8%3.3%3.8%
20.7%
18.6%
15.9%15.9%
9.4%
5.0%
4.1%
UNB
NBAD
ETISALAT
FGB
ALDAR
ADCB
ADIB
RAKBANK
UAB
NBQ
OTHERS

Annual Report2014التقرير السنوي
Statistical Appendix

Annual Report2014التقرير السنوي
46
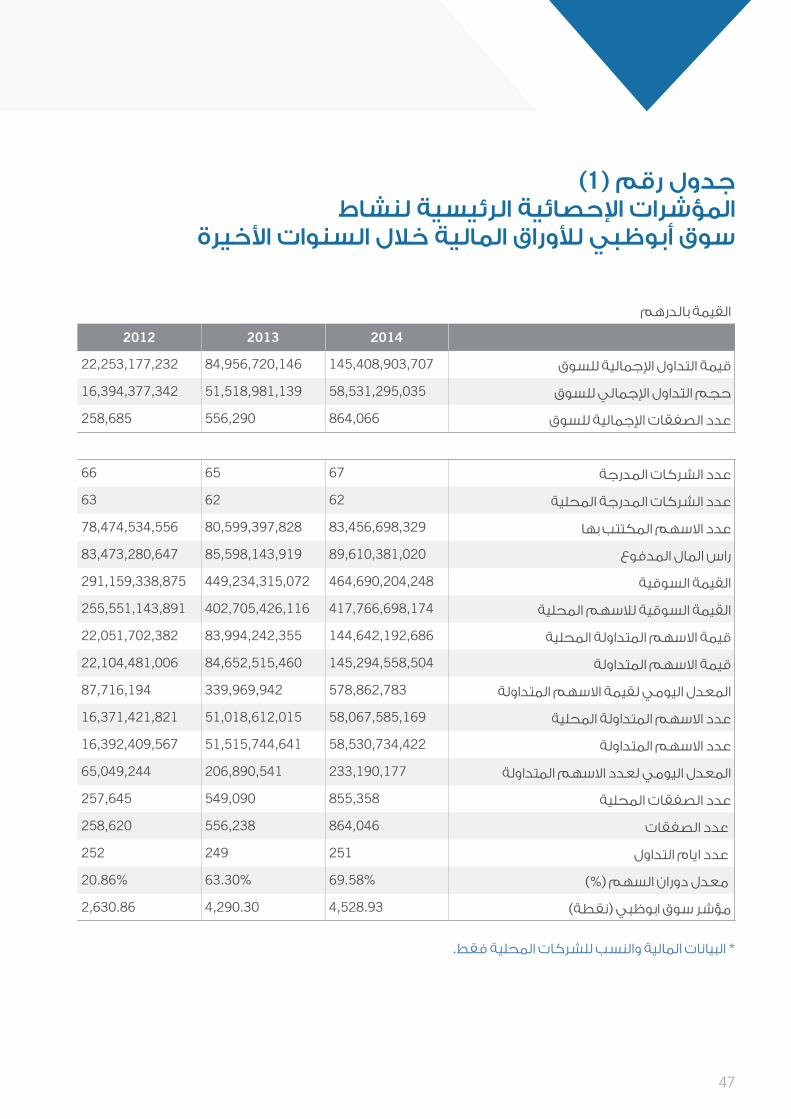
Table (1)Key Statistics ofAbu Dhabi Securities Exchange During the Last Years
* Financial Data and ratios are for doemstic companies only.
جدول رقم )1(المؤشرات اإلحصائية الرئيسية لنشاط
سوق أبوظبي لألوراق المالية خالل السنوات األخيرة
Value in AEDالقيمة بالدرهم
201420132012201120102009
145,408,903,70784,956,720,14622,253,177,23224,861,644,46834,576,090,52770,169,076,806Total Trading Valueقيمة التداول اإلجمالية للسوق
58,531,295,03551,518,981,13916,394,377,34215,857,202,55717,618,838,22337,615,871,102Total No. of Traded Unitsحجم التداول اإلجمالي للسوق
864,066556,290258,685283,368364,327744,710Total No. of Tradesعدد الصفقات اإلجمالية للسوق
676566676567No. of listed Companiesعدد الشركات المدرجة
626263646162No. of Domestic Listed Companiesعدد الشركات المدرجة المحلية
83,456,698,32980,599,397,82878,474,534,55674,217,284,46568,960,016,47468,172,143,873No. of Subscribed sharesعدد االسهم المكتتب بها
89,610,381,02085,598,143,91983,473,280,64777,839,751,86173,180,645,92874,141,123,327Paid up Capitalراس المال المدفوع
464,690,204,248449,234,315,072291,159,338,875261,983,617,688283,893,187,911294,571,204,486Market Capitalizationالقيمة السوقية
417,766,698,174402,705,426,116255,551,143,891232,712,218,425255,696,373,557263,576,540,480Domestic Market Capitalizationالقيمة السوقية لالسهم المحلية
Domestic Shares Trading Value 144,642,192,68683,994,242,35522,051,702,38224,732,574,67634,091,367,87369,655,245,417قيمة االسهم المتداولة المحلية
145,294,558,50484,652,515,46022,104,481,00624,773,871,20134,140,434,64169,982,293,419Shares Trading Valueقيمة االسهم المتداولة
578,862,783339,969,94287,716,19498,309,013136,017,668279,929,174Shares Trading Value Daily Averageالمعدل اليومي لقيمة االسهم المتداولة
58,067,585,16951,018,612,01516,371,421,82115,847,253,94117,602,457,40337,572,649,310No. of Traded Domestic Sharesعدد االسهم المتداولة المحلية
58,530,734,42251,515,744,64116,392,409,56715,855,720,86217,611,128,25437,613,745,645No. of Traded Sharesعدد االسهم المتداولة
233,190,177206,890,54165,049,24462,919,52770,163,858150,454,983No. of Traded Shares Daily Averageالمعدل اليومي لعدد االسهم المتداولة
855,358549,090257,645282,624363,055742,450No. of Domestic Tradesعدد الصفقات المحلية
864,046556,238258,620283,293364,019744,697No. of Trades عدد الصفقات
251249252252251250No. of Traded Days عدد ايام التداول
(%) Turnover ratio%55.11%25.53%21.35%20.86%63.30%69.58 معدل دوران السهم )%(
4,528.934,290.302,630.862,402.282,719.872,743.61ADX Index (Point)مؤشر سوق ابوظبي )نقطة(
* البيانات المالية والنسب للشركات المحلية فقط.
Annual Report2014التقرير السنوي
47
* Financial Data and ratios are for doemstic companies only.
جدول رقم )1(المؤشرات اإلحصائية الرئيسية لنشاط
سوق أبوظبي لألوراق المالية خالل السنوات األخيرة
Value in AEDالقيمة بالدرهم
201420132012201120102009
145,408,903,70784,956,720,14622,253,177,23224,861,644,46834,576,090,52770,169,076,806Total Trading Valueقيمة التداول اإلجمالية للسوق
58,531,295,03551,518,981,13916,394,377,34215,857,202,55717,618,838,22337,615,871,102Total No. of Traded Unitsحجم التداول اإلجمالي للسوق
864,066556,290258,685283,368364,327744,710Total No. of Tradesعدد الصفقات اإلجمالية للسوق
676566676567No. of listed Companiesعدد الشركات المدرجة
626263646162No. of Domestic Listed Companiesعدد الشركات المدرجة المحلية
83,456,698,32980,599,397,82878,474,534,55674,217,284,46568,960,016,47468,172,143,873No. of Subscribed sharesعدد االسهم المكتتب بها
89,610,381,02085,598,143,91983,473,280,64777,839,751,86173,180,645,92874,141,123,327Paid up Capitalراس المال المدفوع
464,690,204,248449,234,315,072291,159,338,875261,983,617,688283,893,187,911294,571,204,486Market Capitalizationالقيمة السوقية
417,766,698,174402,705,426,116255,551,143,891232,712,218,425255,696,373,557263,576,540,480Domestic Market Capitalizationالقيمة السوقية لالسهم المحلية
Domestic Shares Trading Value 144,642,192,68683,994,242,35522,051,702,38224,732,574,67634,091,367,87369,655,245,417قيمة االسهم المتداولة المحلية
145,294,558,50484,652,515,46022,104,481,00624,773,871,20134,140,434,64169,982,293,419Shares Trading Valueقيمة االسهم المتداولة
578,862,783339,969,94287,716,19498,309,013136,017,668279,929,174Shares Trading Value Daily Averageالمعدل اليومي لقيمة االسهم المتداولة
58,067,585,16951,018,612,01516,371,421,82115,847,253,94117,602,457,40337,572,649,310No. of Traded Domestic Sharesعدد االسهم المتداولة المحلية
58,530,734,42251,515,744,64116,392,409,56715,855,720,86217,611,128,25437,613,745,645No. of Traded Sharesعدد االسهم المتداولة
233,190,177206,890,54165,049,24462,919,52770,163,858150,454,983No. of Traded Shares Daily Averageالمعدل اليومي لعدد االسهم المتداولة
855,358549,090257,645282,624363,055742,450No. of Domestic Tradesعدد الصفقات المحلية
864,046556,238258,620283,293364,019744,697No. of Trades عدد الصفقات
251249252252251250No. of Traded Days عدد ايام التداول
(%) Turnover ratio%55.11%25.53%21.35%20.86%63.30%69.58 معدل دوران السهم )%(
4,528.934,290.302,630.862,402.282,719.872,743.61ADX Index (Point)مؤشر سوق ابوظبي )نقطة(
* البيانات المالية والنسب للشركات المحلية فقط.

Annual Report2014التقرير السنوي
48
جدول رقم )2(المؤشرات اإلحصائية الرئيسية لنشاط
سوق أبوظبي لألوراق المالية
2014Value in AEDالقيمة بالدرهم
يناير فبرايرمارسابريلمايويونيويوليوأغسطسسبتمبراكتوبرنوفمبر ديسمبر 2014
DecNovOctSeptAugJulyJuneMayAprilMarchFebJan
145,408,903,7078,726,289,3717,024,607,7435,274,038,7396,907,253,3814,326,903,8827,838,056,65312,678,362,00617,731,890,37822,723,869,99512,266,405,74716,988,003,84522,923,221,967Total Trading Valueقيمة التداول اإلجمالية للسوق
58,531,295,0355,241,332,3103,621,146,3891,815,817,1872,158,254,2591,509,601,9963,509,437,7464,929,820,4065,399,817,4138,591,460,1044,747,470,5116,309,906,73310,697,229,981Total No. of Traded Unitsحجم التداول اإلجمالي للسوق
864,06672,62753,80143,16545,50037,01862,31081,62494,134105,91167,47886,231114,267Total No. of Tradesعدد الصفقات اإلجمالية للسوق
67676765656565656565656565No. of listed Companiesعدد الشركات المدرجة
62626262626262626262626262No. of Domestic Listed Companiesعدد الشركات المدرجة المحلية
83,456,698,32983,456,698,32982,856,698,32982,856,698,32982,856,698,32982,849,421,52382,849,421,52282,796,939,04082,747,771,31582,299,618,46180,972,080,32579,155,567,35479,032,299,689No. of Subscribed sharesعدد االسهم المكتتب بها
89,610,381,02089,610,381,02089,460,381,02089,460,381,02089,460,381,02089,453,104,21489,453,104,21389,400,621,73189,144,865,54588,865,462,69187,537,924,55585,721,411,58485,598,143,919Paid up Capitalراس المال المدفوع
464,690,204,248464,690,204,248468,326,713,815489,115,826,339510,703,874,378511,572,864,024511,565,421,616472,250,848,663538,354,636,335508,175,610,276497,369,888,160505,453,360,678484,665,734,854Market Capitalizationالقيمة السوقية
417,766,698,174417,766,698,174427,211,012,911444,618,158,424466,064,468,667463,048,556,831463,254,563,848423,604,770,389485,295,416,193461,522,790,135453,279,628,019456,858,796,034433,880,812,425Domestic Market Capitalizationالقيمة السوقية لالسهم المحلية
Domestic Shares Trading Value 144,642,192,6868,716,080,2227,002,798,4335,269,448,1076,871,159,7504,265,813,9127,821,322,06712,675,257,40717,728,812,35622,667,244,19412,199,999,57216,852,357,12722,571,899,542قيمة االسهم المتداولة المحلية
145,355,169,1608,726,289,3717,008,867,0715,273,930,7096,890,773,9414,326,827,4667,838,056,65312,678,362,00617,731,890,37822,721,940,24812,266,405,74716,968,643,54422,923,182,028Shares Trading Valueقيمة االسهم المتداولة
579,104,260415,537,589333,755,575263,696,535313,216,997206,039,403391,902,833576,289,182886,594,5191,032,815,466557,563,898848,432,1771,146,159,101Shares Trading Value Daily Averageالمعدل اليومي لقيمة االسهم المتداولة
58,067,585,1695,225,839,7753,614,882,0931,811,065,4562,139,926,0001,452,382,6803,491,498,2934,929,776,6415,399,777,9208,591,053,5654,710,353,0836,230,347,77810,470,681,885No. of Traded Domestic Sharesعدد االسهم المتداولة المحلية
59,186,623,3915,241,332,3103,620,984,5951,815,816,0772,158,083,8091,509,601,2003,509,437,7464,929,820,4066,055,706,3828,591,440,0214,747,470,5116,309,706,73310,697,223,601No. of Traded Sharesعدد االسهم المتداولة
235,803,280249,587,253172,427,83890,790,80498,094,71971,885,771175,471,887224,082,7465,399,817,413390,520,001215,794,114315,485,337534,861,180No. of Traded Shares Daily Averageالمعدل اليومي لعدد االسهم المتداولة
855,35872,26453,63743,04445,18235,97561,87681,61094,112105,81966,52584,674110,640No. of Domestic Tradesعدد الصفقات المحلية
864,05672,62753,79743,16545,50037,01862,31081,62494,134105,90867,47886,229114,266No. of Trades عدد الصفقات
251212120222120222022222020No. of Traded Days عدد ايام التداول
(%) Turnover ratio%13.25%7.87%5.82%10.44%6.53%5.95%4.21%1.75%2.58%2.19%4.36%6.26%69.58 معدل دوران السهم )%(
4,528.934,528.934,675.004,861.455,106.295,082.725,054.954,551.025,253.415,044.624,894.424,958.664,673.07ADX Index (Point)مؤشر سوق ابوظبي )نقطة(
.Financial Data and ratios are for doemstic companies only ** البيانات المالية والنسب للشركات المحلية فقط.
Table (2)Key Statistics ofAbu Dhabi Securities Exchange

Annual Report2014التقرير السنوي
49
جدول رقم )2(المؤشرات اإلحصائية الرئيسية لنشاط
سوق أبوظبي لألوراق المالية
2014Value in AEDالقيمة بالدرهم
يناير فبرايرمارسابريلمايويونيويوليوأغسطسسبتمبراكتوبرنوفمبر ديسمبر 2014
DecNovOctSeptAugJulyJuneMayAprilMarchFebJan
145,408,903,7078,726,289,3717,024,607,7435,274,038,7396,907,253,3814,326,903,8827,838,056,65312,678,362,00617,731,890,37822,723,869,99512,266,405,74716,988,003,84522,923,221,967Total Trading Valueقيمة التداول اإلجمالية للسوق
58,531,295,0355,241,332,3103,621,146,3891,815,817,1872,158,254,2591,509,601,9963,509,437,7464,929,820,4065,399,817,4138,591,460,1044,747,470,5116,309,906,73310,697,229,981Total No. of Traded Unitsحجم التداول اإلجمالي للسوق
864,06672,62753,80143,16545,50037,01862,31081,62494,134105,91167,47886,231114,267Total No. of Tradesعدد الصفقات اإلجمالية للسوق
67676765656565656565656565No. of listed Companiesعدد الشركات المدرجة
62626262626262626262626262No. of Domestic Listed Companiesعدد الشركات المدرجة المحلية
83,456,698,32983,456,698,32982,856,698,32982,856,698,32982,856,698,32982,849,421,52382,849,421,52282,796,939,04082,747,771,31582,299,618,46180,972,080,32579,155,567,35479,032,299,689No. of Subscribed sharesعدد االسهم المكتتب بها
89,610,381,02089,610,381,02089,460,381,02089,460,381,02089,460,381,02089,453,104,21489,453,104,21389,400,621,73189,144,865,54588,865,462,69187,537,924,55585,721,411,58485,598,143,919Paid up Capitalراس المال المدفوع
464,690,204,248464,690,204,248468,326,713,815489,115,826,339510,703,874,378511,572,864,024511,565,421,616472,250,848,663538,354,636,335508,175,610,276497,369,888,160505,453,360,678484,665,734,854Market Capitalizationالقيمة السوقية
417,766,698,174417,766,698,174427,211,012,911444,618,158,424466,064,468,667463,048,556,831463,254,563,848423,604,770,389485,295,416,193461,522,790,135453,279,628,019456,858,796,034433,880,812,425Domestic Market Capitalizationالقيمة السوقية لالسهم المحلية
Domestic Shares Trading Value 144,642,192,6868,716,080,2227,002,798,4335,269,448,1076,871,159,7504,265,813,9127,821,322,06712,675,257,40717,728,812,35622,667,244,19412,199,999,57216,852,357,12722,571,899,542قيمة االسهم المتداولة المحلية
145,355,169,1608,726,289,3717,008,867,0715,273,930,7096,890,773,9414,326,827,4667,838,056,65312,678,362,00617,731,890,37822,721,940,24812,266,405,74716,968,643,54422,923,182,028Shares Trading Valueقيمة االسهم المتداولة
579,104,260415,537,589333,755,575263,696,535313,216,997206,039,403391,902,833576,289,182886,594,5191,032,815,466557,563,898848,432,1771,146,159,101Shares Trading Value Daily Averageالمعدل اليومي لقيمة االسهم المتداولة
58,067,585,1695,225,839,7753,614,882,0931,811,065,4562,139,926,0001,452,382,6803,491,498,2934,929,776,6415,399,777,9208,591,053,5654,710,353,0836,230,347,77810,470,681,885No. of Traded Domestic Sharesعدد االسهم المتداولة المحلية
59,186,623,3915,241,332,3103,620,984,5951,815,816,0772,158,083,8091,509,601,2003,509,437,7464,929,820,4066,055,706,3828,591,440,0214,747,470,5116,309,706,73310,697,223,601No. of Traded Sharesعدد االسهم المتداولة
235,803,280249,587,253172,427,83890,790,80498,094,71971,885,771175,471,887224,082,7465,399,817,413390,520,001215,794,114315,485,337534,861,180No. of Traded Shares Daily Averageالمعدل اليومي لعدد االسهم المتداولة
855,35872,26453,63743,04445,18235,97561,87681,61094,112105,81966,52584,674110,640No. of Domestic Tradesعدد الصفقات المحلية
864,05672,62753,79743,16545,50037,01862,31081,62494,134105,90867,47886,229114,266No. of Trades عدد الصفقات
251212120222120222022222020No. of Traded Days عدد ايام التداول
(%) Turnover ratio%13.25%7.87%5.82%10.44%6.53%5.95%4.21%1.75%2.58%2.19%4.36%6.26%69.58 معدل دوران السهم )%(
4,528.934,528.934,675.004,861.455,106.295,082.725,054.954,551.025,253.415,044.624,894.424,958.664,673.07ADX Index (Point)مؤشر سوق ابوظبي )نقطة(
.Financial Data and ratios are for doemstic companies only ** البيانات المالية والنسب للشركات المحلية فقط.
Table (2)Key Statistics ofAbu Dhabi Securities Exchange
Annual Report2014التقرير السنوي
50
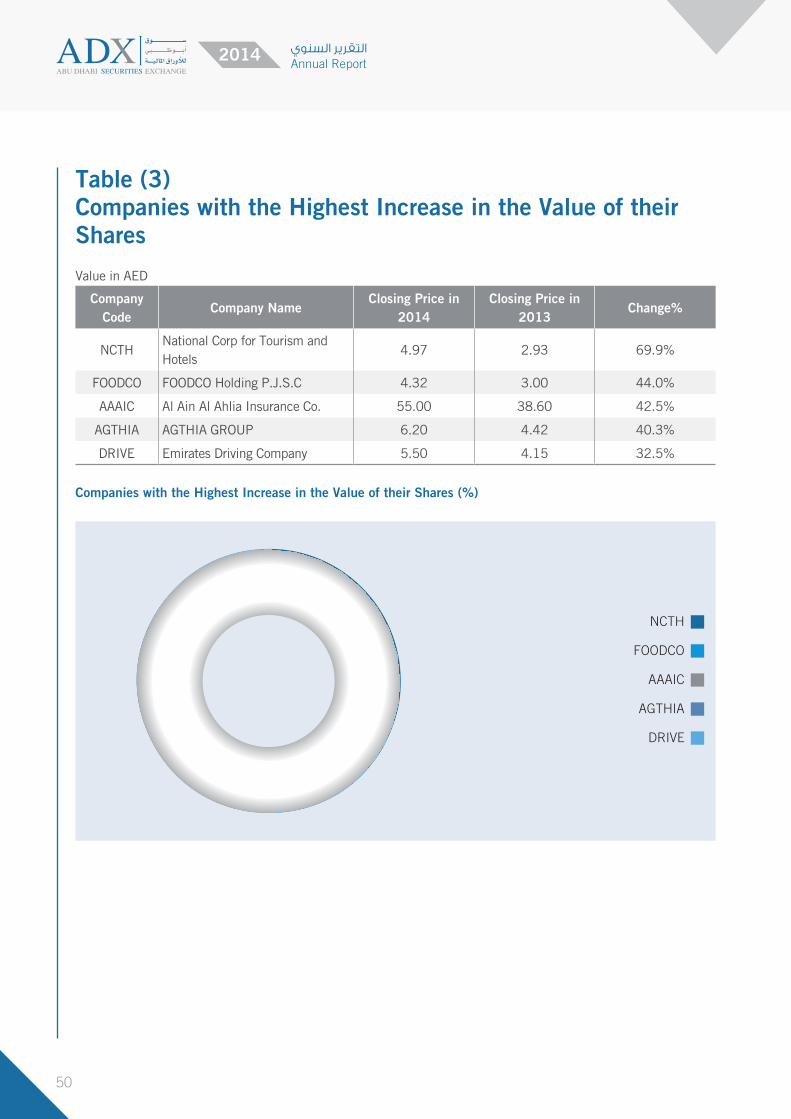
Table (3)Companies with the Highest Increase in the Value of their Shares
Value in AED
Change%Closing Price in
2013Closing Price in
2014Company Name
CompanyCode
69.9%2.934.97 National Corp for Tourism and Hotels
NCTH
44.0%3.004.32FOODCO Holding P.J.S.C FOODCO
42.5%38.6055.00Al Ain Al Ahlia Insurance Co. AAAIC
40.3%4.426.20AGTHIA GROUP AGTHIA
32.5%4.155.50Emirates Driving Company DRIVE
Companies with the Highest Increase in the Value of their Shares (%)
AAAIC
FOODCO
NCTH
DRIVE
AGTHIA
69.9%
32.5%
44.0%42.5%
40.3%

Annual Report2014التقرير السنوي
51
Table (4)Most Active Companies in Trading Value
Value in AED
Closing Price%ValueCompany Name Company
Code
2.6530.1%43,799,367,101Al Dar Properties Co.ALDAR
0.7919.4%28,236,059,086Eshraq Properities Co.ESHRAQ
17.008.4%12,178,659,380First Gulf BankFGB
0.746.3%9,193,244,558RAK PropertiesRAKPROP
2.826.2%9,005,760,127Waha CapitalWAHA
0.504.8%6,955,966,756Dana Gas PJSCDANA
10.954.3%6,266,760,562 Emirates TelecommunicationsETISALAT
7.034.2%6,084,431,824Abu Dhabi Commercial BankADCB
14.002.4%3,452,326,740National Bank of Abu DhabiNBAD
5.701.9%2,778,726,970Abu Dhabi Islamic BankADIB
12.0%17,457,600,602Others Others
87.99%127,951,303,105Total
Most Active Companies in Trading Value (%)
1.9%2.4%
ETISALAT
ESHRAQ
ALDAR
FGB
WAHA
RAKPROP
DANA
ADCB
NBAD
ADIB
OTHERS
30.1%
12.0%
19.4%
8.4%6.3%
6.2%
4.8%
4.3%
4.2%

Annual Report2014التقرير السنوي
52
Table (5)Most Active Companies in Trading Volume
Value in AED
Closing Price%VolumeCompany Name Company
Code
0.7921.3%12,474,648,384Eshraq Properities Co.ESHRAQ
2.6520.0%11,715,677,277Al Dar Properties Co.ALDAR
0.5011.8%6,890,020,406Dana Gas PJSCDANA
0.7411.5%6,744,510,922RAK PropertiesRAKPROP
2.824.7%2,766,380,906Waha CapitalWAHA
1.004.5%2,633,951,507RAK Cement CompanyRAKCC
0.083.4%1,995,299,404 ESHRAQ Right Issue Shares2014
ESRI14
7.032.4%1,394,728,489Abu Dhabi Commercial BankADCB
0.731.8%1,026,755,226Methaq Takaful Insurance Co.METHAQ
17.000.9%505,680,436First Gulf BankFGB
17.7%10,383,081,465 Others Others
82.3%48,147,652,957Total
Most Active Companies in Trading Volume (%)
0.9%1.8%2.4%3.4%
ESRI14
ALDAR
ESHRAQ
DANA
WAHA
RAKPROP
RAKCC
ADCB
METHAQ
FGB
OTHERS
21.3%
17.7%
20.0%11.8%
11.5%
4.7%
4.5%

Annual Report2014التقرير السنوي
53
Table (6)Most Active Companies in Executed Trades
Value in AED
Closing Price%Trades NumberCompany Name Company
Code
2.6525.1%216,918Al Dar Properties Co.ALDAR
0.7918.4%158,764Eshraq Properities Co.ESHRAQ
0.748.2%70,841RAK PropertiesRAKPROP
0.507.4%64,273Dana Gas PJSCDANA
17.006.9%59,335First Gulf BankFGB
10.956.7%57,850 Emirates TelecommunicationsETISALAT
2.825.4%47,069Waha CapitalWAHA
7.034.4%38,402Abu Dhabi Commercial BankADCB
14.002.1%17,794National Bank of Abu DhabiNBAD
1.002.0%16,884RAK Cement CompanyRAKCC
13.4%115,936 Others Others
86.6%748,130Total
Most Active Companies in Executed Trades (%)
2.0%2.1%
WAHA
ESHRAQ
ALDAR
RAKPROP
FGB
DANA
ETISALAT
ADCB
NBAD
RAKCC
OTHERS
25.1%
13.4%
18.4%7.4%
8.2%
6.9%
6.7%
5.4%
4.4%

Annual Report2014التقرير السنوي
54
Table (7)Local Listed Companies with Highest Market Capitalization
Value in AED Company
CodeCompany Name Value % Closing Price
ETISALAT Emirates Telecommunications 86,572,233,000 20.7% 10.95
NBAD National Bank of Abu Dhabi 66,305,561,224 15.9% 14.00
FGB First Gulf Bank 66,300,000,000 15.9% 17.00
ADCB Abu Dhabi Commercial Bank 39,337,049,588 9.4% 7.03
ALDAR Al Dar Properties Co. 20,835,968,448 5.0% 2.65
ADIB Abu Dhabi Islamic Bank 17,100,000,000 4.1% 5.70
UNB Union National Bank 15,958,274,060 3.8% 5.80
RAKBANK National Bank of Ras Al-Khaimah 13,845,787,235 3.3% 8.26
UAB United Arab Bank 7,448,099,568 1.8% 6.50
NBQ National Bank of Umm Al-Qaiwain 6,300,000,056 1.5% 3.75
Others Others 77,763,724,994 18.6%
Total 340,002,973,180 81.4%
Local Listed Companies with Highest Market Capitalization (%)
1.5%1.8%3.3%
UNB
NBAD
ETISALAT
FGB
ALDAR
ADCB
ADIB
RAKBANK
UAB
NBQ
OTHERS
20.7%
18.6%
15.9%15.9%
9.4%
5.0%
4.1%
3.8%

Annual Report2014التقرير السنوي
ADX Annual TradingActivity in 2014

Annual Report2014التقرير السنوي
56
النشرة السنوية لنشاط سوق ابوظبي لالوراق المالية 2014
Value in AED القيمة بالدرهم
Company›s NameTradingDays
TurnoverRatio
Change(%)
ClosingPrice 2013
ClosingPrice
Last Price Low Price High Price Trades Value Volume Symbol اسم الشركة
قطاع البنوك
Abu Dhabi Commercial Bank 249 13.92% 8.15% 6.50 7.03 7.03 5.05 9.38 38,402 6,084,431,824 779,012,293 ADCB بنك أبوظبي التجاري
Abu Dhabi Islamic Bank 251 13.36% 24.68% 4.57 5.70 5.70 4.41 7.49 13,376 2,778,726,970 400,887,866 ADIBمصرف أبوظبي
اإلسالمي
Bank of Sharjah 224 9.59% 12.32% 1.74 1.95 1.95 1.55 2.42 2,564 412,010,881 201,367,176 BOS بنك الشارقة
Commercial Bank International 69 2.72% -2.78% 1.80 1.75 1.75 1.71 2.61 157 97,037,328 45,054,502 CBI البنك التجاري الدولي
Finance House 102 1.73% -6.40% 3.75 3.51 3.53 3.10 4.80 253 19,541,055 5,233,797 FH دار التمويل
First Gulf Bank 251 17.42% 17.55% 14.46 17.00 17.00 12.62 19.35 59,335 12,178,659,380 679,331,870 FGB بنك الخليج األول
Invest Bank 125 4.66% 15.72% 2.45 2.83 2.83 2.36 3.30 423 209,577,973 67,329,679 INVESTB بنك االستثمار
National Bank of Abu Dhabi 247 4.95% 10.79% 12.64 14.00 14.00 10.00 17.25 17,794 3,452,326,740 234,397,856 NBAD بنك أبوظبي الوطني
National Bank of Fujairah 23 3.84% 2.11% 4.75 4.85 4.85 3.50 4.85 219 176,704,236 42,237,835 NBF بنك الفجيرة الوطني
National Bank of Ras Al-Khaimah 226 5.15% 15.69% 7.14 8.26 8.26 7.05 10.00 3,018 754,592,036 86,258,184 RAKBANKبنك رأس الخيمة
الوطني
National Bank of Umm Al Qaiwain 42 1.32% 19.32% 3.14 3.75 3.75 2.91 3.80 53 73,997,767 22,133,236 NBQ بنك أم القيوين الوطني
Sharjah Islamic Bank 246 26.61% 14.29% 1.54 1.76 1.76 1.55 2.37 6,461 1,342,068,894 645,528,104 SIBمصرف الشارقة
اإلسالمي
Union National Bank 249 13.70% 3.75% 5.59 5.80 5.80 4.55 7.24 12,435 2,459,910,242 376,821,662 UNB بنك اإلتحاد الوطني
United Arab Bank 63 2.92% 15.89% 5.61 6.50 6.50 5.61 8.00 241 230,073,276 33,454,438 UAB البنك العربي المتحد
TOTAL 10.80% 15.11% Change Point 9,087.03 Index 154,731 30,269,658,603 3,619,048,498 المجموع
قطاع العقارات
Al Dar Properties Co. 251 154.05% -3.99% 2.76 2.65 2.65 1.95 4.84 216,918 43,799,367,101 12,112,701,205 ALDAR شركة الدار العقارية
Eshraq Properities Co. 251 702.57% -39.98% 1.32 0.79 0.79 0.63 1.78 158,764 28,236,059,086 16,334,703,798 ESHRAQ شركة إشراق العقارية
RAK Properties 251 395.63% -24.49% 0.98 0.74 0.74 0.57 1.52 70,841 9,193,244,558 7,912,509,738 RAKPROPشركة رأس الخيمة
العقارية
TOTAL 298.33% -11.20% Change Point 4,203.75 Index 446,523 81,228,670,746 36,359,914,741 المجموع
Real Estate Sector
Bank Sector
Annual Bulletin of the ADX Activity 2014

Annual Report2014التقرير السنوي
57
النشرة السنوية لنشاط سوق ابوظبي لالوراق المالية 2014
Value in AED القيمة بالدرهم
Company›s NameTradingDays
TurnoverRatio
Change(%)
ClosingPrice 2013
ClosingPrice
Last Price Low Price High Price Trades Value Volume Symbol اسم الشركة
قطاع البنوك
Abu Dhabi Commercial Bank 249 13.92% 8.15% 6.50 7.03 7.03 5.05 9.38 38,402 6,084,431,824 779,012,293 ADCB بنك أبوظبي التجاري
Abu Dhabi Islamic Bank 251 13.36% 24.68% 4.57 5.70 5.70 4.41 7.49 13,376 2,778,726,970 400,887,866 ADIBمصرف أبوظبي
اإلسالمي
Bank of Sharjah 224 9.59% 12.32% 1.74 1.95 1.95 1.55 2.42 2,564 412,010,881 201,367,176 BOS بنك الشارقة
Commercial Bank International 69 2.72% -2.78% 1.80 1.75 1.75 1.71 2.61 157 97,037,328 45,054,502 CBI البنك التجاري الدولي
Finance House 102 1.73% -6.40% 3.75 3.51 3.53 3.10 4.80 253 19,541,055 5,233,797 FH دار التمويل
First Gulf Bank 251 17.42% 17.55% 14.46 17.00 17.00 12.62 19.35 59,335 12,178,659,380 679,331,870 FGB بنك الخليج األول
Invest Bank 125 4.66% 15.72% 2.45 2.83 2.83 2.36 3.30 423 209,577,973 67,329,679 INVESTB بنك االستثمار
National Bank of Abu Dhabi 247 4.95% 10.79% 12.64 14.00 14.00 10.00 17.25 17,794 3,452,326,740 234,397,856 NBAD بنك أبوظبي الوطني
National Bank of Fujairah 23 3.84% 2.11% 4.75 4.85 4.85 3.50 4.85 219 176,704,236 42,237,835 NBF بنك الفجيرة الوطني
National Bank of Ras Al-Khaimah 226 5.15% 15.69% 7.14 8.26 8.26 7.05 10.00 3,018 754,592,036 86,258,184 RAKBANKبنك رأس الخيمة
الوطني
National Bank of Umm Al Qaiwain 42 1.32% 19.32% 3.14 3.75 3.75 2.91 3.80 53 73,997,767 22,133,236 NBQ بنك أم القيوين الوطني
Sharjah Islamic Bank 246 26.61% 14.29% 1.54 1.76 1.76 1.55 2.37 6,461 1,342,068,894 645,528,104 SIBمصرف الشارقة
اإلسالمي
Union National Bank 249 13.70% 3.75% 5.59 5.80 5.80 4.55 7.24 12,435 2,459,910,242 376,821,662 UNB بنك اإلتحاد الوطني
United Arab Bank 63 2.92% 15.89% 5.61 6.50 6.50 5.61 8.00 241 230,073,276 33,454,438 UAB البنك العربي المتحد
TOTAL 10.80% 15.11% Change Point 9,087.03 Index 154,731 30,269,658,603 3,619,048,498 المجموع
قطاع العقارات
Al Dar Properties Co. 251 154.05% -3.99% 2.76 2.65 2.65 1.95 4.84 216,918 43,799,367,101 12,112,701,205 ALDAR شركة الدار العقارية
Eshraq Properities Co. 251 702.57% -39.98% 1.32 0.79 0.79 0.63 1.78 158,764 28,236,059,086 16,334,703,798 ESHRAQ شركة إشراق العقارية
RAK Properties 251 395.63% -24.49% 0.98 0.74 0.74 0.57 1.52 70,841 9,193,244,558 7,912,509,738 RAKPROPشركة رأس الخيمة
العقارية
TOTAL 298.33% -11.20% Change Point 4,203.75 Index 446,523 81,228,670,746 36,359,914,741 المجموع
Annual Bulletin of the ADX Activity 2014

Annual Report2014التقرير السنوي
58
Company›s NameTradingDays
TurnoverRatio
Change(%)
ClosingPrice 2013
ClosingPrice
Last Price Low Price High Price Trades Value Volume Symbol اسم الشركة
شركات خاصة
ESHRAQ Right Issue Shares 2014 10 0.08 0.08 0.03 0.35 4,609 99,375,879 838,361,136 ESRI14أسهم حقوق اكتتاب إشراق العقارية 2014
4,609 99,375,879 838,361,136 المجموع
قطاع االتصاالت
Emirates Telecomuniactions 249 6.84% -6.41% 11.70 10.95 10.95 10.35 12.60 57,850 6,266,760,562 540,948,487 ETISALATمؤسسة االمارات
لالتصاالت
Qatar Telecom (Ooredoo) 52 0.20% 2.50% 140.00 143.50 143.50 122.00 161.00 207 88,458,448 632,669 ORDS اتصاالت قطر )اوريدو(
Sudan Telecommunications 171 39.12% -45.93% 1.28 0.69 0.69 0.56 1.64 8,426 623,727,574 462,053,284 SUDATELالشركة السودانية
لألتصاالت
TOTAL 6.84% -6.81% Change Point 2,465.25 Index 66,483 6,978,946,584 1,003,634,440 المجموع
قطاع السلع اإلستهالكية
AGTHIA GROUP 248 14.06% 40.27% 4.42 6.20 6.20 4.05 7.29 4,919 462,280,659 84,340,668 AGTHIA مجموعة اغذية
Foodco Holding 31 8.74% 44.00% 3.00 4.32 4.15 2.70 6.00 57 35,248,471 8,742,070 FOODCO فودكو القابضة
Gulf livestock Company 11 0.08% -61.32% 6.98 2.70 2.70 2.70 6.29 15 232,425 75,642 GLC شركة الخليج
للمواشي
International Fish Farming Co. 182 7.87% -55.79% 13.55 5.99 5.99 4.60 13.50 1395 56,457,148 6,692,840 ASMAKالشركة العالمية لزراعة
األسماك
RAK poultry & feeding 28 1.32% -29.44% 1.80 1.27 1.27 1.27 2.00 38 1,555,043 1,136,889 RAPCOشركة رأس الخيمة
للدواجن والعلف
TOTAL 10.40% 20.09% Change Point 2,466.97 Index 6,424 555,773,746 100,988,109 المجموع
قطاع الصناعة
Abu Dhabi for Building Materials 224 68.65% -55.06% 1.78 0.80 0.80 0.67 1.80 4233 268,336,548 205,940,486 BILDCOشركة أبو ظبي
الوطنية لمواد البناء
Abu Dhabi Ship Building 236 30.61% -30.40% 2.73 1.90 1.90 1.41 5.33 4235 226,739,964 64,895,589 ADSBشركة ابوظبي لبناء
السفن
Arkan Building Materials Co 237 18.32% 0.00% 1.2 1.20 1.2 1.02 3.48 6,931 679,957,817 320,526,522 ARKANشركة أركان لمواد
البناء
Fujairah Building Industries 15 1.08% 22.88% 1.18 1.45 1.45 1.07 1.75 25 1,897,424 1,364,439 FBICOشركة الفجيرة
لصناعات البناء
Fujairah Cement Industries 30 0.73% 13.45% 1.19 1.35 1.35 1.13 1.59 53 3,139,532 2,607,011 FCIصناعات اسمنت
الفجيرة
Gulf Cement Company 212 70.75% -16.67% 1.44 1.20 1.20 1.01 1.99 9,737 970,773,933 580,904,211 GCEM شركة اسمنت الخليج
Right Issues
Telecommunication Sector
Consumer Staple Sector
Industrial Sector

Annual Report2014التقرير السنوي
59
Company›s NameTradingDays
TurnoverRatio
Change(%)
ClosingPrice 2013
ClosingPrice
Last Price Low Price High Price Trades Value Volume Symbol اسم الشركة
شركات خاصة
ESHRAQ Right Issue Shares 2014 10 0.08 0.08 0.03 0.35 4,609 99,375,879 838,361,136 ESRI14أسهم حقوق اكتتاب إشراق العقارية 2014
4,609 99,375,879 838,361,136 المجموع
قطاع االتصاالت
Emirates Telecomuniactions 249 6.84% -6.41% 11.70 10.95 10.95 10.35 12.60 57,850 6,266,760,562 540,948,487 ETISALATمؤسسة االمارات
لالتصاالت
Qatar Telecom (Ooredoo) 52 0.20% 2.50% 140.00 143.50 143.50 122.00 161.00 207 88,458,448 632,669 ORDS اتصاالت قطر )اوريدو(
Sudan Telecommunications 171 39.12% -45.93% 1.28 0.69 0.69 0.56 1.64 8,426 623,727,574 462,053,284 SUDATELالشركة السودانية
لألتصاالت
TOTAL 6.84% -6.81% Change Point 2,465.25 Index 66,483 6,978,946,584 1,003,634,440 المجموع
قطاع السلع اإلستهالكية
AGTHIA GROUP 248 14.06% 40.27% 4.42 6.20 6.20 4.05 7.29 4,919 462,280,659 84,340,668 AGTHIA مجموعة اغذية
Foodco Holding 31 8.74% 44.00% 3.00 4.32 4.15 2.70 6.00 57 35,248,471 8,742,070 FOODCO فودكو القابضة
Gulf livestock Company 11 0.08% -61.32% 6.98 2.70 2.70 2.70 6.29 15 232,425 75,642 GLC شركة الخليج
للمواشي
International Fish Farming Co. 182 7.87% -55.79% 13.55 5.99 5.99 4.60 13.50 1395 56,457,148 6,692,840 ASMAKالشركة العالمية لزراعة
األسماك
RAK poultry & feeding 28 1.32% -29.44% 1.80 1.27 1.27 1.27 2.00 38 1,555,043 1,136,889 RAPCOشركة رأس الخيمة
للدواجن والعلف
TOTAL 10.40% 20.09% Change Point 2,466.97 Index 6,424 555,773,746 100,988,109 المجموع
قطاع الصناعة
Abu Dhabi for Building Materials 224 68.65% -55.06% 1.78 0.80 0.80 0.67 1.80 4233 268,336,548 205,940,486 BILDCOشركة أبو ظبي
الوطنية لمواد البناء
Abu Dhabi Ship Building 236 30.61% -30.40% 2.73 1.90 1.90 1.41 5.33 4235 226,739,964 64,895,589 ADSBشركة ابوظبي لبناء
السفن
Arkan Building Materials Co 237 18.32% 0.00% 1.2 1.20 1.2 1.02 3.48 6,931 679,957,817 320,526,522 ARKANشركة أركان لمواد
البناء
Fujairah Building Industries 15 1.08% 22.88% 1.18 1.45 1.45 1.07 1.75 25 1,897,424 1,364,439 FBICOشركة الفجيرة
لصناعات البناء
Fujairah Cement Industries 30 0.73% 13.45% 1.19 1.35 1.35 1.13 1.59 53 3,139,532 2,607,011 FCIصناعات اسمنت
الفجيرة
Gulf Cement Company 212 70.75% -16.67% 1.44 1.20 1.20 1.01 1.99 9,737 970,773,933 580,904,211 GCEM شركة اسمنت الخليج

Annual Report2014التقرير السنوي
60
Company›s NameTradingDays
TurnoverRatio
Change(%)
ClosingPrice 2013
ClosingPrice
Last Price Low Price High Price Trades Value Volume Symbol اسم الشركة
Gulf pharmaceutical industries 187 7.63% -2.78% 2.97 2.89 2.89 2.75 3.50 967 232,608,612 76,283,115 JULPHARشركة الخليج
للصناعات الدوائية
RAK Cement 247 252.38% -3.51% 1.04 1.00 1.00 0.65 1.76 16,884 2,233,233,759 1,410,878,395 RAKCCشركة إسمنت رأس
الخيمة
RAK Ceramics 215 26.35% 5.10% 2.85 3.00 3.00 2.66 4.00 3,090 755,358,670 215,383,056 RAKCECشركة سيراميك رأس
الخيمة
RAK white cement 117 5.99% -4.55% 1.57 1.50 1.50 1.38 2.02 297 48,584,675 29,359,528 RAKWCTشركة رأس الخيمة
لإلسمنت األبيض
Sharjah Cement & Industrial Development Co
176 20.14% -18.11% 1.27 1.04 1.05 0.99 1.64 1,787 146,138,194 111,368,576 SCIDCشركة الشارقة
لإلسمنت والتنمية الصناعية
Umm Al Qaiwain Cement Industries
110 39.94% 7.38% 1.22 1.31 1.31 1.10 1.64 725 197,137,112 144,996,442 QCEMشركة صناعات اسمنت
أم القيوين
Union Cement 108 1.60% -38.62% 1.89 1.16 1.16 1.14 2.05 330 16,975,647 10,705,389 UCC شركة اسمنت االتحاد
TOTAL 39.60% -5.64% Change Point 2,387.44 Index 49,294 5,780,881,887 3,175,212,759 المجموع
ادوات الدين
Emirate of Abu Dhabi / Emirate of Abu Dhabi
1 ADGBسندات حكومة
أبوظبي
NBAD Subordinated Convertible Notes
11 -0.75% 96.98 96.25 96.25 96.00 97.35 19 53,694,608 554,233 NBADCN0316سندات بنك أبوظبي
الوطني
TOTAL 19 53,694,608 554,233 المجموع
قطاع التأمين
Abu Dhabi National Takaful Co. 31 2.31% 9.57% 5.75 6.30 6.30 4.67 8.51 65 15,063,666 2,314,022 TKFLشركة أبوظبي الوطنية
للتكافل
Abu Dhabi National Insurance Co. 65 2.04% 2.54% 5.90 6.05 6.05 5.60 7.20 124 50,313,115 7,657,556 ADNICشركة أبوظبي الوطنية
للتأمين
Al Ain Al Ahlia Insurance Co. 18 1.93% 42.49% 38.60 55.00 55.00 38.75 55.00 38 13,853,198 289,542 ALAIN شركة العين للتأمين
Al Buhaira National Insurance Co. 18 2.07% -21.61% 3.10 2.43 2.43 2.35 4.70 18 15,636,630 5,175,940 ABNICشركة البحيرة الوطنية
للتأمين
Al Dhafra Insurance Co. 8 3.06% 22.22% 6.30 7.70 7.70 6.30 8.52 16 19,444,366 3,056,571 DHAFRA شركة الظفرة للتأمين
Al Khazna Insurance Co. 79 1.42% -50.00% 0.88 0.44 0.44 0.44 1.00 215 4,266,112 5,981,358 AKIC شركة الخزنة للتأمين
Al Wathba Insurance Co. 13 0.79% 23.05% 4.35 5.35 5.35 4.26 5.63 26 8,693,835 1,645,520 AWNICشركة الوثبة الوطنية
للتأمين
Emirates Insurance Co. 25 2.64% -2.16% 6.95 6.80 6.80 6.80 8.00 59 25,599,723 3,562,148 EIC شركة اإلمارات للتأمين
Bonds
Insurance Sector

Annual Report2014التقرير السنوي
61
Company›s NameTradingDays
TurnoverRatio
Change(%)
ClosingPrice 2013
ClosingPrice
Last Price Low Price High Price Trades Value Volume Symbol اسم الشركة
Gulf pharmaceutical industries 187 7.63% -2.78% 2.97 2.89 2.89 2.75 3.50 967 232,608,612 76,283,115 JULPHARشركة الخليج
للصناعات الدوائية
RAK Cement 247 252.38% -3.51% 1.04 1.00 1.00 0.65 1.76 16,884 2,233,233,759 1,410,878,395 RAKCCشركة إسمنت رأس
الخيمة
RAK Ceramics 215 26.35% 5.10% 2.85 3.00 3.00 2.66 4.00 3,090 755,358,670 215,383,056 RAKCECشركة سيراميك رأس
الخيمة
RAK white cement 117 5.99% -4.55% 1.57 1.50 1.50 1.38 2.02 297 48,584,675 29,359,528 RAKWCTشركة رأس الخيمة
لإلسمنت األبيض
Sharjah Cement & Industrial Development Co
176 20.14% -18.11% 1.27 1.04 1.05 0.99 1.64 1,787 146,138,194 111,368,576 SCIDCشركة الشارقة
لإلسمنت والتنمية الصناعية
Umm Al Qaiwain Cement Industries
110 39.94% 7.38% 1.22 1.31 1.31 1.10 1.64 725 197,137,112 144,996,442 QCEMشركة صناعات اسمنت
أم القيوين
Union Cement 108 1.60% -38.62% 1.89 1.16 1.16 1.14 2.05 330 16,975,647 10,705,389 UCC شركة اسمنت االتحاد
TOTAL 39.60% -5.64% Change Point 2,387.44 Index 49,294 5,780,881,887 3,175,212,759 المجموع
ادوات الدين
Emirate of Abu Dhabi / Emirate of Abu Dhabi
1 ADGBسندات حكومة
أبوظبي
NBAD Subordinated Convertible Notes
11 -0.75% 96.98 96.25 96.25 96.00 97.35 19 53,694,608 554,233 NBADCN0316سندات بنك أبوظبي
الوطني
TOTAL 19 53,694,608 554,233 المجموع
قطاع التأمين
Abu Dhabi National Takaful Co. 31 2.31% 9.57% 5.75 6.30 6.30 4.67 8.51 65 15,063,666 2,314,022 TKFLشركة أبوظبي الوطنية
للتكافل
Abu Dhabi National Insurance Co. 65 2.04% 2.54% 5.90 6.05 6.05 5.60 7.20 124 50,313,115 7,657,556 ADNICشركة أبوظبي الوطنية
للتأمين
Al Ain Al Ahlia Insurance Co. 18 1.93% 42.49% 38.60 55.00 55.00 38.75 55.00 38 13,853,198 289,542 ALAIN شركة العين للتأمين
Al Buhaira National Insurance Co. 18 2.07% -21.61% 3.10 2.43 2.43 2.35 4.70 18 15,636,630 5,175,940 ABNICشركة البحيرة الوطنية
للتأمين
Al Dhafra Insurance Co. 8 3.06% 22.22% 6.30 7.70 7.70 6.30 8.52 16 19,444,366 3,056,571 DHAFRA شركة الظفرة للتأمين
Al Khazna Insurance Co. 79 1.42% -50.00% 0.88 0.44 0.44 0.44 1.00 215 4,266,112 5,981,358 AKIC شركة الخزنة للتأمين
Al Wathba Insurance Co. 13 0.79% 23.05% 4.35 5.35 5.35 4.26 5.63 26 8,693,835 1,645,520 AWNICشركة الوثبة الوطنية
للتأمين
Emirates Insurance Co. 25 2.64% -2.16% 6.95 6.80 6.80 6.80 8.00 59 25,599,723 3,562,148 EIC شركة اإلمارات للتأمين

Annual Report2014التقرير السنوي
62
Company›s NameTradingDays
TurnoverRatio
Change(%)
ClosingPrice 2013
ClosingPrice
Last Price Low Price High Price Trades Value Volume Symbol اسم الشركة
Al Fujairah National Insurance Company
1 0.00% 0.00% 300.00 300.00 300.00 300.00 300.00 1 6,000 20 AFNICشركة الفجيرة الوطنية
للتأمين
Green Cresent Insurance Co. 131 9.22% -43.08% 1.30 0.74 0.74 0.61 1.50 447 11,375,829 9,221,519 GCICشركة الهالل األخضر
للتأمين
Insurance House P.S.C 24 1.12% -29.58% 1.42 1.00 1.03 1.00 1.51 45 1,808,141 1,345,060 IH دار التأمين ش.م.ع
Methaq Takaful Insurance Co. 249 478.74% -61.58% 1.90 0.73 0.73 0.59 2.27 15,061 1,201,218,738 718,115,454 METHAQشركة ميثاق للتأمين
التكافلي
National Takaful Company 152 19.40% -8.77% 1.14 1.04 1.04 0.81 1.79 1,123 35,175,294 29,095,720 WATANIAشـركـــة الـوطـنـيــــة
للتكــافـــل
Ras Al Khaimah National Insurance Co.
8 0.06% 18.80% 3.18 3.78 3.78 3.45 4.15 11 243,119 65,208 RAKNICشركة رأس الخيمة
الوطنية للتأمين
Sharjah Insurance Co. 6 0.02% -22.00% 5.00 3.90 3.90 3.90 4.50 7 131,962 30,133 SICO شركة الشارقة للتأمين
Union Insurance Co. 38 6.28% 6.67% 1.05 1.12 1.12 0.80 1.20 48 22,610,457 20,779,032 UNION شركة االتحاد للتأمين
United Insurance Co. 3 0.01% -50.00% 4.00 2.00 2.00 2.00 2.00 3 20,666 10,333 UIC شركة التأمين المتحدة
TOTAL 28.85% -1.32% Change Point 2,299.63 Index 17,307 1,425,460,850 808,345,136 المجموع
قطاع الطاقة
Abu Dhabi National Energy Co. 149 5.12% -45.58% 1.47 0.80 0.80 0.74 1.50 5,031 400,740,248 319,027,286 TAQAشركة أبوظبي الوطنية
للطاقة
Dana Gas PJSC 248 119.61% -45.05% 0.91 0.50 0.50 0.40 1.04 64,273 6,955,966,756 8,325,769,091 DANA شركة دانة غاز ش.م.ع
TOTAL 65.56% -47.30% Change Point 1,138.70 Index 69,304 7,356,707,004 8,644,796,377 المحموع
قطاع الخدمات
Abu Dhabi Aviation 102 2.96% -14.29% 3.50 3.00 3.00 2.80 4.19 278 44,268,854 13,172,954 ADAVIATION شركة طيران ابوظبي
Abu Dhabi National Hotels 110 8.41% 29.03% 3.10 4.00 3.80 2.90 4.10 351 294,591,910 84,069,696 ADNHشركة أبوظبي الوطنية
للفنادق
Emirates Driving Company 45 2.88% 32.53% 4.15 5.50 5.50 3.51 5.50 63 10,814,831 2,584,493 DRIVEشركة اإلمارات لتعليم
قيادة السيارات
Gulf Medical Projects Co. 35 5.35% -10.26% 2.23 2.00 2.00 1.87 2.74 58 93,204,458 35,587,089 GMPCشركة الخليج
للمشاريع الطبية
National Co. for Tourism & Hotels 71 1.87% 69.91% 2.93 4.97 4.97 2.93 8.33 152 59,431,458 8,985,959 NCTHالمؤسسة الوطنية
للسياحة والفنادق
National Marine Dredging 78 0.81% -19.77% 8.60 6.90 6.90 5.50 11.00 191 16,371,442 2,023,128 NMDCشركة الجرافات البحرية الوطنية
TOTAL 5.00% 14.98% Change Point 3,195.08 Index 1,093 518,682,953 146,423,319 المجموع
Energy Sector
Service Sector

Annual Report2014التقرير السنوي
63
Company›s NameTradingDays
TurnoverRatio
Change(%)
ClosingPrice 2013
ClosingPrice
Last Price Low Price High Price Trades Value Volume Symbol اسم الشركة
Al Fujairah National Insurance Company
1 0.00% 0.00% 300.00 300.00 300.00 300.00 300.00 1 6,000 20 AFNICشركة الفجيرة الوطنية
للتأمين
Green Cresent Insurance Co. 131 9.22% -43.08% 1.30 0.74 0.74 0.61 1.50 447 11,375,829 9,221,519 GCICشركة الهالل األخضر
للتأمين
Insurance House P.S.C 24 1.12% -29.58% 1.42 1.00 1.03 1.00 1.51 45 1,808,141 1,345,060 IH دار التأمين ش.م.ع
Methaq Takaful Insurance Co. 249 478.74% -61.58% 1.90 0.73 0.73 0.59 2.27 15,061 1,201,218,738 718,115,454 METHAQشركة ميثاق للتأمين
التكافلي
National Takaful Company 152 19.40% -8.77% 1.14 1.04 1.04 0.81 1.79 1,123 35,175,294 29,095,720 WATANIAشـركـــة الـوطـنـيــــة
للتكــافـــل
Ras Al Khaimah National Insurance Co.
8 0.06% 18.80% 3.18 3.78 3.78 3.45 4.15 11 243,119 65,208 RAKNICشركة رأس الخيمة
الوطنية للتأمين
Sharjah Insurance Co. 6 0.02% -22.00% 5.00 3.90 3.90 3.90 4.50 7 131,962 30,133 SICO شركة الشارقة للتأمين
Union Insurance Co. 38 6.28% 6.67% 1.05 1.12 1.12 0.80 1.20 48 22,610,457 20,779,032 UNION شركة االتحاد للتأمين
United Insurance Co. 3 0.01% -50.00% 4.00 2.00 2.00 2.00 2.00 3 20,666 10,333 UIC شركة التأمين المتحدة
TOTAL 28.85% -1.32% Change Point 2,299.63 Index 17,307 1,425,460,850 808,345,136 المجموع
قطاع الطاقة
Abu Dhabi National Energy Co. 149 5.12% -45.58% 1.47 0.80 0.80 0.74 1.50 5,031 400,740,248 319,027,286 TAQAشركة أبوظبي الوطنية
للطاقة
Dana Gas PJSC 248 119.61% -45.05% 0.91 0.50 0.50 0.40 1.04 64,273 6,955,966,756 8,325,769,091 DANA شركة دانة غاز ش.م.ع
TOTAL 65.56% -47.30% Change Point 1,138.70 Index 69,304 7,356,707,004 8,644,796,377 المحموع
قطاع الخدمات
Abu Dhabi Aviation 102 2.96% -14.29% 3.50 3.00 3.00 2.80 4.19 278 44,268,854 13,172,954 ADAVIATION شركة طيران ابوظبي
Abu Dhabi National Hotels 110 8.41% 29.03% 3.10 4.00 3.80 2.90 4.10 351 294,591,910 84,069,696 ADNHشركة أبوظبي الوطنية
للفنادق
Emirates Driving Company 45 2.88% 32.53% 4.15 5.50 5.50 3.51 5.50 63 10,814,831 2,584,493 DRIVEشركة اإلمارات لتعليم
قيادة السيارات
Gulf Medical Projects Co. 35 5.35% -10.26% 2.23 2.00 2.00 1.87 2.74 58 93,204,458 35,587,089 GMPCشركة الخليج
للمشاريع الطبية
National Co. for Tourism & Hotels 71 1.87% 69.91% 2.93 4.97 4.97 2.93 8.33 152 59,431,458 8,985,959 NCTHالمؤسسة الوطنية
للسياحة والفنادق
National Marine Dredging 78 0.81% -19.77% 8.60 6.90 6.90 5.50 11.00 191 16,371,442 2,023,128 NMDCشركة الجرافات البحرية الوطنية
TOTAL 5.00% 14.98% Change Point 3,195.08 Index 1,093 518,682,953 146,423,319 المجموع

Annual Report2014التقرير السنوي
64
Company›s NameTradingDays
TurnoverRatio
Change(%)
ClosingPrice 2013
ClosingPrice
Last Price Low Price High Price Trades Value Volume Symbol اسم الشركة
صناديق االستثمار المتداولة
NBAD OneShare Dow Jones 1UAE 25 ETF
1 0.00% 6.26 6.26 6.26 6.26 6.26 1 39,939 6,380 1UAE بنك أبوظبي ون شير
داو جونز لدولة األمارات
TOTAL 1 39,939 6,380 المجموع
االستثمار والخدمات المالية
Oman & Emirates Invest. Holding Co.-P.J.S.C
37 0.38% -19.31% 1.45 1.17 1.17 1.17 2.00 55 790,453 463,300 OEIHCشركة عمان واإلمارات
لالستثمار القابضة
Waha Capital 251 158.35% 31.39% 2.15 2.82 2.82 2.01 3.47 47,069 9,005,760,127 3,079,212,991 WAHA واحة كابيتل
TOTAL 158.35% 31.38% Change Point 3,906.24 Index 47,124 9,006,550,580 3,079,676,291 المجموع
الصفقات الكبيرة
FOODCO Holding P.J.S.C / 3.00 4.32 4.15 4.00 4.00 2 144,649,128 36,162,282 FOODCOفودكو القابضة
ش.م.ع
Gulf Medical Projects Company / 2.23 2.00 2.00 2.54 2.54 2 67,387,678 26,530,582 GMPC شركة الخليج
للمشاريع الطبية
National Bank of Fujairah PJSC / 4.75 4.85 4.85 3.25 3.85 19 367,417,912 107,401,200 NBFبنك الفجيرة الوطني
ش.م.ع
National Corp for Tourism and Hotels /
2.93 4.97 4.97 5.00 5.50 2 188,098,290 36,119,658 NCTHالمؤسسة الوطنية
للسياحة والفنادق
National Marine Dredging Co. / 8.60 6.90 6.90 7.60 7.60 1 211,648,615 27,848,502 NMDCشركة الجرافات البحرية الوطنية
National Takaful Company / 1.14 1.04 1.04 1.25 1.25 7 121,591,948 97,273,558 WATANIAشـركة الـوطـنـيـة
للتكافل
Ras Al Khaimah Ceramic Co. / 2.85 3.00 3.00 3.50 3.50 5 875,000,000 250,000,000 RAKCEC سراميك رأس الخيمة
Union Insurance Company / 1.05 1.12 1.12 1.10 1.12 2 98,056,101 88,340,992 UNION شركة اإلتحاد للتأمين
TOTAL 40 2,073,849,672 669,676,774 المجموع
شركات خاصة
Manazel Real Estate PJSC 25 0.67 0.53 0.94 1,109 60,481,906 84,521,842 MANAZEL شركة منازل العقارية
ش م خ
The National Investor company 5 0.80 0.00 0.90 5 128,750 135,000 TNIالمستثمر الوطني ش
م خ
TOTAL 1,114 60,610,656 84,656,842 المجموع
GRAND TOTAL 68.47% 5.56% Change Point 4,528.93 Index 858,343 145,248,917,172 57,608,277,057 المجموع العام
ETF
Investment & Financial Services Sector
Big Block
Private Companies

Annual Report2014التقرير السنوي
65
Company›s NameTradingDays
TurnoverRatio
Change(%)
ClosingPrice 2013
ClosingPrice
Last Price Low Price High Price Trades Value Volume Symbol اسم الشركة
صناديق االستثمار المتداولة
NBAD OneShare Dow Jones 1UAE 25 ETF
1 0.00% 6.26 6.26 6.26 6.26 6.26 1 39,939 6,380 1UAE بنك أبوظبي ون شير
داو جونز لدولة األمارات
TOTAL 1 39,939 6,380 المجموع
االستثمار والخدمات المالية
Oman & Emirates Invest. Holding Co.-P.J.S.C
37 0.38% -19.31% 1.45 1.17 1.17 1.17 2.00 55 790,453 463,300 OEIHCشركة عمان واإلمارات
لالستثمار القابضة
Waha Capital 251 158.35% 31.39% 2.15 2.82 2.82 2.01 3.47 47,069 9,005,760,127 3,079,212,991 WAHA واحة كابيتل
TOTAL 158.35% 31.38% Change Point 3,906.24 Index 47,124 9,006,550,580 3,079,676,291 المجموع
الصفقات الكبيرة
FOODCO Holding P.J.S.C / 3.00 4.32 4.15 4.00 4.00 2 144,649,128 36,162,282 FOODCOفودكو القابضة
ش.م.ع
Gulf Medical Projects Company / 2.23 2.00 2.00 2.54 2.54 2 67,387,678 26,530,582 GMPC شركة الخليج
للمشاريع الطبية
National Bank of Fujairah PJSC / 4.75 4.85 4.85 3.25 3.85 19 367,417,912 107,401,200 NBFبنك الفجيرة الوطني
ش.م.ع
National Corp for Tourism and Hotels /
2.93 4.97 4.97 5.00 5.50 2 188,098,290 36,119,658 NCTHالمؤسسة الوطنية
للسياحة والفنادق
National Marine Dredging Co. / 8.60 6.90 6.90 7.60 7.60 1 211,648,615 27,848,502 NMDCشركة الجرافات البحرية الوطنية
National Takaful Company / 1.14 1.04 1.04 1.25 1.25 7 121,591,948 97,273,558 WATANIAشـركة الـوطـنـيـة
للتكافل
Ras Al Khaimah Ceramic Co. / 2.85 3.00 3.00 3.50 3.50 5 875,000,000 250,000,000 RAKCEC سراميك رأس الخيمة
Union Insurance Company / 1.05 1.12 1.12 1.10 1.12 2 98,056,101 88,340,992 UNION شركة اإلتحاد للتأمين
TOTAL 40 2,073,849,672 669,676,774 المجموع
شركات خاصة
Manazel Real Estate PJSC 25 0.67 0.53 0.94 1,109 60,481,906 84,521,842 MANAZEL شركة منازل العقارية
ش م خ
The National Investor company 5 0.80 0.00 0.90 5 128,750 135,000 TNIالمستثمر الوطني ش
م خ
TOTAL 1,114 60,610,656 84,656,842 المجموع
GRAND TOTAL 68.47% 5.56% Change Point 4,528.93 Index 858,343 145,248,917,172 57,608,277,057 المجموع العام


Activity Report Brokerage

Annual Report2014التقرير السنوي
68
Value in AED
اسم شركة الوساطة
المالية Value%Volume%Trades%
Brokerage Firm Name
الرمز كابيتال ذ.م.م
38,462,655,441.0313.23 15,141,139,92912.94 127,5667.38 Al RamzCapital L.L.C.
أبوظبي الوطني لألوراق المالية ذ
م م 36,016,963,512.5812.39 15,115,385,04212.92 190,70911.04
NBAD SECURITIESLLC
المجموعة المالية هيرمس
للتداول-اإلمارات 25,263,595,789.448.69 5,800,546,0554.96 126,9967.35
EFG-HermesBrokerage-UAE
مينا كورب للخدمات المالية
24,230,002,894.488.33 11,096,651,0629.48 139,7758.09 Mena Corp FinancialServices
أبوظبي للخدمات المالية
اإلسالمية 20,675,729,881.967.11 8,131,369,7686.95 224,01312.97
Abu Dhabi Islamic FinancialServices
مباشر للخدمات المالية ش ذ م
19,565,204,618.166.73 7,906,129,1806.76 139,1338.05 Mubasher FinancialServices LLC
المشرق لألوراق المالية
14,896,755,781.725.12 6,386,456,7905.46 80,1844.64 MashreqSecurities
68,0293.94 2,081,951,6821.78 10,573,087,763.893.64 أرقام سكيورتيز Arqaam SecuritiesL.L.C
اإلمارات دبي الوطني لألوراق
المالية 9,523,086,255.603.28 4,650,837,4933.97 69,2954.01
Emirates NBD Securities(ENBDS)
إتش إس بي سي الشرق األوسط
لألوراق المالية 7,328,059,604.082.52 1,509,753,5961.29 34,7152.01
HSBC MiddleEast Securities
أبوظبي التجاري لألوراق المالية
7,281,873,201.902.50 3,230,868,3672.76 47,1572.73 ADCBSecurities LLC
الدار لألسهم والسندات
6,137,587,413.062.11 2,616,381,6782.24 26,8531.55 Al Dar Shares& Bonds
Activity Report Brokerage

Annual Report2014التقرير السنوي
69
Value in AED
اسم شركة الوساطة
المالية Value%Volume%Trades%
Brokerage Firm Name
شركة األنصاري للخدمات المالية
5,131,550,357.651.76 2,762,806,8552.36 38,3702.22 Al Ansari FinancialServices Co.
شركة اإلتحاد للوساطة
4,249,908,566.451.46 1,727,449,6131.48 27,2451.58 Union BrokerageCompany
مركز الشرهان لألسهم ذ .م .م
4,248,771,116.421.46 2,129,260,6141.82 24,9611.44 Al SharhanStock Centre
دبي اإلسالمي للخدمات المالية
4,126,545,544.601.42 2,222,082,2571.90 37,7652.19 Dubai Islamic FinancialServices
الضمان لألوراق المالية
3,933,900,990.551.35 1,797,537,5851.54 20,5421.19 Al DamanSecurities
الخليج األول للخدمات المالية
3,791,962,746.061.30 847,338,0360.72 15,0060.87 First Gulf FinancialServices
الصفوة اإلسالمية
للخدمات المالية 3,595,583,486.701.24 2,071,734,9371.77 18,6541.08
AL SAFWA ISLAMIC FINANCIALSERVICES
دار التمويل لألوراق المالية
3,511,515,280.921.21 1,396,041,4801.19 21,1451.22 Finance House SecuritiesCompany LLC
الفجر لألوراق المالية
3,490,737,789.021.20 1,564,081,1201.34 20,3801.18 Al FajerSecurities
شركة الرؤية كابيتال للوساطة
المالية 2,823,306,029.090.97 1,246,513,7601.07 10,6850.62
Vision Capital BrokerageCompany
مركز الساحل لألسهم
2,642,586,100.410.91 1,429,970,0121.22 11,4350.66 Al SahelShares Center
شركة البروج لألوراق المالية
2,598,185,647.680.89 1,314,089,0481.12 16,5670.96 Al Brooge Securities
تقرير نشاط الوساطة المالية

Annual Report2014التقرير السنوي
70
Value in AED
اسم شركة الوساطة
المالية Value%Volume%Trades%
Brokerage Firm Name
دلما للوساطة المالية
2,292,184,124.890.79 1,468,010,4511.25 16,1300.93 DelmaBrokerage
اإلمارات اإلسالمية
للوساطة المالية 2,223,393,107.650.76 1,087,690,3710.93 15,1390.88
Emirates Islamic FinancialBrokerage
المستثمر للوساطة المالية
2,080,675,780.600.72 1,121,082,6320.96 10,7040.62 Investor FinancialBrokerage
أوراق اإلسالمية لألسهم
والسندات ذ.م.م. 2,033,201,306.320.70 955,255,6430.82 13,1910.76
Awraq Islamic for Shares &Bonds L.L.C.
الظفرة للوساطة المالية
1,984,862,053.710.68 1,198,940,4111.02 17,6351.02 Al Dhafra FinancialBrokers
مركزالوثبة لألسهم
والسندات 1,691,115,238.530.58 442,006,4640.38 10,0690.58
Al Wathbah Shares &Bonds Centre
دبي التجاري للخدمات المالية
1,566,780,936.380.54 624,127,9150.53 9,0150.52 CBD Financial Services
الفردان للخدمات المالية
1,501,764,500.790.52 713,295,7820.61 10,3610.60 Al Fardan FinancialServices
األوراق المالية واالستثمار
اإلمارات 1,386,845,637.430.48 380,535,8430.33 7,5370.44
Securities & InvestmentCompany UAE
نعيم لألسهم والسندات
1,310,856,484.530.45 743,024,9800.63 12,2250.71 Naeem Shares& Bonds
الشارقة اإلسالمي
للخدمات المالية 1,309,902,965.020.45 790,743,8970.68 12,3460.71
Sharjah Islamic FinancialServices
جلوبال لتداول األسهم
والسندات 1,242,912,607.840.43 631,844,1410.54 7,8510.45
Global For Shares &Bonds

Annual Report2014التقرير السنوي
71
Value in AED
اسم شركة الوساطة
المالية Value%Volume%Trades%
Brokerage Firm Name
بايونيرز لألوراق المالية
1,181,205,245.730.41 566,367,7810.48 7,9010.46 Pioneers WaseetSecurities
شروق لألسهم والسندات
940,165,110.270.32 298,451,0300.26 6,5120.38 Shurooq Shares &Bonds
شركة بيت الوساطة لألوراق
المالية 709,420,249.120.24 240,049,1880.21 6,4280.37
Brokerage HouseSecurities
إندكس لألوراق المالية
544,131,768.930.19 255,371,5940.22 4,9770.29 IndexSecurities
موارد لألوراق المالية
520,138,662.850.18 307,765,6810.26 4,3280.25 MawaridSecurities
شركة الفجيرة لألسهم
والسندات 403,647,316.540.14 168,513,3300.14 3,1480.18
Fujairah Shares & BondsCompany
دبي الدولية لألوراق المالية
394,101,998.080.14 185,388,9420.16 4,1670.24 Dubai InternationalSecurities
الهدف لألوراق المالية
364,387,025.220.13 216,805,6080.19 2,4320.14 Al HadafSecurities
أموال للوساطة المالية
340,792,568.670.12 113,082,3140.10 2,2220.13 AmwalBrokerage
الدولي للوساطة المالية ش.ذ.م.م.
300,672,044.680.10 151,068,0400.13 2,7670.16
International Financial BrokerageL.L.C.
ورلد فاينانشيال سيرفيز
172,867,373.620.06 114,938,0080.10 1,0220.06 World FinancialServices
مركز الوافي لألسهم
157,267,063.850.05 84,200,5790.07 1,2330.07 Al Wafisecurites
99.93TOTAL 100.001,726,520 100.00117,034,936,584 290,752,446,984.71المجموع

Annual Report2014التقرير السنوي
72
Activity Brokerage Firms in 2014
10
0,0
00
,00
01
,00
0,0
00
10
,00
01
00
1
Al R
amz C
apita
l LLC
NBA
D S
ECU
RITI
ES LL
C
EFG
-Her
mes
Bro
kera
ge-U
AE
Men
a Cor
p Fi
nanc
ial S
ervi
ces
Abu
Dha
bi Is
lam
ic Fi
nanc
ial S
ervi
cest
Mub
ashe
r Fin
anci
al S
ervi
ces L
LC
Mas
hreq
Sec
uriti
es
Arq
aam
Sec
uriti
es LL
C
Emira
tes N
BD S
ecur
ities
(EN
BDS)
HSB
C M
iddl
e Ea
st S
ecur
ities
AD
CB S
ecur
ities
LLC
Al D
ar S
hare
s & B
onds
Al A
nsar
i Fin
anci
al S
ervi
ces C
o.
Uni
on B
roke
rage
Com
pany
Al S
harh
an S
tock
Cen
tre
Dub
ai Is
lam
ic Fi
nanc
ial S
ervi
ces
Al D
aman
Sec
uriti
es
Firs
t Gul
f Fin
anci
al S
ervi
ces
AL S
AFW
A IS
LAM
IC FI
NA
NCI
AL S
ERVI
CES
Fina
nce
Hou
se S
ecur
ities
Com
pany
LLC
Al F
ajer
Sec
uriti
es
Visi
on C
apita
l Bro
kera
ge C
ompa
ny
Al S
ahel
Sha
res C
ente
r
Al B
roog
e Se
curit
ies
Thou
sand
s

Annual Report2014التقرير السنوي
73
Thou
sand
s
ValueVolumeTrades
Del
ma B
roke
rage
Emira
tes I
slam
ic Fi
nanc
ial B
roke
rage
Inve
stor
Fina
ncia
l Bro
kera
ge
.Aw
raq
Isla
mic
for S
hare
s & B
onds
LLC
Al D
hafr
a Fin
anci
al B
roke
rs
Al W
athb
ah S
hare
s & B
onds
Cen
tre
CBD
Fina
ncia
l Ser
vice
s
Al F
arda
n Fi
nanc
ial S
ervi
ces
Secu
ritie
s & In
vest
men
t Com
pany
UA
E
Nae
em S
hare
s & B
onds
Shar
jah
Isla
mic
Fina
ncia
l Ser
vice
s
Glo
bal F
or S
hare
s & B
onds
Pion
eers
Was
eet S
ecur
ities
Shur
ooq
Shar
es &
Bon
ds
Brok
erag
e H
ouse
Sec
uriti
es
Inde
x Sec
uriti
es
Maw
arid
Sec
uriti
es
Fuja
irah
Shar
es &
Bon
ds C
ompa
ny
Dub
ai In
tern
atio
nal S
ecur
ities
Al H
adaf
Sec
uriti
es
Am
wal
Bro
kera
ge
.Inte
rnat
iona
l Fin
anci
al B
roke
rage
LLC
Wor
ld Fi
nanc
ial S
ervi
ces
Al W
a� se
curit
es
10
0,0
00
,00
01
,00
0,0
00
10
,00
01
00
1

Annual Report2014التقرير السنوي
74

Annual Report2014التقرير السنوي
75
Companies Listed on ADX

Annual Report2014التقرير السنوي
76
Companies Listed on ADX
Email AddressFax NumberPhone NumberCompany
CodeCompany NameNo
[email protected]/574885506/5174444ABNICAl Buhaira
National Insurance Company
1
[email protected]/ 575777502/5758000ADAVIATIONAbu Dhabi Aviation
Company2
[email protected]/ 610986102/6962144ADCBAbu Dhabi
Commercial Bank3
[email protected]/633331602/6343000ADIBAbu Dhabi Islamic
Bank4
[email protected]/444849502/4447228ADNHAbu Dhabi
National Hotels5
[email protected]/408060402/4080100ADNICAbu Dhabi
National Insurance Company
6
[email protected]/551106702/5028498ADSBAbu Dhabi Ship
Building Company7
[email protected]/222434409/2233355AFNICFujairah National
Insurance Company
8
[email protected]/672607002/5960600AGTHIAAgthia Group PJSC9
[email protected]/641821402/6969700AKICAl Khazna Insurance Company
10
[email protected]/445668502/4459900ALAINAl Ain Al Ahlia
Insurance Company 11
[email protected]/810555002/8105555ALDARAldar Properties
PJSC12
[email protected]/666687202/6666724ARKANArkan Building
Materials Company13
[email protected]/644706002/6448090ASMAKInternational Fish Farming Holding Company PJSC
14
[email protected]/677662802/4185300AWNICAl Wathba
National Insurance Company PJSC
15
[email protected]/645554402/6455500BILDCOAbu Dhabi for
Building Materials16
[email protected]/773356806/5694411BOSBank of Sharjah17

Annual Report2014التقرير السنوي
77
Email AddressFax NumberPhone NumberCompany
CodeCompany NameNo
[email protected]/224303604/2242104CBICommercial Bank
International18
[email protected]/655225606/6554449DANADana Gas PJSC19
[email protected]/672983302/6721444DHAFRAAl Dhafra Insurance Company
20
[email protected]/551022702/5510544DRIVEEmirates Driving
Company 21
[email protected]/644522702/6440400EICEmirates Insurance
Company22
[email protected]/635486402/6354854ESHRAQEshraq Properties
Company23
[email protected]/631700002/6283333ETISALAT
Emirates Tele-communications
Corporation24
[email protected]/222731409/2222051FBIFujairah Building Industries PSC
25
[email protected]/222771809/2223111FCIFujairah Cement
Industries26
[email protected]/681372702/6816666FGBFirst Gulf Bank 27
[email protected]/619469902/6219712FHFinance House
PJSC28
[email protected]/673373102/6731000FOODCOFoodco Holding
PJSC29
[email protected]/266020107/2668222GCEMGulf Cement
Company30
[email protected]/445871702/4084700GCICGreen Crescent
Insurance Company
31
[email protected]/228840007/2281153GLSGulf Livestock
Company32
[email protected]/561669906/5619999GMPCGulf Medical
Projects Company33
[email protected]/493440002/4934444IHInsurance House
PSC34
[email protected]/569444006/5694440INVESTBInvest Bank35

Annual Report2014التقرير السنوي
78
Email AddressFax NumberPhone NumberCompany
CodeCompany NameNo
[email protected]/246246207/2462461JULPHARGulf
Pharmaceutical Industries
36
[email protected]/656533402/6565333METHAQMethaq Takaful
Insurance Company
37
[email protected]/62758802/6111111NBADNational Bank of
Abu Dhabi38
[email protected]/222985809/2224518NBFNational Bank of
Fujairah PSC39
[email protected]/764784106/7066666NBQNational Bank of Umm Al-Qaiwain
40
[email protected]/4099990 02/4099999NCTHNational Corp
for Tourism and Hotels
41
[email protected]/551650002/5130000NMDCNational Marine
Dredging Company
42
[email protected] 02/6266171
+96824489465
02/6266443 +968
24489458OEIHC
Oman & Emirates
Inv. Holding Company
43
[email protected]+974 4830466+974 4404025ORDSOoredoo44
[email protected]/768107006/7681999QCEM
Umm Al-Qaiwain Cement
Industries Company
45
[email protected]/243545407/2062222RAKBANKNational Bank of Ras Al-Khaimah
46
[email protected]/266000607/2660111RAKCCRas Al-Khaimah Cement Company
47
[email protected]/244527007/2445046RAKCECRas Al-Khaimah
Ceramic Company
48
[email protected]/228 850007/2273000RAKNIC
Ras Al-Khaimah National
Insurance Company PSC
49
[email protected]/227244407/2330004RAKPROPRas Al-Khaimah
Properties50

Annual Report2014التقرير السنوي
79
Email AddressFax NumberPhone NumberCompany
CodeCompany NameNo
[email protected]/266886607/2668888RAKWCTRas Al-Khaimah White Cement
51
[email protected]/246222007/2462222RAKCO
Ras Al-Khaimah Poultry and
Feeding Company
52
[email protected]/568317106/5695666SCIDCSharjah Cement and Industrial Development
53
[email protected]/530999806/5998888SIBSharjah Islamic
Bank54
[email protected]/519566706/5195666SICOSharjah
Insurance Company
55
[email protected] +249 183 782
322 +249 183 761
100SUDATEL
Sudan Tele-communication Company Ltd
56
[email protected] 02/642255502/6149000TAQAAbu Dhabi
National Energy Company
57
[email protected]/410780002/4107700TKFLAbu Dhabi
National Takaful Company PJSC
58
[email protected]/573390606/5733222UABUnited Arab Bank PJSC
59
[email protected]/26 863507/2668166UCCUnion Cement
Company60
[email protected]/250250404/2502501UICUnited Insurance
Company61
[email protected]/678608002/6741600UNBUnion National
Bank62
[email protected]/7466 99706/7466 996UNIONUnion Insurance
Company63
[email protected]/667738302/6677343WAHAWaha Capital
PJSC64
[email protected]/613880002/6138888WATANIANational Takaful
Company65


Definitions and Terminology

Annual Report2014التقرير السنوي
82
Definitions and Terminology
Par Value (shares) Is the face value set by the company’s issuing the shares at the time of the public offering less subscription expenses.
Market Value per Share The closing price of the share at the end of period.
Book Value per Share The amount of net assets, represented by on share; computed by dividing the amount of net shareholders’ equity by the number of outstanding shares.
Volume Traded Total volume of shares traded during a period.
Value Traded Total Value of shares traded during a period.
Number of Transactions Number of executed transaction during a period.
Shareholders’ Equity The amount of the company net assets after deducting all liabilities. It includes paid-up capital plus all category of reserves and retained earnings less any cumulative loss.
Company Market Capitalization
It is the market value of the subscribed shares and is equal to closing price multiplied by the number of outstanding shares.
Liquid assets Include cash and equivalent, deposit with banks and marketable securities.
Loan and Advances Comprise gross loans and advances less Provision for doubtful loans and advances including suspended interest. For Islamic banking this represents Mudharaba, Murabaha, ljara and lstisna’a.
Customer Deposits Include Current, Saving and Time deposit accounts.
Current Assets Include cash and investment in short term assets that can be liquidated or converted to cash easily within a period of less than a year.
Total Assets Uses of the company financial resources, which include fixed assets, current assets and other assets. It’s equal to total liabilities plus shareholders’ equity.
Current Liabilities Debt obligations of the company due within the firm’s current operating cycle or one year.
Long Term Debt Debts or other obligations that will not be paid within one year.
Liabilities It’s equal to total assets less shareholders’ equity. The amount of the company net assets A
Net Profit for the Year Company net profit realized within a financial year.
Cash Dividend The amount of cash distributed to the shareholders.
Securities Financing or investment instruments (some negotiable, others not) bought and sold in financial markets, such as bonds, debentures, notes, options, shares (stocks), and warrants.

Annual Report2014التقرير السنوي
83
Short selling The sale of a security that is not owned by the seller, or that the seller has borrowed.
Investment Fund A supply of capital belonging to numerous investors that is used to collectively purchase securities while each investor retains ownership and control of his or her own shares.
Market Making A broker-dealer firm that accepts the risk of holding a certain number of shares of a particular security in order to facilitate trading in that security.
Delivery Versus Payment – DVP
A securities industry settlement procedure in which the buyer’s payment for securities is due at the time of delivery.
Exchange-Traded Fund - ETF A security that tracks an index, a commodity or a basket of assets like an index fund, but trades like a stock on an exchange. ETFs experience price changes throughout the day as they are bought and sold.
Custodian A financial institution that holds customers’ securities for safekeeping so as to minimize the risk of their theft or loss.
Portfolio A grouping of financial assets such as stocks, bonds and cash equivalents, as well as their mutual, exchange-traded and closed-fund counterparts. Portfolios are held directly by investors and/or managed by financial professionals.
Covered Warrant A type of warrant that allows the holder to buy or sell a specific amount of equities, currency or other financial instruments from the issuer, usually a bank or a similar financial institution, at a specific price and time.
Subscription Right The right of existing shareholders in a company to retain an equal percentage ownership over time by subscribing to new stock issuances at or below market prices.
Fund Unit A security representing the proportionate share of Investors in the Net Asset Value of the Mutual Fund.

Financial Indicators

Annual Report2014التقرير السنوي
86
Financial Indicator1 Turnover Ratio (%) =
No. of Shares Traded during the period x 100
No. of Shares Subscribed at end of the period
2 Earning per Share (AED) =Net Profit for the Period
No. of Shares Subscribed
3 Price Earnings Ratio (Times) =Market Capitalization
Net Profit
4 Price Book Value (Times) =Market Capitalization
Book Value
5 Dividend Yield (%) =Cash Dividends x 100
Market Capitalization
6 Price Dividend Ratio (Times) =Market Capitalization
Cash Dividends
7 Cash Dividends to Earnings (%) =Cash Dividends x 100
Net Profit
8 Earning Yield (%) =Net Profit x 100
Market Capitalization
9Return on Assets (%) =
Net Profit x 100
Total Assets
10 Return on Equity (%) =Net Profit x 100
Shareholders’ Equity
11 Return on paid-in Capital (%) =Net Profit x 100
Paid-in Capital
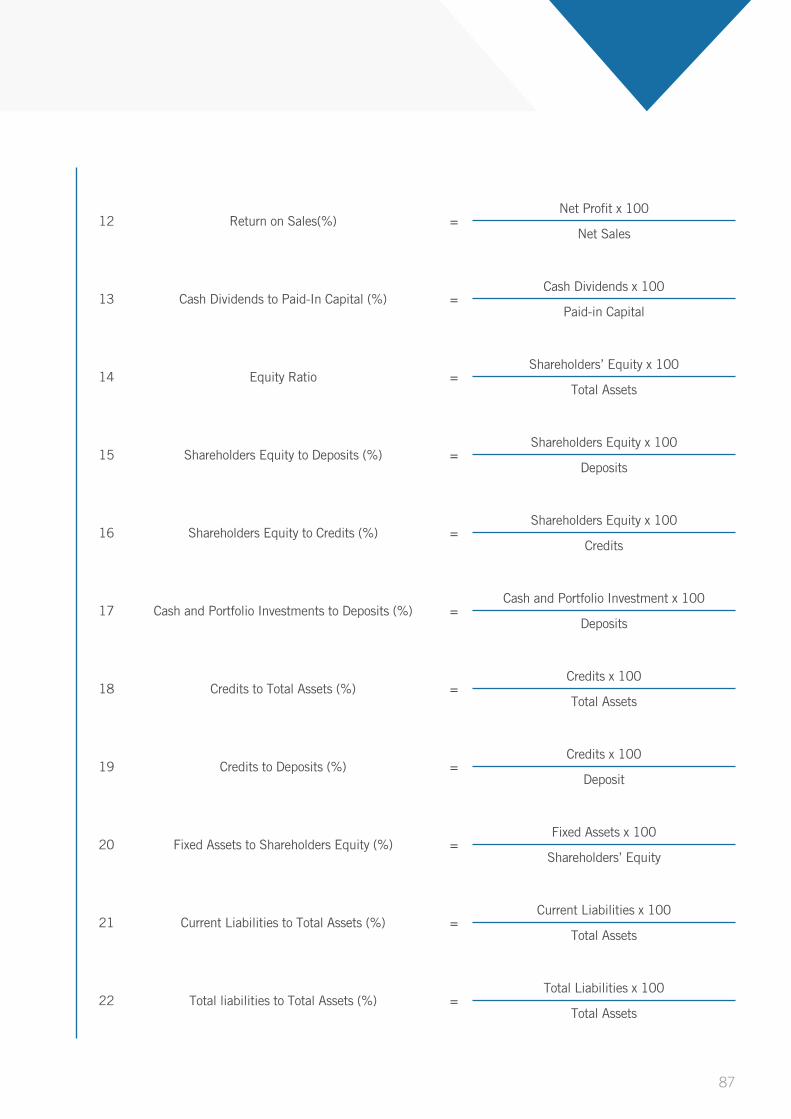
Annual Report2014التقرير السنوي
87
12 Return on Sales(%) =Net Profit x 100
Net Sales
13 Cash Dividends to Paid-In Capital (%) =Cash Dividends x 100
Paid-in Capital
14 Equity Ratio =Shareholders’ Equity x 100
Total Assets
15 Shareholders Equity to Deposits (%) =Shareholders Equity x 100
Deposits
16 Shareholders Equity to Credits (%) =Shareholders Equity x 100
Credits
17 Cash and Portfolio Investments to Deposits (%) =Cash and Portfolio Investment x 100
Deposits
18 Credits to Total Assets (%) =Credits x 100
Total Assets
19 Credits to Deposits (%) =Credits x 100
Deposit
20 Fixed Assets to Shareholders Equity (%) =Fixed Assets x 100
Shareholders’ Equity
21 Current Liabilities to Total Assets (%) =Current Liabilities x 100
Total Assets
22 Total liabilities to Total Assets (%) =Total Liabilities x 100
Total Assets

Annual Report2014التقرير السنوي
88
23 Total Liabilities to Shareholders Equity (%) =Total Liabilities x 100
Shareholders’ Equity
24 Current liabilities to Shareholders Equity (%) =Current Liabilities x 100
Shareholders’ Equity
25 Long-Term Liabilities to Shareholders Equity (%) =Long-Term Liabilities x 100
Shareholders’ Equity
26 Sales to Total Assets (%) =Sales x 100
Total Assets
27 Revenues to Total Assets (%) =Revenues x 100
Total Assets
28 Current Ratio (Times) =Current Assets
Current Liabilities