
Annual Report - ADXAnnual Report 19 ADX Chairman’s Message I am pleased to present to you the Abu...
77
ANNUAL REPORT 2013 www.adx.ae
Transcript of Annual Report - ADXAnnual Report 19 ADX Chairman’s Message I am pleased to present to you the Abu...

www.adx.ae
ANNUAL REPORT
2013www.adx.ae
2013
ABU
DH
ABI S
ECU
RIT
IES
EXCH
ANGE
Ann
ual R
epor
t ي
ـوسنـ
ر اليــ
قرالت
ة يـــ
اللم
ق اورا
�ي ل
ــــظبـ
بوق أ
ـوــــ
س
التقريــر السنــوي

ANNUAL REPORT
2013www.adx.ae
Abu Dhabi Securities Exchange (ADX)
Al Ghaith Tower, Hamdan Street, Abu DhabiP.O.Box 54500, Abu Dhabi, United Arab Emirates Phone: +971 2 6277777 Fax: +971 2 6128728 Toll-free: 800-239 Email: [email protected]: www.adx.ae
Branches Phone Numbers Al Ain: +971 3 7044040, +971 3 7044005, +971 3 7044003Fujairah: +971 9 2055115, +971 9 2055111Madinat Zayed: +971 2 8945407, +971 2 8945408 Ras Al-Khaimah: +971 7 2264011, +971 7 2260693Sharjah: +971 6 5374574, +971 6 5374572, +971 6 5375513
Trading TimesSunday -Thursday 09:30 A.M. - 10:00 A.M. Pre-opening Session 10:00 A.M.- 02:00 P.M. Continuous Trading


His Highness Sheikh Zayed bin Sultan Al NahyanThe Late President, May Allah Rest His Soul In Peace


His Highness Sheikh Khalifa bin Zayed Al NahyanPresident of the United Arab Emirates


His Highness General Sheikh Mohammed Bin Zayed Al NahyanCrown Prince of Abu Dhabi
Deputy Supreme Commander of the U.A.E Armed ForcesChairman of the Executive Council of the Emirate of Abu Dhabi

10 Abu Dhabi Securities Exchange
Disclaimer
All information contained in the Annual Report is for informational purposes only. Nothing herein constitutes an offer, solicitation or recommendation to invest or conduct any transaction in any kind of securities listed on Abu Dhabi Securities Exchange (ADX).
ADX is not liable for any claims or losses or damages of any nature, arising directly or indirectly from use of the data found in this report. ADX endeavors to ensure that the data and other materials found in this report are correct and complete, but does not accept liability or responsibility for any error made or omission in this report.
All materials contained in this guide, including all data, information and content are the property of Abu Dhabi Securities Exchange (ADX).

11Annual Report
Vision
Aspires to become the Exchange of choice.
Mission
To develop the capital market through legal environment that ensures disclosure,transparency and integrity.
Values
IntegrityWe will endeavor to enforce the Law and commit to the highest legal and ethical standards.
ProfessionalismWe will adopt the highest profession standards by benchmarking against international best practice
and being dedicated to best serve our customers needs and by adopting courtesy and respect.
TransparencyWe will endeavor to enhance disclosure standards and disseminate sensitive data in a timely fashion.
FairnessWe will ensure that all of our customers and employees receive relevant information and treatment
without bias, dishonesty, or injustice.
InnovationWe will strive to be innovative in our industry by introducing entrepreneurial solutions to the challenges
and maintain continuous improvements to our organization and processes.
EfficiencyWe will make the best use of our resources in terms of time, efforts and expenses to maximize the
services provided to our clients.
Cost EffectivenessWe will provide our customers with acceptable level of quality and cost.

12 Abu Dhabi Securities Exchange
13Annual Report
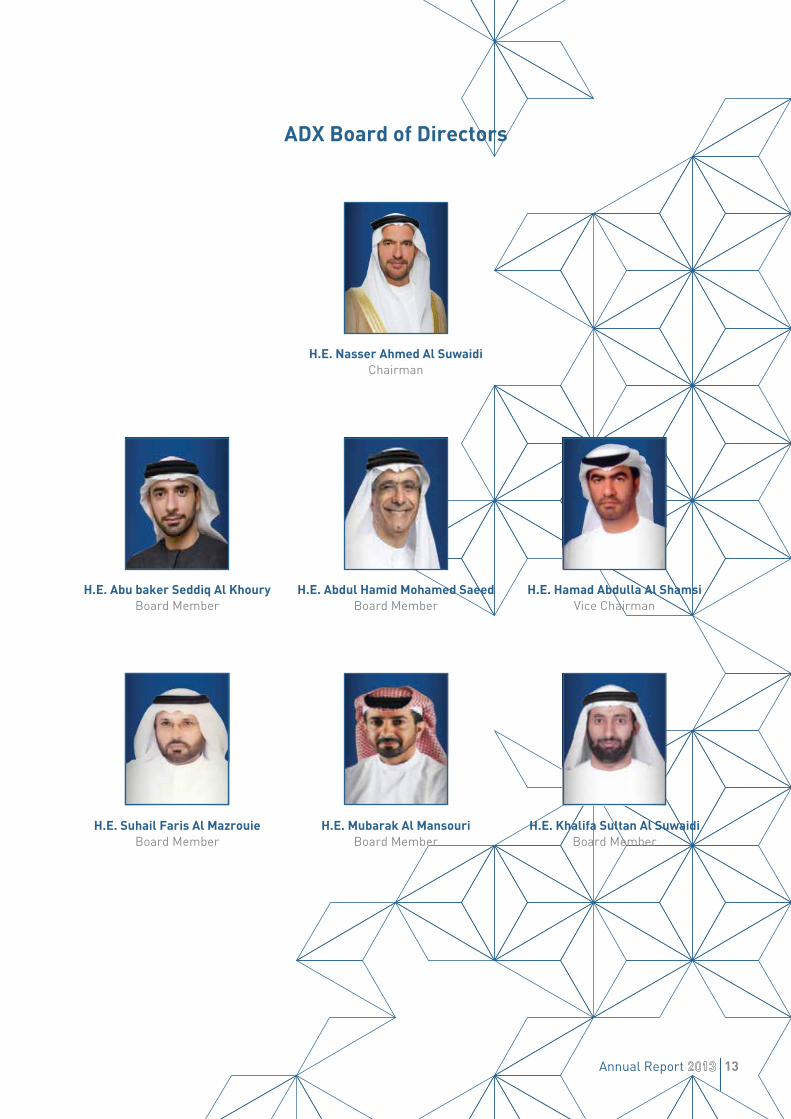
ADX Board of Directors
H.E. Nasser Ahmed Al SuwaidiChairman
H.E. Abdul Hamid Mohamed SaeedBoard Member
H.E. Hamad Abdulla Al ShamsiVice Chairman
H.E. Abu baker Seddiq Al KhouryBoard Member
H.E. Mubarak Al MansouriBoard Member
H.E. Khalifa Sultan Al SuwaidiBoard Member
H.E. Suhail Faris Al MazrouieBoard Member

14 Abu Dhabi Securities Exchange

15Annual Report
ADX Organizational Chart
Board of Directors
Executive Committee
BusinessDevelopment
Advisor
Strategy Media
Finance &Management Affairs
Human Resources
CSD & RegistrySerrvices
Market Operations& Surveillance
I.T. Services
Listed Companies
Legal AdvisorAssisstant Chief
Executive for SupportServices
Deputy Chief Executivefor Operations Affairs
Chief Executive
Internal Auditors
Audit Committee


Table of Contents
Contents
ADX Chairman’s Message
ADX CEO’s Message
Brief on Abu Dhabi Economy
ADX Strategy (2012-2016)
ADX Achievements in 2013
ADX Performance During 2013
Statistical Appendix
Table 1: Key Statistics of ADX During The Past Five Years
Table 2: Key Statistics of ADX
Table 3: Most Gainers
Table 4: Most Decliners
Table 5: Yearly Trading Activity of ADX - 2013
Table 6: Major Financial Data & Indicators for Companies Listed at ADX
Names & Addresses of Listed Companies
Names & Addresses of Brokerage Firms
Financial Terminology
Financial Indicators
Page
18
20
22
23
24
28
40
41
42
44
45
46
54
62
66
72
75

18 Abu Dhabi Securities Exchange
H.E. Nasser Ahmed Al SuwaidiChairman

19Annual Report
ADX Chairman’s Message
I am pleased to present to you the Abu Dhabi Securities Exchange (ADX) Annual Report for 2013. This report comes at a time when we have seen a promising revival of the market, and an increase of our general index with a high volume of transactions executed on the exchange.
Since its inception in 2000, the Abu Dhabi Securities Exchange has accomplished many achievements, thanks to the untiring efforts of its employees and the confidence of investors in the prospects and potential for the economy of Abu Dhabi. The Abu Dhabi government stands firmly behind ADX in its efforts to support the business environment in the emirate, and in providing the means and the opportunity to serve the interests of the national economy. We strive to apply the principles and rules that ensure best practice is applied to the security and accuracy of transactions as well as the protection of investors within a legal framework that ensures disclosure, transparency, credibility, and promotes economic and financial stability.
Through its 2030 Economic Vision the Abu Dhabi government seeks to develop and diversify the economy and to enhance its performance. In line with this quest, ADX is working to be recognized among the top ranking stock markets in the region and today is equipped with the latest trading and monitoring systems. We seek to harmonize our development with the new legislative framework approved by the Securities & Commodities Authority, such as the market maker system, lending and borrowing of securities, short selling, and delivery versus payment.
ADX’s achievements have culminated at a global level in a number of areas, notably the contribution made to the upgrading of the UAE’s local markets to Emerging Market status, and a similar resolution by Standard & Poors which will take effect in September 2014. It is worth noting that the market had been classified as an emerging market in 2010 and 2011 by FTSE, S&P, and Russell Investments.
Since May 2013, ADX also initiated the implementation of the delivery versus payment system, which is applied in many developed and emerging markets, whereby securities are simultaneously delivered against payment.
To this end, I would like to thank ADX staff and employees for their dedication and hard work and wish them further success in their endeavors in the year ahead.

20 Abu Dhabi Securities Exchange
H.E. Rashed Al BaloushiChief Executive Officer

21Annual Report
ADX CEO’s Message
This is is the 13th edition of the ADX Annual Report since our inception in November 2000.
2013 was a year full of achievements for the exchange. Our efforts with our strategic partners culminated in June when we were upgraded by the MSCI Index to Emerging Market status. We also made significant progress in the implementation of a new trading system using cutting edge trading technology, which will be launched in April this year. We introduced the XBRL reporting system for listed companies, and we developed a delivery-versus-payment (DVP) procedure for trading settlements.
We have pledged to employ and train young UAE nationals to form a new generation for the financial and economic sectors, and in this context conducted many awareness lectures at the exchange for university and other students of all ages. We also produced investment awareness guides for the public.
These achievements underpin the increase we saw during the year in trading volumes and values. They helped us support the market, the brokerage firms that form such a vital part of it, and the investors whose interest and engagement we rely upon.
We owe our accomplishments to Abu Dhabi Economic Vision 2030 the wise leadership of our Board and Management and the determination of our staff, all of whom have been vital in enabling the exchange to support the financial sector in Abu Dhabi and the economy of the United Arab Emirates.

22 Abu Dhabi Securities Exchange
Economic indicators for 2013 evidenced the ongoing consolidation of the momentum of economic growth in the UAE in general, and in Abu Dhabi in particular.
At the national level, the Ministry of Economy, The International Monetary Fund and others reported that the GDP of the UAE grew by approximately 4.5% to almost $ 1.4 trillion, which is 231 times more than in 1971 when the UAE was formed.The UAE benefited in particular from the policy of economic diversification whereby various sectors contributed to driving economic growth, giving the UAE a leading position among Arab as well as other economies around the world.
A number of reputable international institutes have acknowledged the strides that have been made by the UAE in developing its economy, ranking it 19th out of 148 global economies in the Global Competitiveness Report 2013/2014, and 23rd in the Ease of Doing Business report issued by the World Bank and the International Finance Corporation.
The UAE Country Report issued by the International Monetary Fund in July 2013 acknowledged that the UAE had benefited from political stability, increased confidence, and the strength of the tourism sector, as well as increased capital inflows due to increased global liquidity. The renewed stability of the real estate sector after the crisis in 2009 was also cited in the report, as well as favorable oil prices.
The Abu Dhabi Department of Economic Development has highlighted the growing contribution of the non-oil sectors in the GDP of the emirate to the economic base and sources of income.
One of the most important drivers of economic growth during the period 2014-2017 is expected to be government support for infrastructural and social development which is already taking place at a rapid pace, and which will help to meet the aspirations of citizens in creating a high quality of life and a value added society. The economic development of Abu Dhabi has been characterized in recent years by focusing on large investments in non-oil activities, which in turn diversifies the economic base and sources of income to meet this objective.
In this context, the emirate is targeting an annual cumulative growth in the industrial sector of at least 9%, and for the industrial sector to contribute about 24% of the Emirate’s total GDP during the period 2014-2017. The most important industrial sectors targeted are Aluminum industries, iron and steel, building materials, transportation and aviation, semiconductors, and renewable energy.
Economic Brief
23Annual Report
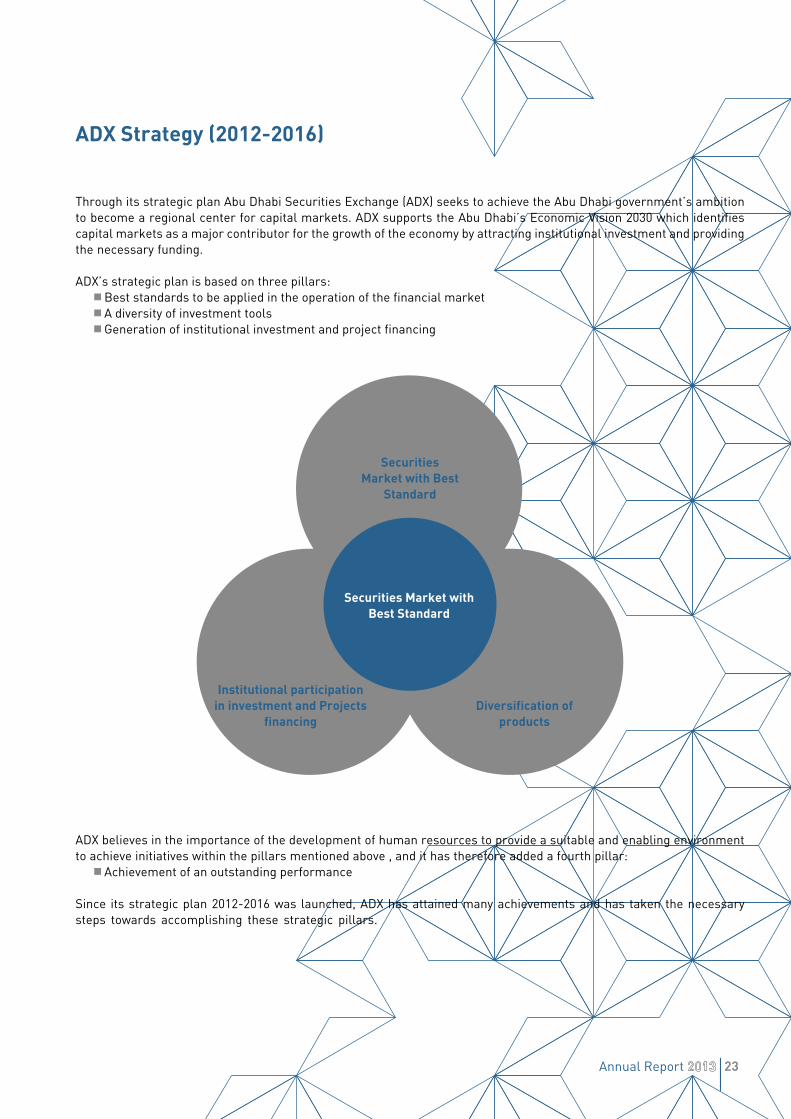
Through its strategic plan Abu Dhabi Securities Exchange (ADX) seeks to achieve the Abu Dhabi government’s ambition to become a regional center for capital markets. ADX supports the Abu Dhabi’s Economic Vision 2030 which identifies capital markets as a major contributor for the growth of the economy by attracting institutional investment and providing the necessary funding.
ADX’s strategic plan is based on three pillars: Best standards to be applied in the operation of the financial market A diversity of investment tools Generation of institutional investment and project financing
ADX believes in the importance of the development of human resources to provide a suitable and enabling environment to achieve initiatives within the pillars mentioned above , and it has therefore added a fourth pillar:
Achievement of an outstanding performance
Since its strategic plan 2012-2016 was launched, ADX has attained many achievements and has taken the necessary steps towards accomplishing these strategic pillars.
ADX Strategy (2012-2016)
Securities Market with Best
Standard
Diversification of products
Institutional participation in investment and Projects
financing
Securities Market with Best Standard
24 Abu Dhabi Securities Exchange
ADX Achievements for 2013
Strategic Achievements:
During 2013, ADX has introduced unique services to stakeholders and attracted additional investment, and strengthened the efficiency of internal operations, supported by the recruitment and training of young national talent. The following is a summary of a number of ADX’s achievements through the year, classified according to the ADX strategic plan.
Pillar: Best standards to be applied in the operation of the financial market
Objective: Establish a legislative framework equivalent to world standards
Contribute to the preparations of new legislation by the Securities & Commodities Authority (SCA), in particular for Rights Issues
Objective: Strengthen the efficiency and integration of internal operations
A number of initiatives were undertaken to enhance the efficiency of ADX’s internal operations through co-operation with the concerned entities to meet the criteria for Emerging Market status set by MSCI. Consequently, MSCI announced that it was upgrading the UAE local markets from to “frontier market” to “emerging market” status as of May 2014.
International equity index firm S&P Dow Jones Indices announced that it was upgrading the UAE local markets to emerging markets status from frontier market status by September 2014. It is worth mentioning that local markets were first upgraded to emerging market status by FTSE in 2010, and then in 2011 by S&P and Russell Investments.
In May 2013, ADX implemented a Delivery Versus Payment (DVP) system. This is a process used in many of the leading international stock markets. DVP is a securities industry settlement procedure in which the buyer’s payment for securities is due at the time of delivery. It stipulates that cash payment must be made prior to or simultaneously with the delivery of the security.
In its pursuit to adopt the most advanced techniques and efficient procedures, ADX has converted its operational reporting on Insider Trading between brokers and the various departments in the exchange to an electronic format.
ADX successfully implemented the Call Auction process which was initiated in 2012. The new mechanism is implemented through a pre-closing auction session running from 1:50 pm to 2:00 pm on each trading day. During this period, brokers will be allowed to enter orders of buy or sell into the automated system as well as alter them but without executing them. After the end of the pre-closing session, the system will automatically determine the closing price and execute the transactions.
A free-float index was implemented whereby the free-float market capitalization of a company is used for the purpose of index calculation.
Objective: Enhance ADX services to meet the needs of stakeholders
A Registrar Agreement was signed with Etihad Capital Company in November 2013, pursuant to the decision of the Minister of Economy No. 360 2009 for the recording of shares of private equity firms and in accordance with the decision of the Securities and Commodities Authority No. 33 2009. ADX also signed a similar agreement with Manazel Real Estate Company in October 2013. ADX has so far signed Registrar Agreements with 5 private joint stock companies.
ADX launched the Extended Business Reporting Language (XBRL) platform in collaboration with listed companies regarding the disclosure process according to standardized methods. XBRL is used in many advanced countries so as to facilitate standardized data reporting for investors and interested parties.

25Annual Report
An SMS text message service was launched for recipients of ADX’s Clearing, Settlement and Depository Department services
Pillar: A Diversity of Investment Tools
Objective: Introduce New Investment Tools for Trading
ADX finalized the development of the necessary technical and legislative procedures to introduce a “Market Maker” mechanism to be formalized during 2014. ADX also finalized the development of the necessary technical and technological procedures to issue and trade Rights Issues, as well as the process of placing the technical and legislative aspects for the use of Borrowing and Lending tools which are to be used in the Market Maker system.
Pillar: Institutional Participation for Investment and Project funding
Objective: Direct Capital to Invest in the Financial Market
ADX participated in many activities at the international level, to promote the exchange and strengthen its presence and profile abroad, promote the investment opportunities available in the Emirate of Abu Dhabi and the United Arab Emirates, and benefit from external expertise and global discussion. Events included:
The annual meeting of the World Federation of Exchanges (WFE), which was held in Mexico City. Represented by its CEO, Mr. Rashed Al Baloushi, ADX participated in a number of sessions. The WFE meeting focused on matters relating to economic policies and financial markets, regulations and rules applicable in equity markets, the emergence of Latin American stock exchanges, the changing face of derivatives markets, and the financing of SMEs.
In March 2013, ADX took part in 4th Middle East Securities Forum (MEFS 2013) in Doha, Qatar.
ADX also took part in the 7th Capital Markets Conference and Exhibition in January 2013 in Cairo, Egypt.
ADX participated in 2nd Abu Dhabi-Tokyo Investment Forum, which aims to highlight investment opportunities and incentives in the Emirate of Abu Dhabi for the Japanese business community. During the forum, ADX’s CEO emphasized ADX’s role in facilitating investments and addressed the various ways for businesses to invest in the UAE.
ADX became a member of both the American Business Group and the French Business Group in Abu Dhabi.
ADX signed a Memorandum of Understanding with the American University of Sharjah (AUS). Under the terms of the agreement ADX will conduct seminars for AUS students on the procedures and methods of trading in the domestic market, as well as provide historical trading records and financial data to be utilized in classes at AUS. The two sides will also work together in preparing and publishing academic studies and in conducting research concerning capital markets in the UAE.
ADX signed a Memorandum of Understanding with Abu Dhabi University (ADU). As part of the agreement, ADX will conduct seminars and workshops for ADU students aiming at explaining market procedures and the methods of trading in the domestic market. ADX will also provide a summer research grant for ADU to work on applied research projects, and will provide a virtual trading platform (Stock Game) for the ADU. The agreement reflects ADX’s strategic plan to promote investment awareness and facilitate cooperation with academic institutions.
ADX launched an awareness campaign targeting high school and university students through organizing specialized lectures in the fields of securities and investment in financial markets.

26 Abu Dhabi Securities Exchange
Pillar: Achieving an outstanding performance
Objective: to attract, develop, and maintain skilled employees
ADX achieved an Emiratisation level of 81% in 2013. It is continuously working with Abu Dhabi Tawteen Council (ADTC) and the Absher initiative to train and develop young national talent as well as contribute to the employment of UAE nationals.
A strategic project - The ADX Working Environment Enhancement Program - was launched in co-operation with the Human Resources department aiming to strengthen the overall business environment in the exchange. The Program seeks to improve and develop the work environment, and identify any difficulties or challenges that face ADX employees. The program also aims at finding solutions and offering suggestions that can create a more attractive and conducive work environment for ADX employees. The program has the following features:
Under the “Teslam” initiative, ADX launched a program to honor and motivate its hard working employees for their exceptional contributions to business excellence. The program aims to inspire and develop employees’ skills and abilities.
Under the “Afkar” initiative, ADX launched a program to encourage its employees to submit ideas on enhancing the ADX business environment.

27Annual Report

28 Abu Dhabi Securities Exchange
The ADX General Index increased 1,659 points during 2013 to close at 4,290 points, an increase of 63.08% compared to 2012.
In 2012, the index reached 2,631 points, an increase of about 10% in comparison to the previous year, and in 2011 the index decreased by about 12% in comparison to 2010 to close at 2,402 points.
Included in the ADX index calculation are all the companies listed on the exchange, with the exception of dual listed foreign companies. The Free Float Index calculation which ADX adopted in 2013 takes into account only the free-float market capitalization of a company for the purpose of index calculation, and assigns weight to stocks in the index. Free-float market capitalization takes into account only those shares issued by the company that are readily available for trading in the market. It rules out government holdings, founders holdings during the period of the trade ban and ownership percentages higher than 10% and other locked-in shares that will not come to the market for trading in the normal course.
Abu Dhabi Securities Exchange (ADX) index ranked second in terms of increase for the year 2013 compared to other GCC markets. The index increased by 63.08% by the end of 2013 to reach 4,290 points while the Dubai Financial Market Index increased by 107.7%.
The accompanying chart indicates that Kuwait’s stock market index finished third with an increase of 27.2% followed by (Tadawul) index with an increase of 25.5%.
The Qatar Exchange index rose by 24.2%, followed by Muscat stock exchange Index which increased by 18.6%. Bahrain stock market index finished last despite rising by 17.2% in 2013.
ADX Performance During 2013
4,500
4,100
4,300
3,900
2,900
3,700
2,700
3,500
2,500
3,300
3,100
ADX General Index 2013
Closed4,290
ADX Index 2013 Increased by 63.08%
Opened2,631

29Annual Report
Trading Activity in 2013
In 2013, total trading value amounted to about AED 85 billion, an almost four fold increase from 2012, where the total trading amounted to some AED 22 billion. December was the highest month in terms of share traded value, with about AED 15 billion worth of shares traded.
MUSCATQATARKSAKUWAITADX
110%
100%
90%
80%
70%
60%
50%
40%
30%
20%
10%
0%
107.7%
63.1%
27.2% 25.5% 24.2%18.6% 17.2%
BAHRAINDFM
GCC Securities Markets Performance 2013
Total Value Traded
90,500
80,500
60,500
40,500
30,500
20,500
10,500
84,957
20132012
22,253
281.8%
Mill
ion
Shar
es

30 Abu Dhabi Securities Exchange
As for the number of shares and units in circulation in 2013, the volume traded amounted to 51.5 billion shares and units, compared with 16.3 billion shares in 2012. On the monthly level for 2013, December was again the highest month with 9.4 billion shares traded.
Monthly Value Traded
Bill
ion
AED
15.014.514.013.513.012.512.011.511.010.510.0
9.59.08.58.07.57.06.56.05.55.04.54.03.53.02.52.01.51.00.50.0
2012
2013DECEMBERNOVEMBEROCTOBERSEPTEMBERAUGUSTJULYJUNEMAYAPRILMARCHFEBRUARYJANUARY
Total Volume Traded
55,500
50,500
45,500
40,500
35,500
30,500
25,500
15,500
10,500
51,519
20132012
16,394
214.2%
Mill
ion

31Annual Report
In 2013, number of transactions executed also increased from the previous year, with 258,685 transactions, compared to 556,290 transactions in 2013.
The market capitalization of all listed companies in the exchange reached more than AED 449 billion at the end of 2013, of which about AED 403 billion was for local listed companies. December topped the monthly market capitalization for the year.
As for 2012, the market capitalization of all listed companies in the exchange reached about AED 291 billion, of which AED 255.5 billion was for local listed companies.
Number of Trades
600,000
500,000
400,000
300,000
200,000
100,000
0
556,290
20132012
258,685
115.0%
Market Capitalization
510,500
410,500
310,500
210,500
110,500
10,500
0
402,705
20132012
255,55157.6%
AED
Mill
ion

32 Abu Dhabi Securities Exchange
Trading Below Par Value in 2013
Statistics show that there was a significant drop in the number of companies whose trading was below par value, usually AED 1, compared with the year 2012, and also a significant increase in the trading price of the remaining companies, which continued to trade lower than their nominal value.
Only four companies’ trade was below nominal value in 2013, while in 2012, there were 16 companies which trade was below nominal value.
The accompanying table shows the substantial increase in prices with one company reaching 158% despite its trade being below nominal value.
Traded Companies Below Par Value
Company Name 31 Dec.13 31 Dec.12 Change
AKIC 0.66 0.88 33%
DANA GAS 0.45 0.91 102%
RAKPROP 0.38 0.98 158%
Sector Performance
The accompanying charts show the volumes and values and percentage rates in 2013 by sector. Additionally, the chart shows the number of transactions conducted for each sector.
ADX comprises nine sectors, which are banking, industrial, energy, consumer staples, investment and financial services, services, insurance, real estate, and telecommunications. All sectors witnessed substantial increases in their annual indices during 2013.
Percentage of Sectors Indices Performance for 2013
350.00
300.00
250.00
200.00
150.00
100.00
50.00
0.00
CONSUMER STAPLES
ENERGY
SERVICES
TELECOMMUNICATIONS
INSURANCE
INVESTMENT &FINANCIAL SERVICESREAL ESTATE
INDUSTRIAL
BANKS
299.98
146.15
70.23 68.04 65.47 54.9931.37 29.00 16.78

33Annual Report
The real estate sector in 2013 ranked first in terms of trading volume with 65% of the total volume traded. Also, the sector recorded trading values in excess of AED 48 billion, which is about 57% of the total value traded on the exchange. The number of transactions made on the shares of real estate companies in the exchange amounted to approximately 290,000 transactions, about 52% of the total transactions conducted.
Moreover, the real estate index increased 146% in 2013 as the real estate index reached 2,772 points. The real estate sector was second in terms of its growth during the year after the investment and financial services sector.
The banking sector ranked second in terms of trading value with more than AED 17 billion, although it was third after the real estate and energy sectors in terms of trading volume with a number of shares exceeding 3 billion shares. However, the banking sector maintained second place in terms of the number of transactions with more than 73,000 transactions completed during 2013, representing 13% of the total transactions registered.
Real Estate, 64.7%
Telecommunications, 1.8%Insurance, 4.0% Services, 0.2%
Consumer Staples, 0.1%Industrial, 4.6%
Investment & Financial Services, 5.3%
Banks, 5.9%
Energy, 13.4%
Percentage of Volume Traded by Sector
Real Estate, 56.7%
Telecommunication, 6.4%
Insurance, 3.6%Services, 0.3%
Consumer Staples, 0.3%Industrial, 3.2%
Investment & Financial Services, 3.7%
Banks, 20.3%
Energy, 5.5%
Percentage of Value Traded By Sectors

34 Abu Dhabi Securities Exchange
The banking sector index increased by about 68% compared to the same period in 2012, reaching 3,225 points.
Meanwhile the telecommunications sector held third place in terms of traded value with AED 5.4 billion and 6.36% of the total traded value of all sectors. The total number of shares traded in the telecommunications sector amounted to 923 million shares, 1.8% of the total number of shares traded, with the number of transactions reaching just over 56,000, about 10% of total transactions traded.
The telecommunications sector index saw an increase of 29%, the lowest increase compared to other sectors, save for the insurance sector which marked a 16,8% increase.
It is worth mentioning that the highest percentage rise in the sectoral indices was in the investment and financial services sector. This increased by 300% in 2013, followed by the real estate sector which increased by about 146% as noted above.
The total contribution for the remaining six sectors, namely industrial, consumer staples, energy , services, investment and financial services, and insurance contributed around 17% of the total traded value of the index, whereas the total increase in the aforementioned sectors, in terms of trading volume, was about 27%.
As for the number of transactions, the percentage contribution of these six sectors was around 25% of the overall total number of transactions.
Real Estate, 52.13%Telecommunication, 10.13%
Insurance, 6.32%
Services, 0.20%
Consumer Staples, 0.76%Industrial, 6.26%
Investment & Financial Services, 3.59%
Banks, 13.20%
Energy, 7.40%
Percentage of Value Traded by Sectors

35Annual Report
Most Active Companies
The accompanying chart illustrates the ten most active companies in terms of trading value listed on the ADX in 2013.
ALDAR Real Estate Company achieved the highest traded value of AED 26.2 billion, representing 31% of the overall traded value on the exchange. ALDAR was ranked second in terms of number of shares traded with 22.7% of the total number of shares traded on the exchange.
ALDAR also occupied first place in terms of the number of transactions executed, reaching 156,421 transactions or, 28.1% of the total number of transactions executed on the exchange.
ESHRAQ Real Estate Company was the second most active company in terms of trading value with AED 12.35 billion, representing 14.6% of the overall traded value on the exchange. ESHRAQ had the highest number of shares traded amounting to 12.47 billion shares, 24.2% of the overall number of shares traded on the exchange.
ESHRAQ Real Estate Company had the second largest number of executed transactions with 66,425 transactions, accounting for 11.9% of the total transactions executed on the exchange.
Top Companies in Trading Value 2013
ALDAR
ESHRAQ
FGB
SOROUH
ETISALAT
ADCB
RAKPROP
DANA
WAHA
METHAQ
OTHERS
5.6%
5.6%
5.3%
5.2%
6.5%
3.8%
3.5%
11.6%
31.0%
14.6%
7.4%

36 Abu Dhabi Securities Exchange
First Gulf Bank was the third ranked company in terms of traded value with a total traded value of AED 6.2 billion, representing 7.4% of the overall traded value on the exchange during 2013.
In terms of the executed number of transactions, First Gulf Bank reached 27,219 transactions representing 4.9% of the total number of transactions executed.
Prior to its merger with ALDAR, Sorouh Real Estate Company ranked fourth most active company in terms of trading value with AED 5.5 billion worth of shares traded, representing 6.5% of the overall traded value on the exchange. Sorouh was ranked 6th in terms of the number of shares traded with 2.63 billion shares, accounting for 5.1% of the total number of shares traded on the exchange. Sorouh also ranked sixth in terms of number of transactions with 34,006 deals, accounting for 6.1% of the overall transactions.
Emirates Telecommunications Corporation (Etisalat) had the highest value in terms of its market capitalization with a market value of more than AED 92.5 billion at the end of 2013, followed by National Bank of Abu Dhabi (NBAD) with a market value of more than AED 59.8 billion. Etisalat ranked fifth in terms of trading value with a percentage of 5.6% of the total value traded on the exchange.
The remaining companies listed on the exchange accounted for 35% of the total traded value, while the number of shares traded reached 51.5 billion shares. The total number of transactions totaled 478,959 transactions in 2013.
Top 10 Companies By Number of Trades 2013
6.1%
6.1%
4.9%
3.7%
6.4%
7.0%
3.0%
13.9%
28.1%
11.9%
8.9%
ALDAR
ESHRAQ
ETISALAT
DANA
RAKPROP
SOROUH
METHAQ
FGB
WAHA
RAKCEMT
OTHERS

37Annual Report
Top 10 Companies in Terms Market Capitalization 2013
3.8%
3.4%
3.0%
2.3%
1.6%
19.7%
5.4%
9.0%
23.0%
14.9%
14.0%
ETISALAT
NBAD
FGB
ADCB
ALDAR
UNB
ADIB
RAKBANK
TAQA
UAB
OTHERS
Top 10 Companies By Trading Volume 2013
5.4%
5.1%
3.9%
2.7%
2.0%1.0%
6.5%
13.1%
13.4%
24.2%
22.7%
ESHRAQ
ALDAR
RAKPROP
DANA
WAHA
SOROUH
METHAQ
RAKCEMT
ADCB
SUDATEL
OTHERS

38 Abu Dhabi Securities Exchange
Contribution to Trading Value based on Nationality 2013
70%
60%
50%
40%
30%
20%
10%
0%
63%
UAE
7.6%
GCC
17.6%
ARABS
11.9%
OTHERS
Trading by Nationality
UAE nationals, including legal persons and companies owned by them, executed the majority of trades on the market in 2013 with a 60% share of shares bought and 61.37% of those sold. The total number of shares bought by UAE nationals, amounted to approximately 30.9 billion shares with a value of nearly AED 53 billion through approximately 305,000 thousand transactions. The number of shares sold by UAE nationals in 2013 amounted to 31.6 billion shares with a value of about AED 54.6 billion through some 306,000 transactions.
The net buying and selling of shares by UAE nationals reached 707 million shares and a net negative balance of slightly over AED 2 billion of the value of shares sold over the value of those bought.
As for GCC nationals, the total number of shares bought amounted to approximately 4.5 billion shares with a value of nearly AED 6.5 billion through some 44,000 transactions. The total number of shares bought by GCC nationals in 2013 amounted to 4.4 billion shares with a value of about AED 6.3 billion through approximately 40,000 transactions.
The net trading by GCC nationals reached a net positive balance of around 58 million shares with a net worth slightly over AED 233 million and a net positive volume of approximately 4 thousand transactions.
Arab nationals bought approximately 11.57 billion shares with a value of nearly AED 15 billion, with shares sold amounting to approximately 11.42 shares worth nearly AED 14.8 billion and a net volume of 150 million shares and a value of AED 184 million.
The numbers of transactions were almost equal between shares bought and sold.
For other nationalities, the number of shares bought was 4.5 billion shares worth AED 10.8 billion, and 4 billion shares were sold worth AED 9.3 billion.

39Annual Report
Investor Number by Nationalities
16000
14000
12000
10000
8000
6000
4000
2000
02013 2012 2011
OTHERS
ARABS
GCC
UAE4,855 4,118 4,366
2803,152
1,797
439
3,525
2,007
994
5,545
4,091
Clearing, Settlement & Depository
The number of Certificates of Ownership deposited in 2013 amounted to 1,171 with the number of shares represented exceeding 767 million shares, which enhances the ambition of ADX to create an electronic paper free environment.
The number of investor numbers issued in 2013 was 15,865 while in 2012 it was 10,324 and 9,877 in 2011.
The overall total number of operations carried out through the clearing system was 40,420 accounting for nearly 19 billion shares. These operations include the transfer of property outside the trading floor with inheritance, family affairs as well as mortgage foreclosure processes.
The numbers of investors’ accounts linked with a custodian in 2013 were 391 accounts.
On the other hand, the 15,865 investor numbers issued in 2013 were distributed among 15,350 individuals, 513 legal persons, and 2 government agencies.
As for the distribution of investor numbers by nationality, UAE nationals accounted for 4,855, while GCC nationals accounted for 994, other Arab nationals 5,545, and 4,091 issued to other nationalities.

40 Abu Dhabi Securities Exchange
Statistical Appendix

41Annual Report
Table 1 Key Statistics of ADX During The Past Five Years
Value in AED
2009 2010 2011 2012 2013
Total Trading Value 70,169,076,806 34,576,090,527 24,861,644,468 22,253,177,232 84,956,720,146
Total No. of Traded Units 37,615,871,102 17,618,838,223 15,857,202,557 16,394,377,342 51,518,981,139
Total No. of Trades 744,710 364,327 283,368 258,685 556,290
No. of Listed Companies 67 65 67 66 65
No. of Domestic Listed Companies
62 61 64 63 62
No. of Subscribed shares 68,172,143,873 68,960,016,474 74,217,284,465 78,474,534,556 79,032,299,689
Paid Up Capital 74,141,123,327 73,180,645,928 77,839,751,861 83,473,280,647 85,598,143,919
Market Capitalization 294,571,204,486 283,893,187,911 261,983,617,688 291,159,338,875 449,234,315,072
Domestic Market Capitalization 263,576,540,480 255,696,373,557 232,712,218,425 255,551,143,891 402,705,426,116
Domestic Shares Trading Value 69,655,245,417 34,091,367,873 24,732,574,676 22,051,702,382 83,994,242,355
Shares Trading Value 69,982,293,419 34,140,434,641 24,773,871,201 22,104,481,006 84,652,515,460
Shares Trading Value Daily Average
279,929,174 136,017,668 98,309,013 87,716,194 339,969,942
No. of Traded Domestic Shares 37,572,649,310 17,602,457,403 15,847,253,941 16,371,421,821 51,018,612,015
No. of Traded Shares 37,613,745,645 17,611,128,254 15,855,720,862 16,392,409,567 51,515,744,641
No. of Traded Shares Daily Average
150,454,983 70,163,858 62,919,527 65,049,244 206,890,541
No. of Domestic Trades 742,450 363,055 282,624 257,645 549,090
No. of Trades 744,697 364,019 283,293 258,620 556,238
No. of Traded Days 250 251 252 252 249
Turnover Ratio (%) 53.93 25.55 22.09 21.29 64.55%
ADX Index (Point) 2,743.61 2,719.87 2,402.28 2,630.86 4,290.30
* Financial data and ratios are for domestic companies only.

42 Abu Dhabi Securities Exchange
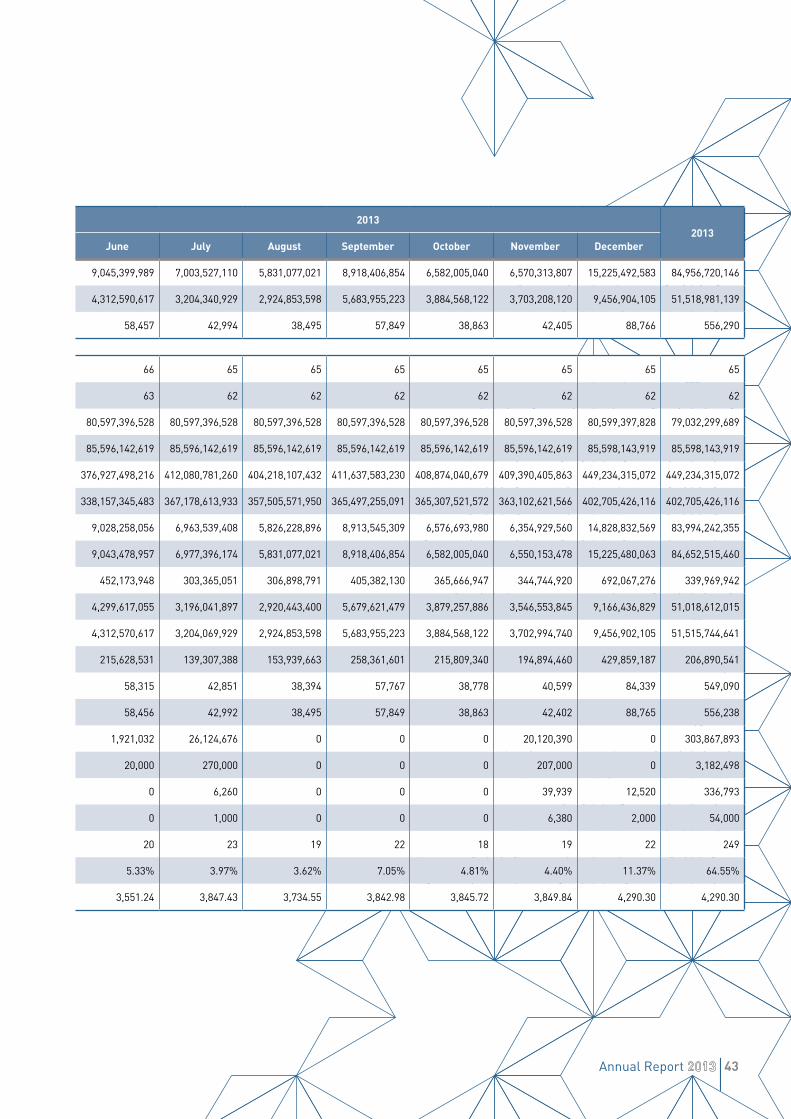
Table 2Key Statistics of ADX
Value in AED
2013 20132013
January February March April May June July August September October November December
Total Trading Value 4,500,035,616 5,133,565,506 3,250,520,575 3,624,445,100 9,271,930,945 9,045,399,989 7,003,527,110 5,831,077,021 8,918,406,854 6,582,005,040 6,570,313,807 15,225,492,583 84,956,720,146
Total No. of Traded Securities 3,269,386,591 4,509,928,308 2,237,710,549 2,275,689,390 6,055,845,587 4,312,590,617 3,204,340,929 2,924,853,598 5,683,955,223 3,884,568,122 3,703,208,120 9,456,904,105 51,518,981,139
Total No. of Trades 37,255 38,064 26,540 29,277 57,325 58,457 42,994 38,495 57,849 38,863 42,405 88,766 556,290
No. of Listed Companies 66 66 66 66 66 66 65 65 65 65 65 65 65
No. of Domestic Listed Companies 63 63 63 63 63 63 62 62 62 62 62 62 62
No. of Domestic Subscribed shares 78,472,533,256 78,908,617,096 78,908,617,096 78,908,617,096 79,841,396,528 80,597,396,528 80,597,396,528 80,597,396,528 80,597,396,528 80,597,396,528 80,597,396,528 80,599,397,828 79,032,299,689
Paid Up Capital 83,471,279,347 83,907,363,187 83,907,363,187 83,907,363,187 84,840,142,619 85,596,142,619 85,596,142,619 85,596,142,619 85,596,142,619 85,596,142,619 85,596,142,619 85,598,143,919 85,598,143,919
Market Capitalization 313,180,966,937 330,852,061,164 325,603,105,497 348,227,773,458 383,768,058,902 376,927,498,216 412,080,781,260 404,218,107,432 411,637,583,230 408,874,040,679 409,390,405,863 449,234,315,072 449,234,315,072
Domestic Market Capitalization 277,229,953,890 293,343,505,774 287,784,540,670 310,379,398,068 344,935,567,262 338,157,345,483 367,178,613,933 357,505,571,950 365,497,255,091 365,307,521,572 363,102,621,566 402,705,426,116 402,705,426,116
Domestic Shares Trading Value 4,475,942,967 4,996,926,677 3,196,852,974 3,579,630,743 9,252,861,217 9,028,258,056 6,963,539,408 5,826,228,896 8,913,545,309 6,576,693,980 6,354,929,560 14,828,832,569 83,994,242,355
Shares Trading Value 4,479,164,578 4,999,489,115 3,200,745,834 3,586,526,540 9,258,591,806 9,043,478,957 6,977,396,174 5,831,077,021 8,918,406,854 6,582,005,040 6,550,153,478 15,225,480,063 84,652,515,460
Shares Trading Value Daily Average 213,293,551 249,974,456 152,416,468 163,023,934 420,845,082 452,173,948 303,365,051 306,898,791 405,382,130 365,666,947 344,744,920 692,067,276 339,969,942
No. of Traded Domestic Shares 3,267,702,519 4,506,330,458 2,234,244,942 2,268,847,298 6,053,514,407 4,299,617,055 3,196,041,897 2,920,443,400 5,679,621,479 3,879,257,886 3,546,553,845 9,166,436,829 51,018,612,015
No. of Traded Shares 3,269,164,811 4,508,519,808 2,237,145,879 2,275,293,427 6,055,706,382 4,312,570,617 3,204,069,929 2,924,853,598 5,683,955,223 3,884,568,122 3,702,994,740 9,456,902,105 51,515,744,641
No. of Traded Shares Daily Average 155,674,515 225,425,990 106,530,756 103,422,429 275,259,381 215,628,531 139,307,388 153,939,663 258,361,601 215,809,340 194,894,460 429,859,187 206,890,541
No. of Domestic Trades 37,170 37,988 26,445 29,210 57,234 58,315 42,851 38,394 57,767 38,778 40,599 84,339 549,090
No. of Trades 37,246 38,049 26,531 29,269 57,321 58,456 42,992 38,495 57,849 38,863 42,402 88,765 556,238
Bonds Value 20,871,038 134,076,391 49,496,667 37,918,560 13,339,139 1,921,032 26,124,676 0 0 0 20,120,390 0 303,867,893
Bonds Volume 221,780 1,408,500 520,050 395,963 139,205 20,000 270,000 0 0 0 207,000 0 3,182,498
ETFs Value 0 0 278,074 0 0 0 6,260 0 0 0 39,939 12,520 336,793
ETFs Volume 0 0 44,620 0 0 0 1,000 0 0 0 6,380 2,000 54,000
No. of Traded Days 21 20 21 22 22 20 23 19 22 18 19 22 249
Turnover Ratio (%) 4.16% 5.71% 2.83% 2.88% 7.58% 5.33% 3.97% 3.62% 7.05% 4.81% 4.40% 11.37% 64.55%
ADX Index (Point) 2,881.78 3,044.89 3,025.33 3,273.63 3,562.88 3,551.24 3,847.43 3,734.55 3,842.98 3,845.72 3,849.84 4,290.30 4,290.30
* Financial data and ratios are for domestic companies only.
43Annual Report
Table 2Key Statistics of ADX
Value in AED
2013 20132013
January February March April May June July August September October November December
Total Trading Value 4,500,035,616 5,133,565,506 3,250,520,575 3,624,445,100 9,271,930,945 9,045,399,989 7,003,527,110 5,831,077,021 8,918,406,854 6,582,005,040 6,570,313,807 15,225,492,583 84,956,720,146
Total No. of Traded Securities 3,269,386,591 4,509,928,308 2,237,710,549 2,275,689,390 6,055,845,587 4,312,590,617 3,204,340,929 2,924,853,598 5,683,955,223 3,884,568,122 3,703,208,120 9,456,904,105 51,518,981,139
Total No. of Trades 37,255 38,064 26,540 29,277 57,325 58,457 42,994 38,495 57,849 38,863 42,405 88,766 556,290
No. of Listed Companies 66 66 66 66 66 66 65 65 65 65 65 65 65
No. of Domestic Listed Companies 63 63 63 63 63 63 62 62 62 62 62 62 62
No. of Domestic Subscribed shares 78,472,533,256 78,908,617,096 78,908,617,096 78,908,617,096 79,841,396,528 80,597,396,528 80,597,396,528 80,597,396,528 80,597,396,528 80,597,396,528 80,597,396,528 80,599,397,828 79,032,299,689
Paid Up Capital 83,471,279,347 83,907,363,187 83,907,363,187 83,907,363,187 84,840,142,619 85,596,142,619 85,596,142,619 85,596,142,619 85,596,142,619 85,596,142,619 85,596,142,619 85,598,143,919 85,598,143,919
Market Capitalization 313,180,966,937 330,852,061,164 325,603,105,497 348,227,773,458 383,768,058,902 376,927,498,216 412,080,781,260 404,218,107,432 411,637,583,230 408,874,040,679 409,390,405,863 449,234,315,072 449,234,315,072
Domestic Market Capitalization 277,229,953,890 293,343,505,774 287,784,540,670 310,379,398,068 344,935,567,262 338,157,345,483 367,178,613,933 357,505,571,950 365,497,255,091 365,307,521,572 363,102,621,566 402,705,426,116 402,705,426,116
Domestic Shares Trading Value 4,475,942,967 4,996,926,677 3,196,852,974 3,579,630,743 9,252,861,217 9,028,258,056 6,963,539,408 5,826,228,896 8,913,545,309 6,576,693,980 6,354,929,560 14,828,832,569 83,994,242,355
Shares Trading Value 4,479,164,578 4,999,489,115 3,200,745,834 3,586,526,540 9,258,591,806 9,043,478,957 6,977,396,174 5,831,077,021 8,918,406,854 6,582,005,040 6,550,153,478 15,225,480,063 84,652,515,460
Shares Trading Value Daily Average 213,293,551 249,974,456 152,416,468 163,023,934 420,845,082 452,173,948 303,365,051 306,898,791 405,382,130 365,666,947 344,744,920 692,067,276 339,969,942
No. of Traded Domestic Shares 3,267,702,519 4,506,330,458 2,234,244,942 2,268,847,298 6,053,514,407 4,299,617,055 3,196,041,897 2,920,443,400 5,679,621,479 3,879,257,886 3,546,553,845 9,166,436,829 51,018,612,015
No. of Traded Shares 3,269,164,811 4,508,519,808 2,237,145,879 2,275,293,427 6,055,706,382 4,312,570,617 3,204,069,929 2,924,853,598 5,683,955,223 3,884,568,122 3,702,994,740 9,456,902,105 51,515,744,641
No. of Traded Shares Daily Average 155,674,515 225,425,990 106,530,756 103,422,429 275,259,381 215,628,531 139,307,388 153,939,663 258,361,601 215,809,340 194,894,460 429,859,187 206,890,541
No. of Domestic Trades 37,170 37,988 26,445 29,210 57,234 58,315 42,851 38,394 57,767 38,778 40,599 84,339 549,090
No. of Trades 37,246 38,049 26,531 29,269 57,321 58,456 42,992 38,495 57,849 38,863 42,402 88,765 556,238
Bonds Value 20,871,038 134,076,391 49,496,667 37,918,560 13,339,139 1,921,032 26,124,676 0 0 0 20,120,390 0 303,867,893
Bonds Volume 221,780 1,408,500 520,050 395,963 139,205 20,000 270,000 0 0 0 207,000 0 3,182,498
ETFs Value 0 0 278,074 0 0 0 6,260 0 0 0 39,939 12,520 336,793
ETFs Volume 0 0 44,620 0 0 0 1,000 0 0 0 6,380 2,000 54,000
No. of Traded Days 21 20 21 22 22 20 23 19 22 18 19 22 249
Turnover Ratio (%) 4.16% 5.71% 2.83% 2.88% 7.58% 5.33% 3.97% 3.62% 7.05% 4.81% 4.40% 11.37% 64.55%
ADX Index (Point) 2,881.78 3,044.89 3,025.33 3,273.63 3,562.88 3,551.24 3,847.43 3,734.55 3,842.98 3,845.72 3,849.84 4,290.30 4,290.30
* Financial data and ratios are for domestic companies only.

44 Abu Dhabi Securities Exchange
Table 3Most Gainers
Value in AED
Change (%)Closing Price in 2012Closing Price in 2013Company CodeCompany Name
397.6%0.412.04 ESHRAQEshraq Properties Company
300.0%0.552.20 WAHAWaha Capital
225.0%0.401.30 GCICGreen Cresent Insurance Company
212.3%0.571.78 BILDCOAbu Dhabi for Building Materials
200.0%0.912.73 ADSBAbu Dhabi Ship Building
188.1%1.093.14 RAKCECRas Al-Khaimah Ceramics
157.9%0.380.98 RAKPROPRas Al-Khaimah Properties
140.0%1.253.00 FOODCOFoodco Holding PJSC
135.8%2.125.00 AWNICAl Wathba Insurance Company
130.5%0.821.89 UCCUnion Cement Company
200.0%
188.1%
157.9%
135.8%
140.0%
397.6%
300.0%
225.0%
212.3%
130.5% ESHRAQ
WAHA
GCIC
BILDCO
ADSB
RAKCEC
RAKPROP
FOODCO
AWNIC
UCC
Most Gainers

45Annual Report
Table 4Most Decliners
Value in AED
Change (%)Closing Price in 2012Closing Price in 2013Company CodeCompany Name
-41.3%2.011.18 FBICOFujairah Cement Industries
-19.5%3.853.10 ABNICAl Buhaira National Insurance Company
-14.0%10.008.60 NMDCNational Marine Dredging Company
-6.7%3.753.50 RAKNICRas Al-Khaimah National Insurance Company
-6.3%1.121.05 UNIONUnion Insurance Company
FBICO
ABNIC
NMDC
RAKNIC
UNION
-19.5%
-14.0%
-6.7%
-41.3%
-6.3%
Most Decliners

46 Abu Dhabi Securities Exchange
Table 5Yearly Trading Activity of ADX - 2013
Value in AED
Company Name Company Code Trading Days Turnover Ratio Change (%)Closing Price
2012Closing Price Last Price Low Price High Price Trades Value Volume
Banks Sector
Abu Dhabi Commercial Bank ADCB 245 18.32% 115.95% 3.01 6.50 6.50 3.05 6.50 15,325 4,709,874,505 1,024,926,022
Abu Dhabi Islamic Bank ADIB 247 9.05% 82.39% 3.18 5.80 5.80 3.15 5.81 5,701 960,861,366 213,936,283
Bank of Sharjah BOS 200 6.42% 39.84% 1.28 1.79 1.79 1.24 1.85 1,617 218,240,668 134,826,208
Commercial Bank International CBI 53 5.63% 68.00% 1.12 1.89 1.89 1.07 3.05 121 219,290,699 88,747,310
Finance House FH 73 2.36% 22.95% 3.05 3.75 3.75 2.75 4.07 143 22,458,570 7,132,734
First Gulf Bank FGB 248 13.43% 62.07% 11.60 18.80 18.80 11.70 18.80 27,001 6,205,608,871 402,824,837
Invest Bank INVESTB 145 9.93% 66.15% 1.62 2.69 2.69 1.58 2.69 539 319,595,371 130,299,229
National Bank of Abu Dhabi NBAD 245 3.68% 48.45% 9.36 13.90 13.90 9.32 14.05 8,874 1,930,219,474 158,400,506
National Bank of Fujairah NBF 36 1.10% 4.40% 4.55 4.75 4.75 2.70 5.23 53 37,787,915 12,148,756
National Bank of Ras Al-Khaimah RAKBANK 199 6.11% 91.56% 3.73 7.14 7.14 3.68 7.50 1,293 559,317,768 102,351,163
National Bank of Umm Al Qaiwain NBQ 43 1.48% 78.38% 1.85 3.30 3.30 1.85 3.50 83 55,965,177 23,712,586
Sharjah Islamic Bank SIB 240 15.88% 67.39% 0.92 1.54 1.54 0.90 1.70 3,867 510,163,983 385,136,637
Union National Bank UNB 246 10.34% 103.42% 2.89 5.87 5.87 2.90 5.89 8,543 1,208,037,275 270,830,396
United Arab Bank UAB 92 7.12% 109.42% 3.08 6.45 6.45 3.00 7.45 289 257,231,745 70,903,704
TOTAL 9.77% 68.22% Change Points 7,965.30 Index 73,449 17,214,653,389 3,026,176,371
Real Estate Sector
ALDAR Properties PJSC ALDAR 248 284.75% 117.32% 1.27 2.76 2.76 1.28 2.96 155,363 25,999,877,380 11,632,500,542
Eshraq Properties Company ESHRAQ 243 821.42% 397.56% 0.41 2.04 2.04 0.35 2.04 65,711 12,106,440,008 12,321,363,009
Ras Al-Khaimah Properties RAKPROP 248 338.39% 157.89% 0.38 0.98 0.98 0.38 1.01 34,888 4,375,154,594 6,767,758,598
Sorouh Properties SOROUH 124 100.34% 117.60% 1.25 2.72 2.72 1.27 3.02 34,006 5,520,999,145 2,633,951,507
TOTAL 326.69% 145.87% Change Points 4,668.16 Index 289,968 48,002,471,127 33,355,573,656
Telecommunications Sector
Emirates Telecommunications Corporation
ETISALAT 246 5.40% 29.00% 9.07 11.70 11.70 9.05 12.10 49,275 4,729,389,012 427,109,822
Ooredoo ORDS 59 0.04% 30.84% 107.00 140.00 140.00 102.00 161.50 122 15,139,001 122,965
Sudan Telecom Company Ltd. SUDATEL 202 44.10% 20.72% 1.11 1.34 1.34 0.87 1.59 6,964 642,125,906 496,115,263
TOTAL 5.40% 29.28% Change Points 2,634.12 Index 56,361 5,386,653,919 923,348,050

47Annual Report
Table 5Yearly Trading Activity of ADX - 2013
Value in AED
Company Name Company Code Trading Days Turnover Ratio Change (%)Closing Price
2012Closing Price Last Price Low Price High Price Trades Value Volume
Banks Sector
Abu Dhabi Commercial Bank ADCB 245 18.32% 115.95% 3.01 6.50 6.50 3.05 6.50 15,325 4,709,874,505 1,024,926,022
Abu Dhabi Islamic Bank ADIB 247 9.05% 82.39% 3.18 5.80 5.80 3.15 5.81 5,701 960,861,366 213,936,283
Bank of Sharjah BOS 200 6.42% 39.84% 1.28 1.79 1.79 1.24 1.85 1,617 218,240,668 134,826,208
Commercial Bank International CBI 53 5.63% 68.00% 1.12 1.89 1.89 1.07 3.05 121 219,290,699 88,747,310
Finance House FH 73 2.36% 22.95% 3.05 3.75 3.75 2.75 4.07 143 22,458,570 7,132,734
First Gulf Bank FGB 248 13.43% 62.07% 11.60 18.80 18.80 11.70 18.80 27,001 6,205,608,871 402,824,837
Invest Bank INVESTB 145 9.93% 66.15% 1.62 2.69 2.69 1.58 2.69 539 319,595,371 130,299,229
National Bank of Abu Dhabi NBAD 245 3.68% 48.45% 9.36 13.90 13.90 9.32 14.05 8,874 1,930,219,474 158,400,506
National Bank of Fujairah NBF 36 1.10% 4.40% 4.55 4.75 4.75 2.70 5.23 53 37,787,915 12,148,756
National Bank of Ras Al-Khaimah RAKBANK 199 6.11% 91.56% 3.73 7.14 7.14 3.68 7.50 1,293 559,317,768 102,351,163
National Bank of Umm Al Qaiwain NBQ 43 1.48% 78.38% 1.85 3.30 3.30 1.85 3.50 83 55,965,177 23,712,586
Sharjah Islamic Bank SIB 240 15.88% 67.39% 0.92 1.54 1.54 0.90 1.70 3,867 510,163,983 385,136,637
Union National Bank UNB 246 10.34% 103.42% 2.89 5.87 5.87 2.90 5.89 8,543 1,208,037,275 270,830,396
United Arab Bank UAB 92 7.12% 109.42% 3.08 6.45 6.45 3.00 7.45 289 257,231,745 70,903,704
TOTAL 9.77% 68.22% Change Points 7,965.30 Index 73,449 17,214,653,389 3,026,176,371
Real Estate Sector
ALDAR Properties PJSC ALDAR 248 284.75% 117.32% 1.27 2.76 2.76 1.28 2.96 155,363 25,999,877,380 11,632,500,542
Eshraq Properties Company ESHRAQ 243 821.42% 397.56% 0.41 2.04 2.04 0.35 2.04 65,711 12,106,440,008 12,321,363,009
Ras Al-Khaimah Properties RAKPROP 248 338.39% 157.89% 0.38 0.98 0.98 0.38 1.01 34,888 4,375,154,594 6,767,758,598
Sorouh Properties SOROUH 124 100.34% 117.60% 1.25 2.72 2.72 1.27 3.02 34,006 5,520,999,145 2,633,951,507
TOTAL 326.69% 145.87% Change Points 4,668.16 Index 289,968 48,002,471,127 33,355,573,656
Telecommunications Sector
Emirates Telecommunications Corporation
ETISALAT 246 5.40% 29.00% 9.07 11.70 11.70 9.05 12.10 49,275 4,729,389,012 427,109,822
Ooredoo ORDS 59 0.04% 30.84% 107.00 140.00 140.00 102.00 161.50 122 15,139,001 122,965
Sudan Telecom Company Ltd. SUDATEL 202 44.10% 20.72% 1.11 1.34 1.34 0.87 1.59 6,964 642,125,906 496,115,263
TOTAL 5.40% 29.28% Change Points 2,634.12 Index 56,361 5,386,653,919 923,348,050

48 Abu Dhabi Securities Exchange
Value in AED
Company Name Company Code Trading Days Turnover Ratio Change (%)Closing Price
2012Closing Price Last Price Low Price High Price Trades Value Volume
Consumer Staples Sector
Agthia Group AGTHIA 245 10.62% 102.75% 2.18 4.42 4.42 2.06 5.29 2,601 203,283,014 63,738,892
Foodco Holding PJSC FOODCO 43 1.62% 140.00% 1.25 3.00 3.00 1.26 3.35 87 2,695,957 1,618,958
Gulf Livestock Company GLC 0 0.00% 0.00% 6.98 0.00 0.00 0.00 0.00 0 0 0
International Fish Farming Company PJSC
ASMAK 74 2.52% -3.21% 14.00 13.55 13.55 10.25 34.30 1426 36,843,510 2,141,137
Ras Al-Khaimah Poultry and Feeding Company
RAPCO 54 8.87% 71.43% 1.05 1.80 1.80 1.05 1.80 111 11,122,339 7,664,168
TOTAL 7.74% 64.94% Change Points 2,125.05 Index 4,225 253,944,820 75,163,155
Industrial Sector
Abu Dhabi for Building Materials BILDCO 206 125.44% 212.28% 0.57 1.78 1.78 0.47 1.81 5072 456,996,117 376,316,302
Abu Dhabi Ship Building Company ADSB 164 60.15% 200.00% 0.91 2.73 2.73 0.90 3.19 3191 211,047,507 127,521,018
Arkan Building Materials Company ARKAN 241 13.25% 76.47% 0.68 1.20 1.2 0.57 1.46 4,851 244,954,967 231,852,323
Fujairah Building Industries PSC FBICO 12 0.35% -41.29% 2.01 1.18 1.18 1.08 1.81 15 670,325 447,537
Fujairah Cement Industries FCI 6 0.03% 30.77% 0.91 1.19 1.19 0.94 1.19 6 101,018 101,022
Gulf Cement Company GCEM 134 5.26% 42.57% 1.01 1.44 1.44 0.92 2.06 1,211 62,751,302 43,221,412
Gulf Pharmaceutical Industries JULPHAR 141 2.24% 19.11% 2.75 3.27 3.27 2.64 4.60 484 59,726,834 19,348,089
Ras Al-Khaimah Cement Company RAKCC 249 269.03% 78.66% 0.64 1.14 1.14 0.64 1.20 16,349 1,322,824,527 1,367,235,398
Ras Al-Khaimah Ceramics Company RAKCEC 222 17.07% 188.07% 1.09 3.14 3.14 1.08 3.19 2,540 240,219,791 126,872,171
Ras Al-Khaimah Co. For White Cement & Construction Company
RAKWCT 96 7.18% 22.22% 1.35 1.65 1.65 1.30 2.15 271 48,723,195 33,551,897
Sharjah Cement & Industrial Development Company
SCIDC 49 1.48% 62.82% 0.78 1.27 1.27 0.75 1.44 118 9,020,255 8,203,061
Umm Al-Qaiwain Cement Industries Company
QCEM 80 12.68% 60.53% 0.76 1.22 1.22 0.73 1.81 416 55,265,113 46,031,967
Union Cement Company UCC 109 1.23% 130.49% 0.82 1.89 1.89 0.78 1.94 306 10,230,237 8,244,045
TOTAL 30.90% 73.00% Change Points 2,566.94 Index 34,830 2,722,531,187 2,388,946,242
Bonds
NBAD Subordinated Convertible Notes NBADCN0316 31 6.57% 91.00 96.98 96.99 84.00 96.99 47 303,867,893 3,182,498
TOTAL 47 303,867,893 3,182,498
Table 5Yearly Trading Activity of ADX - 2013 (continued)

49Annual Report
Value in AED
Company Name Company Code Trading Days Turnover Ratio Change (%)Closing Price
2012Closing Price Last Price Low Price High Price Trades Value Volume
Consumer Staples Sector
Agthia Group AGTHIA 245 10.62% 102.75% 2.18 4.42 4.42 2.06 5.29 2,601 203,283,014 63,738,892
Foodco Holding PJSC FOODCO 43 1.62% 140.00% 1.25 3.00 3.00 1.26 3.35 87 2,695,957 1,618,958
Gulf Livestock Company GLC 0 0.00% 0.00% 6.98 0.00 0.00 0.00 0.00 0 0 0
International Fish Farming Company PJSC
ASMAK 74 2.52% -3.21% 14.00 13.55 13.55 10.25 34.30 1426 36,843,510 2,141,137
Ras Al-Khaimah Poultry and Feeding Company
RAPCO 54 8.87% 71.43% 1.05 1.80 1.80 1.05 1.80 111 11,122,339 7,664,168
TOTAL 7.74% 64.94% Change Points 2,125.05 Index 4,225 253,944,820 75,163,155
Industrial Sector
Abu Dhabi for Building Materials BILDCO 206 125.44% 212.28% 0.57 1.78 1.78 0.47 1.81 5072 456,996,117 376,316,302
Abu Dhabi Ship Building Company ADSB 164 60.15% 200.00% 0.91 2.73 2.73 0.90 3.19 3191 211,047,507 127,521,018
Arkan Building Materials Company ARKAN 241 13.25% 76.47% 0.68 1.20 1.2 0.57 1.46 4,851 244,954,967 231,852,323
Fujairah Building Industries PSC FBICO 12 0.35% -41.29% 2.01 1.18 1.18 1.08 1.81 15 670,325 447,537
Fujairah Cement Industries FCI 6 0.03% 30.77% 0.91 1.19 1.19 0.94 1.19 6 101,018 101,022
Gulf Cement Company GCEM 134 5.26% 42.57% 1.01 1.44 1.44 0.92 2.06 1,211 62,751,302 43,221,412
Gulf Pharmaceutical Industries JULPHAR 141 2.24% 19.11% 2.75 3.27 3.27 2.64 4.60 484 59,726,834 19,348,089
Ras Al-Khaimah Cement Company RAKCC 249 269.03% 78.66% 0.64 1.14 1.14 0.64 1.20 16,349 1,322,824,527 1,367,235,398
Ras Al-Khaimah Ceramics Company RAKCEC 222 17.07% 188.07% 1.09 3.14 3.14 1.08 3.19 2,540 240,219,791 126,872,171
Ras Al-Khaimah Co. For White Cement & Construction Company
RAKWCT 96 7.18% 22.22% 1.35 1.65 1.65 1.30 2.15 271 48,723,195 33,551,897
Sharjah Cement & Industrial Development Company
SCIDC 49 1.48% 62.82% 0.78 1.27 1.27 0.75 1.44 118 9,020,255 8,203,061
Umm Al-Qaiwain Cement Industries Company
QCEM 80 12.68% 60.53% 0.76 1.22 1.22 0.73 1.81 416 55,265,113 46,031,967
Union Cement Company UCC 109 1.23% 130.49% 0.82 1.89 1.89 0.78 1.94 306 10,230,237 8,244,045
TOTAL 30.90% 73.00% Change Points 2,566.94 Index 34,830 2,722,531,187 2,388,946,242
Bonds
NBAD Subordinated Convertible Notes NBADCN0316 31 6.57% 91.00 96.98 96.99 84.00 96.99 47 303,867,893 3,182,498
TOTAL 47 303,867,893 3,182,498

50 Abu Dhabi Securities Exchange
Value in AED
Company Name Company Code Trading Days Turnover Ratio Change (%)Closing Price
2012Closing Price Last Price Low Price High Price Trades Value Volume
Insurance Sector
Abu Dhabi National Takaful Company TKFL 6 0.02% 13.64% 5.06 5.75 5.75 4.56 5.75 9 77,982 15,055
Abu Dhabi National Insurance Company ADNIC 34 0.82% 9.26% 5.40 5.90 5.90 5.40 6.00 54 17,427,819 3,068,213
Al Ain Al Ahlia Insurance Company ALAIN 15 1.60% 20.63% 32.00 38.60 38.60 32.00 47.60 17 9,577,321 240,060
Al Buhaira National Insurance Company ABNIC 15 8.10% -19.48% 3.85 3.10 3.10 2.60 4.37 23 61,142,187 20,247,344
Al Dhafra Insurance Company DHAFRA 6 3.55% 5.00% 6.00 6.30 6.30 6.20 7.00 10 24,715,473 3,547,072
Al Khazna Insurance Company AKIC 109 1.18% 32.57% 0.66 0.88 0.88 0.67 1.00 213 4,095,638 4,945,265
Al Wathba Insurance Company AWNIC 9 0.09% 135.85% 2.12 5.00 5.00 2.25 5.25 9 545,426 162,074
Emirates Insurance Company EIC 13 0.35% 13.75% 6.11 6.95 6.95 6.00 6.95 23 2,969,788 478,530
Al Fujairah National Insurance Company AFNIC 0.00% 300.00
Green Cresent Insurance Company GCIC 145 33.70% 225.00% 0.40 1.30 1.30 0.37 1.50 673 25,853,895 33,703,632
Insurance House PSC IH 52 1.47% 43.43% 0.99 1.42 1.42 0.94 1.65 77 2,281,372 1,760,753
Methaq Takaful Insurance Company METHAQ 247 1307.10% 90.00% 1.00 1.90 1.90 0.96 1.96 33,471 2,892,635,981 1,960,653,777
National Takaful Company WATANIA 88 12.35% 11.76% 1.02 1.14 1.14 0.79 1.55 519 20,382,867 18,528,084
Ras Al-Khaimah National Insurance Company
RAKNIC 8 3.94% -6.67% 3.75 3.50 3.50 3.00 3.85 14 12,598,190 3,938,903
Sharjah Insurance Company SICO 2 0.00% -100.00% 5.00
Union Insurance Company UNION 21 3.35% -6.25% 1.12 1.05 1.05 0.91 1.10 35 11,017,758 11,080,740
United Insurance Company UIC 0.00% 4.00
TOTAL 74.60% 15.37% Change Points 2,315.06 Index 35,147 3,085,321,696 2,062,369,502
Energy Sector
Abu Dhabi National Energy Company TAQA 248 3.97% 8.09% 1.36 1.47 1.47 1.20 1.54 3,125 327,299,021 247,109,173
Dana Gas PJSC DANA 248 100.50% 102.22% 0.45 0.91 0.91 0.44 0.97 38,055 4,306,491,910 6,633,245,275
TOTAL 53.65% 55.89% Change Points 2,100.28 Index 41,180 4,633,790,931 6,880,354,448
Table 5Yearly Trading Activity of ADX - 2013 (continued)

51Annual Report
Value in AED
Company Name Company Code Trading Days Turnover Ratio Change (%)Closing Price
2012Closing Price Last Price Low Price High Price Trades Value Volume
Insurance Sector
Abu Dhabi National Takaful Company TKFL 6 0.02% 13.64% 5.06 5.75 5.75 4.56 5.75 9 77,982 15,055
Abu Dhabi National Insurance Company ADNIC 34 0.82% 9.26% 5.40 5.90 5.90 5.40 6.00 54 17,427,819 3,068,213
Al Ain Al Ahlia Insurance Company ALAIN 15 1.60% 20.63% 32.00 38.60 38.60 32.00 47.60 17 9,577,321 240,060
Al Buhaira National Insurance Company ABNIC 15 8.10% -19.48% 3.85 3.10 3.10 2.60 4.37 23 61,142,187 20,247,344
Al Dhafra Insurance Company DHAFRA 6 3.55% 5.00% 6.00 6.30 6.30 6.20 7.00 10 24,715,473 3,547,072
Al Khazna Insurance Company AKIC 109 1.18% 32.57% 0.66 0.88 0.88 0.67 1.00 213 4,095,638 4,945,265
Al Wathba Insurance Company AWNIC 9 0.09% 135.85% 2.12 5.00 5.00 2.25 5.25 9 545,426 162,074
Emirates Insurance Company EIC 13 0.35% 13.75% 6.11 6.95 6.95 6.00 6.95 23 2,969,788 478,530
Al Fujairah National Insurance Company AFNIC 0.00% 300.00
Green Cresent Insurance Company GCIC 145 33.70% 225.00% 0.40 1.30 1.30 0.37 1.50 673 25,853,895 33,703,632
Insurance House PSC IH 52 1.47% 43.43% 0.99 1.42 1.42 0.94 1.65 77 2,281,372 1,760,753
Methaq Takaful Insurance Company METHAQ 247 1307.10% 90.00% 1.00 1.90 1.90 0.96 1.96 33,471 2,892,635,981 1,960,653,777
National Takaful Company WATANIA 88 12.35% 11.76% 1.02 1.14 1.14 0.79 1.55 519 20,382,867 18,528,084
Ras Al-Khaimah National Insurance Company
RAKNIC 8 3.94% -6.67% 3.75 3.50 3.50 3.00 3.85 14 12,598,190 3,938,903
Sharjah Insurance Company SICO 2 0.00% -100.00% 5.00
Union Insurance Company UNION 21 3.35% -6.25% 1.12 1.05 1.05 0.91 1.10 35 11,017,758 11,080,740
United Insurance Company UIC 0.00% 4.00
TOTAL 74.60% 15.37% Change Points 2,315.06 Index 35,147 3,085,321,696 2,062,369,502
Energy Sector
Abu Dhabi National Energy Company TAQA 248 3.97% 8.09% 1.36 1.47 1.47 1.20 1.54 3,125 327,299,021 247,109,173
Dana Gas PJSC DANA 248 100.50% 102.22% 0.45 0.91 0.91 0.44 0.97 38,055 4,306,491,910 6,633,245,275
TOTAL 53.65% 55.89% Change Points 2,100.28 Index 41,180 4,633,790,931 6,880,354,448

52 Abu Dhabi Securities Exchange
Value in AED
Company Name Company Code Trading Days Turnover Ratio Change (%)Closing Price
2012Closing Price Last Price Low Price High Price Trades Value Volume
Services Sector
Abu Dhabi Aviation ADAVIATION 110 3.65% 21.53% 2.88 3.50 3.50 2.52 3.55 265 43,986,914 14,741,589
Abu Dhabi National Hotels ADNH 126 5.28% 75.14% 1.77 3.10 3.10 1.70 3.20 470 109,370,175 52,820,145
Emirates Driving Company DRIVE 37 2.51% 48.75% 2.79 4.15 4.15 2.95 4.37 66 7,107,242 2,250,285
Gulf Medical Projects Company GMPC 67 2.09% 86.14% 1.26 2.34 2.34 1.30 3.00 125 6,829,307 3,340,335
National Company for Tourism & Hotels NCTH 21 0.13% 24.69% 4.69 5.85 5.85 4.67 7.40 23 1,959,862 304,767
National Marine Dredging NMDC 74 1.31% -14.00% 10.00 8.60 8.60 6.98 11.00 146 24,991,898 2,973,960
TOTAL 2.94% 31.37% Change Points 2,741.55 Index 1,095 194,245,399 76,431,081
ETF
NBAD OneShare MSCI 1UAE 25 ETF 1UAE 5 20.15% 5.21 6.26 6.26 5.99 6.26 5 336,793 54,000
TOTAL 5 336,793 54,000
Investment & Financial Services Sector
Oman & Emirates Investment Holding Company PJSC
OEIHC 49 0.73% 107.14% 0.70 1.45 1.45 0.70 1.45 62 1,008,198 894,398
Waha Capital WAHA 249 143.20% 300.00% 0.55 2.20 2.20 0.56 2.24 19,916 3,137,698,794 2,716,587,738
TOTAL 143.20% 299.98% Change Points 2,973.16 Index 19,978 3,138,706,992 2,717,482,136
Big Block
Gulf Medical Projects Company GMPC 1 1.56% 2.34 2.34 2.04 2.04 5 20,196,000 9,900,000
TOTAL 2.09% 130 27,025,307 13,240,335
GRAND TOTAL 65.51% 63.08% Change Points 4,290.30 Index 556,290 84,956,720,146 51,518,981,139
Table 5Yearly Trading Activity of ADX - 2013 (continued)

53Annual Report
Value in AED
Company Name Company Code Trading Days Turnover Ratio Change (%)Closing Price
2012Closing Price Last Price Low Price High Price Trades Value Volume
Services Sector
Abu Dhabi Aviation ADAVIATION 110 3.65% 21.53% 2.88 3.50 3.50 2.52 3.55 265 43,986,914 14,741,589
Abu Dhabi National Hotels ADNH 126 5.28% 75.14% 1.77 3.10 3.10 1.70 3.20 470 109,370,175 52,820,145
Emirates Driving Company DRIVE 37 2.51% 48.75% 2.79 4.15 4.15 2.95 4.37 66 7,107,242 2,250,285
Gulf Medical Projects Company GMPC 67 2.09% 86.14% 1.26 2.34 2.34 1.30 3.00 125 6,829,307 3,340,335
National Company for Tourism & Hotels NCTH 21 0.13% 24.69% 4.69 5.85 5.85 4.67 7.40 23 1,959,862 304,767
National Marine Dredging NMDC 74 1.31% -14.00% 10.00 8.60 8.60 6.98 11.00 146 24,991,898 2,973,960
TOTAL 2.94% 31.37% Change Points 2,741.55 Index 1,095 194,245,399 76,431,081
ETF
NBAD OneShare MSCI 1UAE 25 ETF 1UAE 5 20.15% 5.21 6.26 6.26 5.99 6.26 5 336,793 54,000
TOTAL 5 336,793 54,000
Investment & Financial Services Sector
Oman & Emirates Investment Holding Company PJSC
OEIHC 49 0.73% 107.14% 0.70 1.45 1.45 0.70 1.45 62 1,008,198 894,398
Waha Capital WAHA 249 143.20% 300.00% 0.55 2.20 2.20 0.56 2.24 19,916 3,137,698,794 2,716,587,738
TOTAL 143.20% 299.98% Change Points 2,973.16 Index 19,978 3,138,706,992 2,717,482,136
Big Block
Gulf Medical Projects Company GMPC 1 1.56% 2.34 2.34 2.04 2.04 5 20,196,000 9,900,000
TOTAL 2.09% 130 27,025,307 13,240,335
GRAND TOTAL 65.51% 63.08% Change Points 4,290.30 Index 556,290 84,956,720,146 51,518,981,139

54 Abu Dhabi Securities Exchange
Table 6Major Financial Data & Indicators for Companies Listed at ADX
Value in AED
Main Financial Ratios Main Financial Data
Market Capitalization
DividendsYear
FinancialPeriodPaid-Up CapitalPar Value
Closing PriceIssued Shares
Company Code Company Name
Earning Yield (%)
DividendYield (%)
P/B.V(Time)
P/E(Time)Cash DividendsNet Income
Shareholders' Equity
Bank Sector
5.093.851.5119.651,398,620,423 1,851,260,00024,050,514,00036,371,382,9772012Q3 20135,595,597,3811.006.505,595,597,381ADCBAbu Dhabi Commercial Bank
7.824.381.0612.79600,616,0001,072,262,00012,941,890,00013,715,294,0812012Q3 20132,364,705,8761.005.802,364,705,876ADIBAbu Dhabi Islamic Bank
6.255.150.8916.00193,500,000234,959,0004,203,209,0003,759,000,0002012Q3 20132,100,000,0001.001.792,100,000,000BOSBank of Sharjah
16.970.001.385.890505,506,0002,161,993,0002,978,370,9432012Q3 20131,575,857,6421.001.891,575,857,642CBICommercial Bank International
5.703.201.6017.5436,300,00064,656,000709,035,0001,134,375,0002012Q3 2013302,500,0001.003.75302,500,000FHFinance House PJSC
7.234.431.8613.822,500,000,0004,079,744,00030,311,172,00056,400,000,0002012Q3 20133,000,000,0001.0018.803,000,000,000FGBFirst Gulf Bank
9.545.311.4110.48187,500,000336,981,0002,498,539,0003,530,625,0002012Q3 20131,312,500,0001.002.691,312,500,000INVESTBInvest Bank
6.882.291.8014.541,369,949,6124,115,743,00033,301,495,00059,847,227,3442012Q3 20134,305,555,9241.0013.904,305,555,924NBADNational Bank of Abu Dhabi
4.882.111.7920.51110,000,000 254,765,0002,921,596,0005,225,000,0002012Q3 20131,100,000,0001.004.751,100,000,000NBFNational Bank of Fujairah PSC
10.895.091.929.18609,543,7921,303,532,0006,242,051,00011,968,392,3562012Q3 20131,676,245,4281.007.141,676,245,428RAKBANKNational Bankof Ras Al-Khaimah
5.674.851.4817.65256,000,000299,142,0003,559,942,0005,280,000,0502012Q3 20131,600,000,0151.003.301,600,000,015NBQNational Bankof Umm Al-Qaiwain
6.953.900.8314.38145,530,000259,753,0004,499,058,0003,735,270,0002012Q3 20132,425,500,0001.001.542,425,500,000SIBSharjah Islamic Bank
19.021.621.035.26249,562,5002,924,901,50015,005,673,00015,381,784,6882012Q3 20132,620,406,2501.005.872,620,406,250UNBUnion National Bank
4.563.882.7321.93249,100,000293,007,0002,354,536,0006,426,788,2562012Q3 2013996,401,2801.006.45996,401,280UABUnited Arab Bank
7.793.501.5612.837,906,222,32717,596,211,500144,760,703,000225,753,510,69330,975,269,79630,975,269,796Total
Real Estate Sector
2.871.241.3434.84268,897,776622,912,00016,238,260,00021,700,857,7042012Q3 20137,862,629,6031.002.767,862,629,603ALDARALDAR Properties PJSC
8.776.201.9411.41189,750,000 268,263,2021,574,029,0003,060,000,0002012Q3 2013375,000,0000.252.041,500,000,000ESHRAQEshraq Properties Company
8.295.100.5512.06100,000,000162,457,0003,555,251,0001,960,000,0002012Q3 20132,000,000,0001.000.982,000,000,000RAKPROPRas Al-Khaimah Properties
3.942.091.2525.36558,647,7761,053,632,20221,367,540,00026,720,857,70410,237,629,60311,362,629,603 Total
Telecommunications Sector
7.025.982.0714.245,534,298,0006,494,853,00044,716,028,00092,501,838,0002012Q3 20137,906,140,0001.0011.707,906,140,000ETISALATEmirates Telecommunications Corporation
8.043.571.4112.441,601,600,0003,604,077,00031,884,374,00044,844,800,0002012Q3 20133,203,200,00010.00140.00320,320,000QTELQatar Telecom
-0.000.38-0(356,333,906)3,988,908,5191,507,370,2062012Q3 20134,131,769,2303.671.341,124,903,139SUDATELSudan Telecom Company Ltd.
7.025.982.0714.245,534,298,0006,494,853,00044,716,028,00092,501,838,0007,906,140,0007,906,140,000TOTAL

55Annual Report
Table 6Major Financial Data & Indicators for Companies Listed at ADX
Value in AED
Main Financial Ratios Main Financial Data
Market Capitalization
DividendsYear
FinancialPeriodPaid-Up CapitalPar Value
Closing PriceIssued Shares
Company Code Company Name
Earning Yield (%)
DividendYield (%)
P/B.V(Time)
P/E(Time)Cash DividendsNet Income
Shareholders' Equity
Bank Sector
5.093.851.5119.651,398,620,423 1,851,260,00024,050,514,00036,371,382,9772012Q3 20135,595,597,3811.006.505,595,597,381ADCBAbu Dhabi Commercial Bank
7.824.381.0612.79600,616,0001,072,262,00012,941,890,00013,715,294,0812012Q3 20132,364,705,8761.005.802,364,705,876ADIBAbu Dhabi Islamic Bank
6.255.150.8916.00193,500,000234,959,0004,203,209,0003,759,000,0002012Q3 20132,100,000,0001.001.792,100,000,000BOSBank of Sharjah
16.970.001.385.890505,506,0002,161,993,0002,978,370,9432012Q3 20131,575,857,6421.001.891,575,857,642CBICommercial Bank International
5.703.201.6017.5436,300,00064,656,000709,035,0001,134,375,0002012Q3 2013302,500,0001.003.75302,500,000FHFinance House PJSC
7.234.431.8613.822,500,000,0004,079,744,00030,311,172,00056,400,000,0002012Q3 20133,000,000,0001.0018.803,000,000,000FGBFirst Gulf Bank
9.545.311.4110.48187,500,000336,981,0002,498,539,0003,530,625,0002012Q3 20131,312,500,0001.002.691,312,500,000INVESTBInvest Bank
6.882.291.8014.541,369,949,6124,115,743,00033,301,495,00059,847,227,3442012Q3 20134,305,555,9241.0013.904,305,555,924NBADNational Bank of Abu Dhabi
4.882.111.7920.51110,000,000 254,765,0002,921,596,0005,225,000,0002012Q3 20131,100,000,0001.004.751,100,000,000NBFNational Bank of Fujairah PSC
10.895.091.929.18609,543,7921,303,532,0006,242,051,00011,968,392,3562012Q3 20131,676,245,4281.007.141,676,245,428RAKBANKNational Bankof Ras Al-Khaimah
5.674.851.4817.65256,000,000299,142,0003,559,942,0005,280,000,0502012Q3 20131,600,000,0151.003.301,600,000,015NBQNational Bankof Umm Al-Qaiwain
6.953.900.8314.38145,530,000259,753,0004,499,058,0003,735,270,0002012Q3 20132,425,500,0001.001.542,425,500,000SIBSharjah Islamic Bank
19.021.621.035.26249,562,5002,924,901,50015,005,673,00015,381,784,6882012Q3 20132,620,406,2501.005.872,620,406,250UNBUnion National Bank
4.563.882.7321.93249,100,000293,007,0002,354,536,0006,426,788,2562012Q3 2013996,401,2801.006.45996,401,280UABUnited Arab Bank
7.793.501.5612.837,906,222,32717,596,211,500144,760,703,000225,753,510,69330,975,269,79630,975,269,796Total
Real Estate Sector
2.871.241.3434.84268,897,776622,912,00016,238,260,00021,700,857,7042012Q3 20137,862,629,6031.002.767,862,629,603ALDARALDAR Properties PJSC
8.776.201.9411.41189,750,000 268,263,2021,574,029,0003,060,000,0002012Q3 2013375,000,0000.252.041,500,000,000ESHRAQEshraq Properties Company
8.295.100.5512.06100,000,000162,457,0003,555,251,0001,960,000,0002012Q3 20132,000,000,0001.000.982,000,000,000RAKPROPRas Al-Khaimah Properties
3.942.091.2525.36558,647,7761,053,632,20221,367,540,00026,720,857,70410,237,629,60311,362,629,603 Total
Telecommunications Sector
7.025.982.0714.245,534,298,0006,494,853,00044,716,028,00092,501,838,0002012Q3 20137,906,140,0001.0011.707,906,140,000ETISALATEmirates Telecommunications Corporation
8.043.571.4112.441,601,600,0003,604,077,00031,884,374,00044,844,800,0002012Q3 20133,203,200,00010.00140.00320,320,000QTELQatar Telecom
-0.000.38-0(356,333,906)3,988,908,5191,507,370,2062012Q3 20134,131,769,2303.671.341,124,903,139SUDATELSudan Telecom Company Ltd.
7.025.982.0714.245,534,298,0006,494,853,00044,716,028,00092,501,838,0007,906,140,0007,906,140,000TOTAL

56 Abu Dhabi Securities Exchange
Table 6Major Financial Data & Indicators for Companies Listed at ADX (continued)
Value in AED
Main Financial Ratios Main Financial Data
Market Capitalization
DividendsYear
FinancialPeriodPaid-Up CapitalPar Value
Closing PriceIssued Shares
Company Code Company Name
Earning Yield (%)
DividendYield (%)
P/B.V(Time)
P/E(Time)Cash DividendsNet Income
Shareholders' Equity
Consumer Staples Sector
3.621.132.1927.6230,000,000 96,011,0001,212,169,0002,652,000,0002012Q3 2013600,000,0001.004.42600,000,000AGTHIAAgthia Group PJSC
3.261.670.8430.695,000,000 9,775,009355,849,000300,000,0002012Q3 2013100,000,0001.003.00100,000,000FOODCOFoodco Holding PJSC
0.052.152.691972.2815,000,000 353,906259,689,919698,000,0002012Q3 2013100,000,0001.006.98100,000,000GLSGulf Livestock Company
-0.001.36-0(73,997,000)844,703,0001,151,750,0002012Q3 201385,000,0001.0013.5585,000,000ASMAKInternational Fish Farming Company PJSC
-2.780.33-4,320,000(11,646,372)475,946,000155,520,0002012Q3 201386,400,0001.001.8086,400,000RAPCORas Al-Khaimah Poultry and Feeding Company
0.411.101.57241.8654,320,00020,496,5433,148,356,9194,957,270,000971,400,000971,400,000Total
Industrial Sector
-0.001.40-0(26,323,570)380,845,642534,000,0002012Q3 2013300,000,0001.001.78300,000,000BILDCOAbu Dhabi for Building Materials
1.770.001.3256.410 10,259,000438,051,000578,738,1602012Q3 2013211,992,0001.002.73211,992,000ADSBAbu Dhabi Ship Building Company
2.800.001.2435.660 58,897,0001,689,810,0002,100,000,0002012Q3 20131,750,000,0001.001.201,750,000,000ARKANArkan Building Materials Company
2.050.000.7548.770 3,060,984199,678,000149,270,0002012Q3 2013126,500,0001.001.18126,500,000FBICOFujairah Building Industries PSC
17.180.000.465.820 72,769,103928,341,000423,479,7312012Q3 2013355,865,3201.001.19355,865,320FCIFujairah Cement Industries
-3.470.97-41,054,841(50,866,159)1,213,946,0001,182,379,4212012Q3 2013821,096,8201.001.44821,096,820GCEMGulf Cement Company
6.612.781.5615.1378,468,669 186,569,0001,804,384,0002,822,518,0142012Q3 2013863,155,3561.003.27863,155,356JULPHARGulf Pharmaceutical Industries
-4.180.83-24,200,000(3,064,421)695,996,000579,348,0002012Q3 2013508,200,0001.001.14508,200,000RAKCCRas Al-Khaimah Cement Company
8.396.370.9511.92148,640,492 195,732,0002,449,544,0002,333,655,7242012Q3 2013743,202,4601.003.14743,202,460RAKCECRas Al-Khaimah Ceramics Company
3.766.060.8426.5946,700,000 28,981,384920,821,000770,550,0002012Q3 2013467,000,0001.001.65467,000,000RAKWCTRas Al-Khaimah Co. For White Cement & Construction Company
3.183.940.5131.4127,647,898 22,359,0001,385,164,000702,256,5992012Q3 2013552,957,9521.001.27552,957,952SCIDCSharjah Cement & Industrial Development Company
-4.920.66-21,780,000(1,777,940)671,763,000442,860,0002012Q3 2013363,000,0001.001.22363,000,000QCEMUmm Al-Qaiwain Cement Industries Company
6.304.761.0115.8760,249,420 79,736,000 1,247,083,0001,265,237,8202012Q3 2013669,438,0001.001.89669,438,000UCCUnion Cement Company
4.153.230.9924.09448,741,320576,331,38114,025,426,64213,884,293,4697,732,407,9087,732,407,908TOTAL

57Annual Report
Value in AED
Main Financial Ratios Main Financial Data
Market Capitalization
DividendsYear
FinancialPeriodPaid-Up CapitalPar Value
Closing PriceIssued Shares
Company Code Company Name
Earning Yield (%)
DividendYield (%)
P/B.V(Time)
P/E(Time)Cash DividendsNet Income
Shareholders' Equity
Consumer Staples Sector
3.621.132.1927.6230,000,000 96,011,0001,212,169,0002,652,000,0002012Q3 2013600,000,0001.004.42600,000,000AGTHIAAgthia Group PJSC
3.261.670.8430.695,000,000 9,775,009355,849,000300,000,0002012Q3 2013100,000,0001.003.00100,000,000FOODCOFoodco Holding PJSC
0.052.152.691972.2815,000,000 353,906259,689,919698,000,0002012Q3 2013100,000,0001.006.98100,000,000GLSGulf Livestock Company
-0.001.36-0(73,997,000)844,703,0001,151,750,0002012Q3 201385,000,0001.0013.5585,000,000ASMAKInternational Fish Farming Company PJSC
-2.780.33-4,320,000(11,646,372)475,946,000155,520,0002012Q3 201386,400,0001.001.8086,400,000RAPCORas Al-Khaimah Poultry and Feeding Company
0.411.101.57241.8654,320,00020,496,5433,148,356,9194,957,270,000971,400,000971,400,000Total
Industrial Sector
-0.001.40-0(26,323,570)380,845,642534,000,0002012Q3 2013300,000,0001.001.78300,000,000BILDCOAbu Dhabi for Building Materials
1.770.001.3256.410 10,259,000438,051,000578,738,1602012Q3 2013211,992,0001.002.73211,992,000ADSBAbu Dhabi Ship Building Company
2.800.001.2435.660 58,897,0001,689,810,0002,100,000,0002012Q3 20131,750,000,0001.001.201,750,000,000ARKANArkan Building Materials Company
2.050.000.7548.770 3,060,984199,678,000149,270,0002012Q3 2013126,500,0001.001.18126,500,000FBICOFujairah Building Industries PSC
17.180.000.465.820 72,769,103928,341,000423,479,7312012Q3 2013355,865,3201.001.19355,865,320FCIFujairah Cement Industries
-3.470.97-41,054,841(50,866,159)1,213,946,0001,182,379,4212012Q3 2013821,096,8201.001.44821,096,820GCEMGulf Cement Company
6.612.781.5615.1378,468,669 186,569,0001,804,384,0002,822,518,0142012Q3 2013863,155,3561.003.27863,155,356JULPHARGulf Pharmaceutical Industries
-4.180.83-24,200,000(3,064,421)695,996,000579,348,0002012Q3 2013508,200,0001.001.14508,200,000RAKCCRas Al-Khaimah Cement Company
8.396.370.9511.92148,640,492 195,732,0002,449,544,0002,333,655,7242012Q3 2013743,202,4601.003.14743,202,460RAKCECRas Al-Khaimah Ceramics Company
3.766.060.8426.5946,700,000 28,981,384920,821,000770,550,0002012Q3 2013467,000,0001.001.65467,000,000RAKWCTRas Al-Khaimah Co. For White Cement & Construction Company
3.183.940.5131.4127,647,898 22,359,0001,385,164,000702,256,5992012Q3 2013552,957,9521.001.27552,957,952SCIDCSharjah Cement & Industrial Development Company
-4.920.66-21,780,000(1,777,940)671,763,000442,860,0002012Q3 2013363,000,0001.001.22363,000,000QCEMUmm Al-Qaiwain Cement Industries Company
6.304.761.0115.8760,249,420 79,736,000 1,247,083,0001,265,237,8202012Q3 2013669,438,0001.001.89669,438,000UCCUnion Cement Company
4.153.230.9924.09448,741,320576,331,38114,025,426,64213,884,293,4697,732,407,9087,732,407,908TOTAL

58 Abu Dhabi Securities Exchange
Value in AED
Main Financial Ratios Main Financial Data
Market Capitalization
DividendsYear
FinancialPeriodPaid-Up CapitalPar Value
Closing PriceIssued Shares
Company Code Company Name
Earning Yield (%)
DividendYield (%)
P/B.V(Time)
P/E(Time)Cash DividendsNet Income
Shareholders' Equity
Insurance Sector
3.312.263.0230.1913,000,000 19,044,557190,291,000575,000,0002012Q3 2013100,000,0001.005.75100,000,000TKFLAbu Dhabi National Takaful Company PJSC
5.626.781.0217.81150,000,000 124,245,0002,178,309,0002,212,500,0002012Q3 2013375,000,0001.005.90375,000,000ADNICAbu Dhabi National Insurance Company
7.887.770.5412.6945,000,000 45,643,0001,080,954,000579,000,0002012Q3 2013150,000,00010.0038.6015,000,000ALAINAl Ain Al Ahlia Insurance Company
2.421.611.2241.2712,500,000 18,776,697637,202,801775,000,0002012Q3 2013250,000,0001.003.10250,000,000ABNICAl Buhaira National Insurance Company
8.256.351.7012.1240,000,000 51,959,434370,254,239630,000,0002012Q3 2013100,000,0001.006.30100,000,000DHAFRAAl Dhafra Insurance Company
-0.000.69-0(70,921,161)535,898,624369,600,0002012Q3 2013420,000,0001.000.88420,000,000AKICAl Khazna Insurance Company
-2.001.39-18,000,000(60,306,000)648,649,000900,000,0002012Q3 2013180,000,0001.005.00180,000,000AWNICAl Wathba National Insurance Company PJSC
12.718.631.047.8781,000,000 119,293,972903,956,611938,250,0002012Q3 2013135,000,0001.006.95135,000,000EICEmirates Insurance Company
6.112.501.8616.377,500,000 18,322,838160,895,973300,000,0002012Q3 2013100,000,000100.00300.001,000,000AFNICFujairah National Insurance Company
-0.001.66-0(33,703,000)78,275,000130,000,0002012Q3 2013100,000,0001.001.30100,000,000GCICGreen Crescent Insurance Company
4.290.001.4223.320 7,307,488120,000,000170,400,0002012Q3 2013120,000,0001.001.42120,000,000IHInsurance House PSC
-0.002.65-0(19,633,053)107,683,236285,000,0002012Q3 2013150,000,0001.001.90150,000,000METHAQMethaq Takaful Insurance Company
-0.001.36-0(18,715,000)126,046,000171,000,0002012Q3 2013150,000,0001.001.14150,000,000WATANIANational Takaful Company
5.894.291.6016.9815,000,000 20,606,594218,107,000350,000,0002012Q3 2013100,000,0001.003.50100,000,000RAKNICRas Al-Khaimah National Insurance
-2.002.48-13,750,000(4,992,549)277,693,000687,500,0002012Q3 2013137,500,0001.005.00137,500,000SICOSharjah Insurance Company
-0.001.21-0(83,951,717)287,835,000347,486,1392012Q3 2013330,939,1801.001.05330,939,180UNIONUnion Insurance Company
-0.002.97-0(22,805,446)134,790,000400,000,0002012Q3 2013100,000,0001.004.00100,000,000UICUnited Insurance Company
1.124.031.2289.14395,750,000110,171,6548,056,840,4849,820,736,1392,998,439,1802,764,439,180TOTAL
Energy Sector
14.016.630.657.14606,630,0001,282,000,00013,989,000,0009,150,750,0002012Q3 20136,225,000,0001.001.476,225,000,000TAQAAbu Dhabi National Energy Company
9.220.000.6510.840 554,000,0009,218,000,0006,007,821,1832012Q3 20136,602,001,3001.000.916,602,001,300DANADana Gas PJSC
12.114.000.658.26606,630,0001,836,000,00023,207,000,00015,158,571,18312,827,001,30012,827,001,300TOTAL
Table 6Major Financial Data & Indicators for Companies Listed at ADX (continued)

59Annual Report
Value in AED
Main Financial Ratios Main Financial Data
Market Capitalization
DividendsYear
FinancialPeriodPaid-Up CapitalPar Value
Closing PriceIssued Shares
Company Code Company Name
Earning Yield (%)
DividendYield (%)
P/B.V(Time)
P/E(Time)Cash DividendsNet Income
Shareholders' Equity
Insurance Sector
3.312.263.0230.1913,000,000 19,044,557190,291,000575,000,0002012Q3 2013100,000,0001.005.75100,000,000TKFLAbu Dhabi National Takaful Company PJSC
5.626.781.0217.81150,000,000 124,245,0002,178,309,0002,212,500,0002012Q3 2013375,000,0001.005.90375,000,000ADNICAbu Dhabi National Insurance Company
7.887.770.5412.6945,000,000 45,643,0001,080,954,000579,000,0002012Q3 2013150,000,00010.0038.6015,000,000ALAINAl Ain Al Ahlia Insurance Company
2.421.611.2241.2712,500,000 18,776,697637,202,801775,000,0002012Q3 2013250,000,0001.003.10250,000,000ABNICAl Buhaira National Insurance Company
8.256.351.7012.1240,000,000 51,959,434370,254,239630,000,0002012Q3 2013100,000,0001.006.30100,000,000DHAFRAAl Dhafra Insurance Company
-0.000.69-0(70,921,161)535,898,624369,600,0002012Q3 2013420,000,0001.000.88420,000,000AKICAl Khazna Insurance Company
-2.001.39-18,000,000(60,306,000)648,649,000900,000,0002012Q3 2013180,000,0001.005.00180,000,000AWNICAl Wathba National Insurance Company PJSC
12.718.631.047.8781,000,000 119,293,972903,956,611938,250,0002012Q3 2013135,000,0001.006.95135,000,000EICEmirates Insurance Company
6.112.501.8616.377,500,000 18,322,838160,895,973300,000,0002012Q3 2013100,000,000100.00300.001,000,000AFNICFujairah National Insurance Company
-0.001.66-0(33,703,000)78,275,000130,000,0002012Q3 2013100,000,0001.001.30100,000,000GCICGreen Crescent Insurance Company
4.290.001.4223.320 7,307,488120,000,000170,400,0002012Q3 2013120,000,0001.001.42120,000,000IHInsurance House PSC
-0.002.65-0(19,633,053)107,683,236285,000,0002012Q3 2013150,000,0001.001.90150,000,000METHAQMethaq Takaful Insurance Company
-0.001.36-0(18,715,000)126,046,000171,000,0002012Q3 2013150,000,0001.001.14150,000,000WATANIANational Takaful Company
5.894.291.6016.9815,000,000 20,606,594218,107,000350,000,0002012Q3 2013100,000,0001.003.50100,000,000RAKNICRas Al-Khaimah National Insurance
-2.002.48-13,750,000(4,992,549)277,693,000687,500,0002012Q3 2013137,500,0001.005.00137,500,000SICOSharjah Insurance Company
-0.001.21-0(83,951,717)287,835,000347,486,1392012Q3 2013330,939,1801.001.05330,939,180UNIONUnion Insurance Company
-0.002.97-0(22,805,446)134,790,000400,000,0002012Q3 2013100,000,0001.004.00100,000,000UICUnited Insurance Company
1.124.031.2289.14395,750,000110,171,6548,056,840,4849,820,736,1392,998,439,1802,764,439,180TOTAL
Energy Sector
14.016.630.657.14606,630,0001,282,000,00013,989,000,0009,150,750,0002012Q3 20136,225,000,0001.001.476,225,000,000TAQAAbu Dhabi National Energy Company
9.220.000.6510.840 554,000,0009,218,000,0006,007,821,1832012Q3 20136,602,001,3001.000.916,602,001,300DANADana Gas PJSC
12.114.000.658.26606,630,0001,836,000,00023,207,000,00015,158,571,18312,827,001,30012,827,001,300TOTAL

60 Abu Dhabi Securities Exchange
Table 6Major Financial Data & Indicators for Companies Listed at ADX (continued)
Value in AED
Main Financial Ratios Main Financial Data
Market Capitalization
DividendsYear
FinancialPeriodPaid-Up CapitalPar Value
Closing PriceIssued Shares
Company Code Company Name
Earning Yield (%)
DividendYield (%)
P/B.V(Time)
P/E(Time)Cash DividendsNet Income
Shareholders' Equity
Services Sector
21.124.290.664.7460,652,800 298,865,0002,135,548,0001,415,232,0002012Q3 2013404,352,0001.003.50404,352,000ADAAbu Dhabi Aviation Company
8.251.610.4012.1250,000,000 255,697,0007,796,593,0003,100,000,0002012Q3 20131,000,000,0001.003.101,000,000,000ADNHAbu Dhabi National Hotels
7.594.821.0413.1817,957,280 28,265,919358,870,901372,613,5602012Q3 201389,786,4001.004.1589,786,400DRIVEEmirates Driving Company
9.952.041.6910.0530,187,500 147,592,318877,666,0001,483,413,7502012Q3 2013633,937,5001.002.34633,937,500GMPCGulf Medical Projects Company
5.727.122.1917.49100,000,000 80,285,441640,475,7311,404,000,0002012Q3 2013240,000,0001.005.85240,000,000NCTHNational Corp for Tourism and Hotels
19.655.810.625.09113,924,251 385,055,0003,169,878,0001,959,497,1172012Q3 2013227,848,5021.008.60227,848,502NMDCNational Marine Dredging Company
12.283.830.658.14372,721,8311,195,760,67814,979,031,6329,734,756,4272,595,924,4022,595,924,402TOTAL
Investment & Financial Services Sector
121.210.000.770.820 214,209,164229,236,109176,718,7502012Q3 2013121,875,0001.001.45121,875,000OEIHCOman & Emirates Investment Holding Company
0.272.731.69368.17113,825,250 11,336,0002,472,379,0004,173,592,5002012Q3 20131,897,087,5001.002.201,897,087,500WAHAWaha Capital PJSC
0.272.731.69368.17113,825,25011,336,0002,472,379,0004,173,592,5001,897,087,5001,897,087,500TOTAL
7.183.971.4613.9415,991,156,50428,894,792,958276,733,305,677402,705,426,11678,141,299,68979,032,299,689OVERALL TOTAL
* Sectors’ Total and Overall Total represent doemstic companies only.** Annual Income represents accumelated income for one year. It is calculated by adding the current period since beginning of the year to the last annual income and subtracting the same period for last year.

61Annual Report
Value in AED
Main Financial Ratios Main Financial Data
Market Capitalization
DividendsYear
FinancialPeriodPaid-Up CapitalPar Value
Closing PriceIssued Shares
Company Code Company Name
Earning Yield (%)
DividendYield (%)
P/B.V(Time)
P/E(Time)Cash DividendsNet Income
Shareholders' Equity
Services Sector
21.124.290.664.7460,652,800 298,865,0002,135,548,0001,415,232,0002012Q3 2013404,352,0001.003.50404,352,000ADAAbu Dhabi Aviation Company
8.251.610.4012.1250,000,000 255,697,0007,796,593,0003,100,000,0002012Q3 20131,000,000,0001.003.101,000,000,000ADNHAbu Dhabi National Hotels
7.594.821.0413.1817,957,280 28,265,919358,870,901372,613,5602012Q3 201389,786,4001.004.1589,786,400DRIVEEmirates Driving Company
9.952.041.6910.0530,187,500 147,592,318877,666,0001,483,413,7502012Q3 2013633,937,5001.002.34633,937,500GMPCGulf Medical Projects Company
5.727.122.1917.49100,000,000 80,285,441640,475,7311,404,000,0002012Q3 2013240,000,0001.005.85240,000,000NCTHNational Corp for Tourism and Hotels
19.655.810.625.09113,924,251 385,055,0003,169,878,0001,959,497,1172012Q3 2013227,848,5021.008.60227,848,502NMDCNational Marine Dredging Company
12.283.830.658.14372,721,8311,195,760,67814,979,031,6329,734,756,4272,595,924,4022,595,924,402TOTAL
Investment & Financial Services Sector
121.210.000.770.820 214,209,164229,236,109176,718,7502012Q3 2013121,875,0001.001.45121,875,000OEIHCOman & Emirates Investment Holding Company
0.272.731.69368.17113,825,250 11,336,0002,472,379,0004,173,592,5002012Q3 20131,897,087,5001.002.201,897,087,500WAHAWaha Capital PJSC
0.272.731.69368.17113,825,25011,336,0002,472,379,0004,173,592,5001,897,087,5001,897,087,500TOTAL
7.183.971.4613.9415,991,156,50428,894,792,958276,733,305,677402,705,426,11678,141,299,68979,032,299,689OVERALL TOTAL
* Sectors’ Total and Overall Total represent doemstic companies only.** Annual Income represents accumelated income for one year. It is calculated by adding the current period since beginning of the year to the last annual income and subtracting the same period for last year.

62 Abu Dhabi Securities Exchange
Names & Addresses of Listed Companies

63Annual Report
Names & Addresses of Listed Companies
Business DirectoryNo Company Name Phone Number Fax Number Email Address
1Al Buhaira National Insurance Company
(ABNIC)06-5174444 06-5748855 [email protected]
2Abu Dhabi Aviation Company
(ADAVIATION) 02-5758000 02-5757775 [email protected]
3Abu Dhabi Commercial Bank
(ADCB)02-6962144 02-6109861 [email protected]
4Abu Dhabi Islamic Bank
(ADIB) 02-6343000 02-6333316 [email protected]
5Abu Dhabi National Hotels
(ADNH)02-4447228 02-4448495 [email protected]
6Abu Dhabi National Insurance Company
(ADNIC) 02-4080100 02-4080604 [email protected]
7Abu Dhabi Ship Building Company
(ADSB)02-5028498 02-5511067 [email protected]
8Fujairah National Insurance Company
(AFNIC)09-2233355 09-2224344 [email protected]
9Agthia Group PJSC
(AGTHIA)02-5960600 02-6726070 [email protected]
10Al Khazna Insurance Company
(AKIC)02-6969700 02-6418214 [email protected]
11Al Ain Al Ahlia Insurance Company
(ALAIN) 02-4459900 02-4456685 [email protected]
12Aldar Properties PJSC
(ALDAR)02-8105555 02-8105550 [email protected]
13Arkan Building Materials Company
(ARKAN)02-6666724 02-6666872 [email protected]
14International Fish Farming Holding Company PJSC
(ASMAK)02-6448090 02-6447060 [email protected]
15Al Wathba National Insurance Company PJSC
(AWNIC)02-4185300 02-6776628 [email protected]
16Abu Dhabi for Building Materials
(BILDCO)02-6455500 02-6455544 [email protected]
17Bank of Sharjah
(BOS)06-5694411 06-7733568 [email protected]
18Commercial Bank International
(CBI)04/2242104 04/2243036 [email protected]
19Dana Gas PJSC
(DANA)06-6554449 06-6552256 [email protected]
20Al Dhafra Insurance Company
(DHAFRA)02-6721444 02-6729833 [email protected]
21Emirates Driving Company
(DRIVE)02-5510544 02-5510227 [email protected]
22Emirates Insurance Company
(EIC)02-6440400 02-6445227 [email protected]
23Eshraq Properties Company
(ESHRAQ)02-6354854 02-6354864 [email protected]
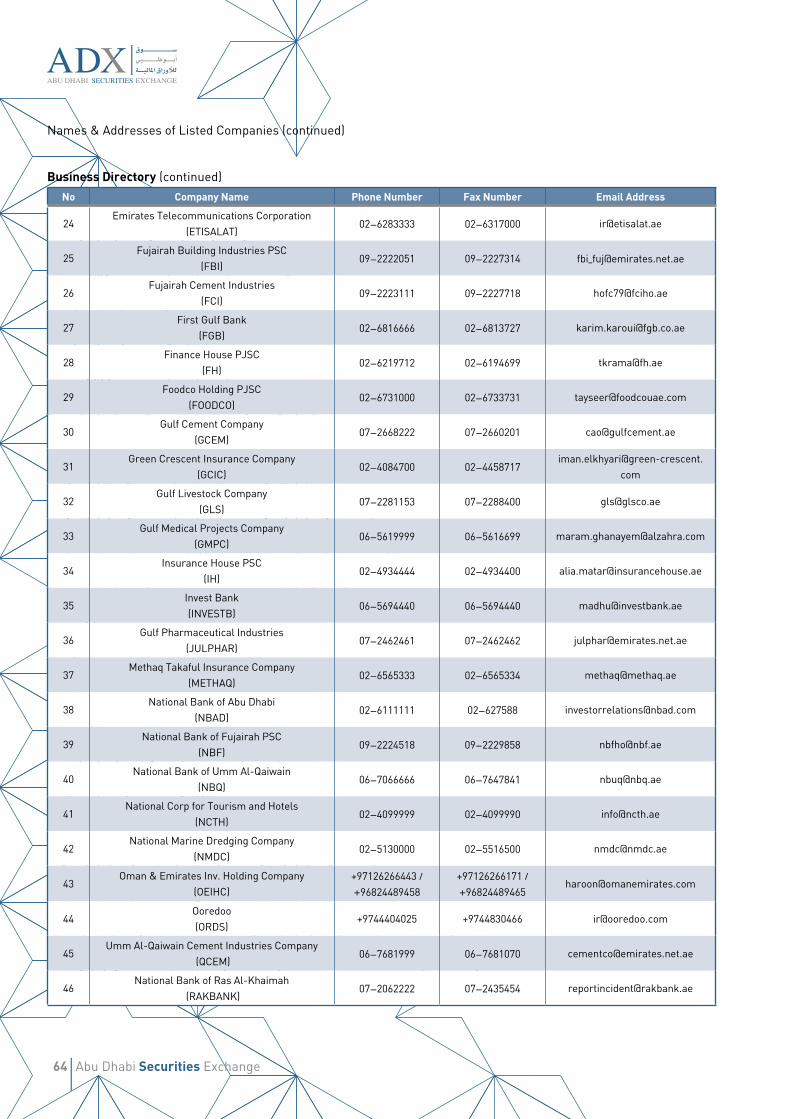
64 Abu Dhabi Securities Exchange
Names & Addresses of Listed Companies (continued)
Business Directory (continued)No Company Name Phone Number Fax Number Email Address
24Emirates Telecommunications Corporation
(ETISALAT)02-6283333 02-6317000 [email protected]
25Fujairah Building Industries PSC
(FBI)09-2222051 09-2227314 [email protected]
26Fujairah Cement Industries
(FCI)09-2223111 09-2227718 [email protected]
27First Gulf Bank
(FGB)02-6816666 02-6813727 [email protected]
28Finance House PJSC
(FH)02-6219712 02-6194699 [email protected]
29Foodco Holding PJSC
(FOODCO)02-6731000 02-6733731 [email protected]
30Gulf Cement Company
(GCEM)07-2668222 07-2660201 [email protected]
31Green Crescent Insurance Company
(GCIC)02-4084700 02-4458717
32Gulf Livestock Company
(GLS)07-2281153 07-2288400 [email protected]
33Gulf Medical Projects Company
(GMPC)06-5619999 06-5616699 [email protected]
34Insurance House PSC
(IH)02-4934444 02-4934400 [email protected]
35Invest Bank(INVESTB)
06-5694440 06-5694440 [email protected]
36Gulf Pharmaceutical Industries
(JULPHAR) 07-2462461 07-2462462 [email protected]
37Methaq Takaful Insurance Company
(METHAQ)02-6565333 02-6565334 [email protected]
38National Bank of Abu Dhabi
(NBAD)02-6111111 02-627588 [email protected]
39National Bank of Fujairah PSC
(NBF)09-2224518 09-2229858 [email protected]
40National Bank of Umm Al-Qaiwain
(NBQ)06-7066666 06-7647841 [email protected]
41National Corp for Tourism and Hotels
(NCTH)02-4099999 02-4099990 [email protected]
42National Marine Dredging Company
(NMDC)02-5130000 02-5516500 [email protected]
43Oman & Emirates Inv. Holding Company
(OEIHC)+97126266443 / +96824489458
+97126266171 / +96824489465
44Ooredoo(ORDS)
+9744404025 +9744830466 [email protected]
45Umm Al-Qaiwain Cement Industries Company
(QCEM)06-7681999 06-7681070 [email protected]
46National Bank of Ras Al-Khaimah
(RAKBANK)07-2062222 07-2435454 [email protected]

65Annual Report
No Company Name Phone Number Fax Number Email Address
47Ras Al-Khaimah Cement Company
(RAKCC)07-2660111 07-2660006 [email protected]
48Ras Al-Khaimah Ceramic Company
(RAKCEC)07-2445046 07-2445270 [email protected]
49Ras Al-Khaimah National Insurance Company PSC
(RAKNIC)07-2273000 07-228 8500 [email protected]
50Ras Al-Khaimah Properties
(RAKPROP)07-2330004 07-2272444 [email protected]
51Ras Al-Khaimah White Cement
(RAKWCT)07-2668888 07-2668866 [email protected]
52Ras Al-Khaimah Poultry and Feeding Company
(RAKCO)07-2462222 07-2462220 [email protected]
53Sharjah Cement and Industrial Development
Company (SCIDC)06-5695666 06-5683171 [email protected]
54Sharjah Islamic Bank
(SIB)06-5998888 06-5309998 [email protected]
55Sharjah Insurance Company
(SICO)06-5195666 06-5195667 [email protected]
56Sudan Telecommunication Company Ltd
(SUDATEL)+249 183 761 100 +249 183 782 322 [email protected]
57Abu Dhabi National Energy Company
(TAQA)02-6149000 02-6422555 [email protected]
58Abu Dhabi National Takaful Company PJSC
(TKFL)02-4107700 02-4107800 [email protected]
59United Arab Bank PJSC
(UAB)06-5733222 06-5733906 [email protected]
60Union Cement Company
(UCC)07-2668166 07-2668635 [email protected]
61United Insurance Company
(UIC)04-2502501 04-2502504 [email protected]
62Union National Bank
(UNB)02-6741600 02-6786080 [email protected]
63Union Insurance Company
(UNION)06-7466 996 06-7466 997 [email protected]
64Waha Capital PJSC
(WAHA)02-6677343 02-6677383 [email protected]
65National Takaful Company
(WATANIA)02-6138888 02-6138800 [email protected]
Business Directory (continued)

66 Abu Dhabi Securities Exchange
Names & Addresses of Brokerage Firms

67Annual Report
Names & Addresses of Brokerage Firms
Brokerage Firms Directory
Company Name Head Office Fax Number Email Address
Securties & Investment Company UAE 02-659010002-6590105
02-6426108 [email protected]
NBAD Securities LLC02-616160002-6161632
Shurooq Shares & Bonds04-305596304-2626685
04-3314980 [email protected]
First Gulf Financial Services 02-4941740 02-6354669 [email protected]
International Financial Brokerage04-212617304-2126326
Emirates NBD Securities04-331911104-7038300
04-3856240 [email protected]
National Financial Brokerage 02-6106000 [email protected]
[email protected]@nfbc.ae
Al Wathbah Shares & Bonds 02-6345700 06-6345800 [email protected]
Shuaa Securities02-409070002-4090704
02-6221707 [email protected]
Al Ramz Securities 02-6262626 02-6262444 [email protected]
Dubai International Securities04-609820004-6098201
04-3965352 [email protected]
Dubai Islamic Financial Services 04-3217000 04-3975691 [email protected]
Al Sharhan Stock06-573074002-6128859
06-5730754 [email protected]
Al Buhaira Securities04-373200004-3732312
Al Sahel Shares 06-5726312 06-5724933 [email protected]
EFG-Hermes Brokerage-UAE04-306944904-3634063
Al Ansari Financial Services02-696833302-6968268
02-696822202-6227204
Al Daman Securities04-408040004-4080370
Al Dar Shares & Bonds 02-6271222 02-6261133 [email protected]
Mashreq Securities04-210641004-2106416
04-4247322 [email protected]
Al Jazeera Financial Services04-304167804-3040760
04-3881189 [email protected]
Amana Financial Services 02-6946666 02-6711711
Al Dhabi Brokerage02-696259302-6973478
02-6109768 [email protected]

68 Abu Dhabi Securities Exchange
Names & Addresses of Brokerage Firms (continued)
Brokerage Firms Directory (continued)
Company Name Head Office Fax Number Email Address
Arabian International Financial Services 02-6444042 02-6459400 [email protected]
Financial House Securities02-619191102-6191990
Global Gate Financial Services 02-4438388 02-4438311 [email protected]
Al Ain Centre for Securities Brokerage 02-6339500 02-6339392
Emirates Financial Services 02-6276670 02-6276673
Amwal International Financial Brokerage 02-6268663 02-6277776 [email protected]
Emaar Financial Services04-362781104-4029402
04-3355212 [email protected]
Fujairah Shares & Bonds 09-2233448 09-2227005 [email protected]
Brokerage House Securities02-666677402-6664101
02-6651777 [email protected]
ADIB Securities02-696033302-6100823
02-6960400 [email protected]
Naeem Shares & Bonds 04-3824700 [email protected]
Al Brooge Shares & Bonds02-633311602-6333901
02-6333955 [email protected]
Atlas Financial Services 03-7551010 03-7551020 [email protected]
Lari Financial Brokerage 02-6221555 02-6220900 [email protected]
Mubasher Financial Services 04-3258258 04-3266144 [email protected]
Makaseb Islamic Financial Services 02-6106500 02-6275558 [email protected]
Premium Financial Services 04-3436888 04-3433346 [email protected]
Essham Securities 04-338899004-338899404-3047505
Pioneers Waseet Securities04-305585204-3055787
04-3315202 [email protected]
Arqaam Securities04-507175204-5071756
04-5071751 [email protected]
Middle East Financial Brokerage 04-3965454 04-3976669 [email protected]
Gulf Baader Capital Markets 04-3298993 04-3296758 [email protected]
National Financial Services Center 02-6266200 02-6274949 [email protected]

69Annual Report
Company Name Head Office Fax Number Email Address
Awraq Islamic for Shares & Bonds02-681936602-6819322
02-6819174 [email protected]
Nqood Financial Brokerage 02-6263060 02-6262155 [email protected]
Noor Financial Services02-626688802-611530104-3355558
02-626717704-3344340
[email protected]@noorcapitaluae.com
Electronic Stock Brokerage02-693930102-6939302
[email protected]@e-stock.ae
Prime Emirates 02-691080002-667090702-6670906
www.primeemirates.ae
Al Dhafra Financial Broker02-621444102-6212220
NBD Financial Services04-303232804-303232902-6676735
04-303221102-6676793
CBD Financial Services04-212101104-212101004-2121030
04-2121076 [email protected]
Mena Corp Financial Services02-626211402-6271215
Al Awael Securities02-613000002-6130022
02-6265252 [email protected]
Al Hadaf For Financial Securities02-617077702-6170700
02-6330636 [email protected]
Shaheen Shares & Bonds 04-3475555 04-3477915 [email protected]
Vision Capital Brokerage 02-4477499 02-4477505 [email protected]
Asayel Shares & Bonds Trading02-667776602-6931500
02-6677556 [email protected]
Al Rouad Marketable Securities 04-2822988 04-2823939 [email protected]
Delma Brokerage02-631220002-6143401
02-6311633 [email protected]
Sharjah Islamic Financial Services06-569000906-5992555
06-5680008 [email protected]
Rasmala Brokerage 02-6522555 02-6359991 [email protected]
Investone Financial Brokerage 02-6663301 02-6658081
IFA Securities 04-2833365 04-2833364 [email protected]
Al Mal Securities 04-3601103 [email protected]

70 Abu Dhabi Securities Exchange
Brokerage Firms Directory (continued)
Names & Addresses of Brokerage Firms (continued)
Company Name Head Office Fax Number Email Address
International Shares & Bonds 03-7020500
Al Fardan Financial Services04-386572004-3868046
04-3865878 [email protected]
Al Fajer Securities02-666889902-6927800
02-6668311 [email protected]
Al Khayal Shares & Stocks 06-5738777 06-5738787 [email protected]
Islamic Brokerage for Financial Services 02-6976660 02-6743600 [email protected]
Taib Securities 04-3372223 04-3366533 [email protected]
World Financial Services 04-3266999 [email protected]
Premier Financial Brokerage 02-6677745 02-6677754 [email protected]
Investor Financial Brokerage02-666665702-6666044
02-6666637 [email protected]
Dubai Financial Brokerage 04-4022222
Al Futtaim HC Securities04-293535304-2935393
Global for Shares & Bonds02-676630902-6766307
02-6761800 [email protected]
Emirates Islamic Financial Brokerage04-383464604-3834708
04-3709139 [email protected]
Amwal Brokerage09-222300509-2223000
Index Securities04-211550004-2500922
Tabadul Shares & Bonds02-691888802-6918890
[email protected] [email protected]
Al Safwa Islamic Financial Services06-519087806-5190888
06-5542406 [email protected]
Mac Sharaf Securities04-409714404-4097100
04-409725504-4097200
[email protected]@mac-sharaf.com
Dubai Tadawul 04-2834343 04-2834114 [email protected]
Al Wafi Shares Center06-764957106-7649641
Darahem Financial Brokerage 04-2204500 04-2390630 [email protected]
Al Wasl Financial Brokerage 04-2831111 04-2868333 [email protected]
Belton Financial Securities-Emirates 04-5090300 04-3321203 [email protected]

71Annual Report
Company Name Head Office Fax Number Email Address
Univest Brokerage 04-5012222 04-5012200 [email protected]
HSBC Middle East Securities04-423698604-4236900
04-4236998 [email protected]
Fortune Financial Services 04-3349493 04-3349200 [email protected]
Arab German International Broker Finance Brokers
02-6518888 [email protected]
Tadawul Shares & Bonds Mediation 02-6323232 02-6333351 [email protected]

72 Abu Dhabi Securities Exchange
Financial Terminology
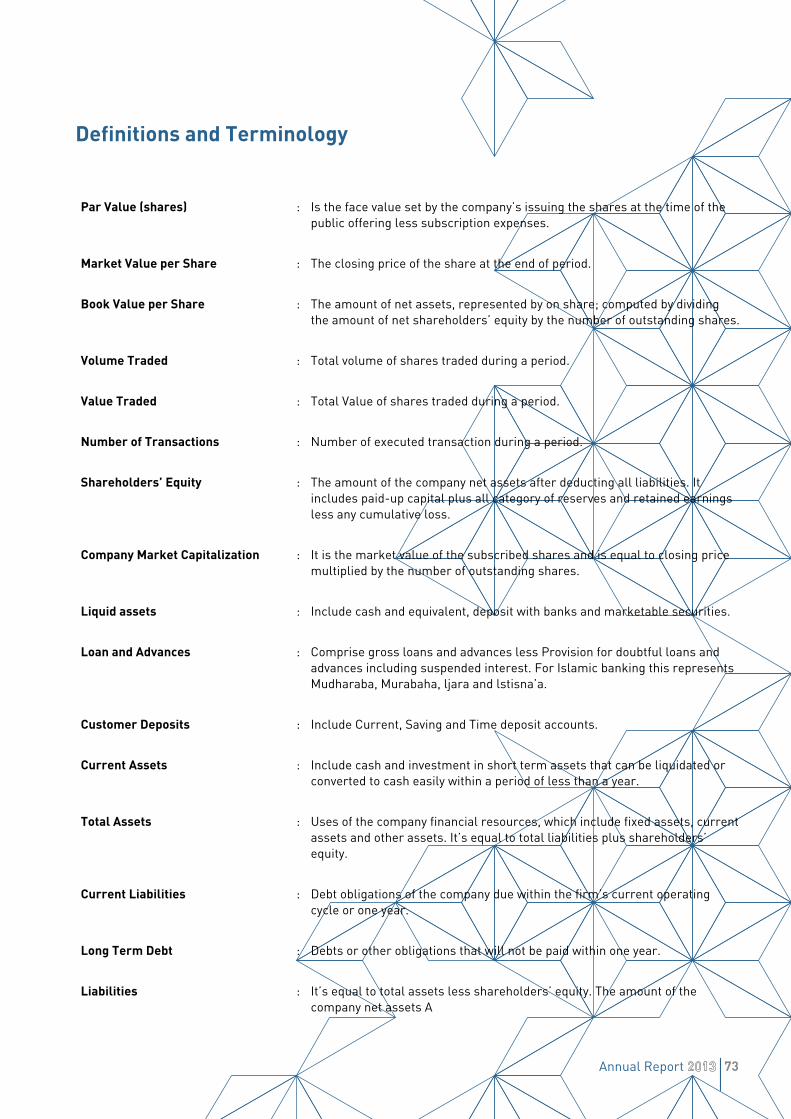
73Annual Report
Definitions and Terminology
Par Value (shares) : Is the face value set by the company’s issuing the shares at the time of the public offering less subscription expenses.
Market Value per Share : The closing price of the share at the end of period.
Book Value per Share : The amount of net assets, represented by on share; computed by dividing the amount of net shareholders’ equity by the number of outstanding shares.
Volume Traded : Total volume of shares traded during a period.
Value Traded : Total Value of shares traded during a period.
Number of Transactions : Number of executed transaction during a period.
Shareholders’ Equity : The amount of the company net assets after deducting all liabilities. It includes paid-up capital plus all category of reserves and retained earnings less any cumulative loss.
Company Market Capitalization : It is the market value of the subscribed shares and is equal to closing price multiplied by the number of outstanding shares.
Liquid assets : Include cash and equivalent, deposit with banks and marketable securities.
Loan and Advances : Comprise gross loans and advances less Provision for doubtful loans and advances including suspended interest. For Islamic banking this represents Mudharaba, Murabaha, ljara and lstisna’a.
Customer Deposits : Include Current, Saving and Time deposit accounts.
Current Assets : Include cash and investment in short term assets that can be liquidated or converted to cash easily within a period of less than a year.
Total Assets : Uses of the company financial resources, which include fixed assets, current assets and other assets. It’s equal to total liabilities plus shareholders’ equity.
Current Liabilities : Debt obligations of the company due within the firm’s current operating cycle or one year.
Long Term Debt : Debts or other obligations that will not be paid within one year.
Liabilities : It’s equal to total assets less shareholders’ equity. The amount of the company net assets A

74 Abu Dhabi Securities Exchange
Net Profit for the Year : Company net profit realized within a financial year.
Cash Dividend : The amount of cash distributed to the shareholders.
Securities Financing or investment instruments (some negotiable, others not) bought and sold in financial markets, such as bonds, debentures, notes, options, shares (stocks), and warrants.
Short selling The sale of a security that is not owned by the seller, or that the seller has borrowed.
Investment Fund A supply of capital belonging to numerous investors that is used to collectively purchase securities while each investor retains ownership and control of his or her own shares.
Market Making A broker-dealer firm that accepts the risk of holding a certain number of shares of a particular security in order to facilitate trading in that security.
Delivery Versus Payment – DVP A securities industry settlement procedure in which the buyer’s payment for securities is due at the time of delivery.
Exchange-Traded Fund - ETF A security that tracks an index, a commodity or a basket of assets like an index fund, but trades like a stock on an exchange. ETFs experience price changes throughout the day as they are bought and sold.
Custodian A financial institution that holds customers’ securities for safekeeping so as to minimize the risk of their theft or loss.
Portfolio A grouping of financial assets such as stocks, bonds and cash equivalents, as well as their mutual, exchange-traded and closed-fund counterparts. Portfolios are held directly by investors and/or managed by financial professionals.
Covered Warrant A type of warrant that allows the holder to buy or sell a specific amount of equities, currency or other financial instruments from the issuer, usually a bank or a similar financial institution, at a specific price and time.
Subscription Right The right of existing shareholders in a company to retain an equal percentage ownership over time by subscribing to new stock issuances at or below market prices.
Fund Unit A security representing the proportionate share of Investors in the Net Asset Value of the Mutual Fund.
Definitions and Terminology (Continued)

75Annual Report
Financial Indicators

76 Abu Dhabi Securities Exchange
Financial Ratios
No. of Shares Traded during the period x 100=Turnover Ratio (%)1
No. of Shares Subscribed at end of the period
Net Profit for the Period=Earning per Share (AED)2
No. of Shares Subscribed
Market Capitalization=Price Earnings Ratio (Times)3
Net Profit
Market Capitalization=Price Book Value (Times)4
Book Value
Cash Dividends x 100=Dividend Yield (%)5
Market Capitalization
Market Capitalization=Price Dividend Ratio (Times)6
Cash Dividends
Cash Dividends x 100=Cash Dividends to Earnings (%)7
Net Profit
Net Profit x 100=Earning Yield (%)8
Market Capitalization
Net Profit x 100=Return on Assets (%)9
Total Assets
Net Profit x 100=Return on Equity (%)10
Shareholders’ Equity
Net Profit x 100=Return on paid-in Capital (%)11
Paid-in Capital
Net Profit x 100=Return on Sales(%)12
Net Sales
Cash Dividends x 100=Cash Dividends to Paid-In Capital (%)13
Paid-in Capital
Shareholders’ Equity x 100=Equity Ratio14
Total Assets

77Annual Report
Shareholders Equity x 100=Shareholders Equity to Deposits (%)15
Deposits
Shareholders Equity x 100=Shareholders Equity to Credits (%)16
Credits
Cash and Portfolio Investment x 100=Cash and Portfolio Investments to Deposits (%)17
Deposits
Credits x 100=Credits to Total Assets (%)18
Total Assets
Credits x 100=Credits to Deposits (%)19
Deposit
Fixed Assets x 100=Fixed Assets to Shareholders Equity (%)20
Shareholders’ Equity
Current Liabilities x 100=Current Liabilities to Total Assets (%)21
Total Assets
Total Liabilities x 100=Total liabilities to Total Assets (%)22
Total Assets
Total Liabilities x 100=Total Liabilities to Shareholders Equity (%)23
Shareholders’ Equity
Current Liabilities x 100=Current liabilities to Shareholders Equity (%)24
Shareholders’ Equity
Long-Term Liabilities x 100=Long-Term Liabilities to Shareholders Equity (%)25
Shareholders’ Equity
Sales x 100=Sales to Total Assets (%)26
Total Assets
Revenues x 100=Revenues to Total Assets (%)27
Total Assets
Current Assets=Current Ratio (Times)28
Current Liabilities


