Annual Report 2017 - Wacker Neuson
148
What we stand for – where we are headed Annual Report 2017
Transcript of Annual Report 2017 - Wacker Neuson
What we stand for – where we are headedAnnual Report 2017
EXCELLENCETo achieve excellence, we will further improve the quality of our products, pro-
cesses and workflows across all areas of the company. Streamlining our Group
structures makes us a faster, better organization. Providing lifelong training for
our employees is particularly important for us. Our corporate culture will con-
tinue to be shaped by commitment and teamwork.
ACCELERATIONWacker Neuson accelerates innovation and digitalization by intelligently network-
ing products and services, utilizing new business models and optimizing processes
such as sales support and production planning.
FOCUS We focus on our core markets and gain market shares through core products that
are important for us in all regions. This is why China will be a key market for us in
2022. We are expanding our spare parts business internationally.
CUSTOMER CENTRICITY We want to inspire our customers today and in the future by going above and beyond
their expectations. Our aim is to further strengthen our sense of customer centricity –
every thought and action will begin with the customer, and we will jointly develop new
products and services that maximize customer value.
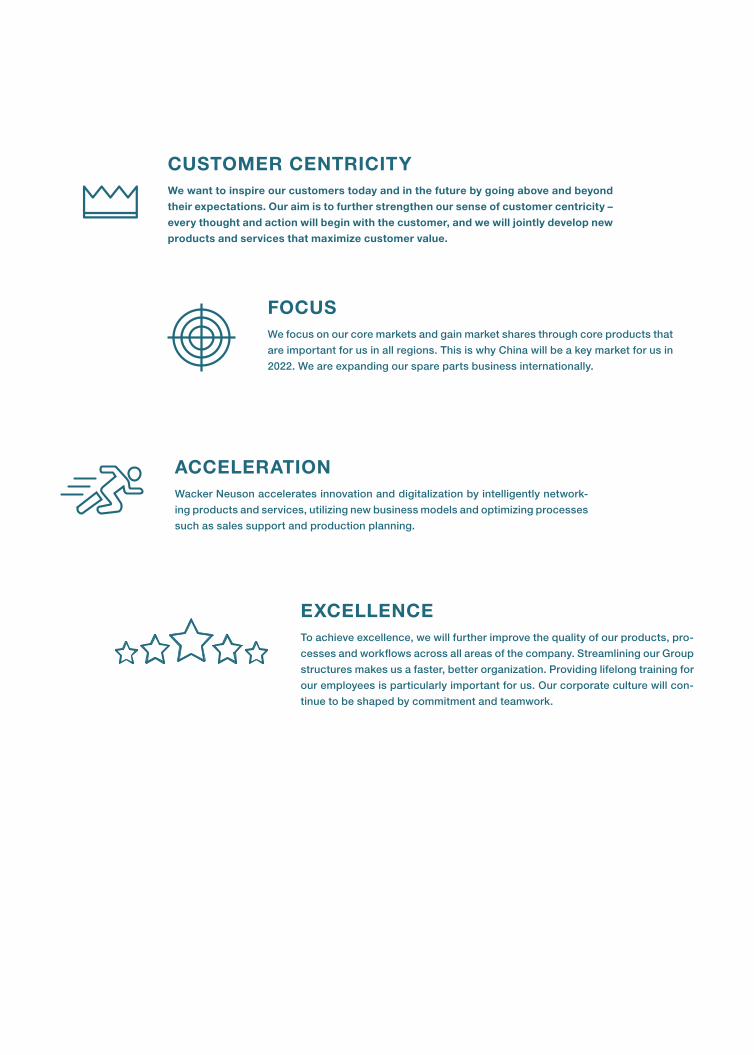
Figures at a glance 2017
WACKER NEUSON GROUP AT DECEMBER 31
IN € MILLION
2017 2016 Changes
Key figures
Revenue 1,533.9 1,361.4 13%
by region
Europe 1,129.8 1,020.7 11%
Americas 357.5 291.8 23%
Asia-Pacific 46.6 48.9 -5%
by business segment1
Light equipment 422.7 377.9 12%
Compact equipment 817.6 709.3 15%
Services 320.4 297.2 8%
EBITDA 207.2 158.1 31%
Depreciation and amortization (in brackets: without rental equipment) 75.8 (43.2) 69.3 (40.7) 9%
EBIT 131.4 88.8 48%
EBT 125.4 81.4 54%
Profit for the period 87.5 57.2 53%
Number of employees2 5,546 5,183 7%
R&D ratio (incl. capitalized expenses) as a % 3.2 3.4 -0.2PP
Share
Earnings per share in € 1.25 0.81 54%
Dividends per share in €3 0.60 0.50 20%
Key profit figures
EBITDA margin as a % 13.5 11.6 1.9PP
EBIT margin as a % 8.6 6.5 2.1PP
Key figures from the balance sheet
Equity 1,114.8 1,092.5 2%
Equity ratio as a % 69.0 69.1 -0.1PP
ROE as a % 7.9 5.3 2.6PP
Net financial debt 148.0 205.8 -28%
Gearing as a % 13.3 18.8 -5.5PP
Non-current assets 757.1 773.0 -2%
Current assets 858.8 807.8 6%
Average net working capital to revenue as a % 36.1 42.0 -5.9PP
ROCE II as a % 6.9 4.6 2.3PP
Cash flow
Cash flow from operating activities 138.0 79.4 74%
Cash flow from investment activities -39.0 -44.0 -11%
Investments (property, plant and equipment and intangible assets) -47.4 -48.5 -2%
Cash flow from financing activities -88.2 -42.8 106%
Free cash flow 99.0 35.4 180%
1 Consolidated revenue before cash discounts. 2 Including temporary workers. 3 The dividend payment to be proposed to the AGM on May 30, 2018 will be EUR 0.60.
Currency effects resulting from the evaluation of receivables and payables in foreign currencies and from the evaluation of cash and cash equivalents are recognized in the financial result as of fiscal 2017 (previously recognized under cost of sales as well as other income and/or other expenses). Prior-year values have been adjusted accordingly. All consolidated figures prepared according to IFRS. To improve readability, the figures in this report have been rounded to the nearest EUR million. Percentage changes refer to these rounded amounts. A ten-year overview of key indicators is provided at the end of this report.
.
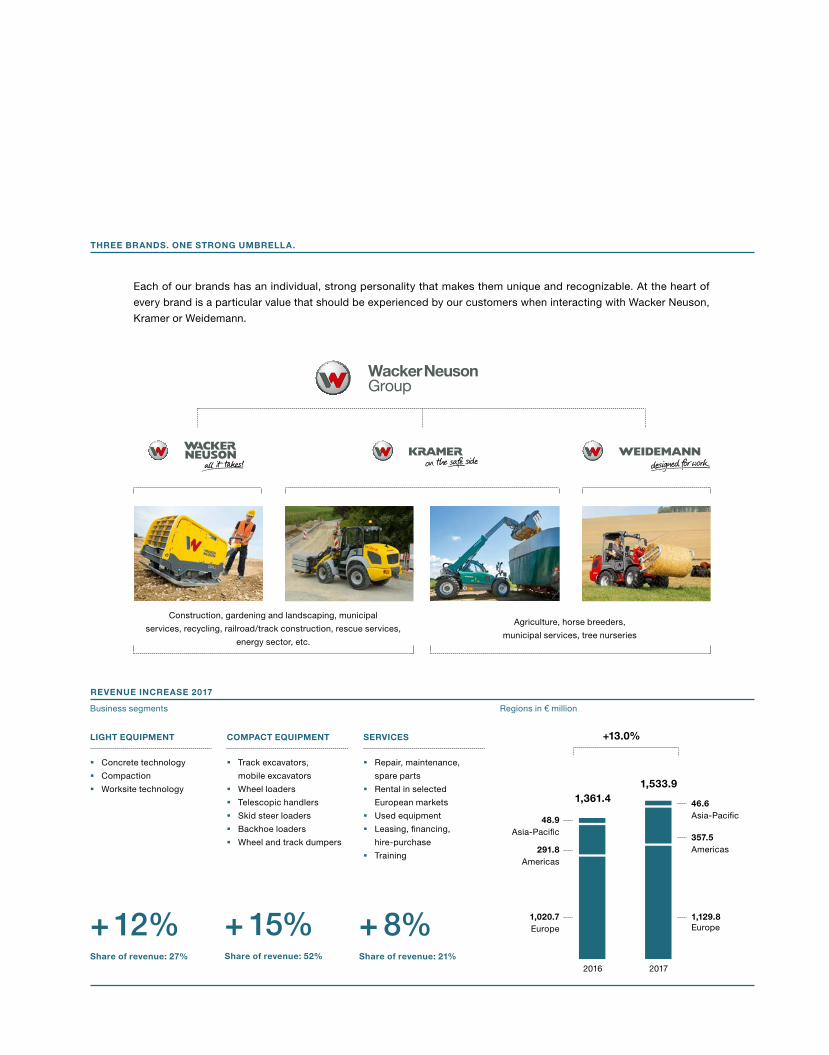
Construction, gardening and landscaping, municipal
services, recycling, railroad/track construction, rescue services,
energy sector, etc.
Agriculture, horse breeders,
municipal services, tree nurseries
THREE BRANDS. ONE STRONG UMBRELLA.
LIGHT EQUIPMENT
§ Concrete technology
§ Compaction
§ Worksite technology
COMPACT EQUIPMENT
§ Track excavators,
mobile excavators
§ Wheel loaders
§ Telescopic handlers
§ Skid steer loaders
§ Backhoe loaders
§ Wheel and track dumpers
SERVICES
§ Repair, maintenance,
spare parts
§ Rental in selected
European markets
§ Used equipment
§ Leasing, financing,
hire-purchase
§ Training
+ 12% Share of revenue: 27%
+ 15% Share of revenue: 52%
+ 8% Share of revenue: 21%
REVENUE INCREASE 2017
Regions in € million
1,533.9
2016 2017
1,361.4
+13.0%
48.9Asia-Pacific
291.8Americas
1,020.7Europe
46.6Asia-Pacific
357.5Americas
1,129.8Europe
Business segments
Each of our brands has an individual, strong personality that makes them unique and recognizable. At the heart of
every brand is a particular value that should be experienced by our customers when interacting with Wacker Neuson,
Kramer or Weidemann.
The Wacker Neuson Group is an international family of companies and a leading manu-
facturer of light and compact equipment with over 50 affiliates and 140 sales and service
stations. The Group offers its customers a broad portfolio of products, a wide range of
services and an efficient spare parts service. The product brands Wacker Neuson, Kramer
and Weidemann belong to the Wacker Neuson Group. Wacker Neuson is the partner of
choice among professional users in construction, gardening, landscaping and agri culture,
as well as among municipal bodies and companies in industries such as recycling, energy
and rail transport. In 2017, Wacker Neuson achieved revenue of EUR 1.53 billion and
employed 5,500 people worldwide.
The Wacker Neuson Group
2 To our shareholders
2 Foreword by the Executive Board
4 Global Presence
6 Product Overview
8 Strategy 2022
10 The Share
14 Report by the Supervisory Board
18 Corporate Governance Declaration and
Report
25 Combined Management Report
79 Consolidated Management Report
133 Further Information
133 Glossary
138 10-Year Comparison
Imprint / Financial Calendar
Content
Dear Ladies and Gentlemen,
2017 was a successful year for our Group overall. The global economy was more buoyant than it had been in a
long time, with almost all key markets for our Group on the upturn. Demand for our products in our core markets
of Europe and North America developed positively as a result. We benefited above all from our innovative prod-
ucts, strong market positioning and skill of our global sales teams in successfully developing local markets. As a
result, Group revenue rose to EUR 1,534 million (2016: EUR 1,361 million), which is an increase of 13 percent rel-
ative to the previous year and a new record high for the company.
Strong demand for light and compact equipment from the construction sector was the biggest growth driver for
us. We were able to further increase market shares in this sector in 2017. Key success factors included our highly
innovative products and the systematic alignment of our portfolio with market needs, enabled through the engage-
ment of our customers in the development process from an early stage. We firmly believe that alternative drive
technologies will play an important role in the future. This trend is being fueled not only by changes in legal reg-
ulations, but also by rising demand from the market as the compelling ergonomics, health and safety benefits of
electric motors resonate with more and more users. With our zero-emissions series, we have already established
a market-leading position here, remain on a steady growth path and aim to systematically expand our portfolio.
Our business with equipment for the agricultural sector also developed positively. After a number of difficult years,
willingness to invest rallied once again, driven by a number of factors including improved food prices. To expand
our footprint in this important industry, we entered into a partnership with John Deere in the summer of 2017.
This collaboration covers the sale of Kramer-brand all-wheel drive wheel loaders, tele wheel loaders and telescopic
handlers. The partnership got underway in the second half of the year and has already started to pay dividends,
giving us every reason to be optimistic about its future development.
Bolstered by a number of factors, such as substantial economies of scale and efficient cost control measures im-
plemented by the Group, the solid rise in revenue had an above-average impact on profit. Profit before interest
and tax (EBIT) grew 48 percent to EUR 131 million, which corresponds to an EBIT margin of 8.6 percent (2016:
6.5 percent). Adjusted to discount one-off effects and
expenses for restructuring measures, the EBIT margin
amounted to 9.4 percent (2016: 6.2 percent).
In 2017, we focused in particular on improving the struc-
ture of our inventories. By systematically selling off old
stock and introducing IT solutions to improve inventory
management, we were able to reduce inventory levels
while simultaneously improving the quality of our inven-
tory mix – a move that benefits the company in times of full order books. Net working capital expressed as a per-
centage of revenue fell markedly to 36 percent (2016: 42 percent). In conjunction with the sharp rise in profit, free
cash flow almost trebled to a record high of EUR 99 million (2016: EUR 35 million).
On September 1, 2017, the three of us – Martin Lehner, Alexander Greschner and Wilfried Trepels – took the helm
at Wacker Neuson SE as the new Executive Board team. Within the framework of our “Strategy 2022”, we aim to
further strengthen the Group’s position as a leading, international manufacturer of light and compact equipment.
One of our top priorities here is to take an even more proactive approach to developing our core markets of Europe
and North America as there is still plenty of potential for us to grow in these key regions. However, our interna-
To Our Shareholders
„ Strong demand for light and compact equipment from the construction sector was the biggest growth driver for us.“
2 Wacker Neuson Group Annual Report 2017
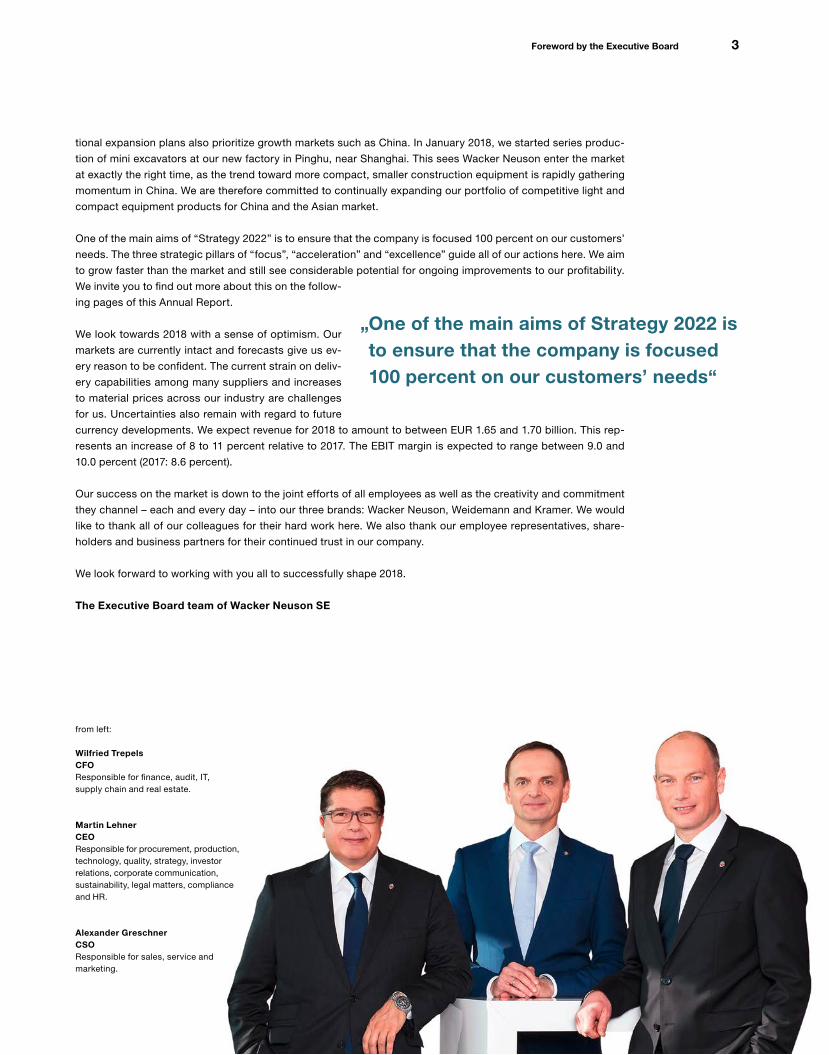
„ One of the main aims of Strategy 2022 is to ensure that the company is focused 100 percent on our customers’ needs“
from left:
Wilfried TrepelsCFOResponsible for finance, audit, IT, supply chain and real estate.
Martin Lehner CEO Responsible for procurement, production, technology, quality, strategy, investor relations, corporate communication, sustainability, legal matters, compliance and HR.
Alexander GreschnerCSOResponsible for sales, service and marketing.
tional expansion plans also prioritize growth markets such as China. In January 2018, we started series produc-
tion of mini excavators at our new factory in Pinghu, near Shanghai. This sees Wacker Neuson enter the market
at exactly the right time, as the trend toward more compact, smaller construction equipment is rapidly gathering
momentum in China. We are therefore committed to continually expanding our portfolio of competitive light and
compact equipment products for China and the Asian market.
One of the main aims of “Strategy 2022” is to ensure that the company is focused 100 percent on our customers’
needs. The three strategic pillars of “focus”, “acceleration” and “excellence” guide all of our actions here. We aim
to grow faster than the market and still see considerable potential for ongoing improvements to our profitability.
We invite you to find out more about this on the follow-
ing pages of this Annual Report.
We look towards 2018 with a sense of optimism. Our
markets are currently intact and forecasts give us ev-
ery reason to be confident. The current strain on deliv-
ery capabilities among many suppliers and increases
to material prices across our industry are challenges
for us. Uncertainties also remain with regard to future
currency developments. We expect revenue for 2018 to amount to between EUR 1.65 and 1.70 billion. This rep-
resents an increase of 8 to 11 percent relative to 2017. The EBIT margin is expected to range between 9.0 and
10.0 percent (2017: 8.6 percent).
Our success on the market is down to the joint efforts of all employees as well as the creativity and commitment
they channel – each and every day – into our three brands: Wacker Neuson, Weidemann and Kramer. We would
like to thank all of our colleagues for their hard work here. We also thank our employee representatives, share-
holders and business partners for their continued trust in our company.
We look forward to working with you all to successfully shape 2018.
The Executive Board team of Wacker Neuson SE
3Foreword by the Executive Board

The Wacker Neuson Group: Around the World
Global distribution via affiliates plus own stations and partners
for sales and services.
UKBirmingham/Stafford
SpainMadrid
FranceParis
CanadaToronto
USMenomonee Falls
USNorton Shores1
USGermantown
USMenomonee Falls
MexicoMexico City
BrazilItatiba (São Paulo)
ChileSantiago de Chile
European affiliates,
sales and service stations
Affiliates Sales and service stations
ColombiaBogota
PeruLima
BrazilItatiba (São Paulo)
1 Until the end of July 2018.
The NetherlandsAmersfoort
BelgiumAsse-Mollem
4 Wacker Neuson Group Annual Report 2017
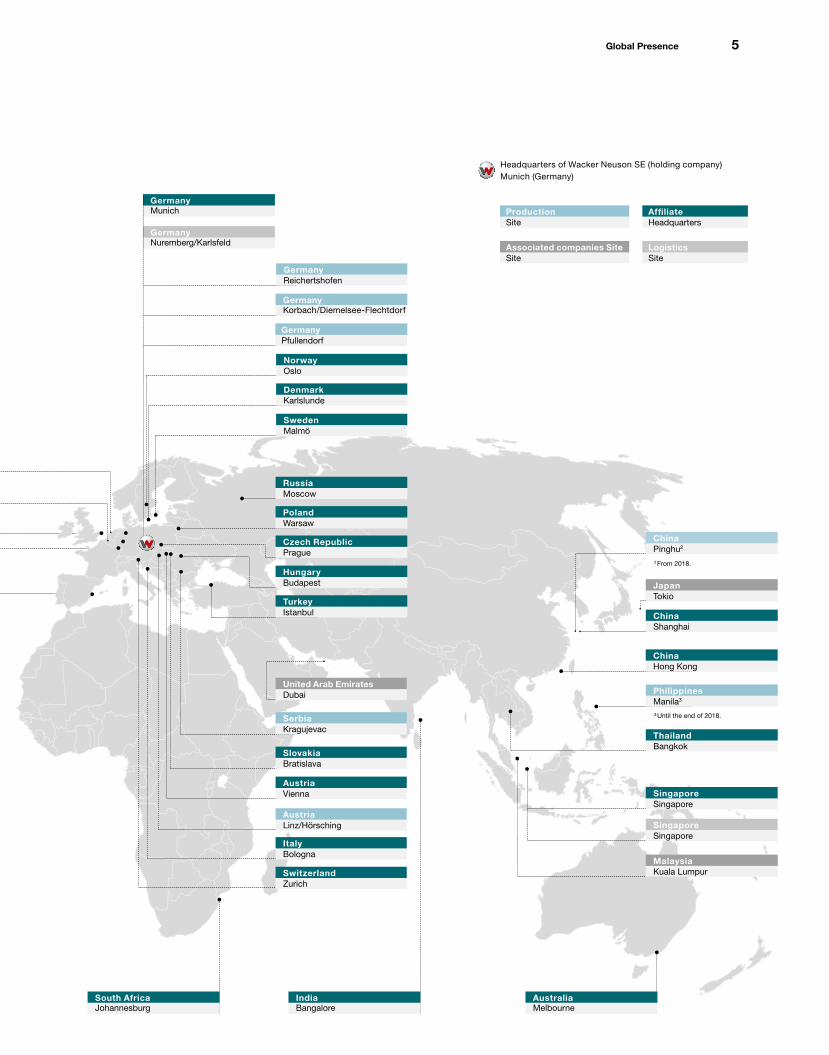
GermanyPfullendorf
GermanyMunich
GermanyNuremberg/Karlsfeld
GermanyReichertshofen
Headquarters of Wacker Neuson SE (holding company)Munich (Germany)
18.01.2008CMYK
AffiliateHeadquarters
ProductionSite
LogisticsSite
NorwayOslo
DenmarkKarlslunde
SwedenMalmö
AustraliaMelbourne
South AfricaJohannesburg
IndiaBangalore
RussiaMoscow
TurkeyIstanbul
Czech RepublicPrague
HungaryBudapest
PolandWarsaw
18.01.2008CMYK
GermanyKorbach/Diemelsee-Flechtdorf
ChinaHong Kong
ChinaPinghu2
PhilippinesManila3
ThailandBangkok
United Arab EmiratesDubai
ChinaShanghai
JapanTokio
2 From 2018.
SingaporeSingapore
SingaporeSingapore
Associated companies SiteSite
SlovakiaBratislava
ItalyBologna
AustriaLinz/Hörsching
AustriaVienna
SwitzerlandZurich
SerbiaKragujevac
MalaysiaKuala Lumpur
3 Until the end of 2018.
5Global Presence
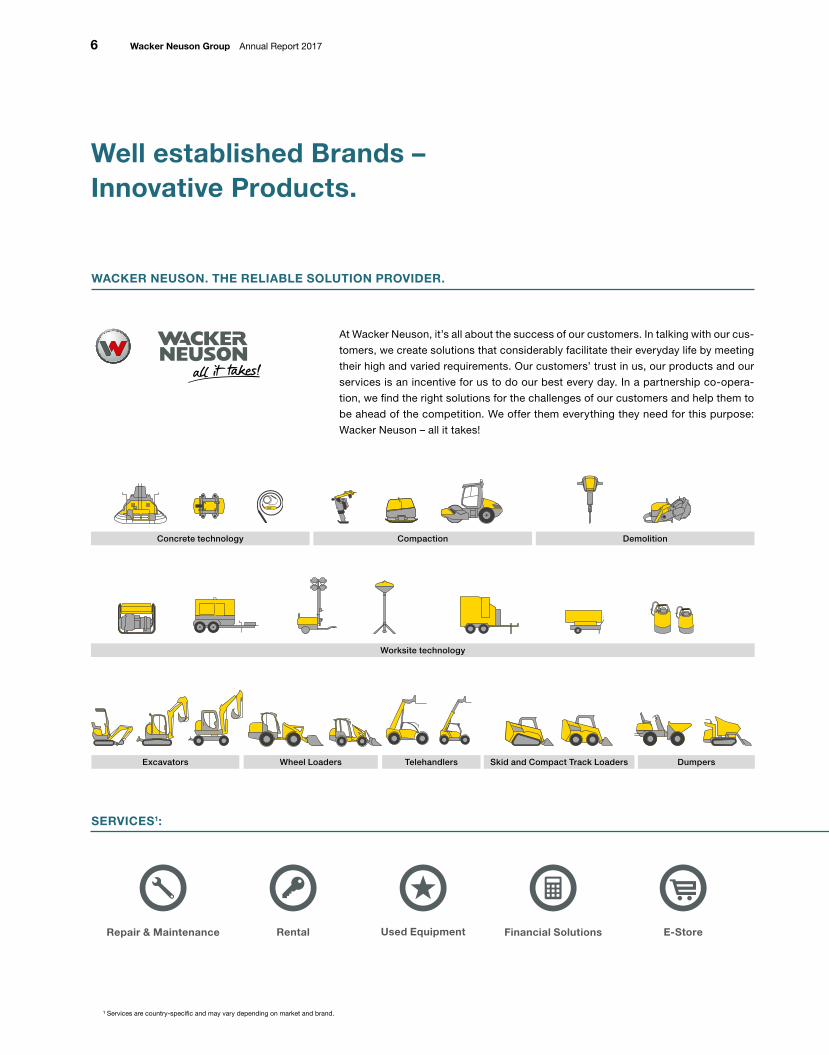
At Wacker Neuson, it’s all about the success of our customers. In talking with our cus-
tomers, we create solutions that considerably facilitate their everyday life by meeting
their high and varied requirements. Our customers’ trust in us, our products and our
services is an incentive for us to do our best every day. In a partnership co-opera-
tion, we find the right solutions for the challenges of our customers and help them to
be ahead of the competition. We offer them everything they need for this purpose:
Wacker Neuson – all it takes!
Worksite technology
Concrete technology Compaction Demolition
Repair & Maintenance E-StoreRental Financial SolutionsUsed Equipment
1 Services are country-specific and may vary depending on market and brand.
Well established Brands – Innovative Products.
WACKER NEUSON. THE RELIABLE SOLUTION PROVIDER.
SERVICES1:
DumpersSkid and Compact Track LoadersTelehandlersWheel LoadersExcavators
6 Wacker Neuson Group Annual Report 2017
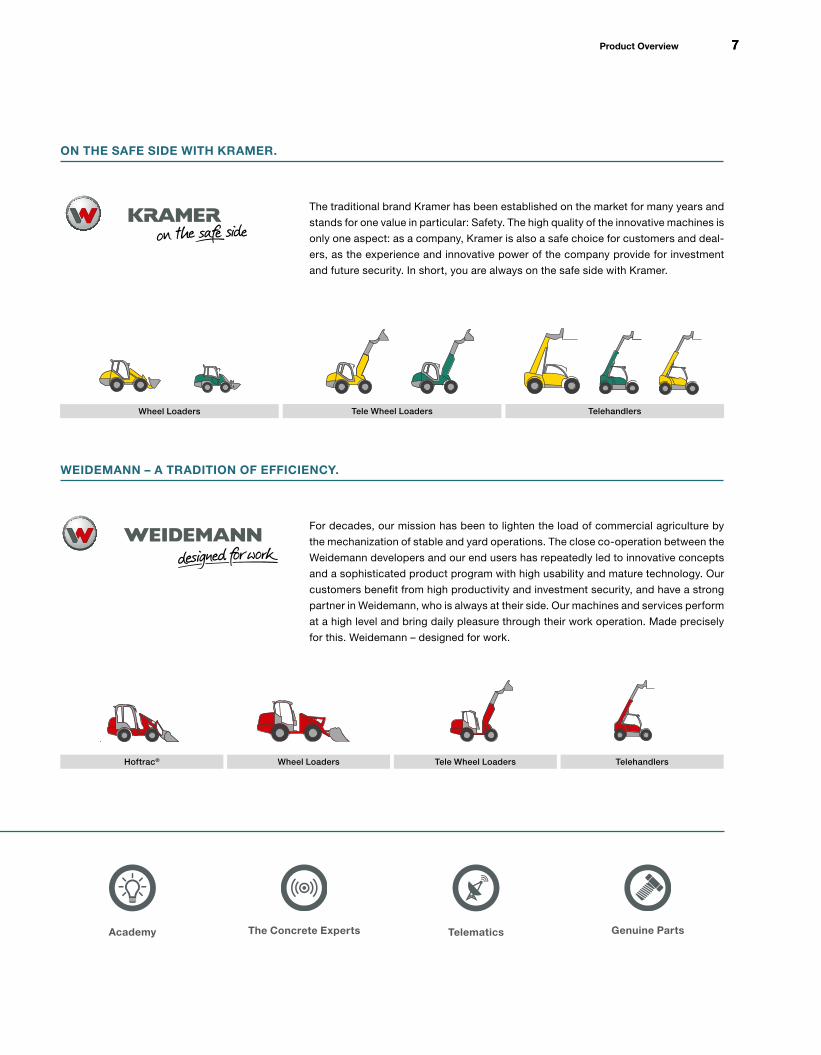
The traditional brand Kramer has been established on the market for many years and
stands for one value in particular: Safety. The high quality of the innovative machines is
only one aspect: as a company, Kramer is also a safe choice for customers and deal-
ers, as the experience and innovative power of the company provide for investment
and future security. In short, you are always on the safe side with Kramer.
TelehandlersTele Wheel LoadersWheel Loaders
For decades, our mission has been to lighten the load of commercial agriculture by
the mechanization of stable and yard operations. The close co-operation between the
Weidemann developers and our end users has repeatedly led to innovative concepts
and a sophisticated product program with high usability and mature technology. Our
customers benefit from high productivity and investment security, and have a strong
partner in Weidemann, who is always at their side. Our machines and services perform
at a high level and bring daily pleasure through their work operation. Made precisely
for this. Weidemann – designed for work.
TelehandlersHoftrac® Wheel Loaders Tele Wheel Loaders
The Concrete Experts Genuine PartsTelematicsAcademy
ON THE SAFE SIDE WITH KRAMER.
WEIDEMANN – A TRADITION OF EFFICIENCY.
77Product Overview
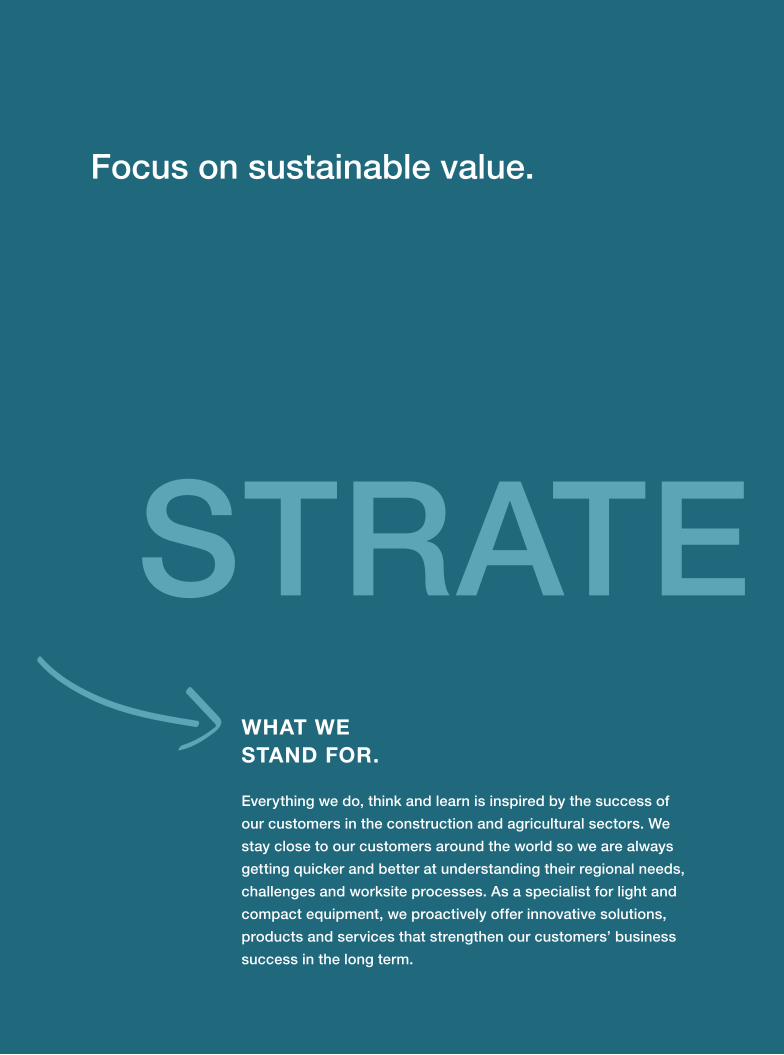
STRATE
Focus on sustainable value.
Everything we do, think and learn is inspired by the success of
our customers in the construction and agricultural sectors. We
stay close to our customers around the world so we are always
getting quicker and better at understanding their regional needs,
challenges and worksite processes. As a specialist for light and
compact equipment, we proactively offer innovative solutions,
products and services that strengthen our customers’ business
success in the long term.
WHAT WE STAND FOR.
7
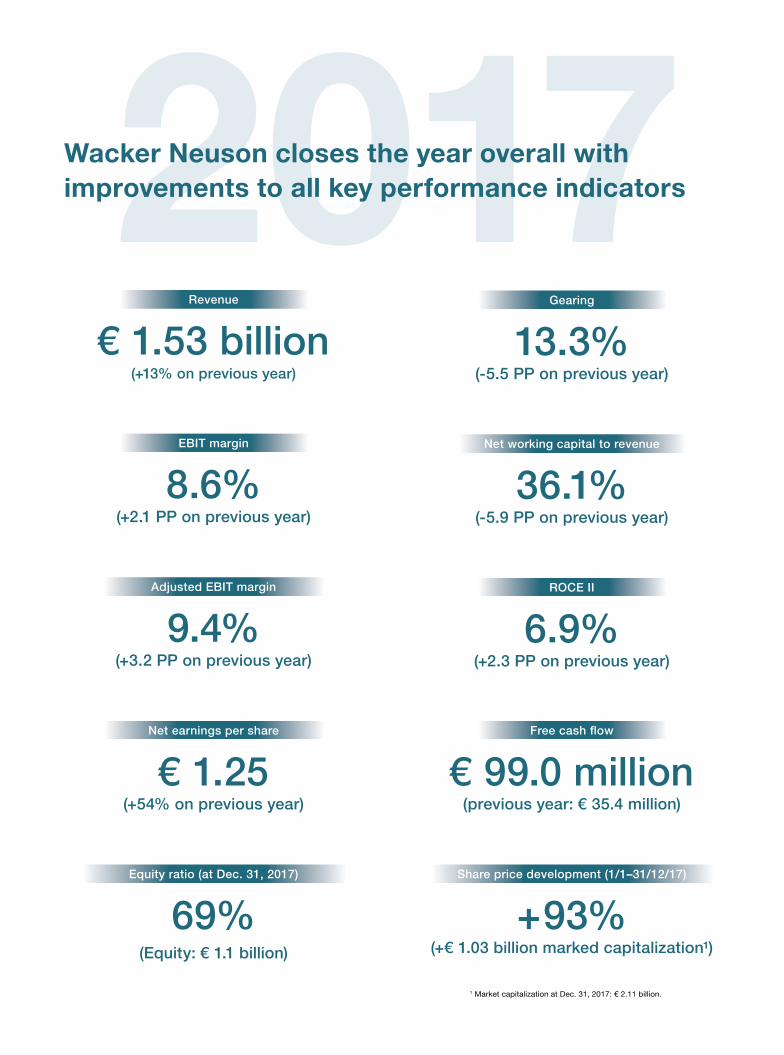
2017Wacker Neuson closes the year overall with improvements to all key performance indicators
1 Market capitalization at Dec. 31, 2017: € 2.11 billion.
€ 1.53 billion(+13% on previous year)
Revenue
69% (Equity: € 1.1 billion)
Equity ratio (at Dec. 31, 2017)
13.3% (-5.5 PP on previous year)
Gearing
36.1%(-5.9 PP on previous year)
Net working capital to revenue
+ 93% (+€ 1.03 billion marked capitalization¹)
Share price development (1/1–31/12/17)
8.6% (+2.1 PP on previous year)
EBIT margin
9.4% (+3.2 PP on previous year)
Adjusted EBIT margin
€ 1.25 (+54% on previous year)
Net earnings per share
€ 99.0 million (previous year: € 35.4 million)
Free cash flow
6.9%(+2.3 PP on previous year)
ROCE II
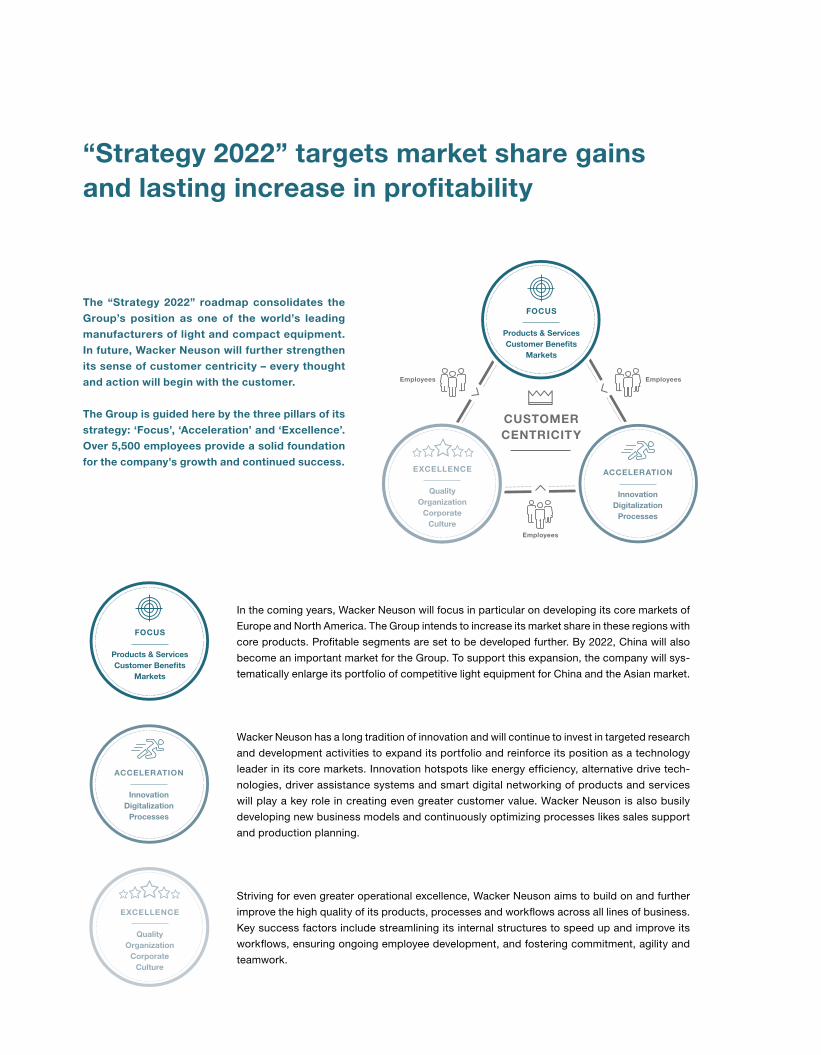
2017 “Strategy 2022” targets market share gains and lasting increase in profitability
CUSTOMER CENTRICITY
FOCUS
Products & ServicesCustomer Benefits
Markets
EXCELLENCE
QualityOrganization
Corporate Culture
ACCELERATION
InnovationDigitalization
Processes
EmployeesEmployees
Employees
The “Strategy 2022” roadmap consolidates the
Group’s position as one of the world’s leading
manufacturers of light and compact equipment.
In future, Wacker Neuson will further strengthen
its sense of customer centricity – every thought
and action will begin with the customer.
The Group is guided here by the three pillars of its
strategy: ‘Focus’, ‘Acceleration’ and ‘Excellence’.
Over 5,500 employees provide a solid foundation
for the company’s growth and continued success.
FOCUS
Products & ServicesCustomer Benefits
Markets
ACCELERATION
InnovationDigitalization
Processes
EXCELLENCE
QualityOrganization
Corporate Culture
In the coming years, Wacker Neuson will focus in particular on developing its core markets of
Europe and North America. The Group intends to increase its market share in these regions with
core products. Profitable segments are set to be developed further. By 2022, China will also
become an important market for the Group. To support this expansion, the company will sys-
tematically enlarge its portfolio of competitive light equipment for China and the Asian market.
Wacker Neuson has a long tradition of innovation and will continue to invest in targeted research
and development activities to expand its portfolio and reinforce its position as a technology
leader in its core markets. Innovation hotspots like energy efficiency, alternative drive tech-
nologies, driver assistance systems and smart digital networking of products and services
will play a key role in creating even greater customer value. Wacker Neuson is also busily
develop ing new business models and continuously optimizing processes likes sales support
and production planning.
Striving for even greater operational excellence, Wacker Neuson aims to build on and further
improve the high quality of its products, processes and workflows across all lines of business.
Key success factors include streamlining its internal structures to speed up and improve its
workflows, ensuring ongoing employee development, and fostering commitment, agility and
teamwork.
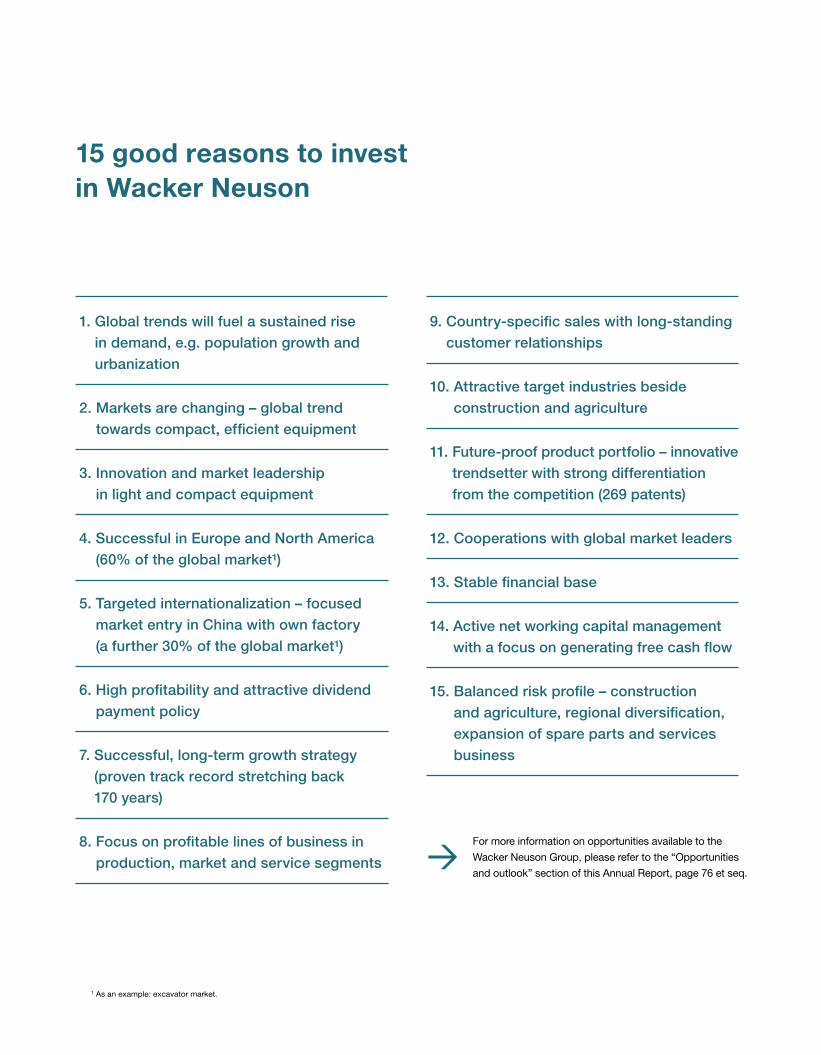
1. Global trends will fuel a sustained rise in demand, e.g. population growth and urbanization
2. Markets are changing – global trend towards compact, efficient equipment
3. Innovation and market leadership in light and compact equipment
4. Successful in Europe and North America (60% of the global market¹)
5. Targeted internationalization – focused market entry in China with own factory (a further 30% of the global market¹)
6. High profitability and attractive dividend payment policy
7. Successful, long-term growth strategy (proven track record stretching back 170 years)
8. Focus on profitable lines of business in production, market and service segments
9. Country-specific sales with long-standing customer relationships
10. Attractive target industries beside construction and agriculture
11. Future-proof product portfolio – innovative trendsetter with strong differentiation from the competition (269 patents)
12. Cooperations with global market leaders
13. Stable financial base
14. Active net working capital management with a focus on generating free cash flow
15. Balanced risk profile – construction and agriculture, regional diversification, expansion of spare parts and services business
202215 good reasons to invest in Wacker Neuson
1 As an example: excavator market.
For more information on opportunities available to the
Wacker Neuson Group, please refer to the “Opportunities
and outlook” section of this Annual Report, page 76 et seq.
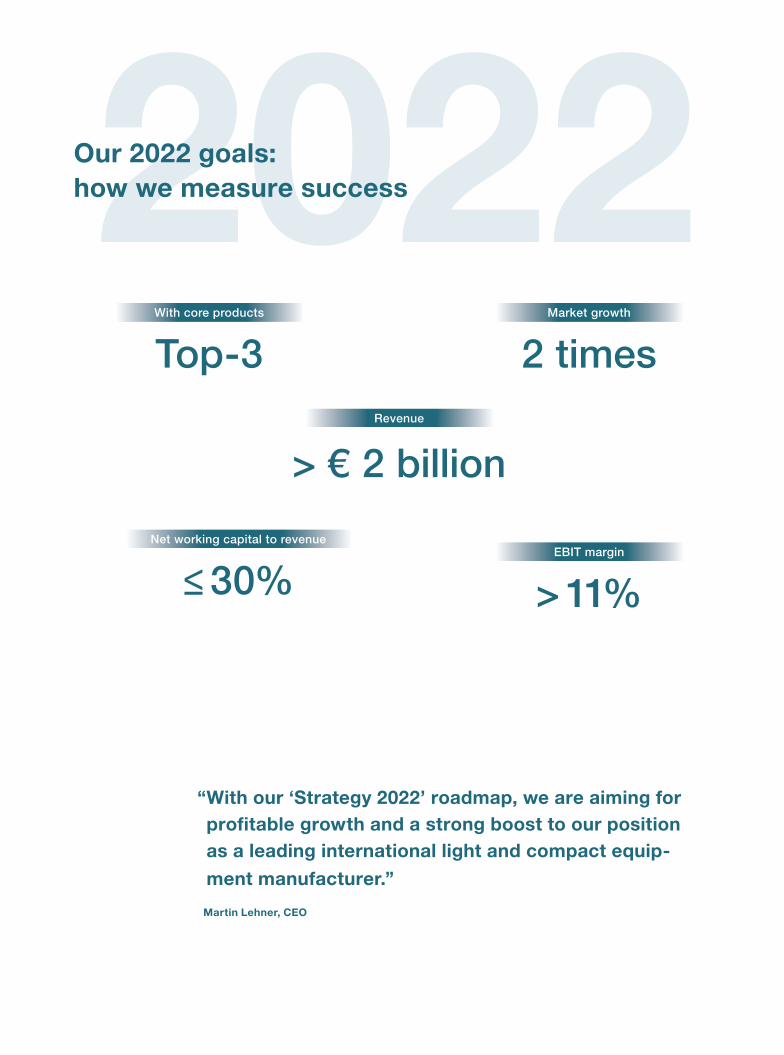
≤ 30%Net working capital to revenue
2022Our 2022 goals: how we measure success
Top-3With core products
2 timesMarket growth
> 11%EBIT margin
> € 2 billionRevenue
“ With our ‘Strategy 2022’ roadmap, we are aiming for profitable growth and a strong boost to our position as a leading international light and compact equip-
ment manufacturer.”
Martin Lehner, CEO
An
un
sere
Ak
tio
nä
reZ
usa
mm
en
ge
fass
ter
La
ge
be
ric
ht
Ko
nze
rna
bsc
hlu
ssW
eit
ere
In
form
ati
on
en
We are the most innovative trendsetter in the industry,
growing twice as fast as the market. We are the partner of
choice for our customers. Our core strengths lie in close
customer ties, customer-centric product development,
digitalization and product/service networking. We main-
tain a corporate culture that values and respects individual
effort and we channel our strengths into gaining a leading
position in all areas.
WHERE WE ARE HEADED.
Employees
Employees
Employees
STRATEGY 2022
CUSTOMER CENTRICITY
FOCUS
Products & ServicesCustomer BenefitsMarkets
EXCELLENCE
QualityOrganizationCorporate
Culture
ACCELERATION
InnovationDigitalizationProcesses
GY 2022
10 Wacker Neuson Group Annual Report 2017
Akti e/Cor porate Gover nance
Our Share in 2017
2017 proved to be another record year for the German stock
market. With a gain of over 90 percent, the Wacker Neuson
share outperformed every other company in the SDAX and also
compared very favorably with its international peer group.
Share and index information
Shares in Wacker Neuson SE have been traded in the regulated Prime
Standard segment of the Frankfurt Stock Exchange since 2007 and
they are listed in the SDAX index. In addition, Wacker Neuson has
been included in the “DAXplus Family” index since 2010. This index
comprises around 120 German and international companies from the
Frankfurt Stock Exchange’s Prime Standard segment. For a company
to be included in the DAXplus Family Index, the founders must hold at
least 25 percent of the voting rights, or sit on the Executive or Super-
visory Board and additionally hold at least 5 percent of the voting
rights. The weighting in this index is based on market capitalization of
the free float.
Stock market trends in 2017
2017 was an extremely good year for the international stock markets.
Aside from global factors like general economic indicators, the mone-
tary policy pursued by the leading central banks and fluctuations in oil
and raw material prices, regional political events and developments
also influenced the performance of individual stock exchanges.
Overall, the German stock market performed very well following a mi-
nor set-back in the summer, going on to register record highs. The
positive trajectory was driven by Emmanuel Macron’s victory in the
French presidential election of summer 2017, the strong upswing in
the global economy, continuation of the loose monetary policy pursued
by the European Central Bank (ECB), and the persistently low level of
inflation. Ongoing political tensions, including the fall-out from Brexit,
developments in North Korea and the independence movement in
Catalonia, barely impacted the international stock markets, and the
elections in the Netherlands and Germany also passed by with little
reaction. The political developments in the United States likewise
caused barely a ripple on the German indexes. Following a subdued
late rally, the DAX still managed to end the year up an impressive
12.5 percent and was able to celebrate a sixth straight year of stock
price gains. The SDAX index had an even more successful year, clos-
ing with an increase of 24.9 percent.
The other principal stock markets of the world performed just as im-
pressively as the German indexes. It was a banner year for the big
American indexes, surging at an exceptional pace. The Dow Jones in
the USA went on a record-breaking run, finishing 2017 with a 25.1 per-
cent gain over the year as a whole. The emerging economies per-
formed even better. The MSCI Emerging Markets Index recorded a
gain of 37.3 percent over the course of the year. While the UK’s FTSE
100 Index did not manage anywhere near this rate of growth, it still
recorded a double-digit increase. The CSI 300 leading index in China
saw a largely upwards trajectory during the year with the exception of
a minor slump in May and a marked downturn in November. The index
ended 2017 on a very positive note.
The Wacker Neuson share
From the company’s perspective, 2017 was a very satisfactory year
for the Wacker Neuson share. Gaining 92.8 percent in value overall, it
was the top-performing share in the SDAX. After starting the year at
EUR 15.60, the share price saw relatively little movement up until early
February. The share hit its low for the year of EUR 15.17 on February
9. After registering strong growth up to the start of May, the share price
had fallen briefly but significantly by mid-June. It rallied after that, re-
turning to its May high-point in August after a few modest ups and
downs. The positive trend continued in the second half of the year,
with September and December standing out as particularly strong
months. The signs for an excellent end-of-year result were already ev-
ident by June with revenue expected to reach the higher end of the
forecast figure. The share price duly reached its high for the year of
EUR 30.08 in December. The upward momentum from the middle of
the year onwards was largely driven by positive reaction to the Group’s
announcements on newly formed strategic alliances and coopera-
tions. Highly positive Q3 figures gave the share another surge in the
closing weeks of the trading year. Overall, the Wacker Neuson share
outperformed its DAX and SDAX peer indexes by a clear margin in
2017.
On February 28, 2018, the share price stood at EUR 29.34, which cor-
responds to a slight loss of 2 percent since the start of the year and a
market capitalization of EUR 2,057.9 million.
Our Share in 2017 11
Konze
rnabschlu
ss
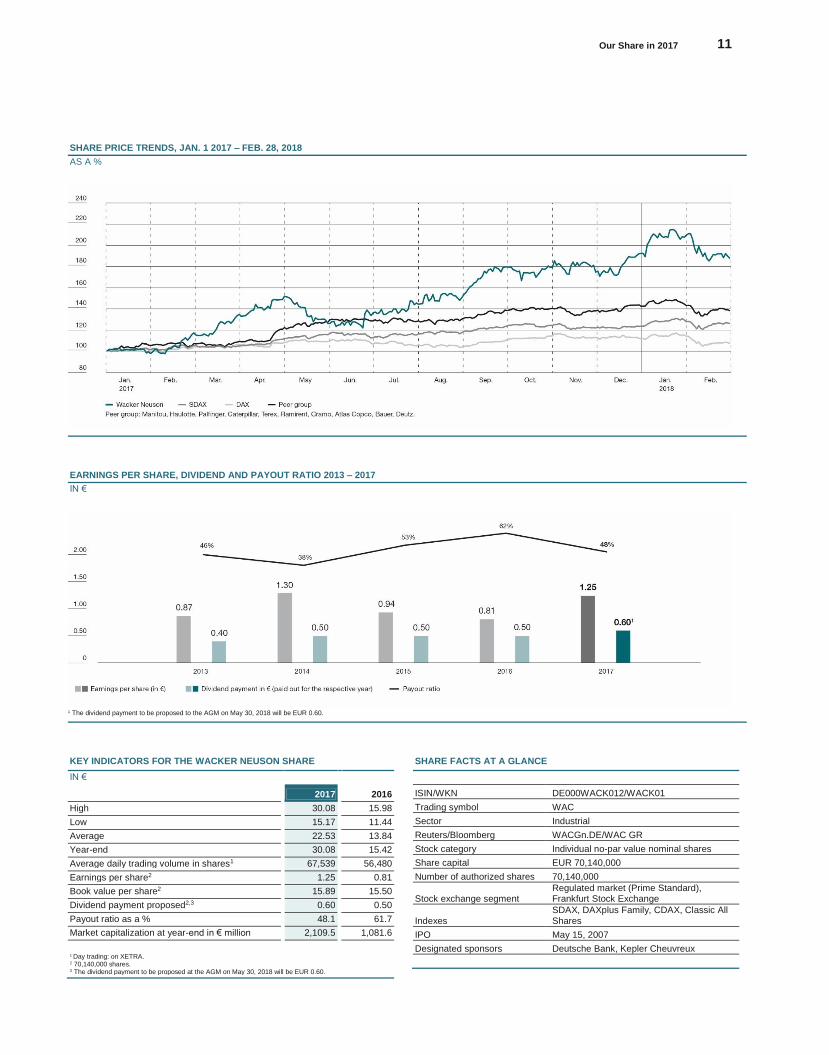
SHARE PRICE TRENDS, JAN. 1 2017 – FEB. 28, 2018
AS A %
EARNINGS PER SHARE, DIVIDEND AND PAYOUT RATIO 2013 – 2017
IN €
1 The dividend payment to be proposed to the AGM on May 30, 2018 will be EUR 0.60.
KEY INDICATORS FOR THE WACKER NEUSON SHARE
IN €
2017 2016
High 30.08 15.98
Low 15.17 11.44
Average 22.53 13.84
Year-end 30.08 15.42
Average daily trading volume in shares1 67,539 56,480
Earnings per share2 1.25 0.81
Book value per share2 15.89 15.50
Dividend payment proposed2,3 0.60 0.50
Payout ratio as a % 48.1 61.7
Market capitalization at year-end in € million 2,109.5 1,081.6
1 Day trading: on XETRA. 2 70,140,000 shares. 3 The dividend payment to be proposed at the AGM on May 30, 2018 will be EUR 0.60.
SHARE FACTS AT A GLANCE
ISIN/WKN DE000WACK012/WACK01
Trading symbol WAC
Sector Industrial
Reuters/Bloomberg WACGn.DE/WAC GR
Stock category Individual no-par value nominal shares
Share capital EUR 70,140,000
Number of authorized shares 70,140,000
Stock exchange segment Regulated market (Prime Standard), Frankfurt Stock Exchange
Indexes
SDAX, DAXplus Family, CDAX, Classic All
Shares
IPO May 15, 2007
Designated sponsors Deutsche Bank, Kepler Cheuvreux
12 Wacker Neuson Group Annual Report 2017
Performance of construction and construction supplier shares
The chart above shows how the Wacker Neuson share performed in
relation to its peers since the start of 2017. The index includes French
companies Manitou, a telescopic handler manufacturer, and Haulotte,
a lifting equipment specialist; Austrian crane and hydraulic lifting sys-
tems manufacturer Palfinger; the American construction equipment
manufacturers Caterpillar and Terex; North European rental compa-
nies Ramirent and Cramo; the Swedish industrial company Atlas
Copco; and German companies Bauer, specialist in underground con-
struction, and Deutz for engines targeted also at the construction
equipment industry. While the performance of the Wacker Neuson
share largely mirrored that of its peer group up to the middle of May,
positive reaction to the half-year report provided further momentum,
and Wacker Neuson, along with Bauer AG, pulled well ahead of the
other peer shares by the end of the year.
General meeting and dividends
The Annual General Meeting of Wacker Neuson SE took place in Mu-
nich on May 30, 2017. 216 shareholders with 59,711,408 voting rights
in total were represented. Based on a share capital of 70,140,000
shares, this corresponds to 85.13 percent of shareholders.
The AGM approved the proposal to pay out a dividend of EUR 0.50
per share for 2016 (previous year: EUR 0.50). This represented a total
payout of EUR 35.07 million. The distribution ratio thus panned out at
around 61.7 percent based on Group profit for 2016 of EUR 56.8 mil-
lion. In what proved to be a challenging fiscal year, this was in line with
the long-term dividend policy pursued by the Supervisory Board and
the Executive Board.
The AGM also approved a new authorized capital proposal. The Ex-
ecutive Board was authorized to increase the company’s share capital,
subject to the approval of the Supervisory Board, by issuing up to
17,535,000 new shares with the option of excluding subscription
rights. The authorized capital will enable the company to acquire suit-
able companies or holdings, for example, in return possibly for shares
in Wacker Neuson SE. It will also enable the company to issue new
shares against cash contributions, thus providing it with an additional
financing instrument independently of banking institutions. The reso-
lution supports the growth strategy pursued by Wacker Neuson.
At the AGM on May 30, 2018, the Executive Board and the Supervi-
sory Board will propose a dividend of EUR 0.60 for 2017. This would
correspond to a payout ratio of 48.1 percent based on 2017 Group
profit for the year of EUR 87.5 million.
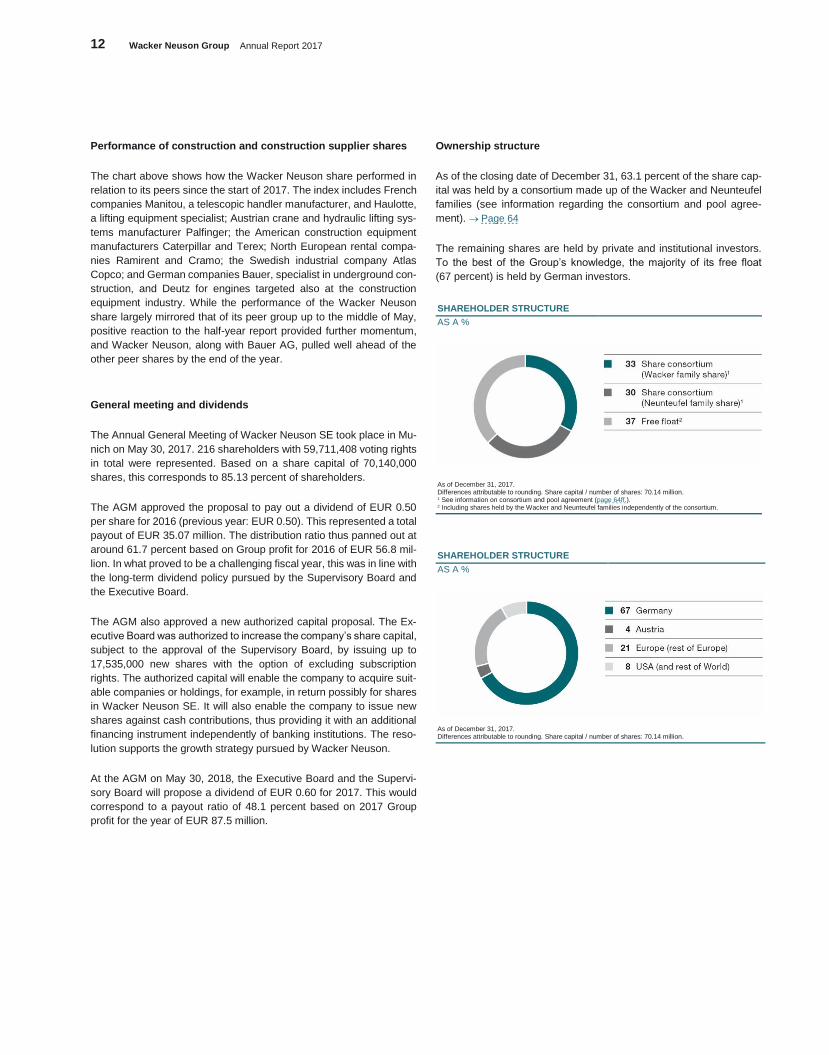
Ownership structure
As of the closing date of December 31, 63.1 percent of the share cap-
ital was held by a consortium made up of the Wacker and Neunteufel
families (see information regarding the consortium and pool agree-
ment). Page 64
The remaining shares are held by private and institutional investors.
To the best of the Group’s knowledge, the majority of its free float
(67 percent) is held by German investors.
SHAREHOLDER STRUCTURE
AS A %
As of December 31, 2017. Differences attributable to rounding. Share capital / number of shares: 70.14 million. 1 See information on consortium and pool agreement (page 64ff.). 2 Including shares held by the Wacker and Neunteufel families independently of the consortium.
SHAREHOLDER STRUCTURE
AS A %
As of December 31, 2017. Differences attributable to rounding. Share capital / number of shares: 70.14 million.
Our Share in 2017 13
Konze
rnabschlu
ss
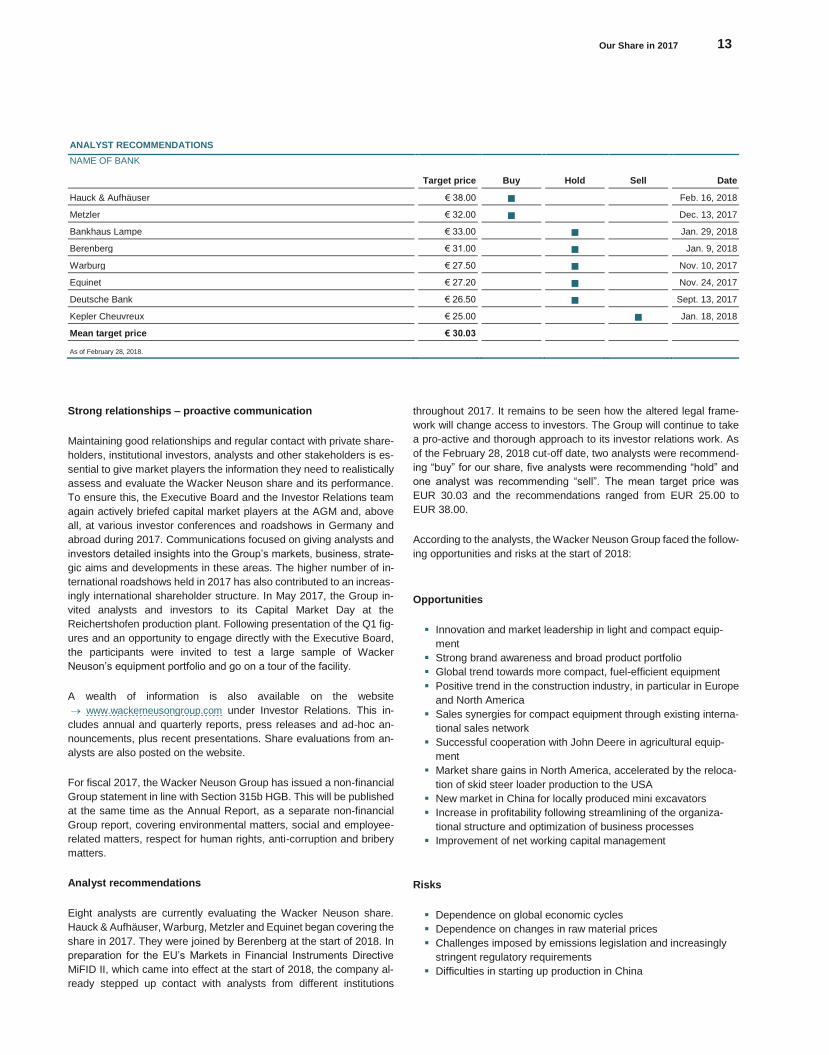
ANALYST RECOMMENDATIONS
NAME OF BANK
Target price Buy Hold Sell Date
Hauck & Aufhäuser € 38.00 ■ Feb. 16, 2018
Metzler € 32.00 ■ Dec. 13, 2017
Bankhaus Lampe € 33.00 ■ Jan. 29, 2018
Berenberg € 31.00 ■ Jan. 9, 2018
Warburg € 27.50 ■ Nov. 10, 2017
Equinet € 27.20 ■ Nov. 24, 2017
Deutsche Bank € 26.50 ■ Sept. 13, 2017
Kepler Cheuvreux € 25.00 ■ Jan. 18, 2018
Mean target price € 30.03
As of February 28, 2018.
Strong relationships – proactive communication
Maintaining good relationships and regular contact with private share-
holders, institutional investors, analysts and other stakeholders is es-
sential to give market players the information they need to realistically
assess and evaluate the Wacker Neuson share and its performance.
To ensure this, the Executive Board and the Investor Relations team
again actively briefed capital market players at the AGM and, above
all, at various investor conferences and roadshows in Germany and
abroad during 2017. Communications focused on giving analysts and
investors detailed insights into the Group’s markets, business, strate-
gic aims and developments in these areas. The higher number of in-
ternational roadshows held in 2017 has also contributed to an increas-
ingly international shareholder structure. In May 2017, the Group in-
vited analysts and investors to its Capital Market Day at the
Reichertshofen production plant. Following presentation of the Q1 fig-
ures and an opportunity to engage directly with the Executive Board,
the participants were invited to test a large sample of Wacker
Neuson’s equipment portfolio and go on a tour of the facility.
A wealth of information is also available on the website
www.wackerneusongroup.com under Investor Relations. This in-
cludes annual and quarterly reports, press releases and ad-hoc an-
nouncements, plus recent presentations. Share evaluations from an-
alysts are also posted on the website.
For fiscal 2017, the Wacker Neuson Group has issued a non-financial
Group statement in line with Section 315b HGB. This will be published
at the same time as the Annual Report, as a separate non-financial
Group report, covering environmental matters, social and employee-
related matters, respect for human rights, anti-corruption and bribery
matters.
Analyst recommendations
Eight analysts are currently evaluating the Wacker Neuson share.
Hauck & Aufhäuser, Warburg, Metzler and Equinet began covering the
share in 2017. They were joined by Berenberg at the start of 2018. In
preparation for the EU’s Markets in Financial Instruments Directive
MiFID II, which came into effect at the start of 2018, the company al-
ready stepped up contact with analysts from different institutions
throughout 2017. It remains to be seen how the altered legal frame-
work will change access to investors. The Group will continue to take
a pro-active and thorough approach to its investor relations work. As
of the February 28, 2018 cut-off date, two analysts were recommend-
ing “buy” for our share, five analysts were recommending “hold” and
one analyst was recommending “sell”. The mean target price was
EUR 30.03 and the recommendations ranged from EUR 25.00 to
EUR 38.00.
According to the analysts, the Wacker Neuson Group faced the follow-
ing opportunities and risks at the start of 2018:
Opportunities
Innovation and market leadership in light and compact equip-
ment
Strong brand awareness and broad product portfolio
Global trend towards more compact, fuel-efficient equipment
Positive trend in the construction industry, in particular in Europe
and North America
Sales synergies for compact equipment through existing interna-
tional sales network
Successful cooperation with John Deere in agricultural equip-
ment
Market share gains in North America, accelerated by the reloca-
tion of skid steer loader production to the USA
New market in China for locally produced mini excavators
Increase in profitability following streamlining of the organiza-
tional structure and optimization of business processes
Improvement of net working capital management
Risks
Dependence on global economic cycles
Dependence on changes in raw material prices
Challenges imposed by emissions legislation and increasingly
stringent regulatory requirements
Difficulties in starting up production in China
14 Wacker Neuson Group Annual Report 2017
Report by the Supervisory Board
Dear Shareholders,
We are pleased to report that Group business developed positively
during the 2017 fiscal year. With successful implementation of the
company strategy and positive overall developments in our core Eu-
ropean and North American markets, revenue rose to a new record
high of EUR 1.53 billion. The Group also made significant progress in
terms of profitability, with the EBIT margin rising to 8.6 percent. We
would like to thank our people for helping us achieve this result. Their
dedication and willingness to assume responsibility was a great sup-
port to company management again in 2017. There are currently many
signs indicating that 2018 will also develop positively for our company.
Cooperation between the Supervisory Board and Executive
Board
In the period under review, the Supervisory Board performed the tasks
assigned to it by law and by the Articles of Incorporation and verified
that the Executive Board applied sound, compliant and effective gov-
ernance practices. Furthermore, the Supervisory Board regularly ad-
vised the Executive Board on the management of the company and
supervised management activities. The Supervisory Board maintained
continuous dialog with the Executive Board regarding business devel-
opment and corporate strategy and was directly involved in all major
decisions regarding the company.
In the run-up to and during its meetings, the Supervisory Board was
brought up to date on business developments; changes in assets,
earnings and financials; fundamental issues regarding company plan-
ning, company strategy, internal control and risk management, and
compliance; and other key measures by means of written and verbal
reports from the Executive Board. The reports to the Supervisory
Board were discussed in depth during Supervisory Board meetings,
both among Supervisory Board members and with the Executive
Board.
Members of the Executive Board regularly took part in Supervisory
Board meetings. When necessary, the Supervisory Board and its com-
mittees also convened without the Executive Board, particularly re-
garding Supervisory Board matters and HR issues relating to the Ex-
ecutive Board. In the year under review, there was no Supervisory
Board member who only attended half or fewer than half of the meet-
ings of the Supervisory Board or committees to which they belong.
Members of the Supervisory Board undertook the training and devel-
opment measures required for their tasks on their own initiative and
were supported by the company.
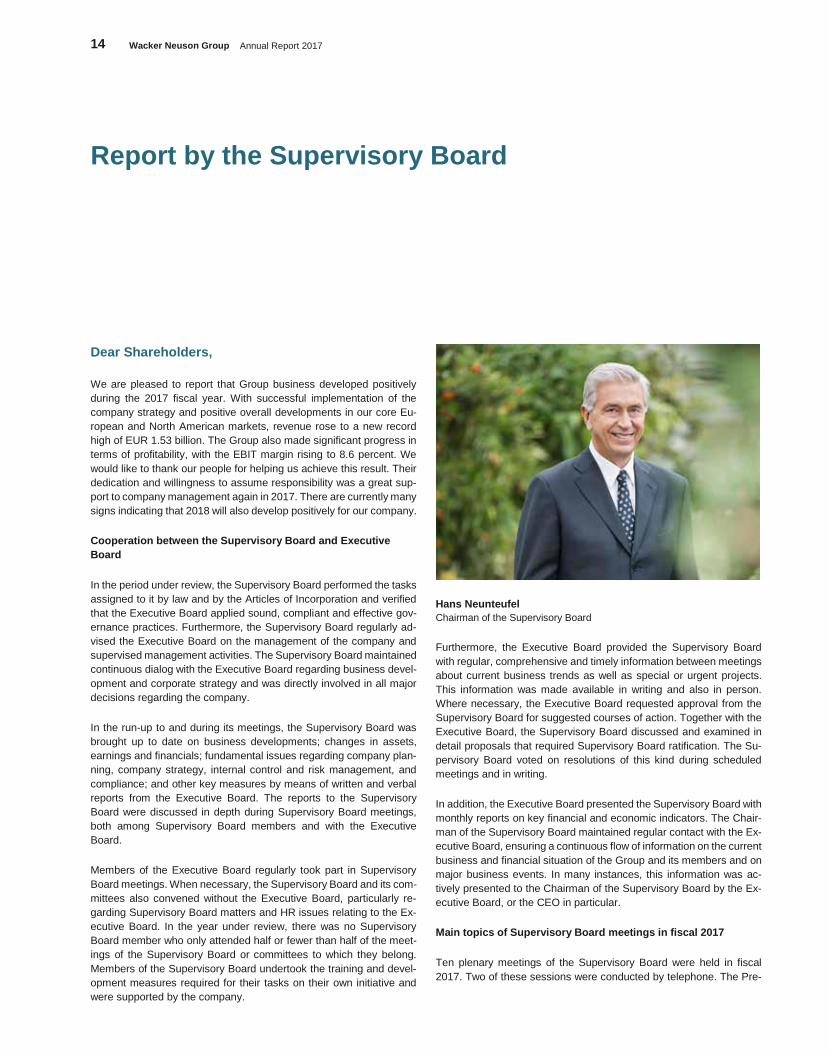
Hans Neunteufel
Chairman of the Supervisory Board
Furthermore, the Executive Board provided the Supervisory Board
with regular, comprehensive and timely information between meetings
about current business trends as well as special or urgent projects.
This information was made available in writing and also in person.
Where necessary, the Executive Board requested approval from the
Supervisory Board for suggested courses of action. Together with the
Executive Board, the Supervisory Board discussed and examined in
detail proposals that required Supervisory Board ratification. The Su-
pervisory Board voted on resolutions of this kind during scheduled
meetings and in writing.
In addition, the Executive Board presented the Supervisory Board with
monthly reports on key financial and economic indicators. The Chair-
man of the Supervisory Board maintained regular contact with the Ex-
ecutive Board, ensuring a continuous flow of information on the current
business and financial situation of the Group and its members and on
major business events. In many instances, this information was ac-
tively presented to the Chairman of the Supervisory Board by the Ex-
ecutive Board, or the CEO in particular.
Main topics of Supervisory Board meetings in fiscal 2017
Ten plenary meetings of the Supervisory Board were held in fiscal
2017. Two of these sessions were conducted by telephone. The Pre-
Report by the Supervisory Board 15
Konze
rnabschlu
ss
siding Committee met twice and the Audit Committee met on four oc-
casions. In five cases, the Supervisory Board voted by means of a
written resolution.
The Supervisory Board was regularly involved in the day-to-day busi-
ness of the Wacker Neuson Group and planning activities at executive
level. Discussions focused in particular on the global economic situa-
tion and its impact on the business performance and organizational
structures of the company and of the Group. Particular emphasis was
placed on the analysis and discussion of Wacker Neuson’s financial
situation as well as the development of revenue, costs and earnings.
During the relevant meetings, any questions from the Supervisory
Board that arose in connection with the regular written and verbal re-
ports were answered in full by the Executive Board. In addition to these
regular reports, the Supervisory Board concentrated its advice and au-
diting activities on the following areas in particular during its meetings:
At the Supervisory Board meeting to approve the financial statements
on March 14, 2017, and following appropriate preparations by the Au-
dit Committee, the Supervisory Board focused on examining the An-
nual Financial Statements, the Consolidated Financial Statements, the
Combined Management Report of Wacker Neuson SE and the
Wacker Neuson Group, as well as related party disclosures for fiscal
2016. In its session immediately before the Supervisory Board meet-
ing, the Audit Committee discussed these documents in detail with the
Executive Board, raising numerous questions with the auditing com-
pany representative present at the meeting, and discussing these is-
sues at length. This took place in addition to the Supervisory Board’s
regular examinations as part of its own preparation for the meeting to
approve the financial statements. The Annual and Consolidated Fi-
nancial Statements along with the Combined Management Report and
the appropriation of net profit suggested by the Executive Board were
approved. The Supervisory Board also ratified the AGM agenda and
the Supervisory Board report. In addition, this meeting covered the
declaration on corporate governance, an assessment of the findings
from the Supervisory Board efficiency audit, and information about
strategic projects.
On May, 9, 2017, the Supervisory Board discussed at length the forth-
coming quarterly report. This meeting also focused on a resolution
concerning the definition of targets for female representation in the
Executive Board and Supervisory Board. Please also refer to the fur-
ther explanations in the declaration on corporate governance in this
regard. Additionally, the decision was taken to establish an affiliate in
Belgium. The Executive Board also provided the Supervisory Board
with information about the affiliate in the Philippines and about the sta-
tus and progression of the Group’s executive development program.
At the meeting held on May 30, 2017 Executive Board matters were
the core focus. The (telephone) meeting on May 31, 2017, was pri-
marily concerned with changes to the Supervisory Board resulting
from Mr. Haßlach’s retirement.
The (telephone) meeting on July 6, 2017 dealt with the resolution to
collaborate with John Deere in the agricultural sector; this was the sole
item on the agenda.
The meeting held on July 11, 2017 centered on HR issues; primarily
the decision regarding the appointment of a new CEO.
The meeting held on August 4, 2017 focused on the forthcoming pub-
lication of the half-year report for 2017 as well as the resolution for
availing of certain balance sheet exemptions for various affiliates and
the company’s obligation to carry the associated loss. In addition, as
a result of the change to the Executive Board composition, a resolution
was passed to adjust the individual mandates of the Executive Board
members.
On October 11, 2017, the Supervisory Board met for its annual strat-
egy meeting; this year held at the Menomonee Falls production site in
the US. Here, the Supervisory Board discussed company strategy with
the Executive Board and received updates on business in North Amer-
ica, in particular.
The meeting held on November 8, 2017 primarily focused on the cur-
rent business situation and publication of the pending quarterly report.
The Supervisory Board also received a progress update on a real es-
tate project. The resolutions passed included the reorganization of lo-
gistics and administrative services. In addition, the Supervisory Board
was informed about the situation and outlook of the affiliate in Serbia.
During its meeting on December 14, 2017, the Supervisory Board fo-
cused on examining the Executive Board’s business plan for fiscal
2018, as well as on medium-term and financial planning. Supervisory
Board members not only assessed the plans, but also discussed the
associated opportunities and risks in detail with the Executive Board,
particularly against the backdrop of the unpredictable global economic
climate. Submission of the updated declaration of compliance with the
German Corporate Governance Code was also on the agenda. Fur-
thermore, the Supervisory Board received information about the or-
ganizational structures in the sales area, for instance, as well as in
staff and Group functions. The agenda also included Executive Board
matters.
The Supervisory Board examined each of the Executive Board’s
monthly reports. During numerous meetings, it also focused in detail
on various acquisition and collaboration projects aimed, for instance,
at expanding the product portfolio and on further development of the
Group’s general sales strategy.
Work performed by the Supervisory Board committees in fiscal
2017
The two Supervisory Board committees (the Presiding and Audit Com-
mittees) also continued their work during the period under review, ef-
fectively supporting the entire Supervisory Board in its duties by pre-
paring Board resolutions and other matters for consideration at its ple-
nary meetings. The members and chairpersons of both committees
are listed in the corporate governance report. The chairpersons of the
committees reported on the work performed by the committees during
the Supervisory Board’s plenary meetings.
At a meeting on March 14, 2017, the Supervisory Board Audit Com-
mittee prepared the Supervisory Board’s resolution on the adoption of
the Annual Financial Statements and the Consolidated Financial
Statements for the year ending December 31, 2016. The committee
also discussed the independence and appointment of an auditor, and
submitted a recommendation in that regard to the Supervisory Board
16 Wacker Neuson Group Annual Report 2017
plenary meeting. The Supervisory Board, in turn, followed this recom-
mendation and proposed the same auditor at the AGM. The internal
audit reports and risk report were also on the agenda.
At its meetings held on May 9, August 4 and November 8, the Audit
committee primarily dealt with publication of the pending quarterly re-
ports. It additionally focused on the work performed by the internal au-
dit department and issues relating to compliance. The Committee also
discussed the Group’s non-financial statement, to be prepared for the
first time for fiscal 2017 and published in a separate, non-financial
Group report, as well as the external auditing thereof. Furthermore,
the Committee looked at various matters relating to finance, controlling
and risk management.
In two meetings held on April 4 and June 28, 2017, the Presiding Com-
mittee focused on various Executive Board matters and prepared cor-
responding resolutions for the Supervisory Board.
Changes in the composition of executive bodies
Mr. Wilfried Trepels took on the role of Chief Finance Officer (CFO) of
Wacker Neuson SE on January 1, 2017. He is responsible for control-
ling, accounting, Group auditing and IT. Since September 1, 2017, he
has also been responsible for the real estate area, and since January
1, 2018, for the newly created Corporate Supply Chain department
(including logistics). Mr. Trepels took over from Günther C. Binder,
who stepped down from his position on the Executive Board on De-
cember 31, 2016. The Supervisory Board is extremely grateful to
Mr. Binder for his many years of dedication and the contribution he
made to the Group’s successful development, and wishes him all the
best for the future.
Mr. Alexander Greschner became Chief Sales Officer (CSO) on Jan-
uary 10, 2017, with responsibility for the Group’s global sales, service,
logistics and marketing activities. He replaced Mr. Jan Willem Jongert
(CSO), who reached a mutual agreement with the Supervisory Board
to leave the company earlier than planned. As of January 1, 2018, the
Group’s logistics activities were transferred to the new Corporate Sup-
ply Chain department, which falls under the responsibility of the CFO.
On September 1, 2017, Mr. Martin Lehner succeeded Mr. Cem Peksa-
glam as CEO and Chairman of the Executive Board of Wacker Neuson
SE. Mr. Peksaglam left the company at the end of his contract on Au-
gust 31, 2017. The Supervisory Board would like to thank Mr. Peksa-
glam for his dedicated service and all his achievements for the Group
over the past six years. Mr. Lehner was previously Deputy CEO along-
side his role as CTO, and already had responsibility for research and
development, procurement, production and quality. In addition to
these areas, in his new role he also assumed responsibility for strat-
egy, investor relations, corporate communication, sustainability, legal
and compliance, and HR.
On June 11, 2017, Mr. Hans Haßlach stood down from his position as
employee representative on the Supervisory Board due to retirement.
Mr. Christian Kekelj took over his role on the Supervisory Board effec-
tive June 12, 2017. The Supervisory Board would like to thank
Mr. Haßlach for his many years of service representing the employees
on the company’s Supervisory Board.
Risk assessment and compliance
The Supervisory Board is satisfied that the company’s internal control
system and risk management system meet the requirements of Sec-
tion 91 (2) AktG, that insurable risks are sufficiently insured and that
operational, financial and contractual risks are subject to suitable con-
trols through approval procedures and organizational processes. A de-
tailed risk reporting system is in place throughout the Group and is
regularly maintained and further developed. The internal control and
risk management systems were also examined by the duly appointed
auditing company, which confirmed that the Executive Board had met
the requirements outlined under Section 91 (2) AktG and established
a suitable early warning system capable of monitoring and identifying
developments that could pose a threat to the company’s continued ex-
istence as a going concern. The Executive Board informed the Super-
visory Board of the current risk situation during Supervisory Board
meetings and in individual conversations. The Supervisory and Exec-
utive Boards discussed all areas deemed to be risks during these ses-
sions. In addition, the Audit Committee addressed compliance issues.
Corporate governance
Both the Supervisory Board and the Executive Board are aware that
sound corporate governance is essential to protect shareholder inter-
ests and secure the company’s long-term success. The Supervisory
Board continuously monitored the further development of the German
Corporate Governance Code and kept up to date with the capital mar-
ket and corporate legislative framework. The Executive Board and Su-
pervisory Board issued an updated declaration of compliance with the
German Corporate Governance Code pursuant to Section 161 AktG
during the period under review, on December 14, 2017. The entire
declaration is permanently available on the company’s website and is
also included in the declaration on corporate governance pursuant to
Section 289f HGB in combination with Section 315d HGB, which can
be found online and in the Annual Report.
There were no conflicts of interest on the part of Executive Board or
Supervisory Board members requiring disclosure to the Supervisory
Board in accordance with Sections 4.3.4 and 5.5.2 of the German Cor-
porate Governance Code.
Annual and Consolidated Financial Statements for 2017
At the AGM on May 30, 2017, the auditing company Ernst & Young
GmbH Wirtschaftsprüfungsgesellschaft (“Ernst & Young”) of Stuttgart,
Germany, was appointed auditor for the company and Group for fiscal
2017. Before the Supervisory Board made its proposal to the AGM,
based in turn on the recommendation by the Audit Committee, the au-
diting company submitted written confirmation to the Chairman of the
Audit Committee that there are no circumstances that could compro-
mise its independence as an auditor or give rise to doubts about its
independence. Ernst & Young also specified the scope of services
other than the audit of annual financial statements performed on be-
half of the company over the previous fiscal year. The Chairman of the
Audit Committee engaged the company in writing with the task of au-
diting the financial accounting procedures.
The Annual Financial Statements for the year ending December 31,
2017 were prepared by the Executive Board in accordance with the
Report by the Supervisory Board 17
Konze
rnabschlu
ss
HGB. The Consolidated Financial Statements for the year ending De-
cember 31, 2017 were prepared by the Executive Board in line with
the International Financial Reporting Standards (IFRS) as adopted by
the EU, and with the additional requirements under German commer-
cial law pursuant to Section 315a HGB. Ernst & Young audited both
sets of statements along with the books. The audit did not give rise to
any reservations, so an unqualified audit opinion was issued for both
the Annual Financial Statements and the Consolidated Financial
Statements.
Each member of the Supervisory Board received the audit documents
for appraisal in good time. Together with the Audit Committee, the en-
tire Supervisory Board undertook a thorough examination of the An-
nual Financial Statements as well as the Consolidated Financial State-
ments, the Combined Management Report for the company and the
Group and the related party disclosures in conjunction with the audit
reports. The documents were discussed in detail at the Audit Commit-
tee meeting on March 15 and 19, 2018, and at the Supervisory Board
plenary meeting of the same date, with the Executive Board and in the
presence of the auditor, who reported the main findings of their audit
and answered questions from Supervisory Board members. After its
own close examination of the documents, the Supervisory Board
raised no objections and endorses the results of the audit report. The
Supervisory Board also approves the Consolidated (Group) Manage-
ment Report and, in particular, the forecast regarding the company’s
further development.
The final examination by the Supervisory Board did not lead to any
reservations. On March 19, 2018, the Supervisory Board therefore en-
dorsed the Annual Financial Statements, the Consolidated Financial
Statements and the Combined Management Report for the company
and the Group as prepared by the Executive Board for the year ending
December 31, 2017. The 2017 Annual Financial Statements have thus
been duly approved. The Supervisory Board also examined the Exec-
utive Board’s suggested appropriation of profit for fiscal 2017, in par-
ticular with regard to the dividend payment policy, impact on Group
liquidity and shareholder interests. It did not raise any objections and,
in line with the Audit Committee’s recommendation, thus gives its un-
qualified consent to the proposal.
The Supervisory Board’s examination also included the Group’s non-
financial statement for fiscal 2017, prepared in accordance with Sec-
tion 315b HGB for publication in the separate, non-financial Group re-
port. Ernst & Young had been tasked with auditing the Group’s non-
financial statement to obtain limited assurance in line with the Interna-
tional Standard on Assurance Engagements (ISAE) 3000, and corre-
spondingly prepared and submitted its report to the Supervisory
Board. The Supervisory Board received the result of the limited assur-
ance engagement undertaken by Ernst & Young and, following its own
in-depth examination, concluded that the Group’s non-financial state-
ment fulfills the appropriate requirements and there are no objections
to raise.
Examination of the Executive Board report on related party dis-
closures
The Executive Board prepared a report on related party disclosures
for fiscal 2017. This report contains in particular a declaration by the
Executive Board about the legal transactions undertaken by Wacker
Neuson SE. The Executive Board states that – to the best of its
knowledge and based on the information known to it at the time the
transactions were entered into – appropriate compensation was re-
ceived in respect of all transactions outlined in the related party disclo-
sures report. Ernst & Young examined the related party disclosures
report and issued the following auditor’s opinion:
“Based on our professional examination and evaluation, we confirm
that:
1. The factual statements contained in the report are correct
2. The performance provided by the company in respect of the trans-
actions listed in the report was not unreasonably high.”
The Audit Committee and the entire Supervisory Board received the
Executive Board’s report on related party disclosures in a timely man-
ner. The contents of the report and the assessment thereof by the au-
ditors were read and understood by these bodies, and both documents
and their results were examined and discussed with the Executive
Board and the auditors. The Supervisory Board endorses the auditor’s
assessment of the related party disclosures report. Based on the final
results of the discussions and its own examination of the related party
disclosures, the Supervisory Board regards the Executive Board’s
conclusions to be true and accurate and has no objection to the clos-
ing statement by the Executive Board.
The management and all employees of the Wacker Neuson Group
showed great personal dedication in fiscal 2017, making a valuable
contribution to the company’s positive development. The Supervisory
Board would like to thank all employees and the Executive Board for
their commitment and performance – both on a day-to-day basis and
under exceptional circumstances.
Munich, March 19, 2018
On behalf of the Supervisory Board
Hans Neunteufel
Chairman of the Supervisory Board
18 Wacker Neuson Group Annual Report 2017
The Share / C orporate Gover nance
Corporate Governance Declaration and Report
Corporate governance takes high priority at the Wacker Neuson
Group. Our Executive and Supervisory Boards see it as their re-
sponsibility to comply with principles ensuring responsible,
professional and transparent company management, as stipu-
lated in the German Corporate Governance Code. Our activities
are geared towards securing our company’s long-term success
and increasing its value. Embedded throughout the company,
our mission statement is thus an integral part of all of our busi-
ness practices.
Declaration on corporate governance
In the following statement, the Executive Board reports on the com-
pany’s corporate governance policies and practices – also for the Su-
pervisory Board. It therefore complies with Section 289f of the German
Commercial Code (HGB) in combination with Section 315d HGB and
Section 3.10 of the German Corporate Governance Code.
1. Declaration of compliance pursuant to Section 161 AktG
The Executive Board and the Supervisory Board of Wacker Neuson
SE consider the German Corporate Governance Code as an important
body of regulations. Both executive bodies feel compelled to comply
with its principles of responsible, professional and transparent corpo-
rate governance. They have therefore thoroughly examined the rec-
ommendations of the German Corporate Governance Code and is-
sued the following declaration of compliance on December 14, 2017.
Declaration of compliance with the German Corporate Govern-
ance Code in accordance with Section 161 AktG (German Stock
Corporation Act)
The German Corporate Governance Code contains recommendations
and proposals for managing and monitoring German listed companies
in relation to shareholders and the Annual General Meeting (AGM),
the Executive Board and the Supervisory Board, transparency, ac-
counting and auditing. The German Stock Corporation Act requires the
Executive Board and the Supervisory Board of listed companies to
disclose each year the recommendations of the German Corporate
Governance Code which the company has not followed or is not fol-
lowing, and to explain the reasons for non-compliance (“comply or ex-
plain”). The Executive Board and the Supervisory Board identify with
the duty as outlined in the German Corporate Governance Code to
uphold the principles of a social market economy and maintain the
substance of the company as a going concern and its ability to gener-
ate value in a sustainable fashion (company interest) and to further
promote responsible and transparent management and governance of
the company.
In accordance with Section 161 AktG, the Executive Board and the
Supervisory Board of Wacker Neuson SE hereby declare that since
the submission of the most recent declaration of compliance of De-
cember 15, 2016, the company has complied with the recommenda-
tions issued by the German Corporate Governance Code Commission
published by the German Federal Ministry of Justice (BMJ) in the offi-
cial section of the Federal Gazette as amended on May 5, 2015 and/or
February 7, 2017 (as of the effective dates) and continues to comply
with the recommendations of the Code as amended on February 7,
2017, with the exceptions listed and explained in more detail below:
1. Section 3.8 (3) of the German Corporate Governance Code:
The company’s directors’ and officers’ (D&O) liability insur-
ance policy for its Supervisory Board has been concluded
without a deductible. The company is of the opinion that a
deductible would not improve the sense of motivation and
responsibility with which the Supervisory Board members
perform their duties. D&O insurance safeguards the com-
pany against substantial internal risks and – only as a sec-
ondary function – protects the assets of members of its ex-
ecutive bodies. Hence it is the company’s intention to refrain
from implementing a deductible on Supervisory Board mem-
bers until further notice.
2. Section 4.2.2 (2) of the German Corporate Governance
Code: According to Section 4.2.2 (2) sent. 3 of the Code,
the Supervisory Board, when setting the overall remunera-
tion payable to individual members of the Executive Board,
shall set the remuneration of the Executive Board also in
relation to the remuneration of senior executives and staff in
general, also over time, whereby the Supervisory Board is
responsible for defining how senior executives are to be dis-
tinguished from staff in general. The Supervisory Board did
not follow this recommendation in the past but will do so in
future decisions relating to remuneration.
3. Section 4.2.3 (2) sent. 3 of the German Corporate Govern-
ance Code: Certain remuneration components spanning
several years which are not related to the future are and
have been agreed upon. The Supervisory Board is currently
of the opinion that it is not necessary to relate all variable
remuneration components to the future to narrow down the
framework delineating reasonable levels of Executive Board
remuneration.
Corporate Governance 19
Konze
rnabschlu
ss
However, the Supervisory Board is closely monitoring de-
velopments in this area and will re-examine the possibility
of complying with this recommendation when concluding
new agreements.
4. Section 4.2.3 (6) of the German Corporate Governance
Code: The AGM is not informed separately about the main
terms of and changes to the remuneration system for Exec-
utive Board members as this information is already dis-
closed in the Group Management Report, which is available
to all shareholders.
5. Sections 4.2.4, 4.2.5, 5.4.6 (3) and 7.1.3 of the German Cor-
porate Governance Code: The AGM has decided not to
publish the income of each individual Executive Board
member in the Notes to the Annual and Consolidated Finan-
cial Statements. In line with this, the remuneration report
and the corporate governance report do not include an indi-
vidualized report on the remuneration of the Executive
Board. Nor do they contain specific information about share-
based incentive systems for the Executive Board (which the
company does not have in any case). For this reason, this
information is not presented in the model tables recom-
mended in Section 4.2.5 (3) of the German Corporate Gov-
ernance Code.
Similarly, the remuneration of individual Supervisory Board
members is not published. Remuneration is clearly regu-
lated in the company’s Articles of Incorporation. The Exec-
utive Board and Supervisory Board are of the view that
these Articles coupled with other mandatory legal disclo-
sures provide investors and the public with sufficient infor-
mation in this area.
6. Section 5.3.3 of the German Corporate Governance Code:
The Supervisory Board has not formed a nomination com-
mittee. The size of the Supervisory Board (four shareholder
representatives) and the shareholder structure do not war-
rant a dedicated committee for proposing the shareholders’
Supervisory Board candidates.
7. Section 5.4.1 (1–4) sent. 1–3 of the German Corporate Gov-
ernance Code: When submitting its election proposals to the
Annual General Meeting regarding the election of the share-
holder representatives, the Supervisory Board takes into ac-
count the statutory requirements and recommendations of
the German Corporate Governance Code in relation to the
personal requirements to be met by Supervisory Board
members.
Here the focus is placed – irrespective of nationality and
gender – on the specialist and personal competence of po-
tential candidates, paying special attention to the company-
specific situation, and not on meeting a defined profile of
skills and expertise or implementing a diversity concept.
Within the scope of evaluating competence, the Supervisory
Board also places appropriate emphasis on the company’s
international engagement, potential conflicts of interest, the
number of independent members of the Supervisory Board,
the age limit stipulated for members of the Supervisory
Board and the principle of diversity and, for elected em-
ployee representatives, the special regulations set down in
Germany’s co-determination acts (Mitbes-
timmungsgesetze).
The Supervisory Board declines to set a limit on the term of
office as it is of the view, given the business context of a
family-run enterprise, that continuity is the main priority. Be-
sides, provisions in place stipulating the maximum age ef-
fectively limit the term of office assuming members join the
Board at the usual age.
In the Supervisory Board’s view, it is not necessary to spec-
ify concrete targets for its composition or to define a skills
profile or a diversity concept for the Board as a whole. Con-
sequently, the corporate governance report similarly does
not outline the details of such profiles and concepts or the
extent to which they have been implemented – with the ex-
ception of statements relating to compliance with legal re-
quirements arising from the German law governing Equal
Participation of Women and Men in Management Positions
(“women’s quota”).
8. Section 5.4.1 (5) sent. 3 of the German Corporate Govern-
ance Code: The Supervisory Board is of the view that the
information made available to the Annual General Meeting
and published on the company’s website as standard prac-
tice to date is sufficient – even if it does not comply with the
new recommendation under the Code, and thus continues
to refrain from complying with the Code’s recommendation
to draft, publish and update detailed résumés for proposed
and current members of the Supervisory Board.
9. Sections 5.4.2, 5.4.1 (4) sent. 3, and 5.3.2 of the German
Corporate Governance Code: The following situation is
noted, which is also described in the Group Management
Report: A pool agreement is in place between some of the
shareholders of the Wacker and Neunteufel families. The
parties to this pool agreement collectively hold about 63 per-
cent of the shares of Wacker Neuson SE and can thus jointly
(but not individually, i.e. individual members of the pool
agreement acting in isolation) control the company. In ac-
cordance with the provisions of the pool agreement, each
party to the pool agreement must exercise its right to vote
and submit proposals at the Annual General Meeting such
that two Supervisory Board members nominated as share-
holders’ representatives by the Wacker family and two by
the Neunteufel family are always elected.
The shareholders’ Supervisory Board members thus
elected are, however, not bound in any way to the directions
of individual, several or all of the parties to the pool agree-
ment and any and all decisions they make within the Super-
visory Board are made exclusively in the company’s inter-
ests. Even though these shareholders’ Supervisory Board
members always enjoy the special trust of the parties to the
pool agreement appointing them, they are not, in the Super-
visory Board’s view, in any personal or business relationship
with a controlling shareholder, which could lead to a funda-
mental conflict of interest. In the view of the Supervisory
Board, the shareholder representatives in the Supervisory
20 Wacker Neuson Group Annual Report 2017
Board, including the Chairman of the Audit Committee, are
therefore to be considered independent. It is therefore the
Supervisory Board’s view that the Supervisory Board is
composed of a sufficient number of independent members,
in particular with regard to the ownership structure. Given
the ongoing legal uncertainty surrounding interpretation of
the term “independence”, the company nonetheless de-
clares non-conformance as a precautionary measure.
Given the independence of all shareholder representatives
on the Supervisory Board and the detailed disclosures re-
lating to their election made herein, the Supervisory Board
shall refrain from providing explicit information about what it
considers to be an appropriate number of members and
their names again in the Corporate Governance report.
10. Section 5.4.3. sent. 3 of the German Corporate Governance
Code: So that the Supervisory Board can continue to vote
impartially for its chairperson, the proposed candidates will
not be announced in advance.
11. Section 5.4.6 (2) sent. 2 of the German Corporate Govern-
ance Code: Along with a fixed remuneration, the Supervi-
sory Board members shall be paid a variable remuneration
which depends exclusively on the success of the relevant
fiscal year. The Executive Board and the Supervisory Board
are of the view that the current remuneration regulation is
still appropriate and reflects the Supervisory Board’s tasks
and functions and therefore are refraining from proposing a
change at the Annual General Meeting.
Munich, December 14, 2017
Wacker Neuson SE
Executive Board and Supervisory Board
The above declaration has been made permanently available to
shareholders on the Wacker Neuson SE company website
www.wackerneusongroup.com under Investor Relations/Corporate
Governance. It is updated as required, at least once a year. Previous
declarations of conformity are stored for reference purposes on our
website for a period of at least five years. Further details on corporate
governance are presented in the following corporate governance re-
port.
Corporate Governance 21
Konze
rnabschlu
ss
2. Corporate governance report
This corporate governance report outlines the role of the Executive
Board and the Supervisory Board as well as the composition and role
of the committees.
Wacker Neuson SE is a European company (Societas Europaea) in-
corporated under German law. Upon foundation of the company,
shareholders chose the dual management system common under the
German Stock Corporation Act, comprising two executive bodies, the
Executive Board and the Supervisory Board, each vested with differ-
ent spheres of competence. The two bodies work closely together on
a basis of mutual trust and are committed to increasing the company’s
long-term value.
Executive Board
The Executive Board represents the company vis-à-vis third parties
and manages its business in accordance with legal regulations, the
Articles of Incorporation and the rules of procedure for the Executive
Board. Since September 1, 2017, the Executive Board comprises
three members (previously four). It is responsible for managing the
company and represents it both legally and otherwise. The Executive
Board functions on the basis of joint accountability. In other words, all
members of the Board are jointly responsible for all areas of company
management.
The Executive Board plans the company’s strategic direction in collab-
oration with the Supervisory Board and ensures it is appropriately ex-
ecuted. It is also responsible for establishing the company and
Group’s business plans for the coming year and beyond as well as
preparing legally required reports such as Annual Financial State-
ments, Consolidated Financial Statements and interim reports. In ad-
dition, the Executive Board also ensures that a suitable risk manage-
ment and control system is in place and that regular, prompt and ex-
tensive reports are presented to the Supervisory Board regarding all
issues relating to strategy, company planning, business develop-
ments, the risk situation, risk management and compliance activities
that are relevant to the company and the Group.
Cooperation and areas of responsibility within the Executive Board are
governed by the rules of procedure for the Executive Board. These
focus not only on the lines of responsibility vested in individual Exec-
utive Board members, but also the issues entrusted to the Executive
Board as a whole, resolutions (quorum requirements in particular) and
the rights and obligations of the chairperson of the Executive Board
(CEO). Executive Board meetings are held regularly and are con-
vened by the CEO or at the request of an Executive Board member.
The Executive Board generally reaches decisions based on a simple
majority of votes cast unless other legal provisions apply. If an equal
number of votes are cast, the chairperson has the casting vote.
The CEO steers and coordinates the entire Executive Board and rep-
resents the company and Group vis-à-vis the public, in particular when
dealing with the authorities, trade associations and publishing houses.
Mr. Martin Lehner has been CEO of Wacker Neuson SE, the parent
company of the Group, since September 1, 2017 (previously: Mr. Cem
Peksaglam). A Deputy CEO has not been appointed since that date
(previously: Mr. Martin Lehner). Further details on individual members
of the Executive Board, in particular their areas of responsibility within
the Executive Board, are disclosed in the Notes to the Consolidated
Financial Statements in Section 32 “Executive bodies” (Wacker
Neuson Group Annual Report 2017).
Measures and transactions of fundamental importance must be ap-
proved by the Supervisory Board as set down in the rules of procedure
for the Executive Board and/or the Articles of Incorporation. They are
also communicated to shareholders and the capital market in a timely
manner, thus ensuring that decision-making processes remain trans-
parent – also throughout the year – and capital market players are kept
sufficiently up to date.
Supervisory Board
The Supervisory Board advises the Executive Board in key decisions,
monitors its activities, appoints members and relieves them of their
duties. The Supervisory Board has six members. In accordance with
the agreement on employee representation in the Wacker Neuson SE
Supervisory Board and the German One-Third Participation Act (Drit-
telbeteiligungsgesetz), four of these are shareholder representatives
and two are employee representatives. Taking the company-specific
situation into consideration, the composition of the Supervisory Board
reflects the company’s international engagement, the need to avoid
conflicts of interest, the number of independent Supervisory Board
members in line with the German Corporate Governance Code, the
age limit applicable to Supervisory Board members and the principle
of diversity.
The terms of office of all Supervisory Board members run until the
close of the AGM that tables a resolution to formally approve the ac-
tions taken by the company in fiscal 2019. Their terms may be no
longer than six years. Further details on individual members of the Su-
pervisory Board are disclosed in the Notes to the Consolidated Finan-
cial Statements in Section 32, “Executive bodies” (Wacker Neuson
Group Annual Report 2017).
The principles of cooperation within the Supervisory Board are gov-
erned by the rules of procedure for the Supervisory Board. These rules
reflect the recommendations of the German Corporate Governance
Code and – as an integral part of the monitoring and controlling pro-
cess – provide for clear and transparent procedures and structures as
well as regular efficiency checks on Supervisory Board work. The Su-
pervisory Board reaches decisions based on a simple majority of votes
cast unless other legal provisions apply. In the event of a tie, the res-
olution or nomination proposal shall be deemed rejected; the chairper-
son shall not have the casting vote. The chairperson of the Supervi-
sory Board convenes and oversees Supervisory Board meetings and
generally coordinates the activities of the Supervisory Board and its
committees.
The Supervisory Board defines the Executive Board’s information and
reporting duties in detail. The core areas of collaboration between the
Executive and Supervisory Boards as well as specific details on the
Supervisory Board’s activities and committees are disclosed in the re-
port by the Supervisory Board.
Composition and role of committees
In contrast to the Executive Board, the Supervisory Board forms two
committees, the Presiding Committee and the Audit Committee.
22 Wacker Neuson Group Annual Report 2017
The responsibilities of the Presiding Committee include in particular
submitting proposals for Executive Board member appointments, ter-
minations and mandate extensions, for Executive Board remuneration
and remuneration scales, and for preparing measures to conclude,
amend or terminate contracts with Executive Board members. The
Presiding Committee members are Mr. Hans Neunteufel, Prof. Dr.
Matthias Schüppen and Mr. Ralph Wacker. Mr. Hans Neunteufel is
Chairman of the Presiding Committee.
The Audit Committee maintains close contact with the auditors. It ap-
points the auditors to review the Annual and Consolidated Financial
Statements, identifies the focal points of the audit and receives the
report. Furthermore, the Audit Committee negotiates the fee with the
auditor, assesses their independence and additional services provided
by the auditor and submits a voting proposal with regard to the auditor
to the Supervisory Board for the AGM. It prepares the Supervisory
Board discussions and resolutions required to approve the Annual and
Consolidated Financial Statements and to review the Executive
Board’s report on related third-party disclosures. It supports and mon-
itors the Executive Board in particular regarding accounting process
issues, the internal control system, risk management system, internal
auditing system and compliance. The Audit Committee members are
Mr. Kurt Helletzgruber, Prof. Dr. Matthias Schüppen, Mr. Ralph
Wacker and Mr. Elvis Schwarzmair. Mr. Kurt Helletzgruber is the
Chairman. As an independent financial expert, he fulfills the require-
ments set out in Sections 100 (5) and 107 (4) AktG.
The respective committee chairpersons provide the Supervisory
Board with regular and timely information about the committees’ activ-
ities. The committees also reach decisions with a simple majority of
votes cast. In the event of a tie, the resolution or nomination proposal
shall be deemed rejected; the respective chairpersons shall not have
the casting vote.
Further details on the activities of the Supervisory Board and its com-
mittees can be found in the current Supervisory Board report (Wacker
Neuson Group Annual Report 2017).
Shareholders and the AGM
Shareholders exercise their rights, including voting rights, at the AGM.
All shares in Wacker Neuson SE provide shareholders with full voting
rights and are registered by name. Each share entitles its holder to
one vote. The AGM agenda plus the reports and documents required
for the AGM are published in good time – also on the company’s web-
site, where they can be easily viewed by shareholders.
The AGM this year will take place on May 30, 2018 in Munich. The
Executive Board makes it easier for shareholders to exercise their vot-
ing rights at the AGM by offering the opportunity to delegate binding
voting instructions to proxies named by the company. Shareholders
can also do this during the AGM. Information on how to vote by proxy
will additionally be included in the invitation to the AGM meeting.
These named proxies are also available at the AGM to shareholders
present at the AGM. Furthermore, it is possible to delegate voting
rights to financial institutions, shareholder associations and other third
parties.
Accounting and auditing
The Consolidated Financial Statements of Wacker Neuson SE are
prepared in line with the International Financial Reporting Standards
(IFRS). The Annual Financial Statements and the Combined Manage-
ment Report of Wacker Neuson SE and its Group are prepared in ac-
cordance with the German Commercial Code (HGB).
The Supervisory Board proposes the election of the auditor at the
AGM, based on a recommendation from the Audit Committee. Prior to
making its proposal, the Supervisory Board obtains a certificate of in-
dependence from the auditor in question.
The Chairman of the Audit Committee asked the auditor to immedi-
ately report all significant findings or incidents identified during the au-
dit and relating in the broadest sense to Supervisory Board duties if
these findings or incidents could not be directly resolved.
Risk management
Responsible handling of risks facing the Group and the company is,
as always, a crucial part of sound corporate governance. The Execu-
tive Board and the Supervisory Board therefore continually monitor the
Wacker Neuson Group’s risk management system and internal control
system along with the accompanying reporting mechanisms.
Specific details on risk management within the Wacker Neuson Group
are disclosed in the risk report in the Combined Management Report
(Wacker Neuson Group Annual Report 2017). This also includes a re-
port on the control system and risk management system in relation to
the accounting process.
Transparency
Regular, active dialog with our shareholders and other stakeholders is
one of the cornerstones of our corporate governance policy. We pro-
vide shareholders, financial analysts, shareholder associations and
the media with information about business trends and significant
changes within the company promptly, regularly and with the greatest
possible transparency. We are fully committed to a policy of active and
honest communication.
As stipulated by the German Securities Trading Act (WpHG) and the
German Corporate Governance Code, we provide information on our
company’s business development and financial situation four times a
year. This takes the form of one Annual Report and three quarterly
reports. The Supervisory Board and the Audit Committee discuss
these reports with the Executive Board prior to their publication. In ad-
dition, the Executive Board answers shareholders’ questions at the
AGM. We also use our website as a way of keeping our stakeholders
up to date. All press and ad-hoc releases, financial reports and our
financial calendar detailing important events are permanently
available under Investor Relations at www.wackerneusongroup.com.
Interested parties can join our distribution list to receive regular up-
dates.
Director’s dealings and significant voting interests
Wacker Neuson SE publishes reports on directors’ dealings pursuant
to Art. 19 of EU regulation No 596/2014 on market abuse. We use
these reports to provide immediate information about securities trans-
actions with regard to Wacker Neuson shares made by members of
the Executive or Supervisory Boards as well as by individuals and le-
Corporate Governance 23
Konze
rnabschlu
ss
gal entities closely related to members of these bodies. This infor-
mation is also disclosed on the company’s website
www.wackerneusongroup.com under Investor Relations/Corporate
Governance. Also under Investor Relations/IR News, we immediately
publish information from shareholders regarding the purchase or sale
of significant voting rights in line with Section 33ff WpHG and the hold-
ing of financial and other instruments in line with Sections 38ff WpHG.
Remuneration report in the corporate governance report
We report on the remuneration system applicable to the Executive
Board in our Combined Management Report under the “Remuneration
framework” section. The AGM approved a resolution not to publish re-
muneration details for individual Executive Board members in the in-
terest of their privacy.
The overall remuneration of the Executive Board and the Supervisory
Board is disclosed in the above-mentioned section and in the Notes to
the Consolidated Financial Statements in Section 33 “Related party
disclosures” (Wacker Neuson Group Annual Report 2017).
Declaration regarding fixed targets for the proportion of women
at management level
When appointing members to the Executive Board and the Supervi-
sory Board, the company focuses on the qualifications and personal
skills of potential female and male candidates particularly in relation to
the company’s specific situation at the time. In the process of evaluat-
ing competency profiles, the Supervisory Board also places particular
emphasis on the company’s international involvement and the princi-
ple of diversity, also in relation to the age, gender, educational back-
ground and professional experience of female and male candidates.
The company does not in the process pursue an explicit diversity con-
cept as set out in the new CSR Directive Implementation Act (CSR-
Richtlinie-Umsetzungsgesetz). For further information on this and to
avoid repetition here, refer to the information in Section 5.4.1 of the
German Corporate Governance Code in the above declaration of com-
pliance.
The German law governing equal participation of women and men in
management positions in the private and public sector came into force
in Germany in 2015. Under this law, listed companies such as Wacker
Neuson SE that are not subject to co-determination in accordance with
the German Co-determination act (Mitbestimmungsgesetz), the Co-
determination Act for Companies active in the Mining, Iron and Steel
Industries (Montan-Mitbestimmungsgesetz), or the Co-determination
Supplementary Act (Mitbestimmungsergänzungsgesetz) are obliged
to set targets for women in the Supervisory Board, Executive Board
and the two management lines below the Executive Board. Since this
law took effect, the Executive Board and the Supervisory Board have
examined this issue several times.
When selecting and appointing members of the Executive Board, the
Supervisory Board focuses on the qualifications and personal skills of
potential men and women candidates, paying special attention to the
company-specific situation. In this context, gender does not play a ma-
jor role in the decision-making process. There are currently no women
on the Wacker Neuson SE Executive Board (current percentage: 0
percent). The Supervisory Board does not wish to be tied by the need
to meet quotas for female representation, so it remains free to priori-
tize qualifications and personal skills as mentioned above. As such,
the Supervisory Board has decided to refrain from setting a target per-
centage for female representation on the Executive Board that would
see the number of women rise from the present level by December 31,
2021 (target percentage: 0 percent).
Equally, the Supervisory Board is focused on the qualifications and
personal skills of potential men and women candidates when selecting
and appointing members of the Supervisory Board, paying special at-
tention to the company-specific situation (petition rights and voting ob-
ligations of key shareholder groups governed by a pool agreement).
In this context, gender also does not play a major role in the decision-
making process. There are currently no women on the Wacker
Neuson SE Supervisory Board (current percentage: 0 percent). The
Supervisory Board does not wish to be tied by the need to meet quotas
for female representation, so it remains free to prioritize qualifications,
personal skills and the company-specific situation as mentioned
above. As such, the Supervisory Board has decided to refrain from
setting a target percentage for female representation on the Supervi-
sory Board that would see the number of women rise from the present
level by December 31, 2021 (target percentage: 0 percent).
As the Executive Board and Supervisory Board are still made up ex-
clusively of men, the previous target of having 0 percent of the Exec-
utive Board and Supervisory Board comprising women as at June 30,
2017 has been met.
The Executive Board has defined the following new targets for the pro-
portion of women appointed to managerial positions at Wacker
Neuson SE, which it intends to achieve by December 31, 2021. These
targets refer to staff who are directly employed by the company
Wacker Neuson SE. The target percentage for line one below the Ex-
ecutive Board is 27 percent (currently 27 percent) and the target for
line two below the Executive Board is 20 percent (currently 67 per-
cent).
The previous targets of 23 percent for line one below the Executive
Board and 20 percent for line two below the Executive Board were
thus met with 27 and 67 percent respectively as at June 30, 2017.
3. Corporate governance best practices
Compliance – principles of sound business and financial gov-
ernance
Moving beyond the guidelines and recommendations of the German
Corporate Governance Code, the Wacker Neuson SE Executive
Board is committed to conducting its business worldwide in a lawful
manner, along socially and ethically responsible lines. Which is why
we have developed a Group-wide strategic mission statement that in-
forms the conduct of each and every individual in the Group – from the
Executive Board through management to employees. This mission
frames the way we do business for shareholders, customers, business
partners, the general public and our employees alike.
Values such as integrity, openness, honesty and respect for other peo-
ple and our surroundings inspire every one of us to succeed, excel
and embrace sustainable business practices. Our corporate values
can be viewed online at the following link:
www.wackerneusongroup.com/en/sustainability/responsible-em-
ployer/corporate-values/
Wacker Neuson has appointed a Chief Compliance Officer. This per-
son serves as a contact point and advisor for compliance issues and
24 Wacker Neuson Group Annual Report 2017
is responsible for implementing a compliance management system
geared towards the specific requirements of the Wacker Neuson
Group. In this context, we defined the “Principles of our company eth-
ics” – a mission statement outlining our commitment to integrity and to
systematic compliance with statutory and regulatory requirements.
This statement is available to the public at the following link:
www.wackerneusongroup.com/en/the-group/compliance/.
Our principles are equally important to us. They help us establish long-
term business relationships built on a foundation of mutual trust at
every step of the value chain. Our commitment here is set down in our
code of conduct for suppliers at
www.wackerneusongroup.com/en/the-group/compliance/code-of-
conduct-for-suppliers/
Corporate Social Responsibility (CSR)
A professional sustainability strategy means that the Wacker Neuson
Group can assess the effects of its value-adding processes on the en-
vironment and take action to maximize resource conservation. Reduc-
ing costs associated with energy consumption and obtaining certifica-
tion for sites in the European Union in accordance with DIN EN ISO
50001 and DIN EN ISO 14001 are also important aspects of the sus-
tainability strategy. The strategy is steered and implemented centrally
by a Sustainability Team.
The Wacker Neuson Group aims to continue developing innovative,
value-adding products and services to the same high levels of quality
and reliability, while implementing sustainable and environmentally
sound production and work processes. This goal is set out in the
Group’s “CSR Mission Statement”, which can be found at:
www.wackerneusongroup.com/en/the-group/mission-vision-strategy/
For 2017, we have issued a non-financial Group statement as a sep-
arate non-financial Group report, which will be published at the same
time as this report and is available on the company website (in line
with Section 315b HGB; CSR Directive Implementation Act [CSR-
Richtlinie-Umsetzungsgesetz]).
Munich, March 19, 2018
Wacker Neuson SE
The Executive Board
Martin Lehner
CEO
Alexander Greschner Wilfried Trepels
CSO CFO
Combined Management Report
26 The Wacker Neuson Group
29 General background
29 Overall economic trends
30 Overview of construction and agricultural industries
31 General legal framework
32 Competitive position
34 Business trends
36 Profit, financials and assets
36 Profit
38 Financial position
43 Assets
44 Developments in Q4 2017
45 General overview of economic situation
46 Profit, financials and assets of Wacker Neuson SE (condensed version according to HGB)
49 Segment reporting by region
49 Europe
50 Americas
51 Asia-Pacific
51 Segment reporting by business segment
51 Light equipment
52 Compact equipment
53 Services
54 Other factors that impacted on results
54 Research and development
56 Production and logistics
57 Procurement and quality
58 Human resources
60 Sales, service and marketing
61 Risk report
68 Information in accordance with Section 315a (1) HGB and Section 289a (1) HGB plus an explanatory report from the Executive Board in accordance with Section 176 (1) Sentence 1 AktG
72 Declaration on corporate governance according to Section 289f HGB in combination with Section 315d HGB
72 Disclosure of non-financial information by the Group for 2017
72 Remuneration framework
73 Supplementary report
74 Opportunities and outlook
74 Overall economic outlook
75 Outlook for construction and agricultural industries
76 Opportunities for future development
78 Forecast
78 Summary forecast
The graphics below are provided for information purposes only. Market statistics and page references have not been audited and are therefore not part of the Combined Management Report. Accounting methods, key indicators and financial terms are defined in the glossaries at the end of this annual report. Whereas figures in this Combined Management Report add up precisely to the totals provided, percentages are given as precise values. This may lead to slight discrepan-cies relative to the values provided in the Notes to the Consolidated Financial Statements.
25Contents Combined Management Report
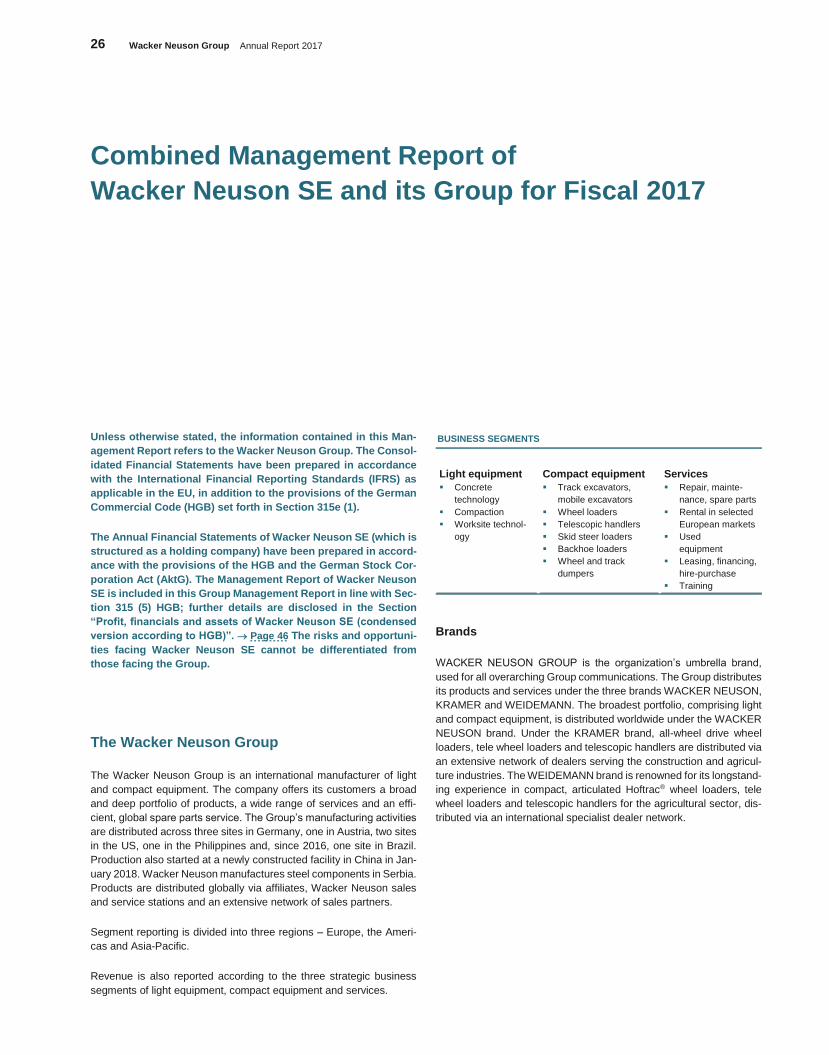
26 Wacker Neuson Group Annual Report 2017
Combined Management Report of
Wacker Neuson SE and its Group for Fiscal 2017
Unless otherwise stated, the information contained in this Man-
agement Report refers to the Wacker Neuson Group. The Consol-
idated Financial Statements have been prepared in accordance
with the International Financial Reporting Standards (IFRS) as
applicable in the EU, in addition to the provisions of the German
Commercial Code (HGB) set forth in Section 315e (1).
The Annual Financial Statements of Wacker Neuson SE (which is
structured as a holding company) have been prepared in accord-
ance with the provisions of the HGB and the German Stock Cor-
poration Act (AktG). The Management Report of Wacker Neuson
SE is included in this Group Management Report in line with Sec-
tion 315 (5) HGB; further details are disclosed in the Section
“Profit, financials and assets of Wacker Neuson SE (condensed
version according to HGB)”. Page 46 The risks and opportuni-
ties facing Wacker Neuson SE cannot be differentiated from
those facing the Group.
The Wacker Neuson Group
The Wacker Neuson Group is an international manufacturer of light
and compact equipment. The company offers its customers a broad
and deep portfolio of products, a wide range of services and an effi-
cient, global spare parts service. The Group’s manufacturing activities
are distributed across three sites in Germany, one in Austria, two sites
in the US, one in the Philippines and, since 2016, one site in Brazil.
Production also started at a newly constructed facility in China in Jan-
uary 2018. Wacker Neuson manufactures steel components in Serbia.
Products are distributed globally via affiliates, Wacker Neuson sales
and service stations and an extensive network of sales partners.
Segment reporting is divided into three regions – Europe, the Ameri-
cas and Asia-Pacific.
Revenue is also reported according to the three strategic business
segments of light equipment, compact equipment and services.
BUSINESS SEGMENTS
Light equipment Compact equipment Services
Concrete
technology
Compaction
Worksite technol-
ogy
Track excavators,
mobile excavators
Wheel loaders
Telescopic handlers
Skid steer loaders
Backhoe loaders
Wheel and track
dumpers
Repair, mainte-
nance, spare parts
Rental in selected
European markets
Used
equipment
Leasing, financing,
hire-purchase
Training
Brands
WACKER NEUSON GROUP is the organization’s umbrella brand,
used for all overarching Group communications. The Group distributes
its products and services under the three brands WACKER NEUSON,
KRAMER and WEIDEMANN. The broadest portfolio, comprising light
and compact equipment, is distributed worldwide under the WACKER
NEUSON brand. Under the KRAMER brand, all-wheel drive wheel
loaders, tele wheel loaders and telescopic handlers are distributed via
an extensive network of dealers serving the construction and agricul-
ture industries. The WEIDEMANN brand is renowned for its longstand-
ing experience in compact, articulated Hoftrac® wheel loaders, tele
wheel loaders and telescopic handlers for the agricultural sector, dis-
tributed via an international specialist dealer network.
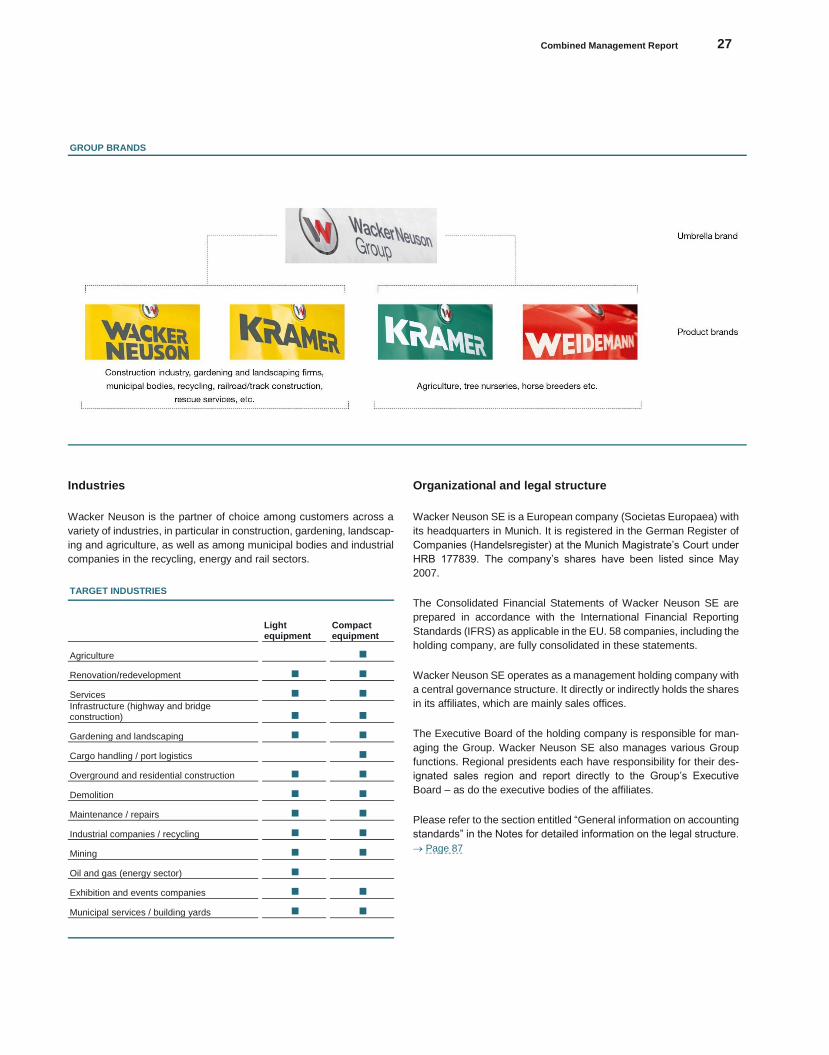
Combined Management Report 27
Konze
rnabschlu
ss
GROUP BRANDS
Industries
Wacker Neuson is the partner of choice among customers across a
variety of industries, in particular in construction, gardening, landscap-
ing and agriculture, as well as among municipal bodies and industrial
companies in the recycling, energy and rail sectors.
TARGET INDUSTRIES
Light equipment
Compact equipment
Agriculture
■
Renovation/redevelopment
■ ■
Services
■ ■
Infrastructure (highway and bridge construction)
■ ■
Gardening and landscaping
■ ■
Cargo handling / port logistics
■
Overground and residential construction
■ ■
Demolition
■ ■
Maintenance / repairs
■ ■
Industrial companies / recycling
■ ■
Mining
■ ■
Oil and gas (energy sector)
■
Exhibition and events companies
■ ■
Municipal services / building yards
■ ■
Organizational and legal structure
Wacker Neuson SE is a European company (Societas Europaea) with
its headquarters in Munich. It is registered in the German Register of
Companies (Handelsregister) at the Munich Magistrate’s Court under
HRB 177839. The company’s shares have been listed since May
2007.
The Consolidated Financial Statements of Wacker Neuson SE are
prepared in accordance with the International Financial Reporting
Standards (IFRS) as applicable in the EU. 58 companies, including the
holding company, are fully consolidated in these statements.
Wacker Neuson SE operates as a management holding company with
a central governance structure. It directly or indirectly holds the shares
in its affiliates, which are mainly sales offices.
The Executive Board of the holding company is responsible for man-
aging the Group. Wacker Neuson SE also manages various Group
functions. Regional presidents each have responsibility for their des-
ignated sales region and report directly to the Group’s Executive
Board – as do the executive bodies of the affiliates.
Please refer to the section entitled “General information on accounting
standards” in the Notes for detailed information on the legal structure.
Page 87
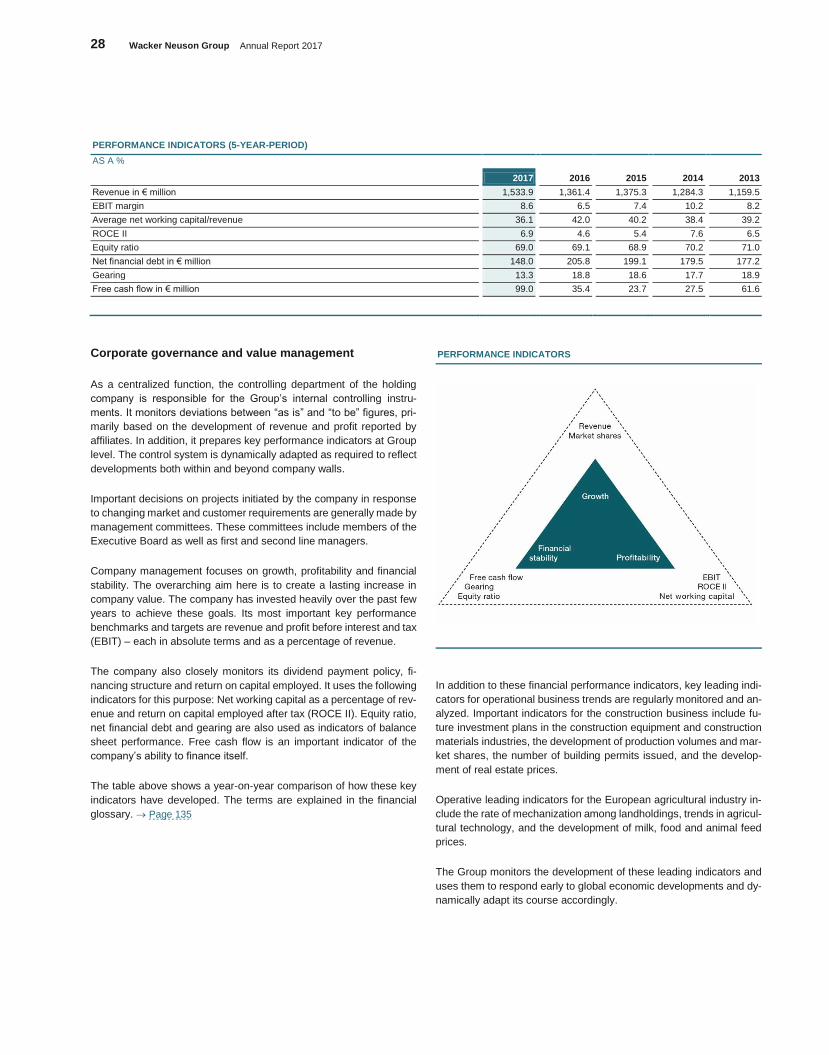
28 Wacker Neuson Group Annual Report 2017
PERFORMANCE INDICATORS (5-YEAR-PERIOD)
AS A %
2017 2016 2015 2014 2013
Revenue in € million 1,533.9 1,361.4 1,375.3 1,284.3 1,159.5
EBIT margin 8.6 6.5 7.4 10.2 8.2
Average net working capital/revenue 36.1 42.0 40.2 38.4 39.2
ROCE II 6.9 4.6 5.4 7.6 6.5
Equity ratio 69.0 69.1 68.9 70.2 71.0
Net financial debt in € million 148.0 205.8 199.1 179.5 177.2
Gearing 13.3 18.8 18.6 17.7 18.9
Free cash flow in € million 99.0 35.4 23.7 27.5 61.6
Corporate governance and value management
As a centralized function, the controlling department of the holding
company is responsible for the Group’s internal controlling instru-
ments. It monitors deviations between “as is” and “to be” figures, pri-
marily based on the development of revenue and profit reported by
affiliates. In addition, it prepares key performance indicators at Group
level. The control system is dynamically adapted as required to reflect
developments both within and beyond company walls.
Important decisions on projects initiated by the company in response
to changing market and customer requirements are generally made by
management committees. These committees include members of the
Executive Board as well as first and second line managers.
Company management focuses on growth, profitability and financial
stability. The overarching aim here is to create a lasting increase in
company value. The company has invested heavily over the past few
years to achieve these goals. Its most important key performance
benchmarks and targets are revenue and profit before interest and tax
(EBIT) – each in absolute terms and as a percentage of revenue.
The company also closely monitors its dividend payment policy, fi-
nancing structure and return on capital employed. It uses the following
indicators for this purpose: Net working capital as a percentage of rev-
enue and return on capital employed after tax (ROCE II). Equity ratio,
net financial debt and gearing are also used as indicators of balance
sheet performance. Free cash flow is an important indicator of the
company’s ability to finance itself.
The table above shows a year-on-year comparison of how these key
indicators have developed. The terms are explained in the financial
glossary. Page 135
PERFORMANCE INDICATORS
In addition to these financial performance indicators, key leading indi-
cators for operational business trends are regularly monitored and an-
alyzed. Important indicators for the construction business include fu-
ture investment plans in the construction equipment and construction
materials industries, the development of production volumes and mar-
ket shares, the number of building permits issued, and the develop-
ment of real estate prices.
Operative leading indicators for the European agricultural industry in-
clude the rate of mechanization among landholdings, trends in agricul-
tural technology, and the development of milk, food and animal feed
prices.
The Group monitors the development of these leading indicators and
uses them to respond early to global economic developments and dy-
namically adapt its course accordingly.
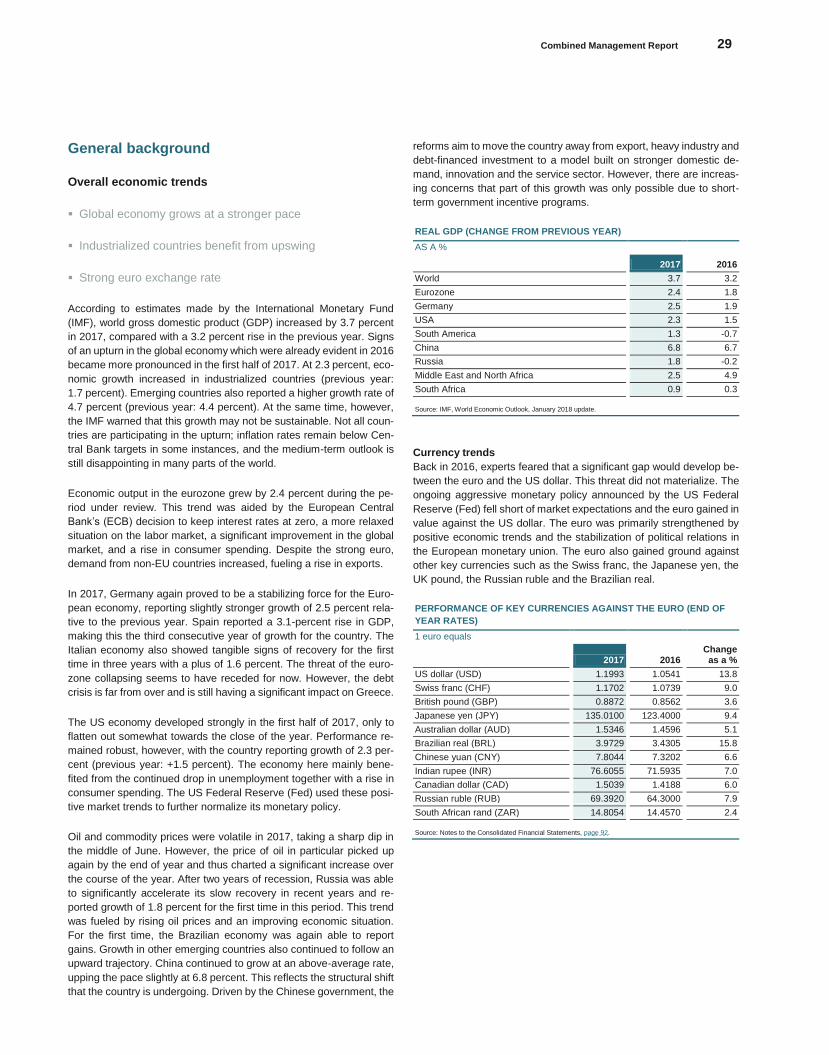
Combined Management Report 29
Konze
rnabschlu
ss
General background
Overall economic trends
Global economy grows at a stronger pace
Industrialized countries benefit from upswing
Strong euro exchange rate
According to estimates made by the International Monetary Fund
(IMF), world gross domestic product (GDP) increased by 3.7 percent
in 2017, compared with a 3.2 percent rise in the previous year. Signs
of an upturn in the global economy which were already evident in 2016
became more pronounced in the first half of 2017. At 2.3 percent, eco-
nomic growth increased in industrialized countries (previous year:
1.7 percent). Emerging countries also reported a higher growth rate of
4.7 percent (previous year: 4.4 percent). At the same time, however,
the IMF warned that this growth may not be sustainable. Not all coun-
tries are participating in the upturn; inflation rates remain below Cen-
tral Bank targets in some instances, and the medium-term outlook is
still disappointing in many parts of the world.
Economic output in the eurozone grew by 2.4 percent during the pe-
riod under review. This trend was aided by the European Central
Bank’s (ECB) decision to keep interest rates at zero, a more relaxed
situation on the labor market, a significant improvement in the global
market, and a rise in consumer spending. Despite the strong euro,
demand from non-EU countries increased, fueling a rise in exports.
In 2017, Germany again proved to be a stabilizing force for the Euro-
pean economy, reporting slightly stronger growth of 2.5 percent rela-
tive to the previous year. Spain reported a 3.1-percent rise in GDP,
making this the third consecutive year of growth for the country. The
Italian economy also showed tangible signs of recovery for the first
time in three years with a plus of 1.6 percent. The threat of the euro-
zone collapsing seems to have receded for now. However, the debt
crisis is far from over and is still having a significant impact on Greece.
The US economy developed strongly in the first half of 2017, only to
flatten out somewhat towards the close of the year. Performance re-
mained robust, however, with the country reporting growth of 2.3 per-
cent (previous year: +1.5 percent). The economy here mainly bene-
fited from the continued drop in unemployment together with a rise in
consumer spending. The US Federal Reserve (Fed) used these posi-
tive market trends to further normalize its monetary policy.
Oil and commodity prices were volatile in 2017, taking a sharp dip in
the middle of June. However, the price of oil in particular picked up
again by the end of year and thus charted a significant increase over
the course of the year. After two years of recession, Russia was able
to significantly accelerate its slow recovery in recent years and re-
ported growth of 1.8 percent for the first time in this period. This trend
was fueled by rising oil prices and an improving economic situation.
For the first time, the Brazilian economy was again able to report
gains. Growth in other emerging countries also continued to follow an
upward trajectory. China continued to grow at an above-average rate,
upping the pace slightly at 6.8 percent. This reflects the structural shift
that the country is undergoing. Driven by the Chinese government, the
reforms aim to move the country away from export, heavy industry and
debt-financed investment to a model built on stronger domestic de-
mand, innovation and the service sector. However, there are increas-
ing concerns that part of this growth was only possible due to short-
term government incentive programs.
REAL GDP (CHANGE FROM PREVIOUS YEAR)
AS A %
2017 2016
World 3.7 3.2
Eurozone 2.4 1.8
Germany 2.5 1.9
USA 2.3 1.5
South America 1.3 -0.7
China 6.8 6.7
Russia 1.8 -0.2
Middle East and North Africa 2.5 4.9
South Africa 0.9 0.3
Source: IMF, World Economic Outlook, January 2018 update.
Currency trends
Back in 2016, experts feared that a significant gap would develop be-
tween the euro and the US dollar. This threat did not materialize. The
ongoing aggressive monetary policy announced by the US Federal
Reserve (Fed) fell short of market expectations and the euro gained in
value against the US dollar. The euro was primarily strengthened by
positive economic trends and the stabilization of political relations in
the European monetary union. The euro also gained ground against
other key currencies such as the Swiss franc, the Japanese yen, the
UK pound, the Russian ruble and the Brazilian real.
PERFORMANCE OF KEY CURRENCIES AGAINST THE EURO (END OF
YEAR RATES)
1 euro equals
2017 2016 Change as a %
US dollar (USD) 1.1993 1.0541 13.8
Swiss franc (CHF) 1.1702 1.0739 9.0
British pound (GBP) 0.8872 0.8562 3.6
Japanese yen (JPY) 135.0100 123.4000 9.4
Australian dollar (AUD) 1.5346 1.4596 5.1
Brazilian real (BRL) 3.9729 3.4305 15.8
Chinese yuan (CNY) 7.8044 7.3202 6.6
Indian rupee (INR) 76.6055 71.5935 7.0
Canadian dollar (CAD) 1.5039 1.4188 6.0
Russian ruble (RUB) 69.3920 64.3000 7.9
South African rand (ZAR) 14.8054 14.4570 2.4
Source: Notes to the Consolidated Financial Statements, page 92.
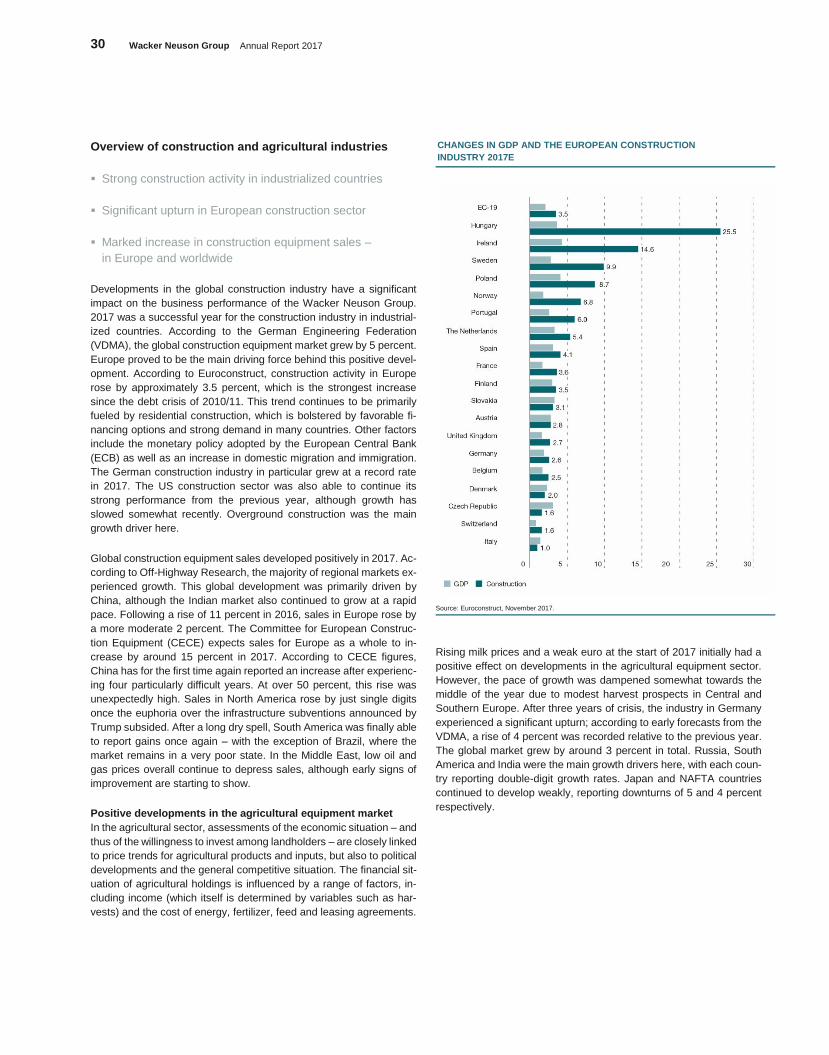
30 Wacker Neuson Group Annual Report 2017
Overview of construction and agricultural industries
Strong construction activity in industrialized countries
Significant upturn in European construction sector
Marked increase in construction equipment sales –
in Europe and worldwide
Developments in the global construction industry have a significant
impact on the business performance of the Wacker Neuson Group.
2017 was a successful year for the construction industry in industrial-
ized countries. According to the German Engineering Federation
(VDMA), the global construction equipment market grew by 5 percent.
Europe proved to be the main driving force behind this positive devel-
opment. According to Euroconstruct, construction activity in Europe
rose by approximately 3.5 percent, which is the strongest increase
since the debt crisis of 2010/11. This trend continues to be primarily
fueled by residential construction, which is bolstered by favorable fi-
nancing options and strong demand in many countries. Other factors
include the monetary policy adopted by the European Central Bank
(ECB) as well as an increase in domestic migration and immigration.
The German construction industry in particular grew at a record rate
in 2017. The US construction sector was also able to continue its
strong performance from the previous year, although growth has
slowed somewhat recently. Overground construction was the main
growth driver here.
Global construction equipment sales developed positively in 2017. Ac-
cording to Off-Highway Research, the majority of regional markets ex-
perienced growth. This global development was primarily driven by
China, although the Indian market also continued to grow at a rapid
pace. Following a rise of 11 percent in 2016, sales in Europe rose by
a more moderate 2 percent. The Committee for European Construc-
tion Equipment (CECE) expects sales for Europe as a whole to in-
crease by around 15 percent in 2017. According to CECE figures,
China has for the first time again reported an increase after experienc-
ing four particularly difficult years. At over 50 percent, this rise was
unexpectedly high. Sales in North America rose by just single digits
once the euphoria over the infrastructure subventions announced by
Trump subsided. After a long dry spell, South America was finally able
to report gains once again – with the exception of Brazil, where the
market remains in a very poor state. In the Middle East, low oil and
gas prices overall continue to depress sales, although early signs of
improvement are starting to show.
Positive developments in the agricultural equipment market
In the agricultural sector, assessments of the economic situation – and
thus of the willingness to invest among landholders – are closely linked
to price trends for agricultural products and inputs, but also to political
developments and the general competitive situation. The financial sit-
uation of agricultural holdings is influenced by a range of factors, in-
cluding income (which itself is determined by variables such as har-
vests) and the cost of energy, fertilizer, feed and leasing agreements.
CHANGES IN GDP AND THE EUROPEAN CONSTRUCTION
INDUSTRY 2017E
Source: Euroconstruct, November 2017.
Rising milk prices and a weak euro at the start of 2017 initially had a
positive effect on developments in the agricultural equipment sector.
However, the pace of growth was dampened somewhat towards the
middle of the year due to modest harvest prospects in Central and
Southern Europe. After three years of crisis, the industry in Germany
experienced a significant upturn; according to early forecasts from the
VDMA, a rise of 4 percent was recorded relative to the previous year.
The global market grew by around 3 percent in total. Russia, South
America and India were the main growth drivers here, with each coun-
try reporting double-digit growth rates. Japan and NAFTA countries
continued to develop weakly, reporting downturns of 5 and 4 percent
respectively.
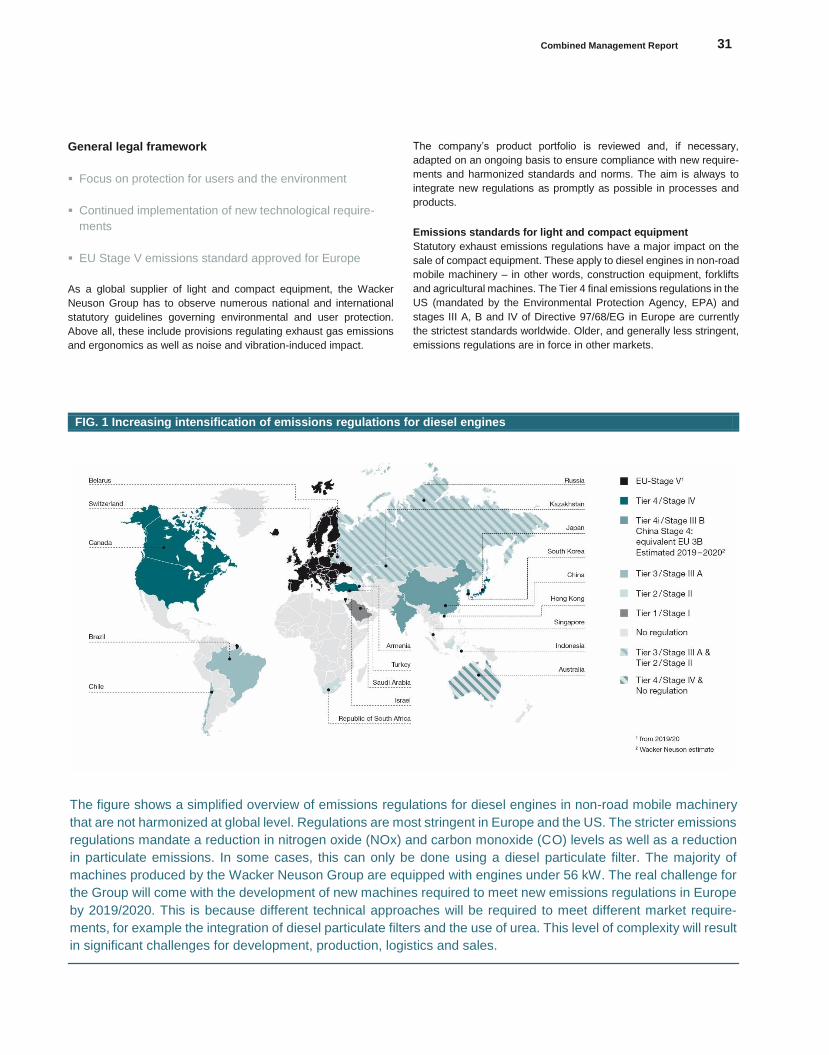
Combined Management Report 31
Konze
rnabschlu
ss
General legal framework
Focus on protection for users and the environment
Continued implementation of new technological require-
ments
EU Stage V emissions standard approved for Europe
As a global supplier of light and compact equipment, the Wacker
Neuson Group has to observe numerous national and international
statutory guidelines governing environmental and user protection.
Above all, these include provisions regulating exhaust gas emissions
and ergonomics as well as noise and vibration-induced impact.
The company’s product portfolio is reviewed and, if necessary,
adapted on an ongoing basis to ensure compliance with new require-
ments and harmonized standards and norms. The aim is always to
integrate new regulations as promptly as possible in processes and
products.
Emissions standards for light and compact equipment
Statutory exhaust emissions regulations have a major impact on the
sale of compact equipment. These apply to diesel engines in non-road
mobile machinery – in other words, construction equipment, forklifts
and agricultural machines. The Tier 4 final emissions regulations in the
US (mandated by the Environmental Protection Agency, EPA) and
stages III A, B and IV of Directive 97/68/EG in Europe are currently
the strictest standards worldwide. Older, and generally less stringent,
emissions regulations are in force in other markets.
FIG. 1 Increasing intensification of emissions regulations for diesel engines
The figure shows a simplified overview of emissions regulations for diesel engines in non-road mobile machinery
that are not harmonized at global level. Regulations are most stringent in Europe and the US. The stricter emissions
regulations mandate a reduction in nitrogen oxide (NOx) and carbon monoxide (CO) levels as well as a reduction
in particulate emissions. In some cases, this can only be done using a diesel particulate filter. The majority of
machines produced by the Wacker Neuson Group are equipped with engines under 56 kW. The real challenge for
the Group will come with the development of new machines required to meet new emissions regulations in Europe
by 2019/2020. This is because different technical approaches will be required to meet different market require-
ments, for example the integration of diesel particulate filters and the use of urea. This level of complexity will result
in significant challenges for development, production, logistics and sales.
32 Wacker Neuson Group Annual Report 2017
On July 5, 2016, the European Parliament approved the next stage of
emissions regulations for non-road mobile machinery. Emissions
Stage V also covers power categories under 19 kW and over 560 kW
for the first time. The new count and weight limits for particulate matter
are even lower than the already strict US standards. These new limits
apply to machinery introduced to the market from January 1, 2019
(power class <56 kW and ≥130 kW) and January 1, 2020 (power class
≥56 kW and <130 kW). In response to pressure from numerous stake-
holder groups, the transition period initially set at just 18 months in the
final draft was extended to 24 months in the approved version.
FIG. 1
Despite this concession, EU Stage V remains a major challenge for all
manufacturers and their suppliers, especially as it will most likely ne-
cessitate the widespread use of closed diesel particulate filter systems
in machines with power classes >19 kW and the use of urea in ma-
chines with power classes >56 kW. The Wacker Neuson Group is par-
ticularly affected by EU Stage V as the different technological solutions
will require new developments for many machines.
Beyond that, the Group is not aware of any other legislative changes
that had a significant impact on its business activities.
Competitive position
Differentiation from the competition through broad range of
products, innovative strength and diversified sales chan-
nels
Market position strengthened and expanded
New strategic alliances forged
The global construction equipment market, which is the Wacker
Neuson Group’s competitive landscape, is very heterogeneous at both
market and product level. The majority of the Group’s competitors fo-
cus either on light equipment or heavy equipment (machines weighing
over 15 tons), or a combination of compact and heavy equipment. The
Wacker Neuson Group’s portfolio of light and compact equipment
weighing up to 15 tons and targeted at professional users is one of the
main factors that sets it apart from the competition.
In the light equipment segment, the Group faces a variety of competi-
tors, including Ammann, Atlas Copco, Bomag, Dynapac, Husqvarna,
Mikasa, Multiquip and Weber. In the compact equipment segment,
Wacker Neuson also competes with specialist manufacturers and
global companies such as Bobcat (Doosan), Kubota, Takeuchi,
Yanmar, Manitou and JCB. Some international heavy equipment man-
ufacturers such as Komatsu, Liebherr, Case New Holland or Volvo CE
also offer compact equipment and are therefore part of the competitive
landscape.
In addition, the Wacker Neuson Group operates in the agricultural
equipment sector through its Weidemann brand. Weidemann-branded
articulated wheel loaders and telescopic handlers enjoy a leading po-
sition in the Central European agricultural market. Kramer has also
been expanding its dedicated sales network for the distribution of its
all-wheel drive machines in the agricultural sector. In this sector, the
Group competes with companies such as Schaeffer, Manitou and
JCB.
A leading global manufacturer
The Group’s strong market position is built mainly on outstanding
product and service quality coupled with a diverse product portfolio, all
backed by comprehensive product development and manufacturing
know-how and an efficient sales and service network. Many of the
Group’s products have established excellent market positions across
the globe. However, there are few official statistics available for market
segmentation, making it difficult for the Group to provide a concrete
overview of market shares, especially in the case of light equipment.
End customers, dealers and professional rental companies select the
manufacturer that offers the most appealing overall package consist-
ing of innovative products, a strong brand, simple and efficient logistics
and all-in service with a sound price/performance ratio across the en-
tire product lifecycle. Customers generally prefer a single point of con-
tact to the manufacturer, since this greatly simplifies processing and
administration. The Wacker Neuson Group meets precisely these cus-
tomer expectations with a one-stop offering spanning a broad portfolio
of light and compact equipment.
Changes in the competitive landscape
Many of the key trends in the competitive landscape observed in pre-
vious years continued in fiscal 2017. A new trend has emerged, how-
ever, with companies showing significantly more investment interest
in alternative drive technologies and digitalization.
Market players responding to intensified competition with con-
solidations, mergers, acquisitions and alliances
A large number of takeovers and acquisitions have shaped the indus-
try. Atlas Copco, for example, has been very active on this front. At
the start of the year, the company announced that it was selling its
road construction equipment division to the French Fayat Group. At
the close of the year, the company then reported its plans to sell its
compaction business to a fellow Swedish company, the Husqvarna
Group. Moving in the opposite direction, Atlas Copco acquired the Bra-
zilian centrifugal pump rental company Itubombas Locação Comércio
Importação e Exportação Ltda, in 2017 in a bid to extend its reach in
emerging markets. Manitou also strengthened its presence in emerg-
ing markets. The Group opened a factory in Brazil in 2016. In 2017, it
then acquired the India-based business Terex Equipment Private Lim-
ited (TEPL).
A major takeover was completed by US tractor manufacturer John
Deere, which acquired the German Wirtgen Group. This acquisition is
aimed at bolstering the group’s global growth strategy in the area of
construction equipment.
United Rentals, one of the largest global rental companies for worksite
technology based in North America, is acquiring Neff Rentals. This fol-
lows the acquisition of NES Rental Holdings, Inc., which was finalized
in April 2017. Acquiring these two US companies will enable United
Rentals to increase its presence in the US market while at the same
time improving its technology know-how, infrastructure and cross-sell-
ing potential.
Combined Management Report 33
Konze
rnabschlu
ss
Strengthening competitive position through alliances and part-
nerships
Cologne-based engine manufacturer Deutz and Liebherr Machines
Bulle S.A. will work together in future to develop four diesel engines
for off-highway use. The companies aim to start production in 2019 to
coincide with the introduction of the EU Stage V emissions standard.
The two groups now supply each other with engines within the frame-
work of this collaboration, which builds on the existing partnership be-
tween these two companies. Manitou and Yanmar have joined forces
in the US market to distribute reconditioned engines, which are then
brought to market via the Gehl and Mustang sales network. This ena-
bles Manitou to offer end customers a more cost-effective alternative
to new engines with shorter lead times.
Increasing efficiency through restructuring measures
Multiple companies have decided to implement extensive restructuring
measures. In January 2017, for example, Atlas Copco announced its
plans to split the group into two companies. In future, the mining, in-
frastructure and raw materials business will operate under the name
Epiroc. Back in 2016, Terex Cranes consolidated its US production
activities into a single site in order to pool its resources. In 2017, the
company closed two more sites – one in China and one in Germany.
It also plans to cut a further 30 percent of its global workforce moving
forward. Caterpillar also plans to make further job cuts. Following the
closure of its factory in Gosselies, Belgium, announced in 2016, the
company now plans to cut 210 jobs at its German factories in Lünen
and Wuppertal.
Alternative drive technologies and digitalization
Digitalization and alternative drive technologies are also becoming in-
creasingly important topics in key markets for the Wacker Neuson
Group. In October 2017, John Deere announced that it was moving
into technologies and applications in the field of artificial intelligence.
As part of its strategy, the company acquired the Blue River Technol-
ogy start-up. Deutz AG is modernizing in two key areas: The Deutz
service portal went online in October, providing customers 24/7 ac-
cess to its service offering. At the same time, the company is investing
in modern drive technologies and has acquired Torqueedo GmbH, a
German manufacturer of electric drives. This move will enable Deutz
to develop hybrid and fully electric solutions for off-highway use in fu-
ture. Other companies are also following this trend. US engine manu-
facturer Cummins has acquired battery producer Brammo Inc. The
company aims to harness Brammo’s expertise in electrified solutions
and expand into new markets. Volvo Construction Equipment is build-
ing a dedicated test center for electric mobility and has announced that
it will be investing around EUR 20 million in the project.
Market position further strengthened
Taking the revenue developments of listed competitors as an indicator
of performance, the Wacker Neuson Group was able to strengthen its
market share both nationally and internationally in 2017 and also bol-
ster its position in selected regions. This was aided in particular by the
Group’s solid position in Europe and the US. The Group is able to
benefit from these positive market trends thanks to its innovative
strength and flexibility as well as ever increasing diversification across
target markets, cross-selling between product areas and its strong fi-
nancial position and independence.
Strategic alliances
The Wacker Neuson Group entered into five new strategic alliances in
2017:
John Deere
Group affiliate Kramer-Werke GmbH and John Deere GmbH & Co.
KG, a member of the Deere & Company Group, USA, entered into a
strategic alliance in 2017 covering the sale of Kramer-branded tele-
scopic handlers and wheel loaders for the agricultural sector. The
agreement between Kramer and John Deere covers the sale of Kra-
mer-branded compact equipment (the “green line”) to customers in the
agricultural industry. Featuring the Kramer design and brand, the ma-
chines are distributed via the John Deere dealer network. The market
for material handling products in the agricultural sector is growing rap-
idly. Kramer is looking to gain broad and lasting access to the agricul-
tural market through this close, future-focused collaboration with the
John Deere dealer network. John Deere recommends Kramer to its
sales partners as the preferred supplier for 13 all-wheel drive, compact
wheel loaders and tele wheel loaders, 9 telescopic handlers (6–9 me-
ter lifting heights) and for a wide selection of attachments, accessories
and spare parts. The products are developed and manufactured at the
Kramer site in Pfullendorf. Operations under the new partnership
started in the second half of the year and has been developing posi-
tively right from the word go. The aim of the agreement is to establish
a long-term collaboration between the two companies.
The strategic alliance between the Kramer Group brand and agricul-
tural equipment manufacturer Claas came to an end at the close of
fiscal 2017. In June 2015, the two partners reached a mutual agree-
ment to terminate their alliance. Claas now collaborates with Liebherr
in the area of telescopic handlers.
ISEKI
In 2017, ISEKI & Co., Ltd., a Japanese agricultural equipment manu-
facturer specializing in tractors, farming machinery and gardening
equipment, and the Weidemann affiliate entered into a strategic sales
alliance. ISEKI distributes Weidemann-branded wheel loaders and
telescopic handlers via its extensive sales network in Japan. The col-
laboration gives Weidemann products access to the Japanese market.
ISEKI is planning to expand distribution of agricultural machinery in
general in Japan. Over the coming years, many Japanese agricultural
organizations will evolve to become modern, mechanized landhold-
ings. Efficiency will be a key priority here and wheel loaders will be the
first machines required for this transition. Additional compact equip-
ment from Weidemann could then be added to the portfolio in future.
Everdigm
In May 2017, Wacker Neuson signed an agreement with a new dealer
for compact equipment in South Korea. The Korean Everdigm Corpo-
ration is a local market leader for concrete pumps and attachments.
The company also manufactures construction equipment, mining
equipment and special-purpose vehicles. The sales alliance will ini-
tially focus on wheel loaders and then gradually expand to include ex-
cavators and other construction equipment.
34 Wacker Neuson Group Annual Report 2017
MHE-Demag
MHE-Demag manufactures cranes, hoists and warehousing equip-
ment. The company distributes its products in the ASEAN region via a
network of over 60 sales and service locations. Wacker Neuson and
MHE-Demag recently announced that they will be entering into a col-
laboration. This will enable Wacker Neuson to further expand its brand
presence and product reach in the region. At the start of December
2017, a range of Wacker Neuson track and mobile excavators, tele-
scopic handlers, wheel loaders and wheel dumpers were unveiled at
a launch event in Parañaque City, in the Philippines. MHE-Demag is
headquartered in Singapore and operates 11 production facilities.
Randon
The Wacker Neuson Group and Brazilian transport and commercial
vehicle manufacturer Randon have formed a strategic alliance cover-
ing the manufacture of backhoe loaders. The compact machines are
manufactured by Randon at its production site in the Brazilian city of
Caxias do Sul and distributed in South America via the Wacker
Neuson sales network. This enables Wacker Neuson to offer backhoe
loaders in the 6- to 7-ton weight class tailored specifically to the needs
of the South American market.
Wirtgen/Hamm
Wacker Neuson formed a strategic alliance in 2015 with Hamm AG. A
member of the Wirtgen Group, Hamm manufactures tandem rollers in
the 1.8- to 4.5-ton category and compactors weighing up to 12 tons in
line with technical and design specifications developed by Wacker
Neuson. This future-oriented cooperation complements the Wacker
Neuson product portfolio, enabling Wacker Neuson to round off its of-
fering in the soil and asphalt compaction segment.
Caterpillar
Wacker Neuson has been developing and manufacturing mini exca-
vators with a total weight of up to three tons for Caterpillar since 2010.
Caterpillar distributes these machines globally under its own brand via
its sales network, with the exception of Japan. In 2016, the Wacker
Neuson Group and Caterpillar announced that they would be termi-
nating their strategic alliance for mini excavators weighing under three
tons as of May 31, 2018. However, Wacker Neuson plans to continue
manufacturing and delivering the full scope of mini excavators for Cat-
erpillar until the end of 2018 as part of an OEM delivery agreement. In
addition, the Group will most likely provide Caterpillar with selected
mini excavator models until the end of 2019.
Forming alliances will remain an important strategy for the Group in
future and an effective means of opening up new sales channels and
complementing its own portfolio with selected products.
1 EBIT margin = EBIT/revenue.
Business trends
Revenue reaches new record high
Strong growth in core markets
Significant rise in profitability
General statement on business performance
Reflecting the successful implementation of its global growth strategy
and the generally positive situation in the core markets of Europe and
North America, the Wacker Neuson Group reported positive business
development in 2017.
Group revenue and profit grew significantly. Revenue rose to a new
record high of EUR 1,533.9 million. Nominal revenue was thus
12.7 percent higher than the previous year (2016: EUR 1,361.4 mil-
lion). Adjusted to discount currency effects, this corresponds to a rise
of 13.4 percent.
In Europe, revenue rose 10.7 percent to EUR 1,129.8 million (2016:
EUR 1,020.7 million). The Group reported its strongest gains in Ger-
many and France, as well as in Austria, Poland, Denmark, Spain and
Italy. A much more upbeat mood in the European agricultural sector
also fueled strong growth in this region.
Revenue for the Americas rose 22.5 percent to EUR 357.5 million
(2016: EUR 291.8 million). The Group reported major gains above all
in North America. This was due, on the one hand, to the need among
North American rental companies to replenish stocks of worksite tech-
nology, including generators and light towers, after the market had
been flooded by overcapacity from the oil and gas industry during the
previous two years. On the other hand, production of skid steer load-
ers at the Group’s US factory was gradually expanded. North America
accounts for over 70 percent of the global market for skid steer load-
ers. Developed specifically by Wacker Neuson for the American mar-
ket, these machines are key enablers in building successful business
relationships with dealers in the region, many of whom view skid steer
loaders as must-have products in their supplier portfolios. Sales of
compact equipment such as excavators and telescopic handlers also
increased markedly.
In the Asia-Pacific region, revenue decreased 4.7 percent to EUR 46.6
million compared to the prior-year quarter (2016: EUR 48.9 million).
The initial stocking of new dealers with compact equipment in the prior
year had pushed the 2016 baseline up.
EBIT rose 48.0 percent to EUR 131.4 million (2016: EUR 88.8 million).
This corresponds to an EBIT margin1 of 8.6 percent (2016: 6.5 per-
cent). The marked improvement in EBIT is primarily attributable to the
rise in revenue, increased productivity at the production sites and
streamlined processes and cost structures.
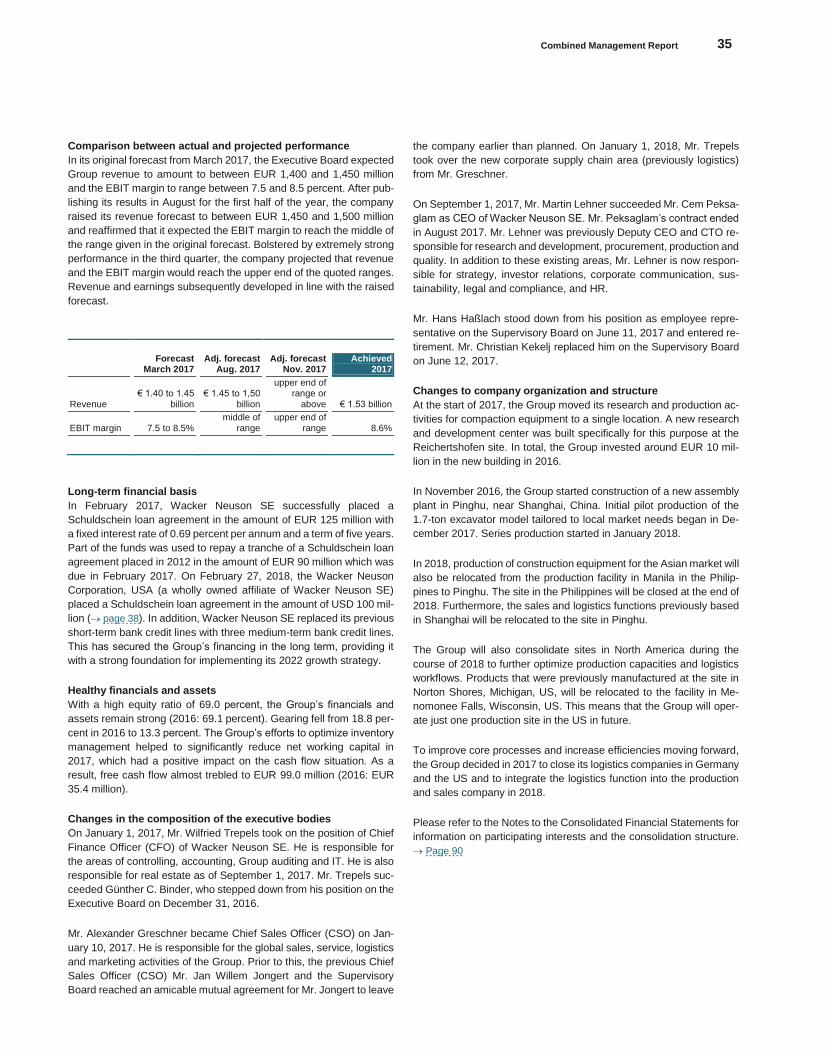
Combined Management Report 35
Konze
rnabschlu
ss
Comparison between actual and projected performance
In its original forecast from March 2017, the Executive Board expected
Group revenue to amount to between EUR 1,400 and 1,450 million
and the EBIT margin to range between 7.5 and 8.5 percent. After pub-
lishing its results in August for the first half of the year, the company
raised its revenue forecast to between EUR 1,450 and 1,500 million
and reaffirmed that it expected the EBIT margin to reach the middle of
the range given in the original forecast. Bolstered by extremely strong
performance in the third quarter, the company projected that revenue
and the EBIT margin would reach the upper end of the quoted ranges.
Revenue and earnings subsequently developed in line with the raised
forecast.
Forecast
March 2017 Adj. forecast
Aug. 2017 Adj. forecast
Nov. 2017 Achieved
2017
Revenue € 1.40 to 1.45
billion € 1.45 to 1,50
billion
upper end of range or
above € 1.53 billion
EBIT margin 7.5 to 8.5% middle of
range upper end of
range 8.6%
Long-term financial basis
In February 2017, Wacker Neuson SE successfully placed a
Schuldschein loan agreement in the amount of EUR 125 million with
a fixed interest rate of 0.69 percent per annum and a term of five years.
Part of the funds was used to repay a tranche of a Schuldschein loan
agreement placed in 2012 in the amount of EUR 90 million which was
due in February 2017. On February 27, 2018, the Wacker Neuson
Corporation, USA (a wholly owned affiliate of Wacker Neuson SE)
placed a Schuldschein loan agreement in the amount of USD 100 mil-
lion (page 38). In addition, Wacker Neuson SE replaced its previous
short-term bank credit lines with three medium-term bank credit lines.
This has secured the Group’s financing in the long term, providing it
with a strong foundation for implementing its 2022 growth strategy.
Healthy financials and assets
With a high equity ratio of 69.0 percent, the Group’s financials and
assets remain strong (2016: 69.1 percent). Gearing fell from 18.8 per-
cent in 2016 to 13.3 percent. The Group’s efforts to optimize inventory
management helped to significantly reduce net working capital in
2017, which had a positive impact on the cash flow situation. As a
result, free cash flow almost trebled to EUR 99.0 million (2016: EUR
35.4 million).
Changes in the composition of the executive bodies
On January 1, 2017, Mr. Wilfried Trepels took on the position of Chief
Finance Officer (CFO) of Wacker Neuson SE. He is responsible for
the areas of controlling, accounting, Group auditing and IT. He is also
responsible for real estate as of September 1, 2017. Mr. Trepels suc-
ceeded Günther C. Binder, who stepped down from his position on the
Executive Board on December 31, 2016.
Mr. Alexander Greschner became Chief Sales Officer (CSO) on Jan-
uary 10, 2017. He is responsible for the global sales, service, logistics
and marketing activities of the Group. Prior to this, the previous Chief
Sales Officer (CSO) Mr. Jan Willem Jongert and the Supervisory
Board reached an amicable mutual agreement for Mr. Jongert to leave
the company earlier than planned. On January 1, 2018, Mr. Trepels
took over the new corporate supply chain area (previously logistics)
from Mr. Greschner.
On September 1, 2017, Mr. Martin Lehner succeeded Mr. Cem Peksa-
glam as CEO of Wacker Neuson SE. Mr. Peksaglam’s contract ended
in August 2017. Mr. Lehner was previously Deputy CEO and CTO re-
sponsible for research and development, procurement, production and
quality. In addition to these existing areas, Mr. Lehner is now respon-
sible for strategy, investor relations, corporate communication, sus-
tainability, legal and compliance, and HR.
Mr. Hans Haßlach stood down from his position as employee repre-
sentative on the Supervisory Board on June 11, 2017 and entered re-
tirement. Mr. Christian Kekelj replaced him on the Supervisory Board
on June 12, 2017.
Changes to company organization and structure
At the start of 2017, the Group moved its research and production ac-
tivities for compaction equipment to a single location. A new research
and development center was built specifically for this purpose at the
Reichertshofen site. In total, the Group invested around EUR 10 mil-
lion in the new building in 2016.
In November 2016, the Group started construction of a new assembly
plant in Pinghu, near Shanghai, China. Initial pilot production of the
1.7-ton excavator model tailored to local market needs began in De-
cember 2017. Series production started in January 2018.
In 2018, production of construction equipment for the Asian market will
also be relocated from the production facility in Manila in the Philip-
pines to Pinghu. The site in the Philippines will be closed at the end of
2018. Furthermore, the sales and logistics functions previously based
in Shanghai will be relocated to the site in Pinghu.
The Group will also consolidate sites in North America during the
course of 2018 to further optimize production capacities and logistics
workflows. Products that were previously manufactured at the site in
Norton Shores, Michigan, US, will be relocated to the facility in Me-
nomonee Falls, Wisconsin, US. This means that the Group will oper-
ate just one production site in the US in future.
To improve core processes and increase efficiencies moving forward,
the Group decided in 2017 to close its logistics companies in Germany
and the US and to integrate the logistics function into the production
and sales company in 2018.
Please refer to the Notes to the Consolidated Financial Statements for
information on participating interests and the consolidation structure.
Page 90
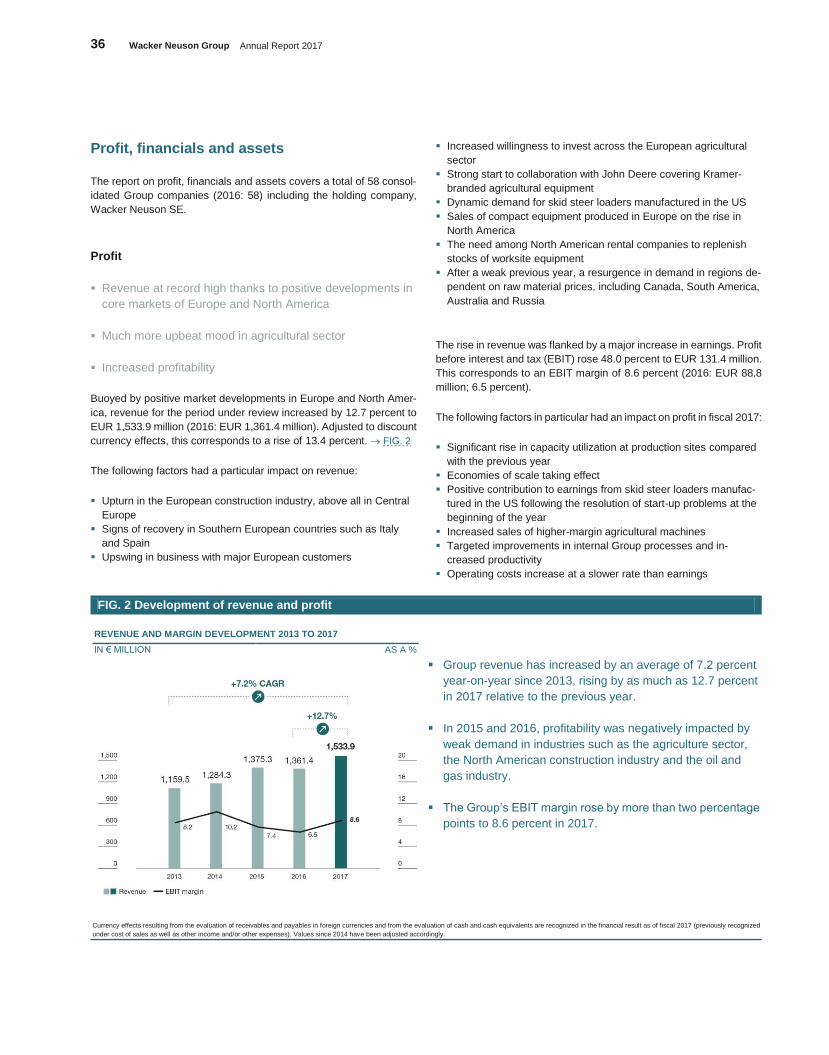
36 Wacker Neuson Group Annual Report 2017
Profit, financials and assets
The report on profit, financials and assets covers a total of 58 consol-
idated Group companies (2016: 58) including the holding company,
Wacker Neuson SE.
Profit
Revenue at record high thanks to positive developments in
core markets of Europe and North America
Much more upbeat mood in agricultural sector
Increased profitability
Buoyed by positive market developments in Europe and North Amer-
ica, revenue for the period under review increased by 12.7 percent to
EUR 1,533.9 million (2016: EUR 1,361.4 million). Adjusted to discount
currency effects, this corresponds to a rise of 13.4 percent. FIG. 2
The following factors had a particular impact on revenue:
Upturn in the European construction industry, above all in Central
Europe
Signs of recovery in Southern European countries such as Italy
and Spain
Upswing in business with major European customers
Increased willingness to invest across the European agricultural
sector
Strong start to collaboration with John Deere covering Kramer-
branded agricultural equipment
Dynamic demand for skid steer loaders manufactured in the US
Sales of compact equipment produced in Europe on the rise in
North America
The need among North American rental companies to replenish
stocks of worksite equipment
After a weak previous year, a resurgence in demand in regions de-
pendent on raw material prices, including Canada, South America,
Australia and Russia
The rise in revenue was flanked by a major increase in earnings. Profit
before interest and tax (EBIT) rose 48.0 percent to EUR 131.4 million.
This corresponds to an EBIT margin of 8.6 percent (2016: EUR 88.8
million; 6.5 percent).
The following factors in particular had an impact on profit in fiscal 2017:
Significant rise in capacity utilization at production sites compared
with the previous year
Economies of scale taking effect
Positive contribution to earnings from skid steer loaders manufac-
tured in the US following the resolution of start-up problems at the
beginning of the year
Increased sales of higher-margin agricultural machines
Targeted improvements in internal Group processes and in-
creased productivity
Operating costs increase at a slower rate than earnings
FIG. 2 Development of revenue and profit
REVENUE AND MARGIN DEVELOPMENT 2013 TO 2017
IN € MILLION AS A %
Group revenue has increased by an average of 7.2 percent
year-on-year since 2013, rising by as much as 12.7 percent
in 2017 relative to the previous year.
In 2015 and 2016, profitability was negatively impacted by
weak demand in industries such as the agriculture sector,
the North American construction industry and the oil and
gas industry.
The Group’s EBIT margin rose by more than two percentage
points to 8.6 percent in 2017.
Currency effects resulting from the evaluation of receivables and payables in foreign currencies and from the evaluation of cash and cash equivalents are recognized in the financial result as of fiscal 2017 (previously recognized
under cost of sales as well as other income and/or other expenses). Values since 2014 have been adjusted accordingly.
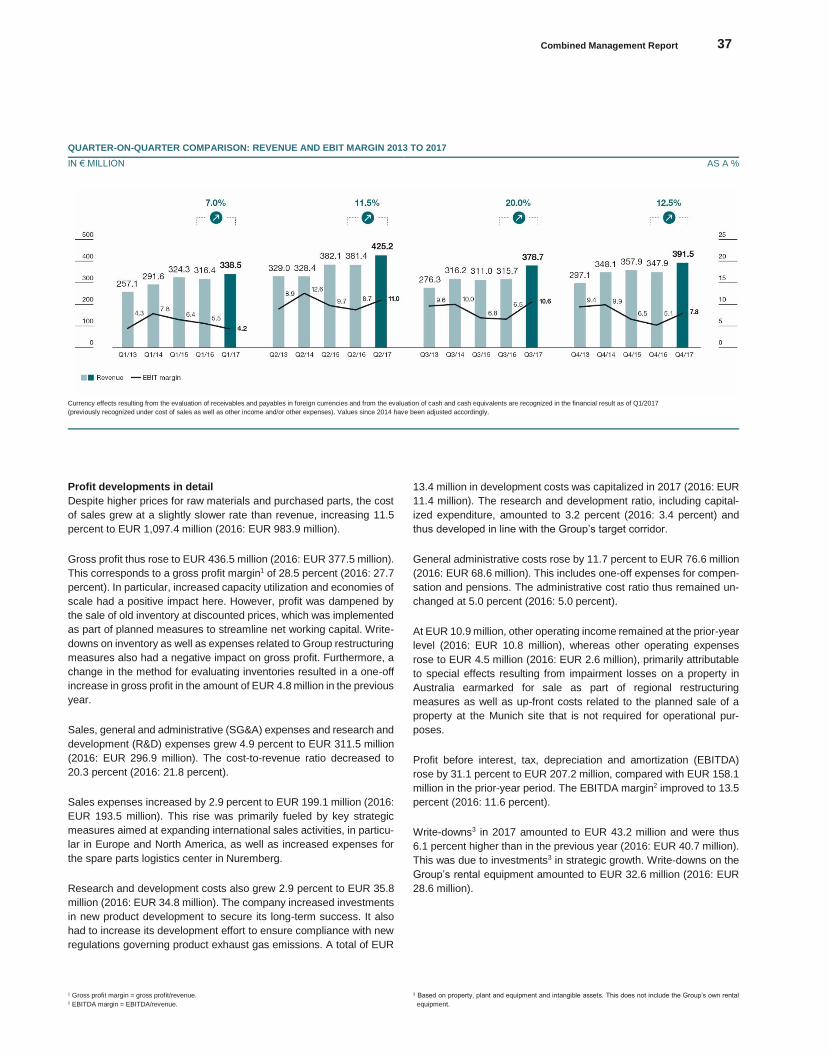
Combined Management Report 37
Konze
rnabschlu
ss
QUARTER-ON-QUARTER COMPARISON: REVENUE AND EBIT MARGIN 2013 TO 2017
IN € MILLION AS A %
Currency effects resulting from the evaluation of receivables and payables in foreign currencies and from the evaluation of cash and cash equivalents are recognized in the financial result as of Q1/2017
(previously recognized under cost of sales as well as other income and/or other expenses). Values since 2014 have been adjusted accordingly.
Profit developments in detail
Despite higher prices for raw materials and purchased parts, the cost
of sales grew at a slightly slower rate than revenue, increasing 11.5
percent to EUR 1,097.4 million (2016: EUR 983.9 million).
Gross profit thus rose to EUR 436.5 million (2016: EUR 377.5 million).
This corresponds to a gross profit margin1 of 28.5 percent (2016: 27.7
percent). In particular, increased capacity utilization and economies of
scale had a positive impact here. However, profit was dampened by
the sale of old inventory at discounted prices, which was implemented
as part of planned measures to streamline net working capital. Write-
downs on inventory as well as expenses related to Group restructuring
measures also had a negative impact on gross profit. Furthermore, a
change in the method for evaluating inventories resulted in a one-off
increase in gross profit in the amount of EUR 4.8 million in the previous
year.
Sales, general and administrative (SG&A) expenses and research and
development (R&D) expenses grew 4.9 percent to EUR 311.5 million
(2016: EUR 296.9 million). The cost-to-revenue ratio decreased to
20.3 percent (2016: 21.8 percent).
Sales expenses increased by 2.9 percent to EUR 199.1 million (2016:
EUR 193.5 million). This rise was primarily fueled by key strategic
measures aimed at expanding international sales activities, in particu-
lar in Europe and North America, as well as increased expenses for
the spare parts logistics center in Nuremberg.
Research and development costs also grew 2.9 percent to EUR 35.8
million (2016: EUR 34.8 million). The company increased investments
in new product development to secure its long-term success. It also
had to increase its development effort to ensure compliance with new
regulations governing product exhaust gas emissions. A total of EUR
1 Gross profit margin = gross profit/revenue. 2 EBITDA margin = EBITDA/revenue.
13.4 million in development costs was capitalized in 2017 (2016: EUR
11.4 million). The research and development ratio, including capital-
ized expenditure, amounted to 3.2 percent (2016: 3.4 percent) and
thus developed in line with the Group’s target corridor.
General administrative costs rose by 11.7 percent to EUR 76.6 million
(2016: EUR 68.6 million). This includes one-off expenses for compen-
sation and pensions. The administrative cost ratio thus remained un-
changed at 5.0 percent (2016: 5.0 percent).
At EUR 10.9 million, other operating income remained at the prior-year
level (2016: EUR 10.8 million), whereas other operating expenses
rose to EUR 4.5 million (2016: EUR 2.6 million), primarily attributable
to special effects resulting from impairment losses on a property in
Australia earmarked for sale as part of regional restructuring
measures as well as up-front costs related to the planned sale of a
property at the Munich site that is not required for operational pur-
poses.
Profit before interest, tax, depreciation and amortization (EBITDA)
rose by 31.1 percent to EUR 207.2 million, compared with EUR 158.1
million in the prior-year period. The EBITDA margin2 improved to 13.5
percent (2016: 11.6 percent).
Write-downs3 in 2017 amounted to EUR 43.2 million and were thus
6.1 percent higher than in the previous year (2016: EUR 40.7 million).
This was due to investments3 in strategic growth. Write-downs on the
Group’s rental equipment amounted to EUR 32.6 million (2016: EUR
28.6 million).
3 Based on property, plant and equipment and intangible assets. This does not include the Group’s own rental
equipment.
38 Wacker Neuson Group Annual Report 2017
Profit before interest and tax (EBIT) rose 48.0 percent to EUR 131.4
million. The EBIT margin came to 8.6 percent (2016: EUR 88.8 million;
6.5 percent).
Profit for 2017 was impacted by expenses for one-off effects and re-
structuring measures in the total amount of EUR 12.6 million. EUR 8.2
million of which is attributable to one-off effects resulting from impair-
ment losses on old inventory, reorganization of the Executive Board
and up-front costs related to the planned sale of a property at the Mu-
nich site that is not required for operational purposes. In addition, the
Group recognized expenses for restructuring foreign affiliates in the
amount of EUR 4.9 million in 2017. The total restructuring item for fis-
cal 2017 amounted to EUR 4.4 million. This includes proceeds from
the reversal of a provision for restructuring measures from 2016 in the
amount of EUR 0.5 million that was no longer required (provision 2016:
EUR 0.7 million). In the previous year, EBIT was increased by a posi-
tive effect resulting from a change in the method for evaluating inven-
tories (EUR 4.8 million).
The financial result amounted to EUR -6.0 million (2016: EUR -7.4 mil-
lion). For further information on the financial result, refer to the “Finan-
cial position” section and item 5, "Financial result" in the Notes to the
Consolidated Financial Statements. Page 98
Profit before tax (EBT) amounted to EUR 125.4 million and thus in-
creased by 54.1 percent (2016: EUR 81.4 million). Tax expenditure
came to EUR 37.9 million (2016: EUR 24.2 million), which corre-
sponds to a Group tax rate of 30.2 percent (2016: 29.7 percent).
Please refer to item 6, “Taxes on income” in the Notes to the Consoli-
dated Financial Statements for further information. Page 99
Group profit is recognized at EUR 87.5 million, which represents an
increase of 53.0 percent (2016: EUR 57.2 million). Net return on rev-
enue rose sharply to 5.7 percent (2016: 4.2 percent).
70.14 million ordinary shares were in circulation at all times during the
fiscal year. This resulted in earnings per share (diluted and undiluted)
of EUR 1.25 (2016: EUR 0.81).
Quarterly developments
The figure above shows quarterly revenue and profit for 2017 and
2016. Revenue for the first quarter increased by 7.0 percent. The pace
of growth accelerated significantly in the second and third quarters,
with the company reporting gains of 11.5 and 20.0 percent respec-
tively compared with the prior-year quarters. Revenue for the fourth
quarter rose by 12.5 percent relative to the prior-year figure. The com-
pany’s performance in the fourth quarter is described in more detail
under “Developments in Q4 2017”. Page 44
Financial position
Investments secure long-term growth prospects
Free cash flow almost trebled due to the rise in profit and
systematic management of net working capital
Principles and targets of financial management
At the Wacker Neuson Group, financial management encompasses
the planning, management and controlling of all measures related to
the sourcing (financing) and utilization (investment) of funds. The main
focus is on ensuring and maintaining liquidity in the form of sufficient
credit lines or liquid funds. Financial management also aims to opti-
mize the company’s risk/return ratio or profitability (return on equity
and on assets) while ensuring conformity with the company’s general
risk policy (general, investment and financing risks). The Group draws
on set balance sheet ratios and key indicators to manage its financing
needs. The most important indicators here are net financial debt – re-
sulting from current net financial liabilities and non-current financial li-
abilities – and the equity ratio.
The company’s aim is to fund day-to-day operations with cash flow
from operating activities. Surplus funds are invested in safe, highly liq-
uid instruments where they earn the prevailing interest rates. Depend-
ing on the currency in question, the interest rates may also have been
negative in 2017.
The Wacker Neuson Group uses standard derivative financial instru-
ments such as foreign exchange forward contracts and foreign ex-
change swaps to minimize risks.
In 2012, Wacker Neuson SE placed a Schuldschein loan agreement
with cooperative, savings and private banks. This loan agreement was
used to convert short-term borrowings into long-term borrowings, thus
optimizing capital structure. Tranche I of the Schuldschein loan agree-
ment in the amount of EUR 90 million was due in February 2017. A
new Schuldschein loan agreement was issued.
KEY FINANCIAL INSTRUMENTS
Amount
in million Due
Interest rate
as a %
Schuldschein loan 2012 agreement (Tranche II) € 29.9 2019 3.66
Schuldschein loan 2017 € 124.9 2022 0.69
Schuldschein loan 2018 agreement (Tranche I) USD 77.4 2023 3.97
Schuldschein loan 2018 agreement (Tranche II) USD 22.5 2025 4.26
Borrowings from banks € 20.3 n/a variable
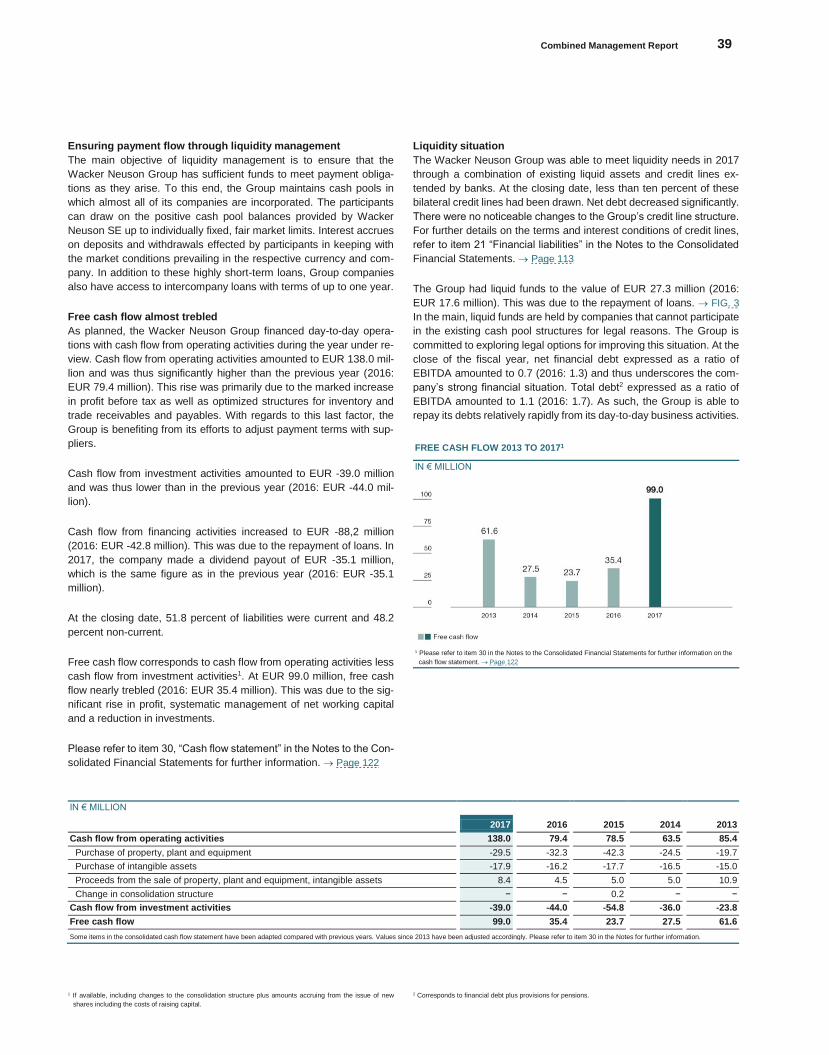
Combined Management Report 39
Konze
rnabschlu
ss
Ensuring payment flow through liquidity management
The main objective of liquidity management is to ensure that the
Wacker Neuson Group has sufficient funds to meet payment obliga-
tions as they arise. To this end, the Group maintains cash pools in
which almost all of its companies are incorporated. The participants
can draw on the positive cash pool balances provided by Wacker
Neuson SE up to individually fixed, fair market limits. Interest accrues
on deposits and withdrawals effected by participants in keeping with
the market conditions prevailing in the respective currency and com-
pany. In addition to these highly short-term loans, Group companies
also have access to intercompany loans with terms of up to one year.
Free cash flow almost trebled
As planned, the Wacker Neuson Group financed day-to-day opera-
tions with cash flow from operating activities during the year under re-
view. Cash flow from operating activities amounted to EUR 138.0 mil-
lion and was thus significantly higher than the previous year (2016:
EUR 79.4 million). This rise was primarily due to the marked increase
in profit before tax as well as optimized structures for inventory and
trade receivables and payables. With regards to this last factor, the
Group is benefiting from its efforts to adjust payment terms with sup-
pliers.
Cash flow from investment activities amounted to EUR -39.0 million
and was thus lower than in the previous year (2016: EUR -44.0 mil-
lion).
Cash flow from financing activities increased to EUR -88,2 million
(2016: EUR -42.8 million). This was due to the repayment of loans. In
2017, the company made a dividend payout of EUR -35.1 million,
which is the same figure as in the previous year (2016: EUR -35.1
million).
At the closing date, 51.8 percent of liabilities were current and 48.2
percent non-current.
Free cash flow corresponds to cash flow from operating activities less
cash flow from investment activities1. At EUR 99.0 million, free cash
flow nearly trebled (2016: EUR 35.4 million). This was due to the sig-
nificant rise in profit, systematic management of net working capital
and a reduction in investments.
Please refer to item 30, “Cash flow statement” in the Notes to the Con-
solidated Financial Statements for further information. Page 122
Liquidity situation
The Wacker Neuson Group was able to meet liquidity needs in 2017
through a combination of existing liquid assets and credit lines ex-
tended by banks. At the closing date, less than ten percent of these
bilateral credit lines had been drawn. Net debt decreased significantly.
There were no noticeable changes to the Group’s credit line structure.
For further details on the terms and interest conditions of credit lines,
refer to item 21 “Financial liabilities” in the Notes to the Consolidated
Financial Statements. Page 113
The Group had liquid funds to the value of EUR 27.3 million (2016:
EUR 17.6 million). This was due to the repayment of loans. FIG. 3
In the main, liquid funds are held by companies that cannot participate
in the existing cash pool structures for legal reasons. The Group is
committed to exploring legal options for improving this situation. At the
close of the fiscal year, net financial debt expressed as a ratio of
EBITDA amounted to 0.7 (2016: 1.3) and thus underscores the com-
pany’s strong financial situation. Total debt2 expressed as a ratio of
EBITDA amounted to 1.1 (2016: 1.7). As such, the Group is able to
repay its debts relatively rapidly from its day-to-day business activities.
FREE CASH FLOW 2013 TO 20171
IN € MILLION
1 Please refer to item 30 in the Notes to the Consolidated Financial Statements for further information on the
cash flow statement. Page 122
IN € MILLION
2017 2016 2015 2014 2013
Cash flow from operating activities 138.0 79.4 78.5 63.5 85.4
Purchase of property, plant and equipment -29.5 -32.3 -42.3 -24.5 -19.7
Purchase of intangible assets -17.9 -16.2 -17.7 -16.5 -15.0
Proceeds from the sale of property, plant and equipment, intangible assets 8.4 4.5 5.0 5.0 10.9
Change in consolidation structure − − 0.2 − −
Cash flow from investment activities -39.0 -44.0 -54.8 -36.0 -23.8
Free cash flow 99.0 35.4 23.7 27.5 61.6
Some items in the consolidated cash flow statement have been adapted compared with previous years. Values since 2013 have been adjusted accordingly. Please refer to item 30 in the Notes for further information.
1 If available, including changes to the consolidation structure plus amounts accruing from the issue of new
shares including the costs of raising capital.
2 Corresponds to financial debt plus provisions for pensions.
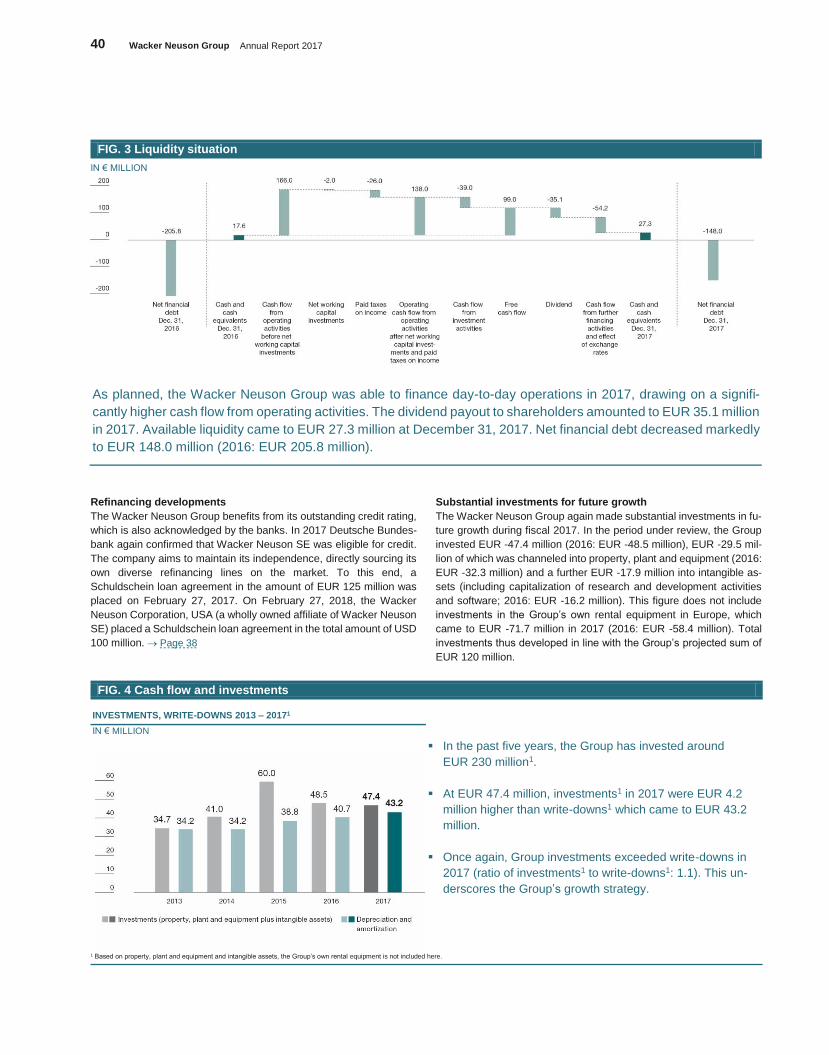
40 Wacker Neuson Group Annual Report 2017
FIG. 3 Liquidity situation
IN € MILLION
As planned, the Wacker Neuson Group was able to finance day-to-day operations in 2017, drawing on a signifi-
cantly higher cash flow from operating activities. The dividend payout to shareholders amounted to EUR 35.1 million
in 2017. Available liquidity came to EUR 27.3 million at December 31, 2017. Net financial debt decreased markedly
to EUR 148.0 million (2016: EUR 205.8 million).
Refinancing developments
The Wacker Neuson Group benefits from its outstanding credit rating,
which is also acknowledged by the banks. In 2017 Deutsche Bundes-
bank again confirmed that Wacker Neuson SE was eligible for credit.
The company aims to maintain its independence, directly sourcing its
own diverse refinancing lines on the market. To this end, a
Schuldschein loan agreement in the amount of EUR 125 million was
placed on February 27, 2017. On February 27, 2018, the Wacker
Neuson Corporation, USA (a wholly owned affiliate of Wacker Neuson
SE) placed a Schuldschein loan agreement in the total amount of USD
100 million. Page 38
Substantial investments for future growth
The Wacker Neuson Group again made substantial investments in fu-
ture growth during fiscal 2017. In the period under review, the Group
invested EUR -47.4 million (2016: EUR -48.5 million), EUR -29.5 mil-
lion of which was channeled into property, plant and equipment (2016:
EUR -32.3 million) and a further EUR -17.9 million into intangible as-
sets (including capitalization of research and development activities
and software; 2016: EUR -16.2 million). This figure does not include
investments in the Group’s own rental equipment in Europe, which
came to EUR -71.7 million in 2017 (2016: EUR -58.4 million). Total
investments thus developed in line with the Group’s projected sum of
EUR 120 million.
FIG. 4 Cash flow and investments
INVESTMENTS, WRITE-DOWNS 2013 – 20171
In the past five years, the Group has invested around
EUR 230 million1.
At EUR 47.4 million, investments1 in 2017 were EUR 4.2
million higher than write-downs1 which came to EUR 43.2
million.
Once again, Group investments exceeded write-downs in
2017 (ratio of investments1 to write-downs1: 1.1). This un-
derscores the Group’s growth strategy.
IN € MILLION
1 Based on property, plant and equipment and intangible assets, the Group’s own rental equipment is not included here.

Combined Management Report 41
Konze
rnabschlu
ss
FIG. 5 Development of net working capital and inventory
NET WORKING CAPITAL 2013 TO 2017 INVENTORIES 2013 TO 2017
IN € MILLION AS A % IN € MILLION IN DAYS
Through the systematic management of net working capital, the ratio of net working capital to revenue fell from 42.0 percent
to 36.1 percent. This is the lowest figure in the last five years. Inventory levels decreased significantly despite the rise in rev-
enue. Days inventory outstanding improved to 145 days. In the medium term, the Group aims to achieve a net working capi-
tal ratio of ≤ 30 percent and days inventory outstanding of < 130 days.
The ratio of investments in tangible and intangible assets to write-
downs amounted to 1.1 (2016: 1.2) and thus underscores the Group’s
commitment to further growth. FIG 4
Net working capital developments
Targeted inventory management is crucial for meeting the needs of
the global market. The company needs to maintain higher stock levels
in light of the increased complexity of managing product parts and
model versions, which is partly due to amended emissions legislation
governing construction equipment. The Group’s inventory levels of fin-
ished products are relatively high in comparison with competitors as it
distributes its products in Europe via its own affiliates, as well as its
sales and service stations. This is a crucial difference compared to the
“dealer-only” model operated by almost all of its competitors, which
means that competitor inventory machines are reported in their deal-
ers’ balance sheets.
The steps outlined by the Executive Board to reduce the share of net
working capital to revenue in the medium term are increasingly taking
effect. This has resulted in a reduction in net working capital despite
the marked rise in revenue. Average net working capital amounted to
EUR 553.9 million (2016: EUR 571.9 million). Average net working
capital expressed as a percentage of revenue for the year improved
markedly at 36.1 percent (2016: 42.0 percent). FIG. 5
Despite the clear rise in revenue, the company managed to reduce
inventory levels by 2.6 percent to EUR 431.4 million (2016: EUR 443.1
million). Days inventory outstanding decreased 15 percent from 170
to 145 days.1 At the same time, the structure of inventory improved.
On the one hand, levels of old inventory fell significantly. On the other
hand, the Group produced inventory for existing orders for the follow-
ing year in the fourth quarter of 2017.
Trade payables grew at an above-average rate of 46.1 percent to EUR
128.0 million (2016: EUR 87.6 million) – not least due to the Group’s
efforts to adjust payment terms. The range for payables rose from 31
to 36 days.2 Trade receivables rose by 10.0 percent to EUR 235.1 mil-
lion (2016: EUR 213.8 million). At 53 days, the range remained at the
same level as the previous year.3
IN € MILLION
2017 2016 2015 2014 2013
Inventory 431.4 443.1 474.6 424.0 333.8
+ Trade receivables 235.1 213.8 180.0 173.3 164.0
- Trade payables 128.0 87.6 80.1 65.2 44.7
Net working capital 538.5 569.3 574.5 532.1 453.1
Average net working capital = (opening + closing)/2 553.9 571.9 553.3 492.6 455.0
Average net working capital to revenue ratio 36.1% 42.0% 40.2% 38.4% 39.2%
1 Note on calculation: Average inventory levels / cost of sales * 365 days. 2 Note on calculation: Average trade payables / cost of sales * 365 days.
3 Note on calculation: Average trade receivables / revenue * 365 days.
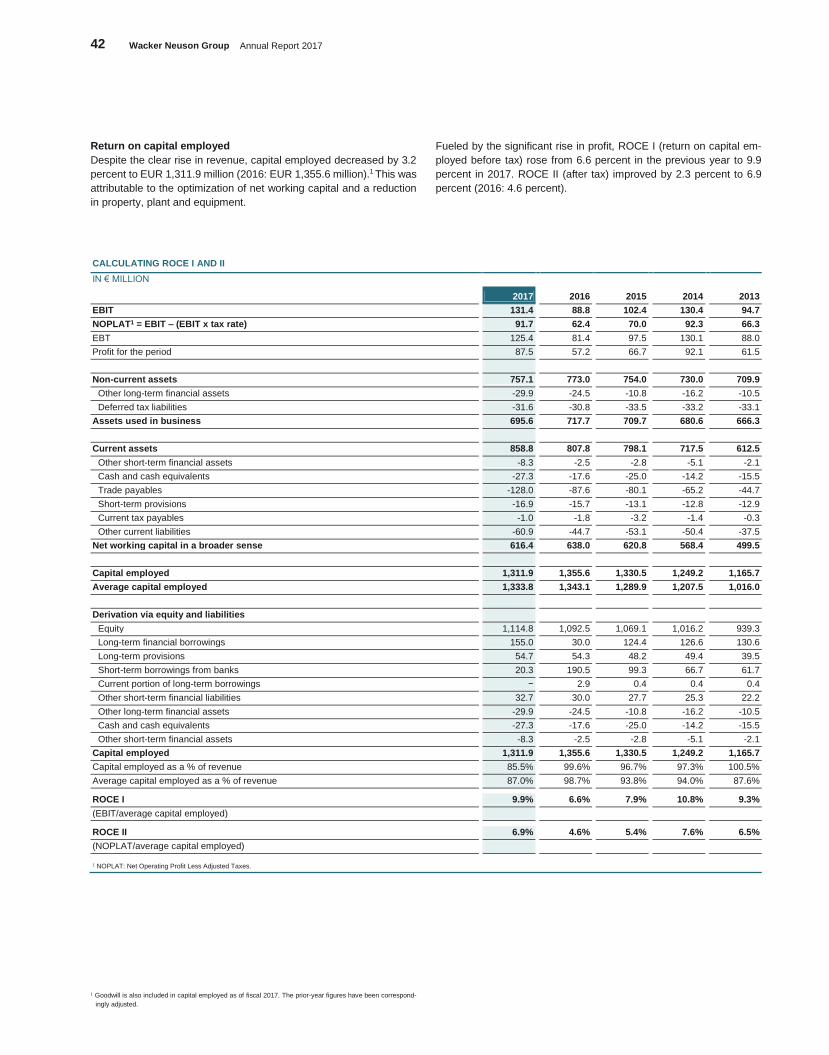
42 Wacker Neuson Group Annual Report 2017
Return on capital employed
Despite the clear rise in revenue, capital employed decreased by 3.2
percent to EUR 1,311.9 million (2016: EUR 1,355.6 million).1 This was
attributable to the optimization of net working capital and a reduction
in property, plant and equipment.
Fueled by the significant rise in profit, ROCE I (return on capital em-
ployed before tax) rose from 6.6 percent in the previous year to 9.9
percent in 2017. ROCE II (after tax) improved by 2.3 percent to 6.9
percent (2016: 4.6 percent).
CALCULATING ROCE I AND II
IN € MILLION
2017 2016 2015 2014 2013
EBIT 131.4 88.8 102.4 130.4 94.7
NOPLAT1 = EBIT – (EBIT x tax rate) 91.7 62.4 70.0 92.3 66.3
EBT 125.4 81.4 97.5 130.1 88.0
Profit for the period 87.5 57.2 66.7 92.1 61.5
Non-current assets 757.1 773.0 754.0 730.0 709.9
Other long-term financial assets -29.9 -24.5 -10.8 -16.2 -10.5
Deferred tax liabilities -31.6 -30.8 -33.5 -33.2 -33.1
Assets used in business 695.6 717.7 709.7 680.6 666.3
Current assets 858.8 807.8 798.1 717.5 612.5
Other short-term financial assets -8.3 -2.5 -2.8 -5.1 -2.1
Cash and cash equivalents -27.3 -17.6 -25.0 -14.2 -15.5
Trade payables -128.0 -87.6 -80.1 -65.2 -44.7
Short-term provisions -16.9 -15.7 -13.1 -12.8 -12.9
Current tax payables -1.0 -1.8 -3.2 -1.4 -0.3
Other current liabilities -60.9 -44.7 -53.1 -50.4 -37.5
Net working capital in a broader sense 616.4 638.0 620.8 568.4 499.5
Capital employed 1,311.9 1,355.6 1,330.5 1,249.2 1,165.7
Average capital employed 1,333.8 1,343.1 1,289.9 1,207.5 1,016.0
Derivation via equity and liabilities
Equity 1,114.8 1,092.5 1,069.1 1,016.2 939.3
Long-term financial borrowings 155.0 30.0 124.4 126.6 130.6
Long-term provisions 54.7 54.3 48.2 49.4 39.5
Short-term borrowings from banks 20.3 190.5 99.3 66.7 61.7
Current portion of long-term borrowings − 2.9 0.4 0.4 0.4
Other short-term financial liabilities 32.7 30.0 27.7 25.3 22.2
Other long-term financial assets -29.9 -24.5 -10.8 -16.2 -10.5
Cash and cash equivalents -27.3 -17.6 -25.0 -14.2 -15.5
Other short-term financial assets -8.3 -2.5 -2.8 -5.1 -2.1
Capital employed 1,311.9 1,355.6 1,330.5 1,249.2 1,165.7
Capital employed as a % of revenue 85.5% 99.6% 96.7% 97.3% 100.5%
Average capital employed as a % of revenue 87.0% 98.7% 93.8% 94.0% 87.6%
ROCE I 9.9% 6.6% 7.9% 10.8% 9.3%
(EBIT/average capital employed)
ROCE II 6.9% 4.6% 5.4% 7.6% 6.5%
(NOPLAT/average capital employed)
1 NOPLAT: Net Operating Profit Less Adjusted Taxes.
1 Goodwill is also included in capital employed as of fiscal 2017. The prior-year figures have been correspond-
ingly adjusted.
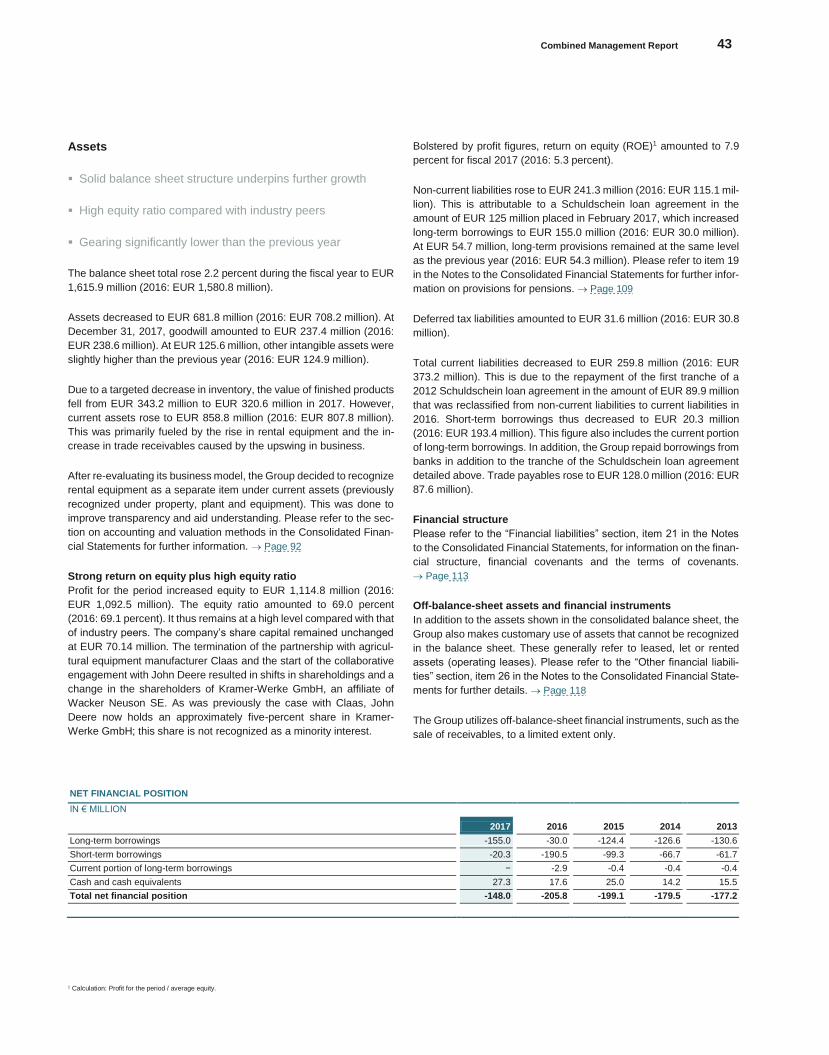
Combined Management Report 43
Konze
rnabschlu
ss
Assets
Solid balance sheet structure underpins further growth
High equity ratio compared with industry peers
Gearing significantly lower than the previous year
The balance sheet total rose 2.2 percent during the fiscal year to EUR
1,615.9 million (2016: EUR 1,580.8 million).
Assets decreased to EUR 681.8 million (2016: EUR 708.2 million). At
December 31, 2017, goodwill amounted to EUR 237.4 million (2016:
EUR 238.6 million). At EUR 125.6 million, other intangible assets were
slightly higher than the previous year (2016: EUR 124.9 million).
Due to a targeted decrease in inventory, the value of finished products
fell from EUR 343.2 million to EUR 320.6 million in 2017. However,
current assets rose to EUR 858.8 million (2016: EUR 807.8 million).
This was primarily fueled by the rise in rental equipment and the in-
crease in trade receivables caused by the upswing in business.
After re-evaluating its business model, the Group decided to recognize
rental equipment as a separate item under current assets (previously
recognized under property, plant and equipment). This was done to
improve transparency and aid understanding. Please refer to the sec-
tion on accounting and valuation methods in the Consolidated Finan-
cial Statements for further information. Page 92
Strong return on equity plus high equity ratio
Profit for the period increased equity to EUR 1,114.8 million (2016:
EUR 1,092.5 million). The equity ratio amounted to 69.0 percent
(2016: 69.1 percent). It thus remains at a high level compared with that
of industry peers. The company’s share capital remained unchanged
at EUR 70.14 million. The termination of the partnership with agricul-
tural equipment manufacturer Claas and the start of the collaborative
engagement with John Deere resulted in shifts in shareholdings and a
change in the shareholders of Kramer-Werke GmbH, an affiliate of
Wacker Neuson SE. As was previously the case with Claas, John
Deere now holds an approximately five-percent share in Kramer-
Werke GmbH; this share is not recognized as a minority interest.
Bolstered by profit figures, return on equity (ROE)1 amounted to 7.9
percent for fiscal 2017 (2016: 5.3 percent).
Non-current liabilities rose to EUR 241.3 million (2016: EUR 115.1 mil-
lion). This is attributable to a Schuldschein loan agreement in the
amount of EUR 125 million placed in February 2017, which increased
long-term borrowings to EUR 155.0 million (2016: EUR 30.0 million).
At EUR 54.7 million, long-term provisions remained at the same level
as the previous year (2016: EUR 54.3 million). Please refer to item 19
in the Notes to the Consolidated Financial Statements for further infor-
mation on provisions for pensions. Page 109
Deferred tax liabilities amounted to EUR 31.6 million (2016: EUR 30.8
million).
Total current liabilities decreased to EUR 259.8 million (2016: EUR
373.2 million). This is due to the repayment of the first tranche of a
2012 Schuldschein loan agreement in the amount of EUR 89.9 million
that was reclassified from non-current liabilities to current liabilities in
2016. Short-term borrowings thus decreased to EUR 20.3 million
(2016: EUR 193.4 million). This figure also includes the current portion
of long-term borrowings. In addition, the Group repaid borrowings from
banks in addition to the tranche of the Schuldschein loan agreement
detailed above. Trade payables rose to EUR 128.0 million (2016: EUR
87.6 million).
Financial structure
Please refer to the “Financial liabilities” section, item 21 in the Notes
to the Consolidated Financial Statements, for information on the finan-
cial structure, financial covenants and the terms of covenants.
Page 113
Off-balance-sheet assets and financial instruments
In addition to the assets shown in the consolidated balance sheet, the
Group also makes customary use of assets that cannot be recognized
in the balance sheet. These generally refer to leased, let or rented
assets (operating leases). Please refer to the “Other financial liabili-
ties” section, item 26 in the Notes to the Consolidated Financial State-
ments for further details. Page 118
The Group utilizes off-balance-sheet financial instruments, such as the
sale of receivables, to a limited extent only.
NET FINANCIAL POSITION
IN € MILLION
2017 2016 2015 2014 2013
Long-term borrowings -155.0 -30.0 -124.4 -126.6 -130.6
Short-term borrowings -20.3 -190.5 -99.3 -66.7 -61.7
Current portion of long-term borrowings − -2.9 -0.4 -0.4 -0.4
Cash and cash equivalents 27.3 17.6 25.0 14.2 15.5
Total net financial position -148.0 -205.8 -199.1 -179.5 -177.2
1 Calculation: Profit for the period / average equity.
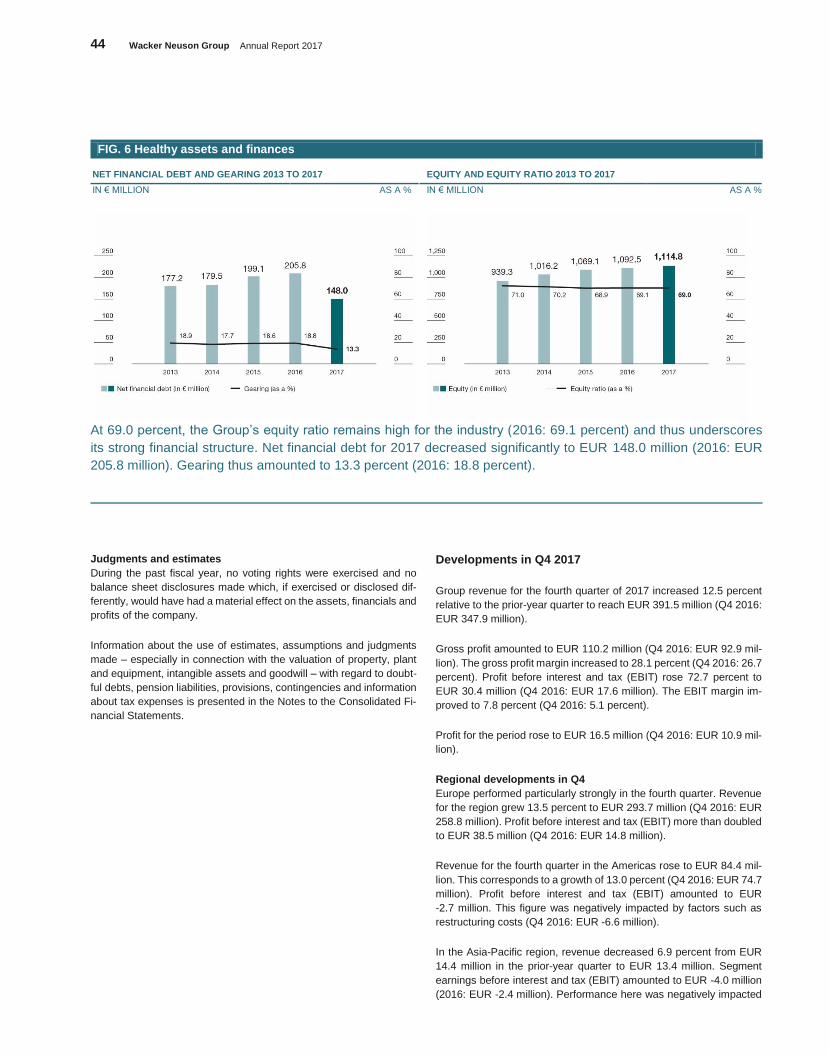
44 Wacker Neuson Group Annual Report 2017
FIG. 6 Healthy assets and finances
NET FINANCIAL DEBT AND GEARING 2013 TO 2017 EQUITY AND EQUITY RATIO 2013 TO 2017
IN € MILLION AS A % IN € MILLION AS A %
At 69.0 percent, the Group’s equity ratio remains high for the industry (2016: 69.1 percent) and thus underscores
its strong financial structure. Net financial debt for 2017 decreased significantly to EUR 148.0 million (2016: EUR
205.8 million). Gearing thus amounted to 13.3 percent (2016: 18.8 percent).
Judgments and estimates
During the past fiscal year, no voting rights were exercised and no
balance sheet disclosures made which, if exercised or disclosed dif-
ferently, would have had a material effect on the assets, financials and
profits of the company.
Information about the use of estimates, assumptions and judgments
made – especially in connection with the valuation of property, plant
and equipment, intangible assets and goodwill – with regard to doubt-
ful debts, pension liabilities, provisions, contingencies and information
about tax expenses is presented in the Notes to the Consolidated Fi-
nancial Statements.
Developments in Q4 2017
Group revenue for the fourth quarter of 2017 increased 12.5 percent
relative to the prior-year quarter to reach EUR 391.5 million (Q4 2016:
EUR 347.9 million).
Gross profit amounted to EUR 110.2 million (Q4 2016: EUR 92.9 mil-
lion). The gross profit margin increased to 28.1 percent (Q4 2016: 26.7
percent). Profit before interest and tax (EBIT) rose 72.7 percent to
EUR 30.4 million (Q4 2016: EUR 17.6 million). The EBIT margin im-
proved to 7.8 percent (Q4 2016: 5.1 percent).
Profit for the period rose to EUR 16.5 million (Q4 2016: EUR 10.9 mil-
lion).
Regional developments in Q4
Europe performed particularly strongly in the fourth quarter. Revenue
for the region grew 13.5 percent to EUR 293.7 million (Q4 2016: EUR
258.8 million). Profit before interest and tax (EBIT) more than doubled
to EUR 38.5 million (Q4 2016: EUR 14.8 million).
Revenue for the fourth quarter in the Americas rose to EUR 84.4 mil-
lion. This corresponds to a growth of 13.0 percent (Q4 2016: EUR 74.7
million). Profit before interest and tax (EBIT) amounted to EUR
-2.7 million. This figure was negatively impacted by factors such as
restructuring costs (Q4 2016: EUR -6.6 million).
In the Asia-Pacific region, revenue decreased 6.9 percent from EUR
14.4 million in the prior-year quarter to EUR 13.4 million. Segment
earnings before interest and tax (EBIT) amounted to EUR -4.0 million
(2016: EUR -2.4 million). Performance here was negatively impacted
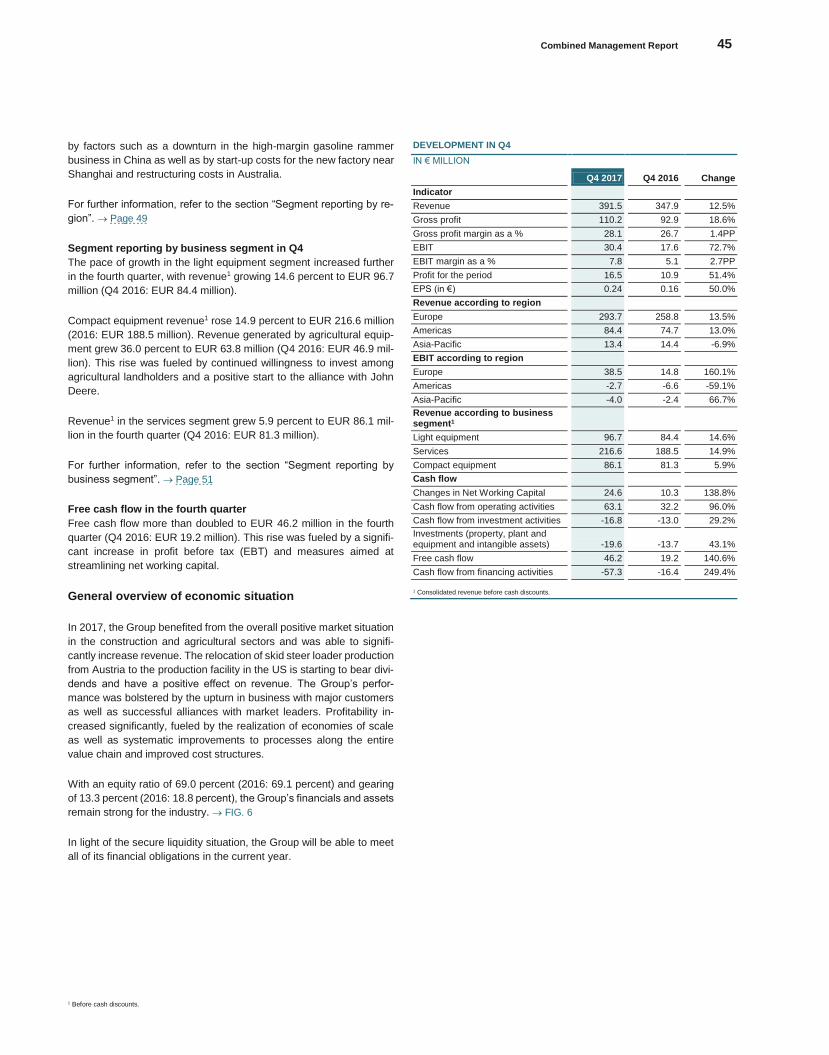
Combined Management Report 45
Konze
rnabschlu
ss
by factors such as a downturn in the high-margin gasoline rammer
business in China as well as by start-up costs for the new factory near
Shanghai and restructuring costs in Australia.
For further information, refer to the section “Segment reporting by re-
gion”. Page 49
Segment reporting by business segment in Q4
The pace of growth in the light equipment segment increased further
in the fourth quarter, with revenue1 growing 14.6 percent to EUR 96.7
million (Q4 2016: EUR 84.4 million).
Compact equipment revenue1 rose 14.9 percent to EUR 216.6 million
(2016: EUR 188.5 million). Revenue generated by agricultural equip-
ment grew 36.0 percent to EUR 63.8 million (Q4 2016: EUR 46.9 mil-
lion). This rise was fueled by continued willingness to invest among
agricultural landholders and a positive start to the alliance with John
Deere.
Revenue1 in the services segment grew 5.9 percent to EUR 86.1 mil-
lion in the fourth quarter (Q4 2016: EUR 81.3 million).
For further information, refer to the section “Segment reporting by
business segment”. Page 51
Free cash flow in the fourth quarter
Free cash flow more than doubled to EUR 46.2 million in the fourth
quarter (Q4 2016: EUR 19.2 million). This rise was fueled by a signifi-
cant increase in profit before tax (EBT) and measures aimed at
streamlining net working capital.
General overview of economic situation
In 2017, the Group benefited from the overall positive market situation
in the construction and agricultural sectors and was able to signifi-
cantly increase revenue. The relocation of skid steer loader production
from Austria to the production facility in the US is starting to bear divi-
dends and have a positive effect on revenue. The Group’s perfor-
mance was bolstered by the upturn in business with major customers
as well as successful alliances with market leaders. Profitability in-
creased significantly, fueled by the realization of economies of scale
as well as systematic improvements to processes along the entire
value chain and improved cost structures.
With an equity ratio of 69.0 percent (2016: 69.1 percent) and gearing
of 13.3 percent (2016: 18.8 percent), the Group’s financials and assets
remain strong for the industry. FIG. 6
In light of the secure liquidity situation, the Group will be able to meet
all of its financial obligations in the current year.
1 Before cash discounts.
DEVELOPMENT IN Q4
IN € MILLION
Q4 2017 Q4 2016 Change
Indicator
Revenue 391.5 347.9 12.5%
Gross profit 110.2 92.9 18.6%
Gross profit margin as a % 28.1 26.7 1.4PP
EBIT 30.4 17.6 72.7%
EBIT margin as a % 7.8 5.1 2.7PP
Profit for the period 16.5 10.9 51.4%
EPS (in €) 0.24 0.16 50.0%
Revenue according to region
Europe 293.7 258.8 13.5%
Americas 84.4 74.7 13.0%
Asia-Pacific 13.4 14.4 -6.9%
EBIT according to region
Europe 38.5 14.8 160.1%
Americas -2.7 -6.6 -59.1%
Asia-Pacific -4.0 -2.4 66.7%
Revenue according to business segment1
Light equipment 96.7 84.4 14.6%
Services 216.6 188.5 14.9%
Compact equipment 86.1 81.3 5.9%
Cash flow
Changes in Net Working Capital 24.6 10.3 138.8%
Cash flow from operating activities 63.1 32.2 96.0%
Cash flow from investment activities -16.8 -13.0 29.2%
Investments (property, plant and equipment and intangible assets) -19.6 -13.7 43.1%
Free cash flow 46.2 19.2 140.6%
Cash flow from financing activities -57.3 -16.4 249.4%
1 Consolidated revenue before cash discounts.
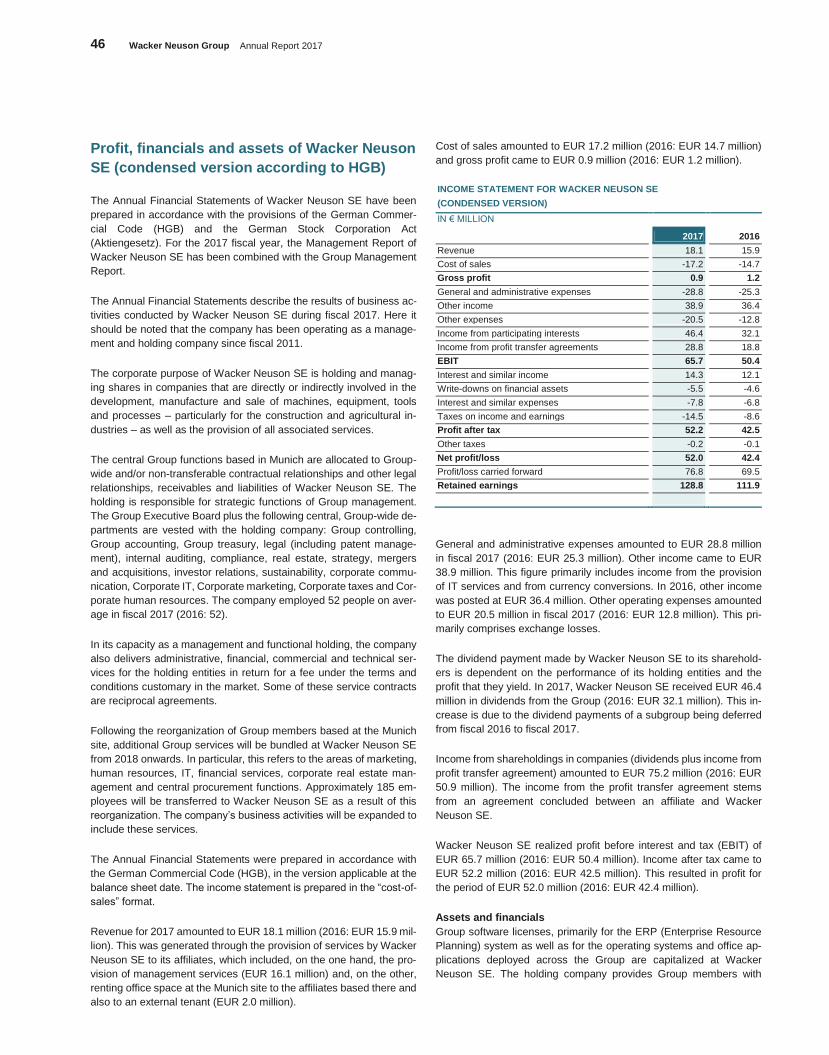
46 Wacker Neuson Group Annual Report 2017
Profit, financials and assets of Wacker Neuson
SE (condensed version according to HGB)
The Annual Financial Statements of Wacker Neuson SE have been
prepared in accordance with the provisions of the German Commer-
cial Code (HGB) and the German Stock Corporation Act
(Aktiengesetz). For the 2017 fiscal year, the Management Report of
Wacker Neuson SE has been combined with the Group Management
Report.
The Annual Financial Statements describe the results of business ac-
tivities conducted by Wacker Neuson SE during fiscal 2017. Here it
should be noted that the company has been operating as a manage-
ment and holding company since fiscal 2011.
The corporate purpose of Wacker Neuson SE is holding and manag-
ing shares in companies that are directly or indirectly involved in the
development, manufacture and sale of machines, equipment, tools
and processes – particularly for the construction and agricultural in-
dustries – as well as the provision of all associated services.
The central Group functions based in Munich are allocated to Group-
wide and/or non-transferable contractual relationships and other legal
relationships, receivables and liabilities of Wacker Neuson SE. The
holding is responsible for strategic functions of Group management.
The Group Executive Board plus the following central, Group-wide de-
partments are vested with the holding company: Group controlling,
Group accounting, Group treasury, legal (including patent manage-
ment), internal auditing, compliance, real estate, strategy, mergers
and acquisitions, investor relations, sustainability, corporate commu-
nication, Corporate IT, Corporate marketing, Corporate taxes and Cor-
porate human resources. The company employed 52 people on aver-
age in fiscal 2017 (2016: 52).
In its capacity as a management and functional holding, the company
also delivers administrative, financial, commercial and technical ser-
vices for the holding entities in return for a fee under the terms and
conditions customary in the market. Some of these service contracts
are reciprocal agreements.
Following the reorganization of Group members based at the Munich
site, additional Group services will be bundled at Wacker Neuson SE
from 2018 onwards. In particular, this refers to the areas of marketing,
human resources, IT, financial services, corporate real estate man-
agement and central procurement functions. Approximately 185 em-
ployees will be transferred to Wacker Neuson SE as a result of this
reorganization. The company’s business activities will be expanded to
include these services.
The Annual Financial Statements were prepared in accordance with
the German Commercial Code (HGB), in the version applicable at the
balance sheet date. The income statement is prepared in the “cost-of-
sales” format.
Revenue for 2017 amounted to EUR 18.1 million (2016: EUR 15.9 mil-
lion). This was generated through the provision of services by Wacker
Neuson SE to its affiliates, which included, on the one hand, the pro-
vision of management services (EUR 16.1 million) and, on the other,
renting office space at the Munich site to the affiliates based there and
also to an external tenant (EUR 2.0 million).
Cost of sales amounted to EUR 17.2 million (2016: EUR 14.7 million)
and gross profit came to EUR 0.9 million (2016: EUR 1.2 million).
INCOME STATEMENT FOR WACKER NEUSON SE
(CONDENSED VERSION)
IN € MILLION
2017 2016
Revenue 18.1 15.9
Cost of sales -17.2 -14.7
Gross profit 0.9 1.2
General and administrative expenses -28.8 -25.3
Other income 38.9 36.4
Other expenses -20.5 -12.8
Income from participating interests 46.4 32.1
Income from profit transfer agreements 28.8 18.8
EBIT 65.7 50.4
Interest and similar income 14.3 12.1
Write-downs on financial assets -5.5 -4.6
Interest and similar expenses -7.8 -6.8
Taxes on income and earnings -14.5 -8.6
Profit after tax 52.2 42.5
Other taxes -0.2 -0.1
Net profit/loss 52.0 42.4
Profit/loss carried forward 76.8 69.5
Retained earnings 128.8 111.9
General and administrative expenses amounted to EUR 28.8 million
in fiscal 2017 (2016: EUR 25.3 million). Other income came to EUR
38.9 million. This figure primarily includes income from the provision
of IT services and from currency conversions. In 2016, other income
was posted at EUR 36.4 million. Other operating expenses amounted
to EUR 20.5 million in fiscal 2017 (2016: EUR 12.8 million). This pri-
marily comprises exchange losses.
The dividend payment made by Wacker Neuson SE to its sharehold-
ers is dependent on the performance of its holding entities and the
profit that they yield. In 2017, Wacker Neuson SE received EUR 46.4
million in dividends from the Group (2016: EUR 32.1 million). This in-
crease is due to the dividend payments of a subgroup being deferred
from fiscal 2016 to fiscal 2017.
Income from shareholdings in companies (dividends plus income from
profit transfer agreement) amounted to EUR 75.2 million (2016: EUR
50.9 million). The income from the profit transfer agreement stems
from an agreement concluded between an affiliate and Wacker
Neuson SE.
Wacker Neuson SE realized profit before interest and tax (EBIT) of
EUR 65.7 million (2016: EUR 50.4 million). Income after tax came to
EUR 52.2 million (2016: EUR 42.5 million). This resulted in profit for
the period of EUR 52.0 million (2016: EUR 42.4 million).
Assets and financials
Group software licenses, primarily for the ERP (Enterprise Resource
Planning) system as well as for the operating systems and office ap-
plications deployed across the Group are capitalized at Wacker
Neuson SE. The holding company provides Group members with
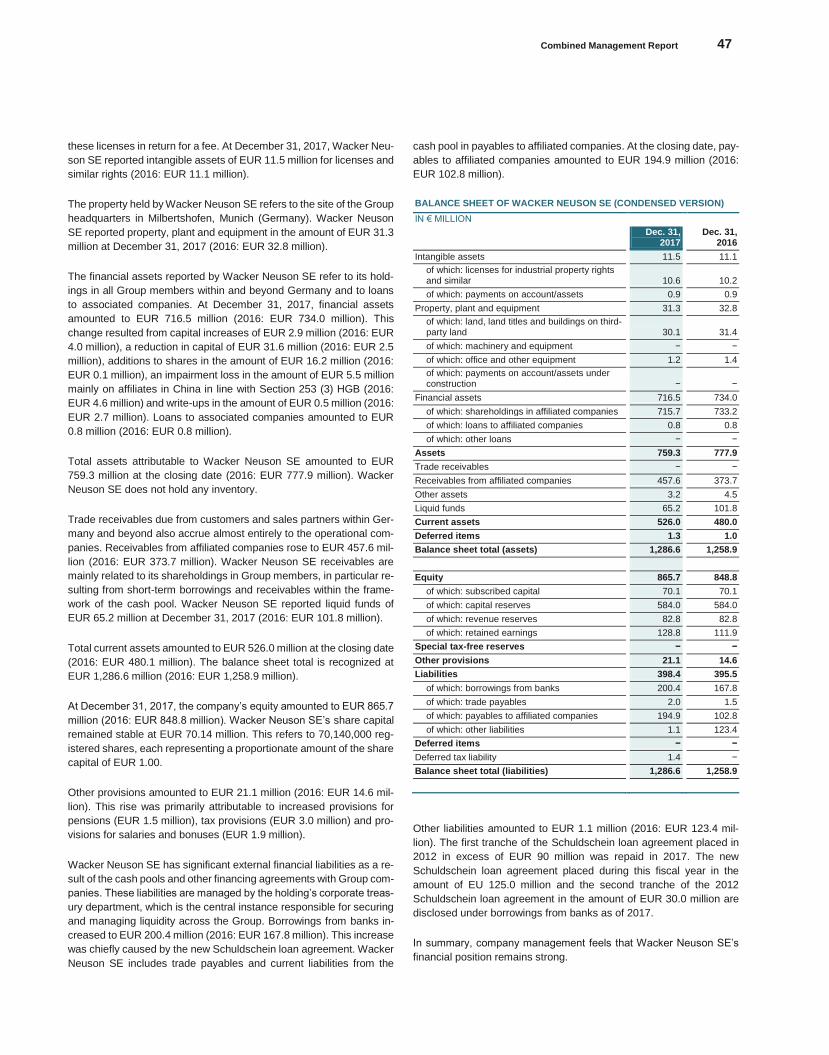
Combined Management Report 47
Konze
rnabschlu
ss
these licenses in return for a fee. At December 31, 2017, Wacker Neu-
son SE reported intangible assets of EUR 11.5 million for licenses and
similar rights (2016: EUR 11.1 million).
The property held by Wacker Neuson SE refers to the site of the Group
headquarters in Milbertshofen, Munich (Germany). Wacker Neuson
SE reported property, plant and equipment in the amount of EUR 31.3
million at December 31, 2017 (2016: EUR 32.8 million).
The financial assets reported by Wacker Neuson SE refer to its hold-
ings in all Group members within and beyond Germany and to loans
to associated companies. At December 31, 2017, financial assets
amounted to EUR 716.5 million (2016: EUR 734.0 million). This
change resulted from capital increases of EUR 2.9 million (2016: EUR
4.0 million), a reduction in capital of EUR 31.6 million (2016: EUR 2.5
million), additions to shares in the amount of EUR 16.2 million (2016:
EUR 0.1 million), an impairment loss in the amount of EUR 5.5 million
mainly on affiliates in China in line with Section 253 (3) HGB (2016:
EUR 4.6 million) and write-ups in the amount of EUR 0.5 million (2016:
EUR 2.7 million). Loans to associated companies amounted to EUR
0.8 million (2016: EUR 0.8 million).
Total assets attributable to Wacker Neuson SE amounted to EUR
759.3 million at the closing date (2016: EUR 777.9 million). Wacker
Neuson SE does not hold any inventory.
Trade receivables due from customers and sales partners within Ger-
many and beyond also accrue almost entirely to the operational com-
panies. Receivables from affiliated companies rose to EUR 457.6 mil-
lion (2016: EUR 373.7 million). Wacker Neuson SE receivables are
mainly related to its shareholdings in Group members, in particular re-
sulting from short-term borrowings and receivables within the frame-
work of the cash pool. Wacker Neuson SE reported liquid funds of
EUR 65.2 million at December 31, 2017 (2016: EUR 101.8 million).
Total current assets amounted to EUR 526.0 million at the closing date
(2016: EUR 480.1 million). The balance sheet total is recognized at
EUR 1,286.6 million (2016: EUR 1,258.9 million).
At December 31, 2017, the company’s equity amounted to EUR 865.7
million (2016: EUR 848.8 million). Wacker Neuson SE’s share capital
remained stable at EUR 70.14 million. This refers to 70,140,000 reg-
istered shares, each representing a proportionate amount of the share
capital of EUR 1.00.
Other provisions amounted to EUR 21.1 million (2016: EUR 14.6 mil-
lion). This rise was primarily attributable to increased provisions for
pensions (EUR 1.5 million), tax provisions (EUR 3.0 million) and pro-
visions for salaries and bonuses (EUR 1.9 million).
Wacker Neuson SE has significant external financial liabilities as a re-
sult of the cash pools and other financing agreements with Group com-
panies. These liabilities are managed by the holding’s corporate treas-
ury department, which is the central instance responsible for securing
and managing liquidity across the Group. Borrowings from banks in-
creased to EUR 200.4 million (2016: EUR 167.8 million). This increase
was chiefly caused by the new Schuldschein loan agreement. Wacker
Neuson SE includes trade payables and current liabilities from the
cash pool in payables to affiliated companies. At the closing date, pay-
ables to affiliated companies amounted to EUR 194.9 million (2016:
EUR 102.8 million).
BALANCE SHEET OF WACKER NEUSON SE (CONDENSED VERSION)
IN € MILLION
Dec. 31,
2017 Dec. 31,
2016
Intangible assets 11.5 11.1
of which: licenses for industrial property rights and similar 10.6 10.2
of which: payments on account/assets 0.9 0.9
Property, plant and equipment 31.3 32.8
of which: land, land titles and buildings on third-party land 30.1 31.4
of which: machinery and equipment − −
of which: office and other equipment 1.2 1.4
of which: payments on account/assets under construction − −
Financial assets 716.5 734.0
of which: shareholdings in affiliated companies 715.7 733.2
of which: loans to affiliated companies 0.8 0.8
of which: other loans − −
Assets 759.3 777.9
Trade receivables − −
Receivables from affiliated companies 457.6 373.7
Other assets 3.2 4.5
Liquid funds 65.2 101.8
Current assets 526.0 480.0
Deferred items 1.3 1.0
Balance sheet total (assets) 1,286.6 1,258.9
Equity 865.7 848.8
of which: subscribed capital 70.1 70.1
of which: capital reserves 584.0 584.0
of which: revenue reserves 82.8 82.8
of which: retained earnings 128.8 111.9
Special tax-free reserves − −
Other provisions 21.1 14.6
Liabilities 398.4 395.5
of which: borrowings from banks 200.4 167.8
of which: trade payables 2.0 1.5
of which: payables to affiliated companies 194.9 102.8
of which: other liabilities 1.1 123.4
Deferred items − −
Deferred tax liability 1.4 −
Balance sheet total (liabilities) 1,286.6 1,258.9
Other liabilities amounted to EUR 1.1 million (2016: EUR 123.4 mil-
lion). The first tranche of the Schuldschein loan agreement placed in
2012 in excess of EUR 90 million was repaid in 2017. The new
Schuldschein loan agreement placed during this fiscal year in the
amount of EU 125.0 million and the second tranche of the 2012
Schuldschein loan agreement in the amount of EUR 30.0 million are
disclosed under borrowings from banks as of 2017.
In summary, company management feels that Wacker Neuson SE’s
financial position remains strong.
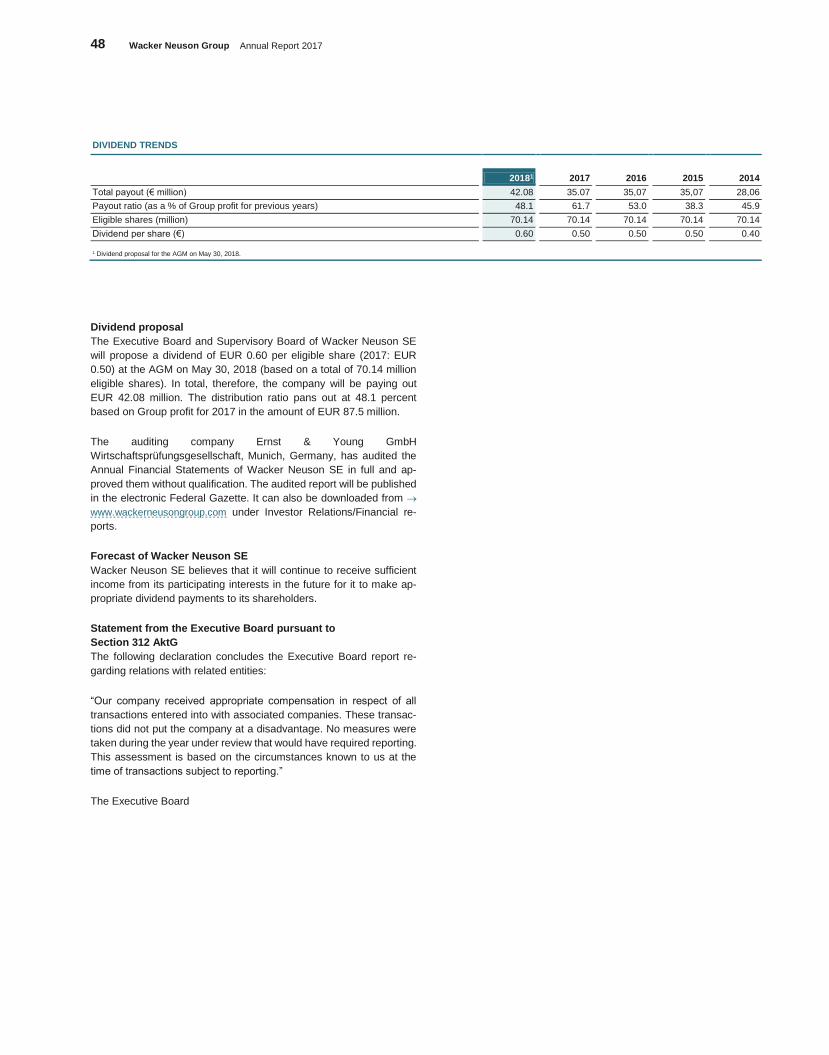
48 Wacker Neuson Group Annual Report 2017
DIVIDEND TRENDS
20181 2017 2016 2015 2014
Total payout (€ million) 42.08 35.07 35,07 35,07 28,06
Payout ratio (as a % of Group profit for previous years) 48.1 61.7 53.0 38.3 45.9
Eligible shares (million) 70.14 70.14 70.14 70.14 70.14
Dividend per share (€) 0.60 0.50 0.50 0.50 0.40
1 Dividend proposal for the AGM on May 30, 2018.
Dividend proposal
The Executive Board and Supervisory Board of Wacker Neuson SE
will propose a dividend of EUR 0.60 per eligible share (2017: EUR
0.50) at the AGM on May 30, 2018 (based on a total of 70.14 million
eligible shares). In total, therefore, the company will be paying out
EUR 42.08 million. The distribution ratio pans out at 48.1 percent
based on Group profit for 2017 in the amount of EUR 87.5 million.
The auditing company Ernst & Young GmbH
Wirtschaftsprüfungsgesellschaft, Munich, Germany, has audited the
Annual Financial Statements of Wacker Neuson SE in full and ap-
proved them without qualification. The audited report will be published
in the electronic Federal Gazette. It can also be downloaded from
www.wackerneusongroup.com under Investor Relations/Financial re-
ports.
Forecast of Wacker Neuson SE
Wacker Neuson SE believes that it will continue to receive sufficient
income from its participating interests in the future for it to make ap-
propriate dividend payments to its shareholders.
Statement from the Executive Board pursuant to
Section 312 AktG
The following declaration concludes the Executive Board report re-
garding relations with related entities:
“Our company received appropriate compensation in respect of all
transactions entered into with associated companies. These transac-
tions did not put the company at a disadvantage. No measures were
taken during the year under review that would have required reporting.
This assessment is based on the circumstances known to us at the
time of transactions subject to reporting.”
The Executive Board
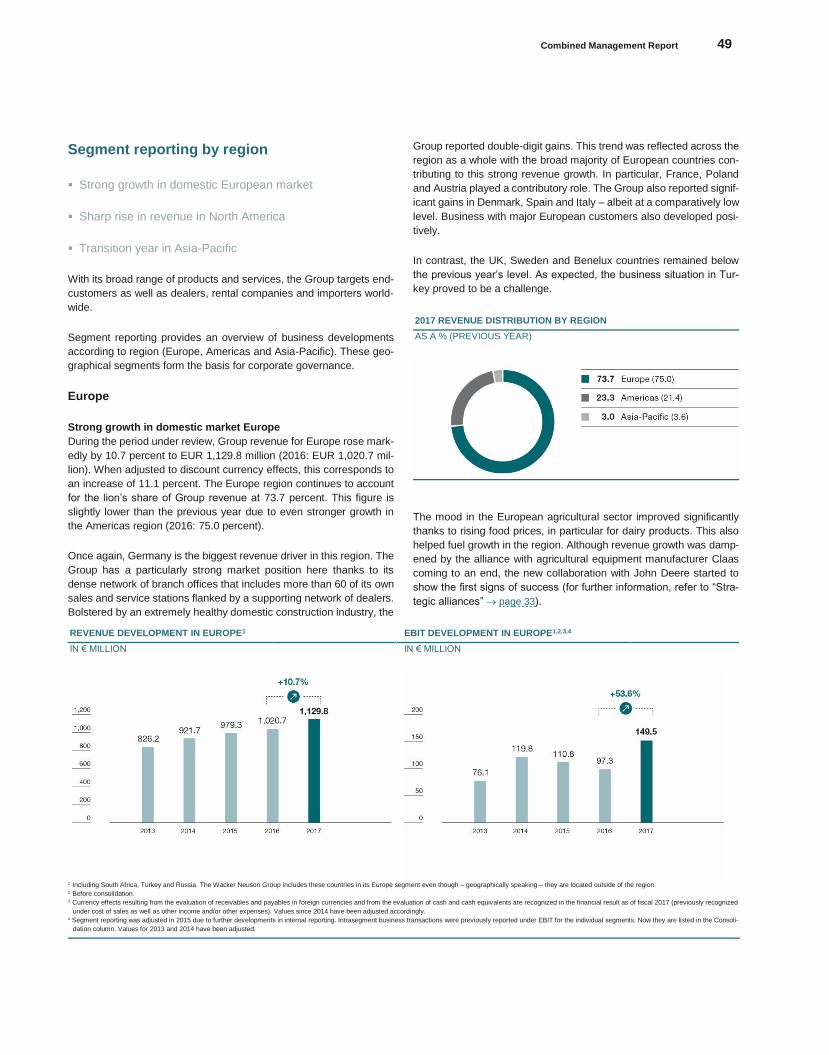
Combined Management Report 49
Konze
rnabschlu
ss
Segment reporting by region
Strong growth in domestic European market
Sharp rise in revenue in North America
Transition year in Asia-Pacific
With its broad range of products and services, the Group targets end-
customers as well as dealers, rental companies and importers world-
wide.
Segment reporting provides an overview of business developments
according to region (Europe, Americas and Asia-Pacific). These geo-
graphical segments form the basis for corporate governance.
Europe
Strong growth in domestic market Europe
During the period under review, Group revenue for Europe rose mark-
edly by 10.7 percent to EUR 1,129.8 million (2016: EUR 1,020.7 mil-
lion). When adjusted to discount currency effects, this corresponds to
an increase of 11.1 percent. The Europe region continues to account
for the lion’s share of Group revenue at 73.7 percent. This figure is
slightly lower than the previous year due to even stronger growth in
the Americas region (2016: 75.0 percent).
Once again, Germany is the biggest revenue driver in this region. The
Group has a particularly strong market position here thanks to its
dense network of branch offices that includes more than 60 of its own
sales and service stations flanked by a supporting network of dealers.
Bolstered by an extremely healthy domestic construction industry, the
Group reported double-digit gains. This trend was reflected across the
region as a whole with the broad majority of European countries con-
tributing to this strong revenue growth. In particular, France, Poland
and Austria played a contributory role. The Group also reported signif-
icant gains in Denmark, Spain and Italy – albeit at a comparatively low
level. Business with major European customers also developed posi-
tively.
In contrast, the UK, Sweden and Benelux countries remained below
the previous year’s level. As expected, the business situation in Tur-
key proved to be a challenge.
2017 REVENUE DISTRIBUTION BY REGION
AS A % (PREVIOUS YEAR)
The mood in the European agricultural sector improved significantly
thanks to rising food prices, in particular for dairy products. This also
helped fuel growth in the region. Although revenue growth was damp-
ened by the alliance with agricultural equipment manufacturer Claas
coming to an end, the new collaboration with John Deere started to
show the first signs of success (for further information, refer to “Stra-
tegic alliances” page 33).
REVENUE DEVELOPMENT IN EUROPE1 EBIT DEVELOPMENT IN EUROPE1,2,3,4
IN € MILLION IN € MILLION
1 Including South Africa, Turkey and Russia. The Wacker Neuson Group includes these countries in its Europe segment even though – geographically speaking – they are located outside of the region.
2 Before consolidation. 3 Currency effects resulting from the evaluation of receivables and payables in foreign currencies and from the evaluation of cash and cash equivalents are recognized in the financial result as of fiscal 2017 (previously recognized
under cost of sales as well as other income and/or other expenses). Values since 2014 have been adjusted accordingly. 4 Segment reporting was adjusted in 2015 due to further developments in internal reporting. Intrasegment business transactions were previously reported under EBIT for the individual segments. Now they are listed in the Consoli-
dation column. Values for 2013 and 2014 have been adjusted.
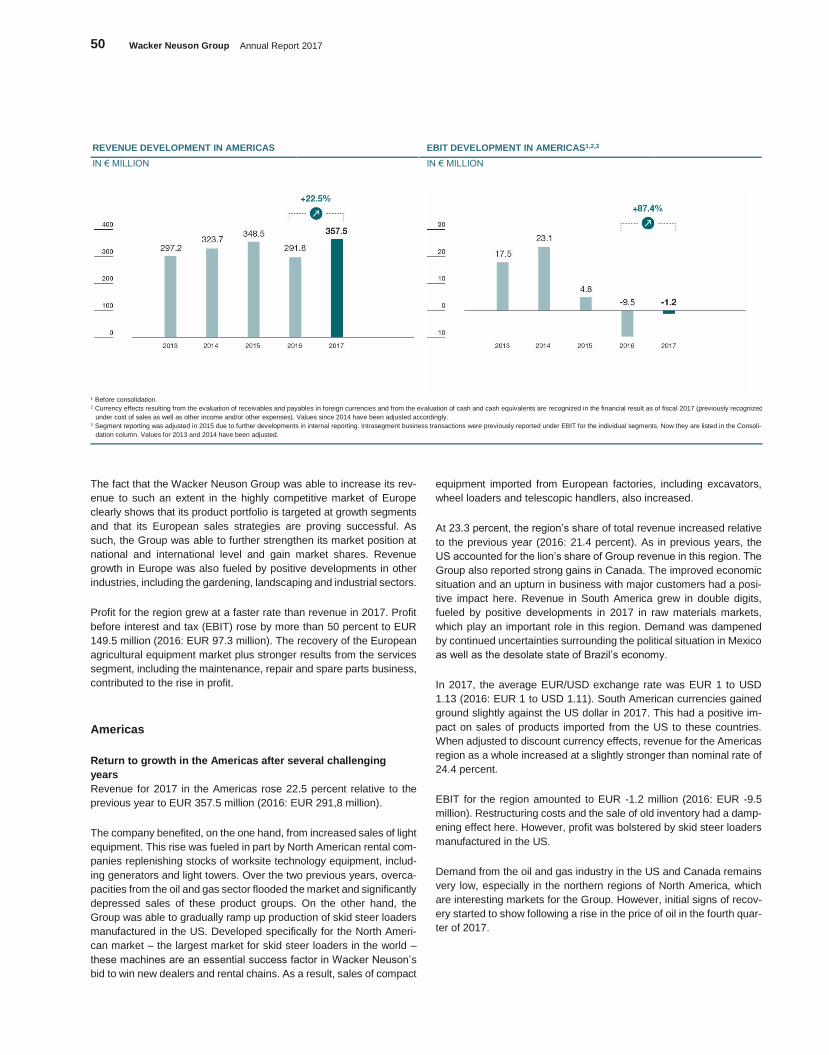
50 Wacker Neuson Group Annual Report 2017
REVENUE DEVELOPMENT IN AMERICAS EBIT DEVELOPMENT IN AMERICAS1,2,3
IN € MILLION IN € MILLION
1 Before consolidation. 2 Currency effects resulting from the evaluation of receivables and payables in foreign currencies and from the evaluation of cash and cash equivalents are recognized in the financial result as of fiscal 2017 (previously recognized
under cost of sales as well as other income and/or other expenses). Values since 2014 have been adjusted accordingly. 3 Segment reporting was adjusted in 2015 due to further developments in internal reporting. Intrasegment business transactions were previously reported under EBIT for the individual segments. Now they are listed in the Consoli-
dation column. Values for 2013 and 2014 have been adjusted.
The fact that the Wacker Neuson Group was able to increase its rev-
enue to such an extent in the highly competitive market of Europe
clearly shows that its product portfolio is targeted at growth segments
and that its European sales strategies are proving successful. As
such, the Group was able to further strengthen its market position at
national and international level and gain market shares. Revenue
growth in Europe was also fueled by positive developments in other
industries, including the gardening, landscaping and industrial sectors.
Profit for the region grew at a faster rate than revenue in 2017. Profit
before interest and tax (EBIT) rose by more than 50 percent to EUR
149.5 million (2016: EUR 97.3 million). The recovery of the European
agricultural equipment market plus stronger results from the services
segment, including the maintenance, repair and spare parts business,
contributed to the rise in profit.
Americas
Return to growth in the Americas after several challenging
years
Revenue for 2017 in the Americas rose 22.5 percent relative to the
previous year to EUR 357.5 million (2016: EUR 291,8 million).
The company benefited, on the one hand, from increased sales of light
equipment. This rise was fueled in part by North American rental com-
panies replenishing stocks of worksite technology equipment, includ-
ing generators and light towers. Over the two previous years, overca-
pacities from the oil and gas sector flooded the market and significantly
depressed sales of these product groups. On the other hand, the
Group was able to gradually ramp up production of skid steer loaders
manufactured in the US. Developed specifically for the North Ameri-
can market – the largest market for skid steer loaders in the world –
these machines are an essential success factor in Wacker Neuson’s
bid to win new dealers and rental chains. As a result, sales of compact
equipment imported from European factories, including excavators,
wheel loaders and telescopic handlers, also increased.
At 23.3 percent, the region’s share of total revenue increased relative
to the previous year (2016: 21.4 percent). As in previous years, the
US accounted for the lion’s share of Group revenue in this region. The
Group also reported strong gains in Canada. The improved economic
situation and an upturn in business with major customers had a posi-
tive impact here. Revenue in South America grew in double digits,
fueled by positive developments in 2017 in raw materials markets,
which play an important role in this region. Demand was dampened
by continued uncertainties surrounding the political situation in Mexico
as well as the desolate state of Brazil’s economy.
In 2017, the average EUR/USD exchange rate was EUR 1 to USD
1.13 (2016: EUR 1 to USD 1.11). South American currencies gained
ground slightly against the US dollar in 2017. This had a positive im-
pact on sales of products imported from the US to these countries.
When adjusted to discount currency effects, revenue for the Americas
region as a whole increased at a slightly stronger than nominal rate of
24.4 percent.
EBIT for the region amounted to EUR -1.2 million (2016: EUR -9.5
million). Restructuring costs and the sale of old inventory had a damp-
ening effect here. However, profit was bolstered by skid steer loaders
manufactured in the US.
Demand from the oil and gas industry in the US and Canada remains
very low, especially in the northern regions of North America, which
are interesting markets for the Group. However, initial signs of recov-
ery started to show following a rise in the price of oil in the fourth quar-
ter of 2017.
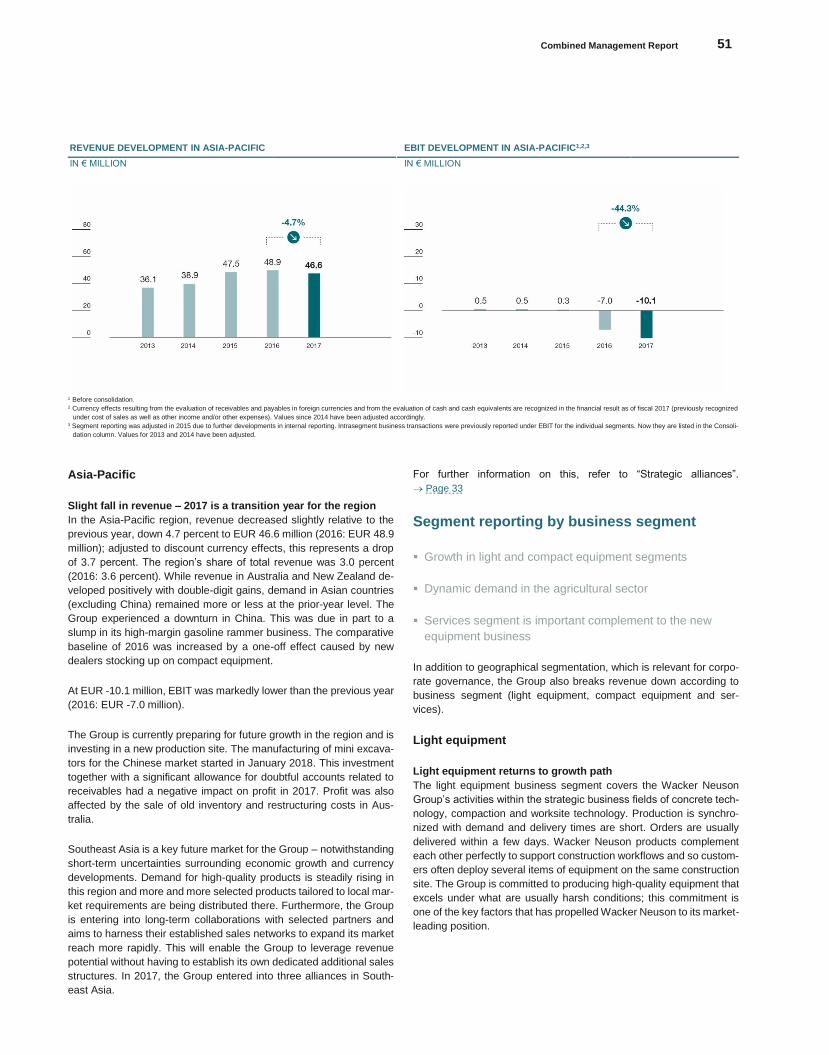
Combined Management Report 51
Konze
rnabschlu
ss
REVENUE DEVELOPMENT IN ASIA-PACIFIC EBIT DEVELOPMENT IN ASIA-PACIFIC1,2,3
IN € MILLION IN € MILLION
1 Before consolidation. 2 Currency effects resulting from the evaluation of receivables and payables in foreign currencies and from the evaluation of cash and cash equivalents are recognized in the financial result as of fiscal 2017 (previously recognized
under cost of sales as well as other income and/or other expenses). Values since 2014 have been adjusted accordingly. 3 Segment reporting was adjusted in 2015 due to further developments in internal reporting. Intrasegment business transactions were previously reported under EBIT for the individual segments. Now they are listed in the Consoli-
dation column. Values for 2013 and 2014 have been adjusted.
Asia-Pacific
Slight fall in revenue – 2017 is a transition year for the region
In the Asia-Pacific region, revenue decreased slightly relative to the
previous year, down 4.7 percent to EUR 46.6 million (2016: EUR 48.9
million); adjusted to discount currency effects, this represents a drop
of 3.7 percent. The region’s share of total revenue was 3.0 percent
(2016: 3.6 percent). While revenue in Australia and New Zealand de-
veloped positively with double-digit gains, demand in Asian countries
(excluding China) remained more or less at the prior-year level. The
Group experienced a downturn in China. This was due in part to a
slump in its high-margin gasoline rammer business. The comparative
baseline of 2016 was increased by a one-off effect caused by new
dealers stocking up on compact equipment.
At EUR -10.1 million, EBIT was markedly lower than the previous year
(2016: EUR -7.0 million).
The Group is currently preparing for future growth in the region and is
investing in a new production site. The manufacturing of mini excava-
tors for the Chinese market started in January 2018. This investment
together with a significant allowance for doubtful accounts related to
receivables had a negative impact on profit in 2017. Profit was also
affected by the sale of old inventory and restructuring costs in Aus-
tralia.
Southeast Asia is a key future market for the Group – notwithstanding
short-term uncertainties surrounding economic growth and currency
developments. Demand for high-quality products is steadily rising in
this region and more and more selected products tailored to local mar-
ket requirements are being distributed there. Furthermore, the Group
is entering into long-term collaborations with selected partners and
aims to harness their established sales networks to expand its market
reach more rapidly. This will enable the Group to leverage revenue
potential without having to establish its own dedicated additional sales
structures. In 2017, the Group entered into three alliances in South-
east Asia.
For further information on this, refer to “Strategic alliances”.
Page 33
Segment reporting by business segment
Growth in light and compact equipment segments
Dynamic demand in the agricultural sector
Services segment is important complement to the new
equipment business
In addition to geographical segmentation, which is relevant for corpo-
rate governance, the Group also breaks revenue down according to
business segment (light equipment, compact equipment and ser-
vices).
Light equipment
Light equipment returns to growth path
The light equipment business segment covers the Wacker Neuson
Group’s activities within the strategic business fields of concrete tech-
nology, compaction and worksite technology. Production is synchro-
nized with demand and delivery times are short. Orders are usually
delivered within a few days. Wacker Neuson products complement
each other perfectly to support construction workflows and so custom-
ers often deploy several items of equipment on the same construction
site. The Group is committed to producing high-quality equipment that
excels under what are usually harsh conditions; this commitment is
one of the key factors that has propelled Wacker Neuson to its market-
leading position.

52 Wacker Neuson Group Annual Report 2017
2017 REVENUE DISTRIBUTION BY BUSINESS SEGMENT1
AS A % (PREVIOUS YEAR)
1 Consolidated revenue before discounts; differences attributable to rounding.
Refer to the “Research and development” section for further infor-
mation on new products. Page 54
Following weak performance in 2015 and 2016, light equipment reve-
nue rose strongly, driven by a resurgence in demand from the con-
struction sector in Europe and the Americas. In the US, several rental
chains needed to replenish stocks of worksite equipment, including
products such as generators and light towers. This fueled significant
gains relative to the previous year. Revenue in the compaction busi-
ness field also rose sharply. In contrast, revenue generated by con-
crete technology was only slightly higher than the prior-year level. To-
tal light equipment revenue1 for the year increased 11.9 percent to
EUR 422.7 million (2016: EUR 377.9 million). Adjusted to discount cur-
rency effects, revenue rose 13.1 percent. This segment’s share of total
revenue was 27.1 percent (2016: 27.3 percent).
The Group distributes a range of light equipment products tailored to
the Asian market and other emerging economies such as South Amer-
ica and Africa (Value Line). These robust products are tailored to local
customer needs and will help the Group enter and extend its reach in
local construction equipment markets.
Compact equipment
Significant revenue growth for compact equipment
The compact equipment business segment covers machinery targeted
at the construction and agricultural industries, at gardening, landscap-
ing and industrial firms as well as at recycling companies and munici-
pal bodies. The portfolio includes wheel loaders, tele wheel loaders,
telescopic handlers, backhoe loaders, skid steer loaders, wheel and
track dumpers and excavators weighing up to 15 tons. The Group also
offers attachments and accessories for products in this segment.
The trend toward compact, versatile machines continues to gather mo-
mentum. At the same time, Group measures to increase market pen-
etration and distribute its offering via its existing sales network fueled
revenue growth in almost all countries where the Group distributes
compact equipment. The Group produces the machinery in Austria
and Germany. Skid steer loaders are produced in the US. As of 2018,
it will also manufacture excavators in China for the regional market.
1 Before cash discounts.
Refer to the “Research and development” section for further infor-
mation on new products. Page 54
Compact equipment revenue1 increased 15.3 percent from EUR 709.3
million in the previous year to EUR 817.6 million. This growth was
fueled by strong demand from the construction industry as well as re-
newed willingness to invest in the European agricultural sector. The
production of skid steer loaders in the US and increased exports of
machines manufactured in Europe to North America were significant
growth drivers for the entire segment.
Adjusted to discount currency effects, revenue grew by 15.9 percent.
As a result, this segment’s share of total revenue increased slightly to
52.4 percent (2016: 51.2 percent).
Rise in revenue in agricultural sector
The mood in the agricultural industry was much more upbeat in 2017.
Rising food prices, above all for dairy products, fueled willingness to
invest among agricultural landholders, which, in turn, also affected de-
mand for agricultural equipment. Although the Group’s alliance with
German agricultural equipment manufacturer Claas came to an end,
revenue generated by agricultural equipment rose 17.4 percent to
EUR 216.2 million (2016: EUR 184.1 million). The new collaboration
with John Deere also started to show the first signs of success. Agri-
cultural compact equipment (including both alliances) accounted for
14.1 percent of total Group revenue in 2017 (2016: 13.5 percent).
Increasingly globalized competition for agricultural products continues
to challenge landholders to focus on efficiency gains in the manage-
ment of their holdings and invest accordingly.
REVENUE BY BUSINESS SEGMENT
IN € MILLION
2017 2016
Change as a %
Light equipment 422.7 377.9 11.9
Compact equipment 817.6 709.3 15.3
Services 320.4 297.2 7.8
Less cash discounts -26.8 -23.0 16.5
= Total 1,533.9 1,361.4 12.7
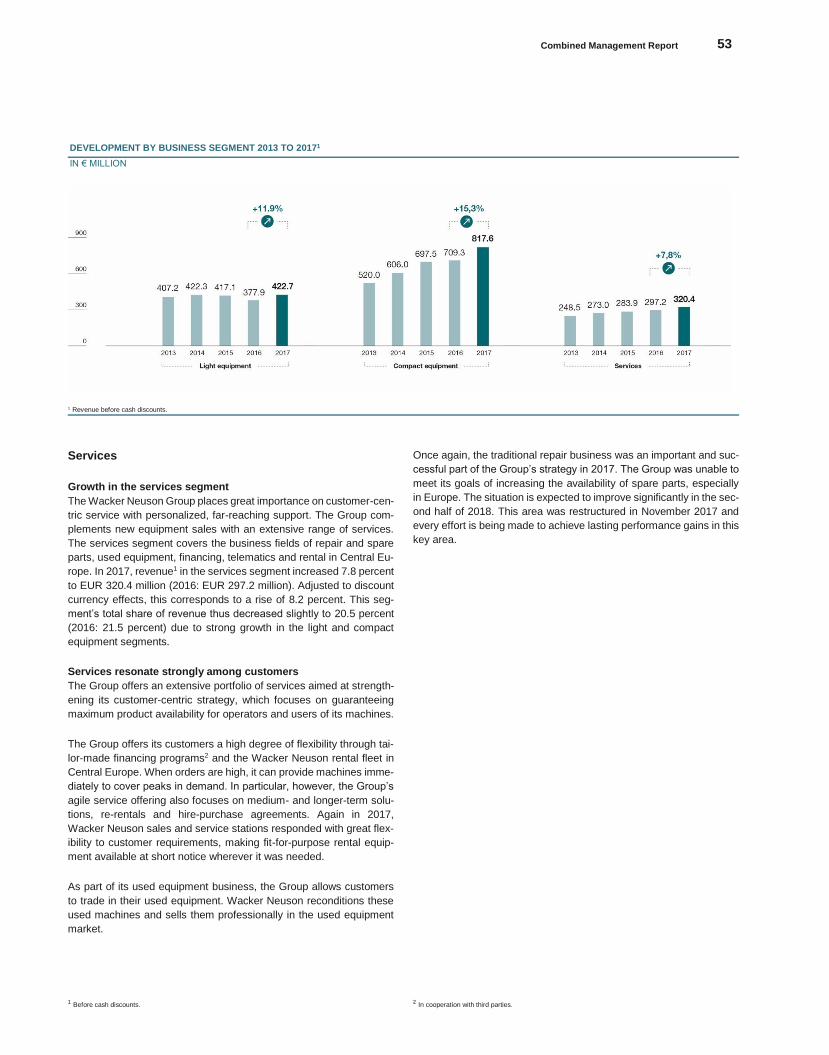
Combined Management Report 53
Konze
rnabschlu
ss
DEVELOPMENT BY BUSINESS SEGMENT 2013 TO 20171
IN € MILLION
1 Revenue before cash discounts.
Services
Growth in the services segment
The Wacker Neuson Group places great importance on customer-cen-
tric service with personalized, far-reaching support. The Group com-
plements new equipment sales with an extensive range of services.
The services segment covers the business fields of repair and spare
parts, used equipment, financing, telematics and rental in Central Eu-
rope. In 2017, revenue1 in the services segment increased 7.8 percent
to EUR 320.4 million (2016: EUR 297.2 million). Adjusted to discount
currency effects, this corresponds to a rise of 8.2 percent. This seg-
ment’s total share of revenue thus decreased slightly to 20.5 percent
(2016: 21.5 percent) due to strong growth in the light and compact
equipment segments.
Services resonate strongly among customers
The Group offers an extensive portfolio of services aimed at strength-
ening its customer-centric strategy, which focuses on guaranteeing
maximum product availability for operators and users of its machines.
The Group offers its customers a high degree of flexibility through tai-
lor-made financing programs2 and the Wacker Neuson rental fleet in
Central Europe. When orders are high, it can provide machines imme-
diately to cover peaks in demand. In particular, however, the Group’s
agile service offering also focuses on medium- and longer-term solu-
tions, re-rentals and hire-purchase agreements. Again in 2017,
Wacker Neuson sales and service stations responded with great flex-
ibility to customer requirements, making fit-for-purpose rental equip-
ment available at short notice wherever it was needed.
As part of its used equipment business, the Group allows customers
to trade in their used equipment. Wacker Neuson reconditions these
used machines and sells them professionally in the used equipment
market.
1 Before cash discounts.
Once again, the traditional repair business was an important and suc-
cessful part of the Group’s strategy in 2017. The Group was unable to
meet its goals of increasing the availability of spare parts, especially
in Europe. The situation is expected to improve significantly in the sec-
ond half of 2018. This area was restructured in November 2017 and
every effort is being made to achieve lasting performance gains in this
key area.
2 In cooperation with third parties.
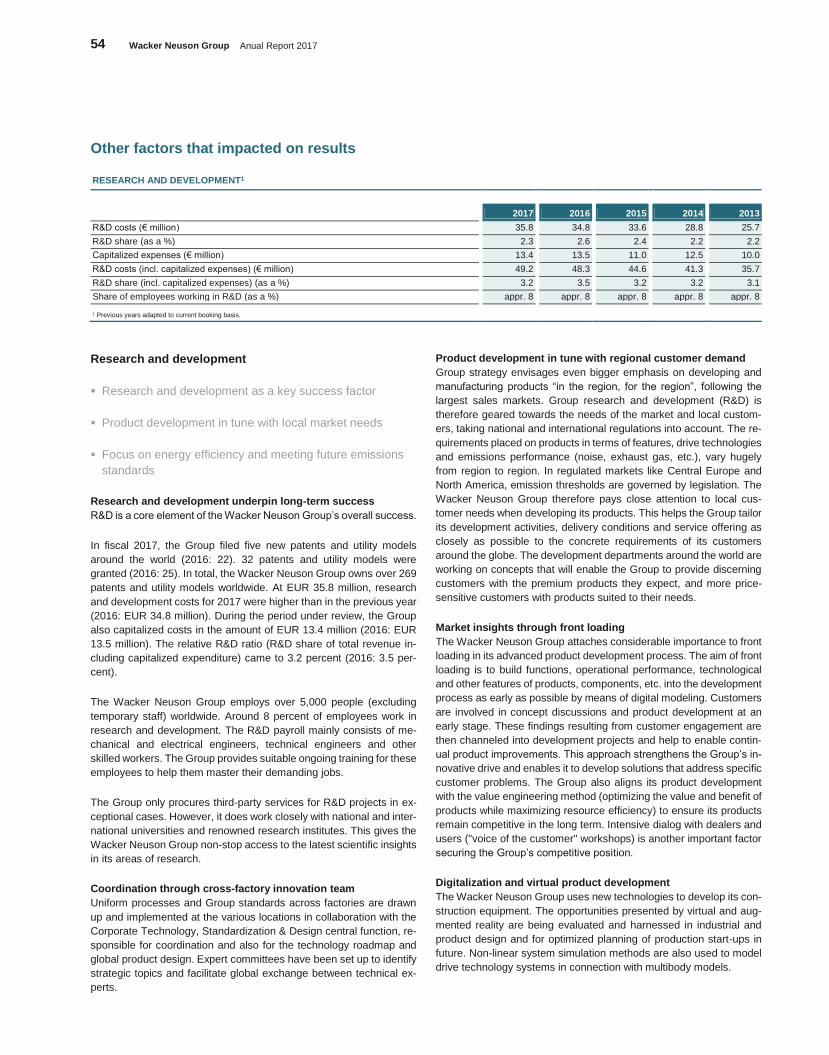
54 Wacker Neuson Group Anual Report 2017
Other factors that impacted on results
RESEARCH AND DEVELOPMENT1
2017 2016 2015 2014 2013
R&D costs (€ million) 35.8 34.8 33.6 28.8 25.7
R&D share (as a %) 2.3 2.6 2.4 2.2 2.2
Capitalized expenses (€ million) 13.4 13.5 11.0 12.5 10.0
R&D costs (incl. capitalized expenses) (€ million) 49.2 48.3 44.6 41.3 35.7
R&D share (incl. capitalized expenses) (as a %) 3.2 3.5 3.2 3.2 3.1
Share of employees working in R&D (as a %) appr. 8 appr. 8 appr. 8 appr. 8 appr. 8
1 Previous years adapted to current booking basis.
Research and development
Research and development as a key success factor
Product development in tune with local market needs
Focus on energy efficiency and meeting future emissions
standards
Research and development underpin long-term success
R&D is a core element of the Wacker Neuson Group’s overall success.
In fiscal 2017, the Group filed five new patents and utility models
around the world (2016: 22). 32 patents and utility models were
granted (2016: 25). In total, the Wacker Neuson Group owns over 269
patents and utility models worldwide. At EUR 35.8 million, research
and development costs for 2017 were higher than in the previous year
(2016: EUR 34.8 million). During the period under review, the Group
also capitalized costs in the amount of EUR 13.4 million (2016: EUR
13.5 million). The relative R&D ratio (R&D share of total revenue in-
cluding capitalized expenditure) came to 3.2 percent (2016: 3.5 per-
cent).
The Wacker Neuson Group employs over 5,000 people (excluding
temporary staff) worldwide. Around 8 percent of employees work in
research and development. The R&D payroll mainly consists of me-
chanical and electrical engineers, technical engineers and other
skilled workers. The Group provides suitable ongoing training for these
employees to help them master their demanding jobs.
The Group only procures third-party services for R&D projects in ex-
ceptional cases. However, it does work closely with national and inter-
national universities and renowned research institutes. This gives the
Wacker Neuson Group non-stop access to the latest scientific insights
in its areas of research.
Coordination through cross-factory innovation team
Uniform processes and Group standards across factories are drawn
up and implemented at the various locations in collaboration with the
Corporate Technology, Standardization & Design central function, re-
sponsible for coordination and also for the technology roadmap and
global product design. Expert committees have been set up to identify
strategic topics and facilitate global exchange between technical ex-
perts.
Product development in tune with regional customer demand
Group strategy envisages even bigger emphasis on developing and
manufacturing products “in the region, for the region”, following the
largest sales markets. Group research and development (R&D) is
therefore geared towards the needs of the market and local custom-
ers, taking national and international regulations into account. The re-
quirements placed on products in terms of features, drive technologies
and emissions performance (noise, exhaust gas, etc.), vary hugely
from region to region. In regulated markets like Central Europe and
North America, emission thresholds are governed by legislation. The
Wacker Neuson Group therefore pays close attention to local cus-
tomer needs when developing its products. This helps the Group tailor
its development activities, delivery conditions and service offering as
closely as possible to the concrete requirements of its customers
around the globe. The development departments around the world are
working on concepts that will enable the Group to provide discerning
customers with the premium products they expect, and more price-
sensitive customers with products suited to their needs.
Market insights through front loading
The Wacker Neuson Group attaches considerable importance to front
loading in its advanced product development process. The aim of front
loading is to build functions, operational performance, technological
and other features of products, components, etc. into the development
process as early as possible by means of digital modeling. Customers
are involved in concept discussions and product development at an
early stage. These findings resulting from customer engagement are
then channeled into development projects and help to enable contin-
ual product improvements. This approach strengthens the Group’s in-
novative drive and enables it to develop solutions that address specific
customer problems. The Group also aligns its product development
with the value engineering method (optimizing the value and benefit of
products while maximizing resource efficiency) to ensure its products
remain competitive in the long term. Intensive dialog with dealers and
users ("voice of the customer" workshops) is another important factor
securing the Group’s competitive position.
Digitalization and virtual product development
The Wacker Neuson Group uses new technologies to develop its con-
struction equipment. The opportunities presented by virtual and aug-
mented reality are being evaluated and harnessed in industrial and
product design and for optimized planning of production start-ups in
future. Non-linear system simulation methods are also used to model
drive technology systems in connection with multibody models.
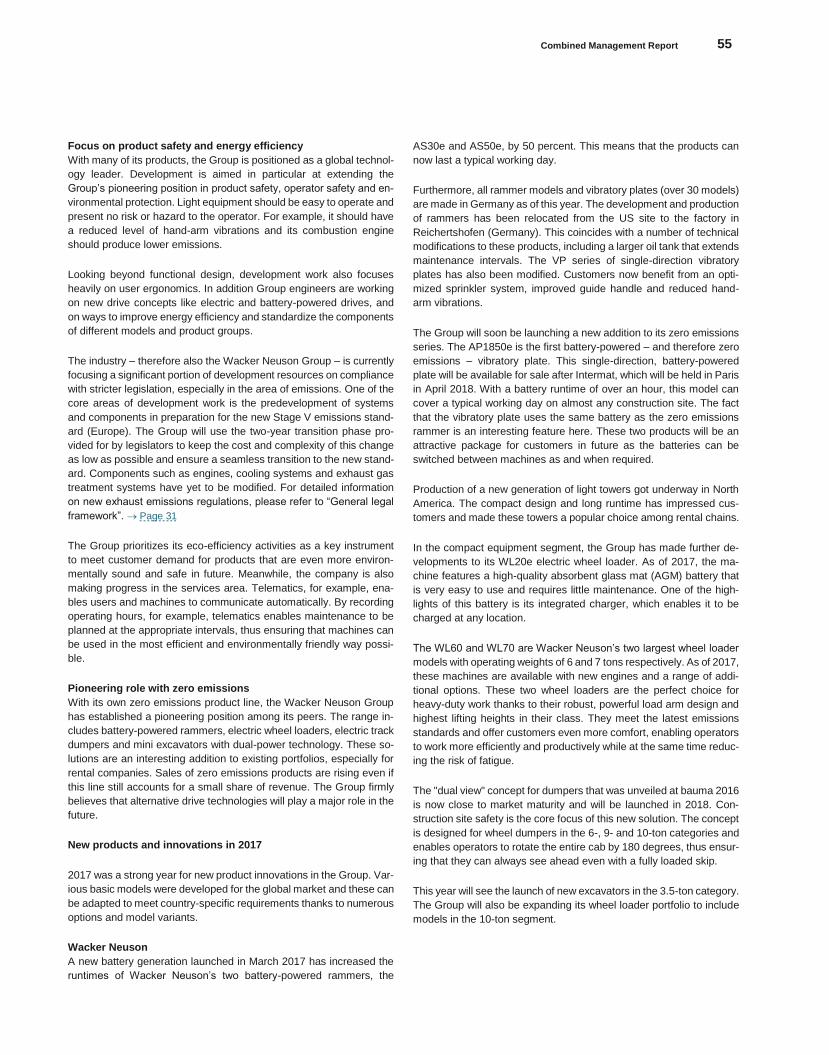
Combined Management Report 55
Konze
rnabschlu
ss
Focus on product safety and energy efficiency
With many of its products, the Group is positioned as a global technol-
ogy leader. Development is aimed in particular at extending the
Group’s pioneering position in product safety, operator safety and en-
vironmental protection. Light equipment should be easy to operate and
present no risk or hazard to the operator. For example, it should have
a reduced level of hand-arm vibrations and its combustion engine
should produce lower emissions.
Looking beyond functional design, development work also focuses
heavily on user ergonomics. In addition Group engineers are working
on new drive concepts like electric and battery-powered drives, and
on ways to improve energy efficiency and standardize the components
of different models and product groups.
The industry – therefore also the Wacker Neuson Group – is currently
focusing a significant portion of development resources on compliance
with stricter legislation, especially in the area of emissions. One of the
core areas of development work is the predevelopment of systems
and components in preparation for the new Stage V emissions stand-
ard (Europe). The Group will use the two-year transition phase pro-
vided for by legislators to keep the cost and complexity of this change
as low as possible and ensure a seamless transition to the new stand-
ard. Components such as engines, cooling systems and exhaust gas
treatment systems have yet to be modified. For detailed information
on new exhaust emissions regulations, please refer to “General legal
framework”. Page 31
The Group prioritizes its eco-efficiency activities as a key instrument
to meet customer demand for products that are even more environ-
mentally sound and safe in future. Meanwhile, the company is also
making progress in the services area. Telematics, for example, ena-
bles users and machines to communicate automatically. By recording
operating hours, for example, telematics enables maintenance to be
planned at the appropriate intervals, thus ensuring that machines can
be used in the most efficient and environmentally friendly way possi-
ble.
Pioneering role with zero emissions
With its own zero emissions product line, the Wacker Neuson Group
has established a pioneering position among its peers. The range in-
cludes battery-powered rammers, electric wheel loaders, electric track
dumpers and mini excavators with dual-power technology. These so-
lutions are an interesting addition to existing portfolios, especially for
rental companies. Sales of zero emissions products are rising even if
this line still accounts for a small share of revenue. The Group firmly
believes that alternative drive technologies will play a major role in the
future.
New products and innovations in 2017
2017 was a strong year for new product innovations in the Group. Var-
ious basic models were developed for the global market and these can
be adapted to meet country-specific requirements thanks to numerous
options and model variants.
Wacker Neuson
A new battery generation launched in March 2017 has increased the
runtimes of Wacker Neuson’s two battery-powered rammers, the
AS30e and AS50e, by 50 percent. This means that the products can
now last a typical working day.
Furthermore, all rammer models and vibratory plates (over 30 models)
are made in Germany as of this year. The development and production
of rammers has been relocated from the US site to the factory in
Reichertshofen (Germany). This coincides with a number of technical
modifications to these products, including a larger oil tank that extends
maintenance intervals. The VP series of single-direction vibratory
plates has also been modified. Customers now benefit from an opti-
mized sprinkler system, improved guide handle and reduced hand-
arm vibrations.
The Group will soon be launching a new addition to its zero emissions
series. The AP1850e is the first battery-powered – and therefore zero
emissions – vibratory plate. This single-direction, battery-powered
plate will be available for sale after Intermat, which will be held in Paris
in April 2018. With a battery runtime of over an hour, this model can
cover a typical working day on almost any construction site. The fact
that the vibratory plate uses the same battery as the zero emissions
rammer is an interesting feature here. These two products will be an
attractive package for customers in future as the batteries can be
switched between machines as and when required.
Production of a new generation of light towers got underway in North
America. The compact design and long runtime has impressed cus-
tomers and made these towers a popular choice among rental chains.
In the compact equipment segment, the Group has made further de-
velopments to its WL20e electric wheel loader. As of 2017, the ma-
chine features a high-quality absorbent glass mat (AGM) battery that
is very easy to use and requires little maintenance. One of the high-
lights of this battery is its integrated charger, which enables it to be
charged at any location.
The WL60 and WL70 are Wacker Neuson’s two largest wheel loader
models with operating weights of 6 and 7 tons respectively. As of 2017,
these machines are available with new engines and a range of addi-
tional options. These two wheel loaders are the perfect choice for
heavy-duty work thanks to their robust, powerful load arm design and
highest lifting heights in their class. They meet the latest emissions
standards and offer customers even more comfort, enabling operators
to work more efficiently and productively while at the same time reduc-
ing the risk of fatigue.
The "dual view" concept for dumpers that was unveiled at bauma 2016
is now close to market maturity and will be launched in 2018. Con-
struction site safety is the core focus of this new solution. The concept
is designed for wheel dumpers in the 6-, 9- and 10-ton categories and
enables operators to rotate the entire cab by 180 degrees, thus ensur-
ing that they can always see ahead even with a fully loaded skip.
This year will see the launch of new excavators in the 3.5-ton category.
The Group will also be expanding its wheel loader portfolio to include
models in the 10-ton segment.
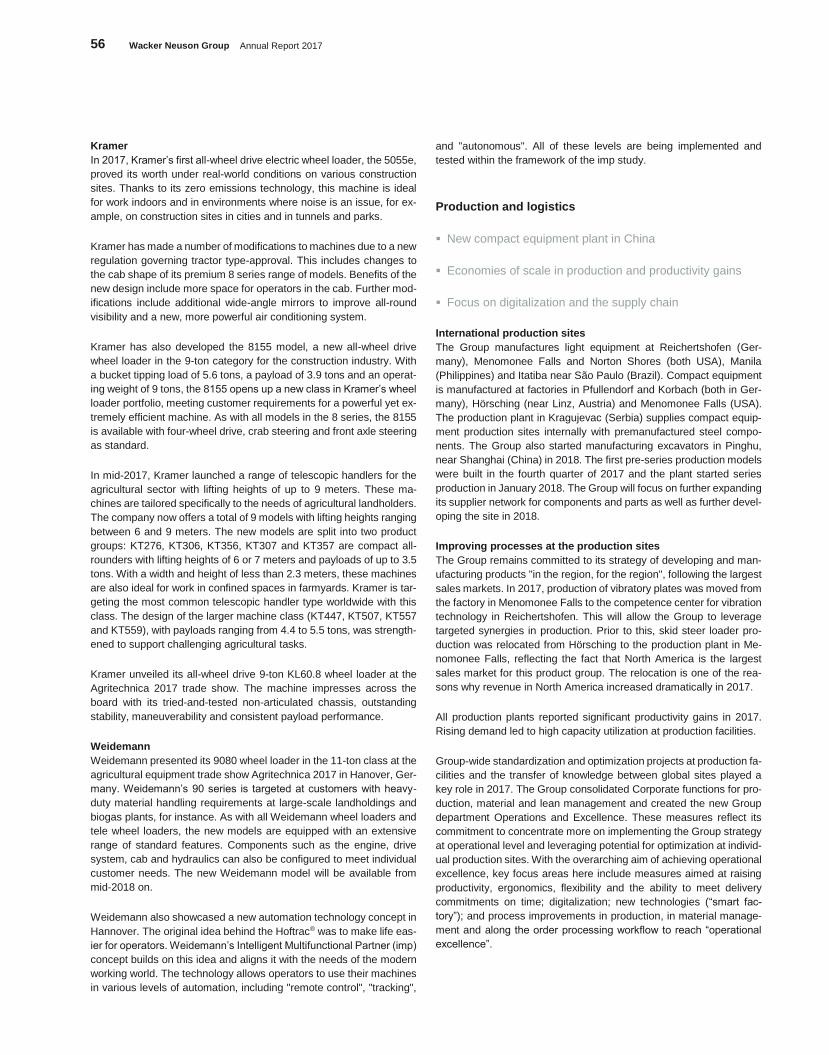
56 Wacker Neuson Group Annual Report 2017
Kramer
In 2017, Kramer’s first all-wheel drive electric wheel loader, the 5055e,
proved its worth under real-world conditions on various construction
sites. Thanks to its zero emissions technology, this machine is ideal
for work indoors and in environments where noise is an issue, for ex-
ample, on construction sites in cities and in tunnels and parks.
Kramer has made a number of modifications to machines due to a new
regulation governing tractor type-approval. This includes changes to
the cab shape of its premium 8 series range of models. Benefits of the
new design include more space for operators in the cab. Further mod-
ifications include additional wide-angle mirrors to improve all-round
visibility and a new, more powerful air conditioning system.
Kramer has also developed the 8155 model, a new all-wheel drive
wheel loader in the 9-ton category for the construction industry. With
a bucket tipping load of 5.6 tons, a payload of 3.9 tons and an operat-
ing weight of 9 tons, the 8155 opens up a new class in Kramer’s wheel
loader portfolio, meeting customer requirements for a powerful yet ex-
tremely efficient machine. As with all models in the 8 series, the 8155
is available with four-wheel drive, crab steering and front axle steering
as standard.
In mid-2017, Kramer launched a range of telescopic handlers for the
agricultural sector with lifting heights of up to 9 meters. These ma-
chines are tailored specifically to the needs of agricultural landholders.
The company now offers a total of 9 models with lifting heights ranging
between 6 and 9 meters. The new models are split into two product
groups: KT276, KT306, KT356, KT307 and KT357 are compact all-
rounders with lifting heights of 6 or 7 meters and payloads of up to 3.5
tons. With a width and height of less than 2.3 meters, these machines
are also ideal for work in confined spaces in farmyards. Kramer is tar-
geting the most common telescopic handler type worldwide with this
class. The design of the larger machine class (KT447, KT507, KT557
and KT559), with payloads ranging from 4.4 to 5.5 tons, was strength-
ened to support challenging agricultural tasks.
Kramer unveiled its all-wheel drive 9-ton KL60.8 wheel loader at the
Agritechnica 2017 trade show. The machine impresses across the
board with its tried-and-tested non-articulated chassis, outstanding
stability, maneuverability and consistent payload performance.
Weidemann
Weidemann presented its 9080 wheel loader in the 11-ton class at the
agricultural equipment trade show Agritechnica 2017 in Hanover, Ger-
many. Weidemann’s 90 series is targeted at customers with heavy-
duty material handling requirements at large-scale landholdings and
biogas plants, for instance. As with all Weidemann wheel loaders and
tele wheel loaders, the new models are equipped with an extensive
range of standard features. Components such as the engine, drive
system, cab and hydraulics can also be configured to meet individual
customer needs. The new Weidemann model will be available from
mid-2018 on.
Weidemann also showcased a new automation technology concept in
Hannover. The original idea behind the Hoftrac® was to make life eas-
ier for operators. Weidemann’s Intelligent Multifunctional Partner (imp)
concept builds on this idea and aligns it with the needs of the modern
working world. The technology allows operators to use their machines
in various levels of automation, including "remote control", "tracking",
and "autonomous". All of these levels are being implemented and
tested within the framework of the imp study.
Production and logistics
New compact equipment plant in China
Economies of scale in production and productivity gains
Focus on digitalization and the supply chain
International production sites
The Group manufactures light equipment at Reichertshofen (Ger-
many), Menomonee Falls and Norton Shores (both USA), Manila
(Philippines) and Itatiba near São Paulo (Brazil). Compact equipment
is manufactured at factories in Pfullendorf and Korbach (both in Ger-
many), Hörsching (near Linz, Austria) and Menomonee Falls (USA).
The production plant in Kragujevac (Serbia) supplies compact equip-
ment production sites internally with premanufactured steel compo-
nents. The Group also started manufacturing excavators in Pinghu,
near Shanghai (China) in 2018. The first pre-series production models
were built in the fourth quarter of 2017 and the plant started series
production in January 2018. The Group will focus on further expanding
its supplier network for components and parts as well as further devel-
oping the site in 2018.
Improving processes at the production sites
The Group remains committed to its strategy of developing and man-
ufacturing products "in the region, for the region", following the largest
sales markets. In 2017, production of vibratory plates was moved from
the factory in Menomonee Falls to the competence center for vibration
technology in Reichertshofen. This will allow the Group to leverage
targeted synergies in production. Prior to this, skid steer loader pro-
duction was relocated from Hörsching to the production plant in Me-
nomonee Falls, reflecting the fact that North America is the largest
sales market for this product group. The relocation is one of the rea-
sons why revenue in North America increased dramatically in 2017.
All production plants reported significant productivity gains in 2017.
Rising demand led to high capacity utilization at production facilities.
Group-wide standardization and optimization projects at production fa-
cilities and the transfer of knowledge between global sites played a
key role in 2017. The Group consolidated Corporate functions for pro-
duction, material and lean management and created the new Group
department Operations and Excellence. These measures reflect its
commitment to concentrate more on implementing the Group strategy
at operational level and leveraging potential for optimization at individ-
ual production sites. With the overarching aim of achieving operational
excellence, key focus areas here include measures aimed at raising
productivity, ergonomics, flexibility and the ability to meet delivery
commitments on time; digitalization; new technologies (“smart fac-
tory”); and process improvements in production, in material manage-
ment and along the order processing workflow to reach “operational
excellence”.
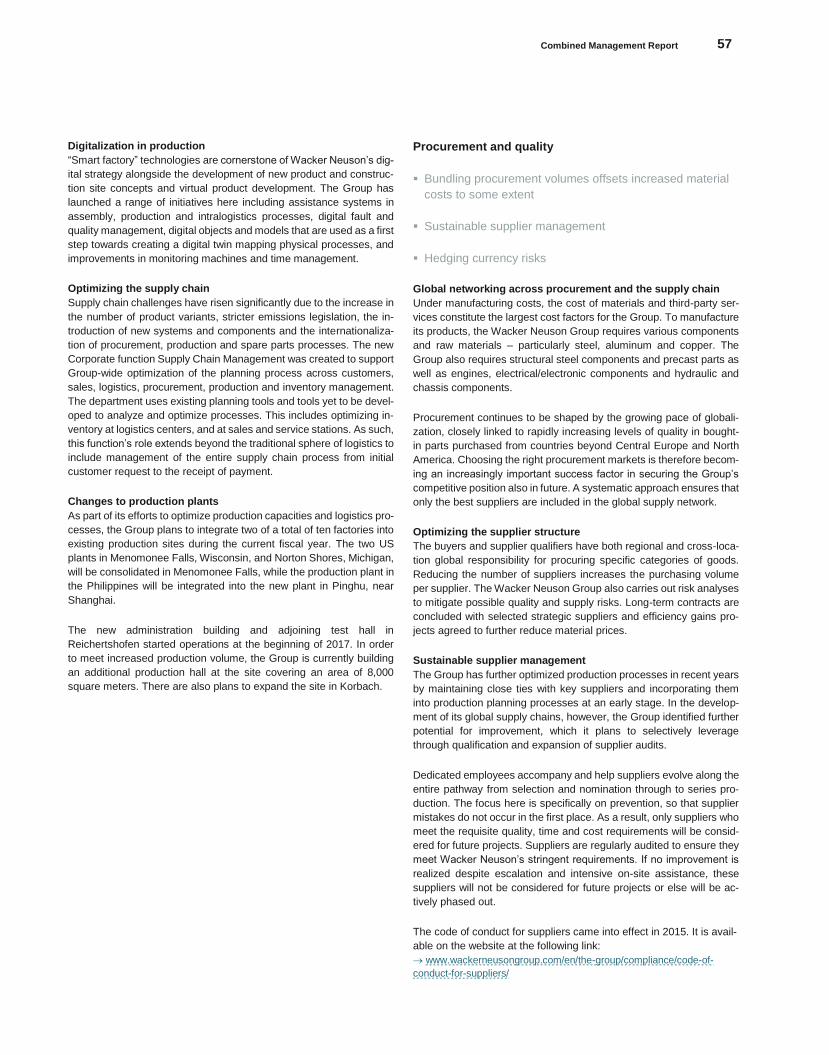
Combined Management Report 57
Konze
rnabschlu
ss
Digitalization in production
“Smart factory” technologies are cornerstone of Wacker Neuson’s dig-
ital strategy alongside the development of new product and construc-
tion site concepts and virtual product development. The Group has
launched a range of initiatives here including assistance systems in
assembly, production and intralogistics processes, digital fault and
quality management, digital objects and models that are used as a first
step towards creating a digital twin mapping physical processes, and
improvements in monitoring machines and time management.
Optimizing the supply chain
Supply chain challenges have risen significantly due to the increase in
the number of product variants, stricter emissions legislation, the in-
troduction of new systems and components and the internationaliza-
tion of procurement, production and spare parts processes. The new
Corporate function Supply Chain Management was created to support
Group-wide optimization of the planning process across customers,
sales, logistics, procurement, production and inventory management.
The department uses existing planning tools and tools yet to be devel-
oped to analyze and optimize processes. This includes optimizing in-
ventory at logistics centers, and at sales and service stations. As such,
this function’s role extends beyond the traditional sphere of logistics to
include management of the entire supply chain process from initial
customer request to the receipt of payment.
Changes to production plants
As part of its efforts to optimize production capacities and logistics pro-
cesses, the Group plans to integrate two of a total of ten factories into
existing production sites during the current fiscal year. The two US
plants in Menomonee Falls, Wisconsin, and Norton Shores, Michigan,
will be consolidated in Menomonee Falls, while the production plant in
the Philippines will be integrated into the new plant in Pinghu, near
Shanghai.
The new administration building and adjoining test hall in
Reichertshofen started operations at the beginning of 2017. In order
to meet increased production volume, the Group is currently building
an additional production hall at the site covering an area of 8,000
square meters. There are also plans to expand the site in Korbach.
Procurement and quality
Bundling procurement volumes offsets increased material
costs to some extent
Sustainable supplier management
Hedging currency risks
Global networking across procurement and the supply chain
Under manufacturing costs, the cost of materials and third-party ser-
vices constitute the largest cost factors for the Group. To manufacture
its products, the Wacker Neuson Group requires various components
and raw materials – particularly steel, aluminum and copper. The
Group also requires structural steel components and precast parts as
well as engines, electrical/electronic components and hydraulic and
chassis components.
Procurement continues to be shaped by the growing pace of globali-
zation, closely linked to rapidly increasing levels of quality in bought-
in parts purchased from countries beyond Central Europe and North
America. Choosing the right procurement markets is therefore becom-
ing an increasingly important success factor in securing the Group’s
competitive position also in future. A systematic approach ensures that
only the best suppliers are included in the global supply network.
Optimizing the supplier structure
The buyers and supplier qualifiers have both regional and cross-loca-
tion global responsibility for procuring specific categories of goods.
Reducing the number of suppliers increases the purchasing volume
per supplier. The Wacker Neuson Group also carries out risk analyses
to mitigate possible quality and supply risks. Long-term contracts are
concluded with selected strategic suppliers and efficiency gains pro-
jects agreed to further reduce material prices.
Sustainable supplier management
The Group has further optimized production processes in recent years
by maintaining close ties with key suppliers and incorporating them
into production planning processes at an early stage. In the develop-
ment of its global supply chains, however, the Group identified further
potential for improvement, which it plans to selectively leverage
through qualification and expansion of supplier audits.
Dedicated employees accompany and help suppliers evolve along the
entire pathway from selection and nomination through to series pro-
duction. The focus here is specifically on prevention, so that supplier
mistakes do not occur in the first place. As a result, only suppliers who
meet the requisite quality, time and cost requirements will be consid-
ered for future projects. Suppliers are regularly audited to ensure they
meet Wacker Neuson’s stringent requirements. If no improvement is
realized despite escalation and intensive on-site assistance, these
suppliers will not be considered for future projects or else will be ac-
tively phased out.
The code of conduct for suppliers came into effect in 2015. It is avail-
able on the website at the following link:
www.wackerneusongroup.com/en/the-group/compliance/code-of-
conduct-for-suppliers/
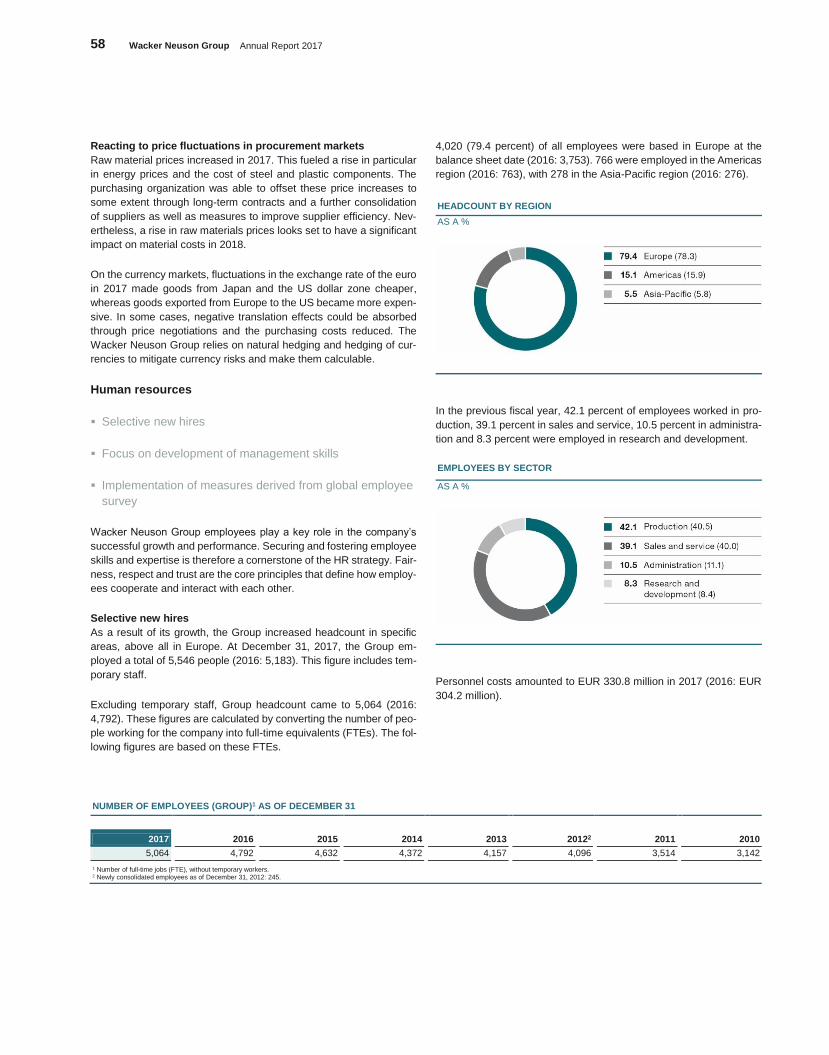
58 Wacker Neuson Group Annual Report 2017
Reacting to price fluctuations in procurement markets
Raw material prices increased in 2017. This fueled a rise in particular
in energy prices and the cost of steel and plastic components. The
purchasing organization was able to offset these price increases to
some extent through long-term contracts and a further consolidation
of suppliers as well as measures to improve supplier efficiency. Nev-
ertheless, a rise in raw materials prices looks set to have a significant
impact on material costs in 2018.
On the currency markets, fluctuations in the exchange rate of the euro
in 2017 made goods from Japan and the US dollar zone cheaper,
whereas goods exported from Europe to the US became more expen-
sive. In some cases, negative translation effects could be absorbed
through price negotiations and the purchasing costs reduced. The
Wacker Neuson Group relies on natural hedging and hedging of cur-
rencies to mitigate currency risks and make them calculable.
Human resources
Selective new hires
Focus on development of management skills
Implementation of measures derived from global employee
survey
Wacker Neuson Group employees play a key role in the company’s
successful growth and performance. Securing and fostering employee
skills and expertise is therefore a cornerstone of the HR strategy. Fair-
ness, respect and trust are the core principles that define how employ-
ees cooperate and interact with each other.
Selective new hires
As a result of its growth, the Group increased headcount in specific
areas, above all in Europe. At December 31, 2017, the Group em-
ployed a total of 5,546 people (2016: 5,183). This figure includes tem-
porary staff.
Excluding temporary staff, Group headcount came to 5,064 (2016:
4,792). These figures are calculated by converting the number of peo-
ple working for the company into full-time equivalents (FTEs). The fol-
lowing figures are based on these FTEs.
4,020 (79.4 percent) of all employees were based in Europe at the
balance sheet date (2016: 3,753). 766 were employed in the Americas
region (2016: 763), with 278 in the Asia-Pacific region (2016: 276).
HEADCOUNT BY REGION
AS A %
In the previous fiscal year, 42.1 percent of employees worked in pro-
duction, 39.1 percent in sales and service, 10.5 percent in administra-
tion and 8.3 percent were employed in research and development.
EMPLOYEES BY SECTOR
AS A %
Personnel costs amounted to EUR 330.8 million in 2017 (2016: EUR
304.2 million).
NUMBER OF EMPLOYEES (GROUP)1 AS OF DECEMBER 31
2017 2016 2015 2014 2013 20122 2011 2010
5,064 4,792 4,632 4,372 4,157 4,096 3,514 3,142
1 Number of full-time jobs (FTE), without temporary workers. 2 Newly consolidated employees as of December 31, 2012: 245.
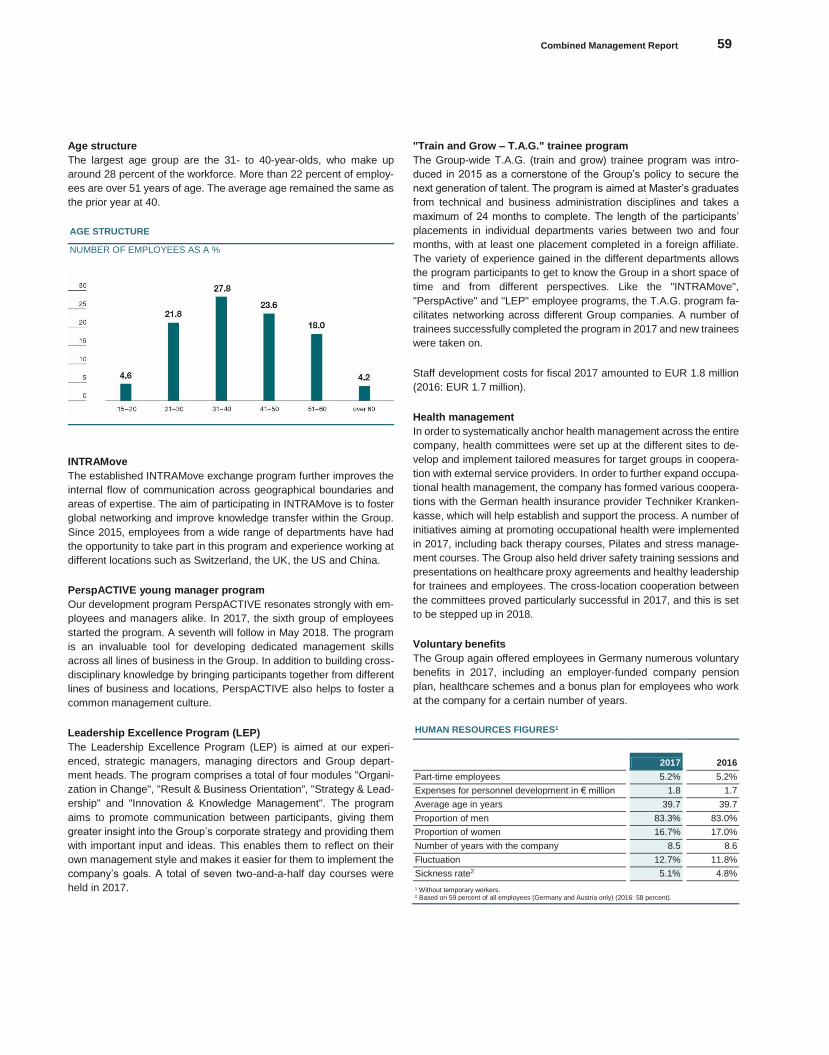
Combined Management Report 59
Konze
rnabschlu
ss
Age structure
The largest age group are the 31- to 40-year-olds, who make up
around 28 percent of the workforce. More than 22 percent of employ-
ees are over 51 years of age. The average age remained the same as
the prior year at 40.
AGE STRUCTURE
NUMBER OF EMPLOYEES AS A %
INTRAMove
The established INTRAMove exchange program further improves the
internal flow of communication across geographical boundaries and
areas of expertise. The aim of participating in INTRAMove is to foster
global networking and improve knowledge transfer within the Group.
Since 2015, employees from a wide range of departments have had
the opportunity to take part in this program and experience working at
different locations such as Switzerland, the UK, the US and China.
PerspACTIVE young manager program
Our development program PerspACTIVE resonates strongly with em-
ployees and managers alike. In 2017, the sixth group of employees
started the program. A seventh will follow in May 2018. The program
is an invaluable tool for developing dedicated management skills
across all lines of business in the Group. In addition to building cross-
disciplinary knowledge by bringing participants together from different
lines of business and locations, PerspACTIVE also helps to foster a
common management culture.
Leadership Excellence Program (LEP)
The Leadership Excellence Program (LEP) is aimed at our experi-
enced, strategic managers, managing directors and Group depart-
ment heads. The program comprises a total of four modules "Organi-
zation in Change", "Result & Business Orientation", "Strategy & Lead-
ership" and "Innovation & Knowledge Management". The program
aims to promote communication between participants, giving them
greater insight into the Group’s corporate strategy and providing them
with important input and ideas. This enables them to reflect on their
own management style and makes it easier for them to implement the
company’s goals. A total of seven two-and-a-half day courses were
held in 2017.
"Train and Grow – T.A.G." trainee program
The Group-wide T.A.G. (train and grow) trainee program was intro-
duced in 2015 as a cornerstone of the Group’s policy to secure the
next generation of talent. The program is aimed at Master’s graduates
from technical and business administration disciplines and takes a
maximum of 24 months to complete. The length of the participants’
placements in individual departments varies between two and four
months, with at least one placement completed in a foreign affiliate.
The variety of experience gained in the different departments allows
the program participants to get to know the Group in a short space of
time and from different perspectives. Like the "INTRAMove",
"PerspActive" and "LEP" employee programs, the T.A.G. program fa-
cilitates networking across different Group companies. A number of
trainees successfully completed the program in 2017 and new trainees
were taken on.
Staff development costs for fiscal 2017 amounted to EUR 1.8 million
(2016: EUR 1.7 million).
Health management
In order to systematically anchor health management across the entire
company, health committees were set up at the different sites to de-
velop and implement tailored measures for target groups in coopera-
tion with external service providers. In order to further expand occupa-
tional health management, the company has formed various coopera-
tions with the German health insurance provider Techniker Kranken-
kasse, which will help establish and support the process. A number of
initiatives aiming at promoting occupational health were implemented
in 2017, including back therapy courses, Pilates and stress manage-
ment courses. The Group also held driver safety training sessions and
presentations on healthcare proxy agreements and healthy leadership
for trainees and employees. The cross-location cooperation between
the committees proved particularly successful in 2017, and this is set
to be stepped up in 2018.
Voluntary benefits
The Group again offered employees in Germany numerous voluntary
benefits in 2017, including an employer-funded company pension
plan, healthcare schemes and a bonus plan for employees who work
at the company for a certain number of years.
HUMAN RESOURCES FIGURES1
2017 2016
Part-time employees 5.2% 5.2%
Expenses for personnel development in € million 1.8 1.7
Average age in years 39.7 39.7
Proportion of men 83.3% 83.0%
Proportion of women 16.7% 17.0%
Number of years with the company 8.5 8.6
Fluctuation 12.7% 11.8%
Sickness rate2 5.1% 4.8%
1 Without temporary workers. 2 Based on 59 percent of all employees (Germany and Austria only) (2016: 58 percent).
60 Wacker Neuson Group Annual Report 2017
Sales, service and marketing
Successful marketing via existing and new sales channels
Long-term customer relationships built on close ties
Strong resonance at industry trade fairs
Customer-centric culture – every thought and action begins with the
customer. As such, the marketing and sales activities in every area of
the company are tailored towards the specific needs of the company’s
target groups.
Global sales network
The Wacker Neuson Group’s corporate culture enables an organiza-
tion with decentralized responsibility, capable of responding quickly,
collaboratively and unbureaucratically to the needs of sales partners
and customers. One of the most important synergies resulting from the
merger of Wacker and Neuson Kramer in 2007 is the ability to market
the entire product portfolio through existing and new distribution chan-
nels. In 2017, this again resulted in a significant rise in sales, in partic-
ular for compact equipment.
Sales structures are aligned with local market dynamics and different
brands and channels are used to market Group products, spare parts
and services, for example direct sales channels, dealer networks, im-
porters, retail chains and, most recently, digital channels. In most mar-
kets, the Wacker Neuson Group works with independent dealers, and
in many cases local sales affiliates support and advise major custom-
ers and dealers in these countries. The Group continually optimizes
its market- and customer-specific sales network in order to consolidate
and further expand its position in different markets. In 2017, the Group
identified and certified new dealers across the world. It acquired its
former dealer in Slovakia in 2017 and incorporated it into its own net-
work.
The Wacker Neuson e-store is now offering a complementary alterna-
tive to existing sales channels. This online platform provides a con-
venient way for customers to learn more about products, spare parts,
accessories and services, check their availability, configure their pre-
ferred options in the case of compact equipment, and submit orders at
any time. The e-store is currently available to end customers in Ger-
many as well as dealers in Germany, the UK, France and the US, and
will gradually be rolled out to other countries.
To further extend its market reach, the Group also partners with mar-
ket leaders to distribute its products via their sales networks. For fur-
ther information, refer to page 33.
Diverse customer base
Diversification is becoming an increasingly important part of sales with
a view to spreading economic risks more widely and achieving further
growth. The Group’s customer base in 2017 again included construc-
tion companies (public and private enterprises), gardening and land-
scaping firms, rental firms, the agricultural sector, municipal bodies,
the energy sector, the mining sector and industrial companies. The
Group is not dependent on individual customers to any significant de-
gree and no single customer accounts for more than 5 percent of total
revenue.
Individualized solutions and customer-centric strategy
During the period under review, the sales and service team focused
on customer acquisition, promotional measures and attractive financ-
ing models via external service providers. The Wacker Neuson Group
also offered customers individualized product and service solutions
tailored to their needs and held various specialist seminars around the
world. These were targeted at the internal sales and service team as
well as at dealers and customers. Participants had the opportunity to
find out more about the Group’s efficient, versatile range of products
and its extensive service offering.
Building lasting customer ties
Customers want machines that add economic benefits to their pro-
cesses. A new product is only a market success if it adds value to
customers (for instance by increasing efficiency), offers an attractive
price/performance ratio and clearly stands out from competitor prod-
ucts. The Group therefore collaborates closely with its customers to
ensure it understands exactly what they need. It involves customers in
product development processes right from the beginning, allowing
them to test equipment and machines before they are ready for mar-
ket, thus ensuring that any suggestions for improvement are incorpo-
rated at an early stage.
Customer satisfaction is crucial to the company’s success. Customers
are looking for new solutions for their daily processes and challenges.
They require a flexible and cost-effective approach flanked by profes-
sional consulting services and have high expectations of the quality
and availability of the Group’s products and services. The company
therefore regularly surveys customers on its products and services
and uses this feedback to continually improve its offering.
Strong resonance at industry trade fairs
The company made successful appearances at many different indus-
try trade shows in 2017, including Tiefbau live, Demopark, NordBau
and Agritechnica in Germany as well as Conexpo and World of Con-
crete in the US. At each exhibition, the Wacker Neuson Group gave
visitors a chance to experience an interesting assortment of products,
services and innovative solutions, all designed to meet evolving cus-
tomer needs. The Group uses trade shows as a platform for present-
ing new products, connecting with new customers and acquiring new
dealers. In regions such as Southeast Asia and South America, exhi-
bitions are an ideal opportunity for the Group to raise awareness of its
brands.
Once a year, the Group organizes the Wacker Neuson Universe in
order to showcase new products and innovations from the Wacker
Neuson brand and give customers the chance to test these on site. It
is the ideal platform for strengthening customer ties and also provides
the company with valuable feedback directly from the market. This
multi-day specialist event was held in and around the factory in
Reichertshofen and attracted over 5,000 visitors.
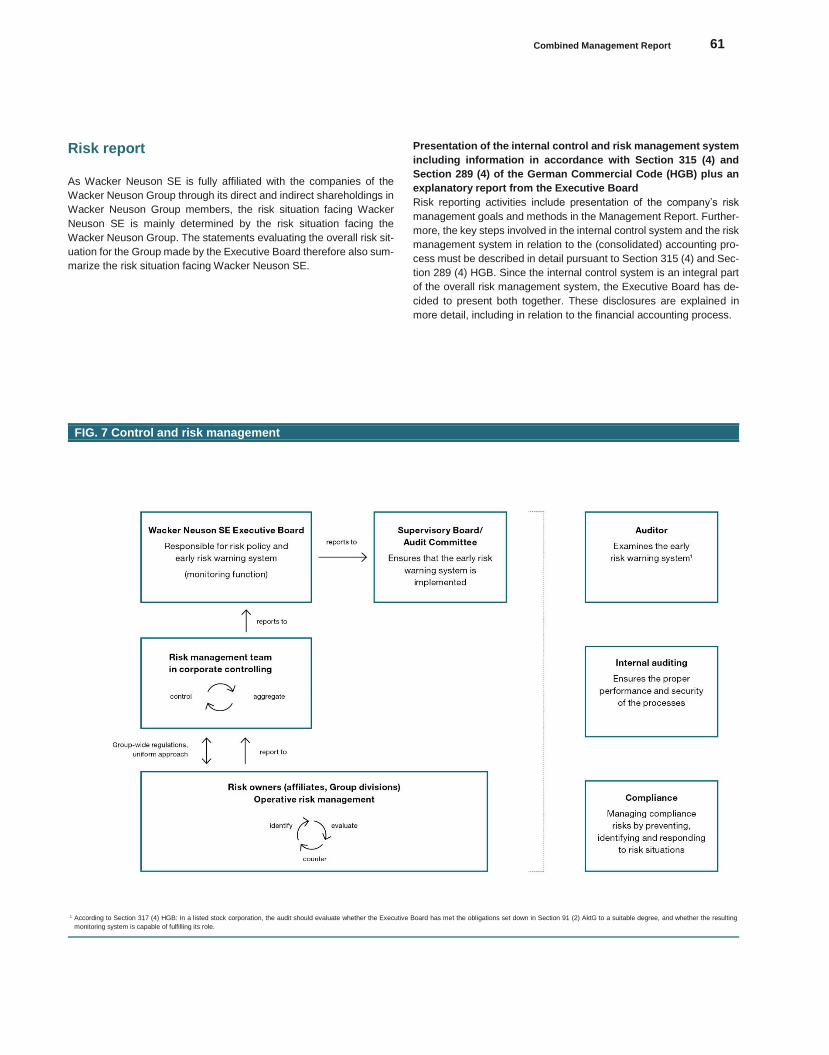
Combined Management Report 61
Konze
rnabschlu
ss
Risk report
As Wacker Neuson SE is fully affiliated with the companies of the
Wacker Neuson Group through its direct and indirect shareholdings in
Wacker Neuson Group members, the risk situation facing Wacker
Neuson SE is mainly determined by the risk situation facing the
Wacker Neuson Group. The statements evaluating the overall risk sit-
uation for the Group made by the Executive Board therefore also sum-
marize the risk situation facing Wacker Neuson SE.
Presentation of the internal control and risk management system
including information in accordance with Section 315 (4) and
Section 289 (4) of the German Commercial Code (HGB) plus an
explanatory report from the Executive Board
Risk reporting activities include presentation of the company’s risk
management goals and methods in the Management Report. Further-
more, the key steps involved in the internal control system and the risk
management system in relation to the (consolidated) accounting pro-
cess must be described in detail pursuant to Section 315 (4) and Sec-
tion 289 (4) HGB. Since the internal control system is an integral part
of the overall risk management system, the Executive Board has de-
cided to present both together. These disclosures are explained in
more detail, including in relation to the financial accounting process.
FIG. 7 Control and risk management
1 According to Section 317 (4) HGB: In a listed stock corporation, the audit should evaluate whether the Executive Board has met the obligations set down in Section 91 (2) AktG to a suitable degree, and whether the resulting
monitoring system is capable of fulfilling its role.
62 Wacker Neuson Group Annual Report 2017
Risk management system
The Group-wide risk management system serves as an early-warning
safety net that identifies, assesses and appropriately communicates
risks and enables the Group to implement corresponding counterac-
tive measures in good time. This calls for the reliable identification,
evaluation and monitoring of all risks that may prevent this goal from
being achieved. Risks are evaluated on a rolling, 12-month basis at
the end of the respective reporting period. The risk management sys-
tem includes a planning process for each of the core business seg-
ments as well as comprehensive Group reports on all affiliates (which
are regularly analyzed, discussed, evaluated and submitted to all de-
cision-makers). The risk management system also covers process
definitions for all business segments, Group auditing and compliance.
FIG. 7
The risk management handbook outlines the Group’s risk policy in
terms of defining, assessing and quantifying potential risks, and the
structure and workflow of the risk management system. It also assigns
roles and responsibilities for identifying, analyzing, monitoring and
communicating risks. This allows us to take suitable measures to ac-
tively counteract known risks. The corporate controlling department
collects data from the departments at Group headquarters and at the
affiliates. Following completeness and plausibility checks, the data
gathered is aggregated and made available to management, for ex-
ample the Executive Board and the Supervisory Board.
The Group’s comprehensive risk management system includes sys-
tematic financial risk management. For this, the Group has defined
guidelines and policies for certain activities such as dealing with for-
eign currency risks, interest rate risks and credit risks, the use of de-
rivative and other financial instruments and the use of liquidity sur-
pluses. The risks are then assessed using both quantitative and qual-
itative methods that are uniform throughout the Group, allowing com-
parison across the various business segments. Please refer to the
Notes to the Consolidated Financial Statements for further information
on the risk management system (item 31). Page 123
Key features of internal control and risk management systems
in relation to financial accounting plus related disclosures
According to the law outlining modernization of German accounting
rules, the internal control system covers the basic principles, pro-
cesses and measures required to ensure effective, efficient, due and
proper performance of financial accounting processes in compliance
with the relevant legal guidelines. This also includes the internal audit-
ing system, to the extent that it relates to financial accounting. As part
of the risk management system, the internal control system – similar
to the auditing system – draws on appropriate control and monitoring
processes for financial accounting. This refers in particular to items on
the balance sheet recognizing the Group’s risk hedging positions.
The Wacker Neuson Group’s internal control and risk management
systems in relation to financial accounting can be described as follows:
The entities responsible for financial accounting are clearly defined
at the level of Wacker Neuson SE and its affiliates. Responsibility
has been vested in the accounting, controlling, auditing and treasury
departments. Ultimate responsibility for financial accounting lies
with the Board. Within financial accounting, in general there is a
clear differentiation between booking and auditing financial data.
Employees involved in financial accounting are qualified to the high-
est standards.
The Group has suitable systems and processes in place for plan-
ning, reporting, controlling and risk management, and implements
these across the Group. Reports due on a quarterly or monthly ba-
sis, financial accounting reports included, enable the Group to re-
spond quickly to unexpected negative developments.
The Group-wide procedural guidelines set down in the accounting
manual, the tax manual and the treasury manual are accessible at
all times to all relevant Group employees. Other regulations such as
the rating guide and list of processes subject to second sign-off also
apply. These guidelines guarantee uniform handling of similar sce-
narios throughout the entire Group. They are updated as required
and aligned with new circumstances and requirements.
Proven standard software supports accounting functions, and all
systems deployed are secured against unauthorized access by third
parties.
Effective controls (including second sign-off and analytical checks)
are in place for accounting-related processes (payment runs, for ex-
ample).
Processes related to financial accounting are regularly checked by
internal auditing.
Various internal bodies, such as the auditing department or the Au-
dit Committee of the Supervisory Board, regularly review and rate
the effectiveness of the internal control and risk management sys-
tems in relation to financial accounting processes.
The audit performed by the auditor serves to examine whether the
system identifies, evaluates, analyzes, communicates and regularly
controls risks (system audit according to standard IDW PS 340.19
of the Institute of Public Auditors in Germany). According to IDW PS
340.6, concrete implementation measures to overcome and man-
age risks are not relevant for the early risk warning system pursuant
to Section 91 (2) AktG and thus not relevant for the audit performed
by the auditors pursuant to Section 317 (4) HGB.
The aim of the internal control and risk management systems in rela-
tion to financial accounting is to ensure that all Group dealings and
circumstances are disclosed, calculated and categorized correctly on
the balance sheet, and correctly represented in the accounting sys-
tem. This enables the Group to largely avoid accounting errors or at
least identify them.
This efficient control process ensures that business transactions are
captured, processed and documented in the accounting systems of
the company and Group in compliance with commercial law and other
statutory regulations, international accounting standards, the Articles
of Incorporation and internal Group guidelines, and that these figures
are rapidly and correctly recognized in the accounts. The Group’s risk
management strategy enables the Group to identify risks at an early
stage, respond appropriately and communicate them in a timely man-
ner. At the same time, it ensures that assets and liabilities are correctly
evaluated and disclosed in the Annual and Consolidated Financial
Statements. This provides Group stakeholders with reliable, meaning-
ful and timely information.
Where possible and economically viable, insurance policies are in
place to cover insurable risks.
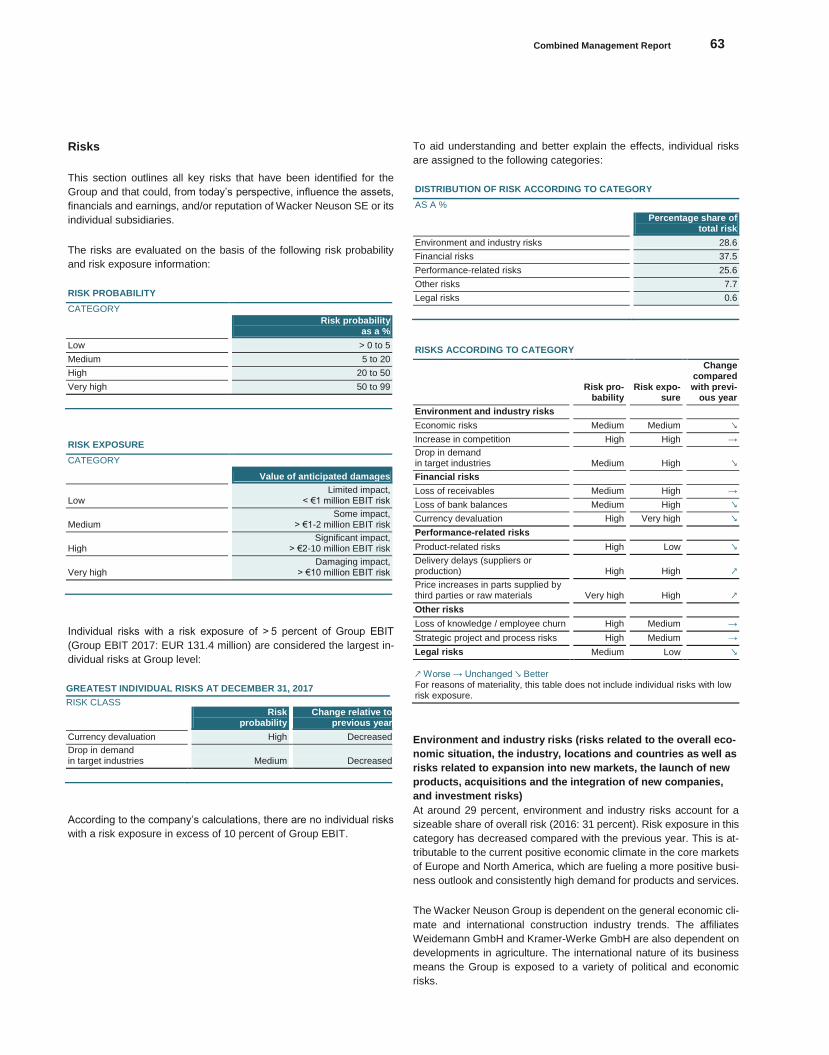
Combined Management Report 63
Konze
rnabschlu
ss
Risks
This section outlines all key risks that have been identified for the
Group and that could, from today’s perspective, influence the assets,
financials and earnings, and/or reputation of Wacker Neuson SE or its
individual subsidiaries.
The risks are evaluated on the basis of the following risk probability
and risk exposure information:
RISK PROBABILITY
CATEGORY
Risk probability
as a %
Low > 0 to 5
Medium 5 to 20
High 20 to 50
Very high 50 to 99
RISK EXPOSURE
CATEGORY
Value of anticipated damages
Low Limited impact,
< €1 million EBIT risk
Medium Some impact,
> €1-2 million EBIT risk
High Significant impact,
> €2-10 million EBIT risk
Very high Damaging impact,
> €10 million EBIT risk
Individual risks with a risk exposure of > 5 percent of Group EBIT
(Group EBIT 2017: EUR 131.4 million) are considered the largest in-
dividual risks at Group level:
GREATEST INDIVIDUAL RISKS AT DECEMBER 31, 2017
RISK CLASS
Risk
probability Change relative to
previous year
Currency devaluation High Decreased
Drop in demand in target industries Medium Decreased
According to the company’s calculations, there are no individual risks
with a risk exposure in excess of 10 percent of Group EBIT.
To aid understanding and better explain the effects, individual risks
are assigned to the following categories:
DISTRIBUTION OF RISK ACCORDING TO CATEGORY
AS A %
Percentage share of
total risk
Environment and industry risks 28.6
Financial risks 37.5
Performance-related risks 25.6
Other risks 7.7
Legal risks 0.6
RISKS ACCORDING TO CATEGORY
Risk pro-
bability Risk expo-
sure
Change compared with previ-
ous year
Environment and industry risks
Economic risks Medium Medium ↘
Increase in competition High High →
Drop in demand in target industries Medium High ↘
Financial risks
Loss of receivables Medium High →
Loss of bank balances Medium High ↘
Currency devaluation High Very high ↘
Performance-related risks
Product-related risks High Low ↘
Delivery delays (suppliers or production) High High ↗
Price increases in parts supplied by third parties or raw materials Very high High ↗
Other risks
Loss of knowledge / employee churn High Medium →
Strategic project and process risks High Medium →
Legal risks Medium Low ↘
↗ Worse → Unchanged ↘ Better For reasons of materiality, this table does not include individual risks with low risk exposure.
Environment and industry risks (risks related to the overall eco-
nomic situation, the industry, locations and countries as well as
risks related to expansion into new markets, the launch of new
products, acquisitions and the integration of new companies,
and investment risks)
At around 29 percent, environment and industry risks account for a
sizeable share of overall risk (2016: 31 percent). Risk exposure in this
category has decreased compared with the previous year. This is at-
tributable to the current positive economic climate in the core markets
of Europe and North America, which are fueling a more positive busi-
ness outlook and consistently high demand for products and services.
The Wacker Neuson Group is dependent on the general economic cli-
mate and international construction industry trends. The affiliates
Weidemann GmbH and Kramer-Werke GmbH are also dependent on
developments in agriculture. The international nature of its business
means the Group is exposed to a variety of political and economic
risks.
64 Wacker Neuson Group Annual Report 2017
Although forecasts for the global agricultural and construction indus-
tries in 2018 and 2019 are positive, there is still an underlying risk that
some markets could be affected by an economic downturn.
The Wacker Neuson Group is active in cyclical and volatile markets.
Falling demand, especially in the core markets of Europe and North
America, could impact the Group’s revenue and profit levels. In addi-
tion, demand is subject to seasonal fluctuations, which can have an
impact on revenue trends during the year. The Group counters these
risks through targeted diversification across various sectors and by
maintaining an international footprint. In addition, its commitment to
increasing its presence in established markets, expanding into tar-
geted new markets and launching new products should offset any eco-
nomic fluctuations at country and industry level. The Group regularly
monitors key leading indicators in order to implement appropriate
countermeasures in good time whenever fluctuations are identified. In
addition, the Group uses flexible work and production models in its
organization to absorb any fluctuations in capacity utilization.
The Wacker Neuson Group faces tough international competition. The
Group is countering the risk of losing market share by using qualified
sales partners (including strategic alliances) to continue expanding its
global distribution and by aligning services and product innovations
with customer needs. In particular, the Wacker Neuson Group is ad-
dressing the digitalization trend and responding to the resulting
changes in customer and business relationships as it aligns its busi-
ness processes specifically with these needs.
The Wacker Neuson Group uses direct and indirect distribution chan-
nels to sell its products. Its business success therefore depends to
some extent on the performance of external sales partners, which can
also impact on brand reputation, customer satisfaction and future buy-
ing behavior. The Group provides comprehensive support to its sales
partners, also offering market-specific training to ensure that its brands
and products are suitably positioned in the relevant markets (dealer
qualification).
Customer structures vary from one country to another. Within an indi-
vidual country, the loss of a major customer (due to insolvency or mar-
ket consolidation, for instance) could have a serious impact on de-
mand for products and services from the affiliate concerned. The
Group counters this risk by diversifying its customer base, continually
acquiring new customers and proactively maintaining strong customer
relationships.
Demand on the international market is becoming increasingly concen-
trated, partly due to mergers and acquisitions among the Group’s cus-
tomer base. There is also the possibility of customers being taken over
by financial investors. These types of developments can have a posi-
tive or negative impact on Wacker Neuson Group sales and revenue.
Financial risks (risks associated with financial instruments, ex-
change rate and interest fluctuations, financing and taxation)
Financial risks account for 38 percent of overall risk to the Group. This
is a decrease on the previous year’s figure of 40 percent. The risk ex-
posure in this category is also considerably lower than in the previous
year due to a reduction in foreign currency holdings, which mitigated
the risk of devaluation.
The financial risk to the Group primarily stems from the ongoing risk
of currency devaluation; a risk the Group has identified for certain
emerging markets should their currencies fall sharply against the
Group’s production currencies (EUR/USD). This would diminish the
value of revenue and profit from these countries when they are trans-
lated into the Group’s consolidated financial statements, which are
drawn up in euro.
A euro that has gained in value, in particular against the US dollar,
could negatively impact exports of products manufactured in the euro-
zone. The Group is countering this risk by continually monitoring cur-
rencies and in some cases negotiating euro or US dollar prices on
deals with customers based in countries outside of the eurozone or
US dollar area. Its international production sites also allow the Group
to counter currency effects to a certain extent (natural hedging).
Liabilities in foreign currencies have also increased due to the rise in
production volumes in 2017. If exchange rates develop unfavorably for
the company in relation to payables expressed in foreign currency, this
will increase the value of liabilities expressed in euros. The Group is
monitoring the corresponding currencies on an ongoing basis. The
Group makes use of targeted hedging instruments to counteract the
risks of devaluation.
Due to the Wacker Neuson Group’s global business activities and the
resulting tax obligations in various countries, there is a risk of an unfa-
vorable Group tax rate arising, depending on how income develops in
the different regions. There is also a risk of changes to tax laws and
related conditions in individual countries.
In the case of an audit, the Group assesses the risk, taking all circum-
stances into account, and makes provisions to the extent that audit
findings are binding and a reliable assessment is possible, or in the
case of possible liabilities that are likely, reports them under contingent
liabilities.
Please refer to the Notes to the Consolidated Financial Statements for
further information on financial risks (items 24 and 31). Pages 117
and 123
Performance-related risks (risks associated with procurement,
production and R&D)
At around 26 percent, performance-related risks account for the third
largest share of overall risks (2016: 19 percent). Risk exposure in this
category has grown relative to the previous year. The risks of material
price increases on the procurement side due to generally high demand
as well as delayed delivery risks are the main reasons for this rise.
Combined Management Report 65
Konze
rnabschlu
ss
The Group requires raw materials to manufacture its products – par-
ticularly steel, aluminum, copper and crude oil. It also uses parts sup-
plied by third parties. In addition, the Group relies on raw materials
and parts supplied by third parties being free of defects and meeting
the relevant specifications and quality standards. Defects in preman-
ufactured parts could result in quality complaints by Wacker Neuson
Group customers on the one hand and slow production on the other,
which may ultimately delay product deliveries to customers. These
scenarios could damage the Group’s brand and corporate image and
potentially result in contractual penalties, claims for damages and
losses in market share. The Group is countering this risk by preemp-
tively qualifying key suppliers, rating the key indicators of quality, time-
scale and cost. These key suppliers are supported on site by qualified
Wacker Neuson Group personnel at every step of the process flow,
from initial nomination through prototyping to series production. To en-
sure security of supply, the Group focuses on ensuring short lead
times so that it can react to fluctuations in demand. In order to reduce
the risk associated with suppliers yet further, a code of conduct for
suppliers was introduced in 2015. The aim for the Group here is to
ensure a sustainable supply chain and prevent the risk of reputational
damage as a result of supplier shortcomings.
Due to the current high level of demand, supplier-side delivery bottle-
necks could result in delayed deliveries of equipment and spare parts
to customers. It would therefore not be possible to satisfy customers
who require delivery within a short timeframe if supplier bottlenecks
occur. To secure delivery capabilities, the Group maintains close and
regular contact with its suppliers and, if required, opens up new supply
sources to meet short-term rises in demand and stabilize the supplier
base.
The risk of temporary production limitations or individual suppliers be-
ing shut down is particularly high in China due to environmental pollu-
tion and the accompanying environmental inspections. The Wacker
Neuson Group analyzes these risks on a continuous basis (including
as part of audits) and seeks out additional supply sources outside of
the affected areas and also beyond China.
Another fundamental risk in this category is the potential loss of a sup-
plier (due to insolvency, for instance), which could compromise the
Group’s delivery capabilities and thus its sales targets. The Wacker
Neuson Group is countering this risk by defining commodity strategies
to ensure that the loss of a supplier will only affect individual commod-
ities and not an entire production facility. It also endeavors to mitigate
this risk further by developing close relationships with suppliers and
concluding special standard agreements that secure its partners’ de-
livery capabilities to a certain extent.
Increases in the prices of raw materials, in particular for steel but also
for other components, caused by a rise in demand, speculation on the
raw materials markets, and exchange rate fluctuations could push up
the cost of materials. Raw materials prices rose sharply in 2017, with
steel and plastic components as well as energy costs particularly af-
fected. For 2018, there is a risk that suppliers will demand higher
prices for raw materials. These price increases in the procurement
market could lead to higher manufacturing costs. The Group is coun-
tering this risk by developing a more flexible and diverse global pro-
curement strategy and concluding longer-term contracts in some
cases (fixed prices). The Group maintains regular contact with busi-
ness partners and suppliers to jointly develop forward-looking solu-
tions.
During the year under review, the Wacker Neuson Group focused
strongly on the development of a new manufacturing facility in Pinghu,
China, for the future assembly of excavators. Normal production got
underway in early 2018. The start-up of production at a new location
carries a range of risks, which could have a negative impact on the
Group’s profit levels. The main risks include: insufficient plant produc-
tivity, quality problems with suppliers and with in-plant assembly, pro-
duction delays, and delivery delays affecting assemblies and parts
from suppliers. The Group is countering these risks through extensive
training for new hires at the plant, careful selection and qualification of
suppliers, and establishing an efficient project management system
for the initial phase of production and for developing further sites.
Political risks and punitive tariffs for commodities and commodity
groups from certain countries of origin could also in principle lead to
higher manufacturing costs. While this risk cannot be ruled out in times
of political and economic uncertainty, the Group is attempting to mini-
mize the potential impact as much as possible by manufacturing pur-
chased parts “in the region, for the region”.
The Wacker Neuson Group depends on developing new products and
bringing these to market in good time. Compliance with ever stricter
national and international laws and directives and factoring these into
product development is essential. New regulations regarding noise
emissions, environmental and user protection, for example, could re-
sult in higher costs for the Wacker Neuson Group. If these new regu-
lations are not implemented on an ongoing basis, the Group’s com-
petitive position and growth opportunities may be impaired in the short
term. The Group’s R&D department therefore continuously works to
develop new products and maintain and enhance its existing portfolio,
always aligning its activities with market demands and observing ap-
plicable regulations, laws and directives.
The Group is closely monitoring political developments around the
regulation of combustion engines and their use in urban areas and –
if necessary – quickly incorporating any policy changes into R&D plan-
ning. If any individual bans are imposed on the use of diesel-powered
compact and light equipment in cities, the Group already has a basic
portfolio of zero-emissions products which it is expanding all the time.
Legal risks (risks related to pending legal proceedings, patent
and trademark law)
Market-leading products are increasingly being copied by manufactur-
ers in emerging markets and this could reduce sales. If the Group were
no longer able to protect its intellectual property sufficiently, this would
impair its competitive ability. The Group is reducing this risk through
focused patent and intellectual property management and by enforc-
ing its intellectual property rights. The Group averts the risk of disputes
with third parties over intellectual property rights through appropriate
prior investigations and research.
Warranty and product liability claims can result in claims for damages
and injunctions. The Wacker Neuson Group is minimizing this risk by
taking the greatest of care in the development and manufacture of its
products on the one hand and, on the other, by drafting contracts care-
fully and ensuring they are properly enforced.
There is a risk that corrupt or fraudulent activities by employees of the
Wacker Neuson Group could inflict financial damage on the Group or
harm its image. The Wacker Neuson Group has set out transparent
compliance rules in its code of conduct for employees and has made
66 Wacker Neuson Group Annual Report 2017
a reporting system available to employees and business partners to
prevent unfair behavior or uncover any such behavior in good time.
No legal proceedings are currently underway or pending that might
have a significant impact on the Wacker Neuson Group’s financial sit-
uation. The Wacker Neuson Group has concluded insurance policies
worldwide to protect as far as possible against significant liability risks
arising from potential damages attributable to the Group.
Other risks (risks in the areas of HR, strategy, processes, IT and
environment)
The success of the Wacker Neuson Group is due in large part to the
skill and motivation of its employees. The loss of highly qualified peo-
ple in key positions could impact negatively on the Group’s growth
plan. The Group is countering this risk by offering employees incen-
tives to commit themselves to the company, for example attractive re-
muneration, long-term personal development opportunities and active
internal successor management.
In order to pursue its ambitious expansion strategy, the Group needs
to hire qualified staff, in particular mechanical and electrical engineers.
However, as the labor market stands, it may not be possible for the
Group to meet or fully meet its need for staff in these areas. The Group
is mitigating this risk with dedicated recruitment efforts, both in Ger-
many and abroad. It also offers attractive remuneration schemes and
interesting work opportunities promising a high degree of personal re-
sponsibility.
The company uses IT systems in numerous areas. Failure of these
systems could negatively impact on production and the flow of goods,
resulting in loss of revenue. The Group is countering this risk through
IT backup strategies and the use of standard software as well as pro-
fessional hardware security. It is pursuing a strict project management
policy to counter risks that can occur during the roll-out of global IT
systems and to prevent additional costs.
There is also a risk that increasingly strict environmental legislation
could entail additional costs at the production facilities or fines as a
result of non-compliance. The Wacker Neuson Group is mitigating this
risk by constantly monitoring the legal regulations and ensuring full
compliance. It also took the step of introducing a central energy and
environment management system in 2014.
The Wacker Neuson Group continues to expand its business seg-
ments as well as its sales and service network in line with the Group’s
growth strategy. This involves investments, which may not necessarily
be recouped. Unforeseeable risks can also arise within individual pro-
jects and delay execution. The Group is managing these risks by
adapting its execution timing to current market dynamics, carefully ex-
amining all planned investments and possible risks, pursuing a lean
project management policy, and maintaining a high level of self-financ-
ing in combination with a high equity ratio.
The company is also exposed to risks in connection with its ongoing
international expansion activities. If the Group’s medium- to long-term
expansion plans do not pan out as anticipated, or if sales and revenue
plans cannot be realized due, for example, to lower-than-anticipated
demand for Group products in certain countries, there is a risk that
long-term growth strategies may have to be changed or downscaled.
The Group counters this risk by setting up specialized teams of market
developers, by regularly evaluating the success of its measures, by
applying high quality standards for market analysis and development,
and by organizing regular review meetings.
The Wacker Neuson Group also considers and carefully assesses al-
liances and acquisitions as a means of gaining market share and ex-
panding its product portfolio. However, there is still a basic risk that the
alliance or acquisition will fail to produce the expected outcome and
that integration of the new company into the Group’s business opera-
tions will cause problems. Failure to evaluate risks accurately when
acquiring another company or entering into a partnership may have a
negative impact on Group business development and growth
prospects. The Group counters such risks through professional project
management and by setting up integration teams.
The unit volumes from the current cooperation agreement with Cater-
pillar for mini excavators are set to fall from 2019 onwards. If the Group
is not able to compensate for this loss of volume by becoming more
proactive in the markets itself, revenue and profit losses may be in-
curred.
Summary of risk situation facing the Group (assessment of risk
situation by management)
Viewed as a percentage of overall risks, the main risks lie in the envi-
ronment and industry, financial, and performance-related categories.
Together, these three categories represent around 92 percent of total
risk (2016: 90 percent).
Projection of the Group-wide risk situation places the overall risk 21
percent lower than that projected last year. The main reason for this
decrease is the lower exposure to environment and industry risks,
which is mainly due to the more positive business outlook in Europe
and America. The exposure to financial risks was also significantly re-
duced – above all due to the downgrading of the devaluation risk. The
main risks are listed in this risk report.
The Wacker Neuson Group is not currently aware of any other signifi-
cant risks to it. Furthermore, it has not identified any risks to its contin-
ued existence as a going concern.
The risk profile of the Wacker Neuson Group is not analyzed or eval-
uated by an external body such as a rating agency.
Main non-financial risks
EU Directive 2014/95/EU on the disclosure of non-financial infor-
mation requires companies to also report on basic non-financial risks
arising from their business activities with an impact on environmental
matters, social and employee-related matters, respect for human
rights, anti-corruption and bribery matters. The Group reports on these
basic non-financial risks in a non-financial Group statement, which is
published as a separate Group report. Page 72
Opportunity management system
Opportunities relate to internal and external developments that could
have a positive impact on the Group. The direct responsibility for iden-
tifying and managing opportunities in a timely manner is vested in
committees rather than specific individuals. These committees make
decisions on matters like strategic projects initiated by the Group in
response to changing market and customer requirements. These com-
mittees include experts and high-ranking decision-makers from across
Combined Management Report 67
Konze
rnabschlu
ss
the Group. The Wacker Neuson Group’s decision-making process fo-
cuses on opportunities while at the same time taking the associated
risks into account. Opportunities should be identified at an early stage
and adapted to the needs of the Group to improve the chances of suc-
cessful capitalization on those opportunities. Selected potential oppor-
tunities for the Wacker Neuson Group are outlined in the “Opportuni-
ties for future development” section. Page 76
68 Wacker Neuson Group Annual Report 2017
Information in accordance with Section 315a
(1) HGB and Section 289a (1) HGB plus an ex-
planatory report from the Executive Board in
accordance with Section 176 (1) Sentence 1
AktG
According to Section 315a (1) HGB, listed companies must disclose
information on the composition of capital, shareholders’ rights and re-
strictions, participating interests and corporate bodies that may be rel-
evant for takeovers in the Group Management Report. The same in-
formation must also be disclosed in the Management Report of
Wacker Neuson SE, pursuant to Section 289a (1) HGB. Furthermore,
according to Section 176 (1) Sentence 1 AktG, the Executive Board
must submit a report containing this information to the AGM. The fol-
lowing contains a summary of the information pursuant to Section
315a (1) and Section 289a (1) HGB as well as the corresponding ex-
planatory comments pursuant to Section 176 (1) Sentence 1 AktG.
Composition of subscribed capital
At December 31, 2017, the company’s share capital amounted to
EUR 70,140,000.00, divided into 70,140,000 individual no-par-value
nominal shares, each representing a proportionate amount of the
share capital of EUR 1.00 according to Section 3 (2) of the Articles of
Incorporation of Wacker Neuson SE. There is only one type of share;
all shares are vested with the same rights and obligations as outlined
in detail in particular under Sections 12, 53a, 133 ff. and 186 AktG.
The provisions of AktG apply to Wacker Neuson SE in accordance
with Section 9 (1) c) ii) and Section 10 of Council Regulation (EC) No
2157/2001 of October 8, 2001 on the Statute for a European company
(SE) (referred to as “SE Regulation” in the following), unless otherwise
specified in the SE Regulation.
Restrictions affecting voting rights or the transfer of
shares
Information on the pool agreement
There is a pool agreement between some of the shareholders and
companies attributable to the Wacker family (Wacker shareholders)
on the one hand, and shareholders and companies of the Neunteufel
family on the other (Neunteufel shareholders). Prior to each AGM of
Wacker Neuson SE, the pool members decide how to exercise voting
and petition rights in the meeting. Each pool member undertakes to
exercise their voting and petition rights in the AGM in line with the
pool’s decisions, or to have these rights exercised in this manner. If
the pool does not reach a decision with regard to a resolution on the
allocation of annual profits, adoption of the Annual Financial State-
ments by the AGM, approval of Executive and Supervisory Board
members’ actions, appointment of the auditor, upholding of minority
interests and compulsory changes to the Articles of Incorporation as a
result of changes to legislation or jurisdiction, the pool members have
the right to freely exercise their voting rights. In all other cases, the
pool members must vote to reject the proposal. Two members of the
Supervisory Board are appointed by the Neunteufel shareholders in
the pool, and two by the Wacker shareholders in the pool.
Shares can be transferred without restriction to spouses, registered
partners, pool members’ children, children adopted when they were
minors by pool members, siblings, foundations set up by pool mem-
bers that are either charitable foundations or in which the beneficiaries
and the controlling members of the management board satisfy the
aforementioned criteria, and companies where the direct or indirect
shareholders also satisfy the aforementioned criteria. If shares are
transferred to any such persons, they must join the pool agreement. If
shares are transferred to third parties, either with or without consider-
ation, the other pool members have the right to acquire these shares.
If the shares are to be sold to third parties in an off-exchange capacity,
all of the other pool members have a preferential purchase right. If a
pool member intends to transfer shares in such a way that more than
50 percent of voting rights in Wacker Neuson SE would be held by
third parties who do not satisfy the criteria defining those individuals to
whom transfers can be freely made, the remaining pool members have
the right to also sell their shares. If a pool member is excluded from
the pool for good reason, the other pool members have a right to ac-
quire the shares or a preferential purchase right. This also applies if a
pool member ceases to qualify as a pool member.
Information on the partnership agreement of Wacker
Familiengesellschaft mbH & Co. KG
Some of the Wacker shareholders hold part of their shares via Wacker
Familiengesellschaft mbH & Co. KG, which in turn also holds shares
via Wacker-Werke GmbH & Co. KG. Economic ownership of the
shares is attributed to the Wacker shareholders.
The pool agreement has precedence over the regulations of the part-
nership agreement as long as Wacker Familiengesellschaft mbH &
Co. KG is party to the above pool agreement. A partners’ meeting is
held prior to every AGM of Wacker Neuson SE. In this meeting, the
Wacker shareholders define how they will vote and exercise their pe-
titioning rights. Votes in the AGM are to be cast in line with the pool’s
decisions. Two of the Wacker shareholders each have the right to pro-
pose one member of the Supervisory Board to the shareholders. This
member is then to be elected by the remainder.
Only the acquisition and preferential purchase rights in the pool agree-
ment apply to Wacker shareholders who are party to the pool agree-
ment. In the case of a sale by a Wacker shareholder who is not a pool
member, acquisition and preferential purchase rights apply if shares
are sold to third parties who do not fulfill the criteria defining those
individuals to whom shares can be freely transferred set forth in the
above mentioned pool agreement. If a Wacker shareholder exits the
company as a result of a termination, the remaining pool members
have a preferential purchase right to buy the shares for a period of two
years from the date this shareholder exits the company. In addition,
the partners’ meeting can resolve that the exiting Wacker shareholder
does not receive compensation in cash but rather in the form of the
shares to which they are financially entitled. Every Wacker share-
holder exiting the company can request compensation in the form of
the shares to which they are financially entitled.
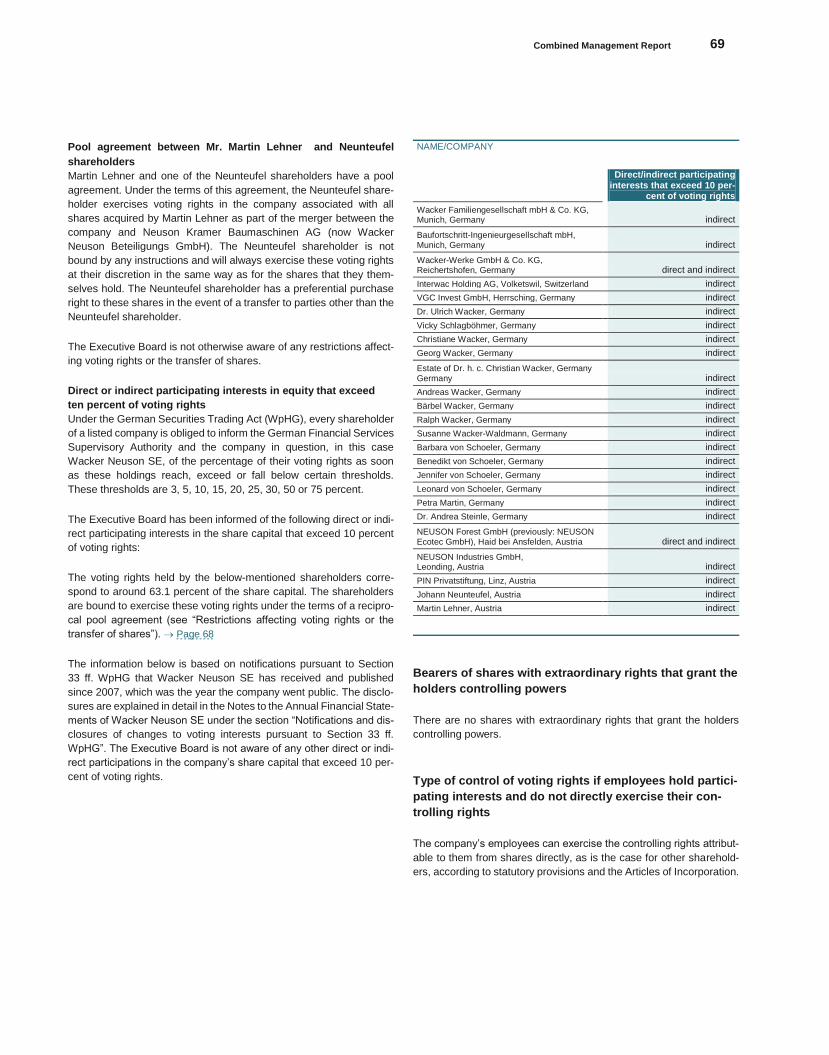
Combined Management Report 69
Konze
rnabschlu
ss
Pool agreement between Mr. Martin Lehner and Neunteufel
shareholders
Martin Lehner and one of the Neunteufel shareholders have a pool
agreement. Under the terms of this agreement, the Neunteufel share-
holder exercises voting rights in the company associated with all
shares acquired by Martin Lehner as part of the merger between the
company and Neuson Kramer Baumaschinen AG (now Wacker
Neuson Beteiligungs GmbH). The Neunteufel shareholder is not
bound by any instructions and will always exercise these voting rights
at their discretion in the same way as for the shares that they them-
selves hold. The Neunteufel shareholder has a preferential purchase
right to these shares in the event of a transfer to parties other than the
Neunteufel shareholder.
The Executive Board is not otherwise aware of any restrictions affect-
ing voting rights or the transfer of shares.
Direct or indirect participating interests in equity that exceed
ten percent of voting rights
Under the German Securities Trading Act (WpHG), every shareholder
of a listed company is obliged to inform the German Financial Services
Supervisory Authority and the company in question, in this case
Wacker Neuson SE, of the percentage of their voting rights as soon
as these holdings reach, exceed or fall below certain thresholds.
These thresholds are 3, 5, 10, 15, 20, 25, 30, 50 or 75 percent.
The Executive Board has been informed of the following direct or indi-
rect participating interests in the share capital that exceed 10 percent
of voting rights:
The voting rights held by the below-mentioned shareholders corre-
spond to around 63.1 percent of the share capital. The shareholders
are bound to exercise these voting rights under the terms of a recipro-
cal pool agreement (see “Restrictions affecting voting rights or the
transfer of shares”). Page 68
The information below is based on notifications pursuant to Section
33 ff. WpHG that Wacker Neuson SE has received and published
since 2007, which was the year the company went public. The disclo-
sures are explained in detail in the Notes to the Annual Financial State-
ments of Wacker Neuson SE under the section “Notifications and dis-
closures of changes to voting interests pursuant to Section 33 ff.
WpHG”. The Executive Board is not aware of any other direct or indi-
rect participations in the company’s share capital that exceed 10 per-
cent of voting rights.
NAME/COMPANY
Direct/indirect participating interests that exceed 10 per-
cent of voting rights
Wacker Familiengesellschaft mbH & Co. KG, Munich, Germany indirect
Baufortschritt-Ingenieurgesellschaft mbH, Munich, Germany indirect
Wacker-Werke GmbH & Co. KG, Reichertshofen, Germany direct and indirect
Interwac Holding AG, Volketswil, Switzerland indirect
VGC Invest GmbH, Herrsching, Germany indirect
Dr. Ulrich Wacker, Germany indirect
Vicky Schlagböhmer, Germany indirect
Christiane Wacker, Germany indirect
Georg Wacker, Germany indirect
Estate of Dr. h. c. Christian Wacker, Germany Germany indirect
Andreas Wacker, Germany indirect
Bärbel Wacker, Germany indirect
Ralph Wacker, Germany indirect
Susanne Wacker-Waldmann, Germany indirect
Barbara von Schoeler, Germany indirect
Benedikt von Schoeler, Germany indirect
Jennifer von Schoeler, Germany indirect
Leonard von Schoeler, Germany indirect
Petra Martin, Germany indirect
Dr. Andrea Steinle, Germany indirect
NEUSON Forest GmbH (previously: NEUSON Ecotec GmbH), Haid bei Ansfelden, Austria direct and indirect
NEUSON Industries GmbH, Leonding, Austria indirect
PIN Privatstiftung, Linz, Austria indirect
Johann Neunteufel, Austria indirect
Martin Lehner, Austria indirect
Bearers of shares with extraordinary rights that grant the
holders controlling powers
There are no shares with extraordinary rights that grant the holders
controlling powers.
Type of control of voting rights if employees hold partici-
pating interests and do not directly exercise their con-
trolling rights
The company’s employees can exercise the controlling rights attribut-
able to them from shares directly, as is the case for other sharehold-
ers, according to statutory provisions and the Articles of Incorporation.
70 Wacker Neuson Group Annual Report 2017
Statutory provisions and provisions of the Articles of In-
corporation regarding the appointment and dismissal of
members of the Executive Board and changes to the Ar-
ticles of Incorporation
Members of the Executive Board are appointed and dismissed accord-
ing to Sections 84 and 85 AktG. The Executive Board of Wacker
Neuson SE must have at least two Board members according to Sec-
tion 6 (1) of the Articles of Incorporation of Wacker Neuson SE. The
Supervisory Board otherwise determines the number of Executive
Board members (Section 6 (2) Sentence 1 of the Articles of Incorpo-
ration). The Supervisory Board is also responsible for appointing and
dismissing Executive Board members; a simple majority of votes cast
suffices for these decisions.
Executive Board members shall be appointed for a maximum term of
six years (Section 9 (1) and Section 39 (2) and Section 46 of the SE
Regulation, Sections 84 and 85 AktG and Section 6 (2) Sentence 1 of
the Articles of Incorporation). The Supervisory Board can appoint a
Chairman of the Executive Board, a Deputy Chairman of the Executive
Board and a Spokesperson for the Executive Board (Section 6 (2)
Sentence 2 of the Articles of Incorporation). Currently, a CEO has
been appointed.
Sections 179 ff. AktG must be observed in the event of changes to the
Articles of Incorporation. Changes to the Articles of Incorporation must
be approved by the shareholders at the AGM (Sections 119 (1) No. 5
and 179 (1) AktG). Under the charter of a European company (So-
cietas Europaea or SE) such as Wacker Neuson SE, all decisions af-
fecting the Articles of Incorporation must be approved with a majority
of at least two thirds of the votes cast, unless the legislation of the
state where the SE is based mandates or allows a larger majority to
apply (Section 59 (1) of the SE Regulation). Each member state is
free, however, to rule that a simple majority of votes cast suffices, pro-
vided at least half of the subscribed capital is represented (Section 59
(2) of the SE Regulation). German legislation has instituted this option
in Section 51 (1) of the law governing implementation of an SE in Ger-
many. This does not apply to changes relating to the object/purpose
of the company or relocation of the company’s registered office. Simi-
larly, it does not apply to instances where the law mandates that the
votes cast must represent a higher percentage of the subscribed cap-
ital (Section 51 (2) of the law governing implementation of an SE in
Germany). Accordingly, Section 21 (1) of the Articles of Incorporation
states that unless otherwise stipulated by law, changes to the Articles
of Incorporation require a two-thirds majority of the votes cast or – if at
least half of the share capital is represented – a simple majority of
votes cast.
The Supervisory Board is entitled to approve changes to the Articles
of Incorporation that are merely a matter of wording (Section 179 (1)
Sentence 2 AktG, Article 15 of the Articles of Incorporation).
The Executive Board’s powers, in particular with regard
to the possibility of issuing or buying back shares
Treasury shares
By a resolution passed at the AGM on May 30, 2017, the Executive
Board is authorized, subject to the prior approval of the Supervisory
Board, to acquire 7,014,000 treasury shares by May 29, 2022. This
acquisition may also be performed by one of the Group members on
or for its or their account by third parties. The authorization can be
exercised in whole or in parts, in the latter case also on multiple occa-
sions. In so doing, the shares acquired as a result of this authorization
together with other shares in the company that it has already acquired
and still holds may not at any time total more than 10 percent of the
existing share capital. Shares must not be purchased for the purpose
of trading company shares on the stock exchange.
At the discretion of the Executive Board, treasury shares may be ac-
quired on the stock exchange or by means of a public offering ad-
dressed to all company shareholders or by means of a public invitation
to shareholders to submit offers for sale (the latter two options jointly
referred to as “public purchase offering” in the following).
If treasury shares are acquired via the stock exchange, the purchase
price per share paid by the company (excluding incidental acquisition
costs) may not be more than 10 percent above or 20 percent below
the volume-weighted average closing price of a company share in
Xetra trading (or a comparable successor system) on the Frankfurt
Stock Exchange over the last three trading days prior to the date on
which the purchase obligation is entered into.
In the event of acquisition by way of public purchase offering, the com-
pany may determine a fixed purchase price or a purchase price range
per share (excluding incidental acquisition costs) within which it is pre-
pared to acquire shares. In the event of a public offering by the com-
pany, the purchase price or price range offered may not be more than
10 percent above or 20 percent below the volume-weighted average
closing price of a company share in Xetra trading (or a comparable
successor system) on the Frankfurt Stock Exchange over the last
three trading days prior to the date on which the offer is publicly an-
nounced.
In the event of an invitation to shareholders to submit offers for sale,
the purchase price per company share (excluding incidental acquisi-
tion costs) calculated based on the offers submitted may not be more
than 10 percent above or 20 percent below the volume-weighted av-
erage closing price of a company share in Xetra trading (or a compa-
rable successor system) on the Frankfurt Stock Exchange over the
last three trading days prior to the date on which the invitation to sub-
mit offers for sale is published.
In principle, following authorization, the treasury shares acquired by
the company may be re-sold in whole or in part, in the latter case also
on multiple occasions, by means of a public offering addressed to all
shareholders or on the stock exchange. They may also be redeemed
– with or without a reduction in share capital.
In addition, the treasury shares acquired by the company may be used
in whole or in part, in the latter case also on multiple occasions, for
other purposes; this may mean excluding shareholder subscription
rights in whole or in part, or that shareholder subscription rights are –
by definition – excluded:
In the case of a public offering of treasury shares addressed to all
shareholders, the Executive Board is authorized, with the approval of
the Supervisory Board, to exclude shareholder subscription rights for
fractional amounts. The Executive Board is authorized to issue
treasury shares to persons who are or were employed by the company
Combined Management Report 71
Konze
rnabschlu
ss
or an affiliated company and to members of executive bodies of com-
panies affiliated with the company. This constitutes an authorization to
issue employee shares. To the extent that shares are to be sold to
Executive Board members within the scope of an Executive Board par-
ticipation model, the terms are decided on by the Supervisory Board
on the basis of a separate authorization granted to it within the frame-
work of its mandate to determine the total remuneration for Executive
Board members.
The Executive Board is also authorized, with the approval of the Su-
pervisory Board, to offer and transfer treasury shares as consideration
in connection with mergers or acquisitions of companies, operations,
parts of companies or participating interests.
It is also envisaged that treasury shares may be used to issue a scrip
dividend. In the case of a scrip dividend using treasury shares, an offer
is made to all shareholders to waive their entitlement to dividend pay-
ment resulting from the resolution on appropriation of net profit passed
by the Annual General Meeting, in order to subscribe for treasury
shares instead.
The Executive Board is also authorized, with the approval of the Su-
pervisory Board, to sell the treasury shares yet to be acquired to third
parties – also in return for cash contributions – subject to the exclusion
of shareholder subscription rights, provided that the sale price per
share is not significantly lower than the stock exchange price of shares
in the company at the time of sale. The final sale price for treasury
shares will be determined shortly before the sale. The Executive Board
will keep any deviation from the stock exchange price as narrow as
the market conditions prevailing at the time of placement permit. Un-
der no circumstances will the discount relative to the stock exchange
price at the time the authorization is exercised exceed 5 percent of the
current stock exchange price. This authorization also applies with the
proviso that shares issued subject to the exclusion of subscription
rights may not exceed a total of 10 percent of share capital, neither at
the time the resolution is passed nor at the time the authorization is
exercised. This limit shall include shares issued or sold during the term
of the resale authorization in direct or corresponding application of
Section 186 (3) Sentence 4 AktG. This also includes shares issued to
service convertible bonds, bonds with warrants, or profit-sharing cer-
tificates with conversion or option rights, to the extent that these bonds
were issued, subject to the exclusion of subscription rights, during the
term of this authorization by that point in time.
Authorized Capital 2017
The authorization approved at the AGM on May 22, 2012 entitling the
Executive Board to increase the company’s share capital by a maxi-
mum of EUR 17,535,000.00 (Authorized Capital 2012) expired on May
21, 2017. A new authorization was approved at the AGM on May 30,
2017.
According to Article 3 (3) of the Articles of Incorporation, the Executive
Board is authorized to increase the company’s share capital by May
20, 2022, with the approval of the Supervisory Board, by issuing new,
registered shares against cash contributions, in full or in partial
amounts, on one or several occasions, however at the most by a max-
imum of EUR 17,535,000 (Authorized Capital 2017).
However, the Executive Board is authorized, with the approval of the
Supervisory Board, to exclude shareholder subscription rights:
in the case of fractional amounts resulting from the subscription ra-
tio;
in the case of capital increases resulting from the granting of shares
in exchange for contributions in kind, in particular for the purpose of
acquiring companies, parts of companies or participating interests
in companies or other assets, or entitlements to acquire assets in-
cluding accounts receivable payable by the company or Group
members;
in the case of capital increases resulting from the granting of shares
in exchange for cash contributions, provided that the issue price of
the new shares is not significantly below the stock market price of
the company’s shares listed at the time when the issue price is fi-
nally determined in accordance with Section 203 (1) and (2) in con-
junction with Section 186 (3) Sentence 4 AktG and that the number
of shares issued subject to the exclusion of subscription rights does
not exceed ten percent in total of the share capital neither on the
date on which this authorization takes effect nor on the date this
authorization is exercised. This limit of ten percent shall include
shares which are sold, issued or due to be issued subject to the
exclusion of subscription rights during the term of this authorization
up until the point in time when it is exercised by virtue of other au-
thorizations in direct or corresponding application of Section 186 (3)
Sentence 4 AktG.
In all other respects, the Executive Board shall, with the approval of
the Supervisory Board, decide on the nature of the respective share
rights, including the issue amount, and other conditions relating to is-
suance of shares.
The authorized capital provisions described above reflect the practices
typical of listed businesses similar to Wacker Neuson. They are not
intended to obstruct takeover bids.
Key company agreements that are subject to a change of
control clause following a takeover bid and the resulting
impact
The Schuldschein loan agreements with terms between five and
seven years placed by Wacker Neuson SE in February 2012 and Feb-
ruary 2017 give the respective creditors termination options if third par-
ties acquire at least 50 percent of voting rights in the company. Similar
conditions are also contained in the Schuldschein loan agreements
with terms between five and seven years placed by Wacker Neuson
Corporation, USA (a wholly-owned subsidiary of the company) in Feb-
ruary 2018.
Kramer-Werke GmbH, a Group member, and the John Deere Group
have entered into a strategic alliance for the international sale of wheel
loaders and telescopic handlers for the agricultural market. The agree-
ment contains a provision that allows John Deere to terminate the
agreement under certain conditions should a competitor to John Deere
acquire a direct or indirect share in Kramer-Werke GmbH or Wacker
Neuson SE in excess of 25 percent or should a competitor gain the
right to determine the majority of the membership of Kramer-Werke
GmbH or Wacker Neuson SE’s executive bodies. The list of competi-
tors is specified in detail in the agreement. As part of this alliance,
John Deere has acquired a financial stake in Kramer-Werke GmbH.
Should a direct competitor of John Deere from the agricultural or con-
struction equipment industries gain more than 25 percent of shares in
72 Wacker Neuson Group Annual Report 2017
Wacker Neuson SE, the Wacker Neuson Group must negotiate with
John Deere regarding the sale of its shares in Kramer-Werke GmbH
to John Deere, to the extent permitted by law.
Compensation agreements between the company and
the members of the Executive Board or its employees in
the event of a takeover bid
There is no such agreement.
Concluding remark
During the period under review, the Executive Board had no reason to
address issues concerning a takeover, or engage with disclosure de-
tails stipulated under the German Takeover Directive Implementation
Act (Übernahmerichtlinie-Umsetzungsgesetz). The Executive Board
therefore does not see the need to add further details to the infor-
mation provided above.
Declaration on corporate governance accord-
ing to Section 289f HGB in combination with
Section 315d HGB
On March 19, 2018, the Executive Board of Wacker Neuson SE issued
a corporate governance declaration pursuant to Section 289f in com-
bination with Section 315d of the German Commercial Code (HGB).
This can be downloaded from the Wacker Neuson SE website at
http://wackerneusongroup.com/en/investor-relations/corporate-
governance/declaration-about-corporate-governance/.
Disclosure of non-financial information by the
Group for 2017
Implementation of EU Directive 2014/95/EU mandating the disclosure
of non-financial information by German legislators means that the ma-
jority of German companies that trade on a regulated market are
obliged as of fiscal 2017 to report every year on environmental, social
and employee-related issues and provide information on the ob-
servance of human rights and the prevention of corruption and bribery.
In recent years, the Wacker Neuson Group has already been publish-
ing information on its sustainability performance within the framework
of its Annual Report and also through annual CSR fact books. For fis-
cal 2017, the Wacker Neuson Group has issued a non-financial Group
statement in accordance with Section 315b HGB. This separate non-
financial Group report was published at the same time as the Annual
Report. The 2017 non-financial Group report published by the Wacker
Neuson Group is also available on the company website at
http://wackerneusongroup.com/en/sustainability/.
Remuneration framework
Information on the Executive Board
According to the German Executive Board Remuneration Disclosure
Act (Vorstandsvergütungs-Offenlegungsgesetz), listed companies
must also disclose individualized information on the Executive Board’s
remuneration in the Notes to the Annual and Consolidated Financial
Statements, broken down into performance-related and non-perfor-
mance-related components as well as long-term incentives. The Act
stipulates that information may be withheld if the AGM adopts a reso-
lution on this with a majority of 75 percent of votes cast. This type of
resolution can be passed for a maximum period of five years. The
company has availed of this opportunity for fiscal years 2016 to 2020
inclusive by way of a resolution by the AGM on May 31, 2016.
The Executive Board’s remuneration is defined by the entire Supervi-
sory Board and reviewed at regular intervals. Defining the structure
and amount of the remuneration is based on the company’s size and
economic position as well as the tasks and performance of the mem-
bers of the Executive Board.
The Executive Board’s remuneration comprises:
A fixed annual basic salary
A variable annual salary
Compensation upon an early exit, in part transitional pay
Remuneration in the case of accident, illness or death
Non-cash remuneration and other additional remuneration
A pension commitment
The individual remuneration components are as follows:
The annual fixed salary is paid in equal monthly installments.
The variable salary is based on average consolidated earnings after
taxes for the previous three fiscal years, as reported in the approved
Consolidated Financial Statements for the respective fiscal years,
as well as on the return on capital employed as reported in the Con-
solidated Financial Statements. The Group’s performance is an-
other indicator for determining variable salary, measured by a com-
bination of the extent to which revenue goals are achieved and the
size of the EBIT margin. The variable salary based on this indicator
is paid out only in part on approval of the Consolidated Financial
Statements for the fiscal year in question. The remaining part
(longer-term component) is paid out only if the performance indica-
tors in the two subsequent years lie above a defined threshold. An
upper threshold for the overall variable remuneration has been
agreed for all Executive Board members.
The proportion of the variable remuneration within the overall remu-
neration package differs in each individual case and ranges from 60
to 67 percent for 100-percent achievement of targets.
If Executive Board member employment contracts are terminated
prematurely, but not for good cause, the members of the Executive
Board shall each receive compensation in the amount of their aver-
age discounted annual remuneration for the remainder of the con-
tractual period including their variable remuneration, up to a maxi-
mum of two annual remunerations. If a contract is terminated after
the age of 55 and prior to the member reaching the age of 62, the
member of the Executive Board in question may claim transitional
payments.
Combined Management Report 73
Konze
rnabschlu
ss
If they are temporarily prevented from working through no fault of
their own, members of the Executive Board continue to receive their
fixed annual salary and bonus for a limited period. In the event of
death, widows and dependent children receive corresponding pay-
ments for a limited period. This does not affect widow’s and orphan’s
pensions under the pension commitment.
The non-cash remuneration and other remuneration includes a sub-
sidy for health insurance and pension provisions, premiums for ac-
cident insurance, the use of a company car, etc.
Under the pension commitment, members of the Executive Board
receive an old-age pension for life when they reach the age of 62
(or in older cases, the age of 60) unless the employment relation-
ship with the company was terminated for good cause for reasons
that lie within the responsibility of the respective Executive Board
member. In addition, an invalidity pension is paid in the event of
disability, and a widow’s and orphan’s pension is paid in the event
of death. Other remuneration may have to be offset against these
amounts payable.
Total remuneration for the Executive Board
Total remuneration for the Executive Board in the fiscal year amounted
to EUR 4.7 million (2016: EUR 3.5 million). Total remuneration for the
Supervisory Board for the same period amounted to EUR 0.5 million
(2016: EUR 0.5 million). At the AGM on May 31, 2016, a resolution
was passed to refrain from itemizing information in line with Section
61 of the SE Regulation in conjunction with Section 285 no. 9a sen-
tences 5 to 8 HGB and Section 314 (1) no. 6a sentences 5 to 8, as
well as Section 315a (1) HGB (in the applicable version), in accord-
ance with Section 286 (5) sentence 1, Section 314 (3) sentence 1,
Section 315a (1) HGB.
Information on the Supervisory Board
The remuneration structure for the members of the Supervisory Board
is set down in Section 14 of the Articles of Incorporation. It was last
amended by the AGM in May 2012. In line with this provision, the fixed
remuneration for each individual member of the Supervisory Board
amounts to EUR 30,000. The Chairman of the Supervisory Board re-
ceives twice this amount, and his/ her Deputy receives 1.5 times the
fixed remuneration. Members of committees receive an additional re-
muneration, with the Chairman of each committee receiving twice the
regular committee remuneration. The members of the Supervisory
Board also receive a fixed allowance for each Supervisory Board
meeting in which they participate. In addition, members of the Super-
visory Board are reimbursed for their out-of-pocket expenses and any
VAT that may be due on their remuneration and out-of-pocket ex-
penses. The individual Supervisory Board members shall also be paid
a variable remuneration.
This variable remuneration is based on the consolidated earnings after
taxes. It is capped at 0.75 times their respective fixed remuneration. It
is calculated in line with the company’s approved Consolidated Finan-
cial Statements taking Section 113 (3) AktG into account.
Supplementary report
Please refer to the Notes to the Consolidated Financial Statements
(Note 28) for information on events since the reporting date, Decem-
ber 31, 2017. Page 121
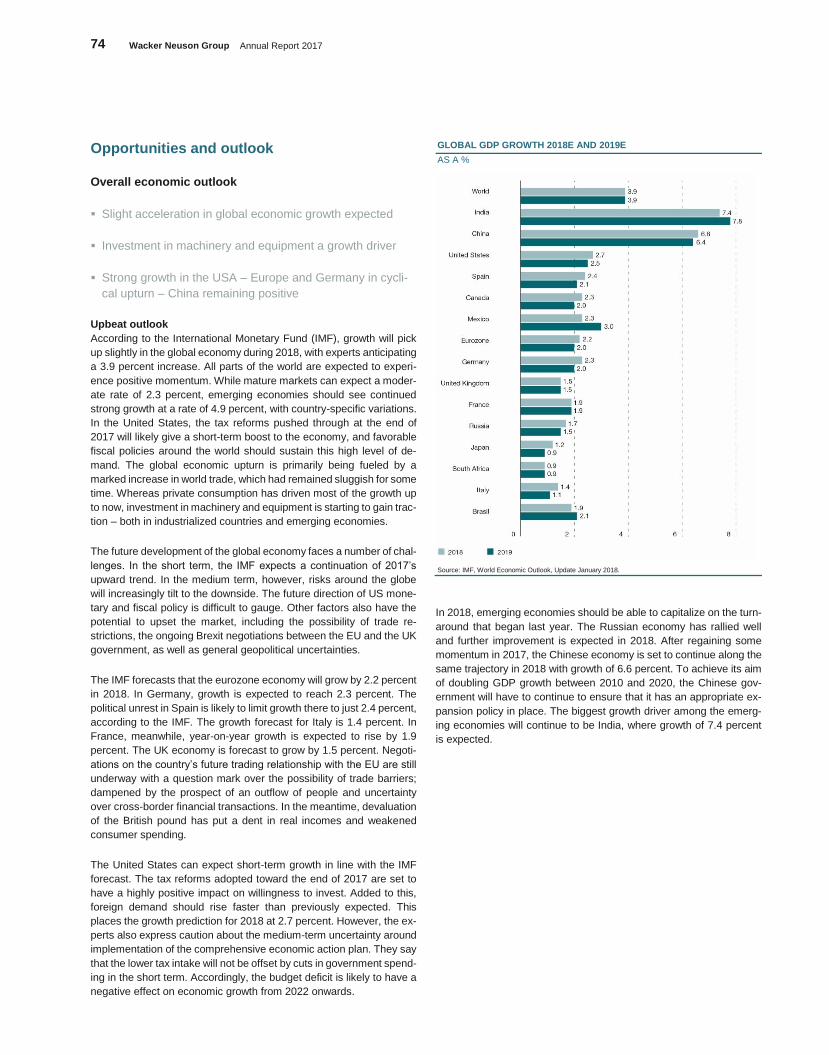
74 Wacker Neuson Group Annual Report 2017
Opportunities and outlook
Overall economic outlook
Slight acceleration in global economic growth expected
Investment in machinery and equipment a growth driver
Strong growth in the USA – Europe and Germany in cycli-
cal upturn – China remaining positive
Upbeat outlook
According to the International Monetary Fund (IMF), growth will pick
up slightly in the global economy during 2018, with experts anticipating
a 3.9 percent increase. All parts of the world are expected to experi-
ence positive momentum. While mature markets can expect a moder-
ate rate of 2.3 percent, emerging economies should see continued
strong growth at a rate of 4.9 percent, with country-specific variations.
In the United States, the tax reforms pushed through at the end of
2017 will likely give a short-term boost to the economy, and favorable
fiscal policies around the world should sustain this high level of de-
mand. The global economic upturn is primarily being fueled by a
marked increase in world trade, which had remained sluggish for some
time. Whereas private consumption has driven most of the growth up
to now, investment in machinery and equipment is starting to gain trac-
tion – both in industrialized countries and emerging economies.
The future development of the global economy faces a number of chal-
lenges. In the short term, the IMF expects a continuation of 2017’s
upward trend. In the medium term, however, risks around the globe
will increasingly tilt to the downside. The future direction of US mone-
tary and fiscal policy is difficult to gauge. Other factors also have the
potential to upset the market, including the possibility of trade re-
strictions, the ongoing Brexit negotiations between the EU and the UK
government, as well as general geopolitical uncertainties.
The IMF forecasts that the eurozone economy will grow by 2.2 percent
in 2018. In Germany, growth is expected to reach 2.3 percent. The
political unrest in Spain is likely to limit growth there to just 2.4 percent,
according to the IMF. The growth forecast for Italy is 1.4 percent. In
France, meanwhile, year-on-year growth is expected to rise by 1.9
percent. The UK economy is forecast to grow by 1.5 percent. Negoti-
ations on the country’s future trading relationship with the EU are still
underway with a question mark over the possibility of trade barriers;
dampened by the prospect of an outflow of people and uncertainty
over cross-border financial transactions. In the meantime, devaluation
of the British pound has put a dent in real incomes and weakened
consumer spending.
The United States can expect short-term growth in line with the IMF
forecast. The tax reforms adopted toward the end of 2017 are set to
have a highly positive impact on willingness to invest. Added to this,
foreign demand should rise faster than previously expected. This
places the growth prediction for 2018 at 2.7 percent. However, the ex-
perts also express caution about the medium-term uncertainty around
implementation of the comprehensive economic action plan. They say
that the lower tax intake will not be offset by cuts in government spend-
ing in the short term. Accordingly, the budget deficit is likely to have a
negative effect on economic growth from 2022 onwards.
GLOBAL GDP GROWTH 2018E AND 2019E
AS A %
Source: IMF, World Economic Outlook, Update January 2018.
In 2018, emerging economies should be able to capitalize on the turn-
around that began last year. The Russian economy has rallied well
and further improvement is expected in 2018. After regaining some
momentum in 2017, the Chinese economy is set to continue along the
same trajectory in 2018 with growth of 6.6 percent. To achieve its aim
of doubling GDP growth between 2010 and 2020, the Chinese gov-
ernment will have to continue to ensure that it has an appropriate ex-
pansion policy in place. The biggest growth driver among the emerg-
ing economies will continue to be India, where growth of 7.4 percent
is expected.
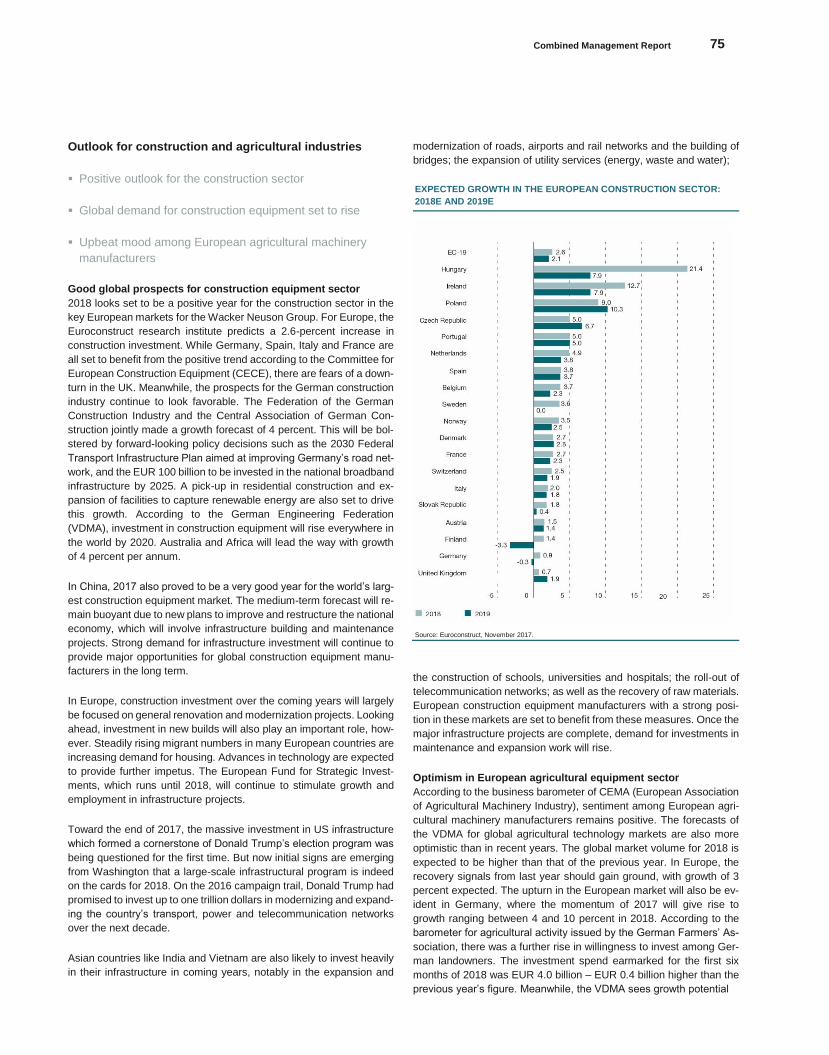
Combined Management Report 75
Konze
rnabschlu
ss
Outlook for construction and agricultural industries
Positive outlook for the construction sector
Global demand for construction equipment set to rise
Upbeat mood among European agricultural machinery
manufacturers
Good global prospects for construction equipment sector
2018 looks set to be a positive year for the construction sector in the
key European markets for the Wacker Neuson Group. For Europe, the
Euroconstruct research institute predicts a 2.6-percent increase in
construction investment. While Germany, Spain, Italy and France are
all set to benefit from the positive trend according to the Committee for
European Construction Equipment (CECE), there are fears of a down-
turn in the UK. Meanwhile, the prospects for the German construction
industry continue to look favorable. The Federation of the German
Construction Industry and the Central Association of German Con-
struction jointly made a growth forecast of 4 percent. This will be bol-
stered by forward-looking policy decisions such as the 2030 Federal
Transport Infrastructure Plan aimed at improving Germany’s road net-
work, and the EUR 100 billion to be invested in the national broadband
infrastructure by 2025. A pick-up in residential construction and ex-
pansion of facilities to capture renewable energy are also set to drive
this growth. According to the German Engineering Federation
(VDMA), investment in construction equipment will rise everywhere in
the world by 2020. Australia and Africa will lead the way with growth
of 4 percent per annum.
In China, 2017 also proved to be a very good year for the world’s larg-
est construction equipment market. The medium-term forecast will re-
main buoyant due to new plans to improve and restructure the national
economy, which will involve infrastructure building and maintenance
projects. Strong demand for infrastructure investment will continue to
provide major opportunities for global construction equipment manu-
facturers in the long term.
In Europe, construction investment over the coming years will largely
be focused on general renovation and modernization projects. Looking
ahead, investment in new builds will also play an important role, how-
ever. Steadily rising migrant numbers in many European countries are
increasing demand for housing. Advances in technology are expected
to provide further impetus. The European Fund for Strategic Invest-
ments, which runs until 2018, will continue to stimulate growth and
employment in infrastructure projects.
Toward the end of 2017, the massive investment in US infrastructure
which formed a cornerstone of Donald Trump’s election program was
being questioned for the first time. But now initial signs are emerging
from Washington that a large-scale infrastructural program is indeed
on the cards for 2018. On the 2016 campaign trail, Donald Trump had
promised to invest up to one trillion dollars in modernizing and expand-
ing the country’s transport, power and telecommunication networks
over the next decade.
Asian countries like India and Vietnam are also likely to invest heavily
in their infrastructure in coming years, notably in the expansion and
modernization of roads, airports and rail networks and the building of
bridges; the expansion of utility services (energy, waste and water);
EXPECTED GROWTH IN THE EUROPEAN CONSTRUCTION SECTOR:
2018E AND 2019E
Source: Euroconstruct, November 2017.
the construction of schools, universities and hospitals; the roll-out of
telecommunication networks; as well as the recovery of raw materials.
European construction equipment manufacturers with a strong posi-
tion in these markets are set to benefit from these measures. Once the
major infrastructure projects are complete, demand for investments in
maintenance and expansion work will rise.
Optimism in European agricultural equipment sector
According to the business barometer of CEMA (European Association
of Agricultural Machinery Industry), sentiment among European agri-
cultural machinery manufacturers remains positive. The forecasts of
the VDMA for global agricultural technology markets are also more
optimistic than in recent years. The global market volume for 2018 is
expected to be higher than that of the previous year. In Europe, the
recovery signals from last year should gain ground, with growth of 3
percent expected. The upturn in the European market will also be ev-
ident in Germany, where the momentum of 2017 will give rise to
growth ranging between 4 and 10 percent in 2018. According to the
barometer for agricultural activity issued by the German Farmers’ As-
sociation, there was a further rise in willingness to invest among Ger-
man landowners. The investment spend earmarked for the first six
months of 2018 was EUR 4.0 billion – EUR 0.4 billion higher than the
previous year’s figure. Meanwhile, the VDMA sees growth potential
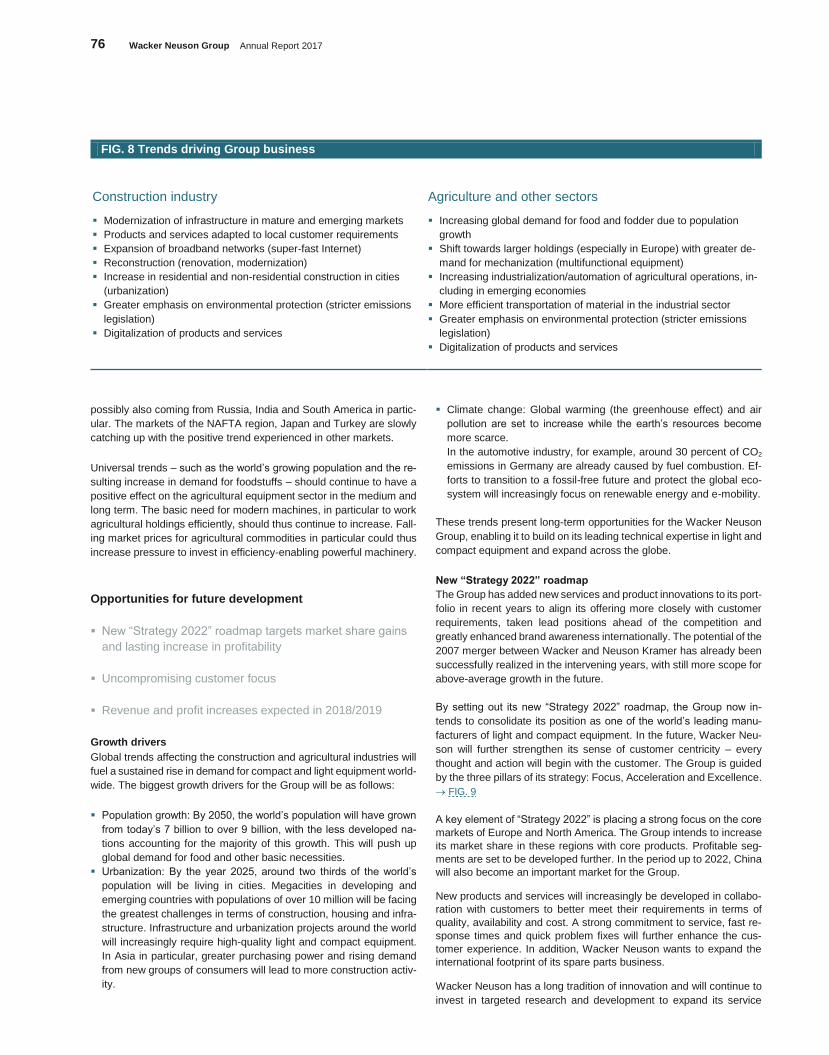
76 Wacker Neuson Group Annual Report 2017
FIG. 8 Trends driving Group business
Construction industry Agriculture and other sectors
Modernization of infrastructure in mature and emerging markets
Products and services adapted to local customer requirements
Expansion of broadband networks (super-fast Internet)
Reconstruction (renovation, modernization)
Increase in residential and non-residential construction in cities
(urbanization)
Greater emphasis on environmental protection (stricter emissions
legislation)
Digitalization of products and services
Increasing global demand for food and fodder due to population
growth
Shift towards larger holdings (especially in Europe) with greater de-
mand for mechanization (multifunctional equipment)
Increasing industrialization/automation of agricultural operations, in-
cluding in emerging economies
More efficient transportation of material in the industrial sector
Greater emphasis on environmental protection (stricter emissions
legislation)
Digitalization of products and services
possibly also coming from Russia, India and South America in partic-
ular. The markets of the NAFTA region, Japan and Turkey are slowly
catching up with the positive trend experienced in other markets.
Universal trends – such as the world’s growing population and the re-
sulting increase in demand for foodstuffs – should continue to have a
positive effect on the agricultural equipment sector in the medium and
long term. The basic need for modern machines, in particular to work
agricultural holdings efficiently, should thus continue to increase. Fall-
ing market prices for agricultural commodities in particular could thus
increase pressure to invest in efficiency-enabling powerful machinery.
Opportunities for future development
New “Strategy 2022” roadmap targets market share gains
and lasting increase in profitability
Uncompromising customer focus
Revenue and profit increases expected in 2018/2019
Growth drivers
Global trends affecting the construction and agricultural industries will
fuel a sustained rise in demand for compact and light equipment world-
wide. The biggest growth drivers for the Group will be as follows:
Population growth: By 2050, the world’s population will have grown
from today’s 7 billion to over 9 billion, with the less developed na-
tions accounting for the majority of this growth. This will push up
global demand for food and other basic necessities.
Urbanization: By the year 2025, around two thirds of the world’s
population will be living in cities. Megacities in developing and
emerging countries with populations of over 10 million will be facing
the greatest challenges in terms of construction, housing and infra-
structure. Infrastructure and urbanization projects around the world
will increasingly require high-quality light and compact equipment.
In Asia in particular, greater purchasing power and rising demand
from new groups of consumers will lead to more construction activ-
ity.
Climate change: Global warming (the greenhouse effect) and air
pollution are set to increase while the earth’s resources become
more scarce.
In the automotive industry, for example, around 30 percent of CO2
emissions in Germany are already caused by fuel combustion. Ef-
forts to transition to a fossil-free future and protect the global eco-
system will increasingly focus on renewable energy and e-mobility.
These trends present long-term opportunities for the Wacker Neuson
Group, enabling it to build on its leading technical expertise in light and
compact equipment and expand across the globe.
New “Strategy 2022” roadmap
The Group has added new services and product innovations to its port-
folio in recent years to align its offering more closely with customer
requirements, taken lead positions ahead of the competition and
greatly enhanced brand awareness internationally. The potential of the
2007 merger between Wacker and Neuson Kramer has already been
successfully realized in the intervening years, with still more scope for
above-average growth in the future.
By setting out its new “Strategy 2022” roadmap, the Group now in-
tends to consolidate its position as one of the world’s leading manu-
facturers of light and compact equipment. In the future, Wacker Neu-
son will further strengthen its sense of customer centricity – every
thought and action will begin with the customer. The Group is guided
by the three pillars of its strategy: Focus, Acceleration and Excellence.
FIG. 9
A key element of “Strategy 2022” is placing a strong focus on the core
markets of Europe and North America. The Group intends to increase
its market share in these regions with core products. Profitable seg-
ments are set to be developed further. In the period up to 2022, China
will also become an important market for the Group.
New products and services will increasingly be developed in collabo-
ration with customers to better meet their requirements in terms of
quality, availability and cost. A strong commitment to service, fast re-
sponse times and quick problem fixes will further enhance the cus-
tomer experience. In addition, Wacker Neuson wants to expand the
international footprint of its spare parts business.
Wacker Neuson has a long tradition of innovation and will continue to
invest in targeted research and development to expand its service
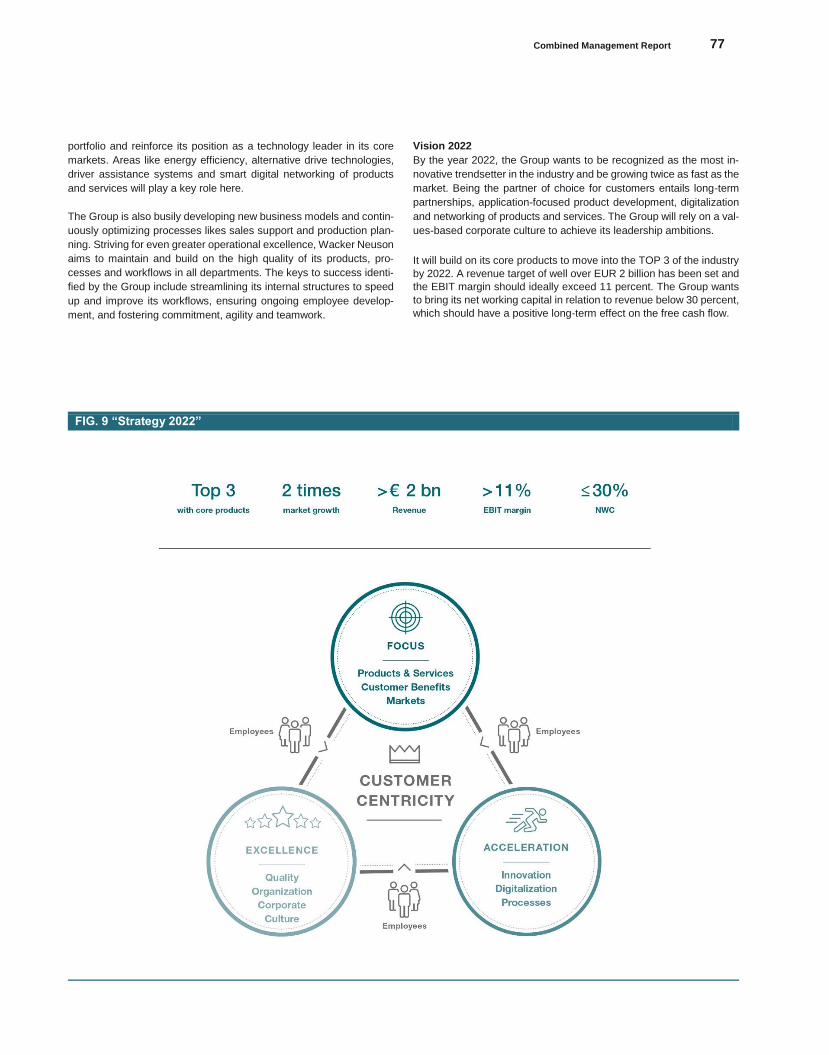
Combined Management Report 77
Konze
rnabschlu
ss
portfolio and reinforce its position as a technology leader in its core
markets. Areas like energy efficiency, alternative drive technologies,
driver assistance systems and smart digital networking of products
and services will play a key role here.
The Group is also busily developing new business models and contin-
uously optimizing processes likes sales support and production plan-
ning. Striving for even greater operational excellence, Wacker Neuson
aims to maintain and build on the high quality of its products, pro-
cesses and workflows in all departments. The keys to success identi-
fied by the Group include streamlining its internal structures to speed
up and improve its workflows, ensuring ongoing employee develop-
ment, and fostering commitment, agility and teamwork.
Vision 2022
By the year 2022, the Group wants to be recognized as the most in-
novative trendsetter in the industry and be growing twice as fast as the
market. Being the partner of choice for customers entails long-term
partnerships, application-focused product development, digitalization
and networking of products and services. The Group will rely on a val-
ues-based corporate culture to achieve its leadership ambitions.
It will build on its core products to move into the TOP 3 of the industry
by 2022. A revenue target of well over EUR 2 billion has been set and
the EBIT margin should ideally exceed 11 percent. The Group wants
to bring its net working capital in relation to revenue below 30 percent,
which should have a positive long-term effect on the free cash flow.
FIG. 9 “Strategy 2022”
78 Wacker Neuson Group Annual Report 2017
Forecast
Revenue and profit growth expected in 2018
Business developed positively in the first few weeks of fiscal 2018.
Wacker Neuson’s target markets are in good shape on the whole and
the order books are well filled.
The Executive Board predicts overall revenue for fiscal 2018 of be-
tween EUR 1.65 and 1.7 billion, which corresponds to growth of 8 to
11 percent (2017: EUR 1.534 billion). The EBIT margin1 is expected
to lie between 9.0 and 10.0 percent (2017: 8.6 percent).
The volatile course of the US dollar is causing some uncertainty. The
forecast is subject to the caveat that no significant political events oc-
cur in the world’s major economies leading to a change in economic
circumstances.
OVERVIEW
2018e 2019e
Revenue €1.65 to 1.70 bn Further growth
EBIT margin1 9.0% to 10.0% Better
Investments approx. €60 million Adapted to market
developments
1 Based on operational profitability – discounting one-off income from a potential transaction related to a real estate deal made by the Group.
Segment trends
For 2018, single-digit growth is expected in the core markets of Eu-
rope, while a double-digit figure is predicted in the US and in the Asia-
Pacific region. China’s share of total revenue is set to increase in 2018
following the start of local production.
The Group predicts growth through 2018 for all three business seg-
ments (light equipment, compact equipment and services). Compact
equipment is expected to continue developing at a dynamic pace,
fueled primarily by increased international sales. The services seg-
ment will continue to grow in line with the rise in sales.
Planned financing options, future investments and cost trends
The Group intends to continue to invest in profitable projects and de-
velop the company further – across all regions and lines of business.
For fiscal 2018, the figure earmarked for investments is approximately
EUR 60 million (2017: EUR 47.4 million)2.
The net working capital for 2018 as a percentage of revenue is ex-
pected to remain at the same level as the previous year (2017 aver-
age: 36.1 percent). This includes targeted measures to increase in-
ventory in preparation for the new emissions regulation EU Stage V
(2020).
The Group’s strong financial position and market reach provide it with
a good foundation to win new market shares and achieve profitable
growth. The Group intends to maintain its comparatively high equity
ratio, which currently stands at around 69 percent. Net financial debt
is relatively low, and the Group’s financial situation is correspondingly
1 Based on operational profitability – discounting one-off income from a potential transaction related to a real estate deal made by the Group.
2 Investments in tangible and intangible assets; does not include the Group’s own rental equipment.
healthy. The Group aims to leverage these strong financials and as-
sets to help drive a robust level of growth also over the coming years.
The Group is planning further collaborations in the medium to long
term and is open to possible acquisitions.
Outlook through 2019
From its current standpoint, the Executive Board predicts revenue
growth and a further profit growth for fiscal 2019.
Summary forecast
The Wacker Neuson Group expects strong performance in fiscal 2018
and fiscal 2019.
The global trend towards infrastructure expansion and improvement
offers opportunities for the Group’s business model. At international
level, investments will continue to be made in road, rail and telecom-
munication networks as well as in the modernization of buildings, fuel-
ing demand for compact and light equipment. The Group is keeping
pace with this by focusing on its core markets, selectively expanding
its international presence and developing competitive products and
services. It is important that the Group’s shareholders continue to
share in its success. The company therefore aims to maintain its
sound dividend policy and plans to make annual dividend payments to
shareholders provided its projections are accurate.
Munich, March 19, 2018
Wacker Neuson SE, Munich, Germany
The Executive Board
Martin Lehner
CEO
Alexander Greschner Wilfried Trepels
CSO CFO
Consolidated Financial Statements
80 Consolidated Income Statement
81 Consolidated Statement of Comprehensive Income
82 Consolidated Balance Sheet
83 Consolidated Statement of Change in Equity
84 Consolidated Cash Flow Statement
85 Consolidated Segmentation
86 Geographical areas
87 Notes to the Consolidated Financial Statements
87 General information on the company
87 General information on accounting standards
87 Changes in accounting under IFRS
92 Accounting and valuation methods
97 Explanatory comments on the income statement
97 (1) Revenue
97 (2) Other income
97 (3) Personnel expenses
98 (4) Other operating expenses
98 (5) Financial result
99 (6) Taxes on income
100 (7) Earnings per share
101 Explanatory Comments on the Balance Sheet
101 (8) Property, plant and equipment
102 (9) Investment properties
103 (10) Intangible assets
106 (11) Other non-current assets
106 (12) Rental
107 (13) Inventories
107 (14) Trade receivables
108 (15) Other current assets
108 (16) Cash and cash equivalents
108 (17) Non-current assets held for sale
109 (18) Equity
109 (19) Provisions for pensions and similar obligations
112 (20) Other provisions
113 (21) Financial liabilities
116 (22) Trade payables
116 (23) Other current liabilities
117 (24) Derivative financial instruments
118 Other information
118 (25) Contingent liabilities
118 (26) Other financial liabilities
119 (27) Additional information on financial instruments
121 (28) Events since the balance sheet date
121 (29) Segmentation
122 (30) Cash flow statement
123 (31) Risk management
124 (32) Executive bodies
126 (33) Related party disclosures
127 (34) Auditor’s fee
127 (35) Declaration regarding the German Corporate Governance Code
127 (36) Availing of exemption provisions according to Section 264 (3) and/or Section 264b HGB
128 Responsibility Statement by Management
129 Independent Auditor’s Report
Contents Combined Management Report 79
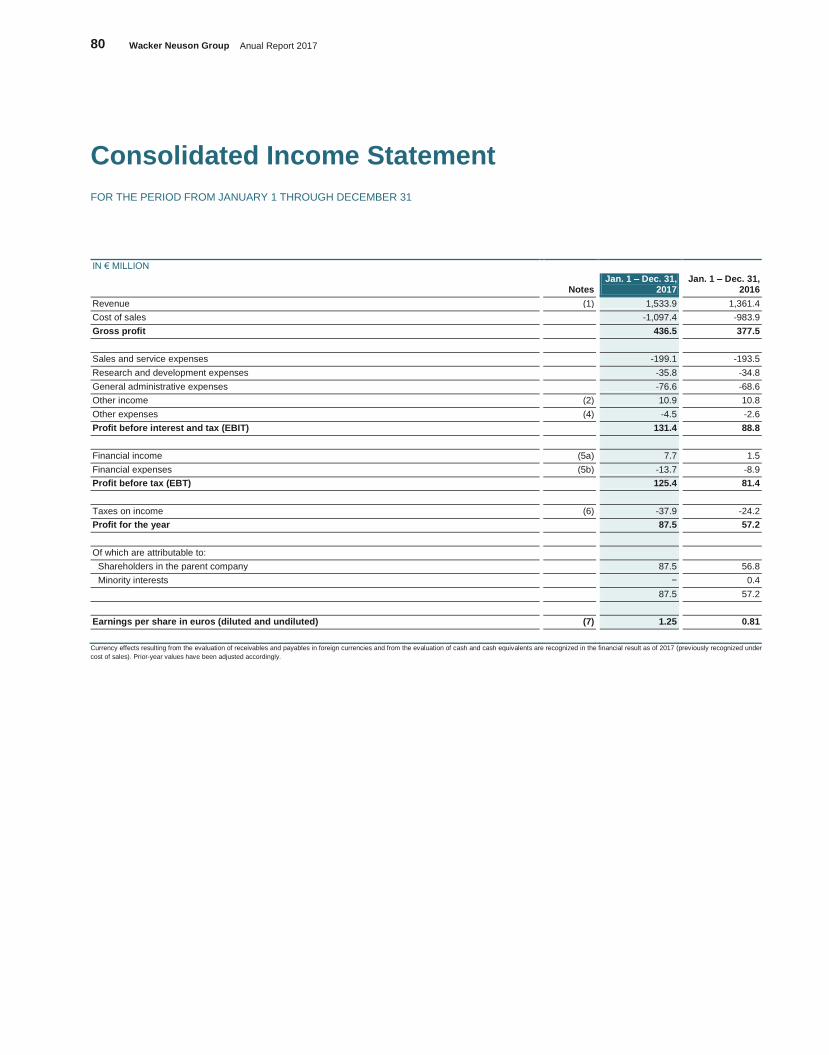
80 Wacker Neuson Group Anual Report 2017
Consolidated Income Statement
FOR THE PERIOD FROM JANUARY 1 THROUGH DECEMBER 31
IN € MILLION
Notes Jan. 1 – Dec. 31,
2017 Jan. 1 – Dec. 31,
2016
Revenue (1) 1,533.9 1,361.4
Cost of sales -1,097.4 -983.9
Gross profit 436.5 377.5
Sales and service expenses -199.1 -193.5
Research and development expenses -35.8 -34.8
General administrative expenses -76.6 -68.6
Other income (2) 10.9 10.8
Other expenses (4) -4.5 -2.6
Profit before interest and tax (EBIT) 131.4 88.8
Financial income (5a) 7.7 1.5
Financial expenses (5b) -13.7 -8.9
Profit before tax (EBT) 125.4 81.4
Taxes on income (6) -37.9 -24.2
Profit for the year 87.5 57.2
Of which are attributable to:
Shareholders in the parent company 87.5 56.8
Minority interests − 0.4
87.5 57.2
Earnings per share in euros (diluted and undiluted) (7) 1.25 0.81
Currency effects resulting from the evaluation of receivables and payables in foreign currencies and from the evaluation of cash and cash equivalents are recognized in the financial result as of 2017 (previously recognized under
cost of sales). Prior-year values have been adjusted accordingly.
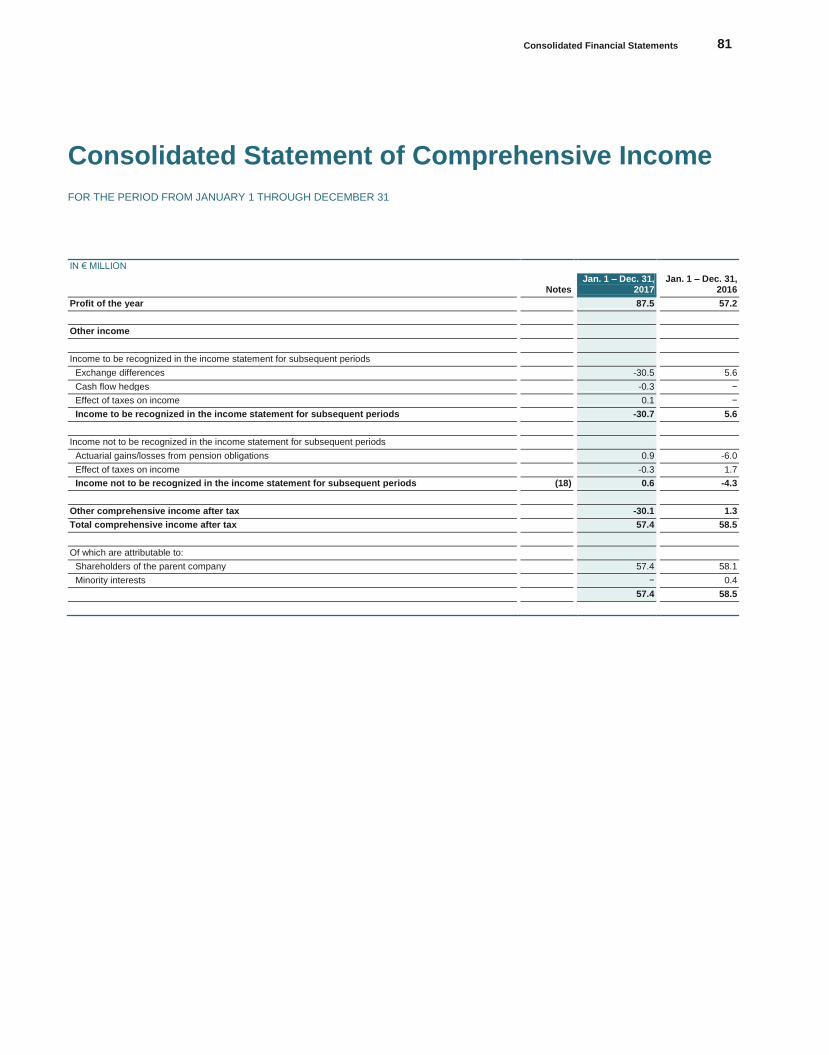
Consolidated Financial Statements 81
Konze
rnabschlu
ss
Consolidated Statement of Comprehensive Income
FOR THE PERIOD FROM JANUARY 1 THROUGH DECEMBER 31
IN € MILLION
Notes Jan. 1 – Dec. 31,
2017 Jan. 1 – Dec. 31,
2016
Profit of the year 87.5 57.2
Other income
Income to be recognized in the income statement for subsequent periods
Exchange differences -30.5 5.6
Cash flow hedges -0.3 −
Effect of taxes on income 0.1 −
Income to be recognized in the income statement for subsequent periods -30.7 5.6
Income not to be recognized in the income statement for subsequent periods
Actuarial gains/losses from pension obligations 0.9 -6.0
Effect of taxes on income -0.3 1.7
Income not to be recognized in the income statement for subsequent periods (18) 0.6 -4.3
Other comprehensive income after tax -30.1 1.3
Total comprehensive income after tax 57.4 58.5
Of which are attributable to:
Shareholders of the parent company 57.4 58.1
Minority interests − 0.4
57.4 58.5
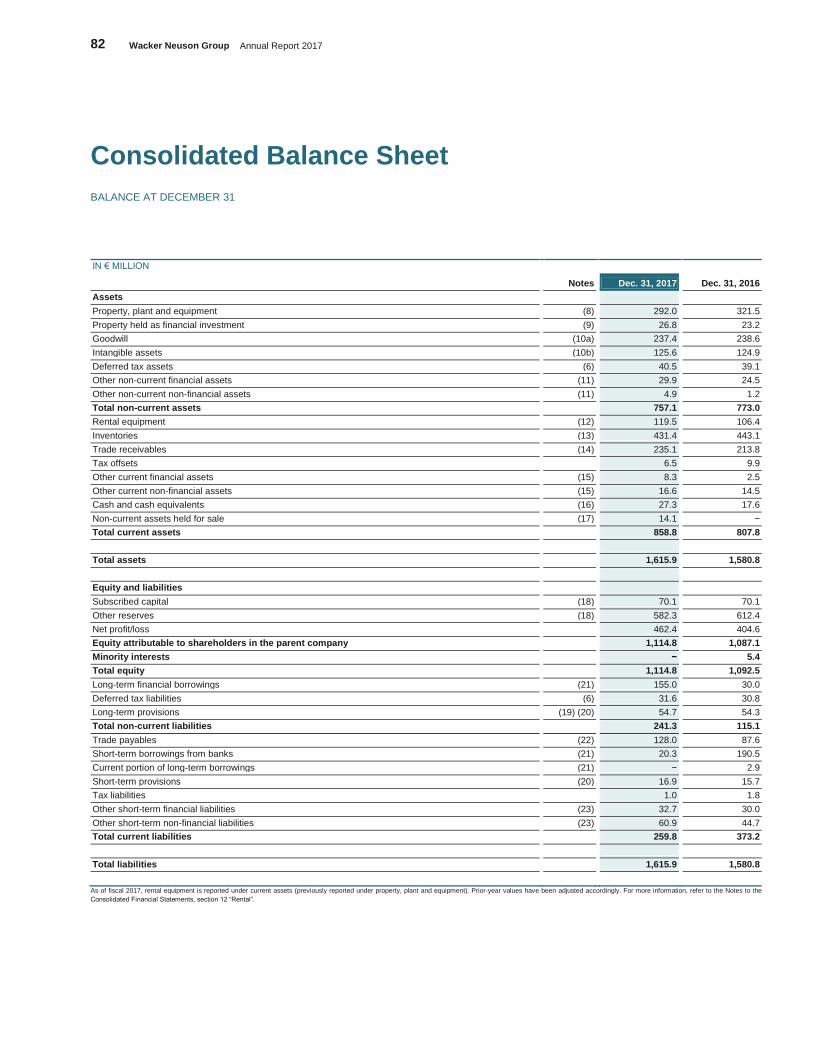
82 Wacker Neuson Group Annual Report 2017
Consolidated Balance Sheet
BALANCE AT DECEMBER 31
IN € MILLION
Notes Dec. 31, 2017 Dec. 31, 2016
Assets
Property, plant and equipment (8) 292.0 321.5
Property held as financial investment (9) 26.8 23.2
Goodwill (10a) 237.4 238.6
Intangible assets (10b) 125.6 124.9
Deferred tax assets (6) 40.5 39.1
Other non-current financial assets (11) 29.9 24.5
Other non-current non-financial assets (11) 4.9 1.2
Total non-current assets 757.1 773.0
Rental equipment (12) 119.5 106.4
Inventories (13) 431.4 443.1
Trade receivables (14) 235.1 213.8
Tax offsets 6.5 9.9
Other current financial assets (15) 8.3 2.5
Other current non-financial assets (15) 16.6 14.5
Cash and cash equivalents (16) 27.3 17.6
Non-current assets held for sale (17) 14.1 −
Total current assets 858.8 807.8
Total assets 1,615.9 1,580.8
Equity and liabilities
Subscribed capital (18) 70.1 70.1
Other reserves (18) 582.3 612.4
Net profit/loss 462.4 404.6
Equity attributable to shareholders in the parent company 1,114.8 1,087.1
Minority interests − 5.4
Total equity 1,114.8 1,092.5
Long-term financial borrowings (21) 155.0 30.0
Deferred tax liabilities (6) 31.6 30.8
Long-term provisions (19) (20) 54.7 54.3
Total non-current liabilities 241.3 115.1
Trade payables (22) 128.0 87.6
Short-term borrowings from banks (21) 20.3 190.5
Current portion of long-term borrowings (21) − 2.9
Short-term provisions (20) 16.9 15.7
Tax liabilities 1.0 1.8
Other short-term financial liabilities (23) 32.7 30.0
Other short-term non-financial liabilities (23) 60.9 44.7
Total current liabilities 259.8 373.2
Total liabilities 1,615.9 1,580.8
As of fiscal 2017, rental equipment is reported under current assets (previously reported under property, plant and equipment). Prior-year values have been adjusted accordingly. For more information, refer to the Notes to the
Consolidated Financial Statements, section 12 “Rental”.
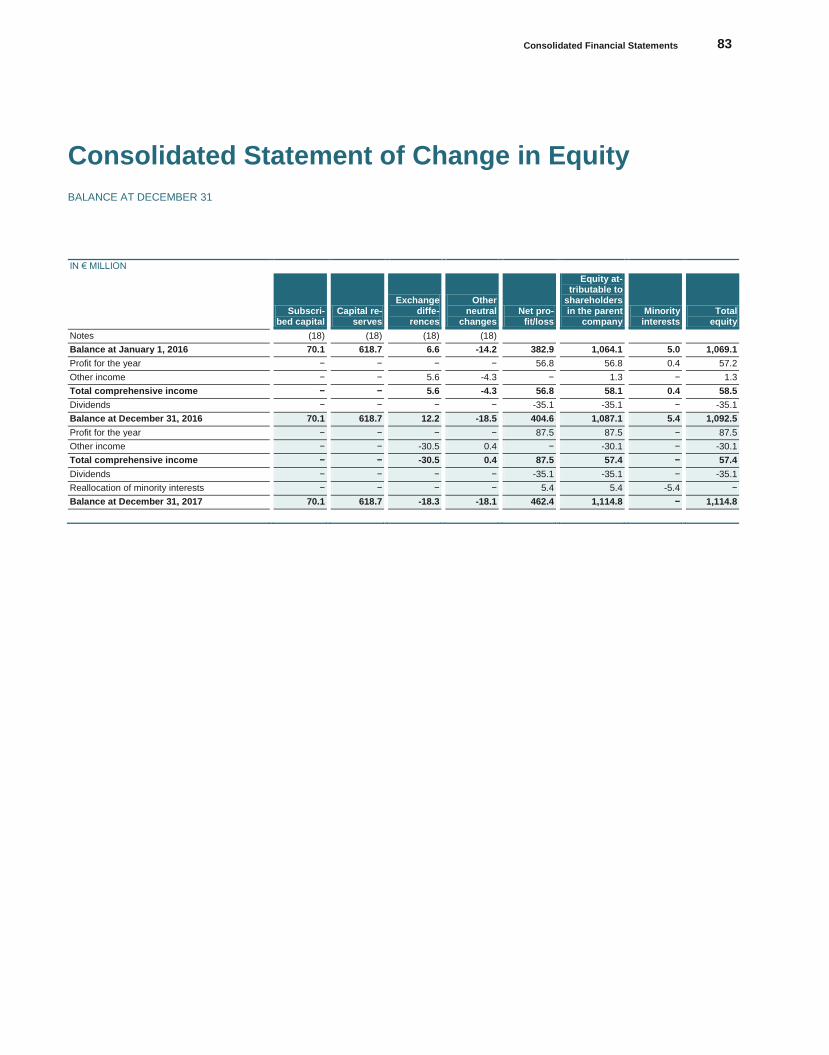
Consolidated Financial Statements 83
Konze
rnabschlu
ss
Consolidated Statement of Change in Equity
BALANCE AT DECEMBER 31
IN € MILLION
Subscri-
bed capital Capital re-
serves
Exchange diffe-
rences
Other neutral
changes Net pro-
fit/loss
Equity at-tributable to
shareholders in the parent
company Minority
interests Total
equity
Notes (18) (18) (18) (18)
Balance at January 1, 2016 70.1 618.7 6.6 -14.2 382.9 1,064.1 5.0 1,069.1
Profit for the year − − − − 56.8 56.8 0.4 57.2
Other income − − 5.6 -4.3 − 1.3 − 1.3
Total comprehensive income − − 5.6 -4.3 56.8 58.1 0.4 58.5
Dividends − − − − -35.1 -35.1 − -35.1
Balance at December 31, 2016 70.1 618.7 12.2 -18.5 404.6 1,087.1 5.4 1,092.5
Profit for the year − − − − 87.5 87.5 − 87.5
Other income − − -30.5 0.4 − -30.1 − -30.1
Total comprehensive income − − -30.5 0.4 87.5 57.4 − 57.4
Dividends − − − − -35.1 -35.1 − -35.1
Reallocation of minority interests − − − − 5.4 5.4 -5.4 −
Balance at December 31, 2017 70.1 618.7 -18.3 -18.1 462.4 1,114.8 − 1,114.8
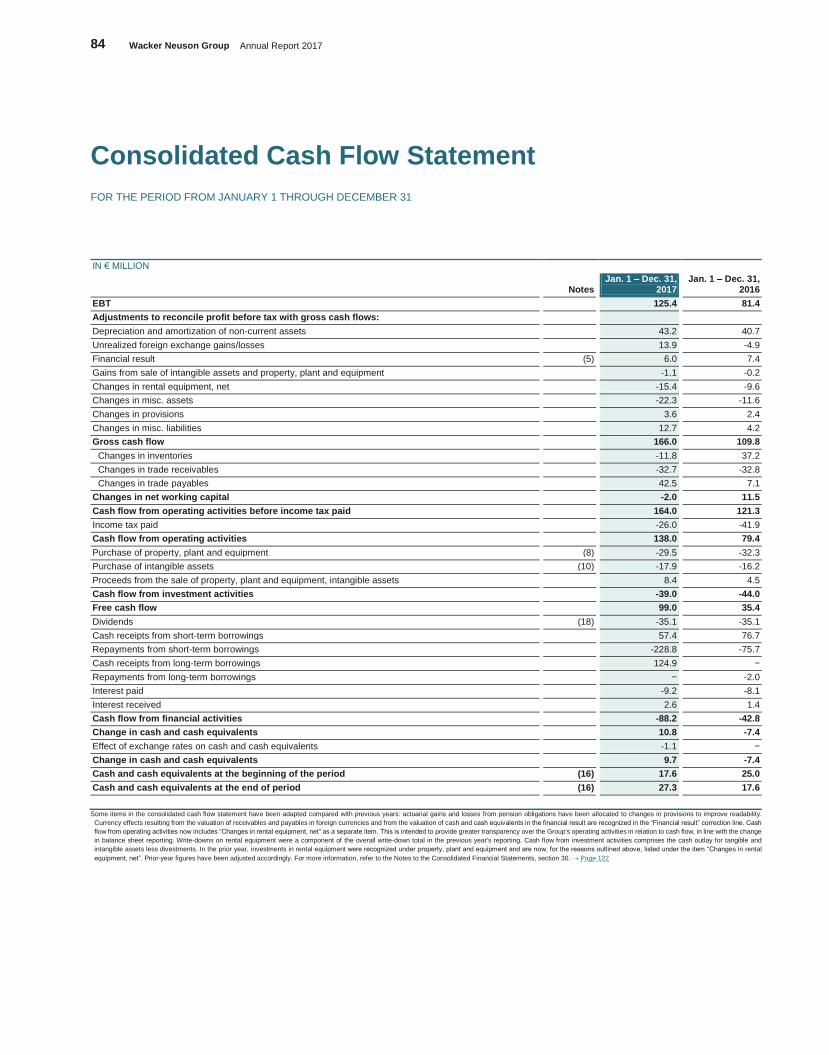
84 Wacker Neuson Group Annual Report 2017
Consolidated Cash Flow Statement
FOR THE PERIOD FROM JANUARY 1 THROUGH DECEMBER 31
IN € MILLION
Notes Jan. 1 – Dec. 31,
2017 Jan. 1 – Dec. 31,
2016
EBT 125.4 81.4
Adjustments to reconcile profit before tax with gross cash flows:
Depreciation and amortization of non-current assets 43.2 40.7
Unrealized foreign exchange gains/losses 13.9 -4.9
Financial result (5) 6.0 7.4
Gains from sale of intangible assets and property, plant and equipment -1.1 -0.2
Changes in rental equipment, net -15.4 -9.6
Changes in misc. assets -22.3 -11.6
Changes in provisions 3.6 2.4
Changes in misc. liabilities 12.7 4.2
Gross cash flow 166.0 109.8
Changes in inventories -11.8 37.2
Changes in trade receivables -32.7 -32.8
Changes in trade payables 42.5 7.1
Changes in net working capital -2.0 11.5
Cash flow from operating activities before income tax paid 164.0 121.3
Income tax paid -26.0 -41.9
Cash flow from operating activities 138.0 79.4
Purchase of property, plant and equipment (8) -29.5 -32.3
Purchase of intangible assets (10) -17.9 -16.2
Proceeds from the sale of property, plant and equipment, intangible assets 8.4 4.5
Cash flow from investment activities -39.0 -44.0
Free cash flow 99.0 35.4
Dividends (18) -35.1 -35.1
Cash receipts from short-term borrowings 57.4 76.7
Repayments from short-term borrowings -228.8 -75.7
Cash receipts from long-term borrowings 124.9 −
Repayments from long-term borrowings − -2.0
Interest paid -9.2 -8.1
Interest received 2.6 1.4
Cash flow from financial activities -88.2 -42.8
Change in cash and cash equivalents 10.8 -7.4
Effect of exchange rates on cash and cash equivalents -1.1 −
Change in cash and cash equivalents 9.7 -7.4
Cash and cash equivalents at the beginning of the period (16) 17.6 25.0
Cash and cash equivalents at the end of period (16) 27.3 17.6
Some items in the consolidated cash flow statement have been adapted compared with previous years: actuarial gains and losses from pension obligations have been allocated to changes in provisions to improve readability.
Currency effects resulting from the valuation of receivables and payables in foreign currencies and from the valuation of cash and cash equivalents in the financial result are recognized in the “Financial result” correction line. Cash
flow from operating activities now includes “Changes in rental equipment, net” as a separate item. This is intended to provide greater transparency over the Group's operating activities in relation to cash flow, in line with the change
in balance sheet reporting. Write-downs on rental equipment were a component of the overall write-down total in the previous year's reporting. Cash flow from investment activities comprises the cash outlay for tangible and
intangible assets less divestments. In the prior year, investments in rental equipment were recognized under property, plant and equipment and are now, for the reasons outlined above, listed under the item “Changes in rental
equipment, net”. Prior-year figures have been adjusted accordingly. For more information, refer to the Notes to the Consolidated Financial Statements, section 30. Page 122
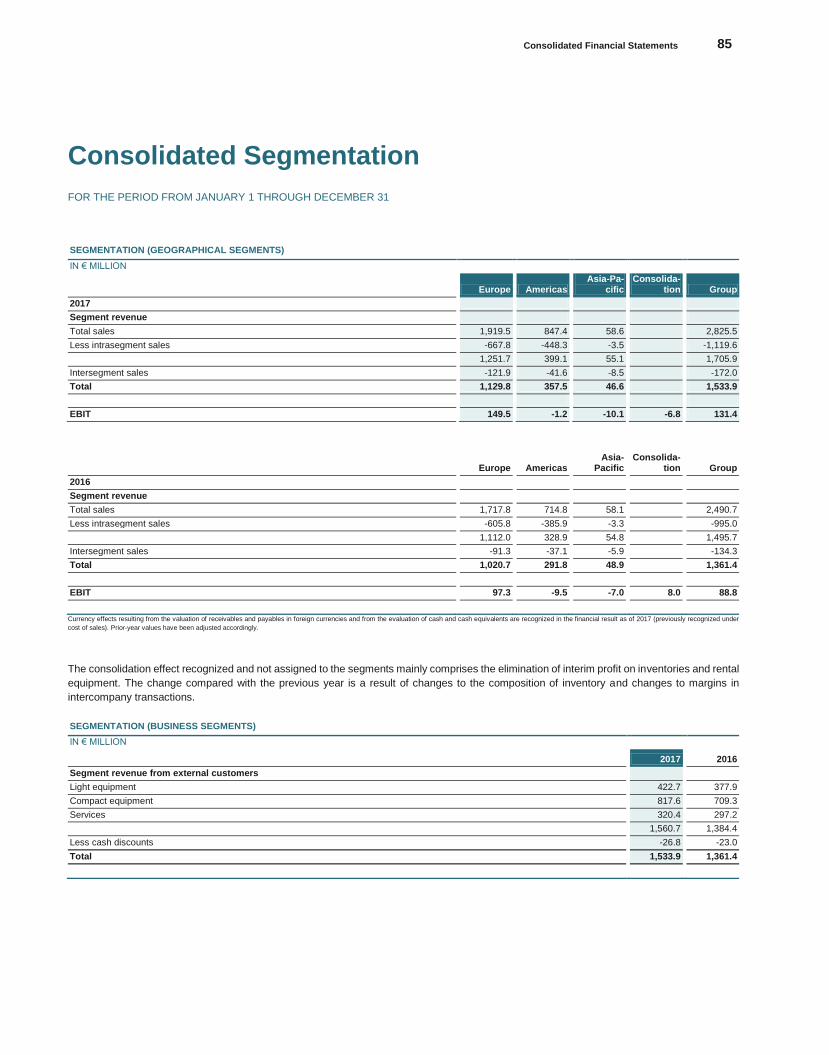
Consolidated Financial Statements 85
Konze
rnabschlu
ss
Consolidated Segmentation
FOR THE PERIOD FROM JANUARY 1 THROUGH DECEMBER 31
SEGMENTATION (GEOGRAPHICAL SEGMENTS)
IN € MILLION
Europe Americas Asia-Pa-
cific Consolida-
tion Group
2017
Segment revenue
Total sales 1,919.5 847.4 58.6 2,825.5
Less intrasegment sales -667.8 -448.3 -3.5 -1,119.6
1,251.7 399.1 55.1 1,705.9
Intersegment sales -121.9 -41.6 -8.5 -172.0
Total 1,129.8 357.5 46.6 1,533.9
EBIT 149.5 -1.2 -10.1 -6.8 131.4
Europe Americas Asia-
Pacific Consolida-
tion Group
2016
Segment revenue
Total sales 1,717.8 714.8 58.1 2,490.7
Less intrasegment sales -605.8 -385.9 -3.3 -995.0
1,112.0 328.9 54.8 1,495.7
Intersegment sales -91.3 -37.1 -5.9 -134.3
Total 1,020.7 291.8 48.9 1,361.4
EBIT 97.3 -9.5 -7.0 8.0 88.8
Currency effects resulting from the valuation of receivables and payables in foreign currencies and from the evaluation of cash and cash equivalents are recognized in the financial result as of 2017 (previously recognized under
cost of sales). Prior-year values have been adjusted accordingly.
The consolidation effect recognized and not assigned to the segments mainly comprises the elimination of interim profit on inventories and rental
equipment. The change compared with the previous year is a result of changes to the composition of inventory and changes to margins in
intercompany transactions.
SEGMENTATION (BUSINESS SEGMENTS)
IN € MILLION
2017 2016
Segment revenue from external customers
Light equipment 422.7 377.9
Compact equipment 817.6 709.3
Services 320.4 297.2
1,560.7 1,384.4
Less cash discounts -26.8 -23.0
Total 1,533.9 1,361.4
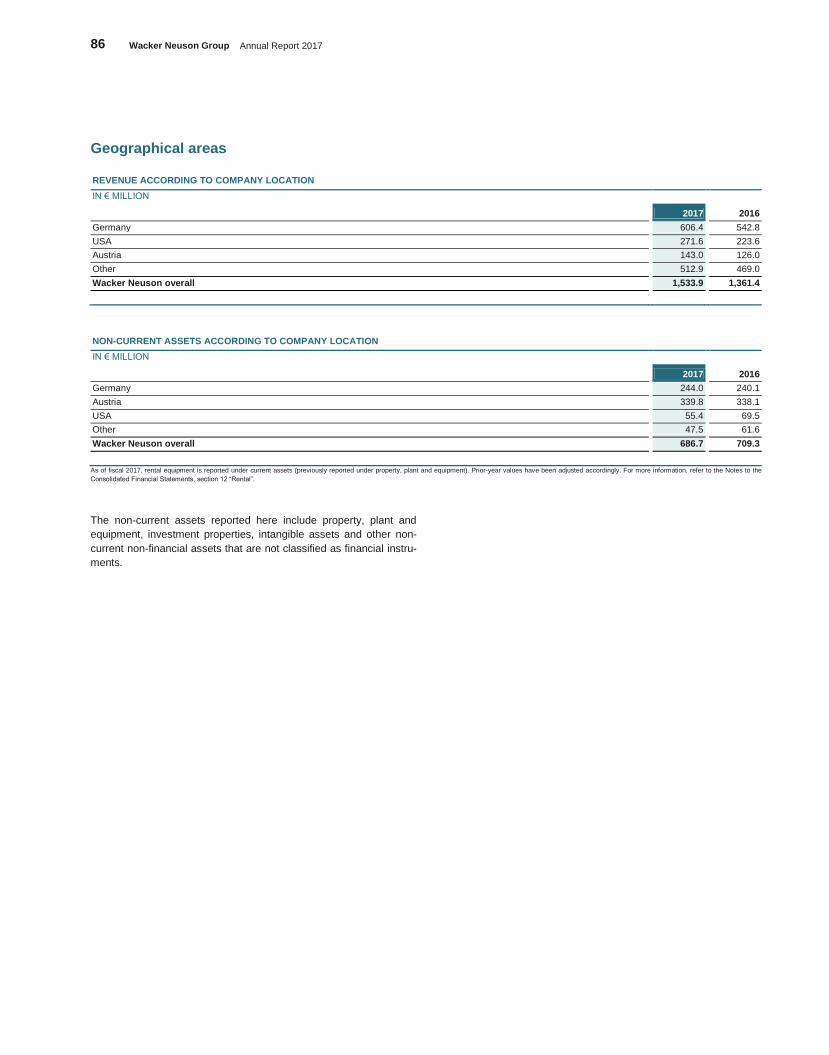
86 Wacker Neuson Group Annual Report 2017
Geographical areas
REVENUE ACCORDING TO COMPANY LOCATION
IN € MILLION
2017 2016
Germany 606.4 542.8
USA 271.6 223.6
Austria 143.0 126.0
Other 512.9 469.0
Wacker Neuson overall 1,533.9 1,361.4
NON-CURRENT ASSETS ACCORDING TO COMPANY LOCATION
IN € MILLION
2017 2016
Germany 244.0 240.1
Austria 339.8 338.1
USA 55.4 69.5
Other 47.5 61.6
Wacker Neuson overall 686.7 709.3
As of fiscal 2017, rental equipment is reported under current assets (previously reported under property, plant and equipment). Prior-year values have been adjusted accordingly. For more information, refer to the Notes to the
Consolidated Financial Statements, section 12 “Rental”.
The non-current assets reported here include property, plant and
equipment, investment properties, intangible assets and other non-
current non-financial assets that are not classified as financial instru-
ments.
Notes to the Consolidated Financial Statements 87
Konze
rnabschlu
ss
Notes to the Consolidated Financial Statements
General information on the company
Wacker Neuson SE (also referred to as “the company” in the following)
is a listed European stock corporation (Societas Europaea or SE)
headquartered in Munich (Germany). It is entered in the Register of
Companies at the Munich Local Court under HRB 177839.
Wacker Neuson shares have been listed since May 2007 on the reg-
ulated Prime Standard segment of the German stock exchange in
Frankfurt. The company has been listed in the SDAX since September
2007.
General information on accounting standards
The following Consolidated Financial Statements for fiscal 2017 were
prepared for the company in accordance with the International Ac-
counting Standards (IAS) as approved and published by the Interna-
tional Accounting Standards Board (IASB) and the International Finan-
cial Reporting Standards (IFRS) as interpreted by the IFRS Interpre-
tation Committee (IFRS IC) as adopted by the EU, and in supplemen-
tary compliance with the provisions set forth in Section 315a (1) of the
German Commercial Code (HGB). All valid and binding standards for
fiscal 2017 have been applied.
The Consolidated Financial Statements comprise the consolidated in-
come statement, the consolidated statement of comprehensive in-
come, the consolidated balance sheet, the consolidated statement of
changes in equity, the consolidated cash flow statement, as well as
the Notes to the Consolidated Financial Statements. In addition, a
Group Management Report, which was combined with the Manage-
ment Report of the company, was prepared in accordance with Sec-
tion 315a HGB. As a rule, the Consolidated Financial Statements are
prepared using the acquisition cost method. The income statement is
prepared in the cost-of-sales format. The Consolidated Financial
Statements have been prepared in euros (EUR). Unless otherwise
stated, all figures are rounded to the nearest million (€ M or EUR mil-
lion)
Wacker Neuson SE’s fiscal year corresponds to the calendar year.
The Consolidated Financial Statements for fiscal 2017 (which include
prior-year figures) were approved for publication by the Executive
Board on March 19, 2018.
Changes in accounting under IFRS
Standards and interpretations applied for the first time in
the fiscal year under review
The following standards, amendments to standards and interpreta-
tions are mandatory as of January 1, 2017.
Name Description
Mandatory as
of1
IAS 7 Amendments to IAS 7: Disclosure initiative January 1,
2017
IAS 12 Amendments to IAS 12: Recognition of de-ferred tax assets for unrealized losses
January 1, 2017
Annual amendments (2014-2016): Amend-ments to IFRS 12:
January 1, 2017
1 For fiscal years that start on or after this date. Initial application in line with EU law.
The standards applicable for the first time in the fiscal year under re-
view did not have any significant impact on the accounting and valua-
tion methods used by the Group.
Standards and interpretations that have been published
but not yet applied
The following accounting standards have been published but have not
yet come into force, which is why there is no obligation to apply them
yet. Should these accounting standards be endorsed by the European
Union, it would, at the company’s discretion, be generally permissible
to apply them at an earlier date. At present, the Group aims to apply
these standards as of the date on which they come into force.
88 Wacker Neuson Group Annual Report 2017
Name Description
Mandatory as
of1
EU endorsement granted by date of approval for publication
IFRS 9
Financial instruments (recognition, classifica-tion and measurement) and hedge account-ing January 1, 2018
IFRS 15 Revenue from contracts with customers January 1, 2018
IFRS 15 Clarifications of IFRS 15: Revenue from con-tracts with customers January 1, 2018
IFRS 4
Amendments to IFRS 4: Application of IFRS 9 “Financial instruments” together with IFRS 4 “Insurance contracts” January 1, 2018
IFRS 16 Leases January 1, 2019
Annual amendments (2014-2016) January 1, 2017/2018
EU endorsement outstanding
IFRS 2
Amendments to IFRS 2: Classification and measurement of share-based payment trans-actions January 1, 2018
IAS 40 Amendments to IAS 40: Transfers of invest-ment property January 1, 2018
IFRIC 22 Foreign currency transactions and advance consideration January 1, 2018
IFRIC 23 Uncertainty over income tax treatments January 1, 2019
IFRS 9 Amendments to IFRS 9: Prepayment features with negative compensation January 1, 2019
IAS 28 Amendments to IAS 28: Long-term interests in associates and joint ventures January 1, 2019
Annual amendments (2015-2017) January 1, 2019
IFRS 17 Insurance contracts January 1, 2021
Sales or contributions of assets between an investor and its associate / joint venture (amendments to IFRS 10 and IAS 28)
2
1 For fiscal years that start on or after this date. Initial application in line with EU law or already endorsed un-der EU law. 2 On December 17, 2015, the IASB decided to delay the initial application date of this amended standard in-definitely.
First-time application of the above-mentioned standards and interpre-
tations is unlikely to substantially change the current accounting and
valuation methods used by the Group, with the exception of the follow-
ing amendments:
IFRS 15
IFRS 15 was published in May 2014. It introduces a five-step model
framework for recognizing revenue from contracts with customers. Un-
der IFRS 15, revenue is recognized in the amount of the consideration
to which an entity can expect to be entitled in exchange for transferring
promised goods or services to a customer (the transaction price as
defined in IFRS 15). The new standard on revenue will replace all cur-
rently existing regulations on revenue recognition as per IFRS. For fis-
cal years starting on or after January 1, 2018, entities must apply the
new standard retrospectively in full or opt for a modified retrospective
application. The Group will apply the new standard on the date on
which it comes into force, opting for the modified retrospective appli-
cation. There were no changes relative to the previous practice. Fur-
thermore, the Group has taken into consideration the clarifications
published by the IASB in April 2016 and will continue to monitor further
developments here.
(a) The sale of goods
Contracts with customers in which the sale of machines and spare
parts are generally expected to be the only performance obligation are
not likely to have an impact on Group revenue. The Group expects
that the revenue will be realized at the point in time when control of
the asset is passed to the customer. This is generally the case when
goods are delivered. The Group takes the following aspects into con-
sideration:
(i) Variable consideration
Contracts with customers provide for price concessions or volume dis-
counts. The Group currently recognizes revenue from the sale of
goods and equipment at fair value of the consideration received or to
which it will be entitled after deduction of returns, refunds, price con-
cessions and volume discounts. If revenue cannot be reliably deter-
mined, the Group does not recognize it until the point in time when it
has established certainty as to the amount receivable. Under IFRS 15,
the estimated variable consideration must be limited to prevent an in-
flated revenue figure from being recognized. The Group will continue
to analyze individual contracts to determine the estimated variable
consideration and the associated limitation. The Group does not ex-
pect the application of this limit to have any impact on Group revenue.
(ii) Warranty obligations
The Group’s contracts with customers include warranties for general
repair obligations as well as extended warranties and maintenance
agreements. The Group does not expect that this amendment will
have any material impact on Group revenue or result in any significant
changes to its current practice.
(b) Presentation and disclosure requirements
The presentation and disclosure requirements of IFRS 15 go much
further than the provisions set down in current standards. The new
presentation requirements represent a significant change to current
practices and will require much more information in the Consolidated
Financial Statements in future. Many of the disclosure requirements in
IFRS 15 are completely new. In fiscal 2017, the Group evaluated its
systems to capture and disclose the requisite information.
IFRS 9
In July 2014, the IASB published the final version of IFRS 9 “Financial
instruments”, which replaces IAS 39 “Financial instruments: Recogni-
tion and measurement” as well as all previous versions of IFRS 9.
IFRS 9 consolidates the three project phases for the accounting of fi-
nancial instruments: ‘Classification and measurement’, ‘Impairment’
and ‘Hedge accounting’. IFRS 9 is effective for the first time for fiscal
years beginning on or after January 1, 2018. With the exception of
hedge accounting, the standard must be retrospectively applied. How-
ever, comparative information does not have to be disclosed. The pro-
visions for hedge accounting must, in general, be applied prospec-
tively with only a few exceptions.
The Group intends to apply the new standard on the date on which it
comes into force. In fiscal 2017, the Group carried out an evaluation
to determine the impact of all three aspects of IFRS 9. The final eval-
uation is based on currently available information. Overall, the Group
does not expect any material impact on its balance sheet or equity in
connection with this new standard.
Notes to the Consolidated Financial Statements 89
Konze
rnabschlu
ss
(a) Classification and measurement
The Group does not expect that application of the classification and
measurement requirements of IFRS 9 will have a material impact on
its balance sheet or equity. The Group assumes all financial assets
that it holds at fair value will continue to be measured at fair value. In
general, the information currently available indicates that there are no
material financial assets or liabilities that are held at fair value. How-
ever, listed shares that are currently recognized as available for sale
and whose profit or loss are disclosed in other income will be recog-
nized at fair value in profit or loss. This recognition increases the vol-
atility of profit or loss disclosures. The reserve for available-for-sale
financial assets, which is currently recognized in accumulated other
income, will be reclassified to the opening balance of revenue re-
serves.
Loans and trade receivables are held to collect contractual cash flows,
which are solely principal and interest payments on the principal
amount outstanding. As such, the Group expects that these will con-
tinue to be recognized at amortized cost under IFRS 9.
(b) Impairment
Under IFRS 9, the Group’s expected credit losses (ECLs) from all of
its debt instruments, loans and trade receivables must be measured
at an amount equal to either the 12-month expected credit losses or
the full lifetime expected credit losses. The Group intends to use the
simplified approach and to recognize the full lifetime expected credit
losses that result from all trade receivables. The methodology used for
the simplified approach under IFRS 9 is the same as the existing
method for determining impairment. As such, this provision will not
have any significant impact on the Group.
(c) Hedge accounting
The Group does not expect this option to have any extensive impact
as it does not engage in any significant transactions with derivative or
non-derivative financial instruments for hedging purposes.
IFRS 16
On January 13, 2016, the IASB published the final IFRS 16 standard
“Leases”. IFRS 16 outlines the principles for recognizing, presenting
and disclosing leases. The resulting changes mainly affect the lessee,
requiring that all leases and associated contractual rights and respon-
sibilities generally be reported in the lessee's balance sheet. IFRS 16
must be applied for fiscal years beginning on or after January 1, 2019.
Earlier application is permitted if IFRS 15 is already applied in the
Group.
The Group intends to evaluate the potential impacts of IFRS 16 in fis-
cal 2018. It will not opt for early adoption of this standard.
Closing date
The closing date for all Group members included in the Consolidated
Financial Statements is December 31 of the respective year. The ac-
counting period valid for the current statements is January 1, 2017
through December 31, 2017.
Consolidation structure see page 90
In addition to the parent company, Wacker Neuson SE, the Consoli-
dated Financial Statements as at December 31, 2017 include the fol-
lowing affiliates controlled by the Group. The Group is deemed to con-
trol a company if it carries the risks associated with or the rights to
fluctuating returns on its shareholding in the company, and if it can
also use its power of control over the company to influence these re-
turns. Control is exercised through the following shareholdings:
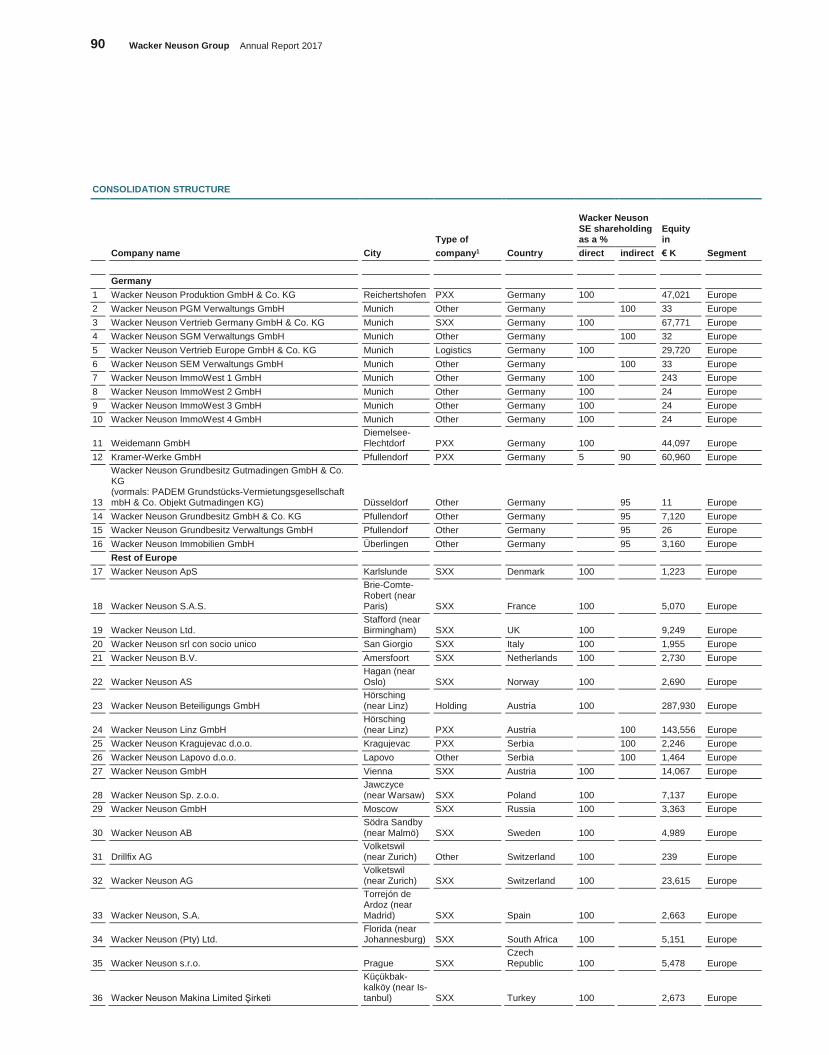
90 Wacker Neuson Group Annual Report 2017
CONSOLIDATION STRUCTURE
Type of
Wacker Neuson SE shareholding as a %
Equity in
Company name City company1 Country direct indirect € K Segment
Germany
1 Wacker Neuson Produktion GmbH & Co. KG Reichertshofen PXX Germany 100 47,021 Europe
2 Wacker Neuson PGM Verwaltungs GmbH Munich Other Germany 100 33 Europe
3 Wacker Neuson Vertrieb Germany GmbH & Co. KG Munich SXX Germany 100 67,771 Europe
4 Wacker Neuson SGM Verwaltungs GmbH Munich Other Germany 100 32 Europe
5 Wacker Neuson Vertrieb Europe GmbH & Co. KG Munich Logistics Germany 100 29,720 Europe
6 Wacker Neuson SEM Verwaltungs GmbH Munich Other Germany 100 33 Europe
7 Wacker Neuson ImmoWest 1 GmbH Munich Other Germany 100 243 Europe
8 Wacker Neuson ImmoWest 2 GmbH Munich Other Germany 100 24 Europe
9 Wacker Neuson ImmoWest 3 GmbH Munich Other Germany 100 24 Europe
10 Wacker Neuson ImmoWest 4 GmbH Munich Other Germany 100 24 Europe
11 Weidemann GmbH Diemelsee-Flechtdorf PXX Germany 100 44,097 Europe
12 Kramer-Werke GmbH Pfullendorf PXX Germany 5 90 60,960 Europe
13
Wacker Neuson Grundbesitz Gutmadingen GmbH & Co. KG (vormals: PADEM Grundstücks-Vermietungsgesellschaft mbH & Co. Objekt Gutmadingen KG) Düsseldorf Other Germany 95 11 Europe
14 Wacker Neuson Grundbesitz GmbH & Co. KG Pfullendorf Other Germany 95 7,120 Europe
15 Wacker Neuson Grundbesitz Verwaltungs GmbH Pfullendorf Other Germany 95 26 Europe
16 Wacker Neuson Immobilien GmbH Überlingen Other Germany 95 3,160 Europe
Rest of Europe
17 Wacker Neuson ApS Karlslunde SXX Denmark 100 1,223 Europe
18 Wacker Neuson S.A.S.
Brie-Comte-Robert (near Paris) SXX France 100 5,070 Europe
19 Wacker Neuson Ltd. Stafford (near Birmingham) SXX UK 100 9,249 Europe
20 Wacker Neuson srl con socio unico San Giorgio SXX Italy 100 1,955 Europe
21 Wacker Neuson B.V. Amersfoort SXX Netherlands 100 2,730 Europe
22 Wacker Neuson AS Hagan (near Oslo) SXX Norway 100 2,690 Europe
23 Wacker Neuson Beteiligungs GmbH Hörsching (near Linz) Holding Austria 100 287,930 Europe
24 Wacker Neuson Linz GmbH Hörsching (near Linz) PXX Austria 100 143,556 Europe
25 Wacker Neuson Kragujevac d.o.o. Kragujevac PXX Serbia 100 2,246 Europe
26 Wacker Neuson Lapovo d.o.o. Lapovo Other Serbia 100 1,464 Europe
27 Wacker Neuson GmbH Vienna SXX Austria 100 14,067 Europe
28 Wacker Neuson Sp. z.o.o. Jawczyce (near Warsaw) SXX Poland 100 7,137 Europe
29 Wacker Neuson GmbH Moscow SXX Russia 100 3,363 Europe
30 Wacker Neuson AB Södra Sandby (near Malmö) SXX Sweden 100 4,989 Europe
31 Drillfix AG Volketswil (near Zurich) Other Switzerland 100 239 Europe
32 Wacker Neuson AG Volketswil (near Zurich) SXX Switzerland 100 23,615 Europe
33 Wacker Neuson, S.A.
Torrejón de Ardoz (near Madrid) SXX Spain 100 2,663 Europe
34 Wacker Neuson (Pty) Ltd. Florida (near Johannesburg) SXX South Africa 100 5,151 Europe
35 Wacker Neuson s.r.o. Prague SXX Czech Republic 100 5,478 Europe
36 Wacker Neuson Makina Limited Şirketi
Küçükbak-kalköy (near Is-tanbul) SXX Turkey 100 2,673 Europe
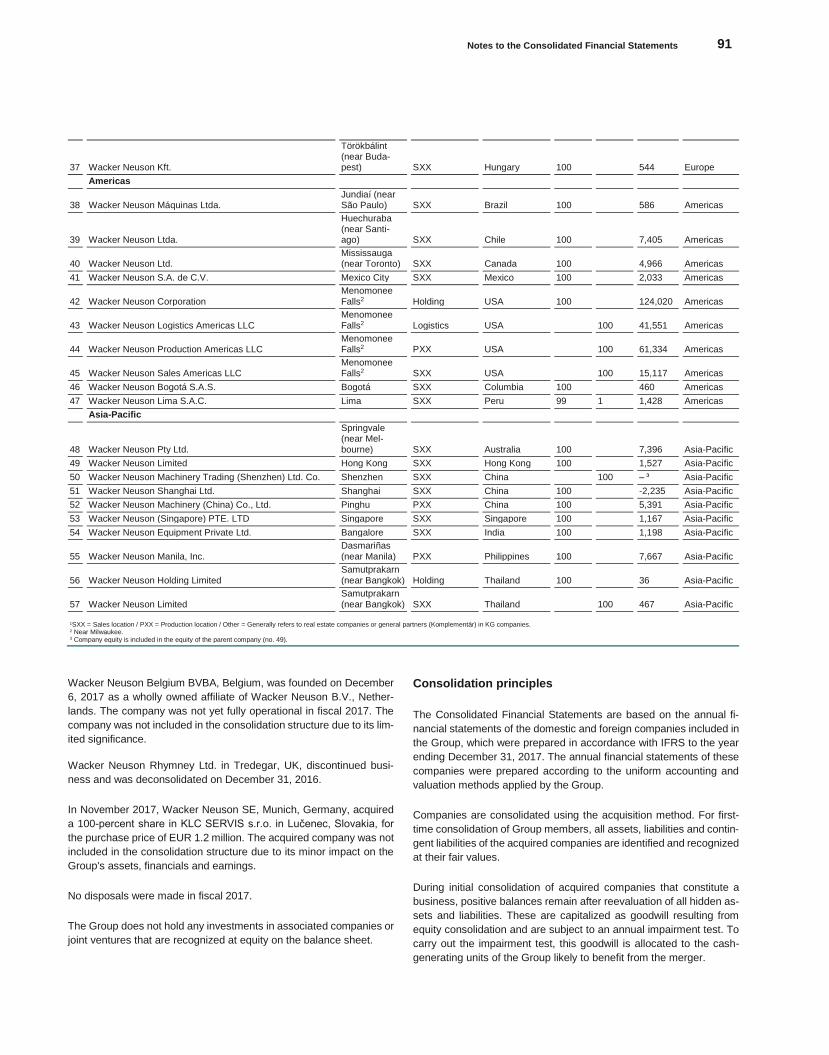
Notes to the Consolidated Financial Statements 91
Konze
rnabschlu
ss
37 Wacker Neuson Kft.
Törökbálint (near Buda-pest) SXX Hungary 100 544 Europe
Americas
38 Wacker Neuson Máquinas Ltda. Jundiaí (near São Paulo) SXX Brazil 100 586 Americas
39 Wacker Neuson Ltda.
Huechuraba (near Santi-ago) SXX Chile 100 7,405 Americas
40 Wacker Neuson Ltd. Mississauga (near Toronto) SXX Canada 100 4,966 Americas
41 Wacker Neuson S.A. de C.V. Mexico City SXX Mexico 100 2,033 Americas
42 Wacker Neuson Corporation
Menomonee
Falls2 Holding USA 100 124,020 Americas
43 Wacker Neuson Logistics Americas LLC Menomonee Falls2 Logistics USA 100 41,551 Americas
44 Wacker Neuson Production Americas LLC Menomonee Falls2 PXX USA 100 61,334 Americas
45 Wacker Neuson Sales Americas LLC Menomonee Falls2 SXX USA 100 15,117 Americas
46 Wacker Neuson Bogotá S.A.S. Bogotá SXX Columbia 100 460 Americas
47 Wacker Neuson Lima S.A.C. Lima SXX Peru 99 1 1,428 Americas
Asia-Pacific
48 Wacker Neuson Pty Ltd.
Springvale (near Mel-bourne) SXX Australia 100 7,396 Asia-Pacific
49 Wacker Neuson Limited Hong Kong SXX Hong Kong 100 1,527 Asia-Pacific
50 Wacker Neuson Machinery Trading (Shenzhen) Ltd. Co. Shenzhen SXX China 100 – ³ Asia-Pacific
51 Wacker Neuson Shanghai Ltd. Shanghai SXX China 100 -2,235 Asia-Pacific
52 Wacker Neuson Machinery (China) Co., Ltd. Pinghu PXX China 100 5,391 Asia-Pacific
53 Wacker Neuson (Singapore) PTE. LTD Singapore SXX Singapore 100 1,167 Asia-Pacific
54 Wacker Neuson Equipment Private Ltd. Bangalore SXX India 100 1,198 Asia-Pacific
55 Wacker Neuson Manila, Inc. Dasmariñas (near Manila) PXX Philippines 100 7,667 Asia-Pacific
56 Wacker Neuson Holding Limited Samutprakarn (near Bangkok) Holding Thailand 100 36 Asia-Pacific
57 Wacker Neuson Limited Samutprakarn (near Bangkok) SXX Thailand 100 467 Asia-Pacific
1SXX = Sales location / PXX = Production location / Other = Generally refers to real estate companies or general partners (Komplementär) in KG companies. 2 Near Milwaukee. 3 Company equity is included in the equity of the parent company (no. 49).
Wacker Neuson Belgium BVBA, Belgium, was founded on December
6, 2017 as a wholly owned affiliate of Wacker Neuson B.V., Nether-
lands. The company was not yet fully operational in fiscal 2017. The
company was not included in the consolidation structure due to its lim-
ited significance.
Wacker Neuson Rhymney Ltd. in Tredegar, UK, discontinued busi-
ness and was deconsolidated on December 31, 2016.
In November 2017, Wacker Neuson SE, Munich, Germany, acquired
a 100-percent share in KLC SERVIS s.r.o. in Lučenec, Slovakia, for
the purchase price of EUR 1.2 million. The acquired company was not
included in the consolidation structure due to its minor impact on the
Group's assets, financials and earnings.
No disposals were made in fiscal 2017.
The Group does not hold any investments in associated companies or
joint ventures that are recognized at equity on the balance sheet.
Consolidation principles
The Consolidated Financial Statements are based on the annual fi-
nancial statements of the domestic and foreign companies included in
the Group, which were prepared in accordance with IFRS to the year
ending December 31, 2017. The annual financial statements of these
companies were prepared according to the uniform accounting and
valuation methods applied by the Group.
Companies are consolidated using the acquisition method. For first-
time consolidation of Group members, all assets, liabilities and contin-
gent liabilities of the acquired companies are identified and recognized
at their fair values.
During initial consolidation of acquired companies that constitute a
business, positive balances remain after reevaluation of all hidden as-
sets and liabilities. These are capitalized as goodwill resulting from
equity consolidation and are subject to an annual impairment test. To
carry out the impairment test, this goodwill is allocated to the cash-
generating units of the Group likely to benefit from the merger.
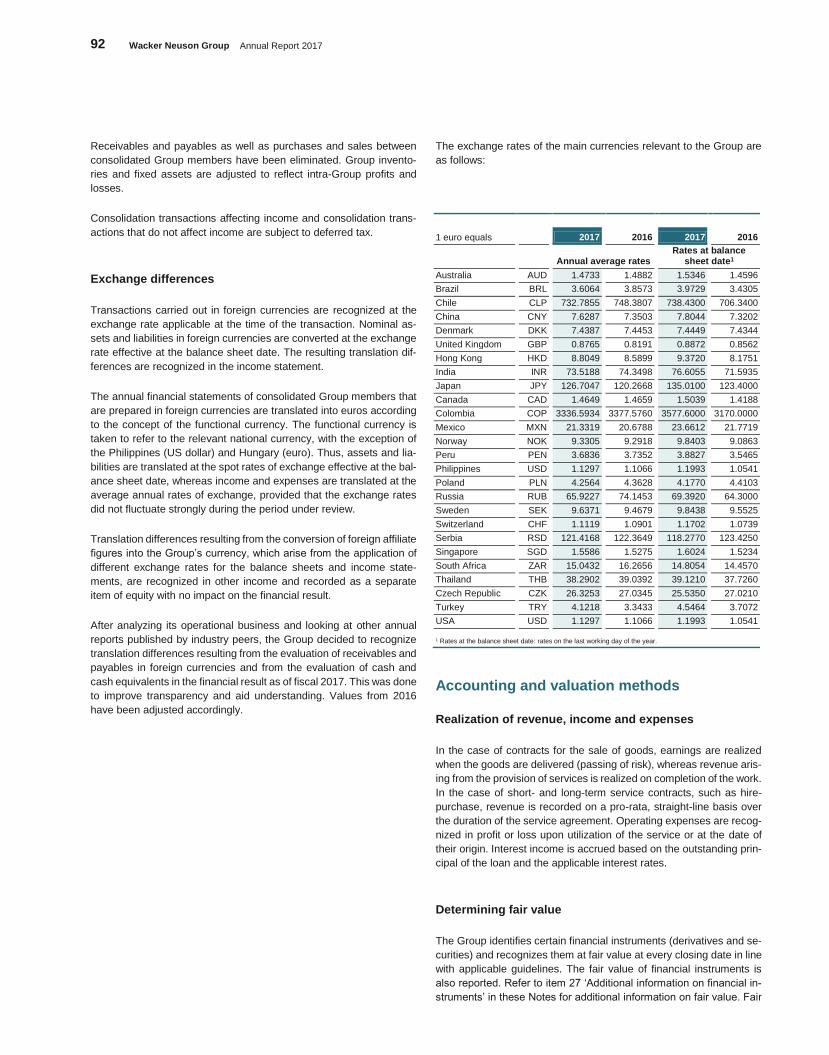
92 Wacker Neuson Group Annual Report 2017
Receivables and payables as well as purchases and sales between
consolidated Group members have been eliminated. Group invento-
ries and fixed assets are adjusted to reflect intra-Group profits and
losses.
Consolidation transactions affecting income and consolidation trans-
actions that do not affect income are subject to deferred tax.
Exchange differences
Transactions carried out in foreign currencies are recognized at the
exchange rate applicable at the time of the transaction. Nominal as-
sets and liabilities in foreign currencies are converted at the exchange
rate effective at the balance sheet date. The resulting translation dif-
ferences are recognized in the income statement.
The annual financial statements of consolidated Group members that
are prepared in foreign currencies are translated into euros according
to the concept of the functional currency. The functional currency is
taken to refer to the relevant national currency, with the exception of
the Philippines (US dollar) and Hungary (euro). Thus, assets and lia-
bilities are translated at the spot rates of exchange effective at the bal-
ance sheet date, whereas income and expenses are translated at the
average annual rates of exchange, provided that the exchange rates
did not fluctuate strongly during the period under review.
Translation differences resulting from the conversion of foreign affiliate
figures into the Group’s currency, which arise from the application of
different exchange rates for the balance sheets and income state-
ments, are recognized in other income and recorded as a separate
item of equity with no impact on the financial result.
After analyzing its operational business and looking at other annual
reports published by industry peers, the Group decided to recognize
translation differences resulting from the evaluation of receivables and
payables in foreign currencies and from the evaluation of cash and
cash equivalents in the financial result as of fiscal 2017. This was done
to improve transparency and aid understanding. Values from 2016
have been adjusted accordingly.
The exchange rates of the main currencies relevant to the Group are
as follows:
1 euro equals 2017 2016 2017 2016
Annual average rates Rates at balance
sheet date1
Australia AUD 1.4733 1.4882 1.5346 1.4596
Brazil BRL 3.6064 3.8573 3.9729 3.4305
Chile CLP 732.7855 748.3807 738.4300 706.3400
China CNY 7.6287 7.3503 7.8044 7.3202
Denmark DKK 7.4387 7.4453 7.4449 7.4344
United Kingdom GBP 0.8765 0.8191 0.8872 0.8562
Hong Kong HKD 8.8049 8.5899 9.3720 8.1751
India INR 73.5188 74.3498 76.6055 71.5935
Japan JPY 126.7047 120.2668 135.0100 123.4000
Canada CAD 1.4649 1.4659 1.5039 1.4188
Colombia COP 3336.5934 3377.5760 3577.6000 3170.0000
Mexico MXN 21.3319 20.6788 23.6612 21.7719
Norway NOK 9.3305 9.2918 9.8403 9.0863
Peru PEN 3.6836 3.7352 3.8827 3.5465
Philippines USD 1.1297 1.1066 1.1993 1.0541
Poland PLN 4.2564 4.3628 4.1770 4.4103
Russia RUB 65.9227 74.1453 69.3920 64.3000
Sweden SEK 9.6371 9.4679 9.8438 9.5525
Switzerland CHF 1.1119 1.0901 1.1702 1.0739
Serbia RSD 121.4168 122.3649 118.2770 123.4250
Singapore SGD 1.5586 1.5275 1.6024 1.5234
South Africa ZAR 15.0432 16.2656 14.8054 14.4570
Thailand THB 38.2902 39.0392 39.1210 37.7260
Czech Republic CZK 26.3253 27.0345 25.5350 27.0210
Turkey TRY 4.1218 3.3433 4.5464 3.7072
USA USD 1.1297 1.1066 1.1993 1.0541
1 Rates at the balance sheet date: rates on the last working day of the year.
Accounting and valuation methods
Realization of revenue, income and expenses
In the case of contracts for the sale of goods, earnings are realized
when the goods are delivered (passing of risk), whereas revenue aris-
ing from the provision of services is realized on completion of the work.
In the case of short- and long-term service contracts, such as hire-
purchase, revenue is recorded on a pro-rata, straight-line basis over
the duration of the service agreement. Operating expenses are recog-
nized in profit or loss upon utilization of the service or at the date of
their origin. Interest income is accrued based on the outstanding prin-
cipal of the loan and the applicable interest rates.
Determining fair value
The Group identifies certain financial instruments (derivatives and se-
curities) and recognizes them at fair value at every closing date in line
with applicable guidelines. The fair value of financial instruments is
also reported. Refer to item 27 ‘Additional information on financial in-
struments’ in these Notes for additional information on fair value. Fair
Notes to the Consolidated Financial Statements 93
Konze
rnabschlu
ss
value is the price that would be received for the sale of an asset or
paid for the transfer of a liability in an orderly transaction between mar-
ket participants at the measurement date. Fair value measurement as-
sumes that the business transaction takes place
on the principle market for the asset or liability or, in the absence of a principle market, on the most advantageous
market for the asset or liability.
The Group must have access to the principle market or the most ad-
vantageous market.
The fair value of an asset or liability is measured on the basis of as-
sumptions that market participants would apply to agree on a price
that is in their best economic interests.
The Group uses valuation techniques appropriate in the circum-
stances and for which sufficient data is available to measure fair value,
maximizing the use of relevant observable inputs and minimizing the
use of unobservable inputs. All assets and liabilities to be measured
or disclosed in the financial statements at fair value are categorized
into the following fair value hierarchies based on the lowest-level input
that is significant overall to the measurements at fair value.
Level 1: Prices quoted in active markets (not adjusted) Level 2: Evaluation techniques where the lowest-level input signifi-
cant to the fair value measurement is observable either directly or indirectly on the market
Level 3: Evaluation techniques where the lowest-level input signifi-cant to the fair value measurement is not observable on the mar-ket
The categorizations are checked at the end of each reporting period.
Property, plant and equipment
Property, plant and equipment is recognized in accordance with IAS
16. Property, plant and equipment is valued at acquisition or manufac-
turing cost less accumulated linear depreciation and accumulated im-
pairment losses. Property, plant and equipment is derecognized on
disposal.
Financing costs are capitalized provided there is a qualified underlying
asset.
Investment properties
Land and buildings held for the purpose of generating rental revenue
are measured at amortized cost using the acquisition cost method.
Straight-line depreciation is calculated using the pro rata temporis
method.
Intangible assets
Intangible assets with a limited useful life are carried at acquisition or
manufacturing cost less accumulated amortization and accumulated
impairment losses and amortized on a straight-line basis depending
on their projected useful life.
Intangible assets with an unlimited useful life are not subject to sched-
uled amortization but are tested for impairment at least once a year.
Financing costs are capitalized provided there is a qualified underlying
asset.
Leases
When the Group is the lessor
Leasing transactions regarding tangible assets in which the Group as
the lessor transfers all material risks and rewards from the use of the
leased object to the lessee are treated as finance leases according to
IAS 17. In such cases, the lessee recognizes the leased object as an
asset in the balance sheet and it is therefore not entered in the Group
balance sheet. Leasing transactions regarding tangible assets and in-
vestment properties in which the Group as the lessor does not transfer
all material risks and rewards are treated as operating leases accord-
ing to IAS 17.
When the Group is the lessee
Leasing transactions regarding tangible assets in which the Group as
the lessee bears all material risks and rewards from the use of the
leased object are treated as finance leases according to IAS 17. In
such cases, the lessee recognizes the leased object as an asset in the
balance sheet and the payment obligation of future lease installments
is disclosed as a liability item. Treatment as a finance lease leads to a
depreciation expense determined by the useful life of the leased object
and to a finance expense in the income statement.
All other leasing contracts are classified as operating leases. In such
cases, the leasing installments or the rental payments are distributed
on a straight-line basis over the duration of the leasing contract and
shown directly as an expense in the income statement.
Rental
Rental is recognized in accordance with IAS 17. Rental equipment is
carried at acquisition or manufacturing cost less accumulated straight-
line depreciation and accumulated impairment losses. Rental equip-
ment is derecognized on disposal. After re-evaluating its rentals busi-
ness model, in particular with regard to operational handling, the
Group decided to recognize rental as a separate item under current
assets. This was done to improve transparency and aid understand-
ing. Prior-year figures have been adjusted accordingly.
Inventories
Inventories of work in process and finished products, as well as raw
materials and supplies, are valued at acquisition or manufacturing cost
in accordance with IAS 2. To the extent that acquisition and manufac-
turing costs of inventories are above fair value, they are written down
to the lower net realizable value at the balance sheet date. The net
realizable value corresponds to the estimated realizable sales price
under normal business conditions, less the estimated manufacturing
and sales costs. If the net realizable value of formerly written-down
inventories has increased, corresponding write-ups will be made.
In determining acquisition costs, incidental acquisition costs are added
and rebates on purchase prices are deducted. Manufacturing costs
include all expenses that are allocable either directly or indirectly to
the manufacturing process.
Acquisition and manufacturing costs for inventories were, for the main
part, determined on the basis of the FIFO method; in other words, on
the assumption that those assets that were acquired first will be con-
sumed first. The moving average cost method is also used to simplify
valuation.
94 Wacker Neuson Group Annual Report 2017
Financial instruments and hedging accounting
Non-derivative financial instruments
Non-derivative financial instruments as disclosed on the assets side
of the balance sheet comprise marketable securities and receivables.
Marketable securities are measured at fair value and recognized un-
der ‘Available-for-sale financial instruments’. Receivables are allo-
cated to the ‘Loans and receivables’ category. Non-current receiva-
bles are discounted at standard interest rates and recognized at amor-
tized cost. Due to their short-term nature, trade receivables and other
receivables are recognized at their nominal values less allowance for
doubtful accounts based on the probable default risk. Assets are rec-
ognized in the balance sheet for the first time when a Group member
becomes party to a contract. Financial assets are recognized as of the
day of performance. Assets are derecognized upon transfer of owner-
ship or expiration of contractual rights to cash flows.
The carrying amounts of assets valued at amortized cost are verified
if there is any indication that the book value exceeds the fair value
(impairment test). Should the book value exceed the fair value, the
asset is written down.
Credit balances with financial institutions are carried at their nominal
values. The Group’s non-derivative financial liabilities comprise trade
payables, borrowings from banks and other financial liabilities. All non-
derivative financial liabilities are initially recognized at fair value less
the directly attributable transaction costs. In subsequent years, they
are measured at amortized cost using the effective interest method.
An outstanding receivable vis-à-vis a foreign business, the discontin-
uation of which is neither planned nor likely in the foreseeable future,
corresponds largely to part of the net investment in this foreign busi-
ness. Translation differences from this outstanding receivable that cor-
responds to part of a net investment in a foreign business are initially
recognized under other income and, in the event that the net invest-
ment is sold, will be reclassified from equity to the income statement.
Derivative financial instruments
The Wacker Neuson Group utilized standard financial instruments
such as foreign exchange forward contracts, FX forwards and interest
rate caps exclusively to minimize risks. These kinds of financial trans-
actions are concluded centrally and always have a corresponding un-
derlying transaction.
Derivative financial instruments are recognized at fair value when the
contract is entered into and also when measured subsequent to initial
recognition at the closing date.
Unless they are formally recognized under hedge accounting in line
with IAS 39, derivative financial instruments are allocated to the assets
or liabilities held for trading and designated at fair value through profit
or loss when first recognized and also in subsequent fiscal years.
Within the framework of the Group's risk management strategy and
initiatives, FX forwards are formally classified as hedges according to
IAS 39 (hedge accounting) on inception of the hedge transaction with
the corresponding underlying transaction. The Group further verifies
at the inception of a hedge and also thereafter on a continual basis
whether or not the derivatives assigned to a hedge effectively com-
pensate for the changes in cash flow of the underlying transactions.
The FX forwards utilized by the Group within the framework of its risk
management strategy are recognized as cash flow hedges, whereby
the effective portion from changes in fair value are reported as equity.
The hedge-ineffective portion is directly recognized in the income
statement. The amounts accrued in equity are reported in the consol-
idated income statement in the same periods, as soon as the underly-
ing transaction affects the consolidated income statement in parallel.
Research and development
Research expenses are recognized in the consolidated income state-
ment in the period in which they are incurred.
Development costs are capitalized, providing the criteria as set forth
in IAS 38.57 ff. are fulfilled.
Trade receivables and other assets
Other non-financial assets are principally recognized at their nominal
values. Allowances are recognized in the full amount for other assets
for which there is a high probability of default.
Cash and cash equivalents
Cash and cash equivalents comprise cash on hand, checks and de-
mand deposits. They belong to the category ‘Loans and receivables’
and have maturities of three months or less. Cash and cash equiva-
lents are converted to the nominal value in euro. In the case of liquid
funds, this corresponds to the fair value.
Government subsidies
Government subsidies are only recognized if there is reasonable as-
surance that the relevant criteria are fulfilled and the funding will be
approved. Subsidies are recognized by reducing the book value of the
asset. The subsidy is then recognized as income through a reduced
write-down value over the duration of the depreciable asset’s useful
life.
Pensions and similar obligations
Provisions for pensions and similar obligations from defined benefit
plans are recognized following the Projected Unit Credit Method, tak-
ing into consideration future adjustments to remuneration payments
and pensions in compliance with the regulations as set forth in IAS 19.
Reevaluations, primarily including actuarial gains and losses, are di-
rectly recognized in the balance sheet and allocated to equity via other
income in the period in which they occur. Reevaluations may not be
reclassified to the income statement in subsequent periods.
Unvested past service costs are recognized in profit or loss at the ear-
lier of the following points in time:
The time at which the adjustment or curtailment of the plan takes effect
The time at which the Group recognizes any costs related to the restructuring
Net interest is determined by applying the discount rate to the balance
of the defined benefit plan. The Group recognizes the following
amendments to defined benefit obligations in the income statement
depending on the functional scope:
Service costs, including current service costs, unvested past ser-vice costs
Notes to the Consolidated Financial Statements 95
Konze
rnabschlu
ss
Profits and losses from plan curtailments and extraordinary plan payments
Net tax expense or income
Pension obligations in Germany are calculated using the demographic
tables for 2005 G developed by Prof. Klaus Heubeck. Pension obliga-
tions abroad are calculated using accounting principles and parame-
ters specific to the corresponding country.
Service costs for vested rights to future pension payments result from
the changes in the present value of the obligation. The interest portion
of the increase in pension provisions is disclosed under the financial
result. Payments under defined contribution benefit plans are recog-
nized directly as an expense.
Other provisions
Other provisions are recognized in accordance with IAS 37 when the
Group has a present legal or constructive obligation as a result of a
past event, which will probably result in an outflow of resources with
economic benefits, the amount of which can be reliably estimated.
Other provisions include allowances for all identifiable obligations. Val-
uation is based on estimations of the expected settlement amount on
due consideration of all business circumstances. Provisions that are
only due after one year and for which the payment amounts and due
dates can be reliably estimated are measured at discounted present
value. Provisions for warranties are calculated on the basis of histori-
cal values, warranty lifetimes and product volumes.
Other provisions are made for all identifiable risks as well as for all
contingent liabilities in the amount that is expected to be incurred.
Deferred tax expense
Deferred and current tax is calculated in line with IAS 12.
Deferred tax assets and liabilities are recognized for temporary differ-
ences between carrying amounts and corresponding tax bases, for
consolidation transactions recognized in the income statement and for
tax loss carry-forwards.
Deferred tax assets on tax loss carry-forwards are only recognized if
the associated reductions in tax are likely to become effective in the
next five years (maximum) and can be applied in subsequent periods.
Deferred tax was recognized for loss carry-forwards in the year under
review.
Deferred tax is calculated at the tax rate applicable to the company in
question that is valid or approved at the balance sheet date and which
will then be valid when the reversal effects will probably be applied.
Changes to deferred tax in the balance sheet generally result in de-
ferred tax expense or income. If any movements that necessitate a
change in deferred tax are charged directly to equity, the resulting
change to deferred tax is also recognized directly in equity.
Material discretionary decisions, estimates and assump-
tions
In preparing the Consolidated Financial Statements, it has been nec-
essary to make estimates and assumptions which may influence the
carrying amounts of assets and liabilities, income and expenses as
well as contingent liabilities as recognized on the balance sheet. The
following significant estimates and assumptions, together with the un-
certainties associated with the accounting and valuation methods ap-
plied, are crucial in understanding the risks underlying financial report-
ing and the impact these estimates, assumptions and uncertainties
could have on the Consolidated Financial Statements:
The value of goodwill and assets with an unlimited useful life (at
least one impairment test per year)
The Group carries out an impairment test on goodwill, intangible as-
sets of unlimited useful life and capitalized development costs once a
year or more often if there is indication that an asset has been im-
paired. This involves making estimates regarding the forecast and dis-
counting of future cash flows. In fiscal 2017, no indications of impair-
ment were identified. For more information on the calculation of im-
pairment, the assumptions indicating impairment and the sensitivity of
these assumptions, please refer to item 10 ‘Intangible assets’ in these
Notes.
Indications for impairment of tangible and intangible assets and
development costs (specific to events or circumstances)
At each closing date, the Group determines whether there are any
grounds to assume that the book value of a tangible asset or an item
under other intangible assets has been impaired. In fiscal 2017, the
Group identified grounds for a significant impairment of intangible as-
sets. Refer to item 10 ‘Intangible assets’ in these Notes for more de-
tailed information.
Taxes on income and earnings
At each closing date, the Group determines whether the probability of
future tax benefits is sufficient to justify deferred tax assets. The rec-
ognized deferred tax assets may be lower if the estimates regarding
scheduled taxable income and the tax benefits realizable through
available tax strategies are lowered, or should changes to current tax
legislation restrict the timeframe or feasibility of future tax benefits. Re-
fer to item 6 ‘Taxes on income’ in these Notes for more detailed infor-
mation.
Tax items are calculated in line with local tax laws as applicable and
the relevant administrative practices. Due to their complexity, they
may be subject to differences in interpretation by tax-paying entities
on the one hand, and by local fiscal authorities on the other. Different
interpretations of tax laws may lead to retrospective tax payments for
previous years; these are taken into consideration based on estimates
made by the Group.
Employee benefits
Pensions and similar obligations are calculated in accordance with ac-
tuarial valuations. These valuations are based on a number of factors
including statistical values in order to anticipate future events. These
factors include actuarial assumptions such as the discount rate, ex-
pected salary increases and mortality rates. These actuarial assump-
tions can deviate considerably from the actual obligations as a result
96 Wacker Neuson Group Annual Report 2017
of changed market and economic conditions, resulting in a change in
the associated future commitment.
For more detailed information on this and the sensitivity of observa-
tions, please refer to item 19 ‘Provisions for pensions and similar obli-
gations’ in these Notes.
Legal risks
Legal risks result from legal action against Wacker Neuson SE or in-
dividual Group members. The outcome of these disputes could have
a substantial impact on Group assets, financials and earnings. Com-
pany management regularly analyses the current information availa-
ble about these cases and builds provisions to cover probable obliga-
tions. Assessments are performed by internal and external experts
and lawyers. When reaching a decision on the need to recognize pro-
visions, company management takes sufficient account of the proba-
bility of an unfavorable outcome and takes due care to estimate the
amount of the obligation sufficiently reliably. For more information,
please refer to item 26, ‘Other financial liabilities’, in these Notes.
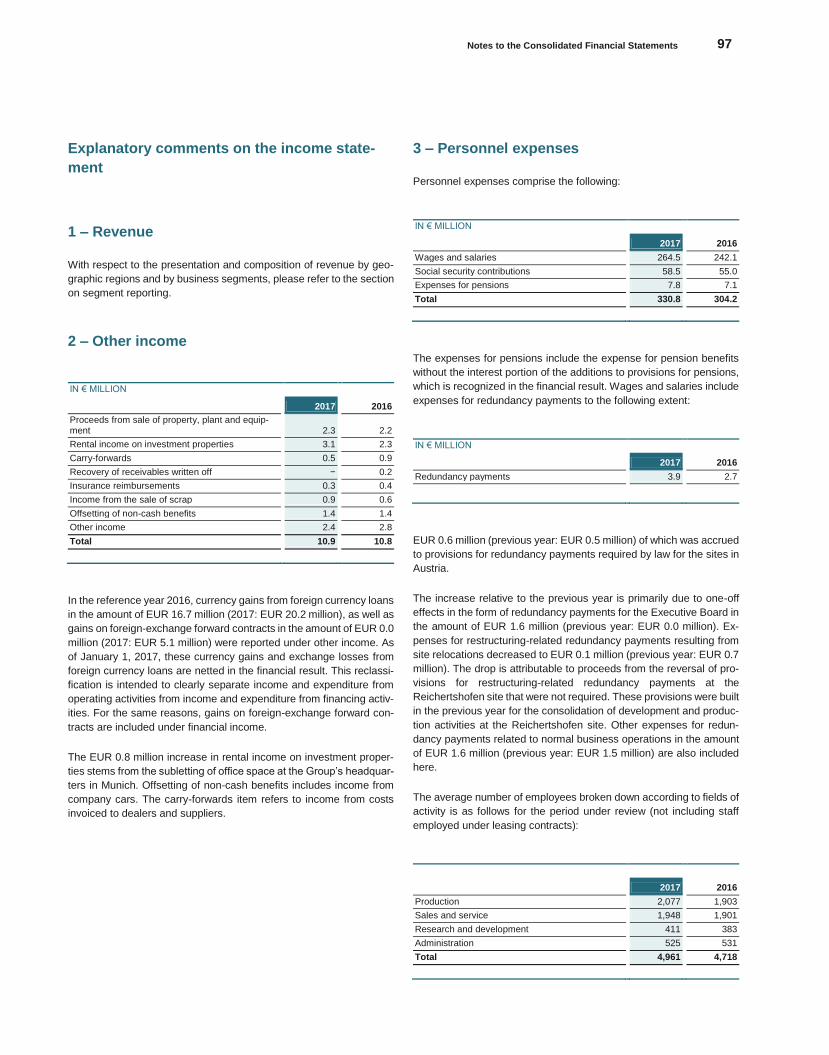
Notes to the Consolidated Financial Statements 97
Konze
rnabschlu
ss
Explanatory comments on the income state-
ment
1 – Revenue
With respect to the presentation and composition of revenue by geo-
graphic regions and by business segments, please refer to the section
on segment reporting.
2 – Other income
IN € MILLION
2017 2016
Proceeds from sale of property, plant and equip-ment 2.3 2.2
Rental income on investment properties 3.1 2.3
Carry-forwards 0.5 0.9
Recovery of receivables written off − 0.2
Insurance reimbursements 0.3 0.4
Income from the sale of scrap 0.9 0.6
Offsetting of non-cash benefits 1.4 1.4
Other income 2.4 2.8
Total 10.9 10.8
In the reference year 2016, currency gains from foreign currency loans
in the amount of EUR 16.7 million (2017: EUR 20.2 million), as well as
gains on foreign-exchange forward contracts in the amount of EUR 0.0
million (2017: EUR 5.1 million) were reported under other income. As
of January 1, 2017, these currency gains and exchange losses from
foreign currency loans are netted in the financial result. This reclassi-
fication is intended to clearly separate income and expenditure from
operating activities from income and expenditure from financing activ-
ities. For the same reasons, gains on foreign-exchange forward con-
tracts are included under financial income.
The EUR 0.8 million increase in rental income on investment proper-
ties stems from the subletting of office space at the Group’s headquar-
ters in Munich. Offsetting of non-cash benefits includes income from
company cars. The carry-forwards item refers to income from costs
invoiced to dealers and suppliers.
3 – Personnel expenses
Personnel expenses comprise the following:
IN € MILLION
2017 2016
Wages and salaries 264.5 242.1
Social security contributions 58.5 55.0
Expenses for pensions 7.8 7.1
Total 330.8 304.2
The expenses for pensions include the expense for pension benefits
without the interest portion of the additions to provisions for pensions,
which is recognized in the financial result. Wages and salaries include
expenses for redundancy payments to the following extent:
IN € MILLION
2017 2016
Redundancy payments 3.9 2.7
EUR 0.6 million (previous year: EUR 0.5 million) of which was accrued
to provisions for redundancy payments required by law for the sites in
Austria.
The increase relative to the previous year is primarily due to one-off
effects in the form of redundancy payments for the Executive Board in
the amount of EUR 1.6 million (previous year: EUR 0.0 million). Ex-
penses for restructuring-related redundancy payments resulting from
site relocations decreased to EUR 0.1 million (previous year: EUR 0.7
million). The drop is attributable to proceeds from the reversal of pro-
visions for restructuring-related redundancy payments at the
Reichertshofen site that were not required. These provisions were built
in the previous year for the consolidation of development and produc-
tion activities at the Reichertshofen site. Other expenses for redun-
dancy payments related to normal business operations in the amount
of EUR 1.6 million (previous year: EUR 1.5 million) are also included
here.
The average number of employees broken down according to fields of
activity is as follows for the period under review (not including staff
employed under leasing contracts):
2017 2016
Production 2,077 1,903
Sales and service 1,948 1,901
Research and development 411 383
Administration 525 531
Total 4,961 4,718
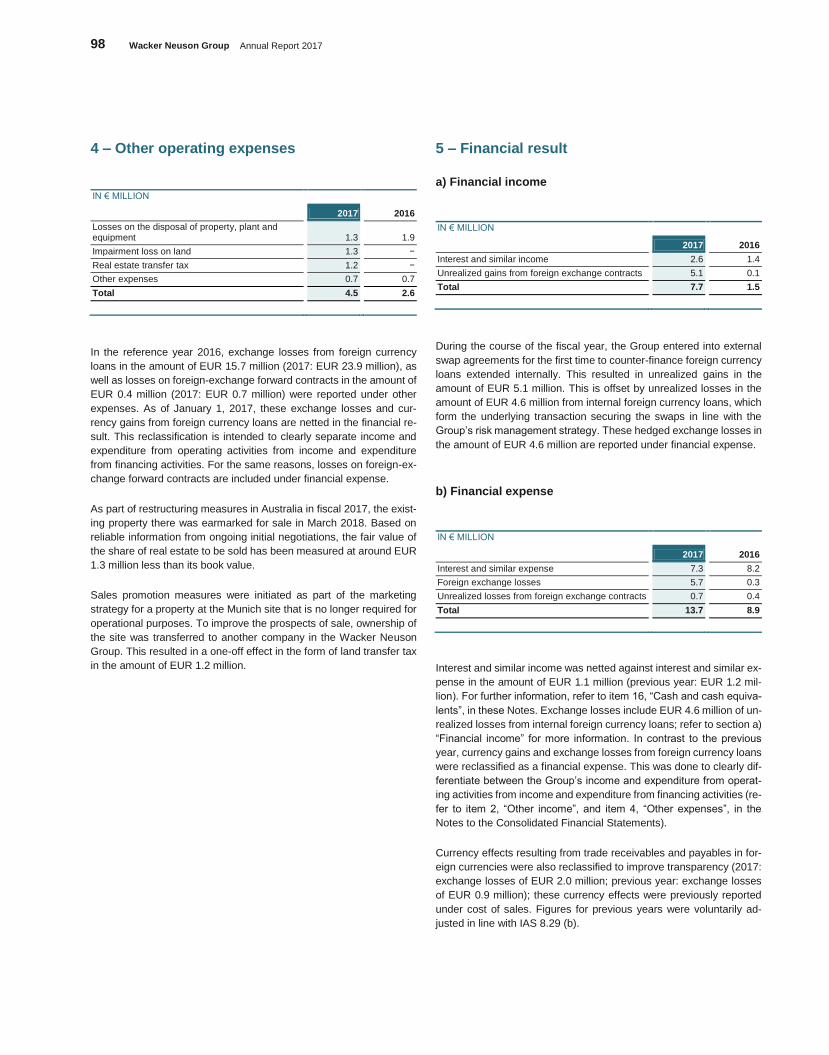
98 Wacker Neuson Group Annual Report 2017
4 – Other operating expenses
IN € MILLION
2017 2016
Losses on the disposal of property, plant and equipment 1.3 1.9
Impairment loss on land 1.3 −
Real estate transfer tax 1.2 −
Other expenses 0.7 0.7
Total 4.5 2.6
In the reference year 2016, exchange losses from foreign currency
loans in the amount of EUR 15.7 million (2017: EUR 23.9 million), as
well as losses on foreign-exchange forward contracts in the amount of
EUR 0.4 million (2017: EUR 0.7 million) were reported under other
expenses. As of January 1, 2017, these exchange losses and cur-
rency gains from foreign currency loans are netted in the financial re-
sult. This reclassification is intended to clearly separate income and
expenditure from operating activities from income and expenditure
from financing activities. For the same reasons, losses on foreign-ex-
change forward contracts are included under financial expense.
As part of restructuring measures in Australia in fiscal 2017, the exist-
ing property there was earmarked for sale in March 2018. Based on
reliable information from ongoing initial negotiations, the fair value of
the share of real estate to be sold has been measured at around EUR
1.3 million less than its book value.
Sales promotion measures were initiated as part of the marketing
strategy for a property at the Munich site that is no longer required for
operational purposes. To improve the prospects of sale, ownership of
the site was transferred to another company in the Wacker Neuson
Group. This resulted in a one-off effect in the form of land transfer tax
in the amount of EUR 1.2 million.
5 – Financial result
a) Financial income
IN € MILLION
2017 2016
Interest and similar income 2.6 1.4
Unrealized gains from foreign exchange contracts 5.1 0.1
Total 7.7 1.5
During the course of the fiscal year, the Group entered into external
swap agreements for the first time to counter-finance foreign currency
loans extended internally. This resulted in unrealized gains in the
amount of EUR 5.1 million. This is offset by unrealized losses in the
amount of EUR 4.6 million from internal foreign currency loans, which
form the underlying transaction securing the swaps in line with the
Group’s risk management strategy. These hedged exchange losses in
the amount of EUR 4.6 million are reported under financial expense.
b) Financial expense
IN € MILLION
2017 2016
Interest and similar expense 7.3 8.2
Foreign exchange losses 5.7 0.3
Unrealized losses from foreign exchange contracts 0.7 0.4
Total 13.7 8.9
Interest and similar income was netted against interest and similar ex-
pense in the amount of EUR 1.1 million (previous year: EUR 1.2 mil-
lion). For further information, refer to item 16, “Cash and cash equiva-
lents”, in these Notes. Exchange losses include EUR 4.6 million of un-
realized losses from internal foreign currency loans; refer to section a)
“Financial income” for more information. In contrast to the previous
year, currency gains and exchange losses from foreign currency loans
were reclassified as a financial expense. This was done to clearly dif-
ferentiate between the Group’s income and expenditure from operat-
ing activities from income and expenditure from financing activities (re-
fer to item 2, “Other income”, and item 4, “Other expenses”, in the
Notes to the Consolidated Financial Statements).
Currency effects resulting from trade receivables and payables in for-
eign currencies were also reclassified to improve transparency (2017:
exchange losses of EUR 2.0 million; previous year: exchange losses
of EUR 0.9 million); these currency effects were previously reported
under cost of sales. Figures for previous years were voluntarily ad-
justed in line with IAS 8.29 (b).
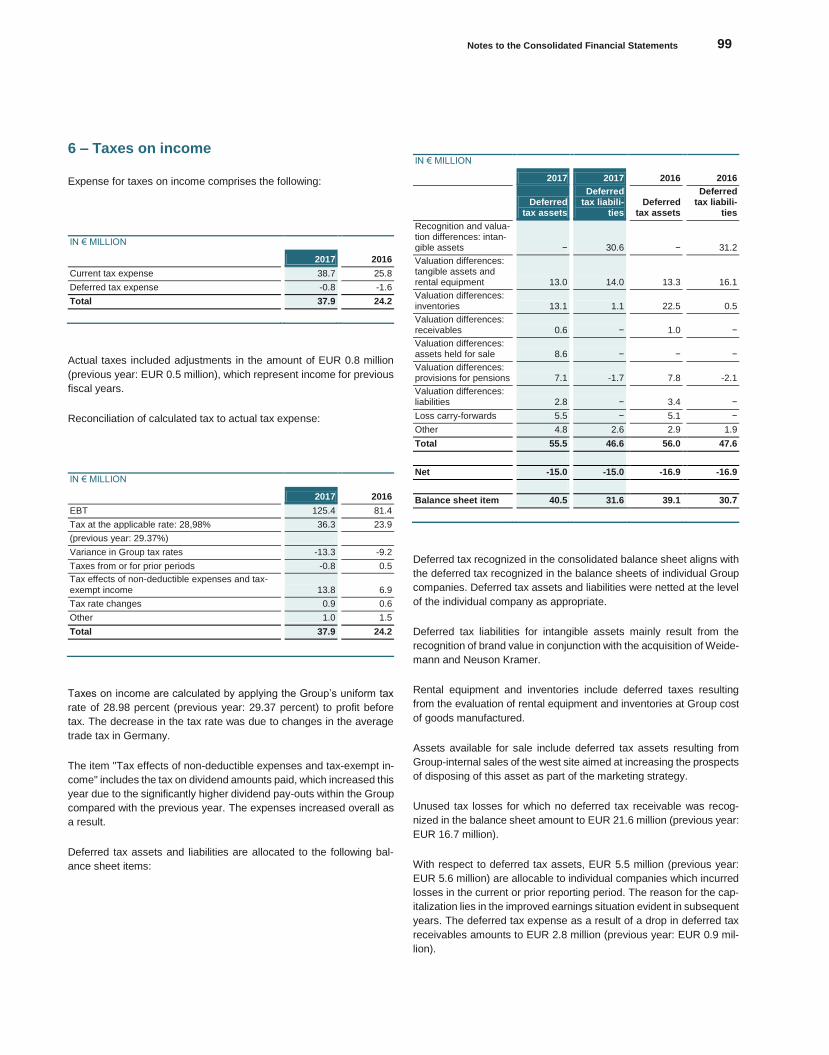
Notes to the Consolidated Financial Statements 99
Konze
rnabschlu
ss
6 – Taxes on income
Expense for taxes on income comprises the following:
IN € MILLION
2017 2016
Current tax expense 38.7 25.8
Deferred tax expense -0.8 -1.6
Total 37.9 24.2
Actual taxes included adjustments in the amount of EUR 0.8 million
(previous year: EUR 0.5 million), which represent income for previous
fiscal years.
Reconciliation of calculated tax to actual tax expense:
IN € MILLION
2017 2016
EBT 125.4 81.4
Tax at the applicable rate: 28,98% 36.3 23.9
(previous year: 29.37%)
Variance in Group tax rates -13.3 -9.2
Taxes from or for prior periods -0.8 0.5
Tax effects of non-deductible expenses and tax-exempt income 13.8 6.9
Tax rate changes 0.9 0.6
Other 1.0 1.5
Total 37.9 24.2
Taxes on income are calculated by applying the Group’s uniform tax
rate of 28.98 percent (previous year: 29.37 percent) to profit before
tax. The decrease in the tax rate was due to changes in the average
trade tax in Germany.
The item "Tax effects of non-deductible expenses and tax-exempt in-
come" includes the tax on dividend amounts paid, which increased this
year due to the significantly higher dividend pay-outs within the Group
compared with the previous year. The expenses increased overall as
a result.
Deferred tax assets and liabilities are allocated to the following bal-
ance sheet items:
IN € MILLION
2017 2017 2016 2016
Deferred
tax assets
Deferred tax liabili-
ties Deferred
tax assets
Deferred tax liabili-
ties
Recognition and valua-tion differences: intan-gible assets − 30.6 − 31.2
Valuation differences: tangible assets and rental equipment 13.0 14.0 13.3 16.1
Valuation differences: inventories 13.1 1.1 22.5 0.5
Valuation differences: receivables 0.6 − 1.0 −
Valuation differences: assets held for sale 8.6 − − −
Valuation differences: provisions for pensions 7.1 -1.7 7.8 -2.1
Valuation differences: liabilities 2.8 − 3.4 −
Loss carry-forwards 5.5 − 5.1 −
Other 4.8 2.6 2.9 1.9
Total 55.5 46.6 56.0 47.6
Net -15.0 -15.0 -16.9 -16.9
Balance sheet item 40.5 31.6 39.1 30.7
Deferred tax recognized in the consolidated balance sheet aligns with
the deferred tax recognized in the balance sheets of individual Group
companies. Deferred tax assets and liabilities were netted at the level
of the individual company as appropriate.
Deferred tax liabilities for intangible assets mainly result from the
recognition of brand value in conjunction with the acquisition of Weide-
mann and Neuson Kramer.
Rental equipment and inventories include deferred taxes resulting
from the evaluation of rental equipment and inventories at Group cost
of goods manufactured.
Assets available for sale include deferred tax assets resulting from
Group-internal sales of the west site aimed at increasing the prospects
of disposing of this asset as part of the marketing strategy.
Unused tax losses for which no deferred tax receivable was recog-
nized in the balance sheet amount to EUR 21.6 million (previous year:
EUR 16.7 million).
With respect to deferred tax assets, EUR 5.5 million (previous year:
EUR 5.6 million) are allocable to individual companies which incurred
losses in the current or prior reporting period. The reason for the cap-
italization lies in the improved earnings situation evident in subsequent
years. The deferred tax expense as a result of a drop in deferred tax
receivables amounts to EUR 2.8 million (previous year: EUR 0.9 mil-
lion).
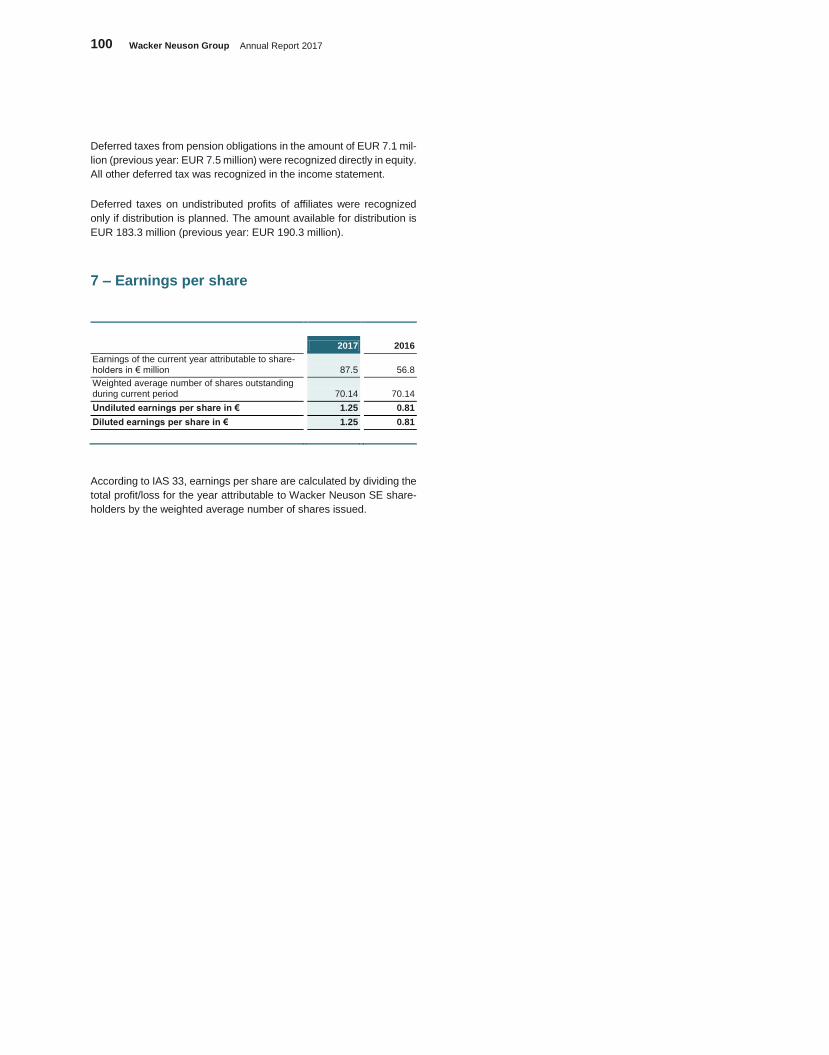
100 Wacker Neuson Group Annual Report 2017
Deferred taxes from pension obligations in the amount of EUR 7.1 mil-
lion (previous year: EUR 7.5 million) were recognized directly in equity.
All other deferred tax was recognized in the income statement.
Deferred taxes on undistributed profits of affiliates were recognized
only if distribution is planned. The amount available for distribution is
EUR 183.3 million (previous year: EUR 190.3 million).
7 – Earnings per share
2017 2016
Earnings of the current year attributable to share-holders in € million 87.5 56.8
Weighted average number of shares outstanding during current period 70.14 70.14
Undiluted earnings per share in € 1.25 0.81
Diluted earnings per share in € 1.25 0.81
According to IAS 33, earnings per share are calculated by dividing the
total profit/loss for the year attributable to Wacker Neuson SE share-
holders by the weighted average number of shares issued.
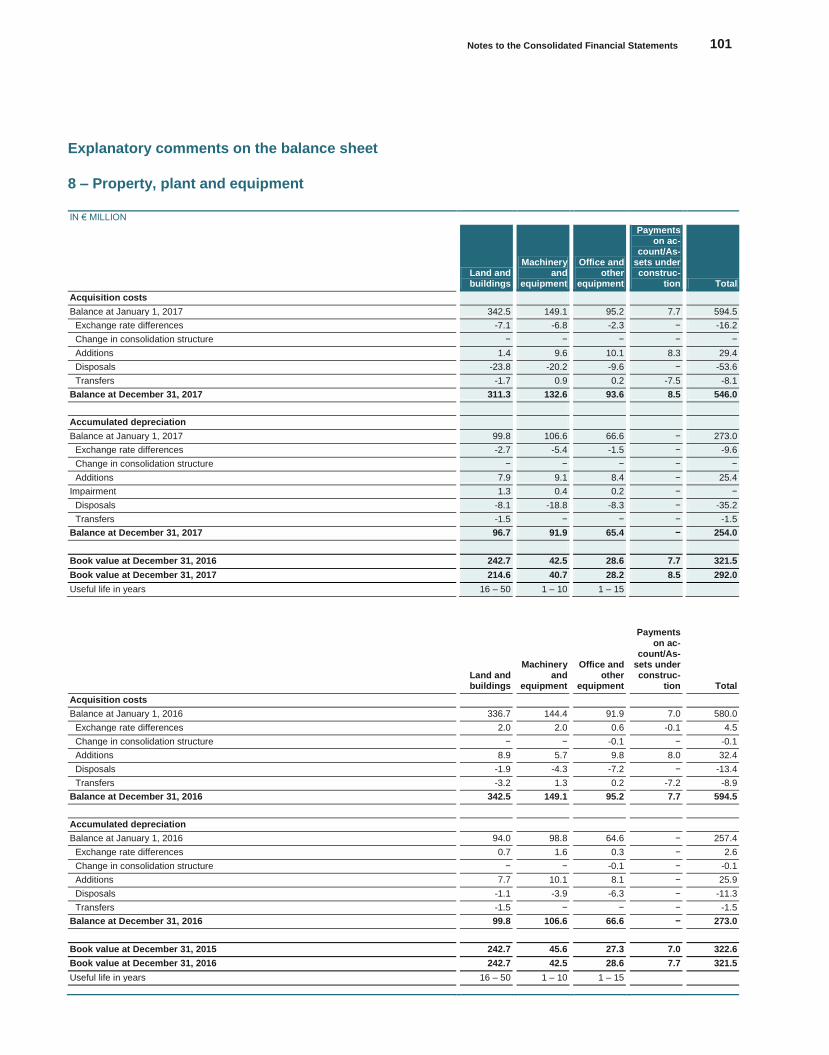
Notes to the Consolidated Financial Statements 101
Konze
rnabschlu
ss
Explanatory comments on the balance sheet
8 – Property, plant and equipment
IN € MILLION
Land and buildings
Machinery and
equipment
Office and other
equipment
Payments on ac-
count/As-sets under construc-
tion Total
Acquisition costs
Balance at January 1, 2017 342.5 149.1 95.2 7.7 594.5
Exchange rate differences -7.1 -6.8 -2.3 − -16.2
Change in consolidation structure − − − − −
Additions 1.4 9.6 10.1 8.3 29.4
Disposals -23.8 -20.2 -9.6 − -53.6
Transfers -1.7 0.9 0.2 -7.5 -8.1
Balance at December 31, 2017 311.3 132.6 93.6 8.5 546.0
Accumulated depreciation
Balance at January 1, 2017 99.8 106.6 66.6 − 273.0
Exchange rate differences -2.7 -5.4 -1.5 − -9.6
Change in consolidation structure − − − − −
Additions 7.9 9.1 8.4 − 25.4
Impairment 1.3 0.4 0.2 − −
Disposals -8.1 -18.8 -8.3 − -35.2
Transfers -1.5 − − − -1.5
Balance at December 31, 2017 96.7 91.9 65.4 − 254.0
Book value at December 31, 2016 242.7 42.5 28.6 7.7 321.5
Book value at December 31, 2017 214.6 40.7 28.2 8.5 292.0
Useful life in years 16 – 50 1 – 10 1 – 15
Land and buildings
Machinery and
equipment
Office and other
equipment
Payments on ac-
count/As-sets under construc-
tion Total
Acquisition costs
Balance at January 1, 2016 336.7 144.4 91.9 7.0 580.0
Exchange rate differences 2.0 2.0 0.6 -0.1 4.5
Change in consolidation structure − − -0.1 − -0.1
Additions 8.9 5.7 9.8 8.0 32.4
Disposals -1.9 -4.3 -7.2 − -13.4
Transfers -3.2 1.3 0.2 -7.2 -8.9
Balance at December 31, 2016 342.5 149.1 95.2 7.7 594.5
Accumulated depreciation
Balance at January 1, 2016 94.0 98.8 64.6 − 257.4
Exchange rate differences 0.7 1.6 0.3 − 2.6
Change in consolidation structure − − -0.1 − -0.1
Additions 7.7 10.1 8.1 − 25.9
Disposals -1.1 -3.9 -6.3 − -11.3
Transfers -1.5 − − − -1.5
Balance at December 31, 2016 99.8 106.6 66.6 − 273.0
Book value at December 31, 2015 242.7 45.6 27.3 7.0 322.6
Book value at December 31, 2016 242.7 42.5 28.6 7.7 321.5
Useful life in years 16 – 50 1 – 10 1 – 15
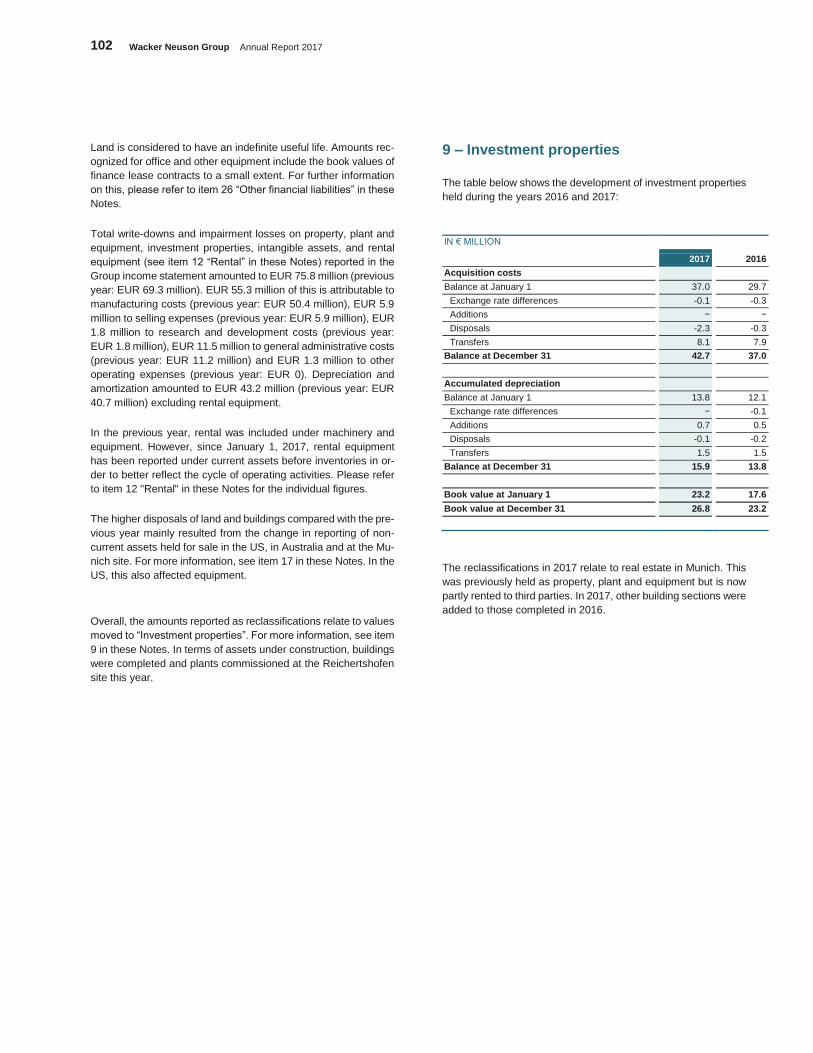
102 Wacker Neuson Group Annual Report 2017
Land is considered to have an indefinite useful life. Amounts rec-
ognized for office and other equipment include the book values of
finance lease contracts to a small extent. For further information
on this, please refer to item 26 “Other financial liabilities” in these
Notes.
Total write-downs and impairment losses on property, plant and
equipment, investment properties, intangible assets, and rental
equipment (see item 12 “Rental” in these Notes) reported in the
Group income statement amounted to EUR 75.8 million (previous
year: EUR 69.3 million). EUR 55.3 million of this is attributable to
manufacturing costs (previous year: EUR 50.4 million), EUR 5.9
million to selling expenses (previous year: EUR 5.9 million), EUR
1.8 million to research and development costs (previous year:
EUR 1.8 million), EUR 11.5 million to general administrative costs
(previous year: EUR 11.2 million) and EUR 1.3 million to other
operating expenses (previous year: EUR 0). Depreciation and
amortization amounted to EUR 43.2 million (previous year: EUR
40.7 million) excluding rental equipment.
In the previous year, rental was included under machinery and
equipment. However, since January 1, 2017, rental equipment
has been reported under current assets before inventories in or-
der to better reflect the cycle of operating activities. Please refer
to item 12 "Rental" in these Notes for the individual figures.
The higher disposals of land and buildings compared with the pre-
vious year mainly resulted from the change in reporting of non-
current assets held for sale in the US, in Australia and at the Mu-
nich site. For more information, see item 17 in these Notes. In the
US, this also affected equipment.
Overall, the amounts reported as reclassifications relate to values
moved to “Investment properties”. For more information, see item
9 in these Notes. In terms of assets under construction, buildings
were completed and plants commissioned at the Reichertshofen
site this year.
9 – Investment properties
The table below shows the development of investment properties
held during the years 2016 and 2017:
IN € MILLION
2017 2016
Acquisition costs
Balance at January 1 37.0 29.7
Exchange rate differences -0.1 -0.3
Additions − −
Disposals -2.3 -0.3
Transfers 8.1 7.9
Balance at December 31 42.7 37.0
Accumulated depreciation
Balance at January 1 13.8 12.1
Exchange rate differences − -0.1
Additions 0.7 0.5
Disposals -0.1 -0.2
Transfers 1.5 1.5
Balance at December 31 15.9 13.8
Book value at January 1 23.2 17.6
Book value at December 31 26.8 23.2
The reclassifications in 2017 relate to real estate in Munich. This
was previously held as property, plant and equipment but is now
partly rented to third parties. In 2017, other building sections were
added to those completed in 2016.
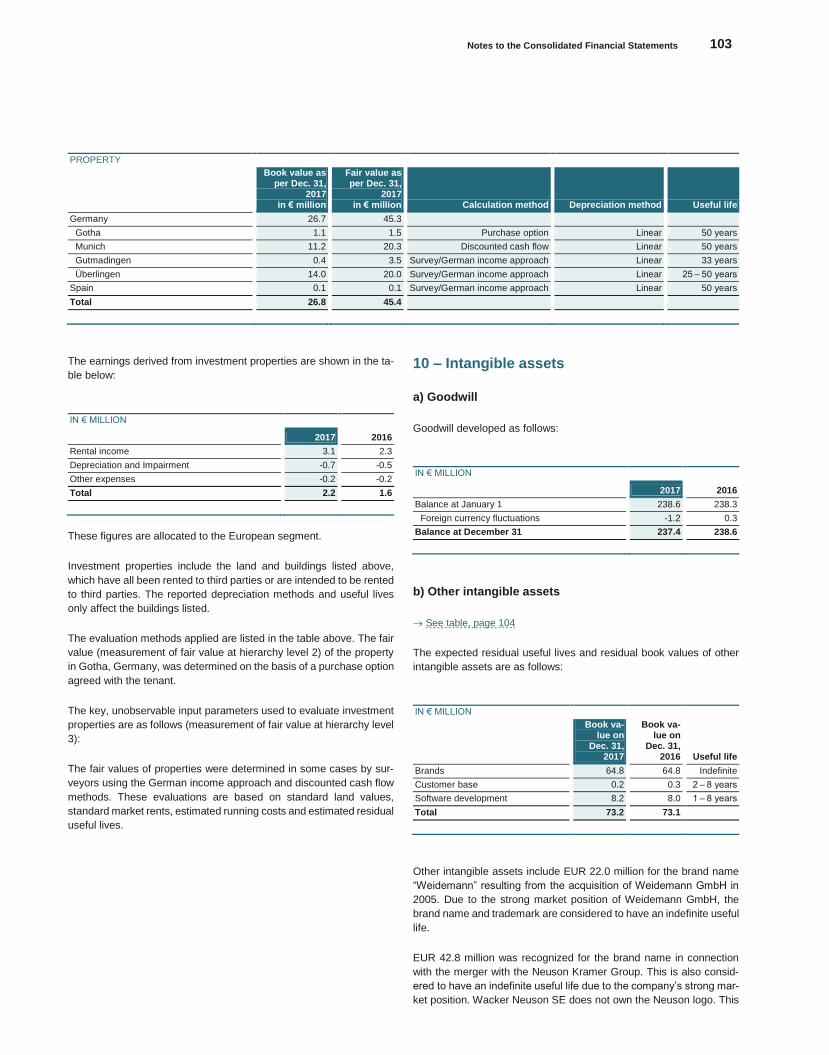
Notes to the Consolidated Financial Statements 103
Konze
rnabschlu
ss
PROPERTY
Book value as per Dec. 31,
2017 in € million
Fair value as per Dec. 31,
2017 in € million Calculation method Depreciation method Useful life
Germany 26.7 45.3
Gotha 1.1 1.5 Purchase option Linear 50 years
Munich 11.2 20.3 Discounted cash flow Linear 50 years
Gutmadingen 0.4 3.5 Survey/German income approach Linear 33 years
Überlingen 14.0 20.0 Survey/German income approach Linear 25 – 50 years
Spain 0.1 0.1 Survey/German income approach Linear 50 years
Total 26.8 45.4
The earnings derived from investment properties are shown in the ta-
ble below:
IN € MILLION
2017 2016
Rental income 3.1 2.3
Depreciation and Impairment -0.7 -0.5
Other expenses -0.2 -0.2
Total 2.2 1.6
These figures are allocated to the European segment.
Investment properties include the land and buildings listed above,
which have all been rented to third parties or are intended to be rented
to third parties. The reported depreciation methods and useful lives
only affect the buildings listed.
The evaluation methods applied are listed in the table above. The fair
value (measurement of fair value at hierarchy level 2) of the property
in Gotha, Germany, was determined on the basis of a purchase option
agreed with the tenant.
The key, unobservable input parameters used to evaluate investment
properties are as follows (measurement of fair value at hierarchy level
3):
The fair values of properties were determined in some cases by sur-
veyors using the German income approach and discounted cash flow
methods. These evaluations are based on standard land values,
standard market rents, estimated running costs and estimated residual
useful lives.
10 – Intangible assets
a) Goodwill
Goodwill developed as follows:
IN € MILLION
2017 2016
Balance at January 1 238.6 238.3
Foreign currency fluctuations -1.2 0.3
Balance at December 31 237.4 238.6
b) Other intangible assets
See table, page 104
The expected residual useful lives and residual book values of other
intangible assets are as follows:
IN € MILLION
Book va-lue on
Dec. 31, 2017
Book va-lue on
Dec. 31, 2016 Useful life
Brands 64.8 64.8 Indefinite
Customer base 0.2 0.3 2 – 8 years
Software development 8.2 8.0 1 – 8 years
Total 73.2 73.1
Other intangible assets include EUR 22.0 million for the brand name
“Weidemann” resulting from the acquisition of Weidemann GmbH in
2005. Due to the strong market position of Weidemann GmbH, the
brand name and trademark are considered to have an indefinite useful
life.
EUR 42.8 million was recognized for the brand name in connection
with the merger with the Neuson Kramer Group. This is also consid-
ered to have an indefinite useful life due to the company’s strong mar-
ket position. Wacker Neuson SE does not own the Neuson logo. This
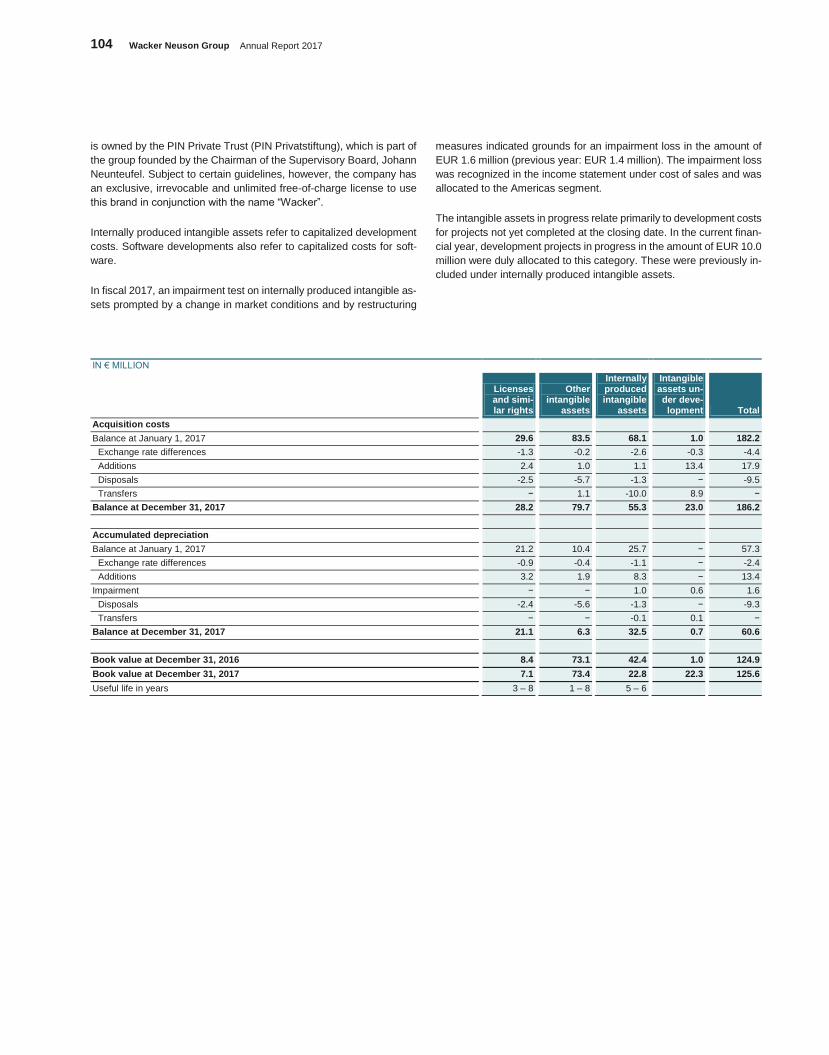
104 Wacker Neuson Group Annual Report 2017
is owned by the PIN Private Trust (PIN Privatstiftung), which is part of
the group founded by the Chairman of the Supervisory Board, Johann
Neunteufel. Subject to certain guidelines, however, the company has
an exclusive, irrevocable and unlimited free-of-charge license to use
this brand in conjunction with the name “Wacker”.
Internally produced intangible assets refer to capitalized development
costs. Software developments also refer to capitalized costs for soft-
ware.
In fiscal 2017, an impairment test on internally produced intangible as-
sets prompted by a change in market conditions and by restructuring
measures indicated grounds for an impairment loss in the amount of
EUR 1.6 million (previous year: EUR 1.4 million). The impairment loss
was recognized in the income statement under cost of sales and was
allocated to the Americas segment.
The intangible assets in progress relate primarily to development costs
for projects not yet completed at the closing date. In the current finan-
cial year, development projects in progress in the amount of EUR 10.0
million were duly allocated to this category. These were previously in-
cluded under internally produced intangible assets.
IN € MILLION
Licenses and simi-lar rights
Other intangible
assets
Internally produced intangible
assets
Intangible assets un-der deve-lopment Total
Acquisition costs
Balance at January 1, 2017 29.6 83.5 68.1 1.0 182.2
Exchange rate differences -1.3 -0.2 -2.6 -0.3 -4.4
Additions 2.4 1.0 1.1 13.4 17.9
Disposals -2.5 -5.7 -1.3 − -9.5
Transfers − 1.1 -10.0 8.9 −
Balance at December 31, 2017 28.2 79.7 55.3 23.0 186.2
Accumulated depreciation
Balance at January 1, 2017 21.2 10.4 25.7 − 57.3
Exchange rate differences -0.9 -0.4 -1.1 − -2.4
Additions 3.2 1.9 8.3 − 13.4
Impairment − − 1.0 0.6 1.6
Disposals -2.4 -5.6 -1.3 − -9.3
Transfers − − -0.1 0.1 −
Balance at December 31, 2017 21.1 6.3 32.5 0.7 60.6
Book value at December 31, 2016 8.4 73.1 42.4 1.0 124.9
Book value at December 31, 2017 7.1 73.4 22.8 22.3 125.6
Useful life in years 3 – 8 1 – 8 5 – 6
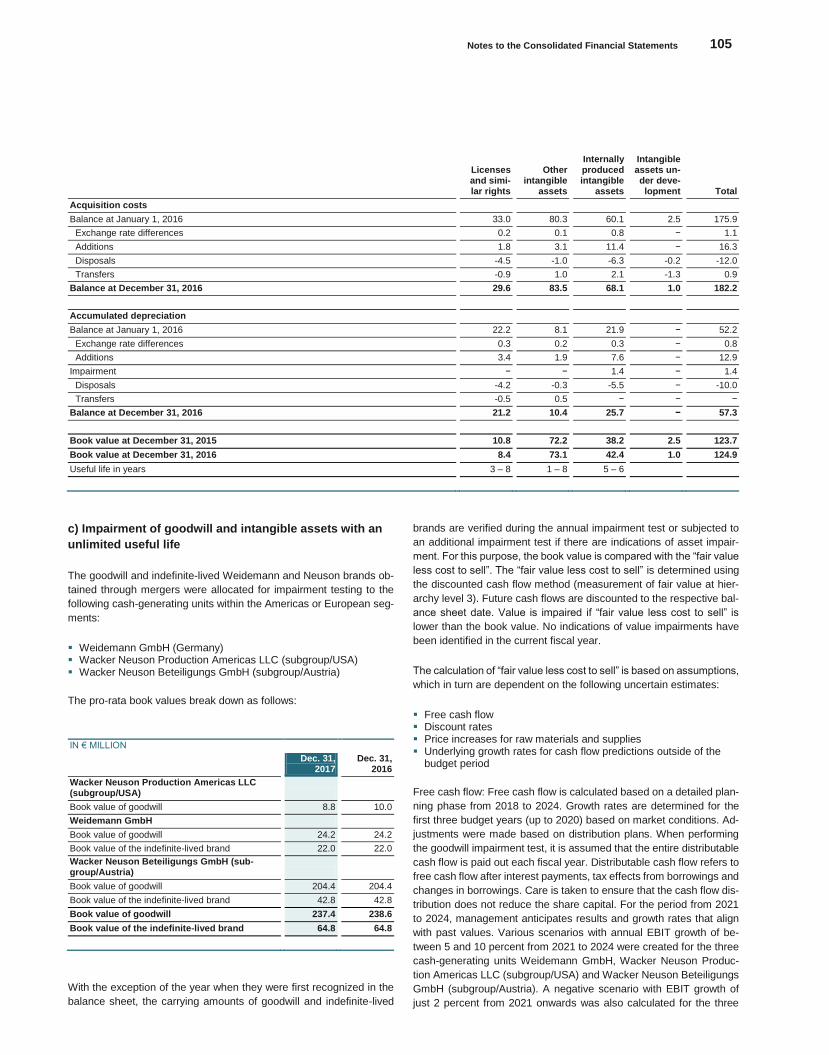
Notes to the Consolidated Financial Statements 105
Konze
rnabschlu
ss
Licenses and simi-lar rights
Other intangible
assets
Internally produced intangible
assets
Intangible assets un-der deve-lopment Total
Acquisition costs
Balance at January 1, 2016 33.0 80.3 60.1 2.5 175.9
Exchange rate differences 0.2 0.1 0.8 − 1.1
Additions 1.8 3.1 11.4 − 16.3
Disposals -4.5 -1.0 -6.3 -0.2 -12.0
Transfers -0.9 1.0 2.1 -1.3 0.9
Balance at December 31, 2016 29.6 83.5 68.1 1.0 182.2
Accumulated depreciation
Balance at January 1, 2016 22.2 8.1 21.9 − 52.2
Exchange rate differences 0.3 0.2 0.3 − 0.8
Additions 3.4 1.9 7.6 − 12.9
Impairment − − 1.4 − 1.4
Disposals -4.2 -0.3 -5.5 − -10.0
Transfers -0.5 0.5 − − −
Balance at December 31, 2016 21.2 10.4 25.7 − 57.3
Book value at December 31, 2015 10.8 72.2 38.2 2.5 123.7
Book value at December 31, 2016 8.4 73.1 42.4 1.0 124.9
Useful life in years 3 – 8 1 – 8 5 – 6
c) Impairment of goodwill and intangible assets with an
unlimited useful life
The goodwill and indefinite-lived Weidemann and Neuson brands ob-
tained through mergers were allocated for impairment testing to the
following cash-generating units within the Americas or European seg-
ments:
Weidemann GmbH (Germany) Wacker Neuson Production Americas LLC (subgroup/USA) Wacker Neuson Beteiligungs GmbH (subgroup/Austria)
The pro-rata book values break down as follows:
IN € MILLION
Dec. 31,
2017 Dec. 31,
2016
Wacker Neuson Production Americas LLC (subgroup/USA)
Book value of goodwill 8.8 10.0
Weidemann GmbH
Book value of goodwill 24.2 24.2
Book value of the indefinite-lived brand 22.0 22.0
Wacker Neuson Beteiligungs GmbH (sub-group/Austria)
Book value of goodwill 204.4 204.4
Book value of the indefinite-lived brand 42.8 42.8
Book value of goodwill 237.4 238.6
Book value of the indefinite-lived brand 64.8 64.8
With the exception of the year when they were first recognized in the
balance sheet, the carrying amounts of goodwill and indefinite-lived
brands are verified during the annual impairment test or subjected to
an additional impairment test if there are indications of asset impair-
ment. For this purpose, the book value is compared with the “fair value
less cost to sell”. The “fair value less cost to sell” is determined using
the discounted cash flow method (measurement of fair value at hier-
archy level 3). Future cash flows are discounted to the respective bal-
ance sheet date. Value is impaired if “fair value less cost to sell” is
lower than the book value. No indications of value impairments have
been identified in the current fiscal year.
The calculation of “fair value less cost to sell” is based on assumptions,
which in turn are dependent on the following uncertain estimates:
Free cash flow Discount rates Price increases for raw materials and supplies Underlying growth rates for cash flow predictions outside of the
budget period
Free cash flow: Free cash flow is calculated based on a detailed plan-
ning phase from 2018 to 2024. Growth rates are determined for the
first three budget years (up to 2020) based on market conditions. Ad-
justments were made based on distribution plans. When performing
the goodwill impairment test, it is assumed that the entire distributable
cash flow is paid out each fiscal year. Distributable cash flow refers to
free cash flow after interest payments, tax effects from borrowings and
changes in borrowings. Care is taken to ensure that the cash flow dis-
tribution does not reduce the share capital. For the period from 2021
to 2024, management anticipates results and growth rates that align
with past values. Various scenarios with annual EBIT growth of be-
tween 5 and 10 percent from 2021 to 2024 were created for the three
cash-generating units Weidemann GmbH, Wacker Neuson Produc-
tion Americas LLC (subgroup/USA) and Wacker Neuson Beteiligungs
GmbH (subgroup/Austria). A negative scenario with EBIT growth of
just 2 percent from 2021 onwards was also calculated for the three
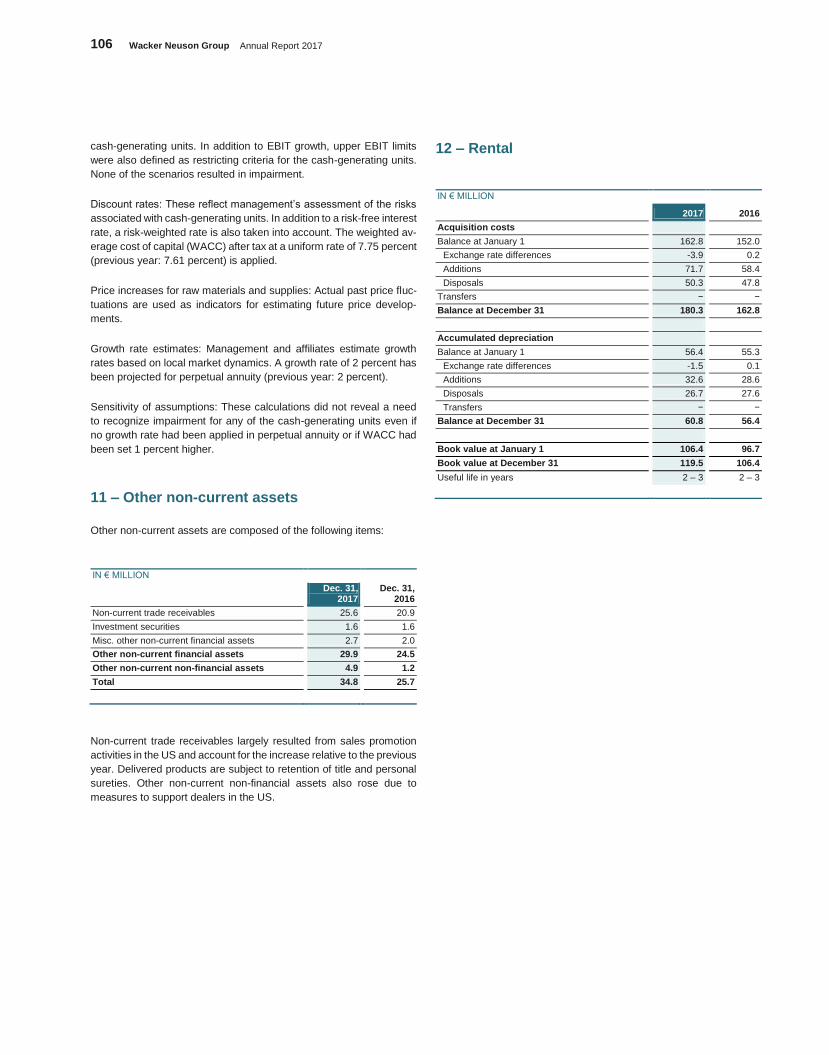
106 Wacker Neuson Group Annual Report 2017
cash-generating units. In addition to EBIT growth, upper EBIT limits
were also defined as restricting criteria for the cash-generating units.
None of the scenarios resulted in impairment.
Discount rates: These reflect management’s assessment of the risks
associated with cash-generating units. In addition to a risk-free interest
rate, a risk-weighted rate is also taken into account. The weighted av-
erage cost of capital (WACC) after tax at a uniform rate of 7.75 percent
(previous year: 7.61 percent) is applied.
Price increases for raw materials and supplies: Actual past price fluc-
tuations are used as indicators for estimating future price develop-
ments.
Growth rate estimates: Management and affiliates estimate growth
rates based on local market dynamics. A growth rate of 2 percent has
been projected for perpetual annuity (previous year: 2 percent).
Sensitivity of assumptions: These calculations did not reveal a need
to recognize impairment for any of the cash-generating units even if
no growth rate had been applied in perpetual annuity or if WACC had
been set 1 percent higher.
11 – Other non-current assets
Other non-current assets are composed of the following items:
IN € MILLION
Dec. 31,
2017 Dec. 31,
2016
Non-current trade receivables 25.6 20.9
Investment securities 1.6 1.6
Misc. other non-current financial assets 2.7 2.0
Other non-current financial assets 29.9 24.5
Other non-current non-financial assets 4.9 1.2
Total 34.8 25.7
Non-current trade receivables largely resulted from sales promotion
activities in the US and account for the increase relative to the previous
year. Delivered products are subject to retention of title and personal
sureties. Other non-current non-financial assets also rose due to
measures to support dealers in the US.
12 – Rental
IN € MILLION
2017 2016
Acquisition costs
Balance at January 1 162.8 152.0
Exchange rate differences -3.9 0.2
Additions 71.7 58.4
Disposals 50.3 47.8
Transfers − −
Balance at December 31 180.3 162.8
Accumulated depreciation
Balance at January 1 56.4 55.3
Exchange rate differences -1.5 0.1
Additions 32.6 28.6
Disposals 26.7 27.6
Transfers − −
Balance at December 31 60.8 56.4
Book value at January 1 106.4 96.7
Book value at December 31 119.5 106.4
Useful life in years 2 – 3 2 – 3
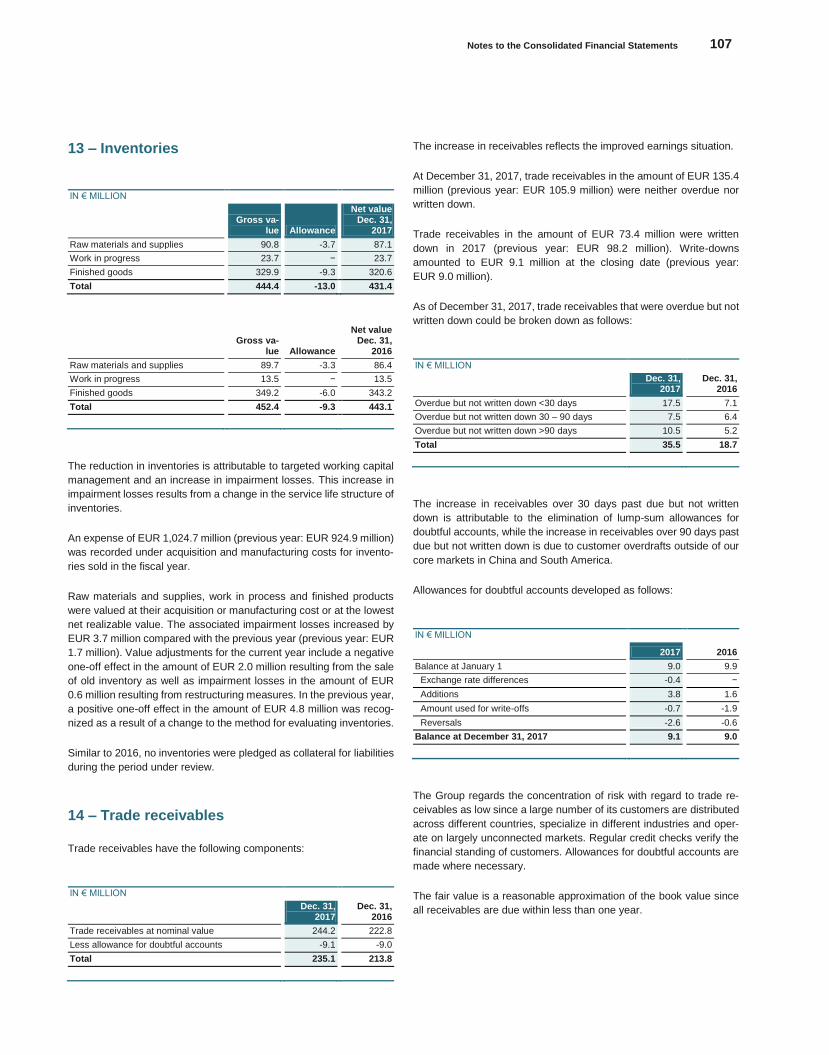
Notes to the Consolidated Financial Statements 107
Konze
rnabschlu
ss
13 – Inventories
IN € MILLION
Gross va-
lue Allowance
Net value Dec. 31,
2017
Raw materials and supplies 90.8 -3.7 87.1
Work in progress 23.7 − 23.7
Finished goods 329.9 -9.3 320.6
Total 444.4 -13.0 431.4
Gross va-
lue Allowance
Net value Dec. 31,
2016
Raw materials and supplies 89.7 -3.3 86.4
Work in progress 13.5 − 13.5
Finished goods 349.2 -6.0 343.2
Total 452.4 -9.3 443.1
The reduction in inventories is attributable to targeted working capital
management and an increase in impairment losses. This increase in
impairment losses results from a change in the service life structure of
inventories.
An expense of EUR 1,024.7 million (previous year: EUR 924.9 million)
was recorded under acquisition and manufacturing costs for invento-
ries sold in the fiscal year.
Raw materials and supplies, work in process and finished products
were valued at their acquisition or manufacturing cost or at the lowest
net realizable value. The associated impairment losses increased by
EUR 3.7 million compared with the previous year (previous year: EUR
1.7 million). Value adjustments for the current year include a negative
one-off effect in the amount of EUR 2.0 million resulting from the sale
of old inventory as well as impairment losses in the amount of EUR
0.6 million resulting from restructuring measures. In the previous year,
a positive one-off effect in the amount of EUR 4.8 million was recog-
nized as a result of a change to the method for evaluating inventories.
Similar to 2016, no inventories were pledged as collateral for liabilities
during the period under review.
14 – Trade receivables
Trade receivables have the following components:
IN € MILLION
Dec. 31, 2017
Dec. 31, 2016
Trade receivables at nominal value 244.2 222.8
Less allowance for doubtful accounts -9.1 -9.0
Total 235.1 213.8
The increase in receivables reflects the improved earnings situation.
At December 31, 2017, trade receivables in the amount of EUR 135.4
million (previous year: EUR 105.9 million) were neither overdue nor
written down.
Trade receivables in the amount of EUR 73.4 million were written
down in 2017 (previous year: EUR 98.2 million). Write-downs
amounted to EUR 9.1 million at the closing date (previous year:
EUR 9.0 million).
As of December 31, 2017, trade receivables that were overdue but not
written down could be broken down as follows:
IN € MILLION
Dec. 31,
2017 Dec. 31,
2016
Overdue but not written down <30 days 17.5 7.1
Overdue but not written down 30 – 90 days 7.5 6.4
Overdue but not written down >90 days 10.5 5.2
Total 35.5 18.7
The increase in receivables over 30 days past due but not written
down is attributable to the elimination of lump-sum allowances for
doubtful accounts, while the increase in receivables over 90 days past
due but not written down is due to customer overdrafts outside of our
core markets in China and South America.
Allowances for doubtful accounts developed as follows:
IN € MILLION
2017 2016
Balance at January 1 9.0 9.9
Exchange rate differences -0.4 −
Additions 3.8 1.6
Amount used for write-offs -0.7 -1.9
Reversals -2.6 -0.6
Balance at December 31, 2017 9.1 9.0
The Group regards the concentration of risk with regard to trade re-
ceivables as low since a large number of its customers are distributed
across different countries, specialize in different industries and oper-
ate on largely unconnected markets. Regular credit checks verify the
financial standing of customers. Allowances for doubtful accounts are
made where necessary.
The fair value is a reasonable approximation of the book value since
all receivables are due within less than one year.
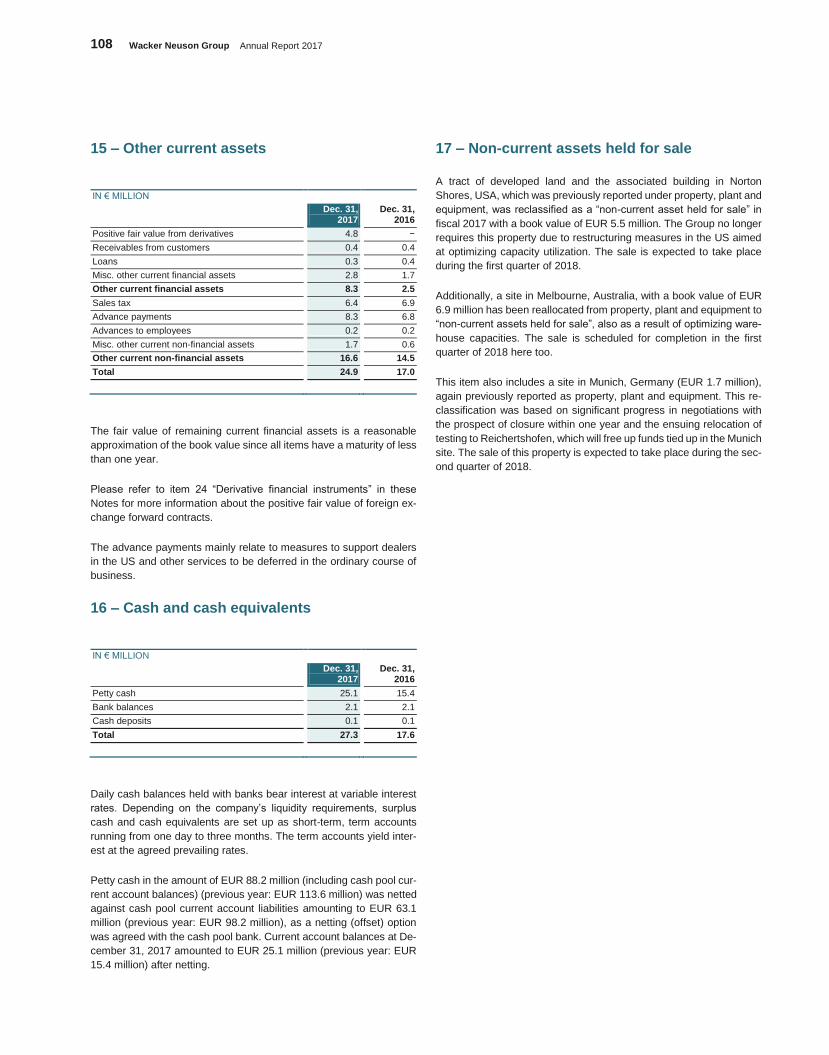
108 Wacker Neuson Group Annual Report 2017
15 – Other current assets
IN € MILLION
Dec. 31,
2017 Dec. 31,
2016
Positive fair value from derivatives 4.8 −
Receivables from customers 0.4 0.4
Loans 0.3 0.4
Misc. other current financial assets 2.8 1.7
Other current financial assets 8.3 2.5
Sales tax 6.4 6.9
Advance payments 8.3 6.8
Advances to employees 0.2 0.2
Misc. other current non-financial assets 1.7 0.6
Other current non-financial assets 16.6 14.5
Total 24.9 17.0
The fair value of remaining current financial assets is a reasonable
approximation of the book value since all items have a maturity of less
than one year.
Please refer to item 24 “Derivative financial instruments” in these
Notes for more information about the positive fair value of foreign ex-
change forward contracts.
The advance payments mainly relate to measures to support dealers
in the US and other services to be deferred in the ordinary course of
business.
16 – Cash and cash equivalents
IN € MILLION
Dec. 31,
2017 Dec. 31,
2016
Petty cash 25.1 15.4
Bank balances 2.1 2.1
Cash deposits 0.1 0.1
Total 27.3 17.6
Daily cash balances held with banks bear interest at variable interest
rates. Depending on the company’s liquidity requirements, surplus
cash and cash equivalents are set up as short-term, term accounts
running from one day to three months. The term accounts yield inter-
est at the agreed prevailing rates.
Petty cash in the amount of EUR 88.2 million (including cash pool cur-
rent account balances) (previous year: EUR 113.6 million) was netted
against cash pool current account liabilities amounting to EUR 63.1
million (previous year: EUR 98.2 million), as a netting (offset) option
was agreed with the cash pool bank. Current account balances at De-
cember 31, 2017 amounted to EUR 25.1 million (previous year: EUR
15.4 million) after netting.
17 – Non-current assets held for sale
A tract of developed land and the associated building in Norton
Shores, USA, which was previously reported under property, plant and
equipment, was reclassified as a “non-current asset held for sale” in
fiscal 2017 with a book value of EUR 5.5 million. The Group no longer
requires this property due to restructuring measures in the US aimed
at optimizing capacity utilization. The sale is expected to take place
during the first quarter of 2018.
Additionally, a site in Melbourne, Australia, with a book value of EUR
6.9 million has been reallocated from property, plant and equipment to
“non-current assets held for sale”, also as a result of optimizing ware-
house capacities. The sale is scheduled for completion in the first
quarter of 2018 here too.
This item also includes a site in Munich, Germany (EUR 1.7 million),
again previously reported as property, plant and equipment. This re-
classification was based on significant progress in negotiations with
the prospect of closure within one year and the ensuing relocation of
testing to Reichertshofen, which will free up funds tied up in the Munich
site. The sale of this property is expected to take place during the sec-
ond quarter of 2018.
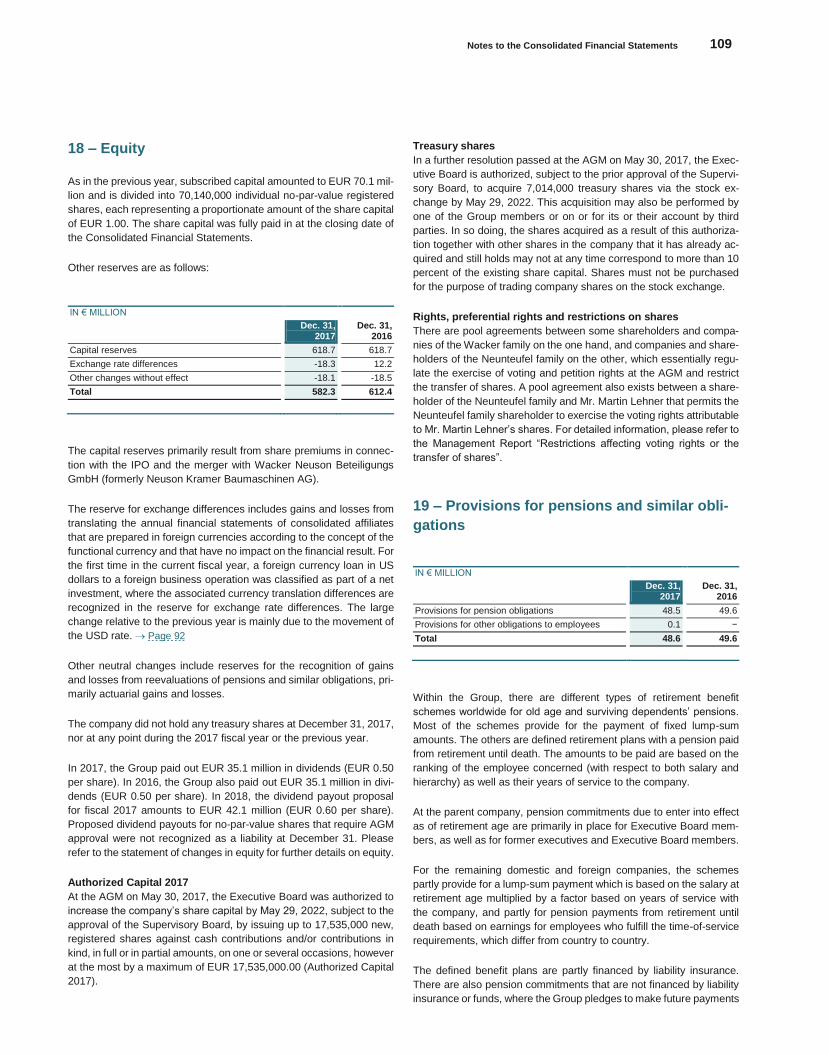
Notes to the Consolidated Financial Statements 109
Konze
rnabschlu
ss
18 – Equity
As in the previous year, subscribed capital amounted to EUR 70.1 mil-
lion and is divided into 70,140,000 individual no-par-value registered
shares, each representing a proportionate amount of the share capital
of EUR 1.00. The share capital was fully paid in at the closing date of
the Consolidated Financial Statements.
Other reserves are as follows:
IN € MILLION
Dec. 31,
2017 Dec. 31,
2016
Capital reserves 618.7 618.7
Exchange rate differences -18.3 12.2
Other changes without effect -18.1 -18.5
Total 582.3 612.4
The capital reserves primarily result from share premiums in connec-
tion with the IPO and the merger with Wacker Neuson Beteiligungs
GmbH (formerly Neuson Kramer Baumaschinen AG).
The reserve for exchange differences includes gains and losses from
translating the annual financial statements of consolidated affiliates
that are prepared in foreign currencies according to the concept of the
functional currency and that have no impact on the financial result. For
the first time in the current fiscal year, a foreign currency loan in US
dollars to a foreign business operation was classified as part of a net
investment, where the associated currency translation differences are
recognized in the reserve for exchange rate differences. The large
change relative to the previous year is mainly due to the movement of
the USD rate. Page 92
Other neutral changes include reserves for the recognition of gains
and losses from reevaluations of pensions and similar obligations, pri-
marily actuarial gains and losses.
The company did not hold any treasury shares at December 31, 2017,
nor at any point during the 2017 fiscal year or the previous year.
In 2017, the Group paid out EUR 35.1 million in dividends (EUR 0.50
per share). In 2016, the Group also paid out EUR 35.1 million in divi-
dends (EUR 0.50 per share). In 2018, the dividend payout proposal
for fiscal 2017 amounts to EUR 42.1 million (EUR 0.60 per share).
Proposed dividend payouts for no-par-value shares that require AGM
approval were not recognized as a liability at December 31. Please
refer to the statement of changes in equity for further details on equity.
Authorized Capital 2017
At the AGM on May 30, 2017, the Executive Board was authorized to
increase the company’s share capital by May 29, 2022, subject to the
approval of the Supervisory Board, by issuing up to 17,535,000 new,
registered shares against cash contributions and/or contributions in
kind, in full or in partial amounts, on one or several occasions, however
at the most by a maximum of EUR 17,535,000.00 (Authorized Capital
2017).
Treasury shares
In a further resolution passed at the AGM on May 30, 2017, the Exec-
utive Board is authorized, subject to the prior approval of the Supervi-
sory Board, to acquire 7,014,000 treasury shares via the stock ex-
change by May 29, 2022. This acquisition may also be performed by
one of the Group members or on or for its or their account by third
parties. In so doing, the shares acquired as a result of this authoriza-
tion together with other shares in the company that it has already ac-
quired and still holds may not at any time correspond to more than 10
percent of the existing share capital. Shares must not be purchased
for the purpose of trading company shares on the stock exchange.
Rights, preferential rights and restrictions on shares
There are pool agreements between some shareholders and compa-
nies of the Wacker family on the one hand, and companies and share-
holders of the Neunteufel family on the other, which essentially regu-
late the exercise of voting and petition rights at the AGM and restrict
the transfer of shares. A pool agreement also exists between a share-
holder of the Neunteufel family and Mr. Martin Lehner that permits the
Neunteufel family shareholder to exercise the voting rights attributable
to Mr. Martin Lehner’s shares. For detailed information, please refer to
the Management Report “Restrictions affecting voting rights or the
transfer of shares”.
19 – Provisions for pensions and similar obli-
gations
IN € MILLION
Dec. 31,
2017 Dec. 31,
2016
Provisions for pension obligations 48.5 49.6
Provisions for other obligations to employees 0.1 −
Total 48.6 49.6
Within the Group, there are different types of retirement benefit
schemes worldwide for old age and surviving dependents’ pensions.
Most of the schemes provide for the payment of fixed lump-sum
amounts. The others are defined retirement plans with a pension paid
from retirement until death. The amounts to be paid are based on the
ranking of the employee concerned (with respect to both salary and
hierarchy) as well as their years of service to the company.
At the parent company, pension commitments due to enter into effect
as of retirement age are primarily in place for Executive Board mem-
bers, as well as for former executives and Executive Board members.
For the remaining domestic and foreign companies, the schemes
partly provide for a lump-sum payment which is based on the salary at
retirement age multiplied by a factor based on years of service with
the company, and partly for pension payments from retirement until
death based on earnings for employees who fulfill the time-of-service
requirements, which differ from country to country.
The defined benefit plans are partly financed by liability insurance.
There are also pension commitments that are not financed by liability
insurance or funds, where the Group pledges to make future payments
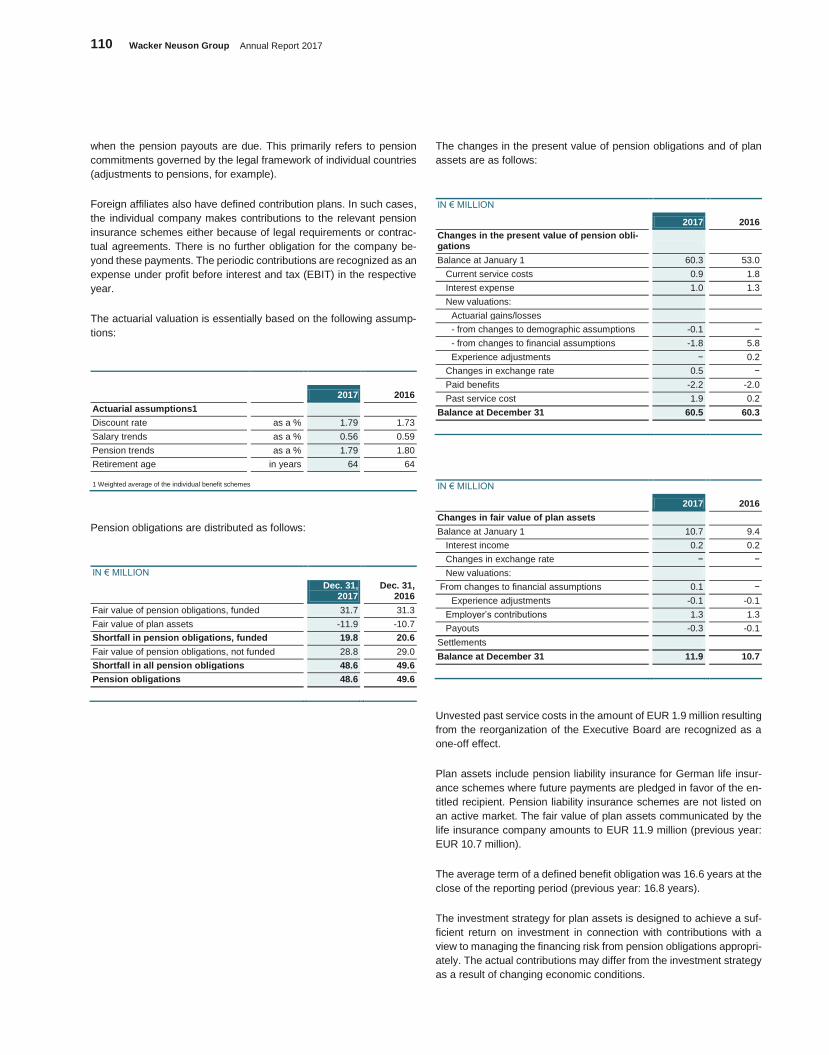
110 Wacker Neuson Group Annual Report 2017
when the pension payouts are due. This primarily refers to pension
commitments governed by the legal framework of individual countries
(adjustments to pensions, for example).
Foreign affiliates also have defined contribution plans. In such cases,
the individual company makes contributions to the relevant pension
insurance schemes either because of legal requirements or contrac-
tual agreements. There is no further obligation for the company be-
yond these payments. The periodic contributions are recognized as an
expense under profit before interest and tax (EBIT) in the respective
year.
The actuarial valuation is essentially based on the following assump-
tions:
2017 2016
Actuarial assumptions1
Discount rate as a % 1.79 1.73
Salary trends as a % 0.56 0.59
Pension trends as a % 1.79 1.80
Retirement age in years 64 64
1 Weighted average of the individual benefit schemes
Pension obligations are distributed as follows:
IN € MILLION
Dec. 31,
2017 Dec. 31,
2016
Fair value of pension obligations, funded 31.7 31.3
Fair value of plan assets -11.9 -10.7
Shortfall in pension obligations, funded 19.8 20.6
Fair value of pension obligations, not funded 28.8 29.0
Shortfall in all pension obligations 48.6 49.6
Pension obligations 48.6 49.6
The changes in the present value of pension obligations and of plan
assets are as follows:
IN € MILLION
2017 2016
Changes in the present value of pension obli-gations
Balance at January 1 60.3 53.0
Current service costs 0.9 1.8
Interest expense 1.0 1.3
New valuations:
Actuarial gains/losses
- from changes to demographic assumptions -0.1 −
- from changes to financial assumptions -1.8 5.8
Experience adjustments − 0.2
Changes in exchange rate 0.5 −
Paid benefits -2.2 -2.0
Past service cost 1.9 0.2
Balance at December 31 60.5 60.3
IN € MILLION
2017 2016
Changes in fair value of plan assets
Balance at January 1 10.7 9.4
Interest income 0.2 0.2
Changes in exchange rate − −
New valuations:
From changes to financial assumptions 0.1 −
Experience adjustments -0.1 -0.1
Employer’s contributions 1.3 1.3
Payouts -0.3 -0.1
Settlements
Balance at December 31 11.9 10.7
Unvested past service costs in the amount of EUR 1.9 million resulting
from the reorganization of the Executive Board are recognized as a
one-off effect.
Plan assets include pension liability insurance for German life insur-
ance schemes where future payments are pledged in favor of the en-
titled recipient. Pension liability insurance schemes are not listed on
an active market. The fair value of plan assets communicated by the
life insurance company amounts to EUR 11.9 million (previous year:
EUR 10.7 million).
The average term of a defined benefit obligation was 16.6 years at the
close of the reporting period (previous year: 16.8 years).
The investment strategy for plan assets is designed to achieve a suf-
ficient return on investment in connection with contributions with a
view to managing the financing risk from pension obligations appropri-
ately. The actual contributions may differ from the investment strategy
as a result of changing economic conditions.
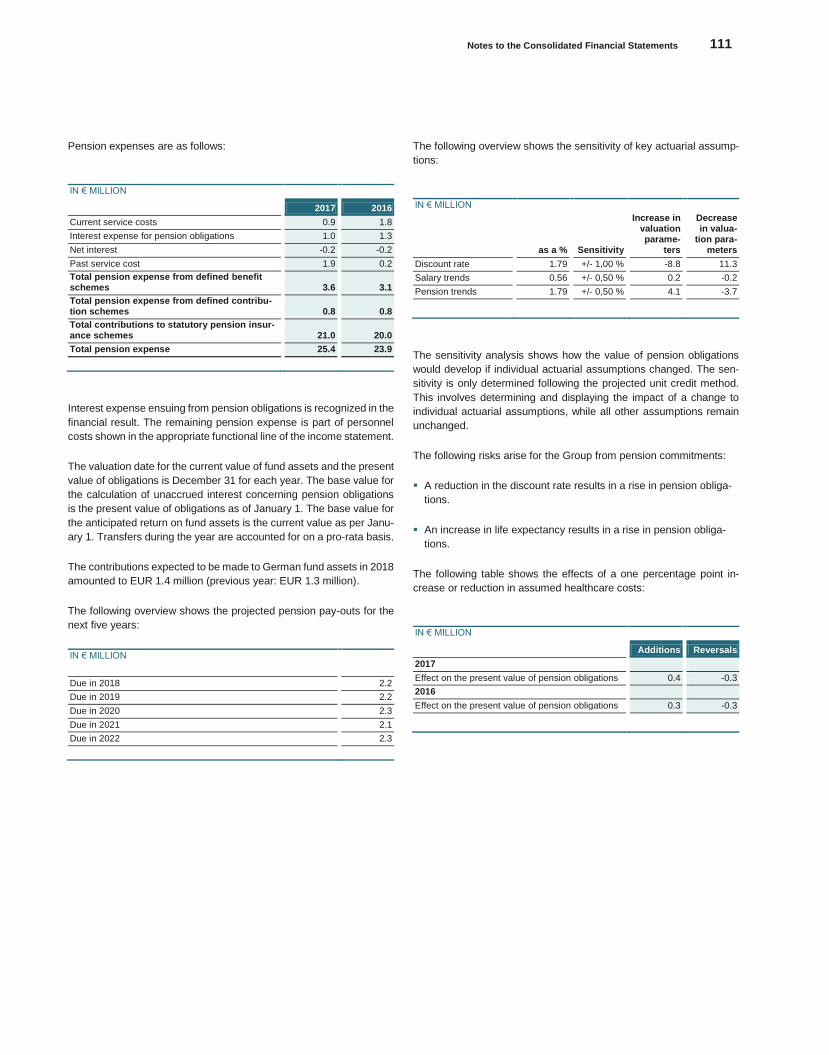
Notes to the Consolidated Financial Statements 111
Konze
rnabschlu
ss
Pension expenses are as follows:
IN € MILLION
2017 2016
Current service costs 0.9 1.8
Interest expense for pension obligations 1.0 1.3
Net interest -0.2 -0.2
Past service cost 1.9 0.2
Total pension expense from defined benefit schemes 3.6 3.1
Total pension expense from defined contribu-tion schemes 0.8 0.8
Total contributions to statutory pension insur-ance schemes 21.0 20.0
Total pension expense 25.4 23.9
Interest expense ensuing from pension obligations is recognized in the
financial result. The remaining pension expense is part of personnel
costs shown in the appropriate functional line of the income statement.
The valuation date for the current value of fund assets and the present
value of obligations is December 31 for each year. The base value for
the calculation of unaccrued interest concerning pension obligations
is the present value of obligations as of January 1. The base value for
the anticipated return on fund assets is the current value as per Janu-
ary 1. Transfers during the year are accounted for on a pro-rata basis.
The contributions expected to be made to German fund assets in 2018
amounted to EUR 1.4 million (previous year: EUR 1.3 million).
The following overview shows the projected pension pay-outs for the
next five years:
IN € MILLION
Due in 2018 2.2
Due in 2019 2.2
Due in 2020 2.3
Due in 2021 2.1
Due in 2022 2.3
The following overview shows the sensitivity of key actuarial assump-
tions:
IN € MILLION
as a % Sensitivity
Increase in valuation parame-
ters
Decrease in valua-
tion para-meters
Discount rate 1.79 +/- 1,00 % -8.8 11.3
Salary trends 0.56 +/- 0,50 % 0.2 -0.2
Pension trends 1.79 +/- 0,50 % 4.1 -3.7
The sensitivity analysis shows how the value of pension obligations
would develop if individual actuarial assumptions changed. The sen-
sitivity is only determined following the projected unit credit method.
This involves determining and displaying the impact of a change to
individual actuarial assumptions, while all other assumptions remain
unchanged.
The following risks arise for the Group from pension commitments:
A reduction in the discount rate results in a rise in pension obliga-
tions.
An increase in life expectancy results in a rise in pension obliga-
tions.
The following table shows the effects of a one percentage point in-
crease or reduction in assumed healthcare costs:
IN € MILLION
Additions Reversals
2017
Effect on the present value of pension obligations 0.4 -0.3
2016
Effect on the present value of pension obligations 0.3 -0.3
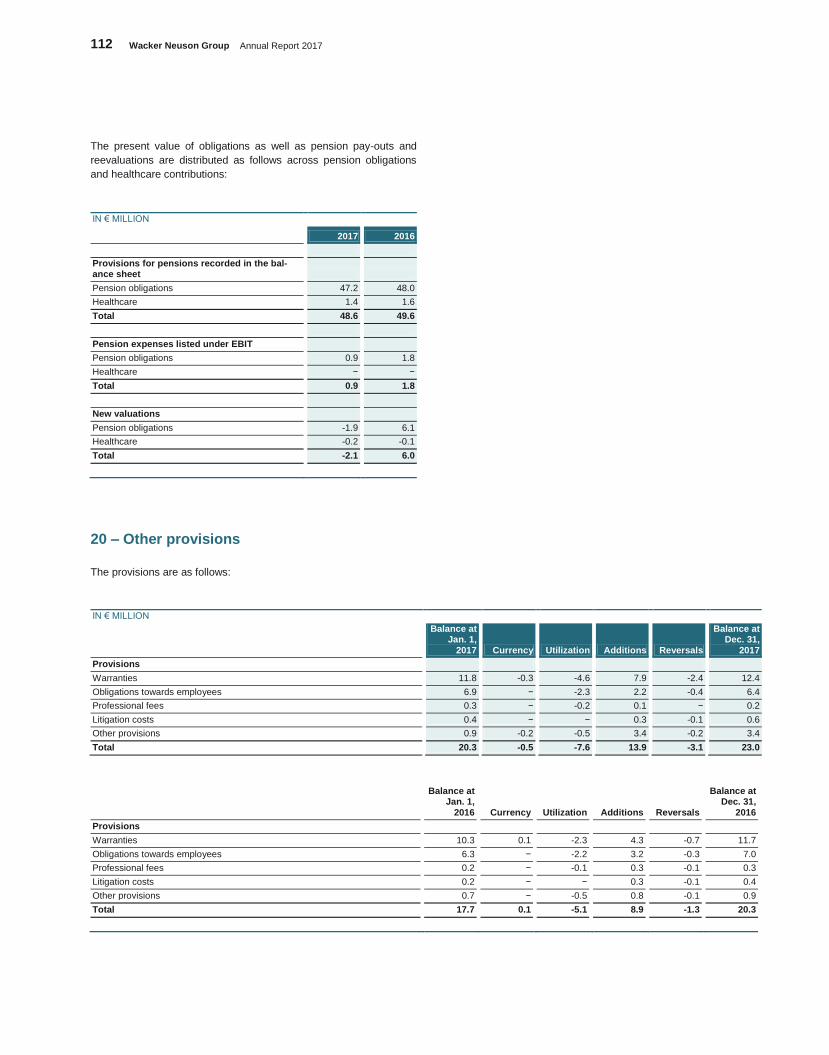
112 Wacker Neuson Group Annual Report 2017
The present value of obligations as well as pension pay-outs and
reevaluations are distributed as follows across pension obligations
and healthcare contributions:
IN € MILLION
2017 2016
Provisions for pensions recorded in the bal-ance sheet
Pension obligations 47.2 48.0
Healthcare 1.4 1.6
Total 48.6 49.6
Pension expenses listed under EBIT
Pension obligations 0.9 1.8
Healthcare − −
Total 0.9 1.8
New valuations
Pension obligations -1.9 6.1
Healthcare -0.2 -0.1
Total -2.1 6.0
20 – Other provisions
The provisions are as follows:
IN € MILLION
Balance at Jan. 1,
2017 Currency Utilization Additions Reversals
Balance at Dec. 31,
2017
Provisions
Warranties 11.8 -0.3 -4.6 7.9 -2.4 12.4
Obligations towards employees 6.9 − -2.3 2.2 -0.4 6.4
Professional fees 0.3 − -0.2 0.1 − 0.2
Litigation costs 0.4 − − 0.3 -0.1 0.6
Other provisions 0.9 -0.2 -0.5 3.4 -0.2 3.4
Total 20.3 -0.5 -7.6 13.9 -3.1 23.0
Balance at Jan. 1,
2016 Currency Utilization Additions Reversals
Balance at Dec. 31,
2016
Provisions
Warranties 10.3 0.1 -2.3 4.3 -0.7 11.7
Obligations towards employees 6.3 − -2.2 3.2 -0.3 7.0
Professional fees 0.2 − -0.1 0.3 -0.1 0.3
Litigation costs 0.2 − − 0.3 -0.1 0.4
Other provisions 0.7 − -0.5 0.8 -0.1 0.9
Total 17.7 0.1 -5.1 8.9 -1.3 20.3
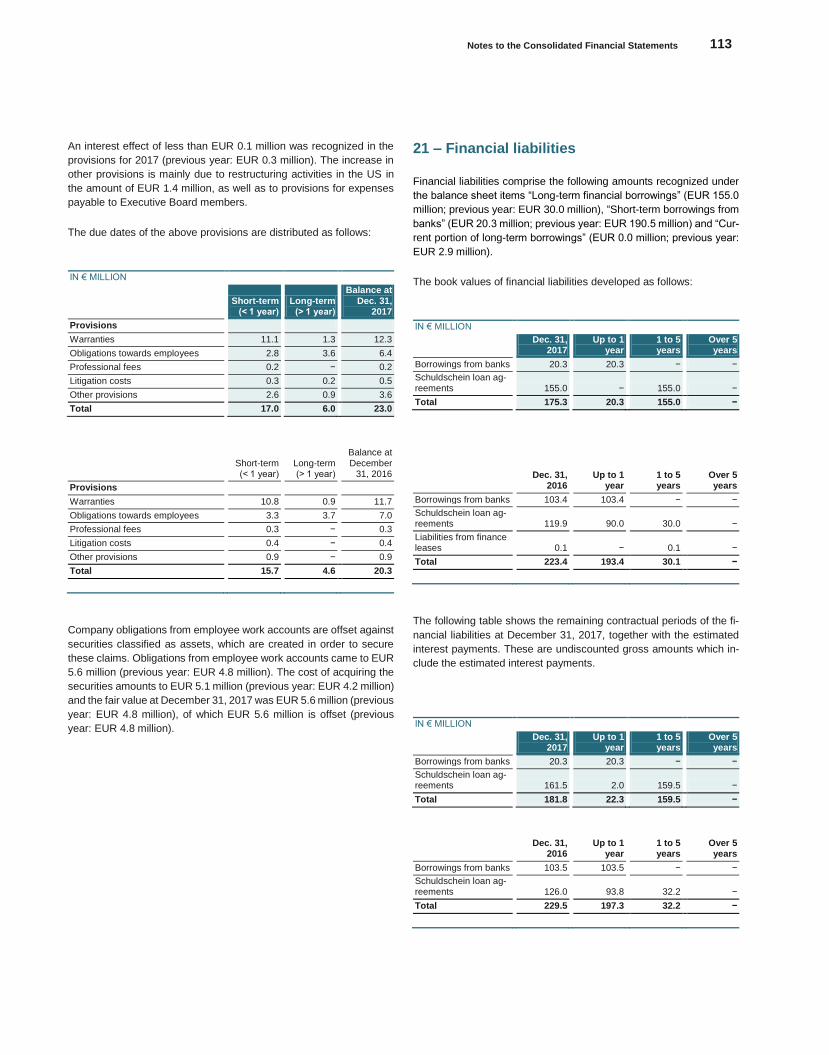
Notes to the Consolidated Financial Statements 113
Konze
rnabschlu
ss
An interest effect of less than EUR 0.1 million was recognized in the
provisions for 2017 (previous year: EUR 0.3 million). The increase in
other provisions is mainly due to restructuring activities in the US in
the amount of EUR 1.4 million, as well as to provisions for expenses
payable to Executive Board members.
The due dates of the above provisions are distributed as follows:
IN € MILLION
Short-term
(< 1 year) Long-term
(> 1 year)
Balance at
Dec. 31, 2017
Provisions
Warranties 11.1 1.3 12.3
Obligations towards employees 2.8 3.6 6.4
Professional fees 0.2 − 0.2
Litigation costs 0.3 0.2 0.5
Other provisions 2.6 0.9 3.6
Total 17.0 6.0 23.0
Short-term (< 1 year)
Long-term (> 1 year)
Balance at December
31, 2016
Provisions
Warranties 10.8 0.9 11.7
Obligations towards employees 3.3 3.7 7.0
Professional fees 0.3 − 0.3
Litigation costs 0.4 − 0.4
Other provisions 0.9 − 0.9
Total 15.7 4.6 20.3
Company obligations from employee work accounts are offset against
securities classified as assets, which are created in order to secure
these claims. Obligations from employee work accounts came to EUR
5.6 million (previous year: EUR 4.8 million). The cost of acquiring the
securities amounts to EUR 5.1 million (previous year: EUR 4.2 million)
and the fair value at December 31, 2017 was EUR 5.6 million (previous
year: EUR 4.8 million), of which EUR 5.6 million is offset (previous
year: EUR 4.8 million).
21 – Financial liabilities
Financial liabilities comprise the following amounts recognized under
the balance sheet items “Long-term financial borrowings” (EUR 155.0
million; previous year: EUR 30.0 million), “Short-term borrowings from
banks” (EUR 20.3 million; previous year: EUR 190.5 million) and “Cur-
rent portion of long-term borrowings” (EUR 0.0 million; previous year:
EUR 2.9 million).
The book values of financial liabilities developed as follows:
IN € MILLION
Dec. 31,
2017 Up to 1
year 1 to 5 years
Over 5 years
Borrowings from banks 20.3 20.3 − −
Schuldschein loan ag-reements 155.0 − 155.0 −
Total 175.3 20.3 155.0 −
Dec. 31,
2016 Up to 1
year 1 to 5 years
Over 5 years
Borrowings from banks 103.4 103.4 − −
Schuldschein loan ag-reements 119.9 90.0 30.0 −
Liabilities from finance leases 0.1 − 0.1 −
Total 223.4 193.4 30.1 −
The following table shows the remaining contractual periods of the fi-
nancial liabilities at December 31, 2017, together with the estimated
interest payments. These are undiscounted gross amounts which in-
clude the estimated interest payments.
IN € MILLION
Dec. 31,
2017 Up to 1
year 1 to 5 years
Over 5 years
Borrowings from banks 20.3 20.3 − −
Schuldschein loan ag-reements 161.5 2.0 159.5 −
Total 181.8 22.3 159.5 −
Dec. 31,
2016 Up to 1
year 1 to 5 years
Over 5 years
Borrowings from banks 103.5 103.5 − −
Schuldschein loan ag-reements 126.0 93.8 32.2 −
Total 229.5 197.3 32.2 −
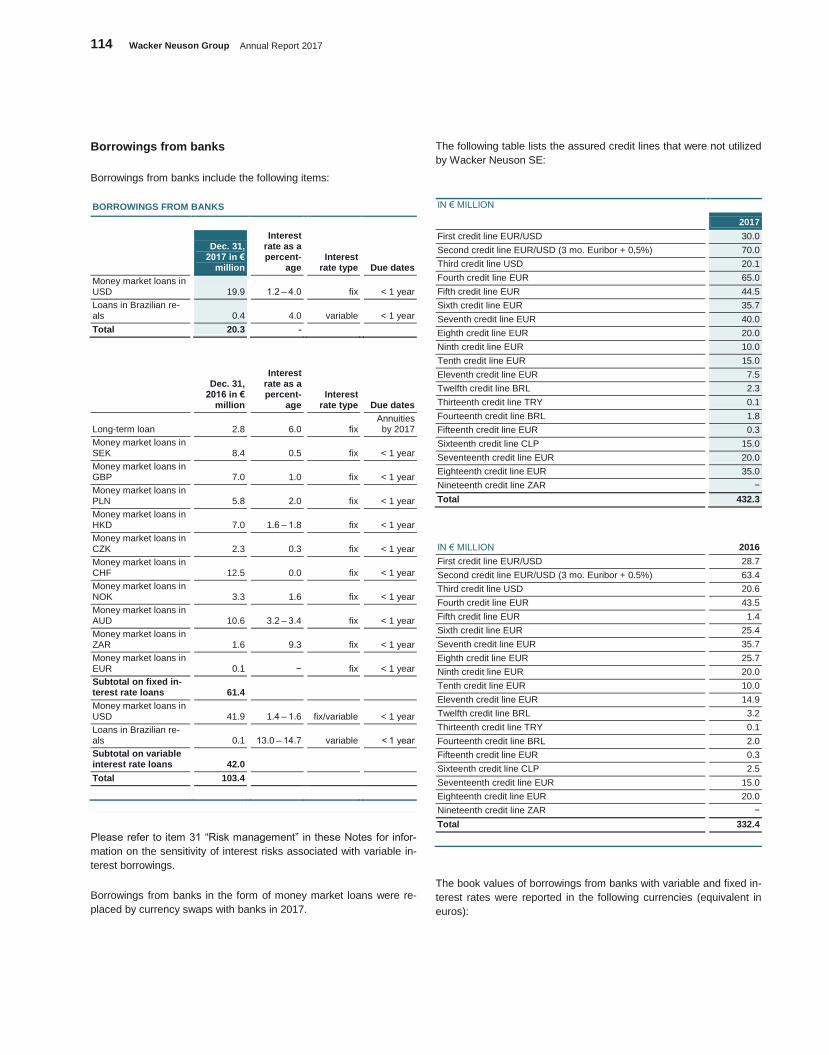
114 Wacker Neuson Group Annual Report 2017
Borrowings from banks
Borrowings from banks include the following items:
BORROWINGS FROM BANKS
Dec. 31, 2017 in €
million
Interest rate as a percent-
age Interest
rate type Due dates
Money market loans in USD 19.9 1.2 – 4.0 fix < 1 year
Loans in Brazilian re-als 0.4 4.0 variable < 1 year
Total 20.3 -
Dec. 31, 2016 in €
million
Interest rate as a percent-
age Interest
rate type Due dates
Long-term loan 2.8 6.0 fix Annuities by 2017
Money market loans in SEK 8.4 0.5 fix < 1 year
Money market loans in GBP 7.0 1.0 fix < 1 year
Money market loans in PLN 5.8 2.0 fix < 1 year
Money market loans in HKD 7.0 1.6 – 1.8 fix < 1 year
Money market loans in CZK 2.3 0.3 fix < 1 year
Money market loans in CHF 12.5 0.0 fix < 1 year
Money market loans in NOK 3.3 1.6 fix < 1 year
Money market loans in AUD 10.6 3.2 – 3.4 fix < 1 year
Money market loans in ZAR 1.6 9.3 fix < 1 year
Money market loans in EUR 0.1 − fix < 1 year
Subtotal on fixed in-terest rate loans 61.4
Money market loans in USD 41.9 1.4 – 1.6 fix/variable < 1 year
Loans in Brazilian re-als 0.1 13.0 – 14.7 variable < 1 year
Subtotal on variable interest rate loans 42.0
Total 103.4
Please refer to item 31 “Risk management” in these Notes for infor-
mation on the sensitivity of interest risks associated with variable in-
terest borrowings.
Borrowings from banks in the form of money market loans were re-
placed by currency swaps with banks in 2017.
The following table lists the assured credit lines that were not utilized
by Wacker Neuson SE:
IN € MILLION
2017
First credit line EUR/USD 30.0
Second credit line EUR/USD (3 mo. Euribor + 0,5%) 70.0
Third credit line USD 20.1
Fourth credit line EUR 65.0
Fifth credit line EUR 44.5
Sixth credit line EUR 35.7
Seventh credit line EUR 40.0
Eighth credit line EUR 20.0
Ninth credit line EUR 10.0
Tenth credit line EUR 15.0
Eleventh credit line EUR 7.5
Twelfth credit line BRL 2.3
Thirteenth credit line TRY 0.1
Fourteenth credit line BRL 1.8
Fifteenth credit line EUR 0.3
Sixteenth credit line CLP 15.0
Seventeenth credit line EUR 20.0
Eighteenth credit line EUR 35.0
Nineteenth credit line ZAR −
Total 432.3
IN € MILLION 2016
First credit line EUR/USD 28.7
Second credit line EUR/USD (3 mo. Euribor + 0.5%) 63.4
Third credit line USD 20.6
Fourth credit line EUR 43.5
Fifth credit line EUR 1.4
Sixth credit line EUR 25.4
Seventh credit line EUR 35.7
Eighth credit line EUR 25.7
Ninth credit line EUR 20.0
Tenth credit line EUR 10.0
Eleventh credit line EUR 14.9
Twelfth credit line BRL 3.2
Thirteenth credit line TRY 0.1
Fourteenth credit line BRL 2.0
Fifteenth credit line EUR 0.3
Sixteenth credit line CLP 2.5
Seventeenth credit line EUR 15.0
Eighteenth credit line EUR 20.0
Nineteenth credit line ZAR −
Total 332.4
The book values of borrowings from banks with variable and fixed in-
terest rates were reported in the following currencies (equivalent in
euros):
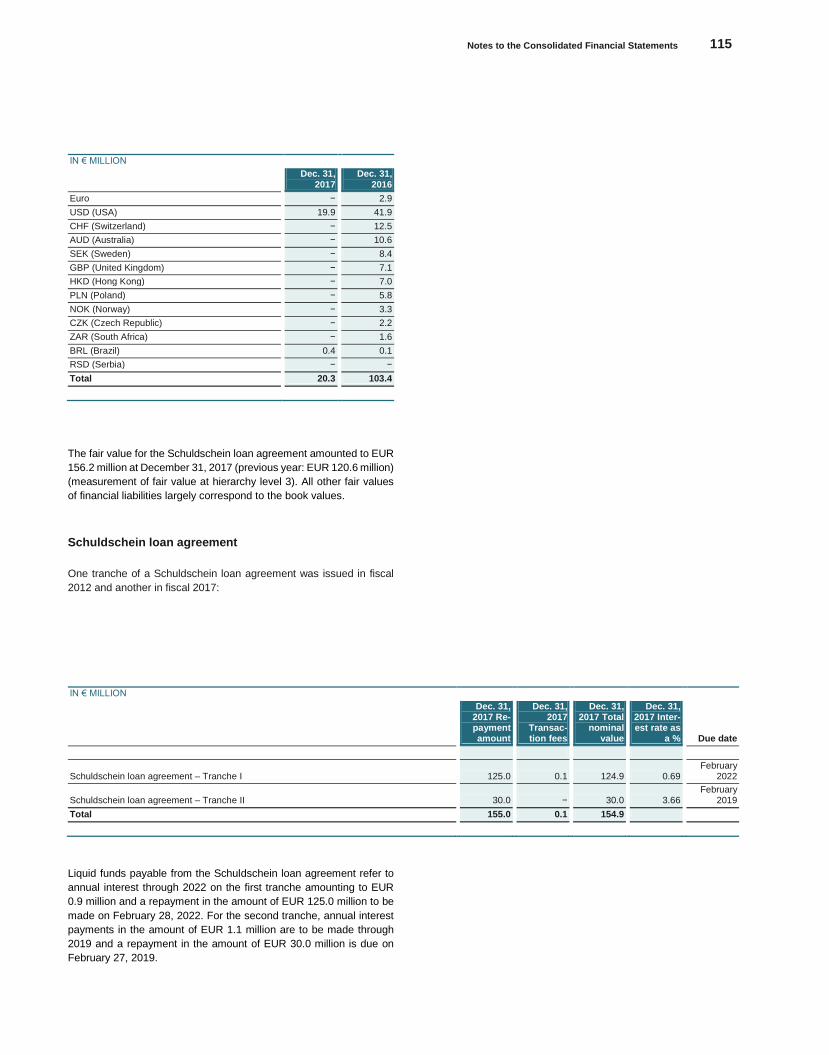
Notes to the Consolidated Financial Statements 115
Konze
rnabschlu
ss
IN € MILLION
Dec. 31, 2017
Dec. 31, 2016
Euro − 2.9
USD (USA) 19.9 41.9
CHF (Switzerland) − 12.5
AUD (Australia) − 10.6
SEK (Sweden) − 8.4
GBP (United Kingdom) − 7.1
HKD (Hong Kong) − 7.0
PLN (Poland) − 5.8
NOK (Norway) − 3.3
CZK (Czech Republic) − 2.2
ZAR (South Africa) − 1.6
BRL (Brazil) 0.4 0.1
RSD (Serbia) − −
Total 20.3 103.4
The fair value for the Schuldschein loan agreement amounted to EUR
156.2 million at December 31, 2017 (previous year: EUR 120.6 million)
(measurement of fair value at hierarchy level 3). All other fair values
of financial liabilities largely correspond to the book values.
Schuldschein loan agreement
One tranche of a Schuldschein loan agreement was issued in fiscal
2012 and another in fiscal 2017:
IN € MILLION
Dec. 31, 2017 Re-payment amount
Dec. 31, 2017
Transac-tion fees
Dec. 31, 2017 Total
nominal value
Dec. 31, 2017 Inter-est rate as
a % Due date
Schuldschein loan agreement – Tranche I 125.0 0.1 124.9 0.69 February
2022
Schuldschein loan agreement – Tranche II 30.0 − 30.0 3.66 February
2019
Total 155.0 0.1 154.9
Liquid funds payable from the Schuldschein loan agreement refer to
annual interest through 2022 on the first tranche amounting to EUR
0.9 million and a repayment in the amount of EUR 125.0 million to be
made on February 28, 2022. For the second tranche, annual interest
payments in the amount of EUR 1.1 million are to be made through
2019 and a repayment in the amount of EUR 30.0 million is due on
February 27, 2019.
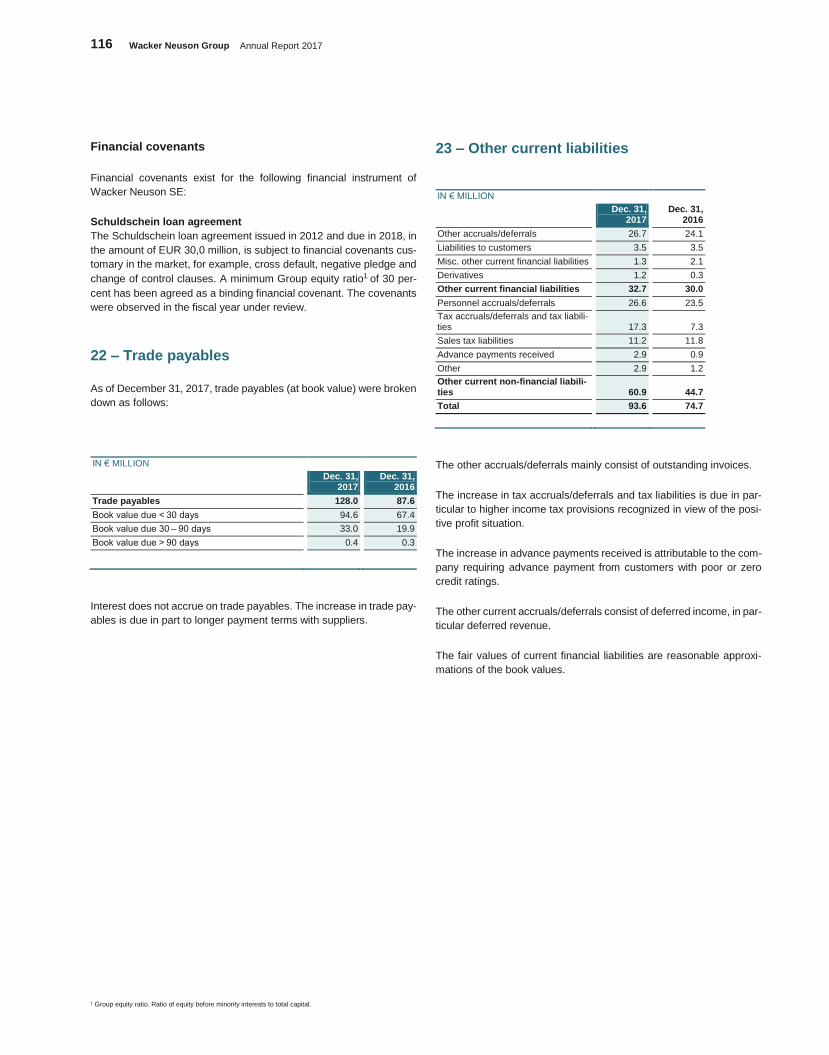
116 Wacker Neuson Group Annual Report 2017
Financial covenants
Financial covenants exist for the following financial instrument of
Wacker Neuson SE:
Schuldschein loan agreement
The Schuldschein loan agreement issued in 2012 and due in 2018, in
the amount of EUR 30,0 million, is subject to financial covenants cus-
tomary in the market, for example, cross default, negative pledge and
change of control clauses. A minimum Group equity ratio1 of 30 per-
cent has been agreed as a binding financial covenant. The covenants
were observed in the fiscal year under review.
22 – Trade payables
As of December 31, 2017, trade payables (at book value) were broken
down as follows:
IN € MILLION
Dec. 31,
2017 Dec. 31,
2016
Trade payables 128.0 87.6
Book value due < 30 days 94.6 67.4
Book value due 30 – 90 days 33.0 19.9
Book value due > 90 days 0.4 0.3
Interest does not accrue on trade payables. The increase in trade pay-
ables is due in part to longer payment terms with suppliers.
1 Group equity ratio. Ratio of equity before minority interests to total capital.
23 – Other current liabilities
IN € MILLION
Dec. 31,
2017 Dec. 31,
2016
Other accruals/deferrals 26.7 24.1
Liabilities to customers 3.5 3.5
Misc. other current financial liabilities 1.3 2.1
Derivatives 1.2 0.3
Other current financial liabilities 32.7 30.0
Personnel accruals/deferrals 26.6 23.5
Tax accruals/deferrals and tax liabili-ties 17.3 7.3
Sales tax liabilities 11.2 11.8
Advance payments received 2.9 0.9
Other 2.9 1.2
Other current non-financial liabili-ties 60.9 44.7
Total 93.6 74.7
The other accruals/deferrals mainly consist of outstanding invoices.
The increase in tax accruals/deferrals and tax liabilities is due in par-
ticular to higher income tax provisions recognized in view of the posi-
tive profit situation.
The increase in advance payments received is attributable to the com-
pany requiring advance payment from customers with poor or zero
credit ratings.
The other current accruals/deferrals consist of deferred income, in par-
ticular deferred revenue.
The fair values of current financial liabilities are reasonable approxi-
mations of the book values.
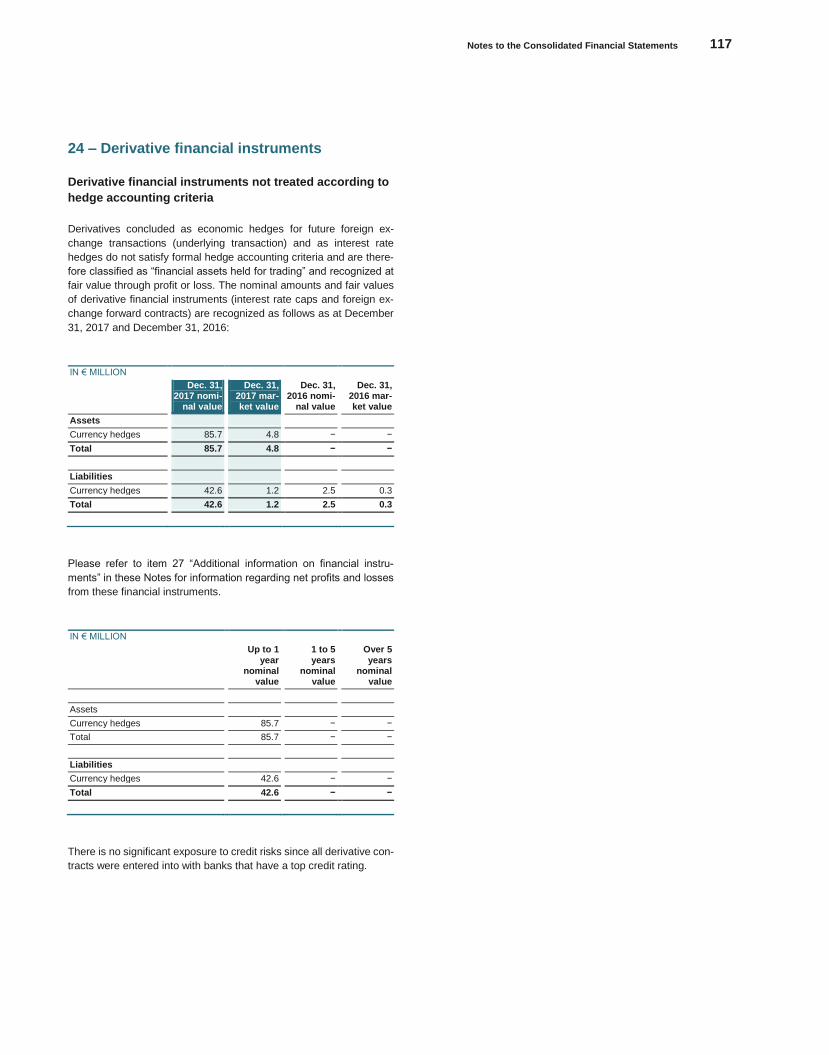
Notes to the Consolidated Financial Statements 117
Konze
rnabschlu
ss
24 – Derivative financial instruments
Derivative financial instruments not treated according to
hedge accounting criteria
Derivatives concluded as economic hedges for future foreign ex-
change transactions (underlying transaction) and as interest rate
hedges do not satisfy formal hedge accounting criteria and are there-
fore classified as “financial assets held for trading” and recognized at
fair value through profit or loss. The nominal amounts and fair values
of derivative financial instruments (interest rate caps and foreign ex-
change forward contracts) are recognized as follows as at December
31, 2017 and December 31, 2016:
IN € MILLION
Dec. 31, 2017 nomi-
nal value
Dec. 31, 2017 mar-ket value
Dec. 31, 2016 nomi-
nal value
Dec. 31, 2016 mar-ket value
Assets
Currency hedges 85.7 4.8 − −
Total 85.7 4.8 − −
Liabilities
Currency hedges 42.6 1.2 2.5 0.3
Total 42.6 1.2 2.5 0.3
Please refer to item 27 “Additional information on financial instru-
ments” in these Notes for information regarding net profits and losses
from these financial instruments.
IN € MILLION
Up to 1 year
nominal value
1 to 5 years
nominal value
Over 5 years
nominal value
Assets
Currency hedges 85.7 − −
Total 85.7 − −
Liabilities
Currency hedges 42.6 − −
Total 42.6 − −
There is no significant exposure to credit risks since all derivative con-
tracts were entered into with banks that have a top credit rating.
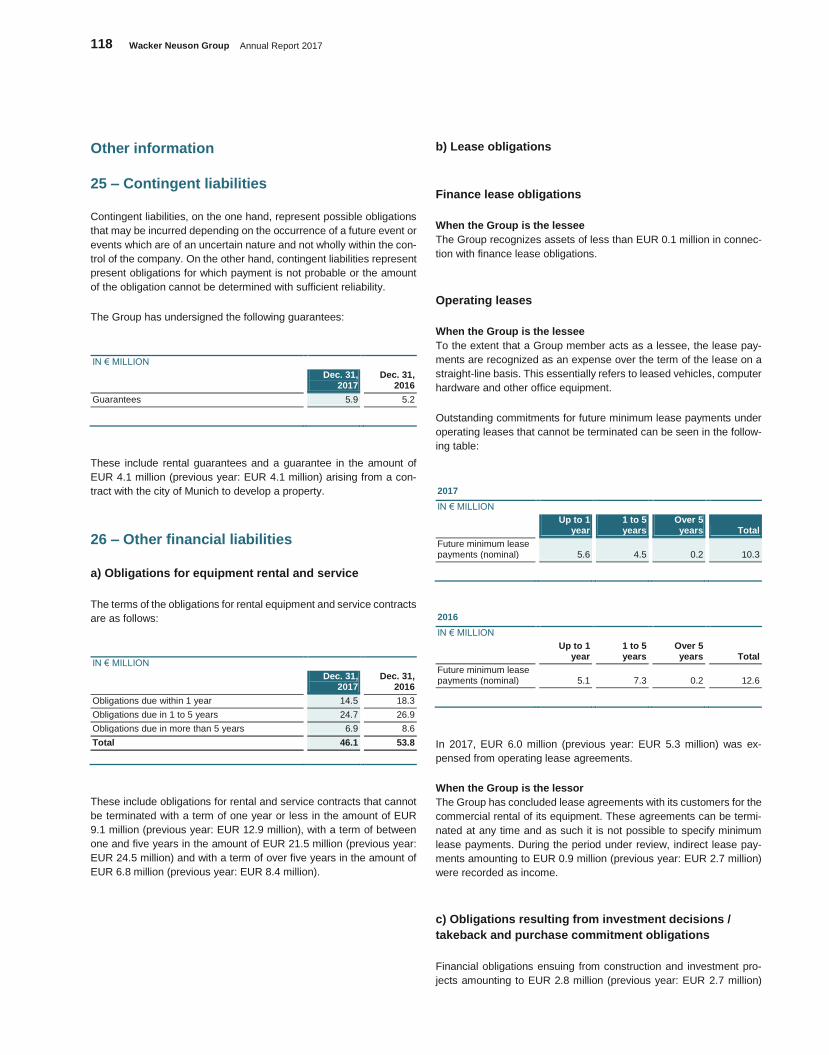
118 Wacker Neuson Group Annual Report 2017
Other information
25 – Contingent liabilities
Contingent liabilities, on the one hand, represent possible obligations
that may be incurred depending on the occurrence of a future event or
events which are of an uncertain nature and not wholly within the con-
trol of the company. On the other hand, contingent liabilities represent
present obligations for which payment is not probable or the amount
of the obligation cannot be determined with sufficient reliability.
The Group has undersigned the following guarantees:
IN € MILLION
Dec. 31,
2017 Dec. 31,
2016
Guarantees 5.9 5.2
These include rental guarantees and a guarantee in the amount of
EUR 4.1 million (previous year: EUR 4.1 million) arising from a con-
tract with the city of Munich to develop a property.
26 – Other financial liabilities
a) Obligations for equipment rental and service
The terms of the obligations for rental equipment and service contracts
are as follows:
IN € MILLION
Dec. 31,
2017 Dec. 31,
2016
Obligations due within 1 year 14.5 18.3
Obligations due in 1 to 5 years 24.7 26.9
Obligations due in more than 5 years 6.9 8.6
Total 46.1 53.8
These include obligations for rental and service contracts that cannot
be terminated with a term of one year or less in the amount of EUR
9.1 million (previous year: EUR 12.9 million), with a term of between
one and five years in the amount of EUR 21.5 million (previous year:
EUR 24.5 million) and with a term of over five years in the amount of
EUR 6.8 million (previous year: EUR 8.4 million).
b) Lease obligations
Finance lease obligations
When the Group is the lessee
The Group recognizes assets of less than EUR 0.1 million in connec-
tion with finance lease obligations.
Operating leases
When the Group is the lessee
To the extent that a Group member acts as a lessee, the lease pay-
ments are recognized as an expense over the term of the lease on a
straight-line basis. This essentially refers to leased vehicles, computer
hardware and other office equipment.
Outstanding commitments for future minimum lease payments under
operating leases that cannot be terminated can be seen in the follow-
ing table:
2017
IN € MILLION
Up to 1
year 1 to 5 years
Over 5 years Total
Future minimum lease payments (nominal) 5.6 4.5 0.2 10.3
2016
IN € MILLION
Up to 1
year 1 to 5 years
Over 5 years Total
Future minimum lease payments (nominal) 5.1 7.3 0.2 12.6
In 2017, EUR 6.0 million (previous year: EUR 5.3 million) was ex-
pensed from operating lease agreements.
When the Group is the lessor
The Group has concluded lease agreements with its customers for the
commercial rental of its equipment. These agreements can be termi-
nated at any time and as such it is not possible to specify minimum
lease payments. During the period under review, indirect lease pay-
ments amounting to EUR 0.9 million (previous year: EUR 2.7 million)
were recorded as income.
c) Obligations resulting from investment decisions /
takeback and purchase commitment obligations
Financial obligations ensuing from construction and investment pro-
jects amounting to EUR 2.8 million (previous year: EUR 2.7 million)
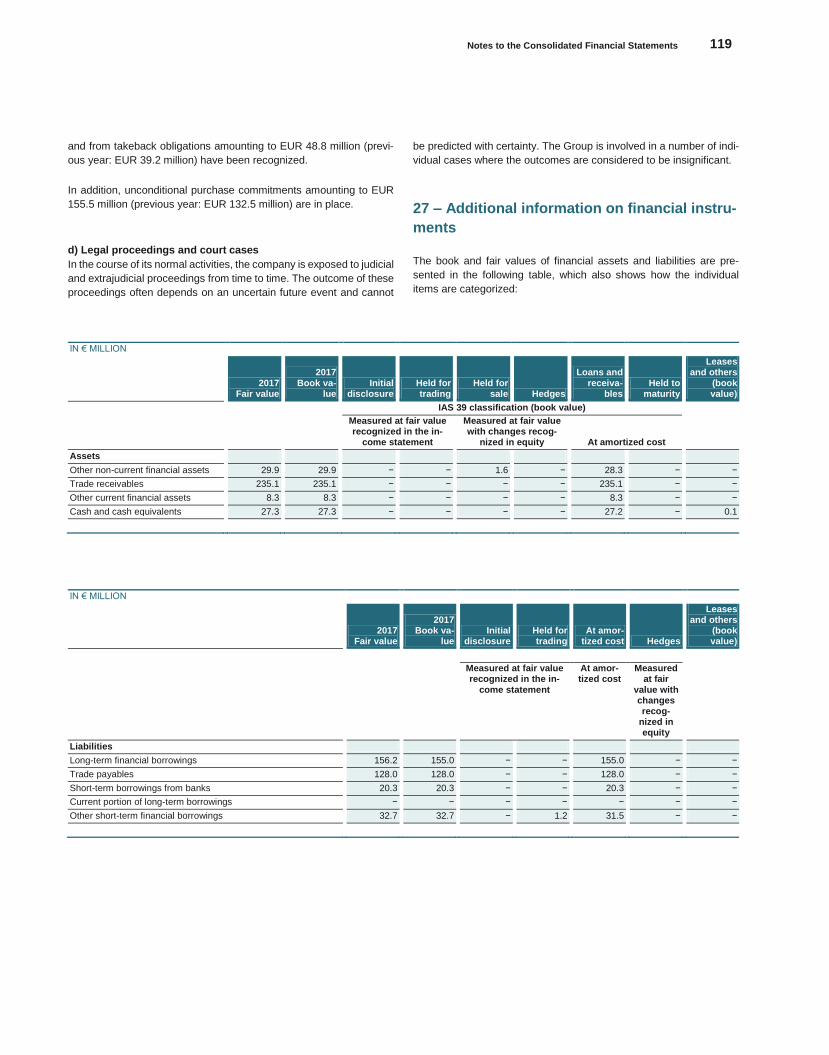
Notes to the Consolidated Financial Statements 119
Konze
rnabschlu
ss
and from takeback obligations amounting to EUR 48.8 million (previ-
ous year: EUR 39.2 million) have been recognized.
In addition, unconditional purchase commitments amounting to EUR
155.5 million (previous year: EUR 132.5 million) are in place.
d) Legal proceedings and court cases
In the course of its normal activities, the company is exposed to judicial
and extrajudicial proceedings from time to time. The outcome of these
proceedings often depends on an uncertain future event and cannot
be predicted with certainty. The Group is involved in a number of indi-
vidual cases where the outcomes are considered to be insignificant.
27 – Additional information on financial instru-
ments
The book and fair values of financial assets and liabilities are pre-
sented in the following table, which also shows how the individual
items are categorized:
IN € MILLION
2017
Fair value
2017 Book va-
lue Initial
disclosure Held for trading
Held for sale Hedges
Loans and receiva-
bles Held to
maturity
Leases and others
(book value)
IAS 39 classification (book value)
Measured at fair value recognized in the in-
come statement
Measured at fair value with changes recog-
nized in equity At amortized cost
Assets
Other non-current financial assets 29.9 29.9 − − 1.6 − 28.3 − −
Trade receivables 235.1 235.1 − − − − 235.1 − −
Other current financial assets 8.3 8.3 − − − − 8.3 − −
Cash and cash equivalents 27.3 27.3 − − − − 27.2 − 0.1
IN € MILLION
2017
Fair value
2017 Book va-
lue Initial
disclosure Held for trading
At amor-tized cost Hedges
Leases and others
(book value)
Measured at fair value recognized in the in-
come statement
At amor-tized cost
Measured at fair
value with changes recog-
nized in equity
Liabilities
Long-term financial borrowings 156.2 155.0 − − 155.0 − −
Trade payables 128.0 128.0 − − 128.0 − −
Short-term borrowings from banks 20.3 20.3 − − 20.3 − −
Current portion of long-term borrowings − − − − − − −
Other short-term financial borrowings 32.7 32.7 − 1.2 31.5 − −
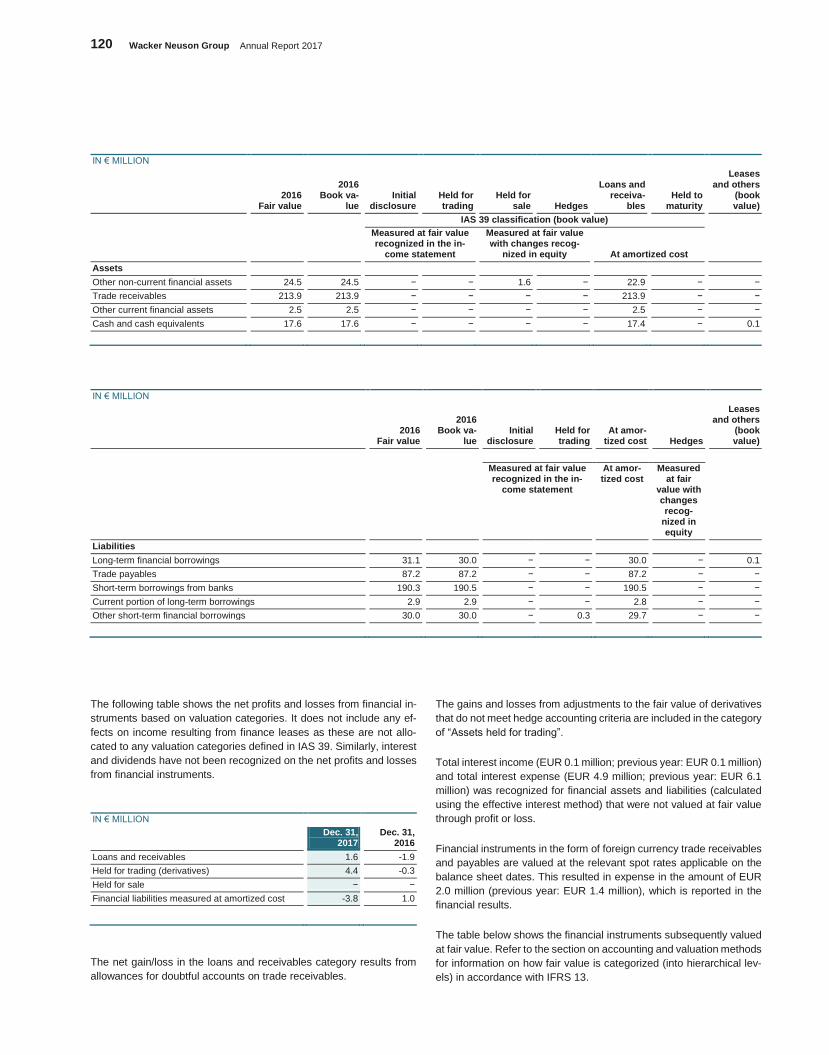
120 Wacker Neuson Group Annual Report 2017
IN € MILLION
2016
Fair value
2016 Book va-
lue Initial
disclosure Held for trading
Held for sale Hedges
Loans and receiva-
bles Held to
maturity
Leases and others
(book value)
IAS 39 classification (book value)
Measured at fair value recognized in the in-
come statement
Measured at fair value with changes recog-
nized in equity At amortized cost
Assets
Other non-current financial assets 24.5 24.5 − − 1.6 − 22.9 − −
Trade receivables 213.9 213.9 − − − − 213.9 − −
Other current financial assets 2.5 2.5 − − − − 2.5 − −
Cash and cash equivalents 17.6 17.6 − − − − 17.4 − 0.1
IN € MILLION
2016
Fair value
2016 Book va-
lue Initial
disclosure Held for trading
At amor-tized cost Hedges
Leases and others
(book value)
Measured at fair value recognized in the in-
come statement
At amor-tized cost
Measured at fair
value with changes recog-
nized in equity
Liabilities
Long-term financial borrowings 31.1 30.0 − − 30.0 − 0.1
Trade payables 87.2 87.2 − − 87.2 − −
Short-term borrowings from banks 190.3 190.5 − − 190.5 − −
Current portion of long-term borrowings 2.9 2.9 − − 2.8 − −
Other short-term financial borrowings 30.0 30.0 − 0.3 29.7 − −
The following table shows the net profits and losses from financial in-
struments based on valuation categories. It does not include any ef-
fects on income resulting from finance leases as these are not allo-
cated to any valuation categories defined in IAS 39. Similarly, interest
and dividends have not been recognized on the net profits and losses
from financial instruments.
IN € MILLION
Dec. 31,
2017 Dec. 31,
2016
Loans and receivables 1.6 -1.9
Held for trading (derivatives) 4.4 -0.3
Held for sale − −
Financial liabilities measured at amortized cost -3.8 1.0
The net gain/loss in the loans and receivables category results from
allowances for doubtful accounts on trade receivables.
The gains and losses from adjustments to the fair value of derivatives
that do not meet hedge accounting criteria are included in the category
of “Assets held for trading”.
Total interest income (EUR 0.1 million; previous year: EUR 0.1 million)
and total interest expense (EUR 4.9 million; previous year: EUR 6.1
million) was recognized for financial assets and liabilities (calculated
using the effective interest method) that were not valued at fair value
through profit or loss.
Financial instruments in the form of foreign currency trade receivables
and payables are valued at the relevant spot rates applicable on the
balance sheet dates. This resulted in expense in the amount of EUR
2.0 million (previous year: EUR 1.4 million), which is reported in the
financial results.
The table below shows the financial instruments subsequently valued
at fair value. Refer to the section on accounting and valuation methods
for information on how fair value is categorized (into hierarchical lev-
els) in accordance with IFRS 13.
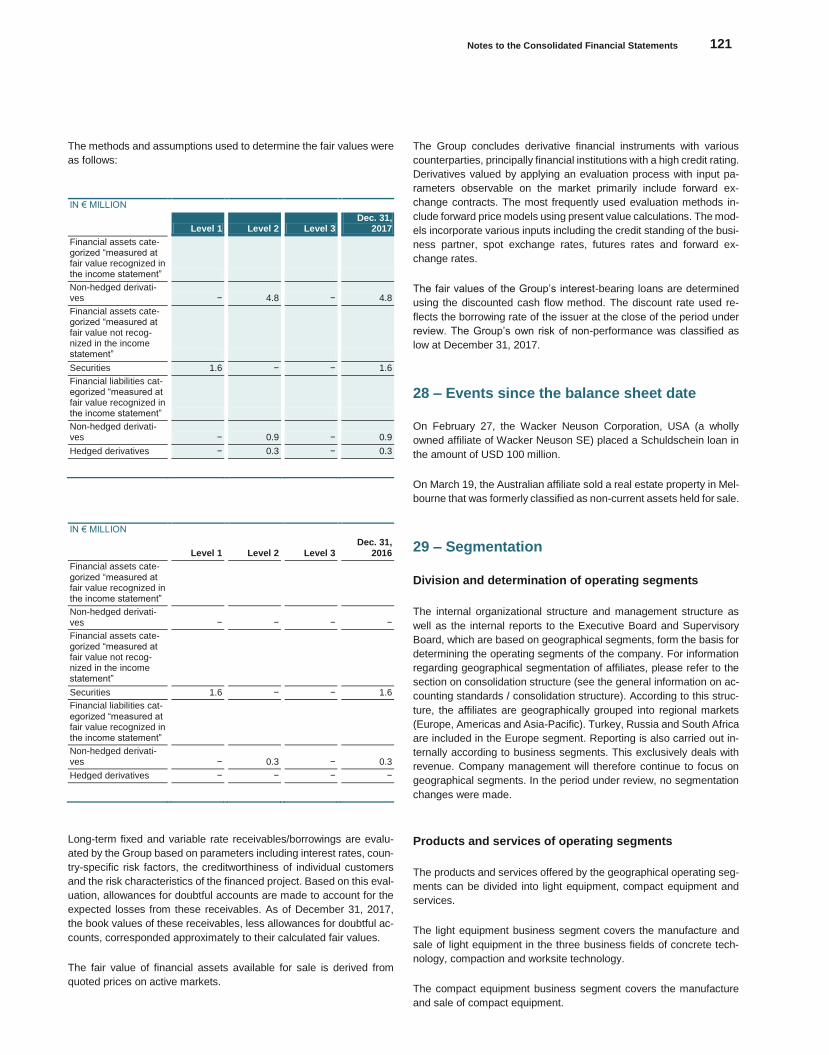
Notes to the Consolidated Financial Statements 121
Konze
rnabschlu
ss
The methods and assumptions used to determine the fair values were
as follows:
IN € MILLION
Level 1 Level 2 Level 3 Dec. 31,
2017
Financial assets cate-gorized “measured at fair value recognized in the income statement”
Non-hedged derivati-ves − 4.8 − 4.8
Financial assets cate-gorized “measured at fair value not recog-nized in the income statement”
Securities 1.6 − − 1.6
Financial liabilities cat-egorized “measured at fair value recognized in the income statement”
Non-hedged derivati-ves − 0.9 − 0.9
Hedged derivatives − 0.3 − 0.3
IN € MILLION
Level 1 Level 2 Level 3
Dec. 31, 2016
Financial assets cate-gorized “measured at fair value recognized in the income statement”
Non-hedged derivati-ves − − − −
Financial assets cate-gorized “measured at fair value not recog-nized in the income statement”
Securities 1.6 − − 1.6
Financial liabilities cat-
egorized “measured at fair value recognized in the income statement”
Non-hedged derivati-ves − 0.3 − 0.3
Hedged derivatives − − − −
Long-term fixed and variable rate receivables/borrowings are evalu-
ated by the Group based on parameters including interest rates, coun-
try-specific risk factors, the creditworthiness of individual customers
and the risk characteristics of the financed project. Based on this eval-
uation, allowances for doubtful accounts are made to account for the
expected losses from these receivables. As of December 31, 2017,
the book values of these receivables, less allowances for doubtful ac-
counts, corresponded approximately to their calculated fair values.
The fair value of financial assets available for sale is derived from
quoted prices on active markets.
The Group concludes derivative financial instruments with various
counterparties, principally financial institutions with a high credit rating.
Derivatives valued by applying an evaluation process with input pa-
rameters observable on the market primarily include forward ex-
change contracts. The most frequently used evaluation methods in-
clude forward price models using present value calculations. The mod-
els incorporate various inputs including the credit standing of the busi-
ness partner, spot exchange rates, futures rates and forward ex-
change rates.
The fair values of the Group’s interest-bearing loans are determined
using the discounted cash flow method. The discount rate used re-
flects the borrowing rate of the issuer at the close of the period under
review. The Group’s own risk of non-performance was classified as
low at December 31, 2017.
28 – Events since the balance sheet date
On February 27, the Wacker Neuson Corporation, USA (a wholly
owned affiliate of Wacker Neuson SE) placed a Schuldschein loan in
the amount of USD 100 million.
On March 19, the Australian affiliate sold a real estate property in Mel-
bourne that was formerly classified as non-current assets held for sale.
29 – Segmentation
Division and determination of operating segments
The internal organizational structure and management structure as
well as the internal reports to the Executive Board and Supervisory
Board, which are based on geographical segments, form the basis for
determining the operating segments of the company. For information
regarding geographical segmentation of affiliates, please refer to the
section on consolidation structure (see the general information on ac-
counting standards / consolidation structure). According to this struc-
ture, the affiliates are geographically grouped into regional markets
(Europe, Americas and Asia-Pacific). Turkey, Russia and South Africa
are included in the Europe segment. Reporting is also carried out in-
ternally according to business segments. This exclusively deals with
revenue. Company management will therefore continue to focus on
geographical segments. In the period under review, no segmentation
changes were made.
Products and services of operating segments
The products and services offered by the geographical operating seg-
ments can be divided into light equipment, compact equipment and
services.
The light equipment business segment covers the manufacture and
sale of light equipment in the three business fields of concrete tech-
nology, compaction and worksite technology.
The compact equipment business segment covers the manufacture
and sale of compact equipment.
122 Wacker Neuson Group Annual Report 2017
The services business segment houses the company’s activities in the
spare parts, maintenance and used equipment business fields.
Segment valuation methods
The intrasegment business transactions that were reported under
EBIT for the individual segments are listed in the consolidation col-
umn. Non-current assets are reported according to key countries.
Segment valuation methods are based on the valuation methods used
in internal reporting. Internal reporting is carried out exclusively in line
with the valid IFRS standards as applicable.
Transactions between the individual Group segments are based on
prices that also apply to third-party transactions.
Reporting format
Segment reporting is presented in the Notes to the Consolidated Fi-
nancial Statements on page 85 of this Annual Report.
Segment revenue and segment earnings, expressed as EBIT, are de-
rived from internal reporting. Figures from the individual companies
are added together to reach this EBIT figure. As the holding company,
Wacker Neuson SE is allocated to the Europe segment. Expenses for
the corporate services it provides are allocated in full to the individual
regional reportable segments.
The consolidation column reflects the eliminated transactions affecting
income that took place between operating segments. This primarily
refers to the consolidation of intercompany profits and losses from the
sale of goods.
Revenue from external customers, categorized according to products
and services, are recognized at company level. In addition, revenue
and non-current assets are reported according to key countries. No
individual customer accounted for more than 10 percent of Group rev-
enue.
30 – Cash flow statement
The cash flow statement is prepared in accordance with IAS 7. It re-
ports cash flows resulting from operating activities, from investing ac-
tivities and from financing activities. Insofar as changes in cash and
cash equivalents are due to foreign exchange rate fluctuations, these
are reported separately. The determination of cash flow from operating
activities was derived using the indirect method.
Current liquid funds comprise cash and cash equivalents that are as
reported on the balance sheet. Short-term borrowings from banks in
the notional Group cash pool were offset against cash and cash equiv-
alents.
Please refer to item 16 in these Notes to see the breakdown of current
liquid funds.
Non-cash operating expenses and income as well as gains or losses
on the sale of property, plant and equipment have been eliminated
from the cash flow from operating activities.
Actuarial gains or losses from pension obligations (2017: gain of EUR
0.9 million; previous year: loss of EUR 6.0 million) have been allocated
to changes in provisions to improve readability. In the past, the change
in provisions resulted primarily from non-cash changes in the actuarial
valuation of pensions. Currency effects from the valuation of receiva-
bles and payables in foreign currencies and from the valuation of cash
and cash equivalents in the financial result are also recognized in the
“Financial result” correction line in the consolidated cash flow state-
ment. The previous year's figures were voluntarily adjusted in line with
IAS 8.29 (b) in this regard.
Cash flow from operating activities now includes net change in rental
equipment as a separate item. This is intended to provide greater
transparency over the Group's operating activities in relation to cash
flow, in line with the change in balance sheet reporting. In contrast with
the previous year's reporting, the new item includes
- Book value from the disposal of rental equipment amounting to
EUR 23.7 million (previous year: EUR 20.2 million)
- Write-downs on rental equipment amounting to EUR 32.6 million
(previous year: EUR 28.6 million)
- Investments in rental equipment amounting to EUR 71.7 million
(previous year: EUR 58.4 million)
Write-downs on rental equipment were a component of the overall
write-down total in the previous year's reporting.
Cash flow from investment activities comprises the cash outlay for tan-
gible and intangible assets less divestments. In the previous year, in-
vestments in rental equipment were reported as investments in prop-
erty, plant and equipment. These are now included as a component of
the item “Change in rental equipment, net” for the reasons stated
above. The previous year's reporting was voluntarily adjusted in line
with IAS 8.29 (b) in this regard.
Notes to the Consolidated Financial Statements 123
Konze
rnabschlu
ss
Cash flow from financing activities contains payments received from
and made to shareholders. It also contains payments resulting from
the borrowing and repayment of debt. After re-evaluating the book-
ings, the Group decided to move interest received in the amount of
EUR 2.6 million (previous year: EUR 1.4 million), primarily attributable
to financing measures for the expansion of sales activities, from cash
flow from operating activities to cash flow from financing activities. This
was done to improve general presentation and transparency. Further-
more, interest paid in the amount of EUR 9.2 million (previous year:
EUR 8.1 million), primarily attributable to borrowings, was moved from
cash flow from operating activities to cash flow from financing activi-
ties. This was also done to improve general presentation and trans-
parency. The previous year’s figures were adjusted accordingly in both
cases.
Refer to the consolidated cash flow statement for information regard-
ing the change to liabilities from financing activities based on cash
flows. The Group also reported unrealized currency gains in the
amount of EUR 1.6 million for fiscal 2017. No other matters have come
to the Group’s attention that would lead to a change in liabilities from
financing activities.
31 – Risk management
Capital management
A key aim of the Group’s capital management policy is to maintain a
high equity ratio to support its business activities.
The Group actively controls and modifies its capital structure in line
with changing market dynamics. The goal of the capital management
policy is to secure the Group’s business and investment activities in
the long term. To maintain a suitable capital structure, the Group can
propose changes to dividend payments to shareholders or issue new
shares. As of December 31, 2017 and December 31, 2016 respec-
tively, no changes were made to objectives, guidelines or procedures
within the framework of the capital structure control policy. The Group
monitors its capital using net financial debt resulting from current net
financial liabilities and non-current financial liabilities as an indicator.
The minimum capital requirements for equity stipulated under German
stock legislation have been fulfilled. Equity is subject to an external
minimum capital requirement of 30 percent due to the Schuldschein
loan agreement in the amount of EUR 30.0 million, which is due for
repayment in February 2019. For further information, please refer to
item 21 “Financial liabilities” in these Notes.
IN € MILLION
Dec. 31,
2017 Dec. 31,
2016
Current financial liabilities 20.3 193.4
Short-term financial liabilities 20.3 190.5
Current portion of long-term financial liabilities − 2.9
Non-current financial liabilities 154.9 30.0
Total equity before minority interests 1,114.8 1,087.2
Total capitalization 1,290.0 1,310.6
IN € MILLION
Dec. 31,
2017 Dec. 31,
2016
Current net financial liabilities -7.0 175.8
Short-term liabilities 20.3 193.4
plus liquid funds -27.3 -17.6
Net financial debt 147.9 205.8
Current net financial liabilities -7.0 175.8
plus non-current financial liabilities 154.9 30.0
Financial risk factors
Due to the global scope of its operations, the Group is exposed to var-
ious financial risks, including foreign currency risks, credit risks, liquid-
ity risks and interest rate risks. The comprehensive risk management
policy of the Group is focused on the unpredictability of developments
in financial markets and aims to minimize any potential negative im-
pact on the Group’s financial position. It is a general policy of the com-
pany to reduce these risks by systematic financial management. In
particular, the Group employs selective derivative financial instru-
ments to hedge against certain risks.
The Group finance department is responsible for risk management in
accordance with the rules and guidelines approved by the Executive
Board. It identifies, evaluates and hedges against financial risks in
close cooperation with the operating units of the Group. The Executive
Board sets guidelines for risk management as well as fixed policies for
specific areas of risk. These include dealing with foreign currency
risks, interest rate risks and credit risks.
The guidelines also specify how derivative and other financial instru-
ments and liquidity surpluses are to be used.
Currency risks
Currency risks arise from expected future transactions, assets and li-
abilities reported in the balance sheet, as well as from net investments
in a currency that diverges from the functional currency. Exchange
risks are naturally hedged by offsetting receivables against payables
in a given currency.
If the USD/EUR exchange rate increased or decreased by 5 percent,
changes in the financial assets and liabilities reported in the balance
sheet in US dollars would have the following impact on profit before
tax and equity:
2017 2016
USD currency trends as a % +5.00/-5.00 +5.00/-5.00
Impact on profit before tax (EBT) in € K 0.8/-1.1 0.5/-0.7
Impact on equity in € K -1.6/1.6 0.5/-0.7
124 Wacker Neuson Group Annual Report 2017
Group profit was hardly affected by significant exchange rate fluctua-
tions relevant to the international flow of goods due to natural currency
hedging, primarily with regard to the euro/US dollar. In 2017, the av-
erage EUR/USD exchange rate was EUR 1 to USD 1.13 (previous
year: EUR 1 to USD 1.11).
The Group is also subject to currency risks from individual transactions
resulting from purchases and sales executed by a Group member in a
currency other than the functional currency.
Credit risks
The Group is not exposed to any material credit risks (default risks).
Contracts for derivative financial instruments and financial transac-
tions are concluded only with financial institutions with a high credit
rating in order to keep the risk of default by the contracting party as
low as possible. The book value of financial assets recognized in the
Consolidated Financial Statements represents the maximum default
risk. For further information on the book value of financial assets,
please refer to item 27 “Additional information on financial instru-
ments” in these Notes.
Continued weakness on construction and financial markets in some
countries may present certain Group customers with financial difficul-
ties, possibly culminating in insolvency. This would lead to a rise in
accounts receivable and a subsequent increased risk of default. The
Group is counteracting the risk of changes in individual customers’
payment patterns through its active accounts receivable management
policy, partner “health checks” and tools such as credit hedging.
Interest rate risks
Interest rate risks are caused by market fluctuations in interest rates.
On the one hand, they impact the amount of interest payments for
which the Group is liable. On the other hand, they influence the fair
value of financial instruments.
The following balance sheet items include variable-interest cash and
cash equivalents, and liabilities which are subject to interest rate risks.
IN € MILLION
Dec. 31,
2017 Dec. 31,
2016
Cash and cash equivalents 27.3 17.6
Long-term borrowings 154.9 30.0
Short-term borrowings 20.3 190.5
Current portion of long-term borrowings − 2.9
202.5 241.0
The following table shows how changes in interest rates that could be
reasonably expected would impact the Group’s earnings before tax
based on the impact this would have on variable interest rate loans
and balances.
The fixed-interest Schuldschein loan agreement was not included
when calculating the impact on earnings. For more information, see
item 21 “Financial liabilities” in these Notes.
The effects on Group earnings before tax also reflect the impact on
equity.
IN € MILLION
2017 2016
Increase in interest rates of 0.2% -0.4 -0.5
Decrease in interest rates of 0.2% 0.4 0.5
Liquidity risks
Liquidity risks involve the availability of funds needed to meet payment
obligations on time. The company is assured of a supply of liquid funds
at all times by the lines of credit it is not currently using. Liquidity is
managed by the Group’s treasury department via a Group-wide cash
pool system. Please refer to item 21 “Financial liabilities” in these
Notes for further information, also on existing credit lines and financial
covenants.
32 – Executive bodies
Executive Board
In the year under review, the Executive Board comprised the following
three/four members:
Cem Peksaglam, CEO, responsible for Group strategy, mergers
and acquisitions, investor relations and corporate communication,
legal matters, real estate, HR, compliance, and sustainability (until
August 31, 2017)
Martin Lehner, CEO (from September 1, 2017), responsible for
procurement, production, technology, quality, strategy, investor re-
lations, corporate communication, sustainability, compliance, HR
and legal matters
Wilfried Trepels, responsible for finance, IT, auditing and real es-
tate
Jan Willem Jongert, responsible for sales, logistics, service and
marketing (until January 9, 2017)
Alexander Greschner, responsible for sales, logistics, service and
marketing (from January 10, 2017)
The members of the Executive Board do not have any additional Su-
pervisory Board positions or seats on comparable supervisory com-
mittees for German or foreign commercial companies outside of the
Wacker Neuson Group.
Notes to the Consolidated Financial Statements 125
Konze
rnabschlu
ss
Supervisory Board
The following are members of the Supervisory Board of Wacker Neu-
son SE or were Supervisory Board members during the year under
review:
Johann Neunteufel, engineer, Chairman of the PIN Private Trust
(PIN Privatstiftung), Linz, Austria; Chairman of the Supervisory
Board
Hans Haßlach, Chairman of the Kramer-Werke GmbH Works
Council (until January 31, 2017), Deputy Chairman of the Group
Works Council (until January 31, 2017), Deputy Chairman of the
SE Works Council (until January 31, 2017), Uhldingen-Mühlhofen,
Germany (until June 11, 2017)
Christian Kekelj, Chairman of the Central Works Council, Chair-
man of the Munich Works Council, Oberschleißheim, Germany
(since June 12, 2017)
Kurt Helletzgruber, Board member of the PIN PrivateTrust (PIN
Privatstiftung), Linz, Austria
Prof. Dr. Matthias Schüppen, attorney at law, auditor, tax adviser
and partner at the Graf Kanitz, Schüppen & Partner law firm,
Stuttgart, Germany
Elvis Schwarzmair, Chairman of the Reichertshofen Works Coun-
cil, Chairman of the Group Works Council and SE Works Council,
Rohrbach, Germany
Ralph Wacker, civil engineer and managing partner of
wacker+mattner GmbH, Munich, Germany; Deputy Chairman of
the Supervisory Board
In accordance with the Articles of Incorporation, the terms of office of
the Supervisory Board members listed above will run until the close of
the AGM that tables a resolution to formally approve the actions taken
by Wacker Neuson SE in fiscal 2019. The terms may be no longer
than six years.
The following members of the Supervisory Board have additional su-
pervisory board positions or seats on comparable supervisory commit-
tees for German or foreign companies:
Johann Neunteufel
Chairman of the Supervisory Board of Allgemeine Sparkasse
Oberösterreich Bankaktiengesellschaft, Linz, Austria
Prof. Dr. Matthias Schüppen
Chairman of the Supervisory Board of ACCERA AG, Mannheim,
Germany
For information on the remuneration of the Executive Board and Su-
pervisory Board, as well as remuneration of former Board members,
please refer to item 33 “Related party disclosures” in these Notes.
126 Wacker Neuson Group Annual Report 2017
33 – Related party disclosures
For the Group, related party disclosures within the meaning of IAS 24
generally refers to shareholders and entities over which shareholders
have control or significant influence (sister companies, members of the
Executive Board and members of the Supervisory Board).
Key trade relations with related parties during the period under review
were as follows:
IN € MILLION
Current re-ceivables
Dec. 31, 2017
Current payables Dec. 31,
2017
Expenses for busi-
ness transac-
tions 2017
Income for business transac-
tions 2017
Relations with shareholders − − 0.6 0.7
Relations with sister companies − − 0.7 0.2
Total − − 1.3 0.9
IN € MILLION
Current re-ceivables
Dec. 31, 2016
Current payables Dec. 31,
2016
Expenses for busi-
ness transac-
tions 2016
Income for business transac-
tions 2016
Relations with shareholders 0.2 0.2 0.5 0.7
Relations with sister companies 0.2 − 0.7 0.4
Total 0.4 0.2 1.2 1.1
Relations with shareholders resulted mainly from goods and services
traded with a shareholder; namely Wacker Werke GmbH, a compe-
tence center for concrete compaction. The goods and services deliv-
ered to this shareholder were valued at EUR 0.6 million (previous year:
EUR 0.7 million). These were counterbalanced with goods and ser-
vices received from the shareholder to the value of EUR 0.7 million
(previous year: EUR 0.5 million). The goods and services were traded
under the terms customary in the market, as agreed with third parties.
Relations with sister companies and entities over which shareholders
have control or significant influence resulted mainly from deliveries
and rental arrangements between affiliates and entities over which
shareholders have control or significant influence. The goods and ser-
vices were traded under the terms customary in the market, as agreed
with third parties.
Total remuneration for the Executive Board in the fiscal year under
review amounted to EUR 4.7 million (previous year: EUR 3.5 million).
This includes one-off effects in the amount of EUR 0.4 million for reor-
ganization of the Executive Board. Furthermore, post-employment
benefits and termination benefits were paid to former Executive Board
members in the amount of EUR 2.7 million.Total remuneration for the
Supervisory Board in the year under review amounted to EUR 0.5 mil-
lion (previous year: EUR 0.5 million). At the AGM on May 31, 2016, a
resolution was passed in line with Section 286 (5) sentence 1, Section
314 (3) sentence 1 and Section 315a (1) HGB to refrain from itemizing
this information in accordance with Section 285 no. 9a sentences 5-8
and Section 314 (1) no. 6a sentences 5-8 HGB in conjunction with
Section 315a (1) HGB. At the closing date, short-term payables to the
Executive Board were outstanding in the amount of EUR 2.1 million
(previous year: EUR 1.6 million), as well as other long-term payables
in the amount of EUR 0.5 million.
Retirement commitments were agreed upon for members of the Exec-
utive Board. The value of pension obligations at the end of the fiscal
year amounted to EUR 5.5 million (previous year: EUR 4.5 million).
The increase in the present value of pension obligations (addition)
amounted to EUR 1.0 million (previous year: allocation of EUR 0.1
million). The present value of pension obligations corresponds to obli-
gations before netting with plan assets and before any possible actu-
arial gains or losses that have not yet been recognized. For more de-
tailed information, please refer to item 19 “Provisions for pensions and
similar obligations” in these Notes.
Pension agreements are also in place for former members of the Ex-
ecutive Board. The value of these pension obligations at the end of
the fiscal year came to EUR 34.0 million (previous year: EUR 33.9
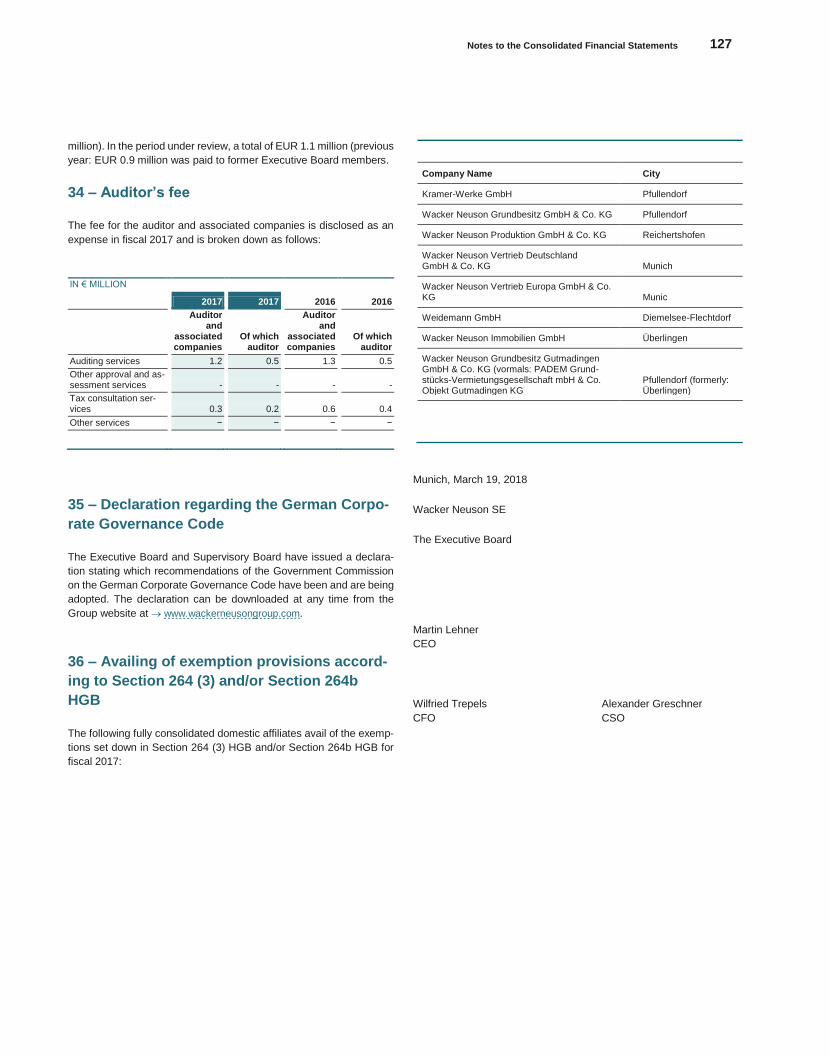
Notes to the Consolidated Financial Statements 127
Konze
rnabschlu
ss
million). In the period under review, a total of EUR 1.1 million (previous
year: EUR 0.9 million was paid to former Executive Board members.
34 – Auditor’s fee
The fee for the auditor and associated companies is disclosed as an
expense in fiscal 2017 and is broken down as follows:
IN € MILLION
2017 2017 2016 2016
Auditor and
associated companies
Of which auditor
Auditor and
associated companies
Of which auditor
Auditing services 1.2 0.5 1.3 0.5
Other approval and as-sessment services - - - -
Tax consultation ser-vices 0.3 0.2 0.6 0.4
Other services − − − −
35 – Declaration regarding the German Corpo-
rate Governance Code
The Executive Board and Supervisory Board have issued a declara-
tion stating which recommendations of the Government Commission
on the German Corporate Governance Code have been and are being
adopted. The declaration can be downloaded at any time from the
Group website at www.wackerneusongroup.com.
36 – Availing of exemption provisions accord-
ing to Section 264 (3) and/or Section 264b
HGB
The following fully consolidated domestic affiliates avail of the exemp-
tions set down in Section 264 (3) HGB and/or Section 264b HGB for
fiscal 2017:
Company Name City
Kramer-Werke GmbH Pfullendorf
Wacker Neuson Grundbesitz GmbH & Co. KG Pfullendorf
Wacker Neuson Produktion GmbH & Co. KG Reichertshofen
Wacker Neuson Vertrieb Deutschland GmbH & Co. KG Munich
Wacker Neuson Vertrieb Europa GmbH & Co. KG Munic
Weidemann GmbH Diemelsee-Flechtdorf
Wacker Neuson Immobilien GmbH Überlingen
Wacker Neuson Grundbesitz Gutmadingen GmbH & Co. KG (vormals: PADEM Grund-stücks-Vermietungsgesellschaft mbH & Co. Objekt Gutmadingen KG
Pfullendorf (formerly: Überlingen)
Munich, March 19, 2018
Wacker Neuson SE
The Executive Board
Martin Lehner
CEO
Wilfried Trepels Alexander Greschner
CFO CSO
128 Wacker Neuson Group Anual Report 2017
Responsibility Statement by Management
“To the best of our knowledge, and in accordance with the applicable
reporting principles, the Consolidated Financial Statements give a true
and fair view of the assets, liabilities, financial position and profit or
loss of the Wacker Neuson Group, and that the Consolidated Manage-
ment Report includes a fair review of the development and perfor-
mance of the business and the position of the Wacker Neuson Group
respectively the parent company Wacker Neuson SE, together with a
description of the principal opportunities and risks associated with the
expected development of the Wacker Neuson Group respectively the
parent company Wacker Neuson SE.”
Munich, March 19, 2018
Wacker Neuson SE, Munich
The Executive Board
Martin Lehner
CEO
Alexander Greschner Wilfried Trepels
CSO CFO
Notes to the Consolidated Financial Statements 129
Konze
rnabschlu
ss
Independent Auditor’s Report
To Wacker Neuson SE, Munich, Germany
Report on the audit of the Consolidated Financial
Statements and Group Management Report
Audit opinion
We have audited the Consolidated Financial Statements of Wacker
Neuson SE, Munich, Germany, and its subsidiaries (the Group), which
comprise the consolidated income statement and consolidated state-
ment of comprehensive income for the fiscal year from January 1,
2017 through December 31, 2017, the consolidated balance sheet as
at December 31, 2017, and the consolidated statement of changes in
equity, consolidated cash flow statement and consolidated segmenta-
tion for the fiscal year from January 1, 2017 through December 31,
2017, along with the Notes to the Consolidated Financial Statements,
including a summary of significant accounting policies. We also au-
dited the Group Management Report of Wacker Neuson SE, which
has been consolidated with the Management Report of Wacker Neu-
son SE, for the fiscal year from January 1, 2017 through December
31, 2017.
In our opinion, based on the findings of our audit:
The accompanying Consolidated Financial Statements comply in all
material respects with the International Financial Reporting Stand-
ards (IFRS) as adopted by the EU, and with the additional require-
ments under German law pursuant to Section 315e (1) of the Ger-
man Commercial Code (HGB). In accordance with these require-
ments, the Consolidated Financial Statements give a true and fair
view of the net assets and financial position of the Group as at De-
cember 31, 2017, as well as of the results of its operations for the
fiscal year from January 1, 2017 through December 31, 2017.
The accompanying Group Management Report as a whole provides
a suitable view of the Group’s position. In all material respects, this
Group Management Report is consistent with the Consolidated Fi-
nancial Statements, complies with German legal requirements and
suitably presents the opportunities and risks of future development.
Pursuant to Section 322 (3) sentence 1 HGB, we declare that our audit
has not led to any reservations regarding the Consolidated Financial
Statements or the Group Management Report.
Basis for audit opinion
We conducted our audit of the Consolidated Financial Statements and
Group Management Report in accordance with Section 317 HGB and
with EU Regulation no. 537/2014 (hereinafter “EU Audit Regulation”),
in compliance with the generally accepted German standards for the
audit of financial statements promulgated by Germany’s Institut der
Wirtschaftsprüfer (Institute of Public Auditors; IDW). Our responsibili-
ties under these regulations and standards are further described in the
“Auditor’s responsibilities for the audit of the Consolidated Financial
Statements and Group Management Report” section of our auditor’s
report. We are independent of Group companies in accordance with
European legislation and German commercial and professional regu-
lations and we have fulfilled our other German auditing responsibilities
in line with these requirements. Pursuant to Article 10 (2) (f) of the EU
Audit Regulation, we additionally declare that we have provided no
prohibited non-audit services under Article 5 (1), EU Audit Regulation.
We believe that the audit evidence we have obtained is sufficient and
appropriate to provide a basis for our
opinion on the Consolidated Financial Statements and on the Group
Management Report.
Key audit matters relating to the Consolidated Financial
Statements
Key audit matters are those matters that, in our professional judgment,
were of most significance in our audit of the Consolidated Financial
Statements for the fiscal year from January 1, 2017 through December
31, 2017. These matters were addressed in the context of our audit of
the Consolidated Financial Statements as a whole, and in forming our
opinion thereon, and we do not provide a separate opinion on these
matters.
The following is a description of the key audit matters in our view:
1. Revenue recognition and deferral
Reasons for identification as key audit matter
The Group generates revenue from the sale of light and compact con-
struction equipment, including used equipment, from equipment rent-
als within Europe and from the supply of spare parts and repair ser-
vices. Distribution takes place either in the form of direct sales or
through sales partners, in particular dealers, rental companies and
strategic partners with whom cooperation agreements are established.
Due to the wide range of products and diverse sales channels and
service offerings, including a variety of guarantee periods, customer
financing and customer bonus models, there is a risk of inaccurately
recognized revenue in relation to the amount of sales revenue rec-
orded and time of recognition. Sales revenue is also a key perfor-
mance indicator. Against this backdrop, revenue recognition and de-
ferral was one of the most significant matters within our audit.
130 Wacker Neuson Group Annual Report 2017
Auditing procedure
We assessed whether the Group’s accounting policies with regard to
revenue recognition and deferral provide a suitable basis for preparing
the Consolidated Financial Statements in compliance with IFRS prin-
ciples. We examined the revenue recognition and deferral processes
and tested the effectiveness of the implemented controls in terms of
accurate revenue recognition and deferral. We performed analytical
audit procedures, in particular a comparison of monthly sales revenue
and gross margins with figures from the corresponding periods of the
previous year. To assess revenue recognition and deferrals appropri-
ate to the period under review, we compared sales revenues recorded
during the year and at year-end with invoices and delivery documents
on a sample basis. Our audit procedures did not lead to any reserva-
tions regarding revenue recognition or deferral.
Reference to related information
With regard to the accounting and valuation principles applied to rev-
enue recognition and deferral, we refer to the information provided
within the Notes to the Consolidated Financial Statements in the sec-
tion “Accounting and valuation methods – realization of revenue, in-
come and expenses” as well as to item 1, “Revenue”.
2. Inventory write-downs
Reasons for identification as key audit matter
The Group’s inventories comprise raw materials and supplies, work in
process and finished products, and used equipment and spare parts.
The value impairment for each inventory category is estimated based
on the age structure of the inventories, as well as on historical experi-
ence and information and on expected future market demand and
market prices. Given the relevance of inventories to the Consolidated
Financial Statements, the range of inventory categories and the scope
for discretion with regard to valuation, impairment losses on invento-
ries constituted a key audit matter.
Auditing procedure
We examined the process and controls in place for determining value
impairment along with the underlying methods and assumptions. We
performed analytical audit procedures, in particular comparing inven-
tories and impairment losses with those of the previous year, with the
average inventory turnover rate and with the ratio of impairment losses
to inventories. We also tested the process used to determine value
impairment for completeness by conducting a comparison with stock
lists. We reconciled the underlying historical experience and infor-
mation with prior-year data and outgoing invoices. We assessed im-
pairment losses recognized for consistency with historical experience
and information and with expected future market demand. We com-
pared the findings from our inventory observations regarding poten-
tially obsolete inventories with the impairment losses recognized. Our
audit procedures did not lead to any reservations regarding impair-
ment losses on inventory.
Reference to related information
With regard to the accounting and valuation principles applied to im-
pairment losses on inventory, we refer to the information provided
within the Notes to the Consolidated Financial Statements in the sec-
tion “Accounting and valuation methods – inventories” as well as to
item 13, “Inventories”.
3. Recognition and measurement of uncertain tax posi-
tions
Reasons for identification as key audit matter
The recognition and measurement of uncertain tax positions was one
of the most significant matters within our audit, as it requires a high
degree of discretionary decisions, estimates and assumptions on the
part of Management.
Auditing procedure
In collaboration with internal tax specialists, we examined the pro-
cesses and internal controls in place for identifying, recognizing and
measuring the Group’s tax positions. Within the scope of our audit pro-
cedures with regard to uncertain tax positions, we assessed whether
Management’s evaluation of the tax effects of significant business
transactions that might result in uncertain tax positions or have an im-
pact on the recognition and measurement of existing uncertain tax po-
sitions is in accordance with tax law and the applicable jurisdiction. In
order to assess the recognition and measurement of uncertain tax po-
sitions, we also considered the opinions of external experts on individ-
ual matters. Our audit procedures did not lead to any reservations re-
garding the recognition and measurement of uncertain tax positions.
Reference to related information
With regard to the accounting and valuation principles applied to the
recognition and measurement of uncertain tax positions, we refer to
the information provided within the Notes to the Consolidated Finan-
cial Statements in the section “Accounting and valuation methods –
deferred tax expense” and under “Taxes on income and earnings” in
the section “Material discretionary powers, estimates and assump-
tions” as well as to item 6, “Taxes on income” and item 23, “Other
current liabilities”.
Other information
The Supervisory Board is responsible for the Supervisory Board re-
port. Management is otherwise responsible for the rest of the other
information. The other information consists of the following elements
intended for the Annual Report: “Figures at a glance”, “To our share-
holders”, “Our share in 2017”, declaration on corporate governance,
corporate governance report, ten-year comparison, responsibility
statement by Management and report by the Supervisory Board. We
received a copy of this other information before issuing this audit re-
port.
Our opinion on the Consolidated Financial Statements and on the
Group Management Report does not cover the other information. Ac-
cordingly, we do not express an opinion or give any other form of as-
surance conclusion thereon.
In connection with our audit, our responsibility is to read the other in-
formation and, in doing so, consider whether the other information:
Notes to the Consolidated Financial Statements 131
Konze
rnabschlu
ss
Is materially inconsistent with the Consolidated Financial State-
ments, with the Group Management Report or with our knowledge
obtained during the audit
Otherwise appears to be materially misstated
Management and Supervisory Board responsibilities for
the Consolidated Financial Statements and Group Man-
agement Report
Management is responsible for the preparation of the Consolidated
Financial Statements in accordance with IFRS as adopted by the EU
and with the additional requirements of German commercial law pur-
suant to Section 315e (1) HGB in all material respects and for ensuring
that the Consolidated Financial Statements give a true and fair view of
the net assets, financial position and results of operations of the Group
in accordance with these requirements. Additionally, Management is
responsible for the internal controls it has determined necessary to
enable the preparation of Consolidated Financial Statements that are
free from material misstatement, whether due to fraud or error.
In preparing the Consolidated Financial Statements, Management is
responsible for assessing the Group’s ability to continue as a going
concern. It also has a responsibility to disclose, as applicable, matters
related to the Group’s ability to continue as a going concern. It is Man-
agement’s responsibility to apply the going concern basis of account-
ing unless Management intends either to liquidate the Group or to
cease operations, or has no realistic alternative but to do so.
Furthermore, Management is responsible for the preparation of a
Group Management Report that as a whole provides a suitable view
of the Group’s position and is, in all material respects, consistent with
the Consolidated Financial Statements, complies with German legal
requirements and suitably presents the opportunities and risks of fu-
ture development. Management is also responsible for the provisions
and measures (systems) it has deemed necessary to enable the prep-
aration of a Group Management Report in accordance with the appli-
cable requirements under German law and to ensure sufficient appro-
priate evidence can be supplied for the statements contained in the
Group Management Report.
The Supervisory Board is responsible for overseeing the Group’s fi-
nancial reporting process for the preparation of the Consolidated Fi-
nancial Statements and Group Management Report.
Auditor’s responsibilities for the audit of the Consolidated
Financial Statements and Group Management Report
Our objectives are to obtain reasonable assurance about whether the
Consolidated Financial Statements as a whole are free from material
misstatement, either due to fraud or error, and whether the Group
Management Report as a whole provides a suitable view of the
Group’s position and is, in all material respects, consistent with the
Consolidated Financial Statements and with the findings of our audit,
complies with German legal requirements and suitably presents the
opportunities and risks of future development; as well as to issue an
auditor’s report that includes our opinion on the Consolidated Financial
Statements and on the Group Management Report.
Reasonable assurance is a high level of assurance, but is not a guar-
antee that an audit conducted in accordance with Section 317 HGB
and with the EU Audit Regulation, in compliance with the generally
accepted German standards for the audit of financial statements
promulgated by the IDW, will always detect a material misstatement if
it exists. Misstatements can arise from fraud or error and are consid-
ered material if, individually or in the aggregate, they could reasonably
be expected to influence the financial decisions of the target audience
taken on the basis of these Consolidated Financial Statements or
Group Management Report.
We exercise due professional judgment and discretion, and maintain
an appropriate level of professional skepticism throughout the audit.
We also:
Identify and assess the risks of material misstatement – whether
due to fraud or error – in Consolidated Financial Statements and
Group Management Report, design and perform audit procedures
responsive to those risks, and obtain audit evidence that is sufficient
and appropriate to provide a basis for our opinion. The risk of not
detecting a material misstatement resulting from fraud is higher than
for one resulting from error, as fraud may involve collusion, forgery,
intentional omissions, misrepresentations, or the override of internal
controls.
Obtain an understanding of the internal control system relevant to
auditing the Consolidated Financial Statements and of the provi-
sions and measures relevant to auditing the Group Management
Report in order to design audit procedures that are appropriate in
the circumstances, but not for the purpose of expressing an opinion
on the effectiveness of these systems.
Evaluate the appropriateness of the accounting policies used and
the reasonableness of accounting estimates and related disclo-
sures made by Management.
Conclude on the appropriateness of Management’s application of
the going concern basis of accounting and, based on the audit evi-
dence obtained, determine whether a material uncertainty exists re-
lated to events or conditions that may cast significant doubt on the
Group’s ability to continue as a going concern. If we conclude that
a material uncertainty exists, we are required to draw attention in
our auditor’s report to the related disclosures in the Consolidated
Financial Statements and Group Management Report or, if such
disclosures are inadequate, to modify our relevant audit opinion.
Our conclusions are based on the audit evidence obtained up to the
date of our auditor’s report. However, future events or conditions
may cause the Group to cease to continue as a going concern.
Evaluate the overall presentation, structure and content of the Con-
solidated Financial Statements, including the disclosures, and de-
termine whether the Consolidated Financial Statements represent
the underlying transactions and events in a manner that gives a true
and fair view of the net assets, financial position and results of op-
erations of the Group in accordance with IFRS as adopted by the
EU and with the additional requirements of German commercial law
pursuant to Section 315e (1) HGB.
Obtain sufficient appropriate audit evidence regarding the financial
accounting information of the entities or business activities within
132 Wacker Neuson Group Annual Report 2017
the Group to express an opinion on the Consolidated Financial
Statements and on the Group Management Report. We are respon-
sible for the direction, supervision and performance of the Group
audit. We remain solely responsible for our audit opinions.
Evaluate alignment between the Group Management Report and
the Consolidated Financial Statements, as well as its compliance
with legislation and its presentation of the Group’s situation.
Perform audit procedures in relation to the forward-looking state-
ments expressed by Management in the Group Management Re-
port. In particular, based on sufficient appropriate audit evidence,
we trace the significant assumptions underlying the forward-looking
statements by Management and evaluate the appropriate derivation
of the forward-looking statements from these assumptions. How-
ever, we do not provide a separate audit opinion on the forward-
looking statements or underlying assumptions. There remains a sig-
nificant and unavoidable risk that future events may differ materially
from the forward-looking statements.
We communicate with those charged with governance regarding,
among other matters, the planned scope and timing of the audit and
significant audit findings, including any deficiencies in the internal con-
trol system that we identify during our audit.
We also provide those charged with governance with a statement that
we have complied with the relevant requirements regarding independ-
ence, and discuss with them all relationships and other matters that
may reasonably be thought have an impact on our independence,
along with any related safeguards in this respect.
From the matters discussed with those charged with governance, we
determine those matters that were of most significance in auditing the
Consolidated Financial Statements for the current reporting period and
therefore constitute key audit matters. We describe these matters in
our auditor’s report unless laws or other regulations preclude public
disclosure of the matter in question.
Other legal and regulatory requirements
Further disclosures under Article 10, EU Audit Regulation
We were elected as the official auditor of the Group by the Annual
General Meeting on May 30, 2017. We were appointed by the Super-
visory Board on May 30, 2017. We have been engaged as the official
auditor for Wacker Neuson SE and the Group since fiscal 2012 without
interruption.
We declare that the opinions contained in this auditor’s report are con-
sistent with the additional report to the Audit Committee under Article
11, EU Audit Regulation (auditor’s report).
In addition to auditing the financial statements for the Group compa-
nies, we performed the following services not disclosed in the Consol-
idated Financial Statements or Group Management Report: voluntary
auditing of financial statements as well as other confirmation services
in connection with the review of the non-financial Group statement.
Responsible auditor
The public auditor responsible for this audit is Peter von Wachter.
Munich, March 19, 2018
Ernst & Young GmbH
Wirtschaftsprüfungsgesellschaft
Keller von Wachter
Wirtschaftsprüfer (Public Auditor) Wirtschaftsprüfer (Public Auditor)
Further Information 133
Konze
rnabschlu
ss
Weiter e Infor mationen
Glossare
Technical Glossary
C
Compact equipment
Group’s strategic business segment. Compact equipment covers ma-
chinery weighing up to 15 tons, particularly wheel loaders and tele-
scopic wheel loaders, skid-steer loaders, four-wheel and track dump-
ers, telescopic handlers as well as mobile and compact excavators.
Compaction
Group’s business field in the light equipment segment. Equipment in
this field is used for compacting soil and asphalt during the construc-
tion of trenches, roads, paths, foundations and industrial buildings. It
includes products such as rammers, vibratory plates and rollers.
Concrete technology
Group’s business field in the light equipment segment. The equipment
is used to compact concrete when laying concrete walls, ceilings and
floors and includes internal and external vibrators as well as trowels
for applying a smooth finish to concrete surfaces.
D
dual power
This dual drive system for compact excavators enables conventional
diesel-powered excavators to be operated in zero-emissions mode
simply by connecting an external electro-hydraulic unit to the excava-
tor’s undercarriage.
Dumpers
Track- or wheel-based machines in the compact equipment segment
primarily used for transporting backfill material.
E
ECO
Seal awarded by Wacker Neuson to products and solutions that are
particularly environmentally friendly (ECOlogy) and cost efficient
(ECOnomy).
H
Heavy equipment
Large construction machinery defined by the company as having a to-
tal weight of over fifteen tons, typically transported to construction sites
for specific projects and operated by specially trained users.
Hoftrac®
Compact wheel loaders made primarily for stable/barn and yard work
in the agricultural sector. Their compact footprint makes them highly
maneuverable and ideal for indoor work. Hoftrac® loaders are signifi-
cantly narrower and more compact than conventional wheel loaders
and have a smaller turning radius.
Hydronic heaters
Mobile heating equipment to thaw frozen ground, heat buildings and
cure concrete at sub-zero conditions, making construction work less
dependent on weather conditions (for example in regions with long
winters such as Canada, Alaska, Russia and Scandinavia).
I
Internal vibrators
Used for concrete compaction, mainly on construction sites. These vi-
brators comprise eccentric weights driven by an electrical motor,
which are encased in a water-tight steel tube so that they can be sub-
merged in fresh concrete.
L
Light equipment
Group’s strategic business segment. It covers predominantly hand-
held, remote control or ride-on equipment weighing up to 3 tons in the
strategic business fields of concrete technology, compaction and
worksite technology.
R
Rammers
First developed in the 1930s by the Wacker Neuson, this pioneering
product is used in soil and asphalt compaction, particularly in small
spaces and even narrow trenches.
134 Wacker Neuson Group Annual Report 2017
S
Skid steer loaders
Small loaders with four wheel drive steering or rubber tracks. They
offer excellent maneuverability thanks to their skid steering system.
They can also be equipped with a wide range of attachments, making
them a flexible option for a wide range of jobs.
T
Telescopic handlers
Like wheel loaders, these compact machines are ideal for the con-
struction and agricultural sectors. Telescopic handlers, however, fea-
ture a detached cabin and support very high lifting heights despite their
compact dimensions. The telescopic arm on the tail provides these
machines with a strong lever effect.
Trowels
Trowels are used to smooth concrete surfaces, in particular freshly
poured concrete, for example, in industrial buildings.
V
Vibratory plate
Soil and asphalt compaction devices, mainly used to precompact foun-
dation soil and compact paving stones. They travel forwards and back-
wards, and can also be equipped with remote control technology.
W
Wheel loaders
Articulated and all-wheel drive wheel loaders are extreme versatile
machines. Thanks to a broad range of attachments and technologies,
they are the perfect choice for a host of jobs, including transporting
and stacking material.
Worksite technology
Group’s business field in the light equipment segment. Equipment in
this field is used for compacting soil and asphalt during the construc-
tion of trenches, roads, paths, foundations and industrial buildings. It
includes products such as rammers, vibratory plates and rollers.
Z
Zero emissions
A range of electrically powered light and compact equipment ideal in
particular for use on indoor construction sites and in areas sensitive to
noise and emissions – such as residential zones, schools or hospitals.
Zero emissions products are particularly effective at protecting both
users and the environment.
Zero-tail excavators
The housing of zero-tail excavators does not protrude over the tracks
when the superstructure rotates (360°). Zero-tail excavators can be
used directly next to walls as they will not cause any damage when
rotating.
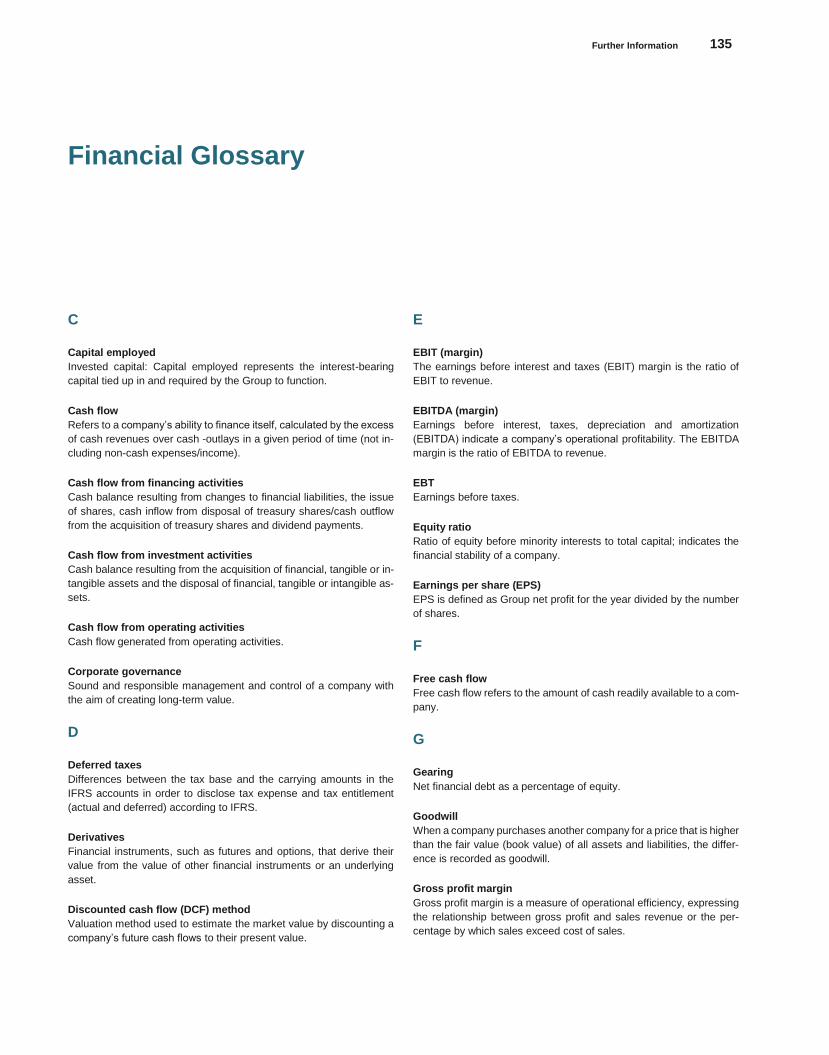
Further Information 135
Konze
rnabschlu
ss
Financial Glossary
C
Capital employed
Invested capital: Capital employed represents the interest-bearing
capital tied up in and required by the Group to function.
Cash flow
Refers to a company’s ability to finance itself, calculated by the excess
of cash revenues over cash outlays in a given period of time (not in-
cluding non-cash expenses/income).
Cash flow from financing activities
Cash balance resulting from changes to financial liabilities, the issue
of shares, cash inflow from disposal of treasury shares/cash outflow
from the acquisition of treasury shares and dividend payments.
Cash flow from investment activities
Cash balance resulting from the acquisition of financial, tangible or in-
tangible assets and the disposal of financial, tangible or intangible as-
sets.
Cash flow from operating activities
Cash flow generated from operating activities.
Corporate governance
Sound and responsible management and control of a company with
the aim of creating long-term value.
D
Deferred taxes
Differences between the tax base and the carrying amounts in the
IFRS accounts in order to disclose tax expense and tax entitlement
(actual and deferred) according to IFRS.
Derivatives
Financial instruments, such as futures and options, that derive their
value from the value of other financial instruments or an underlying
asset.
Discounted cash flow (DCF) method
Valuation method used to estimate the market value by discounting a
company’s future cash flows to their present value.
E
EBIT (margin)
The earnings before interest and taxes (EBIT) margin is the ratio of
EBIT to revenue.
EBITDA (margin)
Earnings before interest, taxes, depreciation and amortization
(EBITDA) indicate a company’s operational profitability. The EBITDA
margin is the ratio of EBITDA to revenue.
EBT
Earnings before taxes.
Equity ratio
Ratio of equity before minority interests to total capital; indicates the
financial stability of a company.
Earnings per share (EPS)
EPS is defined as Group net profit for the year divided by the number
of shares.
F
Free cash flow
Free cash flow refers to the amount of cash readily available to a com-
pany.
G
Gearing
Net financial debt as a percentage of equity.
Goodwill
When a company purchases another company for a price that is higher
than the fair value (book value) of all assets and liabilities, the differ-
ence is recorded as goodwill.
Gross profit margin
Gross profit margin is a measure of operational efficiency, expressing
the relationship between gross profit and sales revenue or the per-
centage by which sales exceed cost of sales.
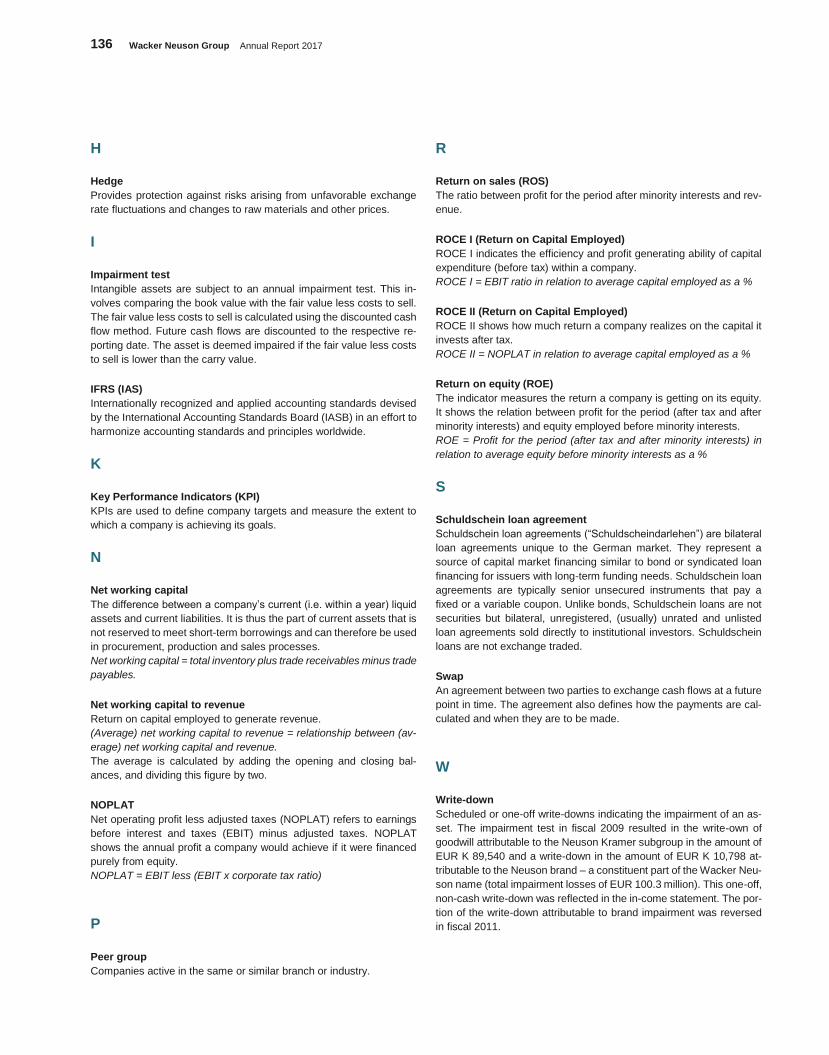
136 Wacker Neuson Group Annual Report 2017
H
Hedge
Provides protection against risks arising from unfavorable exchange
rate fluctuations and changes to raw materials and other prices.
I
Impairment test
Intangible assets are subject to an annual impairment test. This in-
volves comparing the book value with the fair value less costs to sell.
The fair value less costs to sell is calculated using the discounted cash
flow method. Future cash flows are discounted to the respective re-
porting date. The asset is deemed impaired if the fair value less costs
to sell is lower than the carry value.
IFRS (IAS)
Internationally recognized and applied accounting standards devised
by the International Accounting Standards Board (IASB) in an effort to
harmonize accounting standards and principles worldwide.
K
Key Performance Indicators (KPI)
KPIs are used to define company targets and measure the extent to
which a company is achieving its goals.
N
Net working capital
The difference between a company’s current (i.e. within a year) liquid
assets and current liabilities. It is thus the part of current assets that is
not reserved to meet short-term borrowings and can therefore be used
in procurement, production and sales processes.
Net working capital = total inventory plus trade receivables minus trade
payables.
Net working capital to revenue
Return on capital employed to generate revenue.
(Average) net working capital to revenue = relationship between (av-
erage) net working capital and revenue.
The average is calculated by adding the opening and closing bal-
ances, and dividing this figure by two.
NOPLAT
Net operating profit less adjusted taxes (NOPLAT) refers to earnings
before interest and taxes (EBIT) minus adjusted taxes. NOPLAT
shows the annual profit a company would achieve if it were financed
purely from equity.
NOPLAT = EBIT less (EBIT x corporate tax ratio)
P
Peer group
Companies active in the same or similar branch or industry.
R
Return on sales (ROS)
The ratio between profit for the period after minority interests and rev-
enue.
ROCE I (Return on Capital Employed)
ROCE I indicates the efficiency and profit generating ability of capital
expenditure (before tax) within a company.
ROCE I = EBIT ratio in relation to average capital employed as a %
ROCE II (Return on Capital Employed)
ROCE II shows how much return a company realizes on the capital it
invests after tax.
ROCE II = NOPLAT in relation to average capital employed as a %
Return on equity (ROE)
The indicator measures the return a company is getting on its equity.
It shows the relation between profit for the period (after tax and after
minority interests) and equity employed before minority interests.
ROE = Profit for the period (after tax and after minority interests) in
relation to average equity before minority interests as a %
S
Schuldschein loan agreement
Schuldschein loan agreements (“Schuldscheindarlehen”) are bilateral
loan agreements unique to the German market. They represent a
source of capital market financing similar to bond or syndicated loan
financing for issuers with long-term funding needs. Schuldschein loan
agreements are typically senior unsecured instruments that pay a
fixed or a variable coupon. Unlike bonds, Schuldschein loans are not
securities but bilateral, unregistered, (usually) unrated and unlisted
loan agreements sold directly to institutional investors. Schuldschein
loans are not exchange traded.
Swap
An agreement between two parties to exchange cash flows at a future
point in time. The agreement also defines how the payments are cal-
culated and when they are to be made.
W
Write-down
Scheduled or one-off write-downs indicating the impairment of an as-
set. The impairment test in fiscal 2009 resulted in the write-own of
goodwill attributable to the Neuson Kramer subgroup in the amount of
EUR K 89,540 and a write-down in the amount of EUR K 10,798 at-
tributable to the Neuson brand – a constituent part of the Wacker Neu-
son name (total impairment losses of EUR 100.3 million). This one-off,
non-cash write-down was reflected in the in-come statement. The por-
tion of the write-down attributable to brand impairment was reversed
in fiscal 2011.
Further Information 137
Konze
rnabschlu
ss
Write-up
This involves making an upward adjustment to the carrying value of
an asset. If the impairment test reveals that the reasons for the write-
down of an asset in a previous accounting period no longer prevail,
IAS 36 provides for the reversal of impairment up to the maximum
amount of the historic cost under other intangible assets (brands, tech-
nologies, customer pool). This reversal is recognized in the income
statement. IAS 36 specifically prohibits the reversal of impairment
losses for goodwill.
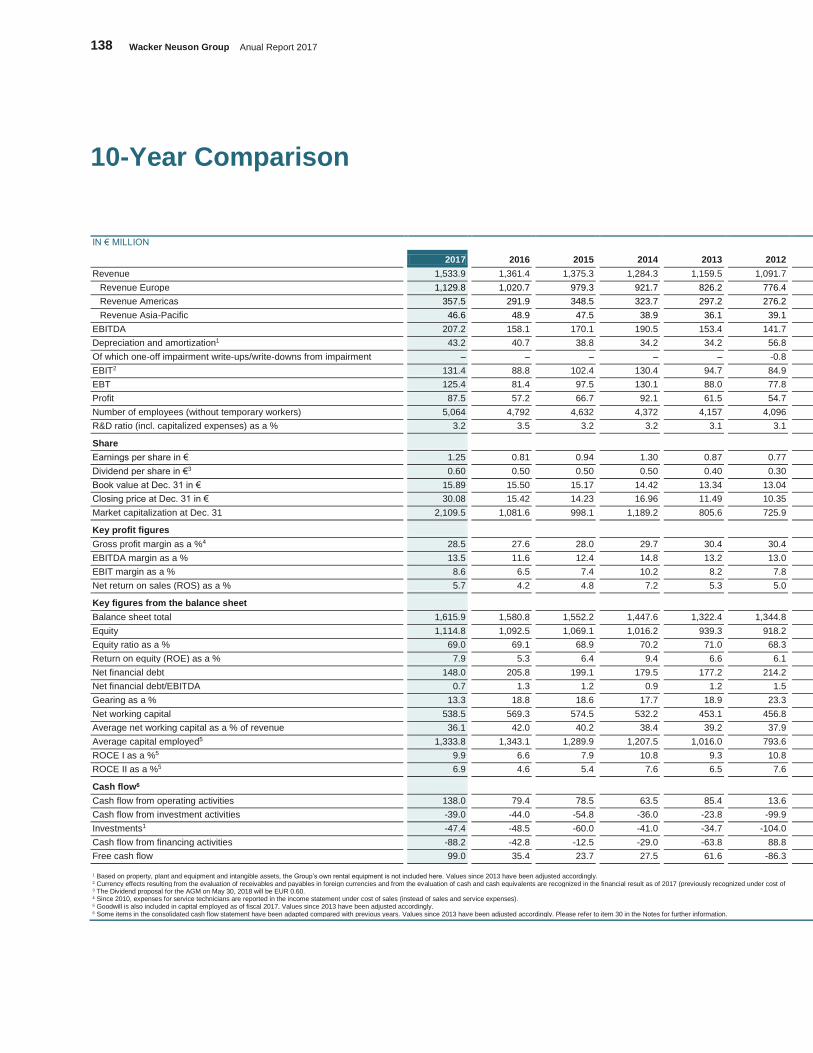
138 Wacker Neuson Group Anual Report 2017
10-Year Comparison
IN € MILLION
2017 2016 2015 2014 2013 2012
Revenue 1,533.9 1,361.4 1,375.3 1,284.3 1,159.5 1,091.7
Revenue Europe 1,129.8 1,020.7 979.3 921.7 826.2 776.4
Revenue Americas 357.5 291.9 348.5 323.7 297.2 276.2
Revenue Asia-Pacific 46.6 48.9 47.5 38.9 36.1 39.1
EBITDA 207.2 158.1 170.1 190.5 153.4 141.7
Depreciation and amortization1 43.2 40.7 38.8 34.2 34.2 56.8
Of which one-off impairment write-ups/write-downs from impairment – – – – – -0.8
EBIT2 131.4 88.8 102.4 130.4 94.7 84.9
EBT 125.4 81.4 97.5 130.1 88.0 77.8
Profit 87.5 57.2 66.7 92.1 61.5 54.7
Number of employees (without temporary workers) 5,064 4,792 4,632 4,372 4,157 4,096
R&D ratio (incl. capitalized expenses) as a % 3.2 3.5 3.2 3.2 3.1 3.1
Share
Earnings per share in € 1.25 0.81 0.94 1.30 0.87 0.77
Dividend per share in €3 0.60 0.50 0.50 0.50 0.40 0.30
Book value at Dec. 31 in € 15.89 15.50 15.17 14.42 13.34 13.04
Closing price at Dec. 31 in € 30.08 15.42 14.23 16.96 11.49 10.35
Market capitalization at Dec. 31 2,109.5 1,081.6 998.1 1,189.2 805.6 725.9
Key profit figures
Gross profit margin as a %4 28.5 27.6 28.0 29.7 30.4 30.4
EBITDA margin as a % 13.5 11.6 12.4 14.8 13.2 13.0
EBIT margin as a % 8.6 6.5 7.4 10.2 8.2 7.8
Net return on sales (ROS) as a % 5.7 4.2 4.8 7.2 5.3 5.0
Key figures from the balance sheet
Balance sheet total 1,615.9 1,580.8 1,552.2 1,447.6 1,322.4 1,344.8
Equity 1,114.8 1,092.5 1,069.1 1,016.2 939.3 918.2
Equity ratio as a % 69.0 69.1 68.9 70.2 71.0 68.3
Return on equity (ROE) as a % 7.9 5.3 6.4 9.4 6.6 6.1
Net financial debt 148.0 205.8 199.1 179.5 177.2 214.2
Net financial debt/EBITDA 0.7 1.3 1.2 0.9 1.2 1.5
Gearing as a % 13.3 18.8 18.6 17.7 18.9 23.3
Net working capital 538.5 569.3 574.5 532.2 453.1 456.8
Average net working capital as a % of revenue 36.1 42.0 40.2 38.4 39.2 37.9
Average capital employed5 1,333.8 1,343.1 1,289.9 1,207.5 1,016.0 793.6
ROCE I as a %5 9.9 6.6 7.9 10.8 9.3 10.8
ROCE II as a %5 6.9 4.6 5.4 7.6 6.5 7.6
Cash flow6
Cash flow from operating activities 138.0 79.4 78.5 63.5 85.4 13.6
Cash flow from investment activities -39.0 -44.0 -54.8 -36.0 -23.8 -99.9
Investments1 -47.4 -48.5 -60.0 -41.0 -34.7 -104.0
Cash flow from financing activities -88.2 -42.8 -12.5 -29.0 -63.8 88.8
Free cash flow 99.0 35.4 23.7 27.5 61.6 -86.3 1 Based on property, plant and equipment and intangible assets, the Group’s own rental equipment is not included here. Values since 2013 have been adjusted accordingly. 2 Currency effects resulting from the evaluation of receivables and payables in foreign currencies and from the evaluation of cash and cash equivalents are recognized in the financial result as of 2017 (previously recognized under cost of (previously recognized under cost of sales as well as other income and/or other expenses). Values from 2014 onwards have been adjusted accordingly. 3 The Dividend proposal for the AGM on May 30, 2018 will be EUR 0.60. 4 Since 2010, expenses for service technicians are reported in the income statement under cost of sales (instead of sales and service expenses). 5 Goodwill is also included in capital employed as of fiscal 2017. Values since 2013 have been adjusted accordingly.
6 Some items in the consolidated cash flow statement have been adapted compared with previous years. Values since 2013 have been adjusted accordingly. Please refer to item 30 in the Notes for further information.
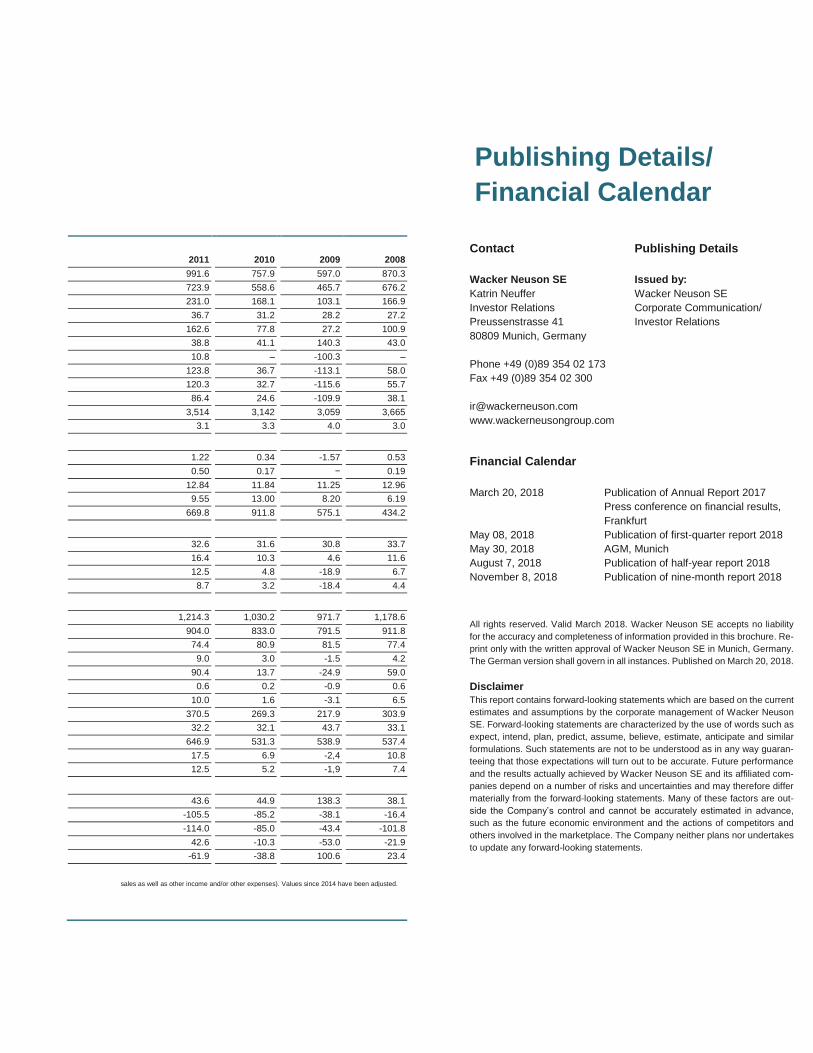
Konze
rnabschlu
ss
2011 2010 2009 2008
991.6 757.9 597.0 870.3
723.9 558.6 465.7 676.2
231.0 168.1 103.1 166.9
36.7 31.2 28.2 27.2
162.6 77.8 27.2 100.9
38.8 41.1 140.3 43.0
10.8 – -100.3 –
123.8 36.7 -113.1 58.0
120.3 32.7 -115.6 55.7
86.4 24.6 -109.9 38.1
3,514 3,142 3,059 3,665
3.1 3.3 4.0 3.0
1.22 0.34 -1.57 0.53
0.50 0.17 − 0.19
12.84 11.84 11.25 12.96
9.55 13.00 8.20 6.19
669.8 911.8 575.1 434.2
32.6 31.6 30.8 33.7
16.4 10.3 4.6 11.6
12.5 4.8 -18.9 6.7
8.7 3.2 -18.4 4.4
1,214.3 1,030.2 971.7 1,178.6
904.0 833.0 791.5 911.8
74.4 80.9 81.5 77.4
9.0 3.0 -1.5 4.2
90.4 13.7 -24.9 59.0
0.6 0.2 -0.9 0.6
10.0 1.6 -3.1 6.5
370.5 269.3 217.9 303.9
32.2 32.1 43.7 33.1
646.9 531.3 538.9 537.4
17.5 6.9 -2,4 10.8
12.5 5.2 -1,9 7.4
43.6 44.9 138.3 38.1
-105.5 -85.2 -38.1 -16.4
-114.0 -85.0 -43.4 -101.8
42.6 -10.3 -53.0 -21.9
-61.9 -38.8 100.6 23.4
sales as well as other income and/or other expenses). Values since 2014 have been adjusted.
Publishing Details/
Financial Calendar
Contact Publishing Details
Wacker Neuson SE
Katrin Neuffer
Investor Relations
Preussenstrasse 41
80809 Munich, Germany
Phone +49 (0)89 354 02 173
Fax +49 (0)89 354 02 300
www.wackerneusongroup.com
Issued by:
Wacker Neuson SE
Corporate Communication/
Investor Relations
Financial Calendar
March 20, 2018
May 08, 2018
May 30, 2018
August 7, 2018
November 8, 2018
Publication of Annual Report 2017
Press conference on financial results,
Frankfurt
Publication of first-quarter report 2018
AGM, Munich
Publication of half-year report 2018
Publication of nine-month report 2018
All rights reserved. Valid March 2018. Wacker Neuson SE accepts no liability
for the accuracy and completeness of information provided in this brochure. Re-
print only with the written approval of Wacker Neuson SE in Munich, Germany.
The German version shall govern in all instances. Published on March 20, 2018.
Disclaimer
This report contains forward-looking statements which are based on the current
estimates and assumptions by the corporate management of Wacker Neuson
SE. Forward-looking statements are characterized by the use of words such as
expect, intend, plan, predict, assume, believe, estimate, anticipate and similar
formulations. Such statements are not to be understood as in any way guaran-
teeing that those expectations will turn out to be accurate. Future performance
and the results actually achieved by Wacker Neuson SE and its affiliated com-
panies depend on a number of risks and uncertainties and may therefore differ
materially from the forward-looking statements. Many of these factors are out-
side the Company’s control and cannot be accurately estimated in advance,
such as the future economic environment and the actions of competitors and
others involved in the marketplace. The Company neither plans nor undertakes
to update any forward-looking statements.

Wacker Neuson GroupPreußenstraße 41, 80809 MünchenTelefon +49 - (0)89 - 354 02 - 0Fax +49 - (0)89 - 354 02 - 300www.wackerneusongroup.com