ANNUAL REPORT 2017 - Linamar Annual Rep… · We are pleased to report to you on another very...
69
ANNUAL REPORT 2017 Linamar Corporation
Transcript of ANNUAL REPORT 2017 - Linamar Annual Rep… · We are pleased to report to you on another very...

ANNUAL REPORT 2017
Linamar Corporation

TABLE OF CONTENTS
1
1. Letter to Our Shareholders ........................................................................................................................................................................ 2
2. Management Discussion and Analysis .................................................................................................................................................... 10
3. Consolidated Financial Statements ........................................................................................................................................................ 30 Management’s Responsibility for the Consolidated Financial Statements .............................................................................................. 31 Independent Auditor’s Report .................................................................................................................................................................. 32 Consolidated Statements of Financial Position ....................................................................................................................................... 33 Consolidated Statements of Earnings ..................................................................................................................................................... 34 Consolidated Statements of Comprehensive Earnings ........................................................................................................................... 35 Consolidated Statements of Changes in Equity ...................................................................................................................................... 36 Consolidated Statements of Cash Flows ................................................................................................................................................. 37 Notes to the Consolidated Financial Statements 1 General Information ........................................................................................................................................................................... 38 2 Basis of Preparation .......................................................................................................................................................................... 38 3 Significant Accounting Policies .......................................................................................................................................................... 38 4 Changes in Accounting Policies ........................................................................................................................................................ 44 5 Critical Accounting Estimates and Judgements................................................................................................................................. 45 6 Long-Term Receivables..................................................................................................................................................................... 46 7 Sale of Receivables ........................................................................................................................................................................... 47 8 Inventories ......................................................................................................................................................................................... 47 9 Income Taxes .................................................................................................................................................................................... 48 10 Property, Plant and Equipment .......................................................................................................................................................... 50 11 Intangible Assets ............................................................................................................................................................................... 51 12 Goodwill ............................................................................................................................................................................................. 52 13 Provisions .......................................................................................................................................................................................... 53 14 Long-Term Debt ................................................................................................................................................................................ 53 15 Capital Stock ..................................................................................................................................................................................... 55 16 Expenses by Nature .......................................................................................................................................................................... 56 17 Employee Benefits ............................................................................................................................................................................. 56 18 Share-Based Compensation ............................................................................................................................................................. 56 19 Other Income and (Expenses) ........................................................................................................................................................... 57 20 Finance (Income) and Expenses ....................................................................................................................................................... 58 21 Earnings per Share ............................................................................................................................................................................ 58 22 Commitments .................................................................................................................................................................................... 58 23 Related Party Transactions ............................................................................................................................................................... 59 24 Segmented Information ..................................................................................................................................................................... 59 25 Business Acquisitions ........................................................................................................................................................................ 61 26 Supplemental Cash Flow Information ................................................................................................................................................ 62 27 Financial Instruments ........................................................................................................................................................................ 63
4. Annual Meeting of Shareholders ............................................................................................................................................................. 68
5. Officers and Directors .............................................................................................................................................................................. 68
6. Auditors, Transfer Agent and Registrar ................................................................................................................................................... 68

2
LETTER TO OUR SHAREHOLDERS
Linamar Corporation

3
LETTER TO OUR SHAREHOLDERS We are pleased to report to you on another very successful year at Linamar, another record in our history in terms of both sales and earnings performance. This represents seven consecutive years of record results which we are very proud of!! We would characterize 2017 as another year of strong growth driving out of innovation in all of our businesses, a great deepening of our global bench and reach, and solid financial and operational performance through simplification and accountability which is exactly what we set out to do at the outset of the year.
Growth Through Bold Innovation We enjoyed a very successful year in 2017 in terms of outstanding performance for our customers, development of our innovation agenda and securing strategically significant business wins, notably in key EV platforms, to continue to support our growth into the future. Our long term market strategies are taking clearer shape, none more so than our Agriculture/Food Business where we made great strides with our acquisition of MacDon, a leader in harvesting equipment. New Business Wins and quote levels are at record highs and market share is growing in each of our businesses. Innovation Innovation continues to play a key role in driving our competitiveness by meeting customer/consumer needs and enabling our growth. Our innovation agenda has 3 key paths; product innovation to develop products our customers need, process innovation to find ways to produce those products as cost effectively as possible and material development to continue to drive lighter, stronger materials to improve product efficiency. Clearly, our product innovation agenda on the vehicle side is about light weighting, electrification, fuel efficiency and noise reduction regardless of the type of vehicle. Our talented R&D team worked hard on several exciting e-axle gearbox programs for Battery Electric Vehicles (BEV) which resulted in 2 major wins in the last year. Annual volume should exceed 1 million units on these programs by the early 2020’s representing 20-25% of expected BEV’s to be produced annually by that time. At Skyjack innovation continues to focus on simple, high quality designs that our customers can rely on. We are taking that same concept to the digital world as well for Skyjack in terms of telematics to better manage next generation equipment. Both are winning innovation strategies helping us to grow market share. Skyjack also continues to innovate on the product side by the ongoing development and launch of new boom products and telehandlers which are helping to deepen our market share in these products globally. Our rental house customers love the simple designs that keep our product in the field delivering revenue and not in the shop costing money. We are also driving many design enhancements to meet customer needs for efficient use in the field – features such as omni-directional wheels to manoeuver the base without changing machine orientation, terrain detection and laser targeting systems to enhance path selections to name a few. At MacDon, innovation has long been the driver of business resulting in market leading products in all key categories. MacDon boasts more than 100 unique patents and continues to drive the next generation of harvesting technology with their development team. The inventor of the rigid and then FlexDraperTM, MacDon drove a harvesting transformation to dramatically improve yield which they continue to evolve to stay a step ahead of the competition. Process innovation happens every day in every plant and office as we continually challenge ourselves to find a better, quicker, more reliable, less costly way to do the work we do. We set new levels of achievement for ourselves this year in terms of our improvement systems and goals with great success which resulted in terrific bottom line performance. A key enabler in this regard is the whole field of Artificial Intelligence and Machine Learning. Southern Ontario is the leading global hub for research and development in this field and Linamar’s proximity to such is giving us a key advantage in terms of access to the latest thinking and technology in this field. We have several projects underway including:
Development of advanced collaborative robots to drive more efficient and safer automation;
Creation of data collection and analysis systems to identify ways to improve equipment uptime, improve tool life and reduce cycle times;
Evolving vision systems to more accurately gauge and inspect products for better product integrity; and
Assessing other processes of analysis and prediction that can be more efficiently and accurately done by machine.
4
Today we have nearly 1,600 advanced robots, 600 vision systems and 1,000 traceability systems in our global facilities. 1,300 of our machines are connected into our global connected system, LMMS, and more are being added every day in a major global initiative around continued digitization. LMMS is an internally developed monitoring system from which we can remotely track performance on every machine in a line. We intend to implement LMMS in every facility globally in 2018. In 2017 we took innovation to a new level at Linamar with our newly formed Innovation Group. The Group scouts interesting technologies the world over who are looking for manufacturing partners to help take their ideas to global markets. We have found some great technologies and are launching production for the first of them in our plants. A great example was an innovative “in wheel” suspension concept for the wheels of the future we found in Israel. We entered into a strategic partnership with the Israeli company, Softwheel who developed the technology to be their manufacturing partner. Sold today to the wheelchair and city bike program market, this technology has great long term potential on the automotive side as well. Long Term Market Strategy Progress Driving Diversification into the Food/Agriculture Market Diversification was another key focus for 2017 which we made significant progress in, and in which innovation played a key role. In the fourth quarter we announced the acquisition of MacDon Industries, a global leader in harvesting equipment. Agriculture/Food is a key long term growth market globally given the growing & developing global population and one in which Linamar has a long history. The move further diversifies Linamar beyond traditional automotive powertrain / driveline manufacturing into exciting new growth fields. As noted, MacDon is an innovative market leader with number one market share in all key products. We see significant growth potential and upside opportunities given the agricultural market is in the early stages of a cyclical recovery. Further there is a large untapped addressable global market opportunity and synergies with global distribution networks for our existing agricultural products. Finally we believe it was a financially attractive deal for which we paid a fair price that is immediately accretive to earnings and cash flow even before synergies. MacDon is a strong, well-managed company with excellent financial performance and outlook. We expect high single digit accretion to Linamar’s expected 2018 and 2019 EPS and cash flow and to maintain a strong balance sheet with rapid deleveraging post-transaction. Exceptional Customer Performance Our customer performance was exceptional in 2017 with mature plants running at world class quality and delivery levels and programs representing approximately $630 million of additional business launched during the year. We are really proud of the operational systems at Linamar which drive flawless launch and serial production in all our facilities. We continue to see excellent recognition of that performance from our customers with continued supplier awards. Significant Levels of Strategically Key NBW and Market Share Growth Continued business wins have resulted in a backlog of more than $4.3 billion in annualized sales under launch at Linamar today. In fact, 2017 was another record year in new business wins for us and we continue to quote a large book of opportunities. New business wins in total for the year were greater than $1.54 billion, with particular success seen around products for e-axles and other BEV components, numerous cylinder head and block programs, many fully machined which is a new and exciting market development, several projects with targeted customers such as the French and Japanese, continued penetration of the opportunistic gear market and great business wins in both Europe and Asia. In fact, 53% of business wins in the last year were for our facilities outside NA. 23% were for electrified vehicles, massively higher than the penetration of these vehicles in the market today and the future for that matter, meaning we are rapidly building our market share and punching way above our weight. All in all, we have secured enough new business to see us well on our way to longer term growth goals; in fact we have between $8.5 and $9 billion of annual sales based on booked business already lined up to be reached by 2021. All of this success is driving significant improvements in market share in all areas of our business. Content per vehicle is up in every region globally for our on highway vehicle business and Skyjack continues to grow market share particularly in new boom and telehandler products.

5
Market share growth is a key element in our growth strategy. With market share growth we grow regardless of how much our markets are growing. As an example, our core NA automotive market was down 4% in 2017 despite which Linamar overall sales were up almost 10%. In a timeframe of market volumes leveling this is a key element to the Linamar story – we continue to target driving growth regardless of flat global markets and our market share growth is what will achieve that.
Deepening the Global Bench & Reach We have continued to build our global employee base, now over 28,000 strong, through a focus on readiness of our people to fill key positions globally whether they be in technical, leadership or support areas. We have continued to focus on Leadership Development as a key priority through intensive internally developed programs supported by excellent internal and external resources. Developing our technical strength is absolutely critical to our success whether in skilled trades, technologists, engineers, metallurgists or a variety of other technical support functions. Technical strength is what drives innovation in both product, process and material development, which drives continuous improvement every day, and ensures we quote and purchase at optimal levels. Our work starts externally where we are involved in many programs to encourage young people into a career in trades, science, technology, engineering and mathematics. We also have invested heavily in trades, engineering and accounting schools at universities and colleges globally to help build fantastic programs and faculties and facilitate young people into these careers. In 2017 we launched a new scholarship program for women in Western’s Dual Engineering and Ivey Business program. We will support 10 women per year through both tuition funding and summer jobs as well as a job on graduation. We love the idea of getting more young people into STEM education and particularly young women! Internal development is the next step. With more than 600 apprentices in our plants globally, continued setup training and international recruitment efforts, we are definitely growing our bench of skilled tradespeople and gaining some momentum. Our Linamar Entrepreneurial Advancement Program (LEAP) continues to deliver in terms of developing young enthusiastic team members for managing our facilities. Each year we pick a handful of talented future leaders to put through a comprehensive, cross functional, multiyear training program designed to make them our General Managers of the future. LEAP is a pivotal part of helping us to deepen our leadership bench strength to support future growth. Succession overall has been a key focus for us with engagement and ownership at all levels for such. Our Each One Teach One program means every manager is developing at least one other person for growth in the organization. We are each responsible for grooming our own successor and it is key we all realize we are only truly successful if those who follow us are at least as successful if not more so than we are! In 2017 we developed a great new planning tool to help us better identify longer term succession and growth needs and link them to specific individuals to fill those gaps. We will begin to utilize this tool in 2018 to ensure we have the talent we need for the future. Turnover is at record lows, employee engagement is up and motivation levels high as we continue to strengthen and build the employee base.
Driving Improvements to Financial Performance – Simple and Accountable 2017 was a year of exceptional financial performance in sales and earnings growth and cash generation at Linamar. Sales reached a new record of $6.5 billion, up 9.0% or more than $540 million through organic growth from multiple new program launches despite soft markets and Skyjack’s solid performance in a strong market. Earnings also reached record levels of $549 million on continued strong margins. We continued to drive significant cash generation to persist in delevering the balance sheet. With net debt less than 1 x EBITDA our balance sheet is again one of the strongest in our industry and giving us lots of flexibility to invest in further growth.
6
Linamar’s cultural instinct for constant improvement and lean systems continues to drive fantastic efficiencies in our operations. Our teams go out every single day to the shop floor to look for ways to reduce cost and every day we find them, big and small. Creating that culture that not only constantly improves but also is very comfortable with change is critical in this world of rapidly changing technology and resultant opportunity. We continue to focus on simple effective systems to better inform every employee to help them do their jobs better. A great example is our OWL system which logs useful information in a wide variety of areas from maintenance to production to purchasing to help keep everyone informed in a very targeted and valuable way. Basically the Google of Linamar, OWL can answer questions for employees in a variety of areas and ensure our best in practice ideas and operational tips are getting maximum exposure and help is available when needed anywhere, anytime. Implementing OWL in every facility is another key objective for 2018. Return on Equity was 19.3% which is fantastic. Ultimately, achieving solid returns for our shareholders is our key goal always, whether in new investment for launching programs or longer term investments in new businesses. We are very proud of our performance in that regard, solidly delivering ROE in the high teens or 20’s year after year. Our strategy at Linamar is the formula to this success.
Strategy The overarching principle in strategy development at Linamar is to develop a strategy that will drive success in a variety of outcomes; a strategy based on optionality. That means identifying long term markets of opportunity, reviewing technology challenges and opportunities in each and assessing the likelihood of a variety of scenarios. We then endeavour to develop a strategy that is not betting on success in a particular market, technology or outcome but can in fact have great success regardless of outcomes. We can’t predict technology changes – what we know is that change will come. We need to be ready to supply a variety of industries with a variety of products to ensure long term success. Our enterprise strategy is to focus on “Diversified Manufactured Products to Power Vehicles, Motion, Work and Lives”. This scope gives us a wide range of markets we can focus on. As we look to the future we see a variety of interesting markets that will be significant over the next 100 years. Markets we are already well entrenched in like Transportation and Infrastructure will absolutely continue to be key markets and we will continue to build a broad portfolio of business for these markets. Our acquisition of MacDon gives us a solid start in the Food/Agriculture market which we intend to rapidly build on. Other interesting markets include Energy, Water, and Age Management, some of which we have some exposure to but not significant. We are interested in developing strategies for these markets to give Linamar added opportunities for growth in the long term and intend to make significant progress on enhancing those strategies in 2018. These markets are hugely opportunistic. Take the global vehicle machined component and assembly business as an example. There is $4,000 of content in the engine, transmission and driveline systems of an internal combustion engine (ICE) driven passenger car today, much more in a commercial vehicle. Coupled with global vehicle production volumes this represents a market that today is close to $400 billion. Approximately 70% of this work is still done by our OEM customers themselves but they are increasingly looking to tap into great supplier technology and efficiency by outsourcing this work. What is really interesting is the current environment of evolving technologies in the auto sector is accelerating this outsourcing. With new types of propulsion, autonomy, and mobility more broadly to invest in, our automaker customers are increasingly looking to suppliers like Linamar to invest in areas they have traditionally invested in themselves in the powertrain and driveline areas. The addressable market at 30% outsourced today is about $120 billion. What is remarkable is that even though the number of ICE vehicles is expected to decline over the next 15 years the addressable global market grows to nearly $300 billion in that same timeframe! Linamar is perfectly aligned to be the supplier of choice to these companies given our outstanding processing and product technology in every machined part in these systems and our unparalleled performance on quality and delivery for such. Our plan is to mine this opportunistic market for as much value as we can extract. Our vehicle product strategy in line with our strategic principle of optionality is centred around a variety of types of powertrains – ICE, Hybrid Vehicles, Electric Vehicles and Fuel Cell Vehicles. We see exciting opportunities on Hybrid systems where we have all the potential of the engine, transmission and driveline in addition to the electric drive systems, a total potential of more than $4,000 per vehicle. Our E-Axle product, which can be utilized

7
to basically turn any vehicle architecture into a hybrid, will be a key product for us in this space and the pure electric vehicles. Our design is compact, lightweight and quiet thereby catching the attention of a number of vehicle manufacturers. We believe hybrid technology will be an important form of electrification in the vehicle in the next few years given the better balance of power utilization on board and better impact overall on the environment than pure electric vehicles given the emissions we see in many countries related to the energy infrastructure but that said, the drive towards electric vehicles is undeniable. Electric vehicles, whether Battery Electric (BEV) or Fuel Cell Electric (FCEV) also offer great growth opportunities for Linamar where our electronic axle can be utilized as well as a variety of machined parts in the electric motor assembly, driveline and chassis systems, multi-speed gear boxes for some applications and importantly cast aluminum structural components which will increasingly replace steel stampings in the vehicle. These components can represent $2,000 or more potential content in a vehicle and are much more likely to be outsourced than done in house given the technology is new, which means a market potential of more than $200 billion in a theoretical fully electric future! This compares to an addressable market of $100 billion on the mainly ICE vehicles today given the low current level of outsourcing, resulting in a bigger market potential! We think the FCEV is a particularly interesting technology thanks to the high energy density of hydrogen as a fuel, better range, quick refuel time, raw material availability and better environmental impact of the production of hydrogen fuel compared to electricity which in many cases is still coming from highly emittive coal plants. We have some very interesting projects we are working on for products specifically for fuel cell vehicles such as highly innovative hydrogen storage units. In fact, if we map out the content potential of all the different vehicle types, expected levels of outsourcing and expected levels of production for each over the next 30 years, we see a fantastic, consistently growing level of addressable market from around $100 billion today to over $300 billion in the future. Linamar will be a key driver of technology for vehicle electrification which will drive great growth potential. The access market where our Skyjack business is based is also highly opportunistic. Although a smaller market at $10 billion globally, the number of players in this business is much smaller meaning the potential for a much larger slice of the market is very real. We are seeing the market in Asia starting to build, primarily in scissor products at the moment. We believe the market in Asia will be quite significant as momentum builds in using access equipment for more efficient and safer building sites. The market in Europe continues to recover as well, meaning great opportunity for continued global growth. The Agriculture/Food market is at the beginning stages of a cyclical recovery. We are seeing great leading indicators of growth for our industry leading harvesting equipment at MacDon. Great opportunities exist for us to build market share in Europe as well with new product designs tailored to the heavier, denser crops in Europe. Our growth strategy at Linamar remains focused in three key areas – Diversification, Globalization, and Green Technologies. Diversification has taken many forms for us over the years at Linamar. It has meant expanding our product offering in our targeted markets as well as finding new customers and markets for the products we already make. Increasingly diversification is translating into process diversification as we vertically integrate forward into more complex modules or assemblies of the products we already make and backward into selective, strategic types of castings or forgings. This has been an area of significant focus for us and execution over the past several years which is translating into real opportunities for collaboratively designed cast or forged and machined products. We have been steadily diversifying our product lineup at Skyjack as we add to our growing boom offering and continuing to enhance our market leading scissor products. Building out our telehandler lineup is well under way and proving to be an important step in diversifying the Skyjack offering. We have seen great success here with market share gains in scissors, booms and telehandlers seen in every global market in 2017. Diversification is also about exploring new industries to take our manufacturing skills in metallic product to. The long term markets mentioned earlier are the areas we are most focused on in this regard and of course became a reality this year with MacDon.

8
Globalization is really just an element of diversification in terms of finding new geographic markets but is important to articulate as a separate element of our strategy in light of the huge impact that growing globally can bring us. Look at the On-Highway vehicle business as an example. In 2017 the industry made approximately 17 million vehicles in North America while Europe made 22 million and Asia 50 million. Markets outside of North America are vastly larger than the markets within it. Growth is prioritized in Europe and Asia to take advantage of these large markets even as we continue to grow strongly in North America thanks to additional outsourcing of targeted product. With our recent acquisitions in Europe we have significantly grown our revenue, plant base and employee base in the region. Over 35% of our employee base now resides in Europe with a growing book of business in the region. In China, continued strong growth is creating many exciting opportunities for suppliers such as ourselves with proven technology and quality performance. We just completed construction on our 4th plant in China based on robust business wins in the region and planning well underway for a 5th. In India, the auto market is really just starting to build to more meaningful levels which are creating opportunities in a variety of areas as our customers look for suppliers to help them put needed capacity in place. We saw several wins for our plants in India in 2017 and will need to start soon to think about a larger facility. Global expansion continues to play out very successfully as well for Skyjack who saw great market share growth in both Europe and Asia in 2017. Finally focusing on Green Technologies is important because developing products that are more fuel efficient, drive lower emissions or are environmentally beneficial in some other way are the products the market is looking for. These are the markets of the future, whether it is more fuel efficient vehicles, rail products, wind energy installations or more efficient access and harvesting equipment, and we want to be a key part of them. Today we have increased content in smaller, more fuel efficient vehicles such as cars, electric cars and crossovers. With our significant electric vehicle wins in 2017 we have booked content for EV’s of nearly $50 a vehicle by the early 2020’s! Our priority in product development is around light weighting, smaller packages and noise reduction, all to drive better fuel economy. A customer in our AWD system business called our product “the global benchmark” in terms of technology and capability. What a fantastic acknowledgement to the capabilities of our hard working R&D team! As we turn to 2018, our focus is in 3 key themes:
Continued focus on the Bold Innovation ideas that will evolve our business;
Deepening our Global Bench and driving Accountability at all levels; and
Focusing on Systems and Simplification to improve efficiency, visibility and responsiveness.
At Linamar we are very excited about our future growth plans. We have the business in hand to drive meaningful growth in the next several years, a market focus and strategy in massive growing markets to drive substantial opportunities for the longer term, the perfect combination for meeting both short and long term shareholder growth goals. We have a 1 year plan, a 5 year plan and a 100 year plan all centred on success, growth and balance.

9
We have the business, we have the markets, we have the innovation, we have a talented and growing group of people and we will continue to turn that into consistent sustainable growth for you our shareholders. Sincerely,
(Signed) “Linda Hasenfratz” (Signed) “Jim Jarrell” Linda Hasenfratz Jim Jarrell Chief Executive Officer President and Chief Operating Officer

10
MANAGEMENT DISCUSSION AND ANALYSIS
Linamar Corporation December 31, 2017 and December 31, 2016 (in millions of dollars)

11
LINAMAR CORPORATION Management’s Discussion and Analysis For the Year Ended December 31, 2017
This Management’s Discussion and Analysis of Financial Condition and Results of Operations ("MD&A") of Linamar Corporation (“Linamar” or the “Company”) should be read in conjunction with its consolidated financial statements for the year ended December 31, 2017. This MD&A has been prepared as at March 7, 2018. The financial information presented herein has been prepared on the basis of International Financial Reporting Standards (“IFRS”). References to the term generally accepted accounting principles (“GAAP”) refer to information contained herein being prepared under IFRS as adopted. All amounts in this MD&A are in millions of Canadian dollars, unless otherwise noted.
Additional information regarding Linamar, including copies of its continuous disclosure materials such as its annual information form, is available on its website at www.linamar.com or through the SEDAR website at www.sedar.com.
OVERALL CORPORATE PERFORMANCE
Overview of the Business
Linamar Corporation (TSX:LNR) is a diversified global manufacturing company of highly engineered products powering vehicles, motion, work and lives. The Company is made up of 2 operating segments – the Powertrain/Driveline segment and the Industrial segment, which are further divided into 5 operating groups – Machining & Assembly, Light Metal Casting, Forging, Skyjack and Agriculture, all world leaders in the design, development and production of highly engineered products. The Company’s Machining & Assembly, Light Metal Casting and Forging operating groups focus on precision metallic components, modules and systems for powertrain, driveline and body systems designed for global electrified and traditionally powered vehicle and industrial markets. The Company’s Skyjack and MacDon companies are noted for their innovative, high quality mobile industrial and harvesting equipment, notably class-leading aerial work platforms, telehandlers, draper headers and self-propelled windrowers. Linamar has more than 28,600 employees in 60 manufacturing locations, 8 R&D centers and 25 sales offices in 17 countries in North and South America, Europe and Asia which generated sales of $6.5 billion in 2017. For more information about Linamar Corporation and its industry leading products and services, visit www.linamar.com or follow us on Twitter at @LinamarCorp.
Overall Corporate Results
The following table sets out certain highlights of the Company’s performance in 2017 and 2016:
Three Months Ended Twelve Months Ended
December 31 December 31
(in millions of dollars, except content per vehicle figures)
2017 2016 +/- +/- 2017 2016 +/- +/-
$ $ $ % $ $ $ %
Sales 1,574.5 1,374.8 199.7 14.5% 6,546.5 6,005.6 540.9 9.0% Gross Margin 251.7 221.0 30.7 13.9% 1,079.3 1,002.6 76.7 7.7%
Operating Earnings (Loss)1 158.2 147.0 11.2 7.6% 707.9 696.8 11.1 1.6%
Attributable to Shareholders of the Company: Net Earnings (Loss) 135.1 116.1 19.0 16.4% 549.4 522.1 27.3 5.2% Net Earnings (Loss) per Share – Diluted 2.04 1.76 0.28 15.9% 8.32 7.92 0.40 5.1%
Net Earnings (Loss) 135.1 116.1 19.0 16.4% 549.4 522.1 27.3 5.2% Unusual item (15.1) - (15.1) (15.1) - (15.1)
Net Earnings (Loss) – Adjusted1 120.0 116.1 3.9 3.4% 534.3 522.1 12.2 2.3% Net Earnings (Loss) per Share – Diluted
– Adjusted1 1.81 1.76 0.05 2.8% 8.09 7.92 0.17 2.1%
Content per Vehicle – North America 157.58 143.26 14.32 10.0% 159.07 153.82 5.25 3.4% Content per Vehicle – Europe 69.93 62.42 7.51 12.0% 69.62 63.60 6.02 9.5% Content per Vehicle – Asia Pacific 9.48 8.56 0.92 10.7% 9.66 8.32 1.34 16.1%
1 For more information refer to the “Non-GAAP and Additional GAAP Measures” section of this MD&A.

12
The changes in these financial highlights are discussed in detail in the following sections of this analysis.
The unusual item relates to adjusting the effective tax rate of 12.1% in Q4 2017 to an expected annual rate of 23.0%. The low effective tax rate was mainly due to the future reduction in foreign tax rates enacted in the quarter on deferred tax liabilities, primarily in the United States and France.
BUSINESS SEGMENT REVIEW
The Company reports its results of operations in two business segments: Powertrain/Driveline and Industrial. The segments are differentiated by the products that each produces and reflects how the chief operating decision makers of the Company manage the business. The following should be read in conjunction with the Company’s consolidated financial statements for the year ended December 31, 2017.
Three Months Ended Three Months Ended
December 31 December 31 2017 2016
Powertrain
/Driveline Industrial Linamar Powertrain
/Driveline Industrial Linamar (in millions of dollars) $ $ $ $ $ $
Sales 1,366.3 208.2 1,574.5 1,230.1 144.7 1,374.8 Operating Earnings (Loss) 129.4 28.8 158.2 122.4 24.6 147.0
Twelve Months Ended Twelve Months Ended
December 31 December 31 2017 2016
Powertrain
/Driveline Industrial Linamar Powertrain
/Driveline Industrial Linamar (in millions of dollars) $ $ $ $ $ $
Sales 5,430.0 1,116.5 6,546.5 5,139.2 866.4 6,005.6 Operating Earnings (Loss) 545.5 162.4 707.9 551.6 145.2 696.8
Powertrain/Driveline Highlights
Three Months Ended Twelve Months Ended
December 31 December 30 2017 2016 +/- +/- 2017 2016 +/- +/- (in millions of dollars) $ $ $ % $ $ $ %
Sales 1,366.3 1,230.1 136.2 11.1% 5,430.0 5,139.2 290.8 5.7% Operating Earnings (Loss) 129.4 122.4 7.0 5.7% 545.5 551.6 (6.1) (1.1%)
Sales for the Powertrain/Driveline segment (“Powertrain/Driveline”) increased by $136.2 million, or 11.1% in Q4 2017 compared with Q4 2016. The sales increase in Q4 2017 was impacted by:
additional sales from launching programs in Europe and North America;
increased volumes from our light vehicle automotive customers in North America, Europe and Asia; and
additional sales from our on- and off-highway vehicle customers; partially offset by
an unfavourable impact on sales from the changes in foreign exchange rates. The 2017 sales for Powertrain/Driveline increased by $290.8 million, or 5.7% compared with 2016. The factors that impacted Q4 2017 primarily impacted the 2017 results in addition to increased annual sales from launching programs in Asia.
Q4 2017 operating earnings for Powertrain/Driveline were higher by $7.0 million or 5.7% over Q4 2016. The Powertrain/Driveline segment’s earnings were impacted by the following:
production volumes increasing on launching programs in Europe and North America;
increased volumes from our light vehicle automotive customers in North America, Europe and Asia; and
on- and off-highway vehicle volume increases; partially offset by
an unfavourable foreign exchange impact from the revaluation of the operating balances on the balance sheet in Q4 2017 in comparison to a favourable impact in Q4 2016;
an unfavourable impact on underlying transactions within operating earnings from the changes in foreign exchange rates; and

13
increased management and sales costs supporting growth.
The 2017 operating earnings decreased by $6.1 million, or 1.1% compared with 2016. The factors that impacted Q4 2017 primarily impacted the full year results.
Industrial Highlights
Three Months Ended Twelve Months Ended December 31 December 31 2017 2016 +/- +/- 2017 2016 +/- +/- (in millions of dollars) $ $ $ % $ $ $ %
Sales 208.2 144.7 63.5 43.9% 1,116.5 866.4 250.1 28.9% Operating Earnings (Loss) 28.8 24.6 4.2 17.1% 162.4 145.2 17.2 11.8%
The Industrial segment (“Industrial”) product sales increased 43.9%, or $63.5 million, to $208.2 million in Q4 2017 from Q4 2016. The sales increase was due to:
strong market share gains and increased volumes for booms in North America, Europe and Asia;
strong market share gains and increased volumes for telehandlers in North America; and
market share gains in scissors in North America and Europe; partially offset by
unfavourable changes in foreign exchange rates.
The 2017 sales for Industrial increased by $250.1 million, or 28.9% compared with 2016. The factors that impacted Q4 2017 primarily impacted the annual results in addition to 2017 market share gains in scissors in Asia.
Industrial segment operating earnings in Q4 2017 were higher by $4.2 million, or 17.1% from Q4 2016. The Industrial operating earnings results were predominantly driven by:
net increase in volumes; partially offset by
an unfavourable foreign exchange impact from the revaluation of the operating balances on the balance sheet in Q4 2017 in comparison to a favourable impact in Q4 2016;
an unfavourable impact on underlying transactions within operating earnings from the changes in foreign exchange rates;
lower margins as a result of changes in customer and product mix favouring new launching products with lower margins; and
increased management and sales costs supporting growth.
The 2017 operating earnings for Industrial increased by $17.2 million, or 11.8% compared with 2016. The factors that impacted Q4 2017 primarily impacted the annual results.

14
AUTOMOTIVE SALES AND CONTENT PER VEHICLE1
Automotive sales by region in the following discussion are determined by the final vehicle production location and, as such, there are differences between these figures and those reported under the geographic segment disclosure, which are based primarily on the Company’s location of manufacturing and include both automotive and non-automotive sales. These differences are the result of products being sold directly to one continent, and the final vehicle being assembled on another continent. It is necessary to show the sales based on the vehicle build location to provide accurate comparisons to the production vehicle units for each continent.
In addition to automotive Original Equipment Manufacturers (“OEMs”), the Company sells powertrain parts to a mix of automotive and non-automotive manufacturers that service various industries such as power generation, construction equipment, marine and automotive. The final application of some parts sold to these manufacturers is not always clear; however the Company estimates the automotive portion of the sales for inclusion in its content per vehicle (“CPV”) calculations. The allocation of sales to regions is based on vehicle production volume estimates from industry sources, published closest to the quarter end date. As these estimates are updated, the Company’s sales classifications can be impacted.
Three Months Ended Twelve Months Ended December 31 December 31
North America 2017 2016 +/- % 2017 2016 +/- %
Vehicle Production Units 2 4.28 4.49 (0.21) (4.7%) 17.58 18.30 (0.72) (3.9%) Automotive Sales 1 $ 675.2 $ 643.9 $ 31.3 4.9% $ 2,797.3 $ 2,815.3 $ (18.0) (0.6%) Content Per Vehicle 1 $ 157.58 $ 143.26 $ 14.32 10.0% $ 159.07 $ 153.82 $ 5.25 3.4%
Europe
Vehicle Production Units 5.80 5.33 0.47 8.8% 22.33 21.49 0.84 3.9% Automotive Sales $ 405.4 $ 332.8 $ 72.6 21.8% $ 1,554.6 $ 1,366.7 $ 187.9 13.7% Content Per Vehicle $ 69.93 $ 62.42 $ 7.51 12.0% $ 69.62 $ 63.60 $ 6.02 9.5%
Asia Pacific
Vehicle Production Units 13.83 13.58 0.25 1.8% 49.96 48.26 1.70 3.5% Automotive Sales $ 131.2 $ 116.2 $ 15.0 12.9% $ 482.7 $ 401.5 $ 81.2 20.2% Content Per Vehicle $ 9.48 $ 8.56 $ 0.92 10.7% $ 9.66 $ 8.32 $ 1.34 16.1%
North American automotive sales for Q4 2017 increased 4.9% from Q4 2016 in a market that saw a decrease of 4.7% in production volumes for the same period. As a result, CPV in Q4 2017 increased 10.0% from $143.26 to $157.58. The increase in North American CPV was a result of increased volumes over market production for OEM's that the company has significant business with, increases on launching programs, as well as increases in volumes from our on and off highway commercial vehicle customers.
European automotive sales for Q4 2017 increased 21.8% from Q4 2016 in a market that saw an increase of 8.8% in production volumes for the same period. As a result, CPV in Q4 2017 increased 12.0% from $62.42 to $69.93. The increase in European CPV was a result of increases on launching programs and increases in volumes over market production from our light vehicle customers.
Asia Pacific automotive sales for Q4 2017 increased 12.9% from Q4 2016 in a market that saw an increase of 1.8% in production volumes for the same period. As a result, CPV in Q4 2017 increased 10.7% from $8.56 to $9.48. The increase in Asian CPV was a result of increases on launching programs in North America that have Asian CPV, as well as an increases in volumes over market production for OEM's that the company has significant business with.
1 Automotive Sales are measured as the amount of the Company’s automotive sales dollars per vehicle, not including tooling sales. CPV does not have a standardized
meaning and therefore is unlikely to be comparable to similar measures presented by other issuers. CPV is an indicator of the Company’s market share for the automotive markets that it operates in.
2 Vehicle production units are derived from industry sources and are shown in millions of units. North American vehicle production units used by the Company for the determination of the Company’s CPV include medium and heavy truck volumes. European and Asia Pacific vehicle production units exclude medium and heavy trucks. All vehicle production volume information is as regularly reported by industry sources. Industry sources release vehicle production volume estimates based on the latest information from the Automotive Manufacturers and update these estimates as more accurate information is obtained. The Company will, on a quarterly basis, update CPV for the current fiscal year in its MD&A as these volume estimates are revised by the industry sources. The CPV figures in this MD&A reflect the volume estimates that were published closest to the quarter end date by the industry sources. These updates to vehicle production units have no effect on the Company’s financial statements for those periods.

15
RESULTS OF OPERATIONS
Gross Margin
Three Months Ended Twelve Months Ended December 31 December 31 (in millions of dollars) 2017 2016 2017 2016
Sales $ 1,574.5 $ 1,374.8 $ 6,546.5 $ 6,005.6 Cost of Sales before Amortization 1,248.9 1,075.0 5,152.2 4,672.0 Amortization 73.9 78.8 315.0 331.0
Cost of Sales 1,322.8 1,153.8 5,467.2 5,003.0
Gross Margin $ 251.7 $ 221.0 $ 1,079.3 $ 1,002.6
Gross Margin Percentage 16.0% 16.1% 16.5% 16.7%
Gross margin percentage remained relatively flat at 16.0% in Q4 2017 from 16.1% in Q4 2016. Cost of sales before amortization as a percentage of sales increased in Q4 2017 to 79.3% compared to 78.2% for the same quarter of last year. The increase in gross margin between Q4 2017 and Q4 2016 is a result of the items discussed earlier in this analysis such as:
increased earnings as a result of increased volumes in both segments; partially offset by
an unfavourable impact on underlying transactions within operating earnings from the changes in foreign exchange rates; and
lower Industrial margins as a result of changes in customer and product mix favouring new launching products with lower margins. Q4 2017 amortization decreased to $73.9 million from $78.8 million in Q4 2016. Amortization as a percentage of sales decreased to 4.7% of sales as compared to 5.7% in Q4 2016.
2017 gross margin percentage decreased to 16.5% from 16.7% in the same period of 2016. The increase in the 2017 gross margin was a result of the factors that primarily impacted Q4 2017. Amortization as a percentage of sales decreased to 4.8% of sales as compared to 5.5% in 2016.
Selling, General and Administration Three Months Ended Twelve Months Ended December 31 December 31 (in millions of dollars) 2017 2016 2017 2016
Selling, general and administrative $ 91.6 $ 82.8 $ 352.1 $ 325.4 SG&A Percentage 5.8% 6.0% 5.4% 5.4%
Selling, general and administrative (“SG&A”) costs increased to $91.6 million from $82.8 million in Q4 2016, but decreased as a percentage of sales to 5.8% from 6.0% when compared to Q4 2016. The increase in SG&A costs was primarily driven by:
additional management and sales costs supporting growth; and
transaction expenses related to the acquisition of MacDon. On an annual basis, SG&A costs reflected a similar pattern of higher dollar costs due to investments made to support launches, future growth and new facilities, but remained flat as a percentage of sales at 5.4% when compared to Q4 2016.
Finance Expense and Income Taxes
Three Months Ended Twelve Months Ended December 31 December 31 2017 2016 2017 2016 (in millions of dollars) $ $ $ $
Operating Earnings (Loss) 158.2 147.0 707.9 696.8 Share of Net Earnings (Loss) of Investments Accounted for Using the Equity
Method (1.9) (1.4) (6.0) (3.0) Finance Expenses 2.7 3.9 9.3 21.1 Provision for (Recovery of) Income Taxes 18.5 25.6 143.2 150.2
Net Earnings (Loss) 135.1 116.1 549.4 522.5
Net Earnings (Loss) Attributable to: Shareholders of the Company 135.1 116.1 549.4 522.1 Non-Controlling Interests - - - 0.4

16
Finance Expenses Finance expenses decreased $1.2 million in Q4 2017 from Q4 2016 to $2.7 million due to:
higher interest earned on the long-term receivables and the investment of excess cash balances;
repayment of private placement debt in Q3 2017 which has been replaced with floating rate debt with lower interest rates;
repayment of short term floating rate debt; partially offset by
higher interest rates due to the Bank of Canada rate hikes in Q3 2017. The 2017 finance expenses decreased $11.8 million compared to 2016 at $21.1 million due to:
higher interest earned on the long-term receivables and the investment of excess cash balances;
repayment of private placement debt in Q3 2017 which has been replaced with floating debt with lower interest rates;
repayment of short term floating rate debt during the year;
a lower borrowing spread due to an improvement in the covenant ratio in Q3 2016; partially offset by
higher interest rates due to the Bank of Canada rate hikes in Q3 2017. The consolidated effective interest rate for Q4 2017 increased to 2.4% (2.2% for the full year of 2017) compared to 2.0% in Q4 2016 (2.1% for the full year of 2016). The effective rate was higher in 2017 compared to 2016 as a result of the Bank of Canada rate hikes in Q3 2017.
Provision for Income Taxes The effective tax rate for Q4 2017 was 12.1%, a decrease from the 18.1% rate in the same quarter of 2016. The effective tax rate in Q4 2017 was:
reduced due to the impact of a future reduction in foreign tax rates on deferred tax liabilities, primarily in the United States and France;
decreased based on a more favourable mix of foreign tax rates in Q4 2017 compared to Q4 2016; partially offset by
an increase due to adjustments recognized in Q4 2016 regarding tax recoveries from prior years which did not recur in Q4 2017. The effective tax rate for 2017 was 20.7%, a decrease from the 22.3% rate in 2016. The 2017 effective tax rate was reduced due to the same factors as the quarter. The annual effective tax rate was additionally impacted by a decrease due to non-deductible expenses incurred in 2016 that did not recur in 2017.
TOTAL EQUITY
Book value per share1 increased to $47.63 per share at December 31, 2017 as compared to $39.69 per share at December 31, 2016.
During the quarter 5,400 options expired unexercised, no options were forfeited and 23,400 options were exercised.
OUTSTANDING SHARE DATA
The Company is authorized to issue an unlimited number of common shares, of which 65,354,495 common shares were outstanding as of March 7, 2018. The Company’s common shares constitute its only class of voting securities. As of March 7, 2018, there were 1,491,876 options to acquire common shares outstanding and 4,250,000 options still available to be granted under the Company’s share option plan.
1 For more information refer to the “Non-GAAP and Additional GAAP Measures” section of this MD&A.

17
SELECTED FINANCIAL INFORMATION
Annual Results The following table sets out selected financial data relating to the Company’s years ended December 31, 2017, 2016 and 2015. This financial data should be read in conjunction with the Company’s consolidated financial statements for these years:
2017 2016 2015 (in millions of dollars, except per share figures) $ $ $
Sales 6,546.5 6,005.6 5,162.4 Net Earnings (Loss) Attributable to Shareholders of the Company 549.4 522.1 436.7 Unusual Item (15.1) - - Net Earnings (Loss) Attributable to Shareholders of the Company - Adjusted 534.3 522.1 436.7 Total Assets 5,851.2 5,227.2 3,799.9 Total Long-term Liabilities 1,442.4 1,370.6 615.1 Cash Dividends declared per share 0.48 0.40 0.40 Net Earnings (Loss) per Share Attributable to Shareholders of the Company:
Basic 8.41 8.01 6.71 Diluted 8.32 7.92 6.63
The unusual item relates to adjusting the effective tax rate of 12.1% in Q4 2017 to an expected annual rate of 23.0%. The low effective tax rate was mainly due to the future reduction in foreign tax rates enacted in the quarter on deferred tax liabilities, primarily in the United States and France.
On February 25, 2016, the Company completed its acquisition of 100% of the shares of Montupet S.A. for a purchase price of $1,187.3 million which was funded by a draw on an amended and restated credit facility. Montupet S.A. is a global leader in the design and manufacture of complex aluminum castings for the global automotive industry with sales and production facilities diversified across several European countries, North America and Asia.
Quarterly Results
The following table sets forth unaudited information for each of the eight quarters ended March 31, 2016 through December 31, 2017. This information has been derived from the Company’s unaudited consolidated interim financial statements which, in the opinion of management, have been prepared on a basis consistent with the audited consolidated financial statements and include all adjustments, consisting only of normal recurring adjustments, necessary for fair presentation of the financial position and results of operations for those periods.
Dec 31 Sep 30 Jun 30 Mar 31 Dec 31 Sep 30 Jun 30 Mar 31
2017 2017 2017 2017 2016 2016 2016 2016 (in millions of dollars, except per share figures) $ $ $ $ $ $ $ $
Sales 1,574.5 1,549.7 1,766.2 1,656.0 1,374.8 1,455.5 1,657.2 1,518.1 Net Earnings (Loss) Attributable to
Shareholders of the Company 135.1 107.3 161.9 145.1 116.1 122.2 157.3 126.4 Net Earnings (Loss) per Share Attributable to
Shareholders of the Company: Basic 2.07 1.64 2.48 2.22 1.78 1.88 2.41 1.94 Diluted 2.04 1.62 2.45 2.20 1.76 1.86 2.39 1.92
The quarterly results of the Company are impacted by the seasonality of certain operational units. Historically, earnings in the second quarter, for the Industrial segment, are positively impacted by the high selling season for both the access equipment and agricultural businesses. For the Powertrain/Driveline segment, vehicle production is typically at its lowest level during the third and fourth quarters due to lower OEM production schedules resulting from shutdowns related to summer and winter maintenance, and model changeovers. The Company takes advantage of summer and winter shutdowns for maintenance activities that would otherwise disrupt normal production schedules.

18
FINANCIAL CONDITION, LIQUIDITY AND CAPITAL RESOURCES
Cash Flows
Three Months Ended Twelve Months Ended December 31 December 31 2017 2016 2017 2016 (in millions of dollars) $ $ $ $
Cash generated from (used in): Operating Activities 205.3 275.3 785.9 898.1 Financing Activities (199.6) (216.4) (170.9) 789.9 Investing Activities (91.7) (107.2) (577.0) (1,574.9) Effect of translation adjustment on cash 0.2 (8.8) (3.9) (47.2)
Net Increase (Decrease) in Cash Position (85.8) (57.1) 34.1 65.9
Cash and Cash Equivalents – Beginning of Period 524.9 462.1 405.0 339.1
Cash and Cash Equivalents – End of Period 439.1 405.0 439.1 405.0
Comprised of: Cash in bank 315.4 233.0 315.4 233.0 Short-term deposits 138.2 192.9 138.2 192.9 Unpresented Cheques (14.5) (20.9) (14.5) (20.9)
439.1 405.0 439.1 405.0
The Company’s cash and cash equivalents (net of unpresented cheques) at December 31, 2017 were $439.1 million, an increase of $34.1 million compared to December 31, 2016.
Cash generated from operating activities was $205.3 million, a decrease of $70.0 million from Q4 2016 due to more cash being used to fund non-cash working capital. Cash generated from operating activities was $785.9 million in 2017, $112.2 million less than was provided in 2016, primarily due an increase in inventory and a decrease in income taxes payable.
During the quarter, financing activities utilized $199.6 million of cash compared to $216.4 million used in Q4 2016. Financing activities used $170.9 million in 2017 primarily due to repayments on long-term debt compared to $789.9 million generated in 2016 due to proceeds from long-term debt, which were primarily used in Q1 2016 to fund the purchase of Montupet S.A.
Investing activities used $91.7 million in Q4 2017 and used $107.2 million in Q4 2016 mainly for the purchase of property, plant and equipment. Investing activities used $1,574.9 million in 2016 mainly for the acquisition of Montupet S.A. and the purchase of property, plant and equipment.
Operating Activities
Three Months Ended Twelve Months Ended December 31 December 31 2017 2016 2017 2016 (in millions of dollars) $ $ $ $
Net earnings (loss) for the Period Attributable to Shareholders of the Company 135.1 116.1 549.4 522.1 Adjustments to earnings 83.8 86.8 336.5 378.0
218.9 202.9 885.9 900.1 Changes in non-cash working capital (13.6) 72.4 (100.0) (2.0)
Cash generated from (used in) operating activities 205.3 275.3 785.9 898.1
Cash generated by operations before the effect of changes in non-cash working capital increased $16.0 million in Q4 2017 to $218.9 million, compared to $202.9 million in Q4 2016. Cash generated from operations before the effect of changes in non-cash working capital decreased $14.2 million to $885.9 million from $900.1 million in 2016.
Non-cash working capital for Q4 2017 increased $13.6 million. Non-cash working capital for 2017 increased $100.0 million primarily due to an increase in inventory and a decrease in income taxes payable.

19
Financing Activities
Three Months Ended Twelve Months Ended December 31 December 31 2017 2016 2017 2016 (in millions of dollars) $ $ $ $
Proceeds from (repayments of) short-term borrowings (1.8) (2.1) - (2.1) Proceeds from (repayments of) long-term debt (190.8) (209.7) (140.9) 826.6 Proceeds from government borrowings - (0.7) 8.1 11.2 Proceeds from exercise of stock options 0.3 0.9 1.4 1.2 Dividends (7.8) (6.5) (31.3) (26.1) Interest received (paid) 0.5 1.7 (8.2) (20.9)
Cash generated from (used in) financing activities (199.6) (216.4) (170.9) 789.9
Financing activities for Q4 2017 used $199.6 million of cash compared to $216.4 million used in Q4 2016. Financing activities for 2017 used $170.9 million of cash compared to $789.9 million provided in 2016. The $826.6 million in 2016 proceeds was from long-term debt primarily provided in Q1 2016 to fund the purchase of Montupet S.A.
Investing Activities
Three Months Ended Twelve Months Ended December 31 December 31 2017 2016 2017 2016 (in millions of dollars) $ $ $ $
Payments for purchase of property, plant and equipment (100.9) (89.8) (410.0) (343.3) Proceeds on disposal of property, plant and equipment 3.7 6.1 13.2 7.9 Payments for purchase of intangible assets (6.5) (2.5) (17.4) (10.6) Business acquisitions, net of cash acquired - - (1.1) (1,133.9) (Increase) decrease in long-term receivables 17.5 (20.8) (152.4) (94.1) Other (5.5) (0.2) (9.3) (0.9)
Cash generated from (used in) investing activities (91.7) (107.2) (577.0) (1,574.9)
Cash spent on investing activities for Q4 2017 was $91.7 million compared to Q4 2016 at $107.2 million due to the collection of long-term receivables partially offset by the purchase of property, plant and equipment. Cash spent on investing activities was $577.0 million compared to Q4 2016 at $1,574.9 million which was primarily for the Q1 2016 acquisition of Montupet S.A.
Capital Resources The Company’s financial condition remains solid given its strong balance sheet, which can be attributed to the Company’s low cost structure, reasonable level of debt, prospects for growth and significant new program launches. Management expects that all future capital expenditures will be financed by cash flow from operations or utilization of existing financing facilities.
At December 31, 2017, cash including short-term deposits (net of unpresented cheques) was $439.1 million, and the Company’s credit facilities had available credit of $643.8 million.

20
Commitments and Contingencies The following table summarizes contractual obligations by category and the associated payments for the next five years:
Total 1 year
Later than 1 year and not later than 5
years Later than 5
years (in millions of dollars) $ $ $ $
Long-Term Debt Principal, excluding Capital Leases 1,286.5 0.9 1,239.3 46.3
Finance Lease Obligations1 14.0 5.5 8.3 0.2 Operating Leases 54.5 15.0 31.8 7.7
Purchase Obligations2 299.9 299.9 - -
Total Contractual Obligations 1,654.9 321.3 1,279.4 54.2
The Company occasionally provides guarantees to third parties who, in turn, provide financing to credit worthy Linamar customers under finance leases for certain industrial access products. In addition, the Company has provided limited guarantees within the purchase agreements of derecognized receivables as discussed in the notes to the Company’s consolidated financial statements for the year ended December 31, 2017.
From time to time, the Company may be contingently liable for litigation, legal and/or regulatory actions and proceedings and other claims. These claims are described in the notes to Company’s consolidated financial statements for the year ended December 31, 2017.
Foreign Currency Activities
The Company pursues a strategy of optimizing its foreign currency cash flows in each region in which it operates. In key foreign exchange markets, the Company’s foreign currency outflows for the purchases of materials and capital equipment are offset through the sale of products denominated in the same foreign currencies, creating a natural hedge. In markets where a natural currency hedge cannot be achieved and a material foreign exchange exposure arises, the Company actively manages the risk through the execution of foreign exchange forward contracts and other derivatives.
The amount and timing of executed forward contracts is dependent upon a number of factors, including estimated production delivery schedules, forecasted customer payments, and the anticipated future direction of foreign currency rates. The Company is exposed to counterparty credit risk when executing foreign exchange derivatives with financial institutions, and in order to mitigate this risk the Company limits foreign exchange trading to counterparties within the credit facility. Despite actively managing the residual foreign exchange exposure, significant long-term movements in relative currency values may affect the Company’s operational results. The Company does not currently hedge all the cash flow activities of its foreign subsidiaries and, accordingly results of operations may be further affected by a significant change in the relative values of the currencies in which the Company operates.
The Company is committed to long-dated forward contracts to buy U.S. dollars which hedge the changes in exchange rates on the U.S. $130 million Private Placement Notes due 2021 (“2021 Notes”). A tranche of the 2017 Notes matured and were repaid during the quarter ended September 30, 2017. These forward exchange contracts qualify as cash flow hedges for accounting purposes and any fair value unrealized gains and losses are included in other comprehensive earnings, with reclassifications to net earnings for the effective portion to match the net earnings impact of the principal portion.
The Company is committed to a series of forward contracts to lock in the exchange rate on the semi-annual coupon payments related to the 2021 Notes. These forward contracts qualify as cash flow hedges for accounting purposes and any fair value unrealized gains and losses are included in other comprehensive earnings, with reclassifications to net earnings for the effective portion to match the net earnings impact of the coupon portion.
During the first quarter of 2016, the Euro denominated debt used to purchase Montupet S.A. was designated as a net investment hedge. Hedges of net investments are accounted for in a similar manner as cash flow hedges with amounts accumulated in other comprehensive earnings. The amounts accumulated in other comprehensive earnings are reclassified to net earnings in the period in which the foreign operation is partially disposed of, or sold.
For more information regarding the Company’s long-term debt and forward contracts including related risks please see the notes to the Company’s consolidated financial statements for the year ended December 31, 2017.
1 Finance Lease Obligations includes the interest component in accordance with the definition of minimum lease payments under IFRS. 2 Purchase Obligations means an agreement to purchase goods or services that is enforceable and legally binding that specifies all significant terms, including: fixed or
minimum quantities to be purchased; fixed, minimum or variable price provisions; and the approximate timing of the transaction.

21
Off Balance Sheet Arrangements
The Company leases various land and buildings under cancellable and non-cancellable operating lease arrangements. The lease terms are between 1 and 13 years, and the majority of lease arrangements are renewable at the end of the lease period at market rates. The Company also leases various machinery and transportation equipment under non-cancellable operating lease arrangements. The lease terms are between 1 and 9 years and require notice for termination of the agreements. The Company expects that existing leases will either be renewed or replaced, or alternatively, capital expenditures will be incurred to acquire equivalent capacity.
For a summary of these lease commitments please see the notes to the Company’s consolidated financial statements for the year ended December 31, 2017.
TRANSACTIONS WITH RELATED PARTIES
Included in the costs of property, plant and equipment is the construction of buildings, building additions and building improvements performed by related parties in the aggregate amount of $1.6 million at December 31, 2017 ($5.4 million for 2016). Related party transactions included in the cost of sales are expenses such as rent, maintenance and transportation costs of $1.6 million for the year ended December 31, 2017 ($1.6 million for 2016). The maintenance and construction costs represent general contracting and construction activities related to plant construction, improvements, additions and maintenance for a number of facilities. Amounts owed to related parties at December 31, 2017 were $0.4 million ($1.0 at December 31, 2016).
CURRENT AND PROPOSED TRANSACTIONS
Subsequent to year end, the Company announced the acquisition of 100% of the outstanding equity interest of Moray Marketing Ltd., parent company of MacDon and its Group of Companies (“MacDon”) for a preliminary purchase price of $1,312,920 comprised of $1,237,920 in cash consideration and an assumed liability of $75,000. The liability was immediately extinguished using a portion of the acquired cash of MacDon. Headquartered in Winnipeg, Manitoba, Canada, MacDon is a global innovative market leader in the design and manufacturing of specialized agriculture harvesting equipment such as drapers and self-propelled windrowers. Due to the timing of the close and complexities associated with the transaction, the determination of the fair value of consideration, assets acquired and liabilities assumed is not yet complete and are subject to further adjustments.
RISK MANAGEMENT
The following risk factors, as well as the other information contained in this MD&A, and the Company’s Annual Information Form for the year ended December 31, 2017 or otherwise incorporated herein by reference, should be considered carefully. These risk factors could materially and adversely affect the Company’s future operating results and could cause actual events to differ materially from those described in forward-looking statements related to the Company.
Competition, Outsourcing and Insourcing The Company faces numerous sources of competition in its Powertrain/Driveline segment, including its OEM customers and their affiliated parts manufacturers, other direct competitors and product alternatives. In many product areas, the primary competition comes from in-house divisions of the OEMs. In the Industrial segment the Company also faces competition from well-established aerial work platform OEMs.
As the Company’s OEM customers face continued cost pressures as well as wide ranging areas of required capital investment within their business, some have decided to “outsource” some of their requirements. This outsourcing has continued to represent an additional source of new business for the Company. However, because of various factors affecting the OEMs, such as the level of consumer spending on automobiles and related market volumes, entrenched capital assets, labour contracts, and other economic factors, this impacts the decision on whether to outsource work or not; such changes and decisions are reflected in the Company’s results through reduced volume on some existing programs and the ability to bid on, and receive, new business.
Other competition in machining and assembly work comes from high precision machining companies which typically have several manufacturing locations and substantial capital resources to invest in equipment for high volume, high precision, and long-term contracts. Several of these companies are heavily involved in the automotive industry and are suppliers to major OEMs.
The Company believes that there are no suppliers which have the diversified capability to produce all of the components, modules and systems which the Company currently produces. Rather, Linamar faces a higher number of suppliers that compete on a product by product basis. Some of these competitors are larger and may have access to greater resources than the Company, but the Company believes that none of them are dominant in the markets in which the Company operates. The basis for supplier selection by OEMs is not

22
typically determined solely by price, but would usually also include such elements as quality, service, historical performance, timeliness of delivery, proprietary technologies, scope of in-house capabilities, existing agreements, responsiveness and the supplier’s overall relationship with the OEM, as well as being influenced by the degree of available and unutilized capacity of resources in the OEMs’ manufacturing facilities, labour relations issues and other factors. The number of competitors that OEMs solicit to bid on any individual product has, in certain circumstances, been significantly reduced and management expects that further reductions will occur as a result of the OEMs’ stated intention to deal with fewer suppliers and to award those suppliers longer-term contracts.
Sources and Availability of Raw Materials The primary raw materials utilized by the precision machining operations are iron and aluminum castings and forgings, which are readily obtained from a variety of suppliers globally that support the Company’s operations. The Company is not substantially dependent on any one supplier. A disruption in the supply of components could cause the temporary shut-down and a prolonged supply disruption, including the inability to re-source or in-source production of a critical component, could have a material adverse effect on the Company’s business.
Raw materials supply factors such as allocations, pricing, quality, timeliness of delivery, transportation and warehousing costs may affect the raw material sourcing decisions of the Company and its plants. When appropriate and available, the Company may negotiate long-term agreements with raw material suppliers to ensure continued availability of certain raw materials on more favourable terms. In the event of significant unanticipated increase in demand for the Company’s products and the supply of raw materials, the Company may be unable to manufacture certain products in a quantity sufficient to meet its customers’ demand.
Labour Markets and Dependence on Key Personnel For the development and production of products, the ability for the Company to compete successfully will depend on its ability to acquire and retain competent trades people, management, and product development staff that allow the Company to quickly adapt to technological change and advances in processes. Loss of certain members of the executive team or key technical leaders of the Company could have a disruptive effect on the implementation of the Company’s business strategy and the efficient running of day-to-day operations until their replacement is found. Competition for personnel throughout the industry is intense. The Company may be unable to retain its key employees or attract, assimilate, train or retain other necessary qualified employees, which may restrict its growth potential.
Dependence on Certain Customers The Company’s Powertrain/Driveline segment has a limited number of customers that individually account for more than 10% of its consolidated revenues or receivables at any given time. The global precision machining industry is characterized by a large number of manufacturers. As a result, manufacturers, such as the Company, tend to have a relatively small share of the markets they serve. Nonetheless, the Company believes that it is currently the sole supplier being used by its customers worldwide for products that represent more than half of the Company’s Powertrain/Driveline sales.
Typically, sales are similarly concentrated for the Industrial segment as product distribution is largely through major rental companies. Through its Skyjack subsidiary, the Company engages in the production and sale of access equipment including scissor lifts, booms and telehandlers. There is a relatively defined sales cycle in this industry segment, as it is closely related to, and affected by, product life cycle and the construction sector. Therefore, the risks and fluctuations in the construction industry in the countries that Skyjack operates in also affect Skyjack’s sales.
Any disruption in the Company’s relationships with these major customers or any decrease in revenue from these major customers, as a consequence of current or future conditions or events in the economy or markets in general or in the automotive (including medium/heavy duty trucks) and industrial industries in particular, could have a material adverse effect on the Company’s business, financial condition, or results of operations.
Technological Change and Product Launches The automotive and non-automotive precision machining industry may encounter technological change, new product introductions, product abandonment, and evolving industry requirements and standards. Accordingly, the Company believes that its future success depends on its ability to launch new programs as well as enhance or develop current and future products at competitive prices and in a timely manner. The Company’s inability, given technological or other reasons, to enhance, develop, or launch products in a timely manner in response to changing market conditions or customer requirements could have a material adverse effect on the Company’s results of operations. In addition, there can be no assurance that products or technologies developed by other companies will not render the Company’s products uncompetitive or obsolete.
Foreign Currency Risk Although the Company’s financial results are reported in Canadian dollars, a significant portion of the Company’s revenues and operating costs are realized in other currencies. Fluctuations in the exchange rates between these currencies may affect the Company’s results of operations.

23
The Company’s foreign currency cash flows for the purchases of materials and certain capital equipment denominated in foreign currencies are naturally hedged when contracts to sell products are denominated in those same foreign currencies. In an effort to manage the remaining exposure to foreign currency risk, if material, the Company will employ hedging programs as appropriate. The Company uses forecasted future cash flows of foreign currencies to determine the residual foreign exchange exposure. The purpose of the Company's foreign currency hedging activities is to minimize the effect of exchange rate fluctuations on business decisions and the resulting uncertainty on future financial results. From time to time the Company will incur foreign denominated debt to finance the acquisition of foreign operations. In these cases the Company may elect to designate the foreign denominated debt as a net investment hedge of the foreign operation.
Long-term Contracts Through its Powertrain/Driveline businesses, the Company principally engages in machining and assembly for the automotive industry, which generally involves long-run processes for long-term contracts. Long-term contracts support the long-term sales of the Company but these contracts do not guarantee production volumes and as such the volumes produced by the Company could be significantly different than the volume capacity for which the contract was awarded.
Contracts for customer programs not yet in production generally provide for the supply of components for a customer’s future production levels. Actual production volumes may vary significantly from these estimates. These contracts can be terminated by a customer at any time and, if terminated, could result in the Company incurring pre-production, engineering and other various costs which may not be recoverable from the customer.
Long term supply agreements may also include mutually agreed price reductions over the life of the agreement. The Company attempts to offset price concessions and costs in a number of ways, including through negotiations with our customers, improved operating efficiencies and cost reduction efforts.
Acquisition and Expansion Risk The Company may expand its operations, depending on certain conditions, by acquiring additional businesses, products or technologies. There can be no assurance that the Company will be able to identify, acquire or profitably manage additional businesses, or successfully integrate any acquired businesses, products or technologies into the Company without substantial expenses, delays or other operational or financial problems. Furthermore, acquisitions may involve a number of special risks, including diversion of management’s attention, failure to retain key personnel, unanticipated events or circumstances, and legal liabilities, some or all of which could have a material adverse effect on the Company’s business, results of operations and financial condition. In addition, there can be no assurance that acquired businesses, products or technologies, if any, will achieve anticipated revenues and income. The failure of the Company to manage its acquisition or expansion strategy successfully could have a material adverse effect on the Company’s business, results of operations and financial condition.
Foreign Business Risk The Company’s operations in Europe, the America’s, and Asia, are subject to general business risks that do not exist in Canada. The political climate and government policies are less stable and less predictable in certain of these countries. As well, certain countries do not currently have the same economic infrastructure as exists in Canada.
Operations outside Canada subject the Company to other potential risks associated with international operations, including, but not limited to: complications in both compliance with and unexpected changes in foreign government laws and regulations, tariffs and other trade barriers, potential adverse tax consequences, fluctuations in currency exchange rates, difficulty in collecting accounts receivable, difficulty in staffing and managing foreign operations, events of international terrorism, economic effects of public health threats, recessionary environments in foreign economies, uncertainties in local commercial practices, and uncertainties in local accepted business practices and standards which may not be similar to accepted business practices and standards in Canada and which may create unforeseen business or public relations situations.
Expansion of the Company’s operations in non-traditional markets is an important element of our strategy and, as a result, our exposure to the risks described above may be greater in the future. The likelihood of such occurrences and their potential effect on the Company vary from country to country and are unpredictable.
Cyclicality and Seasonality The demand for the Company’s products is cyclical and is driven by changing market conditions in which the Company’s sells into. Current or future conditions or events in the economy or markets in general, or in the automotive (including medium/heavy duty trucks) and industrial industries in particular, could have a material adverse effect on the Company’s business, financial condition, or results of operations.
Historically, earnings in the second quarter, for the Industrial segment, are positively impacted by the high selling season for both the access equipment and agricultural businesses. For the Powertrain/Driveline segment, vehicle production is typically at its lowest level

24
during the months of July and August due to model changeovers by the OEMs and in December for maintenance shut-down periods. Since the Company’s working capital requirements are dependent upon industry production volumes, they are typically at their lowest level at this time. The Company takes advantage of summer and winter shutdowns for maintenance activities that would otherwise disrupt normal production schedules.
Capital and Liquidity Risk The Company is engaged in a capital-intensive business and it has fewer financial resources than some of its principal competitors. There is no assurance that the Company will be able to obtain additional debt or equity financing that may be required to successfully achieve its strategic plans.
The Company’s current credit facility and the 2021 Notes require the Company to comply with certain financial covenants. The 2017 Notes matured and were repaid during 2017 and were replaced by short-term floating rate debt. There can be no assurance of the Company’s ability to continue to comply with its financial covenants, to appropriately service its debt, or to obtain continued commitments from debt providers. Additionally the Company, if required, cannot guarantee access to additional equity or capital given current or future economic market events related to changes in the Company’s segments.
Legal Proceedings and Insurance Coverage The Company may be threatened from time to time in the ordinary course of conducting its business with, or may be named as a defendant in, various legal and regulatory proceedings. These legal proceedings could include securities, environmental or occupational health and safety regulatory proceedings, as well as product liability claims, warranty or recall claims, or other consequential damages claims. A significant judgment against the Company, or the imposition of a significant fine or penalty as a result of a finding that the Company has failed to comply with laws or regulations, could have a material adverse effect on the Company.
No assurance can be given that the insurance coverage or insurance coverage limits of the Company would be adequate to protect it against any claims for product liability claims, warranty or recall claims, or business interruption claims that may arise. The Company may require additional insurance coverage in these areas as the Company advances its involvement with product design and development. This type of insurance could be expensive and may not be available on acceptable terms, or at all. Any uninsured or underinsured product liability claims, warranty or recall claims, or business interruption claims could have a material adverse effect on the Company’s financial condition, results of operations and prospects.
Credit Risk The Company’s financial assets that are exposed to credit risk consist primarily of cash and cash equivalents and receivables. The Company’s credit risk for cash and cash equivalents is reduced as balances are held with major financial institutions with investment grade ratings. A substantial portion of the Company’s receivables are with large customers in the automotive, truck and industrial sectors which gives rise to concentration risk within those industries. The Company cannot guarantee that its customers will not experience financial difficulties in the future, making it unable to collect all of its receivables.
Emission Standards Emissions and Corporate Average Fuel Economy (CAFÉ) regulations continue to be a major influence on technology within the auto industry. These regulations could potentially impact the sales of certain products the Company manufactures; in particular components for internal combustion engines could be negatively impacted by increased penetration of electric or fuel cell vehicles. In recent years, the Company has made strides however, in mitigating this risk by increasing its portfolio of Hybrid, Electric and Fuel Cell Electric Vehicle component offerings. The Company’s strategy is to target content in each technology (or propulsion system) to ensure it is well prepared for whichever technology becomes the most dominant in the market.
Tax Laws The tax laws in Canada and abroad are continuously changing and no assurance can be given that Canadian federal or provincial tax laws or the tax laws in foreign jurisdictions will not be changed in a manner that adversely affects the Company. Over the past several years, many countries have reduced their tax rate in an effort to attract new business investment. There is no assurance that this trend will continue or that tax rates will remain unchanged. The Company currently has tax losses and credits in a number of countries that, given unforeseen changes in tax laws, may not continue indefinitely. Also, the Company’s expansion into emerging markets subjects the Company to new tax regimes that may change based on political or social conditions.
Securities Laws Compliance and Corporate Governance Standards The securities laws in Canada and abroad may change at any time. The impact of these changes on the Company cannot be predicted.
Environmental Matters The Company’s manufacturing operations are subject to a wide range of environmental laws and regulations imposed by governmental authority in the jurisdictions in which the Company conducts business, including among other things, soil, surface water and groundwater contamination; the generation, storage, handling, use, disposal and transportation of hazardous materials; the emission and discharge of

25
materials, including greenhouse gases, into the environment; and health and safety. Changes in laws and regulations, however, and the enforcement of such laws and regulations, are ongoing and may make environmental compliance, such as emissions control, site clean-ups and waste disposal, increasingly expensive. Senior management regularly assesses the work and costs required to address environmental matters, but is not able to predict the future costs (whether or not material) that may be incurred to meet environmental obligations.
DISCLOSURE CONTROLS AND PROCEDURES AND INTERNAL CONTROLS OVER FINANCIAL REPORTING
Disclosure Controls and Procedures
National Instrument 52-109, “Certification of Disclosure in Issuers’ Annual and Interim Filings”, issued by the Canadian Securities Administrators (“CSA”) requires Chief Executive Officers (“CEOs”) and Chief Financial Officers (“CFOs”) to certify that they are responsible for establishing and maintaining disclosure controls and procedures for the issuer, that disclosure controls and procedures have been designed and are effective in providing reasonable assurance that material information relating to the issuer is made known to them, that they have evaluated the effectiveness of the issuer’s disclosure controls and procedures, and that their conclusions about the effectiveness of those disclosure controls and procedures at the end of the period covered by the relevant annual filings have been disclosed by the issuer.
As of December 31, 2017, the Company’s management evaluated the effectiveness of the Company’s disclosure controls and procedures, as defined under rules adopted by the CSA. This evaluation was performed under the supervision of, and with the participation of, the CEO and the CFO.
The Company’s management, inclusive of the CEO and the CFO, does not expect that the Company’s disclosure controls and procedures will prevent or detect all error and all fraud. The inherent limitations in all control systems are such that they can provide only reasonable, not absolute, assurance that all control issues and instances of fraud or error, if any, within the Company have been detected.
Based on this evaluation, the CEO and the CFO have concluded that, subject to the inherent limitations noted above, the Company’s disclosure controls and procedures are effective in providing reasonable, not absolute assurance that the objectives of our disclosure control system have been met.
Internal Control over Financial Reporting
National Instrument 52-109 also requires CEOs and CFOs to certify that they are responsible for establishing and maintaining internal controls over financial reporting for the issuer, that those internal controls have been designed and are effective in providing reasonable assurance regarding the reliability of financial reporting and the preparation of financial statements in accordance with Canadian generally accepted accounting principles, and that the issuer has disclosed any changes in its internal controls during its most recent interim period that has materially affected, or is reasonably likely to materially affect, its internal control over financial reporting.
As of December 31, 2017, the Company’s management evaluated the effectiveness of the Company’s internal control over financial reporting, as defined under rules adopted by the CSA. This evaluation was performed under the supervision of, and with the participation of, the CEO and the CFO.
The Company’s internal control over financial reporting is designed to provide reasonable assurance regarding the reliability of financial reporting and the preparation of financial statements for external purposes in accordance with generally accepted accounting principles.
Internal control over financial reporting, no matter how well designed, has inherent limitations. Therefore, internal control over financial reporting can provide only reasonable, not absolute assurance with respect to financial statement preparation and may not prevent or detect all misstatements.
Based on this evaluation, the CEO and the CFO have concluded that, subject to the inherent limitations noted above, the Company’s internal control over financial reporting is effective in providing reasonable, not absolute assurance regarding the reliability of financial reporting and the preparation of financial statements for external purposes in accordance with generally accepted accounting principles.
Changes in Internal Controls over Financial Reporting
There were no changes in the Company’s internal control over financial reporting during the quarter ended December 31, 2017, which have materially affected, or is reasonably likely to materially affect, the Company’s internal control over financial reporting.

26
CRITICAL ACCOUNTING ESTIMATES AND JUDGEMENTS
The preparation of financial statements in conformity with IFRS requires management to make estimates and judgements about the future. Estimates and judgements are continually evaluated and are based on the historical experience and other factors, including expectations of future events that are believed to be reasonable under the circumstances. Actual results could differ from those estimates under different assumptions or conditions. The following discussion sets forth management’s most critical estimates and assumptions in determining the value of assets and liabilities and most critical judgements in applying accounting policies that have a significant risk of causing a material adjustment to the carrying amounts of assets and liabilities within the next year.
Impairment of Non-Financial Assets
The Company believes that the estimate of impairment for goodwill and non-financial assets is a “critical accounting estimate” because management is required to make significant forward looking assumptions. The recoverable amounts of cash generating units have been determined based on the higher of fair value less costs of disposal or value in use calculations, which require the use of estimates. Uncertain changes in the discount rate used, and forward looking assumptions regarding improvement plans, costing assumptions, timing of program launches, and production volumes may affect the fair value of estimates used. No known trends, commitments, events or other uncertainties are currently believed to materially affect the assumptions used.
Current Income Taxes
The Company is subject to income taxes in numerous jurisdictions where it has foreign operations. Significant judgement is required in determining the worldwide provision for income taxes. There are many transactions and calculations for which the ultimate tax determination is uncertain. The Company recognizes liabilities for anticipated tax audit issues based on estimates of whether additional taxes will be due. Where the final tax outcome of these matters is different from the amounts that were initially recorded, such differences will impact the current and deferred income tax assets and liabilities in the period in which such determination is made.
Deferred Income Tax Assets and Liabilities
Deferred income tax assets and liabilities result from timing differences between the financial reporting and tax bases of assets and liabilities. Loss carry forwards also comprise a portion of the temporary differences and result in a deferred income tax asset. Deferred income tax assets are only recognized to the extent that management considers it probable that a deferred income tax asset will be realized. The assessment for the recognition of a deferred tax asset requires significant judgement. The factors used to assess the likelihood of realization are the Company’s forecast of future taxable income and available tax planning strategies that could be implemented to realize the deferred tax assets. The Company has and continues to use tax planning strategies to realize deferred tax assets in order to avoid the potential loss of benefits. Unknown future events and circumstances, such as changes in tax rates and laws, may materially affect the assumptions and estimates made from one period to the next. Any significant change in events, tax laws, and tax rates beyond the control of the Company may materially affect the consolidated financial statements.
Useful Lives of Depreciable Assets
Due to the significance of property, plant and equipment and intangible assets on the Company’s statement of financial position, the Company considers the amortization policy relating to property, plant and equipment and intangible assets to be a “critical accounting estimate”. The Company considers the expected useful life of the assets, expected residual value, and contract length when setting the amortization rates of its assets. Judgement is involved when establishing these estimates as such factors as technological innovation, maintenance programs, and relevant market information must be taken into consideration. The asset’s residual values, useful lives and amortization methods are reviewed at the end of each reporting period and are adjusted if expectations differ from previous estimates. If circumstances impacting these assumptions and estimates change, the change in accounting estimates may represent a material impact to the consolidated financial statements.
Purchase Price Allocations
The purchase price related to a business combination is allocated to the underlying acquired assets and liabilities based on their estimated fair values at the time of acquisition. The determination of fair value requires the Company to make assumptions, estimates and judgements regarding future events. The allocation process is inherently subjective and impacts the amounts assigned to individually identifiable assets and liabilities. As a result, the purchase price allocation impacts the Company’s reported assets and liabilities and future net earnings due to the impact on future depreciation and amortization expense and impairment tests.
RECENT ACCOUNTING CHANGES AND EFFECTIVE DATES
For information pertaining to accounting changes effective in 2017 and for future fiscal years please see the Company’s consolidated financial statements for the year ended December 31, 2017.

27
NON-GAAP AND ADDITIONAL GAAP MEASURES
Non-GAAP Measures
The Company uses certain non-GAAP financial measures including net earnings (loss) – adjusted, net earnings (loss) per share – diluted – adjusted and book value per share. The Company believes these non-GAAP financial measures provide useful information to both management and investors in assessing the financial performance and financial condition of the Company.
Certain expenses and income that must be recognized under GAAP are not necessarily reflective of the Company’s underlying operational performance. For this reason, management uses certain non-GAAP financial measures to exclude the impact of these items when analyzing consolidated and segment underlying operational performance, on a consistent basis. The exclusion of certain items does not imply that they are non-recurring.
These Non-GAAP financial measures do not have a standardized meaning prescribed by GAAP and therefore they are unlikely to be comparable to similarly titled measures presented by other publicly traded companies, and they should not be construed as an alternative to other financial measures determined in accordance with GAAP.
Net Earnings (Loss) – Adjusted The Company believes net earnings (loss) – adjusted is useful in assessing the Company’s underlying operational performance and in making decisions regarding the ongoing operations of the business. Net earnings (loss) – adjusted is calculated as net earnings (loss) as presented in the Company’s consolidated financial statements less any unusual items that are considered not to be indicative of underlying operational performance. See the “Overall Corporate Results” section of this MD&A for a description of the unusua l items impacting the operational performance discussed in this MD&A and a reconciliation of net earnings (loss) – adjusted to GAAP net earnings (loss).
Net Earnings (Loss) per Share – Diluted – Adjusted The Company believes net earnings (loss) per share – adjusted is useful in assessing the Company’s underlying operational performance and in making decisions regarding the ongoing operations of the business. Net earnings (loss) per share – adjusted is calculated as net earnings (loss) - adjusted (as defined above) divided by the fully diluted number of shares outstanding as at the period end date. See the “Overall Corporate Results” section of this MD&A for a description of the unusual items impacting the operational performance discussed in this MD&A and a reconciliation of net earnings (loss) per share – adjusted to GAAP net earnings (loss) per share.
Book Value per Share This measure, as used by the chief operating decision makers and management, indicates the value of the Company based on the carrying value of the Company’s net assets. Book value per share is calculated by the Company as total equity divided by shares outstanding at the end of the period.
December 31 December 31 (in millions of dollars except share and per share figures) 2017 2016
Total equity $ 3,112.8 $ 2,590.3 Shares outstanding at the end of the period 65,354,495 65,258,426 Book value per share $ 47.63 $ 39.69
Additional GAAP Measures
IFRS mandates certain minimum line items for financial statements and requires presentation of additional line items, headings and subtotals when such presentation is relevant to an understanding of an entity’s financial position and performance. The Company presents the following additional GAAP measures in the Company’s consolidated financial statements.
Operating Earnings Operating earnings (loss) is calculated as net earnings (loss) before income taxes, finance expenses and share of net earnings (loss) of investments accounted for using the equity method, as presented on the Company’s consolidated statements of earnings. This measure, along with other GAAP and non-GAAP measures are used by the chief operating decision makers and management to assess operating performance and the effective use and allocation of resources and to provide more meaningful comparisons of operating results.

28
SUMMARY OF CONTENT PER VEHICLE BY QUARTER
Estimates as of December 31, 2017 Three Months Ended Year to Date
Mar 31 Jun 30 Sep 30 Dec 31 Mar 31 Jun 30 Sep 30 Dec 31
North America 2017 2017 2017 2017 2017 2017 2017 2017
Vehicle Production Units 4.64 4.58 4.09 4.28 4.64 9.21 13.30 17.58 Automotive Sales $ 722.3 $ 735.3 $ 664.5 $ 675.2 $ 722.3 $ 1,457.6 $ 2,122.1 $ 2,797.3 Content Per Vehicle $ 155.83 $ 160.71 $ 162.49 $ 157.58 $ 155.83 $ 158.25 $ 159.55 $ 159.07
Europe
Vehicle Production Units 5.86 5.72 4.96 5.80 5.86 11.57 16.53 22.33 Automotive Sales $ 386.8 $ 397.2 $ 365.1 $ 405.4 $ 386.8 $ 784.0 $ 1,149.1 $ 1,554.6 Content Per Vehicle $ 66.05 $ 69.48 $ 73.60 $ 69.93 $ 66.05 $ 67.75 $ 69.50 $ 69.62
Asia Pacific
Vehicle Production Units 12.56 11.48 12.08 13.83 12.56 24.05 36.13 49.96 Automotive Sales $ 114.5 $ 123.1 $ 114.0 $ 131.2 $ 114.5 $ 237.6 $ 351.6 $ 482.7 Content Per Vehicle $ 9.11 $ 10.72 $ 9.44 $ 9.48 $ 9.11 $ 9.88 $ 9.73 $ 9.66
Estimates as of September 30, 2017 Three Months Ended Year to Date Mar 31 Jun 30 Sep 30 Mar 31 Jun 30 Sep 30 North America 2017 2017 2017 2017 2017 2017
Vehicle Production Units 4.64 4.58 4.18 4.64 9.21 13.39 Automotive Sales $ 718.1 $ 732.3 $ 662.2 $ 718.1 $ 1,450.4 $ 2,112.6 Content Per Vehicle $ 154.93 $ 160.05 $ 158.28 $ 154.93 $ 157.48 $ 157.73
Europe
Vehicle Production Units 5.85 5.73 5.00 5.85 11.58 16.58 Automotive Sales $ 387.8 $ 393.5 $ 361.1 $ 387.8 $ 781.2 $ 1,142.3 Content Per Vehicle $ 66.23 $ 68.70 $ 72.18 $ 66.23 $ 67.45 $ 68.88
Asia Pacific
Vehicle Production Units 12.55 11.48 11.90 12.55 24.04 35.93 Automotive Sales $ 118.7 $ 129.8 $ 123.9 $ 118.7 $ 248.5 $ 372.3 Content Per Vehicle $ 9.45 $ 11.30 $ 10.41 $ 9.45 $ 10.34 $ 10.36
Change in Estimates from Prior Quarter Three Months Ended Year to Date Mar 31 Jun 30 Sep 30 Mar 31 Jun 30 Sep 30 2017 2017 2017 2017 2017 2017 North America +/- +/- +/- +/- +/- +/-
Vehicle Production Units - - (0.09) - - (0.09) Automotive Sales $ 4.2 $ 3.0 $ 2.3 $ 4.2 $ 7.2 $ 9.5 Content Per Vehicle $ 0.90 $ 0.66 $ 4.21 $ 0.90 $ 0.77 $ 1.82
Europe
Vehicle Production Units 0.01 (0.01) (0.04) 0.01 (0.01) (0.05) Automotive Sales $ (1.0) $ 3.7 $ 4.0 $ (1.0) $ 2.8 $ 6.8 Content Per Vehicle $ (0.18) $ 0.78 $ 1.42 $ (0.18) $ 0.30 $ 0.62
Asia Pacific
Vehicle Production Units 0.01 - 0.18 0.01 0.01 0.20 Automotive Sales $ (4.2) $ (6.7) $ (9.9) $ (4.2) $ (10.9) $ (20.7) Content Per Vehicle $ (0.34) $ (0.58) $ (0.97) $ (0.34) $ (0.46) $ (0.63)
FORWARD LOOKING INFORMATION
Certain information provided by Linamar in this MD&A, the Annual Report and other documents published throughout the year which are not recitation of historical facts may constitute forward-looking statements. The words “may”, “would”, “could”, “will”, “likely”, “estimate”,

29
“believe”, “expect”, “plan”, “forecast” and similar expressions are intended to identify forward-looking statements. Readers are cautioned that such statements are only predictions and the actual events or results may differ materially. In evaluating such forward-looking statements, readers should specifically consider the various factors that could cause actual events or results to differ materially from those indicated by such forward-looking statements.
Such forward-looking information may involve important risks and uncertainties that could materially alter results in the future from those expressed or implied in any forward-looking statements made by, or on behalf of, Linamar. Some of the factors and risks and uncertainties that cause results to differ from current expectations include, but are not limited to, changes in the competitive environment in which Linamar operates, OEM outsourcing and insourcing; sources and availability of raw materials; labour markets and dependence on key personnel; dependence on certain customers and product programs; technological change in the sectors in which the Company operates and by Linamar’s competitors; delays in or operational issues with product launches; foreign currency risk; long-term contracts that are not guaranteed; acquisition and expansion risk; foreign business risk; cyclicality and seasonality; capital and liquidity risk; legal proceedings and insurance coverage; credit risk; emission standards; tax laws; securities laws compliance and corporate governance standards; fluctuations in interest rates; environmental emissions and safety regulations; trade and labour disruptions; world political events; pricing concessions to customers; and governmental, environmental and regulatory policies.
The foregoing is not an exhaustive list of the factors that may affect Linamar’s forwarding looking statements. These and other factors should be considered carefully and readers should not place undue reliance on Linamar’s forward-looking statements. Linamar assumes no obligation to update the forward-looking statements, or to update the reasons why actual results could differ from those reflected in the forward-looking statements.

30
CONSOLIDATED FINANCIAL STATEMENTS
Linamar Corporation December 31, 2017 and December 31, 2016 (in thousands of dollars)

MANAGEMENT’S RESPONSIBILITY FOR THE CONSOLIDATED FINANCIAL STATEMENTS
31
The management of Linamar Corporation (the “Company”) is responsible for the preparation of all information included in this annual report. The consolidated financial statements have been prepared in accordance with International Financial Reporting Standards, and necessarily include some amounts that are based on management’s best estimates and judgements. Financial information included elsewhere is this annual report is consistent with that in the consolidated financial statements. Management maintains a system of internal accounting controls to provide reasonable assurance that the consolidated financial statements are accurate and reliable and that the assets are safeguarded from loss or unauthorized use. The Company’s external auditors, appointed by the shareholders, have prepared their report, which outlines the scope of their examination and expresses their opinion on the consolidated financial statements. The Board of Directors, through its Audit Committee, is responsible for assuring that management fulfills its financial reporting responsibilities. The Audit Committee is composed of independent directors who are not employees of the Company. The Audit Committee meets periodically with management and with the auditors to review and to discuss accounting policy, auditing and financial reporting matters. The Committee reports its findings to the Board of Directors for their consideration in reviewing and approving the consolidated financial statement for issuance to the shareholders. (Signed) “Linda Hasenfratz” (Signed) “Dale Schneider” Linda Hasenfratz Dale Schneider Chief Executive Officer Chief Financial Officer March 7, 2018

INDEPENDENT AUDITOR’S REPORT
32
March 7, 2018 To the Shareholders of Linamar Corporation We have audited the accompanying consolidated financial statements of Linamar Corporation and its subsidiaries, which comprise the consolidated statements of financial position as at December 31, 2017 and December 31, 2016 and the consolidated statements of earnings, comprehensive earnings, changes in equity and cash flows for the years then ended, and the related notes, which comprise a summary of significant accounting policies and other explanatory information.
Management’s responsibility for the consolidated financial statements Management is responsible for the preparation and fair presentation of these consolidated financial statements in accordance with International Financial Reporting Standards, and for such internal control as management determines is necessary to enable the preparation of consolidated financial statements that are free from material misstatement, whether due to fraud or error.
Auditor’s responsibility Our responsibility is to express an opinion on these consolidated financial statements based on our audits. We conducted our audits in accordance with Canadian generally accepted auditing standards. Those standards require that we comply with ethical requirements and plan and perform the audit to obtain reasonable assurance about whether the consolidated financial statements are free from material misstatement.
An audit involves performing procedures to obtain audit evidence about the amounts and disclosures in the consolidated financial statements. The procedures selected depend on the auditor’s judgment, including the assessment of the risks of material misstatement of the consolidated financial statements, whether due to fraud or error. In making those risk assessments, the auditor considers internal control relevant to the entity’s preparation and fair presentation of the consolidated financial statements in order to design audit procedures that are appropriate in the circumstances, but not for the purpose of expressing an opinion on the effectiveness of the entity’s internal control. An audit also includes evaluating the appropriateness of accounting policies used and the reasonableness of accounting estimates made by management, as well as evaluating the overall presentation of the consolidated financial statements.
We believe that the audit evidence we have obtained in our audits is sufficient and appropriate to provide a basis for our audit opinion.
Opinion In our opinion, the consolidated financial statements present fairly, in all material respects, the financial position of Linamar Corporation and its subsidiaries as at December 31, 2017 and December 31, 2016 and their financial performance and their cash flows for the years then ended in accordance with International Financial Reporting Standards.
(Signed) “PricewaterhouseCoopers LLP”
Chartered Professional Accountants, Licensed Public Accountants Toronto, Ontario

LINAMAR CORPORATION Consolidated Statements of Financial Position (in thousands of Canadian dollars)
33
December 31
2017 December 31
2016 $ $
ASSETS Cash and cash equivalents 439,064 404,966 Accounts and other receivables (Note 27) 1,083,322 898,445 Inventories (Note 8) 791,670 691,385 Income taxes recoverable (Note 9) 33,145 11,466 Current portion of long-term receivables (Note 6) 103,276 74,557 Current portion of derivative financial instruments (Note 27) 1,333 44,904 Other current assets 25,387 17,177
Current Assets 2,477,197 2,142,900
Long-term receivables (Note 6) 304,514 199,369 Property, plant and equipment (Note 10) 2,209,884 2,052,055 Investments accounted for using the equity method 9,263 5,881 Intangible assets (Note 11) 287,827 279,587 Goodwill (Note 12) 485,610 456,791 Derivative financial instruments (Note 27) 25,854 37,134 Deferred tax assets (Note 9) 51,074 53,453
Assets 5,851,223 5,227,170
LIABILITIES Short-term borrowings 8,836 7,972 Accounts payable and accrued liabilities (Note 27) 1,215,803 974,612 Provisions (Note 13) 31,486 31,713 Income taxes payable (Note 9) 33,446 54,836 Current portion of long-term debt (Note 14) 6,399 197,157
Current Liabilities 1,295,970 1,266,290
Long-term debt (Note 14) 1,288,826 1,228,035 Deferred tax liabilities (Note 9) 153,589 142,584
Liabilities 2,738,385 2,636,909
EQUITY Capital stock (Note 15) 122,393 120,385 Retained earnings 2,904,552 2,386,524 Contributed surplus 25,027 23,332 Accumulated other comprehensive earnings (loss) 60,866 60,020
Equity 3,112,838 2,590,261
Liabilities and Equity 5,851,223 5,227,170
The accompanying notes are an integral part of these consolidated financial statements.
On behalf of the Board of Directors: (Signed) “Frank Hasenfratz” (Signed) “Linda Hasenfratz” Frank Hasenfratz Linda Hasenfratz
Director Director

LINAMAR CORPORATION Consolidated Statements of Earnings For the years ended December 31, 2017 and December 31, 2016 (in thousands of Canadian dollars, except per share figures)
34
2017 2016 $ $
Sales 6,546,458 6,005,584 Cost of sales (Note 16) 5,467,162 5,003,034
Gross Margin 1,079,296 1,002,550 Selling, general and administrative (Note 16) 352,163 325,364 Other income and (expenses) (Note 19) (19,261) 19,591
Operating Earnings (Loss) 707,872 696,777 Share of net earnings (loss) of investments accounted for using the equity method (6,057) (2,976) Finance (income) and expenses (Note 20) 9,257 21,071
Net Earnings (Loss) before Income Taxes 692,558 672,730 Provision for (recovery of) income taxes (Note 9) 143,188 150,202
Net Earnings (Loss) for the Year 549,370 522,528
Net Earnings (Loss) Attributable to:
Shareholders of the Company 549,370 522,127 Non-Controlling Interests (Note 25) - 401
549,370 522,528
Net Earnings (Loss) per Share Attributable to Shareholders of the Company: (Note 21)
Basic 8.41 8.01 Diluted 8.32 7.92
The accompanying notes are an integral part of these consolidated financial statements.
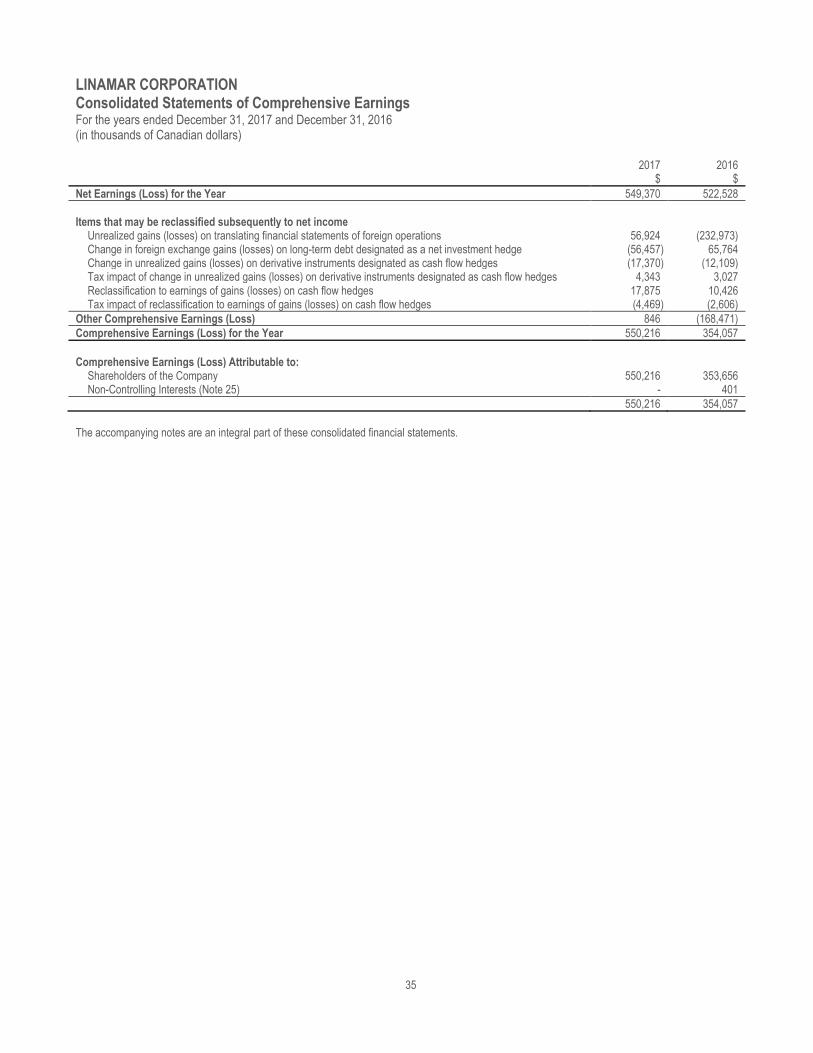
LINAMAR CORPORATION Consolidated Statements of Comprehensive Earnings For the years ended December 31, 2017 and December 31, 2016 (in thousands of Canadian dollars)
35
2017 2016 $ $
Net Earnings (Loss) for the Year 549,370 522,528
Items that may be reclassified subsequently to net income
Unrealized gains (losses) on translating financial statements of foreign operations 56,924 (232,973) Change in foreign exchange gains (losses) on long-term debt designated as a net investment hedge (56,457) 65,764 Change in unrealized gains (losses) on derivative instruments designated as cash flow hedges (17,370) (12,109) Tax impact of change in unrealized gains (losses) on derivative instruments designated as cash flow hedges 4,343 3,027 Reclassification to earnings of gains (losses) on cash flow hedges 17,875 10,426 Tax impact of reclassification to earnings of gains (losses) on cash flow hedges (4,469) (2,606)
Other Comprehensive Earnings (Loss) 846 (168,471)
Comprehensive Earnings (Loss) for the Year 550,216 354,057
Comprehensive Earnings (Loss) Attributable to:
Shareholders of the Company 550,216 353,656 Non-Controlling Interests (Note 25) - 401
550,216 354,057
The accompanying notes are an integral part of these consolidated financial statements.

LINAMAR CORPORATION Consolidated Statements of Changes in Equity For the years ended December 31, 2017 and December 31, 2016 (in thousands of Canadian dollars)
36
Capital stock Retained earnings
Contributed surplus
Cumulative translation adjustment
Hedging reserves
Equity Attributable to Shareholders
Non-Controlling
Interests Total Equity $ $ $ $ $ $ $ $
Balance at January 1, 2016 118,609 1,890,473 21,094 228,306 185 2,258,667 - 2,258,667 Net Earnings (Loss) - 522,127 - - - 522,127 401 522,528 Other comprehensive earnings (loss) - - - (167,209) (1,262) (168,471) - (168,471)
Comprehensive Earnings (Loss) - 522,127 - (167,209) (1,262) 353,656 401 354,057 Share-based compensation - - 2,765 - - 2,765 - 2,765 Shares issued on exercise of options 1,776 - (527) - - 1,249 - 1,249 Acquisition of non-controlling interests - - - - - - (401) (401) Dividends - (26,076) - - - (26,076) - (26,076)
Balance at December 31, 2016 120,385 2,386,524 23,332 61,097 (1,077) 2,590,261 - 2,590,261 Net Earnings (Loss) - 549,370 - - - 549,370 - 549,370 Other comprehensive earnings (loss) - - - 467 379 846 - 846
Comprehensive Earnings (Loss) - 549,370 - 467 379 550,216 - 550,216 Share-based compensation - - 2,290 - - 2,290 - 2,290 Shares issued on exercise of options 2,008 - (595) - - 1,413 - 1,413 Dividends - (31,342) - - - (31,342) - (31,342)
Balance at December 31, 2017 122,393 2,904,552 25,027 61,564 (698) 3,112,838 - 3,112,838
The accompanying notes are an integral part of these consolidated financial statements.

LINAMAR CORPORATION Consolidated Statements of Cash Flows For the years ended December 31, 2017 and December 31, 2016 (in thousands of Canadian dollars)
37
2017 2016 $ $
Cash generated from (used in) Operating Activities Net earnings (loss) Attributable to Shareholders of the Company 549,370 522,127 Adjustments for:
Amortization of property, plant and equipment 293,961 306,316 Amortization of other intangible assets 25,819 27,311 Deferred income taxes 10,200 (12,192) Property, plant and equipment impairment provision, net of reversals (6,160) 30,610 Share-based compensation 2,290 2,765 Finance expense 9,257 21,071 Other 1,156 2,097
885,893 900,105
Changes in non-cash working capital
(Increase) decrease in accounts and other receivables (184,216) (91,386) (Increase) decrease in inventories (89,878) (81,304) (Increase) decrease in other current assets (8,191) (2,761) Increase (decrease) in income taxes (43,383) 11,315 Increase (decrease) in accounts payable and accrued liabilities 225,463 156,753 Increase (decrease) in provisions 237 5,345
(99,968) (2,038)
Cash generated from (used in) operating activities 785,925 898,067
Financing Activities Proceeds from (repayments of) short-term borrowings (25) (2,087) Proceeds from (repayments of) long-term debt (140,899) 826,556 Proceeds from government borrowings 8,104 11,193 Proceeds from exercise of stock options 1,413 1,249 Dividends (31,342) (26,076) Interest received (paid) (8,220) (20,905)
Cash generated from (used in) financing activities (170,969) 789,930
Investing Activities Payments for purchase of property, plant and equipment (410,032) (343,273) Proceeds on disposal of property, plant and equipment 13,204 7,939 Payments for purchase of intangible assets (17,365) (10,638) Business acquisitions, net of cash acquired (1,060) (1,133,945) (Increase) decrease in long-term receivables (152,381) (94,118) Other (9,321) (883)
Cash generated from (used in) investing activities (576,955) (1,574,918)
38,001 113,079 Effect of translation adjustment on cash (3,903) (47,192)
Increase (decrease) in cash and cash equivalents 34,098 65,887 Cash and cash equivalents - Beginning of Year 404,966 339,079
Cash and cash equivalents - End of Year 439,064 404,966
Comprised of: Cash in bank 315,371 233,002 Short-term deposits 138,205 192,922 Unpresented cheques (14,512) (20,958)
439,064 404,966
The accompanying notes are an integral part of these consolidated financial statements.

LINAMAR CORPORATION Notes to Consolidated Financial Statements For the years ended December 31, 2017 and December 31, 2016 (in thousands of Canadian dollars, except where otherwise noted)
38
1 General Information
Linamar Corporation and its subsidiaries, including jointly controlled entities, (together, the “Company”) is a diversified global manufacturing company of highly engineered products. The Company is incorporated in Ontario, Canada with common shares listed on the Toronto Stock Exchange. The Company is domiciled in Canada and its registered office is 287 Speedvale Avenue West, Guelph, Ontario, Canada.
The consolidated annual financial statements of the Company for the year ended December 31, 2017 were authorized for issue in accordance with a resolution of the Company’s Board of Directors on March 7, 2018.
2 Basis of Preparation
The Company has prepared its consolidated annual financial statements in accordance with International Financial Reporting Standards (“IFRS”) as issued by the International Accounting Standards Board (“IASB”) and with interpretations of the International Financial Reporting Issues Committee.
3 Significant Accounting Policies
The principal accounting policies applied in the preparation of these consolidated financial statements are set out below. These policies have been consistently applied to all the periods presented, unless otherwise stated.
Basis of Measurement These consolidated financial statements were prepared on a going concern basis, under the historical cost convention, as modified by the revaluation of financial assets and financial liabilities (including derivative instruments) at fair value.
Basis of Consolidation Subsidiaries are all entities over which the Company has control and all subsidiaries are wholly owned. These consolidated financial statements include the accounts of the Company and its subsidiaries. The Company controls an entity when the Company is exposed to, or has rights to, variable returns from its involvement with the entity and has the ability to affect those returns through its power over the entity. Subsidiaries are fully consolidated from the date on which control is transferred to the Company and are deconsolidated from the date that control ceases. All significant inter-company transactions are eliminated on consolidation.
Acquisitions of subsidiaries and businesses are accounted for using the acquisition method. The consideration transferred for the acquisition of a subsidiary is the fair value (at the date of exchange) of the assets acquired, liabilities incurred or assumed, and equity instruments issued by the Company in exchange for control of the acquiree. Any excess of the acquisition cost over the fair value of the net assets acquired and liabilities and contingent liabilities recognized, is recorded in assets as goodwill. If this consideration is lower than the fair value of the net assets acquired, the difference is recognized in profit or loss. Acquisition-related costs are expensed as incurred.
Any contingent consideration to be transferred by the acquirer is recognized and estimated at fair value at the acquisition date. Subsequent changes to the fair value of the contingent consideration which is deemed to be an asset or liability will be recognized in accordance with the applicable standard either in net earnings or as a change to other comprehensive earnings. If the contingent consideration is classified as equity, it shall not be re-measured and shall be accounted for within equity.
The Company has partial ownership in joint ventures over whose activities the Company has joint control, established by contractual agreements and requiring unanimous consent for strategic, financial and operating decisions. The Company accounts for the jointly controlled entities using the equity method whereby the Company’s investment is originally recognized at cost. The consolidated financial statements include the Company’s share of the income and expenses and equity movements of the jointly controlled entity, after adjustments to align the accounting policies with those of the Company, from the date that the significant influence of joint control commences until the date that significant influence or joint control ceases. Dividends are recognized as a reduction in the carrying amount of the investment.
Unrealized gains on transactions between the Company and the jointly controlled entities are eliminated to the extent of the Company’s interest in the joint venture. Unrealized losses are eliminated unless the transaction provides evidence of impairment.

LINAMAR CORPORATION Notes to Consolidated Financial Statements For the years ended December 31, 2017 and December 31, 2016 (in thousands of Canadian dollars, except where otherwise noted)
39
Foreign Currency Translation Functional and presentation currency The Company’s consolidated financial statements are presented in Canadian dollars (“dollars”), which is also the Company’s functional currency. Each entity in the Company maintains its accounting records in its functional currency. An entity’s functional currency is the currency of the principal economic environment in which it operates.
Transactions and balances Foreign currency transactions are translated into the functional currency using the average exchange rate of the reporting period. At the end of each reporting period, monetary assets and liabilities denominated in foreign currencies are re-translated at period end exchange rates. Non-monetary assets and liabilities, which are measured in terms of historical cost in a foreign currency, are not re-translated. Foreign exchange gains and losses arising from borrowings are presented in the statement of earnings within finance expenses and all other foreign exchange gains and losses are presented within operating earnings except for those which relate to qualifying cash flow hedges or are attributable to part of the net investment in a foreign operation, which are presented in other comprehensive earnings within accumulated other comprehensive earnings until realized.
Foreign Operations For the purposes of presenting consolidated financial statements, the results and financial position of all entities that have a functional currency different from the presentation currency are translated into the presentation currency as follows:
(a) Assets and liabilities are translated at the closing rate at the reporting period end date;
(b) Income and expenses are translated at average exchange rates for the reporting period; and
(c) All resulting exchange differences are recognized as a separate component of equity.
On consolidation, exchange differences arising from the translation of the net investment in foreign operations are taken to equity. When a foreign operation is sold, or there is a disposal involving a loss of control, exchange differences that were recorded in equity are recognized in the statement of earnings as part of the gain or loss on sale or disposal.
Cash and Cash Equivalents Cash and cash equivalents include cash in bank and short-term deposits. Cash equivalents are short-term, highly liquid investments, that are readily convertible to known amounts of cash and which are subject to insignificant risk of changes in value. Investments normally qualify as cash equivalents if they have a term to maturity at the date of purchase of three months or less.
Receivables Receivables are amounts due from customers for products sold or services performed in the ordinary course of business.
Receivables are recognized initially at fair value and subsequently measured at amortized cost using the effective interest method, less allowances for doubtful accounts. The allowance for doubtful accounts is determined by taking into consideration the age of the receivables, the Company’s prior experience with the customer including their ability to pay, and/or an assessment of the current economic conditions. Receivables and allowance for doubtful accounts are written off when the balance is no longer considered to be collectible.
Leases Leases are classified as finance leases whenever the terms of the lease transfer substantially all the risks and rewards of ownership. All other leases are classified as operating leases.
Company as a lessee The Company leases certain property, plant and equipment under both finance leases and operating leases. Payments made under operating leases are charged to net earnings on a straight-line basis over the period of the lease. Assets leased by the Company that qualify as finance leases are initially recognized as assets of the Company at their fair value at the inception of the lease or, if lower, at the present value of the minimum lease payments. The corresponding liability is included in the statement of financial position as a finance lease obligation. Lease payments under finance leases are allocated between finance charges and a reduction of the outstanding lease obligation. Finance charges are recognized immediately in net earnings, unless they are directly attributable to qualifying assets, in which case they are capitalized in accordance with the Company’s general policy on borrowing costs. The property, plant and equipment acquired under finance leases are depreciated over the shorter of the useful life of the asset and the lease term.

LINAMAR CORPORATION Notes to Consolidated Financial Statements For the years ended December 31, 2017 and December 31, 2016 (in thousands of Canadian dollars, except where otherwise noted)
40
Company as a lessor The Company leases certain industrial access products to customers under both finance leases and operating leases. Amounts due from lessees under operating lease arrangements are recognized as revenue over the course of the lease arrangement. Contingent rents are recognized as revenue in the period in which they are earned. Amounts due from lessees under finance lease arrangements are recognized as receivables at the amount of the Company’s net investments in the leases. Finance lease income is allocated to accounting periods so as to reflect a constant rate of return on the Company’s net investment outstanding.
Sale of Receivables The sale of receivables is recognized when the Company transfers the financial asset and substantially all the risks and rewards of ownership of the asset to another entity. If the Company retains substantially all the risks and rewards of ownership of a transferred financial asset, the Company continues to recognize the financial asset and also recognizes a borrowing for the proceeds received.
Inventories Inventories are valued at the lower of cost and net realizable value. The cost of finished goods and work-in-process is comprised of material costs, direct labour costs and other direct costs and related production overheads (based on normal operating capacity). Costs are allocated to inventory on the basis of weighted average costs. Net realizable value for finished goods and work-in-process is the estimated selling price in the ordinary course of business, less estimated costs of completion and applicable variable selling expenses. For raw materials and general stores inventories the replacement cost is considered to be the best available measure of net realizable value. The amount of inventories recognized as an expense during the period is shown in costs of sales. Write-downs for inventories are recorded when the net realizable value is lower than cost. The write-downs may be reversed if the circumstances which caused them no longer exist.
Taxation Income taxes recoverable and payable The taxes currently payable are based on taxable earnings for the reporting period. Taxable earnings differs from earnings as reported in the consolidated statement of earnings because of items of income or expense that are taxable or deductible in other years and items that are never taxable or deductible. The Company’s liability for current tax is calculated using tax rates that have been enacted or substantively enacted by the end of the reporting period, in each jurisdiction that the Company operates in.
Deferred tax assets and liabilities Deferred tax assets and liabilities are recognized on temporary differences between the carrying amounts of assets and liabilities in the financial statements and the corresponding tax bases used in the computation of taxable earnings. Deferred tax assets are generally recognized for all deductible temporary differences to the extent that it is probable that taxable earnings will be available against which those deductible temporary differences can be utilized. Deferred tax liabilities are generally recognized for all taxable temporary differences. Such deferred tax assets and liabilities are not recognized if the temporary difference arises from goodwill.
Deferred tax assets and liabilities are not recognized for temporary differences between the carrying amount and tax bases of investments in foreign operations where the timing of the reversal of the temporary difference is controlled by the Company and it is probable that the temporary differences will not reverse in the foreseeable future. Deferred tax assets arising from deductible temporary differences associated with such investments and interests are only recognized to the extent that it is probable that there will be sufficient taxable earnings against which to utilize the benefits of the temporary differences and they are expected to reverse in the foreseeable future. The ability to realize the tax benefits for tax loss carry-forwards is dependent upon a number of factors, including the future profitability of operations in the jurisdictions in which the tax losses arose.
The carrying amount of deferred tax assets is reviewed at the end of each reporting period and reduced to the extent that it is no longer probable that sufficient taxable earnings will be available to allow all or part of the asset to be recovered.
Deferred tax assets and liabilities are measured at the tax rates that are expected to apply in the period in which the liability is settled or the asset realized, based on tax rates (and tax laws) that have been enacted or substantively enacted by the end of the reporting period. The measurement of deferred tax assets and liabilities reflects the tax consequences that would follow from the manner in which the Company expects, at the end of the reporting period, to recover or settle the carrying amount of its assets and liabilities.

LINAMAR CORPORATION Notes to Consolidated Financial Statements For the years ended December 31, 2017 and December 31, 2016 (in thousands of Canadian dollars, except where otherwise noted)
41
Deferred tax assets and liabilities are offset when there is a legally enforceable right to offset current tax assets against current tax liabilities and when they relate to income taxes levied by the same taxation authority and the Company intends to settle its current tax assets and liabilities on a net basis.
Provision for current and deferred income taxes Income tax expense represents the sum of the current and deferred income taxes for the period.
Current and deferred tax are recognized as an expense or income in net earnings, except when they relate to items that are recognized outside net earnings (whether in other comprehensive earnings or directly in equity), in which case the tax is also recognized outside net earnings, or where they arise from the initial accounting for a business acquisition. In the case of a business acquisition, the tax effect is included in the accounting for the business acquisition.
Property, Plant and Equipment Property, plant and equipment are recorded at cost less accumulated amortization and impairment. Amortization of property, plant and equipment commences when they are ready for their intended use. Amortization is charged to earnings in amounts sufficient to depreciate the cost of property, plant and equipment over their estimated useful lives using the diminishing balance and straight-line methods as follows:
Land-use rights Straight-line over the life of the contract
Buildings 5% diminishing balance
Machinery Straight-line over 5 - 20 years or 15% - 20% diminishing balance
Office equipment Straight-line over 2 - 3 years or 20% diminishing balance
Transportation equipment 10% - 30% diminishing balance
Tooling Straight-line over 1 year
Where components of more substantial assets have differing useful lives, these are depreciated separately. Subsequent costs are capitalized in the asset’s carrying amount or recognized as a separate asset, as appropriate, only when it is probable that future economic benefits associated with the item will flow to the Company and the cost of the item can be measured reliably. The carrying amount of the replaced part is derecognized. The asset’s residual values, useful lives and amortization methods are reviewed, and adjusted if appropriate, at the end of each reporting period. Repair and maintenance costs are expensed as incurred, except where they serve to increase productivity or to prolong the useful life of an asset, in which case they are capitalized.
Borrowing costs that are directly attributable to the acquisition, construction or production of qualified assets are capitalized as part of the acquisition costs of the qualified asset. All other borrowing costs are recognized in net earnings.
Intangibles Intangible assets acquired through purchase are initially measured at cost. Intangible assets acquired through business combinations are initially measured at fair value at the date of acquisition. Amortization is charged to earnings in amounts sufficient to depreciate the cost of intangible assets over their estimated useful lives using the straight-line method or a unit of production basis as follows:
Trade names Straight-line over 20 years
Customer relationships Straight-line over 12 - 15 years
Technology Straight-line over 10 - 15 years
Product development costs Unit of production basis
The asset’s residual values, useful lives and amortization methods are reviewed, and adjusted if appropriate, at the end of each reporting period.
Goodwill Goodwill represents the excess of the cost of the acquisition over the fair value of the Company’s share of the net identifiable assets of the acquired subsidiary at the date of acquisition. Goodwill is not amortized but is reviewed for impairment annually, or more frequently when there is an indication of impairment.
LINAMAR CORPORATION Notes to Consolidated Financial Statements For the years ended December 31, 2017 and December 31, 2016 (in thousands of Canadian dollars, except where otherwise noted)
42
Impairment of Non-Financial Assets At the end of each reporting period, or more frequently based on specific events or changes in circumstances, the Company reviews the carrying amounts of its non-financial assets to determine whether there is any indication that those assets have suffered an impairment loss. If any such indication exists, the recoverable amount of the asset is estimated in order to determine the extent of the impairment loss (if any). Where it is not possible to estimate the recoverable amount of an individual asset, the assets are grouped at the lowest level for which there are separately identifiable cash inflows and the Company estimates the recoverable amount at the cash-generating units (“CGU”) level. The Company has determined a CGU to be an individual entity or group of entities with separately identifiable cash inflows. Where a reasonable and consistent basis of allocation can be identified, corporate assets are also allocated to individual CGUs, or otherwise they are allocated to the smallest group of CGUs for which a reasonable and consistent allocation basis can be identified.
For the purpose of impairment testing, goodwill is allocated to each of the Company’s CGUs expected to benefit from the synergies of the combination.
The recoverable amount is the higher of the fair value less costs of disposal or value in use. If the recoverable amount of an asset (or CGU) is estimated to be less than its carrying amount, the full impairment loss is charged against earnings and the impairment loss is allocated first to reduce the carrying amount of any goodwill allocated to the CGU and then to the other assets of the unit on a pro-rata basis to the carrying amount of each asset in the unit.
Where an impairment loss subsequently reverses, the carrying amount of the asset (or CGU) is increased to the revised estimate of its recoverable amount, but not in excess of the carrying amount that would have been determined had no impairment loss been recognized for the asset (or CGU) in prior years. A reversal of an impairment loss is recognized immediately in net earnings. Any impairment loss recognized for goodwill is not reversed in a subsequent period.
Provisions Provisions are recognized when the Company has a present obligation (legal or constructive) as a result of a past event, it is probable that the Company will be required to settle the obligation, and a reliable estimate can be made of the amount of the obligation.
The amount recognized as a provision is the best estimate of the consideration required to settle the present obligation at the end of the reporting period, taking into account the risks and uncertainties surrounding the obligation. Where a provision is measured using the cash flows estimated to settle the present obligations, its carrying amount is the present value of those cash flows. The increase in the provision due to passage of time is recognized as interest expense.
A provision for warranties is recognized when the underlying products or services are sold. The provision is based on historical warranty data and a weighting of all possible outcomes against their associated probabilities.
Financial Instruments A financial instrument is any contract that at the same time gives rise to a financial asset of one entity and a financial liability or equity instrument of another entity. Financial instruments are recognized as soon as the Company becomes a contracting party to the financial instrument.
Financial assets are classified into the following specified categories: financial assets “at fair value through profit or loss”, “held to maturity” investments, “available for sale” financial assets and “loans and receivables”. Financial liabilities are classified “at fair value through profit or loss” or “other financial liabilities”. The classification depends on the nature and purpose of the financial asset or financial liability and is determined at the time of initial recognition.
Classification and measurement of financial instruments: (a) Loans and receivables are non-derivative financial assets with fixed or determinable payments that are not quoted in an active
market. They are included in current assets, except for maturities greater than 12 months after the end of the reporting period. These are classified as non-current assets. The Company’s loans and receivables comprise cash and cash equivalents, accounts and other receivables and long-term receivables. They are recorded at cost, which upon their initial measurement is equal to their fair value. Subsequent measurements on loans and receivables are recorded at amortized cost using the effective interest method.
(b) Other financial liabilities include short-term bank borrowings, accounts payable and accrued liabilities and long-term debt. They are recorded at cost, which upon their initial measurement is equal to their fair value. Subsequent measurements of other financial liabilities are recorded at amortized cost using the effective interest method. Debt issue and other transaction costs are netted

LINAMAR CORPORATION Notes to Consolidated Financial Statements For the years ended December 31, 2017 and December 31, 2016 (in thousands of Canadian dollars, except where otherwise noted)
43
against the carrying value of the long-term debt and are then amortized over the life of the debt using the effective interest rate method.
(c) Cash flow hedges are derivative financial instruments measured at fair value at the end of each period with the gains or losses resulting from re-measurement recognized in other comprehensive earnings, with any ineffective portion recognized in net earnings.
Fair value hierarchy The Company estimates fair values related to financial instruments and classifies these measurements using a fair value hierarchy that reflects the significance of their respective inputs. The Level 1, 2 and 3 classifications utilized by the Company are defined as follows:
Level 1 - Fair values are determined using inputs from quoted prices (unadjusted) in active markets for identical assets or liabilities.
Level 2 - Fair values are determined using inputs other than quoted prices included in Level 1 that are observable for the asset or liability either directly or indirectly. Derivative financial instruments are valued based on observable market data.
Level 3 - Fair values are determined based on inputs which are not based on observable market data.
The fair value hierarchy is used for all fair value measurement requirements. The Company recognizes transfers into and transfers out of fair value hierarchy levels as of the date of the event or change in circumstances that caused the transfer.
Derivative financial instruments including hedge accounting Derivative financial instruments are initially recognized at fair value on the date a derivative contract is entered into and are subsequently re-measured at their fair value. The method of recognizing the resulting gain or loss depends on whether the derivative is designated as a hedging instrument, and if so, the nature of the item being hedged. The Company uses derivatives as part of its risk management program to mitigate variability associated with changing market values related to the hedged item. Some of the derivatives used meet hedge effectiveness criteria and are designated in a hedge accounting relationship. There are controls in place to detect the holding or issuance of derivative financial instruments for trading or speculative purposes.
The Company applies hedge accounting for certain foreign exchange forward contracts as cash flow hedges. The Company hedges certain risks associated with the cash flows of recognized liabilities and highly probable forecast transactions. Amounts accumulated in other comprehensive earnings are reclassified to net earnings in the period in which the hedged transaction occurs. The fair values are determined based on observable market data.
The Company may designate certain portions of its foreign denominated long-term debt as a net investment hedge. Hedges of net investments are accounted for similarly to cash flow hedges with amounts accumulated in other comprehensive earnings. The amounts accumulated in other comprehensive earnings are reclassified to net earnings in the period in which the foreign operation is partially disposed of or sold.
The Company documents at the inception of the hedging transaction the relationship between hedging instruments and hedged items, as well as its risk management objectives and strategy for undertaking various hedging transactions. The Company also documents its assessment, both at hedge inception and on an ongoing basis, of whether the derivatives that are used in hedging transactions are highly effective in offsetting changes in fair values or cash flows of hedged items.
When a hedging instrument expires or is sold, or when a hedge no longer meets the criteria for hedge accounting, any cumulative gain or loss existing in accumulated other comprehensive earnings at that time remains in accumulated other comprehensive earnings until the forecasted transaction is eventually recognized in net earnings. When a forecasted transaction is no longer expected to occur, the cumulative gain or loss that was reported in accumulated other comprehensive earnings is immediately transferred to net earnings.
Share-based Compensation Under the Company’s share-based compensation plan, the Company with the approval of the Board of Directors may grant equity-settled stock options and, if they so choose, tandem share appreciation rights (“SARs”) to its key employees and directors.
The Company recognizes a compensation expense for stock options granted and measures the compensation expense at fair value calculated on the grant date using the Black-Scholes option pricing model. The expense is recognized on a graded-vesting basis in which the fair value of each tranche is recognized over its respective vesting period when all of the specified vesting conditions are satisfied. Contributed surplus consists of accumulated share-based compensation expense less the fair value of options at the grant date that have been exercised and credited to common shares.
LINAMAR CORPORATION Notes to Consolidated Financial Statements For the years ended December 31, 2017 and December 31, 2016 (in thousands of Canadian dollars, except where otherwise noted)
44
Accumulated Other Comprehensive Earnings Reserves Hedging reserves The cash flow hedge reserve contains the effective portion of the cash flow hedge relationships incurred as at the reporting date.
Cumulative translation adjustment The cumulative translation adjustment reserve is used to record exchange differences arising from the translation of the financial statements of foreign subsidiaries along with the effective portion of the net investment hedge relationship incurred as at the reporting date.
Revenue Recognition Revenue from the sale of products is recognized when the risks and rewards incidental to ownership are transferred. This generally corresponds to when goods are shipped to customers. Revenue from services is recognized when services are rendered.
Revenue from the sale of tooling is recognized once the tooling is substantially complete and the customer approves the initial production sample.
Engineering services are accounted for as a separate revenue element only in circumstances where the engineering has value to the customer on a standalone basis. Revenues from significant engineering service contracts that qualify as separate revenue elements are recognized on a percentage of completion basis. Percentage of completion is generally determined based on the proportion of accumulated expenditures to date as compared to total anticipated expenditures. If estimated costs to completion indicate a loss on the contract, the loss is recognized immediately.
Segment Reporting Operating segments are reported in a manner consistent with the internal reporting provided to the chief operating decision-makers. The chief operating decision-makers for the Company who are responsible for allocating resources and assessing performance of the operating segments have been identified as the Senior Executive Group that makes strategic decisions.
Research and Development Research costs are expensed as incurred. When certain criteria are met development costs are accounted for as intangible assets and capitalized and amortized. Investment tax credits related to research and development are credited against the related qualifying expense or against the carrying amount of the related asset.
Government Grants Grants from the government are recognized at their fair value where there is a reasonable assurance that the grant will be received and the Company will comply with all required conditions.
The benefit of a government loan at a below-market rate of interest is treated as a government grant, measured as the difference between proceeds received and the fair value of the loan based on prevailing market interest rates.
Government grants relating to costs are deferred and recognized in net earnings over the period necessary to match them with the costs that they are intended to compensate and these are presented as a reduction of the related expense. Government grants relating to property, plant and equipment are recognized as a reduction in the carrying amount of the related asset.
Pension Costs The Company has various contributory and non-contributory defined contribution pension plans which cover most employees. The Company pays these contributions to a privately administered pension insurance plan after which the Company incurs no further payment obligations. The contributions are accrued and recognized as employee benefit expense when they are due.
4 Changes in Accounting Policies
New Standards and Amendments Adopted Certain new standards and amendments became effective during the current fiscal year; however the adoption of these new standards and amendments did not significantly impact the Company’s net earnings or financial position.
New Standards and Interpretations Not Yet Adopted At the date of authorization of these financial statements, certain new standards, amendments and interpretations to existing standards have been published but are not yet effective, and have not been adopted early by the Company.

LINAMAR CORPORATION Notes to Consolidated Financial Statements For the years ended December 31, 2017 and December 31, 2016 (in thousands of Canadian dollars, except where otherwise noted)
45
All pronouncements will be adopted in the Company's accounting policies for the first period beginning after the effective date of the pronouncement. Information on new standards, amendments and interpretations that are expected to be relevant to the Company’s financial statements is provided below. Certain other new standards, amendments and interpretations may have been issued but are not expected to have a material impact on the Company's financial statements.
IFRS 15 Revenue from Contracts with Customers Effective for interim and annual financial statements relating to fiscal years beginning on or after January 1, 2018, the IASB issued this new standard to replace IAS 18 Revenue and IAS 11 Construction Contracts. The core principle of the new standard is for companies to recognize revenue to depict the transfer of goods or services to customers in amounts that reflect the consideration to which the Company expects to be entitled in exchange for those goods or services. The new standard will also result in enhanced disclosures about revenue, provide guidance for transactions that were not previously addressed comprehensively, and improve guidance for multiple-element arrangements.
Management has evaluated each of the five steps in the new revenue recognition model for the Company’s revenue streams. Through its evaluation, management does not expect the new revenue guidance will have a significant impact to the Company’s consolidated statement of financial position or the consolidated statement of earnings in comparison to the current revenue recognition guidance. The new standard will impact the nature and quantity of annual disclosures. Management has implemented the Company’s revised revenue policies, reporting processes, and related controls.
The Company has adopted this guidance effective January 1, 2018 using the modified retrospective approach, resulting in no adjustment to opening retained earnings.
IFRS 9 Financial Instruments Effective for interim and annual financial statements relating to fiscal years beginning on or after January 1, 2018, the IASB issued this new standard to replace IAS 39 Financial Instruments: Recognition and Measurement. IFRS 9 replaces the provisions of IAS 39 and introduces a model for classification and measurement, a single, forward-looking ‘expected loss’ impairment model and an updated approach to hedge accounting. The new single, principle based approach for determining the classification of financial assets is driven by cash flow characteristics and the business model in which an asset is held. The new standard also results in a single impairment model being applied to all financial instruments, which will require more timely recognition of expected credit losses. In addition, IFRS 9 significantly amends other standards dealing with financial instruments such as IFRS 7 Financial Instruments: Disclosures.
Management has evaluated all the changes introduced by IFRS 9. Through its evaluation, management determined that the new financial instruments guidance did not have a significant impact to the Company’s consolidated statement of financial position or the consolidated statement of earnings. The new standard will impact the nature and quantity of annual disclosures. Management has implemented the Company’s revised policies, reporting processes and related controls.
The Company has adopted this guidance effective January 1, 2018, resulting in an insignificant adjustment to opening retained earnings.
IFRS 16 Leases Effective for interim and annual financial statements relating to fiscal years beginning on or after January 1, 2019, the IASB issued this new standard to replace IAS 17 Leases. The new standard provides a comprehensive model for the identification of lease arrangements and their treatment in the financial statements of both lessees and lessors. IFRS 16 applies a control model to the identification of leases, distinguishing between leases and service contracts on the basis of whether there is an identified asset controlled by the customer. Significant changes to lessee accounting are introduced, with the distinction between operating and finance leases removed and assets and liabilities recognized in respect of all leases (subject to limited exceptions for short-term leases and leases of low value assets). Management is currently assessing the impact that this new standard will have on the financial statements of the Company.
5 Critical Accounting Estimates and Judgements
The preparation of financial statements in conformity with IFRS requires management to make estimates and judgements about the future. Estimates and judgements are continually evaluated and are based on the historical experience and other factors, including expectations of future events that are believed to be reasonable under the circumstances. Actual results could differ from those estimates under different assumptions or conditions. The following discussion sets forth management’s most critical estimates and assumptions in determining the value of assets and liabilities and most critical judgements in applying accounting policies that have a significant risk of causing a material adjustment to the carrying amounts of assets and liabilities within the next year.
LINAMAR CORPORATION Notes to Consolidated Financial Statements For the years ended December 31, 2017 and December 31, 2016 (in thousands of Canadian dollars, except where otherwise noted)
46
Impairment of Non-Financial Assets The Company believes that the estimate of impairment for goodwill and non-financial assets is a “critical accounting estimate” because management is required to make significant forward looking assumptions. The recoverable amounts of CGUs have been determined based on the higher of fair value less costs of disposal or value in use calculations, which require the use of estimates. Uncertain changes in the discount rate used, and forward looking assumptions regarding improvement plans, costing assumptions, timing of program launches, and production volumes may affect the fair value of estimates used. No known trends, commitments, events or other uncertainties are currently believed to materially affect the assumptions used.
Current Income Taxes The Company is subject to income taxes in numerous jurisdictions where it has foreign operations. Significant judgement is required in determining the worldwide provision for income taxes. There are many transactions and calculations for which the ultimate tax determination is uncertain. The Company recognizes liabilities for anticipated tax audit issues based on estimates of whether additional taxes will be due. Where the final tax outcome of these matters is different from the amounts that were initially recorded, such differences will impact the current and deferred income tax assets and liabilities in the period in which such determination is made.
Deferred Income Tax Assets and Liabilities Deferred income tax assets and liabilities result from timing differences between the financial reporting and tax bases of assets and liabilities. Loss carry forwards also comprise a portion of the temporary differences and result in a deferred income tax asset. Deferred income tax assets are only recognized to the extent that management considers it probable that a deferred income tax asset will be realized. The assessment for the recognition of a deferred tax asset requires significant judgement. The factors used to assess the likelihood of realization are the Company’s forecast of future taxable income and available tax planning strategies that could be implemented to realize the deferred tax assets. The Company has and continues to use tax planning strategies to realize deferred tax assets in order to avoid the potential loss of benefits. Unknown future events and circumstances, such as changes in tax rates and laws, may materially affect the assumptions and estimates made from one period to the next. Any significant change in events, tax laws, and tax rates beyond the control of the Company may materially affect the consolidated financial statements.
Useful Lives of Depreciable Assets Due to the significance of property, plant and equipment and intangible assets on the Company’s statement of financial position, the Company considers the amortization policy relating to property, plant and equipment and intangible assets to be a “critical accounting estimate”. The Company considers the expected useful life of the assets, expected residual value, and contract length when setting the amortization rates of its assets. Judgement is involved when establishing these estimates as such factors as technological innovation, maintenance programs, and relevant market information must be taken into consideration. The asset’s residual values, useful lives and amortization methods are reviewed at the end of each reporting period and are adjusted if expectations differ from previous estimates. If circumstances impacting these assumptions and estimates change, the change in accounting estimates may represent a material impact to the consolidated financial statements.
Purchase Price Allocations The purchase price related to a business combination is allocated to the underlying acquired assets and liabilities based on their estimated fair values at the time of acquisition. The determination of fair value requires the Company to make assumptions, estimates and judgements regarding future events. The allocation process is inherently subjective and impacts the amounts assigned to individually identifiable assets and liabilities. As a result, the purchase price allocation impacts the Company’s reported assets and liabilities and future net earnings due to the impact on future depreciation and amortization expense and impairment tests.
6 Long-Term Receivables
The Company enters into finance lease arrangements for certain of its industrial access products. The average term of the lease arrangements is 3 to 5 years. There are no contingent rent arrangements related to these lease arrangements.
LINAMAR CORPORATION Notes to Consolidated Financial Statements For the years ended December 31, 2017 and December 31, 2016 (in thousands of Canadian dollars, except where otherwise noted)
47
Minimum lease payments receivable
Present value of minimum lease payments receivable
December 31
2017 December 31
2016 December 31
2017 December 31
2016
$ $ $ $
Not later than 1 year 98,547 66,848 89,108 60,371
Later than 1 year and not later than 5 years 270,590 191,131 244,850 173,087
Later than 5 years 20,119 11,072 18,541 9,543
389,256 269,051 352,499 243,001
Less: unearned finance income 36,757 26,050 - -
Present value of minimum lease payments receivable 352,499 243,001 352,499 243,001
Other long-term receivables 55,291 30,925
Long-term receivables 407,790 273,926
Less: current portion 103,276 74,557
304,514 199,369
The maximum exposure to credit risk of finance lease receivables for the current and prior periods is the carrying amount of the receivables. An insignificant balance of the finance lease receivables at December 31, 2017 and December 31, 2016 are either past due or considered impaired.
7 Sale of Receivables
The Company sells a portion of its receivables through various purchase agreements. Under the agreements, the receivables are mostly sold on a fully serviced basis, so that the Company continues to administer the collection of such receivables. The Company receives no fee for administration of the collection of such receivables. The Company has derecognized the receivables as substantially all of the risks and rewards of ownership of the assets have been transferred. Although the receivables have been derecognized, the Company has provided limited guarantees within the purchase agreements in regards to the risk of default. At December 31, 2017, the maximum exposure to loss is $4,245 (2016 – $5,910).
8 Inventories
December 31
2017 December 31
2016
$ $
General stores 129,257 121,886
Raw materials 193,255 172,912
Work-in-process 240,255 182,753
Finished goods 228,903 213,834
791,670 691,385
The cost of inventories recognized as an expense during the year ended December 31, 2017 was $4,920,466 (2016 – $4,423,974).
A provision for obsolescence for slow moving inventory items is estimated by management based on historical and expected future sales and is included in cost of sales. In the year ended December 31, 2017 the Company recognized a charge to cost of sales for the write-down of slow moving and obsolete inventory, and adjustments to net realizable value aggregating $26,300 (2016 – $41,172). In the year ended December 31, 2017 the Company recognized a gain to cost of sales for reversal of inventory provisions with a value of $260 (2016 – $283). The inventory balance has been reduced by a provision of $73,880 as at December 31, 2017 (2016 – $68,633).

LINAMAR CORPORATION Notes to Consolidated Financial Statements For the years ended December 31, 2017 and December 31, 2016 (in thousands of Canadian dollars, except where otherwise noted)
48
9 Income Taxes
(i) Income Tax Recognized in Net Earnings
December 31
2017 December 31
2016
$ % $ %
Earnings before taxes 692,558 672,730
Combined basic Canadian Federal and Ontario Provincial income taxes,
including manufacturing and processing reduction 173,139 25.00% 168,182 25.00%
Increase (decrease) in income taxes resulting from:
Rate changes on deferred income taxes (12,705) -1.83% - - Effect of expenses that are not deductible in determining taxable
earnings 738 0.11% 3,924 0.58%
Effect of unused tax losses not recognized as deferred tax assets 6,352 0.91% 6,277 0.93% Effect of previously unrecognized deferred tax assets and unrecognized
unused tax losses (359) -0.05% (603) -0.09%
Effect of different tax rates of subsidiaries operating in other jurisdictions (21,844) -3.15% (20,090) -2.98% Adjustments recognized in the current year in relation to the current tax
of prior years (2,766) -0.40% (7,921) -1.17%
Other 633 0.09% 433 0.06%
Income tax expense and effective income tax rate 143,188 20.68% 150,202 22.33%
Current tax 132,988 162,394
Deferred tax 10,200 (12,192)
Income tax expense 143,188 150,202
The tax rate used in the reconciliation above is the Canadian corporate tax rate of 25.0% (2016 – 25.0%). Deferred income tax expense (recovery) directly recognized in equity for the year was $126 (2016 – recovery of $421).
(ii) Deferred Tax Balances
December 31
2017 December 31
2016
$ $
Tax benefit of tax credits and loss carry forwards 36,375 42,468
Goodwill deductible for tax 216 940
Tax benefit (liability) of derivative financial instruments 119 (31)
Other assets - tax value in excess of book value 69,027 62,752
Cumulative tax amortization in excess of book amortization (137,516) (123,227)
Other liabilities - book value in excess of tax value (70,736) (72,033)
Deferred tax net position (102,515) (89,131)
Reconciliation of deferred tax net balance:
2017 2016
$ $
At January 1 (89,131) (23,289)
Tax recovery (expense) during the period recognized in earnings (10,200) 12,192
Tax recovery (expense) during the period recognized in other comprehensive earnings (126) 421
Impact of foreign currency translation adjustment (3,051) 985
Net tax liability related to business acquisition - (77,450)
Other (7) (1,990)
At December 31 (102,515) (89,131)

LINAMAR CORPORATION Notes to Consolidated Financial Statements For the years ended December 31, 2017 and December 31, 2016 (in thousands of Canadian dollars, except where otherwise noted)
49
Net deferred tax balances in the statement of financial position are comprised of the following:
December 31
2017 December 31
2016
$ $
Deferred tax assets to be recovered after more than 12 months 100,929 106,153
Deferred tax assets to be recovered within 12 months 12,143 18,074
Total deferred tax assets 113,072 124,227
Deferred tax liabilities to be utilized after more than 12 months (194,719) (190,913)
Deferred tax liabilities to be utilized within 12 months (20,868) (22,445)
Total deferred tax liabilities (215,587) (213,358)
Deferred tax balances (net) (102,515) (89,131)
Unrecognized deferred tax assets were as follows:
December 31 2017
December 31 2016
$ $
Tax losses 21,399 19,687
Unused tax credits - 782
Temporary differences 1,917 1,940
Total deferred tax assets not recognized 23,316 22,409
The temporary difference in respect of the amount of undistributed earnings of foreign operations for December 31, 2017 was $1,295,580 (2016 – $999,186).

LINAMAR CORPORATION Notes to Consolidated Financial Statements For the years ended December 31, 2017 and December 31, 2016 (in thousands of Canadian dollars, except where otherwise noted)
50
10 Property, Plant and Equipment
Land
Land use
rights Buildings Machinery Office
equipment Transportation
equipment Tooling Total
$ $ $ $ $ $ $ $
Cost 43,069 4,527 403,673 2,797,151 11,047 21,423 18,017 3,298,907
Accumulated amortization - (312) (114,989) (1,440,896) (6,080) (3,319) (11,429) (1,577,025)
Book value at January 1, 2016 43,069 4,215 288,684 1,356,255 4,967 18,104 6,588 1,721,882 Effect of cumulative translation adjustment (3,298) (505) (18,783) (97,378) (163) (158) (219) (120,504)
Additions, net of government grants 1,494 6,298 26,751 276,947 3,218 472 6,289 321,469
Business acquisition (Note 25) 22,189 - 86,082 363,684 2,627 1,136 - 475,718
Impairment provision - - (98) (30,501) (7) (4) - (30,610)
Disposals (3,463) - (136) (5,927) (23) (35) - (9,584)
Amortization - (132) (20,576) (272,074) (2,611) (2,323) (8,600) (306,316)
Book value at December 31, 2016 59,991 9,876 361,924 1,591,006 8,008 17,192 4,058 2,052,055
Cost 59,991 10,288 492,415 3,179,777 17,256 22,742 21,486 3,803,955
Accumulated amortization - (412) (130,491) (1,588,771) (9,248) (5,550) (17,428) (1,751,900)
Book value at December 31, 2016 59,991 9,876 361,924 1,591,006 8,008 17,192 4,058 2,052,055 Effect of cumulative translation adjustment 273 (122) 6,867 22,624 150 25 7 29,824
Additions, net of government grants 83 (367) 16,489 402,530 4,647 806 6,963 431,151 Impairment provision, net of
reversals - - - 6,160 - - - 6,160
Disposals (289) - - (14,917) (21) (118) - (15,345)
Amortization - (78) (21,123) (259,102) (4,826) (2,493) (6,339) (293,961)
Book value at December 31, 2017 60,058 9,309 364,157 1,748,301 7,958 15,412 4,689 2,209,884
Cost 60,058 9,797 586,994 3,689,006 29,042 24,061 13,163 4,412,121
Accumulated amortization - (488) (222,837) (1,940,705) (21,084) (8,649) (8,474) (2,202,237)
Book value at December 31, 2017 60,058 9,309 364,157 1,748,301 7,958 15,412 4,689 2,209,884
Amortization expense of $289,135 (2016 – $303,705) has been charged in cost of sales and $4,826 (2016 – $2,611) in selling, general and administration.
During 2016, an impairment loss of $30,501 was recorded in cost of sales for machinery in the Powertrain/Driveline segment primarily related to customer contracts that prematurely ended. These contracts mainly relate to off highway commercial vehicle programs.
Government grants recognized as a reduction in the carrying amount of the assets during the year was $21,083 (2016 – $13,925). See Note 16 for more details regarding government grants.
As of December 31, 2017, property, plant and equipment includes $295,947 (2016 – $186,817) of assets in the course of construction for production purposes.

LINAMAR CORPORATION Notes to Consolidated Financial Statements For the years ended December 31, 2017 and December 31, 2016 (in thousands of Canadian dollars, except where otherwise noted)
51
The Company leases machinery under cancellable and non-cancellable finance lease agreements with terms between 4 and 8 years. The majority of the lease agreements are renewable at the end of the lease term at market rates. The following amounts are included in property, plant and equipment where the Company is a lessee under finance leases:
December 31
2017 December 31
2016
$ $
Cost 29,983 32,578
Accumulated amortization (17,225) (13,924)
Book value 12,758 18,654
Leased assets are pledged as security for finance lease obligations.
11 Intangible Assets
Trade names Customer
relationships Technology
Product development
costs Other Total
$ $ $ $ $ $
Cost or valuation 1,400 8,659 11,759 26,534 1,324 49,676
Accumulated amortization (578) (4,935) (6,867) (12,838) (868) (26,086)
Book value at January 1, 2016 822 3,724 4,892 13,696 456 23,590 Effect of cumulative translation adjustment
- (15,535) (8,188) (693) - (24,416)
Additions - - - 10,638 - 10,638
Business acquisition (Note 25) - 189,796 97,899 9,391 - 297,086
Amortization (70) (12,325) (7,147) (7,720) (49) (27,311)
Book value at December 31, 2016 752 165,660 87,456 25,312 407 279,587
Cost or valuation 1,400 182,915 101,394 41,569 1,177 328,455
Accumulated amortization (648) (17,255) (13,938) (16,257) (770) (48,868)
Book value at December 31, 2016 752 165,660 87,456 25,312 407 279,587 Effect of cumulative translation adjustment
- 11,153 5,983 (442) - 16,694
Additions - - - 17,365 - 17,365
Amortization (69) (12,770) (7,240) (5,536) (204) (25,819)
Book value at December 31, 2017 683 164,043 86,199 36,699 203 287,827
Cost or valuation 1,400 194,115 107,517 57,234 1,176 361,442
Accumulated amortization (717) (30,072) (21,318) (20,535) (973) (73,615)
Book value at December 31, 2017 683 164,043 86,199 36,699 203 287,827
Amortization of intangible assets is included in cost of sales. Product development costs are internally generated intangible assets.

LINAMAR CORPORATION Notes to Consolidated Financial Statements For the years ended December 31, 2017 and December 31, 2016 (in thousands of Canadian dollars, except where otherwise noted)
52
12 Goodwill
2017 2016
$ $
Cost 468,457 41,822
Accumulated impairment losses (11,666) (12,015)
Book value at January 1 456,791 29,807
Business acquisition (Note 25) - 466,637
Effect of cumulative translation adjustment 28,819 (39,653)
Book value at December 31 485,610 456,791
Cost 496,492 468,457
Accumulated impairment losses (10,882) (11,666)
Book value at December 31 485,610 456,791
Goodwill has been allocated for impairment testing purposes to the following CGUs:
December 31
2017 December 31
2016
$ $
Montupet S.A. (Note 25) 455,775 427,983
Skyjack 12,983 12,983
Linamar Antriebstechnik GmbH 11,897 11,172
Seissenschmidt 4,955 4,653
485,610 456,791
Management performed the annual goodwill impairment analysis during the fourth quarters of 2017 and 2016 and found that goodwill was not impaired. The recoverable amounts of the CGUs were determined on a value in use calculation. The calculation uses cash flow projections based on financial budgets approved by the Board of Directors, covering a five-year period.
Key assumptions used in the estimated impairment of goodwill include:
(a) Operating costs and capital expenditures are based on internal management forecasts. Cost assumptions incorporate the Company’s experience and expertise, current operating costs, the nature and location of each CGU and the risk associated with each CGU. All committed and anticipated capital expenditures adjusted for future cost estimates have been included in the projected cash flows.
(b) Forecast growth rates are principally based on the Company’s expectations for future performance. For the purpose of the impairment test, the Company adjusted the terminal value to reflect a zero growth rate for the present value calculation.
(c) Discount rates used reflect specific risks relating to the relevant segments and the countries in which they operate. The pre-tax discount rates used range from 10.8% to 12.0% (2016 – 9.6% to 10.1%).
A sensitivity of goodwill impairment tests relating to discount rates was performed. A 1% increase in the discount rate would have no impact on the results of goodwill impairment tests in the year ended December 31, 2017.

LINAMAR CORPORATION Notes to Consolidated Financial Statements For the years ended December 31, 2017 and December 31, 2016 (in thousands of Canadian dollars, except where otherwise noted)
53
13 Provisions
Claims and
litigation
Product warranties and
product defects Other Total
(a) (b) (c)
$ $ $ $
At January 1, 2016 6,450 15,585 4,163 26,198
Charged (credited) to earnings:
Additional provisions 12,489 11,512 37 24,038
Business acquisition (Note 25) 319 693 - 1,012
Unused amounts reversed (3,887) (2,992) (1,148) (8,027)
Used during year (2,980) (5,919) (1,640) (10,539)
Effect of cumulative translation adjustment (395) (472) (102) (969)
At December 31, 2016 11,996 18,407 1,310 31,713
Charged (credited) to earnings:
Additional provisions 6,632 16,212 49 22,893
Unused amounts reversed (1,926) (4,465) - (6,391)
Used during year (2,175) (13,416) (616) (16,207)
Effect of cumulative translation adjustment (486) (44) 8 (522)
At December 31, 2017 14,041 16,694 751 31,486
(a) Claims and litigation: Claims and litigation provision related to certain legal and commercial claims brought against the Company
by stakeholders and potential repayment of government assistance in various jurisdictions. In management’s opinion, after taking appropriate legal advice, the outcome of these claims will not give rise to any significant loss beyond the amounts provided at December 31, 2017.
(b) Product warranties and product defects: Product warranties and product defects represent the legal or constructive responsibility of the Company for the proper function of products sold and the obligation arising from the use of products sold.
(c) Other: Includes onerous contracts and decommissioning provision which relates to the legal or constructive obligations for removing leased equipment at the completion of the lease arrangement. The provision charge is recognized in earnings within cost of sales.
14 Long-Term Debt
The following amounts represent the Company’s long-term debt obligations:
December 31
2017 December 31
2016
Note $ $
Senior unsecured notes (i) 162,868 349,244
Bank borrowings (ii) 1,053,956 998,527
Obligations under finance leases (iii) 13,216 18,074
Government borrowings (iv) 65,185 58,287
Other financing - 1,060
1,295,225 1,425,192
Less: current portion 6,399 197,157
1,288,826 1,228,035

LINAMAR CORPORATION Notes to Consolidated Financial Statements For the years ended December 31, 2017 and December 31, 2016 (in thousands of Canadian dollars, except where otherwise noted)
54
Principal payments required to meet the long-term obligations were as follows:
December 31
2017 December 31
2016
$ $
Not later than 1 year 6,399 197,157
Later than 1 year and not later than 5 years 1,247,645 1,188,681
Later than 5 years 46,482 44,698
Total principal payments 1,300,526 1,430,536
Less: debt issue costs 5,301 5,344
1,295,225 1,425,192
(i) Senior unsecured notes The Senior unsecured notes consist of:
(a) U.S. $130 million (the “2017 Notes”) effective July 2010, coming due July 2017 and paying interest at 5.31%;
(b) U.S. $130 million (the “2021 Notes”) effective September 2011, coming due September 2021 and paying interest at 4.84%.
The senior unsecured notes are guaranteed by material subsidiaries of the Company as defined in the bank credit agreement. The senior unsecured notes require the Company to maintain certain financial ratios and impose limitations on specific activities. The Company is in compliance with all financial covenants. The Company entered into long-dated forward exchange contracts to lock in the exchange rate on the principal repayment component upon maturity of the 2017 and 2021 Notes. The unrealized foreign exchange loss determined at inception of the principal swaps is accrued over the term of the forward contracts and is treated as additional costs of the notes recorded through interest. The Company also entered into a series of forward exchange contracts to lock in the exchange rate on the semi-annual coupon payments of the 2017 and 2021 Notes and to hedge the effective changes in exchange rates. The hedge has the effect of converting the U.S. stated coupon rate of 5.31% to a Canadian interest rate of 5.47% for the 2017 Notes and converting the U.S. stated coupon rate of 4.84% to a Canadian interest rate of 5.00% for the 2021 Notes.
During the year the 2017 Notes matured and were repaid. The corresponding long-dated forwards also matured which locked in the exchange rate on the principal repayment component and exchange rate on the semi-annual coupon payments to a Canadian interest rate of 5.47%.
(ii) Bank borrowings In January 2016, the Company amended and restated the credit facility in connection with the acquisition of Montupet S.A. The amended and restated credit facilities include a non-revolving term credit facility in the aggregate principal amount of up to $600 million and the continuation and increase of the previously existing revolving credit facility to the aggregate principal amount of up to $950 million. Both the new term and revolving facilities expire in 2021. The facility is unsecured and is guaranteed by material subsidiaries of the Company as defined in the credit agreement. The bank borrowings require the Company to maintain certain financial ratios and impose limitations on specified activities. The amended and restated credit facilities provide for Euro drawings. The Euro denominated debt used to purchase the net assets of Montupet S.A. has been designated as a net investment hedge. The Company is in compliance with all financial covenants.
In January 2016, the Company assumed the credit facility agreement held by Montupet S.A which matures in December 2019 and by the end of 2017, included only a revolving facility. The facility is unsecured and the bank borrowings require the Company to maintain certain financial ratios and impose limitations on specified activities.
During 2017, the Company amended and restated the credit facility that only impacted the non-revolving term credit facility which was decreased from $600 million to the aggregate principal amount of up to $572 million. No other terms were changed.
In February 2018, the Company amended and restated the credit facility in connection with the acquisition of the MacDon Group of Companies (Note 25). The amended and restated credit facilities include a new non-revolving term credit facility in the aggregate principal amount of up to $1.2 billion, the continuation of the previously existing non-revolving credit facility to the aggregate principal amount of up to $572 million and the continuation and increase of the previously existing revolving credit facility to the aggregate principal amount of up to $1.15 billion. The new term and existing revolving facilities were extended and expire in 2023, and the

LINAMAR CORPORATION Notes to Consolidated Financial Statements For the years ended December 31, 2017 and December 31, 2016 (in thousands of Canadian dollars, except where otherwise noted)
55
previously existing term facility expires in 2021. All facilities are under terms and conditions largely consistent with Linamar’s previous existing credit facility.
As of December 31, 2017, $643,834 was available under the various credit facilities.
(iii) Obligations under finance leases The Company has various finance leases for machinery which are included in property, plant and equipment. The Company’s obligations under the finance leases are secured by the Lessors’ title to the assets.
Minimum lease payments Present value of minimum lease
payments
December 31
2017 December 31
2016 December 31
2017 December 31
2016
$ $ $ $
Not later than 1 year 5,525 5,943 5,158 5,407
Later than 1 year and not later than 5 years 8,299 12,269 7,830 11,490
Later than 5 years 230 1,201 228 1,177
14,054 19,413 13,216 18,074
Less: future finance charges 838 1,339 - -
Present value of minimum lease payments 13,216 18,074 13,216 18,074
(iv) Government Borrowings Government borrowings are comprised of three non-revolving interest free term loans:
(a) The Technology Partnerships Canada is a program provided by the Ministry of Industry by the Federal Canadian Government. The cumulative net amount received at the end of fiscal 2017 was $4,485 (2016 – $5,382). The discounted value of the debt recognized amounted to $3,960 at the end of fiscal 2017 (2016 – $4,659). The loan is due in ten equal annual payments starting in 2013 with the final amount due 2022.
(b) The Automotive Innovation Fund is a program provided by the Ministry of Industry by the Federal Canadian Government. There are two non-revolving interest free loans under this program. The cumulative gross amount of both loans received at the end of fiscal 2017 was $69,414 (2016 – $61,310). The discounted value of the total debt recognized at the end of fiscal 2017 was $61,225 (2016 – $53,628). The loans are both due in ten annual payments, starting in 2019 for the first loan and 2025 for the second loan.
15 Capital Stock
The Company is incorporated under the Ontario Business Corporations Act in Canada and is authorized to issue an unlimited number of common and special shares.
Common
Shares Issued Stated capital
# $
At January 1, 2016 65,173,426 118,609
Stock options exercised 85,000 1,776
At December 31, 2016 65,258,426 120,385
Stock options exercised 96,069 2,008
At December 31, 2017 65,354,495 122,393

LINAMAR CORPORATION Notes to Consolidated Financial Statements For the years ended December 31, 2017 and December 31, 2016 (in thousands of Canadian dollars, except where otherwise noted)
56
16 Expenses by Nature
Year Ended December 31
2017
Year Ended December 31
2016
$ $
Cost of materials 3,368,691 3,036,463
Employee benefits (Note 17) 1,452,699 1,344,258
Amortization (Notes 10, 11) 319,780 333,627
Other 678,155 614,050
5,819,325 5,328,398
During 2017, the benefits of government grants recorded in the statements of earnings was $23,571 (2016 - $23,974). In all cases, repayment of government grants is contingent on employment related measures, investment related measures or both.
17 Employee Benefits
Year Ended December 31
2017
Year Ended December 31
2016
$ $
Wages, salaries and commissions 1,145,917 1,052,567
Social charges and other personnel expenses 282,661 264,522
Termination benefits 2,946 3,966
Share-based compensation (Note 18) 2,290 2,765
Pension expenses under defined contribution plans 18,885 20,438
1,452,699 1,344,258
18 Share-Based Compensation
The Company is authorized to grant options for common stock to its key employees and directors. The exercise price of each option equals the average of the high and low market price of the Company’s stock for the five trading days prior to the date of grant. An option’s maximum term is 10 years and vesting is determined by the Board of Directors. The Company issues new common shares to satisfy stock options exercised. Options are forfeited when the option holder ceases to be an employee or director of the Company.
2017 2016
Number of
options
Weighted average
exercise price Number of
options
Weighted average
exercise price
$ $
At January 1 1,593,345 25.66 1,579,945 23.51
Granted - - 100,000 50.14
Forfeited - - (1,600) 14.70
Exercised (96,069) 14.70 (85,000) 14.70
Expired (5,400) 14.70 - -
At December 31 1,491,876 26.41 1,593,345 25.66
Vested at December 31 1,108,175 20,41 1,080,294 18.97
In 2017, the average share price, during the period the share options were exercised, was $65.52 (2016 – $54.87).

LINAMAR CORPORATION Notes to Consolidated Financial Statements For the years ended December 31, 2017 and December 31, 2016 (in thousands of Canadian dollars, except where otherwise noted)
57
The following table is a summary of information about the stock options outstanding at December 31, 2017:
Year of Grant Exercise Price
Number of options
outstanding
Weighted average
remaining life in years
2009 $12.89 600,000 1.7
2010 $19.32 491,876 2.7
2012 $21.59 50,000 5.0
2013 $41.11 50,000 6.0
2014 $66.63 100,000 6.9
2015 $73.52 100,000 7.9
2016 $50.14 100,000 8.9
1,491,876 3.5
For all grants, the weighted average fair value of share options granted, and weighted average assumptions used in the fair value estimation at the time of grant, using the Black-Scholes model, are as follows:
Granted in
2016
Share option fair value (per share) $26.18
Risk free interest rate 1.43%
Expected life (years) 10
Expected volatility 49.44%
Dividend yield 0.70%
The expected life used in the Black-Scholes model is the same as the contractual term of the options. The risk free interest rate used in determining the fair value of the options granted is based on a Government of Canada zero coupon yield that was current at the time of grant and has a term corresponding to the contractual term of the options. The expected volatility considers the historical volatility of the Company’s shares for the 10 year period preceding the share option grant date. The dividend yield is the annualized dividend at the date of grant divided by the average exercise price.
There were no options for common stock granted in 2017. Subsequent to year end, 100,000 options were granted with an exercise price of $73.96.
There were no tandem share appreciation rights (“SARs”) outstanding at the end of either period.
19 Other Income and (Expenses)
Year Ended December 31
2017
Year Ended December 31
2016
$ $
Foreign exchange gain (loss) (21,033) 19,271
Other income (expense) 1,772 320
(19,261) 19,591

LINAMAR CORPORATION Notes to Consolidated Financial Statements For the years ended December 31, 2017 and December 31, 2016 (in thousands of Canadian dollars, except where otherwise noted)
58
20 Finance (Income) and Expenses
Year Ended December 31
2017
Year Ended December 31
2016
$ $
Interest on long-term debt 29,394 35,949
Foreign exchange (gain) loss on debt and derivatives 987 (4,076)
Interest earned (26,616) (15,834)
Other 5,492 5,032
9,257 21,071
21 Earnings per Share
Basic earnings per share are calculated by dividing the net earnings attributable to equity holders of the Company by the weighted average number of ordinary shares outstanding throughout the year. Diluted earnings per share are calculated by adjusting the weighted average number of shares outstanding during the year to assume conversion of all dilutive potential shares.
Year Ended December 31
2017
Year Ended December 31
2016
$ $
Net earnings (loss) 549,370 522,127
Weighted average common shares 65,296,870 65,189,571
Incremental shares from assumed conversion of stock options 767,259 720,078
Adjusted weighted average common shares for diluted earnings per share 66,064,129 65,909,649
Net earnings (loss) per share:
Basic 8.41 8.01
Diluted 8.32 7.92
22 Commitments
(i) Lease Commitments The Company leases various land and buildings under cancellable and non-cancellable operating lease arrangements. The lease terms are between 1 and 13 years, and the majority of lease arrangements are renewable at the end of the lease period at market rate. The Company also leases various machinery and transportation equipment under non-cancellable operating lease arrangements. The lease terms are between 1 and 9 years and require notice for termination of the agreements. The operating lease expenditure charged to earnings during the year ended December 31, 2017 was $20,362 (2016 - $15,462).
The future aggregate minimum lease payments under non-cancellable operating leases were as follows:
December 31
2017
$
Not later than 1 year 15,007
Later than 1 year and not later than 5 years 31,805
Later than 5 years 7,723
54,535
(ii) Other Commitments As at December 31, 2017, outstanding commitments for capital expenditures under purchase orders and contracts amounted to $299,877 (December 31, 2016 - $220,940). Of this amount $293,911 (December 31, 2016 - $211,748) relates to the purchase of manufacturing equipment and $5,966 (December 31, 2016 - $9,192) relates to general contracting and construction costs in respect

LINAMAR CORPORATION Notes to Consolidated Financial Statements For the years ended December 31, 2017 and December 31, 2016 (in thousands of Canadian dollars, except where otherwise noted)
59
of plant construction. The majority of these commitments are due within the next twelve months. $120 of the outstanding construction commitments (December 31, 2016 - $586) represents amounts committed to a related party.
23 Related Party Transactions
Details of the transactions between the Company and related parties are disclosed below:
(i) Key Management Personnel The Company’s key management includes members of the Senior Executive Group and Board of Directors. The compensation paid, or payable, to key management for employee services during the year was as follows:
Year Ended December 31
2017
Year Ended December 31
2016
$ $
Compensation and short-term benefits 43,299 39,084
Share-based compensation 2,290 2,689
Total compensation 45,589 41,773
The remuneration of the Chairman and Chief Executive Officer (“CEO”) is ultimately the responsibility of the Board of Directors who receives significant support and recommendations from the Human Resource and Corporate Governance Committee. The remuneration of other members of the Senior Executive Group is determined and approved by the CEO. All key management remuneration is determined having regard to the performance of individuals and market trends.
(ii) Other Related Party Transactions Included in the costs of property, plant and equipment is the construction of buildings, building additions and building improvements performed by related parties in the aggregate amount of $1,645 at December 31, 2017 (December 31, 2016 - $5,371). Related party transactions included in the cost of sales are expenses such as rent, maintenance and transportation costs of $1,603 for the year ended December 31, 2017 (December 31, 2016 - $1,553). The maintenance and construction costs represent general contracting and construction activities related to plant construction, improvements, additions and maintenance for a number of facilities. Amounts owed to related parties at December 31, 2017 were $424 (December 31, 2016 - $984).
24 Segmented Information
Management has determined the operating segments based on the reports reviewed by the Senior Executive Group that are used to make strategic decisions.
Powertrain/Driveline: The Powertrain/Driveline segment derives revenues primarily from the collaborative design, development and manufacture of precision metallic components, modules and systems for global vehicle and power generation markets.
Industrial: The Industrial segment is a world leader in the design and production of innovative mobile industrial equipment, notably its class-leading aerial work platforms, telehandlers and agricultural equipment.
The segments are differentiated by the products that each produces and reflects how the Senior Executive Group manages the business. Corporate headquarters and other small operating entities are allocated to the Powertrain/Driveline and Industrial operating segments accordingly.
The Company accounts for inter-segment sales and transfers as arm’s length transactions at current market rates. The Company ensures that the measurement and policies are consistently followed among the Company’s reportable segments for sales, operating earnings, net earnings and assets.
The Company’s three largest customers account for 24.7%, 12.0% and 7.6% of total revenue (2016 – 23.6%, 14.3 % and 7.6%).

LINAMAR CORPORATION Notes to Consolidated Financial Statements For the years ended December 31, 2017 and December 31, 2016 (in thousands of Canadian dollars, except where otherwise noted)
60
Operational Segments Powertrain/
Driveline Industrial Total 2017
$ $ $
Total revenue 5,476,572 1,118,582
Inter-segment sales 46,602 2,094
Sales to external customers 5,429,970 1,116,488 6,546,458
Costs of sales before amortization 4,303,728 848,480 5,152,208
Amortization 307,303 7,651 314,954
Selling, general and administration 265,470 86,693 352,163
Other income (expense) (7,962) (11,299) (19,261)
Operating earnings (loss) 545,507 162,365 707,872
Share of net earnings (loss) of investments accounted for using the equity method (6,057)
Finance expenses 9,257
Income taxes 143,188
Net earnings (loss) 549,370
Payments for property, plant and equipment 397,150 12,882 410,032
Total assets 4,969,411 881,812 5,851,223
Operational Segments Powertrain/
Driveline Industrial Total 2016
$ $ $
Total revenue 5,181,892 866,921
Inter-segment sales 42,753 476
Sales to external customers 5,139,139 866,445 6,005,584
Costs of sales before amortization 4,030,247 641,771 4,672,018
Amortization 326,352 4,664 331,016
Selling, general and administration 247,543 77,821 325,364
Other income (expense) 16,572 3,019 19,591
Operating earnings (loss) 551,569 145,208 696,777
Share of net earnings (loss) of investments accounted for using the equity method (2,976)
Finance expenses 21,071
Income taxes 150,202
Net earnings (loss) 522,528
Payments for property, plant and equipment 337,352 5,921 343,273
Total assets 4,599,923 627,247 5,227,170
The Company operates in five geographic segments – Canada, United States, Asia Pacific, Mexico and Europe.
Geographic Segments Canada United States Asia Pacific Mexico Europe Total 2017
$ $ $ $ $ $
Total sales 3,264,128 554,053 364,789 327,388 2,373,265
Inter-segment sales 222,891 11,784 15,063 67,343 20,084
Sales to external customers 3,041,237 542,269 349,726 260,045 2,353,181 6,546,458
Goodwill 12,983 - - - 472,627 485,610
Intangible assets 7,744 3,549 545 - 275,989 287,827
Property, plant and equipment 694,584 232,963 177,429 131,968 972,940 2,209,884
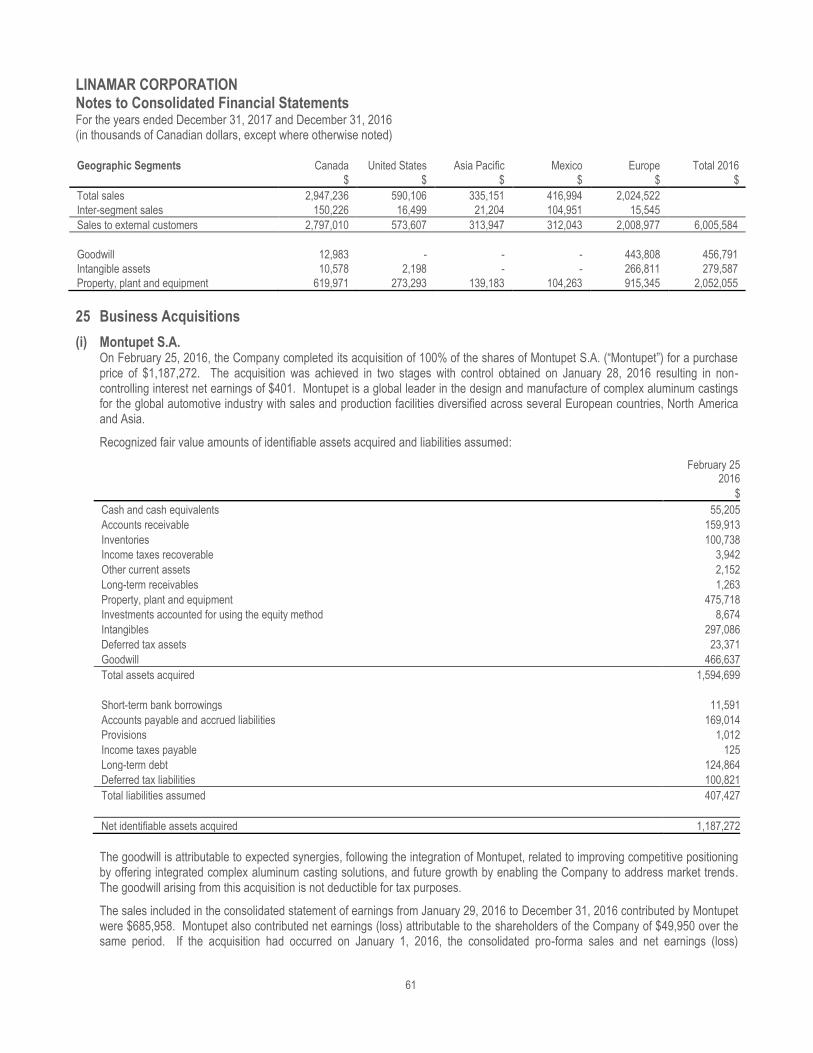
LINAMAR CORPORATION Notes to Consolidated Financial Statements For the years ended December 31, 2017 and December 31, 2016 (in thousands of Canadian dollars, except where otherwise noted)
61
Geographic Segments Canada United States Asia Pacific Mexico Europe Total 2016
$ $ $ $ $ $
Total sales 2,947,236 590,106 335,151 416,994 2,024,522
Inter-segment sales 150,226 16,499 21,204 104,951 15,545
Sales to external customers 2,797,010 573,607 313,947 312,043 2,008,977 6,005,584
Goodwill 12,983 - - - 443,808 456,791
Intangible assets 10,578 2,198 - - 266,811 279,587
Property, plant and equipment 619,971 273,293 139,183 104,263 915,345 2,052,055
25 Business Acquisitions
(i) Montupet S.A. On February 25, 2016, the Company completed its acquisition of 100% of the shares of Montupet S.A. (“Montupet”) for a purchase price of $1,187,272. The acquisition was achieved in two stages with control obtained on January 28, 2016 resulting in non-controlling interest net earnings of $401. Montupet is a global leader in the design and manufacture of complex aluminum castings for the global automotive industry with sales and production facilities diversified across several European countries, North America and Asia.
Recognized fair value amounts of identifiable assets acquired and liabilities assumed:
February 25
2016
$
Cash and cash equivalents 55,205
Accounts receivable 159,913
Inventories 100,738
Income taxes recoverable 3,942
Other current assets 2,152
Long-term receivables 1,263
Property, plant and equipment 475,718
Investments accounted for using the equity method 8,674
Intangibles 297,086
Deferred tax assets 23,371
Goodwill 466,637
Total assets acquired 1,594,699
Short-term bank borrowings 11,591
Accounts payable and accrued liabilities 169,014
Provisions 1,012
Income taxes payable 125
Long-term debt 124,864
Deferred tax liabilities 100,821
Total liabilities assumed 407,427
Net identifiable assets acquired 1,187,272
The goodwill is attributable to expected synergies, following the integration of Montupet, related to improving competitive positioning by offering integrated complex aluminum casting solutions, and future growth by enabling the Company to address market trends. The goodwill arising from this acquisition is not deductible for tax purposes.
The sales included in the consolidated statement of earnings from January 29, 2016 to December 31, 2016 contributed by Montupet were $685,958. Montupet also contributed net earnings (loss) attributable to the shareholders of the Company of $49,950 over the same period. If the acquisition had occurred on January 1, 2016, the consolidated pro-forma sales and net earnings (loss)

LINAMAR CORPORATION Notes to Consolidated Financial Statements For the years ended December 31, 2017 and December 31, 2016 (in thousands of Canadian dollars, except where otherwise noted)
62
attributable to the shareholders of the Company for the year ended December 31, 2016 would have been $6,081,484 and $528,038 respectively. These amounts have been calculated using Montupet’s results adjusted for the additional depreciation and amortization that would have been charged assuming the fair value adjustments to property, plant and equipment and intangible assets had applied from January 1, 2016, together with the consequential tax effects.
(ii) MacDon Group of Companies Subsequent to year end, the Company announced the acquisition of 100% of the outstanding equity interest of Moray Marketing Ltd., parent company of MacDon and its Group of Companies (“MacDon”) for a preliminary purchase price of $1,312,920 comprised of $1,237,920 in cash consideration and an assumed liability of $75,000. The liability was immediately extinguished using a portion of the acquired cash of MacDon. Headquartered in Winnipeg, Manitoba, Canada, MacDon is a global innovative market leader in the design and manufacturing of specialized agriculture harvesting equipment such as drapers and self-propelled windrowers. Due to the timing of the close and complexities associated with the transaction, the determination of the fair value of consideration, assets acquired and liabilities assumed is not yet complete and are subject to further adjustments.
26 Supplemental Cash Flow Information
Year Ended December 31
2017
Year Ended December 31
2016
$ $
Interest paid 34,836 36,739
Interest received 26,616 15,834
Taxes paid (received) - net 176,376 159,295
Net Debt Reconciliation of Liabilities Arising from Financing Activities
Cash and cash
equivalents
Short-term borrowings
and Long-term debt Net debt
Derivative financial
instruments Asset
(Liability) Total
$ $ $ $ $
At January 1 404,966 (1,433,164) (1,028,198) 82,038 (946,160)
Cash flows 38,001 172,509 210,510 (39,689) 170,821
Effect of cumulative translation adjustment (3,903) (5,904) (9,807) - (9,807)
Effect of foreign exchange adjustments 19,440 19,440 (17,875) 1,565
Amount recognized in other comprehensive earnings (56,457) (56,457) 505 (55,952)
Other changes (485) (485) 2,208 1,723
At December 31 439,064 (1,304,061) (864,997) 27,187 (837,810)
The table above details changes in the Company’s liabilities arising from financing activities, including both cash and non-cash changes. Liabilities arising from financing activities are those for which cash flows were, or future cash flows will be, classified in the Company’s consolidated statement of cash flows as cash flows from financing activities. This also applies to derivative financial instruments held to hedge liabilities arising from financing activities. The Company is also presenting cash and cash equivalents to reflect net debt.

LINAMAR CORPORATION Notes to Consolidated Financial Statements For the years ended December 31, 2017 and December 31, 2016 (in thousands of Canadian dollars, except where otherwise noted)
63
27 Financial Instruments
(i) Accounts and Other Receivables
December 31
2017 December 31
2016
$ $
Accounts and other receivables 1,088,048 902,363
Less: allowance for doubtful accounts 4,726 3,918
1,083,322 898,445
(ii) Accounts Payable and Accrued Liabilities
December 31
2017 December 31
2016
$ $
Accounts payable 782,438 619,727
Accrued liabilities 394,450 320,473
Deferred revenues 38,915 34,412
1,215,803 974,612
(iii) Composition of Financial Instruments
The comparison of fair values to carrying amounts of financial assets and financial liabilities along with the fair value hierarchy for financial assets and financial liabilities carried at fair value on a recurring basis is as follows:
December 31, 2017 December 31, 2016
Subsequent
Measurement
Carrying Value Asset
(Liability) Fair Value
Carrying Value Asset
(Liability) Fair Value $ $ $ $
Long-term receivables (Note 6) Amortized cost (Level 2) 407,790 413,064 273,926 280,265 Derivative financial instruments (iv):
US dollar interest payment forward contracts Fair value (Level 2) 5,077 5,077 10,952 10,952 US dollar debt principal forward contracts Fair value (Level 2) 22,110 22,110 71,086 71,086
Long-term debt designated as net investment hedge (Note 14) Amortized cost (Level 2) (925,883) (847,296) (927,529) (848,309)
Long-term debt, other (Note 14) Amortized cost (Level 2) (369,342) (357,801) (497,663) (508,018)
The fair value of the long-term receivables, derivative financial instruments, and long-term debt are determined by using valuation techniques based on observable market data other than quoted prices. The fair value of other financial instruments such as cash and cash equivalents, accounts and other receivables, short-term bank borrowings and accounts payable and accrued liabilities approximate their carrying values due to the short-term maturities of these instruments. There were no transfers in the fair value hierarchy between Level 1 and Level 2 during the year.
Specific valuation techniques used to value financial instruments include:
(a) Quoted market prices for similar instruments;
(b) The fair value of forward foreign exchange contracts is determined using forward exchange rates at the reporting date; or
(c) Other techniques, such as discounted cash flow analysis, are used to determine fair value for the remaining financial instruments.

LINAMAR CORPORATION Notes to Consolidated Financial Statements For the years ended December 31, 2017 and December 31, 2016 (in thousands of Canadian dollars, except where otherwise noted)
64
(iv) Derivative Financial Instruments Including Hedge Accounting The summary of the Company’s derivative financial instruments and hedge accounting is as follows:
Hedge notional values
in foreign currency
Amount of gain/(loss) recognized in other
comprehensive earnings
Amount of gain/(loss) reclassified from other
comprehensive earnings to finance expense (effective
portion)
CAD$ CAD$
a) US dollar interest payment forward contracts 25,168 USD$ (4,770) -
b) US dollar debt principal forward contracts 130,000 USD$ (12,600) 17,875
(17,370) 17,875
c) Hedge of net investment in foreign entity (56,457) -
Year Ended December 31, 2017 (73,827) 17,875
Hedge notional values in
foreign currency
Amount of gain/(loss) recognized in other
comprehensive earnings
Amount of gain/(loss) reclassified from other
comprehensive earnings to finance expense (effective
portion)
CAD$ CAD$
a) US dollar interest payment forward contracts 38,363 USD$ (5,461) -
b) US dollar debt principal forward contracts 260,000 USD$ (6,648) 10,426
(12,109) 10,426 c) Hedge of net investment in foreign entity 65,764 -
Year Ended December 31, 2016 53,655 10,426
a) US Dollar Interest Payment Forward Contracts
In 2012, the Company entered into a series of forward exchange contracts to lock in the exchange rate on the semi-annual coupon payments on the USD $130 million of senior unsecured Notes due 2021. The forward exchange contracts have been designated as cash flow hedges for accounting purposes.
In 2011, the Company entered into a series of forward exchange contracts to lock in the exchange rate on the semi-annual coupon payments on the USD $130 million of senior unsecured Notes due 2017. The forward exchange contracts had been designated as cash flow hedges for accounting purposes and matured during the year.
Further terms of the forward exchange contracts are disclosed in Note 14(i).
b) US Dollar Debt Principal Forward Contracts In 2011, the Company completed the placement of USD $130 million of senior unsecured Notes due 2021. In 2012, the Company entered into a long-dated forward exchange contract to lock in the exchange rate on the principal repayment component upon maturity of the Notes and to hedge the effective changes in exchange rates. The long-dated forward exchange contracts have been designated as cash flow hedges for accounting purposes.
In 2010, the Company completed the placement of USD $130 million of senior unsecured Notes due 2017. In 2011, the Company entered into a long-dated forward exchange contract to lock in the exchange rate on the principal repayment component upon maturity of the Notes and to hedge the effective changes in exchange rates. The long-dated forward exchange contracts had been designated as cash flow hedges for accounting purposes and matured during the year.
Further terms of the long-dated foreign exchange forward contracts are disclosed in Note 14(i).
c) Hedge of Net Investment in Foreign Entity In 2016, Euro denominated debt used to purchase the net assets of Montupet S.A. was designated as a net investment hedge in this foreign entity.
Further terms of the Euro denominated debt are disclosed in Note 14(ii).

LINAMAR CORPORATION Notes to Consolidated Financial Statements For the years ended December 31, 2017 and December 31, 2016 (in thousands of Canadian dollars, except where otherwise noted)
65
(v) Financial Risk Management The Company is primarily exposed to market risk, liquidity risk, credit risk and capital risk as a result of holding financial instruments.
Market Risk – Foreign Exchange Risk The Company operates in several different geographical regions in the world and has many business arrangements with customers and suppliers also based in different geographical regions. The Company therefore is impacted by changes in foreign exchange rates. These foreign exchange rate changes affect net sales and expenses based in foreign currencies and the translation of monetary balances in relation to functional currencies.
Approximate Foreign Exchange Exposure as related to the following currencies:
December 31
2017 December 31
2016 % %
U.S. dollar activity 79.0 61.7 Euro activity 13.4 31.2 British pound activity 4.4 3.4 Mexican peso activity 0.2 0.4
The Company has foreign operations with the following functional currencies that differ from the parent: Hungarian forint, Mexican peso, U.S. dollar, Euro, British pound, Korean won, Chinese renminbi, Japanese yen, Australian dollar, Swedish krona, Brazilian real, Indian rupee and Bulgarian lev.
Assuming all other variables are constant a 5% strengthening of the following currencies against the functional currency of the Company and its foreign subsidiaries would result in gains/(losses) by the amounts shown below:
Impact on net earnings gain/(loss)
Impact on hedging reserve gain/(loss)
December 31
2017 December 31
2016 December 31
2017 December 31
2016 $ $ $ $
U.S. dollar 5,919 2,828 1,521 2,508 Euro 1,008 1,431 (46,294) (46,376) British pound 330 155 - - Mexican peso (16) (19) - -
A weakening of the same above currencies at December 31 would have had the equal but opposite effect, on the basis that all other variables remain constant.
Market Risk – Interest Rate Risk Due to the Company’s capital structure, there is some degree of exposure to changes in the Canadian, US, European and Asian money market rates of interest. The Company does invest excess funds at times to maximize interest income earned. The investment quality must meet internal standards for ratings and liquidity to safeguard the Company’s cash and cash equivalents. Interest rate swap agreements are used by the Company from time to time to manage the fixed and floating interest rate mix of the Company’s total debt portfolio and related overall cost of borrowing.
The interest rate swap agreements involve the periodic exchange of interest payments without the exchange of the notional principal amount upon which the payments are based. Interest expense on the debt is then adjusted to include the payments made or received under the interest rate swaps.
As at December 31, 2017, an interest rate change of 50 basis points (all other variables held constant) would have an impact on net earnings for the year of $3,967 (2016 - $3,759).
Liquidity Risk Liquidity risk is the Company’s ability to meet its financial obligations when they come due. The Company manages the liquidity risk of forecasted cash flows from operations, by ensuring that there are cash resources available to meet these needs. As at

LINAMAR CORPORATION Notes to Consolidated Financial Statements For the years ended December 31, 2017 and December 31, 2016 (in thousands of Canadian dollars, except where otherwise noted)
66
December 31, 2017, the Company’s revolving bank facilities had available credit of $643,834. The facilities mature in 2019 and 2021.
The amount of financial resources available to invest in a Company’s growth is dependent upon its size and willingness to utilize debt and issue equity. The Company has fewer financial resources than some of its principal competitors. If the Company deviates from its growth expectations, it may require additional debt or equity financing. There is no assurance that the Company will be able to obtain additional financial resources that may be required to successfully compete in its markets on favourable commercial terms. Failure to obtain such financing could result in the delay or abandonment of certain strategic plans for product manufacturing or development.
The undiscounted contractual maturities of the Company’s financial liabilities are as follows:
Current year Maturing in 1
to 2 years Maturing after
2 years Total As at December 31, 2017 $ $ $ $
Accounts payable and accrued liabilities 1,215,803 - - 1,215,803 Long-term debt and contractual interest payments, derivative financial
instruments, and financial guarantees 29,172 26,605 1,290,194 1,345,971
1,244,975 26,605 1,290,194 2,561,774
Current year Maturing in 1
to 2 years Maturing after
2 years Total As at December 31, 2016 $ $ $ $
Accounts payable and accrued liabilities 974,612 - - 974,612 Long-term debt and contractual interest payments, derivative financial
instruments, and financial guarantees 188,246 60,675 1,203,084 1,452,005
1,162,858 60,675 1,203,084 2,426,617
Credit Risk The maximum exposure to credit risk at the reporting date is represented by the net carrying amount of the Company’s cash and cash equivalents, accounts and other receivables, long-term receivables, derivative financial instruments and financial guarantees. The Company is exposed to credit risk from potential default by counterparties that carry the Company’s cash and cash equivalents and derivative financial instruments. The Company attempts to mitigate this risk by dealing only with large financial institutions with investment grade credit ratings. All of the financial institutions within the bank syndicate providing the Company’s credit facility meet these qualifications.
Credit risk can arise from the inability of customers to discharge their obligation to the Company. A substantial portion of the Company’s receivables are with large customers in the automotive, truck and industrial sectors and are subject to normal industry credit risks. At December 31, 2017, the receivables from the Company’s three largest customers amounted to 16.6%, 8.8% and 3.2% (December 31, 2016 – 15.7%, 11.9%, and 4.3%) of total receivables. The level of receivables that were past due as at December 31, 2017 are part of normal payment patterns within the industry and the allowance for doubtful accounts is less than 1.0% of total receivables for all periods and movements in the current year are minimal.
The aging of receivables not impaired is as follows:
December 31
2017 December 31
2016
$ $
Current 1,271,213 953,652
Past due 1-30 days 152,259 170,856
Past due 31-60 days 29,853 24,049
Past due 61-90 days 7,812 4,906
Past due >91 days 29,975 18,908
1,491,112 1,172,371

LINAMAR CORPORATION Notes to Consolidated Financial Statements For the years ended December 31, 2017 and December 31, 2016 (in thousands of Canadian dollars, except where otherwise noted)
67
Capital Risk Management The Company’s capital management objectives are to ensure the stability of its capital so as to support continued operations, provide an adequate return to shareholders and generate benefits for other stakeholders. The Company’s capital is composed of shareholders’ equity, and is not subject to any capital requirements imposed by a regulator.
The Company manages the capital structure and makes adjustments to it in light of changes in economic conditions and the risk characteristics of the underlying assets. To maintain or adjust the capital structure, the Company may attempt to issue or re-acquire shares, acquire or dispose of assets, and adjust the amount of cash and cash equivalents. There were no changes in the Company’s capital risk management strategy during the year.

68
ANNUAL MEETING OF SHAREHOLDERS The Company’s Annual Meeting of Shareholders will take place in May 2018: Date: May 17, 2018 Time: 10:00 a.m. (EST) Location: The Frank Hasenfratz Centre of Excellence in Manufacturing
700 Woodlawn Road West, Guelph, Ontario Officers: Frank Hasenfratz Chairman of the Board
Linda Hasenfratz Chief Executive Officer
Jim Jarrell President & Chief Operating Officer
Roger Fulton Executive Vice President – Human Resources, General Counsel & Corporate Secretary
Mark Stoddart Chief Technology Officer & Executive Vice President - Marketing
Dale Schneider Chief Financial Officer
Brian Ahlborn Group President, Linamar Machining & Assembly, Europe & Linamar Montupet Casting
Brad Boehler President, Skyjack Inc.
Ken McDougall Group President, Linamar Machining & Assembly, Americas
Henry Huang Group President, Linamar Machining & Assembly, Asia | Pacific
Directors: Frank Hasenfratz Chairman of the Board
Linda Hasenfratz Director
Mark Stoddart Director
Dennis Grimm Director Chair, Audit Committee Member of the Human Resources & Corporate Governance Committee
William Harrison Director Member of the Human Resources & Corporate Governance Committee and Audit Committee
Terry Reidel Director Chair, Human Resources & Corporate Governance Committee Member of Audit Committee
Auditors, Transfer Agent and Registrar PricewaterhouseCoopers LLP, Chartered Accountants, Toronto, Ontario are the auditors of Linamar Corporation. The transfer agent and registrar for the common shares of the Company is Computershare Investor Services Inc. at its principal offices in Toronto. Linamar Shares are listed on the Toronto Stock Exchange, trading under LNR.