Annual Report 2017 - KSB...ans r T l at gi Di ormaf iont As one of the world’s leading suppliers...
184
KSB Group Annual Report 2017
Transcript of Annual Report 2017 - KSB...ans r T l at gi Di ormaf iont As one of the world’s leading suppliers...

KSB
Gro
up
An
nu
al R
epo
rt 2
017
KSB Group
Annual Report 2017

KSB Profile: KSB is a leading supplier of pumps, valves and related support services. Our reliable, high-efficiency products are used in applications worldwide where fluids need to be transported or shut off, covering everything from building ser-vices, industry and water transport to waste water treatment, power plant processes and mining. Wherever our customers are in the world, 170 service centres are on hand to provide local inspection, servicing, maintenance and repair services. Innovative technology that is the fruit of KSB’s research and development activities forms the basis for the company’s success and that of our customers.
Cover: Pump impellers can be reconstructed and reproduced using reverse engineering.

GROUP FINANCIAL HIGHLIGHTS
BUSINESS DEVELOPMENT AND EARNINGS2017 2016 2015 2014 2013
Order intake € m 2,265.3 2,156.6 2,261.2 2,321.2 2,241.2
Sales revenue € m 2,205.0 2,165.7 2,334.8 2,181.7 2,247.3
Earnings before interest and taxes (EBIT) € m 117.2 88.2 105.2 89.2* 136.2
Earnings before income taxes (EBT) € m 104.2 74.6 93.4 72.8* 119.4
Earnings after income taxes € m 52.1 47.8 52.2 46.3* 79.9
Cash flow € m 124.4 139.8 137.5 124.4* 142.3
BALANCE SHEET2017 2016 2015 2014 2013
Balance sheet total € m 2,253.4 2,350.2 2,291.1 2,277.9* 2,151.5
Fixed assets € m 642.6 641.2 633.1 622.6 591.2
Capital expenditure € m 101.9 82.2 82.8 85.1 57.1
Depreciation and amortisation expense € m 70.6 72.6 72.8 66.2 60.2
Current assets € m 1,519.1 1,596.9 1,573.6 1,568.5 1,520.6
Equity (incl. non-controlling interests) € m 885.4 890.3 870.2 819.7* 844.5
Equity ratio (incl. non-controlling interests) % 39.3 37.9 38.0 36.0* 39.3
PROFITABILITY 2017 2016 2015 2014 2013
Return on sales % 4.7 3.5 4.0 3.3 5.3
Return on equity % 11.7 8.5 11.1 8.8* 14.2
Return on capital employed % 5.4 4.1 4.9 4.3 6.6
EMPLOYEES 2017 2016 2015 2014 2013
Number of employees at 31 Dec. 15,455 15,572 16,196 16,309 16,546
Staff costs € m 796.7 798.8 819.3 784.8* 787.6
SHARES 2017 2016 2015 2014 2013
Market capitalisation at 31 Dec. € m 884.4 637.7 659.2 735.7 804.3
Earnings per ordinary share (EPS) € 21.10 18.68 22.30 21.97* 37.38
Earnings per preference share (EPS) € 21.36 18.94 22.56 22.23* 37.64
Dividend per ordinary share € 7.50 5.50 5.50 8.50 12.00
Dividend per preference share € 7.76 5.76 5.76 8.76 12.26
* Adjustment under IAS 8

PRODUCTS AND SERVICES
INDUSTRY BUILDING SERVICES
ENERGY SUPPLY
WATER ENGINEERING WASTE WATER ENGINEERING
MINING
KE
Y I
ND
ICA
TOR
S /
PR
OD
UC
TS A
ND
SE
RV
ICE
S
KSB pumps and valves are primarily used to transport or shut off all kinds of fluid. Their efficient and reliable operation is taken care of by 3,000 service specialists worldwide offering inspection, servicing, maintenance, repair and consultancy services. The most important fields of application for our products are:

Digital Trans formation As one of the world’s leading suppliers of pumps, valves and related support services, KSB is a pioneer in top-tier technology. And the expertise of our highly qualified employ-ees makes this the foundation for our success. To improve the efficiency, performance and reliability of our pumps and valves in indus-try and energy generation, water and waste water, building services and mining appli-cations, KSB has expanded its research and development work and embraced digital technologies. These enable us to continually enhance our products and services, paving the way for KSB’s profitable and sustainable growth.
DIG
ITA
L T
RA
NS
FOR
MA
TIO
N
GR
OU
P M
AN
AG
EM
EN
T R
EP
OR
TC
ON
SO
LID
AT
ED
FIN
AN
CIA
L S
TAT
EM
EN
TS
GE
NE
RA
L IN
FOR
MA
TIO
N
DIG
ITA
L T
RA
NS
FOR
MA
TIO
N
GR
OU
P M
AN
AG
EM
EN
T R
EP
OR
TC
ON
SO
LID
AT
ED
FIN
AN
CIA
L S
TAT
EM
EN
TS
GE
NE
RA
L IN
FOR
MA
TIO
N

2
MANAGEMENT AND ISSUES 2017
4 Management
6 To Our Shareholders
8 Report of the Supervisory Board
18 A Look Back at 2017
20 Corporate Social Responsibility
(Combined Separate Non-financial Report)
GROUP MANAGEMENT REPORT
56 Basic Principles of the Group
56 Group Business Model
58 Control System
58 Research and Development
59 Economic Review
59 Macroeconomic Environment and Sector View
60 Business Development and Results of Operations
64 Financial Position and Net Assets
68 Summary of the Performance in the Financial Year
68 Dependent Company Report
69 Report on Expected Developments
72 Opportunities and Risks Report
84 Acquisition-related Disclosures
86 Corporate Governance Statement (Section 315d
of the HGB in Conjunction with Section 289f of the HGB)
87 Statement on the Non-financial Report (Sections 315b,
315c in Conjunction with Sections 289b to 289e of the HGB)
88 Remuneration of the Board of Management
DIGITAL TRANSFORMATION
32 Overview
34 KSB Cloud
38 MyFlow Drive
42 Digital Life Cycle Log
46 Additive Manufacturing
50 Reverse Engineering
GENERAL INFORMATION
164 Responsibility Statement
165 Independent Auditor’s Report
175 Glossary
176 Contacts
COVER
Group Financial Highlights
Products and Services
Global Presence
Financial Calendar
LEGEND
Glossary
Reference to table
CONSOLIDATED FINANCIAL STATEMENTS
92 Balance Sheet
93 Statement of Comprehensive Income
94 Statement of Changes in Equity
96 Statement of Cash Flows
97 Notes
154 List of Shareholdings
158 Supervisory Board
160 Legal Representatives
161 Proposal on the Appropriation of the
Net Retained Earnings of KSB SE & Co. KGaA2
1
3
4
5

4 Management 6 To Our Shareholders 8 Report of the Supervisory Board 18 A Look Back at 2017 20 Corporate Social Responsibility (Combined Separate Non-financial Report)
DIG
ITA
L T
RA
NS
FOR
MA
TIO
N
GR
OU
P M
AN
AG
EM
EN
T R
EP
OR
TC
ON
SO
LID
AT
ED
FIN
AN
CIA
L S
TAT
EM
EN
TS
GE
NE
RA
L IN
FOR
MA
TIO
N
MA
NA
GE
ME
NT
AN
D I
SS
UE
S 2
01
7
GENERAL INFORMATIONMANAGEMENT AND ISSUES 2017CONSOLIDATED FINANCIAL STATEMENTSGROUP MANAGEMENT REPORTDIGITAL TRANSFORMATION
MANAGEMENT AND ISSUES 2017

Dr. Stephan Timmermann
took over as the Chairman of the Board of
Management of KSB AG on 13 November
2017. Since 17 January 2018 he has been a
Managing Director and CEO of KSB Manage-
ment SE. His areas of responsibility include
Strategy, Human Resources, Communications,
and Legal and Compliance.
Ralf Kannefass
has been responsible for Sales and Service
since 1 July 2017. Having initially taken charge
of these areas as a member of the Board of
Management of KSB AG, he is now assigned
this responsibility as a Managing Director of
KSB Management SE.
MANAGEMENT AND ISSUES 20174
MANAGEMENT

Dr. Matthias Schmitz
was assigned responsibility for Controlling /
Finance, Information Technology and Global
Procurement as a member of the Board of
Management of KSB AG on 1 June 2017. Since
17 January 2018 he has been in charge of
these areas as a Managing Director of KSB
Management SE.
Dr. Stephan Bross
has been responsible for Technology as well as
the Corporate Unit Pumps and Corporate Unit
Valves since 15 September 2017, initially as a
member of the Board of Management of KSB
AG and since 17 January 2018 as a Managing
Director of KSB Management SE. In 2018, he also
took on responsibility for Global Operations.
5GENERAL INFORMATIONMANAGEMENT AND ISSUES 2017CONSOLIDATED FINANCIAL STATEMENTSGROUP MANAGEMENT REPORTDIGITAL TRANSFORMATION
Management

Dear Shareholders and Business Partners,
As a global company, we operate in a market environment that can change dramatically overnight due to political or social events. At the same time we are facing developments that may be less sudden, but will nevertheless have radical consequences for the economy and working life.
For a mechanical engineering company like KSB, it is above all the rapid change in technology that calls for new solutions in research and development. The ongoing trend towards globalisation is also putting traditional production concepts into question. Similarly, the rapid rise of some emerging markets is changing the economic areas we serve, which is something we have to adapt to in terms of sales and service. Finally, demographic trends make it necessary for us to adjust our work and life models in relation to age. For this purpose, we are developing regionally differentiated concepts, including qualification and development programmes.
People shape our brand
To change KSB in a positive way, and thus make it better and wellequipped for the future, is a task we are focusing on. In doing so, we can rely on the readiness to learn, creativity and commitment of our employees. With their work they represent what the KSB brand stands for. And it is they who keep our brand promise every day: Technology that drives success. Wherever they do more for their customers than others, they lay the foundation for future success.
To lead our staff through the present changes, to develop their professional skills so they can meet new requirements, and to provide an inspiring work environment for them – these are the tasks which we, as the company’s management, are dedicated to achieving in an effective manner.
Dr. Stephan Timmermann
MANAGEMENT AND ISSUES 20176

Digitalisation generates ideas
Currently we are succeeding particularly well in this with our Business Innovation Lab, where KSB staff collaborate with external specialists and students, and which won an award in 2017. An unconventional approach to thinking and working helps us adapt to digital change and overcome the boundaries between mechanical engineering and information technology.
Linking together these fields of technology creates space for innovations which lead to new products, services and business models. From 3D printing to cloudbased service solutions, our aim is to be a pioneer in the industry.
Growth opens up new avenues
Change requires ideas, performance, and the will to make the most of both. It also requires financial resources to bring promising concepts to a successful conclusion. We achieve this through profitable growth and a sustainable ownership structure. Both of these give us the necessary freedom to act.
In 2017 we made good progress with a leap in profits of almost 40 %. Our order intake rose by 5.0 % and sales revenue will follow this development in due course. In addition, a comfortable net financial position provides us with sufficient leeway to do all that is needed to help our customers, motivate our employees and secure our future.
A new structure creates a new basis
From an organisational point of view, we are also on the road to change. In midJanuary KSB AG converted into a KGaA, a partnership limited by shares. This follows a resolution passed at last year’s Annual General Meeting. With this change in legal form, we have opened up new financial and strategic options for our company, as well as providing a solid basis.
The operative business of the new KSB SE & Co. KGaA will be managed by my three colleagues on the former Board of Management and myself as Managing Directors of a newly founded management company. In this KSB Management SE, we rely on the advice and experience of a fivemember Administrative Board. It is formally the highest management body of the KGaA.
As shareholders, you have automatically become limited partners of the KGaA. Apart from this your status and rights at the Annual General Meeting remain largely unchanged. One exception is the discontinuation of the Supervisory Board’s personnel decisionmaking competence: The new organisation with four Managing Directors no longer has a board of management to be elected by this monitoring body.
In the present configuration we will work intensively with the Administrative Board and the Supervisory Board to continually improve both the competitiveness and profitability of the company. We feel that we are currently on the right track here. We will be glad if you, as shareholders or business partners, continue with us on the road ahead.
Dr. Stephan Timmermann, CEO
7GENERAL INFORMATIONMANAGEMENT AND ISSUES 2017CONSOLIDATED FINANCIAL STATEMENTSGROUP MANAGEMENT REPORTDIGITAL TRANSFORMATION
To Our Shareholders

The 2017 financial year was dominated by personnel and structural changes, including the change in legal form of KSB Aktiengesellschaft to a partnership limited by shares [Kommandit-gesellschaft auf Aktien] by resolution of the Annual General Meeting on 10 May 2017, which was successfully completed by entry in the Handelsregister [German Commercial Register] on 17 January 2018. Under section 203, sentence 1 of the UmwG [Umwandlungsgesetz – German Transformation Act], the members of the Supervisory Board of KSB Aktiengesellschaft became members of the Supervisory Board of KSB SE & Co. KGaA for the rest of their term in office. By contrast, a Kommanditgesellschaft auf Aktien (KGaA) has no Board of Management; the latter’s tasks have been performed by the general partner of the company, KSB Management SE, Frankenthal, since the change in legal form came into effect. This company is represented by Managing Directors, with the previous members of the Board of Management of KSB AG having been appointed to these positions. For the 2017 financial year and the subsequent period until 17 January 2018, this report is based on the former structure of a public limited company under German law [Aktiengesellschaft] with the Board of Management as the management and representative body. Where periods after 17 January 2018 are discussed herein, this report refers to the new legal form of a KGaA.
Throughout the last financial year, the Supervisory Board continued to perform its tasks with great care in accordance with the law, the Articles of Association and the Rules of Procedure. We regularly advised the Board of Management on corporate management issues and monitored its work. The Supervisory Board was consulted directly and at an early stage with regard to decisions of fundamental importance. The Board of Management informed us in a comprehensive and timely manner, and in compliance with its duty to inform under the law and Rules of Procedure, about the position of the company, in particular its business, financial and staffing situation, planned investments, as well as relevant corporate planning and strategic and organisational development issues via written and oral reports prepared regularly and on an ad hoc basis. As in the past, we continued to meet on a regular basis to discuss selected issues in the absence of the Board of Management.
We discussed all business transactions significant for the company in detail on the basis of the Board of Management’s reports. Any departures in business developments from the plans and targets were reviewed and commented on in detail by the Board of Management. We adopted our resolutions on the reports and proposals by the Board of Management after thorough examination and discussion. Beyond the intensive work in the plenary sessions and in the committees, the Chairman of the Supervisory Board in particular and other Supervisory Board members were in frequent contact with the Board of Management outside the meetings to discuss the current business development and significant transactions as well as questions of strategy, planning, risk assessment, risk management and compliance.
Conflicts of interest of the Supervisory Board members Klaus Kühborth and Monika Kühborth within the framework of the below discussion of relations covering the supply of services of KSB AG to its majority shareholder, Johannes und Jacob Klein GmbH (formerly Klein Pumpen
MANAGEMENT AND ISSUES 20178
REPORT OF THE SUPERVISORY BOARD

GmbH), as well as to other related parties, were disclosed to the Supervisory Board; both did not participate in the taking of resolutions on this subject area. In the reporting period, no other conflicts of interest arose involving members of the Board of Management and Supervisory Board that would have been subject to disclosure in the Report of the Supervisory Board.
MAIN FOCUS OF WORK IN THE SUPERVISORY BOARD PLENARY SESSIONS
Key topics of our consultations with the Board of Management were the revision of strategic objectives, the monitoring of the rollout of a shared services organisation decided on in 2016 and the continued development of the corporate organisation, including the appointment of four new members to the Board of Management with a view to the change in legal form implemented early in 2018. The analysis of business development in the segments and Regions represented an additional focus, as did major investment projects at various sites. We dealt on an ongoing basis with the company’s economic position, the progress of the new efficiency improvement programme, and the prospects facing selected markets. Based on the recommendations and suggestions contained in the German Corporate Governance Code, we also looked at fundamental aspects of good corporate governance. Special emphasis was placed on corporate culture as KSB again recorded and evaluated employees’ views concerning the company by means of an international spot check.
In 2017 four regular Supervisory Board meetings and a constituent meeting were held; the committee also met three times to discuss special topics. The performance of KSB Aktiengesellschaft and the Group was the subject of regular discussions, primarily with regard to net assets, financial position, employment levels and strategic direction, as well as material investment, divestment and acquisition projects.
The Board of Management regularly explained to us in detail the ways in which KSB can achieve the planned growth for the coming years, including the underlying methodological and strategic considerations. Required investments were subjected to critical analysis before being approved and their implementation was subsequently monitored by us. In this context, the Supervisory Board approved significant financial resources to maintain the high technical level of plants on a Groupwide basis, while at the same time taking into account specific site related aspects. We also repeatedly dealt with the status of the comprehensive investments that were initiated in recent years. For instance, we convinced ourselves that, in particular, the expansion work in our French and our Indian subsidiary is making good progress at the sites in La Roche Chalais and Shirwal. The fundamental upgrade of the Pakistani foundry and the construction of our new building in Moscow were largely completed. The latter will serve both administrative and production purposes, and we thereby aim to strengthen the close business relationships with Russia and in the neighbouring states. As reported in previous years, considerable technically demanding preparations were required to win a major Chinese order
9GENERAL INFORMATIONMANAGEMENT AND ISSUES 2017CONSOLIDATED FINANCIAL STATEMENTSGROUP MANAGEMENT REPORTDIGITAL TRANSFORMATION
Report o f the Superv isory Board

for the delivery of pumps. We expect the successful implementation of this ambitious project, whose completion is scheduled for 2018, to strengthen KSB’s market position over the long term. We therefore had the Board of Management continuously update us on the status of order processing. Where the start or expansion of business activities led to property acquisitions, we discussed the longterm impact of such measures.
In the light of the ongoing change of requirements to be met by an efficient corporate structure, we completed the discussion about the transformation of KSB AG. To align the company with the future requirements of capital markets and to secure its independence over the long term, the Supervisory Board decided at the start of 2017 to prepare the conversion of KSB AG into a – still stock exchangelisted – partnership limited by shares. After obtaining approval from the Annual General Meeting in May 2017, this was implemented by entry in the German Commercial Register on 17 January 2018.
We also used the past financial year for a fundamental redesign of corporate management. Following the proposal of the Personnel Committee in each case, four new members of the Board of Management were appointed, including Dr. Stephan J. Timmermann as the Chairman [Sprecher] of the Board of Management. With Dr. Peter Buthmann’s departure as of the end of 2017 following his retirement, we completed the reshuffle. We see major potential for our business in the opportunities provided by a stronger focus on certain areas of responsibility. In the course of the change in the legal form of KSB, the members of the Board of Management were appointed Managing Directors of the general partner.
Repeatedly on the agenda was the continued development of other aspects of the corporate organisation. We devoted particular attention to the reduction in internal administrative expenses, for instance by monitoring the programme kicked off at the end of 2015 by the Board of Management to improve efficiency in all Group areas, which also includes reducing the number of Group companies. Against this background, the outsourcing of standardised processes to external services providers (shared services) was also of great importance. With this ambitious project, KSB aims to further standardise internal processes, in particular in the commercial areas, and optimise cost structures permanently in the future. Some adjustment requirements became apparent upon the start of the implementation of this demanding project; we discussed them in detail with the Board of Management. Another focus of our delib erations continued to be the progress made towards strengthening our valuebased corporate culture, with the Board of Management providing regular updates. Both interesting findings and new needs for action emerged from a spot check employee engagement survey as a follow
MANAGEMENT AND ISSUES 201710

up process to the broadly designed 2016 survey. These have to be addressed in order to continue the constructive dialogue with staff and meet their expectations. By doing this we ensure that the employees’ willingness to perform and engagement are continually strengthened.
We also considered the relations covering the supply of services of KSB AG to its majority shareholder and other related parties in the year under review. After initial indications that individual services to related parties may no longer have been provided on an arm’s length basis or may have been settled either incorrectly or not at all in the past, the Supervisory Board, together with the Board of Management, commissioned auditing and tax consultancy firms as well as a law firm with a comprehensive independent examination of the facts along with the resulting consequences. The Chairman of the Audit Committee reported regularly on the status of this matter.
For the September session, the Supervisory Board convened for a meeting at the Lille site in France. On this occasion, we discussed in detail with the Board of Management its considerations on the realignment of the individual Board of Management portfolios. Within the scope of compliance with the nonfinancial reporting requirements imposed by law we commissioned the auditors to review this report. The local management informed us of the opportunities and risks of the French market. In addition, we visited the modern technical facilities at the plant.
At the two sessions in November and December, a focus was on the general economic development in China and the consequences this may have on the organisation of KSB’s business in this important market. We also looked at business performance during the financial year and, in particular, at planning for 2018.
MAIN FOCUS OF WORK IN THE COMMITTEES
In order to perform its duties efficiently, the Supervisory Board worked with five committees in 2017. These prepare the Supervisory Board’s resolutions and the special topics to be discussed in the plenary sessions. In addition, they also make their own decisions – to the extent that this is legally permissible – within the scope of their areas of responsibility. This allocation has proved worthwhile in practice. The Chairs of the committees regularly and comprehensively report in the plenary sessions on the content and results of the work carried out in the committees.
11GENERAL INFORMATIONMANAGEMENT AND ISSUES 2017CONSOLIDATED FINANCIAL STATEMENTSGROUP MANAGEMENT REPORTDIGITAL TRANSFORMATION
Report o f the Superv isory Board

AUDIT COMMITTEE
Until 14 April 2017 Dr. Jörg Matthias GroßmannFrom 15 April 2017 Klaus BurchardsNo. of meetings: 7
MEDIATION COMMITTEE
Until 28 February 2017 Dr. Thomas SeebergFrom 23 March 2017 Dr. Bernd FlohrNo. of meetings: 0
NOMINATION COMMITTEE
Until 28 February 2017 Dr. Thomas SeebergFrom 23 March 2017 Dr. Bernd FlohrNo. of meetings: 3
PERSONNEL COMMITTEE
Until 28 February 2017 Dr. Thomas SeebergFrom 23 March 2017 Dr. Bernd Flohr No. of meetings: 9
CORPORATE DEVELOPMENT COMMITTEE
Until 28 February 2017 Dr. Martin Auer From 23 March 2017 Oswald BubelNo. of meetings: 4
COMMITTEES OF THE SUPERVISORY BOARDand their Chairs, as well as number of meetings in the year under review
The Nomination Committee prepared proposals for the appointment of shareholder representatives to the Supervisory Board, in particular the Supervisory Board’s nominations for the election of Supervisory Board members by the Annual General Meeting on 10 May 2017. It convened three times in the year under review. In looking for and evaluating suitable candidates with the requisite expertise and experience of the industry, longterm succession plan ning is a key factor.
The Corporate Development Committee deals with the company’s strategic development, as well as with annual planning and finance, and technology issues. At four meetings in the year under review, it discussed in particular the areas of strategy controlling, production management and innovation, and – on an ongoing basis – looked at a number of major investments, which require the approval of the Supervisory Board. The development of certain business types, including but not limited to the general and project businesses, also figured on the agenda, as did tiein measures during acquisitions and selected projects. The Committee looked in detail at the optimisation of production capacities within our international manufacturing network and the progress of global production integration. Another focus was on the opportunities offered by digitalisation, which need to be closely observed and harnessed. In addition to members of the Board of Management, the Heads of the relevant specialist departments also regularly took part in the committee meetings.
MANAGEMENT AND ISSUES 201712

The Personnel Committee held nine meetings in the year under review. It primarily addresses personnel decisions as well as topics relating to the Board of Management’s remuneration, including the terms of the individual service contracts, as well as other Board of Management issues. Decisions on the appointment and remuneration of members of the Board of Management were made in plenary session, with the committee acting in a preparatory capacity in each case. In the year under review, the Committee also discussed staff development issues with the aim of ensuring that any need for action in terms of filling Board of Management positions and positions at the management level directly below the Board is identified at an early stage and followed up. Not least, the Committee is promoting the internal developments within the company that aim at an increased proportion of women in leadership roles.
The main focus of deliberations in the financial year was the specific preparation of the personnel decisions for Board of Management positions. For instance, the Supervisory Board consented to the early resignation of Werner Stegmüller from the Board of Management – at his own request – effective 31 May 2017. As successor for the Finance portfolio and member of the Board of Management, the Supervisory Board appointed Dr. Matthias Schmitz on 22 March 2017, initially for a term of office of three years from 1 June 2017 to 31 May 2020. Ralf Kannefass was appointed on 9 May as the Board of Management member responsible for the Sales portfolio for a term of three years, from 1 July 2017 to 30 June 2020. The term of office of the longstanding member of the Board of Management and Human Resources Director, Dr. Peter Buthmann, was extended, for six months until the end of 2017, to ensure adequate continuity in the Board of Management. The Supervisory Board approved that the age limit applicable to members of the Board of Management was moderately exceeded. On 12 September 2017, Dr. Stephan Bross was appointed member of the Board of Management (Technology) for five years with effect from 15 September 2017 until 14 September 2022. Finally, the Supervisory Board appointed Dr. Stephan J. Timmermann as Chairman [Sprecher] of the Board of Management on 18 October 2017 from 13 November 2017 until 30 November 2020 and therefore for about three years; from 1 January 2018, Dr. Timmermann also assumed the role of Human Resources Director. All the above decisions were based on the proposals of the Personnel Committee.
The competencies of the committee changed with the coming into effect of the change in legal form. It now essentially decides on the approval of any internal transactions with KSB Management SE, its Administrative Board members and / or its Managing Directors, on the consent to other activities of these persons, the granting of loans to them and on any matters related to the remuneration of the Supervisory Board members.
The seven meetings of the Audit Committee in the year under review were always attended by a member of the Board of Management and, on several occasions, by the auditors and the Heads of relevant departments. The Committee discussed the 2016 annual and consolidated
13GENERAL INFORMATIONMANAGEMENT AND ISSUES 2017CONSOLIDATED FINANCIAL STATEMENTSGROUP MANAGEMENT REPORTDIGITAL TRANSFORMATION
Report o f the Superv isory Board

financial statements, as well as the corresponding audit reports submitted by the auditors. The Audit Committee also prepared the independent examination by the Supervisory Board of the financial statements, the management reports and the proposal on the appropriation of the net retained earnings. In addition, the 2015 halfyear financial report was discussed with the Board of Management. Moreover, the Committee presented a substantiated recommendation to the Supervisory Board for the election of the auditors at last year’s Annual General Meeting. It then assigned to the auditors the audit of the annual and consolidated financial statements for the 2017 financial year and specified the key audit areas. The declaration of independence by the auditors was obtained in accordance with the recommendations of the German Corporate Governance Code (section 7.2.1), and the auditors’ continued independence and performance of nonaudit services were monitored. The Committee also focused on monitoring accounting, the accounting process, the risk management system – taking into account the relevant reports from Internal Audits – and the effectiveness of the internal control and auditing system, including compliance and the auditing of the annual financial statements. In this context, the committee members discussed in detail the supply of services to Johannes und Jacob Klein GmbH, as well as to other related parties. In the context of the clarification of facts and rectification, they also examined the measures taken by the Board of Management to obtain compensation for any disadvantages experienced by the company.
There was no requirement during the financial year under review to convene the Mediation Committee required by section 27(3) MitbestG [Mitbestimmungsgesetz – German CoDetermination Act]. It became obsolete with the coming into effect of the change in legal form.
CORPORATE GOVERNANCE AND STATEMENT OF COMPLIANCE
The Supervisory Board continuously monitored developments in corporate governance standards throughout the financial year. The Board of Management and the Supervisory Board have so far reported on corporate governance at KSB in accordance with section 3.10 of the German Corporate Governance Code as part of the Corporate Governance Statement pursu ant to sections 289f(2 and 3) and 315d HGB [Handelsgesetzbuch – German Commercial Code]. On 12 September 2017 they issued a joint updated statement of compliance in accordance with section 161 of the AktG [Aktiengesetz – German Public Companies Act] and made it permanently available to shareholders on the company’s web site. The general partner will now take the place of the Board of Management at KSB SE & Co. KGaA. KSB Aktiengesellschaft complied with the German Corporate Governance Code’s recommendations subject to a few justified exceptions. The same applies to KSB SE & Co. KGaA, unless limited deviations from the Code arise from the change in legal form. On 21 March 2018, the Supervisory Board and the general partner, acting via its Managing Directors, issued a joint statement of compliance updated in this respect.
MANAGEMENT AND ISSUES 201714

AUDIT OF THE 2017 ANNUAL AND CONSOLIDATED FINANCIAL STATEMENTS
The Supervisory Board examined the annual financial statements and the management report of KSB SE & Co. KGaA (formerly KSB AG) for the year ended 31 December 2017, which were prepared in accordance with the provisions of the Handelsgesetzbuch (HGB), as well as the consolidated financial statements and the group management report for the year ended 31 December 2017, which were prepared in accordance with the International Financial Reporting Standards (IFRSs), and the proposal by the general partner on the appropriation of the net retained earnings. This also applies to the combined separate nonfinancial report of the company and the Group.
The accounting documentation, the proposal by the general partner on the appropriation of the net retained earnings, the nonfinancial reports and the audit reports submitted by the auditors were provided in good time to all members of the Supervisory Board. The documents were discussed in detail by the Audit Committee, in particular on 14 March 2018, as well as in the Supervisory Board plenary session on 21 March 2018 and explained in depth by the Managing Directors of the general partner. The auditors attended the meetings of both bodies, reported on the findings of the audit and were available to provide additional information.
The Mannheim office of PricewaterhouseCoopers GmbH Wirtschaftsprüfungsgesellschaft, Frankfurt, audited the annual financial statements and the management report of KSB SE & Co. KGaA (formerly KSB AG) for the year ended 31 December 2017, as well as the consolidated financial statements and the Group management report for the year ended 31 December 2017, and issued an unqualified opinion. The key audit areas defined for the auditors by the Audit Committee for the year under review mainly included the recognition of sales revenue based on the accrual principle of accounting and the recording and presentation of transactions with related parties. The nonfinancial reports were reviewed. The auditors reported on their findings on these key audit areas both orally and in writing.
The Supervisory Board concurs with the auditors’ findings. Following the final result of the examination by the Audit Committee and its own review, the Supervisory Board raised no objections to the annual financial statements, consolidated financial statements, management report and Group management report, as well as the separate nonfinancial report of the company and the Group. In accordance with the recommendation of the Audit Committee, the Supervisory Board approved the annual financial statements prepared by the general partner. The proposal of the general partner on the appropriation of the net retained earnings of KSB SE & Co. KGaA, and in particular the increase in the dividend to EUR 7.50 per ordinary noparvalue share and EUR 7.76 per preference noparvalue share, is deemed to be appropriate by the Supervisory Board in accordance with its own review; it concurs with it.
15GENERAL INFORMATIONMANAGEMENT AND ISSUES 2017CONSOLIDATED FINANCIAL STATEMENTSGROUP MANAGEMENT REPORTDIGITAL TRANSFORMATION
Report o f the Superv isory Board

DEPENDENT COMPANY REPORT
The auditors also audited the dependent company report for the 2017 financial year prepared by the general partner in accordance with section 312 of the AktG and issued the following unqualified audit opinion on this report:
“On completion of our audit and assessment in accordance with professional standards, we confirm that
1. The actual amounts and disclosures in the report are correct. 2. The consideration paid by the company for the transactions listed in the report was not
inappropriately high, or disadvantages were compensated.”
The report of the general partner and the audit report were provided in good time to all members of the Supervisory Board and were also discussed by the Audit Committee and in plenary sessions. The auditors attended the meetings of both bodies, reported on the material findings of the audit and were available to provide additional information. The Supervisory Board concurs with the auditors’ findings. Both the recommendation by the Audit Committee and the final results of the Supervisory Board plenary session’s examination did not give rise to any objections to the dependent company report prepared by the general partner and to the statement by the general partner at the end of the dependent company report.
CHANGES TO THE BOARD OF MANAGEMENT AND SUPERVISORY BOARD
The changes to the Board of Management, i.e. the appointment of Dr. Stephan Bross, Ralf Kannefass, Dr. Matthias Schmitz and Dr. Stephan J. Timmermann as well as the departure of Werner Stegmüller and Dr. Peter Buthmann are described above in detail.
Dr. Martin Auer and Dr. Thomas Seeberg resigned from their office as members of the Supervisory Board as of 28 February in the reporting year, with Dr. Seeberg also stepping down from his position as Chairman of the Supervisory Board. Dr. Stella Ahlers and Dr. Jörg Matthias Großmann resigned from their office as members of the Supervisory Board with effect from the end of 20 March and 14 April 2017, respectively. Monika Kühborth, Oswald Bubel and Dr. Bernd Flohr were appointed members of the Supervisory Board by order of the Amts-gericht Ludwigshafen am Rhein [Local Court] on 21 March 2017 and Klaus Burchards by order of 18 April 2017, as successors for members who had stepped down. The Super visory Board elected Dr. Flohr as its Chairman in the session of 22 March 2017. All new members were confirmed in their office by the Annual General Meeting on 10 May 2017, and Dr. Flohr
MANAGEMENT AND ISSUES 201716

was reelected as the Chairman of the Supervisory Board in the immediately following constituent Supervisory Board meeting. Due to his appointment as member of the Board of Management, Dr. Stephan Bross left the Supervisory Board with effect from 14 September 2017; Dr. Hans Stefan Wiß succeeded him as the elected replacement candidate. Monika Kühborth and Oswald Bubel resigned as members of the Supervisory Board as of the end of January 2018 in order to focus on their responsibilities at KSB Management SE. In their stead, Arturo Esquinca and Prof. Dr.Ing. Corinna Salander were appointed members of the Supervisory Board by order of the Amtsgericht Ludwigshafen am Rhein dated 26 February 2018. The Supervisory Board would like to thank the members who have left the Board for their close cooperation. We also thank Dr. Seeberg for his prudent leadership.
The Supervisory Board would like to thank the Board of Management, the employees and employee representatives of all Group companies for their continued constructive and committed work during the past financial year.
Frankenthal, 21 March 2018
The Supervisory Board
17GENERAL INFORMATIONMANAGEMENT AND ISSUES 2017CONSOLIDATED FINANCIAL STATEMENTSGROUP MANAGEMENT REPORTDIGITAL TRANSFORMATION
Report o f the Superv isory Board

KSB ZAMBIAThe South African holding company KSB Pumps S.A. (Pty) Ltd. acquires KSB Zambia Limited. Based in Kitwe, the company supplies pumping equipment for the mining industry and water applications.
BEREAVEMENTDr. Wolfgang Kühborth dies at the age of 92 on 31 January; many employees mourn his loss. A descendant of the Klein family, KSB’s founders, Dr. Kühborth occupied various positions at KSB, playing a central role in the company’s history for around 50 years.
CHANGE IN LEGAL FORMThe Annual General Meeting adopts a resolution to convert KSB Aktiengesellschaft into a partnership limited by shares [Komman-ditgesellschaft auf Aktien – KGaA]. From 2018, the company can trade under the name of KSB SE & Co. KGaA and will be led by a separate management company.
AWARDKSB’s Business Innovation Lab is crowned “Newcomer of the Year 2017” by the Capital business magazine. KSB specialists, external experts and students have been developing new business models at the think tank since the beginning of the year. Their mission is to facilitate KSB’s digital transformation.
USAKSB divests the business activities of US company KSB AMRI, Inc. with effect from 31 January. Located in Houston, Texas, the company produces butterfly valves and actuators for the chemical industry. The sale is part of an initiative to streamline the Group’s structure.
NEW PRESSURE BOOSTER SYSTEMKSB showcases its new range of fully automatic pressure booster systems, KSB Delta Compact, at the ISH trade fair. The energy efficient systems are designed for water supply applications in residential buildings, trade and industry. They ensure constant pressure even with fluctuating water consumption.
TRAININGKSB is considered one of “Germany’s top training companies 2017” according to a study commissioned by Deutschland Test and the Focus Money business magazine. The study evaluated the training quality of the 5,000 largest employers in a range of industries.
NEW FACTORYAfter just ten months of construction work, KSB opens a modern factory in Shirwal, India, for producing pumps destined for power plants. Representing an investment of 40 million euros, the building fulfils high standards with regard to energy efficiency and environmental protection. It also provides the necessary space for modernising and expanding pump production. India is one of a group of countries with an underdeveloped energy supply infrastructure.
Q1 Q2
MANAGEMENT AND ISSUES 201718
A LOOK BACK AT 2017
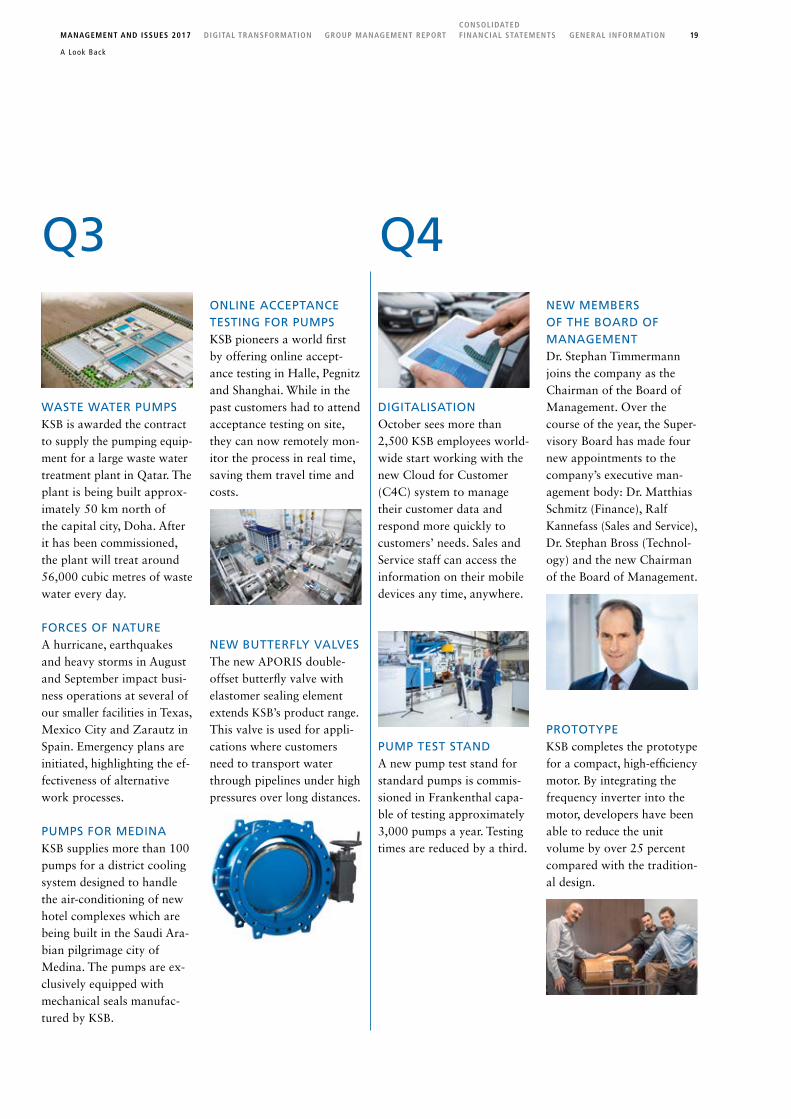
WASTE WATER PUMPSKSB is awarded the contract to supply the pumping equipment for a large waste water treatment plant in Qatar. The plant is being built approximately 50 km north of the capital city, Doha. After it has been commissioned, the plant will treat around 56,000 cubic metres of waste water every day.
FORCES OF NATUREA hurricane, earthquakes and heavy storms in August and September impact business operations at several of our smaller facilities in Texas, Mexico City and Zarautz in Spain. Emergency plans are initiated, highlighting the effectiveness of alternative work processes.
PUMPS FOR MEDINAKSB supplies more than 100 pumps for a district cooling system designed to handle the airconditioning of new hotel complexes which are being built in the Saudi Arabian pilgrimage city of Medina. The pumps are exclusively equipped with mechanical seals manufactured by KSB.
ONLINE ACCEPTANCE TESTING FOR PUMPSKSB pioneers a world first by offering online acceptance testing in Halle, Pegnitz and Shanghai. While in the past customers had to attend acceptance testing on site, they can now remotely monitor the process in real time, saving them travel time and costs.
NEW BUTTERFLY VALVESThe new APORIS double offset butterfly valve with elastomer sealing element extends KSB’s product range. This valve is used for applications where customers need to transport water through pipelines under high pressures over long distances.
DIGITALISATIONOctober sees more than 2,500 KSB employees worldwide start working with the new Cloud for Customer (C4C) system to manage their customer data and respond more quickly to customers’ needs. Sales and Service staff can access the information on their mobile devices any time, anywhere.
PUMP TEST STANDA new pump test stand for standard pumps is commissioned in Frankenthal capable of testing approximately 3,000 pumps a year. Testing times are reduced by a third.
NEW MEMBERS OF THE BOARD OF MANAGEMENTDr. Stephan Timmermann joins the company as the Chairman of the Board of Management. Over the course of the year, the Supervisory Board has made four new appointments to the company’s executive management body: Dr. Matthias Schmitz (Finance), Ralf Kannefass (Sales and Service), Dr. Stephan Bross (Technology) and the new Chairman of the Board of Management.
PROTOTYPEKSB completes the prototype for a compact, highefficiency motor. By integrating the frequency inverter into the motor, developers have been able to reduce the unit volume by over 25 percent compared with the traditional design.
Q3 Q4
19GENERAL INFORMATIONMANAGEMENT AND ISSUES 2017CONSOLIDATED FINANCIAL STATEMENTSGROUP MANAGEMENT REPORTDIGITAL TRANSFORMATION
A Look Back

Percentage of renewable energy in our power consumption:
33.3%(KSB AG: 51.0 %)
The term “sustainability” is commonly used in a variety of ways. At KSB, we define sustainability as aligning our business with environmental, social and economic values. As well as responsible use of natural resources and the environment, it includes our responsibility towards our employees and our commitment to society. We present these issues in a separate combined nonfinancial report pursuant to sections 315b and 315c in conjunction with sections 289c to 289e of the HGB [Handelsgesetzbuch – German Commercial Code]. The report fulfils the requirements of the CSR Directive Implementation Act [CSR-Richtlinie- Umsetzungs-gesetz] and combines the statement at company level with the Group statement outside of the management report.
The concepts outlined here apply to both the Group and to KSB AG (on 17 January 2018 the conversion into the new legal form KSB SE & Co. KGaA took legal effect); any instances where this is not the case are duly indicated. All information in the nonfinancial report relates to the former KSB AG in 2017. References to information not included in the group management report and any captions in this section represent supplementary information and are not part of the separate nonfinancial report. PricewaterhouseCoopers GmbH, Mannheim, performed a limited assurance engagement on the information in this report in accordance with ISAE 3000 (Revised) and issued an independent assurance report.
The concepts and activities outlined in this report follow the principles of the UN Global Compact in the areas of human rights, labour standards, the environment and anti corruption.
In accordance with our business model, we aim to supply customers worldwide with highquality pumps and valves, as well as related support services. The vast majority of our products are developed inhouse and are manufactured in factories on four continents. Our products are sold via our own sales organisation, supported by dealer networks composed of selected partners. KSB’s business model is presented in our group management report on page 56.
By signing the UN Global Compact in 2010, we committed ourselves to aligning our business activities with ten universal principles. But it is not only our managers and employees who endorse the principles of the Global Compact – our suppliers and business partners also share these commitments. We ask our strategically most important business partners whether and to what extent they use these or comparable standards as a source of orientation.
KSB’s sustainability principles are binding for all locations and companies of the KSB Group. These principles are set forth in our sustainability policy which applies to the entire Group. Our progress in these areas is regularly reviewed by a committee. Group management also receives a compliance report twice a year as well as an annual review of management issues relating to quality, the environment and occupational health and safety.
KSB operates a globally integrated management system in order to fulfil the same high standards worldwide with regard to quality, risk, environment, occupational health and safety, and sustainability. The management system is processoriented and complies with the requirements of the international ISO 9001, ISO 14001, OHSAS 18001 and ISO 26000 standards as well as the UN Global Compact. It governs the organisational processes and workflows, responsibilities, procedures and processes at Group level and at our individual locations.
MANAGEMENT AND ISSUES 201720
CORPORATE SOCIAL RESPONSIBILITY
COMBINED SEPARATE NON-FINANCIAL REPORT

Rele
vanc
e fo
r st
akeh
olde
rs
High Very high
Very high
Relevance for KSB
Key sustainability topics for KSB
Respecting human rights
Equal opportunities
Resource efficiency
Energy-efficient products
Emissions
Compliance
Training
SocietyEnvironment Business
Sustainability in the supply chain
Social responsibility
Product reliability
Occupational health and safety
We continually assess the requirements and expectations of the various stakeholders with regard to our company. In 2016, we carried out an analysis of this for the first time in order to identify the key sustainability topics for KSB. Against the background of the new requirements defined in the HGB for nonfinancial reporting, the results were evaluated by the relevant specialist departments and our sustainability committee together with Group management in 2017. This enabled us to identify aspects and factors necessary for understanding the development and performance of the business and the position of the company as well as the impact of our activities on the following issues:
Environment (resource efficiency, manufacturing of energy efficient products, emissions and product safety)
Combating corruption and bribery (compliance) Respecting human rights (sustainability in the supply chain)
Employee concerns (training and development, equal opportunities, occupational health and safety)
These issues are directly related to our manufacturing activities, our products, our business partners and our employees. Our products also directly contribute towards protect
ing the environment, for example, by saving energy or through their use in waste water treatment applications.
KSB’s corporate responsibility also includes our commitment to society. In this section we report on our social engagement, including activities which do not have a direct or material impact on our business success.
KSB does not see any material risks, as assessed based on the net evaluation method, associated with our own business or the business relations of the company, its products and services which have or could have a serious negative impact on nonfinancial aspects, like the environment, anticorruption, human rights, employee concerns and social issues. All other risks with an impact on our business activities are described in the group management report from page 75.
The nonfinancial report – unless otherwise stated – encompasses 28 key companies within the KSB Group. We have chosen these companies due to their impact in terms of aspects such as energy consumption and the percentage of employees involved. The 28 Group companies include all consolidated subsidiaries with production plants and two service companies with energyintensive workshops.
21GENERAL INFORMATIONMANAGEMENT AND ISSUES 2017CONSOLIDATED FINANCIAL STATEMENTSGROUP MANAGEMENT REPORTDIGITAL TRANSFORMATION
Corporate Soc ia l Respons ib i l i ty

Social commitment: In 2017, KSB supported an
aid project to repair well pumps in Ivory Coast
(large image), improving the drinking water supply
for almost 2,000 Ivorians. Alongside measures
to secure water supply, educational initiatives are
central to KSB’s social commitment.
To spark an interest in technology and science
among young people, KSB regularly invites children
and youngsters to its factories (small image) and
supports projects run by the Wissensfabrik – Unter-
nehmen für Deutschland e.V. [Knowledge Factory –
Companies for Germany] initiative.
Financial aid: In India, KSB is regularly engaged in initiatives around its
locations. These benefit socially disadvantaged children, the disabled, the
elderly and the sick (upper image). As well as providing financial support,
we also support facilities and organisations by donating technical equipment.
In 2017, we financed multiple projects in Asia for supplying school facilities
with water.
In Nepal (image on the left), this enabled two schools in Dakshinkali and
Bhaktapur to solve problems with water supply and sanitary facilities.
MANAGEMENT AND ISSUES 201722

ENVIRONMENT
As a manufacturing company, we strive to minimise our impact on the environment and to reduce energy consumption as far as possible. By pursuing this approach, we help to conserve natural resources and also increase the economic efficiency of our products in times of rising raw material prices. Furthermore, we avoid economic and legal risks which could potentially result from environmental damage and failure to comply with laws and regulations.
KSB follows the internationally recognised ISO 14001 environmental management system to ensure we deal responsibly with the natural environment. To date, we have established the environmental management system at 37 production and assembly locations (KSB AG: 3 locations), covering 90 percent of our production operations. As part of an evaluation process, we ask our strategically most important suppliers whether they comply with the requirements of applicable national or international environmen tal management standards. In 2017, we wrote to 1,058 of these suppliers, 537 of which responded. The proportion of these suppliers using recognised environmental standards as a source of orientation was 45 %.
In order to reduce energy consumption and CO² emissions, we conduct regular energy audits at our European locations. The resulting measures include the energyefficient refurbishment of our buildings and foundries. To help cut electricity consumption, for example, we use highefficiency lights and sensorcontrolled lighting. We are also continually expanding our video conference system worldwide in
order to minimise the need to travel for our employees and to keep the associated costs and impact on the environment as low as possible.
We regularly record our energy consumption and CO² emissions so we can analyse this data. In the year under review, our energy consumption was 273,750 megawatt hours (KSB AG: 94,868 megawatt hours). With regard to energy consumption, 33.3 % (KSB AG: 51.0 %) of our energy came from renewable sources. We want to increase this percentage. In accordance with Scope 1 and Scope 2 of the GHG protocol , we calculated CO² emissions of 97,248 tonnes (KSB AG: 22,072 tonnes).
Waste is produced during the manufacturing and transport of industrial products. KSB strives to keep waste levels as low as possible, returning materials to the material cycle wherever possible. For example, we collect paper and metal which is then sent for recycling.
We are reducing the volume of hazardous substances by progressively modernising our existing plants. If we discover any environmental pollution at our locations, we set aside provisions to meet the liabilities for the necessary cleanup work. In 2017, these provisions amounted to € 775,000 for KSB AG.
In order to minimise the impact of our business activities on the environment, we ensure that our manufacturing processes are as environmentally friendly as possible. We go even further than this by aiming to produce products that
Energy consumption
Total KSB AG Europe*** Asia / Pacific Americas Middle East / Africa
Total energy consumption* 273,750 MWh 94,868 MWh 141,900 MWh 38,258 MWh 80,432 MWh 13,160 MWh
Total electricity** 156,407 MWh 37,260 MWh 58,296 MWh 33,708 MWh 53,202 MWh 11,200 MWh
Electricity from renewables 52,064 MWh 18,989 MWh 23,629 MWh 5,712 MWh 19,908 MWh 2,815 MWh
CO² emissions 97,248 t 22,072 t 31,042 t 29,916 t 28,871 t 7,418 t
* Electricity, gas, fuel oil, district heating, wood, etc. ** Total deviates due to rounding *** Including KSB AG
23GENERAL INFORMATIONMANAGEMENT AND ISSUES 2017CONSOLIDATED FINANCIAL STATEMENTSGROUP MANAGEMENT REPORTDIGITAL TRANSFORMATION
Corporate Soc ia l Respons ib i l i ty

Number of employees trained in compliance topics:
5,240
only require a small amount of electricity during their service life and that contribute towards preserving our environment.
Our energyefficient products help reduce the amount of energy consumed by our customers. Our specialists adopt an integrated approach to optimising our customers’ plants, analysing the entire hydraulic system and the complete life cycle of the plant. This enables us to ensure that all system components are perfectly matched.
Our declared goal is continual growth in the area of energy efficient products. The benefits are threefold: reducing the environmental impact caused by our customers, increasing our sales revenue and ensuring the future viability of our company. Digital transformation also plays a key role by helping us to identify potential energy savings in our customers’ plants. In the year under review, we set up a Business Innovation Lab where we develop new business models to be implemented as part of the process of progressive digitalisation.
If products fail to meet a sufficient standard of quality, this could result in accidents and environmental pollution. We therefore attach great importance to the safety of our products. During the manufacturing process, we comply with recognised standards such as CE and established quality management systems. We are therefore able to design processes such that systematic errors during product manufacturing can be avoided. Furthermore, we introduced an internal certification process: “Made by KSB”. It ensures an equally high standard of quality at 13 locations which ex
ceeds the requirements of the international quality management standard. Our internal certification stands for quali ty, short delivery times, professional support services and optimum manufacturing processes.
COMBATING CORRUPTION AND BRIBERY (COMPLIANCE)
Our customers and business partners expect KSB to conduct business with integrity. That is why compliance with legal regulations and Groupwide directives is part of our core values. The actions of a single individual can result in a permanent loss of trust in our company and seriously compromise our reputation.
To support employee compliance, we have developed a binding compliance management system. It ensures that legal requirements and internal KSB rules are adhered to, securing the success of our business in the long term. The compliance system is designed to ensure that KSB and its employees always act in line with applicable laws and direc tives.
Group management is responsible for organising compliance, monitored by the Supervisory Board’s Audit Committee. A Group Compliance Officer is responsible for compliance management and reports to Group management on relevant topics every six months. Support is provided by a Group Compliance Committee, consisting of toplevel managers from the company.
In the year under review, we revised our Compliance Manual which describes structures and processes to ensure compliant conduct. It also sets out responsibilities and compliance instruments.
A core element of our compliance system is the KSB Code of Conduct which applies across the entire Group. It describes the key legal and business policy principles, providing our employees with guidance for their actions. The Code also sets forth the corporate values which govern our conduct in our daily work: honesty, responsibility, profession
MANAGEMENT AND ISSUES 201724

96Social projects actively supported by KSB or financially supported with at
least EUR 5,000
alism, trust and appreciation. On this basis, we have formulated and communicated specific principles and rules of conduct.
In order to avoid risks resulting from a loss of reputation and legal repercussions, KSB introduced two binding Corporate Directives, one covering compliance with cartel / anti trust law and one dealing with the prevention of corruption. Both of these directives help to prevent potential violations. Employees receive appropriate training in recognising potential risks and receive practical guidance on impeccable conduct.
Our goal is to train all relevant employees in cartel / anti trust law and the prevention of corruption. Using a global matrix of requirements, we ensure that all personnel with customer or supplier contact are familiarised with these topics. Currently, 5,240 employees across the Group have received this training. We carry out this training at threeyear intervals, with interim demand being met via additional training sessions every six months.
In the event that employees become aware of violations or are unsure whether their actions are compliant, they refer the matter to the compliance organisation, and specifically to the designated Compliance Officer. If necessary, reports will be treated anonymously. In addition, any circumstances that give rise to legal or antitrust concerns can be reported directly to an independent ombudsperson, who can process potential cases without naming informants. If reliable evidence is presented, then this is pursued. In 2017, the om
budsperson received one notification of suspected compliance violation. We were also notified of another suspected instance via an email contact form. When the compliance organisation receives relevant information, the necessary steps and measures for clarifying the situation are initiated following a precisely specified procedure. KSB does not tolerate any violations of compliance by its employees. If investigations reveal sufficient evidence of a violation, this will have consequences for the individual concerned. Depending on the severity, sanctions range from a disciplinary warn ing to immediate termination of employment; law enforcement agencies may also be involved.
RESPECTING HUMAN RIGHTS
By signing the UN Global Compact (see page 20), KSB committed itself to respecting and supporting the protection of international human rights. We have also pledged not to indirectly tolerate violations of human rights, for example when it comes to selecting our suppliers. As a company, we comply with the conventions of the International Labour Organisation (ILO). Basic conduct requirements within the workforce are governed by the KSB Code of Conduct. We are aware that human rights infringements are not only morally unacceptable, they can also damage a company’s reputation and thus result in financial losses.
KSB is therefore committed to combating all forms of forced and child labour. We do not tolerate any discrimination in our work environment on the basis of individual characteristics such as age, race, religion, appearance, gender, sexual orientation, disability or marital status. Furthermore, we respect the freedom of association and the right to collective bargaining in our companies. We also observe government sanctions such as embargoes and issue inter nal export control directives.
In order to identify and avoid risks in the supply chain, we practice active supplier management. For every order we place, the supplier declares that it complies with the rules in our Code of Conduct’, which corresponds with the human rights principles defined in the UN Global Compact. This
25GENERAL INFORMATIONMANAGEMENT AND ISSUES 2017CONSOLIDATED FINANCIAL STATEMENTSGROUP MANAGEMENT REPORTDIGITAL TRANSFORMATION
Corporate Soc ia l Respons ib i l i ty
enables us to make sure we avoid purchasing raw materials from areas of conflict where violations of human rights may have been involved in their production. We do not cooper ate with companies that are known to have committed human rights violations.
In 2017, we wrote to 1,058 of our strategically most important suppliers asking whether they implement measures to counteract human rights violations. Of the 537 companies that replied, 445 confirmed such measures are implemented.
Our employees can contact the compliance organisation or an ombudsperson regarding human rights issues, following the same procedure as for suspected compliance violations (see page 25).
EMPLOYEE CONCERNS
Our company is defined by the people within it. Their commitment, skills and knowledge ultimately decide our economic success. KSB currently employs more than 15,000 staff. In order to achieve sustainable success, we continue to require well qualified experts. A lack of specialist personnel would harm KSB’s economic future.
In order to stand our ground in the intense competition for top talent, we must succeed in recruiting highly qualified
expert engineers, securing their professional development and creating a longterm bond between them and KSB. Potential applicants and colleagues should perceive us as an attractive employer. We foster and develop our own talent to prepare them for highlevel specialist and leadership positions, as well as pursuing structured succession planning.
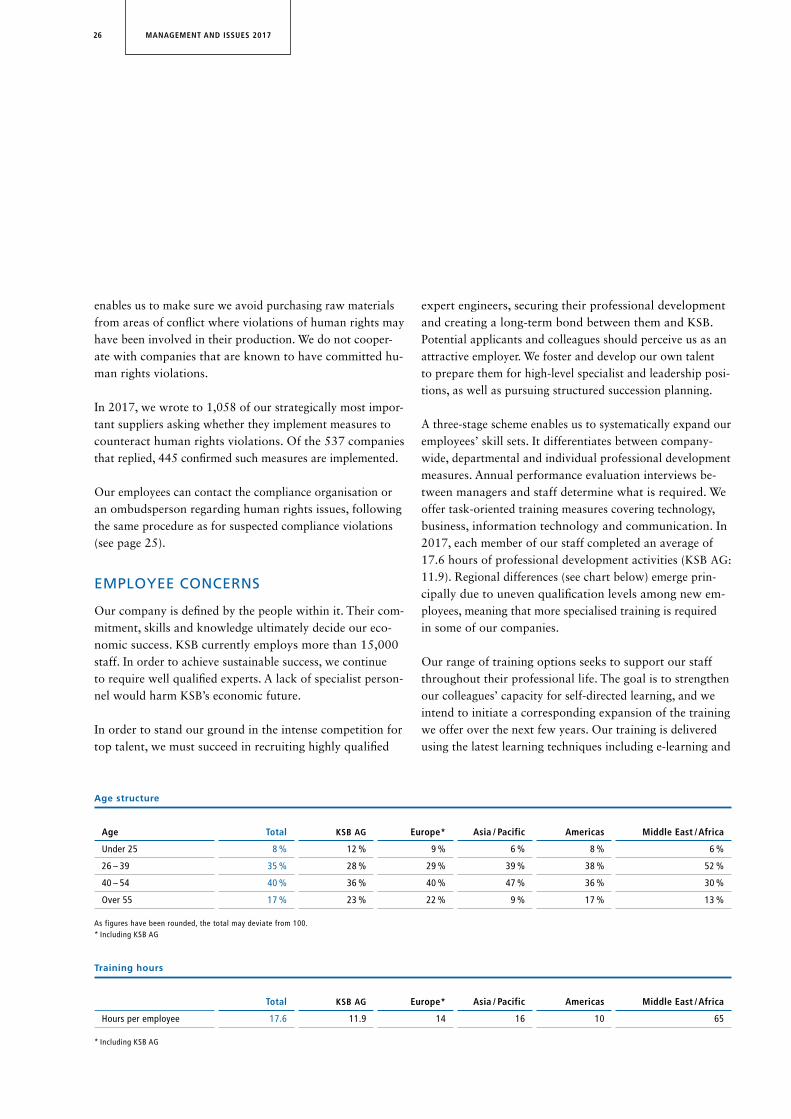
A threestage scheme enables us to systematically expand our employees’ skill sets. It differentiates between company wide, departmental and individual professional development measures. Annual performance evaluation interviews between managers and staff determine what is required. We offer taskoriented training measures covering technology, business, information technology and communication. In 2017, each member of our staff completed an average of 17.6 hours of professional development activities (KSB AG: 11.9). Regional differences (see chart below) emerge principally due to uneven qualification levels among new employees, meaning that more specialised training is required in some of our companies.
Our range of training options seeks to support our staff throughout their professional life. The goal is to strengthen our colleagues’ capacity for selfdirected learning, and we intend to initiate a corresponding expansion of the training we offer over the next few years. Our training is delivered using the latest learning techniques including elearning and
Age structure
Age Total KSB AG Europe* Asia / Pacific Americas Middle East / Africa
Under 25 8 % 12 % 9 % 6 % 8 % 6 %
26 – 39 35 % 28 % 29 % 39 % 38 % 52 %
40 – 54 40 % 36 % 40 % 47 % 36 % 30 %
Over 55 17 % 23 % 22 % 9 % 17 % 13 %
As figures have been rounded, the total may deviate from 100. * Including KSB AG
Training hours
Total KSB AG Europe* Asia / Pacific Americas Middle East / Africa
Hours per employee 17.6 11.9 14 16 10 65
* Including KSB AG
MANAGEMENT AND ISSUES 201726

Well qualified staff: Innovative companies need specialist staff. Vocational
training at KSB means practical learning (image on the left).
A wide range of professional development opportunities for enhancing and
expanding new skills are available to employees. These are delivered using
the latest learning techniques including e-learning and webinars (image on
the right).
Health and family: Possibilities for reconciling
the commitments of work and family are highly
valued by many KSB staff. Family days like the one
held at the Halle factory in 2017 allow a glimpse
behind the scenes of working life at KSB. At the
same time, children get the chance to try out their
craft work skills (large image).
In implementing its company health management
system, KSB seeks not only to protect its employees
against occupational injuries and diseases but also
to provide individualised preventive healthcare. At
the Frankenthal location, company doctor Parvin
Shahidi Asl (small image) looks after employees’
health.
27GENERAL INFORMATIONMANAGEMENT AND ISSUES 2017CONSOLIDATED FINANCIAL STATEMENTSGROUP MANAGEMENT REPORTDIGITAL TRANSFORMATION
Corporate Soc ia l Respons ib i l i ty

webinars. We also value the potential of learning from one another and foster the establishment of communities which facilitate the direct exchange of knowledge and experience.
In order to meet demand for specialist staff, we are continually engaged in training young talent. Our German locations participate in the country’s dual vocational education system. In the year under review, we trained a total of 229 young people to take on a role in our company. 2017 saw us invest around EUR 6.6 million in vocational training.
KSB offers attractive prospects for dedicated young people. Promising talent can benefit from a career springboard we provide via vocational training, work placements and student projects.
Those who take up vocational training or dual work / degree programmes with KSB experience practical learning. Alongside specialist skills, we set great store by the sense of responsibility exercised by our trainee staff. They are, for example, also involved in social and ecological projects around their locations.
Many Western countries are experiencing ageing populations, and companies are affected by this demographic shift. We thus monitor the age profiles of our staff in different regions (see chart on page 26) so that we can take timely action in ensuring we achieve the right balance in each company, for example, by recruiting younger trainees in sufficient numbers. It is then possible for us to distribute
valuable knowledge within the company across different age groups.
KSB is committed to diversity and equal opportunities internationally. The binding human resources principles we updated in the year under review harmonise with the conventions of the ILO and apply to all KSB companies. In keeping with these principles, when recruiting we focus solely on the professional requirements of the role to be filled and the individual performance and potential of the candidate. Clear responsibilities have been established to ensure this. Management works to ensure that the principles of equal opportunities and diversity are realised in company practice. Our human resources staff communicate these principles within the Group and adapt them where required. They also foster an awareness of this important topic and offers corresponding training and advice.
We have no doubt that diversity improves performance within our company. So we want to see leadership positions filled by diverse personalities, all giving their best for KSB. As well as recruiting more nonGerman candidates for management roles, we have set ourselves the goal of increasing the number of women in leadership positions. We wish to be seen as a fair company and an attractive employer for women with all kinds of qualifications. Currently, the proportion of female managers is 11 %. In terms of our workforce as a whole, women make up 15 %. In order to support our female staff, we are strengthening the measures taken by KSB to reconcile the commitments of family and work. Such measures include offering child
Workforce by gender
Total KSB AG Europe* Asia / Pacific Americas Middle East / Africa
Male employees 85 % 84 % 83 % 89 % 87 % 87 %
Female employees 15 % 16 % 17 % 11 % 13 % 13 %
Male managers 89 % 92 % 89 % 90 % 88 % 90 %
Female managers 11 % 8 % 11 % 10 % 12 % 10 %
* Including KSB AG
MANAGEMENT AND ISSUES 201728
care during the school holidays. We also offer advice on caring for family members, and both male and female staff can benefit from our flexible working time models.
We aim to reduce the risk of occupational accidents to avoid injuries to staff and limit periods of leave, with a focus on measures implemented in production areas. Appropriate training sessions, instruction and further preventive measures are implemented regularly. In the year under review, 35 of our manufacturing and assembly plants (including all of KSB AG’s factories) were certified according to the OHSAS 18001 occupational health and safety management system. This represents 85 % of our locations. The requirements for prevention set out in the standard serve to increase levels of occupational health and safety.
However, health awareness at work is an important topic also at our administrative departments. We therefore offer training including an annual elearning course on safety in the office.
Investment in the health and wellbeing of our staff is also an investment in our own successful future. KSB thus takes a holistic approach to actively implementing its company health management system.
This sees us fulfilling not only the legal requirements of the company health service, but also offering voluntary healthcare services such as screening for skin cancer, flu vaccinations and events relating to healthy eating and exercise. Staff aged over 50 are additionally offered an annual preventive medical checkup covering their cardiovascular system, metabolism and musculoskeletal system. If necessary, further tests or treatment are recommended.
KSB greatly values the active engagement of its employees in the development of the company and its work processes. In 2016 we undertook a global survey of around 11,000 members of staff from the Group companies with the highest sales revenues. Respondents offered their opinions on their company, working environment and engagement. The
results revealed opportunities for improvements. These were translated into measures which we promptly started to implement.
SOCIETY
An awareness of our social responsibility motivates us to get involved in social initiatives. As a successful company, KSB is committed to sustainable development and well functioning cooperation within our society. With this goal in mind, and in line with our donation directive, we support organisations and projects dedicated to the education, social support and protection of children and young people. We are also committed to supporting the disadvantaged. In the event of disasters we provide assistance for both people and organisations. In the year under review, we actively participated in or provided financial support of at least EUR 5,000 to a total of 96 social projects.
Education for young people is a core element of our commitment to social issues. It is important for us that young people develop their skills early enough to then pursue a career that offers the right fit for their talents and capabilities. For this reason we joined other companies to found the initiative Wissensfabrik – Unternehmen für Deutsch land e.V. [Knowledge Factory – Companies for Germany].
The provision of financial support for aid projects has a long tradition at KSB. This includes ongoing support for social developments in the areas around our locations. We donate regularly to projects seeking to supply people with clean drinking water, for which we also provide noncash support such as pumps.
More information on our social commitment is available at www.ksb.com/csr
29GENERAL INFORMATIONMANAGEMENT AND ISSUES 2017CONSOLIDATED FINANCIAL STATEMENTSGROUP MANAGEMENT REPORTDIGITAL TRANSFORMATION
Corporate Soc ia l Respons ib i l i ty

30

32 Overview
34 KSB Cloud
38 MyFlow Drive
42 Digital Life Cycle Log
46 Additive Manufacturing
50 Reverse Engineering
GR
OU
P M
AN
AG
EM
EN
T R
EP
OR
TC
ON
SO
LID
AT
ED
FIN
AN
CIA
L S
TAT
EM
EN
TS
GE
NE
RA
L IN
FOR
MA
TIO
N
DIG
ITA
L T
RA
NS
FOR
MA
TIO
N
DIGITAL TRANS- FORMATION
GENERAL INFORMATIONMANAGEMENT AND ISSUES 2017CONSOLIDATED FINANCIAL STATEMENTSGROUP MANAGEMENT REPORTDIGITAL TRANSFORMATION

Digital Transformation We seek to harness the potential of digitalisation to achieve high levels of efficiency, performance and fault-free operation. KSB has developed a bold transformation strategy in three key areas.
32

Products and servicesIn order to offer user-friendly products and efficient support services, we work together with our customers to estab-lish their needs from technical data to operation. This allows us to pinpoint where digitalisation can unlock new opportunities and develop tailored solu -tions offering added value.
TechnologiesWe are looking to combine our classic engineering expertise with know-how in the digital realm. KSB is therefore investing in developing its own cloud systems, researching materials for 3D printing and building digital infrastructure. This will form a basis from which to offer innovative solutions for the entire product life cycle.
Internal processesImplementing the digital transformation helps make our processes quicker, more agile, and thus more effective. KSB’s long- term goal is to secure a seamless flow of information between different media: All product data – from development to configuration, production and shipping – should be available at any time and in any location.
33GENERAL INFORMATIONMANAGEMENT AND ISSUES 2017CONSOLIDATED FINANCIAL STATEMENTSGROUP MANAGEMENT REPORTDIGITAL TRANSFORMATION

In the future, every smart pump will be connected to the KSB Cloud. A digital copy is created based on all of its data. This “digital twin” enables us to react ahead of time or implement defined measures as soon as operating data indicates that a critical point has been reached.
34

The KSB Cloud: We are networking our products, processes and services with each other. Reliability, safety and transparency remain central throughout this process. The first digital twins of KSB’s smart pumps went live on our network at the beginning of 2018. They replicate the exact conditions of the monitored pump sets. For our customers, this is a step forward in the efficiency and reliability of systems operation. In the future, the KSB Cloud will provide the data basis for all accounting, production and order-handling processes, including simplified spare parts supply.
35GENERAL INFORMATIONMANAGEMENT AND ISSUES 2017CONSOLIDATED FINANCIAL STATEMENTSGROUP MANAGEMENT REPORTDIGITAL TRANSFORMATION
KSB Cloud

Dr. Thomas Paulus, Head of Digital Transformation, in conversation with Miriam Rischer, KSB Guard project manager
“ We are harnessing the benefits of digitalisation for our customers. In 2018 we will launch to market
an innovative pump moni-toring unit networked to the cloud.”
2017 saw KSB found a Business Innova-
tion Lab in Mannheim with the aim of
developing new digital business models
The idea of combining a start-up envi-
ronment in the university town with
KSB’s wealth of experience is paying off:
Two new developments have already
been implemented – one of them a
cloud-based monitoring unit.
Dr. Thomas Paulus
36

37GENERAL INFORMATIONMANAGEMENT AND ISSUES 2017CONSOLIDATED FINANCIAL STATEMENTSGROUP MANAGEMENT REPORTDIGITAL TRANSFORMATION
KSB Cloud

Today, almost 70 percent of all standardised pumps operate at a constant
motor speed. The MyFlow Drive allows “virtual impeller trimming” in
that a fixed speed pump can be adjusted to the required operating point.
38

MyFlow Drive: A system’s operating condi-tions often differ substantially from the parameters originally planned. As a result, over-sized pump sets are not uncommon. In the past, rectifying the situation required operators to make costly changes to their hardware. The new Industry 4.0-compatible MyFlow Drive allows a fixed motor speed to be set in line with individual requirements. This provides users with greater planning reliability as the pump’s flow rate can be in creased or decreased quickly and easily. Another plus point: As the minimum frequency inverter modulates the supply voltage of the IE5 synchronous reluctance motor , the drive can also be operated on almost any power grid worldwide.
39GENERAL INFORMATIONMANAGEMENT AND ISSUES 2017CONSOLIDATED FINANCIAL STATEMENTSGROUP MANAGEMENT REPORTDIGITAL TRANSFORMATION
MyFlow Dr ive

Josephine Vega Völk and Dr. Jochen Schaab played a key role in developing KSB’s MyFlow technology.
“ Our MyFlow Drive is a revo-lution in pump technology. In the past, changes in system conditions meant the impeller had to be trimmed mechanically.
Today, the adjustment is achieved virtually.”
MyFlow Drive is an innovation
from KSB’s in-house research
and development teams. They
work on the automation of
products, processes and services
to ensure these are as efficient
as possible and offer sustainable
reliability.
Josephine Vega Völk
40

41GENERAL INFORMATIONMANAGEMENT AND ISSUES 2017CONSOLIDATED FINANCIAL STATEMENTSGROUP MANAGEMENT REPORTDIGITAL TRANSFORMATION
MyFlow Dr ive

Pumps and their digital life cycle logs are connected via QR codes.
42

Digital life cycle logs: Although they may look similar from the outside, pumps can differ from one another hugely in terms of their hydraulic design. We therefore use digital life cycle logs to document the data of each in di-vidual pump. These include type series specifi-cation and production history, equipment, maintenance information and inspection or test reports. The log is quickly accessible to our on-site technical staff. It helps with maintenance measures and supports process analysis and optimisation during operation. In the long term, this can be considered a bridging technology. As our pumps remain in operation for years and often decades, it will be some time before all of our active pump sets are “smart”. Until this point, QR codes or chips will connect older pump models with their digital logs.
43GENERAL INFORMATIONMANAGEMENT AND ISSUES 2017CONSOLIDATED FINANCIAL STATEMENTSGROUP MANAGEMENT REPORTDIGITAL TRANSFORMATION
Dig i ta l L i fe Cyc le Log

44

“ The digital life cycle log gives me on-site access to everything I need to know about the pump in front of me. This means I can see far more quickly where
maintenance is needed or optimisation possible.”
Markus Nowak, engineer for system optimisation, works all over the world for KSB.
Digitalisation helps us provide
efficient service and develop
new maintenance models which
specifically target the needs
of our customers. The digital life
cycle log reduces the documen-
tation workload for system opera-
tors and service engineers.
45GENERAL INFORMATIONMANAGEMENT AND ISSUES 2017CONSOLIDATED FINANCIAL STATEMENTSGROUP MANAGEMENT REPORTDIGITAL TRANSFORMATION
Dig i ta l L i fe Cyc le Log

Laser melting simplifies the production of complex components.
46

Additive manufacturing: Complex geomet-rical shapes such as hollow bodies or lattice structures represent the limits of feasibility for classic casting processes. Conventional methods may also make producing components quickly or in small quantities uneconomical. KSB has thus been investing in 3D printing technology for some years. In this innovative process, a laser controlled via a data set melts metal powder onto a platform, creating components layer by layer. It takes specialised know-how and years of experience with materials to ensure that these “printouts” offer the same quality as traditionally cast components. Drawing on this expertise, the technology offers completely new design and manufacturing options.
47GENERAL INFORMATIONMANAGEMENT AND ISSUES 2017CONSOLIDATED FINANCIAL STATEMENTSGROUP MANAGEMENT REPORTDIGITAL TRANSFORMATION
Addi t ive Manufactur ing

48
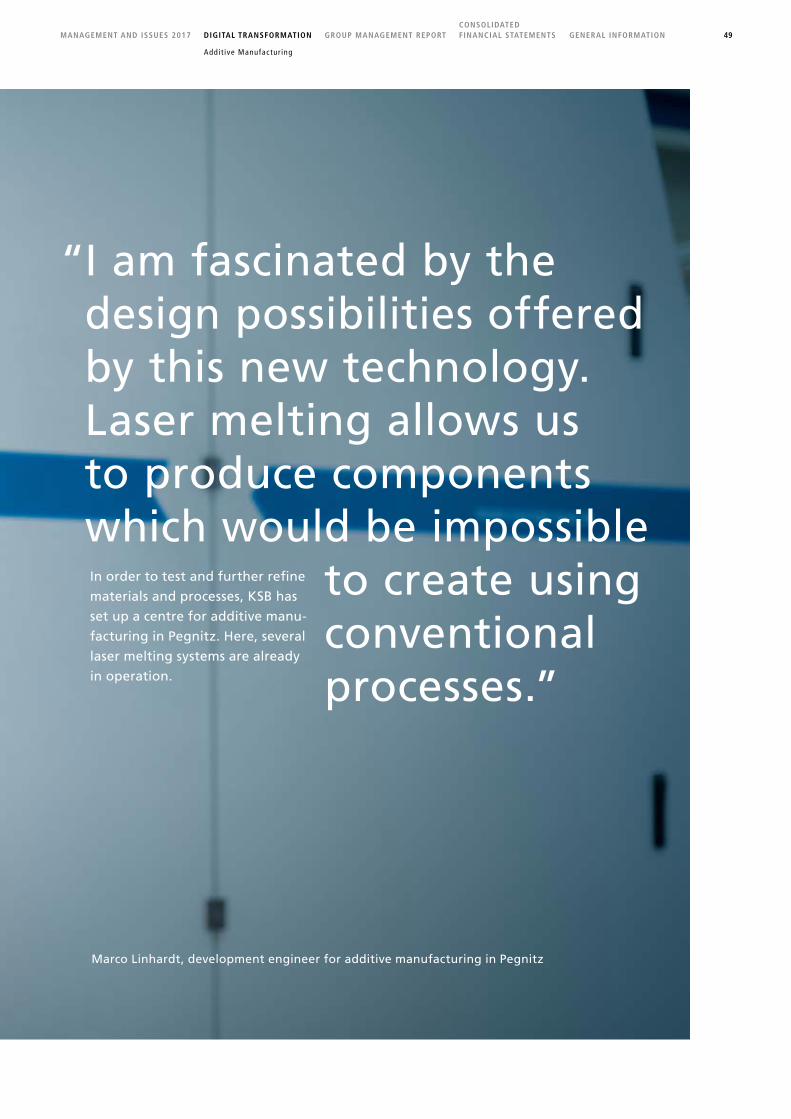
“ I am fascinated by the design possibilities offered by this new technology. Laser melting allows us to produce components which would be impossible
to create using conventional processes.”
Marco Linhardt, development engineer for additive manufacturing in Pegnitz
In order to test and further refine
materials and processes, KSB has
set up a centre for additive manu-
facturing in Pegnitz. Here, several
laser melting systems are already
in operation.
49GENERAL INFORMATIONMANAGEMENT AND ISSUES 2017CONSOLIDATED FINANCIAL STATEMENTSGROUP MANAGEMENT REPORTDIGITAL TRANSFORMATION
Addi t ive Manufactur ing

In order to exactly reproduce a pump impeller, KSB scans the original. Damaged areas can then be “repaired” virtually using CAD reconstruction. If requested by the customer, the model can be subjected to a digital flow simulation test using CFD before the impeller is manufactured.
50

Reverse engineering: Scanning in three dimensions, digitisation, additive manufacturing: This is the new way to reconstruct pump and valve components. When customers need replacement components, quick action is required to minimise their systems’ downtime. However, searching for a replacement part can prove challenging. This is particularly the case if neither the part nor the old casting mould are available any longer, or when the delivery period would be too long. A solution is on hand with reverse engineering from KSB. Service specialists scan the original and can virtually reconstruct damaged areas or even partially destroyed components. Depending on the size, they can then print out the com-ponent directly or produce a new casting mould. Not only does this technology make replacement parts available quickly, the quality often even exceeds that of the original.
51GENERAL INFORMATIONMANAGEMENT AND ISSUES 2017CONSOLIDATED FINANCIAL STATEMENTSGROUP MANAGEMENT REPORTDIGITAL TRANSFORMATION
Reverse Engineer ing

“ Our reverse engineering ensures that the customer gets the replacement part
quickly, and that its quality is at least as good as the original.”
Richard Martinez (right), Managing Director of KSB subsidiary Standard Alloys, in conversation with Rory Novich
KSB’s US-American subsidiary
Standard Alloys is a specialist in
spare parts management for
pumps and compressors. The com-
pany has been refining reverse
engineering technology for many
years. The process of accurately
reproducing components is in no
way restricted to the company’s
own products – it can also be
applied to products from manufac-
turers no longer active on the
market.Richard Martinez
52

GENERAL INFORMATIONMANAGEMENT AND ISSUES 2017CONSOLIDATED FINANCIAL STATEMENTSGROUP MANAGEMENT REPORTDIGITAL TRANSFORMATION
Reverse Engineer ing
53

54
56 Basic Principles of the Group 56 Group Business Model 58 Control System 58 Research and Development 59 Economic Review 59 Macroeconomic Environment and Sector View 60 Business Development and Results of Operations 64 Financial Position and Net Assets 68 Summary of the Performance in the Financial Year 68 Dependent Company Report 69 Report on Expected Developments 72 Opportunities and Risks Report 84 Acquisition-related Disclosures 86 Corporate Governance Statement
(Section 315d of the HGB in Conjunction with Section 289f of the HGB) 87 Statement on the Non-financial Report
(Sections 315b, 315c in Conjunction with Sections 289b to 289e of the HGB) 88 Remuneration of the Board of Management
GROUP MANAGEMENT REPORT
CO
NS
OLI
DA
TE
D F
INA
NC
IAL
STA
TE
ME
NT
SG
EN
ER
AL
INFO
RM
AT
ION
GR
OU
P M
AN
AG
EM
EN
T R
EP
OR
T
GENERAL INFORMATIONMANAGEMENT AND ISSUES 2017CONSOLIDATED FINANCIAL STATEMENTSGROUP MANAGEMENT REPORTDIGITAL TRANSFORMATION

BASIC PRINCIPLES OF THE GROUP
GROUP BUSINESS MODEL
The KSB Group’s mission is to supply customers around the world with top-quality pumps and valves as well as related systems. We also provide a wide range of service offerings to users of these products.
KSB SE & Co. KGaA (until 17 January 2018: KSB Aktien-gesellschaft), Frankenthal / Pfalz, Germany, as the parent com-pany, directly or indirectly holds the shares in the companies belonging to the Group. Besides it, 9 domestic and 73 foreign companies are fully consolidated; 6 other companies are accounted for under the equity method. KSB is currently rep-resented in over 40 countries with its own subsidiaries.
As well as KSB SE & Co. KGaA itself, the companies in the KSB Group with the highest sales revenue are
KSB S.A.S., Gennevilliers (Paris), France KSB Shanghai Pump Co., Ltd., Shanghai, China KSB Pumps Limited, Pimpri (Pune), India GIW Industries, Inc., Grovetown / Georgia, USA
KSB Service GmbH, Frankenthal, Germany KSB BRASIL LTDA., Várzea Paulista (Brazil) KSB Italia S.p.A., Milan, Italy
Our basic business model has not changed during the year under review. External economic and political changes, how-ever, have had a partial effect on our business. These are – where relevant and material to KSB – described in the follow-ing sections.
ORGANISATION, MANAGEMENT AND CONTROL
In the year under review, the Board of Management of KSB Aktiengesellschaft managed and controlled the KSB Group. This body formed of at least two persons under the Articles of Association was assisted in operational decisions by a management team of senior executives. Managers and em-ployees implemented the strategy and instructions of the Board of Management within an organisation that is struc-
tured according to responsibilities for product groups, corpo-rate functions and regions.
All organisational units in the KSB Group act with the aim of ensuring sustainable, profitable growth that will secure both KSB’s financial independence and its medium- and long-term future. Management is monitored by a Supervisory Board consisting of twelve members. The Annual General Meeting of shareholders appoints six members of the Supervisory Board, with the remaining six being delegated by the employ-ees under the terms of the Mitbestimmungsgesetz [German Co-determination Act].
The KSB Group organises its business activities in three seg-ments based on product groups: Pumps, Valves and Service. The Pumps segment covers single- and multistage pumps, and associated control and drive systems. Applications are indus-try (manufacturing, chemical / petrochemical, transport), energy supply, water transport and waste water treatment, construc-tion / building services and the hydraulic transport of solids in mining. The Valves segment covers butterfly, globe, gate, control, diaphragm and ball valves, as well as associated actua-tors and control systems. The applications for these products are essentially identical to those for pumps. The Service seg-ment covers the installation, commissioning, start-up, in-spection, servicing, maintenance and repair of pumps, related systems and valves for all these applications, as well as modu-lar service concepts and system analyses for complete systems.
After the reporting period, KSB Aktiengesellschaft changed its legal form to that of an SE & Co. KGaA by entry in the Handelsregister [German Commercial Register] on 17 January 2018. The partnership limited by shares [Kommanditgesellschaft auf Aktien – KGaA] is a common legal form in Germany for companies with a family- and foundation-dominated ownership structure. The Annual General Meeting of KSB AG adopted a resolution on 10 May 2017 on the announced change in the legal form of the company. The general partner is KSB Management SE, a European public limited company. The shares in this company are wholly owned (100 %) by
56 GROUP MANAGEMENT REPORT

The former KSB Aktiengesellschaft is now managed in the legal form of a partnership limited by shares [Kommanditgesellschaft auf Aktien – KGaA]. Management is the responsi-
bility of KSB Management SE, the individually liable general partner. The responsibilities of the bodies are governed by law and the Articles of Associations. This is the basis for
efficient corporate governance, which contributes to sustainable corporate growth.
Bodies / Structure
Annual General Meeting
Supervisory Board
KSB SE & Co. KGaA
KSB shareholders
Limited partners
KSB Management SE
General partner
manages
monitors
Klein, Schanzlin & Becker GmbH, a subsidiary of the non- profit KSB Stiftung [KSB Foundation] and the Kühborth-Stif-tung GmbH [Kühborth Foundation]. KSB SE & Co. KGaA and thus the KSB Group are managed via KSB Management SE, which has four Managing Directors and a five-member Administrative Board.
MARKETS AND LOCATIONS
Within the KSB Group, centrifugal pumps account for around two thirds of sales revenue. These pumps, as well as valves, are sold to engineering contractors, OEMs and end users or, in some cases, distributed via dealers. The same applies to con-trol and monitoring systems, and to package units with pumps and valves.
The best developed sales market for these products is Europe, where KSB operates its main manufacturing facilities in Germany and France. The main plant of the present KSB SE & Co. KGaA in Frankenthal is its largest in Europe, ahead of the production sites in Pegnitz (Bavaria) and Halle (Saxony- Anhalt) in Germany, and La Roche-Chalais in France.
The second-largest market for KSB products is currently the Region Asia / Pacific, followed by the Region Americas and the Region Middle East / Africa. Outside Europe, KSB’s biggest manufacturing plants are in Brazil, China, India and the USA.
KSB manufactures products and components in a total of 16 countries; they are sold through the Group’s own companies or agencies in more than 100 countries. With their products, the Group companies serve customers in industry including the chemical and petrochemical industries, customers in the energy and construction / building services sectors, transport equipment manufacturers and operators (e.g. ships, rail vehi-cles), water and waste water utilities, and mining companies. Once again in 2017, the top-selling markets for our products were the industrial and energy supply sectors.
In order to be able to offer our products at favourable prices, we combine the Group’s purchasing requirements and source affordable suppliers around the world who meet our quality standards. The focus is currently upon Asian companies. We are able to maintain our market position as one of the leading
57GENERAL INFORMATIONMANAGEMENT AND ISSUES 2017CONSOLIDATED FINANCIAL STATEMENTSGROUP MANAGEMENT REPORTDIGITAL TRANSFORMATION
Bas ic Pr inc ip les of the GroupGroup Bus iness Model

pump and valve manufacturers through our good and long-term relationships with our customers and suppliers. Our highly trained and motivated employees as well as the high quality of our products have also helped cement our reputation.
CONTROL SYSTEM
Based upon our matrix organisation, we determine our key financial performance indicators as follows:
Management decisions are taken primarily on the basis of the key indicators that are determined for the Pumps, Valves and Service segments: order intake, sales revenue and earnings be-fore interest and taxes (EBIT). In 2016, instead of the latter control parameter, the operating earnings (EBIT excluding the effects from measuring construction contracts in accordance with IAS 11) were relevant. Following a change in internal reporting, the sales revenue and effects on earnings from construction contracts under IAS 11 have been reported at segment level since January 2017. As a result, sales revenue and EBIT including these effects were reported to Management and decisions taken on this basis in the reporting year under review.
For further information on these key indicators see the Notes to the Consolidated Financial Statements, section VIII. Segment Reporting.
For the control of the entire Group, we use the key indicators of order intake, sales revenue, earnings before income taxes (EBT), pre-tax return on sales as well as the net financial po-sition, and from the 2018 financial year onwards also the earnings before interest and taxes (EBIT). The pre-tax return on sales describes the ratio between the earnings before in-come taxes (EBT) and the sales revenue; net financial position is the balance of financial liabilities and interest-bearing financial assets (current and non-current financial instruments, interest-bearing loans, cash and cash equivalents, and re-ceivables from cash deposits). When specifying and evaluating
these key indicators, we are guided on the one hand by de-velopments in the market, and on the other by the performance of our key competitors.
We do not consult any non-financial performance indicators for controlling the Group and for making decisions regarding management issues.
RESEARCH AND DEVELOPMENT
Innovations are a fundamental pillar of our activities and are part of the core elements of our strategy. We define them as solutions that create added value for customers and translate into new products, services or business models.
With our pumps and valves, we serve a broad range of tech-nical applications. The integration of hydraulic and electronic systems is a focus of our activities. As many of our products come into contact with fluids that are more or less corrosive or abrasive, materials research is another key area of our developers’ work.
In these activities, we are primarily drawing on our strong research and development competencies in Europe and India. In addition, we cooperate with external institutes and research facilities. Overall, we spent around € 47 million on R & D in the year under review. This equates to about 2 % of our sales revenue.
€ 47million
Research and development expenses in 2017
58 GROUP MANAGEMENT REPORT

MACROECONOMIC ENVIRONMENT AND SECTOR VIEW
The growth of the global economy accelerated in the reporting year and at + 3.7 % developed slightly better than forecast by the International Monetary Fund (IMF) (+ 3.4 %). We regu-larly consider the forecast figures of the IMF in our annual growth planning. The economic upswing was seen in nearly all countries important for the global economy in 2017 as opposed to previous years.
Among the advanced economies, the euro zone countries (+ 2.4 %) and the US (+ 2.3 %) made particularly good progress. Performance in our European home market continued to be supported by a weak euro, which buttressed the export in-dustry, as well as by low interest rates. They facilitated the financing of investments in industry and the construction sec-tor, which also had a partial impact on our industry. The German economy performed better than expected in this envi-ronment, with an increase in the gross domestic product of 2.5 %. In this context, local industry production increased above average.
The economy in emerging economies saw are more expan-sionary trend than in the previous year. In this process, coun-tries exporting commodities and energy sources benefited from tangible price increases. China and India, as the two key markets in Asia for KSB, showed a different performance. Whereas China continued its upswing and slightly exceeded the previous year’s growth rate at 6.8 %, in India the cash reform and introduction of a national value-added tax pre-vented a similar rise as in 2016. However, India’s economic growth remained at a high level at 6.7 %. In Brazil, where KSB continues to be the leading pump supplier, demand for in-dustrial goods rose gain after a three-year recession. Production in Russia also saw an upward trend, but the sanctions of Western countries continued to weigh on economic perfor-mance.
RISING DEMAND IN KEY SALES INDUSTRIES
Thanks to the improved market conditions, companies caught up with measures to upgrade or expand their technical sys-tems. In this context, plans to boost efficiency and improve plant reliability played a central role. There was a continued trend towards automation of fluid transport systems, which we fit with pumps and valves.
In industry, which is a particularly important market for us, demand rose above all in the manufacturing sector, as well as in the chemical and petrochemical industries. In petrochem-ical companies, in particular, catch-up effects were the cause of an increase in investments.
In addition to industry, water and waste water management was our second sales focus. In this area, our sales staff faced a market with a strong recovery in demand in the utilities sec-tor. Furthermore, the start of major water supply and waste water treatment projects in China and India resulted in corre-sponding contracts being awarded.
As a result of the recovery of commodities prices, mining companies made investments to upgrade their plants that had been shelved for some time. In North America, oil sands mining picked up speed again. This is relevant for our business with slurry pumps from the US, which are used for the hy-draulic transport of raw materials as well as residues.
Companies engaged in the liquefaction and transport of natu-ral gas continued to largely refrain from investments due to their overcapacities, although gas prices were also on the rise. This made selling our high-performance cryogenic butterfly valves more difficult.
In the energy industry, the trend towards exiting coal contin-ued. By contrast, operators of combined cycle power stations but also of nuclear power plants had a need for equipment goods and support services.
ECONOMIC REVIEW
59GENERAL INFORMATIONMANAGEMENT AND ISSUES 2017CONSOLIDATED FINANCIAL STATEMENTSGROUP MANAGEMENT REPORTDIGITAL TRANSFORMATION
Bas ic Pr inc ip les of the GroupContro l System Research and Deve lopment
Economic Rev iewMacroeconomic Env i ronment and Sector View
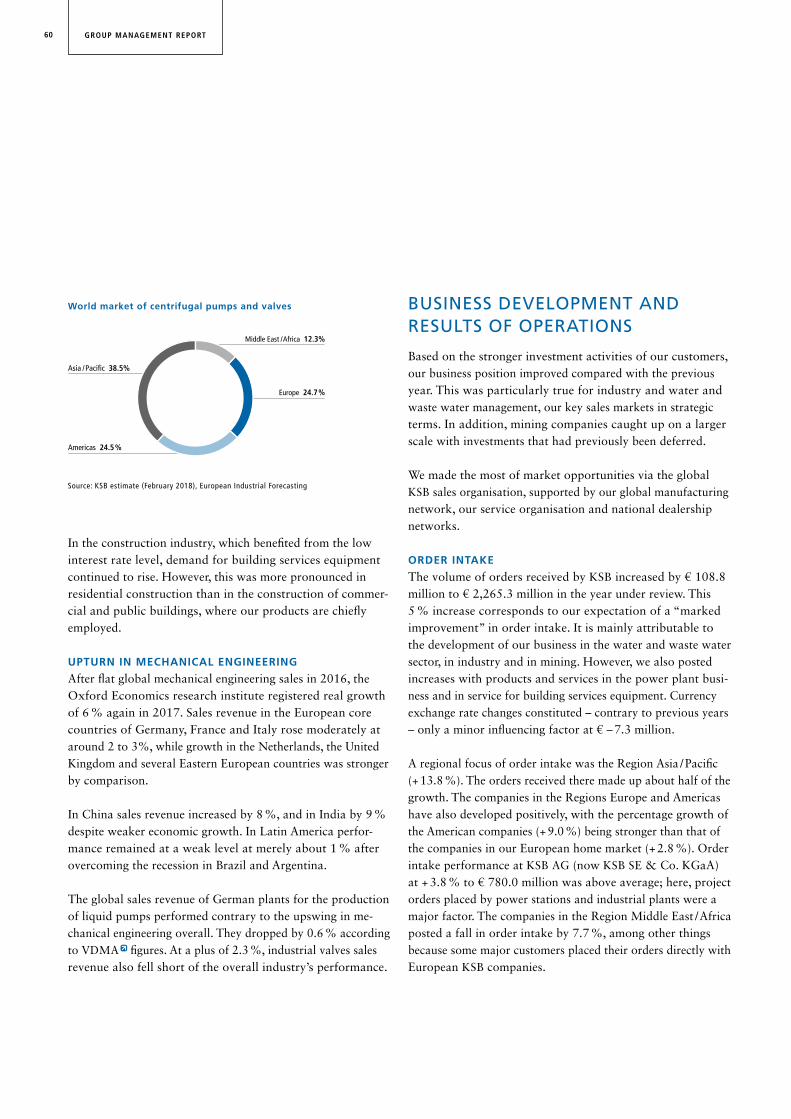
World market of centrifugal pumps and valves
Source: KSB estimate (February 2018), European Industrial Forecasting
Asia /Pacific 38.5%
Americas 24.5%
Middle East /Africa 12.3%
Europe 24.7%
In the construction industry, which benefited from the low interest rate level, demand for building services equipment continued to rise. However, this was more pronounced in residential construction than in the construction of commer-cial and public buildings, where our products are chiefly employed.
UPTURN IN MECHANICAL ENGINEERING
After flat global mechanical engineering sales in 2016, the Oxford Economics research institute registered real growth of 6 % again in 2017. Sales revenue in the European core countries of Germany, France and Italy rose moderately at around 2 to 3%, while growth in the Netherlands, the United Kingdom and several Eastern European countries was stronger by comparison.
In China sales revenue increased by 8 %, and in India by 9 % despite weaker economic growth. In Latin America perfor-mance remained at a weak level at merely about 1 % after overcoming the recession in Brazil and Argentina.
The global sales revenue of German plants for the production of liquid pumps performed contrary to the upswing in me-chanical engineering overall. They dropped by 0.6 % according to VDMA figures. At a plus of 2.3 %, industrial valves sales revenue also fell short of the overall industry’s performance.
BUSINESS DEVELOPMENT AND RESULTS OF OPERATIONS
Based on the stronger investment activities of our customers, our business position improved compared with the previous year. This was particularly true for industry and water and waste water management, our key sales markets in strategic terms. In addition, mining companies caught up on a larger scale with investments that had previously been deferred.
We made the most of market opportunities via the global KSB sales organisation, supported by our global manufacturing network, our service organisation and national dealership networks.
ORDER INTAKE
The volume of orders received by KSB increased by € 108.8 million to € 2,265.3 million in the year under review. This 5 % increase corresponds to our expectation of a “marked improvement” in order intake. It is mainly attributable to the development of our business in the water and waste water sector, in industry and in mining. However, we also posted increases with products and services in the power plant busi-ness and in service for building services equipment. Currency exchange rate changes constituted – contrary to previous years – only a minor influencing factor at € – 7.3 million.
A regional focus of order intake was the Region Asia / Pacific (+ 13.8 %). The orders received there made up about half of the growth. The companies in the Regions Europe and Americas have also developed positively, with the percentage growth of the American companies (+ 9.0 %) being stronger than that of the companies in our European home market (+ 2.8 %). Order intake performance at KSB AG (now KSB SE & Co. KGaA) at + 3.8 % to € 780.0 million was above average; here, project orders placed by power stations and industrial plants were a major factor. The companies in the Region Middle East / Africa posted a fall in order intake by 7.7 %, among other things because some major customers placed their orders directly with European KSB companies.
60 GROUP MANAGEMENT REPORT

Pumps
At € 1,473.6 million, the order intake in the pumps segment outperformed the prior-year value by € 87.0 million, corre-sponding to an increase of 6.3 %, which is in line with our expectation expressed in the previous year. The pump busi-ness, which was intensified by sales initiatives and new prod-uct launches, benefited from the recovery in the industrial market and the continued good performance of the water and waste water business. In the field of waste water transport and purification, our sales staff won over customers with an enhanced, particularly reliable waste water pump series. We also added new high-pressure and submersible borehole pumps to our water engineering portfolio. In addition, the broadening of our range of mechanical seals manufactured in- house had a positive effect on order intake.
Rising commodity prices strengthened demand from mining, which we served above all with US slurry pumps. In this field, at a 35.5 % increase, we posted the highest growth rate in the pumps segment. The focus was on replacement investments by customers; only a few mine operators tackled expansion projects. The demand situation in the fossil-fuelled power plant business remained challenging; order intake for boiler feed, condensate and cooling water pumps dropped further.
Valves
In the valves segment, we posted order intake up by 3.7 %; it rose by € 12.3 million to € 343.5 million. Most of the orders for globe, gate and butterfly valves came from industry. Chemical and petrochemical companies also placed more purchase orders again. The sale of the valves business of our US subsidiary KSB AMRI, Inc., which had specialised in the production and sale of butterfly valves for chemical appli-cations, had an opposite effect.
The strongest growth rate was posted for orders for globe, gate and butterfly valves for energy generation applications, in-cluding high-safety valves for nuclear power plants in Europe and Asia. We did not yet see any improvement in the business with cryogenic butterfly valves for liquefied gas tankers and
loading stations for the reasons outlined above. Our expecta-tion of a significant improvement materialised.
Service
Order intake for support services rose by € 9.4 million to € 448.2 million. This slight increase of 2.1 % correlated with our forecast that growth in service would be weaker than that of pumps and valves. As expected, the sale of a French service company at the end of 2016 and the integration of several service companies into larger units in the USA and France had an opposite effect. In addition, as many as three service sites in the south of the USA were affected by the im-pact of the tropical hurricane Harvey in 2017.
We posted the strongest order intake overall in the water and waste water business as well as in the power plant sector. Energy providers in China and India, in particular, increasingly used our services. Service orders from mining and building services also rose, only orders from industry remained slightly below the previous year’s level.
We were particularly successful regionally in Asia in 2017. There, we are continuously expanding our service organisation, thus winning new customers. 2017, for instance, saw the opening of a service centre in the south of China.
SALES REVENUE
Our consolidated sales revenue improved year on year by € 39.3 million to € 2,205.0 million. This 1.8 % increase slightly exceeded our expectation of reaching the prior-year level. The intensification of our installed base business , which re-sulted in a higher share of orders with a short-cycle impact on sales revenue, was a positive factor. Exchange rate changes had only a minor impact on sales at € – 5.8 million.
The Region with the strongest sales revenue continued to be Europe with a share of some 57 %, where in particular KSB AG (now KSB SE & Co. KGaA) and KSB S.A.S. also process orders from countries outside Europe. Overall, the sales reve-nue of the European countries rose by 1.4 %. KSB AG saw
61GENERAL INFORMATIONMANAGEMENT AND ISSUES 2017CONSOLIDATED FINANCIAL STATEMENTSGROUP MANAGEMENT REPORTDIGITAL TRANSFORMATION
Economic Rev iewMacroeconomic Env i ronment and Sector ViewBus iness Deve lopment and Resu l ts o f Operat ions

Sales revenue by segment
Service 19%
Valves 15%
Pumps 66%
a rise of 2.7 % to € 780.8 million (previous year € 760.6 million). The strongest upward development was posted by the Asian companies with growth of 13.0 %. In contrast, sales revenue in the Region Americas (– 6.8 %) and the Region Middle East / Africa (– 3.6 %) contracted.
As the effects from construction contracts in the 2017 finan-cial year can also be presented at segment level, as described above, the comparison with the prior-year figures is slightly limited.
Pumps
Sales revenue for pumps increased by € 15.9 million, equalling 1.1 %, to € 1,444.4 million. Growth drivers were above all our companies in Asia, with several local companies also in-voicing major orders. Due to the lower number of project orders from previous years, however, the general business with standard products and the installed base business formed the basis of our pump sales revenue. Key growth sectors were the water and waste water sector as well as mining, which we are supplying with replacement pumps and spare parts in greater volumes again. Our expectation of a significant de-cline did therefore not materialise.
Valves
The rise in order intake did not yet have an impact on sales revenue in the reporting year. The order gap occurring in the project business in previous years was not offset by the de-velopments in the general and installed base business. For that reason, sales revenue dropped again contrary to forecast. It declined by € 21.9 million, or 6.1 %, to € 338.8 million. In this context, the above-mentioned sale of the business of our US valve subsidiary KSB AMRI Inc. reduced sales revenue by about € 7.5 million.
Service
Sales revenue from support services met our expectations of a stable performance. While we assumed at the start of the year that the continued difficult order situation in the energy business and in the oil and gas industry would only permit sales revenue at the previous year’s level, we posted growth of € 5.2 million over the year. The sales revenue volume thus rose by 1.2 % to € 421.7 million. In particular the Region Asia / Pacific benefited from the performance of our new service centres.
EARNINGS BEFORE INTEREST AND TAXES (EBIT)
The KSB Group achieved earnings before interest and taxes (EBIT) of € 117.2 million (previous year: € 88.2 million). The Pumps segment contributed EBIT of € 79.9 million (previous year: € 60.9 million). This means that the forecast (of a signif-icant rise) made in the previous year’s report was exceeded. In the Valves segment, the predicted substantial growth in EBIT did not materialise; instead, the EBIT dropped to € 0.1 mil-lion (previous year € 8.8 million). This was caused by the write- down of the goodwill of KSB Seil Co., Ltd., South Korea. The EBIT of the Service segment rose strongly to € 37.3 million (previous year € 33.3 million), which confirmed our forecast.
62 GROUP MANAGEMENT REPORT

In 2016, the preceding section referred to the operating earn-ings (EBIT excluding the effects from the measurement of construction contracts under IAS 11). An adjustment of the previous year’s figures was not possible, as the effects from construction contracts could not be established at segment level. Additional information can be found in Section I. Basic Principles of the Group – Control System.
TOTAL OUTPUT OF OPERATIONS
The above increase in sales revenue is also reflected in a higher total output of operations, totalling € 2,210.5 million compared with € 2,174.2 million in the previous year. Work in progress and inventories of finished goods remained virtually unchanged. Other work performed and capitalised amounts to € 5.6 million and is therefore unchanged year on year.
INCOME AND EXPENSES
Other income declined from € 47.2 million to € 69.2 million, partly due to higher income from the disposal of assets and high insurance compensations.
The cost of materials increased in line with the total output of operations, meaning that the cost of materials as a percent-
age of total output of operations, at 40.2 %, remained un-changed year on year. Overall, the cost of materials increased to € 887.8 million compared with € 874.2 million.
Staff costs fell by 0.3 % to € 796.7 million. Staff costs as a percentage of total output of operations dropped by 0.7 per-centage points. The key factor was the continued reduction in headcount. Compared with 2016, the number of employees fell by 117, taking the total figure at the end of the year un-der review to 15,455. The European companies recorded the strongest decrease with a reduction of 249 staff. The biggest falls came at the French and German sites. Employee numbers were also markedly down in the Americas with 134 fewer people working for KSB on the reporting date compared with the end of December 2016. This development is the result of measures introduced to bring our cost structures into line with new market conditions. The KSB Group employed on average 392 fewer people than in the previous year. Based on the moderately higher total output of operations and simul-taneous decrease in the number of employees, the average out-put per employee improved from € 137 thousand in the previous financial year to € 142 thousand.
The ratio of other expenses to total output of operations rose from 17.1 % to 17.8 %. In absolute terms, this represents a change from € 372.4 million to € 392.4 million. Causes were higher levels of repairs, external services and other staff costs, which could not be offset by lower selling costs.
Financial income / expense improved by € 3.2 million. This is primarily a reflection of the strong increase in income from investments accounted for using the equity method. Based on the contribution to income from our Chinese joint venture, we reported income totalling € 1.5 million. This compares with expenses of € 1.3 million in the previous year.
€ 2.2 billion
Consolidated sales revenue in 2017
63GENERAL INFORMATIONMANAGEMENT AND ISSUES 2017CONSOLIDATED FINANCIAL STATEMENTSGROUP MANAGEMENT REPORTDIGITAL TRANSFORMATION
Economic Rev iewBus iness Deve lopment and Resu l ts o f Operat ions
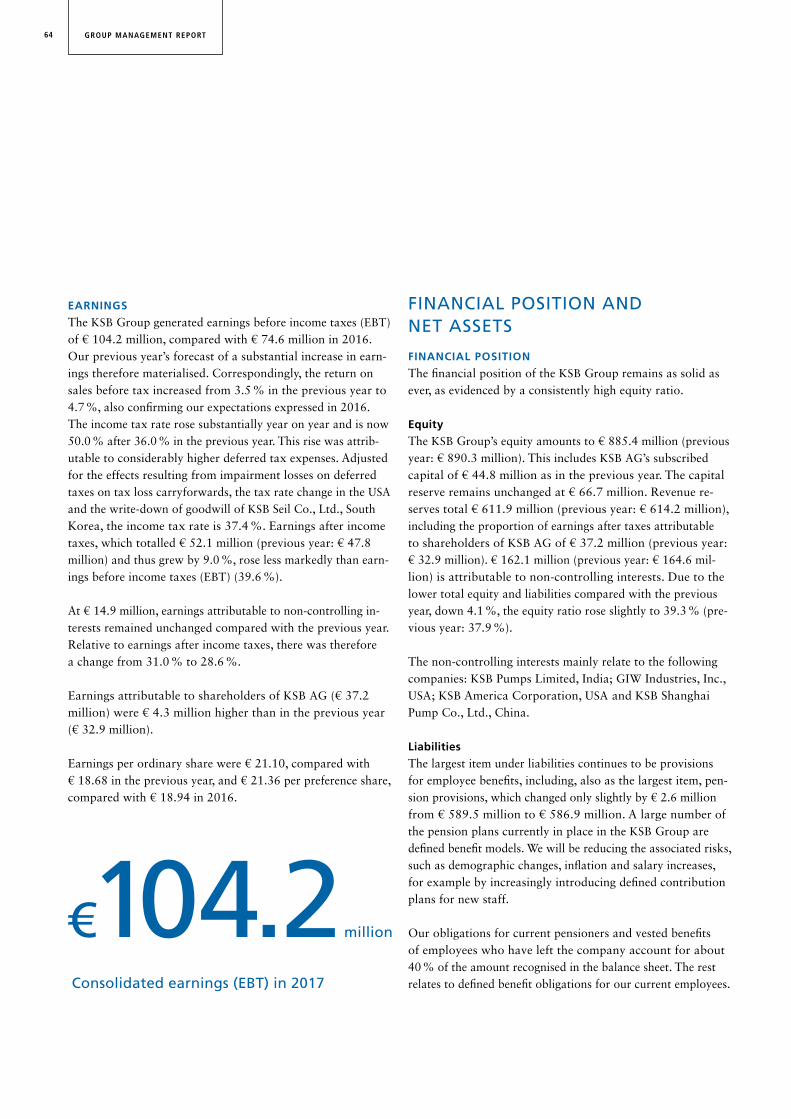
EARNINGS
The KSB Group generated earnings before income taxes (EBT) of € 104.2 million, compared with € 74.6 million in 2016. Our previous year’s forecast of a substantial increase in earn-ings therefore materialised. Correspondingly, the return on sales before tax increased from 3.5 % in the previous year to 4.7 %, also confirming our expectations expressed in 2016. The income tax rate rose substantially year on year and is now 50.0 % after 36.0 % in the previous year. This rise was attrib-utable to considerably higher deferred tax expenses. Adjusted for the effects resulting from impairment losses on deferred taxes on tax loss carryforwards, the tax rate change in the USA and the write-down of goodwill of KSB Seil Co., Ltd., South Korea, the income tax rate is 37.4 %. Earnings after income taxes, which totalled € 52.1 million (previous year: € 47.8 million) and thus grew by 9.0 %, rose less markedly than earn-ings before income taxes (EBT) (39.6 %).
At € 14.9 million, earnings attributable to non-controlling in-terests remained unchanged compared with the previous year. Relative to earnings after income taxes, there was therefore a change from 31.0 % to 28.6 %.
Earnings attributable to shareholders of KSB AG (€ 37.2 million) were € 4.3 million higher than in the previous year (€ 32.9 million).
Earnings per ordinary share were € 21.10, compared with € 18.68 in the previous year, and € 21.36 per preference share, compared with € 18.94 in 2016.
FINANCIAL POSITION AND NET ASSETS
FINANCIAL POSITION
The financial position of the KSB Group remains as solid as ever, as evidenced by a consistently high equity ratio.
Equity
The KSB Group’s equity amounts to € 885.4 million (previous year: € 890.3 million). This includes KSB AG’s subscribed capital of € 44.8 million as in the previous year. The capital reserve remains unchanged at € 66.7 million. Revenue re-serves total € 611.9 million (previous year: € 614.2 million), including the proportion of earnings after taxes attributable to shareholders of KSB AG of € 37.2 million (previous year: € 32.9 million). € 162.1 million (previous year: € 164.6 mil-lion) is attributable to non-controlling interests. Due to the lower total equity and liabilities compared with the previous year, down 4.1 %, the equity ratio rose slightly to 39.3 % (pre-vious year: 37.9 %).
The non-controlling interests mainly relate to the following companies: KSB Pumps Limited, India; GIW Industries, Inc., USA; KSB America Corporation, USA and KSB Shanghai Pump Co., Ltd., China.
Liabilities
The largest item under liabilities continues to be provisions for employee benefits, including, also as the largest item, pen-sion provisions, which changed only slightly by € 2.6 million from € 589.5 million to € 586.9 million. A large number of the pension plans currently in place in the KSB Group are defined benefit models. We will be reducing the associated risks, such as demographic changes, inflation and salary increases, for example by increasingly introducing defined contribution plans for new staff.
Our obligations for current pensioners and vested benefits of employees who have left the company account for about 40 % of the amount recognised in the balance sheet. The rest relates to defined benefit obligations for our current employees.
€104.2 million
Consolidated earnings (EBT) in 2017
64 GROUP MANAGEMENT REPORT

Other provisions for employee benefits, which are predomi-nantly current, rose to € 101.5 million (previous year: € 86.9 million).
The development of other provisions, which we created almost exclusively for current uncertain liabilities, was stable (€ 99.8 million compared with € 99.6 million in 2016). An increase in the provisions for warranty obligations and contractual penalties as well as provisions for expected losses from uncom-pleted transactions offset declining provisions for restruc-turing measures and provisions for other obligations.
Non-current financial liabilities fell by € 3.7 million to € 54.3 million, which was caused by the reduction in bank loans and overdrafts. The loan against borrower’s note, which still amounts to € 48. million, is expected to be repaid in 2019 and 2021.
Current liabilities decreased overall by € 102.7 million (€ 510.8 million compared with € 613.5 million at the 2016 year end). Trade payables rose only slightly to € 212.0 million (€ 210.8 million in the previous year) despite the higher business vol-ume. Other non-financial liabilities increased (+ € 7.2 million), but other financial liabilities fell to the same extent (– € 7.9 million). The decrease in current financial liabilities by € 98.0 million is attributable to the planned repayment, referred to above, of the loan against borrower’s note. Taking into
account the fall in total equity and liabilities, the share of current liabilities in total equity is 22.7 % (previous year: 26.1 %).
Investments
The additions to intangible assets amounting to € 12.5 million (previous year: € 10.0 million) primarily concerned advance payments and own work capitalised for a new software to be deployed in Sales, as in the previous year.
Investments in property, plant and equipment in the reporting year amounted to € 89.4 million, considerably up on the fig-ure of € 72.2 million for the previous year. The highest addi-tions at € 29.0 million (previous year: € 21.1 million) relate to plant and machinery. A further € 20.4 million (previous year: € 23.6 million) relates to advance payments and assets under construction. As in 2016, the focus of our investment activities was Europe, and predominantly Germany and France. Outside of Europe, the highest additions were again made at our plants in India (in particular in Shirwal), in Pakistan, the USA and in China. We maintained our policies for measuring depreciation and amortisation in the year un-der review.
Net financial position
The net financial position, at € 288.0 million compared with € 259.5 million in the previous year, developed much more favourably than forecast twelve months earlier (€ 240 to 260 million) due to a decrease in trade receivables.
Liquidity
Cash flows from operating activities amounted to € 120.7 million, a year-on-year decrease of € 13.8 million. This was principally attributable to the high commitment of funds in trade receivables and other assets and in inventories (release of funds in previous year). This contrasted with higher advances received and provisions, which failed to offset the commitment of funds.
39.3 %Equity ratio in 2017
65GENERAL INFORMATIONMANAGEMENT AND ISSUES 2017CONSOLIDATED FINANCIAL STATEMENTSGROUP MANAGEMENT REPORTDIGITAL TRANSFORMATION
Economic Rev iewBus iness Deve lopment and Resu l ts o f Operat ionsFinanc ia l Pos i t ion and Net Assets

The outflows from our investing activities decreased by € 105.8 million compared with 2016. The return of term de-posits and commercial papers increased cash flows considera-bly. Accordingly, cash flows from investing activities rose sig-nificantly to € – 8.2 million (previous year: € – 114.0 million).
Negative cash flows from financing activities increased strong-ly, totalling € – 106.0 million compared with € – 9.6 million in the previous year. The reason are the planned repayments of the loan against borrower’s note.
Cash and cash equivalents from all cash flows barely changed from € 288.9 million to € 289.5 million. Exchange rate effects amounting to € – 6.8 million (previous year: € + 4.3 million) contributed to this.
We assume that, in future, we will continue to be able to meet our outgoing payments largely from operating cash flow. From the current perspective our financial management is meeting the goal of ensuring our liquidity at all times essen-tially without any additional external financing measures. For more information on liquidity management (such as credit lines) see the section on Risk Reporting on the Utilisation of Financial Instruments elsewhere in this group management report.
Contingencies and commitments
The KSB Group’s off-balance sheet contingent liabilities to-talled € 16.1 million as at the reporting date (previous year: € 15.9 million). These arise mainly from collateral and per-formance guarantees.
There are no other extraordinary obligations and commit-ments beyond the reporting date. Other financial obligations arise only within the normal scope from long-term rental, lease and service agreements (in particular IT and telecommu-nications) necessary for business operations and from pur-chase commitments amounting to € 12.2 million (previous year: € 17.9 million).
NET ASSETS
Our total assets fell by 4.1 % to € 2,253.4 million. Consider-able decreases were recorded for both non-current assets (particularly deferred tax assets) and for other financial assets. Increases were only recorded in property, plant and equip-ment and intangible assets, as well as in other non-financial assets.
Around 28.5 % is attributable to fixed assets (previous year: 27.3 %). Intangible assets and property, plant and equipment with a historical cost of € 1,424.3 million (previous year: € 1,393.1 million) have carrying amounts of € 614.3 million (previous year: € 608.2 million). Intangible assets were re-duced by € 5.6 milliion due to the above-mentioned write-down of goodwill of our company KSB Seil Co., Ltd., South Korea. This was more than offset by the advance payments made on intangible assets, meaning that the intangible assets rose from € 106.7 million to € 108.1 million. With investments in property, plant and equipment (€ 89.4 million) once again exceeding write-downs (€ 60.9 million), this balance sheet item increased by € 4.6 million. The carrying amount of financial assets and investments accounted for using the equity method
€ 288 million
Net financial position in 2017
66 GROUP MANAGEMENT REPORT

Assets (in %)
Intangible assets Property, plant and equipment Non-current financial assets Deferred tax assets
Inventories Receivables and other current assets Cash and cash equivalents Assets held for sale
2017
2016
2017
2016
(in %)
2017
2016
Cost of materials Staff costs Depreciation and amortisation expense Other expenses
Balance sheet structure
Equity and liabilities (in %)
Equity Non-current liabilities Current liabilities
30.1
28.8
30.6
33.3
39.3
37.9
34.1
35.1
12.8
12.3
20.5
19.9
4.1
4.8
1.3
1.4
22.4
21.4
4.8
4.5
41.3
41.3
37.1
37.7
3.3
3.4
18.3
17.6
Expenses in statement of comprehensive income
0.6
fell by a total of € 4.7 million to € 28.3 million. The invest-ments accounted for using the equity method accounted for € – 2.3 million. Deferred tax assets decreased to € 91.7 mil - lion (previous year: € 112.2 million).
Inventories totalled € 461.9 million, down € 5.5 million from the 2016 year end. Materials, consumables and supplies as well as work in progress fell, whereas finished goods and goods purchased and held for resale increased. Inventories continued to tie up around 20 % of our resources.
Despite the higher business volume, trade receivables and PoC could be reduced by € 1.0 million compared with the 2016 year-end figure. Overall – taking into account the change in total assets – this balance sheet item accounts for approxi-mately 27 % (previous year: 26 %) of total assets.
Other financial assets fell from € 187.0 million to € 117.0 million, as we wound up term deposits and commercial papers with a maturity of 3 to 12 months. This is contrasted
by an increase in recoverable taxes from € 18.1 million to € 30.8 million. This increase is attributable to higher receiv-ables from indirect taxes in Asia.
Cash and cash equivalents account for around 13 % of assets, totalling € 289.5 million (previous year: € 288.9 million).
There were no assets held for sale in the financial year, as we sold the valves business of our US subsidiary KSB AMRI Inc., and a Chinese company.
Inflation and exchange rate effects
There were no consolidated companies within the Group whose financial statements were required to be adjusted for the effects of inflation.
The currency translation of financial statements of consoli-dated companies that are not prepared in euro gave rise to a difference of € – 54.1 million (previous year € + 20.2 million). This was taken directly to equity.
67GENERAL INFORMATIONMANAGEMENT AND ISSUES 2017CONSOLIDATED FINANCIAL STATEMENTSGROUP MANAGEMENT REPORTDIGITAL TRANSFORMATION
Economic Rev iewFinanc ia l Pos i t ion and Net Assets

SUMMARY OF THE PERFORMANCE IN THE FINANCIAL YEAR
The forecasts made in the previous year’s report were largely realised due to the circumstances outlined.
We participated in the stronger investment activities of our customers in industry and water and waste water management. Our customers also made previously deferred investments in mining, which had a positive impact on order intake, mean-ing that the significant improvements in order intake pre-dicted in the previous year materialised. As expected, the growth of the Pumps and Valves segments exceeded the increase in the Service segment.
We slightly exceeded the stable sales revenue predicted in the previous year, although the forecast on the sales revenue de-velopment was not realised in all segments. For instance, sales revenue in the Pumps segments rose slightly (forecast in the previous year: significant decline). In the Valves segment, con-trary to our expectations of a slight rise, there was a tangible fall. In the Service segment, however, our forecast of stable sales revenue proved correct.
The significant improvement in EBIT predicted in the previ-ous year materialised as expected. In this context, the increase in the Pumps segment exceeded our forecast of significant growth; the substantial improvement predicted for the Service segment was confirmed. In the Valves segment, however, our expectation of a substantial rise did not materialise. Instead, EBIT fell strongly due to the write-down of goodwill of our company KSB Seil Co., Ltd., South Korea. Like the substantial improvement in EBIT outlined above, the earnings before income taxes (EBT) and the return on sales increased as ex-
pected. The earnings before income taxes (EBT) continue to be impacted by one-off costs in the amount of € 50 million, as expected. The net financial position, at € 288.0 million compared with € 259.5 million in the previous year, developed more favourably than predicted twelve months earlier.
Overall, therefore, order intake and sales revenue developed somewhat better than expected in the reporting year. Our expectations for the earnings figures of the Group were met in full overall. This also applies to the return on sales.
KSB continues to have a healthy financial basis for the future.
DEPENDENT COMPANY REPORTThe Board of Management has submitted the dependent company report to the Supervisory Board. This concludes with the following declaration: “In accordance with section 312(3) of the AktG [Aktiengesetz – German Public Companies Act], we declare that our company – on the basis of the circum-stances known to us at the time when the transactions were made – did not receive adequate compensation for all trans-actions listed in the dependent company report. All disadvan-tages have been compensated for in the course of the finan-cial year. No measures subject to reporting requirements were undertaken in the financial year.”
68 GROUP MANAGEMENT REPORT
For 2018, the International Monetary Fund expects global growth in real terms of 3.9 %. Accordingly, the dynamic per-formance of the past year will continue and perhaps accelerate slightly. In this context, the IMF and other institutions assume a synchronous economic development, which includes all key economic areas.
In the industrialised nations, economic development will con-tinue at a comparable growth speed as in 2017 based on ex-pected growth of 2.3 %. Companies in these nations can bene-fit from growing demand from emerging markets in addition to a good domestic economy. In the euro zone, which is of key significance for our business, the favourable financing options continue to bolster the economic upswing. According to IMF figures, this should result in a gross domestic product that is higher by 2.2 %. Where this goes hand in hand with inten-sified investment activities, it will have a positive impact on the pumps and valves industry. Boosted by the tax reform, the growth signal in the USA is also green. Investment activities there will likely increase, which will create more favourable framework conditions for the local KSB companies.
The emerging market and developing countries are forecast to see slightly stronger momentum overall, which may result in an increase of 4.9 %. Economic prospects in the countries in Asia and Latin America that are key for our global business are promising. Economists expect 7.4 % GDP growth in India. This goes hand in hand with the expectation that the economy will overcome the uncertainty caused by the cash and tax reform. Our strong local production base will also help us to benefit from the Make in India campaign . In China it is to be expected that the expansionary momentum will drop to 6.6 % due to the politically intended shift towards a ser-vice-driven and sustainable economy. This goes hand in hand with measures to stem the growth in debts. The country
remains a key growth market for equipment goods such as pumps and valves despite the slight weakening.
Argentina, Brazil, Chile and Peru will also continue to benefit from the recovery of commodity prices, as will Russia. In particular for our companies in South America, opportunities are therefore increasing to expand their business with pumps, valves and support services. In Russia we can use a new assem-bly and servicing plant to serve the reviving market in the current financial year.
According to the assessment of the VDMA , the mechanical engineering sector will participate adequately in the global economic performance. Globally, the VDMA expects a real in-crease of 4 %; its forecast for the German mechanical engi-neering sector is only slightly weaker at 3.0 %.
As far as manufacturers of liquid pumps in Germany are con-cerned, the VDMA expects real sales revenue growth of 3 % in the current year; for industrial valves, the association expects an increase of 2 %.
PROSPECTS IN ORDER INTAKE AND SALES REVENUE
The announced continuation of global economic growth is creating good framework conditions for an expansion of our business in and outside Europe. Overall, we are expecting continued growth of our order intake in the current year. This will be based largely on the expansion of our business with standard products, support services and spare parts. In addi-tion, the rising willingness of our customers to invest gives rise to expectations that they will increasingly also tackle ma-jor projects. For these, we can supply products tailored to project specifications in addition to standard pumps and valves. Overall, we expect a tangible increase both in order intake and sales revenue.
REPORT ON EXPECTED DEVELOPMENTS
69GENERAL INFORMATIONMANAGEMENT AND ISSUES 2017CONSOLIDATED FINANCIAL STATEMENTSGROUP MANAGEMENT REPORTDIGITAL TRANSFORMATION
Economic Rev iewSummary of the Per formance in the Financ ia l Year
Dependent Company Report
Report on Expected Deve lopments
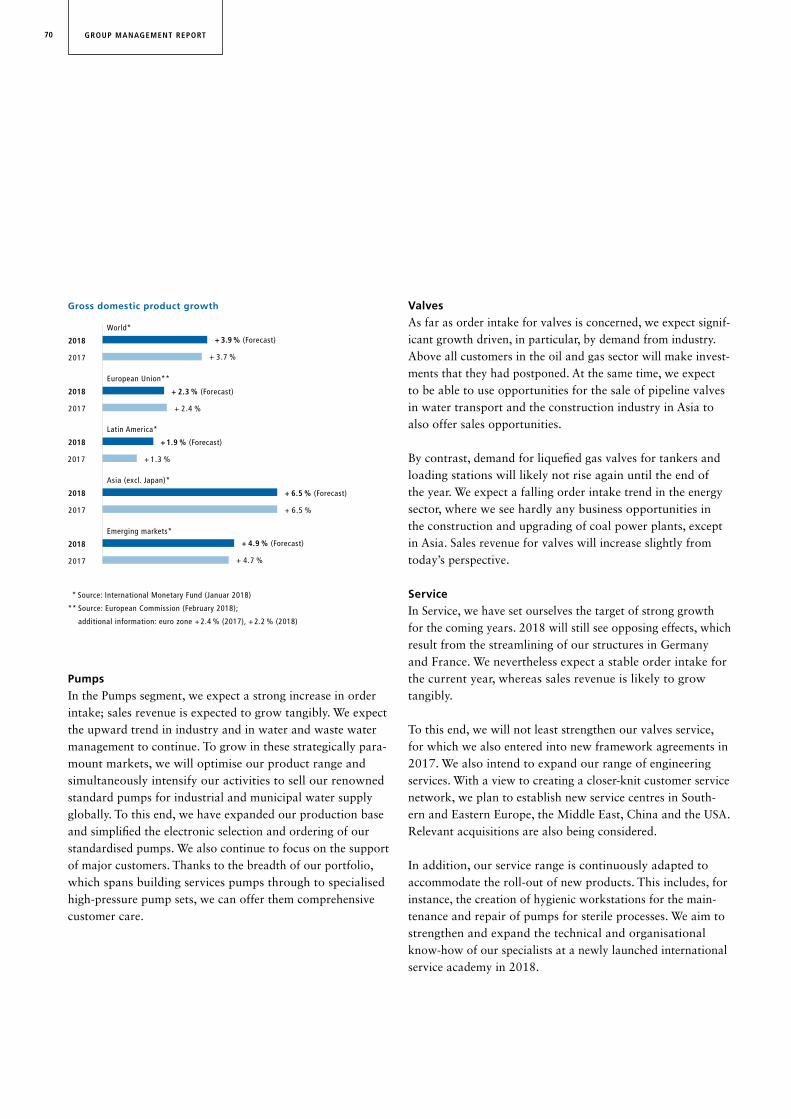
* Source: International Monetary Fund (Januar 2018)
** Source: European Commission (February 2018);
additional information: euro zone + 2.4 % (2017), + 2.2 % (2018)
Gross domestic product growth
World*
2018
2017
+ 3.9 % (Forecast)
+ 3.7 %
Emerging markets*
2018
2017
+ 4.9 % (Forecast)
+ 4.7 %
Latin America*
2018
2017
+ 1.9 % (Forecast)
+ 1.3 %
2018
2017
+ 6.5 % (Forecast)
Asia (excl. Japan)*
+ 6.5 %
2018
2017
+ 2.3 % (Forecast)
European Union**
+ 2.4 %
Pumps
In the Pumps segment, we expect a strong increase in order intake; sales revenue is expected to grow tangibly. We expect the upward trend in industry and in water and waste water management to continue. To grow in these strategically para-mount markets, we will optimise our product range and simultaneously intensify our activities to sell our renowned standard pumps for industrial and municipal water supply globally. To this end, we have expanded our production base and simplified the electronic selection and ordering of our standardised pumps. We also continue to focus on the support of major customers. Thanks to the breadth of our portfolio, which spans building services pumps through to specialised high-pressure pump sets, we can offer them comprehensive customer care.
Valves
As far as order intake for valves is concerned, we expect signif-icant growth driven, in particular, by demand from industry. Above all customers in the oil and gas sector will make invest-ments that they had postponed. At the same time, we expect to be able to use opportunities for the sale of pipeline valves in water transport and the construction industry in Asia to also offer sales opportunities.
By contrast, demand for liquefied gas valves for tankers and loading stations will likely not rise again until the end of the year. We expect a falling order intake trend in the energy sector, where we see hardly any business opportunities in the construction and upgrading of coal power plants, except in Asia. Sales revenue for valves will increase slightly from today’s perspective.
Service
In Service, we have set ourselves the target of strong growth for the coming years. 2018 will still see opposing effects, which result from the streamlining of our structures in Germany and France. We nevertheless expect a stable order intake for the current year, whereas sales revenue is likely to grow tangibly.
To this end, we will not least strengthen our valves service, for which we also entered into new framework agreements in 2017. We also intend to expand our range of engineering services. With a view to creating a closer-knit customer service network, we plan to establish new service centres in South - ern and Eastern Europe, the Middle East, China and the USA. Relevant acquisitions are also being considered.
In addition, our service range is continuously adapted to accommodate the roll-out of new products. This includes, for instance, the creation of hygienic workstations for the main-tenance and repair of pumps for sterile processes. We aim to strengthen and expand the technical and organisational know-how of our specialists at a newly launched international service academy in 2018.
70 GROUP MANAGEMENT REPORT

Source: International Monetary Fund (January 2018)
Gross domestic product growth in the BRIC countries
Brazil
2018
2017 + 1.1 %
+ 1.9 % (Forecast)
Russia
2018
2017
+ 1.7 % (Forecast)
+ 1.8 %
India
2018
2017
+ 7.4 % (Forecast)
2018
2017 + 6.8 %
+ 6.6 % (Forecast)
China
+ 6.7 %
SUMMARY OF EXPECTED DEVELOPMENT
For the current business period, we expect, as outlined above, a tangible improvement in order intake. Major orders will contribute to this, among others in India, where we have ex-panded our capacities. We expect a strong increase in the Pumps segment. The development in the Valves segment will be slightly weaker, but we still expect a significant increase in order intake. For the Service segment, however, we expect a stable order intake.
We expect sales revenue, too, to rise tangibly overall. In this context, we expect significant growth in the Pumps and Service segments, and a slight rise in the Valves segment.
We will be continuing with our measures for long-term im-provements in our profit situation, which were initiated in the previous years. These aim to reduce material, staff and overhead costs. We expect savings that will have a positive effect on future earnings. For 2018, we are planning consoli-dated earnings before interest and income taxes (EBIT) that should tangibly exceed the prior-year level. EBIT in the pumps segment is planned to rise substantially. In the Service seg-ment, we expect significant increases, while we expect only a
stable earnings contribution from the Valves segment. Among other factors, the one-off development costs for major power plant valves, for which we have already received orders, and the further delay in the recovery of the business with lique-fied gas valves are weighing on performance.
In terms of earnings before income taxes (EBT) and the re-turn on sales, our expectation is that both key indicators will increase strongly.
For the net financing position, we plan to achieve a value sig-nificantly above the previous year.
The forecast horizon for all the afore-mentioned measures is the 2018 financial year. Material special factors beyond this period may result from our measures geared towards the long-term improvement of our profit situation.
FORWARD-LOOKING STATEMENTS
This report contains forward-looking statements and informa-tion that are based upon the assumptions of Management. They express our current forecasts and expectations with re-gard to future events. As a result, these forward-looking statements and information are exposed to risks and uncertain-ties that lie outside the Management’s sphere of influence. We wish to point out that actual events or results may differ materially from the forward-looking statements and infor-mation mentioned, if one or more of the following opportuni-ties or risks, or other opportunities, risks and uncertainties should materialise, or if the assumptions underlying the state-ments prove to be inaccurate.
71GENERAL INFORMATIONMANAGEMENT AND ISSUES 2017CONSOLIDATED FINANCIAL STATEMENTSGROUP MANAGEMENT REPORTDIGITAL TRANSFORMATION
Report on Expected Deve lopments

As an organisation that operates throughout the world, the KSB Group is exposed to macroeconomic, sector-typical, financial and company-specific risks. Our risk policy is designed to enable us to grow sustainably and profitably. We aim to reduce the risks associated with our business and where possi-ble avoid them completely. At the same time our global align-ment and our extensive product range offer a wealth of oppor-tunities. This includes in particular any opportunities that arise on the basis of our research and development activities, as well as any that are linked to the quality and cost effective-ness of our products. Our competitive position is also being strengthened by optimising our global sales and production network. We always review opportunities to expand our global presence and are able to achieve this through start-ups and acquisition projects.
We see opportunities and risks as possible future develop-ments or events that may lead to forecast or target deviation. The deviation can be both positive and negative. In order to manage the varied opportunities and risks professionally and efficiently, we align our actions accordingly and focus upon the respective situation when selecting the persons responsible. In doing so, Controlling, Finance and Accounting as well as Internal Audits perform important monitoring tasks.
RISK MANAGEMENT SYSTEM
KSB has implemented a Group-wide risk management system for identifying and assessing relevant risks and reporting these to Group headquarters. The risk management process of the KSB Group consists of the successive phases of iden-tification, assessment, management, control, documentation and communication of risks. The six phases form a continu-ous and IT-based closed-loop system. This is documented in our risk management manual as well as the management responsibility and the description of all relevant tasks.
Managers are encouraged to take timely action to define and implement measures to limit or avoid damage that may result from the occurrence of risk events. All corporate and central functions and Group companies, including Group companies
that are not consolidated, are included in the risk manage-ment system. The responsible managers are required to supply their relevant key business and financial indicators each month. As well as creating quarterly forecasts on business trends, they also twice a year report the recognised risks for the next 24 months from the reporting date for the categories of market and competitive risks, technological risks, project- and product-related risks, financial risks and procurement risks. Other business risks (environmental, human resources, etc.) are also reported in this cycle to the Risk Managers at the Group headquarters. We classify risks as qualitative and quan-titative risks:
Qualitative risks are long-term developments that could have a negative impact on the KSB Group and which cannot or cannot yet be thoroughly quantified due to a lack of precise information. In order to still be able to evaluate them, how-ever, we make estimates of the probability of occurrence and scope. With respect to probability of occurrence, the extent to which the information indicating the potential risk is de-tailed must be determined. The scope describes the potential influence of the individual risk on the earnings before interest and taxes (EBIT) of the KSB Group or the respective Group company.
Quantitative risks are those risks with possible monetary impact on the earnings of the KSB Group or the respective Group company. They are evaluated taking into account the probability of occurrence in combination with the potential amount of loss.
In order to assess whether qualitative and quantitative individ-ual risks are significant for us, we classify them as acceptable, neutral or significant risks. We consider as material for the KSB Group all individual risks categorised as neutral or significant that are detailed in the “Individually assessed opportunities and risks” section. The relevant classification can be deter-mined from the matrices below:
Qualitative risks – Quantitative risks
OPPORTUNITIES AND RISKS REPORT
72 GROUP MANAGEMENT REPORT

Qualitative risks Quantitative risks
Low Medium High
Prob
abili
ty o
f oc
curr
ence
Scope
Significant SignificantHigh
Medium
Low Acceptable Acceptable
Neutral Neutral
Low Medium HighPr
obab
ility
of
occu
rren
ce
Amount of loss
High>70 %
Low< 30 %
Medium30 –70 %
agement process at Group level and investigates all reported risks to determine whether they are relevant for the financial statements. It ensures that there is a systematic link with the Group accounting process. The Board of Management and the Supervisory Board’s Audit Committee received at least two risk reports per financial year. These reports include all the risks that are categorised as significant or neutral that exceed pre-defined threshold values individually or collectively, not considering any action that has been taken. Particularly criti-cal topics are reported on an ad-hoc basis by the managers in charge. In contrast, opportunities are not taken into account in this system, but are examined separately in consultation with segment managers and regional managers applying a different assessment system.
With regard to financial risks we also make use of additional risk identification, assessment, management and communi-cation. The central Finance department is responsible for this task which is described in further detail later in this section.
Evaluation of the amount of loss is based on just three possible classifications: low, medium and high. The above criteria apply.
Classification of amount of loss
This approach gives us the necessary transparency to identify risks in their entirety and to manage them effectively, profes-sionally and in an economically responsible manner.
The bodies to which specific responsibilities and competen-cies were assigned in KSB’s risk management system in the reporting year are shown and explained in the diagram below.
Risk management at KSB
The Board of Management of KSB AG had overall responsi-bility for risk management. It reported to the Supervisory Board during regular Audit Committee meetings and was mon-itored by the latter. The Board of Management was supported by the Chief Compliance Officer and the Group Finance and Accounting department. The latter coordinates the risk man-
Classification of amount of loss
Amount of loss in € thousands
Magnitude Sales revenue Low Medium High
Small companies Up to € 20 million 50 – 125 125 – 250 > 250
Medium-sized companies € 20 to € 80 million 75 – 250 250 – 500 > 500
Large companies, holding companies, organisational units From € 80 million 100 – 500 500 – 1,000 > 1,000
73GENERAL INFORMATIONMANAGEMENT AND ISSUES 2017CONSOLIDATED FINANCIAL STATEMENTSGROUP MANAGEMENT REPORTDIGITAL TRANSFORMATION
Opportuni t ies and R isks Report

Supervisory Board
Board of Management
Auditors
• Audit of the annual financial statements
• Recommendations for improvement
• Monitoring of proper functioning and effectiveness
Internal AuditsRisk Managers
• Controlling the risk management process
• Analysing the risk reports• Reporting to the Board of Management
Risk Owners
• Risk identification• Risk evaluation• Risk control and monitoring
(incl. implementation of measures)• Risk recording• Risk communication / Ad hoc reporting
Risk management at KSB
Compliance risks are dealt with by the Chief Compliance Officer, who is assigned to the Legal and Compliance, Patents and Trademarks staff function. The Chief Compliance Officer is supported by the members of the Compliance Committee and the Compliance Managers of the individual companies.
The Internal Audits department is integrated into the risk management system as part of our internal control system. When planning audits, it prioritises areas according to po-tential risks and is provided with all the necessary information. The auditors ensure that all audited units adhere to the ap-plicable guidelines, actively participate in the risk management system, and control or avoid their risks. Information obtained by Internal Audits on both the recognised risks and the coun-termeasures introduced in response forms an integral part of the reporting to the Board of Management and the Audit Committee of the Supervisory Board.
Our risk management system is regularly reviewed and promptly updated where necessary, for example, in the event of relevant legal or organisational changes. In addition, our auditor examines within the scope of the annual audit the early risk detection system, establishing that it is present and checking that it is fit for purpose.
INTERNAL CONTROL SYSTEM AND
RISK MANAGEMENT SYSTEM WITH REGARD
TO THE GROUP ACCOUNTING PROCESS
The accounting-related internal control system (ICS) contrib-utes towards ensuring proper financial reporting. The aim is to ensure that the consolidated financial statements and group management report comply with all relevant regulations. Key elements of the ICS are – as well as the risk management system described above – guidelines and regulations, which include standard accounting and measurement policies. They must be applied to the full extent by all our Group compa-nies. Functional separation and the principle of dual control are observed; this is ensured by the audits carried out by our Internal Audits department.
74 GROUP MANAGEMENT REPORT

lar basis to make sure that their expert knowledge remains up to date.
We have defined access authorisations for the accounting- related IT system. This protects the data against unauthorised access as well as improper usage and modification. The data is checked at many stages, helping to ensure the processing quality. Alongside regular system reviews by the auditors, these checks contribute to limiting operational risks.
INDIVIDUALLY ASSESSED OPPORTUNITIES AND RISKS
The categories presented below – unless stipulated otherwise – include the qualitative and quantitative gross risks classified as significant or neutral and the main opportunities for our business development. The main influencing factor remains the economic development. All other opportunities and risks are assessed as secondary.
Markets / Competition
Risks
Our business opportunities are again affected by changes in the economic and political environments in the current re-porting year.
We manage the risk of fluctuations in the economy and in demand by remaining active in several market sectors and in-dustries with different economic cycles. Furthermore we are monitoring the development of the economic environment for our market sectors. If necessary, we adjust capacities, relocate production facilities and implement cost-cutting measures.
Asia remains our most important sales market for power plant equipment, including pumps and valves. However, com-petition in China intensified further. For the KSB Group, this has created increased pricing pressure and thus represents a “significant” risk. Political decisions too, such as the post-ponement or even abandonment of energy projects in several Chinese provinces, have impacted negatively on our business performance. In order to tap into the Asian market more wide-ly, we have agreed a strategic alliance with our long-term partner, the Chinese SEC Group, in late 2015. This aims at
In addition, the Accounting department carries out regular analytical plausibility checks using time series analyses and actual / budget variance analyses. This enables us to identify significant changes early on, which we then examine for accounting and measurement discrepancies. The resulting find-ings are then discussed at management level.
The responsibility for Group accounting lies with the employ-ees in the central Accounting KSB Group department. We employ the services of qualified external reviewers for certain calculations as part of financial reporting (such as the calcula-tion of complex pension obligations using actuarial assump-tions).
Binding schedules and guidelines apply to accounting within the KSB Group and to accounting at each individual subsidi-ary. The accounting methods that must be applied to compile the consolidated financial statements are defined in writing in a manual that we update and revise on a continual basis. This also includes the guidelines for posting intra-group transac-tions. We continually analyse new accounting principles and other official announcements with regard to their relevance and impact on the consolidated financial statements. We adapt our guidelines and manual where necessary and communi-cate any changes immediately to our companies. Accounting KSB Group monitors compliance with these regulations. This enables us to reduce the risk of compiling inappropriate financial statements or failing to publish them by the defined deadlines.
We automatically process the financial statement information for all Group companies using certified and tested standard consolidation software. Systematic checks are implemented to help us validate the data. Employees in Accounting KSB Group verify any warning signals that arise before using the data. The sequence of the processing steps is strictly specified through the use of the consolidation monitor within our IT system. This ensures the correct processing of data.
To enable a seamless and accurate accounting process, we only assign employees to this task who have the appropriate specialist know-how. These employees are trained on a regu-
75GENERAL INFORMATIONMANAGEMENT AND ISSUES 2017CONSOLIDATED FINANCIAL STATEMENTSGROUP MANAGEMENT REPORTDIGITAL TRANSFORMATION
Opportuni t ies and R isks Report

closer cooperation so that KSB can achieve success in Asian power plant projects outside of China.
The risk from the political situation in various parts of this world, however, lost some significance year on year. Accord-ing to our assessment, the framework conditions in the coun-tries of the Region Middle East / Africa, which were presented in the 2016 annual report as risks, are no longer material risks in the financial year. However, the East / West relations that are under considerable strain given the political differ-ences between Russia and the USA, and between Russia and most European countries, continue to be significant. This also becomes apparent in the Russian government’s import substitution programme, which constitutes a “significant” risk. Russian companies are to increasingly order products that have been made in Russia or involve a high proportion of local value added. Our KSB company in Moscow has pre-pared for this development, setting up a local assembly site for industrial and water engineering pumps in leased premises. In addition, an own production site is being established, which will start operations in 2018 according to our plans. Our company almost doubled the domestic value added share already in the reporting year.
We considered the risk of a fall in demand in the petrochemi-cal industry in China in our sales strategy. It is therefore no longer material for our expected business development, con-trary to the previous year.
Opportunities
Whereas business in the field of fossil-source energy generation remains weak, there is a trend towards growing demand for technical equipment from energy supply companies operating nuclear power stations. Here, KSB sees opportunities as a provider of high-safety components to participate in the supply of equipment, but also to provide maintenance and repair services for such plants with its specially qualified staff.
In China business prospects are arising in the retrofitting of coal-fired power plants, which are upgraded to become more efficient and environmentally friendly. In addition, KSB Shanghai Pump Co., Ltd. can contribute its expertise to the construction of fossil-fuelled power plants, which Chinese plant engineers are planning and installing in selected countries within the framework of the One Road, One Belt policy.
In China and India with their strong need to catch up with environmental protection requirements, ongoing action plans offer good opportunities for waste water pumps, which are required in sewage treatment plants and the requisite infra-structure. In India, in particular, which is suffering from seri-ous air pollution, tackling the causes may also increase de-mand for flue gas desulphurisation pumps from our portfolio.
Projects / Products
Risks
The markets’ requirements for our products are constantly changing. We will only succeed if we meet our delivery dead-lines and offer technically advanced products in good quality at affordable prices. To minimise the risk of delivery delays, which can lead to an adverse effect on our reputation with customers and also result in financial penalties, we constantly monitor our sales and manufacturing operations. If we dis-cover that machinery needs to be renewed or capacities ex-panded, we examine these investment projects as part of a step-by-step approval process. By doing this, we counter the risk of schedule and cost overruns that is rated as “signifi-cant”.
Regular market analysis and monitoring minimise the risk that our products will become technically obsolete or that we offer them at prices not acceptable in the market. At the same time, we are exposed to the risk posed by cheap products from Eastern Europe and Asia that compete with KSB’s port-
76 GROUP MANAGEMENT REPORT

folio. This calls for continuous quality management, which we have introduced across the Group.
In our business, there are special requirements when it comes to the processing of large-scale projects with long contract terms. There are also always associated risks. There may be cost overruns, tighter import regulations, staff shortages, technical difficulties or quality problems – including possible contractual penalties – that reduce our margins. We therefore train our employees in project management and equip them with specialist knowledge. This enables them to identify the risks associated with longer-term orders at an early stage. With this in mind, our project managers are also provided with appropriate management tools. Decisions are made in conjunction with clearly structured authorisation processes.
There are also technical and financial risks to orders with newly designed products. We limit technical risks to the extent that we define intermediate steps for development work and subject partial solutions to assessments. This also applies to pumps that we provide within the framework of a major contract running over a number of years for the construction of a new type of power plant in China. We minimise finan-cial risks by using appropriate contractual clauses, and ensure that advances cover the costs incurred. We set aside suitable provisions for warranty obligations and contractual penalty risks. These amounted to € 51 million in the consolidated financial statements for 2017 compared with € 50 million in the previous year; beyond this there is no other major resid-ual risk (net risk).
The protection of intellectual property is also becoming ever more significant in our increasingly interconnected world. We are addressing a growing risk by registering patents early, monitoring Internet platforms for the sale of pumps and valves and taking legal action against anyone violating our rights.
Opportunities
Digital transformation enables us to better fulfil customer requirements with new products and services and to generate competitive advantages. A new pump monitoring system to be launched in the market in the current year serves this aim. It sends values measured by sensors into a cloud for analysis and increases transparency for operators of machinery. As a result, deterioration and damage can be identified early on and appropriate measures be initiated. This can result in a higher number of service orders in the medium term. The in-troduction of the new SAP C4C cloud software enables us to better control service processes and to plan assembly assign-ments precisely.
There are also good chances that our customers will increas-ingly ask for products newly launched in 2017, such as high- pressure pumps and pressure booster sets, oil pumps to API standards, waste water pumps with high efficiencies and sub-mersible borehole pumps. This also applies to new valves for use in water pipelines, ANSI valves for power plants and-diaphragm valves with improved pneumatic actuators.
New high-efficiency waste water pumps open up opportuni-ties for KSB BRASIL LTDA. to improve its market position in the waste water market compared with competitors.
The expansion of our range of mechanical seals to more than 30 type series provides added options for fitting pumps for the most varied applications with this core component or for supplying such seals as spare parts. By intensifying the sale of these components produced in-house, we are increasing the value-added depth and thus our pumps business profit.
Finance / Liquidity
Risks
As a group with global operations, we are exposed to a wide variety of currency risks. We counter these with foreign ex-change hedges. However, our global manufacturing network
77GENERAL INFORMATIONMANAGEMENT AND ISSUES 2017CONSOLIDATED FINANCIAL STATEMENTSGROUP MANAGEMENT REPORTDIGITAL TRANSFORMATION
Opportuni t ies and R isks Report

also offers us the opportunity to benefit from currency effects and to use these where appropriate in competition with other manufacturers. In addition to uncertainties regarding exchange rates, interest rate developments on the capital markets play a role for us. We use bank loans subject to variable interest rates to counter the interest rate risk by hedging our future interest payment flows accordingly.
Alongside the euro, the most important currencies for the KSB Group are the US dollar, the Indian rupee, the Brazilian real and the Chinese yuan. If the exchange rate differs from our assumptions, this would have positive or negative effects on our business volumes and our earnings. A strict receiva-bles management system and the use of trade credit insurance helps us avoid situations where receivables cannot be col-lected from our customers.
Risks regarding margins and liquidity are typical of the pro-ject business. As well as the continued pressure on our selling prices, which is reducing our profit margins, these include unfavourable contract conditions such as reduced advances and tougher contractual penalties. As we comply exactly with our approval processes in the quotation phase, we mini-mise this risk. At the same time, this enables us to recognise and avoid liquidity shortages. Where necessary, we secure suf-ficient liquidity by agreeing appropriate credit lines early on.
Persistent recessions or newly emerging crises may adversely affect the financial situation of our customers. Resulting delays in payment and bad debts which were rated as “signifi-cant” in the financial year would weigh on our results of op-erations. The same effect might occur if the foreign exchange regulations become stricter for individual countries. We counter this by means of a strict receivables management sys-tem and intensive customer contacts.
Changing market conditions mean that our business models need to be fundamentally reviewed time and time again. This can also mean that we adjust our product range accordingly.
As regards tax matters, the global orientation of our activities must be taken into consideration. Based on our operative activities in numerous countries with varying tax laws and administrative interpretation, differentiated assessment is required for measuring our tax obligations. Uncertainty may arise due to different interpretations by taxable entities on the one hand and local finance authorities on the other. These may come to light during audits. By cooperating closely with external local tax specialists, we counteract the risk of having to pay back taxes, which is rated as “significant”. As we continually monitor unclear issues, we can generally classify the probability of occurrence. Should a need for subsequent payment arise, we create the corresponding provisions in good time. In the 2017 consolidated financial statements, we set aside € 0 million (previous year: € 1.3 million) for circum-stances that are classified as a significant or neutral risk. In addition, there are contingent liabilities in the expected amount of € 1.6 million (previous year: € 7.4 million).
Procurement
Risks
Commodity prices and procurement times are subject to strong market-related fluctuations. This may adversely affect our earnings situation if we do not manage to make up for cost increases or pass them onto our customers. Delays or bottlenecks in our supply chain for raw materials and compo-nents may negatively impact our business operations. If we do not benefit promptly from declining procurement prices, the persistent pressure on the selling price of our products would have a negative effect on our earnings.
In the context of our procurement strategy, we are also careful to avoid becoming dependent on individual suppliers and thereby counteract the risk of a supplier default. If local con-ditions mean that it is impossible to ensure sufficient diver-sification in this regard, we make use of additional foreign business partners. In selected cases, we also integrate ex-ternal expertise into our company, not least to make the best possible use of our capacity.
78 GROUP MANAGEMENT REPORT

Our suppliers are also further developing their product ranges. In some cases, this results in changes to the specifications for the materials that we require. We consistently monitor any potential impact on the quality of our products. Should risks emerge, we reserve higher volumes based on the original ma-terial structure, where possible, and assess alternative pro-curement sources.
Opportunities
Process improvements and new forms of the global procure-ment of materials and services are key elements of our Effi-ciency Improvement Programme. A reduction in costs is in-creasingly served by online auctions, which help to achieve favourable purchase prices thanks to the strong competition. The processes, which can be controlled with comparatively few members of staff, reduce the indirect procurement costs and offer the opportunity of a high level of transparency in supplier selection, which we can base on a large number of providers.
Technology / Research and Development
Risks
It is essential to our future success that we have a product and service range that is suited to the market in terms of tech-nology, price and delivery time. The changing needs of our customers and new standards and regulations – especially in promising markets such as China – require that we continu-ously develop and improve our products and services. Research and development required for adjustments consumes signi-ficant financial and human resources, with no guarantee of success in either the medium or the long term.
To avoid any negative impact on earnings, it is important to recognise the market-related or technical risks early on. To this end, we are constantly updating our development process, which incorporates various control levels. As sales employees are regularly included in this process, risks arising from changes in markets or applications can be taken into account in good time in the evaluation.
Opportunities
At our Business Innovation Lab we develop new business models on the basis of digital technologies. The aim is to offer customers smart solutions to problems in liquid transport using plant-based data and to simultaneously ensure a high level of security and transparency of their processes. In a test phase, we check these models for functionality and market-ability in order to tap new business opportunities.
For example, we deal with application software (apps) for the remote control of our products, the electronic change of fixed speeds – as an alternative to mechanical adjustments – as well as the miniaturisation of power electronics and its integra-tion in the motor. New cooling concepts and loss-reduced semi-conductors serve precisely this purpose. In the current year, we will be launching a cloud-based system for pump monitor-ing into the market for the first time, which will provide users with structured information and early warnings. We see opportunities of receiving orders in a noteworthy volume for this new development as early as in 2018.
With a view to serving our customers in the oil and gas indus-try, we focused on the development of pumps to API 610 standards in 2017 and enhanced our range of products for downstream applications. This opens up opportunities for winning additional orders. Initial order successes for new API pumps were recorded already in 2017.
As far as pumps for energy engineering are concerned, a focus of our development work was on product adjustments in order to supply combined-cycle power plants in North America with the technical equipment needed. To this end, we expand-ed our portfolio with new variants of boiler feed and con-densate pumps. On the basis of these technological develop-ments, we expect to boost sales in this application area.
We have established a dedicated development team to provide large tubular casing pumps meeting the required specifica-tions. This enables us to produce customised variants of this
79GENERAL INFORMATIONMANAGEMENT AND ISSUES 2017CONSOLIDATED FINANCIAL STATEMENTSGROUP MANAGEMENT REPORTDIGITAL TRANSFORMATION
Opportuni t ies and R isks Report

product for the project business in a narrow time frame. We received orders for this type of pump in 2017 for cooling water supply and for flood control. The latter will increase in sig-nificance on account of global warming. Aiming to expand the business with tubular casing pumps, we are currently driving the development of fish-friendly propellers. They will expand the potential uses of these pumps.
Rapid manufacturing will have an impact on the availability of parts. Using CAD data, it is today possible to manufacture the components of pumps and valves anywhere in the world. We achieved further progress in the use of additive manu-facturing processes in 2017 and will install a large stainless steel powder bed 3D plant in the current year. The use of this technology allows offering customers new production alter-natives and receiving corresponding orders.
Other business-specific risks – Environment
Risks
Our business activities, primarily in the area of production, are subject to numerous environmental protection laws and regulations. Environmental damage of any kind (for example, groundwater contamination, renovation needed due to out-dated construction materials or unpleasant odours arising from the use of chemicals) may result in losses not covered by an insurance policy. Therefore, at all company sites officers mon-itor compliance with laws and regulations as well as with internal KSB rules, which in some cases exceed the prescribed environmental standards. If we discover any contamination, we set aside provisions to meet the liabilities for the necessary clean-up work. In the 2017 consolidated financial statements, these amounted to just under € 0.2 million for significant or neutral risks.
As part of acquisition projects, we examine properties for possible contamination before purchase. We take account of critical issues by way of corresponding contractual regula-
tions with the seller and implement appropriate measure in consultation it.
In markets where environmental regulations are becoming more stringent, there is a risk that our products and own or purchased services may cause infringements that lead to us losing our market authorisation and which damage our repu-tation. A change in rules on liability in environmental pro-tection can also increase the risks for our business success. As a member of national and international professional associa-tions we become aware of imminent changes in environmental law early on. We also continually update the legal frame-works that are in place in our Operational Units, enabling us to ensure that our employees always abide by the applicable law. This is also monitored by external auditors as part of the management certifications.
Opportunities
At KSB, environmental awareness is combined with an active and forward-looking approach as well as internal processes that enable permanent cost reductions. This applies, for in-stance, to all measures that reduce energy consumption in pro-duction, service and in the administrative areas. Inversely, we offer the users of our products the opportunity to reduce their electricity costs by selecting energy-efficient KSB products.
Hazards to people and nature may emanate from the produc-tion and processing methods of manufacturing companies. Our global environmental management system helps us to iden-tify these risks early on and to initiate protective measures in good time. We thereby not only prevent pollution, but also its financial consequences.
Drawing on a functioning and certified environmental manage-ment system, we fulfil a requirement of numerous public- sector customers, large companies and entire industries such as the automotive sector. For them, evidence of an environ-mental management system is an increasingly important crite-rion in the selection of suppliers. By having our production
80 GROUP MANAGEMENT REPORT
and service plants checked by auditors and certified to interna-tional standards, we and our customers are both assured that KSB companies respect the environment. Our commitment to the UN Global Compact also meets the expectations of our customers and improves our order opportunities with compa-nies that pick their suppliers with a view to their responsi-bility for the environment and society, among other things.
Other business-specific risks –
Human resources, legal aspects and IT
Risks
To achieve our growth and profitability business objectives, we need qualified employees at all our locations, including technical specialists. Due to the demographic change in some countries, the competition for these and other highly skilled professionals is increasing, and will intensify if economic re-covery sets in. We counter this risk with demand-oriented measures, systematic human resources planning and interna-tional recruitment processes.
Changing market conditions can have a negative impact on the funded status of our pension obligations. Strong fluctua-tions in the evaluation of capital market interest rates to be paid may have a considerable impact on the Group’s earnings and the equity carried on the balance sheet. To limit this risk, we validate alternative models.
Like all companies, KSB has to adapt to new market condi-tions. We are currently implementing a global efficiency im-provement programme, which also encompasses staff reduction measures. By seeking out socially responsible solutions in the areas of the company concerned and by keeping our employees up to date at all times, we are aiming to keep motivation high and to avoid the departure of employees from key posi-tions.
Changes to our processes and organisational structure, such as the introduction of shared services centres, require clearly defined project responsibilities and valid project plans, as well as the selection of suitably qualified external partners. This helps to avoid teething troubles when changes are introduced to structures and processes, as such problems could impact on the expected cost benefits.
Other potential risks associated with the activities of our employees include dishonest conduct or violations of laws, that could damage the image of KSB. We counter these risks and safeguard our reputation among our customers by organising regular compliance training and through individual initiatives in critical regions.
We address maintenance and repair risks, which could result in production downtime or health hazards for persons, by monitoring them permanently. As soon as necessary refurbish-ment work is identified, we implement the requisite measures in good time. For instance, we are currently overhauling our heating systems and planning structural measures regarding roofing at the Frankenthal site.
Legal disputes cannot always be avoided within the framework of our business activities. These are usually disputes arising from operations, generally involving unclear warranty issues. If as a result of these issues we expect negative effects on the success of our business, we set aside corresponding provisions, which cover not only the anticipated amount of loss, but also the costs of proceedings. To rule out a net risk, the 2017 con-solidated financial statements include about € 1 million (pre-vious year: € 3 million) for those cases classified as significant or neutral risks. We have also created provisions for litigation with authorities and for staff matters. These amount to just under € 3 million overall (previous year: € 2 million) to cover any cases we classify as significant or neutral within our risk assessment methodology. Overall, we rate the risk from legal disputes in the financial year to be significant.
81GENERAL INFORMATIONMANAGEMENT AND ISSUES 2017CONSOLIDATED FINANCIAL STATEMENTSGROUP MANAGEMENT REPORTDIGITAL TRANSFORMATION
Opportuni t ies and R isks Report

The manipulation and loss of electronic data can lead to serious commercial disadvantages. We limit this risk by means of adequate security systems and access procedures. An increased centralisation of the IT systems of our various operating units assists us in this. In this way, we implement high security standards and thus reduce the risk of data loss or corruption.
Opportunities
To remain successful, we need to keep seeking opportunities to optimise our services for customers, simplify processes and reduce costs. In this context, ideas and improvement suggestions by employees provide key impulses. With a view to translating such ideas into innovations, we launched an Internet-based ideas management portal in 2017. Its aim is to generate more employee ideas and to have other portal users provide their comments on or expand them. We will globalise the tool, which was initially rolled out in Germany, in order to use the ideas potential of our employees world-wide.
IMPORTANT OPPORTUNITIES AND RISKS BY SEGMENT
As in the previous year, the opportunities and risks for the Pumps, Valves and Service segments are most influenced by economic development. The future development of China remains important to KSB. Particularly in Eastern Europe, uncertainty regarding political risk is of great significance to the Pumps and Valves segments, and to a lesser degree to Service. Compared with the previous year, we rate the poli-tical situation in some countries in the world to be no longer material for the business of the KSB Group. However, politi - cal decisions on energy projects in China and the considerable strain on East / West relations continue to be significant risks for us. Worsening payment morale also bears corresponding risk potential for future business. As regards our most signi-ficant influencing factor, the economic development, our risk assessment compared with the previous year has changed in that the development of the oil price is no longer a significant risk for the KSB Group. We now assume that the oil price will not recover fully in the coming years, and we have imple-mented this factor in our strategy. If the oil price were to develop better than expected, however, this would likely have positive effects on our business. The economic development
in general continues to be the most significant risk for us due to the difficulty of assessability. By contrast, we continue to hope that our measures intended to foster growth will provide us with considerable support in achieving our goals. Our customers are also often affected by recessions and more in-tense competition, which can decrease their ability to pay in individual cases.
Negative currency changes in growth countries could threaten our exports, in particular those from our European plants. But this would also enable our production facilities in the countries affected to benefit from such developments and to increase their export volumes.
RISK REPORT ON THE UTILISATION
OF FINANCIAL INSTRUMENTS
Central financial management in the KSB Group performs its duties within the framework of the guidelines laid down by the Board of Management. We base the nature and scope of all financial transactions exclusively on the requirements of our business and do not conduct business of a speculative na-ture. The aim is to ensure liquidity at all times and to finance our activities under optimal conditions. With respect to our ex-port business, we hedge foreign exchange and credit risks to the greatest extent possible. We continuously improve our re-ceivables management methods with the goal of settling our outstanding amounts by their due dates.
We are exposed to the following financial risks as a conse-quence of our business activities:
On the one hand, we are exposed to credit risk. We define credit risk as potential default or delays in the receipt of con-tractually agreed payments. We are also exposed to liquidity risk, which is the risk that an entity will be unable to meet its financial obligations, or will be unable to meet them in full. Finally, we are exposed to market risk. The risk of exchange rate or interest rate changes may adversely affect the eco-nomic position of the Group. Risks from fluctuations in the prices of financial instruments are not material for us.
82 GROUP MANAGEMENT REPORT

We use foreign exchange hedges to reduce the risks from transactions involving different currencies, These are generally currency forwards, which we use both for transactions that have already been recognised and for future cash flows from orders still to be processed. At year end, the notional volume of currency forwards used to hedge exchange rate risks was € 276.5 million (previous year: € 269.8 million). Foreign currency items denominated in US dollars account for the major volume hedged by forwards. By strengthening our production sites worldwide, we can realise “natural” currency hedging in currency markets that continue to be volatile.
To minimise interest rate risks, we concluded interest rate swaps to hedge cash flows from underlyings amounting to € 0.0 million (previous year: € 39.5 million). Underlyings and hedge transactions share the same variable interest rates and maturities (1 year).
We limit all these risks through an appropriate risk manage-ment system, defining how these risks are addressed through guidelines and work instructions. In addition, we monitor the current risk characteristics and continuously provide the in-formation obtained in this way to the Board of Management and the Supervisory Board in the form of standardised re-ports and individual analyses.
For more information on the three risk areas and the impact on the balance sheet, see the Notes, section VI. Additional Disclosures on Financial Instruments.
OVERALL ASSESSMENT OF OPPORTUNITIES AND RISKS
The opportunities and risks for the KSB Group are mainly derived from macroeconomic influencing factors and their effects on the global mechanical engineering markets and the competition.
The overall risk situation improved a little compared with the previous year. The reason for this is that we no longer rate the oil price to be a significant risk. Overall, we expect an eco-nomic performance in line with the IMF forecast for next year. Our structural measures will afford us additional support in achieving our objectives. The weakening economic momen-
tum in the growth markets as well as political developments, however, continue to constitute risks, as described in the risk situation by segments. The same applies to geopolitical insta-bilities, decisions on sanctions and volatile currencies. Such circumstances would have a negative effect on our business volumes as well as our budgeted earnings.
In this environment, the KSB Group continues to rely on its ability to match capacities and resources to the changing market conditions. For us, a solid financial position and an efficient cost structure are vital in order to maintain our long-term competitiveness. We are convinced that we can continue to successfully overcome the risks arising from the above-mentioned challenges.
The risk management system in place as well as the related organisational measures allow the Board of Management to identify risks in a timely manner and to take adequate meas-ures. In view of the somewhat uncertain situation, the focus of activities in 2018 will continue to be on the management of market risks. The Board of Management states that, based on the risk management system established by the KSB Group, at present there are no risks that could lead to a lasting and significant impact on the net assets, financial position and results of the KSB Group.
83GENERAL INFORMATIONMANAGEMENT AND ISSUES 2017CONSOLIDATED FINANCIAL STATEMENTSGROUP MANAGEMENT REPORTDIGITAL TRANSFORMATION
Opportuni t ies and R isks Report

A summary of the acquisition-related disclosures required by section 315(4) of the HGB [Handelsgesetzbuch – German Commercial Code] is given below and explanatory informa-tion is provided pursuant to sections 175(2) and 176(1) of the AktG [Aktiengesetz – German Public Companies Act]. In-formation is disclosed only to the extent that it applies to KSB AG (KSB SE & Co. KGaA since 17 January). In the fol-lowing, only the term KSB AG will be used.
KSB AG’s share capital amounts to € 44.8 million, of which € 22.7 million is represented by 886,615 no-par-value ordinary shares and € 22.1 million by 864,712 no-par-value preference shares. Each no-par-value share represents an equal notional amount of the share capital. All shares are bearer shares. They are listed for trading on the regulated market and are traded in the General Standard segment of the Frankfurt Stock Exchange.
Each ordinary share entitles the holder to one vote at KSB AG’s Annual General Meeting. Some 84 % of ordinary shares are held by Johannes und Jacob Klein GmbH, Frankenthal (until 4 May 2017, the company operated as Klein Pumpen GmbH), whose shares are majority-owned by KSB Stiftung [KSB Foun-dation], Stuttgart. The preference shares carry separate cu-mulative preferred dividend rights and progressive additional dividend rights. Detailed information on the share capital and shareholders holding an interest of more than 10 % is pro-vided in the Notes to the Consolidated Financial Statements. Holders of preference shares are entitled to voting rights only in the cases prescribed by law. The issue of additional ordi - nary shares does not require the consent of the preference share - holders. Similarly, the issue of additional preference shares does not require the consent of the preference shareholders pro-
vided that the subscription rights do not exclude newly issued senior or pari passu preference shares.
The company is authorised by a resolution passed at the Annual General Meeting on 6 May 2015 to purchase, until 5 May 2020, company shares of any type totalling up to 10 % of the current share capital or, if lower, of the share cap-ital at the time of this authorisation being exercised. The Board of Management shall be entitled to: (1) sell company shares purchased on the basis of this authorisation either on the stock exchange or by another means that safeguards the rule of equal treatment of all shareholders, for example by means of an offer to all of the company’s shareholders; (2) sell the acquired shares of the company with the consent of the Supervisory Board, excluding shareholders’ subscription rights, if the shares are sold for cash and at a price that is not materially lower than the market price for company shares of the same type and with the same features at the time of the sale. This authorisation is limited to the sale of shares that overall represent no more than 10 % of the existing share capital on the date on which such authorisation becomes effec-tive or, if the amount is lower, the date this authorisation is exercised. The 10 % limit shall be reduced by the proportional amount of share capital for shares (i) issued within the scope of a capital increase during the term of the authorisation excluding subscription rights pursuant to section 186(3) sen-tence 4 of the AktG or (ii) to be issued for the purpose of servicing warrants and convertible bonds, provided that the bonds were issued during the term of the authorisation ex-cluding subscription rights pursuant to section 186(3) sen-tence 4 of the AktG; (3) sell the shares with the consent of the Supervisory Board, excluding shareholders’ subscription rights, to third parties for the purpose of acquiring compa-
ACQUISITION-RELATED DISCLOSURES
84 GROUP MANAGEMENT REPORT
nies, parts thereof and/or financial interests in companies as well as within the scope of corporate mergers or (4) redeem the acquired shares without any further resolution of the Annual General Meeting in full or in part, including in several partial steps. The redemption may also take place without a capital reduction by adjusting the proportional amount of the other no-par-value shares in the company’s share capital. In such cases, the Board of Management shall be authorised by the Articles of Association to adjust the number of no-par-value shares. KSB AG has not yet made use of this authorisa-tion to purchase treasury shares.
There are no resolutions by the Annual General Meeting authorising the company’s Board of Management to increase the share capital (authorised capital).
In accordance with its Articles of Association, KSB AG was managed by at least two Board of Management members. The Supervisory Board decided on the appointment and termina-tion of the mandate of members of the Board of Management in accordance with the statutory provisions. Since 17 Janu-ary 2018, KSB Management SE has conducted the business of KSB SE & Co. KGaA. Under the Articles of Association, the management of KSB SE & Co. KGaA is the responsibility of the Managing Directors.
Amendments to the company’s Articles of Association are re-solved by the Annual General Meeting. If the amendments only affect the wording of the Articles of Association, they can be made by the Supervisory Board, which operates and is formed in accordance with the regulations of the German Co-determination Act.
85GENERAL INFORMATIONMANAGEMENT AND ISSUES 2017CONSOLIDATED FINANCIAL STATEMENTSGROUP MANAGEMENT REPORTDIGITAL TRANSFORMATION
Acquis i t ion- re lated Disc losures

CORPORATE GOVERNANCE STATEMENT (SECTION 315d OF THE HGB IN CONJUNCTION WITH SECTION 289f OF THE HGB)
The Corporate Governance Statement pursuant to section 289f of the HGB [German Commercial Code] in conjunction with section 315d of the HGB dated 21 March 2018 is accessible to the public at www.ksb.com > Investor Relations > Corporate Governance / Corporate Governance Statement.
In addition to the Corporate Governance Report (including the Statement of Compliance in accordance with section 161 of the Aktiengesetz [German Public Companies Act], the Corporate Governance Statement includes relevant information on corporate governance practices applied at KSB SE & Co. KGaA that go beyond statutory requirements. Also described are the working methods of the Board of Management and Supervisory Board, and the composition and working methods of the committees of the Supervisory Board.
86 GROUP MANAGEMENT REPORT

The separate combined non-financial report is prepared in accordance with sections 315b, 315c in conjunction with 289b to 289e of the HGB and disclosed together with the group management report in accordance with section 325 of the HGB. The report can be accessed at: www.non-financial- report2017.ksb.com
STATEMENT ON THE NON-FINANCIAL REPORT (SECTIONS 315b, 315c IN CONJUNCTION WITH SECTIONS 289b TO 289e OF THE HGB)
87GENERAL INFORMATIONMANAGEMENT AND ISSUES 2017CONSOLIDATED FINANCIAL STATEMENTSGROUP MANAGEMENT REPORTDIGITAL TRANSFORMATION
Corporate Governance Statement (Sect ion 315d of the HGB in Conjunct ion wi th Sect ion 289f of the HGB)
Statement on the Non- f inanc ia l Report (Sect ions 315b, 315c in Conjunct ion wi th Sect ions 289b to 289e of the HGB)

year assessment. They were partly based (60 %) on the degree of implementation of the corporate strategy and its actual market success, and partly (20 %) on the return on investment measured according to the economic value added method based on a past average value over a medium-term horizon. The short-term share (20 %) was based on the development of the net financial position in the respective financial year as compared with the planned development. The total amount of the variable remuneration components was limited in order to take extraordinary, unforeseen developments into account.
The weighting factors above do not reflect the additional possibility of a bonus, to be paid out in individual cases at the discretion of the Supervisory Board, of no more than three monthly salary payments per financial year in recognition of any special performance of individual members of the Board of Management. Such decisions are only made on an irregular basis, meaning that they do not necessarily have to be made annually.
In December 2017 the Supervisory Board discussed and de-cided to adjust the measurement bases for variable remunera-tion as of 2018. Determination of the long-term components is now carried out on the basis of the net profit plus depreci-ation / amortisation weighted for 3 years. The short-term share is measured in equal proportions based on the development of the annual EBIT margin, sales revenue and success in the achievement of a personal goal.
Furthermore, when Board of Management contracts are con-cluded it is agreed that payments made to a Board of Manage-ment member in the event of his or her Board of Management tenure being terminated prematurely without good reason shall not exceed the value of two years’ remuneration including fringe benefits (settlement cap in accordance with item 4.2.3 of the German Corporate Governance Code). No other payments have been promised to any Board of Management members in the event of termination of service; similarly no compensation will be paid in the event of a takeover offer. If a contract of service is terminated by a Board of Management member for cause, the company shall not make any severance
REMUNERATION OF THE BOARD OF MANAGEMENT
(REMUNERATION REPORT)
The Remuneration Report summarises the principles applied when determining the remuneration arrangements for the Board of Management of KSB AG. It is prepared in accordance with the recommendations of the German Corporate Gov-ernance Code (item 4.2.5) and explains the remuneration system in place for Board of Management members. This sys-tem is geared towards sustainable corporate development. It is adopted by the Supervisory Board plenary session based on the recommendation of the Personnel Committee and reviewed at regular intervals. The same applies to individual Board of Management compensation amounts.
The remuneration arrangements for the Board of Manage-ment were structured as clearly and transparently as possible. The total amount of remuneration for the individual Board of Management members was determined based on various parameters. Criteria for assessing the appropriateness of the remuneration included the responsibilities of the individual Board of Management members, their personal performance, the economic situation, the company’s success and prospects as well as customary remuneration amounts when taking peer companies and the remuneration structure used elsewhere within the company into consideration.
The remuneration of the Board of Management consisted of fixed and variable components. Fixed components were granted regardless of performance and consisted of a fixed sum plus benefits, as well as pension commitments (retirement, disability, widow’s or orphan’s pension). The fixed sum made up 60 % of the maximum annual salary and was paid out as a monthly basic remuneration. All Board of Management members were equally entitled to the accompanying fringe benefits which included the private use of a company car, pay-ment of insurance premiums and any payments associated with a post-contractual non-competition clause. No loans or advance payments were granted to members of the Board of Management in the year under review.
To ensure the sustainability of the nature of the remuneration, the variable remuneration component consisted mainly of future-oriented components determined on the basis of a multi-
88 GROUP MANAGEMENT REPORT

payments. On 6 May 2015 – using a legally permissible option – the Annual General Meeting again resolved not to disclose the details of the compensation for individual members of the Board of Management for a period of five years.
In total, the short-term benefits (total remuneration) paid to the members of the Board of Management for their activities in the 2017 financial year amounted to € 1,858 thousand (previous year: € 1,250 thousand), and the payments for bene-fits after termination of work € 1,422 thousand (previous year: € 1,388 thousand). € 2,934 thousand (previous year: € 5,255 thousand) has been provided for pension obliga-tions to current members of the Board of Management, and € 42,202 thousand (previous year: € 39,309 thousand) to former members of the Board of Management and their surviv-ing dependants; total benefits paid to these persons amounted to € 2,422 thousand in the year under review (previous year: € 2,244 thousand). No stock options or other share-based payment arrangements are granted to members of the Board of Management.
The short-term benefits (total remuneration) paid to members of the Supervisory Board amounted to € 834 thousand for the 2017 financial year (previous year: € 716 thousand). Infor-mation on the structure of the remuneration arrangements for the Supervisory Board is provided in the Corporate Govern-ance Statement pursuant to section 289f of the HGB.
Frankenthal, 21 March 2018
KSB Management SE The Managing Directors
89GENERAL INFORMATIONMANAGEMENT AND ISSUES 2017CONSOLIDATED FINANCIAL STATEMENTSGROUP MANAGEMENT REPORTDIGITAL TRANSFORMATION
Remunerat ion of the Board of Management

90
CONSOLI- DATED FINANCIAL STATEMENTS 92 Balance Sheet 93 Statement of Comprehensive Income 94 Statement of Changes in Equity 96 Statement of Cash Flows 97 Notes
154 List of Shareholdings 158 Supervisory Board 160 Legal Representatives 161 Proposal on the Appropriation of the
Net Retained Earnings of KSB SE & Co. KGaA
GE
NE
RA
L IN
FOR
MA
TIO
NC
ON
SO
LID
AT
ED
FIN
AN
CIA
L S
TAT
EM
EN
TS
GENERAL INFORMATIONMANAGEMENT AND ISSUES 2017CONSOLIDATED FINANCIAL STATEMENTSGROUP MANAGEMENT REPORTDIGITAL TRANSFORMATION

Assets
€ thousands Notes 31 Dec. 2017
31 Dec. 2016
Non-current assets
Intangible assets 1 108,054 106,596
Property, plant and equipment 2 506,214 501,606
Non-current financial assets 3 6,132 8,526
Investments accounted for using the equity method 4 22,185 24,439
Deferred tax assets 17 91,736 112,166
734,321 753,333
Current assets
Inventories 5 461,877 467,437
Trade receivables and PoC 6 613,311 614,293
Other financial assets 6 116,970 186,995
Other non-financial assets 6 37,402 24,923
Cash and cash equivalents 7 289,535 288,883
Assets held for sale 2 – 14,369
1,519,095 1,596,900
2,253,416 2,350,233
Equity and liabilities
€ thousands Notes 31 Dec. 2017 31 Dec. 2016
Equity 8
Subscribed capital 44,772 44,772
Capital reserve 66,663 66,663
Revenue reserves 611,855 614,238
Equity attributable to shareholders of KSB SE & Co. KGaA 723,290 725,673
Non-controlling interests 162,108 164,661
885,398 890,334
Non-current liabilities
Deferred tax liabilities 17 14,703 12,375
Provisions for employee benefits 9 606,875 605,540
Other provisions 9 1,397 1,406
Financial liabilities 10 54,333 57,962
677,308 677,283
Current liabilities
Provisions for employee benefits 9 81,472 70,916
Other provisions 9 98,407 98,160
Financial liabilities 10 21,960 119,958
Trade payables 10 212,029 210,813
Other financial liabilities 10 81,467 89,406
Other non-financial liabilities 10 190,161 182,979
Income tax liabilities 10 5,214 9,354
Liabilities held for sale 2 – 1,030
690,710 782,616
2,253,416 2,350,233
Also see the relevant information in the Notes.
BALANCE SHEET
92 CONSOLIDATED FINANCIAL STATEMENTS

Income statement
€ thousands Notes 2017 2016
Sales revenue 11 2,204,958 2,165,652
Changes in inventories – 49 2,948
Work performed and capitalised 5,588 5,646
Total output of operations 2,210,497 2,174,246
Other income 12 69,170 47,227
Cost of materials 13 – 887,820 – 874,156
Staff costs 14 – 796,732 – 798,750
Depreciation and amortisation expense 1, 2 – 70,593 – 72,592
Other expenses 15 – 392,414 – 372,441
Other taxes – 15,753 – 13,491
116,355 90,043
Financial income 16 6,417 6,612
Financial expense 16 – 20,106 – 20,672
Income from / expense to investments accounted for using the equity method 16 1,514 – 1,342
– 12,175 – 15,402
Earnings before income taxes 104,180 74,641
Taxes on income 17 – 52,076 – 26,864
Earnings after income taxes 52,104 47,777
Attributable to:
Non-controlling interests 18 14,923 14,834
Shareholders of KSB SE & Co. KGaA 37,181 32,943
Diluted and basic earnings per ordinary share (€) 19 21.10 18.68
Diluted and basic earnings per preference share (€) 19 21.36 18.94
Statement of income and expense recognised in equity
€ thousands Notes 2017 2016
Earnings after income taxes 52,104 47,777
Remeasurement of defined benefit plans 9 9,328 – 47,278
Taxes on income – 3,843 13,546
Expense and income recognised directly in equity and not reclassified to profit or loss in subsequent periods 5,485 – 33,732
Currency translation differences – 54,238 20,223
Attributable to: Expense and income recognised directly in equity attributable to investments accounted for using the equity method – 2,225 – 157
Changes in the fair value of financial instruments 7,203 – 1,622
Taxes on income – 2,257 453
Expense and income recognised directly in equity and reclassified to profit or loss in subsequent periods – 49,292 19,054
Other comprehensive income – 43,807 – 14,678
Total comprehensive income 8,297 33,099
Attributable to:
Non-controlling interests – 62 17,836
Shareholders of KSB SE & Co. KGaA 8,359 15,263
Also see the relevant information in the Notes.
STATEMENT OF COMPREHENSIVE INCOME
93GENERAL INFORMATIONMANAGEMENT AND ISSUES 2017CONSOLIDATED FINANCIAL STATEMENTSGROUP MANAGEMENT REPORTDIGITAL TRANSFORMATION
Balance Sheet
Statement of Comprehens ive Income

Revenue reserves
Other comprehensive income
€ thousands
Subscribed capital of
KSB SE & Co. KGaA
Capital reserveof KSB SE & Co.
KGaA
Otherrevenue reserves
Currencytranslationdifferences
Changes inthe fair value
of financial instruments
Remeasurementof defined
benefit plans
Equityattributable to
shareholdersof KSB SE & Co.
KGaANon-controlling
interestsTotal
equity
1 Jan. 2016 44,772 66,663 813,771 – 61,498 – 3,342 – 139,772 720,594 149,623 870,217
Other comprehensive income – – – 16,991 – 1,257 – 33,414 – 17,680 3,002 – 14,678
Earnings after income taxes – – 32,943 – – – 32,943 14,834 47,777
Total comprehensive income – – 32,943 16,991 – 1,257 – 33,414 15,263 17,836 33,099
Dividends paid (Notes No. 8) – – – 9,857 – – – – 9,857 – 2,798 – 12,655
Capital increase / decrease (Notes No. 8) – – – – – – – – –
Change in consolidated Group / Step acquisitions – – – 327 – – – – 327 – – 327
Other – – – – – – – – –
31 Dec. 2016 44,772 66,663 836,530 – 44,507 – 4,599 – 173,186 725,673 164,661 890,334
STATEMENT OF CHANGES IN EQUITY
Revenue reserves
Other comprehensive income
€ thousands
Subscribed capital of
KSB SE & Co. KGaA
Capital reserveof KSB SE & Co.
KGaA
Otherrevenue reserves
Currencytranslationdifferences
Changes inthe fair value
of financial instruments
Remeasurementof defined
benefit plans
Equityattributable to
shareholdersof KSB SE & Co.
KGaANon-controlling
interestsTotal
equity
1 Jan. 2017 44,772 66,663 836,530 – 44,507 – 4,599 – 173,186 725,673 164,661 890,334
Other comprehensive income – – – – 39,357 5,036 5,499 – 28,822 – 14,985 – 43,807
Earnings after income taxes – – 37,181 – – – 37,181 14,923 52,104
Total comprehensive income – – 37,181 – 39,357 5,036 5,499 8,359 – 62 8,297
Dividends paid (Notes No. 8) – – – 9,857 – – – – 9,857 – 2,491 – 12,348
Capital increase / decrease (Notes No. 8) – – – – – – – – –
Change in consolidated Group / Step acquisitions – – – 980 95 – – – 885 – – 885
Other – – – – – – – – –
31 Dec. 2017 44,772 66,663 862,874 – 83,769 437 – 167,687 723,290 162,108 885,398
Accumulated currency translation differences (€ thousands)
Equityattributable to
shareholders of KSB SE & Co.
KGaANon-controlling
interestsTotal
equity
Balance at 1 Jan. 2016 – 61,498 – 8,496 – 69,994
Change in 2016 16,991 3,232 20,223
Balance at 31 Dec. 2016 / 1 Jan. 2017 – 44,507 – 5,264 – 49,771
Change in 2017 – 39,262 – 14,881 – 54,143
Balance at 31 Dec. 2017 – 83,769 – 20,145 – 103,914
94 CONSOLIDATED FINANCIAL STATEMENTS
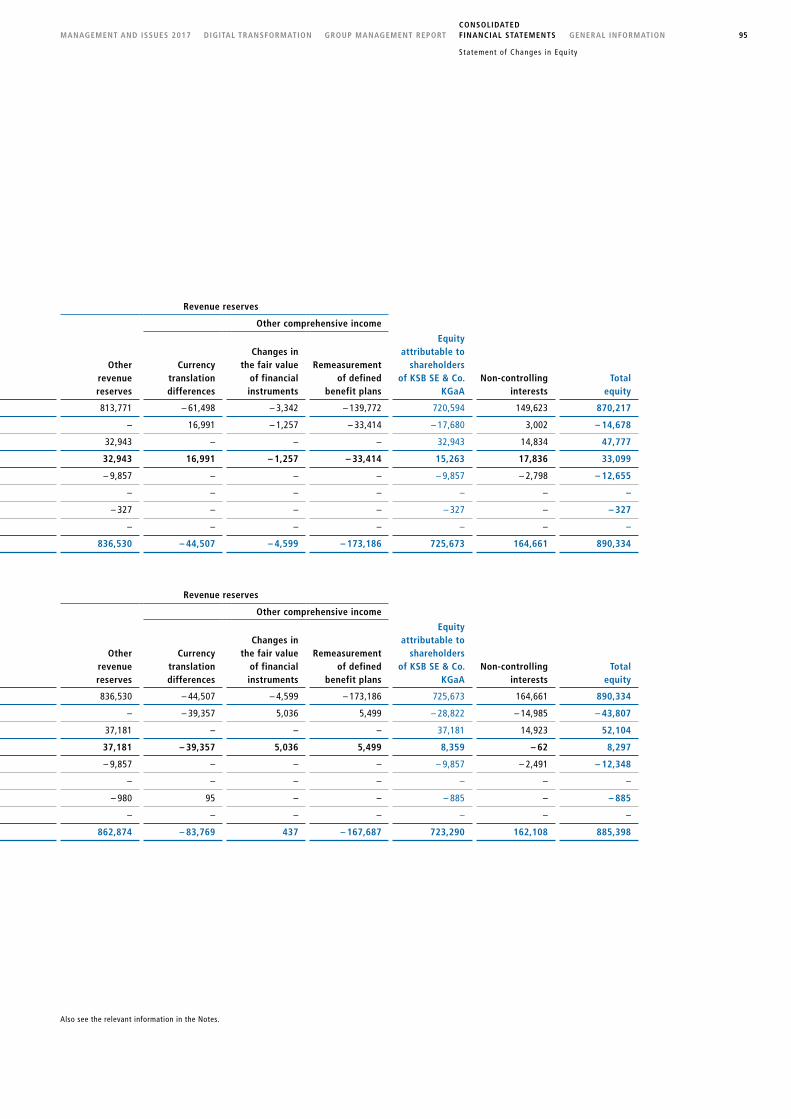
Revenue reserves
Other comprehensive income
€ thousands
Subscribed capital of
KSB SE & Co. KGaA
Capital reserveof KSB SE & Co.
KGaA
Otherrevenue reserves
Currencytranslationdifferences
Changes inthe fair value
of financial instruments
Remeasurementof defined
benefit plans
Equityattributable to
shareholdersof KSB SE & Co.
KGaANon-controlling
interestsTotal
equity
1 Jan. 2016 44,772 66,663 813,771 – 61,498 – 3,342 – 139,772 720,594 149,623 870,217
Other comprehensive income – – – 16,991 – 1,257 – 33,414 – 17,680 3,002 – 14,678
Earnings after income taxes – – 32,943 – – – 32,943 14,834 47,777
Total comprehensive income – – 32,943 16,991 – 1,257 – 33,414 15,263 17,836 33,099
Dividends paid (Notes No. 8) – – – 9,857 – – – – 9,857 – 2,798 – 12,655
Capital increase / decrease (Notes No. 8) – – – – – – – – –
Change in consolidated Group / Step acquisitions – – – 327 – – – – 327 – – 327
Other – – – – – – – – –
31 Dec. 2016 44,772 66,663 836,530 – 44,507 – 4,599 – 173,186 725,673 164,661 890,334
Also see the relevant information in the Notes.
Revenue reserves
Other comprehensive income
€ thousands
Subscribed capital of
KSB SE & Co. KGaA
Capital reserveof KSB SE & Co.
KGaA
Otherrevenue reserves
Currencytranslationdifferences
Changes inthe fair value
of financial instruments
Remeasurementof defined
benefit plans
Equityattributable to
shareholdersof KSB SE & Co.
KGaANon-controlling
interestsTotal
equity
1 Jan. 2017 44,772 66,663 836,530 – 44,507 – 4,599 – 173,186 725,673 164,661 890,334
Other comprehensive income – – – – 39,357 5,036 5,499 – 28,822 – 14,985 – 43,807
Earnings after income taxes – – 37,181 – – – 37,181 14,923 52,104
Total comprehensive income – – 37,181 – 39,357 5,036 5,499 8,359 – 62 8,297
Dividends paid (Notes No. 8) – – – 9,857 – – – – 9,857 – 2,491 – 12,348
Capital increase / decrease (Notes No. 8) – – – – – – – – –
Change in consolidated Group / Step acquisitions – – – 980 95 – – – 885 – – 885
Other – – – – – – – – –
31 Dec. 2017 44,772 66,663 862,874 – 83,769 437 – 167,687 723,290 162,108 885,398
95GENERAL INFORMATIONMANAGEMENT AND ISSUES 2017CONSOLIDATED FINANCIAL STATEMENTSGROUP MANAGEMENT REPORTDIGITAL TRANSFORMATION
Statement of Changes in Equi ty

€ thousands 2017 2016
Earnings after income taxes 52,104 47,777
Depreciation and amortisation expense / Write-ups 71,445 72,592
Increase in non-current provisions 9,947 14,952
Gain / loss on disposal of fixed assets – 9,150 – 208
Other non-cash income / expenses 29 4,714
Cash flow 124,375 139,827
Increase in inventories – 15,725 – 11,834
Increase / Decrease in trade receivables and other assets – 21,001 51,091
Increase / Decrease in current provisions 8,231 – 8,475
Increase / Decrease in advances received from customers 15,536 – 12,161
Increase / Decrease in liabilities (excluding financial liabilities) 10,535 – 22,690
Other non-cash expenses (operating) – 1,260 – 1,260
– 3,684 – 5,329
Cash flows from operating activities 120,691 134,498
Proceeds from disposal of intangible assets 4 90
Payments to acquire intangible assets – 11,941 – 11,775
Proceeds from disposal of property, plant and equipment 20,224 2,956
Payments to acquire property, plant and equipment – 88,526 – 71,606
Proceeds from disposal of non-current financial assets 218 91
Payments to acquire non-current financial assets – 819 – 925
Proceeds from / payments for investments in Group companies that are not fully consolidated 295 – 12,044
Proceeds from commercial papers 74,820 –
Payments for commercial papers – 29,979 – 74,944
Proceeds from term deposits (maturity of more than 3 and up to 12 months) 55,825 110,027
Payments for term deposits (maturity of more than 3 and up to 12 months) – 28,447 – 55,824
Other non-cash expenses / income 165 –
Cash flows from investing activities – 8,161 – 113,954
Dividends paid for prior year – Shareholders of KSB SE & Co. KGaA (Notes No. 8) – 9,857 – 9,857
Dividends paid for prior year – Non-controlling interests (Notes No. 8) – 2,491 – 2,798
Payments for loan against borrower’s note – 74,500 –
Payments for / Proceeds from financial liabilities – 19,150 3,044
Cash flows from financing activities – 105,998 – 9,611
Changes in cash and cash equivalents 6,532 10,933
Effects of exchange rate changes on cash and cash equivalents – 6,828 4,325
Effects of changes in consolidated Group 948 489
Cash and cash equivalents at beginning of period 288,883 273,136
Cash and cash equivalents at end of period 289,535 288,883
Cash flows from operating activities include cash flows from interest received amounting to € 6,139 thousand (previous year: € 6,357 thousand) and cash flows from income taxes totalling
€ – 40,193 thousand (previous year: € – 31,807 thousand). Cash flows from investing activities for the 2017 financial year include cash flows from dividends received of € 1,654 thousand
(previous year: € 2,716 thousand). Cash flows from financing activities include cash flows from interest expense of € – 8,649 thousand (previous year: € – 7,619 thousand).
See also Section VII. Statement of Cash Flows in the Notes to the Consolidated Financial Statements.
STATEMENT OF CASH FLOWS
96 CONSOLIDATED FINANCIAL STATEMENTS

I. GENERAL INFORMATION ON THE GROUP
KSB SE & Co. KGaA (formerly KSB Aktiengesellschaft), Frankenthal / Pfalz, Germany, is a capital marketoriented partnership limited by shares [Kommanditgesellschaft auf Aktien] under the law of the Federal Republic of Germany. The company is registered with the Handelsregister [German Commercial Register] of the Amtsgericht [Local Court] Ludwigshafen am Rhein, regis tration No. HRB 65657, and has its registered office in Frankenthal / Pfalz, Germany. After the reporting period, KSB Aktiengesellschaft changed its legal form into that of a SE & Co. KGaA by entry in the German Commercial Register on 17 January 2018. The Annual General Meeting of KSB AG adopted a resolution on 10 May 2017 on the announced change in the legal form of the company. The general partner is KSB Management SE, a European public limited company. The shares in this company are wholly owned (100 %) by Klein, Schanzlin & Becker GmbH, a subsidiary of the nonprofit KSB Stiftung [KSB Foundation] and the nonprofit KühborthStiftung GmbH [Kühborth Foundation]. KSB SE & Co. KGaA and thus the KSB Group are managed via KSB Management SE, which has four Managing Directors and a fivemember Administrative Board.
In the previous year, KSB SE & Co. KGaA and its subsidiaries were included in the consolidated financial statements of Johannes und Jacob Klein GmbH (formerly Klein Pumpen GmbH), Frankenthal, Germany. Johannes und Jacob Klein GmbH, Frankenthal, is the parent company that prepares the consolidated financial statements for the largest group of companies. The consolidated financial statements are published in the Bundesanzeiger [German Federal Gazette].
The KSB Group is a global supplier of highquality pumps, valves and related systems and also provides a wide range of support services to users of these products. The Group’s operations are divided into three segments: Pumps, Valves and Service.
Basis of preparation of the consolidated financial statements
The accompanying consolidated financial statements of KSB SE & Co. KGaA were prepared in accordance with the International Financial Reporting Standards (IFRSs) as adopted by the European Union (EU) and the additional requirements of Ger
NOTES
man commercial law under section 315e(1) of the HGB [Han-delsgesetzbuch – German Commercial Code]. We applied the Framework, and all Standards applicable at the reporting date and adopted by the European Commission for use in the EU that are of relevance to the KSB Group, as well as the Interpretations issued by the IFRS Interpretations Committee. For the purposes of this document, the term IFRSs includes applicable International Accounting Standards (IASs). The consolidated financial statements of KSB SE & Co. KGaA therefore meet the requirements of the IFRSs as applicable in the EU. The consolidated financial statements were prepared on a going concern basis in accordance with IAS 1.25. They were prepared using the historical cost convention, with the exception of measurement at market value for availableforsale financial assets and measurement at fair value through profit and loss for financial assets and liabilities (including derivatives). Our investments in joint ventures and associates are measured using the equity method.
The financial year of the companies consolidated is the calendar year.
The income statement as part of the statement of comprehensive income has been prepared using the nature of expense method.
All material items of the balance sheet and the income statement are presented separately and explained in these Notes.
The main accounting policies used to prepare the consolidated financial statements are presented below. The policies described were applied consistently for the reporting periods presented unless stated otherwise.
The consolidated financial statements and the group management report, as well as the annual financial statements and management report of the Group’s parent company, are submitted to and published in the Bundesanzeiger [German Federal Gazette].
The present consolidated financial statements, due to be approved by the Supervisory Board on 21 March 2018, will be approved for publication on 28 March 2018 by the Managing Directors of KSB Management SE.
97GENERAL INFORMATIONMANAGEMENT AND ISSUES 2017CONSOLIDATED FINANCIAL STATEMENTSGROUP MANAGEMENT REPORTDIGITAL TRANSFORMATION
Statement of Cash F lows
Notes

Three IFRS standards were amended by the Annual Improve-ments to IFRS Standards – 2014 – 2016 Cycle, with only the following amendment being required to be applied in 2017: IFRS 12 clarifies that on principle the disclosure requirements also apply to interests in subsidiaries, joint ventures and associates that are classified as held for sale as defined by the IFRSs. Exceptions are disclosures under IFRS 12.B10 – B12 (financial information). This clarification does not have any impact on our reporting.
b) Accounting principles that have been published but that are not yet mandatory
The following standards and revised standards issued by the IFRS Interpretations Committee (IFRIC) were not yet mandatory and were not applied in the 2017 financial year:
IFRS announcement
In May 2014, the IASB published the new IFRS 15 Revenue from Contracts with Customers standard. The new accounting standard, which is to be applied to financial years that begin on
New accounting principles
a) Accounting principles applied for the first time in the 2017 financial year
The following new and revised Standards issued by the International Accounting Standards Board (IASB) were required to be applied for the first time in financial year 2017:
The amendment to IAS 12 Income taxes clarifies that writedowns to a lower market value of debt instruments measured at fair value arising from a change in market interest rates can give rise to deductible temporary differences. For clarification, rules and examples were expanded, for example, to indicate how future taxable income needs to be calculated in order to capitalise deferred tax assets.
The amendment to IAS 7 Statement of Cash Flows aims to add information that will help users of financial statements to assess changes in the entity’s liabilities from financing activities. The “Changes in cash flows from financing activities” table in Section VII. Statement of Cash Flows has thus been supplemented.
IFRS announcement
First-time appli-cation in the EU
Improvements to the International Financial Reporting Standards (2014 to 2016) 1 Jan. 2018
IFRS 15 Revenue from Contracts with Customers 1 Jan. 2018
Clarifications to IFRS 15 Revenue from Contracts with Customers 1 Jan. 2018
IFRS 9 Financial Instruments 1 Jan. 2018
IFRS 2 Share-based Payment 1 Jan. 2018
IFRS 4 Insurance Contracts 1 Jan. 2018
IFRIC 22 Foreign Currency Transactions and Advance Consideration 1 Jan. 2018
IAS 40 Investment Property 1 Jan. 2018
IAS 28 Investments in Associates and Joint Ventures and IFRS 10 Consolidated Financial Statements 1 Jan. 2019
IFRS 16 Leases 1 Jan. 2019
IFRIC 23 Uncertainty over Income Tax Treatment 1 Jan. 2019
IAS 19 Employee Benefits 1 Jan. 2019
Improvements to the International Financial Reporting Standards (2015 to 2017) 1 Jan. 2019
IFRS 17 Insurance Contracts 1 Jan. 2021
98 CONSOLIDATED FINANCIAL STATEMENTS

or after 1 January 2018, defines principles that an entity should apply when reporting on the nature, amount, timing and uncertainty of revenue and cash flows arising from a contract with a customer. Sales revenue is recognised when the customer has control over the agreed goods and services and can derive benefits from these. It supersedes the previous IAS 11 Construction Contracts and IAS 18 Revenue standards.
KSB will not apply IFRS 15 early for the first time, instead deciding to initially apply the standard in the 2018 financial year using the modified retrospective method. The cumulated impact on earnings resulting from the transition will be recognised directly in equity at the beginning of the comparative period.
The focus of the Groupwide project to introduce IFRS 15, underway since 2016, has been on ensuring complete identification of the resulting effects, training the Group companies, creating and implementing the technical concept, and analysing the materiality of the identified effects of IFRS 15. The impact analysis carried out in the 2017 financial year confirmed our assumptions that no material effects are to be expected.
We expect minimal effects for the construction contracts recognised using the percentageofcompletion method until the end of the 2017 financial year. For a number of these contracts, the criteria laid down in IFRS 15.35 for sales revenue recognition over time were not fulfilled. This led to sales revenue being recognised later. At the moment, we expect reported consolidated sales revenue to decrease by approx. 2 %. In the consolidated balance sheet there will be reclassifications between receivables recognised by PoC and contractual assets under Assets, and between advances received from customers PoC and contractual liabilities under Equity and Liabilities.
In July 2014, the IASB published IFRS 9 Financial Instruments as the successor to IFRS 39 Financial Instruments: Recognition and Measurement. IFRS9 specifies revised rules for classifying and measuring financial instruments, new rules regarding the impairment of financial assets and additional rules for recognising hedges.
The rules for classification of financial instruments under IFRS 9 are based on the following two criteria: the business model – hold or sell – and the type of cash flows – repayment of principal or interest. Changes to the financial liabilities measured at fair value were fully recognised in the income statement under IFRS 39, while IFRS 9 requires a separate treatment. If changes are a result of credit risk developments, then they are to be recognised in other comprehensive income; other changes will be recognised in the income statement. As the Group currently measures all of its financial liabilities at amortised cost, and intends to maintain this approach, no material effects on financial liabilities are to be expected from the application of IFRS 9. Based on our review, the measurement of financial assets will remain mostly unaffected by the changes.
According to the new rules regarding impairment the incurred loss model (retrospective) applied under IAS 39 is to be replaced by the expected credit loss model (prospective). The standard stipulates a general 3stage model (impairment model) and a simplified method for determining the anticipated impairment. For all financial instruments that fall within the scope of the new impairment model, the calculated prospective impairment needs to be recorded at the time of initial recognition based on a valid future estimation. The Group intends to apply the simplified method for the measurement of trade receivables. As far as the relevant impairment losses are concerned, the Group expects an increase of approx. 1 % in relation to the current receivables.
IFRS 9 also requires a calculation of expected credit loss (ECL) for investments (term deposits) with a maturity of more than three months, investments in Euro Commercial Papers (ECP) and loans to third parties. When transitioning to IFRS 9, the effect of the firsttime application of the standard will be taken directly to equity. Subsequent changes will be recognised in profit or loss. However, we do not expect any material impact in this respect.
Notes
99GENERAL INFORMATIONMANAGEMENT AND ISSUES 2017CONSOLIDATED FINANCIAL STATEMENTSGROUP MANAGEMENT REPORTDIGITAL TRANSFORMATION

In addition, IFRS 9 covers hedge accounting. A particular focus is on the presentation of crosscurrency basis spreads as derivative components. KSB currently intends to use the option of excluding the forwards points and crosscurrency basis spread component. The effects will thus be recognised directly in equity as “Cost of hedging reserve” under a new item in other comprehensive income. We do not expect any material effects in this respect.
Furthermore, any hedges need to be consistent with the objectives and strategy of Group risk management in order to better present the associated activities. It is expected that the hedge accounting relations of the Group meet all requirements of IFRS 9.
KSB will apply the IFRS 9 accounting rules for the first time in the 2018 financial year. Comparative disclosures will not be adjusted. Consequently, all differences between the carrying amounts of the financial instruments before and after the application of IFRS 9 will be recognised in revenue reserves and other reserves as of 1 January 2018.
The amendments to IFRS 2 Share-based Payment relate to the accounting treatment of cashsettled sharebased payment transactions. Some of the new provisions concern the calculation of the fair value of obligations resulting from sharebased payments.
The changes to IFRS 4 Insurance Contracts aim to reduce the impact of the differing start dates for IFRS 9 Financial Instruments and the successor standard to IFRS 4, above all for entities with comprehensive insurance activities.
IFRIC 22 Foreign Currency Transactions and Advance Consid-eration clarifies the exchange rate to be used on initial recognition for the conversion of foreign currency transactions that include the receipt or payment of advance consideration.
IAS 40 Investment Property has been amended in order to clarify that an entity may only transfer a property to or out of its investment property portfolio if there is evidence of a change of use.
The amendments to IAS 28 Investments in Associates and Joint Ventures and IFRS 10 Consolidated Financial Statements remove an inconsistency between the rules laid down in the Standards for dealing with assets being sold to an associate or joint venture and/or the contribution of assets in an associate or joint venture. In future, any gain or loss arising from the loss of control over a subsidiary that is being incorporated into a joint venture or associate must be recognised in the full amount by the investor if the transaction relates to a business as defined in IFRS 3 Business Combinations. If, in contrast, the assets do not form a business, the gain / loss may only be recognised pro rata. On 12 October 2017, the IASB published amendments regarding accounting for longterm interests in associates and joint ventures. The amendments to IAS 28 clarify that IFRS 9 is to be applied to longterm interests in associates or joint ventures that are not accounted for using the equity method.
IFRS 16 Leases specifies the new rules on recognising, measuring, presenting and disclosing leases. The classification into operating and finance leases shall no longer apply to lessees in future. Pursuant to IFRS 16, all leases shall as a general rule be accounted for in the form of a right of use with corresponding lease obligation. These are to be reported in separate balance sheet items under fixed assets or liabilities, or may be described in the Notes.
As far as lessees are concerned, the new standard offers various accounting options. Leases with a term of less than 12 months and lowvalue assets may be capitalised. If this option is used, the lease will be accounted for in a comparable way to that stipulated to date under IAS 17 for operating leases. A further simplification is provided by the option of applying the new rules to a lease portfolio, provided that the resulting effect does not involve any significant change compared with an individual approach.
Comprehensive qualitative and quantitative disclosures will be required in the Notes in future.
100 CONSOLIDATED FINANCIAL STATEMENTS

Based on current knowledge, IFRS 16 will be applied for the first time on a modified, retrospective basis within the KSB Group by recording the cumulative effect from the firsttime application in equity. On this basis, only those existing contracts that are already classified as leases under IAS 17 will be covered by the scope of IFRS 16. Other existing contracts need not be reviewed to determine whether they would be covered by the new standard based on the amended definitions in IFRS 16. For the Group, this means that the assets and liabilities for operating leases already in place must be reported. The discounted residual lease payments are to be recognised as a lease liability. The right of use can either be recognised at the amount that would have resulted from application of the standard at the start of the lease or, more simply, at the amount of the liability (adjusted to take account of any payments before the lease began).
Information on the current leases applicable within the Group are included in Section IX. Other Disclosures of the present Notes. Based on current information, we will be exercising the options applicable to leases with a term of less than 12 months and low value assets in such a way that we account for these leases in a comparable way to that stipulated to date under IAS 17 for operating leases. Other leases result in a balance sheet extension, which, however, will not correspond to the full scope of the operating lease volume (€ 49.7 million) presented in Section IX. Other Disclosures. There will also be a change in the income statement, given that lease payments for operating leases currently reported under other expenses will in future be partially replaced with a depreciation expense for rights of use and interest expenses for liabilities from leases. Within the statement of cash flows, too, the firsttime application of IFRS 16 will result in shifts between the individual cash flows. However, because the redemption component of lease payments in the future will be an element of cash flows from financing activities, this will result in an improvement of cash flows from operating activities. Accounting for finance leases in place will not be affected by the new standard.
In order to estimate the workload and expense for the firsttime application and ensure the correct implementation of the standard at the time of that firsttime application, we began to implement an associated project plan in the financial year under review. This included an inventory evaluation of leases of the parent company KSB SE & Co. KGaA and the other Group companies / KSB companies. We have already obtained an overview of the workload and costs involved in the initial compilation of contractual data in a contract management tool designed for that purpose. The analysis of the lease situation that has already begun will be extended in 2018 to include all contracts, and we will also create a questionnaire on IFRS 16 that will have to be completed by every Group company. The results will be used to derive any further system changes required and create guidelines for correctly handling contracts after 1 January 2019. Appropriate changes to the reporting forms and accounting instructions will also be made.
IFRIC 23 Uncertainty over Income Tax Treatment specifies requirements for the recognition and measurement of uncertain income tax items. As part of the assessment of uncertainty, a company needs to evaluate whether it is probable that the tax jurisdiction will accept the treatment of income taxes.
The IASB has revised IAS 19 Employee Benefits with regard to plan amendment, curtailment and settlement. As of 1 January 2019, in the event of amendment, curtailment or settlement related to a defined benefit pension plan, the current service cost and the net interest for the remaining financial year are to be determined based on the current actuarial assumptions that were used for the required remeasurement of net liabilities.
IFRS 17 Insurance Contracts stipulates the principles governing the recognition, measurement, presentation and disclosure of insurance contracts within the scope of the standard. The objective is to ensure that the reporting companies provide relevant information that faithfully represents the insurance contracts.
Notes
101GENERAL INFORMATIONMANAGEMENT AND ISSUES 2017CONSOLIDATED FINANCIAL STATEMENTSGROUP MANAGEMENT REPORTDIGITAL TRANSFORMATION

As a matter of principle, we have not voluntarily applied the abovementioned new or revised Standards or the Interpretation prior to their effective dates. We do not anticipate any, or any material, impact on our net assets, financial position or results of operations.
With regard to IFRS 9 Financial Instruments, IFRS 15 Revenue from Contracts with Customers and IFRS 16 Leases, please refer to the comments in the previous sections.
II. BASIS OF CONSOLIDATION
Consolidated Group
In addition to KSB SE & Co. KGaA, 9 German and 73 foreign companies (previous year: 9 German and 79 foreign companies) were fully consolidated. We hold a majority interest, either directly or indirectly, in the voting power of these subsidiaries which the KSB Group has the option to control under IFRS 10.
The Thai company KSB Pumps Co. Ltd., Bangkok, and the Indian company KSB Pumps Limited, Pimpri (Pune) are includ
ed in the group of fully consolidated affiliates despite the fact that we hold less than 50 % of the voting rights. We do, however, have the power to determine their business and financial policies and thus the level of variable returns.
Companies that were not consolidated due to there being no material impact are reported under financial assets – other investments.
The following table shows the subsidiaries with noncontrolling interests that are material subsidiaries of the KSB Group. “Seat” refers to the country in which the main activity is performed.
Material subsidiaries with non-controlling interests
The summarised financial information regarding the KSB Group’s material subsidiaries with noncontrolling interests is provided below. This information corresponds to the amounts given in the subsidiaries’ financial statements prepared in accordance with IFRS prior to intercompany eliminations.
Summarised balance sheet
Summarised statement of comprehensive income
Condensed statement of cash flows
Material subsidiaries with non-controlling interests
Name and seat
Non- controlling interest in
capital
Earnings after income taxes attributable to
non-controlling interestsAccumulated
non-controlling interests
€ thousands 2017 / 2016 31 Dec. 2017 31 Dec. 2016 31 Dec. 2017 31 Dec. 2016
GIW Industries, Inc., USA 49.0 % 4,191 4,860 28,878 29,927
KSB Pumps Limited, India 59.5 % 4,742 4,889 53,508 53,604
KSB America Corporation, USA 49.0 % 91 245 23,736 25,062
KSB Shanghai Pump Co., Ltd., China 20.0 % – 847 491 10,569 12,150
Individually immaterial fully consolidated subsidiaries with non-controlling interests 6,746 4,349 45,417 43,918
Total amount of non-controlling interests 14,923 14,834 162,108 164,661
102 CONSOLIDATED FINANCIAL STATEMENTS

Summarised balance sheet
GIW Industries, Inc. KSB Pumps Limited KSB America Corporation KSB Shanghai Pump Co., Ltd.
€ thousands / 31 Dec. 2017 2016 2017 2016 2017 2016 2017 2016
Non-current assets 49,366 58,303 48,551 41,469 29,591 35,399 25,398 31,474
Current assets 55,819 62,755 101,760 95,337 54,731 57,686 137,263 149,400
Non-current liabilities – 6,643 – 6,899 – 5,223 – 3,327 – – – –
Current liabilities – 20,173 – 33,687 – 56,330 – 44,527 – 25,950 – 27,931 – 113,214 – 127,922
Net assets 78,369 80,472 88,758 88,952 58,372 65,154 49,447 52,952
Summarised statement of comprehensive income
GIW Industries, Inc. KSB Pumps Limited KSB America Corporation KSB Shanghai Pump Co., Ltd.
€ thousands 2017 2016 2017 2016 2017 2016 2017 2016
Sales revenue 127,114 134,612 127,563 109,147 – – 146,291 129,850
Earnings after income taxes 8,554 9,919 8,804 9,026 1,175 4,457 – 5,478 2,540
Other comprehensive income – 2,821 2,712 – 4,083 – 163 – 7,957 2,144 7,893 – 7,507
Comprehensive income 5,733 12,631 4,721 8,863 – 6,782 6,601 2,415 – 4,967
Other comprehensive income attribut-able to non-controlling interests – 1,382 1,329 – 2,428 – 97 – 3,899 1,051 1,579 – 1,501
Comprehensive income attributable to non-controlling interests 2,809 6,189 2,807 5,270 – 3,323 3,234 483 – 993
Dividends paid to non-controlling interests – – – 1,549 – 1,531 – – – –
Condensed statement of cash flows
GIW Industries, Inc. KSB Pumps Limited KSB America Corporation KSB Shanghai Pump Co., Ltd.
€ thousands 2017 2016 2017 2016 2017 2016 2017 2016
Cash flows from operating activities 9,577 23,570 – 3,606 7,562 1,670 3,819 9,495 9,660
Cash flows from investing activities – 664 – 6,477 – 10,354 – 8,235 1,638 – 193 – 1,112
Cash flows from financing activities – 8,856 – 18,072 – 2,867 – 2,848 2,827 – 12,257 – 9,121 – 11,203
Changes in cash and cash equivalents 57 – 979 – 16,827 – 3,521 6,135 – 8,438 567 – 2,655
Cash and cash equivalents at beginning of period 180 1,169 28,241 31,707 14,849 22,956 2,292 5,301
Effects of exchange rate changes – 25 – 10 – 1,150 54 – 2,156 332 – 301 – 355
Cash and cash equivalents at end of period 212 180 10,264 28,240 18,828 14,850 2,558 2,291
Notes
103GENERAL INFORMATIONMANAGEMENT AND ISSUES 2017CONSOLIDATED FINANCIAL STATEMENTSGROUP MANAGEMENT REPORTDIGITAL TRANSFORMATION

KSB Pump & Valve Technology Service (Tianjin) Co., Ltd and KSB PHILIPPINES, INC., previously not consolidated due to there being no material impact, were included in the group of consolidated companies on 1 January 2017. These affiliates, which were consolidated for the first time, were established some years earlier. Firsttime consolidations contributed € 3,669 thousand to sales revenue and also had the following impact on the consolidated balance sheet:
First-time consolidations – Impact on balance sheet
€ thousands 2017
Non-current assets – 659
Current assets 2,624
Assets 1,965
Equity – 885
Non-current liabilities –
Current liabilities 2,850
Equity and liabilities 1,965
Other effects resulting from the consolidation of companies were not material.
With effect from 1 January 2017, the previously fully consolidated service companies KSB Service Est S.A.S., Algrange, and Service CentreEst S.A.S., VillefranchesurSaône, were merged with KSB S.A.S. in France, which has its head office in Gennevilliers and is also fully consolidated. The two previously fully consolidated service companies KSB SERVICE MEDIATEC S.A.S., ChalonsurSaône, and KSB SERVICE ETC S.A.S., ChalonsurSaône, were merged, with effect from 1 January 2017, with Rambervillersbased KSB Service Energie S.A.S.U., which is also fully consolidated.
With effect from 1 January 2017, the previously fully consolidated company KSB Válvulas Ltda., Jundiaí, was merged with KSB BRASIL LTDA., which has its head office in Várzea Paulista (Brazil) and is also fully consolidated.
In China, we had already transferred the foundry operations of KSB Shanghai Pump Co., Ltd., Shanghai, to a new, independent
company (KSB Shanghai Precision Casting Co., Ltd.) in the previous year. 95 % of the interest held in the company, which at the time was classified as being held for sale, was sold within the reporting period, with a remaining share of 5 %.
The Danish company T. Smedegaard A/S, Glostrup and the Chinese company KSB Valves (Shanghai) Co. Ltd., Shanghai, were liquidated in the financial year.
We sold our valves business in the USA, operated KSB AMRI Inc., Houston, in the financial year.
In December 2017 we purchased 51 % of the shares in Pumpen Partner Netzwerk UG. Due to reasons of materiality the company will not be consolidated.
The impact of the above changes on the consolidated financial statements was not material.
A full list of the shareholdings held by the KSB Group is provided at the end of these Notes to the Consolidated Financial Statements.
Consolidation methods
For the purposes of consolidation, the effects of any intercompany transactions are eliminated in full. Any receivables and liabilities between the consolidated companies are offset against each other, and any unrealised gains and losses recognised in fixed assets and inventories are eliminated. Any revenues from intercompany sales are offset against the corresponding expenses.
Capital consolidation uses the purchase method of accounting pursuant to IFRS 3. This means that the acquisition cost of the parent’s shares in the subsidiaries is eliminated against the remeasured equity attributable to the parent at the date of acquisition.
Any goodwill created from the application of the purchase method denominated in a currency other than the functional currency of the KSB Group is measured at the relevant current closing rate. Goodwill is reported under intangible assets and tested for impairment at least once a year. If an impairment is
104 CONSOLIDATED FINANCIAL STATEMENTS
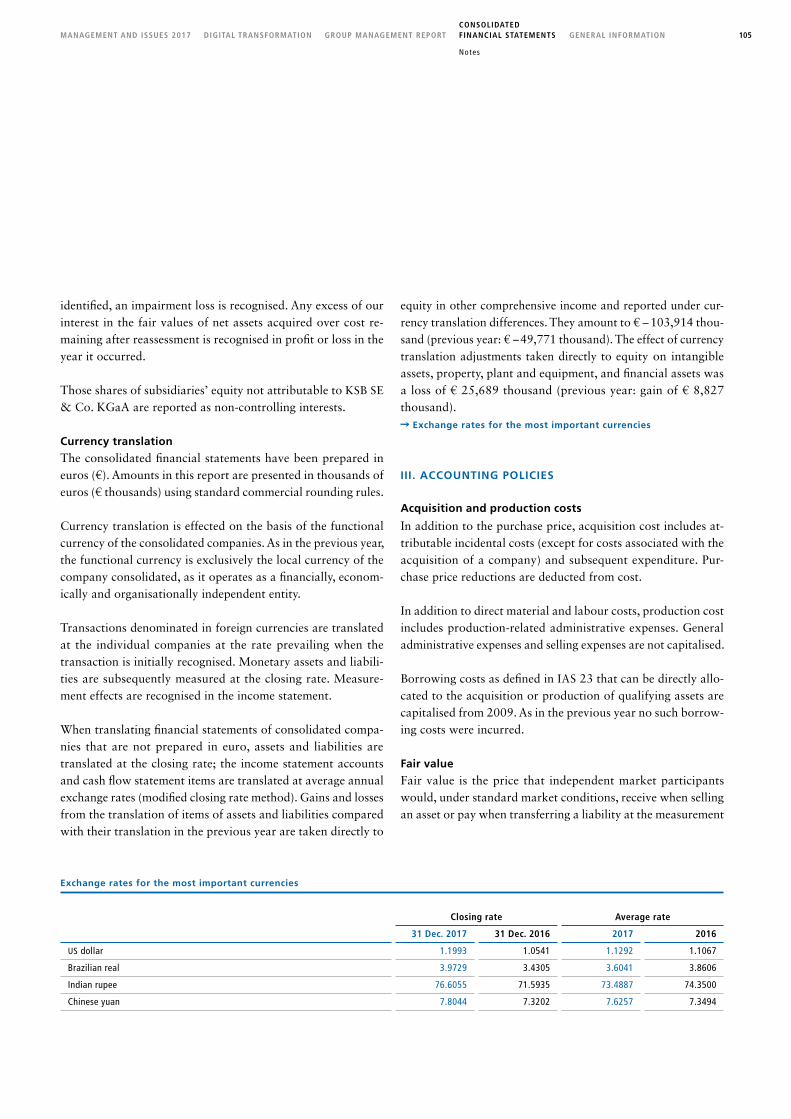
identified, an impairment loss is recognised. Any excess of our interest in the fair values of net assets acquired over cost remaining after reassessment is recognised in profit or loss in the year it occurred.
Those shares of subsidiaries’ equity not attributable to KSB SE & Co. KGaA are reported as noncontrolling interests.
Currency translation
The consolidated financial statements have been prepared in euros (€). Amounts in this report are presented in thousands of euros (€ thousands) using standard commercial rounding rules.
Currency translation is effected on the basis of the functional currency of the consolidated companies. As in the previous year, the functional currency is exclusively the local currency of the company consolidated, as it operates as a financially, economically and organisationally independent entity.
Transactions denominated in foreign currencies are translated at the individual companies at the rate prevailing when the transaction is initially recognised. Monetary assets and liabilities are subsequently measured at the closing rate. Measurement effects are recognised in the income statement.
When translating financial statements of consolidated companies that are not prepared in euro, assets and liabilities are translated at the closing rate; the income statement accounts and cash flow statement items are translated at average annual exchange rates (modified closing rate method). Gains and losses from the translation of items of assets and liabilities compared with their translation in the previous year are taken directly to
equity in other comprehensive income and reported under currency translation differences. They amount to € – 103,914 thousand (previous year: € – 49,771 thousand). The effect of currency translation adjustments taken directly to equity on intangible assets, property, plant and equipment, and financial assets was a loss of € 25,689 thousand (previous year: gain of € 8,827 thousand).
Exchange rates for the most important currencies
III. ACCOUNTING POLICIES
Acquisition and production costs
In addition to the purchase price, acquisition cost includes attributable incidental costs (except for costs associated with the acquisition of a company) and subsequent expenditure. Purchase price reductions are deducted from cost.
In addition to direct material and labour costs, production cost includes productionrelated administrative expenses. General administrative expenses and selling expenses are not capitalised.
Borrowing costs as defined in IAS 23 that can be directly allocated to the acquisition or production of qualifying assets are capitalised from 2009. As in the previous year no such borrowing costs were incurred.
Fair value
Fair value is the price that independent market participants would, under standard market conditions, receive when selling an asset or pay when transferring a liability at the measurement
Exchange rates for the most important currencies
Closing rate Average rate
31 Dec. 2017 31 Dec. 2016 2017 2016
US dollar 1.1993 1.0541 1.1292 1.1067
Brazilian real 3.9729 3.4305 3.6041 3.8606
Indian rupee 76.6055 71.5935 73.4887 74.3500
Chinese yuan 7.8044 7.3202 7.6257 7.3494
Notes
105GENERAL INFORMATIONMANAGEMENT AND ISSUES 2017CONSOLIDATED FINANCIAL STATEMENTSGROUP MANAGEMENT REPORTDIGITAL TRANSFORMATION

date. This applies irrespectively of whether the price is directly observable or has been estimated using a measurement method.
The KSB Group defined a monitoring framework concept for determining fair value. This includes a measurement team with general responsibility for monitoring all key measurements at fair value and notifying management and, if necessary, the Audit Committee of any major issues. For the purposes of calculating fair value, we make use wherever possible of estimates from market participants or estimates derived from these. In a first step we regularly review the extent to which there are current prices on active markets for identical transactions. If no quoted market prices are available, our preference is to use the market based approach (deriving the fair value from the market or transaction prices of comparable assets, for example multipliers) or the incomebased approach (calculation of fair value as a future value by discounting future cash surpluses).
Based upon the input factors used in the measurement methods, fair values are assigned to different levels of the fair value hierarchy.
Level 1: Quoted prices (unadjusted) on active markets for identical assets and liabilities
Level 2: Measurement parameters that are not the quoted prices taken into account for level 1, but that are observable for the asset or the liability either directly as a price or indirectly derived from prices
Level 3: Measurement parameters for assets or liabilities that are not based on observable market data
If input factors categorised into different levels are included in the fair value measurement, the measurement must be categorised in its entirety in the level of the lowest level input factor that is material for the entire measurement.
We record reclassifications between different levels in the fair value hierarchy at the end of the reporting period during
which the change has occurred. There were no reclassifications carried out in the year under review.
Financial instruments
A financial instrument is any contract that gives rise to both a financial asset of one enterprise and a financial liability or equity instrument of another enterprise.
Financial assets and financial liabilities are recognised in the consolidated balance sheet at the time when KSB becomes a party to a financial instrument. When the contractual right to payments from financial assets expires, these are derecognised. Financial liabilities are derecognised at the time when the contractual obligations are settled or cancelled or have expired. Regular way purchases and sales of financial instruments are recognised at their value at the settlement date; only derivatives are recognised at their value at the trade date. This applies to primary financial instruments such as trade receivables and monetary receivables, as well as to trade payables and financial liabilities (from or to third parties as well as affiliates and equity investments).
a) Primary financial instruments
Within the KBS Group, primary financial instruments are allocated to the following categories as financial assets or liabilities:
Loans and Receivables (LaR) Loans and financial assets not quoted in an active market Financial Liabilities Measured at Amortised Cost (FLAC) Liabilities that are not quoted in an active market, such as trade payables
AvailableforSale (AfS) financial assets Nonderivative financial instruments that are not allocated to
any other measurement category, such as investments in nonconsolidated subsidiaries or securities
None of our financial instruments are classified as “heldto maturity investments”.
106 CONSOLIDATED FINANCIAL STATEMENTS

Financial instruments are carried at fair value on initial recognition, while LaR and FLAC take into account the transaction costs. Subsequent measurement is based on fair value for category AfS and on amortised cost for categories LaR and FLAC. Subsequent measurement of the LaR and FLAC categories is based on amortised cost using the effective interest method. The fair values of the current and noncurrent financial instruments are based on prices quoted in active markets on the reporting date.
Primary financial instruments classified as “availableforsale financial instruments” are recognised directly in equity in other comprehensive income and reported under “Changes in the fair value of financial instruments”. They are recognised in profit or loss when the assets are sold or deemed to be otherthantemporarily impaired. If an asset is derecognised, the accumulated other comprehensive income is reclassified to the income statement.
As in the previous year, we did not make any reclassifications between the individual measurement categories.
We do not currently make use of the fair value option.
b) Derivative financial instruments
We only use derivatives for hedging purposes. We hedge both future cash flows and existing recognised underlyings against foreign currency and interest rate risks (cash flow hedges). The hedging instruments used are exclusively currency forwards, currency options and interest rate derivatives entered into with primerated banks. We hedge currency risks primarily for transactions in US dollars (USD). Interest rate risks are minimised for longterm borrowings at floating rates of interest. Group guidelines govern the use of these instruments. These transactions are also subject to continuous risk monitoring.
In the case of cash flow hedges, changes in the fair value of the effective portions of the currency derivatives are recognised under other comprehensive income and reported under “Changes in the fair value of financial instruments” in equity for as long as the underlying transaction is not recognised in the income statement.
Changes in the market value of interest rate derivatives used to hedge against interest rate risks in liabilities are recognised under other comprehensive income and reported under “Changes in the fair value of financial instruments” in equity.
The carrying amounts equal fair value and are determined on the basis of input factors observable either directly (as a price) or indirectly (derived from prices). Fair values may be positive or negative. Fair value is the amount that we would receive or have to pay at the reporting date to settle the financial instrument. This amount is determined using the relevant exchange rates, interest rates and counterparty credit ratings at the reporting date. All our information is obtained from recognised external sources.
Currency forwards and interest rate swaps are reported under other receivables and other current assets, and under miscellaneous other liabilities.
As in the previous year, maturities of the currency derivatives used are mostly between one and two years; there are no interest rate derivatives for the financial year in the Group. The maturities of the hedging instruments are matched to the period in which the forecast transactions are expected to occur. In the year under review, almost all hedged forecast transactions occurred as expected.
Notes
107GENERAL INFORMATIONMANAGEMENT AND ISSUES 2017CONSOLIDATED FINANCIAL STATEMENTSGROUP MANAGEMENT REPORTDIGITAL TRANSFORMATION

Intangible assets
Intangible assets are carried at (acquisition or production) cost and reduced by straightline amortisation. Depreciation / amortisation is reported under “Depreciation and amortisation expense” in the income statement. The underlying useful lives of intangible assets – excluding goodwill (indefinite useful life) – is between two and five years. If the reasons for an impairment loss in a previous period no longer apply, it is reversed (writeup) up to a maximum of amortised cost.
We test goodwill for impairment once a year. This relates to cashgenerating units (CGU), which at KSB are generally the legal entities. Occasionally a group of cashgenerating units may also serve as the basis, provided these units reflect the lowest level on which we monitor goodwill. The goodwill (and, if necessary, other assets) is reduced by the difference in value if the recoverable amount – the higher of the fair value less costs to sell and the value in use – is lower than the carrying amount of the CGU. Reversal of an impairment loss from an earlier period is not possible. In addition, a review of impairment is always carried out when events or circumstances (“trigger events”) suggest that the value could be impaired.
We apply the discounted cash flow model to determine the recoverable amount (value in use). The future earnings (EBIT in accordance with IFRS) applied were taken from a multiyear financial plan (generally covering a maximum of five years), the basis of which was adopted in December taking into account the mediumterm strategy approved by management for the respective cashgenerating unit. We carried out this planning based on certain assumptions which were drawn from both forecasts from external sources, e.g. current German Engineering Federation (VDMA) publications, and our own experiencebased knowledge of markets and competitors. In our calculations we consistently extrapolated the result of the last plan year as a constant, considering that level to be achievable in the long term. We derived growth rates taking account of the rate of inflation and estimates with regard to regional and seg
mentspecific circumstances. The Group regularly tests goodwill for impairment in the fourth quarter based on the figures as per 30 September of the year in question.
As part of the assessment, the Group conducts sensitivity analyses to estimate the risk of impairment. The following assumptions are used in the process: a 5 % increase in the cost of capital (Sensitivity 1), a 0.25 % reduction in the growth rate (Sensitivity 2) and a reduction in sales revenue with the corresponding impact on expense items and performance indicators (Sensitivity 3). Sensitivity 3 is only applied to the most important goodwills of the KSB Group.
If the recoverable amount is calculated as the fair value less costs to sell, the costs to sell are, based on past experience, set at a maximum of 2 % of the fair value. For the purposes of calculating value, we make use wherever possible of estimates from market participants (Level 1) or estimates derived from these (Level 2). In the absence of any market estimates, we make use of experiencebased assumptions of the management (Level 3). In a first step we review the extent to which there are current prices on active markets for identical transactions. If no quoted market prices are available, our preference is to use the marketbased approach (deriving the fair value from the market or transaction prices of comparable assets, for example multipliers) or the incomebased approach (calculation of fair value as a future value by discounting future cash surpluses).
When acquiring companies we apply purchase price allocations and determine the fair value of the assets and liabilities acquired. In addition to the assets and liabilities already recognised by the selling party, we also assess marketingrelated aspects (primarily brands or trademarks and competitive restrictions), customerrelated aspects (primarily customer lists, customer relations and orders on hand), contractrelated aspects (mainly particularly advantageous service, work, purchasing and employment contracts) as well as technologyrelated aspects (primarily patents, knowhow and databases). To
108 CONSOLIDATED FINANCIAL STATEMENTS

determine values we primarily apply the residual value method, the excess earnings method and costoriented procedures.
Development costs are capitalised as internally generated intangible assets at cost where the criteria described in IAS 38 are met and reduced by straightline amortisation at the time of their capitalisation. Research costs are expensed as incurred. Where research and development costs cannot be reliably distinguished within a project, no costs are capitalised.
Property, plant and equipment
In accordance with IAS 16, property, plant and equipment is carried at cost and reduced by straightline depreciation over its useful life. If an asset’s recoverable amount is lower than its carrying amount, an impairment loss is recognised. If the reasons for an impairment loss recognised in a previous period no longer apply, the impairment loss is reversed (writeup) up to a maximum of amortised cost.
Government grants relating to property, plant and equipment are transferred to an adjustment item on the liabilities side. This adjustment item is reversed over a defined utilisation period. As far as government grants recognised which are to be held for specific periods of time are concerned, we expect that these periods will be complied with.
Maintenance expenses are recognised as an expense in the period in which they are incurred, unless they lead to the expansion or material improvement of the asset concerned.
The following useful lives are applied:
Useful lives of property, plant and equipment
Buildings 10 to 50 years
Plant and machinery 5 to 25 years
Other equipment, operating and office equipment 3 to 25 years
Leases
IAS 17 defines a lease as an arrangement under which a lessor provides a lessee with the right to use an asset for an agreed period of time in exchange for a payment. A lease is classified as a finance lease if it transfers substantially all the risks and rewards incident to ownership to the lessee. Otherwise, such transactions are classified as operating leases.
Lease payments that are payable under operating leases are recognised as expenses in the period in which they are incurred. In the case of finance leases, the leased asset is recognised at the time of inception of the lease at the lower of fair value and the present value of future minimum lease payments. A liability is recognised in the same amount for the future lease payment. The asset’s carrying amount is reduced by depreciation over its useful life or the shorter lease term.
Non-current financial assets
Interestbearing loans and investments in nonconsolidated subsidiaries are measured at amortised cost. Financial instruments are carried at their fair values at the reporting date.
Investments accounted for using the equity method
Investments accounted for using the equity method are companies in which the parties exercise joint control (joint venture) or have the power to exercise significant influence over the companies’ operating and financial policies (associate); this is usually the case where an entity holds between 20 % and 50 % of the voting power. These assets are recognised at cost at the time of acquisition. If the costs of acquisition exceed the share of the net assets, adjustments are made on the basis of the fair value (pro rata hidden reserves and liabilities). The remaining amount is recorded as goodwill. It forms part of the carrying amount of the joint venture or associate and is not amortised. For subsequent measurement, the carrying amounts are increased / reduced annually by the prorata earnings, distributed dividends or other changes in equity of the joint venture or the
Notes
109GENERAL INFORMATIONMANAGEMENT AND ISSUES 2017CONSOLIDATED FINANCIAL STATEMENTSGROUP MANAGEMENT REPORTDIGITAL TRANSFORMATION

associate. If local accounting principles differ from the accounting methods used in the Group, we make the necessary adjustments. The share of earnings is reported in the consolidated income statement in a separate line (earnings from investments accounted for using the equity method), and changes such as currency translation effects are taken directly to Group equity. If the losses attributable to the KSB Group correspond to the carrying amount of the company or exceed this, they are not recognised unless KSB has entered into obligations or has made payments for the company. Intercompany gains and losses from transactions between Group companies and investments accounted for using the equity method are offset against the carrying amount in profit or loss. At each reporting date we review whether there are any objective indications of impairment, and calculate the amount of such impairment if required. If the carrying amount exceeds the recoverable amount of an investment, it is written down to the recoverable amount. Any impairments or reversals of impairments are reported in the consolidated income statement under financial income / expense.
Inventories
Pursuant to IAS 2, inventories are carried at the lower of cost and net realisable value as at the reporting date. Cost is measured using the weighted average method. Writedowns to the net realisable value take account of the inventory risks resulting from slowmoving goods or impaired marketability. This also applies if the selling price is lower than production cost plus costs still to be incurred. If the reasons for an impairment loss charged in a previous period no longer apply, the impairment loss is reversed (writeup).
Advance payments made on inventories are also presented here because of the correlation and expected realisation of these advances (through conversion into inventories) within the normal business cycle. Advances received from customers are recognised as current liabilities.
Construction contracts under IAS 11
In the case of construction contracts covered by IAS 11, we apply the percentage of completion (PoC) method. According to this method, a production order is a contract for the customerspecific production of individual items or a number of items that, in terms of their design, technology and function or with regard to their use, are linked to one another or dependent on each other. If the earnings from a production order can be reliably estimated, we recognise the revenue based on the percentage of completion method. The percentage of completion of contracts is determined on the basis of the proportion that contract costs incurred for work performed up to the reporting date bear to the estimated total contract costs at the reporting date. Contract revenue consists of all contractually agreed revenues, as well as additional claims and incentive payments that are likely to result in revenue and are capable of being reliably measured. Contract revenue may vary from one period to the next, for instance because of cost escalation clauses, variations or penalties. It is measured at the fair value received or receivable. If the earnings from a production order cannot be reliably estimated, revenue will only be recognised in the amount of the contract costs incurred that are likely to be covered and the contract costs recognised as an expense for the period in which they are incurred.
The percentage contract revenue less the related advances received from customers is reported – depending on the balance – in trade receivables and PoC or within other financial liabilities. Effects in the period are recognised in the income statement as part of sales revenue.
Trade receivables and other current assets
Trade receivables and other current assets are subsequently carried at amortised cost. Lowinterest or noninterestbearing receivables are discounted. In addition, we take account of identifiable risks by charging specific writedowns using allowance accounts. Receivables that are not individually impaired are subdivided into risk classes according to how overdue they
110 CONSOLIDATED FINANCIAL STATEMENTS

are, and written down on a portfolio basis using historical default rates. If the reasons for an impairment loss charged in a previous period no longer apply, the impairment loss is reversed (writeup).
We hedge part of the credit risk exposure of our receivables (for further explanations, refer to the Financial Risks – Credit Risk section).
The prepaid expenses reported relate to accrued expenditure prior to the reporting date that will only be classified as an expense after the reporting date.
Cash and cash equivalents
Cash (cash and sight deposits) and cash equivalents (shortterm, highly liquid financial investments that are readily convertible to defined amounts of cash, and that are subject to only immaterial fluctuations in terms of their value) are recognised at amortised cost.
Assets held for sale
Pursuant to IFRS 5, noncurrent assets or disposal groups are classified as held for sale if it is highly likely that the carrying amount will be realised primarily by a sales transaction and not through continued use of that asset. It must be assumed that the sale will be completed within one year. If the Group is committed to a sale that involves loss of control of a subsidiary, all assets and liabilities of that subsidiary will be classified as held for sale, provided the above conditions are met. The intangible assets and property, plant and equipment of the heldforsale assets are no longer amortised / depreciated, but instead are recognised at the lower of the carrying amount and fair value less costs to sell.
Deferred taxes
We account for deferred taxes in accordance with IAS 12 using the balance sheet liability method on the basis of the enacted or substantively enacted local tax rates. This means that deferred tax
assets and liabilities generally arise when the tax base of assets and liabilities differs from their carrying amount in the IFRS financial statements, and this leads to future tax expense or income. We also recognise deferred tax assets from tax loss carryforwards in those cases where it is more likely than not that there will be sufficient taxable profit available in the near future against which these tax loss carryforwards can be utilised. Deferred taxes are also recognised for consolidation adjustments. Deferred taxes are not discounted. Deferred tax assets and liabilities are always offset where they relate to the same tax authority. Changes to deferred taxes in the consolidated balance sheet generally result in deferred tax expense or income. If, however, a direct entry is made in other comprehensive income in equity, the change in deferred taxes is also taken directly to equity.
Provisions
a) Provisions for pensions and similar obligations
Provisions for pensions and similar obligations pursuant to IAS 19 are calculated on the basis of actuarial reports. They are based on defined benefit pension plans. They are measured using the projected unit credit method.
Actuarial gains and losses are taken directly to other comprehensive income and reported in equity under “Remeasurement of defined benefit plans”. The actuarial demographic assumptions and the setting of the discount rate (based on senior, fixedincome corporate bonds) and other measurement parameters (for example income and pension trends) are based on best estimates.
Net interest is calculated by multiplying the discount rate with the net liability (pension obligation minus plan assets) or the net asset value that results if the plan assets exceed the pension obligation.
The defined benefit costs include the service cost, which is included in staff costs under pension costs, and the net interest income or expense on the net liability or net realisable value,
Notes
111GENERAL INFORMATIONMANAGEMENT AND ISSUES 2017CONSOLIDATED FINANCIAL STATEMENTSGROUP MANAGEMENT REPORTDIGITAL TRANSFORMATION

which is recognised in financial income / expense under interest and similar expenses or under interest and similar income.
KSB companies that use a defined contribution pension plan do not recognise provisions. The premium payments are recognised directly in the income statement as pension costs in the staff costs. Other than an obligation to pay premiums, these companies have no further obligations. Consequently, the insurance risk remains with the insured parties.
b) Other provisions
Provisions are recognised if a past event results in a present legal or constructive external obligation that the company has no realistic alternative to settling, where settlement of this obligation is expected to result in an outflow of resources embodying economic benefits, and the amount of the obligation can be estimated reliably. The amount of the provision corresponds to the best estimate of the settlement amount of the current obligation on the reporting date. Any more or less secure recourse or reimbursement claims are recognised as separate assets.
Provisions for restructurings are recognised only if the criteria set out in IAS 37 are met.
Noncurrent provisions are discounted if the effects are material.
Financial liabilities
Financial liabilities are recognised with their amortised costs using the effective interest rate method.
Contingent liabilities (contingencies and commitments)
Contingent liabilities, which are not recognised, are possible obligations that arise from past events and whose existence will be confirmed only by the occurrence or nonoccurrence of uncertain future events. Contingent liabilities may also be pres
ent obligations that arise from past events where it is possible but not probable that there will be an outflow of resources embodying economic benefits.
Contingent liabilities correspond to the extent of liability at the reporting date.
Income and expenses
Sales revenue consists of charges for deliveries and services billed to customers. This relates to revenue from the sale of goods and goods purchased and held for resale from the production, sale and trade of machinery, systems and other industrial products, particularly pumps and valves. In addition, sales revenue from services and licence income is reported under sales revenue for the period concerned in accordance with the economic content of the underlying contract. Sales revenue is recognised pursuant to IAS 18 when the deliveries have been effected or the services have been rendered and the significant risks and rewards associated with ownership have thus been transferred to the customer. At the time of revenue recognition, receipt of the consideration must be probable and the amount of sales revenue must be reliably measurable. A reliable estimation of the associated costs and potential return of the goods must also be possible. We essentially recognise sales revenue from the delivery of standard products upon handover to the carrier. For some international deliveries, the contractual risk transfer takes place when the goods are loaded onto a cargo ship in the port or delivered to the customer in the destination country. In these cases, sales revenue is recognised on the basis of the contractually agreed INCOTERMS. For certain deliveries and services, a declaration of acceptance by the customer is required for the recognition of sales revenue.
In individual cases and under strict conditions, sales revenue is recognised prior to delivery of the goods (socalled bill and hold arrangements).
112 CONSOLIDATED FINANCIAL STATEMENTS

Sales revenue for customerspecific construction contracts is reported using the percentage of completion method. We use the socalled costtocost method, according to which the proceeds determined at the beginning of the sales order are compared with the estimated costs, and the sales revenue of a period is determined according to the percentage of completion measured on the basis of the costs incurred; see the explanations on “Construction contracts under IAS 11”.
Sales allowances reduce sales revenue.
Interest income and expense are recognised in the period in which they occur.
Dividend income from investments is collected when the legal entitlement to payment is created.
Operating expenses are recognised when they are incurred or when the services are utilised.
Income taxes are calculated in accordance with the statutory tax rules in the countries in which the Group operates. Deferred taxes are accounted for on the basis of the enacted or substantively enacted income tax rates.
Estimates and assumptions
The preparation of consolidated financial statements in accordance with the IFRSs as adopted by the EU requires management to make estimates and assumptions that affect the accounting policies to be applied. When implementing such accounting policies, estimates and assumptions affect the assets, liabilities, income and expenses recognised in the consolidated financial statements, and their presentation. These estimates and assumptions are based on past experience and a variety of other factors deemed appropriate under the circumstances. Actual amounts may differ from these estimates and assumptions. We continu
ously review the estimates and assumptions that we apply. If more recent information and additional knowledge are available, recognised amounts are adjusted to reflect the new circumstances. Any changes in estimates and assumptions that result in material differences are explained separately.
Impairment tests for goodwill, which are conducted at least once per year, require an estimate of the recoverable amounts for each cashgenerating unit (CGU). These correspond to the higher amount from the fair value less costs to sell and value in use. The earnings forecast on the basis of these estimates are affected by various factors, which may include exchange rate fluctuations, progress in Group integration or the expectations for the economic development of these units. Although management believes that the assumptions used to calculate the recoverable amount are appropriate, any unforeseen changes in these assumptions could lead to an impairment loss.
Estimates and assumptions must also be made to review the value of assets. For each asset it must be verified to what extent there are indications of an impairment. When determining the recoverable amount of property, plant and equipment, the estimation of the relevant useful life is subject to uncertainty. The measurement of doubtful receivables is based on forecasts about the creditworthiness of customers. A material change in the assumptions or circumstances can lead in future to additional impairment losses or reversals.
For construction contracts with clients in the project business we recognise sales revenue according to the percentage of completion method. This requires estimates regarding the total contract costs and revenue, contract risks as well as other relevant factors. These estimates are reviewed regularly by those with operative responsibility and adjusted where necessary.
Notes
113GENERAL INFORMATIONMANAGEMENT AND ISSUES 2017CONSOLIDATED FINANCIAL STATEMENTSGROUP MANAGEMENT REPORTDIGITAL TRANSFORMATION

Provisions for employee benefits, especially pensions and similar obligations, are determined according to actuarial principles which are based on statistical and other factors so as to anticipate future events. Material factors are the reported market discount rates and life expectancy. The actuarial assumptions made may differ from actual developments as a result of changing market and economic conditions, and this can have material effects on the amount of provisions and thus on the company’s overall net assets, financial position and results of operations.
Other provisions are reported based on the best possible estimate of the probability of future outflows. The later, actual outflow can, however, differ from the estimate as a result of changed economic, political or legal conditions. This will be reflected in additional expenses or income from reversals.
The global scope of our activities must be taken into account in relation to taxes on income. Based on our operative activities in numerous countries with varying tax laws and administrative interpretation, differentiated assessment is required for determining our tax obligations. Uncertainty may arise due to different interpretations by taxable entities on the one hand and local finance authorities on the other. Uncertain tax assets and liabilities are recognised if their probability of occurrence exceeds 50 %. For the reporting, the best estimate is based on the expected tax payment. Although we believe we have made a reasonable
estimate regarding any tax uncertainties, it is possible that the actual tax obligation will differ from our original estimate. With regard to future tax benefits, we assess their realisability as of every reporting date. For this reason, we only recognise deferred tax assets if sufficient taxable income is available in future. In assessing this future taxable income within a planning horizon of normally five years it must be taken into account that expected future business developments are subject to uncertainties and are in some cases excluded from control by company management (for example changes to applicable tax legislation). If we come to the conclusion that previously reported deferred tax assets cannot be realised because of changed assumptions, then the assets will be written down by the appropriate amount.
Maturities
Maturities of up to one year are classified as current.
Assets that can only be realised after more than 12 months, as well as liabilities that only become due after more than 12 months, are also classified as current if they are attributable to the operating cycle defined in IAS 1. An operating cycle of more than 12 months typically applies to madetoorder production (construction contracts).
Assets and liabilities not classified as current are noncurrent.
114 CONSOLIDATED FINANCIAL STATEMENTS

IV. BALANCE SHEET DISCLOSURES
Intangible assets
Statement of changes in intangible assets
€ thousands
Concessions, industrial property and similar
rights and assets, as well as licences in
such rights and assets Goodwill Advance paymentsIntangible assets
Total
Historical cost 2017 2016 2017 2016 2017 2016 2017 2016
Balance at 1 January 71,167 61,708 104,189 103,910 15,781 8,550 191,137 174,168
Changes in consolidated Group 28 2 – 135 – – 28 137
Currency translation adjustments – 2,014 700 – 813 482 – – – 2,827 1,182
Other – 6 6,502 – – 338 – – – 6 6,164
Additions 2,767 2,519 – – 9,692 7,520 12,459 10,039
Disposals 285 726 166 – – 14 451 740
Reclassifications 226 1,061 – – – 162 – 275 64 786
Reclassification to assets held for sale – – 599 – – – – – – 599
Balance at 31 December 71,883 71,167 103,210 104,189 25,311 15,781 200,404 191,137
Accumulated depreciation and amortisation 2017 2016 2017 2016 2017 2016 2017 2016
Balance at 1 January 57,294 51,032 27,247 21,061 – – 84,541 72,093
Currency translation adjustments – 1,441 605 – 132 46 – – – 1,573 651
Other – 6 2,089 – 1 – 338 – – – 7 1,751
Additions 4,114 4,447 5,556 6,478 – – 9,670 10,925
Disposals 281 650 – – – – 281 650
Reclassifications – – – – – – – –
Reclassification to assets held for sale – – 229 – – – – – – 229
Balance at 31 December 59,680 57,294 32,670 27,247 – – 92,350 84,541
Carrying amount at 31 December 12,203 13,873 70,540 76,942 25,311 15,781 108,054 106,596
1
The additions to intangible assets amounting to € 12.5 million (previous year: € 10.0 million) primarily concerned, as in the previous year, advance payments and own work capitalised for a new software to be deployed in Sales.
As in the previous year, we did not capitalise any development costs in the financial year because not all of the comprehensive recognition criteria defined in IAS 38 were met. The “Concessions, industrial property and similar rights and as
Notes
115GENERAL INFORMATIONMANAGEMENT AND ISSUES 2017CONSOLIDATED FINANCIAL STATEMENTSGROUP MANAGEMENT REPORTDIGITAL TRANSFORMATION

sets, as well as licences in such rights and assets” item includes € 8.3 million (previous year: € 9.3 million) of software including software licences valid for a limited period. As in the previous year, there are no restrictions on ownership or use.
The carrying amounts of the cashgenerating units in connection with the impairment testing of goodwill do not contain any items relating to taxes or financing activities.
To determine the discount factor, the weighted average cost of capital (WACC) method is applied in conjunction with the capital asset pricing model (CAPM), taking into account a peer group. Under this method, first the cost of equity is determined using CAPM and the borrowing costs are defined, and then the individual capital components are weighted in accordance with the capital structure taking account of the peer group. This peer group information includes things like beta factors, capital structure data and borrowing costs. The peer group includes companies that are similar to the KSB Group in terms of industry, size and activity. To account for changes in market parameters, the composition of the peer group is reviewed at regular intervals and adjusted if necessary (e.g. changes in the business model of either the company, the cashgenerating unit or the comparable company being looked at). This year’s review resulted in an adjustment of the peer group.
The interest rate for riskfree 30year Bunds was used as a base rate. This rate was 1.25 % in the year under review (previous year: 0.5 %). The market risk premium was set at 5.75 %, which was unchanged on the previous year, with a beta factor of 0.94 (previous year: 1.06). In addition, countryspecific tax rates and country risk premiums are taken into account individually for each cashgenerating unit (CGU). As in the previous year, we applied growth rates of between 0.75 % and 1.25 %.
Discount rates
Before taxes in % (value in use) 2017 2016
Companies in Germany 8.7 – 8.8 8.5 – 8.6
Companies in The Netherlands 8.3 8.1
Companies in the USA 9.7 9.1
Companies in South Africa 12.2 12.8
Companies in the rest of Europe 8.2 – 13.8 8.3 – 14.5
After taxes in % (fair value less costs to sell) 2017 2016
Companies in South Korea 7.3 7.3
Goodwill
Name of CGU / € thousands 31 Dec. 2017 31 Dec. 2016
KSB Seil Co., Ltd., South Korea 21,665 27,432
DP industries B.V., The Netherlands 18,285 18,285
Société de travaux et Ingénierie Industrielle (ST II), France 5,689 5,689
Dynamik-Pumpen GmbH, Germany 3,150 3,150
Uder Elektromechanik GmbH, Germany 2,980 2,980
KSB Finland Oy, Finland 2,603 2,603
KSB Pumps (S.A.) (Pty) Ltd., South Africa 2,010 2,059
KSB SERVICE ETC S.A.S., France* 1,412 1,412
57,794 63,610
Other 16 (previous year: 16) companies 12,746 13,332
Total 70,540 76,942
* Merged with KSB Service Energie S.A.S.U. in the financial year
As part of the regular review, the peer group was adjusted based on updated findings regarding the business models of the comparable companies. The change in the peer group also resulted in a change to the weighted capital cost factor. The adjustment only had a material impact on the goodwill of KSB Seil Co., Ltd., Busan, South Korea, with a change in the discount factor after taxes from 7.9 % to 7.3 %.
Impairment loss on goodwill
116 CONSOLIDATED FINANCIAL STATEMENTS

According to an assessment by management, the impairment of the cashgenerating unit was the result of a significant delay in the recovery in the shipbuilding market that was longer than forecast in previous years. The impairment loss will be reported in the income statement under “Depreciation and amortisation expense”.
Detailed information on key goodwill items
Cash-generating unit Method
Carrying amount of
goodwill € millions
Percentage of total
goodwill Discount rateGrowth
rateUnderlying assumptions, corporate planning
Method for assessing the value of the underlying assumption
KSB Seil Co., Ltd.
Fair value less costs to sell (costs to sell of € 250 thousand)
21.7 31 % 7.3 % after taxes
1.00 Slower recovery in the shipbuilding sector than expected
Little change in exchange rates
Consideration of macro- economic key data and external market research
DP industries B.V.
Value in use 18.3 26 % 8.3 % before taxes
1.25 Low to significant market growth rates
Consideration of macro- economic key data and internal estimates of the relevant purchasing and sales departments
Impairment loss on goodwill
Name of CGU Segment Discount factor
Recoverable amount
€ thousandsImpairment loss
€ thousands
KSB Seil Co. Ltd., Busan, South Korea Valves 7.3 % 41,662 5,556
Total 31 Dec. 2017 5,556
REEL s.r.l., Italy Pumps 13.5 % 2,412 5,526
KSB, Inc. – Western Division (USA) Service 9.1 % – 952
Total 31 Dec. 2016 6,478
Notes
117GENERAL INFORMATIONMANAGEMENT AND ISSUES 2017CONSOLIDATED FINANCIAL STATEMENTSGROUP MANAGEMENT REPORTDIGITAL TRANSFORMATION

For the annual impairment test, the assumptions presented in the “Basic assumptions for goodwill considered material” table were made regarding the development of order intake, sales revenue and operating earnings for goodwill deemed to be material.
Basic assumptions for goodwill considered material
The business performance of KSB Seil Co., Ltd. is closely linked to the economic development of the longcycle shipbuilding industry. This is also documented in the market development studies from external sources we used, which contain forecasts for the next seven years. Correspondingly, we have selected a monitoring period of seven years instead of our commonly used fiveyear period for impairment testing of this cashgenerating unit.
For the purposes of calculating the fair value less costs to sell of the South Korean KSB Seil Co., Ltd., the input factors used for the discounted cash flow method are largely based on ob
Basic assumptions for goodwill considered material
Cash-generating unit Order intake Sales revenue EBIT Planning time horizon
KSB Seil Co., Ltd. Slowly improving growth, on average
Slowly improving growth, on average
Slowly improving growth, on average, as a result of sales
revenue and cost planning
7 years
DP industries B.V. Constant growth, on average Constant growth, on average Moderate growth, on average, as a result of sales
revenue and cost planning
5 years
servable market data (base interest rate) or freely accessible information (for example sovereign risk classification, tax rates, procurement prices, sales prices, market studies).
As well as impairment testing, sensitivity analyses were conducted for each cashgenerating unit. These only increased the impairment loss for KSB Seil Co., Ltd. (Sensitivity 1: € 7.5 million; Sensitivity 2: € 6.6 million; Sensitivity 3: € 8.0 million). No additional impairment loss would have resulted for a further cashgenerating unit.
Before adjusting the peer group, an impairment loss of € 10.4 million would have been incurred (Sensitivity 1: € 13.8 million, Sensitivity 2: € 11.5 million, Sensitivity 3: € 11.4 million); this would have primarily affected KSB Seil Co. Ltd. (South Korea).
As in the previous year, we did not recognise any impairment losses on other intangible assets in the reporting year.
118 CONSOLIDATED FINANCIAL STATEMENTS

Assets resulting from finance leases are recognised as fixed assets in accordance with IAS 17, and corresponding financial liabilities are recognised. The carrying amount of these capitalised assets amounts to € 1,382 thousand (previous year: € 2,022 thousand), of which € 429 thousand (previous year: € 918 thousand) relate to land and buildings, € 13 thousand (previous year: € 123 thousand) to plant and machinery and € 940 thousand (previous year: € 981 thousand) to other equipment, operating and office equipment.
Property, plant and equipment
Statement of changes in property, plant and equipment
€ thousands
Land and buildings
Plant and machinery
Other equipment, operating and
office equipment
Advance payments and assets under
construction
Property, plant and equipment
Total
Historical cost 2017 2016 2017 2016 2017 2016 2017 2016 2017 2016
Balance at 1 January 372,075 344,473 583,604 551,208 215,203 212,750 31,049 53,791 1,201,931 1,162,222
Changes in consolidated Group 149 10 605 12 132 102 – – 886 124
Currency translation adjustments – 13,032 5,482 – 20,397 6,873 – 7,892 2,878 – 1,813 92 – 43,134 15,325
Other – 68 6 – 2,073 – 2,586 – 8 – – 445 – 2
Additions 18,226 10,888 29,041 21,113 21,762 16,599 20,402 23,554 89,431 72,154
Disposals 3,989 529 10,596 12,165 10,972 17,789 23 156 25,580 30,639
Reclassifications 8,226 19,651 12,970 23,921 4,284 1,874 – 25,544 – 46,232 – 64 – 786
Reclassification to assets held for sale – – 7,906 – – 7,358 – – 1,203 – – – – 16,467
Balance at 31 December 381,587 372,075 593,154 583,604 225,103 215,203 24,071 31,049 1,223,915 1,201,931
Accumulated depreciation and amortisation 2017 2016 2017 2016 2017 2016 2017 2016 2017 2016
Balance at 1 January 153,019 146,566 394,668 372,554 152,638 149,271 – – 700,325 668,391
Currency translation adjustments – 3,962 801 – 11,936 4,266 – 5,449 2,286 – – – 21,347 7,353
Other – 603 – – 2,161 2 2,641 – 40 – – – 123 – 38
Additions 10,466 8,832 31,910 34,178 18,547 18,657 – – 60,923 61,667
Disposals 2,132 273 9,581 11,201 10,364 16,600 – – 22,077 28,074
Reclassifications – 333 – – 796 – 1,129 – – – – –
Reclassification to assets held for sale – – 2,907 – – 5,131 – – 936 – – – – 8,974
Balance at 31 December 156,455 153,019 402,104 394,668 159,142 152,638 – – 717,701 700,325
Carrying amount at 31 Dec. 225,132 219,056 191,050 188,936 65,961 62,565 24,071 31,049 506,214 501,606
2
In December 2017, 95 % of the interest in the Chinese company KSB Shanghai Precision Casting Co., Ltd., Shanghai (Pumps segment) was sold, with a remaining share of 5 %.
The property of our Australian company classified as held for sale in the previous year, which is assigned to the Pumps segment, was sold in the second half of 2017.
Notes
119GENERAL INFORMATIONMANAGEMENT AND ISSUES 2017CONSOLIDATED FINANCIAL STATEMENTSGROUP MANAGEMENT REPORTDIGITAL TRANSFORMATION

We also divested the valves business of the US company KSB AMRI, Inc., Houston, in late January 2017.
Income from the sale of assets and liabilities presented as held for sale in the previous year totalled € 9.3 million and were recognised in other income. Of that, € 1.3 million relate to KSB Shanghai Precision Casting Co., Ltd., Shanghai, € 5.3 million to the property in Australia and € 2.7 million to the valves business of the US company KSB AMRI, Inc., Houston, Texas.
Disposals of intangible assets and items of property, plant and equipment resulted in book gains of € 12,319 thousand (previous year: € 1,478 thousand) and book losses of € 3,169 thousand (previous year: € 1,270 thousand). The book gains and losses are reported in the income statement under other income and other expenses.
We did not recognise any impairment losses on property, plant and equipment (previous year: € 3.757 thousand).
Non-current financial assets
€ thousands 31 Dec. 2017 31 Dec. 2016
Other investments 2,985 5,401
Non-current financial instruments 657 667
Loans 2,490 2,458
6,132 8,526
3
Other investments are investments in nonconsolidated affiliates that were not consolidated due to there being no material impact. Writedowns on other investments amounted to € 850 thousand (previous year: none). € 186 thousand of the loans are loans to equity investments (previous year: none).
Investments accounted for using the equity method
The table below lists the KSB Group’s material joint ventures. “Seat” refers to the country in which the main activity is performed. All joint ventures and associates are accounted for using the equity method and can also be found in the list of shareholdings in these Notes to the Consolidated Financial Statements. The share of capital corresponds to the share of voting rights.
Material joint ventures
Neither of the two joint ventures included in the table below is listed on a stock market; there is therefore no available active market value.
Summarised financial information on the material joint ventures of the KSB Group is provided below.
Summarised balance sheet
Summarised statement of comprehensive income
Reconciliation to carrying amount of group share in joint ventures
Summarised information on joint ventures that are immaterial individually
4
Material joint ventures
Name and seat Capital share Nature of the entity’s relationship
KSB Pumps Arabia Ltd., Saudi Arabia
50.00 % KSB Pumps Arabia Ltd. in Riyadh, Saudi Arabia, offers a wide range of services and activities for the energy mar-ket as well as in water, waste water and building services applications. The portfolio includes business develop-ment and marketing, supply chain management, production of pressure booster systems and pump sets, sale of pumps, valves and systems and technical service activities. KSB Pumps Arabia Ltd. is important for the growth of the Group in the Saudi Arabian market.
Shanghai Electric-KSB Nuclear Pumps and Valves Co., Ltd., China
45.00 % Shanghai Electric-KSB Nuclear Pumps and Valves Co., Ltd. in Shanghai, China, produces suitable auxiliary pumps for the secondary coolant circuits and modern reactor coolant pumps for the primary cooling circuits of nuclear power stations. Shanghai Electric-KSB Nuclear Pumps and Valves Co., Ltd. is a strategic partnership on the part of the Group, through which KSB is participating in the expansion of energy capacity in China and other Asian markets.
120 CONSOLIDATED FINANCIAL STATEMENTS

Summarised balance sheet
KSB Pumps Arabia Ltd.Shanghai Electric-KSB Nuclear
Pumps and Valves Co., Ltd.
€ thousands 31 Dec. 2017 31 Dec. 2016 31 Dec. 2017 31 Dec. 2016
Non-current assets 9,958 4,051 79,251 90,404
Current assets 36,141 43,248 102,249 86,062
of which cash and cash equivalents 157 5,093 7,116 7,569
Non-current liabilities – 4,619 – 7,583 – 35,836 – 39,238
of which non-current financial liabilities (excluding trade payables and provisions) – 3,334 – 6,336 – –
Current liabilities – 26,193 – 20,779 – 116,777 – 107,448
of which current financial liabilities (excluding trade payables and provisions) – 4,989 – 3,650 – 37,227 – 40,649
Net assets 15,287 18,937 28,887 29,780
Summarised statement of comprehensive income
KSB Pumps Arabia Ltd.Shanghai Electric-KSB Nuclear
Pumps and Valves Co., Ltd.
€ thousands 2017 2016 2017 2016
Sales revenue 39,056 38,387 53,331 29,841
Depreciation / amortisation 590 290 4,223 3,758
Interest income 11 – 35 18
Interest expense – 608 – 418 – 2,617 – 2,833
Earnings from continuing operations 1,872 3,074 1,569 – 6,164
Taxes on income – 680 – 1,109 – 592 – 934
Earnings after taxes from continuing operations 1,192 1,965 977 – 7,098
Earnings after taxes from discontinued operations – – – –
Other comprehensive income – 2,941 549 – 1,870 – 1,384
Comprehensive income – 1,749 2,514 – 893 – 8,482
Dividends received from joint ventures 951 1,969 – –
Reconciliation to carrying amount of group share in joint ventures
KSB Pumps Arabia Ltd.Shanghai Electric-KSB Nuclear
Pumps and Valves Co., Ltd.
€ thousands 2017 2016 2017 2016
Net carrying amount at 1 January 18,938 20,361 29,780 38,262
Earnings after income taxes 1,192 1,965 977 – 7,098
Distribution of dividends – 1,902 – 3,937 – –
Other comprehensive income – 2,941 549 – 1,870 – 1,384
Net carrying amount at 31 December 15,287 18,938 28,887 29,780
Investment in joint venture (50 % / 45 %) 7,643 9,469 12,999 13,401
Elimination of intercompany profit and loss – – – 2,969 – 3,058
Goodwill – – – –
Carrying amount at 31 December 7,643 9,469 10,030 10,343
Notes
121GENERAL INFORMATIONMANAGEMENT AND ISSUES 2017CONSOLIDATED FINANCIAL STATEMENTSGROUP MANAGEMENT REPORTDIGITAL TRANSFORMATION

As in the previous year, there are no pro rata losses that have not been recognised from the consolidation at equity.
Inventories
€ thousands 31 Dec. 2017 31 Dec. 2016
Raw materials, consumables and supplies 162,577 168,455
Work in progress 161,394 179,859
Finished goods and goods purchased and held for resale 121,421 100,534
Advance payments 16,485 18,589
461,877 467,437
€ 51,933 thousand (previous year: € 52,336 thousand) of the inventories is carried at net realisable value. The impairment losses recognised as an expense in the reporting period amount to € 11,969 thousand (previous year: € 18,318 thousand). Due to new estimates, we reversed writedowns totalling € 1,303 thousand (previous year: € 7,856 thousand) where the current net realisable value was higher than the priorperiod value. Inventories amounting to € 887,869 thousand (previous year: € 871,208 thousand) were recognised as an expense in the reporting period.
5
Trade receivables and PoC as well as other financial and non-financial assets
Trade receivables and PoC as well as other financial and non-financial assets
There were impairment losses on trade receivables from third parties of € 33,995 thousand (previous year: € 34,530 thousand) and on receivables from other investments of € 839 thousand (previous year: € 2,627 thousand). Impairment losses on receivables from loans to other equity investments amounted to € 3,127 (previous year: € 3,656). There were no impairment losses on receivables from joint ventures or associates, as in the previous year.
Sales revenue under IAS 11 amounts to € 376,499 thousand (previous year: € 406,604 thousand). The balance of receivables recognised by PoC (gross) carried as assets or liabilities includes costs of € 131,097 thousand (previous year: € 114,911 thousand) and a share in profits of € 37,695 thousand (previous year: € 32,167).
Other receivables and other current assets include hedges of credit balances prescribed by law for partial retirement arrangements and longterm working time accounts of the German Group companies in the amount of € 20,900 thousand (previous year: € 16,951 thousand).
6
Summarised information on joint ventures that are immaterial individually
€ thousandsJoint ventures
2017Associates
2017Total 2017
Joint ventures 2016
Associates2016
Total 2016
Group share of earnings from continuing operations 211 583 794 266 524 790
Group share of other comprehensive income – 460 – – 460 107 – 107
Group share of comprehensive income – 249 583 334 383 524 907
Total carrying amounts of Group shares in these companies 3,347 1,165 4,512 3,595 1,032 4,627
122 CONSOLIDATED FINANCIAL STATEMENTS

Trade receivables and PoC as well as other financial and non-financial assets
€ thousands 31 Dec. 2017 31 Dec. 2016
Trade receivables and PoC 613,311 614,293
Trade receivables from third parties 480,928 504,595
Trade receivables from other investments, associates and joint ventures 32,341 33,576
thereof from other investments 3,524 6,480
thereof from associates 280 39
thereof from joint ventures 28,537 27,057
Receivables recognised by PoC, net 100,042 76,122
Receivables recognised by PoC, gross 130,021 107,144
Advances received from customers (PoC) – 29,979 – 31,022
Other financial assets 116,970 186,995
Receivables from loans to other investments, associates and joint ventures 13,344 13,578
Currency forwards 5,074 2,170
Other receivables and other current assets 98,552 171,247
Other non-financial assets 37,402 24,923
Other tax assets 30,830 18,100
Deferred income 6,572 6,823
€ 23,681 thousand (previous year: € 25,230 thousand) of all receivables and other assets is due after more than one year.
Cash and cash equivalents
Cash and cash equivalents are term deposits with short maturities and call deposits, and also current account balances.
Equity
There was no change in the share capital of KSB as against the previous year. In accordance with the Articles of Association, it totals € 44,771,963.82 and, as in the previous year, is composed of 886,615 ordinary shares and 864,712 preference shares. Each noparvalue share represents an equal notional amount of the share capital. The preference shares carry separate cumulative preferred dividend rights and progressive additional dividend rights. All shares are noparvalue bearer shares. The individual shares have no par value.
7
8
The capital reserve results from the appropriation of premiums from capital increases in previous years.
In addition to revenue reserves from previous years, the revenue reserves include currency translation adjustments, consolidation effects, remeasurements of defined benefit plans under IAS 19 and changes in the market value of interest rate derivatives taken directly to equity. These effects resulted in deferred tax assets in the amount of € 70,477 thousand (previous year: € 75,663 thousand) and deferred tax liabilities in the amount of € 187 thousand (previous year: € 39 thousand).
A total of € 9,857 thousand (dividend of € 5.50 per ordinary share and € 5.76 per preference share) was paid from equity by resolution of the Annual General Meeting of the Group’s parent company KSB SE & Co. KGaA, Frankenthal, on 10 May 2017.
Notes
123GENERAL INFORMATIONMANAGEMENT AND ISSUES 2017CONSOLIDATED FINANCIAL STATEMENTSGROUP MANAGEMENT REPORTDIGITAL TRANSFORMATION

Noncontrolling interests relate primarily to PAB GmbH, Frankenthal, and the interests it holds, as well as to our companies in India and China. KSB SE & Co. KGaA holds a 51 % interest in PAB GmbH, while Johannes und Jacob Klein GmbH, Frankenthal, holds a 49 % interest.
Details of the changes in equity accounts and noncontrolling interests are presented in the Statement of Changes in Equity.
The proposal on the appropriation of the net retained earnings of KSB SE & Co. KGaA calculated in accordance with HGB is shown at the end of these Notes.
Capital disclosures
Sufficient financial independence is a key requirement for safeguarding KSB’s continued existence in the long term. Obtaining the necessary funds for ongoing business operations is also extremely important for us. A key management parameter for us is the net financial position, which is the balance of financial liabilities and interestbearing financial assets (current and noncurrent financial instruments, interestbearing loans, cash and cash equivalents, and receivables from cash deposits). Our longterm objective is to avoid net debt. We regularly monitor the development of this key performance indicator and manage it through active working capital management and by constantly optimising our financial structure, among other things. In the financial year we exceeded our original target of € 240 to 260 million and achieved € 288 million, based on further successes in working capital management and a consistently focused investment policy. Our net financial position was already developing more positively in the previous year than originally planned (€ 260 million compared with a planned figure of € 200 to 210 million). This can also be attributed to successes in working capital management and a focused investment policy.
Provisions
Composition of provisions
Development of individual provision categories
Provisions for pensions and similar obligations
The pension obligations in the KSB Group include defined contribution and defined benefit plans and contain both obligations from current pensions and future pension benefit entitlements.
For employees of Group companies in Germany there is a defined contribution plan under the German statutory pension insurance scheme into which the employer must pay the currently valid pension contribution rate. Contributions to state pension insurance funds recognised in the income statement totalled € 25,989 thousand (previous year: € 25,676 thousand). € 7,446 thousand (previous year: € 8,488 thousand) was spent on defined contribution schemes for employees in other countries in the year under review.
The obligations for defined benefit pension plans for employees of the Group are mainly due to pension obligations in Germany, as well as in France, the United States and Switzerland.
More than 90 % of the defined benefit pension plans are attributable to the German Group companies. These relate to direct commitments by the companies to their employees. The commitments are based on salary and length of service. Contributions from employees themselves are also considered. This pension provision can be broken down into purely companyfinanced basic provision and the topup provision from the employer. The latter is based on the amount of own contributions and the generated return on sales before taxes on income. Both components take account of the general pension contribution (the amount of which partially depends on company performance), personal income (the relationship between pensionable income and maximum income threshold) and the annuity conversion factor (based on age). Pension benefits are paid in annual instalments of one tenth of the amount. However, under certain conditions it is also possible to make a capital payment or pay a monthly pension instead.
9
124 CONSOLIDATED FINANCIAL STATEMENTS

Pension schemes in France are governed by the provisions of the respective collective agreements. The obligations are basically covered by assets that have been paid in to an external fund. At the beginning of the final quarter of each year, an actuarial report is prepared to calculate the current obligation. If there is a shortfall, a compensation payment is made to the fund. Differences in the calculation parameters under local and
Composition of provisions
31 Dec. 2017 31 Dec. 2016
€ thousands Total Non-current Current Total Non-current Current
Employee benefits 688,347 606,875 81,472 676,456 605,540 70,916
Pensions and similar obligations 586,861 586,861 – 589,542 589,542 –
Other employee benefits 101,486 20,014 81,472 86,914 15,998 70,916
Other provisions 99,804 1,397 98,407 99,566 1,406 98,160
Warranty obligations and contractual penalties 51,275 – 51,275 50,257 – 50,257
Provisions for restructuring 2,750 – 2,750 5,294 – 5,294
Miscellaneous other provisions 45,779 1,397 44,382 44,015 1,406 42,609
788,151 608,272 179,879 776,022 606,946 169,076
Development of individual provision categories
€ thousands 1 Jan. 2017
Changes in consolidated Group / CTA* /
OtherUtilisation /
Prepayments Reversal Additions 31 Dec. 2017
Employee benefits 676,456 – 613 – 71,179 – 3,532 87,215 688,347
Pensions and similar obligations 589,542 – 1,145 – 18,055 – 195 16,714 586,861
Other employee benefits 86,914 532 – 53,124 – 3,337 70,501 101,486
Other provisions 99,566 – 510 – 46,918 – 11,512 59,178 99,804
Warranty obligations and contractual penalties 50,257 – 1,205 – 22,263 – 6,001 30,487 51,275
Provisions for restructuring 5,294 – 3 – 3,827 – 30 1,316 2,750
Miscellaneous other provisions 44,015 698 – 20,828 – 5,481 27,375 45,779
776,022 – 1,123 – 118,097 – 15,044 146,393 788,151
* CTA = Currency translation adjustments
international law ultimately result in a surplus of obligations in the Group. Upon retirement, the employees concerned receive a oneoff payment from the fund.
The defined benefit pension plans in the United States are closed to new entrants. The pension benefit amount is derived from the average salary and years of service before closure of the
Notes
125GENERAL INFORMATIONMANAGEMENT AND ISSUES 2017CONSOLIDATED FINANCIAL STATEMENTSGROUP MANAGEMENT REPORTDIGITAL TRANSFORMATION

plan. The retirement age is 65 years; from this point a monthly payment is made to the beneficiaries. The pension benefits are financed by external funds.
Pension obligations in Switzerland are predominantly based on statutory obligations. This also includes details on a minimum pension which all employees with uninterrupted contributions are entitled to by law. The employer is therefore required to pay in contributions which are high enough for the respective pension fund or insurance company to pay out these minimum amounts. As well as pension benefits, the plans encompass other benefits such as disability or survivors’ benefits. Both employer and employee contributions are paid to the pension fund, with the company having to make contributions that at least match the employee contributions specified in the terms and conditions of the plan. The retirement benefits are paid out in monthly instalments, but all employees have the option to receive a (partial) capital payment.
In addition, employees in other countries are also entitled to a limited extent to retirement and partly to medical care benefits, depending mainly on the length of service and salary.
These defined benefit plans impose actuarial risks on the Group, such as the longevity risk and interest rate risk. The payments linked to pension obligations are paid largely from our liquid assets. Plan assets are also partially available for financing these obligations. Most of the plan assets are managed by insurers who set their own appropriate investment policies.
The actuarial valuations of the plan assets and the present value of the defined benefit obligation (and the related current service cost and the past service cost) are measured and calculated annually on the basis of actuarial reports using the projected unit credit method (IAS 19).
Balance sheet figures for defined benefit plans
Change in cash value of defined benefit obligations
The current and past service cost is recognised in staff costs under pension costs, and the interest cost is recognised in financial income / expense under interest and similar expenses.
The expected contributions in the following year are anticipated to be € 11,448 thousand (previous year: € 11,770 thousand).
Changes in the fair value of the plan assets
Interest income is recognised in financial income net of the DBO interest expense under interest and similar expenses.
Changes to the net liability of the defined benefit obligations
Composition of plan assets
We allocate to the pension funds the amount of money needed to meet statutory minimum requirements.
The actual income from plan assets amounted to € 5,109 thousand (previous year: € 4,843 thousand).
Actuarial assumptions
A mean fluctuation rate (2.0 %) continues to be applied to staff turnover for the German plans, as in the previous year. The biometric assumptions continue to be based on the 2005G mortality tables published by Prof. Klaus Heubeck as in the previous year, and the retirement age used for the calculations is based on the Rentenversicherungs-Altersgrenzenanpassungs-gesetz 2007 [RVAGAnpG – German Act Adapting the Standard Retirement Age for the Statutory Pension Insurance System]. Other measurement parameters (e.g. cost trends in the medical care area) are not material.
The discount rate and future mortality were identified as key actuarial assumptions. As in the previous year the basis for the calculation of the sensitivities is the same method which was used for the calculation of the provisions for pensions and similar obligations.
126 CONSOLIDATED FINANCIAL STATEMENTS
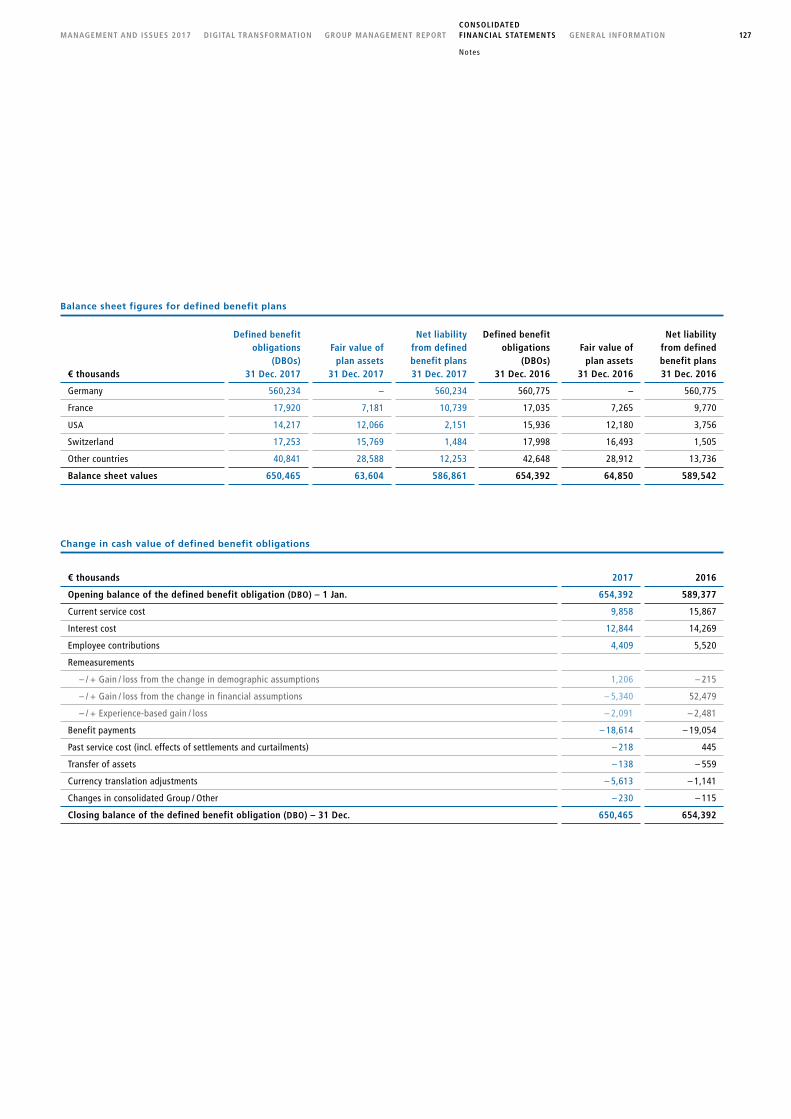
Balance sheet figures for defined benefit plans
€ thousands
Defined benefit obligations
(DBOs) 31 Dec. 2017
Fair value of plan assets
31 Dec. 2017
Net liability from defined benefit plans 31 Dec. 2017
Defined benefit obligations
(DBOs) 31 Dec. 2016
Fair value of plan assets
31 Dec. 2016
Net liability from defined benefit plans 31 Dec. 2016
Germany 560,234 – 560,234 560,775 – 560,775
France 17,920 7,181 10,739 17,035 7,265 9,770
USA 14,217 12,066 2,151 15,936 12,180 3,756
Switzerland 17,253 15,769 1,484 17,998 16,493 1,505
Other countries 40,841 28,588 12,253 42,648 28,912 13,736
Balance sheet values 650,465 63,604 586,861 654,392 64,850 589,542
Change in cash value of defined benefit obligations
€ thousands 2017 2016
Opening balance of the defined benefit obligation (DBO) – 1 Jan. 654,392 589,377
Current service cost 9,858 15,867
Interest cost 12,844 14,269
Employee contributions 4,409 5,520
Remeasurements
– / + Gain / loss from the change in demographic assumptions 1,206 – 215
– / + Gain / loss from the change in financial assumptions – 5,340 52,479
– / + Experience-based gain / loss – 2,091 – 2,481
Benefit payments – 18,614 – 19,054
Past service cost (incl. effects of settlements and curtailments) – 218 445
Transfer of assets – 138 – 559
Currency translation adjustments – 5,613 – 1,141
Changes in consolidated Group / Other – 230 – 115
Closing balance of the defined benefit obligation (DBO) – 31 Dec. 650,465 654,392
Notes
127GENERAL INFORMATIONMANAGEMENT AND ISSUES 2017CONSOLIDATED FINANCIAL STATEMENTSGROUP MANAGEMENT REPORTDIGITAL TRANSFORMATION

Changes in the fair value of the plan assets
€ thousands 2017 2016
Opening balance of the plan assets measured at fair value – 1 Jan. 64,850 63,344
Interest income 2,008 2,329
Remeasurements
– / + Gain / loss from plan assets excluding amounts already recognised in interest income 3,101 2,514
Contributions by the employer 1,655 2,216
Contributions by the beneficiary employees 223 279
Currency translation adjustments – 4,485 – 1,292
Changes in consolidated Group – –
Paid benefits – 2,801 – 4,614
Other – 947 74
Closing balance of the plan assets measured at fair value – 31 Dec. 63,604 64,850
Changes to the net liability of the defined benefit obligations
€ thousands 2017 2016
Opening balance of the net liability of the defined benefit obligations – 1 Jan. 589,542 526,033
Current service cost 9,858 15,867
Interest income – 2,008 – 2,329
Interest cost 12,844 14,269
Employee contributions 4,186 5,241
Contributions by the employer – 1,655 – 2,216
Remeasurements
– / + Gain / loss from plan assets excluding amounts already recognised in interest income – 3,101 – 2,514
– / + Gain / loss from the change in demographic assumptions 1,206 – 215
– / + Gain / loss from the change in financial assumptions – 5,340 52,479
– / + Experience-based gain / loss – 2,091 – 2,481
Benefit payments – 15,813 – 14,440
Past service cost (incl. effects of settlements and curtailments) – 218 445
Transfer of assets – 138 – 559
Currency translation adjustments – 1,128 151
Changes in consolidated Group / Other 717 – 189
Closing balance of the net liability of the defined benefit obligations – 31 Dec. 586,861 589,542
128 CONSOLIDATED FINANCIAL STATEMENTS
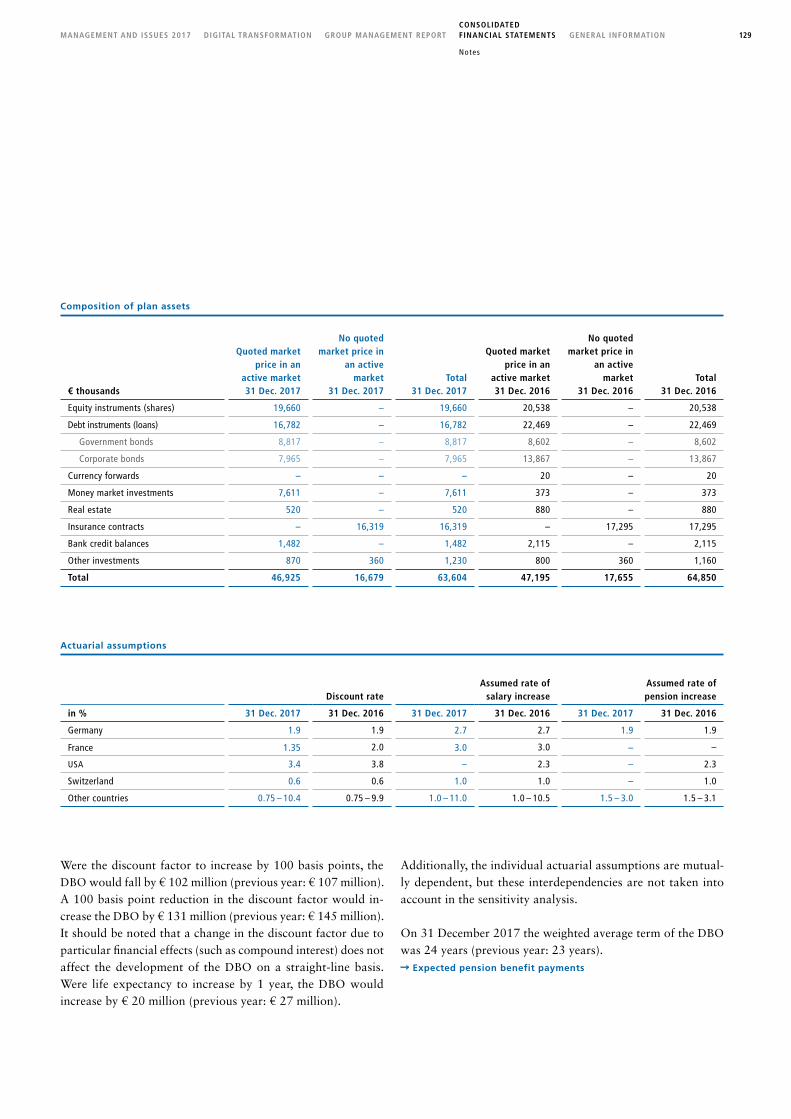
Composition of plan assets
€ thousands
Quoted market price in an
active market 31 Dec. 2017
No quoted market price in
an active market
31 Dec. 2017Total
31 Dec. 2017
Quoted market price in an
active market 31 Dec. 2016
No quoted market price in
an active market
31 Dec. 2016Total
31 Dec. 2016
Equity instruments (shares) 19,660 – 19,660 20,538 – 20,538
Debt instruments (loans) 16,782 – 16,782 22,469 – 22,469
Government bonds 8,817 – 8,817 8,602 – 8,602
Corporate bonds 7,965 – 7,965 13,867 – 13,867
Currency forwards – – – 20 – 20
Money market investments 7,611 – 7,611 373 – 373
Real estate 520 – 520 880 – 880
Insurance contracts – 16,319 16,319 – 17,295 17,295
Bank credit balances 1,482 – 1,482 2,115 – 2,115
Other investments 870 360 1,230 800 360 1,160
Total 46,925 16,679 63,604 47,195 17,655 64,850
Actuarial assumptions
Discount rateAssumed rate of
salary increaseAssumed rate of pension increase
in % 31 Dec. 2017 31 Dec. 2016 31 Dec. 2017 31 Dec. 2016 31 Dec. 2017 31 Dec. 2016
Germany 1.9 1.9 2.7 2.7 1.9 1.9
France 1.35 2.0 3.0 3.0 – –
USA 3.4 3.8 – 2.3 – 2.3
Switzerland 0.6 0.6 1.0 1.0 – 1.0
Other countries 0.75 – 10.4 0.75 – 9.9 1.0 – 11.0 1.0 – 10.5 1.5 – 3.0 1.5 – 3.1
Were the discount factor to increase by 100 basis points, the DBO would fall by € 102 million (previous year: € 107 million). A 100 basis point reduction in the discount factor would increase the DBO by € 131 million (previous year: € 145 million). It should be noted that a change in the discount factor due to particular financial effects (such as compound interest) does not affect the development of the DBO on a straightline basis. Were life expectancy to increase by 1 year, the DBO would increase by € 20 million (previous year: € 27 million).
Additionally, the individual actuarial assumptions are mutually dependent, but these interdependencies are not taken into account in the sensitivity analysis.
On 31 December 2017 the weighted average term of the DBO was 24 years (previous year: 23 years).
Expected pension benefit payments
Notes
129GENERAL INFORMATIONMANAGEMENT AND ISSUES 2017CONSOLIDATED FINANCIAL STATEMENTSGROUP MANAGEMENT REPORTDIGITAL TRANSFORMATION

Other employee benefits
Provisions for other employee benefits relate primarily to profit sharing, jubilee payments, partial retirement obligations and severance payments. The provisions include € 15,770 thousand (previous year: € 12,234 thousand) created on account of the Efficiency Improvement Programme.
Other provisions
The provisions for warranty obligations and contractual penalties cover the statutory and contractual obligations to customers and are based on estimates prepared using historical data for similar products and services.
The miscellaneous other provisions include provisions for anticipated losses from the project business (€ 4,656 thousand for 2017 and € 1,667 thousand for 2016), customer bonuses and environmental protection measures. They also cover risks of litigation and legal proceedings if the recognition criteria for a pro
vision are met (€ 5.3 million; previous year: € 9.2 million). These are usually risks arising from legal disputes in relation to operations or, in rare cases, disputes with government agencies or personnel matters. In order to determine the amount of the provisions, the facts related to each case, the size of the claim, the results of comparable proceedings and independent legal opinions are considered in individual cases along with assumptions regarding the probability of occurrence and the range of potential claims. In addition, there are contingent liabilities resulting from legal disputes in relation to the operative business in the amount of € 56.7 million (previous year: € 71.8 million). There are no longer any insurance claims to be covered for 2017 (previous year: € 11.0 million).
€ 18,489 thousand (previous year: € 18,392 thousand) of the other provisions are expected to become casheffective after more than one year.
Expected pension benefit payments
€ millions at 31 Dec. 2017 2018 2019 2020 2021 2022
Expected payments 23,964 21,181 21,241 22,230 21,716
€ millions at 31 Dec. 2016 2017 2018 2019 2020 2021
Expected payments 21,659 21,315 21,549 21,605 22,569
130 CONSOLIDATED FINANCIAL STATEMENTS

Liabilities
Non-current liabilities
€ thousands 31 Dec. 2017 31 Dec. 2016
Financial liabilities 54,333 57,962
Loan against borrower’s note 47,964 47,918
Bank loans and overdrafts 5,468 9,229
Finance lease liabilities 574 693
Other 327 122
Current liabilities
€ thousands 31 Dec. 2017 31 Dec. 2016
Financial liabilities 21,960 119,958
Loan against borrower’s note – 74,500
Bank loans and overdrafts 21,275 44,571
Finance lease liabilities 353 501
Liabilities to other investments, associates and joint ventures 322 376
Other 10 10
Trade payables 212,029 210,813
Trade payables to third parties 210,819 208,774
Liabilities to other investments, associates and joint ventures 1,210 2,039
Other financial liabilities 81,467 89,406
Advances received from customers PoC (net) 49,401 44,046
Advances received from customers PoC (gross) 88,172 83,980
Receivables recognised by PoC – 38,771 – 39,934
Currency forwards 1,883 11,203
Interest rate swaps – 435
Miscellaneous other financial liabilities 30,183 33,722
Other non-financial liabilities 190,161 182,979
Advances received from customers 97,703 92,505
Social security and liabilities to employees 48,703 52,657
Tax liabilities (excluding income taxes) 28,171 22,022
Prepaid expenses 10,788 10,882
Investment grants and subsidies 4,796 4,913
Income tax liabilities 5,214 9,354
10
Notes
131GENERAL INFORMATIONMANAGEMENT AND ISSUES 2017CONSOLIDATED FINANCIAL STATEMENTSGROUP MANAGEMENT REPORTDIGITAL TRANSFORMATION

In 2012, to safeguard liquidity in the medium term, KSB SE & Co. KGaA took the precaution of placing a loan against borrower’s note with a total volume of € 175 million. This loan is divided into repayment tranches of 3, 5, 7 and 10 years. As the different repayment tranches have different terms, different rates of interest apply, some of which are fixed and some variable. In the year under review, € 74.5 million was repaid; in the previous year there were no repayments.
Further information on receivables recognised by PoC can be found in Section IV. Balance Sheet Disclosures – Notes No. 6. “Trade receivables and PoC as well as other financial and nonfinancial assets”.
€ 27.5 million (unchanged on the previous year) of the liabilities arising from the loan against borrower’s note are classified as bank loans and overdrafts, and € 20.5 million as other financial liabilities (also unchanged).
Assets amounting to € 6,098 thousand (previous year: € 2,351 thousand) have been pledged as security in the KSB Group for bank loans and other liabilities on the basis of standard terms
and conditions. Of these, none (as in the previous year) relate to property, plant and equipment, € 1,522 thousand (previous year: € 724 thousand) to inventories, none (as in the previous year) to receivables and € 4,576 thousand (previous year: € 1,627 thousand) to other securities.
As in the previous year, no liabilities were secured by land charges or similar rights in the year under review.
The reported investment grants and subsidies largely comprise funding from the European Union and German entities for new buildings and development aid projects.
The weighted average interest rate on bank loans and overdrafts as well as on an openmarket credit (loan against borrower’s note) was 4.31 % (previous year: 3.44 %). Interest rate risk exists for the major portion of the loan against borrower’s note mentioned above.
There were no covenant agreements for loans in the year under review, as was the case in the previous year too.
132 CONSOLIDATED FINANCIAL STATEMENTS

V. INCOME STATEMENT DISCLOSURES
Sales revenue
€ thousands 2017 2016
Revenue from the sale of goods and goods purchased and held for resale 1,951,928 1,915,739
Services sales revenue 253,030 249,913
Sales revenue 2,204,958 2,165,652
The breakdown of sales revenue by pumps, valves and service is presented in the segment reporting.
Other income
€ thousands 2017 2016
Income from disposal of assets 12,319 1,478
Income from current assets 5,834 9,277
Currency translation gains 5,767 3,629
Income from the reversal of provisions 14,845 8,400
Miscellaneous other income 30,405 24,443
69,170 47,227
Income from current assets is primarily from the reversal of impairment losses on receivables. Miscellaneous other income relates primarily to insurance compensation amounting to € 12,491 thousands (previous year: € 1,899 thousands). Grants and subsidies, rental and lease income and commission income are also part of miscellaneous other income. Income from gov
11
12
ernment grants for individual projects (for example, for research activities) amounted to € 3,065 thousand (previous year: € 2,564 thousand).
Cost of materials
€ thousands 2017 2016
Cost of raw materials, production supplies and of goods purchased and held for resale 795,559 789,298
Cost of purchased services 92,261 84,858
887,820 874,156
Staff costs
€ thousands 2017 2016
Wages and salaries 640,390 641,451
Social security contributions and employee assistance costs 128,563 129,574
Pension costs 27,779 27,725
796,732 798,750
Pension costs are reduced by the interest component of provisions for pensions and similar obligations, which is reported as an interest cost in financial income / expense.
Employees
The firsttime inclusion of fully consolidated companies in China and in the Philippines led to an increase of 43 in the average number of employees over the year and in the total number at the reporting date.
13
14
Employees
Average for the year At reporting date
2017 2016 31 Dec. 2017 31 Dec. 2016
Wage earners 6,998 7,311 6,954 7,091
Salaried employees 8,073 8,125 8,047 8,015
15,071 15,436 15,001 15,106
Apprentices 450 477 454 466
15,521 15,913 15,455 15,572
Notes
133GENERAL INFORMATIONMANAGEMENT AND ISSUES 2017CONSOLIDATED FINANCIAL STATEMENTSGROUP MANAGEMENT REPORTDIGITAL TRANSFORMATION
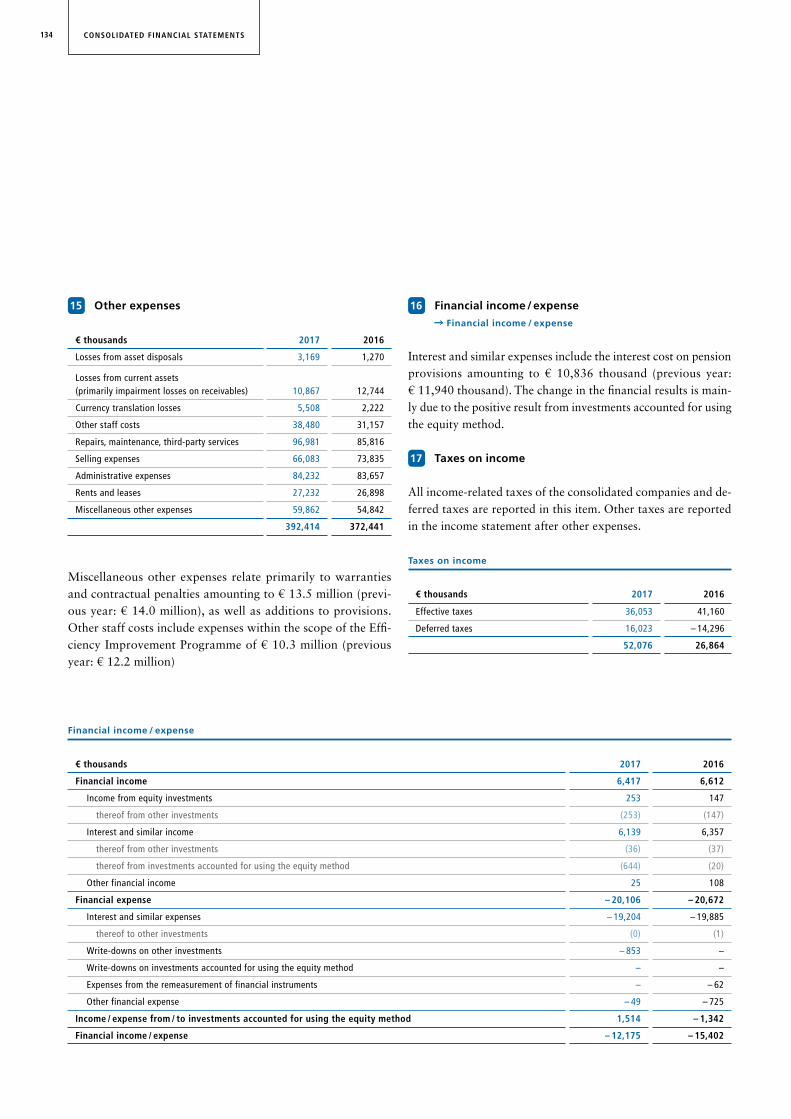
Other expenses
€ thousands 2017 2016
Losses from asset disposals 3,169 1,270
Losses from current assets (primarily impairment losses on receivables) 10,867 12,744
Currency translation losses 5,508 2,222
Other staff costs 38,480 31,157
Repairs, maintenance, third-party services 96,981 85,816
Selling expenses 66,083 73,835
Administrative expenses 84,232 83,657
Rents and leases 27,232 26,898
Miscellaneous other expenses 59,862 54,842
392,414 372,441
Miscellaneous other expenses relate primarily to warranties and contractual penalties amounting to € 13.5 million (previous year: € 14.0 million), as well as additions to provisions. Other staff costs include expenses within the scope of the Efficiency Improvement Programme of € 10.3 million (previous year: € 12.2 million)
15 Financial income / expense
Financial income / expense
Interest and similar expenses include the interest cost on pension provisions amounting to € 10,836 thousand (previous year: € 11,940 thousand). The change in the financial results is mainly due to the positive result from investments accounted for using the equity method.
Taxes on income
All incomerelated taxes of the consolidated companies and deferred taxes are reported in this item. Other taxes are reported in the income statement after other expenses.
Taxes on income
€ thousands 2017 2016
Effective taxes 36,053 41,160
Deferred taxes 16,023 – 14,296
52,076 26,864
16
17
Financial income / expense
€ thousands 2017 2016
Financial income 6,417 6,612
Income from equity investments 253 147
thereof from other investments (253) (147)
Interest and similar income 6,139 6,357
thereof from other investments (36) (37)
thereof from investments accounted for using the equity method (644) (20)
Other financial income 25 108
Financial expense – 20,106 – 20,672
Interest and similar expenses – 19,204 – 19,885
thereof to other investments (0) (1)
Write-downs on other investments – 853 –
Write-downs on investments accounted for using the equity method – –
Expenses from the remeasurement of financial instruments – – 62
Other financial expense – 49 – 725
Income / expense from / to investments accounted for using the equity method 1,514 – 1,342
Financial income / expense – 12,175 – 15,402
134 CONSOLIDATED FINANCIAL STATEMENTS

€ 425 thousand (previous year: € 875 thousand) of the effective taxes in the year under review related to priorperiod tax refunds and € 2,632 thousand (previous year: € 2,923 thousand) to tax arrears.
Reconciliation of deferred taxes
€ thousands 2017 2016
Change in deferred tax assets 20,430 – 27,806
Change in deferred tax liabilities 2,328 – 664
Change in deferred taxes recognised in balance sheet 22,758 – 28,470
Change in deferred taxes taken directly to equity – 6,100 13,999
Changes in consolidated Group / CTA* / Other – 635 175
Deferred taxes recognised in income statement 16,023 – 14,296
* CTA = Currency translation adjustments
Allocation of deferred taxes
Allocation of deferred taxes
Deferred tax assets Deferred tax liabilities
€ thousands 2017 2016 2017 2016
Non-current assets 1,456 1,828 28,220 31,309
Intangible assets 739 1,152 105 279
Property, plant and equipment 717 612 28,060 30,964
Non-current financial assets – 64 55 66
Current assets 54,912 57,152 50,142 45,621
Inventories 49,356 48,516 143 1,924
Receivables and other current assets 5,556 7,096 49,999 43,554
Assets held for sale – 1,540 – 143
Non-current liabilities 93,504 96,462 88 25
Provisions 93,312 96,305 77 –
Other liabilities 192 157 11 25
Current liabilities 15,806 20,949 11,438 8,573
Provisions 10,408 11,248 1,261 1,201
Other liabilities 5,398 9,701 10,177 7,372
Tax loss carryforwards 1,243 8,928 – –
Gross deferred taxes – before offsetting 166,921 185,319 89,888 85,528
Offset under IAS 12.74 – 75,185 – 73,153 – 75,185 – 73,153
Net deferred taxes – after offsetting 91,736 112,166 14,703 12,375
As at the reporting date, deferred tax assets of € 80,111 thousand (previous year: € 97,825 thousand) were recognised, arising from companies posting a loss in the financial year or previous year, whose realisation exclusively depends on the creation of future profit. Based on the planning figures available, we expect realisation to take place.
Income taxes included under equity
€ thousands 2017 2016
Remeasurement of defined benefit plans 9,328 – 47,278
Taxes on income – 3,843 13,546
Currency translation differences – 54,238 20,223
Taxes on income – –
Changes in the fair value of financial instruments 7,203 – 1,622
Taxes on income – 2,257 453
Other comprehensive income – 43,807 – 14,678
Notes
135GENERAL INFORMATIONMANAGEMENT AND ISSUES 2017CONSOLIDATED FINANCIAL STATEMENTSGROUP MANAGEMENT REPORTDIGITAL TRANSFORMATION
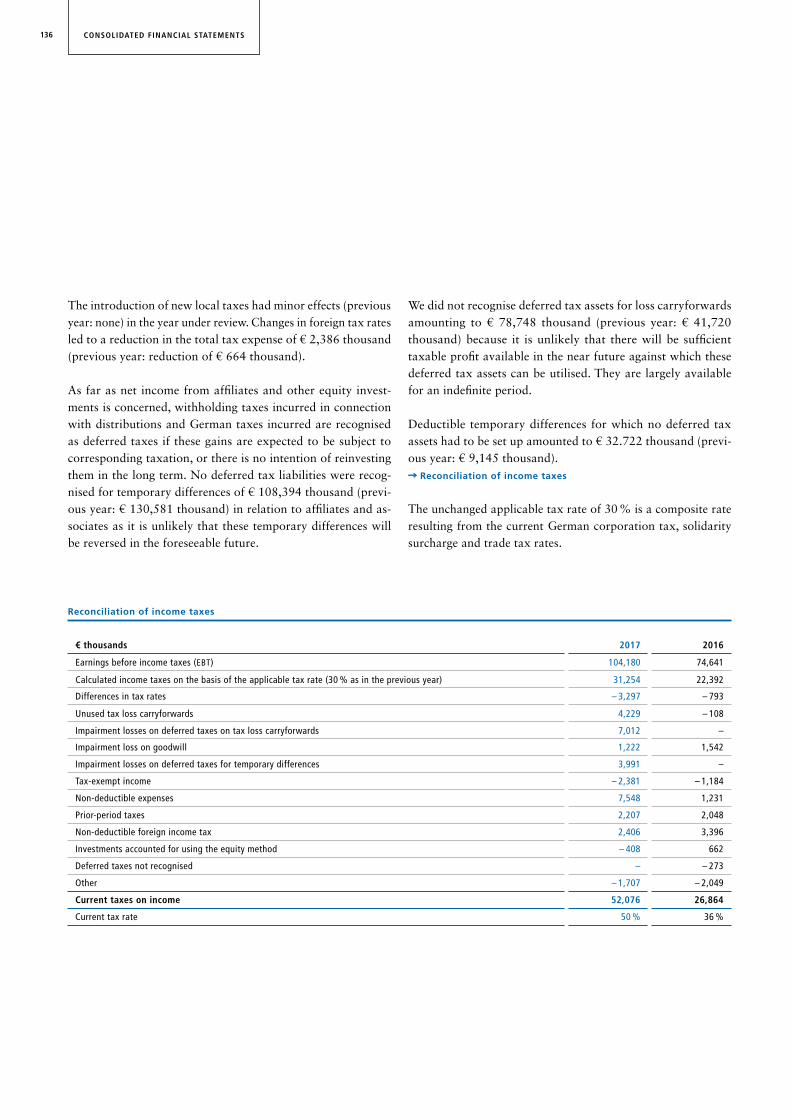
The introduction of new local taxes had minor effects (previous year: none) in the year under review. Changes in foreign tax rates led to a reduction in the total tax expense of € 2,386 thousand (previous year: reduction of € 664 thousand).
As far as net income from affiliates and other equity investments is concerned, withholding taxes incurred in connection with distributions and German taxes incurred are recognised as deferred taxes if these gains are expected to be subject to corresponding taxation, or there is no intention of reinvesting them in the long term. No deferred tax liabilities were recognised for temporary differences of € 108,394 thousand (previous year: € 130,581 thousand) in relation to affiliates and associates as it is unlikely that these temporary differences will be reversed in the foreseeable future.
Reconciliation of income taxes
€ thousands 2017 2016
Earnings before income taxes (EBT) 104,180 74,641
Calculated income taxes on the basis of the applicable tax rate (30 % as in the previous year) 31,254 22,392
Differences in tax rates – 3,297 – 793
Unused tax loss carryforwards 4,229 – 108
Impairment losses on deferred taxes on tax loss carryforwards 7,012 –
Impairment loss on goodwill 1,222 1,542
Impairment losses on deferred taxes for temporary differences 3,991 –
Tax-exempt income – 2,381 – 1,184
Non-deductible expenses 7,548 1,231
Prior-period taxes 2,207 2,048
Non-deductible foreign income tax 2,406 3,396
Investments accounted for using the equity method – 408 662
Deferred taxes not recognised – – 273
Other – 1,707 – 2,049
Current taxes on income 52,076 26,864
Current tax rate 50 % 36 %
We did not recognise deferred tax assets for loss carryforwards amounting to € 78,748 thousand (previous year: € 41,720 thousand) because it is unlikely that there will be sufficient taxable profit available in the near future against which these deferred tax assets can be utilised. They are largely available for an indefinite period.
Deductible temporary differences for which no deferred tax assets had to be set up amounted to € 32.722 thousand (previous year: € 9,145 thousand).
Reconciliation of income taxes
The unchanged applicable tax rate of 30 % is a composite rate resulting from the current German corporation tax, solidarity surcharge and trade tax rates.
136 CONSOLIDATED FINANCIAL STATEMENTS

Earnings per share
2017 2016
Earnings after income taxes attributable to KSB SE & Co. KGaA shareholders € thousands 37,181 32,943
Additional dividend attributable to preference shareholders (€ 0.26 per preference share) € thousands – 225 – 225
€ thousands 36,956 32,718
Number of ordinary shares 886,615 886,615
Number of preference shares 864,712 864,712
Total number of shares 1,751,327 1,751,327
Diluted and basic earnings per ordinary share € 21.10 18.68
Diluted and basic earnings per preference share € 21.36 18.94
Earnings after income taxes – Non-controlling interests
The net profit attributable to noncontrolling interests amounts to € 15,770 thousand (previous year: € 15,190 thousand) and the net loss attributable to noncontrolling interests amounts to € 847 thousand (previous year: € 356 thousand). They relate primarily to PAB GmbH, Frankenthal, Germany, and the interests it holds, as well as to our companies in India and Pakistan.
Earnings per share
18
19
Notes
137GENERAL INFORMATIONMANAGEMENT AND ISSUES 2017CONSOLIDATED FINANCIAL STATEMENTSGROUP MANAGEMENT REPORTDIGITAL TRANSFORMATION

VI. ADDITIONAL DISCLOSURES ON
FINANCIAL INSTRUMENTS
Financial instruments – Carrying amounts and fair values by measurement category:
Financial instruments by measurement categories – Assets
Balance sheet item / Class € thousands
Measure-ment
categoryInitial / subsequent
measurement
Carrying amount
31 Dec. 2017Fair value
31 Dec. 2017
Carrying amount
31 Dec. 2016Fair value
31 Dec. 2016
Non-current assets
Other investments n / a Amortised cost 2,985 – 5,401 –
Non-current financial instruments AfS Fair value 657 657 667 667
Loans LaRFair value /
Amortised cost 2,490 2,490 2,458 2,458
Current assets
Trade receivables LaRFair value /
Amortised cost 480,928 480,928 504,595 504,595
Trade receivables from other investments, associates and joint ventures LaR
Fair value / Amortised cost 32,341 32,341 33,576 33,576
Receivables from loans to other invest-ments, associates and joint ventures LaR
Fair value / Amortised cost 13,344 13,344 13,578 13,578
Receivables recognised by PoC, net LaRFair value /
Amortised cost 100,042 100,042 76,122 76,122
Currency forwards used as hedges n / a Fair value 5,074 5,074 2,170 2,170
Other receivables and other current assets LaRFair value /
Amortised cost 98,552 98,552 171,247 171,247
Cash and cash equivalents LaRFair value /
Amortised cost 289,535 289,535 288,883 288,883
138 CONSOLIDATED FINANCIAL STATEMENTS

Financial instruments by measurement categories – Equity and liabilities
Balance sheet item / Class € thousands
Measure-ment
categoryInitial / subsequent
measurement
Carrying amount
31 Dec. 2017Fair value
31 Dec. 2017
Carrying amount
31 Dec. 2016Fair value
31 Dec. 2016
Non-current liabilities
Financial liabilities excluding finance lease liabilities FLAC
Fair value / Amortised cost 53,759 52,622 57,269 55,803
Finance lease liabilities n / a Under IAS 17 574 579 693 699
Current liabilities
Financial liabilities excluding finance lease liabilities FLAC
Fair value / Amortised cost 21,607 21,607 119,457 119,457
Finance lease liabilities n / a Under IAS 17 353 359 501 561
Trade payables FLACFair value /
Amortised cost 212,029 212,029 210,813 210,813
Advances received from customers (PoC) FLACFair value /
Amortised cost 49,401 49,401 44,046 44,046
Interest rate swaps used as hedges n / a Fair value – – 435 435
Currency forwards used as hedges n / a Fair value 1,883 1,883 11,203 11,203
Other financial liabilities FLACFair value /
Amortised cost 30,183 30,183 33,722 33,722
Thereof aggregated by category in accordance with IAS 39
Loans and receivables LaRFair value /
Amortised cost 1,017,232 1,017,232 1,090,459 1,090,459
Available-for-sale financial instruments AfS Fair value 657 657 667 667
Financial liabilities measured at amortised cost FLAC
Fair value / Amortised cost 366,979 365,842 465,307 463,841
Notes
139GENERAL INFORMATIONMANAGEMENT AND ISSUES 2017CONSOLIDATED FINANCIAL STATEMENTSGROUP MANAGEMENT REPORTDIGITAL TRANSFORMATION

The carrying amount of financial assets measured at amortised cost, with the exception of noncurrent loans, approximates fair value. This is also the case for all financial liabilities shown on the balance sheet, with the exception of noncurrent financial liabilities. This is mainly due to the short maturities of these financial instruments.
The fair values of noncurrent financial liabilities and loans are determined as the present value of the cash flows associated with the liabilities. We apply an appropriate yield curve to arrive at this present value.
The fair values of the current and noncurrent financial instruments presented in the table above are based on prices quoted in active markets (level 1). Fair values within level 2 are determined based on a discounted cash flow method. Future cash flows from currency forwards are estimated on the basis of forward exchange rates (observable rates on the reporting date) and the contracted forward exchange rates, and are discounted
with an adequate interest rate. Future cash flows from interest rate swaps are estimated on the basis of forward interest rates (observable interest structure curves on the reporting date) and the contracted interest rates, and are discounted with an adequate interest rate. Level 3 includes financial instruments whose fair value is determined on the basis of inputs not based on observable market data. Foreign exchange derivatives are measured using forward exchange rates. For interest rate swaps the fair value is determined through the discount rate of future expected cash flows based on the market interest rates and yield curves that apply to the remaining term of the contracts.
The following table shows the financial assets and liabilities, as well as loans and receivables, measured at fair value on a recurring basis, broken down into measurement categories and the previously described hierarchy levels. There were no reclassifications carried out during the year under review.
Hierarchy levels 2017
Hierarchy levels 2016
Hierarchy levels 2017
€ thousands Level 1 Level 2 Level 3 Total
Financial assets recognised at fair value
Current financial instruments 657 – – 657
Currency forwards – 5,074 – 5,074
Financial liabilities recognised at fair value
Currency forwards – 1,883 – 1,883
Interest rate swaps – – – –
Loans and receivables measured at amortised cost
Loans – 2,490 – 2,490
Trade receivables – 480,928 – 480,928
Receivables from other investments, associates and joint ventures – 45,685 – 45,685
Receivables recognised by PoC (inc. advances received from customers PoC) – 100,042 – 100,042
Other receivables and other current assets – 98,552 – 98,552
Cash and cash equivalents – 289,535 – 289,535
Financial liabilities measured at amortised cost
Financial liabilities excluding finance lease liabilities – 74,229 – 74,229
Trade payables – 212,029 – 212,029
Advances received from customers (PoC) – 49,401 – 49,401
Miscellaneous other financial liabilities – 30,183 – 30,183
140 CONSOLIDATED FINANCIAL STATEMENTS

Hierarchy levels 2016
€ thousands Level 1 Level 2 Level 3 Total
Financial assets recognised at fair value
Current financial instruments 667 – – 667
Currency forwards – 2,170 – 2,170
Financial liabilities recognised at fair value
Currency forwards – 11,203 – 11,203
Interest rate swaps – 435 – 435
Loans and receivables measured at amortised cost
Loans – 2,458 – 2,458
Trade receivables – 504,595 – 504,595
Receivables from other investments, associates and joint ventures – 47,154 – 47,154
Receivables recognised by PoC (inc. advances received from customers PoC) – 76,122 – 76,122
Other receivables and other current assets – 171,247 – 171,247
Cash and cash equivalents – 288,883 – 288,883
Financial liabilities measured at amortised cost
Financial liabilities excluding finance lease liabilities – 175,260 – 175,260
Trade payables – 210,813 – 210,813
Advances received from customers (PoC) – 44,046 – 44,046
Miscellaneous other financial liabilities – 33,722 – 33,722
The net gains and losses from financial instruments, after taking into account the relevant tax effect, are presented in the following table:
Net results by measurement category in 2017
Net results by measurement category in 2016
The interest shown is a component of financial income / expense. The effect from the application of the effective interest rate method is immaterial here as the interest expenses are virtually offset by the resulting interest income. The other gains and losses are partly reported in other income and other expenses.
The AfS measurement category resulted in a remeasurement value of € 0 thousand (previous year: € – 4 thousand), which was recognised directly in other comprehensive income and reported under “Change in the fair value of financial instruments” in equity. In the year under review, € 0 thousand (previous year: € 0 thousand) was withdrawn from equity or realised.
The amount of financial assets and liabilities subject to offsetting agreements is not material.
Financial risks
We are exposed to certain financial risks as a consequence of our business activities. These risks can be classified into three areas:
For one thing, we are exposed to credit risk. We define credit risk as potential default or delays in the receipt of contractually agreed payments. We are also exposed to liquidity risk, which is the risk that an entity will be unable to meet its financial obligations, or will be unable to meet them in full. Finally, we are exposed to market risk. The risk of exchange rate or interest rate changes may adversely affect the economic position of the Group. Risks from fluctuations in the prices of financial instruments are not material for us.
Notes
141GENERAL INFORMATIONMANAGEMENT AND ISSUES 2017CONSOLIDATED FINANCIAL STATEMENTSGROUP MANAGEMENT REPORTDIGITAL TRANSFORMATION

Net results by measurement category in 2017
€ thousandsFrom interest and dividends
From subsequent measurement
From disposal Net resultsAt fair valueCurrency
translationImpairment
losses
LaR 6,164 – – 718 – 1,476 – 3,970
AfS 265 – – – 2 – 263
FLAC – 9,542 – 228 – – – 9,314
– 3,113 – – 490 – 1,478 – – 5,081
Net results by measurement category in 2016
€ thousandsFrom interest and dividends
From subsequent measurement
From disposal Net resultsAt fair valueCurrency
translationImpairment
losses
LaR 6,357 – – 1,029 – 6,815 – – 1,487
AfS 161 – – – – 87 74
FLAC – 7,607 – 2,636 – – – 4,971
– 1,089 – 1,607 – 6,815 – 87 – 6,384
We limit all of these risks through an appropriate risk management system, and define how these risks are addressed through guidelines and work instructions. In addition, we monitor the current risk characteristics continuously and regularly provide the information obtained in this way to the Managing Directors and the Supervisory Board in the form of standardised reports and individual analyses.
The three risk areas are described in detail in the following. Additional information is also provided in the group management report, in particular in the Economic Review, Report on Expected Developments, Opportunities and Risks Report sections.
Credit risk
The primary credit risk is that there is a delay in settling a receivable, or that it is not settled either in full or in part. We minimise this risk using a variety of measures. As a matter of principle, we run credit checks on potential and existing counterparties. We only enter into business relationships if the results of this check are positive. Additionally, our European companies in particular
take out trade credit insurance policies. As in the previous year, these policies account for around 10 % of the Group’s trade receivables in total. In exceptional cases we accept other securities (collateral) such as guarantees. The insurance policies primarily cover the risk of loss of receivables. Moreover, we also take out cover against political and commercial risks in the case of certain customers in selected countries. For both types of insurance, we have agreed deductibles, which represent significantly less than 50 % of the insured volume. As part of our receivables management system, we continuously monitor outstanding items, perform maturity analyses and establish contact with customers at an early stage if delays in payment occur. In the case of major projects, our terms and conditions provide for prepayments, guarantees and – for export transactions – letters of credit. These also mitigate risk. Impairment losses are recognised for the residual risk remaining in trade receivables. We examine regularly the extent to which individual receivables need to be written down for impairment. Indications of this are significant financial difficulties of the debtor, such as insolvency or bankruptcy. We also cover the credit risk of receivables that are past due by providing for the risk involved on the basis of historical loss
142 CONSOLIDATED FINANCIAL STATEMENTS

experience. Receivables are derecognised if it is reasonably certain that receipt of payment cannot be expected (for example, after completion of insolvency or bankruptcy proceedings).
Impairment losses on trade receivables are the only material impairment losses in the KSB Group.
Impairment losses from the “trade receivables” category
€ thousands 2017 2016
Opening balance at 1 January 34,530 35,560
Additions 8,219 9,776
Utilised – 3,004 – 4,614
Reversals – 3,903 – 5,818
Changes in consolidated Group / CTA* / Other – 1,847 – 374
Closing balance at 31 December 33,995 34,530
* CTA = Currency translation adjustments
Maturity structure for trade receivables
€ thousands 31 Dec. 2017 31 Dec. 2016
Receivables that are neither past due nor individually impaired 329,503 364,733
Receivables that are past due but not individually impaired
1 to 30 days 62,517 49,802
31 to 90 days 31,251 29,827
91 to 180 days 16,839 16,590
> 180 days 35,091 30,716
Total 145,698 126,935
Receivables individually determined to be impaired 5,727 12,927
Receivables individually determined to be impaired at their principal amount 39,722 47,457
Specific write-downs 33,995 34,530
Carrying amount (net) 480,928 504,595
With regard to the trade receivables that are neither past due nor individually impaired, there are no indications at the reporting date that our debtors will not meet their payment obligations. The same applies to all other financial instruments.
The maximum default risk, excluding collateral received, corresponds to the carrying amount of the financial assets.
There is no concentration of risk because the diversity of our business means that we supply a considerable number of customers in different sectors.
Liquidity risk
Our liquidity management ensures that we minimise this risk in the Group and that our solvency is ensured at all times. There are no concentrations of risk because we work together with a number of credit institutions, on which we impose strict creditworthiness requirements.
We generate our financial resources primarily from our operating business. We use them to finance investments in noncurrent assets. We also use them to cover our working capital requirements. To keep these as low as possible, we monitor changes in our receivables, inventories and liabilities regularly using a standardised Group reporting system.
The reporting system additionally ensures, with the help of monthly rolling cash flow planning , that the Group’s centralised financial management is continuously informed about liquidity surpluses and requirements. This enables us to optimally meet the needs of the Group as a whole and of the individual companies. For selected companies we use a cash pooling system to ensure that available cash is deployed optimally within the Group. We also apply a worldwide receivables netting procedure within the KSB Group so as to minimise both the volume of cash flows and the associated fees. In order to be able to provide the necessary collateral in the project business, corresponding guarantee volumes are made available. Adequate proportions are confirmed for a period of more than one year. In addition, we always ensure that credit facilities are sufficient; we identify the need for these on the basis of regular liquidity plans. In this way we can react to fluctuating liquidity requirements at all times. Our approved cash loans and credit lines total approximately € 893.5 million (previous year: approx. € 968.7 million), of which € 620.2 million has not yet been utilised (previous year: € 648.1 million).
Notes
143GENERAL INFORMATIONMANAGEMENT AND ISSUES 2017CONSOLIDATED FINANCIAL STATEMENTSGROUP MANAGEMENT REPORTDIGITAL TRANSFORMATION

The following tables show the contractually agreed nondiscounted future cash flows of the financial liabilities (primary financial instruments) and derivative financial instruments. Interest payments on fixedrate liabilities are determined on the basis of the fixed rate. Floatingrate interest payments are based on the last floating interest rates fixed before 31 December. Projections for future new liabilities are not included in the presentation. Based on our current state of knowledge, it is neither expected that the cash flows will take place significantly earlier, nor that the amounts will differ significantly.
Cash flows of financial liabilities 2017
Cash flows of financial liabilities 2016
Market price risk
Our global business activities expose us primarily to currency and interest rate risk. Any changes in market prices can affect fair values and future cash flows. We use sensitivity analyses to determine the hypothetical impact of such market price fluctuations on profit and equity. In doing so, we assume that the portfolio at the reporting date is representative for the full year.
We reduce the risks resulting from changes in prices on the procurement side for orders with extended delivery dates by agreeing cost escalation clauses or, in the case of fixedprice contracts, by including the expected rate of cost increases in our sales price.
Currency risk mainly affects our cash flows from operating activities. It arises when Group companies settle transactions in currencies that are not their functional currency. We minimise this risk using currency forwards and, on rare occasions, options. You will find further information on this in the “Derivative financial instruments” section of the Notes. We use micro hedges with regard to both transactions already recognised and cash flows that are expected in the future with a high degree of probability. The hedging instruments used share the essential terms and conditions with the underlying transactions, i.e. with regard to amount, term and quality. Internal guidelines govern the use of financial instruments. Such transactions are also subject to ongoing risk control measures. The hedging instruments used are exclusively currency forwards entered into
Cash flows of financial liabilities 2017
€ thousands Total Up to 1 year 1 – 5 years > 5 years
Financial liabilities 82,888 24,827 57,504 557
Trade payables 212,029 212,029 – –
Miscellaneous other financial liabilities 30,184 30,176 8 –
Derivative financial instruments – Incoming payments – 5,074 – 4,690 – 384 –
Derivative financial instruments – Outgoing payments 1,883 1,489 375 19
321,910 263,831 57,503 576
Cash flows of financial liabilities 2016
€ thousands Total Up to 1 year 1 – 5 years > 5 years
Financial liabilities 190,914 127,826 39,477 23,611
Trade payables 210,813 210,813 – –
Miscellaneous other financial liabilities 33,722 29,801 3,921 –
Derivative financial instruments – Incoming payments – 3,094 – 2,718 – 376 –
Derivative financial instruments – Outgoing payments 12,562 11,000 1,493 69
444,917 376,722 44,515 23,680
144 CONSOLIDATED FINANCIAL STATEMENTS

with primerated banks. In order to measure the effectiveness of our hedges, the market values of the underlying and the hedge transactions are compared. Changes in the market values of the derivatives are almost completely offset by changes in the fair values of the cash flows from the underlyings (hypothetical derivative method). As a rule, we do not hedge currency risks from the translation of foreign operations into the Group currency (€).
At the reporting date, the notional volume of all currency forwards was € 276,489 thousand (previous year: € 269,794 thousand), and the notional volume of all interest rate derivatives was € 0 thousand (previous year: € 39,500 thousand). The contractual maturities of payments for currency forwards and interest rate derivatives are as follows:
Notional volumes 2017
Notional volumes 2016
Changes in derivatives
€ thousands 2017 2016
Opening balance at 1 January – 6,644 – 5,026
Changes in consolidated Group / CTA* / Other – 272 8
Disposals 8,179 948
Additions – 686 – 2,574
Closing balance at 31 December 577 – 6,644
* CTA = Currency translation adjustments
The main currencies in the KSB Group are the Chinese yuan (CNY) and US dollar (USD). For the currency sensitivity analysis, we simulate the effects based on the notional volume of our existing foreign currency derivatives and our foreign currency receivables and liabilities at the reporting date. For the analysis, we assume a 10 % increase (decrease) in the value of the euro versus the other currencies. In the reporting year, this would have amounted to approximately € 1.5 million for CNY (previous year: € 2.0 million) and € 1.2 million (previous year: € 1.2 million) for USD.
Currency volumes
Notional volumes 2017
€ thousands Total Up to 1 year 1 – 5 years > 5 years
Currency forwards 276,489 261,560 14,819 110
Interest rate derivatives – – – –
276,489 261,560 14,819 110
Notional volumes 2016
€ thousands Total Up to 1 year 1 – 5 years > 5 years
Currency forwards 269,794 203,390 670 65,704
Interest rate derivatives 39,500 39,500 – –
309,294 242,890 670 65,704
Notes
145GENERAL INFORMATIONMANAGEMENT AND ISSUES 2017CONSOLIDATED FINANCIAL STATEMENTSGROUP MANAGEMENT REPORTDIGITAL TRANSFORMATION

Based on the measurement of derivatives, at the reporting date, equity and the fair value of the derivatives would have been € 11.7 million lower (higher), with € 9.0 million resulting from USD and € 2.7 million from the other currencies. At the previous year’s reporting date, equity and the fair value of the derivatives would have been € 11.3 million lower (higher), with € 8.7 million resulting from USD and € 2.6 million from the other currencies.
We regularly monitor the interest rate risks associated with our financing activities. To avoid the negative effects of interest rate fluctuations on the international capital markets, we conclude interest rate hedges (interest rate swaps) where necessary, generally for longterm loans. These are used exclusively to hedge floating rate loans against rising interest rates. No such transactions were recognised in the financial year.
As part of our interest rate sensitivity analysis, we simulate a 50 basis point increase (decrease) in market interest rates and analyse the impact on the floating rate financial instruments. In 2017, the net interest balance would have been € 1.7 million (€ 1.2 million) (previous year: € 2.0 million (€ 2.0 million) higher (lower). There were no interest rate derivatives in the Group in the financial year. In the previous year, changes in the fair value of interest rate derivatives used to hedge floating rate liabilities increased (decreased) equity by € 0.1 million (€ 0.1 million).
VII. STATEMENT OF CASH FLOWS
In the statement of cash flows, cash flows are classified by operating, investing and financing activities. Effects of changes in the consolidated Group and in exchange rates are eliminated in the
Currency volumes
CNY 31 Dec. 2017 CNY 31 Dec. 2016 USD 31 Dec. 2017 USD 31 Dec. 2016
Trade receivables € 57.5 million € 66.7 million € 22.3 million € 26.4 million
Trade payables € 42.1 million € 46.6 million € 10.8 million € 14.9 million
Balance € 15.4 million € 20.1 million € 11.5 million € 11.5 million
relevant items. The effect of exchange rate changes (based on annual average rates) and changes in the consolidated Group on cash and cash equivalents is presented separately.
Cash flows from operating activities include a “cash flow” subtotal that merely comprises the net profit for the year; depreciation, amortisation and impairment losses as well as reversals of impairment losses; changes in noncurrent provisions; and noncash effects, for example, of the disposal of fixed assets. This subtotal is combined with the changes in the other operating components of assets (including current financial instruments) and liabilities to determine cash flows from operating activities. Only those changes that are recognised in the income statement are taken into account.
Cash flows from investing activities exclusively reflect cash effective acquisitions and disposals of investments in intangible assets, property, plant and equipment, noncurrent financial assets, and changes in term deposits with a maturity of more than 3 months, including commercial papers.
In addition to cash flows resulting from equity items (capitalisation measures and dividend payments), cash flows from financ ing activities also comprise cash flows arising from changes in financial liabilities.
If cash and cash equivalents include restricted cash, this is reported separately.
Changes in cash flows from financing activities
146 CONSOLIDATED FINANCIAL STATEMENTS

VIII. SEGMENT REPORTING
Segment reporting is prepared in accordance with IFRS 8 based on the management approach and corresponds to our internal organisational and management structure as well as the report-ing lines to the Managing Directors as the chief operating deci-sion-makers. In our matrix organisation, management decisions are primarily taken on the basis of the key performance indica-tors – order intake, external sales revenue and earnings before interest and taxes (EBIT) – determined for the Pumps, Valves and Service segments. Reporting the relevant assets, number of employees and inter-segment sales revenue for these segments is not part of our internal reporting. The managers in charge of the segments, which are geared to product groups, have profit and loss responsibility. They identify business opportunities across markets and industries and assess our options based on current and future market requirements. They also proactively encourage the development of new products and improvements to the available range of products. In this context, they work closely with our Sales organisation and Operations.
The Pumps segment includes single- and multistage pumps, submersible pumps and associated control and drive systems. Applications include process engineering, building services, wa-ter and waste water transport, energy conversion and solids transport.
The Valves segment covers butterfly, globe, gate, control, dia-phragm and ball valves, as well as associated actuators and control systems. Applications primarily include process engi-neering, building services, energy conversion and solids trans-port.
The Service segment covers the installation, commissioning, start-up, inspection, servicing, maintenance and repair of pumps, related systems and valves for all applications; as well as modular service concepts and system analyses for complete systems.
Our companies can be allocated to one or more segments based on their business activities.
The amounts disclosed for the individual segments have been established in compliance with the accounting policies of the underlying consolidated financial statements.
Transfer prices for intercompany sales are determined on an arm’s length basis.
There were no discontinued operations in the period under review, as in the comparative period of the previous year.
Changes in cash flows from financing activities
Cash-effective Non-cash
€ thousands 31 Dec. 2016 Acquisitions
Exchange- rate-related
changes 31 Dec. 2017
Non-current liabilities 57,269 – 2,122 – – 1,388 53,759
Current liabilities 119,082 – 95,491 – – 2,306 21,285
Lease liabilities 1,193 – 223 – – 43 927
Total liabilities from financing activities 177,544 – 97,386 – – 3,737 75,971
Dividend payments – – 12,348 – – –
Salary conversion (provisions for pensions) – 4,186 – – –
Total cash flows from financing activities – – 105,998 – – –
Notes
147GENERAL INFORMATIONMANAGEMENT AND ISSUES 2017CONSOLIDATED FINANCIAL STATEMENTSGROUP MANAGEMENT REPORTDIGITAL TRANSFORMATION

Segment reporting
Order intake Sales revenue EBIT
€ thousands 2017 2016 2017 2016 2017 2016
Pumps segment 1,473,628 1,386,617 1,444,392 1,428,491 79,891 60,876
Valves segment 343,505 331,182 338,849 360,794 51 8,794
Service segment 448,179 438,756 421,717 416,521 37,303 33,279
Reconciliation to PoC – – – – 40,154 – – 14,780
Total 2,265,312 2,156,555 2,204,958 2,165,652 117,245 88,169
Financial income – Interest and similar income 6,139 6,357
Financial expense – Interest and similar expenses – 19,204 – 19,885
Earnings before income taxes (EBT) 104,180 74,641
€ 588,997 thousand (previous year: € 552,538 thousand) of the sales revenue presented was generated by the companies based in Germany, € 228,404 thousand (previous year: € 262,601 thousand) by the companies based in France, € 167,274 thousand (previous year: € 200,779 thousand) by the companies based in the USA, and € 1,220,283 thousand (previous year: € 1,149,734 thousand) by the other Group companies.
There were no relationships with individual customers that accounted for a material proportion of Group sales revenue.
At the reporting date, the total noncurrent assets of the KSB Group amounted to € 636,453 thousand (yearend figure in 2017: € 632,641 thousand), with 204,209 thousand (yearend figure in 2017: € 199,272 thousand) being attributable to the companies based in Germany and € 432,244 thousand (yearend figure in 2017: € 433,369 thousand) being attributable to the other Group companies. They include intangible assets, property, plant and equipment and investments accounted for using the equity method; noncurrent financial instruments and deferred tax assets are not included.
The order intake by segment presents order intake generated with third parties and nonconsolidated Group companies.
The external sales revenue by segment presents sales revenue generated with third parties and nonconsolidated Group companies.
The table shows earnings before interest and taxes (EBIT) and consolidated earnings before income taxes (EBT) including noncontrolling interests.
Segment reporting
The EBIT of the Pumps segment includes depreciation and amortisation expense of € 47.0 million (previous year: € 49.2 million), the EBIT of the Valves segment includes depreciation and amortisation expense of € 9.6 million (previous year: € 11.1 million) and the EBIT of the Service segment includes depreciation and amortisation expense of € 14.9 million (previous year: € 12.3 million).
148 CONSOLIDATED FINANCIAL STATEMENTS

IX. OTHER DISCLOSURES
Contingent liabilities (contingencies and commitments)
Contingent liabilities and collateral
€ thousands 2017 2016
Liabilities from guarantees 4,877 4,481
Liabilities from warranties 482 224
Liabilities from the granting of other security for third-party liabilities and other contingent liabilities 10,696 11,231
16,055 15,936
Other contingent liabilities are expected to include up to € 1,599 thousand (previous year: € 7,380 thousand) for tax items (plus any interest). At present, there are no indications that any claims will be asserted under these obligations.
The Group has contingent liabilities as a result of its investment in associates and joint ventures of € 7,426 thousand (previous year: € 9,344 thousand). The reported amount is the Group’s share of contingent liabilities from joint ventures. Contingent liabilities relating to other investments total € 963 thousand (previous year: € 1,006 thousand). The extent to which these will result in a cash outflow depends on the future business performance of the respective company.
Operating leases
Minimum lease payments
€ thousands 2017 2016
Due within 1 year 15,696 16,627
Due between 1 and 5 years 30,069 29,269
Due after more than 5 years 3,941 7,001
49,706 52,897
In the year under review, € 16,627 thousand (previous year: € 17,832 thousand) was spent.
Operating leases relate primarily to vehicles and real estate. Finance leases
Finance leases relate mostly to real estate, as well as to other equipment, operating and office equipment. The term of the contract covers most of the useful life of the asset concerned.
The annual obligations from IT services agreements amount to € 41,844 thousand (previous year: € 56,243 thousand) over a term of one to five years.
As in the previous year, there are no purchase price obligations from acquisitions of companies and no payment obligations from capitalisation measures at Group companies.
Finance leases
Minimum lease payments Present values
€ thousands 2017 2016 2017 2016
Due within 1 year 359 561 353 501
Due between 1 and 5 years 579 587 574 584
Due after more than 5 years – 112 – 109
938 1,260 927 1,194
Notes
149GENERAL INFORMATIONMANAGEMENT AND ISSUES 2017CONSOLIDATED FINANCIAL STATEMENTSGROUP MANAGEMENT REPORTDIGITAL TRANSFORMATION

The aggregate purchase obligation for investments (principally items of property, plant and equipment) amounts to € 12,249 thousand (previous year: € 17,854 thousand). Almost all of the corresponding payments are due in 2018.
Research and development costs
Research and development costs in the year under review amounted to € 47,106 thousand (previous year: € 51,262 thousand). Some of these costs are contract costs under IAS 11.
Related party disclosures
Balances and transactions between KSB SE & Co. KGaA and its subsidiaries, which are related parties, have been eliminated during the consolidation process and are not explained in further detail. Details regarding transactions between the KSB Group and other related parties are provided below.
Other related parties include:
Pursuant to section 21(1) of the WpHG [Wertpapierhandels-gesetz – German Securities Trade Act], KSB Stiftung [KSB Foundation], Stuttgart, notified us on 21 May 2008 that its voting interest in KSB SE & Co. KGaA, Frankenthal / Pfalz exceeded the 75.00 % threshold on 5 May 2008 and amounted to 80.24 % (711,453 voting shares) on this date. 0.54 % of the voting rights (4,782 voting shares) were held directly by KSB Stiftung, Stuttgart, and 79.70 % (706,671 voting shares) were attributable to KSB Stiftung, Stuttgart, pursuant to section 22(1), sentence 1, No. 1 of the WpHG. The voting rights attributed to KSB Stiftung, Stuttgart, were held by Johannes und Jacob Klein GmbH, Frankenthal. In 2017 the voting interest of Johannes und Jacob Klein GmbH increased to 83.76 %.
Related parties also include the subsidiary companies and joint ventures of Johannes und Jacob Klein GmbH, Frankenthal, as well as the Kühborth Stiftung GmbH [Kühborth Foundation], Stuttgart, which holds 1 % of the shares in Johannes und Jacob Klein GmbH. In addition, related parties include the Managing Directors of Johannes und Jacob Klein GmbH, as well as enti
ties controlled or jointly controlled by the Managing Directors of Johannes und Jacob Klein GmbH.
In the reporting period, related parties also included the Supervisory Board and the Board of Management of KSB, which operated under the legal form of a public limited company under German law [Aktiengesellschaft] until the end of the financial year.
The following table shows services provided and used, as well as pending receivables and liabilities owed from and to related parties:
Services, receivables and liabilities in dealings with related parties
Further information on joint ventures and associates (related party disclosures) can be found in Section IV. Balance Sheet Disclosures – Notes No. 4 “Investments accounted for under the equity method”, No. 6 “Trade receivables and PoC as well as other financial and nonfinancial assets” and No. 10 “Liabilities”, and in Section IX. Other Disclosures – Contingent Liabilities.
The transactions in relation to the parent company Johannes und Jacob Klein GmbH are based on a rental and services agreement. In addition, Johannes und Jacob Klein GmbH received dividend payments.
Transactions with subsidiaries of Johannes und Jacob Klein GmbH comprise transactions with Palatina Versicherungsservice GmbH, Abacus alpha GmbH, Abacus Resale GmbH, Abacus Experten GmbH and Salinnova GmbH (formerly AIM Separation GmbH). There were no transactions with associates or joint ventures of Johannes und Jacob Klein GmbH in the financial year.
A rental and services agreement for insurances is in place between Palatina Versicherungsservice GmbH and KSB SE & Co. KGaA. Abacus Experten GmbH concluded a number of service
150 CONSOLIDATED FINANCIAL STATEMENTS

agreements with KSB SE & Co. KGaA; there is a framework delivery and service agreement with Abacus Resale GmbH for the purchase of returns and the provision of additional associated services. In addition, products were delivered to the company as part of the normal business activities. KSB SE & Co. KGaA and Abacus alpha GmbH have also concluded service agreements. Our products were delivered to airinotec GmbH and Salinnova GmbH as part of normal business activities. We purchased spare parts from Salinnova GmbH. In the financial year, two Supervisory Board members held an immaterial share of interests in our company.
Transactions with related parties are, as a rule, performed at arm’s length. Transactions that initially were not performed at arm’s length in the 2017 financial year were compensated in the financial year.
Until the end of the 2017 financial year, the company was granted reimbursements under agreements for the compensation of dis
Services, receivables and liabilities in dealings with related parties
Sales of goods and services
Purchases of goods and services Receivables Liabilities
€ thousands 2017 2016 2017 2016 31 Dec. 2017 31 Dec. 2016 31 Dec. 2017 31 Dec. 2016
KSB Stiftung and Kühborth-Stiftung GmbH – – – – – – – –
Johannes und Jacob Klein GmbH (formerly: Klein Pumpen GmbH) 1,708 143 16 35 4 133 16 –
Subsidiaries of Johannes und Jacob Klein GmbH 1,448 75 2,845 765 182 124 774 214
Associates / joint ventures of Johannes und Jabob Klein GmbH – 483 – 2,172 – – – 25
Other related parties (corporate bodies), excluding “Management remuneration” 105 12 16 16 6 1 – –
advantages concluded with Johannes und Jacob Klein GmbH as well as related and other parties, amounting to € 2.5 million for rental and services transactions. They were recorded under other operating income. € 0.1 million of these relate to the period from January to April 2017, € 2.1 million to the financial years from 2006 to 2016 and € 0.3 million to cost reimbursements in connection with tax issues. This resulted in tax liabilities including interest amounting to a total of € 5.1 million for the financial years from 2007 to 2016, with a final settlement being agreed with the fiscal authorities. A major share of this amount was already paid in the 2017 financial year. Within the scope of ongoing legal investigations commissioned by the company, further claims of the company exceeding the volume covered by the agreements already made in financial years 2016 and 2017 are being reviewed by an external legal consultancy firm.
Pending balances at the year end are unsecured, do not accrue interest and are settled by means of payments. No guarantees were given or received. The receivables presented here, as in the
Notes
151GENERAL INFORMATIONMANAGEMENT AND ISSUES 2017CONSOLIDATED FINANCIAL STATEMENTSGROUP MANAGEMENT REPORTDIGITAL TRANSFORMATION

previous year, are not subject to write-downs and no provisions have been created for this purpose.
Disclosures and information on affiliates and investments ac-counted for using the equity method provided in other section of these Notes refer to relations covering the supply of products and services on an arm’s length basis, unless stated otherwise.
Pursuant to IAS 24, the remuneration of key management per-sonnel of the Group must be disclosed. The following table con-tains the relevant figures for the KSB Group with regard to the remuneration paid to members of the Board of Management of KSB, which operated under the legal form of a public limited company under German law [Aktiengesellschaft] until the end of the financial year.
Management remuneration
€ thousands 31 Dec. 2017 31 Dec. 2016
Short-term benefits (total remuneration) 1,858 1,250
Post-employment benefits 1,422 1,388
Other long-term benefits – –
Termination benefits – –
Share-based payments – –
Total 3,280 2,638
Based on the relevant legal provisions, the Annual General Meeting on 6 May 2015 resolved not to disclose the remuner-ation of the Board of Management separately for each member and classified by components. € 2,934 thousand (previous year: € 5,255 thousand) has been provided for pension obligations to active members of the Board of Management as at 31 Dec. 2017, and € 42,202 thousand (previous year: € 39,309 thou-
sand) to former members of the Board of Management and their surviving dependants; total benefits paid to these persons amounted to € 2,422 thousand in the year under review (pre-vious year: € 2,244 thousand).
The short-term benefits paid to members of the Supervisory Board amount to € 834 thousand for the 2017 financial year (previous year: € 716 thousand).
The members of the Supervisory Board and the Board of Man-agement are listed before the presentation of the proposal on the appropriation of the net retained earnings of KSB AG.
Auditors
PricewaterhouseCoopers GmbH Wirtschaftsprüfungsgesell-schaft, based in Frankfurt am Main with an office in Mannheim, were appointed as auditors and group auditors for the 2017 financial year at the Annual General Meeting of KSB SE & Co. KGaA on 10 May 2017. Overall, fees (including expenses) amounting to € 1,334 thousand were recognised as expenses. Of this, € 1,086 thousand relates to audit services, € 49 thou-sand to other assurance services and € 199 thousand to other services.
KSB applied the IDW RS HFA 36 (new version) standard for the financial year ending on 31 December 2016, i.e. earlier than required. The audit fees include costs for the audit of the con-solidated financial statements and of the statutory annual finan-cial statements of KSB SE & Co. KGaA and the German sub-sidiaries included in the consolidated financial statements. The fees for other certification services primarily include attestation services outside of the audit of the annual financial statements. The fees for other services mainly include fees for project- specific consultancy services.
152 CONSOLIDATED FINANCIAL STATEMENTS

Use of exemption option
KSB Service GmbH, Frankenthal, KSB Service GmbH, Schwedt and Uder Elektromechanik GmbH, Friedrichsthal, have made partial use of the exemption provision under section 264(3) of the HGB.
Events after the reporting period
The Annual General Meeting of KSB SE & Co. KGaA adopted a resolution on 10 May 2017 on the announced change in the legal form of the company to a partnership limited by shares [Kommanditgesellschaft auf Aktien – KGaA]. An entry was made to that effect in the Handelsregister [German Commercial Register] on 17 January 2018.
No further significant events occurred after the balance sheet date that would have a material effect on the company’s results of operations, financial position and net assets.
German Corporate Governance Code
The Managing Directors and the Supervisory Board of KSB SE & Co. KGa issued the current statement of compliance with the recommendations of the Government Commission on the Ger-man Corporate Governance Code in accordance with section 161 of the AktG [Aktiengesetz – German Public Companies Act] on 21 March 2018. The statement of compliance is published on our web site (www.ksb.com) and has thus been made per-manently accessible.
Notes
153GENERAL INFORMATIONMANAGEMENT AND ISSUES 2017CONSOLIDATED FINANCIAL STATEMENTSGROUP MANAGEMENT REPORTDIGITAL TRANSFORMATION

No. Name and seat Country Capital share in % Held by No.
National
1 Dynamik-Pumpen GmbH, Stuhr Germany 100.00
2 KAGEMA Industrieausrüstungen GmbH, Pattensen Germany 100.00
3 KSB Armaturen Verwaltungs- und Beteiligungs-GmbH, Frankenthal Germany 100.00
4 KSB Service GmbH, Frankenthal Germany 100.00
5 KSB Service GmbH, Schwedt Germany 100.00
6 PAB Pumpen- und Armaturen-Beteiligungsges. mbH, Frankenthal Germany 51.00
7 PMS-BERCHEM GmbH, Neuss Germany 100.00
8 Pumpen-Service Bentz GmbH, Reinbek Germany 100.00
9 Uder Elektromechanik GmbH, Friedrichsthal Germany 100.00
International
10 Aplicaciones Mecánicas Válvulas Industriales, S.A. (AMVI), Burgos Spain 100.00 27
11 Canadian Kay Pump Limited, Mississauga / Ontario Canada 100.00
12 Dalian KSB AMRI Valves Co., Ltd., Dalian China 100.00 27
13 DP industries B.V., Alphen aan den Rijn The Netherlands 100.00 26
14 FORTY FOUR ACTIVIA PARK (PTY) LTD, Germiston (Johannesburg) South Africa 100.00 49
15 GIW Industries, Inc., Grovetown / Georgia USA 100.00 17
16 Hydroskepi GmbH, Amaroussion (Athens) Greece 100.00
17 KSB America Corporation, Richmond / Virginia USA 100.00 6
18 KSB AMRI Inc., Houston / Texas USA10.03 57
89.97 17
19 KSB Australia Pty Ltd, Bundamba QLD Australia 100.00 27
20 KSB Belgium S.A., Bierges-lez-Wavre Belgium 100.00 27
21 KSB BRASIL LTDA., Várzea Paulista Brazil 100.00 27
22 KSB, Bombas e Válvulas, SA, Albarraque Portugal 95.00
23 KSB Chile S.A., Santiago Chile 100.00
24 KSB Compañía Sudamericana de Bombas S.A., Carapachay (Buenos Aires) Argentina95.00 27
5.00
25 KSB de Mexico, S.A. de C.V., Querétaro Mexico 100.00
26 KSB Finance Nederland B.V., Zwanenburg The Netherlands 100.00 27
27 KSB FINANZ S.A., Echternach Luxembourg 100.00
28 KSB Finland Oy, Kerava Finland 100.00
29 KSB, Inc., Richmond / Virginia USA 100.00 17
30 KSB, Inc. – Western Division, Bakersfield / California USA 100.00 17
31 KSB Italia S.p.A., Milan Italy 100.00 27
32 KSB ITUR Spain S.A., Zarautz Spain 100.00 27
33 KSB Korea Ltd., Seoul South Korea 100.00
34 KSB Limited, Hong Kong China 100.00
35 KSB Limited, Loughborough United Kingdom 100.00 27
LIST OF SHAREHOLDINGS
Affiliates (national and international)
154 CONSOLIDATED FINANCIAL STATEMENTS

No. Name and seat Country Capital share in % Held by No.
36 KSB Malaysia Pumps & Valves Sdn. Bhd., Shah Alam Malaysia 100.00 63
37 KSB Middle East FZE, Dubai U.A.E. 100.00 27
38 KSB MIL Controls Limited, Annamanada India49.00 54
51.00
39 KSB Sverige Aktiebolag AB, Gothenburg Sweden 100.00
40 KSB Nederland B.V., Zwanenburg The Netherlands 100.00 26
41 KSB New Zealand Limited, Albany / Auckland New Zealand 100.00 19
42 KSB Norge AS, Ski Norway 100.00
43 KSB Österreich Gesellschaft mbH, Vienna Austria 100.00 27
44 KSB PHILIPPINES, INC., Makati City Philippines 100.00 63
45 KSB-Pompa, Armatür Sanayi ve Ticaret A.S., Ankara Turkey 100.00 27
46 KSB POMPES ET ROBINETTERIES S.à.r.l. d'Associé unique, Casablanca Morocco 100.00 57
47 KSB Pompy i Armatura Sp. z o.o., Ozarow-Mazowiecki Poland 100.00
48 KSB Pump & Valve Technology Service (Tianjin) Co., Ltd, Tianjin China 100.00 34
49 KSB Pumps and Valves (Pty) Ltd., Germiston (Johannesburg) South Africa 84.99 55
50 KSB Pumps and valves L.t.d., Domžale Slovenia 100.00
51 KSB Pumps Co. Ltd., Bangkok Thailand 40.00
52 KSB Pumps Company Limited, Lahore Pakistan 58.89
53 KSB Pumps Inc., Mississauga / Ontario Canada 100.00 27
54 KSB Pumps Limited, Pimpri (Pune) India 40.54 11
55 KSB Pumps (S.A.) (Pty) Ltd., Germiston (Johannesburg) South Africa 100.00 27
56 KSB-Pumpy+Armatury s.r.o., koncern, Prague Czech Republic 100.00
57 KSB S.A.S., Gennevilliers (Paris) France 100.00 27
58 KSB Seil Co., Ltd., Busan South Korea 100.00
59 KSB Service Belgium S.A./N.V., Bierges-lez-Wavre Belgium 100.00 20
60 KSB Service EITB-SITELEC S.A.S., Montfavet France 100.00 57
61 KSB Service Energie S.A.S.U., Rambervillers France 100.00 57
62 KSB Shanghai Pump Co., Ltd., Shanghai China 80.00 27
63 KSB Singapore (Asia Pacific) Pte Ltd, Singapore Singapore 100.00
64 KSB Szivattyú és Armatura Kft., Budapest Hungary 100.00
65 KSB Taiwan Co., Ltd., New Taipei City Taiwan 100.00
66 KSB Tech Pvt. Ltd., Pimpri (Pune) India 100.00
67 KSB Valves (Changzhou) Co., Ltd., Jiangsu China 100.00
68 KSB Verwaltung (Schweiz) AG, Reinach Switzerland 100.00 27
69 KSB Vietnam Co., Ltd, Long Thanh District Vietnam 100.00 63
70 KSB (Schweiz) AG, Oftringen Switzerland 100.00
71 KSB SERVICE COTUMER S.A.S., Déville lès Rouen France 100.00 61
72 OOO “KSB“, Moscow Russia 100.00 3
73 PT. KSB Indonesia, Cibitung Indonesia94.10 27
5.90
74 PT. KSB Sales Indonesia, Cibitung Indonesia99.00 73
1.00
155GENERAL INFORMATIONMANAGEMENT AND ISSUES 2017CONSOLIDATED FINANCIAL STATEMENTSGROUP MANAGEMENT REPORTDIGITAL TRANSFORMATION
NotesL is t o f Sharehold ings

No. Name and seat Country Capital share in % Held by No.
75 PUMPHUSET Sverige AB, Sollentuna Sweden 100.00 39
76 REEL s.r.l., Ponte di Nanto Italy 100.00
77 SISTO Armaturen S.A., Echternach Luxembourg 52.85 27
78 Smedegaard Pumps Limited, Bridgwater United Kingdom 100.00 35
79 Société de travaux et Ingénierie Industrielle S.A.S., Déville lès Rouen France 100.00 71
80 SPI Energie S.A.S., La Ravoire France 100.00 57
81 Standard Alloys Incorporated, Port Arthur / Texas USA 100.00 17
82 VM Pumpar AB, Gothenburg Sweden 100.00 39
No. Name and seat CountryCapital share
in %Held by
No.Equity*
€ thousands
Net profit / loss for the year*
€ thousands
National
83 Nikkiso-KSB GmbH, Pegnitz Germany 50.00 – 455 40
International
84 KSB MOTOR TEKNOLOJİLERİ SANAYİ VE TİCARET ANONİM ŞİRKETİ, Ankara Turkey 55.00 45 101 – 5
85 KSB Pumps Arabia Ltd., Riyadh Saudi Arabia 50.00 27 15,286 1,192
86 KSB Service LLC, Abu Dhabi U.A.E. 49.00 6,715 437
87 Shanghai Electric-KSB Nuclear Pumps and Valves Co., Ltd., Shanghai China 45.00 28,886 977
No. Name and seat CountryCapital share
in %Held by
No.Equity*
€ thousands
Net profit / loss for the year*
€ thousands
International
88 Motori Sommersi Riavvolgibili S.r.l., Cedegolo Italy 25.00 4,661 2,333
Joint ventures (national and international)
Associates (national and international)
* Data according to latest annual financial statements under IFRS
Prior-period figures
156 CONSOLIDATED FINANCIAL STATEMENTS

No. Name and seat CountryCapital share
in %Held by
No.Equity*
€ thousands
Net profit / loss for the year*
€ thousands
National
89 gear-tec GmbH, Eggebek Germany 51.00 327 – 7
90 Pumpen Partner Netzwerk UG, Stein Germany 51.00 4 2 0
International
91 IOOO “KSB BEL“, Minsk Belarus98.10 72
481 1711.90 3
92 KSB Algérie Eurl, Bordj el Kifane (Alger) Algeria 100.00 27 794 318
93 KSB Čerpadlá a Armatúry, s.r.o., Bratislava Slovakia 100.00 332 5
94 KSB Colombia SAS, Funza (Cundinamarca) Colombia 100.00 27 584 7
95 KSB Ltd., Tokyo Japan 100.00 – 1,658 – 483
96 KSB Perú S.A., Lurin Peru 100.00 1,210 55
97 KSB Pumpe i Armature d.o.o. Beograd, Belgrade Serbia 100.00 50 56 – 3
98 KSB pumpe i armature d.o.o., Rakov Potok Croatia 100.00 50 150 42
99 KSB ZAMBIA LIMITED, Kitwe Zambia 60.00 55 2 4
100 Techni Pompe Service Maroc (TPSM), Casablanca Morocco 100.00 46 – 482 – 41
101 TOO “KSB Kazakhstan“, Almaty Kazakhstan 100.00 72 137 87
102 TOV “KSB Ukraine“, Kiev Ukraine 100.00 72 293 112
Companies not consolidated because of immateriality – Affiliates (national and international)
* Data according to latest annual financial statements under IFRS
Prior-period figures
157GENERAL INFORMATIONMANAGEMENT AND ISSUES 2017CONSOLIDATED FINANCIAL STATEMENTSGROUP MANAGEMENT REPORTDIGITAL TRANSFORMATION
NotesL is t o f Sharehold ings

SUPERVISORY BOARD
Dr. Wolfgang Kühborth, Dipl.-Ing., Frankenthal
Honorary Chairman of the Supervisory Board
(† 31 Jan. 2017)
Dr. Thomas Seeberg, Dipl.-Kfm., Icking 1)
Former Managing Director of OSRAM GmbH
(Chairman of the Supervisory Board until 28 Feb. 2017)
Dr. Bernd Flohr, Dipl.-Kfm., Dipl.-Soz., Geislingen
Former Executive Board Member of WMF AG
(Chairman of the Supervisory Board since 22 March 2017)
Alois Lautner, Lathe Operator, Kirchenthumbach 2)
Deputy Chairman of the Pegnitz Works Council
(Deputy Chairman of the Supervisory Board)
Dr. Stella A. Ahlers, Kauffrau, Feusisberg, Switzerland 3)
Chairwoman of the Board of Management of Ahlers AG
(Member of the Supervisory Board from 11 May 2016 to 20 March 2017)
Dr. Martin Auer, Mannheim 4)
Head of Corporate Legal, Compliance, Procurement and Logistic Services
MVV Energie AG
(Member of the Supervisory Board until 28 Feb. 2017)
Dr.-Ing. Stephan Bross, Freinsheim 5)
Head of Corporate Unit Pumps
(Member of the Supervisory Board until 14 Sept. 2017)
Oswald Bubel, Dipl.-Betriebswirt, Saarbrücken
Managing Director of Hager Electro GmbH & Co. KG
(Member of the Supervisory Board from 21 March 2017 to 31 Jan. 2018)
Klaus Burchards, Dipl.-Kfm., Stuttgart
Independent Auditor
(Member of the Supervisory Board since 18 April 2017)
Arturo Esquinca, Dipl.-Chemieing., Forch, Switzerland
Coesia Group, Industrial Process Division, Zurich, Switzerland
Head of Business Development
(Member of the Supervisory Board since 26 Feb. 2018)
Dr. Jörg Matthias Großmann, Dipl.-Kfm., Großhesselohe 6)
Member of the Management / CFO of
Freudenberg Chemical Specialities SE & Co. KG
(Member of the Supervisory Board until 14 April 2017)
René Klotz, NC Programmer, Frankenthal
Chairman of the General Works Council
Wolfgang Kormann, Hand Moulder, Pegnitz
Member of the European Works Council,
Chairman of the Group Works Council
Klaus Kühborth, Dipl.-Wirtsch.Ing., Frankenthal
Managing Director of Johannes und Jacob Klein GmbH
Monika Kühborth, Editor, Homburg
Managing Director of Klein, Schanzlin & Becker GmbH
(Member of the Supervisory Board from 21 March 2017 to 31 Jan. 2018)
Birgit Mohme, Industrial Business Management Assistant, Frankenthal 7)
Trade Union Secretary of IG Metall Ludwigshafen-Frankenthal
Volker Seidel, Electrical and Electronics Installer, Münchberg
1. Delegate of IG Metall Ostoberfranken
Prof. Dr.-Ing. Corinna Salander, Stuttgart 8)
Head of Railway Vehicle Technology, Stuttgart University
(Member of the Supervisory Board since 26 Feb. 2018)
Gabriele Sommer, Dipl.-Geol., Wörthsee 9)
Global Head of Human Resources TÜV SÜD AG
Dr. Hans-Stefan Wiß, Ludwigshafen
Head of Legal & Compliance, KSB SE & Co. KGaA
(Member of the Supervisory Board since 15 Sept. 2017)
158 CONSOLIDATED FINANCIAL STATEMENTS
Mandates of KSB Supervisory Board members on the Supervisory Board / Board of Directors of other companies
1) Member of the Board of Trustees of WTS-Stiftung für Altersversorgung, Munich, Germany 2) BKK advita, Alzey, Germany 3) Adolf Ahlers AG, Zug, Switzerland 4) PALATINA Versicherungsservice GmbH, Frankenthal, Germany Stadtwerke Ingolstadt Beteiligungs GmbH, Ingolstadt, Germany 5) Burckhardt Compression AG, Winterthur, Switzerland 6) Klüber Lubrication München SE & Co. KG, Munich, Germany Klüber Lubrication India Pvt. Ltd., Bangalore, India FCS Holding Inc., Wilmington, USA Chem-Trend Holding LP, Wilmington, USA Externa Holding S.R.L., Milan, Italy
7) Deutsche Rentenversicherung Rheinland-Pfalz, Speyer, Germany 8) Supervisory Board, Bombardier Transportation GmbH Scientific Committee Shift2Rail Group of publishers of Eisenbahntechnische Rundschau (ETR) Scientific Advisory Council of ZEVrail University bodies Chair of the Doctoral Candidate Admissions Committee of Faculty 7 Spokesperson of the Centre for Transportation Research of Stuttgart University (FOVUS) Member of the Research / Young Scientists and Equal Opportunities senate committees Deputy Equal Opportunities Officer of Stuttgart University 9) TÜV SÜD Industrie Service GmbH, Munich, Germany TÜV SÜD Auto Service GmbH, Stuttgart, Germany
159GENERAL INFORMATIONMANAGEMENT AND ISSUES 2017CONSOLIDATED FINANCIAL STATEMENTSGROUP MANAGEMENT REPORTDIGITAL TRANSFORMATION
NotesSuperv isory Board

Mandates of the Managing Directors
on the Board of Directors of KSB companies
1) SISTO Armaturen S.A., Echternach, Luxembourg KSB FINANZ S.A., Echternach, Luxembourg KSB Pumps (S.A.) (Pty) Ltd., Germiston (Johannesburg), South Africa (until 31 May 2017) KSB Pumps and Valves (Pty) Ltd., Germiston (Johannesburg), South Africa (until 31 May 2017)
2) KSB Finanz S.A., Echternach, Luxembourg KSB Finance Nederland B.V., Zwanenburg, The Netherlands Canadian Kay Pump Limited, Mississauga / Ontario, Canada KSB America Corporation, Richmond / Virginia, USA KSB Pumps Limited, Pimpri (Pune), India KSB Shanghai Pump Co., Ltd., Shanghai, China Shanghai Electric-KSB Nuclear Pumps and Valves Co., Ltd., Shanghai, China KSB Bombas Hidráulicas S.A., Várzea Paulista, Brazil GIW Industries, Inc., Grovetown / Georgia, USA KSB, Inc., Richmond / Virginia, USA
3) KSB Finanz S.A., Echternach, Luxembourg KSB Finance Nederland B.V., Zwanenburg, The Netherlands Canadian Kay Pump Limited, Mississauga / Ontario, Canada KSB America Corporation, Richmond / Virginia, USA (from 7 July 2017) KSB Pumps Limited, Pimpri (Pune), India (from 25 July 2017) KSB Shanghai Pump Co., Ltd., Shanghai, China Shanghai Electric-KSB Nuclear Pumps and Valves Co., Ltd., Shanghai, China GIW Industries, Inc., Grovetown / Georgia, USA
4) SISTO Armaturen S.A., Echternach, Luxembourg (from 20 Feb. 2018) KSB Shanghai Pump Co., Ltd., Shanghai, China
5) KSB Pumps Limited, Pimpri (Pune), India KSB Pumps (S.A.) (Pty) Ltd., Germiston (Johannesburg), South Africa KSB Pumps and Valves (Pty) Ltd., Germiston (Johannesburg), South Africa
Gate Motor Teknolojileri Sanayi ve Ticaret A.S., TurkeyDP industries B.V., Alphen, The Netherlands (until 31 Dec. 2017)
Dr.-Ing. Peter Buthmann, Frankenthal 1) (until 31 Dec. 2017)
Human Resources Director
Technology, Production, Sales, Purchasing, Human Resources
and the Pumps and Valves segments
Werner Stegmüller, Mannheim 2) (until 30 May 2017)
Finance and Accounting, Controlling,
Communications, Investor Relations, IT, Patents & Trademarks,
Legal & Compliance, Internal Audits and the Service segment
Dr. Matthias Schmitz, Frankenthal 3) (from 1 June 2017)
Finance, Controlling, Investor Relations, IT, Purchasing
Ralf Kannefass, Regensburg 4) (from 1 July 2017)
Sales, Service
Dr. Stephan Bross, Freinsheim 5) (from 15 Sept. 2017)
Technology, Products, Operations, Digital Transformation
Dr. Stephan Jörg Timmermann, Augsburg (from 13 Nov. 2017)
Sprecher [Chairman]
Strategy, Human Resources, Communications, Legal & Compliance
LEGAL REPRESENTATIVES
Managing Directors of KSB Management SE (from 17 January 2018, previously: Board of Management of KSB Aktiengesellschaft)
160 CONSOLIDATED FINANCIAL STATEMENTS

PROPOSAL ON THE APPROPRIATION OF THE NET RETAINED EARNINGS OF KSB SE & Co. KGaA
We will propose to the Annual General Meeting that the net retained earnings of € 13,359,777.62 of KSB SE & Co. KGaA be appropriated as follows:
Distribution of a dividend of € 7.50 per ordinary noparvalue share € 6,649,612.50
and, in accordance with the Articles of Association, € 7.76 per preference noparvalue share € 6,710,165.12
Frankenthal, 21 March 2018
KSB Management SE
The Managing Directors
The annual financial statements of KSB SE & Co. KGaA were prepared in accordance with German accounting principles. They are published in the Bundesanzeiger [German Federal Gazette]. The annual financial statements can also be downloaded from our web site at www.ksb.com, or sent in print form on request.
161GENERAL INFORMATIONMANAGEMENT AND ISSUES 2017CONSOLIDATED FINANCIAL STATEMENTSGROUP MANAGEMENT REPORTDIGITAL TRANSFORMATION
NotesLegal Representat ivesProposa l on the Appropr iat ion of the Net Reta ined Earn ings of KSB SE & Co. KGaA

162

GE
NE
RA
L IN
FOR
MA
TIO
N
GENERAL INFORMATIONMANAGEMENT AND ISSUES 2017CONSOLIDATED FINANCIAL STATEMENTSGROUP MANAGEMENT REPORTDIGITAL TRANSFORMATION
GENERAL INFOR- MATION 164 Responsibility Statement 165 Independent Auditor’s Report 175 Glossary 176 Contacts
164
To the best of our knowledge, and in accordance with the applicable reporting principles, the consolidated financial statements give a true and fair view of the assets, liabilities, finan-cial position and profit or loss of the Group, and the group management report includes a fair review of the development and performance of the business and the position of the Group, together with a description of the principal opportunities and risks associated with the expected development of the Group.
Frankenthal, 21 March 2018
KSB Management SE
The Managing Directors
RESPONSIBILITY STATEMENT
GENERAL INFORMATION

165
To KSB SE & Co. KGaA, Frankenthal / Pfalz
REPORT ON THE AUDIT OF THE CONSOLIDATED FINANCIAL STATEMENTS AND OF THE GROUP MANAGEMENT REPORT
AUDIT OPINIONS
We have audited the consolidated financial statements of KSB SE & Co. KGaA (formerly KSB Aktiengesellschaft), Frankenthal / Pfalz, and its subsidiaries (the Group), which comprise the statement of financial position as at 31 December 2017, and the statement of comprehensive income, statement of changes in equity and statement of cash flows for the financial year from 1 January to 31 December 2017, and notes to the consolidated financial statements, includ - ing a summary of significant accounting policies. In addition, we have audited the group man-agement report of KSB SE & Co. KGaA for the financial year from 1 January to 31 December 2017. We have not audited the content of those parts of the group management report listed in the “Other Information” section of our auditor's report in accordance with the German legal requirements.
In our opinion, on the basis of the knowledge obtained in the audit,
the accompanying consolidated financial statements comply, in all material respects, with the IFRSs as adopted by the EU, and the additional requirements of German commercial law pursuant to § [Article] 315e Abs. [paragraph] 1 HGB [Handelsgesetzbuch: German Commer-cial Code] and, in compliance with these requirements, give a true and fair view of the as-sets, liabilities, and financial position of the Group as at 31 December 2017, and of its finan-cial performance for the financial year from 1 January to 31 December 2017 and
the accompanying group management report as a whole provides an appropriate view of the Group’s position. In all material respects, this group management report is consistent with the consolidated financial statements, complies with German legal requirements and appro-priately presents the opportunities and risks of future development. Our audit opinion on the group management report does not cover the content of those parts of the group manage-ment report listed in the “Other Information” section of our auditor’s report.
Pursuant to § 322 Abs. 3 Satz [sentence] 1 HGB, we declare that our audit has not led to any reservations relating to the legal compliance of the consolidated financial statements and of the group management report.
BASIS FOR THE AUDIT OPINIONS
We conducted our audit of the consolidated financial statements and of the group management report in accordance with § 317 HGB and the EU Audit Regulation (No. 537 / 2014, referred to subsequently as “EU Audit Regulation”) and in compliance with German Generally Accepted
INDEPENDENT AUDITOR’S REPORT
GENERAL INFORMATIONMANAGEMENT AND ISSUES 2017CONSOLIDATED FINANCIAL STATEMENTSGROUP MANAGEMENT REPORTDIGITAL TRANSFORMATION
Respons ib i l i ty S tatementIndependent Audi tor ’s Report

166
Standards for Financial Statement Audits promulgated by the Institut der Wirtschaftsprüfer [Institute of Public Auditors in Germany] (IDW). Our responsibilities under those requirements and principles are further described in the “Auditor's Responsibilities for the Audit of the Consolidated Financial Statements and of the Group Management Report” section of our au-ditor’s report. We are independent of the group entities in accordance with the requirements of European law and German commercial and professional law, and we have fulfilled our other German professional responsibilities in accordance with these requirements. In addition, in accordance with Article 10 (2) point (f) of the EU Audit Regulation, we declare that we have not provided non-audit services prohibited under Article 5 (1) of the EU Audit Regulation. We believe that the audit evidence we have obtained is sufficient and appropriate to provide a basis for our audit opinions on the consolidated financial statements and on the group man-agement report.
KEY AUDIT MATTERS IN THE AUDIT OF THE
CONSOLIDATED FINANCIAL STATEMENTS
Key audit matters are those matters that, in our professional judgment, were of most significance in our audit of the consolidated financial statements for the financial year from 1 January to 31 December 2017. These matters were addressed in the context of our audit of the consol-idated financial statements as a whole, and in forming our audit opinion thereon; we do not provide a separate audit opinion on these matters.
In our view, the matters of most significance in our audit were as follows:
1 Recoverability of goodwill2 Accounting treatment for customer-specific construction contracts 3 Recognition and presentation of transactions with “related parties”
Our presentation of these key audit matters has been structured in each case as follows:
1 Matter and issue 2 Audit approach and findings3 Reference to further information
Hereinafter we present the key audit matters:
1 Recoverability of goodwill
1 In the Company’s consolidated financial statements goodwill amounting in total to EUR 70.5 million is reported under the "Intangible assets" balance sheet item. Goodwill is tested for impairment by the Company once a year or when there are indications of impairment to determine any possible need for write-downs. Impairment testing is carried out at the level
GENERAL INFORMATION

167
of the cash-generating units to which the relevant goodwill is allocated. The carrying amount of the relevant cash-generating unit, including goodwill, is compared with the cor-responding recoverable amount in the context of the impairment test. The recoverable amount is generally calculated on the basis of the value in use, and in one case on the basis of the fair value less costs of disposal. The present value of the future cash flows from the respective cash-generating unit normally serves as the basis of valuation. The present values are calculated using discounted cash flow models. For this purpose, the adopted medium-term business plan of the Group forms the starting point which is extrapolated based on assumptions about long-term rates of growth. Expectations relating to future market developments and assumptions about the development of macroeconomic factors are also taken into account. The discount rate used is the weighted average cost of capital for the relevant cash-generating unit. The impairment test resulted in the recognition of a write-down amounting to a total of EUR 5.6 million with respect to the cash-generating unit KSB Seil Co. Ltd., Busan / South Korea. The outcome of this valuation is dependent to a large extent on the estimates made by the executive directors with respect to the future cash inflows from the respective cash-generating unit, on the discount rate used, the rate of growth as well as other assumptions, and is therefore subject to considerable uncertainty. Against this background and due to the complex nature of the valuation, this matter was of particular significance in the context of our audit.
2 As part of our audit, we assessed the methodology employed for the purposes of performing
the impairment test, among other things. After matching the future cash inflows used for the calculation against the adopted medium-term business plan of the Group, we assessed the appropriateness of the calculation, in particular by reconciling it with general and sector-specific market expectations. We also assessed the appropriate consideration of the costs of Group functions. In the knowledge that even relatively small changes in the dis-count rate applied can have a material impact on the value of the entity calculated using this method, we focused our testing in particular on the parameters used to determine the discount rate applied, and assessed the calculation model. We evaluated the sensitivity analy-ses performed by the Company, in order to reflect the uncertainty inherent in the projec-tions. We evaluated that the necessary disclosures were made in the notes relating to cash- generating units for which a reasonably possible change in an assumption would result in the recoverable amount falling below the carrying amount of the cash-generating units including the allocated goodwill.
Overall, the measurement parameters and assumptions used by the executive directors are in line with our expectations and are also within the ranges considered by us to be reasonable.
3 The Company’s disclosures on goodwill are contained in section IV. note 1 of the notes to the consolidated financial statements.
GENERAL INFORMATIONMANAGEMENT AND ISSUES 2017CONSOLIDATED FINANCIAL STATEMENTSGROUP MANAGEMENT REPORTDIGITAL TRANSFORMATION
Independent Audi tor ’s Report

168
2 Accounting treatment for customer-specific construction contracts
1 Revenue totaling EUR 376.5 million reported in the consolidated financial statements of KSB SE & Co. KGaA is attributable to customer-specific construction contracts. Provided that the criteria of IAS 11 have been met, the revenue is recognized in accordance with the percentage-of-completion method, with the estimate of the stage of completion being based on the ratio of contract costs actually incurred to the planned total costs (“cost-to-cost method”). In particular, estimating the planned total costs and appropriately allocating the costs actually incurred to the contracts are based on the estimates and assumptions made by the executive directors. Against this background and due to the resulting uncertainties and the complexity of the accounting treatment, this matter was of particular significance in the context of our audit.
2 During our audit we assessed the processes and controls established by the Group in relation to recognizing revenue from customer-specific construction contracts taking into account the stage of completion. In addition, we examined projects on a sample basis to determine whether they met the requirements for the recognition of revenue in accordance with the percentage of completion pursuant to IAS 11. Moreover, we evaluated the determination of the stage of completion of customer-specific contracts on the basis of the cost-to-cost method and the resulting proportion of revenue recognized, considering that a prospective loss must be recognized immediately. In this connection we assessed the calculation of not only the planned total costs but also the costs actually incurred. We assessed the stage of completion, among other things based on interviews with project managers and by in-specting project documentation. In addition, we assessed the consistency of the methods used to calculate the costs incurred. Furthermore, we addressed the inherent audit risk in this audit area by audit procedures that were consistently carried out throughout the Group. We were able to satisfy ourselves that overall the established systems and processes as well as controls in place are appropriate and that the estimates and assumptions made by the exec-utive directors concerning the recognition and measurement of revenue according to the stage of completion are appropriately documented.
3 The Company’s disclosures regarding revenue from customer-specific construction contracts are contained in sections III., IV. note 6 and section V. note 11 of the notes to the consoli-dated financial statements.
GENERAL INFORMATION

169
3 Recognition and presentation of transactions with “related parties”
1 In the financial year 2017, the Group generated revenue from the sale of goods and services with related parties and incurred expenses from the sale of goods and services. The defini-tion of related parties pursuant to IAS 24 includes both entities and natural persons that are directly or indirectly controlled or significantly influenced by KSB SE & Co. KGaA, as well as entities and natural persons that directly or indirectly control, or exert significant influence over, KSB SE & Co. KGaA (hereinafter referred to as “related parties”). Legal transactions with related parties are generally executed at arm’s length. The Company has made disclosures in the consolidated financial statements on legal trans actions that were not originally executed at arm’s length in the financial year 2017 but were compensated for in the course of the financial year.
By the end of the financial year 2017, the Company had received reimbursements from agreements on compensation for disadvantages in the amount of EUR 2.5 million, which were recognized in “other operating income”. EUR 0.1 million of this amount relates to the period from January to April 2017, EUR 2.1 million relates to the financial years from 2006 to 2016 and EUR 0.3 million relates to cost reimbursements for tax processing. An external law firm was involved in the calculation of the compensation for disadvantages and the assertion of the claims. This resulted in tax obligations including interest in the total amount of EUR 5.1 million for the years from 2007 to 2016 that were agreed as part of an actual agreement with the tax authorities based on an expert opinion prepared by an external tax consultancy firm. As part of legal investigations commissioned by the Company which are still ongoing, other claims of the Company extending beyond the agreements already reached in the financial years 2016 and 2017 will be assessed by an external law firm.
Against this background and given the risk that not all transactions with related parties have been recognized by the Company, or that the disclosures on the related parties in the con-solidated financial statements are incomplete or incorrect, this matter was of particular sig-nificance during our audit.
2 As part of our audit, initially we conducted discussions with the executive directors and the legal department of KSB SE & Co. KGaA to obtain an understanding of the establishment of the organizational measures used to identify and approve the conclusion of agreements with related parties, as well as the controls established by the Company in this regard, and assessed these measures and controls. Furthermore, we obtained a full list of all agree-ments and business relationships with related parties from the executive directors of KSB SE & Co KGaA. We obtained letters of confirmation from the supervisory board members of KSB SE & Co. KGaA in office in the financial year 2017, the managing directors of KSB Management SE (as the former members of the Board of Management of KSB Aktienge-
GENERAL INFORMATIONMANAGEMENT AND ISSUES 2017CONSOLIDATED FINANCIAL STATEMENTSGROUP MANAGEMENT REPORTDIGITAL TRANSFORMATION
Independent Audi tor ’s Report

170
sellschaft as the Company’s legal predecessor) and KSB Stiftung, Kühborth Stiftungs GmbH and Johannes und Jacob Klein GmbH (formerly Klein Pumpen GmbH) as parent compa-nies, in which they list the business relationships, both those in line with the arm’s length principle and those not in line with the arm’s length principle, with KSB SE & Co. KGaA in the financial year 2017. By comparing the full list of the agreements and business relation-ships with the related parties against the customer and vendor accounts set up in the finan-cial accounting records of KSB SE & Co. KGaA, we examined whether there were any other business relationships with related parties not specified by the Company. We also exam-ined that the new agreements concluded with the related parties in the financial year since May 2017 had been approved by the supervisory board. We also evaluated that agree-ments with related parties that were not concluded at arm’s length in the previous years and up until April 2017 were terminated or adjusted to reflect standard market conditions in the financial year 2017. We assessed the controls established by the Company to evaluate agreements with related parties for adherence to the arm’s length principle prior to a con-tract conclusion. We assessed the Company’s calculations on the disadvantages suffered by it, which were taken as a basis for the agreements on compensation for disadvantages. In addition, we compared the incoming payments at KSB SE & Co KGaA with these agree-ments. With regard to the recognition of possible risks resulting from legal disputes and tax risks, we also obtained confirmations from attorneys and tax consultants as at 31 Decem-ber 2017. Based on our audit procedures, we were able to satisfy ourselves that the esti-mates and assumptions made by the executive directors relating to the disclosures on trans-actions with related parties are substantiated and sufficiently documented.
3 The Company’s disclosures on transactions with related parties are contained in section IX. of the notes to the consolidated financial statements.
OTHER INFORMATION
The executive directors are responsible for the other information. The other information com-prises the following non-audited parts of the group management report:
the statement on corporate governance pursuant to § 289f HGB and § 315d HGB included in section “Corporate Governance Statement” of the group management report
the corporate governance report pursuant to No. 3.10 of the German Corporate Govern-ance Code
the separate non-financial report pursuant to § 289b Abs. 3 HGB and § 315b Abs. 3 HGB
The other information comprises further the remaining parts of the annual report – excluding cross-references to external information – with the exception of the audited consolidated finan-cial statements, the audited group management report and our auditor’s report.
GENERAL INFORMATION

171
Our audit opinions on the consolidated financial statements and on the group management re-port do not cover the other information, and consequently we do not express an audit opinion or any other form of assurance conclusion thereon.
In connection with our audit, our responsibility is to read the other information and, in so doing, to consider whether the other information
is materially inconsistent with the consolidated financial statements, with the group manage-ment report or our knowledge obtained in the audit, or
otherwise appears to be materially misstated.
RESPONSIBILITIES OF THE EXECUTIVE DIRECTORS AND THE
SUPERVISORY BOARD FOR THE CONSOLIDATED FINANCIAL
STATEMENTS AND THE GROUP MANAGEMENT REPORT
The executive directors are responsible for the preparation of the consolidated financial state-ments that comply, in all material respects, with IFRSs as adopted by the EU and the addition-al requirements of German commercial law pursuant to § 315e Abs. 1 HGB and that the con-solidated financial statements, in compliance with these requirements, give a true and fair view of the assets, liabilities, financial position, and financial performance of the Group. In addition the executive directors are responsible for such internal control as they have determined neces-sary to enable the preparation of consolidated financial statements that are free from material misstatement, whether due to fraud or error.
In preparing the consolidated financial statements, the executive directors are responsible for as-sessing the Group’s ability to continue as a going concern. They also have the responsibility for disclosing, as applicable, matters related to going concern. In addition, they are responsible for financial reporting based on the going concern basis of accounting unless there is an inten-tion to liquidate the Group or to cease operations, or there is no realistic alternative but to do so.
Furthermore, the executive directors are responsible for the preparation of the group manage-ment report that, as a whole, provides an appropriate view of the Group’s position and is, in all material respects, consistent with the consolidated financial statements, complies with German legal requirements, and appropriately presents the opportunities and risks of future development. In addition, the executive directors are responsible for such arrangements and measures (systems) as they have considered necessary to enable the preparation of a group management report that is in accordance with the applicable German legal requirements, and to be able to provide sufficient appropriate evidence for the assertions in the group manage-ment report.
The supervisory board is responsible for overseeing the Group’s financial reporting process for the preparation of the consolidated financial statements and of the group management report.
GENERAL INFORMATIONMANAGEMENT AND ISSUES 2017CONSOLIDATED FINANCIAL STATEMENTSGROUP MANAGEMENT REPORTDIGITAL TRANSFORMATION
Independent Audi tor ’s Report

172
AUDITOR’S RESPONSIBILITIES FOR THE AUDIT OF THE CONSOLIDATED
FINANCIAL STATEMENTS AND OF THE GROUP MANAGEMENT REPORT
Our objectives are to obtain reasonable assurance about whether the consolidated financial statements as a whole are free from material misstatement, whether due to fraud or error, and whether the group management report as a whole provides an appropriate view of the Group’s position and, in all material respects, is consistent with the consolidated financial statements and the knowledge obtained in the audit, complies with the German legal require-ments and appropriately presents the opportunities and risks of future development, as well as to issue an auditor’s report that includes our audit opinions on the consolidated financial statements and on the group management report.
Reasonable assurance is a high level of assurance, but is not a guarantee that an audit con-ducted in accordance with § 317 HGB and the EU Audit Regulation and in compliance with German Generally Accepted Standards for Financial Statement Audits promulgated by the Institut der Wirtschaftsprüfer (IDW) will always detect a material misstatement. Misstatements can arise from fraud or error and are considered material if, individually or in the aggregate, they could reasonably be expected to influence the economic decisions of users taken on the basis of these consolidated financial statements and this group management report.
We exercise professional judgment and maintain professional skepticism throughout the audit. We also:
Identify and assess the risks of material misstatement of the consolidated financial statements and of the group management report, whether due to fraud or error, design and perform audit procedures responsive to those risks, and obtain audit evidence that is sufficient and appropriate to provide a basis for our audit opinions. The risk of not detecting a material misstatement resulting from fraud is higher than for one resulting from error, as fraud may involve collusion, forgery, intentional omissions, misrepresentations, or the override of internal control.
Obtain an understanding of internal control relevant to the audit of the consolidated financial statements and of arrangements and measures (systems) relevant to the audit of the group management report in order to design audit procedures that are appropriate in the circum-stances, but not for the purpose of expressing an audit opinion on the effectiveness of these systems.
Evaluate the appropriateness of accounting policies used by the executive directors and the reasonableness of estimates made by the executive directors and related disclosures.
GENERAL INFORMATION

173
Conclude on the appropriateness of the executive directors’ use of the going concern basis of accounting and, based on the audit evidence obtained, whether a material uncertainty exists related to events or conditions that may cast significant doubt on the Group’s ability to con-tinue as a going concern. If we conclude that a material uncertainty exists, we are required to draw attention in the auditor’s report to the related disclosures in the consolidated financial statements and in the group management report or, if such disclosures are inadequate, to modify our respective audit opinions. Our conclusions are based on the audit evidence ob-tained up to the date of our auditor’s report. However, future events or conditions may cause the Group to cease to be able to continue as a going concern.
Evaluate the overall presentation, structure and content of the consolidated financial state-ments, including the disclosures, and whether the consolidated financial statements present the underlying transactions and events in a manner that the consolidated financial statements give a true and fair view of the assets, liabilities, financial position and financial perfor-mance of the Group in compliance with IFRSs as adopted by the EU and the additional re-quirements of German commercial law pursuant to § 315e Abs. 1 HGB.
Obtain sufficient appropriate audit evidence regarding the financial information of the entities or business activities within the Group to express audit opinions on the consolidated finan -cial statements and on the group management report. We are responsible for the direction, supervision and performance of the group audit. We remain solely responsible for our audit opinions.
Evaluate the consistency of the group management report with the consolidated financial statements, its conformity with German law, and the view of the Group’s position it provides.
Perform audit procedures on the prospective information presented by the executive directors in the group management report. On the basis of sufficient appropriate audit evidence we evaluate, in particular, the significant assumptions used by the executive directors as a basis for the prospective information, and evaluate the proper derivation of the prospective in-formation from these assumptions. We do not express a separate audit opinion on the pro-spective information and on the assumptions used as a basis. There is a substantial unavoid-able risk that future events will differ materially from the prospective information.
We communicate with those charged with governance regarding, among other matters, the planned scope and timing of the audit and significant audit findings, including any significant deficiencies in internal control that we identify during our audit.
GENERAL INFORMATIONMANAGEMENT AND ISSUES 2017CONSOLIDATED FINANCIAL STATEMENTSGROUP MANAGEMENT REPORTDIGITAL TRANSFORMATION
Independent Audi tor ’s Report

174
We also provide those charged with governance with a statement that we have complied with the relevant independence requirements, and communicate with them all relationships and other matters that may reasonably be thought to bear on our independence, and where appli-cable, the related safeguards.
From the matters communicated with those charged with governance, we determine those matters that were of most significance in the audit of the consolidated financial statements of the current period and are therefore the key audit matters. We describe these matters in our auditor’s report unless law or regulation precludes public disclosure about the matter.
OTHER LEGAL AND REGULATORY REQUIREMENTS
FURTHER INFORMATION PURSUANT TO ARTICLE 10 OF THE EU AUDIT REGULATION
We were elected as group auditor by the annual general meeting on 10 May 2017. We were engaged by the supervisory board on 29 June 2017. We have been the group auditor of KSB SE & Co. KGaA, Frankenthal / Pfalz, without interruption since the financial year 2015.
We declare that the audit opinions expressed in this auditor’s report are consistent with the additional report to the audit committee pursuant to Article 11 of the EU Audit Regulation (long-form audit report).
GERMAN PUBLIC AUDITOR RESPONSIBLE FOR THE ENGAGEMENT
The German Public Auditor responsible for the engagement is Dr. Ulrich Störk.
Mannheim, 21 March 2018
PricewaterhouseCoopers GmbH Wirtschaftsprüfungsgesellschaft
Dr. Ulrich Störk ppa. Christina PöpperlWirtschaftsprüfer Wirtschaftsprüferin
GENERAL INFORMATION

175
ANSI
American National Standards
Institute
API
American Petroleum Institute
API 610
New edition of a centrifugal pump
code for the petrochemical industry
GDP
Gross domestic product
ISO 14001
International standard stipulating
requirements for environmental
management systems
IMF
International Monetary Fund
VDMA
Verband Deutscher Maschinen-
und Anlagenbau e. V.
[German Engineering Federation]
KEY CORPORATE
AND TECHNICAL TERMS
Additive manufacturing
Previously referred to as rapid
prototyping; it describes a process
which enables quick and cost-
effective production of patterns,
samples, prototypes, tools and
final products.
ABBREVIATIONS
GLOSSARY
Business Innovation Lab
A think tank where a KSB team
develops future-proof business
models for the age of digitalisation
CE marking
The CE marking documents that
goods are in conformity with the
health and safety requirements of
the European Union.
Downstream
Activities in the oil and gas indus-
try are categorised as upstream
or downstream. The term “down-
stream” is used to describe the
processing of crude oil into petro-
leum products.
GHG Protocol
(Greenhouse Gas Protocol)
Standard for measuring CO² and
other greenhouse gas emissions
IE5 synchronous
reluctance motor
Highly energy-efficient motors
whose specially designed rotor
laminations guide the lines of
magnetic flux. Rare earths are not
required to manufacture these
motors.
Installed Base
KSB sales channel for expanding
business in the area of spare parts
and support services
International Labour
Organisation (ILO)
The specialised agency of the
United Nations is responsible for
setting and implementing interna-
tional labour and social standards.
Make in India
Indian government campaign to
boost India’s domestic economy
One Belt, One Road
Chinese government project to
develop an intercontinental infra-
structure network between China
and countries in Asia, Europe and
Africa
Rapid prototyping
See additive manufacturing
Retrofitting
Refurbishment of pumps as an
alternative to buying new products
SAP C4C
Cloud-based IT solution for cus-
tomer relationship management in
Sales and Service
Stakeholders
Groups of persons that are directly
or indirectly affected by the
activities of a company; KSB’s main
stakeholders are our customers,
suppliers, investors, employees and
the public.
UN Global Compact
United Nations initiative for re-
sponsible company management
based on ten universal principles
GENERAL INFORMATIONMANAGEMENT AND ISSUES 2017CONSOLIDATED FINANCIAL STATEMENTSGROUP MANAGEMENT REPORTDIGITAL TRANSFORMATION
Independent Audi tor ’s ReportGlossary

176
CONTACTS
A print version of the KSB Group’s Annual Report is additionally available in German. We also publish German and English versions online in PDF and HTML formats at http://annualreport2017.ksb.com
EDITOR
KSB SE & Co. KGaAJohann-Klein-Str. 967227 Frankenthal, GermanyTel. +49 6233 86-0Fax +49 6233 86-3401
ONLINE NEWS
You will find the latest news on the KSB Group at: www.ksb.com
Should you need additional information, please contact:
INVESTOR RELATIONS
Dieter PottTel. +49 6233 86-2615Fax +49 6233 86-3454E-mail: [email protected]
COMMUNICATIONS
Ullrich BingenheimerTel. +49 6233 86-2138Fax +49 6233 86-3456E-mail: [email protected]
CONCEPT AND DESIGN
KSB Communications, Frankenthal 3st kommunikation, Mainz
PHOTOGRAPHY
KSB Image LibraryRobert Kwiatek, Frankenthal (p. 4 / 5, 6, 27, 36 / 37, 40 / 41, 44 / 45, 48 / 49)Kenneth Dupuis, USA (p. 52 / 53)Kevin Brown, USA (title, p. 50)Habitat for Humanity (p. 22, top left) Egbert Schmitt, Halle (p. 27, top right)Vikas Shinde, India (p. 22, bottom right) Getty Images (p. 22, bottom left)
PRINTING
Ottweiler Druckerei und Verlag GmbH, Ottweiler
As a signatory to the United Nations Global Compact , KSB is committed to endorsing the ten principles of the international community in the areas of human rights, labour standards, environmental protection and anti-corruption.
GENERAL INFORMATION

FINANCIAL CALENDAR
28 MARCH 2018Financial press conference
10:00, Frankenthal, Germany
29 MARCH 2018Invitation to Annual General Meeting
27 APRIL 2018Interim report
January – March 2018
16 MAY 2018Annual General Meeting
10:00, Frankenthal
14 AUGUST 2018Half-year financial report
January – June 2018
8 NOVEMBER 2018Interim report
January – September 2018

GLOBAL PRESENCE
GLO
BA
LE P
RÄ
SE
NZ
GLO
BA
L P
RE
SE
NC
E
Backed up by production and assembly sites around the world, as well as a tight-knit sales and service network, KSB staff are always close at hand.
KSB production / assembly sites KSB sales / service sites

Norway Poland Portugal Russia SerbiaSlovak Republic Slovenia SpainSweden Switzerland The Netherlands Ukraine United Kingdom
MIDDLE EAST / AFRICA
AlgeriaEgypt Ghana IranKenya Morocco OmanQatar Saudi ArabiaSouth Africa TurkeyUnited Arab EmiratesZambia
ASIA / PACIFIC
Australia China IndiaIndonesia JapanKazakhstan MalaysiaNew ZealandPakistanPhilippinesSingaporeSouth KoreaTaiwanThailandVietnam
AMERICAS
Argentina Brazil Chile CanadaColumbiaMexicoPeru USA
EUROPE
Austria Belarus Belgium CroatiaCzech Republic EstoniaFinland France Germany HungaryItaly LatviaLuxembourg

KSB SE & Co. KGaA 67225 Frankenthal (Germany)www.ksb.com K
SB G
rou
pA
nn
ual
Rep
ort
201
7