
Annual Report 2017 - Financials
236
2017 Annual Report
Transcript of Annual Report 2017 - Financials

2017Annual Report

60YEARS OFDEDICATIONWith a historic identity and solid leadership, Packages Limited has been instrumental in shaping the business land-scape of Pakistan, and stands today as a hallmark of success within the business sphere. This remarkable prosperity is due in no small part to the outstanding dedication at the heart of the Company that has, through its collective foresight and knowledge, guided the Company over the years to achieve remarkable results. For this year’s report, we honor those visionaries whose leadership and hard work has been the cornerstone for the Company’s effective administration and success.

CONTENTS
3 Company Profile7 Organogram8 Company Information9 Management Team10 Nature of Business12 Board of Directors14 Management Committees17 Vision17 Mission Statement19 Entity Rating20 Policies21 Core Values22 Code of Conduct24 Decade at a Glance26 Horizontal and Vertical Analysis30 Value Added and its Distribution31 Sources and Application of Funds32 Corporate Social Responsibility36 Corporate Calendar38 Notice of Annual General Meeting43 44 Chairman’s Review Report45 Directors’ Report to the Shareholders5557 Shareholders’ Information64 Statement of Compliance with the Code of Corporate Governance66 Review Report on Statement of Compliance with Best Practices of Code of Corporate Governance68 Auditors’ Report to the Members69 Financial Statements132 Directors’ Report on the Consolidated Financial Statements134135 Auditors’ Report to the Members on the Consolidated Financial Statements136 Consolidated Financial Statements219 Video Conference Facility221223 Electronic Transmission Consent 225227 Form of Proxy229231 Electronic Credit Mandate Form232
1
ANNUALREPORT 2017

As an entrepreneur and industrialist, Syed Wajid Ali set up and managed a number of industrial ventures. He remained Chairman of some of the largest enterprises in Pakistan, including Packages Limited, Treet Corporation, Zulfeqar Industries, Loads Limited and Wazir Ali Industries. He was involved in all aspects of the development and growth of Packages Limited, which has thrived to become a trendsetter for the local industry.
His activities in the healthcare sector included his efforts in founding Liaquat National Hospital in 1953 in Karachi of which he was the Chairman. He also remained Chairman of Pakistan Red Crescent Society from 1968 to 1998.
His dedication to sports has been exemplary. He remained the President of Pakistan Olympic Association for more than 25 years. He also remained the member of International Olympic Committee (IOC) Executive Board, member of Information and Culture Commission of IOC and member and Vice Chairman of Coordination and Supervising committee for IOC.
SYED WAJID ALI
2

COMPANY PROFILE
Packages Limited was established in 1957 as a joint venture between the Ali Group of Pakistan and Akerlund & Rausing of Sweden, to convert paper and paperboard into packaging for consumer industry. Over the years, Packages has continued to enhance its facilities to meet the growing demand of packaging products.
In 1968, with IFC participation, Packages integrated upstream by establishing a Pulp and Paper Mill with a capacity of 24,000 tons per year based on waste paper and agricultural by-products i.e. wheat straw and river grass. With growing demand, the capacity was increased periodically and in January 2003, total capacity was nearly 100,000 tons per year.
In 1982, Packages modified a paper machine to produce tissue paper in response to growing awareness and demand for hygienic and disposable tissues. The “Rose Petal” brand name was launched with facial tissues and was later expanded to include toilet paper, kitchen roll and table napkins.
In 1986, the Company established a flexible packaging unit to cater to the increasing demand from consumers for sophisticated packaging used primarily in the food industry.
In 1993, a joint venture agreement was signed with Mitsubishi Corporation of Japan for the manufacture of Polypropylene films at the Industrial Estate in Hattar, Khyber Pakhtunkhwa. This project, Tri-Pack Films Limited, commenced production in June 1995 with equity participation by Packages Limited, Mitsubishi Corporation, Al-Tawfeek Company for Investment Funds, Saudi Arabia and general public. Packages Limited owns 33.33% of Tri Pack Films Limited’s equity.
In July, 1994, Coates Lorilleux Pakistan Limited (currently DIC Pakistan Limited), in which Packages Limited has 54.98% ownership, commenced production and sale of printing inks.
During the same year, the Company initiated the capacity expansion of its Paper and Board Mill to 65,000 tons per year and conversion capacity to 56,000 tons per year. At the same time, the Company also upgraded the quality of Packages’ products and substantially improved pollution control to meet the World Bank environmental guidelines. The said expansion was completed in 1998 at a cost of PKR 2.7 billion.
In 1996, Packages entered into a joint venture agreement with Printcare (Ceylon) Limited for the production of flexible packaging materials in Sri Lanka. The project, Packages Lanka (Private) Limited, in which Packages Limited has 79.07% ownership, commenced production in 1998.
During 1999-2000, Packages successfully completed the expansion of the flexible packaging line by installing a new rotogravure printing machine and enhancing the carton line by putting up a new Lemanic rotogravure inline printing and cutting creasing machine. In addition, a new 8-color Flexographic printing machine was also installed in the flexible packaging line in 2001.
Packages commenced production of corrugated boxes from its plant in
Karachi in 2002.
In 2005, the Company embarked upon its Paper & Board expansion plan at a new site ‘Bulleh Shah Paper Mills’ (currently Bulleh Shah Packaging (Private) Limited), almost tripling its capacity from 100,000 tons per annum to 300,000 tons per annum. Capacity expansion at Bulleh Shah Paper Mills was completed in two phases. In the first phase, Brown Board Machine (PM-6) along-with high yield straw pulping & OCC plants and its back processes such as 11 MW Power House, Gas Turbine and Primary Effluent Treatment Plant were installed and commercial operations were commenced during the year 2007. Second phase
HISTORICAL OVERVIEW
Packages Limited is Pakistan’s leading packaging solution provider. Our job is to deliver high quality packaging in the most efficient, profitable and sustainable way. We are primarily a “business to business” company and our customer base includes some of the world’s best-known branded consumer products companies across industries.
We are also a leading manufacturer of tissue paper products. Our leadership position in tissue products is a result of our ability to offer products manufactured under highest standards of hygiene and quality to meet the household and cleanliness needs of our consumers. We provide a complete range of tissue paper products that are convenient, quick and easy to use.
3
ANNUALREPORT 2017

comprising of Writing and Printing Paper Machine (PM-7), De-inking Pulp Plant, 41MW Power House, Steam Turbine and Secondary Effluent Treatment Plant was completed in the year 2009.
In 2008, the Company embarked upon capacity expansion in its tissue division through installation of a new tissue paper manufacturing machine (PM-9) with production capacity of 33,000 tons per annum.
During 2011, a lamination machine was installed in the flexible department at a cost of PKR 96 million. This was Pakistan’s first high speed solvent-less automatic lamination machine. It has turret winders for automatic reel and a capacity of 450 meters per minute. The rebuild project of Paper Machine (PM-6), installed at Bulleh Shah Paper Mills, was completed in the second quarter of 2011 leading to capacity expansion of 30,000 tons. The machine started commercial operations with enhanced capability of producing high value added liquid packaging and bleached board. Moreover, the Corrugator Machine in Kasur Plant was upgraded in 2011 to improve efficiency, reliability, enhance capacity and reduce waste. This upgrade activity resulted in increased capacity of 14%.
In 2012, the Company invested in a rotogravure machine for its Flexible Packaging business with a total estimated project cost of PKR 326 million as part of the Company’s efforts to remain abreast of improved technological developments in the Packaging business. In the same year, to enable continuous growth and technical development in the Paper & Paperboard segment, Packages signed a 50/50 Joint Venture agreement with Stora Enso OYJ Group of Finland in its 100%
wholly owned subsidiary, Bulleh Shah Packaging (Private) Limited. The Joint Venture included Paper & Paperboard and Corrugated business operations at Kasur and Karachi. The Joint Venture Agreement with Stora Enso OYJ Group, signed in 2012, was implemented in 2013 and Packages completed the transfer of assets and related obligations of Paper & Paperboard and Corrugated business operations to Bulleh Shah Packaging (Private) Limited along with cash equity injection for a 65% stake.
During 2014, the Company invested in an Offset Printing Line in continuation of its efforts to remain abreast of improved technological developments in the Packaging business. The Offset Printing Line commenced its commercial operations during the first quarter of 2014 and had made available additional capacity to meet growing customer demands in the Folding Carton business. In May 2014, as part of its asset and income diversification strategy, the Company initiated development of a high quality retail mall at its Lahore land through its subsidiary, Packages Construction (Private) Limited. The Company currently holds 75.16% equity in Packages Construction (Private) Limited.
In 2015, as a part of its continuing efforts towards technological upgradation, the Company invested in a new toilet roll line to cater to the growing demand. A new brand by the name of “Maxob” produced on this machine was launched. In line with strategy to diversify and enter into new high growth markets, in June 2015, the company
Subsidiaries Joint venture Associates
DIC PakistanLimited54.98%
Bulleh Shah Packaging (Private) Limited100%
Packages Construction
(Private) Limited75.16%
Packages Lanka
(Private) Limited79.07%
IGI Holdings Limited10.46%
Tri-Pack FilmsLimited33.33%
AnemoneHoldingsLimited100%
PackagesPower
(Private)Limited100%
OmyaPack
(Private) Limited
50%
Flexible Packages
Convertors (Pty)Limited
55.00%
Linnaea HoldingInc.
100%
Chantler Packages Inc. 80.00%
PACKAGES LIMITED
4

completed the acquisition of 55% share in the operation of a flexible packaging company in South Africa. Further, during 2015, the Board of Directors resolved to start a 50/50 joint venture with Omya Group of Switzerland. The joint venture will set up a production facility to supply a range of high quality ground calcium carbonate products.
In 2016, as a part of Company’s continuing efforts towards technological upgradation, the Company invested Rs 292 million in a new offset printing line having double coating capability to cater to the growing demand in the folding cartons business. The Company also made an investment of Rs 122 million in their pre-press department for a state of art engraving machine and cylinder making line. This investment was in line with the Company’s efforts to provide its customers with the highest quality of printing. Further, the Company made strategic investments of Rs 82 million including a new facial line, toilet roll line and a fully automated party pack machine to meet growing customer demand.
In line with strategy to diversify, the Company incorporated a wholly-owned subsidiary, Packages Power (Private) Limited, for the purpose of setting up a 3.1 MW hydropower project with an initial equity injection of Rs 25 million.
The Company also made an additional investment of Rs 309.5 million in the equity of Omya Pack (Private) Limited (“JV Company”). This was followed by matching cumulative equity investment by joint venture partner, Omya Singapore Pte Limited.
In 2017, the Company invested Rs 540 million in upgradation of the flexible packaging line that includes wide-web Flexo Printing Press as well as a state of the art 7-layer blown film Extruder which not only boasts of higher production capabilities but also adds depth to the Packaging solutions. Further investments to the tune of Rs 105 million have been made in the downstream operations of lamination, slitting and bag-making to complement the additional capacity brought in. All these investments are in line with the Company’s efforts to provide its customers with the highest quality of Packaging solutions for Flexible Packaging line and to grow the market share despite ever growing competition by staying ahead of the technological curve.
Packages Mall was inaugurated on April 20, 2017 and the customer response has been very encouraging. The mall has been designed on international standards by a team of foreign and local professionals. Packages Mall offers over 180 brands, a multiplex cinema, food court, play area and Hyperstar all under one roof. During the year, the Company acquired remaining 35% shares held by Stora Enso in Bulleh Shah Packaging (Private) Limited (“BSPPL”). Accordingly, BSPPL became the fully owned subsidiary of the Company from September 18, 2017.
OmyaPack (Private) Limited, the JV Company is in its final phase to set up a state of the art production facility and commercial production is targeted for Q2-2018.
Year
2017
5
ANNUALREPORT 2017

As an entrepreneur and visionary, Syed Babar Ali envisioned and set up Packages Limited, Milkpak Limited–now Nestlé Pakistan Limited, Tetra Pak Pakistan Limited, IGI Insurance Company Limited, Tri-Pack Films Limited and IGI Investment Bank. He is Chairman of Sanofi-Aventis Pakistan Limited, IGI Insurance Limited, Tetra Pak Pakistan Limited,Tri-Pack Films Limited and Coca-Cola Beverages Pakistan Limited. He believes in the joint venture philosophy and most of his businesses are joint ventures with major multinationals.
As an educationist, he led the establishment of the Lahore University of of Management Sciences (LUMS) in 1985 of which he is the first Pro-Chancellor. LUMS is Pakistan’s premier management education institution. In 1992, he founded Ali Institute of Education for training of primary and secondary school teachers. He is a member of the Board of the following important educational institutions of Lahore: Aitchison College, LUMS and Lahore School of Economics. He is also a Founding Member of the South Asia Initiative of Harvard University and the Co-Chair of South Asia Centre for Policy Studies currently based in Nepal. He served as Pakistan’s Minister of Finance, Economic Affairs & Planning in 1993.
He promoted the cause of the World Wide Fund for Nature (earlier World Wildlife Fund) where he served in various capacities, both in Pakistan and internationally, from 1972 to 1996. He was International President of WWF from 1996 to 1999 succeeding HRH Prince Philip, the Duke of Edinburgh. He is now Vice President Emeritus, WWF International, and President Emeritus WWF-Pakistan.
Being a philanthropic, he set up Babar Ali Foundation in 1985. He is also a member of Layton Rehmatullah Benevolent Trust, Karachi and Shalamar Hospital, Lahore.
He received honors and awards from the Government of Sweden, the Netherlands, an OBE from Britain (1997), and was awarded an Honorary Doctorate Degree of Laws from McGill University, Montreal, Canada (1997).
SYED BABAR ALI
6

ORGANOGRAM
BOARD OFDIRECTORS
CHIEF EXECUTIVE & MANAGING DIRECTOR
HEAD OF PACKAGING DIVISION
AUDIT COMMITTEE
HEAD OFINTERNALAUDIT
HEAD OF CONSUMER DIVISION
HEAD OF ENGINEERING
HUMAN RESOURCE
CHIEF FINANCIAL OFFICER
FOLDING CARTONS
FLEXIBLE PACKAGING
ROLL COVERS &MECHANICAL FABRICATION
ADMINISTRATIONPOWERHOUSE
FINANCE
INFORMATION TECHNOLOGY
SUPPLY MANAGEMENT
INDUSTRIAL RELATIONS
MANUFACTURING EXCELLENCE
SECURITY
7
ANNUALREPORT 2017

COMPANYINFORMATION
BOARD OF DIRECTORSTowfiq Habib ChinoyChairmanNon-Executive Director
Syed Hyder AliChief Executive & Managing Director Executive Director
Asghar AbbasExecutive Director
Imran Khalid NiaziNon-Executive Director
Josef Meinrad MuellerNon-Executive Director
Muhammad AurangzebIndependent Director
Shamim Ahmad KhanNon-Executive Director
Syed Aslam MehdiNon-Executive Director
Syed Shahid AliNon-Executive Director
Tariq Iqbal KhanNon-Executive Director
ADVISORSyed Babar Ali
CHIEF FINANCIAL OFFICERKhurram Raza Bakhtayari
COMPANY SECRETARYAdi J. Cawasji
RATING AGENCYPACRA
COMPANY CREDIT RATING Long-Term : AAShort-Term : A1+
AUDITORSA.F. Ferguson & Co.Chartered Accountants
LEGAL ADVISORSHassan & Hassan - Lahore
Orr, Dignam & Co. – Karachi
SHARES REGISTRARFAMCO Associates (Pvt.) Ltd8-F, Next to Hotel FaranNursery, Block 6, P.E.C.H.S.Shahrah-e-FaisalKarachi-75400PABX : (021) 34380101-5 (021 34384621-3Fax : (021) 34380106Email : [email protected]
BANKERS & LENDERSAllied Bank LimitedAskari Bank LimitedBank Alfalah LimitedBank Al-Habib LimitedDeutsche Bank A.G.Dubai Islamic Bank Pakistan LimitedHabib Bank LimitedHabib Metropolitan Bank LimitedInternational Finance Corporation (IFC)JS Bank LimitedMCB Bank LimitedMeezan Bank LimitedSamba Bank LimitedSoneri Bank LimitedStandard Chartered Bank (Pakistan) LimitedThe Bank of PunjabThe Bank of Tokyo - Mitsubishi UFJ, LimitedUnited Bank Limited
HEAD OFFICE & WORKSSHAHRAH-E-ROOMIP.O. Amer SidhuLahore - 54760, PakistanPABX : (042) 35811541-46
Fax : 042) 35811195
OFFICESRegistered Office & Regional Sales office
4th Floor, The ForumSuite No. 416 - 422, G-20, Block 9Khayaban-e-Jami, CliftonKarachi - 75600, PakistanPABX :(021) 35874047-49 :(021) 35378650-51 :(021) 35831618, 35833011, 35831664Fax :(021) 35860251
REGIONAL SALES OFFICE2nd Floor, G.D. Arcade73-E, Fazal-ul-Haq Road, Blue AreaIslamabad - 44000, PakistanPABX :(051) 2348307-9 :(051) 2806267Fax :(051) 2348310
ZONAL SALES OFFICESC-2, Hassan Arcade Nusrat RoadMultan Cantt. - 60000, PakistanTel. & Fax :(061) 4504553
2nd Floor Sitara TowerBilal chowk, Civil LinesFaisalabad - PakistanTel :(041) 2602415Fax :(041) 2629415
WEB PRESENCEwww.packages.com.pk
8

From Left to Right (Sitting)
Khurram Raza BakhtayariChief Financial Officer
Shaheen SadiqHead of Consumer Products Division
Syed Hyder AliChief Executive and Managing Director
Asghar AbbasHead of Packaging Division
Syeda Henna Babar AliAdvisor Tissue Division
From Left to Right (Standing)
Samad GorayaHead of Engineering
Mehreen NasirBusiness Unit Manager - Flexible Packaging
Nauman NoorBusiness Unit Manager - Folding Cartons
Bilal NaeemComptroller of Accounts
MANAGEMENT TEAM
9
ANNUALREPORT 2017

PACKAGING DIVISIONPackages provides multi-dimensional and multi product packaging solutions to its clients that are involved in manufacturing consumer products across industries.
The Packaging Division comprises of two business units based on packaging material categories:
1. Folding Cartons2. Flexible Packaging
FOLDING CARTONSWith decades of experience in providing reliable service and quality, Folding Cartons business provides a wide range of carton board packaging products to various industry segments.
Folding Cartons business is equipped with state of the art machinery and a dedicated and qualified workforce that is supported by strong value chain. These factors contribute in providing high volumes and consistent quality at a competitive price for our esteemed customers.
Market Segment – As the consumer industry in Pakistan matures, competition in the market has increased and the market has a greater focus on product differentiation through branding. In the first instance, this is carried out through attractive and unique packaging which is driving demand for our products. Our team understands well the needs of the market and thus development work and packing modifications are undertaken correspondingly. Folding Cartons business works to deliver the best carton board products that result in high value-added packaging for industries like:
• Pharmaceutical
• Tobacco
• Personal care
• Confectionery
• Home care products
• Food (including frozen)
FLEXIBLE PACKAGINGTo accommodate increasing demand for sophisticated packaging, Packages established a Flexible Packaging business unit in 1986 at its Lahore Plant. Flexible Packaging business provides a one stop packaging
solution by providing high quality detailed graphics in Flexographic and Rotogravure printing. Flexible Packaging business also provides lamination for plastic films, aluminium foil, paper, multi-layer blown film extrusion for high speed technology in multi-lane slitting, standalone spout inserted bags, poly-bags, zipper-bags, sleeves and ice cream-cones. As part of environmental friendly organization, Flexible Packaging business unit is also working on 4 R’s of Packaging i.e. Reduce, Re-use, Recycle and Recover.
Market Segment – Flexible packaging business unit not only provides cost effective and perfect packaging solutions to our valuable customers but also offers them strong technical support on products. We have great in-house R&D facilities which help us in keeping ourselves updated to aggressive market needs. The Flexible Packaging business caters to a wide range of customers across industries including food, soaps & detergents, pharmaceuticals, pesticides and personal & home care.
CONSUMER PRODUCTS DIVISIONPackages started commercial production of tissue and other consumer products in 1982 at the Lahore Plant. We currently provide a complete range of tissue and personal hygiene products that are convenient, quick and easy to use; ranging from facial tissues to tissue rolls, table napkins, pocket packs, kitchen towels, party packs, paper plates and cups. We understand that tissue and allied products are seen as a luxury item without the requisite attention being paid to the hygiene element. Packages has always attempted to develop the market for this business segment through education of the population on the hygiene associated with the use of the products.
Product development has always been our focus based on the demands and needs of our consumers. Great effort is put into producing improved and innovative products to make life hygienic and comfortable for our consumers.
BRANDSKey brands of Consumer Products Division are:
• Rose Petal
• Tulip
• Maxob
• Double Horse
• Zzoop
NATURE OFBUSINESS
10

CERTIFICATIONSThe disciplined, motivated and hardworking team of Packages Limited has never compromised on the standards of work environment. This positive professional attitude has helped the business divisions to acquire numerous certifications including:
• Food Safety System Certification-ISO 22000: 2005 + PASS 223
• ISO 14001: 2015
• OHSAS 18001: 2007
• ISO 9001 & FSC CoC
• HALAL (S.A.N.H.A) / HALAL Packaging Management System
• British Retail Consortium Grade “A”
• Green Office Diploma
Packaging Division is also certified for URSA (Unilever Responsible Sourcing Audit). The Company is aiming for implementation of Total Productive Maintenance (TPM) to achieve zero downtimes, defects and accidents.
SERVICE DEPARTMENTSPackages believes that its entire operations have to be in line with the needs of the customers. Our operations are supported by excellent service departments who consistently strive to deliver what the customers need on timely basis.
CUSTOMER SERVICES DEPARTMENT (CSD)Our Customer Services Department (CSD) constantly monitors production and supply chain to ensure on-time delivery to the customer, to ensure that the right quality product reaches the customer at the right time. CSD also performs core liaison function to arrange development activities as well as technical support and after sales support to customers. Customer complaints are followed by proper feedback and management reporting so that customers are always given the due attention they require.
PRE-PRESS DEPARTMENTPre-Press is the nerve center of Packages Limited where concepts and ideas are developed and woven with marketing strategies of customers to attract the end users of the products produced by customers.
The department has been revolutionized over the last two decades and now follows the design process completely in soft form; images and texts are simultaneously directed from computers to:
• Image setters;
• Plate making devices (CDI, Digital System for Flexo); and
• Digital engraving machines
In the Art and Camera Department, the Company has high-tech computer systems where digital files are produced instead of photographic negatives. For achieving high quality in all of printing methods (Roto, Flexo and Offset), Pre-Press department is equipped with the latest technology in cylinder, photo polymer and plate making equipment which provides support to various production departments.
Pre-Press converts the packaging design according to the technical requirements on any printing technique like Gravure, Flexography and Offset without compromising the creative integrity of designs.
RESEARCH AND DEVELOPMENT (R&D)Research & Development continues to be one of Packages unique selling points. As the consumer industry focuses on cost control, limiting carbon footprint and an overall mindset of “more with less”, innovation is the name of the game.
The Research and Development department at Packages is tirelessly working to understand consumer needs and providing innovations on both design and structure based on global trends. The department also plays a key role in supporting the customers in their cost control initiatives as we see the growth of our customers business as our success.
11
ANNUALREPORT 2017

BOARD OFDIRECTORS
MR. TOWFIQ HABIB CHINOY
Syed Hyder Ali joined Packages Limited in July 1987 and presently holds the position of Managing Director of the Company. He has done his Masters in Sciences from Institute of Paper Chemistry and has also served as Mill Manager of Paper and Board operations of the Company. He holds directorship in several other companies including IGI Holdings Limited (formerly IGI Insurance Limited), IGI Life Insurance Company Limited, International Steels Limited, Nestle Pakistan Limited, Packages Construction (Private) Limited, Packages Lanka (Private) Limited, Sanofi-Aventis Pakistan Limited, Tri-Pack Films Limited, Tetra Pak Pakistan Limited, Bulleh Shah Packaging (Private) Limited, KSB Pumps Company Limited and Flexible Packages Convertors (Proprietary) Limited, South Africa. He is also serving on the Board of several philanthropic, educational, charitable and business support organizations including Pakistan Centre for Philanthropy, National Management Foundation, Packages Foundation, Syed Maratib Ali Religious and Charitable Trust Society and Babar Ali Foundation. He is also board member of Ali Institute of Education, International Chamber of Commerce, Lahore University of Management Sciences and World-Wide Fund for Nature.
Mr. Asghar Abbas joined the Company in 1998 and currently holds the position of Director and Head of Packaging Operations of the Company. He has been associated with the Group in various capacities over the years including Managing Director of Packages Lanka (Private) Limited. He holds a Masters’ degree in Business Administration from Nanyang Technological University (NTU), Singapore. Currently, he also holds directorship of Bulleh Shah Packaging (Private) Limited, Packages Lanka (Private) Limited, Anemone Holdings Limited and Flexible Packages Convertors (Proprietary) Limited.
Mr. Imran Khalid Niazi is associated with the Company as a Non-Executive Director. He is a seasoned leader having provided professional, technical leadership at multinational companies across the globe. His professional journey has taken him from fertilizer, food, dairy and pharmaceutical multinational companies to Coca-Cola Company. He holds a Masters’ degree in Chemical Engineering from the University of Arizona, USA. Currently, he also holds directorship of Bulleh Shah Packaging (Private) Limited, Dynamic Textiles (Pvt.) Ltd, Lahore, Damen (a Women Development NGO), Lahore and Damen Support Program (a Microfinance Institution), Lahore.
Mr. Josef Meinrad Mueller is associated with the Company as a Non-Executive Director. He was born in Switzerland where he obtained his education including MBA from IMD (formerly IMEDE) in Lausanne where he also served as an Executive-in-Residence. He has over 38 years of senior international management experience at the Nestle Group in developed and emerging markets. He is familiar with Pakistan where he served as Managing Director of Nestle Pakistan Limited during 1992-1995. Throughout his international career, he was entrusted with several senior leadership positions in different countries, including his important role as CEO and Chairman of Nestle in the Greater China Region. Following his retirement from the Nestle Group, Mr. Mueller continues to remain very active in the international business world as an independent business advisor.
Mr. Towfiq Habib Chinoy, Non-Executive Director, has been associated with the Company as Chairman of the Board of Directors since 2008. He also holds chairmanship at the board of Jubilee General Insurance Company Limited. He holds directorship of IGI Investment Bank Limited and Pakistan Business Council. He is also the Chairman of the Board of Governors of Indus Valley School of Arts and Architecture and Trustee of Mohatta Palace Gallery Trust and Habib University Foundation.
SYED HYDER ALI MR. ASGHAR ABBAS MR. IMRAN KHALID NIAZI MR. JOSEF MEINRAD MUELLER
12

Mr. Muhammad Aurangzeb is an Independent Director of the Company and has over 29 years of banking experience. He is currently the CEO of Global Corporate Bank, Asia Pacific at JP Morgan. He has served as Non-Executive Director of RBS Berhad and was also a member of the Risk Management, Remuneration and Nominating Committee, all of which are sub-committees of the Board. He has also served on Boards of various business schools, Aga Khan Foundation and ABN AMRO Foundation.
MR. MUHAMMAD AURANGZEB
MR. SHAMIM AHMAD KHAN
SYED ASLAM MEHDI SYED SHAHID ALI MR. TARIQ IQBAL KHAN
Mr. Shamim Ahmad Khan is associated with the Company as Non-Executive Director. He has served various government organisations in different capacities namely Securities and Exchange Commission of Pakistan and Ministry of Commerce. He was the founder Chairman of the Securities and Exchange Commission of Pakistan. He has also been engaged with consultancy assignments for Asian Development Bank and other organizations. Currently, he holds directorship of Abbott Laboratories Pakistan Limited, Attock Refinery Limited, IGI Holdings Limited (formerly IGI Insurance Limited), IGI Life Insurance Company Limited and Karandaaz (Pvt) Limited. He is also a member of Board of Governors of Sustainable Development Policy Institute and is serving on the Board of Trustees of Packages Foundation.
Syed Aslam Mehdi, Non-Executive Director, has a Masters degree in Business Administration from Institute of Business Administration, Karachi and has been associated with different companies of the Packages Group in various capacities over the years. He also served as the General Manager of Packages Limited from September 2008 to September 2014. Currently, he is the Managing Director of Bulleh Shah Packaging (Private) Limited and holds directorship of DIC Pakistan Limited, Packages Construction (Private) Limited, Tri-Pack Films Limited, Packages Lanka (Private) Limited, Tetra Pak Pakistan Limited and Printcare PLC, Sri Lanka. He is also the member of the Board of Governors of the National Management Foundation and is serving on the Board of Trustees of Packages Foundation.
Syed Shahid Ali is currently associated with the company as Non-Executive Director. He also holds directorship of several other companies including Treet Corporation Limited, Treet Assets (Private) Limited, Treet Power Limited, Loads Limited, IGI Holdings Limited (formerly IGI Insurance Limited), Ali Automobiles Limited, First Treet Manufacturing Modaraba, Global Econo Trade (Private) Limited, Multiple Auto Parts Industries (Private) Limited, Specialized Autoparts Industries (Private) Limited and Specialized Motorcycles (Private) Limited. He is also actively involved in social and cultural activities and holds senior positions on the governing boards of several hospitals and philanthropic organizations including Liaquat National Hospital.
Mr. Tariq Iqbal Khan is associated with the Company as a Non-Executive Director. He is a Fellow member of the Institute of Chartered Accountants of Pakistan, with diversified experience of more than 41 years. He has held leading policy-making positions in various associations and institutions in the country, including being a Founding Director and President of Islamabad Stock Exchange, Commissioner and Acting Chairman Securities and Exchange Commission of Pakistan and Managing Director/Chairman at Investment Corporation of Pakistan/National Investment Trust. Currently, he holds directorship of Attock Refinery Limited, International Steels Limited, Lucky Cement Limited, National Refinery Limited, Silk Bank Limited, Pakistan Oilfields Limited and FFC Energy Limited.
13
ANNUALREPORT 2017

MANAGEMENTCOMMITTEES
EXECUTIVE COMMITTEESyed Hyder Ali Chairman(EXECUTIVE DIRECTOR)
Syed Aslam Mehdi Member(Non-Executive Director)
Asghar Abbas Member (Executive Director)
Executive Committee is involved in day to day operations of the Company and is authorised to conduct every business except the businesses to be carried out by the Board as required by section 183 of the Companies Act, 2017. The Executive Committee meets periodically to review operating performance of the Company against pre-defined objectives, commercial business decisions and investment and funding requirements. The Executive Committee is also responsible for formulation of business strategy, review of risks and their mitigation plan.
AUDIT COMMITTEETariq Iqbal Khan Chairman (Non-Executive Director)
Muhammad Aurangzeb Member(Independent Director)
Shamim Ahmad Khan Member(Non-Executive Director)
Imran Khalid Niazi Member(Non-Executive Director)
Syed Aslam Mehdi Member(Non-Executive Director)
Syed Shahid Ali Member(Non-Executive Director)
Adi J. Cawasji Secretary(Company Secretary)
The terms of reference of the Audit Committee is derived from the Code of Corporate Governance applicable to listed companies in Pakistan. The Audit Committee is, among other things, responsible for recommending to the Board of Directors the appointment of external auditors by the Company’s shareholders and considering any questions of resignation or removal of external auditors, audit fees and provision by external
auditors of any service to the Company in addition to audit of its financial statements. In the absence of strong grounds to proceed otherwise, the Board of Directors act in accordance with the recommendations of the Audit Committee in all these matters.
The terms of reference of the Audit Committee also include the following:
a) Determination of appropriate measures to safeguard the Company’s assets;
b) Review of quarterly, half-yearly and annual financial statements of the Company, prior to their approval by the Board of Directors, focusing on:
• Major judgemental areas;
• Significant adjustments resulting from the audit;
• Going-concern assumption;
• Any changes in accounting policies and practices;
• Compliance with applicable accounting standards;
• Compliance with listing regulations and other statutory and regulatory requirements; and
• Significant related party transactions
c) Review of preliminary announcements of results prior to publication;
d) Facilitating the external audit and discussion with external auditors of major observations arising from interim and final audits and any matter that the auditors may wish to highlight (in the absence of management, where necessary);
e) Review of management letter issued by external auditors and management’s response thereto;
f) Ensuring coordination between the internal and external auditors of the Company;
g) Review of the scope and extent of internal audit and ensuring that the internal audit function has adequate resources and is appropriately placed within the Company;
h) Consideration of major findings of internal investigations of activities characterised by fraud, corruption and abuse of power and management’s response thereto;
i) Ascertaining that the internal control systems including financial and operational controls, accounting systems for timely and appropriate recording of purchases and sales, receipts and payments, assets and liabilities and the reporting structure are adequate and effective;
14

j) Review of the Company’s statement on internal control systems prior to endorsement by the Board of Directors and internal audit reports;
k) Instituting special projects, value for money studies or other investigations on any matter specified by the Board of Directors, in consultation with the Chief Executive Officer and to consider remittance of any matter to the external auditors or to any other external body;
l) Determination of compliance with relevant statutory requirements;
m) Monitoring compliance with the best practices of corporate governance and identification of significant violations thereof; and
n) Consideration of any other issue or matter as may be assigned by the Board of Directors
HUMAN RESOURCE AND REMUNERATION (HR&R) COMMITTEETowfiq Habib Chinoy Chairman(Non-Executive Director)
Josef Meinrad Mueller Member(Non-Executive Director)
Imran Khalid Niazi Member(Non-Executive Director)
Syed Hyder Ali Member(Executive Director)
Mr. Tariq Iqbal Khan Member(Non-Executive Director)
Mr. Nayab Baig Secretary(Group Head of Human Resource)
This Committee is responsible for:
a) Recommending human resource management policies to the Board;
b) Recommending to the Board the selection, evaluation, compensation (including retirement benefits) and succession planning of the CEO;
c) Recommending to the Board the selection, evaluation, compensation (including retirements benefits) of Chief Financial Officer, Company Secretary, Head of Human Resource, Head of Packaging Division, Head of Consumer Division, Head of Engineering and Head of Internal Audit; and
d) Consideration and approval on recommendations of CEO on such matters for key management positions who report directly to CEO
SYSTEM AND TECHNOLOGY COMMITTEEAsghar Abbas Chairman(Executive Director)
Khurram Raza Bakhtayari Member(Chief Financial Officer)
Suleman Javed Member(Manager ERP)
This Committee is responsible for:
a) Devising the I.T. strategy within the organisation to keep all information systems of the Company updated in a fast changing environment. This committee is also responsible for evaluating Enterprise Resource Planning (ERP) solutions and data archiving solutions to achieve Company’s overall goal towards Green Office Project;
b) Reviewing and recommending information technology proposals suggested by management;
c) Promoting awareness of all stakeholders on needs for investment in technology and related research work; and
d) Reviewing and assessing Company’s systems and procedures, recommending proposals on technological innovations including plant upgradation, technology improvements etc. with relevant cost benefit analysis
15
ANNUALREPORT 2017

Syed Hyder Ali, graduated from University of Michigan, USA with a Bachelor of Science degree in Chemical Engineering in 1979. He completed his Master of Science in June 1981, specializing in paper chemistry. In 1997, Mr. Ali also attended the program for Management Development at the Harvard Business School, Boston, USA.
Currently, he is the Chief Executive and Managing Director of the Company. Mr. Ali has wide and varied professional working experience spanning over many years in paper production, conversion and packaging. Mr. Ali has been involved in the development and implementation of processes for the pulp and paper mill at Packages Ltd. using wheat straw as a raw material. He is the co-author of two USA patents for the recycling of milk and juice cartons.
Mr. Ali serves on the Board of a number of companies like IGI Insurance Limited, IGI Life Insurance Company Limited, International Steels Limited, Nestle Pakistan Limited, Packages Construction (Private) Limited, Packages Lanka (Private) Limited, Sanofi-Aventis Pakistan Limited, Tri-Pack Films Limited, Tetra Pak Pakistan Limited, Bulleh Shah Packaging (Private) Limited, KSB Pumps Company Limited and Flexible Packages Convertors (Proprietary) Limited, South Africa.
SYED HYDER ALI
16

To be a leader in the markets we serve by providing quality products and superior service to our customers, while learning from their feedback to set even higher standards for our products.
To be a Company that continuously enhances its superior technological competence to provide innovative solutions to customer needs.
To be a Company that attracts and retains outstanding people by creating a culture that fosters openness and innovation, promotes individual growth and rewards initiative and performance.
To be a Company which combines its people, technology, management systems and market opportunities to achieve profitable growth while providing fair returns to its investors.
To be a Company that endeavors to set the highest standards in corporate ethics in serving the society.
MISSIONSTATEMENT
Position ourselves to be a regional player of quality packaging and consumer products.
Improve on contemporary measures including cost, quality, service, speed of delivery and mobilisation.
Keep investing in technology, systems and human resource to effectively meet the challenges every new dawn brings.
Develop relationships with all our stakeholders based on sustainable cooperation, upholding ethical values which the shareholders, management and employees represent and continuously strive for.
VISION
17
ANNUALREPORT 2017

Syed Irshad Hussain was studying civil engineering at Boston in 1947, Syed Babar Ali met him and persuaded him to join Packages as General Manager. The construction of factory building was his first responsibility. He ensured timely completion of the building and supervised provision of all ancillary requirements such as government permits and provision of utilities thus laying the basis for the Company for future years. He continued discharging his responsibilities in a methodical and capable manner, till he left Packages Limited to join the UN in 1973.
SYED IRSHAD HUSSAIN
18

ENTITY RATING OFPACKAGES LIMITED
Long Term AAShort Term A1+Rated by: The Pakistan Credit Rating Agency Limited
RATING AS ON: DECEMBER 30, 2017
Rating Type Rating Rating Comments
Long Term AA (Double A) Very high credit rating. AA Rating denote a very low expectation of credit risk. This indicates very strong capacity for timely payment of financial commitments. This capacity is not significantly vulnerable to foreseeable events.
Short Term A1+ (A One Plus) Obligations supported by the highest capacity for timely repayment.
19
ANNUALREPORT 2017

POLICIES
INTEGRATED MANAGEMENT SYSTEM (IMS) POLICYWe intend to be a world class Company that not only delivers quality goods & services but also takes care of its employees’ health, safety & environment as a whole.
We are committed to achieving this by:
1. Complying with all applicable laws and regulatory requirements;
2. Setting objectives and targets for reviewing and improving management systems;
3. Developing an effective IMS to prevent incidents / accidents, ill health, pollution, waste reduction, hazards and environmental impacts;
4. Ensuring that all food related packaging material is produced, stored and delivered in safe and hygienic condition as per relevant requirements;
5. Continually improving our Environment, Health & Safety (EHS) and food safety management system effectiveness;
6. Creating a safe and work friendly environment for all stakeholders; and
7. Implementing individual accountability to comply with IMS requirements
This policy is applicable to each individual whether employee, contractor / sub-contractor, supplier, visitor and all other stakeholders of Company.
QUALITY POLICYPackages Limited is strongly committed to produce quality products that conform to consumer’s requirements at a competitive price.
We shall continually improve our Quality Management System (QMS) and quality performance of all business processes.
We shall set quality objectives at all levels and allocate appropriate resources to achieve them.
We shall ensure all employees are well aware of Company quality policy and are motivated to apply it in their areas of responsibility.
TOTAL PRODUCTIVE MAINTENANCE (TPM) POLICYWe believe that TPM provides the life cycle approach of improving the overall performance of the machine / equipment through:
• Improving productivity by highly motivated staff / workers; and
• Satisfying the customer needs by delivering the right quantity at right time with desired quality.
We are committed to follow the TPM principles to enhance our competitive position in the market and hence financial position by achieving:
• Zero accidents;
• Zero breakdowns; and
• Zero defects
WHISTLE BLOWING POLICYIn line with our commitment towards highest standards of ethical, moral and legal business conduct, we have an established whistle blowing policy which encourages employees to openly raise any concerns related to unethical behavior, corruption and fraudulent activities that may cause damage to the Company’s assets and / or reputation.
All concerns raised are assessed in an objective and independent manner, with protection from retaliation or victimisation, to improve the Company’s policies, controls and working environment.
RISK MANAGEMENT POLICYThe Company has an effective and robust mechanism for identification, assessment and reporting of all types of risk arising out of the business operations. These risks includes strategic, operational, financial or compliance risks which may compromise the achievement of overall business objectives.
Through this policy, all the departments ensure that:
• Existing and potential material risks that could impact the achievement of strategic objectives are identified, managed or mitigated;
• Risk management methods are applied appropriately;
• Appropriate resources & controls are allocated to risk areas; and
• Non-controllable risks are identified, monitored, understood and mitigated where possible
20

CORE VALUES
Underlying everything we do and everything we believe in is a set of core values. These guide us to deal with every aspect of any issue we might encounter in our personal and professional lives. These values help us grow inside & outside, personally and as an organisation.
GOOD GOVERNANCEWe are committed to running our business successfully and efficiently, providing long term benefits to our employees and shareholders, and enriching the lives of those whom we serve by fulfilling our corporate responsibility to the best of our ability. We expect excellence from all processes, whether they relate to policy formation and accounting procedures or product development and customer service.
WORK ENVIRONMENTOur policies and core values are aimed towards creating an informal yet stimulating team-oriented work environment with a culture of sharing and open communication. We cherish the diversity of viewpoint of every individual; we realise this encourages innovation and develops character.
All employees have the right to a stress and injury free work environment. We ensure our employee health and safety by providing various in-house facilities such as a gym and making sure that all staff understand and uphold our safety policy. All our employees are permitted and encouraged to afford time and attention to personal concerns.
OUR PEOPLEThe success of any organisation is largely dependent on the people working for it. Each member of our team is considered equally important and provided constant training, motivation and guidance. We possess a dedicated staff of the highest caliber committed to making our business a success. We ensure that every employee has the opportunity for maximum professional development. To achieve this goal, we seek to provide challenging work prospects for all employees. Each person is compensated and rewarded for his or her performance and hard work on a strict merit basis.
CONSERVATIONWe expect and encourage our employees to actively participate in community service and to take care of the environment entrusted to us as citizens sharing the earth’s resources.
CUSTOMER SATISFACTIONWe are customer-driven; we go the extra mile to make sure our clients’ expectations are met and exceeded on every issue. We partner with leading companies to arm ourselves with the latest technology and provide customers with innovative solutions in the most cost-effective manner available.
ETHICAL BEHAVIORWe make it clear that being a sincere, honest and decent human being takes precedence over everything else. In the Packages family, there is an all-round respect for elders, tolerance for equals and affection for youngsters. Managers are expected to lead from the front, train junior colleagues through delegation, resolve conflicts quickly, be visible at all times and act as role models for others.
21
ANNUALREPORT 2017

CODE OFCONDUCT
PACKAGES LIMITED HAS BUILT A REPUTATION FOR CONDUCTING ITS BUSINESS WITH INTEGRITY, IN ACCORDANCE WITH HIGH STANDARDS OF ETHICAL BEHAVIOR AND IN COMPLIANCE WITH THE LAWS AND REGULATIONS THAT GOVERN OUR BUSINESS. THIS REPUTATION IS AMONG OUR MOST VALUABLE ASSETS AND ULTIMATELY DEPENDS UPON THE INDIVIDUAL ACTIONS OF EACH OF OUR EMPLOYEES ALL OVER THE COUNTRY.
Our code of conduct (“the Code”) has been prepared to assist each of us in our efforts to not only maintain but enhance this reputation. It provides guidance for business conduct in a number of areas and references to more detailed corporate policies for further direction.
The adherence of all employees to high standards of integrity and ethical behavior is mandatory and benefits all stakeholders viz. our customers, our communities, our shareholders and ourselves.
The Company carefully checks for compliance with the Code by providing suitable information, prevention and control tools and ensuring transparency in all transactions and behaviors by taking creative measures if and when required.
The Code applies to all affiliates, employees and others who act for us countrywide, within all sectors, regions, areas and functions.
GENERAL PRINCIPLES• Compliance with the applicable laws, regulations, statutory
provisions, ethical integrity and fairness is a constant commitment and duty of all Packages employees and characterises the conduct of the organisation.
• The Company’s business and activities have to be carried out in a transparent, honest and fair way, in good faith and in full compliance. Any form of discrimination, corruption, forced or child labor is rejected. Particular attention is paid to the acknowledgment and safeguarding of the dignity, freedom and equality of human beings.
• All employees, without any distinction or exception whatsoever, respect the principles and contents of the Code in their actions
and behaviors while performing their functions according to their responsibilities, because compliance with the Code is fundamental for the quality of their working and professional performance. Relationships among employees, at all levels, must be characterised by honesty, fairness, cooperation, loyalty and mutual respect.
• The belief that one is acting in favor or to the advantage of the Company can never , in any way, justify – not even in part – any behavior that conflict with the principles and content of the Code.
• The Code aims at guiding the “Packages team” with respect to standards of conduct expected in areas where improper activities could result in adverse consequences to the Company, harm its reputation or diminish its competitive advantage.
• Every employee is expected to adhere to, and firmly inculcate in his / her everyday conduct, this mandatory framework; any contravention or deviation will be regarded as misconduct and may attract disciplinary action in accordance with the Company service rules and relevant laws.
STATEMENT OF ETHICAL PRACTICESIt is the basic principle of Packages Limited to obey the law of the land and comply with its legal system. Accordingly, every Director and employee of the Company shall obey the law. Any Director and employee guilty of violation will be liable to disciplinary consequences because of the violation of his / her duties.
Employees must avoid conflict of interest between their private financial activities and conduct of Company business.
All business transactions on behalf of Packages Limited must be reflected accordingly in the accounts of the Company. The image and reputation of Packages Limited is determined by the way each and every one of us acts and conducts himself / herself at all times.
We are an equal opportunity employer. Our employees are entitled to a safe and healthy workplace.
Every manager and supervisor shall be responsible to see that there is no violation of laws within his / her area of responsibility which proper supervision could have prevented. The manager and supervisor shall still be responsible if he / she delegates particular tasks.
22

There are few who built the dream of Packages Limited as diligently and with such dedication as Mr. Tariq Hamid. A role model, true leader and integral part of the Company’s journey, his life story is inspiration for many. Tariq Hamid joined the company as a civil engineer but progressively rose up because of his talent, hard work and dedication eventually succeeding Syed Irshad Hussain as General Manager in 1973. Tariq Hamid saw the Company through some of its toughest times across all spheres ranging from Human Resource to Information Technology eventually retiring in 1994.
TARIQHAMID
23
ANNUALREPORT 2017

(Rupees in Million) 2017 2016 2015 2014 2013 2012 2011 2010 2009 2008
Assets Employed: Fixed Assets at Cost 11,514 10,068 10,036 9,835 9,744 9,275 28,472 27,749 26,887 25,789 Accumulated Depreciation / Amortisation 6,190 5,665 6,055 5,973 5,956 5,749 10,057 9,101 7,605 6,323 Net Fixed Assets 5,324 4,403 3,981 3,861 3,788 3,526 18,415 18,649 19,282 19,465 Other Non-Current Assets 60,185 50,104 45,037 47,445 41,122 20,893 16,402 12,442 8,347 8,645 Current Assets 8,380 7,641 7,918 8,548 8,359 7,030 8,841 8,534 7,979 6,923 Current Liabilities 4,929 5,025 4,904 5,130 5,331 4,482 3,442 2,421 1,743 5,617 Net Current and Other Non-Current Assets 63,636 52,719 48,051 50,864 44,150 23,441 21,800 18,555 14,583 9,952 Assets of Disposal Group - - - - - 14,543 - - - - Net Assets Employed 68,960 57,122 52,031 54,725 47,938 41,510 40,215 37,204 33,865 29,417
Financed By: Paid up Capital 894 894 884 864 844 844 844 844 844 844 Reserves 64,166 51,284 45,593 47,567 39,640 28,173 26,666 24,480 20,967 15,429 Preference Shares / Convertible stock reserve 606 606 1,310 1,572 1,606 1,606 1,606 1,606 1,606 - Shareholder’s Equity 65,666 52,784 47,786 50,003 42,090 30,623 29,115 26,930 23,417 16,273 Deferred Liabilities 1,027 736 488 467 654 748 2,525 2,317 2,478 841 Long Term Finances 2,267 3,602 3,757 4,255 5,195 4,471 8,575 7,956 7,971 12,304 Total Non-Current Liabilities 3,294 4,338 4,245 4,722 5,848 5,219 11,100 10,274 10,448 13,145 Liabilities of Disposal Group - - - - - 5,669 - - - - Total Funds Invested 68,960 57,122 52,031 54,725 47,938 41,510 40,215 37,204 33,865 29,418
Invoiced Sales - Gross 21,389 19,794 18,711 17,627 17,314* 13,871* 13,797* 21,837 16,533 14,301 Materials Consumed 10,240 9,313 9,005 9,131 9,131* 7,407 * 7,282* 10,211 8,685 7,639 Cost of Goods Sold 14,370 13,221 12,664 12,873 12,893* 10,270* 10,071* 17,733 13,736 11,281 Gross Profit 3,736 3,618 3,361 2,215 1,995* 1,475 * 1,315* 803 307 943 Employees Remuneration 2,331 2,209 1,732 1,521 1,363* 1,018 * 912* 1,502 1,229 1,033 Profit / (loss) from Operations 1,328 1,797 1,828 947 997* **1,011 * **872* (104) **(384) 405 Profit / (loss) before Interest & Tax 7,156 6,961 3,803 2,750 2,194* 2,378* 1,037* (317) 5,770 (308)Profit / (loss) after Tax 6,216 5,596 3,295 2,536 1,796* 1,488* 161* (332) 4,064 (196)EBITDA (from operations) 2,277 2,427 2,497 1,383 1,268* 1,103* 896* 1,242 719 955
Key Ratios: Profitability Gross Profit Ratio (%) 20.63 21.49 20.98 14.68 13.40* 12.56* 11.55* 4.33 2.19 7.72 Profit Before Tax (%) 39.53 41.34 23.73 18.22 14.74* 20.25* 9.11* (1.71) 41.08 (2.52)EBITDA Margin to Sales (%) 12.58 14.41 15.58 9.16 8.51* 9.40* 7.87* 6.70 5.12 7.81 Total Assets Turnover Ratio 0.25 0.27 0.28 0.25 0.28* 0.37* 0.26* 0.47 0.39 0.35 Fixed Assets Turnover Ratio 4.12 3.92 4.27 4.18 4.35* 3.75* 0.62* 1.04 0.73 1.08
Liquidity Current Ratio 1.70 1.52 1.61 1.67 1.57 1.57 2.57 3.52 4.58 1.23 Quick Ratio 1.20 1.07 1.15 1.13 1.07 1.03 0.96 1.57 1.72 0.43
Gearing Debt : Equity Ratio 5:95 7:93 8:92 8:92 11:89 15:85 24:76 23:77 25:75 44:56 Return on Equity (%) 9.47 10.60 6.90 5.07 4.27* **4.85* **0.55* (1.23) **(13.05) (1.20)
Investment Basic EPS (Rs.) 69.05 62.61 37.42 29.89 21.28* 17.64* 1.90* (3.94) 48.16 (2.32)Diluted EPS (Rs.) 65.02 58.45 33.62 26.59 20.01* 17.09* 1.90* (3.94) 44.72 (2.32)Price - Earning Ratio 7.38 13.58 15.56 22.70 12.81* 8.57* 43.43* (32.65) 2.99 (34.98)Interest Cover Ratio 17.96 6.43 7.08 4.67 3.61* 5.52* 3.16* 0.74 5.55 0.81 Dividend Yield (%) 5.88 2.94 2.58 1.32 2.93 2.98 1.81 2.53 2.26 - Dividend Cover Ratio 2.32 2.50 2.46 3.23 2.66* 3.92* 1.27* (1.21) 14.82 - Cash Dividend % 300.00 250.00 151.70 90.00 80.00 45.00 15.00 32.50 32.50 - Break-up value per Ordinary Share (Rs.) 727.90 583.78 519.99 554.26 479.78 343.89 326.02 300.12 258.49 192.85 Market Value per Ordinary Share - Year End (Rs.) 509.83 850.05 582.11 678.29 272.63 151.16 82.72 128.61 144.00 81.19 Cash Dividend per Share 30.00 25.00 15.00 9.00 8.00 4.50 1.50 3.25 3.25 - * Represents Continuing operation. ** Excluding effect of capital gain and reversal of impairment / (impairment loss) on available for sale financial assets, if any.
DECADE ATA GLANCE
24

(Rupees in Million) 2017 2016 2015 2014 2013 2012 2011 2010 2009 2008
Assets Employed: Fixed Assets at Cost 11,514 10,068 10,036 9,835 9,744 9,275 28,472 27,749 26,887 25,789 Accumulated Depreciation / Amortisation 6,190 5,665 6,055 5,973 5,956 5,749 10,057 9,101 7,605 6,323 Net Fixed Assets 5,324 4,403 3,981 3,861 3,788 3,526 18,415 18,649 19,282 19,465 Other Non-Current Assets 60,185 50,104 45,037 47,445 41,122 20,893 16,402 12,442 8,347 8,645 Current Assets 8,380 7,641 7,918 8,548 8,359 7,030 8,841 8,534 7,979 6,923 Current Liabilities 4,929 5,025 4,904 5,130 5,331 4,482 3,442 2,421 1,743 5,617 Net Current and Other Non-Current Assets 63,636 52,719 48,051 50,864 44,150 23,441 21,800 18,555 14,583 9,952 Assets of Disposal Group - - - - - 14,543 - - - - Net Assets Employed 68,960 57,122 52,031 54,725 47,938 41,510 40,215 37,204 33,865 29,417
Financed By: Paid up Capital 894 894 884 864 844 844 844 844 844 844 Reserves 64,166 51,284 45,593 47,567 39,640 28,173 26,666 24,480 20,967 15,429 Preference Shares / Convertible stock reserve 606 606 1,310 1,572 1,606 1,606 1,606 1,606 1,606 - Shareholder’s Equity 65,666 52,784 47,786 50,003 42,090 30,623 29,115 26,930 23,417 16,273 Deferred Liabilities 1,027 736 488 467 654 748 2,525 2,317 2,478 841 Long Term Finances 2,267 3,602 3,757 4,255 5,195 4,471 8,575 7,956 7,971 12,304 Total Non-Current Liabilities 3,294 4,338 4,245 4,722 5,848 5,219 11,100 10,274 10,448 13,145 Liabilities of Disposal Group - - - - - 5,669 - - - - Total Funds Invested 68,960 57,122 52,031 54,725 47,938 41,510 40,215 37,204 33,865 29,418
Invoiced Sales - Gross 21,389 19,794 18,711 17,627 17,314* 13,871* 13,797* 21,837 16,533 14,301 Materials Consumed 10,240 9,313 9,005 9,131 9,131* 7,407 * 7,282* 10,211 8,685 7,639 Cost of Goods Sold 14,370 13,221 12,664 12,873 12,893* 10,270* 10,071* 17,733 13,736 11,281 Gross Profit 3,736 3,618 3,361 2,215 1,995* 1,475 * 1,315* 803 307 943 Employees Remuneration 2,331 2,209 1,732 1,521 1,363* 1,018 * 912* 1,502 1,229 1,033 Profit / (loss) from Operations 1,328 1,797 1,828 947 997* **1,011 * **872* (104) **(384) 405 Profit / (loss) before Interest & Tax 7,156 6,961 3,803 2,750 2,194* 2,378* 1,037* (317) 5,770 (308)Profit / (loss) after Tax 6,216 5,596 3,295 2,536 1,796* 1,488* 161* (332) 4,064 (196)EBITDA (from operations) 2,277 2,427 2,497 1,383 1,268* 1,103* 896* 1,242 719 955
Key Ratios: Profitability Gross Profit Ratio (%) 20.63 21.49 20.98 14.68 13.40* 12.56* 11.55* 4.33 2.19 7.72 Profit Before Tax (%) 39.53 41.34 23.73 18.22 14.74* 20.25* 9.11* (1.71) 41.08 (2.52)EBITDA Margin to Sales (%) 12.58 14.41 15.58 9.16 8.51* 9.40* 7.87* 6.70 5.12 7.81 Total Assets Turnover Ratio 0.25 0.27 0.28 0.25 0.28* 0.37* 0.26* 0.47 0.39 0.35 Fixed Assets Turnover Ratio 4.12 3.92 4.27 4.18 4.35* 3.75* 0.62* 1.04 0.73 1.08
Liquidity Current Ratio 1.70 1.52 1.61 1.67 1.57 1.57 2.57 3.52 4.58 1.23 Quick Ratio 1.20 1.07 1.15 1.13 1.07 1.03 0.96 1.57 1.72 0.43
Gearing Debt : Equity Ratio 5:95 7:93 8:92 8:92 11:89 15:85 24:76 23:77 25:75 44:56 Return on Equity (%) 9.47 10.60 6.90 5.07 4.27* **4.85* **0.55* (1.23) **(13.05) (1.20)
Investment Basic EPS (Rs.) 69.05 62.61 37.42 29.89 21.28* 17.64* 1.90* (3.94) 48.16 (2.32)Diluted EPS (Rs.) 65.02 58.45 33.62 26.59 20.01* 17.09* 1.90* (3.94) 44.72 (2.32)Price - Earning Ratio 7.38 13.58 15.56 22.70 12.81* 8.57* 43.43* (32.65) 2.99 (34.98)Interest Cover Ratio 17.96 6.43 7.08 4.67 3.61* 5.52* 3.16* 0.74 5.55 0.81 Dividend Yield (%) 5.88 2.94 2.58 1.32 2.93 2.98 1.81 2.53 2.26 - Dividend Cover Ratio 2.32 2.50 2.46 3.23 2.66* 3.92* 1.27* (1.21) 14.82 - Cash Dividend % 300.00 250.00 151.70 90.00 80.00 45.00 15.00 32.50 32.50 - Break-up value per Ordinary Share (Rs.) 727.90 583.78 519.99 554.26 479.78 343.89 326.02 300.12 258.49 192.85 Market Value per Ordinary Share - Year End (Rs.) 509.83 850.05 582.11 678.29 272.63 151.16 82.72 128.61 144.00 81.19 Cash Dividend per Share 30.00 25.00 15.00 9.00 8.00 4.50 1.50 3.25 3.25 - * Represents Continuing operation. ** Excluding effect of capital gain and reversal of impairment / (impairment loss) on available for sale financial assets, if any.
25
ANNUALREPORT 2017

HORIZONTAL & VERTICAL ANALYSISBALANCE SHEET
HORIZONTAL ANALYSIS(Rupees in Million)
2017 17 vs 16 2016 16 vs 15 2015 15 vs 14 2014 14 vs 13 2013 13 vs 12 2012 Re-statedEquity & Liabilities Rs. % Rs. % Rs. % Rs. % Rs. % Rs.
SHARE CAPITAL & RESERVES
Issued, subscribed and paid up capital 894 - 894 1.11 884 2.34 864 2.35 844 - 844 Reserves 57,673 16.39 49,550 18.32 41,878 (6.45) 44,766 17.64 38,054 22.46 31,075 Preference shares / convertible stock reserve 606 - 606 (53.72) 1,310 (16.65) 1,572 (2.14) 1,606 - 1,606 Unappropriated profit / (loss) 6,492 274.40 1,734 (53.32) 3,715 32.64 2,801 76.60 1,586 (154.65) (2,902) NON-CURRENT LIABILITIES
Long term finances 2,254 (36.96) 3,576 (4.12) 3,729 (11.81) 4,229 (18.20) 5,170 15.63 4,471 Deferred tax 344 (0.12) 344 39.80 246 (15.95) 293 (42.92) 513 60.31 320 Liabilities against assets subject to finance lease 13 (49.36) 26 (5.77) 28 7.66 26 7.02 24 100.00 - Retirement benefits 358 310.36 87 115.97 40 100.00 - (100.00) 0.58 (99.81) 307 Deferred liabilities 325 6.62 305 51.31 202 15.46 175 24.70 140 15.70 121 CURRENT LIABILITIES
Current portion of long term finances 1,334 130.56 579 47.53 392 91.64 205 0.34 204 (79.60) 1,000 Finances under mark up arrangements - secured 300 (78.24) 1,377 55.69 884 (29.95) 1,263 (16.83) 1,518 87.64 809 Derivative financial instruments - - - - - - - (100.00) 27 (83.64) 165 Trade and other payables 3,105 9.03 2,848 (13.12) 3,278 4.24 3,145 3.04 3,052 54.38 1,977 Accrued finance cost 190 (14.42) 222 (36.52) 349 (32.52) 518 (2.33) 530 - 530 Liabilities directly associated with non-current assets classified as held-for-sale - - - - - - - - - (100.00) 5,669 TOTAL 73,889 18.89 62,148 9.15 56,936 (4.88) 59,854 12.36 53,269 15.82 45,992
VERTICAL ANALYSIS(Rupees in Million)
2017 2016 2015 2014 2013 2012 Re-statedEquity & Liabilities Rs. % Rs. % Rs. % Rs. % Rs. % Rs. %
SHARE CAPITAL & RESERVES
Issued subscribed and paid up capital 894 1.21 894 1.44 884 1.55 864 1.44 844 1.58 844 1.84 Reserves 57,673 78.05 49,550 79.73 41,878 73.55 44,766 74.79 38,054 71.44 31,075 67.57 Preference shares / convertible stock reserve 606 0.82 606 0.98 1,310 2.30 1,572 2.63 1,606 3.01 1,606 3.49 Unappropriated profit / (loss) 6,492 8.79 1,734 2.79 3,715 6.52 2,801 4.68 1,586 2.98 (2,902) (6.31) NON-CURRENT LIABILITIES
Long term finances 2,254 3.05 3,576 5.75 3,729 6.55 4,229 7.07 5,170 9.71 4,471 9.72 Deferred tax 344 0.47 344 0.55 246 0.43 293 0.49 513 0.96 320 0.70 Liabilities against assets subject to finance lease 13 0.02 26 0.04 28 0.05 26 0.04 24 0.05 - - Retirement benefits 358 0.48 87 0.14 40 0.07 - - 1 0.00 307 0.67 Deferred liabilities 325 0.44 305 0.49 202 0.35 175 0.29 140 0.26 121 0.26 CURRENT LIABILITIES
Current portion of long term finances 1,334 1.81 579 0.93 392 0.69 205 0.34 204 0.38 1,000 2.17 Finances under mark up arrangements - secured 300 0.41 1,377 2.22 884 1.55 1,263 2.11 1,518 2.85 809 1.76 Derivative financial instruments - - - - - - - - 27 0.05 165 0.36 Trade and other payables 3,105 4.20 2,848 4.58 3,278 5.76 3,145 5.25 3,052 5.73 1,977 4.30 Accrued finance cost 190 0.26 222 0.36 349 0.61 518 0.86 530 0.99 530 1.15 Liabilities directly associated with non-current assets classified as held-for-sale - - - - - - - - - - 5,669 12.33 TOTAL 73,889 100.00 62,148 100.00 56,936 100.00 59,854 100.00 53,269 100.00 45,992 100.00
0 10,000 20,000 30,000 40,000 50,000 60,000 70,000 80,000
2017
2016
2014
2015
2013
2012
Share Capital & Reserves Non-Current Liabilities Current Liabilities
EQUITY AND LIABILITIES (RUPEES IN MILLION)
30,623 5,219 10,150
42,090 5,848 5,331
50,003 4,722 5,130
11%67% 22%
10%11%79%
83% 8% 9%
47,787 4,245 4,904
7% 9%84%
52,784 4,338 5,0258%7%85%
65,666 3,294 4,929
89% 4% 7%
26

HORIZONTAL ANALYSIS(Rupees in Million)
2017 17 vs 16 2016 16 vs 15 2015 15 vs 14 2014 14 vs 13 2013 13 vs 12 2012 Re-statedAssets Rs. % Rs. % Rs. % Rs. % Rs. % Rs.
NON-CURRENT ASSETS Property, plant and equipment 5,185 21.71 4,260 11.97 3,804 3.21 3,686 0.57 3,665 5.96 3,459 Intangible assets 5 (52.48) 10 (52.40) 21 (45.45) 38 18.75 32 (21.95) 41 Investment property 135 1.14 133 (14.31) 155 12.63 138 51.65 91 250.00 26 Investments 60,166 20.15 50,078 11.29 44,998 (4.88) 47,304 15.24 41,048 97.38 20,796 Long term loans and deposits 18 (29.87) 26 (33.86) 39 (25.95) 53 (20.90) 67 (30.93) 97 Retirement benefits - - - - - (100.00) 88 1,366.67 6 100.00 - CURRENT ASSETS Stores and spares 422 5.03 402 (17.63) 488 (1.00) 493 (13.36) 569 23.16 462 Stock-in-trade 1,955 10.51 1,769 (0.64) 1,780 (20.21) 2,231 8.04 2,065 8.12 1,910 Trade debts 2,392 10.14 2,172 21.95 1,781 16.64 1,527 (5.91) 1,623 (28.82) 2,280 Loans, advances, deposits, prepayments and other receivables 729 (32.61) 1,081 (19.65) 1,346 (25.09) 1,797 6.27 1,691 309.44 413 Income tax receivable 2,700 27.00 2,126 (12.19) 2,421 7.70 2,248 3.31 2,176 35.75 1,603 Cash and bank balances 182 101.08 91 (10.94) 102 (59.63) 252 6.78 236 (34.81) 362 Non-current assets classified as held-for-sale - - - - - - - - - (100.00) 14,543
TOTAL 73,889 18.89 62,148 9.15 56,936 (4.88) 59,855 12.36 53,269 15.82 45,992
VERTICAL ANALYSIS(Rupees in Million)
2017 2016 2015 2014 2013 2012 Re-statedAssets Rs. % Rs. % Rs. % Rs. % Rs. % Rs. %
NON-CURRENT ASSETS Property, plant and equipment 5,185 7.02 4,260 6.85 3,804 6.68 3,686 6.16 3,665 6.88 3,459 7.52 Intangible assets 5 0.01 10 0.02 21 0.04 38 0.06 32 0.06 41 0.09 Investment property 135 0.18 133 0.21 155 0.27 138 0.23 91 0.17 26 0.06 Investments 60,166 81.43 50,078 80.58 44,998 79.03 47,304 79.03 41,048 77.06 20,796 45.22 Long term loans and deposits 18 0.02 26 0.04 39 0.07 53 0.09 67 0.13 97 0.21 Retirement benefits - - - - - - 88 0.15 6 0.01 - - CURRENT ASSETS Stores and spares 422 0.57 402 0.65 488 0.86 493 0.82 569 1.07 462 1.00 Stock-in-trade 1,955 2.65 1,769 2.85 1,780 3.13 2,231 3.73 2,065 3.88 1,910 4.15 Trade debts 2,392 3.24 2,172 3.49 1,781 3.13 1,527 2.55 1,623 3.05 2,280 4.96 Loans, advances, deposits, prepayments and other receivables 729 0.99 1,081 1.74 1,346 2.36 1,797 3.00 1,691 3.17 413 0.90 Income tax receivable 2,700 3.65 2,126 3.42 2,421 4.25 2,248 3.76 2,176 4.08 1,603 3.49 Cash and bank balances 182 0.25 91 0.15 102 0.18 252 0.42 236 0.44 362 0.79 Non-current assets classified as held-for-sale - - - - - - - - - - 14,543 31.62
TOTAL 73,889 100 62,148 100 56,936 100 59,855 100 53,269 100 45,992 100
0 10,000 20,000 30,000 40,000 50,000 60,000 70,000 80,000
2017
2016
2014
2015
2013
2012
Operating Fixed Assets Other Non-current Assets Current Assets
ASSETS (RUPEES IN MILLION)
3,526
3,788
3,862
8%
20,893
45%
21,573
47%
7%
41,121
77%
8,360
16%
6%
47,445
79%
8,548
14%
3,981
7%
45,037
79%
7,918
14%
4,4037%
50,10481%
7,64112%
5,324 60,185 8,380
7% 81% 11%
27
ANNUALREPORT 2017

2017 17 vs 16 2016 16 vs 15 2015 15 vs 14 2014 14 vs 13 2013 13 vs 12 2012 Re-stated Rs. % Rs. % Rs. % Rs. % Rs. % Rs.
Continuing operations
Local sales 21,359 8.05 19,766 5.80 18,683 6.26 17,582 1.95 17,245 24.89 13,808
Export sales 30 12.41 27 (4.44) 28 (37.70) 45 (34.12) 69 9.52 63
Gross sales 21,389 8.06 19,794 5.78 18,711 6.15 17,627 1.81 17,314 24.82 13,871
Sales tax and excise duty (3,284) 11.92 (2,934) 10.41 (2,657) 5.63 (2,516) 4.60 (2,405) 13.98 (2,110)
Commission - (100.00) (20) (29.82) (29) 18.91 (24) 16.49 (21) 31.25 (16)
Net sales 18,105 7.52 16,839 5.08 16,025 6.21 15,087 1.34 14,888 26.76 11,745
Cost of sales (14,370) 8.68 (13,221) 4.40 (12,664) (1.63) (12,873) (0.16) (12,893) 25.54 (10,270)
Gross profit 3,736 3.26 3,618 7.63 3,361 51.79 2,215 11.00 1,995 35.25 1,475
Administrative expenses (1,010) 12.54 (897) 19.22 (753) (4.38) (787) 33.89 (588) 82.61 (322)
Distribution and marketing costs (1,129) 22.56 (922) 35.93 (678) 16.87 (580) (1.01) (586) 46.50 (400)
Other operating expenses (496) 26.36 (392) 13.04 (347) 56.38 (222) 44.14 (154) 396.77 (31)
Other operating income 227 (41.81) 390 59.94 244 (24.25) 322 (2.08) 329 13.84 289
Profit / (loss) from operations 1,328 (26.11) 1,797 (1.68) 1,828 92.91 947 (4.88) 996 (1.48) 1,011
Finance costs (445) (65.93) (1,308) 103.33 (643) (14.44) (752) (11.06) (845) 60.04 (528)
Investment income 6,274 (3.06) 6,472 147.22 2,618 2.51 2,554 25.00 2,043 33.18 1,534
Reversal of impairment on investments - - - - - - - - - (100.00) 361
Profit / (loss) before tax 7,156 2.80 6,961 83.08 3,803 38.30 2,750 25.32 2,194 (7.74) 2,378
Tax (940) (31.18) (1,366) 169.33 (507) 137.83 (213) (46.43) (398) (55.28) (890)
Profit / (loss) for the year from continuing operations 6,216 11.09 5,596 69.80 3,295 29.93 2,536 41.22 1,796 20.70 1,488
Loss for the year from Discontinued operations - - - - - - - - (249) 93.66 (3,929)
Profit / (loss) for the year 6,216 11.09 5,596 69.80 3,295 29.93 2,536 63.95 1,547 163.38 (2,441)
Basic earnings / (loss) per share
- From Continuing operations 69.05 62.61 37.42 29.89 21.28 17.64
- From Discontinued operations - - - - (2.95) (46.56)
- From profit / (loss) for the year 69.05 62.61 37.42 29.89 18.33 (28.92)
Diluted earnings / (loss) per share
- From Continuing operations 65.02 58.45 33.62 26.59 20.01 17.09
- From Discontinued operations - - - - (2.95) (46.56)
- From profit / (loss) for the year 65.02 58.45 33.62 26.59 17.06 (29.47)
The financial information is based upon audited financial results of the Company of respective periods unless represented in accordance with applicable financial reporting framework.
HORIZONTAL ANALYSIS(Rupees in Million)
HORIZONTAL & VERTICAL ANALYSISPROFIT AND LOSS ACCOUNT
28

VERTICAL ANALYSIS(Rupees in Million)
2017 2016 2015 2014 2013 2012 Re-stated Rs. % Rs. % Rs. % Rs. % Rs. % Rs. %
Continuing operations
Local sales 21,359 99.86 19,766 99.86 18,683 99.85 17,582 99.74 17,245 99.60 13,808 99.55
Export sales 30 0.14 27 0.14 28 0.15 45 0.26 69 0.40 63 0.45
Gross sales 21,389 100.00 19,794 100.00 18,711 100.00 17,627 100.00 17,314 100.00 13,871 100.00
Sales tax and excise duty (3,284) (15.35) (2,934) (14.82) (2,657) (14.20) (2,516) (14.27) (2,405) (13.89) (2,110) (15.21)
Commission - - (20) (0.10) (29) (0.16) (24) (0.14) (21) (0.12) (16) (0.12)
Net sales 18,105 84.65 16,839 85.07 16,025 85.64 15,087 85.59 14,888 85.99 11,745 84.67
Cost of sales (14,370) (67.18) (13,221) (66.80) (12,664) (67.68) (12,873) (73.03) (12,893) (74.47) (10,270) (74.04)
Gross profit 3,736 17.47 3,618 18.28 3,361 17.96 2,215 12.56 1,995 11.52 1,475 10.63
Administrative expenses (1,010) (4.72) (897) (4.53) (753) (4.02) (787) (4.47) (588) (3.40) (322) (2.32)
Distribution and marketing costs (1,129) (5.28) (922) (4.66) (678) (3.62) (580) (3.29) (586) (3.38) (400) (2.88)
Other operating expenses (496) (2.32) (392) (1.98) (347) (1.86) (222) (1.26) (154) (0.89) (31) (0.22)
Other operating income 227 1.06 390 1.97 244 1.30 322 1.83 329 1.90 289 2.08
Profit / (loss) from operations 1,328 6.21 1,797 9.08 1,828 9.77 947 5.37 996 5.75 1,011 7.29
Finance costs (445) (2.08) (1,308) (6.61) (643) (3.44) (752) (4.26) (845) (4.88) (528) (3.81)
Investment income 6,274 29.33 6,472 32.70 2,618 13.99 2,554 14.49 2,043 11.80 1,534 11.06
Reversal of impairment on investments - - - - - - - - - - 361 2.60
Profit / (loss) before tax 7,156 33.46 6,961 35.17 3,803 20.32 2,750 15.60 2,194 12.67 2,378 17.14
Taxation (940) (4.39) (1,366) (6.90) (507) (2.71) (213) (1.21) (398) (2.30) (890) (6.42)
Profit / (loss) for the year from continuing operations 6,216 29.06 5,596 28.27 3,295 17.61 2,536 14.39 1,796 10.37 1,488 10.73
Loss for the year from Discontinued operations - - - - (249) (3,929)
Profit / (loss) for the year 6,216 29.06 5,596 28.27 3,295 17.61 2,536 14.39 1,547 8.93 (2,441) (17.60)
Basic earnings / (loss) per share
- From Continuing operations 69.05 62.61 37.42 29.89 21.28 17.64
- From Discontinued operations - - - - (2.95) (46.56)
- From profit / (loss) for the year 69.05 62.61 37.42 29.89 18.33 (28.92)
Diluted earnings / (loss) per share
- From Continuing operations 65.02 58.45 33.62 26.59 20.01 17.09
- From Discontinued operations - - - - (2.95) (46.56)
- From profit / (loss) for the year 65.02 58.45 33.62 26.59 17.06 (29.47)
The financial information is based upon audited financial results of the Company of respective periods unless represented in accordance with applicable financial reporting framework.
2017
2016
2014
2015
2013*
2012*
Materials Consumed Fuel & Power Depreciation & AmortisationCost of Sales (Other Components) Selling & Administrative Expenses Finance Costs & Other Charges *Represents Continuing Operations only
PROFIT AND LOSS - BREAKUP OF MAJOR EXPENSES AS % OF SALES
0 10 20 30 40 50 60 70 80 90 100
53% 7% 3% 11% 5% 4%
53% 5% 3% 13% 7% 6%
52% 5% 2% 14% 8% 6%
49% 5% 2% 12% 8% 5%
47% 3% 3% 14% 9% 9%
48% 3% 3% 13% 10% 4%
29
ANNUALREPORT 2017

(Rupees in thousand) 2017 2016 2015
Wealth Generated
Sales 21,388,949 19,793,529 18,711,298 Dividend income 6,273,905 6,472,005 2,617,891 Other income 227,127 390,298 244,022
Total 27,889,981 100% 26,655,832 100% 21,573,211 100% Wealth Distributed
Bought-in-materials & services 16,238,514 58% 15,585,322 58% 14,358,651 67% To Employees Remuneration, benefits and facilities 2,331,375 8% 2,209,389 8% 1,732,494 8% To Government Income Tax, Sales Tax, Custom & Excise Duties, Workers’ Funds, EOBI & Social Security Contribution, Professional & Local Taxes 2,479,695 9% 1,931,523 7% 1,448,365 7% To Providers of CapitalCash dividend to the ordinary shareholders 2,681,385 10% 2,234,488 8% 1,340,693 6%Finance costs 445,495 2% 1,307,505 5% 643,032 3% Retained for Reinvestment & Future Growth / (Utilized from reserves) 3,713,517 13% 3,387,605 13% 2,049,976 9%
Total 27,889,981 100% 26,655,832 100% 21,573,211 100%
The statement below shows value added by the operations of the Company and its distribution to the stakeholders
VALUE ADDED & ITS DISTRIBUTION
Wealth Generated & Distribution - 2017 (Percentage)
58%
13%
2%
10%
9%
8%
Bought-in-materials & services
EmployeesGovernmentShareholders Finance costRetained for re-investment & future growth
Wealth Generated & Distribution - 2016 (Percentage)
58%
13%
5%
8%
7%
8%
Bought-in-materials & services
EmployeesGovernmentShareholders Finance costRetained for re-investment & future growth
30

(Rupees in thousand) 2017 2016 2015 2014 2013 2012
Cash flow from operating activities Cash inflow from operations 2,249,638 2,323,393 3,182,034 1,432,406 2,530,095 395,637 Finance cost paid (477,465) (525,475) (811,384) (764,241) (1,090,306) (1,509,395)Taxes paid (1,437,792) (1,278,772) (686,226) (535,873) (548,880) (758,677)Payments for accumulating compensated absences (21,595) (26,046) (23,533) (17,079) (81,855) (28,670)Retirement benefits paid (21,339) (17,917) (15,329) (13,450) (320,767) (73,960)
Net cash inflow / outflow from operating activities 291,447 475,183 1,645,562 101,763 488,287 (1,975,065) Cash flow from investing activities Fixed capital expenditure (1,663,202) (1,026,871) (713,480) (629,738) (824,797) (1,234,627)Investment - net (958,526) (701,167) (2,437,175) (600,000) (2,274,953) 4 Net decrease / (increase) in long term loans and deposits 1,393 13,289 13,311 14,448 11,499 13,768 Investments made in Government securities (1,599,994) - - - - - Proceeds from disposal of Government securities 1,603,171 - - - - - Proceeds from disposal of property, plant and equipment 69,455 93,797 91,023 106,792 69,982 113,764 Proceeds from assets written off due to fire - - - - 102,003 233,463 Dividends received 6,273,905 6,472,005 2,617,891 2,553,678 2,043,111 1,534,440
Net cash inflow / (outflow) from investing activities 3,726,202 4,851,053 (428,430) 1,445,180 (873,155) 660,812 Cash flow from financing activities Repayment of long term finances - secured (571,420) (1,885,710) (200,000) (600,000) (1,100,000) (5,485,714)Proceeds from long term finances - 3,000,000 - - 1,000,000 2,000,000 Liabilities against assets subject to finance lease - net (10,617) (7,438) (7,038) (3,599) 27,884 - Redemption of preference shares - (5,601,500) - - - - Participating dividend on preference shares paid (45,000) - - - - - Dividend paid (2,221,580) (1,335,268) (782,731) (671,684) (378,218) (126,044)
Net cash outflow from financing activities (2,848,617) (5,829,916) (989,769) (1,275,283) (450,334) (3,611,758) Net increase / (decrease) in cash and cash equivalents 1,169,032 (503,680) 227,363 271,660 (835,202) (4,926,011)Cash and cash equivalents at the beginning of the year (1,286,421) (782,741) (1,010,104) (1,281,764) (5,546,562) (620,551)Cash and cash equivalents transferred to subsidiary - - - - 5,100,000 -
Cash and cash equivalents at the end of the year (117,389) (1,286,421) (782,741) (1,010,104) (1,281,764) (5,546,562)
Over the last six years
SOURCES & APPLICATION OF FUNDS
OPERATING ACTIVITIES (Rupees in Million)
(1,975)
488
102
1,646
475
291
-2,500
-2,000
-1,500
-1,000
-500
0
500
1,000
1,500
2,000
2017201720162015201420132012
INVESTING ACTIVITIES(Rupees in Million)
661
(873)
1,445
(428)
4,851
3,726
-2000
-1000
0
1,000
2,000
3,000
4,000
5,000
6,000
2017201720162015201420132012
FINANCING ACTIVITIES(Rupees in Million)
-7,000
-6,000
-5,000
-4,000
-3,000
-2,000
-1,000
0
2017201720162015201420132012
(3,612)
(450)
(1,275)(990)
(2,849)
(5,830)
31
ANNUALREPORT 2017

Packages Limited recognises the importance of being a good corporate citizen in the conduct of its business as well as fulfilling its corporate and social obligations. We have always acknowledged our social responsibility to the health and well being of the communities in which we operate. We are committed to the principle of ‘giving back to the society’.
Our commitment to our stakeholders and the community is exemplified through our Corporate Social Responsibility (CSR) activities; result of which is a recognition in the form of CSR Award 2018 by NFEH (National Forum for Environment & Health).
We endorse the spirit of definitions of sustainable development: ‘development that meets the needs of the present without compromising the ability of future generations to meet their own needs’’ and “improving the quality of life while living within the earth’s carrying capacities”. Our aim is to play a proactive role in contributing to achieve sustainability where we have influenced. We are committed to accountability and transparency in our sustainability performance.
RESPONSIBLE SOURCING AUDITPackages Limited as one of the leading packaging Company is fully aware of the consequences, its operations can have, upon the forests. Therefore, it has acquired FSC CoC Certification which ensures buying of pulp and paper board from responsible sources and thus playing its role in forest conservation.
Considering our religious obligation and for the satisfaction of our customers, we have acquired Halal Certification which ensures that all our products are being manufactured from 100% Halal raw materials.
Furthermore, we are RS compliant for our big customer Unilever. Its audit was conducted on 12th of July 2017 and we have now URSA Compliant site till July 2019.
CUSTOMER SATISFACTIONBusiness success rests upon customer satisfaction. Packages Limited therefore ensures to provide quality products to its customers fulfilling all the requirements through the following audits:
SUPPLIER MEMBER ETHICAL TRADE AUDITSWe are also a SEDEX member. We complied SMETA 4 pillars audit requirements in year 2017, It is globally recognised by many customers like PepsiCo, Nestle etc.
WORKPLACE CONDITION ASSESSMENT AUDITWe are WCA compliant for British American Tobacco. The audit was conducted in July 2017.
SUPPLIER WORKPLACE ACCOUNTABILITY AUDITSWA audit was successfully conducted on August 2017 by Arsheadvisors on behalf of McDonald’s.
ENERGY & ENVIRONMENTWe are a member of the global network of green offices project of the World Wide Fund for Nature, and the first company in Pakistan to be awarded Green Office diploma in the manufacturing sector. Green Office is an environmental service for/by offices. With its help, work places are able to reduce their burden on the environment, achieve savings and slow down environmental changes. We obtained the certificate for all our major offices.
We have phased out Chloro Fluoro Carbons (CFCs) according to Montreal Protocol with environmentally friendly refrigerants and have been consistently reducing the consumption of Hydro Chloro Fluoro Carbons (HCFCs) by replacing them with approved gases to curtail our contribution to the greenhouse effect.
CORPORATE SOCIAL RESPONSIBILITY & SUSTAINABILITY
32

We routinely conduct energy audits to identify projects that can efficiently use, reduce or recycle energy. Replacement of factory’s conventional lights with energy efficient LED’s/LVD’s (environment friendly lights) have been completed along with usage of renewable solar energy of approximately 500kW. Lux Monitoring and Motion Sensors are also being installed in phases to reduce energy cost. Lux sensors are being used to measure the amount of available daylight and adjust the light levels accordingly to reduce unnecessary energy consumption by utilising natural light resources while ensuring that appropriate light levels are maintained.
Reduced paper and water consumption measures were being strongly focused upon for the entire year.
Through these activities, we demonstrate our commitment to the community to protect the environment. We have also calculated our carbon footprint and are in process of reducing it drastically by efficient utilisation and optimisation of resources. Product life cycle assessment (LCA) is another initiative we are aggressively working upon to exactly gauge our impacts and reduce them.
We have successfully done the transition on Environmental standard ISO 14001; 2015 version. Based on above mentioned initiatives, the Company obtained the Annual Environment Excellence Award AEEA 2017 from NFEH as well as ISO certification En-Ms ISO 50001 in 2017.
HEALTH AND SAFETY Ensuring the protection of the health and well being of our employees, customers and the communities in which we operate is an ongoing process and has always been one of our chief concerns.
Our main procedures in safety include Comprehensive Risk assessment and Controls, Permit to work, Near miss reporting, Incident reporting, Emergency response and Compliance evaluation procedures. All newly hired employees go through safety orientation programs and sign an affidavit of their awareness. We routinely conduct trainings, both internal and external, regarding occupational health and safety, dengue prevention, road safety, safe removal of waste, first aid and fire safety. In 2017, amongst other trainings, an EHS awareness theater production was carried out for our employees to create awareness about the importance of environment and health related issues through a candid and relatable platform.
Fully equipped ambulance facility at site, well maintained dedicated smoking areas, robust fire hydrant system as per NFPA Guidelines etc. are few of major initiatives that have contributed in improving our safety infrastructure through PDCA.
We are certified for Food Safety System Certification (FSSC) which is a part of the world’s fastest growing Global Food Safety Initiative (GFSI) certification program accredited by The Consumer Goods Forum. Through this system, we ensure that the packaging material and tissue we manufacture is procured, processed, stored and transported by adopting and implementing the hygiene standards and controls. We also have ‘Halal Certification’ from South African National Halal Authority (S.A.N.H.A).
We are also making progress in our focus areas of behavior based safety and controlling risks with engineering as well as administrative controls and thus minimising the risk of injuries and accidents.
Packages Limited is BRC (the British Retail Consortium (BRC) – Food Safety Certification) certified. The Company complied all 230 requirements of BRC and was awarded BRC certificate with grade ‘A’ in High Hygiene Category, in November 2017.
SOCIETYWe firmly believe that for an organisation to be successful and for it to create value for its shareholders, it must also create value for its society. We consider it our responsibility to make sustainable positive impact on the communities in which we operate. Whether it’s through the grants we provide to various organisations that share our mission or through the inspiring volunteer efforts, we are passionate about helping people live better.
We strive to contribute to societal welfare through providing educational opportunities, employment, sponsoring various events, promoting culture, arts and awareness campaigns.
COMMUNITY WELFARE SCHEMESAs a corporate citizen, we have consistently and consciously tried to make a difference in the society by our corporate giving, assistance in community development and supporting groups; aiming for a progressive social change and the up-lift of the community at large. We provide contributions and assistance to a number of hospitals, trusts and other various non-profit organizations through ‘Packages Foundation’.
ROSE FESTIVALEvery spring more than three hundred types of roses welcome our esteemed guests to ‘The Packages Rose Festival’. The vividly decorated gardens are graced by the presence of our customers, vendors, employees and guests from the local community. Another essential attraction in this famous event is the spectacular display of different types of peacocks.
33
ANNUALREPORT 2017

PROMOTING TRADITIONAL ‘MELA’ CULTUREWe always look forward to arranging different events to promote traditional activities within the society. ‘Mela’ is one of such activities which we have been organising for the last many years. The objective of this event is to provide traditional entertainment to the family members of our employees and the residents of our vicinity. More than 1,000 families participate in the event every year.
SPORTS ACTIVITIES“Health is the thing that makes you feel that now is the best time of the year” – we at Packages believe that mental exertion must be balanced by physical activity; resultantly promotion of sports has always played a vital role in our CSR initiatives. To carry out all these sports activities, we have an in-house sports complex. Some of the activities aimed to promote sports at grass root level within the country are:
• Jaffar Memorial Inter School Hockey Tournament• Babar Ali Foundation Inter School Football Tournament• Babar Ali Foundation Inter School Hockey Tournament for Girls
In addition, we offer sports facilities for our employees as well. Every year, inter-departmental tournament starts the sports year of Packages and ends with the annual sports day celebrations. These sports activities also provide a platform to the employees to become part of the Packages Sports Teams which represents the Company in different sports competitions.
HUMAN CAPITALOur people are our greatest asset. We are committed to attracting, retaining and developing the highest quality and most dedicated work force. We strive to hire and promote people on the basis of their qualifications, performance and abilities and are determined to provide equal opportunities to our employees and a work environment free of any form of discrimination.
TRAININGSEmployee training needs are periodically reviewed, and various in-house and customised training programs are arranged as needed for production, marketing, human resource, supply management and finance personnel.
During the year, the Company conducted a number of soft skills and technical trainings, both in-house and externally.
In order to develop the top talent of the organization for taking on broader leadership roles in the future, the organization shortlists its high potential employees for a year-long certificate program in business management (CPBM) which is conducted at Rausing Executive Development Center (REDC), LUMS. The program is conducted from time to time and is aimed to ensure that executives develop a business-wide perspective beyond their specific area of expertise, learn to appreciate and leverage the interlinkages among individual organizational functions; and develop broader perspectives as well as understanding growth and sustainability challenges at a more strategic level.
The Company also holds a recreational training at the end of each year primarily for sales team and allied personnel from various departments as a team building exercise and to freshen up the employees after the whole year’s hard work. The training involves various activities which ensures effective team building among cross functional employees in a highly interactive setting.
The objective of these programs is to develop human resource and provide personnel with the necessary technical and soft skills to enhance performance and prepare individuals for higher roles and responsibilities.
FAIR PRICE SHOPWe have established a fair price shop for our employees to facilitate them in the purchase of their grocery items. We provide subsidy on purchase of pulses for the workers. Fair Price shop is also offering other general stores and clothing items on no profit no loss basis to employees.
SCHOLARSHIPSWe offer merit scholarships to the children of our employees to appreciate their talent and promote healthy competition in the form of monitory re-imbursements that vary with the level of education.
HAJJ FACILITYEvery year, Packages has the privilege to send 10 of its employees for Hajj through ballot. This includes 7 employees from non-executive staff and 3 from executive and management staff. We bear all expenses of these employees pertaining to this religious offering.
LONG SERVICE AWARDSEvery year, as a token of appreciation for the continued association with us, we give awards to our employees who achieve a significant milestone of service years.
CORPORATE SOCIAL RESPONSIBILITY& SUSTAINABILITY
34

Mr. Rafi Iqbal joined the Company in 1965 and was a civil engineer. He had remained a part of Tariq Hamid’s team and had followed a career path almost similar to his. His career, prior to assuming the role of General Manager in 1994, centered mainly around production and planning with a two year secondment in 1974 to Kibo Paper in Tanzania. During his tenure as General Manager, Packages underwent major expansions across all businesses, whether paper, carton or flexible. Mr. Rafi Iqbal retired in October 2001.
RAFIIQBALAHMAD
35
ANNUALREPORT 2017

CORPORATE CALENDAR
01
03
05
07
09
02
04
06
08
Audit Committee and BOD meetings to consider annual accounts of the Company for the yearended December 31, 2016
February 28, 2017
Strategic partnership agreement between Packages Limited and A & R Carton AB
March 1, 2017
Annual General Meeting of shareholders to consider annual accounts of the Company for the year ended
December 31, 2016 and dividend announcement
April 25, 2017
Audit Committee and BOD meetings to consider half yearly accounts of the Company for the
period ended June 30, 2017
August 21, 2017
Audit Committee and BOD meetings to consider quarterly accounts of the Company for the period
ended September 30, 2017
October 25, 2017
Audit Committee and BOD meetings to considerquarterly accounts of the Company for the quarter ended March 31, 2017
April 19, 2017
Board of Directors resolved to purchase 35% shares held by Stora Enso in Bulleh Shah Packaging (Private) Limited at a price of up to 8 million US Dollars
July 26, 2017
Acquisition of 35% shareholding in Bulleh Shah Packaging (Private) Limited (BSPPL), with completion of this acquisition BSPPL became a fully owned subsidiary of Packages September 18, 2017
Group registration [Packages Limited and Bulleh Shah Packaging (Private) Limited] under regulation 3 of the Group Companies Registration Regulations, 2008 for the purpose of Group Taxation
December 14, 2017
36

SAULATSAID
Mr. Saulat Said joined the Company in 1967 after completing his M.Sc. (Chemistry). In 1990, he was designated as Sales Manager in the Marketing Department, then in 1994 he was made Marketing Manager and Deputy General Manager in the same year. Mr. Saulat took over from Rafi Iqbal in 2001 and retired in 2004. He was involved in all the foreign collaborations, local expansions and diversifications, joint ventures and multinationals arrangements and other numerous projects for quality and productivity improvement.
37
ANNUALREPORT 2017

Notice is hereby given that the 63rd Annual General Meeting of Packages Limited will be held on Thursday, April 19, 2018 at 10.30 a.m. at the Beach Luxury Hotel, Moulvi Tamizuddin Khan Road, Karachi to transact the following businesses:-
A. ORDINARY BUSINESS:
1. To confirm the Minutes of the Extraordinary General Meeting of the Company held on February 26, 2018.
2. To receive, consider and adopt the Audited Financial Statements of the Company for the year ended December 31, 2017 together with the Chairman’s Review Report and Directors and Auditors Reports thereon.
3. To consider and approve the payment of cash dividend for the year ended December 31, 2017 as recommended by the Board of Directors:
a) to the preference share/convertible stock holder (International Finance Corporation) at the rate of Rs. 29.077 (15.304%) per preference share/convertible stock of Rs. 190 proposed by the Board in terms of and as adjusted under the Subscription Agreement between Packages Limited and International Finance Corporation, totalling Rs.238,048,677; and
b) to the ordinary shareholders at the rate of Rs. 30.00 (300%) per ordinary share of Rs. 10.
4. To appoint Auditors for the year 2018 and to fix their remuneration. The current Auditors, M/s A.F. Ferguson & Co., Chartered Accountants have consented to be appointed as Auditors for the Financial Year 2018 and the Board of Directors has recommended their appointment.
B. SPECIAL BUSINESS:
5. To obtain consent of the shareholders and pass an ordinary resolution for the approval of transmission of annual audited financial statements, auditors’ report, directors’ report and chairman’s review report etc., along with notices of general meetings to Members through CD/DVD/USB at their registered addresses as allowed by the Securities and Exchange Commission of Pakistan (SECP) under SRO 470(1)/2016 dated May 31, 2016. (Attached to this Notice is a Statement of Material Facts covering the above-mentioned Special Business, as required under Section 134(3) of the Companies Act, 2017).
NOTICE OF ANNUALGENERAL MEETING
By Order of the Board
Karachi Adi J. CawasjiFebruary 28, 2018 Company Secretary
38

NOTES:1. CLOSURE OF SHARE TRANSFER BOOKS:
The Share Transfer Books of the Company will remain closed from April 12, 2018 to April 19, 2018 (both days inclusive). Transfers received in order at the office of the Company’s Share Registrar, Messrs FAMCO ASSOCIATES (PVT.) LIMITED, 8-F, Next to Hotel Faran, Nursery, Block 6, P.E.C.H.S., Shahrah-e-Faisal, Karachi-75400 by close of business on April 11, 2018 will be treated in time for payment of the final dividend to the transferees.
2. PARTICIPATION IN THE ANNUAL GENERALMEETING:A Member entitled to attend and vote at the Meeting may appoint another person as his proxy to attend, vote and speak at the Meeting instead of him/her. A proxy need not be a member of the Company. The instrument appointing a proxy and the power of attorney or other authority / board resolution under which it is signed or a notarially attested copy of power of attorney must be deposited at the Registered Office of the Company at 4th Floor, The Forum, Suite # 416-422, G-20, Block 9, Khayaban-e-Jami, Clifton, Karachi-75600 at least forty-eight (48) hours before the time appointed for the Meeting.
Members can exercise their right to demand a poll subject to meeting requirements of Sections 143 to 145 of the Companies Act, 2017 and applicable clauses of Companies (Postal Ballot) Regulations, 2018.
3. CHANGE IN ADDRESSES:Shareholders (Non-CDC) are requested to promptly notify the Company’s Share Registrar of any change in their addresses. Members whose shares are deposited in any sub-account or investor account with CDC should submit any change in their addresses to the CDC.
4. ACCOUNT OR SUB-ACCOUNT WITH THE CENTRAL DEPOSITORY COMPANY (“CDC”):Any individual beneficial owner having an account or sub-account with the CDC, entitled to vote at this Meeting, must bring his/her Computerized National Identity Card (“CNIC”) with him/her to prove his/her identity, and in case of proxy must enclose an attested copy of his/her CNIC. The representatives of corporate bodies should
bring attested copies of board of directors’ resolution/powers of attorney and/or all such documents as are required under Circular No.1 dated 26 January 2000 issued by the Securities and Exchange Commission of Pakistan (“SECP”) for the purpose.
5. NOTICE TO SHAREHOLDERS WHO HAVE NOT PROVIDED COPIES OF THEIR CNICs:In accordance with the notification of the SECP, SRO 779(I)/2011 dated August 18, 2011 and SRO 831(1)/2012 dated July 5, 2012, dividend warrants should bear CNIC numbers of the registered Member or the authorized person, except in case of minor(s) and corporate Members.
Accordingly, Members who have not yet submitted copy of their valid CNIC or NTN (in case of corporate entities) are again requested to submit the same to the Share Registrar, with Members folio number mentioned thereon. It may kindly be noted that in case of non-receipt of the copy of valid CNIC, the Company would be constrained to withhold dispatch of dividend warrants. Members whose shares are deposited in any sub-account or investor account with CDC should submit their CNICs or NTNs, as the case may be, to CDC.
6. MANDATORY PAYMENT OF CASH DIVIDEND THROUGH ELECTRONIC MODE:In compliance with Section 242 of the Companies Act, 2017 and SRO No.1145(I)/2017 dated November 6, 2017, payment of dividend will only be made by way of electronic mode directly to the bank accounts of entitled shareholders. In this regard E-Dividend Mandate Form has already been sent to all the shareholders. Members whose shares are deposited in any sub-account or investor account with CDC should submit their E-dividend Mandate to CDC.
7. DEDUCTION OF TAX FROM DIVIDEND INCOME:1. The Government of Pakistan through Finance Act, 2017 has made
certain amendments in the Income Tax Ordinance, 2001 whereby different rates are prescribed for deduction of withholding tax on the amount of dividend paid by companies. These rates are as under:
• For filers of income tax returns:15.0%
• For non-filers of income tax returns: 20.0%
To enable the Company to make tax deduction on the amount of cash dividend @15.0% instead of 20.0%, all the shareholders
39
ANNUALREPORT 2017

whose names are not entered into the Active Tax-payers List (ATL) provided on the website of Federal Board of Revenue, despite the fact that they are filers, are advised to make sure that their names are entered into ATL, otherwise tax on their cash dividend will be deducted @ 20.0% instead @15.0%.
For Members holding their shares jointly, as per the clarification issued by the Federal Board of Revenue, withholding tax will be determined separately on ‘Filer/Non-Filer’ status of principal shareholder as well as joint holder(s) based on their shareholding proportions, in case of joint accounts.
2. For any query / problem / information, the investors may contact the Company and / or the Share Registrar at the following phone numbers or email addresses:-
CONTACT PERSONS:
Mr. S.M. Munawar Moosvi Tel. # 92 21 35831618 / 35831664 / 35833011 Email: [email protected]
Mr. Ovais Khan Tel. # 92 21 34380101-2 Email: [email protected]
8. UNCLAIMED DIVIDEND / SHARES: Shareholders who could not collect their dividend/physical shares
are advised to contact our Share Registrar to collect/enquire about their unclaimed dividend or shares, if any. In compliance with Section 244 of the Companies Act, 2017, after having completed the stipulated procedure, all such dividend and shares outstanding for a period of three (3) years or more from the date due and payable shall be deposited to the credit of the Federal Government in case of unclaimed dividend and in case of shares, shall be delivered to the SECP. Notices for unclaimed dividend/physical shares were dispatched to the shareholders on November 17, 2017.
9. ATTENDANCE OF MEETING BY VIDEO-LINK: If Members holding ten (10) percent of the total paid up capital,
reside in a city, such Members, may demand the Company to provide them the facility of video-link for attending the Meeting.
If you wish to take benefit of this facility, please fill the attached form and submit it to the Company at its registered address at least seven (7) days prior to the date of the Meeting.
The Company will intimate to the Members the venue of the video-link facility at least five (5) days before the date of the Meeting along with all the information necessary to enable them to access the facility.
10. VALID TAX EXEMPTION CERTIFICATE FOR EXEMPTION FROM WITHHOLDING TAX:
A valid tax exemption certificate is necessary for exemption from the deduction of withholding tax under Section 150 of the Income Tax Ordinance, 2001. Members who qualify under Income Tax Ordinance, 2001 and wish to seek exemption must provide a copy of their valid tax exemption certificate to the Shares Registrar prior to the date of book closure otherwise tax will be deducted according to applicable law.
11. PLACEMENT OF FINANCIAL STATEMENTS ON WEBSITE:
The financial statements of the Company for the year ended December 31, 2017 along with reports have been placed on the website of the Company www.packages.com.pk.
12. TRANSMISSION OF ANNUAL FINANCIAL STATEMENTS THROUGH EMAIL:
The Companies Act, 2017 and the SECP vide SRO 787(1)/2014 dated September 8, 2014 has allowed companies to circulate Audited Financial Statements and Notices of meetings to its Members through e-mail. Members who wish to avail this facility can communicate their email addresses to the Company Secretary and/or Share Registrar on the Standard Request Form available on the Company’s website.
13. PROXY FORMS: The Form of Proxy in English and Urdu is attached in the Annual
Report and should be witnessed by two persons whose names, addresses and CNIC Numbers should be mentioned on the forms.
NOTICE OF ANNUALGENERAL MEETING
40

STATEMENT OF MATERIAL FACTS UNDER SECTION 134 (3) OF THE COMPANIES ACT, 2017
ITEM NO. 5 OF THE NOTICETRANSMISSION OF ANNUAL AUDITED ACCOUNTS THROUGH CD/DVD/USB The Securities and Exchange Commission of Pakistan (“SECP”) through its SRO 470(1)/2016 dated May 31, 2016 has allowed companies to circulate the annual balance sheet and profit and loss account (being the annual audited financial statements under the Companies Act, 2017), auditor’s report and directors’ report, etc. (collectively “Annual Audited Accounts”), through CD/DVD/USB to its members at their registered addresses, subject to consent of the shareholders in general meeting.
For the purpose aforesaid, it is proposed to consider and if thought fit, to pass the following resolution as an ordinary resolution, with or without modifications, to obtain consent of the shareholders for the transmission of annual audited financial statements and accompanying reports, along with notices of the general meetings by CD/DVD/USB:-
“RESOLVED THAT the consent and approval of the shareholders of the Company be and is hereby accorded for the transmission of annual audited financial statements, auditor’s report, directors’ report and chairman’s review report etc. (“Annual Audited Accounts”) along with notices of general meetings, to members through CD/DVD/USB at their registered addresses in terms of SRO 470(1)/2016 dated May 31, 2016 issued by the Securities and Exchange Commission of Pakistan.”
The Company shall, however, supply hard copies of the aforesaid documents to the shareholders on demand, at their registered addresses, free of cost, within one week of such demand. To facilitate Members, the Company shall place on its website a Standard Request Form which Members may use to communicate their preference for hard copies or otherwise (including their preference for all future audited annual financial statements and reports) to the Company Secretary or the Share Registrar.
The Directors are not interested in the above special business, except to the extent of their shareholdings in the Company.
41
ANNUALREPORT 2017

42

43
ANNUALREPORT 2017

CHAIRMAN’S REVIEW REPORT
I am pleased by the performance of Packages Limited for the year ended December 31, 2017. Operating in an environment of increasing competition, the
Company posted increase in sales by 8% as compared to last year. However, profitability showed a decline mainly owing to increased raw material costs
and the fact that it was not fully passed on to the customers.
The composition of the Board of Directors reflects mix of varied backgrounds and rich experience in the fields of business, finance, banking and regulations.
The Board provides strategic direction to the management and is available for guidance. The Board approves the budget and ensures that a competent
and energetic team is in position to achieve the goals set. The Board ensures compliance of all regulatory requirements by the Management. During the
year, the Board approved a risk management framework after identification of risks and mitigating measures specific to the Company. As required under
the Code of Corporate Governance, the Board evaluates its own performance through a mechanism developed by it.
The Board is ably assisted by its Committees. The Audit Committee reviews the financial statements and ensures that the accounts fairly represent the
financial position of the Company. It also ensures effectiveness of internal controls. The HR Committee overviews HR policy framework and recommends
selection and compensation of senior management team. An important role of the Committee is succession planning.
During the year, the Company has made investments in technological upgradation. For this purpose sizeable investments have been made in the flexible
packaging, folding carton and tissue divisions. The technological improvements would help in capacity and capability enhancements.
I pray to Allah that the Company continues to maintain its momentum of growth in the future.
Towfiq Habib ChinoyChairman
Lahore, February 28, 2018
44

DIRECTORS’ REPORT TO THE SHAREHOLDERS
The Directors of the Company take pleasure in submitting their Annual Report along with the audited financial statements of the Company for the year ended December 31, 2017.
FINANCIAL PERFORMANCESummarized financial performance is as follows:
2017 2016 (Rupees in million)
Net Sales from Operations 18,105 16,839
EBITDA- operations 2,276 2,427Depreciation & amortization (680) (628)
EBIT – operations 1,596 1,799Finance costs (445) (1,308)Other operating income/(expenses) – net (269) (2)Investment income 6,274 6,472
Earnings before tax 7,156 6,961Taxation (940) (1,365)
Earnings after tax 6,216 5,596
Basic earnings per share – Rupees 69.05 62.61
* Represents Continuing Operations only
INVOICED SALES - NET(Rupees in Million)
0
2,000
4,000
6,000
8,000
10,000
12,000
14,000
16,000
18,000
20,000
11,7
45 13,5
58 15,0
87
16,0
25
16,8
39 18,1
05
201720172016201520142013*2012*
* Represents Continuing Operations only
EARNINGS PER SHARE(Rupees)
0
10
20
30
40
50
60
70
17.6
4 21.2
8
29.8
9
37.4
2
62.6
1 69.0
5
201720172016201520142013*2012*
45
ANNUALREPORT 2017

The operations have achieved net sales of Rs. 18,105 million in 2017 against net sales of Rs. 16,839 million of last year representing sales growth of 8% based primarily on a volume growth of 7%.
The operations generated Earnings before Interest, Tax, Depreciation and Amortization (EBITDA) of Rs. 2,276 million during 2017 against Rs. 2,427 million of 2016 reflecting decline of 6%. The EBITDA is lower compared to that of corresponding period last year, partly due to increase in raw material and conversion costs that were not passed on to the customers during the year. Another factor was increase in expenses of advertisement of consumer products.
A brief review of the operations of the Company’s business divisions is as follows:
PACKAGING DIVISION
Packaging Operations have achieved net sales of Rs. 13,560 million during 2017 as compared to Rs. 12,794 million of 2016 representing sales growth of 6%.The primarily volume driven sales increase coupled with inflationary fixed costs and raw material price increases, have resulted in decreased EBITDA by Rs. 225 million i.e. 12% over 2016 values. The Company is focusing on value and volume growth of sales as well as internal cost savings and tighter controls over fixed costs to improve operating results of this division.
During the year your Company has made significant investment in machinery for enhancing capacity and quality. The Company has invested Rs. 260 million in a new, wide web Flexo Printing machine. It has also made an investment of Rs 280 million in a state of the art 7 Layer blown film Extruder. Further investment of Rs 105 million has been made in
Lamination, Slitting and Bag making machines in flexible packaging division. Another investment of Rs 58 million has been made in equipment for folding carton division.
CONSUMER PRODUCTS DIVISION
Consumer Products Division achieved sales of Rs. 4,387 million during the year 2017 as compared to Rs. 3,837 million of 2016 representing sales growth of 14%.
The Division’s EBITDA increased by Rs 53 million in 2017 as compared to 2016 due to revenue growth, improved capacity utilization and operating cost control initiatives.
The Company has also invested Rs 166 million in a toilet roll line to cater to market demand.
PRODUCTION STATISTICS
The production statistics for the year under review along with its comparison with the corresponding year are as follows:
2017 2016Consumer products produced-tons 13,861 14,353Carton Board & Consumer products converted-tons 41,552 36,890Plastics all sorts converted-tons 20,143 20,995
INVESTMENT INCOME
Investment income has decreased by Rs. 198 million during 2017 as compared to 2016 mainly due to decline in dividend income received from IGI Holdings Limited (formerly IGI Insurance Limited) and DIC.
FINANCE COSTS
Finance cost of the Company has decreased by Rs 863 million during 2017 over 2016, as last year 8.5 million preference shares of International Finance Corporation were redeemed at a premium of Rs 910 million.
INVESTMENT IN BULLEH SHAH PACKAGING (PRIVATE) LIMITED
The BOD, at the meeting held on July 26, 2017, resolved to purchase the remaining 35% shareholding held by Stora Enso in Bulleh Shah Packaging (Private) Limited (“BSPPL”). The transaction was approved by the shareholders through a special resolution at the Extraordinary General Meeting of the Company dated August 28, 2017. Accordingly, BSPPL became a fully owned subsidiary of the Company on September 18, 2017.
REAL ESTATE DEVELOPMENT – PACKAGES MALL
Packages Mall was inaugurated on April 20th, 2017 and the customer response has been encouraging. The Board believes that this investment will bring considerable benefit to the shareholders in the form of dividend income and capital gains.
INVESTMENT IN 100% SUBSIDIARY (ANEMONE HOLDINGS LIMITED)
Your Company contributed Rs 124.948 million (equivalent to USD 1.183 million) as equity in Anemone Holdings Limited, Mauritius (“AHL”) for the purposes of financing debt. AHL is a special purpose vehicle established in 2015 for the acquisition of operations of a flexible packaging company in South Africa as disclosed to the Stock Exchange in the directors reports of the respective year.
DIRECTORS’ REPORT TO THE SHAREHOLDERS
46

OMYAPACK (PRIVATE) LIMITED
As part of its asset and income diversification strategy, the JV Company, Omya Pack (Private) Limited will set up a state of the art production facility in Kasur, Punjab and will be positioned to supply a range of high quality ground calcium carbonate products specifically tailored to meet local and regional markets. The Company expects commercial production to commence from Q2-2018.
FINANCIAL MANAGEMENT
The Company continued its focus on managing optimal levels of inventory and trade receivables. Sound business performance, operating efficiencies and cost savings across the organization helped generate positive cash flows.
The Company has an effective Cash Flow Management System in place whereby cash inflows and outflows are projected on regular basis and rigorously monitored.
Working capital requirements are planned to be financed through efficient management of trade receivables, payables and inventory levels. Business unit managers are assigned working capital targets which are monitored on regular basis.
Capital expenditure is managed carefully through evaluation of profitability and risk. Large capital expenditure is further backed by long term contracts so as to minimize cash flow risk to the business. Capital expenditure during 2017 was at Rs 1,663 million.The investment portfolio of the Company
is fairly diversified, as reflected by equity participation in Nestle Pakistan Limited, Tri-Pack Films Limited, Tetra Pak Pakistan Limited, Bulleh Shah Packaging (Private) Limited, DIC Pakistan Limited, Packages Construction (Private) Limited, Packages Lanka (Private) Limited, Packages Power (Private) Limited and Anemone Holdings Limited.
The Board is satisfied that there are no short or long term financial constraints including access to credit and a strong balance sheet with December 2017 with net debt: equity ratio at 5:95.
RISK MITIGATION
The Board of Directors and the Audit Committee of the Board regularly review the risk matrix in terms of impact and probability of occurrence. The senior management team, led by the Chief Executive Officer is responsible for risk mitigation measures. The Company’s ability to continually assess market conditions and its timely response enables the Company to manage risks effectively.
CREDIT RISK
All financial assets of the Company, except cash in hand, are subject to credit risk. The Company believes that it is not exposed to major concentration of credit risk. Exposure is managed through application of credit limits to its customers and diversification of its investment portfolio placed with ‘A’ ranked banks and financial institutions.
LIQUIDITY RISK
Prudent liquidity risk management ensures availability of sufficient funds for meeting contractual commitments. The Company’s fund management strategy aims at managing liquidity risk through internal cash generation and committed credit lines with financial institutions.
INTEREST RATE RISK
Variable rate long-term financing is hedged against interest rate risk by holding “prepayment option”, which can be exercised upon any adverse movement in the underlying interest rates.
FOREIGN EXCHANGE RISK
Foreign currency risk arises mainly where receivables and payables exist due to transaction in foreign currencies. The Company is mainly exposed to short term USD/PKR and Euro/PKR parity on its import of raw materials and plant and machinery.
CAPITAL MANAGEMENT
The Company’s policy is to maintain a strong capital base so as to maintain investor, creditor and market confidence and to sustain future development of the business. There were no changes to the Company’s approach to capital management during the year.
FIXED ASSETS(Rupees in Million)
0
2,000
4,000
6,000
8,000
10,000
12,000
14,000
28,472
9,27
5
9,74
4
9,83
5
10,0
36
10,0
68
11,5
14
2017201720162015201420132012
0
500
1,000
1,500
2,000
2,500
3,000
3,500
25% 18%
16%
13%
14%15%
2,88
9 2,96
3
2,70
0
2,30
0
2,72
9
2,66
2
Working Capital Working Capital as % age to Sales
0%
5%
10%
15%
20%
25%
30%
WORKING CAPITAL(Rupees in Million)
2017201720162015201420132012
0
10
20
30
40
50
60
70
80
90
100
8515
8911 8 8 7 5
9292 93 95
Debt Equity
DEBT TO EQUITY(Percentage)
2017201720162015201420132012
47
ANNUALREPORT 2017

CONTRIBUTION TO NATIONAL EXCHEQUER
Your Company is a significant contributor to the national economy and has contributed Rs. 2,480 million during the year 2017 to the national exchequer on account of sales tax, income tax, import duties and statutory levies.
Environment, Health & Safety / Sustainability: Your Company is striving to excel in and endorse best environmental, health and safety standards that are eco/human friendly along with energy conserving strategies.
During the year, your Company obtained new certifications and successful surveillances for the following:
• British Retail Consortium. Grade “A”
• OHSAS 18001: 2007
• Green Office Diploma
The prime areas of focus in the year continued to be energy efficiency, improving working conditions and training and development of workforce. Regular campaigns are an integral part of the environmental, health and safety initiatives; significant campaigns of 2017 include the following:
• Food Safety Campaign
• Road Safety Campaign
• EHS awareness Campaign
Corporate Social Responsibility (‘CSR’)
On CSR, the Company’s management continued its focus on education, healthcare, skill development, environmental protection and social welfare during the current year.
The Company is making contributions/donations to Packages Foundation for carrying out its social work, the Company donated PKR 65.011 million towards various causes in the current year.
RETIREMENT FUNDS
There are three retirement funds currently being operated by the Company namely Provident Fund, Gratuity Fund and Pension Fund.
The value of investment of these funds based on their audited accounts as on December 31, 2017 were as follows:
Provident Fund Rs. 2,262.328 millionGratuity Fund Rs. 368.516 millionPension Fund Rs. 1,750.177 million
APPROPRIATION
In view of the financial results of the Company for the year 2017, the Board of directors of the Company has recommended cash dividend of 300 percent (i.e. Rs. 30 per share). Accordingly, the following appropriations have been made: Rupees in thousand
Total Comprehensive Income for the year 2017 after appropriation of preference dividend / return 6,037,694Un-appropriated profit brought forward 454,570
Available for appropriation 6,492,264Transferred to General Reserve (3,000,000)Cash dividend (2,763,884)
To be carried forward to 2018 728,380
AUDITORS
The present auditors M/s A.F Ferguson & Co., Chartered Accountants retire and have offered themselves for reappointment. They have confirmed having achieved satisfactory rating by the Institute of Chartered Accountants of Pakistan (ICAP) as well as compliance with the Guidelines on the Code of Ethics of the International Federation of Accountants (IFAC) as adopted by ICAP.
As suggested by the Audit Committee, the Board of Directors has recommended their reappointment as Auditors of the Company for the year ending December 31, 2018, at a fee to be mutually agreed.
COMPLIANCE WITH THE CODE OF CORPORATE GOVERNANCE
The requirements of the Code of Corporate Governance set out by the Pakistan Stock Exchange Limited in its Listing Regulations have been adopted by the Company and have been duly complied with. A Statement to this effect is annexed.
MATERIAL CHANGES
There have been no material changes since December 31, 2017 and the Company has not entered into any commitment, which would affect its financial position at the date except for those mentioned in the audited financial statements of the Company for the year ended December 31, 2017.
CHANGE IN THE COMPOSITION OF THE BOARD
During the year 2017, Mr. Jari Latvanen resigned and Mr. Khurram Raza Bakhtayari appointed to fill the casual vacancy. Subsequently, Mr. Imran Khalid Niazi was appointed and Mr. Khurram Raza Bakhtayari was asked to resign. The Board wishes to
0
1
2
3
4
5
1.03
1.57 1.571.67 1.61 1.53 1.70
1.07 1.13
1.15
1.08 1.20
Current Ratio Quick Ratio
0
1
2
3
4
5
CURRENT & QUICK RATIO
2017201720162015201420132012
DIRECTORS’ REPORT TO THE SHAREHOLDERS
48

record its appreciation of the valuable services rendered by the outgoing Directors and welcomes the new Director. MEETINGS OF BOARD OF DIRECTORS
During the year 2017, seven (7) Board meetings were held and the number of meetings attended by each Director is given hereunder :-
Name of Director No. of meetingsattended
1. Mr. Towfiq Habib Chinoy 6 (Chairman)
2. Syed Hyder Ali 6 (Chief Executive)
3. Mr. Josef Meinrad Mueller 2
4. Mr. Asghar Abbas 7
5. Mr. Khurram Raza Bakhtayari 3 (Appointed on 25 January 2017 and retired w.e.f. 26 May 2017)
6. Mr. Jari Latvanen (Resigned on 25 January 2017) –
7. Mr. Muhammad Aurangzeb 2
8. Mr. Shamim Ahmad Khan 7
9. Syed Aslam Mehdi 5
10. Syed Shahid Ali 4
11. Mr. Tariq Iqbal Khan 6
12. Mr. Imran Khalid Niazi 4 (Elected w.e.f. 26 May 2017)
Leave of absence was granted to the Directors who could not attend the Board meetings.
AUDIT COMMITTEE
An Audit Committee of the Board has been in existence since the enforcement of the Code of Corporate Governance. It comprises of six Non-Executive Directors.
Four meetings of the Audit Committee were held during the year. Attendance of each Member is given hereunder –
Name of Members No. of meetingsattended
Mr. Tariq Iqbal Khan 3(Chairman) (Non-Executive)
Mr. Mohammad Aurangzeb –(Independent)
Mr. Shamim Ahmad Khan 4(Non-Executive)
Syed Shahid Ali 3 (Non-Executive)
Syed Aslam Mehdi 4 (Non-Executive)
Mr. Imran Khalid Niazi 2 (Appointed w.e.f. 26 May 2017)
Leave of absence was granted to the Members who could not attend the meetings of the Audit Committee.
The Audit Committee has adopted its terms of reference which has been provided in the Code of Corporate Governance.
CORPORATE AND FINANCIAL REPORTING FRAMEWORK
The Directors of your company state that:
(a) The financial statements, prepared by the management of the company fairly present the state of affairs, the result of its operations, cash flows and changes in equity;
(b) Proper books of account of the company have been maintained;
(c) Appropriate accounting policies have been applied in preparation of financial statements and accounting estimates are based on reasonable and prudent judgment;
(d) The financial statements have been prepared in conformity with the Companies Ordinance, 1984 and International Financial Reporting Standards, as applicable in Pakistan. Any departures therefrom has been adequately disclosed and explained;
(e) Internal control system is sound in design and has been effectively implemented and monitored;
(f) There are no doubts about the company’s ability to continue as a going concern;
(g) There has been no material departure from the best practices of the Code Corporate Governance as detailed in the Listing regulations;
(h) Significant deviations from last year’s in operating results of the Company has been highlighted and reasons have been explained in the Directors report;
(i) Key operating and financial data of last six years is annexed;
(j) Where any statutory payment on account of taxes, duties, levies and charges is outstanding, the amount together with a brief description and reasons for the same is disclosed in the financial statements;
(k) Significant plans and decisions, such as corporate restructuring, business expansion and discontinuance of operations, has been outlined along with future prospects, risks and uncertainties, if any;
70%20%
10%
Non Executive Directors Executive Directors
Independent
BOARD COMPOSITION (Percentage)
49
ANNUALREPORT 2017

(l) The number of board and committees’ meetings held during the year and attendance by each director is annexed;
(m) The details of training programs attended by directors is annexed;
(n) The pattern of shareholding is annexed;
and
(p) All trades in the shares of the company, carried out by its directors, executives and their spouses and minor children is annexed.
Details of trading of Shares by Chief Executive, Directors, Chief Financial Officer, Company Secretary, Head of Internal Audit, their spouses and minor children given below:
Purchase of Shares: No. of shares
Chief Executive Officer NILDirectors 2,600Chief Financial Officer NILCompany Secretary NILHead of Internal Audit NILSpouse NILMinor Children NIL
Sale of Shares NIL
PATTERN OF SHAREHOLDING
A statement of the pattern of shareholding of certain class of shareholders as at December 31, 2017, whose disclosure is required under the reporting framework, is included in the annexed shareholders’ information.
The Directors, CEO, CFO, Company Secretary, Head of Internal Audit and their spouses or minor children did not carry out any trade in the shares of the Company during the year, except as noted above.
FUTURE OUTLOOK
The management is optimistic about improvement in economic conditions at the macro level and has made significant investments in equipment in the current year to enhance capacity and also to further improve the quality of its products and service. The Company is committed to increase sales by focusing on volumetric growth and improve profitability through cost efficiencies and product mix management.
(Towfiq Habib Chinoy) Chairman Lahore, February 28, 2018
(Syed Hyder Ali)Chief Executive & Managing DirectorLahore, February 28, 2018
COMPANY’S STAFF AND CUSTOMERS
The management is thankful to the Company’s stakeholders especially its customers for their continuing confidence in its products and services.
The management also wishes to express its gratitude to all the Company’s employees who have worked tirelessly. We appreciate their hard work, loyalty and dedication.
DIRECTORS’ REPORT TO THE SHAREHOLDERS
50

Mr. Mujeeb Rashid joined the Marketing Department of Packages in 1970 and held various offices in Group Companies during his tenure ranging from Managing Director, Nestle Lanka Ltd to Managing Director Tri-Pack Films Limited eventually rejoining Packages in 2001 as Deputy General Manager. He took over as General Manager in 2004 and retired in 2008 focusing on creating value by leading and directing the talents and efforts of employees towards high performance levels.
MUJEEB RASHID
51
ANNUALREPORT 2017

52

53
ANNUALREPORT 2017

54

55
ANNUALREPORT 2017

SYEDASLAMMEHDI
Syed Aslam Mehdi has a Master’s degree in Business Administration from Institute of Business Administration, Karachi and joined the Company in 1980 as a management trainee in Sales eventually becoming Managing Director of Packages Lanka in 1999. He returned in 2004 as Deputy General Manager and was sent to Kasur as Project Director for the new setup Bulleh Shah Paper Mills in 2007. He became General Manager in 2008, subsequently shifting to Tri Pack Films Limited as Managing Director in 2014 and is currently acting in the capacity of Managing Director of Bulleh Shah Packaging (Private) Limited since 2016.
56

SHAREHOLDERS’INFORMATION
REGISTERED OFFICE4th Floor, The Forum Suite # 416-422, G-20, Block 9Khayaban-e-Jami, Clifton Karachi-75600Tel. # 92 21 35831618 / 35831664 / 35833011 / 35874047 – 49 / 35378650-51Fax # 92 21 35860251
SHARES REGISTRAR FAMCO Associates (Pvt.) Ltd8-F, Next to Hotel FaranNursery, Block 6, P.E.C.H.S.,Shahrah-e-Faisal Karachi-75400Tel. # 92 21 34380101-2Fax # 92 21 34380106
LISTING ON STOCK EXCHANGEPackages equity shares are listed on the Pakistan Stock Exchange Limited.
LISTING FEESThe annual listing fee for the financial year 2017-18 has been paid to the stock exchange within the prescribed time limit.
STOCK CODEThe stock code for dealing in equity shares of Packages at the Stock Exchange is PKGS.
SHARES REGISTRARPackages’ shares department is operated by FAMCO Associates (Pvt.) Ltd and serves around 4,493 shareholders. It is managed by a well-experienced team of professionals and is equipped with the necessary infrastructure in terms of computer facilities and comprehensive set of systems and procedures for conducting the Registration function.
The Shares Registrar has online connectivity with Central Depository Company of Pakistan Limited. It undertakes activities pertaining to dematerialization of shares, share transfers, transmissions, issue of duplicate/re-validated dividend warrants, issue of duplicate/ replaced share certificates, change of address and other related matters.
For assistance, shareholders may contact either the Registered Office or the Shares Registrar.
For requests received
through postOver the counter
Transfer of shares 15 days after receipt 15 days after receipt
Transmission of shares 15 days after receipt 15 days after receipt
Issue of duplicate share certificates 30 days after receipt 30 days after receipt
Issue of duplicate dividend warrants 5 days after receipt 5 days after receipt
Issue of revalidated dividend warrants 5 days after receipt 5 days after receipt
Change of address 2 days after receipt 2 days after receipt
CONTACT PERSONSMr. S.M. Munawar MoosviTel. # 92 21 35831618 / 35831664 / 35833011 / 35874047 – 49 / 35378650-51Fax # 92 21 35860251
Mr. Ovais KhanTel. # 92 21 34380101-5 / 34384621-3Fax # 92 21 34380106
SERVICE STANDARDSPackages has always endeavored to provide investors with prompt services. Listed below are various investor services and the maximum time limits set for their execution:
Well qualified personnel of the Shares Registrar have been entrusted with the responsibility of ensuring that services are rendered within the set time limits.
STATUTORY COMPLIANCE During the year, the company has complied with all applicable provisions, filed all returns/ forms and furnished all the relevant particulars as required under the Companies Act, 2017 and allied rules, the Securities and Exchange Commission of Pakistan (SECP) Notifications/Circulars and the Listing requirements.
DEMATERIALISATION OF SHARESThe equity shares of the company are under the dematerialization category. As of date 73.6% of the equity shares of the company have been dematerialized by the shareholders.
57
ANNUALREPORT 2017

DIVIDEND ANNOUNCEMENTThe board of directors of the company has recommended for the financial year ended December 31, 2017 payment of cash dividend as follows -
• to the preference share/convertible stock holder (International Finance Corporation) at the rate of Rs. 29.077 (15.304%) per preference share/convertible stock of Rs. 190.00 in terms of the Subscription Agreement between Packages Limited and International Finance Corporation (2016: 12.893% or Rs. 24.497 per preference share/convertible stock of Rs. 190.00).
• to the ordinary shareholders at the rate of 300% (Rs. 30.00 per ordinary share of Rs. 10.00) subject to approval by the ordinary shareholders of the company at the Annual General Meeting (2016: cash dividend at the rate of 250% or Rs. 25.00 per ordinary share).
BOOK CLOSURE DATESThe Register of Members and Share Transfer Books of the company will remain closed from April 12, 2018 to April 19, 2018 both days inclusive.
DIVIDEND REMITTANCEPreference dividend/return will be paid to the preference/convertible stockholder prior to payment of ordinary dividend to the ordinary shareholders.
Ordinary dividend declared and approved at the Annual General Meeting shall be paid in terms of Section 242 of the Companies Act, 2017/Companies (Distribution of Dividends) Regulations, 2017:
• For shares held in physical form: to shareholders whose names appear in the Register of Members of the company after entertaining all requests for transfer of shares lodged with the company on or before the book closure date.
• For shares held in electronic form: to shareholders whose names appear in the statement of beneficial ownership furnished by CDC as at end of business on book closure date.
WITHHOLDING OF TAX & ZAKAT ON ORDINARY DIVIDEND As per the provisions of Section 150 of the Income Tax Ordinance, 2001, Income Tax is deductible at source on dividend payable by the company at the rate of 15.0% for filers of income tax returns, wherever applicable, and at the rate of 20.0% for non-filers of income tax returns.
Zakat is also deductible at source from the ordinary dividend at the rate of 2.5% of the face value of the share, other than corporate holders or individuals who have provided an undertaking for non-deduction.
INVESTORS’ GRIEVANCESTo date none of the investors or shareholders has filed any letter of complaint against any service provided by the company to its shareholders.
LEGAL PROCEEDINGSNo case has ever been filed by shareholders against the Company for non-receipt of shares / refund.
GENERAL MEETINGS & VOTING RIGHTSPursuant to Section 132 of the Companies Act, 2017, Packages Limited holds
a General Meeting of shareholders at least once a year. Every shareholder has a
right to attend the General Meeting. The notice of such meeting is sent to all the
shareholders at least 21 days before the meeting and also advertised in at least
one English and one Urdu newspaper having circulation in Karachi, Lahore and
Islamabad.
Nov
5,87
2
966
825 835 806785
798
660 641600
570
510584
898 897 905890
845
739713
640
574549
515
460
2,88
9
2,96
3
2,70
0
2,30
0
2,72
9
0
100
200
300
400
500
600
700
800
900
1,000
Oct
Sep
Aug
Jul
Jun
MayAp
r
Mar
Feb
Jan
Dec
SHARE PRICE MOVEMENT(Share price on PSX (Rupees / Share)
Highest Lowest
5,87
2
2,70
0
2,30
0
2,72
9
0
500
1,000
1,500
2,000
2,500
3,000
3,500
4,000
4,500
TRADING VOLUME (Volume of shares traded on the PSX (in thousands)
Nov
Oct
Sep
Aug
Jul
Jun
MayAp
r
Mar
Feb
Jan
Dec
3,887
2,147
1,482
1,546
1,306
1,469
943 598
411
1,250
745
1,108
SHAREHOLDERS’INFORMATION
58

Shareholders having holding of at least 10% of voting rights may also apply to the
board of directors to call for meeting of shareholders, and if board does not take
action on such application within 21 days, the shareholders may themselves call
the meeting.
All ordinary shares issued by the company carry equal voting rights. Generally,
matters at the general meetings are decided by a show of hands in the first
instance. Voting by show of hands operates on the principle of “One Member-One
Vote”. If majority of shareholders raise their hands in favor of a particular resolution,
it is taken as passed, unless a poll is demanded.
Since the fundamental voting principle in a company is “One Share-One Vote”,
voting takes place by a poll, if demanded. On a poll being taken, the decision
arrived by poll is final, overruling any decision taken on a show of hands.
PROXIESPursuant to Section 137 of the Companies Act, 2017 and according to the
Memorandum and Articles of Association of the Company, every shareholder of the
company who is entitled to attend and vote at a general meeting of the company
can appoint another person as his/her proxy to attend and vote instead of him/her.
Every notice calling a general meeting of the company contains a statement that a
shareholder entitled to attend and vote is entitled to appoint a proxy. A proxy may
not be a member of the company.
The instrument appointing a proxy (duly signed by the shareholder appointing that
proxy) should be deposited at the office of the company not less than forty-eight
hours before the meeting.
WEB PRESENCE Updated information regarding the company can be accessed at Packages website, www.packages.com.pk. The website contains the latest financial results of the company together with company’s profile, the corporate philosophy and major
products.
SHARE PRICE / VOLUMEThe monthly high and low prices and the volume of shares traded on the Pakistan
Stock Exchange during the financial year 2017 are as under:
060
120180240300360420480540600660720780840900
272.
63
678.
29
582.
11
850.
05
509.
8382
.72
151.
16MARKET VALUE PER SHARE (Rupees)
2017201720162015201420132012
050
100150200250300350400450500550600650700750
343.
89
479.
78
560.
68
525.
88 583.
78
727.
90
BREAK-UP VALUE PER ORDINARY SHARE (Rupees)
2017201720162015201420132012
MonthShare price on the PSX (Rs.)
Volume of shares tradedHighest Lowest
January 965.98 825.00 3,886,900
February 898.00 835.00 2,147,450
March 897.00 806.00 1,481,850
April 905.00 785.25 1,546,300
May 890.00 798.00 1,305,950
June 845.00 660.40 1,469,350
July 739.00 641.11 943,350
August 712.50 600.00 597,500
September 640.00 570.00 411,150
October 574.44 510.00 1,250,100
November 548.99 483.01 744,600
December 515.00 460.00 1,108,150
59
ANNUALREPORT 2017

PATTERN OF SHAREHOLDINGThe shareholding pattern of the equity share capital of the Company as at December 31, 2017 is as follows:
Shareholding Number of Total From To shareholders shares held
1 100 2,080 56,230 101 500 971 281,306 501 1,000 393 310,997 1,001 5,000 583 1,388,473 5,001 10,000 157 1,154,036 10,001 15,000 54 683,977 15,001 20,000 35 617,215 20,001 25,000 31 702,884 25,001 30,000 20 555,595 30,001 35,000 14 458,187 35,001 40,000 13 491,787 40,001 45,000 11 461,695 45,001 50,000 9 433,363 50,001 55,000 9 477,549 55,001 60,000 7 403,158 60,001 65,000 5 312,647 65,001 70,000 4 265,332 75,001 80,000 3 232,463 80,001 85,000 4 331,679 90,000 95,000 4 366,452 95,001 100,000 6 588,366 100,001 105,000 2 203,550 105,001 110,000 1 109,391 110,001 115,000 3 341,741 120,001 125,000 1 122,000 125,001 130,000 1 126,183 130,001 135,000 1 133,636 135,001 140,000 2 276,999 145,001 150,000 3 444,800 150,001 155,000 2 302,950 155,001 160,000 3 474,856 165,001 170,000 1 168,950 170,001 175,000 1 173,000 180,001 185,000 1 184,000 190,000 195,000 4 770,347 195,001 200,000 1 196,743 200,001 205,000 1 201,515 210,001 215,000 1 214,450 220,001 225,000 1 221,210 225,001 230,000 1 229,829 230,001 235,000 1 233,968 245,001 250,000 1 249,830 250,001 255,000 1 250,750
Shareholding Number of Total From To shareholders shares held
265,001 270,000 1 265,960 270,001 275,000 1 273,390 275,001 280,000 1 276,734 280,001 285,000 1 283,000 285,001 290,000 1 287,290 300,001 305,000 1 304,718 305,001 310,000 2 614,370 315,001 320,000 2 635,735 325,001 330,000 1 326,052 350,000 355,000 1 350,000 355,001 360,000 1 358,000 365,001 370,000 2 737,089 375,001 380,000 1 379,801 400,000 405,000 2 803,055 435,001 440,000 1 439,200 440,001 445,000 1 441,000 500,001 505,000 1 503,650 520,001 525,000 1 523,479 525,001 530,000 1 527,653 530,001 535,000 1 533,853 560,001 565,000 1 561,400 600,001 605,000 1 602,728 615,001 620,000 1 615,585 630,001 635,000 1 631,350 820,001 825,000 1 821,714 855,001 860,000 1 856,000 860,001 865,000 1 864,887 955,001 960,000 1 959,300 990,001 995,000 1 990,641 1,195,001 1,200,000 1 1,198,668 1,660,001 1,665,000 1 1,660,979 1,790,001 1,795,000 1 1,791,159 2,285,001 2,290,000 1 2,287,175 2,455,001 2,460,000 1 2,459,107 3,095,001 3,100,000 1 3,097,030 3,255,001 3,260,000 1 3,256,676 3,520,001 3,525,000 1 3,520,700 3,685,001 3,690,000 1 3,686,903 3,915,001 3,920,000 1 3,917,505 4,000,001 4,005,000 1 4,002,128 5,395,001 5,400,000 1 5,396,650 21,130,001 21,135,000 1 21,133,101
4,493 89,379,504
60

Number of Number ofShareholders’ category shareholders shares held
i. Associated Companies, Undertakings and Related Parties (name wise details)
BABAR ALI FOUNDATION 2 3,415,128
GURMANI FOUNDATION 1 1,198,668
IGI INSURANCE LIMITED 2 24,653,801
PACKAGES LIMITED EMPLOYEES GRATUITY FUND 2 104,494
PACKAGES LIMITED MANAGEMENT STAFF PENSION FUND 2 660,036
PACKAGES LIMITED EMPLOYEES PROVIDENT FUND 2 2,067,893
Total : 11 32,100,020
ii. Mutual Funds (name wise details)
CDC - TRUSTEE ABL ISLAMIC PENSION FUND - EQUITY SUB FUND 1 6,850
CDC - TRUSTEE ABL PENSION FUND - EQUITY SUB FUND 1 6,250
CDC - TRUSTEE ABL STOCK FUND 1 439,200
CDC - TRUSTEE AKD INDEX TRACKER FUND 1 6,789
CDC - TRUSTEE AL AMEEN ISLAMIC DEDICATED EQUITY FUND 1 317,637
CDC - TRUSTEE AL MEEZAN MUTUAL FUND 1 602,728
CDC - TRUSTEE AL-AMEEN ISLAMIC ASSET ALLOCATION FUND 1 40,700
CDC - TRUSTEE AL-AMEEN SHARIAH STOCK FUND 1 192,763
CDC - TRUSTEE ALFALAH GHP ALPHA FUND 1 67,000
CDC - TRUSTEE ALFALAH GHP ISLAMIC DEDICATED EQUITY FUND 1 52,732
CDC - TRUSTEE ALFALAH GHP ISLAMIC STOCK FUND 1 233,968
CDC - TRUSTEE ALFALAH GHP STOCK FUND 1 100,650
CDC - TRUSTEE ALFALAH GHP VALUE FUND 1 77,550
CDC - TRUSTEE ALHAMRA ISLAMIC STOCK FUND 1 1,200
CDC - TRUSTEE APF-EQUITY SUB FUND 1 1,850
CDC - TRUSTEE APIF - EQUITY SUB FUND 1 10,000
CDC - TRUSTEE ATLAS ISLAMIC STOCK FUND 1 55,000
CDC - TRUSTEE ATLAS STOCK MARKET FUND 1 94,450
CDC - TRUSTEE FIRST CAPITAL MUTUAL FUND 1 2,550
CDC - TRUSTEE FIRST HABIB STOCK FUND 1 1,400
CDC - TRUSTEE HBL - STOCK FUND 1 159,100
CDC - TRUSTEE HBL IPF EQUITY SUB FUND 1 6,150
CDC - TRUSTEE HBL ISLAMIC ASSET ALLOCATION FUND 1 35,350
CDC - TRUSTEE HBL PF EQUITY SUB FUND 1 6,300
CDC - TRUSTEE JS ISLAMIC PENSION SAVINGS FUND-EQUITY ACCOUNT 1 3,000
CDC - TRUSTEE KSE MEEZAN INDEX FUND 1 54,862
CDC - TRUSTEE MEEZAN ASSET ALLOCATION FUND 1 102,900
CDC - TRUSTEE MEEZAN BALANCED FUND 1 369,923
CDC - TRUSTEE MEEZAN ISLAMIC FUND 1 3,686,903
CDC - TRUSTEE MEEZAN TAHAFFUZ PENSION FUND - EQUITY SUB FUND 1 379,801
CDC - TRUSTEE NATIONAL INVESTMENT (UNIT) TRUST 1 4,002,128
CDC - TRUSTEE NIT ISLAMIC EQUITY FUND 1 168,950
CDC - TRUSTEE NIT-EQUITY MARKET OPPORTUNITY FUND 1 114,882
INFORMATIONAS REQUIRED UNDER THE CODE OF CORPORATE GOVERNANCE
61
ANNUALREPORT 2017

Number of Number ofShareholders’ category shareholders shares held
CDC - TRUSTEE PICIC ISLAMIC STOCK FUND 1 47,550
CDC - TRUSTEE PICIC STOCK FUND 1 12,300
CDC - TRUSTEE PIML ASSET ALLOCATION FUND 1 9,800
CDC - TRUSTEE PIML ISLAMIC EQUITY FUND 1 12,200
CDC - TRUSTEE PIML STRATEGIC MULTI ASSET FUND 1 3,500
CDC - TRUSTEE PIML VALUE EQUITY FUND 1 12,650
CDC - TRUSTEE UBL RETIREMENT SAVINGS FUND - EQUITY SUB FUND 1 31,900
CDC - TRUSTEE UBL STOCK ADVANTAGE FUND 1 147,300
CDC-TRUSTEE AL-AMEEN ISLAMIC RET. SAV. FUND-EQUITY SUB FUND 1 37,600
CDC-TRUSTEE ALHAMRA ISLAMIC ASSET ALLOCATION FUND 1 350
CDC-TRUSTEE FIRST HABIB ISLAMIC STOCK FUND 1 3,700
CDC-TRUSTEE HBL ISLAMIC STOCK FUND 1 52,550
MCBFSL - TRUSTEE ABL ISLAMIC STOCK FUND 1 194,100
MCBFSL TRUSTEE ABL ISLAMIC DEDICATED STOCK FUND 1 157,950
Total: 47 12,124,966
iii. Directors and their spouse(s) and minor children (name wise details)
MR. ASGHAR ABBAS 1 100
MR. IMRAN KHALID NIAZI 1 100
MR. MUHAMMAD AURANGZEB 1 500
MR. SHAMIM AHMAD KHAN 1 603
SYED SHAHID ALI 1 2,000
SYED ASLAM MEHDI 1 9,781
SYED HYDER ALI 1 2,287,175
MR. TARIQ IQBAL KHAN 1 6,000
MR. TOWFIQ HABIB CHINOY 1 56,871
MRS. AZRA TARIQ W/O MR. TARIQ IQBAL KHAN 1 4,100
Total: 10 2,367,230
iv. Executives 6 5,017,880
Total: 6 5,017,880
v. Public Sector Companies and Corporations 3 4,739,419
Total: 3 4,739,419
vi. Banks, Development Finance Institutions, Non-Banking Finance
Institutions, Insurance Companies, Takaful, Modaraba and Pension Funds 41 4,834,237
Total: 41 4,834,237
vii. Shareholders Holding five percent or more Voting Rights in the Listed
Company (name wise details)
IGI INSURANCE LIMITED 1 21,133,101
STORA ENSO AB 1 5,396,650
Total : 2 26,529,751
INFORMATIONAS REQUIRED UNDER THE CODE OF CORPORATE GOVERNANCE
62

No. of No. of Shareholders’ category shareholders shares Percentage
1 Directors, Chief Executive Officer, and their spouses and minor children 10 2,367,230 2.65
2 Associated Companies, undertakings and related parties 11 32,100,020 35.91
3 Banks Development Financial Institutions, Non Banking Financial Institutions 19 3,089,474 3.46
4 Insurance Companies 15 5,889,404 6.59
5 Modarabas and Mutual Funds 50 12,131,225 13.57
6 Shareholder holding 10% 1 21,133,101 23.64
7 General Public:
a. Local 4,213 19,797,487 22.15 b. Foreign 4 6,690,241 7.49
8 Others 171 7,314,423 8.18
Total (excluding: shareholder holding 10%) 4,493 89,379,504 100.00
63
ANNUALREPORT 2017

This statement is being presented to comply with the Code of Corporate Governance (the “Code”) contained in Listing Regulation No.5.19 of the Pakistan Stock Exchange Limited for the purpose of establishing a framework of good governance, whereby a listed company is managed in compliance with the best practices of corporate governance.
The Company has applied the principles contained in the Code in the following manner:
1. The Company encourages representation of independent non-executive directors and directors representing minority interests on its Board of Directors. At present the Board includes
Category Names
Independent Director Mr. Muhammad Aurangzeb
Executive Directors Syed Hyder Ali Mr. Asghar Abbas
Non-Executive Directors Syed Aslam Mehdi Mr. Imran Khalid Niazi Mr. Josef Meinrad Mueller Syed Shahid Ali Mr. Shamim Ahmad Khan Mr. Tariq Iqbal Khan Mr. Towfiq Habib Chinoy
The independent director meets the criteria of independence under clause 5.19.1(b) of the Code.
2. The Directors have confirmed that none of them is serving as a director on more than seven listed companies, including this Company (excluding the listed subsidiaries of listed holding companies).
3. All the resident directors of the Company are registered as taxpayers and none of them has defaulted in payment of any loan to a banking company, a DFI or an NBFI or, being a Broker of a stock exchange, has been declared as a defaulter by that stock exchange.
4. A casual vacancy that occurred on the Board on January 25, 2017 was filled up by the Directors on the same day.
5. The Company has prepared a “Code of Conduct” and has ensured that appropriate steps have been taken to disseminate it throughout the Company along with its supporting policies and procedures.
6. The Board has developed a Vision/Mission Statement, overall corporate strategy and significant policies of the Company. A
STATEMENT OF COMPLIANCE WITH THE CODE OF CORPORATE GOVERNANCE FOR THE YEAR ENDED DECEMBER 31, 2017
complete record of particulars of significant policies along with the dates on which they were approved or amended has been maintained.
7. All the powers of the Board have been duly exercised and decisions on material transactions, including appointment and determination of remuneration and terms and conditions of employment of the CEO, other Executive and Non-Executive Directors, have been taken by the Board.
8. The meetings of the Board were presided over by the Chairman and, in his absence, by a Director elected by the Board for this purpose and the Board met at least once in every quarter. Written notices of the Board meetings, along with agenda and working papers, were circulated at least seven days before the meetings. The minutes of the meetings were appropriately recorded and circulated.
9. The Company arranged one orientation course for its Directors during the year to apprise them of their duties and responsibilities.
During the year, Mr. Imran Khalid Niazi attended the Directors Training Program conducted by the Institute of Chartered Accountants of Pakistan. Only Mr. Muhammad Aurangzeb, who is a non-resident director, has yet to undergo certification under the Directors Training Program. The remaining directors have either obtained certification under the Directors Training Program or have minimum of 14 years of education and 15 years or more experience on the boards of listed companies, and hence are exempt from the Directors Training Program.
10. The Board had approved appointment of CFO, Company Secretary and Head of Internal Audit, including their remuneration and terms and conditions of employment. No new appointments of CFO, Company Secretary and Head of Internal Audit have been made during the year.
11. The Directors’ Report for this year has been prepared in compliance with the requirements of the Code and fully describes the salient matters required to be disclosed.
12. The financial statements of the Company were duly endorsed by CEO and CFO before approval of the Board.
13. The Directors, CEO and executives do not hold any interest in the shares of the Company other than that disclosed in the pattern of shareholding.
14. The Company has complied with all the corporate and financial reporting requirements of the Code.
64

15. The Board has formed an Audit Committee. It comprises of six members, including one Independent Director and five Non-Executive Directors, including the Chairman.
16. The meetings of the Audit Committee were held at least once every quarter prior to approval of interim and final results of the Company, as required by the Code. The terms of reference of the Committee have been formed and advised to the Committee for compliance.
17. The Board has formed a Human Resource and Remuneration Committee. It comprises of five members, of whom four are Non-Executive Directors, including the Chairman. The terms of reference of the Committee have been formed and advised to the Committee for compliance.
18. The Board has set up an effective internal audit function manned by suitably qualified and experienced personnel for the purpose and are conversant with the policies and procedures of the Company.
19. The statutory auditors of the Company have confirmed that they have been given a satisfactory rating under the quality control review program of the ICAP, that they or any of the partners of the firm, their spouses and minor children do not hold shares of the Company and that the firm and all its partners are in compliance with International Federation of Accountants (IFAC) guidelines on code of ethics as adopted by the ICAP.
20. The statutory auditors or the persons associated with them have not been appointed to provide other services except in accordance with the listing regulations and the auditors have confirmed that they have observed IFAC guidelines in this regard.
21. The ‘closed period’, prior to the announcement of interim / final results, and business decisions, which may materially affect the market price of the Company’s securities, was determined and intimated to Directors, employees and stock exchange.
22. Material/price sensitive information has been disseminated among all market participants at once through stock exchange.
23. The Company has complied with the requirements relating to maintenance of register of persons having access to inside information by designated senior management officer in a timely manner and maintained proper record including basis for inclusion or exclusion of names of persons from the said list.
24. We confirm that all other material principles enshrined in the Code have been complied with.
(Syed Hyder Ali) (Asghar Abbas) Chief Executive & Managing Director Director Lahore, February 28, 2018
65
ANNUALREPORT 2017

We have reviewed the enclosed Statement of Compliance with the best practices contained in the Code of Corporate Governance (the ‘Code’) prepared by the Board of Directors of Packages Limited (the ‘Company’) for the year ended December 31, 2017, to comply with the requirements of clause No. 5.19 of the Regulations of the Pakistan Stock Exchange Limited where the Company is listed.
The responsibility for compliance with the Code is that of the Board of Directors of the Company. Our responsibility is to review, to the extent where such compliance can be objectively verified, whether the Statement of Compliance reflects the status of the Company’s compliance with the provisions of the Code and report if it does not and to highlight any non-compliance with the requirements of the Code. A review is limited primarily to inquiries of the Company’s personnel and review of various documents prepared by the Company to comply with the Code.
As a part of our audit of the financial statements, we are required to obtain an understanding of the accounting and internal control systems sufficient to plan the audit and develop an effective audit approach. We are not required to consider whether the Board of Directors’ statement on internal control covers all risks and controls or to form an opinion on the effectiveness of such internal controls, the Company’s corporate governance procedures and risks.
The Code requires the Company to place before the Audit Committee, and upon recommendation of the Audit Committee, place before the Board of Directors for their review and approval, its related party transactions distinguishing between transactions carried out on terms equivalent to those that prevail in arm’s length transactions and transactions which are not executed at arm’s length price and recording proper justification for using such alternate pricing mechanism. We are only required and have ensured compliance of this requirement to the extent of the approval of the related party transactions by the Board of Directors upon recommendation of the Audit Committee. We have not carried out any procedures to determine whether the related party transactions were undertaken at arm’s length price or not.
Based on our review, nothing has come to our attention which causes us to believe that the Statement of Compliance does not appropriately reflect the Company’s compliance, in all material respects, with the best practices contained in the Code as applicable to the Company for the year ended December 31, 2017..
A.F. Ferguson & Co. Chartered AccountantsLahore, February 28, 2018
Name of engagement partner:Muhammad Masood
REVIEW REPORT TO THE MEMBERS ON THE STATEMENT OF COMPLIANCE WITH THE CODE OF CORPORATE GOVERNANCE
66

Mr. Rizwan Ghani joined the Company in 1982 after completing post-graduate diploma in Business Studies from United Kingdom. He rose through the ranks eventually becoming Managing Director of Packages Lanka (Private) Limited and returning as Deputy General Manager in 2013. He took over from Syed Aslam Mehdi in 2014 and retired as General Manager of Packages Limited in 2016.
RIZWAN GHANI
67
ANNUALREPORT 2017

We have audited the annexed balance sheet of Packages Limited (the ‘Company’) as at December 31, 2017 and the related profit and loss account, statement of comprehensive income, cash flow statement and statement of changes in equity, together with the notes forming part thereof, for the year then ended and we state that we have obtained all the information and explanations which, to the best of our knowledge and belief, were necessary for the purposes of our audit.
It is the responsibility of the Company’s management to establish and maintain a system of internal control, and prepare and present the above said statements in conformity with the approved accounting standards and the requirements of the Companies Ordinance, 1984. Our responsibility is to express an opinion on these statements based on our audit.
We conducted our audit in accordance with the auditing standards as applicable in Pakistan. These standards require that we plan and perform the audit to obtain reasonable assurance about whether the above said statements are free of any material misstatement. An audit includes examining, on a test basis, evidence supporting the amounts and disclosures in the above said statements. An audit also includes assessing the accounting policies and significant estimates made by management, as well as, evaluating the overall presentation of the above said statements. We believe that our audit provides a reasonable basis for our opinion and, after due verification, we report that:
(a) in our opinion, proper books of account have been kept by the Company as required by the Companies Ordinance, 1984;
(b) in our opinion
(i) the balance sheet and profit and loss account together with the notes thereon have been drawn up in conformity with the Companies Ordinance, 1984, and are in agreement with the books of account and are further in accordance with accounting policies consistently applied;
(ii) the expenditure incurred during the year was for the purpose of the Company’s business; and
(iii) the business conducted, investments made and the expenditure incurred during the year were in accordance with the objects of the Company;
(c) in our opinion and to the best of our information and according to the explanations given to us, the balance sheet, profit and loss account, statement of comprehensive income, cash flow statement and statement of changes in equity, together with the notes forming part thereof conform with approved accounting standards as applicable in Pakistan, and, give the information required by the Companies Ordinance, 1984, in the manner so required and respectively give a true and fair view of the state of the Company’s affairs as at December 31, 2017 and of the profit, total comprehensive income, cash flows and its changes in equity for the year then ended; and
(d) in our opinion Zakat deductible at source under the Zakat and Ushr Ordinance, 1980, was deducted by the Company and deposited in the Central Zakat Fund established under section 7 of that Ordinance.
A.F. Ferguson & Co.Chartered AccountantsLahore, March 13, 2018
Name of engagement partner: Muhammad Masood
AUDITORS’ REPORT TO THE MEMBERSAUDITORS’ REPORT TO THE MEMBERS
68

69
ANNUALREPORT 2017
FINANCIALSTATEMENTSFor the year ended December 31, 2017

70
(Rupees in thousand) Note 2017 2016
EQUITY AND LIABILITIES
CAPITAL AND RESERVES
Authorised capital
150,000,000 (2016: 150,000,000) ordinary shares of Rs. 10 each 1,500,000 1,500,000
22,000,000 (2016: 22,000,000) 10% non-voting preference
shares / convertible stock of Rs. 190 each 4,180,000 4,180,000
Issued, subscribed and paid up capital
89,379,504 (2016: 89,379,504) ordinary shares of Rs. 10 each 5 893,795 893,795
8,186,842 (2016: 8,186,842) 10% non-voting preference shares /
convertible stock of Rs. 190 each 6 606,222 606,222
Reserves 57,673,481 49,550,396
Un-appropriated profit 6,492,264 1,734,057
65,665,762 52,784,470
NON-CURRENT LIABILITIES
Long term finances 6 2,254,100 3,575,520
Liabilities against assets subject to finance lease 7 13,195 26,057
Deferred taxation 8 343,673 344,085
Retirement benefits 9 358,264 87,304
Deferred liabilities 10 325,181 304,996
3,294,413 4,337,962
CURRENT LIABILITIES
Current portion of non-current liabilities 11 1,334,309 578,732
Finances under mark up arrangements - secured 12 299,596 1,377,033
Trade and other payables 13 3,104,993 2,847,914
Accrued finance costs 14 189,760 221,730
4,928,658 5,025,409
CONTINGENCIES AND COMMITMENTS 15
73,888,833 62,147,841
BALANCE SHEETas at December 31, 2017

71
ANNUALREPORT 2017
(Rupees in thousand) Note 2017 2016
ASSETS
NON-CURRENT ASSETS
Property, plant and equipment 16 5,184,739 4,260,139
Investment properties 17 134,696 133,179
Intangible assets 18 4,688 9,866
Investments 19 60,166,443 50,077,782
Long term loans and deposits 20 18,204 25,958
65,508,770 54,506,924
CURRENT ASSETS
Stores and spares 21 422,218 402,146
Stock-in-trade 22 1,954,668 1,768,706
Trade debts 23 2,392,215 2,171,966
Loans, advances, deposits, prepayments and other receivables 24 728,868 1,081,622
Income tax receivable 25 2,699,887 2,125,865
Cash and bank balances 26 182,207 90,612
8,380,063 7,640,917
73,888,833 62,147,841
The annexed notes 1 to 47 form an integral part of these financial statements.
Khurram Raza BakhtayariChief Financial Officer
Syed Hyder AliChief Executive & Managing Director
Asghar AbbasDirector

72
(Rupees in thousand) Note 2017 2016
Local sales 21,358,527 19,766,465
Export sales 30,422 27,064
21,388,949 19,793,529
Less: Sales tax 3,283,647 2,933,794
Commission – 20,415
3,283,647 2,954,209
Net sales 18,105,302 16,839,320
Cost of sales 27 (14,369,523) (13,221,323)
Gross profit 3,735,779 3,617,997
Administrative expenses 28 (1,009,898) (897,392)
Distribution and marketing costs 29 (1,129,438) (921,550)
Other operating expenses 30 (495,779) (392,362)
Other income 31 227,127 390,298
Profit from operations 1,327,791 1,796,991
Finance costs 32 (445,495) (1,307,505)
Investment income 33 6,273,905 6,472,005
Profit before taxation 7,156,201 6,961,491
Taxation 34 (939,903) (1,365,762)
Profit for the year 6,216,298 5,595,729
Earnings per share
Basic Rupees 43 69.05 62.61
Diluted Rupees 43 65.02 58.45
The annexed notes 1 to 47 form an integral part of these financial statements.
PROFIT AND LOSS ACCOUNTfor the year ended December 31, 2017
Khurram Raza BakhtayariChief Financial Officer
Syed Hyder AliChief Executive & Managing Director
Asghar AbbasDirector

73
ANNUALREPORT 2017
STATEMENT OF COMPREHENSIVE INCOMEfor the year ended December 31, 2017
(Rupees in thousand) Note 2017 2016
Profit for the year 6,216,298 5,595,729
Other comprehensive (loss) / income:
Items that will not be reclassified to profit or loss
Remeasurement of retirement benefit obligations (255,149) (37,663)
Tax effect 8.2 76,545 11,299
(178,604) (26,364)
Items that may be reclassified subsequently to profit or loss
Changes in fair value of available for sale financial assets 19.3 9,123,085 4,379,097
Other comprehensive income for the year - net of tax 8,944,481 4,352,733
Total comprehensive income for the year 15,160,779 9,948,462
The annexed notes 1 to 47 form an integral part of these financial statements.
Khurram Raza BakhtayariChief Financial Officer
Syed Hyder AliChief Executive & Managing Director
Asghar AbbasDirector

74
STATEMENT OF CHANGES IN EQUITYfor the year ended December 31, 2017
Balance as on January 01, 2016 883,795 1,309,682 3,588,769 24,479,228 – 13,810,333 3,714,566 47,786,373
Appropriation of funds
Transfer to general reserve – – – – – 1,500,000 (1,500,000) –
Transaction with preference shareholder
Redemption of preference shares / convertible stock
(8,500,000 preference shares of Rs. 190 each) - note 6.3 – (629,412) – – 1,615,000 – (4,709,181) (3,723,593)
Total transactions with owners, recognised directly in equity
Final dividend for the year ended December 31, 2015
Rs. 15.00 per share – – – – – – (1,340,693) (1,340,693)
Conversion of preference shares / convertible stock into ordinary share
capital (1,000,000 ordinary shares of Rs. 10 each) 10,000 (74,048) 177,969 – – – – 113,921
10,000 (74,048) 177,969 – – – (1,340,693) (1,226,772)
Total comprehensive income / (loss) for the year ended
December 31, 2016
Profit for the year – – – – – – 5,595,729 5,595,729
Other comprehensive income / (loss) for the year – – – 4,379,097 – – (26,364) 4,352,733
– – – 4,379,097 – – 5,569,365 9,948,462
Balance as on December 31, 2016 893,795 606,222 3,766,738 28,858,325 1,615,000 15,310,333 1,734,057 52,784,470
Appropriation of funds
Transfer from general reserve – – – – – (1,000,000) 1,000,000 –
Transaction with preference shareholders
Participating dividend on preference shares - note 35 – – – – – – (45,000) (45,000)
Total transactions with owners, recognised directly in equity
Final dividend for the year ended December 31, 2016
Rs. 25.00 per share – – – – – – (2,234,487) (2,234,487)
Total comprehensive income / (loss) for the year ended
December 31, 2017
Profit for the year – – – – – – 6,216,298 6,216,298
Other comprehensive income / (loss) for the year – – – 9,123,085 – – (178,604) 8,944,481
– – – 9,123,085 – – 6,037,694 15,160,779
Balance as on December 31, 2017 893,795 606,222 3,766,738 37,981,410 1,615,000 14,310,333 6,492,264 65,665,762
The annexed notes 1 to 47 form an integral part of these financial statements.
Issued, subscribed Reserves Capital and and paid up capital Capital reserves Revenue reserves reserves
Preference Ordinary shares / Capital share convertible Share Fair value redemption General Un-appropriated (Rupees in thousand) capital stock reserve premium reserve reserve reserve profit Total
Khurram Raza BakhtayariChief Financial Officer
Syed Hyder AliChief Executive & Managing Director
Asghar AbbasDirector

75
ANNUALREPORT 2017
(Rupees in thousand) Note 2017 2016
Cash flows from operating activities
Cash generated from operations 41 2,249,638 2,323,393
Finance cost paid (477,465) (525,475)
Income tax paid (1,437,792) (1,278,772)
Payments for accumulating compensated absences (21,595) (26,046)
Retirement benefits paid (21,339) (17,917)
Net cash inflow from operating activities 291,447 475,183
Cash flows from investing activities
Fixed capital expenditure (1,663,202) (1,026,871)
Investments made in equity securities (958,526) (701,167)
Long term loans and deposits - net 1,393 13,289
Investments made in Government securities (1,599,994) –
Proceeds from disposal of Government securities 1,603,171 –
Proceeds from disposal of operating fixed assets 69,455 93,797
Dividends received 6,273,905 6,472,005
Net cash inflow from investing activities 3,726,202 4,851,053
Cash flows from financing activities
Repayment of long term finances - secured (571,420) (1,885,710)
Proceeds from long term finances - secured – 3,000,000
Redemption of preference shares – (5,601,500)
Liabilities against assets subject to finance lease - net (10,617) (7,438)
Participating dividend on preference shares paid (45,000) –
Dividends paid (2,221,580) (1,335,268)
Net cash outflow from financing activities (2,848,617) (5,829,916)
Net increase / (decrease) in cash and cash equivalents 1,169,032 (503,680)
Cash and cash equivalents at the beginning of the year (1,286,421) (782,741)
Cash and cash equivalents at the end of the year 42 (117,389) (1,286,421)
The annexed notes 1 to 47 form an integral part of these financial statements.
CASH FLOW STATEMENTfor the year ended December 31, 2017
Khurram Raza BakhtayariChief Financial Officer
Syed Hyder AliChief Executive & Managing Director
Asghar AbbasDirector

76
1. Legal status and nature of business
Packages Limited (the ‘Company’) is a public limited company incorporated in Pakistan and is listed on Pakistan Stock Exchange Limited. It is principally engaged in the manufacture and sale of packaging materials and tissue products. The registered office of the Company is situated at 4th floor, the Forum, Suite No. 416 - 422, G-20, Block 9, Khayaban-e-Jami, Clifton, Karachi, Pakistan. Head office and factory is located at Shahrah-e-Roomi, P.O. Amer Sidhu, Lahore, Pakistan.
The Company also holds investments in companies engaged in the manufacture and sale of inks, flexible packaging material, paper,
paperboard and corrugated boxes, biaxially oriented polypropylene (‘BOPP’) film and cast polypropylene (‘CPP’) film, production and sale of ground calcium carbonate products, and companies engaged in insurance, power generation and real estate business.
These financial statements are the separate financial statements of the Company. Consolidated financial statements are prepared
separately. 2. Basis of preparation
2.1 Statement of compliance
These financial statements have been prepared in accordance with approved accounting standards as applicable in Pakistan. During the year, the Companies Ordinance, 1984 (hereinafter referred to as the ‘Ordinance’) has been repealed after the enactment of the Companies Act, 2017. However, as allowed by the Securities and Exchange Commission of Pakistan (‘SECP’) vide Circular No. 23/2017 dated October 4, 2017 and further clarified by the Institute of Chartered Accountants of Pakistan through its Circular No. 17/2017 dated October 6, 2017, companies whose financial year, closes on or before December 31, 2017, shall prepare financial statements in accordance with the provisions of the repealed Ordinance. Accordingly, these financial statements have been prepared in accordance with the requirements of the International Financial Reporting Standards (‘IFRSs’) issued by the International Accounting Standards Board (‘IASB’) as are notified under the repealed Ordinance, provisions of and directives issued under the repealed Ordinance. Wherever the requirements of the repealed Ordinance or directives issued by SECP differ with the requirements of IFRSs, the requirements of the repealed Ordinance or the requirements of the said directives prevail.
2.2 Initial application of standards, amendments or an interpretation to existing standards
The following amendments to existing standards have been published that are applicable to the Company’s financial statements covering annual periods, beginning on or after the following dates:
2.2.1 Standards, amendments to published standards and interpretations that are effective in the current year
Certain standards, amendments and interpretations to approved accounting standards are effective for accounting periods beginning on January 1, 2017 but are considered not to be relevant or to have any significant effect on the Company’s operations (although they may affect the accounting for future transactions and events) and are, therefore, not detailed in these financial statements, except for the following:
International Accounting Standard (‘IAS’) 7, ‘Cash flow statements: Disclosure initiative’ (effective for periods beginning on or after January 1, 2017). This amendment requires disclosure to explain changes in liabilities for which cash flows have been, or will be classified as financing activities in the statement of cash flows. The amendment only covers balance sheet items for which cash flows are classified as financing activities. In case other items are included within the reconciliation, the changes in liabilities arising from financing activities will be identified separately. A reconciliation of the opening to closing balance is not specifically required but instead the information can be provided in other ways. In the first year of adoption, comparative information need not be provided. The Company’s current accounting treatment is already in line with the requirements of this standard.
‘Equity method in separate financial statements – Amendments to IAS 27’ (effective for periods beginning on or after January 1, 2017).
These amendments have allowed entities to use the equity method in their separate financial statements to measure investments in subsidiaries, joint ventures and associates. IAS 27 previously allows entities to measure their investments in subsidiaries, joint ventures and associates either at cost or as a financial asset in their separate financial statements. The amendments introduce the equity method as a third option. The election can be made independently for each category of investment (subsidiaries, joint ventures and associates). Entities wishing to change to the equity method must do so retrospectively. The Company has elected to measure its investments in subsidiaries, joint ventures and associates at cost in its separate financial statements, which has been followed earlier.
NOTES TO AND FORMING PART OFTHE FINANCIAL STATEMENTSfor the year ended December 31, 2017

77
ANNUALREPORT 2017
2.2.2 Standards, amendments and interpretations to existing standards that are not yet effective and have not been early adopted by the Company
There are certain standards, amendments to approved accounting standards and interpretations that are mandatory for the Company’s
accounting periods beginning on or after January 1, 2018, but are considered not to be relevant or to have any significant effect on the
Company’s operations and are, therefore, not detailed in these financial statements, except for the following:
IFRS 9, ‘Financial instruments’: (effective for periods beginning on or after January 1, 2018). This standard has been notified by the SECP
to be effective for annual periods beginning on or after July 1, 2018. This standard replaces the guidance in IAS 39, ‘Financial instruments:
Recognition and measurement’. It includes requirements on the classification and measurement of financial assets and liabilities; it also
includes an expected credit losses model that replaces the current incurred loss impairment model. The Company is yet to assess the full
impact of the standard.
IFRS 15, ‘Revenue from contracts with customers’: (effective for periods beginning on or after January 1, 2018). This standard has been
notified by the SECP to be effective for annual periods beginning on or after July 1, 2018. This standard deals with revenue recognition
and establishes principles for reporting useful information to users of the financial statements about the nature, amount, timing and
uncertainty of revenue and cash flows arising from an entity’s contracts with customers. Revenue is recognised when a customer obtains
control of a good or service and thus has the ability to direct the use and obtain the benefits from the good or service. The standard
replaces IAS 18, ‘Revenue’, and IAS 11, ‘Construction contracts’, and related interpretations. The Company is yet to assess the full impact
of the standard.
IFRIC 22, ‘Foreign currency transactions and advance consideration’ (effective for periods beginning on or after January 1, 2018). This
IFRIC addresses foreign currency transactions or parts of transactions where there is consideration that is denominated or priced in a
foreign currency. The interpretation provides guidance for when a single payment/receipt is made as well as for situations where multiple
payments/receipts are made. The guidance aims to reduce diversity in practice. It is unlikely that the interpretation will have any significant
impact on the Company’s financial statements.
Amendments to IAS 40, ‘Investment property’ relating to transfers of investment property (effective for periods beginning on or after 1
January 2018). These amendments clarify that to transfer to, or from, investment properties there must be a change in use. To conclude if
a property has changed use, there should be an assessment of whether the property meets the definition. This change must be supported
by evidence. It is unlikely that the interpretation will have any significant impact on the Company’s financial statements.
IFRS 16, ‘Leases’: (effective for periods beginning on or after January 1, 2019). However, this standard is yet to be notified by the SECP.
This standard replaces the current guidance in IAS 17, ‘Leases’ and is a far reaching change in accounting by lessees in particular. Under
IAS 17, lessees were required to make a distinction between a finance lease (on balance sheet) and an operating lease (off balance
sheet). IFRS 16 now requires lessees to recognise a lease liability reflecting future lease payments and a ‘right-of-use asset’ for virtually
all lease contracts. The IASB has included an optional exemption for certain short-term leases and leases of low-value assets; however,
this exemption can only be applied by lessees. For lessors, the accounting stays almost the same. However, as the IASB has updated the
guidance on the definition of a lease (as well as the guidance on the combination and separation of contracts), lessors will also be affected
by the new standard. At the very least, the new accounting model for lessees is expected to impact negotiations between lessors and
lessees. The Company is yet to assess the full impact of this standard.
IFRIC 23, ‘Uncertainty over income tax treatments’: (effective for periods beginning on or after 1 January 2019). This IFRIC clarifies
how the recognition and measurement requirements of IAS 12 ‘Income taxes’, are applied where there is uncertainty over income tax
treatments. The IFRIC explains how to recognise and measure deferred and current income tax assets and liabilities where there is
uncertainty over a tax treatment. An uncertain tax treatment is any tax treatment applied by an entity where there is uncertainty over
whether that treatment will be accepted by the tax authority. The IFRIC applies to all aspects of income tax accounting where there is an
uncertainty regarding the treatment of an item, including taxable profit or loss, the tax bases of assets and liabilities, tax losses and credits
and tax rates. The Company is yet to assess the full impact of the interpretation.

78
3. Basis of measurement
3.1 These financial statements have been prepared under the historical cost convention except for certain financial instruments which are
carried at fair values and certain employee retirement benefits which are carried at present value.
3.2 Critical accounting estimates and judgements
The Company’s significant accounting policies are stated in note 4. Not all of these significant policies require the management to make
difficult, subjective or complex judgments or estimates. The following is intended to provide an understanding of the policies that the
management considers critical because of their complexity, judgment and estimation involved in their application and impact on these
financial statements. Judgments and estimates are continually evaluated and are based on historical experience, including expectations of
future events that are believed to be reasonable under the circumstances. These judgments involve assumptions or estimates in respect
of future events and the actual results may differ from these estimates. The areas involving a higher degree of judgments or complexity,
or areas where assumptions and estimates are significant to the financial statements are as follows:
i) Estimated useful lives and residual values of property, plant and equipment - note 4.2 & 16
ii) Employee retirement and other service benefit obligations- note 4.8, 9 & 10
iii) Provision for taxation - note 4.1, 8, 25 & 34
4. Significant accounting policies
The significant accounting policies adopted in the preparation of these financial statements are set out below. These policies have been
consistently applied to all the years presented, unless otherwise stated.
4.1 Taxation
Income tax expense comprises current and deferred tax. SECP vide its certificate dated December 14, 2017, has registered the Company
and its wholly-owned subsidiary Bulleh Shah Packaging (Private) Limited (‘BSPPL’) (together the ‘Group’) as a Group and has also, vide
its certificate dated January 1, 2018, designated the Group for the purpose of group taxation under Section 59AA of the Income tax
Ordinance, 2001. Consequently, the Group will now be taxed as one fiscal unit for the tax year 2018.
Current
Provision for current tax is based on the taxable income for the year determined in accordance with the prevailing law for taxation of
income. The charge for current tax is calculated using prevailing tax rates or tax rates expected to apply to the profit for the year, if enacted.
The charge for current tax also includes adjustments, where considered necessary, to provision for taxation made in previous years arising
from assessments framed during the year for such years.
Deferred
Deferred tax is accounted for using the balance sheet liability method in respect of all temporary differences arising from differences
between the carrying amount of assets and liabilities in the financial statements and the corresponding tax basis used in the computation
of the taxable profit. Deferred tax liabilities are generally recognised for all taxable temporary differences and deferred tax assets are
recognised to the extent that it is probable that taxable profits shall be available against which the deductible temporary differences,
unused tax losses and tax credits can be utilised.
Deferred tax is calculated at the rates that are expected to apply to the period when the differences reverse, based on tax rates that have
been enacted or substantively enacted by the balance sheet date. Deferred tax is charged or credited in the profit and loss account, except
in the case of items credited or charged to other comprehensive income or equity in which case it is included in other comprehensive
income or equity.
Group taxation adjustments
Current and deferred taxes based on the consolidated results of the Group are allocated within the Group on the basis of separate return
method, modified for determining realisibility of tax credits and tax losses which are assessed at Group level. Any adjustments in the
current and deferred taxes of the Company on account of group taxation are credited or charged to profit and loss account in the year in
which they arise.

79
ANNUALREPORT 2017
4.2 Property, plant and equipment
4.2.1 Operating fixed assets
4.2.1.1 Owned assets
Owned assets, except freehold land, are stated at cost less accumulated depreciation and any identified impairment loss. Freehold land is
stated at cost less any identified impairment loss. Cost in relation to certain plant and machinery signifies historical cost, gains and losses
transferred from equity on qualifying cash flow hedges as referred to in note 4.16 and borrowing costs as referred to in note 4.14. Cost
includes expenditure that is directly attributable to the acquisition of the asset.
Depreciation on all owned assets is charged to profit and loss account on straight-line method so as to write off the depreciable amount
of an asset over its estimated useful life at the following annual rates:
Buildings 2.50% to 20.00%
Plant and machinery 6.25% to 50.00%
Other equipments 6.67% to 33.33%
Furniture and fixtures 10.00% to 33.33%
Vehicles 20.00%
The assets’ residual values and useful lives are reviewed, at each financial year end, and adjusted if impact on depreciation is significant.
The Company’s estimate of the residual values and useful lives of its owned assets as at December 31, 2017 has not required any
adjustment as its impact is considered insignificant.
Depreciation on additions to owned assets is charged from the month in which an asset is acquired or capitalised while no depreciation
is charged for the month in which the asset is disposed off.
The Company assesses at each balance sheet date whether there is any indication that an asset may be impaired. If such indication exists,
the carrying amounts of such assets are reviewed to assess whether they are recorded in excess of their recoverable amount. Where
carrying amounts exceed the respective recoverable amount, assets are written down to their recoverable amounts and the resulting
impairment loss is recognised in profit and loss account. The recoverable amount is the higher of an asset’s fair value less costs to sell
and value in use. Where an impairment loss is recognised, the depreciation charge is adjusted in the future periods to allocate the asset’s
revised carrying amount over its estimated useful life.
Subsequent costs are included in the asset’s carrying amount or recognised as a separate asset, as appropriate, only when it is probable
that future economic benefits associated with the item shall flow to the Company and the cost of the item can be measured reliably. All
other repair and maintenance costs are charged to profit and loss account during the period in which they are incurred.
The gain or loss on disposal or retirement of an asset represented by the difference between the sale proceeds and the carrying amount
of the asset is recognised as an income or expense.
4.2.1.2 Assets subject to finance lease
Assets acquired under a finance lease are depreciated over the estimated useful life of the asset on a straight-line method at the rate of
20.00% per annum. Depreciation of leased assets is charged to profit and loss account.
Residual values and the useful lives of leased assets are reviewed at each financial year end and adjusted if impact on depreciation is
significant. The Company’s estimate of the residual values and useful lives of its leased assets as at December 31, 2017 has not required
any adjustment as its impact is considered insignificant.
4.2.2 Capital work-in-progress
Capital work-in-progress is stated at cost less any identified impairment loss. All expenditure connected with specific assets incurred
during installation and construction period are carried under capital work-in-progress. These are transferred to owned assets as and when
these are available for use.

80
4.2.3 Major spare parts and stand-by equipment
Major spare parts and stand-by equipment qualify as property, plant and equipment when the Company expects to use them for more
than one year. Transfers are made to relevant owned assets category as and when such items are available for use.
4.3 Investment properties
Property not held for own use or for sale in the ordinary course of business is classified as investment property. The investment properties
of the Company comprise land and buildings. The investment properties, except freehold land, are stated at cost less accumulated
depreciation and any identified impairment losses. Freehold land is stated at cost less any identified impairment loss.
Depreciation on buildings is charged to profit and loss account on straight-line method so as to write off the depreciable amount of
building over its estimated useful life at the rates ranging from 2.50% to 10.00% per annum. Depreciation on additions to investment
properties is charged from the month in which a property is acquired or capitalised while no depreciation is charged for the month in which
the property is disposed off.
The assets’ residual values and useful lives are reviewed, at each financial year end, and adjusted if impact on depreciation is significant.
The Company’s estimate of the residual values and useful lives of its investment properties as at December 31, 2017 has not required
any adjustment as its impact is considered insignificant.
The Company assesses at each balance sheet date whether there is any indication that investment properties may be impaired. If such
indication exists, the carrying amounts of such assets are reviewed to assess whether they are recorded in excess of their recoverable
amount. Where carrying amounts exceed the respective recoverable amount, assets are written down to their recoverable amount and the
resulting impairment loss is recognised in profit and loss account. The recoverable amount is the higher of an asset’s fair value less costs
to sell and value in use. Where an impairment loss is recognised, the depreciation charge is adjusted in the future periods to allocate the
asset’s revised carrying amount over its estimated useful life.
The gain or loss on disposal or retirement of an asset represented by the difference between the sale proceeds and the carrying amount
of the asset is recognised as an income or expense.
4.4 Intangible assets
Expenditure incurred to acquire computer software, SAP Enterprise Resource Planning (‘ERP’) System and develop websites are capitalised
as intangible assets and stated at cost less accumulated amortisation and any identified impairment loss. Intangible assets are amortised
using the straight-line method over their estimated useful lives at the rates ranging from 14.00% to 33.00%.
Costs associated with maintaining intangible assets are recognised as an expense as incurred. Development costs that are directly
attributable to the design and testing of identifiable and unique software products controlled by the Company are recognised as intangible
assets when the following criteria are met:
- it is technically feasible to complete the intangible asset so that it will be available for use;
- management intends to complete the intangible asset and use or sell it;
- there is an ability to use or sell the intangible asset;
- it can be demonstrated how the intangible asset will generate probable future economic benefits;
- adequate technical, financial and other resources to complete the development and to use or sell the intangible asset are available; and
- the expenditure attributable to the intangible asset during its development can be reliably measured.
Other development expenditures that do not meet these criteria are recognised as an expense as incurred. Development costs previously
recognised as an expense are not recognised as an asset in a subsequent period.
Useful lives of intangible assets are reviewed, at each balance sheet date and adjusted if the impact of on amortisation is significant. The
Company’s estimate of the useful lives of its intangible assets as at December 31, 2017 has not required any adjustment as its impact is
considered insignificant.

81
ANNUALREPORT 2017
Amortisation on additions to intangible assets is charged from the month in which an asset is acquired or capitalised while no amortisation
is charged for the month in which the asset is disposed off.
The Company assesses at each balance sheet date whether there is any indication that intangible assets may be impaired. If such
indication exists, the carrying amounts of such assets are reviewed to assess whether they are recorded in excess of their recoverable
amount. Where carrying amounts exceed the respective recoverable amount, assets are written down to their recoverable amounts and
the resulting impairment loss is recognised in profit and loss account. The recoverable amount is the higher of an asset’s fair value less
costs to sell and value in use. Where an impairment loss is recognised, the amortisation charge is adjusted in the future periods to allocate
the asset’s revised carrying amount over its estimated useful life.
4.5 Leases
(1) The Company is the lessee:
Finance leases
Leases where the Company has substantially all the risks and rewards of ownership are classified as finance leases. At inception, finance
leases are capitalised at the lower of present value of minimum lease payments under the lease agreements and the fair value of the
assets.
The related rental obligations, net of finance charges, are included in liabilities against assets subject to finance lease as referred to in
note 7. The liabilities are classified as current and long term depending upon the timing of the payment.
Each lease payment is allocated between the liability and finance charges so as to achieve a constant rate on the balance outstanding.
The interest element of the rental is charged to profit and loss account over the lease term.
Operating leases
Leases, including Ijarah financing, where a significant portion of the risks and rewards of ownership are retained by the lessor are
classified as operating leases. Payments made under operating leases (net of any incentives received from the lessor) are charged to
profit and loss account on a straight-line basis over the lease / Ijarah term unless another systematic basis is representative of the time
pattern of the Company’s benefit.
(2) The Company is the lessor:
Operating leases
Assets leased out under operating leases are included in investment properties as referred to in note 17. They are depreciated over their
expected useful lives on a basis consistent with similar owned property, plant and equipment. Rental income (net of any incentives given
to lessees) is recognised on a straight-line basis over the lease term.
4.6 Investments
Investments intended to be held for less than twelve months from the balance sheet date or to be sold to raise operating capital, are
included in current assets, all other investments are classified as non-current. Management determines the appropriate classification of
its investments at the time of the purchase and re-evaluates such designation on a regular basis.
4.6.1 Investments in equity instruments of subsidiaries, associates and joint ventures
Investments in subsidiaries, associates and joint ventures are measured at cost less any identified impairment loss in the Company’s
separate financial statements. Cost represents the fair value of the consideration given, including any transaction costs paid, by the
Company at the time of purchase of such equity instruments. Cost in relation to investments made in foreign currency is determined
by translating the consideration paid in foreign currency into Pak Rupees at exchange rate prevailing on the date of transaction. In case
of an increase in the investment in a subsidiary, associate or joint venture, the accumulated cost represents the carrying value of the
investment. This is also applicable if the additional investment in an associate or joint venture results in becoming a subsidiary.

82
At each balance sheet date, the Company reviews the carrying amounts of the investments in subsidiaries, associates and joint ventures
to assess whether there is any indication that such investments have suffered an impairment loss. If any such indication exists, the
recoverable amount is estimated in order to determine the extent of the impairment loss, if any. The recoverable amount is the higher
of an asset’s fair value less costs to sell and value in use. Impairment losses are recognised as expense in the profit and loss account.
Investments in subsidiaries, associates and joint ventures, that suffered an impairment, are reviewed for possible reversal of impairment
at each reporting date. Impairment losses recognised in the profit and loss account are reversed through the profit and loss account.
The carrying amount of an investment carried at cost is derecognised when it is sold or otherwise disposed of. The difference between the
fair value of any consideration received on disposal and the carrying amount of the investment is recorded in the profit and loss account
as a gain or loss on disposal.
The Company is required to issue consolidated financial statements along with its separate financial statements in accordance with
the requirements of the approved accounting standards. Investments in associates and joint ventures, in the consolidated financial
statements, are being accounted for using the equity method.
4.7 Financial assets
4.7.1 Classification
The Company classifies its financial assets in the following categories: at fair value through profit or loss, loans and receivables, available-
for-sale and held-to-maturity. The classification depends on the purpose for which the financial assets were acquired. Management
determines the classification of its financial assets at the time of initial recognition.
a) Financial assets at fair value through profit or loss
Financial assets at fair value through profit or loss are financial assets held for trading and financial assets designated upon initial
recognition as at fair value through profit or loss. A financial asset is classified as held for trading if acquired principally for the purpose of
selling in the short term. Assets in this category are classified as current assets if expected to be settled within twelve months, otherwise,
they are classified as non-current assets.
b) Loans and receivables
Loans and receivables are non-derivative financial assets with fixed or determinable payments that are not quoted in an active market.
They are included in current assets, except for maturities greater than twelve months after the balance sheet date, which are classified
as non-current assets. Loans and receivables comprise trade debts, loans, advances, deposits and other receivables and cash and cash
equivalents in the balance sheet.
c) Available for sale financial assets
Available for sale financial assets are non-derivatives that are either designated in this category or not classified in any of the other
categories. They are included in non-current assets unless management intends to dispose off the investments within twelve months from
the balance sheet date.
The financial assets including investments in associated undertakings where the Company does not have significant influence and that
are intended to be held for an indefinite period of time or may be sold in response to the need for liquidity, are also classified as available-
for-sale.
d) Held to maturity
Financial assets with fixed or determinable payments and fixed maturity, where management has the intention and ability to hold till
maturity are classified as held to maturity and are stated at amortised cost.
83
ANNUALREPORT 2017
4.7.2 Recognition and measurement
All financial assets are recognised at the time when the Company becomes a party to the contractual provisions of the instrument. Regular
purchases and sales of investments are recognised on trade date; the date on which the Company commits to purchase or sell the asset.
Financial assets are initially recognised at fair value plus transaction costs for all financial assets not carried at fair value through profit
or loss. Financial assets carried at fair value through profit or loss are initially recognised at fair value and transaction costs are expensed
in the profit and loss account. Financial assets are derecognised when the rights to receive cash flows from the assets have expired or
have been transferred and the Company has transferred substantially all the risks and rewards of ownership. Available for sale financial
assets and financial assets at fair value through profit or loss are subsequently carried at fair value. For investments having quoted price
in active market, the quoted price represents the fair value. In other cases, fair value is measured using appropriate valuation methodology
and where fair value cannot be measured reliably, these are carried at cost. Loans and receivables and held-to-maturity investments are
carried at amortised cost using the effective interest method.
Gains or losses arising from changes in the fair value of the ‘financial assets at fair value through profit or loss’ category are presented in
the profit and loss account in the period in which they arise. Dividend income from financial assets at fair value through profit or loss is
recognised in the profit and loss account when the Company’s right to receive payments is established.
Changes in the fair value of securities classified as available-for-sale are recognised in other comprehensive income. When securities
classified as available-for-sale are sold or impaired, the accumulated fair value adjustments recognised in equity are included in the profit
and loss account as gains and losses from investment securities. Dividends on available for sale equity instruments are recognised in the
profit and loss account when the Company’s right to receive payments is established.
The Company assesses at each balance sheet date whether there is an objective evidence that a financial asset or a group of financial
assets is impaired. If any such evidence exists for available-for-sale financial assets, the cumulative loss is removed from equity and
recognised in the profit and loss account. Impairment losses recognised in the profit and loss account on equity instruments are not
reversed through the profit and loss account. Impairment testing of trade debts and other receivables is described in note 4.11.
4.7.3 Financial liabilities
All financial liabilities are recognised at the time when the Company becomes a party to the contractual provisions of the instrument.
A financial liability is derecognised when the obligation under the liability is discharged or cancelled or expired. Where an existing financial
liability is replaced by another from the same lender on substantially different terms, or the terms of an existing liability are substantially
modified, such an exchange or modification is treated as a derecognition of the original liability and the recognition of a new liability, and
the difference in respective carrying amounts is recognised in the profit and loss account.
4.7.4 Offsetting of financial assets and liabilities
Financial assets and liabilities are offset and the net amount is reported in the financial statements only when there is a legally enforceable
right to set off the recognised amount and the Company intends either to settle on a net basis or to realise the assets and to settle the
liabilities simultaneously.
4.8 Employee retirement and other service benefit obligations
Retirement benefits are payable to staff on completion of prescribed qualifying period of service. The main features of the schemes
operated by the Company for its employees are as follows:
4.8.1 Defined benefit plans
A defined benefit plan is a post-employment benefit plan other than the defined contribution plan. The Company’s net obligation in respect
of defined benefit plans is calculated by estimating the amount of future benefit that employees have earned in return for their service in
current and prior periods; that benefit is discounted to determine its present value. The calculation is performed annually by a qualified
actuary using the Projected Unit Credit method.

84
(a) Gratuity plan
There is an approved funded defined benefit gratuity plan for all permanent employees subject to attainment of service of prescribed
minimum period. Monthly contributions are made to this fund on the basis of actuarial recommendations at the rate of 4.5 percent per
annum of basic salaries. The latest actuarial valuation for the gratuity scheme was carried out as at December 31, 2017. The actual return
on plan assets during the year was Rs. 36.179 million (2016: Rs. 37.642 million). The employees of the Company are entitled to gratuity
payments on basis of their service with the Company.
The future contribution rates of these plans include allowances for deficit and surplus. Projected Unit Credit Method, using the following
significant assumptions, is used for valuation of this scheme:
Per annum 2017 2016
Discount rate 8.25% 8.00%
Expected rate of increase in salary level 8.25% 8.00%
Expected mortality rate SLIC (2001-2005) SLIC (2001-2005)
mortality table mortality table
Expected rate of return 8.25% 8.00%
Plan assets include long term Government bonds, equity instruments of listed companies, units of mutual funds, izafa certificates, treasury
bills, sukuk and term deposits with banks.
The Company is expected to contribute Rs. 22.504 million to the gratuity fund in the next financial year.
Actuarial gains and losses arising from experience adjustments and changes in actuarial assumptions are charged or credited to equity in
other comprehensive income in the period in which they arise. Past service costs are recognised immediately in profit and loss account.
(b) Pension plan
Management and executive staff hired before January 1, 2016 participate in the pension fund of the Company. On December 26, 2012,
the Board of Trustees of the pension fund, decided to convert the Defined Benefit Plan to Defined Contribution Plan for all its active
employees with effect from January 01, 2013 with no impact on the pensioners appearing on the pensioners’ list as of that date. The
proposed scheme was approved for implementation by the Commissioner Inland Revenue on February 22, 2013 and employees’ consent
to the proposed scheme was sought and obtained. Management and executive staff who have joined on or after January 1, 2016, do not
participate in the pension fund.
Consequently, the pension fund currently operates two different plans for its members:
Defined contribution plan for active employees hired before January 1, 2016; and
Defined benefit plan for pensioners who have retired on or before December 31, 2012.
In respect of the defined contribution plan, the Company contributes 20% of members’ monthly basic salary to the scheme; whereas, an
employee may or may not opt to contribute 6% of his monthly basic salary to the scheme.
The obligation in respect of the defined benefit plan is determined by the Company appointed actuary at each year end. Any funding gap
identified by the Company appointed actuary is paid by the Company from time to time. The last actuarial valuation was carried out as at
December 31, 2017.

85
ANNUALREPORT 2017
Per annum 2017 2016
Discount rate 8.25% 8.00%
Expected rate of increase in pension level 1.00% 1.00%
Expected mortality rate SLIC (2001-2005) SLIC (2001-2005)
mortality table mortality table
Expected rate of return 8.25% 8.00%
Plan assets include long term Government bonds, equity instruments of listed companies, units of mutual funds, term finance certificates,
izafa certificates, treasury bills, sukuk and term deposits with banks.
Actuarial gains and losses arising from experience adjustments and changes in actuarial assumptions for the defined benefit plan
are charged or credited to equity in other comprehensive income in the period in which they arise. Past service costs are recognised
immediately in profit and loss account.
Pension fund is a multi-employer plan formed by the Company in collaboration with Tri Pack Films Limited. Packages reports its
proportionate share of the plan’s commitments, managed assets and costs, after deducting share of Tri Pack Films Limited, in accordance
with guidance provided by IAS 19 - Employee Benefits, regarding defined benefit plans.
4.8.2 Accumulating compensated absences
The Company provides for accumulating compensated absences when the employees render services that increase their entitlement
to future compensated absences. The annual leaves can be encashed at the time the employee leaves the Company on the basis of
the gross salary while no encashment is available for medical leaves. The employees of the Company are entitled to earned annual and
medical leaves on the basis of their service with the Company and in accordance with the Company policy.
Provisions are made annually to cover the obligation for accumulating compensated absences based on actuarial valuation and are
charged to profit and loss account. The most recent valuation was carried out as at December 31, 2017 using the Projected Unit Credit
Method.
The amount recognised in the balance sheet represents the present value of the defined benefit obligations. Actuarial gains and losses
are charged to the profit and loss account immediately in the period when these occur.
Projected Unit Credit Method, using the following significant assumptions, has been used for valuation of accumulating compensated
absences:
Per annum 2017 2016
Discount rate 8.25% 8.00%
Expected rate of increase in salary level 8.25% 8.00%
Expected mortality rate SLIC (2001-2005) SLIC (2001-2005)
mortality table mortality table

86
4.8.3 Defined contribution plans
A defined contribution plan is a post-employment benefit plan under which an entity pays fixed contribution into a separate entity and will
have no legal or constructive obligation to pay further amounts. Obligations for contributions to defined contribution plans are recognised
as an employee benefit expense in profit and loss account when they are due. Prepaid contributions are recognised as an asset to the
extent that a cash refund or a reduction in future payments is available.
The Company operates a recognised / approved contributory provident fund for its permanent employees. Equal monthly contributions
at the rate of 10.00 percent per annum (2016: 10.00 percent per annum) of basic salaries plus dearness allowance and cost of living
allowance are made by the Company and the employees to the fund.
The nature of contributory pension fund has been explained in note 4.8.1 (b) above.
4.9 Stores and spares
These are valued at weighted average cost except for items in transit which are stated at invoice value plus other charges paid thereon till
the balance sheet date. For items which are slow-moving and/or identified as obsolete, adequate provision is made for any excess book
value over estimated realisable value on a regular basis.
4.10 Stock-in-trade
All stocks except for stock-in-transit are stated at the lower of cost and net realisable value. Cost of raw materials is determined using
the moving average cost method. Cost of work-in-process and finished goods comprises direct production costs such as raw materials,
consumables and labour as well as production overheads such as employee wages, depreciation, maintenance, etc. The production
overheads based on normal operating capacity are measured based on a standard cost method, which is reviewed regularly to ensure
relevant measures of utilisation, production lead time etc.
Stock-in-transit is stated at cost comprising invoice value plus other charges paid thereon till the balance sheet date.
If the expected sales price less completion costs and costs to execute sales (net realisable value) is lower than the carrying amount, a
write-down is recognised for the amount by which the carrying amount exceeds its net realisable value. Provision is made in the financial
statements for obsolete and slow-moving stock-in-trade based on management estimate.
4.11 Trade debts and other receivables
Trade debts and other receivables are recognised initially at invoice amount, which approximates fair value, and subsequently measured
at amortised cost using the effective interest method, less provision for impairment.
A provision for impairment is established when there is objective evidence that the Company will not be able to collect all amounts
due according to the original terms of the receivable. Significant financial difficulties of the debtor, probability that the debtor will enter
bankruptcy or financial reorganisation, and default or delinquency in payments are considered indicators that the trade debt is impaired.
The provision is recognised in the profit and loss account. Trade debts, considered irrecoverable, are written off as and when identified.
Subsequent recoveries of amounts previously written off are credited to the profit and loss account.
Exchange gains and losses arising in respect of trade and other receivables in foreign currency are added to the carrying amount of
receivables.
4.12 Cash and cash equivalents
Cash and cash equivalents comprise cash in hand, demand deposits, other short term highly liquid investments with original maturities
of three months or less that are readily convertible to known amounts of cash and which are subject to an insignificant risk of changes
in value, and finances under mark-up arrangements. In the balance sheet, finances under mark-up arrangements are included in current
liabilities.

87
ANNUALREPORT 2017
4.13 Non-current assets / disposal group held for sale
Non-current assets are classified as assets held-for-sale when their carrying amount is to be recovered principally through a sale
transaction and a sale is considered highly probable. They are stated at the lower of carrying amount and fair value less cost to sell.
4.14 Borrowings
Borrowings are recognised initially at fair value (proceeds received), net of transaction costs incurred. Borrowings are subsequently carried
at amortised cost; any difference between the proceeds (net of transaction costs) and the redemption value is recognised in the profit and
loss account over the period of the borrowings using the effective interest method.
Fees paid on the establishment of loan facilities are recognised as transaction costs of the loan to the extent that it is probable that some
or all of the facility will be drawn down. In this case, the fee is deferred until the draw-down occurs. To the extent there is no evidence that
it is probable that some or all of the facility will be drawn down, the fee is capitalised as a pre-payment for liquidity services and amortised
over the period of the facility to which it relates.
Borrowings are classified as current liabilities unless the Company has an unconditional right to defer settlement of the liability for at least
twelve months after the balance sheet date.
Finance costs are accounted for on an accrual basis and are shown as accrued finance cost to the extent of the amount remaining unpaid.
4.15 Trade and other payables
Trade and other payables are recognised initially at fair value and subsequently measured at amortised cost using the effective interest
method. Exchange gains and losses arising on translation in respect of liabilities in foreign currency are added to the carrying amount of
the respective liabilities.
4.16 Derivative financial instruments
These are initially recorded at cost on the date a derivative contract is entered into and are remeasured to fair value at subsequent
reporting dates. The method of recognising the resulting gain or loss depends on whether the derivative is designated as a hedging
instrument, and if so, the nature of the item being hedged. The Company designates certain derivatives as cash flow hedges.
The Company documents at the inception of the transaction the relationship between the hedging instruments and hedged items, as well
as its risk management objective and strategy for undertaking various hedge transactions. The Company also documents its assessment,
both at hedge inception and on an on-going basis, of whether the derivatives that are used in hedging transactions are highly effective in
offsetting changes in cash flow of hedged items.
The effective portion of changes in the fair value of derivatives that are designated and qualify as cash flow hedges are recognised in
statement of other comprehensive income. The gain or loss relating to the ineffective portion is recognised immediately in the profit and
loss account.
Amounts accumulated in equity are recognised in profit and loss account in the periods when the hedged item shall effect profit or
loss. However, when the forecast hedged transaction results in the recognition of a non-financial asset or liability, the gains and losses
previously deferred in equity are transferred from equity and included in the initial measurement of the cost of the asset or liability.
4.17 Revenue recognition
Revenue comprises the fair value of the consideration received or receivable for the sale of goods and services in the ordinary course of
the Company’s activities, net of discounts and sales tax. The Company recognises revenue when the amount of revenue can be reliably
measured and it is probable that future economic benefits will flow to the Company and specific criteria has been met for each of the
Company’s activities as described below:
88
(i) Sales revenue is recognised at the time the Company has transferred the significant risks and rewards of ownership of goods, which
is considered to be at the time of dispatch of goods and performance of services;
(ii) Returns on bank deposits are accrued on a time proportion basis by reference to the principal outstanding amount and the applicable
rate of return; and
(iii) Dividend income is recognised when right to receive such dividend is established.
4.18 Foreign currency transactions and translation
a) Functional and presentation currency
Items included in the financial statements of the Company are measured using the currency of the primary economic environment in
which the Company operates (the functional currency). The financial statements are presented in Pak Rupees, which is the Company’s
functional and presentation currency. Figures are rounded off to the nearest thousand of Pak Rupees.
b) Transactions and balances
All monetary assets and liabilities in foreign currencies are translated into Pak Rupees at exchange rates prevailing at the balance sheet
date. Transactions in foreign currencies are translated into Pak Rupees at exchange rates prevailing at the dates of the transactions.
Foreign exchange gains and losses resulting from the settlement of such transactions and from the translation at year end exchange rates
of monetary assets and liabilities denominated in foreign currencies are charged or credited to profit and loss account. Non-monetary
assets and liabilities that are measured in terms of historical cost in a foreign currency are translated into Pak Rupees at exchange rates
prevailing at the date of transaction. Non-monetary assets and liabilities denominated in foreign currency that are stated at fair value are
translated into Pak Rupees at exchange rates prevailing at the date when fair values are determined.
4.19 Borrowing costs
General and specific borrowing costs that are directly attributable to the acquisition, construction or production of a qualifying asset are
capitalised during the period of time that is required to complete and prepare the asset for its intended use or sale. Qualifying assets are
assets that necessarily take a substantial period of time to get ready for their intended use or sale.
Investment income earned on the temporary investment of specific borrowings pending their expenditure on qualifying assets is deducted
from the borrowing costs eligible for capitalisation.
All other borrowing / finance costs are recognised in profit and loss account in the period in which they are incurred.
4.20 Dividend and other appropriations
Dividend distribution to the Company’s shareholders is recognised as a liability in the period in which the dividends are declared and other
appropriations are recognised in the period in which these are approved by the Board of Directors of the Company (‘BOD’).
4.21 Compound financial instruments
Compound financial instruments issued by the Company represent preference shares / convertible stock that can be converted into
ordinary shares or can be settled in cash.
The liability component of a compound financial instrument is recognised initially at the fair value of a similar liability that does not have an
equity conversion option. The equity component is recognised initially at the difference between the fair value of the compound financial
instrument as a whole and the fair value of the liability component. Any directly attributable transaction costs are allocated to the liability
and equity components in proportion to their initial carrying amounts.
Subsequent to initial recognition, the liability component of a compound financial instrument is measured at amortised cost using the
effective interest method. The equity component of a compound financial instrument is not remeasured subsequent to initial recognition.

89
ANNUALREPORT 2017
4.22 Provisions
Provisions are recognised when the Company has a present legal or constructive obligation as a result of past events and it is probable
that an outflow of resources embodying economic benefits will be required to settle the obligation and a reliable estimate of the amount
can be made. Provisions are not recognised for future operating losses.
Where there are a number of similar obligations, the likelihood that an outflow shall be required in settlement is determined by considering
the class of obligations as a whole. A provision is recognised even if the likelihood of an outflow with respect to any one item included in
the same class of obligations may be small.
Provisions are measured at the present value of the expenditures expected to be required to settle the obligation using a pre-tax rate that
reflects current market assessments of the time value of money and the risks specific to the obligation. The increase in the provision due
to passage of time is recognised as interest expense.
Provisions are reviewed at each balance sheet date and adjusted to reflect the current best estimate.
4.23 Share capital
Ordinary shares are classified as equity and recognised at their face value. Incremental costs directly attributable to the issue of new
shares are shown in equity as a deduction, net of tax, if any.
4.24 Earnings per share
The Company presents basic and diluted earnings per share (‘EPS’) data for its ordinary shares. Basic EPS is calculated by dividing the
profit or loss attributable to ordinary shareholders of the Company by the weighted average number of ordinary shares outstanding during
the year. Diluted EPS is determined by adjusting the profit or loss attributable to ordinary shareholders and the weighted average number
of ordinary shares outstanding for the effects of all dilutive potential ordinary shares.
4.25 Contingent liabilities
Contingent liability is disclosed when:
There is a possible obligation that arises from past events and whose existence will be confirmed only by the occurrence or
non-occurrence of one or more uncertain future events not wholly within the control of the Company; or
There is present obligation that arises from past events but it is not probable that an outflow of resources embodying economic benefits
will be required to settle the obligation or the amount of the obligation cannot be measured with sufficient reliability.

90
5. Issued, subscribed and paid up capital
2017 2016 2017 2016 (Number of shares) (Rupees in thousand)
Ordinary shares of Rs. 10 each as at the
beginning of the year
33,603,295 33,603,295 fully paid in cash 336,033 336,033
148,780 148,780 fully paid for consideration other than cash 1,488 1,488
fully paid against conversion of preference
5,000,000 4,000,000 shares / convertible stock 50,000 40,000
50,627,429 50,627,429 fully paid bonus shares 506,274 506,274
89,379,504 88,379,504 893,795 883,795
Issuance of shares upon conversion of
– 1,000,000 preference shares / convertible stock - note 5.1 – 10,000
Ordinary shares of Rs. 10 each as at the
end of the year
33,603,295 33,603,295 fully paid in cash 336,033 336,033
148,780 148,780 fully paid for consideration other than cash 1,488 1,488
fully paid against conversion of preference
5,000,000 5,000,000 shares / convertible stock 50,000 50,000
50,627,429 50,627,429 fully paid bonus shares 506,274 506,274
89,379,504 89,379,504 893,795 893,795
5.1 Last year, under the terms of redemption / conversion of preference shares / convertible stock mentioned in note 6.2, the Company,
converted 1 million preference shares / convertible stock of Rs. 190 each held by International Finance Corporation, Washington D.C, USA
(‘IFC’) into 1 million fully paid ordinary shares of Rs. 10 each.
5.2 24,653,801 (2016: 24,309,601) ordinary shares of the Company are held by IGI Holdings Limited (‘IGIHL’) (formerly IGI Insurance
Limited), an associate.
(Rupees in thousand) Note 2017 2016
6. Long term finances
These are composed of:
Local currency loans - secured
Long term finance facility I 6.1.1 1,142,870 1,714,290
Long term finance facility II 6.1.2 1,500,000 1,500,000
2,642,870 3,214,290
Preference shares / convertible stock - unsecured 6.2 932,650 932,650
3,575,520 4,146,940
Current portion shown under current liabilities 11 (1,321,420) (571,420)
2,254,100 3,575,520
6.1 Local currency loans - secured
6.1.1 Long term finance facility I
This loan has been obtained from Meezan Bank Limited under the Islamic mode of finance as a Musharika. It is secured by a first pari
passu charge over all present and future moveable fixed assets and specific land and buildings of the Company located at Kasur and
Karachi amounting to Rs. 2,500 million. The balance is repayable in 4 equal semi-annual installments ending on December 28, 2019. The
loan carries mark up at the rate of six month Karachi Inter Bank Offer Rate (“KIBOR”) plus 0.10 percent per annum. The effective mark up
charged during the year ranges from 6.24 percent to 6.31 percent per annum (2016: 6.18 percent to 6.77 percent per annum).

91
ANNUALREPORT 2017
6.1.2 Long term finance facility II
This represents a Term Finance Facility (the ‘Facility’) of Rs. 11 billion obtained from Habib Bank Limited to finance the redemption of
preference shares issued to IFC. The Facility is secured against pledge of Nestle Pakistan Limited’s shares owned by the Company
under a “Share Pledge Agreement” as referred to note 19.2.2. During last year, the Company made a drawdown of Rs. 3,000 million
on September 8, 2016 out of which, Rs. 1,500 million was prepaid before December 31, 2016 as permitted under the Facility. As per
the agreement, the Company is entitled to make drawdowns of the remaining Facility within 18 months of the first drawdown date. The
Facility carries mark up at the rate of six month KIBOR plus 0.25 percent per annum and is payable in 4 equal semi annual installments
commencing on March 8, 2018 and ending on September 8, 2019. The effective mark up rate charged during the year ranges from 6.30
percent to 6.40 percent per annum (2016: 6.30 percent per annum).
6.2 Preference shares / convertible stock - unsecured
During the year 2009, the Company issued 10 percent local currency non-voting preference shares / convertible stock at the rate of
Rs. 190 per share amounting to USD 50 million equivalent to PKR 4,120.50 million under “Subscription Agreement” dated March 25,
2009 with IFC.
Terms of redemption / conversion
Each holder of preference shares / convertible stock shall have a right to settle at any time, at the option of holder, either in the form
of fixed number of ordinary shares, one ordinary share for one preference share / convertible stock, or cash. The Company may, on
its discretion, refuse to purchase the preference shares / convertible stock offered to it for purchase in cash. In case of refusal by the
Company, preference shareholders shall have the right to either retain the preference shares / convertible stock or to convert them
into ordinary shares. The preference shares / convertible stock can be held till perpetuity if preference shareholders do not opt for the
conversion or cash settlement.
Rate of return
The preference share / convertible stock holders have a preferred right of return at the rate of 10 percent per annum on a non-cumulative
basis till the date of settlement of preference shares / convertible stock either in cash or ordinary shares. In case the amount of dividend
paid to an ordinary shareholder exceeds that paid to a preference shareholder, the preference shareholders have the right to share the
excess amount with the ordinary shareholders on an as-converted basis.
Preference shares / convertible stock are recognised in the balance sheet as follows:
(Rupees in thousand) Note 2017 2016
Face value of preference shares / convertible stock
[8,186,842 (2016: 8,186,842) shares of Rs. 190 each] 1,555,500 1,555,500
Transaction costs (16,628) (16,628)
1,538,872 1,538,872
Equity component - classified under capital and reserves 6.2.1 (606,222) (606,222)
Liability component - classified under long term finances 6.2.2 932,650 932,650
Accrued return on preference shares / convertible stock
classified under accrued finance cost 14 155,550 155,550
The fair value of the liability component of the preference shares / convertible stock is calculated by discounting cash flows at a rate of
approximately 16.50 percent till perpetuity which represents the rate of similar instrument with no associated equity component. The
residual amount, representing the value of the equity conversion component, is included in shareholders’ equity as preference shares /
convertible stock.

92
6.2.1 Movement in equity component - classified under capital and reserves
2017 2016 Note 2017 2016 (Number of shares) (Rupees in thousand)
8,186,842 17,686,842 Equity component at the beginning of the year 606,222 1,309,682
– – Transfer from liability component 6.2.2 – 113,921
Conversion into: 5.1
– (1,000,000) ordinary share capital – (10,000)
share premium – (177,969)
– (1,000,000) – (74,048)
– (8,500,000) Redemption of preference shares 6.3 – (629,412)
8,186,842 8,186,842 Equity component at the end of the year 606,222 606,222
(Rupees in thousand) Note 2017 2016
6.2.2 Movement in liability component
Liability component of 8,186,842 (2016: 17,686,842) preference
shares as at the beginning of the year 932,650 2,014,895
Transfer to equity component upon conversion of Nil
(2016: 1,000,000) preference shares into ordinary shares 6.2.1 – (113,921)
Redemption of Nil (2016: 8,500,000) preference shares 6.3 – (968,324)
Liability component of 8,186,842 (2016: 8,186,842) preference
shares as at the end of the year 932,650 932,650
6.3 Last year, under the terms of redemption / conversion of preference shares / convertible stock mentioned in note 6.2, IFC exercised its
right to redeem 8,500,000 preference shares / convertible stock of Rs. 190 each into cash. The mutually agreed redemption consideration
was allocated to liability and equity portions in the same manner as was used for separation of these components at the time of initial
recognition at the prevailing market rates and both were extinguished in the same ratio.
(Rupees in thousand) Note 2017 2016
7. Liabilities against assets subject to finance lease
Present value of minimum lease payments 26,084 33,369
Current maturity shown under current liabilities 11 (12,889) (7,312)
13,195 26,057
Interest rate used as discounting factor ranges from 6.42 percent to 10.72 percent per annum (2016: 6.28 percent to 10.72 percent per
annum). Taxes, repairs and insurance costs are borne by the lessee.
The amount of the future payment of the lease as shown in the balance sheet and the period in which these payments will become due
are as follows:
Minimum Future Present value of lease lease finance liability(Rupees in thousand) payments charge 2017 2016
Not later than one year 13,536 647 12,889 7,312
Later than one year but not later than five years 13,928 733 13,195 26,057
27,464 1,380 26,084 33,369

93
ANNUALREPORT 2017
(Rupees in thousand) Note 2017 2016
8. Deferred tax
The liability for deferred tax comprises temporary differences relating to:
Accelerated tax depreciation 453,075 490,177
Minimum tax available for carry forward 8.1 – (52,925)
Provision for accumulating compensated absences (97,554) (91,499)
Others (11,848) (1,668)
343,673 344,085
8.1 Deferred tax asset on tax losses representing minimum tax available for carry forward under section 113 of the Income Tax Ordinance,
2001 is recognised to the extent that the realisation of related tax benefits through future taxable profits of the Group is probable. The
Company has not recognised deferred tax asset of Rs. 11.657 million (2016: Nil), set to lapse in the accounting year 2022, in respect
of minimum tax available for carry forward arisen after the formation of the Group as referred to in note 4.1, as sufficient taxable profits
would not be available to the Group to utilise these in the foreseeable future. Deferred tax asset has also not been recognised on aggregate
minimum taxes prior to the formation of the Group amounting to Rs. 212.759 million (2016: Rs. 270.768 million) as the same can not
be realised against the taxable profits of the Group. However, in case the Company opts out of the Group, these minimum tax credits will
become available for realisation against the taxable profits of the Company. Out of these minimum tax credits, Rs. 159.834 million is set
to lapse in the accounting year 2018 and Rs. 52.925 million is set to lapse in the accounting year 2021.
8.2 The gross movement in net deferred tax liability during the year is as follows:
(Rupees in thousand) Note 2017 2016
Opening balance 344,085 246,119
Charged to profit and loss account 34 76,133 109,265
Credited to other comprehensive income (76,545) (11,299)
Closing balance 343,673 344,085
(Rupees in thousand) Note 2017 2016
9. Retirement benefits
Classified under non-current liabilities
Pension fund 9.1 181,715 14,983
Gratuity fund 9.1 176,549 72,321
358,264 87,304
Pension fund Gratuity fund(Rupees in thousand) 2017 2016 2017 2016
9.1 Amounts recognised in balance sheet
The amounts recognised in the balance sheet
are as follows:
Fair value of plan assets 521,244 691,464 372,000 416,664
Present value of defined benefit obligation (702,959) (706,447) (548,549) (488,985)
Liability as at December 31 (181,715) (14,983) (176,549) (72,321)
9.1.1 Movement in net liability for retirement benefits
Net liability as at January 1 (14,983) (24,744) (72,321) (15,681)
Charge to profit and loss account (1,199) (2,227) (35,951) (24,906)
Net remeasurement for the year recorded in
other comprehensive income (‘OCI’) (165,533) 11,988 (89,616) (49,651)
Contribution by the Company – – 21,339 17,917
Net liability as at December 31 (181,715) (14,983) (176,549) (72,321)

94
Pension fund Gratuity fund(Rupees in thousand) 2017 2016 2017 2016
9.1.2 Movement in present value of defined benefit obligation
Present value of defined benefit obligation
as at January 1 706,447 651,753 488,985 378,247
Service cost – – 31,018 24,301
Interest cost 53,604 55,520 37,736 31,668
Benefits paid (72,795) (69,723) (34,122) (49,806)
Actuarial (gains) / losses from change in
financial assumptions (19,902) 42,316 106 39,529
Experience adjustments 35,605 26,581 24,826 65,046
Present value of defined benefit obligation as
at December 31 702,959 706,447 548,549 488,985
9.1.3 Movement in fair value of plan assets
Fair value as at January 1 691,464 627,009 416,664 362,566
Interest income on plan assets 52,405 53,293 32,803 31,063
Company contributions – – 21,339 17,917
Benefits paid (72,795) (69,723) (34,122) (49,806)
Return on plan assets, excluding interest income (149,830) 80,885 (64,684) 54,924
Fair value as at December 31 521,244 691,464 372,000 416,664
9.1.4 Risks faced by the Company on account of gratuity and pension funds
Final salary risks - The risk that the final salary at the time of cessation of service is greater than what was assumed. Since the benefit is
calculated on the final salary, the benefit amount would also increase proportionately.
Asset volatility - Most assets are invested in risk free investments of 3, 5 or 10 years in Government Bonds. However, investments in equity
instruments are subject to adverse fluctuations as a result of change in the market price.
Discount rate fluctuation - The plan liabilities are calculated using a discount rate set with reference to corporate bond yields. A decrease
in corporate bond yields will increase plan liabilities, although this will be partially offset by an increase in the value of the current plans
bond holdings.
Investment risks - The risk of the investments under performing and not being sufficient to meet the liabilities. This risk is mitigated by
closely monitoring the performance of investments.
Risk of insufficiency of assets - This is managed by making regular contribution to the funds as advised by the actuary.
Pension fund Gratuity fund(Rupees in thousand) 2017 2016 2017 2016
9.1.5 Amounts recognised in the profit and loss account
Current service cost – – 31,018 24,301
Interest cost 53,604 55,520 37,736 31,668
Interest income on plan assets (52,405) (53,293) (32,803) (31,063)
Net expense charged to profit and loss account 1,199 2,227 35,951 24,906

95
ANNUALREPORT 2017
Pension fund Gratuity fund(Rupees in thousand) 2017 2016 2017 2016
9.1.6 Remeasurements charged to OCI
Actuarial (gains) / losses from change in
financial assumptions (19,902) 42,316 106 39,529
Experience adjustments 35,605 26,581 24,826 65,046
Return on plan assets, excluding interest income 149,830 (80,885) 64,684 (54,924)
Total remeasurements charged/ (credited) to OCI 165,533 (11,988) 89,616 49,651
9.1.7 Plan assets
Debt instruments 225,959 248,235 182,838 164,204
Shares and units of mutual funds 277,562 426,910 177,332 246,284
Cash at banks 14,751 16,319 11,830 6,176
Others 2,972 – – –
521,244 691,464 372,000 416,664
9.1.8 The present value of defined benefit obligation, the fair value of plan assets and the deficit or surplus of pension fund is as follows:
(Rupees in thousand) 2017 2016 2015 2014 2013
As at December 31
Present value of defined benefit obligation (702,959) (706,447) (651,753) (641,863) (568,285)
Fair value of plan assets 521,244 691,464 627,009 700,115 567,707
(Deficit) / surplus (181,715) (14,983) (24,744) 58,252 (578)
Experience adjustment on obligation 5% 4% -5% 2% 1%
Experience adjustment on plan assets -28% 12% -11% 24% 2%
Fair value of plan assets include ordinary shares of the Company, whose fair value as at December 31, 2017 is Rs. 336.507 million (2016:
Rs. 561.064 million).
9.1.9 The present value of defined benefit obligation, the fair value of plan assets and the deficit or surplus of gratuity fund is as follows:
(Rupees in thousand) 2017 2016 2015 2014 2013
As at December 31
Present value of defined benefit obligation (548,549) (488,985) (378,247) (309,873) (275,115)
Fair value of plan assets 372,000 416,664 362,566 339,502 281,655
(Deficit) / surplus (176,549) (72,321) (15,681) 29,629 6,540
Experience adjustment on obligation 5% 13% 6% 13% 9%
Experience adjustment on plan assets -17% 13% 1% 21% 14%
Fair value of plan assets include ordinary shares of the Company, whose fair value as at December 31, 2017 is Rs. 53.274 million (2016:
Rs. 88.825 million).

96
2017 (Rupees in thousand) Pension fund Gratuity fund
9.1.10 Sensitivity analysis
Year end sensitivity analysis on defined benefit obligation are as follows:
Discount rate + 100 bps 655,962 504,771
Discount rate - 100 bps 756,636 599,351
Salary indexation + 100 bps 756,816 599,299
Salary indexation - 100 bps 655,265 503,995
(Rupees in thousand) Note 2017 2016
10. Deferred liabilities
This represents provision made to cover the obligation
for accumulating compensated absences.
Opening balance 304,996 201,576
Charged to profit and loss account 10.2 41,780 129,466
346,776 331,042
Payments made during the year (21,595) (26,046)
Closing balance 10.1 325,181 304,996
10.1 Movement in liability for accumulating compensated absences
Present value of obligation as at January 1 304,996 201,576
Current service cost 11,500 6,709
Interest cost on defined benefit obligation 23,524 16,970
Benefits paid during the year (21,595) (26,046)
Remeasurement during the year 6,756 105,787
Present value of obligation as at December 31 325,181 304,996
10.2 Charged during the year
Current service cost 11,500 6,709
Interest cost 23,524 16,970
Remeasurement during the year 6,756 105,787
Expense charged to the profit and loss account 41,780 129,466
10.3 Amounts of current period and previous four periods of accumulating compensated absences are as follows:
(Rupees in thousand) 2017 2016 2015 2014 2013
As at December 31
Present value of accumulating
compensated absences 325,181 304,996 201,576 174,581 139,576
Actuarial remeasurements 6,756 105,787 28,195 30,965 17,568

97
ANNUALREPORT 2017
2017 Accumulating compensated (Rupees in thousand) absences
10.4 Sensitivity analysis
Year end sensitivity analysis on defined benefit obligation are as follows:
Discount rate + 100 bps 274,777
Discount rate - 100 bps 323,029
Salary indexation + 100 bps 323,231
Salary indexation - 100 bps 274,169
(Rupees in thousand) Note 2017 2016
11. Current portion of non-current liabilities
Current portion of long term finances - secured 6 1,321,420 571,420
Current portion of liabilities against assets subject
to finance lease 7 12,889 7,312
1,334,309 578,732
12. Finances under mark up arrangements - secured
Running finances - secured 12.1 299,596 637,033
Bills discounted - secured 12.2 – –
Short term finances - secured 12.3 – 740,000
299,596 1,377,033
12.1 Running finances - secured
Short term running finances available from a consortium of commercial banks under mark up arrangements amount to Rs. 7,910 million
(2016: Rs. 7,910 million). The rates of mark up are based on KIBOR plus spread and range from 6.15% to 7.40% (2016: 6.19% to
7.74%) or part thereof on the balances outstanding. In the event the Company fails to pay the balances on the expiry of the quarter, year
or earlier demand, mark up is to be computed at the rates ranging from 7.38% to 9.03% (2016: 7.43% to 9.44%) or part thereof on the
balances unpaid. The aggregate running finances are secured by hypothecation of stores, spares, stock-in-trade and trade debts.
12.2 Bills discounted - secured
Facilities for discounting of export / inland bills of Rs. 631 million (2016: Rs. 631 million) are available to the Company as a sub-limit of
the running finance facilities referred to in note 12.1. Mark up is fixed as per mutual agreement at the time of transaction. The outstanding
balance of bills discounted is secured, in addition to the securities referred to in note 12.1, on the specific bills discounted. The facility has
not been availed in the current year.
12.3 Short term finances - secured
Facilities for obtaining short term finances of Rs. 7,135 million (2016: Rs. 7,135 million) are available to the Company as a sub-limit of the
running finance facilities referred to in note 12.1. The rates of mark-up are based on KIBOR plus spread ranging from 6.04% to 6.15%
(2016: 6.03% to 6.49%) or part thereof on the balances outstanding.
12.4 Letters of credit and bank guarantees
Of the aggregate facilities of Rs. 6,489 million (2016: Rs. 6,489 million) for opening letters of credit (a sub-limit of running finance facilities)
and Rs. 794.350 million (2016: Rs. 794.350 million) for guarantees, the amounts utilised at December 31, 2017 were Rs. 715.560
million (2016: Rs. 648.747 million) and Rs. 189.474 million (2016: Rs. 246.146 million) respectively. The facilities for guarantees are
secured by second hypothecation charge over stores, spares, stock-in-trade and trade debts.

98
(Rupees in thousand) Note 2017 2016
13. Trade and other payables
Trade creditors 13.1 1,435,501 1,276,456
Accrued liabilities 13.2 507,854 438,354
Bills payable 140,178 417,723
Sales tax payable 6,398 32,576
Advances from customers 13.3 73,816 53,932
Payable to retirement funds 13.4 17,165 15,948
Deposits - interest free repayable on demand 7,193 6,922
Profit payable on Term Finance Certificates (‘TFCs’) 1,387 1,387
Unclaimed dividends 39,307 26,400
Workers’ profit participation fund 13.5 778,948 489,671
Workers’ welfare fund 13.6 17,065 7,351
Others 13.7 80,181 81,194
3,104,993 2,847,914
13.1 Trade creditors include amounts due to related parties as follows:
Subsidiaries
DIC Pakistan Limited 87,381 90,681
Packages Lanka (Private) Limited – 738
Bulleh Shah Packaging (Private) Limited 281,683 –
Joint venture
Bulleh Shah Packaging (Private) Limited – 178,473
Associates
Tri-Pack Films Limited 47,378 46,530
IGI Holdings Limited [Formerly IGI Insurance Limited] 11,206 5,758
IGI Life Insurance Limited 3,597 3,470
431,246 325,650
13.2 Accrued liabilities include amounts due to related parties as follows:
Subsidiary
DIC Pakistan Limited 1,082 2,591
Joint venture
Bulleh Shah Packaging (Private) Limited – 411
Associate
IGI Life Insurance Limited 5,028 1,155
6,110 4,157
13.3 Included in advances from customers, Rs. 0.432 million (2016: Rs. 0.544 million) is due to Tri-Pack Films Limited, an associate.

99
ANNUALREPORT 2017
(Rupees in thousand) Note 2017 2016
13.4 Payable to retirement funds
Employees’ provident fund 13.4.1 9,685 7,978 Employees’ gratuity fund 1,787 1,545 Management staff pension fund 5,693 6,425
17,165 15,94813.4.1 Employees’ provident fund
Size of the fund - total assets 2,293,187 2,918,181 Cost of investments made out of provident fund 998,508 861,963 Fair value of investments made out of provident fund 13.4.2 2,262,328 2,890,075 Percentage of investments made out of provident fund 98.65% 99.04%
2017 2016 Rupees in % age of Rupees in % age of thousand investment thousand investment
13.4.2 Breakup of fair value of investments out of Provident Fund
Equity shares of listed companies 1,396,593 61.73% 2,117,688 73.27%Mutual funds 252,735 11.17% 318,533 11.02%Government securities 249,548 11.03% 94,503 3.27%Term deposit receipts with banks 261,302 11.55% 303,831 10.51%Bank balances 24,625 1.09% 2,063 0.07%Others 77,525 3.43% 53,457 1.86%
2,262,328 100.00% 2,890,075 100.00%
Fair value of investments include ordinary shares of the Company, whose fair value as at December 31, 2017 is Rs. 1,054.274 million
(2016: Rs. 1,757.812 million).
13.4.3 The figures are based on the audited financial statements of the employees’ provident fund. The investments out of the employees’
provident fund have been made in accordance with the provisions of section 218 of the Companies Act, 2017 and rules formulated for
this purpose.
(Rupees in thousand) Note 2017 2016
13.5 Workers’ profit participation fund
Opening balance 489,671 204,216 Provision for the year 30 377,540 358,855
867,211 563,071 Payments made during the year (88,263) (73,400)
Closing balance 778,948 489,671 13.6 Workers’ welfare fund
Opening balance 7,351 174,237 Provision for the year 30 17,065 7,351 Reversal of excess provision of prior years 31 (7,351) (150,606)
17,065 30,982 Payments made during the year – (23,631)
Closing balance 17,065 7,351
13.7 Includes Rs. 0.328 million (2016: Rs. Nil) due to Packages Power (Private) Limited, a subsidiary of the Company.

100
(Rupees in thousand) Note 2017 2016
14. Accrued finance costs
Accrued mark up / return on:
Long term local currency loans - secured 30,247 51,608
Preference shares / convertible stock - unsecured 6.2 155,550 155,550
Finances under markup arrangements - secured 3,963 14,572
189,760 221,730
15. Contingencies and commitments
15.1 Contingencies in respect of:
(i) Claims against the Company by ex-employees not acknowledged as debts amounting to Rs. 28.294 million (2016: Rs. 14.861
million).
(ii) Post dated cheques not provided in the financial statements have been furnished by the Company in favour of the Collector of
Customs against custom levies aggregating to Nil (2016: Rs. 18.981 million) in respect of goods imported.
(iii) Standby letter of credit issued by Habib Bank Limited, Pakistan (‘HBL Pakistan’) in favor of Habib Bank Limited, Bahrain (‘HBL
Bahrain’) on behalf of the Company amounting to Rs. 1,223.503 million (2016: Rs. 1,231.116 million) to secure long term
finance facility provided by HBL Bahrain to Anemone Holdings Limited (‘AHL’) (wholly-owned subsidiary of the Company). The
standby letter of credit is secured against pledge of Nestle Pakistan Limited’s shares owned by the Company as referred to in
note 19.2.2.
(iv) Letters of guarantees issued to various parties aggregating to Rs. 189.474 million (2016: Rs. 246.146 million).
15.2 Commitments in respect of:
(i) Letters of credit and contracts for capital expenditure amounting to Rs. 353.626 million (2016: Rs. 191.973 million).
(ii) Letters of credit and contracts for other than capital expenditure amounting to Rs. 458.930 million (2016: Rs. 488.757 million).
(Rupees in thousand) Note 2017 2016
16. Property, plant and equipment
Operating fixed assets
Owned assets 16.1 4,168,989 4,060,129
Assets subject to finance lease 16.2 29,021 33,263
4,198,010 4,093,392
Capital work-in-progress 16.3 925,160 105,018
Major spare parts and stand-by equipment 16.4 61,569 61,729
5,184,739 4,260,139

101
ANNUALREPORT 2017
16.1 Owned assets 2017
Accumulated Depreciation Accumulated Book value Cost as at Cost as at depreciation charge / depreciation as at December Addition/ Transfer December as at December (deletions) Transfer as at December December (Rupees in thousand) 31, 2016 (deletions) in 31, 2017 31, 2016 for the year in 31, 2017 31, 2017
Freehold land 207,543 121,247 – 328,790 – – – – 328,790
– – – –
Buildings on freehold land 537,991 47,490 – 585,481 179,923 22,624 – 202,547 382,934
– – – –
Buildings on leasehold land 189,589 – – 189,589 111,666 8,458 – 120,124 69,465
– – – –
Plant and machinery 7,374,182 444,675 – 7,697,638 4,401,082 502,340 – 4,784,607 2,913,031
(121,219) – (118,815) –
Other equipments (computers, lab
equipments and other office equipments) 815,711 103,814 – 910,568 579,688 96,992 – 668,118 242,450
(8,957) – (8,562) –
Furniture and fixtures 15,671 4,719 – 20,327 13,751 742 – 14,430 5,897
(63) – (63) –
Vehicles 314,831 100,845 1,549 340,782 109,279 32,060 557 114,360 226,422
(76,443) – (27,536) –
9,455,518 822,790 1,549 10,073,175 5,395,389 663,216 557 5,904,186 4,168,989
(206,682) – (154,976) –
2016
Accumulated Depreciation Accumulated Book value Cost as at Cost as at depreciation charge / depreciation as at December Addition/ Transfer December as at December (deletions) Transfer as at December December (Rupees in thousand) 31, 2015 (deletions) in / (out) 31, 2016 31, 2015 for the year (out) 31, 2016 31, 2016
Freehold land 137,297 22,950 47,296 207,543 – – – – 207,543
– – – –
Buildings on freehold land 498,458 39,533 – 537,991 160,034 19,889 – 179,923 358,068
– – – –
Buildings on leasehold land 221,419 – – 189,589 120,425 9,066 – 111,666 77,923
– (31,830) – (17,825)
Plant and machinery 7,453,853 864,046 – 7,374,182 4,878,183 457,130 – 4,401,082 2,973,100
(943,717) – (934,231) –
Other equipments (computers, lab
equipments and other office equipments) 774,770 108,944 – 815,711 559,803 85,882 – 579,688 236,023
(68,003) – (65,997) –
Furniture and fixtures 14,928 743 – 15,671 13,123 628 – 13,751 1,920
– – – –
Vehicles 268,126 90,467 – 314,831 97,271 28,638 – 109,279 205,552
(43,762) – (16,630) –
9,368,851 1,126,683 47,296 9,455,518 5,828,839 601,233 – 5,395,389 4,060,129
(1,055,482) (31,830) (1,016,858) (17,825)
16.1.1 Owned assets include assets amounting to Rs. 52.800 million (2016: Rs. 70.059 million) which are not operational.
16.1.2 The cost of fully depreciated assets which are available for use as at December 31, 2017 is Rs. 2,669.240 million (2016: Rs. 2,437.999
million).
16.1.3 A portion of the land on which the Company’s factory is situated is on lease from the Government of Punjab for the past 60 years. The term
of this lease expired in December 2015 and the Company has filed an application with the relevant authorities for its renewal.
16.1.4 The depreciation charge for the year has been allocated as follows:
(Rupees in thousand) Note 2017 2016
Cost of sales 27 616,076 564,242
Administrative expenses 28 34,131 26,422
Distribution and marketing costs 29 13,009 10,569
663,216 601,233

102
16.1.5 Disposal of owned assets
Detail of owned assets disposed off during the year is as follows:
(Rupees in thousand) 2017
Particulars Accumulated Sales Mode ofof assets Sold to Cost depreciation Book value proceeds disposal
Plant and machinery Outsider - related party
Bulleh Shah Packaging (Private) Limited (subsidiary) 3,780 3,524 256 256 Negotiation Bulleh Shah Packaging (Private) Limited (subsidiary) 13,588 11,818 1,770 1,770 Negotiation Other Equipments Outsider - related party
Bulleh Shah Packaging (Private) Limited (subsidiary) 98 22 76 76 Negotiation Vehicles Employees
Abdul Rehman 750 450 300 418 Company Policy Adi J. Cawasji 1,286 965 321 322 - do - Adnan Tufail 1,050 620 430 485 - do - Akhtar Bashir 1,003 592 411 590 - do - Akhtar Javed 1,145 687 458 731 - do - Ameer Taimoor Ali 1,019 102 917 901 - do - Anis Ahmed 1,495 897 598 1,013 - do - Arslan Bashir 1,297 156 1,141 1,126 - do - Ather Ayub Khan 3,742 1,197 2,545 3,116 - do - Ayesha Siddiq 800 328 472 524 - do - Bilal Ahmad 683 225 458 494 - do - Fazal Ahmad 1,760 422 1,338 1,412 - do - Ghani Shah 601 360 241 283 - do - Gohar Ali Shahzad 1,788 179 1,609 1,592 - do - Hammas Ali Naik 1,391 83 1,308 1,391 - do - Hina Jamil 860 516 344 464 - do - Kamal Bariq 650 390 260 291 - do - Kashif Ahmed 1,560 686 874 982 - do - Mehreen Zafar 1,057 338 719 651 - do - Mian Javaid Iqbal 1,555 933 622 1,197 - do - Mohammad Abbas 850 502 348 456 - do - Mudassar Anjum 1,788 197 1,591 1,547 - do - Muhammad Ahmad 1,534 307 1,227 1,393 - do - Muhammad Ashiq 1,640 361 1,279 1,403 - do - Muhammad Farhan 2,383 1,215 1,168 1,830 - do - Muhammad Rizwan 1,438 863 575 963 - do - Muhammad Usman 1,191 703 488 697 - do - Mumtaz Ali 1,020 469 551 646 - do - Munir Alam Shah 708 14 694 626 - do - Musab Mukhtar Malik 1,112 378 734 792 - do - Mustansar Bashir 1,973 1,184 789 1,380 - do - Nauman Noor 1,548 807 741 982 - do - Nazish Siddique 707 424 283 314 - do - Raheel Shakeel 1,014 162 852 897 - do - Raja Asad 1,807 199 1,608 1,653 - do - Rizwan Ahmed Butt 923 554 369 488 - do - Samreen Saleem 647 369 278 288 - do - Shahid Islam 700 175 525 430 - do - Shahida Naeem 1,680 1,008 672 1,021 - do - Shoaib Nangiana 1,365 819 546 769 - do - Subbayal Najeeb 1,039 218 821 820 - do - Subhan Zahid 2,017 - 2,017 2,017 - do - Syed Baqir Ali Shah 1,498 629 869 939 - do - Syed Imran Adil 749 449 300 396 - do - Syed Rizwan Ali 708 71 637 650 - do - Syed Zia Ul Hassan 1,642 147 1,495 1,453 - do - Syeda Zehra Qaiser 825 495 330 435 - do - Tahira Yasmeen 1,275 701 574 832 - do - Umer Shabbir 678 61 617 678 - do - Usaid Faizi 1,014 51 963 894 - do - Usman Tahir 707 424 283 316 - do - Uzair Haseeb 688 89 599 585 - do - Waqas Munir 2,448 612 1,836 1,999 - do - Zeeshan Akram 1,000 360 640 694 - do - Zeeshan Akram 1,667 83 1,584 1,667 - do - Zia Ur Rehman 683 198 485 431 - do -
Carried forward 87,624 40,788 46,836 53,466

103
ANNUALREPORT 2017
(Rupees in thousand) 2017
Particulars Accumulated Sales Mode ofof assets Sold to Cost depreciation Book value proceeds disposal
(Rupees in thousand) 2016
Particulars Accumulated Sales Mode of
of assets Sold to Cost depreciation Book value proceeds disposal
Plant and machinery Outsider
5 Star Enterprises 832,494 822,514 9,980 47,327 Negotiation Other Equipments Employee
Seema Riaz 137 53 84 75 Negotiation Outsider - related party
IGI Holdings Limited [Formerly IGI Insurance Limited) (associate)] 111 28 83 52 Insurance Claim Settlement Outsider
Muhammad Amin 1,015 85 930 436 Negotiation Vehicles Employees
Abdullah Ikhlaq 1,804 397 1,407 1,451 Company Policy Ali Raza Madni 683 41 642 581 - do - Asad Javed 1,046 324 722 738 - do - Asma Yousaf 1,673 452 1,221 1,194 - do - Ata u Noor 1,639 754 885 1,173 - do - Ayesha Khalid 554 332 222 256 - do - Ayesha Tariq 683 41 642 604 - do - Bilal Naeem 1,057 137 920 764 - do - Dr. Asad Ali 1,200 720 480 787 - do - Hafiz Awais Ahmad 743 431 312 411 - do - Humayun Munir 640 371 269 315 - do - Imran Aziz Salaria 1,021 327 694 720 - do - Ismail Cheema 550 297 253 247 - do - Jamshaid Iqbal 735 441 294 405 - do - Jazib Faizi 1,013 608 405 630 - do - Khalid Bashir 748 441 307 413 - do - Mudassar Anjum 1,628 98 1,530 1,490 - do - Muhammad Ali 1,325 596 729 812 - do - Muhammad Azm Uddin 683 123 560 493 - do - Muhammad Bilal Ashraf 525 315 210 237 - do - Muhammad Umar 437 169 268 431 - do - Muhammad Umer Farooq 688 227 461 424 - do - Muhammad Yousaf 541 303 238 243 - do - Nadeem Bhatty 1,662 133 1,529 1,435 - do - Omer Iqbal 1,054 253 801 827 - do - Saad Imran Butt 1,034 165 869 819 - do - Sagheer Ahmed 955 573 382 579 - do - Sajjad Hussain Malik 979 558 421 604 - do - Sameeha Fazeel 1,418 199 1,219 1,244 - do - Sh Waqas Ahmad 700 105 595 507 - do -
Carried forward 863,175 832,611 30,564 68,725
Brought forward 87,624 40,788 46,836 53,466
Outsider - related parties
IGI Holdings Limited [Formerly IGI Insurance Limited (associate)] 1,811 670 1,141 1,313 Insurance Claim Settlement Bulleh Shah Packaging (Private) Limited (subsidiary) 1,533 46 1,487 1,487 Negotiation Packages Construction (Private) Limited (subsidiary) 1,549 558 991 378 Negotiation Outsider
Farid Khan 1,394 836 558 1,260 Negotiation Other assets with book value less than Rs. 50,000 109,138 108,787 351 8,117 Negotiation
Assets written off 3,633 3,291 342 – Written off
206,682 154,976 51,706 66,021

104
Brought forward 863,175 832,611 30,564 68,725
Shafique Shakir 677 508 169 303 - do - Shahzad Ahmed 680 211 469 418 - do - Shahzad Murtaza 533 304 229 244 - do - Suleman Javed 1,700 1,003 697 1,069 - do - Syed Izzat Hassan 1,111 527 584 627 - do - Talha Ahmed Iftikhar 622 355 267 346 - do - Tanveer Akhtar 700 140 560 507 - do - Usama Pervaiz 1,527 31 1,496 1,527 - do - Usman Munir 1,518 228 1,290 1,340 - do - Wali Haider 892 – 892 892 - do - Outsiders
Muhammad Mohsin 1,340 1,005 335 1,180 Negotiation Hassan Goraya 1,009 353 656 815 - do - Other assets with book value less than Rs. 50,000 179,347 179,300 47 15,804 Negotiation
Assets written off 651 282 369 – Written Off
1,055,482 1,016,858 38,624 93,797
(Rupees in thousand) 2016
Particulars Accumulated Sales Mode ofof assets Sold to Cost depreciation Book value proceeds disposal
16.2 Assets subject to finance lease
2017
Accumulated Depreciation Accumulated Book value Cost as at Cost as at depreciation charge / depreciation as at December Additions / Transfer December as at December (deletions) Transfer as at December December (Rupees in thousand) 31, 2016 (deletions) (out) 31, 2017 31, 2016 for the year (out) 31, 2017 31, 2017
Vehicles 45,686 5,685 – 45,548 12,423 5,501 – 16,527 29,021
(4,274) (1,549) (840) (557)
45,686 5,685 – 45,548 12,423 5,501 – 16,527 29,021
(4,274) (1,549) (840) (557)
2016
Accumulated Depreciation Accumulated Book value Cost as at Cost as at depreciation charge / depreciation as at December Additions / Transfer December as at December (deletions) Transfer as at December December (Rupees in thousand) 31, 2015 (deletions) in / (out) 31, 2016 31, 2015 for the year in (out) 31, 2016 31, 2016
Vehicles 43,673 6,583 – 45,686 8,425 5,186 – 12,423 33,263
(4,570) (1,188)
43,673 6,583 – 45,686 8,425 5,186 – 12,423 33,263
(4,570) – (1,188)
(Rupees in thousand) Note 2017 2016
16.2.1 Depreciation charge for the year has been allocated as follows:
Cost of sales 27 817 565
Administrative expenses 28 4,684 4,621
5,501 5,186

105
ANNUALREPORT 2017
16.3 Capital work-in-progress 2017
Capital Balance as at expenditure Advances Transfers within Charged Transfers Transfers Transfers Balance as December incurred during given during capital work off during to operating to other to investment at December (Rupees in thousand) 31, 2016 the year the year in progress the year fixed assets assets properties 31, 2017
Civil works 4,050 133,853 – 657 (144) (23,547) – (7,072) 107,797
Plant and machinery 65,278 1,223,672 – 47,092 (9,299) (557,194) – – 769,549
Advances to suppliers 35,690 – 101,702 (47,749) – (41,293) (536) – 47,814
105,018 1,357,525 101,702 – (9,443) (622,034) (536) (7,072) 925,160
2016
Capital Balance as at expenditure Advances Transfers within Charged Transfers Transfers Transfers Balance as December incurred during given during capital work off during to operating to other to investment at December (Rupees in thousand) 31, 2015 the year the year in progress the year fixed assets assets properties 31, 2016
Civil works 11,895 31,827 – – – (39,672) – – 4,050
Plant and machinery 193,472 838,836 – 6,257 (5,952) (967,335) – – 65,278
Advances to suppliers 23,850 – 41,047 (6,257) – (22,950) – – 35,690
229,217 870,663 41,047 – (5,952) (1,029,957) – – 105,018
16.3.1 Plant and machinery includes machinery in transit amounting Rs. 9.497 million (2016: Rs. 29.663 million)
(Rupees in thousand) 2017 2016
16.4 Major spare parts and stand-by equipment
Balance at the beginning of the year 61,729 60,954
Additions during the year 1,831 3,308
Transfers made during the year (1,991) (2,533)
Balance at the end of the year 61,569 61,729
17. Investment property 2017
Accumulated Accumulated Book value Cost as at Cost as at depreciation Depreciation depreciation as at December Additions / Transfer December as at December charge Transfer as at December December (Rupees in thousand) 31, 2016 (deletions) in 31, 2017 31, 2016 for the year in / (out) 31, 2017 31, 2017
Land 76,695 – – 76,695 – – – – 76,695
Buildings on freehold land 89,836 – 7,072 96,908 57,233 3,626 – 60,859 36,049
Buildings on leasehold land 39,575 – – 39,575 15,694 1,929 – 17,623 21,952
206,106 – 7,072 213,178 72,927 5,555 – 78,482 134,696
2016
Accumulated Accumulated Book value Cost as at Cost as at depreciation Depreciation depreciation as at December Additions / Transfer December as at December charge Transfer as at December December (Rupees in thousand) 31, 2015 (deletions) in / (out) 31, 2016 31, 2015 for the year in 31, 2016 31, 2016
Land 123,991 – (47,296) 76,695 – – – – 76,695
Buildings on freehold land 41,151 16,855 31,830 89,836 35,579 3,829 17,825 57,233 32,603
Buildings on leasehold land 39,575 – – 39,575 13,712 1,982 – 15,694 23,881
204,717 16,855 (15,466) 206,106 49,291 5,811 17,825 72,927 133,179
17.1 Depreciation charge for the year has been allocated to administrative expenses.

106
17.2 Land of the Company measuring 119 kanals, 15 marlas and 62.25 sq.fts situated at Lahore with a book value of Rs. 6.149 million (2016:
Rs. 6.149 million) and all present and future moveable fixed assets and buildings of Packages Construction (Private) Limited (“PCPL”) in
aggregate (“the Mortgaged Security”), have been mortgaged under a first exclusive equitable charge of Rs. 7,333 million (2016: Rs. 7,333
million) in favor of MCB Bank Limited against a term finance facility of upto Rs. 4,500 million (2016: Rs. 4,500 million) and a running
finance facility of upto Rs. 1,000 million (2016: Rs. 1,000 million) provided to PCPL by MCB Bank Limited under a tri-partite agreement
between the Company, MCB Bank Limited and PCPL. The Mortgaged Security has also been mortgaged under a first pari passu charge in
favour of Allied Bank Limited against a term finance facility of upto Rs. 3,500 million (2016: Rs. 3,500 million) provided to PCPL by Allied
Bank Limited under a tri-partite agreement between the Company, Allied Bank Limited and PCPL.
17.3 Fair value of the investment properties, based on the valuation carried out by an independent valuer, as at December 31, 2017 is
Rs. 3,877.830 million (2016: Rs. 3,530.120 million ). The valuation is considered to be level 2 in the fair value hierarchy due to significant
observable inputs used in the valuation. The different levels have been defined in note 44.5.
Valuation techniques used to derive level 2 fair values
Level 2 fair value of investment property has been derived using a sales comparison approach. Sale prices of comparable land and
buildings in close proximity are adjusted for differences in key attributes such as location and size of the property. The most significant
input into this valuation approach is price per square foot.
(Rupees in thousand) Note 2017 2016
18. Intangible assets
This represents computer softwares, website development costs and ERP system.
Cost As at January 1 194,233 189,270
Additions during the year – 4,963
As at December 31 194,233 194,233
Accumulated amortisation
As at January 1 (184,367) (168,541)
Amortisation for the year 18.1 (6,204) (15,826)
As at December 31 (190,571) (184,367)
Intangible assets under development 1,026 –
Book value as at December 31 4,688 9,866
18.1 The amortisation charge for the year has been allocated as follows:
Cost of sales 27 5,411 9,768
Administrative expenses 28 793 6,058
6,204 15,826
19. Investments
These represent the long term investments in:
Related parties - at cost 19.1 18,185,102 17,219,525
Others - available for sale 19.2 41,981,341 32,858,257
60,166,443 50,077,782

107
ANNUALREPORT 2017
(Rupees in thousand) Note 2017 2016
19.1 Related parties - at cost
Subsidiaries - unquoted DIC Pakistan Limited, Pakistan
3,377,248 (2016: 3,377,248) fully paid ordinary shares of Rs. 10 each
Equity held 54.98% (2016: 54.98%) 15,010 15,010
Packages Construction (Private) Limited, Pakistan
302,500,000 (2016: 302,500,000) fully paid ordinary shares of Rs. 10 each
Equity held 75.16% (2016: 75.16%) 3,019,090 3,019,090
Packages Lanka (Private) Limited, Sri Lanka
44,698,120 (2016: 44,698,120) shares of SL Rupees 10 each
Equity held 79.07% (2016: 79.07%) 442,938 442,938
Anemone Holdings Limited, Mauritius
1,534,055 (2016: 351,088) shares of USD 1 each
Equity held 100.00% (2016: 100.00%) 19.1.1 161,623 36,675
Packages Power (Private) Limited, Pakistan
2,500,000 (2016: 2,500,000) fully paid ordinary shares of Rs. 10 each
Equity held 100.00% (2016: 100.00%) 25,000 25,000
Bulleh Shah Packaging (Private) Limited, Pakistan
1,091,873,871 (2016: Nil) fully paid ordinary shares of Rs. 10 each
Equity held 100.00% (2016: Nil) 19.1.2 10,807,230 –
14,470,891 3,538,713
Joint ventures - unquoted Bulleh Shah Packaging (Private) Limited, Pakistan
Nil (2016: 709,718,013) fully paid ordinary shares of Rs. 10 each
Equity held Nil (2016: 65.00%) 19.1.2 – 9,973,652
OmyaPack (Private) Limited, Pakistan
31,000,000 (2016: 31,000,000) fully paid ordinary shares of Rs. 10 each
Equity held 50.00% (2016: 50.00%) 310,000 310,000
310,000 10,283,652
Associates - quoted IGI Holdings Limited, Pakistan
[Formerly IGI Insurance Limited]
13,072,211 (2016: 13,022,093) fully paid ordinary shares of Rs. 10 each
Equity held 10.46% (2016: 10.61%)
Market value - Rs. 3,828.720 million (2016: Rs. 4,009.372 million) 19.1.3 896,311 878,378
Tri-Pack Films Limited, Pakistan
12,933,333 (2016: 12,933,333) fully paid ordinary shares of Rs. 10 each
Equity held 33.33% (2016: 33.33%)
Market value - Rs. 1,808.985 million (2016: Rs. 3,797.744 million) 2,507,900 2,507,900
IGI Investment Bank Limited, Pakistan Nil (2016: 4,610,915) fully paid ordinary shares of Rs. 10 each
Equity held Nil (2016: 2.17%)
Market value - Nil (2016: Rs. 15.032 million) 19.1.3 – 10,882
3,404,211 3,397,160
18,185,102 17,219,525

108
19.1.1 During the year, the Company contributed USD 1.183 million (equivalent to PKR 124.948 million) (2016: Nil) as equity in AHL by remitting the loan payment due by AHL to HBL Bahrain under the finance facility agreement as referred to in note 15.1.
19.1.2 The BOD, at their meeting held on July 26, 2017, resolved to purchase the remaining 35% shareholding held by Stora Enso South Asia
Holdings AB (‘Stora Enso’) in BSPPL. The transaction was approved by the shareholders through a special resolution at the Extraordinary General Meeting of the Company dated August 28, 2017. Accordingly, consequent to execution of share purchase agreement with Stora Enso, BSPPL became a fully owned subsidiary of the Company on September 18, 2017.
19.1.3 The Company’s investment in IGIHL is less than 20% but it is considered to be an associate as per the requirement of IAS 28 ‘Investments
in Associates’ because the Company has significant influence over the financial and operating policies through representation on the board of directors of the company.
During the prior year, the boards of directors of IGIHL and IGI Investment Bank Limited (‘IGIBL’) approved Scheme of Amalgamation
(‘Amalgamation Scheme’) under Sections 284 to 288 of the repealed Ordinance for the amalgamation of the entire undertaking, assets, entitlements and liabilities of IGIBL with and into IGIHL. In addition, the boards of directors of IGIHL and its wholly owned subsidiaries i.e. IGI General Insurance Limited and IGI Investments (Private) Limited have also approved Scheme of Arrangement (‘Arrangement Scheme’) under Sections 284 to 288 of the repealed Ordinance for the demerger of the insurance division and certain investments along with corresponding liabilities, if any, held by IGIHL into its two wholly-owned subsidiaries, IGI General Insurance Limited and IGI Investments (Private) Limited respectively, subsequent to the merger under Amalgamation Scheme.
Both Amalgamation Scheme and Arrangement Scheme were filed by these entities with Honorable Sindh High Court (the ‘Court’) in
January 2017. The Court, through its order dated December 16, 2017, has sanctioned the Amalgamation Scheme and Arrangement Scheme. In terms of the Scheme, shares of IGIBL have been cancelled in lieu of issuance and allotment of fully paid up shares of IGIHL on the basis of swap ratio of 1:92 (i.e. one share of IGIHL for every ninety-two shares of IGIBL cancelled) to the shareholders of IGIBL. Consequently, 50,118 shares have been issued to the Company after the reporting date. The gain on exchange of shares computed as the difference between the market value of new shares of IGHL and the cost of shares of IGIBL in the books of the Company amounting to Rs. 7.050 million has been recognised in profit and loss account.
(Rupees in thousand) Note 2017 2016
19.2 Others - available for sale Quoted
Nestle Pakistan Limited 3,649,248 (2016: 3,649,248) fully paid ordinary shares of Rs. 10 each Equity held 8.05% (2016: 8.05%) 19.2.1 41,966,316 32,843,232 Cost - Rs. 5,778.896 million (2016: Rs. 5,778.896 million) & 19.2.2 Unquoted 19.2.3
Tetra Pak Pakistan Limited 1,000,000 (2016: 1,000,000) fully paid non-voting 19.2.1 ordinary shares of Rs. 10 each & 19.2.4 10,000 10,000
Coca-Cola Beverages Pakistan Limited 500,000 (2016: 500,000) fully paid ordinary shares of Rs. 10 each Equity held 0.14% (2016: 0.14%) 5,000 5,000
Pakistan Tourism Development Corporation Limited 2,500 (2016: 2,500) fully paid ordinary shares of Rs. 10 each 25 25
Orient Match Company (Private) Limited 1,900 (2016: 1,900) fully paid ordinary shares of Rs. 100 each – –
15,025 15,025
41,981,341 32,858,257

109
ANNUALREPORT 2017
19.2.1 Nestle Pakistan Limited and Tetra Pak Pakistan Limited are associated undertakings of the Company as per the Companies Act, 2017.
However, for the purpose of measurement, investments in others have been classified as available for sale as referred to in note 4.7.
19.2.2 As of December 31, 2017, an aggregate of 775,000 (2016: 775,000) shares of Nestle Pakistan Limited having market value
Rs. 8,912.492 million (2016: 6,975.000 million) have been pledged in favor of HBL Pakistan. Out of aggregate shares pledged, 410,000
(2016: 410,000) shares are pledged against issuance of standby letter of credit in favor of HBL Bahrain as referred to in note 15.1 and
the remaining 365,000 shares (2016: 365,000) are pledged against the term finance loan from HBL as referred to in note 6.1.2.
19.2.3 Unquoted investments are measured at cost less any identified impairment loss as it is not possible to apply any other valuation
methodology.
19.2.4 These non-voting ordinary shares of Tetra Pak Pakistan Limited entitle the Company to receipt of dividend for a period of ten years starting
from 2009 and ending in 2018, both years inclusive. These shares do not entitle the Company to any voting or other rights.
(Rupees in thousand) Note 2017 2016
19.3 Cumulative fair value gain on available- for-sale financial assets
Balance as at beginning of the year 28,858,325 24,479,228
Changes in fair value of available-for-sale financial assets 9,123,085 4,379,097
Balance as at end of the year 37,981,410 28,858,325
20. Long term loans and deposits
Considered good
Loans to employees 20.1 4,380 2,860
Loan to Sui Northern Gas Pipelines Limited (‘SNGPL’) 20.2 – 16,400
Security deposits 14,884 24,109
19,264 43,369
Current portion of long term loans and deposits
Loans to employees 24 (1,060) (1,011)
Loan to SNGPL 24 – (16,400)
(1,060) (17,411)
18,204 25,958
20.1 These represent interest free loans to employees for purchase of motor cycles and cycles and are repayable in monthly installments over
a period of 60 to 260 months.
Loans to employees aggregating Rs. 3.977 million (2016: Rs. 2.394 million) are secured by joint registration of motor cycles in the name
of employees and the Company. The remaining loans are unsecured.
20.2 This represented an unsecured loan given to SNGPL for the development of the infrastructure for the supply of natural gas to BSPPL, the
subsidiary. Mark up was charged at the rate of 1.5% per annum and was received annually. The loan amount has been fully received
during the current year.

110
(Rupees in thousand) Note 2017 2016
21. Stores and spares
Stores [including in transit Rs. 6.796 million (2016: Rs. 7.706 million)] 225,458 235,099
Spares [including in transit Rs. 2.566 million (2016: Rs. 7.434 million)] 203,463 167,047
21.1 428,921 402,146
Provision for obsolete / slow moving stores and spares 21.2 (6,703) –
422,218 402,146
21.1 Stores and spares include items which may result in fixed capital expenditure but are not distinguishable.
(Rupees in thousand) Note 2017 2016
21.2 The movement in provision for obsolete / slow moving
stores and spares during the year is as follows:
Balance as at January 1 – –
Provision for the year 27 6,703 –
Balance as at December 31 6,703 –
22. Stock-in-trade
Raw materials [including in transit Rs. 156.506 million
(2016: Rs. 247.656 million)] 1,214,331 996,150
Work-in-process 218,569 219,626
Finished goods 552,232 569,898
22.1 1,985,132 1,785,674
Provision for obsolete / slow moving stock-in-trade 22.2 (30,464) (16,968)
1,954,668 1,768,706
22.1 Finished goods costing Rs. 46.277 million (2016: Rs. 62.334 million) are being valued at net realisable value of Rs. 38.524 million (2016:
Rs. 48.668 million).
(Rupees in thousand) Note 2017 2016
22.2 The movement in provision for obsolete / slow moving
stock-in-trade during the year is as follows:
Balance as at January 1 16,968 2,813
Provision for the year 27 13,496 14,155
Balance as at December 31 30,464 16,968
23. Trade debts
Considered good
Related parties - unsecured 23.1 22,254 35,447
Others 23.2 2,369,961 2,136,519
2,392,215 2,171,966
Considered doubtful 8,998 15,635
2,401,213 2,187,601
Provision for doubtful debts 23.3 (8,998) (15,635)
2,392,215 2,171,966

111
ANNUALREPORT 2017
(Rupees in thousand) 2017 2016
23.1 Related parties - unsecured
Subsidiaries
DIC Pakistan Limited 2,206 6,477
Packages Construction (Private) Limited 1,150 3,795
Bulleh Shah Packaging (Private) Limited 13,892 –
Chantler Packages Inc. 1,023 –
Joint ventures
OmyaPack (Private) Limited 234 –
Bulleh Shah Packaging (Private) Limited – 22,445
Associate
Tri-Pack Films Limited 3,749 2,730
22,254 35,447
23.2 Others include trade debts of Rs. 565.729 million (2016: Rs. 220.387 million) which are secured by way of inland letters of credit.
(Rupees in thousand) Note 2017 2016
23.3 The movement in provision for doubtful debts during the year is as follows:
Balance as at January 1 15,635 25,037
Reversal during the year 31 (4,232) (4,248)
Bad debts written off (2,405) (5,154)
Balance as at December 31 8,998 15,635
24. Loans, advances, deposits, prepayments and other receivables
Current portion of loans to employees 20 1,060 1,011
Current portion of loan receivable from SNGPL - considered good 20 – 16,400
Advances - considered good
To employees 24.1 8,025 11,731
To suppliers 24.2 17,166 11,326
25,191 23,057
Due from related parties - unsecured 24.3 128,222 532,334
Trade deposits - considered good 45,500 45,081
Prepayments 24.4 47,898 36,486
Balances with statutory authorities
Customs duty 16,109 20,591
Sales tax recoverable 128,216 97,879
Sales tax refundable 24.5 292,214 292,214
436,539 410,684
Mark up receivable on loan to SNGPL – 13
Other receivables 44,458 16,556
728,868 1,081,622
24.1 Included in advances to employees are amounts due from executives of Rs. 2.770 million (2016: Rs. 1.428 million).

112
(Rupees in thousand) Note 2017 2016
24.2 Advances to suppliers
Considered good 17,166 11,326
Considered doubtful 1,000 1,000
18,166 12,326
Provision for doubtful advances 24.2.1 (1,000) (1,000)
17,166 11,326
24.2.1 The movement in provision for doubtful advances during the year is as follows:
Balance as at January 1 1,000 1,000
Provision during the year – –
Balance as at December 31 1,000 1,000
24.3 Due from related parties - unsecured
Subsidiaries
DIC Pakistan Limited 22,420 17,189
Packages Lanka (Private) Limited 6,353 6,090
Packages Construction (Private) Limited 29,600 16,734
Flexible Packages Convertors (Proprietary) Limited 14,225 9,122
Packages Power (Private) Limited – 1,528
Bulleh Shah Packaging (Private) Limited 41,766 –
Joint ventures
OmyaPack (Private) Limited 3,480 108
Bulleh Shah Packaging (Private) Limited – 469,760
Associates
Tri-Pack Films Limited 2,205 2,335
IGI Holdings Limited (formerly IGI Insurance Limited) 3,990 6,421
IGI Finex Securities Limited 81 47
IGI Life Insurance Limited 4,102 3,000
128,222 532,334
These are in the normal course of business and are interest free.
24.4 Prepayments include Rs. 15.389 million (2016: Rs. 10.155 million) made to IGI Life Insurance Limited, a related party.
24.5 The Deputy Commissioner Inland Revenue (‘DCIR’) in his order dated June 24, 2015 alleged that the Company has incorrectly adjusted
input sales tax credit amounting to Rs. 146.107 million on purchases of raw materials from certain suppliers who were subsequently
“blacklisted / suspended” and disallowed the same along with levy of default surcharge and penalty. During last year, the Taxation
Authorities adjusted an amount of Rs. 292.214 million from income tax refunds of the Company against the said sales tax order.
The Appellate Tribunal of Inland Revenue (‘ATIR’) through order dated August 28, 2017 has decided the case in favor of the Company. The
Company has already filed an application before the respective authorities to give effect to the order.

113
ANNUALREPORT 2017
(Rupees in thousand) Note 2017 2016
25. Income tax receivable
Income tax refundable 2,663,874 2,089,852
Income tax recoverable 25.1 36,013 36,013
2,699,887 2,125,865
25.1 In 1987, the then Income Tax Officer (‘ITO’) re-opened the Company’s assessments for the accounting years ended December 31, 1983
and 1984 disallowing primarily tax credit given to the Company under section 107 of the Income Tax Ordinance, 1979. The tax credit
amounting to Rs. 36.013 million on its capital expenditure for these years was refused on the grounds that such expenditure represented
an extension of the Company’s undertaking which did not qualify for tax credit under this section in view of the Company’s location. The
assessments for these years were revised by the ITO on these grounds and taxes reassessed were adjusted against certain sales tax
refunds and the tax credits previously determined by the ITO and set off against the assessments framed for these years.
The Company had filed an appeal against the revised orders of the ITO before the then Commissioner of Income Tax (Appeals) [‘CIT(A)’],
Karachi. CIT(A) in his order issued in 1988, held the assessments reframed by the ITO for the years 1983 and 1984 presently to be
void and of no legal effect. The ITO has filed an appeal against the CIT(A)’s order with the then Income Tax Appellate Tribunal (‘ITAT’). The
ITAT has in its order issued in 1996 maintained the order of CIT(A). The assessing officer after the receipt of the appellate order passed
by CIT(A), had issued notices under section 65 of the Income Tax Ordinance, 1979 and the Company had filed a writ petition against the
aforesaid notices with the High Court of Sindh, the outcome of which is still pending.
The amount recoverable of Rs. 36.013 million represents the additional taxes paid as a result of the disallowance of the tax credits on
reframing of the assessments. The Company has not made any provision against the above order as the management is confident that
the ultimate outcome of the writ petition would be in favour of the Company, inter alia on the basis of the advice of the tax consultant and
the relevant law and the facts.
25.2 In respect of tax year 2014, the department has, against taxable loss of Rs. 706.039 million as per return filed by the Company, assessed
a taxable income of Rs. 2,614.710 million and amended the deemed order for the year raising a tax demand of Rs. 606.328 million. In
this order, among other issues, the income tax department has not accepted the Company’s contention for non-taxation of the transfer of
paper and paperboard and corrugated business segments to Bulleh Shah Packaging (Private) Limited under section 97 of the Income Tax
Ordinance, 2001. Such transfer has been taxed as capital gain on the value of assets transferred. The matter is currently being contested
before the Commissioner Inland Revenue (Appeals) [‘CIR(A)’].
Further, certain other disallowances interalia including on account of allocation of various expenses towards dividend and other incomes,
effectively reducing the available tax losses by approximately Rs. 1,200 million, have also been made by the department in respect of
previous tax years, through orders framed during the year.
The Company is contesting the above orders before CIR(A) and has not made any provision against the above demand or disallowances
as the management is confident that the ultimate outcome of the appeals would be in favor of the Company, inter alia on the basis of the
advice of the tax consultant and the relevant law and the facts.
25.3 In respect of tax year 2016, the department has, against taxable income of Rs. 1,157.926 million as per return filed by the Company,
assessed a taxable income of Rs. 2,437.836 million and amended the deemed order for the year raising a tax demand of Rs. 464.187
million. The Company being aggrieved of the said order filed the appeal before CIR(A). CIR(A), through order dated December 11, 2017,
has accepted all the contentions of the Company except the allowability of provision for workers’ profit participation fund on payment
rather than accrual basis thereby reducing the tax refundable claimed by the Company from Rs. 331.817 million to Rs. 328.320 million.
The Company is in the process of filing appeal before Appellate Tribunal against the CIR(A)’s disallowance and has not made any provision
against the above disallowance as the management is confident that the ultimate outcome of the appeal would be in favor of the Company,
inter alia on the basis of the advice of the tax consultant and the relevant law and the facts.

114
(Rupees in thousand) Note 2017 2016
26. Cash and bank balances
At banks:
On saving accounts 26.1 82,056 7,638
On current accounts 26.2 95,672 79,195
177,728 86,833
In hand [including USD 8,684 (2016: USD 1,412)
and Nil (2016: EUR 500)] 4,479 3,779
182,207 90,612
26.1 The balances in saving accounts bear mark up which ranges from 3.75% to 4.00% (2016: 3.75% to 5.75%) per annum.
26.2 Included in these are total restricted funds of Rs. 1.332 million (2016: Rs. 1.332 million) held as payable to TFC holders.
(Rupees in thousand) Note 2017 2016
27. Cost of sales
Materials consumed 10,226,365 9,299,156
Salaries, wages and amenities 27.1 & 27.2 1,385,379 1,337,069
Travelling and conveyance 27,895 29,739
Fuel and power 681,020 556,119
Production supplies consumed 384,994 469,634
Rent, rates and taxes 27.3 & 28.4 73,494 32,433
Insurance 39,053 37,286
Provision for obsolete / slow moving stores and spares 21.2 6,703 –
Provision for obsolete / slow moving stock-in-trade 22.2 13,496 14,155
Repairs and maintenance 315,505 345,496
Packing expenses 310,467 312,072
Depreciation on owned assets 16.1.4 616,076 564,242
Depreciation on assets subject to finance lease 16.2.1 817 565
Amortisation of intangible assets 18.1 5,411 9,768
Technical fees and royalty 31,661 30,047
Other expenses 224,445 218,205
14,342,781 13,255,986
Opening work-in-process 219,626 210,945
Closing work-in-process (218,569) (219,626)
Cost of goods manufactured 27.4 14,343,838 13,247,305
Opening stock of finished goods 564,573 538,591
14,908,411 13,785,896
Closing stock of finished goods (538,888) (564,573)
14,369,523 13,221,323

115
ANNUALREPORT 2017
(Rupees in thousand) 2017 2016
27.1 Salaries, wages and amenities include following in respect of retirement benefits:
Defined benefit plan
Gratuity fund 21,362 15,165
Defined contribution plans
Provident fund 22,634 19,626
Pension fund 29,207 27,342
Other benefit plan
Accumulating compensated absences 25,014 78,026
98,217 140,159
27.2 Salaries, wages and amenities include Rs. 310.090 million (2016: Rs. 315.487 million) in respect of labour contractors for services
rendered during the year.
27.3 Rent, rates and taxes include operating lease rentals amounting to Rs. 30.573 million (2016: Rs. 28.221 million).
27.4 Cost of goods manufactured includes Rs. 1,792.496 million (2016: Rs. 1,751.024 million) for stores and spares consumed and
Rs. 11.831 million (2016: Rs. 23.128 million), Rs. 1.220 million (2016: Rs. 1.017 million) and Rs. 0.851 million (2016: Rs. 4.267 million)
for raw materials, stores and spares and finished goods directly written off respectively.
(Rupees in thousand) Note 2017 2016
28. Administrative expenses
Salaries, wages and amenities 28.1& 28.2 587,924 563,948
Travelling and conveyance 24,645 26,466
Rent, rates and taxes 28.3 & 28.4 86,925 53,210
Insurance 17,054 15,263
Printing, stationery and periodicals 18,559 17,540
Postage, telephone and telex 16,581 16,095
Motor vehicles running 10,228 7,407
Computer charges 24,911 19,120
Professional services 28.5 60,259 54,332
Repairs and maintenance 23,998 18,266
Depreciation on owned assets 16.1.4 34,131 26,422
Depreciation on assets subject to finance lease 16.2.1 4,684 4,621
Amortisation of intangible assets 18.1 793 6,058
Depreciation on investment properties 17.1 5,555 5,811
Other expenses 93,651 62,833
1,009,898 897,392

116
(Rupees in thousand) 2017 2016
28.1 Salaries, wages and amenities include following in respect of retirement benefits:
Defined benefit plans
Gratuity fund 9,067 6,323
Pension fund 1,199 2,227
Defined contribution plans
Provident fund 9,605 8,504
Pension fund 12,395 11,848
Other benefit plan
Accumulating compensated absences 11,439 33,810
43,705 62,712
28.2 Salaries, wages and amenities include Rs. 63.492 million (2016: Rs. 50.945 million) in respect of labour contractors for services rendered
during the year.
28.3 Rent, rates and taxes include operating lease rentals amounting to Rs. 48.940 million (2016: Rs. 42.308 million).
28.4 In June 2017, Walton Cantonment Board concluded its assessment for property tax payable by the Company relating to June 2014 to
June 2017 resulting in a demand of Rs. 47.910 million which has been charged in the current year. Out of the total amount Rs. 39.983
million has been charged to administrative expenses and Rs. 7.927 million has been charged to cost of sales.
(Rupees in thousand) 2017 2016
28.5 Professional services
The charges for professional services include the following
in respect of auditors’ services for:
Statutory audit 3,132 2,900
Half yearly review 968 880
Tax services 8,910 10,500
Workers’ profit participation fund audit, management staff pension
and gratuity fund audit, audit of consolidated financial statements
and other certification charges 4,574 3,000
Out of pocket expenses 871 650
18,455 17,930
28.6 Administrative expenses include Rs. 50.235 million (2016: Rs. 88.618 million) in respect of stores and spares consumed.

117
ANNUALREPORT 2017
(Rupees in thousand) Note 2017 2016
29. Distribution and marketing costs
Salaries, wages and amenities 29.1 & 29.2 358,072 308,372
Travelling and conveyance 41,623 32,052
Rent, rates and taxes 29.3 8,430 9,708
Freight and distribution 200,231 149,466
Insurance 32,631 30,815
Advertisement and sales promotion 421,924 356,884
Depreciation on owned assets 16.1.4 13,009 10,569
Bad debts written off 18,764 –
Other expenses 34,754 23,684
1,129,438 921,550
29.1 Salaries, wages and amenities include following in respect of retirement benefits:
Defined benefit plan
Gratuity fund 5,522 3,418
Defined contribution plans
Provident fund 5,850 4,434
Pension fund 7,549 6,178
Other benefit plan
Accumulating compensated absences 5,327 17,630
24,248 31,660
29.2 Salaries, wages and amenities include Rs. 46.394 million (2016: Rs. 45.553 million) in respect of labour contractors for services rendered
during the year.
29.3 Rent, rates and taxes represent operating lease rentals.
29.4 Distribution and marketing costs include Rs. 3.618 million (2016: Rs. 22.997 million) in respect of stores and spares consumed.
(Rupees in thousand) Note 2017 2016
30. Other operating expenses
Workers’ profit participation fund 13.5 377,540 358,855
Workers’ welfare fund 13.6 & 30.1 17,065 7,351
Exchange loss - net 36,163 226
Donations 30.2 65,011 25,930
495,779 392,362
30.1 As explained in note 4.1, the Company has opted for group taxation during the current year. Consequently, the workers’ welfare fund
expense is based on the Company’s share of the consolidated results of the Group.

118
30.2 The Company made a donation of Rs. 64.856 million (2016: Rs. 25.610 million) to its related party, Packages Foundation. Following is
the interest of the Directors of the Company in the donee during the year:
Name of donee Directors of the Company Interest in donee
Packages Foundation Syed Hyder Ali Trustee
Shamim Ahmad Khan Trustee
Syed Aslam Mehdi Trustee
No other Directors or their spouses had any interest in any of the donees during the year.
(Rupees in thousand) Note 2017 2016
31. Other income
Income from financial assets
Income on bank deposits 2,879 10,254
Capital gain on disposal of Government securities 3,177 –
Gain on exchange of shares in associates 19.1.3 7,050 –
Interest on loan to SNGPL 278 471
Reversal of provision for doubtful debts 23.3 4,232 4,248
17,616 14,973
Income from non-financial assets
Rental income from investment properties [including Rs. 110.129 million
million (2016: Rs. 80.598 million) from related parties] 114,637 85,137
Profit on disposal of owned assets 14,315 55,173
128,952 140,310
Others
Management and technical fee from related parties 44,131 36,179
Insurance commission from related party 4,958 5,501
Liabilities no longer payable written back 7,488 23,174
Reversal of provision for workers’ welfare fund 13.6 7,351 150,606
Others [including Rs. 15.683 million (2016: Rs. 16.271 million)
from related parties] 16,631 19,555
80,559 235,015
227,127 390,298
32. Finance costs
Interest and mark up including commitment charges on:
Long term finances - secured 193,571 183,419
Finances under mark up arrangements - secured 71,671 35,716
Liabilities against assets subject to finance lease 1,057 1,161
Return on preference shares / convertible stock 155,550 136,553
Premium on redemption of preference shares / convertible stock – 909,582
Loan handling charges – 16,654
Commission on bank guarantees 21,067 21,424
Bank charges 2,579 2,996
445,495 1,307,505

119
ANNUALREPORT 2017
(Rupees in thousand) Note 2017 2016
33. Investment income
Dividend income from related parties 33.1 301,784 417,014 Dividend income from others 5,972,121 6,054,991
6,273,905 6,472,005 33.1 Dividend income from related parties
Subsidiaries
DIC Pakistan Limited 57,413 217,832 Packages Lanka (Private) Limited 115,038 97,094 Associates
IGI Holdings Limited [Formerly IGI Insurance Limited] – 52,088 Tri-Pack Films Limited 129,333 50,000
301,784 417,014 34. Taxation
Current
Current year 656,102 882,245 Prior years 207,668 374,252
863,770 1,256,497 Deferred 8.2 76,133 109,265
34.1 939,903 1,365,762
34.1 As explained in note 4.1, the Company’s provision for tax (current and deferred) is based on the consolidated results of the Group which represents tax under ‘final tax regime’ and minimum tax on turnover under section 113 of the Income Tax Ordinance, 2001 net of investment tax credit available to the Group by virtue of investment in plant and machinery in accordance with Section 65B of the Income Tax Ordinance, 2001. The Group taxation has resulted in a reduction of Rs. 383.717 million (2016: Nil) in the tax expense of the Company for the year.
34.2 Through the Finance Act, 2017, an amendment has been made to section 5A of the Income Tax Ordinance, 2001 whereby ‘tax on undistributed reserves’ has been substituted by ‘tax on undistributed profits’. As per the amended provision, income tax at the rate of 7.5% of accounting profit before tax for tax year 2017 and onwards is applicable where the Company does not distribute at least 40% of its after tax profits, whether in the form of cash or bonus shares, within nine months of the end of tax year 2017, i.e. September 30, 2017, and within six months of the end of tax year 2018 and onwards. Liability in respect of such income tax, if any, is recognised when the prescribed time period for distribution expires. The Company has already distributed 40% of its after tax profits for the tax year 2017.
(Percentage) 2017 2016
34.3 Tax charge reconciliation
Numerical reconciliation between the average effective tax rate and the applicable tax rate Applicable tax rate 30.00 31.00 Tax effect of: Amounts that are not deductible for tax purposes 0.58 0.36 Amounts that are exempt for tax purposes (0.22) (0.83) Amounts that are chargeable to tax at different rates (14.52) (17.32) Group taxation as explained in note 4.1 (5.36) – Change in prior years’ tax 2.79 5.38 Deferred tax asset not recognised on minimum tax available for carry forward 0.90 2.24 Tax credits utilised (1.04) (1.21)
(16.87) (11.38)
Average effective tax rate charged to profit and loss account 13.13 19.62

120
35. As referred to in note 6.2, in addition to the preferred right of return at the rate of 10 percent per annum, either in cash or ordinary shares
on a non-cumulative basis till the date of settlement of preference shares / convertible stock, the preference shareholders also have the
right to share the excess amount with the ordinary shareholders on an as-converted basis in case the amount of dividend per share paid
to an ordinary shareholder exceeds that paid to a preference shareholder. Since ordinary dividend of Rs. 25.00 per share was approved
for the year ended December 31, 2016, which exceeded the preferred return for that year, the additional preference dividend to be paid
to the preference shareholders has been distributed to the preference shareholders as participating dividend and charged directly to the
equity.
36. Remuneration of Chief Executive, Directors and Executives
36.1 The aggregate amount charged in the financial statements for the year for remuneration, including certain benefits, to the Chief Executive, Executive
Directors and Executives of the Company are as follows:
Chief Executive Executive Directors Executives
(Rupees in thousand) 2017 2016 2017 2016 2017 2016
Short term employee benefits
Managerial remuneration 27,221 22,668 9,800 6,953 215,629 175,749
Housing 12,482 9,453 3,780 2,589 90,706 73,498
Utilities 3,079 2,101 844 595 30,168 23,866
Bonus 24,479 21,972 8,253 6,845 112,086 109,377
Leave passage 4,817 8,456 717 962 5,327 4,017
Medical expenses 4,181 5,295 44 61 4,469 3,418
76,259 69,945 23,438 18,005 458,385 389,925
Post employment benefits
Contribution to provident,
gratuity and pension funds 8,867 7,404 2,957 2,026 39,655 33,551
85,126 77,349 26,395 20,031 498,040 423,476
Number of persons 1 1 2 2 125 102
The Company also provides the Chief Executive, Executive Directors and certain Executives with Company maintained cars, free transport
and utilities.
36.2. Premium charged in the financial statements in respect of directors’ indemnity insurance policy, purchased by the Company during the
year, amounted to Rs. 0.753 million (2016: Rs. 0.753 million).
36.3 Remuneration to Non-Executive Directors
Aggregate amount charged in the financial statements for the year for fee to 5 directors (2016: 5 directors) is Rs. 4.550 million
(2016: Rs. 4.425 million).

121
ANNUALREPORT 2017
37. Transactions with related parties
The related parties comprise of subsidiaries, joint ventures, associates, directors, key management personnel and staff retirement plans.
The Company in the normal course of business carries out transactions with various related parties. Amounts due from and to related
parties are shown under receivables and payables, amounts due from directors and key management personnel are shown under
receivables and remuneration of directors is disclosed in note 36. Other significant transactions and balances with related parties are
disclosed elsewhere, except for the following:
Relationship with the Nature of transactions 2017 2016 Company (Rupees in thousand)
i. Subsidiaries Purchase of goods and services 2,307,435 1,055,816
Sale of goods and services 136,062 121,214
Sale of operating fixed assets 2,403 1,339
Dividend income 172,451 314,926
Rental and other income 60,214 25,448
Management and technical fee received 44,131 36,179
ii. Joint ventures Purchase of goods and services 1,861,762 2,272,575
Sale of goods and services 49,577 84,208
Purchase of property, plant and equipment – 1,244
Sale of owned assets 1,144 9,781
Rental and other income 48,065 65,589
iii. Associates Purchase of goods and services 1,139,171 1,025,714
Sale of goods and services 19,287 3,563
Purchase of property, plant and equipment – 615
Insurance premium paid 161,056 155,064
Commission earned 4,958 5,501
Insurance claims received 26,167 333
Rental and other income 14,582 5,833
Dividend income 129,333 102,088
Dividend paid 607,740 322,832
iv. Retirement obligations Expense charged in respect of retirement plans 124,388 105,065
Dividend paid 70,811 42,486
v. Key management personnel Salaries and other employee benefits 168,378 133,261
Dividend paid 57,182 34,309
All transactions with related parties have been carried out on mutually agreed terms and conditions.
38. Capacity and production - tons
Capacity Actual production 2017 2016 2017 2016
Paper and paperboard produced 41,400 41,400 13,861 14,353
Paper and paperboard converted 52,855 50,800 41,851 36,890
Plastics all sorts converted 24,500 24,500 20,143 20,995
The variance of actual production from capacity is primarily on account of production planned as per market demand.

122
2017 2016
39. Number of employees
Total number of employees as at December 31 1,510 1,497
Average number of employees during the year 1,504 1,490
40. Rates of exchange
Liabilities in foreign currencies have been translated into Pak Rupees at USD 0.9050 (2016: USD 0.9542), Euro 0.7588 (2016: Euro
0.9065), CHF 0.8857 (2016: CHF 0.9741), GBP 0.7768 (2016: GBP 0.7768), equal to Rs. 100. Assets in foreign currencies have been
translated into Pak Rupees at USD 0.9066 (2016: USD 0.9560) equal to Rs. 100.
(Rupees in thousand) Note 2017 2016
41. Cash generated from operations
Profit before tax 7,156,201 6,961,491
Adjustments for non-cash items:
Depreciation on owned assets 16.1.4 663,216 601,233
Depreciation on assets subject to finance lease 16.2.1 5,501 5,186
Depreciation on investment properties 17 5,555 5,811
Capital gain on disposal of Government securities 31 (3,177) –
Gain on exchange of shares in associates 31 (7,050) –
Liabilities no longer payable written back 31 (7,488) (23,174)
Amortisation on intangible assets 18 6,204 15,826
Provision for accumulating compensated absences 10 41,780 129,466
Provision for retirement benefits 9 37,150 27,133
Exchange loss - net 30 36,163 226
Reversal of provision for doubtful debts 31 (4,232) (4,248)
Provision for obsolete / slow moving stock-in-trade 27 13,496 14,155
Provision for obsolete / slow moving stores and spares 27 6,703 –
Capital work-in-progress charged to profit and loss account 16.3 9,443 5,952
Profit on disposal of owned assets 31 (14,315) (55,173)
Reversal of provision for workers’ welfare fund 31 (7,351) (150,606)
Finance costs 32 445,495 1,307,505
Dividend income 33 (6,273,905) (6,472,005)
Profit before working capital changes 2,109,389 2,368,778
Effect on cash flow due to working capital changes:
(Increase) / decrease in stores and spares (26,775) 24,186
(Increase) / decrease in stock-in-trade (199,458) 11,471
Increase in trade debts (216,017) (447,109)
(Increase) / decrease in loans, advances, deposits, prepayments
and other receivables (54,049) 604,518
Increase / (decrease) in trade and other payables 636,548 (261,399)
140,249 (45,385)
2,249,638 2,323,393
42. Cash and cash equivalents
Cash and bank balances 26 182,207 90,612
Finances under mark up arrangements - secured 12 (299,596) (1,377,033)
(117,389) (1,286,421)

123
ANNUALREPORT 2017
2017 2016
43. Earnings per share
43.1 Basic earnings per share
Profit for the year Rupees in thousand 6,216,298 5,595,729
Participating dividend on preference shares Rupees in thousand (45,000) –
Rupees in thousand 6,171,298 5,595,729
Weighted average number of ordinary shares Numbers 89,379,504 89,379,504
Basic EPS Rupees 69.05 62.61
43.2 Diluted earnings per share
Profit for the year Rupees in thousand 6,216,298 5,595,729
Return on preference shares /
convertible stock - net of tax Rupees in thousand 127,314 107,332
6,343,612 5,703,061
Weighted average number of ordinary shares Numbers 89,379,504 89,379,504
Weighted average number of notionally
converted preference shares / convertible stock Numbers 8,186,842 8,186,842
97,566,346 97,566,346
Diluted EPS Rupees 65.02 58.45
44. Financial risk management
44.1 Financial risk factors
The Company’s activities expose it to a variety of financial risks: market risk (including currency risk, fair value interest rate risk, cash flow interest rate risk and price risk), credit risk and liquidity risk. The Company’s overall risk management programme focuses on the unpredictability of financial markets and seeks to minimise potential adverse effects on the Company’s financial performance. The Company uses derivative financial instruments to hedge certain risk exposures.
Risk management is carried out by the Company’s finance department under policies approved by the BOD. The Company’s finance
department evaluates and hedges financial risks. The BOD provides written principles for overall risk management, as well as written policies covering specific areas, such as foreign exchange risk, interest rate risk, credit risk, use of derivative financial instruments and non-derivative financial instruments, and investment of excess liquidity.
The Company’s overall risk management procedures to minimize the potential adverse effects of financial market on the Company’s
performance are as follows: (a) Market risk
(i) Foreign exchange risk
Foreign exchange risk is the risk that the fair value of future cash flows of a financial instrument shall fluctuate because of changes in foreign exchange rates.
The Company operates internationally and is exposed to foreign exchange risk arising from various currency exposures, primarily with
respect to the USD and the Euro. Foreign exchange risk arises from future commercial transactions and recognised assets and liabilities. Foreign exchange risk arises when future commercial transactions or recognised assets or liabilities or net investments in foreign operations that are denominated in a currency that is not the Company’s functional currency.
At December 31, 2017, if the Pak Rupee had strengthened / weakened by 10% against the USD with all other variables held constant,
post-tax profit for the year would have been Rs. 36.140 million higher / lower (2016: Rs. 29.030 million higher / lower), mainly as a result
of foreign exchange gains / losses on translation of US dollar-denominated financial assets and liabilities.

124
At December 31, 2017, if the Pak Rupee had strengthened / weakened by 10% against the Euro with all other variables held constant,
post-tax profit for the year would have been Rs. 13.165 million higher / lower (2016: Rs. 32.930 million higher / lower), mainly as a result
of foreign exchange gains / losses on translation of Euro-denominated financial assets and liabilities.
(ii) Price risk
Price risk represents the risk that the fair value or future cash flows of a financial instrument will fluctuate because of changes in market
prices (other than those arising from interest rate risk or currency risk), whether those changes are caused by factors specific to the
individual financial instrument or its issuer, or factors affecting all similar financial instruments traded in the market. The Company is
exposed to equity securities price risk because of investments held by the Company and classified as available-for-sale. The Company is
not exposed to commodity price risk. To manage its price risk arising from investments in equity securities, the Company diversifies its
portfolio. Diversification of the portfolio is done in accordance with the limits set by the Board.
The Company’s quoted investments classified under available-for-sale investments in equity of other entities are publicly traded on
Pakistan Stock Exchange Limited.
The table below summarises the impact of increases / decreases of the KSE-100 index on the Company’s post-tax profit for the year and
on equity. The analysis is based on the assumption that the KSE had increased / decreased by 10% with all other variables held constant
and all the Company’s equity instruments moved according to the historical correlation with the index:
Impact on post - tax profit Impact on other components of equity(Rupees in thousand) 2017 2016 2017 2016
Pakistan Stock Exchange Limited – – 3,566,469 2,791,675
Post-tax profit for the year would decrease / increase as a result of losses / gains on equity securities classified as at fair value through profit or loss. Other components of equity would decrease / increase as a result of losses / gains on equity securities classified as available-for-sale. As at December 31, 2017 the Company has no investment classified at fair value through profit or loss.
(iii) Cash flow and fair value interest rate risk
Interest rate risk represents the risk that the fair value or future cash flows of a financial instrument will fluctuate because of changes in market interest rates.
As the Company has no significant floating interest rate assets, the Company’s income is substantially independent of changes in market
interest rates. The Company’s interest rate risk arises from short term and long term borrowings. These borrowings issued at variable rates expose the
Company to cash flow interest rate risk. The Company analyses its interest rate exposure on a dynamic basis. Various scenarios are simulated taking into consideration refinancing,
renewal of existing positions, alternative financing and hedging. Based on these scenarios, the Company calculates the impact on profit and loss of a defined interest rate shift. The scenarios are run only for liabilities that represent the major interest-bearing positions.
At December 31, 2017, if interest rates on floating rate borrowings had been 1% higher / lower with all other variables held constant,
post-tax profit for the year would have been Rs. 24.545 million (2016: Rs. 21.171 million ) lower / higher, mainly as a result of higher / lower interest expense on floating rate borrowings.
(b) Credit risk
Credit risk represents the risk of financial loss being caused if counter party fails to discharge an obligation. Credit risk of the Company arises from cash and cash equivalents and deposits with banks and financial institutions, as well as credit
exposures to distributors and customers, including outstanding receivables and committed transactions. The management assesses the credit quality of the customers, taking into account their financial position, past experience and other factors. Individual risk limits are set based on internal or external ratings in accordance with limits set by the Board. The utilisation of credit limits is regularly monitored. For banks and financial institutions, only independently rated parties with a strong credit rating are accepted.

125
ANNUALREPORT 2017
The Company monitors the credit quality of its financial assets with reference to historical performance of such assets and available
external credit ratings. The carrying values of financial assets exposed to credit risk are as under:
(Rupees in thousand) 2017 2016
Long term loans and deposits 18,204 25,958
Trade debts 2,392,215 2,171,966
Loans, advances, deposits and other receivables 235,346 621,710
Balances with banks 177,728 86,833
2,823,493 2,906,467
As of December 31, 2017, trade debts of Rs. 731.480 million (2016: Rs. 403.323 million) were past due but not impaired. These relate
to a number of independent customers for whom there is no recent history of default. The aging analysis of these trade receivables is as
follows:
(Rupees in thousand) 2017 2016
Neither past due nor impaired 1,660,735 1,768,733
Past due but not impaired
Up to 90 days 668,151 278,151
90 to 180 days 40,066 84,895
181 to 365 days 23,263 40,187
731,480 403,233
2,392,215 2,171,966
The management estimates the recoverability of trade debts on the basis of financial position and past history of its customers based on
the objective evidence that it shall not receive the amount due from the particular customer. The provision is written off by the Company
when it expects that it cannot recover the balance due. Any subsequent repayments in relation to amount written off, are credited directly
to profit and loss account.
The aging analysis of trade debts from related parties as at balance sheet date is as follows:
(Rupees in thousand) 2017 2016
Neither past due nor impaired 10,240 19,234
Past due but not impaired
Up to 90 days 10,373 5,121
90 to 180 days 1 8,575
181 to 365 days 1,640 2,517
12,014 16,213
22,254 35,447

126
The credit quality of Company’s bank balances can be assessed with reference to external credit ratings as follows:
Rating Rating Rating (Rupees in thousand) Short term Long term Agency 2017 2016
Askari Bank Limited A1+ AA+ PACRA 52 –
Bank Al-Habib Limited A1+ AA+ PACRA 1,659 –
Citibank N.A. P1 A1 Moody’s 480 341
Deutsche Bank AG P2 Baa2 Moody’s – 185
Dubai Islamic Bank (Pakistan) Limited A1 AA- JCR-VIS 22 36
Habib Bank Limited A1+ AAA JCR-VIS 48,811 44,017
Habib Metropolitan Bank Limited A1+ AA+ PACRA 15 –
JS Bank Limited A1+ AA- PACRA 50 681
MCB Bank Limited A1+ AAA PACRA 142 416
Meezan Bank Limited A1+ AAA JCR-VIS 143 4,253
National Bank of Pakistan A1+ AAA PACRA 337 12,709
Samba Bank Limited A1 AA JCR-VIS 1,332 1,332
Standard Chartered Bank Pakistan Limited A1+ AAA PACRA 124,685 22,805
The Bank of Punjab A1+ AA PACRA – 58
177,728 86,833
(c) Liquidity risk
Liquidity risk represents the risk that the Company shall encounter difficulties in meeting obligations associated with financial liabilities.
Prudent liquidity risk management implies maintaining sufficient cash and marketable securities, the availability of funding through
an adequate amount of committed credit facilities. Due to the dynamic nature of the Company’s businesses, the Company’s finance
department maintains flexibility in funding by maintaining availability under committed credit lines.
Management monitors the forecasts of the Company’s cash and cash equivalents (note 42) on the basis of expected cash flow. This is
generally carried out in accordance with practice and limits set by the Company. These limits vary by location to take into account the
liquidity of the market in which the entity operates. In addition, the Company’s liquidity management policy involves projecting cash flows
in each quarter and considering the level of liquid assets necessary to meet its liabilities, monitoring balance sheet liquidity ratios against
internal and external regulatory requirements and maintaining debt financing plans.
The table below analyses the Company’s financial liabilities into relevant maturity groupings based on the remaining period at the balance
sheet to the contractual maturity date. The amounts disclosed in the table are the contractual undiscounted cash flows as the impact of
discounting is not significant.
Carrying Less than Between 1 Between 2 Over
(Rupees in thousand) value 1 year and 2 years and 5 years 5 years
At December 31, 2017
Long term finances 3,575,520 1,321,420 1,321,450 – 932,650
Liabilities against assets subject to
finance lease 26,084 12,889 3,225 9,970 –
Finances under mark up
arrangements - secured 299,596 299,596 – – –
Trade and other payables 3,104,993 3,104,993 – – –
Accrued finance cost 189,760 189,760 – – –
7,195,953 4,928,658 1,324,675 9,970 932,650

127
ANNUALREPORT 2017
Carrying Less than Between 1 Between 2 Over
(Rupees in thousand) value 1 year and 2 years and 5 years 5 years
At December 31, 2016
Long term finances 4,146,940 571,420 946,420 1,696,450 932,650
Liabilities against assets subject to
finance lease 33,369 7,312 13,342 12,715 –
Finances under mark-up
arrangements - secured 1,377,033 1,377,033 – – –
Trade and other payables 2,847,914 2,847,914 – – –
Accrued finance cost 221,730 221,730 – – –
8,626,986 5,025,409 959,762 1,709,165 932,650
44.2 Financial instruments by categories
The carrying values of following financial assets and liabilities reflected in the financial statements approximate their fair values. Fair value
is determined on the basis of objective evidence at reporting date.
Available Loans and (Rupees in thousand) for sale receivables Total
Financial assets as at December 31, 2017
Long term loans and deposits – 18,204 18,204
Trade debts – 2,392,215 2,392,215
Loans, advances, deposits and other receivables – 235,346 235,346
Investments 41,981,341 – 41,981,341
Balances with banks – 177,728 177,728
41,981,341 2,823,493 44,804,834
Available Loans and (Rupees in thousand) for sale receivables Total
Financial assets as at December 31, 2016
Long term loans and deposits – 25,958 25,958
Trade debts – 2,171,966 2,171,966
Loans, advances, deposits and other receivables – 621,710 621,710
Investments 32,858,257 – 32,858,257
Balances with banks – 86,833 86,833
32,858,257 2,906,467 35,764,724

128
At amortised cost
(Rupees in thousand) 2017 2016
Financial liabilities
Long term finances 3,575,520 4,146,940
Liabilities against assets subject to finance lease 26,084 33,369
Finances under mark up arrangements - secured 299,596 1,377,033
Trade and other payables 3,104,993 2,847,914
Accrued finance cost 189,760 221,730
7,195,953 8,626,986
44.3 Offsetting financial assets and financial liabilities
There are no significant financial assets and financial liabilities that are subject to offsetting, enforceable master netting arrangements
and similar agreements.
44.4 Capital risk management
The Company’s objectives when managing capital are to safeguard the Company’s ability to continue as a going concern in order to
provide returns for shareholders and benefits for other stakeholders and to maintain an optimal capital structure to reduce the cost of
capital.
The Company manages its capital structure and makes adjustments to it in the light of changes in economic conditions. In order to
maintain or adjust the capital structure, the Company may adjust the amount of dividends paid to shareholders or issue new shares.
Consistent with the others in industry, the Company monitors capital on the basis of the gearing ratio. This ratio is calculated as net debt
divided by total capital. Net debt is calculated as total borrowings including the current and non-current borrowings as disclosed in note 6
less cash and cash equivalents as disclosed in note 42. Total capital is calculated as equity as shown in the balance sheet plus net debt.
The gearing ratio as at year end is as follows:
(Rupees in thousand) Note 2017 2016
Long term finances 6 2,254,100 3,575,520
Current portion of long term finances 11 1,321,420 571,420
Cash and cash equivalents 42 117,389 1,286,421
Net debt 3,692,909 5,433,361
Total equity 65,665,762 52,784,470
Total capital 69,358,671 58,217,831
Gearing ratio 5% 9%
In accordance with the terms of agreements with certain lenders of long term finances, the Company is required to comply with certain
financial covenants. The Company has complied with these covenants throughout the reporting period.

129
ANNUALREPORT 2017
44.5 Fair value of financial instruments
Fair value is the amount for which an asset could be exchanged, or liability settled, between knowledgeable willing parties in an arm’s
length transaction. Underlying the definition of fair value is the presumption that the Company is a going concern without any intention
or requirement to curtail materially the scale of its operations or to undertake a transaction on adverse terms. The carrying values of all
financial assets and liabilities reflected in these financial statements approximate their fair values. Fair value is determined on the basis
of objective evidence at each reporting date.
The carrying amount less impairment provision of trade receivables and payables are assumed to approximate their fair values. The fair
value of financial liabilities for disclosure purposes is estimated by discounting the future contractual cash flows at the current market
interest rate that is available to the Company for similar financial instruments.
Specific valuation techniques used to value financial instruments include:
- Quoted prices (unadjusted) in active markets for identical assets or liabilities (level 1).
- Inputs other than quoted prices included within level 1 that are observable for the asset or liability, either directly (that is, as prices)
or indirectly (that is, derived from prices) (level 2).
- Inputs for the asset or liability that are not based on observable market data (that is, unobservable inputs) (level 3).
The following table presents the Company’s significant assets that are measured at fair value:
(Rupees in thousand) Level 1 Level 2 Level 3 Total
At December 31, 2017
Assets
Recurring fair value measurement of
available for sale investments 41,966,316 – – 41,966,316
(Rupees in thousand) Level 1 Level 2 Level 3 Total
At December 31, 2016
Assets
Recurring fair value measurement of
available for sale investments 32,843,232 – – 32,843,232

130
130
Valuation techniques used to measure fair values
The fair value of financial instruments traded in active markets is based on quoted market prices at the balance sheet date. A market is
regarded as active if quoted prices are readily and regularly available from an exchange, dealer, broker, industry group, pricing service, or
regulatory agency, and those prices represent actual and regularly occurring market transactions on an arm’s length basis. The quoted
market price used for financial assets held by the Company is the current bid price. These instruments are included in Level 1. The
fair value of financial instruments that are not traded in an active market is determined by using valuation techniques. These valuation
techniques maximise the use of observable market data where it is available and rely as little as possible on entity specific estimates. If
all significant inputs required to measure fair value of an instrument are observable, the instrument is included in Level 2. If one or more
of the significant inputs is not based on observable market data, the instrument is included in Level 3.
There were no other material Level 1, 2 or 3 assets or liabilities during current or prior year.
There were no transfers between levels 1 and 2 for recurring fair value measurements during the year.
45. Date of authorisation for issue
These financial statements were authorised for issue on February 28, 2018 by the Board of Directors.
46. Non-adjusting events after the balance sheet date
The Board of Directors has proposed a final cash dividend for the year ended December 31, 2017 of Rs. 30.00 per share (2016: Rs. 25.00
per share), amounting to Rs. 2,681.385 million (2016: Rs. 2,234.487 million) at their meeting held on February 28, 2018 for approval of
the members at the Annual General Meeting to be held on April 19, 2018. Reference to the ordinary dividend proposed by the Board and
the rights of IFC as detailed in note 6.2, the Board has further proposed such amount of additional preference dividend to be paid to IFC
as per the terms of subscription agreement.
47. Corresponding figures
Corresponding figures have been reclassified wherever necessary to reflect more appropriate presentation of events and transactions for
the purpose of comparison. However, no significant reclassification has been made.
Khurram Raza BakhtayariChief Financial Officer
Syed Hyder AliChief Executive & Managing Director
Asghar AbbasDirector

131
ANNUALREPORT 2017
CONSOLIDATEDFINANCIALSTATEMENTSFor the year ended December 31, 2017
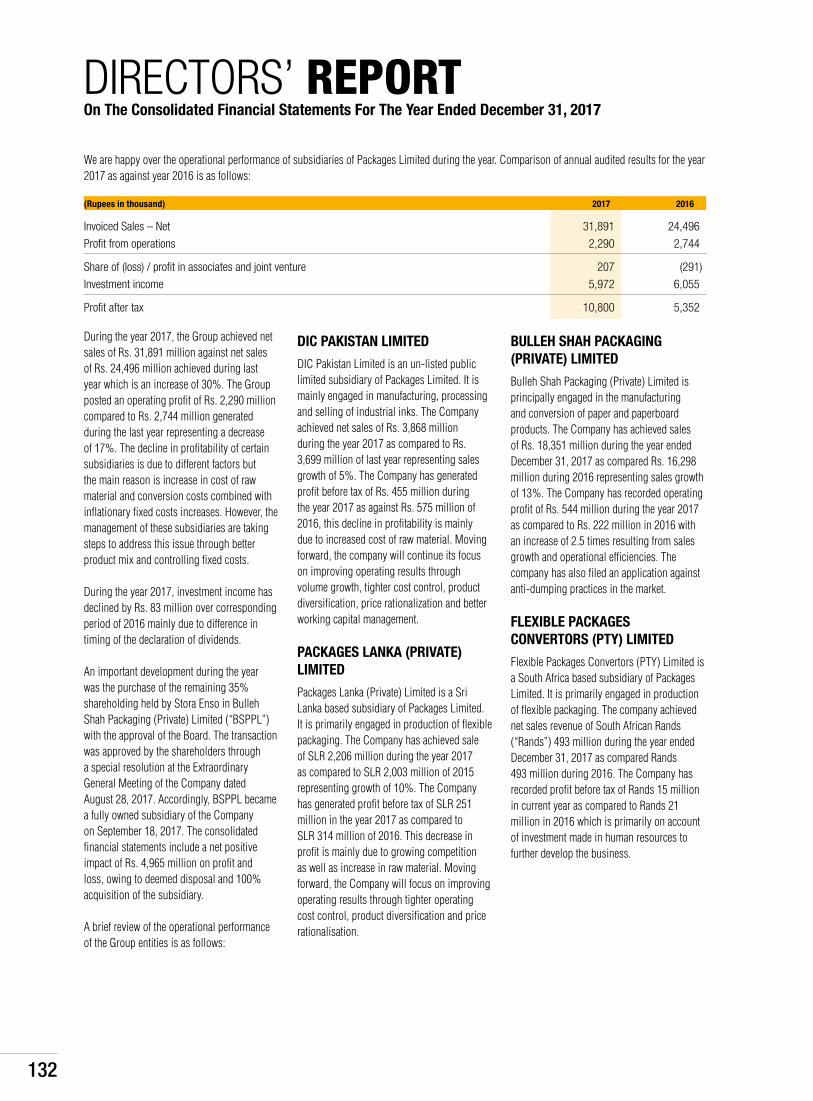
132
DIRECTORS’ REPORTOn The Consolidated Financial Statements For The Year Ended December 31, 2017
We are happy over the operational performance of subsidiaries of Packages Limited during the year. Comparison of annual audited results for the year 2017 as against year 2016 is as follows:
(Rupees in thousand) 2017 2016
Invoiced Sales – Net 31,891 24,496
Profit from operations 2,290 2,744
Share of (loss) / profit in associates and joint venture 207 (291)
Investment income 5,972 6,055
Profit after tax 10,800 5,352
During the year 2017, the Group achieved net sales of Rs. 31,891 million against net sales of Rs. 24,496 million achieved during last year which is an increase of 30%. The Group posted an operating profit of Rs. 2,290 million compared to Rs. 2,744 million generated during the last year representing a decrease of 17%. The decline in profitability of certain subsidiaries is due to different factors but the main reason is increase in cost of raw material and conversion costs combined with inflationary fixed costs increases. However, the management of these subsidiaries are taking steps to address this issue through better product mix and controlling fixed costs.
During the year 2017, investment income has declined by Rs. 83 million over corresponding period of 2016 mainly due to difference in timing of the declaration of dividends.
An important development during the year was the purchase of the remaining 35% shareholding held by Stora Enso in Bulleh Shah Packaging (Private) Limited (“BSPPL”) with the approval of the Board. The transaction was approved by the shareholders through a special resolution at the Extraordinary General Meeting of the Company dated August 28, 2017. Accordingly, BSPPL became a fully owned subsidiary of the Company on September 18, 2017. The consolidated financial statements include a net positive impact of Rs. 4,965 million on profit and loss, owing to deemed disposal and 100% acquisition of the subsidiary.
A brief review of the operational performance of the Group entities is as follows:
DIC PAKISTAN LIMITED
DIC Pakistan Limited is an un-listed public limited subsidiary of Packages Limited. It is mainly engaged in manufacturing, processing and selling of industrial inks. The Company achieved net sales of Rs. 3,868 million during the year 2017 as compared to Rs. 3,699 million of last year representing sales growth of 5%. The Company has generated profit before tax of Rs. 455 million during the year 2017 as against Rs. 575 million of 2016, this decline in profitability is mainly due to increased cost of raw material. Moving forward, the company will continue its focus on improving operating results through volume growth, tighter cost control, product diversification, price rationalization and better working capital management.
PACKAGES LANKA (PRIVATE) LIMITED
Packages Lanka (Private) Limited is a Sri Lanka based subsidiary of Packages Limited. It is primarily engaged in production of flexible packaging. The Company has achieved sale of SLR 2,206 million during the year 2017 as compared to SLR 2,003 million of 2015 representing growth of 10%. The Company has generated profit before tax of SLR 251 million in the year 2017 as compared to SLR 314 million of 2016. This decrease in profit is mainly due to growing competition as well as increase in raw material. Moving forward, the Company will focus on improving operating results through tighter operating cost control, product diversification and price rationalisation.
BULLEH SHAH PACKAGING (PRIVATE) LIMITED
Bulleh Shah Packaging (Private) Limited is principally engaged in the manufacturing and conversion of paper and paperboard products. The Company has achieved sales of Rs. 18,351 million during the year ended December 31, 2017 as compared Rs. 16,298 million during 2016 representing sales growth of 13%. The Company has recorded operating profit of Rs. 544 million during the year 2017 as compared to Rs. 222 million in 2016 with an increase of 2.5 times resulting from sales growth and operational efficiencies. The company has also filed an application against anti-dumping practices in the market.
FLEXIBLE PACKAGES CONVERTORS (PTY) LIMITED
Flexible Packages Convertors (PTY) Limited is a South Africa based subsidiary of Packages Limited. It is primarily engaged in production of flexible packaging. The company achieved net sales revenue of South African Rands (“Rands”) 493 million during the year ended December 31, 2017 as compared Rands 493 million during 2016. The Company has recorded profit before tax of Rands 15 million in current year as compared to Rands 21 million in 2016 which is primarily on account of investment made in human resources to further develop the business.

133
ANNUALREPORT 2017
PACKAGES CONSTRUCTION (PRIVATE) LIMITED
Packages Construction (Private) Limited is a subsidiary of Packages Limited. It is primarily engaged in the business of all types of construction activities and development of real estate. It is currently operating the real estate project titled “Packages Mall”. Packages Mall was inaugurated on April 20th, 2017 and the customer response has been encouraging. The Company has achieved sale of Rs. 1,702 million during the year 2017. The Company has generated profit from operations of Rs. 81 million during the year.
Moving forward, the Board believes that this investment will bring considerable benefit to the shareholders in the form of dividend income and capital gains.
Investment in 100% Subsidiary (Anemone Holdings Limited)
Your Company contributed Rs. 124.948 million (equivalent to USD 1.183 million) as equity in Anemone Holdings Limited, Mauritius (“AHL”) for the purposes of financing debt. AHL is a special purpose vehicle established in 2015 for the acquisition of operations of a flexible packaging company in South Africa as disclosed to the Stock Exchange and the directors reports of the respective year.
PACKAGES POWER (PRIVATE) LIMITED
The Company has incorporated Packages Power (Private) Limited as a wholly owned subsidiary of Packages Limited for the purpose of setting up a 3.1 MW hydropower project as advertised by the Punjab Power Development Board (PPDB). Accordingly, an initial equity injection of Rs. 25 million was made on December 13, 2016. Subsequently the Company has moved forward with the requisite studies and approvals and is in liaison with the relevant Government authorities to take the project forward.
OMYAPACK (PRIVATE) LIMITED
As part of asset and income diversification strategy, the JV Company, Omya Pack (Private) Limited will set up a state of the art production facility in Kasur, Punjab and will be positioned to supply a range of high quality ground calcium carbonate products specifically tailored to meet local and regional markets, primary users being the paper, paints and pharmaceutical industries. The construction of the plant is in its final phases and commercial production is expected to commence from Q2-2018.
(Towfiq Habib Chinoy) Chairman Lahore, February 28, 2018
(Syed Hyder Ali)Chief Executive & Managing DirectorLahore, February 28, 2018

134

135
ANNUALREPORT 2017
AUDITORS’ REPORT TO THE MEMBERSWe have audited the annexed consolidated financial statements comprising consolidated balance sheet of Packages Limited (the ‘holding company’) and its subsidiary companies (hereinafter referred to as ‘the Group’) as at December 31, 2017 and the related consolidated profit and loss account, consolidated statement of comprehensive income, consolidated cash flow statement and consolidated statement of changes in equity together with the notes forming part thereof, for the year then ended. We have also expressed separate opinions on the financial statements of the holding company and its subsidiary companies, except for Packages Lanka (Private) Limited, Anemone Holdings Limited and Flexible Packages Convertors (Proprietary) Limited which were audited by other firms of auditors, whose report has been furnished to us and our opinion in so far as it relates to the amounts included for such companies, is based solely on the report of such other auditors. These consolidated financial statements are the responsibility of the holding company’s management. Our responsibility is to express an opinion on these consolidated financial statements based on our audit.
Our audit was conducted in accordance with the International Standards on Auditing and accordingly included such tests of accounting records and such other auditing procedures as we considered necessary in the circumstances.
The Group’s share of net comprehensive income from investments accounted for under equity method amounting to Rs. 4,994.046 million as shown in the consolidated statement of comprehensive income and in the notes 24.2 and 24.3 to the consolidated financial statements includes income amounting to Rs. 5,010.181 million, that represents the Group’s share in one of its associates, which is based on unaudited financial statements of the associate.
Except for the effects, if any, of the matter referred to in the preceding paragraph, in our opinion the consolidated financial statements present fairly the financial position of Packages Limited and its subsidiary companies as at December 31, 2017 and the results of their operations for the year then ended.
A.F. Ferguson & Co.Chartered AccountantsLahore, March 13, 2018
Name of engagement partner: Muhammad Masood

136
CONSOLIDATED BALANCE SHEETas at December 31, 2017
(Rupees in thousand) Note 2017 2016
EQUITY AND LIABILITIES
CAPITAL AND RESERVES
Authorised capital
150,000,000 (2016: 150,000,000) ordinary shares of Rs. 10 each 1,500,000 1,500,000
22,000,000 (2016: 22,000,000) 10% non-voting preference
shares / convertible stock of Rs. 190 each 4,180,000 4,180,000
Issued, subscribed and paid up capital
89,379,504 (2016: 89,379,504) ordinary shares of Rs. 10 each 5 893,795 893,795
8,186,842 (2016: 8,186,842) 10% non-voting preference shares /
convertible stock of Rs. 190 each 6 606,222 606,222
Reserves 62,382,915 49,350,660
Equity portion of loan from shareholder of the Parent Company 7 171,187 77,991
Un-appropriated profit 11,087,931 1,879,569
Capital and reserves attributable to owners of the Parent Company 75,142,050 52,808,237
Non-controlling interest 2,117,100 1,950,579
TOTAL EQUITY 77,259,150 54,758,816
NON-CURRENT LIABILITIES
Long term finances 6 14,626,258 10,306,006
Loan from shareholder of the Parent Company - unsecured 8 409,380 –
Liabilities against assets subject to finance lease 9 49,391 73,851
Security deposits 10 277,655 –
Deferred income 11 107,889 –
Deferred taxation 12 2,565,506 802,529
Retirement benefits 13 516,586 102,825
Deferred liabilities 14 525,282 349,437
19,077,947 11,634,648
CURRENT LIABILITIES
Current portion of non-current liabilities 15 3,427,251 828,884
Short term loan from shareholder of the Parent Company - unsecured 16 – 462,930
Finances under mark up arrangements - secured 17 5,091,722 1,918,079
Trade and other payables 18 7,512,233 5,126,373
Accrued finance costs 19 495,278 313,512
Provision for taxation 22,176 66,199
16,548,660 8,715,977
CONTINGENCIES AND COMMITMENTS 20 – –
112,885,757 75,109,441

137
ANNUALREPORT 2017
Khurram Raza BakhtayariChief Financial Officer
Syed Hyder AliChief Executive & Managing Director
Asghar AbbasDirector
(Rupees in thousand) Note 2017 2016
ASSETS
NON-CURRENT ASSETS
Property, plant and equipment 21 25,992,806 6,550,076
Investment properties 22 12,342,428 10,922,713
Intangible assets 23 286,621 164,294
Investments accounted for under equity method 24 9,802,130 13,867,035
Other long term investments 25 41,981,048 32,857,963
Long term loans and deposits 26 157,208 39,858
90,562,241 64,401,939
CURRENT ASSETS
Stores and spares 27 1,707,667 453,479
Stock-in-trade 28 8,439,160 2,846,446
Trade debts 29 5,946,606 3,561,210
Loans, advances, deposits, prepayments and other receivables 30 1,138,978 1,131,050
Income tax receivable 31 4,002,315 2,303,516
Cash and bank balances 32 1,088,790 411,801
22,323,516 10,707,502
112,885,757 75,109,441
The annexed notes 1 to 57 form an integral part of these consolidated financial statements.

138
(Rupees in thousand) Note 2017 2016
Revenue 33 31,891,199 24,495,674
Cost of sales and services 34 (25,852,219) (19,061,596)
Gross profit 6,038,980 5,434,078
Administrative expenses 35 (1,715,650) (1,428,118)
Distribution and marketing costs 36 (1,691,770) (1,225,621)
Other operating expenses 37 (588,067) (444,213)
Other income 38 246,421 407,504
Profit from operations 2,289,914 2,743,630
Finance costs 39 (1,175,701) (1,494,508)
Investment income 40 5,972,121 6,054,991
Gains and losses relating to business combinations 54 4,965,355 –
Share of profit / (loss) of investments accounted for under
equity method - net of tax 24.2 206,530 (290,862)
Profit before taxation 12,258,219 7,013,251
Taxation 41 (1,458,435) (1,661,744)
Profit for the year 10,799,784 5,351,507
Attributable to:
Equity holders of the Parent Company 10,673,355 5,139,901
Non-controlling interest 126,429 211,606
10,799,784 5,351,507
Earnings per share attributable to equity holders of the Parent Company during the year Basic Rupees 50 118.91 57.51
Diluted Rupees 50 110.70 53.78
The annexed notes 1 to 57 form an integral part of these consolidated financial statements.
CONSOLIDATED PROFIT AND LOSS ACCOUNTfor the year ended December 31, 2017
Khurram Raza BakhtayariChief Financial Officer
Syed Hyder AliChief Executive & Managing Director
Asghar AbbasDirector

139
ANNUALREPORT 2017
CONSOLIDATED STATEMENT OF COMPREHENSIVE INCOMEfor the year ended December 31, 2017
(Rupees in thousand) Note 2017 2016
Profit for the year 10,799,784 5,351,507
Other comprehensive (loss) / income:
Items that will not be reclassified to consolidated profit and loss account
Remeasurement of retirement benefit obligations 13 (265,019) (37,663)
Tax effect 12.4 79,503 10,202
(185,516) (27,461)
Items that may be reclassified subsequently to consolidated profit and loss account
Changes in fair value of available for sale financial assets 25.5 9,123,085 4,379,097
Exchange differences on translating foreign subsidiaries 180,789 163,679
Share of other comprehensive income / (loss) of investments
accounted for under equity method - net of tax 24.3 4,787,516 (28,915)
14,091,390 4,513,861
Other comprehensive income for the year - net of tax 13,905,874 4,486,400
Total comprehensive income for the year 24,705,658 9,837,907
Attributable to:
Equity holders of the Parent Company 24,478,375 9,545,384
Non-controlling interest 227,283 292,523
24,705,658 9,837,907
The annexed notes 1 to 57 form an integral part of these consolidated financial statements.
Khurram Raza BakhtayariChief Financial Officer
Syed Hyder AliChief Executive & Managing Director
Asghar AbbasDirector

140
CONSOLIDATED STATEMENT OF CHANGE IN EQUITYfor the year ended December 31, 2017
Issued, subscribed Reserves Capital and and paid up capital Capital reserves Revenue reserves reserves
Preference Exchange Other Equity portion of Share/ differences reserves Transaction short term loan Ordinary convertible on translation Fair relating to with non- from shareholder Capital Non- Share stock Share of foreign value associates and controlling of the Parent Redemption General Accumulated controlling(Rupees in thousand) capital reserve Premium subsidiaries reserve joint ventures interest Company reserve reserve profit Total interest Total
Balance as on December 31, 2015 883,795 1,309,682 3,588,769 (239,195) 24,479,228 (32,842) – 46,596 – 13,810,333 4,316,773 48,163,139 929,138 49,092,277
Appropriation of funds
Transferred to general reserve account – – – – – – – – – 1,500,000 (1,500,000) – – –
Share of other reserves of investments accounted for under equity method – – – – – (4,297) – – – – – (4,297) – (4,297)
Transaction with preference shareholders
Redemption of preference shares / convertible stock (8,500,000 preference shares of Rs. 190 each) – (629,412) – – – – – – 1,615,000 – (4,709,181) (3,723,593) – (3,723,593)
Total transactions with owners, recognised directly in equity
Final dividend for the year ended December 31, 2015 Rs. 15.00 per share – – – – – – – – – – (1,340,693) (1,340,693) – (1,340,693)
Dividends relating to 2015 paid to non - controlling interests – – – – – – – – – – – – (256,665) (256,665)
Conversion of preference shares / convertible stock into ordinary share
capital (1,000,000 ordinary shares of Rs. 10 each) 10,000 (74,048) 177,969 – – – – – – – – 113,921 – 113,921
Equity portion of short term loan from shareholder of the Parent Company (note - 16) – – – – – – – 31,395 – – – 31,395 8,564 39,959
Interest acquired in subsidiary by non - controlling interest (note 53.3) – – – – – – 22,981 – – – – 22,981 977,019 1,000,000
10,000 (74,048) 177,969 – – – 22,981 31,395 – – (1,340,693) (1,172,396) 728,918 (443,478)
Total comprehensive income for the year ended December 31, 2016
Profit for the year – – – – – – – – – – 5,139,901 5,139,901 211,606 5,351,507
Other comprehensive income:
Surplus on remeasurement of available for sale financial assets – – – – 4,379,097 – – – – – – 4,379,097 – 4,379,097
Exchange differences on translation of foreign subsidiaries – – – 82,532 – – – – – – – 82,532 81,147 163,679
Other comprehensive loss of investments accounted for under equity method – – – – – (28,915) – – – – – (28,915) – (28,915)
Remeasurement of retirement benefit liability - net of tax – – – – – – – – – – (27,231) (27,231) (230) (27,461)
Total comprehensive income / (loss) for the year – – – 82,532 4,379,097 (28,915) – – – – 5,112,670 9,545,384 292,523 9,837,907
Balance as on December 31, 2016 893,795 606,222 3,766,738 (156,663) 28,858,325 (66,054) 22,981 77,991 1,615,000 15,310,333 1,879,569 52,808,237 1,950,579 54,758,816
Appropriation of funds
Transfer from general reserve – – – – – – – – – (1,000,000) 1,000,000 – – –
Transaction with preference shareholders
Participating dividend on preference shares - note 42 – – – – – – – – – – (45,000) (45,000) – (45,000)
Total transactions with owners, recognised directly in equity
Final dividend for the year ended December 31, 2016 Rs. 25.00 per share – – – – – – – – – – (2,234,487) (2,234,487) – (2,234,487)
Dividends relating to 2016 paid to non - controlling interests – – – – – – – – – – – – (104,273) (104,273)
Equity portion of long term loan from shareholder of the holding company – – – – – – – 68,110 – – – 68,110 22,510 90,620
Equity portion of short term loan from shareholder of the holding company – – – – – – – 25,086 – – – 25,086 8,291 33,377
Non-controlling interests on acquisition of subsidiary – – – – – – – – – – – – 12,710 12,710
– – – – – – – 93,196 – – (2,234,487) (2,141,291) (60,762) (2,202,053)
Total comprehensive income for the year ended December 31, 2017
Profit for the year – – – – – – – – – – 10,673,355 10,673,355 126,429 10,799,784
Other comprehensive income:
Surplus on remeasurement of available for sale financial assets – – – – 9,123,085 – – – – – – 9,123,085 – 9,123,085
Exchange differences on translation of foreign subsidiaries – – – 79,925 – – – – – – – 79,925 100,864 180,789
Other comprehensive loss of investments accounted for under equity method – – – 3,424 – 4,784,092 – – – – – 4,787,516 – 4,787,516
Remeasurement of retirement benefit liability - net of tax – – – – – – – – – – (185,506) (185,506) (10) (185,516)
Total comprehensive income for the year – – – 83,349 9,123,085 4,784,092 – – – – 10,487,849 24,478,375 227,283 24,705,658
Share of gains recognised directly in equity from investments accounted for under equity method - net of tax – – – – – 41,729 – – – – – 41,729 – 41,729
Balance as on December 31, 2017 893,795 606,222 3,766,738 (73,314) 37,981,410 4,759,767 22,981 171,187 1,615,000 14,310,333 11,087,931 75,142,050 2,117,100 77,259,150
The annexed notes 1 to 57 form an integral part of these consolidated financial statements.
Khurram Raza BakhtayariChief Financial Officer
Syed Hyder AliChief Executive & Managing Director
Asghar AbbasDirector

141
ANNUALREPORT 2017
(Rupees in thousand) Note 2017 2016
Cash flows from operating activities
Cash generated from operations 48 4,097,722 3,742,716
Finance cost paid (982,234) (854,379)
Income tax paid (2,023,783) (1,558,656)
Acquisition-related costs of business combinations paid (57,323) –
Payments for accumulating compensated absences (24,196) (25,530)
Retirement benefits paid (26,829) (18,679)
Net cash inflow from operating activities 983,357 1,285,472
Cash flows from investing activities
Fixed capital expenditure (4,386,117) (7,192,206)
Net investments in equity securities – (674,016)
Acquisitions under business combinations, net of cash and cash equivalents (4,831,904) –
Investments made in government securities (1,599,994) –
Proceeds from disposal of government securities 1,603,171 –
Net (increase) / decrease in long term loans and deposits (35,025) 526
Proceeds from disposal of operating fixed assets 110,180 109,627
Dividends received 6,107,412 6,158,514
Net cash outflow from investing activities (3,032,278) (1,597,555)
Cash flows from financing activities
Proceeds from long term finances - secured 2,604,853 7,939,350
Repayment of long term finances - secured (664,205) (1,953,690)
Redemption of preference shares – (5,601,500)
Transactions with non-controlling interest – 1,000,000
Repayment of liabilities against assets subject to finance lease - net (17,528) (244,417)
Dividends paid to equity holders of Parent Company (2,221,580) (1,335,268)
Participating dividend on preference shares paid (45,000) –
Dividends paid to non-controlling interest (104,273) (256,665)
Net cash outflow from financing activities (447,733) (452,190)
Net decrease in cash and cash equivalents (2,496,654) (764,273)
Cash and cash equivalents at the beginning of the year (1,506,278) (742,005)
Cash and cash equivalents at the end of the year 49 (4,002,932) (1,506,278)
The annexed notes 1 to 57 form an integral part of these consolidated financial statements.
CONSOLIDATED CASH FLOW STATEMENTfor the year ended December 31, 2017
Khurram Raza BakhtayariChief Financial Officer
Syed Hyder AliChief Executive & Managing Director
Asghar AbbasDirector

142
1. Legal status and nature of business
Packages Limited (‘the Parent Company’) and its subsidiaries, DIC Pakistan Limited, Bulleh Shah Packaging (Private) Limited, Packages Lanka (Private) Limited, Linnaea Holdings Inc., Chantler Packages Inc., Packages Construction (Private) Limited, Packages Power (Private) Limited, Anemone Holdings Limited and Flexible Packages Convertors (Proprietary) Limited (together, ‘the Group’) are engaged in the following businesses:
- Packaging: Representing manufacture and sale of packaging materials and tissue products. - Inks: Representing manufacture and sale of finished and semi finished inks. - Construction: Representing all types of construction activities and development of real estate. - Power generation: Representing the development and management of hydropower project. - Paper and paperboard: Representing manufacture and sale of paper and paperboard of all kinds. The Group also holds investment in companies engaged in the manufacture and sale of biaxially oriented polypropylene (BOPP) film and
cast polypropylene (CPP) film, plastic, insurance business and production and sale of ground calcium carbonate products. During the year, Packages Lanka (Private) Limited , a subsidiary of Packages Limited, incorporated a wholly owned subsidiary in Canada
named Linnaea Holdings Inc. (‘Linnaea’), which ultimately incorporated a wholly owned subsidiary, Chantler Packages Inc. (‘CPI’) in Canada, to acquire the flexible packaging business operations of Chantler Packaging Inc. The transaction was settled on July 1 2017 for a total consideration of CAD 600,000 resulting in Linnaea becoming 80% shareholder of CPI.
Furthermore, on September 18, 2017, the Parent Company has purchased 35% shareholding held by Stora Enso South Asia Holdings AB
(‘Stora Enso’) in Bulleh Shah Packaging (Private) Limited (“BSPPL”), previously a joint venture of the Group. Further details of the business combination have been disclosed in note 54.1.
The registered office of the Group is situated at 4th Floor, the Forum, Suite No. 416 - 422, G-20, Block 9, Khayaban-e-Jami, Clifton,
Karachi, Pakistan. Head office is located at Shahrah-e-Roomi, P.O. Amer Sidhu, Lahore, Pakistan. 2. Basis of preparation
2.1 Statement of compliance
These consolidated financial statements have been prepared in accordance with approved accounting standards as applicable in Pakistan. During the year, the Companies Ordinance, 1984 (hereinafter referred to as the ‘Ordinance’) has been repealed after the enactment of the Companies Act, 2017. However, as allowed by the Securities and Exchange Commission of Pakistan (‘SECP’) vide Circular No. 23/2017 dated October 4, 2017 and further clarified by the Institute of Chartered Accountants of Pakistan through its Circular No. 17/2017 dated October 06, 2017, companies whose financial year, closes on or before December 31, 2017, shall prepare financial statements in accordance with the provisions of the repealed Ordinance. Accordingly, these consolidated financial statements have been prepared in accordance with the requirements of the International Financial Reporting Standards (‘IFRSs’) issued by the International Accounting Standards Board (‘IASB’) as are notified under the repealed Ordinance, provisions of and directives issued under the repealed Ordinance. Wherever the requirements of the repealed Ordinance or directives issued by SECP differ with the requirements of IFRSs, the requirements of the repealed Ordinance or the requirements of the said directives prevail.
2.2 Initial application of standards, amendments or an interpretation to existing standards
The following amendments to existing standards have been published that are applicable to the Group’s consolidated financial statements covering annual periods, beginning on or after the following dates:
2.2.1 Standards, amendments to published standards and interpretations that are effective in the current year
Certain standards, amendments and interpretations to approved accounting standards are effective for accounting periods beginning on January 1, 2017 but are considered not to be relevant or to have any significant effect on the Group’s operations (although they may affect the accounting for future transactions and events) and are, therefore, not detailed in these consolidated financial statements, except for the following:
International Accounting Standard (‘IAS’) 7, ‘Cash flow statements: Disclosure initiative’ (effective for periods beginning on or after January
1, 2017). This amendment requires disclosure to explain changes in liabilities for which cash flows have been, or will be classified as financing activities in the statement of cash flows. The amendment only covers balance sheet items for which cash flows are classified as financing activities. In case other items are included within the reconciliation, the changes in liabilities arising from financing activities
NOTES TO AND FORMING PART OFTHE CONSOLIDATED FINANCIAL STATEMENTSfor the year ended December 31, 2017

143
ANNUALREPORT 2017
will be identified separately. A reconciliation of the opening to closing balance is not specifically required but instead the information can be provided in other ways. In the first year of adoption, comparative information need not be provided. The Group’s current accounting treatment is already in line with the requirements of this standard.
2.2.2 Standards, amendments and interpretations to existing standards that are not yet effective and have not been early
adopted by the Group
There are certain standards, amendments to approved accounting standards and interpretations that are mandatory for the Group’s accounting periods beginning on or after January 1, 2018, but are considered not to be relevant or to have any significant effect on the Group’s operations and are, therefore, not detailed in these consolidated financial statements, except for the following:
IFRS 9, ‘Financial instruments’: (effective for periods beginning on or after January 1, 2018). This standard has been notified by the SECP
to be effective for annual periods beginning on or after July 1, 2018. This standard replaces the guidance in IAS 39, ‘Financial instruments: Recognition and measurement’. It includes requirements on the classification and measurement of financial assets and liabilities; it also includes an expected credit losses model that replaces the current incurred loss impairment model. The Group is yet to assess the full impact of the standard.
IFRS 15, ‘Revenue from contracts with customers’: (effective for periods beginning on or after January 1, 2018). This standard has been
notified by the SECP to be effective for annual periods beginning on or after July 1, 2018. This standard deals with revenue recognition and establishes principles for reporting useful information to users of the financial statements about the nature, amount, timing and uncertainty of revenue and cash flows arising from an entity’s contracts with customers. Revenue is recognised when a customer obtains control of a good or service and thus has the ability to direct the use and obtain the benefits from the good or service. The standard replaces IAS 18, ‘Revenue’, and IAS 11, ‘Construction contracts’, and related interpretations. The Group is yet to assess the full impact of the standard.
IFRIC 22, ‘Foreign currency transactions and advance consideration’ (effective for periods beginning on or after January 1, 2018). This
IFRIC addresses foreign currency transactions or parts of transactions where there is consideration that is denominated or priced in a foreign currency. The interpretation provides guidance for when a single payment/receipt is made as well as for situations where multiple payments/receipts are made. The guidance aims to reduce diversity in practice. It is unlikely that the interpretation will have any significant impact on the Group’s consolidated financial statements.
Amendments to IAS 40, ‘Investment property’ relating to transfers of investment property (effective for periods beginning on or after 1
January 2018). These amendments clarify that to transfer to, or from, investment properties there must be a change in use. To conclude if a property has changed use, there should be an assessment of whether the property meets the definition. This change must be supported by evidence. It is unlikely that the interpretation will have any significant impact on the Group’s consolidated financial statements.
IFRS 16, ‘Leases’: (effective for periods beginning on or after January 1, 2019). However, this standard is yet to be notified by the SECP.
This standard replaces the current guidance in IAS 17, ‘Leases’ and is a far reaching change in accounting by lessees in particular. Under IAS 17, lessees were required to make a distinction between a finance lease (on balance sheet) and an operating lease (off balance sheet). IFRS 16 now requires lessees to recognise a lease liability reflecting future lease payments and a ‘right-of-use asset’ for virtually all lease contracts. The IASB has included an optional exemption for certain short-term leases and leases of low-value assets; however, this exemption can only be applied by lessees. For lessors, the accounting stays almost the same. However, as the IASB has updated the guidance on the definition of a lease (as well as the guidance on the combination and separation of contracts), lessors will also be affected by the new standard. At the very least, the new accounting model for lessees is expected to impact negotiations between lessors and lessees. The Group is yet to assess the full impact of this standard.
IFRIC 23, ‘Uncertainty over income tax treatments’: (effective for periods beginning on or after 1 January 2019). This IFRIC clarifies
how the recognition and measurement requirements of IAS 12 ‘Income taxes’, are applied where there is uncertainty over income tax treatments. The IFRIC explains how to recognise and measure deferred and current income tax assets and liabilities where there is uncertainty over a tax treatment. An uncertain tax treatment is any tax treatment applied by an entity where there is uncertainty over whether that treatment will be accepted by the tax authority. The IFRIC applies to all aspects of income tax accounting where there is an uncertainty regarding the treatment of an item, including taxable profit or loss, the tax bases of assets and liabilities, tax losses and credits and tax rates. The Group is yet to assess the full impact of the interpretation.

144
3. Basis of measurement
3.1 These consolidated financial statements have been prepared under the historical cost convention except for revaluation of certain financial
instruments at fair value and recognition of certain employee retirement benefits at present value.
3.2. Critical accounting estimates and judgements
The Group’s significant accounting policies are stated in note 4. Not all of these significant policies require the management to make
difficult, subjective or complex judgments or estimates. The following is intended to provide an understanding of the policies that the
management considers critical because of their complexity, judgment and estimation involved in their application and impact on these
consolidated financial statements. Judgments and estimates are continually evaluated and are based on historical experience, including
expectations of future events that are believed to be reasonable under the circumstances. These judgments involve assumptions or
estimates in respect of future events and the actual results may differ from these estimates. The areas involving a higher degree of
judgments or complexity or areas where assumptions and estimates are significant to the consolidated financial statements are as follows:
i) Estimated useful lives and residual values of property, plant and equipment - note 4.3 & 21
ii) Estimated useful lives and residual values of investment properties - note 4.3 & 22
iii) Employee retirement and other service benefit obligations- note 4.8, 13 & 14
iv) Provision for taxation - note 4.2, 12, 13
4. Significant accounting policies
The significant accounting policies adopted in the preparation of these consolidated financial statements are set out below. These policies
have been consistently applied to all the years presented, unless otherwise stated.
4.1 Principles of consolidation and equity accounting
a) Subsidiaries
Subsidiaries are all entities (including structured entities) over which the Group has control. The Group controls an entity when the Group
is exposed to, or has rights to, variable returns from its involvement with the entity and has the ability to affect those returns through its
power to direct the activities of the entity. Subsidiaries are fully consolidated from the date on which control is transferred to the Group.
They are deconsolidated from the date that control ceases.
The acquisition method of accounting is used to account for business combinations by the Group (refer to note 4.7).
Intercompany transactions, balances and unrealised gains on transactions between group companies are eliminated. Unrealised losses
are also eliminated unless the transaction provides evidence of an impairment of the transferred asset. Accounting policies of subsidiaries
have been changed where necessary to ensure consistency with the policies adopted by the Group.
Non-controlling interest in the results and equity of subsidiaries are shown separately in the consolidated profit and loss account,
consolidated statement of comprehensive income, consolidated statement of changes in equity and consolidated balance sheet
respectively.
When the Group ceases to have control, any retained interest in the entity is re-measured to its fair value at the date when control is lost,
with the change in carrying amount recognised in consolidated profit and loss account. The fair value is the initial carrying amount for
the purposes of subsequent accounting for the retained interest as an associate, joint venture or financial asset. In addition, any amounts
previously recognised in other comprehensive income in respect of that entity are accounted for as if the Group had directly disposed
of the related assets or liabilities. This may mean that amounts previously recognised in consolidated other comprehensive income are
reclassified to consolidated profit and loss account.
b) Associates
Associates are all entities over which the Group has significant influence but not control or joint control. This is generally the case where
the Group holds between 20% and 50% of the voting rights. Investments in associates are accounted for using the equity method of
accounting (refer to note 4.1 (d)), after initially being recognised at cost in the consolidated balance sheet.

145
ANNUALREPORT 2017
c) Joint arrangements
Under IFRS 11, Joint Arrangements, investments in joint arrangements are classified as either joint operations or joint ventures. The
classification depends on the contractual rights and obligations of each investor, rather than the legal structure of the joint arrangement.
The Group has investments in joint ventures.
Joint ventures
Interests in joint ventures are accounted for using the equity method (refer to note 4.1 (d)), after initially being recognised at cost in the
consolidated balance sheet.
d) Equity method
Under the equity method of accounting, the investments are initially recognised at cost and adjusted thereafter to recognise the Group’s
share of the post-acquisition profits or losses of the investee in the consolidated profit and loss account, and the Group’s share of
movements in consolidated other comprehensive income of the investee in consolidated other comprehensive income. Dividends received
or receivable from associates and joint ventures are recognised as a reduction in the carrying amount of the investment.
When the Group’s share of losses in an equity-accounted investment equals or exceeds its interest in the entity, including any other
unsecured long-term receivables, the Group does not recognise further losses, unless it has incurred obligations or made payments on
behalf of the other entity.
Unrealised gains on transactions between the Group and its associates and joint ventures are eliminated to the extent of the Group’s
interest in these entities. Unrealised losses are also eliminated unless the transaction provides evidence of an impairment of the asset
transferred. Accounting policies of equity accounted investees have been changed where necessary to ensure consistency with the
policies adopted by the Group.
The Group determines at each reporting date whether there is any objective evidence that the investment in the associate is impaired. If
this is the case, the Group calculates the amount of impairment as the difference between the recoverable amount of the associate and
its carrying value and recognises the amount adjacent to share of profit / (loss) of associates in the consolidated profit and loss account.
e) Changes in ownership interests
The Group treats transactions with non-controlling interest that do not result in a loss of control as transactions with equity owners of
the Group. A change in ownership interest results in an adjustment between the carrying amounts of the controlling and non-controlling
interest to reflect their relative interests in the subsidiary. Any difference between the amount of the adjustment to non-controlling interest
and any consideration paid or received is recognised in a separate reserve within equity attributable to owners of the Group.
When the Group ceases to consolidate or equity account for an investment because of a loss of control, joint control or significant influence,
any retained interest in the entity is remeasured to its fair value with the change in carrying amount recognised in the consolidated profit
and loss account. This fair value becomes the initial carrying amount for the purposes of subsequently accounting for the retained interest
as an associate, joint venture or financial asset. In addition, any amounts previously recognised in other comprehensive income in respect
of that entity are accounted for as if the Group had directly disposed of the related assets or liabilities. This may mean that amounts
previously recognised in other comprehensive income are reclassified to the consolidated profit and loss account.
If the ownership interest in a joint venture or an associate is reduced but joint control or significant influence is retained, only a proportionate
share of the amounts previously recognised in other comprehensive income are reclassified to the consolidated profit and loss account
where appropriate.
4.2 Taxation
Income tax expense comprises current and deferred tax. SECP vide its certificate dated December 14, 2017, has registered the Parent
Company and its wholly-owned subsidiary BSPPL (together the ‘Taxation Group’) as a Group and has also, vide its certificate dated
January 1, 2018, designated the Group for the purpose of group taxation under Section 59AA of the Income tax Ordinance, 2001.
Consequently, the Taxation Group will now be taxed as one fiscal unit for the tax year 2018.

146
Current
Provision of current tax is based on the taxable income for the year determined in accordance with the prevailing law for taxation of
income. The charge for current tax is calculated using prevailing tax rates or tax rates expected to apply to the profit for the year, if enacted.
The charge for current tax also includes adjustments, where considered necessary, to provision for taxation made in previous years arising
from assessments framed during the year for such years.
Deferred
Deferred tax is accounted for using the balance sheet liability method in respect of all temporary differences arising from differences
between the carrying amount of assets and liabilities in the consolidated financial statements and the corresponding tax basis used in
the computation of the taxable profit. Deferred tax liabilities are generally recognised for all taxable temporary differences and deferred
tax assets are recognised to the extent that it is probable that taxable profits shall be available against which the deductible temporary
differences, unused tax losses and tax credits can be utilised.
Deferred tax is calculated at the rates that are expected to apply to the period when the differences reverse based on tax rates that have
been enacted or substantively enacted by the balance sheet date. Deferred tax is charged or credited in the consolidated profit and loss
account, except in the case of items credited or charged to other comprehensive income or equity in which case it is included in other
comprehensive income or equity.
Deferred tax liability is not recognized in respect of taxable temporary differences associated with undistributed reserves and exchange
translation reserves of subsidiaries, where the timing of the reversal of the temporary difference can be controlled and it is probable that
the temporary differences will not reverse in the foreseeable future.
Group taxation adjustments
Current and deferred taxes based on the consolidated results of the Taxation Group are allocated within the Taxation Group on the basis
of separate return method, modified for determining realizability of text credits and tax losses which are assessed at Group level. Any
adjustments in the current and deferred taxes of the Parent Company on account of group taxation are credited or charged to consolidated
profit and loss account in the year in which they arise.
4.3 Property, plant and equipment
4.3.1 Operating fixed assets
4.3.1.1 Owned assets
Owned assets, except freehold land, are stated at cost less accumulated depreciation and any identified impairment loss. Freehold land is
stated at cost less any identified impairment loss. Cost in relation to certain plant and machinery signifies historical cost, gains and losses
transferred from equity on qualifying cash flow hedges as referred to in note 4.23 and borrowing costs as referred to in note 4.21. Cost
includes expenditure that is directly attributable to the acquisition of the asset.
Depreciation on all owned assets is charged to consolidated profit and loss account on straight-line method so as to write off the
depreciable amount of an asset over its estimated useful life at the following annual rates:
Buildings 2.50% to 20.00%
Plant and machinery 3.33% to 50.00%
Other equipments 5.00% to 33.33%
Furniture and fixtures 10.00% to 33.33%
Vehicles 15.00% to 33.33%
The assets’ residual values and useful lives are reviewed, at each financial year end, and adjusted if impact on depreciation is significant.
The Group’s estimate of the residual value of its owned assets as at December 31, 2017 has not required any adjustment as its impact
is considered insignificant.
Depreciation on additions to owned assets is charged from the month in which an asset is acquired or capitalised while no depreciation
is charged for the month in which the asset is disposed off.

147
ANNUALREPORT 2017
The Group assesses at each balance sheet date whether there is any indication that asset may be impaired. If such indication exists, the
carrying amounts of such assets are reviewed to assess whether they are recorded in excess of their recoverable amount. Where carrying
amounts exceed the respective recoverable amount, assets are written down to their recoverable amounts and the resulting impairment
loss is recognised in consolidated profit and loss account. The recoverable amount is the higher of an asset’s fair value less costs to sell
and value in use. Where an impairment loss is recognised, the depreciation charge is adjusted in the future periods to allocate the asset’s
revised carrying amount over its estimated useful life.
Subsequent costs are included in the asset’s carrying amount or recognised as a separate asset, as appropriate, only when it is probable
that future economic benefits associated with the item shall flow to the Group and the cost of the item can be measured reliably. All other
repair and maintenance costs are charged to consolidated profit and loss account during the period in which they are incurred.
The gain or loss on disposal or retirement of an asset represented by the difference between the sale proceeds and the carrying amount
of the asset is recognised as an income or expense.
4.3.1.2 Assets subject to finance lease
Assets acquired under a finance lease are depreciated over the estimated useful life of the asset on a straight-line method at the rate of
20.00% per annum. Depreciation of leased assets is charged to consolidated profit and loss account.
Residual values and the useful lives of leased assets are reviewed at each financial year end and adjusted if impact on depreciation is
significant. The Group’s estimate of the residual values and useful lives of its leased assets as at December 31, 2017 has not required
any adjustment as its impact is considered insignificant.
4.3.2 Capital work-in-progress
Capital work-in-progress is stated at cost less any identified impairment loss. All expenditure connected with specific assets incurred
during installation and construction period are carried under capital work-in-progress. These are transferred to owned assets as and when
these are available for use.
4.3.3 Major spare parts and stand-by equipment
Major spare parts and stand-by equipment qualify as property, plant and equipment when the Group expects to use them for more than
one year. Transfers are made to relevant owned assets category as and when such items are available for use.
4.4 Investment properties
Property not held for own use or for sale in the ordinary course of business is classified as investment property. The investment properties
of the Group comprise of land, buildings an related assets and equipment. Investment properties also include property that is being
constructed or developed for future use as investment property. Some of the investment properties are leased to tenants under long
term operating leases with rentals, payable monthly. The investment properties, except freehold land, are stated at cost, including related
transaction costs and applicable borrowing costs less accumulated depreciation and any identified impairment losses. Freehold land is
stated at cost less any identified impairment loss. Under construction properties are classified as investment property under development
and carried at cost less any identified impairment losses.
Depreciation on investment properties is charged to consolidated profit and loss account on the straight line method so as to write off
the depreciable amount of investment property over its estimated useful life at the rates ranging from 2.50% to 20.00% per annum.
Depreciation on additions to investment properties is charged from the month in which a property is acquired or capitalised while no
depreciation is charged for the month in which the property is disposed off.
The assets’ residual values and useful lives are reviewed, at each financial year end, and adjusted if impact on depreciation is significant.
The Group’s estimate of the residual values and useful lives of its investment properties as at December 31, 2017 has not required any
adjustment as its impact is considered insignificant.

148
The Group assesses at each balance sheet date whether there is any indication that investment properties may be impaired. If such
indication exists, the carrying amounts of such assets are reviewed to assess whether they are recorded in excess of their recoverable
amount. Where carrying amounts exceed the respective recoverable amount, assets are written down to their recoverable amount and the
resulting impairment loss is recognised in consolidated profit and loss account. The recoverable amount is the higher of an asset’s fair
value less costs to sell and value in use. Where an impairment loss is recognised, the depreciation charge is adjusted in the future periods
to allocate the asset’s revised carrying amount over its estimated useful life.
The gain or loss on disposal or retirement of an asset represented by the difference between the sale proceeds and the carrying amount
of the asset is recognised as an income or expense.
4.5 Intangible assets
4.5.1 Goodwill
Goodwill arises through acquisitions of subsidiaries and represents the excess of the consideration transferred over the net fair value
of the net identifiable assets, liabilities and contingent liabilities of the acquiree and the fair value of the non-controlling interest in the
acquiree. Goodwill on acquisition of subsidiaries is included in ‘intangible assets’. Goodwill on acquisitions of associates and joint ventures
is included in ‘investments in associates’ and ‘investments in joint ventures’ respectively and is tested for impairment as part of the
overall balance. Separately recognised goodwill is tested annually for impairment and carried at cost less accumulated impairment losses.
Impairment losses on goodwill are not reversed. Gains and losses on the disposal of an entity include the carrying amount of goodwill
relating to the entity sold.
Goodwill is allocated to cash-generating units for the purpose of impairment testing. The allocation is made to those cash-generating units
or groups of cash-generating units that are expected to benefit.
4.5.2 Softwares
Expenditure incurred to acquire computer softwares and SAP Enterprise Resource Planning (‘ERP’) System and develop websites are
capitalised as intangible assets and stated at cost less accumulated amortisation and any identified impairment loss.
Costs associated with maintaining intangible assets are recognised as an expense as incurred. Development costs that are directly
attributable to the design and testing of identifiable and unique software products controlled by the Group are recognised as intangible
assets when the following criteria are met:
- it is technically feasible to complete the intangible asset so that it will be available for use;
- management intends to complete the intangible asset and use or sell it;
- there is an ability to use or sell the intangible asset;
- it can be demonstrated how the intangible asset will generate probable future economic benefits;
- adequate technical, financial and other resources to complete the development and to use or sell the intangible asset are
available; and
- the expenditure attributable to the intangible asset during its development can be reliably measured.
Directly attributable costs that are capitalised as part of the software include employee costs and an appropriate portion of relevant
overheads. Capitalised development costs are recorded as intangible assets and amortised from the point at which the asset is ready for
use.
4.5.3 Research and development
Research expenditure and development expenditure that do not meet the criteria in 4.5.2 above are recognised as an expense as
incurred. Development costs previously recognised as an expense are not recognised as an asset in a subsequent period.

149
ANNUALREPORT 2017
4.5.4 Amortisation methods and periods
Intangible assets are amortised using the straight line method over the estimated useful lives at the rates ranging from 10.00% to
33.00%. Goodwill and intangible assets that have an indefinite useful life are not subject to amortisation and are tested annually for
impairment, or more frequently if events or changes in circumstances indicate that they might be impaired. Useful lives of intangible
assets are reviewed, at each balance sheet date and adjusted if the impact of on amortisation is significant. The Group’s estimate of the
useful lives of its intangible assets as at December 31, 2017 has not required any adjustment as its impact is considered insignificant.
Amortisation on additions to intangible assets is charged from the month in which an asset is acquired or capitalised while no amortisation
is charged for the month in which the asset is disposed off.
The Group assesses at each balance sheet date whether there is any indication that intangible assets may be impaired. If such indication
exists, the carrying amounts of such assets are reviewed to assess whether they are recorded in excess of their recoverable amount.
Where carrying amounts exceed the respective recoverable amount, assets are written down to their recoverable amounts and the
resulting impairment loss is recognised in consolidated profit and loss account. The recoverable amount is the higher of an asset’s fair
value less costs to sell and value in use. Where an impairment loss is recognised, the amortisation charge is adjusted in the future periods
to allocate the asset’s revised carrying amount over its estimated useful life.
4.6 Leases
(1) The Group is the lessee:
Finance leases
Leases where the Group has substantially all the risks and rewards of ownership are classified as finance leases. At inception, finance
leases are capitalised at the lower of present value of minimum lease payments under the lease agreements and the fair value of the
assets.
The related rental obligations, net of finance charges, are included in liabilities against assets subject to finance lease as referred to in
note 9. The liabilities are classified as current and long term depending upon the timing of the payment.
Each lease payment is allocated between the liability and finance charges so as to achieve a constant rate on the balance outstanding.
The interest element of the rental is charged to consolidated profit and loss account over the lease term.
Operating leases
Leases, including Ijarah financing, where a significant portion of the risks and rewards of ownership are retained by the lessor are
classified as operating leases. Payments made under operating leases (net of any incentives received from the lessor) are charged to
consolidated profit and loss account on a straight-line basis over the lease / Ijarah term unless another systematic basis is representative
of the time pattern of the Group’s benefit.
(2) The Group is the lessor:
Operating leases
Properties leased / licensed out under operating leases are included in investment properties in the consolidated balance sheet as referred
to in note 22. See note 4.19 for the recognition of rental income / license fee. They are depreciated over their expected useful lives on a
basis consistent with similar owned property, plant and equipment.
The Group makes payments to agents for services in connection with negotiating lease contracts with the Group’s lessees. The letting fees
are capitalised within the carrying amount of the related investment properties and amortised over the lease term.

150
4.7 Business combinations
The acquisition method of accounting is used to account for all business combinations, regardless of whether equity instruments or other
assets are acquired. The consideration transferred for the acquisition of a subsidiary comprises the following:
fair values of the assets transferred;
liabilities incurred to the former owners of the acquired business;
equity interests issued by the Group;
fair value of any asset or liability resulting from a contingent consideration arrangement; and
fair value of any pre-existing equity interest in the subsidiary.
Identifiable assets acquired and liabilities and contingent liabilities assumed in a business combination are, with limited exceptions,
measured initially at their fair values at the acquisition date. The Group recognises any non-controlling interest in the acquired entity on
an acquisition-by-acquisition basis either at fair value or at the non-controlling interest’s proportionate share of the acquired entity’s net
identifiable assets.
Acquisition-related costs are expensed as incurred.
The excess of the:
consideration transferred;
amount of any non-controlling interest in the acquired entity and;
acquisition-date fair value of any previous equity interest in the acquired entity
over the fair value of the net identifiable assets acquired is recorded as goodwill. If those amounts are less than the fair value of the net
identifiable assets of the subsidiary acquired, the difference is recognised directly in the consolidated profit and loss account as a bargain
purchase.
Where settlement of any part of cash consideration is deferred, the amounts payable in the future are discounted to their present value
as at the date of exchange. The discount rate used is the entity’s incremental borrowing rate, being the rate at which a similar borrowing
could be obtained from an independent financier under comparable terms and conditions.
Contingent consideration is classified either as equity or a financial liability. Amounts classified as a financial liability are subsequently
remeasured to fair value with changes in fair value recognised in the consolidated profit and loss account.
If the business combination is achieved in stages, the acquisition date carrying value of the acquirer’s previously held equity interest in
the acquiree is remeasured to fair value at the acquisition date. Any gains or losses arising from such remeasurement are recognised in
the consolidated profit and loss account.
4.8 Employee retirement and other service benefit obligations
Retirement benefits are payable to staff on completion of prescribed qualifying period of service. The main features of the schemes
operated by the Group for its employees are as follows:
4.8.1 Defined benefit plans
A defined benefit plan is a post-employment benefit plan other than the defined contribution plan. The Group’s net obligation in respect
of defined benefit plans is calculated by estimating the amount of future benefit that employees have earned in return for their service in
current and prior periods; that benefit is discounted to determine its present value. The calculation is performed annually by a qualified
actuary using the Projected Unit Credit method.

151
ANNUALREPORT 2017
(a) Gratuity plan
There is an approved funded defined benefit gratuity plan for all permanent employees of the Parent Company and BSPPL subject to
attainment of service of prescribed minimum period. Monthly contributions are made to this fund on the basis of actuarial recommendations
at the rate of 4.50 percent per annum of basic salaries. The latest actuarial valuation for the gratuity scheme was carried out as at
December 31, 2017. The actual return on plan assets during the year was Rs. 39.656 million (2016: Rs. 37.642 million). The employees
of the Parent Company and BSPPL are entitled to gratuity payments on basis of their service with the Group.
The future contribution rates of these plans include allowances for deficit and surplus. Projected unit credit method, using the following
significant assumptions, is used for valuation of this scheme:
Per annum 2017 2016
Discount rate 8.25% 8.0%
Expected rate of increase in salary level 8.25% 8.0%
Expected mortality rate SLIC (2001-2005) SLIC (2001-2005)
mortality table mortality table
Expected rate of return 8.25% 8.0%
Plan assets include long term Government bonds, equity instruments of listed companies, units of mutual funds, izafa certificates, treasury
bills, sukuk and term deposits with banks.
The Group is expected to contribute Rs. 35.413 million to the gratuity fund in the next financial year.
Actuarial gains and losses arising from experience adjustments and changes in actuarial assumptions are charged or credited to equity
in other comprehensive income in the period in which they arise. Past service costs are recognised immediately in consolidated profit and
loss account.
(b) Pension plan
Management and executive staff hired before January 01, 2016 participate in the pension fund of the Company. On December 26,
2012, the Board of Trustees of the pension fund, decided to convert the Defined Benefit Plan to Defined Contribution Plan for all its active
employees with effect from January 01, 2013 with no impact on the pensioners appearing on the pensioners’ list as of that date. The
proposed scheme was approved for implementation by the Commissioner Inland Revenue on February 22, 2013 and employees’ consent
to the proposed scheme was sought and obtained. Management and executive staff who have joined on or after January 01, 2016, do
not participate in the pension fund.
Consequently, the pension fund currently operates two different plans for its members:
Defined contribution plan for active employees of Parent Company and BSPL hired before January 01, 2016; and
Defined benefit plan for pensioners who have retired before December 31, 2012.
Packages Limited
In respect of the defined contribution plan, the Parent Company contributes 20% of members’ monthly basic salary to the scheme;
whereas, an employee may or may not opt to contribute 6% of his monthly basic salary to the scheme.
Bulleh Shah Packaging (Private) Limited
In respect of the defined contribution plan, BSPPL contributes 20% of members’ monthly basic salary to the scheme; whereas, an
employee may or may not opt to contribute 6% of his monthly basic salary to the scheme.

152
The obligation in respect of the defined benefit plan is determined by the Fund’s actuary at each year end. Any funding gap identified
by the Fund’s actuary is paid by the Parent Company and BSPPL from time to time. The last actuarial valuation was carried out as at
December 31, 2017.
Per annum 2017 2016
Discount rate 8.25% 8.0%
Expected rate of increase in pension level 1.00% 1.00%
Expected mortality rate SLIC (2001-2005) SLIC (2001-2005)
mortality table mortality table
Expected rate of return 8.25% 8.00%
Plan assets include long term Government bonds, equity instruments of listed companies, units of mutual funds, term finance certificates,
izafa certificates, treasury bills, sukuk and term deposits with banks.
Actuarial gains and losses arising from experience adjustments and changes in actuarial assumptions for the defined benefit plan
are charged or credited to equity in other comprehensive income in the period in which they arise. Past service costs are recognised
immediately in consolidated profit and loss account.
Pension fund is a multi-employer plan formed by the Group in collaboration with Tri Pack Films Limited, an associate. Parent Company
reports its proportionate share of the plan’s commitments, managed assets and costs, after deducting share of Tri Pack Films Limited, in
accordance with guidance provided by IAS 19 - Employee Benefits, regarding defined benefit plans.
(c) Accumulating compensated absences
The Group provides for accumulating compensated absences when the employees render services that increase their entitlement to
future compensated absences. The annual leaves can be encashed at the time the employee leaves the Group on the basis of gross salary
while no encashment is available for medical leaves. The employees of the Group are entitled to earned annual and medical leaves on
basis of their service with the Group and in accordance with the Group policy.
Provisions are made annually to cover the obligation for accumulating compensated absences based on actuarial valuation and are
charged to consolidated profit and loss account. The most recent valuation was carried out as at December 31, 2017 using the Projected
Unit Credit Method.
The amount recognised in the consolidated balance sheet represents the present value of the defined benefit obligations. Actuarial gains
and losses are charged to the consolidated profit and loss account immediately in the period when these occur.
Projected unit credit method, using the following significant assumptions, has been used for valuation of accumulating compensated
absences:
Per annum 2017 2016
Discount rate 8.25% 8.00%
Expected rate of increase in salary level 8.25% 8.00%
Expected mortality rate SLIC (2001-2005) SLIC (2001-2005)
mortality table mortality table
4.8.2 Defined contribution plan
A defined contribution plan is a post-employment benefit plan under which an entity pays fixed contribution into a separate entity and will
have no legal or constructive obligation to pay further amounts. Obligations for contributions to defined contribution plans are recognised
as an employee benefit expense in consolidated profit and loss account when they are due. Prepaid contributions are recognised as an
asset to the extent that a cash refund or a reduction in future payments is available.

153
ANNUALREPORT 2017
The Parent Company operates a recognised / approved contributory provident fund for its permanent employees. Equal monthly
contributions at the rate of 10.00 percent per annum (2016: 10.00 percent per annum) of basic salaries plus dearness allowance and
cost of living allowance are made by the Parent Company and the employees to the fund. The nature of contributory pension fund has
been explained in note 4.8.1 (b) above.
BSPPL operates a recognised / approved contributory provident fund for its permanent employees. Equal monthly contributions at the rate
of 10.00 percent per annum (2016: 10.00 percent per annum) of basic salaries plus dearness allowance and cost of living allowance are
made by BSPPL and the employees to the fund. The nature of contributory pension fund has been explained in note 4.8.1 (b) above.
Employees of Packages Lanka (Private) Limited are eligible for Employees’ Provident Fund Contributions and Employees’ Trust Fund
Contributions in line with the respective statutes and regulations. The contributions are made at the rate of 12.0% and 3.0% per annum
of gross emoluments of employees to Employees’ Provident Fund and Employees’ Trust Fund, respectively.
4.9 Stores and spares
These are valued at moving weighted average cost except for items in transit which are stated at invoice value plus other charges paid
thereon till the balance sheet date. For items which are slow-moving and/or identified as obsolete, adequate provision is made in the
consolidated financial statements based on the management estimate for any excess book value over estimated realisable value on a
regular basis.
4.10 Stock-in-trade
All stocks except for stock-in-transit are stated at the lower of cost and net realisable value. Cost of raw materials is determined using
the moving average cost method. Cost of work-in-process and finished goods comprises direct production costs such as raw materials,
consumables and labour as well as production overheads such as employee wages, depreciation, maintenance, etc. The production
overheads based on normal operating capacity are measured based on a standard cost method, which is reviewed regularly to ensure
relevant measures of utilisation, production lead time etc.
Stock-in-transit is stated at cost comprising invoice value plus other charges paid thereon till the balance sheet date.
If the expected sales price less completion costs and costs to execute sales (net realisable value) is lower than the carrying amount,
a write-down is recognised for the amount by which the carrying amount exceeds its net realisable value. Provision is made in the
consolidated financial statements for obsolete and slow-moving stock-in-trade based on management estimate.
4.11 Investments
Investments intended to be held for less than twelve months from the balance sheet date or to be sold to raise operating capital, are
included in current assets, all other investments are classified as non-current. Management determines the appropriate classification of
its investments at the time of the purchase and re-evaluates such designation on a regular basis.
4.11.1 Investments in equity instruments of subsidiaries, associates and joint ventures
Investments in equity instruments of associates and joint ventures are accounted for using equity method of accounting as referred to in
note 4.1 (d).
4.12 Financial instruments
4.12.1 Financial assets
4.12.1.1 Classification
The Group classifies its financial assets in the following categories: at fair value through consolidated profit or loss, loans and receivables,
available for sale and held to maturity. The classification depends on the purpose for which the financial assets were acquired. Management
determines the classification of its financial assets at the time of initial recognition.

154
a) Financial assets at fair value through profit or loss
Financial assets at fair value through profit or loss are financial assets held for trading and financial assets designated upon initial recognition as at fair value through profit or loss. A financial asset is classified as held for trading if acquired principally for the purpose of selling in the short term. Assets in this category are classified as current assets if expected to be settled within twelve months, otherwise, they are classified as non-current assets.
b) Loans and receivables
Loans and receivables are non-derivative financial assets with fixed or determinable payments that are not quoted in an active market. They are included in current assets, except for maturities greater than twelve months after the consolidated balance sheet date, which are classified as non-current assets. Loans and receivables comprise trade debts, loans, advances, deposits and other receivables and cash and cash equivalents in the consolidated balance sheet.
c) Available for sale financial assets
Available for sale financial assets are non-derivatives that are either designated in this category or not classified in any of the other categories. They are included in non-current assets unless management intends to dispose off the investments within twelve months from the consolidated balance sheet date.
The financial assets including investments in associated undertakings where the Group does not have significant influence and that are
intended to be held for an indefinite period of time or may be sold in response to the need for liquidity, are also classified as available for sale.
d) Held to maturity
Financial assets with fixed or determinable payments and fixed maturity, where management has the intention and ability to hold till maturity are classified as held-to-maturity and are stated at amortised cost.
4.12.1.2 Recognition and measurement
All financial assets are recognised at the time when the Group becomes a party to the contractual provisions of the instrument. Regular purchases and sales of investments are recognised on trade date; the date on which the Group commits to purchase or sell the asset. Financial assets are initially recognised at fair value plus transaction costs for all financial assets not carried at fair value through profit or loss. Financial assets carried at fair value through profit or loss are initially recognised at fair value and transaction costs are expensed in the consolidated profit and loss account. Financial assets are derecognised when the rights to receive cash flows from the assets have expired or have been transferred and the Group has transferred substantially all the risks and rewards of ownership. Available for sale financial assets and financial assets at fair value through profit or loss are subsequently carried at fair value. For investments having quoted price in active market, the quoted price represents the fair value. In other cases, fair value is measured using appropriate valuation methodology and where fair value cannot be measured reliably, these are carried at cost. Loans and receivables and held to maturity investments are carried at amortised cost using the effective interest method.
Gains or losses arising from changes in the fair value of the ‘financial assets at fair value through profit or loss’ category are presented
in the consolidated profit and loss account in the period in which they arise. Dividend income from financial assets at fair value through profit or loss is recognised in the consolidated profit and loss account when the Group’s right to receive payments is established.
Changes in the fair value of securities classified as available-for-sale are recognised in other comprehensive income. When securities
classified as available-for-sale are sold or impaired, the accumulated fair value adjustments recognised in equity are included in the consolidated profit and loss account as gains and losses from investment securities. Dividends on available for sale equity instruments are recognised in the consolidated profit and loss account when the Group’s right to receive payments is established.
The Group assesses at each balance sheet date whether there is an objective evidence that a financial asset or a group of financial
assets is impaired. If any such evidence exists for available-for-sale financial assets, the cumulative loss is removed from equity and recognised in the consolidated profit and loss account. Impairment losses recognised in the consolidated profit and loss account on equity instruments are not reversed through the consolidated profit and loss account. Impairment testing of trade debts and other receivables is
described in note 4.13.

155
ANNUALREPORT 2017
4.12.2 Financial liabilities
All financial liabilities are recognised at the time when the Group becomes a party to the contractual provisions of the instrument.
A financial liability is derecognised when the obligation under the liability is discharged or cancelled or expired. Where an existing financial liability is replaced by another from the same lender on substantially different terms, or the terms of an existing liability are substantially modified, such an exchange or modification is treated as a derecognition of the original liability and the recognition of a new liability, and the difference in respective carrying amounts is recognised in the consolidated profit and loss account.
4.12.3 Offsetting of financial assets and liabilities
Financial assets and liabilities are offset and the net amount is reported in the consolidated financial statements only when there is a legally enforceable right to set off the recognised amount and the Group intends either to settle on a net basis or to realise the assets and to settle the liabilities simultaneously.
4.13 Trade debts and other receivables
Trade debts are amounts due from customers for merchandise sold or services performed in the ordinary course of business. If collection is expected in one year or less (or in the normal operating cycle of the business, if longer), they are classified as current assets. If not, they are presented as non-current assets. Trade debts and other receivables are recognised initially at invoice amount, which approximates fair value, and subsequently measured at amortised cost using the effective interest method, less provision for impairment.
A provision for impairment is established when there is objective evidence that the Group will not be able to collect all amounts due
according to the original terms of the receivable. Significant financial difficulties of the debtor, probability that the debtor will enter bankruptcy or financial reorganisation, and default or delinquency in payments are considered indicators that the trade debt is impaired. The provision is recognised in the consolidated profit and loss account. Trade debts, considered irrecoverable, are written off as and when identified. Subsequent recoveries of amounts previously written off are credited to the consolidated profit and loss account.
Exchange gains and losses arising in respect of trade and other receivables in foreign currency are added to the carrying amount of
receivables. 4.14 Cash and cash equivalents
Cash and cash equivalents are carried in the consolidated balance sheet at cost. For the purpose of cash flow statement, cash and cash equivalents comprise of cash in hand, demand deposits and other short term highly liquid investments that are readily convertible to known amounts of cash and which are subject to an insignificant risk of change in value and finances under mark-up arrangements. In the consolidated balance sheet, finances under mark-up arrangements are included in current liabilities.
4.15 Non-current assets / disposal group held for sale
Non-current assets are classified as assets held-for-sale when their carrying amount is to be recovered principally through a sale transaction and a sale is considered highly probable. They are stated at the lower of carrying amount and fair value less cost to sell.
4.16 Borrowings
Borrowings are recognised initially at fair value (proceeds received), net of transaction costs incurred. Borrowings are subsequently carried at amortised cost; any difference between the proceeds (net of transaction costs) and the redemption value is recognised in the consolidated profit and loss over the period of the borrowings using the effective interest method.
Fees paid on the establishment of loan facilities are recognised as transaction costs of the loan to the extent that it is probable that some
or all of the facility will be drawn down. In this case, the fee is deferred until the draw-down occurs. To the extent there is no evidence that it is probable that some or all of the facility will be drawn down, the fee is capitalised as a pre-payment for liquidity services and amortised over the period of the facility to which it relates.
Borrowings are classified as current liabilities unless the Group has an unconditional right to defer settlement of the liability for at least
twelve months after the balance sheet date. Finance costs are accounted for on an accrual basis and are shown as accrued finance cost to the extent of the amount remaining
unpaid.

156
4.17 Trade and other payables
Trade and other payables are obligations to pay for goods or services that have been acquired in the ordinary course of business from
suppliers. Accounts payable are classified as current liabilities if payment is due within one year or less (or in the normal operating cycle
of the business if longer). If not, they are presented as non-current liabilities.
Trade and other payables are recognised initially at fair value and subsequently measured at amortised cost using the effective interest
method. Exchange gains and losses arising on translation in respect of liabilities in foreign currency are added to the carrying amount of
the respective liabilities.
4.18 Derivative financial instruments
These are initially recorded at cost on the date a derivative contract is entered into and are remeasured to fair value at subsequent
reporting dates. The method of recognising the resulting gain or loss depends on whether the derivative is designated as a hedging
instrument, and if so, the nature of the item being hedged. The Group designates certain derivatives as cash flow hedges.
The Group documents at the inception of the transaction the relationship between the hedging instruments and hedged items, as well
as its risk management objective and strategy for undertaking various hedge transactions. The Group also documents its assessment,
both at hedge inception and on an on-going basis, of whether the derivatives that are used in hedging transactions are highly effective in
offsetting changes in cash flow of hedged items.
The effective portion of changes in the fair value of derivatives that are designated and qualify as cash flow hedges are recognised in
statement of other comprehensive income. The gain or loss relating to the ineffective portion is recognised immediately in the consolidated
profit and loss account.
Amounts accumulated in equity are recognised in consolidated profit and loss account in the periods when the hedged item shall effect
profit or loss. However, when the forecast hedged transaction results in the recognition of a non-financial asset or liability, the gains and
losses previously deferred in equity are transferred from equity and included in the initial measurement of the cost of the asset or liability.
4.19 Revenue recognition
Revenue comprises the fair value of the consideration received or receivable for the sale of goods and services in the ordinary course of
the Group’s activities, net of discounts and sales tax. The Group recognises revenue when the amount of revenue can be reliably measured
and it is probable that future economic benefits will flow to the Group and specific criteria has been met for each of the Group’s activities
as described below:
(i) Sales revenue is recognised at the time the Group has transferred the significant risks and rewards of ownership of goods, which is
considered to be at the time of dispatch of goods and performance of services;
(ii) License fee from operating leases / license is recognised on a straight-line basis over the lease / license term. When the Group
provides incentives to its tenants, the cost of incentives is recognised over the lease / license term, on a straight-line basis, as a
reduction of rental income;
(iii) Service and management charges are recognised in the accounting period in which the services are rendered. When the Group is
acting as an agent, the commission rather than gross income is recorded as revenue;
(iv) Ancillary and marketing income is recognised when the event is performed;
(v) Returns on bank deposits are accrued on a time proportion basis by reference to the principal outstanding amount and the applicable
rate of return; and
(vi) Dividend income is recognised when right to receive such dividend is established.

157
ANNUALREPORT 2017
4.20 Foreign currency transactions and translation
a) Functional and presentation currency
Items included in the consolidated financial statements of the Group are measured using the currency of the primary economic environment
in which the Group operates (the functional currency). The consolidated financial statements are presented in Pak Rupees, which is the
Group’s functional and presentation currency. Figures are rounded off to the nearest thousand of Pak Rupees.
b) Transactions and balances
All monetary assets and liabilities in foreign currencies are translated into Pak Rupees at exchange rates prevailing at the consolidated
balance sheet date. Transactions in foreign currencies are translated into Pak Rupees at exchange rates prevailing at the dates of the
transactions. Foreign exchange gains and losses resulting from the settlement of such transactions and from the translation at year end
exchange rates of monetary assets and liabilities denominated in foreign currencies are charged or credited to consolidated profit and
loss account. Non-monetary assets and liabilities that are measured in terms of historical cost in a foreign currency are translated into
Pak Rupees at exchange rates prevailing at the date of transaction. Non-monetary assets and liabilities denominated in foreign currency
that are stated at fair value are translated into Pak Rupees at exchange rates prevailing at the date when fair values are determined.
Foreign exchange gains and losses are recognised in the consolidated profit and loss account except in case of items recognised in other
comprehensive income or equity in which case it is included in other comprehensive income or equity respectively.
c) Group Companies
The results and financial position of all the group entities (none of which has the currency of a hyper-inflationary economy) that have a
functional currency different from the presentation currency are translated into the presentation currency as follows:
(a) assets and liabilities for each consolidated balance sheet item presented are translated at the closing rate at the date of that
consolidated balance sheet;
(b) income and expenses for each item of consolidated profit and loss account are translated at average exchange rates (unless this
average is not a reasonable approximation of the cumulative effect of the rates prevailing on the transaction dates, in which case
income and expenses are translated at the rate on the dates of the transactions); and
(c) all resulting exchange differences are recognised in consolidated other comprehensive income.
Goodwill and fair value adjustments arising on the acquisition of a foreign entity are treated as assets and liabilities of the foreign entity
and translated at the closing rate. Exchange differences arising are recognised in consolidated other comprehensive income.
4.21 Borrowing costs
General and specific borrowing costs directly attributable to the acquisition, construction or production of qualifying assets, which are
assets that necessarily take a substantial period of time to get ready for their intended use or sale, are added to the cost of those assets,
until such time as the assets are substantially ready for their intended use or sale.
Investment income earned on the temporary investment of specific borrowings pending their expenditure on qualifying assets is deducted
from the borrowing costs eligible for capitalisation.
All other borrowing / finance costs are recognised in consolidated profit and loss account in the period in which they are incurred.
4.22 Dividend and other appropriations
Dividend distribution to the Group’s shareholders is recognised as a liability in the period in which the dividends are declared and other
appropriations are recognised in the period in which these are approved by the Board of Directors (‘BOD’).
4.23 Compound financial instruments
Compound financial instruments issued by the Group represent preference shares / convertible stock that can be converted into ordinary
shares or can be settled in cash.

158
The liability component of a compound financial instrument is recognised initially at the fair value of a similar liability that does not have an
equity conversion option. The equity component is recognised initially at the difference between the fair value of the compound financial
instrument as a whole and the fair value of the liability component. Any directly attributable transaction costs are allocated to the liability
and equity components in proportion to their initial carrying amounts.
Subsequent to initial recognition, the liability component of a compound financial instrument is measured at amortised cost using the
effective interest method. The equity component of a compound financial instrument is not remeasured subsequent to initial recognition.
4.24 Segment reporting
Operating segments are reported in a manner consistent with the internal reporting provided to the Chief Operating decision maker. The
Chief Operating decision-maker, who is responsible for allocating resources and assessing performance of the operating segments, has
been identified as the BOD of the Parent Company.
4.25 Provisions
Provisions are recognised when the Group has a present legal or constructive obligation as a result of past events and it is probable that
an outflow of resources embodying economic benefits will be required to settle the obligation and a reliable estimate of the amount can
be made. Restructuring provisions include lease termination penalties and employee termination payments and such other costs that are
necessarily entailed by the restructuring and not associated with on-going activities of the Group. Provisions are not recognised for future
operating losses.
Where there are a number of similar obligations, the likelihood that an outflow shall be required in settlement is determined by considering
the class of obligations as a whole. A provision is recognised even if the likelihood of an outflow with respect to any one item included in
the same class of obligations may be small.
Provisions are measured at the present value of the expenditures expected to be required to settle the obligation using a pre-tax rate that
reflects current market assessments of the time value of money and the risks specific to the obligation. The increase in the provision due
to passage of time is recognised as interest expense.
Provisions are reviewed at each balance sheet date and adjusted to reflect the current best estimate.
4.26 Share capital
Ordinary shares are classified as equity and recognised at their face value. Incremental costs directly attributable to the issue of new
shares are shown in equity as a deduction, net of tax, if any.
4.27 Earnings per share
The Group presents basic and diluted earnings per share (‘EPS’) data for its ordinary shares. Basic EPS is calculated by dividing the
consolidated profit or loss attributable to ordinary shareholders of the Parent Company by the weighted average number of ordinary shares
outstanding during the year. Diluted EPS is determined by adjusting the consolidated profit or loss attributable to ordinary shareholders
and the weighted average number of ordinary shares outstanding for the effects of all dilutive potential ordinary shares.
4.28 Contingent liabilities
Contingent liability is disclosed when:
There is a possible obligation that arises from past events and whose existence will be confirmed only by the occurrence or non-
occurrence of one or more uncertain future events not wholly within the control of the Group; or
There is present obligation that arises from past events but it is not probable that an outflow of resources embodying economic benefits
will be required to settle the obligation or the amount of the obligation cannot be measured with sufficient reliability.

159
ANNUALREPORT 2017
5. Issued, subscribed and paid up capital
2017 2016 Note 2017 2016 (Number of shares) (Rupees in thousand)
Ordinary shares of Rs. 10 each as at the
beginning of the year
33,603,295 33,603,295 - fully paid in cash 336,033 336,033
148,780 148,780 - fully paid for consideration other than cash 1,488 1,488
- fully paid against conversion of preference
5,000,000 4,000,000 shares / convertible stock 50,000 40,000
50,627,429 50,627,429 - fully paid bonus shares 506,274 506,274
89,379,504 88,379,504 893,795 883,795
Issuance of shares upon conversion of
– 1,000,000 preference shares / convertible stock 5.1 – 10,000
Ordinary shares of Rs. 10 each as at the
end of the year
33,603,295 33,603,295 - fully paid in cash 336,033 336,033
148,780 148,780 - fully paid for consideration other than cash 1,488 1,488
- fully paid against conversion of preference
5,000,000 5,000,000 shares / convertible stock 50,000 50,000
50,627,429 50,627,429 - fully paid bonus shares 506,274 506,274
89,379,504 89,379,504 893,795 893,795
5.1 Last year, under the terms of redemption / conversion of preference shares / convertible stock mentioned in note 6.9, the Group,
converted 1 million preference shares / convertible stock of Rs. 190 each held by International Finance Corporation, Washington D.C, USA
(‘IFC’) into 1 million fully paid ordinary shares of Rs. 10 each.
5.2 24,653,801 (2016: 24,309,601) ordinary shares of the Parent Company are held by IGI Holdings Limited (IGIHL)[Formerly IGI Insurance
Limited], an associate.
(Rupees in thousand) Note 2017 2016
6. Long term finances
These are composed of:
Local currency loans - secured
Long term finance facility I 6.1 1,142,870 1,714,290
Long term finance facility II 6.2 1,500,000 1,500,000
Long term finance facility III 6.3 4,495,649 4,482,547
Long term finance facility IV 6.4 3,491,223 993,003
Long term finance facility V 6.5 4,935,000 –
15,564,742 8,689,840
Foreign currency loans - secured
Term finance loan I 6.6 875,754 916,960
Term finance loan II 6.7 552,403 452,090
Term finance loan III 6.8 62,651 121,012
1,490,808 1,490,062
Preference shares / convertible stock - unsecured 6.9 932,650 932,650
17,988,200 11,112,552
Current portion shown under current liabilities 15 (3,361,942) (806,546)
14,626,258 10,306,006

160
6.1 Long term finance facility I
This loan has been obtained from Meezan Bank Limited under the Islamic mode of finance as a Musharika. It is secured by a first pari
passu charge over all present and future moveable fixed assets and specific land and buildings of the Parent Company located at Kasur
and Karachi amounting to Rs. 2,500 million. The balance is repayable in 4 equal semi-annual installments ending on December 28, 2019.
The loan carries mark-up at the rate of six month Karachi Inter Bank Offer Rate (“KIBOR”) plus 0.10 percent per annum. The effective
mark-up charged during the year ranges from 6.24 percent to 6.31 percent per annum (2016: 6.18 percent to 6.77 percent per annum).
6.2 Long term finance facility II
This represents a Term Finance Facility (the ‘Facility’) of Rs. 11 billion obtained from Habib Bank Limited to finance the redemption of
preference shares issued to IFC. The Facility is secured against pledge of Nestle Pakistan Limited’s shares owned by the Parent Company
under a “Share Pledge Agreement”. During last year, the Parent Company made a drawdown of Rs. 3,000 million on September 8,
2016 out of which, Rs. 1,500 million was prepaid before December 31, 2016 as permitted under the Facility. As per the agreement, the
Parent Company is entitled to make drawdowns of the remaining Facility within 18 months of the first drawdown date. The Facility carries
mark up at the rate of six month KIBOR plus 0.25 percent per annum and is payable in 4 equal semi annual installments commencing on
March 8, 2018 and ending on September 8, 2019. The effective mark-up rate charged during the year ranges from 6.30 percent to 6.40
percent per annum (2016: 6.30 percent per annum).
6.3 Long term finance facility III
This represents term finance facility of Rs. 4,500 million from MCB Bank Limited. As at December 31, 2017 the Group has availed Rs.
4,500 million (2016: Rs. 4,500 million) against term finance. The loan carries mark up at annual rate of six month KIBOR plus 0.14
percent per anum and 0.40 percent per anum during first and last three and half years respectively during the tenure of the loan. Mark
up is payable half yearly in arrears. The tenure of the loan is seven years and it is repayable after a grace period of three and half years
in seven semi annual installments commencing from September 30, 2019. This facility is secured to the extent of Rs. 7,333.334 million
against the following:
First exclusive charge over all present and future movable fixed assets of the Group’s subsidiary, namely, Packages Construction
(Private) Limited (‘PCPL’) including but not limited to plant, machinery, equipment, fixtures and other installations and such movables of
whatsoever nature installed or to be installed at the premises of PCPL located anywhere in Pakistan.
First exclusive equitable mortgage charge on all that piece and parcel of property owned by the Parent Company, measuring 119
kanals 15 marlas and 62.25 Sq. fts in aggregate, situated at Moza Amar Saddhu, Tehsil/District Lahore together with all present and
future construction thereon, and present & future fixtures and fittings attached thereto, that are presently and/or in future the property
of the Parent Company.
6.4 Long term finance facility IV
This represents term finance facility of Rs. 3,500 million from Allied Bank Limited. As at December 31, 2017 the Group has availed
Rs. 1,000 million against term finance. The loan carries mark up at six month KIBOR plus 0.275 percent per annum. The tenure of the
loan is seven years and it is repayable after a grace period of three and half years in seven semi-annual installments commencing from
February 10, 2020. The loan is secured to the extent of Rs. 4,667 million against the following:
First pari passu charge over all present and future movable fixed assets and buildings of PCPL but not limited to plant, machinery,
equipment, machinery in transit, tools, spares, fittings and fixtures and other installations installed or to be installed, stored and kept at
the premises of customer located anywhere in Pakistan.
First pari passu charge on all that piece and parcel of property owned by the Parent Company, measuring 119 kanals, 15 marlas and
62.25 Sq. fts in aggregate, situated at Moza Amar Saddhu, Tehsil / District Lahore together with all present and future construction
thereon, and present & future fixtures and fittings attached thereto, that are presently and / or in future the property of the parent
Company.

161
ANNUALREPORT 2017
6.5 Long term finance facility V
This represents the loan availed by Group against aggregate facility of Rs. 7,000 million obtained from a consortium of commercial banks
led by MCB Bank Limited. It is secured by an aggregate sum of Rs. 9,333 million by a first priority charge on the hypothecated assets
of BSPPL of at least the charge amount and a first priority mortgage of title deeds of the immovable properties of at least the charge
amount. It carries mark up at six month KIBOR plus 0.45 percent per annum (2016: Nil). The balance is repayable in 6 equal semi annual
installments ending on September 2020. The effective mark up charged during the year ranges from 6.50 per cent to 6.60 percent per
annum (2016: Nil).
Under the terms of this loan facility, BSPPL is required to comply with certain financial covenants. BSPPL has complied with those
covenants throughout the year, except for the ‘Minimum debt service coverage ratio.’
6.6 Term finance loan I
This represents loan obtained from Habib Bank Limited, Offshore Banking Unit, Bahrain (‘HBL Bahrain’) of USD 9.5 million to finance
the acquisition of Group subsidiary, namely, Flexible Packages Convertors (Proprietary) Limited (‘FPC’). This facility is provided against a
guarantee in the form of a Standby Letter of Credit (‘SBLC’) issued by Habib Bank Limited Pakistan (‘HBL Pakistan’) in favor of HBL Bahrain
as referred to in note 20.1. SBLC is secured against pledge of Nestle Pakistan Limited shares owned by the Parent Company. It carries
mark up at the rate of London Inter Bank offer Rate (‘LIBOR’) plus 5.25 percent per annum and the balance USD 8.8 million is payable in
10 equal semi annual installments started from November 2017 and ending in May 2022.
6.7 Term finance loan II
This represents a term loan from First National Bank South Africa at a prime rate with a sixty month fixed repayment period, against the
security of a portion of plant and machinery of the Group.
6.8 Term finance loan III
This term loan has been obtained from MCB Bank Limited Sri Lanka and is repayable over seven years including two years grace period.
6.9 Preference shares / convertible stock - unsecured
During the year 2009, the Parent Company issued 10 percent local currency non-voting preference shares / convertible stock at the rate
of Rs 190 per share amounting to USD 50 million equivalent to Rs. 4,120.50 million under “Subscription Agreement” dated March 25,
2009 with IFC.
Terms of redemption / conversion
Each holder of preference shares / convertible stock shall have a right to settle at any time, at the option of holder, either in the form of
fixed number of ordinary shares, one ordinary share for one preference share / convertible stock, or cash. The Parent Company may, on
its discretion, refuse to purchase the preference shares / convertible stock offered to it for purchase in cash. In case of refusal by the
Parent Company, preference shareholders shall have the right to either retain the preference shares / convertible stock or to convert them
into ordinary shares. The preference shares / convertible stock can be held till perpetuity if preference shareholders do not opt for the
conversion or cash settlement.
Rate of return
The preference share / convertible stock holders have a preferred right of return at the rate of 10 percent per annum on a non-cumulative
basis till the date of settlement of preference shares / convertible stock either in cash or ordinary shares. In case the amount of dividend
paid to an ordinary shareholder exceeds that paid to a preference shareholder, the preference shareholders have the right to share the
excess amount with the ordinary shareholders on an as-converted basis.

162
Preference shares / convertible stock are recognised in the consolidated balance sheet as follows:
(Rupees in thousand) Note 2017 2016
Face value of preference shares / convertible stock
[8,186,842 (2016: 8,186,842) shares of Rs. 190 each] 1,555,500 1,555,500
Transaction costs (16,628) (16,628)
1,538,872 1,538,872
Equity component - classified under capital and reserves 6.9.1 (606,222) (606,222)
Liability component - classified under long term finances 6.9.2 932,650 932,650
Accrued return on preference shares / convertible stock
classified under accrued finance cost 19 155,550 155,550
The fair value of the liability component of the preference shares / convertible stock is calculated by discounting cash flows at a rate of
approximately 16.50 percent till perpetuity which represents the rate of similar instrument with no associated equity component. The
residual amount, representing the value of the equity conversion component, is included in shareholders’ equity as preference shares /
convertible stock.
6.9.1 Movement in equity component - classified under capital and reserves
2017 2016 Note 2017 2016 (Number of shares) (Rupees in thousand)
8,186,842 17,686,842 Equity component at the beginning of the year 606,222 1,309,682
– – Transfer from liability component 6.9.2 – 113,921
Conversion into: 5.1
– (1,000,000) ordinary share capital – (10,000)
– – share premium – (177,969)
– (1,000,000) – (74,048)
– (8,500,000) Redemption of preference shares 6.9.3 – (629,412)
8,186,842 8,186,842 Equity component at the end of the year 606,222 606,222
(Rupees in thousand) Note 2017 2016
6.9.2 Movement in liability component
Liability component of 8,186,842 (2016: 17,686,842) preference
shares as at the beginning of the year 932,650 2,014,895
Transfer to equity component upon conversion of Nil
(2016: 1,000,000) preference shares into ordinary shares 6.9.1 – (113,921)
Redemption of Nil (2016: 8,500,000) preference shares 6.9.3 – (968,324)
Liability component of 8,186,842 (2016: 8,186,842) preference
shares as at the end of the year 932,650 932,650
6.9.3 Last year, under the terms of redemption / conversion of preference shares / convertible stock mentioned in note 6.9, IFC exercised its
right to redeem 8.5 million preference shares / convertible stock of Rs. 190 each into cash. The mutually agreed redemption consideration
was allocated to liability and equity portions in the same manner as was used for separation of these components at the time of initial
recognition at the prevailing market rates and both were extinguished in the same ratio.

163
ANNUALREPORT 2017
7. Equity portion of loans from shareholder of the Parent Company
This represents equity portion of interest free loan from shareholder of the Parent Company. On April 26, 2017 the terms of the loan
were modified and tenure of the loan was extended to December 31, 2017. On December 31, 2017, the terms of the loan were again
modified and tenure of the loan was extended to December 31, 2019. The gain of Rs. 33.377 million on renegotiation(s) and gain of
Rs. 90.620 million on initial recognition of long term loan, are classified directly in equity as a capital contribution of the shareholder of the
Parent Company.
(Rupees in thousand) Note 2017 2016
Opening balance 77,991 46,596
Equity portion of long term loan at initial recognition 8 90,620 –
Equity portion of short term loan at renegotiation(s) 16 33,377 39,959
Amount attributable to NCI (30,801) (8,564)
Closing balance 171,187 77,991
8. Loan from shareholder of the Parent Company - unsecured
Transferred from short term loan 16 500,000 –
Equity portion of loan at initial recognition 7 (90,620) –
409,380 –
8.1 This loan has been obtained from Syed Babar Ali, shareholder of the Parent Company and is interest free. The loan is payable on
December 31, 2019. It is being carried at amortised cost using a market interest rate of 10.50 percent for a similar instrument.
(Rupees in thousand) Note 2017 2016
9. Liabilities against assets subject to finance lease
Present value of minimum lease payments 81,993 96,189
Current maturity shown under current liabilities 15 (32,602) (22,338)
49,391 73,851
Interest rate used as discounting factor ranges from 6.42 percent to 10.72 percent per annum (2016: 6.28 percent to 10.72 percent per
annum). Taxes, repairs and insurance costs are borne by the lessee.
The amount of the future payment of the lease as shown in the consolidated balance sheet and the period in which these payments will
become due are as follows:
Minimum Future Present value of lease lease finance liability(Rupees in thousand) payments charge 2017 2016
Not later than one year 38,534 5,932 32,602 22,338
Later than one year and not later than five years 54,362 4,971 49,391 73,851
92,896 10,903 81,993 96,189

164
10. Security deposits
These represent interest free security deposits from tenant’s and are repayable on cancellation / withdrawal of the license / lease agreement or on cessation of business with PCPL. Gross value received from tenants as at year end is Rs. 418.251 million. These have been carried at amortised cost using a market interest rate of 10 percent for a similar instrument. The gain on initial recognition is
recognised as deferred income and would spread over the license lease term.
(Rupees in thousand) Note 2017 2016
Gross proceeds from tenants 418,251 – Deferred income 11 (140,596) –
277,655 –11. Deferred income
Deferred income recognised 10 140,596 – Income to be recognised in the following year classified under current liabilities 15 (32,707) –
107,889 – 12. Deferred tax
The liability for deferred tax comprises temporary differences relating to: Accelerated tax depreciation 2,480,498 841,170 Unused tax losses (965,476) – Fair value gain on acquisition of subsidiary 899,608 – Investments in associates and joint ventures 372,000 155,000 Minimum tax available for carry forward 12.1 – (52,925) Provision for accumulating compensated absences (154,534) (104,832) Others (66,590) (35,884)
2,565,506 802,529 12.1 Deferred tax asset on tax losses representing minimum tax available for carry forward under section 113 of the Income Tax Ordinance,
2001 is recognised to the extent that the realisation of related tax benefits through future taxable profits of the Group is probable. The Group has not recognised deferred tax asset of Rs. 214.823 million (2016: Nil), set to lapse in the accounting year 2022, in respect of minimum tax available for carry forward arisen after the formation of the Taxation Group as referred to in note 4.2, as sufficient taxable profits would not be available to the Taxation Group to utilise these in the foreseeable future. Deferred tax asset has also not been recognised on aggregate minimum taxes prior to the formation of the Taxation Group amounting to Rs. 801.931 million (2016: Rs. 859.940 million) as the same can not be realised against the taxable profits of the Taxation Group. However, in case the Parent Company and BSPPL opt out of the Taxation Group, these minimum tax credits will become available for realisation against the taxable profits of the Parent Company and BSPPL. Out of these minimum tax credits, Rs. 262.042 million, Rs. 166.389 million, Rs. 157.677 million and Rs. 215.823 million are set to lapse by December 31, 2018, December 31, 2019, December 31, 2020 and December 31, 2021 respectively.
12.2 The unabsorbed depreciation loss of Rs. 3,218.255 million (2016: Rs. 3,218.255 million) is available for set off against income of BSPPL
under separate return for indefinite period. However, it is not available for set off against the Group Taxation model. Therefore, no deferred tax asset has been recongised on this loss.
12.3 For the purpose of current taxation unused tax losses available for carry forward to PCPL are Rs. 852.604 million (2016: Rs. 223.912 million). PCPL has not recognised any related deferred tax asset based on prudence principal as sufficient tax profits would not be available to set these off in the foreseeable future. Tax loses amounting to Rs. 0.112 million, Rs. 39.678 million, Rs. 74.285 million, Rs. 94.745 million and Rs. 105.759 million are set to lapse by years ending on December 31, 2020, 2021, 2022, 2023 and 2024 respectively.

165
ANNUALREPORT 2017
(Rupees in thousand) Note 2017 2016
13. Retirement benefits
Classified under non-current liabilities
Funded
Pension fund 13.1 181,715 14,983
Gratuity fund 13.1 317,539 72,321
499,254 87,304
Unfunded
Staff gratuity 13.2 17,332 15,521
516,586 102,825
Pension fund Gratuity fund(Rupees in thousand) 2017 2016 2017 2016
13.1 Amounts recognised in consolidated balance sheet
The amounts recognised in the consolidated
balance sheet are as follows:
Fair value of plan assets 521,244 691,464 510,715 416,664
Present value of defined benefit obligation (702,959) (706,447) (828,254) (488,985)
Liability as at December 31 (181,715) (14,983) (317,539) (72,321)
13.1.1 Movement in net liability for retirement benefits
Net liability as at January 1 (14,983) (24,744) (72,321) (15,681)
Acquisition of subsidiary – – (127,089) –
Charged to consolidated profit and loss account (1,199) (2,227) (43,028) (24,906)
Net remeasurement for the year recorded
in consolidated other comprehensive income (‘OCI’) (165,533) 11,988 (99,421) (49,651)
Contribution by the Group – – 24,320 17,917
Net liability as at December 31 (181,715) (14,983) (317,539) (72,321)
(Rupees in thousand) Note 2017 2016
12.4 The gross movement in net deferred tax liability during the year is as follows:
Opening balance 802,529 693,332
Acquisition of subsidiary 1,466,019 –
Charged to consolidated profit and loss account 41 328,550 78,499
Credited to consolidated other comprehensive income (79,503) (10,202)
Exchange loss 47,911 40,900
Closing balance 2,565,506 802,529

166
Pension fund Gratuity fund(Rupees in thousand) 2017 2016 2017 2016
13.1.2 Movement in present value of defined benefit obligation
Present value of defined benefit obligation
as at January 1 706,447 651,753 488,985 378,247
Acquisition of subsidiary – – 267,305 –
Service cost – – 36,506 24,301
Interest cost 53,604 55,520 42,303 31,668
Benefits paid (72,795) (69,723) (35,127) (49,806)
Actuarial (gains) / losses from change in
financial assumptions (19,902) 42,316 121 39,529
Experience adjustments 35,605 26,581 28,161 65,046
Present value of defined benefit obligation
as at December 31 702,959 706,447 828,254 488,985
Pension fund Gratuity fund(Rupees in thousand) 2017 2016 2017 2016
13.1.3 Movement in fair value of plan assets
Fair value as at January 1 691,464 627,009 416,664 362,566
Acquisition of subsidiary – – 140,216 –
Interest income on plan assets 52,405 53,293 35,781 31,063
Group contributions – – 24,320 17,917
Benefits paid (72,795) (69,723) (35,127) (49,806)
Return on plan assets, excluding interest income (149,830) 80,885 (71,139) 54,924
Fair value as at December 31 521,244 691,464 510,715 416,664
13.1.4 Risks faced by the Group on account of gratuity and pension funds
Final salary risks - The risk that the final salary at the time of cessation of service is greater than what was assumed. Since the benefit is
calculated on the final salary, the benefit amount would also increase proportionately.
Asset volatility - Most assets are invested in risk free investments of 3, 5 or 10 years in Government Bonds. However, investments in equity
instruments are subject to adverse fluctuations as a result of change in the market price.
Discount rate fluctuation - The plan liabilities are calculated using a discount rate set with reference to corporate bond yields. A decrease
in corporate bond yields will increase plan liabilities, although this will be partially offset by an increase in the value of the current plans’
bond holdings.
Investment risks - The risk of the investments underperforming and not being sufficient to meet the liabilities. This risk is mitigated by
closely monitoring the performance of investments.
Risk of insufficiency of assets - This is managed by making regular contribution to the funds as advised by the actuary.
Pension fund Gratuity fund(Rupees in thousand) 2017 2016 2017 2016
13.1.5 Amounts recognised in the consolidated profit and loss account
Current service cost – – 36,506 24,301
Interest cost for the year 53,604 55,520 42,303 31,668
Interest income on plan asset (52,405) (53,293) (35,781) (31,063)
Net expense charged to consolidated
profit and loss account 1,199 2,227 43,028 24,906

167
ANNUALREPORT 2017
Pension fund Gratuity fund(Rupees in thousand) 2017 2016 2017 2016
13.1.7 Plan assets
Plan assets are comprised as follows:
Debt instruments 225,959 248,235 226,631 164,204
Shares and units of mutual funds 277,562 426,910 264,056 246,284
Cash at banks 14,751 16,319 20,028 6,176
Others 2,972 – – –
521,244 691,464 510,715 416,664
13.1.8 The present value of defined benefit obligation, the fair value of plan assets and the deficit or surplus of pension fund is as follows:
(Rupees in thousand) 2017 2016 2015 2014 2013
As at December 31
Present value of defined benefit obligation (702,959) (706,447) (651,753) (641,863) (568,285)
Fair value of plan assets 521,244 691,464 627,009 700,115 567,707
(Deficit) / surplus (181,715) (14,983) (24,744) 58,252 (578)
Experience adjustment on obligation 5% 4% -5% 2% 1%
Experience adjustment on plan assets -28% 12% -11% 24% 2%
Fair value of plan assets includes ordinary shares of the Parent Company, whose fair value as at December 31, 2017 is Rs. 336.507
million (2016: Rs. 561.064 million).
13.1.9 The present value of defined benefit obligation, the fair value of plan assets and the deficit or surplus of gratuity fund is as follows:
(Rupees in thousand) 2017 2016 2015 2014 2013
As at December 31
Present value of defined benefit obligation (828,254) (488,985) (378,247) (309,873) (275,115)
Fair value of plan assets 510,715 416,664 362,566 339,502 281,655
(Deficit) / surplus (317,539) (72,321) (15,681) 29,629 6,540
Experience adjustment on obligation 3% 13% 6% 13% 9%
Experience adjustment on plan assets 14% 13% 1% 21% 14%
Fair value of plan assets include ordinary shares of the Parent Company, whose fair value as at December 31, 2017 is Rs. 53.274 million
(2016: Rs. 88.825 million).
Pension fund Gratuity fund(Rupees in thousand) 2017 2016 2017 2016
13.1.6 Remeasurements charged to consolidated OCI
Actuarial (gains) / losses from change in
financial assumptions (19,902) 42,316 121 39,529
Experience adjustments 35,605 26,581 28,161 65,046
Return on plan assets, excluding interest income 149,830 (80,885) 71,139 (54,924)
Total remeasurements charged / (credited) to consolidated OCI 165,533 (11,988) 99,421 49,651

168
(Rupees in thousand) 2017 2016
13.2 Unfunded retirement benefits - staff gratuity
As at the beginning of the year 15,521 13,266 Interest cost 1,842 1,300 Charge for the year 1,804 1,717 Payments made during the year (2,508) (1,181) Actuarial loss 66 1,000 Exchange adjustment 607 (581)
As at the end of the year 17,332 15,521 2017 (Rupees in thousand) Pension fund Gratuity fund
13.3 Sensitivity analysis
Year end sensitivity analysis on defined benefit obligation:
Discount rate + 100 bps 655,962 (336,881) Discount rate - 100 bps 756,636 1,525,192 Salary increases / indexation + 100 bps 756,816 1,550,818 Salary increases / indexation - 100 bps 655,265 (375,835) (Rupees in thousand) Note 2017 2016
14. Deferred liabilities
This represents provision made to cover the obligation for accumulating compensated absences.
Opening balance 349,437 234,990 Acquisition of subsidiary 133,908 – Charged to consolidated profit and loss account 14.2 66,133 140,558 549,478 375,548 Payments made during the year (24,196) (26,111)
Closing balance 14.1 525,282 349,437 14.1 Movement in liability for accumulating compensated absences
Present value of obligation as at January 1 349,437 234,990 Acquisition of subsidiary 133,908 – Current service cost 29,039 8,906 Interest cost on defined benefit obligation 29,337 19,974 Benefits paid during the year (24,196) (26,111) Remeasurement during the year 7,757 111,678
Present value of obligation as at December 31 525,282 349,437
14.2 Charges during the year
Current service cost 29,039 8,906
Interest cost 29,337 19,974
Remeasurement during the year 7,757 111,678
Expense charged to the consolidated profit and loss account 66,133 140,558

169
ANNUALREPORT 2017
14.3 Amounts of current period and previous four periods of accumulating compensated absences are as follows:
(Rupees in thousand) 2017 2016 2015 2014 2013
As at December 31
Present value of accumulating
compensated absences 525,282 349,437 234,990 201,030 156,415
Actuarial remeasurements 7,757 111,678 30,679 32,372 17,568
2017 Accumulating compensated (Rupees in thousand) absenses
14.4 Sensitivity analysis
Year end sensitivity analysis on defined benefit obligation are as follows:
Discount rate + 100 bps 448,568
Discount rate - 100 bps 531,957
Salary increases + 100 bps 532,176
Salary increases - 100 bps 447,635
(Rupees in thousand) Note 2017 2016
15. Current portion of non-current liabilities
Current portion of long term finances - secured 6 3,361,942 806,546
Current portion of liabilities against assets subject
to finance lease 9 32,602 22,338
Current portion of deferred income 11 32,707 –
3,427,251 828,884
16. Short term loan from shareholder of the Parent Company - unsecured
Loan is recognised in the consolidated balance sheet as follows:
Opening balance 462,930 478,110
Equity portion of loan at renegotiations 7 (33,377) (39,959)
Fair value of the loan at initial recognition 429,553 438,151
Interest accrued during the year 70,447 24,779
500,000 462,930
Transferred to long term 8 (500,000)
Closing balance – 462,930

170
(Rupees in thousand) Note 2017 2016
17. Finances under mark up arrangements - secured
Running finances - secured 17.1 3,001,722 1,038,079
Bills discounted - secured 17.2 – –
Short term finances - secured 17.3 2,090,000 880,000
5,091,722 1,918,079
17.1 Running finances - secured
Short term running finances available from a consortium of commercial banks under mark-up arrangements amount to Rs. 18,240 million (2016: Rs. 9,922 million). The rates of mark-up are based on KIBOR plus spread and range from 6.13% to 7.40% (2016: 6.19% to 7.74%) per annum or part thereof on the balances outstanding. In the event the Group fails to pay the balances on the expiry of the quarter, year or earlier demand, mark-up is to be computed at the rates ranging from 7.38% to 9.03% (2016: 7.43% to 9.44%) per annum or part thereof on the balances unpaid. The aggregate running finances are secured by hypothecation of stores, spares, stock-in-trade and trade debts.
17.2 Bills discounted - secured
Facilities for discounting of export / inland bills of Rs. 631 million (2016: Rs. 631 million) are available to the Group as a sub-limit of the running finance facilities referred to in note 17.1. Mark-up is fixed as per mutual agreement at the time of transaction. The outstanding balance of bills discounted is secured, in addition to the securities referred to in note 17.1, on the specific bills discounted. The facility has not been availed in the current year.
17.3 Short term finances - secured
Facilities for obtaining short term finances of Rs. 16,365 million (2016: Rs. 8,665 million) are available to the Group as a sub-limit of the running finance facilities referred to in note 17.1. The rates of mark-up are based on KIBOR plus spread ranging from 6.04% to 6.28% (2016: 6.03% to 6.55%) per annum or part thereof on the balances outstanding.
17.4 Letters of credit and bank guarantees
Of the aggregate facilities of Rs. 16,109 million (2016: Rs. 7,909 million) for opening letters of credit (including Rs. 11,359 million available to Group as sub-limit of the sublimit of running finance facilities referred to in note 17.1) and Rs. 1,867 million (2016: Rs. 849 million) for guarantees, the amounts utilised at December 31, 2017 were Rs. 2,974 million (2016: Rs. 660 million) and Rs. 1,208 million (2016: Rs. 248 million) respectively. The facilities for guarantee are secured by second hypothecation charge over stores, spares, stock-in-trade and trade debts.
(Rupees in thousand) Note 2017 2016
18. Trade and other payables
Trade creditors 18.1 3,790,051 2,227,002 Accrued liabilities 18.2 & 18.3 1,960,100 1,272,892 Bills payable 171,940 417,723 Retention money payable 169,450 188,401 Sales tax payable 6,398 47,253 Federal excise duty payable 3,590 3,789 VAT Payable 11,939 – Advances from customers 18.4 151,710 215,458 Payable to retirement funds 18.5 17,165 15,948 Deposits - interest free repayable on demand 13,035 6,922 Profit payable on term finance certificate (‘TFC’) 1,387 1,387 Unclaimed dividends 39,307 26,400 Workers’ profit participation fund 18.6 803,402 487,351 Workers’ welfare fund 18.7 27,413 19,540 Operating lease rentals 76,875 57,169 Others 18.8 268,471 139,138
7,512,233 5,126,373

171
ANNUALREPORT 2017
(Rupees in thousand) 2017 2016
18.1 Trade creditors include amount due to related parties as follows:
Joint venture
Bulleh Shah Packaging (Private) Limited – 179,316
Associates
Tri-Pack Films Limited 47,504 46,530 IGI Holdings Limited [Formerly IGI Insurance Limited] 12,247 6,367 IGI Life Insurance Limited 3,597 3,470
Other Related Parties
DIC Asia Pacific Pte Limited 9,088 36,385 DIC Corporation Tokyo – 3,616 DIC Corporation Japan 9,463 – DIC Fine Chemicals Pvt Limited – 186 DIC India Limited 15,149 8,814 DIC Malaysia SDN. BHD 1,771 364 Sun Chemical S.A. 697 3,521 Sun Chemical S.P.A. – 113 PT Pardic Jaya Chemicals, Indonesia 22,971 – Nantong DIC Color Company Limited 1,464 – Coates Screen Inks GMBH 22 22
123,973 288,704
18.2 Accrued liabilities include amounts due to related parties as follows:
Joint venture
Bulleh Shah Packaging (Private) Limited – 411
Associate
IGI Holdings Limited [Formerly IGI Insurance Limited] 7,267 1,155
Other related parties
Tetra Pak Pakistan Limited 1,875 1,987 DIC Asia Pacific Pte Limited 41,173 37,891
50,315 41,444 18.3 Included in accrued liabilities is a provision for Rs. 492.195 million (2016: Nil) relating to Gas Infrastructure Development Cess (‘GIDC’) and
differential of applicable tariff rate to industrial and captive power users along with the Late payment surcharge (‘LPS’) on the outstanding balance of GIDC. BSPPL contended itself as an ‘industrial power user’ whereas it was classified as a ‘captive power user’ by Sui Northern Gas Pipelines Limited (‘SNGPL’). The matter was being contested before the Honorable Lahore High Court (‘LHC’). Subsequent to year end, the LHC has set aside the decision of Oil and Gas Regulatory Authority (‘OGRA’) dated January 14, 2016, declaring the BSPPL as an industrial power user. Consequently, BSPPL has reversed the provision in respect of LPS recorded on differential of applicable tariff rate.
18.4 Included in advances from customers, Rs. 0.432 million (2016: Rs. 0.544 million) is due to Tri-Pack Films Limited, an associate. (Rupees in thousand) Note 2017 2016
18.5 Payable to retirement funds
Employees’ provident fund 18.5.1 9,685 7,978 Employees’ gratuity fund 1,787 1,545 Management staff pension fund 5,693 6,425
17,165 15,948

172
(Rupees in thousand) Note 2017 2016
18.5.1 Employees’ provident fund
Size of the fund - total assets 2,698,458 2,918,181 Cost of investments made out of provident fund 1,412,891 861,963 Fair value of investments made out of provident fund 18.5.2 2,641,928 2,890,075 Percentage of investments made out of provident fund 97.91% 99.04%
2017 2016 Rupees in % age of Rupees in % age of thousand investment thousand investment
18.5.2 Break-up of value of investments
Equity shares of listed companies 1,396,593 52.86% 2,117,688 73.27%Listed debt securities 76,337 2.89% – 0.00%Mutual funds 468,683 17.74% 318,533 11.02%Government securities 249,548 9.45% 94,503 3.27%Term Deposit Receipts with banks 261,302 9.89% 303,831 10.51%Bank balances 111,940 4.24% 2,063 0.08%Others 77,525 2.93% 53,457 1.85%
2,641,928 100.00% 2,890,075 100.00% 18.5.3 The investments out of the employees’ provident fund have been made in accordance with the provisions of section 218 of the Companies
Act, 2017 and rules formulated for this purpose. The figures are based on the audited financial statements of the employees’ provident
fund of the Parent Company and the un-audited financial statements of employees’ provident fund of BSPPL.
(Rupees in thousand) Note 2017 2016
18.6 Workers’ profit participation fund
Opening balance 487,351 202,337 Refund claimed 2,320 1,879 Provision for the year 37 401,994 388,535
891,665 592,751 Payments made during the year (88,263) (105,400)
Closing balance 803,402 487,351
18.7 Workers’ welfare fund
Opening balance 19,540 186,485 Provision for the year 37 26,054 19,547 Reversal of excess provision of prior years 38 (7,351) (150,606)
38,243 55,426 Payments made during the year (9,092) (35,886)
Closing balance 29,151 19,540 18.8 Others include due to related parties amounting to Rs. 13.367 million (2016: Rs. 3.268 million).
(Rupees in thousand) 2017 2016
19. Accrued finance costs
Accrued mark up / return on: Long term local currency loans - secured 290,138 135,583 Long term foreign currency loans - secured 6,150 5,497 Preference shares / convertible stock - unsecured 155,550 155,550 Finances under mark up arrangements - secured 43,440 16,882
495,278 313,512

173
ANNUALREPORT 2017
20. Contingencies and commitments
20.1 Contingencies in respect of:
(i) Claims against the Group by ex-employees not acknowledged as debts amounting to Rs. 28.294 million (2016: Rs. 14.861
million).
(ii) Guarantee issued in favor of Excise and Taxation Officer amounting to Rs. 1.624 million (2016: 1.624 million).
(iii) Post dated cheques not provided in the consolidated financial statements furnished by the Group in favour of the Collector of
Customs against custom levies aggregated to Nil (2016: Rs. 19.632 million) in respect of goods imported.
(iv) Standby letter of credit issued by Habib Bank Limited, Pakistan (‘HBL Pakistan’) in favor of Habib Bank Limited, Bahrain (‘HBL
Bahrain’) on behalf of the Parent Company amounting to Rs. 1,223.503 million (2016: Rs. 1,231.116 million) to secure long term
finance facility provided by HBL Bahrain to Anemone Holdings Limited (‘AHL’) (wholly-owned subsidiary of the Parent Company).
The standby letter of credit is secured against pledge of Nestle Pakistan Limited’s shares owned by the Parent Company
(v) Letters of guarantees issued to various parties aggregating to Rs. 189.474 million (2016: Rs. 246.146 million).
(vi) During the year the Walton Cantonment Board (‘WCB’) issued a notice to PCPL requiring payment of commercialisation fee of Rs.
544 million. The Group challenged the demand of WCB before the LHC through Writ Petition No. 8636/17. The LHC after hearing
the point of view of the Group, by its order dated March 24, 2017, remitted the matter to WCB to decide the same within forty
days and further directed that no coercive to be taken against the Group in the meanwhile.
WCB conducted a hearing on May 9, 2017 and representative of WCB could not justify the charging of commercialisation fee and
sought time to produce statutory documents permitting the reason for imposing such fee. The Group’s legal counsel continuously
followed up with WCB for statutory instrument, however WCB did not respond to those requests. In view of the foregoing and
lapse of the deadline of LHC, the management considers that there are strong grounds to support the Group’s stance and thus
no provision has been made in these consolidated financial statements.
20.2 Commitments in respect of:
(i) Letters of credit and contracts for capital expenditure Rs. 558.812 million (2016: Rs. 870.599 million).
(ii) Letters of credit and contracts for other than for capital expenditure Rs. 2,587.985 million (2016: Rs. 511.677 million).
(iii) The amount of future payments under operating leases and the period in which these payments will become due are as follows:
(Rupees in thousand) Note 2017 2016
Not later than one year 175,359 98,799
Later than one year and not later than five years 480,532 457,006
Later than five years 15,628 77,946
671,519 633,751
There are no commitments with related parties.
21. Property, plant and equipment
Operating fixed assets
Owned assets 21.1 23,787,270 6,288,589
Assets subject to finance lease 21.2 84,248 91,099
23,871,518 6,379,688
Capital work-in-progress 21.3 1,999,477 108,659
Major spare parts and stand-by equipment 21.4 121,811 61,729
25,992,806 6,550,076

174
21.1 Owned assets 2017 Accumulated Depreciation Accumulated Book value Cost as at Cost as at depreciation charge / depreciation as at December Acquisition of Exchange Additions / Transfer December as at December Exchange (deletions) Transfer as at December December(Rupees in thousand) 31, 2016 subsidiary differences (deletions) in 31, 2017 31, 2016 differences for the year in 31, 2017 31, 2017
Freehold land 236,207 349,156 4,476 121,247 61,953 773,039 – – – – – 773,039
– – – –
Buildings on freehold land 629,071 2,947,241 3,153 49,168 34,855 3,663,488 214,280 604 82,414 32,035 329,333 3,334,155
– – – –
Buildings on leasehold land 242,684 – 5,879 6,784 15,833 271,180 132,048 1,358 13,155 2,565 149,126 122,054
– – – –
Plant and machinery 10,047,411 14,051,384 352,111 685,330 – 24,939,960 5,158,859 73,462 1,316,631 – 6,372,002 18,567,958
(196,276) – (176,950) –
Other equipments (computers, lab
equipments and other office equipments) 1,193,035 107,382 27,750 206,744 – 1,517,181 834,264 21,139 186,083 – 1,024,931 492,250
(17,730) – (16,555) –
Furniture and fixtures 77,221 9,026 3,386 64,548 – 153,549 45,527 989 13,918 – 59,810 93,739
(632) – (624) –
Vehicles 383,482 115,262 801 143,599 1,549 549,679 135,544 508 44,962 557 145,604 404,075
(95,014) – (35,967) –
12,809,111 17,579,451 397,556 1,277,420 114,190 31,868,076 6,520,522 98,060 1,657,163 35,157 8,080,806 23,787,270
(309,652) – (230,096) –
2016 Exchange Exchange Accumulated adjustment Depreciation Accumulated Book value Cost as at adjustment Cost as at depreciation as on opening charge / Transfer depreciation as as at December on opening Additions / Transfer December at December accumulated (deletions) in / (out) at December December(Rupees in thousand) 31, 2015 cost (deletions) in / (out) 31, 2016 31, 2015 depreciation for the year (note 18.2) 31, 2016 31, 2016
Freehold land 171,158 (5,198) 22,951 47,296 236,207 – – – – – 236,207
– – – –
Buildings on freehold land 580,275 (3,336) 52,132 – 629,071 191,825 (382) 22,837 – 214,280 414,791
– – – –
Buildings on leasehold land 268,856 5,020 638 – 242,684 136,238 530 13,105 – 132,048 110,636
– (31,830) – (17,825)
Plant and machinery 8,805,381 173,592 1,314,684 713,291 10,047,411 5,418,612 5,893 606,747 64,028 5,158,859 4,888,552
(959,537) – (936,421) –
Other equipments (computers, lab
equipments and other office equipments) 1,076,258 4,070 184,242 – 1,193,035 747,558 1,161 154,976 – 834,264 358,771
(71,535) – (69,431) –
Furniture and fixtures 69,171 2,704 6,131 – 77,221 39,095 288 6,895 – 45,527 31,694
(785) – (751) –
Vehicles 325,496 251 105,597 – 383,482 119,777 (42) 35,385 – 135,544 247,938
(47,862) – (19,576) –
11,296,595 177,103 1,686,375 760,587 12,809,111 6,653,105 7,448 839,945 64,028 6,520,522 6,288,589
(1,079,719) (31,830) (1,026,179) (17,825)
21.1.1 Owned assets include assets amounting to Rs. 52.800 million (2016: Rs. 70.059 million) of the Group which are not in operation.
21.1.2 The cost of fully depreciated assets which are available for use as at December 31, 2017 is Rs. 3,444.478 million (2016: Rs. 2,453.082
million).
21.1.3 The depreciation charge for the year has been allocated as follows:
(Rupees in thousand) Note 2017 2016
Cost of sales and services 34 1,554,145 782,214
Administrative expenses 35 75,635 42,281
Distribution and marketing costs 36 20,495 15,450
Investment property under construction 6,888 –
1,657,163 839,945

175
ANNUALREPORT 2017
21.1.5 Disposal of owned assets
Detail of owned assets disposed off during the year is as follows:
(Rupees in thousand) 2017
Particulars Accumulated Sales Mode ofof assets Sold to Cost depreciation Book value proceeds disposal
Plant and machinery Assets written off 42,392 39,776 2,616 – Scrapped
Outsider - Related party
Bulleh Shah Packaging (Private) Limited 3,780 3,524 256 256 Negotiation Outsider
Sunlyn (Pty) Ltd 18,060 2,789 15,271 19,646 Negotiation Other Equipments Assets written off 5,182 4,615 567 – Written off
Outsider - Related parties Omya Pack (Private) Limited 104 52 52 61 Negotiation Bulleh Shah Packaging (Private) Limited 98 22 76 76 - do - Vehicles Employees
Abdul Rehman 750 450 300 418 Company Policy Adi J. Cawasji 1,286 965 321 322 - do - Adnan Tufail 1,050 620 430 485 - do - Akhtar Bashir 1,003 592 411 590 - do - Akhtar Javed 1,145 687 458 731 - do - Ameer Taimoor Ali 1,019 102 917 901 - do - Anis Ahmed 1,495 897 598 1,013 - do - Arslan Bashir 1,297 156 1,141 1,126 - do - Ather Ayub Khan 3,742 1,197 2,545 3,116 - do - Ayesha Siddiq 800 328 472 524 - do - Bilal Ahmad 683 225 458 494 - do - Fazal Ahmad 1,760 422 1,338 1,412 - do - Ghani Shah 601 360 241 283 - do - Gohar Ali Shahzad 1,788 179 1,609 1,592 - do - Hammas Ali Naik 1,391 83 1,308 1,391 - do - Hina Jamil 860 516 344 464 - do - Kamal Bariq 650 390 260 291 - do - Kashif Ahmed 1,560 686 874 982 - do - Mehreen Zafar 1,057 338 719 651 - do - Mian Javaid Iqbal 1,555 933 622 1,197 - do - Mohammad Abbas 850 502 348 456 - do - Mudassar Anjum 1,788 197 1,591 1,547 - do - Muhammad Ahmad 1,534 307 1,227 1,393 - do - Muhammad Ashiq 1,640 361 1,279 1,403 - do - Muhammad Farhan 2,383 1,215 1,168 1,830 - do - Muhammad Rizwan 1,438 863 575 963 - do - Muhammad Usman 1,191 703 488 697 - do - Mumtaz Ali 1,020 469 551 646 - do - Munir Alam Shah 708 14 694 626 - do - Musab Mukhtar Malik 1,112 378 734 792 - do - Mustansar Bashir 1,973 1,184 789 1,380 - do - Nauman Noor 1,548 807 741 982 - do - Nazish Siddique 707 424 283 314 - do - Raheel Shakeel 1,014 162 852 897 - do - Raja Asad 1,807 199 1,608 1,653 - do - Rizwan Ahmed Butt 923 554 369 488 - do - Samreen Saleem 647 369 278 288 - do - Shahid Islam 700 175 525 430 - do - Shahida Naeem 1,680 1,008 672 1,021 - do - Shoaib Nangiana 1,365 819 546 769 - do - Subbayal Najeeb 1,039 218 821 820 - do - Subhan Zahid 2,017 - 2,017 2,017 - do - Syed Baqir Ali Shah 1,498 629 869 939 - do - Syed Imran Adil 749 449 300 396 - do - Syed Rizwan Ali 708 71 637 650 - do - Syed Zia Ul Hassan 1,642 147 1,495 1,453 - do - Syeda Zehra Qaiser 825 495 330 435 - do - Tahira Yasmeen 1,275 701 574 832 - do - Umer Shabbir 678 61 617 678 - do -
Carried forward 130,742 73,890 56,852 64,382

176
(Rupees in thousand) 2017
Particulars Accumulated Sales Mode ofof assets Sold to Cost depreciation Book value proceeds disposal
Brought forward 130,742 73,890 56,852 64,382
Usaid Faizi 1,014 51 963 894 - do - Usman Tahir 707 424 283 316 - do - Uzair Haseeb 688 89 599 585 - do - Waqas Munir 2,448 612 1,836 1,999 - do - Zeeshan Akram 1,000 360 640 694 - do - Zeeshan Akram 1,667 83 1,584 1,667 - do - Zia Ur Rehman 683 198 485 431 - do - Rafiq Shahid 1,742 923 819 1,147 - do - Usman Malik 550 330 220 247 - do - Shiraz Khan 732 439 293 327 - do - Muhammad Abbas 688 248 440 424 - do - Muhammad Naeem Chohan 1,662 582 1,080 1,279 - do - Salman Hassan 1,014 193 821 897 - do - Arslan Shahid 915 388 527 628 - do - Ihtasham Ashraf 652 385 267 292 - do - Tahir Mahmood 1,125 675 450 547 - do - Ehtisham Qureshi 1,425 855 570 748 - do - Amad Rafiq 1,260 529 731 830 - do - Shahzad Naeem 1,657 381 1,276 1,512 - do - Usman Tahir 1,073 386 687 800 - do - Outsiders - related parties
IGI Holdings Limited [Formerly: IGI Insurance Limited (associate)] 1,811 670 1,141 1,313 Insurance Claim Settlement Omya Pack (Private) Limited (joint venture) 1,686 354 1,332 1,600 Company policy Omya Pack (Private) Limited (joint venture) 1,099 176 923 978 Negotiation Bulleh Shah Packaging (Private) Limited (subsidiary) 1,533 46 1,487 1,487 Negotiation Outsiders
Farid Khan 1,394 836 558 1,260 Negotiation We buy Cars 7,691 6,422 1,270 2,938 Negotiation Mian Tariq 1,340 1,005 335 1,107 Auction Rizwan Butt 1,340 1,005 335 1,085 Auction Other assets with book value less than Rs 50,000 137,489 137,066 422 12,746
309,652 230,096 79,556 105,595
(Rupees in thousand) 2016
Particulars Accumulated Sales Mode of
of assets Sold to Cost depreciation Book value proceeds disposal
Plant and machinery Outsider
5 Star Enterprises 832,494 822,514 9,980 47,327 Negotiation MaShaAllah Engineering Company 2,229 1,876 353 51 - do - Muhammad Israil 414 314 100 99 - do - Other Equipments Assets written off 651 282 369 - Written Off
Employees Seema Riaz 137 53 84 75 Negotiation Outsiders - related party IGI Holdings Limited [Formerly IGI Insurance Limited] 111 28 83 52 Claim Settlement Outsider Muhammad Amin 1,015 85 930 436 Negotiation Vehicles Employees
Abdullah Ikhlaq 1,804 397 1,407 1,451 Company Policy Ali Raza Madni 683 41 642 581 - do - Asad Javed 1,046 324 722 738 - do -
Carried forward 840,584 825,914 14,670 50,810

177
ANNUALREPORT 2017
Brought forward 840,584 825,914 14,670 50,810
Asma Yousaf 1,673 452 1,221 1,194 - do - Ata u Noor 1,639 754 885 1,173 - do - Ayesha Khalid 554 332 222 256 - do - Ayesha Tariq 683 41 642 604 - do - Bilal Naeem 1,057 137 920 764 - do - Dr. Asad Ali 1,200 720 480 787 - do - Hafiz Awais Ahmad 743 431 312 411 - do - Humayun Munir 640 371 269 315 - do - Imran Aziz Salaria 1,021 327 694 720 - do - Ismail Cheema 550 297 253 247 - do - Jamshaid Iqbal 735 441 294 405 - do - Jazib Faizi 1,013 608 405 630 - do - Khalid Bashir 748 441 307 413 - do - Mudassar Anjum 1,628 98 1,530 1,490 - do - Muhammad Ali 1,325 596 729 812 - do - Muhammad Azm Uddin 683 123 560 493 - do - Muhammad Bilal Ashraf 525 315 210 237 - do - Muhammad Umar 437 169 268 431 - do - Muhammad Umer Farooq 688 227 461 424 - do - Muhammad Yousaf 541 303 238 243 - do - Nadeem Bhatty 1,662 133 1,529 1,435 - do - Omer Iqbal 1,054 253 801 827 - do - Saad Imran Butt 1,034 165 869 819 - do - Sagheer Ahmed 955 573 382 579 - do - Sajjad Hussain Malik 979 558 421 604 - do - Sameeha Fazeel 1,418 199 1,219 1,244 - do - Sh Waqas Ahmad 700 105 595 507 - do - Shafique Shakir 677 508 169 303 - do - Shahzad Ahmed 680 211 469 418 - do - Shahzad Murtaza 533 304 229 244 - do - Suleman Javed 1,700 1,003 697 1,069 - do - Syed Izzat Hassan 1,111 527 584 628 - do - Talha Ahmed Iftikhar 622 355 267 346 - do - Tanveer Akhtar 700 140 560 507 - do - Usama Pervaiz 1,527 31 1,496 1,527 - do - Usman Munir 1,518 228 1,290 1,340 - do - Wali Haider 892 - 892 892 - do - Asad Javaid 1,325 994 331 526 - do - Farkhanda Imran 862 517 345 661 Negotiation Khalid Mahmood 1,263 947 316 1,176 - do - Outsiders
Muhammad Mohsin 1,340 1,005 335 1,180 Negotiation Muhammad Nadeen Farooqi 1,009 353 656 815 - do - Muhammad Israil 650 488 162 14 - do -
Other assets with book value less than Rs 50,000 196,841 183,485 13,356 29,107 Negotiation
1,079,719 1,026,179 53,540 109,627
(Rupees in thousand) 2016
Particulars Accumulated Sales Mode ofof assets Sold to Cost depreciation Book value proceeds disposal

178
21.2 Assets subject to finance lease
2017
Accumulated Deprecation Accumulated Book value Cost as at Cost as at depreciation charge / depreciation as at December Exchange Additions / Transfer December as at December Exchange (deletions) Transfer as at December December (Rupees in thousand) 31, 2016 differences (deletions) (out) 31, 2017 31, 2016 differences for the year (out) 31, 2017 31, 2017
Vehicles 79,782 4,971 5,685 – 77,184 26,707 2,408 11,277 – 32,715 44,469
(11,705) (1,549) – – – (7,120) (557)
Plant and equipment 41,107 7,110 – – 48,217 3,083 1,068 4,287 – 8,438 39,779
– – – –
120,889 12,081 5,685 – 125,401 29,790 3,476 15,564 – 41,153 84,248
(11,705) (1,549) (7,120) (557)
2016
Accumulated Deprecation Accumulated Book value Cost as at Cost as at depreciation charge / depreciation as at December Exchange Additions / Transfer December as at December Exchange (deletions) Transfer as at December December (Rupees in thousand) 31, 2015 differences (deletions) in / (out) 31, 2016 31, 2015 differences for the year (out) 31, 2016 31, 2016
Vehicles 74,717 6,391 6,583 – 79,782 12,024 1,341 15,878 – 26,707 53,075
(7,909) (2,536) –
Plant and equipment 624,548 91,130 38,720 – 41,107 29,666 4,394 33,051 – 3,083 38,024
(713,291) – (64,028)
699,265 97,521.00 45,303 – 120,889 41,690 5,735 48,929 – 29,790 91,099
(7,909) (713,291) (2,536) (64,028)
(Rupees in thousand) Note 2017 2016
21.2.1 Depreciation charge for the year has been allocated as follows:
Cost of sales and services 34 5,104 33,616
Administrative expenses 35 7,572 9,967
Distribution and marketing costs 36 2,888 5,346
15,564 48,929
21.3 Capital work-in-progress 2017
Capital Transfers to Balance as at expenditure Advances Transfers within Charged operating Transfers to Transfer to Balance as December Acquisition of Exchange incurred during given during capital work off during fixed other investment at December (Rupees in thousand) 31, 2016 subsidiary differences the year the year in progress the year assets assets properties 31, 2017
Civil works 4,050 4,473 – 145,085 – 657 (144) (23,937) – (7,072) 123,112
Plant and machinery 65,657 858,254 2,043 1,430,207 – 47,092 (9,299) (639,421) – – 1,754,533
Advances to suppliers 38,952 7,884 – _ 179,015 (47,749) _ (55,734) (536) – 121,832
108,659 870,611 2,043 1,575,292 179,015 – (9,443) (719,092) (536) (7,072) 1,999,477
2016
Capital Transfers to Balance as at expenditure Advances Transfers within Charged operating Transfers to Transfer to Balance as December Acquisition of Exchange incurred during given during capital work off during fixed other investment at December (Rupees in thousand) 31, 2015 subsidiary differences the year the year in progress the year assets assets properties 31, 2016
Civil works 11,229 – – 32,493 – – – (39,672) – – 4,050
Plant and machinery 202,281 – (33) 982,122 – 6,257 (5,952) (1,119,018) – – 65,657
Advances to suppliers 23,851 – – – 44,627 (6,257) – (23,269) – – 38,952
237,361 – (33) 1,014,615 44,627 – (5,952) (1,181,959) – – 108,659

179
ANNUALREPORT 2017
(Rupees in thousand) Note 2017 2016
21.4 Major spare parts and stand-by equipment
Balance at the beginning of the year 61,729 60,954
Acquisition of subsidiary 54,887 –
Additions during the year 8,506 3,308
Transfers made during the year (3,311) (2,533)
Balance at the end of the year 121,811 61,729
22. Investment properties
Developed 22.1 12,342,428 115,082
Under development 22.2 – 10,807,631
12,342,428 10,922,713
22.1 Developed 2017
Accumulated Transfer in Book value Cost as at Transfer from Cost as at depreciation Depreciation depreciation as at December Acquisition of under construction Transfer December as at December charge Transfer as at December December (Rupees in thousand) 31, 2016 subsidiary property Additions out 31, 2017 31, 2016 for the year out 31, 2017 31, 2017
Land 68,101 18,744 – – (61,953) 24,892 – – – – 24,892
Buildings on freehold land 83,540 – 7,593,817 18,187 (27,783) 7,667,761 51,149 193,167 (32,035) 212,281 7,455,480
Buildings on leasehold land 16,743 – – – (15,833) 910 2,153 831 (2,565) 419 491
Mall equipment – – 34,594 5,575 – 40,169 – 5,151 – 5,151 35,018
External development – – 1,174,159 4,200 – 1,178,359 – 26,078 – 26,078 1,152,281
HVAC system – – 1,363,841 3,747 – 1,367,588 – 120,754 – 120,754 1,246,834
Electrical system – – 2,598,486 32,886 – 2,631,372 – 203,940 – 203,940 2,427,432
168,384 18,744 12,764,897 64,595 (105,569) 12,911,051 53,302 549,921 (34,600) 568,623 12,342,428
2016
Accumulated Transfer in Book value Cost as at Transfer from Cost as at depreciation Depreciation depreciation as at December Acquisition of under construction Transfer December as at December charge Transfer as at December December (Rupees in thousand) 31, 2015 subsidiary property Additions in / out 31, 2016 31, 2015 for the year in 31, 2016 31, 2016
Land 115,397 – – – (47,296) 68,101 – – – – 68,101
Buildings on freehold land 34,855 – – 16,855 31,830 83,540 29,915 3,409 17,825 51,149 32,391
Buildings on leasehold land 16,743 – – – – 16,743 1,068 1,085 – 2,153 14,590
166,995 – – 16,855 (15,466) 168,384 30,983 4,494 17,825 53,302 115,082
(Rupees in thousand) Note 2017 2016
22.1.1 Depreciation charge for the year has been
allocated as follows:
Cost of sales and services 34.3 545,903 –
Administrative expenses 35 4,018 4,494
549,921 4,494

180
22.1.2 Fair value of investment properties
Level 2 fair values
Fair value of certain investment properties, based on the valuation carried out by an independent valuer, as at December 31, 2017 is Rs 2,742.454 million (2016: Rs 3,915.224 million). The valuation is considered to be level 2 in the fair value hierarchy due to significant observable inputs used in the valuation. The different levels have been defined in note 52.4.
Valuation techniques used to derive level 2 fair values
Level 2 fair value of investment property has been derived using a sales comparison approach. Sale prices of comparable land and buildings in close proximity are adjusted for differences in key attributes such as location and size of the property. The most significant input into this valuation approach is price per square foot.
Level 3 fair values
In the absence of current prices in an active market, the fair value is determined by considering the aggregate of the estimated cash flows expected to be received from licensing / leasing out the property less the costs to complete and the estimated operating expenses. The valuation is considered to be level 3 in the fair value hierarchy due to significant unobservable inputs used in the valuation. The different levels have been defined in note 52.4. Fair value of such investment properties has been determined to be Rs 17,611 million (Rs 15,362 million).
Valuation techniques used to derive level 3 fair values
The Group has determined the fair value of as on December 31, 2017 by internally generated valuation model instead of involving independent professionally qualified valuer. The valuation is considered to be level 3 in the fair value hierarchy due to unobservable inputs used in the valuation. The major assumptions used in valuation model and valuation result at balance sheet date are as follows:
2017 2016
Gross buildable area (sq ft) – 1,185,369 Estimated costs to complete (Rs in million) – 12,451 Gross rentable area (sq ft) 581,553 555,370 Rent rates assumed per sq ft (Rs) 75 – 1,000 75–450 Inflation in rent and operating costs 1.90% – 7.50% 7.50% Discount rate (%) 14.00% 14.00% Fair value (Rs in million) 17,611 15,362
22.2 Investment property - under development
This represented the under-construction “Packages Mall” Real Estate project: Balance as at Additions / Transferred to Balance as at December 31, adjustments during developed December 31, (Rupees in thousand) 2016 the year property 2017
Civil works 7,576,585 1,490,011 (9,066,596) –Equipments 1,299,242 140,123 (1,439,365) –Unallocated expenditure 22.2.1 & 22.2.2 1,593,204 665,425 (2,258,629) – Advances to suppliers 261,223 (260,916) (307) –Advances against services 77,377 (77,377) – –
10,807,631 1,957,266 (12,764,897) –
22.2.1 This also includes salaries, wages and benefits of Rs. 58.19 million capitalised during the year. 22.2.2 This also represents borrowing costs capitalised during the year, aggregating to Rs. 171.228 million in respect of finance cost on long
term finances as referred to in note 6 and long term loan from shareholder of the Parent Company as referred in note 8.

181
ANNUALREPORT 2017
Computer software (Rupees in thousand) Note Goodwill and ERP System Total
23. Intangible assets
Year ended December 31, 2017
Cost
As at January 1, 2017 152,505 213,599 366,104
Acquisition of subsidiary – 87,207 87,207
Additions during the year – 21,658 21,658
Exchange differences 26,375 582 26,957
As at December 31, 2017 178,880 323,046 501,926
Accumulated amortisation
As at January 1, 2017 – (201,810) (201,810)
Amortisation for the year 23.2 – (14,521) (14,521)
As at December 31, 2017 – (216,331) (216,331)
Intangible assets under development – 1,026 1,026
Book value as at December 31, 2017 178,880 107,741 286,621
Year ended December 31, 2016
Cost
As at January 1, 2016 125,636 208,340 333,976
Additions during the year – 5,188 5,188
Exchange differences 26,869 71 26,940
As at December 31, 2016 152,505 213,599 366,104
Accumulated amortisation
As at January 1, 2016 – (183,539) (183,539)
Amortisation for the year 23.2 – (18,271) (18,271)
As at December 31, 2016 – (201,810) (201,810)
Book value as at December 31, 2016 152,505 11,789 164,294
23.1 Impairment test for Goodwill
For the purpose of annual impairment testing, goodwill is allocated to the operating segments expected to benefit from the synergies of
the business combination in which the goodwill arises, as follows:
Flexible Packages Convertors (Proprietary) Limited, South African project
The recoverable amount of the subsidiary is determined on the discounted cash flow basis.
The Company as a whole is determined to be a segment due to the fact that there are no distinguishable segments.
These calculations use cash flow projections based on financial budgets approved by management covering a five year period. The
present value of the expected cash flows of the above segments is determined by applying a suitable internal rate of return.
As the goodwill arose as a result of an acquisition of business during the financial period ended 31 December 2015, an impairment test
is performed annually.

182
Percentage 2017 2016
The key assumptions used for the discounted cash flow calculation are as follows:
Internal rate of return (IRR) 26.74% 26.74%
Discount rate (pre-tax) 15.00% 15.00%
Growth rate 10.00% 10.00%
(Rupees in thousand) Note 2017 2016
23.2 The amortisation charge for the year has been allocated as follows:
Cost of sales and services 34 7,571 9,768
Administrative expenses 35 6,950 8,503
14,521 18,271
24. Investments accounted for using the equity method
24.1 Amounts recognised in consolidated balance sheet
Investments in associates 24.4 9,470,360 4,390,677
Investment in joint ventures 24.5 331,770 9,476,358
9,802,130 13,867,035
24.2 Amounts recognised in consolidated profit and loss account
Investments in associates 24.4 393,608 357,945
Investment in joint ventures 24.5 (187,078) (648,807)
206,530 (290,862)
24.3 Amounts recognised in consolidated other comprehensive income
Investments in associates 24.4 4,797,426 (1,524)
Investment in joint ventures 24.5 (9 960) (27,391)
4,787,516 (28,915)
24.4 Investments in associates
Cost
Opening balance 3,421,278 3,421,278
Disposal of interest in associate on exchange of shares (35,000) –
Closing balance 3,386,278 3,421,278
Post acquisition share of profits and reserves net of impairment losses
Opening balance 969,399 719,363
Share of profit from associates - net of tax 393,608 357,945
Share of other comprehensive income / (loss) - net of tax 4,797,476 (1,524)
Share of other reserves of associates – (4,297)
Gain on exchange of shares of associate 17,932 –
Reversal of accumulated loss 35,000 –
Dividends received during the year (129,333) (102,088)
Closing balance 6,084,082 969,399
Balance as on December 31 9,470,360 4,390,677

183
ANNUALREPORT 2017
(Rupees in thousand) Note 2017 2016
24.4.1 Investments in equity instruments of associates - Quoted
Tri-Pack Films Limited, Pakistan
12,933,333 (2016: 12,933,333) fully paid ordinary shares of Rs. 10 each
Equity held 33.33% (2016: 33.33%)
Market value - Rs. 1,808.985 million (2016: Rs. 3,797.744 million) 3,075,353 3,023,783
IGI Holdings Limited, Pakistan
(formerly IGI Insurance Limited)
13,072,211 (2016: 13,022,093) fully paid ordinary shares of Rs. 10 each
Equity held 10.46% (2016: 10.61%)
Market value - Rs. 3,828.720 million (2016: Rs. 4,009.372 million) 24.4.1.1 6,395,007 1,366,894
IGI Investment Bank Limited, Pakistan
Nil (2016: 4,610,915) fully paid ordinary shares of Rs. 10 each
Equity held Nil (2016: 2.17%)
Market value - Nil (2016: Rs. 15.032 million) 24.4.1.1 – –
9,470,360 4,390,677
24.4.1.1 The Group’s investment in IGI Holdings Limited (‘IGIHL’) [Formerly IGI Insurance Limited] is less than 20% but it is considered to be an
associate as per the requirement of IAS 28 ‘Investments in Associates’ because the Group has significant influence over the financial and
operating policies through representation on the board of directors of the company.
During the prior year, the boards of directors of IGIHL and IGI Investment Bank Limited (‘IGIBL’) approved Scheme of Amalgamation
(‘Amalgamation Scheme’) under Sections 284 to 288 of the repealed Ordinance for the amalgamation of the entire undertaking, assets,
entitlements and liabilities of IGIBL with and into IGIHL. In addition, the boards of directors of IGIHL and its wholly owned subsidiaries i.e.
IGI General Insurance Limited and IGI Investments (Private) Limited have also approved Scheme of Arrangement (‘Arrangement Scheme’)
under Sections 284 to 288 of the repealed Ordinance for the demerger of the insurance division and certain investments along with
corresponding liabilities, if any, held by IGIHL into its two wholly-owned subsidiaries, IGI General Insurance Limited and IGI Investments
(Private) Limited respectively, subsequent to the merger under Amalgamation Scheme.
Both Amalgamation Scheme and Arrangement Scheme were filed by these entities with Honorable Sindh High Court (the ‘Court’) in
January 2017. The Court, through its order dated December 16, 2017, has sanctioned the Amalgamation Scheme and Arrangement
Scheme. In terms of the Scheme, shares of IGIBL have been cancelled in lieu of issuance and allotment of fully paid up shares of
IGIHL on the basis of swap ratio of 1:92 (i.e. one share of IGIHL for every ninety-two shares of IGIBL cancelled) to the shareholders of
IGIBL. Consequently, 50,118 shares have been issued to the Parent Company after the reporting date. The gain on exchange of shares
computed as the difference between the market value of new shares of IGIHL and the cost of shares of IGIBL in the books of the Group
amounting to Rs. 17.932 million has been recognised in consolidated profit and loss account.

184
(Rupees in thousand) Note 2017 2016
24.5 Investment in joint ventures
Cost
Opening balance 10,329,991 10,022,642
Joint venture - OmyaPack (Private) Limited, Pakistan
Cost of investment – 310,000
Reserves on date of transfer – (2,651)
– 307,349
Interest in joint venture transferred to interest in subsidiary - Bulleh Shah
Packaging (Private) Limited, Pakistan
Cost of investment 9,973,651 –
Reserves on date of transfer (990,330) –
(8,983,321) –
Closing balance 1,346,670 10,329,991
Post acquisition share of loss and reserves
Opening balance (853,633) (176,000)
Share of loss from joint ventures - net of tax (187,078) (648,807)
Share of other comprehensive loss from joint ventures - net of tax (9,960) (27,391)
Share of gains recognised directly in equity from joint ventures - net of tax 41,729 –
Dividends received during the year (5,958) (1,435)
Closing balance (1,014,900) (853,633)
Balance as on December 31 24.5.1 331,770 9,476,358
24.5.1 Investments in equity instruments of joint ventures - Unquoted
Bulleh Shah Packaging (Private) Limited, Pakistan
Nil (2016: 709,718,013) fully paid ordinary shares of Rs. 10 each
Equity held Nil (2016: 65.00%) – 9,151,720
Plastic Extrusions (Proprietary) Limited, South Africa
500 (2016: 500) fully paid ordinary shares of ZAR 1 each
Equity held 50.00% (2016: 50.00%) 24,081 17,571
OmyaPack (Private) Limited, Pakistan
31,000,000 (2016: 31,000,000) fully paid ordinary shares of Rs. 10 each
Equity held 50.00% (2016: 50.00%) 307,689 307,067
331,770 9,476,358

185
ANNUALREPORT 2017
(Rupees in thousand) Note 2017 2016
25. Other long term investments
Quoted
Nestle Pakistan Limited 3,649,248 (2016: 3,649,248) fully paid ordinary shares of Rs. 10 each
Equity held 8.05% (2016: 8.05%) 25.1 & 25.2 41,966,317 32,843,232
Cost - Rs. 5,778.896 million (2016: Rs. 5,778.896 million)
Unquoted 25.3
Tetra Pak Pakistan Limited
1,000,000 (2016: 1,000,000) fully paid non-voting
ordinary shares of R.s 10 each 25.1 & 25.4 10,000 10,000
Coca-Cola Beverages Pakistan Limited
500,000 (2016: 500,000) fully paid ordinary shares of Rs. 10 each
Equity held 0.14% (2016: 0.14%) 4,706 4,706
Pakistan Tourism Development Corporation Limited
2,500 (2016: 2,500) fully paid ordinary shares of Rs. 10 each 25 25
Orient Match Company (Private) Limited
1,900 (2016: 1,900) fully paid ordinary shares of Rs. 100 each – –
14,731 14,731
41,981,048 32,857,963
25.1 Nestle Pakistan Limited and Tetra Pak Pakistan Limited are associated undertakings of the Parent Company as per the Companies Act,
2017. However, for the purpose of measurement, investments in others have been classified as available for sale as referred to in note 4.12.1.1.
25.2 As of December 31, 2017, an aggregate of 775,000 (2016: 775,000) shares of Nestle Pakistan Limited having market value
Rs. 8,912.492 million (2016: 6,975.000 million) have been pledged in favor of HBL Pakistan. Out of aggregate shares pledged, 410,000 (2016: 410,000) shares are pledged against issuance of standby letter of credit in favor of HBL Bahrain as referred to in note 20.1 and the remaining 365,000 shares (2016: 365,000) are pledged against the term finance loan from HBL as referred to in note 6.6.
25.3 Unquoted investments are measured at cost less any identified impairment loss as it is not possible to apply any other valuation
methodology. 25.4 These non-voting ordinary shares of Tetra Pak Pakistan Limited entitle the Parent Company to receipt of dividend for a period of ten years
starting from 2009 and ending in 2018, both years inclusive. These shares do not entitle the Parent Company to any voting or other rights.
(Rupees in thousand) 2017 2016
25.5 Cumulative fair value gain on available for sale financial assets
Balance as at beginning of the year 28,858,325 24,479,228
Changes in fair value of available for sale financial assets 9,123,085 4,379,097
Balance as at end of the year 37,981,410 28,858,325

186
(Rupees in thousand) Note 2017 2016
26. Long term loans and deposits
Considered good
Loans to employees 26.1 5,395 3,494
Loan to Sui Northern Gas Pipelines Limited (‘SNGPL’) 26.2 – 16,400
Security deposits 26.3 153,247 37,601
158,642 57,495
Current portion of long term loans and deposits
Loans to employees 30 (1,434) (1,237)
Loan to SNGPL 30 – (16,400)
(1,434) (17,637)
157,208 39,858
26.1 These represent interest free loans to employees for purchase of motor cycles and cycles and are repayable in monthly installments over
a period of 60 to 260 months.
Loans to employees aggregating Rs. 3.977 million (2016: Rs. 2.394 million) are secured by joint registration of motor cycles in the name
of employees and the Parent Company. The remaining loans are unsecured.
26.2 This represents an unsecured loan given to SNGPL for the development of the infrastructure for the supply of natural gas to BSPL, the
subsidiary. Mark up is charged at the rate of 1.5% per annum and is received annually. The loan amount has been fully received during
the current year.
26.3 These represent interest free security deposits with SNGPL amounting to Rs. 31.600 million and Lahore Electric Supply Company
amounting to Rs. 14.4 million and are refundable to Group subsidiary namely, PCPL on cancellation / withdrawal of the connections.
(Rupees in thousand) Note 2017 2016
27. Stores and spares
Stores [including in transit Rs. 34.174 million (2016: Rs. 7.706 million)] 734,814 238,064
Spares [including in transit Rs. 23.943 million (2016: Rs. 7.434 million)] 979,556 215,415
27.1 1,714,370 453,479
Provision for obsolete / slow moving stores and spares 27.2 (6,703) –
1,707,667 453,479
27.1 Stores and spares include items which may result in fixed capital expenditure but are not distinguishable.
(Rupees in thousand) Note 2017 2016
27.2 The movement in provision for obsolete / slow moving
stores and spares during the year is as follows:
Balance as at January 1 – –
Provision for the year 27 6,703 –
Balance as at December 31 6,703 –

187
ANNUALREPORT 2017
(Rupees in thousand) Note 2017 2016
28. Stock-in-trade
Raw materials [including in transit Rs. 1,142.92 million
(2016: Rs. 313.876 million)] 28.1 4,180,635 1,724,365
Work-in-process 28.2 405,698 393,587
Finished goods 28.3 & 28.4 3,848,924 722,187
Goods purchased for resale 28.5 44,490 29,355
8,479,747 2,869,494
Provision for obsolete / slow moving stock in trade 28.6 (40,587) (23,048)
8,439,160 2,846,446
28.1 Raw materials amounting to Rs. 67.000 million (2016: Rs. 7.213 million) are in the possession of various vendors of the Group for further
processing into semi finished and finished goods to be supplied to the Group.
28.2 Work-in-process amounting to Rs. 9.200 million (2016: Rs. 7.030 million) is in the possession of various vendors of the Group for further
processing into other semi finished and finished goods to be supplied to the Group.
28.3 Finished goods amounting to Rs. 0.1902 million (2016: Rs. 0.152 million) are in the possession of various vendors of the Group that are
yet to be sold by the Group to these vendors.
28.4 Finished goods with a cost of Rs. 606.380 million (2016: Rs. 62.334 million) are being valued at net realisable value (‘NRV’) of
Rs. 526.590 million (2016: Rs. 48.668 million).
28.5 Goods purchased for resale of Rs. 4.804 million (2016: Nil) are carried at their NRV amounting to Rs. 4.410 million (2016: Nil) and the
resulting NRV write down expense amounting to Rs. 0.430 million (2016: Nil) has been charged to cost of sales and services.
(Rupees in thousand) Note 2017 2016
28.6 The movement in provision for obsolete / slow moving
stock-in-trade during the year is as follows:
Opening balance 23,048 4,393
Provision for the year 20,013 20,235
Stocks written off against provision (2,474) (1,580)
Closing balance 40,587 23,048
29. Trade debts
Considered good
Related parties - unsecured 29.1 77,203 57,278
Others 29.2 5,869,403 3,503,932
5,946,606 3,561,210
Considered doubtful 86,248 34,351
6,032,854 3,595,561
Provision for doubtful debts 29.3 (86,248) (34,351)
5,946,606 3,561,210

188
(Rupees in thousand) 2017 2016
29.1 Related parties - unsecured
Joint ventures
Bulleh Shah Packaging (Private) Limited – 27,962
Plastic Extrusions (Proprietary) Limited 10,456 26,586
OmyaPack (Private) Limited 234 –
Associate
Tri-Pack Films Limited 4,310 2,730
Other related parties
Tetra Pak Pakistan Limited 52,959 –
Ceylon Tea Services Limited 6,959 –
74,918 57,278
These are in the normal course of business and are interest free.
29.2 Others include trade debts of Rs. 565.729 million (2016: Rs. 220.387 million) which are secured by way of inland letters of credit.
(Rupees in thousand) Note 2017 2016
29.3 The movement in provision during the year is as follows:
Balance as at January 1 34,351 27,622
Acquisition of subsidiaries 28,914 –
Provision for the year 21,218 13,066
Bad debts written off (3,014) (6,337)
Exchange loss 4,779 –
Balance as at December 31 86,248 34,351
30. Loans, advances, deposits, prepayments and other receivables
Current portion of loans to employees 26 1,434 1,237
Current portion of loan receivable from SNGPL 26 – 16,400
Advances - considered good
To employees 30.1 16,334 12,013
To suppliers 30.2 96,053 16,760
112,387 28,773
Due from related parties - unsecured 30.3 23,182 482,711
Trade deposits - considered good 77,302 55,125
Security deposits 18,139 10,413
Prepayments 30.4 70,989 57,410
Balances with statutory authorities
Customs duty 31,738 20,591
Sales tax recoverable 129,398 99,446
Sales tax refundable 30.5 292,214 292,214
Export rebate recoverable 13,785 5,437
467,135 417,688
Other receivables - considered good 368,410 61,293
1,138,978 1,131,050

189
ANNUALREPORT 2017
30.1 Included in advances to employees are amounts due from executives of Rs. 9.016 million (2016: Rs. 1.428 million).
(Rupees in thousand) Note 2017 2016
30.2 Advances to suppliers
Considered good 96,053 16,760
Considered doubtful 1,000 1,000
97,053 17,760
Provision for doubtful advances 30.2.1 (1,000) (1,000)
96,053 16,760
30.2.1 The movement in provision for doubtful advances during the year is as follows:
Balance as at January 1 1,000 1,000
Provision during the year – –
Balance as at December 31 1,000 1,000
30.3 Due from related parties - unsecured
Joint ventures
Bulleh Shah Packaging (Private) Limited – 469,760
OmyaPack (Private) Limited 8,080 108
Associates
IGI Finex Securities Limited 81 47
IGI Holdings Limited [Formely: IGI insurance Limited] 4,719 6,421
IGI Life Insurance Limited 4,199 3,000
Tri-Pack Films Limited 2,542 2,335
Others
DIC Asia Pacific Pte Limited 2,267 1,040
Packages Foundation 617 –
Tetra Pak Pakistan Limited 677 –
23,182 482,711
These are in the normal course of business and are interest free.
30.4 Prepayments include Rs. 15.389 million (2016: Rs. 10.155 million) made to IGI Life Insurance Limited, a related party and Rs 2.622
million (2016: Nil) made to IGI Holdings Limited (formerly IGI insurance Limited), an associate.
30.5 The Deputy Commissioner Inland Revenue (‘DCIR’) in his order dated June 24, 2015 alleged that the Group has incorrectly adjusted input
sales tax credit amounting to Rs. 146.107 million on purchases of raw materials from certain suppliers who were subsequently “blacklisted
/ suspended” and disallowed the same alongwith levy of default surcharge and penalty. During last year, the Taxation Authorities adjusted
an amount of Rs. 292.214 million from income tax refunds of the Group against the said sales tax order.
The Appellate Tribunal of Inland Revenue (‘ATIR’) through order dated August 28, 2017 has decided the case in favour of the Group. The
Group has already filed an application before the respective authorities to give effect to the order.

190
(Rupees in thousand) Note 2017 2016
31. Income tax receivable
Income tax refundable 31.1 3,966,302 2,267,503
Income tax recoverable 31.2 36,013 36,013
4,002,315 2,303,516
31.1 In 1987, the then Income Tax Officer (‘ITO’) re-opened the Parent Company’s assessments for the accounting years ended December 31,
1983 and 1984 disallowing primarily tax credit given to the Parent Company under section 107 of the Income Tax Ordinance, 1979. The
tax credit amounting to Rs. 36.013 million on its capital expenditure for these years was refused on the grounds that such expenditure
represented an extension of the Company’s undertaking which did not qualify for tax credit under this section in view of the Parent
Company’s location. The assessments for these years were revised by the ITO on these grounds and taxes reassessed were adjusted
against certain sales tax refunds and the tax credits previously determined by the ITO and set off against the assessments framed for
these years.
The Parent Company had filed an appeal against the revised orders of the ITO before the then Commissioner of Income Tax (Appeals)
[‘CIT(A)’], Karachi. CIT(A) in his order issued in 1988, held the assessments reframed by the ITO for the years 1983 and 1984 presently
to be void and of no legal effect. The ITO has filed an appeal against the CIT(A)’s order with the then Income Tax Appellate Tribunal (‘ITAT’).
The ITAT has in its order issued in 1996 maintained the order of CIT(A). The assessing officer after the receipt of the appellate order
passed by CIT(A), had issued notices under section 65 of the Income Tax Ordinance, 1979 and the Parent Company had filed a writ
petition against the aforesaid notices with the High Court of Sindh, the outcome of which is still pending.
The amount recoverable of Rs. 36.013 million represents the additional taxes paid as a result of the disallowance of the tax credits on
reframing of the assessments. The Parent Company has not made any provision against the above order as the management is confident
that the ultimate outcome of the writ petition would be in favour of the Parent Company, inter alia on the basis of the advice of the tax
consultant and the relevant law and the facts.
31.2 In respect of tax year 2014, the department has, against taxable loss of Rs. 706.039 million as per return filed by the Parent Company,
assessed a taxable income of Rs. 2,614.710 million and amended the deemed order for the year raising a tax demand of Rs. 606.328
million. In this order, among other issues, the income tax department has not accepted the Parent Company’s contention for non-taxation
of the transfer of paper and paperboard and corrugated business segments to BSPPL under section 97 of the Income Tax Ordinance,
2001. Such transfer has been taxed as capital gain on the value of assets transferred. The matter is currently being contested before the
Commissioner Inland Revenue (Appeals) [‘CIR(A)’].
Further, certain other disallowances interalia including on account of allocation of various expenses towards dividend and other incomes,
effectively reducing the available tax losses by approximately Rs. 1,200 million, have also been made by the department in respect of
previous tax years, through orders framed during the year.
The Parent Company is contesting the above orders before CIR(A) and has not made any provision against the above demand or
disallowances as the management is confident that the ultimate outcome of the appeals would be in favour of the Parent Company, inter
alia on the basis of the advice of the tax consultant and the relevant law and the facts.
31.3 In respect of tax year 2016, the department has, against taxable income of Rs. 1,157.926 million as per return filed by the Parent
Company, assessed a taxable income of Rs. 2,437.836 million and amended the deemed order for the year raising a tax demand of
Rs. 464.187 million. The Parent Company being aggrieved of the said order filed the appeal before CIR(A). CIR(A), through order dated
December 11, 2017, has accepted all the contentions of the Parent Company except the allowability of provision for workers’ profit
participation fund on payment rather than accrual basis thereby reducing the tax refundable claimed by the Parent Company from
Rs. 331.817 million to Rs. 328.320 million. The Parent Company is in the process of filing appeal before Appellate Tribunal against the
CIR(A)’s disallowance and has not made any provision against the above disallowance as the management is confident that the ultimate
outcome of the appeal would be in favor of the Parent Company, inter alia on the basis of the advice of the tax consultant and the relevant
law and the facts.

191
ANNUALREPORT 2017
(Rupees in thousand) Note 2017 2016
32. Cash and bank balances
At banks:
On deposit accounts [including nill (2016: ZAR 0.318
million) and nill (2016: SLR 20 million)] 32.1 350 105,452
On saving accounts 32.2 683,981 7,638
On current accounts [including USD 0.472 million USD
(2016: USD 0.114 million) and SLR 37.898 million
(2016: SLR 98.153 million)] 32.3 396,947 294,387
1,081,278 407,477
In hand [including USD 8,684 (2016: USD 1,412)
and EUR Nil (2016: EUR 500)] 7,512 4,324
1,088,790 411,801
32.1 The balances in deposit accounts bear mark up which is nill (2016: 4.0% to 10.0%) per annum.
32.2 The balances in saving accounts bear mark up which ranges from 3.75% to 5.50% (2016: 3.75% to 5.75%) per annum.
32.3 Included in these are total restricted funds of Rs. 1.332 million (2016: Rs. 1.332 million) held as payable to TFC holders.
(Rupees in thousand) Note 2017 2016
33 Revenue
The group derives the following types of revenue:
Sale of goods 33.1 30,189,322 24,495,674
Services 33.2 1,701,877 –
Total Revenue 31,891,199 24,495,674
33.1 Sale of goods
Local sales
Own manufactured 33,541,623 27,075,230
Purchased for resale 338,041 215,810
33,879,664 27,291,040
Export sales 699,997 612,004
34,579,661 27,903,044
Sales tax (4,371,619) (3,360,556)
Commission (18,720) (46,814)
(4,390,339) (3,407,370)
Net sales 30,189,322 24,495,674
33.2 Services
License fee 33.2.1 909,456 –
Service and management charges 33.2.2 693,198 –
Advertisements and parking income 33.2.3 99,223 –
1,701,877 –

192
(Rupees in thousand) 2017 2016
33.2.1 The future aggregate minimum rentals / license receivable under non - cancellable operating leases are as follows:
Not later than one year 1,935,246 –
Later than one year and not later than five years 6,494,551 –
8,429,797 –
Variable license fee recognised during the year as income were Rs. 63.651 million.
33.2.2 This includes Rs. 544.239 million chargeable to sales tax and it is exclusive of sales tax of Rs. 96.203 million.
33.2.3 This includes Rs. 61.065 million chargeable to sales tax and it is exclusive of sales tax of Rs. 17.962 million.
(Rupees in thousand) Note 2017 2016
34 Cost of sales and services Cost of sales - own manufactured 34.1 24,222,490 18,916,373
Cost of sales - purchased for resale 34.2 239,593 145,223
Cost of services 34.3 1,390,136 –
25,852,219 19,061,596
34.1 Cost of sales - own manufactured Materials consumed 16,944,962 13,715,148
Salaries, wages and amenities 34.1.1 & 34.1.2 2,280,406 1,759,647
Travelling and conveyance 57,485 41,334
Fuel and power 34.1.3 1,619,481 704,663
Production supplies consumed 558,690 491,800
Rent, rates and taxes 34.1.4 & 34.1.5 72,033 35,530
Insurance 84,275 53,496
Repairs and maintenance 589,745 452,453
Packing expenses 524,527 430,832
Depreciation on owned assets 21.1.4 1,554,145 782,214
Depreciation on assets subject to finance lease 21.2.1 5,104 33,616
Amortisation of intangible assets 23.2 7,571 9,768
Technical fee and royalty 34.1.6 115,144 113,710
Provision for slow moving stock in trade 28.6 20,013 20,862
Provision for slow moving stores and spares 27.2 6,703 –
Material handling charges 40,887 –
Medical expenses 11,703 –
Other expenses 378,297 343,782
24,871,171 18,988,855
Opening work-in-process 393,587 324,838
Acquisition of subsidiary 12,289 –
Closing work-in-process (405,698) (393,587)
Cost of goods manufactured 34.1.7 24,871,349 18,920,106
Opening stock of finished goods 700,525 696,792
Acquisition of subsidiary 2,486,196 –
28,058,070 19,616,898
Closing stock of finished goods (3,835,580) (700,525)
24,222,490 18,916,373

193
ANNUALREPORT 2017
(Rupees in thousand) 2017 2016
34.1.1 Salaries, wages and amenities include following in respect of retirement benefits:
Defined benefit plans
Gratuity fund 27,041 15,165
Defined contribution plans
Provident fund 28,180 19,626
Pension fund 38,443 27,342
Other benefit plan – –
Accumulating compensated absences 30,388 84,067
124,052 146,200
34.1.2 Salaries, wages and amenities include Rs. 310.090 million (2016: Rs. 315.487 million) in respect of labour contractors for services
rendered during the year.
34.1.3 This includes the reversal of provision recorded against the LPS on rate differential of Rs. 159.680 million (2016: Nil) .
34.1.4 Rent, rates and taxes include operating lease rentals amounting to Rs. 30.573 million (2016: Rs. 28.221 million).
34.1.5 Technical fee and royalty includes fee for services charged by DIC Asia Pacific Pte Limited, a related party amounting to Rs. 74.302 million
(2016: Rs. 77.601 million).
34.1.6 Cost of goods manufactured includes Rs. 2,065.338 million (2016: Rs. 1,751.024 million ) for stores and spares consumed, Rs. 28.184
million (2016: Rs. 23.128 million), Rs. 2.543 million (2016: Rs. 1.017 million) and Rs. 0.851 million (2016: Rs. 4.267 million) for raw
material, stores and spares and finished goods written off respectively.
(Rupees in thousand) Note 2017 2016
34.2 Cost of sales - purchased for resale
Purchases 254,728 145,883
Opening stock of goods purchased for resale 29,355 28,695
Closing stock of goods purchased for resale (44,490) (29,355)
239,593 145,223
34.3 Cost of services
Salaries, wages and benefits 95,734 –
Depreciation on investment properties 22.1 545,903 –
Fuel and power 325,053 –
Rent, rates and taxes 164,285 –
Insurance 30,665 –
Consultancy 12,680 –
Mall operating expenses 215,816 –
1,390,136 –

194
(Rupees in thousand) Note 2017 2016
35. Administrative expenses
Salaries, wages and amenities 35.1 & 35.2 968,795 831,824
Travelling and conveyance 51,770 44,920
Rent, rates and taxes 35.3 & 35.4 180,287 138,636
Insurance 27,108 23,464
Printing, stationery and periodicals 27,283 27,459
Postage, telephone and telex 28,730 24,207
Medical expenses 1,735 –
Entertainment expenses 452 –
Motor vehicles running 13,943 9,370
Computer charges 26,953 20,193
Training expenses 2,823 –
Professional services 35.5 132,240 112,198
Consultancy and transaction advisory fee 35.6 3,926 9,241
Repairs and maintenance 29,898 22,406
Depreciation on owned assets 21.1.4 75,635 42,281
Depreciation on assets subject to finance lease 21.2.1 7,572 9,967
Amortisation of intangible assets 23.2 6,950 8,503
Depreciation on investment properties 22.1 4,018 4,494
Security services 3,821 3,986
Other expenses 121,711 94,969
1,715,650 1,428,118
35.1 Salaries, wages and amenities include following in respect of retirement benefits
Defined benefit plans
Gratuity fund 10,167 6,323
Pension fund 1,199 2,227
Defined contribution plans
Provident fund 10,680 10,106
Pension fund 14,185 14,569
Other benefit plan
Accumulating compensated absences 12,480 37,373
48,711 70,598
35.2 Salaries, wages and amenities include Rs. 63.492 million (2016: Rs. 50.945 million) in respect of labour contractors for services rendered
during the year.
35.3 Rent, rates and taxes include operating lease rentals amounting to Rs. 48.940 million (2016: Rs. 42.308 million).
35.4 In June 2017, Walton Cantonment Board concluded its assessment for property tax payable by the Parent Company relating to June 2014
to June 2017 resulting in a demand of Rs. 47.910 million which has been charged in the current year. Out of the total amount Rs. 39.983
million has been charged to administrative expenses and Rs. 7.927 million has been charged to cost of sales and services.

195
ANNUALREPORT 2017
(Rupees in thousand) 2017 2016
35.5 Professional services
The charges for professional services include the following in respect of auditors’ services for: Statutory audit 11,320 7,098 Half yearly review 2,611 2,194 Tax services 14,566 14,371 Workers’ profit participation fund audit, management staff pension and gratuity fund audit, audit of consolidated financial statements and other certification charges 5,331 3,095 Out of pocket expenses 1,561 992
35,389 27,750
35.6 Administrative expenses include Rs. 55.699 million (2016: Rs. 88.618 million) for stores and spares consumed.
(Rupees in thousand) Note 2017 2016
36. Distribution and marketing costs
Salaries, wages and amenities 36.1 & 36.2 559,916 435,866 Travelling and conveyance 101,579 79,434 Rent, rates and taxes 36.3 8,430 9,708 Freight and distribution 334,169 227,264 Insurance 41,147 36,272 Electricity 947 – Postage,telephone and telex 580 – Advertisement and sales promotion 522,828 376,423 Depreciation on owned assets 21.1.4 20,495 15,450 Depreciation on assets subject to finance lease 21.2.1 2,888 5,346 Repairs and maintenance 602 – Provision for doubtful debts - net 29.3 21,218 13,066 Bad debts written off 19,834 – Other expenses 57,137 26,792
1,691,770 1,225,621 36.1 Salaries, wages and amenities include following in respect of retirement benefits:
Defined benefit plan
Gratuity fund 5,819 3,418
Defined contribution plans
Provident fund 6,140 5,116 Pension fund 8,033 7,337
Other benefit plan
Accumulating compensated absences 5,608 19,118
25,600 34,989
36.2 Salaries, wages and amenities include Rs. 46.394 million (2016: Rs. 45.553 million) in respect of labour contractors for services rendered
during the year.
36.3 Rent, rates and taxes include operating lease rentals amounting to Rs. 8.430 million (2016: Rs. 9.668 million ).
36.4 Distribution and marketing costs include Rs. 3.995 million (2016: Rs. 22.997 million) for stores and spares consumed.

196
(Rupees in thousand) Note 2017 2016
37. Other operating expenses
Worker’s profit participation fund 18.6 401,994 388,535
Workers’ welfare fund 18.7 & 37.1 26,054 19,547
Exchange loss - net 95,008 6,370
Advance written off – 3,705
Donations 37.2 65,011 25,930
CSR Project – 126
588,067 444,213
37.1 As explained in note 4.2, the Parent Company and BSPPL has opted for Group Taxation during the current year. Consequently, the workers’
welfare fund expense is based on the Parent Company’s share of the consolidated results of the Taxation Group.
37.2 The Parent Company made a donation of Rs. 64.856 million (2016: Rs. 25.610 million) to its related party, Packages Foundation.
Following is the interest of Directors of the Parent Company in the donees during the year:
Name of donee Directors of the Company Interest in donee
Packages Foundation Syed Hyder Ali Trustee
Shamim Ahmad Khan Trustee
Syed Aslam Mehdi Trustee
No other directors and their spouses had any interest in any of the donees during the year.
(Rupees in thousand) Note 2017 2016
38. Other income
Income from financial assets
Income on bank deposits 21,328 13,769 Capital gain on disposal of Government securities 3,177 – Income on term deposits – 5,748 Interest charged on trade and other receivables 4,348 2,837 Interest on loan to SNGPL 278 471
29,131 22,825 Income from non-financial assets
Rental income from investment property 54,423 59,689 Profit on disposal of owned assets 26,039 56,087 Service fees 4,488 – Scrap sales 14,003 12,968
98,953 128,744 Others
Insurance commission from related party 7,669 6,093 Liabilities no longer payable written back 20,786 25,277 Insurance claims received – 15,282 Exchange gain – 1,195 Gain on exchange of shares of associates 24.4 17,932 – Reversal of provision for workers’ welfare fund 18.7 7,351 150,606 Rebate income 38.1 43,524 26,277 Others 38.2 21,075 31,205
118,337 255,935
246,421 407,504

197
ANNUALREPORT 2017
38.1 This includes indent commission income aggregating Rs. 0.805 million (2016 : Rs. 0.657 million) charged to Sun Chemicals Limited, DIC
India Limited and DIC Asia Pacific Pte Ltd, related parties (associated companies).
38.2 This includes compensation of Nil (2016 : Rs. 0.73 million) charged to DIC Asia Pacific Pte Limited (associated company) against not
providing material as per required specifications.
(Rupees in thousand) Note 2017 2016
39. Finance costs
Interest and mark up including commitment charges on
Long term finances - secured
Local currency 610,435 183,419
Foreign currency 78,763 58,051
Finances under mark up arrangements - secured 204,385 94,617
Liabilities against assets subject to finance lease 57,970 58,474
Loan from shareholder of Parent Company 33,377 –
Return on preference shares / convertible stock 155,550 136,553
Premium on redemption of preference shares / convertible stock 6.9.3 – 909,582
Loan handling charges – 16,654
Commission on guarantees 21,067 21,424
Bank charges 14,154 15,734
1,175,701 1,494,508
40. This represents dividend income from other long term investments as referred in note 25.
(Rupees in thousand) Note 2017 2016
41. Taxation
Current Current year 41.1 939,443 1,160,613
Prior years 190,442 422,632
1,129,885 1,583,245
Deferred 328,550 78,499
1,458,435 1,661,744
41.1 As explained in note 4.2, the Taxation Group’s provision for taxation (current and deferred) included in the charge for the current year is
based on the consolidated results of the Taxation Group which represents tax under ‘final tax regime’ and minimum tax on turnover net of
investment tax credit available to the Taxation Group by virtue of investment in plant and machinery. The Group taxation has resulted in a
reduction of Rs 69.471 million (2016: Nil) in the tax expense of the Taxation Group for the year.

198
Percentage 2017 2016
41.2 Tax charge reconciliation
Numerical reconciliation between the average effective tax rate and the applicable tax rate Applicable tax rate 30.00 31.00 Tax effect of amounts that are: Associates and joint ventures results reported net of tax (10.13) 2.50 Differences in overseas taxation rates (0.01) (0.28) Asset for share transaction of foreign subsidiary – (0.03) Not deductible for tax purposes 0.42 0.53 Deductible for tax purposes (0.20) (0.13) Exempt for tax purposes (0.13) (0.82) Chargeable to tax at different rates (8.48) (17.19) Effect of change in prior years’ tax 1.49 6.05 Group taxation as explained in note 4.2 (2.55) – Tax credits and losses in respect of which no deferred tax asset has been recognised (0.62) 2.11 Tax effect under presumptive tax regime and others 0.23 0.72 Tax credits and losses recognised during the year – 0.43 Deferred tax asset not recognised 2.06 – Minimum tax 0.16 – Effect of allowance against property income (0.34) – Investment tax credit – (1.20)
(18.10) (7.31)
Average effective tax rate charged to consolidated profit and loss account 11.90 23.69
42. As referred to in note 6.9, in addition to the preferred right of return at the rate of 10 percent per annum, either in cash or ordinary shares on a non-cumulative basis till the date of settlement of preference shares / convertible stock, the preference shareholders also have the right to share the excess amount with the ordinary shareholders on an as-converted basis in case the amount of dividend per share paid to an ordinary shareholder exceeds that paid to a preference shareholder. Since ordinary dividend of Rs. 25.00 per share was approved for the year ended December 31, 2016, which exceeded the preferred return for that year, the additional preference dividend to be paid to the preference shareholders has been distributed to the preference shareholders as participating dividend and charged directly to the equity.
43. Remuneration of Chief Executive, Directors and Executives
43.1 The aggregate amount charged in the consolidated financial statements for the year for remuneration, including certain benefits, to the
Chief Executive, Executive Directors and Executives of the Group are as follows:
Chief Executive Executive Directors Executives
(Rupees in thousand) 2017 2016 2017 2016 2017 2016
Short term employee benefits
Managerial remuneration 27,221 22,668 9,800 6,953 463,357 318,218 Housing 12,482 9,453 3,780 2,589 142,251 103,141 Utilities 3,079 2,101 844 595 45,624 31,120 Bonus 24,479 21,972 8,253 6,845 164,147 135,134 Leave passage 4,817 8,456 717 962 12,776 7,594 Medical expenses 4,181 5,295 44 61 9,336 1,065
76,259 69,945 23,438 18,005 837,491 596,272 Post employment benefits
Contribution to provident, gratuity and pension funds 8,867 7,404 2,957 2,026 72,307 51,117
85,126 77,349 26,395 20,031 909,798 647,457
Number of persons 1 1 2 2 282 146
The Group also provides the Chief Executive, Executive Directors and certain Executives with Group maintained cars, free transport and utilities.

199
ANNUALREPORT 2017
43.2 Premium charged in the consolidated financial statements in respect of directors’ indemnity insurance policy, purchased by the Group during the year, amounted to Rs. 0.753 million (2016: Rs. 0.753 million)
43.3 Aggregate amount charged in the consolidated financial statements for the year for fee to 5 directors (2016: 5 directors) is Rs 4.550 million (2016: Rs 4.425 million).
44. Transactions with related parties
The related parties comprise joint ventures, associates, directors, key management personnel, post employment benefit plans and other related parties. The Group in the normal course of business carries out transactions with various related parties. Amounts due from and to related parties are shown under receivables and payables, amounts due from directors and key management personnel are shown under receivables and remuneration of directors and key management personnel is disclosed in note 43. Other significant transactions
with related parties are as follows:
Relationship with the Nature of transactions 2017 2016 Group (Rupees in thousand)
i. Joint Ventures Purchase of goods & services 2,095,076 2,305,555
Sale of goods & services 341,632 386,071
Dividend income 5,958 1,435
Purchase of property, plant & equipment – 1,244
Rental income 48,065 65,589
Sale of Property, plant & equipment 1,144 9,781
ii. Associates Purchase of goods & services 1,141,722 1,041,308
Sale of goods & services 21,950 3,563
Purchase of Property, plant & equipment – 615
Dividend income 129,333 102,088
Insurance premium paid 247,866 177,285
Rental and other income 16,255 5,833
Insurance claims received 25,601 569
Commission earned 6,799 6,093
Dividend paid 607,740
Investment – 366,667
Issuance of share capital – 1,000,000
iii. Other related parties Purchase of goods & services 464,255 146,114
Sale of goods & services – 710
Dividend paid 47,009 178,358
Commission earned 1,224 –
Commission expense 14,463 –
Royalty and technical fee - expense 74,342 77,601
Rebate received – 752
Donations of Parent Company 64,857 25,610
iv. Retirement obligations Expense charged in respect of retirement benefit plans 124,388 129,877
Dividend paid 70,811 42,486
(v) Key management personnel Salaries and other employee benefits 168,378 133,261
Dividend paid 57,182 34,309
All transactions with related parties have been carried out on mutually agreed terms and conditions.
There are no transactions with key management personnel other than under the term of employment.

200
45. Capacity and production
Capacity Actual production
2017 2016 2017 2016
Paper and paperboard produced tons 281,400 41,400 65,832 14,353
Paper and paperboard converted tons 50,800 50,800 36,890 36,890
Plastics all sorts converted tons 43,700 43,700 20,995 36,621
Inks produced - tons 15,194 13,158 9,925 9,649
Flexible packaging material - meters ‘000’ 90,000 90,000 79,658 72,726
Corrugator 96,000 – 21,904 –
The variance of actual production from capacity is primarily on account of production planned as per market demand.
2017 2016
46. Number of employees
Total number of employees as at December 31 3,483 2,065
Average number of employees during the year 3,363 2,044
47. Rates of exchange
Liabilities in foreign currencies have been translated into PKR at USD 0.9050 (2016: USD 0.9542), EURO 0.7588 (2016: EURO 0.9065),
CHF 0.8857 (2016: CHF 0.9741), SEK 7.4627 (2016: SEK 8.6881), GBP 0.6724 (2016: GBP 0.7768), SGD 1.2096 (2016: SGD 1.3801),
YEN 102.0721 (2016: YEN 90.0901), SLR 138.4658 (2016:146.4340) and ZAR 11.1607 (2016: 7.2038) equal to Rs. 100. Assets in
foreign currencies have been translated into PKR at USD 0.90662 (2016: USD 0.9560), SLR 139.15948 (2016: 146.4340) and ZAR
11.21202 (2016: 7.2038) equal to Rs. 100.
(Rupees in thousand) Note 2017 2016
48. Cash generated from operations
Profit before tax 12,258,219 7,013,251
Adjustments for:
Depreciation on owned assets 21.1.4 1,650,275 839,945
Depreciation on assets subject to finance lease 21.2.1 15,564 48,929
Depreciation on investment property 22.1 549,921 4,494
Amortization on intangible assets 23.2 14,521 18,271
Provision for accumulating compensated absences 14 66,133 140,558
Provision for retirement benefits 13 47,873 30,150
Provision for doubtful debts 29.3 21,218 13,066
Net exchange adjustments (40,524) (102,742)
Profit on disposal of operating fixed assets 38 (26,039) (56,087)
Reversal of provision for workers’ welfare fund 38 (7,351) (150,606)
Liabilities no longer payable written back 38 (20,786) (25,277)
Gain on exchange of shares of associates 38 (17,932) –
Capital work-in-progress charged to consolidated profit and loss account 21.3 9,443 5,592
Advances written off – 3,705
Finance costs 39 1,175,701 1,494,508
Provision for obsolete / slow moving stores and spares 27.2 6,703 –
Provision for obsolete / slow moving stock in trade 28.6 20,013 20,862
Dividend income 40 (5,972,121) (6,054,991)
Gains and losses relating to business combinations 54 (4,965,355) –
Share of (loss) / profit of investments accounted for under
equity method - net of tax 24.2 (206,530) 290,862
Profit before working capital changes 4,578,946 3,534,850

201
ANNUALREPORT 2017
(Rupees in thousand) 2017 2016
Effect on cash flow due to working capital changes:
(Increase) / decrease in stores and spares (132,986) 24,341
Increase in stock-in-trade (700,891) (131,100)
Increase in trade debts (853,980) (746,512)
Decrease in loans, advances, deposits, prepayments
and other receivables 103,289 569,208
Increase in rental security deposits 418,251 –
Increase in trade and other payables 685,093 512,791
(481,224) 207,866
4,097,722 3,742,716
(Rupees in thousand) Note 2017 2016
49. Cash and cash equivalents
Cash and bank balances 32 1,088,790 411,801
Finances under mark up arrangements - secured 17 (5,091,722) (1,918,079)
(4,002,932) (1,506,278)
50. Earnings per share
50.1 Basic earnings per share
Profit for the year Rupees in thousand 10,673,355 5,139,901
Participating dividend on preference shares Rupees in thousand (45,000) –
Rupees in thousand 10,628,355 5,139,901
Weighted average number of ordinary shares Numbers 89,379,504 89,379,504
Basic earnings per share Rupees 118.91 57.51
50.2 Diluted earnings per share
Profit for the year Rupees in thousand 10,673,355 5,139,901
Return on preference shares /
convertible stock - net of tax Rupees in thousand 127,314 107,332
10,800,669 5,247,233
Weighted average number of ordinary shares Numbers 89,379,504 89,379,504
Weighted average number of notionally
converted preference shares / convertible stock Numbers 8,186,842 8,186,842
97,566,346 97,566,346
Diluted earnings per share Rupees 110.70 53.78
51. Segment Information
A business segment is a group of assets and operations engaged in providing products that are subject to risk and returns that are
different from those of other business segments.
Types of Segments Nature of business
Packaging Manufacture and market packing products
Consumer Products Manufacture and market consumer / tissue products
Ink Manufacture and market industrial and commercial ink products
Real Estate Construction and development of real estate
Paper and Paper Board Manufacture and market paper and board products
Unallocated Workshop and other general business

202
Pack
aging
Co
nsum
er Ink
Re
al Pa
per a
nd
Div
ision
Pro
ducts
Divis
ion
Divisi
on
Estat
e Pa
per B
oard
Unall
ocate
d To
tal
(Rup
ees i
n tho
usan
d)
2017
20
16
2017
20
16
2017
20
16
2017
20
16
2017
20
16
2017
20
16
2017
20
16
To
tal re
venu
e 2
0,70
7,05
1
18,
206,
462
4
,374
,835
3
,848
,427
3
,868
,353
3
,690
,144
1
,701
,878
–
2
,804
,947
–
2
88,5
05
343
,947
3
3,74
5,56
9
26,
088,
980
Int
erse
gmen
t rev
enue
(1
,387
,440
) (4
39,5
22)
(129
,920
) (1
1,50
4)
(1,0
43,2
29)
(934
,562
) –
(6
6,43
4)
(1,4
37,6
25)
– (1
41,3
19)
(141
,284
) (4
,139
,533
) (1
,593
,306
)
Re
venu
e fro
m ex
terna
l cus
tomer
s 1
9,31
9,61
1
17,
766,
940
4
,244
,915
3
,836
,923
2
,825
,124
2
,755
,582
1
,701
,878
(6
6,43
4)
1,3
67,3
22
– 1
47,1
86
202
,663
2
9,60
6,03
6
24,
495,
674
Pe
rcen
tage o
f rev
enue
65
%
73%
14
%
16%
10
%
11%
6%
0%
5%
0%
0%
1%
10
0%
100%
Int
eres
t rev
enue
2
,041
2
,241
–
– –
–
16,
005
7
,410
–
– 3
,560
1
3,17
4
21,
606
2
2,82
5
Int
eres
t exp
ense
(3
56,3
89)
(170
,220
) (2
0,75
8)
(8,0
70)
(30,
522)
(2
2,69
8)
(367
,393
) –
(8
7,89
1)
– (3
68,6
98)
(1,2
93,5
20)
(1,2
31,6
51)
(1,4
94,5
08)
De
prec
iation
and
amor
tisati
on
(1,2
31,4
31)
(619
,695
) (1
27,1
38)
(107
,012
) (2
9,59
1)
(27,
266)
(5
62,7
01)
(2,9
00)
(398
,898
) –
(1
41,1
71)
(154
,766
) (2
,490
,930
) (9
11,6
39)
Se
gmen
t pro
fit / (
loss)
befor
e tax
1
,407
,453
1
,755
,626
6
69,9
60
659
,715
4
55,6
41
551
,728
(2
86,5
48)
(90,
235)
(9
3,63
3)
– 5
,240
,026
4
,818
,904
7
,392
,899
7
,695
,738
Se
gmen
t tax
ation
(1
06,4
93)
(214
,119
) (1
2,08
4)
(30,
089)
(1
30,0
69)
(223
,035
) (8
1,01
0)
(4,9
90)
(15,
250)
–
(8
95,5
12)
(1,2
37,0
18)
(1,2
40,4
18)
(1,7
09,2
51)
Se
gmen
t pro
fit / (
loss)
after
tax
1,3
00,9
60
1,5
41,5
06
657
,876
6
29,6
26
325
,572
3
28,6
93
(367
,558
) (9
5,22
5)
(108
,883
) –
4
,344
,514
3
,581
,887
6
,152
,481
5
,986
,487
%
age o
f pro
fit / (
loss)
after
tax
21%
26
%
11%
11
%
5%
5%
-6%
-2
%
-2%
0%
71
%
60%
10
0%
100%
Se
gmen
t ass
ets
21,
923,
522
9
,790
,948
1,
849,
118
1
,603
,568
1
,781
,752
1
,485
,012
1
3,51
8,94
3
11,
030,
559
1
5,90
0,47
3
– 6
,722
,694
1
,178
,369
6
1,69
6,50
2
25,
088,
456
Se
gmen
t liab
ilities
3
,256
,886
8
84,6
15
215
,559
1
19,0
48
211
,309
2
78,2
71
264
,349
9
6,77
2
1,4
85,5
24
– 3
0,33
5,55
0
18,
981,
614
3
5,76
9,17
7
20,
360,
320

203
ANNUALREPORT 2017
(Rupees in thousand) 2017 2016
51.1 Reconciliation of segment profit
Total profit for reportable segments 7,392,899 7,695,738 Net income / (loss) from associates and joint ventures 197,486 (394,385) Intercompany adjustment (297,521) (288,102) Gains relating to business combination 4,965,355 –
Profit before tax as per consolidated profit and loss account 12,258,219 7,013,251
(Rupees in thousand) 2017 2016
51.2 Reconciliation of segment assets
Total assets for reportable segments 61,696,502 25,088,456 Intersegment assets (9,039,584) (3,549,300) Other corporate assets 60,228,839 53,570,285
Total assets as per consolidated balance sheet 112,885,757 75,109,441 Segment assets are measured in the same way as in the financial statements. These assets are allocated based on the operations of
the segment and the physical location of the asset. Investment in shares (classified as available for sale financial assets, held to maturity investments or financial assets at fair value through profit or loss) held by the Group are not considered to be segment assets, but are managed by the treasury function.
(Rupees in thousand) 2017 2016
51.3 Reconciliation of reportable segment liabilities
Total liabilities for reportable segments 5,433,627 1,378,706 Intersegment liabilities (142,574) (9,695) Unallocated liabilities 30,335,550 18,981,614
Total liabilities as per consolidated balance sheet 35,626,603 20,350,625 Segment liabilities are measured in the same way as in the financial statements. These liabilities are allocated based on the operations of
the segment. The Group’s borrowings are not considered to be segment liabilities, but are managed by the treasury function.
(Rupees in thousand) 2017 2016
51.4 Reconciliation of segment taxation
Total tax expense for reportable segments (1,240,418) (1,709,251) Intercompany adjustment (218,018) (47,507)
Tax as per consolidated profit and loss account (1,458,436) (1,756,758)
(Rupees in thousand) 2017 2016
51.5 Reconciliation of segment profit after tax
Total profit after tax for reportable segments 6,152,481 5,986,487 Intercompany adjustment for (loss) before tax (100,034) (682,487) Gains relating to business combinations 4,965,355 – Intercompany adjustment for taxation (218,018) 47,507
Profit as per consolidated profit and loss account 10,799,784 5,351,507

204
51.6 Information by geographical area Revenue Non - current assets(Rupees in thousand) 2017 2016 2017 2016
Afghanistan 29,042 30,274 – –
Bahrain 213,800 162,802 – –
Bangladesh 9,885 5,193 – –
Oman 9,682 9,005 – –
Pakistan 26,177,220 19,316,938 36,217,834 15,329,786
Indonesia – – – –
Sri Lanka 1,448,398 1,347,791 553,539 417,560
South Africa 3,915,746 3,540,016 – 1,563,384
Kenya 76,554 80,681 – –
Mauritius – – – 170,075
Malaysia – 668 – –
Canada 4,696 – – –
UK 1,111 1,611 – –
UAE 5,065 696 – –
31,891,199 24,495,674 36,771,373 17,480,805
Sales are allocated to geographical areas according to the country of receiving the goods or providing services.
51.7 Information about major customers
Included in the total revenue is revenue from four (2016: four) customers of the Group from the packaging (2016: packaging) segment
which represents approximately Rs. 8,548.273 million (2016: Rs. 6,035.433 million) of the Group’s total revenue. The Group’s revenue
from other segments is earned from a large mix of customers.
52. Financial risk management
52.1 Financial risk factors
The Group’s activities expose it to a variety of financial risks: market risk (including currency risk, fair value interest rate risk, cash
flow interest rate risk and price risk), credit risk and liquidity risk. The Group’s overall risk management programme focuses on the
unpredictability of financial markets and seeks to minimise potential adverse effects on the Group’s financial performance. The Group
uses derivative financial instruments to hedge certain risk exposures.
Risk management is carried out by the Group’s finance department under policies approved by the Board of Directors. The Group’s finance
department evaluates and hedges financial risks. The Board provides written principles for overall risk management, as well as written
policies covering specific areas, such as foreign exchange risk, interest rate risk, credit risk, use of derivative financial instruments and
non-derivative financial instruments, and investment of excess liquidity.
The Group’s overall risk management procedures to minimize the potential adverse effects of financial market on the Group’s performance
are as follows:
(a) Market risk
(i) Foreign exchange risk
Foreign exchange risk is the risk that the fair value of future cash flows of a financial instrument shall fluctuate because of changes in
foreign exchange rates.
The Group operates internationally and is exposed to foreign exchange risk arising from various currency exposures, primarily with
respect to the US dollar, the Euro and the Sri Lankan rupee. Foreign exchange risk arises from future commercial transactions and
recognised assets and liabilities. Foreign exchange risk arises when future commercial transactions or recognised assets or liabilities or
net investments in foreign operations that are denominated in a currency that is not the Group’s functional currency.

205
ANNUALREPORT 2017
At December 31, 2017, if the Rupee had strengthened / weakened by 10% against the US dollar with all other variables held constant,
post-tax profit for the year would have been Rs. 86.248 million higher / lower (2016: Rs. 37.836 million higher / lower) mainly as a result
of foreign exchange gains / losses on translation of US dollar-denominated financial assets and liabilities.
At December 31, 2017, if the Rupee had strengthened / weakened by 10% against the Euro with all other variables held constant, post-
tax profit for the year would have been Rs. 49.581 million higher / lower (2016: Rs. 32.587 million) higher / lower, mainly as a result of
foreign exchange gains / losses on translation of Euro-denominated financial assets and liabilities.
At December 31, 2017, if the Rupee had strengthened / weakened by 10% against the Sri Lankan rupee with all other variables held
constant, other component of equity would have been Rs. 72.165 million (2016: Rs. 71.184 million) lower / higher, mainly as a result of
foreign exchange losses / gains on translation of net assets of Packages Lanka (Private) Limited, denominated in Sri Lankan Rupee.
At December 31, 2017, if the Rupee had strengthened / weakened by 10% against the South African Rand with all other variables held
constant, other component of equity would have been Rs. 15.748 million higher / lower (2016: 10.253 million higher / lower) , mainly as
a result of foreign exchange gains / losses on translation of Rand-denominated financial assets and liabilities.
At December 31, 2017, if the Rupee had strengthened / weakened by 10% against the Swedish Krona with all other variables held
constant, post-tax profit for the year would have been Rs. 0.056 million (2016: NIL) higher / lower, mainly as a result of foreign exchange
gains / losses on translation of Krona-denominated financial assets and liabilities.
(ii) Price risk
Price risk represents the risk that the fair value or future cash flows of a financial instrument will fluctuate because of changes in
market prices (other than those arising from interest rate risk or currency risk), whether those changes are caused by factors specific
to the individual financial instrument or its issuer, or factors affecting all similar financial instruments traded in the market. The Group is
exposed to equity securities price risk because of investments held by the Group and classified as available for sale. The Group is not
exposed to commodity price risk. To manage its price risk arising from investments in equity securities, the Group diversifies its portfolio.
Diversification of the portfolio is done in accordance with the limits set by the board of directors.
The Group’s quoted investments in equity of other entities are publicly traded on Pakistan Stock Exchange.
The table below summarises the impact of increases / decreases of the KSE-100 index on the Group’s post-tax profit for the year and on
equity. The analysis is based on the assumption that the KSE had increased / decreased by 10% with all other variables held constant and
all the Group’s equity instruments moved according to the historical correlation with the index:
Impact on post - tax profit Impact on other components of equity(Rupees in thousand) 2017 2016 2017 2016
Pakistan Stock Exchange – – 3,566,469 2,791,675
Post-tax profit for the year would decrease / increase as a result of losses / gains on equity securities classified as at fair value through
profit or loss. Other components of equity would decrease / increase as a result of losses / gains on equity securities classified as available
for sale. As at December 31, 2017 the Group has no investment classified at fair value through profit or loss.
(iii) Cash flow and fair value interest rate risk
Interest rate risk represents the risk that the fair value or future cash flows of a financial instrument will fluctuate because of changes in
market interest rates.
As the Group has no significant floating interest rate assets, the Group’s income is substantially independent of changes in market interest
rates.
The Group’s interest rate risk arises from short term and long term borrowings. These borrowings issued at variable rates expose the
Group to cash flow interest rate risk.

206
The Group analyses its interest rate exposure on a dynamic basis. Various scenarios are simulated taking into consideration refinancing,
renewal of existing positions, alternative financing and hedging. Based on these scenarios, the Group calculates the impact on profit and
loss of a defined interest rate shift. The scenarios are run only for liabilities that represent the major interest-bearing positions.
At December 31, 2017, if interest rates on floating rate borrowings had been 1% higher / lower with all other variables held constant,
post-tax profit for the year would have been Rs. 104.33 million (2016: Rs. 23.730 million ) lower / higher, mainly as a result of higher /
lower interest expense on floating rate borrowings.
(b) Credit risk
Credit risk represents the risk of financial loss being caused if counter party fails to discharge an obligation.
Credit risk of the Group arises from cash and cash equivalents, derivative financial instruments and deposits with banks and financial
institutions, as well as credit exposures to distributors and wholesale and retail customers, including outstanding receivables and
committed transactions. The management assesses the credit quality of the customers, taking into account their financial position, past
experience and other factors. Individual risk limits are set based on internal or external ratings in accordance with limits set by the board.
The utilisation of credit limits is regularly monitored and major sales to retail customers are settled in cash. For banks and financial
institutions, only independently rated parties with a strong credit rating are accepted.
The Group monitors the credit quality of its financial assets with reference to historical performance of such assets and available external
credit ratings. The carrying values of financial assets exposed to credit risk are as under:
(Rupees in thousand) 2017 2016
Long term loans and deposits 157,208 39,858
Trade debts 5,946,606 3,561,210
Loans, advances, deposits, prepayments and other receivables 488,467 627,179
Balances with banks 1,081,278 407,477
7,673,559 4,635,724
As of December 31, 2017, trade receivables of Rs. 2,336.837 million (2016: Rs. 698.007 million) were past due but not impaired. These
relate to a number of independent customers for whom there is no recent history of default. The aging analysis of these trade receivables
is as follows:
(Rupees in thousand) 2017 2016
Neither past due nor impaired 3,609,769 2,863,203
Past due but not impaired:
Up to 90 days 2,154,768 491,704
90 to 180 days 157,657 120,744
181 to 366 days 24,412 85,559
2,336,837 698,007
5,946,606 3,561,210
The management estimates the recoverability of trade receivables on the basis of financial position and past history of its customers
based on the objective evidence that it shall not receive the amount due from the particular customer. The provision is written off by the
Group when it expects that it cannot recover the balance due. Any subsequent repayments in relation to amount written off, are credited
directly to consolidated profit and loss account.
The aging analysis of trade receivables from related parties as at balance sheet date is as follows:

207
ANNUALREPORT 2017
(Rupees in thousand) 2017 2016
Neither past due nor impaired 62,904 35,548
Past due but not impaired:
Up to 90 days 10,373 10,638
90 to 180 days 1 8,575
181 to 366 days 1,640 2,517
12,014 21,730
74,918 57,278
The credit quality of Group’s bank balances can be assessed with reference to external credit ratings as follows:
Rating Rating Rating (Rupees in thousand) Short term Long term Agency 2017 2016
Allied Bank Limited A1+ AA+ PACRA 47,746 1,252
Askari Bank Limited A1+ AA+ PACRA 52 –
Bank Al-Habib Limited A1+ AA+ PACRA 1,659 –
Citibank N.A. P1 A1 Moody’s 480 341
Commercial Bank of Ceylon Limited Sri Lanka AA- – Fitch 6 7
Deutsche Bank AG P2 Baa2 Moody’s 980 240
Dubai Islamic Bank (Pakistan) Limited A1 AA- JCR-VIS 22 36
Faysal Bank Limited A-1+ AA JCR-VIS 49,366 60,742
First National Bank South Africa – BBB JCR-VIS 12,961 6,547
Habib Bank Limited A1+ AAA JCR-VIS 461,756 44,181
Habib Bank Limited Mauritius A – JCR-VIS 350 8,943
Habib Metropolitan Bank Limited A1+ AA+ PACRA 15 –
Hatton Bank Limited Sri Lanka – AA- Fitch 7,206 14,034
JS Bank Limited A1+ AA- PACRA 50 681
MCB Bank Limited A1+ AAA PACRA 284,976 145,124
MCB Bank Limited South Africa A+ – ICRA 49,882 47,537
Meezan Bank Limited A1+ AAA JCR-VIS 143 4,253
National Bank of Pakistan A1+ AAA PACRA 28,708 28,526
NDB Bank A+ - Fitch 8,853 20,788
Samba Bank Limited A1 AA JCR-VIS 1,332 1,332
Standard Chartered Bank (Pakistan) Limited A1+ AAA PACRA 124,685 22,805
The Bank of Punjab A1+ AA- PACRA – 58
United Bank Limited A1+ AAA JCRVIS 50 50
1,081,278 407,477
(c) Liquidity risk
Liquidity risk represents the risk that the Group shall encounter difficulties in meeting obligations associated with financial liabilities.
Prudent liquidity risk management implies maintaining sufficient cash and marketable securities, the availability of funding through an
adequate amount of committed credit facilities. Due to the dynamic nature of the Group’s businesses, the Group’s finance department
maintains flexibility in funding by maintaining availability under committed credit lines.
Management monitors the forecasts of the Group’s cash and cash equivalents (note 44) on the basis of expected cash flow. This is
generally carried out in accordance with practice and limits set by the Group. These limits vary by location to take into account the liquidity
of the market in which the entity operates. In addition, the Group’s liquidity management policy involves projecting cash flows in each
quarter and considering the level of liquid assets necessary to meet its liabilities, monitoring balance sheet liquidity ratios against internal
and external regulatory requirements and maintaining debt financing plans.
The table below analyses the Group’s financial liabilities and net-settled derivative financial liabilities into relevant maturity groupings
based on the remaining period at the balance sheet to the contractual maturity date. The amounts disclosed in the table are the contractual
undiscounted cash flows as the impact of discounting is not significant.
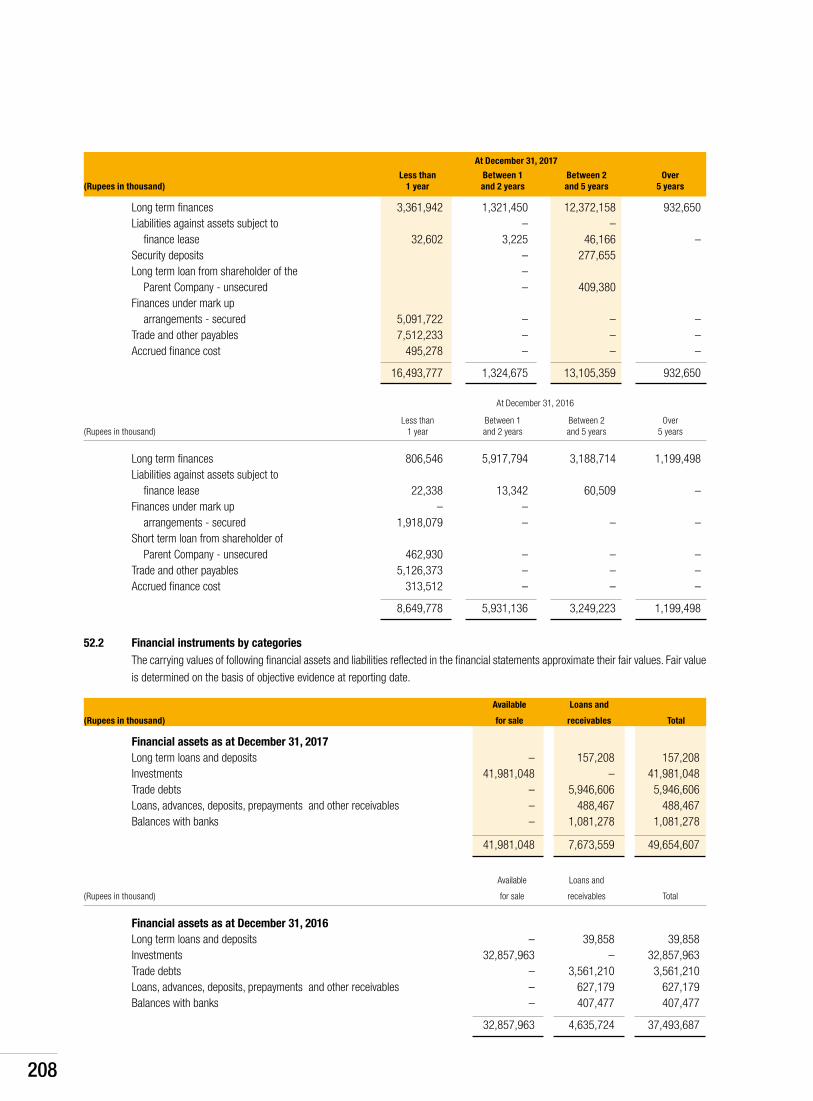
208
At December 31, 2017
Less than Between 1 Between 2 Over(Rupees in thousand) 1 year and 2 years and 5 years 5 years
Long term finances 3,361,942 1,321,450 12,372,158 932,650 Liabilities against assets subject to – – finance lease 32,602 3,225 46,166 – Security deposits – 277,655 Long term loan from shareholder of the – Parent Company - unsecured – 409,380 Finances under mark up arrangements - secured 5,091,722 – – – Trade and other payables 7,512,233 – – – Accrued finance cost 495,278 – – –
16,493,777 1,324,675 13,105,359 932,650
At December 31, 2016
Less than Between 1 Between 2 Over (Rupees in thousand) 1 year and 2 years and 5 years 5 years
Long term finances 806,546 5,917,794 3,188,714 1,199,498 Liabilities against assets subject to finance lease 22,338 13,342 60,509 – Finances under mark up – – arrangements - secured 1,918,079 – – – Short term loan from shareholder of Parent Company - unsecured 462,930 – – – Trade and other payables 5,126,373 – – – Accrued finance cost 313,512 – – –
8,649,778 5,931,136 3,249,223 1,199,498
52.2 Financial instruments by categories The carrying values of following financial assets and liabilities reflected in the financial statements approximate their fair values. Fair value
is determined on the basis of objective evidence at reporting date.
Available Loans and
(Rupees in thousand) for sale receivables Total
Financial assets as at December 31, 2017 Long term loans and deposits – 157,208 157,208 Investments 41,981,048 – 41,981,048 Trade debts – 5,946,606 5,946,606 Loans, advances, deposits, prepayments and other receivables – 488,467 488,467 Balances with banks – 1,081,278 1,081,278
41,981,048 7,673,559 49,654,607
Available Loans and
(Rupees in thousand) for sale receivables Total
Financial assets as at December 31, 2016 Long term loans and deposits – 39,858 39,858 Investments 32,857,963 – 32,857,963 Trade debts – 3,561,210 3,561,210 Loans, advances, deposits, prepayments and other receivables – 627,179 627,179 Balances with banks – 407,477 407,477
32,857,963 4,635,724 37,493,687

209
ANNUALREPORT 2017
At amortised cost
(Rupees in thousand) 2017 2016
Financial liabilities
Long term finances 17,988,200 11,112,552
Liabilities against assets subject to finance lease 81,993 96,189
Security deposits 277,655 –
Long term loan from shareholder of the Parent Company - unsecured 409,380 –
Short term loan from shareholder of the Parent Company - unsecured – 462,930
Finances under mark up arrangements - secured 5,091,722 1,918,079
Trade and other payables 7,512,233 5,126,373
Accrued finance cost 495,278 313,512
31,856,461 19,029,635
52.3 Capital risk management
The Group’s objectives when managing capital are to safeguard the Group’s ability to continue as a going concern in order to provide
returns for shareholders and benefits for other stakeholders and to maintain an optimal capital structure to reduce the cost of capital
The Group manages its capital structure and makes adjustments to it in the light of changes in economic conditions. In order to maintain
or adjust the capital structure, the Group may adjust the amount of dividends paid to shareholders or issue new shares. Consistent with
the others in industry, the Group monitors capital on the basis of the gearing ratio. This ratio is calculated as net debt divided by total
capital. Net debt is calculated as total borrowings including the current and non-current borrowings as disclosed in note 6 less cash and
cash equivalents as disclosed in note 44. Total capital is calculated as equity as shown in the balance sheet plus net debt. The gearing
ratio as at year end is as follows:
(Rupees in thousand) Note 2017 2016
Long term finances 6 14,626,258 10,306,006
Current portion of long term finances 15 3,361,942 806,546
Cash and cash equivalents 49 4,002,932 1,506,278
Net debt 21,991,132 12,618,830
Total equity 75,142,050 52,808,237
Total capital 97,133,182 65,427,067
Gearing ratio 23% 19%
52.4 Fair value of financial instruments
Fair value is the amount for which an asset could be exchanged, or liability settled, between knowledgeable willing parties in an arm’s
length transaction. Underlying the definition of fair value is the presumption that the Group is a going concern without any intention or
requirement to curtail materially the scale of its operations or to undertake a transaction on adverse terms. The carrying values of all
financial assets and liabilities reflected in these consolidated financial statements approximate their fair values. Fair value is determined
on the basis of objective evidence at each reporting date.
The carrying amount less impairment provision of trade receivables and payables are assumed to approximate their fair values. The fair
value of financial liabilities for disclosure purposes is estimated by discounting the future contractual cash flows at the current market
interest rate that is available to the Group for similar financial instruments.

210
Specific valuation techniques used to value financial instruments include:
- Quoted prices (unadjusted) in active markets for identical assets or liabilities (level 1).
- Inputs other than quoted prices included within level 1 that are observable for the asset or liability, either directly (that is, as prices)
or indirectly (that is, derived from prices) (level 2).
- Inputs for the asset or liability that are not based on observable market data (that is, unobservable inputs) (level 3).
The following table presents the Group’s assets that are measured at fair value:
At December 31, 2017(Rupees in thousand) Level 1 Level 2 Level 3 Total
Assets
Recurring fair value measurement of
available-for-sale investments 41,966,317 – – 41,966,317
At December 31, 2016(Rupees in thousand) Level 1 Level 2 Level 3 Total
Assets
Recurring fair value measurement of
available for sale investments 32,843,232 – – 32,843,232
Valuation techniques used to measure fair values
The fair value of financial instruments traded in active markets is based on quoted market prices at the balance sheet date. A market is
regarded as active if quoted prices are readily and regularly available from an exchange, dealer, broker, industry group, pricing service, or
regulatory agency, and those prices represent actual and regularly occurring market transactions on an arm’s length basis. The quoted
market price used for financial assets held by the Group is the current bid price. These instruments are included in Level 1. The fair value
of financial instruments that are not traded in an active market is determined by using valuation techniques. These valuation techniques
maximise the use of observable market data where it is available and rely as little as possible on entity specific estimates. If all significant
inputs required to fair value an instrument are observable, the instrument is included in Level 2. If one or more of the significant inputs is
not based on observable market data, the instrument is included in Level 3.
There were no other material Level 1, 2 or 3 assets or liabilities during current or prior year.
There were no transfers between levels 1 and 2 for recurring fair value measurements during the year.

211
ANNUALREPORT 2017
53. Interests in other entities
53.1 Subsidiaries
The Group’s principal subsidiaries at 31 December 2017 are set out below. Unless otherwise stated, they have share capital consisting
solely of ordinary shares that are held directly by the Group, and the proportion of ownership interests held equals the voting rights held
by the Group. The country of incorporation or registration is also their principal place of business.
Name of Entity Place of business Ownership interest held Ownership interest held Principal / country of by the Group by by non-controlling interests activities incorporation 2017 2016 2017 2016
Bulleh Shah Packaging (Private) Pakistan 100.00% 0.00% 0.00% 0.00% Manufacturing and sale of Limited [BSPPL] paper, paperboard and corrugated boxes. Anemone Holdings Limited [AHL] Mauritius 100.00% 100.00% 0.00% 0.00% Intermediate holding company of FPCL DIC Pakistan Limited [DIC] Pakistan 54.98% 54.98% 45.02% 45.02% Manufacturing and sale of inks Flexible Packages Convertors South Africa 55.00% 55.00% 45.00% 45.00% Manufacturing and sale of (Proprietary) Limited [FPCL] flexible packaging Packages Lanka (Private) Limited [PLL] Sri Lanka 79.07% 79.07% 20.93% 20.93% Manufacturing and sale of flexible packaging Linnaea Holdings Inc. [LHI] Canada 79.07% 0.00% 20.93% 0.00% Intermediate holding company of [CPI] Chantler Packaging Inc. [CPI] Canada 63.26% 0.00% 36.74% 0.00% Manufacturing and sale of flexible packaging Packages Construction (Private) Limited [PCPL] Pakistan 75.16% 75.16% 24.84% 24.84% Development and construction of real estate Packages Power (Private) Limited [PPPL] Pakistan 100.00% 100.00% 0.00% 0.00% Generation and sale of electricity
53.2 Non-controlling interests (NCI)
Set out below is summarised financial information for each subsidiary that has non-controlling interests that are material to the Group.
The amounts disclosed for each subsidiary are before inter-company eliminations.
DIC Pakistan Flexible Package Lanka Packages Limited Packages Convertors (Private) ConstructionSummarised balance sheet (Proprietary) Limited Limited (Private) Limited(Rupees in thousand) 2017 2016 2017 2016 2017 2016 2017 2016 Current assets 1,633,220 1,347,961 1,486,356 1,067,014 691,083 572,876 1,084,566 205,238 Current liabilities (795,084) (730,770) (1,354,627) (1,092,762) (503,325) (251,694) (1,076,675) (1,661,141)
Current net assets / (liabilities) 838,136 617,191 131,729 (25,748) 187,758 321,182 7,891 (1,455,903) Non - current assets 148,532 144,371 2,158,527 1,903,534 615,934 399,236 12,434,377 10,825,322 Non - current liabilities (56,529) (52,572) (836,111) (672,682) (82,038) (136,178) (8,791,962) (5,475,550)
Non - current net assets 92,003 91,799 1,322,416 1,230,852 533,896 263,058 3,642,415 5,349,772
Net assets 930,139 708,990 1,454,145 1,205,104 721,654 584,240 3,650,306 3,893,869
Accumulated NCI 418,749 318,563 654,327 542,206 136,607 122,573 906,736 967,237

212
DIC Pakistan Flexible Package Lanka Packages Limited Packages Convertors (Private) ConstructionSummarised statement of comprehensive income (Proprietary) Limited Limited (Private) Limited(Rupees in thousand) 2017 2016 2017 2016 2017 2016 2017 2016 Revenue 3,868,353 3,690,144 3,915,746 3,540,016 1,525,884 1,429,488 1,701,878 –
Profit / (loss) for the year 325,572 328,693 95,540 110,756 134,563 156,524 (367,561) (95,225) Other comprehensive income / (loss) – – 132,289 196,584 20,482 (36,053) – –
Total comprehensive income / (loss) 325,572 328,693 227,829 307,340 155,045 120,471 (367,561) (95,225) Total comprehensive income / (loss) allocated to NCI 146,573 147,353 42,993 138,303 28,164 25,215 (91,302) (18,348)
Dividends paid to NCI 30,198 178,359 27,065 54,088 47,010 24,218 – –
DIC Pakistan Flexible Package Lanka Packages Limited Packages Convertors (Private) ConstructionSummarised cash flow (Proprietary) Limited Limited (Private) Limited(Rupees in thousand) 2017 2016 2017 2016 2017 2016 2017 2016 (used in) / generated from operating activities (7,352) 279,919 100,623 182,568 72,833 261,384 (34,659) 147,455
(used in) / generated from investing activities (28,956) (43,026) (97,899) 69,429 (271,951) (267,270) (1,991,410) (5,598,322)
(used in) / generated from financing activities (104,423) (396,191) (70,793) (339,606) (59,831) (67,980) 2,495,859 5,487,260
Net (decrease) / increase in cash
and cash equivalents (140,731) (159,298) (68,069) (87,609) (258,949) (73,866) 469,790 36,393
53.3 Transactions with non-controlling interests
During the last year on March 3, 2016 and July 19, 2016, PCPL issued 75,000,000 and 25,000,000 ordinary shares of Rs. 10 each at
par, which were not subscribed to by the Parent Company and consequently were issued to IGI Insurance Limited representing NCI. This
resulted in reduction of interest in subsidiary by 24.84%, which had been recorded at its proportionate interest of the carrying value of the
subsidiary. The difference between the amount by which the NCI was recorded and the fair value of the consideration received had been
recognised directly in equity and attributed to the controlling interest.
(Rupees in thousand) 2017 2016
Consideration received – 1,000,000
Recognition of NCI at proportionate share of net asset – (977,019)
Credit to equity – 22,981
There were no transactions with non-controlling interests in 2017.

213
ANNUALREPORT 2017
53.4 Interests in associates and joint ventures
Set out below are the associates and joint ventures of the Group as at December 31, 2017 which, in the opinion of the Directors, are
material to the Group. The entities listed below have share capital consisting solely of ordinary shares, which are held directly by the group.
The country of incorporation or registration is also their principal place of business, and the proportion of ownership interest is the same
as the proportion of voting rights held.
Place of % of ownership Nature of Measurement Quoted fair Carrying business / country interest relationship method value amount Name of Entity of incorporation 2017 2016 2017 2016 2017 2016
Tri-Pack Films Limited [TPFL] Pakistan 33.33% 33.33% Associate Equity method 1,808,985 3,797,774 3,075,353 3,023,783
IGI Holdings Limited [Formerly IGI
Insurance Limited] Pakistan 10.46% 10.61% Associate Equity method 3,828,720 4,009,372 6,395,007 1,366,894
IGI Investment Bank Limited [IGIIBL] Pakistan 0.00% 2.17% Associate Equity method – 15,032 – –
Bulleh Shah Packaging (Private)
Limited [BSPL] Pakistan 0.00% 65.00% Joint venture Equity method – (*) – 9,151,720
Plastic Extrusions (Proprietary)
Limited [PEPL] South Africa 50.00% 50.00% Joint venture Equity method (*) (*) 24,081 17,571
OmyaPack (Private) Limited [OPL] Pakistan 50.00% 50.00% Joint venture Equity method (*) (*) 307,689 307,067
Total equity accounted investments 9,802,130 13,867,035
Tri-Pack Films limited is in the business of manufacture and sale of biaxially oriented polypropylene (BoPP) film and cast polypropylene
(CPP) films.
IGI Holdings Limited [Formerly IGI Insurance Limited] is engaged in insurance business.
IGI Investment Bank Limited is engaged in investment banking.
Bulleh Shah Packaging (Private) Limited is engaged in the manufacture and sale of paper, paperboard and corrugated boxes.
Plastic Extrusions (Proprietary) Limited is engaged in the manufacture and sale of plastics.
OmyaPack (Private) Limited is engaged in manufacture and sale of high quality ground calcium carbonate products. The Company has not
yet commercially commenced operations.
(*) These are privately held entities for which no quoted price is available.
53.4.1 There are no commitments and contingent liabilities of the Group in respect of associates and joint ventures.

214
53.4.2 Summarised financial information for associates
The table below provides summarised financial information of those associates that are material to the Group. The information disclosed
reflects the amounts presented in the financial statements of the relevant associates and not the Group’s share of those amounts:
Tri-Pack Films Limited IGI Holdings Limited Summarised balance sheet [Formerly IGI Insurance Limited(Rupees in thousand) 2017 2016 2017 2016
Current assets 5,011,279 4,792,064 (**) (**)
Non-current assets 6,183,335 6,353,016
Total assets 11,194,614 11,145,080 89,276,503 38,695,112
Current liabilities (5,517,025) (4,581,833) (**) (**)
Non-current liabilities (1,723,120) (2,762,429)
Total liabilities (7,240,145) (7,344,262) (26,071,168) (23,872,314)
Net assets 3,954,469 3,800,818 63,205,335 14,822,798
Reconciliation to carrying amounts:
Opening net assets 3,800,818 2,113,802 14,822,798 13,475,358
Profit for the year 572,642 754,482 2,418,815 1,796,553
Other comprehensive (loss) / income (30,991) (4,573) 45,963,722 41,645
Further issuance of shares – 1,087,107 – –
Dividends paid (388,000) (150,000) – (490,758)
Closing net assets 3,954,469 3,800,818 63,205,335 14,822,798
Group’s share - % 33.33% 33.33% 10.46% 10.61%
Group’s share 1,317,963 1,266,393 6,378,897 1,350,784
Goodwill 1,757,390 1,757,390 16,110 16,110
Carrying amount 3,075,353 3,023,783 6,395,007 1,366,894
Summarised statement of comprehensive income
Revenue 12,255,793 11,778,067 10,690,132 8,601,883
Profit for the year 572,642 754,482 2,418,815 1,796,553
Other comprehensive (loss) / income (30,991) (4,573) 45,963,722 41,645
Total comprehensive income 541,651 749,909 48,382,537 1,838,198
Dividends received from associates 129,333 50,000 – 52,088
(**) The information related to IGI Holdings Limited [Formerly IGI Insurance Limited] for the year ended December 31, 2017 is un-
audited. Further, the balance of IGIHL is presented according to the requirements of the Insurance Ordinance, 2000 and do not provide
classification between current and non-current.
53.4.3 Summarised financial information for joint ventures
The table below provides summarised financial information of those joint ventures that are material to the Group. The information disclosed
reflects the amounts presented in the financial statements of the relevant joint ventures and not the Group’s share of those amounts.
These have been amended to reflect adjustments made by the entity when using the equity method, including fair value adjustments and
modifications for differences in accounting policy:

215
ANNUALREPORT 2017
Bulleh Shah Packaging Omya Pack Summarised balance sheet (Private Limited) (Private Limited)(Rupees in thousand) 2017 2016 2017 2016
Current assets
Cash and cash equivalents – 92,903 308,498 607,753
Other current assets – 7,511,683 57,723 2,513
Total current assets – 7,604,586 366,221 610,266
Non-current assets – 16,204,750 359,561 4,893
Current liabilities
Financial liabilities (excluding trade payables) – (3,227,283) (110,379) (708)
Other current liabilities – (2,656,726) – (293)
Total current liabilities – (5,884,009) (110,379) (1,001)
Non-current liabilities
Financial liabilities (excluding trade payables) – 4,935,000 – –
Other non-current liabilities – 479,198 – –
Total non-current liabilities – 5,414,198 – –
Net assets – 12,511,129 615,403 614,158
Reconciliation to carrying amounts:
Opening net assets – 13,564,070 614,158 –
(Loss) / Profit for the year – (1,006,978) 1,245 (2,744)
Other comprehensive loss – (45,963) – –
Shares issued during the year – – – 616,902
Closing net assets – 12,511,129 615,403 614,158
Group’s share - % 0.00% 65.00% 50.00% 50.00%
Group’s share – 8,131,589 307,689 307,067
Goodwill – 1,020,131 – –
Carrying amount – 9,151,720 307,689 307,067
Summarised statement of comprehensive income
Revenue – 16,298,214 – –
Interest income – – 3,910
Depreciation and amortization – 1,471,240 5
Interest expense – 477,725 – –
Income tax income – (431,444) – (1,156)
(Loss) / Profit for the year – (1,006,978) 1,245 (2,744)
Other comprehensive loss – (45,963) – –
Total comprehensive loss / income – (1,052,941) 1,245 (2,744)

216
53.4.4.1 Individually immaterial joint ventures
In addition to the interests in joint ventures disclosed above, the Group also has interests in individually immaterial joint venture, Plastic
Extrusions (Proprietary) Limited, that is accounted for using the equity method:
(Rupees in thousand) 2017 2016
Aggregate carrying value of individually immaterial
associates and joint ventures 24,081 17,571
Aggregate amounts of the Group’s share of:
Profit from continuing operations 9,044 6,218
Other comprehensive income 3,424 2,485
Total comprehensive income 12,468 8,703
53.4.4.2 Individually immaterial associates
In addition to the interests in associates disclosed above, the Group also had interests in individually immaterial associate, IGI Investment
Bank Limited that was accounted for using the equity method and has been merged into IGI Holdings Limited [Formerly IGI Insurance
Limited] during the year as explained in note 24.4.1.1.
54. Business combinations
54.1 Acquisition of Bulleh Shah Packaging (Private) Limited
Prior to September 18, 2017, the Parent Company held 65% of the share capital of BSPPL, a company principally engaged in the
manufacturing and conversion of paper and paperboard products. The BOD of the Parent Company, at their meeting held on July 26,
2017, resolved to purchase the remaining 35% shareholding held by Stora Enso South Asia Holdings AB (‘Stora Enso’) in BSPPL. The
transaction was approved by the shareholders through a special resolution at the Extraordinary General Meeting of the Parent Company
dated August 28, 2017. Accordingly, consequent to execution of share purchase agreement with Stora Enso, BSPPL became a fully
owned subsidiary of the Parent Company on September 18, 2017. Stora Enso divested its investment in BSPPL on account of the reason
that BSPPL’s asset base in Pakistan with its product mix and related future outlook had become a non-strategic fit in its consumer board
portfolio due to changed global growth outlook. Whereas, the BOD of the Parent Company strongly believes in the future growth prospects
of BSPPL and that it shall bring considerable benefits to the equity holders of the Parent Company.
Details of the purchase consideration, the net assets acquired and bargain purchase gain are as follows:
(Rupees in thousand)
Cash 776,255
Fair value of equity interest held in BSPPL
before the business combination 9,608,465
Total purchase consideration 10,384,720
The Group recognised a gain of Rs. 625.144 million as a result of measuring at fair value its 65% equity interest in BSPPL held before
the business combination. The gain has been recognised in gains and losses relating to business combinations in the consolidated profit
and loss account for the year ended December 31, 2017.

217
ANNUALREPORT 2017
The assets and liabilities recognised as a result of the acquisition are as follows:
Carrying Fair value and Fair value as at amounts as at other at September(Rupees in thousand) September 18, 2017 adjustments 18, 2017
Assets
Property, plant and equipment 15,011,735 3,493,214 18,504,949
Investment property 5,699 13,045 18,744
Intangible assets 87,207 – 87,207
Long term loans and deposits 88,686 – 88,686
Stores and spares 1,127,905 – 1,127,905
Stock-in-trade 4,911,836 – 4,911,836
Trade debts 1,874,842 (285,487) 1,589,355
Loans, advances, deposits, prepayments and other receivables 377,482 – 377,482
Income tax receivable 801,013 – 801,013
Cash and bank balances 89,071 – 89,071
24,375,476 3,220,772 27,596,248
Liabilities
Long term finances - secured 3,290,000 – 3,290,000
Deferred taxation 490,954 975,065 1,466,019
Retirement benefits 127,090 – 127,090
Deferred liabilities 133,908 – 133,908
Current portion of long term finances - secured 1,645,000 – 1,645,000
Finances under mark up arrangements - secured 4,084,367 – 4,084,367
Trade and other payables 2,294,349 (36,721) 2,257,628
Accrued finance cost 58,746 – 58,746
12,124,414 938,344 13,062,758
Net assets acquired 12,251,062 2,282,428 14,533,490
Gain on bargain purchase (4,148,770)
10,384,720
Gain on bargain purchase has been recognised in gains and losses relating to business combinations in the consolidated profit and loss
account for the year ended December 31, 2017.
Acquisition-related costs of Rs. 57.323 million have been recogised in gains and losses relating to business combinations in the
consolidated profit and loss account for the year ended December 31, 2017.
Transaction recognised separately from business combination on account of elimination of net payable balance to BSPPL as at the
date of acquisition amounting to Rs. 248.766 million has been recogised in gains and losses relating to business combinations in the
consolidated profit and loss account for the year ended December 31, 2017.
The fair value of acquired trade receivables is Rs. 1,589.355 million. The gross contractual amount for trade receivables due is
Rs. 1,618.269 million, of which Rs. 28.914 million is expected to be uncollectible. The fair value of all other acquired receivables is equal
to their gross contractual amounts.
The carrying value of identifiable assets acquired and liabilities assumed, except investment property and freehold land, buildings and
plant and machinery included in property, plant and equipment, approximate their fair values. The Parent Compay has carried fair valuation
exercise and incorporated fair value adjustments in these consolidated financial statements.

218
There were no acquisitions in the year ended December 31, 2016.
The acquired business contributed revenues of Rs. 3,776.729 million and net loss of Rs. 187.416 million to the Group for the period from
September 18, 2017 to December 31, 2017.
If the acquisition had occurred on January 1, 2017, consolidated pro-forma revenue and profit for the year ended December 31, 2017
would have been Rs. 43,886.468 million and Rs. 25,258.611 million respectively. These amounts have been calculated using BSPPL’s
revenues adjusted for intergroup sales and Group’s share of BSPPL’s total comprehensive loss and BSPPL’s loss before acquisition date.
54.2 Other business combinations
Other business combinations which occurred during the current year, as referred to in note 1, are considered to be individually and
collectively immaterial to the Group. Hence, the details of these business combinations have not been disclosed in these consolidated
financial statements.
55. Date of authorisation for issue
These consolidated financial statements were authorised for issue on February 28, 2018 by the Board of Directors of the Parent
Company.
56. Non-adjusting events after the balance sheet date
The Board of Directors of the Parent Company has proposed a final cash dividend for the year ended December 31, 2017 of Rs. 30.00 per
share (2016: Rs. 25.00 per share), amounting to Rs. 2,681.385 million (2016: Rs. 2,234.487 million) at their meeting held on February
28, 2018 for approval of the members at the Annual General Meeting to be held on April 19, 2018. Reference to the ordinary dividend
proposed by the Board of the Parent Company and the rights of IFC as detailed in note 6.2, the Board of the Parent Company has further
proposed such amount of additional preference dividend to be paid to IFC as per the terms of subscription agreement.
57. Corresponding figures
Corresponding figures have been re-arranged and reclassified, wherever necessary, for the purposes of comparison. However, no
significant reclassifications have been made.
Khurram Raza BakhtayariChief Financial Officer
Syed Hyder AliChief Executive & Managing Director
Asghar AbbasDirector

219
ANNUALREPORT 2017
VIDEO CONFERENCE FACILITY
VIDEO CONFERENCE CONSENT FORM
In this regard, please fill the following form and submit to registered address of the Company 7 days before holding of the Annual General
Meeting.
If the Company receives consent from Members holding ten percent (10%) or more shareholding residing in a city, to participate in the Meeting
through video- link at least [7] days prior to date of Meeting, the Company will arrange video- link facility in the city subject to availability of
such facility in that city.
The Company will intimate Members regarding venue of video-link facility at least 5 days before the date of the Annual General Meeting along
with complete information necessary to enable them to access the facility.
I/We, ___________________________________________ of _________________________________________ being a member of
Packages Limited, holder of ____________________ Ordinary shares as per Register Folio No. / CDC Accounts No._________________
hereby opt for video-link facility at ____________________.
_____________________Signature of member

220
AFFIXCORRECTPOSTAGE
The Company SecretaryPACKAGES LIMITED4th Floor, The ForumSuite # 416 - 422G-20, Block 9, Khayaban-e-JamiClifton, Karachi - 75600

221
ANNUALREPORT 2017

222
AFFIXCORRECTPOSTAGE
The Company SecretaryPACKAGES LIMITED4th Floor, The ForumSuite # 416 - 422G-20, Block 9, Khayaban-e-JamiClifton, Karachi - 75600

223
ANNUALREPORT 2017
Pursuant to the allowance granted through SRO 787(I)/2014 dated September 8, 2014, by the Securities and Exchange Commission of
Pakistan, the Company can circulate its Audited Financial Statements along with the Company’s Notice of Annual General Meetings etc.,
through email to its shareholders. Those shareholders who wish to receive the Company’s Annual Reports via email are requested to provide a
completed consent form to the Company’s Share Registrar, FAMCO Associates (Pvt) Limited.
PLEASE NOTE THAT RECEIPT OF THE ANNUAL REPORTS VIA EMAIL IS OPTIONAL AND NOT COMPULSORY.
ELECTRONIC TRANSMISSION CONSENT FORM
The Share Registrar
Date:__________________
FAMCO Associates (Pvt) Limited
8F, Block 6, PECHS, Nursery,
Next to Hotel Faran, Shahrah-e-Faisal,
Karachi.
Pursuant to the directions given by the Securities and Exchange Commission of Pakistan through its SRO 787(I)/2014 dated September
8, 2014, I, Mr./Ms. S/o, D/o, W/o hereby consent
to have Packages Limited’s Audited Financial Statements and Notice of Annual General Meetings etc., delivered to me via email on my email
address provided below:
Name of Member / Shareholder
Folio/ CDC Account Number
Email Address:
It is stated that the above mentioned information is true and correct and that I shall notify the Company and its Share Registrar in writing of
any change in my email address or withdrawal of my consent to email delivery of the Company’s Audited Financial Statements and Notice of
Annual General Meetings etc. .
Signature of the Member/ Shareholder
ELECTRONIC TRANSMISSION CONSENT

224
AFFIXCORRECTPOSTAGE
The Company SecretaryPACKAGES LIMITED4th Floor, The ForumSuite # 416 - 422G-20, Block 9, Khayaban-e-JamiClifton, Karachi - 75600

225
ANNUALREPORT 2017

226
AFFIXCORRECTPOSTAGE
The Company SecretaryPACKAGES LIMITED4th Floor, The ForumSuite # 416 - 422G-20, Block 9, Khayaban-e-JamiClifton, Karachi - 75600

227
ANNUALREPORT 2017
FORM OF PROXY63rd Annual General Meeting
I/We
of being a member of Packages Limited and
holder of Ordinary Shares as per Share Register Folio No. (Number of Shares)
and/or CDC Participant I.D. No. and Sub Account No.
hereby appoint of
or failing him of
or failing him of as my proxy to vote for me and on my behalf at the Annual General Meeting of the Company to be held on Thursday, April 19, 2018 at 10.30 a.m. at Beach Luxury Hotel, Moulvi Tamizuddin Khan Road, Karachi and at any adjournment thereof.
Signed this day of 2018
WITNESSES:
1. Signature :
Name :
Address :
CNIC or
Passport No. :
2. Signature :
Name :
Address :
CNIC or
Passport No.:
Note: Proxies in order to be effective, must be received by the Company not less than 48 hours before the meeting. A proxy need not be a member of the Company.
CDC Shareholders and their Proxies are each requested to attach an attested photocopy of their Computerized National Identity Card or Passport with this proxy form before submission to the Company.
Signature
(Signature should agree withthe specimen signature
registered with the Company)
Please affixRupees five
revenue stamp

228
AFFIXCORRECTPOSTAGE
The Company SecretaryPACKAGES LIMITED4th Floor, The ForumSuite # 416 - 422G-20, Block 9, Khayaban-e-JamiClifton, Karachi - 75600

229
ANNUALREPORT 2017

230
AFFIXCORRECTPOSTAGE
The Company SecretaryPACKAGES LIMITED4th Floor, The ForumSuite # 416 - 422G-20, Block 9, Khayaban-e-JamiClifton, Karachi - 75600

231
ANNUALREPORT 2017
Dear Shareholder,
ELECTRONIC CREDIT MANDATE FORM
We wish to inform you that in accordance with the provisions of Section 242 of the Companies Act, 2017, it is mandatory for alisted company to pay cash dividend to its shareholders only through electronic mode directly into the bank account designated by the entitled shareholders.
In order to receive your dividends directly in your Bank account, please complete the particulars as mentioned below and return this letter duly signed along with a copy of your CNIC to the Registrar of the Company M/s FAMCO Associates (Pvt.) Limited, 8F, Near Hotel Faran, Nursery, Block 6, P.E.S.C.H.S., Shahrah-e-Faisal, Karachi.
In case your shares are held in CDC then you must submit this dividend mandate form directly to your Broker/Participant/CDCAccount Services.
Yours sincerely,For PACKAGES LIMITED
(Adi J. Cawasji)Company Secretary
SHAREHOLDER’S SECTIONS:I hereby communicate to receive my future dividends directly in my Bank account as detailed below:
Name of shareholder : Company name: Packages LimitedFolio No. / CDC Participant ID & A/C No. : Contact number of shareholder : Landline: Cell:Name of Bank : Bank branch & full mailing address : IBAN Number (See Note below) : Title of Account : CNIC No. (copy attached) : NTN (in case of corporate entity) :
It is stated that the above particulars given by me are correct to the best of my knowledge and I shall keep the Company/Participant/CDC Investor Account Services informed in case of any change in the said particulars in future.
CNIC No. Shareholders Signature (Copy attached)
Note:Please provide complete IBAN, after checking with your concerned branch to enable electronic credit directly into your bank account.
The payment of cash dividend will be processed on the basis of the account number alone. Your company is entitled to rely on the account number as per your instructions. The company shall not be responsible for any loss, damage, liability or claim arising, directly or indirectly, from any error, delay, or failure in performance of any of its obligations hereunder which is caused by incorrect payment instruction and / or due to any event beyond the control of the company.
Head Office, Sales Office & Works :SHAHRAH-E-ROOMl, P.O. AMER SIDHU, LAHORE - 54760, PAKISTAN PH : 35811541-46, 35811191-94 CABLE : PACKAGE LAHORE FAX : (042) 35811195
Registered Office & Regional Sales office :4TH FLOOR, THE FORUM, SUITE, # 416-422, G-20, BLOCK 9, KHAYABAN-E-JAMI, CLIFTON, KARACHI-75600, PAKISTAN. PH :35874047-49, 35378650-51, 35833011 FAX: (021) 35860251
Regional Sales Office;G.D. ARECADE, 2ND FLOOR, 73E FAZAL-UL-HAQ ROAD, BLUE AREA, ISLAMABAD - 44000, PAKISTAN PH : 2348307-09, 2348306 FAX : (051) 2348310
PACKAGES LIMITED

232
PACKAGES LIMITED

INVESTORS’ EDUCATIONIn pursuance of SRO 924(1)/2015 dated September 9th, 2015 issued by the Securities and Exchange Commission of Pakistan (SECP), the
following informational message has been reproduced to educate investors:

Head Office
Shahrah-e-Roomi, P.O. Amer SidhuLahore - 54760, PakistanTel: +92 42 35811541-6Fax: +92 42 35811195
www.packages.com.pk


