ANNUAL REPORT 2016 - argosy.co.nz · Case Study – Snickel Lane 34 Industrial Portfolio 36 Office...
82
ANNUAL REPORT 2016
Transcript of ANNUAL REPORT 2016 - argosy.co.nz · Case Study – Snickel Lane 34 Industrial Portfolio 36 Office...

ANNUAL REPORT 2016

Chairman’s Review 2
Financial Summary 4
Chief Executive Officer’s Review 6
Board of Directors 10
Our People 12
Strategy 16
Environment and Community 18
Corporate Governance 22
Portfolio Overview 30
Case Study – Snickel Lane 34
Industrial Portfolio 36
Office Portfolio 40
Retail Portfolio 42
Financial Statements 44
Audit Report 75
Investor Statistics 76
Directory and Key Dates 78
CONTENTS
HIGHLIGHTS
GROSS DISTRIBUTABLE INCOME
7.60cents
Gross distributable income increased by 7.50% to 7.60 cents per share
NET DISTRIBUTABLE INCOME
6.25cents
Net distributable income increased 3.82% to 6.25 cents per share
DIVIDEND
6.025cents
Dividend increased to 6.025 cents per share for the 12 months to 31 March 2016
Cover image: 8 Nugent Street AUCKLAND

“�Argosy�is,�and�will�remain,�invested�in��a�portfolio�that�is�diversified�by�sector,�grade,�location��and�tenant�mix.”�
OCCUPANCY
99.4%Occupancy (by rental) increased to 99.4%
WALT
5.24years
Weighted average lease term remains over five years
PORTFOLIO
$1.37b
Total portfolio value of $1.37 billion
66 193PROPERTIES TENANTS
Sale of 44 hectares of vacant land in Palmerston North
Acquisition of 8 Nugent Street in Auckland
Adoption of new Health and Safety Policy and Health and Safety Strategic Goals

2
ARGOSY PROPERTY LIMITED | Annual Report 2016
CHAIRMAN’S REVIEW
MICHAEL SMITHCHAIRMAN
“I am pleased to report that Argosy has delivered ahead of guidance and has achieved another excellent result for our shareholders.”
DELIVERING CONSISTENTLY

3
ARGOSY PROPERTY LIMITED | Annual Report 2016
On behalf of the Board of Directors, I am pleased to present Argosy’s 2016 Annual Report.
It has been another successful year of solid growth for Argosy as we continue on our path of realigning and improving the quality of the portfolio. This year we have continued to divest non Core assets, including 44 hectares of vacant land in Palmerston North, acquired a quality office building in Auckland and have announced some exciting property developments for existing tenants.
The metrics of the portfolio remain strong with a high occupancy rate and a Weighted Average Lease Term (WALT) of over five years. The share price closed the financial year at an eight-year high of $1.18, giving shareholders a total return of 9.6% for the year, and an impressive five year annualised return of 17.6%, outperforming the S&P/NZX50 and NZ Gross Property Index during this period.
Net distributable income has increased to 6.25 cents per share, from 6.02 cents per share in 2015.
We have delivered ahead of guidance and subsequently the Board is pleased to announce a full year cash dividend of 6.025 cents per share. The dividend has remained flat over the past four financial years, as Argosy transitioned into a taxpaying position. The dividend payout ratio is 96.4%.
The final quarter dividend of 1.525 cents per share, with imputation credits of 0.1972 cents per share attached, will be paid to shareholders on 29 June 2016. The record date will be 15 June 2016. The dividend reinvestment plan (DRP) will continue with a discount of 1% applied to the price at which shares will be issued under the DRP.
The Board can confirm that, based on current projections for the portfolio, a dividend of 6.10 cents per share is expected to be paid for the year to 31 March 2017.
CAPITAL MANAGEMENTArgosy’s capital management policy is to maintain a debt-to-total-assets ratio of 35% to 40% in the medium term. As at 31 March 2016, the ratio was within this target range at 36.7%.
STRATEGYOur investment strategy remains unchanged. Argosy’s portfolio will consist of Core and Value Add properties. Core properties are well constructed, well located assets which are intended to be long-term investments (>10 years). Core properties will make up 75% to 85% of the portfolio by value. Core properties enjoy strong long-term demand (well located and generic), a leasing profile that provides for rental growth of at least CPI and good structural integrity with minimal maintenance capital expenditure required.
Value Add properties are assets which, through skilled asset management, can increase future earnings and provide capital growth. Value Add properties will already be well located with the potential for strong long-term tenant demand. These properties are available for near to medium term repositioning or development with the view to moving into the Core category.
More detail on Argosy’s strategy can be found on pages 16 and 17 of this report.
GOVERNANCEAt the Annual Meeting in August 2015, Chris Hunter and Jeff Morrison were re-elected as independent Directors. At the date of this report, the Board comprised six Directors, who are all independent.
OUTLOOKThe efforts of the Argosy team throughout the year have produced another strong result for the Company. I would like to thank them for their hard work.
We are confident that with a diversified portfolio of good quality and well located properties, a clear investment strategy and the continued application of a patient, careful and disciplined approach to property investment and management, the Company remains in a strong position to enable us to make the most of current economic conditions.
Thank you once again for your support and I look forward to another successful year ahead.
P MICHAEL SMITH Chairman
36.7%DEBT-TO-TOTAL-ASSETS RATIO WITHIN TARGET RANGE
17.6%TOTAL SHAREHOLDER RETURN PER ANNUM OVER 5 YEARS

4
ARGOSY PROPERTY LIMITED | Annual Report 2016
FINANCIAL SUMMARY
2012$000s
2013$000s
2014$000s
2015$000s
2016$000s
Net property income 71,210 69,866 82,218 90,878 98,350
Profit before financial income/(expenses) and other gains/(losses) and tax
35,123 63,110 74,817 83,029 89,402
Revaluation gains on investment property 3,658 9,344 33,488 38,633 42,218
Profit/(loss) for the year (before taxation) (2,958) 38,650 98,803 68,553 83,554
Profit for the year (after taxation) 1,949 39,155 85,550 64,370 78,897
Earnings per share – cents per share 0.35 6.69 11.45 8.08 9.79
Gross distributable income – cents per share 6.03 6.90 6.64 7.07 7.60
Net distributable income – cents per share 6.03 7.22 6.69 6.02 6.25
Investment properties 905,249 976,862 1,226,266 1,306,395 1,367,551
Total assets 929,265 992,749 1,232,388 1,313,186 1,374,891
Debt-to-total-assets ratio 41.4% 33.1% 36.5% 37.8% 36.7%
Cash dividend – cents per share 6.00 6.00 6.00 6.00 6.03
Securities on issue at year end – shares (000s) 558,517 680,932 790,912 802,629 812,616
Net assets backing per share – cents per share 87 88 94 96 100
Total equity 488,446 601,337 739,522 768,726 810,404
PROPERTY METRICS
2012 2013 2014 2015 2016
Occupancy factor (rent) 94.1% 96.2% 98.7% 99.2% 99.4%
Occupancy factor (sqm) 92.5% 94.5% 98.7% 99.3% 99.6%
Weighted average lease term (years) 4.77 5.24 5.68 5.54 5.24
Number of tenants 232 221 224 192 193
Number of properties* 65 63 66 68 66
Average property value ($m) $13.93 $15.51 $18.58 $19.21 $20.72
Net lettable area (sqm) 463,656 485,531 590,991 607,799 601,045
* Certain titles have been consolidated and treated as one. The total number of buildings excludes properties held for sale.
FINANCIAL SUMMARY

5
ARGOSY PROPERTY LIMITED | Annual Report 2016
8 Nugent Street AUCKLAND

6
ARGOSY PROPERTY LIMITED | Annual Report 2016
CHIEF EXECUTIVE OFFICER’S REVIEW
PETER MENCE CHIEF EXECUTIVE OFFICER
“This has been another strong year for Argosy. We have made excellent progress on our strategic objectives and have continued to increase the quality of our portfolio and improve the operating metrics.”
CONFIDENT PROGRESS

7
ARGOSY PROPERTY LIMITED | Annual Report 2016
PERFORMANCE OVERVIEWWe have continued to make significant progress on the repositioning of the portfolio in line with our investment strategy and have built Argosy into a good quality, medium to low risk portfolio with a consistent earnings profile.
Gross distributable income has increased by 7.50% to 7.60 cents per share, from 7.07 cents per share in the previous year. Gross distributable income per share has now grown by a compound annual growth rate of 6.0% over the past five years.
Net distributable income has also increased to 6.25 cents per share from 6.02 cents per share in 2015, a 3.82% increase.
Net property income increased by $7.5 million to $98.4 million (2015: $90.9 million), an increase of 8.2%.
Earnings before finance costs, property revaluations and tax increased to $89.4 million (2015: $83.0 million), a 7.7% increase.
Interest expense has increased by $1.4 million compared to the previous period. An increase in average debt levels of $44.0 million has largely been offset by a reduced weighted average interest rate in the current year. Capitalised interest in the current year of $76,000 was lower than the prior year’s capitalised interest of $1.3 million, which related to the Stout Street development in Wellington.
Profit before tax, after allowing for the non-cash impact of interest rate swaps and property revaluations, was $83.6 million, compared to $68.6 million in the previous period.
PORTFOLIO ACTIVITYMarket UpdateReductions in the OCR have resulted in an increase in investor activity and a subsequent firming of yields across all sectors, especially in Auckland and Wellington where 94% of Argosy’s properties are located. While property investment continues to look expensive on a historical basis, net absorption
continues to be positive, indicating it is hard to see a real catalyst for change in the foreseeable future.
According to CBRE research, a reduction in incentives and modest growth in face rents provided slight rental growth in 2015, which sets the backdrop for a more sustainable pattern for future rental growth.
Vacancy remains at low levels, most notably in Auckland’s industrial and prime office sectors.
LeasingThe 2016 financial year has been successful with regard to leasing. We started the year with 11.8% of the portfolio (by rental) expiring within 12 months and we have managed to successfully re-lease the majority of these leases. Among these successes was a new 15 year lease to Compac Sorting Equipment at 4 Henderson Place, Onehunga, an eight year lease renewal to EziBuy Limited at 31 El Prado Drive in Palmerston North and a nine year lease renewal to Farmers Trading Co. Limited at the Albany Mega Centre in Auckland.
Occupancy (by rental) has improved to 99.4%, from 99.2% at 31 March 2015. Outstanding lease expiries for the period to 31 March 2017 were 10.1% at 31 March 2016.
During the year, 45 lease transactions were completed, including 15 new leases and 30 lease renewals and extensions. The WALT remains at a high level and was 5.24 years at 31 March 2016, compared with 5.54 years at 31 March 2015.
Acquisitions and Major ProjectsIn September 2015, Argosy acquired the property at 8 Nugent Street, Grafton, in Auckland, for $42.0 million. This is a quality, 4 Green Star designed office building in an area where Argosy already owns two properties (25 Nugent Street and 99 Khyber Pass Road). It is pleasing to note that the building had an $850,000 revaluation uplift at year end.
Consistent with Argosy’s strategy of working with existing tenants, we have entered into a number of tenant driven developments within the portfolio.
In November 2015, Argosy announced the agreement to acquire a property adjacent to our current industrial property at 19 Nesdale Avenue, Wiri, in Auckland. The acquisition, at 240 Puhinui Road, entails the purchase on completion of a new design/build facility from one of Argosy’s existing tenants, Cardinal Logistics (Cardinal).
The property, whose design and specifications will be identical to the very high, modern standard of the existing facility, is to be acquired for $22.6 million. Settlement of the building is expected in December 2016. New 15 year leases have been agreed with Cardinal over both buildings.
Argosy has agreed to acquire 22,575 square metres of land at Highgate Business Park in Silverdale, Auckland, for $8.1 million and will undertake a $14.2 million development at the site for Mighty Ape, also an existing tenant in the portfolio. The development will consist of 9,000 square metres of warehouse and 1,500 square metres of office area, as well as 116 carparks, with practical completion expected to be September 2017. It is expected to have a return on cost of 7.35%.
$42.2mPOSITIVE PROPERTY REVALUATION
6.0%FIVE YEAR COMPOUND ANNUAL GROWTH RATE OF GROSS DISTRIBUTABLE INCOME PER SHARE

8
ARGOSY PROPERTY LIMITED | Annual Report 2016
CHIEF EXECUTIVE OFFICER’S REVIEW
Mighty Ape has agreed to sign a new ten year net lease commencing from the date of practical completion, with two yearly rent reviews to market.
The $7.5 million redevelopment at 8 Foundry Drive, Christchurch, which was damaged during the earthquakes in 2010 and 2011, is progressing well and is due to be completed later this year.
Argosy was also pleased to announce a modernisation upgrade to the Citibank Centre in Auckland, which will include a laneway style development called ‘Snickel Lane’. The new laneway will complement the surrounding area which includes Fort Lane, Fort Street Precinct and the Imperial Lane development. More details on Snickel Lane can be found on pages 34 and 35 of this report.
New Zealand Post HouseArgosy has worked closely with New Zealand Post (NZ Post) to achieve an outcome reflecting the changes in the NZ Post business that was beneficial to both parties. The remaining upgrade work to the building at Waterloo Quay in Wellington has been revised as a result of NZ Post’s changed accommodation requirements.
A new 10 year lease to NZ Post has been agreed across 85% of the net lettable area of the building, with the top three floors remaining vacant. The new lease replaces the current five year evergreen lease over the whole building.
After year end, NZ Post made a payment of $12 million to Argosy, $6 million as a reduction of the original purchase price of the building and $6 million in consideration for the termination of the lease over the top three floors.
A new construction contract with Hawkins Construction NI Limited has been agreed. The expected cost of the new construction contract is $13 million and the project will provide functional improvements to the lifts, stairwells, ablutions and other associated services.
Divestment of non Core AssetsA key strategy of Argosy’s is to divest vacant land and non Core assets and we have been successful at achieving this over the past year.
The most notable disposal of the year was the sale of 44 hectares of vacant land at the Manawatu Industrial Park (the Park) in Palmerston North.
Other assets that were disposed of during the year included the Porirua Mega Centre for $11.5 million, 65 Upper Queen Street, Auckland, for $6.5 million and the Storage King building at Wagener Place, St Lukes, for $10.5 million.
Following these disposals, 8% of the portfolio is considered neither Core nor Value Add and will be divested as market conditions allow.
Bank FacilityArgosy restructured the syndicated bank facility in August 2015. Following the restructure, the expiry of the first tranche ($275 million) is 30 September 2018 and the second tranche ($275 million) is 30 September 2020. An additional tranche of $50 million was also added to the facility but was subsequently cancelled on 31 March 2016. The weighted average debt expiry at 31 March 2016 was 3.5 years.
As a result of these restructures, Argosy has been receiving further margin and line fee savings.
Argosy continues to maintain strong relationships with our banking partners and remains well within all bank covenants.
Valuations An independent revaluation of the portfolio was undertaken as at 31 March 2016 resulting in a full year gain of $42.2 million, a 3.2% increase on the book value of the portfolio (note that $27.6 million was included in the interim accounts at 30 September 2015).
The Company’s portfolio following the revaluation shows a passing yield on values of 7.57% and a yield on fully let market rentals of 7.53%.
“Argosy has worked closely with New Zealand Post (NZ Post) to achieve an outcome reflecting the changes in the NZ Post business that was beneficial to both parties. The remaining upgrade work to the building at Waterloo Quay in Wellington has been revised as a result of NZ Post’s changed accommodation requirements.”

9
ARGOSY PROPERTY LIMITED | Annual Report 2016
NZ Post House WELLINGTON
OutlookAs always, our focus remains on adhering to the strategy, maintaining the portfolio’s high level of occupancy, reducing near term lease expiries and improving tenant retention rates. We will continue to look for opportunities to develop the portfolio in line with our strategy.
Argosy has delivered another excellent performance this year, thanks to the hard work of the management team and members of staff and the support and commitment of the Board of Directors, for which I am truly grateful.
I would like to also thank our tenants for their continued association with Argosy, and to our shareholders for their support.
PETER MENCE Chief Executive Officer

10
ARGOSY PROPERTY LIMITED | Annual Report 2016
BOARD OF DIRECTORS
The Board reviews all aspects of portfolio, asset and financial management strategy, formulates and reviews compliance programmes, and approves transactions and capital expenditures.
The Board currently comprises six members, each of whom brings a significant level of expertise to Argosy. Their experience includes property investment, management
and development, finance, property law and corporate management. The Board has determined that all Board members are independent Directors under the NZX Main Board Listing Rules. All Board members are non-executive Directors.
The�Board�of�Directors�(the Board)�has�overall�responsibility�for�the�management��of�Argosy.�
Peter BrookDIRECTOR
Chris HunterDIRECTOR
Andrew EvansDIRECTOR
Michael SmithCHAIRMAN
Mark CrossDIRECTOR
Jeff MorrisonDIRECTOR

11
ARGOSY PROPERTY LIMITED | Annual Report 2016
MICHAEL SMITH ChairmanDirector since December 2002
Mr Smith was employed by Lion Nathan Limited for 29 years. During that time, he held a number of senior executive positions with the Lion Nathan Group and was a director of the parent company for 16 years. Mr Smith is a director of a number of companies, including Greymouth Petroleum Limited, Maui Capital Indigo Fund Limited and Maui Capital Aqua Fund Limited. His previous directorships/trusteeships include Lion Nathan Limited, The Lion Foundation, Fonterra Co-operative Group Limited, Auckland International Airport Limited, OnePath Holdings (NZ) Limited and Fisher & Paykel Healthcare Corporation Limited.
Mr Smith holds a Master of Commerce degree from The University of Auckland and is a Graduate of the Program for Management at Harvard Business School. He is also a member of the Institute of Directors in New Zealand.
PETER BROOKDirector since December 2002
Mr Brook has 20 years’ experience in the investment banking industry, retiring in 2000 to pursue his own business and consultancy activities. He is presently Chairman of BurgerFuel Worldwide Limited, Trust Investments Management Limited and Generate Investment Management Limited. Mr Brook is also a trustee of the Melanesian Mission Trust Board, a member of the Institute of Finance Professionals New Zealand Inc. and a director of several private companies.
Mr Brook holds a Bachelor of Commerce degree from The University of Auckland and is a member of Chartered Accountants Australia and New Zealand.
CHRIS HUNTERDirector since June 2013
Mr Hunter has extensive commercial property experience including more than 25 years’ in New Zealand’s construction industry, most recently as the Chief Executive Officer of Hawkins Construction and he has recently invested in NZ Strong Group. Over the past 20 years he has been associated with more than $10 billion of developments across the industrial, commercial, retail, residential and infrastructure sectors. Mr Hunter currently has a portfolio of business investments and is active in the property development sector. He is advising a number of publicly listed companies in their property and construction ventures.
Mr Hunter is a member of the New Zealand Institute of Quantity Surveyors, a fellow of the Royal Institute of Chartered Surveyors and holds a Master of Business Administration degree from Massey University.
JEFF MORRISONDirector since July 2013
Mr Morrison has 38 years’ of experience as a property lawyer, 29 of them as a commercial property partner at Russell McVeagh, and now practises on his own account. He is a trustee of the Spirit of Adventure and other charitable trusts and holds a number of private company directorships.
Mr Morrison is a qualified lawyer with a Bachelor of Laws degree from The University of Auckland. He is also a member of the Institute of Directors in New Zealand.
MARK CROSSDirector since March 2012
Mr Cross has more than 20 years’ experience in investment banking, holding senior positions in New Zealand, Australia and the United Kingdom. Alongside consulting and private investment activities, he is currently Chairman of Milford Asset Management Limited and MFL Mutual Fund Limited/Superannuation Investments Limited, and a director of Genesis Energy Limited, Z Energy Limited, Triathlon New Zealand Inc. and other private companies.
Mr Cross holds a Bachelor of Business Studies degree from Massey University. He is a member of Chartered Accountants Australia and New Zealand and the Institute of Directors in New Zealand.
ANDREW EVANSDirector since August 2003
Mr Evans has more than 25 years’ experience in commercial real estate and asset management, previously holding executive positions in listed and unlisted real estate investment businesses. He is a director of Vital Healthcare Management Limited, Holmes Group Limited, Holmes GP Fire Limited, Trust Investments Management Limited, Hughes & Cossar Group Holdings Limited and Westbrooke Capital Partners Limited. In addition, Mr Evans is a past national president of the Property Council of New Zealand, a foundation member of the Property Institute of New Zealand, a government appointee to the Land Valuation Tribunal (Waikato No.1) and is a trustee of the Marist Brothers Rugby Charitable Trust.
Mr Evans is a Chartered Fellow of the Institute of Directors and is on the Auckland Branch Committee. He has Bachelor of Business Studies and Master of Business Administration (with distinction) degrees from Massey University and a Graduate Diploma in Finance from The University of Auckland.
On 1 March 2012 Argosy Property Trust converted from a unit trust into a company, Argosy Property Limited, through a corporatisation process. On incorporation, the Board of Argosy Property Limited comprised the same directors as the Board of Argosy Property Management Limited, the manager of Argosy Property Trust. Prior to 1 March 2012, Michael Smith, Peter Brook and Andrew Evans were directors of the manager of the former Trust and began their tenures in December 2002, December 2002 and August 2003 respectively.

12
ARGOSY PROPERTY LIMITED | Annual Report 2016
OUR PEOPLE
The Argosy team is made up of 17 well-qualified and experienced property professionals who perform at the highest level in the industry. They are supported by an equally committed and competent finance, legal and administration staff of ten.
Warren CateASSET MANAGER
Scott LunnyINVESTOR RELATIONS MANAGER
Anna HamillFINANCIAL CONTROLLER
Peter MenceCHIEF EXECUTIVE OFFICER
Dave FraserCHIEF FINANCIAL OFFICER
David SnellingGENERAL COUNSEL
Our�people�are��an�integral�part��of�our�business.

13
ARGOSY PROPERTY LIMITED | Annual Report 2016
Marilyn StoreyASSET MANAGER
Joanna SharpeASSET MANAGER
Saatyesh BhanaASSET MANAGER
Wade AllenLEASING MANAGER
Rob SmithASSET MANAGER
Tony FrostASSET MANAGER

14
ARGOSY PROPERTY LIMITED | Annual Report 2016
OUR PEOPLE
PETER MENCEChief Executive Officer
Peter is the Chief Executive Officer of Argosy Property Limited. An engineer by background, he has 35 years of experience in the property industry working with Progressive Enterprises, Challenge Properties, Richard Ellis and Green & McCahill. Peter joined Armstrong Jones (NZ) in 1994 and was appointed General Manager of Argosy (then known as ING Property Trust) in 2007. Instrumental in the rebranding and internalisation of the Company’s management, he was appointed Chief Executive of the business in 2009.
Peter is a fellow of the Property Institute, is a past lecturer in Advanced Property Management at The University of Auckland and is the current President of the Property Council of New Zealand. In 2013, he was honoured with the Stuart McIntosh award in recognition of his contribution to the University.
DAVE FRASER Chief Financial Officer
Dave joined the team in 2011 and was originally responsible for the planning and execution of the management internalisation and Argosy’s corporatisation. He now oversees the financial and corporate activities of the Company.
Dave has spent over 28 years in senior financial and general management roles both in New Zealand and overseas, including six years in Japan as a senior vice president with the Jupiter Group. He has broad experience in strategic and operational planning, business development, debt restructures, equity raisings, and mergers and acquisitions.
In addition to being a qualified Chartered Accountant, Dave has Bachelor of Commerce and Master of Business Administration degrees from The University of Auckland.
DAVID SNELLINGGeneral Counsel
David joined Argosy in 2011 to manage day-to-day corporate compliance. He also provides legal assistance to the property team and general in-house legal support.
Prior to joining Argosy, David’s experience includes working in the tax practices of large New Zealand firms; he has been involved in a broad range of transactions across the property, primary, energy, petroleum, telecommunications, banking and finance sectors. David also has a strong track record in dispute work. He has published articles on topical issues in CCH’s Tax Planning Report.
David is a qualified lawyer, a member of the New Zealand Law Society’s Property Law Section and of the Auckland District Law Society’s Health and Safety Law Committee. He graduated from Victoria University in Wellington.
SCOTT LUNNYInvestor Relations Manager
Scott has been with Argosy Property Limited since July 2006 and has over 18 years’ experience in the banking, managed funds and property industries, gaining considerable expertise in all aspects of financial reporting, treasury, tax management and investor relations. Prior to joining Argosy, Scott spent two years in the UK working for various fund managers and five years in the managed funds division of ING New Zealand.
Scott is a Chartered Accountant and has a Bachelor of Business Studies degree and a Postgraduate Diploma in Business and Administration, majoring in Finance, both from Massey University.
ANNA HAMILLFinancial Controller
Anna joined Argosy in 2013 and has responsibility for the financial and management reporting as well as budgeting functions of the Company. Prior to joining Argosy, she worked in the external reporting team of one of New Zealand’s largest general insurers. Before that, Anna spent over six years working in audit and assurance services at Deloitte where her client base consisted of larger corporate and listed entities.
Anna is a Chartered Accountant and has a Bachelor of Commerce degree majoring in Accounting and Marketing and a Postgraduate Diploma in Commerce majoring in Management, both from The University of Auckland.
WARREN CATEAsset Manager
Warren is responsible for a wide variety of properties in the Argosy portfolio. In addition to strategic management and financial performance accountabilities, his extensive property industry experience is utilised to good effect in the investigation and analysis of many of our property acquisition initiatives.
Graduating from The University of Auckland with a Bachelor of Engineering degree, Warren has held a diverse range of roles over more than 25 years in the industry, including as General Manager Property for Magnum Corporation. He joined the team in 1995, making him one of the longest-serving members.

15
ARGOSY PROPERTY LIMITED | Annual Report 2016
ROB SMITHAsset Manager
Rob joined Argosy in 2015 and is responsible for the strategic management and financial performance of a portfolio of properties in the Wellington region.
His 25 year property career includes a variety of private sector retail and commercial property management roles that have included acquisitions, divestments, leasing and project management. Rob graduated with a Bachelor of Commerce degree and Postgraduate Diploma in Business from The University of Auckland.
WADE ALLENLeasing Manager
Wade is responsible for maximising the leasing and transactional side of Argosy’s business.
Wade has over 30 years’ experience in the commercial property business, having worked in asset management for NZI, Brierley Investments, Trans Tasman Properties and National Bank.
More recently, Wade spent four years as Commercial Manager at Manson Developments involved in leasing and acquisitions. Wade has also run his own property consultancy practice focusing on leasing solutions and the sale and purchase of commercial property assets.
Wade graduated from The University of Auckland with a Bachelor of Arts degree in Economics.
TONY FROSTAsset Manager
Tony’s property career includes a wide variety of property and development management roles in private and public sector entities.
He joined the management team in 2007 and has responsibility for a varied portfolio of Argosy’s properties. In addition to strategic management and financial performance accountabilities, Tony is particularly effective at investigating and analysing development projects, using his extensive property industry experience to enhance many of our portfolio initiatives.
Tony has a Diploma in Valuation from The University of Auckland and is a member of the Property Institute.
SAATYESH BHANAAsset Manager
Saatyesh has been with the management team for over ten years and is responsible for the strategic management and financial performance of a portfolio of properties.
He graduated from Massey University with a Bachelor of Business Studies degree, specialising in Valuation and Property Management. Saatyesh has worked in a variety of private sector and listed property businesses. His 19 years’ experience includes acquisitions, divestments, leasing and value add projects. He has strong tenant relationship skills, which enable a collaborative approach with clients.
MARILYN STOREYAsset Manager
Marilyn has been with the Argosy team for more than eight years and has over 20 years’ experience in the commercial property industry ranging from working with tenants and landlords, consulting, project work and energy management.
She is responsible for a mix of properties across Argosy’s portfolio including development work. On top of her extensive experience, Marilyn is also well qualified with a Master of Business Administration degree from the University of Otago and a Bachelor’s degree in both Property and Commerce from The University of Auckland. She joined Argosy after operating her own property consulting business.
JOANNA SHARPEAsset Manager
Joanna joined the Argosy team in July 2013. She has over 18 years’ experience in the retail and property industries including working with retailers and landlords, project work, and resource consents and planning.
Joanna is responsible for our retail portfolio across New Zealand including development work. In addition to her experience, she is also well qualified with a Master of Arts (Social Science) degree in Business and Psychology from Glasgow University. Joanna has been in New Zealand for 16 years since moving from the UK. Most recently, she worked for Wellington Airport and Foodstuffs (Wellington) Cooperative Society Limited.

16
ARGOSY PROPERTY LIMITED | Annual Report 2016
STRATEGY
We have a clearly defined investment strategy and acquisition policy which guides our commercial decision making.
Argosy is, and will remain, invested in a portfolio that is diversified by sector, grade, location and tenant mix.
Argosy�strives�to�deliver�reliable�and�sustainable�returns�to�shareholders.�
The portfolio consists of Core and Value Add properties. Core properties are well constructed, well located assets, intended to be long-term investments (>10 years), making up 75% to 85% of the portfolio by value.
The key features of Core properties are:
— strong long term demand (well located and generic)
— a leasing profile that provides for rental growth of at least CPI
— excellent structural integrity with minimal maintenance capital expenditure required.
INDUSTRIAL
35%-45%OFFICE
35%-45%RETAIL
15%-25%
Focus on good quality Office, Industrial and Large Format Retail
Concentrate on Auckland (65%-75%) and Wellington (20%-30%). Regional North Island
or South Island tenant-driven only (<10%)
Target “off-market” acquisitions and avoid competitive processes
Target Value Add properties where we can leverage internal
expertise within overall Core/Value Add targets
Target contiguous properties with potential
LNo leasehold
INo international
properties
VALUE PARAMETERS
Greater than $10 million unless strategically imperative ($6 million for Industrial)
No more than 10% of overall portfolio value
WHERE WILL WE BUY?
DUE DILIGENCE
Apply Argosy’s due diligence checklist
Structural integrity ≥ 70% (unless this represents a Value Add opportunity)
DEVELOPMENT
Developments only for tenants who provide strategic value to Argosy
Joint ventures will be undertaken only where the counterparty is of sufficient financial standing to carry their share of risk
OTHER
No third party management of external portfolios

17
ARGOSY PROPERTY LIMITED | Annual Report 2016
Value Add properties are assets which, through skilled asset management, can increase future earnings and provide capital growth. Value Add properties will already be well located with the potential for strong long term tenant demand. These properties are available for near to medium term repositioning or development with the view to moving into the Core category.
Properties that are considered neither Core nor Value Add are divested as market conditions allow.
INVESTMENT POLICYOur Investment Policy clearly defines what properties we will seek to own; i.e. it sets the boundaries within which we will operate and invest. The investment policy delivers a clear acquisition checklist and every potential acquisition (and portfolio asset) can be measured against that checklist.
In some cases a portfolio of assets may be considered. The strategy for the acquired portfolio must be consistent with the overall Argosy Portfolio Investment Strategy (i.e. the majority by value of the properties either are Core or offer potential to move to Core in the medium term).
In certain circumstances exceptions to the Investment Policy may be considered where an acquisition is made to meet the requirements of a valued tenant.
Argosy has a diversified portfolio of quality properties with an average value of $20.7 million. This allows the Company to react quickly to changing market conditions without the need for potentially dilutive capital raisings when the market is weak. Liquid properties (which are properties that could potentially be under contract within a short period) currently represent 24% of the portfolio.
CAPITAL MANAGEMENTThe optimal capital structure for Argosy should be one that enables the Company to maximise its earnings yield through the property cycle within the following parameters:
— properties can be acquired when they meet the approved Investment Policy criteria, or sold when they are non Core
— there are limited forced sales of properties or a requirement to issue equity at a price that is dilutive to shareholders
— measured dividend growth is maintained.
Argosy’s capital structure policy is to retain the debt-to-total-assets ratio at between 35% and 40% in the medium term.
This ratio is monitored on an ongoing basis. Any movement beyond pre-set parameters requires an action plan and timeframe to move debt levels to within the prescribed range.
RISK MANAGEMENTArgosy strives to deliver reliable and sustainable returns to shareholders. We take a considered approach to development, acquisition, divestment, leasing and capital management decisions, reflecting our proposition to shareholders as a dividend stock.
Argosy generally operates within a medium/low overall risk range. Argosy adopts a medium risk appetite for risks associated with leasing metrics and the repositioning of the portfolio, in line with our overall investment strategy.
Argosy has a low risk appetite for risks associated with managing developments and Value Add projects and compliance matters.
The Company will continue to focus on the leasing metrics of the portfolio as well as on repositioning the portfolio in line with the overall Investment Strategy. Adding value through developments with existing tenants and managing Argosy’s risk profile remain important focus areas for the Company.
Citibank Centre AUCKLAND

18
ARGOSY PROPERTY LIMITED | Annual Report 2016
ENVIRONMENT AND COMMUNITY
Argosy strives to deliver financial, environmental and social value to all of our stakeholders, including shareholders, tenants, our people and the environment.
We understand that the way in which we engage with, and our impact on, our stakeholders is critical to the continued sustainable success of our business.
We believe that with improved Environmental, Social and Governance policies and practices, shareholders can make better informed investment decisions.
143 Lambton Quay
As a leading owner of property in New Zealand, we are well aware of the impact of our actions on the natural environment.
We have therefore commenced on a journey of sustainable development and operations. We do this to better meet the needs of our tenants and ensure the long-term sustainability of our business. We pay attention to environmental issues and encourage environmentally responsible behaviour. We strive to improve the environmental performance of our properties.
Argosy is a member of the New Zealand Green Building Council, a not-for-profit industry organisation dedicated to accelerating the development and adoption of market based green building practices.
As a responsible investor, Argosy is keen to ensure there are initiatives to achieve environmentally sustainable features in individual building’s strategic plan. We consider the initiative to produce environmentally responsible developments, a fundamental requirement of any project, be it an existing building management matter, a new development or a retrofit.
This view is supported by tenant demand for environmentally sustainable accommodation that:
— illustrates a tenant’s commitment to the environment
— provides a reduction in operating costs — mitigates the functional obsolescence of an investment.
We are committed to finding new and innovative ways of making our buildings more environmentally sound and energy efficient.
Argosy currently has one building with a NABERSNZ rating (another one is pending). NABERSNZ is a system for rating the energy efficiency of office buildings. Argosy is looking to move towards having ratings on more office properties in the portfolio over time.
ENVIRONMENT
NABERSNZ Rating
½

19
ARGOSY PROPERTY LIMITED | Annual Report 2016
01. �EthicsDoing the right thing and doing things right
02. �CultureCreating a fun environment that encourages excellence
03. �RespectTreating all stakeholders with courtesy and understanding
04. �AccountabilityTaking ownership and responsibility
05. �CommunicationPromoting responsive, proactive, honest and appropriate communication with all stakeholders
WORKPLACE AND COMMUNITY
Argosy’s values guide our internal conduct as well as our relationships with external parties.
The company is committed to achieving outstanding performance and results within the listed property sector to provide value to our shareholders, while considering the interests of workers, tenants, the community and others with whom we do business. In striving for outstanding performance and results, we do not compromise our ethics or principles. Argosy places great importance on honesty, integrity, quality and trust.
OUR VALUES

20
ARGOSY PROPERTY LIMITED | Annual Report 2016
ENVIRONMENT AND COMMUNITY
The Company is committed to health and safety in the workplace and the aspirational vision of zero harm.
Our health and safety commitment includes accurate recording and reporting of workplace incidents, supporting innovation and fresh ideas to improve health and safety systems, support for worker participation through health and safety representatives, and supporting the safe and early return to work of injured employees.
Argosy strives to provide and maintain a healthy and safe workplace for its employees and workers, monitor health and safety outcomes, and provide the information, training, resources and supervision needed to achieve this. We also acknowledge our responsibilities to tenants, other workers and the public.
ZER O HARM
HEALTH & SAFETY ASPIRATIONAL VISION
STRATEGIC GOALS
HEALTH AND SAFETY STRATEGIC GOALSArgosy strives to create a positive safety culture. It is important that we manage health and safety risks, provide adequate training and resources and ensure that managers and individuals are accountable for their actions or inaction. We have developed seven key strategic goals to provide a safer work environment.
We will proactively identify hazards and implement actions to eliminate, isolate or minimise the risk of harm.
We will consult and actively engage with employees and contractors to ensure they have the training, skills, knowledge and resources to maintain a healthy and safe workplace.
We will maintain and continually improve our health and safety system.
We will actively encourage our contractors and tenants to demonstrate the same commitment to achieving excellence in health and safety performance as Argosy does.
We will support the health and wellbeing of Argosy staff and encourage the safe and early return to work of injured or ill employees.
We will comply with relevant legislation and regulations.
We will accurately report our incidents and investigate root causes, in a timely manner.
Argosy has progressed well towards achieving these seven strategic goals. We have invested in new health and safety systems, training and processes and have employed a Compliance Manager to lead our health and safety program. We are also active members of industry and contractor working groups.
HEALTH AND SAFETY
1
2
3
4
5
7
7
6

21
ARGOSY PROPERTY LIMITED | Annual Report 2016
RED BEACH SURF LIFESAVING CLUB (SLSC) – SUPER SIX SPONSOR
As a nation that is surrounded by water, millions of New Zealanders head to the ocean every summer and New Zealand’s lifeguards do a fantastic job keeping us and our loved one’s safe in the water.
Argosy has recognised the contribution our life guards provide and, for the past three years, has had a proud association with the Red Beach SLSC as one its Super Six Sponsors.
Last season, Red Beach SLSC’s lifeguards contributed 2,728 hours of their time guarding both Red Beach and Pakiri beaches. They carried out over 299 preventative actions and saved 31 lives, while also providing 37 first aid treatments. This highlights their serious commitment to community safety.
Red Beach volunteer lifeguards have been responsible for supporting and delivering lifesaving services to the community, its residents and visitors for more than 60 years.
For the past four seasons, Red Beach SLSC has undertaken to patrol Pakiri Beach in addition to their existing patrol activities at Red Beach. This is an opportunity for lifeguards to extend their skills and experience, provide an extended community service to the local area and, most importantly, fulfil a vital need following the unfortunate drowning at the beach the previous summer.
The Argosy sponsorship of the Surfboat Division has directly contributed to 14 new volunteers gaining their lifeguard award.
Six of these new lifeguards were involved in the rescue of 12 members of the public on one busy afternoon at Pakiri Beach during the 2015/16 summer.
Over the past three years, Argosy has donated $84,000 to the Red Beach Surf Lifesaving Club.
COMMUNITY INVOLVEMENT
2,7282015/16 299 37 31HOURS ON PATROL
SUMMER SEASON
PREVENTATIVE ACTIONS
FIRST AID TREATMENTS
LIVES SAVED
60+YEARS OF DELIVERING LIFESAVING SERVICES TO THE COMMUNITY, ITS RESIDENTS AND VISITORS

22
ARGOSY PROPERTY LIMITED | Annual Report 2016
CORPORATE GOVERNANCE
THE COMPANYArgosy is a limited liability company incorporated under the Companies Act 1993. Argosy shares are listed on the NZX Main Board (NZX code: ARG). Argosy’s constitution is available on its website (www.argosy.co.nz) and the New Zealand Companies Office website (www.business.govt.nz/companies).
CORPORATE GOVERNANCE PHILOSOPHYUltimate responsibility for corporate governance of the Company resides with the Board of Directors. The Board sees strong corporate governance and stewardship as fundamental to the strong performance of the Company and, accordingly, the Board’s commitment is to the highest standards of business behaviour and accountability.
Outlined below are the main corporate governance practices in place throughout the year, which, in the Board’s opinion, comply with the NZX Corporate Governance Best Practice Code (NZX Code) and the Corporate Governance in New Zealand Principles and Guidelines published by the Financial Markets Authority, unless otherwise stated.
ETHICAL STANDARDSThe Board has adopted a Code of Conduct and Ethics, which sets out the ethical and behavioural standards expected of Argosy’s Directors, officers and employees. The purpose of the Code of Conduct and Ethics is to uphold the highest ethical standards, acting in good faith and in the best interests of shareholders at all times. The Code of Conduct and Ethics outlines the Company’s policies in respect of conflicts of interest, fair dealing, compliance with applicable laws and regulations, maintaining confidentiality of information, dealing with company assets and use of company information.
Procedures for dealing with breaches of these policies are contained in the Code of Conduct and Ethics, which forms part of each employee’s conditions of employment.
Argosy’s Code of Conduct and Ethics is available on its website (www.argosy.co.nz).
COMPOSITION OF THE BOARDArgosy is committed to having a Board whose members have the capacity to act independently and have the composite skills to optimise the financial performance of the Company and returns to shareholders. The constitution provides for there to be not fewer than three Directors. All the members of the Board are non-executive Directors. The members of the Board are listed below and their brief resumés are included in the section headed “Board of Directors” on page 10.
ATTENDANCE OF DIRECTORSBoard Meetings attended
Michael Smith (Chair) 8 of 8
Peter Brook 8 of 8
Mark Cross 8 of 8
Andrew Evans 8 of 8
Chris Hunter 8 of 8
Jeff Morrison 8 of 8
All of the above persons were Directors as at 31 March 2016.
The Board does not impose a restriction on the tenure of any Director as it considers that such a restriction may lead to the loss of experience and expertise from the Board.
INDEPENDENT DIRECTORSThe Company recognises that independent directors are important in assuring shareholders that the Board is properly fulfilling its role and is diligent in holding management accountable for its performance.
In determining whether a Director is independent, the Board considers whether the Director is independent of management and free of any business or other relationship that could materially interfere with, or could reasonably be perceived to materially interfere with, the exercise of his or her unfettered and independent judgement. In accordance with Rule 3.3.2 of the NZX Main Board Listing Rules, the Board has determined that all of the Directors are, in its view, independent directors as at balance date as they do not have a disqualifying relationship with the Company.
BOARD AND DIRECTOR PERFORMANCEThe Board has an annual performance assessment, carried out under the direction of the Chairman. Assessment of individual Directors’ performance is a process determined by the Chairman, taking into account the attendance, contribution and experience of each individual Director concerned.

23
ARGOSY PROPERTY LIMITED | Annual Report 2016
INSIDER TRADING AND RESTRICTED PERSONS TRADINGArgosy’s Directors, officers and employees, their families and related parties must comply with the Insider Trading and Restricted Persons Trading policy. Amongst other requirements, the policy identifies two ‘black-out periods’ where trading in the Company’s shares is prohibited (unless a special circumstances trading application is granted). The black-out periods are from the close of trading on 28 February (or 29 February in a leap year) until the day following the full year announcement date and from the close of trading on 31 August until the day following the half year announcement date each year. Ongoing fixed participation in the Dividend Reinvestment Plan (DRP) is available throughout the year.
Trading by Directors, officers and senior employees requires pre-trade approval (with limited exceptions, such as shares acquired under the DRP). Officers and employees must obtain approval from any two Directors or a Director and the Chief Financial Officer and Directors must obtain pre-trade approval from the Chairman (or in the case of the Chairman, the Chairman of the Audit and Risk Committee). The holdings of Directors of shares in Argosy are disclosed in the section headed “Holdings of Directors” on page 77.
Argosy’s Insider Trading and Restricted Persons Trading Policy is available on its website (www.argosy.co.nz).
DIRECTORS AND OFFICERS’ INDEMNIFICATION AND INSURANCEIn accordance with section 162 of the Companies Act 1993 and the constitution of the Company, Argosy has indemnified and insured its Directors and employees, including Directors and employees of subsidiaries, in respect of liability incurred for any act or omission in their capacity as a Director or employee (including defence costs). The insurer reimburses the Company where it has indemnified the Directors or employees.
BOARD COMMITTEESBoard committees assist with the execution of the Board’s responsibilities to shareholders. Each committee operates under a constitution approved by the Board, setting out its role, responsibilities, authority, relationship with the Board, reporting requirements, composition, structure and membership. Argosy’s board committee constitutions are available on its website (www.argosy.co.nz).
REMUNERATION COMMITTEEThe Board has established a Remuneration Committee which considers the remuneration of the Directors and senior executives, and administers the Company’s bonus scheme. The members of the Remuneration Committee are Michael Smith (Chairman), Peter Brook and Jeff Morrison.
ATTENDANCE AT REMUNERATION COMMITTEERemuneration Committee Meetings Attended
Michael Smith (Chair) 3 of 3
Peter Brook 3 of 3
Jeff Morrison 3 of 3
NOMINATIONS COMMITTEEThe Board does not maintain a Nominations Committee. As all Directors participate in nomination decisions a nominations committee is considered unnecessary.
AUDIT AND RISK COMMITTEEThe Board has established an Audit and Risk Committee, which is responsible for overseeing the financial, accounting and risk management responsibilities of the Company. The minimum number of members on the Audit and Risk Committee is three. All members must be Directors, the majority must be independent directors and at least one member must have an accounting or financial background.
The members of the Audit and Risk Committee are Mark Cross (Chairman), Peter Brook and Michael Smith. The Audit and Risk Committee assists the Board in fulfilling its corporate governance and disclosure responsibilities with particular reference to financial matters, external audit and risk management, and is specifically responsible for:
— ensuring that processes are in place and monitoring those processes so that the Board is properly and regularly informed and updated on corporate financial matters;
— the appointment and removal of the external auditor; — meeting regularly to monitor and review external
audit practices; — having direct communication with and unrestricted
access to the external auditors; — reviewing the financial reports and advising the
Board whether they comply with the appropriate laws and regulations;
— ensuring the external auditor or lead audit partner is changed at least every five years;
— reviewing the performance and independence of the external auditor;
— monitoring compliance with the Financial Markets Conduct Act 2013, the Financial Reporting Act 2013, Companies Act 1993 and the NZX Main Board Listing Rules; and
— overseeing the Company’s risk management policy and framework and monitoring compliance.
ATTENDANCE AT AUDIT AND RISK COMMITTEEAudit and Risk Committee Meetings Attended
Mark Cross (Chair) 4 of 4
Peter Brook 4 of 4
Michael Smith 4 of 4

24
ARGOSY PROPERTY LIMITED | Annual Report 2016
CORPORATE GOVERNANCE
DIRECTORS’ REMUNERATIONDirectors’ FeesThe current total Directors’ fee pool approved by ordinary resolution at the Company’s 2015 Annual Meeting is $665,000 per annum.
Directors’ RemunerationRemuneration paid to Directors by the Company during the year is as follows:
Michael Smith (Chair) $149,549
Peter Brook $81,808
Andrew Evans $71,205
Mark Cross $87,410
Chris Hunter $71,205
Jeff Morrison $73,705
The Company considers it desirable to attract and retain high performing Directors whose skills and experience are well suited to the Company’s requirements. To this end, it is important that the Directors are remunerated appropriately. The Directors’ fees are presently set as follows:
— each Director (other than the Chairman) is paid $75,000 per annum.
— the Chairman is paid $140,000 per annum. — additional amounts are paid to committee members.
The Audit and Risk Committee Chairman receives $20,000 per annum and its members each receive $10,000 per annum. The Remuneration Committee Chairman receives $5,000 per annum and its members each receive $2,500 per annum.
The Board takes advice from independent remuneration specialists when considering any proposal to increase the Directors’ fees.
Additional payments may be made to Directors who assume additional responsibilities (including in relation to one-off project work) from time to time beyond the scope of their usual responsibilities. No payments were made in the year to 31 March 2016 (2015: Nil).
GENDER BALANCEAs at 31 March 2016 the gender balance of the Company’s Directors, officers and all employees was as follows:
Directors Officers All employees
Female 0 (2015: 0) 3 (2015: 3) 12 (2015: 12)
Male 6 (2015: 6) 9 (2015: 8) 15 (2015: 13)
Total 6 (2015: 6) 12 (2015: 11) 27 (2015: 25)
REMUNERATION REPORTUnder the guidance of the Remuneration Committee, the Board has established a remuneration framework which is designed to attract, retain and reward individual employees to deliver premium performance aligned to business objectives, strategy, shareholder interests and investment performance.
Employee RemunerationAn employee’s remuneration is comprised of some or all of the following components:
— fixed remuneration — variable or ‘at risk’ components
The fixed remuneration component (including salary, Kiwisaver contributions, health and disability benefits and vehicles) is designed to reward employees for their skills and experience and the accountability of their role. The variable component is comprised of a short term incentive scheme for all permanent employees and a long term incentive scheme for eligible employees.
Short Term Incentive Scheme (STI)The STI is a non-guaranteed variable pay scheme for permanent employees, designed to reward participants for premium performance over the financial year. The STI comprises both company-related performance and individual-related performance measures, with both measures based on stretch performance goals. The STI for the Chief Executive Officer and for the Chief Financial Officer is based solely on Company performance.
Long term Incentive Scheme (LTI)The Board has approved an LTI scheme for senior executives which commenced on 1 April 2015. Under the scheme, the Company may issue performance share rights (PSRs) to eligible employees each year (currently the Chief Executive Officer and Chief Financial Officer).
LTI performance measures require the Company’s Total Shareholder Return (TSR) against a comparator group of listed entities determined by the Board from the S&P/NZX All Real Estate Gross Index. The TSRs of the entities in the comparison group over the performance period (which is three years) will be ranked from highest to lowest.
If Argosy’s TSR over the performance period exceeds the TSR of the company ranked at the 50th percentile in the comparison group, 50% of the PSRs will vest. If Argosy’s TSR over the performance period exceeds the TSR of the company ranked at the 75th percentile in the comparison group, 100% of the PSRs will vest. There is a straight line progression and apportionment between these two points. No shares will vest if the TSR over the performance period is negative.
No PSRs vested in the year ending 31 March 2016.

25
ARGOSY PROPERTY LIMITED | Annual Report 2016
REMUNERATIONAll employees of the Group are employed by Argosy Property Management Limited. The number of employees or former employees of the Group, not being Directors of Argosy Property Limited who received remuneration and any other benefits in their capacity as employees of $100,000 per annum or more, are set out below:
31-Mar-16 31-Mar-15
$100,001 $110,000 5 2
$110,001 $120,000 – –
$120,001 $130,000 1 1
$130,001 $140,000 1 1
$140,001 $150,000 1 1
$150,001 $160,000 1 –
$160,001 $170,000 1 –
$170,001 $180,000 – 1
$180,001 $190,000 1 1
$190,001 $200,000 – 2
$200,001 $210,000 1 1
$210,001 $220,000 2 –
$220,001 $230,000 1 1
$230,001 $240,000 3 2
$240,001 $250,000 – –
$250,001 $260,000 1 –
$280,001 $290,000 – 1
$530,001 $540,000 – 1
$550,001 $560,000 1 –
$650,001 $660,000 – 1
$740,001 $750,000 1 –
21 16
Citibank Centre AUCKLAND

26
ARGOSY PROPERTY LIMITED | Annual Report 2016
CORPORATE GOVERNANCE
INTERESTS REGISTERSDirectors’ shareholdingsEquity securities in which each Director and associated person of each Director held a relevant interest as at 31 March 2016 are listed below:
Director Holder Trustees Interest No. of Shares
Philip Michael Smith FNZ Custodians Limited for the trustees of the Mallowdale Trust
Philip Michael Smith and Dale Gaye D’Rose
Non beneficial 242,576
Peter Brook Peter Clynton Brook n/a Beneficial 129,689
FNZ Custodians Limited for the trustees of the Bayview Trust
Peter Clynton Brook, Mary Patricia Brook, Samuel John Goldwater, Nicholas Paul Goldwater
Non beneficial 360,288
Andrew Mark Cross Nil Nil Nil Nil
Andrew Evans Trustees of the Hardwick Trust
Andrew Hardwick Evans and The Hardwick Trustees Limited
Non beneficial 90,243
Trustees of the Graeme Horsley No. 3 Trust
Graeme Horsley, Susan Horsley, Andrew Evans
Non beneficial 18,976
Chris Hunter Nil Nil Nil Nil
Jeff Morrison Investment Custodial Services Limited for the trustees of the Suzanne Fisher Trust
Jeff Morrison and Barry Fisher Non beneficial 435,002
Investment Custodial Services Limited for as trustees of the LJ Fisher Trust
Andrew Spencer and Jeff Morrison
Non beneficial 93,000
Trustees of the JM Thompson Trust
Jeff Morrison, Robyn Shearer Non beneficial 336,545
Trustees of the Dalbeth Family Trust No.2
Audrey Dalbeth, Anthony Hudson, Bronwyn Patterson, William Dalbeth, Jeff Morrison
Non beneficial 38,300
Trustees of the Dalbeth Family Trust No.3
William Dalbeth and Jeff Morrison
Non-beneficial 133,400
Trustees of the Dalbeth Family Trust No.4
William Dalbeth and Jeff Morrison
Non-beneficial 190,400

27
ARGOSY PROPERTY LIMITED | Annual Report 2016
SENIOR MANAGERS’ SHAREHOLDINGSEquity securities in which each Senior Manager and associated person of each Senior Manager held a relevant interest as at 31 March 2016 are listed below:
Senior Manager Holder Trustees Interest No. of Shares PSRs Vested
Peter Mence n/a n/a PSR 176,991 –
David Fraser n/a n/a PSR 102,212 –
DIRECTORS AND SENIOR MANAGERS’ SHARE DEALINGSThe Directors and Senior Managers entered into the following share dealings which relate to the acquisition of shares in the Company during the year:
— Peter Brook acquired a beneficial interest in 1,671 shares in the Company on 26 June 2015 for consideration of $1,843.98 under the Company’s dividend reinvestment plan.
— Peter Brook acquired a beneficial interest in 1,752 shares in the Company on 23 September 2015 for consideration of $1,869.05 under the Company’s dividend reinvestment plan.
— Peter Brook acquired a beneficial interest in 1,675 shares in the Company on 17 December 2015 for consideration of $1,895.33 under the Company’s dividend reinvestment plan.
— Peter Brook acquired a beneficial interest in 1,659 shares in the Company on 30 March 2016 for consideration of $1,920.45 under the Company’s dividend reinvestment plan.
— Andrew Evans acquired a non-beneficial (trust) interest in 1,161 shares in the Company on 26 June 2015 for consideration of $1,281.77 under the Company’s dividend reinvestment plan.
— Andrew Evans acquired a non-beneficial (trust) interest in 1,219 shares in the Company on 23 September 2015 for consideration of $1,300.56 under the Company’s dividend reinvestment plan.
— Andrew Evans acquired a non-beneficial (trust) interest in 1,165 shares in the Company on 17 December 2015 for consideration of $1,318.85 under the Company’s dividend reinvestment plan.
— Andrew Evans acquired a non-beneficial (trust) interest in 1,155 shares in the Company on 30 March 2016 for consideration of $1,336.32 under the Company’s dividend reinvestment plan.
— Dave Fraser acquired 102,212 PSRs on 6 May 2015 under the Company’s Long Term Incentive Scheme.
— Peter Mence acquired 176,991 PSRs on 6 May 2015 under the Company’s Long Term Incentive Scheme.
— Jeff Morrison acquired a non-beneficial (trust) interest in 4,336 shares in the Company on 26 June 2015 for consideration of $4,785.18 under the Company’s dividend reinvestment plan.
— Jeff Morrison acquired a non-beneficial (trust) interest in 70,000 shares in the Company on 26 June 2015 for consideration of $77,000 through an on-market acquisition.
— Jeff Morrison acquired a non-beneficial (trust) interest in 100,000 shares in the Company on 26 June 2015 for consideration of $110,000 through an on-market acquisition.
— Jeff Morrison acquired a non-beneficial (trust) interest in 63,400 shares in the Company on 16 September 2015 for consideration of $68,655.86 through an on-market acquisition.
— Jeff Morrison acquired a non-beneficial (trust) interest in 90,400 shares in the Company on 16 September 2015 for consideration of $97,894.16 through an on-market acquisition.
— Jeff Morrison acquired a non-beneficial (trust) interest in 4,545 shares in the Company on 23 September 2015 for consideration of $4,850.22 under the Company’s dividend reinvestment plan.
— Jeff Morrison acquired a non-beneficial (trust) interest in 4,346 shares in the Company on 17 December 2015 for consideration of $4,918.40 under the Company’s dividend reinvestment plan.
— Jeff Morrison acquired a non-beneficial (trust) interest in 4,306 shares in the Company on 30 March 2016 for consideration of $4,983.59 under the Company’s dividend reinvestment plan.

28
ARGOSY PROPERTY LIMITED | Annual Report 2016
CORPORATE GOVERNANCE
DIRECTORS’ INTERESTSThe Directors have declared interests in the entities listed below. Where (R) is included next to the interest, the Director has ceased to have that interest during the year.
Director Position Company/Organisation
Michael Smith Director Greymouth Petroleum Limited
Director Maui Capital Indigo Fund
Director Maui Capital Aqua Fund Limited
Indirect interest Partners Life Limited
Peter Brook Trustee Melanesia Mission Trust Board
Chairman Trust Investments Management Limited
Chairman Burger Fuel Worldwide Limited
Chairman Generate Investment Management Limited
Mark Cross Director Alpha Investment Partners Limited
Director Aspect Productivity Technology Limited
Director Emcee Squared Limited
Chairman Superannuation Investments Limited
Chairman MFL Mutual Fund Limited
Chairman Milford Asset Management Limited
Director Milford Funds Limited
Board member Triathlon New Zealand Inc.
Director Genesis Energy Limited
Director Milford Private Wealth Limited
Director Virsae Group Limited
Director Z Energy Limited
Andrew Evans Director Vital Healthcare Management Limited
Director Holmes Group Limited
Director Holmes Fire & Safety Limited
Director Trust Investments Management Limited
Director Holmes GP Fire Limited
Director Hughes & Cossar Limited
Director Westbrooke Capital Partners Limited
Chris Hunter Director Hunter Corporation Limited
Director Amalgamated Builders Limited
Director Hunter Consulting Services Limited
Director NZ Strong Group Limited
Peter Mence Director Argosy Property No. 3 Limited
Director Argosy Property No. 1 Limited
Director Argosy Property Unit Holdings Limited
Director Argosy Property Management Limited
Dave Fraser Director Argosy Property No. 3 Limited
Director Argosy Property No. 1 Limited
Director Argosy Property Unit Holdings Limited
Director Argosy Property Management Limited

29
ARGOSY PROPERTY LIMITED | Annual Report 2016
INFORMATION USED BY DIRECTORSNo Director requested to use information received in his or her capacity as a director that would not otherwise be available to the Director.
INDEMNITIES AND INSURANCEThe Company effected indemnities for Directors and employees for liability (including defence costs) arising in respect of acts or omissions while acting in the capacity of a director or employee.
The Company effected insurance for Directors and employees for liability (including defence costs) arising in respect of acts or omissions while acting in the capacity of a director or employee, and a policy for defence costs.
EXTERNAL AUDIT FIRM GUIDELINESIn addition to the formal constitution under which the Audit and Risk Committee operates, the Audit and Risk Committee has adopted an External Auditor Independence Policy containing procedures to ensure the independence of the Company’s external auditor.
The Audit and Risk Committee is responsible for recommending the appointment of the external auditor and maintaining procedures for the rotation of the external audit lead partner. Under the Auditor Independence Policy, the external audit lead partner must be rotated every five years.
The policy covers provision of non-audit services with the general principle being that the external auditor should not have any involvement in the production of financial information or preparation of financial statements such that they might be perceived as auditing their own work. It is, however, appropriate for the external auditor to provide services of due diligence on proposed transactions and accounting policy advice.
Deloitte has been appointed as the Company’s external auditor.
INVESTOR RELATIONS The Board aims to ensure that investors are informed of all information necessary to assess the Company’s performance.
It does so through a communication strategy which includes:
— periodic and continuous disclosure to NZX in accordance with the continuous disclosure requirements;
— information and briefings provided to analysts and media;
— annual and interim reports distributed to shareholders; — the annual shareholders’ meeting and any other
meetings called to obtain approval for Company actions as appropriate;
— notices and explanatory memoranda for annual and special meetings;
— investor roadshows; — the Company’s website www.argosy.co.nz; and — periodic Investor Update newsletters.
Shareholders have the opportunity to question Directors on the management of the Company at annual and special meetings.
NZX RULINGS AND WAIVERSThe Company did not apply to NZX for, nor rely on, any rulings or waivers during the year.
DONATIONSThe Company is a Super Six Sponsor of the Red Beach Surf Lifesaving Club Inc, for a term of three years. The Company contributed $28,000 in each of the 2014, 2015 and 2016 financial years.
No other member of the Group made donations in the 2016 financial year.
ARGOSY SUBSIDIARIES – DIRECTORSAs at 31 March 2016:
— Michael Smith, Peter Brook, Andrew Evans, Peter Mence and David Fraser were the directors of Argosy Property No. 1 Limited.
— Michael Smith, Peter Brook, Andrew Evans, Peter Mence and David Fraser were the directors of Argosy Property No. 3 Limited.
— Michael Smith, Peter Brook, Andrew Evans, Peter Mence and David Fraser were the directors of Argosy Property Management Limited.
— Michael Smith, Peter Brook, Peter Mence and David Fraser were the directors of Argosy Property Unit Holdings Limited.
No director of any Argosy subsidiary received additional remuneration or benefits in respect of their directorships. The directors of Argosy’s subsidiaries who are not also directors of the Company have no interests recorded in the interest registers of those companies.
101 Carlton Gore Road AUCKLAND

30
ARGOSY PROPERTY LIMITED | Annual Report 2016
PORTFOLIO OVERVIEW
The�property�market�continues�to�show�solid�fundamentals�with�investment�demand�in�excess�of�supply�and�low�interest�rates�increasing��the�attraction�of�property�relative�to�other�classes�of�investment.

TOTAL PORTFOLIO VALUEBY SECTOR
23% Retail
40% Office
37% Industrial
TOTAL PORTFOLIO VALUEBY REGION
67% Auckland
27% Wellington
6% North Island regional and South Island
81% Core properties
11% Value Add properties
8% Properties and land to divest
PORTFOLIO STATISTICS
TOTAL PROPERTIES Industrial Office Retail
Number of buildings 66 39 17 10
Market value of assets ($m) $1,367.55 $507.11 $548.61 $311.83
Net lettable area (sqm) 601,045 362,561 126,607 111,877
Vacancy factor by rent 0.6% 0.1% 0.9% 0.8%
Weighted average lease term (WALT) (years) 5.24 5.99 4.82 4.78
Average value ($m) $20.72 $13.00 $32.27 $31.18
Passing yield 7.57% 7.70% 7.56% 7.36%
PORTFOLIO MIX
The amount of new space the market requires (net absorption) continues positively and new development is yet to negatively affect vacancy levels.
The New Zealand economy remains in a solid positive phase and the country is increasingly seen as a safe place for the international investor to place real estate investment funds.
99.4%OCCUPANCY
ARGOSY PROPERTY LIMITED | Annual Report 2016
31

32
ARGOSY PROPERTY LIMITED | Annual Report 2016
PORTFOLIO OVERVIEW
OCCUPANCY, LEASING AND WALT Occupancy remains very high at 99.4% at year end, slightly improved from 99.2% last year. It is very pleasing to have been able to maintain the occupancy at such high levels across all sectors of the portfolio.
A total of 10.1% of the leases in the portfolio are expiring in the coming 12 months which is very manageable. The lease expiry profile as at 31 March 2016 is shown on page 33.
NEW LEASES AND LEASE EXTENSIONSBY SECTOR
Floor Area (sqm)
Average Lease Term (years) No. of Leases
Office 14,131 1.11 18
Industrial 101,929 5.83 15
Retail 14,060 3.69 12
Total 130,120 4.13 45
The WALT was 5.24 years at 31 March 2016, compared with 5.54 years in the prior year. The WALT is very important because portfolio values are fundamentally affected by security of income streams. The WALT by sector is represented in the chart on page 33.
During the year, 45 lease transactions were completed (excluding car parks) including 15 new leases and 30 lease renewals and extensions. A total of 88 rental reviews were completed, resulting in an increased annual rental of $809,000.
VALUATIONSAn independent revaluation of the portfolio was undertaken as at 31 March 2016 resulting in a gain of $42.2 million, a 3.2% increase on the book value of the portfolio (note that $27.6 million was included in the interim accounts at 30 September 2015).
The Company’s portfolio following the revaluation shows a passing yield on values of 7.57% and a yield on fully let market rentals of 7.53%.
NEW LEASES AND LEASE EXTENSIONSBY TYPE
Floor Area (sqm)
Average Lease Term (years) No. of Leases
New lease 35,841 7.65 15
Right of renewal 46,677 5.75 12
Extension 47,602 0.86 18
Total 130,120 4.13 45
RENT REVIEWSBY SECTOR
No. of ReviewsAnnualised
Rent IncreaseIncrease over
Contract ($)
Office 36 1.3% 150,015
Industrial 16 2.9% 289,128
Retail 36 3.0% 369,857
Total 88 2.3% 809,000
An independent revaluation of the portfolio was undertaken as at 31 March 2016 resulting in a gain of $42.2 million, a 3.2% increase on the book value of the portfolio. (2015: $38.6 million)

33
ARGOSY PROPERTY LIMITED | Annual Report 2016
YE
AR
S
0
1
2
3
4
5
6
TOTAL INDUSTRIAL OFFICE RETAIL
5.24
5.99
4.82 4.78
WEIGHTED AVERAGE LEASE TERMBY SECTOR
LEASE EXPIRY PROFILEBY RENT
0123456789
101112131415161718
Per
cen
tage
of
por
tfol
io (
by
inco
me)
Vacant Mar-17 Mar-18 Mar-19 Mar-20 Mar-21 Mar-22 Mar-23 Mar-24 Mar-25 Mar-26 Mar-27+
YEAR ENDING
0.6%
32
36 34
24
16
19
7
9
9
3
411.7%
2.0%
10.7%
7.3%
1.9%
17.5%
5.0%
9.4%
12.1%11.7%
10.1%
The number above each bar denotes the total tenant expiries per year (excluding monthly car parks and tenants with multiple leases within one property).
Total expiry
Largest single expiry
Vacant
Albany Mega Centre AUCKLAND

34
ARGOSY PROPERTY LIMITED | Annual Report 2016
CASE STUDY – SNICKEL LANE
Snickel Lane is an exciting new laneway that Argosy is building at the Citibank Centre in Auckland. The concept has been developed to coincide with the modernisation of the building and to retain the character of the surrounding area including Fort Lane, the Fort Street Precinct and Imperial Lane.
QU
EEN
STR
EET
FORT
LA
NE
IMPERIAL LANESNICKEL LANE
FORT STREET
CO
MM
ERC
E ST
REE
T
CUSTOMS ST EAST

35
ARGOSY PROPERTY LIMITED | Annual Report 2016
City Laneways
WHAT IMPACT IS THIS PROJECT EXPECTED TO HAVE ON THE LOCAL ENVIRONMENT?
W This pedestrian link will help focus the area as a pedestrian friendly environment and, along with the adjacent Fort and Imperial Lanes, will help bring a critical mass to attract people to the area. Snickel Lane’s personality adds another flavour of genuine vintage laneway style to food/drink/shop options in the area. Also, there is going to be an Art Wall – another annually changing reason to visit.
J It’s going to be a very cool place to eat and a great spot to hang out with friends. Snickel Lane will link beautifully to the existing City Laneways development and provide Auckland CBD workers and residents with an interactive link between Queen Street and the upper end of town and Britomart. People will be able to walk from one end to the other through an urban laneway that offers a mix of great food and companion retail.
HOW DOES THIS FIT INTO AUCKLAND COUNCIL’S PLANS FOR THE CBD?
W Auckland Council are very supportive of the style of development that Snickel Lane is because it fits perfectly with its inner CBD plans for this precinct.
WHAT TYPE OF TENANTS ARE EXPECTED TO OCCUPY SNICKEL LANE?
J We are seeking high quality bespoke food retailers. A type of tenant that possibly has only one or two other stores, if any, and maintains individuality in their food offering and fit out. Snickel Lane reflects the changes to what customers want to see in the food sector. They are looking for a fashion forward space where they can socialise with friends and offer a variety of food options that are all affordable and of high quality.
WHAT DO YOU EXPECT THE IMPACT WILL BE ON THE CITIBANK CENTRE AS A RESULT OF THIS PROJECT?
W Increased foot traffic can only improve the desirability of the location and have a positive impact on all our ground floor tenancies. Interestingly, the general upgrade of the ground floor also has a very positive impact on desirability for the office floors above it, which will be positive for rentals and demand.
Warren Cate and Joanna Sharpe, Argosy’s two Asset Managers heading this project answer some questions about Snickel Lane.
Warren Cate and Joanna SharpeASSET MANAGERS

36
ARGOSY PROPERTY LIMITED | Annual Report 2016
INDUSTRIAL PORTFOLIO
INDUSTRIAL
$507.110.1%5.99
7.70%
The industrial sector remains in good heart with new supply matching demand. Low volatility and solid fundamentals continue to provide a relatively conservative and rewarding return.
In Auckland, a scarcity of vacant land will push development both north and south with the potential for brownfields development becoming viable in the years ahead.
While yield firming has been dominant in showing capital value growth for the past few years, we expect to see income or rental growth as the prime value mover in the future.
During the year, Argosy added to the industrial portfolio with the acquisition of 0.72 hectares of land at 246 Puhinui Road, Wiri for $2.85 million. An agreement was also reached to acquire 240 Puhinui Road, for $22.6 million, with settlement due to take place in December 2016.
Argosy also agreed to acquire 22,575 square metres of land at Highgate in Silverdale for $8.1 million and will undertake a development for Mighty Ape for $14.2 million.
The remaining 44 hectares of vacant land at the Manawatu Industrial Park was sold in March 2016 for $23.3 million, as was the Storage King property at Wagener Place, St Lukes, for $10.5 million.
The $7.5 million redevelopment of 8 Foundry Drive, Christchurch, continues on track with completion expected by the end of this year.
Leasing highlights included a 15 year lease to Compac Sorting Equipment at Henderson Place, Onehunga, a new six year lease to Gud NZ Holdings Limited at 39 Randwick Road, Lower Hutt and an eight year lease renewal to EziBuy at 31 El Prado Drive in Palmerston North.
TOP 10 INDUSTRIAL TENANTSBY PERCENTAGE OF RENTAL INCOME
NUMBER OF BUILDINGS
MARKET VALUE OF ASSETS $M
39
VACANCY FACTOR BY RENT
WALT YEARS
PASSING YIELD
� General Distributors Limited
Cardinal Logistics Limited
EziBuy Limited
PBT Transport Limited
Hall's Logistics Limited
DSE (NZ) Limited
Amcor Flexibles (New Zealand) Limited
Compac Sorting Equipment Limited
VisyPET (NZ) Limited
Recall New Zealand Limited
Other

37
ARGOSY PROPERTY LIMITED | Annual Report 2016
67 Dalgety Drive, Manukau
VALUATION $4,350,000
WALT 1.00
NET LETTABLE AREA (SQM) 3,698
VACANT SPACE (SQM) –
PASSING YIELD 8.39%
1 Rothwell Avenue, Albany
VALUATION $20,000,000
WALT 8.00
NET LETTABLE AREA (SQM) 12,936
VACANT SPACE (SQM) –
PASSING YIELD 7.21%
5 Unity Drive, Albany
VALUATION $5,050,000
WALT 3.00
NET LETTABLE AREA (SQM) 3,046
VACANT SPACE (SQM) –
PASSING YIELD 6.93%
19 Nesdale Avenue, Wiri
VALUATION $42,500,000
WALT 12.82
NET LETTABLE AREA (SQM) 20,677
VACANT SPACE (SQM) –
PASSING YIELD 6.72%
15 Unity Drive, Albany
VALUATION $4,070,000
WALT 4.00
NET LETTABLE AREA (SQM) 7,002
VACANT SPACE (SQM) –
PASSING YIELD 5.77%
9 Ride Way, Albany
VALUATION $15,450,000
WALT 1.46
NET LETTABLE AREA (SQM) 9,178
VACANT SPACE (SQM) –
PASSING YIELD 8.80%
90 - 104 Springs Road, East Tamaki
VALUATION $3,800,000
WALT 0.41
NET LETTABLE AREA (SQM) 3,875
VACANT SPACE (SQM) –
PASSING YIELD 9.10%
80 Springs Road, East Tamaki
VALUATION $8,650,000
WALT 1.02
NET LETTABLE AREA (SQM) 9,675
VACANT SPACE (SQM) –
PASSING YIELD 9.67%
12-16 Bell Avenue, Mt Wellington
VALUATION $18,600,000
WALT 3.96
NET LETTABLE AREA (SQM) 14,809
VACANT SPACE (SQM) –
PASSING YIELD 7.14%
2 Allens Road, East Tamaki
VALUATION $3,744,000
WALT 2.47
NET LETTABLE AREA (SQM) 2,920
VACANT SPACE (SQM) –
PASSING YIELD 7.92%
8 Forge Way, Panmure
VALUATION $17,000,000
WALT 2.52
NET LETTABLE AREA (SQM) 4,230
VACANT SPACE (SQM) –
PASSING YIELD 7.73%
4 Henderson Place, Onehunga
VALUATION $18,830,000
WALT 14.46
NET LETTABLE AREA (SQM) 10,453
VACANT SPACE (SQM) –
PASSING YIELD 7.38%
211 Albany Highway, Albany
VALUATION $14,700,000
WALT 1.84
NET LETTABLE AREA (SQM) 14,589
VACANT SPACE (SQM) –
PASSING YIELD 8.79%
18-20 Bell Avenue, Mt Wellington
VALUATION $11,600,000
WALT 5.17
NET LETTABLE AREA (SQM) 8,998
VACANT SPACE (SQM) –
PASSING YIELD 7.13%
12 Allens Road, East Tamaki
VALUATION $3,159,000
WALT 2.47
NET LETTABLE AREA (SQM) 2,372
VACANT SPACE (SQM) –
PASSING YIELD 7.77%
10 Transport Place, East Tamaki
VALUATION $26,150,000
WALT 8.33
NET LETTABLE AREA (SQM) 10,641
VACANT SPACE (SQM) –
PASSING YIELD 6.78%
1 - 3 Unity Drive, Albany
VALUATION $8,800,000
WALT 5.50
NET LETTABLE AREA (SQM) 6,204
VACANT SPACE (SQM) –
PASSING YIELD 7.81%
80-120 Favona Road, Mangere
VALUATION $79,650,000
WALT 8.42
NET LETTABLE AREA (SQM) 59,448
VACANT SPACE (SQM) –
PASSING YIELD 7.65%
32 Bell Avenue, Mt Wellington
VALUATION $9,450,000
WALT 4.08
NET LETTABLE AREA (SQM) 8,790
VACANT SPACE (SQM) –
PASSING YIELD 7.46%
AUCKLAND
Passing yield is net contract income divided by property valuation.
A
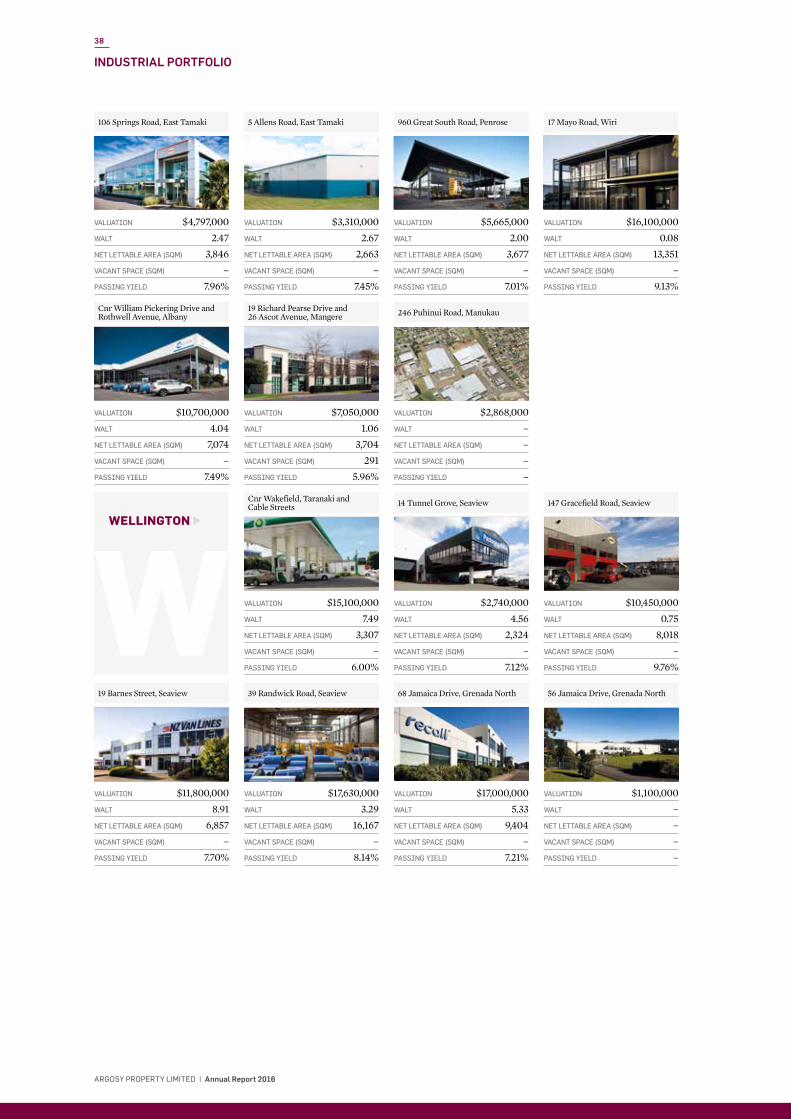
38
ARGOSY PROPERTY LIMITED | Annual Report 2016
INDUSTRIAL PORTFOLIO
106 Springs Road, East Tamaki
VALUATION $4,797,000
WALT 2.47
NET LETTABLE AREA (SQM) 3,846
VACANT SPACE (SQM) –
PASSING YIELD 7.96%
5 Allens Road, East Tamaki
VALUATION $3,310,000
WALT 2.67
NET LETTABLE AREA (SQM) 2,663
VACANT SPACE (SQM) –
PASSING YIELD 7.45%
960 Great South Road, Penrose
VALUATION $5,665,000
WALT 2.00
NET LETTABLE AREA (SQM) 3,677
VACANT SPACE (SQM) –
PASSING YIELD 7.01%
17 Mayo Road, Wiri
VALUATION $16,100,000
WALT 0.08
NET LETTABLE AREA (SQM) 13,351
VACANT SPACE (SQM) –
PASSING YIELD 9.13%
Cnr William Pickering Drive and Rothwell Avenue, Albany
VALUATION $10,700,000
WALT 4.04
NET LETTABLE AREA (SQM) 7,074
VACANT SPACE (SQM) –
PASSING YIELD 7.49%
19 Richard Pearse Drive and 26 Ascot Avenue, Mangere
VALUATION $7,050,000
WALT 1.06
NET LETTABLE AREA (SQM) 3,704
VACANT SPACE (SQM) 291
PASSING YIELD 5.96%
246 Puhinui Road, Manukau
VALUATION $2,868,000
WALT –
NET LETTABLE AREA (SQM) –
VACANT SPACE (SQM) –
PASSING YIELD –
WELLINGTON
WCnr Wakefield, Taranaki and Cable Streets
VALUATION $15,100,000
WALT 7.49
NET LETTABLE AREA (SQM) 3,307
VACANT SPACE (SQM) –
PASSING YIELD 6.00%
147 Gracefield Road, Seaview
VALUATION $10,450,000
WALT 0.75
NET LETTABLE AREA (SQM) 8,018
VACANT SPACE (SQM) –
PASSING YIELD 9.76%
19 Barnes Street, Seaview
VALUATION $11,800,000
WALT 8.91
NET LETTABLE AREA (SQM) 6,857
VACANT SPACE (SQM) –
PASSING YIELD 7.70%
39 Randwick Road, Seaview
VALUATION $17,630,000
WALT 3.29
NET LETTABLE AREA (SQM) 16,167
VACANT SPACE (SQM) –
PASSING YIELD 8.14%
14 Tunnel Grove, Seaview
VALUATION $2,740,000
WALT 4.56
NET LETTABLE AREA (SQM) 2,324
VACANT SPACE (SQM) –
PASSING YIELD 7.12%
56 Jamaica Drive, Grenada North
VALUATION $1,100,000
WALT –
NET LETTABLE AREA (SQM) –
VACANT SPACE (SQM) –
PASSING YIELD –
68 Jamaica Drive, Grenada North
VALUATION $17,000,000
WALT 5.33
NET LETTABLE AREA (SQM) 9,404
VACANT SPACE (SQM) –
PASSING YIELD 7.21%

39
ARGOSY PROPERTY LIMITED | Annual Report 2016
OTHER
O44 Neil Lane, Palmerston North
VALUATION $3,140,000
WALT 4.17
NET LETTABLE AREA (SQM) 3,232
VACANT SPACE (SQM) –
PASSING YIELD 6.37%
1 Pandora Road, Napier
VALUATION $7,880,000
WALT –
NET LETTABLE AREA (SQM) 18,269
VACANT SPACE (SQM) –
PASSING YIELD 13.10%
31 El Prado Drive, Palmerston North
VALUATION $26,300,000
WALT 7.92
NET LETTABLE AREA (SQM) 24,656
VACANT SPACE (SQM) –
PASSING YIELD 9.10%
8 Foundry Drive, Woolston, Christchurch
VALUATION $5,880,000
WALT 12.18
NET LETTABLE AREA (SQM) 4,160
VACANT SPACE (SQM) –
PASSING YIELD 8.16%
223 Kioreroa Road, Whangarei
VALUATION $13,100,000
WALT 5.91
NET LETTABLE AREA (SQM) 9,797
VACANT SPACE (SQM) –
PASSING YIELD 8.57%
1478 Omahu Road, Hastings
VALUATION $8,950,000
WALT 7.34
NET LETTABLE AREA (SQM) 8,514
VACANT SPACE (SQM) –
PASSING YIELD 7.26%
19 Nesdale Avenue AUCKLAND

40
ARGOSY PROPERTY LIMITED | Annual Report 2016
OFFICE PORTFOLIO
OFFICE
$548.610.9%4.82
7.56%
17NUMBER OF BUILDINGS
MARKET VALUE OF ASSETS $M
VACANCY FACTOR BY RENT
WALT YEARS
PASSING YIELD
TOP 10 OFFICE TENANTSBY PERCENTAGE OF RENTAL INCOME
� New Zealand Post Limited
Ministry of Business, Innovation and Employment
Department of Internal Affairs
Tonkin & Taylor Limited
Te Puni Ko-kiri
Arawata Assets Limited
IBM New Zealand Limited
Vector Limited
National Institute of Water & Atmospheric
Earthquake Commission
Other
The office sector is set to experience an oversupply in both Auckland and Wellington as new supply in Auckland and a reduction in the space required by the Government in Wellington take a toll over the next five years.
In Auckland, relatively solid net absorption is expected to bring vacancy back to a sustainable level over a three to four year period, while Wellington is expected to see building conversions, particularly in the southern precinct of the city.
During the past year, Argosy acquired the quality, 4 Green Star designed property at 8 Nugent Street for $42.0 million in September 2015 and disposed of 65 Upper Queen Street for $6.5 million in December 2015.
105 Carlton Gore Road AUCKLAND

41
ARGOSY PROPERTY LIMITED | Annual Report 2016
AUCKLAND
A99-107 Khyber Pass Road, Grafton
VALUATION $7,200,000
WALT 1.88
NET LETTABLE AREA (SQM) 2,442
VACANT SPACE (SQM) –
PASSING YIELD 8.72%
101 Carlton Gore Road, Newmarket
VALUATION $26,100,000
WALT 2.10
NET LETTABLE AREA (SQM) 4,714
VACANT SPACE (SQM) –
PASSING YIELD 6.61%
8 Nugent Street, Grafton
VALUATION $43,000,000
WALT 4.19
NET LETTABLE AREA (SQM) 8,125
VACANT SPACE (SQM) –
PASSING YIELD 7.06%
39 Market Place, Viaduct Harbour
VALUATION $33,700,000
WALT 5.80
NET LETTABLE AREA (SQM) 10,233
VACANT SPACE (SQM) –
PASSING YIELD 10.95%
302 Great South Road, Greenlane
VALUATION $7,500,000
WALT 3.79
NET LETTABLE AREA (SQM) 1,890
VACANT SPACE (SQM) –
PASSING YIELD 7.67%
308 Great South Road, Greenlane
VALUATION $5,680,000
WALT 4.67
NET LETTABLE AREA (SQM) 1,570
VACANT SPACE (SQM) 1,151
PASSING YIELD 2.27%
105 Carlton Gore Road, Newmarket
VALUATION $29,100,000
WALT 2.20
NET LETTABLE AREA (SQM) 5,312
VACANT SPACE (SQM) –
PASSING YIELD 7.23%
626 Great South Road, Ellerslie
VALUATION $8,770,000
WALT 3.12
NET LETTABLE AREA (SQM) 2,647
VACANT SPACE (SQM) –
PASSING YIELD 7.95%
107 Carlton Gore Road, Newmarket
VALUATION $27,600,000
WALT 3.10
NET LETTABLE AREA (SQM) 6,061
VACANT SPACE (SQM) –
PASSING YIELD 7.16%
25 Nugent Street, Grafton
VALUATION $9,250,000
WALT 2.57
NET LETTABLE AREA (SQM) 3,028
VACANT SPACE (SQM) –
PASSING YIELD 7.49%
Citibank Centre, 23 Customs Street East
VALUATION $48,100,000
WALT 2.00
NET LETTABLE AREA (SQM) 9,539
VACANT SPACE (SQM) 306
PASSING YIELD 7.26%
IBM Centre, 82 Wyndham Street
VALUATION $29,000,000
WALT 2.60
NET LETTABLE AREA (SQM) 6,154
VACANT SPACE (SQM) –
PASSING YIELD 8.33%
WELLINGTON
W143 Lambton Quay
VALUATION $27,900,000
WALT 3.25
NET LETTABLE AREA (SQM) 6,216
VACANT SPACE (SQM) –
PASSING YIELD 7.47%
147 Lambton Quay
VALUATION $34,500,000
WALT 3.09
NET LETTABLE AREA (SQM) 9,014
VACANT SPACE (SQM) –
PASSING YIELD 8.41%
New Zealand Post House, 7-27 Waterloo Quay
VALUATION $101,250,000
WALT 6.00
NET LETTABLE AREA (SQM) 24,977
VACANT SPACE (SQM) –
PASSING YIELD 7.71%
15-21 Stout Street
VALUATION $95,400,000
WALT 10.42
NET LETTABLE AREA (SQM) 19,629
VACANT SPACE (SQM) –
PASSING YIELD 6.54%
8-14 Willis Street
VALUATION $14,560,000
WALT 1.48
NET LETTABLE AREA (SQM) 5,056
VACANT SPACE (SQM) –
PASSING YIELD 8.89%

42
ARGOSY PROPERTY LIMITED | Annual Report 2016
RETAIL PORTFOLIO
RETAIL
$311.830.8%4.78
7.36%
10NUMBER OF BUILDINGS
MARKET VALUE OF ASSETS $M
VACANCY FACTOR BY RENT
WALT YEARS
PASSING YIELD
TOP 10 RETAIL TENANTSBY PERCENTAGE OF RENTAL INCOME
� The Warehouse Limited
Bunnings Limited
Mitre 10 (New Zealand) Limited
Steinhoff Asia Pacific Limited
Warehouse Stationery Limited
Fletcher Distribution Limited
Briscoes Group Limited
Farmers Trading Co. Limited
Cotton On Clothing (NZ) Limited
North Beach Trading Limited
Other
The retail sector is showing continued pressure from internet sales with growth focused on strong regional locations, neighbourhood convenience centres, strong high street locations and entertainment and leisure.
Suburban centres are expected to continue to struggle to show significant growth in the rebalancing of the changing needs of the consumer.
During the year, Argosy sold the Porirua Mega Centre for $11.5 million and secured renewed leases to Farmers Trading Co. Limited for nine years and Bed, Bath & Beyond for eight years at the Albany Mega Centre.
Stewart Dawsons Corner WELLINGTON

43
ARGOSY PROPERTY LIMITED | Annual Report 2016
28-30 Catherine Street, Henderson
VALUATION $5,600,000
WALT 1.40
NET LETTABLE AREA (SQM) 2,427
VACANT SPACE (SQM) –
PASSING YIELD 9.35%
Albany Mega Centre, Albany
VALUATION $97,500,000
WALT 5.40
NET LETTABLE AREA (SQM) 25,155
VACANT SPACE (SQM) –
PASSING YIELD 6.87%
320 Ti Rakau Drive, East Tamaki
VALUATION $40,150,000
WALT 2.25
NET LETTABLE AREA (SQM) 28,206
VACANT SPACE (SQM) 497
PASSING YIELD 7.71%
AUCKLAND
A7 Wagener Place, St Lukes
VALUATION $26,800,000
WALT 3.16
NET LETTABLE AREA (SQM) 7,056
VACANT SPACE (SQM) –
PASSING YIELD 7.79%
50 and 54-62 Cavendish Drive, Manukau
VALUATION $24,300,000
WALT 8.90
NET LETTABLE AREA (SQM) 9,939
VACANT SPACE (SQM) –
PASSING YIELD 6.84%
252 Dairy Flat Highway, Albany
VALUATION $6,300,000
WALT 4.00
NET LETTABLE AREA (SQM) 2,107
VACANT SPACE (SQM) –
PASSING YIELD 6.32%
Albany Lifestyle Centre, Albany
VALUATION $78,700,000
WALT 5.73
NET LETTABLE AREA (SQM) 25,029
VACANT SPACE (SQM) –
PASSING YIELD 7.25%
WELLINGTON
W180-202 Hutt Road, Kaiwharawhara
VALUATION $7,768,000
WALT 2.37
NET LETTABLE AREA (SQM) 6,019
VACANT SPACE (SQM) –
PASSING YIELD 9.48%
Stewart Dawsons Corner
VALUATION $15,160,000
WALT 2.96
NET LETTABLE AREA (SQM) 1,752
VACANT SPACE (SQM) 302
PASSING YIELD 9.30%
OTHER
OCnr Taniwha and Paora Hapi Streets, Taupo
VALUATION $9,550,000
WALT 6.54
NET LETTABLE AREA (SQM) 4,187
VACANT SPACE (SQM) –
PASSING YIELD 7.41%

HEADER
44
ARGOSY PROPERTY LIMITED | Annual Report 2016
CONTENTS
Consolidated Statement of Financial Position 45
Consolidated Statement of Comprehensive Income 46
Consolidated Statement of Changes in Equity 47
Consolidated Statement of Cash Flows 48
Notes to the Consolidated Financial Statements 49
Auditor’s Report 75
CONSOLIDATEDFINANCIAL STATEMENTS

45
ARGOSY PROPERTY LIMITED | Annual Report 2016
CONSOLIDATED STATEMENT OF FINANCIAL POSITIONAS AT 31 MARCH 2016
Note
Group2016
$000s
Group 2015
$000s
Non-current assets
Investment properties 5 1,367,551 1,306,395
Other non-current assets 7 1,656 88
Total non-current assets 1,369,207 1,306,483
Current assets
Cash and cash equivalents 1,130 1,494
Trade and other receivables 8 4,281 1,825
Other current assets 9 273 381
5,684 3,700
Non-current assets classified as held for sale 10 – 3,003
Total current assets 5,684 6,703
Total assets 1,374,891 1,313,186
Shareholders’ funds
Share capital 11 777,514 766,431
Hedging reserves 12 – (586)
Share based payments reserve 13 65 –
Retained earnings 14 32,825 2,881
Total shareholders’ funds 810,404 768,726
Non-current liabilities
Borrowings 15 502,323 495,272
Derivative financial instruments 6 39,858 21,357
Deferred tax 21 8,952 14,533
Total non-current liabilities 551,133 531,162
Current liabilities
Trade and other payables 16 10,430 9,827
Derivative financial instruments 6 51 –
Other current liabilities 17 2,591 2,369
Taxation payable 282 1,102
Total current liabilities 13,354 13,298
Total liabilities 564,487 544,460
Total shareholders’ funds and liabilities 1,374,891 1,313,186
For and on behalf of the Board
P Michael Smith Mark Cross Director Director
Date: 25 May 2016
The notes to the accounts form part of and are to be read in conjunction with these consolidated financial statements.
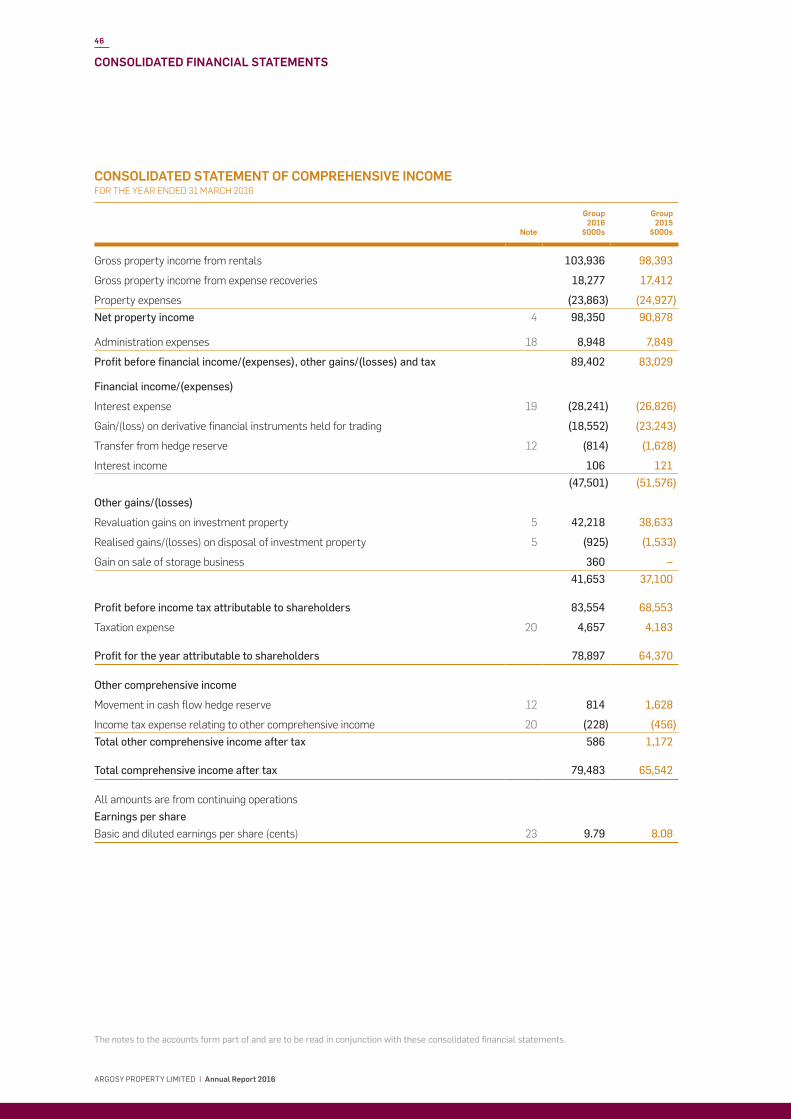
46
ARGOSY PROPERTY LIMITED | Annual Report 2016
CONSOLIDATED FINANCIAL STATEMENTS
CONSOLIDATED STATEMENT OF COMPREHENSIVE INCOMEFOR THE YEAR ENDED 31 MARCH 2016
Note
Group2016
$000s
Group2015
$000s
Gross property income from rentals 103,936 98,393
Gross property income from expense recoveries 18,277 17,412
Property expenses (23,863) (24,927)
Net property income 4 98,350 90,878
Administration expenses 18 8,948 7,849
Profit before financial income/(expenses), other gains/(losses) and tax 89,402 83,029
Financial income/(expenses)
Interest expense 19 (28,241) (26,826)
Gain/(loss) on derivative financial instruments held for trading (18,552) (23,243)
Transfer from hedge reserve 12 (814) (1,628)
Interest income 106 121
(47,501) (51,576)
Other gains/(losses)
Revaluation gains on investment property 5 42,218 38,633
Realised gains/(losses) on disposal of investment property 5 (925) (1,533)
Gain on sale of storage business 360 –
41,653 37,100
Profit before income tax attributable to shareholders 83,554 68,553
Taxation expense 20 4,657 4,183
Profit for the year attributable to shareholders 78,897 64,370
Other comprehensive income
Movement in cash flow hedge reserve 12 814 1,628
Income tax expense relating to other comprehensive income 20 (228) (456)
Total other comprehensive income after tax 586 1,172
Total comprehensive income after tax 79,483 65,542
All amounts are from continuing operationsEarnings per share
Basic and diluted earnings per share (cents) 23 9.79 8.08
The notes to the accounts form part of and are to be read in conjunction with these consolidated financial statements.

47
ARGOSY PROPERTY LIMITED | Annual Report 2016
CONSOLIDATED STATEMENT OF CHANGES IN EQUITYFOR THE YEAR ENDED 31 MARCH 2016
Note
Group2016
$000s
Group2015
$000s
Shareholders’ funds at the beginning of the year 768,726 739,522
Profit for the year 78,897 64,370
Movement in cash flow hedge reserve 586 1,172
Total comprehensive income for the year 79,483 65,542
Contributions by shareholders
Issue of shares from Dividend Reinvestment Plan 11 11,121 12,019
Issue costs of shares 11 (38) (41)
Dividends to shareholders 14 (48,953) (48,316)
Equity settled share based payments 13 65 –
Shareholders’ funds at the end of the year 810,404 768,726
The notes to the accounts form part of and are to be read in conjunction with these consolidated financial statements.

48
ARGOSY PROPERTY LIMITED | Annual Report 2016
CONSOLIDATED FINANCIAL STATEMENTS
Note
Group2016
$000s
Group2015
$000s
Cash flows from operating activities
Cash was provided from:
Property income 124,249 115,210
Interest received 106 121
Cash was applied to:
Property expenses (26,024) (23,644)
Interest paid (28,230) (26,260)
Employee benefits (5,028) (4,476)
Taxation paid (11,269) (11,651)
Other expenses (3,524) (3,285)
Net cash from/(used in) operating activities 22 50,280 46,015
Cash flows from investing activities
Cash was provided from:
Sale of properties less deferrals 57,515 59,841
Sale of storage business 500 –
Cash was applied to:
Capital additions on investment properties (28,074) (44,635)
Capitalised interest on investment properties (76) (1,283)
Purchase of properties and deposits (49,245) (59,081)
Net cash from/(used in) investing activities (19,380) (45,158)
Cash flows from financing activities
Cash was provided from:
Debt drawdown 98,179 128,724
Cash was applied to:
Repayment of debt (91,263) (81,245)
Dividends paid to shareholders net of reinvestments (37,832) (36,289)
Issue cost of shares (38) (43)
Facility refinancing fee (310) (441)
Swap contract termination payments – (11,363)
Net cash from/(used in) financing activities (31,264) (657)
Net increase/(decrease) in cash and cash equivalents (364) 200
Cash and cash equivalents at the beginning of the year 1,494 1,294
Cash and cash equivalents at the end of the year 1,130 1,494
CONSOLIDATED STATEMENT OF CASH FLOWSFOR THE YEAR ENDED 31 MARCH 2016
The notes to the accounts form part of and are to be read in conjunction with these consolidated financial statements.

49
ARGOSY PROPERTY LIMITED | Annual Report 2016
NOTES TO THE CONSOLIDATED FINANCIAL STATEMENTS
1. REPORTING ENTITYArgosy Property Limited (APL or the Company) is an FMC Reporting Entity under the Financial Markets Conduct Act 2013 and the Financial Reporting Act 2013. APL is incorporated under the Companies Act 1993 and domiciled in New Zealand.
The Company’s principal activity is investment in properties which include industrial, office and retail properties throughout New Zealand.
These financial statements are the consolidation of APL and its subsidiaries (the Group).
2. BASIS OF PREPARATION
Statement of compliance
These financial statements have been prepared in accordance with Generally Accepted Accounting Practice in New Zealand (NZ GAAP). The accounting policies applied in these financial statements comply with New Zealand equivalents to International Financial Reporting Standards (NZ IFRS) and other applicable Financial Reporting Standards issued and effective at the time of preparing these statements as applicable to the Company as a profit-oriented entity. These Group financial statements also comply with International Financial Reporting Standards (IFRS).
These financial statements were approved by the Board of Directors on 25 May 2016.
Basis of measurement
The financial statements have been prepared on the historical cost basis except for derivative financial instruments and investment properties which are measured at fair value.
Use of estimates and judgements
The preparation of financial statements in conformity with NZ IFRS requires the use of certain critical accounting estimates that affect the application of policies and reported amount of assets and liabilities, income and expenses. The areas involving a higher degree of judgement or complexity, or areas where assumptions and estimates are significant to the financial statements are as follows:
Note 5 – Valuation of investment property
Note 6 – Valuation of derivative financial instruments
Note 21 – Deferred tax (and Taxation in Note 20)
Functional and presentation currency
These financial statements are presented in New Zealand dollars which is the Company’s functional currency and have been rounded to the nearest thousand dollars ($000).
Basis of consolidation
The Group’s financial statements incorporate the financial statements of APL and its controlled subsidiaries as set out in Note 25. Control is achieved when the Company has power over the investee; is exposed, or has rights, to variable returns from its involvement with the investee, and has the ability to use its power to affect its returns. The results of the subsidiaries are included in the consolidated statement of comprehensive income from the date of acquisition which is the date the Company became entitled to income from the subsidiaries acquired. All significant intercompany transactions are eliminated on consolidation.
Statement of cash flows
The statement of cash flows is prepared on a GST exclusive basis, which is consistent with the statement of comprehensive income.
The following terms are used in the statement of cash flows:
Operating activities are the principal revenue producing activities of the Group and other activities that are not investing or financing activities.
Investing activities are the acquisition and disposal of long term assets and other investments not included in cash equivalents.
Financing activities are activities that result in changes in the size and composition of the contributed equity and borrowings of the entity. Termination payments for swap contracts, establishment fees, extension fees and arranger fees are considered financing activities as they effect a change in the company’s borrowing arrangements.
Cash and cash equivalents comprise cash balances and demand deposits. Bank overdrafts that are repayable on demand and form an integral part of the Group’s cash management are included as a component of cash and cash equivalents for the purpose of the statement of cash flows.

50
ARGOSY PROPERTY LIMITED | Annual Report 2016
NOTES TO THE CONSOLIDATED FINANCIAL STATEMENTS (CONTINUED)
CONSOLIDATED FINANCIAL STATEMENTS
3. SIGNIFICANT ACCOUNTING POLICIES
Change in accounting policies
Accounting policies have been applied consistently to all periods and by all group entities.
Standards and interpretations in issue not yet effective
At the date of authorisation of these financial statements the following relevant Standards and Interpretations were in issue but not yet effective and have not been applied in preparing these financial statements. These changes are not expected to have a material impact on the financial statements but may affect presentation and disclosure:
NZ IFRS 9 Financial Instruments (effective for accounting periods beginning on or after 1 January 2018) introduces a new classification and measurement regime for financial assets and liabilities.
NZ IFRS 16 Leases (effective for accounting periods beginning on or after 1 January 2019) eliminates the distinction between operating and finance leases for lessees and will result in lessees bringing most leases onto their balance sheet, with the exception of certain short-term leases and leases of low-value assets. There are minimal changes from the current NZ IAS 17 requirements for lessors.
Other Standards and Interpretations in issue but not yet effective are not expected to have an impact on the financial statements of the Group in the period of initial application.

51
ARGOSY PROPERTY LIMITED | Annual Report 2016
NOTES TO THE CONSOLIDATED FINANCIAL STATEMENTS (CONTINUED)
4. SEGMENT INFORMATIONThe principal business activity of the Group is to invest in, and actively manage, properties in New Zealand. NZ IFRS 8 requires operating segments to be identified on the basis of internal reports about components of the Group that are regularly reviewed by the chief operating decision maker, being the Chief Executive Officer, in order to allocate resources to the segments and to assess their performance.
The information reported to the Group’s Chief Executive Officer includes information by investment property and has been aggregated based on three business sectors, being Industrial, Office and Retail, based on what occupants actual or intended use is. Segment profit represents the profit earned by each segment including allocation of identifiable revaluation gains on investment properties and gains/(losses) on disposal of investment properties. This is the measure reported to the Chief Executive Officer.
The following is an analysis of the Group’s results by reportable segments.
Industrial Office Retail Total
2016$000s
2015$000s
2016$000s
2015$000s
2016$000s
2015$000s
2016$000s
2015$000s
Segment profit
Net property income 36,175 32,527 40,873 31,419 21,302 26,932 98,350 90,878
Other income/(expenses) 18 688 (15) (18) (568) (2,203) (565) (1,533)
36,193 33,215 40,858 31,401 20,734 24,729 97,785 89,345
Revaluation gains on investment properties 23,387 7,270 8,204 19,933 10,627 11,430 42,218 38,633 Total segment profit 59,580 40,485 49,062 51,334 31,361 36,159 140,003 127,978
Unallocated:
Administration expenses (8,948) (7,849)
Interest income/(expenses) (28,135) (26,705)
Gain/(loss) on derivative financial instruments held for trading and transfer from hedge reserve (19,366) (24,871)Profit before income tax 83,554 68,553
Taxation (4,657) (4,183)Profit for the year 78,897 64,370
Net property income consists of revenue generated from external tenants less property operating expenditure.
There were no inter-segment sales during the year (31 March 2015: nil).

52
ARGOSY PROPERTY LIMITED | Annual Report 2016
NOTES TO THE CONSOLIDATED FINANCIAL STATEMENTS (CONTINUED)
CONSOLIDATED FINANCIAL STATEMENTS
Industrial Office Retail Total
2016$000s
2015$000s
2016$000s
2015$000s
2016$000s
2015$000s
2016$000s
2015$000s
Segment assets
Current assets 2,571 480 598 1,482 472 139 3,641 2,101
Investment properties 507,113 510,420 548,610 483,560 311,828 312,415 1,367,551 1,306,395
Non-current assets classified as held for sale – 3,003 – – – – – 3,003
Total segment assets 509,684 513,903 549,208 485,042 312,300 312,554 1,371,192 1,311,499
Unallocated assets 3,699 1,687 Total assets 1,374,891 1,313,186
Industrial Office Retail Total
2016$000s
2015$000s
2016$000s
2015$000s
2016$000s
2015$000s
2016$000s
2015$000s
Segment liabilities
Current liabilities 2,453 1,029 4,547 5,048 493 1,331 7,493 7,408 Total segment liabilities 2,453 1,029 4,547 5,048 493 1,331 7,493 7,408
Unallocated liabilities 556,994 537,052 Total liabilities 564,487 544,460
For the purposes of monitoring segment performance and allocating resources between segments:– all assets are allocated to reportable segments other than cash and cash equivalents, derivatives, tax assets, other non-current assets and
other minor current assets that cannot be allocated to particular segments. – all liabilities are allocated to reportable segments other than borrowings, derivatives, tax liabilities and other minor current liabilities that
cannot be allocated to particular segments.
4. SEGMENT INFORMATION (CONTINUED)

53
ARGOSY PROPERTY LIMITED | Annual Report 2016
NOTES TO THE CONSOLIDATED FINANCIAL STATEMENTS (CONTINUED)
5. INVESTMENT PROPERTIES
Accounting policy – Investment properties
Investment property is property held either to earn rental income, for capital appreciation or for both. Investment property is initially measured at cost and subsequently measured at fair value with any change therein recognised in profit or loss.
Initial direct costs incurred in negotiating and arranging operating leases and lease incentives granted are added to the carrying amount of the leased asset.
In accordance with the valuation policy of the Group, complete property valuations are carried out at least annually by independent registered valuers. The valuation policy stipulates that the same valuer may not value a building for more than two consecutive years. The fair values are based on market values being the estimated amount for which a property could be exchanged on the date of the valuation between a willing buyer and a willing seller in an arm’s length transaction after proper marketing wherein the parties had each acted knowledgeably, prudently and without compulsion.
The valuations are prepared using a weighted combination of the Capitalisation of Contract Income, Capitalisation of Market Income and Discounted Cash Flow methodologies. Discounted Cash Flow methodology is based on the estimated rental cash flows expected to be received from the property adjusted by a discount rate that appropriately reflects the risks inherent in the expected cash flows.
Investment properties are derecognised when they have been disposed of and any gains or losses incurred on disposal are recognised in profit or loss in the year of derecognition.
Borrowing costs directly attributable to property under development are capitalised as part of the cost of those assets.
Industrial 2016
$000s
Office2016
$000s
Retail2016
$000s
Group2016
$000s
Movement in investment properties
Balance at 1 April 510,420 483,560 312,415 1,306,395
Acquisition of properties 5,990 42,020 – 48,010
Capitalised costs 6,592 22,098 842 29,532
Disposals (38,535) (6,407) (11,625) (56,567)
Change in fair value 23,387 8,204 10,627 42,218
Change in capitalised leasing costs 105 (254) (271) (420)
Change in lease incentives (846) (611) (160) (1,617)
Total investment properties balance at 31 March 507,113 548,610 311,828 1,367,551

54
ARGOSY PROPERTY LIMITED | Annual Report 2016
NOTES TO THE CONSOLIDATED FINANCIAL STATEMENTS (CONTINUED)
CONSOLIDATED FINANCIAL STATEMENTS
Industrial 2015
$000s
Office2015
$000s
Retail2015
$000s
Group2015
$000s
Movement in investment properties
Balance at 1 April 441,781 437,340 347,145 1,226,266
Acquisition of properties 59,081 – – 59,081
Capitalised costs 5,929 35,641 2,402 43,972
Disposals (127) (10,130) (48,895) (59,152)
Transfer to properties held for sale (3,003) – – (3,003)
Change in fair value 7,270 19,933 11,430 38,633
Change in capitalised leasing costs (304) (81) 57 (328)
Change in lease incentives (207) 857 276 926
Total investment properties balance at 31 March 510,420 483,560 312,415 1,306,395
Investment properties are classified as level 3 (inputs are unobservable for the asset or liability) under the fair value hierarchy on the basis that adjustments must be made to observable data of similar properties to determine the fair value of an individual property.
The Group holds the freehold to all investment properties other than 39 Market Place, Viaduct Harbour, Auckland and part of 19 Barnes Street, Wellington.
5. INVESTMENT PROPERTIES (CONTINUED)

55
ARGOSY PROPERTY LIMITED | Annual Report 2016
NOTES TO THE CONSOLIDATED FINANCIAL STATEMENTS (CONTINUED)
Properties purchased and disposed of during the year are as follows:
Group2016
$000s
Group2015
$000s
Acquisition of properties
15 Unity Drive, Albany, Auckland 3,122 –
8 Nugent Street, Grafton, Auckland 42,020 –
246 Puhinui Road, Wiri, Auckland 2,868 –
14 Tunnel Grove, Wellington – 2,647
147 Gracefield Road, Wellington – 11,729
19 Barnes Street, Wellington – 10,957
39-49 Randwick Road, Wellington – 17,112
56 Jamaica Drive, Wellington – 1,104
68 Jamaica Drive, Wellington – 15,532
48,010 59,081
Disposal of properties
1 Allens Road, East Tamaki, Auckland1 3,003 –
Lot 56, 11-17 Valor Drive, Palmerston North 272 –
2 Allens Road, East Tamaki (land only) 310 –
5 Allens Road, East Tamaki (land only) 321 –
Lot 58, 19-25 El Prado Drive, Palmerston North 238 –
Porirua Mega Centre, 2-10 Semple Street, Porirua, Wellington 11,625 –
Lot 60, 20-28 El Prado Drive, Palmerston North 591 –
7 El Prado Drive, Palmerston North 1,758 –
65 Upper Queen Street, Auckland 6,407 –
Manawatu Industrial Park, Palmerston North2 24,545 –
Storage King, Wagener Place, Mt Albert, Auckland 10,500 –
Lot 22, 57-86 El Prado Drive, Palmerston North1 – 634
537 Main Street, Palmerston North – 2,250
8 Pacific Rise, Mt Wellington, Auckland – 10,130
Lot 55, Valor Drive, Palmerston North – 127
Waitakere Mega Centre, Henderson, Auckland – 46,645
59,570 59,786
Sale proceeds of properties disposed of 60,018 59,841
Net gain/(loss) on disposal 448 55
Selling costs (1,373) (1,588)
Total gain/(loss) on disposal (925) (1,533)
1 These properties were included as non-current assets classified as held for sale in the prior year. 2 Includes $2.4 million of land previously classified as part of 31 El Prado Drive, Palmerston North (Ezibuy expansion land).
5. INVESTMENT PROPERTIES (CONTINUED)

56
ARGOSY PROPERTY LIMITED | Annual Report 2016
NOTES TO THE CONSOLIDATED FINANCIAL STATEMENTS (CONTINUED)
CONSOLIDATED FINANCIAL STATEMENTS
All investment properties (with the exception of Lot 2, 246 Puhinui Road, Wiri, acquired in January 2016) were independently valued as at 31 March 2016 in accordance with the Group’s accounting policy. The valuations were prepared by independent registered valuers CBRE Limited and Colliers International New Zealand Limited. The total value per valuer was as follows:
Group2016
$000s
Group2015
$000s
CBRE Limited 705,924 368,150
Colliers International New Zealand Limited 658,759 746,080
Jones Lang LaSalle – 192,165
Not valued (Lot 2, 246 Puhinui Road, Wiri) 2,868 –
1,367,551 1,306,395
Investment properties are stated at fair value by independent valuers supported by market evidence of property sale transactions and leasing activity. These valuations are reviewed by the Asset Management team within Argosy. The major inputs and assumptions that are used in the valuation that require judgement include forecasts of the current and expected future market rentals and growth, maintenance and capital expenditure requirements, an assessment of yields, discount rates, occupancy, leasing costs and weighted average lease terms.
In deriving a market value under each approach, all assumptions are based, where possible, on market based evidence and transactions for properties with similar locations, conditions and quality of construction and fit out.
Generally as occupancy and weighted average lease terms increase, yields firm, resulting in increased fair values for investment properties. A movement in any of these assumptions could result in a significant change in fair value.
Investment property metrics for the year ended 31 March 2016 are as follows:
Industrial Office Retail Total
Contract yield - Average 7.70% 7.56% 7.36% 7.57%
- Maximum 13.10% 10.95% 9.48% 13.10%
- Minimum 0.00% 2.27% 6.32% 0.00%
Market yield - Average 7.69% 7.62% 7.09% 7.53%
- Maximum 12.09% 9.49% 9.32% 12.09%
- Minimum 0.00% 6.84% 6.00% 0.00%
Occupancy (rent) 99.88% 99.09% 99.20% 99.39%
Occupancy (net lettable area) 99.92% 98.85% 99.29% 99.58%
Weighted average lease term (years) 5.99 4.82 4.78 5.24
No. of buildings1 39 17 10 66
Fair value total ( $000s) $507,113 $548,610 $311,828 $1,367,551
1 Certain titles have been consolidated and treated as one. The total number of buildings excludes properties held for sale.
5. INVESTMENT PROPERTIES (CONTINUED)
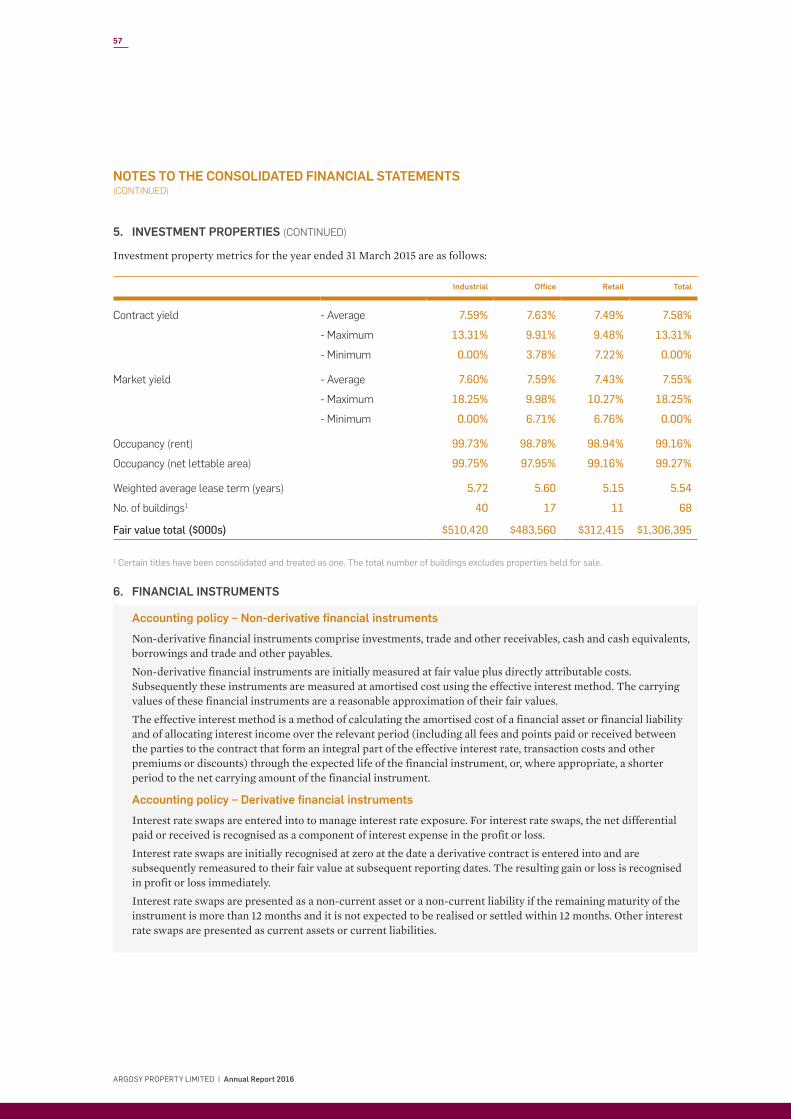
57
ARGOSY PROPERTY LIMITED | Annual Report 2016
NOTES TO THE CONSOLIDATED FINANCIAL STATEMENTS (CONTINUED)
Investment property metrics for the year ended 31 March 2015 are as follows:
Industrial Office Retail Total
Contract yield - Average 7.59% 7.63% 7.49% 7.58%
- Maximum 13.31% 9.91% 9.48% 13.31%
- Minimum 0.00% 3.78% 7.22% 0.00%
Market yield - Average 7.60% 7.59% 7.43% 7.55%
- Maximum 18.25% 9.98% 10.27% 18.25%
- Minimum 0.00% 6.71% 6.76% 0.00%
Occupancy (rent) 99.73% 98.78% 98.94% 99.16%
Occupancy (net lettable area) 99.75% 97.95% 99.16% 99.27%
Weighted average lease term (years) 5.72 5.60 5.15 5.54
No. of buildings1 40 17 11 68
Fair value total ($000s) $510,420 $483,560 $312,415 $1,306,395
1 Certain titles have been consolidated and treated as one. The total number of buildings excludes properties held for sale.
6. FINANCIAL INSTRUMENTS
Accounting policy – Non-derivative financial instruments
Non-derivative financial instruments comprise investments, trade and other receivables, cash and cash equivalents, borrowings and trade and other payables.
Non-derivative financial instruments are initially measured at fair value plus directly attributable costs. Subsequently these instruments are measured at amortised cost using the effective interest method. The carrying values of these financial instruments are a reasonable approximation of their fair values.
The effective interest method is a method of calculating the amortised cost of a financial asset or financial liability and of allocating interest income over the relevant period (including all fees and points paid or received between the parties to the contract that form an integral part of the effective interest rate, transaction costs and other premiums or discounts) through the expected life of the financial instrument, or, where appropriate, a shorter period to the net carrying amount of the financial instrument.
Accounting policy – Derivative financial instruments
Interest rate swaps are entered into to manage interest rate exposure. For interest rate swaps, the net differential paid or received is recognised as a component of interest expense in the profit or loss.
Interest rate swaps are initially recognised at zero at the date a derivative contract is entered into and are subsequently remeasured to their fair value at subsequent reporting dates. The resulting gain or loss is recognised in profit or loss immediately.
Interest rate swaps are presented as a non-current asset or a non-current liability if the remaining maturity of the instrument is more than 12 months and it is not expected to be realised or settled within 12 months. Other interest rate swaps are presented as current assets or current liabilities.
5. INVESTMENT PROPERTIES (CONTINUED)
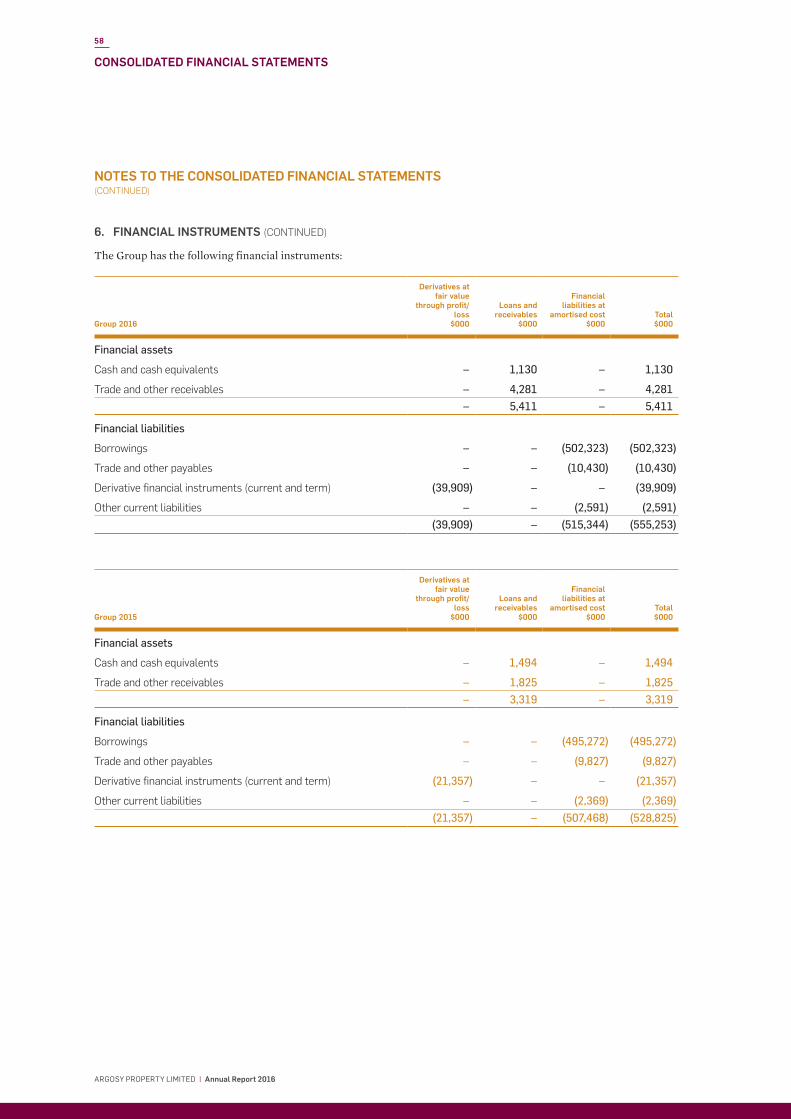
58
ARGOSY PROPERTY LIMITED | Annual Report 2016
NOTES TO THE CONSOLIDATED FINANCIAL STATEMENTS (CONTINUED)
CONSOLIDATED FINANCIAL STATEMENTS
The Group has the following financial instruments:
Group 2016
Derivatives at fair value
through profit/loss
$000
Loans and receivables
$000
Financial liabilities at
amortised cost$000
Total$000
Financial assets
Cash and cash equivalents – 1,130 – 1,130
Trade and other receivables – 4,281 – 4,281
– 5,411 – 5,411
Financial liabilities
Borrowings – – (502,323) (502,323)
Trade and other payables – – (10,430) (10,430)
Derivative financial instruments (current and term) (39,909) – – (39,909)
Other current liabilities – – (2,591) (2,591)
(39,909) – (515,344) (555,253)
Group 2015
Derivatives at fair value
through profit/loss
$000
Loans and receivables
$000
Financial liabilities at
amortised cost$000
Total$000
Financial assets
Cash and cash equivalents – 1,494 – 1,494
Trade and other receivables – 1,825 – 1,825
– 3,319 – 3,319
Financial liabilities
Borrowings – – (495,272) (495,272)
Trade and other payables – – (9,827) (9,827)
Derivative financial instruments (current and term) (21,357) – – (21,357)
Other current liabilities – – (2,369) (2,369)
(21,357) – (507,468) (528,825)
6. FINANCIAL INSTRUMENTS (CONTINUED)

59
ARGOSY PROPERTY LIMITED | Annual Report 2016
NOTES TO THE CONSOLIDATED FINANCIAL STATEMENTS (CONTINUED)
Risk management
The use of financial instruments exposes the Group to credit, interest rate and liquidity risks. The Group’s overall risk management programme focuses on the unpredictability of financial markets and seeks to minimise potential adverse effects on the Group’s financial performance.
Credit risk
Credit risk relates to the risk that the counterparty to a financial instrument may default on its obligations to the Group, resulting in financial loss.
The Group’s main exposure to credit risk arises from trade receivables and transactions with financial institutions, and is summarised in the table on page 58. There are no significant concentrations of credit risk in specific receivables due to receivables mainly comprising a large number of tenants in the Group’s property portfolio and the Group policy to limit the amount of credit exposure to any financial institution.
The Group manages its exposure to credit risk from trade receivables through its credit policy which includes performing credit evaluations on customers requiring credit. The Group does not hold any collateral in respect of balances past due. Details of impairment losses relating to trade receivables together with the ageing of receivables is provided in Note 8.
The risk from financial institutions is managed by placing cash and deposits with high credit quality financial institutions only. Cash deposits are placed with ANZ Bank New Zealand Limited.
Interest rate risk
Interest rate risk arises from long term borrowings (refer Note 15). Variable rate borrowings expose the Group to cash flow interest rate risk while fixed rate borrowings expose the group to fair value interest rate risk.
The Group manages its exposure to interest rate risk through derivatives in the form of floating to fixed interest rate swaps. These derivatives provide an economic hedge against variability in cash flows as a result of changes in variable interest rates on borrowings.
The Group’s policy is to maintain a range of approximately 50%-100% of its borrowings in fixed interest rate instruments unless otherwise instructed by the Board of Directors. At year end, 66% of borrowings, after the effect of associated swaps, were at fixed rates (2015: 66%).
Liquidity risk
Liquidity risk is the risk that the Group may encounter difficulty in meeting its obligations associated with its financial liabilities that are settled by delivering cash or another financial asset. Liquidity risk mainly arises from the Group’s obligations in respect of long term borrowings, derivatives and trade and other payables. The Group aims to maintain flexibility in funding by keeping committed credit lines available (refer Note 15).
6. FINANCIAL INSTRUMENTS (CONTINUED)

60
ARGOSY PROPERTY LIMITED | Annual Report 2016
NOTES TO THE CONSOLIDATED FINANCIAL STATEMENTS (CONTINUED)
CONSOLIDATED FINANCIAL STATEMENTS
The expected undiscounted cash flows of the Group’s financial liabilities by remaining contractual maturity at the balance sheet date is as follows:
Group 2016
Carrying Amount
$000
Less than 1 year $000
1-2 years $000
2-3 years $000
3-4 years $000
4-5 years $000
5+ years $000
Financial liabilities
Borrowings1 (502,323) (19,267) (19,267) (289,097) (8,927) (233,382) –
Trade and other payables (10,430) (10,430) – – – – –
Derivative financial instruments (39,909) (7,205) (7,962) (7,472) (6,678) (6,347) (5,911)
Other current liabilities (2,591) (2,591) – – – – –
(555,253) (39,493) (27,229) (296,569) (15,605) (239,729) (5,911)
Group 2015
Carrying Amount
$000
Less than 1 year $000
1-2 years $000
2-3 years $000
3-4 years $000
4-5 years $000
5+ years $000
Financial liabilities
Borrowings1 (495,272) (24,995) (24,995) (295,467) (11,410) (229,608) –
Trade and other payables (9,827) (9,827) – – – – –
Derivative financial instruments (21,357) (3,554) (3,612) (3,501) (3,318) (3,139) (3,139)
Other current liabilities (2,369) (2,369) – – – – –
(528,825) (40,745) (28,607) (298,968) (14,728) (232,747) (3,139)
1 The undiscounted cashflows on borrowings includes interest, margin and line fees.
To manage the Group’s exposure to interest rate risk on variable rate instruments, the Group has implemented a hedging strategy that uses interest rate swaps that have a range of maturities. At 31 March 2016, the Group had active interest rate derivatives with a notional contract amount of $335 million (2015: $330 million). The active derivatives mature over the next 9 years (2015: 10 years) and have fixed interest rates ranging from 3.87% to 4.90% (2015: 3.87% to 4.97%). Contracts entered into but not yet effective at 31 March 2016 had a notional contract amount of $25 million (2015: $25 million).
Interest rate swaps are measured at present value of future cash flows estimated and discounted based on applicable yield curves derived from observable market interest rates. Accepted market best practice valuation methodology using mid-market interest rates at the period end date is used, provided from sources perceived to be reliable and accurate. Interest rate swaps have been classified into Level 2 of the fair value hierarchy on the basis that valuation techniques used to determine the values at period end date use observable inputs.
The net liability for derivative financial instruments as at 31 March 2016 is $39.91 million (31 March 2015: $21.36 million). The mark-to-market increase in the liability for derivative financial instruments is a result of the movement in the interest rate curve during the financial year.
6. FINANCIAL INSTRUMENTS (CONTINUED)

61
ARGOSY PROPERTY LIMITED | Annual Report 2016
NOTES TO THE CONSOLIDATED FINANCIAL STATEMENTS (CONTINUED)
Sensitivity analysis
The sensitivity analysis below details the potential future impact of reasonably possible changes in the observable inputs over the next financial period. It has been determined based on the exposure to interest rates for both derivative and non-derivative financial instruments at the reporting date.
2016Group
2015Group
Impact on Profit & Loss
$000s
Impact on Profit & Loss
$000s
Increase of 100 basis points 21,619 21,496
Decrease of 100 basis points (23,638) (23,641)
7. OTHER NON-CURRENT ASSETS
Accounting policy – Property, plant and equipment
All property, plant and equipment is stated at historical cost less depreciation and accumulated impairment losses. Historical cost includes expenditure that is directly attributable to the acquisition of the items.
At the end of each reporting period, the Group reviews the carrying amounts of its assets to determine whether there is any indication that those assets have suffered an impairment loss. If any such indication exists, the recoverable amount of the asset is estimated in order to determine the extent of the impairment loss (if any). Where it is not possible to estimate the recoverable amount of an individual asset, the Group estimates the recoverable amount of the cash-generating unit to which the asset belongs.
An impairment loss is recognised immediately in profit or loss. There was no impairment loss in the current year (2015: nil).
Group2016
$000s
Group2015
$000s
Property, plant and equipment 492 88
Deposits associated with future acquisitions 1,164 –
Total other non-current assets 1,656 88
6. FINANCIAL INSTRUMENTS (CONTINUED)

62
ARGOSY PROPERTY LIMITED | Annual Report 2016
NOTES TO THE CONSOLIDATED FINANCIAL STATEMENTS (CONTINUED)
CONSOLIDATED FINANCIAL STATEMENTS
8. TRADE AND OTHER RECEIVABLES
Accounting policy – Trade and other receivables
Trade and other receivables are recognised initially at fair value and subsequently measured at amortised cost using the effective interest method, less provision for impairment. A provision for impairment of trade receivables is established when there is objective evidence that the Group will not be able to collect all amounts due according to the original terms of the receivables. The amount of the provision is the difference between the asset’s carrying amount and the present value of estimated future cash flows, discounted at the original effective interest rate.
Group2016
$000s
Group2015
$000s
Trade receivables 1,772 1,911
Allowance for doubtful debts (37) (153)
1,735 1,758
Capitalised divestment costs 22 67
Amount receivable from insurance proceeds 21 –
Other receivables from deferred settlement of properties divested 2,503 –
Total trade and other receivables 4,281 1,825
The average credit period on receivables is 3.5 days (2015: 4.3 days). The Group is entitled to charge interest on trade receivables as determined in each individual lease agreement. Interest is charged on receivables over 90 days on a case by case basis. The Group has provided for 50% of all receivables over 90 days that are considered doubtful. This amount increases to 100% of any receivable that is determined as not being recoverable. Trade receivables less than 90 days are provided for based on estimated irrecoverable amounts, determined by reference to past default experience.
Aged past due but not impaired trade receivables
Group2016
$000s
Group2015
$000s
30-60 Days 184 90
61-90 Days 24 122
Beyond 90 days 4 1
212 213
Included in the Group’s trade receivable balance are debtors with a carrying amount of $211,589 (2015: $213,083) which are past due at the reporting date, for which the Group has not provided as there has not been a significant change in credit quality and the amounts are still considered recoverable.

63
ARGOSY PROPERTY LIMITED | Annual Report 2016
NOTES TO THE CONSOLIDATED FINANCIAL STATEMENTS (CONTINUED)
Movement in the allowance for doubtful debts
Group2016
$000s
Group2015
$000s
Balance at the beginning of the year 153 187
Amounts written off as uncollectible (67) (107)
(Decrease) / increase in allowance recognised in profit or loss (49) 73
Balance at end of the year 37 153
9. OTHER CURRENT ASSETS
Group2016
$000s
Group2015
$000s
Accrued Income 28 15
Prepayments 112 156
Other 133 210
Total other current assets 273 381
10. PROPERTY HELD FOR SALE
Accounting policy – Non-current assets held for sale
Non-current assets are classified as held for sale if their carrying amount will be recovered principally through a sale transaction rather than through continuing use. This condition is regarded as met only when the sale is highly probable and the asset is available for immediate sale in its present condition.
Non-current assets classified as held for sale (principally investment property) are measured at the lower of their previous carrying amount and fair value.
No investment properties were subject to an unconditional sale and purchase agreement at balance date (2015: 1 Allens Road, East Tamaki, Auckland ($3,003,000)).
8. TRADE AND OTHER RECEIVABLES (CONTINUED)

64
ARGOSY PROPERTY LIMITED | Annual Report 2016
NOTES TO THE CONSOLIDATED FINANCIAL STATEMENTS (CONTINUED)
11. SHARE CAPITAL
Group2016
$000s
Group2015
$000s
Balance at the beginning of the year 766,431 754,453
Issue of shares from Dividend Reinvestment Plan 11,121 12,019
Issue costs of shares (38) (41)
Total share capital 777,514 766,431
The number of shares on issue at 31 March 2016 was 812,615,602 (2015: 802,628,756).
All securities are fully paid and rank equally with one vote attached and carry the right to dividends. All ordinary securities have equal voting rights.
Reconciliation of number of shares (in thousands of shares)
Group2016000s
Group2015000s
Balance at the beginning of the year 802,629 790,912
Issue of shares from Dividend Reinvestment Plan 9,987 11,717
Total number of shares on issue 812,616 802,629
Capital risk management
The Group’s capital includes shares, reserves and retained earnings with total shareholders’ funds equal to $810.4m (2015: $768.7m).
The Group maintains a strong capital base so as to maintain investor, creditor and market confidence and to sustain the Group’s future on-going activities and development of the business. The impact of the level of capital on equity holder returns is also recognised along with the need to maintain a balance between the higher returns that might be possible with greater gearing and the advantages and security afforded by a sound capital position.
The Board’s intention is to maintain the debt-to-total-assets ratio between 35%-40% in the medium term. The Group’s banking covenants require that the aggregate principal amount of the loan outstanding does not exceed 50% of the fair value of property at all times. All banking covenants have been met during the year.
The Group manages its capital to ensure that entities in the Group will be able to continue as a going concern while maximising the return to stakeholders through optimisation of debt and equity. The Group’s policies in respect of capital management and allocation are reviewed regularly by the Board of Directors. There have been no material changes in the Group’s overall strategy during the year.
CONSOLIDATED FINANCIAL STATEMENTS

65
ARGOSY PROPERTY LIMITED | Annual Report 2016
NOTES TO THE CONSOLIDATED FINANCIAL STATEMENTS (CONTINUED)
12. HEDGING RESERVES
Accounting policy – Hedge accounting
The Group no longer applies hedge accounting. However, the cumulative gains and losses relating to derivatives that were previously designated as effective hedges are recognised in profit or loss when the forecast transactions are ultimately recognised. When a forecast transaction is no longer expected to occur, the cumulative gains and losses that were previously recognised in equity are recognised immediately in profit or loss.
Group2016
$000s
Group2015
$000s
Balance at the beginning of the year (586) (1,758)
Transferred to financial income/(expense) 814 1,628
Tax on fair value (losses)/gains on cashflow hedges (228) (456)
Total hedging reserves – (586)
13. SHARE BASED PAYMENTS RESERVE
Accounting policy – Share based payments
The fair value of performance share rights (PSRs) are recognised as an expense in the statement of financial performance over the vesting period of the rights with a corresponding entry to the share based payments reserve.
PSRs were offered to Senior Executives, commencing 1 April 2015. Under the scheme, PSRs are issued to participants which give them the right to receive ordinary shares in the Company after a three year period, subject to certain vesting and other conditions being met. The vesting of the PSRs is subject to the Company achieving a positive total shareholder return (measured against the Company’s share price on the date of the issue of the PSRs, and including dividends) over a three year measurement period. The total number which actually vest will be dependent on the relative ranking of the Company’s total shareholder returns against a comparator group of listed entities determined by the Board from the S&P/NZX All Real Estate Gross Index.
The total expense recognised in the year to 31 March 2016 in relation to equity settled share based payments was $64,800 (31 March 2015: nil). No rights were exercised or forfeited during the period.
Grant date Shares grantedWeighted average
issue price Vesting date
1 April 2015 279,203 $1.13 1 April 2018
14. RETAINED EARNINGS
Group2016
$000s
Group2015
$000s
Balance at the beginning of the year 2,881 (13,173)
Profit/(loss) for the year 78,897 64,370
Dividends to shareholders (48,953) (48,316)
Total retained earnings 32,825 2,881
The annual dividend paid to shareholders was 6.025 cents per share, paid in three quarterly distributions of 1.5 cents per share and one quarterly distribution of 1.525 cents per share (2015: annual dividend was 6.00 cents per share).
After 31 March 2016, the final dividend was declared. The dividend has not been provided for. Refer to Note 27.

66
ARGOSY PROPERTY LIMITED | Annual Report 2016
NOTES TO THE CONSOLIDATED FINANCIAL STATEMENTS (CONTINUED)
15. BORROWINGS
Accounting policy – Bank borrowings
Interest-bearing bank loans and overdrafts are initially measured at fair value net of transaction costs. Subsequent to initial recognition, borrowings are measured at amortised cost with any difference being recognised in profit or loss over the period of the borrowing using the effective interest method.
Group2016
$000s
Group2015
$000s
ANZ Bank New Zealand Limited 251,959 248,501
Bank of New Zealand 151,175 149,100
The Hongkong and Shanghai Banking Corporation Limited 100,784 99,400
Borrowing costs (1,595) (1,729)
Total borrowings 502,323 495,272
Shown as:
Term 502,323 495,272
The Group has a syndicated revolving facility with ANZ Bank New Zealand Limited, Bank of New Zealand and The Hongkong and Shanghai Banking Corporation Limited of $550,000,000 (31 March 2015: $550,000,000) secured by way of mortgage over the investment properties of the Group. The facility includes a Tranche A limit of $275,000,000 and a Tranche B limit of $275,000,000. Tranche A expires on 30 September 2018 and Tranche B on 30 September 2020 (31 March 2015: Tranche A ($275,000,000) expired on 30 November 2017 and Tranche B ($275,000,000) expired on 30 November 2019).
The weighted average interest rate on borrowings (including margin and line fee and interest rate swaps) as at 31 March 2016 was 5.12% (2015: 5.60%).
Borrowing costs are the costs incurred in establishing the bank facility. These costs are amortised over the life of the facility.
16. TRADE AND OTHER PAYABLES
Accounting policy – Trade and other payables
Trade and other payables are recognised initially at fair value and subsequently measured at amortised cost using the effective interest method.
Group2016
$000s
Group2015
$000s
GST payable 939 1,020
Other creditors and accruals 9,491 8,807
Total trade and other payables 10,430 9,827
CONSOLIDATED FINANCIAL STATEMENTS

67
ARGOSY PROPERTY LIMITED | Annual Report 2016
NOTES TO THE CONSOLIDATED FINANCIAL STATEMENTS (CONTINUED)
17. OTHER CURRENT LIABILITIES
Accounting policy – Employee benefits
A provision is recognised for benefits accruing to employees in respect of annual leave and long service leave when it is probable that settlement will be required and they are capable of being measured reliably.
Provisions made in respect of employee benefits expected to be settled within 12 months are measured at their nominal values using the remuneration rate expected to apply at the time of settlement. Provisions made in respect of employee benefits which are not expected to be settled within 12 months are measured as the present value of the estimated future outflows to be made by the Group in respect of services provided by employees up to the reporting date.
Group2016
$000s
Group2015
$000s
Employee entitlements 306 330
Other liabilities 2,285 2,039
Total other current liabilities 2,591 2,369
18. ADMINISTRATION EXPENSES
Group2016
$000s
Group2015
$000s
Auditors' remuneration:
Audit of the annual financial statements 148 144
Review of the interim financial statements 27 27
Other assurance services¹ 7 7
Employee benefits 5,322 4,650
Other expenses 3,493 2,948
Doubtful debts expense (116) (34)
Bad debts 67 107
Total administration expenses 8,948 7,849
1 In 2016, $7,300 was paid to Deloitte for services rendered at the Annual Shareholders’ Meeting (2015: $7,300 was paid to Deloitte for services rendered at Annual Shareholders’ Meeting).

68
ARGOSY PROPERTY LIMITED | Annual Report 2016
NOTES TO THE CONSOLIDATED FINANCIAL STATEMENTS (CONTINUED)
19. INTEREST EXPENSE
Accounting policy – Financial income and expenses
Finance expenses comprise interest expense on borrowings and gains and losses on hedging instruments that are recognised in profit or loss. Interest expense on borrowings is recognised using the effective interest method. Finance income comprises interest income using the effective interest method.
Group2016
$000s
Group2015
$000s
Interest expense (28,317) (28,109)
Less amount capitalised to investment properties 76 1,283
Total interest expense (28,241) (26,826)
Capitalised interest relates to the Polarcold Development at 8 Foundry Drive, Christchurch (2015: capitalised interest relates to the development project at 15-21 Stout Street, Wellington).
CONSOLIDATED FINANCIAL STATEMENTS
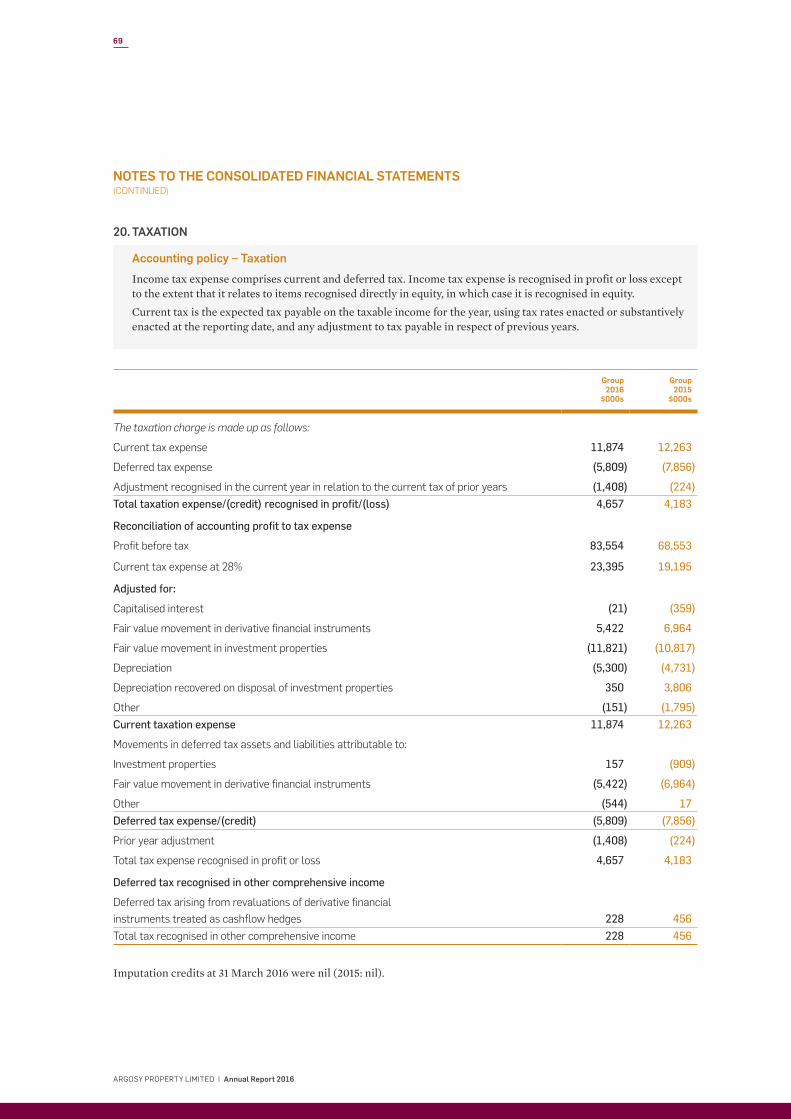
69
ARGOSY PROPERTY LIMITED | Annual Report 2016
NOTES TO THE CONSOLIDATED FINANCIAL STATEMENTS (CONTINUED)
20. TAXATION
Accounting policy – Taxation
Income tax expense comprises current and deferred tax. Income tax expense is recognised in profit or loss except to the extent that it relates to items recognised directly in equity, in which case it is recognised in equity.
Current tax is the expected tax payable on the taxable income for the year, using tax rates enacted or substantively enacted at the reporting date, and any adjustment to tax payable in respect of previous years.
Group2016
$000s
Group2015
$000s
The taxation charge is made up as follows:
Current tax expense 11,874 12,263
Deferred tax expense (5,809) (7,856)
Adjustment recognised in the current year in relation to the current tax of prior years (1,408) (224)
Total taxation expense/(credit) recognised in profit/(loss) 4,657 4,183
Reconciliation of accounting profit to tax expense
Profit before tax 83,554 68,553
Current tax expense at 28% 23,395 19,195
Adjusted for:
Capitalised interest (21) (359)
Fair value movement in derivative financial instruments 5,422 6,964
Fair value movement in investment properties (11,821) (10,817)
Depreciation (5,300) (4,731)
Depreciation recovered on disposal of investment properties 350 3,806
Other (151) (1,795)
Current taxation expense 11,874 12,263
Movements in deferred tax assets and liabilities attributable to:
Investment properties 157 (909)
Fair value movement in derivative financial instruments (5,422) (6,964)
Other (544) 17
Deferred tax expense/(credit) (5,809) (7,856)
Prior year adjustment (1,408) (224)
Total tax expense recognised in profit or loss 4,657 4,183
Deferred tax recognised in other comprehensive income
Deferred tax arising from revaluations of derivative financial instruments treated as cashflow hedges 228 456
Total tax recognised in other comprehensive income 228 456
Imputation credits at 31 March 2016 were nil (2015: nil).

70
ARGOSY PROPERTY LIMITED | Annual Report 2016
NOTES TO THE CONSOLIDATED FINANCIAL STATEMENTS (CONTINUED)
CONSOLIDATED FINANCIAL STATEMENTS
21. DEFERRED TAX
Accounting policy – Deferred tax
Deferred tax is recognised on temporary differences between the carrying amount of assets and liabilities in the financial statements and the corresponding tax bases used in the computation of taxable profit, and is accounted for using the balance sheet liability method. Deferred tax liabilities are generally recognised for all taxable temporary differences and deferred tax assets are recognised to the extent that it is probable that taxable profits will be available against which deductible temporary differences can be utilised. Such assets and liabilities are not recognised if the temporary difference arises from goodwill or from the initial recognition (other than in a business combination) of other assets and liabilities in a transaction that affect neither the taxable profit nor the accounting profit.
Deferred tax is calculated at the tax rates that are expected to apply in the period when the liability is settled or the asset realised.
Under NZ IAS 12, the measurement of deferred tax liabilities and deferred tax assets depends on whether an entity expects to recover an asset by using it or by selling it and includes a presumption that an investment property is recovered entirely through sale unless all of its useful life will be consumed.
The following are the major deferred tax liabilities and assets recognised by the Group, and the movements thereon during the current and prior reporting years:
Interest rate swaps$000s
Investment property
$000sOther
$000sTotal
$000s
At 1 April 2015 (5,981) 16,825 3,689 14,533
Credit to other comprehensive income for the year 228 – – 228
Charge/(credit) to deferred taxation expense for the year (5,422) 157 (544) (5,809)
At 31 March 2016 (11,175) 16,982 3,145 8,952
At 1 April 2014 (2,690) 21,111 3,668 22,089
Credit to other comprehensive income for the year 456 – – 456
Charge/(credit) to deferred taxation expense for the year (6,964) (909) 17 (7,856)
Charge/(credit) to taxation payable 3,217 (3,377) 4 (156)
At 31 March 2015 (5,981) 16,825 3,689 14,533
Significant estimates and judgements in the determination of deferred tax include:
Deferred tax on depreciation – deferred tax is provided in respect of depreciation expected to be recovered on the sale of property at fair value. Depreciation is claimed at Inland Revenue Department approved rates.
Deferred tax on changes in fair value of investment properties – investment properties are valued each year by independent valuers (as outlined in Note 5). These values include an allocation of the valuation between the land and building components. The calculation of deferred tax on depreciation recovered and changes in fair value relies on the split provided by the valuers.
Deferred tax on fixtures and fittings – it is assumed that all fixtures and fittings will be sold at their tax book value.

71
ARGOSY PROPERTY LIMITED | Annual Report 2016
NOTES TO THE CONSOLIDATED FINANCIAL STATEMENTS (CONTINUED)
22. RECONCILIATION OF PROFIT FOR THE YEAR AFTER TAXATION WITH CASH FLOWS FROM OPERATING ACTIVITIES
Group2016
$000s
Group2015
$000s
Profit after tax for the year 78,897 64,370
Movements in working capital items relating to investing and financing activities 2,387 1,726
Non cash items
Movement in deferred tax liability (5,581) (7,556)
Movement in interest rate swaps 18,552 23,243
Fair value change in investment properties (42,218) (38,633)
Movement in cashflow hedge reserve 586 1,172
Movements in working capital items
Trade and other receivables (2,456) 78
Taxation payable (820) 544
Trade and other payables 603 1,037
Other current assets 108 (14)
Other current liabilities 222 48
Net cash from operating activities 50,280 46,015
23. EARNINGS PER SHAREBasic and diluted earnings per share is calculated by dividing the profit attributable to shareholders of the Company by the weighted average number of ordinary shares on issue during the year.
Group2016
Group2015
Profit attributable to shareholders of the Company ($000s) 78,897 64,370
Weighted average number of shares on issue (000s) 806,199 796,376
Basic and undiluted earnings per share (cents) 9.79 8.08
On 25 May 2016, a final dividend of 1.525 cents per share was approved by the Company. Continuation of the Dividend Reinvestment Plan programme will increase the number of shares on issue.

72
ARGOSY PROPERTY LIMITED | Annual Report 2016
NOTES TO THE CONSOLIDATED FINANCIAL STATEMENTS (CONTINUED)
CONSOLIDATED FINANCIAL STATEMENTS
24. DISTRIBUTABLE INCOME
Group2016
$000s
Group2015
$000s
Profit before income tax 83,554 68,553
Adjustments:
Revaluation gains on investment property (42,218) (38,633)
Realised losses/(gains) on disposal of investment properties 925 1,533
Derivative fair value loss/(gain) 19,366 24,871
Gain on sale of storage business (360) –
Gross distributable income 61,267 56,324
Tax impact of depreciation recovered on disposal of investment properties and taxable gains on disposal of revenue account properties 410 3,298
Tax paid (11,269) (11,651)
Net distributable income 50,408 47,971
Weighted average number of ordinary shares (000s) 806,199 796,376
Gross distributable income per share – (cents per share) 7.60 7.07
Net distributable income per share – (cents per share) 6.25 6.02
The Company’s dividend policy is based on net distributable income. Net distributable income is determined under the Company’s bank facility agreement.
25. INVESTMENT IN SUBSIDIARIES APL has control over the following subsidiaries:
Name of subsidiary Principal activity
Place of incorporation and operation Holding 2016 Holding 2015
Argosy Property No.1 Limited Property investment NZ 100% 100%
Argosy No.1 Trust Property investment NZ 100% 100%
Argosy Property Management Limited Management company NZ 100% 100%
Argosy Property No.3 Limited Property investment NZ 100% 100%
Argosy Property Unit Holdings Limited Holding company NZ 100% 100%
The subsidiaries have the same reporting date as the Company.

73
ARGOSY PROPERTY LIMITED | Annual Report 2016
NOTES TO THE CONSOLIDATED FINANCIAL STATEMENTS (CONTINUED)
26. COMMITMENTS
Accounting policy – Leases
Leases are classified as finance leases whenever the terms of the lease transfer substantially all the risks and rewards of ownership to the lessee. All other leases are classified as operating leases.
APL has entered into commercial property leases on its investment properties. APL has determined that it retains all significant risks and rewards of ownership of these properties and has thus classified these leases as operating leases.
The Group as lessor
Rental income from operating leases is recognised in the period to which it relates. Initial direct costs incurred in negotiating and arranging an operating lease are added to the carrying amount of the leased asset and amortised to property expenses on a straight-line basis over the lease term.
In the event that lease incentives are paid to enter into the operating leases, such incentives are recognised as an asset. The aggregate cost of incentives is recognised as a reduction of rental revenue on a straight-line basis.
The Group as lessee
Operating lease payments are recognised as an expense on a straight-line basis over the lease term, except where another systematic basis is more representative of the time pattern in which economic benefits from the leased asset are consumed.
Ground rent
Ground leases exist over 39 Market Place, Viaduct Harbour, Auckland and part of 19 Barnes Street, Wellington. The amount paid in respect of the Auckland ground lease during the year was $1.0 million (2015: $1.0 million). The annual ground lease commitment is $1.0 million and is generally recoverable from tenants in proportion to their area of occupancy. The Auckland ground lease is renewable in perpetuity with the next renewal date in 2019.
Building upgrades
Estimated capital commitments contracted for building projects not yet completed at 31 March 2016 and not provided for were $46.8 million (2015: $22.9 million). Of this total, $13.2 million (2015: $17.3 million) relates to the building upgrade at New Zealand Post House, Waterloo Quay, Wellington and $14.2 million relates to Mighty Ape redevelopment at Parkway Drive, Highgate.
Sale and purchase agreements have been entered into to acquire $8.1 million of land at Highgate for the Mighty Ape development and an industrial property at 240 Puhinui Road, Wiri, for $22.6 million.
There were no other commitments as at 31 March 2016 (2015: nil).
Non-cancellable operating lease receivable
Operating leases relate to the investment properties owned by the Group with the leases expiring between 2016 and 2030. The lessee does not have an option to purchase the property at the expiry of the period.
Group2016
$000s
Group2015
$000s
Within one year 103,096 98,102
One year or later and not later than five years 291,394 287,670
Later than five years 180,132 188,545
574,622 574,317

74
ARGOSY PROPERTY LIMITED | Annual Report 2016
NOTES TO THE CONSOLIDATED FINANCIAL STATEMENTS (CONTINUED)
CONSOLIDATED FINANCIAL STATEMENTS
Non-cancellable operating lease payable
Operating lease commitments relate mainly to the IT infrastructure and vehicle leases. There are no renewal options or options to purchase in respect of these leases.
Group2016
$000s
Group2015
$000s
Within one year 256 103
One year or later and not later than five years 224 140
Later than five years – –
480 243
There were no contingent rents recognised as income during the year.
The Company has the following guarantee, which is not expected to be called upon:
As a condition of listing on the New Zealand Stock Exchange (NZSX), NZX requires all issuers to provide a bank bond to NZX under NZX Main Board/Debt Market Listing Rule 2.6.2. The bank bond required from APL for listing on the NZX Main Board is $75,000.
27. SUBSEQUENT EVENTSOn 25 May 2016, a final dividend of 1.525 cents per share was approved by the Company. The record date for the final dividend is 15 June 2016 and a payment is scheduled to shareholders on 29 June 2016. Imputation credits of 0.1972 cents per share are attached to the dividend.
28. RELATED PARTY TRANSACTIONSBalances and transactions between the Company and its subsidiaries, which are related parties of the Company, have been eliminated on consolidation and are not disclosed in this note. Details of transactions between the Group and other related parties are disclosed below.
Group2016
$000s
Group2015
$000s
Key management and directors compensation
Salaries and other short term employee benefits 1,370 1,197
Directors' fees 535 514
Total 1,905 1,711
26. COMMITMENTS (CONTINUED)

75
ARGOSY PROPERTY LIMITED | Annual Report 2016
INDEPENDENT AUDITOR’S REPORT
TO THE SHAREHOLDERS OF ARGOSY PROPERTY LIMITED
Report on the Consolidated Financial Statements
We have audited the accompanying consolidated financial statements of Argosy Property Limited (‘the Company’) and its subsidiaries (‘the Group’) on pages 45 to 74, which comprise the consolidated statement of financial position as at 31 March 2016, and the consolidated statement of comprehensive income, statement of changes in equity and statement of cash flows for the year then ended, and a summary of significant accounting policies and other explanatory information.
This report is made solely to the company’s shareholders, as a body. Our audit has been undertaken so that we might state to the company’s shareholders those matters we are required to state to them in an auditor’s report and for no other purpose. To the fullest extent permitted by law, we do not accept or assume responsibility to anyone other than the company’s shareholders as a body, for our audit work, for this report, or for the opinions we have formed.
Board of Directors’ Responsibility for the Consolidated Financial Statements
The Board of Directors are responsible on behalf of the company for the preparation and fair presentation of these consolidated financial statements, in accordance with New Zealand Equivalents to International Financial Reporting Standards and International Financial Reporting Standards, and for such internal control as the Board of Directors determine is necessary to enable the preparation of consolidated financial statements that are free from material misstatement, whether due to fraud or error.
Auditor’s Responsibilities
Our responsibility is to express an opinion on these consolidated financial statements based on our audit. We conducted our audit in accordance with International Standards on Auditing and International Standards on Auditing (New Zealand). Those standards require that we comply with ethical requirements and plan and perform the audit to obtain reasonable assurance about whether the consolidated financial statements are free from material misstatement.
An audit involves performing procedures to obtain audit evidence about the amounts and disclosures in the consolidated financial statements. The procedures selected depend on the auditor’s judgement, including the assessment of the risks of material misstatement of the consolidated financial statements, whether due to fraud or error. In making those risk assessments, the auditor considers internal control relevant to the entity’s preparation and fair presentation of the consolidated financial statements in order to design audit procedures that are appropriate in the circumstances, but not for the purpose of expressing an opinion on the effectiveness of the entity’s internal control. An audit also includes evaluating the appropriateness of the accounting policies used and the reasonableness of accounting estimates, as well as the overall presentation of the consolidated financial statements.
We believe that the audit evidence we have obtained is sufficient and appropriate to provide a basis for our audit opinion.
Other than in our capacity as auditor and the provision of other assurance services, we have no relationship with or interests in Argosy Property Limited or any of its subsidiaries. These services have not impaired our independence as auditor of the Company and Group.
Opinion
In our opinion, the consolidated financial statements on pages 45 to 74 present fairly, in all material respects, the financial position of Argosy Property Limited and its subsidiaries as at 31 March 2016, and their financial performance and cash flows for the year then ended in accordance with New Zealand Equivalents to International Financial Reporting Standards and International Financial Reporting Standards.
Chartered Accountants25 May 2016Auckland, New Zealand

76
ARGOSY PROPERTY LIMITED | Annual Report 2016
INVESTOR STATISTICS
20 LARGEST REGISTERED FINANCIAL PRODUCT HOLDERS AS AT 31 MARCH 2016
Rank Holder Name Total Percentage
1 New Zealand Central Securities Depository Limited 170,081,327 20.93
2 New Zealand Central Securities Depository Limited <DRP Account> 135,069,716 16.62
3 FNZ Custodians Limited 48,011,458 5.90
4 Custodial Services Limited <A/C 3> 30,986,563 3.81
5 Investment Custodial Services Limited <A/C C> 25,206,798 3.10
6 Forsyth Barr Custodians Limited <1-Custody> 25,106,718 3.08
7 Custodial Services Limited <A/C 2> 15,077,121 1.85
8 Custodial Services Limited <A/C 4> 8,633,914 1.06
9 Custodial Services Limited A/C 18> 7,053,805 0.86
10 Peter John Whiting & Janet Graham Whiting & Peter Austin Gowing <Whiting Family A/C>
6,130,000 0.75
11 James Harvey Mansell & Christine Anne Mansell & Douglas Tony Brown <Harvan A/C>
6,000,000 0.73
12 University Of Otago Foundation Trust 5,956,739 0.73
13 Southern Capital Limited 5,500,000 0.67
14 Custodial Services Limited <A/C 1> 5,201,367 0.64
15 New Zealand Depository Nominee Limited <A/C 1> Cash Account 4,522,706 0.55
16 NZPT Custodians (Grosvenor) Limited 3,896,715 0.47
17 Jarden Custodians Limited <A/C 7> 3,200,000 0.39
18 Jarden Custodians Limited <A/C 6> 3,000,000 0.36
19 Antony Trevor Morris & James Edward Webber <Lasik No.2 A/C> 2,700,000 0.33
20 Custodial Services Limited <A/C 16> 2,458,052 0.30
5 LARGEST FINANCIAL PRODUCT HOLDERS DISCLOSED BY THE NEW ZEALAND CENTRAL SECURITIES DEPOSITORY LIMITED AS AT 31 MARCH 2016
Rank Holder Name No of Shares
1 Accident Compensation Corporation – NZCSD 52,654,239
2 BNP Paribas Nominees (NZ) Limited – NZCSD 42,446,283
3 Guardian Nominees No 2 A/C Westpac W/S Enhanced Cash Trust – NZCSD 38,227,020
4 HSBC Nominees (New Zealand) Limited – NZCSD 31,771,584
5 Citibank Nominees (New Zealand) Limited – NZCSD 29,302,400

77
ARGOSY PROPERTY LIMITED | Annual Report 2016
INVESTOR STATISTICS
SUBSTANTIAL PRODUCT HOLDERS AS AT 31 MARCH 2016The substantial product holders in the Company as at 31 March 2016 were as follows:
Date notice filed No of shares% of total
issued shares
Accident Compensation Corporation 27-Oct-15 54,639,720 6.77
Salt Funds Management Limited 5-May-15 43,091,485 5.37
The total number of shares on issue in the Company as at 31 March 2016 was 812,615,602. The only class of shares on issue as at 31 March 2016 was ordinary shares.
The number and percentage of shares shown are as advised in the substantial security holder notice to the Company disclosed by 31 March 2016 and may not be that substantial holder’s current relevant interest.
DISTRIBUTION OF FINANCIAL PRODUCT HOLDERS AND FINANCIAL PRODUCT HOLDINGS AS AT 31 MARCH 2016
Holding Range Holder Count Holder Count % Holding QuantityHolding
Quantity %
1 to 999 146 1.62 64,793 0.01
1,000 to 1,999 262 2.91 341,038 0.04
2,000 to 4,999 963 10.70 3,403,087 0.42
5,000 to 9,999 1,732 19.24 12,508,842 1.54
10,000 to 49,999 4,631 51.45 102,273,391 12.59
50,000 to 99,999 759 8.43 50,808,664 6.25
100,000 to 499,999 441 4.90 80,477,225 9.90
500,000 to 999,999 26 0.29 17,256,057 2.12
1,000,000 + 41 0.46 545,482,505 67.13
Total 9,001 100 812,615,602 100
HOLDINGS OF DIRECTORS OF THE COMPANY AS AT 31 MARCH 2016
DirectorNo of shares
non-beneficialNo of shares
beneficial
Michael Smith 242,576 –
Peter Brook 360,288 129,689
Mark Cross – –
Andrew Evans 109,219 –
Chris Hunter – –
Jeff Morrison 1,226,647
DIRECTORS’ STATEMENTThe Board is responsible for preparing the Annual Report. This report is dated 25 May 2016 and is signed on behalf of the Board of Argosy Property Limited by Michael Smith, Chairman, and Mark Cross, Director:
P Michael Smith Mark CrossChairman Director

78
ARGOSY PROPERTY LIMITED | Annual Report 2016
DIRECTORY
DIRECTORS
Argosy Property LimitedPhilip Michael Smith, Auckland (Chair)Peter Clynton Brook, AucklandAndrew Mark Cross, AucklandAndrew Hardwick Evans, AucklandChristopher Brent Hunter, AucklandJeffrey Robert Morrison, Auckland
REGISTERED OFFICE
Argosy Property Limited39 Market PlaceAuckland 1010PO Box 90214Victoria Street WestAuckland 1142Telephone: (09) 304 3400Facsimile: (09) 302 0996
REGISTRAR
Computershare Investor Services Limited159 Hurstmere RoadTakapunaPrivate Bag 92119Auckland 1142Telephone: (09) 488 8777Facsimile: (09) 488 8787
AUDITOR
DeloitteDeloitte Centre80 Queen StreetPrivate Bag 115-003Auckland 1010Telephone: (09) 303 0700Facsimile: (09) 303 0701
LEGAL ADVISERS
Harmos Horton LuskVero Centre48 Shortland StreetPO Box 28 Auckland 1010Telephone: (09) 921 4300Facsimile: (09) 921 4319
Russell McVeaghVero Centre48 Shortland StreetPO Box 8 Auckland 1140Telephone: (09) 367 8000Facsimile: (09) 367 8163
BANKERS TO THE COMPANY
ANZ Bank New Zealand LimitedANZ House23–29 Albert StreetPO Box 6243 Auckland 1141
Bank of New Zealand LimitedDeloitte Centre80 Queen StreetPrivate Bag 99208Auckland 1142
The Hongkong and Shanghai Banking Corporation LimitedHSBC House1 Queen StreetPO Box 5947Wellesley StreetAuckland 1141
29 June 2016 FY16 final dividend payment
9 August 2016 Annual Shareholders Meeting
WHERE: Royal New Zealand Yacht Squadron 101 Curran Street Westhaven Marina Auckland TIME: 2pm
28 September 2016 FY17 first interim dividend payment
23 November 2016 FY17 interim results announcement
22 December 2016 FY17 second interim dividend payment
KEY DATES
( DATES ARE INDICATIVE AND MAY BE SUBJECT TO CHANGE)

insightcreative.co.nz
ARG
111

39 MARKET PLACEPO BOX 90214, VICTORIA STREET WEST, AUCKLAND 1142P / 09 304 3400F / 09 302 0996
www.argosy.co.nz