ANNUAL REPORT 2016 - Deceuninck · statements and annual report, q monitoring of KPIs, q...
58
ANNUAL REPORT 2016 FINANCIAL
Transcript of ANNUAL REPORT 2016 - Deceuninck · statements and annual report, q monitoring of KPIs, q...

ANNUAL REPORT 2016
FINANCIAL
Table of contents
01 REPORT OF THE BOARD OF DIRECTORS 5Corporate Governance Statement 6Legal structure 32The Deceuninck Share 34
02 FINANCIAL STATEMENTS 37Deceuninck consolidated 38Consolidated financial statements and notes 42Deceuninck NV 101External auditor’s report 104Declaration regarding the information given in this annual report 106
Addresses 107Glossary 111
3DECEUNINCK FINANCIAL REPORT 2016

Rep
ort o
f th
e B
oard
of D
irect
ors01
4 5DECEUNINCK FINANCIAL REPORT 2016 DECEUNINCK FINANCIAL REPORT 2016

Corporate Governance Statement
Changes in the composition of the Board of Directors in 2016
q Holve NV, represented by Francis Van Eeckhout, was member of the Board of Directors until 1 March 2016. Holve NV was succeeded by Beneconsult BVBA, represented by Francis Van Eeckhout, as of 1 March 2016. Beneconsult BVBA was appointed member of the Board of Directors at the Annual General Meeting of 2016.
q On 1 March 2016, Beneconsult BVBA, represented by Francis Van Eeckhout, was appointed CEO of Deceuninck. Tom Debusschere Comm. V, represented by Tom Debusschere, resigned as CEO as of 1 March 2016. His director’s mandate came to an end at the Annual General Meeting of 2016.
q On 14 October 2016, The Board of Directors unanimously decided to appoint Pentacon BVBA, represented by Paul Thiers, as the new independent Chairman of the Board. As announced during the Annual Shareholder’s Meeting of 2016, Pierre Alain Baron De Smedt resigned as Chairman of the Board. He remains Director of the Board until the Annual General Meeting of 2017.
q In its meeting of 21 December 2016, the Board of Directors decided to co-opt Alchemy Partners BVBA, represented by Anouk Lagae as independent member of the Board of Directors, effective January 1st, 2017 and until the following Annual General Meeting in 2017.
Proposed changes in the composition of the Board of Directors in 2017
q After the Annual General Meeting of 2017, Pierre Alain Baron De Smedt will resign from the Board of Directors, as his mandate expires and he exceeds the age limit set for reappointment in the Corporate Governance Charter.
q Alchemy Partners BVBA, represented by Anouk Lagae was co-opted by the Board of Directors as Independent Director, effective 1 January 2017. At the Annual General Meeting of 2017, Alchemy Partners BVBA will be proposed for appointment as Independent Director until the Annual General Meeting in 2021.
Other
Deceuninck’s honorary Directors are: q Pierre Alain Baron De Smedt was nominated
honorary Chairman following his resignation as Chairman on 14 October 2016
q Willy Deceuninck, permanent representative of T.R.D. Comm VA
q Arnold Deceuninck, permanent representative of R.A.M. Comm VA
The Secretary of the Board of Directors is Ann Bataillie, Director HR & Legal.The Internal Auditor is Philippe Maeckelberghe, represented by SophiDelphi BVBA
The Board of Directors and its Committees
Composition of the Board of Directors
Current composition
The Board of Directors currently consists of eight Directors. One member is Executive Director (‘CEO’) and four members are Independent Directors in accordance with article 526ter of the Belgian Companies Code. Four Directors were appointed on the recommendation of important shareholders.
These are the functions and memberships of the Directors within the Board of Directors and its Committees per 24 March 2017:
Deceuninck’s Corporate Governance Charter, which can be consulted at www.deceuninck.com, contains the main aspects of its corporate governance policy. It is based on the principles of corporate governance and transparency as determined by the Belgian Corporate Governance Code of 12 March 2009 (hereinafter ‘the Code’). The Code has been adopted as reference code for Deceuninck’s corporate governance. This Corporate Governance Statement contains further information on the application of Deceuninck’s corporate governance policy during 2016.
FUNCTION NAME MEMBERSHIP COMMITTEES LATEST RENEWAL MANDATE
MANDATE EXPIRY
EXECUTIVE DIRECTOR
CEO Beneconsult BVBA represented by Francis Van Eeckhout
12/05/2015 AGM 2019
NON-EXECUTIVE DIRECTORS
ChairmanIndependent Director
Pentacon BVBA represented by Paul Thiers
- Audit Committee (member)- Remuneration and Nomination
Committee (Chairman)
12/05/2015 AGM 2019
Vice Chairman François Gillet - Audit Committee (member)- Remuneration and Nomination
Committee (member)
13/05/2014 AGM 2018
Independent Director Marcel Klepfisch SARL represented by Marcel Klepfisch
- Audit Committee (Chairman)- Remuneration and Nomination
Committee (member)
13/05/2014 AGM 2018
Independent Director Pierre Alain Baron De Smedt 14/05/2013 AGM 2017
Director Bene Invest BVBA represented by Benedikte Boone
12/05/2015 AGM 2019
Director Mardec Invest BVBA represented by Evelyn Deceuninck
16/12/2015 AGM 2019
Independent Director Alchemy Partners BVBA, represented by Anouk Lagae
01/01/2017 AGM 2017
6 7DECEUNINCK FINANCIAL REPORT 2016 DECEUNINCK FINANCIAL REPORT 2016
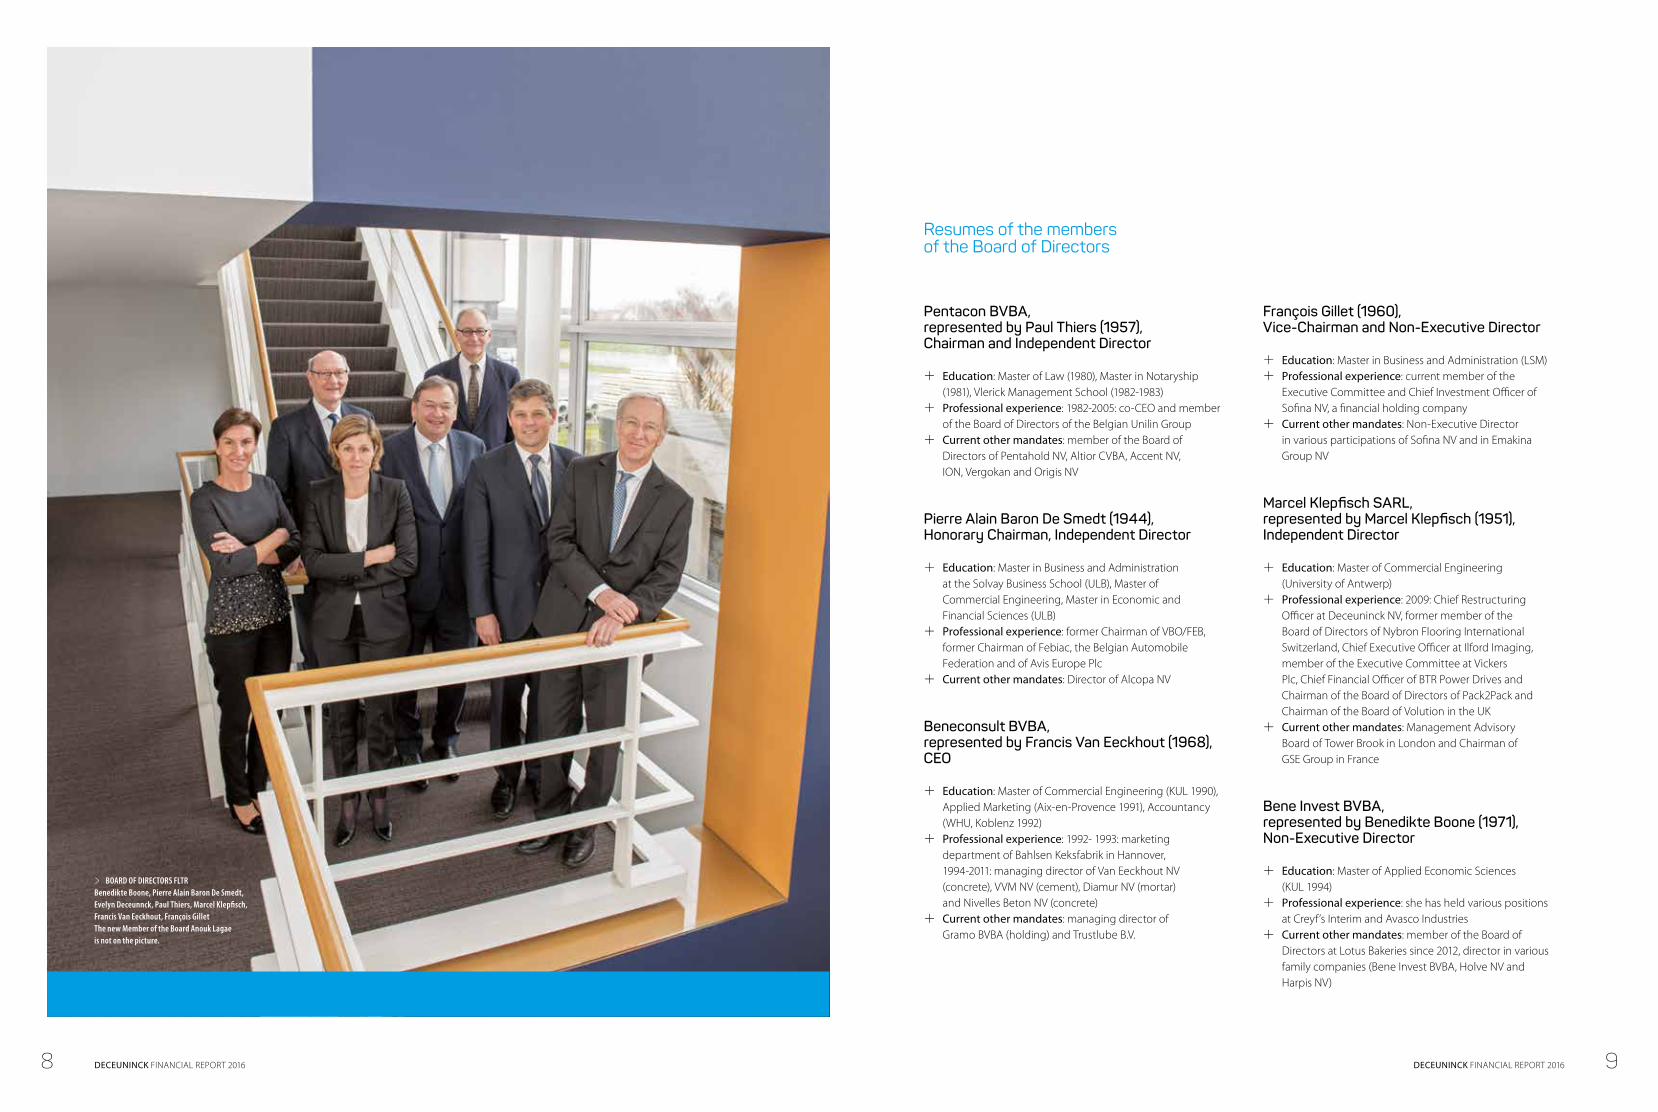
Resumes of the members of the Board of Directors
Pentacon BVBA, represented by Paul Thiers (1957), Chairman and Independent Director
q Education: Master of Law (1980), Master in Notaryship (1981), Vlerick Management School (1982-1983)
q Professional experience: 1982-2005: co-CEO and member of the Board of Directors of the Belgian Unilin Group
q Current other mandates: member of the Board of Directors of Pentahold NV, Altior CVBA, Accent NV, ION, Vergokan and Origis NV
Pierre Alain Baron De Smedt (1944), Honorary Chairman, Independent Director
q Education: Master in Business and Administration at the Solvay Business School (ULB), Master of Commercial Engineering, Master in Economic and Financial Sciences (ULB)
q Professional experience: former Chairman of VBO/FEB, former Chairman of Febiac, the Belgian Automobile Federation and of Avis Europe Plc
q Current other mandates: Director of Alcopa NV
Beneconsult BVBA, represented by Francis Van Eeckhout (1968), CEO
q Education: Master of Commercial Engineering (KUL 1990), Applied Marketing (Aix-en-Provence 1991), Accountancy (WHU, Koblenz 1992)
q Professional experience: 1992- 1993: marketing department of Bahlsen Keksfabrik in Hannover, 1994-2011: managing director of Van Eeckhout NV (concrete), VVM NV (cement), Diamur NV (mortar) and Nivelles Beton NV (concrete)
q Current other mandates: managing director of Gramo BVBA (holding) and Trustlube B.V.
François Gillet (1960), Vice-Chairman and Non-Executive Director
q Education: Master in Business and Administration (LSM) q Professional experience: current member of the
Executive Committee and Chief Investment Officer of Sofina NV, a financial holding company
q Current other mandates: Non-Executive Director in various participations of Sofina NV and in Emakina Group NV
Marcel Klepfisch SARL, represented by Marcel Klepfisch (1951), Independent Director
q Education: Master of Commercial Engineering (University of Antwerp)
q Professional experience: 2009: Chief Restructuring Officer at Deceuninck NV, former member of the Board of Directors of Nybron Flooring International Switzerland, Chief Executive Officer at Ilford Imaging, member of the Executive Committee at Vickers Plc, Chief Financial Officer of BTR Power Drives and Chairman of the Board of Directors of Pack2Pack and Chairman of the Board of Volution in the UK
q Current other mandates: Management Advisory Board of Tower Brook in London and Chairman of GSE Group in France
Bene Invest BVBA, represented by Benedikte Boone (1971), Non-Executive Director
q Education: Master of Applied Economic Sciences (KUL 1994)
q Professional experience: she has held various positions at Creyf’s Interim and Avasco Industries
q Current other mandates: member of the Board of Directors at Lotus Bakeries since 2012, director in various family companies (Bene Invest BVBA, Holve NV and Harpis NV)
u BOARD OF DIRECTORS FLTR Benedikte Boone, Pierre Alain Baron De Smedt, Evelyn Deceunnck, Paul Thiers, Marcel Klepfisch, Francis Van Eeckhout, François Gillet The new Member of the Board Anouk Lagae is not on the picture.
8 9DECEUNINCK FINANCIAL REPORT 2016 DECEUNINCK FINANCIAL REPORT 2016
Mardec Invest BVBA, represented by Evelyn Deceuninck (1979), Non-Executive Director
q Education: Bachelor Physiotherapy (Ghent 2001), Osteopathy for horses (Roosendaal, NL), Certificate of Competence in International Passenger Transport; certificate of Public Coach Company (OBO)
q Professional experience: managing director of Deceuninck Auto’s NV, a coach company operated by De Lijn (Belgium)
q Current other mandates: managing director of tyre service centre Bandeman
Alchemy Partners BVBA, represented by Anouk Lagae (1975), Independent Director
q Education: Master in Business and Engineering (Solvay Management School), Kellogg School of Management, Northwestern University in Chicago, USA
q Professional experience: Coca Cola (Brussels, London and Sydney), Unilever (Brussels), Chief Marketing Officer at Duvel Moortgat
q Current other mandates: director at Brasserie D’Achouffe SA
Composition of the Committees of the Board of Directors
General
The Board of Directors has set up specialized committees to deal with specific matters and to give advice to the Board of Directors. The Committees have an advisory role. The ultimate decision making responsibility lies with the Board of Directors.
Audit Committee
The current Audit Committee consists of three members, all of which are Non-Executive Directors. Two members of the Audit Committee are independent as defined in article 526ter of the Belgian Companies Code:
q Marcel Klepfisch SARL, represented by Marcel Klepfisch, Chairman
q François Gillet q Pentacon BVBA, represented by Paul Thiers
The Audit Committee members as a whole have competence relevant to the sector in which Deceuninck is operating and at least one member has competence in accounting and/or auditing.
Holve NV, represented by Francis Van Eeckhout, was member of the Audit Committee until 1 March 2016.
Remuneration and Nomination Committee
The current Remuneration and Nomination Committee consists of three members, all of which are Non-Executive Directors. Two members of the Remuneration and Nomination Committee are independent as defined in article 526ter of the Belgian Companies Code:
q Pentacon BVBA, represented by Paul Thiers, Chairman q François Gillet q Marcel Klepfisch SARL, represented by Marcel Klepfisch
Taking into account their education and professional experience, the members have the necessary expertise in the field of remuneration policy.
Pierre Alain Baron De Smedt was member and Chairman of the Remuneration and Nomination Committee until 21 October 2016. Bene Invest BVBA, represented by Benedikte Boone, was member of the Remuneration and Nomination Committee until 20 April 2016.
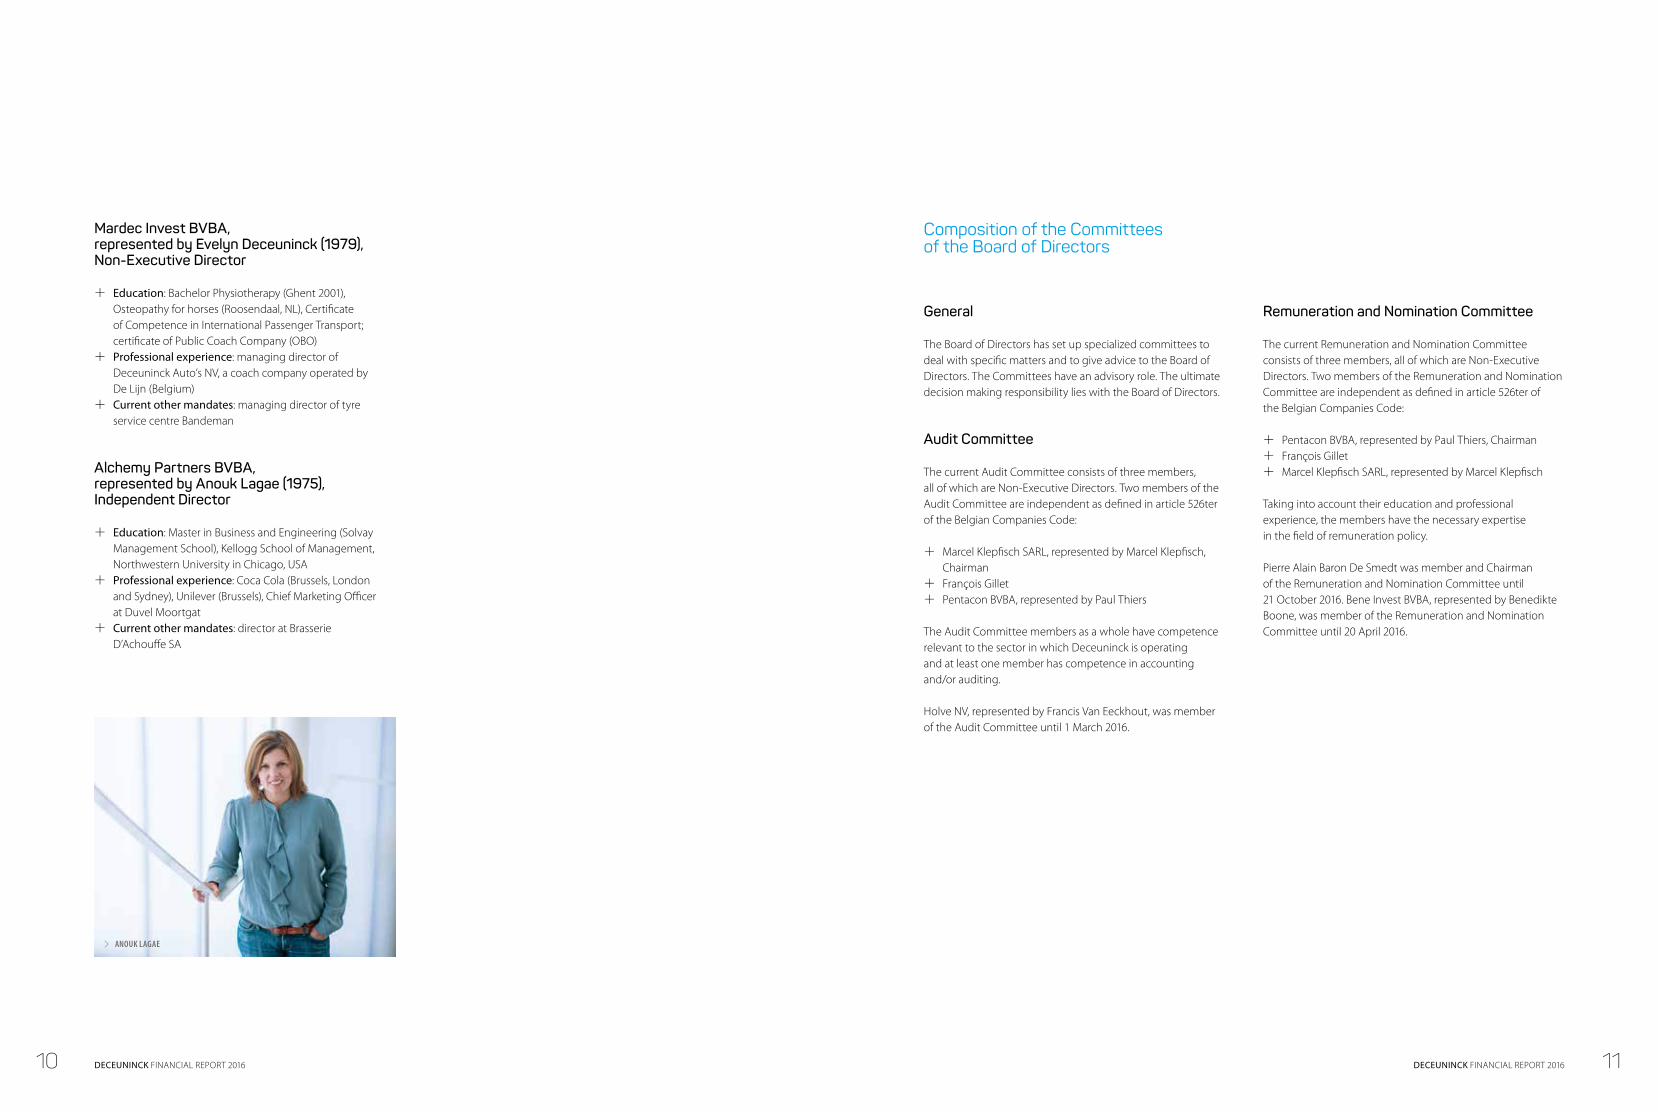
u ANOUK LAGAE
10 11DECEUNINCK FINANCIAL REPORT 2016 DECEUNINCK FINANCIAL REPORT 2016
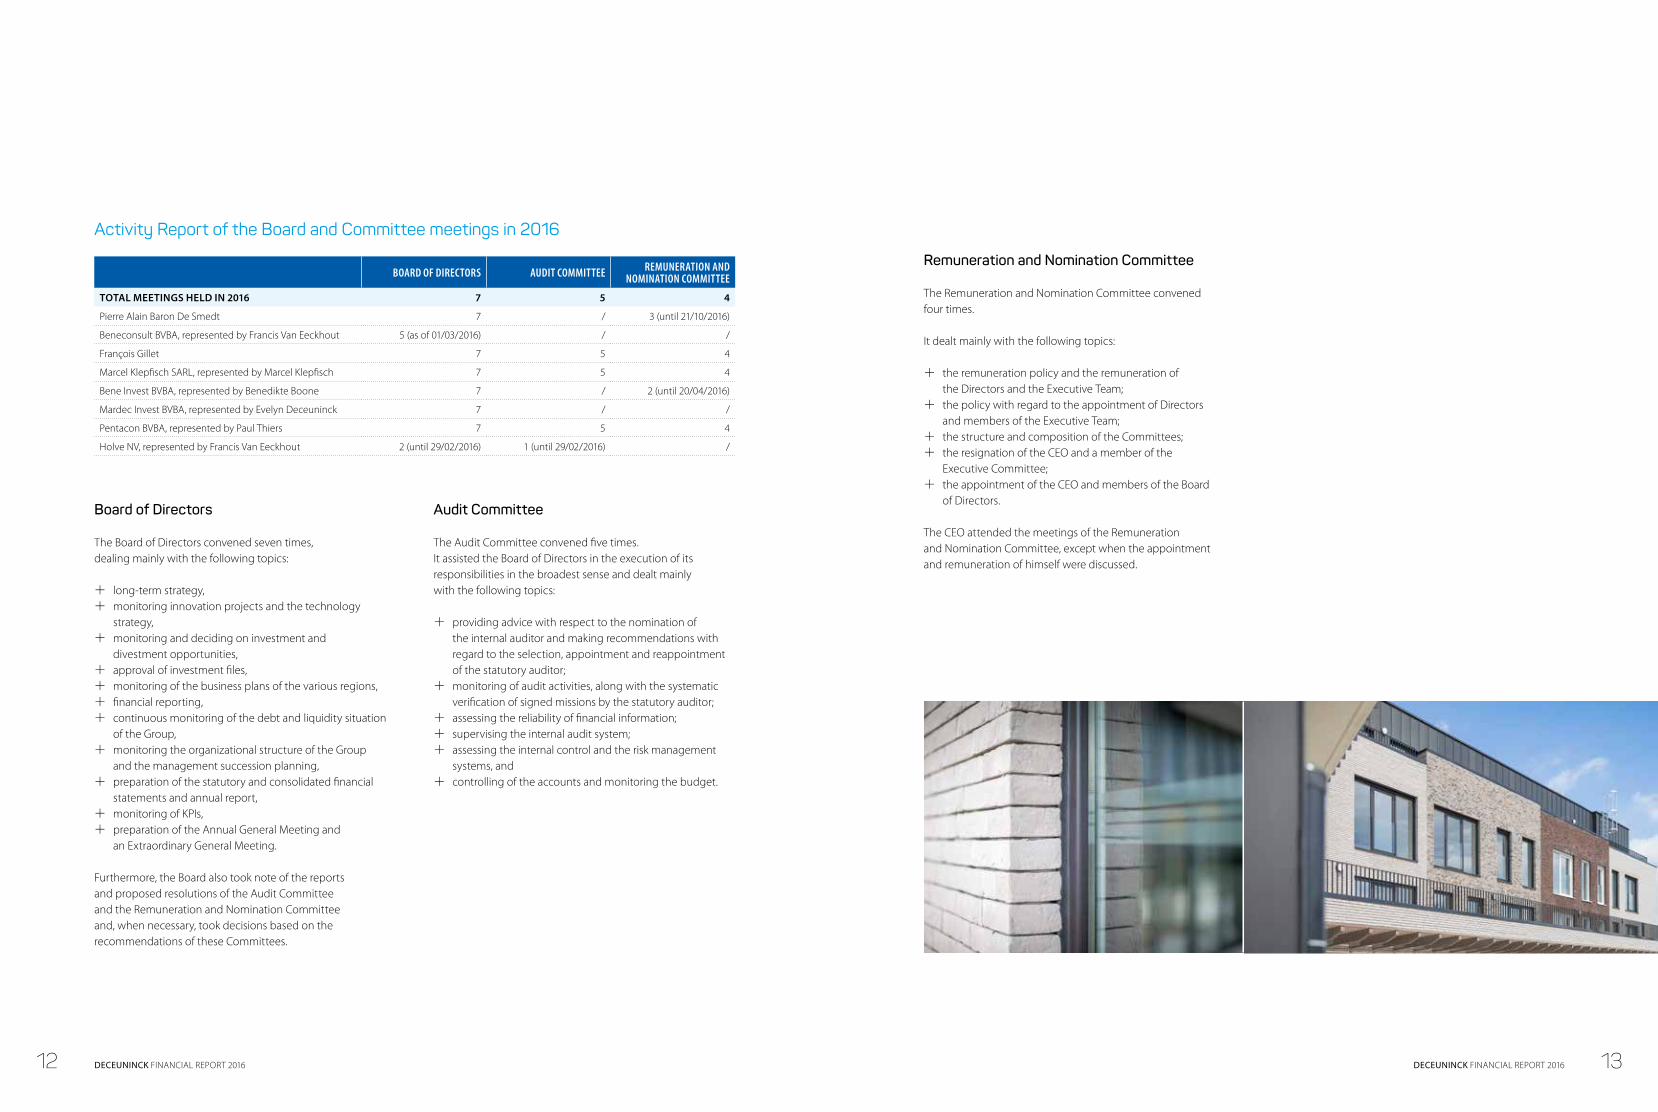
Activity Report of the Board and Committee meetings in 2016
BOARD OF DIRECTORS AUDIT COMMITTEE REMUNERATION AND NOMINATION COMMITTEE
TOTAL MEETINGS HELD IN 2016 7 5 4
Pierre Alain Baron De Smedt 7 / 3 (until 21/10/2016)
Beneconsult BVBA, represented by Francis Van Eeckhout 5 (as of 01/03/2016) / /
François Gillet 7 5 4
Marcel Klepfisch SARL, represented by Marcel Klepfisch 7 5 4
Bene Invest BVBA, represented by Benedikte Boone 7 / 2 (until 20/04/2016)
Mardec Invest BVBA, represented by Evelyn Deceuninck 7 / /
Pentacon BVBA, represented by Paul Thiers 7 5 4
Holve NV, represented by Francis Van Eeckhout 2 (until 29/02/2016) 1 (until 29/02/2016) /
Board of Directors
The Board of Directors convened seven times, dealing mainly with the following topics:
q long-term strategy, q monitoring innovation projects and the technology
strategy, q monitoring and deciding on investment and
divestment opportunities, q approval of investment files, q monitoring of the business plans of the various regions, q financial reporting, q continuous monitoring of the debt and liquidity situation
of the Group, q monitoring the organizational structure of the Group
and the management succession planning, q preparation of the statutory and consolidated financial
statements and annual report, q monitoring of KPIs, q preparation of the Annual General Meeting and
an Extraordinary General Meeting.
Furthermore, the Board also took note of the reports and proposed resolutions of the Audit Committee and the Remuneration and Nomination Committee and, when necessary, took decisions based on the recommendations of these Committees.
Audit Committee
The Audit Committee convened five times. It assisted the Board of Directors in the execution of its responsibilities in the broadest sense and dealt mainly with the following topics:
q providing advice with respect to the nomination of the internal auditor and making recommendations with regard to the selection, appointment and reappointment of the statutory auditor;
q monitoring of audit activities, along with the systematic verification of signed missions by the statutory auditor;
q assessing the reliability of financial information; q supervising the internal audit system; q assessing the internal control and the risk management
systems, and q controlling of the accounts and monitoring the budget.
Remuneration and Nomination Committee
The Remuneration and Nomination Committee convened four times.
It dealt mainly with the following topics:
q the remuneration policy and the remuneration of the Directors and the Executive Team;
q the policy with regard to the appointment of Directors and members of the Executive Team;
q the structure and composition of the Committees; q the resignation of the CEO and a member of the
Executive Committee; q the appointment of the CEO and members of the Board
of Directors.
The CEO attended the meetings of the Remuneration and Nomination Committee, except when the appointment and remuneration of himself were discussed.
12 13DECEUNINCK FINANCIAL REPORT 2016 DECEUNINCK FINANCIAL REPORT 2016
Composition of the Executive Team
The Executive Team is a Management Committee in accordance with article 524bis of the Belgian Companies Code. The Executive Team supports the CEO in the day-to-day operational management of the Group and the execution of its responsibilities in accordance with the values, strategies, policies, plans and budgets that are determined by the Board of Directors.
In 2016, Tom Debusschere Comm. VA, represented by Tom Debusschere, CEO and Yves Dubois, Director Southwest Europe & General Manager France, resigned as members of the Executive Team.
The regions Northwest Europe and Southwest Europe are merged into Western Europe as of 1 April 2017. The region will be led by DILEC BVBA, represented by Didier Leclercq.
Transactions between the Company and its Directors, not covered by the legal provisions governing conflicts of interest
Deceuninck’s policy regarding transactions and other contractual relations between the Company (including its affiliated companies) and its Directors, not covered by the conflict of interest rules set out in Articles 523, 524 or 524ter of the Belgian Companies Code is incorporated in the Corporate Governance Charter.
The Charter provides that every transaction between the Company (or any of its subsidiaries) with any Director must be approved in advance by the Board of Directors, whether or not such a transaction is subject to applicable legal rules. Such a transaction can only take place based on terms in accordance with market practices.
Policy for the prevention of market abuse
The Board has drawn up a dealing code regulating transactions and the disclosure of such transactions in shares of Deceuninck or in derivatives or other financial instruments linked to them carried out for their own account by persons discharging managerial responsibilities and certain key employees.
The principles of Deceuninck’s Dealing Code have been annexed to the Corporate Governance Charter.
Main features of the evaluation process of the Board, its Committees and the Directors
The Board of Directors is responsible for a regular evaluation of its own performance with a view to constantly improving the management of the group. To this end, the Board of Directors, led by its Chairman, carries out an evaluation of its scope, composition, activities and interaction with the Executive Team, preferably every three years.
The Board of Directors also assesses the functioning of the Committees and the individual Directors.
The evaluation process has four objectives:
q to assess the activities of the Board of Directors and of the relevant Committees;
q to check whether important issues are thoroughly prepared and discussed;
q to evaluate the actual contribution of the Board of Directors; and
q to assess the current composition of the Board of Directors or the Committees in light of the desired composition of the Board of Directors or the Committees.
On the basis of the results of the evaluation, the Chairman provides the Board of Directors with a report describing the strengths and weaknesses and, if necessary, propose the appointment of a new Director or the non-renewal of a Director’s mandate to the Remuneration and Nomination Committee.
A new performance evaluation process will start in June 2017, the results of which will be available by the end of 2017.
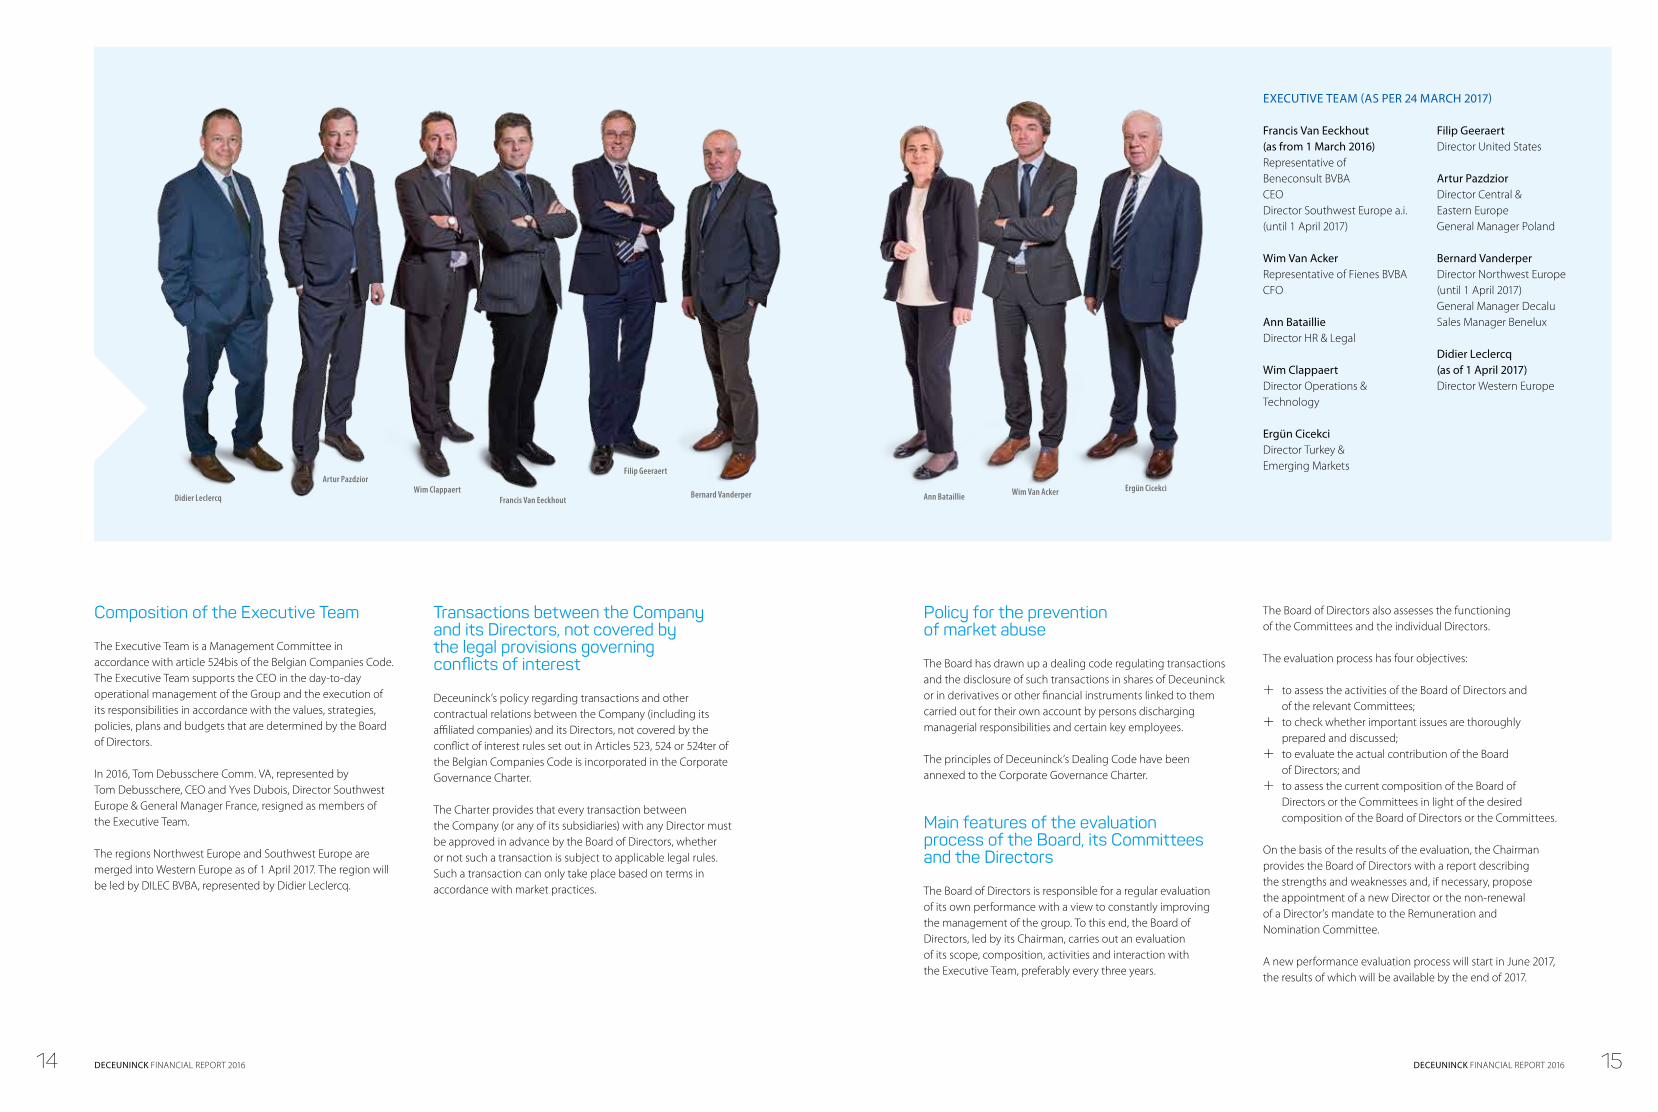
EXECUTIVE TEAM (AS PER 24 MARCH 2017)
Francis Van Eeckhout (as from 1 March 2016)Representative of Beneconsult BVBACEODirector Southwest Europe a.i. (until 1 April 2017)
Wim Van AckerRepresentative of Fienes BVBACFO
Ann BataillieDirector HR & Legal
Wim ClappaertDirector Operations & Technology
Ergün CicekciDirector Turkey & Emerging Markets
Filip GeeraertDirector United States
Artur PazdziorDirector Central & Eastern EuropeGeneral Manager Poland
Bernard VanderperDirector Northwest Europe (until 1 April 2017)General Manager DecaluSales Manager Benelux
Didier Leclercq (as of 1 April 2017)Director Western Europe
Ann BataillieFrancis Van EeckhoutWim Van AckerWim Clappaert
Artur Pazdzior
Didier Leclercq
Filip Geeraert
Bernard VanderperErgün Cicekci
14 15DECEUNINCK FINANCIAL REPORT 2016 DECEUNINCK FINANCIAL REPORT 2016

Remuneration Report
Procedure for developing the remuneration policy and for determining the remuneration granted to individual Directors and members of the Executive Team
Non-Executive Directors
The General Meeting of the Company fixes the remuneration of Directors following the proposal of the Board of Directors which is based on the recommendations of the Remuneration and Nomination Committee.
In line with the overall remuneration strategy of the Company, the Remuneration and Nomination Committee regularly establishes a benchmark for the remuneration of Non-Executive Directors with comparable Belgian listed companies. This is done in order to ensure that the remuneration is still appropriate, and in conformity with market practices, taking into account the size of the Company, its financial situation, its position within the Belgian economic environment, and the responsibilities that the Directors bear.
Members of the Executive Team
The remuneration of the members of the Executive Team, including the CEO, is determined by the Board of Directors based on the recommendations of the Remuneration and Nomination Committee. The aim of the general remuneration policy of the Group is to attract, retain and motivate competent and professional employees. For this reason, the amount of the remuneration is determined in proportion to the individual tasks and responsibilities. The Remuneration and Nomination Committee annually reviews and fixes the total compensation based on the strategic positioning of each of the functions versus the benchmark in the market and the expected market trends. Every two years, a thorough benchmark is conducted with comparable international companies of similar size and structure. The contribution made by members of the Executive Team to the development of the activities and the results of the Group constitutes an important part of the remuneration policy.
Declaration regarding the remuneration policy used for members of the Board and the Executive Team during 2016
Non-Executive Directors
Non-Executive Directors receive a fixed amount as remuneration for the execution of their mandate and a fixed amount for each Board meeting attended, limited to a maximum amount. Performance-based remuneration such as bonuses, stock-related incentive programs and fringe benefits are excluded. The amount of remuneration is different for the Chairman, the Vice-Chairman and the other Non-Executive Directors. If the Non-Executive Directors are also members of a Committee, their remuneration will be increased by a fixed amount per meeting of the relevant Committee.
The fixed remuneration remained unchanged in 2016.
(IN EUR) MIN/YEAR (FIX)
ALLOWANCE PER BOARD OF
DIRECTORS
ALLOWANCE PER COMMITTEE MAX/YEAR
Chairman 40,000 3,000 1,000 80,000
Vice-Chairman 30,000 1,500 1,000 60,000
Director 20,000 1,500 1,000 40,000
The Group does not issue any personal loans, guarantees, etc. to the members of the Board of Directors or the Executive Team.
If Directors are assigned special tasks and projects, they may receive an appropriate remuneration for this. No termination compensation is provided for Non-Executive Directors.
The Board of Directors will propose to the Annual General Meeting of 2017 to approve the possibility to grant warrants to Non-Executive Directors. Other than that, it is not the intention to make changes to the remuneration awarded to Non-Executive Directors in the two financial years to come.
Members of the Executive Team
The total remuneration of the Executive Team members consists of the following elements: the fixed remuneration, the short term variable remuneration, options and/or warrants.
FIXED REMUNERATIONThe fixed remuneration of the members of the Executive Team is determined according to their individual responsibilities and skills. It is awarded independently of any result.Part of this fixed remuneration may be used, at the discretion of the Executive Team member, for pension and insurance contributions like:
q the payment of a life endowment in favour of the insured person on the date of his retirement;
q the payment of a death benefit in case of death of the member prior to retirement, for the benefit of its beneficiaries (plus an additional benefit in case of accidental death);
q the payment of a disability annuity in case of accident or sickness (other than occupational), and;
q the exemption from insurance premiums in case of illness or accident.
q health insurance.
SHORT-TERM VARIABLE REMUNERATIONIn order to align the interests of the Group and its shareholders with the interests of Executive Team members, part of the remuneration package is linked to Group performance and another part to individual performance. By weighing both factors against each other in a responsible manner (70% corporate results / 30% individual results) a balance can be achieved between a result-oriented approach (Top Performance) and the manner in which these results are obtained (taking into account the core values, i.e. Candor, Top Performance and Entrepreneurship). If the manner in which results were obtained is not totally in line with the core values, the Remuneration and Nomination Committee reserves the right to decide not to pay any bonus.
For the members of the Executive Team, the performance of the Group (70%) is based on the EBITDA and on the Adjusted Free Cash Flow of the past financial year. The Board of Directors reviews these criteria annually on the proposal of the Remuneration and Nomination Committee, and may
revise them if necessary. For 2016, the evaluation criteria for the performance of the CEO and the other members of the Executive Team were: EBITDA Group (55%) and Adjusted Free Cash Flow Group (15%). For members of the Executive Team who bear an ultimate responsibility at a regional level, the EBITDA of the Group (15%), the EBITDA of the region (40%) and the Adjusted Free Cash Flow Region (15%) are taken into account to consider the performance.
The individual performance (30%) is based on a clearly defined evaluation system that is built around the achievement of specific measurable individual targets, the realization of important key figures and compliance with core values which are important to the Group. All the targets must always be in line with the group strategy, the business plan, the core values and the guidelines. The individual targets are set annually during individual interviews at the start of the financial year. The Remuneration and Nomination Committee evaluated the achievement of the 2016 objectives for the members of the Executive Team and proposed to the Board of Directors to pay a short-term variable remuneration based on the 2016 performance criteria.
The short-term variable remuneration is in principle 30% of the fixed annual remuneration for the members of the Executive Team and 75% of the annual fixed remuneration of the CEO. This percentage may be exceeded as far as the Group results are concerned, but should never exceed 37.65% (for the members of the Executive Team) or 97.5% (for the CEO). The variable remuneration related to the Group objectives are only granted if 90% or more of the pre-established financial targets have been achieved.
The basis for the variable remuneration is the remuneration earned during the financial year. The payment takes place end of March of the following year.
The variable remuneration is not spread over time. The Extraordinary General Meeting of the Company of 16 December 2011 decided that the Company is not bound by the limitations of the rules of article 520ter paragraph 2 of the Belgian Companies Code concerning the spreading of the variable remuneration of the Directors, the CEO and members of the Executive Team, over time.
16 17DECEUNINCK FINANCIAL REPORT 2016 DECEUNINCK FINANCIAL REPORT 2016

STOCK OPTIONS AND WARRANTSThe Company also offers options and/or warrants on shares of the Company. The purpose of this kind of remuneration is to motivate and retain employees who (can) have a significant impact on the Group results in the medium-term. When granting options and/or warrants, due account is taken of the strategic impact of the function that the employee performs and his/her future (growth) potential. The underlying philosophy of this form of remuneration is to raise Deceuninck’s value to the maximum extent in the long term, by linking the interests of the warrant holders to those of shareholders, and to strengthen the long-term vision of the management. In this context, the exercise period of an option and warrant is max. 10 years. The stock options and warrants can only be exercised the 3rd year following the year in which the options and warrants were offered. If they are not exercised at the end of the exercise period, they are, ipso facto, reduced to zero, and lose all value.
One third of the warrants/options are each time released for exercise in the fourth, in the fifth and in the sixth calendar year after the year in which the offer has been made up to the end of the term.
In the event of voluntary or involuntary dismissal (except in case of termination of contract for cause), the accepted and acquired stock options/warrants can only be exercised during the first exercise period following the date of the termination of contract. The options/warrants that are not acquired shall be cancelled. In the event of involuntary dismissal for cause, the unexercised, accepted stock options and warrants are cancelled, whether or not they were acquired. These terms and conditions relating to the acquisition and exercise of options and warrants in the event of voluntary or involuntary dismissal can be applied without prejudice to the competence of the Board of Directors to make changes to these stipulations to the advantage of the beneficiary, based on objective and relevant criteria. If the employment agreement ends due to legal retirement or end of career, the warrants/options shall remain exercisable. The shares that may be acquired in connection with the exercise of the options/warrants are listed on Euronext Brussels. They are of the same type and have the same rights as the existing ordinary Deceuninck shares. The members of the Executive Team have no other remuneration linked to shares.
As of next year, the members of the Executive Team, not including the CEO, will be eligible for a bonus of 35% of their annual fixed fee. Other than that, it is not the intention to make any changes to the remuneration awarded to the members of the Executive Team in the two financial years to come.
Remuneration of the Non-Executive Directors in 2016
The total remuneration (gross) paid to the non-executive members of the Board of Directors in the financial year 2016 amounted to € 259,500. The amount includes an additional remuneration for the attendance at Committee meetings.
In 2016, the Company or any affiliated Company of the Group did not grant any loans to any of the Directors, nor are there any outstanding repayments owed by the Directors to the Company or any affiliated Company of the Group.
BOARD AUDIT COMMITTEEREMUNERATION
AND NOMINATION COMMITTEE
FIXED REMUNERATION
TOTAL GROSS REMUNERATION
Pierre Alain Baron De Smedt € 21,000 - € 3,000 € 40,000 € 64,000
François Gillet € 10,500 € 5,000 € 4,000 € 30,000 € 49,500
Marcel Klepfisch SARL, represented by Marcel Klepfisch
€ 10,500 € 5,000 € 4,000 € 20,000 € 39,500
Bene Invest BVBA, represented by Benedikte Boone
€ 10,500 - € 2,000 € 20,000 € 32,500
Mardec Invest BVBA, represented by Evelyn Deceuninck
€ 10,500 - - € 20,000 € 30,500
Pentacon BVBA, represented by Paul Thiers
€ 10,500 € 5,000 € 4,000 € 20,000 € 39,500
Holve NV, represented by Francis Van Eeckhout (until 29 February 2016)
€ 3,000 € 1,000 - - € 4,000
Beneconsult BVBA, represented by Francis Van Eeckhout (as of 1 March 2016)
- - - - -
The member of the Executive Team who is also a member of the Board as executive director, Beneconsult BVBA, represented by Francis Van Eeckhout, did not receive either a fixed remuneration or any attendance fees.
18 19DECEUNINCK FINANCIAL REPORT 2016 DECEUNINCK FINANCIAL REPORT 2016
Shares, stock options and other rights to acquire Deceuninck shares that were granted, exercised or that have lapsed during 2016
Stock options
The Extraordinary General Meeting of October 2006 approved a stock option plan on existing shares under which the Board of Directors is authorized to allocate 75,000 options on existing shares each year.
In 2016, no stock options were granted to the members of the Executive Team, no stock options were exercised by the members of the Executive Team and no stock options lapsed.
Warrants
The Extraordinary General Meeting of 16 December 2015 approved a warrant plan for 2015 for the issue of 3,000,000 warrants (‘Warrant Plan 2015’), 1,255,000 warrants of which were offered by the Board of Directors on 21 December 2016. The members of the Executive Team were offered 710,000 warrants of this Warrant Plan 2015, granted as follows: q The CEO was offered 500,000 warrants q Each member of the Executive Team was offered
30,000 warrants.
The warrants offered in 2016 have an exercise price of € 2,395 (for the members of the Executive Team and the CEO).
In 2016, Filip Geeraert exercised 10,834 warrants.No warrants of the members of the Executive Team lapsed during 2016.
Right of recovery
The stipulations of the agreements between the Company and the CEO and the members of the Executive Team do not contain recovery clauses.
Severance Pay
For the members of the Executive Team and the CEO, special severance pay conditions of 12 months base salary have been agreed in the management agreements. No special agreements that could deviate from the applicable current employment laws and practice were made with the regional managers in France, North America and Turkey.
Tom Debusschere Comm. V., represented by Tom Debusschere, and Yves Dubois both received severance pay amounting to 12 months base salary.
Remuneration of the CEO and the members of the Executive Team in 2016
CEO
The former CEO received a monthly fee of € 44,358 (or € 532.296 annually) at the time of departure. At the time of his appointment, the current CEO, Beneconsult BVBA, represented by Francis Van Eeckhout, decided to hand in 20% of the CEO remuneration compared to the remuneration received by the former CEO. In 2016, the CEO received a fixed remuneration in the amount of € 383,400. This amount also includes a pension allowance, which can be contributed for pension plans or for insurance, at the sole discretion of the CEO. The variable remuneration, acquired in 2016 and paid in 2017, amounted to € 263,534.The CEO does not have a company car.
Members of the Executive Team
The members of the Executive Team (including 1 member that left the Company in December 2016 and excluding the CEO) received a remuneration of € 2,521,475, including a variable remuneration of € 462,376 based on the performance criteria for 2016. This variable remuneration was paid in February 2017. The remuneration package awarded to members of the Executive Team does not include a long-term cash bonus. This amount also includes a pension allowance, which can be contributed for pension plans or for insurance, at the sole discretion of the members of the Executive Team.
Deceuninck provides a company car to the members of the Executive Team, except for the members acting through a management company. In this context, the Company tries to achieve a maximum balance between the representative attributes of the car and the personal needs of the members of the Executive Team. Under the Environments charter, the environmental impact, including consumption and CO2 emissions, plays a substantial role during the selection of these types of cars.
20 21DECEUNINCK FINANCIAL REPORT 2016 DECEUNINCK FINANCIAL REPORT 2016
Internal control and risk management systems
Main features
The most important features and elements of the internal control and risk management systems, including the financial reporting, implemented by management, can be summarised as follows:
q Distributing and updating an accounting manual and developing further specific elements as required;
q Defining targets for permanent follow-up on the activities, the operational results, the use of working capital and the financial position of the Group and the individual companies;
q Constant evaluation of the past and forecasting the most important future targets;
q Following up on exchange rate risks with actions to manage the risks;
q Defining the company’s policies and procedures for compliance with applicable laws and regulations;
q Clear procedures on authorisation, reviewed for compliance by the internal audit department;
q Managing information technology systems; q Discussion of internal audit reports with the internal
auditor and, if required, further consultation for additional information and clarification as well as taking measures in order to implement and be compliant with the recommendations;
q Constant monitoring of raw material prices; q Requesting statements and confirmation from the local
general managers to ensure that they comply with the applicable laws and regulations and internal procedures of the company;
q Monitoring and regular discussion with the legal department of litigation that could be of material significance.
Deceuninck’s core values are Candor, Top Performance and Entrepreneurship. Taking calculated risks is an integral part of operational management. The purpose of risk management is to identify and to manage the risks.
Risk framework
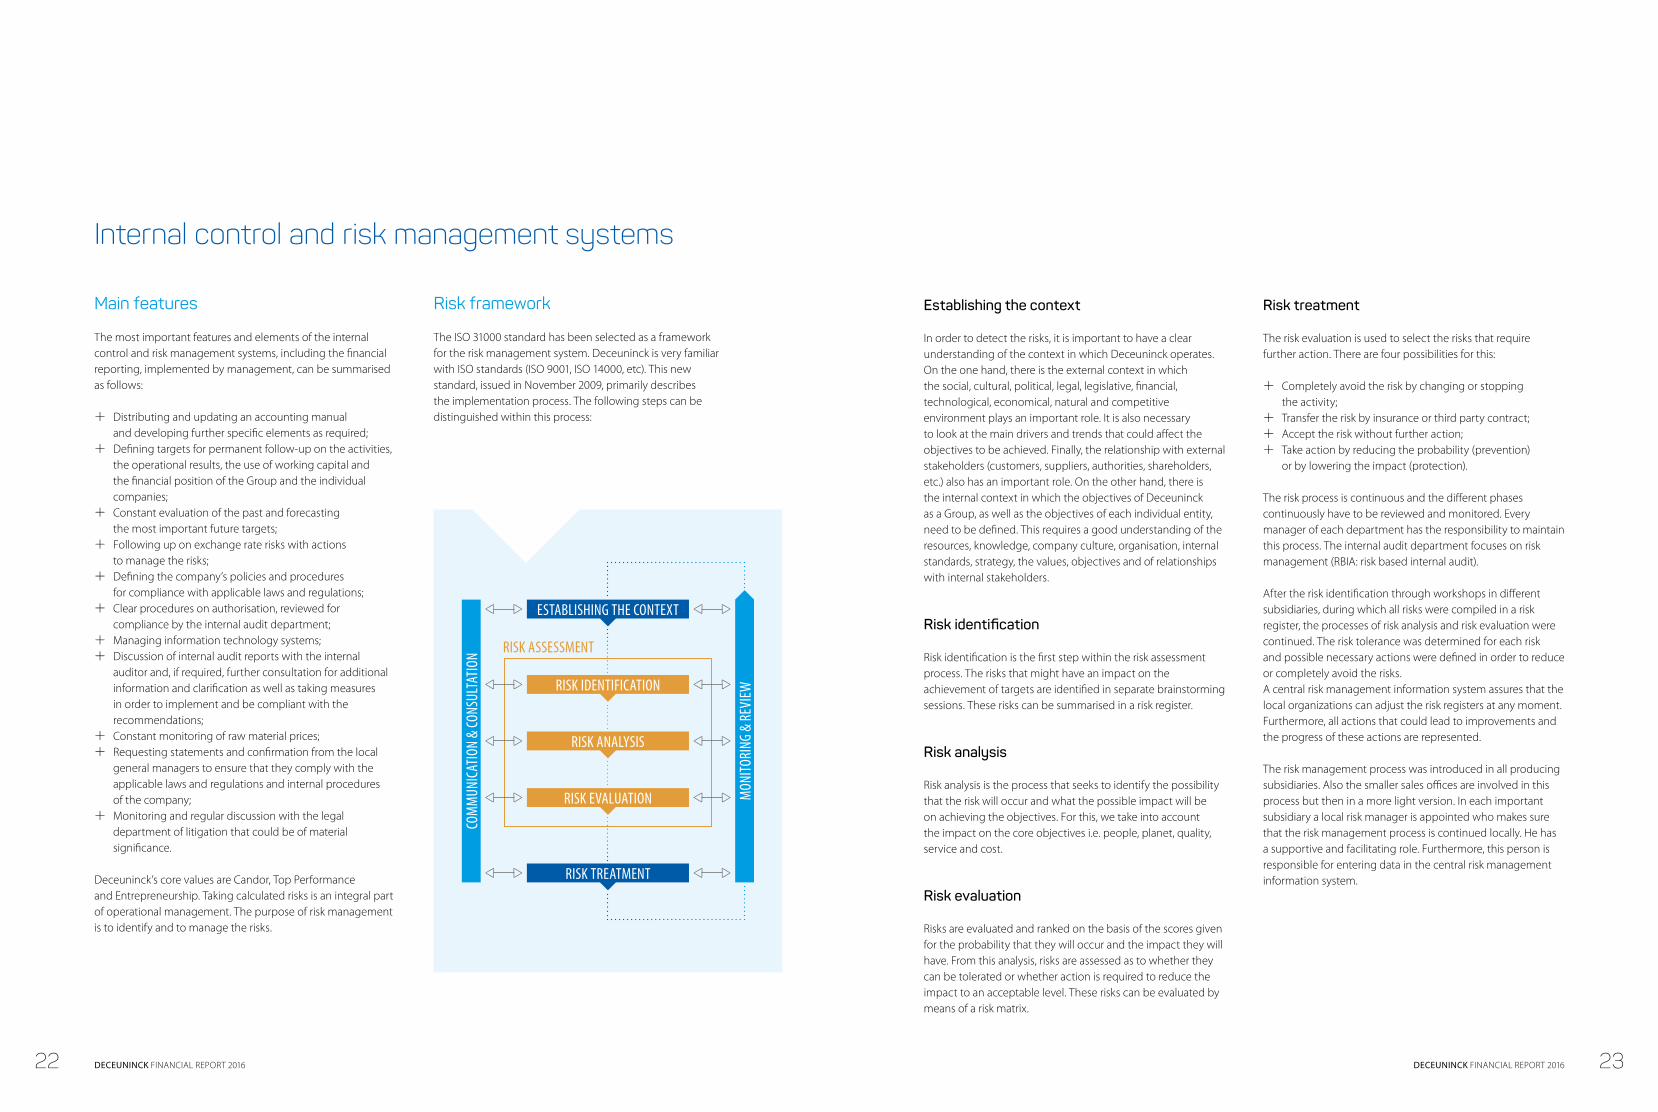
The ISO 31000 standard has been selected as a framework for the risk management system. Deceuninck is very familiar with ISO standards (ISO 9001, ISO 14000, etc). This new standard, issued in November 2009, primarily describes the implementation process. The following steps can be distinguished within this process:
Establishing the context
In order to detect the risks, it is important to have a clear understanding of the context in which Deceuninck operates. On the one hand, there is the external context in which the social, cultural, political, legal, legislative, financial, technological, economical, natural and competitive environment plays an important role. It is also necessary to look at the main drivers and trends that could affect the objectives to be achieved. Finally, the relationship with external stakeholders (customers, suppliers, authorities, shareholders, etc.) also has an important role. On the other hand, there is the internal context in which the objectives of Deceuninck as a Group, as well as the objectives of each individual entity, need to be defined. This requires a good understanding of the resources, knowledge, company culture, organisation, internal standards, strategy, the values, objectives and of relationships with internal stakeholders.
Risk identification
Risk identification is the first step within the risk assessment process. The risks that might have an impact on the achievement of targets are identified in separate brainstorming sessions. These risks can be summarised in a risk register.
Risk analysis
Risk analysis is the process that seeks to identify the possibility that the risk will occur and what the possible impact will be on achieving the objectives. For this, we take into account the impact on the core objectives i.e. people, planet, quality, service and cost.
Risk evaluation
Risks are evaluated and ranked on the basis of the scores given for the probability that they will occur and the impact they will have. From this analysis, risks are assessed as to whether they can be tolerated or whether action is required to reduce the impact to an acceptable level. These risks can be evaluated by means of a risk matrix.
Risk treatment
The risk evaluation is used to select the risks that require further action. There are four possibilities for this:
q Completely avoid the risk by changing or stopping the activity;
q Transfer the risk by insurance or third party contract; q Accept the risk without further action; q Take action by reducing the probability (prevention)
or by lowering the impact (protection).
The risk process is continuous and the different phases continuously have to be reviewed and monitored. Every manager of each department has the responsibility to maintain this process. The internal audit department focuses on risk management (RBIA: risk based internal audit).
After the risk identification through workshops in different subsidiaries, during which all risks were compiled in a risk register, the processes of risk analysis and risk evaluation were continued. The risk tolerance was determined for each risk and possible necessary actions were defined in order to reduce or completely avoid the risks.A central risk management information system assures that the local organizations can adjust the risk registers at any moment. Furthermore, all actions that could lead to improvements and the progress of these actions are represented.
The risk management process was introduced in all producing subsidiaries. Also the smaller sales offices are involved in this process but then in a more light version. In each important subsidiary a local risk manager is appointed who makes sure that the risk management process is continued locally. He has a supportive and facilitating role. Furthermore, this person is responsible for entering data in the central risk management information system.
ESTABLISHING THE CONTEXT
RISK IDENTIFICATION
RISK ANALYSIS
RISK EVALUATION
RISK TREATMENT
COM
MUN
ICAT
ION
& CO
NSUL
TATIO
N RISK ASSESSMENT
MON
ITORI
NG &
REVI
EW
22 23DECEUNINCK FINANCIAL REPORT 2016 DECEUNINCK FINANCIAL REPORT 2016
Risk structure
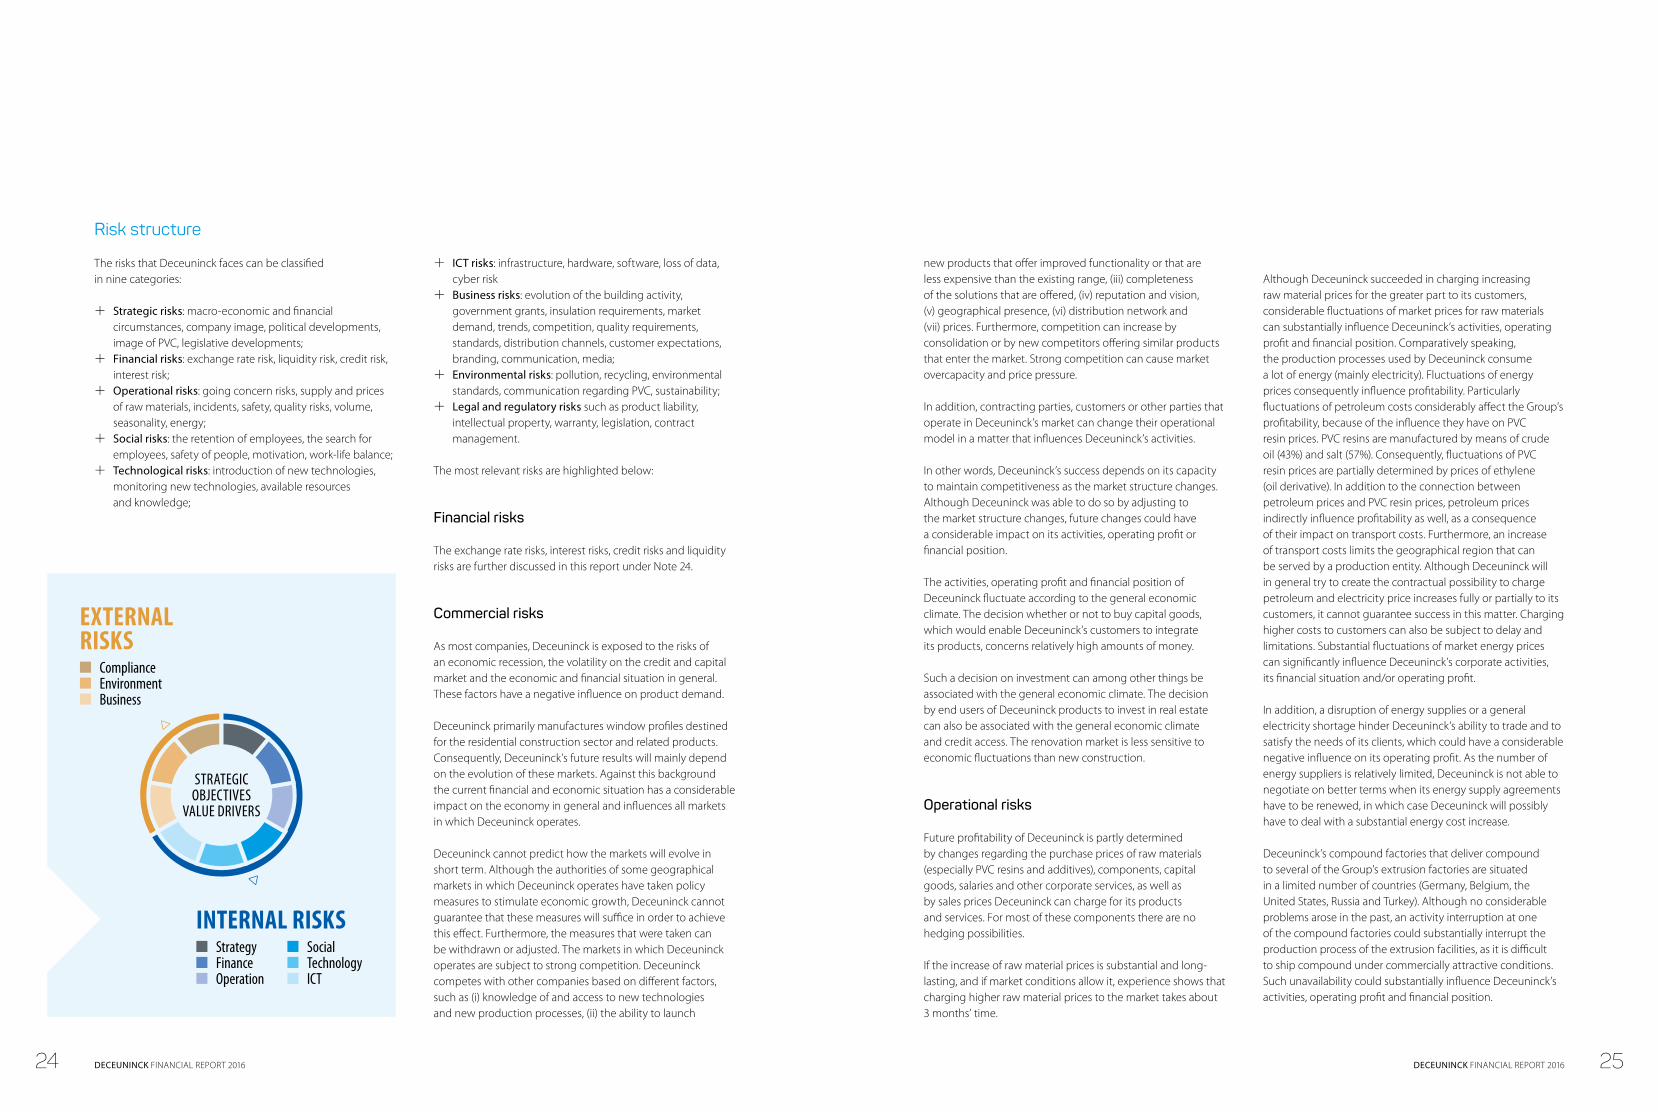
The risks that Deceuninck faces can be classified in nine categories:
q Strategic risks: macro-economic and financial circumstances, company image, political developments, image of PVC, legislative developments;
q Financial risks: exchange rate risk, liquidity risk, credit risk, interest risk;
q Operational risks: going concern risks, supply and prices of raw materials, incidents, safety, quality risks, volume, seasonality, energy;
q Social risks: the retention of employees, the search for employees, safety of people, motivation, work-life balance;
q Technological risks: introduction of new technologies, monitoring new technologies, available resources and knowledge;
q ICT risks: infrastructure, hardware, software, loss of data, cyber risk
q Business risks: evolution of the building activity, government grants, insulation requirements, market demand, trends, competition, quality requirements, standards, distribution channels, customer expectations, branding, communication, media;
q Environmental risks: pollution, recycling, environmental standards, communication regarding PVC, sustainability;
q Legal and regulatory risks such as product liability, intellectual property, warranty, legislation, contract management.
The most relevant risks are highlighted below:
Financial risks
The exchange rate risks, interest risks, credit risks and liquidity risks are further discussed in this report under Note 24.
Commercial risks
As most companies, Deceuninck is exposed to the risks of an economic recession, the volatility on the credit and capital market and the economic and financial situation in general. These factors have a negative influence on product demand.
Deceuninck primarily manufactures window profiles destined for the residential construction sector and related products. Consequently, Deceuninck’s future results will mainly depend on the evolution of these markets. Against this background the current financial and economic situation has a considerable impact on the economy in general and influences all markets in which Deceuninck operates.
Deceuninck cannot predict how the markets will evolve in short term. Although the authorities of some geographical markets in which Deceuninck operates have taken policy measures to stimulate economic growth, Deceuninck cannot guarantee that these measures will suffice in order to achieve this effect. Furthermore, the measures that were taken can be withdrawn or adjusted. The markets in which Deceuninck operates are subject to strong competition. Deceuninck competes with other companies based on different factors, such as (i) knowledge of and access to new technologies and new production processes, (ii) the ability to launch
new products that offer improved functionality or that are less expensive than the existing range, (iii) completeness of the solutions that are offered, (iv) reputation and vision, (v) geographical presence, (vi) distribution network and (vii) prices. Furthermore, competition can increase by consolidation or by new competitors offering similar products that enter the market. Strong competition can cause market overcapacity and price pressure.
In addition, contracting parties, customers or other parties that operate in Deceuninck’s market can change their operational model in a matter that influences Deceuninck’s activities.
In other words, Deceuninck’s success depends on its capacity to maintain competitiveness as the market structure changes. Although Deceuninck was able to do so by adjusting to the market structure changes, future changes could have a considerable impact on its activities, operating profit or financial position.
The activities, operating profit and financial position of Deceuninck fluctuate according to the general economic climate. The decision whether or not to buy capital goods, which would enable Deceuninck’s customers to integrate its products, concerns relatively high amounts of money.
Such a decision on investment can among other things be associated with the general economic climate. The decision by end users of Deceuninck products to invest in real estate can also be associated with the general economic climate and credit access. The renovation market is less sensitive to economic fluctuations than new construction.
Operational risks
Future profitability of Deceuninck is partly determined by changes regarding the purchase prices of raw materials (especially PVC resins and additives), components, capital goods, salaries and other corporate services, as well as by sales prices Deceuninck can charge for its products and services. For most of these components there are no hedging possibilities.
If the increase of raw material prices is substantial and long-lasting, and if market conditions allow it, experience shows that charging higher raw material prices to the market takes about 3 months’ time.
Although Deceuninck succeeded in charging increasing raw material prices for the greater part to its customers, considerable fluctuations of market prices for raw materials can substantially influence Deceuninck’s activities, operating profit and financial position. Comparatively speaking, the production processes used by Deceuninck consume a lot of energy (mainly electricity). Fluctuations of energy prices consequently influence profitability. Particularly fluctuations of petroleum costs considerably affect the Group’s profitability, because of the influence they have on PVC resin prices. PVC resins are manufactured by means of crude oil (43%) and salt (57%). Consequently, fluctuations of PVC resin prices are partially determined by prices of ethylene (oil derivative). In addition to the connection between petroleum prices and PVC resin prices, petroleum prices indirectly influence profitability as well, as a consequence of their impact on transport costs. Furthermore, an increase of transport costs limits the geographical region that can be served by a production entity. Although Deceuninck will in general try to create the contractual possibility to charge petroleum and electricity price increases fully or partially to its customers, it cannot guarantee success in this matter. Charging higher costs to customers can also be subject to delay and limitations. Substantial fluctuations of market energy prices can significantly influence Deceuninck’s corporate activities, its financial situation and/or operating profit.
In addition, a disruption of energy supplies or a general electricity shortage hinder Deceuninck’s ability to trade and to satisfy the needs of its clients, which could have a considerable negative influence on its operating profit. As the number of energy suppliers is relatively limited, Deceuninck is not able to negotiate on better terms when its energy supply agreements have to be renewed, in which case Deceuninck will possibly have to deal with a substantial energy cost increase.
Deceuninck’s compound factories that deliver compound to several of the Group’s extrusion factories are situated in a limited number of countries (Germany, Belgium, the United States, Russia and Turkey). Although no considerable problems arose in the past, an activity interruption at one of the compound factories could substantially interrupt the production process of the extrusion facilities, as it is difficult to ship compound under commercially attractive conditions. Such unavailability could substantially influence Deceuninck’s activities, operating profit and financial position.
INTERNAL RISKS ■ Strategy■ Finance■ Operation
■ Social■ Technology■ ICT
STRATEGIC OBJECTIVES
VALUE DRIVERS
EXTERNAL RISKS ■ Compliance■ Environment■ Business
◁
◁
24 25DECEUNINCK FINANCIAL REPORT 2016 DECEUNINCK FINANCIAL REPORT 2016
Deceuninck wants to continue to grow, through organic growth on the one hand, and through the acquisition of companies on the other hand. There is a possible risk of non-corresponding corporate cultures in the acquired companies, of synergies that are not fully realized as expected, of reorganizations that turn out to be more expensive than initially expected or of acquired companies that are more difficult to integrate than expected. The preceding factors can substantially influence the Group’s activities, operating profit and financial position.
Legal and compliance risks
Deceuninck relies on a combination of trademarks, trade names, trade secrets, patents and knowhow to define and protect its intellectual property rights of its products and operational processes. So it is of the utmost importance that Deceuninck is able to continue to use its intellectual properties and to sufficiently protect all valuable intellectual properties by acting against violations of its intellectual property rights, by maintaining trade secrets and by using the available legal means such as trademarks, patents and design registrations. Although there are no important disputes, the Company cannot exclude judicial procedures in order protect to its rights.
In case the above-mentioned methods cannot sufficiently protect Deceuninck’s intellectual property rights in its most important markets or in case the protection is no longer valid, third parties (competitors included) could commercialize its innovations or products or use its knowhow, which could affect Deceuninck’s activities and/or operating results.Deceuninck cannot guarantee that all trademarks and patents that are applied for will be approved in the future. Deceuninck cannot exclude the risk that certain trademark and patent registrations of Deceuninck will expire should Deceuninck not succeed in extending such trademark and patent registrations. In certain geographical markets it might be more difficult for Deceuninck to obtain property rights.
Deceuninck’s success will partially depend on its ability to exercise its activities without infringing on third parties’ property rights, or without unlawfully appropriating those rights. Although there are currently no important claims against Deceuninck regarding the violation of intellectual property rights, Deceuninck cannot guarantee that it will not (unintentionally) infringe on third parties’ patents from time to time. Deceuninck might be obliged to spend a lot of time
and efforts or might incur judicial costs should the Company have to deal with legal claims on intellectual property rights, irrespective of their justifiability.
If Deceuninck indeed infringes or has infringed on patents or other intellectual property rights of third parties, it can be subject to substantial insurance claims that could impact the Group’s cash flow, activities, financial situation or operating results. The Group might also be required to put a halt to the development, use or sales of the product or process concerned. It might also need to obtain a license in order to be able to use the disputed rights, which is not available at commercially reasonable conditions or not available at all. To reduce probability of such a violation, the management has implemented a process to continuously examine possible infringements of patents and intellectual property rights.
Deceuninck’s activities are subject to possible product liability risks that are characteristic to the production and distribution of its products. Product liability can also apply to new products that will be manufactured or distributed in the future. A possible insufficiency of the product liability insurance to cover product liability claims could substantially influence the Group’s activities, financial situation and operating results. Furthermore, defense against such claims can exert considerable pressure on the management, considerable damages can be claimed or Deceuninck’s reputation can be influenced negatively, even if the Group’s defense against such claims regarding the products they put on the market is successful.
External audit
2016
The statutory auditor, Ernst & Young Bedrijfsrevisoren BCBVA, represented by Marnix Van Dooren, was appointed for a period of three years at the General Annual General Meeting 2014, which means until the closing of the Annual General Meeting of 2017. The overall fee paid to Ernst & Young for the consolidated accounts of Deceuninck in 2016 amounted to € 540,500.
Proposal to re-appoint the statutory auditor in 2017
On the recommendation of the Audit Committee, the Board will propose to the General Annual Meeting to re-appoint Ernst & Young Bedrijfsrevisoren BCBVA, represented by Marnix Van Dooren, as statutory auditor for a period of three years.
The fees paid to the statutory auditor will amount to € 566,410 for financial year 2017, € 546,108 for financial year 2018 and to € 551,930 for financial year 2019.
Gender diversityDeceuninck complies with the rules on gender diversity in the composition of the Board of Directors.
In accordance with the Law of 28 July 2011, at least one-third of the Board’s members must be of a different gender than the other members, by no later than 1 January 2019.
On 31 December 2016, two women and five men were member of the Board. On 24 March 2017, the Board consists of three women and five men.
Transactions between related parties
General
Each Director and each member of the Executive Team are encouraged to arrange their personal and business interests so that there is no direct or indirect conflict of interest with the Group. Deceuninck has no knowledge of any potential conflict of interest affecting the members of the Board of Directors and the Executive Team between any of their duties to the Group and their private and/or other duties.
Directors’ conflicts of interest
The conflict of interest settlement procedure of article 523 of the Belgian Companies Code was not applied in 2016.
Transactions with affiliated companies
The conflict of interest settlement procedure of article 524 of the Belgian Companies Code was not applied in 2016.
26 27DECEUNINCK FINANCIAL REPORT 2016 DECEUNINCK FINANCIAL REPORT 2016

Article 34 of the Belgian Royal Decree of 14 November 2007 concerning the obligations of issuers of financial instruments admitted to trading on a regulated market
Capital structure on 31 December 2016
The share capital was fully paid up and was represented by 135,382,446 shares without nominal value.
Restrictions on transferring securities as laid down by law or the Articles of Association
The Company offers stock options and warrants on shares of the Company. Stock options and warrants are assigned personally and are not transferable, except in case of decease of the holder.
Holders of any securities with special control rights
None
Systems of control of any employee share scheme where the control rights are not exercised directly by the employees
None
Restrictions on exercising voting rights as laid down by law or the Articles of Association
The voting rights attached to the shares held by Deceuninck and its direct and indirect subsidiaries are suspended. At 31 December 2016, these rights were suspended for 102,121 shares (0.08% of the shares in circulation at that time).
Shareholder agreements known to Deceuninck NV that could restrict the transfer of securities and/or the exercise of voting rights
None
Rules governing the appointment and replacement of Board members and the amendment of the Articles of Association of Deceuninck NV
The members of the Board of Directors are appointed by the General Meeting of Shareholders. Their initial term of office lasts maximum 4 years (based on the Company’s Corporate Governance Charter) but can be renewed. The Remuneration and Nomination Committee presents one or more candidates, considering the needs of the Company and taking into account the nomination and selection criteria established by the Board of Directors. In the composition of the Board of Directors an appropriate balance is sought, based on (a.o.) gender, skills, experience and knowledge.
The age limit for Directors is set at 70 years at the time of the (re)appointment. In principle, a Director’s term ends after the Annual General Meeting, at which moment his or her mandate can be considered ended.
The amendment of Deceuninck’s Articles of Association is to be executed in accordance with legal provisions of the Belgian Companies Code. In 2016, the Articles of Association were amended by the Extraordinary General Meeting held on 21 December 2016. All documents can be found at www.deceuninck.com/investors.
Powers of the Board with regard to the issue and repurchase of treasury shares
At the Extraordinary General Meeting of 21 December 2016, it was decided to grant the Board of Directors the authority to acquire treasury shares, by purchase or exchange, directly or by intervention of a person who acts in his own name but at the expense of the Company at a minimum price of € 1.00 and at a maximum price of € 10.00, provided that by doing so, not for a moment the Company possesses treasury shares whose nominal value is higher than 20% of the Company’s subscribed capital. No preceding decision by the General Meeting is necessary in case the acquisition of stocks occurs in order to offer them to the Company’s staff.
Furthermore, the Board of Directors is authorized to sell these shares without being bound to above-mentioned price and time limitations.
This authorization is valid for a period of five years starting on 21 December 2016 and can be renewed in accordance with article 620 of the Belgian Companies Code.
During the financial year 2016, no treasury shares were purchased.
At the Extraordinary General Meeting of 21 December 2016, it was decided to grant the Board of Directors the authority to acquire or sell treasury shares, profit-sharing bonds or certificates which relate to these bonds, according to articles
620 and the following of the Companies Code, when the acquisition or alienation is necessary to avoid threatening serious damages to the Company. This authorization is valid for a period of three years as from its publication in the Annexed to the Belgian Official Gazette and can be renewed in accordance with article 620 of the Companies Code.
Authorised capital
The Board of Directors is authorized, for a period of 5 years as from the date of publication of the deed concerning the modification of the articles of association dated 21 December 2016, to increase the Company’s issued capital on one or several occasions to a maximum amount of € 53,324,946.55. This capital increase can take place in conformity with the conditions determined by the Board of Directors by a cash contribution, a contribution in kind, an incorporation of the reserves or share premiums, with or without the issuance of new shares, as well as by issuing debt securities that can be converted to shares on one or several occasions, debt securities with warrants or warrants that whether or not are linked to other stocks. However, the capital increase as decided by the Board of Directors cannot be reimbursed by shares without indication of nominal value issued below accountable par value of the old shares.
The Extraordinary General Meeting of 21 December 2016 authorized the Board of Directors, for a period of 3 years, under the conditions and within the limitations of article 607 of the
28 29DECEUNINCK FINANCIAL REPORT 2016 DECEUNINCK FINANCIAL REPORT 2016
Belgian Companies Code, to use the authorised capital in case of notification by the Financial Services and Markets Authority (FSMA) of a public takeover bid on the Company’s shares. The Board of Directors determines the data and conditions of the instructed capital increases in application of the foregoing, including the possible payment of issue premiums.
If the foregoing occurs (including for the issuance of convertible debt securities or warrants), the Board of Directors determines, in accordance with articles 592 and following of the Belgian Companies Code, the term and other conditions concerning the exercise of the shareholder’s preferential rights as assigned by the law.
Furthermore, it can, in accordance with articles 592 and following, in the Company’s interest and under the conditions determined by law, limit or cancel the shareholder’s preferential rights in favour of one person or several people that are selected, no matter whether or not these people are part of the Company’s or its subsidiaries’ staff.
If an issue premium is paid as a consequence of a capital increase, than it is transferred by right to an unavailable account named ‘issue premiums’ which can only be used under the conditions required for the capital decrease. It can, however, always be added to the instructed capital; this decision can be taken by the Board of Directors as stated above. Furthermore, said extraordinary general meeting of the Company authorized the Board of Directors, considering the coordination of the articles of association, as soon as the authorized capital or a part of it is converted into instructed capital, to amend the relevant article of the articles of association.
In 2016, there were no capital increases within the authorized capital, other than the three confirmatory capital increases within the framework of authorized capital as a result of the exercise of warrants (on 20 June, 20 September and 21 December 2016).
Significant agreements to which Deceuninck NV is a party and which take effect, alter or terminate upon a change of control of Deceuninck NV following a public takeover bid
None
Agreements between Deceuninck NV and its Directors or employees providing for compensation if the directors resign or are made redundant, or if employees are made redundant, without valid reason following a public takeover bid
None
Shareholders structureEvery shareholder holding a minimum of 3% of the voting rights needs to comply with the law of 2 May 2007 in respect of the notification of significant investments, the Royal Decree of 14 February 2008 and the Belgian Companies Code.
The involved parties need to submit a notification to the Financials Services and Markets Authority (FSMA) and to the Company.
In application of the Law of 2 May 2007, the latest report of participations that have been received shows the following breakdown of shareholders on 31 December 2016:
Gramo BVBA 1 35,549,561 26.26%
Sofina NV 23,461,513 17.33%
Fidec 2 6,881,869 5.08%
Lazard 6,695,000 4.95%
Allacha 3 5,379,317 3.97%
Evalli 4 4,258,171 3.15%
Treasury shares 102,121 0.08%
Others 53,054,894 39.19%
TOTAL 135,382,446 100.00%
(1) Holding controlled by Francis Van Eeckhout(2) Holding controlled by Frank Deceuninck(3) Civil company represented by its statutory manager Willy Deceuninck and partners Alain, Laurenz and Charlotte Deceuninck(4) Civil company represented by its statutory manager Arnold Deceuninck and partners Evelyn, Alexander and Lieselot Deceuninck
30 31DECEUNINCK FINANCIAL REPORT 2016 DECEUNINCK FINANCIAL REPORT 2016
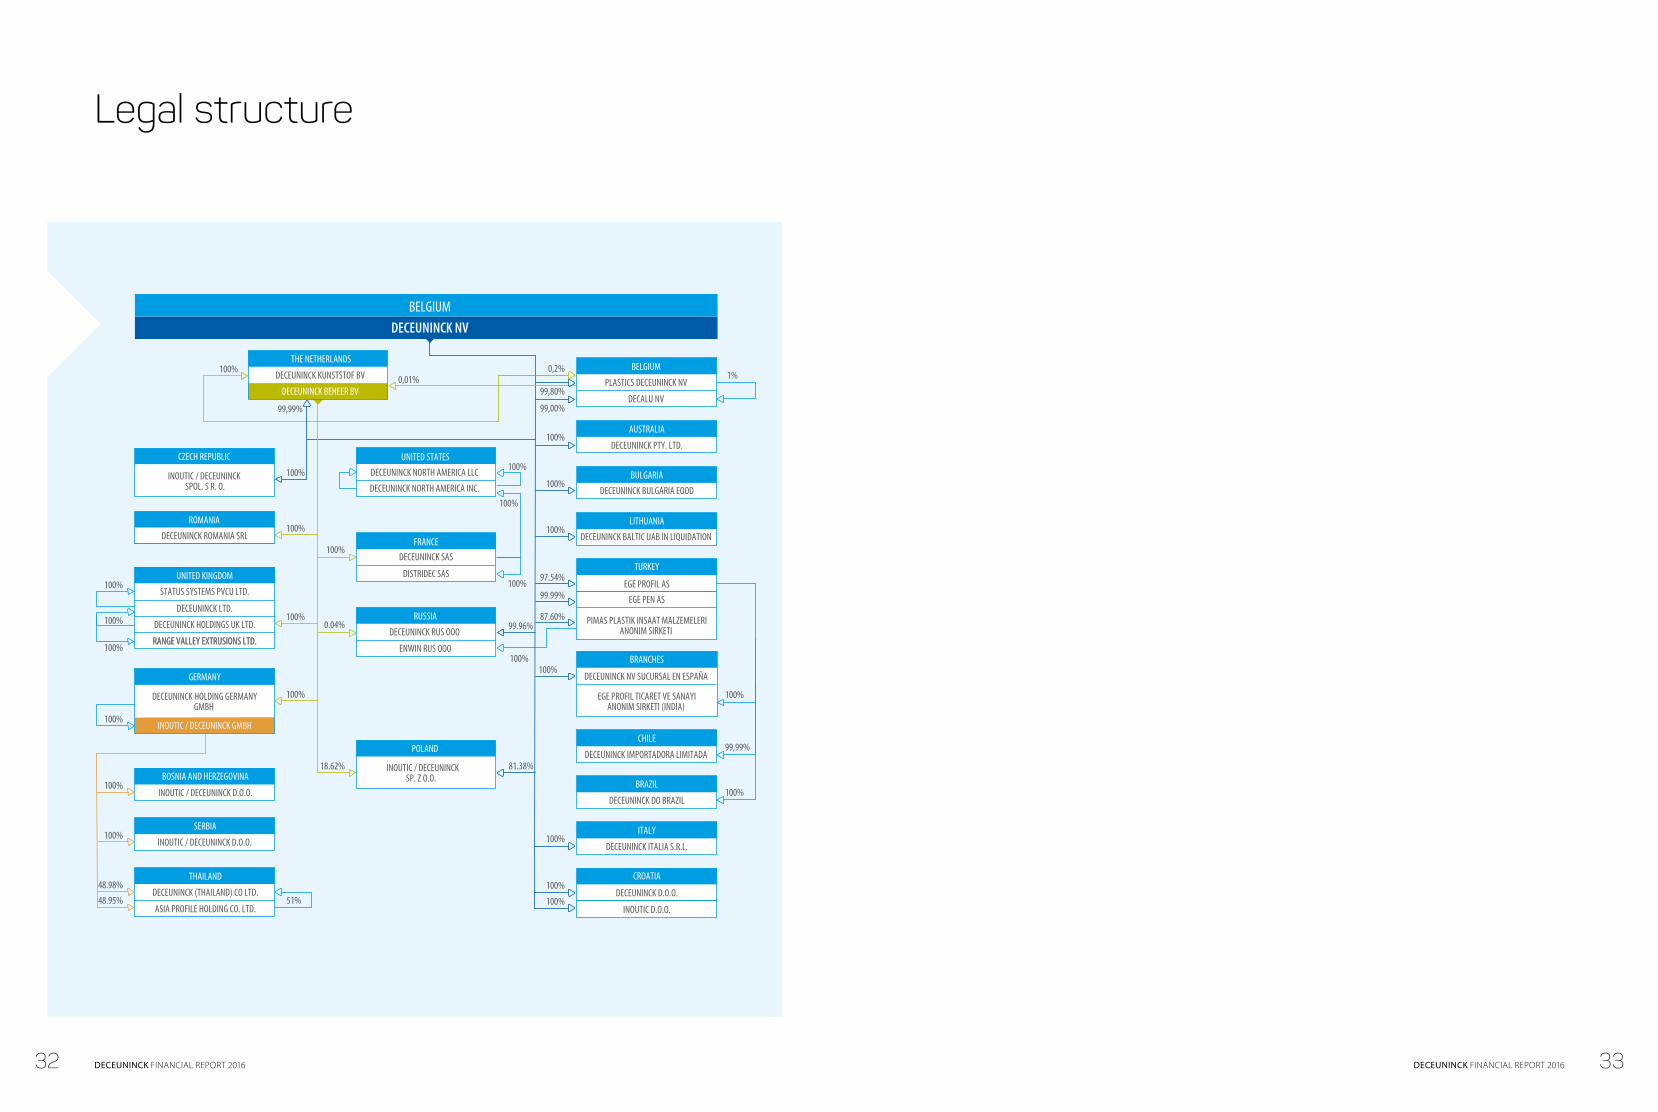
Legal structure
100%0,01%
0,2%
99,00%
99,80%
99,99%
100%
100%
100%
UNITED STATES
DECEUNINCK NORTH AMERICA LLC
DECEUNINCK NORTH AMERICA INC.
100%AUSTRALIA
DECEUNINCK PTY. LTD.
100%
100%
100%100%
100%
0.04% 99.96%
LITHUANIA
DECEUNINCK BALTIC UAB IN LIQUIDATION
100%
100%
100%
100% RUSSIA
DECEUNINCK RUS OOO
ENWIN RUS OOO100%
97.54%
99.99%
87.60%
100%
100%
1%
18.62%
100%
81.38%
100%
100%
CHILE
DECEUNINCK IMPORTADORA LIMITADA 99,99%
100%BRAZIL
DECEUNINCK DO BRAZIL
SERBIA
INOUTIC / DECEUNINCK D.O.O. 100%100% ITALY
DECEUNINCK ITALIA S.R.L.
100%
CROATIA
DECEUNINCK D.O.O.
INOUTIC D.O.O.
48.98%
51%48.95%
BELGIUM
PLASTICS DECEUNINCK NV
DECALU NV
FRANCE
DISTRIDEC SAS
DECEUNINCK SAS
BULGARIA
DECEUNINCK BULGARIA EOOD
100%
ROMANIA
DECEUNINCK ROMANIA SRL
CZECH REPUBLIC
INOUTIC / DECEUNINCK SPOL. S R. O.
BOSNIA AND HERZEGOVINA
INOUTIC / DECEUNINCK D.O.O.
DECEUNINCK KUNSTSTOF BV
THE NETHERLANDS
THAILAND
DECEUNINCK (THAILAND) CO LTD.
ASIA PROFILE HOLDING CO. LTD.
DECEUNINCK NV SUCURSAL EN ESPAÑA
EGE PROFIL TICARET VE SANAYIANONIM SIRKETI (INDIA)
BRANCHES
TURKEY
EGE PROFIL AS
EGE PEN AS
PIMAS PLASTIK INSAAT MALZEMELERIANONIM SIRKETI
UNITED KINGDOM
DECEUNINCK LTD.
DECEUNINCK HOLDINGS UK LTD.
RANGE VALLEY EXTRUSIONS LTD.RANGE VALLEY EXTRUSIONS LTD.
STATUS SYSTEMS PVCU LTD.
GERMANY
DECEUNINCK HOLDING GERMANYGMBH
POLAND
INOUTIC / DECEUNINCKSP. Z O.O.
POLAND
INOUTIC / DECEUNINCKSP. Z O.O.
BELGIUMDECEUNINCK NV
INOUTIC / DECEUNINCK GMBH
DECEUNINCK BEHEER BV
32 33DECEUNINCK FINANCIAL REPORT 2016 DECEUNINCK FINANCIAL REPORT 2016

Number and types of sharesThe Company capital amounts to € 53,392,846.45 and is represented by 135,382,446 shares. Deceuninck holds 102,121 treasury shares, as at 31 December 2016.There are 116,524,064 dematerialised shares and 18,858,382 registered shares.
Quotation on the stock exchange – stock exchange indexDeceuninck shares are listed under the code DECB and are traded on the Continuous segment of Euronext Brussels. DECB is part of the BELSMALL index.
ICB sectorial classification: 2353 Building materials & fixtures.
Evolution of the Deceuninck share priceThe closing price of the Deceuninck share decreased from € 2.43 on 31 December 2015 to € 2.26 on 31 December 2016. The Volume Weighted Average Price (VWAP) for 2016 was € 2.278. The lowest closing price was € 2.03 on 18 January 2016 and the highest closing price was € 2.466 on 21 September 2016.
DividendsAt the Annual General Meeting scheduled on 25 April 2017, the Board of Directors will propose to pay a dividend of € 0.03 per share for the financial year 2016.
Institutional investors and financial analystsDeceuninck has continuously and consistently informed the financial community about the evolution of the Company. Press releases with the annual results, half year results and interim statements were issued at scheduled intervals before stock exchange opening and published on the Investors page of the website (www.deceuninck.com) and on the website of the FSMA.
Institutional investors at home and abroad were informed by Deceuninck during one-to-one meetings, as well as in group meetings during roadshows and investor events. Opportunities were offered to institutional investors to meet or set up conference calls with the CEO and CFO at the head offices in Hooglede-Gits. Deceuninck participated in investor conferences and/or roadshows in Paris and London. Retail investors had the opportunity to inform themselves during a conference for Bolero customers in Ghent and a Bolero factory visit in Diksmuide on 4 June and 29 September respectively and during the retail investor events of the VFB (Flemish Federation of Investment Clubs and Investors), which took place in April and October.
Investor relations contactInvestor relations: Bert Castel Telephone: +32 (0) 51 239 204 E-mail: [email protected] Website: http://www.deceuninck.com/investorsAddress: Deceuninck NV, Bruggesteenweg 360, BE-8830 Hooglede-Gits
On the Investors page of the Deceuninck corporate website (http://www.deceuninck.com/investors) you can register to receive financial news and financial press releases per e-mail.
Financial calendar 2017FEBRUARY 2017 APRIL 2017 AUGUST 2017
232016
annual results
25Annual General
Meeting at 4 pm
241H 2017 results
The Deceuninck Share
DECB/B.A.S.
0.5 9,000
2.0 12,000
1.0 10,000
2.5 13,000
1.5 11,000
0 8,000
JAN
FEB
MA
RA
PRM
AYJU
NJU
LA
UG
SEP
OC
TN
OV
DEC
DECB B.A.S.
34 35DECEUNINCK FINANCIAL REPORT 2016 DECEUNINCK FINANCIAL REPORT 2016

Fina
ncia
l sta
tem
ents02
36 37DECEUNINCK FINANCIAL REPORT 2016 DECEUNINCK FINANCIAL REPORT 2016
Deceuninck consolidated
2016 Results
Sales
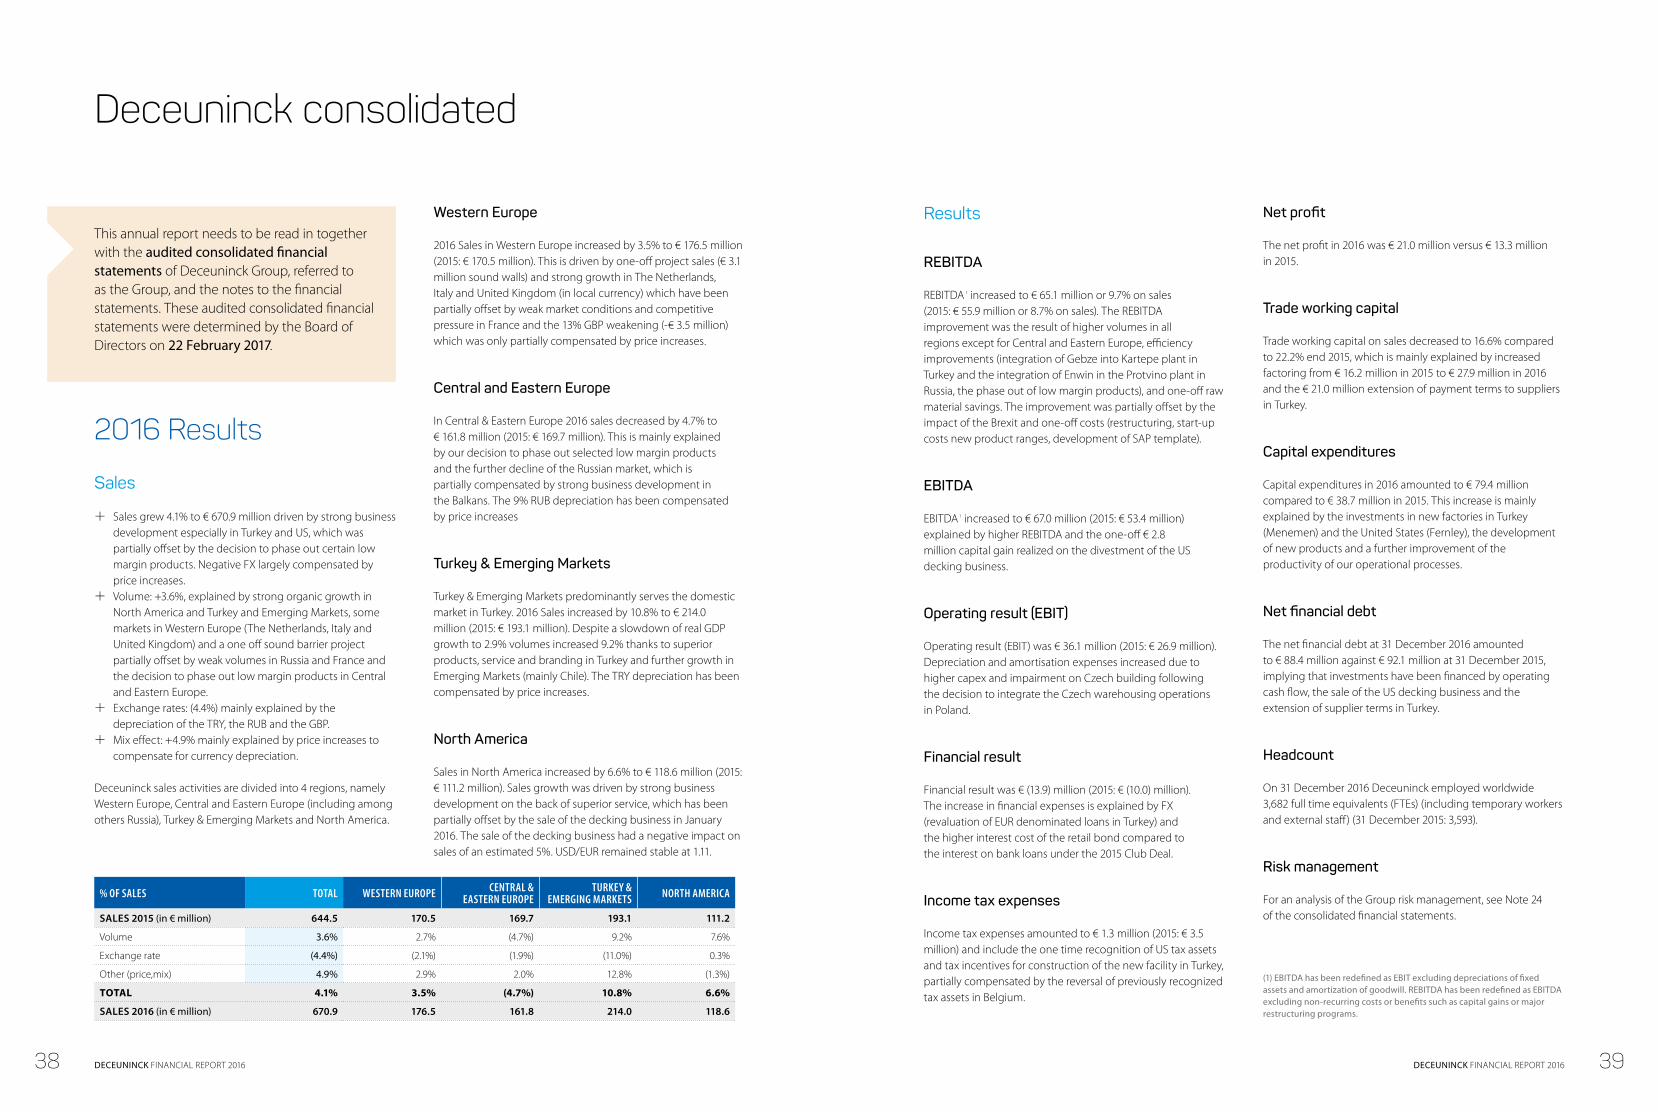
q Sales grew 4.1% to € 670.9 million driven by strong business development especially in Turkey and US, which was partially offset by the decision to phase out certain low margin products. Negative FX largely compensated by price increases.
q Volume: +3.6%, explained by strong organic growth in North America and Turkey and Emerging Markets, some markets in Western Europe (The Netherlands, Italy and United Kingdom) and a one off sound barrier project partially offset by weak volumes in Russia and France and the decision to phase out low margin products in Central and Eastern Europe.
q Exchange rates: (4.4%) mainly explained by the depreciation of the TRY, the RUB and the GBP.
q Mix effect: +4.9% mainly explained by price increases to compensate for currency depreciation.
Deceuninck sales activities are divided into 4 regions, namely Western Europe, Central and Eastern Europe (including among others Russia), Turkey & Emerging Markets and North America.
% OF SALES TOTAL WESTERN EUROPE CENTRAL & EASTERN EUROPE
TURKEY & EMERGING MARKETS NORTH AMERICA
SALES 2015 (in € million) 644.5 170.5 169.7 193.1 111.2
Volume 3.6% 2.7% (4.7%) 9.2% 7.6%
Exchange rate (4.4%) (2.1%) (1.9%) (11.0%) 0.3%
Other (price,mix) 4.9% 2.9% 2.0% 12.8% (1.3%)
TOTAL 4.1% 3.5% (4.7%) 10.8% 6.6%
SALES 2016 (in € million) 670.9 176.5 161.8 214.0 118.6
This annual report needs to be read in together with the audited consolidated financial statements of Deceuninck Group, referred to as the Group, and the notes to the financial statements. These audited consolidated financial statements were determined by the Board of Directors on 22 February 2017.
Results
REBITDA
REBITDA 1 increased to € 65.1 million or 9.7% on sales (2015: € 55.9 million or 8.7% on sales). The REBITDA improvement was the result of higher volumes in all regions except for Central and Eastern Europe, efficiency improvements (integration of Gebze into Kartepe plant in Turkey and the integration of Enwin in the Protvino plant in Russia, the phase out of low margin products), and one-off raw material savings. The improvement was partially offset by the impact of the Brexit and one-off costs (restructuring, start-up costs new product ranges, development of SAP template).
EBITDA
EBITDA 1 increased to € 67.0 million (2015: € 53.4 million) explained by higher REBITDA and the one-off € 2.8 million capital gain realized on the divestment of the US decking business.
Operating result (EBIT)
Operating result (EBIT) was € 36.1 million (2015: € 26.9 million). Depreciation and amortisation expenses increased due to higher capex and impairment on Czech building following the decision to integrate the Czech warehousing operations in Poland.
Financial result
Financial result was € (13.9) million (2015: € (10.0) million). The increase in financial expenses is explained by FX (revaluation of EUR denominated loans in Turkey) and the higher interest cost of the retail bond compared to the interest on bank loans under the 2015 Club Deal.
Income tax expenses
Income tax expenses amounted to € 1.3 million (2015: € 3.5 million) and include the one time recognition of US tax assets and tax incentives for construction of the new facility in Turkey, partially compensated by the reversal of previously recognized tax assets in Belgium.
Net profit
The net profit in 2016 was € 21.0 million versus € 13.3 million in 2015.
Trade working capital
Trade working capital on sales decreased to 16.6% compared to 22.2% end 2015, which is mainly explained by increased factoring from € 16.2 million in 2015 to € 27.9 million in 2016 and the € 21.0 million extension of payment terms to suppliers in Turkey.
Capital expenditures
Capital expenditures in 2016 amounted to € 79.4 million compared to € 38.7 million in 2015. This increase is mainly explained by the investments in new factories in Turkey (Menemen) and the United States (Fernley), the development of new products and a further improvement of the productivity of our operational processes.
Net financial debt
The net financial debt at 31 December 2016 amounted to € 88.4 million against € 92.1 million at 31 December 2015, implying that investments have been financed by operating cash flow, the sale of the US decking business and the extension of supplier terms in Turkey.
Headcount
On 31 December 2016 Deceuninck employed worldwide 3,682 full time equivalents (FTEs) (including temporary workers and external staff) (31 December 2015: 3,593).
Risk management
For an analysis of the Group risk management, see Note 24 of the consolidated financial statements.
Western Europe
2016 Sales in Western Europe increased by 3.5% to € 176.5 million (2015: € 170.5 million). This is driven by one-off project sales (€ 3.1 million sound walls) and strong growth in The Netherlands, Italy and United Kingdom (in local currency) which have been partially offset by weak market conditions and competitive pressure in France and the 13% GBP weakening (-€ 3.5 million) which was only partially compensated by price increases.
Central and Eastern Europe
In Central & Eastern Europe 2016 sales decreased by 4.7% to € 161.8 million (2015: € 169.7 million). This is mainly explained by our decision to phase out selected low margin products and the further decline of the Russian market, which is partially compensated by strong business development in the Balkans. The 9% RUB depreciation has been compensated by price increases
Turkey & Emerging Markets
Turkey & Emerging Markets predominantly serves the domestic market in Turkey. 2016 Sales increased by 10.8% to € 214.0 million (2015: € 193.1 million). Despite a slowdown of real GDP growth to 2.9% volumes increased 9.2% thanks to superior products, service and branding in Turkey and further growth in Emerging Markets (mainly Chile). The TRY depreciation has been compensated by price increases.
North America
Sales in North America increased by 6.6% to € 118.6 million (2015: € 111.2 million). Sales growth was driven by strong business development on the back of superior service, which has been partially offset by the sale of the decking business in January 2016. The sale of the decking business had a negative impact on sales of an estimated 5%. USD/EUR remained stable at 1.11.
(1) EBITDA has been redefined as EBIT excluding depreciations of fixed assets and amortization of goodwill. REBITDA has been redefined as EBITDA excluding non-recurring costs or benefits such as capital gains or major restructuring programs.
38 39DECEUNINCK FINANCIAL REPORT 2016 DECEUNINCK FINANCIAL REPORT 2016
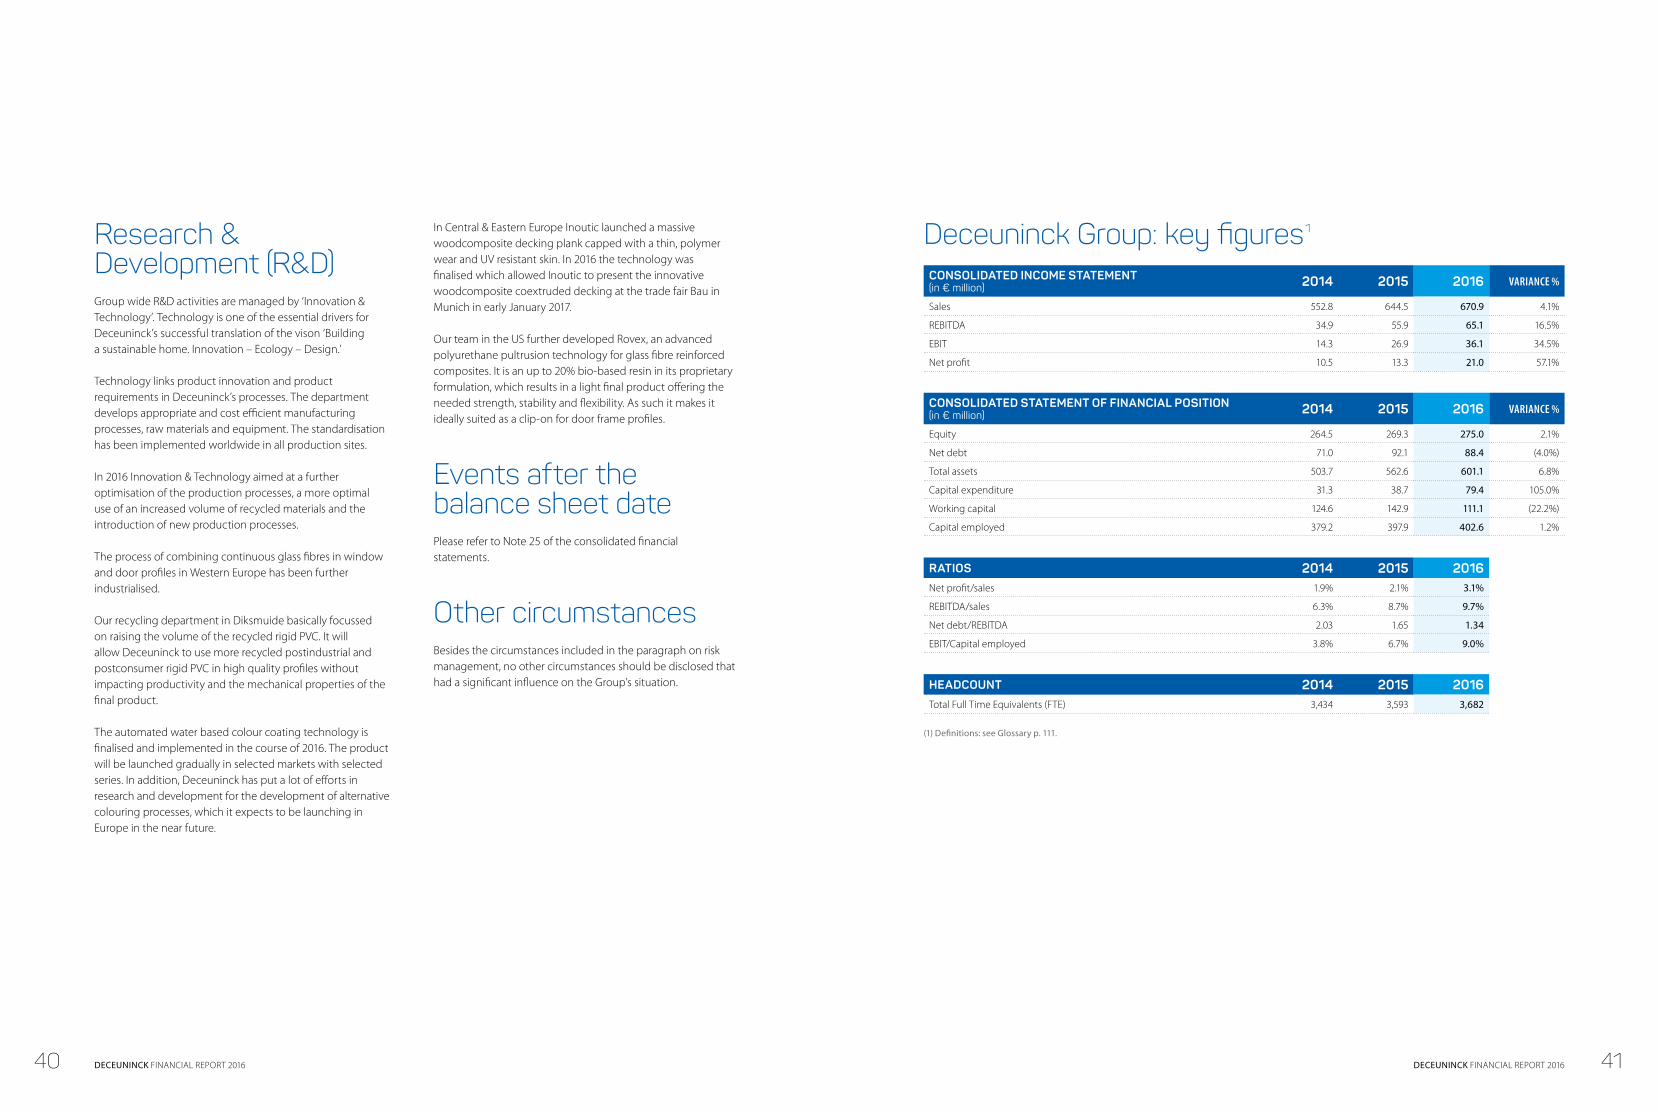
Deceuninck Group: key figures 1
CONSOLIDATED INCOME STATEMENT (in € million) 2014 2015 2016 VARIANCE %
Sales 552.8 644.5 670.9 4.1%
REBITDA 34.9 55.9 65.1 16.5%
EBIT 14.3 26.9 36.1 34.5%
Net profit 10.5 13.3 21.0 57.1%
CONSOLIDATED STATEMENT OF FINANCIAL POSITION (in € million) 2014 2015 2016 VARIANCE %
Equity 264.5 269.3 275.0 2.1%
Net debt 71.0 92.1 88.4 (4.0%)
Total assets 503.7 562.6 601.1 6.8%
Capital expenditure 31.3 38.7 79.4 105.0%
Working capital 124.6 142.9 111.1 (22.2%)
Capital employed 379.2 397.9 402.6 1.2%
RATIOS 2014 2015 2016Net profit/sales 1.9% 2.1% 3.1%
REBITDA/sales 6.3% 8.7% 9.7%
Net debt/REBITDA 2.03 1.65 1.34
EBIT/Capital employed 3.8% 6.7% 9.0%
HEADCOUNT 2014 2015 2016Total Full Time Equivalents (FTE) 3,434 3,593 3,682
(1) Definitions: see Glossary p. 111.
Research & Development (R&D)Group wide R&D activities are managed by ‘Innovation & Technology’. Technology is one of the essential drivers for Deceuninck’s successful translation of the vison ‘Building a sustainable home. Innovation – Ecology – Design.’
Technology links product innovation and product requirements in Deceuninck’s processes. The department develops appropriate and cost efficient manufacturing processes, raw materials and equipment. The standardisation has been implemented worldwide in all production sites.
In 2016 Innovation & Technology aimed at a further optimisation of the production processes, a more optimal use of an increased volume of recycled materials and the introduction of new production processes.
The process of combining continuous glass fibres in window and door profiles in Western Europe has been further industrialised.
Our recycling department in Diksmuide basically focussed on raising the volume of the recycled rigid PVC. It will allow Deceuninck to use more recycled postindustrial and postconsumer rigid PVC in high quality profiles without impacting productivity and the mechanical properties of the final product.
The automated water based colour coating technology is finalised and implemented in the course of 2016. The product will be launched gradually in selected markets with selected series. In addition, Deceuninck has put a lot of efforts in research and development for the development of alternative colouring processes, which it expects to be launching in Europe in the near future.
In Central & Eastern Europe Inoutic launched a massive woodcomposite decking plank capped with a thin, polymer wear and UV resistant skin. In 2016 the technology was finalised which allowed Inoutic to present the innovative woodcomposite coextruded decking at the trade fair Bau in Munich in early January 2017.
Our team in the US further developed Rovex, an advanced polyurethane pultrusion technology for glass fibre reinforced composites. It is an up to 20% bio-based resin in its proprietary formulation, which results in a light final product offering the needed strength, stability and flexibility. As such it makes it ideally suited as a clip-on for door frame profiles.
Events after the balance sheet datePlease refer to Note 25 of the consolidated financial statements.
Other circumstancesBesides the circumstances included in the paragraph on risk management, no other circumstances should be disclosed that had a significant influence on the Group’s situation.
40 41DECEUNINCK FINANCIAL REPORT 2016 DECEUNINCK FINANCIAL REPORT 2016

Deceuninck consolidated statement of comprehensive income
FOR THE 12 MONTH PERIOD ENDED 31 DECEMBER(in € thousand) 2015 2016
NET PROFIT 13,341 20,954
Currency translation adjustments (8,449) (8,662)
Income tax impact (510)
Net other comprehensive income potentially to be reclassified to profit or loss in subsequent periods (8,449) (9,172)
Actuarial gains (+) / losses (-) on defined benefit plans 1,419 (4,833)
Income tax impact (190) 1,294
Net other comprehensive income not to be reclassified to profit or loss in subsequent periods 1,230 (3,538)
OTHER COMPREHENSIVE INCOME (+) / LOSS (-) AFTER TAX IMPACT (7,219) (12,711)
TOTAL COMPREHENSIVE INCOME (+) / LOSS (-) 6,122 8,243
THE TOTAL COMPREHENSIVE INCOME (+) / LOSS (-) IS ATTRIBUTABLE TO(in € thousand) 2015 2016
Shareholders of the parent company 6,363 8,847
Non-controlling interests (241) (604)
Deceuninck consolidated income statementFOR THE 12 MONTH PERIOD ENDED 31 DECEMBER (in € thousand) NOTES 2015 2016SALES 3 644,524 670,880
Cost of goods sold 4 (462,522) (466,150)
GROSS PROFIT 182,002 204,730
Marketing, sales and distribution expenses (104,465) (113,122)
Research and development expenses (7,643) (8,034)
Administrative and general expenses (40,818) (45,875)
Other net operating result 4 (2,127) (1,576)
Impairment on goodwill (96) 0
OPERATING PROFIT (EBIT) 26,853 36,123
Financial charges 4 (17,473) (38,956)
Financial income 4 7,483 25,059
PROFIT BEFORE TAXES (EBT) 16,864 22,226
Income taxes 5 (3,522) (1,272)
NET PROFIT 13,341 20,954
THE NET PROFIT IS ATTRIBUTABLE TO 2015 2016Shareholders of the parent company 13,582 20,795
Non-controlling interests (241) 159
EARNINGS PER SHARE DISTRIBUTABLE TO THE SHAREHOLDERS OF THE PARENT COMPANY (in €) 2015 2016
Normal earnings per share 0.10 0.15
Diluted earnings per share 0.10 0.15
Consolidated financial statements and notes
42 43DECEUNINCK FINANCIAL REPORT 2016 DECEUNINCK FINANCIAL REPORT 2016
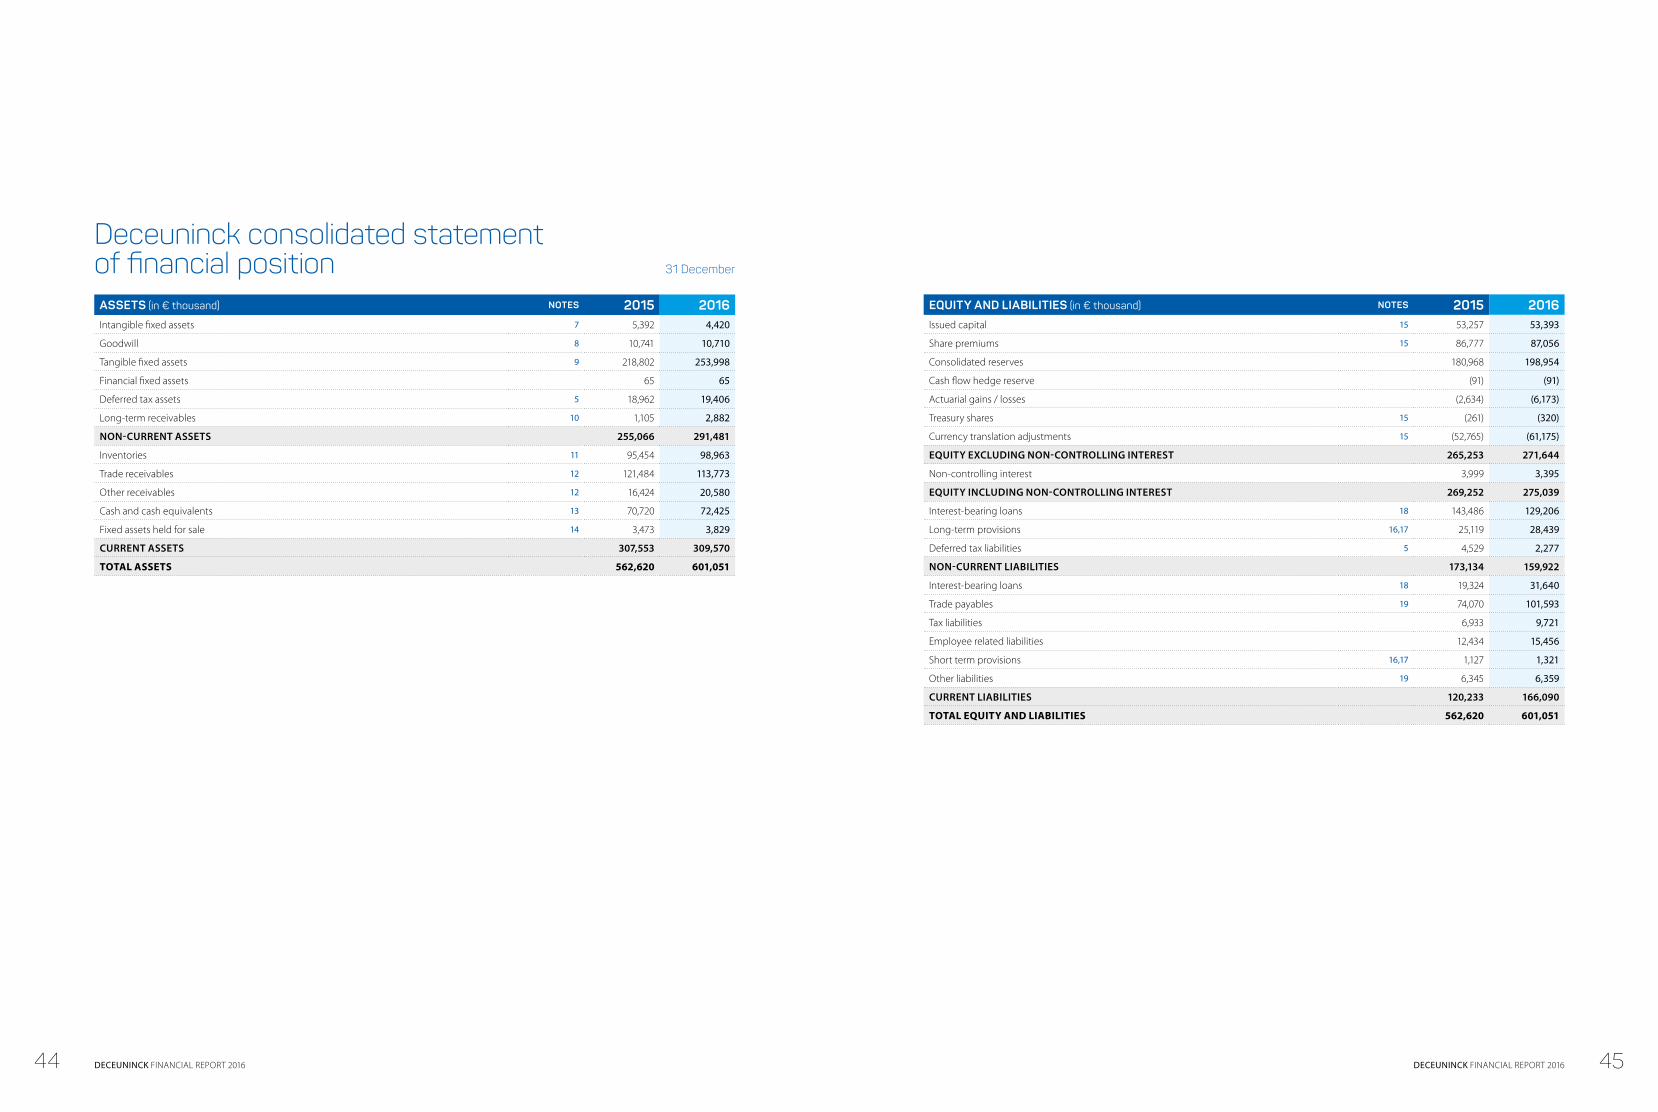
Deceuninck consolidated statement of financial position 31 December
ASSETS (in € thousand) NOTES 2015 2016Intangible fixed assets 7 5,392 4,420
Goodwill 8 10,741 10,710
Tangible fixed assets 9 218,802 253,998
Financial fixed assets 65 65
Deferred tax assets 5 18,962 19,406
Long-term receivables 10 1,105 2,882
NON-CURRENT ASSETS 255,066 291,481
Inventories 11 95,454 98,963
Trade receivables 12 121,484 113,773
Other receivables 12 16,424 20,580
Cash and cash equivalents 13 70,720 72,425
Fixed assets held for sale 14 3,473 3,829
CURRENT ASSETS 307,553 309,570
TOTAL ASSETS 562,620 601,051
EQUITY AND LIABILITIES (in € thousand) NOTES 2015 2016Issued capital 15 53,257 53,393
Share premiums 15 86,777 87,056
Consolidated reserves 180,968 198,954
Cash flow hedge reserve (91) (91)
Actuarial gains / losses (2,634) (6,173)
Treasury shares 15 (261) (320)
Currency translation adjustments 15 (52,765) (61,175)
EQUITY EXCLUDING NON-CONTROLLING INTEREST 265,253 271,644
Non-controlling interest 3,999 3,395
EQUITY INCLUDING NON-CONTROLLING INTEREST 269,252 275,039
Interest-bearing loans 18 143,486 129,206
Long-term provisions 16,17 25,119 28,439
Deferred tax liabilities 5 4,529 2,277
NON-CURRENT LIABILITIES 173,134 159,922
Interest-bearing loans 18 19,324 31,640
Trade payables 19 74,070 101,593
Tax liabilities 6,933 9,721
Employee related liabilities 12,434 15,456
Short term provisions 16,17 1,127 1,321
Other liabilities 19 6,345 6,359
CURRENT LIABILITIES 120,233 166,090
TOTAL EQUITY AND LIABILITIES 562,620 601,051
44 45DECEUNINCK FINANCIAL REPORT 2016 DECEUNINCK FINANCIAL REPORT 2016
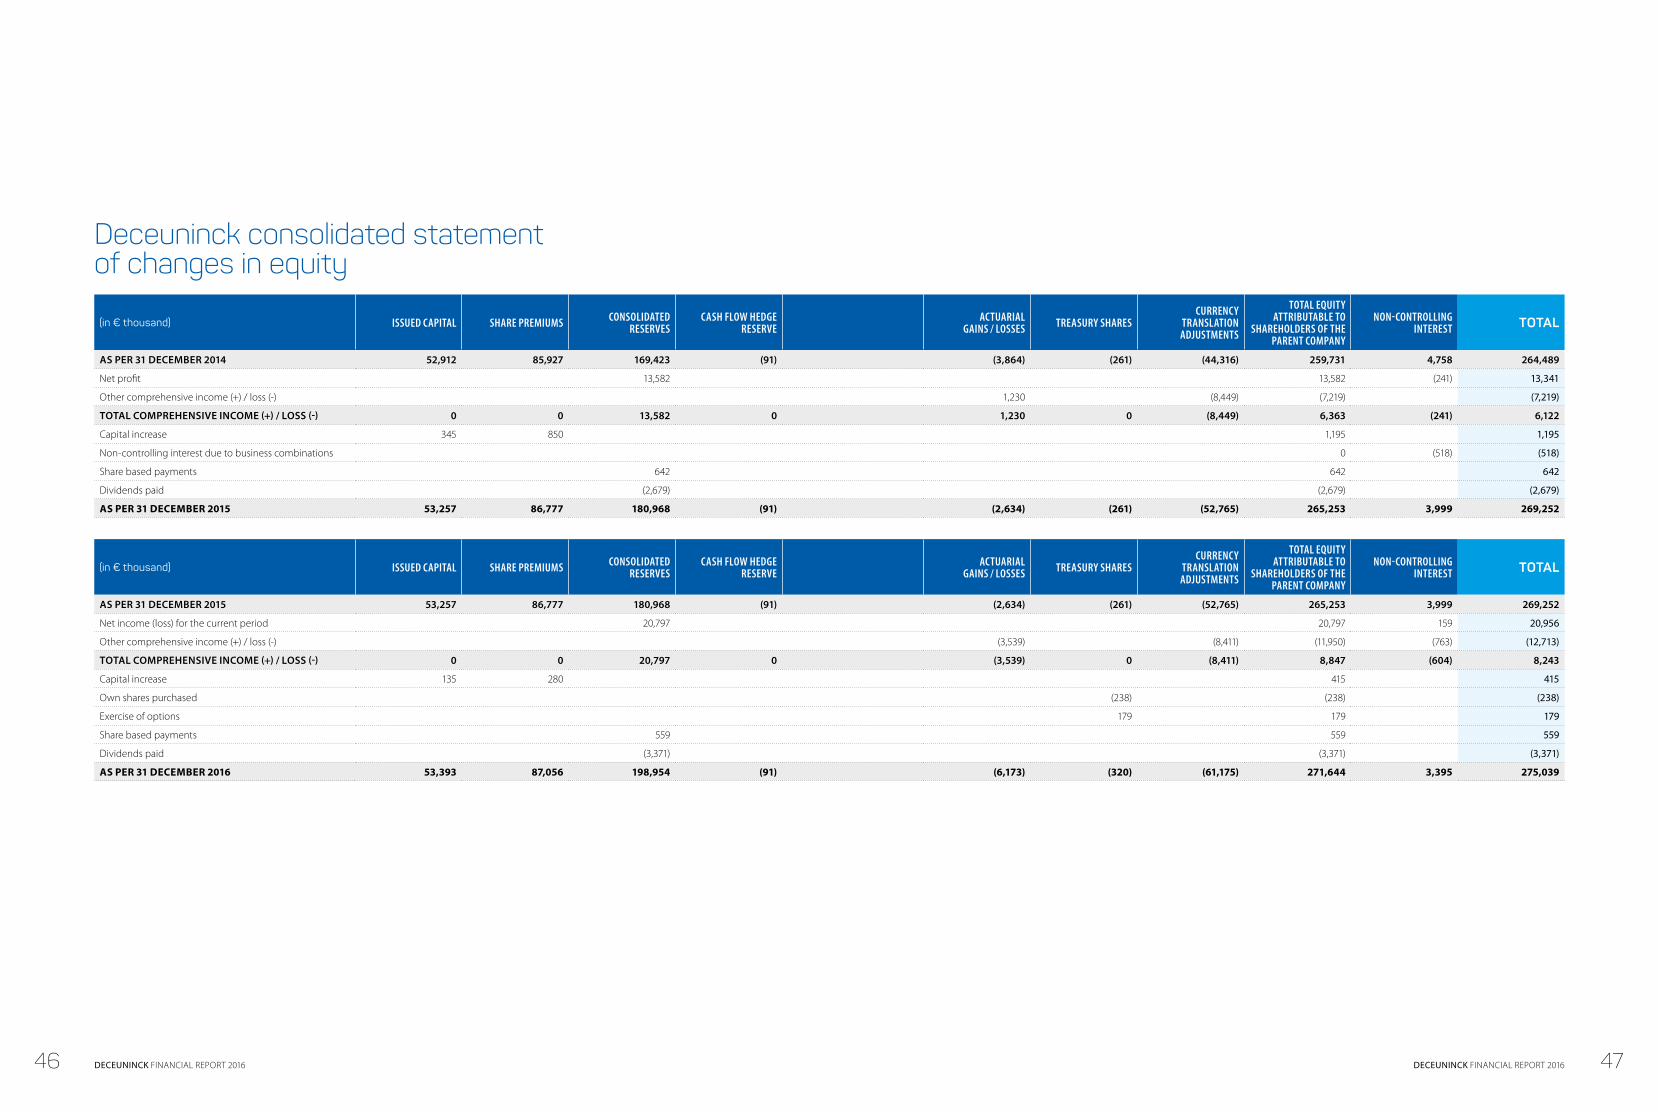
Deceuninck consolidated statement of changes in equity
(in € thousand) ISSUED CAPITAL SHARE PREMIUMS CONSOLIDATED RESERVES
CASH FLOW HEDGE RESERVE
ACTUARIAL GAINS / LOSSES TREASURY SHARES
CURRENCY TRANSLATION ADJUSTMENTS
TOTAL EQUITY ATTRIBUTABLE TO
SHAREHOLDERS OF THE PARENT COMPANY
NON-CONTROLLING INTEREST TOTAL
AS PER 31 DECEMBER 2014 52,912 85,927 169,423 (91) (3,864) (261) (44,316) 259,731 4,758 264,489
Net profit 13,582 13,582 (241) 13,341
Other comprehensive income (+) / loss (-) 1,230 (8,449) (7,219) (7,219)
TOTAL COMPREHENSIVE INCOME (+) / LOSS (-) 0 0 13,582 0 1,230 0 (8,449) 6,363 (241) 6,122
Capital increase 345 850 1,195 1,195
Non-controlling interest due to business combinations 0 (518) (518)
Share based payments 642 642 642
Dividends paid (2,679) (2,679) (2,679)
AS PER 31 DECEMBER 2015 53,257 86,777 180,968 (91) (2,634) (261) (52,765) 265,253 3,999 269,252
(in € thousand) ISSUED CAPITAL SHARE PREMIUMS CONSOLIDATED RESERVES
CASH FLOW HEDGE RESERVE
ACTUARIAL GAINS / LOSSES TREASURY SHARES
CURRENCY TRANSLATION ADJUSTMENTS
TOTAL EQUITY ATTRIBUTABLE TO
SHAREHOLDERS OF THE PARENT COMPANY
NON-CONTROLLING INTEREST TOTAL
AS PER 31 DECEMBER 2015 53,257 86,777 180,968 (91) (2,634) (261) (52,765) 265,253 3,999 269,252
Net income (loss) for the current period 20,797 20,797 159 20,956
Other comprehensive income (+) / loss (-) (3,539) (8,411) (11,950) (763) (12,713)
TOTAL COMPREHENSIVE INCOME (+) / LOSS (-) 0 0 20,797 0 (3,539) 0 (8,411) 8,847 (604) 8,243
Capital increase 135 280 415 415
Own shares purchased (238) (238) (238)
Exercise of options 179 179 179
Share based payments 559 559 559
Dividends paid (3,371) (3,371) (3,371)
AS PER 31 DECEMBER 2016 53,393 87,056 198,954 (91) (6,173) (320) (61,175) 271,644 3,395 275,039
46 47DECEUNINCK FINANCIAL REPORT 2016 DECEUNINCK FINANCIAL REPORT 2016

Deceuninck consolidated statement of cash flowsFOR THE 12 MONTH PERIOD ENDED 31 DECEMBER (in € thousand)
NOTES 2015 2016
OPERATING ACTIVITIES
Net profit 13,341 20,954
Depreciations of (in)tangible fixed assets 7,9,14 25,260 26,455
Impairments on (in)tangible fixed assets 7,9,14 1,276 4,396
Provisions for pensions and other risks & charges 1,930 (783)
Impairments on current assets (932) 5,137
Net financial charges 4 9,989 13,897
Profit on sale of tangible fixed assets 4 (1,533) (2,117)
Loss on sale of tangible fixed assets 4 100 1,123
Income taxes 5 3,522 1,272
Share-based payment transactions settled in equity 642 559
Cash flow from operating activities before movements in working capital and provisions 53,596 70,892
Decrease / (increase) in trade and other receivables (14,147) (7,523)
Decrease / (increase) in inventories (2,277) (7,507)
Increase / (decrease) in trade payables (7,552) 36,310
Decrease / (increase) in other non-current assets 12 (1,677)
Decrease / (increase) in other current assets/liabilities (5,145) (4,183)
Increase / (decrease) in other non-current liabilities 1,567 406
Cash flow generated from operating activities 26,053 86,718
Interest received (3) 1,294
Income taxes paid (-) / received (+) (1,730) (1,142)
CASH FLOW FROM OPERATING ACTIVITIES 24,319 86,870
INVESTING ACTIVITIES
Cash receipts on sale of tangible fixed assets 5,297 6,647
Purchases of tangible fixed assets 9,14 (37,839) (78,791)
Purchases of intangible fixed assets 7 (906) (639)
CASH FLOW FROM INVESTING ACTIVITIES (33,448) (72,783)
FOR THE 12 MONTH PERIOD ENDED 31 DECEMBER (in € thousand)
NOTES 2015 2016
FINANCING ACTIVITIES
Capital increase 1,195 415
New (+) / repayments (-) of long-term debts 18 108,791 (8,571)
New (+) / repayments (-) of short-term debts 18 (40,583) 11,955
Interests paid (270) (8,873)
Dividends paid (2,679) (3,371)
Net financial result, excl interests (4,375) (474)
CASH FLOW FROM FINANCING ACTIVITIES 62,079 (8,917)
Net increase (+) / decrease (-) in cash and cash equivalents 52,951 5,170
Cash and cash equivalents as per beginning of period 13 29,046 70,720
Impact of exchange rate fluctuations (1,877) (3,464)
Cash and cash equivalents as per end of period 13 70,720 72,425
48 49DECEUNINCK FINANCIAL REPORT 2016 DECEUNINCK FINANCIAL REPORT 2016

Notes
1. Significant accounting principles
The consolidated financial statements have been prepared in accordance with the ‘International Financial Reporting Standards’ (IFRS), as endorsed by the European Union. The consolidated financial statements were determined by the Board of Directors on 22 February 2017. They can still be modified until the General Meeting of Deceuninck NV takes place, which is scheduled to be held on 25 April 2017.
Basis of presentation
The consolidated financial statements are presented in € thousand, unless noted otherwise. These statements have been prepared on the basis of the historic cost price method, except for the valuation of the fair value of derivatives. The consolidated financial statements present the financial position on 31 December 2016. They have been prepared prior to the distribution of profits proposed by the parent company at the Annual General Meeting of Shareholders.
Please note that numbers in certain tables in the financial statements may not add up due to rounding.
Consolidation principles
The consolidated financial statements include the individual financial statements of Deceuninck NV and its subsidiaries (‘the Group’).
The Group controls a subsidiary if, and only if, the Group has: q Power over the subsidiary (i.e., existing rights that give
it the current ability to direct the relevant activities of the subsidiary);
q Exposure, or rights, to variable returns from its involvement with the subsidiary;
q The ability to use its power over the subsidiary to affect its returns.
Generally, there is a presumption that a majority of voting rights result in control.
The acquisition of subsidiaries is accounted for under the acquisition method. The annual reporting date of subsidiaries is identical to that of the parent company. The same valuation principles apply to their financial statements.
Associated companies are companies in which Deceuninck NV exercises, either directly or indirectly significant influence, without controlling them. This is generally the case if the Group holds between 20% and 50% of the shares with voting rights. Associated companies are consolidated using the equity method, from the date the significant influence begins until the date it ends. If the Group’s share in the losses exceeds the carrying value of the associated company, then this value is reduced to zero and the losses exceeding this amount are not recognized, except when the Group has contractual obligations relating to this company. On 31 December 2015 and 31 December 2016, the Group does not own any associated companies with the exception of Asia Profile Holding Co Ltd. A list of the subsidiaries of Deceuninck NV is disclosed in Note 26 of these financial statements.
Use of estimates and assumptions
In order to produce the annual financial statements in accordance with the IFRS standards, management has to use a number of estimates and assumptions, that have an impact on the amounts disclosed in the financial statements. The estimates made on the reporting date reflect the existing conditions on this date, such as market prices, interest rates and foreign exchange rates.
Even though management makes these estimates based on its best possible knowledge of current business transactions, and of the transactions the Group may undertake, the actual results can vary in relation to these estimates.
USE OF ASSUMPTIONSIn accordance with the Group’s accounting principles, the following assumption has been made:
Provision for early retirementThe Company considers it has a constructive obligation, and that the existing collective labour agreement will be renewed on an ongoing basis.
USE OF ESTIMATESThe most important estimates that are likely to have a significant influence on the net carrying value of assets and liabilities for the coming year relate to:
Impairment of goodwillGoodwill relating to business combinations is assessed on an annual basis by means of an impairment test. This test requires an estimate of the value in use of cash generating units, to which the goodwill is attributed. The estimation of the value in use requires an estimate of expected future cash flows of the cash generating units and the choice of an appropriate discount rate in order to determine the present value of these cash flows. For more details on this subject, please see Note 8.
Employee benefits – Pension schemesThe costs of the granted pension schemes and the current value of the pension obligations are determined on the basis of an actuarial calculation. The actuarial calculation uses assumptions with regard to the discount rate, expected yield of the pension funds, future increases in compensation, mortality tables and future increases in pensions. All the assumptions are reassessed on the reporting date. Further details with regard to these assumptions are documented in Note 16.
Employee benefits – Share-based paymentsThe Group values the cost of the stock option plans granted to employees on the basis of the actual value of the instruments, on the date they are granted. The estimation of the fair value of compensations in shares requires an adapted valuation model, which depends on the condition under which the grant is made. The valuation model also requires adapted input data, such as the expected life of the option, the volatility of the share price and the dividend yield. The assumptions and the valuation model used for the estimation of the actual value of compensations in shares are explained in Note 20.
Deferred tax assetsDeferred tax assets related to tax losses carry forward are only recognized if it is probable that sufficient taxable profits will be generated in the future. Significant estimates are required from management in order to determine the amount of the deferred tax assets, based on the time period and the level of future taxable profits. More details on this subject are provided in section Income Taxes and in Note 5.
Bad debt allowanceOpen trade receivables are evaluated during each monthly closing, and bad debt allowances are recorded on an individual client-per-client basis if there is a deterioration in payment behaviour and indicators on going concern.In estimating the bad debt allowance, credit insurance limits and guarantees received are considered in the calculation of the allowance.
Foreign currencies
TRANSACTIONS IN FOREIGN CURRENCIESThe Group’s reporting currency is the euro. Transactions in foreign currencies are accounted for using the end of month exchange rate (exchange rate fixed by the European Central Bank (ECB) on the last working day of the preceeding month). Monetary assets and liabilities in foreign currencies are converted using the exchange rate as fixed by the ECB on the balance sheet date. Profits and losses resulting from conversion of monetary assets and liabilities in foreign currencies into euro are recognized in the consolidated income statement as operating or financial exchange result, depending on the nature of the transaction. Non-monetary assets and liabilities are converted into euro using the historic exchange rate (exchange rate applicable for that month in which the transaction occurs). Assets and liabilities from subsidiaries outside the eurozone are converted to euro on balance sheet date, using the ECB exchange rates applicable on that date. The income statements of these subsidiaries are converted into euro at the annual exchange rate, which approximates the exchange rates applicable on the transaction date. The components of equity are converted at their historic exchange rate. Exchange rate differences, caused by the conversion of equity into euro at the closing rate applicable on the balance sheet date, are disclosed as ‘Currency translation adjustments’ under the heading ‘Equity’.
Exchange rate differences resulting from the translation of foreign currency intra-group current accounts, loans or trade receivables and payables are recognized in the consolidated income statement as operating or financial exchange result, depending on the nature of the transaction. Exception to this accounting treatment is when the intra-group loans are considered as part of an entity’s net investment in a foreign operation, then the exchange difference is recognized in other comprehensive income and accumulated in a separate component of equity until the disposal of the foreign operation.
50 51DECEUNINCK FINANCIAL REPORT 2016 DECEUNINCK FINANCIAL REPORT 2016
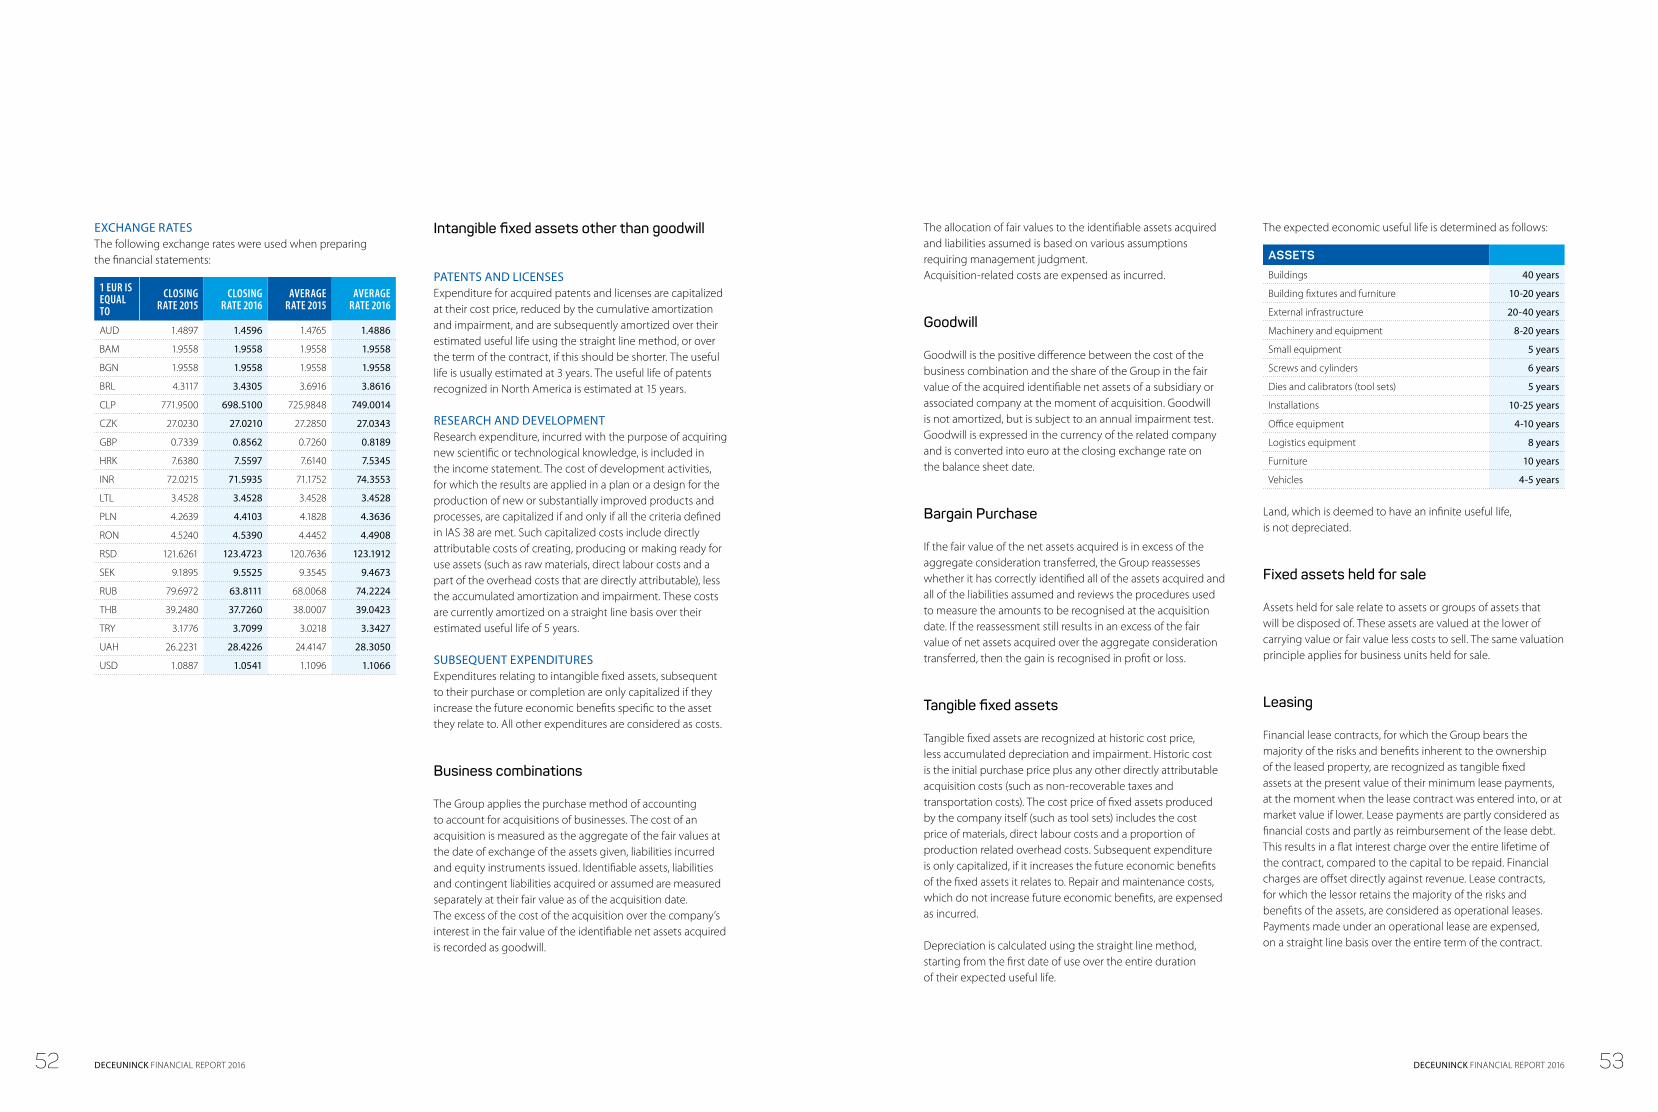
EXCHANGE RATESThe following exchange rates were used when preparing the financial statements:
1 EUR IS EQUAL TO
CLOSING RATE 2015
CLOSING RATE 2016
AVERAGE RATE 2015
AVERAGE RATE 2016
AUD 1.4897 1.4596 1.4765 1.4886
BAM 1.9558 1.9558 1.9558 1.9558
BGN 1.9558 1.9558 1.9558 1.9558
BRL 4.3117 3.4305 3.6916 3.8616
CLP 771.9500 698.5100 725.9848 749.0014
CZK 27.0230 27.0210 27.2850 27.0343
GBP 0.7339 0.8562 0.7260 0.8189
HRK 7.6380 7.5597 7.6140 7.5345
INR 72.0215 71.5935 71.1752 74.3553
LTL 3.4528 3.4528 3.4528 3.4528
PLN 4.2639 4.4103 4.1828 4.3636
RON 4.5240 4.5390 4.4452 4.4908
RSD 121.6261 123.4723 120.7636 123.1912
SEK 9.1895 9.5525 9.3545 9.4673
RUB 79.6972 63.8111 68.0068 74.2224
THB 39.2480 37.7260 38.0007 39.0423
TRY 3.1776 3.7099 3.0218 3.3427
UAH 26.2231 28.4226 24.4147 28.3050
USD 1.0887 1.0541 1.1096 1.1066
Intangible fixed assets other than goodwill
PATENTS AND LICENSESExpenditure for acquired patents and licenses are capitalized at their cost price, reduced by the cumulative amortization and impairment, and are subsequently amortized over their estimated useful life using the straight line method, or over the term of the contract, if this should be shorter. The useful life is usually estimated at 3 years. The useful life of patents recognized in North America is estimated at 15 years.
RESEARCH AND DEVELOPMENTResearch expenditure, incurred with the purpose of acquiring new scientific or technological knowledge, is included in the income statement. The cost of development activities, for which the results are applied in a plan or a design for the production of new or substantially improved products and processes, are capitalized if and only if all the criteria defined in IAS 38 are met. Such capitalized costs include directly attributable costs of creating, producing or making ready for use assets (such as raw materials, direct labour costs and a part of the overhead costs that are directly attributable), less the accumulated amortization and impairment. These costs are currently amortized on a straight line basis over their estimated useful life of 5 years.
SUBSEQUENT EXPENDITURESExpenditures relating to intangible fixed assets, subsequent to their purchase or completion are only capitalized if they increase the future economic benefits specific to the asset they relate to. All other expenditures are considered as costs.
Business combinations
The Group applies the purchase method of accounting to account for acquisitions of businesses. The cost of an acquisition is measured as the aggregate of the fair values at the date of exchange of the assets given, liabilities incurred and equity instruments issued. Identifiable assets, liabilities and contingent liabilities acquired or assumed are measured separately at their fair value as of the acquisition date. The excess of the cost of the acquisition over the company’s interest in the fair value of the identifiable net assets acquired is recorded as goodwill.
The allocation of fair values to the identifiable assets acquired and liabilities assumed is based on various assumptions requiring management judgment.Acquisition-related costs are expensed as incurred.
Goodwill
Goodwill is the positive difference between the cost of the business combination and the share of the Group in the fair value of the acquired identifiable net assets of a subsidiary or associated company at the moment of acquisition. Goodwill is not amortized, but is subject to an annual impairment test. Goodwill is expressed in the currency of the related company and is converted into euro at the closing exchange rate on the balance sheet date.
Bargain Purchase
If the fair value of the net assets acquired is in excess of the aggregate consideration transferred, the Group reassesses whether it has correctly identified all of the assets acquired and all of the liabilities assumed and reviews the procedures used to measure the amounts to be recognised at the acquisition date. If the reassessment still results in an excess of the fair value of net assets acquired over the aggregate consideration transferred, then the gain is recognised in profit or loss.
Tangible fixed assets
Tangible fixed assets are recognized at historic cost price, less accumulated depreciation and impairment. Historic cost is the initial purchase price plus any other directly attributable acquisition costs (such as non-recoverable taxes and transportation costs). The cost price of fixed assets produced by the company itself (such as tool sets) includes the cost price of materials, direct labour costs and a proportion of production related overhead costs. Subsequent expenditure is only capitalized, if it increases the future economic benefits of the fixed assets it relates to. Repair and maintenance costs, which do not increase future economic benefits, are expensed as incurred.
Depreciation is calculated using the straight line method, starting from the first date of use over the entire duration of their expected useful life.
The expected economic useful life is determined as follows:
ASSETS Buildings 40 years
Building fixtures and furniture 10-20 years
External infrastructure 20-40 years
Machinery and equipment 8-20 years
Small equipment 5 years
Screws and cylinders 6 years
Dies and calibrators (tool sets) 5 years
Installations 10-25 years
Office equipment 4-10 years
Logistics equipment 8 years
Furniture 10 years
Vehicles 4-5 years
Land, which is deemed to have an infinite useful life, is not depreciated.
Fixed assets held for sale
Assets held for sale relate to assets or groups of assets that will be disposed of. These assets are valued at the lower of carrying value or fair value less costs to sell. The same valuation principle applies for business units held for sale.
Leasing
Financial lease contracts, for which the Group bears the majority of the risks and benefits inherent to the ownership of the leased property, are recognized as tangible fixed assets at the present value of their minimum lease payments, at the moment when the lease contract was entered into, or at market value if lower. Lease payments are partly considered as financial costs and partly as reimbursement of the lease debt. This results in a flat interest charge over the entire lifetime of the contract, compared to the capital to be repaid. Financial charges are offset directly against revenue. Lease contracts, for which the lessor retains the majority of the risks and benefits of the assets, are considered as operational leases. Payments made under an operational lease are expensed, on a straight line basis over the entire term of the contract.
52 53DECEUNINCK FINANCIAL REPORT 2016 DECEUNINCK FINANCIAL REPORT 2016
Financial instruments
CRITERIA RELATING TO THE INITIAL RECOGNITION OR DERECOGNITION OF FINANCIAL ASSETS AND LIABILITIESFinancial instruments are recognized initially when the Group subscribes to the related contractual provisions. Purchases and sales of financial assets are recognized on the transaction date. Financial assets (or parts thereof) are derecognized, when the Group exercises their contractual rights, when these rights mature, when the Group renounces them, or when the Group loses control of the contractual rights associated with the financial assets. Financial liabilities (or parts thereof) are derecognized, if the obligation stipulated in the contract is withdrawn, cancelled or expired.
CRITERIA FOR OFFSETTING FINANCIAL ASSETS AND LIABILITIESA financial asset and a financial liability are offset and the net amount is recorded in the balance sheet, if there is a legally enforceable right to offset the recognized amounts, and if there is an intention to settle the liability and simultaneously realize the asset or to settle the liability on a net basis.
Financial fixed assetsAll financial assets are initially recognized at their cost price plus the cost of acquisition of such an investment. Unrealized profits or losses, resulting from changes in the fair value of financial assets available for sale, are directly recognized in other comprehensive income within the equity until the asset is sold, cashed in or disposed of, or when the financial asset is subject to an impairment. At that time, the accumulated profits and losses previously booked in equity are recognized in the income statement of the related period. Reversals of impairments booked in relation to shares will not be recorded in the income statement.
Financial assets valued at fair value through the income statementFinancial assets valued at fair value through the income statement consist of financial assets that are held for trading purposes or financial assets that are initially recognized at fair value through the income statement. Financial assets held for trading purposes are those acquired with the objective of selling them in a short-term notice. This category also contains derivative financial instruments, which do not fulfil the criteria of IAS 39 for ‘hedge accounting’. Unrealized profits or losses, resulting from the changes in the fair value of financial assets held for trading, are directly booked in the income statement.
Trade receivablesTrade receivables are booked at their nominal value less possible provisions for bad debt. When recovery of the full amount becomes improbable an estimate is made of the provisions for bad debt. Provisions for bad debts are recognized in the income statement of the period during which they are identified.
Cash and cash equivalentsCash and cash equivalents consist mainly of cash in hand, short-term deposits and short-term investments (maturing within three months after their acquisition date) which are readily convertible into cash and which are subject to a limited risk of changes in value. Within the cash flow statement, cash and cash equivalents include bank balances (current and deposit accounts). Any negative cash position is presented net of short-term debts with financial institutions (‘bank overdrafts’).
Interest bearing loansInterest bearing financial debts are initially valued at the fair value of the remuneration received minus any costs related to the transaction. After the initial recognition interest-bearing financial debts are valued at their amortized cost. The difference between the amortized cost and the repayment value is expensed over the duration of the loan based on the effective interest rate method or until the debt is no longer held.
DERIVATIVE FINANCIAL INSTRUMENTSThe Group uses derivative financial instruments (mainly interest rate swaps and FX forward contracts) in order to limit the risks associated with interest and exchange rate fluctuations. The Group’s policy prohibits the use of these instruments for speculative purposes.
Derivative financial instruments are classified as either ‘fair value’ hedges, if these instruments hedge changes in the fair value of recognized assets and liabilities, or as ‘cash flow’ hedges, if they cover cash flow variations associated with a specific risk in relation to a recognized asset or liability or an expected transaction.
For ‘fair value’ hedges, profits or losses resulting from the revaluation of ‘fair value’ hedging instruments are directly recorded through profit or loss. Gains or losses on the hedged position lead to an adjustment of the book value of the hedged position and should be recorded through profit or
loss. If the adjustment is associated with the book value of an interest bearing financial debt, it is amortized through profit or loss until it is entirely amortized upon maturity.
For ‘cash flow’ hedges on the Group’s firm commitments, which satisfy the special requirements for recognition as hedging transaction, the proportion of the profit or loss on the hedge instrument considered as an effective hedge is recorded through other comprehensive income and the non-effective proportion is recorded through profit or loss.
Financial instruments, not meeting the special requirements for recognition as a hedging transaction are valued at their fair value, and any profit or loss resulting from a change in the fair value of the instrument is directly expensed.
Inventories
Inventories are valued at the lower of cost price or net realizable value. The net realizable value is defined as the estimated selling price under normal operating conditions net of any estimated costs for handling and selling the product. Costs incurred in bringing each product to its current location and conditions are recorded as follows: q Raw materials and consumables – purchase price,
based on the FIFO principle; q Finished goods and work in process – direct material
and labour costs, plus a part of the general production costs, based on normal production capacity;
q Trade goods – purchase price, based on the FIFO principle.
Treasury shares
The amount paid, including any directly attributable expenses, for treasury shares acquired by the Company is deducted from equity.
Impairments
The Group’s assets, excluding inventories and deferred tax assets, are assessed for impairment indicators at each balance sheet date. If impairment indicators are present, the recoverable amount of the asset is estimated. An impairment is recognized, if the carrying value of an asset, or that of the cash-generating unit to which it belongs, is higher than its recoverable amount. Impairments are recorded in the income statement.
FINANCIAL ASSETSThe realizable value of held-to-maturity financial assets and of receivables is calculated as the net present value of expected, future cash flows, discounted at the initial effective interest rate inherent to these assets.
Impairments on held-to-maturity investments or receivables are reversed if a subsequent increase in their realizable value can be objectively associated with an event arising after the recognition of an impairment loss.
NON-FINANCIAL FIXED ASSETSThe recoverable amount of other assets is the higher of their fair value less cost to sell or its value in use of the corresponding assets. In order to determine the value in use, the net present value of expected future cash flows is calculated using a pre-tax discount rate, which reflects both current market rates and the asset’s specific inherent risks. When an asset does not generate cash flows, that are largely independent of the other assets, the recoverable amount of the cash generating unit to which this asset belongs, is determined.
Impairments relating to goodwill are not reversed. Impairments of other assets are reversed, if a change takes place in the estimates used to determine the recoverable amount. An increase in the carrying value of an asset, resulting from the reversal of an impairment, cannot be higher than the carrying value (after depreciation) that would have been obtained, if no impairments had been recorded for this asset in previous years.
54 55DECEUNINCK FINANCIAL REPORT 2016 DECEUNINCK FINANCIAL REPORT 2016
Provisions
Provisions are accounted for whenever the Group has to settle a legal or constructive obligation resulting from a past event, when it is probable that a cash outflow will be required to settle these obligations, and to the extent that these can be reliably estimated.
When the Group expects that all or part of the expenditure, which is required to settle legal obligations, will be reimbursed by another party, the amount to be reimbursed will only be recognized as an asset if it is practically certain that they will be effectively collected. A warranty provision is established for all products under warranty, based on historical data relating to repairs and returns of goods.
Employee benefits
PENSIONSThe Group participates primarily in defined contribution plans, and has defined benefit plans in Belgium and Germany. The funds of these plans consist of employer and employee contributions. The Group treats the employer and employee contributions for the defined contribution plans as expenses for the year in which they were made, except for Belgian defined contribution plans, accounted for as defined benefit plans. For defined benefit plans, the pension obligation is estimated by using the projected unit credit method.
Remeasurements, comprising of actuarial gains and losses, the effect of the asset ceiling, excluding net interest (not applicable to the Group) and the return on plan assets (excluding net interest), are recognised immediately in the statement of financial position with a corresponding debit or credit to retained earnings through OCI in the period in which they occur. Remeasurements are not reclassified to profit or loss in subsequent periods.
Past service costs are recognised in profit or loss on the earlier of: q the date of the plan amendment or curtailment, and q the date that the Group recognises restructuring-related
costs
Net interest is calculated by applying the discount rate to the net defined benefit liability or asset. The Group recognises the following changes in the net defined benefit obligation under ‘other net operating result’ in the consolidated income statement (by function): q service costs comprising current service costs, past-service
costs, gains and losses on curtailments and non-routine settlements
q net interest expense or income
ADDITIONAL NOTE ON BELGIAN PENSION PLANSThe new law about occupational pension plans has been published on 18th of December 2015.
This law includes changes that may have an impact on the accounting for defined contribution and defined benefit plans under IAS 19R in Belgium.
The first change relates to the minimum guaranteed return. The new law replaces the 3.25% (employer) and 3.75% (employee) as from 1/1/2016 by 65% of 10-year OLO yield averaged on 1 June over last 24 months (possibly increased to 75% (1 January 2018) and 85% (2019) if NBB approves) with a minimum of 1.75% and a maximum of 3.75%. For insured plans the current 3.25% and 3.75% remain applicable to pre-2016 contributions. For other plans the new rates also apply to the accumulated pre-2016 contributions as from 1/1/2016 onwards.
Following IAS 19R, this implies that the (so called) Belgian defined contribution plans with a minimum funding guarantee should be accounted for as defined benefit pension plans.
As a result of the new law about occupational pension plans, which was published on 18 December 2015 and introduced changes that are expected to have impact on the accounting for defined contribution plans, management decided to account for the defined contribution plans using the Projected Unit Credit (PUC) method without application of para 115 of IAS19R, compared to the intrinsic value method, which was applied until the year ended 31 December 2015. Per 30 June 2016, the impact of this change in accounting estimate was accounted for through other comprehensive income. Subsequent to June 30, 2016 the plans were accounted for following the stipulations of IAS19R.
The second change to the law includes an increase of the legal retirement age to 66 year in 2025 and 67 year in 2030. The group does not anticipate a material impact on the pension liability.
SHARE-BASED PAYMENTSVarious stock option and warrant programs enable the staff members, senior management members and members of the Executive Team to acquire company shares. The exercise price for options or warrants is equal to the market price of the underlying shares on the grant date. Equity is increased respectively by the amounts received or the exercise price, when such options or warrants are exercised. The cost of share-based payment transactions is valued at fair value on the grant date. The fair value is determined by an expert, using a binominal tree structure. The cost of share-based payment transactions and at the same time as the corresponding increase in equity, is recognized over the vesting period.
If the conditions of equity settled share-based payment transactions are modified, the minimal cost equals the cost as if the conditions had not been changed. An additional cost is recognized for any modification which increases the fair value of share-based payment transaction or includes a benefit for the employee as of the date of modification (IFRS 2.28).
When a share-based payment is cancelled, then this is considered as a compensation that was granted on the date of cancellation and the relating unamortized cost is immediately recognized. However, if a new share-based payment is granted as a replacement for the cancelled compensation and if this is recorded as a replacement compensation on the grant date, then the cancelled and the new compensations are treated as a modification of the original share-based payment transaction, as described in the preceding paragraph.
BONUSESContractual bonuses are granted based on planned key financial objectives and personal performances. The estimated amount of the bonus is recognized as a cost, based on an estimate as of the balance sheet date.
Sales
Sales (which consists primarily of the sales of goods) are considered to be earned when it is probable that the economic benefits associated with the transaction will be received by the Group, if the amount of revenue can be reliably determined, when the risks and rewards of the sale are entirely transferred to the purchaser, and when there is no longer uncertainty in terms of the collection of the consideration, the transaction costs and any possible return of the goods.
Government grants
Government grants are recognized at their fair value, when there is reasonable assurance that they will be received and that the Group will fulfil all of the conditions attached to them. When the grant relates to an expense item, it is recognized as income over the period necessary to match the grant on a systematic basis to the costs that is intended to compensate. Where the grant relates to an asset, it is recognized as deferred income.
Borrowing costs
Borrowing costs are capitalized when they are directly attributable to the acquisition, construction or production of a qualifying asset.
56 57DECEUNINCK FINANCIAL REPORT 2016 DECEUNINCK FINANCIAL REPORT 2016

Income taxes
Income taxes include current and deferred taxes. Taxes are recognized in the income statement, unless they are associated with items that are booked immediately to equity. In that case, the corresponding tax is recognized directly against equity. Current taxes include the expected amount payable on taxable earnings for the period, along with adjustments of fiscal liabilities for previous years. A taxable earnings calculation for the year is based on the tax rates applicable on the reporting date. Deferred taxation is calculated in accordance with the liability method, for all temporary differences between the tax base of assets and liabilities and their carrying amount for financial reporting purposes. The calculation is based on rates of taxation for which the legislative process has been (largely) completed on the reporting date. Under this method, the Group also has to calculate deferred tax on the difference between the fair value of the net assets acquired and their tax base as a result of a new acquisition. Deferred tax assets are only recognized if it is probable that sufficient taxable profits will be generated in the future in order to use the tax benefit or the tax losses; 2 elements are considered to assess the likelihood of future taxable profits: 1/ the profitability in the past, at least 2 consecutive years of profitability is needed and 2/ the expected profitability of the next 3 years according to the detailed budget of next year and the higher level business plan of the 2 following years. The carrying amount of a deferred tax asset is reduced, when it becomes unlikely that the relating tax benefit will be realized.
Financial income/charges
Interest income includes interest earned on loans granted to third parties or bank deposits, and interest charges include interest due on loans contracted by the Group. Recorded interest is based on the ‘effective interest’ method. Financial income or charges, next to realized and unrealized exchange rate gains or losses related to interest-bearing loans and deposits, also include recorded gains or losses due to a revaluation of the fair value of financial derivatives, which are considered as ‘fair value’ hedging instruments if the hedged risks are of a financial nature, or if financial instruments do not meet the special ‘hedge accounting’ requirements.
Changes in accounting policies and disclosures
The entity applied the same IFRSs as those adopted in the previous years, except for the new IFRSs and interpretations the entity adopted as of 1st January 2016.
The nature and the effect of each of the following new standards, amendments and/or interpretations are described below: q Amendments to IFRS 10, IFRS 12 and IAS 28 –
Investment Entities: Applying the Consolidation Exception, effective 1 January 2016
q Amendments to IFRS 11 Joint Arrangements – Accounting for Acquisitions of Interests in Joint Operations, effective 1 January 2016
q Amendments to IAS 1 Presentation of Financial Statements – Disclosure Initiative, effective 1 January 2016
q Amendments to IAS 16 Property, Plant and Equipment and IAS 38 Intangible Assets – Clarification of Acceptable Methods of Depreciation and Amortisation, effective 1 January 2016
q Amendments to IAS 16 Property, Plant and Equipment and IAS 41 Agriculture – Bearer Plants, effective 1 January 2016
q Amendments to IAS 19 Employee Benefits – Defined Benefit Plans: Employee Contributions, effective 1 February 2015
q Amendments to IAS 27 Separate Financial Statements – Equity Method in Separate Financial Statements, effective 1 January 2016
q Annual Improvements to IFRSs 2010-2012 Cycle (issued December 2013), effective 1 February 2015
q Annual Improvements to IFRSs 2012-2014 Cycle (issued September 2014), effective 1 January 2016
The improvements become effective for annual periods beginning on or after 1 January 2016.
The Group has applied these changes and concluded that these changes did not result in a material impact on the IFRS financial statements.
Standards issued but not yet effective
Standards and interpretations issued but not yet effective during the reporting period are listed below.
q Amendments to IFRS 2 Share-based Payment – Classification and Measurement of Share-based Payment Transactions, effective 1 January 2018
q Amendments to IFRS 4 Insurance Contracts – Applying IFRS 9 Financial instruments with IFRS 43, effective 1 January 2018
q IFRS 9 Financial Instruments, effective 1 January 2018 q IFRS 15 Revenue from Contracts with customers,
including amendments to IFRS 15: Effective date of IFRS 15 and Clarifications to IFRS 15 Revenue from Contracts with customers, effective 1 January 2018
q IFRS 16 Leases3, effective 1 January 2019 q Amendments to IAS 7 Statement of Cash Flows –
Disclosure Initiative3, effective 1 January 2017 q Amendments to IAS 12 Income Taxes – Recognition
of Deferred Tax Assets for Unrealised Losses, effective 1 January 2017
q Amendments to IAS 40 Investment Property – Transfers of Investment Property, effective 1 January 2018
q IFRIC 22 Foreign Currency Transactions and Advance Consideration, effective 1 January 2018
q Annual Improvements to IFRSs 2014-2016 Cycle (issued December 2016), effective 1 January 2017 and 1 January 2018
The Group has examined these changes and is currently assessing the results. The Group anticipates that these changes will have no material effect on the financial statements.
For IFRS 16 impact we refer to the disclosure on operational lease (note 18)
58 59DECEUNINCK FINANCIAL REPORT 2016 DECEUNINCK FINANCIAL REPORT 2016

2. Interests in other entities
For information on the composition of the Group, we refer to Note 26. List of subsidiaries.As per 31 December 2016, the Group has 2 subsidiaries that have material non-controlling interests: q Ege Profil Ticaret ve Sanayi AS (Turkey) (ownership = 97.54%) q Pimaş Plastik Insaat Malzemeleri A.S. (Turkey) (ownership = 87.6%)
Ege Profil Ticaret ve Sanayi AS
Financial information of Ege Profil Ticaret ve Sanayi AS is provided below. The information is based on amounts before intercompany eliminations.
Summarized income statement
FOR THE 12 MONTH PERIOD ENDED 31 DECEMBER (in € thousand) 2015 2016SALES 153,143 203,628
Cost of goods sold (114,062) (149,744)
GROSS PROFIT 39,081 53,884
Operational expenses (21,204) (31,092)
OPERATING PROFIT (EBIT) 17,877 22,792
Financial result (2,553) (7,474)
Transfer Price adjustments (855) 171
PROFIT BEFORE TAXES (EBT) 14,469 15,489
Income taxes (1,035) 3,008
NET PROFIT 13,434 18,498
Other comprehensive income after tax impact (7,349) (11,718)
TOTAL COMPREHENSIVE INCOME 6,084 6,780
TOTAL COMPREHENSIVE INCOME IS ATTRIBUTABLE TO: 2015 2016Shareholders of the parent company 5,935 6,613
Non-controlling interests 150 167
Summarized statement of financial position 31 december
(in € thousand) 2015 2016ASSETS
Intangible fixed assets 2,002 1,670
Goodwill 216 185
Tangible fixed assets 38,976 64,384
Financial fixed assets 687 687
Deferred tax assets 0 2,425
Long-term receivables 90 50
NON-CURRENT ASSETS 41,971 69,401
Inventories 13,136 18,378
Trade receivables 75,718 81,755
Other receivables 4,384 8,507
Cash and cash equivalents 28,159 24,173
Fixed assets held for sale 498 488
CURRENT ASSETS 121,895 133,301
TOTAL ASSETS 163,866 202,702
EQUITY 69,426 76,205
Interest-bearing loans 39,070 28,924
Long-term provisions 2,125 1,837
Deferred tax liabilities 1,810 0
NON-CURRENT LIABILITIES 43,006 30,760
Interest-bearing loans 15,885 30,131
Trade payables 32,156 61,420
Other current liabilities 3,393 4,186
CURRENT LIABILITIES 51,434 95,737
TOTAL EQUITY AND LIABILITIES 163,866 202,702
TOTAL EQUITY IS ATTRIBUTABLE TO: 2015 2016Shareholders of the parent company 67,718 74,330
Non-controlling interests 1,708 1,875
Summarized statement of cash flows
FOR THE 12 MONTH PERIOD ENDED 31 DECEMBER (in € thousand) 2015 2016Cash flow from operating activities 14,157 34,096
Cash flow from investing activities (11,593) (38,736)
Cash flow from financing activities 21,680 4,699
NET INCREASE (+) / DECREASE (-) IN CASH AND CASH EQUIVALENTS 24,244 60
60 61DECEUNINCK FINANCIAL REPORT 2016 DECEUNINCK FINANCIAL REPORT 2016
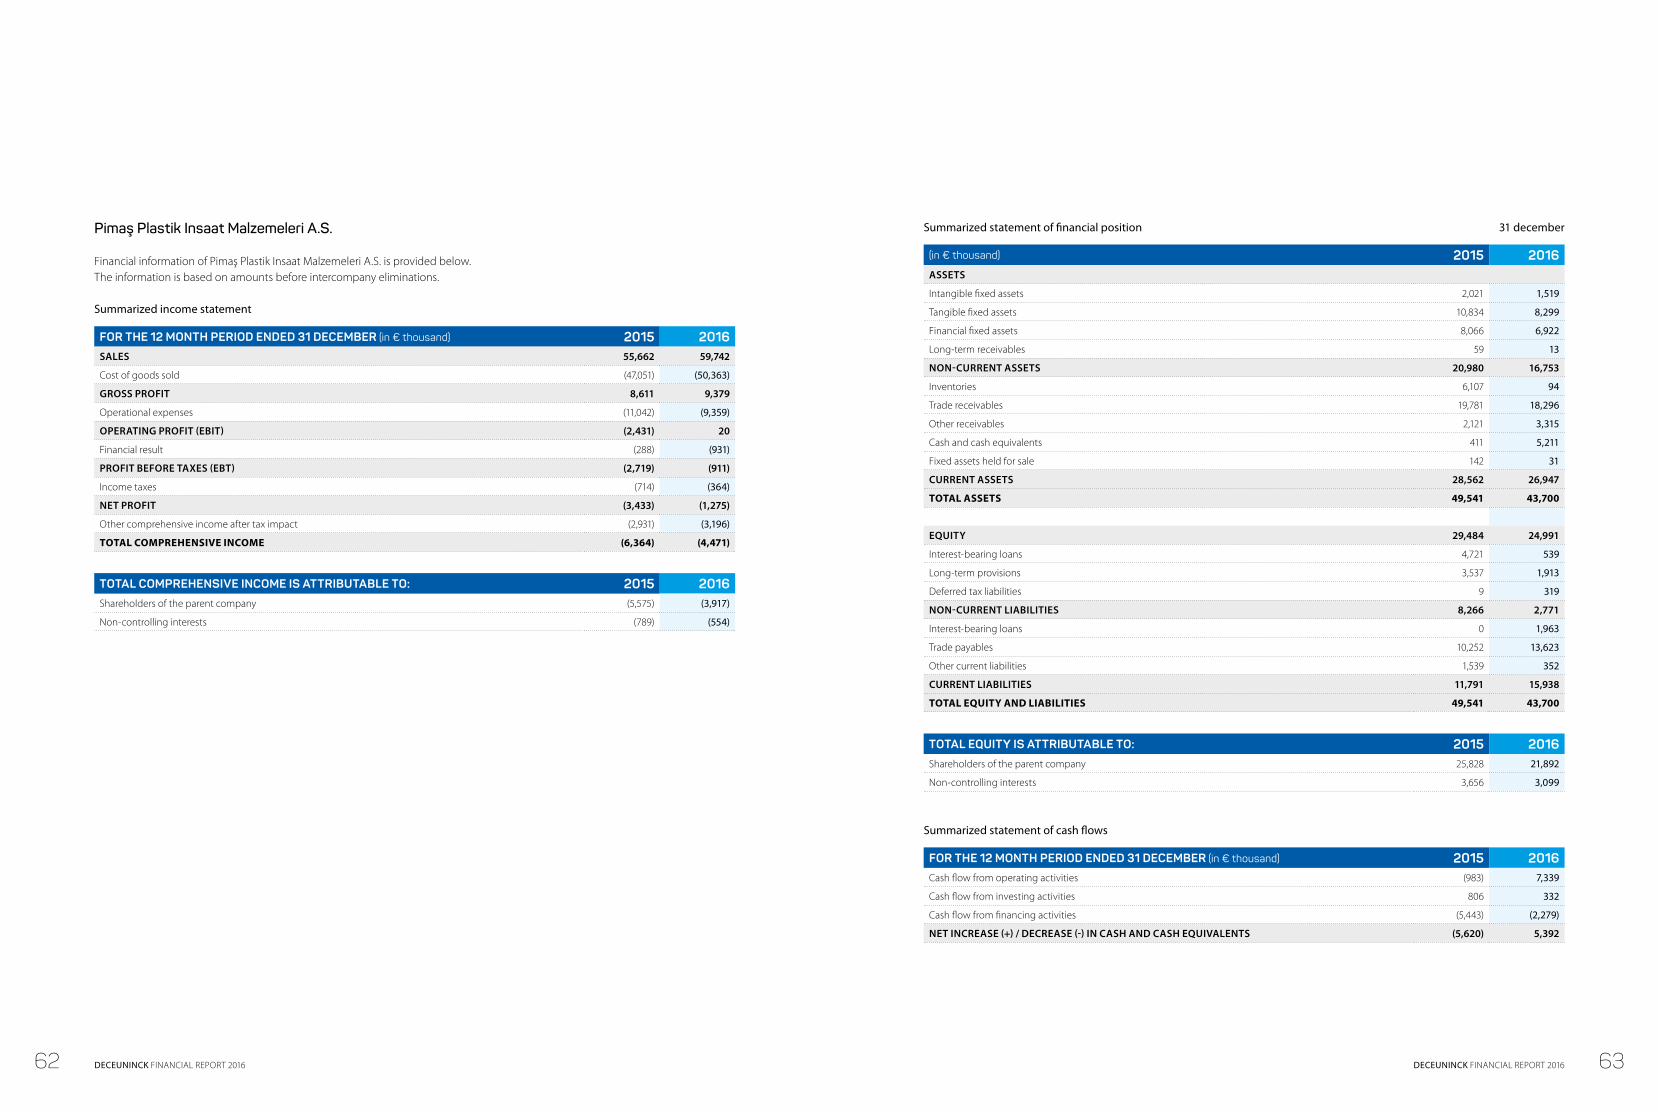
Pimaş Plastik Insaat Malzemeleri A.S.
Financial information of Pimaş Plastik Insaat Malzemeleri A.S. is provided below. The information is based on amounts before intercompany eliminations.
Summarized income statement
FOR THE 12 MONTH PERIOD ENDED 31 DECEMBER (in € thousand) 2015 2016SALES 55,662 59,742
Cost of goods sold (47,051) (50,363)
GROSS PROFIT 8,611 9,379
Operational expenses (11,042) (9,359)
OPERATING PROFIT (EBIT) (2,431) 20
Financial result (288) (931)
PROFIT BEFORE TAXES (EBT) (2,719) (911)
Income taxes (714) (364)
NET PROFIT (3,433) (1,275)
Other comprehensive income after tax impact (2,931) (3,196)
TOTAL COMPREHENSIVE INCOME (6,364) (4,471)
TOTAL COMPREHENSIVE INCOME IS ATTRIBUTABLE TO: 2015 2016Shareholders of the parent company (5,575) (3,917)
Non-controlling interests (789) (554)
Summarized statement of financial position 31 december
(in € thousand) 2015 2016ASSETS
Intangible fixed assets 2,021 1,519
Tangible fixed assets 10,834 8,299
Financial fixed assets 8,066 6,922
Long-term receivables 59 13
NON-CURRENT ASSETS 20,980 16,753
Inventories 6,107 94
Trade receivables 19,781 18,296
Other receivables 2,121 3,315
Cash and cash equivalents 411 5,211
Fixed assets held for sale 142 31
CURRENT ASSETS 28,562 26,947
TOTAL ASSETS 49,541 43,700
EQUITY 29,484 24,991
Interest-bearing loans 4,721 539
Long-term provisions 3,537 1,913
Deferred tax liabilities 9 319
NON-CURRENT LIABILITIES 8,266 2,771
Interest-bearing loans 0 1,963
Trade payables 10,252 13,623
Other current liabilities 1,539 352
CURRENT LIABILITIES 11,791 15,938
TOTAL EQUITY AND LIABILITIES 49,541 43,700
TOTAL EQUITY IS ATTRIBUTABLE TO: 2015 2016Shareholders of the parent company 25,828 21,892
Non-controlling interests 3,656 3,099
Summarized statement of cash flows
FOR THE 12 MONTH PERIOD ENDED 31 DECEMBER (in € thousand) 2015 2016Cash flow from operating activities (983) 7,339
Cash flow from investing activities 806 332
Cash flow from financing activities (5,443) (2,279)
NET INCREASE (+) / DECREASE (-) IN CASH AND CASH EQUIVALENTS (5,620) 5,392
62 63DECEUNINCK FINANCIAL REPORT 2016 DECEUNINCK FINANCIAL REPORT 2016
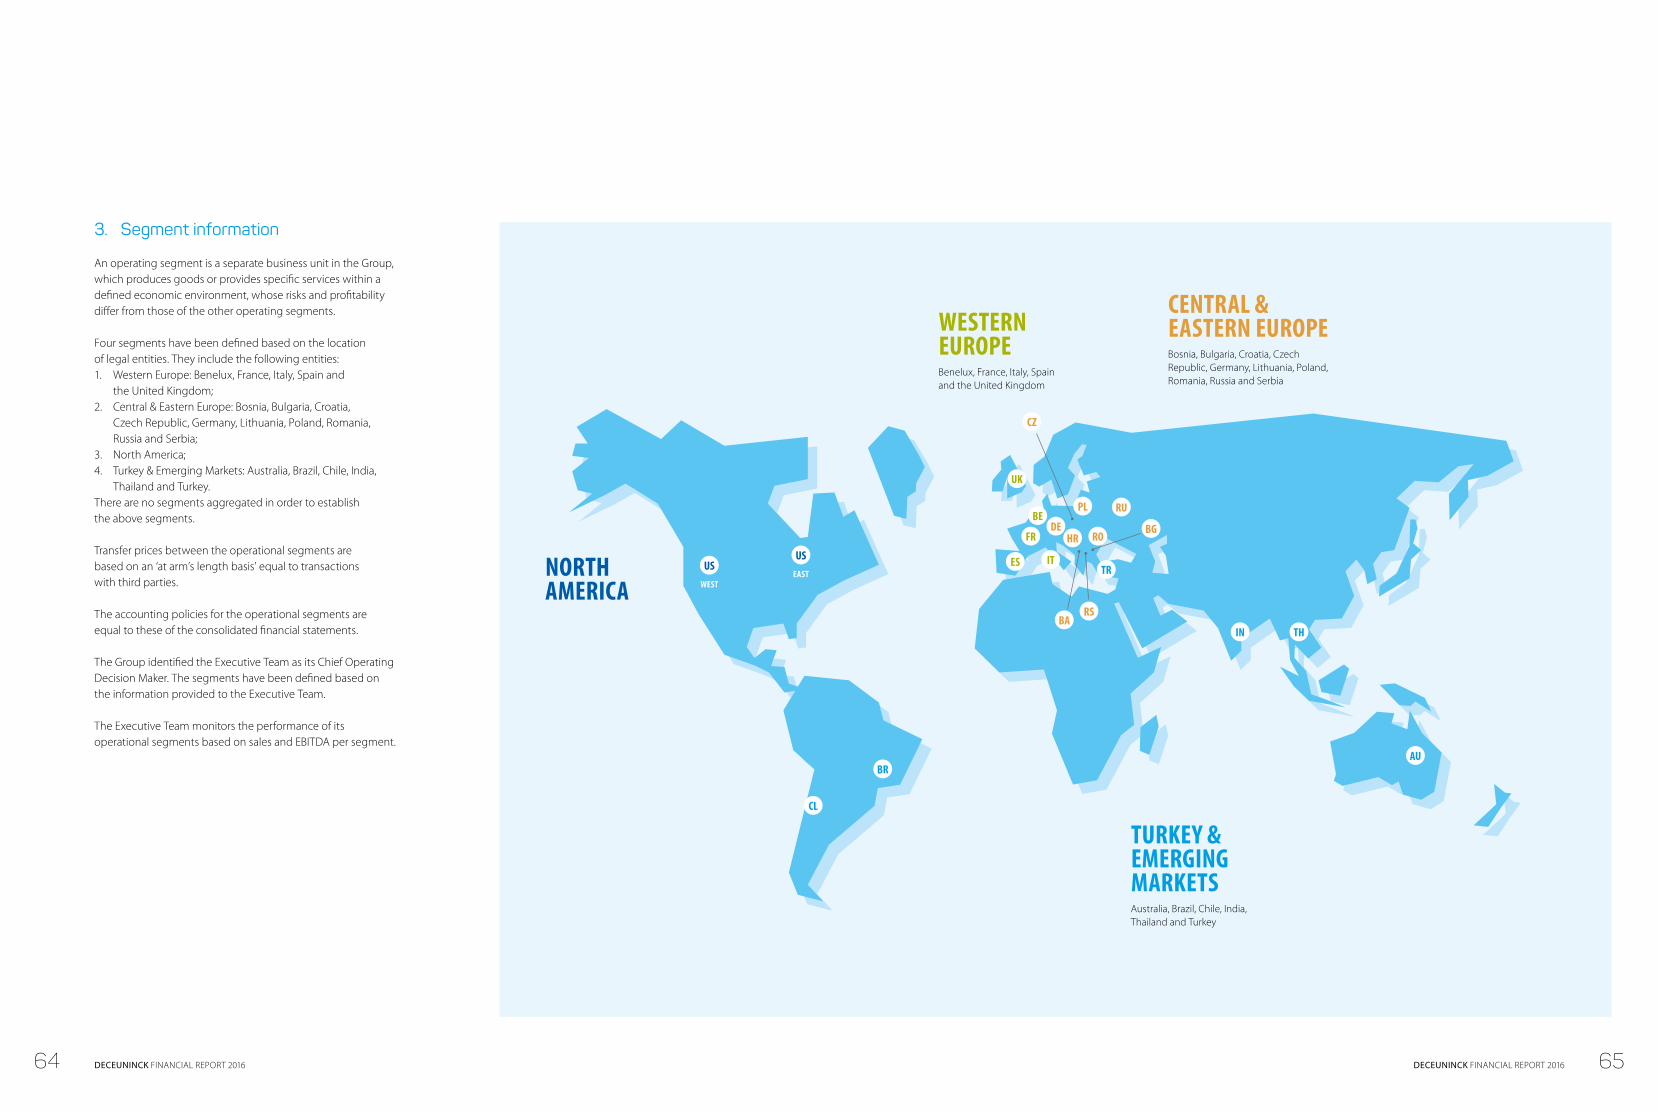
3. Segment information
An operating segment is a separate business unit in the Group, which produces goods or provides specific services within a defined economic environment, whose risks and profitability differ from those of the other operating segments.
Four segments have been defined based on the location of legal entities. They include the following entities:1. Western Europe: Benelux, France, Italy, Spain and
the United Kingdom;2. Central & Eastern Europe: Bosnia, Bulgaria, Croatia,
Czech Republic, Germany, Lithuania, Poland, Romania, Russia and Serbia;
3. North America;4. Turkey & Emerging Markets: Australia, Brazil, Chile, India,
Thailand and Turkey.There are no segments aggregated in order to establish the above segments.
Transfer prices between the operational segments are based on an ‘at arm’s length basis’ equal to transactions with third parties.
The accounting policies for the operational segments are equal to these of the consolidated financial statements.
The Group identified the Executive Team as its Chief Operating Decision Maker. The segments have been defined based on the information provided to the Executive Team.
The Executive Team monitors the performance of its operational segments based on sales and EBITDA per segment.
CENTRAL & EASTERN EUROPE Bosnia, Bulgaria, Croatia, Czech Republic, Germany, Lithuania, Poland, Romania, Russia and Serbia
WESTERN EUROPE Benelux, France, Italy, Spain and the United Kingdom
TURKEY & EMERGING MARKETSAustralia, Brazil, Chile, India, Thailand and Turkey
NORTH AMERICA
RU
UK
FRDE
ES
CZ
BA
AU
RO
RS
IT
BG
CL
HR
PL
TH
BR
IN
USWEST
USEAST
BE
TR
64 65DECEUNINCK FINANCIAL REPORT 2016 DECEUNINCK FINANCIAL REPORT 2016

Segment information includes results, assets and liabilities that can be attributed directly to a segment.
FOR THE 12 MONTH PERIOD ENDED 31 DECEMBER (in € thousand)
WESTERN EUROPE CENTRAL & EASTERN EUROPE NORTH AMERICA TURKEY & EMERGING MARKETS INTERSEGMENT ELIMINATIONS CONSOLIDATED
2015 2016 2015 2016 2015 2016 2015 2016 2015 2016 2015 2016External sales 170,462 176,484 169,723 161,817 111,221 118,567 193,118 214,012 644,524 670,880
Intersegment sales 18,766 14,737 11,270 15,443 467 377 5,903 7,341 (36,406) (37,899)
Total sales 189,228 191,221 180,993 177,260 111,688 118,944 199,021 221,354 (36,406) (37,899) 644,524 670,880
REBITDA 21,305 17,504 3,832 5,775 12,429 14,088 18,765 28,306 (458) (591) 55,874 65,082
Financial result (9,989) (13,897)
Income taxes (3,522) (1,272)
Depreciations of (in)tangible fixed assets (9,339) (9,522) (6,873) (6,371) (4,571) (5,368) (4,912) (5,013) 436 464 (25,260) (25,810)
Impairments on (in)tangible fixed assets (451) (206) (585) (3,632) (1) (295) (239) (908) (1,276) (5,041)
Capital expenditures (capex) 10,320 24,162 4,810 5,107 9,120 12,249 16,245 39,645 (1,751) (1,734) 38,745 79,430
Assets:
FOR THE 12 MONTH PERIOD ENDED 31 DECEMBER (in € thousand)
CONSOLIDATED
2015 2016Western Europe 209,670 176,471
Central & Eastern Europe 113,749 115,123
North America 70,521 78,844
Turkey and Emerging Markets 171,005 199,751
INTERSEGMENT ASSETS 564,945 570,190
Cash and Cash Equivalents 70,720 72,425
Intersegmenent Eliminations (73,045) (41,564)
TOTAL GROUP ASSETS 562,620 601,051
Liabilities:
FOR THE 12 MONTH PERIOD ENDED 31 DECEMBER (in € thousand)
CONSOLIDATED
2015 2016Western Europe 44,176 50,533
Central & Eastern Europe 26,492 29,410
North America 17,633 17,735
Turkey and Emerging Markets 42,999 70,987
INTERSEGMENT LIABILITIES 131,301 168,665
Equity including non-controlling interest 269,252 275,039
Long-term interest-bearing loans 143,486 129,206
Long-term provisions 25,119 28,439
Deferred income tax liabilities 4,529 2,277
Short-term interest-bearing loans 19,324 31,640
Intersegment eliminations (30,392) (34,215)
TOTAL GROUP LIABILITIES 562,620 601,051
Sales by product group is presented in the table below (in %):
FOR THE 12 MONTH PERIOD ENDED 31 DECEMBER (in %)
WESTERN EUROPE CENTRAL & EASTERN EUROPE NORTH AMERICA TURKEY & EMERGING MARKETS CONSOLIDATED
2015 2016 2015 2016 2015 2016 2015 2016 2015 2016Window and door systems 70.8% 72.8% 80.5% 80.2% 94.4% 97.0% 94.5% 93.9% 84.6% 85.6%
Outdoor living 7.8% 7.1% 6.5% 8.2% 5.1% 1.9% 0.0% 0.0% 4.6% 4.2%
Home protection 21.4% 20.1% 13.0% 11.6% 0.5% 1.1% 5.5% 6.1% 10.8% 10.2%
TOTAL 100.0% 100.0% 100.0% 100.0% 100.0% 100.0% 100.0% 100.0% 100.0% 100.0%
There is no significant concentration of sales (>10%) with one or a limited number of customers.
66 67DECEUNINCK FINANCIAL REPORT 2016 DECEUNINCK FINANCIAL REPORT 2016
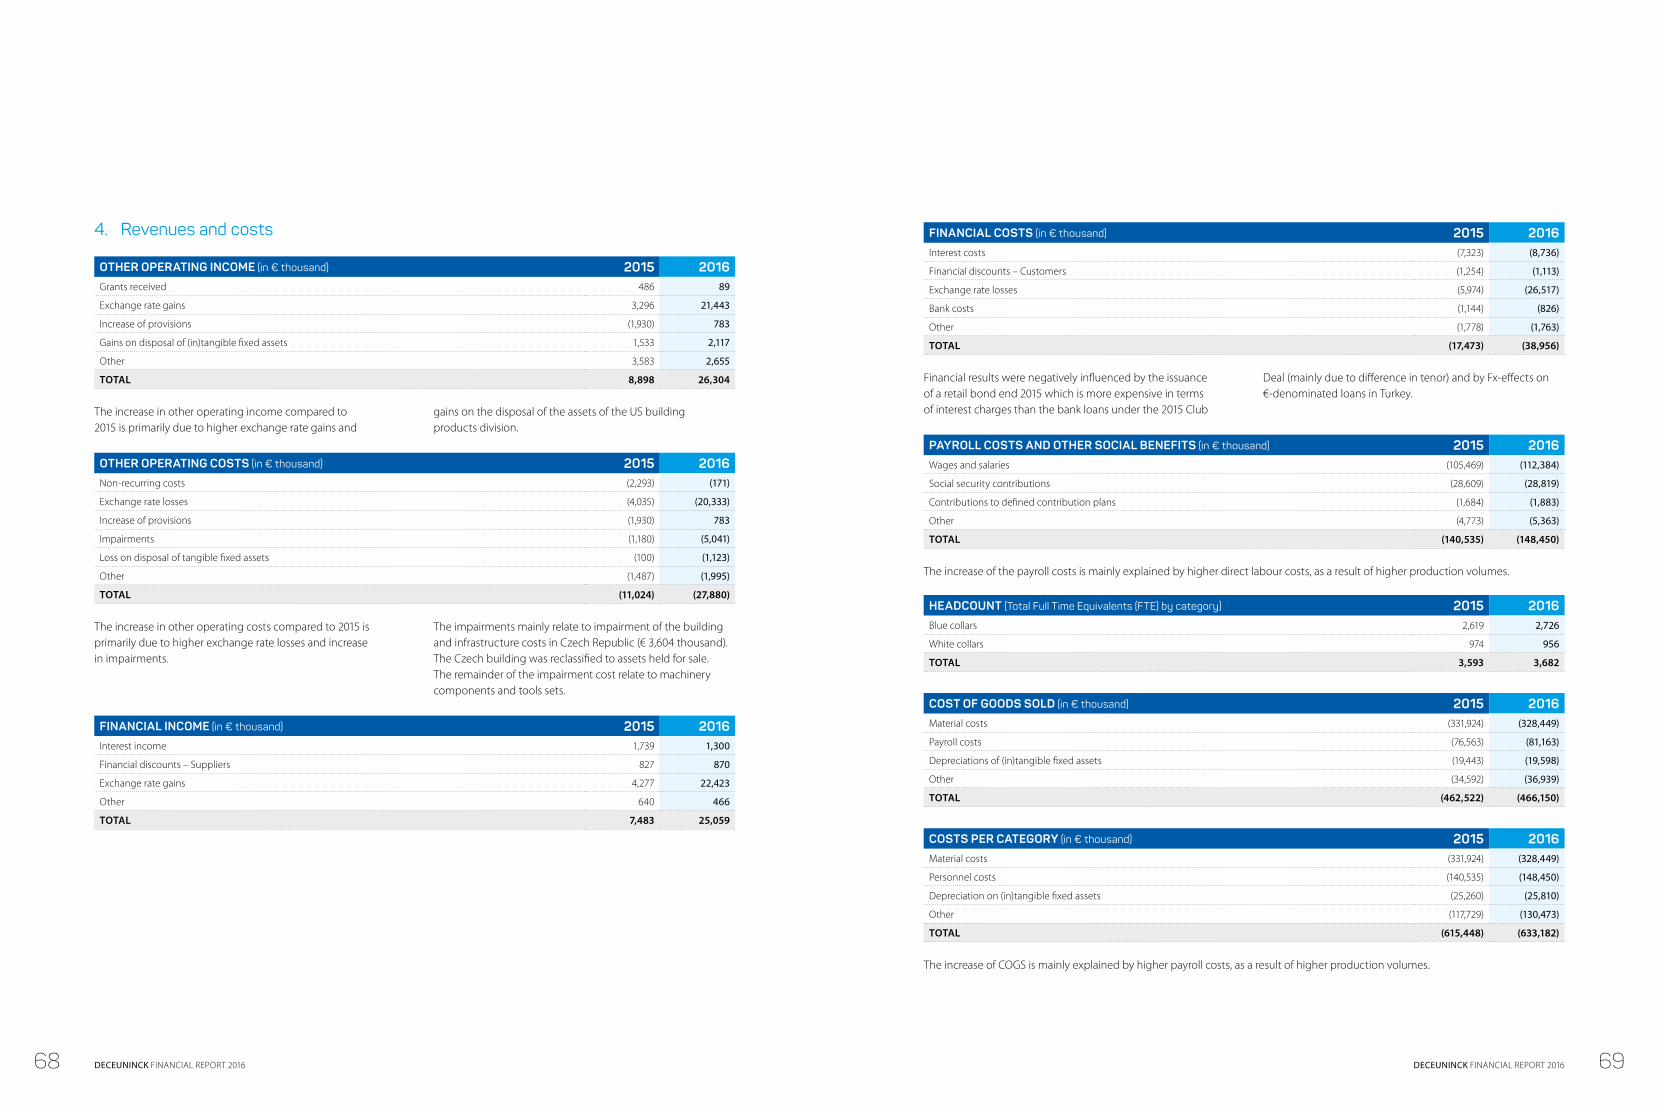
4. Revenues and costs
OTHER OPERATING INCOME (in € thousand) 2015 2016Grants received 486 89
Exchange rate gains 3,296 21,443
Increase of provisions (1,930) 783
Gains on disposal of (in)tangible fixed assets 1,533 2,117
Other 3,583 2,655
TOTAL 8,898 26,304
The increase in other operating income compared to 2015 is primarily due to higher exchange rate gains and
gains on the disposal of the assets of the US building products division.
OTHER OPERATING COSTS (in € thousand) 2015 2016Non-recurring costs (2,293) (171)
Exchange rate losses (4,035) (20,333)
Increase of provisions (1,930) 783
Impairments (1,180) (5,041)
Loss on disposal of tangible fixed assets (100) (1,123)
Other (1,487) (1,995)
TOTAL (11,024) (27,880)
The increase in other operating costs compared to 2015 is primarily due to higher exchange rate losses and increase in impairments.
The impairments mainly relate to impairment of the building and infrastructure costs in Czech Republic (€ 3,604 thousand). The Czech building was reclassified to assets held for sale. The remainder of the impairment cost relate to machinery components and tools sets.
FINANCIAL INCOME (in € thousand) 2015 2016Interest income 1,739 1,300
Financial discounts – Suppliers 827 870
Exchange rate gains 4,277 22,423
Other 640 466
TOTAL 7,483 25,059
FINANCIAL COSTS (in € thousand) 2015 2016Interest costs (7,323) (8,736)
Financial discounts – Customers (1,254) (1,113)
Exchange rate losses (5,974) (26,517)
Bank costs (1,144) (826)
Other (1,778) (1,763)
TOTAL (17,473) (38,956)
Financial results were negatively influenced by the issuance of a retail bond end 2015 which is more expensive in terms of interest charges than the bank loans under the 2015 Club
Deal (mainly due to difference in tenor) and by Fx-effects on €-denominated loans in Turkey.
PAYROLL COSTS AND OTHER SOCIAL BENEFITS (in € thousand) 2015 2016Wages and salaries (105,469) (112,384)
Social security contributions (28,609) (28,819)
Contributions to defined contribution plans (1,684) (1,883)
Other (4,773) (5,363)
TOTAL (140,535) (148,450)
The increase of the payroll costs is mainly explained by higher direct labour costs, as a result of higher production volumes.
HEADCOUNT (Total Full Time Equivalents (FTE) by category) 2015 2016Blue collars 2,619 2,726
White collars 974 956
TOTAL 3,593 3,682
COST OF GOODS SOLD (in € thousand) 2015 2016Material costs (331,924) (328,449)
Payroll costs (76,563) (81,163)
Depreciations of (in)tangible fixed assets (19,443) (19,598)
Other (34,592) (36,939)
TOTAL (462,522) (466,150)
COSTS PER CATEGORY (in € thousand) 2015 2016Material costs (331,924) (328,449)
Personnel costs (140,535) (148,450)
Depreciation on (in)tangible fixed assets (25,260) (25,810)
Other (117,729) (130,473)
TOTAL (615,448) (633,182)
The increase of COGS is mainly explained by higher payroll costs, as a result of higher production volumes.
68 69DECEUNINCK FINANCIAL REPORT 2016 DECEUNINCK FINANCIAL REPORT 2016
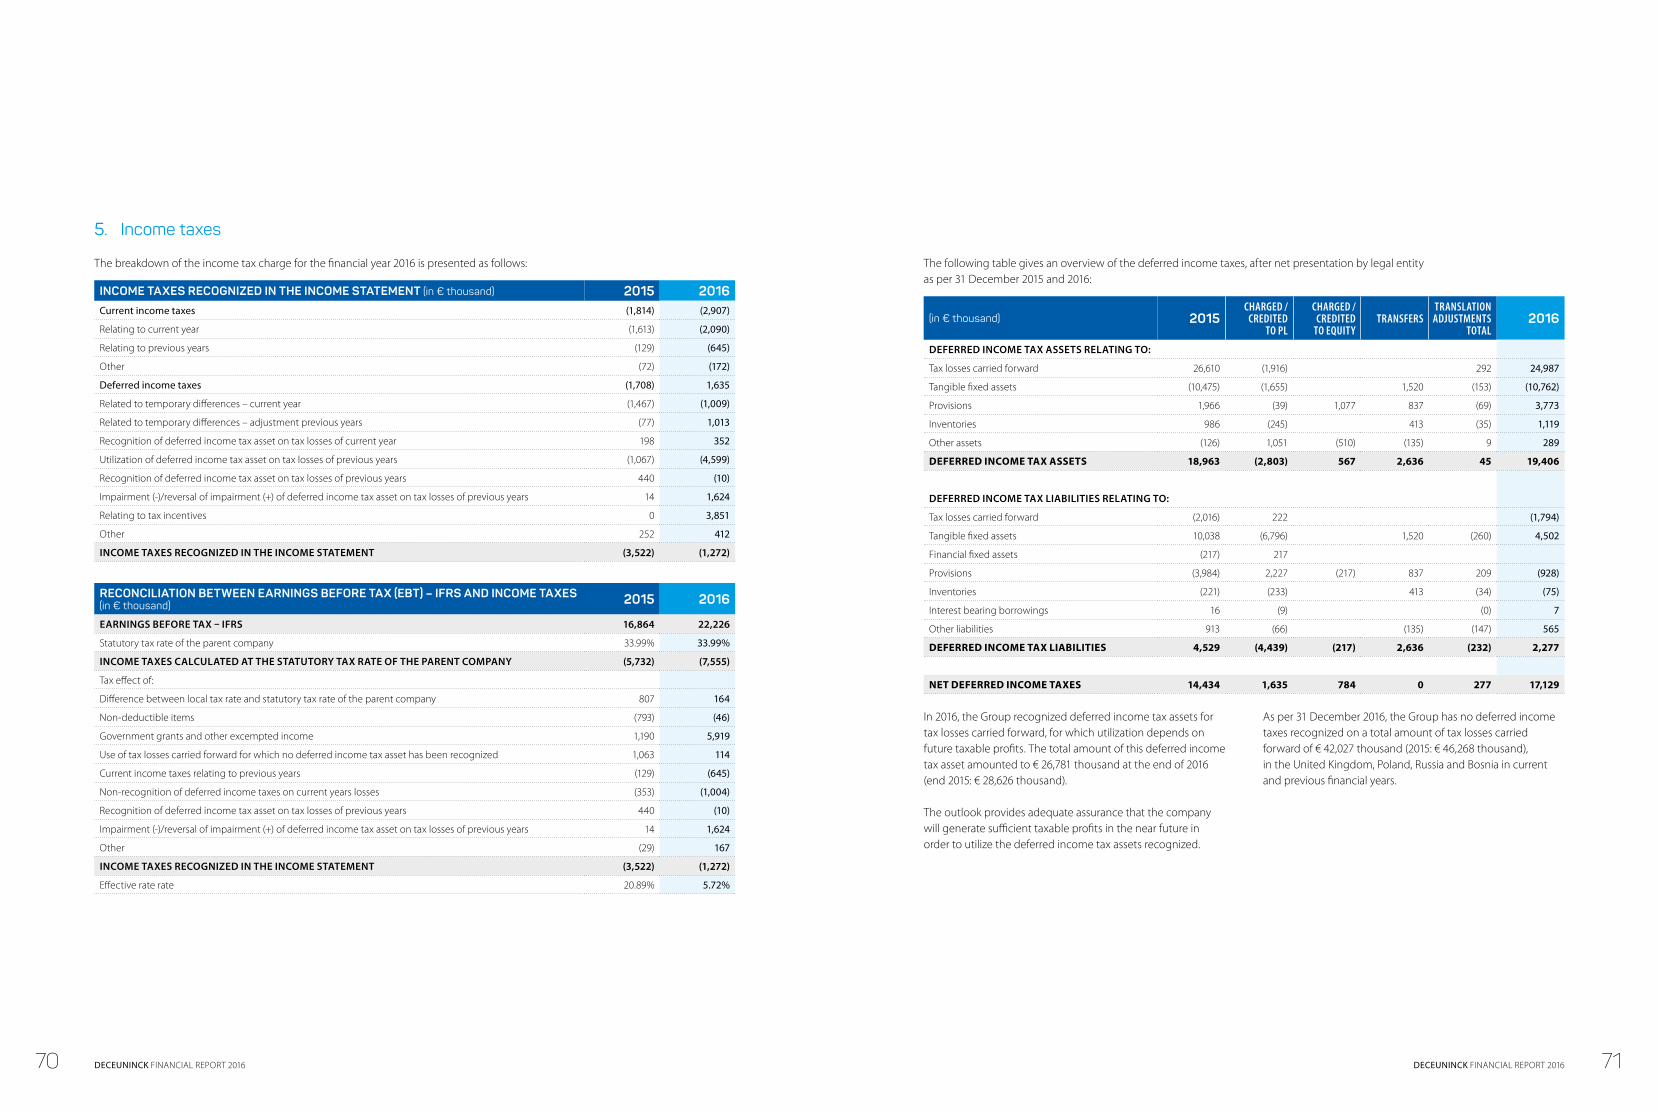
5. Income taxes
The breakdown of the income tax charge for the financial year 2016 is presented as follows:
INCOME TAXES RECOGNIZED IN THE INCOME STATEMENT (in € thousand) 2015 2016Current income taxes (1,814) (2,907)
Relating to current year (1,613) (2,090)
Relating to previous years (129) (645)
Other (72) (172)
Deferred income taxes (1,708) 1,635
Related to temporary differences – current year (1,467) (1,009)
Related to temporary differences – adjustment previous years (77) 1,013
Recognition of deferred income tax asset on tax losses of current year 198 352
Utilization of deferred income tax asset on tax losses of previous years (1,067) (4,599)
Recognition of deferred income tax asset on tax losses of previous years 440 (10)
Impairment (-)/reversal of impairment (+) of deferred income tax asset on tax losses of previous years 14 1,624
Relating to tax incentives 0 3,851
Other 252 412
INCOME TAXES RECOGNIZED IN THE INCOME STATEMENT (3,522) (1,272)
RECONCILIATION BETWEEN EARNINGS BEFORE TAX (EBT) – IFRS AND INCOME TAXES (in € thousand) 2015 2016
EARNINGS BEFORE TAX – IFRS 16,864 22,226
Statutory tax rate of the parent company 33.99% 33.99%
INCOME TAXES CALCULATED AT THE STATUTORY TAX RATE OF THE PARENT COMPANY (5,732) (7,555)
Tax effect of:
Difference between local tax rate and statutory tax rate of the parent company 807 164
Non-deductible items (793) (46)
Government grants and other excempted income 1,190 5,919
Use of tax losses carried forward for which no deferred income tax asset has been recognized 1,063 114
Current income taxes relating to previous years (129) (645)
Non-recognition of deferred income taxes on current years losses (353) (1,004)
Recognition of deferred income tax asset on tax losses of previous years 440 (10)
Impairment (-)/reversal of impairment (+) of deferred income tax asset on tax losses of previous years 14 1,624
Other (29) 167
INCOME TAXES RECOGNIZED IN THE INCOME STATEMENT (3,522) (1,272)
Effective rate rate 20.89% 5.72%
The following table gives an overview of the deferred income taxes, after net presentation by legal entity as per 31 December 2015 and 2016:
(in € thousand) 2015CHARGED /
CREDITED TO PL
CHARGED / CREDITED
TO EQUITYTRANSFERS
TRANSLATION ADJUSTMENTS
TOTAL2016
DEFERRED INCOME TAX ASSETS RELATING TO:
Tax losses carried forward 26,610 (1,916) 292 24,987
Tangible fixed assets (10,475) (1,655) 1,520 (153) (10,762)
Provisions 1,966 (39) 1,077 837 (69) 3,773
Inventories 986 (245) 413 (35) 1,119
Other assets (126) 1,051 (510) (135) 9 289
DEFERRED INCOME TAX ASSETS 18,963 (2,803) 567 2,636 45 19,406
DEFERRED INCOME TAX LIABILITIES RELATING TO:
Tax losses carried forward (2,016) 222 (1,794)
Tangible fixed assets 10,038 (6,796) 1,520 (260) 4,502
Financial fixed assets (217) 217
Provisions (3,984) 2,227 (217) 837 209 (928)
Inventories (221) (233) 413 (34) (75)
Interest bearing borrowings 16 (9) (0) 7
Other liabilities 913 (66) (135) (147) 565
DEFERRED INCOME TAX LIABILITIES 4,529 (4,439) (217) 2,636 (232) 2,277
NET DEFERRED INCOME TAXES 14,434 1,635 784 0 277 17,129
In 2016, the Group recognized deferred income tax assets for tax losses carried forward, for which utilization depends on future taxable profits. The total amount of this deferred income tax asset amounted to € 26,781 thousand at the end of 2016 (end 2015: € 28,626 thousand).
The outlook provides adequate assurance that the company will generate sufficient taxable profits in the near future in order to utilize the deferred income tax assets recognized.
As per 31 December 2016, the Group has no deferred income taxes recognized on a total amount of tax losses carried forward of € 42,027 thousand (2015: € 46,268 thousand), in the United Kingdom, Poland, Russia and Bosnia in current and previous financial years.
70 71DECEUNINCK FINANCIAL REPORT 2016 DECEUNINCK FINANCIAL REPORT 2016
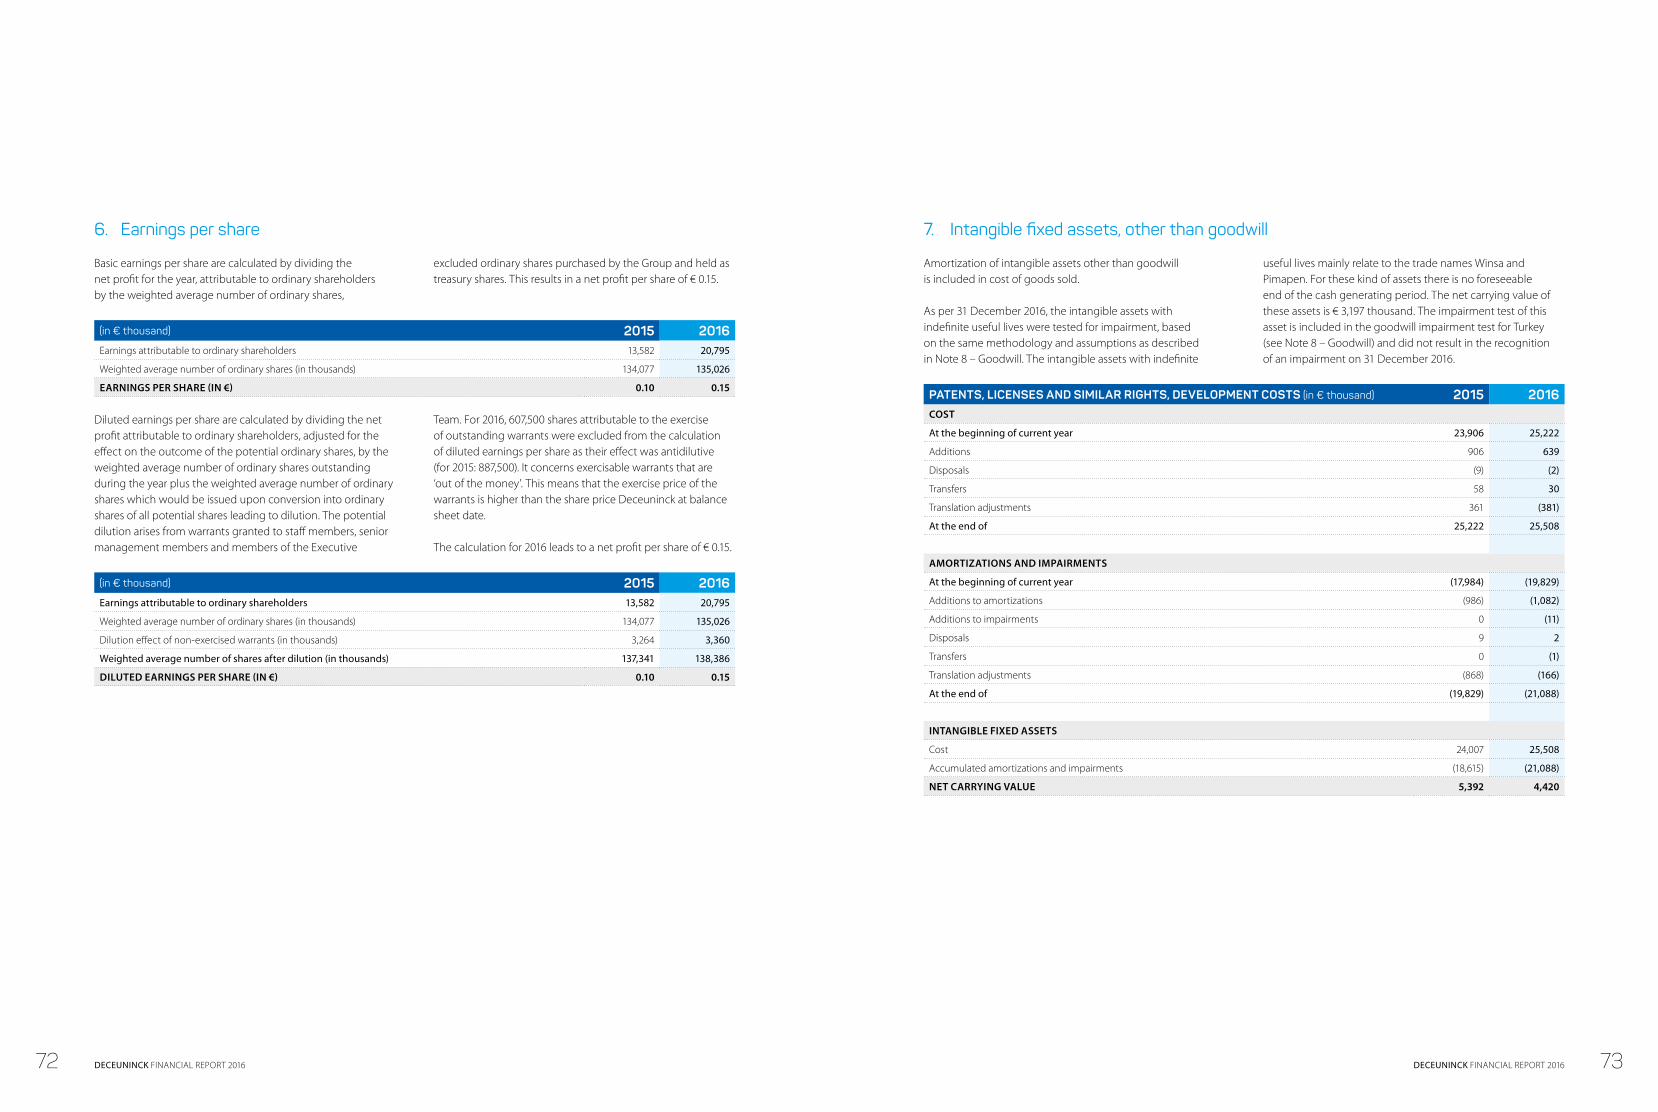
6. Earnings per share
Basic earnings per share are calculated by dividing the net profit for the year, attributable to ordinary shareholders by the weighted average number of ordinary shares,
excluded ordinary shares purchased by the Group and held as treasury shares. This results in a net profit per share of € 0.15.
(in € thousand) 2015 2016Earnings attributable to ordinary shareholders 13,582 20,795
Weighted average number of ordinary shares (in thousands) 134,077 135,026
EARNINGS PER SHARE (IN €) 0.10 0.15
Diluted earnings per share are calculated by dividing the net profit attributable to ordinary shareholders, adjusted for the effect on the outcome of the potential ordinary shares, by the weighted average number of ordinary shares outstanding during the year plus the weighted average number of ordinary shares which would be issued upon conversion into ordinary shares of all potential shares leading to dilution. The potential dilution arises from warrants granted to staff members, senior management members and members of the Executive
Team. For 2016, 607,500 shares attributable to the exercise of outstanding warrants were excluded from the calculation of diluted earnings per share as their effect was antidilutive (for 2015: 887,500). It concerns exercisable warrants that are ‘out of the money’. This means that the exercise price of the warrants is higher than the share price Deceuninck at balance sheet date.
The calculation for 2016 leads to a net profit per share of € 0.15.
(in € thousand) 2015 2016Earnings attributable to ordinary shareholders 13,582 20,795
Weighted average number of ordinary shares (in thousands) 134,077 135,026
Dilution effect of non-exercised warrants (in thousands) 3,264 3,360
Weighted average number of shares after dilution (in thousands) 137,341 138,386
DILUTED EARNINGS PER SHARE (IN €) 0.10 0.15
7. Intangible fixed assets, other than goodwill
Amortization of intangible assets other than goodwill is included in cost of goods sold.
As per 31 December 2016, the intangible assets with indefinite useful lives were tested for impairment, based on the same methodology and assumptions as described in Note 8 – Goodwill. The intangible assets with indefinite
useful lives mainly relate to the trade names Winsa and Pimapen. For these kind of assets there is no foreseeable end of the cash generating period. The net carrying value of these assets is € 3,197 thousand. The impairment test of this asset is included in the goodwill impairment test for Turkey (see Note 8 – Goodwill) and did not result in the recognition of an impairment on 31 December 2016.
PATENTS, LICENSES AND SIMILAR RIGHTS, DEVELOPMENT COSTS (in € thousand) 2015 2016COST
At the beginning of current year 23,906 25,222
Additions 906 639
Disposals (9) (2)
Transfers 58 30
Translation adjustments 361 (381)
At the end of 25,222 25,508
AMORTIZATIONS AND IMPAIRMENTS
At the beginning of current year (17,984) (19,829)
Additions to amortizations (986) (1,082)
Additions to impairments 0 (11)
Disposals 9 2
Transfers 0 (1)
Translation adjustments (868) (166)
At the end of (19,829) (21,088)
INTANGIBLE FIXED ASSETS
Cost 24,007 25,508
Accumulated amortizations and impairments (18,615) (21,088)
NET CARRYING VALUE 5,392 4,420
72 73DECEUNINCK FINANCIAL REPORT 2016 DECEUNINCK FINANCIAL REPORT 2016

8. Goodwill
(in € thousand) 2015 2016COST
At the beginning of 63,568 67,754
Translation adjustments 4,186 (1,161)
At the end of 67,754 66,593
IMPAIRMENTS
At the beginning of (52,697) (57,013)
Additions (96) 0
Translation adjustments (4,220) 1,130
At the end of (57,013) (55,883)
GOODWILL
Cost 67,754 66,593
Accumulated impairments (57,013) (55,883)
NET CARRYING VALUE 10,741 10,710
The application of IFRS 3 ‘Business combinations’ stipulates that all identifiable assets and liabilities should be recognized at their fair value at the moment of acquisition. All differences between the cost of the business combination and the fair value defined at the time of the acquisition should be
attributed to goodwill and any potential remaining differences in equity.
The net carrying value of goodwill is allocated as follows:
CASH-GENERATING UNIT (in € thousand) 2015 2016Turkey 9,494 9,463
Belgium 1,247 1,247
NET CARRYING VALUE 10,741 10,710
At 31 December 2016, the net carrying value of goodwill amounts to € 9.5 million for Turkey and € 1.2 million for Belgium.
In accordance with IAS 36, goodwill is not amortized but is subject to an annual impairment test. This test is always performed at year end whenever there is an indication of a possible impairment.
The test consists in comparing the recoverable amount of each cash-generating unit with its carrying amount. An impairment loss is recognized whenever the recoverable amount is lower than the net book value. The Group carried out the impairment test at 31 December 2016, consistent with previous years.
Impairment test goodwill Turkey
CASH GENERATING UNITThe cash generating unit is Ege Profil, which holds the brands Ege Pen Deceuninck and Winsa, but with a carve out for the IC flow related with subcontracted production of Pimapen in the Kartepe plant which also produces the Winsa brand. Ege Pen Deceuninck brand represents the goodwill and carrying value of the participation in Ege Profil while Winsa brand represents the intangibles resulting from the Winsa asset deal in 2004.
DISCOUNT RATEThe discount rate is based on the risk free rate in the currency region where the activities are deployed and current market assessment of the risks specific to the Deceuninck Group. The discount rate was estimated based on the weighted average cost of capital (WACC) and is 10.9% for 2016 (2015: 10.0%).
ASSUMPTIONS FOR 2017-2021For EBITDA of 2017, management has worked out a target based on detailed plans and actions. A similar carve out for IC flow on subcontracted production of Pimapen in the Kartepe plant has been applied.For the period 2018-2021 the EBITDA estimate is based on the 2017 detailed plans.
SENSITIVITY ANALYSISOne scenario with reasonable growth expectations has been worked out. As the headroom towards impairment is so large and taking into account the cautious assumptions, there is no need to more scenario’s.
CONCLUSIONNo need for impairment of goodwill.
Impairment test goodwill Belgium
CASH GENERATING UNITThe cash generating unit is Western Europe, composed of legal entities Deceuninck NV (Belgium), Deceuninck Ltd (UK), Deceuninck SAS (France) and Deceuninck Sucursal en España (Spain).
This is the lowest level at which EBITDA can be measured without being influenced by transfer prices. It is also the level of our segment reporting.
DISCOUNT RATEThe discount rate is based on the risk free rate in the currency region where the activities are deployed and current market assessment of the risks specific to the Deceuninck Group. The discount rate was estimated based on the weighted average cost of capital (WACC) and is 5.1% for 2015 (2015: 6.7%).
ASSUMPTIONS FOR 2017-2021For EBITDA of 2017, management has worked out a target based on detailed plans and actions. For the period 2018-2021 the EBITDA estimate is based on longer term plans, taking into account reasonable growth levels in line with country specific evolutions of the building industry.
SENSITIVITY ANALYSISOne scenario with reasonable growth expectations has been worked out: q EBITDA: a growth rate between 0% and
+8.1% was assumed. q Operating working capital: +4.4% growth for 2017,
+0.5% for 2018 and +4.2% for 2019 and flat from 2020 onwards.
CONCLUSIONNo need for impairment of goodwill.
74 75DECEUNINCK FINANCIAL REPORT 2016 DECEUNINCK FINANCIAL REPORT 2016
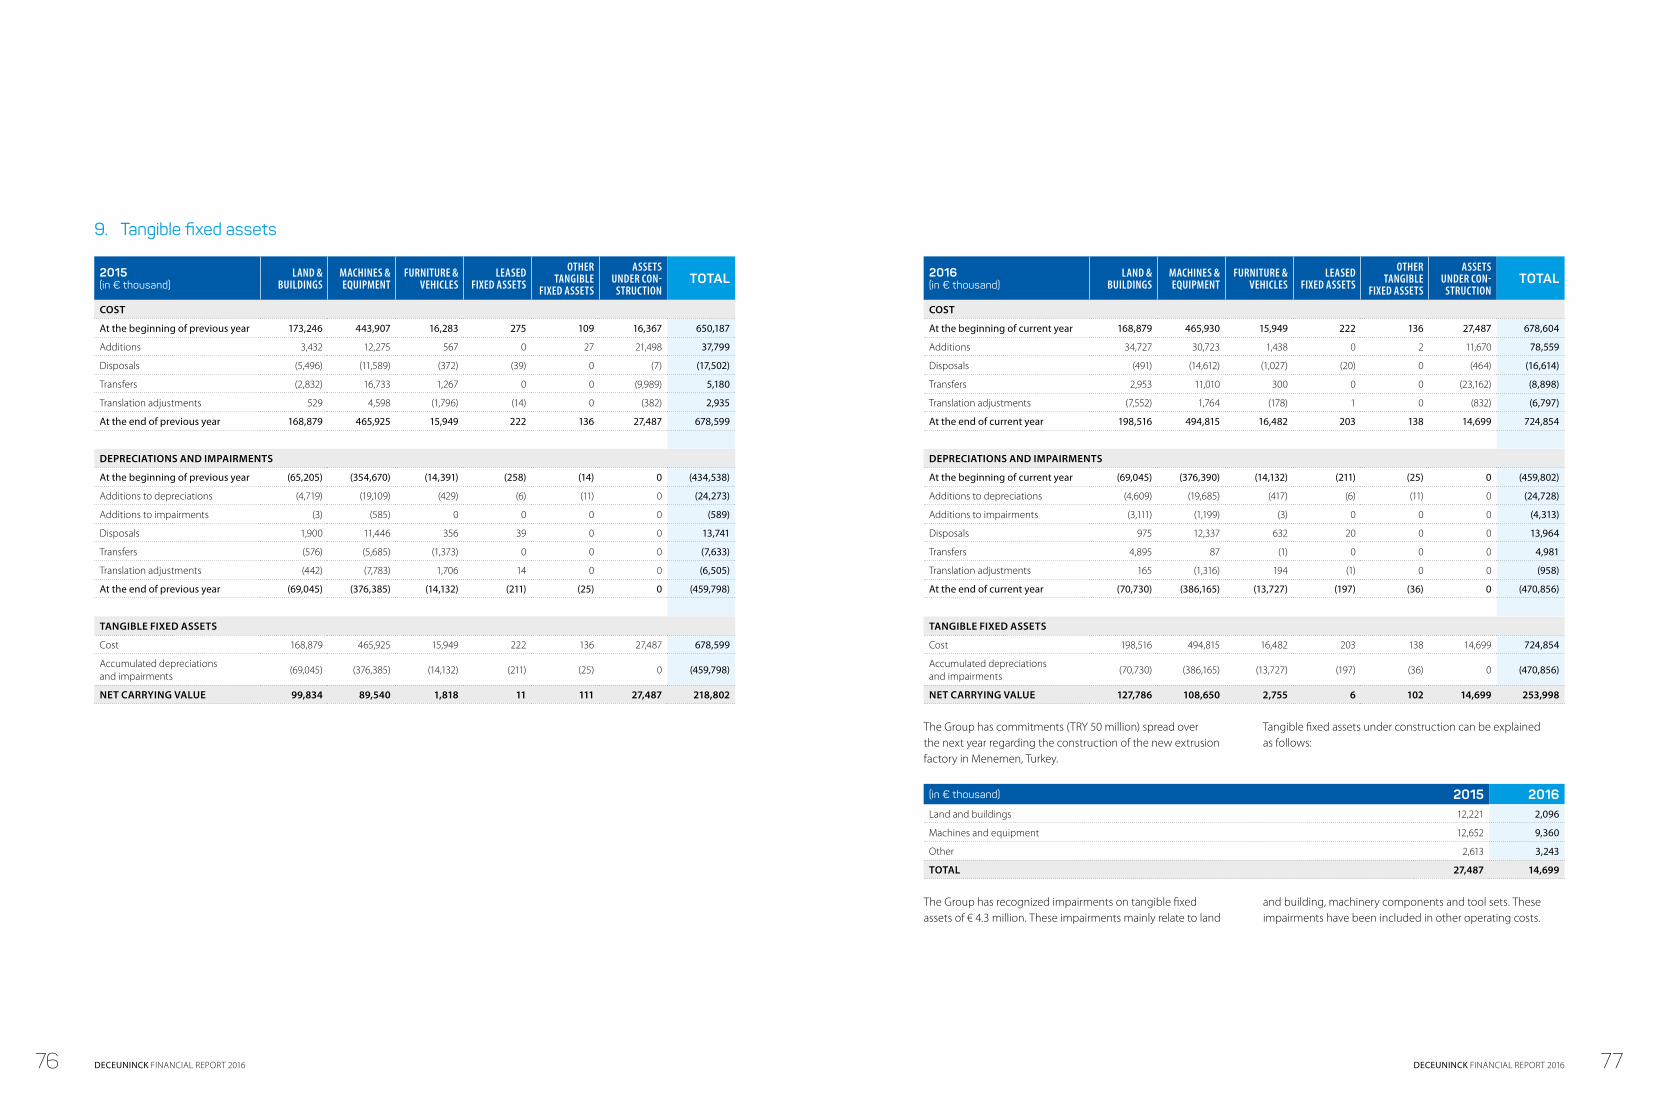
9. Tangible fixed assets
2015(in € thousand)
LAND & BUILDINGS
MACHINES & EQUIPMENT
FURNITURE & VEHICLES
LEASED FIXED ASSETS
OTHER TANGIBLE
FIXED ASSETS
ASSETS UNDER CON-
STRUCTIONTOTAL
COST
At the beginning of previous year 173,246 443,907 16,283 275 109 16,367 650,187
Additions 3,432 12,275 567 0 27 21,498 37,799
Disposals (5,496) (11,589) (372) (39) 0 (7) (17,502)
Transfers (2,832) 16,733 1,267 0 0 (9,989) 5,180
Translation adjustments 529 4,598 (1,796) (14) 0 (382) 2,935
At the end of previous year 168,879 465,925 15,949 222 136 27,487 678,599
DEPRECIATIONS AND IMPAIRMENTS
At the beginning of previous year (65,205) (354,670) (14,391) (258) (14) 0 (434,538)
Additions to depreciations (4,719) (19,109) (429) (6) (11) 0 (24,273)
Additions to impairments (3) (585) 0 0 0 0 (589)
Disposals 1,900 11,446 356 39 0 0 13,741
Transfers (576) (5,685) (1,373) 0 0 0 (7,633)
Translation adjustments (442) (7,783) 1,706 14 0 0 (6,505)
At the end of previous year (69,045) (376,385) (14,132) (211) (25) 0 (459,798)
TANGIBLE FIXED ASSETS
Cost 168,879 465,925 15,949 222 136 27,487 678,599
Accumulated depreciations and impairments
(69,045) (376,385) (14,132) (211) (25) 0 (459,798)
NET CARRYING VALUE 99,834 89,540 1,818 11 111 27,487 218,802
2016(in € thousand)
LAND & BUILDINGS
MACHINES & EQUIPMENT
FURNITURE & VEHICLES
LEASED FIXED ASSETS
OTHER TANGIBLE
FIXED ASSETS
ASSETS UNDER CON-
STRUCTIONTOTAL
COST
At the beginning of current year 168,879 465,930 15,949 222 136 27,487 678,604
Additions 34,727 30,723 1,438 0 2 11,670 78,559
Disposals (491) (14,612) (1,027) (20) 0 (464) (16,614)
Transfers 2,953 11,010 300 0 0 (23,162) (8,898)
Translation adjustments (7,552) 1,764 (178) 1 0 (832) (6,797)
At the end of current year 198,516 494,815 16,482 203 138 14,699 724,854
DEPRECIATIONS AND IMPAIRMENTS
At the beginning of current year (69,045) (376,390) (14,132) (211) (25) 0 (459,802)
Additions to depreciations (4,609) (19,685) (417) (6) (11) 0 (24,728)
Additions to impairments (3,111) (1,199) (3) 0 0 0 (4,313)
Disposals 975 12,337 632 20 0 0 13,964
Transfers 4,895 87 (1) 0 0 0 4,981
Translation adjustments 165 (1,316) 194 (1) 0 0 (958)
At the end of current year (70,730) (386,165) (13,727) (197) (36) 0 (470,856)
TANGIBLE FIXED ASSETS
Cost 198,516 494,815 16,482 203 138 14,699 724,854
Accumulated depreciations and impairments
(70,730) (386,165) (13,727) (197) (36) 0 (470,856)
NET CARRYING VALUE 127,786 108,650 2,755 6 102 14,699 253,998
The Group has commitments (TRY 50 million) spread over the next year regarding the construction of the new extrusion factory in Menemen, Turkey.
Tangible fixed assets under construction can be explained as follows:
(in € thousand) 2015 2016Land and buildings 12,221 2,096
Machines and equipment 12,652 9,360
Other 2,613 3,243
TOTAL 27,487 14,699
The Group has recognized impairments on tangible fixed assets of € 4.3 million. These impairments mainly relate to land
and building, machinery components and tool sets. These impairments have been included in other operating costs.
76 77DECEUNINCK FINANCIAL REPORT 2016 DECEUNINCK FINANCIAL REPORT 2016

10. Long-term receivables
(in € thousand) 2015 2016Trade receivables 532 409
Other receivables 573 2,473
TOTAL 1,105 2,882
The maturity of such trade receivables ranges from 1 to 3 years.
11. Inventories
(in € thousand) 2015 2016Raw materials and consumables 30,425 32,697
Work in progress 5 0
Finished products 40,940 40,422
Trade goods 24,083 25,844
TOTAL 95,454 98,963
During 2016 a net amount of € 2,019 thousand was posted as write-down inventory (in 2015: income of € 473 thousand). These write-downs are shown as Marketing, sales and distribution expenses. The cost of inventories recognized
as an expense during 2016 amounted to € 466,150 thousand (2015: € 462,522 thousand).No inventories were pledged as security for liabilities (2015: idem).
12. Trade receivables and other receivables
(in € thousand) 2015 2016Gross trade receivables 135,600 131,495
Impairments (14,117) (17,722)
TRADE RECEIVABLES 121,484 113,773
VAT and other taxes 8,556 11,748
Derivative financial instruments 1,278 1,947
Prepaid charges 1,781 2,833
Accrued revenues 1,476 1
Short-term warranties 239 247
Other 3,093 3,804
OTHER RECEIVABLES 16,424 20,580
Trade receivables decreased € 4.1 million mainly due to increased factoring. Total factoring amounted to € 27.8 million at 31 December 2016 (2015 € 16.3 million).
Days sales outstanding (DSO) improved year-on-year from 70 days in 2015 to 60 days in 2016, mainly as a result of higher factoring.
The factoring cost for 2016 amounts to € 660 thousand (2015 € 481 thousand). The effect of the factoring agreement is shown as a decrease in trade receivables, as substantially
all risks and rewards relating to the trade receivables, are transferred to the factor company (non-recourse factoring).
The gross trade receivables consist of invoiced sales, an accrual for invoices to be issued, an accrual for credit notes to be received, exchange rate differences and advance payments made.
An analysis is provided below, which shows the ageing of gross outstanding trade receivables granted to customers, after deduction of impairments on those amounts:
AGEING ANALYSIS OF TRADE RECEIVABLES (in € thousand)
NET CARRYING VALUE
NOT DUE NOR IMPAIRED
OVERDUE BUT NOT IMPAIRED
<30 DAYS
31-60 DAYS
61-90 DAYS
91-120 DAYS
>120 DAYS
As per 31 December 2015 121,484 107,389 8,891 2,039 (193) 1,010 2,348
As per 31 December 2016 113,773 104,022 6,222 1,474 555 503 998
As per 21 December 2016 an amount of € 17,722 thousand (2015 € 14,117 thousand) was recognized as an impairment on trade receivables to customers.
The movements during the last 2 financial years are presented in the following table:
IMPAIRMENT ALLOWANCE (in € thousand) 2015 2016AT THE BEGINNING OF (17,903) (14,117)
Additions (1,572) (7,383)
Reversals 1,795 201
Utilizations 0 2,605
Transfers 2,719 (620)
Translation adjustments 845 1,591
AT THE END OF (14,117) (17,722)
13. Cash and cash equivalents
(in € thousand) 2015 2016Cash and current bank accounts 43,655 46,439
Short term deposits 27,065 25,986
TOTAL 70,720 72,425
78 79DECEUNINCK FINANCIAL REPORT 2016 DECEUNINCK FINANCIAL REPORT 2016

14. Fixed assets held for sale
(in € thousand) 2015 2016COST
At the beginning 2,275 4,828
Additions 40 232
Disposals (214) (3,684)
Transfers 3,080 8,831
Translation adjustments (353) (116)
At the end of 4,828 10,091
DEPRECIATIONS AND IMPAIRMENTS
At the beginning (215) (1,355)
Additions to impairments (569) (717)
Disposals 89 645
Transfers (685) (4,943)
Translation adjustments 23 108
At the end of (1,355) (6,262)
FIXED ASSETS HELD FOR SALE
Cost 4,828 10,091
Accumulated depreciations and impairments (1,355) (6,262)
NET CARRYING VALUE 3,473 3,829
The fixed assets held for sale relate to real estate in Czech Republic, land in Poland and flats in Turkey. All assets are available for immediate sale. Necessary actions have been taken in order to place these assets on the market and sales are expected during 2017.
Following the reclassification to ‘held-for-sale’, assets held for sale are no longer depreciated. The measurement in accordance with IFRS 5 resulted in the recognition of a total impairment loss of € 3,604 thousand relating to the building in Czech Republic.
15. Issued capital and reserves
Issued capital
ISSUED CAPITAL 2015 2016Amount (in € thousand) 53,257 53,393
Number of shares (without nominal value) 135,039,121 135,382,446
Share premiums
SHARE PREMIUMS 2015 2016Amount (in € thousand) 86,777 87,056
As per 31 December 2016, issued capital is set at € 53,393 thousand and is composed of 135,382 thousand shares without a nominal value.
Treasury shares
TREASURY SHARES 2015 2016Amount (in € thousand) (261) (123)
Number of shares (without nominal value) 217,121 102,121
On 31 December 2016, the Group held 102,121 treasury shares to fulfil its commitments with respect to stock option plans.
Currency translation adjustments
Currency translation adjustments include all exchange rate differences resulting from the conversion of the financial statements of subsidiaries into euro. The total currency translation adjustments amount to € (62,433) thousand at 31 December 2016.
An overview of the currency translation adjustments by currency is given below:
CURRENCY TRANSLATION ADJUSTMENTS (in € thousand) 2015 2016USD (7,810) (6,570)
TRY (28,133) (42,299)
RUB (9,996) (9,170)
PLN (2,553) (3,016)
GBP (3,101) 72
CZK (248) (248)
Other (1,073) (1,202)
TOTAL (52,914) (62,433)
80 81DECEUNINCK FINANCIAL REPORT 2016 DECEUNINCK FINANCIAL REPORT 2016
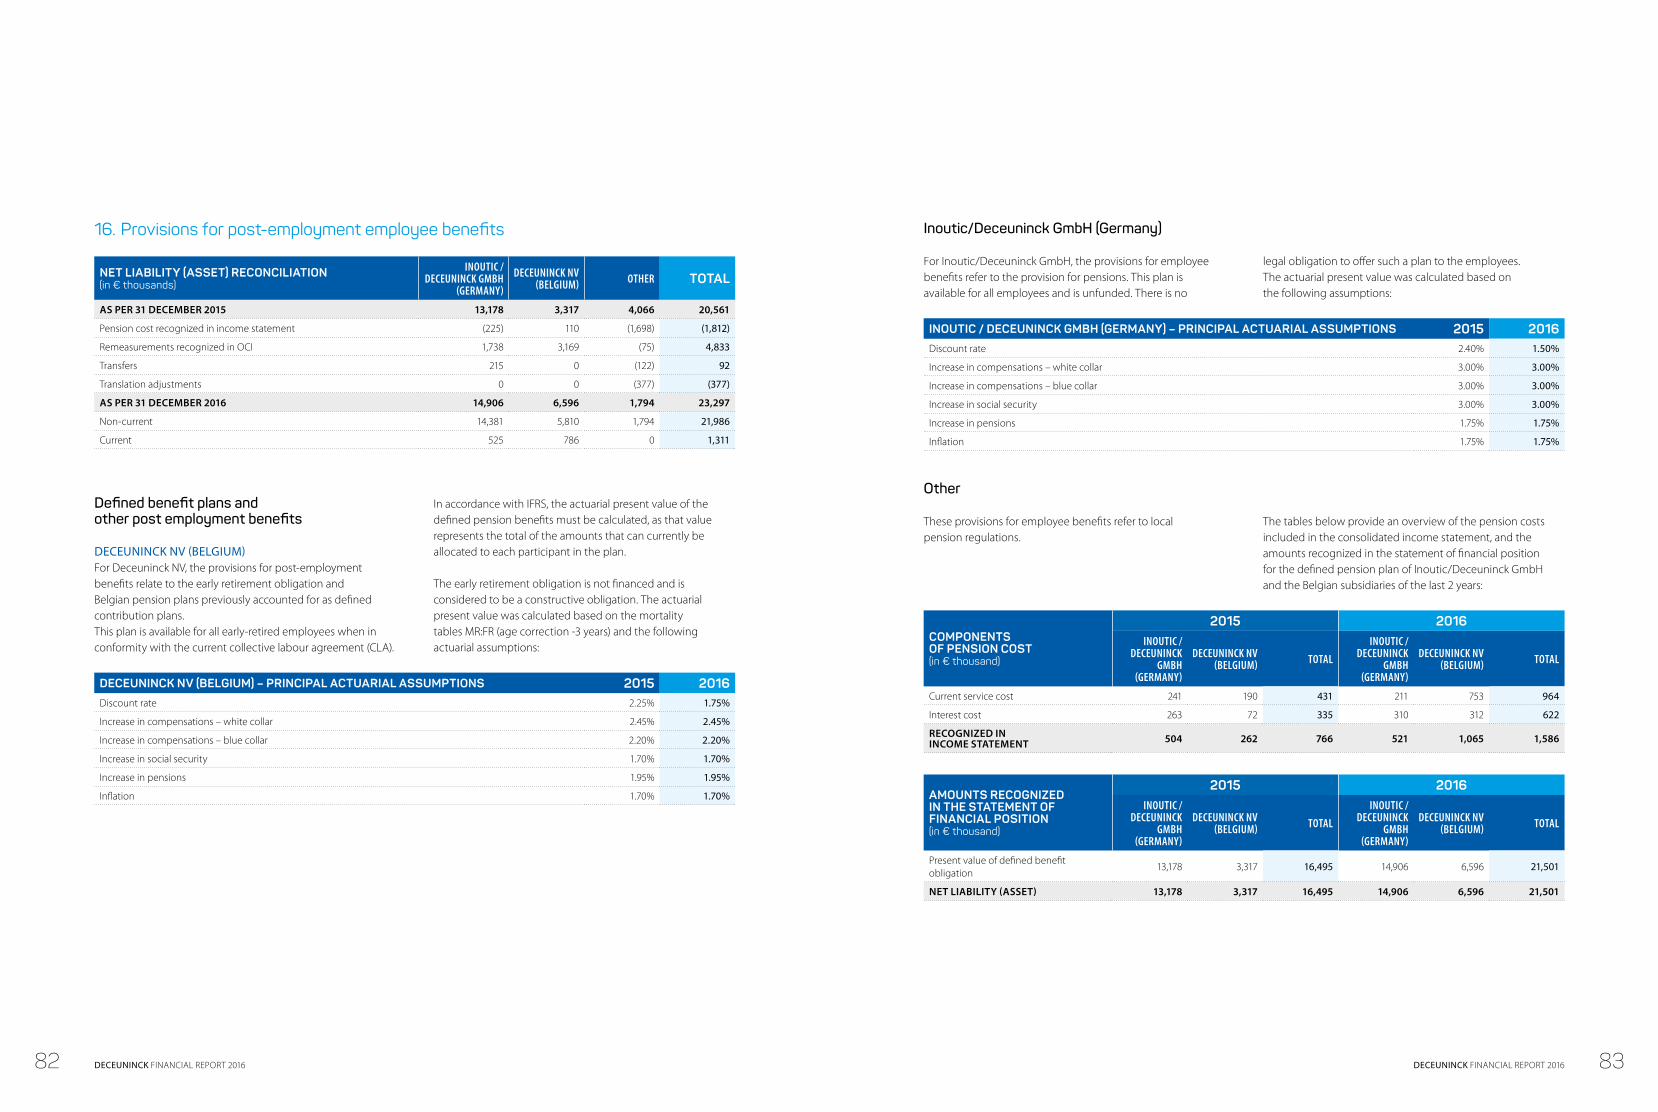
16. Provisions for post-employment employee benefits
NET LIABILITY (ASSET) RECONCILIATION (in € thousands)
INOUTIC / DECEUNINCK GMBH
(GERMANY)
DECEUNINCK NV (BELGIUM) OTHER TOTAL
AS PER 31 DECEMBER 2015 13,178 3,317 4,066 20,561
Pension cost recognized in income statement (225) 110 (1,698) (1,812)
Remeasurements recognized in OCI 1,738 3,169 (75) 4,833
Transfers 215 0 (122) 92
Translation adjustments 0 0 (377) (377)
AS PER 31 DECEMBER 2016 14,906 6,596 1,794 23,297
Non-current 14,381 5,810 1,794 21,986
Current 525 786 0 1,311
Defined benefit plans and other post employment benefits
DECEUNINCK NV (BELGIUM)For Deceuninck NV, the provisions for post-employment benefits relate to the early retirement obligation and Belgian pension plans previously accounted for as defined contribution plans.This plan is available for all early-retired employees when in conformity with the current collective labour agreement (CLA).
In accordance with IFRS, the actuarial present value of the defined pension benefits must be calculated, as that value represents the total of the amounts that can currently be allocated to each participant in the plan.
The early retirement obligation is not financed and is considered to be a constructive obligation. The actuarial present value was calculated based on the mortality tables MR:FR (age correction -3 years) and the following actuarial assumptions:
DECEUNINCK NV (BELGIUM) – PRINCIPAL ACTUARIAL ASSUMPTIONS 2015 2016Discount rate 2.25% 1.75%
Increase in compensations – white collar 2.45% 2.45%
Increase in compensations – blue collar 2.20% 2.20%
Increase in social security 1.70% 1.70%
Increase in pensions 1.95% 1.95%
Inflation 1.70% 1.70%
Inoutic/Deceuninck GmbH (Germany)
For Inoutic/Deceuninck GmbH, the provisions for employee benefits refer to the provision for pensions. This plan is available for all employees and is unfunded. There is no
legal obligation to offer such a plan to the employees. The actuarial present value was calculated based on the following assumptions:
INOUTIC / DECEUNINCK GMBH (GERMANY) – PRINCIPAL ACTUARIAL ASSUMPTIONS 2015 2016Discount rate 2.40% 1.50%
Increase in compensations – white collar 3.00% 3.00%
Increase in compensations – blue collar 3.00% 3.00%
Increase in social security 3.00% 3.00%
Increase in pensions 1.75% 1.75%
Inflation 1.75% 1.75%
Other
These provisions for employee benefits refer to local pension regulations.
The tables below provide an overview of the pension costs included in the consolidated income statement, and the amounts recognized in the statement of financial position for the defined pension plan of Inoutic/Deceuninck GmbH and the Belgian subsidiaries of the last 2 years:
COMPONENTS OF PENSION COST (in € thousand)
2015 2016INOUTIC /
DECEUNINCK GMBH
(GERMANY)
DECEUNINCK NV (BELGIUM) TOTAL
INOUTIC / DECEUNINCK
GMBH (GERMANY)
DECEUNINCK NV (BELGIUM) TOTAL
Current service cost 241 190 431 211 753 964
Interest cost 263 72 335 310 312 622
RECOGNIZED IN INCOME STATEMENT 504 262 766 521 1,065 1,586
AMOUNTS RECOGNIZED IN THE STATEMENT OF FINANCIAL POSITION(in € thousand)
2015 2016INOUTIC /
DECEUNINCK GMBH
(GERMANY)
DECEUNINCK NV (BELGIUM) TOTAL
INOUTIC / DECEUNINCK
GMBH (GERMANY)
DECEUNINCK NV (BELGIUM) TOTAL
Present value of defined benefit obligation
13,178 3,317 16,495 14,906 6,596 21,501
NET LIABILITY (ASSET) 13,178 3,317 16,495 14,906 6,596 21,501
82 83DECEUNINCK FINANCIAL REPORT 2016 DECEUNINCK FINANCIAL REPORT 2016
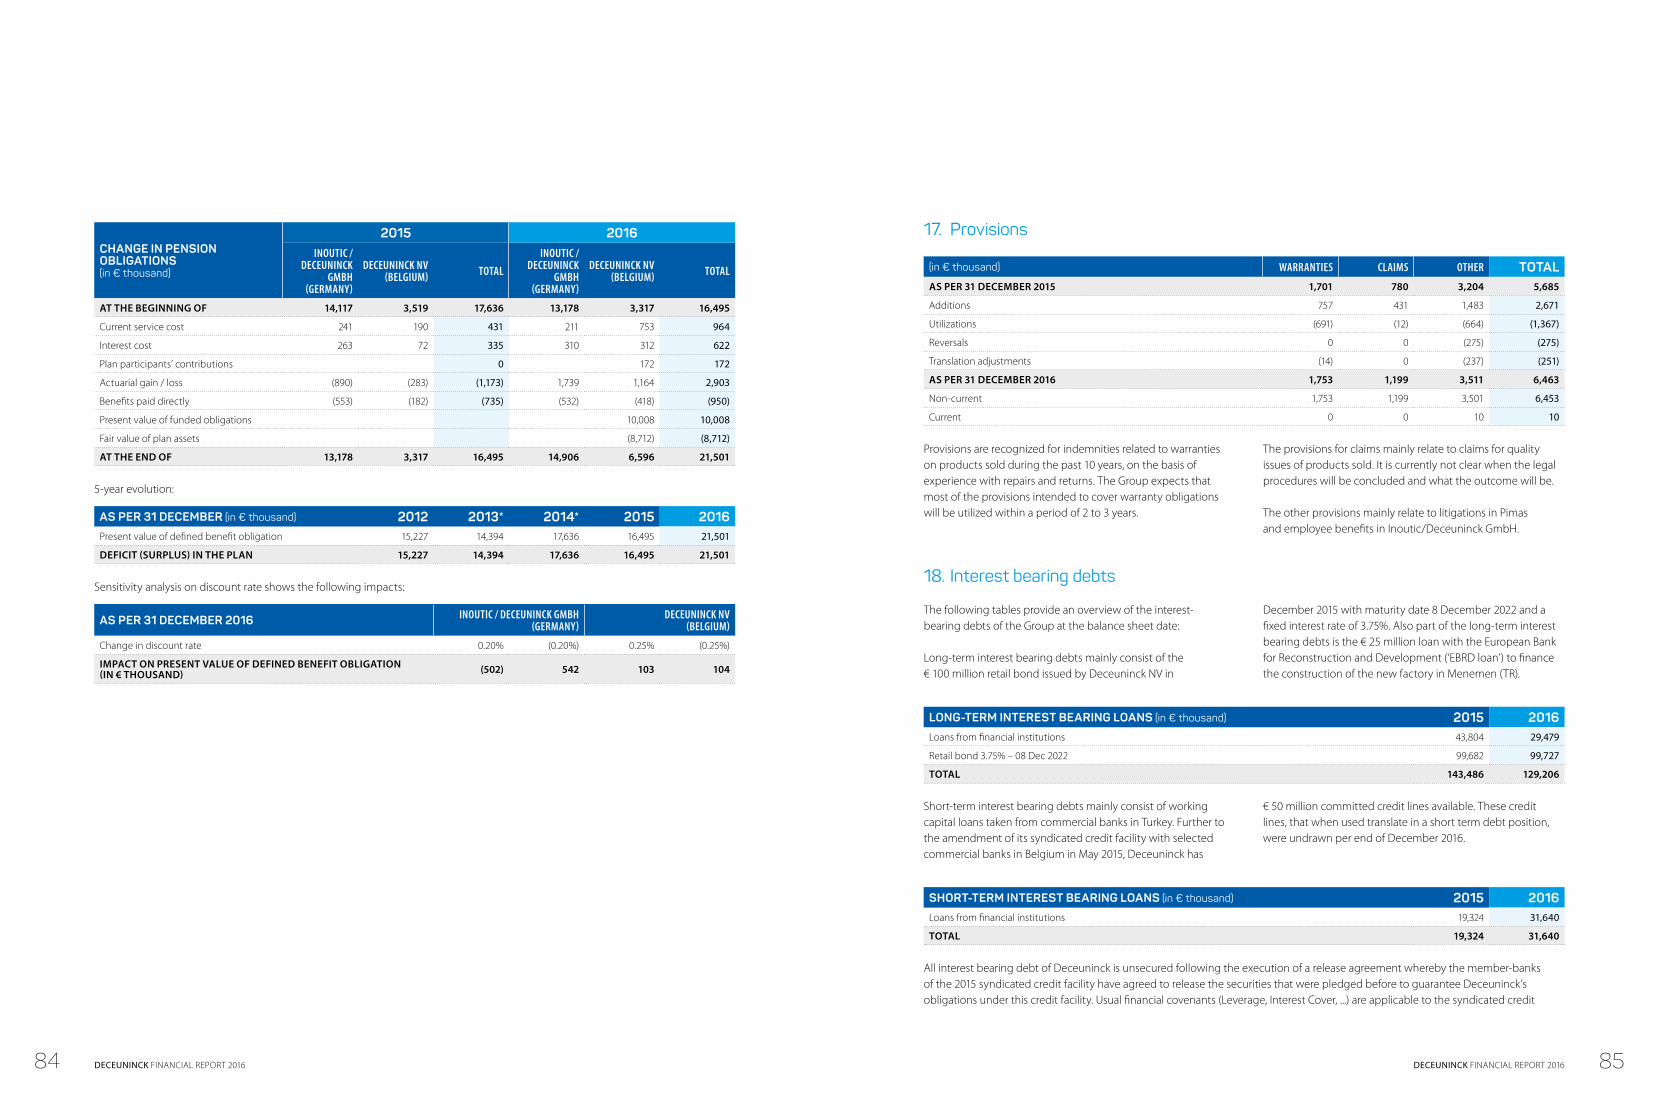
CHANGE IN PENSION OBLIGATIONS(in € thousand)
2015 2016INOUTIC /
DECEUNINCK GMBH
(GERMANY)
DECEUNINCK NV (BELGIUM) TOTAL
INOUTIC / DECEUNINCK
GMBH (GERMANY)
DECEUNINCK NV (BELGIUM) TOTAL
AT THE BEGINNING OF 14,117 3,519 17,636 13,178 3,317 16,495
Current service cost 241 190 431 211 753 964
Interest cost 263 72 335 310 312 622
Plan participants’ contributions 0 172 172
Actuarial gain / loss (890) (283) (1,173) 1,739 1,164 2,903
Benefits paid directly (553) (182) (735) (532) (418) (950)
Present value of funded obligations 10,008 10,008
Fair value of plan assets (8,712) (8,712)
AT THE END OF 13,178 3,317 16,495 14,906 6,596 21,501
5-year evolution:
AS PER 31 DECEMBER (in € thousand) 2012 2013* 2014* 2015 2016Present value of defined benefit obligation 15,227 14,394 17,636 16,495 21,501
DEFICIT (SURPLUS) IN THE PLAN 15,227 14,394 17,636 16,495 21,501
Sensitivity analysis on discount rate shows the following impacts:
AS PER 31 DECEMBER 2016 INOUTIC / DECEUNINCK GMBH (GERMANY)
DECEUNINCK NV (BELGIUM)
Change in discount rate 0.20% (0.20%) 0.25% (0.25%)
IMPACT ON PRESENT VALUE OF DEFINED BENEFIT OBLIGATION (IN € THOUSAND) (502) 542 103 104
17. Provisions
(in € thousand) WARRANTIES CLAIMS OTHER TOTALAS PER 31 DECEMBER 2015 1,701 780 3,204 5,685
Additions 757 431 1,483 2,671
Utilizations (691) (12) (664) (1,367)
Reversals 0 0 (275) (275)
Translation adjustments (14) 0 (237) (251)
AS PER 31 DECEMBER 2016 1,753 1,199 3,511 6,463
Non-current 1,753 1,199 3,501 6,453
Current 0 0 10 10
Provisions are recognized for indemnities related to warranties on products sold during the past 10 years, on the basis of experience with repairs and returns. The Group expects that most of the provisions intended to cover warranty obligations will be utilized within a period of 2 to 3 years.
The provisions for claims mainly relate to claims for quality issues of products sold. It is currently not clear when the legal procedures will be concluded and what the outcome will be.
The other provisions mainly relate to litigations in Pimas and employee benefits in Inoutic/Deceuninck GmbH.
18. Interest bearing debts
The following tables provide an overview of the interest-bearing debts of the Group at the balance sheet date:
Long-term interest bearing debts mainly consist of the € 100 million retail bond issued by Deceuninck NV in
December 2015 with maturity date 8 December 2022 and a fixed interest rate of 3.75%. Also part of the long-term interest bearing debts is the € 25 million loan with the European Bank for Reconstruction and Development (‘EBRD loan’) to finance the construction of the new factory in Menemen (TR).
LONG-TERM INTEREST BEARING LOANS (in € thousand) 2015 2016Loans from financial institutions 43,804 29,479
Retail bond 3.75% – 08 Dec 2022 99,682 99,727
TOTAL 143,486 129,206
Short-term interest bearing debts mainly consist of working capital loans taken from commercial banks in Turkey. Further to the amendment of its syndicated credit facility with selected commercial banks in Belgium in May 2015, Deceuninck has
€ 50 million committed credit lines available. These credit lines, that when used translate in a short term debt position, were undrawn per end of December 2016.
SHORT-TERM INTEREST BEARING LOANS (in € thousand) 2015 2016Loans from financial institutions 19,324 31,640
TOTAL 19,324 31,640
All interest bearing debt of Deceuninck is unsecured following the execution of a release agreement whereby the member-banks of the 2015 syndicated credit facility have agreed to release the securities that were pledged before to guarantee Deceuninck’s obligations under this credit facility. Usual financial covenants (Leverage, Interest Cover, ...) are applicable to the syndicated credit
84 85DECEUNINCK FINANCIAL REPORT 2016 DECEUNINCK FINANCIAL REPORT 2016

facility, the retail bond and the EBRD loan. As per 31 December 2016 and at all preceding testing dates throughout 2016, Deceuninck Group has met all its covenants.
The following table provides a summary of the outstanding financial debt by currency, the average interest rates and maturity profile as per 31 December 2016:
TERMS AND MATURITY PROFILE (in € thousand) DUE WITHIN1 YEAR
DUE BETWEEN1 AND 5 YEARS
DUE AFTER5 YEARS TOTAL
2015 19,324 18,804 124,682 162,810
2016 31,640 24,934 104,272 160,846
Of which
EUR (3.6%) 5,551 18,465 104,272 128,288
TRY (10.9%) 26,088 6,469 0 32,557
Operational leasing
The Group leases mainly vehicles, office equipment and buildings. Additionally, at the end of 2015 a $ 11.4 million Land & Property lease agreement relating to a new production facility in Fernley, Nevada was concluded. The contract term is 9.25 years.
The total amount paid in 2016 for operational leasing amounts to € 8,390 thousand (2015: € 7,207 thousand). The table below provides an overview of the payments to be made over the coming financial years:
OPERATIONAL LEASING (in € thousands) 2015 2016<1 year 6,324 7,208
1-5 years 13,690 14,245
>5 years 5,566 14,367
TOTAL 25,580 35,820
19. Trade payables and other liabilities
(in € thousand) 2015 2016TRADE DEBTS 74,070 101,593
Derivative financial instruments 271 330
Guarantees from customers 1,867 1,546
Accrued interests 1,719 1,188
Accrued charges 687 1,427
Deferred income 1,123 1,064
Other 678 803
OTHER LIABILITIES 6,345 6,359
The conditions for the above mentioned trade debts and other debts are as follows: q Trade debts do not bear interest and are usually paid
on the basis of payment terms that can vary depending on the market. On average, these payment terms fluctuate between 45 and 65 days from the end of the month in which the debt is incurred. In Turkey this can be up to one year after the invoice date.
q For the conditions with regard to the financial instruments, we refer you to Note 24.
q The guarantees from customers do not bear any interest and are immediately payable, as soon as the contractual obligations of the customer have been fulfilled.
Trade debts include, besides the invoiced purchases also a provision for invoices to be received, a provision for credit notes to be issued, foreign currency translation differences and advance payments received.
AGEING ANALYSIS OF TRADE DEBTS(in € thousand)
NET CARRYING VALUE
PAYABLE
<90 DAYS 91-180 DAYS 181-365 DAYS >365 DAYS
As per 31 December 2015 74,070 73,552 280 29 209
As per 31 December 2016 101,593 100,896 145 226 326
86 87DECEUNINCK FINANCIAL REPORT 2016 DECEUNINCK FINANCIAL REPORT 2016

20. Share-based payments
The Group offers the possibility to staff members, senior management members and the members of the Executive Team to register for stock option and warrant agreements. The purpose for such a decision is to motivate the staff members, senior management and the members of the Executive Team, by enabling them to acquire shares in the company under relatively advantageous terms, thereby increasing and improving their commitment to the company.
Stock option plans
The balance of outstanding options (Plans 2003-2010) at the end of December 2016 is 205,125. One option entitles the holder to one Deceuninck share at a fixed exercise price
corresponding to the market price at grant date. All options relating to the stock option plans granted in 1999, 2000, 2001 and 2002 have been exercised, forfeited or expired. The options expire if they are not exercised on the last day of the last exercise period. The options can be exercised for the first time after the end of the third calendar year, following the year in which the offer has taken place. The exercise period, relating to the plans of 2003, 2004, 2005 and 2007, has been extended with 5 years in 2009.
The exercise price of an option will be equal to the lowest of (i) the average price of the share on the stock exchange during the 30-day period preceding the offer, or (ii) the latest closing price preceding the day of the offer
STOCK OPTION PLANS DECEUNINCK NV 2003 2004 2005 2007 2008 2009 2010 TOTAL
Grant date 19/12/03 23/12/04 22/12/05 19/12/07 12/12/08 27/10/09 23/12/10
Acceptance date 17/02/04 21/02/05 20/02/06 17/02/08 11/02/09 26/12/09 22/02/11
Number of beneficiaries at grant date
42 33 53 74 68 2 4
Exercise price (in €) 25.22 22.7 22.81 15.54 2.95 1.36 1.7
Granted 64,000 49,000 66,250 70,750 70,750 75,000 75,000 470,750
Accepted 47,500 35,375 64,250 64,500 64,150 75,000 75,000 425,775
Exercised 0 0 0 0 0 50,000 65,000 115,000
Forfeited (14,000) (10,750) (22,750) (27,250) (25,900) 0 (5,000) (105,650)
Expired 0 0 0 0 0 0 0 0
OUTSTANDING 31/12/2016 33,500 24,625 41,500 37,250 38,250 25,000 5,000 205,125
Exercisable 31/12/2016 33,500 24,625 41,500 37,250 38,250 25,000 5,000 205,125
Exercise periods 2007-2013 2008-2014 2009-2015 2011-2017 2012-2018 2013-2019 2014-2020
Extension of exercise periods 2014-2018 2015-2019 2016-2020 2018-2022 N/A N/A N/A
MOVEMENTS 2015 2003 2004 2005 2007 2008 2009 2010 TOTAL
WEIGHTED AVERAGE EXERCISE
PRICE
OUTSTANDING 2014 35,250 25,625 43,750 40,250 42,500 75,000 75,000 337,375 10.22
Accepted 0 0 0 0 0 0 0 0 N/A
Exercised 0 0 0 0 0 0 0 0 N/A
Forfeited (750) 0 (750) (500) (1,500) 0 0 (3,500) 13.78
Expired 0 0 0 0 0 0 0 0 N/A
OUTSTANDING 2015 34,500 25,625 43,000 39,750 41,000 75,000 75,000 333,875 10.19
MOVEMENTS 2016 2003 2004 2005 2007 2008 2009 2010 TOTAL
WEIGHTED AVERAGE EXERCISE
PRICE
OUTSTANDING 2015 34,500 25,625 43,000 39,750 41,000 75,000 75,000 333,875 10.19
Accepted 0 N/A
Exercised (50,000) (65,000) (115,000) N/A
Forfeited (1,000) (1,000) (1,500) (2,500) (2,750) 0 (5,000) (13,750) 10.01
Expired 0 N/A
OUTSTANDING 2016 33,500 24,625 41,500 37,250 38,250 25,000 5,000 205,125 15.04
Warrant plans
The balance of the outstanding warrants at the end of December 2016 is 3,360,006. One warrant entitles the holder to one Deceuninck share at a fixed exercise price corresponding with the market price at grant date. Within the scope of the warrant plans, 343,325 warrants were exercised in the course of 2016. The warrants expire if they have not been exercised at the last day of the last exercise period. The warrants can be exercised for the first time at the end of the third calendar year of the grant.
The exercise price of a warrant will be fixed by the Committee on the date of offer and:
a) for staff members and senior management members it will be equal to the lowest of (i) of the average price of the share on the stock exchange during the 30-day period preceding the offer, or (ii) the latest closing price preceding the day of the offer,
b) for other than staff members and senior management members it will be equal to the lowest of (i) of the average price of the share on the stock exchange during the 30-day period preceding the offer, or (ii) the latest closing price preceding the day of the offer, it being understood that the exercise price must not be lower than the average price of the share on the stock exchange during the 30-day period preceding the issue of the Plan.
88 89DECEUNINCK FINANCIAL REPORT 2016 DECEUNINCK FINANCIAL REPORT 2016
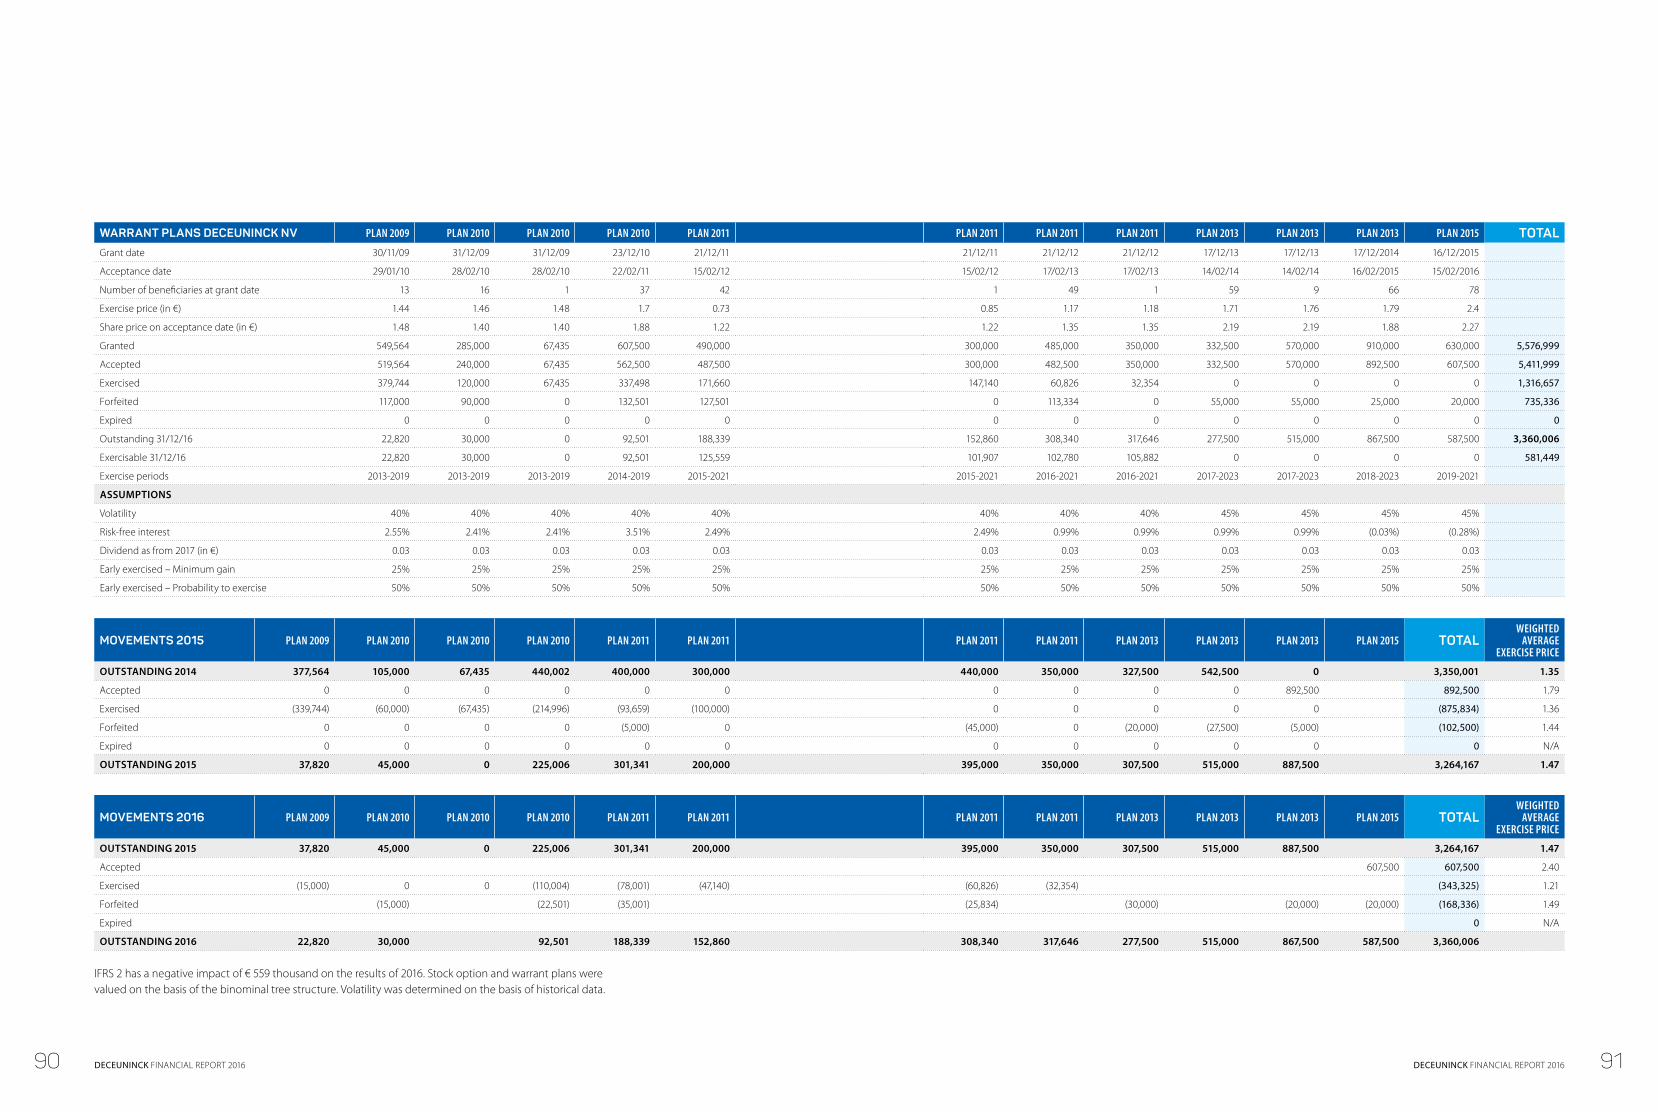
WARRANT PLANS DECEUNINCK NV PLAN 2009 PLAN 2010 PLAN 2010 PLAN 2010 PLAN 2011 PLAN 2011 PLAN 2011 PLAN 2011 PLAN 2013 PLAN 2013 PLAN 2013 PLAN 2015 TOTALGrant date 30/11/09 31/12/09 31/12/09 23/12/10 21/12/11 21/12/11 21/12/12 21/12/12 17/12/13 17/12/13 17/12/2014 16/12/2015
Acceptance date 29/01/10 28/02/10 28/02/10 22/02/11 15/02/12 15/02/12 17/02/13 17/02/13 14/02/14 14/02/14 16/02/2015 15/02/2016
Number of beneficiaries at grant date 13 16 1 37 42 1 49 1 59 9 66 78
Exercise price (in €) 1.44 1.46 1.48 1.7 0.73 0.85 1.17 1.18 1.71 1.76 1.79 2.4
Share price on acceptance date (in €) 1.48 1.40 1.40 1.88 1.22 1.22 1.35 1.35 2.19 2.19 1.88 2.27
Granted 549,564 285,000 67,435 607,500 490,000 300,000 485,000 350,000 332,500 570,000 910,000 630,000 5,576,999
Accepted 519,564 240,000 67,435 562,500 487,500 300,000 482,500 350,000 332,500 570,000 892,500 607,500 5,411,999
Exercised 379,744 120,000 67,435 337,498 171,660 147,140 60,826 32,354 0 0 0 0 1,316,657
Forfeited 117,000 90,000 0 132,501 127,501 0 113,334 0 55,000 55,000 25,000 20,000 735,336
Expired 0 0 0 0 0 0 0 0 0 0 0 0 0
Outstanding 31/12/16 22,820 30,000 0 92,501 188,339 152,860 308,340 317,646 277,500 515,000 867,500 587,500 3,360,006
Exercisable 31/12/16 22,820 30,000 0 92,501 125,559 101,907 102,780 105,882 0 0 0 0 581,449
Exercise periods 2013-2019 2013-2019 2013-2019 2014-2019 2015-2021 2015-2021 2016-2021 2016-2021 2017-2023 2017-2023 2018-2023 2019-2021
ASSUMPTIONS
Volatility 40% 40% 40% 40% 40% 40% 40% 40% 45% 45% 45% 45%
Risk-free interest 2.55% 2.41% 2.41% 3.51% 2.49% 2.49% 0.99% 0.99% 0.99% 0.99% (0.03%) (0.28%)
Dividend as from 2017 (in €) 0.03 0.03 0.03 0.03 0.03 0.03 0.03 0.03 0.03 0.03 0.03 0.03
Early exercised – Minimum gain 25% 25% 25% 25% 25% 25% 25% 25% 25% 25% 25% 25%
Early exercised – Probability to exercise 50% 50% 50% 50% 50% 50% 50% 50% 50% 50% 50% 50%
MOVEMENTS 2015 PLAN 2009 PLAN 2010 PLAN 2010 PLAN 2010 PLAN 2011 PLAN 2011 PLAN 2011 PLAN 2011 PLAN 2013 PLAN 2013 PLAN 2013 PLAN 2015 TOTALWEIGHTED
AVERAGE EXERCISE PRICE
OUTSTANDING 2014 377,564 105,000 67,435 440,002 400,000 300,000 440,000 350,000 327,500 542,500 0 3,350,001 1.35
Accepted 0 0 0 0 0 0 0 0 0 0 892,500 892,500 1.79
Exercised (339,744) (60,000) (67,435) (214,996) (93,659) (100,000) 0 0 0 0 0 (875,834) 1.36
Forfeited 0 0 0 0 (5,000) 0 (45,000) 0 (20,000) (27,500) (5,000) (102,500) 1.44
Expired 0 0 0 0 0 0 0 0 0 0 0 0 N/A
OUTSTANDING 2015 37,820 45,000 0 225,006 301,341 200,000 395,000 350,000 307,500 515,000 887,500 3,264,167 1.47
MOVEMENTS 2016 PLAN 2009 PLAN 2010 PLAN 2010 PLAN 2010 PLAN 2011 PLAN 2011 PLAN 2011 PLAN 2011 PLAN 2013 PLAN 2013 PLAN 2013 PLAN 2015 TOTALWEIGHTED
AVERAGE EXERCISE PRICE
OUTSTANDING 2015 37,820 45,000 0 225,006 301,341 200,000 395,000 350,000 307,500 515,000 887,500 3,264,167 1.47
Accepted 607,500 607,500 2.40
Exercised (15,000) 0 0 (110,004) (78,001) (47,140) (60,826) (32,354) (343,325) 1.21
Forfeited (15,000) (22,501) (35,001) (25,834) (30,000) (20,000) (20,000) (168,336) 1.49
Expired 0 N/A
OUTSTANDING 2016 22,820 30,000 92,501 188,339 152,860 308,340 317,646 277,500 515,000 867,500 587,500 3,360,006
IFRS 2 has a negative impact of € 559 thousand on the results of 2016. Stock option and warrant plans were valued on the basis of the binominal tree structure. Volatility was determined on the basis of historical data.
90 91DECEUNINCK FINANCIAL REPORT 2016 DECEUNINCK FINANCIAL REPORT 2016
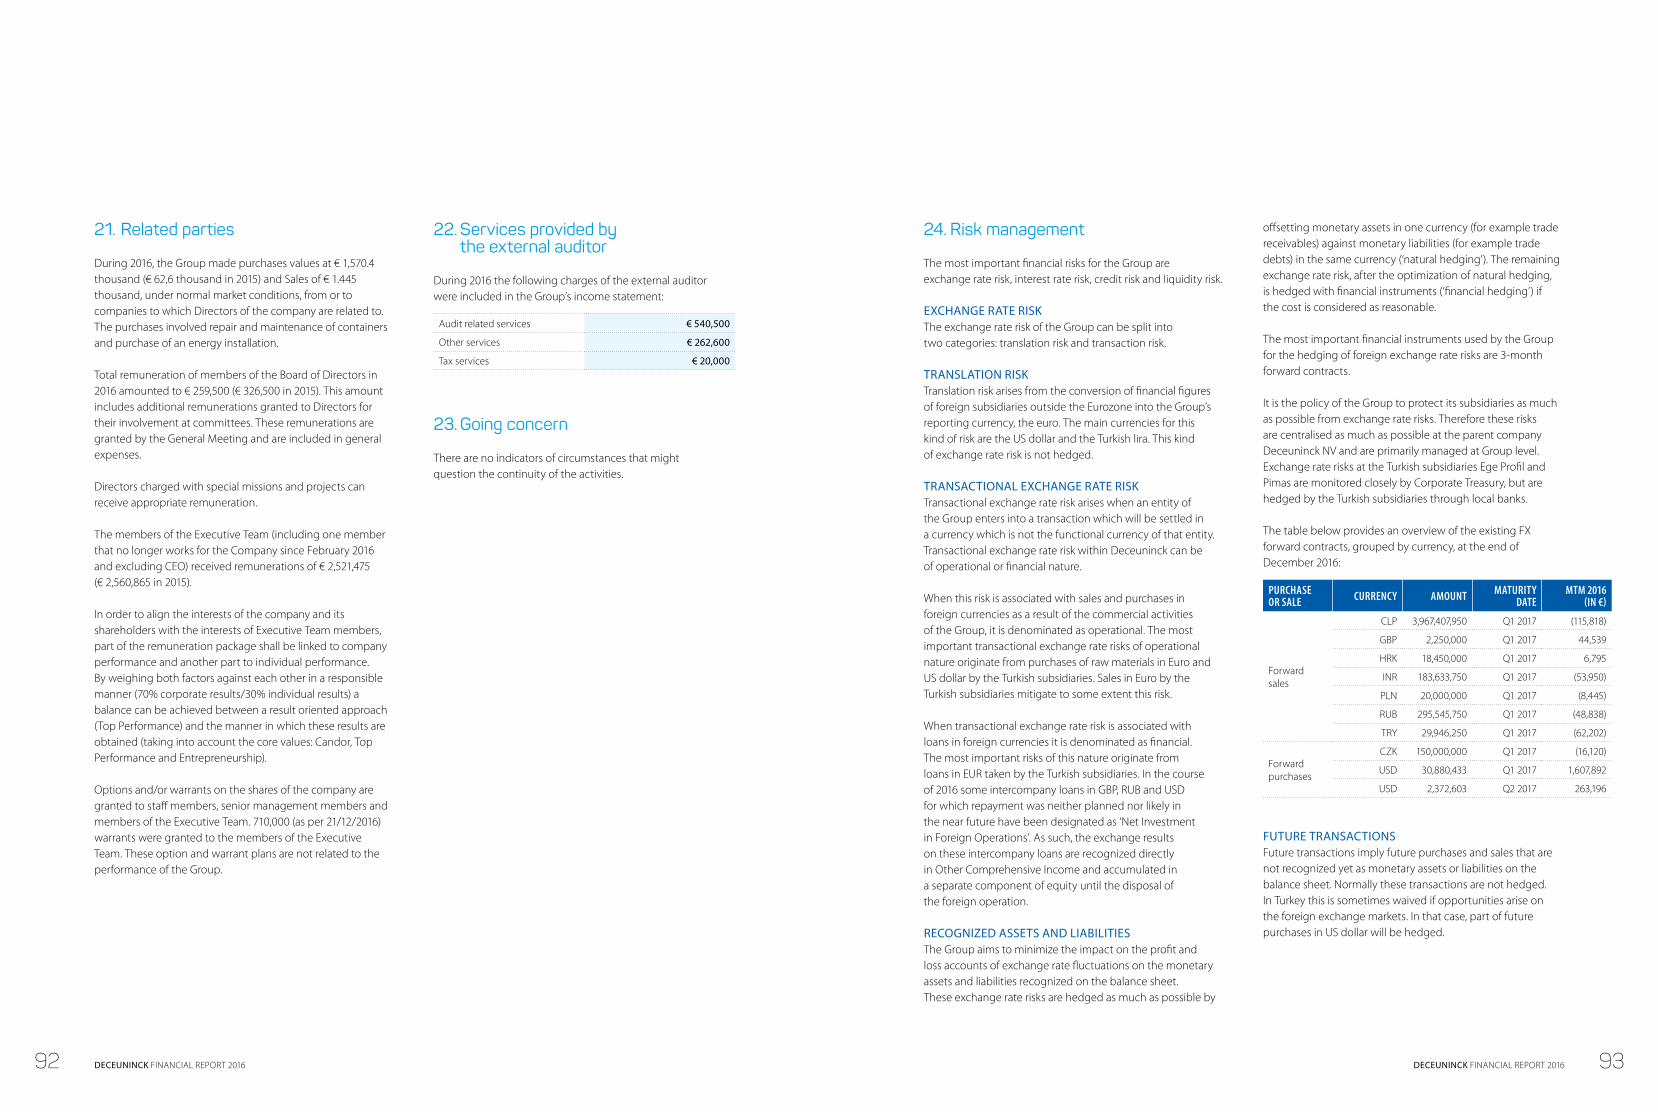
21. Related parties
During 2016, the Group made purchases values at € 1,570.4 thousand (€ 62,6 thousand in 2015) and Sales of € 1.445 thousand, under normal market conditions, from or to companies to which Directors of the company are related to.The purchases involved repair and maintenance of containers and purchase of an energy installation.
Total remuneration of members of the Board of Directors in 2016 amounted to € 259,500 (€ 326,500 in 2015). This amount includes additional remunerations granted to Directors for their involvement at committees. These remunerations are granted by the General Meeting and are included in general expenses.
Directors charged with special missions and projects can receive appropriate remuneration.
The members of the Executive Team (including one member that no longer works for the Company since February 2016 and excluding CEO) received remunerations of € 2,521,475 (€ 2,560,865 in 2015).
In order to align the interests of the company and its shareholders with the interests of Executive Team members, part of the remuneration package shall be linked to company performance and another part to individual performance. By weighing both factors against each other in a responsible manner (70% corporate results/30% individual results) a balance can be achieved between a result oriented approach (Top Performance) and the manner in which these results are obtained (taking into account the core values: Candor, Top Performance and Entrepreneurship).
Options and/or warrants on the shares of the company are granted to staff members, senior management members and members of the Executive Team. 710,000 (as per 21/12/2016) warrants were granted to the members of the Executive Team. These option and warrant plans are not related to the performance of the Group.
22. Services provided by the external auditor
During 2016 the following charges of the external auditor were included in the Group’s income statement:
Audit related services € 540,500
Other services € 262,600
Tax services € 20,000
23. Going concern
There are no indicators of circumstances that might question the continuity of the activities.
24. Risk management
The most important financial risks for the Group are exchange rate risk, interest rate risk, credit risk and liquidity risk.
EXCHANGE RATE RISKThe exchange rate risk of the Group can be split into two categories: translation risk and transaction risk.
TRANSLATION RISKTranslation risk arises from the conversion of financial figures of foreign subsidiaries outside the Eurozone into the Group’s reporting currency, the euro. The main currencies for this kind of risk are the US dollar and the Turkish lira. This kind of exchange rate risk is not hedged.
TRANSACTIONAL EXCHANGE RATE RISKTransactional exchange rate risk arises when an entity of the Group enters into a transaction which will be settled in a currency which is not the functional currency of that entity. Transactional exchange rate risk within Deceuninck can be of operational or financial nature.
When this risk is associated with sales and purchases in foreign currencies as a result of the commercial activities of the Group, it is denominated as operational. The most important transactional exchange rate risks of operational nature originate from purchases of raw materials in Euro and US dollar by the Turkish subsidiaries. Sales in Euro by the Turkish subsidiaries mitigate to some extent this risk.
When transactional exchange rate risk is associated with loans in foreign currencies it is denominated as financial. The most important risks of this nature originate from loans in EUR taken by the Turkish subsidiaries. In the course of 2016 some intercompany loans in GBP, RUB and USD for which repayment was neither planned nor likely in the near future have been designated as ‘Net Investment in Foreign Operations’. As such, the exchange results on these intercompany loans are recognized directly in Other Comprehensive Income and accumulated in a separate component of equity until the disposal of the foreign operation.
RECOGNIZED ASSETS AND LIABILITIESThe Group aims to minimize the impact on the profit and loss accounts of exchange rate fluctuations on the monetary assets and liabilities recognized on the balance sheet. These exchange rate risks are hedged as much as possible by
offsetting monetary assets in one currency (for example trade receivables) against monetary liabilities (for example trade debts) in the same currency (‘natural hedging’). The remaining exchange rate risk, after the optimization of natural hedging, is hedged with financial instruments (‘financial hedging’) if the cost is considered as reasonable.
The most important financial instruments used by the Group for the hedging of foreign exchange rate risks are 3-month forward contracts.
It is the policy of the Group to protect its subsidiaries as much as possible from exchange rate risks. Therefore these risks are centralised as much as possible at the parent company Deceuninck NV and are primarily managed at Group level. Exchange rate risks at the Turkish subsidiaries Ege Profil and Pimas are monitored closely by Corporate Treasury, but are hedged by the Turkish subsidiaries through local banks.
The table below provides an overview of the existing FX forward contracts, grouped by currency, at the end of December 2016:
PURCHASE OR SALE CURRENCY AMOUNT MATURITY
DATEMTM 2016
(IN €)
Forward sales
CLP 3,967,407,950 Q1 2017 (115,818)
GBP 2,250,000 Q1 2017 44,539
HRK 18,450,000 Q1 2017 6,795
INR 183,633,750 Q1 2017 (53,950)
PLN 20,000,000 Q1 2017 (8,445)
RUB 295,545,750 Q1 2017 (48,838)
TRY 29,946,250 Q1 2017 (62,202)
Forward purchases
CZK 150,000,000 Q1 2017 (16,120)
USD 30,880,433 Q1 2017 1,607,892
USD 2,372,603 Q2 2017 263,196
FUTURE TRANSACTIONSFuture transactions imply future purchases and sales that are not recognized yet as monetary assets or liabilities on the balance sheet. Normally these transactions are not hedged. In Turkey this is sometimes waived if opportunities arise on the foreign exchange markets. In that case, part of future purchases in US dollar will be hedged.
92 93DECEUNINCK FINANCIAL REPORT 2016 DECEUNINCK FINANCIAL REPORT 2016

ESTIMATED SENSITIVITY FOR EXCHANGE RATE FLUCTUATIONSAs required by IFRS 7, ‘Financial instruments: Disclosures’, a sensitivity analysis was carried out on the evolution of the exchange rates. Based on the volatility of the relevant
currencies, we have estimated the impact of the possible exchange rate movements on our financial result as follows:
SENSITIVITY ANALYSIS ON THE POSITIONS IN FOREIGN CURRENCIES AS PER 31 DECEMBER 2016*
CURRENCY AMOUNT (IN THOUSAND)
CLOSING RATE 31/12/2016
POSSIBLE VOLATILITY OF THE EXCHANGE
RATE IN %**
RATE USED FOR THE SENSITIVITY ANALYSIS
EFFECT ON REVALUATION (IN € THOUSAND)
USD 647 1.0541 4.55% 1.1021 1.0061 (27) 29
GBP 323 0.85618 5.94% 0.9071 0.8053 (21) 24
PLN (818) 4.4103 3.27% 4.5547 4.2659 6 (6)
CZK 33,821 27.021 0.32% 27.1065 26.9355 (4) 4
TRY 3,977 3.7099 4.89% 3.8914 3.5284 (50) 55
RUB 206,430 63.8111 9.58% 69.9212 57.7010 (283) 343
TOTAL (379) 449
(*) Position after financial hedging (net exposures) (**) 3 month volatility
If the euro would have weakened/strengthened during 2016 in line with the above mentioned possible rates, the profit of the financial year would have been about € 449 thousand higher / € 379 thousand lower.
Interest rate risk
After the issuance in December 2015 of a 100 million euro retail bond at a fixed interest rate of 3.75%, all of the outstanding financial debt on 31 December 2016 was financed at a fixed interest rate.
Since at 31 December 2016 there are no outstanding debts at variable interest rate, there was no necessity to – as required by IFRS 7, ‘Financial instruments: disclosures’ – carry out a sensitivity analysis on the evolution of the interest rates.
Credit risk
The products of Deceuninck are used almost exclusively in the construction industry. Hence, the exposure to credit risk is highly dependent on the performance of the building industry and the general economic conditions.
In order to minimize the credit risk, we are using advanced reporting and monitoring systems that give a perfect insight in the payment behaviour of each debtor. Deceuninck uses credit insurance as a means to mitigate the credit risk related to trade receivables. Two credit policies have been concluded with two different insurers. Commercial limits, set based on financial information and on business knowledge, can be higher than the insured limits.
In 2016, we saw in Western Europe an increasing credit risk in Belgium, Italy and UK. France is getting better but still difficult and Spain and the Netherlands are stable. Central and Eastern Europe remains also stable with exception of Russia where it is difficult to obtain any credit insurance. Credit insurance is also not possible in Turkey. Credit risk in Turkey has increased after the military coup and the geopolitical unrest afterwards. In the US we see an increased risk appetite from the credit insurers due to the positive economic situation.
In 2016 the Group continued to use its non-recourse factoring programs in Belgium, France, Germany, the UK and the US.
Liquidity risk and risks linked to the outstanding debt
After the refinancing of its syndicated bank loans in May 2015 and the successful issue in December 2015 of a 100 million euro retail bond, Deceuninck Group holds sufficient cash, cash equivalents and committed credit facilities for the funding of its operating activities.
Liquidity problems could arise if an event of default would occur under the syndicated loan agreement or the retail bond which is not remedied within the foreseen remedy period. In that case, the outstanding amounts under the syndicated loan agreement and the retail bond might become immediately due and payable, which would jeopardize the liquidity situation of Deceuninck.
In order to detect possible events of default as a consequence of non-compliance with financial covenants at an early stage and to enable the Group to take corrective measures, a monthly financial forecast is prepared until the end of the current accounting year. The key figures of this financial forecast are used as input for a specially designed ‘covenant module’ which tests if the covenants will be met within the current accounting year. In addition, also the budget of 2017 was processed in this ‘covenant module’ to verify if the covenants will be met at every test date in 2017. No issues have been identified.
For the Turkish subsidiaries, liquidity problems could arise if loans becoming due could not be refinanced through local Turkish banks. However, given the good health of the Turkish banking sector, and given the excellent reputation and track record of the Turkish subsidiaries of the Group, this is very unlikely. Moreover, under the current financing terms it is possible for the Restricted Group to give intercompany loans to the Turkish subsidiaries. These intercompany loans are however limited in duration (up to 3 months) and amount (up to € 7,500,000).
In addition to the above mentioned risk of non-compliance with the financial covenants, the liquidity risk is also linked to the evolution of the working capital of the Group, which is highly subject to seasonal fluctuations and the capital expenditure level of the Group.
The Group monitors the changes in working capital by means of increased focus in certain areas. Examples of this are the increase in inventory rotation, or by increased monitoring of the credit terms granted to its customers. Deceuninck also makes use of the payment conditions that are granted by its suppliers, in order to cover its needs in working capital.
A comparison is provided below between the net carrying value and the fair value of financial instruments, which have been included in the financial statements. The fair value of the loans was calculated by defining the expected future cash flows, and by discounting these on common, accepted interest rates.
FINANCIAL INSTRUMENTS (in € thousand)
NET CARRYING VALUE FAIR VALUE
2015 2016 2015 2016FINANCIAL ASSETS
Cash and cash equivalents 70,720 72,425 70,720 72,425
Long-term trade receivables 532 409 532 409
Financial fixed assets 65 65 65 65
Derivative financial instruments 1,278 1,947 1,278 1,947
FINANCIAL LIABILITIES
Loans with a variable interest rate 25,940 25,940 0
Loans with a fixed interest rate 136,871 160,846 136,161 166,452
Financial leasing (0) (0) (0) (0)
Derivative financial instruments 271 330 271 330
94 95DECEUNINCK FINANCIAL REPORT 2016 DECEUNINCK FINANCIAL REPORT 2016
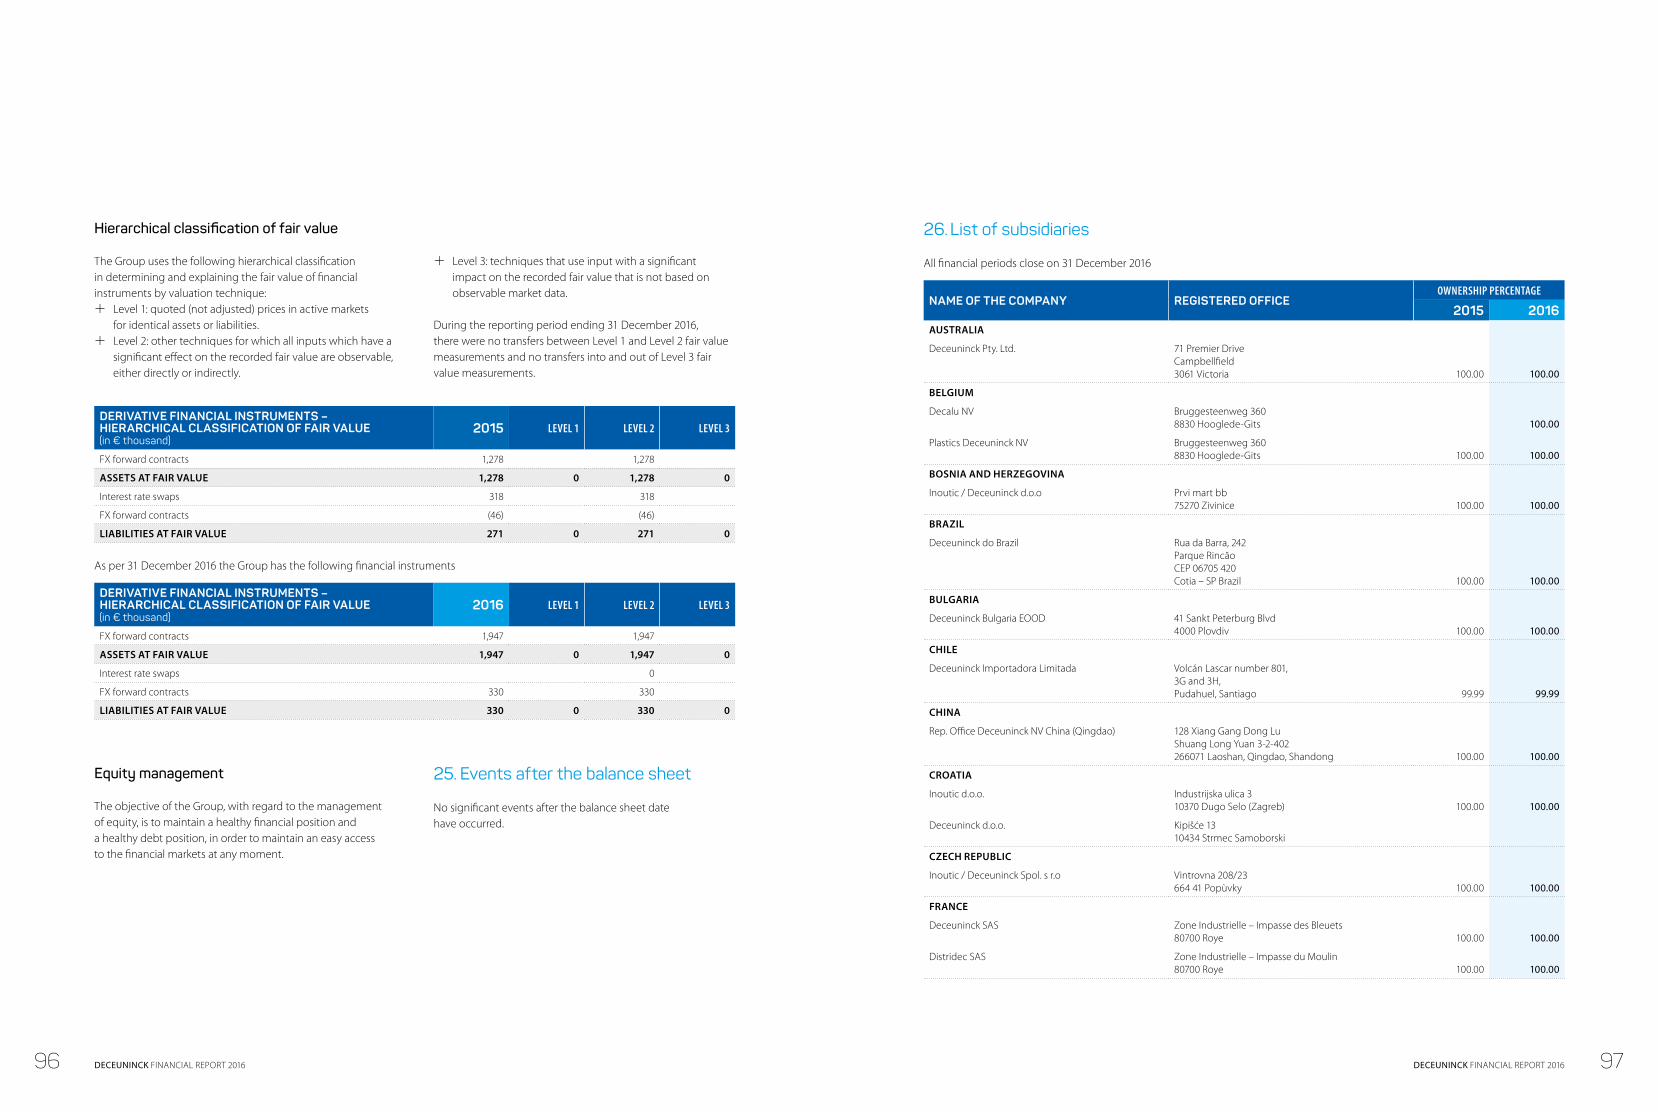
Hierarchical classification of fair value
The Group uses the following hierarchical classification in determining and explaining the fair value of financial instruments by valuation technique: q Level 1: quoted (not adjusted) prices in active markets
for identical assets or liabilities. q Level 2: other techniques for which all inputs which have a
significant effect on the recorded fair value are observable, either directly or indirectly.
q Level 3: techniques that use input with a significant impact on the recorded fair value that is not based on observable market data.
During the reporting period ending 31 December 2016, there were no transfers between Level 1 and Level 2 fair value measurements and no transfers into and out of Level 3 fair value measurements.
DERIVATIVE FINANCIAL INSTRUMENTS – HIERARCHICAL CLASSIFICATION OF FAIR VALUE(in € thousand)
2015 LEVEL 1 LEVEL 2 LEVEL 3
FX forward contracts 1,278 1,278
ASSETS AT FAIR VALUE 1,278 0 1,278 0
Interest rate swaps 318 318
FX forward contracts (46) (46)
LIABILITIES AT FAIR VALUE 271 0 271 0
As per 31 December 2016 the Group has the following financial instruments
DERIVATIVE FINANCIAL INSTRUMENTS – HIERARCHICAL CLASSIFICATION OF FAIR VALUE(in € thousand)
2016 LEVEL 1 LEVEL 2 LEVEL 3
FX forward contracts 1,947 1,947
ASSETS AT FAIR VALUE 1,947 0 1,947 0
Interest rate swaps 0
FX forward contracts 330 330
LIABILITIES AT FAIR VALUE 330 0 330 0
Equity management
The objective of the Group, with regard to the management of equity, is to maintain a healthy financial position and a healthy debt position, in order to maintain an easy access to the financial markets at any moment.
25. Events after the balance sheet
No significant events after the balance sheet date have occurred.
26. List of subsidiaries
All financial periods close on 31 December 2016
NAME OF THE COMPANY REGISTERED OFFICEOWNERSHIP PERCENTAGE
2015 2016AUSTRALIA
Deceuninck Pty. Ltd. 71 Premier DriveCampbellfield3061 Victoria 100.00 100.00
BELGIUM
Decalu NV Bruggesteenweg 3608830 Hooglede-Gits 100.00
Plastics Deceuninck NV Bruggesteenweg 3608830 Hooglede-Gits 100.00 100.00
BOSNIA AND HERZEGOVINA
Inoutic / Deceuninck d.o.o Prvi mart bb75270 Zivinice 100.00 100.00
BRAZIL
Deceuninck do Brazil Rua da Barra, 242 Parque RincãoCEP 06705 420Cotia – SP Brazil 100.00 100.00
BULGARIA
Deceuninck Bulgaria EOOD 41 Sankt Peterburg Blvd4000 Plovdiv 100.00 100.00
CHILE
Deceuninck Importadora Limitada Volcán Lascar number 801,3G and 3H,Pudahuel, Santiago 99.99 99.99
CHINA
Rep. Office Deceuninck NV China (Qingdao) 128 Xiang Gang Dong LuShuang Long Yuan 3-2-402266071 Laoshan, Qingdao, Shandong 100.00 100.00
CROATIA
Inoutic d.o.o. Industrijska ulica 310370 Dugo Selo (Zagreb) 100.00 100.00
Deceuninck d.o.o. Kipišće 1310434 Strmec Samoborski
CZECH REPUBLIC
Inoutic / Deceuninck Spol. s r.o Vintrovna 208/23664 41 Popùvky 100.00 100.00
FRANCE
Deceuninck SAS Zone Industrielle – Impasse des Bleuets80700 Roye 100.00 100.00
Distridec SAS Zone Industrielle – Impasse du Moulin80700 Roye 100.00 100.00
96 97DECEUNINCK FINANCIAL REPORT 2016 DECEUNINCK FINANCIAL REPORT 2016
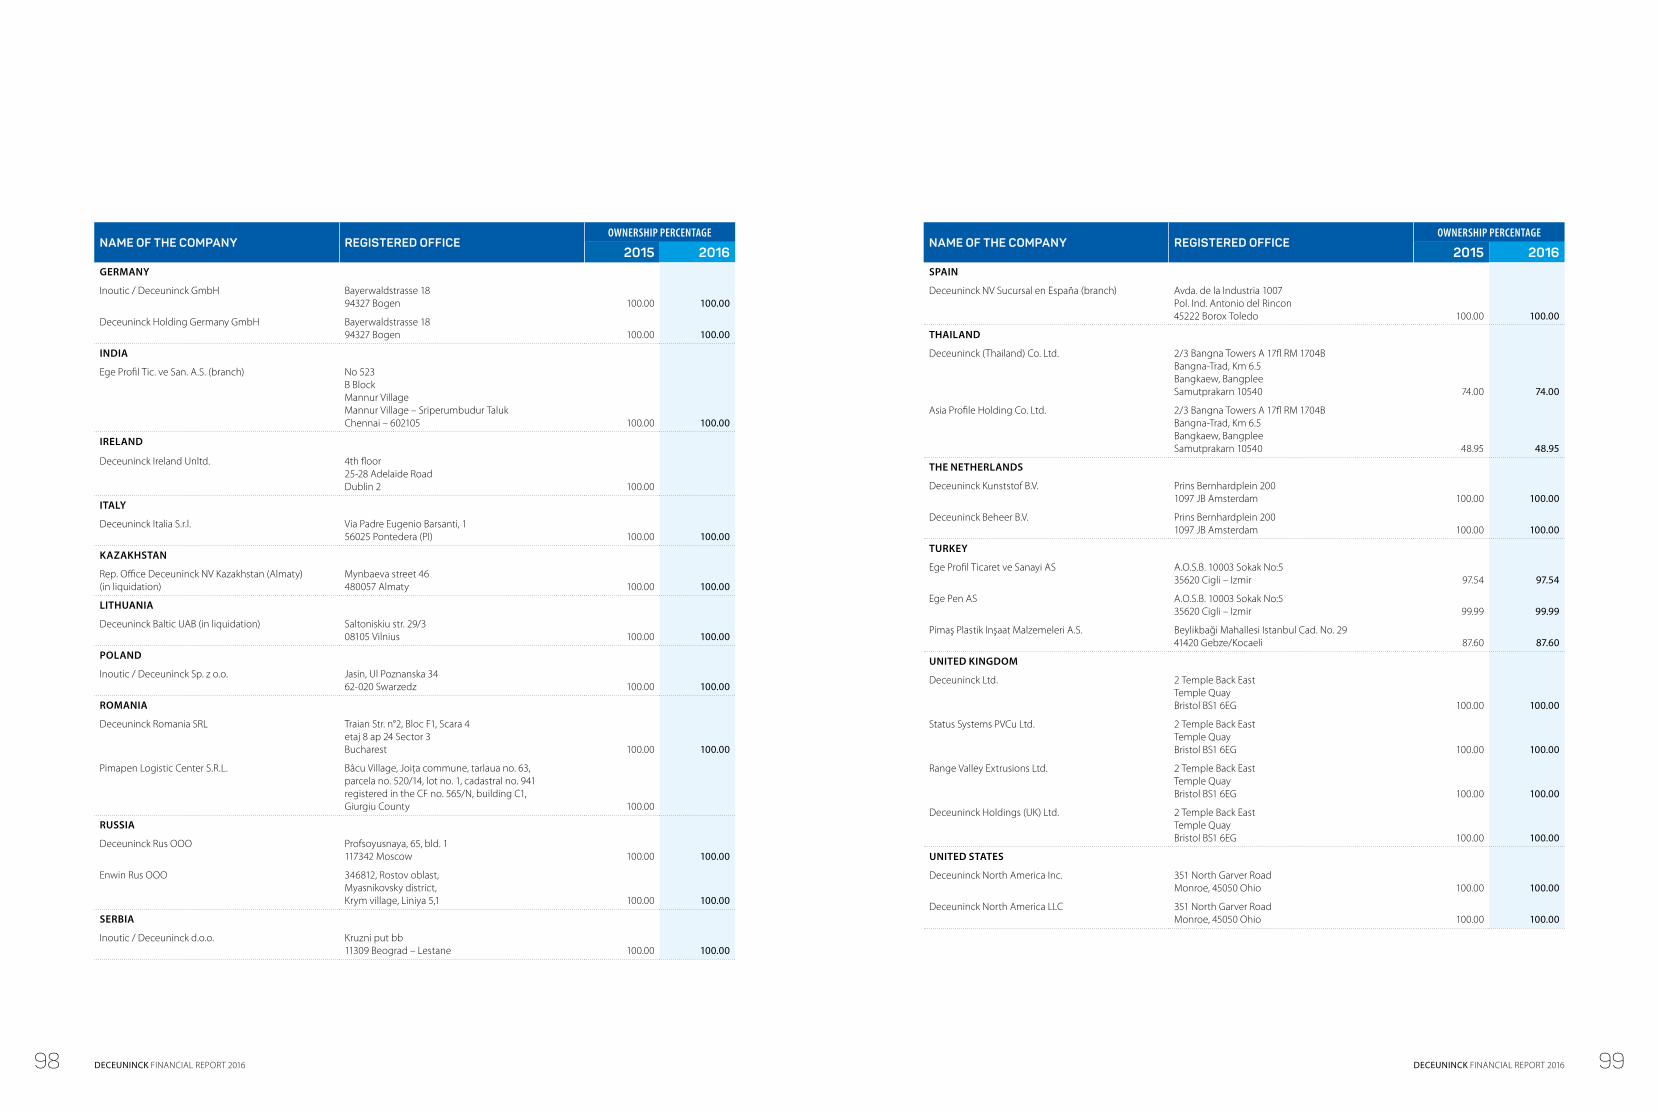
NAME OF THE COMPANY REGISTERED OFFICEOWNERSHIP PERCENTAGE
2015 2016GERMANY
Inoutic / Deceuninck GmbH Bayerwaldstrasse 1894327 Bogen 100.00 100.00
Deceuninck Holding Germany GmbH Bayerwaldstrasse 1894327 Bogen 100.00 100.00
INDIA
Ege Profil Tic. ve San. A.S. (branch) No 523B BlockMannur VillageMannur Village – Sriperumbudur TalukChennai – 602105 100.00 100.00
IRELAND
Deceuninck Ireland Unltd. 4th floor25-28 Adelaide RoadDublin 2 100.00
ITALY
Deceuninck Italia S.r.l. Via Padre Eugenio Barsanti, 156025 Pontedera (PI) 100.00 100.00
KAZAKHSTAN
Rep. Office Deceuninck NV Kazakhstan (Almaty) (in liquidation)
Mynbaeva street 46480057 Almaty 100.00 100.00
LITHUANIA
Deceuninck Baltic UAB (in liquidation) Saltoniskiu str. 29/308105 Vilnius 100.00 100.00
POLAND
Inoutic / Deceuninck Sp. z o.o. Jasin, Ul Poznanska 3462-020 Swarzedz 100.00 100.00
ROMANIA
Deceuninck Romania SRL Traian Str. n°2, Bloc F1, Scara 4etaj 8 ap 24 Sector 3Bucharest 100.00 100.00
Pimapen Logistic Center S.R.L. Bâcu Village, Joiţa commune, tarlaua no. 63, parcela no. 520/14, lot no. 1, cadastral no. 941 registered in the CF no. 565/N, building C1, Giurgiu County 100.00
RUSSIA
Deceuninck Rus OOO Profsoyusnaya, 65, bld. 1117342 Moscow 100.00 100.00
Enwin Rus OOO 346812, Rostov oblast,Myasnikovsky district,Krym village, Liniya 5,1 100.00 100.00
SERBIA
Inoutic / Deceuninck d.o.o. Kruzni put bb11309 Beograd – Lestane 100.00 100.00
NAME OF THE COMPANY REGISTERED OFFICEOWNERSHIP PERCENTAGE
2015 2016SPAIN
Deceuninck NV Sucursal en España (branch) Avda. de la Industria 1007Pol. Ind. Antonio del Rincon45222 Borox Toledo 100.00 100.00
THAILAND
Deceuninck (Thailand) Co. Ltd. 2/3 Bangna Towers A 17fl RM 1704BBangna-Trad, Km 6.5Bangkaew, BangpleeSamutprakarn 10540 74.00 74.00
Asia Profile Holding Co. Ltd. 2/3 Bangna Towers A 17fl RM 1704BBangna-Trad, Km 6.5Bangkaew, BangpleeSamutprakarn 10540 48.95 48.95
THE NETHERLANDS
Deceuninck Kunststof B.V. Prins Bernhardplein 2001097 JB Amsterdam 100.00 100.00
Deceuninck Beheer B.V. Prins Bernhardplein 2001097 JB Amsterdam 100.00 100.00
TURKEY
Ege Profil Ticaret ve Sanayi AS A.O.S.B. 10003 Sokak No:535620 Cigli – Izmir 97.54 97.54
Ege Pen AS A.O.S.B. 10003 Sokak No:535620 Cigli – Izmir 99.99 99.99
Pimaş Plastik Inşaat Malzemeleri A.S. Beylikbaği Mahallesi Istanbul Cad. No. 2941420 Gebze/Kocaeli 87.60 87.60
UNITED KINGDOM
Deceuninck Ltd. 2 Temple Back EastTemple QuayBristol BS1 6EG 100.00 100.00
Status Systems PVCu Ltd. 2 Temple Back EastTemple QuayBristol BS1 6EG 100.00 100.00
Range Valley Extrusions Ltd. 2 Temple Back EastTemple QuayBristol BS1 6EG 100.00 100.00
Deceuninck Holdings (UK) Ltd. 2 Temple Back EastTemple QuayBristol BS1 6EG 100.00 100.00
UNITED STATES
Deceuninck North America Inc. 351 North Garver RoadMonroe, 45050 Ohio 100.00 100.00
Deceuninck North America LLC 351 North Garver RoadMonroe, 45050 Ohio 100.00 100.00
98 99DECEUNINCK FINANCIAL REPORT 2016 DECEUNINCK FINANCIAL REPORT 2016
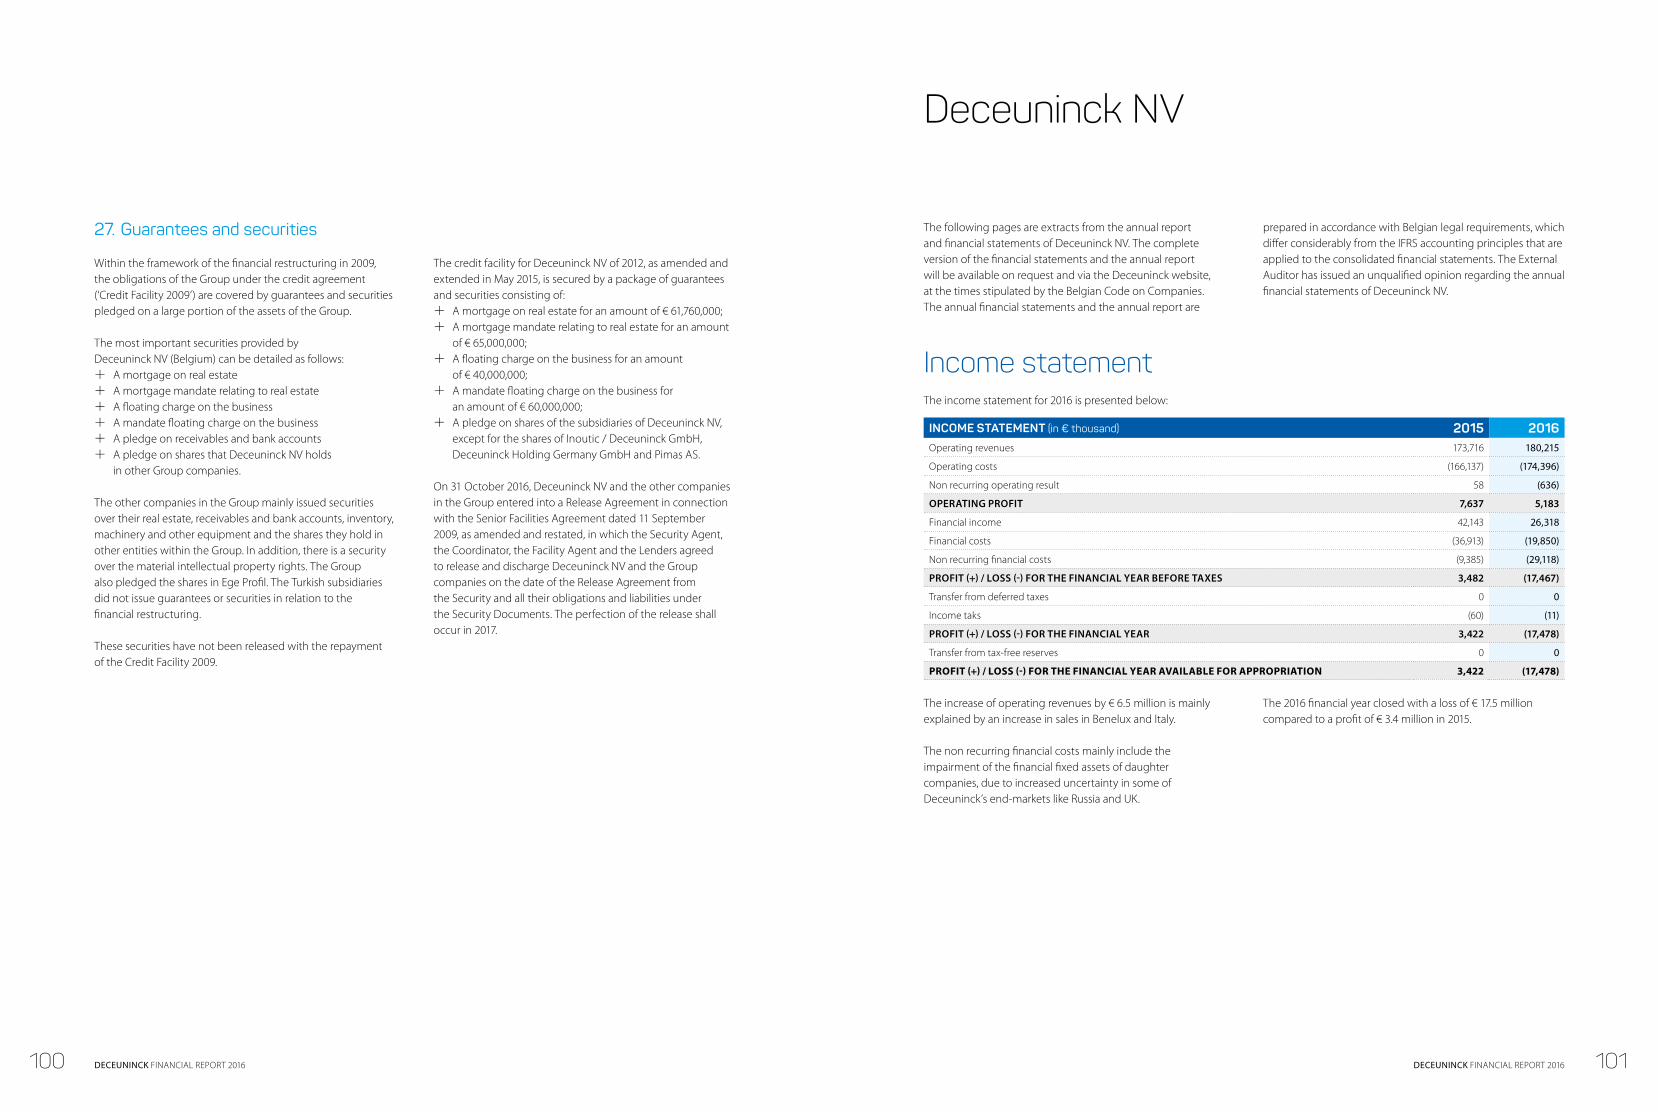
27. Guarantees and securities
Within the framework of the financial restructuring in 2009, the obligations of the Group under the credit agreement (‘Credit Facility 2009’) are covered by guarantees and securities pledged on a large portion of the assets of the Group.
The most important securities provided by Deceuninck NV (Belgium) can be detailed as follows: q A mortgage on real estate q A mortgage mandate relating to real estate q A floating charge on the business q A mandate floating charge on the business q A pledge on receivables and bank accounts q A pledge on shares that Deceuninck NV holds
in other Group companies.
The other companies in the Group mainly issued securities over their real estate, receivables and bank accounts, inventory, machinery and other equipment and the shares they hold in other entities within the Group. In addition, there is a security over the material intellectual property rights. The Group also pledged the shares in Ege Profil. The Turkish subsidiaries did not issue guarantees or securities in relation to the financial restructuring.
These securities have not been released with the repayment of the Credit Facility 2009.
The credit facility for Deceuninck NV of 2012, as amended and extended in May 2015, is secured by a package of guarantees and securities consisting of: q A mortgage on real estate for an amount of € 61,760,000; q A mortgage mandate relating to real estate for an amount
of € 65,000,000; q A floating charge on the business for an amount
of € 40,000,000; q A mandate floating charge on the business for
an amount of € 60,000,000; q A pledge on shares of the subsidiaries of Deceuninck NV,
except for the shares of Inoutic / Deceuninck GmbH, Deceuninck Holding Germany GmbH and Pimas AS.
On 31 October 2016, Deceuninck NV and the other companies in the Group entered into a Release Agreement in connection with the Senior Facilities Agreement dated 11 September 2009, as amended and restated, in which the Security Agent, the Coordinator, the Facility Agent and the Lenders agreed to release and discharge Deceuninck NV and the Group companies on the date of the Release Agreement from the Security and all their obligations and liabilities under the Security Documents. The perfection of the release shall occur in 2017.
The following pages are extracts from the annual report and financial statements of Deceuninck NV. The complete version of the financial statements and the annual report will be available on request and via the Deceuninck website, at the times stipulated by the Belgian Code on Companies. The annual financial statements and the annual report are
prepared in accordance with Belgian legal requirements, which differ considerably from the IFRS accounting principles that are applied to the consolidated financial statements. The External Auditor has issued an unqualified opinion regarding the annual financial statements of Deceuninck NV.
Income statementThe income statement for 2016 is presented below:
INCOME STATEMENT (in € thousand) 2015 2016 Operating revenues 173,716 180,215
Operating costs (166,137) (174,396)
Non recurring operating result 58 (636)
OPERATING PROFIT 7,637 5,183
Financial income 42,143 26,318
Financial costs (36,913) (19,850)
Non recurring financial costs (9,385) (29,118)
PROFIT (+) / LOSS (-) FOR THE FINANCIAL YEAR BEFORE TAXES 3,482 (17,467)
Transfer from deferred taxes 0 0
Income taks (60) (11)
PROFIT (+) / LOSS (-) FOR THE FINANCIAL YEAR 3,422 (17,478)
Transfer from tax-free reserves 0 0
PROFIT (+) / LOSS (-) FOR THE FINANCIAL YEAR AVAILABLE FOR APPROPRIATION 3,422 (17,478)
The increase of operating revenues by € 6.5 million is mainly explained by an increase in sales in Benelux and Italy.
The non recurring financial costs mainly include the impairment of the financial fixed assets of daughter companies, due to increased uncertainty in some of Deceuninck’s end-markets like Russia and UK.
The 2016 financial year closed with a loss of € 17.5 million compared to a profit of € 3.4 million in 2015.
Deceuninck NV
100 101DECEUNINCK FINANCIAL REPORT 2016 DECEUNINCK FINANCIAL REPORT 2016
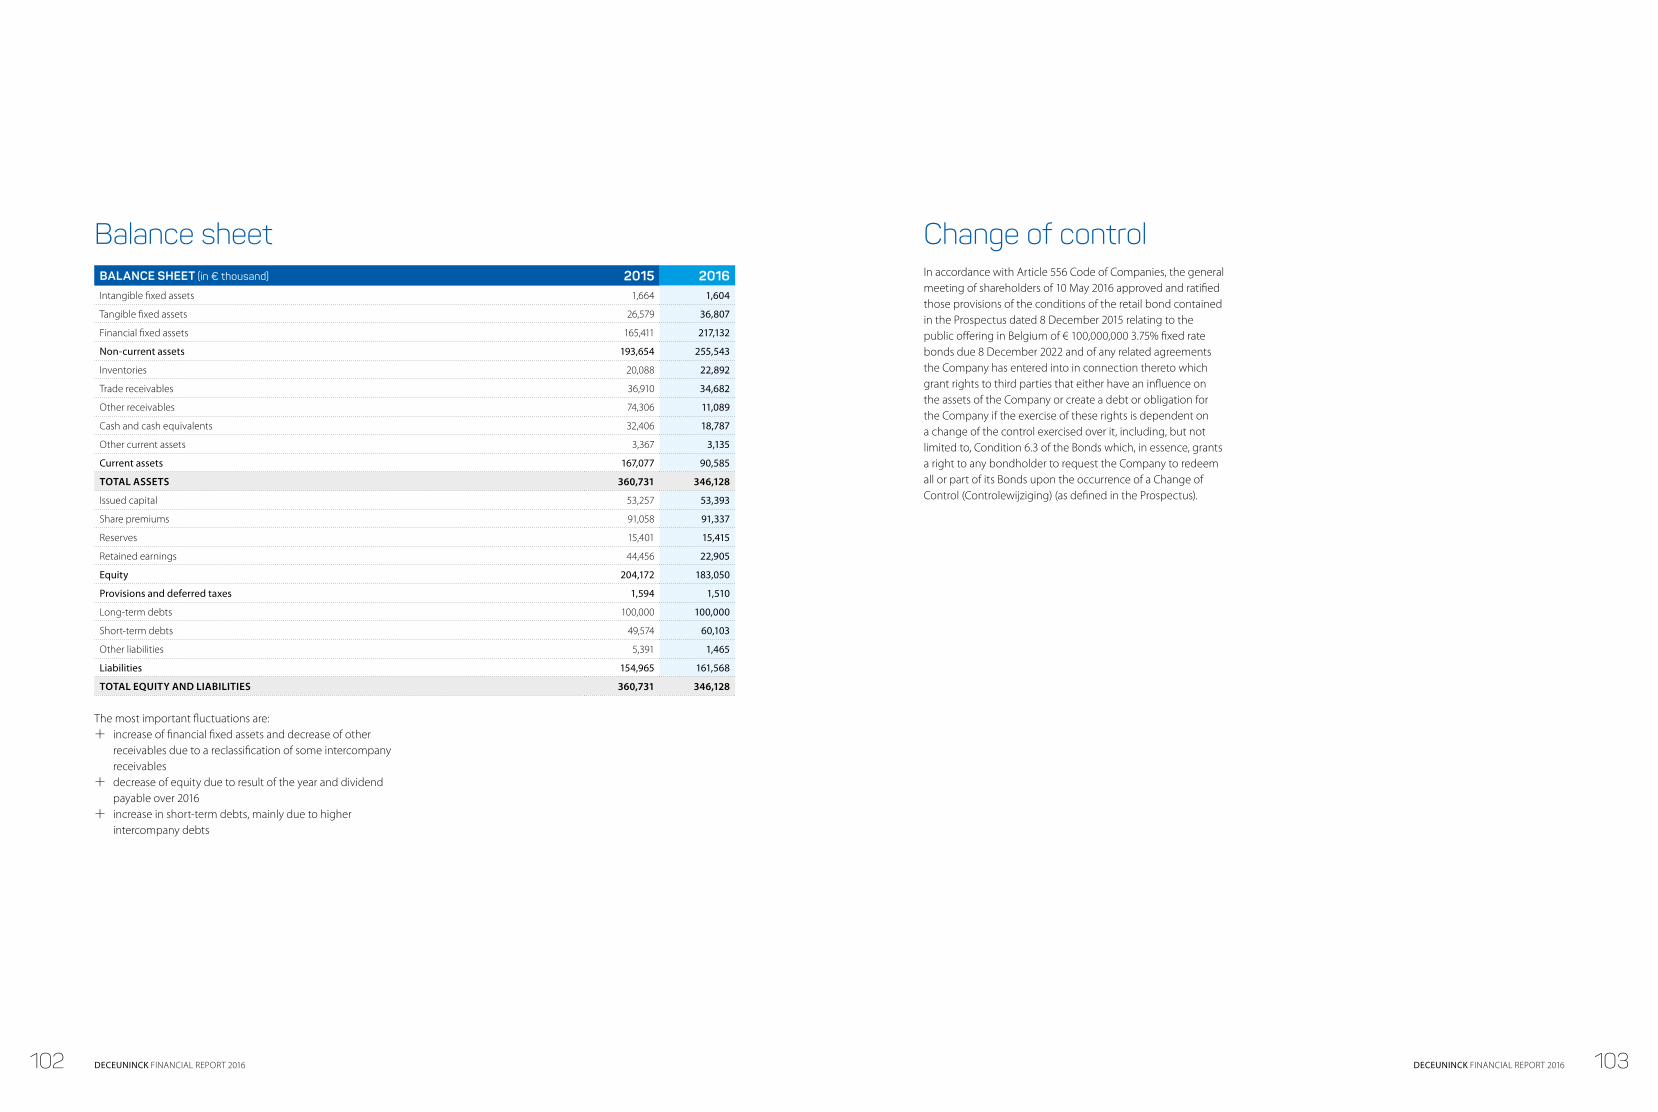
Balance sheetBALANCE SHEET (in € thousand) 2015 2016Intangible fixed assets 1,664 1,604
Tangible fixed assets 26,579 36,807
Financial fixed assets 165,411 217,132
Non-current assets 193,654 255,543
Inventories 20,088 22,892
Trade receivables 36,910 34,682
Other receivables 74,306 11,089
Cash and cash equivalents 32,406 18,787
Other current assets 3,367 3,135
Current assets 167,077 90,585
TOTAL ASSETS 360,731 346,128
Issued capital 53,257 53,393
Share premiums 91,058 91,337
Reserves 15,401 15,415
Retained earnings 44,456 22,905
Equity 204,172 183,050
Provisions and deferred taxes 1,594 1,510
Long-term debts 100,000 100,000
Short-term debts 49,574 60,103
Other liabilities 5,391 1,465
Liabilities 154,965 161,568
TOTAL EQUITY AND LIABILITIES 360,731 346,128
The most important fluctuations are: q increase of financial fixed assets and decrease of other
receivables due to a reclassification of some intercompany receivables
q decrease of equity due to result of the year and dividend payable over 2016
q increase in short-term debts, mainly due to higher intercompany debts
Change of control In accordance with Article 556 Code of Companies, the general meeting of shareholders of 10 May 2016 approved and ratified those provisions of the conditions of the retail bond contained in the Prospectus dated 8 December 2015 relating to the public offering in Belgium of € 100,000,000 3.75% fixed rate bonds due 8 December 2022 and of any related agreements the Company has entered into in connection thereto which grant rights to third parties that either have an influence on the assets of the Company or create a debt or obligation for the Company if the exercise of these rights is dependent on a change of the control exercised over it, including, but not limited to, Condition 6.3 of the Bonds which, in essence, grants a right to any bondholder to request the Company to redeem all or part of its Bonds upon the occurrence of a Change of Control (Controlewijziging) (as defined in the Prospectus).
102 103DECEUNINCK FINANCIAL REPORT 2016 DECEUNINCK FINANCIAL REPORT 2016
Statutory auditor’s report to the general meeting of Deceuninck NV for the year ended 31 December 2016
In accordance with the legal requirements, we report to you in the context of our statutory auditor’s mandate. This report includes our opinion on the consolidated statement of financial position as at 31 December 2016, the consolidated income statement, the consolidated statement of comprehensive income, the consolidated statement of changes in equity and the consolidated statement of cash flows for the year ended 31 December 2016 and the notes (all elements together ‘the Consolidated Financial Statements’), and includes as well our report on other legal and regulatory requirements.
Report on the Consolidated Financial Statements – Unqualified opinion
We have audited the Consolidated Financial Statements of Deceuninck NV (‘the Company’) and its subsidiaries (together ‘the Group’) as of and for the year ended 31 December 2016, prepared in accordance with the International Financial Reporting Standards as adopted by the European Union, which show a consolidated statement of financial position total of € 601.051 thousand and of which the consolidated income statement shows a profit for the year of € 20.954 thousand.
RESPONSIBILITY OF THE BOARD OF DIRECTORS FOR THE PREPARATION OF THE CONSOLIDATED FINANCIAL STATEMENTSThe Board of Directors is responsible for the preparation of Consolidated Financial Statements that give a true and fair view in accordance with the International Financial Reporting Standards as adopted by the European Union. This responsibility includes: designing, implementing and maintaining internal control relevant to the preparation of Consolidated Financial Statements that give a true and fair view and that are free from material misstatement, whether due to fraud or error; selecting and applying appropriate accounting policies; and making accounting estimates that are reasonable in the given circumstances.
RESPONSIBILITY OF THE STATUTORY AUDITOR Our responsibility is to express an opinion on these Consolidated Financial Statements based on our audit. We conducted our audit in accordance with International Standards on Auditing (‘ISAs’). Those standards require that we comply with the ethical requirements and plan and perform the audit to obtain reasonable assurance about whether the Consolidated Financial Statements are free from material misstatement.
An audit involves performing procedures to obtain audit evidence about the amounts and disclosures in the Consolidated Financial Statements. The procedures selected depend on the statutory auditor’s judgment, including the assessment of the risks of material misstatement of the Consolidated Financial Statements, whether due to fraud or error.
In making those risk assessments, the statutory auditor considers internal control relevant to the Group’s preparation and presentation of the Consolidated Financial Statements that give a true and fair view, in order to design audit procedures that are appropriate in the circumstances, but not for the purpose of expressing an opinion on the effectiveness of the Group’s internal control. An audit also includes evaluating the appropriateness of accounting policies used, the reasonableness of accounting estimates made by the Board of Directors, as well as evaluating the overall presentation of the Consolidated Financial Statements.
We have obtained from the Board of Directors and the Company’s officials the explanations and information necessary for performing our audit and we believe that the audit evidence we have obtained is sufficient and appropriate to provide a basis for our opinion.
UNQUALIFIED OPINIONIn our opinion, the Consolidated Financial Statements of the Group as at 31 December 2016 give a true and fair view of the consolidated net equity and financial position, as well as its consolidated results and its consolidated cash flows for the year then ended in accordance with the International Financial Reporting Standards as adopted by the European Union.
Report on other legal and regulatory requirements
The Board of Directors is responsible for the preparation and the content of the Board of Director’s report on the Consolidated Financial Statements, in accordance with article 119 of the Belgian Company Code.
In the context of our mandate and in accordance with the additional standard issued by the ‘Instituut van de Bedrijfsrevisoren/Institut des Réviseurs d’Entreprises’ as published in the Belgian Gazette on 28 August 2013 (the ‘Additional Standard’), it is our responsibility to perform certain procedures to verify, in all material respects, compliance with certain legal and regulatory requirements, as defined in the Additional Standard.
On this basis, we make the following additional statement, which does not modify the scope of our opinion on the Consolidated Financial Statements. The Board of Director’s report to the Consolidated Financial Statements includes the information required by law, is consistent with the Consolidated Financial Statements and does not present any material inconsistencies with the information that we became aware of during the performance of our mandate.
Ghent, 24 March 2017
Ernst & Young Bedrijfsrevisoren BCVBAStatutory auditorrepresented by
Marnix Van DoorenPartner*
(*) Acting on behalf of a BVBA/SPRLRef.: 17MVD0075
External auditor’s report
104 105DECEUNINCK FINANCIAL REPORT 2016 DECEUNINCK FINANCIAL REPORT 2016
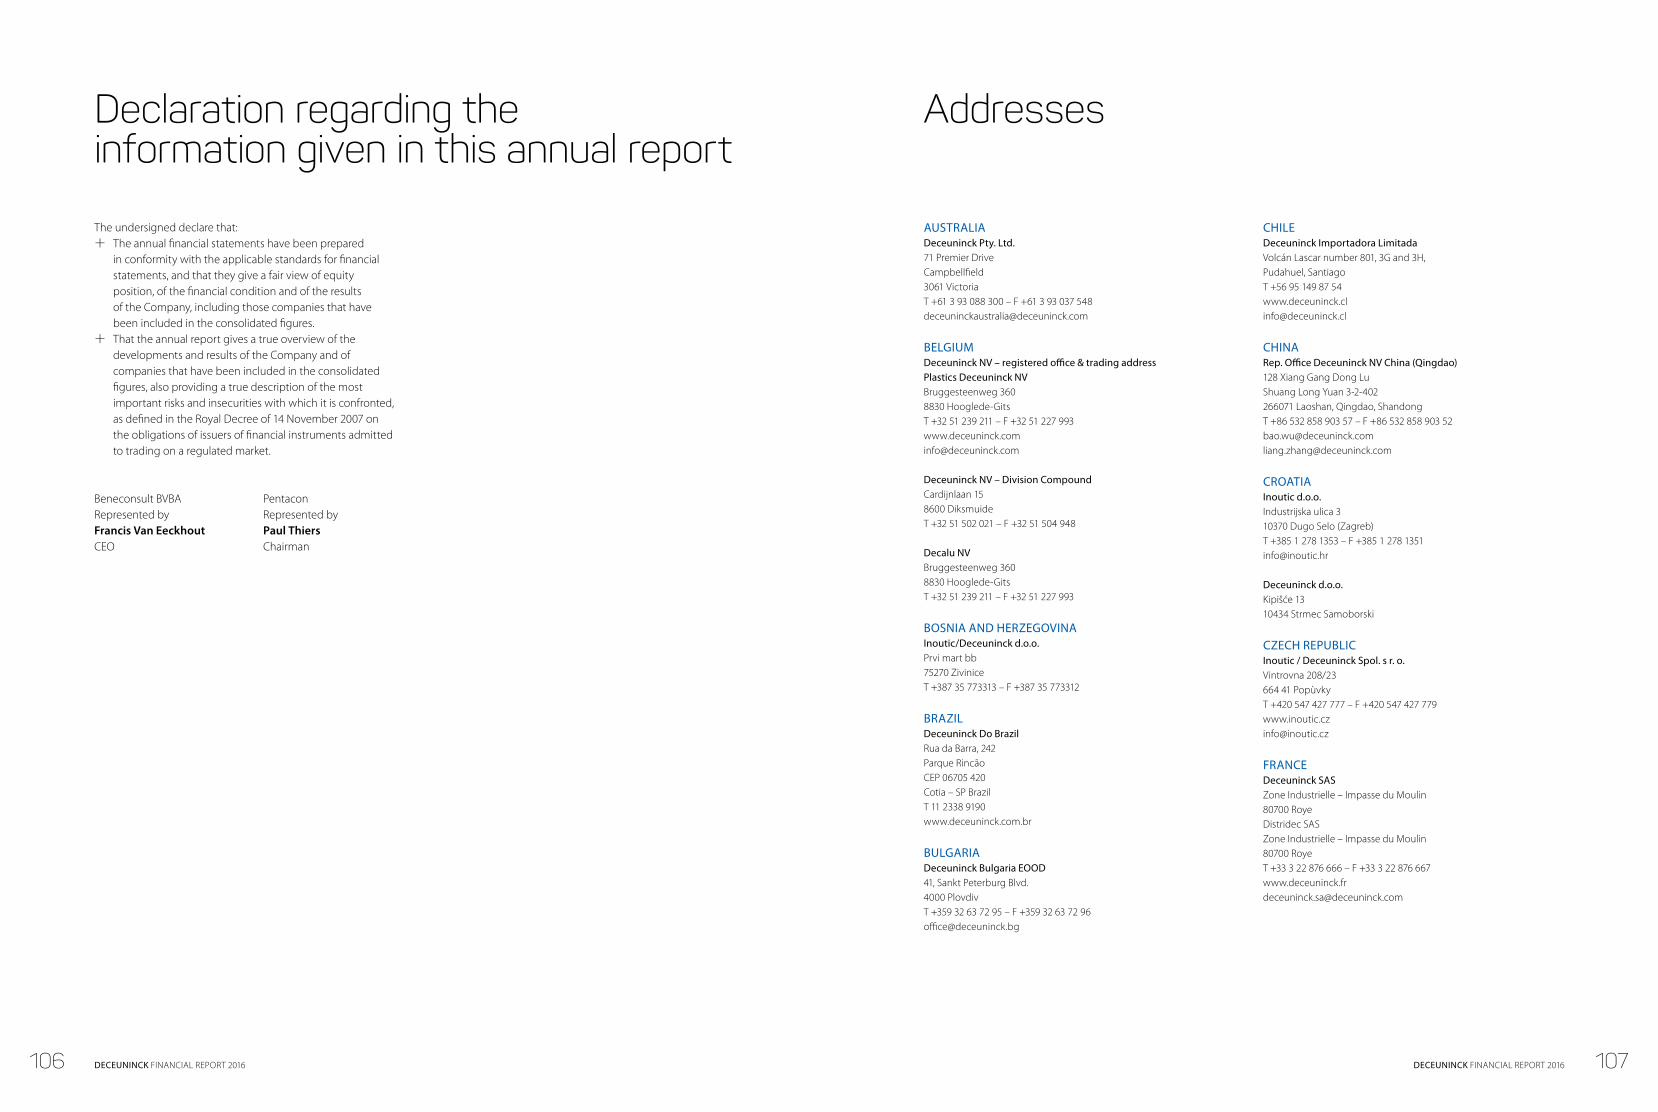
The undersigned declare that: q The annual financial statements have been prepared
in conformity with the applicable standards for financial statements, and that they give a fair view of equity position, of the financial condition and of the results of the Company, including those companies that have been included in the consolidated figures.
q That the annual report gives a true overview of the developments and results of the Company and of companies that have been included in the consolidated figures, also providing a true description of the most important risks and insecurities with which it is confronted, as defined in the Royal Decree of 14 November 2007 on the obligations of issuers of financial instruments admitted to trading on a regulated market.
Beneconsult BVBA PentaconRepresented by Represented byFrancis Van Eeckhout Paul ThiersCEO Chairman
AUSTRALIADeceuninck Pty. Ltd.71 Premier DriveCampbellfield3061 VictoriaT +61 3 93 088 300 – F +61 3 93 037 [email protected]
BELGIUMDeceuninck NV – registered office & trading addressPlastics Deceuninck NVBruggesteenweg 3608830 Hooglede-GitsT +32 51 239 211 – F +32 51 227 [email protected]
Deceuninck NV – Division CompoundCardijnlaan 158600 DiksmuideT +32 51 502 021 – F +32 51 504 948
Decalu NVBruggesteenweg 3608830 Hooglede-GitsT +32 51 239 211 – F +32 51 227 993
BOSNIA AND HERZEGOVINAInoutic/Deceuninck d.o.o.Prvi mart bb75270 ZiviniceT +387 35 773313 – F +387 35 773312
BRAZILDeceuninck Do BrazilRua da Barra, 242 Parque RincãoCEP 06705 420Cotia – SP Brazil T 11 2338 9190www.deceuninck.com.br
BULGARIADeceuninck Bulgaria EOOD41, Sankt Peterburg Blvd.4000 PlovdivT +359 32 63 72 95 – F +359 32 63 72 [email protected]
CHILEDeceuninck Importadora LimitadaVolcán Lascar number 801, 3G and 3H,Pudahuel, SantiagoT +56 95 149 87 [email protected]
CHINARep. Office Deceuninck NV China (Qingdao)128 Xiang Gang Dong LuShuang Long Yuan 3-2-402266071 Laoshan, Qingdao, ShandongT +86 532 858 903 57 – F +86 532 858 903 [email protected]@deceuninck.com
CROATIAInoutic d.o.o.Industrijska ulica 310370 Dugo Selo (Zagreb)T +385 1 278 1353 – F +385 1 278 [email protected]
Deceuninck d.o.o. Kipišće 1310434 Strmec Samoborski
CZECH REPUBLICInoutic / Deceuninck Spol. s r. o.Vintrovna 208/23664 41 PopùvkyT +420 547 427 777 – F +420 547 427 [email protected]
FRANCEDeceuninck SASZone Industrielle – Impasse du Moulin80700 RoyeDistridec SASZone Industrielle – Impasse du Moulin80700 RoyeT +33 3 22 876 666 – F +33 3 22 876 [email protected]
Declaration regarding the information given in this annual report
Addresses
106 107DECEUNINCK FINANCIAL REPORT 2016 DECEUNINCK FINANCIAL REPORT 2016
GERMANYInoutic / Deceuninck GmbHDeceuninck Holding Germany GmbHBayerwaldstraße 1894327 BogenT +49 94 22 821 0 – F +49 94 22 821 [email protected]
INDIAEge Profil Tic. ve San. A.S.No 523B BlockMannur VillageMannur Village – Sriperumbudur TalukChennai – 602105T +919717707732 – F +91 [email protected]
ITALYDeceuninck Italia S.r.l.Via Padre Eugenio Barsanti, 156025 Pontedera (Pl)T +39 0587 484426 – F +39 0587 [email protected]
KAZAKHSTANRep. Office Deceuninck NVKazakhstan (Almaty) (in liquidation)Mynbaeva street, 46480057 Almaty
LITHUANIADeceuninck Baltic UAB (in liquidation)Saltoniškiu str. 29/3,08105 Vilnius
POLANDInoutic / Deceuninck Sp. z o.o.Jasin, Ul. Poznanska 3462-020 SwarzedzT +48 61 81 87000 – F +48 61 81 [email protected]
ROMANIADeceuninck Romania SRLTraian Str. n°2, Bloc F1, Scara 4, etaj 8, ap. 24,Sector 3BucharestT +40 21 327 49 52 – F +40 21 323 52 [email protected]
RUSSIADeceuninck Rus OOO – registered officeProfsoyusnaya, 65, bld. 1117342 MoscowT +7 495 642 87 95 – F +7 495 642 87 [email protected]
Deceuninck Rus OOO – trading addresspr. Naumova, 5142281 Protvino, Moscow RegionT +7 4967 31 12 44 – F +7 4967 31 12 43
Enwin Rus OOO346812, Rostov oblast,Myasnikovsky district,Krym village, Liniya 5,1T +7 (86349)2-40-11; +7 (86349) 2-40-12F +7 (86349)2-40-23 [email protected]
Sales Offices
Northern RussiaPilot Pilyutov street, 11, bld. 1, liter A198206 St. PetersburgT-F +7 812 644 43 89; +7 911 956 54 23 [email protected]
Russian Far EastNeftyanaya street, 1, liter A, floor 2680022 KhabarovskT-F +7 914 422 07 20; +7 962 151 10 [email protected]
SiberiaKommunisticheskaya street, 13 (premises #11)630007 NovosibirskT-F +7 383 236 25 83; +7 913 379 40 [email protected]
SERBIAInoutic / Deceuninck d.o.o.Kruzni put bb11309 Beograd-LestaneT +381 11 3443217 – F +381 11 2442343
SPAINDeceuninck NV Sucursal en EspañaAvda. de la Industria, 1007Pol. Ind. Antonio del Rincón45222 Borox – ToledoT +34 902 209 001 – F +34 902 209 [email protected]
THAILANDDeceuninck (Thailand) Co. Ltd.Asia Profile Holding Co. Ltd.2/3 Bangna Towers A, 17 Fl., Rm.1704BBangna-Trad, Km. 6.5,Bangkaew, Bangplee,Samutprakarn 10540T +66 2 751 9544-5 – F +66 2 751 [email protected]
THE NETHERLANDSDeceuninck Kunststof B.V.Deceuninck Beheer B.V.Prins Bernhardplein 2001097JB [email protected]
TURKEYEge Profil Ticaret ve Sanayi AS (production)Ege Pen ASA.O.S.B. 10003 Sokak No:535620 Cigli – IzmirT +90 232 398 98 98 – F +90 232 398 99 [email protected]
Winsa (production)Sarımese BeldesiKızılcıklık Mahallesi, İnonu Cad. Suadiye Yolu uzeriNo:141320 Sarımeşe / Kartepe /KocaeliT +90 262 371 57 27 – F +90 262 371 57 [email protected]
Pimaş Plastik Inşaat Malzemeleri A.S.Beylikbaği Mahallesi Istanbul Cad. No. 29, 41420 Gebze/Kocaeliwww.pimas.com.trT +90 262 677 77 77 – F +90 262 677 77 00 [email protected]
Sales offices
Ege Pen Deceuninck IzmirA.O.S.B. 10003 Sokak No:535620 Cigli – IzmirT +90 232 398 98 98 – F +90 232 398 99 83
Winsa IzmirA.O.S.B. 10003 Sokak No:535620 Cigli – IzmirT +90 232 328 11 37 – F +90 232 328 11 39
Ege Pen Deceuninck IstanbulRuzgarli Bahce Mahallesi, Kavak Sokak,Impa Plaza No:12, Kat:2Beykoz/IstanbulT +90 216 537 13 60 – F +90 216 537 13 64
Winsa IstanbulIcerenkoy Mahallesi, Hal Yolu Caddesi, No:5Bay Plaza Kat:12 (Regional Office)34752 Atasehir/IstanbulT +90 216 574 58 65 – F +90 216 574 10 53
Winsa IstanbulIcerenkoy Mahallesi, Hal Yolu Caddesi, No:5Bay Plaza Kat:3 (Sales & Marketing)34752 Atasehir/IstanbulT +90 216 574 58 65 – F +90 216 574 10 53
Ege Pen Deceuninck AnkaraKizilirmak Mah. Alternatif Plaza 12/26 Çukurambar/Çankaya06550 Yıldız /Cankaya/AnkaraT +90 312 440 16 15 – F +90 312 441 11 18
Winsa AnkaraKizilirmak Mah. 1446.Cd 12/17 Çukurambar06550 Yıldız/Cankaya/AnkaraT +90 312 442 83 60 – F +90 312 442 71 11
Ege Pen Deceuninck AdanaYeni Mahalle 87071 Sk. Bozkurtlar Residence 50 k-3 d-3Seyhan/AdanaT +90 322 247 23 90 – F +90 322 247 23 85
Winsa AdanaYeni Mahalle 87071 Sk. Bozkurtlar Residence 50 k-3 d-3Seyhan/AdanaT +90 322 247 23 80 – F +90 322 247 23 81
108 109DECEUNINCK FINANCIAL REPORT 2016 DECEUNINCK FINANCIAL REPORT 2016

UNITED KINGDOMDeceuninck Ltd.Status Systems PVCu Ltd.Range Valley Extrusions Ltd.
Deceuninck Holdings (UK) Ltd.
Unit 2, Stanier Road – trading addressPorte Marsh Industrial EstateCalne – Wiltshire SN11 9PXT +44 1249 816 969 – F +44 1249 815 234www.deceuninck.com/[email protected]
2 Temple Back East – registered officeTemple QuayBristol BS1 6EG
UNITED STATESDeceuninck North America LLCDeceuninck North America Inc.351 North Garver RoadMonroe, 45050 Ohio 240 North Pacific Parkway 89408 Fernley, Nevada T +1 513 539 4444 – F +1 513 539 [email protected]
1 EBITDA Earnings before interest, taxes, depreciation/ impairments of fixed assets as well as amortisation/impairment of goodwill and effect of negative goodwill = operating cash flow
2 REBITDARecurring earnings before interest, taxes, depreciation/ impairments of fixed assets as well as amortisation/impairment of goodwill and effect of negative goodwill = EBITDA excluding non-recurring costs/benefits,eg restructuring costs = recurring operating cash flow
3 EBITA Earnings before interest, taxes and amortization
4 EBIT Earnings before interest and taxes = operational result
5 EBT Earnings before taxes
6 EPS (non-diluted) (Non-diluted) earnings per share
7 EPS (diluted) (Diluted) earnings per share
8 Net debt Financial debts – cash and cash equivalents
9 Working capital Trade receivables + inventories – trade debts
10 Liquidity Current assets/current liabilities
11 ROCE Return on capital employed = EBIT/Capital employed (CE)
12 Capital employed (CE) The sum of goodwill, intangible, tangible and financial fixed assets and working capital
13 Subsidiaries Companies in which the group owns a participation in excess of 50%
14 Associated companies Companies in which the group owns a participation between 20-50%, which are valued according to the equity method
15 Gearing Net debt compared to the equity capital
16 MTM Marked-to-Market
17 Headcount (FTE) Total Full Time Equivalents including temporary and external staff
Glossary
110 111DECEUNINCK FINANCIAL REPORT 2016 DECEUNINCK FINANCIAL REPORT 2016
Linktrusion, Building a sustainable home, Zendow, Decoroc, Winsa, Inoutic, Rovex, Revolution Tilt and Turn, Genius, Grandparc, Belface, Cyclefoam, e.a. are registered trademarks of Deceuninck NV and its subsidiaries.
This annual report is available in Dutch and English.Dit jaarrapport is verkrijgbaar in het Nederlands en het Engels.
Responsible editorWim Van AckerRepresentative of Fienes BVBACFO
Creationwww.linknv.be
Copyright © 2017 Deceuninck NV – All rights reservedRegistered office & business address:Deceuninck NVBruggesteenweg 360 – B-8830 Hooglede-Gits (Belgium)VAT BE405.548.486 – RPR GHENT, DIVISION COURTRAI
112 DECEUNINCK FINANCIAL REPORT 2016

Deceuninck NVBruggesteenweg 360B-8830 Hooglede-Gits (Belgium)T +32 51 23 92 11F +32 51 22 79 [email protected]
www.deceuninck.com