ANNUAL REPORT 2016 - Prosafe Filer/Annual reports/Annual... · the consolidated accounts, ... with...
82
ANNUAL REPORT 2 0 1 6
Transcript of ANNUAL REPORT 2016 - Prosafe Filer/Annual reports/Annual... · the consolidated accounts, ... with...

1
A N N U A L R E P O R T 2 0 1 6

2
The annual report is only made in
electronical format, but can easily be
printed.
The annual report comprises the directors' report, the consolidated accounts, the parent company accounts for Prosafe SE, the independent auditors' report and a theme article.
Information about HSEQA, corporate governance, social responsibility, financial and analytical information, executive management and the board of directors can be found on www.prosafe.com
3
CONTENT
Financial calendar and key figures
About Prosafe
Theme: Plan the work and work the plan
Directors’ report
Statement of the members of the board of directors and other responsible persons
Consolidated accounts
Parent company accounts Prosafe SE
Independent auditors’ report
5
6
8
11
22
24
61
76

4

5
FINANCIAL CALENDARINTERIM REPORTINGThe following dates have been set for quarterly interim reporting in 2017:
1st quarter 11 May 20172nd quarter 24 August 20173rd quarter 2 November 20174th quarter 8 February 2018
ANNUAL GENERAL MEETINGThe AGM for Prosafe SE will be held in the company’s premises at Stadiou 126, CY-6020 Larnaca, Cyprus on 10 May 2017.
KEY FIGURESNote 2016 2015 2014 2013 2012
ProfitOperating revenues USD million 474.0 474.7 548.7 523.5 510.4EBITDA USD million 1 253.2 262.9 312.6 306.6 280.1Operating profit USD million 52.8 30.8 248.3 245.1 222.4Net profit USD million 172.6 (50.6) 178.8 199.1 177.5
Earnings per share USD 2 8.36 (21.00) 76.00 85.00 80.00
Balance sheetTotal assets USD million 2 686.9 2 187.2 1 816.8 1 619.9 1 487.2Interest-bearing debt USD million 1 390.8 1 247.0 830.1 779.6 810.4Net interest-bearing debt USD million 3 1 185.1 1 189.9 707.7 666.2 706.8Book equity USD million 1 129.5 715.2 748.5 739.7 516.3Book equity ratio 4 42.0 % 32.6 % 41.2 % 45.7 % 34.7 %
ValuationMarket capitalisation USD million 306 619 725 1 816 1 894Share price NOK 5 37 2 100 2 300 4 680 4 732
1. Operating profit before depreciation2. Net profit / Average number of outstanding and potential shares. EPS restated to reflect reverse split in 2016.3. Interest-bearing debt - Cash and deposits4. (Book equity / Total assets) * 1005. Restated to reflect reverse split in 2016

6
ABOUT PROSAFEProsafe is a leading owner and operator of semi-submersible accommodation vessels.

7
Prosafe owns/operates nine semi-submersible accommodation, safety and support vessels and one Tender Support Vessel (TSV) that is providing drilling support services on the Norwegian Continental Shelf.
Furthermore, Prosafe has three new build harsh environment vessels available at COSCO Qidong shipyard in China. The Safe Eurus is available for prompt delivery and Prosafe has options on the Safe Nova and Safe Vega with both vessels nearing completion with a planned preservation and strategic stacking mode in the yard.
Prosafe's fleet consists of a combination of dynamically positioned and anchored vessels. Thereby, the fleet is versatile and able to operate in nearly all offshore environments.
Prosafe’s operations are amongst other related to maintenance and modification of installations on fields already in production, hook-up and commissioning of new fields, tie-backs to existing infrastructure and decommissioning.
Accommodation vessels offer additional accommodation, engineering, construction or storage capacity offshore. Prosafe’s vessels have accommodation capacity for 306-780 people and offer high quality welfare and catering facilities, storage, workshops, offices, medical services, deck cranes and lifesaving and fire fighting equipment. The vessels are positioned
alongside the host installation and are connected by means of a telescopic
gangway so that personnel can walk to work.
Prosafe has a strong track record from demanding operations world wide, with first class operational performance and good safety results. The company has
extensive experience from operating gangway connected
to fixed installations, FPSOs, TLPs, Semis and Spars.
The company’s track record comprises operations offshore Norway, UK, Mexico, USA, Brazil, Denmark, Tunisia, West Africa, North-west and South Australia, the Philippines and Russia.
Prosafe is listed on the Oslo Stock Exchange with ticker code PRS.
The company’s track record comprises
operations offshore Norway, UK, Mexico, USA, Brazil,
Denmark, Tunisia, West Africa, North-West and South Australia, the Philippines and Russia.

8
PLAN THE WORK AND WORK THE PLANStrategic development and value creation is all about planning the work and working the plan. In Prosafe we have a systematic approach that involves a continuous and close dialogue between management and the Board, and that combines short-term and long-term perspectives and goals in a balanced way.

9
VISION, STRATEGY AND PERFORMANCE MANAGEMENT
It is our aim to drive the business forward for continuous profitable growth and improvement without compromising safe and efficient operations.
Prosafe’s vision is clear, namely to be a leading and innovative provider of technology and services in selected niches of the global oil and gas industry.
Prosafe’s strategy is to be the preferred provider of semi-submersible accommodation and service vessels and to pursue profitable growth within the high-end of the offshore accommodation industry.
This strategy is vigorously pursued guided by a set of well founded core values:
• Profitability• Respect• Innovation• Safety• Ambition• Focus • The environment
Our vision, strategy and core values combined with our management system, delegated authorities and laws and regulations define our “room to manoeuvre” and ensure focus, priority, quality and compliance.
Based on this, we define short-term and long-term goals in the form of;
• Quarterly goals and actions • Annual goals, budget and actions• Long-term strategic goals and actions
We are focused on understanding and managing risk on the upside and downside. The management team applies the established risk methodology on a continuous basis in order to derive the action plan that is used to drive the company forward. The goals and actions are continuously pursued through this action plan, and delivery is measured in regular performance management reports.
ACTIONS, ACHIEVEMENTS AND DEVELOPMENTS IN 20162016 was a demanding year for Prosafe characterized by a series of parallel challenges and developments, however, the company still managed to ensure safe and efficient operations and no Lost Time Incidents.
The main challenges can be summed up as follows:
Financial restructuring of the company A comprehensive refinancing has led to an improved cash flow of ca. USD 1 billion through till end of 2020, providing financial flexibility and downside protection.
Reorganisation of the company and simplification In order to adapt to the current market situation and weak future outlook, we have moved from a matrix organisation to a simple line organisation. This model allows the business to get "back to basics" and be a focused, one-product line operating company building on its key competitive strength which is advanced and efficient marine operations. This has resulted in fewer depart-ments with fewer people doing the same tasks.
Cost and spend reduction for max cash As part of the reorganisation the company has also reduced the onshore organisation by about 40% and are continuing to streamline the organisation. In addition to reduction in personnel, the company has introduced a number of cost saving efficiencies initiatives such as standardisation of equipment, reduced travelling, improved reliability based mainte-nance, focused procurement and reduced prices under vendor agreements. At the same time spending is brought down in line with reduced activity and prioritization of investments.
Fleet high grading via scrapping of older vessels We aim to rightsize and high grade the fleet via scrapping. During the year the company has scrapped vessels for the first time and taken lead in industry renewal by selling Safe Britannia, Safe Hibernia and Jasminia for scrap.

10
Fleet renewal and consolidation.We have in 2016 taken delivery of two new build vessels, and have an option on one addi-tional new build vessel. Furthermore, we have acquired control over the two new build vessels Safe Nova and Safe Vega, thereby taking the lead in strategic consolidation in the offshore accommodation industry.
Strengthened management team On the basis of all the challenges, develop-ments and achievements in 2016, Prosafe will from 2017 onwards focus even more toward the external market and on improving the supply side of the industry. The Board has high ambitions for the company in the next phase and aims to regain profitability, add share-holder value and to be a leading player in the offshore accommodation industry. In order to ensure sufficient capacity and focus to deliver on the high ambitions for the company in the next phase, the Board employed Jesper Kragh Andresen as CEO and Stig H. Christiansen as Deputy CEO & CFO. Mr. Andresen and Mr. Christiansen will have shared responsibilities and both will report to the Board within their defined areas of responsibility, thereby creating a complementary team with increased capacity to enable the company to best achieve the Board’s ambitious plans for the next years.In 2017, we will continue with high priority on the following key subjects;
• Safe and efficient operations• Further improvement of the organisation• Further efficiency measures• Further fleet high grading and scrapping.
Prosafe has sold Safe Lancia for scrap/recycling in early 2017.
• Negotiate optimal flexibility with regards to delivery time, cost and financing for the three semi-submersible vessels in China
• Market adapted commercial strategy• Consolidation
It is our aim to re-establish Prosafe as the leading company in our niches as per our vision statement.
When the upturn comes, Prosafe will be a robust, sustainable competitive company, and we will be in a strong position to continue to deliver on our stakeholder promises.

11
DIRECTORS’ REPORTThe directors present their annual report on the affairs of Prosafe SE (the “Company” or the “Parent Company”) and its subsidiaries (the Company and its subsidiaries referred to as the “Group” or “Prosafe”) together with the Group’s and the Parent Company’s audited financial statements for the year ended 31 December 2016.
12
This report shall be deemed to be a management report for the purposes of Cyprus law.
PRINCIPAL ACTIVITYProsafe is a leading owner and operator of semi-submersible accommodation support vessels whose objective is to strengthen its competitive position globally. The Parent Company, Prosafe SE, is managed and controlled in Cyprus and is the ultimate owner of all group companies.
FINANCIAL RESULTS, FINANCING AND FINANCIAL POSITION OF THE GROUP(The figures in brackets correspond to the 2015 comparatives)
INCOME STATEMENTOperating revenues totalled USD 474.0 million in 2016 (2015: USD 474.7 million), with utilisation1) of the fleet dropping to 43 per cent (70 per cent). The main reason for the reduction in utilisation was non-extension of the contracts in the Gulf of Mexico.
The flat development in operating revenues compared to the significantly reduced utilisation is due to a higher average day rate, which reflects that units which generate a relatively high day rate have been on contract during this year as opposed to last year when several of the vessels were on bareboat contracts in the Gulf of Mexico. Operating revenues in 2016 include a re-phasing charge of USD 30 million relating to the contract with Statoil for the Mariner project as well as a mobilisation fee of USD 17 million relating to the Safe Notos contract in Brazil.
The main markets for the Prosafe vessels are currently the North Sea and Brazil, serving primarily oil and gas operating companies
as end clients on projects typically related to installation or maintenance and modification of offshore oil and gas fields. The vessels are normally provided on a time charter basis where Prosafe man and operate the vessels directly.
Total operating expenses increased to USD 220.8 million (USD 211.8 million), largely as a result of the fact that there are more vessels operating on time-charters in the North Sea as opposed to bareboat charters in the Gulf of Mexico. In addition, during 2016, there were non-recurring costs in excess of USD 60 million relating to i) the scrapping of vessels which previously operated in the Gulf of Mexico ii) financial restructuring iii) rightsizing of the organisation and iv) acquisition of other companies.
Depreciation increased to USD 115.7 million (USD 86.5 million) as a result of the conversion of Safe Scandinavia to a tender support vessel (TSV), as well as the delivery of the new builds, Safe Zephyrus in Q1 2016 and Safe Notos in Q4 2016. In addition, there was an impairment charge of USD 84.7 million related to Safe Astoria. In 2015 impairment charges amounted to USD 145.6 million.
The resulting operating profit amounts to USD 52.8 million (USD 30.8 million).
Interest expenses totalled USD 85.6 million (USD 41.6 million). This increase is mainly due to higher interest-bearing debt following the delivery and financing of the new builds. In accordance with IFRS, interest costs totalling USD 1.6 million (USD 12.8 million) have been allocated to new build and refurbishment projects and consequently capitalised as part of the vessel investment costs.
Other financial items amounted to USD 222.2 million (USD -29.5 million). This figure includes a gain on forgiveness of bond debt of USD 197.6 million which was recognised as a result of the refinancing which took place in the third quarter 2016.
1) Utilisation = actual vessel days in operation in the period / possible vessel days in the period x 100

13
Taxes for 2016 were USD 17.1 million (USD 10.5 million). This increase being primarily due to higher taxation on UK operations. Net profit amounted to USD 172.6 million (net loss of USD 50.6 million), resulting in diluted earnings per share of USD 8.10 (USD -21.29).
ASSETSTotal assets amounted to USD 2,686.9 million (USD 2,187.2 million) at the end of 2016. Investments in tangible assets totalled USD 543.7 million (USD 700.7 million). The investments in 2016 mainly relate to the delivery of the new builds Safe Zephyrus and Safe Notos and the acquisition of the Axis Vega and Axis Nova new build projects.
As at year-end 2016, the Group had total liquid assets of USD 205.7 million (USD 57.1 million). The liquidity reserve (liquid assets plus undrawn credit facilities) totalled USD 205.7 million (USD 157.1 million).
FINANCING AND FINANCIAL RESTRUCTURINGTotal shareholders’ equity amounted to USD 1,129.5 million (USD 715.2 million), resulting in a book equity ratio of 42 per cent (32.7 per cent).
Interest-bearing debt amounted to USD 1,391 million (USD 1,247 million) at year-end. Repayments of debt totalled USD 112.5 million (USD 816.5 million) and gross increase in borrowing amounted to USD 503.3 million (USD 1,290 million).
The interest-bearing debt agreements are subject to termination, repayment or buy back clauses in the event of a change of control of the Company (as control is defined in the relevant agreements).
On 7 July 2016 the Company announced a proposed comprehensive refinancing. The refinancing included a private placement of
USD 150 million at an issue price of NOK 0.25 per share, and a subsequent equity offering of USD 15 million. NOK 2.4 billion (approx. USD 290 million) in aggregate face value of the Company's outstanding senior unsecured bonds were converted into new shares (USD 42 million), convertible bonds (USD 9.8 million) plus a cash settlement of USD 40.3 million. The refinancing was completed in November 2016.
The combined effect of the reduction in bank debt amortisation from Q1 2017 until and including Q4 2020, and the interest rate swap restructuring is expected to provide a total positive liquidity impact of approximately USD 493 million. There is also a significant financial covenant relief on all facilities to provide the Company with sufficient headroom to operate.
As part of the refinancing, the Company agreed with Cosco a deferred delivery of Safe Eurus to Q4 2019 (or such earlier time required by the Company) and a limitation on any further liability in the event Prosafe does not take delivery of the vessel, giving the Company increased flexibility and reduced financing risk. In addition, Prosafe and Cosco also agreed a deferral of the repayment of the USD 29 million seller's credit to Q4 2019.
FINANCIAL RESULTS AND FINANCIAL POSITION OF THE PARENT COMPANYThe operating loss for the year amounted to USD 411.4 million (USD 331.2 million) and includes impairment charges relating to invest-ments in subsidiaries of USD 396.5 million (USD 331.2 million). Net financial income amounted to USD 158.1 million (net financial costs of USD 85 million) and includes a gain on forgiveness of debt USD 197.6 million. Net loss for the year equalled USD 253.3 million (USD 418.2 million).
Total net assets for the year amounted to USD 1,355 million (USD 1,368 million).

14
OPERATIONS AND PROJECTSAs at year-end, the fleet comprised 11 vessels plus three new builds in progress.
Specifications for each of the vessels and details of the current vessel contracts can be found on the Company’s website www.prosafe.com/accommodation-vessels/.
Safe Scandinavia commenced the TSV contract with Statoil at Oseberg in mid-March 2016. This contract has a firm period through to July 2018. Safe Zephyrus was delivered from the Singa-pore construction yard in the first quarter of 2016, and commenced a contract with Aker BP in Norway in late July 206. The contract was extended until end January 2017.
Safe Notos was delivered from the construction yard in China in the first quarter of 2016, and commenced its 3 years and 222 days duration contract for Petrobras on 7 December 2016.
Safe Boreas commenced the contract with Repsol Sinopec at Montrose in the UK mid-March 2016, and was subsequently extended at a market adjusted rate until 27 March 2017.
Safe Concordia completed the contract with Petrobras in the fourth quarter of 2016. The vessel has continued on short-term extensions at a market adjusted day rate.
Safe Caledonia completed her operation for BP in August 2016 and the vessel has been laid up in the UK since then.
Regalia operated for Shell on two different locations in the UK, firstly from late May until early July and secondly from early August until mid-October 2016.
Safe Bristolia is currently cold-stacked in Norway after completion of a two-month contract with BG Group in the UK in late July 2016.
Safe Astoria has been off-hire throughout 2016 and is currently cold-stacked in Batam, Indonesia.
Jasminia and Safe Britannia were off-hire during the first quarter 2016 and Safe Hibernia came off contract mid-February 2016. Based on a strategic fleet review, Prosafe decided to scrap these three vessels. The vessels were sold for scrap/recycling in the US in the summer of 2016.
The contracts for Safe Lancia and Safe Regency were suspended in mid-March 2016. Safe Lancia has been sold for scrapping as referred to below and is cold stacked in Port Isabel, Texas, USA, and Safe Regency is laid up in Curaçao.
In December 2016 following an audit by the Petroleum Safety Authority Norway (PSA), the PSA issued an order in relation to non conformances which are currently being closed out. Prosafe remain committed to safe and compliant operations at all times.
Safe Eurus is in a preserved mode with COSCO (Qidong) Offshore Co., Ltd (Cosco) in China awaiting recovery of the market. Prosafe has acquired control over the Axis Nova and Axis Vega semi submersibles which Prosafe intends to rename Safe Nova and Safe Vega, respectively. Prosafe has commenced negotia-tions with Cosco who are currently completing
15
construction of the vessels with the aim of reaching an acceptable commercial solution regarding timing and terms of delivery. If an agreement is not reached, Prosafe has the right to cancel the new build contracts due to late delivery and claim a refund of the gross deposit of approx. USD 60 million secured by Bank of China.
Following completion of the right to take delivery of the Axis Nova and Axis Vega vessels, Prosafe has sold Safe Lancia for scrapping. This is the fourth vessel sold for scrap since the summer of 2016.
WESTCON DISPUTEThe litigation process relating to the final costs of the conversion of the Safe Scandinavia into a tender support vessel remains ongoing between Westcon Yards AS and Prosafe Rigs Pte. Ltd. A court mediation was held in March 2017 without conclusive outcome. Mediation may continue between the parties, while a potential court case is scheduled for August and September 2017. As the final outcome cannot be reasonably measured, no asset or liability has been recognised relating to the settlement with the yard.
OUTLOOKThe accommodation support segment is late cyclical by nature. Historically, a majority of the work has been related to existing producing fields (‘brownfield’), whereas the remainder has been related to hook-up and commissioning of new developments (‘greenfield’). Accom-modation support vessels are also used during decommissioning of offshore installations. The Company expects the maintenance and modification part of the market to grow in the medium term with the return of brownfield projects, whereas the decommissioning market is anticipated to develop in the years ahead. The supply side has experienced sizable growth during the period from 2012 to 2016
with the entry into the market of a number of accommodation support vessels. However the growth has been lower than earlier anticipated as a result of the extended down-cycle leading to both scrapping of existing vessels and delays in completion of new builds. More scrapping is antici-pated, as well as further consolidation activities, and therefore the Company foresees a continued rebalancing of the market towards 2020.
As all providers of oil production support services are dependent on oilfield operators’ cash flow, reductions in spending plans have led to a substantial decrease in demand for oilfield services, including accommoda-tion support vessels. 2016 saw a continued slow-down in contracting activity with the gross value of charter contracts, including clients’ extension options, reducing by approximately 39 per cent to USD 967 million (USD 1,595 million). Total order backlog2) as of 31 December 2016 amounted to USD 967 million of which USD 486 million related to firm contracts and USD 481 million related to options. Secured utilisation for 2017 is 35%. For 2018, secured utilisation is currently 22%.
Prosafe continues to rebuild its position by taking the lead in respect of cost efficiency, scrapping, fleet renewal and consolidation while retaining its focus on safe operations at all times.
Positive developments this year include a new contract secured for the Safe Caledonia in the UK sector of the North Sea, in addition to securing short term extensions for Safe Concordia, Safe Boreas and Safe Zephyrus at market adjusted rates. The Safe Scandinavia TSV (‘Tender Support Vessel’) commenced and continued strong technical performance delivering drilling support services on the Norwegian Continental Shelf. The Company remains cautiously optimistic about extensions for the TSV at Oseberg East. The Company’s prospects tracking, continue to indicate that the market is at, or is near the bottom of the down cycle and that it is anticipated there will be a gradual recovery in demand and utilisation from 2018.
2) Order backlog = amount of contracted revenue not recognised in income statement yet

Further, a combination of elements such as falling reserve replacement ratios, significantly lower break-even prices for oil companies, apparent oil price stability and the fact that spending by oil companies on maintaining offshore fields cannot be deferred indefinitely, should result in guarded optimism about the future recovery in activity levels.
RISKProsafe categorises its primary risks under the following headings: strategic, operational, financial and compliance related. The Company’s board and senior officers manage these risk factors through continuous reporting, board meetings, periodic reviews of the business and tenders, and rolling strategy and planning processes. This is supplemented by dialogue and exchange of views with the Group’s management.
The Company aims to create shareholder value by allocating capital and resources to the busi-ness opportunities that yield the best return relative to the risk involved within its specified strategic direction.
Prosafe seeks to reduce its exposure to opera-tional, financial and compliance related risk through proper operating routines, the use of financial instruments and insurance policies.
Market risk comprises of macro factors such as oil price and industry specific factors such as supply/demand balance and competitive position. Demand for accommodation units is sensitive to oil price fluctuations and changes in exploration and production spending.

17
The Company is exposed to financial risks such as currency risk, interest rate risk, financing and liquidity risk and credit and counterparty risk. The continued negative development in the offshore market involves risk that reduced charter revenues will continue in the short and medium term.
The Company reports in USD and generates income in USD, whereas parts of its operating costs are in other currencies such as NOK and GBP. This exposure is hedged on a 50-75% basis of estimated currency exposure on a 12-month basis using currency forward instruments. The interest rate risk is partly hedged by the use of interest swaps for 75-100% of the debt. The Company carries out credit checks on clients as part of its tendering processes and has a history of minimal loss from debtors. There are no material overdue receivables as of year-end. Further information on financial risk manage-ment is provided in note 19 to the consolidated financial statements.
An account of the main features of Prosafe’s internal control and risk management systems is available on its website www.prosafe.com/risk-management/category894.html
INTERNAL CONTROLSInternal control is effected in accordance with Prosafe’s policies and procedures which aim to ensure the effectiveness and efficiency of its operations, reliability of its financial reporting and compliance with applicable laws and regulations. These policies and procedures are designed, inter alia, to safeguard assets and protect from accidental loss or fraud.
In addition, the policies and procedures are reinforced inter alia, by the organisation and the competence of its personnel, segregation of duties, regular risk assessments and internal reporting, management meetings, board meetings, internal audit committee and internal audits together with external audit and public reporting and communication.
In respect of internal controls relating to the preparation of financial statements, the board of directors demonstrates independence from management and exercises oversight of the development and performance of internal control. Management establishes, with board oversight, structures, reporting lines, and appropriate authorities and responsibilities in the pursuit of objectives. The Company is committed to attract, develop, and retain competent individuals in alignment with its objectives. The Company holds individuals accountable for their internal control responsi-bilities in the pursuit of its objectives.
The Company identifies and analyses risks which may potentially affect the achievement of its objectives and how these should be managed. It also considers the potential for fraud, and identifies and assesses changes that could significantly affect the system of internal control.
The Company selects, develops and deploys controls for the mitigation of risks related to the achievement of its financial reporting objectives, including controls over technology. It deploys these controls through policies that establish what is expected and its procedures.
Prosafe carries out regular reviews to ascertain whether the internal controls are present and functioning, and evaluates and communicates any internal control deficiencies in a timely manner to those parties responsible for taking corrective action, including senior management and the board of directors, as appropriate.
HEALTH, SAFETY AND THE ENVIRONMENT (HSE)Robust HSE performance is fundamental to all of Prosafe’s operations and is therefore reflected in its core values. As a consequence, Prosafe works proactively and systematically to reduce injuries and sickness absence.
18
In 2016, Prosafe recorded zero incidents classified as a Lost Time Injury (LTI), i.e. those injuries resulting in an employee being absent from the next work shift due to the injury.
The LTI frequency is calculated by multiplying the number of LTIs by 1 million and dividing this by the total number of man-hours worked. In 2016, the LTI frequency was 0.0, as compared to 3.4 in 2015.
Prosafe operates a zero accident mind-set philosophy which means that no accidents or serious incidents are acceptable. Over the past years, it has focused on preventive measures and a number of initiatives have been implemented in order to further strengthen the safety culture. These initiatives will be continuously developed in order to improve safety performance further.
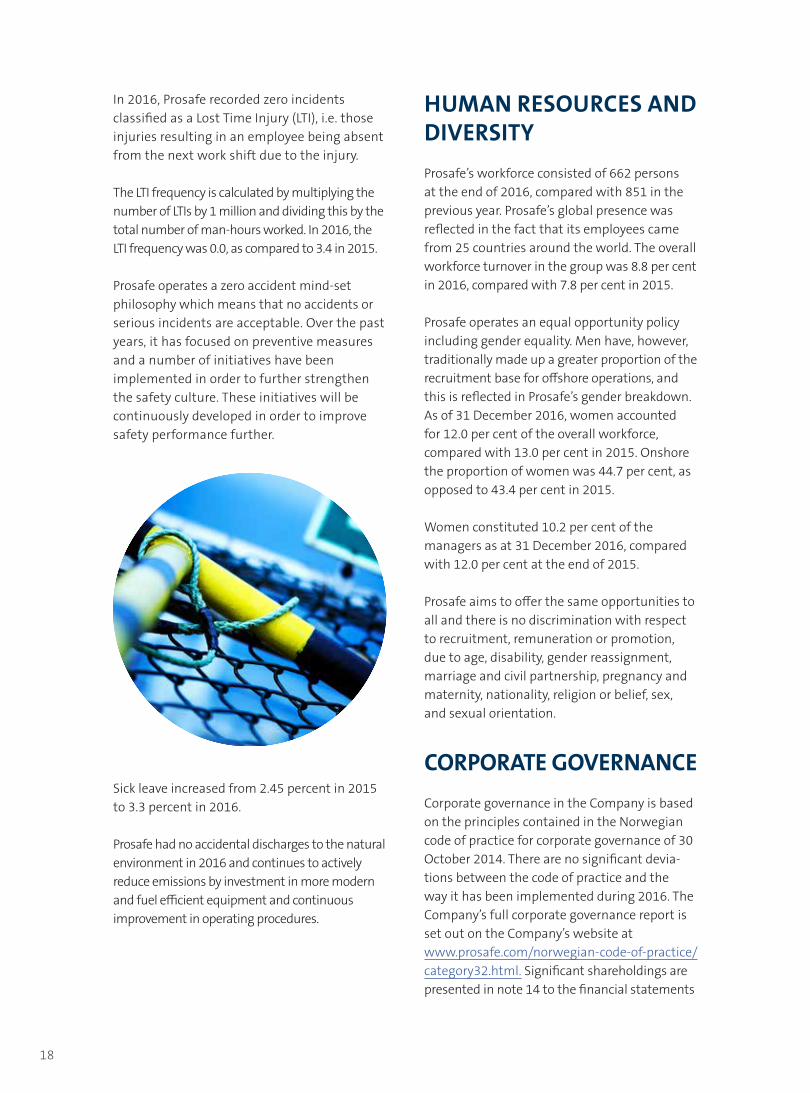
Sick leave increased from 2.45 percent in 2015 to 3.3 percent in 2016.
Prosafe had no accidental discharges to the natural environment in 2016 and continues to actively reduce emissions by investment in more modern and fuel efficient equipment and continuous improvement in operating procedures.
HUMAN RESOURCES AND DIVERSITYProsafe’s workforce consisted of 662 persons at the end of 2016, compared with 851 in the previous year. Prosafe’s global presence was reflected in the fact that its employees came from 25 countries around the world. The overall workforce turnover in the group was 8.8 per cent in 2016, compared with 7.8 per cent in 2015.
Prosafe operates an equal opportunity policy including gender equality. Men have, however, traditionally made up a greater proportion of the recruitment base for offshore operations, and this is reflected in Prosafe’s gender breakdown. As of 31 December 2016, women accounted for 12.0 per cent of the overall workforce, compared with 13.0 per cent in 2015. Onshore the proportion of women was 44.7 per cent, as opposed to 43.4 per cent in 2015.
Women constituted 10.2 per cent of the managers as at 31 December 2016, compared with 12.0 per cent at the end of 2015.
Prosafe aims to offer the same opportunities to all and there is no discrimination with respect to recruitment, remuneration or promotion, due to age, disability, gender reassignment, marriage and civil partnership, pregnancy and maternity, nationality, religion or belief, sex, and sexual orientation.
CORPORATE GOVERNANCECorporate governance in the Company is based on the principles contained in the Norwegian code of practice for corporate governance of 30 October 2014. There are no significant devia-tions between the code of practice and the way it has been implemented during 2016. The Company’s full corporate governance report is set out on the Company’s website at www.prosafe.com/norwegian-code-of-practice/category32.html. Significant shareholdings are presented in note 14 to the financial statements

and on the Company’s website atwww.prosafe.com/largest-shareholders/category160.html.
Corporate governance is a key focus for the Company in order to strengthen confidence in Prosafe among shareholders, the capital market and other interested parties, and to help ensure maximum value creation over time in the best interest of shareholders, employees and other stakeholders.
The members of the board of directors at 31 December 2016 and at the date of this report are set out on page 21. Several changes took place during 2016 which are set out below:
On 25 May, Harald Espedal resigned and Glen Ole Rødland was appointed as interim chairman. At the extraordinary general meeting on 30 November, Mr Rødland was appointed as chairman.
With the exception of Harald Espedal, Glen Ole Rødland, Christian Brinch and Svend Anton Maier all the remaining members of the board were directors throughout the year. Except for the changes in chairman during the year, there were no significant changes in the assignment of the responsibilities of the members of the board of directors. The remuneration of themembers of the board of directors is disclosed in note 6 to the financial statements.
The Articles of Association of the Company provide for all directors to serve for a period of two years unless the general meeting decides that a director shall serve for a specified period shorter than two years.

20
At the following general meetings in 2016, the directors set out below were appointed or reappointed (as the case may be) for the periods specified:
15 March: Glen Ole Rødland for a period expiring at the 2017 annual general meeting, 25 May: Roger Cornish, Carine Smith Ihenacho, Nancy Ch. Erotocritou and Anastasis Ziziros for a period of one year30 November: Svend Anton Maier for a period expiring at the 2018 annual general meeting.
At the extraordinary general meeting on 15 March 2016, it was resolved that the board of directors of the Company be increased from six to up to seven non-executive Directors. The board of directors currently comprises six directors.
As at 31 December 2016 the only Director holding shares in the Company (including associated parties), was Roger Cornish who is the registered shareholder and beneficial owner of 70 shares (approximately 0,00009802% of the issued share capital of the Company).
There have been no changes to the holdings after 31 December 2016.
CORPORATE SOCIAL RESPONSIBILITYProsafe aims to be a socially responsible Group and to further develop its business in a sustainable manner. In order to ensure long-term, viable development and profit, Prosafe balances economic, environmental and social objectives and integrates them into its daily business activities and decisions.
Prosafe’s objectives for corporate social respon-sibility are based on the Group’s strategy, core values, Code of Conduct and principles for corporate governance, in addition to international
recognised principles and guidelines. In order to advance its commitment to sustainability and corporate citizenship, Prosafe signed up as a member of the United Nations Global Compact in October 2008.
Going forward, Prosafe will continue to aim for continuous improvement of internal standards, the way it works with partners and suppliers, and to manage the impact of its operations.
Further information is available on Prosafe’s website at www.prosafe.com/corporate-responsibility/.
GOING CONCERNThe board of directors confirms that the accounts have been prepared under the assumption that the Company is a going concern and that this assumption is realistic at the date of the accounts. This assumption is based on the results for the year and the Prosafe Group’s long-term forecasts for the following years. As a result of the suspension of the two contracts in Mexico and the increased liquidity risk, a material uncertainty around the going concern assumption arose during the first quarter 2016. Based on the successful completion of the refinancing as described above, the board of directors concludes that the going concern assumption is justified.
AUDITORThe auditors of the Company, Messrs KPMG Limited, have expressed their willingness to continue in office. A resolution for authorising the board of directors to fix their remuneration will be submitted at the forthcoming annual general meeting. Reference to auditors’ fee is made in note 6 to the consolidated accounts.

21
SHAREHOLDERS AND SHARE CAPITALAccording to the shareholder register as at 31 December 2016, the twenty largest share-holders held a total of 71.2 per cent of the issued shares. The number of shareholders was 6,227. North Sea Strategic Investments AS was the largest shareholder with a holding of 21.7 per cent of the issued shares.
As at 31 December 2016 Prosafe had an issued share capital of 71,399,002 ordinary shares at a nominal value of EUR 0.10 each.
Further information on the share capital and changes thereon are shown in note 14 to the consolidated financial statements.
DIVIDENDSProsafe’s longer term aim is that its shareholders receive a competitive return on their shares through a combination of share price appreciation and a direct return in the form of dividends.
In November 2015, the board decided to temporarily suspend dividend payments. The board believes that this will be beneficial for the Company from a commercial, financial and strategic perspective, and that it will improve the Company’s financial robustness and optionality. In addition, as part of the agreed amendments to its credit facilities, Prosafe has agreed that it will not issue any dividends, unless all deferred instalments have been prepaid or cancelled and a 12-month financial forecast has been provided which confirms compliance with the financial covenants.
At 31 December 2016, Prosafe SE had a distrib-utable equity of USD 216.2 million.
EVENTS AFTER THE BALANCE SHEET DATEReference is made to note 24 to the consolidated accounts, and note 16 to the Parent Company’s separate accounts for a description of events after the balance sheet date.
Glen Ole Rødland Roger Cornish Svend Anton MaierNon-executive Chairman Non-executive Deputy Chairman Non-executive Director
Nancy Ch. Erotocritou Carine Smith Ihenacho Anastasis ZizirosNon-executive Director Non-executive Director Non-executive Director
Larnaca, 22nd March 2017Board of Directors of Prosafe SE

22
STATEMENT OF THE MEMBERS OF THE BOARD OF DIRECTORS AND OTHER RESPONSIBLE PERSONSStatement of the members of the Board of Directors and other responsible persons of Prosafe SE for the financial statements in the Annual Report for the year ending December 2016
23
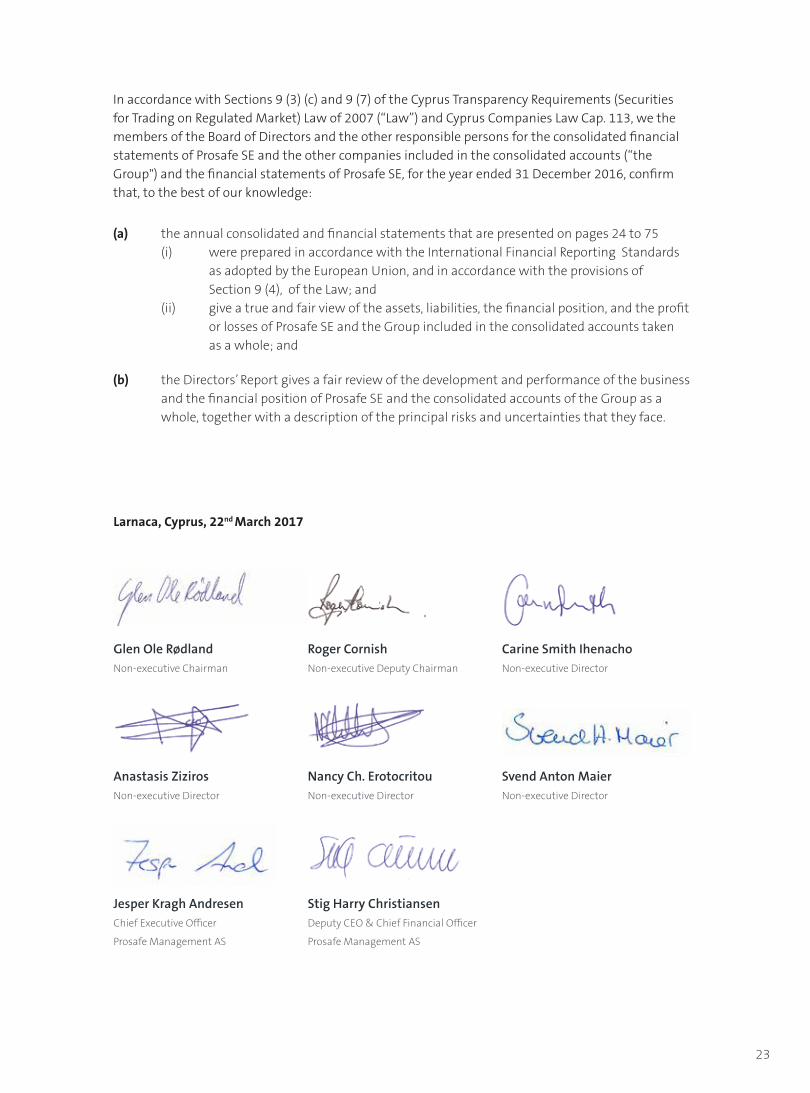
In accordance with Sections 9 (3) (c) and 9 (7) of the Cyprus Transparency Requirements (Securities for Trading on Regulated Market) Law of 2007 (“Law”) and Cyprus Companies Law Cap. 113, we the members of the Board of Directors and the other responsible persons for the consolidated financial statements of Prosafe SE and the other companies included in the consolidated accounts (“the Group") and the financial statements of Prosafe SE, for the year ended 31 December 2016, confirm that, to the best of our knowledge:
(a) the annual consolidated and financial statements that are presented on pages 24 to 75 (i) were prepared in accordance with the International Financial Reporting Standards as adopted by the European Union, and in accordance with the provisions of Section 9 (4), of the Law; and (ii) give a true and fair view of the assets, liabilities, the financial position, and the profit or losses of Prosafe SE and the Group included in the consolidated accounts taken as a whole; and
(b) the Directors’ Report gives a fair review of the development and performance of the business and the financial position of Prosafe SE and the consolidated accounts of the Group as a whole, together with a description of the principal risks and uncertainties that they face.
Glen Ole Rødland Roger Cornish Carine Smith IhenachoNon-executive Chairman Non-executive Deputy Chairman Non-executive Director
Anastasis Ziziros Nancy Ch. Erotocritou Svend Anton MaierNon-executive Director Non-executive Director Non-executive Director
Jesper Kragh Andresen Stig Harry Christiansen Chief Executive Officer Deputy CEO & Chief Financial Officer
Prosafe Management AS Prosafe Management AS
Larnaca, Cyprus, 22nd March 2017

24
CONSOLIDATED ACCOUNTS

25
CONSOLIDATED INCOME STATEMENT
(USD million) Note 2016 2015Charter revenues 4 375.5 425.4 Other operating revenues 4, 5 98.5 49.3 Operating revenues 474.0 474.7 Employee benefits 6 (91.6) (98.9)Other operating expenses 7 (129.2) (112.9)Operating profit before depreciation and impairment 253.2 262.9 Depreciation 8 (115.7) (86.5)Impairment 8 (84.7) (145.6)Operating profit 52.8 30.8 Interest income 10 0.3 0.2 Interest expenses 10 (85.6) (41.6)Other financial income 9, 10 267.3 44.1 Other financial expenses 9, 10 (45.1) (73.6)Net financial items 136.9 (70.9)Profit/(loss) before taxes 189.7 (40.1)Taxes 11 (17.1) (10.5)Net profit/(loss) 172.6 (50.6)
Attributable to equity holders of the parent 172.6 (50.6)
Earnings per share (USD) 12 8.36 (21.29)Diluted earnings per share (USD) 12 8.10 (21.29)
CONSOLIDATED STATEMENT OF COMPREHENSIVE INCOME
(USD million) Note 2016 2015Net profit/(loss) for the year 172.6 (50.6)
Other comprehensive income to be reclassified to profit or loss in subsequent periodsForeign currency translation 1.7 (5.0)Net gain/loss on cash flow hedges 19 (22.2) (9.5)Net other comprehensive income to be reclassified to profit or loss in subsequent periods
(20.5) (14.5)
Total comprehensive income for the year, net of tax 152.1 (65.1)
Attributable to equity holders of the parent 152.1 (65.1)

26
CONSOLIDATED STATEMENT OF FINANCIAL POSITION
(USD million) Note 31/12/2016 31/12/2015ASSETSGoodwill 8 226.7 226.7 Vessels 8 2 029.3 1 578.6 New builds 8, 23 122.2 228.5 Other tangible assets 8 3.9 4.9 Investments in associated companies 13 10.0 0.0 Total non-current assets 2 392.1 2 038.7 Cash and deposits 18, 20 205.7 57.1 Debtors 18, 19 60.0 60.0 Other current assets 18, 21 29.1 31.4 Total current assets 294.8 148.5 Total assets 2 686.9 2 187.2
EQUITY AND LIABILITIESShare capital 14 7.9 72.1 Convertible bonds 14 57.0 0.0 Other equity 1 064.6 643.1 Total equity 1 129.5 715.2 Interest-bearing non-current liabilities 15, 18, 19 1 342.9 1 107.5 Deferred tax 11 6.0 7.8 Derivatives 18 51.3 48.5 Other provisions 4.9 2.6 Total non-current liabilities 1 405.1 1 166.4 Interest-bearing current debt 15, 18, 19 47.9 139.5 Accounts payable 18 16.9 17.8 Taxes payable 11 22.8 13.7 Derivatives 18, 19 7.9 40.7 Other current liabilities 16, 18, 19 56.8 93.9 Total current liabilities 152.3 305.6 Total equity and liabilities 2 686.9 2 187.2
On 22 March 2017 the Board of Directors of Prosafe SE approved and authorised these financial statements for issue.
Glen Ole Rødland Roger Cornish Svend Anton MayerNon-executive chair Non-executive deputy chair Non-executive director
Nancy Ch. Erotocritou Carine Smith Ihenacho Anastasis ZizirosNon-executive Director Non-executive director Non-executive director

27
CONSOLIDATED CASH FLOW STATEMENT
(USD million) Note 2016 2015
CASH FLOW FROM OPERATING ACTIVITIES
Profit/(loss) before taxes 189.7 (40.1)Unrealised currency (gain)/loss on long-term debt 18.3 (56.6)Gain on forgiveness of bond debt (197.6) 0.0 Loss/(gain) on sale of tangible assets (0.6) 1.4 Depreciation and impairment 8 200.4 232.1 Interest income (0.3) (0.2)Interest expenses 85.6 41.6 Taxes paid (10.0) (16.8)Change in working capital (59.4) 15.3 Other items from operating activities (40.2) (5.2)Net cash flow from operating activities 185.9 171.5
CASH FLOW FROM INVESTING ACTIVITIES
Proceeds from sale of tangible assets 0.7 0.0 Acquisition of tangible assets 8, 23 (483.9) (700.7)Interest received 0.3 0.2 Net cash flow from investing activities (482.9) (700.5)
CASH FLOW FROM FINANCING ACTIVITIES
Proceeds from new interest-bearing debt 15, 18, 19 503.3 1 290.0 Repayments of interest-bearing debt 15, 18, 19 (112.5) (816.5)Share issue 14 140.4 65.8 Dividends paid 0.0 (34.0)Interest paid (85.6) (41.6)Net cash flow from financing activities 445.6 463.7
Net cash flow 148.6 (65.3)Cash and deposits at 1 January 57.1 122.4 Cash and deposits at 31 December 20 205.7 57.1

28
CONSOLIDATED STATEMENT OF CHANGES IN EQUITY
(USD million)Share
capital
Con-vertible
bondsOther
equityCash flow
hedges
Foreign currency
translationTotal
equity
Equity at 31 December 2014 65.9 0.0 676.1 (29.8) 36.4 748.5 Net loss 0.0 0.0 (50.6) 0.0 0.0 (50.6)Other comprehensive income 0.0 0.0 0.0 (9.5) (5.0) (14.5)Total comprehensive income 0.0 0.0 (50.6) (9.5) (5.0) (65.1)Share issue 6.2 0.0 59.6 0.0 0.0 65.8 Dividend 0.0 0.0 (34.0) 0.0 0.0 (34.0)Equity at 31 December 2015 72.1 0.0 651.1 (39.3) 31.4 715.3 Net profit 0.0 0.0 172.6 0.0 0.0 172.6 Other comprehensive income 0.0 0.0 0.0 (22.2) 1.7 (20.5)Total comprehensive income 0.0 0.0 172.6 (22.2) 1.7 152.1 Capital reduction (71.8) 0.0 71.8 0.0 0.0 0.0 Share and bond issues 7.6 57.0 197.5 0.0 0.0 262.1 Equity at 31 December 2016 7.9 57.0 1 093.0 (61.5) 33.1 1 129.5
The legal form of the share capital and the share premium accounts are reflected in the statement of changes in equity of the accompanying parent financial statements. Other equity includes share premium reserve, capital reduction reserve and retained earnings.

29
NOTES TO THE CONSOLIDATED FINANCIAL STATEMENTS NOTE 1: CORPORATE INFORMATION AND PRINCIPAL ACTIVITY
Prosafe SE (the 'Company') is a public limited company domiciled in Larnaca, Cyprus. The registered office of the Company is Stadiou 126, 6020 Larnaca, Cyprus. The Company is listed on the Oslo Stock Exchange with ticker code PRS. The consolidated financial statements comprise the financial statements of the Company and its subsidiaries (together referred to as the 'Group'). The consolidated financial statements for the year ended 31 December 2016 were approved and authorised for issue in accordance with a resolution of the board of directors on 22 March 2017. The Group is a leading owner and operator of semi-submersible accommodation vessels.
NOTE 2: BASIS OF PREPARATION
The consolidated financial statements have been prepared in accordance with International Financial Reporting Standards (IFRS) endorsed by the European Union (EU) and the requirements of the Cyprus Companies Law, Cap 113. The accounts have been prepared on a historical cost basis, except for derivative financial instruments which are stated at fair value. The consolidated financial statements are presented in US dollars (USD), and all values are presented in USD million unless otherwise stated. The accounting principles adopted are consistent with those of the previous financial year. JUDGMENTS. The preparation of the Group’s consolidated financial statements requires management to make judgments, estimates and assumptions that affect the reported amounts of revenue, expenses, assets and liabilities, and the disclosure of contingent liabilities at the end of the reporting period. However, uncertainty about these assumptions and estimates could result in outcomes that require a material adjustment to the carrying amount of the asset or liability affected in future periods.
ESTIMATES AND ASSUMPTIONS. The estimates and assumptions are assessed on a continuous basis. The estimates and assumptions which have the most significant effect on the amounts recognised in the financial statements relate to depreciation and impairment assessment of non-financial assets. Estimated useful life of the Group's semi-submersible accommodation/service vessels is 30 to 50 years dependent on the age at the time of acquisition and subsequent refurbishments. The management determines whether goodwill is impaired at least on an annual basis. This requires an estimation of the value in use of the group of cash generating units to which the goodwill is allocated, which requires management to estimate the future cash flow from the cash-generating units and to apply a suitable discount rate. Further details are given in note 8. Impairment of shares in subsidiaries is a significant estimate required for the preparation of the parent company accounts.
NEW AND AMENDED STANDARDS. The accounting policies adopted are consistent with those of the previous financial year. Standards issued but not yet effective, which the Group has not early adopted IASB has issued multiple new standards and interpretations that may impact the Group, which are described below. These standards are not yet effective, and the Group has not early adopted these standards. The Group has not yet finalised the full analysis of the impact on the Group's consolidated financial statements of the standards below, but the effect on the consolidated financial statements is not expected to be signifcant.

30
IFRS 9 Financial Instruments IFRS 9 will eventually replace IAS 39 Financial instruments: Recognition and Measurement and is effective from 1 January 2018 with earlier adoption allowed. The standard was issued July 2014, but is not yet endorsed by the EU. The standard deals with classification, measurement, hedge accounting and impairment of financial instruments, and will replace IAS 39 on these topics. IFRS 15 Revenue from Contracts with Customers IFRS 15 is a joint revenue recognition standard issued from IASB and FASB and is effective from 1 January 2018, with earlier adoption allowed. The standard presents a single, principles-based five-step model for determination and recognition of revenue to be applied to all contracts with customers. The standard replaces existing IFRS requirements in IAS 11 Construction Contracts and IAS 18 Revenue, as well as supplemental IFRIC guidance. The standard is not yet endorsed by the EU. The new standard might result in deferred recognition of mobilisation fees and/or earlier recognition of demobilisation fees. IFRS 16 Leases IFRS 16 was issued by IASB in January 2016. The standard principally requires lessees to recognize assets and liabilities for all leases and to present the rights and obligations associated with these leases in the statement of financial position, and is effective from 1 January 2019. Going forward, lessees will therefore no longer be required to make the distinction between finance and operating leases that was required in the past in accordance with IAS 17. The standard is not yet endorsed by the EU.
NOTE 3: SIGNIFICANT ACCOUNTING POLICIES
BASIS OF CONSOLIDATION. The consolidated financial statements comprise the financial statements of the parent company and its subsidiaries. Subsidiaries are fully consolidated from the date of acquisition, being the date on which the Group obtains control, and continue to be consolidated until the date that such control ceases. The financial statements of the subsidiaries are prepared for the same reporting period as the parent company, using consistent accounting policies. All intra-group balances, income and expenses, unrealised gains and losses and dividends resulting from intra-group transactions are eliminated in full.
BUSINESS COMBINATIONS AND GOODWILL. Business combinations are accounted for using the acquisition method. The cost of an acquisition is measured as the aggregate of the consideration transferred, measured at acquisition date fair value. Acquisition related costs incurred are expensed and included in administrative expenses.
When the Group acquires a business, it assesses the financial assets and liabilities assumed for appropriate classification and designation in accordance with the contractual terms, economic circumstances and pertinent conditions as at the acquisition date.
Goodwill is initially measured at cost being the excess of the aggregate of the consideration transferred and the amount recognised for non-controlling interest over the net identifiable assets acquired and liabilities assumed. If this consideration is lower than the fair value of the net assets of the subsidiary acquired, the difference is recognised in profit and loss.
After initial recognition, goodwill is measured at cost less any accumulated impairment losses. For the purpose of impairment testing, goodwill acquired in a business combination is, from the acquisition date,
31
allocated to each of the Group’s cash generating units that are expected to benefit from the combination, irrespective of whether other assets or liabilities of the acquiree are assigned to those units.
Where goodwill forms part of a cash generating unit and part of the operation within that unit is disposed of, the goodwill associated with the operation disposed of is included in the carrying amount of the operation when determining the gain or loss on disposal of the operation. Goodwill disposed of in this circumstance is measured based on the relative values of the operation disposed of and the portion of the cash generating unit retained.
FOREIGN CURRENCY TRANSLATION. The presentation currency is USD. This is also the functional currency for the parent company. Transactions in other currencies than the functional currency are translated at the exchange rate prevailing at the transaction date. Monetary items in other currencies than the functional currency are translated to the functional currency at the exchange rate on the reporting date, and the currency difference is recognised in the profit and loss account. Non-monetary items in other currencies than the functional currency are translated at the exchange rate at the transaction date. When consolidating companies with a functional currency other than the USD, profit and loss items are translated at the monthly average exchange rate, while balance sheet items are translated at the exchange rate on the reporting date. Translation differences are taken to other comprehensive income. On disposal of a foreign operation, the deferred cumulative amount recognised in other comprehensive income, relating to that particular operation, is recognised in the income statement.
SEGMENT REPORTING. For management and monitoring purposes, the Group is organised into one segment; chartering and operation of accommodation/service vessels. For geographical information, reference is made to note 4.
REVENUE RECOGNITION. The Group's vessels may operate on time charters or bareboat charters. Revenue is recognised to the extent that it is probable that the economic benefits will flow to Prosafe and the revenue can be reliably measured. Revenue is measured at the fair value of the consideration received. Charter income is recognised on a straight line basis over the period the vessel has operated. Mobilisation and demobilisation fees are recognised in the period in which the mobilisation or demobilisation takes place. Prosafe does not transfer the risks or benefits of ownership of the asset to the customers and none of the contracts are accounted for as a lease. Management, crew services and other related income are recognised in the period the services are rendered. Interest income is recognised on an accrual basis. Interest income is included in financial items in the income statement. Dividends are recognised when Prosafe’s right to receive the payment is established. Proceeds from customers for catering and other services that is provided by sub-contractors of Prosafe is recognised as reimbursement revenue. These services are recognised in the period when the services are rendered.
PROVISIONS are recognised when, and only when, the Group has a present obligation as a result of events that have taken place, and it can be proven probable that a financial settlement will take place as a result of this liability, and that the size of the amount can be measured reliably. Provisions are reviewed on each balance sheet date and their level reflects the best estimate of the liability. When Prosafe expects some or all of a provision to be reimbursed, the reimbursement is recognised as a separate asset, but only when the reimbursement is virtually certain. The expense relating to any provision is presented in the income statement net of any reimbursement.
TANGIBLE ASSETS are stated at acquisition cost less cumulative depreciation and accumulated impairment losses, if any. Assets are depreciated on a straight-line basis over their estimated economically useful lives, with account taken of their estimated residual value. Management makes
32
annual assessments of residual value, methods of depreciation and the remaining economic life of the assets. Components of an asset which have an estimated shorter life than the main component of the asset are accordingly depreciated over this shorter period. Acquisition cost includes costs directly attributable to the acquisition of the assets. Subsequent expenditures are added to the book value of the asset or accounted for on a separate basis, when it is likely that future benefits would derive from the expenditures. The vessels are subject to a periodic survey every five years, and associated costs are amortised over the five-year period to the next survey. Other repair and maintenance costs are expensed in the period they are incurred.
Expenditures for new builds are capitalised, including instalments paid to the yard, project management costs, and costs relating to the initial preparation, mobilisation and commissioning until the vessel is placed into service. In accordance with IAS 23, borrowing costs are capitalised on qualifying assets.
Tangible fixed assets are depreciated on a straight line basis over their useful lifetime as follows:
• Semi-submersible vessels – 5 to 50 years dependent on the age at the time of the acquisition and subsequent refurbishments • Buildings – 20 to 30 years • Equipment – 3 to 5 years
IMPAIRMENT OF NON-FINANCIAL ASSETS. The Group assesses at each reporting date whether there is an indication that an asset may be impaired. If any indication exists, or when annual impairment testing for an asset is required, the Group estimates the asset's recoverable amount. An asset’s recoverable amount is the higher of an asset’s or cash generating unit’s fair value less costs to sell and its value in use and is determined for an individual asset, unless the asset does not generate cash inflows that are largely independent of those from other assets or groups of assets. Where the carrying amount of an asset or cash generating unit exceeds its recoverable amount, the asset is considered impaired and is written down to its recoverable amount. In assessing value in use, the estimated future cash flows are discounted to their present value using a pre-tax discount rate that reflects current market assessments of the time value of money and risks specific to the asset. In determining fair value less costs to sell, recent market transactions are taken into account, if available. If no such transactions can be identified, an appropriate valuation model is used. These calculations are corroborated by valuation multiples.
The Group bases its impairment calculation on a detailed forecast calculation which is prepared for the Group’s cash generating units. The forecast calculation is generally covering a period of five years. For longer periods, a long term growth rate is calculated and applied to project future cash flows after the fifth year.
For non-financial assets excluding goodwill, an assessment is made at each reporting date as to whether there is any indication that previously recognised impairment losses may no longer exist or may have decreased. If such indication exists, Prosafe estimates the asset’s recoverable amount. A previously recognised impairment loss is reversed only if there has been a change in the assumptions used to determine the asset’s recoverable amount since the last impairment loss was recognised.
IMPAIRMENT OF GOODWILL. Goodwill is tested for impairment annually, and when circumstances indicate that the carrying value may be impaired. Impairment is determined by assessing the recoverable amount of the cash generating units to which the goodwill relates. When the recoverable

33
amount is lower than the carrying amount, the impairment loss is recognised in the income statement. Impairment losses related to goodwill cannot be reversed in future periods.
FINANCIAL ASSETS
Initial recognition Financial assets are classified as financial assets at fair value through profit or loss, loans and receivables or as derivatives designated as hedging instruments in an effective hedge, as appropriate. Prosafe determines the classification of its financial assets at initial recognition. Financial assets are recognised initially at fair value plus directly attributable costs, with the exception of assets measured at fair value through profit and loss. Prosafe’s financial assets include cash and short-term deposits, trade and other receivables and financial derivatives.
Financial assets at fair value through profit and loss Financial assets at fair value through profit and loss include financial assets held for trading. Financial assets are classified as held for trading if they are acquired for the purpose of selling in the near future. This category also includes derivative instruments entered into that do not meet the hedge accounting criteria as defined by IAS 39. Financial assets at fair value through profit and loss are carried in the balance sheet at fair value with gains and losses recognised in the income statement.
Loans and receivables Loans and receivables are non-derivative financial assets with fixed or determinable payments that are not quoted in an active market. Such financial assets are carried at amortised cost using the effective interest rate method. Gains and losses are recognised in the consolidated income statement when the loans and receivables are derecognised or impaired, as well as through the amortisation process.
Impairment of financial assets The Group assesses at each reporting date whether there is any objective evidence that a financial asset or a group of financial assets is impaired. A financial asset or a group of financial assets are deemed to be impaired if, and only if, there is objective evidence of impairment as a result of one or more events that have occurred after the initial recognition of the asset and that loss event has an impact on the estimated future cash flows of the financial asset or the group of financial assets that can be reliable estimated.
FINANCIAL LIABILITIES
Initial recognition Financial liabilities within the scope of IAS 39 are classified as financial liabilities at fair value through profit or loss, financial liabilities measured at amortised cost or as derivatives designated as hedging instruments in an effective hedge, as appropriate. Prosafe determines the classification of its financial liabilities at initial recognition. Financial liabilities are recognised initially at fair value and, in case of loans and borrowings, net of directly attributable costs. Prosafe’s financial liabilities include non-derivative financial instruments (trade and other payables, bank overdraft, loans and borrowings, financial guarantee contracts) and derivative financial instruments.
Non-derivative financial instruments Subsequent to initial recognition, these liabilities are measured at amortised cost using the effective interest method.

34
Financial liabilities at fair value through profit and loss Financial liabilities at fair value through profit and loss include financial liabilities held for trading. Financial liabilities are classified as held for trading if they are acquired for the purpose of selling in the near future. This category also includes derivative instruments entered into that do not meet the hedge accounting criteria as defined by IAS 39. Gains and losses on liabilities held for trading are recognised in the income statement.
Derecognition A financial liability is derecognised when the obligation under the liability is discharged or cancelled or expires. When an existing financial liability is replaced by another from the same lender on substantially different terms, or the terms of an existing liability are substantially modified, such an exchange or modification is treated as a derecognition of the original liability and the recognition of a new liability, and the difference in the respective carrying amounts is recognised in the income statement.
FAIR VALUE OF FINANCIAL INSTRUMENTS. The fair value of financial instruments that are actively traded in organised financial markets is determined by reference to quoted market bid prices at the close of business on the balance sheet date. For financial instruments where there is no active market, fair value is determined using valuation techniques. Such techniques may include using recent arm’s length market transactions, reference to the current fair value of another instrument that is substan-tially the same, discounted cash flow analysis or other valuation models.
EMPLOYEE BENEFITS. Companies within the Group make contributions to pension schemes that are defined contribution plans. The companies’ payments are recognised in the income statement for the year to which the contribution applies.
BORROWING COSTS. Borrowing costs directly attributable to the acquisition, construction or production of an asset that necessarily takes a substantial period of time to get ready for its intended use or sale are capitalised as part of the cost of the respective assets. Other borrowing costs are capitalised as calculated using the effective interest method.
DERIVATIVE FINANCIAL INSTRUMENTS. Prosafe uses derivative financial instruments such as forward currency contracts and interest rate swaps to hedge its foreign currency risks and interest rate risks respectively. Such instruments are initially recognised at fair value on the date on which a derivative contract is entered into and are subsequently remeasured at fair value. Derivatives are carried as financial assets when the fair value is positive and as financial liabilities when the fair value is negative.
Any gains and losses arising from changes in fair value on derivatives during the year that do not qualify for hedge accounting and the ineffective portion of an effective hedge, are recognised in the income statement. The fair value of forward currency contracts is the discounted difference between the forward exchange rate and the contract price. The fair value of interest rate swap contracts is determined by reference to market price for similar instruments.
At the inception of a hedge relationship, Prosafe formally designates and documents the hedge relationship to which the Group wishes to apply hedge accounting and the risk management objective and strategy for undertaking the hedge. The documentation includes identification of the hedging instrument, the hedged item or transaction, the nature of the risk being hedged and how the entity will assess the hedging instrument’s effectiveness in offsetting the exposure to changes in the hedged item’s fair value or cash flows attributable to the hedged risk. Such hedges are expected

35
to be highly effective in achieving offsetting changes in fair value or cash flows, and are assessed on an ongoing basis to determine that they actually have been highly effective throughout the financial reporting periods for which they were designated.
Prosafe applied hedge accounting for the interest rate swaps until 30 June 2016 when this practice ceased. Hedges which met the strict criteria for hedge accounting were accounted for as follows:
Cash flow hedges The effective portion of the gain and loss on the hedging instrument was recognised directly in other comprehensive income, while any ineffective portion was recognised immediately in the income statement. Amounts recognised as other comprehensive income were transferred to the income statement when the hedged transaction affected profit and loss, such as when the hedged financial income or financial expense was recognised.
Current versus non-current classification Derivative instruments that were not a designated and effective hedging instrument were classified as current or non-current or separated into a current and non-current portion based on an assessment of the facts and circumstances.
When Prosafe held a derivative as an economic hedge for a period beyond 12 months after the balance sheet date or a derivative instrument was designated as an effective hedging instrument, the fair value of the derivative instrument was classified as current or non-current consistent with the classification of the underlying item. Economic hedges were not treated as hedging for accounting purposes.
INCOME TAXES in the income statement include taxes payable and changes in deferred tax. Deferred tax is calculated on the basis of temporary differences between book and tax values that exist at the end of the period. Deferred tax asset is recognised in the statement of financial position when it is probable that the tax benefit can be utilised. Deferred tax and deferred tax asset are measured at nominal value.
Income tax assets and liabilities for the current and prior periods are measured at the amount expected to be recovered or paid to the taxation authorities. Deferred tax liabilities are measured at the tax rates that are expected to apply in the year when the liability is settled, based on tax rates that have been enacted or substantively enacted at the reporting date. Deferred tax is provided using the liability method. Deferred tax assets and liabilities are offset if a legally enforceable right exists to set off current tax assets against current income tax liabilities and the deferred taxes relate to the same taxable entity and the same taxation authority.
The carrying amount of deferred tax assets is reviewed at each reporting date and reduced to the extent that it is no longer probable that sufficient taxable profit will be available to allow all or part of the deferred tax asset to be utilised. Unrecognised deferred tax assets are reassessed at each reporting date and are recognised to the extent that it has become probable that future taxable profits will allow the deferred tax asset to be recovered.
CASH AND DEPOSITS comprise cash at banks and short-term deposits with an original maturity of three months or less, which are subject to an insignificant risk of changes in value.
DIVIDEND distribution to the shareholders is recognised in the financial statements on the date on which the shareholders' right to receive payment is established.
SHAREHOLDER'S EQUITY. Any difference between the issue price of share capital and the nominal value is recognised as share premium. The costs incurred attributable to the issue of share capital are deducted from equity.

36
ASSOCIATED COMPANIES. The equity method is applied for investments in associated companies. Investments are initially recognised at acquisition costs, and subsequently adjusted for profit or loss, changes arising from the proportionate interest in the associated company and other comprehensive income and dividends received. NOTE 4: SEGMENT REPORTING Prosafe has one segment, which is chartering and operation of accommodation/service vessels.
Operating revenues by geographical location 2016 2015
Europe excl. Cyprus 389.2 307.3 Cyprus 0.0 0.0 Americas 84.8 111.5 Australia/Asia 0.0 55.9 Total operating revenues 474.0 474.7
The revenue allocation is based on place of operation of the vessel.
Operating revenues from major customers situated in: 2016 20151) 2) 1) 2)
Europe1 125.3 26 % 0.0 0 %Europe2 71.2 15 % 0.0 0 %Americas1 68.5 14 % 33.3 7 %Europe3 68.2 14 % 37.9 8 %Europe4 56.7 12 % 44.9 9 %Europe5 0.0 0 % 84.0 18 %Americas2 16.3 3 % 78.2 16 %Australia/Asia1 0.0 0 % 55.8 12%
1) Operating revenues in USD million 2) Percentage of total revenues
Total assets by geographical location 2016 2015
Europe excl. Cyprus 1 966.1 1 603.2 Cyprus 85.6 31.2 Americas 470.3 198.6 Australia/Asia 164.9 354.2 Total assets 2 686.9 2 187.2

37
NOTE 5: OTHER OPERATING REVENUES
2016 2015
Mobilisation/demobilisation income 34.0 5.4 Reimbursement revenues 64.5 43.9 Total other operating revenues 98.5 49.3
NOTE 6: EMPLOYEE BENEFITS, MANAGEMENT REMUNERATION AND AUDIT FEE
2016 2015
Wages and salaries 58.0 58.5 Contract personnel 13.8 14.8 Other personnel-related expenses 9.1 11.2 Social security taxes 4.9 5.8 Pension expenses 3.8 5.1 Other remuneration 2.0 3.4 Total employee benefits 91.6 98.9
Severance payCertain senior officers have agreements on severance pay. Under these agreements, the Company guarantees a remuneration corresponding to the base salary received at the time of departure for a period of up to two years after the normal six-month period of notice.
In accordance with the code of practice for corporate governance recommended by the Oslo Stock Exchange, remuneration for the corporate management and the board of directors is specified below.
38
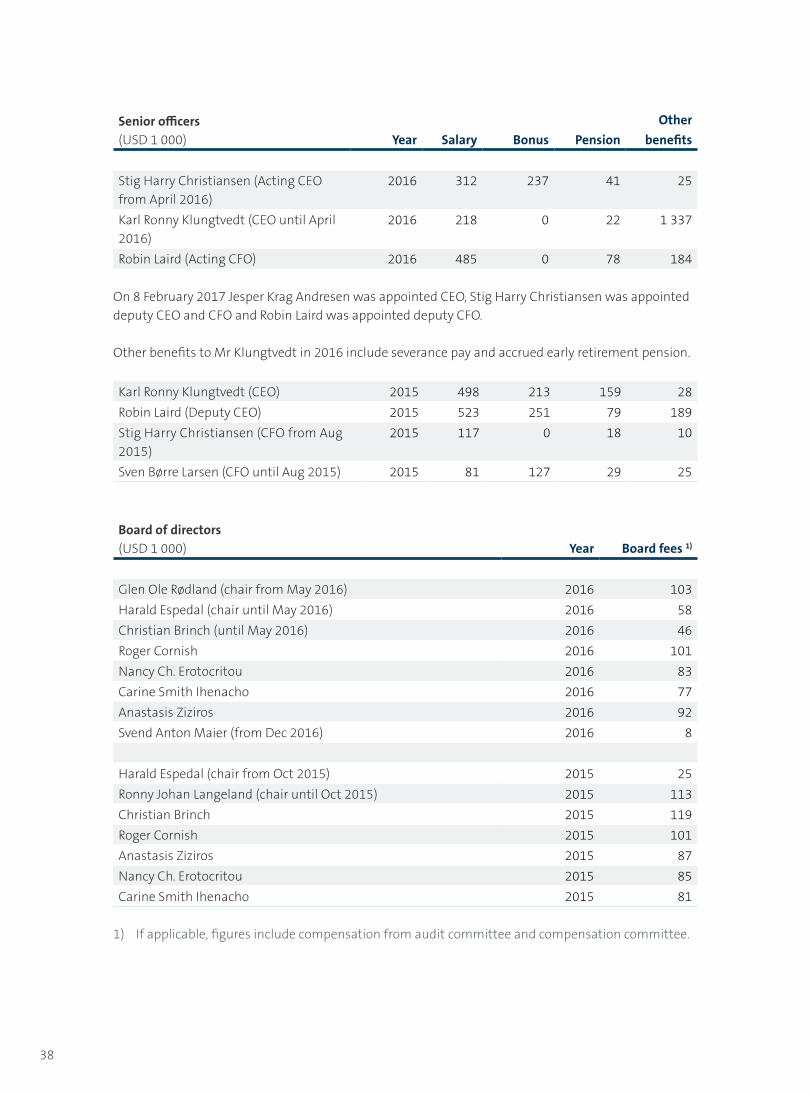
Senior officers(USD 1 000) Year Salary Bonus Pension
Otherbenefits
Stig Harry Christiansen (Acting CEO from April 2016)
2016 312 237 41 25
Karl Ronny Klungtvedt (CEO until April 2016)
2016 218 0 22 1 337
Robin Laird (Acting CFO) 2016 485 0 78 184
On 8 February 2017 Jesper Krag Andresen was appointed CEO, Stig Harry Christiansen was appointed deputy CEO and CFO and Robin Laird was appointed deputy CFO.
Other benefits to Mr Klungtvedt in 2016 include severance pay and accrued early retirement pension.
Karl Ronny Klungtvedt (CEO) 2015 498 213 159 28Robin Laird (Deputy CEO) 2015 523 251 79 189Stig Harry Christiansen (CFO from Aug 2015)
2015 117 0 18 10
Sven Børre Larsen (CFO until Aug 2015) 2015 81 127 29 25
Board of directors(USD 1 000) Year Board fees 1)
Glen Ole Rødland (chair from May 2016) 2016 103Harald Espedal (chair until May 2016) 2016 58Christian Brinch (until May 2016) 2016 46Roger Cornish 2016 101Nancy Ch. Erotocritou 2016 83Carine Smith Ihenacho 2016 77Anastasis Ziziros 2016 92Svend Anton Maier (from Dec 2016) 2016 8
Harald Espedal (chair from Oct 2015) 2015 25Ronny Johan Langeland (chair until Oct 2015) 2015 113Christian Brinch 2015 119Roger Cornish 2015 101Anastasis Ziziros 2015 87Nancy Ch. Erotocritou 2015 85Carine Smith Ihenacho 2015 81
1) If applicable, figures include compensation from audit committee and compensation committee.
39
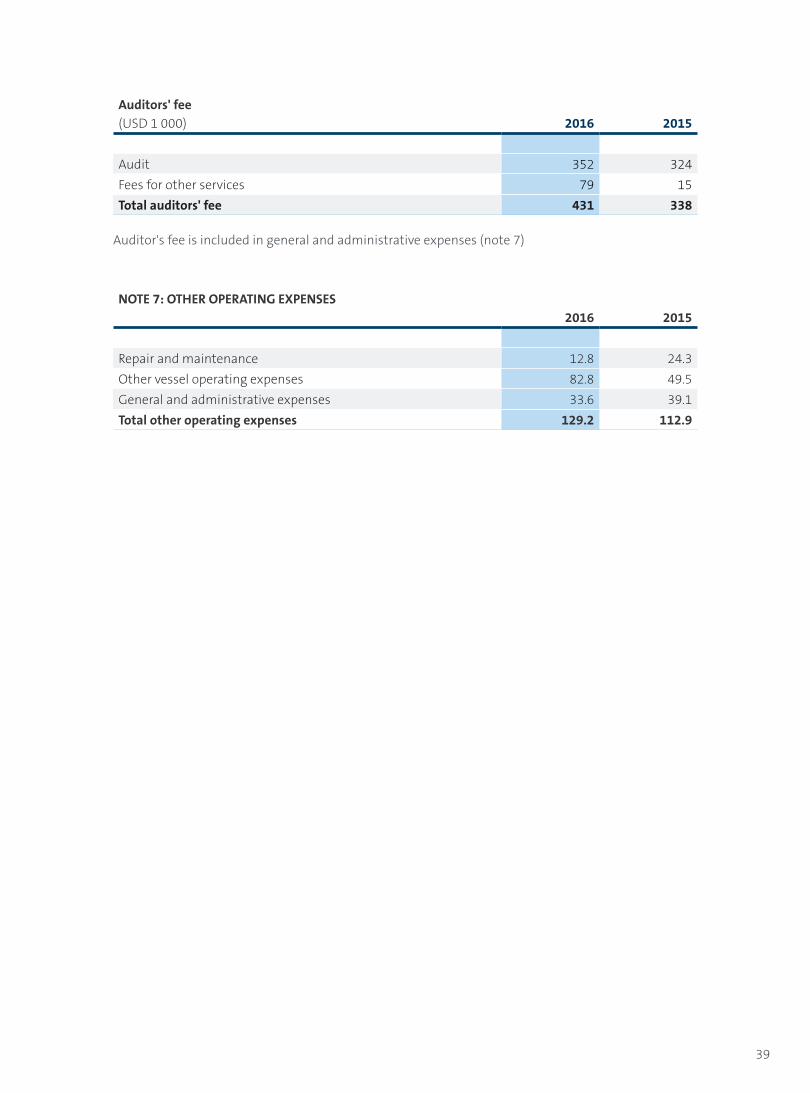
Auditors' fee(USD 1 000) 2016 2015
Audit 352 324Fees for other services 79 15Total auditors' fee 431 338
Auditor's fee is included in general and administrative expenses (note 7)
NOTE 7: OTHER OPERATING EXPENSES2016 2015
Repair and maintenance 12.8 24.3 Other vessel operating expenses 82.8 49.5 General and administrative expenses 33.6 39.1 Total other operating expenses 129.2 112.9

40
NOTE 8: TANGIBLE ASSETS AND GOODWILL
VesselsNew
builds Equipment Buildings Goodwill Total
Acquisition cost 31 December 2014
1 679.4 311.8 5.9 7.9 226.7 2 231.6
Additions 783.8 (83.3) 0.2 0.0 0.0 700.7 Disposals (2.1) 0.0 0.0 0.0 0.0 (2.1)Acquisition cost 31 December 2015
2 461.1 228.5 6.1 7.9 226.7 2 930.2
Additions 650.0 (106.3) 0.0 0.0 0.0 543.7 Disposals (5.6) 0.0 0.0 0.0 0.0 (5.6)Acquisition cost 31 December 2016
3 105.5 122.2 6.1 7.9 226.7 3 468.3
Accumulated depreciation 31 December 2014
652.1 0.0 3.6 4.5 0.0 660.2
Accumulated depreciation on disposals
(0.7) 0.0 0.0 0.0 0.0 (0.7)
Depreciation for the year 85.5 0.0 0.4 0.5 0.0 86.5 Impairment 145.6 0.0 0.0 0.0 0.0 145.6 Accumulated depreciation 31 December 2015
882.5 0.0 4.0 5.0 0.0 891.5
Accumulated depreciation on disposals
(5.7) 0.0 0.0 0.0 0.0 (5.6)
Depreciation for the year 114.7 0.0 0.5 0.5 0.0 115.7 Impairment 84.7 0.0 0.0 0.0 0.0 84.7 Accumulated depreciation 31 December 2016
1 076.2 0.0 4.6 5.5 0.0 1 086.3
Net carrying amount 31 December 2016
2 029.3 122.2 1.5 2.4 226.7 2 382.1
Net carrying amount 31 December 2015
1 578.6 228.5 2.1 2.9 226.7 2 038.7
Depreciation rate (%) 2-20 - 20-33 3-5 - -Economically useful life (years) 5-50 - 3-5 20-30 - -
New builds include prepayment to the yard cost, owner-furnished equipment and other project costs incurred.
Tangible fixed assets and goodwill are initially recorded at cost. Subsequent to recognition, tangible fixed assets are stated at cost less accumulated depreciation and any accumulated impairment losses. These assets are depreciated on a straight line basis. The costs of upgrades and modification of vessels are capitalised.
41
Borrowing costs are capitalised as part of the asset in accordance with revised IAS 23. As at 31 December 2016, capitalised borrowing costs amount to USD 29.0 million (31 December 2015: USD 28.4 million). The amount of borrowing costs capitalised in the period equalled USD 1.6 million (USD 12.8 million) and the capitalisation rate used to determine the amount of borrowing costs eligible for capitalisation was 3.1% (2.7%).
Estimated useful life for the semi-submersible accommodation vessels is 30-50 years. Certain equipment on a vessel is depreciated over a shorter period than the life of the vessel itself. The estimated scrap value per vessel is between USD 3 million and USD 6 million. This estimate is based on steel prices and costs associated with scrapping and is reviewed on an annual basis.
Management performed an annual impairment assessment of the fixed assets in line with IFRS. Management looked at each individual vessel as a cash generating unit, and concluded that there is an impairment relating to Safe Astoria due to a weaker market outlook. On this basis, an impairment charge amounting to USD 84.7 million has been made in the accounts. The estimated recoverable amount of Safe Astoria is nil.
The goodwill of USD 226.7 million relates to the acquisition of Consafe Offshore AB in 2006. Prosafe has only one reporting segment comprising of all accommodation/service vessels which the goodwill has been allocated to. The recoverable amount has been identified by calculating the value in use. The calculation is based on the present value of the estimated cash flow. The discount rates applied reflect management's estimate of the risks specific to each unit. The present value of this cash flow exceeds the carrying value, and no need for a write-down is indicated.
The present value of the estimated cash flows from the cash-generating units, is based on the following inputs:
Revenues - Current contracts portfolio and contract renewals reflecting current market conditions, remaining life of asset, and historical utilisation rates - Annual increase of operating revenues 3% (general sector inflation assumption) - No mobilisation or demobilisation fees have been included
Expenses - Operating expenses and overheads reflecting current market conditions and historical utilisation rates - Annual increase of operating expenses and overheads 3% (general sector inflation assumption)
Capital expenditures - Capex reflecting long-term capex projections (excluding value enhancing investments) - Annual increase of capital expenditures 3% (general sector inflation assumption) Pre-tax discount rate 8%. - Sensitivity: a 1% increase in the pre-tax discount rate would have lead to an additional impairment of around USD 34 million on the cash generating units (vessels), and the goodwill would have been impaired by USD 43 million.
- Sensitivity: a 2% increase in the pre-tax discount rate would have lead to an additional impairment of around USD 111 million on the cash generating units (vessels), and the goodwill would have been fully impaired (USD 227 million).

42
NOTE 9: OTHER FINANCIAL ITEMS
2016 2015
Gain on forgiveness of bond debt 197.6 0.0 Fair value adjustment currency forwards 32.8 44.1 Fair value adjustment interest rate swaps 36.9 0.0 Total other financial income 267.3 44.1
Currency loss (40.4) (55.7)Amortisation of borrowing costs (3.0) (12.8)Other financial expenses (1.7) (5.1)Total other financial expenses (45.1) (73.6)
NOTE 10: FINANCIAL ITEMS - IAS 39 CATEGORIES
Year ended 31 Dec 2016Loans and
receivables
Fair value through
profit and loss
Financialliabilities
measured at amortised cost Total
Interest income 0.3 0.0 0.0 0.3 Fair value adjustment currency forwards 0.0 32.8 0.0 32.8 Fair value adjustment interest rate swaps 0.0 36.9 0.0 36.9 Gain on forgiveness of bond debt 0.0 0.0 197.6 197.6 Total financial income 0.3 69.7 197.6 267.6
Interest expenses 0.0 0.0 (85.6) (85.6)Amortisation of borrowing costs 0.0 0.0 (3.0) (3.0)Other financial expenses 0.0 0.0 (1.7) (1.7)Currency loss 1) 0.0 0.0 0.0 (40.4)Total financial expenses 0.0 0.0 (90.3) (130.7)
Net financial items 0.3 69.7 107.3 136.9

43
Year ended 31 Dec 2015Loans and
receivables
Fair value through
profit and loss
Financialliabilities
measured at amortised cost Total
Interest income 0.2 0.0 0.0 0.2 Fair value adjustment currency forwards 0.0 44.1 0.0 44.1 Currency gain 1) 0.0 0.0 0.0 0.0 Total financial income 0.2 44.1 0.0 44.3
Interest expenses 0.0 0.0 (41.6) (41.6)Amortisation of borrowing costs 0.0 0.0 (12.8) (12.8)Other financial expenses 0.0 0.0 (5.1) (5.1)Currency loss 1) 0.0 0.0 0.0 (55.7)Total financial expenses 0.0 0.0 (59.5) (115.2)
Net financial items 0.2 44.1 (59.5) (70.9)
1) Currency effects (gain/loss) are excluded from the category break-down, but added to the total for net effect.

44
NOTE 11: TAXES
2016 2015
Taxes in income statement: Taxes payable 19.1 13.2 Change in deferred tax (2.0) (2.7)Total taxes in income statement 17.1 10.5
Temporary differences: Exit from Norwegian tonnage tax system 26.8 32.8 Long-term liabilities (1.7) 0.0 Non-current assets (1.2) (1.5) Current assets 0.0 0.0 Current liabilities 0.1 0.0 Basis for deferred tax 24.0 31.3 Recognised deferred tax 6.0 7.8
Deferred tax 1 January 7.8 13.4 Change in deferred tax in income statement (2.0) (2.7)Translation difference 0.2 (2.9)Deferred tax 31 December 6.0 7.8
Payable tax as at 31 December 22.8 13.7
The cumulated tax loss carried forward in Cyprus as at 31 December 2016 and 2015 amounts to USD 150 million and USD 47 million respectively. The tax rate in Cyprus is 12.5%. No deferred tax asset is recognised in respect of this tax loss carried forward as utilisation of this deferred tax asset is deemed not probable. The tax loss for each year may be carried forward for five years.
The majority of the Group's vessels are subject to taxation based on the special rules for taxation of shipping and offshore companies in Singapore.
The deferred tax liability related to the enforced departure of the vessel business from the Norwegian tonnage tax system effective 1 January 2006, was initially calculated to NOK 780 million equivalent to USD 115 million applying the exchange rate prevailing on this date. This liability is paid at a rate of 20 per cent annually on the outstanding balance. The tax rate in Norway was 25% in 2016, but effective 1 January 2017 the tax rate is 24%.

45
NOTE 12: EARNINGS PER SHARE
Earnings per share are calculated by dividing net profit by the weighted average number of ordinary shares outstanding during the year. Diluted earnings per share are calculated by dividing net profit by the weighted average number of ordinary shares plus the number of potential shares relating to the convertible bonds. The 2015 figures have been restated to reflect the reverse share split which took place in December 2016.
2016 2015
Net profit/(loss) 172.6 (50.6)Weighted average number of outstanding shares (1 000) 20 643 2 377 Basic earnings per share 8.36 (21.29)Weighted average number of outstanding and potential shares (1 000) 21 319 2 377 Diluted earnings per share 8.10 (21.29)
NOTE 13: ASSOCIATED COMPANIES
This item relates to the 25% shareholding in Dan Swift Pte Ltd, a company incorporated in Singapore, which was acquired in December 2016. The company owns one accommodation monohull, the Safe Swift, which is currently laid up in Denmark. This investment is measured using the equity method.
2016 2015
Carrying amount as at 31.12.15 0.0 0.0 Acquisition costs 2016 10.0 0.0 Net profit 0.0 0.0 Carrying amount as at 31.12.16 10.0 0.0
NOTE 14: SHARE CAPITAL, SHAREHOLDER INFORMATION AND CONVERTIBLE BONDS
2016 2015
Issued and paid number of ordinary shares at 31 December 71 399 002 259 570 359Authorised number of shares at 31 December 130 440 177 275 924 148Nominal value at 31 December EUR 0.10 EUR 0.25Number of shareholders at 31 December 6 227 3 961
In August 2016 the share capital of the Company was reduced by cancelling paid up nominal capital (in lieu and without cancelling any shares per se) amounting to EUR 64,633,019 (equivalent to USD 71,846,225), being EUR 0.249 per share on each of the 259,570,359 ordinary fully paid up shares, reducing the nominal value of all such ordinary share from EUR 0.25 each to EUR 0.001 each with the corresponding effect on authorized share capital; the entire amount of EUR 64,633,019

46
corresponding to the amount cancelled was credited to the capital reduction reserve fund. In September 2016 4,376,600,000 shares were issued in a private placement, 1,400,839,757 were issued to the bond holders and 12,000,000 shares were issued to convertible bond holders. In November 2016 504,000,000 shares were issued in a subsequent share offering. A 100:1 reverse share split was completed on 30 November 2016. Prior to the reverse split, the share capital consisted of 6,553,010,116 shares at face value of EUR 0.001 each. Subsequent to the reverse split, the share capital consisted of 65,530,102 shares at face value of EUR 0.10 each. In December 2016 5,868,900 shares were issued as a part of the consideration relating to the acquisition of Axis Nova Singapore Pte Ltd and Axis Vega Singapore Pte Ltd.
Largest shareholders/groups of shareholders at 31.12.2016 No of shares Percentage
North Sea Strategic Investments AS 15 479 410 21.7 %State Street Bank and Trust (nom.) 12 602 690 17.7 %Axis Offshore Pte Ltd 5 868 900 8.2 %Pareto Aksje Norge 2 329 584 3.3 %Verdipapirfondet Holberg Kreditt 1 689 565 2.4 %Verdipapirfondet DNB Norge (IV) 1 471 095 2.1 %RBC Investor Services Trust (nom.) 1 381 644 1.9 %Six Sis AG (nom.) 1 333 128 1.9 %Nordnet Bank AB (nom.) 1 077 043 1.5 %SEB STO, SFMA1, Skandinaviska Enskilda Banken AB 1 000 001 1.4 %Forsvarets Personellservice 896 088 1.3 %MP Pensjon PK 800 835 1.1 %Pareto Høyrente 760 000 1.1 %Anaxo Capital AS 691 223 1.0 %Verdipapirfondet DNB High Yield 669 689 0.9 %DNB Livsforsikring ASA 612 473 0.9 %Euroclear Bank S.A./N.V. (nom.) 583 657 0.8 %Danske Bank A/S (nom.) 566 302 0.8 %Verdipapirfondet DNB Norden (III) 531 164 0.7 %Verdipapirfondet DNB SMB 519 914 0.7 %Total 20 largest shareholders/groups of shareholders 50 864 405 71,2 %
All ordinary shares rank equally. Holders of these shares are entitled to dividends from time to time and are entitled to one vote per share at general meetings of the Company.
Convertible bonds As part of the refinancing completed in September 2016, zero coupon convertible bonds amounting to NOK 81,790,013 were issued. On 23 September 2016, convertible bonds of nominal value NOK 3 million were converted into Prosafe shares. As of 31 December 2016 the remaining outstanding principal of this convertible bond loan was NOK 78,790,013. These bonds can be converted into Prosafe shares at a price of NOK 25 per share.

47
In December 2016, as part consideration of the shares in Axis Vega Singapore Ltd, Axis Nova Singapore Ltd and Dan Swift Singapore Pte Ltd, zero coupon convertible bonds of nominal value NOK 403,092,000 were issued to Axis Offshore Pte Ltd. These bonds can be converted into Prosafe shares at a price of NOK 30 per share.
NOTE 15: INTEREST-BEARING DEBT
2016 2015
Credit facility 1 350.0 945.0 Bond loans 0.0 302.0 Sellers' credits 56.0 0.0 Unamortised borrowing costs (15.2) 0.0 Total interest-bearing debt 1 390.8 1 247.0
Debt in NOK 0.0 302.0 Debt in USD 1 390.8 945.0 Total interest-bearing debt 1 390.8 1 247.0
Non-current interest-bearing debt 1 342.9 1 107.5 Current interest-bearing debt 47.9 139.5 Total interest-bearing debt 1 390.8 1 247.0
USD 1,300 million credit facility
The credit facility of USD 1,300 million consists of two term loan tranches of USD 800 million and USD 200 million (drawn on delivery of Safe Zephyrus in January 2016) and a revolving credit facility of USD 300 million. In September 2016 the amortisation profile and covenants relating to this facility were amended. Prior to the amendment, the term loan tranches were reduced semi-annually by USD 55 and USD 10 million, respectively. 90 per cent of the originally scheduled repayments in the period 1 January 2017 until 30 June 2019 have been postponed and are to be repaid on the final maturity date. For the period 1 July 2019 until 31 December 2020, 70 per cent of the scheduled repayments have been postponed until the final maturity date. As of 31 December 2016, there was no amount available under the revolving credit facility.
The annual interest rate above 3-month LIBOR depends on leverage ratio (see definition below); 2.00 per cent per annum if below 3.00 2.15 per cent per annum if above 3.00 and less than or equal to 4.00 2.30 per cent per annum if above 4.00 and less than or equal to 5.00 2.50 per cent per annum if above 5.00 and less than or equal to 5.50 2.75 per cent per annum if above 5.50

48
As part of the amendment, a cash sweep mechanism has been included whereby the Company on 30 April annually (first time in 2018) shall make cash sweep payments to the banks based on excess cash available. Any cash sweep payment shall only be made if the firm contract backlog represents no less than USD 350 million of revenue for the next 12 months.
Financial covenants as per amendment in September 2016: Dividend restrictions: No dividends until repayments have been made equal to the deferred instalments. Minimum liquidity: USD 65 million Interest coverage ratio:1) Minimum 1.0 until 31.12.19, thereafter minimum 1.5. Leverage ratio:2) Suspended until 31.12.20, thereafter to be negotiated. Equity ratio: Deleted from covenants. Market value vessels: Suspended until 31.12.18, thereafter minimum 110% of total outstanding loans based on two consecutive market value test dates (31 March each year)
There is also a maximum capital expenditure covenant which is agreed before the start of each financial year.
1) Interest coverage ratio = adjusted EBITDA/net interest expenses 2) Leverage ratio = net borrowings/adjusted EBITDA
USD 288 million credit facility
This credit facility, which has a maturity of seven years, consists of two tranches of USD 144 million (USD 288 million in total). The first one was drawn upon delivery of Safe Notos in February 2016, and the second one can be drawn upon delivery of Safe Eurus. In September 2016 the amortisation profile and covenants relating to this facility were amended. Prior to the amendment, the term loan tranches were reduced quarterly by USD 3 million, starting three months after delivery of the tranche security. 90 per cent of the originally scheduled repayments for the Safe Notos tranches in the period 1 January 2017 until 30 June 2019 have been postponed and are to be repaid on the final maturity date. For the period 1 July 2019 until 31 December 2020, 70 per cent of the scheduled repayments for the Safe Notos tranches have been postponed until the final maturity date. In the event that the Company takes delivery of Safe Eurus, these tranches shall follow the same amortisation and relief as per the Safe Notos tranches defined above. The annual interest rate above 3-month LIBOR depends on leverage ratio; 2.25 per cent per annum if below 4.00 2.30 per cent per annum if above 4.00 and less than or equal to 5.00 2.50 per cent per annum if above 5.00 and less than or equal to 5.50 2.75 per cent per annum if above 5.50
The USD 288 million facility has the same covenants and cash sweep mechanism as the USD 1,300 million facility as described above.

49
Financial covenants as of 31 December 2016
Cash and deposits 205.7 Amount available for utilisation, revolving credit facility (max USD 25 million) 0.0 Liquidity (minimum USD 65 million) 205.7
EBITDA 253.2 Adjustment for new builds 109.0 EBITDA adjusted 362.2 Interest expenses 85.6 Interest coverage ratio (minimum 1.0) 4.2
Sellers' creditsIn November 2015, Jurong Shipyard Pte Ltd. granted Prosafe a sellers’ credit of USD 30 million as a reduction on the final delivery instalment of the Safe Zephyus. The sellers’ credit is due to be repaid in a single payment on or before 15 June 2017, together with the annual interest rate of 6.7%.
In January 2016, Cosco (Qidong) Offshore Co. Ltd. granted a sellers’ credit of around USD 29 million as a reduction on the final delivery instalment of the Safe Notos. In August 2016, further amendment was made to the existing payment schedule. It was agreed that the first instalment of USD 2.3 million was to be paid in October 2016 and thereafter USD 300k monthly until December 2019. The remain-ing balance of the sellers’ credit amount is due to be repaid in a single payment on or before Decem-ber 2019. The interest cost is estimated to be around 6%.
NOTE 16: OTHER CURRENT LIABILITIES
2016 2015
Various accrued costs 42.0 80.1 Accrued interest costs 4.2 5.0 Deferred income 4.3 4.6 Other interest-free current liabilities 6.3 4.1 Total interest-free current liabilities 56.8 93.9

50
NOTE 17: MORTGAGES AND GUARANTEES
2016 As of 31 December 2016, Prosafe’s interest-bearing debt secured by mortgages totalled USD 1,350 million. The debt was secured by mortgages on the accommodation/service vessels Safe Astoria, Safe Bristolia, Safe Caledonia, Safe Concordia, Safe Scandinavia, Regalia, Safe Boreas, Safe Zephyrus and Safe Notos (net carrying value USD 2,029 million). Negative pledge clauses apply on shares in the vessel owning subsidiaries. Earnings accounts are pledged as security for the credit facilities, but cash will only be restricted if a continuing event of default occurs. A bank guarantee has been issued on behalf of Prosafe Rigs Pte. Ltd. in favour of Westcon Yards AS, amounting to NOK 245 million at 31 December 2016. This bank guarantee is secured by a cash deposit of USD 5 million and a counter bank guarantee of USD 30 million issued under the USD 1.3 billion facility. As at 31 December 2016, Prosafe had issued parent company guarantees to clients and vendors on behalf of its subsidiaries in connection with the award and performance of contracts totalling approximately USD 345 million and a parent company guarantee and indemnity relating to the bank guarantee referred to above. The amounts specified with regard to parent company guarantees reflect the sum of the capped liability under the relevant agreements.
2015 As of 31 December 2015, Prosafe’s interest-bearing debt secured by mortgages totalled USD 945 million. The debt was secured by mortgages on the accommodation/service vessels Safe Astoria, Safe Bristolia, Safe Caledonia, Safe Concordia, Safe Scandinavia, Regalia, Safe Boreas (net carrying value USD 1,391 million) and Safe Zephyrus when delivered. Negative pledge clauses apply on shares in the vessel owning subsidiaries. Earnings accounts are pledged as security for the credit facilities, but cash will only be restricted if a continuing event of default occurs.
Bank guarantees amounted to NOK 290 million at 31 December 2015. The guarantees were secured by parent company guarantee and mortgages on the accommodation/service vessels Safe Regency, Safe Lancia, Safe Hibernia, Safe Britannia and Jasminia (net carrying value USD 0 million).
As of 31 December 2015, Prosafe had issued parent company guarantees to clients and vendors on behalf of its subsidiaries in connection with the award and performance of contracts totalling USD 542 million.

51
NOTE 18: FINANCIAL ASSETS AND LIABILITIES
As of 31 December 2016, the group had financial assets and liabilities in the following categories:
Year ended 31 Dec 2016Loans and
receivables
Fair value through
profit andloss
Financialliabilities
measured at amortised
costBookvalue
Fairvalue
Cash and deposits 205.,7 0.0 0.0 205.7 205.7 Accounts receivable 60.0 0.0 0.0 60.0 60.0 Other current assets 25.2 0.0 0.0 25.2 25.2 Total financial assets 290.9 0.0 0.0 290.9 290.9
Credit facilities 1) 0.0 0.0 1 350.0 1 350.0 1 300.0 Fair value interest swaps 0.0 51.3 0.0 51.3 51.3 Fair value currency forwards 0.0 7.9 0.0 7.9 7.9 Accounts payable 0.0 0.0 16.9 16.9 16.9 Other current liabilities 0.0 0.0 46.2 46.2 46.2 Total financial liabilities 0.0 59.2 1 413.1 1 472.3 1 422.3
1) Fair value reflects current market conditions with the assumption that the credit margin would increase from the actual 215 basis points to 300 basis points. The net present value of the interest advantage, discounted with USD 5-year swap rate, is around USD 50 million.
Management assessed the cash and deposits, accounts receivables, other current assets, accounts payable and other current liabilities to approximate their carrying amounts largely due to the short-term maturities of these instruments.
The Group enters into derivative financial instruments with various counterparties, principally financial institutions with investments grade credit ratings. Derivatives valued using valuation techniques with market observable inputs are mainly interest rate swaps and foreign exchange forward contracts. The most frequently applied valuation techniques include forward pricing and swap models, using present value calculations. The models incorporate various inputs including the credit quality of counterparties, foreign exchange spot and forward rates, interest rate and forward rate curves. All derivative contracts are secured under the USD 1,300 million credit facility.
Year ended 31 Dec 2016 Total Level 1 Level 2 Level 3Fair value currency forwards (7.9) 0.0 (7.9) 0.0 Fair value interest swaps (51.3) 0.0 (51.3) 0.0 Total financial assets/liabilities (59.2) 0.0 (59.2) 0.0

52
As of 31 December 2015, the group had financial assets and liabilities in the following categories:
Year ended 31 Dec 2015Loans and
receivables
Fair value through
profit andloss
Financialliabilities
measured at amortised
costBookvalue
Fairvalue
Cash and deposits 57.1 0.0 0.0 57.1 57.1 Accounts receivable 60.0 0.0 0.0 60.0 60.0 Other current assets 26.3 0.0 0.0 26.3 26.3 Total financial assets 143.4 0.0 0.0 143.4 143.4
Credit facility 1300 million 1) 0.0 0.0 945.0 945.0 905.0 Bond loan PRS07 2) 0.0 0.0 29.5 29.5 29.6 Bond loan PRS08 3) 0.0 0.0 56.8 56.8 55.4 Bond loan PRS09 4) 0.0 0.0 56.8 56.8 46.6 Bond loan PRS10 5) 0.0 0.0 79.5 79.5 69.0 Bond loan PRS11 6) 0.0 0.0 79.5 79.5 65.1 Fair value interest swaps 7) 0.0 48.5 0.0 48.5 48.5 Fair value currency forwards 0.0 40.7 0.0 40.7 40.7 Accounts payable 0.0 0.0 17.8 17.8 17.8 Other current liabilities 0.0 0.0 84.8 84.8 84.8 Total financial liabilities 0.0 89.2 1 349.7 1 438.9 1 362.4
1) Fair value reflects current market conditions with the assumption that the credit margin would increase from the actual 187.5 basis points to 200 basis points. The net present value of the interest advantage, discounted with USD 5-year swap rate, is around USD 8 million. 2,3,4,5,6) Fair value reflects current market conditions based on prices estimated by the Norwegian Securities Dealers Association as of 31 December 2014: PRS07 99.000, PRS08 97.146, PRS09 87.955, PRS10 89.895, PRS11 95.313. 7) Interest swaps were treated as effective hedges (hedge accounting), and changes in fair value affected other comprehensive income, not profit and loss.
Year ended 31 Dec 2015 Total Level 1 Level 2 Level 3Fair value currency forwards (40.7) 0.0 (40.7) 0.0 Fair value interest swaps (48.5) 0.0 (48.5) 0.0 Total financial assets/liabilities (89.2) 0.0 (89.2) 0.0

53
Assets measured at fair value in the balance sheet
The Group uses the following hierarchy for determining and disclosing the fair value of financial instruments by valuation technique:
Level 1 - Quoted prices (unadjusted) in active markets for identical assets or liabilities Level 2 - Inputs other than quoted prices included within level 1 that are observable for assets or liabilities, either directly (i.e. as prices) or indirectly (i.e. derived from prices) Level 3 - Inputs for assets or liabilities that are not based on observable market data (unobservable inputs). The currency forwards and interest swaps are valued based on current exchange rates and forward curves.
NOTE 19: FINANCIAL RISKS AND DERIVATIVE FINANCIAL INSTRUMENTS
Prosafe operates on a global basis with cash flows and financing in various currencies. This means that the Group is exposed to market risks related to fluctuations in exchange rates and interest rates. Prosafe's presentation currency is USD, and financial risk exposure is managed with financial instruments in accordance with internal policies and standards approved by the board of directors.
Currency risk
Prosafe is exposed to currencies other than USD associated with operating expenditure, capital expenditure, interest-bearing debt, tax, cash and deposits. Cash and deposits are mainly denominated in USD, GBP, EUR and NOK. Cash and deposits in currencies other than USD, are to a certain extent natural hedges for any GBP, EUR and NOK liabilities. The proportion of the total currency exposure hedged by use of financial derivatives will normally lie between 50 and 75 per cent for the next 12-month period, by using forward contracts.
Operating expenditure Operating expenditure are mainly denominated in GBP and NOK, but depending on the country of operation and the nationality of the crew, operating expenses can also be in SGD, SEK, EUR, USD and BRL. Operating expenditure and maintenance related capital expenditure currencies other than USD is typically currency-hedged using forward contracts with a time horizon of 9-12 months.
Capital expenditure
Capital expenditure will, depending on the origin of equipment and the location of the yard, tend to be in USD, GBP, EUR and NOK. Planned capital expenditure in currencies other than USD is typically currency-hedged independent of time horizon, by using forward contracts.
Interest bearing debt
As of 31 December 2016, interest bearing debt consists of USD denominated liabilities only. The principal amounts of liabilities denominated in other currencies than USD are fully hedged by using multiple forward contracts with different settlement dates with a time horizon of up to 12 months. At maturity, the forwards are rolled for further 12 months until debt maturity.
Tax
Tax liabilities predominantly consist of a NOK denominated deferred tax associated with the exit from the Norwegian tonnage tax system effective 1 January 2006. Payable tax related to the deferred tax liability is also currency-hedged.

54
Fair value of forward exchange contracts are estimated using quoted market prices. The fair value estimates the gain or loss that would have been realised if the contracts had been closed out at the balance sheet date. As of 31 December 2015, the fair value and maximum credit risk exposure of forward exchange contracts was USD 40.7 million negative.
A negative fair market value on currency forwards will be associated with a positive effect on the fair market value of the underlying hedged item. For example, a NOK depreciation will cause a negative fair market value on currency forwards, but a positive effect on the fair market value of future operating expenses, capital expenditure, NOK denominated interest-bearing debt and NOK denominated tax liabilities. A NOK appreciation will have the opposite effects.
As of 31 December 2016, Prosafe had entered into the following forward exchange contracts:
Maturity Prosafe buy NOK Amount Rate Prosafe sell USD Amount11/01/2017 30 000 000 8.46 3 547 17123/01/2017 30 000 000 8.88 3 379 90103/02/2017 50 000 000 8.65 5 779 57208/02/2017 30 000 000 8.46 3 545 41906/03/2017 40 000 000 8.68 4 608 44408/03/2017 30 000 000 8.45 3 550 69118/04/2017 50 000 000 8.23 6 074 05704/05/2017 40 000 000 8.03 4 981 23308/06/2017 40 000 000 8.19 4 884 55430/06/2017 45 000 000 8.44 5 331 37107/07/2017 40 000 000 8.31 4 816 031
Maturity Prosafe buy GBP amount Rate Prosafe sell USD Amount13/02/2017 6 000 000 1.44 8 661 39006/03/2017 6 000 000 1.41 8 441 07013/04/2017 6 000 000 1.43 8 569 23008/05/2017 6 000 000 1.46 8 750 55012/06/2017 6 000 000 1.46 8 784 57008/07/2017 6 000 000 1.30 7 817 880
Currency risk - sensitivityThe sensitivity analysis is based on a reasonably possible change in the relevant exchange rates and reflects the main effects on profit or loss and equity assuming that the change had occurred at the balance sheet date. A 10% strengthening/weakening of the USD against NOK and GBP will have the following effects. Exposures to foreign currency changes for all other currencies are not material.

55
2016 2015Pre-tax effects Income
statementeffect
OCI effect
Income statement
effectOCI
effectUSD +10% Re-valuation cash and deposits (2.6) 0.0 (3.2) 0.0 Re-valuation currency forwards (8.9) 0.0 (40.0) 0.0 Re-valuation NOK bonds 0.0 0.0 27.5 0.0 Total (11.5) 0.0 (15.7) 0.0
USD -10%Re-valuation cash and deposits 2.8 0.0 3.7 0.0 Re-valuation currency forwards 15.8 0.0 52.0 0.0 Re-valuation NOK bonds 0.0 0.0 (33.5) 0.0 Total 18.6 0.0 22.2 0.0
Interest rate risk Interest on debt is in principle floating, but has been hedged to reduce the variability of cash flows in the interest payments through the use of interest rate swap agreements. Prosafe evaluates the hedge profile in relation to the repayment schedule of its loans, the company’s portfolio of contracts, cash flow and cash in hand. The proportion hedged will normally lie between 75 and 100 per cent for all loans.
Hedge accounting The objective of the interest rate hedging is to reduce the variability of cash flows in the interest payments for the floating-rate debt (i.e. cash flow hedging). Changes in the cash flows of the interest rate swaps are expected to offset the changes in cash flows (i.e. changes in interest payments) attributable to fluctuations in the benchmark interest rate on the part of the floating-rate debt that is hedged. Effective 1 July 2016, the Company decided, based on a cost-benefit evaluation, to abandon hedge accounting of interest rate swaps. As from this date, any change in fair value of interest rate swaps is taken through the income statement rather than via other comprehensive income. As a result of the abandonment of hedge accounting, an amount of USD 36.9 million has been expensed in the income statement. Please refer to note 9.
As of 31 December 2016, Prosafe’s hedging agreements totalled USD 1,000 million:
Notional amount Fixed rate Maturity Swap type Fair value
USD 400 million 2.3150 % 2022 Bullet (22.8)USD 225 million 2.4440 % 2022 Bullet (15.9)USD 135 million 2.3630 % 2022 Bullet (7.5)USD 120 million 1.5330 % 2022 Bullet (0.1)USD 120 million 2.1280 % 2022 Bullet (5.0)Total (51.3)

56
Fair value of interest rate swap agreements are estimated using quoted market prices. The fair value estimates the gain or loss that would have been realised if the contracts had been closed out at the balance sheet date.´
Interest rate risk - sensitivity The sensitivity analysis is based on a reasonably possible change in the relevant forward curves and reflects the main effects on profit or loss and equity assuming that the change had occurred at the balance sheet date. A forward curve shift of ±100bps is applied in the analysis.
2016 2015
Pre-tax effectsIncome
statement effectOCI
effectIncome
statement effectOCI
effectForward curve +100bps Re-valuation interest rate swaps 46.8 0.0 0.0 39.2 Total 46.8 0.0 0.0 39.2
Forward curve -100bpsRe-valuation interest rate swaps (49.5) 0.0 0.0 (70.7)Total (49.5) 0.0 0.0 (70.7)
Changes in other comprehensive income related to financial instrumentsAs of 31 December 2016, the following changes in other comprehensive income were related to financial instruments:
Change 2016 2015Re-valuation interest rate swaps (12.7) (22.2) (9.5)Total (12.7) (22.2) (9.5)
Credit risk In line with industry practice, other contracts normally contain clauses which give the customer an opportunity for early cancellation under specified conditions. Providing Prosafe has not acted negligently, however, the effect on results in such cases will normally be wholly or partly offset by a financial settlement in the company’s favour. Following a potential notice of convenience termination, the customer will have to pay Prosafe a substantial part of the remaining contract value.
Credit assessment of financial institutions issuing guarantees in favour of Prosafe, yards, sub-contractors and equipment suppliers is part of Prosafe’s project evaluations and risk analyses.
The counterparty risk is in general limited when it comes to Prosafe’s clients, since these are typically major oil companies and national oil companies.
As of 31 December 2016, there is no objective evidence that accounts receivable is impaired, and no impairment loss has been recognised in the income statement.
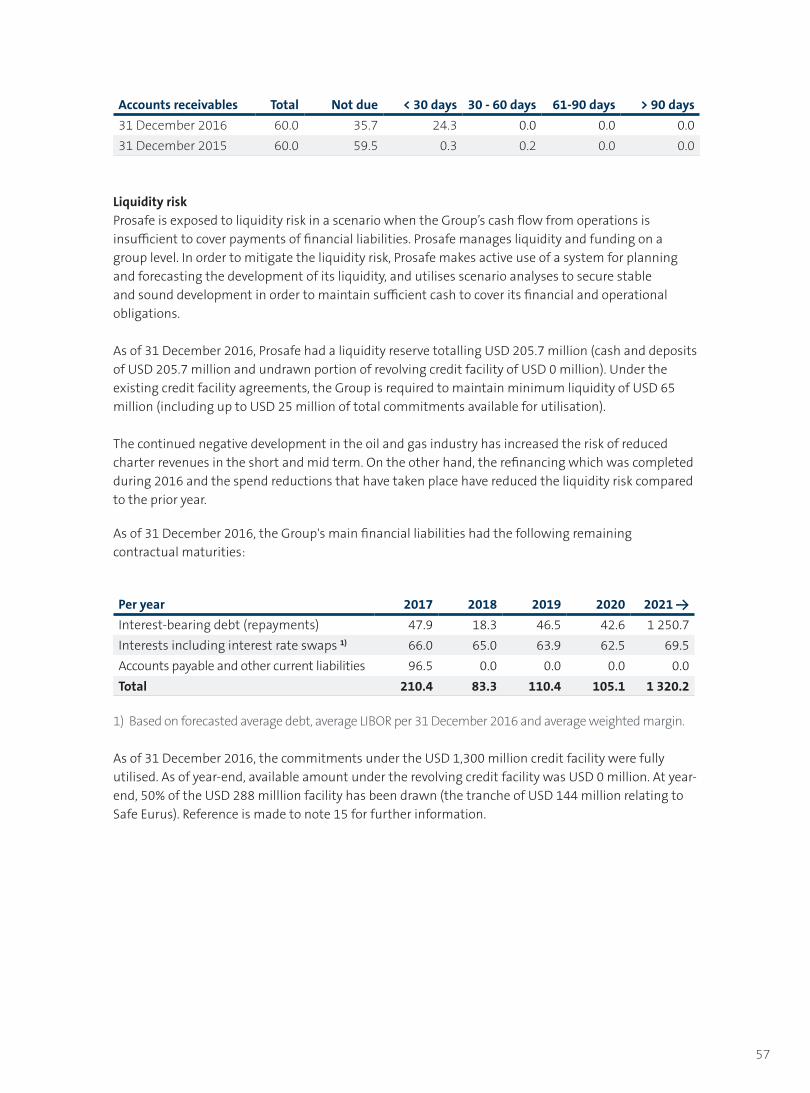
57
Accounts receivables Total Not due < 30 days 30 - 60 days 61-90 days > 90 days31 December 2016 60.0 35.7 24.3 0.0 0.0 0.031 December 2015 60.0 59.5 0.3 0.2 0.0 0.0
Liquidity risk Prosafe is exposed to liquidity risk in a scenario when the Group’s cash flow from operations is insufficient to cover payments of financial liabilities. Prosafe manages liquidity and funding on a group level. In order to mitigate the liquidity risk, Prosafe makes active use of a system for planning and forecasting the development of its liquidity, and utilises scenario analyses to secure stable and sound development in order to maintain sufficient cash to cover its financial and operational obligations. As of 31 December 2016, Prosafe had a liquidity reserve totalling USD 205.7 million (cash and deposits of USD 205.7 million and undrawn portion of revolving credit facility of USD 0 million). Under the existing credit facility agreements, the Group is required to maintain minimum liquidity of USD 65 million (including up to USD 25 million of total commitments available for utilisation). The continued negative development in the oil and gas industry has increased the risk of reduced charter revenues in the short and mid term. On the other hand, the refinancing which was completed during 2016 and the spend reductions that have taken place have reduced the liquidity risk compared to the prior year.
As of 31 December 2016, the Group's main financial liabilities had the following remaining contractual maturities:
Per year 2017 2018 2019 2020 2021 →Interest-bearing debt (repayments) 47.9 18.3 46.5 42.6 1 250.7 Interests including interest rate swaps 1) 66.0 65.0 63.9 62.5 69.5 Accounts payable and other current liabilities 96.5 0.0 0.0 0.0 0.0 Total 210.4 83.3 110.4 105.1 1 320.2
1) Based on forecasted average debt, average LIBOR per 31 December 2016 and average weighted margin. As of 31 December 2016, the commitments under the USD 1,300 million credit facility were fully utilised. As of year-end, available amount under the revolving credit facility was USD 0 million. At year-end, 50% of the USD 288 milllion facility has been drawn (the tranche of USD 144 million relating to Safe Eurus). Reference is made to note 15 for further information.

58
As of 31 December 2015, the Group's main financial liabilities had the following remaining contractual maturities:
Per year 2016 2017 2018 2019 2020 →Interest-bearing debt (repayments) 139.5 210.8 233.5 233.5 429.7 Interests including interest rate swaps 1) 74.5 84.4 85.0 86.3 146.4 Accounts payable and other current liabilities 17.8 0.0 0.0 0.0 0.0 Total 231.8 295.2 318.5 319.8 576.1
1) Based on forecasted average debt, average LIBOR per 31 December 2015 and average weighted margin.
As of 31 December 2015, the commitments under the USD 1,300 million credit facility totalled USD 1,245 million (including the USD 200 million term loan for financing of Safe Zephyrus), of which USD 945 was utilised. As of year-end, available amount under the revolving credit facility was USD 100 million, meaning that scheduled downpayment for 2016 amounted to USD 10 million. Following delivery of Safe Zephyrus, scheduled semi-annual amortisations amount to USD 65 million. At year-end, the USD 288 facility was unutilised and consists of two tranches of USD 144 million each. Following delivery of Safe Notos and Safe Eurus, each tranche which will be reduced quarterly with USD 3 million. Reference is made to note 15 for further information.
Capital management The primary objective of the Group's capital management is to ensure that it maintains a healthy capital structure in line with economic conditions. Prosafe manages the total of shareholders' equity and long term debt as their capital. Prosafe's main tool to assess its capital structure is the leverage ratio, which is calculated by dividing net interest-bearing debt including bank guarantees, by EBITDA over the last 12 months.
NOTE 20: CASH AND DEPOSITS
2016 2015
Restricted cash deposits (withholding personal income tax) 0.2 0.2 Free cash and short-term deposits 205.5 56.9 Total cash and deposits 205.7 57.1
NOTE 21: OTHER CURRENT ASSETS
2016 2015
Receivables 24.7 7.2 Prepayments 3.0 4.2 Stock 0.9 0.9 Other current assets 0.5 19.1 Total other current assets 29.1 31.4

59
NOTE 22: RELATED PARTY DISCLOSURES
The financial statements comprise the parent company, Prosafe SE, and the subsidiaries listed below.
Company nameCountry
of incorporation OwnershipVoting
share
Prosafe AS Norway 100 % 100 %
Prosafe Management AS Norway 100 % 100 %Prosafe Offshore AS Norway 100 % 100 %Prosafe (UK) Holdings Limited United Kingdom 100 % 100 %Prosafe Rigs Limited United Kingdom 100 % 100 %Prosafe Offshore Limited United Kingdom 100 % 100 %Prosafe Rigs (Cyprus) Limited Cyprus 100 % 100 %Prosafe Holding Limited Cyprus 100 % 100 %Prosafe Offshore Accommodation Ltd Jersey 100 % 100 %Prosafe Rigs Pte. Ltd. Singapore 100 % 100 %Prosafe Offshore Pte. Limited Singapore 100 % 100 %Prosafe Offshore Employment Company Pte. Limited Singapore 100 % 100 %Prosafe Offshore Services Pte. Ltd. Singapore 100 % 100 %Prosafe Offshore Asia Pacific Pte. Ltd. Singapore 100 % 100 %Prosafe Offshore S.a.r.l. Luxembourg 100 % 100 %Prosafe Offshore Sp.zo.o. Poland 100 % 100 %Prosafe Offshore BV Netherlands 100 % 100 %Prosafe Services Maritimos Ltda Brazil 100 % 100 %Axis Vega Singapore Pte Ltd Singapore 100 % 100 %Axis Nova Singapore Pte Ltd Singapore 100 % 100 %
Transactions and outstanding balances within the Group have been eliminated in full. Shares owned by senior officers and directors at 31 December 2016: (includes shares owned by wholly-owned companies)
Senior officers: Shares
Stig Harry Christiansen - Acting CEO (deputy CEO and CFO from 8 Feb 2017) 0Robin Laird - Acting CFO (deputy CFO from 8 Feb 2017) 580
On 10 February 2017, deputy CEO and CFO Stig Harry Christiansen purchased 26,500 shares in Prosafe SE.

60
Senior officers: Shares
Glen Ole Rødland - chairman 0Svend Anton Mayer - director 0Roger Cornish - director 70Carine Smith Ihenacho - director 0Nancy Ch. Erotocritou - director 0Anastasis Ziziros - director 0
NOTE 23: CONTINGENT LIABILITIES AND CAPITAL COMMITMENTS
Westcon dispute The litigation process relating to the final costs of the conversion of the Safe Scandinavia into a tender support vessel remains ongoing between Westcon Yards AS and Prosafe Rigs Pte. Ltd. A court mediation was held in March 2017 without conclusive outcome. Mediation may continue between the parties, while a potential court case is scheduled for August and September 2017. As the final outcome cannot be reasonably measured, no asset or liability has been recognised relating to the settlement with the yard.
New builds As at 31 December 2016 the Group had three new builds under construction; Safe Eurus, Safe Nova and Safe Vega. The estimated final instalment on Safe Eurus, is USD 180 million. The final instalments on Safe Nova and Safe Vega are being negotiated with the yard.
NOTE 24: EVENTS AFTER THE BALANCE SHEET DATE Conversion of convertible bonds to shares In February 2017, convertible bonds of nominal value NOK 200,184 were converted into 8,007 new ordinary shares in the Company at a conversion price of NOK 25 per share. Following this conver-sion, the remaining outstanding principal of the convertible bonds is reduced to NOK 78,589,829. The number of outstanding shares in the Company has increased to 71,407,009 shares, each at a nominal value EUR 0.10.
NOTE 25: GOING CONCERN The Board of Directors confirms that the accounts have been prepared under the assumption that the Company is a going concern and that this assumption is realistic at the date of the accounts. This assumption is based on the results for the year and the Prosafe Group’s long-term forecasts for the following years. As a result of the suspension of the two contracts in Mexico and the increased liquidity risk, a material uncertainty around the going concern assumption arose during the first quarter this year. Based on the successful completion of the refinancing in Q3 2016, the Board of Directors concludes that the going concern assumption is justified. For additional comments on liquidity risk, please refer to note 19. Details on the effects on financial covenants and liquidity from the comprehensive refinancing are provided in note 15.

61
ACCOUNTS PROSAFE SE

62
INCOME STATEMENT - PROSAFE SE
(USD 1 000) Note 2016 2015
Income from investments in subsidiaries 11 397 9 670 Impairment of shares in subsidiaries 7 (396 516) (331 209)Results of investing activities (385 119) (321 539)Operating expenses 2 (26 253) (11 634)Depreciation 3 (7) (8)Operating loss (411 379) (333 180)Other financial income 4, 5 332 148 167 061 Other financial expenses 4, 5 (174 063) (252 063)Net financial items 5 158 085 (85 002)Loss before taxes (253 294) (418 182)Taxes 6 (1) (1)Net loss (253 294) (418 183)
Attributable to the owners of the company (253 294) (418 183)
STATEMENT OF COMPREHENSIVE INCOME - PROSAFE SE
(USD 1 000) 2016 2015
Net loss (253 294) (418 183)
Other comprehensive income to be reclassified to profit or loss in subsequent periodsNet loss on cash flow hedges (21 693) (9 530)
Other comprehensive loss to be reclassified to profit or loss in subsequent periods
(21 693) (9 530)
Total comprehensive (loss)/income for the year, net of tax (274 987) (427 713)
Attributable to the owners of the company (274 987) (427 713)

63
STATEMENT OF FINANCIAL POSITION - PROSAFE SE
(USD 1 000) Note 31/12/16 31/12/15ASSETSTangible assets 3 12 19 Shares in subsidiaries and associated companies 7 2 572 565 2 227 991 Intra-group non-current receivables 12, 14 118 473 556 225 Total non-current assets 2 691 049 2 784 235 Cash and deposits 14 83 751 12 194 Other current assets 8, 14 140 22 557 Total current assets 83 890 34 751 Total assets 2 774 940 2 818 986
EQUITY AND LIABILITIESShare capital 9 7 914 72 135 Share premium reserve 1 002 282 804 700 Share capital reduction reserve 71 846 0 Total paid-in equity 1 082 043 876 835 Retained earnings 216 155 491 143 Total retained earnings 216 155 491 143 Convertible bonds 56 987 0 Total equity 1 355 184 1 367 978 Interest-bearing long-term debt 10 1 320 595 1 107 464 Derivatives 14 51 286 48 510 Interest-free long-term liabilities 14, 15 1 742 1 733 Total long-term liabilities 1 373 624 1 157 707 Interest-bearing current debt 10, 15 14 200 139 500 Derivatives 14 7 886 40 707 Intra-group current liabilities 12, 14, 15 15 104 105 053 Other interest-free current liabilities 11, 14, 15 8 941 8 041 Total current liabilities 46 131 293 301 Total equity and liabilities 2 774 940 2 818 986
On 22 March 2017 the Board of Directors of Prosafe SE approved and authorised these financial statements for issue.
Glen Ole Rødland Svend Anton Maier Carine Smith IhenachoNon-executive Chair Non-executive director Non-executive director
Roger Cornish Nancy Ch. Erotocritou Anastasis ZizirosNon-executive deputy chair Non-executive director Non-executive director
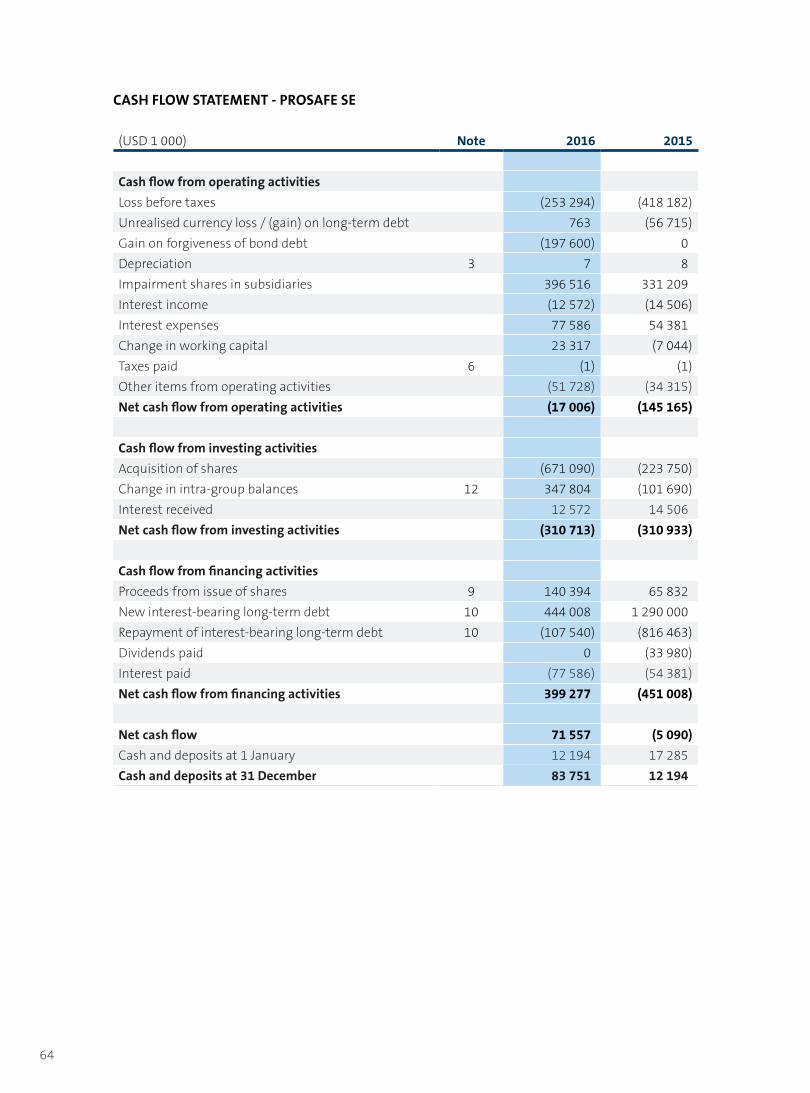
64
CASH FLOW STATEMENT - PROSAFE SE
(USD 1 000) Note 2016 2015
Cash flow from operating activitiesLoss before taxes (253 294) (418 182)Unrealised currency loss / (gain) on long-term debt 763 (56 715)Gain on forgiveness of bond debt (197 600) 0 Depreciation 3 7 8 Impairment shares in subsidiaries 396 516 331 209 Interest income (12 572) (14 506)Interest expenses 77 586 54 381 Change in working capital 23 317 (7 044)Taxes paid 6 (1) (1)Other items from operating activities (51 728) (34 315)Net cash flow from operating activities (17 006) (145 165)
Cash flow from investing activitiesAcquisition of shares (671 090) (223 750)Change in intra-group balances 12 347 804 (101 690)Interest received 12 572 14 506 Net cash flow from investing activities (310 713) (310 933)
Cash flow from financing activitiesProceeds from issue of shares 9 140 394 65 832 New interest-bearing long-term debt 10 444 008 1 290 000 Repayment of interest-bearing long-term debt 10 (107 540) (816 463)Dividends paid 0 (33 980)Interest paid (77 586) (54 381)Net cash flow from financing activities 399 277 (451 008)
Net cash flow 71 557 (5 090)Cash and deposits at 1 January 12 194 17 285 Cash and deposits at 31 December 83 751 12 194

65
STATEMENT OF CHANGES IN EQUITY - PROSAFE SE
(USD 1 000)Share
capitalShare
premium
Share capital reduction
reserveRetained earnings
Convert-ible
BondsCash flow
hedgesTotal
equity
Equity at 31 December 2014
65 894 745 109 0 982 798 0 (29 962) 1 763 839
Net loss 0 0 0 (418 183) 0 0 (418 183)Other comprehensive income
0 0 0 0 0 (9 530) (9 530)
Total comprehensive income 1)
0 0 0 (418 183) 0 (9 530) (427 713)
Dividends 0 0 0 (33 980) 0 0 (33 980)Share issue 6 241 59 591 0 0 0 0 65 832 Equity at 31 December 2015
72 135 804 700 0 530 635 0 (39 492) 1 367 978
Net loss 0 0 0 (253 294) 0 0 (253 294)Other comprehensive income
0 0 0 0 0 (21 693) (21 693)
Total comprehensive income 1)
0 0 0 (253 294) 0 (21 693) (274 987)
Share capital reduction (71 846) 0 71 846 0 0 0 0 Share issue 7 625 197 582 0 0 56 987 0 262 194 Equity at 31 December 2016
7 914 1 002 282 71 846 277 340 56 987 (61 185) 1 355 184
1) Total comprehensive income is attributable to the owners of the company
NOTES - PROSAFE SEAll figures in USD 1 000 unless otherwise stated.
NOTE 1: ACCOUNTING POLICIES The financial statements have been prepared in accordance with the International Financial Reporting Standards (IFRS) endorsed by the European Union (EU) and the requirements of the Cyprus Companies Law, Cap 113. The accounting policies applied to the consolidated accounts have also been applied to the parent company, Prosafe SE. The parent company financial statements should be read in conjunction with the consolidated accounts. The notes to the consolidated accounts provide additional information to the parent company's accounts which is not presented here separately. The Company's functional currency is US dollars (USD), and the financial statements are presented in USD. Investments in subsidiaries and associates are measured at historic cost, unless there is any indication of impairment. In case of impairment, an investment is written down to recoverable amount.

66
NOTE 2: OPERATING EXPENSES
2016 2015
Services from subsidiaries 5 592 6 692 Directors’ fees 622 574 Salaries and management bonus 417 453 Other remuneration 34 37 Payroll taxes 36 34 Pension expenses (100) (92)Auditors' audit fees 155 24 Auditors' other fees 75 10 Other operating expenses 19 423 3 902 Total operating expenses 26 253 11 634
NOTE 3: TANGIBLE ASSETS
Equipment Total
Acquisition cost 31.12.14 211 211 Additions 0 0 Disposals at acquisition cost 0 0 Acquisition cost 31.12.15 211 211 Additions 0 0 Disposals at acquisition cost 0 0 Acquisition cost 31.12.16 211 211
Accumulated depreciation 31.12.14 184 184 Accumulated depreciation on disposals 0 0 Depreciation for the year 8 10 Accumulated depreciation 31.12.15 192 192 Accumulated depreciation on disposals 0 0 Depreciation for the year 7 7 Accumulated depreciation 31.12.16 199 199
Carrying value 31.12.16 12 12
Carrying value 31.12.15 19 19
Depreciation rate (%) 20-30 -

67
NOTE 4: OTHER FINANCIAL ITEMS
2016 2015
Interest receivable from subsidiaries 12 436 14 436 Other interest receivable 136 70 Gain on forgiveness of bond debt 197 600 0 Currency gain 52 238 108 254 Fair value adjustment currency forwards 32 821 44 123 Fair value adjustment interest rate swaps 36 917 0 Other financial income 0 178 Total other financial income 332 148 167 061
Interest expenses (77 586) (54 381)Currency loss (86 320) (178 280)Other financial expenses (10 157) (19 402)Total other financial expenses (174 063) (252 063)
NOTE 5: FINANCIAL ITEMS - IAS 39 CATEGORIES
Year ended 31 Dec 2016Loans and
receivables
Fair value through
profit and loss
Financial liabilities
measured at amortised
cost Total
Interest income 12 572 0 0 12 572 Currency gain 1) 0 0 0 52 238 Fair value adjustment currency forwards 0 0 32 821 32 821 Fair value adjustment interest swaps 0 36 917 0 36 917 Gain on forgiveness of bond debt 0 0 197 600 197 600 Total financial income 12 572 36 917 230 421 332 148
Interest expenses 0 0 (77 586) (77 586)Currency loss 1) 0 0 0 (86 320)Other financial expenses 0 0 (10 157) (10 157)Total financial expenses 0 0 (87 742) (174 063)
Net financial items 12 572 36 917 142 678 158 085
1) Excluded from the category breakdown, but added to the total for net effect.

68
Year ended 31 Dec 2015Loans and
receivables
Fair value through
profit and loss
Financial liabilities
measured at amortised
cost Total
Interest income 14 506 0 0 14 506 Currency gain 1) 0 0 0 108 254 Loan from subsidiary written off 0 0 44 123 44 123 Other financial income 0 0 178 178 Total financial income 14 506 0 44 301 167 061 Interest expenses 0 0 (54 381) (54 381)Currency loss 1) 0 0 0 (178 280)Other financial expenses 0 0 (19 402) (19 402)Total financial expenses 0 0 (73 783) (252 063)
Net financial items 14 506 0 (29 482) (85 002)
1) Excluded from the category breakdown, but added to the total for net effect.
NOTE 6: TAXES
2016 2015
Taxes 1 1
Temporary differences:Loss carried forward (150 451) (44 873)Basis for deferred tax liability (+)/benefit (-) (150 451) (44 873)Deferred tax liability (+)/benefit (-) 0 0
Taxes payable at 31 December 0 0
No deferred tax asset has been recognised in respect of the tax loss carried forward as utilisation of this deferred tax asset is deemed not probable. Tax losses for each year are carried forward for 5 years. The tax rate in Cyprus is 12.5% (2015: 12.5%)

69
Reconciliation in accordance with IAS 12.812016 2015
Loss before taxes (253 294) (418 182)Corporation tax thereon at the applicable tax rates (31 662) (52 273)Tax effect of expenses not deductible for tax purposes 64 940 30 472 Tax on income not taxable in determining taxable profit (41 165) (20 280)Effect of unused current year tax losses 7 887 680 Special contribution to defence fund 1 1 Tax charge 1 1
NOTE 7: SHARES IN SUBSIDIARIES AND ASSOCIATED COMPANIES
(Share capital and carrying value in 1 000)
CompanyShare
capitalCarrying
value 2016Carrying
value 2015 Ownership
Prosafe AS NOK 100 69 316 69 316 100 %Prosafe Offshore AS NOK 100 270 270 100 %Prosafe Management AS NOK 100 15 15 100 %Prosafe (UK) Holdings Ltd GBP 11 000 9 826 9 826 100 %Prosafe Offshore Pte Ltd USD 10 000 498 380 244 533 100 %Prosafe Offshore Services Pte Ltd USD 10 150 150 100 %Prosafe Asia Pacific Pte Ltd SGD 10 7 7 100 %Prosafe Rigs Pte Ltd USD 2 500 040 1 924 600 1 903 873 91 %Axis Nova Singapore Pte. Ltd USD 30 000 30 000 0 100 %Axis Vega Singapore Pte. Ltd USD 30 000 30 000 0 100 %Dan Swift Singapore Pte. Ltd USD 10 000 10 000 0 25 %Total carrying value 2 572 565 2 227 991
In December 2016, the Company acquired a 25% shareholding in Dan Swift Pte Ltd, a company incorporated in Singapore. This company owns one accommodation monohull, the Safe Swift, which is currently laid up in Denmark.
In December 2016, the Company also acquired 100% of the shares in Axis Nova Singapore Pte Ltd and Axis Vega Singapore Pte Ltd. Each of these companies owns a new build vessel under construction in China.
In the income statement for 2016, the following impairment charges were made:Prosafe Rigs Pte Ltd USD 324.4 million and Prosafe Offshore Pte Ltd USD 72.2 million.
In 2015, the following impairment charges were made:Prosafe Rigs Pte Ltd USD 255.7 million and Prosafe Offshore Pte Ltd USD 75.5 million.
There are mortgages on the shares in Prosafe Rigs Pte Ltd and Prosafe Offshore Services Pte Ltd. Please refer to note 13.

70
NOTE 8: OTHER CURRENT ASSETS
2016 2015
Current receivables from group companies 23 4 218 Other current assets 117 18 339 Total other current assets 140 22 557
NOTE 9: SHARE CAPITAL
2016 2015
Issued and paid number of ordinary shares at 31 December 71 399 002 259 570 359Authorised number of shares at 31 December 130 440 177 275 924 148Nominal value at 31 December EUR 0.10 EUR 0.25Number of shareholders at 31 December 6 227 3 961
In August 2016 the share capital of the Company was reduced by cancelling paid up nominal capital (in lieu and without cancelling any shares per se) amounting to EUR 64,633,019 (equivalent to USD 71,846,225), being EUR 0.249 per share on each of the 259,570,359 ordinary fully paid up shares, reducing the nominal value of all such ordinary share from EUR 0.25 each to EUR 0.001 each with the corresponding effect on authorized share capital; the entire amount of EUR 64,633,019 corresponding to the amount cancelled was credited to the capital reduction reserve fund.
In September 2016 4,376,600,000 shares were issued in a private placement, 1,400,839,757 were issued to the bond holders and 12,000,000 shares were issued to convertible bond holders. In November 2016 504,000,000 shares were issued in a subsequent share offering. A 100:1 reverse share split was completed on 30 November 2016. Prior to the reverse split, the share capital consisted of 6,553,010,116 shares at face value of EUR 0.001 each. Subsequent to the reverse split, the share capital consisted of 65,530,102 shares at face value of EUR 0.10 each. In December 2016 5,868,900 shares were issued as a part of the consideration relating to the acquisition of Axis Nova Singapore Pte Ltd and Axis Vega Singapore Pte Ltd.
Convertible bondsAs part of the refinancing completed in September 2016, zero coupon convertible bonds amounting to NOK 81,790,013 were issued. On 23 September 2016, convertible bonds of nominal value NOK 3 million were converted into Prosafe shares. As of 31 December 2016 the remaining outstanding principal of this convertible bond loan was NOK 78,790,013. These bonds can be converted into Prosafe shares at a price of NOK 25 per share. In December 2016, as part consideration of the shares in Axis Vega Singapore Ltd, Axis Nova Singapore Ltd and Dan Swift Singapore Pte Ltd, zero coupon convertible bonds of nominal value NOK 403,092,000 were issued to Axis Offshore Pte Ltd. These bonds can be converted into Prosafe shares at a price of NOK 30 per share.
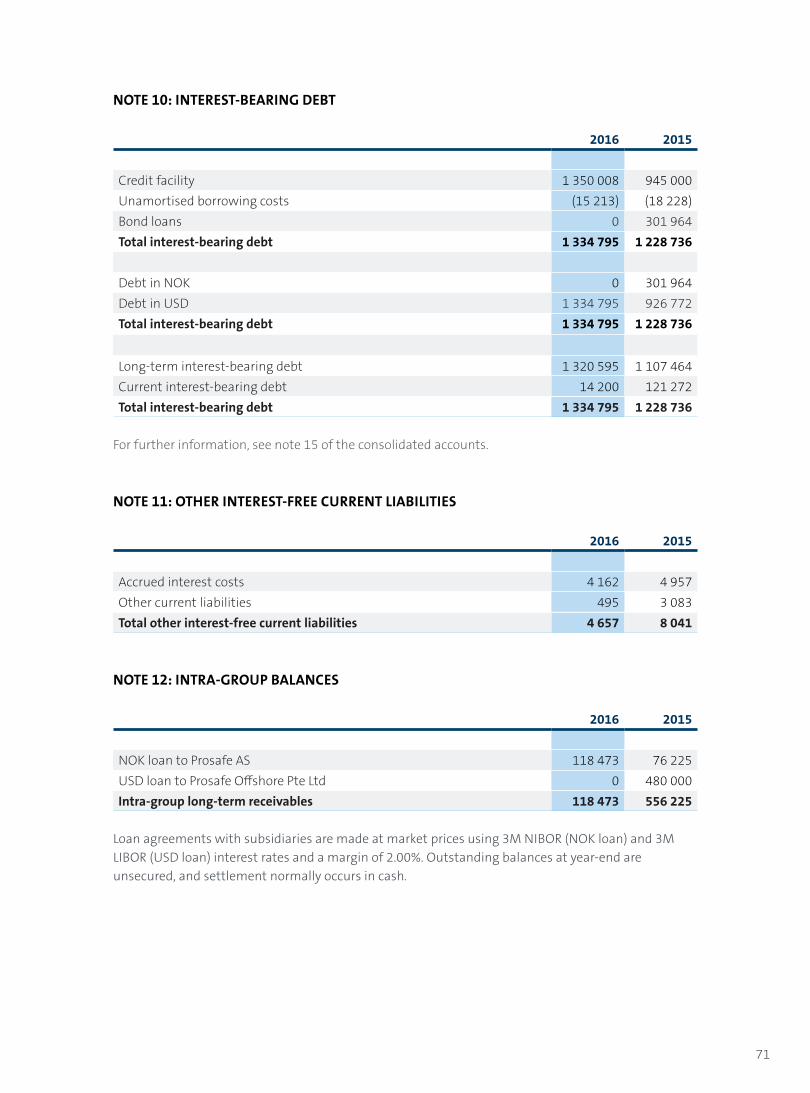
71
NOTE 10: INTEREST-BEARING DEBT
2016 2015
Credit facility 1 350 008 945 000 Unamortised borrowing costs (15 213) (18 228)Bond loans 0 301 964 Total interest-bearing debt 1 334 795 1 228 736
Debt in NOK 0 301 964 Debt in USD 1 334 795 926 772 Total interest-bearing debt 1 334 795 1 228 736
Long-term interest-bearing debt 1 320 595 1 107 464 Current interest-bearing debt 14 200 121 272 Total interest-bearing debt 1 334 795 1 228 736
For further information, see note 15 of the consolidated accounts.
NOTE 11: OTHER INTEREST-FREE CURRENT LIABILITIES
2016 2015
Accrued interest costs 4 162 4 957 Other current liabilities 495 3 083 Total other interest-free current liabilities 4 657 8 041
NOTE 12: INTRA-GROUP BALANCES
2016 2015
NOK loan to Prosafe AS 118 473 76 225 USD loan to Prosafe Offshore Pte Ltd 0 480 000 Intra-group long-term receivables 118 473 556 225
Loan agreements with subsidiaries are made at market prices using 3M NIBOR (NOK loan) and 3M LIBOR (USD loan) interest rates and a margin of 2.00%. Outstanding balances at year-end are unsecured, and settlement normally occurs in cash.

72
Transactions with related parties 2016 2015
TransactionsAdministrative services from subsidiaries (5 592) (6 692)Interest income 12 436 14 436 Dividend 11 397 9 670
Prosafe AS and Prosafe Management AS are performing services on behalf of Prosafe SE relating to management, corporate activities, investor relations, financing and insurance. The services are in-voiced on monthly basis and paid on market terms. Please refer to note 7 to the consolidated accounts for disclosure of remuneration to directors.
Year-end balances
Intra-group long-term receivables 118 473 556 225 Current payables from the ultimate parent to subsidiaries 15 104 105 053
Current receivables and payables are not subject to any interest calculation. The balances will be settled on ordinary market terms.

73
NOTE 13: MORTGAGES AND GUARANTEES
2016 As of 31 December 2016, Prosafe’s interest-bearing debt secured by mortgages totalled USD 1,350 million. The debt was secured by mortgages on the accommodation/service vessels Safe Astoria, Safe Bristolia, Safe Caledonia, Safe Concordia, Safe Scandinavia, Regalia, Safe Boreas, Safe Zephyrus and Safe Notos (net carrying value USD 2,029 million). Negative pledge clauses apply on shares in the vessel owning subsidiaries. Earnings accounts are pledged as security for the credit facilities, but cash will only be restricted if a continuing event of default occurs. A bank guarantee has been issued on behalf of Prosafe Rigs Pte. Ltd. in favour of Westcon Yards AS, amounting to NOK 245 million at 31 December 2016. This bank guarantee is secured by a cash deposit of USD 5 million and a counter bank guarantee of USD 30 million issued under the USD 1.3 billion facility. As at 31 December 2016, Prosafe had issued parent company guarantees to clients and vendors on behalf of its subsidiaries in connection with the award and performance of contracts totalling approximately USD 345 million and a parent company guarantee and indemnity relating to the bank guarantee referred to above. The amounts specified with regard to parent company guarantees reflect the sum of the capped liability under the relevant agreements. 2015 As of 31 December 2015, Prosafe’s interest-bearing debt secured by mortgages totalled USD 945 million. The debt was secured by mortgages on the accommodation/service vessels Safe Astoria, Safe Bristolia, Safe Caledonia, Safe Concordia, Safe Scandinavia, Regalia, Safe Boreas (net carrying value USD 1,391 million) and Safe Zephyrus when delivered. Negative pledge clauses apply on shares in the vessel owning subsidiaries. Earnings accounts are pledged as security for the credit facilities, but cash will only be restricted if a continuing event of default occurs.
Bank guarantees amounted to NOK 290 million at 31 December 2015. The guarantees were secured by parent company guarantee and mortgages on the accommodation/service vessels Safe Regency, Safe Lancia, Safe Hibernia, Safe Britannia and Jasminia (net carrying value USD 0 million).
As of 31 December 2015, Prosafe had issued parent company guarantees to clients and vendors on behalf of its subsidiaries in connection with the award and performance of contracts totalling USD 542 million.

74
NOTE 14: FINANCIAL ASSETS AND LIABILITIES
Year ended 31 Dec 2016Loans and
receivables
Fair value through
profit and loss
Financial liabilities
measured at amortised
cost Book value
Intra-group long-term receivable 118 473 0 0 118 473 Cash and deposits 83 751 0 0 83 751 Other current assets 140 0 0 140 Total assets 202 363 0 0 202 363
Credit facility 0 0 1 350 008 1 350 008 Fair value derivatives 0 59 172 0 59 172 Interest-free long-term liabilities 0 0 1 742 1 742 Intra-group current liabilities 0 0 15 104 15 104 Other interest free current liabilities 0 0 8 941 8 941 Total liabilities 0 59 172 1 375 795 1 434 968
Year ended 31 Dec 2015Loans and
receivables
Fair value through
profit and loss
Financial liabilities
measured at amortised
cost Book value
Intra-group long-term receivable 556 225 0 0 556 225 Cash and deposits 12 194 0 0 12 194 Other current assets 22 557 0 0 22 557 Total assets 590 976 0 0 590 976
Credit facility 0 0 945 000 945 000 Bond loan PRS07 0 0 29 515 29 515 Bond loan PRS08 0 0 56 760 56 760 Bond loan PRS09 0 0 56 760 56 760 Bond loan PRS10 0 0 79 464 79 464 Bond loan PRS11 0 0 79 464 79 464 Fair value derivatives 0 89 217 0 89 217 Interest-free long-term liabilities 0 0 1 733 1 733 Intra-group current liabilities 0 0 105 053 105 053 Other interest free current liabilities 0 0 8 041 8 041 Total liabilities 0 89 217 1 361 791 1 451 008
For further information, see note 18 of the consolidated accounts.

75
NOTE 15: MATURITY PROFILE LIABILITIES
Year ended 31 Dec 2016 2017 2018 2019 2020 2021 →
Interest-bearing debt (downpayments) 14 200 14 200 28 400 42 600 1 250 608 Interests incl interest swaps 66 039 64 980 63 943 62 518 69 455 Intra-group current liabilities 15 104 0 0 0 0 Other interest-free current liabilities 8 941 0 0 0 0 Total 104 284 79 180 92 343 105 118 1 320 063
Year ended 31 Dec 2015 2016 2017 2018 2019 2020 →
Interest-bearing debt (downpayments) 139 500 210 800 233 500 233 500 429 700 Interests incl interest swaps 74 500 84 400 85 000 86 300 146 400 Intra-group current liabilities 105 053 0 0 0 0 Interest-free long-term liabilities 0 2 081 0 0 0 Other interest-free current liabilities 8 041 0 0 0 0 Total 327 094 297 281 318 500 319 800 576 100
NOTE 16: EVENTS AFTER THE BALANCE SHEET DATE
Conversion of convertible bonds to sharesIn February 2017, convertible bonds of nominal value NOK 200,184 were converted into 8,007 new ordinary shares in the Company at a conversion price of NOK 25 per share. Following this conversion, the remaining outstanding principal of the convertible bonds is reduced to NOK 78,589,829. The number of outstanding shares in the Company has increased to 71,407,009 shares, each at a nominal value EUR 0.10.
NOTE 17: GOING CONCERN
The Board of Directors confirms that the accounts have been prepared under the assumption that the Company is a going concern and that this assumption is realistic at the date of the accounts. This assumption is based on the results for the year and the Prosafe Group’s long-term forecasts for the following years. As a result of the suspension of the two contracts in Mexico and the increased liquidity risk, a material uncertainty around the going concern assumption arose during the first quarter this year. Based on the successful completion of the refinancing in Q3 2016, the Board of Directors concludes that the going concern assumption is justified. For additional comments on liquidity risk, please refer to note 19 to the consolidated accounts. Details on the effects on financial covenants and liquidity from the comprehensive refinancing are provided in note 15 to the consolidated accounts.

76
INDEPENDENT AUDITORS' REPORT

77
To the members of Prosafe SEREPORT ON THE AUDIT OF THE FINANCIAL STATEMENTS
Opinion We have audited the accompanying consoli-dated financial statements of Prosafe SE (the “Company”), and its subsidiaries (together with the Company, the “Group”), which are presented on pages 11 to 46 and comprise the consolidated statement of financial position of the Group and the statement of financial posi-tion of the Company as at 31 December 2016, and the consolidated income statement and statements of other comprehensive income, changes in equity and cash flows of the Group, and the income statement, and statements of comprehensive income, changes in equity and cash flows of the Company for the year then ended, and notes to the consolidated financial statements, including a summary of significant accounting policies.
In our opinion, the accompanying consolidated financial statements of the Group and the separate financial statements of the Company give a true and fair view of the financial position of the Group and the Company, respectively, as at 31 December 2016, and of their financial performance and cash flows for the year then ended in accordance with International Financial Reporting Standards as adopted by the European Union (IFRS-EU) and the requirements of the Cyprus Companies Law, Cap. 113 as amended from time to time (the “Companies Law, Cap. 113”).
Basis for opinion We conducted our audit in accordance with International Standards on Auditing (ISAs). Our responsibilities under those standards are further described in the Auditors’ responsibilities for the audit of the consolidated and separate financial statements section of our report. We are
independent of the Group in accordance with the Code of Ethics for Professional Accountants of the International Ethics Standards Board for Accountants (IESBA Code), and the ethical requirements in Cyprus that are relevant to our audit of the consolidated and the separate financial statements, and we have fulfilled our other ethical responsibilities in accordance with these requirements and the IESBA Code. We believe that the audit evidence we have obtained is sufficient and appropriate to provide a basis for our opinion.
Key audit matters Key audit matters are those matters that, in our professional judgment, were of most significance in our audit of the consolidated and the separate financial statements of the current period. These matters were addressed in the context of our audit of the consolidated and the separate financial statements as a whole, and in forming our opinion thereon, and we do not provide a separate opinion on these matters. VALUATION OF GOODWILL AND RIGS Refer to Note 3 and 8 to the consolidated financial statements.
The key audit matter There is a risk of irrecoverability of the Group’s carrying amount of Property Plant and Equipment (specifically, rigs) and goodwill due to weak demand in key markets. An impairment assessment of Property Plant and Equipment and goodwill is carried out annually by the Group by assessing the value in use of the Group’s cash generating units (CGUs) which requires significant assumptions about future developments. Due to the inherent uncertainty involved in forecasting and discounting future cash flows, which are the basis of the assessment of recoverability, this is one of the key judgmental areas that our audit is concentrated on.

78
How the matter was addressed in our audit Our audit procedures included testing of the Group’s budgeting procedures and principles on which the forecasts are based and the integrity of the Group’s discounted cash flow (DCF) model. This included comparison of the key assumptions to external data as well as our own assessments in relation to key inputs and calculations such as utilization rates, operating revenues/expenses, expected lifetime of the rigs, annual capital expenditure and terminal value, based on our knowledge of the industry. We considered the historical accuracy of the Group’s assumptions and used external data and our own valuation special-ists when assessing the discount rate applied. We assessed whether the DCF valuation is performed at the appropriate level of CGU. We also assessed whether the Group’s disclosures about the sensitivity of the outcome of the impairment assessment to changes in key assumptions reflects the risks inherent in the valuation of goodwill.
FINANCIAL RESTRUCTURINGRefer to Note 14, 15 and 19 to the consolidated financial statements and note 9 to the separate financial statements.
The key audit matterThe Group completed a financial restructuring during 2016. The restructuring involved complex transactions such as renegotiation of restrictive covenants, share capital and bond issues and debt restructuring. The accounting treatment of some of these transactions is inherently subjective.
How the matter was addressed in our auditWe inspected the financial restructuring documentation and we assessed the accounting treatment applied as well as the appropriateness of the disclosures to the notes in the financial statements.
INVESTMENTS IN SUBSIDIARIESRefer to Note 7 to the separate financial statements and note 3 to the consolidated financial statements.
The key audit matterThere is a risk of irrecoverability of the Compa-ny’s significant investment in subsidiaries. As a consequence of the risk of impairment of rigs (detailed above), the Company’s invest-ments in the rig owning entities are exposed to impairment risk.
How the matter was addressed in our auditOur audit procedures included testing of the principles and integrity of the Company’s valuation model. These included evaluating the methodology and assumptions used by the Company and comparing the Company’s assumptions to our own assessments in rela-tion to key inputs.
OTHER INFORMATIONThe Board of Directors is responsible for the other information. The other information comprises the information included in the Annual Report, but does not include the consolidated and the separate financial statements and our auditor’s report thereon.
Our opinion on the consolidated and separate financial statements does not cover the other information and we do not express any form of assurance conclusion thereon, except as required by the Companies Law, Cap.113.
In connection with our audit of the consoli-dated and separate financial statements, our responsibility is to read the other information and, in doing so, consider whether the other information is materially inconsistent with the consolidated and separate financial statements or our knowledge obtained in the audit or otherwise appears to be materially misstated. If, based on the work we have performed, we conclude that there is a

79
material misstatement of this other informa-tion, we are required to report that fact. We have nothing to report in this regard. Please also refer to the “Report on other legal require-ments” section where we are reporting on other legal requirements with respect to the management report (designated as “Directors’ report” in the Annual Report) - and the corporate governance statement.
Responsibilities of the Board of Directors for the consolidated and separate financial statementsThe Board of Directors is responsible for the preparation of consolidated and separate finan-cial statements that give a true and fair view in accordance with IFRS-EU and the requirements of the Companies Law, Cap. 113, and for such internal control as the Board of Directors deter-mines is necessary to enable the preparation of consolidated and separate financial statements that are free from material misstatement, whether due to fraud or error.
In preparing the consolidated and separate financial statements, the Board of Directors is responsible for assessing the Group’s and the Company’s ability to continue as a going concern, disclosing, as applicable, matters related to going concern and using the going concern basis of accounting unless there is an intention to either liquidate the Group or the Company or to cease operations, or there is no realistic alternative but to do so.
The Board of Directors is responsible for over-seeing the Group’s and the Company’s financial reporting process.
Auditor’s responsibilities for the audit of the consolidated and separate financial statementsOur objectives are to obtain reasonable assurance about whether the consolidated and separate financial statements as a whole are free from material misstatement, whether due to fraud or error, and to issue an auditors’ report that includes our opinion. Reasonable assurance is a high level of assurance, but is not a guarantee that an audit conducted in accordance with ISAs
will always detect a material misstatement when it exists. Misstatements can arise from fraud or error and are considered material if, individually or in the aggregate, they could reasonably be expected to influence the economic decisions of users taken on the basis of these consolidated and separate financial statements.
As part of an audit in accordance with ISAs, we exercise professional judgment and maintain professional skepticism throughout the audit. We also:
• Identify and assess the risks of material misstatement of the consolidated and separate financial statements, whether due to fraud or error, design and perform audit procedures responsive to those risks, and obtain audit evidence that is sufficient and appropriate to provide a basis for our opinion. The risk of not detecting a material misstatement resulting from fraud is higher than for one resulting from error, as fraud may involve collusion, forgery, intentional omissions, misrepresentations, or the override of internal control.
• Obtain an understanding of internal control relevant to the audit in order to design audit procedures that are appropriate in the circumstances, but not for the purpose of expressing an opinion on the effectiveness of the Group’s and the Company’s internal control.
• Evaluate the appropriateness of accounting policies used and the reasonableness of accounting estimates and related disclosures made by the Board of Directors.
• Conclude on the appropriateness of the Board of Directors’ use of the going concern basis of accounting and, based on the audit evidence obtained, whether a material uncertainty exists related to events or conditions that may cast significant doubt on the Group’s and the Company’s ability to continue as a going concern. If we conclude that a material
80
uncertainty exists, we are required to draw attention in our auditors’ report to the related disclosures in the consolidated and separate financial statements or, if such disclosures are inadequate, to modify our opinion. Our conclusions are based on the audit evidence obtained up to the date of our auditors’ report. However, future events or conditions may cause the Group or the Company to cease to continue as a going concern.
• Evaluate the overall presentation, structure and content of the consolidated and separate financial statements, including the disclosures, and whether the consolidated and separate financial statements represent the underlying transactions and events in a manner that achieves a true and fair view.
• Obtain sufficient appropriate audit evidence regarding the financial information of the entities or business activities within the Group to express an opinion on the consolidated financial statements. We are responsible for the direction, supervision and performance of the Group audit. We remain solely responsible for our audit opinion.
We communicate with the Board of Directors regarding, among other matters, the planned scope and timing of the audit and significant audit findings, including any significant deficiencies in internal control that we identify during our audit.
We also provide the Board of Directors with a statement that we have complied with relevant ethical requirements regarding independence, and to communicate with them all relationships and other matters that may reasonably be thought to bear on our independence, and where applicable, related safeguards.
From the matters communicated with the Board of Directors, we determine those matters that were of most significance in
the audit of the consolidated and separate financial statements of the current period and are therefore the key audit matters. We describe these matters in our auditor's’ report unless law or regulation precludes public disclosure about the matter or when, in extremely rare circumstances, we determine that a matter should not be communicated in our report because the adverse consequences of doing so would reasonably be expected to outweigh the public interest benefits of such communication.
REPORT ON OTHER LEGAL REQUIREMENTSPursuant to the additional requirements of the Auditors and Statutory Audits of Annual and Consolidated Accounts Law of 2009 L.42(I)/2009, as amended from time to time (“Law 42(I)/2009”), we report the following:
• We have obtained all the information and explanations we considered necessary for the purposes of our audit.
• In our opinion, proper books of account have been kept by the Company, so far as it appears from our examination of these books.
• The consolidated and separate financial statements are in agreement with the books of account.
• In our opinion and to the best of our information and according to the explanations given to us, the consolidated and separate financial statements give the information required by the Companies Law, Cap. 113, in the manner so required.
• In our opinion, the management report on pages 1 to 9, the preparation of which is the responsibility of the Board of Directors, has been prepared in accordance with the requirements of the Companies Law, Cap. 113, and the information given is consistent with the consolidated and separate financial statements.

81
• In the light of the knowledge and understanding of the business and its environment obtained in the course of our audit, we have not identified material misstatements in the management report.
• In our opinion, the corporate governance statement includes all information referred to in subparagraphs (i), (ii), (iii) and (vi) of paragraph 2(a) of Article 151 of the Cyprus Companies Law, Cap. 113. OTHER MATTER This report, including the opinion, has been prepared for and only for the Company’s members as a body in accordance with Section 34 of Law 42(I)/2009 and for no other purpose. We do not, in giving this opinion, accept or assume responsibility for any other purpose or to any other person to whose knowledge this report may come to. The engagement partner on the audit resulting in this independent auditor’s report is Sylvia A. Loizides.
Sylvia A. LoizidesCertified Public Accountant and Registered Auditor for and behalf of KPMG Limited Certified Public Accountants and Registered Auditors
KPMG Center,No.11, 16th June 1943 Street,3022 Limassol,Cyprus.
Limassol, 22 March 2017

82
Stadiou 126CY-6020 Larnaca, Cyprus
Phone: +357 2462 2450Fax: +357 2462 2480
Design: Olavstoppen. Photo: Tom Haga
Accommodating the Offshore Industry