Annual report 2016 - Kvaerner Report 2016 web_.… · Completed in connection with periodical ......
84
Annual report 2016
Transcript of Annual report 2016 - Kvaerner Report 2016 web_.… · Completed in connection with periodical ......

Annual report 2016


Contents
Message from the President & CEO 4
Board of Directors' report 6
Annual accounts Kvaerner group 18
Annual accounts Kværner ASA 66
Board of Directors 80
Company information 82
3KVAERNER ANNUAL REPORT 2016
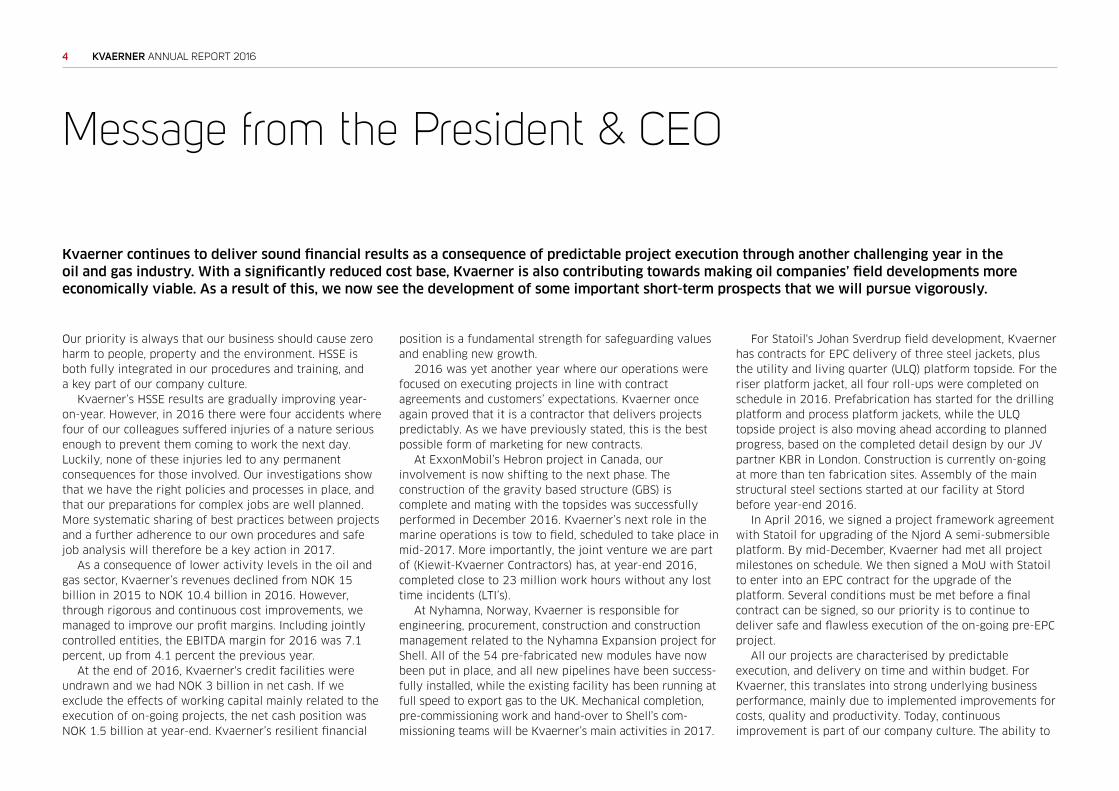
Message from the President & CEO
Our priority is always that our business should cause zero harm to people, property and the environment. HSSE is both fully integrated in our procedures and training, and a key part of our company culture.
Kvaerner’s HSSE results are gradually improving year-on-year. However, in 2016 there were four accidents where four of our colleagues suffered injuries of a nature serious enough to prevent them coming to work the next day. Luckily, none of these injuries led to any permanent consequences for those involved. Our investigations show that we have the right policies and processes in place, and that our preparations for complex jobs are well planned. More systematic sharing of best practices between projects and a further adherence to our own procedures and safe job analysis will therefore be a key action in 2017.
As a consequence of lower activity levels in the oil and gas sector, Kvaerner’s revenues declined from NOK 15 billion in 2015 to NOK 10.4 billion in 2016. However, through rigorous and continuous cost improvements, we managed to improve our profit margins. Including jointly controlled entities, the EBITDA margin for 2016 was 7.1 percent, up from 4.1 percent the previous year.
At the end of 2016, Kvaerner's credit facilities were undrawn and we had NOK 3 billion in net cash. If we exclude the effects of working capital mainly related to the execution of on-going projects, the net cash position was NOK 1.5 billion at year-end. Kvaerner’s resilient financial
position is a fundamental strength for safeguarding values and enabling new growth.
2016 was yet another year where our operations were focused on executing projects in line with contract agreements and customers’ expectations. Kvaerner once again proved that it is a contractor that delivers projects predictably. As we have previously stated, this is the best possible form of marketing for new contracts.
At ExxonMobil’s Hebron project in Canada, our involvement is now shifting to the next phase. The construction of the gravity based structure (GBS) is complete and mating with the topsides was successfully performed in December 2016. Kvaerner’s next role in the marine operations is tow to field, scheduled to take place in mid-2017. More importantly, the joint venture we are part of (Kiewit-Kvaerner Contractors) has, at year-end 2016, completed close to 23 million work hours without any lost time incidents (LTI’s).
At Nyhamna, Norway, Kvaerner is responsible for engineering, procurement, construction and construction management related to the Nyhamna Expansion project for Shell. All of the 54 pre-fabricated new modules have now been put in place, and all new pipelines have been success-fully installed, while the existing facility has been running at full speed to export gas to the UK. Mechanical completion, pre-commissioning work and hand-over to Shell’s com-missioning teams will be Kvaerner’s main activities in 2017.
Kvaerner continues to deliver sound financial results as a consequence of predictable project execution through another challenging year in the oil and gas industry. With a significantly reduced cost base, Kvaerner is also contributing towards making oil companies’ field developments more economically viable. As a result of this, we now see the development of some important short-term prospects that we will pursue vigorously.
For Statoil's Johan Sverdrup field development, Kvaerner has contracts for EPC delivery of three steel jackets, plus the utility and living quarter (ULQ) platform topside. For the riser platform jacket, all four roll-ups were completed on schedule in 2016. Prefabrication has started for the drilling platform and process platform jackets, while the ULQ topside project is also moving ahead according to planned progress, based on the completed detail design by our JV partner KBR in London. Construction is currently on-going at more than ten fabrication sites. Assembly of the main structural steel sections started at our facility at Stord before year-end 2016.
In April 2016, we signed a project framework agreement with Statoil for upgrading of the Njord A semi-submersible platform. By mid-December, Kvaerner had met all project milestones on schedule. We then signed a MoU with Statoil to enter into an EPC contract for the upgrade of the platform. Several conditions must be met before a final contract can be signed, so our priority is to continue to deliver safe and flawless execution of the on-going pre-EPC project.
All our projects are characterised by predictable execution, and delivery on time and within budget. For Kvaerner, this translates into strong underlying business performance, mainly due to implemented improvements for costs, quality and productivity. Today, continuous improvement is part of our company culture. The ability to
4 KVAERNER ANNUAL REPORT 2016

All our projects are characterised by predictable execution, and
delivery on time and within budget. For Kvaerner, this translates into
strong underlying business performance, mainly due to implemented
improvements for costs, quality and productivity.
detect quality deviations at an early stage and identify improvement opportunities is crucial in this respect. Even more essential is our capability to implement the improvements and harvest actual effects across all our projects. Adherence to man datory key working processes and the sharing of best practice was further strengthened with the organisation of all operations under One Kvaerner early in 2016.
For example, from 2014 to 2016, we reduced our cost base for new projects by about 15 to 20 percent. The largest decrease was for jackets. From 2016 and into 2017, we have continued our efforts in improving our delivery model. Our ambition is that we for new topside bids in 2017 have a cost base that is 20 to 25 percent lower than what we had in 2014. This includes reducing our overhead costs by NOK 100 million in 2017. Together with the overhead cost reductions we have made during 2016, Kvaerner has reduced its overhead costs by about NOK 300 million.
Our improvements related to costs, quality and productivity benefit our customers. Reducing capital expenditure will help make our customers’ field developments more economically viable. Further, they have a direct effect on Kvaerner’s competitiveness, both for new large EPC projects, and, to an even greater extent, when we compete for medium-sized contracts for upgrades and modification.
Several of our customers report that the industry’s improvements over the last years make it possible to realise new projects with a 20 to 50 percent lower cost level compared to 2013. Hence, some important projects are moving forward. For 2017 and 2018, we have
identified certain opportunities within our traditional EPC segment. Nevertheless, several oil companies have limited flexibility to launch large projects. Overall, we see higher potential for increased activity in segments where each contract is typically of a more moderate size and where the value we add is increasing compared to previous projects.
The continued volatility of the market creates challenges for our activity levels in 2017. A key objective will be to continue to balance our capacity with the short-term activity level, and simultaneously ensure that we have the right capabilities available for future growth. Since 2015, Kvaerner’s workforce is reduced by approximately 400 people. Of these, the majority have left through natural attrition, retirement and gratuity pension. At the same time, Kvaerner has also recruited new specialists and trained existing personnel within selected areas. It is a priority to ensure recruitment to balance age representation in the organisation. As an example of the latter, we will in 2017 continue to offer around 60 apprenticeships.
The core of Kvaerner’s strategy is to maintain our reputation for predictable delivery of EPC, hook-up and commissioning for both offshore platforms and onshore plants. In a competitive market, we see that Kvaerner’s recognised quality level is exactly what many customers are asking for.
Jan Arve HauganPresident & CEOKvaerner
5KVAERNER ANNUAL REPORT 2016

Operational highlightsNew contracts secured
> Framework agreement with Statoil for upgrade of Njord A platform, including:– Call-off #1: front-end engineering and design– Call off #2: pre-EPC work: preparations and docking
Key project milestones and deliveries
> Nyhamna: Largest ever turnaround at Norwegian onshore facility. Completed in connection with periodical maintenance shut-down
> Johan Sverdrup riser platform jacket: All four roll-ups completed on schedule
> Johan Sverdrup drilling platform and process platform jackets: Detailed design and engineering completed, and prefabrication started
> Johan Sverdrup utility and living quarter topside (ULQ): reached 20 percent completion in the third quarter and detail design freeze in November
> Hebron: Completion of mechanical outfitting of systems inside the GBS, following the completion of the construction phase. Subsequent successful submergence test of the GBS, with consecutive mating of GBS and platform topside
> Njord A: Preparations for upgrade and execution of docking of the platform
Strategic developmentIn 2016, Kvaerner balanced the need to work at full
capacity to deliver on-going projects predictably, with the requirement to simultaneously prepare the organisation for a period with reduced activity level. Kvaerner has also made significant steps to further improve its productivity and reduce costs. The objective is to position the company to win new projects while executing its order backlog safely and according to plan. As an example of the latter, at the end of 2016 all of Kvaerner’s on-going projects were on track for predictable delivery.
Strategic development and improvement is a continuous process. In 2015, Kvaerner announced that the company’s own improvements over the last few years, including reduced project cost base and internal costs, made it possible to offer steel jacket substructures at the same price level as ten years ago adjusted for inflations. This achievement was a key enabler for winning three of the four jacket contracts for the first phase of the Johan Sverdrup development.
In 2016, Kvaerner continued its efforts to improve productivity and thereby the company’s competitiveness. One such effort was the investment in increased automatisation of fabrication, which started yielding positive results in 2016.
Another major improvement effort was a reorganisation of Kvaerner which was completed at the end of May 2016. It resulted in a simpler organisation model and by implementing streamlined work processes in the projects. The core of the new organisational structure is a stronger focus on project execution where value creation takes
place. The objective is to increase productivity through better internal cooperation and utilisation of common resources as well as spending fewer working hours on internal processes between different units. It also introduced a simplified company structure with a merging of legal entities in Norway.
In total, these improvements have reduced Kvaerner’s costs for new platform topsides by 15 to 20 percent, compared to the cost a few years ago. This is important as Kvaerner understands that several oil companies are ready to start new projects if the field development is profitable with an oil price of USD 40 per barrel or lower. Kvaerner’s improvements over the last few years mean that the company can deliver many projects below or in line with that threshold.
Kvaerner also believes that this industry can achieve significant further improvements if the many on-going cost improvement initiatives in individual companies can be combined. As one of the leading players, Kvaerner is actively engaged in driving such joint efforts forward.
At the core of Kvaerner’s strategy is to maintain the company’s reputation as a contractor that delivers predictably for EPC and hook-up and commissioning projects to both offshore platforms and onshore plants. An important part of this strategy is to continue the efforts to become even more competitive, both in Norway and internationally.
In 2017, Kvaerner will actively develop new strategic prospects, with focus on adjacent segments such as major
Board of Directors' report 2016
6 KVAERNER ANNUAL REPORT 2016 BOARD OF DIRECTORS’ REPORT

platform modifications and decommissioning. The framework agreement with Statoil for upgrade of the Njord A platform is a good example of the former. Kvaerner also has a solid track record within decommissioning, as proven by the NOK 200 million North Sea decommissioning award early 2017.
In the North Sea in particular, Kvaerner sees future opportunities for the company’s standardised Subsea on a Stick® – unmanned wellhead platform. Additionally, the company aims to develop new products and services such as the Arctic Driller – a concrete drilling platform for exploration in Arctic waters, and a concrete LNG solution for Arctic regions.
Kvaerner will also consider selected structural measures to grow and create an even more robust company, if the right opportunities arise.
Business overviewPrinciple operationsKvaerner is one of the industry’s market leaders for delivery of complete offshore platforms and onshore plants for oil and gas upstream projects. The company has been a key contractor for around 70 percent of the platform development projects on the Norwegian continental shelf. Kvaerner has also delivered a number of challenging offshore projects elsewhere in the world.
The track record includes 46 steel jacket contracts delivered in 45 years. For concrete substructures to field developments globally, Kvaerner is the undisputed market leader with two dozen reference projects. Kvaerner has also been a key contractor for seven out of the seven largest onshore oil and gas plants in Norway.
In addition, Kvaerner has been a front runner for establishing the first purpose-built facility for effective and environmentally friendly decommissioning and recycling of offshore platforms after shut down. The company has extensive experience from decommissioning of offshore installations from both the Norwegian and UK continental shelf, with a recycling rate of more than 99 percent.
Kvaerner has a particularly strong position for projects where engineering, procurement and construction (EPC) are
integrated in one contract. With the technical complexity of large oil and gas installations with a relatively short schedule for delivery, there are few contractors world-wide who have credible expertise for such complete deliveries.
The implementation of a new and more efficient matrix-based organisational structure was completed in May 2016. The base organisation ensures effective use of common resources across Kvaerner with most employees organised in one of the two functional areas:
> EPCI (Engineering, Procurement, Construction and Installations): personnel involved in the execution of projects, including engineering, procurement, construction and installation
> Commercial Project Services (CPS): personnel within administration and support functions who work across the projects and operational areas
The projects are the main focus of the new model. The execution of all key projects are organised as one of the four operational areas’ responsibility:
> Process Solutions: Responsible for delivering contracts for platform topsides and onshore facilities. Current projects include execution of the Johan Sverdrup ULQ project, the Nyhamna Onshore project, and the pre-EPC call-off for the preparations and docking of the Njord A platform
> New Solutions: Responsible for hook-up, completion, decommissioning and business opportunities in adjacent segments. Current projects include assistance for hook-up and commissioning related to the Aasta Hansteen platform as well as two projects awarded to Kvaerner early 2017; offshore hook-up of the Johan Sverdrup riser platform and dismantling and recycling of a North Sea platform
> Concrete Solutions: Responsible for concrete substructure projects. Current projects include the Hebron GBS project and studies for customers related to Kvaerner’s concepts for Arctic LNG
> Structural Solutions: Responsible for steel jacket substructure projects, including three jackets for the Johan Sverdrup field development. Also responsible for
Kvaerner’s Subsea on a Stick® concept and the high-tech piping manufacturing plant which is integrated in the facility in Verdal. Current projects include three EPC contracts for jackets to the Johan Sverdrup field as well as several smaller projects within piping technology
From 1 March 2017, the organisational structure was adjusted to further reduce costs and improve competitiveness.
Strategic partnerships and use of subcontractorsKvaerner’s business model includes a clear strategy for not executing all parts of a project in-house if it benefits the value chain to use partners and subcontractors. Internally, the company has its own multi-discipline organisation and specialised facilities organised in focused functional areas. In addition, Kvaerner has established strategic cooperation with selected partners. The joint venture with KBR as a partner for the Johan Sverdrup ULQ Topside contract illustrates the potential synergy effects of such partner–ships in combination with Kvaerner’s own capabilities. The use of Aker Solutions as engineering subcontractor on Eldfisk and Edvard Grieg, as well as the close cooperation for Njord A and Johan Sverdrup hook-up, is another example of strategic partnerships. Kvaerner will continue to develop more effective and flexible delivery models, and optimise contributions from external partners when that can enhance the results.
Project Execution ModelKvaerner’s Project Execution Model (PEMTM) is based on 40 years’ experience with complex oil and gas industry projects, and the model is continuously further improved by including learnings and experiences from execution of EPC projects. The PEMTM ensures that the work progresses in a controlled manner and that Kvaerner meets its business objectives. Consequently, the PEMTM contributes to maintain our record of safe and successful project execution. The Kvaerner PEMTM shall safeguard safety, the environment, quality and cost efficiency by securing:
> Quality in our deliveries by proper quality planning,
7KVAERNER ANNUAL REPORT 2016BOARD OF DIRECTORS’ REPORT
assurance and control throughout the value chain, where strong efforts shall be invested in the early phases giving optimum return on investment
> Continuous improvement of processes and products. Lessons learnt from previous projects are always taken into account
> Predictability in project execution and operations by using standard and transparent methodology well known to the teams
> Coordinated efforts across disciplines based on understanding of interactions between work processes
> Control of internal and external interfaces as a foundation for a successful project execution
> Effective management within the defined scope, quality, resources (time and budget) and risk criteria
> That appropriate governance and control are developed, executed and monitored throughout the project’s life-time
Markets and target regionsMarketsThe fundamental driver for Kvaerner’s business is the global demand for oil and gas. Over the last years, the dynamics in the oil and gas industry has changed dramatically. The industry has witnessed an oversupply of oil and LNG projects that are now coming on stream, thereby continuing to put pressure on oil and gas prices. As a consequence the oil and gas prices have fallen significantly below the levels seen in 2013 and 2014. Despite some uptick in oil price during 2016, several analysts now suggest a lower-for-longer oil price scenario and oil companies appear to be lowering their planning prices. As a consequence, some field developments have been postponed. For those developments still being pursued, commercial terms and conditions are under significant pressure.
Target regionsKvaerner’s traditional home markets, the Norwegian and UK continental shelves, are evolving. Overall greenfield capex spend is assumed to be lower in the coming years.
We expect to see a gradual increase of opportunities in the Barents Sea and, thus, an increasing share of floating production facilities relative to fixed platforms. In the North Sea and Norwegian Sea, we anticipate more tie-ins and associated host platform modifications.
Kvaerner offers effective execution of challenging projects, particularly for developments in regions with harsh weather conditions. Geographically, Kvaerner has a strong position for oil and gas projects in the countries around the Arctic Circle, particularly in Norway, Canada and Russia. For the market in Russia, the geopolitical situation with trade restrictions may limit some opportunities.
Kvaerner has a network of offices around the world for studies and business development. Outside Norway, Kvaerner currently has offices in London, UK; Houston, USA; Moscow, Russia; St. John's, Canada; Beijing, China and Ulvila, Finland. In Norway, Kvaerner has own facilities in Verdal, Trondheim, Molde, Stord and Oslo.
Market segmentsKvaerner is fully focused on upstream oil and gas production projects and pursues opportunities within the following market segments:
> EPC projects for fixed and floating oil and gas production facilities
> EPC projects for steel and concrete substructures for offshore platforms
> EPC projects for onshore oil and gas upstream facilities
> EPC projects for larger rebuilds/refurbishment of offshore platforms/onshore plants
> Separate contracts for assembly, hook-up, completion, commissioning of offshore platforms and onshore plants
> Separate contracts for engineering management, procurement management, fabrication management or project management related to offshore platforms or onshore plants
> Unmanned wellhead platforms for tieback of satellite fields and reservoirs
> Major modifications and redeployments of offshore facilities
> Decommissioning of offshore installations
Objectives and strategic directionKvaerner's ambition is to support oil companies in developing their most challenging projects.
Kvaerner's mission as a supplier in this industry is clear: We make it possible for our customers to realise the world's most amazing and demanding projects. We make it possible for our clients and for societies to realise energy projects for prosperity, in balance with our target of zero harm to people, property and the environment.
Strategic directionWith lower oil prices and significant pressure on commer–cial terms and conditions, Kvaerner continues its efforts to further improve competitiveness. Kvaerner has a strong track record of delivery on time and quality, and will con–tinue its focus on improving delivery model and cost position. The company saw positive effects of this in 2015–2016 and expects to see further effects of these efforts when bidding for projects in 2017 and onwards.
Against this background, Kvaerner's focus for the coming years is to:
> Successfully execute its existing backlog
> Continue cost and operational improvement initiatives
> Achieve a profitable development of business opportunities in adjacent market segments
> Gradually strengthen its position as a leading EPC player
Report for 2016FinancialsKvaerner presents its accounts in accordance with International Financial Reporting Standards (IFRS), as adopted by the EU. Unless otherwise specified, figures in brackets represent figures for the previous year (2015).
Profit and lossConsolidated operating revenue for 2016 was NOK 7 896 million (NOK 12 084 million). Lower revenue compared to 2015 is mainly due to lower activity within operational area Process Solutions.
Earnings before interest, taxes, depreciation,
8 KVAERNER ANNUAL REPORT 2016 BOARD OF DIRECTORS’ REPORT

amortisation and impairment (EBITDA) were NOK 629 million for 2016 (NOK 574 million).
The group's key measure of financial performance is adjusted EBITDA. Adjusted EBITDA excludes impact of embedded foreign currency derivatives reported in jointly controlled entities closely related to Kvaerner’s operating activities. Please see Note 8 Operating segments (page 38) how the adjusted EBITDA measure is derived from the consolidated financial statements.
Adjusted EBITDA amounted to NOK 680 million, an increase of NOK 144 million from 2015 (NOK 536 million). The adjusted EBITDA margin for 2016 was 8.6 percent (4.4 percent). The positive margin development reflects that Kvaerner has continued its processes to improve costs, productivity and quality. The effect of better performance and improved project portfolio mix has resulted in a higher margin compared to last year. The result for the year is further positively impacted by final account for a recently completed project, including performance bonus of NOK 50 million, recognition of accumulated profit for three projects passing 20 percent progress and settlement with a sub-contractor.
Adjusted EBITDA excludes NOK 50 million loss accounting impact from embedded foreign currency derivatives, related to equity accounted investees closely related to Kvaerner’s operating activities (NOK 38 million profit).
Depreciation and amortisation charges totalled NOK 100 million, an increase of NOK 19 million from 2015 (NOK 81 million), an increase mainly reflecting capital investments at the Verdal yard and full year amortisation of intangible assets that were developed during 2015.
Goodwill impairment charges amounted to NOK 198 million and relates to operating area Concrete Solutions. The impairment is based on the company’s impairment test in accordance with International Financial Reporting Standard (IFRS) IAS 36 Impairment of Assets, reflecting accounting judgements following market developments. The impairment is a result of assessment of the uncertainty of the amounts and timing of new project awards and does not reflect Kvaerner’s view on long-term prospects within
the concrete business. Kvaerner will continue to invest in concrete core competence to position itself to win new projects.
Consolidated earnings before interest and taxes (EBIT) were NOK 331 million (NOK 493 million). Net financial expense amounted to NOK 117 million (income of NOK 86 million) and include accounting loss on embedded derivatives of NOK 128 million (gain of NOK 133 million), net interest expense of NOK 4 million (NOK 35 million), other financial expenses of NOK 8 million (profit of NOK 8 million), partly offset by profit on foreign currency contracts of NOK 22 million (loss of NOK 24 million) and net foreign exchange gain of NOK 1 million (NOK 3 million). Foreign currency embedded derivatives impact if reflecting accounting effects of awarded multicurrency contracts. Loss on foreign currency contracts is related to hedging instruments not qualifying for hedge accounting.
The tax expense was NOK 132 million (NOK 241 million), which corresponded to an effective tax rate of 62 percent (42 percent). The relatively high rate compared to the Norwegian statutory tax rate of 25 percent is mainly due to goodwill impairment not being tax deductible and tax increasing items related to withholding taxes, deferred tax assets not recognised on losses in some jurisdictions and higher tax rate in some jurisdictions, in which the group operates. Excluding impact of goodwill impairment, the effective tax rate for the year was 32 percent. The nominal tax rate in Norway is 24 percent as from 2017 with insignificant impacts on 2016 deferred tax charge resulting from valuing deferred tax assets at the lower tax rate.
Profit from continuing operations amounted to NOK 82 million (NOK 337 million), and basic and diluted earnings per share from continuing operations were NOK 0.31 (NOK 1.26).
Net profit from discontinued operations was NOK 345 million (NOK 56 million). The result for was positively impacted by foreign exchange accounting effect on repayment of capital from subsidiaries of NOK 261 million (NOK 139 million). The result also reflects net insurance recoveries related to the Longview Power project of USD 23 million. Basic and diluted earnings per share for
discontinued operations were NOK 1.30 (NOK 0.21).Net profit for total operations in 2016 was NOK
426 million (NOK 393 million), with basic and diluted earnings per share of NOK 1.60 (NOK 1.47). The increase from last year’s result is due to improved EBITDA, lower tax charges and higher result from discontinued operation, partly offset by goodwill impairment charges and negative accounting effect of embedded derivatives.
Cash flowConsolidated cash flow from operating activities depend on a number of factors, including progress on and delivery of projects, changes in working capital and pre-payments from customers. Net cash inflow from operating activities was NOK 1 718 million in 2016 (inflow of NOK 1 183 million). The increase mainly reflects reduced working capital, increased adjusted EBITDA and lower tax payments, partly offset by lower dividends from equity accounted investees. Cash inflow is positively impacted by settlement on the Longview Power project of USD 70 million and net insurance recovery of USD 23 million related to the same project.
Net cash outflow from investing activities in 2016 was NOK 201 million (outflow of NOK 50 million). The capital expenditures for 2016 amounted to NOK 203 million (NOK 55 million). Beyond investments in three new cranes at the facility in Verdal, Norway, there have been other, smaller capacity and maintenance investments. A total maintenance capex for the group of approximately NOK 30−50 million is expected annually.
Net cash outflow from financing activities was NOK 30 million in 2016 (outflow of NOK 786 million), reflecting fees on credit facility and transactions in own shares. Higher outflow in 2015 was mainly due to repayment of borrowings of NOK 500 million and dividend payments of NOK 220 million.
The group’s total assets were NOK 5 980 million on 31 December 2016 (NOK 5 649 million). Net current operating assets (NCOA) were negative NOK 1 534 million at year-end, a reduction of NOK 477 million from the end of 2015 (negative NOK 1 057 million). The group’s NCOA is normally
9KVAERNER ANNUAL REPORT 2016BOARD OF DIRECTORS’ REPORT

expected to be in the range of negative NOK 500 million to negative NOK 1 500 million, with quarterly fluctuations. Movements in working capital will impact cash balances and at year-end 2016, net cash excluding negative NCOA was NOK 1 513 million. Equity as of 31 December 2016 totalled NOK 2 656 million (NOK 2 550 million). The group’s equity ratio was 44.4 percent at year-end 2016, compared with 45.1 percent at year-end 2015.
The loan agreement that was refinanced in July 2015, a revolving credit facility of NOK 2 000 million, is maturing in July 2020. The facility is provided by a syndicate of high quality international banks. The revolving credit facility was undrawn per 31 December 2016. The terms and conditions include restrictions which are customary for these kinds of facilities, including inter alia negative pledge provisions and restrictions related to acquisitions, disposals and mergers. There are also certain provisions of change of control included in the agreement. There are no restrictions for dividend payments. The facility is unsecured.
The financial covenants are based on three sets of key financial ratios; an equity ratio based on consolidated total borrowings/consolidated total equity, a cash covenant calculated by consolidated total borrowings less consolidated net current operating assets and consolidated cash and cash equivalent assets and an interest coverage ratio based on consolidated EBITDA/consolidated finance costs. The financial covenants are tested on a quarterly basis. As of 31 December 2016 the company is in compliance with all covenants. The margin applicable to the facility is based on a price grid determined by the gearing ratio.
Consolidated non-current assets totalled NOK 1 505 million (NOK 1 715 million) as of 31 December 2016, of which goodwill amounted to NOK 607 million (NOK 805 million). Net interest-bearing deposits and loans amounted to NOK 3 047 million at the end of 2016 (NOK 1 562 million). With undrawn, committed, long-term credit facilities of NOK 2 billion, the Board considers available capital adequacy and liquidity as good and ensures that Kvaerner is well positioned to meet the challenges and opportunities over the coming years.
Segment reviewFollowing the sale of Kvaerner’s onshore construction business in North America in December 2013, Kvaerner only has one reportable segment; Field Development (previously named Upstream). Up until year-end 2015; the segment included the business areas Topsides, Onshore, Jackets and Concrete Solutions.
As from 1 January 2016, Kvaerner changed to a matrix based organisation model with enhanced focus on project execution. The business area structure has been removed and most of the Norwegian employees are allocated into resource centres. The previous business areas are replaced by the following operational areas: Process Solutions (previously Topsides and Onshore), Structural Solutions (previously Jackets), New Solutions and Concrete Solutions. The operational areas comprise the Field Development segment as from 2016. These changes have not changed the group’s segment reporting.
Field DevelopmentOperating revenues in 2016 totalled NOK 10 364 million (NOK 14 917 million). EBITDA was NOK 741 million (NOK 613 million), with an EBITDA margin of 7.1 percent, an increase from 4.1 percent in 2015. The positive development in EBITDA and margin reflects that Kvaerner has continued its processes to improve costs, productivity and quality. The effect of better performance and improved project portfolio mix has resulted in a higher margin compared to last year. The result is further positively impacted by final account for a recently completed project, including performance bonus of NOK 50 million, recognition of accumulated profit for three projects passing 20 percent progress and settlement with a sub-contractor. Reduced activity is mainly within operational area Process Solutions, where one major project is approaching completion, but activity has also been lower within Concrete Solutions. These reductions are partly offset by higher activity within Structural Solutions with EPC contracts for three steel jacket substructures to the Johan Sverdrup field development being executed.
Order intake for the year amounted to NOK 2 938
million (NOK 12 846 million) and reflects growth in existing projects as well as smaller orders. Order backlog as of 31 December 2016 was NOK 6 459 million (NOK 14 346 million).
Process Solutions’ activity in the year was mainly related to Nyhamna onshore project, Johan Sverdrup ULQ project and FEED and pre-EPC work related to the Njord A Future project. Further, offshore hook-up and commissioning of the Edvard Grieg platform was completed in first quarter 2016.
Remaining modules for the Nyhamna Expansion project were delivered on site early 2016 with following fabrication and installation activities. In May, Kvaerner completed the largest ever turnaround at a Norwegian onshore facility, Turn Around 2016, which was exectuted in connection with a regular maintenance shutdown at Nyhamna. Peak manning in the project was reached during the summer. The Nyhamna project is completing remaining construction and pre-commissioning activities in parallel with on-going commissioning being executed by Shell with support from Kvaerner. The Static Var System (SVS) plant has been handed over to Shell according to schedule and put into operation. Mechanical completion, pre-commissioning work and hand-over to commissioning will be the main activities going forward.
The Johan Sverdrup ULQ topside project was moving ahead according to planned progress. Construction started at the Stord yard and three other locations end of March 2016. Design engineering was completed according to schedule and construction is on-going at thirteen sites in Norway, Sweden and Poland. Project headquarters were moved from Leatherhead in the UK to Stord, Norway in December.
The Njord A platform moored at Stord in August 2016. The Njord A Future project completed the FEED in December according to plan and post FEED work was agreed. Pre-EPC work is progressing according to schedule with start of prefabrication of pontoons early December, removal activities completed and entering into the dry-dock mid-December. Memorandum of Understanding (MOU) for the EPC phase was signed in December.
Within Concrete Solutions, the Hebron gravity based
10 KVAERNER ANNUAL REPORT 2016 BOARD OF DIRECTORS’ REPORT

structure (GBS) project progressed in Newfoundland and Labrador, Canada. During the year, construction activities continued at the Bull Arm deep-water site with mechanical outfitting activities in the shaft and completion of the civil works. Construction of the Hebron GBS was completed in 2016. In December, the submergence of the GBS was performed and mating with the topsides was successfully completed in December. The project is a 50/50 joint venture between Peter Kiewit Infrastructure and Kvaerner.
Kvaerner will deliver the three largest steel jacket substructures to the Johan Sverdrup field development, and detailed engineering for all three jackets has been completed in 2016. In October, four clusters and two floatation tanks for the riser platform arrived from Dubai. Assembly of the riser jacket is on-going in Verdal according to plan and important milestones for the project were the last roll-up of the four main frames in October and installation of the first two pile clusters in December and January. This jacket shall be delivered in summer 2017. For the production platform and drilling platform jackets to be delivered in 2018, steel cutting started in second quarter and prefabrication is on-going both in Verdal and in Dubai. The arbitration process for the Nordsee Ost project is still on-going and will take time due to high complexity. It is currently not possible to estimate when the arbitration will be finalised. Please see Note 29 Contingent events (page 64), for further details.
Discontinued operationsIn December 2013 Kvaerner sold its onshore construction business in North America to Matrix Service Company. Kvaerner retained the assets and liabilities related to the contract with Longview Power LLC, including any financial effects of the arbitration.
In early March 2016, settlement agreements were reached with Amec Foster Wheeler North America Corp of all claims related to the Longview Power project. Kvaerner received the settlement amount of USD 70 million in March 2016, replacing recognised receivable with cash in the balance sheet. In addition, the result from discontinued operations reflects positive impacts of insurance recoveries,
totalling more than net USD 23 million, recognised and received in 2016.
Net profit from discontinued operations was NOK 345 million (NOK 56 million). The result for 2016 was significantly impacted by a foreign exchange accounting effect of NOK 261 million on repayment of capital (NOK 139 million). Please see Note 28 Discontinued operations (page 64) for Summary of financial data for Discontinued operations.
Corporate and unallocated costsFor the full year, unallocated costs were NOK 61 million (NOK 77 million). It is expected that the recurring level of net corporate costs will be approximately NOK 60–70 million annually.
Capacity reductions and restructuring costsKvaerner continues to drive cost reductions, productivity improvements and other measures to strengthen competitiveness. In 2016, restructuring costs of NOK 18 million was expensed (NOK 25 million). Additional restructuring and capacity reduction costs for 2017 and onwards will depend on outcome of tender activities. For 2015 and 2016 combined, Kvaerner has reduced its number of employees by almost 390.
Going concernBased on the group’s financial results and position described above, the Board of Directors confirms that the company is a going concern and that the annual accounts for 2016 have been prepared under this assumption.
Parent company accounts The parent company, Kværner ASA, had a net loss of NOK 26 million for 2016 (loss of NOK 64 million). Kværner ASA has no employees and operating expenses are mainly shareholder costs for the parent holding company. The parent company’s main asset is shareholdings in subsidiaries. Equity ratio was 62.7 percent at year-end 2016 (62.8 percent).
Dividend policyThe Board of Directors revised the dividend policy in July 2015 to reflect the developments in Kvaerner’s long term markets and outlook. The dividend policy reflects that retaining a solid balance sheet and cash position is a priority.
Kværner ASA's dividend policy is based on semi-annual dividend payments. Decisions as to dividend payments depend on outlook, liquidity and considerations such as alternative use of cash and strengthening of the company’s financial structure. In periods of weak economic conditions, the dividend can be paid-out as long as the group’s capital structure permits. The Board approves interim dividends based on an authorisation from the General Meeting, while the Annual General Meeting approves the final (and total annual) dividend based on a proposal from the Board of Directors.
No dividends were paid in 2016.
Allocation of net resultsThe Board of Directors thereby proposes the following allocation of net loss in Kværner ASA:
Transferred from other equity (NOK 26 million)Total allocated (NOK 26 million)
Total equity in Kværner ASA after the proposed allocation of net loss amounts to NOK 4 367 million (NOK 4 405 million).
Events after the balance sheet dateFurther simplification of organisation and workforce reductions Kvaerner will further simplify the organisation, reduce the amount of management positions and downsize the workforce with 40–50 employees during first half of 2017. The objective is to further reduce costs to continue strengthening the competitiveness. As a consequence, the organisational structure was adjusted effective from 1 March 2017 including changes to the executive management team.
11KVAERNER ANNUAL REPORT 2016BOARD OF DIRECTORS’ REPORT

Changes to the executive management team (EMT)In January 2017, Sturla Magnus was appointed new executive vice president (EVP) for Structural Solutions and responsible for Kvaerner's yard at Verdal. He started in his new position 6 March 2017. Previous EVP of Structural Solutions, Sverre Myklebust stepped down as EVP for Structural Solutions at year-end 2016. Ellen Grete Andersen, Terje Johansen and Knut Johan Malvik will no longer be part of EMT as of 1 March 2017. They will continue in Kvaerner being responsible for HSSE & Quality Management, Completion/HUC and HR, Organisational Development & Continual Improvement respectively.
Contract for offshore hook-up of the riser platform for Johan Sverdrup On 31 January 2017, Kvaerner was together with Aker Solutions awarded a contract for offshore hook-up of the riser platform for the Johan Sverdrup field. Kvaerner will formally operate as a subcontractor to Aker Solutions. The contract has an estimated value for Kvaerner of about NOK 450 million. The scope will primarily consist of planning, management and hook-up of the seven platform modules, scheduled to arrive in Norway in second quarter 2018. The contract also includes options for offshore hook-up of the process and living quarter platforms for Johan Sverdrup.
Contract for decommissioning projectIn February 2017, Kvaerner won a contract to dismantle and recycle a North Sea platform with contract value of approximately NOK 200 million. Kvaerner will dismantle the platform, recycle and dispose all materials. The deconstruction and disposal work will start with the receipt of the first units in 2017 and continue throughout 2019.
DividendThe Board of Directors has proposed no dividend distribution for second half of 2016. A robust balance sheet and cash position is important to maintain resilience through the challenging cycle and come out with an even stronger business. The solid financial position is a competitive lever in the positioning for new contracts.
It also provides flexibility to pursue selected opportunities for strategic development in connection with the on-going market shift.
Corporate governanceKvaerner performs corporate governance within the relevant framework of several different legal regulations and principles in the respective jurisdictions in which it operates.
As Kvaerner exercises ultimate governance and control from its headquarters in Norway, and is listed on Oslo Børs (Oslo Stock Exchange), Norwegian legislation is a significant framework in terms of company and securities legislation, financial reporting and other corporate issues. As part of its corporate governance model, Kvaerner’s Board of Directors has adopted the Norwegian Code of Practice for Corporate Governance. Kvaerner’s detailed corporate governance statement can be found on www.kvaerner.com/cg. In general, corporate governance in Kvaerner is based on the model wherein shareholders, at the Annual General Meeting appoint the Board of Directors to act as their representatives in governing the company.
The Board of Directors sets the strategic direction, the overall governance structure, values and policies, in accordance with Norwegian legislation and frameworks. Kvaerner has a Code of Conduct and a set of global policies and procedures which provides direction on acceptable performance and guides decision-making in all parts of the company. In 2016 the Kvaerner Code of Conduct was reviewed and an updated version was published in first quarter 2017. All Kvaerner policies are subject to an annual review and, when deemed necessary, updates are made.
As set out in the Norwegian Public Limited Liability Companies Act, Kvaerner's Board of Directors has established an Audit Committee, currently consisting of the Directors Lone Fønss Schrøder (Chair), Thorhild Widvey and Rune Rafdal. The Board has also established a Remuneration Committee, with the Directors Leif-Arne Langøy (Chairman), Tore Torvund and Thorhild Widvey as members.
Kvaerner encourages its employees as well as contract
staff, partners, suppliers and customers to report any concerns in terms of compliance with law and/or ethical standards. The company has an established whistleblowing channel to the Head of Compliance and an investigation team for follow-up of compliance issues.
Risk managementKvaerner focuses on risk management in all parts of the organisation. Every year, a risk review is performed and presented to the Board of Directors, with updates during the year. The risk review is executed to identify the most significant risk areas and to establish risk reducing actions within these areas. In this assessment, the consolidated view across all Kvaerner’s units is looked into, top five company risks are identified and risk reducing measures agreed upon.
Please see Note 5 Financial risk management and exposures (page 31), for a detailed description of the group’s financial risks and Note 28 Contingent events (page 64) for an overview of significant current disputes. Kvaerner has defined procedures and routines for managing the group’s financial market exposure.
The Corporate Risk Committee performs tender reviews. In addition, the team performs selected project reviews after start-up.
The Corporate Internal Audit Function team performs audits within compliance with the Kvaerner policies, laws and regulations as well as project specific audits. The basis for the selection of the corporate internal audits is the result of the annual risk review. In 2016, three corporate internal audits were executed.
The line managers in the matrix organisations and project managers are responsible for ensuring compliance with governing documentation and with all other applicable regulations and legal requirements. The process owners are responsible for describing the key processes, drive process improvement and monitor adherence to the processes. Risk management is handled in the projects according to the risk management process that is owned and followed-up by process owners.
The Project Execution Model (PEM™) is the methodology
12 KVAERNER ANNUAL REPORT 2016 BOARD OF DIRECTORS’ REPORT

followed when executing projects. All risk management processes and controls shall be described according to the respective operating system of the operational area. In each of the project phases there are defined milestones that the project needs to pass and between all the phases there are defined gate reviews/audits.
All projects in Kvaerner have a register where identified risks and opportunities are categorised and assessed in terms of impact and probability. Kvaerner works with a number of partners and hundreds of suppliers and subcontractors around the world. Kvaerner performs risk based due diligence as part of the pre-qualification processes. Kvaerner’s supplier qualification and information system database is a key enabler for Kvaerner to increase supplier performance.
All potential joint venture partners and third party representatives must go through due diligence assessments and have to be approved by the President & CEO of Kvaerner.
Health, safety, security and environment (HSSE)Care for Health, Safety, Security and the Environment (HSSE) is a core value in Kvaerner and expressed in the Just Care™ mind-set. HSSE is a fundament to all Kvaerner’s operations and the people working for Kvaerner are all keystones in our work towards the ultimate goal of an injury and illness free workplace, causing zero harm to people, material, non-material assets and to the environment. This ambition is not only part of the company’s core values, but is the company’s licence to operate.
Kvaerner’s HSSE management is based on strong and visible management responsibility and commitment, where all HSSE processes are driven by the line management from the President & CEO to the first line supervisors. HSSE is the cornerstone in all of Kvaerner’s work and a core value in the company. Kvaerner’s HSSE mind-set states that: We take personal responsibility for HSSE because we care.
In 2016, the change in organisational model resulted in one HSSE organisation for the entire company. A united HSSE team in Kvaerner has improved learning and sharing
across the company’s locations, and Kvaerner was in June certified as one company according to ISO 14001 and OHS 18001.
During 2016 Kvaerner continuously improved its HSSE performance. At year-end, a lost time incident frequency (LTIF) of 0.28, the same as in 2015 and a total recordable incident frequency (TRIF) of 1.92 compared to 2.5 in 2015 were recorded. These figures include Kvaerner’s subcontractors and are calculated per million man-hours worked.
The Hebron project in Newfoundland and the Nyhamna expansion projects are examples of projects with good HSSE performance. The Hebron project has executed more than 23 million worked hours without any lost time incident. As a recognition of great HSSE achievement the Hebron GBS project received the 2015 ExxonMobil Development Company (EMDC) SSH&E Award.
In 2016, 13 serious incidents or serious near misses were identified and thoroughly investigated. Actions for improvement are identified and implemented. Following serious incidents, lessons learned packages are produced and shared throughout Kvaerner with the aim of preventing similar incidents in the future. In 2016, the number of documented risk observations was 33 069/4.5 observations per man-year worked, compared to 66 300.1/5.1 observations per man-year worked in 2015.
For further information about Kvaerner’s HSSE programme and activities, including key performance indicators, please see the chapter Caring about Health, Safety, Security and the Environment in the company’s CSR report: www.kvaerner.com/csr.
The HSSE operating environmentKvaerner may have business activities in regions or operating environments where it is challenging to establish and maintain a strong HSSE performance. HSSE is an integrated part of Kvaerner’s management system and is divided into seven main sections: leadership, organisation, communication, risk management, product realisation, third-party relationships and continual improvement.
The Just Care™ mind-set is Kvaerner’s umbrella for
driving HSSE-related awareness-building and under–standing. A key element in the Kvaerner's Just Care™ approach is that all employees accept personal responsibility for HSSE by actively caring for themselves, co-workers and the environment.
A common HSSE operating system sets expectations for the key elements in HSSE management and leadership. Regular reviews uncover possible gaps in relation to expectations, and the necessary activities for improvement are identified and initiated. Key HSSE performance indicators have been implemented. A strong focus on leading activities in the HSSE field, combined with defined targets measured against actual results, guides Kvaerner towards continual improvements in HSSE performance.
Just Rules is a set of concrete guidelines within Kvaerner’s HSSE operating system. These have been established to control the most safety-critical activities in our operations. Just Rules is a mandatory part of Kvaerner’s safety training for all employees, providing clear and simple check-lists and controls for operations.
HSSE trainingCompetence occupies a central place in Kvaerner’s HSSE programme. All personnel must be competent, possess the necessary knowledge, skills and behaviour to perform their work safely. To reach out to all employees in an efficient way, Kvaerner uses dedicated training programmes at operational and project levels, as well as eLearning programmes for key areas within HSSE.
During 2016 1.03 percent of total worked hours were invested in HSSE training compared to 1.2 in 2015. Training programmes and key performance indicators have been established to promote observation, interaction and intervention in the areas of HSSE.
SafetyAt year-end 2016, a lost time incident frequency (LTIF) of 0.28 and a total recordable injury frequency (TRIF) of 1.92 was recorded, compared to corresponding 0.28 and 2.5 for 2015. These figures include Kvaerner’s subcontractors and are calculated per million man-hours worked. The company
13KVAERNER ANNUAL REPORT 2016BOARD OF DIRECTORS’ REPORT

had four lost time injuries in 2016. These injuries were dislocated elbow, fractured ankle, lost fingernail and broken arm.
Kvaerner will continue the development of safety tools and processes and we will strive to secure compliance to our rules and regulations. Close cooperation and further development of relationships with our subcontractors within HSSE will also continue to be a priority. In addition, it is important for Kvaerner to maintain an active dialogue between employees and management. This will contribute towards further improving Kvaerner’s competitiveness.
Occupational health Total sick leave for Kvaerner in 2016 was 254 326 hours for own employees compared to 220 852 sick leave hours in 2015. Sick leave is above target of 4.5 percent. Mitigating actions are taken by HR and HSSE and a detailed action plan to reduce sick leave has been developed and implementation is on-going. Following these actions, the trend was positive at year-end 2016. Reducing sick leave is important to Kvaerner will continue to be a key focus area in 2017.
Kvaerner in Norway participate in the More Inclusive Working Life (IA) agreement. The IA Agreement is an instru-ment aimed at reducing sick leave and to increase the focus on job presence.
The company’s participation in the Aker Active programme which offers a wide range of activities within physical exercise and nutrition for employees on all locations is an example of health initiatives.
EnvironmentKvaerner continuously works to reduce its environmental footprint. Total energy consumption by the business in 2016, based on recorded use of oil, gas and electricity, amounted to 34 985 megawatt-hours compared to 59 300 megawatt-hours in 2015. Carbon emissions relating to this use are estimated at 1 400 tonnes in 2016, compared to 4 700 tonnes in 2015.
The methodology used derives from the Greenhouse Gas Protocol (GHG), and Global Reporting Initiative (GRI). Kvaerner is certified according to the ISO 14001:2015
standard. The company’s main energy consumption, carbon emissions and waste disposal are related to activities at the yards.
The HSSE leadership development initiatives include an eLearning and a management system. These incorporate clear components that focus on the environment. Collectively, these contribute to continuous improvements in environmental awareness and attitudes among managers and employees. This inspires the organisation to achieve further gains in environmental performance in Kvaerner’s own activities. It is also a key motivation for assisting customers in making environmental improvements through the products and projects Kvaerner develops and delivers to them.
SecurityDue to the global nature of Kvaerner’s operations, the company is exposed to changes in the global risk situation. Kvaerner operates in a wide range of regions, which means that potential security threats may arise. Kvaerner is linked to International SOS and Control Risks, which provides a global tool for risk assessment and risk control. To mitigate possible risk situations, all employees can at all times be provided with a reliable and updated risk assessment and have access to information, as well as to local contacts and a pre-established network. Currently, Kvaerner has no operations in areas with high or extreme risk as classified by International SOS. Based on the global terror situation, Kvaerner issued travel bands for airports and countries after performing travel risk assessments. For some, special security measures are implemented. Specific security assessments and audits are performed at location based on Kvaerner’s annual risk review.
Corporate social responsibility (CSR)At the foundation of Kvaerner is the company’s commitment to conduct its business with integrity and high ethical standards. That is why CSR is an integrated part of the management responsibility within Kvaerner. The company’s corporate goals and activities within CSR are anchored at the Board of Directors level.
Kvaerner is a significant part of some of the societies in which it operates, both locally and internationally. Kvaerner’s aim within CSR is to ensure that the operations are run in line with the company’s values, Code of Conduct and policies, relevant laws and regulations and society’s expectations – with integrity. Kvaerner continuously works to identify opportunities to improve and aims at running a business which has a positive impact on people, society and the environment.
The company is committed to respect the fundamental human and trade union rights, including a specific focus on non-discrimination. Kvaerner’s CSR principles are based on the company’s values, and on a wide range of Norwegian and international guidelines, standards, regulations and laws.
The results of the company’s CSR efforts are systematically measured, and Kvaerner annually publishes a separate in-depth report on CSR and risk management results and principles. For further information regarding Kvaerner's CSR efforts and risk management, please see the separate CSR report published on www.kvaerner.com/csr.
People and organisationFrom 1 January 2016, Kvaerner started working according to a leaner and more agile operating model. In this matrix organisation, the company can better utilise the total resources across various projects and business activities. Most employees in technical functions related to project execution are organised in the functional area EPCI (Engineering, Procurement, Construction and Installation). Most employees in support functions are organised in the functional area Commercial Project Services. The projects are followed up by the heads of the operational areas Process Solutions, Concrete Solutions, Structural Solutions and New Solutions. The new operational model has enabled further cost reductions as well as fewer managers across the organisation.
For further information about people and organisation, including key performance indicators, please see the chapter Caring about our people in the company’s CSR report: www.kvaerner.com/csr.
14 KVAERNER ANNUAL REPORT 2016 BOARD OF DIRECTORS’ REPORT

Executive management team (EMT)The executive management team represents national and international business experience. The eleven EMT members have experience from senior positions in major oil and gas companies as well as from the supply industry, and have worked on some of the largest field development projects around the globe. The EMT members have also worked in a broad range of complementary and associated industries.
One replacement has taken place in the team in course of 2016. The executive vice president & CFO Eiliv Gjesdal left Kvaerner and was replaced by Idar Eikrem from 1 April 2016. Eikrem has comprehensive experience from a variety of top management positions, including financial management and turn-around processes.
A complete presentation of the EMT is available at www.kvaerner.com/emt.
Developing people and teamsKvaerner is recognised for its expertise in oil and gas projects, organised in an effective value chain. Kvaerner has earned this reputation due to extensive investments in organised workplace training.
Investments in personnel over time are crucial for Kvaerner's ability to execute projects successfully. Consequently Kvaerner focuses on continuous training at all levels of the organisation, including professional employees, teams, project management and leaders.
All training is based on the company’s core values, Code of Conduct and leadership principles. HSSE is a core value and part of all training activities.
The Kvaerner Leadership Training programme (KLT) provides practical training for leaders in the organisation. To secure that the leadership principles and learnings are implemented in the company’s operations, follow-up training is provided to each project.
To maintain and upgrade formal project management qualification certification, post-qualifying education and certification is provided for selected managers in projects. The Kvaerner Training Centre is a key tool to secure align–ment between project management teams and the top management.
Kvaerner has for many years relied heavily on the apprenticeship scheme and at year-end 2016 a total of 95 apprentices were under contract. A high number of vocational courses are also carried out each year.
Organisation and recruitmentAs of 31 December 2016, the overall workforce comprised 3 091 individuals which included 2 663 permanent employees and 428 contract staff. Corresponding figures for 2015 were 2 811 permanent employees and 451 contract staff. The gender distribution is approximately 15 percent female and 85 percent male employees. 97 percent of the permanent employees work in Norway, while the remaining three percent work in USA, Finland, China, Canada and Russia.
The company offers an inspiring and challenging work place with a high degree of teamwork and good individual career and development opportunities. In 2016, Kvaerner recruited 39 new employees, of which four were women and 35 were men. 28 percent of the new employees were below 30 years of age, 39 percent were between 30 and 50 years old, and 33 percent were above the age of 50. The total voluntary employee turnover was three percent in 2016, equal to three percent in 2015.
Kvaerner operates two specialised fabrication and assembly facilities in Norway; at Stord and in Verdal. A prudent inflow of new generations of skilled workers and operators is vital for the ability to effectively transfer core knowledge and experience. Apprenticeships are an important method of recruiting to these professions, and Kvaerner has a continuous focus on recruiting new apprentices. In 2016, 38 new apprentices were recruited. At year-end 2016, there were a total of 95 apprentices under applicable agreements, compared to a total of 121 apprentices at year-end 2015.
Kvaerner’s second People Survey was carried out in 2016 and included working environment topics as well as organisational issues. A response rate of 82.5 percent was achieved (80 percent in 2014). The report provided valu–able feedback and recommendations, and a plan to system–atically follow-up improvements has been established. For
further information about the People Survey, please see the CSR Report at www.kvaerner.com/csr.
Diversity and equal opportunityAs the nature of Kvaerner’s operations calls for employees from different operating entities and geographical regions nationally and internationally, the principles of equal opportunity are well established throughout the group. No differences shall exist between treatment of genders, nationalities or ethnic groups. Employment conditions and compensation packages are based on responsibility and personal performance, irrespective of gender or ethnicity.
Kvaerner’s commitment to diversity and equal opportunities are described in the policies and in the Global Framework Agreement for development of good working relations, a three-party frame agreement with national and international trade unions.
Since 2012, Kvaerner has had strong focus on training all employees to avoid any form of discrimination, harassment and bullying. This training has continued throughout 2016, and will commence in the years to come. All leadership training includes a section focusing on preventing discrimination, harassment and bullying in the work place.
Leadership training is an important contribution toward increasing the number of women promoted to managerial positions. In 2016 the share of women holding senior management positions was 16 percent compared to 20 percent in 2015, whereof the share completing leadership training was 26 percent. In 2016, two of the eleven EMT members were females and two of Kvaerner’s four shareholder-elected Directors are females. All of the Directors elected by and among the employees are men. This is in line with legal requirements, as women account for less than 20 percent of Kvaerner’s workforce.
Remuneration and performance cultureKvaerner shall maintain an individual compensation level for employees and management which enables the company to attract and retain employees and leaders with the right attitudes, skills and the ability to deliver strong performance in accordance with Kvaerner’s values and the
15KVAERNER ANNUAL REPORT 2016BOARD OF DIRECTORS’ REPORT

Code of Conduct. Kvaerner aims to reward attitudes, skills, performance and results. The total remuneration shall be internally fair, consistent, comprehensible and competitive without being market leading.
The total remuneration for executives, senior management and management consists of three main elements:
> Annual base salary
> Benefits
> Participation in a variable pay programme
The executives, senior management and management are members of the standard pension and insurance plans applicable to all employees in the company. Other benefit programmes are not granted. The variable pay programmes shall secure a market competitive total remuneration as well as being a driver for exceptional financial and personal performance.
Completion of the performance management process is fundamental to secure the connection between performance and remuneration. For management taking part in variable pay programmes, predefined financial, operational and personal objectives are set on annual basis. The achievement of the objectives is assessed and form basis for the remuneration triggered by the variable pay programmes. For employees, the achievement of individual and team performance is combined with pre-defined professional and personal goals.
The assessment of achieved goals and performance takes place in a dialogue between the leader and his/her direct reports which provides the opportunity for recognition, consideration of career development and future direction for individual performance improvements.
Further details about remuneration to EMT members are provided in Note 9 Salaries, wages and social security costs (page 43) in the consolidated financial statements. The report to shareholders on executives’ remuneration is approved by the Board of Directors and is available on www.kvaerner.com.
Research and development (R&D)There is a growing demand for field development solutions which can help oil companies reduce their overall costs and increase their value creation. Part of Kvaerner’s competitive strength is solutions and methods which make it technically possible and financially attractive to develop reserves which have previously been considered non-viable. Kvaerner can also offer concepts and effective project execution models which may contribute to reduce the total costs for new field developments.
Kvaerner's R&D strategy has a clear focus on creating values and results. The company strives to identify the potential commercial opportunities before new R&D activities are started, and new developments are preferably executed with customers or business partners as sponsors. This approach increases the market interest in new technologies and methods.
In 2016, there has been a continued focus on R&D projects which will contribute to distinguish Kvaerner from competitors in upcoming projects. In cooperation with clients, Kvaerner has further developed the CONDEEP® concrete floater, suitable for upcoming Barents Sea developments. Focus areas have been the development of oil storage solution with zero pollution of the vulnerable Arctic environment, as well as cost effective and construction friendly topside design, allowing for alternative means of evacuation in ice covered waters and integrating power from shore solution.
The CONDEEP® concrete GBS has been further developed for Barents Sea applications, with a cost effective mono-shaft solution for water depths up to 275 metres in ice covered waters and exposed to iceberg impact. For both the GBS and the floater, the potential for construction of the concrete substructures in northern part of Norway has been further developed.
New this year is the cooperation with Technip for a concrete spar for deep, ice infested waters offshore Newfoundland, Canada. Kvaerner’s expertise in concrete hull design and execution, in combination with Technip’s recognised spar expertise, results in an attractive concept that has been well received.
Other examples include subsea treatment of produced water based on concrete tanks on the seabed, where internal development activities resulted in a client-funded joint industry development project with start-up end of 2016.
The R&D activity continues for the light unmanned wellhead platform concept named Subsea on a Stick®. The concept offers several advantages for marginal and satellite field developments compared to subsea installations, especially with respect to Increased Oil Recovery (IOR) rates. The concepts have been well received by major oil companies, including contracts for concept evaluations for future field developments.
Kvaerner actively participates in several joint industry research projects. Several projects are on-going, especially related to arctic technology and concrete technology. In 2016 Kvaerner was awarded funding from the Horizon 2020 programme for two new projects, of which one is related to a large European research project on concrete technology and the other on ice tank model testing.
Share capitalThe company’s shares are listed on Oslo Børs (Oslo Stock Exchange) and are freely transferable. No transferability restrictions are incorporated into the Articles of Association. There are 269 000 000 shares issued and outstanding, all of which are of the same class and with equal voting and dividend rights. Each share has a par value of NOK 0.34.
The largest shareholder of Kværner ASA is Aker Kværner Holding AS, holding 41.02 percent of the shares. Aker ASA owns 70 percent of Aker Kværner Holding AS, while the Norwegian Government owns 30 percent as of 31 December 2016. Proposition No. 88 (2006–2007) to the Storting (Norwegian Parliament) contains more detailed information concerning the establishment of Aker Kværner Holding AS and the agreement between Aker ASA and the Norwegian Government. The company is not party to any agreement that is conditional upon offerings of take-over in the company.
Kvaerner had 8 546 shareholders (9 075) as of 31 December 2016, of which 28 percent (29 percent) were
16 KVAERNER ANNUAL REPORT 2016 BOARD OF DIRECTORS’ REPORT
non-Norwegian. The share price was NOK 12.10 at year-end 2016, compared to NOK 8.22 at year-end 2015.
As of 31 December 2016, Kværner ASA held 3 674 061 treasury shares.
OutlookKvaerner has in a challenging environment delivered solid operational performance in 2016. The company’s first priority is always to execute existing projects safely and predictably and several projects have reached milestones as planned during the last quarters. Kvaerner has over the last years worked intensely to improve costs, quality, productivity and competitiveness. These efforts are yielding results on the current portfolio of projects. Many of Kvaerner’s contracts include bonuses and incentives related to good performance and for meeting key milestones, in particular towards the end of the project. Improved performance in the on-going project portfolio is therefore expected to continue to have positive impact on project results when milestones are concluded.
2017 will be the third consecutive year where oil companies’ investments in new field developments are declining. The next 12–15 months are expected to be challenging for many players in the oil service supply industry. Kvaerner has the required robustness to this volatility. Still, the company’s activity level in 2017 is expected to be lower than in 2016, with expected full year gross revenue of around NOK 6 billion. Although the revenue level will be lower in 2017, activity level at the yards will be higher than in 2016 due to phasing of projects and portfolio mix. Key customers communicate that they may start new capital investments and Kvaerner is implementing further improvements in 2017. The company’s resilient financial position is also fundamental for safeguarding values and enables future growth.
Acknowledgements2016 was a year with relatively high activity for Kvaerner with execution and deliveries according to plans and expectations. At the same time, further cost and
productivity improvements to strengthen competitiveness and maintain sound margins have been implemented. The company has also established a new and more efficient matrix based model. In addition, the organisation has managed to implement further improvements in on-going projects.
In a demanding cycle, Kvaerner is recognised for both predictable deliveries and for implementing both own improvements as well as contributing to industry improvement initiatives. A solid financial position with net cash at year-end is an accomplishment. This continues to provide strength and manoeuvrability also for 2017. The Board of Directors extends its appreciation to management and employees for both the comprehensive efforts and for the achievements they have delivered in the past year.
Fornebu, 16 March 2017Board of Directors and President & CEO of Kværner ASA
Leif-Arne Langøy Tore Torvund Kjell Inge Røkke Lone Fønss Schrøder Thorhild Widvey Chairman Deputy Chairman Director Director Director
Rune Rafdal Ståle Knoff Johansen Bernt Harald Kilnes Jan Arve Haugan Director Director Director President & CEO
17KVAERNER ANNUAL REPORT 2016BOARD OF DIRECTORS’ REPORT

Annual accounts Kvaerner group
Consolidated income statement 01.01 – 31.12 19
Consolidated statement of comprehensive income 01.01 – 31.12 20
Consolidated balance sheet as of 31 December 21
Consolidated statement of changes in equity 01.01 – 31.12 22
Consolidated statement of cash flows 01.01 – 31.12 23
Note 1 Company information 24
Note 2 Basis of preparation 24
Note 3 Significant accounting policies 24
Note 4 Accounting estimates and judgments 30
Note 5 Financial risk management and exposures 31
Note 6 Earnings/(loss) per share 35
Note 7 Related parties 36
Note 8 Operating segments 38
Note 9 Salaries, wages and social security costs 43
Note 10 Operating leases 47
Note 11 Other operating expenses 47
Note 12 Finance income and expenses 48
Note 13 Income taxes 48
Note 14 Trade and other current receivables 50
Note 15 Construction contracts 51
Note 16 Trade and other payables 51
Note 17 Provisions 52
Note 18 Derivative financial instruments 52
Note 19 Property, plant and equipment 55
Note 20 Intangible assets 55
Note 21 Other non-current assets 57
Note 22 Equity-accounted investees 57
Note 23 Interest-bearing liabilities 59
Note 24 Employee benefits – pensions 60
Note 25 Financial instruments 63
Note 26 Cash and cash equivalents 63
Note 27 Group companies as of 31 December 2016 63
Note 28 Discontinued operations 64
Note 29 Contingent events 64
Note 30 Subsequent events 65
Note 31 Capital and reserves 65
18 KVAERNER ANNUAL REPORT 2016 ANNUAL ACCOUNTS – KVAERNER GROUP

Consolidated income statement 01.01 - 31.12
Amounts in NOK million Note 2016 2015
Total revenue and other income 8 7 896 12 084
Materials, goods and services (4 751) (8 434)Salaries, wages and social security costs 9 (2 269) (2 497)Other operating expenses 11 (247) (580)Operating profit before depreciation, amortisation and impairment 629 574
Depreciation and amortisation 19, 20 (100) (81)Goodwill impairment 20 (198) - Operating profit 331 493
Financial income 12 42 161 Financial expenses 12 (159) (75)Profit before tax 214 579
Income tax expense 13 (132) (241)Profit from continuing operations 82 337Profit/(loss) from discontinued operations 28 345 56
Profit/(loss) for the year 426 393
Profit for the period attributable to:Equity holders of the parent company 426 393
Earnings per share (NOK):Basic and diluted EPS – continuing operations 6 0.31 1.26Basic and diluted EPS – discontinued operations 6 1.30 0.21Basic and diluted EPS – total operations 6 1.60 1.47
The notes on pages 24 to 65 are an integral part of these consolidated financial statements.
19KVAERNER ANNUAL REPORT 2016ANNUAL ACCOUNTS – KVAERNER GROUP

Consolidated statement of comprehensive income 01.01 - 31.12
Amounts in NOK million 2016 2015
Profit/(loss) for the year 426 393
Items that may be reclassified to profit or loss in subsequent periods:Cash flow hedges, net of tax– Fair value adjustment recognised in equity (7) 10 – Reclassified to profit or loss (2) - Translation differences – equity-accounted investees (no tax impact) (0) (7)Translation differences – foreign operations (no tax impact) (23) 187 Reclassification of translation differences on repayment of capital (261) (139)Items that may be reclassified to profit or loss in subsequent periods (294) 51
Items not to be reclassified to profit or loss in subsequent periods:Actuarial gains/(losses) on defined benefit pension plans, pre tax (18) 5 Actuarial gains/(losses) on defined benefit pension plans, tax effect 4 (2)Actuarial gains/(losses) on defined benefit pension plans, net of tax (14) 3 Items not to be reclassified to profit or loss in subsequent periods (14) 3
Total other comprehensive income for the year, net of tax (308) 53 Total comprehensive income for the year 118 446
Total comprehensive income attributable to:Equity holders of the parent company 118 446
The notes on pages 24 to 65 are an integral part of these consolidated financial statements.
20 KVAERNER ANNUAL REPORT 2016 ANNUAL ACCOUNTS – KVAERNER GROUP

Consolidated balance sheet as of 31 December
Amounts in NOK million Note 2016 2015
AssetsNon-current assetsProperty, plant and equipment 19 798 687 Deferred tax assets 13 - 1 Intangible assets 20 666 873 Investments in associated companies and jointly controlled entities 22 35 134 Other non-current assets 21 6 20 Total non-current assets 1 505 1 715
Current assetsTrade and other current assets 14 1 413 1 590 Fair value embedded derivatives 18 14 150 Cash and cash equivalents 26 3 047 1 560 Retained assets of business sold 28 1 633 Total current assets 4 474 3 934 Total assets 5 980 5 649
Amounts in NOK million Note 2016 2015
Equity and liabilitiesEquityShare capital 91 91 Share premium 729 729 Retained earnings 1 881 1 468 Other reserves (46) 262 Total equity 6, 31 2 656 2 550
Non-current liabilitiesEmployee benefits obligations 24 191 169 Other long term liabilities 13 11 Deferred tax liabilities 13 62 - Total non-current liabilities 267 180
Current liabilitiesCurrent tax liabilities 13 46 73 Provisions 17 135 164 Fair value embedded derivatives 18 6 13 Trade and other payables 16 2 820 2 620 Retained liabilities of business sold 28 51 49 Total current liabilities 3 058 2 919 Total liabilities 3 324 3 099 Total liabilities and equity 5 980 5 649
The notes on pages 24 to 65 are an integral part of these consolidated financial statements.
Fornebu, 16 March 2017Board of Directors and President & CEO of Kværner ASA
Leif-Arne Langøy Tore Torvund Kjell Inge Røkke Lone Fønss Schrøder Thorhild Widvey Chairman Deputy Chairman Director Director Director
Rune Rafdal Ståle Knoff Johansen Bernt Harald Kilnes Jan Arve Haugan Director Director Director President & CEO
21KVAERNER ANNUAL REPORT 2016ANNUAL ACCOUNTS – KVAERNER GROUP

Consolidated statement of changes in equity 01.01 - 31.12
Amounts in NOK million
Number of shares
Share capital
Share premium
Retained earnings
Hedge reserve
Currency translation reserve
Pension reserve Total equity
Equity as of 31 December 2014 269 000 000 91 729 1 309 0 246 (38) 2 337
Profit/(loss) for the period - - 393 - - - 393Other comprehensive income - - - 10 41 3 53Total comprehensive income - - 393 10 41 3 446
Treasury shares - - (13) - - - (13)Dividend - - (220) - - - (220)Equity as of 31 December 2015 269 000 000 91 729 1 468 11 287 (36) 2 550
Profit/(loss) for the period - - 426 - - - 426Other comprehensive income - - - (9) (284) (14) (308)Total comprehensive income - - 426 (9) (284) (14) 118
Treasury shares - - (12) - - - (12)Other - - (1) - - 1 -Equity as of 31 December 2016 269 000 000 91 729 1 881 1 2 (49) 2 656
The notes on pages 24 to 65 are an integral part of these consolidated financial statements.
22 KVAERNER ANNUAL REPORT 2016 ANNUAL ACCOUNTS – KVAERNER GROUP

Consolidated statement of cash flows 01.01 - 31.12
Amounts in NOK million Note 2016 2015
Cash flow from operating activitiesProfit/(loss) for the period 426 393
Adjusted for:Income tax expense 13 132 241Net financial items 12 117 (86)Foreign exchange accounting effect on repayment of capital from subsidiaries 28 (261) (139)Depreciation, amortisation and impairment 19, 20 298 81Difference between pension premiums paid and pension expense, defined benefit schemes 31 (16)Difference between income and dividends received from equity accounted investees 22 90 174 Interest income received 16 12 Income taxes paid (77) (203)Changes in other net operating assets 945 726Net cash from operating activities 8 1 718 1 183
Cash flow from investing activitiesAcquisition of property, plant and equipment 19 (203) (55)Other cash flow from financing activities 1 5Net cash from investing activities (201) (50)
Cash flow from financing activitiesInterest expense and fees paid (17) (52)Instalment borrowings - (500)Payments of dividend - (220)Transactions in own shares (13) (14)Net cash from financing activities (30) (786)Effect of exchange rate changes on cash and bank equivalents (1) 6 Net increase/(decrease) in cash and bank equivalents 1 486 352
Cash and cash equivalents at the beginning of the period 1 560 1 208Cash and cash equivalents at the end of the period 26 3 047 1 560
The notes on pages 24 to 65 are an integral part of these consolidated financial statements.
23KVAERNER ANNUAL REPORT 2016ANNUAL ACCOUNTS – KVAERNER GROUP

Note 1 Company information
Kværner ASA (the company) and its subsidiaries (together Kvaerner or the group) is a specialised provider of engineering, procurement and construction services for offshore platforms and onshore plants. Kværner ASA is listed on Oslo Børs (Oslo Stock Exchange) under the ticker KVAER. Kværner ASA’s registered office address is Oksenøyveien 10, 1366 Lysaker, Norway.
Note 2 Basis of preparation
Statement of complianceThese consolidated financial statements have been prepared in accordance with International Financial Reporting Standards (IFRS) as adopted by the European Union, relevant interpretations and additional requirements following the Norwegian Accounting Act as of 31 December 2016.
The consolidated financial statements were approved by the Board of Directors and President & CEO as shown on the dated and signed balance sheet.
The consolidated financial statements will be approved by the Annual General Meeting on 20 April 2017.
Basis of measurementThe consolidated financial statements are prepared on the historical cost basis, except for derivative financial instruments and defined benefit pension plan assets and liabilities which are measured at fair value.
Functional and presentation currencyThe consolidated financial statements are presented in Norwegian kroner (NOK), which is Kværner ASA’s functional currency.
All financial information presented in NOK has been rounded to the nearest million, except where otherwise indicated. As a result of rounding differences, numbers or percentages may not add up to the total.
Measurement of performanceThe group's key measure of financial performance is adjusted EBITDA. Adjusted EBITDA excludes impact of embedded foreign currency derivatives reported in jointly controlled entities closely related to Kvaerner’s operating activities. See Note 8 for adjusted EBITDA performance. EBITDA definition: Earnings before interest (net financial items), Taxes, Depreciation, Amortisation and Impairment.
Note 3 Significant accounting policies
The accounting policies set out below have been applied consistently to all periods presented in these consolidated financial statements.
Basis of consolidationConsolidationThe consolidated financial statements of Kværner ASA incorporate the financial statements of the company and its subsidiaries, and the group’s interest in associates and joint arrangements.
SubsidiariesSubsidiaries are entities controlled by the group. Control exists when the group is exposed to or has rights to, variable returns from its involvement with the investee and has the ability to affect those returns through its power over the investee. The financial statements of subsidiaries are included in the consolidated financial statements from the date that control commences until the date that control ceases.
Investments in associatesAssociates are those entities in which the group has significant influence, but not control or joint control, over the financial and operating policies. Significant influence is presumed to exist when the group holds between 20 and 50 percent of the voting power of another entity, but this is assessed on a case-by-case basis.
Investments in associates are accounted for using the equity method and are recognised initially at cost.
The consolidated financial statements include the group’s share of the profit or loss and other comprehensive income of equity accounted investees, after adjustments to align the accounting policies with those of the group, from the date that significant influence or joint control commences until the date that significant influence or joint control ceases.
When the group’s share of losses exceeds its interest in an equity-accounted investee, the carrying amount of that interest, including any long-term investments, is reduced to zero, and further losses are not recognised except to the extent that the group has legal or constructive obligations or has made payments on behalf of the investee.
Joint arrangementsJoint arrangements exist when the group has joint control over such an arrangement, established by contractual agreement and requiring unanimous consent of the parties to the arrangement for strategic, financial and operating decisions. Joint arrangements may be either joint ventures or joint operations.
Joint venturesA joint venture is a joint arrangement whereby the venturers have rights to the net assets of the arrangement. Investments in joint ventures are accounted for using the equity method, with Kvaerner’s share of net result after tax recognised in profit or loss. For joint ventures where tax is levied on the partners rather than the joint venture, Kvaerner’s share of the tax will be included in the tax expense line in the group’s consolidated income statement.
24 KVAERNER ANNUAL REPORT 2016 ANNUAL ACCOUNTS – KVAERNER GROUP

Joint operationsA joint operation is a joint arrangement whereby the parties have rights to the assets, liabilities and obligations relating to the arrangement. Joint operations are proportionately consolidated in the group financial statements. For the years reported, the group have not had any joint operations.
Transactions eliminated in consolidationIntra-group balances and transactions, and any unrealised gains and losses or income and expenses arising from intra-group transactions, are eliminated when preparing the consolidated financial statements. Unrealised gains arising from transactions with associates and joint ventures are eliminated to the extent of the group’s interest in the entity. Unrealised losses are eliminated in the same way as unrealised gains, but only to the extent that there is no evidence of impairment.
Presentation of resultsThe purpose of the investment determines where its results are presented in profit or loss. When entities are formed to share risk in executing a project or are closely related to Kvaerner's operating activities, the share of the profit or loss is reported as part of other income in operating profit. Share of profit or loss from financial investments is reported as part of financial items.
Foreign currencyForeign currency transactions and balancesTransactions in foreign currencies are translated to the respective functional currencies of the group entities at the exchange rate at the date of the transaction. Monetary assets and liabilities denominated in foreign currencies at the balance sheet date are retranslated to the functional currency at the exchange rate on that date. Non-monetary assets and liabilities measured at historical cost in a foreign currency are translated using the exchange rate on the date of the transaction. Non-monetary assets and liabilities denominated in foreign currencies that are stated at fair value are translated according to the functional currency at the exchange rates on the date the fair value was determined.
Foreign exchange translation differences are recognised in profit or loss, except for differences arising from translation of qualifying cash flow hedges (to the extent that the hedge is effective), which are recognised in other comprehensive income. Translation impacts of monetary assets and liabilities related to operating activities are recognised within operating result.
Foreign operationsItems included in the financial statements of each of the group’s entities are measured using the currency of the primary economic environment in which the entity operates. The results and financial position of all group entities that have a functional currency different from the group’s presentation currency are translated to the group’s presentation currency of NOK as follows:
> Assets and liabilities, including goodwill and applicable consolidation adjustments, for each balance sheet presented, are translated at the closing rate on the date of that balance sheet
> Income and expenses for each income statement are translated at the average exchange rates for the year, calculated on the basis of 12 monthly rates
Foreign exchange differences arising from this translation are recognised in other comprehensive income, and presented as a separate component in equity.
Exchange differences arising from the translation of the net investment in foreign operations are included in other comprehensive income as a translation reserve. These translation differences are reclassified to the income statement upon disposal or liquidation of the related operations.
Exchange differences arising from non-current monetary receivable or payable by a foreign operation where settlement is neither planned nor likely in the foreseeable future, forms part of the net investment in that entity and are recognised in other comprehensive income. These translation differences are reclassified to the income statement upon disposal of the related operations or when settlement of the receivable or payable is planned or is considered likely to happen in the foreseeable future.
FINANCIAL INSTRUMENTS
Financial assetsThe group initially recognises loans and receivables on the date that they originate. All other financial assets are recognised on the trade-date, being the date that the group becomes party to the contractual provisions of the instrument. Financial assets are derecognised when the rights to receive cash flows from the investments have expired or have been transferred and the group has substantially transferred all risks and rewards of ownership.
Financial assets and liabilities are offset and the net amount presented only when the group has the legal right to offset the amounts and intends either to settle on a net basis or to realise the asset and settle the liability simultaneously.
The group classifies its financial assets according to the following categories: at fair value through profit or loss; loans and receivables and available for sale. The classification depends on the purpose for which the financial assets were acquired. Management determines the classification of its financial assets at initial recognition.
Financial assets at fair value through profit or lossA financial asset is classified at fair value through profit or loss if it is classified as held for trading or is designated as such on initial recognition. Financial assets are designated at fair value through profit or loss if the group manages such investments and makes purchase and sale decisions based on their fair value in accordance with the group’s documented risk management or investment strategy.
Financial assets carried at fair value through profit or loss are initially recognised at fair value, with transaction costs expensed in profit or loss as incurred, and are subsequently carried at fair value with any changes therein recognised in profit or loss.
The group’s financial assets at fair value through profit or loss comprise derivative financial instruments which are not designated as hedges.
Loans and receivablesLoans and receivables are non-derivative financial assets with fixed or determinable payments that are not quoted in an active market.
25KVAERNER ANNUAL REPORT 2016ANNUAL ACCOUNTS – KVAERNER GROUP

Loans and receivables are initially recognised at fair value, plus any related transaction costs, and are subsequently carried at amortised cost using the effective interest method, less any impairment losses.
The group’s loans and receivables comprise "Trade and other current assets" in the balance sheet.
Cash and cash equivalents include cash on hand, demand deposits held at banks and other short-term highly liquid investments with original maturity of three months or less. The amounts fluctuate with the projects’ life cycle and are usually released when the project is delivered or close to delivery.
Available-for-saleAvailable-for-sale financial assets are non-derivative financial assets that are either designated in this category or not classified in any of the other categories.
Available-for-sale financial assets are initially recognised at fair value, plus any related transaction costs, and are subsequently carried at fair value with any changes therein recognised in other comprehensive income and presented in fair value reserve in equity. If fair value is lower than book value and the fall in value is significant or long term, impairment will be recognised in the income statement.
Financial liabilitiesKvaerner initially recognises financial liabilities on the trade-date, being the date that the group becomes party to the contractual provisions of the instrument. Financial liabilities are derecognised when the group’s contractual obligations are discharged, cancelled or expire.
Non-derivative financial liabilities are classified as other financial liabilities category. Such financial liabilities are initially recognised at fair value, less any related transaction costs, and are subsequently carried at amortised cost using the effective interest method.
The group’s other financial liabilities comprise trade and other payables in the balance sheet.
Derivative financial instrumentsThe group holds derivative financial instruments to hedge its exposure to foreign exchange risks arising from operational, financial and investment activities.
Embedded derivatives may exist where commercial contracts are to be settled in a currency different from the functional currency of the contracting parties. Embedded foreign exchange derivatives are separated from the host contract and accounted for separately if the economic characteristics and risks of the host contract and the embedded derivative are not closely related, a separate instrument with the same terms as the embedded derivative would meet the definition of a derivative, and the combined instrument is not measured at fair value through profit or loss.
All derivatives are initially recognised at fair value on the date a derivative contract is entered into and are subsequently re-measured at their fair value. The gain or loss on re-measurement of the group’s embedded derivatives and other derivatives that do not qualify for hedge accounting is recognised immediately in profit or loss.
Where derivatives qualify for hedge accounting, recognition of any gain or loss depends on the nature of the item being hedged.
Hedging activitiesKvaerner has in periods presented held derivative financial instruments to hedge foreign currency risks which have been designated as cash flow hedges.
On initial designation of the derivative as a hedging instrument, the group formally documents the relationship between the hedging instrument and the hedged item, including the risk management objectives and strategy in undertaking the hedge transaction and the hedged risk, together with the methods that will be used to assess the effectiveness of the hedging relationship.
The group makes an assessment, at inception and on an on-going basis, of whether the hedging instruments are expected to be highly effective in offsetting the changes in the fair value or cash flows, and whether the actual results of each hedge are within a range of 80–125 percent. For a cash flow hedge of a forecast transaction, the transaction should be highly probable to occur and should present an exposure to variations in cash flows that ultimately could affect reported profit or loss.
The effective portion of changes in the fair value of derivatives that are designated and qualify as a cash flow hedge is recognised in other comprehensive income and presented as a hedge reserve in equity. Any ineffective portion of changes in the fair value of the derivative is recognised immediately in profit or loss within finance income and expenses. The amount accumulated in hedge reserves is reclassified as profit or loss in the periods when the hedged item affects profit or loss.
Hedge accounting is discontinued when the group revokes the hedging relationship, or when the hedging instrument expires or is sold, terminated or exercised, or no longer qualifies for hedge accounting. Any cumulative gain or loss deferred in comprehensive income as a hedge reserve at that time, remains in the hedge reserve and is recognised in the income statement when the forecast transaction is ultimately recognised in the income statement. When a forecast transaction is no longer expected to occur, the cumulative gain or loss that was deferred in the hedge reserve is recognised immediately in profit or loss.
Revenue recognitionEngineering and construction contractsRevenues from contracts to provide construction, engineering, design or similar services are recognised using the percentage-of-completion method, based primarily on contract costs incurred to date compared to estimated total contract costs. As a general practice, total amount of any settlement with customers related to disputed matters and arbitration awards are included within revenues.
When the final outcome of a contract cannot be reliably estimated, contract revenue is recognised only to the extent costs incurred are expected to be recoverable. The revenue recognised in one period will be the revenues attributable to the period’s progress and the progress to date effect of any changes to the estimated final outcome. Losses on contracts are fully recognised when identified.
26 KVAERNER ANNUAL REPORT 2016 ANNUAL ACCOUNTS – KVAERNER GROUP

Contract revenues include variation orders and incentive bonuses when it is probable that they will result in revenue that can be measured reliably. Disputed amounts and claims are recognised when it is probable the customer will accept the claim and the amount can be measured reliably. Management updates its assessment of recognised revenues at each reporting period.
See Note 4 Accounting estimates and judgements, for further details of revenue recognition criteria in respect of engineering and construction contracts.
Goods sold and other services renderedRevenue from the sale of goods is recognised when the significant risks and rewards of ownership have been transferred to the buyer, which is usually when goods are shipped to customers.
Revenue from other services rendered is recognised in proportion to the stage of completion of the transaction at the balance sheet date, or is invoiced based on hours performed at agreed rates. The stage of completion is normally assessed based on the proportion of costs incurred for work performed to date compared to the estimated total contract costs.
Other incomeOther income include share of profit from associated companies and jointly controlled operations closely related to the group’s operating activities, gains and losses related to sale of operating assets and further revenue from FEED, studies and other projects.
Materials, goods and services costsMaterials, goods and services costs reflect costs that relate directly to the specific contracts and costs that are attributable to contract activity. Costs that cannot be allocated to contract activity are expensed as incurred and are classified as other operating expenses.
Finance income and expensesFinance income and expenses comprise interest receivable on funds invested, dividend income, foreign exchange gains and losses, interest payable on borrowings calculated using the effective interest rate method, fair value gains or losses on financial assets at fair value through profit or loss, gains or losses on hedging instruments that are recognised in profit or loss and reclassification of amounts previously recognised in other comprehensive income.
There has been a change to the presentation of foreign currency gains and losses which are now presented net. Comparative figures have been restated accordingly.
Income taxIncome tax expense comprises current and deferred tax. Income tax is recognised in profit or loss except to the extent that it relates to items recognised directly in equity or in other comprehensive income.
Current tax is the expected tax payable or receivable on the taxable income or loss for the year, using tax rates enacted or substantially enacted at the reporting date. Current tax also includes any adjustment to tax payable in respect of previous years and any tax liability arising from the declaration of dividends.
Deferred tax is recognised in respect of temporary differences between carrying amounts of assets and liabilities for financial reporting purposes and amounts used for taxation purposes. Deferred tax is not recognised for:
> Goodwill not deductible for tax purposes
> The initial recognition of assets or liabilities that affect neither accounting nor taxable profit
> Differences relating to investments in subsidiaries and joint ventures to the extent that they will not reverse in the foreseeable future
Deferred tax is measured at the tax rates that are expected to be applied to temporary differences when they reverse, based on the laws that have been enacted or substantively enacted at the reporting date.
Deferred tax assets and liabilities are offset if there is a legally enforceable right to offset current tax liabilities and assets, and they relate to income taxes levied by the same tax authority on the same taxable entity, or on different tax entities, but they intend to settle current tax liabilities and assets on a net basis or their tax assets and liabilities will be realised simultaneously.
A deferred tax asset is recognised for unused tax losses, tax credits and deductible temporary differences, to the extent that it is probable that future taxable profits will be available against amounts that can be utilised. Deferred tax assets are reviewed at each reporting date and are reduced to the extent that it is no longer probable that the related tax benefit will be realised.
Property, plant and equipmentProperty, plant and equipment are stated at cost less accumulated depreciation and impairment losses. The cost of self-constructed assets includes the cost of materials, direct labour, interest cost on qualifying assets, an appropriate proportion of production overheads, and, where relevant, the estimated costs of dismantling and removing the items and restoring the site on which they are located.
Where components of property, plant and equipment have different useful lives, they are accounted for as separate components.
DepreciationDepreciation is recognised on a straight line basis based upon the costs of the assets less any residual value over the estimated useful lives of the assets.
Intangible assetsGoodwillGoodwill represents the excess of the cost of an acquisition over the fair value of the group’s share of the net identifiable assets. Where fair value of net assets acquired exceeds consideration paid, the resulting gain arising on an acquisition is recognised directly in the income statement. Goodwill recognised on acquisitions of subsidiaries is presented within intangible assets.
Acquisitions of equity accounted investees do not result in goodwill as the full cost of acquisition is included in the carrying value of the investment.
Goodwill is carried at cost less accumulated impairment losses (see Impairment).
27KVAERNER ANNUAL REPORT 2016ANNUAL ACCOUNTS – KVAERNER GROUP

Research and developmentExpenditures on research activities undertaken with the prospect of obtaining new scientific or technical knowledge and understanding is recognised in profit or loss as incurred.
Expenditures on development activities, whereby research findings are applied to a plan or design for the production of new or substantially improved products and processes, is capitalised if the product or process is technically and commercially feasible as well as being a separable asset. Capitalised costs include the cost of materials, external contractors, direct labour and capitalised interest on qualifying assets arising. Other development expenditures are recognised in profit or loss as incurred.
AmortisationExcept for goodwill, intangible assets, all of which have finite useful lives, are amortised on a straight-line basis over their estimated useful lives, from the date they are available for use.
Construction work in progressConstruction work in progress represents the value of construction work performed less payments by customers. The value of construction work performed is measured at revenue recognised to date less progress billings and recognised losses. If payments by customers exceed revenues recognised, the difference is presented as advances from customers.
IMPAIRMENT
Financial assetsKvaerner recognises impairment of financial assets measured at amortised cost, including trade receivables, when there is objective evidence that it will be unable to recover balances in full. Balances are written off when the probability of recovery is assessed as being unlikely.
Non-financial assetsCarrying amounts of the group’s non-financial assets, other than inventories, deferred tax assets and employee benefit assets are reviewed at the end of each reporting period to determine whether there is any indication of impairment. If any such indication exists, then the asset’s recoverable amount is estimated. Goodwill is tested for impairment annually or more frequent if impairment indicators are identified.
An impairment loss is recognised if the carrying value of an asset or cash generating unit (CGU) exceeds its recoverable amount.
Recoverable amountThe recoverable amount of an asset or a CGU is the greater of their net selling price and value in use. In assessing value in use, estimated future cash flows are discounted to their present value using a pre-tax discount rate that reflects current market assessments of the time value of money and the risks specific to the asset or CGU.
For the purpose of impairment testing, assets are grouped together into the smallest group of assets that generate cash flows independently of other assets or CGUs. Subject to the operating segment limit, CGUs to which goodwill has been allocated are aggregated so that the level at which impairment testing is performed, reflects the lowest level at which goodwill is monitored for internal reporting purposes.
Goodwill is allocated to groups of CGUs that are expected to benefit from the business combination in which the goodwill arose.
Impairment loss recognitionImpairment losses are recognised in profit or loss. Impairment losses recognised in respect of CGUs are allocated first to reduce the carrying amount of any goodwill allocated to the CGU (or group of CGUs) and then, to reduce the carrying amount of the other non-financial assets in the CGU (or group of CGUs) on a pro rata basis.
Reversals of impairmentAn impairment loss on goodwill is not reversed. An impairment loss on other assets is reversed if there has been a change in the estimates used to determine the recoverable amount.
An impairment loss is reversed only to the extent that the asset’s carrying amount does not exceed the carrying amount that would have been determined, net of depreciation or amortisation, if no impairment loss had been recognised.
OTHER ACCOUNTING POLICIES
ProvisionsA provision is recognised in the balance sheet when the group has a present obligation as a result of a past event, it is probable that the group will be required to settle the obligation and the amount can be reliably estimated. Provisions are determined by discounting the expected future cash flows at a market based pre-tax rate that reflects current market assessments of the time value of money and, where appropriate, the liability-specific risks. The unwinding of the discount is recognised as a finance cost.
WarrantiesA provision for warranties is recognised when the underlying products or services are sold. The provision is based on historical warranty data.
LeasesPayments made under an operating lease are recognised in profit or loss on a straight-line basis over the term of the lease. Lease incentives received are recognised as an integral part of the total lease expense, over the term of the lease.
Minimum lease payments made under finance leases are apportioned between the finance expense and the reduction of the outstanding liability. The group does currently not have any leases classified as finance lease.
Employee benefitsVariable pay programmeExecutives in the group receive remuneration in the form of a variable pay programme. One part of the programme is a short term employee benefit recognised at estimated value over the vesting periods.
In addition, some executives are entitled to a matching element paid in Kvaerner shares. The monetary amount earned is converted into a number of shares based on the market value of the
28 KVAERNER ANNUAL REPORT 2016 ANNUAL ACCOUNTS – KVAERNER GROUP

shares the year after the grant date of the programme. Expected dividends per annum at grant date is reflected in determining the grant date fair value per share. The fair value of the shares are expensed over the vesting period until the shares are allocated.
Defined contribution plansObligations for contributions to defined contribution pension plans are recognised as an expense in the profit or loss as incurred.
Defined benefit plansThe group’s net obligation in respect of defined benefit pension plans is calculated separately for each plan by estimating the amount of future benefit that employees have earned in return for their service in the current and prior periods; that benefit is discounted to determine its present value, and the fair value of plan assets is deducted. When the actuarial calculation results in a benefit to the group, the recognised asset is limited to the present value of any future refunds from the plan or reductions in future contributions to the plan.
The discount rate is the yield at the balance sheet date on high-quality corporate bonds with maturities consistent with the terms of the obligations. The calculation is performed by a qualified actuary using the projected unit credit method.
The group determines the net interest expense/(income) on the net defined benefit liability/(asset) for the period by applying the discount rate used to measure the defined benefit obligation at the beginning of the annual period to the net defined benefit liability/(asset).
Remeasurements arising from defined benefit plans comprise actuarial gains and losses, and the return on plan assets excluding interest. The group recognises actuarial gains and losses immediately in other comprehensive income and all other expenses related to defined benefit plans are recognised as employee benefits in profit or loss.
When the benefits of a plan are changed, or when a plan is curtailed, the portion of the changed benefit related to past service by employees, or the gain or loss on curtailment, is recognised immediately in profit or loss when the plan amendment or curtailment occurs. The group recognises gains and losses on settlements of defined benefit plans when settlements occur.
Cash flow statementThe cash flow statement is presented using the indirect method. Cash and cash equivalents includes cash and bank deposits. Changes in other net operating assets within operating cash flows are presented net and is mainly related to the group’s Net current operating assets arising from projects.
New standards and interpretations not yet adoptedA number of new standards, amendments to standards and interpretations have been published, but are not yet effective and have not been applied in preparing these consolidated financial statements.
The most relevant changes for Kvaerner are:
IFRS 15 Revenue from Contracts with Customers, effective for annual reporting periods beginning from 1 January 2018, replaces the existing revenue recognition guidance, including IAS 11
Construction Contracts and IAS 18 Revenue. The standard introduces a new revenue recognition model that features a contract-based five-step analysis of transactions to determine whether, how much and when revenue is recognised. Progress-based recognition of revenue over time is expected to continue to be the applicable method for Kvaerner’s projects.
Based on Kvaerner’s preliminary analysis and current project portfolio, Kvaerner does not anticipate significant impacts on its consolidated financial statements when upon transition to the new standard. However, reported results may be impacted by the following changes:
> Variable consideration (bonuses and incentives) and change of scope (variation orders and amendments) will have a higher threshold for revenue recognition than under the current standard
> Liquidated damages and penalties will have a lower threshold for revenue reduction
> Waste cost must be expensed immediately and cannot be considered as project cost recognised in accordance with progress as under the current standard
Other changes are currently not expected to impact Kvaerner’s project accounting. However, this may change during Kvaerner’s final stages of the implementation project, as clarifications are issued by the IASB and as practice develops in the industry.
Kvaerner will use the cumulative effect method at the date of initial application; 1 January 2018, with no restatement of comparative periods presented. The new standard will only be applied to contracts not completed by initial application date.
IFRS 9 Financial Instruments, effective for annual reporting periods beginning from 1 January 2018, replaces the existing guidance in IAS 39 Financial Instruments Recognition and Measurement. The standard includes revised guidance on classification and measurement of financial instruments, including a new expected credit loss model for calculating impairment on financial assets, and new general hedge accounting requirements. Kvaerner expects limited potential impact on its consolidated financial statements resulting from the application of IFRS 9. The group hedges its cash-flows on a one-to-one basis towards external banks, so under normal circumstances most hedges should qualify for hedge accounting under the current IAS 39 standard. The percentage of qualifying hedges is expected to increase under IFRS 9 as the hedge accounting model is more aligned with risk management, including prospective testing and less restrictive requirements on qualifying hedging instruments. This is expected to result in less net foreign currency effects reported under financial items.
The effect of classification of financial instruments and the expected credit loss principle are not expected to have material impact on the financial reporting, following the group’s customer portfolio.
IFRS 16 Leasing, effective for annual reporting periods beginning from 1 January 2019, replaces the existing guidance in IAS 17 Leases. Current assessment is that the new standard will significantly change how the group accounts for its lease contracts, as IFRS 16 introduces a single, on-balance sheet accounting model for lessees, with the following impacts:
> Assets and liabilities are expected to increase with an amount close to net present value of future lease payments
29KVAERNER ANNUAL REPORT 2016ANNUAL ACCOUNTS – KVAERNER GROUP

> Earnings before interest, taxes, depreciation and amortisation (EBITDA) will increase as the lease payments will be presented as depreciation and finance cost rather than operating expense
> Operating cash flow will increase and investing and financing cash flow will decrease as lease payments will not be classified as operating cash flow
> Transition method has yet not been determined
The expected impacts as described above may change as clarifications are issued by IASB or as practice develops in the industry.
Note 4 Accounting estimates and judgments
The preparation of these consolidated financial statements requires management to make judgments, estimates and assumptions that affect the group’s reported revenues, expenses, assets and liabilities. Given the size and complexity of Kvaerner's projects, the financial results could be materially impacted for any differences between current estimates and actual outcomes. Estimation uncertainties result primarily from the outcome of arbitration processes and final project results impacted by costs to complete, incentives etc. Estimates and underlying assumptions are continuously reviewed, based on historical experiences and expectations of future events. Revisions to accounting estimates are recognised in the period in which the estimates are revised and in any future periods affected.
Assumptions and estimation uncertainties that may impact the next financial year are detailed below.
Contract accounting estimatesThe majority of the group's revenues and profits are derived from long-term construction contracts which often have a duration of three to four years from award date. These contracts typically comprise integrated engineering, procurement, construction and integration activities, often with the use of subcontractors, and give rise to complex technical and execution risks as they are highly customised to customer requirements.
Contracts may be lump sum, reimbursable, target cost or a combination thereof, and often include incentive payments based on key performance indicators (KPIs) and meeting key milestones, in particular towards the end of the projects. KPIs can be related to schedule, cost targets, HSSE measures and others of which some are objective, subject to interpretation or at the discretion of customers, and can include reductions for penalty clauses for late delivery (liquidated damages).
The scope of work to be performed by the group may also change over time and can be subject to variations and claims with both the customer and subcontractors which impact various factors including compensation, costs, and contractual delivery dates.
Following the above, estimates are inherent in the group's accounting for long-term construction contracts and judgments are required to:
> Determine the forecast revenues and profit margin on each contract based on: – Estimates of contract revenues including variable revenues which may be dependent upon future performance; and – Forecasts of contract costs at completion including contingencies for uncertain costs to complete
> Assess the stage of completion of the contract, which determines the revenues, costs and margins to be recognised based on the project forecast. Progress measurement based on costs has an inherent risk related to the cost estimate and the estimation uncertainty during the early stages of a contract is mitigated by a policy of normally not recognising revenue in excess of costs on large projects before the contract reaches 20 percent completion
> Appropriately provide for any loss-making contracts
Even though management has extensive experience in assessing both project revenue, cost and margin, uncertainties exist.
Cost to complete depends on productivity factors and the cost of inputs. Weather conditions, performance of subcontractors and others with an impact on schedules, commodity prices and currency rates can all affect cost estimates. Experience, systematic use of the project execution model and focus on core competencies reduces but do not eliminate the risk that estimates may change significantly. A risk contingency is included in project cost based on the risk register that is prepared for every project and is updated throughout the project as the need for contingencies lapses or new risks are identified.
Legal and arbitration proceedingsIn the group’s view, the legacy project related to Nordsee Ost is subject to significant estimation uncertainty and the outcome could have a material impact on the consolidated financial statements. Management's assessments of the likely outcome of these proceedings, which form the basis of the recoverable amounts recognised in the financial statements, are subject to a high degree of uncertainty as the proceedings may last several years, are subject to complex interpretations of contractual, engineering, design and project execution issues and there are a wide range of reasonably possible outcomes. Please see Note 28 Contingent events, for further information.
WarrantiesA provision is made for expected warranty expenditures. The warranty period is normally two years. Based on experience, the provision is often set at one percent of the contract value, but can also be a higher or lower amount following a specific evaluation of the actual circumstances for each contract. The evaluations are based on experience from earlier projects. Factors that could affect the estimated warranty cost include the group’s quality initiatives and project execution model. See Note 17 Provisions, for further information about provisions for warranty expenditures on delivered projects.
GoodwillIn accordance with the stated accounting policy, the group tests whether goodwill has suffered any impairment, annually or more frequently if impairment indicators are identified. In response to the lower and on-going volatility in oil prices, the oil companies which are the group's main customers have cancelled or deferred many capital intensive projects, reducing the number of potential new contracts for Kvaerner and increasing the level of competition for available
30 KVAERNER ANNUAL REPORT 2016 ANNUAL ACCOUNTS – KVAERNER GROUP

contracts. These industry trends are indicators of impairment and are reflected in the group’s annual impairment test.
Management's determination of the recoverable amounts of the cash generating units includes assumptions regarding future project wins, their profitability and terminal values. The recoverable amounts of cash-generating units have been determined based on value-in-use calculations, which require the use of estimates and judgments. Further details about assumptions used for value-in-use calculations are included in Note 20 Intangible assets.
Income taxesKvaerner is subject to income taxes in numerous jurisdictions. Significant judgment is required to determine the worldwide provision for income taxes. There are many transactions and calculations for which the ultimate tax determination is uncertain during the ordinary course of business. Provisions are based on estimates of eventual additional taxes.
Income tax expense is calculated based on reported income in the different legal entities. Deferred income tax expense is calculated based on the differences between the assets' carrying value for financial reporting purposes and their respective tax basis that are considered temporary in nature.
The total amount of income tax expense and allocation between current and deferred income tax requires management's interpretation of complex tax laws and regulations in tax jurisdictions where Kvaerner operates. Valuation of deferred tax assets is dependent on management's assessment of future recoverability of the deferred benefit. Expected recoverability may result from expected taxable income in the near future, planned transactions or planned tax optimising measures. Economic conditions may change and lead to a different conclusion regarding recoverability, and such change may affect the results for each reporting period.
Further details about income taxes are included in Note 13 Income taxes.
Pension benefitsThe present value of pension obligations depends on a number of factors determined on the basis of actuarial assumptions. These assumptions include financial factors such as discount rate, expected salary growth and return on assets as well as demographical factors concerning mortality, employee turnover, disability and early retirement. Assumptions about all these factors are based on the situation at the time the assessment is made. However, it is reasonably certain that such factors will change over the very long periods for which pension calculations are made. Any changes in these assumptions will affect the calculated pension obligations. Further information about the pension obligations and the assumptions used are included in Note 3 Significant accounting policies and Note 24 Employee benefits – pensions.
Note 5 Financial risk management and exposures
Financial risksThe group is exposed to a variety of financial risks: currency risk, interest rate risk, price risk, credit risk, liquidity risk and capital risk. Market risk affects the value of financial instruments held. The objective of financial risk management is to manage and control financial risk exposure and thereby increase the predictability and minimise the potential adverse effects on the group’s financial performance. The group uses derivative financial instruments to hedge certain risk exposure and applies hedge accounting in order to reduce profit or loss volatility.
The group's approach to risk management includes identifying, evaluating and managing risk in all activities using a top-down approach with the purpose of avoiding sub-optimisation and utilising correlations observed from a group perspective.
Risk management is present in every project and it is the responsibility of the project managers in cooperation with Treasury to identify, evaluate and hedge financial risk under policies approved by the Board of Directors. The group has well-established principles for overall risk management, as well as policies for the use of derivatives and financial investments.
Currency riskKvaerner operates internationally and is exposed to currency risk on commercial transactions, recognised assets and liabilities. Commercial transactions and recognised assets and liabilities are subject to currency risk when payments are denominated in a currency other than the respective functional currency of the group company. The group's exposure to currency risk is primarily related to RUB, USD, GBP, CAD, SEK, PLN, and EUR.
The purpose of the group's hedging policy is generally to secure that entities hedge their entire contractually binding currency risk exposure in any project using forward contracts. Treasury manages internal exposures by entering into external forward contracts. The group has a number of contracts involving potential foreign currency exposures and the currency risk policy has been established for many years.
For segment reporting purposes, each legal entity designates all currency hedge contracts with Treasury as cash flow hedges. External foreign exchange contracts are designated at group level as hedges of currency risk on a gross basis. These hedges are done back-to-back. When hedges do not qualify for hedge accounting under IFRS, an adjustment is done at group level. See Note 18 Derivative financial instruments for information regarding the accounting treatment of hedging and embedded derivatives.
31KVAERNER ANNUAL REPORT 2016ANNUAL ACCOUNTS – KVAERNER GROUP

The group's exposure to its main foreign currencies
2016Amounts in million RUB PLN SEK CAD GBP USD EUR
Cash 14 0 34 2 5 9 10 Balance sheet exposure 14 0 34 2 5 9 10 Estimated forecast receipts from customers - - 28 - 6 19 63 Estimated forecast payments to vendors - (25) - - - (2) - Cash flow exposure - (25) 28 - 6 17 63 Forward exchange contracts - 25 (28) - (6) (17) (63)Net exposure 14 0 34 2 5 9 10
2015Amounts in million RUB PLN SEK CAD GBP USD EUR
Cash 34 1 25 16 9 26 30 Balance sheet exposure 34 1 25 16 9 26 30
Estimated forecast receipts from customers - - 34 15 10 16 93 Estimated forecast payments to vendors - (142) - - - - (16)Cash flow exposure - (142) 34 15 10 16 77 Forward exchange contracts - 142 (34) (15) (10) (16) (77)Net exposure 34 1 25 16 9 26 30
32 KVAERNER ANNUAL REPORT 2016 ANNUAL ACCOUNTS – KVAERNER GROUP

Estimated forecasted receipts and payments in the tables above are calculated based on the group's hedge transactions through Treasury. These are considered to be the best estimate of the currency exposure given that all currency exposure is hedged, in accordance with the group's policy. A foreign currency sensitivity analysis indicates that changes in the foreign currency rates would only have minor effects on equity and profit and loss. A ten percent weakening of the NOK against the currencies listed as of 31 December would have increased/(decreased) equity and profit and loss by the amounts shown in the table below. The selected rate of ten percent is seen as a reasonable possibility for NOK fluctuations within a normal year.
Changes in currency rates change the values of hedging derivatives, embedded derivatives, and cash balances. The table below illustrates the aggregated effects of derivatives and cash balances. Hedges that qualify for hedge accounting are reported in the profit and loss according to the progress of projects. Deferred value of cash flow hedges is reported as hedging reserve in equity. Any changes to currency rates will therefore affect equity.
Value of hedging instruments that do not qualify for hedge accounting cannot be deferred from profit and loss. Changes in profit and loss are based on changes in fair values of the hedges that do not qualify for hedge accounting and any ineffectiveness in hedges that are hedge accounted. The analysis includes only project-related items and assumes that all other variables, in particular interest rates, remain constant. Calculations are based on amounts and foreign currency exchange rates as of 31 December 2016. The analysis is performed on the same basis as it was for 2015. Changes in fair value to embedded derivatives will also have an effect directly to profit and loss.
Although not all foreign exchange contracts are part of hedge accounting relationships, they are used to economically hedge current risk. The effect on profit and loss under financial items in the table below will have an opposite effect on future operating income or expense as progress on projects increases. Equity in the following table is the hedge reserve that follows from cash flow hedges.
2016 2015Amounts in NOK million Profit before tax2 Equity1 Profit before tax2 Equity1
USD 2 - 8 - EUR 6 (6) 14 (5)GBP 2 (1) 4 (1)SEK 3 (3) 3 (3)PLN - 1 - 7
1 The effects to equity that follow directly from the effects to profit and loss are not included2 The effect on profit before tax is mainly related to embedded derivatives
A ten percent strengthening of the NOK against the above currencies as of 31 December 2016 would have had the equal but opposite effect on the above amounts, on the basis that all other variables remain constant. The sensitivity analysis does not include effects on the consolidated result and equity from changed exchange rates used for consolidation of foreign subsidiaries.
Translation exposureTranslation exposure occurs when foreign operations are translated for inclusion in the financial statements of the group.
Kvaerner has several investments in foreign operations, whose net assets are exposed to foreign currency translation risk. Currency exposure arising from the net assets of the group’s foreign operations is normally only hedged to the extent of agreed future payments.
Significant exchange rates applied for group reporting and consolidation
Average rate Closing rateCurrency 2016 2015 2016 2015
USD 8.4458 8.0605 8.6065 8.8222CAD 6.3594 6.3342 6.4062 6.3698EUR 9.2973 8.9610 9.0826 9.6003GBP 11.4596 12.3016 10.6500 13.0550SEK 0.9854 0.9585 0.9521 1.0478PLN 2.1342 2.1353 2.0611 2.2452
The next table illustrates the group’s exposure to translation risk. Had the Norwegian currency depreciated by ten percent during 2016, the consolidated financial statements would have been affected by the changes in the table below. The sensitivity analysis is only a translation sensitivity and does not reflect changes in competitiveness, derivatives or other effects from currency fluctuations. Sensitivity analysis per currency has been made. The total result is given in the presented table.
Amounts in NOK million Total 10% depreciation Change
Revenue EBITDA Equity Revenue EBITDA Equity Revenue EBITDA Equity
2016 7 896 629 2 656 7 921 637 2 640 25 8 (16)2015 12 084 574 2 550 12 118 568 2 616 34 (6) 66
Interest rate riskKvaerner’s interest rate risk arises from cash balances and external loans. Kvaerner does not have any interest bearing external loans as of 31 December 2016.
An increase of 100 basis points in interest rates during 2016 would have increased equity and profit or loss by the amounts shown in the table below. This analysis assumes that all other variables, in particular foreign currency rates, remain constant. The analysis is performed on the same basis as for 2015.
33KVAERNER ANNUAL REPORT 2016ANNUAL ACCOUNTS – KVAERNER GROUP

Amounts in NOK million 2016 2015
Cash and cash equivalents 30 16 Cash flow sensitivity (net) 30 16
Price riskKvaerner is exposed to fluctuations in market prices in the operational areas related to individual contracts, including changes in market price for raw materials, equipment and development in wages. These risks are managed in bid processes by locking in committed prices from vendors as a basis for offers to customers or through escalation clauses with customers.
Credit riskCustomer credit riskCredit risk is the risk of financial loss to the group if customer or counterparty to financial investments/instruments fails to meet its contractual obligations, and arises principally from external receivables. Assessment of credit risk related to customers and subcontractors is an important requirement in the bid phase and throughout the contract period. Such assessments are based on credit ratings, income statement and balance sheet reviews and on using credit assessment tools available (e.g. Dun & Bradstreet). Sales to customers are settled in cash.
Based on estimates of incurred losses in respect of trade and other receivables, the group establishes a provision for impairment. Provisions for loss on debtors are based on individual assessments. Provisions for loss on receivables are low, and there are no historical losses of any significance.
Revenues are mainly related to large and long-term projects closely followed up in terms of payments up front and in accordance with agreed milestones. Normally, lack of payment is due to disagreements related to project deliveries and is solved together with the customer or escalated for resolution through arbitration or other mechanisms provided for in the contract.
Customers are typically large and highly reputable oil companies with a low credit risk, which reduces the credit risk significantly. However, the contractual counterparty may be a special purpose asset owning vehicle or similar entity of the customer. In these cases an evaluation of credit risk takes into account the facts and circumstances of such arrangements, and credit risk is mitigated where possible by requiring parent company guarantees, customer pre-payments, obtaining contractor liens and other such actions. The risk of counterparties not meeting their contractual obligations will normally be related to legal disputes, see Note 29 Contingent events.
The maximum exposure to credit risk as at the reporting date equals the book value of each category’s financial assets. The group does not hold collateral as security.
Derivative credit riskDerivatives are only traded against approved banks through Treasury. All approved banks are participants in the group's loan syndicate and have the highest ratings at Moody's and S&P. Credit risk related to derivatives is therefore considered to be insignificant.
Liquidity riskLiquidity risk is the risk that the group could encounter difficulty in meeting the obligations associated with its financial liabilities. The group's approach in managing liquidity is to ensure, as far as possible, that it will always have sufficient liquidity reserves to meet its liabilities when due. The nature of the group's business dictates a close monitoring of liquidity. Payment from customers is often monthly cash-calls and involves large sums of cash.
Prudent liquidity risk management includes maintaining sufficient cash, the availability of funding from an adequate amount of committed credit facilities and the ability to close out market positions. Due to the dynamic nature of the underlying businesses, Treasury maintains flexibility in funding by maintaining availability under committed credit lines, see Note 23 Interest-bearing liabilities.
Management monitors rolling bi-weekly and monthly forecasts of the group’s liquidity reserve on the basis of expected cash flows. For information regarding capital expenditures and net operating assets, see Note 8 Operating Segments.
Financial liabilities and the period in which they mature
2016
Amounts in NOK million Note Book valueTotal undiscounted
cash flow1 6 mths and less
Trade and other payables 16 (2 820) (2 820) (2 820)Total (2 820) (2 820) (2 820)
2015
Amounts in NOK million Note Book valueTotal undiscounted
cash flow 1 6 mths and less
Trade and other payables 16 (2 620) (2 620) (2 620)Total (2 620) (2 620) (2 620)
1 Nominal currency value including interests
34 KVAERNER ANNUAL REPORT 2016 ANNUAL ACCOUNTS – KVAERNER GROUP

Group policy for the purpose of optimising availability and flexibility of cash within the group is to operate a centrally managed cash-pooling arrangement. Such arrangements are either organised with a bank as a service provider, or as a part of the operation of the internal treasury function. An important condition for the participants (legal entities) in such cash-pooling arrangements is that the group as an owner of such pools is financially viable and capable of servicing its obligations concerning repayment of any net deposits made by the entities.
Capital managementThe group’s objective for managing capital is to safeguard its ability to continue as a going concern in order to provide returns for shareholders and benefits for other stakeholders, while maintaining an optimal capital structure to reduce the cost of capital.
In order to maintain or adjust the capital structure, the group may adjust the amount of dividends paid to shareholders, return capital to shareholders, or sell assets to reduce debt.
The group monitors capital on the basis of equity ratio (gross debt/total equity), cash (gross debt less Net Current Operating Assets (NCOA) and cash and cash equivalents) and interest coverage ratio (EBITDA/net finance cost). The ratios are calculated from gross debt, including all interest-bearing liabilities as shown in Note 25 Financial instruments, EBITDA and finance cost. The reported ratios are well within the requirements of the loan agreements.
Guarantee obligationsThe group has provided the following guarantees on behalf of wholly owned subsidiaries as of 31 December 2016 (all obligations are per date of issue):
Amounts in NOK million 2016 2015
Parent company guarantees to group companies1 47 052 56 304Counter guarantees for bank/surety bonds 1 439 1 555Total 48 491 57 859
1 Kværner ASA has provided indemnities to Akastor of NOK 6.4 billion in respect of parent company guarantees issued by Akastor (included in the figures) on behalf of Kvaerner group companies
Note 6 Earnings/(loss) per share
Kværner ASA's share capital has a value of NOK 91 460 000, consisting of 269 000 000 shares.
2016 2015
Profit/(loss) attributable to ordinary shares (NOK million):Net profit/(loss) – continuing operations 82 337Net profit/(loss) – discontinued operations 345 56Net profit/(loss) – total operations 426 393
Weighted average number of shares outstanding 265 937 761 267 709 674
Earnings per share (NOK):Basic and diluted EPS – continuing operations 0.31 1.26Basic and diluted EPS – discontinued operations 1.30 0.21Basic and diluted EPS – total operations 1.60 1.47
35KVAERNER ANNUAL REPORT 2016ANNUAL ACCOUNTS – KVAERNER GROUP

Note 7 Related parties
The largest shareholder of Kværner ASA, Aker Kværner Holding AS, is controlled by Aker ASA (70 percent) which in turn is controlled by Kjell Inge Røkke and his family through TRG Holding AS and The Resource Group AS. All entities controlled by Aker ASA are considered related parties to Kvaerner. These entities are referred to as Aker Solutions, Akastor and other entities controlled by Aker in this note.
Kvaerner operates in an industry where it is common to establish associated companies and joint ventures to deliver large and complex projects to customers. In such arrangements two or more suppliers have responsibility for parts of a project. The group holds stakes in associated companies and joint ventures related to significant projects in the portfolio, and these meet the definition of a related party. See Note 22 Equity-accounted investees.
In accordance with International Accounting Standards 24 Related Party Disclosures, all entities controlled by Aker ASA, associated companies and joint ventures of Kvaerner and certain other related parties are reported as related parties to Kvaerner.
Related party transactions with entities controlled by Aker Solutions and AkastorServices acquired from Aker Solutions and Akastor include subcontracting, hire of personnel and shared services, transactions which are all part of Kvaerner’s ordinary business operations. Revenue is mainly related to sale of man hours.
Pricing models vary between types of projects and services, but all transactions with related parties are based on arms-length terms.
Related party transactions with associated companies and joint venturesOperating revenue from joint ventures is mainly sale of man hours to joint venture projects. Operating expenses from associated entities are mainly related to rent of buildings and sale of man hours. See further details in Note 22 Equity accounted investees on joint venture dividends and Note 10 Operating leases for details on long term lease with related party Fornebuporten AS.
Related party transactions with entities controlled by AkerAker PensjonskasseAker Pensjonskasse was established by Aker ASA to manage the retirement plan for employees and retirees in Kvaerner as well as other Aker companies. Kvaerner’s premiums paid to Aker Pensjonskasse amount to NOK 19 million in 2016 (2015: NOK 22 million).
OtherKvaerner ASA has entered into an agreement with employee representatives that regulates use of grants to employee unions for activities related to professional updating. The grant in 2016 was NOK 492 000 (2015: NOK 492 000).
36 KVAERNER ANNUAL REPORT 2016 ANNUAL ACCOUNTS – KVAERNER GROUP

2016
Amounts in NOK million Aker Solutions Akastor Other entities
controlled by AkerAssociated companies
Joint ventures
Other related parties Total
Income statementOperating revenues 105 7 6 1 488 - 607 Operating expenses (471) (179) (1) (68) (5) - (724)
Balance sheet as of 31 DecemberTrade and other receivables 35 3 1 - 97 - 136 Trade and other payables (48) (1) - (6) (18) - (73)
2015
Amounts in NOK million Aker Solutions AkastorOther entities
controlled by AkerAssociated companies
Joint ventures
Other related parties Total¹
Income statementOperating revenues 137 12 - 3 286 - 438 Operating expenses (984) (208) (9) (92) 1 (3) (1 295)
Balance sheet as of 31 December
Trade and other receivables 20 6 0 1 56 - 84 Trade and other payables (56) (27) (1) (6) - - (91)
1 Figures include discontinued operations
Trade receivables and trade payables are derived from ordinary business operations
37KVAERNER ANNUAL REPORT 2016ANNUAL ACCOUNTS – KVAERNER GROUP

Note 8 Operating segments
Kvaerner does not have any remaining operations in the US within the Downstream & Industrials segment, and remaining legacies within the segment are presented as discontinued operations in the group’s financial statements. Consequently, Kvaerner only has one reportable segment; Field Development (previously named Upstream).
Up until year-end 2015, the segment included the four separate business areas: Topsides delivering topsides and floaters; Jackets delivering large steel jackets for oil and gas installations; Concrete Solutions delivering concrete substructures and Onshore delivering onshore upstream facilities. As from 1 January 2016, Kvaerner changed to a new matrix based organisation model with enhanced focus on project execution. The business area structure has been removed and most of the Norwegian employees are allocated into resource centres. The previous business areas are replaced by the following operational areas: Process Solutions (previously Topsides and Onshore), Structural Solutions (previously Jackets), New Solutions and Concrete Solutions. The operational areas will comprise the Field Development segment as from 2016, with no changes to the group’s segment reporting.
The operational areas within the Field Development segment may meet the definition of an operating segment but have been aggregated based upon criteria in IFRS. Aggregation of the operating segments are considered to be consistent with the core principle of IFRS 8, as the projects within all operational areas are engineering, procurement and construction services relating to the construction of onshore and offshore facilities to be used in the upstream oil and gas industry. The operating segments are considered to have similar economic characteristics. Demand for the products and services in all the operational areas are driven by the oil price. The gross margin and profit/loss in a given year is not necessarily similar. There are few projects within each operational area and the gross margin and profit/loss in a given year may be influenced by specific circumstances in one project. However, the long term gross margin is expected to be similar over the long term and into the future.
Cash flows and capex are also similar, as well as the use of EPC contracts. Customer contracts for the operational areas are typically a combination of reimbursable elements, lump sum elements and incentives and penalties. The operational areas are considered similar in the respects of nature of product/service, nature of production processes, the type of customer, distribution method and regulatory environment. All operational areas execute large and complex EPC projects. The different operational area products are to some extent substitute solutions, for example both jackets and concrete Gravity Based Structures (GBS) are substructures for offshore platforms. Projects within all operational areas typically construct the equipment on-shore, either on a yard or at site. The majority of Kvaerner employees can be used for projects within all areas, as skills and knowledge needed is similar in the projects within the different areas. The main customers for all projects are the large, international oil companies.
Measurement of segment performancePerformance is measured by segment earnings before interest (net financial items), taxes, depreciation, amortisation and impairment (EBITDA) and earnings before interest (net financial items) and taxes (EBIT), as included in the internal management reports. The Field Development segment reporting includes Kvaerner’s share (proportionate consolidation) of jointly controlled entities closely related to Kvaerner’s operating activities. Segment profit, together with key
financial information as described below, gives management relevant information in evaluating the results of the operating segment and is relevant in evaluating the results of the segment relative to other entities operating within the industry. The President & CEO will normally not review financial items or total liabilities on segment level.
Inter-segment pricing is determined according to arm's length principles.
The accounting principles of the reportable segment are the same as described in Note 2 Basis of preparation and Note 3 Significant accounting policies, except for hedge accounting. When contract revenues and contract costs are denominated in a foreign currency, the subsidiaries hedge the exposure with Treasury. Hedge accounting is applied in segment reporting independently of whether the hedge qualifies for hedge accounting in accordance with IFRS or not. The correction of the non-qualifying hedges to ensure that the consolidated financial statements are in accordance with IFRS, is made as an adjustment at Kvaerner’s corporate level. This means that the group’s segment reporting reflects all hedging relationships as if hedge accounting applies even though they may not qualify in accordance with IFRS.
38 KVAERNER ANNUAL REPORT 2016 ANNUAL ACCOUNTS – KVAERNER GROUP

2016 Operating segments
Amounts in NOK million Note Field Development Other/Eliminations1 Total
Operating revenue and other incomeConstruction contracts 7 009 13 7 022 Services revenue 64 - 64 Share of result from joint ventures 3 119 (2 933) 186 Other income2 137 486 623 External operating revenue 10 330 (2 434) 7 896 Inter-segment revenue 34 (34) - Total operating revenue and other income 10 364 (2 468) 7 896
EBITDA 741 (111) 629 Depreciation and amortisation 19, 20 (96) (4) (100)Goodwill impairment 20 (198) - (198)EBIT 447 (116) 331
EBITDA 741 (111) 629 Adjustment for equity accounted investees3 - 50 50 Adjusted EBITDA 741 (61) 680
AssetsCurrent operating assets 1 461 (35) 1 427 Non-current operating assets 1 482 (16) 1 466 Operating assets 2 943 (50) 2 893 Investments in associates and jointly controlled entities 35 Investments in other companies 4 Cash and cash equivalents 3 047 Retained assets of business sold 1 Total assets 5 980
39KVAERNER ANNUAL REPORT 2016ANNUAL ACCOUNTS – KVAERNER GROUP

Amounts in NOK million Note Field Development Other/Eliminations1 Total
LiabilitiesCurrent operating liabilities 3 259 (298) 2 961 Non-current operating liabilities 191 13 205 Operating liabilities 3 450 (285) 3 165 Tax-related liabilities 108 Retained liabilities of business sold 51 Total liabilities 3 324
Net current operating assets (1 797) 263 (1 534)
Cash flowCash flow from operating activities 1 444 274 1 718 Acquisition of property, plant and equipment4 19 200 - 200
Order intake (unaudited) 2 938 - 2 938 Order backlog (unaudited) 6 459 - 6 459 Own employees (unaudited) 2 629 34 2 663
1 Other/Eliminations include Discontinued operations for cash flow from operating activities and own employees2 Other income includes studies, FEEDs, sale of man hours etc3 Impact of embedded derivatives reported in jointly controlled entities closely related to Kvaerner’s operating activities4 Compared to capital expenditure in the cash flow statement acquisition of property, plant and equipment excludes NOK 3 million for intangible assets
40 KVAERNER ANNUAL REPORT 2016 ANNUAL ACCOUNTS – KVAERNER GROUP

2015 Operating segments
Amounts in NOK million Note Field Development Other/Eliminations1 Total
Operating revenue and other incomeConstruction contracts 11 318 - 11 318 Services revenue 101 - 101 Share of result from joint ventures 2 946 (2 774) 173 Other income2 498 (5) 492 External operating revenue 14 863 (2 779) 12 084 Inter-segment revenue 53 (53) - Total operating revenue and other income 14 917 (2 832) 12 084
EBITDA 613 (39) 574 Depreciation and amortisation 19, 20 (77) (4) (81)EBIT 536 (43) 493
EBITDA 613 (39) 574 Adjustment for equity accounted investees3 - (38) (38)Adjusted EBITDA 613 (77) 536
AssetsCurrent operating assets 1 528 212 1 740 Non-current operating assets 1 501 70 1 571 Operating assets 3 030 282 3 311 Tax-related assets 2 Investments in associates and jointly controlled entities 134 Investments in other companies 7 Financial receivables 2 Cash and cash equivalents 1 560 Retained assets of business sold 633 Total assets 5 649
41KVAERNER ANNUAL REPORT 2016ANNUAL ACCOUNTS – KVAERNER GROUP

Amounts in NOK million Note Field DevelopmentOther/
Eliminations1 Total
LiabilitiesCurrent operating liabilities 2 634 163 2 797 Non-current operating liabilities 163 17 180 Operating liabilities 2 797 180 2 977 Tax-related liabilities 73 Retained liabilities of business sold 49 Total liabilities 3 099
Net current operating assets (1 106) 49 (1 057)
Cash flowCash flow from operating activities 736 447 1 183 Acquisition of property, plant and equipment4 19 24 4 28
Order intake (unaudited) 12 846 (49) 12 798 Order backlog (unaudited) 14 346 (0) 14 346 Own employees (unaudited) 2 769 42 2 811
1 Other/Eliminations include figures for the Downstream & Industrials segment for cash flow from operating activities and own employees2 Other income includes studies, FEEDs, sale of man hours etc3 Impact of embedded derivatives reported in jointly controlled entities closely related to Kvaerner’s operating activities4 Compared to capital expenditure in the cash flow statement acquisition of property, plant and equipment excludes NOK 27 million for intangible assets
Major customersFor the group, revenue and other income from the three largest customers represented NOK 7.4 billion, or 94 percent, of total revenue of NOK 7.9 billion (2015: NOK 10.8 billion and 89 percent). Of this, one customer represented 56 percent (2015: 69 percent), the second represented 36 percent (2015: 13 percent) and the third represented two percent (2015: seven percent) of the total revenue of the Kvaerner group.
For the Field Development segment, revenue and other income from the three largest customers represented NOK 10 billion, or 97 percent, of the segment’s total revenue of NOK 10.4 billion (2015: NOK 12.7 billion and 85 percent). Of this, one customer represented 43 percent (2015: 56 percent), the second represented 36 percent (2015: 18 percent) and the third represented 18 percent (2015: 11 percent) of the total revenue of the Field Development segment.
Geographical informationGeographical segment revenue is based on the geographical location of customers’ operations. Non-current segment assets are based on geographical location of the assets.
Total revenue and other income Non-current segment assets Amounts in NOK million 2016 2015 2016 2015
Norway 7 483 11 646 1 481 1 499 Europe 58 58 1 1 Canada 305 352 0 0 Rest of the world 50 28 1 1 Total 7 896 12 084 1 482 1 501
42 KVAERNER ANNUAL REPORT 2016 ANNUAL ACCOUNTS – KVAERNER GROUP

Note 9 Salaries, wages and social security costs
Amounts in NOK million Note 2016 20151
Salaries and wages including holiday allowance 1 760 1 974Social security tax/national insurance contribution 260 271Pension costs including social security tax 24 157 151Other employee costs 92 100Salaries, wages and social security costs 2 269 2 497
1 The numbers have been restated for consistent classification of social security taxes and pension costs (AFP), with no impact on total amount
Guidelines for remuneration to the President & CEO and the executive management of KvaernerThe main purpose of the executive remuneration programme is to encourage a strong and sustainable performance-based culture, which supports growth in shareholder value. The total remuneration to executives consists of a base salary, standard benefits and participation in the company’s executive variable pay programme.
GeneralThe company practices standard employment contracts and standard terms and conditions regarding notice period and severance pay for the President & CEO and executive management.
BenefitsThe President & CEO and the members of the executive management team participate in a standard employee and management pension scheme, a standard disability pension scheme and a standard insurance plan applicable to all employees in the company.
Variable pay programmeThe company has a deliberate policy of offering limited fixed benefits, and rather securing market competitiveness by offering participation in an annual executive variable pay programme. The objective of the programme is to recognise and reward the achievement of financial and operational results as well as personal performance. The earnings under the programme are dependent on annual achievement of financial targets, the company’s key performance indicators and personal performance rating.
One element of the programme will be paid in Kvaerner shares after three years. The monetary amount earned is converted into a number of shares based on the market value of the shares on 30 April the year after the grant date of the programme. The shares will be allocated to the executive based upon continued employment. If the executive leaves Kvaerner or has delivered his or her resignation before the shares are allocated, the executive will lose the right to the shares. The executive does not receive any dividends until the shares are allocated.
In 2016 the company allocated 552 974 shares under the 2015 programme which will be delivered to executive management employees in 2018, if still employed. Expected dividends per annum at grant date has been reflected in determining the grant date fair value per share of
NOK 7.12. The total expense in 2016 related to share based payments, was NOK 2.9 million (NOK 2.3 million in 2015).
Employee share purchase programmesNo share purchase programme was offered in 2016. Kvaerner offered a share purchase programme in 2015. In 2015, 1 561 303 Kværner ASA shares were distributed to employees and managers of the company.
Share options programmeThe company does not offer share options programmes to any managers or employees or other share based payment compensation programmes, except for the share based variable pay programme described above.
Severance paySeverance pay is applicable in case there is a mutual understanding between the company and the executive that the employment shall be terminated or the company requests the resignation of the executive out of concern for the affairs of Kvaerner. If so, the executive would be entitled to severance pay corresponding to three or six month’s regular fixed salary. Severance pay does not include holiday allowance or pension entitlements.
Kvaerner has no outstanding loans or guarantees to any employees, managers or Directors.
43KVAERNER ANNUAL REPORT 2016ANNUAL ACCOUNTS – KVAERNER GROUP

Remuneration to members of the executive management team
2016Amounts in NOK Base salary¹ Variable pay² Other benefits³ Pension benefits4 Total remuneration
Jan Arve Haugan 01.01.2016 – 31.12.2016 4 872 323 2 392 000 16 784 100 219 7 381 326 Steinar Røgenes 01.01.2016 – 31.12.2016 2 222 572 1 046 387 17 860 145 341 3 432 160 Sverre Myklebust 01.01.2016 – 31.12.2016 2 165 809 1 197 204 107 321 319 758 3 790 091 Elly Bjerknes 01.01.2016 – 31.12.2016 1 923 385 725 364 12 120 171 568 2 832 436 Hans Petter Mølmen 01.01.2016 – 31.12.2016 1 822 154 690 260 11 510 172 351 2 696 274 Terje Johansen 01.01.2016 – 31.12.2016 1 495 846 554 571 18 844 74 639 2 143 900 Eiliv Gjesdal5 01.01.2016 – 31.03.2016 614 818 2 066 377 2 616 59 437 2 743 248 Idar Eikrem 04.04.2016 – 31.12.2016 1 735 138 1 525 127 7 054 59 441 3 326 760 Arnt Knudsen 01.01.2016 – 31.12.2016 2 080 615 963 675 17 938 300 777 3 363 005 Ellen Grete Andersen 01.01.2016 – 31.12.2016 1 717 542 509 609 15 074 193 646 2 435 870 Henrik Inadomi 01.01.2016 – 31.12.2016 2 116 735 1 120 916 15 405 110 494 3 363 551 Knut Johan Malvik 01.01.2016 – 31.12.2016 2 224 454 958 474 12 689 211 747 3 407 364
24 991 392 13 749 962 255 214 1 919 418 40 915 985
1 Base salary represents salary expensed while holding an executive position, and includes holiday pay2 Variable pay reported is based on expensed, rather than paid benefits, and includes holiday pay3 Other benefits include telephone, insurance agreements, car allowance etc4 Pension benefits include the standard employee and management pension scheme and a disability pension scheme5 For the period 01.04.2016 - 30.06.2016 consultative tasks were performed, hence remuneration in this period has not been included in the above table. Variable pay reflects severance pay at the end of employment including the expensing of cash
and shares elements of the variable pay programme as a result of acceleration of vesting conditions. Share element expensed in 2016 was NOK 281 000
2015Amounts in NOK Base salary¹ Variable pay² Other benefits³ Pension benefits4 Total remuneration
Jan Arve Haugan 01.01.2015 – 31.12.2015 5 056 954 1 910 720 11 942 81 184 7 060 800 Steinar Røgenes 01.01.2015 – 31.12.2015 2 275 221 2 365 578 10 456 159 597 4 810 852 Sverre Myklebust 01.01.2015 – 31.12.2015 2 211 935 2 782 902 74 534 333 647 5 403 018 Arnt Knudsen 01.01.2015 – 31.12.2015 2 117 523 1 952 414 34 081 294 840 4 398 859 Olav Jan Støve5 01.01.2015 – 31.12.2015 3 066 503 - 94 000 - 3 160 503 Eiliv Gjesdal 01.01.2015 – 31.12.2015 2 240 036 2 593 777 10 456 136 658 4 980 927 Henrik Inadomi 01.01.2015 – 31.12.2015 2 161 276 2 335 842 10 966 89 187 4 597 271 Knut Johan Malvik 01.01.2015 – 31.12.2015 2 227 077 1 972 334 10 456 202 424 4 412 291
21 356 524 15 913 569 256 891 1 297 538 38 824 521
1 Base salary represents salary expensed while holding an executive position, and includes holiday pay2 Variable pay reported is based on expensed, rather than paid benefits, and includes holiday pay3 Other benefits include telephone, insurance agreements, car allowance etc4 Pension benefits include the standard employee and management pension scheme and a disability pension scheme5 External hired in consultant. Base salary represent hours invoiced from privately held company
44 KVAERNER ANNUAL REPORT 2016 ANNUAL ACCOUNTS – KVAERNER GROUP

Remuneration to the Board of Directors
2016
Amounts in NOK Board fees1
Audit Committee fees1
Remuneration Committee fees1
Leif-Arne Langøy 602 000 48 989 31 500 Tore Torvund2 521 900 - 31 500 Kjell Inge Røkke 328 000 - - Vibeke Hammer Madsen3 98 579 - 9 467 Thorhild Widvey4 229 421 58 754 22 033 Lone Fønss Schrøder4 229 421 114 011 - Rune Rafdal5 164 000 84 000 - Ståle Knoff Johansen5 164 000 - - Bernt Harald Kilnes5 164 000 - -
1 Fees listed in table are earned remuneration for work performed in 2016 related to Board, Audit Committee and Remuneration Committee meetings based on fees approved by the Annual General Meeting April 2016
2 Directors resident outside Scandinavia are granted additional compensation of NOK 12 700 per physical Board meeting
3 The Director Vibeke Hammer Madsen left the Board April 20164 Directors appointed at the Annual General Meeting April 20165 Directors appointed by and from the employees. Board fees to employee elected Directors are reduced in accordance
with agreement with employee representatives. Employee elected Directors have in addition received ordinary salaries from the companies in which they are employed
2015
Amounts in NOK Board fees1
Audit Committee fees1
Remuneration Committee fees1
Leif-Arne Langøy 602 000 74 578 31 500 Tore Torvund2 521 900 - 31 500 Kjell Inge Røkke 328 000 - - Vibeke Hammer Madsen 328 000 - 31 500 Birgit Nørgaard3 269 589 69 041 - Trine Sæther Romuld4 177 929 88 422 - Rune Rafdal5 164 000 84 000 - Ståle Knoff Johansen5 164 000 - - Bernt Harald Kilnes5 164 000 - -
1 Fees listed in table are earned remuneration for work performed in 2015 related to Board, Audit Committee and Remuneration Committee meetings based on fees approved by the Annual General Meeting April 2015
2 Directors resident outside Scandinavia are granted additional compensation of NOK 12 700 per physical Board meeting.3 Resigned from the Board October 20154 Resigned from the Board July 2015. Leif-Arne Langøy replaced Mrs. Romuld as Chair of the Audit Committee5 Directors appointed by and from the employees. Board fees to employee elected Directors are reduced in accordance
with agreement with employee representatives. Employee elected Directors have in addition received ordinary salaries from the companies in which they are employed
Fees to Directors employed in companies in which Aker has ownership will be paid to the companies, not to the Directors in person. The same procedure applies for fees to members of the Remuneration and Audit Committees.
Nomination CommitteeThe Articles of Association stipulate that the company shall have a Nomination Committee. The Nomination Committee shall have no less than three members, who shall normally serve for a term of two years.
The current members of the Nomination Committee are:Arild S. Frick (Chair), Georg F. Rabl and Walter Qvam. Kvaerner’s General Meeting has adopted guidelines governing the duties of the Nomination Committee.
Audit CommitteeThe current members of the Audit Committee are the following three Directors:Lone Fønss Schrøder (Chair), Thorhild Widvey and Rune Rafdal.
Remuneration CommitteeThe current members of the Remuneration Committee are the following three Directors:Leif-Arne Langøy (Chair), Tore Torvund and Thorhild Widvey.
Fees to members of the Audit and Remunerations committees are subject to approval by the Annual General Meeting, 20 April 2017.
45KVAERNER ANNUAL REPORT 2016ANNUAL ACCOUNTS – KVAERNER GROUP

Directors' and members of executive management team's shareholding
Direct shareholding2
Shares allocated as part of 2015 variable
pay programme³
Shares allocated as part of 2014 variable
pay programme³
Jan Arve Haugan¹ President & CEO 190 944 - - Steinar Røgenes EVP EPCI 14 000 90 504 61 706 Sverre Myklebust EVP Structural Solutions - 93 522 123 478 Elly Bjerknes EVP Process Solutions - 31 654 - Hans Petter Mølmen EVP Concrete Solutions 11 616 28 677 - Terje Johansen EVP New Solutions 7 397 21 419 - Idar Eikrem EVP & CFO - - - Arnt Knudsen SVP Business Development 24 194 86 565 64 497 Ellen Grete Andersen SVP HSSE 10 925 22 713 -Henrik Inadomi SVP Legal 4 981 89 672 108 553 Knut Johan Malvik EVP Commercial Project Services - 88 248 20 349
Ståle Johansen Director 8 431 - - Rune Rafdal Director 6 329 - - Bernt Harald Kilnes Director 19 265 - -
1 Jan Arve Haugan and related parties2 The overview includes only direct ownership of Kvaerner shares and does not include: – Chairman Leif-Arne Langøy’s holdings of 44 827 shares through a privately owned company – Director Kjell Inge Røkke's indirect ownership in Aker ASA through the Resource Group TRG AS and subsidiaries which he co-owns with his wife3 Allocated shares related to 2014 variable pay programme will be transferred in 2017, and allocated shares related to 2015 variable pay programme will be transferred in 2018, if still employed at applicable future dates
46 KVAERNER ANNUAL REPORT 2016 ANNUAL ACCOUNTS – KVAERNER GROUP

Note 10 Operating leases
Kvaerner has entered into various operating lease contracts, mainly related to rental of buildings. In addition Kvaerner is leasing a demolition area at Stord, and various, insignificant, equipment and machinery related to operations at the Stord and Verdal yards. The lease terms vary from short term contracts to contracts with duration up to 12 years. None of the leases include significant contingent payments. The majority of the contracts are renewable at the end of the lease period at market rates.
In 2013 Kvaerner signed an agreement with Fornebuporten AS for a long term lease for Kvaerner’s new headquarters at Fornebu. Kvaerner moved to new offices at Fornebuporten end of June 2015. The lease contract is for approximately 8 000 square metres at market terms, representing an all-inclusive annual average lease payment of NOK 27 million for the initial lease term. The term of the agreement is 12 years with options for five plus five years. Fornebuporten AS was owned by Aker ASA, related party to Kvaerner, when the lease agreement was entered into. In November 2015 Fornebuporten AS was sold to Fornebu Gateway AS, that is related party to Aker ASA and Kvaerner.
Total non-cancellable operating lease commitments
Amounts in NOK million 2016 2015
Amount due within one year 48 49 Amount due between one and five years 151 152 Amount due later than five years 154 156 Total 353 357
Minimum lease payments recognised in the income statement
Amounts in NOK million 2016 2015
Buildings 44 80 Plant, equipment and machinery 14 5 Total 59 84
As from 2016, common service costs relating to leases are excluded from operating lease commitments.
Sub-lease payments and contingent rent recognised in the income statement for the years ended 31 December 2016 and 2015 were insignificant. The group has non-cancellable sub-lease contract for offices in Houston, USA. Future minimum sub-lease income at year-end 2016 is NOK 7 million.
Note 11 Other operating expenses
Amounts in NOK million 2016 2015
Rental cost for buildings and other office and premises cost 32 72Other operating expenses related to office and equipment 15 113Hired services and external consultants including audit fees 81 175Travel expenses 20 37Insurance, guarantee and other service cost1 (5) 33Maintenance buildings and equipment 20 64Other2 84 86Total3 247 580
1 Insurance, guarantees and other service cost of negative NOK 5 million in 2016 mainly due to positive impact from project warranty releases. Please see Note 17 Provisions
2 Other expenses mainly include electricity, gas, tools, welding material and miscellaneous maintenance and personnel costs
3 Significant reductions in 2016 reflecting reduced activity, continuous improvements and reorganisation with mergers of Norwegian entities
Fees to auditor
Amounts in NOK million 2016 2015
Audit 4 5Other assurance services1 1 1Other services2 1 1Total fees to KPMG 6 7Total audit fees – other auditor 0 0Total continuing operations 6 7Total discontinued operations 0 0Total 6 8
1 Other assurance services in 2016 mainly related to assistance with preparation of statutory accounts and tax returns, and statutory opinions related to mergers of Norwegian entities
2 Other services include NOK 0.7 million in assistance on compliance related matters for 2016 and NOK 1.1 million in tax advisory services for 2015
47KVAERNER ANNUAL REPORT 2016ANNUAL ACCOUNTS – KVAERNER GROUP
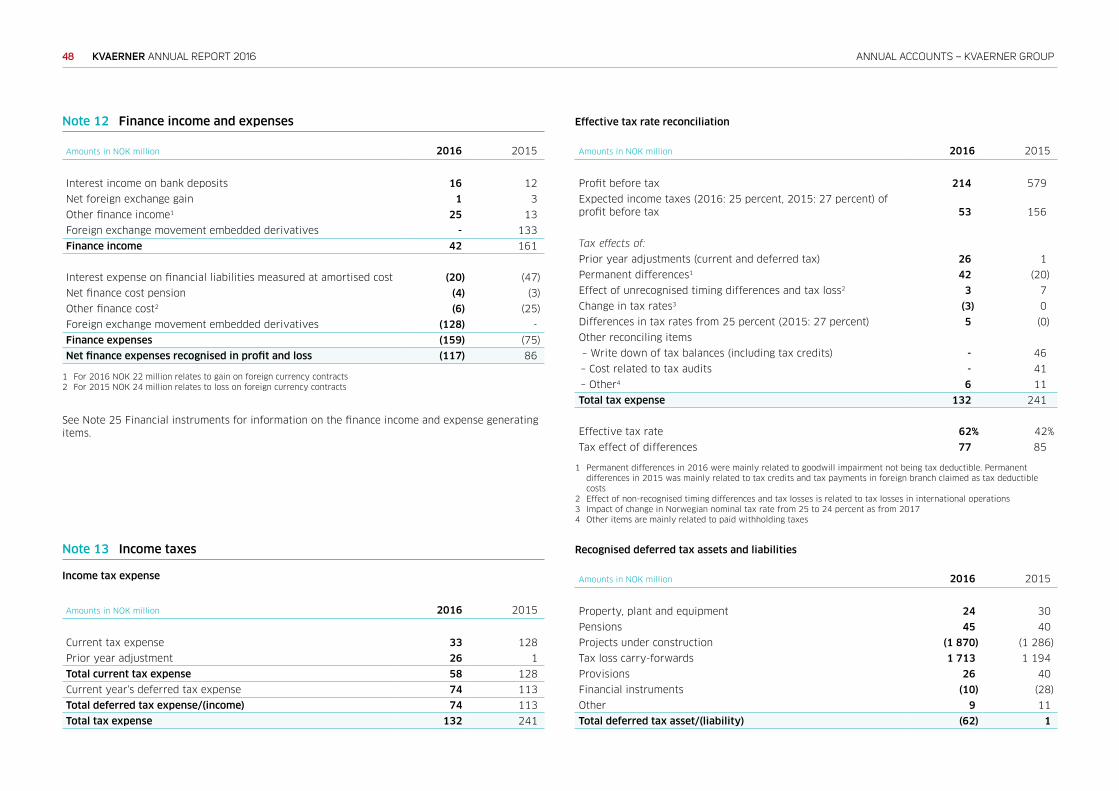
Note 12 Finance income and expenses
Amounts in NOK million 2016 2015
Interest income on bank deposits 16 12 Net foreign exchange gain 1 3 Other finance income1 25 13 Foreign exchange movement embedded derivatives - 133 Finance income 42 161
Interest expense on financial liabilities measured at amortised cost (20) (47)Net finance cost pension (4) (3)Other finance cost2 (6) (25)Foreign exchange movement embedded derivatives (128) - Finance expenses (159) (75)Net finance expenses recognised in profit and loss (117) 86
1 For 2016 NOK 22 million relates to gain on foreign currency contracts2 For 2015 NOK 24 million relates to loss on foreign currency contracts
See Note 25 Financial instruments for information on the finance income and expense generating items.
Note 13 Income taxes
Income tax expense
Amounts in NOK million 2016 2015
Current tax expense 33 128 Prior year adjustment 26 1 Total current tax expense 58 128 Current year's deferred tax expense 74 113 Total deferred tax expense/(income) 74 113 Total tax expense 132 241
Effective tax rate reconciliation
Amounts in NOK million 2016 2015
Profit before tax 214 579 Expected income taxes (2016: 25 percent, 2015: 27 percent) of profit before tax 53 156
Tax effects of:
Prior year adjustments (current and deferred tax) 26 1 Permanent differences1 42 (20)Effect of unrecognised timing differences and tax loss2 3 7 Change in tax rates3 (3) 0 Differences in tax rates from 25 percent (2015: 27 percent) 5 (0)Other reconciling items – Write down of tax balances (including tax credits) - 46 – Cost related to tax audits - 41 – Other4 6 11 Total tax expense 132 241
Effective tax rate 62% 42%Tax effect of differences 77 85
1 Permanent differences in 2016 were mainly related to goodwill impairment not being tax deductible. Permanent differences in 2015 was mainly related to tax credits and tax payments in foreign branch claimed as tax deductible costs
2 Effect of non-recognised timing differences and tax losses is related to tax losses in international operations3 Impact of change in Norwegian nominal tax rate from 25 to 24 percent as from 20174 Other items are mainly related to paid withholding taxes
Recognised deferred tax assets and liabilities
Amounts in NOK million 2016 2015
Property, plant and equipment 24 30 Pensions 45 40 Projects under construction (1 870) (1 286)Tax loss carry-forwards 1 713 1 194 Provisions 26 40 Financial instruments (10) (28)Other 9 11 Total deferred tax asset/(liability) (62) 1
48 KVAERNER ANNUAL REPORT 2016 ANNUAL ACCOUNTS – KVAERNER GROUP

Change in net recognised deferred tax assets and liabilities
2016
Amounts in NOK million
Balance as of 1 January
Recognised in profit and loss
Other adjustments
Balance as of 31 December
Property, plant and equipment 30 (11) 5 24 Net pensions 40 7 (2) 45 Projects under construction (1 286) (592) 8 (1 870)Tax loss carry-forwards 1 194 517 2 1 713 Provisions 40 (11) (2) 26 Financial instruments (28) 26 (8) (10)Other 12 (10) 8 9 Total 1 (74) 11 (62)
2015
Amounts in NOK million
Balance as of 1 January
Recognised in profit and loss
Other adjustments
Balance as of 31 December
Property, plant and equipment 34 (1) (2) 30 Net pensions 47 (6) (1) 40 Projects under construction (1 146) (140) - (1 286)Tax loss carry-forwards 1 133 58 2 1 194 Provisions 18 22 - 40 Financial instruments - (26) (1) (28)Other 38 (19) (7) 12 Total 123 (113) (9) 1
49KVAERNER ANNUAL REPORT 2016ANNUAL ACCOUNTS – KVAERNER GROUP

Tax loss carry-forwards
Amounts in NOK million 2016 2015
Recognised tax losses carried forward 7 139 4 768Unrecognised tax losses carried forward 77 106Total tax losses carried forward - continuing operations 7 216 4 874
Recognised tax losses are related to the Norwegian operations of which NOK 49 million is related to interest deduction limitation rules in Norway and expire after ten years. Remaining recognised tax losses have indefinite expiry dates. Unrecognised tax losses are related to international offices of which NOK 18 million expire after five years and the remaining have indefinite expiry dates.
In addition to the tax losses above for continuing operations, unrecognised tax losses in the group’s discontinued operations in North America amounted to NOK 665 million at year-end 2016 (2015: NOK 830 million).
Tax losses are recognised in the balance sheet to the extent that forecasts and realistic expectations about results show that Kvaerner will be able to use the tax losses before they expire.
Current tax liabilities of NOK 46 million (2015: NOK 73 million) is mainly related to tax on joint venture results where tax is levied on the partners.
Note 14 Trade and other current receivables
Amounts in NOK million Note 2016 2015
Trade receivables 802 557Less provision for impairment of receivables (28) (31)Trade receivables, net 774 526 Advances to suppliers 2 2Work in progress 15 68 199Accrued operating revenue 353 554Other receivables 200 251Derivative financial instruments 18 9 50Total trade and other receivables 1 407 1 583 Other 6 7Total trade and other current assets 1 413 1 590
Impairment losses in 2016 was nil (2015: nil).
Aging of trade receivables
Amounts in NOK million 2016 2015
Current 689 454 Past due 0-30 days 53 39 Past due 31-90 days 9 7 Past due 91 days to one year 52 58 Total 802 557
50 KVAERNER ANNUAL REPORT 2016 ANNUAL ACCOUNTS – KVAERNER GROUP

Note 15 Construction contracts
Amounts in NOK million Note 2016 2015
Construction revenue in the period 8 7 022 11 318
Amounts due from customers for construction work 68 199 Advances received from customers (687) (137)Construction contracts in progress, net position (618) 62
Construction contracts in progress at the end of the reporting periodAggregate amount of cost incurred and recognised gross profits to date 33 389 27 055
Largest projects in progress at year end 2016 (unaudited):
Project CustomerEstimated
delivery
Field Development segment:Nyhamna onshore Shell 2017Hebron gravity based structure ExxonMobil 2017Johan Sverdrup utility and living quarter topside Statoil 2019Johan Sverdrup riser platform jacket Statoil 2017Johan Sverdrup drilling platform jacket Statoil 2018Johan Sverdrup process platform jacket Statoil 2018
Note 16 Trade and other payables
Amounts in NOK million Note 2016 2015
Trade creditors 671 653Advances from customers 739 137Accrued operating and financial costs 1 237 1 441Derivative financial instruments 18 8 111Sundry taxes 148 214Other current liabilities 18 64Total trade and other payables 2 820 2 620
51KVAERNER ANNUAL REPORT 2016ANNUAL ACCOUNTS – KVAERNER GROUP
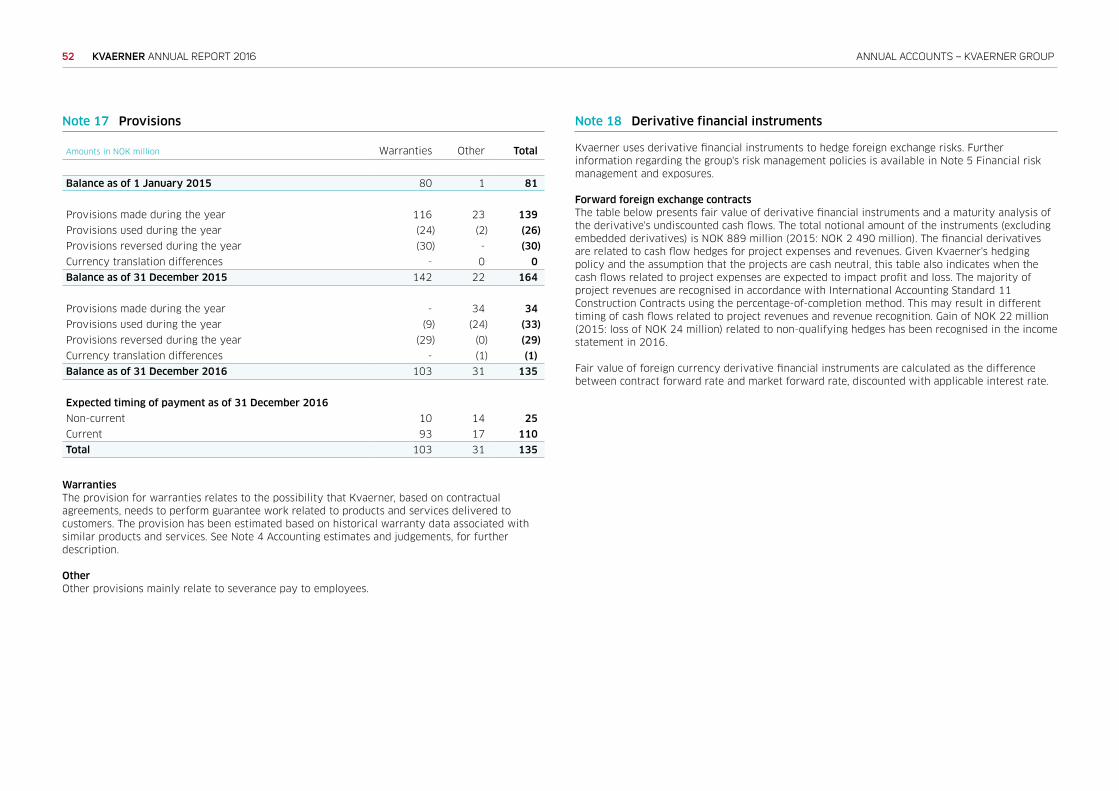
Note 17 Provisions
Amounts in NOK million Warranties Other Total
Balance as of 1 January 2015 80 1 81
Provisions made during the year 116 23 139 Provisions used during the year (24) (2) (26)Provisions reversed during the year (30) - (30)Currency translation differences - 0 0 Balance as of 31 December 2015 142 22 164
Provisions made during the year - 34 34 Provisions used during the year (9) (24) (33)Provisions reversed during the year (29) (0) (29)Currency translation differences - (1) (1)Balance as of 31 December 2016 103 31 135
Expected timing of payment as of 31 December 2016Non-current 10 14 25 Current 93 17 110 Total 103 31 135
WarrantiesThe provision for warranties relates to the possibility that Kvaerner, based on contractual agreements, needs to perform guarantee work related to products and services delivered to customers. The provision has been estimated based on historical warranty data associated with similar products and services. See Note 4 Accounting estimates and judgements, for further description.
OtherOther provisions mainly relate to severance pay to employees.
Note 18 Derivative financial instruments
Kvaerner uses derivative financial instruments to hedge foreign exchange risks. Further information regarding the group's risk management policies is available in Note 5 Financial risk management and exposures.
Forward foreign exchange contractsThe table below presents fair value of derivative financial instruments and a maturity analysis of the derivative's undiscounted cash flows. The total notional amount of the instruments (excluding embedded derivatives) is NOK 889 million (2015: NOK 2 490 million). The financial derivatives are related to cash flow hedges for project expenses and revenues. Given Kvaerner's hedging policy and the assumption that the projects are cash neutral, this table also indicates when the cash flows related to project expenses are expected to impact profit and loss. The majority of project revenues are recognised in accordance with International Accounting Standard 11 Construction Contracts using the percentage-of-completion method. This may result in different timing of cash flows related to project revenues and revenue recognition. Gain of NOK 22 million (2015: loss of NOK 24 million) related to non-qualifying hedges has been recognised in the income statement in 2016.
Fair value of foreign currency derivative financial instruments are calculated as the difference between contract forward rate and market forward rate, discounted with applicable interest rate.
52 KVAERNER ANNUAL REPORT 2016 ANNUAL ACCOUNTS – KVAERNER GROUP

2016
Amounts in NOK million Assets at fair valueLiabilities
at fair value Net fair valueTotal undiscounted
cash flow1 6 mths or less 6–12 mths 1–2 years
Cash flow hedges 8 (8) 0 0 (0) 1 - Embedded derivatives 14 (6) 8 8 0 3 6 Not hedge accounted 1 (0) 1 1 1 1 - Total 24 (14) 10 10 0 4 6
2015
Amounts in NOK million Assets at fair valueLiabilities
at fair value Net fair valueTotal undiscounted
cash flow1 6 mths or less 6–12 mths 1–2 years
Cash flow hedges 5 (21) (16) (16) (16) - - Embedded derivatives 150 (13) 137 138 34 34 70 Not hedge accounted - (45) (45) (45) (45) - - Total 155 (79) 76 77 (27) 34 70
1 Undiscounted cash flows are translated to NOK using the exchange rates as of the balance sheet date
53KVAERNER ANNUAL REPORT 2016ANNUAL ACCOUNTS – KVAERNER GROUP

Fair value of a hedging derivative is classified as a non-current asset or liability if the remaining maturity is more than 12 months and as a current asset or liability if the maturity is less than 12 months. If the hedged item is related to projects, such as work in progress or trade receivables, the hedging derivative is classified as a current asset or liability.
Foreign exchange derivativesKvaerner hedges the group's future transactions in foreign currencies against external banks, with currency exposure hedged back-to-back in order to meet the requirements for hedge accounting and to efficiently reduce currency risk. Treasury provides this service also to jointly controlled entities. Some hedges are not designated as hedges for accounting purposes and will have an effect on profit or loss. These are related to hedging of cash flows which are labelled embedded derivatives. All hedges qualifying for hedge accounting are cash flow hedges.
Hedged transactions in foreign currency that are subject to cash flow hedge accounting are highly probable future transactions expected to occur at various dates during the next one to two years, depending on progress in the projects. Gains and losses on forward foreign exchange contracts are recognised in comprehensive income and reported as hedging reserve in equity until they are recognised in the income statement in the period or periods during which the hedged transactions affect the income statement. This is generally within 12 months from the balance sheet date.
Foreign currency embedded derivativesEmbedded derivatives may exist where commercial contracts are to be settled in a currency different from the functional currency of the contracting parties. If certain conditions are met, embedded foreign exchange derivatives are separated from the host contract and accounted for separately at fair value.
Embedded derivatives themselves are non-cash items, and their fair values will converge to zero as the underlying cash flows are realised.
The majority of project revenues and costs are recognised in accordance with International Accounting Standard 11 Construction Contracts using the percentage-of-completion method. This may result in different timing of cash flows related to project revenues and costs, and embedded derivative effects. The total notional amount of the embedded instruments is NOK 842 million (2015: NOK 3 003 million).
Forward exchange contractsThe following table shows unsettled cash flow hedges' impact on profit or loss and equity (not adjusted for tax).
Forward exchange contracts
Amounts in NOK million 2016 2015
Fair value of all hedging instruments 3 (16)Recognised in profit and loss (2) 18 Deferred in equity (hedging reserve) 1 2
The purpose of the hedging instrument is to secure a situation where the hedged item and the hedging instrument together represent a predetermined value independent of fluctuations of exchange rates. Revenue and expense on the underlying construction contracts are recognised in the income statement in accordance with progress. The majority of the hedging reserve in equity will be reclassified to income statement within the next six months.
54 KVAERNER ANNUAL REPORT 2016 ANNUAL ACCOUNTS – KVAERNER GROUP

Note 19 Property, plant and equipment
Amounts in NOK million
Buildings and sites
Machinery, equipment
and softwareUnder
construction Total
Historical cost as of 1 January 2015 825 1 007 0 1 832 Additions 11 16 - 28 Disposals (1) (0) - (1)Scrapping - (68) - (68)Transfers 218 (218) - - Currency translation differences 1 0 0 1 Historical cost as of 31 December 2015 1 054 737 0 1 791
Accumulated depreciation as of 1 January 2015 (475) (621) - (1 095)Depreciation for the year (42) (35) - (77)Disposals 1 0 - 1 Scrapping - 68 - 68 Transfers (4) 4 - - Currency translation differences (1) (0) - (1)Accumulated depreciation as of 31 December 2015 (521) (583) - (1 104)Book value as of 31 December 2015 533 154 0 687
Historical cost as of 1 January 2016 1 054 737 0 1 791 Additions 6 173 20 200 Disposals - (0) - (0)Scrapping (4) (1) - (4)Transfers - 0 - 0 Currency translation differences (0) 0 (0) (0)Historical cost as of 31 December 2016 1 057 909 20 1 986
Accumulated depreciation as of 1 January 2016 (521) (583) - (1 104)Depreciation for the year (39) (49) - (89)Disposals - 0 - 0 Scrapping 4 1 - 4 Transfers - 0 - 0 Currency translation differences 0 (0) - 0Accumulated depreciation as of 31 December 2016 (557) (631) - (1 188)Book value as of 31 December 2016 500 278 20 798
Kvaerner has not entered into any financial lease contracts as of 31 December 2016. At year-end 2016, Kvaerner has no significant contractual commitments for acquisition of property, plant and equipment.
DepreciationAssets are mainly depreciated on a straight-line basis over their expected economic useful lives as follows:
Machinery, equipment and software 3–15 yearsBuildings 8–30 yearsSites No depreciation
Estimates for residual values are reviewed annually.
Note 20 Intangible assets
Amounts in NOK million
Intangible assets excl. goodwill Goodwill Total
Balance as of 1 January 2015 44 805 850 Amortisation (4) - (4)Additions 27 - 27 Balance as of 31 December 2015 68 805 873 Amortisation (12) - (12)Impairment - (198) (198)Additions 3 - 3 Balance as of 31 December 2016 59 607 666
Intangible assets other than goodwill have finite useful lives and are amortised over their expected economic useful life, ranging between five to ten years.
Research and development costsFor the year ended 31 December 2016, the group capitalised NOK 3 million related to development of a 3D CAD system for Structural Solutions. In 2015 NOK 27 million was capitalised related to other intangible assets. In 2016 NOK 15 million (2015: NOK 11 million) has been expensed for research and development as the criteria for capitalisation were not met. There were no research and development costs paid by customers in the period (2015: nil).
55KVAERNER ANNUAL REPORT 2016ANNUAL ACCOUNTS – KVAERNER GROUP

Goodwill – allocation by operating segment
Amounts in NOK million 2016 2015
Process Solutions 421 421 Structural Solutions 186 186 Concrete Solutions - 198 Total Field Development 607 805
Impairment testing of goodwillGoodwill originates from a number of historic acquisitions. Goodwill was allocated to the business areas, based on relative fair value estimates of the businesses at the time of demerger from Aker Solutions in 2011. Following changes in the composition of the previous cash generating unit Topsides/Onshore (business area), effective from 1 January 2016, goodwill has been reallocated to the new operational areas Process Solutions and New Solutions. Based on relative values for the two areas, the full goodwill value was allocated to Process Solutions. Concrete Solutions and Structural Solutions (previously business area Jackets) are mainly unchanged and goodwill allocated to these areas remains as before.
The group performs an impairment test annually, or more frequently if indications of impairment exists, to ensure that the recoverable amount related to recorded goodwill exceeds the related carrying value. Recoverable amounts are based on value in use calculations.
2016 Impairment testKey assumptionsManagement’s approach to determine the values that are assigned to each key assumption reflect past experience and are as follows:
> Assumed project awards is an essential element in the impairment testing. The group’s business development organisation is reviewing and considering market prospects and selecting target projects. Assumed project wins reflect past experience, strategic considerations and Kvaerner’s capacity to execute projects
> Cash flow projections for Process Solutions and Structural Solutions are based on budgets and strategic forecasts for the period 2017–2020. These projections include both current on-going projects and assumed project wins. Assumed new projects are included with full cash flow values. If these projects are not awarded there are several back-up projects that can be pursued
> Terminal values reflecting long term, steady state revenue and margin levels for Process Solutions and Structural Solutions are estimated based on a combination of historic levels and judgment
> An annual growth rate of two percent is used in calculating the terminal value for Process Solutions and Structural Solutions
> Due to higher uncertainty regarding the market situation and potential new project awards for Concrete Solutions, a different model is used for this operational area. Prospects are included based on a probability weighting assessed by Business Development, i.e. probability that pro-jects will go ahead and probability that Kvaerner will be selected as supplier. The forecasting period for Concrete Solutions is 2017 to 2028. This is based on the actual prospects in the market for Concrete Solutions. No terminal value is calculated for this area
> The pre-tax discount rate (based on a weighted average cost of capital assessment) used is calculated based on the post-tax rate using an iterative process that gives the same net present value of cash flows pre- and post-tax. The post-tax discount rate applied in the testing is 10.3 percent, and pre-tax discount rates are 12.7 percent for Process Solutions and Structural Solutions and 22.5 percent for Concrete Solutions due to only using an explicit period for this operational area
For operational areas Process Solutions and Structural Solutions recoverable amount for recognised goodwill exceeds the related carrying values, and consequently the analysis indicates that no impairment is required. There is considerable headroom compared to the carrying amount for these operating areas.
Calculated recoverable amount for recognised goodwill in Concrete Solutions is lower than the related carrying value, indicating required impairment. Cash flows used in the impairment test for Concrete Solutions are highly sensitive with regards to both future market, final concept choice and final project wins. This is further stressed by assumed project wins being some years into the future. The market for GBS solutions is still uncertain, although Kvaerner sees positive signals with high study activity and a long list of potential prospects. Given the uncertainty, including development and project wins depending on several factors, Kvaerner has concluded to fully impair goodwill of NOK 198 million allocated to this operational area. The impairment is a result of assessment of the uncertainty of the amounts and timing of new project awards and does not reflect Kvaerner’s view on long-term prospects within the Concrete business. Kvaerner will continue to invest in concrete core competence to position itself to win new projects.
SensitivitiesNo reasonable changes in key assumptions would lead to required impairment of goodwill related to Process Solutions. For Structural Solutions the following adverse changes could occur simultaneously before any impairment is required; revenue reduction of 30 percent, EBITDA margin reduction of one percentage point and increase in pre-tax discount rate of one point four percentage points.
56 KVAERNER ANNUAL REPORT 2016 ANNUAL ACCOUNTS – KVAERNER GROUP

Note 21 Other non-current assets
Amounts in NOK million Note 2016 2015
Pension funds 24 2 11Interest-bearing non-current receivables 0 2Other investments 4 7Total 6 20
Note 22 Equity-accounted investees
Joint ventures are accounted for using the equity method. Associated companies and joint ventures are defined as related parties to Kvaerner. See Note 7 Related parties, for overview of transactions and balances between Kvaerner and associated companies and joint ventures.
Joint Venture Agreement with Peter Kiewit Infrastructure CoKiewit-Kvaerner Contractors (KKC) is a partnership under Newfoundland and Labrador law, owned 50 percent by each of the partners Peter Kiewit Infrastructure Co and Kvaerner. The partnership is regulated by a partnership agreement and it follows from the partnership act and the partnership agreement that both partners are jointly and severally liable for the obligations of the partnership. The risk is limited on partner level as the partners are limited liability companies. Parent company guarantee is issued by parent company Kværner ASA for the contractual obligations, refer to Note 5 Financial risk management and exposures. Partnership property is held in the name of the partnership. Profit is shared 50:50 by the partners. KKC is building the gravity base structure (GBS) for the Hebron oil platform for ExxonMobil Corporation. The work is performed in Newfoundland and Labrador, Canada.
Joint Venture Agreement with Kellogg Brown & Root (Norway) ASKvaerner and Kellogg Brown & Root (Norway) AS (KBR) have formed a joint venture, K2JV ANS, for project execution with an ownership of 51 percent to Kvaerner and 49 percent to KBR. A Norwegian ANS entity implies that both partners are jointly and several liable for the obligations of the partnership. The risk is limited on partner level as the partners are limited liabilities companies. Parent company guarantee is issued by parent company Kværner ASA for the contractual obligations, refer to Note 5 Financial risk management and exposures. Partnership property is held in the name of the partnership. Profit is shared 51:49 by the partners. K2JV is executing the Johan Sverdrup utility and living quarter (ULQ) platform topside EPC project for Statoil.
57KVAERNER ANNUAL REPORT 2016ANNUAL ACCOUNTS – KVAERNER GROUP

Investments in associated companies and jointly controlled entities
2016
Amounts in NOK million
Book value as of 1 January Dividend Profit/(loss)1
Other movements2
Currency translation differences
Book value as of 31 December
Kiewit-Kvaerner Contractors (KKC) 65 (232) 166 - (0) (1)K2JV ANS3 46 (42) 21 (7) - 18 Other associated companies and jointly controlled entities 22 (3) (1) (0) 0 18 Total 134 (277) 186 (8) (0) 35
2015
Amounts in NOK million
Book value as of 1 January Dividend Profit/(loss)1
Other movements2
Currency translation differences
Book value as of 31 December
Kiewit-Kvaerner Contractors (KKC) 270 (340) 139 - (4) 65 K2JV ANS3 - - 38 8 - 46 Other associated companies and jointly controlled entities 17 (7) (4) 19 (3) 22 Total 288 (347) 172 27 (7) 134
1 Purpose of investment decides presentation in the income statement. Results from KKC and K2JV are presented within operating revenue and other income in the income statement2 Other movements for K2JV relates to cash flow hedges qualifying for hedge accounting. Other movements in 2015 for other associated companies and jointly controlled entities relate to write down of receivables recognised in Profit/(loss) from
equity accounted investees and against receivables in the balance sheet3 Profit from K2JV includes accounting effect of embedded derivatives, a loss of NOK 50 million in 2016. Result in 2015 was all related to embedded derivatives
Summary of financial information for significant equity accounted investees (100 percent basis)
2016Amounts in NOK million Business office Percentage held1 Assets Liabilities Equity Revenues Net profit/(loss)
Kiewit-Kvaerner Contractors (KKC)2 Newfoundland, Canada 50.0% 99 101 (2) 3 670 331 K2JV ANS2 Stord, Norway 51.0% 566 530 36 2 517 42
2015Amounts in NOK million Business office Percentage held1 Assets Liabilities Equity Revenues Net profit/(loss)
Kiewit-Kvaerner Contractors (KKC)2 Newfoundland, Canada 50.0% 212 81 131 5 412 278 K2JV ANS2 Stord, Norway 51.0% 329 239 90 451 75
1 Percentage of voting rights equals percentage held2 Jointly controlled entity
58 KVAERNER ANNUAL REPORT 2016 ANNUAL ACCOUNTS – KVAERNER GROUP

Note 23 Interest-bearing liabilities
This note provides information about the contractual terms of the group's interest-bearing loans and borrowings which are measured at amortised cost. For more information about the group's exposure to capital risk, including interest rates, foreign currency and liquidity risk, see Note 5 Financial risk management and exposures.
Bank debtThe revolving credit facility agreement of 8 July 2015 is a revolving credit facility of NOK 2 000 million, maturing in July 2020. The facility is provided by a syndicate of high quality international banks. The revolving credit facility was undrawn per 31 December 2016. The terms and conditions include restrictions which are customary for these kind of facilities, including inter alia negative pledge provisions and restrictions related to acquisitions, disposals and mergers. There are also certain provisions of change of control included in the agreement. There are no restrictions for dividend payments. The facility is unsecured.
The financial covenants are based on three sets of key financial ratios; an equity ratio based on consolidated total borrowings/consolidated total equity, a cash covenant calculated by consolidated total borrowings less consolidated net current operating assets and consolidated cash and cash equivalent assets and an interest coverage ratio based on consolidated EBITDA/consolidated finance costs. The financial covenants are tested on a quarterly basis. As of 31 December 2016 the company is in compliance with all covenants. The margin applicable to the facility is based on a price grid determined by the gearing ratio.
2016 and 2015
Amounts in NOK million Currency Nominal currency value Book value Interest margin Interest rate Effective interest rate Maturity date Interest terms
Revolving credit facility Multi currency 2 000 - 2.00% - - 8 July 2020 IBOR + Margin1
Total non-current borrowings -
1 The margin applicable to the facility is decided by a price grid based on the gearing ratio. Commitment fee is 40 percent of the margin
59KVAERNER ANNUAL REPORT 2016ANNUAL ACCOUNTS – KVAERNER GROUP

Note 24 Employee benefits – pensions
The group’s pension costs represent the future pension entitlement earned by employees in the financial year. In a defined contribution plan the company is responsible for paying an agreed contribution to the employee’s pension assets. In such a plan the annual contribution is also the cost. In a defined benefit plan it is the company's responsibility to provide a certain pension benefit. The measurement of the cost and the pension liability for such arrangements are subject to actuarial valuations.
Pension plans in NorwayThe main pension arrangement in Norway is a general pension plan organised by the Norwegian state. This arrangement provides the main general pension entitlement of all Norwegians. All pension arrangements by employers, consequently represent limited additional pension entitlements.
Norwegian employers are obliged to provide an employment pension plan, which can be organised as a defined benefit plan or as a defined contribution plan. Kvaerner closed its defined benefit plans in 2008 and are now providing defined contribution plans for all of their employees under 67 years of age.
Defined contribution planThe annual contribution expensed for the defined contribution plan was NOK 88 million (2015: NOK 100 million). The estimated contributions expected to be paid in 2017 is NOK 97 million.
Defined benefit planEmployees who were 58 years or more in 2008, when the plan was closed, are still in the defined benefit plan. This is a funded plan and represent most of the funded pension liability reported. Kvaerner’s contribution to this plan in 2016 was NOK 19 million (2015: NOK 22 million) and expected contribution for 2017 is NOK 17 million. Contributions will reduce as the employees retire.
The net pension obligation is sensitive to deviations in mortality for the members versus the mortality table used for calculating the obligation. As payments of the funds are relatively close in time – in a pension perspective – the net pension obligation is sensitive to reductions in the values of the investments.
Compensation planTo ensure that the employees were treated fairly at the change from the defined benefit plan to the defined contribution plan, the company introduced a compensation plan. The employees are entitled to a compensation amount being the difference between calculated pension capital in the defined benefit plan and the value of the defined benefit plan at the age of 67 years. The compensation amount will be adjusted annually in accordance with the adjustment of the employees’ pensionable income and accrued interest according to market interest. The compensation plan is an unfunded plan, and the obligation is calculated by actuary on a yearly basis. The first payment to employees from this plan will start in 2017.
AFP – early retirement arrangementAFP is an early retirement arrangement organised by Norwegian employers, The Norwegian
Confederation of Trade Unions (LO) and the Norwegian state. The AFP arrangement was established to provide pension between the age of 62 and 67 for employees who retired before the general retirement age.
A “new AFP” plan was established in 2011 to provide additional life long pensions to employees that retire early to compensate for the reduction in the ordinary pension entitlements. In this plan the employees are given a choice of retirement age, but with lower pension at earlier retirement. The Norwegian Accounting Standards Board has issued a comment concluding that the "new AFP" plan is a multi-employer defined benefit plan. The "new AFP" plan exposes the participating entities to actuarial risk associated with employees of other entities with the result that there is no consistent and reliable basis for allocating the obligation, plan assets and costs to individual participating entities. Sufficient information is not available to use defined benefit accounting and the "new AFP" plan is accounted for as a defined contribution plan. The annual contribution expensed for the “new AFP” plan was NOK 31 million (2015: NOK 33 million). The estimated contributions expected to be paid in 2017 is NOK 31 million.
Pension plans outside NorwayAll pension plans outside Norway are defined contribution plans. Contributions to these plans were NOK 1 million in 2016 (2015: NOK 2 million). Estimated contributions in 2017 is NOK 1 million.
Pension cost including payroll tax
Amounts in NOK million 2016 2015
Service cost¹ 36 18 Administration cost 1 2 Curtailments and settlements - (4)Net periodic pension cost defined benefit plans 38 15 Pension cost defined contribution plans2 120 135 Net periodic pension cost 157 151 Net interest cost/(income) 4 4 Net periodic pension cost including net interest cost 161 154
1 In 2016 and 2015, the service cost was increased by NOK 17 million and reduced by NOK 5 million respectively, following changes of numbers of employees within AFP scheme being part of defined benefit plans
2 2015 amount is restated to also include “new AFP” plan, refer also to note 9 Salaries, wages and social security costs
60 KVAERNER ANNUAL REPORT 2016 ANNUAL ACCOUNTS – KVAERNER GROUP

Movement in pension obligation and plan asset
Amounts in NOK million 2016 2015
Projected benefit obligation as of 1 January 494 539 Service cost 36 18 Interest expense 13 13 Plan amendments 0 (3)Payroll tax of employer contribution assets (3) (3)Benefits paid (39) (35)Remeasurements loss/(gain) to other comprehensive income (OCI) 1 (34)Projected benefit obligation as of 31 December 500 494
Plan assets at fair value as of 1 January 335 365 Interest income 9 8 Contributions paid into the plan 28 22 Benefits paid (39) (27)Payroll tax of employer contribution assets (3) (3)Administrative expenses paid (1) 0 Remeasurements loss/(gain) to other comprehensive income 3 (29)Plan assets at fair value as of 31 December 331 335Effect of asset ceiling1 (20) 0 Net benefit obligation as of 31 December 190 158
As presented in the balance sheetEmployee benefit assets 2 11 Employee benefit obligations (191) (169)Total (190) (158)
1 Asset ceiling is implemented to reduce net pension assets according to the IFRS definition of assets. The effect is booked to other comprehensive income
Defined benefit obligation specified by funded and unfunded pension plans
Amounts in NOK million 2016 2015
Funded 309 331 Unfunded 191 163 Net employee benefit assets / (employee benefit obligations) 500 494
Plan assets at fair value of funded schemes are NOK 331 million (2015: NOK 335 million).
Included in other comprehensive income (OCI)
Amounts in NOK million 2016 2015
Remeasurements loss/(gain) from changes in:Effect of changes in financial assumptions (33) (24)Effect of changes in demographic assumptions 28 - Effect of experience adjustments 6 7 Return on plan assets (excluding interest income) (3) 13 Changes in asset ceiling/onerous liability (excluding interest income) 20 - OCI losses/(gains) 18 (5)
61KVAERNER ANNUAL REPORT 2016ANNUAL ACCOUNTS – KVAERNER GROUP

Analyses of plan assetsPlan assets comprise:
Amounts in NOK million 2016 2015
Equity instruments – Oil & Gas 2 5 – Oilfield Services & Equipment 6 5 – Renewable Energy 1 - – Telecom Services - 1 – Chemicals 2 2 Bonds – Government 5 2 – Finance 57 56 – Private and Government enterprise 65 60 – Municipalities 168 193 Fund/Private Equity 25 10 Plan assets 331 335
Fair value of equities is based on their quoted prices at the reporting date without any deduction for estimated future selling cost. The equity portfolio is invested globally.
Investments in bonds are done in the Norwegian market and most of the bonds are not listed on any exchange. Market value at year-end is based on official prices provided by the Norwegian Securities Dealers Association. Bond investments have on average a high credit rating, and most of the investments are in Norwegian municipalities with a credit rating of AA.
Investments in fund/private equity are mainly funds that invest in listed securities and where fund value is based on quoted prices.
Actuarial assumptionsThe following are the principal actuarial assumptions at the reporting date.
2016 2015
Discount rate 2.50% 2.60%Asset return 2.50% 2.60%Salary progression 2.25% 2.50%Pension indexation 0 – 2.25% 0.75 – 2.60%G – multiplier 2.00% 2.25%Mortality table K2013 K2013 BE
The discount rate is based on the Norwegian high quality corporate bond rate.
Assumptions regarding future mortality are based on the dynamic mortality table K2013. The dynamic model expects improvements in life expectancy over time, and that is expected for Kvaerner employees as well. The current longevities underlying the values of the defined benefit obligation at the reporting date were as follows:
2016 2015
Assumed life expectancy retiring today (member age 65)Males 22.1 21.3 Females 25.4 24.4
Assumed life expectancy retiring in 25 years (member age 40 today)Males 24.4 23.5 Females 27.9 26.8
Sensitivity analysisCalculation of the defined benefit obligation is sensitive to the actuarial assumptions set out above. An entity shall disclose a sensitivity analysis for each significant actuarial assumption. Possible changes at the reporting date to one of the relevant actuarial assumptions, holding other assumptions constant, would have affected the defined benefit obligation by amounts shown below:
Defined benefit obligationEffects in NOK million Increase Decrease
Discount rate (1% movement) (42) 50 Future salary growth (1% movement) 11 (10)Future pension growth (1% movement) 39 (34)
62 KVAERNER ANNUAL REPORT 2016 ANNUAL ACCOUNTS – KVAERNER GROUP

Note 25 Financial instruments
Financial instruments are classified into level 1, 2 and 3 in the measurement hierarchy based on how objective the measuring method is. Level 1 indicates use of quoted prices in an active market for identical assets and liabilities. Kvaerner has limited financial instruments beyond cash and short term receivables and payables. The fair value of cash, receivables and payables are approximates to their carrying values based on their short maturities.
Level 2 implies fair value measurements based on price inputs, other than quoted prices, which are derived from observable market transactions in an active market for identical assets or liabilities. Kvaerner’s financial instruments within this category are related to derivative financial instruments, where fair value is determined based on forward prices on foreign currency exchange rates, see Note 18 Derivative financial instruments. Fair value measurements in level 3 indicate use of unobservable inputs; fair value calculations on the basis of input and assumptions that are not from observable market transactions. Kvaerner has no such level 3 assets or liabilities.
Note 26 Cash and Cash Equivalents
Amounts in NOK million 2016 2015
Restricted cash 1 1 Cash pool 443 1 512 Interest-bearing deposits 2 602 47 Total 3 047 1 560
Note 27 Group companies as of 31 December 2016
Company name CityCountry of incorporation
Ownership (percent)1
Kværner ASA Oslo NorwayKværner Holding AS (previously Kværner AS) Oslo Norway 100Kværner AS (previously Kværner Stord AS)2 Stord Norway 100Kværner Contracting Spain AS Oslo Norway 100Kværner Contracting Italy AS Oslo Norway 100Norwegian Contractors AS Sandvika Norway 100Aker Solutions Contracting AS Oslo Norway 100Kværner Resources AS Oslo Norway 100Kvaerner Finland Oy Ulvila Finland 100Kvaerner Contracting Ltd London UK 100Kvaerner Resources Ltd London UK 100Kvaerner Field Development Inc Houston USA 100Kvaerner Americas Holdings Inc Canonsburg USA 100Kvaerner North American Construction Inc Canonsburg USA 100Kvaerner Oil & Gas Australia Pty Ltd Perth Australia 100Kvaerner Canada Ltd St. John’s Canada 100Kvaerner Engineering & Technology (Beijing) Co Ltd Beijing China 100Kvaerner LLC Moscow Russia 100
1 Ownership equaling the percentage of voting shares2 Following an internal reorganisation in 2016 several Norwegian subsidiaries have been merged into Kværner AS
63KVAERNER ANNUAL REPORT 2016ANNUAL ACCOUNTS – KVAERNER GROUP

Note 28 Discontinued operations
Following the sale of Kvaerner’s onshore construction business in North America in December 2013, Kvaerner does not have any remaining operations in USA within the Downstream & Industrials segment, and remaining legacies within the segment are presented as discontinued operations in the group’s financial statements.
The results for the discontinued business is reported separately under the heading Profit/(loss) from discontinued operations in the group’s income statement.
In March 2016, settlement agreements were reached with Amec Foster Wheeler North America Corp of all claims related to the Longview Power project. Kvaerner received the settlement amount of USD 70 million in March 2016. The financial effects of the settlement have been recognised in Kvaerner’s accounts. The positive operating result for 2016 reflects recognition of insurance recoveries of more than net USD 23 million related to the Longview Power project. Financial income is related to foreign exchange accounting effect on repayment of capital of NOK 261 million in 2016 and NOK 139 million in 2015, with no impact on group equity.
Summary of financial data for discontinued operations
Amounts in NOK million 2016 2015
Total revenue and other income 0 (0)Administrative and legal expenses, net of insurance recoveries 85 (85)EBIT 85 (85)Net financial income/(expense) 261 142 Profit/(loss) before tax 346 57 Income tax expense (1) (1)Net profit/(loss) discontinued operations 345 56
Basic and diluted earnings/(losses) per share (NOK) 1.30 0.21 Net assets (50) 584
Cash flow from discontinued operations
Amounts in NOK million 2016 2015
Cash flow from operating activities 735 321 Cash transferred (to)/from parent (730) (319)Translation adjustments (1) 5 Net increase/(decrease) in cash and bank deposits 4 6
Cash and cash equivalents at the beginning of the period 30 24 Cash and cash equivalents at the end of the period 35 30
Note 29 Contingent events
Given the scope of Kvaerner’s worldwide operations, group companies are inevitably involved in legal disputes in the course of their activities. Provisions have been recognised to cover expected outcome of any disputes and litigation proceedings in accordance with applicable accounting rules. Such provisions are based on management's best judgement and estimates of a likely outcome of the dispute and will be subject for review by in-house or external legal advisors. However, the final outcome of such disputes and litigation proceedings will always be subject to uncertainties, and resulting liabilities may exceed recorded provisions. The disputes and litigation proceedings are continuously monitored and reviewed, and recognised provisions are adjusted to reflect management’s best estimates of most recent facts and circumstances. Litigation and arbitration costs are recognised as they occur.
Significant current disputesNordsee Ost projectIn 2012, arbitration related to the Nordsee Ost project was filed. The last wind jackets for the project were delivered in October 2013. The arbitration process for the project will take time due to high complexity. It is currently not possible to estimate when the arbitration will be finalised.
There is substantial uncertainty with respect to the final financial outcome of the Nordsee Ost project, and to avoid prejudicing Kvaerner's position, no estimate of the expected final outcome is disclosed.
64 KVAERNER ANNUAL REPORT 2016 ANNUAL ACCOUNTS – KVAERNER GROUP

Note 30 Subsequent events
Contract for offshore hook-up of the Johan Sverdrup riser platformKvaerner has together with Aker Solutions been awarded a contract for offshore hook-up of the riser platform for the Johan Sverdrup field. Kvaerner will formally operate as a subcontractor to Aker Solutions. The contract has an estimated value for Kvaerner of about NOK 450 million. The scope will primarily consist of planning, management and hook-up of the seven platform modules, scheduled to arrive in Norway in second quarter 2018. The contract also includes options for offshore hook-up of the process and living quarter platforms for Johan Sverdrup.
Contract for decommissioning project In February 2017, Kvaerner won a contract to dismantle and recycle a North Sea platform with contract value of approximately NOK 200 million. Kvaerner will dismantle the platform, recycle and dispose all materials. The deconstruction and disposal work will start with the receipt of the first units in 2017 and continue throughout 2019.
Further simplification of organisation and workforce reductions Kvaerner will further simplify the organisation, reduce the amount of management positions and downsize the workforce with 40–50 employees. The objective is to further reduce costs to continue strengthening competitiveness. As a consequence, the organisational structure will be adjusted effective from 1 March 2017. An updated organisational chart is published on www.kvaerner.com/emt.
Note 31 Capital and reserves
Share capitalKværner ASA has one class of shares, ordinary shares, with equal rights for all shares. The holders of ordinary shares are entitled to receive dividends and are entitled to one vote per share at General Meetings.
Total outstanding shares are 269 000 000 at par value of NOK 0.34 per share. All issued shares are fully paid.
Dividends 2016 2015
Paid dividend per share (NOK) - 0.82
Dividends paid in and proposed for 2016 was nil.
Hedging reserveThe hedging reserve relates to cash flow hedges of future revenues and expenses against exchange rate fluctuations. The income statement effects of such instruments are recognised in accordance with the progress of the underlying construction contract as part of revenues or expenses as appropriate. The hedging reserve represents the value of such hedging instruments that are not yet recognised in the income statement. The underlying nature of a hedge is that a positive value on a hedging instrument exists to cover a negative value on the hedged position, see Note 18 Derivative financial instruments.
Currency translation reserve The currency translation reserve includes exchange differences arising from the translation of the net investment in foreign operations.
65KVAERNER ANNUAL REPORT 2016ANNUAL ACCOUNTS – KVAERNER GROUP

Annual accounts Kværner ASA
Income statement 01.01 – 31.12 67
Balance sheet as of 31 December 68
Statement of cash flows 01.01 – 31.12 69
Notes to the financial statements 70
Note 1 Accounting principles 70
Note 2 Operating revenue and operating expenses 71
Note 3 Net financial items 71
Note 4 Tax 71
Note 5 Investments in group companies 72
Note 6 Shareholders' equity 73
Note 7 Receivables and borrowings from group companies and related parties 73
Note 8 Non-current liabilities 74
Note 9 Other current receivables and current liabilities 74
Note 10 Interest-bearing liabilities 74
Note 11 Guarantees 74
Note 12 Financial risk management and exposures 75
Note 13 Shareholders 75
66 KVAERNER ANNUAL REPORT 2016 ANNUAL ACCOUNTS – KVÆRNER ASA

Income statement 01.01 - 31.12
Amounts in NOK thousands Note 2016 2015
Operating revenue 2 24 895 20 057 Operating expenses 2 (35 804) (41 979)Operating loss (10 909) (21 922)Net financial items 3 (24 666) (60 858)Profit/(loss) before tax (35 575) (82 780)
Tax income/(expense) 4 9 629 19 018 Net profit/(loss) (25 946) (63 762)
Net profit/(loss) for the year are distributed as follows: Dividends paid - 40 070 Transferred from other equity (25 946) (103 832)Net profit/(loss) (25 946) (63 762)
67KVAERNER ANNUAL REPORT 2016ANNUAL ACCOUNTS – KVÆRNER ASA

Balance sheet as of 31 December
Amounts in NOK thousands Note 2016 2015
AssetsDeferred tax asset 4 51 288 41 659 Investments in group companies 5 6 843 335 6 843 335 Non-current interest-bearing receivables from group companies 5 889 696 Total non-current assets 6 900 512 6 885 690
Non interest-bearing receivables from group companies 7 - 60 365 Other current receivables 9 12 975 16 738 Cash and cash equivalents 7 54 218 47 530 Total current assets 67 193 124 633 Total assets 6 967 705 7 010 323
Liabilities and shareholders' equityIssued capital 91 460 91 460 Share premium reserve 729 027 729 027 Other equity 3 546 583 3 584 767 Total equity 6 4 367 070 4 405 254
Non-current liabilities 8 13 109 10 535 Total non-current liabilities 13 109 10 535
Interest-bearing current liabilities to group companies 7 2 459 567 2 396 245 Current liabilities to group companies 7 3 280 - Other current liabilities to group companies 74 470 90 862 Other current liabilities to related parties 7 1 334 27 522 Other current liabilities 9 48 875 79 905 Total current liabilities 2 587 526 2 594 534 Total liabilities and shareholders' equity 6 967 705 7 010 323
Fornebu, 16 March 2017Board of Directors and President & CEO of Kværner ASA
Leif-Arne Langøy Tore Torvund Kjell Inge Røkke Lone Fønss Schrøder Thorhild Widvey Chairman Deputy Chairman Director Director Director
Rune Rafdal Ståle Knoff Johansen Bernt Harald Kilnes Jan Arve Haugan Director Director Director President & CEO
68 KVAERNER ANNUAL REPORT 2016 ANNUAL ACCOUNTS – KVÆRNER ASA

Statement of cash flows 01.01 - 31.12
Amounts in NOK thousands Note 2016 2015
Profit/(loss) before tax (35 575) (82 780)Changes in accounts receivable - 1 810 Changes in accounts payable 3 471 13 851 Changes in other net operating assets (21 586) 578 Non-cash effect on group hedging 37 456 6 306 Amortisation of loan costs 3 702 1 325 Net cash from operating activities (12 532) (58 910)
Increase/(reduction) in external interest-bearing debt 10 - (500 000)Increase/(decrease) in long term borrowings to group companies 19 018 770 537 Proceeds from employee share purchase programme 6 - 412 Share purchase for the variable pay program, net of refund from subsidiaries 8 202 (384)Dividends paid - (220 300)Net cash from financing activities 19 220 50 265
Net increase (decrease) in cash and bank deposits 6 688 (8 645)
Cash and bank deposits at the beginning of the period 47 530 56 175Cash and bank deposits at the end of the period 54 218 47 530
69KVAERNER ANNUAL REPORT 2016ANNUAL ACCOUNTS – KVÆRNER ASA

Notes to the financial statements
Note 1 Accounting principles
Kværner ASA was incorporated on 12 January 2011 and is domiciled in Norway. Kværner ASA’s registered office address is Oksenøyveien 10, 1366 Lysaker, Norway. Kværner ASA is listed on Oslo Børs (Oslo Stock Exchange).
The financial statements are prepared in accordance with Norwegian legislation and Norwegian generally accepted accounting principles. The functional and presentation currency is Norwegian kroner (NOK).
Foreign currency translationTransactions in foreign currency are translated at the rate applicable on the transaction date. Monetary items in a foreign currency are translated into NOK using the exchange rate applicable on the balance sheet date. Foreign currency exchange impacts are recognised in the income statement as they occur.
Revenue recognitionOperating revenue comprise parent company guarantees recharged entities within the group. The revenue is recognised over the guarantee period.
TaxTax income/(expense) in the income statement comprises current tax and change in deferred tax. Deferred tax is calculated at 24 percent of temporary differences between accounting and tax values as well as any tax losses carried forward. Net deferred taxes are only recognised to the extent it is probable it can be utilised against future taxable profits.
Classification and valuation of balance sheet itemsCurrent assets and current liabilities include items due within one year or items that are part of the operating cycle. Other balance sheet items are classified as non-current assets/debt.
Current assets are valued at the lowest of cost and fair value. Current debt is valued at nominal value at time of recognition.
Non-current debt is initially valued at transaction value less attributable transaction costs. Subsequent to initial recognition, interest-bearing long-term debt is recognised at amortised cost with any difference between cost and redemption value being recognised in the income statement over the period of the borrowing on an effective interest basis.
Accounts receivable and other current receivables are recognised in the balance sheet at nominal value less provisions for doubtful accounts.
Variable pay programmeExecutives in the group receive remuneration in the form of a variable pay program. One part of the program is a short term employee benefit and is recognised at estimated value over the period the employee must work to receive the incentive.
In addition the employee is entitled to a matching element that is paid in the form of Kvaerner ASA shares. The monetary amount of the earned bonus is converted to a corresponding number of shares based on the market value of the shares 30 April in the year after the award is granted. The shares are delivered to the employee three years after the grant date based upon continued employment. Kvaerner ASA hold the shares presented as treasury shares until they are distributed to the eligible employees.
Investment in subsidiaries and associatesSubsidiaries and investments in associates are measured at cost in the company accounts, less any impairment losses. The investments are impaired to fair value if the impairment is not considered temporary. Impairment losses are reversed if the basis for the impairment loss is no longer present.
Dividends, group contributions and other distributions from subsidiaries are recognised in the same year as they are recognised in the financial statement of the provider. If dividends or group contribution exceed withheld profits after the acquisition date, the excess amount represents repayment of invested capital, and is recognised as a reduction in carrying value of the investment.
Cash in cash pool systemKværner ASA has a cash pool that includes parent company’s cash as well as net deposits from subsidiaries in the group cash pooling system owned by parent company. Correspondingly, the parent company’s current debt to group companies will include their net deposits in the group’s cash pool system.
Share capitalCost related to purchase and sale of treasury shares are accounted for directly against equity, including any transactions costs.
Cash flowThe cash flow is presented using the indirect method. Cash and cash equivalents include cash, bank deposits and other short-term liquid investments.
70 KVAERNER ANNUAL REPORT 2016 ANNUAL ACCOUNTS – KVÆRNER ASA

Note 2 Operating revenue and operating expenses
Operating revenue relates to parent company guarantees recharged entities within the Kvaerner group and related parties, as recognised over the guarantee period.
There are no employees in Kværner ASA and hence no salary or pension related costs, and no loans or guarantees related to the executive management team. Group management and corporate staff are employed by other Kvaerner companies and costs for their services as well as other parent company costs are recharged to Kværner ASA.
Fees to KPMG for statutory audit of the parent company amounted to NOK 1 million (2015: NOK 2.6 million) whereof NOK 0.8 million relates to ordinary audit fee and 0.2 million to other assurance services excluding VAT.
NOK 2.9 million (2015: NOK 3.1 million) has been allocated to payable fees to the Board of Directors for 2016.
See Note 9 Salaries, wages and social security costs in the group accounts for further details regarding remuneration of the Board of Directors and President & CEO.
Note 3 Net financial items
Amounts in NOK thousands 2016 2015
Interest income from group companies 3 804 3 092 Interest expense to group companies (28 528) (18 050)Net interest group companies (24 724) (14 958)External interest income 10 724 - External interest expense1 (20 133) (45 470)Net interest external (9 409) (45 470)Net other financial items 9 467 (430)Net financial items (24 666) (60 858)
1 External interest expense reflects amortised prepaid fees and commitment fee related to the credit facility
Note 4 Tax
Amounts in NOK thousands 2016 2015
Taxable incomeProfit/(loss) before tax (35 575) (82 780)Interest deduction limit 24 724 14 958 Permanent differences1 (11 489) - Taxable income/(loss) (22 340) (67 822)
Temporary differences and deferred tax Tax loss carried forward due to interest deduction limit (39 682) (14 958)Tax losses carried forward (174 018) (151 678)Total temporary differences (213 700) (166 636)Deferred tax asset 51 288 41 659
Tax incomeChange in deferred tax 11 766 22 351Effect of change in tax rate (2 137) (3 333)Total tax income in income statement 9 629 19 018Effective tax rate 27% 23%
1 Permanent differences relate to reversal of previous years' write-down on loans to group companies
71KVAERNER ANNUAL REPORT 2016ANNUAL ACCOUNTS – KVÆRNER ASA

Note 5 Investments in group companies
Amounts in NOK
thousands
Registered office
Share capital
Number of shares held
Book value1
Percentage owner-/voting share
Kværner Holding AS
Bærum, Norway 1 010 10 000 6 843 335 100%
Kværner Holding AS financial information 2016
Amounts in NOK thousands
Profit/(loss) for the period 297 166Equity as of 31 December 2016 6 200 450
1 Impairment test performed by 31 December supports carrying value of investment in Kværner Holding AS
Investments are impaired to fair value if the impairment is not considered temporary. Impairment testing of shares in Kværner Holding AS has taken place as carrying value in the balance sheet is higher than the market capitalisation of the group, indicating a potential permanent reduction in the value of the underlying investments.
The impairment test is following a value in use methodology, and performed by comparing the carrying value of the investment with estimated value of equity for Kvaerner group excluding Kværner ASA based on value in use calculations. In these calculations, management has made assumptions regarding future performance of the subsidiaries, associates and other investments of the Company, which in turn requires assumptions on current and future projects.
See Note 20 in the Annual accounts for the group for further details on key assumptions used in the impairment test.
Calculated recoverable amount exceeds book value of the shares, hence no impairment is required as per year end 2016. The calculations are sensitive to key assumptions such as revenue and margin levels in the subsidiaries owned by Kværner Holding AS. Compared to assumptions used in the testing, a combination of 10 percent revenue reduction, 1 percentage point EBITDA margin reduction and 1 percentage point increase in post-tax discount rate would lead to a required impairment of the investment in Kværner Holding AS of approximately NOK 1 billion.
72 KVAERNER ANNUAL REPORT 2016 ANNUAL ACCOUNTS – KVÆRNER ASA
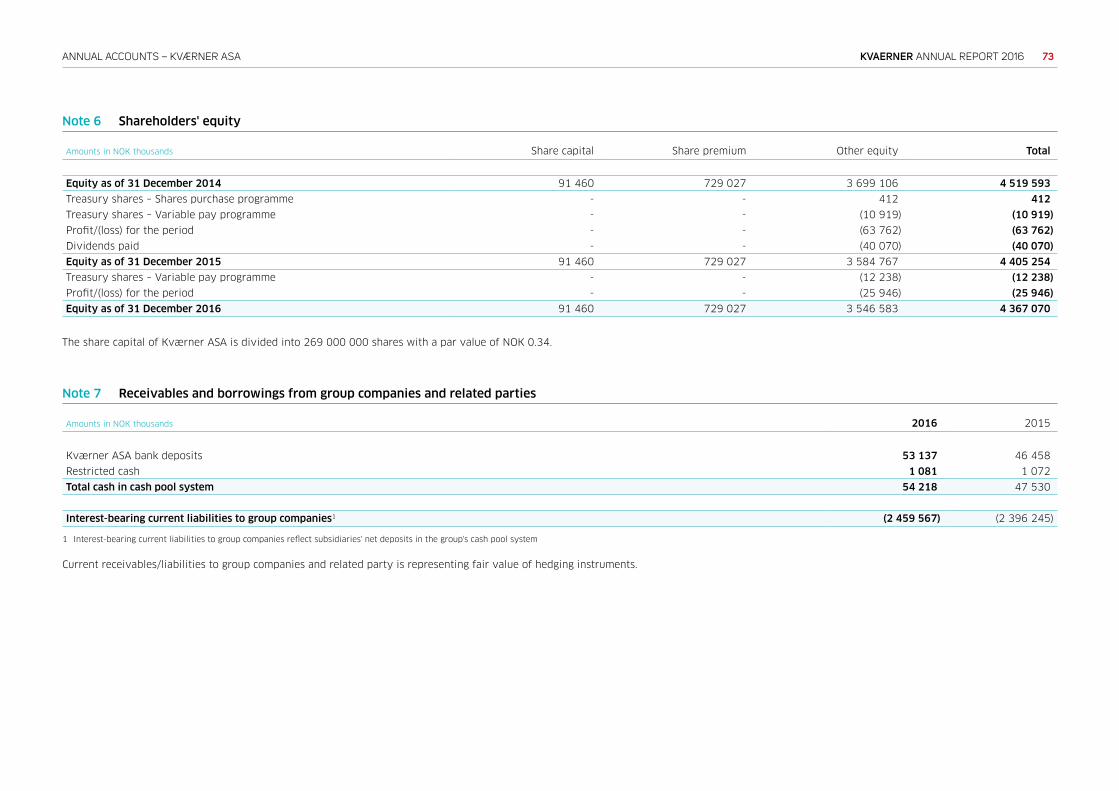
Note 6 Shareholders' equity
Amounts in NOK thousands Share capital Share premium Other equity Total
Equity as of 31 December 2014 91 460 729 027 3 699 106 4 519 593 Treasury shares – Shares purchase programme - - 412 412 Treasury shares – Variable pay programme - - (10 919) (10 919)Profit/(loss) for the period - - (63 762) (63 762)Dividends paid - - (40 070) (40 070)Equity as of 31 December 2015 91 460 729 027 3 584 767 4 405 254 Treasury shares – Variable pay programme - - (12 238) (12 238)Profit/(loss) for the period - - (25 946) (25 946)Equity as of 31 December 2016 91 460 729 027 3 546 583 4 367 070
The share capital of Kværner ASA is divided into 269 000 000 shares with a par value of NOK 0.34.
Note 7 Receivables and borrowings from group companies and related parties
Amounts in NOK thousands 2016 2015
Kværner ASA bank deposits 53 137 46 458 Restricted cash 1 081 1 072 Total cash in cash pool system 54 218 47 530
Interest-bearing current liabilities to group companies1 (2 459 567) (2 396 245)
1 Interest-bearing current liabilities to group companies reflect subsidiaries' net deposits in the group's cash pool system
Current receivables/liabilities to group companies and related party is representing fair value of hedging instruments.
73KVAERNER ANNUAL REPORT 2016ANNUAL ACCOUNTS – KVÆRNER ASA

Note 8 Non-current liabilities
Amounts in NOK thousands 2016 2015
Debt to Kvaerner employees for matching shares1 (13 109) (10 535)Total non-current liabilities (13 109) (10 535)
1 Reference is made to Note 9 in the group accounts for futher details related to the variable pay programme
Note 9 Other current receivables and current liabilities
Amounts in NOK thousands 2016 2015
Other current external receivables 12 975 16 738 Other current external liabilities (48 875) (79 905)Net other current receivables and liabilities (35 900) (63 167)
Net other current receivables and other current liabilities include unrealised forward exchange contracts with external counterparts, see also Note 12 Financial risk management and exposures. Other current external liabilities includes debt to Kvaerner employees for matching shares related to incentive programme.
Note 10 Interest-bearing liabilities
This note provides information about the contractual terms of Kværner ASA's interest-bearing loans and borrowings which are measured at amortised cost. For more information about Kværner ASA's exposure to interest rates, foreign currency and liquidity risk, see Note 12 Financial risk management and exposures.
Bank debtThe revolving credit facility agreement of 8 July 2015 is a revolving credit facility of NOK 2 000 million, maturing in July 2020. The facility is provided by a syndicate of high quality international banks. The revolving credit facility was undrawn per 31 December 2016. The terms and conditions include restrictions which are customary for these kind of facilities, including inter alia negative pledge provisions and restrictions related to acquisitions, disposals and mergers. There are also certain provisions of change of control included in the agreement. There are no restrictions for dividend payments. The facility is unsecured.
The financial covenants are based on three sets of key financial ratios; an equity ratio based on consolidated total borrowings/consolidated total equity, a cash covenant calculated by consolidated total borrowings less consolidated net current operating assets and consolidated cash and cash equivalent assets and an interest coverage ratio based on consolidated EBITDA/consolidated finance costs. The financial covenants are tested on a quarterly basis. As of 31 December 2016 the company is in compliance with all covenants. The margin applicable to the facility is based on a price grid determined by the gearing ratio.
See Note 5 and 23 in the Annual accounts for the group for further details.
Note 11 Guarantees
Amounts in NOK million 2016 2015
Parent company guarantees to group companies1 44 834 56 304Counter guarantees for bank/surety bonds 1 439 1 555Total 46 273 57 859
1 Kværner ASA has provided indemnities to Akastor of NOK 6.4 billion (included in the amount above) in respect of parent company guarantees issued by Akastor on behalf of Kvaerner group companies
The guarantees/surety bonds are issued under contractual obligations with third party, hence these are not included in Kværner ASA accounts as liabilities.
74 KVAERNER ANNUAL REPORT 2016 ANNUAL ACCOUNTS – KVÆRNER ASA

Note 12 Financial risk management and exposures
Foreign exchangeKværner ASA's currency contracts with subsidiaries as of 31 December 2016 has a notional value of NOK 904 million. Hundred percent of contracts are hedged back-to-back with external banks.
Currency exposure from equity investments in foreign currencies is only hedged when specifically instructed by management.
Currency risk and balance sheet hedging
2016 2015Amounts in NOK thousands Assets Liabilities Assets Liabilities
Fair value of forward exchange contracts with group companies 3 667 (6 947) 69 030 (8 665)Fair value of forward exchange contracts with related parties 1 188 (2 522) 14 144 (41 666)Fair value of forward exchange contracts with external counterparts 9 469 (4 855) 50 331 (83 174)Total 14 324 (14 324) 133 505 (133 505)
Interest rate riskThe company is exposed to changes in interest rates because of floating interest rate on loan receivables and loan payables. The company does not hedge transactions exposure in financial markets, and does not have any fixed interest rate loan receivables nor loan payables. The company is therefore not exposed to fair value risk on its outstanding loan receivables or loan payables. Interest bearing loan receivables and loan payables expose the company to income statement and cash flow interest rate risk.
Credit riskCredit risk relates to loans to subsidiaries and associated companies, hedging contracts, guarantees to subsidiaries and deposits with external banks and related parties. Loans to subsidiaries are assessed by the internal credit committee. Loss provisions are made in situations of negative equity and where the company is not expected to be able to fulfil its loan obligations from future earnings. External deposits and forward contracts are done according to a list of approved banks and primarily with banks where the company also have a borrowing relation.
Liquidity riskLiquidity risk relates to the risk that the company will not be able to meet its debt and guarantee obligations and is managed through maintaining sufficient cash and available credit facilities. Development in the group's and thereby Kværner ASA's available liquidity, is continuously monitored through weekly and monthly cash forecasts, annual budgets and long term planning.
Note 13 Shareholders
Shareholders with more than one percent shareholding as of 31 December 2016
2016
Company NomineeNumber of
shares heldOwnership
percent
AKER KVÆRNER HOLDING AS 110 333 615 41.02NORTH SEA STRATEGIC INVESTMENTS AS 42 735 434 15.89JP MORGAN BANK LUXEMBOURG S.A X 5 332 496 1.98KVÆRNER ASA 3 674 061 1.37JPMORGAN CHASE BANK, N.A X 3 550 905 1.32CITIBANK, N.A. X 3 332 294 1.24J.P. MORGAN SECURITIES LLC X 3 264 526 1.21
Source: Norwegian Central Securities Depository (VPS)
75KVAERNER ANNUAL REPORT 2016ANNUAL ACCOUNTS – KVÆRNER ASA
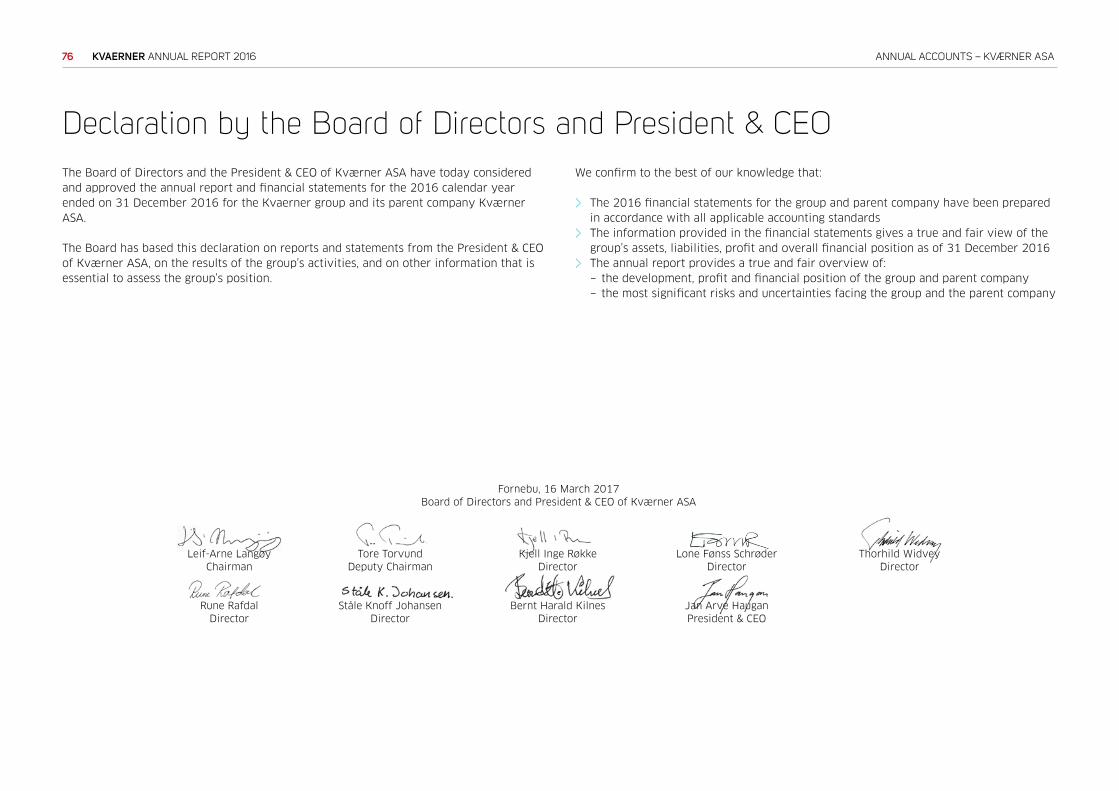
Declaration by the Board of Directors and President & CEO
Fornebu, 16 March 2017Board of Directors and President & CEO of Kværner ASA
Leif-Arne Langøy Tore Torvund Kjell Inge Røkke Lone Fønss Schrøder Thorhild Widvey Chairman Deputy Chairman Director Director Director
Rune Rafdal Ståle Knoff Johansen Bernt Harald Kilnes Jan Arve Haugan Director Director Director President & CEO
The Board of Directors and the President & CEO of Kværner ASA have today considered and approved the annual report and financial statements for the 2016 calendar year ended on 31 December 2016 for the Kvaerner group and its parent company Kværner ASA.
The Board has based this declaration on reports and statements from the President & CEO of Kværner ASA, on the results of the group’s activities, and on other information that is essential to assess the group’s position.
We confirm to the best of our knowledge that:
> The 2016 financial statements for the group and parent company have been prepared in accordance with all applicable accounting standards
> The information provided in the financial statements gives a true and fair view of the group’s assets, liabilities, profit and overall financial position as of 31 December 2016
> The annual report provides a true and fair overview of:− the development, profit and financial position of the group and parent company− the most significant risks and uncertainties facing the group and the parent company
76 KVAERNER ANNUAL REPORT 2016 ANNUAL ACCOUNTS – KVÆRNER ASA

77KVAERNER ANNUAL REPORT 2016ANNUAL ACCOUNTS – KVÆRNER ASA

78 KVAERNER ANNUAL REPORT 2016 ANNUAL ACCOUNTS – KVÆRNER ASA

79KVAERNER ANNUAL REPORT 2016ANNUAL ACCOUNTS – KVÆRNER ASA

Board of Directors
Leif-Arne LangøyChairman
Leif-Arne Langøy (born 1956) is chairman of the board for Det Norske Veritas and Sparebanken Møre. Mr Langøy has gained senior executive experience from several companies, including as President & CEO of Aker Yards and Aker ASA. Mr Langøy has extensive experience as the chairman of non-executive boards from a number of different industrial companies. Mr Langøy holds M.Sc. in economics from the Norwegian School of Economics in Bergen, Norway. He holds 44 827 shares in Kværner ASA through a privately owned company, and has no stock options. Mr Langøy is a Norwegian citizen. He has been elected for the period 2015–2017.
Tore TorvundDeputy Chairman
Tore Torvund (born 1952) is the President & CEO of REC Silicon ASA. Mr Torvund has senior executive experience from more than twenty years in the oil and gas industry, including as executive vice president of Exploration & Production Norway at the oil company StatoilHydro, and executive vice president of Oil and Energy at Norsk Hydro. He was also the chairman of the board of Oljeindustriens Landsforening (now Norsk olje & gass) in the period 2003–2008. He has held several management positions related to drilling operations, field development and technology projects. Mr Torvund holds a M.Sc. in petroleum engineering from the Norwegian University of Science and Technology. He holds no shares in Kværner ASA, and has no stock options. Mr Torvund is a Norwegian citizen. He has been elected for the period 2015–2017.
Kjell Inge RøkkeDirector
Kjell Inge Røkke (born 1958) is an entrepreneur and industrialist, and has been a driving force in the development of Aker since the 1990's. Mr Røkke owns 68.18 percent of Aker ASA through The Resource Group TRG AS and subsidiaries which he co-owns with his wife. He is chairman of Aker ASA, board member of Aker Solutions ASA, Aker PB ASA and Ocean Yield ASA. He holds no shares in Kværner ASA, and has no stock options. Mr Røkke is a Norwegian citizen. He has been elected for the period 2015–2017.
Thorhild WidveyDirector
Thorhild Widvey (born 1956) was Minister of culture from 2013 to 2015 and Minster of Petroleum and Energy from 2004 to 2005. Ms Widvey was state secretary in the Norwegian Ministry of Foreign Affairs from 2003 to 2005 and in the Norwegian Ministry of Fisheries from 2002 to 2003. Prior to this she was a Member of Parliament (Stortinget) from 1989 to 1997, representing Høyre (the Conservative Party of Norway). Ms Widvey is chair of the board in Statkraft AS; and has previously held a number of board positions both in privately and stock listed companies, including e.g. HitecVision AS (2006 to 2015); ENI Norway AS (2007 to 2015), Aker Drilling ASA (2005 to 2006), Oslo Havn KF (2012 to 2015), Aker Philadelphia Shipyard AS (2011 to 2015) and the Norwegian Church Abroad (2006 to 2015). Ms Widvey holds no shares in Kværner ASA, and has no stock options. Ms Widvey is a Norwegain citizen. She has been elected for the period 2016–2018.
80 KVAERNER ANNUAL REPORT 2016 ANNUAL ACCOUNTS – KVÆRNER ASA
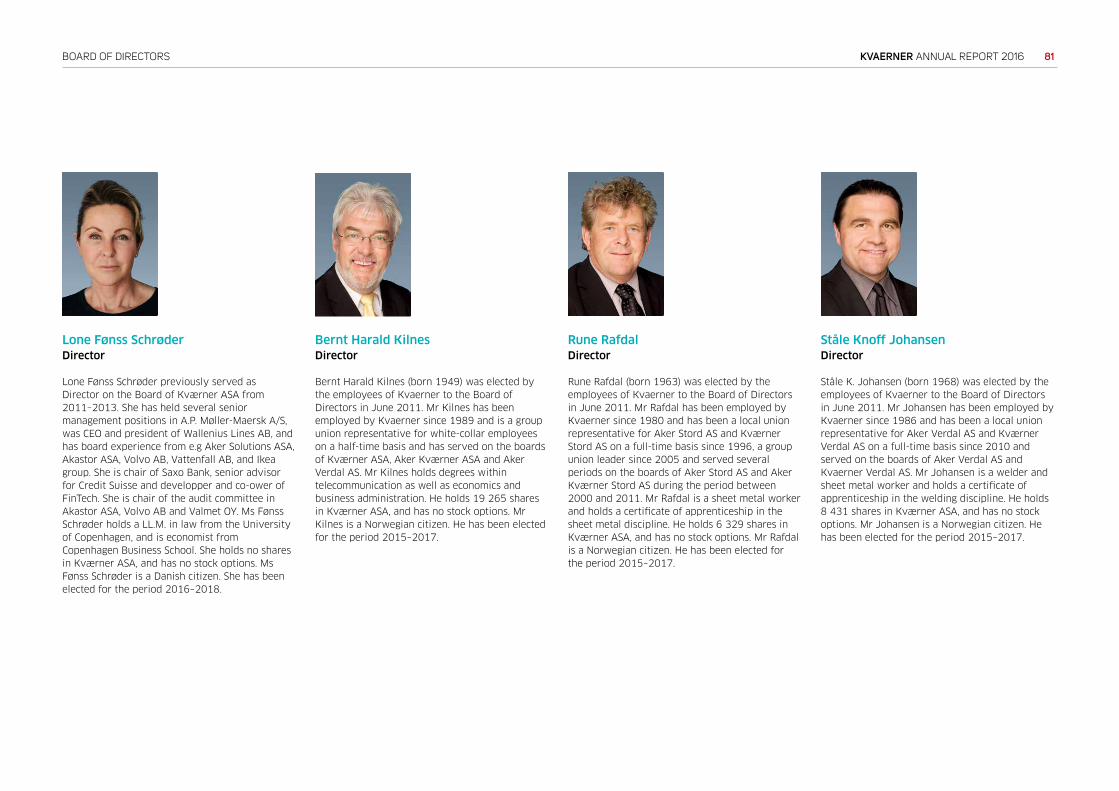
Lone Fønss SchrøderDirector
Lone Fønss Schrøder previously served as Director on the Board of Kværner ASA from 2011–2013. She has held several senior management positions in A.P. Møller-Maersk A/S, was CEO and president of Wallenius Lines AB, and has board experience from e.g Aker Solutions ASA, Akastor ASA, Volvo AB, Vattenfall AB, and Ikea group. She is chair of Saxo Bank, senior advisor for Credit Suisse and developper and co-ower of FinTech. She is chair of the audit committee in Akastor ASA, Volvo AB and Valmet OY. Ms Fønss Schrøder holds a LL.M. in law from the University of Copenhagen, and is economist from Copenhagen Business School. She holds no shares in Kværner ASA, and has no stock options. Ms Fønss Schrøder is a Danish citizen. She has been elected for the period 2016–2018.
Bernt Harald KilnesDirector
Bernt Harald Kilnes (born 1949) was elected by the employees of Kvaerner to the Board of Directors in June 2011. Mr Kilnes has been employed by Kvaerner since 1989 and is a group union representative for white-collar employees on a half-time basis and has served on the boards of Kværner ASA, Aker Kværner ASA and Aker Verdal AS. Mr Kilnes holds degrees within telecommunication as well as economics and business administration. He holds 19 265 shares in Kværner ASA, and has no stock options. Mr Kilnes is a Norwegian citizen. He has been elected for the period 2015–2017.
Rune RafdalDirector
Rune Rafdal (born 1963) was elected by the employees of Kvaerner to the Board of Directors in June 2011. Mr Rafdal has been employed by Kvaerner since 1980 and has been a local union representative for Aker Stord AS and Kværner Stord AS on a full-time basis since 1996, a group union leader since 2005 and served several periods on the boards of Aker Stord AS and Aker Kværner Stord AS during the period between 2000 and 2011. Mr Rafdal is a sheet metal worker and holds a certificate of apprenticeship in the sheet metal discipline. He holds 6 329 shares in Kværner ASA, and has no stock options. Mr Rafdal is a Norwegian citizen. He has been elected for the period 2015–2017.
Ståle Knoff JohansenDirector
Ståle K. Johansen (born 1968) was elected by the employees of Kvaerner to the Board of Directors in June 2011. Mr Johansen has been employed by Kvaerner since 1986 and has been a local union representative for Aker Verdal AS and Kværner Verdal AS on a full-time basis since 2010 and served on the boards of Aker Verdal AS and Kvaerner Verdal AS. Mr Johansen is a welder and sheet metal worker and holds a certificate of apprenticeship in the welding discipline. He holds 8 431 shares in Kværner ASA, and has no stock options. Mr Johansen is a Norwegian citizen. He has been elected for the period 2015–2017.
81KVAERNER ANNUAL REPORT 2016BOARD OF DIRECTORS

Company information
COPYRIGHT AND LEGAL NOTICE Copyright in all published material including photographs, drawings and images in this publication remains vested in Kvaerner and third party contributors to this publication as appropriate. Accordingly, neither the whole nor any part of this publication can be reproduced in any form without express prior permission. Articles and opinions appearing in this publication do not necessarily represent the views of Kvaerner. While all steps have been taken to ensure the accuracy of the published contents, Kvaerner does not accept any responsibility for any errors or resulting loss or damage whatsoever caused and readers have the responsibility to thoroughly check these aspects for themselves. Enquiries about reproduction of content from this publication should be directed to Kværner ASA.
Kværner ASAOksenøyveien 10,1366 Lysaker
Postal address:P.O.Box 74NO-1325 Lysaker
Telephone: +47 21 08 90 00
e-mail: [email protected]: www.kvaerner.com
82 KVAERNER ANNUAL REPORT 2016 BOARD OF DIRECTORS

Production: Bolt Communication AS Photos: StudioVest AS; Bård Gudim
www.kvaerner.com© 2017 KvaernerAll rights reserved