ANNUAL REPORT 2016 - Book cheap flights with the low … REPORT 2016 NORWEGIAN AIR SHUTTLE ASA...
99
2016-NORWEGIAN.INDD • CREATED: 09.10.2014 • MODIFIED: 06.04.2017 : 19:44 ALL RIGTHS RESERVED © 2017 TEIGENS DESIGN ANNUAL REPORT 2016 NORWEGIAN AIR SHUTTLE ASA
Transcript of ANNUAL REPORT 2016 - Book cheap flights with the low … REPORT 2016 NORWEGIAN AIR SHUTTLE ASA...
2016-NorwegiaN.iNdd • Created: 09.10.2014 • Modified: 06.04.2017 : 19:44 all rigths reserved © 2017 teigeNs desigN
ANNUAL REPORT 2016
NORWEGIAN AIR SHUTTLE ASA
2016-NorwegiaN.iNdd • Created: 09.10.2014 • Modified: 06.04.2017 : 19:44 all rigths reserved © 2017 teigeNs desigN
IPDF USER GUIDEThis document is an interactive PDF (iPDF). It works as a regular PDF, but has interactive functions for navigation. For a printer friendly version, see under “printing version” below.
NAVIGATIONYou can navigate the document by clicking on menus, buttons, hyperlinks or the tables of contents.
Left-hand arrow: Flip one page chronologically backward (or use arrow keys) Right-hand arrow: Flip one page chronologically forward (or use arrow keys) Previous view: Go back to previously viewed page Next view: Go forward to previously viewed page Find text: Search for text in Adobe Reader/Acrobat Full screen view on/off
Click on the Norwegian logo in the top left corner to go back to the front cover.
PRINTING VERSION OF THE ANNUAL REPORTYou can download an A4 printer friendly version of this annual report here: https://www.norwegian.no/om-oss/selskapet/investor-relations/reports-and-presentations/
PDF READERSThis iPDF report is designed for Adobe Reader/Acrobat 8 or later.
Some functions may not work in web browsers with pdf plug-ins. If you experience problems viewing in your web browser, please save/download the report to your hard drive and re-open the PDF in Adobe Reader/ Acrobat.
Download the free Adobe Reader here: http://get.adobe.com/uk/reader/otherversions
Help | Contents | Highlights | Letter from CEO | Board of Directors' report | Financial statements | CSR | Corporate governance | Board and management | Definitions | Contact | 02 / 99
NORWEGIAN ANNUAL REPORT 2016
2016-NorwegiaN.iNdd • Created: 09.10.2014 • Modified: 06.04.2017 : 19:44 all rigths reserved © 2017 teigeNs desigN
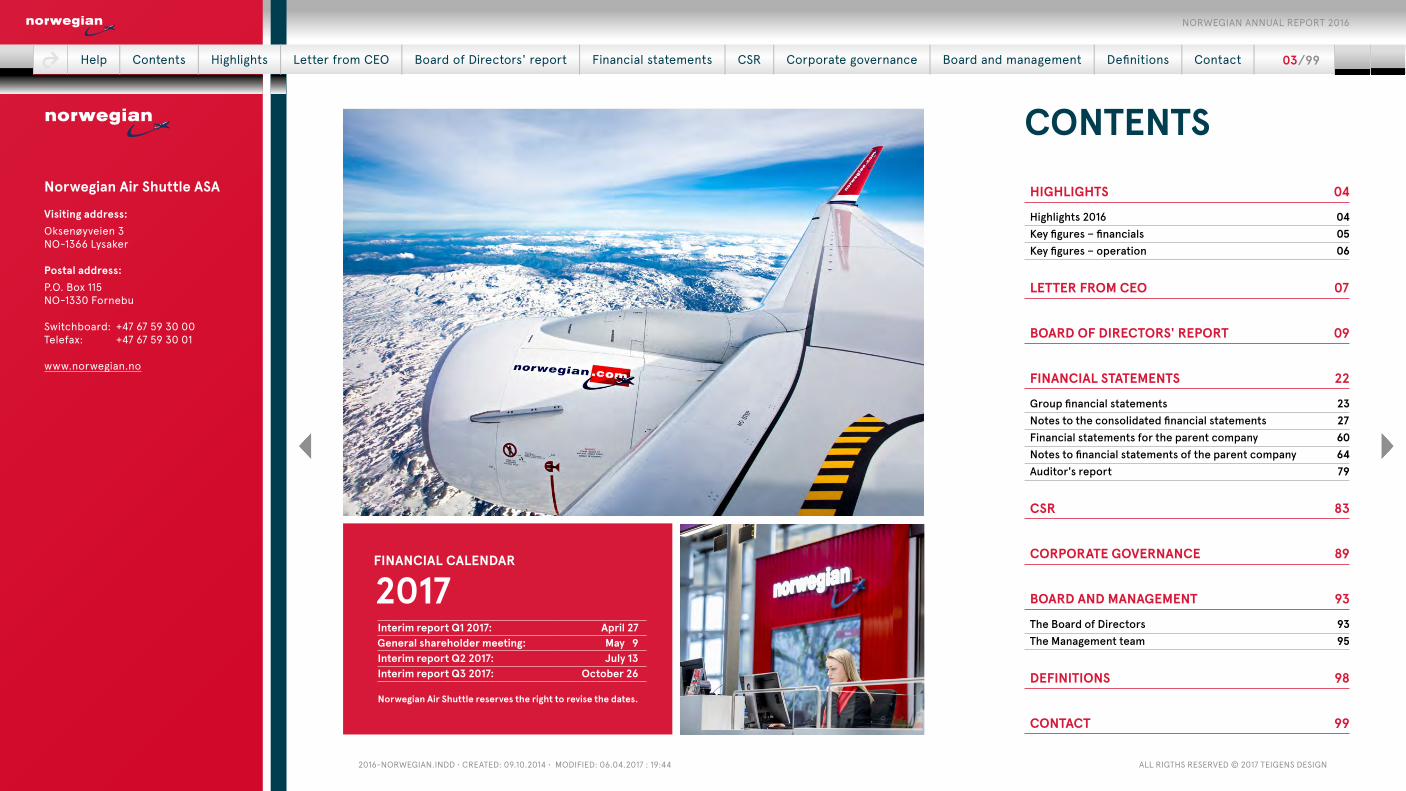
CONTENTS HIGHLIGHTS 04
Highlights 2016 04Key figures – financials 05Key figures – operation 06
LETTER FROM CEO 07
BOARD OF DIRECTORS' REPORT 09
FINANCIAL STATEMENTS 22
Group financial statements 23Notes to the consolidated financial statements 27Financial statements for the parent company 60Notes to financial statements of the parent company 64Auditor's report 79
CSR 83
CORPORATE GOVERNANCE 89
BOARD AND MANAGEMENT 93
The Board of Directors 93The Management team 95
DEFINITIONS 98
CONTACT 99
FINANCIAL CALENDAR
2017Interim report Q1 2017: April 27General shareholder meeting: May 9Interim report Q2 2017: July 13Interim report Q3 2017: October 26
Norwegian Air Shuttle reserves the right to revise the dates.
Help | Contents | Highlights | Letter from CEO | Board of Directors' report | Financial statements | CSR | Corporate governance | Board and management | Definitions | Contact | 03 / 99
NORWEGIAN ANNUAL REPORT 2016
Norwegian Air Shuttle ASA
Visiting address:Oksenøyveien 3NO-1366 Lysaker
Postal address:P.O. Box 115NO-1330 Fornebu
Switchboard: +47 67 59 30 00Telefax: +47 67 59 30 01
www.norwegian.no
2016-NorwegiaN.iNdd • Created: 09.10.2014 • Modified: 06.04.2017 : 19:44 all rigths reserved © 2017 teigeNs desigN
HIGHLIGHTS
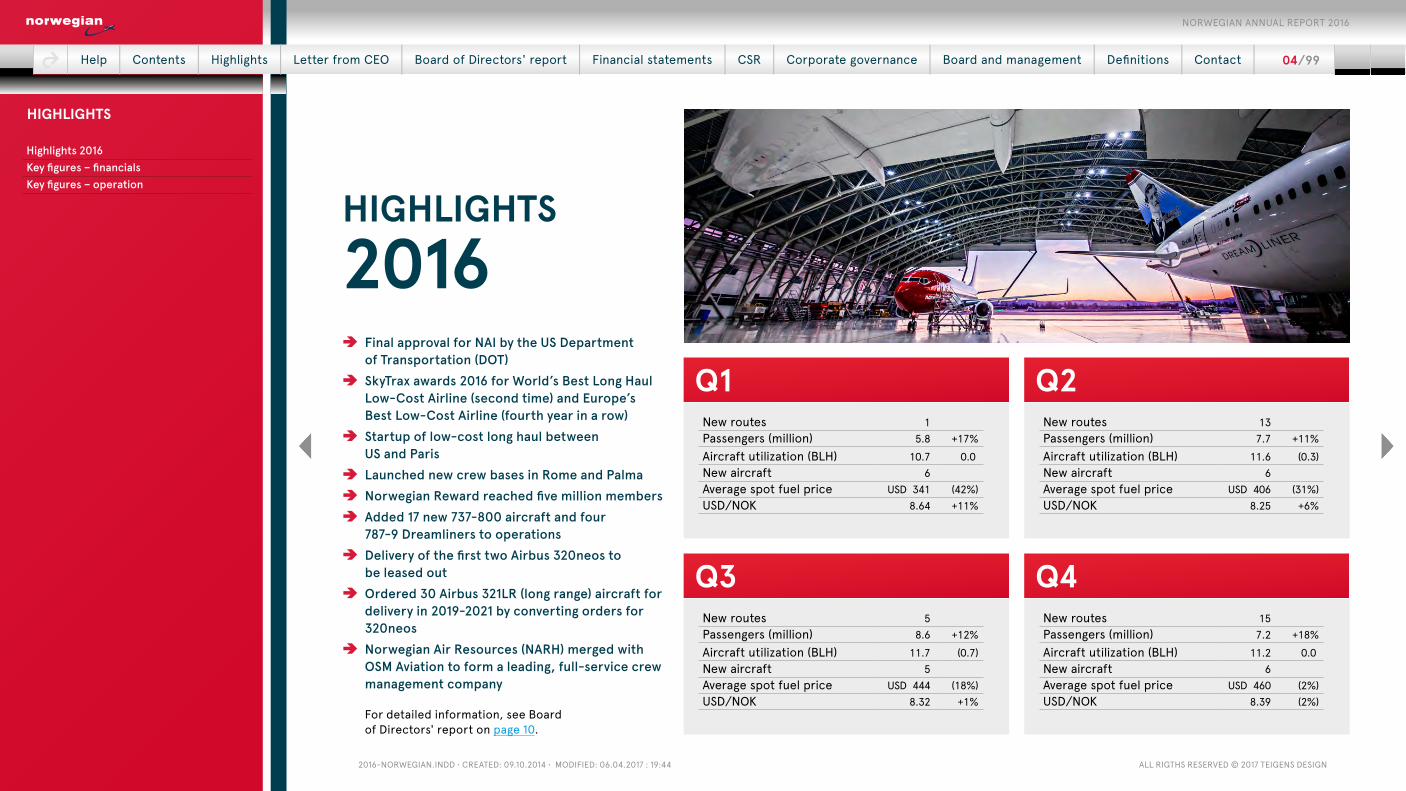
2016 Ä Final approval for NAI by the US Department of Transportation (DOT)
Ä SkyTrax awards 2016 for World’s Best Long Haul Low-Cost Airline (second time) and Europe’s Best Low-Cost Airline (fourth year in a row)
Ä Startup of low-cost long haul between US and Paris
Ä Launched new crew bases in Rome and Palma Ä Norwegian Reward reached five million members Ä Added 17 new 737-800 aircraft and four 787-9 Dreamliners to operations
Ä Delivery of the first two Airbus 320neos to be leased out
Ä Ordered 30 Airbus 321LR (long range) aircraft for delivery in 2019-2021 by converting orders for 320neos
Ä Norwegian Air Resources (NARH) merged with OSM Aviation to form a leading, full-service crew management company
For detailed information, see Board of Directors' report on page 10.
New routes 13 Passengers (million) 7.7 +11%Aircraft utilization (BLH) 11.6 (0.3)New aircraft 6 Average spot fuel price USD 406 (31%)USD/NOK 8.25 +6%
New routes 15 Passengers (million) 7.2 +18%Aircraft utilization (BLH) 11.2 0.0New aircraft 6 Average spot fuel price USD 460 (2%)USD/NOK 8.39 (2%)
New routes 1 Passengers (million) 5.8 +17%Aircraft utilization (BLH) 10.7 0.0New aircraft 6 Average spot fuel price USD 341 (42%)USD/NOK 8.64 +11%
New routes 5 Passengers (million) 8.6 +12%Aircraft utilization (BLH) 11.7 (0.7)New aircraft 5 Average spot fuel price USD 444 (18%)USD/NOK 8.32 +1%
Q2
Q4
Q1
Q3
Help | Contents | Highlights | Letter from CEO | Board of Directors' report | Financial statements | CSR | Corporate governance | Board and management | Definitions | Contact | 04 / 99
NORWEGIAN ANNUAL REPORT 2016
Highlights 2016Key figures – financialsKey figures – operation
HIGHLIGHTS
2016-NorwegiaN.iNdd • Created: 09.10.2014 • Modified: 06.04.2017 : 19:44 all rigths reserved © 2017 teigeNs desigN
KEY FIGURES – FINANCIALS
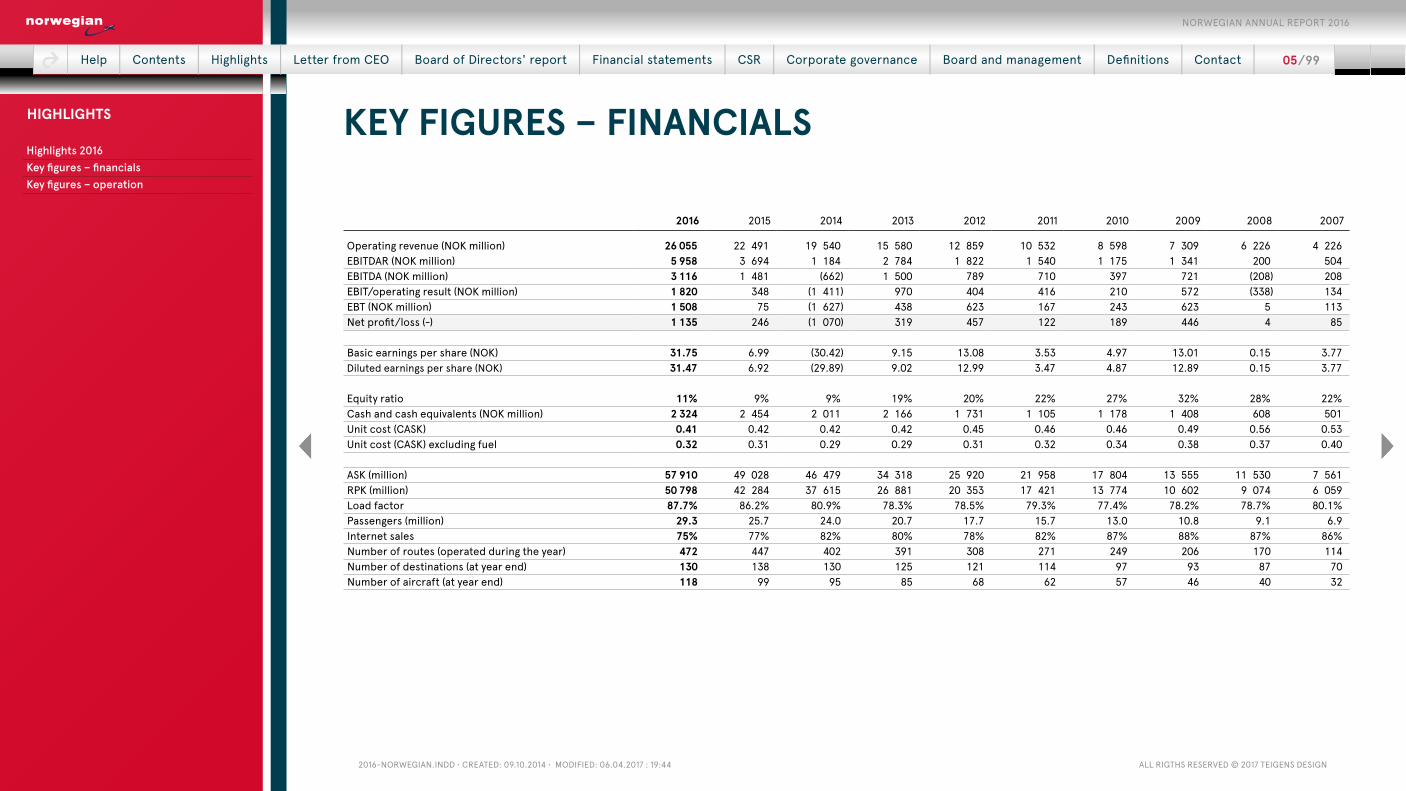
2016 2015 2014 2013 2012 2011 2010 2009 2008 2007
Operating revenue (NOK million) 26 055 22 491 19 540 15 580 12 859 10 532 8 598 7 309 6 226 4 226EBITDAR (NOK million) 5 958 3 694 1 184 2 784 1 822 1 540 1 175 1 341 200 504EBITDA (NOK million) 3 116 1 481 (662) 1 500 789 710 397 721 (208) 208EBIT/operating result (NOK million) 1 820 348 (1 411) 970 404 416 210 572 (338) 134EBT (NOK million) 1 508 75 (1 627) 438 623 167 243 623 5 113Net profit/loss (-) 1 135 246 (1 070) 319 457 122 189 446 4 85
Basic earnings per share (NOK) 31.75 6.99 (30.42) 9.15 13.08 3.53 4.97 13.01 0.15 3.77Diluted earnings per share (NOK) 31.47 6.92 (29.89) 9.02 12.99 3.47 4.87 12.89 0.15 3.77
Equity ratio 11% 9% 9% 19% 20% 22% 27% 32% 28% 22%Cash and cash equivalents (NOK million) 2 324 2 454 2 011 2 166 1 731 1 105 1 178 1 408 608 501Unit cost (CASK) 0.41 0.42 0.42 0.42 0.45 0.46 0.46 0.49 0.56 0.53Unit cost (CASK) excluding fuel 0.32 0.31 0.29 0.29 0.31 0.32 0.34 0.38 0.37 0.40
ASK (million) 57 910 49 028 46 479 34 318 25 920 21 958 17 804 13 555 11 530 7 561 RPK (million) 50 798 42 284 37 615 26 881 20 353 17 421 13 774 10 602 9 074 6 059 Load factor 87.7% 86.2% 80.9% 78.3% 78.5% 79.3% 77.4% 78.2% 78.7% 80.1%Passengers (million) 29.3 25.7 24.0 20.7 17.7 15.7 13.0 10.8 9.1 6.9Internet sales 75% 77% 82% 80% 78% 82% 87% 88% 87% 86%Number of routes (operated during the year) 472 447 402 391 308 271 249 206 170 114Number of destinations (at year end) 130 138 130 125 121 114 97 93 87 70Number of aircraft (at year end) 118 99 95 85 68 62 57 46 40 32
Help | Contents | Highlights | Letter from CEO | Board of Directors' report | Financial statements | CSR | Corporate governance | Board and management | Definitions | Contact | 05 / 99
NORWEGIAN ANNUAL REPORT 2016
Highlights 2016Key figures – financialsKey figures – operation
HIGHLIGHTS
2016-NorwegiaN.iNdd • Created: 09.10.2014 • Modified: 06.04.2017 : 19:44 all rigths reserved © 2017 teigeNs desigN
KEY FIGURES – OPERATION
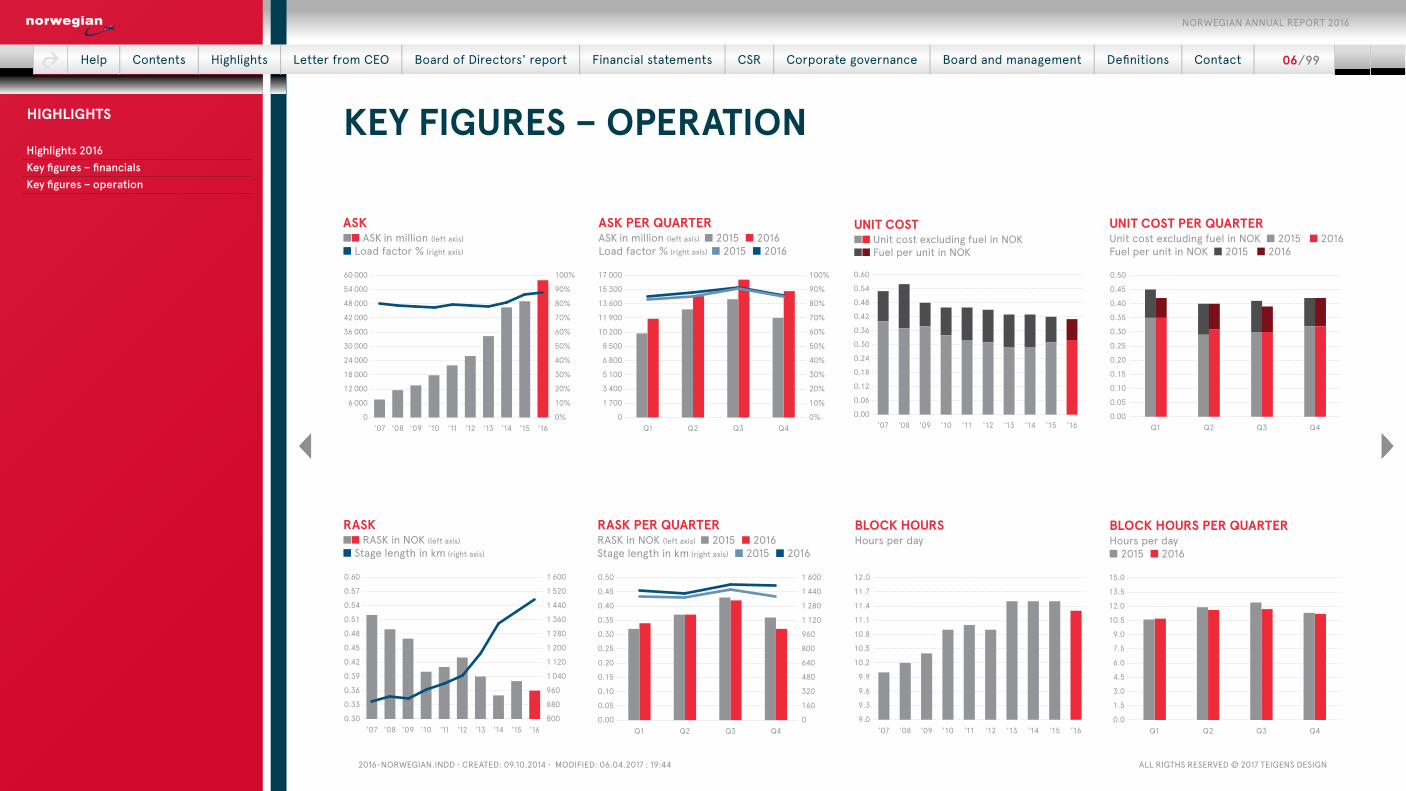
UNIT COST ■■ Unit cost excluding fuel in NOK ■■ Fuel per unit in NOK
0.00
0.06
0.12
0.18
0.24
0.30
0.36
0.42
0.48
0.54
0.60
'16'15'14'13'12'11'10'09'08'07
UNIT COST PER QUARTER Unit cost excluding fuel in NOK ■ 2015 ■ 2016 Fuel per unit in NOK ■ 2015 ■ 2016
0.00
0.05
0.10
0.15
0.20
0.25
0.30
0.35
0.40
0.45
0.50
Q4Q3Q2Q1
BLOCK HOURS PER QUARTERHours per day ■ 2015 ■ 2016
0.0
1.5
3.0
4.5
6.0
7.5
9.0
10.5
12.0
13.5
15.0
Q4Q3Q2Q1
BLOCK HOURSHours per day
9.0
9.3
9.6
9.9
10.2
10.5
10.8
11.1
11.4
11.7
12.0
'16'15'14'13'12'11'10'09'08'07
ASK PER QUARTER ASK in million (left axis) ■ 2015 ■ 2016 Load factor % (right axis) ■ 2015 ■ 2016
0
1 700
3 400
5 100
6 800
8 500
10 200
11 900
13 600
15 300
17 000
Q4Q3Q2Q10%
10%
20%
30%
40%
50%
60%
70%
80%
90%
100%
ASK ■■ ASK in million (left axis) ■ Load factor % (right axis)
0
6 000
12 000
18 000
24 000
30 000
36 000
42 000
48 000
54 000
60 000
'16'15'14'13'12'11'10'09'08'070%
10%
20%
30%
40%
50%
60%
70%
80%
90%
100%
RASK PER QUARTER RASK in NOK (left axis) ■ 2015 ■ 2016Stage length in km (right axis) ■ 2015 ■ 2016
0.00
0.05
0.10
0.15
0.20
0.25
0.30
0.35
0.40
0.45
0.50
Q4Q3Q2Q10
160
320
480
640
800
960
1 120
1 280
1 440
1 600
RASK ■■ RASK in NOK (left axis) ■ Stage length in km (right axis)
0.30
0.33
0.36
0.39
0.42
0.45
0.48
0.51
0.54
0.57
0.60
'16'15'14'13'12'11'10'09'08'07800
880
960
1 040
1 120
1 200
1 280
1 360
1 440
1 520
1 600
Help | Contents | Highlights | Letter from CEO | Board of Directors' report | Financial statements | CSR | Corporate governance | Board and management | Definitions | Contact | 06 / 99
NORWEGIAN ANNUAL REPORT 2016
Highlights 2016Key figures – financialsKey figures – operation
HIGHLIGHTS

2016-NorwegiaN.iNdd • Created: 09.10.2014 • Modified: 06.04.2017 : 19:44 all rigths reserved © 2017 teigeNs desigN
DEAR SHAREHOLDERSAnother eventful year has passed. 2016 has been a year characterized by major international expansion, record-high passenger figures, the establishment of more international bases and several new routes to exciting destinations on both sides of the Atlantic. New passengers have flown with us for the first time as we have continued our global expansion. Hundreds of wonderful and talented colleagues joined Norwegian in 2016 – and many more will join us in the years to come.
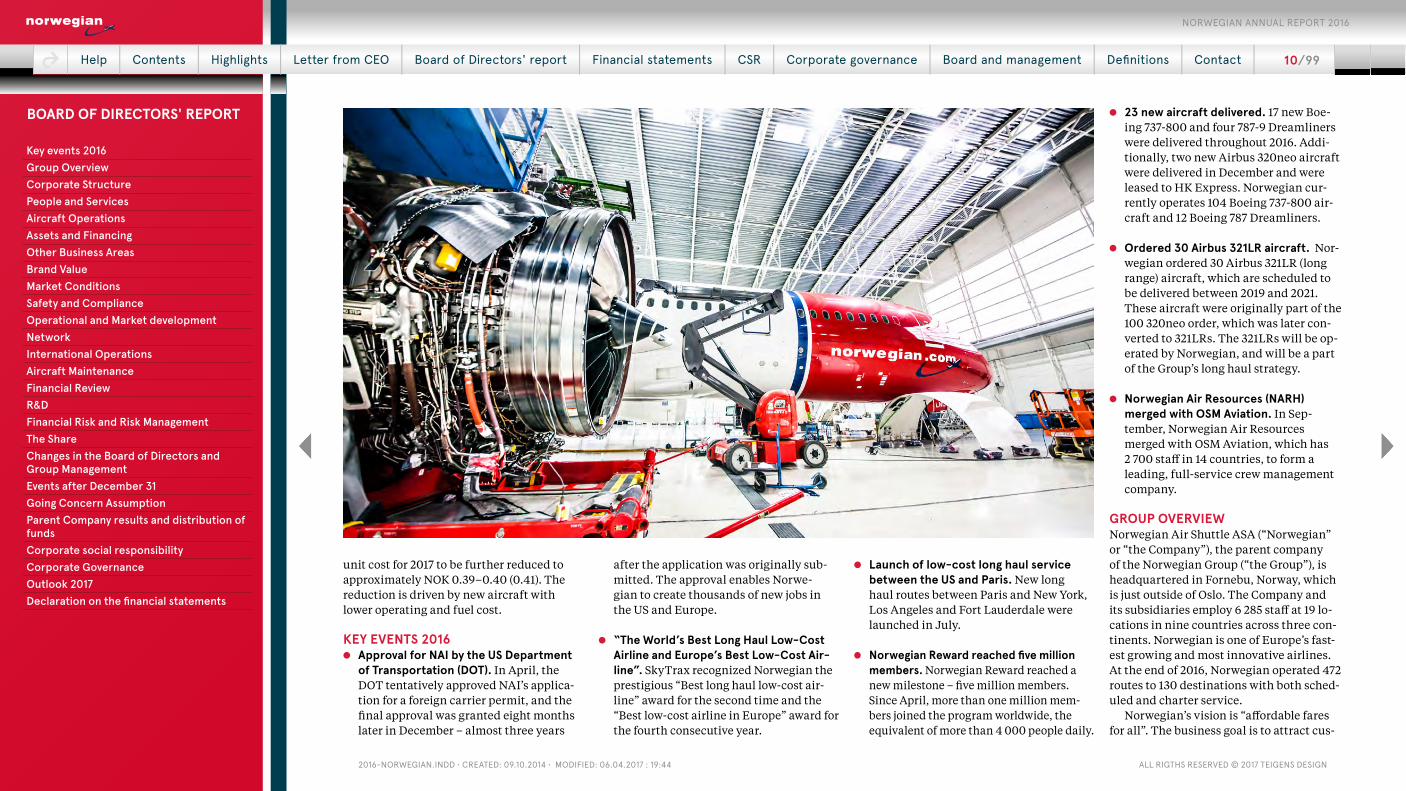
KEEPING COSTS DOWN – FOR THE PASSENGERS AND FOR THE ENVIRONMENTIn 2016, we took delivery of 17 brand-new 737-800 aircraft and four 787-9 Dreamlin-ers. A new fleet is necessary to keep our costs down, and in turn enable us to of-fer inexpensive fares. It gives our passen-gers a comfortable and enjoyable journey, and not least, it reduces emissions con-siderably, making Norwegian’s fleet one of the most environmentally friendly in the world.
LOYAL PASSENGERSI cannot talk about the year that has passed without mentioning some of the many awards we have won. It means a lot that we yet again were named the “World’s Best Long Haul Low-Cost Airline” and “Best Low-Cost Airline in Europe”. The awards we have won prove that our service is ap-preciated and we promise to keep working hard to meet our customers’ expectations. I would like to thank all our first-timers, returning and loyal passengers, and our hard-working colleagues in the air and on the ground; these fantastic recognitions would not have been possible without their support and hard work.
THE POWER OF GLOBAL EXPANSIONOur global expansion will be more important than ever this year. Why? Well, up to a third of our long haul passengers connect to a short haul flight. By connecting our long haul network with our short haul network, we will get a symbiosis that makes Norwegian even stronger. Not least, our growth will also help secure existing jobs and create thousands of new ones in the near future. In addition, global expansion and new routes boost lo-cal tourism; create new jobs; drive economic growth and social progress. A growing pop-ulation and increased globalization will lead to more mobility and create more demand for air travel.
AFFORDABLE FARES FOR ALLThe legacy carriers see us as a threat (and rightly so), but at the same time we are also creating our own market by giving new groups of travelers the ability to fly. There is a large, unserved demand for reasonably priced air travel, especially transatlantic travel. Since 2013, almost four million pas-sengers have travelled across the Atlantic on one of our many flights – a large share of which are Americans. Our vision is “af-fordable fares for all,” and we are well on our way realizing this vision.
"A growing population and increased globalization will
lead to more mobility and create more demand for air travel"
Help | Contents | Highlights | Letter from CEO | Board of Directors' report | Financial statements | CSR | Corporate governance | Board and management | Definitions | Contact | 07 / 99
NORWEGIAN ANNUAL REPORT 2016
LETTER FROM CEO

2016-NorwegiaN.iNdd • Created: 09.10.2014 • Modified: 06.04.2017 : 19:44 all rigths reserved © 2017 teigeNs desigN
A NEW WORLD OF POSSIBILITIESOnce the Boeing 737 MAX 8 enters Nor-wegian’s fleet this year, in addition to the Airbus 321LR (long range) within the next couple of years, we will once again demon-strate that we are able to create a new mar-ket and disrupt the industry. How? The range of these aircraft will open up a new world of possibilities, which will allow us to offer people in smaller cities their first di-rect connection across continents on a sin-gle aisle aircraft at an affordable price. We will be able to offer our product on routes where there is little or no competition. Who
wants to fly through a large international hub when you can fly directly from their hometown?
EXPLORING NEW MARKETSIn 2016, we launched our first non-stop flights between Paris and the US with great success, and in 2017 we will start flying be-tween Barcelona and the US. In other words, our strategy going forward is clear; we will focus on cost efficiency and scale and con-tinue to expand globally, while exploring new markets where we face less head-to-head competition. For instance, we have long seen a great potential in the South American market, which is one of the most underserved markets in the world and we are now exploring the possibilities of bring-ing Norwegian to the region. And I am pleased to say that this is just the beginning!
EXCITING PLANS AHEADAs if 2016 was not eventful enough, I am pleased to say that we have entered a year with even more exciting plans and oppor-tunities in the pipeline. In 2017, 17 brand-new Boeing 737-800 and nine Boeing 787-9 Dreamliners will join our fleet. In addition, we will be the first airline in Europe to take delivery of the new Boeing 737 MAX 8, an upgraded version of the current Boeing 737-800; six of which will enter commercial traffic this year.
2017 will bring great things, and I can promise that our passengers and every-body working for Norwegian can look for-ward to another exciting year.
Bjørn KjosChief Executive Officer
PASSENGERS PER QUARTERIn million ■ 2015 ■ 2016
0
1
2
3
4
5
6
7
8
9
10
Q4Q3Q2Q1
PASSENGERS In million
0
3
6
9
12
15
18
21
24
27
30
'16'15'14'13'12'11'10'09'08'07
Help | Contents | Highlights | Letter from CEO | Board of Directors' report | Financial statements | CSR | Corporate governance | Board and management | Definitions | Contact | 08 / 99
NORWEGIAN ANNUAL REPORT 2016
LETTER FROM CEO
2016-NorwegiaN.iNdd • Created: 09.10.2014 • Modified: 06.04.2017 : 19:44 all rigths reserved © 2017 teigeNs desigN
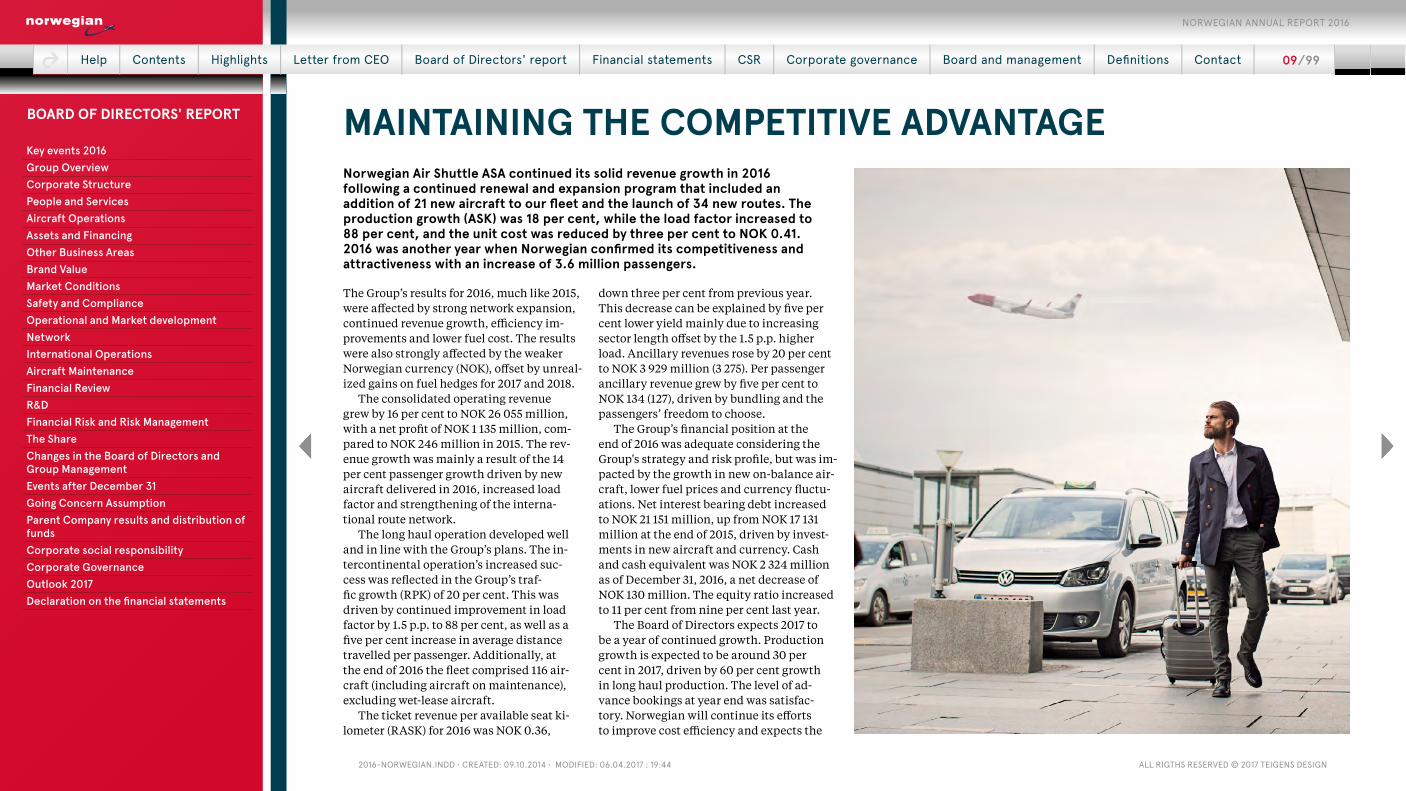
MAINTAINING THE COMPETITIVE ADVANTAGE Norwegian Air Shuttle ASA continued its solid revenue growth in 2016 following a continued renewal and expansion program that included an addition of 21 new aircraft to our fleet and the launch of 34 new routes. The production growth (ASK) was 18 per cent, while the load factor increased to 88 per cent, and the unit cost was reduced by three per cent to NOK 0.41. 2016 was another year when Norwegian confirmed its competitiveness and attractiveness with an increase of 3.6 million passengers.
The Group’s results for 2016, much like 2015, were affected by strong network expansion, continued revenue growth, efficiency im-provements and lower fuel cost. The results were also strongly affected by the weaker Norwegian currency (NOK), offset by unreal-ized gains on fuel hedges for 2017 and 2018.
The consolidated operating revenue grew by 16 per cent to NOK 26 055 million, with a net profit of NOK 1 135 million, com-pared to NOK 246 million in 2015. The rev-enue growth was mainly a result of the 14 per cent passenger growth driven by new aircraft delivered in 2016, increased load factor and strengthening of the interna-tional route network.
The long haul operation developed well and in line with the Group’s plans. The in-tercontinental operation’s increased suc-cess was reflected in the Group’s traf-fic growth (RPK) of 20 per cent. This was driven by continued improvement in load factor by 1.5 p.p. to 88 per cent, as well as a five per cent increase in average distance travelled per passenger. Additionally, at the end of 2016 the fleet comprised 116 air-craft (including aircraft on maintenance), excluding wet-lease aircraft.
The ticket revenue per available seat ki-lometer (RASK) for 2016 was NOK 0.36,
down three per cent from previous year. This decrease can be explained by five per cent lower yield mainly due to increasing sector length offset by the 1.5 p.p. higher load. Ancillary revenues rose by 20 per cent to NOK 3 929 million (3 275). Per passenger ancillary revenue grew by five per cent to NOK 134 (127), driven by bundling and the passengers’ freedom to choose.
The Group’s financial position at the end of 2016 was adequate considering the Group's strategy and risk profile, but was im-pacted by the growth in new on-balance air-craft, lower fuel prices and currency fluctu-ations. Net interest bearing debt increased to NOK 21 151 million, up from NOK 17 131 million at the end of 2015, driven by invest-ments in new aircraft and currency. Cash and cash equivalent was NOK 2 324 million as of December 31, 2016, a net decrease of NOK 130 million. The equity ratio increased to 11 per cent from nine per cent last year.
The Board of Directors expects 2017 to be a year of continued growth. Production growth is expected to be around 30 per cent in 2017, driven by 60 per cent growth in long haul production. The level of ad-vance bookings at year end was satisfac-tory. Norwegian will continue its efforts to improve cost efficiency and expects the
Help | Contents | Highlights | Letter from CEO | Board of Directors' report | Financial statements | CSR | Corporate governance | Board and management | Definitions | Contact | 09 / 99
NORWEGIAN ANNUAL REPORT 2016
Key events 2016Group OverviewCorporate StructurePeople and ServicesAircraft OperationsAssets and FinancingOther Business Areas Brand ValueMarket ConditionsSafety and ComplianceOperational and Market developmentNetworkInternational OperationsAircraft MaintenanceFinancial ReviewR&DFinancial Risk and Risk ManagementThe Share Changes in the Board of Directors and Group ManagementEvents after December 31 Going Concern AssumptionParent Company results and distribution of fundsCorporate social responsibilityCorporate GovernanceOutlook 2017 Declaration on the financial statements
BOARD OF DIRECTORS' REPORT
2016-NorwegiaN.iNdd • Created: 09.10.2014 • Modified: 06.04.2017 : 19:44 all rigths reserved © 2017 teigeNs desigN
unit cost for 2017 to be further reduced to approximately NOK 0.39–0.40 (0.41). The reduction is driven by new aircraft with lower operating and fuel cost.
KEY EVENTS 2016 ● Approval for NAI by the US Department
of Transportation (DOT). In April, the DOT tentatively approved NAI’s applica-tion for a foreign carrier permit, and the final approval was granted eight months later in December – almost three years
after the application was originally sub-mitted. The approval enables Norwe-gian to create thousands of new jobs in the US and Europe.
● “The World’s Best Long Haul Low-Cost Airline and Europe’s Best Low-Cost Air-line”. SkyTrax recognized Norwegian the prestigious “Best long haul low-cost air-line” award for the second time and the “Best low-cost airline in Europe” award for the fourth consecutive year.
● Launch of low-cost long haul service between the US and Paris. New long haul routes between Paris and New York, Los Angeles and Fort Lauderdale were launched in July.
● Norwegian Reward reached five million members. Norwegian Reward reached a new milestone – five million members. Since April, more than one million mem-bers joined the program worldwide, the equivalent of more than 4 000 people daily.
● 23 new aircraft delivered. 17 new Boe-ing 737-800 and four 787-9 Dreamliners were delivered throughout 2016. Addi-tionally, two new Airbus 320neo aircraft were delivered in December and were leased to HK Express. Norwegian cur-rently operates 104 Boeing 737-800 air-craft and 12 Boeing 787 Dreamliners.
● Ordered 30 Airbus 321LR aircraft. Nor-wegian ordered 30 Airbus 321LR (long range) aircraft, which are scheduled to be delivered between 2019 and 2021. These aircraft were originally part of the 100 320neo order, which was later con-verted to 321LRs. The 321LRs will be op-erated by Norwegian, and will be a part of the Group’s long haul strategy.
● Norwegian Air Resources (NARH) merged with OSM Aviation. In Sep-tember, Norwegian Air Resources merged with OSM Aviation, which has 2 700 staff in 14 countries, to form a leading, full-service crew management company.
GROUP OVERVIEWNorwegian Air Shuttle ASA (“Norwegian” or “the Company”), the parent company of the Norwegian Group (“the Group”), is headquartered in Fornebu, Norway, which is just outside of Oslo. The Company and its subsidiaries employ 6 285 staff at 19 lo-cations in nine countries across three con-tinents. Norwegian is one of Europe’s fast-est growing and most innovative airlines. At the end of 2016, Norwegian operated 472 routes to 130 destinations with both sched-uled and charter service.
Norwegian’s vision is “affordable fares for all”. The business goal is to attract cus-
Help | Contents | Highlights | Letter from CEO | Board of Directors' report | Financial statements | CSR | Corporate governance | Board and management | Definitions | Contact | 10 / 99
NORWEGIAN ANNUAL REPORT 2016
Key events 2016Group OverviewCorporate StructurePeople and ServicesAircraft OperationsAssets and FinancingOther Business Areas Brand ValueMarket ConditionsSafety and ComplianceOperational and Market developmentNetworkInternational OperationsAircraft MaintenanceFinancial ReviewR&DFinancial Risk and Risk ManagementThe Share Changes in the Board of Directors and Group ManagementEvents after December 31 Going Concern AssumptionParent Company results and distribution of fundsCorporate social responsibilityCorporate GovernanceOutlook 2017 Declaration on the financial statements
BOARD OF DIRECTORS' REPORT
2016-NorwegiaN.iNdd • Created: 09.10.2014 • Modified: 06.04.2017 : 19:44 all rigths reserved © 2017 teigeNs desigN
tomers by offering a high-quality low fare travel experience based on operational ex-cellence and helpful, friendly service. Op-erationally, safety always comes first. Nor-wegian’s vision is to become the preferred air carrier in each of its markets and to gen-erate return to its shareholders.
Key elements to fulfill Norwegian’s strategy:
● Attract customers and stimulate markets by offering competitive fares and a qual-ity travel experience based on low oper-ating costs, operational excellence and helpful friendly service across all markets we operate.
● Offer the freedom to choose. Our custom-ers will have the choice to select additional products and services. Norwegian pro-vides a core, low-cost product to the price sensitive customer and a more comprehen-sive package for those who may want a lit-tle extra to ensure a broad market reach.
● Short-cut the traditional hub and spoke
model with focus on point-to-point leisure travelers. Offer new routes and destinations to selected markets utilizing Norwegian’s core strengths and create new direct routes to a broader market, focusing on routes not serviced today.
● Utilize the strong brand awareness and efficient distribution channels to further increase the Norwegian Group’s revenue and profitability.
● Keep a lean and flat organization, which makes the decision-making processes simple and direct while enabling Norwegian to easily adapt to changes and opportunities in market. Always continue to improve the cost base.
● Maintain an innovative, “out-of-the-box” approach to the way we do business and explore new opportunities across the global market place.
● Have a positive and entrepreneurial organization in which everyone has the possibility to make a difference.
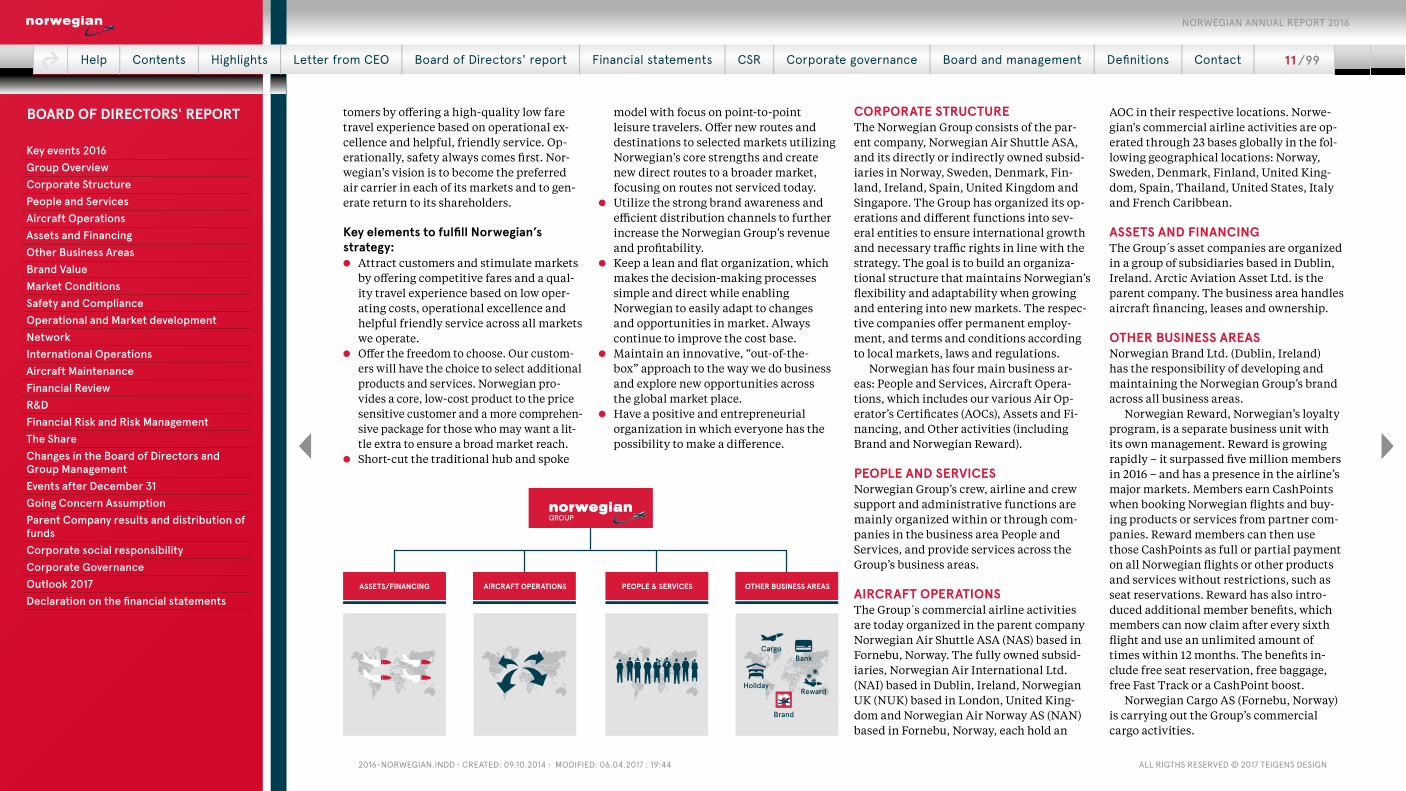
CORPORATE STRUCTUREThe Norwegian Group consists of the par-ent company, Norwegian Air Shuttle ASA, and its directly or indirectly owned subsid-iaries in Norway, Sweden, Denmark, Fin-land, Ireland, Spain, United Kingdom and Singapore. The Group has organized its op-erations and different functions into sev-eral entities to ensure international growth and necessary traffic rights in line with the strategy. The goal is to build an organiza-tional structure that maintains Norwegian’s flexibility and adaptability when growing and entering into new markets. The respec-tive companies offer permanent employ-ment, and terms and conditions according to local markets, laws and regulations.
Norwegian has four main business ar-eas: People and Services, Aircraft Opera-tions, which includes our various Air Op-erator’s Certificates (AOCs), Assets and Fi-nancing, and Other activities (including Brand and Norwegian Reward).
PEOPLE AND SERVICESNorwegian Group’s crew, airline and crew support and administrative functions are mainly organized within or through com-panies in the business area People and Services, and provide services across the Group’s business areas.
AIRCRAFT OPERATIONSThe Group s commercial airline activities are today organized in the parent company Norwegian Air Shuttle ASA (NAS) based in Fornebu, Norway. The fully owned subsid-iaries, Norwegian Air International Ltd. (NAI) based in Dublin, Ireland, Norwegian UK (NUK) based in London, United King-dom and Norwegian Air Norway AS (NAN) based in Fornebu, Norway, each hold an
AOC in their respective locations. Norwe-gian's commercial airline activities are op-erated through 23 bases globally in the fol-lowing geographical locations: Norway, Sweden, Denmark, Finland, United King-dom, Spain, Thailand, United States, Italy and French Caribbean.
ASSETS AND FINANCINGThe Group s asset companies are organized in a group of subsidiaries based in Dublin, Ireland. Arctic Aviation Asset Ltd. is the parent company. The business area handles aircraft financing, leases and ownership.
OTHER BUSINESS AREAS Norwegian Brand Ltd. (Dublin, Ireland) has the responsibility of developing and maintaining the Norwegian Group’s brand across all business areas.
Norwegian Reward, Norwegian’s loyalty program, is a separate business unit with its own management. Reward is growing rapidly – it surpassed five million members in 2016 – and has a presence in the airline’s major markets. Members earn CashPoints when booking Norwegian flights and buy-ing products or services from partner com-panies. Reward members can then use those CashPoints as full or partial payment on all Norwegian flights or other products and services without restrictions, such as seat reservations. Reward has also intro-duced additional member benefits, which members can now claim after every sixth flight and use an unlimited amount of times within 12 months. The benefits in-clude free seat reservation, free baggage, free Fast Track or a CashPoint boost.
Norwegian Cargo AS (Fornebu, Norway) is carrying out the Group’s commercial cargo activities.
ASSETS/FINANCING AIRCRAFT OPERATIONS PEOPLE & SERVICES
GROUP
OTHER BUSINESS AREAS
Bank
HolidayReward
Cargo
Brand
Help | Contents | Highlights | Letter from CEO | Board of Directors' report | Financial statements | CSR | Corporate governance | Board and management | Definitions | Contact | 11 / 99
NORWEGIAN ANNUAL REPORT 2016
Key events 2016Group OverviewCorporate StructurePeople and ServicesAircraft OperationsAssets and FinancingOther Business Areas Brand ValueMarket ConditionsSafety and ComplianceOperational and Market developmentNetworkInternational OperationsAircraft MaintenanceFinancial ReviewR&DFinancial Risk and Risk ManagementThe Share Changes in the Board of Directors and Group ManagementEvents after December 31 Going Concern AssumptionParent Company results and distribution of fundsCorporate social responsibilityCorporate GovernanceOutlook 2017 Declaration on the financial statements
BOARD OF DIRECTORS' REPORT
2016-NorwegiaN.iNdd • Created: 09.10.2014 • Modified: 06.04.2017 : 19:44 all rigths reserved © 2017 teigeNs desigN
Norwegian Holidays AS (Fornebu, Nor-way) provides holiday packages to custom-ers in the end market through the Group’s web booking.
Bank Norwegian AS is an online bank for private customers in Norway and is a fully owned subsidiary of Norwegian Fi-nans Holding ASA, an associated company to the Group’s parent company Norwegian Air Shuttle ASA. The parent company owns 20 per cent of the shares in Bank Norwe-gian through the associated company. Nor-wegian Finans Holding ASA was listed on the Oslo Stock Exchange in June 2016.
BRAND VALUEAs the Norwegian Group grows and estab-lishes its business throughout the world, the need to protect and develop the com-mercial brand value is becoming increas-ingly more important. Norwegian Brand Ltd. (Dublin, Ireland) was established in
2013 to undertake the role as a professional asset management company, and it is re-sponsible for developing brand value. The Company has ownership of all intellectual property (IP) assets within the Norwegian Group. Norwegian Brand Ltd. licenses out the relevant IP to all businesses within the Norwegian Group.
Brand Finance ranked Norwegian the 31st most valuable airline brand in the world (up from 44th last year). Brand Fi-nance is one of the world’s leading inde-pendent brand valuation and consultancy firms.
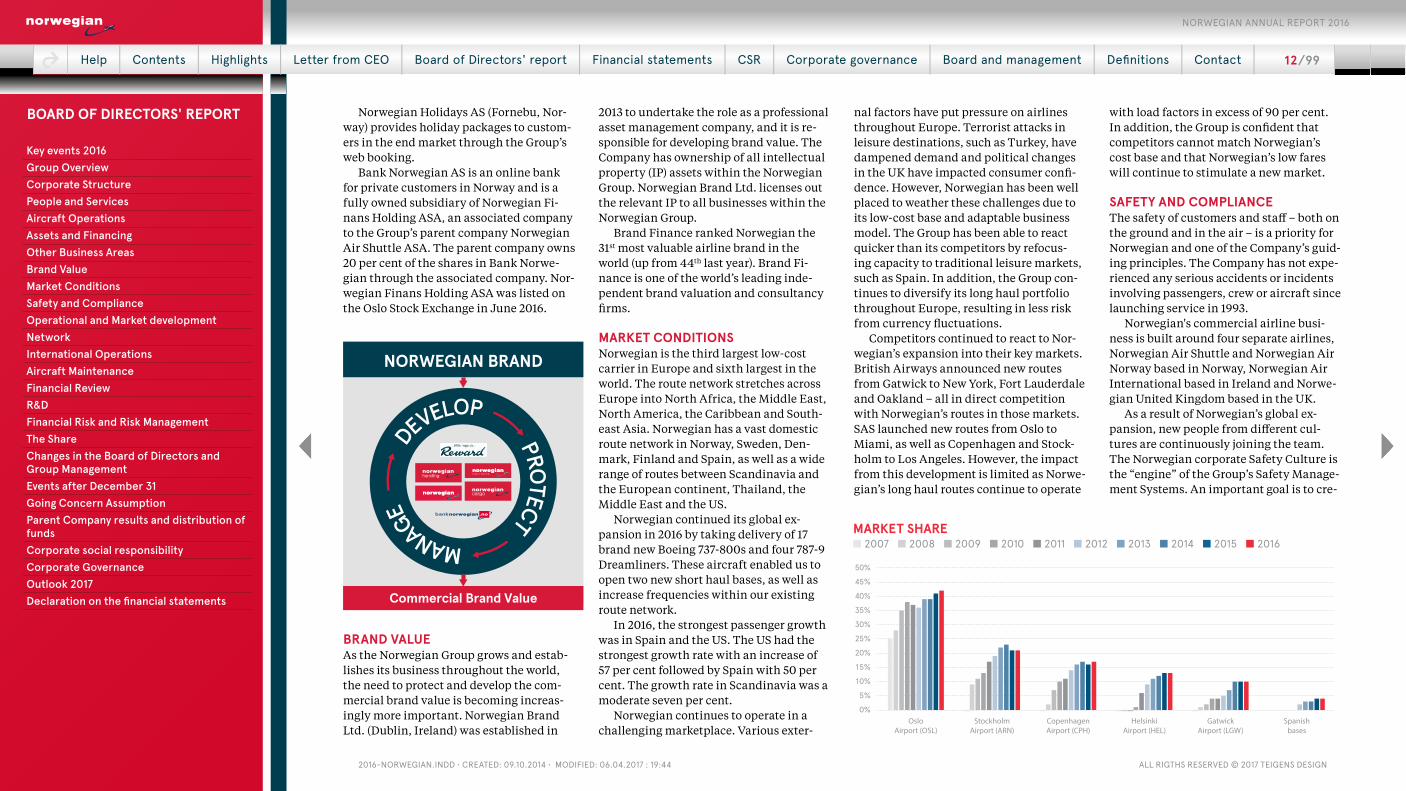
MARKET CONDITIONSNorwegian is the third largest low-cost carrier in Europe and sixth largest in the world. The route network stretches across Europe into North Africa, the Middle East, North America, the Caribbean and South-east Asia. Norwegian has a vast domestic route network in Norway, Sweden, Den-mark, Finland and Spain, as well as a wide range of routes between Scandinavia and the European continent, Thailand, the Middle East and the US.
Norwegian continued its global ex-pansion in 2016 by taking delivery of 17 brand new Boeing 737-800s and four 787-9 Dreamliners. These aircraft enabled us to open two new short haul bases, as well as increase frequencies within our existing route network.
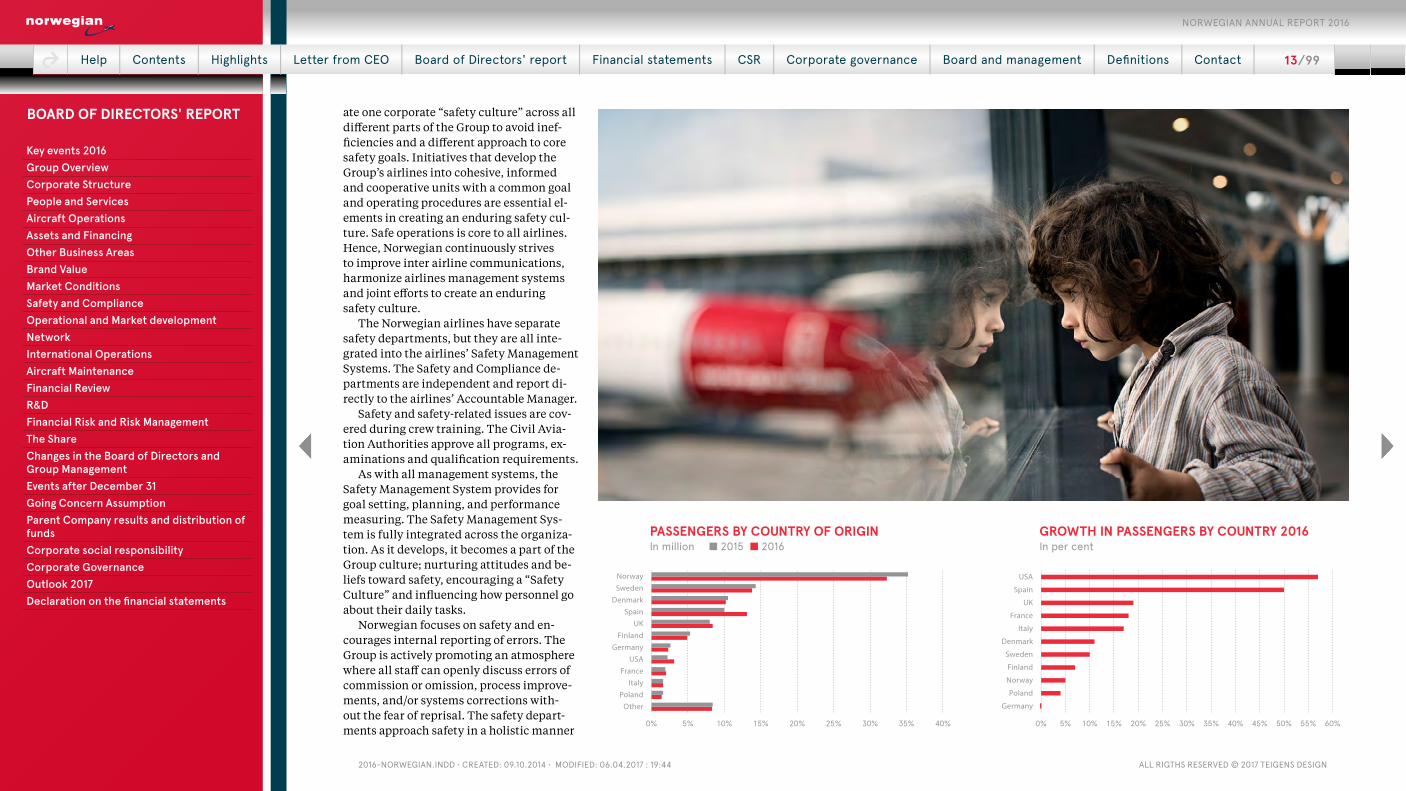
In 2016, the strongest passenger growth was in Spain and the US. The US had the strongest growth rate with an increase of 57 per cent followed by Spain with 50 per cent. The growth rate in Scandinavia was a moderate seven per cent.
Norwegian continues to operate in a challenging marketplace. Various exter-
nal factors have put pressure on airlines throughout Europe. Terrorist attacks in leisure destinations, such as Turkey, have dampened demand and political changes in the UK have impacted consumer confi-dence. However, Norwegian has been well placed to weather these challenges due to its low-cost base and adaptable business model. The Group has been able to react quicker than its competitors by refocus-ing capacity to traditional leisure markets, such as Spain. In addition, the Group con-tinues to diversify its long haul portfolio throughout Europe, resulting in less risk from currency fluctuations.
Competitors continued to react to Nor-wegian’s expansion into their key markets. British Airways announced new routes from Gatwick to New York, Fort Lauderdale and Oakland – all in direct competition with Norwegian’s routes in those markets. SAS launched new routes from Oslo to Miami, as well as Copenhagen and Stock-holm to Los Angeles. However, the impact from this development is limited as Norwe-gian’s long haul routes continue to operate
with load factors in excess of 90 per cent. In addition, the Group is confident that competitors cannot match Norwegian’s cost base and that Norwegian’s low fares will continue to stimulate a new market.
SAFETY AND COMPLIANCEThe safety of customers and staff – both on the ground and in the air – is a priority for Norwegian and one of the Company’s guid-ing principles. The Company has not expe-rienced any serious accidents or incidents involving passengers, crew or aircraft since launching service in 1993.
Norwegian's commercial airline busi-ness is built around four separate airlines, Norwegian Air Shuttle and Norwegian Air Norway based in Norway, Norwegian Air International based in Ireland and Norwe-gian United Kingdom based in the UK.
As a result of Norwegian’s global ex-pansion, new people from different cul-tures are continuously joining the team. The Norwegian corporate Safety Culture is the “engine” of the Group’s Safety Manage-ment Systems. An important goal is to cre-
MARKET SHARE■ 2007 ■ 2008 ■ 2009 ■ 2010 ■ 2011 ■ 2012 ■ 2013 ■ 2014 ■ 2015 ■ 2016
0%
5%
10%
15%
20%
25%
30%
35%
40%
45%
50%
Spanishbases
GatwickAirport (LGW)
HelsinkiAirport (HEL)
CopenhagenAirport (CPH)
StockholmAirport (ARN)
OsloAirport (OSL)
NORWEGIAN BRAND
Commercial Brand Value
DEVELOP PROTECT MANAGE
Help | Contents | Highlights | Letter from CEO | Board of Directors' report | Financial statements | CSR | Corporate governance | Board and management | Definitions | Contact | 12 / 99
NORWEGIAN ANNUAL REPORT 2016
Key events 2016Group OverviewCorporate StructurePeople and ServicesAircraft OperationsAssets and FinancingOther Business Areas Brand ValueMarket ConditionsSafety and ComplianceOperational and Market developmentNetworkInternational OperationsAircraft MaintenanceFinancial ReviewR&DFinancial Risk and Risk ManagementThe Share Changes in the Board of Directors and Group ManagementEvents after December 31 Going Concern AssumptionParent Company results and distribution of fundsCorporate social responsibilityCorporate GovernanceOutlook 2017 Declaration on the financial statements
BOARD OF DIRECTORS' REPORT
2016-NorwegiaN.iNdd • Created: 09.10.2014 • Modified: 06.04.2017 : 19:44 all rigths reserved © 2017 teigeNs desigN
ate one corporate “safety culture” across all different parts of the Group to avoid inef-ficiencies and a different approach to core safety goals. Initiatives that develop the Group’s airlines into cohesive, informed and cooperative units with a common goal and operating procedures are essential el-ements in creating an enduring safety cul-ture. Safe operations is core to all airlines. Hence, Norwegian continuously strives to improve inter airline communications, harmonize airlines management systems and joint efforts to create an enduring safety culture.
The Norwegian airlines have separate safety departments, but they are all inte-grated into the airlines’ Safety Management Systems. The Safety and Compliance de-partments are independent and report di-rectly to the airlines’ Accountable Manager.
Safety and safety-related issues are cov-ered during crew training. The Civil Avia-tion Authorities approve all programs, ex-aminations and qualification requirements.
As with all management systems, the Safety Management System provides for goal setting, planning, and performance measuring. The Safety Management Sys-tem is fully integrated across the organiza-tion. As it develops, it becomes a part of the Group culture; nurturing attitudes and be-liefs toward safety, encouraging a “Safety Culture” and influencing how personnel go about their daily tasks.
Norwegian focuses on safety and en-courages internal reporting of errors. The Group is actively promoting an atmosphere where all staff can openly discuss errors of commission or omission, process improve-ments, and/or systems corrections with-out the fear of reprisal. The safety depart-ments approach safety in a holistic manner
PASSENGERS BY COUNTRY OF ORIGINIn million ■ 2015 ■ 2016
0% 5% 10% 15% 20% 25% 30% 35% 40%
OtherPoland
ItalyFrance
USAGermany
FinlandUK
SpainDenmark
SwedenNorway
GROWTH IN PASSENGERS BY COUNTRY 2016In per cent
0% 5% 10% 15% 20% 25% 30% 35% 40% 45% 50% 55% 60%
Germany
Poland
Norway
Finland
Sweden
Denmark
Italy
France
UK
Spain
USA
Help | Contents | Highlights | Letter from CEO | Board of Directors' report | Financial statements | CSR | Corporate governance | Board and management | Definitions | Contact | 13 / 99
NORWEGIAN ANNUAL REPORT 2016
Key events 2016Group OverviewCorporate StructurePeople and ServicesAircraft OperationsAssets and FinancingOther Business Areas Brand ValueMarket ConditionsSafety and ComplianceOperational and Market developmentNetworkInternational OperationsAircraft MaintenanceFinancial ReviewR&DFinancial Risk and Risk ManagementThe Share Changes in the Board of Directors and Group ManagementEvents after December 31 Going Concern AssumptionParent Company results and distribution of fundsCorporate social responsibilityCorporate GovernanceOutlook 2017 Declaration on the financial statements
BOARD OF DIRECTORS' REPORT
2016-NorwegiaN.iNdd • Created: 09.10.2014 • Modified: 06.04.2017 : 19:44 all rigths reserved © 2017 teigeNs desigN
involving all staff. Such activity is essen-tial to an effective Safety Management Sys-tem, where each department considers not alone its own risks, but also the risk that its plans and/or activities will have on other departments. In order to achieve Norwe-gians goal of obtaining best practices, the Group move beyond just authority compli-ance. The Group actively engages in inter-national safety research projects, exchanges data with the aviation industry and strives to follow industry best practices.
In order to comply with European and International Safety Management System requirements, a number of organizational changes have been implemented. A new safety organization has been introduced, bringing a whole new approach to safety and how it is exercised. As a result, the fo-cus on safety is no longer limited to flight safety alone; it now embraces safety across the entire Group and allows every staff member to be a part of our safety strategy. Everyone – regardless of role or function – has the responsibility of reporting safety hazards, occurrences and issues via the SafetyNet reporting system. By engaging with active reporting, Norwegian’s staff can identify risks and ultimately prevent costly incidents and accidents.
In 2016, Norwegian Safety deployed of a new IT system in order to enable the mea-surement of its risk exposure in real time and to foresee potential risks. This initia-tive will work in conjunction with our Safe-tyNet reporting system and Flight Data Monitoring program to provide cutting edge risk awareness technology. Automatic collection and collation of data from the entire organization, combined with logical processing of current and historical data, provides a view of future risk. By analyzing
key data and trends over time, Norwegian can uncover areas that need additional at-tention and understand the effects of cor-rective measures taken. Transitioning from reactive to proactive and predictive identi-fication of risks enable potential deviations to be corrected before they occur.
OPERATIONAL AND MARKET DEVELOPMENTIn 2016, Norwegian continued its network expansion which included 34 new routes; 12 in the UK, 10 in Spain, three in France, five in Norway, two in Denmark, one in Sweden and one in the French Caribbean. Of those 34 routes, 25 were within the short haul network, and the remaining nine were within the long haul network. Norwegian also took delivery of 17 environmentally friendly Boeing 737-800 aircraft and four 787-9 during the year.
NETWORKThe Group’s route network spans across Eu-rope into North Africa, the Middle East, North America, The Caribbean and South-east Asia, serving both business and leisure markets. Norwegian’s network development objectives are to identify major point-to-point markets that have been over-priced or underserved, while simultaneously maxi-mizing aircraft and crew utilization.
Norwegian also opened two new Euro-pean bases in the summer; one in Rome (two aircraft) and one in Palma de Mallorca (two aircraft). These bases enabled Nor-wegian to retain its presence in key Nordic markets while also introducing new in-tra-European routes.
The Group saw significant growth in Spain with a net increase of six stationed aircraft. These aircraft were used to launch
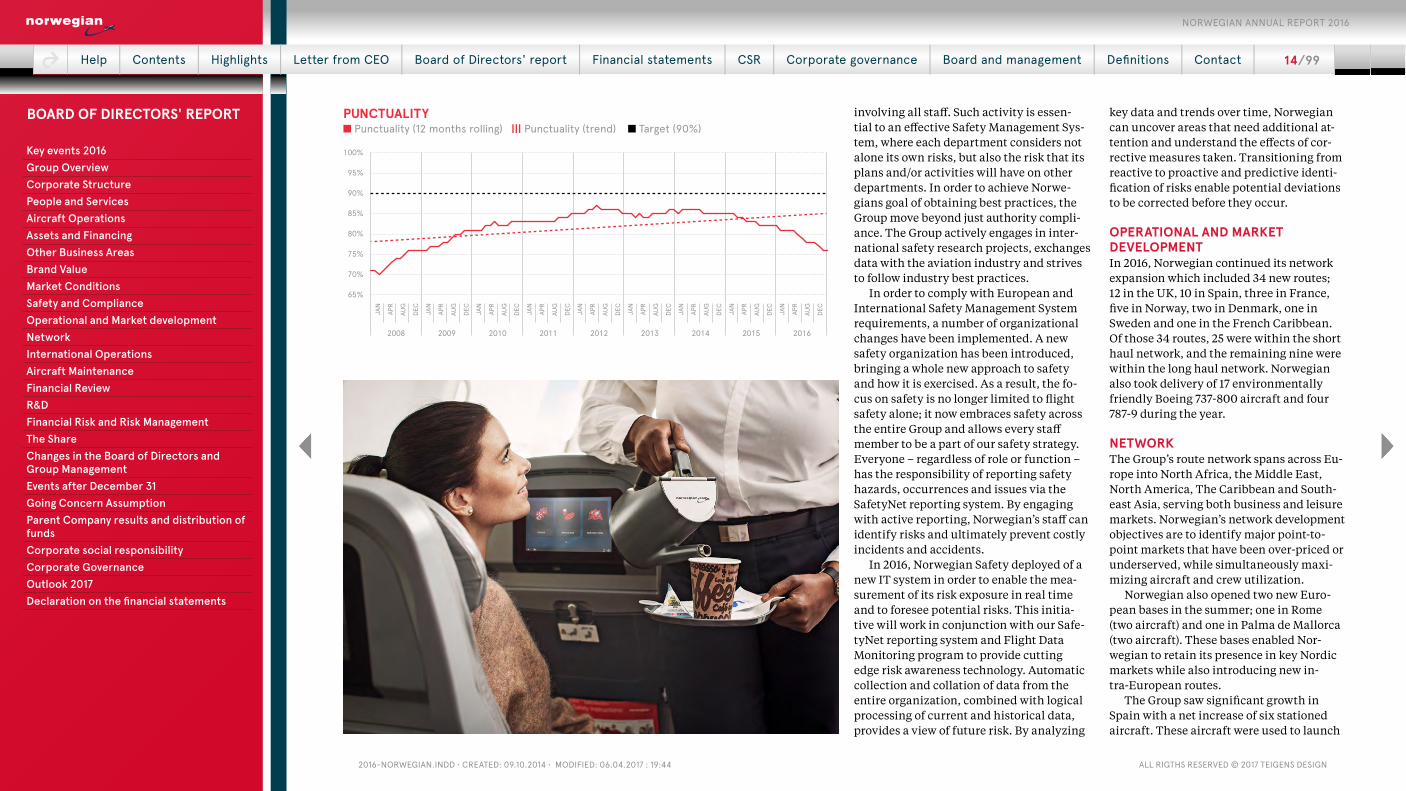
PUNCTUALITY■ Punctuality (12 months rolling) ||| Punctuality (trend) ■ Target (90%)
2008 2009 2010 2011 2012 2013 2014 2015 2016
JAN
APR
AUG
DEC
JAN
APR
AUG
DEC
JAN
APR
AUG
DEC
JAN
APR
AUG
DEC
JAN
APR
AUG
DEC
JAN
APR
AUG
DEC
JAN
APR
AUG
DEC
JAN
APR
AUG
DEC
JAN
APR
AUG
DEC
65%
70%
75%
80%
85%
90%
95%
100%
Help | Contents | Highlights | Letter from CEO | Board of Directors' report | Financial statements | CSR | Corporate governance | Board and management | Definitions | Contact | 14 / 99
NORWEGIAN ANNUAL REPORT 2016
Key events 2016Group OverviewCorporate StructurePeople and ServicesAircraft OperationsAssets and FinancingOther Business Areas Brand ValueMarket ConditionsSafety and ComplianceOperational and Market developmentNetworkInternational OperationsAircraft MaintenanceFinancial ReviewR&DFinancial Risk and Risk ManagementThe Share Changes in the Board of Directors and Group ManagementEvents after December 31 Going Concern AssumptionParent Company results and distribution of fundsCorporate social responsibilityCorporate GovernanceOutlook 2017 Declaration on the financial statements
BOARD OF DIRECTORS' REPORT

2016-NorwegiaN.iNdd • Created: 09.10.2014 • Modified: 06.04.2017 : 19:44 all rigths reserved © 2017 teigeNs desigN
further high volume leisure routes as well as cement our place as a leading domestic airline in Spain with the launch of the Bar-celona-Bilbao route.
The growth in aircraft based in Spain and Italy has helped to clear the way for an increased focus on the core Nordic do-mestic and intra-Scandinavian route net-work. Routes in these markets tend to have high daily frequencies, and Norwegian has continued to optimize these routes to con-nect to both short and long haul service throughout Scandinavia.
In total, Norwegian operates 18 short haul bases, seven of which are in Spain, four are in Norway, two are in the French Caribbean and one is in Sweden, Denmark, Finland, Italy, and the UK respectively. All mainland European bases serve a pan-Eu-ropean international route network.
In 2016, Norwegian continued its ag-gressive long haul growth by taking de-livery of four new Boeing 787-9 Dreamlin-ers. These aircraft were used to establish long haul operations from Paris as well as increasing service to the US from London Gatwick. This growth brought Norwegian’s long haul service offering to more than 40 routes from Europe.
Norwegian’s high growth rate is ex-pected to continue into 2017 when an ad-ditional nine new 787-9 Dreamliners enter the fleet and long haul service to Barcelona is launched. In addition, there are 23 new narrow body deliveries that will enable en-tries into new markets throughout Europe.
INTERNATIONAL OPERATIONSNorwegian Air International Ltd. (NAI)During 2016, Norwegian Air International (NAI) went from operating 20 aircraft to operating 47 aircraft; all of which are Boe-
ing 737-800s. Additionally, NAI had a per-manent wet lease from Norwegian UK during the year.
At the end of the year, NAI operated out of bases in Finland, Italy, Spain and the UK. Moreover, it was decided that the current Norwegian Air Shuttle ASA 737-800 operation out of Copenhagen should be transferred to NAI. The transfer is planned to take place in the first quarter of 2017.
In February 2014, NAI applied the US De-partment of Transportation (DOT) for a for-eign air carrier permit to operate flights to the USA. NAI was granted the necessary per-missions on December 2, 2016.
Norwegian Air UK Ltd. (NUK)Norwegian Air UK Ltd (NUK) was estab-lished in the United Kingdom in January 2015, and NUK received its Operational Li-cense and Air Operating Certificate in Oc-tober 2015. NUK has one Boeing 737-800 registered on the operational specifica-tions and operates wet-lease operations for Norwegian Air International Ltd. New UK headquarters was established at London Gatwick airport in 2016 to accommodate NUK’s 30 staff, with more staff expected over the next few years. In December 2015, two years after the NAI application was submitted, the Group submitted NUK’s ap-plication for a foreign air carrier permit to the DOT. At the date of publishing, the de-cision from the DOT is still pending.
AIRCRAFT MAINTENANCEThe Boeing 737 fleet is operated by the par-ent company (NAS) and it’s fully owned subsidiary Norwegian Air Norway (NAN), Norwegian Air International (NAI) and Norwegian UK (NUK). Norwegian Air Shut-
tle (NAS) operates the Boeing 787-9 fleet. Each individual operator has its own Air
Operator Certificate (AOC) with its respec-tive civil aviation authority oversight and approval. Each AOC must have a civil avi-ation authority approved maintenance or-ganization (CAMO) and maintenance pro-gram (AMP).
NAS and NAN manage their own main-tenance operations from the technical bases at Oslo Gardermoen Airport. NAI manages its maintenance operations from its technical base in Dublin, Ireland. NUK manages its maintenance operations from its technical base in London, UK.
Continuing Airworthiness activities – activities that keep the aircraft suitable for safe flights – for the 787-9 fleet are sub-con-tracted to Boeing Fleet Technical Manage-ment (Boeing FTM). Control and oversight of the activities is performed by Norwegian Air Shuttle Maintenance operations in ad-dition to civil aviation authorities.
Major airframe as well as workshop maintenance is performed by external sources subject to approval by the Euro-pean Aviation Safety Agency (EASA) and by the national aviation authorities.
Airframe (base) maintenance for the 737 fleet is currently carried out by Lufthansa Technik in Budapest, Hungary. Lufthansa Technik and Boeing are undertaking en-gine and component workshop mainte-nance.
Airframe maintenance for the fleet of 787-9 is currently carried out by British Air-ways, NAS and Monarch.
Rolls Royce UK currently carries out en-gine maintenance.
All maintenance, planning and fol-low-up activities, both internally and ex-ternally, are performed according to both the manufacturers’ requirements and ad-ditional internal requirements, and are in full compliance with international au-thority regulations. The Group carries out initial quality approval, as well as contin-uously monitoring all maintenance sup-pliers.
All supplier contracts are subject to ap-proval and monitoring by the national avi-ation authorities.
FINANCIAL REVIEWNorwegian reports consolidated financial information compliant to the International Financial Reporting Standards (IFRS) as adopted by the EU.
The preparation of the accounts and ap-plication of the chosen accounting prin-ciples involve using assessments and es-timates and necessitate the application of assumptions that affect the carrying amount of assets and liabilities, income and expenses. The estimates and the per-taining assumptions are based on expe-rience and other factors. The uncertainty associated with this implies that the actual figures may deviate from the estimates. It is especially the maintenance reserves lia-bilities that are associated with this type of uncertainty.
"Norwegian’s high growth rate is expected to continue into 2017"
Help | Contents | Highlights | Letter from CEO | Board of Directors' report | Financial statements | CSR | Corporate governance | Board and management | Definitions | Contact | 15 / 99
NORWEGIAN ANNUAL REPORT 2016
Key events 2016Group OverviewCorporate StructurePeople and ServicesAircraft OperationsAssets and FinancingOther Business Areas Brand ValueMarket ConditionsSafety and ComplianceOperational and Market developmentNetworkInternational OperationsAircraft MaintenanceFinancial ReviewR&DFinancial Risk and Risk ManagementThe Share Changes in the Board of Directors and Group ManagementEvents after December 31 Going Concern AssumptionParent Company results and distribution of fundsCorporate social responsibilityCorporate GovernanceOutlook 2017 Declaration on the financial statements
BOARD OF DIRECTORS' REPORT
2016-NorwegiaN.iNdd • Created: 09.10.2014 • Modified: 06.04.2017 : 19:44 all rigths reserved © 2017 teigeNs desigN
Consolidated statement of profit and loss The Group’s total operating revenues and income for 2016 grew by 16 per cent and came to NOK 26 055 million (NOK 22 491 million), of which ticket revenues ac-counted for NOK 21 096 million (NOK 18 506 million). Ancillary passenger reve-nues were NOK 3 929 million (NOK 3 275 million), while NOK 926 million (NOK 710 million) was related to freight, third-party products and other income. The revenue growth is a result of increased number of passengers, as the yield has decreased. The load factor increased by 1.5 percentage points compared to the same period last year. The ticket revenue per available seat kilometer (RASK) for 2016 was NOK 0.36 (NOK 0.38), down three per cent from pre-vious year. Ancillary revenues rose by five per cent to NOK 134 per PAX (127).
Operating costs (including leasing and excluding depreciation and write-downs) amounted to NOK 22 938 million (NOK 21 010 million), with a unit cost of NOK 0.41 (NOK 0.42). The unit cost excluding fuel was up by two per cent to NOK 0.32 (NOK 0.31). The increase in unit cost was mainly a consequence of currency. CASK exclud-ing fuel in constant currency was one per cent lower than previous year. Earnings before interest, depreciation and amorti-zations (EBITDA) were NOK 3 116 million, compared to NOK 1 481 million last year.
Financial items in 2016 resulted in a loss of NOK 525 million, compared to a loss of NOK 376 million in 2015. Included in finan-cial items is NOK 116 million in net foreign exchange gains, compared to a gain of NOK 27 million previous year. With regards to accounting for the prepayments on pur-chase contracts with aircraft manufactur-
ers, NOK 262 million (NOK 269 million) in interest costs were capitalized in 2016. In 2007, the Group established Bank Norwe-gian, a wholly owned subsidiary of Nor-wegian Finans Holding ASA, in which the Group has a 20 per cent stake. The Com-pany was listed at the Oslo Stock Exchange main list in June 2016 with the ticker NOFI. The Group’s share of OSM Aviation and Bank Norwegian’s net profit resulted in a net gain of NOK 213 million (NOK 103 mil-lion) in the consolidated profit and loss.
Earnings before tax in 2016 amounted to a gain of NOK 1 508 million (NOK 75 mil-lion) and net profit after tax was a gain of NOK 1 135 million (NOK 246 million). Earnings per share was NOK 31.7 per share (NOK 6.99).
Consolidated statement of financial position The Group’s total debt and assets are im-pacted by the asset acquisitions, depreci-ation of NOK against USD and the capac-ity increase that have taken place during the year. Total assets at December 31, 2016 were NOK 37 763 million (NOK 31 634 mil-lion). The book value of aircraft increased by NOK 4 090 million to 22 572 during the year. Prepayments to aircraft manufactur-ers were NOK 7 156 million at the end of 2016, an increase of NOK 1 217 million from December 31, 2015. Trade and other receiv-ables were NOK 3 014 million (NOK 2 551 million).
At the balance sheet date, the Group had a cash balance of NOK 2 324 million (NOK 2 454 million). Total borrowings increased by NOK 3 890 million to NOK 23 475 mil-lion (NOK 19 584 million) related to financ-ing of new aircraft.
Help | Contents | Highlights | Letter from CEO | Board of Directors' report | Financial statements | CSR | Corporate governance | Board and management | Definitions | Contact | 16 / 99
NORWEGIAN ANNUAL REPORT 2016
Key events 2016Group OverviewCorporate StructurePeople and ServicesAircraft OperationsAssets and FinancingOther Business Areas Brand ValueMarket ConditionsSafety and ComplianceOperational and Market developmentNetworkInternational OperationsAircraft MaintenanceFinancial ReviewR&DFinancial Risk and Risk ManagementThe Share Changes in the Board of Directors and Group ManagementEvents after December 31 Going Concern AssumptionParent Company results and distribution of fundsCorporate social responsibilityCorporate GovernanceOutlook 2017 Declaration on the financial statements
BOARD OF DIRECTORS' REPORT
2016-NorwegiaN.iNdd • Created: 09.10.2014 • Modified: 06.04.2017 : 19:44 all rigths reserved © 2017 teigeNs desigN
Capital structure The Group’s total equity was NOK 4 049 million (NOK 2 965 million) at December 31, 2016 with an equity ratio of 11 per cent (nine per cent). Total equity increased by NOK 1 084 million following net profit for the pe-riod of NOK 1 135 million, exchange rate loss on equity in Group companies of NOK 103 million and actuarial gains on pension plans of NOK 25 million.
All issued shares in the parent company are fully paid with a par value of NOK 0.1 per share. There is only one class of shares, and all shares have equal rights. The Group’s ar-ticles of association have no limitations re-garding the trading of Norwegian Air Shut-tle ASA’s shares on the stock exchange.
The Group’s aggregated net interest-bear-ing debt was NOK 21 151 million (NOK 17 131 million) at year-end. The Group’s gross in-terest-bearing liabilities of NOK 23 475 mil-lion (NOK 19 584 million) mainly consisted of financing for aircraft amounting to NOK 17 580 million, bond loans with a net book value of NOK 4 154 million, Pre-Delivery Payment syndicated credit facilities of NOK 1 416 million and a credit facility of NOK 325 million. In 2016, the Group successfully tapped existing bonds in NOK and EUR. NOK 4 768 million of the interest-bearing loans mature in 2017. NOK 1 416 million is re-lated to financing of prepayments to aircraft manufacturers and will be replaced by long term financing at the time of delivery of the aircraft.
Consolidated statement of cash flow The Group’s cash flow from operations was NOK 3 047 million (NOK 2 357 million) in 2016. The net cash flow from operating ac-tivities consists of the profit before tax of NOK 1 508 million; add back of deprecia-tion and other expenses without cash ef-fects of NOK 1 296 million and interests on borrowings of NOK 801 million included in financial activities. Changes in work-ing capital mainly due to traffic growth amounted to NOK 130 million. During 2016, the Group paid NOK 29 million in taxes. The net cash flow used for invest-ment activities was negative of NOK 6 512 million (negative of NOK 5 189 million), related to the purchases of 17 new Boeing 737-800s, two Airbus 320neos and net of pre-delivery payments. The net cash flow from financial activities in 2016 was NOK 3 303 million (NOK 3 282 million). New loans, including draw downs on facilities for aircraft prepayments and bond issues were NOK 5 806 million, while repayments on long term debt were NOK 1 573 million. The Group has a strong focus on liquidity planning and the Board is confident in the Group’s financial position at the beginning of 2017.
R&DThe Group did not carry out any significant R&D activities in 2016, and there is no ma-terial impact of such activities in the finan-cial statements.
FINANCIAL RISK AND RISK MANAGEMENTRisk management in the Norwegian Group is based on the principle that risk evaluation is an integral part of all business activities. Policies and procedures have been estab-lished to manage risks. The Group’s Board of Directors reviews and evaluates the overall risk management systems and environment in the Group on a regular basis.
The Group faces many risks and un-certainties in a marketplace that has be-come increasingly global. The variety of economic environments and market con-ditions can be challenging, with the risk that Norwegian may not succeed in re-ducing the unit cost sufficiently to com-pensate in case of weaker consumer and business confidence in its key markets. Price volatility may have a significant im-pact on the Group’s results. Higher lever-age as well as changes in borrowing costs may increase Norwegian’s borrowing cost and cost of capital. Norwegian is continu-ously exposed to the risk of counterparty default. The Group’s reported results and net assets denominated in foreign curren-cies are influenced by fluctuations in cur-rency exchange rates and in particular the US dollar.
The Group’s main strategy for mitigat-ing risks related to volatility in cash flows is to maintain a solid financial position and a strong credit rating. Financial risk man-agement is carried out by a central trea-sury department (Group treasury), under policies approved by the Board of Direc-tors. Group treasury identifies, evaluates and hedges financial risk in close coopera-tion with the Group’s operating units. The Board provides principles for overall risk management such as foreign currency risk,
jet-fuel risk, interest rate risk, and credit risk, use of derivative financial instru-ments and investment of excess liquidity.
Interest risk The Group is exposed to changes in the interest rate level, following the substan-tial amount of interest bearing debt. The Group’s cash flow interest rate risk arises from cash and cash equivalents and float-ing interest rate. Floating interest rate bor-rowings consist of unsecured bonds, air-craft and prepayment financing, loan fa-cility and financial lease liabilities. Bor-rowings issued at fixed rates expose the Group to fair value interest rate risk. Fixed interest rate borrowings consist of aircraft financing guaranteed by the Ex-Im Bank of the United States, Commercial debt for aircraft and unsecured bonds. Borrowings are denominated in USD, EUR and NOK. Hence, there is an operational hedge in the composition of the debt.
Foreign currency risk A substantial part of the Group’s revenues and expenses are denominated in foreign currencies. Revenues are increasingly ex-posed to changes in foreign currencies against NOK as the Group expands glob-ally with more customers travelling from the USA and between European destina-tions. The Group’s leases, aircraft borrow-ings, maintenance, jet-fuel and related ex-penses are mainly denominated in USD, and airplane operation expenses are partly denominated in EUR. Foreign exchange risk arises from future commercial trans-actions, recognized assets and liabilities and net investments in foreign operations. In order to reduce currency risk, the Group has a mandate to hedge up to 100 per cent
"Borrowings are denominated in USD, EUR and NOK. Hence, there is an operational edge in the composition of the debt"
Help | Contents | Highlights | Letter from CEO | Board of Directors' report | Financial statements | CSR | Corporate governance | Board and management | Definitions | Contact | 17 / 99
NORWEGIAN ANNUAL REPORT 2016
Key events 2016Group OverviewCorporate StructurePeople and ServicesAircraft OperationsAssets and FinancingOther Business Areas Brand ValueMarket ConditionsSafety and ComplianceOperational and Market developmentNetworkInternational OperationsAircraft MaintenanceFinancial ReviewR&DFinancial Risk and Risk ManagementThe Share Changes in the Board of Directors and Group ManagementEvents after December 31 Going Concern AssumptionParent Company results and distribution of fundsCorporate social responsibilityCorporate GovernanceOutlook 2017 Declaration on the financial statements
BOARD OF DIRECTORS' REPORT
2016-NorwegiaN.iNdd • Created: 09.10.2014 • Modified: 06.04.2017 : 19:44 all rigths reserved © 2017 teigeNs desigN
of its currency exposure for the following 12 months. The hedging consists of forward currency contracts and flexible forwards.
Price risk Expenses for jet-fuel represent a substan-tial part of the Group’s operating costs, and fluctuations in the jet-fuel prices influence the projected cash flows. The objective of the jet-fuel price risk management policy is to safeguard against significant and sudden increases in jet-fuel prices whilst retain-ing access to price reductions. The Group manages jet-fuel price risk using fuel deriv-atives. The Management has a mandate to hedge up to 100 per cent of its expected con-sumption over the next 24 months with for-ward commodity contracts.
Liquidity risk The Group monitors rolling forecasts of the liquidity reserves, cash and cash equiva-lents, on the basis of expected cash flows. In addition, the Group’s liquidity man-agement policy involves projecting cash flows in major currencies and evaluating the level of liquid assets required. Further-more, these analyses are used to monitor balance sheet liquidity ratios against inter-nal and external regulatory requirements and maintaining debt financing plans. Fol-lowing the acquisition of aircraft with fu-ture deliveries, Norwegian will have ongo-ing financing activities. The Group’s strat-egy is to diversify the financing of aircraft through sale-and-leaseback transactions and term loan financing supported by the
export credit agencies in the United States and EU.
Credit risk Credit risks are managed on a Group level. Credit risks arise from cash and cash equivalents, derivative financial instru-ments and deposits with banks and finan-cial institutions, as well as credit exposure to commercial customers. The Group’s pol-icy is to maintain credit sales at a mini-mum level and sales to consumers are set-tled by using credit card companies. The risks arising from receivables on credit card companies or credit card acquirers are monitored closely. At December 31, 2016, 46 per cent of total trade receivables are with counterparties with an external credit rating of A or better, and 86 per cent of to-tal cash and cash equivalents are placed with A+ or better rated counterparties.
THE SHARE The Company’s shares are listed on Oslo Børs (Oslo Stock Exchange) with the ticker symbol NAS and is included in the bench-mark index OBX, which comprises the 25 most liquid shares on Oslo Børs.
Norwegian aims to generate competitive returns to its shareholders. The Board has recommended not to distribute dividends but to retain earnings for investment in ex-pansion and other investment opportuni-ties as stated in the articles of association, thereby enhancing profitability and returns to shareholders. The Company has not paid dividends during the last three years.
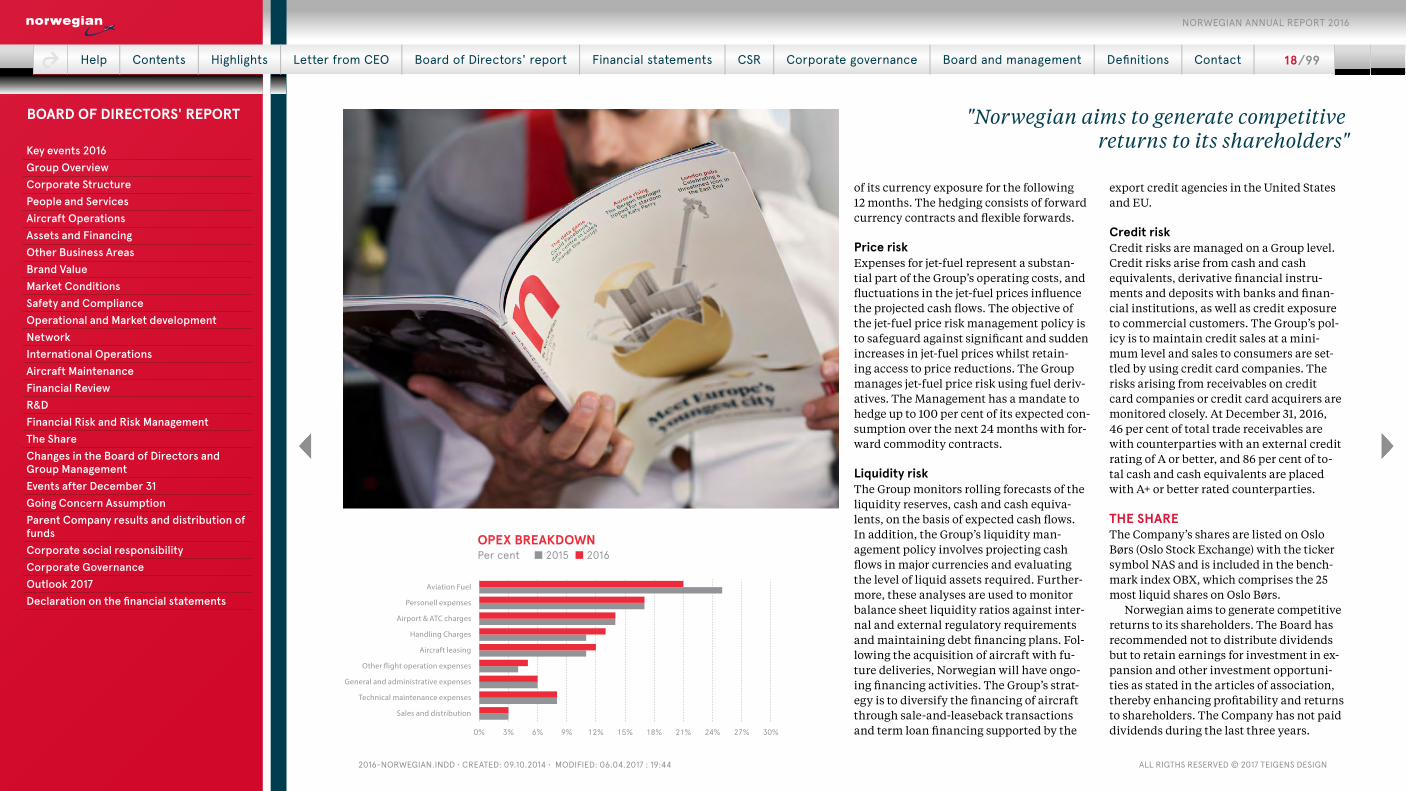
OPEX BREAKDOWNPer cent ■ 2015 ■ 2016
0% 3% 6% 9% 12% 15% 18% 21% 24% 27% 30%
Sales and distribution
Technical maintenance expenses
General and administrative expenses
Other �ight operation expenses
Aircraft leasing
Handling Charges
Airport & ATC charges
Personell expenses
Aviation Fuel
"Norwegian aims to generate competitive returns to its shareholders"
Help | Contents | Highlights | Letter from CEO | Board of Directors' report | Financial statements | CSR | Corporate governance | Board and management | Definitions | Contact | 18 / 99
NORWEGIAN ANNUAL REPORT 2016
Key events 2016Group OverviewCorporate StructurePeople and ServicesAircraft OperationsAssets and FinancingOther Business Areas Brand ValueMarket ConditionsSafety and ComplianceOperational and Market developmentNetworkInternational OperationsAircraft MaintenanceFinancial ReviewR&DFinancial Risk and Risk ManagementThe Share Changes in the Board of Directors and Group ManagementEvents after December 31 Going Concern AssumptionParent Company results and distribution of fundsCorporate social responsibilityCorporate GovernanceOutlook 2017 Declaration on the financial statements
BOARD OF DIRECTORS' REPORT
2016-NorwegiaN.iNdd • Created: 09.10.2014 • Modified: 06.04.2017 : 19:44 all rigths reserved © 2017 teigeNs desigN
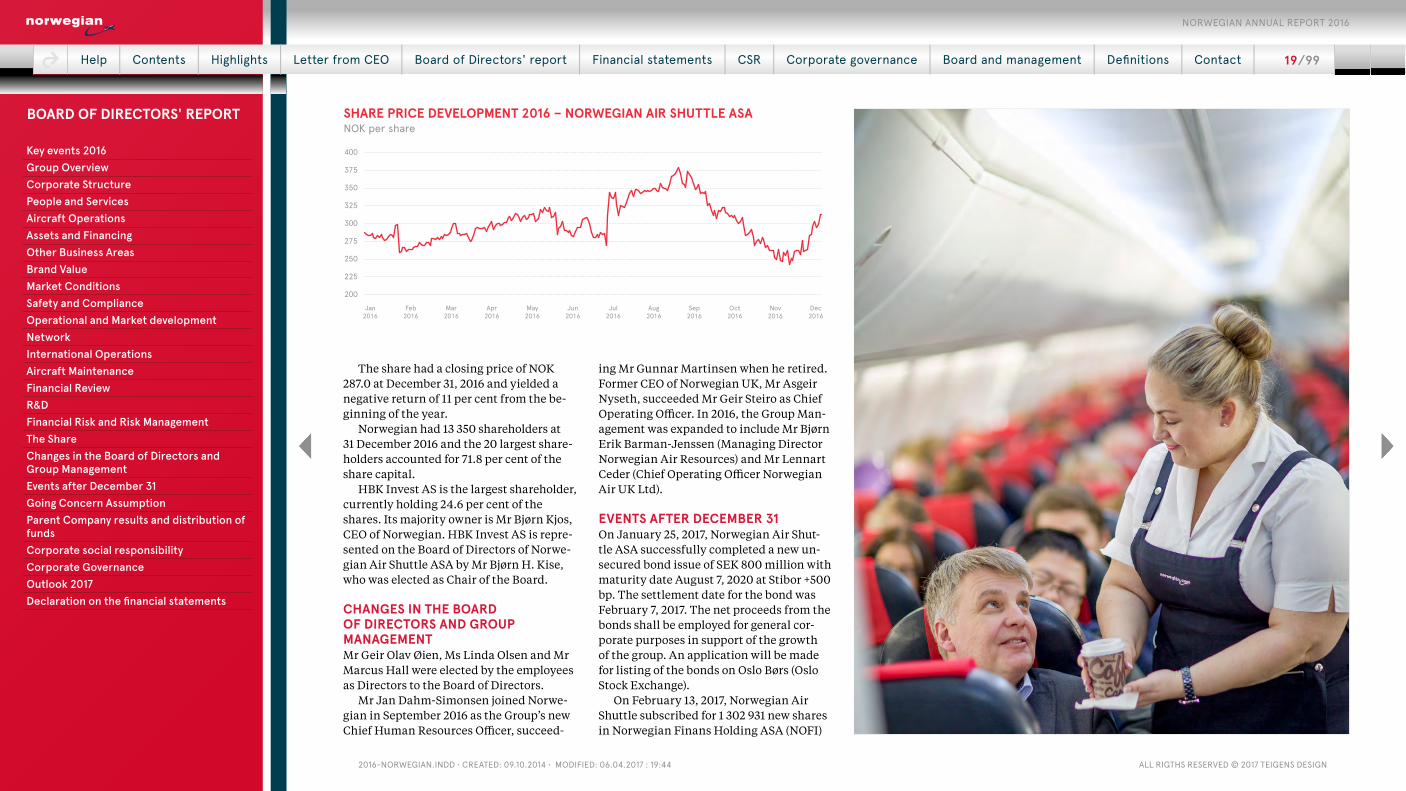
The share had a closing price of NOK 287.0 at December 31, 2016 and yielded a negative return of 11 per cent from the be-ginning of the year.
Norwegian had 13 350 shareholders at 31 December 2016 and the 20 largest share-holders accounted for 71.8 per cent of the share capital.
HBK Invest AS is the largest shareholder, currently holding 24.6 per cent of the shares. Its majority owner is Mr Bjørn Kjos, CEO of Norwegian. HBK Invest AS is repre-sented on the Board of Directors of Norwe-gian Air Shuttle ASA by Mr Bjørn H. Kise, who was elected as Chair of the Board.
CHANGES IN THE BOARD OF DIRECTORS AND GROUP MANAGEMENTMr Geir Olav Øien, Ms Linda Olsen and Mr Marcus Hall were elected by the employees as Directors to the Board of Directors.
Mr Jan Dahm-Simonsen joined Norwe-gian in September 2016 as the Group’s new Chief Human Resources Officer, succeed-
ing Mr Gunnar Martinsen when he retired. Former CEO of Norwegian UK, Mr Asgeir Nyseth, succeeded Mr Geir Steiro as Chief Operating Officer. In 2016, the Group Man-agement was expanded to include Mr Bjørn Erik Barman-Jenssen (Managing Director Norwegian Air Resources) and Mr Lennart Ceder (Chief Operating Officer Norwegian Air UK Ltd).
EVENTS AFTER DECEMBER 31 On January 25, 2017, Norwegian Air Shut-tle ASA successfully completed a new un-secured bond issue of SEK 800 million with maturity date August 7, 2020 at Stibor +500 bp. The settlement date for the bond was February 7, 2017. The net proceeds from the bonds shall be employed for general cor-porate purposes in support of the growth of the group. An application will be made for listing of the bonds on Oslo Børs (Oslo Stock Exchange).
On February 13, 2017, Norwegian Air Shuttle subscribed for 1 302 931 new shares in Norwegian Finans Holding ASA (NOFI)
SHARE PRICE DEVELOPMENT 2016 – NORWEGIAN AIR SHUTTLE ASANOK per share
200
225
250
275
300
325
350
375
400
Jan2016
Feb2016
Mar2016
Apr2016
May2016
Jun2016
Jul2016
Aug2016
Sep2016
Oct2016
Nov2016
Dec2016
Help | Contents | Highlights | Letter from CEO | Board of Directors' report | Financial statements | CSR | Corporate governance | Board and management | Definitions | Contact | 19 / 99
NORWEGIAN ANNUAL REPORT 2016
Key events 2016Group OverviewCorporate StructurePeople and ServicesAircraft OperationsAssets and FinancingOther Business Areas Brand ValueMarket ConditionsSafety and ComplianceOperational and Market developmentNetworkInternational OperationsAircraft MaintenanceFinancial ReviewR&DFinancial Risk and Risk ManagementThe Share Changes in the Board of Directors and Group ManagementEvents after December 31 Going Concern AssumptionParent Company results and distribution of fundsCorporate social responsibilityCorporate GovernanceOutlook 2017 Declaration on the financial statements
BOARD OF DIRECTORS' REPORT
2016-NorwegiaN.iNdd • Created: 09.10.2014 • Modified: 06.04.2017 : 19:44 all rigths reserved © 2017 teigeNs desigN
at a subscription price of 76.75. The invest-ment of NOK 100 million corresponds to 20 per cent of the private placement as publicly announced by NOFI on February 13. After the transaction, Norwegian Air Shuttle AS owns 37 323 739 shares in NOFI equal to 20 per cent of the shares issued.
Norwegian is the launch customer in Eu-rope of the new Boeing 737 MAX and has announced 12 new trans-atlantic routes, which will be served with the new aircraft from the summer 2017.
GOING CONCERN ASSUMPTIONPursuant to the requirements of Norwe-gian accounting legislation, the Board con-firms that the requirements for the going concern assumption have been met and that the annual accounts have been pre-pared on this basis.
PARENT COMPANY RESULTS AND DISTRIBUTION OF FUNDSNet profit for the parent company Norwe-gian Air Shuttle ASA was NOK 784.2 million.
In accordance with the Company’s cor-porate governance policy, the Board recom-mends the following distribution of funds:
(Amounts in NOK million)
Dividend 0Transferred from other equity 784.2 Total allocated 784.2
CORPORATE SOCIAL RESPONSIBILITYNorwegian strives to be a good corporate citizen in every area of operation. The Com-pany is committed to operate in accordance with responsible, ethical, sustainable and sound business principles, with respect for people, the environment and the society.
The requirements of the Norwegian Ac-
counting Act § 3-3c for reporting on have been covered within the separate report Corporate Social Responsibility at Norwe-gian, presented in a separate section of the annual report and available on the Group’s website www.norwegian.no. Included in this report is reporting on environmen-tal impact as well as working environment, equality and non-discrimination.
CORPORATE GOVERNANCEGood corporate governance is a priority for the Board of Directors. Norwegian’s objec-tive for corporate governance is based on accountability, transparency, fairness and simplicity with the ultimate goal of max-imizing shareholder value while creating added value for all stakeholders. The prin-ciples are designed in compliance with laws, regulations and ethical standards. Norwegian’s core values are simplicity, di-rectness and relevance, but no business conduct within the Group should under any circumstances jeopardize safety and quality.
Norwegian is subject to the annual cor-porate governance reporting requirements under section 3-3b of the Norwegian Ac-counting Act and the Norwegian Code of Practice for Corporate Governance, cf. sec-tion 7 on Oslo Børs’ continuing obligations of listed companies. The Accounting Act may be found (in Norwegian) at www.lov-data.no. The Norwegian Code of Practice for Corporate Governance (“the code”), which was last revised on October 30, 2014, may be found at www.nues.no.
The annual corporate governance state-ment is approved by the Board of Directors and is pursuant to Section 5-6 of the Pub-lic Limited Companies Act, subject to ap-proval by the Annual General Meeting.
Help | Contents | Highlights | Letter from CEO | Board of Directors' report | Financial statements | CSR | Corporate governance | Board and management | Definitions | Contact | 20 / 99
NORWEGIAN ANNUAL REPORT 2016
Key events 2016Group OverviewCorporate StructurePeople and ServicesAircraft OperationsAssets and FinancingOther Business Areas Brand ValueMarket ConditionsSafety and ComplianceOperational and Market developmentNetworkInternational OperationsAircraft MaintenanceFinancial ReviewR&DFinancial Risk and Risk ManagementThe Share Changes in the Board of Directors and Group ManagementEvents after December 31 Going Concern AssumptionParent Company results and distribution of fundsCorporate social responsibilityCorporate GovernanceOutlook 2017 Declaration on the financial statements
BOARD OF DIRECTORS' REPORT
2016-NorwegiaN.iNdd • Created: 09.10.2014 • Modified: 06.04.2017 : 19:44 all rigths reserved © 2017 teigeNs desigN
Norwegian has adapted to the code and subsequent amendments in all areas.
The annual statement on how Norwegian complies with the Code of Practice and the Norwegian Accounting Act’s requirements for corporate governance is included as a separate document in a separate section of the annual report, which is available on the Group’s website www.norwegian.no.
OUTLOOK 2017 The demand for travelling with Norwegian and advance bookings have been satisfac-tory entering the first quarter of 2017. Nor-wegian will continue to take advantage of its increasing competitive power realized
through continuous cost efficiency, and from introducing larger aircraft (seven-teen new Boeing 737-800s, nine new Boe-ing 787-9s and six 737 MAX will be deliv-ered in 2017) with a lower operating cost. In addition, three Airbus 320neo aircraft are scheduled to be delivered in 2017, which will be leased to the airline HK Express.
Norwegian has 23 operational bases globally.
Norwegian guides for a production growth (ASK) of 30 per cent for 2017. The growth in Boeing 737 production is by add-ing Boeing 737-800s, and introducing Boe-ing 737 MAX. The Boeing 787 production will grow in accordance with the phasing
in of aircraft and the Company will have 21 Boeing 787s by the end of 2017. Norwe-gian may decide to adjust capacity in order to optimize the route portfolio depending on the development in the overall economy and in the marketplace.
Assuming a fuel price of USD 500 per ton, USD/NOK 8.25 and EUR/NOK 9.00 for the year 2017 (excluding hedged volumes) and with the currently planned route portfolio, the Company is targeting a unit cost (CASK) in the range of NOK 0.39 to 0.40 for 2017.
Norwegian continues to establish and de-velop an organizational structure that will secure cost efficient international expansion and necessary traffic rights for the future.
DECLARATION ON THE FINANCIAL STATEMENTSWe confirm that the financial statements for the year 2016, to the best of our knowl-edge, have been prepared in accordance with International Financial Reporting Standards (IFRS), gives a true and fair view of the Company’s and Group’s consolidated assets, liabilities, financial position and results of operations, and that the annual report includes a fair review of the develop-ment, results and position of the Company and Group, together with a description of the most central risks and uncertainty fac-tors facing the companies.
Fornebu, March 21, 2017
Bjørn H. Kise Liv Berstad Christian Fredrik Stray Chair Deputy Chair Director
Ada Kjeseth Marcus Daniel Hall Linda OlsenDirector Director
(elected by the employees)Director
(elected by the employees)
Geir Olav Øien Bjørn KjosDirector
(elected by the employees)Chief Executive Officer
Help | Contents | Highlights | Letter from CEO | Board of Directors' report | Financial statements | CSR | Corporate governance | Board and management | Definitions | Contact | 21 / 99
NORWEGIAN ANNUAL REPORT 2016
Key events 2016Group OverviewCorporate StructurePeople and ServicesAircraft OperationsAssets and FinancingOther Business Areas Brand ValueMarket ConditionsSafety and ComplianceOperational and Market developmentNetworkInternational OperationsAircraft MaintenanceFinancial ReviewR&DFinancial Risk and Risk ManagementThe Share Changes in the Board of Directors and Group ManagementEvents after December 31 Going Concern AssumptionParent Company results and distribution of fundsCorporate social responsibilityCorporate GovernanceOutlook 2017 Declaration on the financial statements
BOARD OF DIRECTORS' REPORT
2016-NorwegiaN.iNdd • Created: 09.10.2014 • Modified: 06.04.2017 : 19:44 all rigths reserved © 2017 teigeNs desigN
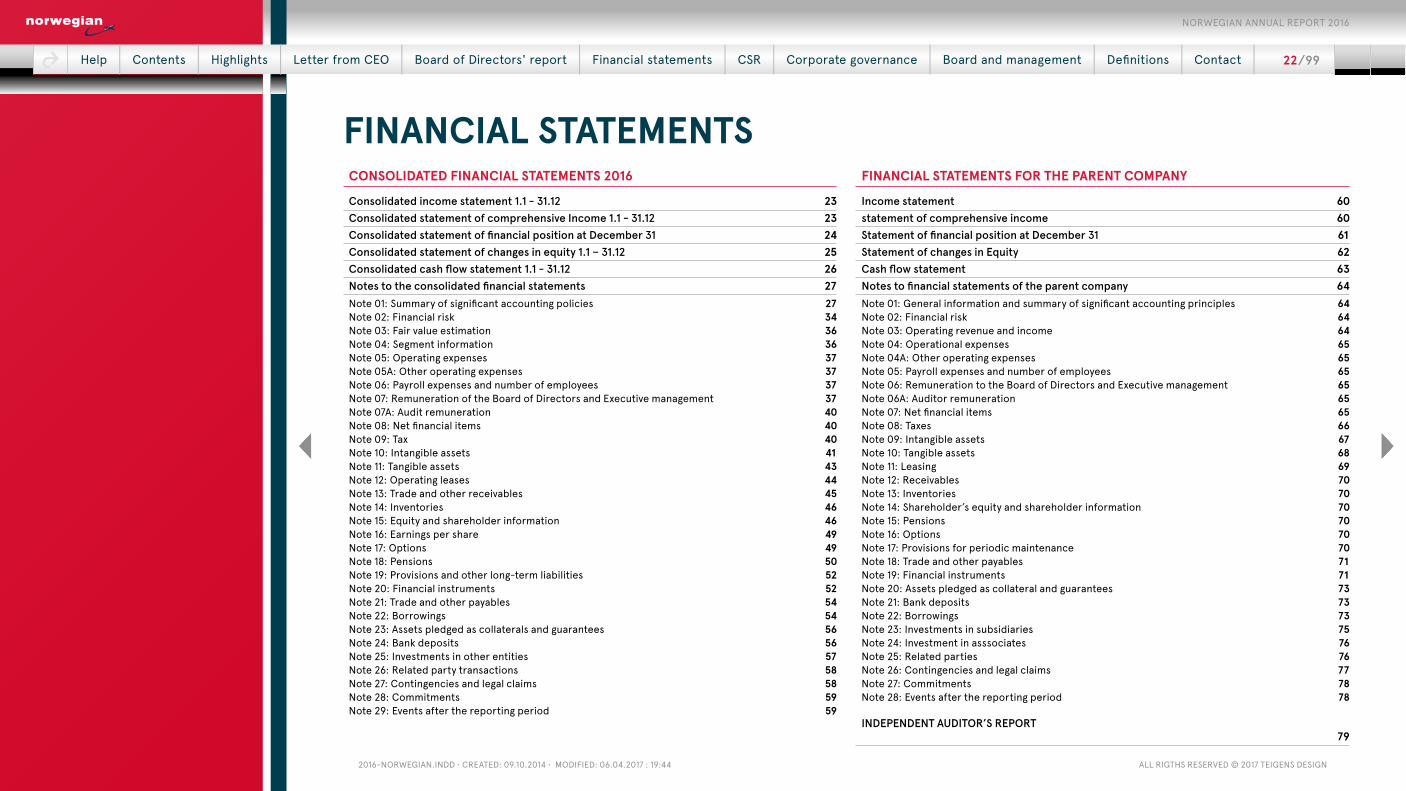
FINANCIAL STATEMENTSCONSOLIDATED FINANCIAL STATEMENTS 2016
Consolidated income statement 1.1 - 31.12 23Consolidated statement of comprehensive Income 1.1 - 31.12 23Consolidated statement of financial position at December 31 24Consolidated statement of changes in equity 1.1 – 31.12 25Consolidated cash flow statement 1.1 - 31.12 26Notes to the consolidated financial statements 27Note 01: Summary of significant accounting policies 27Note 02: Financial risk 34Note 03: Fair value estimation 36Note 04: Segment information 36Note 05: Operating expenses 37Note 05A: Other operating expenses 37Note 06: Payroll expenses and number of employees 37Note 07: Remuneration of the Board of Directors and Executive management 37Note 07A: Audit remuneration 40Note 08: Net financial items 40Note 09: Tax 40Note 10: Intangible assets 41Note 11: Tangible assets 43Note 12: Operating leases 44Note 13: Trade and other receivables 45Note 14: Inventories 46Note 15: Equity and shareholder information 46Note 16: Earnings per share 49Note 17: Options 49Note 18: Pensions 50Note 19: Provisions and other long-term liabilities 52Note 20: Financial instruments 52Note 21: Trade and other payables 54Note 22: Borrowings 54Note 23: Assets pledged as collaterals and guarantees 56Note 24: Bank deposits 56Note 25: Investments in other entities 57Note 26: Related party transactions 58Note 27: Contingencies and legal claims 58Note 28: Commitments 59Note 29: Events after the reporting period 59
FINANCIAL STATEMENTS FOR THE PARENT COMPANY
Income statement 60statement of comprehensive income 60Statement of financial position at December 31 61Statement of changes in Equity 62Cash flow statement 63Notes to financial statements of the parent company 64Note 01: General information and summary of significant accounting principles 64Note 02: Financial risk 64Note 03: Operating revenue and income 64Note 04: Operational expenses 65Note 04A: Other operating expenses 65Note 05: Payroll expenses and number of employees 65Note 06: Remuneration to the Board of Directors and Executive management 65Note 06A: Auditor remuneration 65Note 07: Net financial items 65Note 08: Taxes 66Note 09: Intangible assets 67Note 10: Tangible assets 68Note 11: Leasing 69Note 12: Receivables 70Note 13: Inventories 70Note 14: Shareholder’s equity and shareholder information 70Note 15: Pensions 70Note 16: Options 70Note 17: Provisions for periodic maintenance 70Note 18: Trade and other payables 71Note 19: Financial instruments 71Note 20: Assets pledged as collateral and guarantees 73Note 21: Bank deposits 73Note 22: Borrowings 73Note 23: Investments in subsidiaries 75Note 24: Investment in asssociates 76Note 25: Related parties 76Note 26: Contingencies and legal claims 77Note 27: Commitments 78Note 28: Events after the reporting period 78 INDEPENDENT AUDITOR’S REPORT 79
Help | Contents | Highlights | Letter from CEO | Board of Directors' report | Financial statements | CSR | Corporate governance | Board and management | Definitions | Contact | 22 / 99
NORWEGIAN ANNUAL REPORT 2016
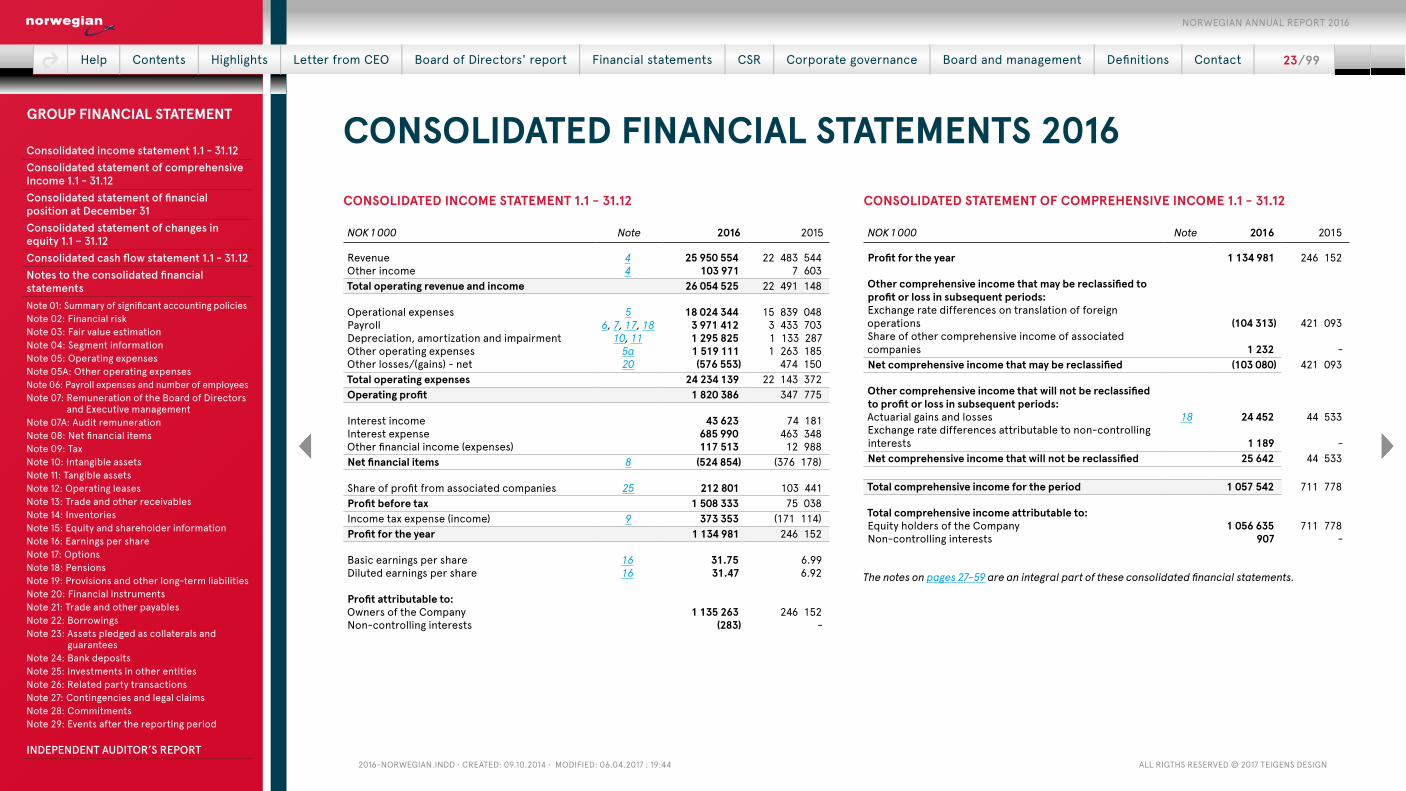
2016-NorwegiaN.iNdd • Created: 09.10.2014 • Modified: 06.04.2017 : 19:44 all rigths reserved © 2017 teigeNs desigN
CONSOLIDATED FINANCIAL STATEMENTS 2016CONSOLIDATED INCOME STATEMENT 1.1 - 31.12
NOK 1 000 Note 2016 2015
Revenue 4 25 950 554 22 483 544Other income 4 103 971 7 603Total operating revenue and income 26 054 525 22 491 148
Operational expenses 5 18 024 344 15 839 048Payroll 6, 7, 17, 18 3 971 412 3 433 703Depreciation, amortization and impairment 10, 11 1 295 825 1 133 287Other operating expenses 5a 1 519 111 1 263 185Other losses/(gains) - net 20 (576 553) 474 150Total operating expenses 24 234 139 22 143 372Operating profit 1 820 386 347 775
Interest income 43 623 74 181Interest expense 685 990 463 348Other financial income (expenses) 117 513 12 988Net financial items 8 (524 854) (376 178)
Share of profit from associated companies 25 212 801 103 441Profit before tax 1 508 333 75 038Income tax expense (income) 9 373 353 (171 114)Profit for the year 1 134 981 246 152
Basic earnings per share 16 31.75 6.99Diluted earnings per share 16 31.47 6.92
Profit attributable to:Owners of the Company 1 135 263 246 152Non-controlling interests (283) -
CONSOLIDATED STATEMENT OF COMPREHENSIVE INCOME 1.1 - 31.12
NOK 1 000 Note 2016 2015
Profit for the year 1 134 981 246 152
Other comprehensive income that may be reclassified to profit or loss in subsequent periods:Exchange rate differences on translation of foreign operations (104 313) 421 093Share of other comprehensive income of associated companies 1 232 - Net comprehensive income that may be reclassified (103 080) 421 093
Other comprehensive income that will not be reclassified to profit or loss in subsequent periods:Actuarial gains and losses 18 24 452 44 533 Exchange rate differences attributable to non-controlling interests 1 189 -Net comprehensive income that will not be reclassified 25 642 44 533
Total comprehensive income for the period 1 057 542 711 778
Total comprehensive income attributable to:Equity holders of the Company 1 056 635 711 778Non-controlling interests 907 -
The notes on pages 27–59 are an integral part of these consolidated financial statements.
Help | Contents | Highlights | Letter from CEO | Board of Directors' report | Financial statements | CSR | Corporate governance | Board and management | Definitions | Contact | 23 / 99
NORWEGIAN ANNUAL REPORT 2016
Consolidated income statement 1.1 - 31.12Consolidated statement of comprehensive Income 1.1 - 31.12Consolidated statement of financial position at December 31Consolidated statement of changes in equity 1.1 – 31.12Consolidated cash flow statement 1.1 - 31.12Notes to the consolidated financial statementsNote 01: Summary of significant accounting policiesNote 02: Financial riskNote 03: Fair value estimationNote 04: Segment informationNote 05: Operating expensesNote 05A: Other operating expensesNote 06: Payroll expenses and number of employeesNote 07: Remuneration of the Board of Directors
and Executive managementNote 07A: Audit remunerationNote 08: Net financial itemsNote 09: TaxNote 10: Intangible assetsNote 11: Tangible assetsNote 12: Operating leasesNote 13: Trade and other receivablesNote 14: InventoriesNote 15: Equity and shareholder informationNote 16: Earnings per shareNote 17: OptionsNote 18: PensionsNote 19: Provisions and other long-term liabilitiesNote 20: Financial instrumentsNote 21: Trade and other payablesNote 22: BorrowingsNote 23: Assets pledged as collaterals and
guaranteesNote 24: Bank depositsNote 25: Investments in other entitiesNote 26: Related party transactionsNote 27: Contingencies and legal claimsNote 28: CommitmentsNote 29: Events after the reporting period INDEPENDENT AUDITOR’S REPORT
GROUP FINANCIAL STATEMENT
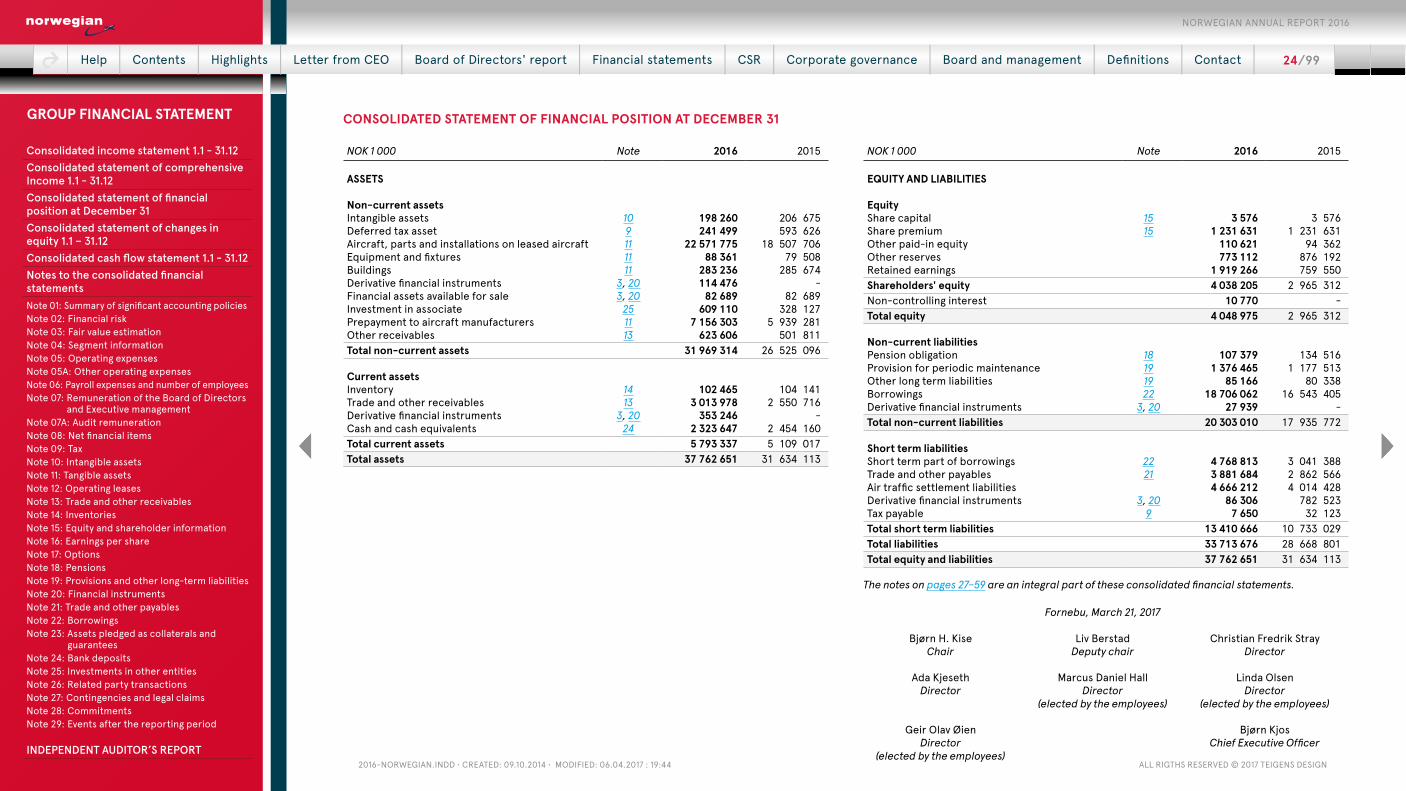
2016-NorwegiaN.iNdd • Created: 09.10.2014 • Modified: 06.04.2017 : 19:44 all rigths reserved © 2017 teigeNs desigN
CONSOLIDATED STATEMENT OF FINANCIAL POSITION AT DECEMBER 31
NOK 1 000 Note 2016 2015
ASSETS
Non-current assetsIntangible assets 10 198 260 206 675Deferred tax asset 9 241 499 593 626Aircraft, parts and installations on leased aircraft 11 22 571 775 18 507 706Equipment and fixtures 11 88 361 79 508Buildings 11 283 236 285 674Derivative financial instruments 3, 20 114 476 - Financial assets available for sale 3, 20 82 689 82 689Investment in associate 25 609 110 328 127Prepayment to aircraft manufacturers 11 7 156 303 5 939 281Other receivables 13 623 606 501 811Total non-current assets 31 969 314 26 525 096
Current assetsInventory 14 102 465 104 141Trade and other receivables 13 3 013 978 2 550 716Derivative financial instruments 3, 20 353 246 - Cash and cash equivalents 24 2 323 647 2 454 160Total current assets 5 793 337 5 109 017Total assets 37 762 651 31 634 113
NOK 1 000 Note 2016 2015
EQUITY AND LIABILITIES
EquityShare capital 15 3 576 3 576Share premium 15 1 231 631 1 231 631Other paid-in equity 110 621 94 362Other reserves 773 112 876 192Retained earnings 1 919 266 759 550Shareholders' equity 4 038 205 2 965 312Non-controlling interest 10 770 - Total equity 4 048 975 2 965 312
Non-current liabilitiesPension obligation 18 107 379 134 516Provision for periodic maintenance 19 1 376 465 1 177 513Other long term liabilities 19 85 166 80 338Borrowings 22 18 706 062 16 543 405Derivative financial instruments 3, 20 27 939 - Total non-current liabilities 20 303 010 17 935 772
Short term liabilitiesShort term part of borrowings 22 4 768 813 3 041 388Trade and other payables 21 3 881 684 2 862 566Air traffic settlement liabilities 4 666 212 4 014 428Derivative financial instruments 3, 20 86 306 782 523Tax payable 9 7 650 32 123Total short term liabilities 13 410 666 10 733 029Total liabilities 33 713 676 28 668 801Total equity and liabilities 37 762 651 31 634 113
The notes on pages 27–59 are an integral part of these consolidated financial statements.
Fornebu, March 21, 2017
Bjørn H. Kise Liv Berstad Christian Fredrik Stray Chair Deputy chair Director
Ada Kjeseth Marcus Daniel Hall Linda OlsenDirector Director
(elected by the employees)Director
(elected by the employees)
Geir Olav Øien Bjørn KjosDirector
(elected by the employees)Chief Executive Officer
Help | Contents | Highlights | Letter from CEO | Board of Directors' report | Financial statements | CSR | Corporate governance | Board and management | Definitions | Contact | 24 / 99
NORWEGIAN ANNUAL REPORT 2016
Consolidated income statement 1.1 - 31.12Consolidated statement of comprehensive Income 1.1 - 31.12Consolidated statement of financial position at December 31Consolidated statement of changes in equity 1.1 – 31.12Consolidated cash flow statement 1.1 - 31.12Notes to the consolidated financial statementsNote 01: Summary of significant accounting policiesNote 02: Financial riskNote 03: Fair value estimationNote 04: Segment informationNote 05: Operating expensesNote 05A: Other operating expensesNote 06: Payroll expenses and number of employeesNote 07: Remuneration of the Board of Directors
and Executive managementNote 07A: Audit remunerationNote 08: Net financial itemsNote 09: TaxNote 10: Intangible assetsNote 11: Tangible assetsNote 12: Operating leasesNote 13: Trade and other receivablesNote 14: InventoriesNote 15: Equity and shareholder informationNote 16: Earnings per shareNote 17: OptionsNote 18: PensionsNote 19: Provisions and other long-term liabilitiesNote 20: Financial instrumentsNote 21: Trade and other payablesNote 22: BorrowingsNote 23: Assets pledged as collaterals and
guaranteesNote 24: Bank depositsNote 25: Investments in other entitiesNote 26: Related party transactionsNote 27: Contingencies and legal claimsNote 28: CommitmentsNote 29: Events after the reporting period INDEPENDENT AUDITOR’S REPORT
GROUP FINANCIAL STATEMENT
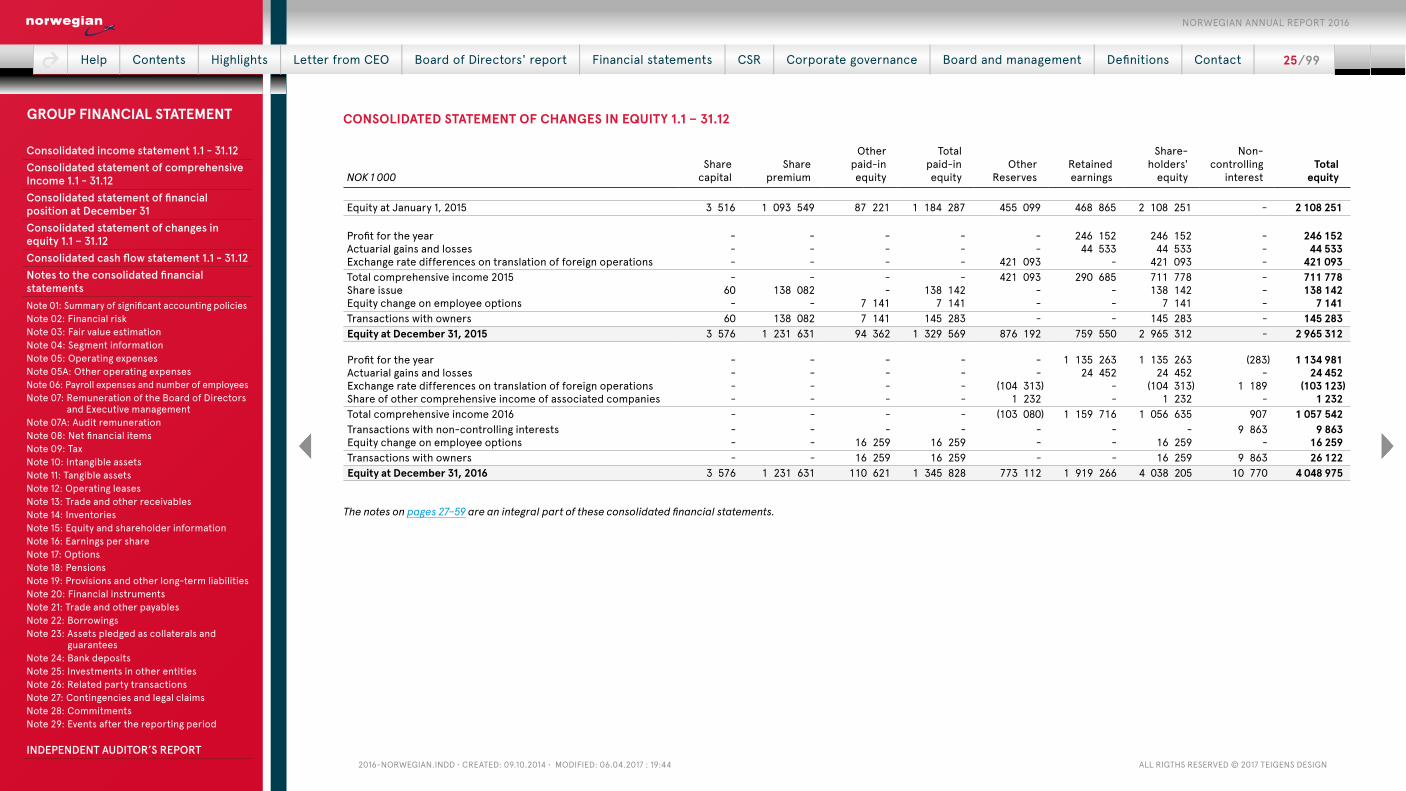
2016-NorwegiaN.iNdd • Created: 09.10.2014 • Modified: 06.04.2017 : 19:44 all rigths reserved © 2017 teigeNs desigN
CONSOLIDATED STATEMENT OF CHANGES IN EQUITY 1.1 – 31.12
NOK 1 000Share
capitalShare
premium
Other paid-inequity
Total paid-inequity
Other Reserves
Retainedearnings
Share-holders'
equity
Non- controlling
interestTotal
equity
Equity at January 1, 2015 3 516 1 093 549 87 221 1 184 287 455 099 468 865 2 108 251 - 2 108 251
Profit for the year - - - - - 246 152 246 152 - 246 152Actuarial gains and losses - - - - - 44 533 44 533 - 44 533Exchange rate differences on translation of foreign operations - - - - 421 093 - 421 093 - 421 093Total comprehensive income 2015 - - - - 421 093 290 685 711 778 - 711 778Share issue 60 138 082 - 138 142 - - 138 142 - 138 142Equity change on employee options - - 7 141 7 141 - - 7 141 - 7 141Transactions with owners 60 138 082 7 141 145 283 - - 145 283 - 145 283Equity at December 31, 2015 3 576 1 231 631 94 362 1 329 569 876 192 759 550 2 965 312 - 2 965 312
Profit for the year - - - - - 1 135 263 1 135 263 (283) 1 134 981Actuarial gains and losses - - - - - 24 452 24 452 - 24 452Exchange rate differences on translation of foreign operations - - - - (104 313) - (104 313) 1 189 (103 123)Share of other comprehensive income of associated companies - - - - 1 232 - 1 232 - 1 232Total comprehensive income 2016 - - - - (103 080) 1 159 716 1 056 635 907 1 057 542Transactions with non-controlling interests - - - - - - - 9 863 9 863 Equity change on employee options - - 16 259 16 259 - - 16 259 - 16 259Transactions with owners - - 16 259 16 259 - - 16 259 9 863 26 122Equity at December 31, 2016 3 576 1 231 631 110 621 1 345 828 773 112 1 919 266 4 038 205 10 770 4 048 975
The notes on pages 27–59 are an integral part of these consolidated financial statements.
Help | Contents | Highlights | Letter from CEO | Board of Directors' report | Financial statements | CSR | Corporate governance | Board and management | Definitions | Contact | 25 / 99
NORWEGIAN ANNUAL REPORT 2016
Consolidated income statement 1.1 - 31.12Consolidated statement of comprehensive Income 1.1 - 31.12Consolidated statement of financial position at December 31Consolidated statement of changes in equity 1.1 – 31.12Consolidated cash flow statement 1.1 - 31.12Notes to the consolidated financial statementsNote 01: Summary of significant accounting policiesNote 02: Financial riskNote 03: Fair value estimationNote 04: Segment informationNote 05: Operating expensesNote 05A: Other operating expensesNote 06: Payroll expenses and number of employeesNote 07: Remuneration of the Board of Directors
and Executive managementNote 07A: Audit remunerationNote 08: Net financial itemsNote 09: TaxNote 10: Intangible assetsNote 11: Tangible assetsNote 12: Operating leasesNote 13: Trade and other receivablesNote 14: InventoriesNote 15: Equity and shareholder informationNote 16: Earnings per shareNote 17: OptionsNote 18: PensionsNote 19: Provisions and other long-term liabilitiesNote 20: Financial instrumentsNote 21: Trade and other payablesNote 22: BorrowingsNote 23: Assets pledged as collaterals and
guaranteesNote 24: Bank depositsNote 25: Investments in other entitiesNote 26: Related party transactionsNote 27: Contingencies and legal claimsNote 28: CommitmentsNote 29: Events after the reporting period INDEPENDENT AUDITOR’S REPORT
GROUP FINANCIAL STATEMENT
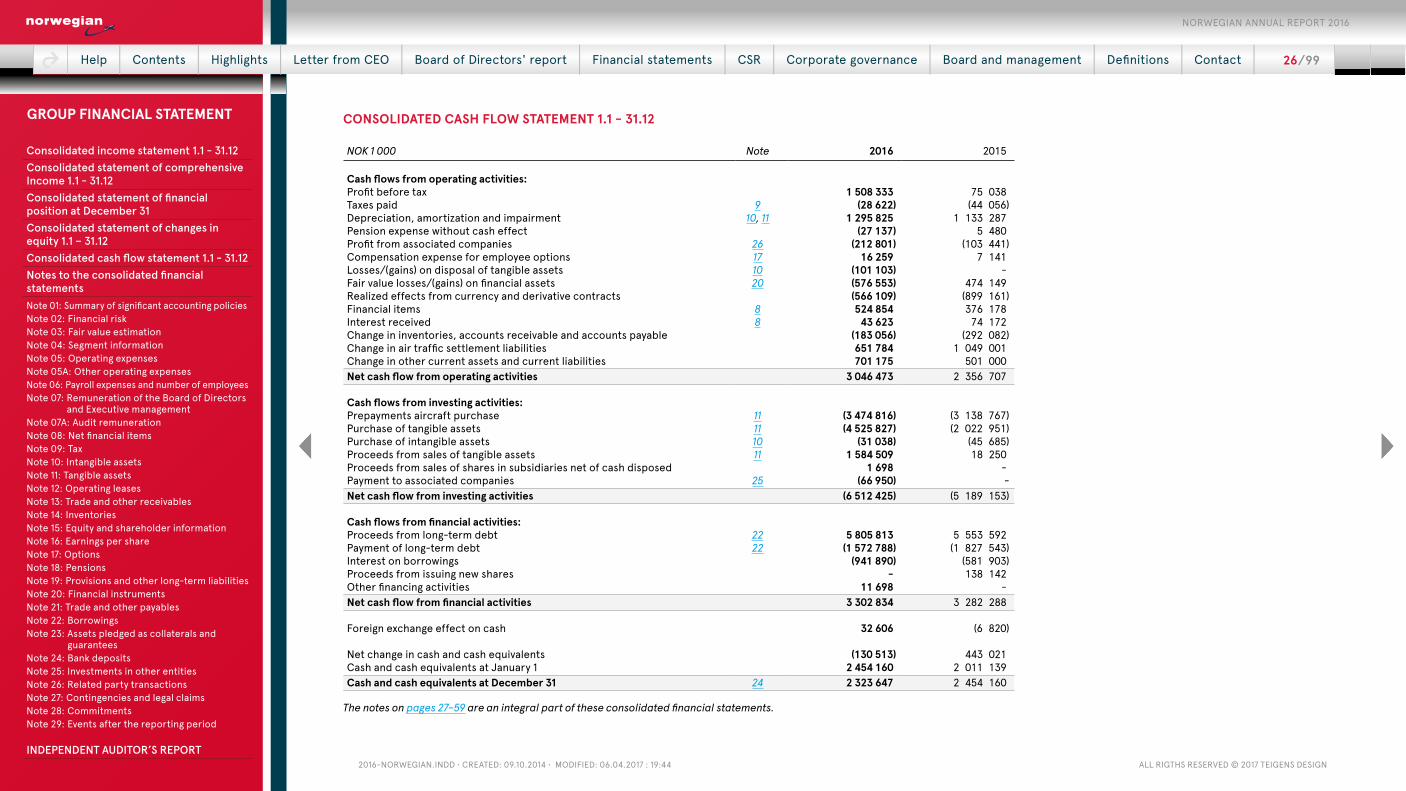
2016-NorwegiaN.iNdd • Created: 09.10.2014 • Modified: 06.04.2017 : 19:44 all rigths reserved © 2017 teigeNs desigN
CONSOLIDATED CASH FLOW STATEMENT 1.1 - 31.12
NOK 1 000 Note 2016 2015
Cash flows from operating activities:Profit before tax 1 508 333 75 038Taxes paid 9 (28 622) (44 056)Depreciation, amortization and impairment 10, 11 1 295 825 1 133 287Pension expense without cash effect (27 137) 5 480Profit from associated companies 26 (212 801) (103 441)Compensation expense for employee options 17 16 259 7 141Losses/(gains) on disposal of tangible assets 10 (101 103) - Fair value losses/(gains) on financial assets 20 (576 553) 474 149Realized effects from currency and derivative contracts (566 109) (899 161)Financial items 8 524 854 376 178Interest received 8 43 623 74 172Change in inventories, accounts receivable and accounts payable (183 056) (292 082)Change in air traffic settlement liabilities 651 784 1 049 001 Change in other current assets and current liabilities 701 175 501 000Net cash flow from operating activities 3 046 473 2 356 707
Cash flows from investing activities:Prepayments aircraft purchase 11 (3 474 816) (3 138 767)Purchase of tangible assets 11 (4 525 827) (2 022 951)Purchase of intangible assets 10 (31 038) (45 685)Proceeds from sales of tangible assets 11 1 584 509 18 250Proceeds from sales of shares in subsidiaries net of cash disposed 1 698 - Payment to associated companies 25 (66 950) - Net cash flow from investing activities (6 512 425) (5 189 153)
Cash flows from financial activities:Proceeds from long-term debt 22 5 805 813 5 553 592Payment of long-term debt 22 (1 572 788) (1 827 543)Interest on borrowings (941 890) (581 903)Proceeds from issuing new shares - 138 142Other financing activities 11 698 - Net cash flow from financial activities 3 302 834 3 282 288
Foreign exchange effect on cash 32 606 (6 820)
Net change in cash and cash equivalents (130 513) 443 021Cash and cash equivalents at January 1 2 454 160 2 011 139Cash and cash equivalents at December 31 24 2 323 647 2 454 160
The notes on pages 27–59 are an integral part of these consolidated financial statements.
Help | Contents | Highlights | Letter from CEO | Board of Directors' report | Financial statements | CSR | Corporate governance | Board and management | Definitions | Contact | 26 / 99
NORWEGIAN ANNUAL REPORT 2016
Consolidated income statement 1.1 - 31.12Consolidated statement of comprehensive Income 1.1 - 31.12Consolidated statement of financial position at December 31Consolidated statement of changes in equity 1.1 – 31.12Consolidated cash flow statement 1.1 - 31.12Notes to the consolidated financial statementsNote 01: Summary of significant accounting policiesNote 02: Financial riskNote 03: Fair value estimationNote 04: Segment informationNote 05: Operating expensesNote 05A: Other operating expensesNote 06: Payroll expenses and number of employeesNote 07: Remuneration of the Board of Directors
and Executive managementNote 07A: Audit remunerationNote 08: Net financial itemsNote 09: TaxNote 10: Intangible assetsNote 11: Tangible assetsNote 12: Operating leasesNote 13: Trade and other receivablesNote 14: InventoriesNote 15: Equity and shareholder informationNote 16: Earnings per shareNote 17: OptionsNote 18: PensionsNote 19: Provisions and other long-term liabilitiesNote 20: Financial instrumentsNote 21: Trade and other payablesNote 22: BorrowingsNote 23: Assets pledged as collaterals and
guaranteesNote 24: Bank depositsNote 25: Investments in other entitiesNote 26: Related party transactionsNote 27: Contingencies and legal claimsNote 28: CommitmentsNote 29: Events after the reporting period INDEPENDENT AUDITOR’S REPORT
GROUP FINANCIAL STATEMENT
2016-NorwegiaN.iNdd • Created: 09.10.2014 • Modified: 06.04.2017 : 19:44 all rigths reserved © 2017 teigeNs desigN
NOTES TO THE CONSOLIDATED FINANCIAL STATEMENTS
NOTE 01: SUMMARY OF SIGNIFICANT ACCOUNTING POLICIES
1.1 General informationNorwegian Air Shuttle ASA and its subsidiar-ies (henceforth referred to as ‘the Group’) are a low-cost airline incorporated in Norway and headquartered at Fornebu outside of Oslo. Norwegian Air Shuttle ASA is a public limited liability company and listed on the Oslo Stock Exchange.
The cosolidated financial statements of Nor-wegian Air Shuttle ASA for the year ended De-cember 31, 2016 were authorized for issue by the Board of Directors on March 21, 2017. The annual shareholders meeting, to be held May 9, 2017, have the power to amend and reissue the financial statements.
1.2 Basis of preparationThe consolidated financial statements of Nor-wegian Air Shuttle ASA have been prepared in accordance with the International Financial Reporting Standards (IFRS) and IFRIC inter-pretations, as adopted by the EU. The consoli-dated financial statements have been prepared under the historical cost convention, as mod-ified by the revaluation of available-for-sale fi-nancial assets, financial assets and financial lia-bilities (including derivative instruments) at fair value through profit or loss.
In order to prepare financial statements in conformity with IFRS, it is necessary to apply certain critical accounting estimates. It also requires the Management to exercise its judg-ment when applying the Group’s accounting policies. The areas involving a greater degree of judgment or complexity, or areas where as-sumptions and estimates are significant to the consolidated financial statements are dis-closed below. See paragraph 1.23.
The Group is in a strong financial position and there are no indications that the Group is in breach of the going concern convention. The
Group continues to adopt the going concern convention in preparing its consolidated finan-cial statements.
1.2.1 Changes in accounting policies and disclosuresStandards, amendments and interpretations that are adoptedThe Group has applied the following standards and amendments for the first time for their an-nual reporting period commencing January 1, 2016:
● Accounting for acquisitions of interests in joint operations – Amendments to IFRS 11;
● Clarification of acceptable methods of de-preciation and amortization – Amendments to IAS 16 and IAS 38;
● Annual improvements to IFRSs 2012 – 2014 cycle, and;
● Disclosure initiative – amendments to IAS 1.
The adoption of these amendments did not have any impact on the current period or any prior period and is not likely to affect future periods.
New standards, amendments and interpreta-tions not yet adoptedCertain new accounting standards and inter-pretations have been published that are not mandatory for December 31, 2016 reporting periods and have not been early adopted by the Group. The Group’s assessment of the im-pact of these new standards and interpreta-tions is set out below.
● IFRS 9, Financial instrumentsIFRS 9 addresses the classification, measure-ment and derecognition of financial assets and financial liabilities, and introduces new
rules for hedge accounting and a new impair-ment model for financial assets. IFRS 9 estab-lishes three primary measurement categories for financial assets: amortized cost, fair value through OCI and fair value through P&L. While the Group has yet to undertake a detailed as-sessment of the classification and measure-ment of financial assets, we do not, however, expect the new guidance to have a significant impact on the classification and measurements of financial assets.
There will be no impact on the Group’s ac-counting for financial liabilities, as the new re-quirements only affect the accounting for fi-nancial liabilities that are designated at fair value through profit or loss, and the Group does not have any such liabilities. The derecog-nition rules have been transferred from IAS 39 Financial Instruments: Recognition and Mea-surement and have not been changed.
The new hedge accounting rules will align the accounting for hedging instruments more closely with the Group’s risk management practices. As a general rule, more hedge rela-tionships might be eligible for hedge account-ing, as the standard introduces a more prin-ciples-based approach. Currently, the Group does not use hedge accounting. While the Group is yet to undertake a detailed assess-ment, the new standard could result in the use of hedge accounting for derivatives.
The new impairment model requires the recognition of impairment provisions based on expected credit losses (ECL) rather than only incurred credit losses as is the case under IAS 39. It applies to financial assets classified at amortized cost, debt instruments measured at FVOCI, contract assets under IFRS 15 Revenue from Contracts with Customers, lease receiv-ables, loan commitments, and certain financial guarantee contracts. While the Group has not
yet undertaken a detailed assessment of how its impairment provisions would be affected by the new model, it may result in an earlier rec-ognition of credit losses.
The new standard also introduces ex-panded disclosure requirements and changes in presentation. These are expected to change the nature and extent of the Group’s disclosures about its financial instruments particularly in the year of the adoption of the new standard.
The standard is effective for accounting pe-riods beginning on or after January 1, 2018. The Group does not intend to adopt IFRS 9 before its mandatory date.
● IFRS 15, Revenue from contracts with customers:
IFRS 15 deals with revenue recognition and establishes principles for reporting useful information to users of financial statements about the nature, amount, timing and uncer-tainty of revenue and cash flows arising from an entity’s contracts with customers. Reve-nue is recognized when a customer obtains control of a good or service and thus has the ability to direct the use and benefit from the good or service. The standard replaces IAS 18, Revenue and IAS 11, Construction contracts and related interpretations. The standard is effective for annual periods beginning on or after January 1, 2018 and earlier application is permitted.
The Group is currently evaluating the finan-cial and operational impact of adopting IFRS 15, Revenue from Contracts with Customers. The review of the impact of IFRS 15 will require an assessment of all revenue streams, and the impact of adopting the standard cannot be re-liably estimated until this work is substantially complete.
Help | Contents | Highlights | Letter from CEO | Board of Directors' report | Financial statements | CSR | Corporate governance | Board and management | Definitions | Contact | 27 / 99
NORWEGIAN ANNUAL REPORT 2016
Consolidated income statement 1.1 - 31.12Consolidated statement of comprehensive Income 1.1 - 31.12Consolidated statement of financial position at December 31Consolidated statement of changes in equity 1.1 – 31.12Consolidated cash flow statement 1.1 - 31.12Notes to the consolidated financial statementsNote 01: Summary of significant accounting policiesNote 02: Financial riskNote 03: Fair value estimationNote 04: Segment informationNote 05: Operating expensesNote 05A: Other operating expensesNote 06: Payroll expenses and number of employeesNote 07: Remuneration of the Board of Directors
and Executive managementNote 07A: Audit remunerationNote 08: Net financial itemsNote 09: TaxNote 10: Intangible assetsNote 11: Tangible assetsNote 12: Operating leasesNote 13: Trade and other receivablesNote 14: InventoriesNote 15: Equity and shareholder informationNote 16: Earnings per shareNote 17: OptionsNote 18: PensionsNote 19: Provisions and other long-term liabilitiesNote 20: Financial instrumentsNote 21: Trade and other payablesNote 22: BorrowingsNote 23: Assets pledged as collaterals and
guaranteesNote 24: Bank depositsNote 25: Investments in other entitiesNote 26: Related party transactionsNote 27: Contingencies and legal claimsNote 28: CommitmentsNote 29: Events after the reporting period INDEPENDENT AUDITOR’S REPORT
GROUP FINANCIAL STATEMENT

2016-NorwegiaN.iNdd • Created: 09.10.2014 • Modified: 06.04.2017 : 19:44 all rigths reserved © 2017 teigeNs desigN
● IFRS 16, Leases IFRS 16 replaces the current standards IAS 17, Leases, whereas IFRS 16 eliminates the classifi-cation of leases as either operating leases or fi-nance leases for a lessee. Instead, all leases are treated in a similar way to finance leases apply-ing IAS 17. Under IFRS 16 leases are capitalized by recognizing the present value of the lease payments and showing them either as lease as-sets (right-of-use assets) or together with prop-erty, plant and equipment. If lease payments are made over time, a company also recognizes a financial liability representing its obligation to make future lease payments. IFRS 16 replaces the straight-line operating lease expense for those leases applying IAS 17 with a depreciation charge for the lease asset (included within oper-ating costs) and an interest expense on the lease liability (included within finance costs). As the Group is lessee in a large number of leases be-ing classified as operational leases under IAS 17, one expects a major increase in balance sheet totals and also material reclassifications be-tween line items of the income statement. The Group is currently evaluating the financial and operational impact of adopting IFRS 16, Leases. The review of the impact of IFRS 16 will require an assessment of all leases, and the impact of adopting the standard cannot be reliably esti-mated until this work is substantially complete.
The standard is effective for accounting pe-riods beginning on or after January 1, 2019. The standard has not yet been approved by the EU. At this stage, the Group does not intend to adopt IFRS 16 before its mandatory date.
Further information on leases today clas-sified as operational leases are presented in Note 12.
There are no other IFRSs or IFRIC interpre-tations that are not yet effective that would be expected to have a material impact on the Group.
1.3 Basis of consolidation and equity accounting1.3.1. SubsidiariesSubsidiaries are all entities (including struc-tured entities) over which the Group has con-
trol. The Group controls an entity when the Group is exposed to, or has rights to, vari-able returns from its involvement with the en-tity and has the ability to affect those returns through its power to direct the activities of the entity. Subsidiaries are fully consolidated from the date on which control is transferred to the Group.
The Group’s consolidated financial state-ments comprise Norwegian Air Shuttle ASA, and its subsidiaries, presented in Note 23 in the parent company financial statements. Ad-ditionally, the Group has consolidated Special Purpose Vehicles (SPVs) according to IFRS 10. The SPVs are solely established for aircraft fi-nancing purposes. The Group does not own the shares in those SPVs nor does it have control over the Management of those SPVs, but the Group has accepted all risks and rewards re-lated to the assets, liabilities and operations of the SPVs.
The financial statements of the subsidiaries and SPVs are prepared for the same reporting period as the parent company, using consis-tent accounting policies.
The acquisition method is applied when ac-counting for business combinations. Compa-nies acquired or sold during the year are in-cluded in the consolidated financial statements from the date when control was achieved until the date when control ceased.
The consideration that is transferred for the acquisition of a subsidiary consists of the fair values of the assets transferred, the lia-bilities incurred to the former owners of the acquiree, and the equity interests issued by the Group. The transferred consideration in-cludes the fair value of any asset or liability resulting from a contingent consideration ar-rangement. Acquisition-related costs are ex-pensed as incurred. Acquired identifiable as-sets, liabilities and contingent liabilities as-sumed in a business combination are initially measured at their fair values at the acquisition date. On an acquisition-by-acquisition basis, the Group recognizes any non-controlling in-terests of the acquiree either at fair value, or at the non-controlling interest’s proportionate
share of the acquiree’s identifiable net assets. The excess of the consideration transferred and the amount of the non-controlling interest over the fair value of the Group’s share of the identifiable net assets acquired are recorded as goodwill. If, in the case of a bargain pur-chase, the total of consideration transferred, non-controlling interest recognized and pre-viously held interest measured is less than the fair value of the net assets of the subsidiary ac-quired, the difference is recognized directly in the income statement.
All intra-Group balances, transactions and unrealized gains and losses on transactions be-tween Group companies are eliminated.
1.3.2 AssociatesAssociates are all entities over which the Group has significant influence but not con-trol or joint control. This is generally the case where the Group holds between 20% and 50% of the voting rights. Investments in associates are accounted for using the equity method of accounting (see 1.3.4 below), after initially be-ing recognized at cost.
1.3.3 Joint arrangementsUnder IFRS 11 Joint Arrangements investments in joint arrangements are classified as either joint operations or joint ventures. The classifi-cation depends on the contractual rights and obligations of each investor, rather than the legal structure of the joint arrangement. The Group only has investments in joint ventures. Interests in joint ventures are accounted for using the equity method (see 1.3.4 below), after initially being recognized at cost in the consoli-dated balance sheet.
1.3.4 Equity methodThe consolidated financial statements include the Group’s share of the profits/losses from associates and joint ventures, accounted for using the equity method, from the date when a significant influence is achieved until the date when such influence ceases. The Group’s share of its associates’ post- acquisition profits or losses is recognized in the income statement,
and its share of post-acquisition movements in other comprehensive income is recognized in other comprehensive income. The cumula-tive post-acquisition movements are adjusted against the carrying amount of the investment.
When the Group’s share of a loss exceeds the Group’s investment in an investee, the amount carried in the Group’s statement of fi-nancial position is reduced to zero and further losses are not recognized unless the Group has an obligation to cover any such losses. Unreal-ized gains on transactions between the Group and its associates and joint ventures are elim-inated to extend of the Group’s interest in these entities. Unrealized losses are also elimi-nated unless the transaction provides evidence of an impairment of the asset transferred.
1.3.5 Changes in ownershipThe Group considers transactions with non-controlling interests that do not result in loss of control, as transactions with equity owners of the Group. Any difference between considerations paid and the relevant share ac-quired from the carrying value of net assets are recorded in equity. Gains or losses on dis-posals to non-controlling interests are also re-corded in equity.
When the Group ceases to consolidate or equity account for an investment because of loss of control, joint control or significant in-fluence, any retained interest in the entity is remeasured to its fair value with the change in carrying amount recognized in profit or loss. The fair value becomes the initial carry-ing amount for purposes of subsequently ac-counting for the retained interest as an asso-ciate, joint venture or financial asset. In addi-tion, any amounts any retained interest in the entity is remeasured to its fair value at the date when control ceased, with the change in carry-ing amount recognized in profit or loss. The fair value is the initial carrying amount for the pur-poses of subsequently accounting for the re-tained interest as an associate, joint venture or financial asset. In addition, any amounts previ-ously recognized in other comprehensive in-come in respect of that entity are accounted
Help | Contents | Highlights | Letter from CEO | Board of Directors' report | Financial statements | CSR | Corporate governance | Board and management | Definitions | Contact | 28 / 99
NORWEGIAN ANNUAL REPORT 2016
Consolidated income statement 1.1 - 31.12Consolidated statement of comprehensive Income 1.1 - 31.12Consolidated statement of financial position at December 31Consolidated statement of changes in equity 1.1 – 31.12Consolidated cash flow statement 1.1 - 31.12Notes to the consolidated financial statementsNote 01: Summary of significant accounting policiesNote 02: Financial riskNote 03: Fair value estimationNote 04: Segment informationNote 05: Operating expensesNote 05A: Other operating expensesNote 06: Payroll expenses and number of employeesNote 07: Remuneration of the Board of Directors
and Executive managementNote 07A: Audit remunerationNote 08: Net financial itemsNote 09: TaxNote 10: Intangible assetsNote 11: Tangible assetsNote 12: Operating leasesNote 13: Trade and other receivablesNote 14: InventoriesNote 15: Equity and shareholder informationNote 16: Earnings per shareNote 17: OptionsNote 18: PensionsNote 19: Provisions and other long-term liabilitiesNote 20: Financial instrumentsNote 21: Trade and other payablesNote 22: BorrowingsNote 23: Assets pledged as collaterals and
guaranteesNote 24: Bank depositsNote 25: Investments in other entitiesNote 26: Related party transactionsNote 27: Contingencies and legal claimsNote 28: CommitmentsNote 29: Events after the reporting period INDEPENDENT AUDITOR’S REPORT
GROUP FINANCIAL STATEMENT

2016-NorwegiaN.iNdd • Created: 09.10.2014 • Modified: 06.04.2017 : 19:44 all rigths reserved © 2017 teigeNs desigN
for as if the Group had directly disposed of the related assets or liabilities. This may mean that amounts previously recognized in other com-prehensive income are reclassified to profit or loss.
If the ownership interest in a joint venture or an associate is reduced but joint control or significant influence is retained, only a propor-tionate share of the amounts previously recog-nized in other comprehensive income are re-classified to profit or loss where appropriate. Dilution gains and losses arising from invest-ments in associates are recognized in the in-come statement.
1.3.6 Other investmentsAll other investments are recognized in accor-dance with IAS 39, Financial Instruments: Rec-ognition and Measurement, and additional in-formation are provided in Note 20.
1.4 Foreign currency translationThe Group’s presentation currency is Nor-wegian Krone (NOK). Norwegian Air Shuttle ASA’s functional currency is NOK. Each en-tity of the Group determines its own func-tional currency and items that are included in the entities’ financial statements are mea-sured in that functional currency. For consoli-dation purposes, the results and financial po-sition of all the Group’s entities that have a functional currency other than NOK are trans-lated to the closing rate at the reporting date of each month. Income and expenses for each income statement are translated to the aver-age exchange rate for the period, this being a reasonable approximation for estimating ac-tual rate. Exchange differences are recognized in comprehensive income and specified sepa-rately in equity.
Transactions in foreign currencies are ini-tially recorded at the functional currency rate using the exchange rates prevailing on the dates of the transactions or valuation where items are re-estimated. Monetary assets and liabilities denominated in foreign currencies are translated to the functional currency ex-change rate of the reporting date. Any dif-
ferences are recognized in the income state-ment. Non-monetary items that are measured in terms of historical cost in a foreign currency are translated using the exchange rates of the dates of the initial transactions.
Foreign currency gains and losses on oper-ating activities are recognized within operat-ing profit. Foreign currency gains and losses on financing activities are recognized within net financial items.
Goodwill and fair value adjustments aris-ing on the acquisition of a foreign entity are treated as assets and liabilities of the for-eign entity and translated at the closing rate. Any differences in exchange are recognized in other comprehensive income.
1.5 Tangible assetsTangible assets including buildings are carried at historical cost, less accumulated depreci-ation and impairment losses. When assets are sold or disposed of, the gross carrying amount and accumulated depreciation and impairment losses are derecognized. Any gain on the sale is recognized in the income statement as other income and any loss on the sale or disposal is recognized in the income statement as other losses/ (gains)-net.
The gross carrying amount of non-current assets is the purchase price, including duties/taxes and direct acquisition costs relating to making the non-current asset ready for its in-tended use. Subsequent costs, such as repair and maintenance costs, are normally recog-nized in profit or loss as incurred. When in-creased future economic benefits are the re-sult of verified repair and maintenance work, these costs will be recognized in the statement of financial position as additions to non-cur-rent assets. Borrowing costs are capitalized on qualifying assets.
Non-current assets are depreciated on a straight-line basis or by airborne hours and cy-cles over the estimated useful life of the asset beginning when the asset is ready for its in-tended use. Residual values, where applicable, are reviewed annually against prevailing mar-ket rates at the reporting date for equivalently
aged assets and depreciation rates adjusted accordingly on a prospective basis. The carry-ing value is reviewed for impairment if events or changes in circumstances indicate that the carrying value may not be recoverable.
An aircraft is recognized as two compo-nents for depreciation purposes in order to consider different useful lives of the aircraft components. The first aircraft component is defined as maintenance components. In accor-dance with official requirements, the aircraft must be maintained which means significant components must be changed after a specific number of take-offs or airborne hours. These components are identified as two heavy main-tenance checks of the aircraft body, power restoration and life limited parts for the two engines on each aircraft, as well as mainte-nance on landing gears and APU. The mainte-nance and overhauls of these components oc-cur on a defined interval, and the value is de-preciated based on the number of take-offs or airborne hours until the next maintenance is conducted. Completed maintenance and over-haul are capitalized and depreciated until the next relevant maintenance and overhauls. The second aircraft component is defined as the remainder of the aircraft and depreciated over the estimated useful life.
Investments in leased aircraft including cabin interior modifications are depreciated over their useful lives, but not exceeding the remaining leasing period.
Rotable spare parts are carried as non-cur-rent assets and depreciated over their useful lives.
The Group capitalizes prepayments on the purchase contracts of aircraft. The prepay-ments are classified as tangible assets as pre-sented at the face of the statement of financial position. The prepayments include capitalized borrowing costs. On the delivery of the air-craft, the prepayments are included in the ac-quisition costs of the aircraft and reclassified as aircraft in the statement of financial posi-tion.
Financial lease assets are initially recognized at the lower of acquisition cost or future min-
imum lease payments. The assets are carried as non-current assets and depreciated on a straight-line basis over their expected useful lives.
The depreciation period and method are assessed annually to ensure that they reconcile with the substance of the non-current asset. Additional details on tangible assets are out-lined in Note 11.
1.6 Intangible assets1.6.1 Computer softwareAcquired computer software licenses are cap-italized on the basis of the costs incurred to obtain and apply the specific software. These costs are amortized over their estimated use-ful lives.
Costs associated with developing or main-taining computer software programs are rec-ognized as an expense as incurred. Costs which are directly associated with the devel-opment of identifiable software products con-trolled by the Group, and which are estimated to generate economic benefits, are recognized as intangible assets. The costs of computer software developments recognized as assets are amortized over their estimated useful lives. The depreciation of the software commences as each module is completed.
1.6.2 Goodwill and other intangible assetsGoodwill represents the excess of the cost of an acquisition over the fair value of the Group’s share of the net identifiable assets of the ac-quired subsidiary at the date of acquisition. Goodwill is tested annually for impairment and carried at cost less accumulated impairment losses. Gains and losses on the disposal of an entity include the carrying amount of goodwill relating to the entity sold.
Other intangible assets are related to iden-tifiable assets from business combinations and investments in other intangible assets.
Intangible assets which are determined as having indefinite useful lives, are not amor-tized, but subject to annual impairment test-ing. The determination of indefinite useful lives is based on assessment by management as to
Help | Contents | Highlights | Letter from CEO | Board of Directors' report | Financial statements | CSR | Corporate governance | Board and management | Definitions | Contact | 29 / 99
NORWEGIAN ANNUAL REPORT 2016
Consolidated income statement 1.1 - 31.12Consolidated statement of comprehensive Income 1.1 - 31.12Consolidated statement of financial position at December 31Consolidated statement of changes in equity 1.1 – 31.12Consolidated cash flow statement 1.1 - 31.12Notes to the consolidated financial statementsNote 01: Summary of significant accounting policiesNote 02: Financial riskNote 03: Fair value estimationNote 04: Segment informationNote 05: Operating expensesNote 05A: Other operating expensesNote 06: Payroll expenses and number of employeesNote 07: Remuneration of the Board of Directors
and Executive managementNote 07A: Audit remunerationNote 08: Net financial itemsNote 09: TaxNote 10: Intangible assetsNote 11: Tangible assetsNote 12: Operating leasesNote 13: Trade and other receivablesNote 14: InventoriesNote 15: Equity and shareholder informationNote 16: Earnings per shareNote 17: OptionsNote 18: PensionsNote 19: Provisions and other long-term liabilitiesNote 20: Financial instrumentsNote 21: Trade and other payablesNote 22: BorrowingsNote 23: Assets pledged as collaterals and
guaranteesNote 24: Bank depositsNote 25: Investments in other entitiesNote 26: Related party transactionsNote 27: Contingencies and legal claimsNote 28: CommitmentsNote 29: Events after the reporting period INDEPENDENT AUDITOR’S REPORT
GROUP FINANCIAL STATEMENT
2016-NorwegiaN.iNdd • Created: 09.10.2014 • Modified: 06.04.2017 : 19:44 all rigths reserved © 2017 teigeNs desigN
whether there is any foreseeable limit to the period over which the asset is expected to generate net cash inflows for the entity.
See Note 1.7 for details of impairment testing of non-financial assets and Note 10 for addi-tional details on intangible assets.
1.7 Impairment of non-financial assetsIntangible assets with indefinite useful lives are not subject to amortization, and are tested an-nually for impairment. Assets that are subject to amortization are reviewed for impairment whenever events or changes in circumstances indicate that the carrying amount may not be recoverable. An impairment loss is recognized for the amount by which the asset’s carrying amount exceeds its recoverable amount. The recoverable amount is the higher of an asset’s fair value less costs to sell and value in use.
For the purposes of impairment testing, as-sets are grouped at the lowest levels of sep-arately identifiable cash flows (cash-gener-ating units). The allocation is made to those cash-generating units that are expected to benefit from the assets. The Management has assessed the Group as one segment and the Group’s total operations as its cash generat-ing unit. The determination of cash generating units is based on how the Management oper-ates and assesses the Group’s performance, profit and cash flow. The aircraft fleet is oper-ated as one unit, and the route portfolio is ad-ministered and diversified as one unit gener-ating the Group's profit and cash flow, hence goodwill and other non-current assets are re-allocated to the entire Group for the purpose of impairment testing.
Non-current assets other than goodwill that have suffered impairment are reviewed for a possible reversal of the impairment at each re-porting date. Impairment losses on goodwill are not reversed.
1.8 Financial assetsFinancial assets are classified according to the following categories: as fair value through profit or loss, held-to-maturity investments, loans and receivables, and available-for-sale.
The Group holds financial instruments that are classified as fair value through profit or loss, available-for-sale, and loans and receivables. The classification depends on the purpose for which the financial assets were acquired. The Management determines the classification of its financial assets at initial recognition.
Financial assets that are categorized as fair value through profit or loss are financial assets held for trading. A financial asset is classified as in this category if it was principally acquired for the purpose of selling on a short-term ba-sis. Derivatives are also categorized as held for trading unless they are designated as hedges. Assets in this category are classified as current assets.
Loans and receivables are non-derivative financial assets with fixed or determinable pay-ments that are not quoted in an active market. They are included in current assets, except for maturities greater than 12 months after the re-porting date. These are classified as non-cur-rent assets. The Group’s loans and receivables comprise trade and other payables/receiv-ables, and cash and cash equivalents in the statement of financial position (See Note 1.11 and 1.12 respectively).
Available-for-sale financial assets are non-derivatives that are either designated in this category or not classified as being in any of the other categories. They are included in non-current assets unless the Management in-tends to dispose of the investments within 12 months of the reporting date.
Regular purchases and sales of financial as-sets are recognized on the trade date; the date which the Group commits to purchase or sell the asset. Investments are initially recognized at fair value plus transaction costs for all fi-nancial assets not carried at fair value through profit or loss. Financial assets carried at fair value through profit or loss, are initially rec-ognized at fair value and transaction costs are expensed in the income statement. Financial assets are derecognized when the rights to re-ceive cash flows from the investments have ex-pired or have been transferred and the Group has substantially transferred all risks and re-
wards of ownership. Available-for-sale finan-cial assets and financial assets at fair value through profit or loss are subsequently carried at fair value. Loans and receivables are carried at amortized cost using the effective interest method.
Gains or losses arising from changes in the fair value of the financial assets at fair value through profit or loss- category are presented in the income statement within other losses/ (gains) – net of the period in which they oc-cur. Gains or losses that occur from changes in the fair value of the available-for-sale cate-gory are presented in equity within other com-prehensive income in the period in which they occur. Interest on available-for-sale securities which is calculated using the effective interest method, is recognized in the income statement as part of other income. Dividend income from financial assets at fair value through profit or loss and available-for-sale financial assets are recognized in the income statement as a part of other income when the Group’s right to re-ceive payments is established.
Financial assets and liabilities are offset and the net amount reported in the balance sheet when there is a legally enforceable right to off-set the recognized amounts and there is an in-tention to settle on a net basis or realize the asset and settle the liability simultaneously. The legally enforceable right must not be con-tingent on future events and must be enforce-able in the normal course of business and in the event of default, insolvency or bankruptcy of the company or the counterparty.
1.8.1 Impairment of financial assetsThe Group assesses at each reporting date whether there is objective evidence that a fi-nancial asset or a group of financial assets is impaired. The fair values of quoted invest-ments are based on current mid prices at the reporting date. If the market for a financial as-set is not active (and for unlisted securities), the Group establishes fair value by using valu-ation techniques. The valuation hierarchy for financial assets is detailed in Note 3 where the techniques are making maximum use of market
inputs and relying as little as possible on enti-ty-specific inputs.
Impairment losses of financial assets mea-sured at amortized cost are incurred only if there is objective evidence of impairment as a result of one or more events that occur after initial recognition. Impairment losses are rec-ognized in the consolidated income statement if the losses have had an impact on the esti-mated future cash flows and that the impact can be reliably estimated.
For the loans and receivables category, the amount of the loss is measured as the differ-ence between the asset’s carrying amount and the present value of estimated future cash flows (excluding future credit losses that have not been incurred) discounted at the financial asset’s original effective interest rate.
Impairment losses of available-for-sale fi-nancial assets are incurred if there is objective evidence that a financial asset or a group of fi-nancial assets is impaired. For debt securities, if any such evidence exists the cumulative loss – measured as the difference between the ac-quisition cost and the current fair value, less any impairment loss on that financial asset pre-viously recognized in profit or loss – is removed from equity and recognized in profit or loss. If, in a subsequent period, the fair value of a debt instrument classified as available for sale in-creases and the increase can be objectively related to an event occurring after the impair-ment loss was recognized in profit or loss, the impairment loss is reversed through the con-solidated income statement.
For equity investments, a significant or pro-longed decline in the fair value of the security below its cost is also evidence that the assets are impaired. If any such evidence exists the cumulative loss – measured as the difference between the acquisition cost and the current fair value, less any impairment loss on that fi-nancial asset previously recognized in profit or loss – is removed from equity and recognized in profit or loss. Impairment losses recognized in the consolidated income statement on eq-uity instruments are not reversed through the consolidated income statement.
Help | Contents | Highlights | Letter from CEO | Board of Directors' report | Financial statements | CSR | Corporate governance | Board and management | Definitions | Contact | 30 / 99
NORWEGIAN ANNUAL REPORT 2016
Consolidated income statement 1.1 - 31.12Consolidated statement of comprehensive Income 1.1 - 31.12Consolidated statement of financial position at December 31Consolidated statement of changes in equity 1.1 – 31.12Consolidated cash flow statement 1.1 - 31.12Notes to the consolidated financial statementsNote 01: Summary of significant accounting policiesNote 02: Financial riskNote 03: Fair value estimationNote 04: Segment informationNote 05: Operating expensesNote 05A: Other operating expensesNote 06: Payroll expenses and number of employeesNote 07: Remuneration of the Board of Directors
and Executive managementNote 07A: Audit remunerationNote 08: Net financial itemsNote 09: TaxNote 10: Intangible assetsNote 11: Tangible assetsNote 12: Operating leasesNote 13: Trade and other receivablesNote 14: InventoriesNote 15: Equity and shareholder informationNote 16: Earnings per shareNote 17: OptionsNote 18: PensionsNote 19: Provisions and other long-term liabilitiesNote 20: Financial instrumentsNote 21: Trade and other payablesNote 22: BorrowingsNote 23: Assets pledged as collaterals and
guaranteesNote 24: Bank depositsNote 25: Investments in other entitiesNote 26: Related party transactionsNote 27: Contingencies and legal claimsNote 28: CommitmentsNote 29: Events after the reporting period INDEPENDENT AUDITOR’S REPORT
GROUP FINANCIAL STATEMENT
2016-NorwegiaN.iNdd • Created: 09.10.2014 • Modified: 06.04.2017 : 19:44 all rigths reserved © 2017 teigeNs desigN
1.9 Derivative financial instruments and hedging activitiesDerivatives are initially recognized at fair value on the transaction date and subsequently measured at their fair value. Derivatives are classified within the category ‘financial assets at fair value through profit or loss’ as long as the derivatives are not designated as hedging instruments for accounting purposes.
The Group has not designated any deriva-tives as hedging instruments for accounting purposes in 2016 or 2015.
1.10 InventoryInventory of spare parts are carried at the lower of acquisition cost and net realizable value. Cost is determined using the first in – first out (FIFO) method. Obsolete inventory has been fully rec-ognized as impairment losses. Inventory is con-sumed during maintenance and overhaul of the aircraft, and is expensed when consumed.
1.11 Trade receivablesTrade receivables are amounts due from cus-tomers for services performed and goods sold in the ordinary course of business. If collection is expected in one year or less, they are clas-sified as current assets. If not, they are pre-sented as non-current assets. Trade receiv-ables are recognized initially at fair value and subsequently measured at amortized cost us-ing the effective interest method, less provi-sion for impairment.
Receivables from credit card companies are classified as trade receivables in the statement of financial position.
1.12 Cash and cash equivalentsCash and cash equivalents include cash in hand and in the bank, as well as short-term depos-its with an original maturity of three months or less. Cash and cash equivalents in the state-ment of financial position include restricted funds from withheld employee tax, guarantees and deposits pledged as collateral to suppliers (Note 24).
The Group holds investments in money mar-ket funds. These investments are classified
as either cash equivalents or financial assets available-for-sale depending on the maturity of the investments.
1.13 Equity Share capital comprises the number of shares multiplied by their nominal value, and are clas-sified as equity.
Transaction costs directly attributable to an equity transaction are recognized directly in equity net of tax.
Acquisitions of own shares are recognized in share capital and retained earnings. The number of shares purchased multiplied by the nominal value is deducted from outstanding share capital. The share premium paid is rec-ognized in other equity. The sale of own shares is booked accordingly, with nominal value as increase of share capital, and share premium in other equity.
1.14 LiabilitiesBorrowings are recognized initially at fair value, net of transaction costs incurred. Borrow-ings are subsequently measured at amortized cost; difference between the proceeds (net of transaction costs) and the redemption value is recognized in the income statement over the period of the borrowings using the effective interest method.
Borrowings are classified as current liabil-ities unless the Group has an unconditional right to defer settlement of the liability for at least 12 months after the reporting date.
Trade payables are obligations to pay for goods or services purchased from suppliers in accordance with general course of business. Accounts payables are classified as current li-abilities if payment is due within the next 12 months. Payables due after the next 12 months are classified as non-current liabilities. Trade payables are recognized initially at fair value and subsequently measured at amortized cost using the effective interest method.
1.15 ProvisionsProvisions are recognized when the Group has a present obligation (legal or constructive) as
a result of a past event, it is probable that an outflow of resources will be required to set-tle the obligation and the amount has been reliably estimated. Where the Group expects some or all of a provision to be reimbursed, for example under an insurance contract, the re-imbursement is recognized as a separate as-set but only when the reimbursement is virtu-ally certain. The expense relating to any provi-sion is presented in the income statement net of any reimbursement. If the effect of the time value of money is material, provisions are dis-counted using a current pre-tax rate that re-flects, where appropriate, the risks specific to the liability. Where discounting is used, the in-crease in the provision due to the passage of time is recognized as a finance cost.
1.16 Employee benefitsThe Group operates various pension schemes. The schemes are generally funded through payments to insurance companies or trust-ee-administered funds, determined by peri-odic actuarial calculations.
1.16.1 Defined benefit plansThe Group operated a defined benefit pension plan until December 1, 2012, when the plan was closed and all employees were transferred to a defined contribution plan (see 1.16.2). In No-vember 2013, the Group issued a new defined benefit pension plan, according to the Collec-tive Agreement with the Norwegian Pilot Union.
The cost of providing benefits under the de-fined benefit plan is determined using the pro-jected unit credit actuarial valuation method. The past service cost is recognized as an ex-pense on a straight-line basis over the aver-age period until the benefits are vested. If the benefits are already vested immediately fol-lowing the introduction of or changes to a pen-sion plan, past service cost is recognized im-mediately.
The defined benefit obligation is the aggre-gate of the present value of the defined bene-fit obligation and actuarial gains and losses not recognized reduced by past service costs not yet recognized and the fair value of plan assets
out of which the obligations are to be settled directly. If such aggregate is negative, the as-set is measured at the lower of such aggregate or at the aggregate of cumulative unrecog-nized net actuarial losses and past service cost and the present value of any economic ben-efits available in the form of refunds from the plan or reductions in the future contributions to the plan.
In addition, the Group participates in an early retirement plan (AFP) for all employees in Norway. The AFP pension plan is a multi-em-ployer defined benefit plan. However, the plan is recognized in the income statement as a de-fined contribution plan as the plans adminis-trator has not allocated actuarial gains/losses to the members of the AFP pension plan as of December 31, 2016.
Provisions for pension costs are detailed in Note 18.
1.16.2 Defined contribution plansIn addition to the defined benefit plan de-scribed above, the Group operates a defined contribution plan. A defined contribution plan is a pension plan under which the Group pays fixed contributions to a separate entity. The Group has no legal or constructive obligations to pay further contributions should the fund not hold sufficient assets to pay all employees the benefits relating to employee service in the current and prior periods. The contributions are recognized as employee benefit expenses when they are due. Prepaid contributions are recognized as an asset to the extent that a cash refund or a reduction in the future payments is available.
1.16.3 Share-based paymentsThe Group operates a number of equity-set-tled, share-based compensation plans un-der which the entity receives services from employees as consideration for equity in-struments of the Group. The fair value of the employee services received in exchange for the grants of the options is recognized as an expense over the vesting period. The to-tal amount to be expensed is determined
Help | Contents | Highlights | Letter from CEO | Board of Directors' report | Financial statements | CSR | Corporate governance | Board and management | Definitions | Contact | 31 / 99
NORWEGIAN ANNUAL REPORT 2016
Consolidated income statement 1.1 - 31.12Consolidated statement of comprehensive Income 1.1 - 31.12Consolidated statement of financial position at December 31Consolidated statement of changes in equity 1.1 – 31.12Consolidated cash flow statement 1.1 - 31.12Notes to the consolidated financial statementsNote 01: Summary of significant accounting policiesNote 02: Financial riskNote 03: Fair value estimationNote 04: Segment informationNote 05: Operating expensesNote 05A: Other operating expensesNote 06: Payroll expenses and number of employeesNote 07: Remuneration of the Board of Directors
and Executive managementNote 07A: Audit remunerationNote 08: Net financial itemsNote 09: TaxNote 10: Intangible assetsNote 11: Tangible assetsNote 12: Operating leasesNote 13: Trade and other receivablesNote 14: InventoriesNote 15: Equity and shareholder informationNote 16: Earnings per shareNote 17: OptionsNote 18: PensionsNote 19: Provisions and other long-term liabilitiesNote 20: Financial instrumentsNote 21: Trade and other payablesNote 22: BorrowingsNote 23: Assets pledged as collaterals and
guaranteesNote 24: Bank depositsNote 25: Investments in other entitiesNote 26: Related party transactionsNote 27: Contingencies and legal claimsNote 28: CommitmentsNote 29: Events after the reporting period INDEPENDENT AUDITOR’S REPORT
GROUP FINANCIAL STATEMENT
2016-NorwegiaN.iNdd • Created: 09.10.2014 • Modified: 06.04.2017 : 19:44 all rigths reserved © 2017 teigeNs desigN
by referring to the fair value of the options granted.
The fair value of the options to be settled in equity instruments is estimated at the grant date. The fair value is determined by an exter-nal part by applying the Black and Scholes op-tion-pricing model. The assumptions underly-ing the number of options expected to vest are adjusted to reflect conditions prevailing at the reporting date. For further details see Note 17.
The social security contributions payable in connection with the grant of the share op-tions is considered an integral part of the grant itself, and the charge will be treated as a cash-settled transaction.
1.16.4 Employee share purchase savings program Bonus shares and employer’s contribution are measured at fair value using the Black and Scholes option pricing model. Expenses for bonus shares are included in payroll expenses. The fair value of the bonus shares and the es-timated employer’s contribution are distrib-uted as expenses over the expected period un-til settlement. Changes in estimates affecting employer’s contribution are expensed over the remaining expected period. For further details see Note 17.
1.17 Current and deferred income taxThe tax expense for the period comprises cur-rent and deferred tax. Tax is recognized in the income statement, except to the extent when it relates to items recognized in other com-prehensive income or directly in equity. In this case, the tax is also recognized in other com-prehensive income or directly in equity, re-spectively.
1.17.1 Current income taxCurrent income tax assets and liabilities for the current and prior periods are measured at the amount expected to be recovered from or paid to the taxation authorities. The tax rates and tax laws that are used to compute the amount are those which are enacted or substantively enacted at the reporting date.
1.17.2 Deferred income taxDeferred income tax is determined by us-ing the liability method on temporary differ-ences at the reporting date between the tax bases of assets and liabilities and their carrying amounts for financial reporting purposes.
Deferred income tax liabilities are recog-nized for all taxable temporary differences. Deferred income tax assets are recognized for all deductible temporary differences, carry forward of unused tax credits and unused tax losses, to the extent that it is probable that taxable profit will be available against which the deductible temporary differences, and the carry forward of unused tax credits and un-used tax losses can be utilized.
The carrying amount of deferred income tax assets is reviewed at each reporting date and reduced to the extent that it is no longer prob-able that sufficient taxable profit will be avail-able to allow all or part of the deferred income tax asset to be utilized. Unrecognized deferred income tax assets are reassessed at each re-porting date and are recognized to the extent that it has become probable that future tax-able profit will allow the deferred tax asset to be recovered.
Deferred income tax assets and liabili-ties are measured at the tax rates that are ex-pected in the year when the assets are realized or when the liabilities are settled, based on tax rates (and tax laws) which have been enacted, or substantively enacted, at the reporting date.
Deferred income tax assets and deferred income tax liabilities are offset to the extent that:
● the Group has a legal and enforceable right to offset the recognized amounts and;
● if deferred tax assets and tax liabilities re-lates to income tax from the same tax au-thorities and the same taxable entity in the Group, or if different taxable entities in the Group intends either to settle on a net ba-sis, or to realize the asset and settle the lia-bility simultaneously.
Deferred income tax is provided based on temporary differences arising from invest-ments in subsidiaries and associates, except where the timing of the reversal of the tempo-rary difference is controlled by the Group and it is probable that the temporary difference will not reverse in the foreseeable future.
1.18 Contingent assets and liabilitiesA contingent asset is not recognized in the an-nual financial statements, but disclosed in the notes where an inflow of economic benefits is probable.
Contingent liabilities are defined as possible obligations arising from past events the exis-tence of which depends on future events, or for which it is improbable that they will lead to an outflow of resources, or which cannot be measured with sufficient reliability
Contingent liabilities are not recognized in the annual financial statements, but significant contingent liabilities are disclosed in the notes to the financial statements, with the exception of contingent liabilities where the probability of the liability occurring is remote.
1.19 Revenue recognitionRevenue comprises the fair value of the con-sideration received or receivable for the sale of goods and services in the general course of the Group’s activities. Revenue is shown net of value-added tax and discounts. The Group rec-ognizes revenue when the amount of revenue can be reliably measured, it is probable that future economic benefits will flow to the en-tity and when specific criteria have been met for each of the Group’s activities as described below.
1.19.1 Passenger revenuePassenger revenue is reported as traffic rev-enue when the air transport has been carried out. The value of tickets sold and which are still valid but not used by the reporting date (amounts sold in excess of revenue recog-nized) is reported as air traffic settlement lia-bility. This liability is reduced either when the Group or another airline completes the trans-
portation or when the passenger requests a refund.
1.19.2 Ancillary revenueAncillary revenue comprises sales of ticket-re-lated products and services, e.g. revenue from baggage sales and seating. Some of the prod-ucts and services are earned at the time of the transport, and such revenue is recognized in the same manner as passenger revenue. Other products and services are earned at the time of purchase and immediately recognized in the income statement.
Amounts paid by ‘no show’ customers are recognized as revenue when the booked ser-vice is provided. ‘No show’ customers with low fare tickets are not entitled to change flights or seek refunds once a flight has departed.
1.19.3 Other revenueOther revenue comprises third party revenue, such as wet lease, cargo and revenue from business activities in subsidiaries which are not airlines.
Other airline revenues are recognized when the services have been rendered, fees are reli-able measurable, collections are probable, and when other significant obligations have been fulfilled.
Revenue from sales of Wi-Fi products and services comprises traffic fees. Revenue traffic fees are recognized as revenue at the time of consumption.
1.19.4 Customer loyalty program – Norwegian RewardThe Group has implemented a frequent flyer program: Norwegian Reward. Reward members earn “CashPoints” and additional “Rewards” in the following circumstances:
● Bank Norwegian Customer; 1 per cent of the
payment is earned as cashpoints on all pur-chases. CashPoints are also earned on all LowFare and Flex tickets purchased from Norwegian Air Shuttle ASA, and which are paid with the Bank Norwegian credit card, with 5 and 20 per cent of the purchase
Help | Contents | Highlights | Letter from CEO | Board of Directors' report | Financial statements | CSR | Corporate governance | Board and management | Definitions | Contact | 32 / 99
NORWEGIAN ANNUAL REPORT 2016
Consolidated income statement 1.1 - 31.12Consolidated statement of comprehensive Income 1.1 - 31.12Consolidated statement of financial position at December 31Consolidated statement of changes in equity 1.1 – 31.12Consolidated cash flow statement 1.1 - 31.12Notes to the consolidated financial statementsNote 01: Summary of significant accounting policiesNote 02: Financial riskNote 03: Fair value estimationNote 04: Segment informationNote 05: Operating expensesNote 05A: Other operating expensesNote 06: Payroll expenses and number of employeesNote 07: Remuneration of the Board of Directors
and Executive managementNote 07A: Audit remunerationNote 08: Net financial itemsNote 09: TaxNote 10: Intangible assetsNote 11: Tangible assetsNote 12: Operating leasesNote 13: Trade and other receivablesNote 14: InventoriesNote 15: Equity and shareholder informationNote 16: Earnings per shareNote 17: OptionsNote 18: PensionsNote 19: Provisions and other long-term liabilitiesNote 20: Financial instrumentsNote 21: Trade and other payablesNote 22: BorrowingsNote 23: Assets pledged as collaterals and
guaranteesNote 24: Bank depositsNote 25: Investments in other entitiesNote 26: Related party transactionsNote 27: Contingencies and legal claimsNote 28: CommitmentsNote 29: Events after the reporting period INDEPENDENT AUDITOR’S REPORT
GROUP FINANCIAL STATEMENT
2016-NorwegiaN.iNdd • Created: 09.10.2014 • Modified: 06.04.2017 : 19:44 all rigths reserved © 2017 teigeNs desigN
price, respectively, except for tickets for long distance and domestic travel in Nor-way and Sweden, which earn 2% on LowFare tickets and 20% on Flex tickets.
● Norwegian Air Shuttle ASA; Reward Mem-bers earn 2% on all LowFare tickets and 20% on all Flex tickets.
● Corporate agreement; 4% on all LowFare tickets and 12% on all Flex tickets.
● CashPoints are also earned by members making purchases of goods and services from the Reward Partners according to the applicable accumulation rates and condi-tions set by the Reward Partners.
● More rewarding Rewards were introduced in 2015, and in addition to earning Cash-points on all flights, members can receive additional Rewards for every sixth single flight. Additional Rewards are CashPoints Boost, Free Seating, Free luggage and Free Fast Track. Each reward can be used by the member on every flight for at least 12 months.
Member CashPoints gained from travelled
airline tickets are recognized as a liability in the statement of financial position and recog-nized as revenue only when it has fulfilled its obligations. The member Cashpoint liability, is derecognized from the statement of financial position and recognized as income when cus-tomers utilize their CashPoints.
All other earned CashPoints are recognized as a liability towards members in the state-ment of financial position and immediately ex-pensed. The cash points earned with other merchants are invoiced and recognized as in-come in the corresponding period. When the customers use their collected CashPoints, the liability is derecognized and cash payment on the Group’s services is reduced.
CashPoints are valid throughout the year they were earned, plus two years. In this pe-riod, Cashpoints are presented as deferred
revenue in the balance sheet, and they are released to the income statement when the points are redeemed or expire.
The deferred income is measured by refer-ence to fair value. It is classified as short term as available statistics as of December 31, 2016 indicate that members CashPoints are utilized within one year. Hence, the carrying value of the liability is estimated as the fair value of the liability.
1.20 LeasingTo determine whether an arrangement is, or contains a lease, it is necessary to assess whether the fulfilment of the arrangement is dependent on the use of a specific asset and whether the arrangement conveys a right to use the asset.
The lease agreements, in which, most of the risk lies with the contracting party are classi-fied as operating leases. Operating lease pay-ments are recognized as an expense in the in-come statement on a straight-line basis over the lease term. Payments for the lease and payments for other elements are recognized separately.
Deposits made at the inception of operat-ing leases are carried at amortized cost. The difference between the nominal value of a de-posit paid, carried at less than market interest and its fair value, is considered as additional rent, payable to the lessor and is expensed on a straight-line basis over the lease term.
The Group leases tangible assets where the lease agreements transfer all material risks and rewards of the asset to the lessee at the end of the lease term. Such lease agreements are classified as financial leases. Financial leases are recognized at inception to the lowest of acquisition cost and the net present value of minimum lease payments. Financial lease as-sets are depreciated on a straight-line basis over the lease period if such is shorter than the useful life of the financial lease asset. Fi-nancial lease assets are included in the state-ment of financial position as tangible assets.
Each lease payment under financial leases is split between the lease liability and finance
cost to amortize the financial costs related to such leases for the duration of the lease pe-riod. The lease liability is classified as borrow-ings, see Note 22 for details.
Sale and lease back transactions are treated as financial leases and operating leases, depending on the nature of the lease. The Group entered into four sale and lease back transactions in 2016 (none in 2015). All sales and lease back transac-tions are defined as operating leases established at fair value and any profit or loss is recognized immediately in the income statement as other income or operating expenses.
1.21 Segment reportingOperating segments are reported in a manner consistent with the internal reporting provided to the chief operating decision maker who is responsible for allocating resources and as-sessing the performance of the operating seg-ments. The chief operating decision maker has been identified as the Board of Directors and the Executive Management. The Group has one operating segment, which is low cost air pas-senger travel. The Group has one geographical segment which is the route portfolio. See Note 4 for further details.
1.22 Events after the reporting dateNew information regarding the Group’s po-sitions at the reporting date is taken into ac-count in the preparation of the annual financial statements. Events occurring after the report-ing date which do not affect the Group’s po-sition at the reporting date, but which will af-fect the Group’s position in the future, are dis-closed if significant.
1.23 Critical accounting estimates and judgmentsIn preparing the consolidated financial state-ments, the Management is required to assess judgments, estimates and assumptions that af-fect the reported amounts of assets and liabil-ities, income and expenses. The critical judg-ments and key sources of estimation uncer-tainty that have been made in preparing the consolidated financial statements are detailed
below. These judgments involve assumptions or estimates in light of future events that can differentiate from what is expected.
The aircraft held under operating lease agreements are subject to specific redeliv-ery conditions stated in the contracts as well as periodic maintenance programs as de-fined by the aircraft and engines manufactur-ers. To meet these requirements, the Group must conduct maintenance, both regularly and at the expiration of the leasing period. Provi-sions are made based on the estimated costs of overhauls and maintenance. In order to esti-mate these conditions, the Management must make assumptions regarding expected mainte-nance costs. Description of maintenance cost estimates are described in Note 19.
Non-current assets are depreciated on a straight-line basis or by airborne hours and cycles over the estimated useful lives, taking expected residual value into consideration. An aircraft is decomposed into several com-ponents for depreciation purposes in order to consider different useful lives of the air-craft components, in accordance with offi-cial requirements. The depreciation period and method are assessed annually to ensure that they reconcile with the substance of the non-current asset, and the residual value is estimated at each year-end. The assessments require Management to make assumptions re-garding expected useful lives and residual val-ues.
Deferred tax assets are recognized for all unused tax losses to the extent that taxable profits are probable. Deferred tax liabilities are recognized when an obligation has been incurred. Significant management judgment is required to determine the amounts of de-ferred tax assets that can be recognized, based on the anticipated timing and level of future taxable profits together with future tax plan-ning strategies. Deferred tax liabilities that have been incurred are based on the best es-timate of the likely obligation at each report-ing period. These estimates are subject to re-vision based on the outcome of tax audits and discussions with authorities that can take sev-
Help | Contents | Highlights | Letter from CEO | Board of Directors' report | Financial statements | CSR | Corporate governance | Board and management | Definitions | Contact | 33 / 99
NORWEGIAN ANNUAL REPORT 2016
Consolidated income statement 1.1 - 31.12Consolidated statement of comprehensive Income 1.1 - 31.12Consolidated statement of financial position at December 31Consolidated statement of changes in equity 1.1 – 31.12Consolidated cash flow statement 1.1 - 31.12Notes to the consolidated financial statementsNote 01: Summary of significant accounting policiesNote 02: Financial riskNote 03: Fair value estimationNote 04: Segment informationNote 05: Operating expensesNote 05A: Other operating expensesNote 06: Payroll expenses and number of employeesNote 07: Remuneration of the Board of Directors
and Executive managementNote 07A: Audit remunerationNote 08: Net financial itemsNote 09: TaxNote 10: Intangible assetsNote 11: Tangible assetsNote 12: Operating leasesNote 13: Trade and other receivablesNote 14: InventoriesNote 15: Equity and shareholder informationNote 16: Earnings per shareNote 17: OptionsNote 18: PensionsNote 19: Provisions and other long-term liabilitiesNote 20: Financial instrumentsNote 21: Trade and other payablesNote 22: BorrowingsNote 23: Assets pledged as collaterals and
guaranteesNote 24: Bank depositsNote 25: Investments in other entitiesNote 26: Related party transactionsNote 27: Contingencies and legal claimsNote 28: CommitmentsNote 29: Events after the reporting period INDEPENDENT AUDITOR’S REPORT
GROUP FINANCIAL STATEMENT
2016-NorwegiaN.iNdd • Created: 09.10.2014 • Modified: 06.04.2017 : 19:44 all rigths reserved © 2017 teigeNs desigN
eral years to conclude. See Notes 9 and 27 for further details of tax positions.
The Group tests annually whether good-will and other intangible assets with indefinite useful lives, have suffered any impairment in accordance with the accounting policy stated in Note 1.8. The recoverable amounts of cash-generating units have been determined based on value-in-use calculations. These calculations require the use of estimates (see Note 10). Estimating value in use for owned aircraft and for purchase contracts, require
judgement. In 2016 indications of impairment have not been identified for neither aircraft nor purchase contracts.
Bad debt provisions for credit card receiv-ables are based on actual historical loss per-centage and actual withdrawal for payments from credit card companies.
Fair value of financial instruments is deter-mined using fair value estimation techniques. Valuation techniques and details on financial instruments are outlined in Note 3.
NOTE 02: FINANCIAL RISK
The Group’s activities expose it to a variety of financial risks; market risk (including currency risk, interest rate risk and price risk), credit risk and liquidity risk. The Group’s overall financial risk management program focuses on changes and fluctuations in financial markets and seeks to minimize potential adverse effects on the Group’s financial performance. The Group uses derivative financial instruments to hedge cer-tain financial risk exposures.
Financial risk management is carried out by a central treasury department (Group Trea-sury), under policies approved by the Board of Directors. Group treasury identifies, evalu-ates and hedges financial risk in close co-op-eration with the Group’s operating units. The Board provides principles for overall risk management such as foreign currency risk, interest rate risk, credit risk, use of derivative financial instruments and investment of ex-cess liquidity.
2.1 Market riskMarket risk is the risk of changes in market prices, such as foreign exchange rates, jet fuel prices and interest rates which will affect the Group’s income or value of its holdings of financial instruments.
2.2 Foreign exchange risk A substantial part of the Group’s expenses is denominated in foreign currencies. The
Group’s leases, aircraft borrowings, main-tenance, jet fuel and related expenses are mainly denominated in USD, and airplane op-eration expenses are partly denominated in EUR. The carrying amount of the Group’s net investments in foreign entities and proceeds from these investments varies with changes in the foreign exchange rate. In order to re-duce currency risk, the Group has a mandate to hedge up to 100% of its currency exposure for the following 12 months. The hedging con-sists of forward currency contracts and flexi-ble forwards.
Exchange rate risk sensitivity analysisThis analysis does not take into account cor-relation between currencies. Empirical stud-ies confirm substantial diversification effect across the currencies that the Group is ex-posed to.
Effects on net currency gains (losses)The Group is exposed to currency fluctua-tions on monetary items in the statement of financial position, denominated in other cur-rencies than the functional currency.
If NOK had weakened/strengthened by 1% against USD in 2016, with all other variables held constant, post-tax profit would have been NOK 22.4 million (2015: NOK 30.2 mil-lion) higher/lower, mainly as a result of for-eign exchange losses/gains on receivables,
payables, derivative financial instruments and cash and cash equivalents.
If NOK had weakened/strengthened by 1% against EUR with all other variables held con-stant, post-tax profit and post-tax equity ef-fect for the year would have been NOK 9.7 million (2015: NOK -5.4 million) lower/higher, mainly as a result of foreign exchange losses/gains on receivables, payables, derivative fi-nancial instruments, cash and cash equiva-lents and long-term borrowings denominated in EUR.
If NOK had weakened/strengthened by 1% against GBP with all other variables held con-stant, post-tax profit and post-tax equity ef-fect for the year would have been NOK 0.9 million (2015: NOK 7.4 million) higher/lower, mainly as a result of foreign exchange losses/gains on receivables, payables, derivative fi-nancial instruments and cash and cash equiv-alents.
Effects due to foreign exchange translations on other comprehensive incomeThe Group has major investments in opera-tions abroad, whose net assets are exposed to foreign currency translation risk. Cur-rency exposure arising from the net assets of the Group’s foreign operations can be mate-rial, but the variances create a natural hedge against the Group’s currency exposure on operating expenses. If NOK had weakened/strengthened with 1% against USD with all other variables held constant, other com-prehensive income would have been NOK 38.7 million (2015: 29.7 million) higher/lower. If NOK had weakened/strengthened with 1% against EUR with all other variables held con-stant, other comprehensive income would have been NOK 2.5 million (2015: 0.7 million) higher/lower.
2.3 Cash flow and fair value interest rate riskAs the Group has net interest bearing debt, the Group’s income and operating cash flows are dependent on changes in the market in-terest rates. The Group’s cash flow interest
rate risk arises from cash and cash equiva-lents and floating interest rate borrowings. Floating interest rate borrowings consist of unsecured bond issue, aircraft and prepay-ment financing, loan facility and financial lease liabilities. Borrowings issued at fixed rates expose the Group to fair value interest rate risk. Fixed interest rate borrowings con-sist of aircraft financing, guaranteed by the Ex-Im Bank of the United States. Borrowings are denominated in USD and NOK.
If the floating interest rate in 2016 had been 1% higher/lower with all other variables held constant, post-tax profit and post-tax equity effect for the year would have been NOK 22.4 million (2015: NOK 35.7 million) lower/higher, mainly as a result of higher/lower interest income on floating rate cash and cash equivalents and borrowings.
The sensitivity analysis of interest rate risk is calculated based on amortized cost of floating rate borrowings, cash and cash equivalents.
The Group measures borrowings at amor-tized cost. No changes in fair value of fixed rate interest rate borrowings would be ac-counted for. Fair value calculations of fixed in-terest rate borrowings are detailed in Note 22.
2.4 Jet fuel pricesExpenses for jet fuel represent a substan-tial part of the Group’s operating costs, and fluctuations in jet fuel prices influence the projected cash flows. The objective of the jet fuel price risk management policy is to safeguard against significant and sudden in-creases in jet fuel prices whilst retaining ac-cess to price reductions. The Group man-ages jet fuel price risk using fuel derivatives. The Management has a mandate to hedge up to 100% of its expected consumption over the next 24 months with forward commodity contracts.
The Group holds forward commodity con-tracts to hedge jet fuel price risk. Such de-rivative contracts affect the financial state-ments through unrealized gains/losses from jet fuel prices. At December 31, 2016, the
Help | Contents | Highlights | Letter from CEO | Board of Directors' report | Financial statements | CSR | Corporate governance | Board and management | Definitions | Contact | 34 / 99
NORWEGIAN ANNUAL REPORT 2016
Consolidated income statement 1.1 - 31.12Consolidated statement of comprehensive Income 1.1 - 31.12Consolidated statement of financial position at December 31Consolidated statement of changes in equity 1.1 – 31.12Consolidated cash flow statement 1.1 - 31.12Notes to the consolidated financial statementsNote 01: Summary of significant accounting policiesNote 02: Financial riskNote 03: Fair value estimationNote 04: Segment informationNote 05: Operating expensesNote 05A: Other operating expensesNote 06: Payroll expenses and number of employeesNote 07: Remuneration of the Board of Directors
and Executive managementNote 07A: Audit remunerationNote 08: Net financial itemsNote 09: TaxNote 10: Intangible assetsNote 11: Tangible assetsNote 12: Operating leasesNote 13: Trade and other receivablesNote 14: InventoriesNote 15: Equity and shareholder informationNote 16: Earnings per shareNote 17: OptionsNote 18: PensionsNote 19: Provisions and other long-term liabilitiesNote 20: Financial instrumentsNote 21: Trade and other payablesNote 22: BorrowingsNote 23: Assets pledged as collaterals and
guaranteesNote 24: Bank depositsNote 25: Investments in other entitiesNote 26: Related party transactionsNote 27: Contingencies and legal claimsNote 28: CommitmentsNote 29: Events after the reporting period INDEPENDENT AUDITOR’S REPORT
GROUP FINANCIAL STATEMENT

2016-NorwegiaN.iNdd • Created: 09.10.2014 • Modified: 06.04.2017 : 19:44 all rigths reserved © 2017 teigeNs desigN
Group held forward contracts totaling 831 766 tons of jet fuel, equaling approximately 52% of fuel consumption in 2017 and 14% of fuel consumption in first half of 2018.
2.5 Credit risk Credit risk is managed on a Group-wide ba-sis. Credit risk arises from cash and cash equivalents, derivative financial instruments and deposits with banks and financial insti-tutions, as well as credit exposures to travel agencies and commercial customers, includ-ing outstanding receivables and committed transactions. The utilization of credit limits is regularly monitored. The Group’s policy is to maintain credit sales at a minimum level. Sales to private customers are settled in cash or using major credit card companies.
A portion of the Group’s sales, are paid for by the customers at the time of booking and Norwegian receive the actual payments from the credit card companies, or acquires are received at a later point in time. Delayed pay-ments from credit card companies vary be-tween credit card brands. The risk arising from receivables on credit card companies or credit card acquires are monitored closely.
Credit risk related to bank defaults is closely monitored and partly offset by diver-sifying the Group’s deposit portfolio.
There is re-invoicing of maintenance costs on aircraft to leasing companies, and Nor-wegian regularly evaluates and assesses the value of these credits. See Note 20 for fur-ther disclosure on credit risk.
2.6 Liquidity riskPrudent liquidity risk management implies maintaining sufficient cash and marketable securities, the availability of funding through an adequate amount of committed credit fa-cilities and the ability to close out market po-sitions.
Management monitors rolling forecasts of the Group’s liquidity reserve, cash and cash equivalents (see Note 24) on the basis of ex-
pected cash flow. The Group's liquidity man-agement policy involves projecting cash flows in major currencies and considering the level of liquid assets necessary to monitor liquidity ratios against internal and external regulatory requirements and maintaining debt financ-ing plans.
The Group’s aircraft fleet consist of leased aircraft (Note 12) and owned aircraft (Note 11), whereof the Group has 255 owned and leased aircraft on firm order with future de-livery. In accordance with airline industry market practice the total order is not fully financed. The financing will be secured on a periodic basis, the size and timing depending on the schedule of aircraft delivery and mar-ket conditions. The table below shows the expected timeline of future deliveries of air-craft at December 31, 2016. Prepayments to aircraft manufacturers on future aircraft de-liveries are financed by internal and external funds.
Norwegian has historically utilized aircraft financing institutions, like the Export-Import Bank of the United States Bank (Ex-Im), as its primary funding source in relation to air-craft acquisitions in addition to the US Cap-ital market by way of Private Placements, EETC and sale and leaseback arrangements. Norwegian is dependent on access to one of these or other financing forms to finance the delivery of aircraft. Deliveries in 2017 will be financed through export guaranteed fi-nancing, in the US capital market or through other commercial sources of financing. The Group is currently in the process of securing pre-delivery payment financing and term fi-nancing according to the Group’s financing policy for deliveries in the finance planning for 2017-2019. The Group’s financing policy in-cludes sales and lease backs transactions on several aircraft to diversify its aircraft fleet. In 2016, four aircraft were delivered and fi-nanced as sales and lease backs transactions (none in 2015).
Aircraft delivery 2017 2018–2019 2020– Total
Boeing 737-800 17 2 - 19Boeing 737 Max 8 6 26 76 108Boeing 787-9 Dreamliner 4 10 5 19Boeing 787-9 Dreamliner (operational lease) 5 6 - 11Airbus 320 neo 3 32 33 68Airbus 321 neo - 8 22 30Total 35 84 136 255
The table below analyses the maturity profile of the Group’s financial liabilities at the reporting date. The amounts disclosed are the contractual undiscounted cash flows:
NOK 1 000Less than 1
yearBetween 1
and 2 yearsBetween 2
and 5 yearsOver
5 years
At December 31, 2016Borrowings 4 768 813 6 417 052 8 746 430 4 013 356 Derivative contracts - payments 86 306 27 939 - - Trade and other payables 3 881 684 - - - Calculated interest on borrowings 919 351 1 399 801 1 719 880 434 643 Total financial liabilities 9 656 154 7 844 792 10 466 309 4 447 999
NOK 1 000Less than 1
yearBetween 1
and 2 yearsBetween 2
and 5 yearsOver
5 years
At December 31, 2015Borrowings 2 984 682 2 592 408 6 863 040 7 640 661Derivative contracts - payments 782 523 - - - Trade and other payables 2 862 566 - - - Calculated interest on borrowings 594 935 537 951 1 201 827 843 391Total financial liabilities 7 224 707 3 130 359 8 064 867 8 484 052
2.7 Capital risk managementThe Group’s capital management policy is to have a capital structure which meets the de-mands of operations, reduces cost of capital and complies with financial covenants and fu-ture investments planned by the Group. The
Group will at all times adjust debt and eq-uity to maintain and secure an optimal capi-tal structure by continuously monitoring the total equity level and the equity ratio of the Group. This ratio is calculated as equity di-vided by total assets as presented in the con-
Help | Contents | Highlights | Letter from CEO | Board of Directors' report | Financial statements | CSR | Corporate governance | Board and management | Definitions | Contact | 35 / 99
NORWEGIAN ANNUAL REPORT 2016
Consolidated income statement 1.1 - 31.12Consolidated statement of comprehensive Income 1.1 - 31.12Consolidated statement of financial position at December 31Consolidated statement of changes in equity 1.1 – 31.12Consolidated cash flow statement 1.1 - 31.12Notes to the consolidated financial statementsNote 01: Summary of significant accounting policiesNote 02: Financial riskNote 03: Fair value estimationNote 04: Segment informationNote 05: Operating expensesNote 05A: Other operating expensesNote 06: Payroll expenses and number of employeesNote 07: Remuneration of the Board of Directors
and Executive managementNote 07A: Audit remunerationNote 08: Net financial itemsNote 09: TaxNote 10: Intangible assetsNote 11: Tangible assetsNote 12: Operating leasesNote 13: Trade and other receivablesNote 14: InventoriesNote 15: Equity and shareholder informationNote 16: Earnings per shareNote 17: OptionsNote 18: PensionsNote 19: Provisions and other long-term liabilitiesNote 20: Financial instrumentsNote 21: Trade and other payablesNote 22: BorrowingsNote 23: Assets pledged as collaterals and
guaranteesNote 24: Bank depositsNote 25: Investments in other entitiesNote 26: Related party transactionsNote 27: Contingencies and legal claimsNote 28: CommitmentsNote 29: Events after the reporting period INDEPENDENT AUDITOR’S REPORT
GROUP FINANCIAL STATEMENT
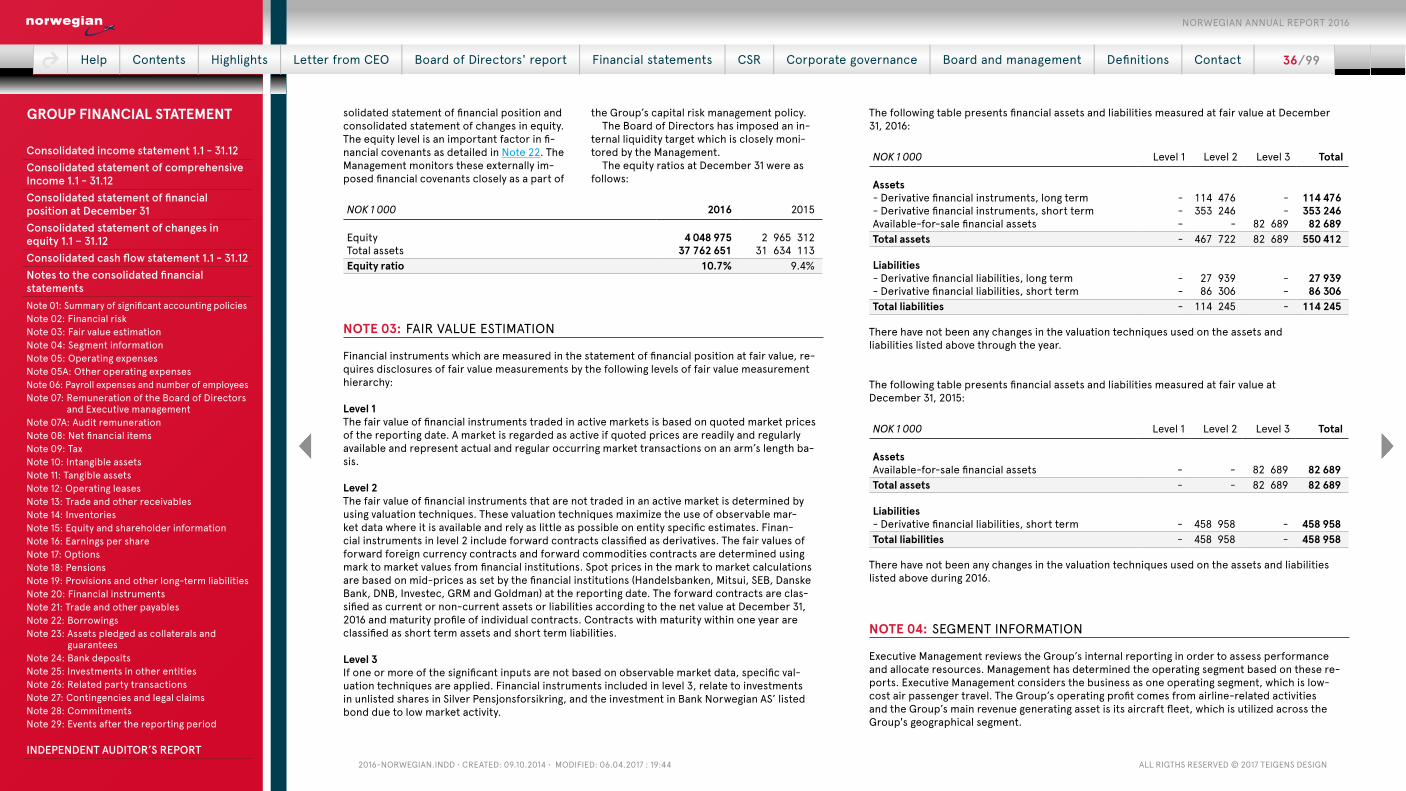
2016-NorwegiaN.iNdd • Created: 09.10.2014 • Modified: 06.04.2017 : 19:44 all rigths reserved © 2017 teigeNs desigN
solidated statement of financial position and consolidated statement of changes in equity. The equity level is an important factor in fi-nancial covenants as detailed in Note 22. The Management monitors these externally im-posed financial covenants closely as a part of
the Group’s capital risk management policy. The Board of Directors has imposed an in-
ternal liquidity target which is closely moni-tored by the Management.
The equity ratios at December 31 were as follows:
NOK 1 000 2016 2015
Equity 4 048 975 2 965 312 Total assets 37 762 651 31 634 113 Equity ratio 10.7% 9.4%
NOTE 03: FAIR VALUE ESTIMATION
Financial instruments which are measured in the statement of financial position at fair value, re-quires disclosures of fair value measurements by the following levels of fair value measurement hierarchy:
Level 1The fair value of financial instruments traded in active markets is based on quoted market prices of the reporting date. A market is regarded as active if quoted prices are readily and regularly available and represent actual and regular occurring market transactions on an arm’s length ba-sis.
Level 2The fair value of financial instruments that are not traded in an active market is determined by using valuation techniques. These valuation techniques maximize the use of observable mar-ket data where it is available and rely as little as possible on entity specific estimates. Finan-cial instruments in level 2 include forward contracts classified as derivatives. The fair values of forward foreign currency contracts and forward commodities contracts are determined using mark to market values from financial institutions. Spot prices in the mark to market calculations are based on mid-prices as set by the financial institutions (Handelsbanken, Mitsui, SEB, Danske Bank, DNB, Investec, GRM and Goldman) at the reporting date. The forward contracts are clas-sified as current or non-current assets or liabilities according to the net value at December 31, 2016 and maturity profile of individual contracts. Contracts with maturity within one year are classified as short term assets and short term liabilities.
Level 3If one or more of the significant inputs are not based on observable market data, specific val-uation techniques are applied. Financial instruments included in level 3, relate to investments in unlisted shares in Silver Pensjonsforsikring, and the investment in Bank Norwegian AS’ listed bond due to low market activity.
The following table presents financial assets and liabilities measured at fair value at December 31, 2016:
NOK 1 000 Level 1 Level 2 Level 3 Total
Assets- Derivative financial instruments, long term - 114 476 - 114 476 - Derivative financial instruments, short term - 353 246 - 353 246 Available-for-sale financial assets - - 82 689 82 689 Total assets - 467 722 82 689 550 412
Liabilities- Derivative financial liabilities, long term - 27 939 - 27 939 - Derivative financial liabilities, short term - 86 306 - 86 306 Total liabilities - 114 245 - 114 245
There have not been any changes in the valuation techniques used on the assets and liabilities listed above through the year.
The following table presents financial assets and liabilities measured at fair value at December 31, 2015:
NOK 1 000 Level 1 Level 2 Level 3 Total
AssetsAvailable-for-sale financial assets - - 82 689 82 689 Total assets - - 82 689 82 689
Liabilities- Derivative financial liabilities, short term - 458 958 - 458 958 Total liabilities - 458 958 - 458 958
There have not been any changes in the valuation techniques used on the assets and liabilities listed above during 2016.
NOTE 04: SEGMENT INFORMATION
Executive Management reviews the Group’s internal reporting in order to assess performance and allocate resources. Management has determined the operating segment based on these re-ports. Executive Management considers the business as one operating segment, which is low-cost air passenger travel. The Group’s operating profit comes from airline-related activities and the Group’s main revenue generating asset is its aircraft fleet, which is utilized across the Group's geographical segment.
Help | Contents | Highlights | Letter from CEO | Board of Directors' report | Financial statements | CSR | Corporate governance | Board and management | Definitions | Contact | 36 / 99
NORWEGIAN ANNUAL REPORT 2016
Consolidated income statement 1.1 - 31.12Consolidated statement of comprehensive Income 1.1 - 31.12Consolidated statement of financial position at December 31Consolidated statement of changes in equity 1.1 – 31.12Consolidated cash flow statement 1.1 - 31.12Notes to the consolidated financial statementsNote 01: Summary of significant accounting policiesNote 02: Financial riskNote 03: Fair value estimationNote 04: Segment informationNote 05: Operating expensesNote 05A: Other operating expensesNote 06: Payroll expenses and number of employeesNote 07: Remuneration of the Board of Directors
and Executive managementNote 07A: Audit remunerationNote 08: Net financial itemsNote 09: TaxNote 10: Intangible assetsNote 11: Tangible assetsNote 12: Operating leasesNote 13: Trade and other receivablesNote 14: InventoriesNote 15: Equity and shareholder informationNote 16: Earnings per shareNote 17: OptionsNote 18: PensionsNote 19: Provisions and other long-term liabilitiesNote 20: Financial instrumentsNote 21: Trade and other payablesNote 22: BorrowingsNote 23: Assets pledged as collaterals and
guaranteesNote 24: Bank depositsNote 25: Investments in other entitiesNote 26: Related party transactionsNote 27: Contingencies and legal claimsNote 28: CommitmentsNote 29: Events after the reporting period INDEPENDENT AUDITOR’S REPORT
GROUP FINANCIAL STATEMENT
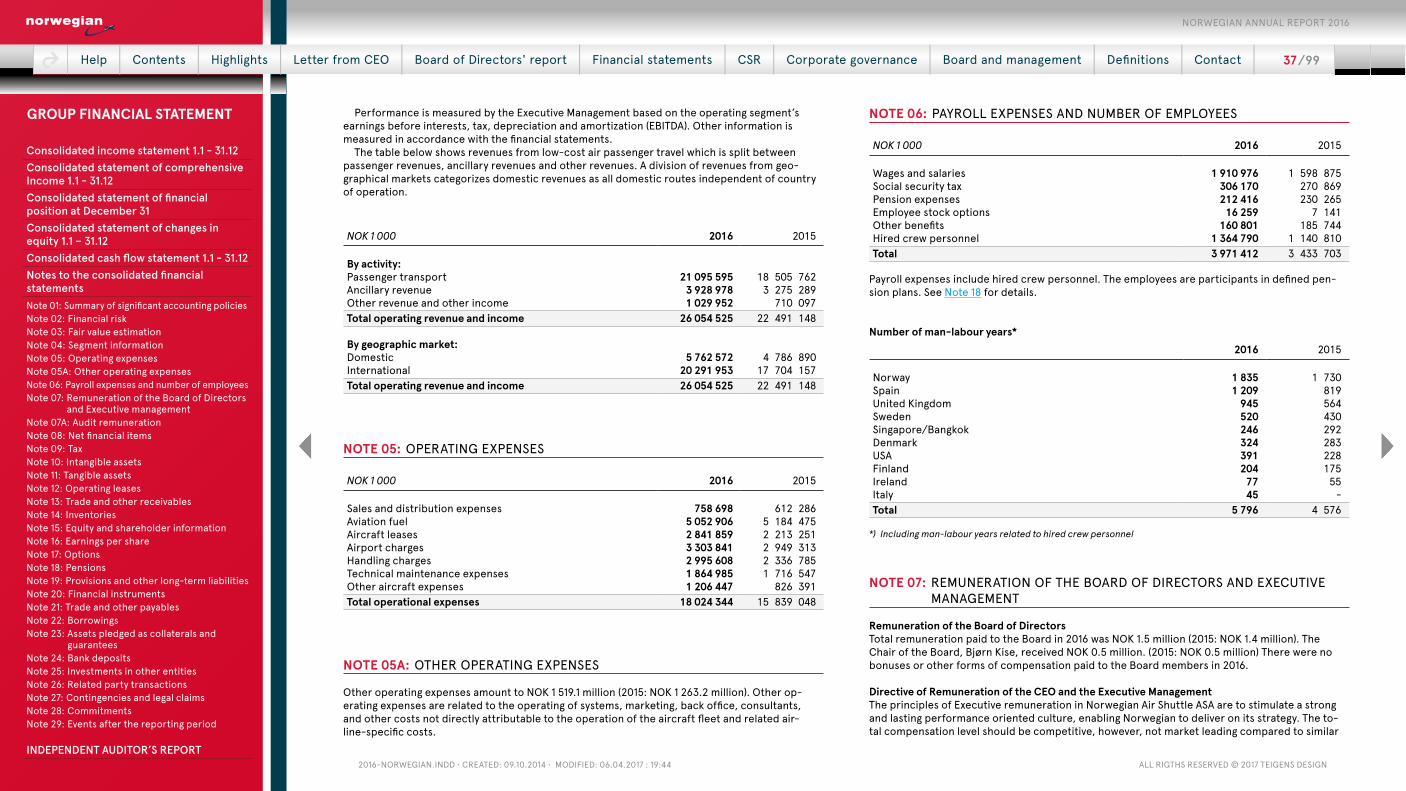
2016-NorwegiaN.iNdd • Created: 09.10.2014 • Modified: 06.04.2017 : 19:44 all rigths reserved © 2017 teigeNs desigN
Performance is measured by the Executive Management based on the operating segment’s earnings before interests, tax, depreciation and amortization (EBITDA). Other information is measured in accordance with the financial statements.
The table below shows revenues from low-cost air passenger travel which is split between passenger revenues, ancillary revenues and other revenues. A division of revenues from geo-graphical markets categorizes domestic revenues as all domestic routes independent of country of operation.
NOK 1 000 2016 2015
By activity:Passenger transport 21 095 595 18 505 762Ancillary revenue 3 928 978 3 275 289Other revenue and other income 1 029 952 710 097Total operating revenue and income 26 054 525 22 491 148
By geographic market:Domestic 5 762 572 4 786 890International 20 291 953 17 704 157Total operating revenue and income 26 054 525 22 491 148
NOTE 05: OPERATING EXPENSES
NOK 1 000 2016 2015
Sales and distribution expenses 758 698 612 286Aviation fuel 5 052 906 5 184 475Aircraft leases 2 841 859 2 213 251Airport charges 3 303 841 2 949 313Handling charges 2 995 608 2 336 785Technical maintenance expenses 1 864 985 1 716 547Other aircraft expenses 1 206 447 826 391Total operational expenses 18 024 344 15 839 048
NOTE 05A: OTHER OPERATING EXPENSES
Other operating expenses amount to NOK 1 519.1 million (2015: NOK 1 263.2 million). Other op-erating expenses are related to the operating of systems, marketing, back office, consultants, and other costs not directly attributable to the operation of the aircraft fleet and related air-line-specific costs.
NOTE 06: PAYROLL EXPENSES AND NUMBER OF EMPLOYEES
NOK 1 000 2016 2015
Wages and salaries 1 910 976 1 598 875Social security tax 306 170 270 869Pension expenses 212 416 230 265Employee stock options 16 259 7 141Other benefits 160 801 185 744Hired crew personnel 1 364 790 1 140 810Total 3 971 412 3 433 703
Payroll expenses include hired crew personnel. The employees are participants in defined pen-sion plans. See Note 18 for details.
Number of man-labour years*2016 2015
Norway 1 835 1 730Spain 1 209 819United Kingdom 945 564Sweden 520 430Singapore/Bangkok 246 292Denmark 324 283USA 391 228Finland 204 175Ireland 77 55Italy 45 - Total 5 796 4 576
*) Including man-labour years related to hired crew personnel
NOTE 07: REMUNERATION OF THE BOARD OF DIRECTORS AND EXECUTIVE MANAGEMENT
Remuneration of the Board of DirectorsTotal remuneration paid to the Board in 2016 was NOK 1.5 million (2015: NOK 1.4 million). The Chair of the Board, Bjørn Kise, received NOK 0.5 million. (2015: NOK 0.5 million) There were no bonuses or other forms of compensation paid to the Board members in 2016.
Directive of Remuneration of the CEO and the Executive ManagementThe principles of Executive remuneration in Norwegian Air Shuttle ASA are to stimulate a strong and lasting performance oriented culture, enabling Norwegian to deliver on its strategy. The to-tal compensation level should be competitive, however, not market leading compared to similar
Help | Contents | Highlights | Letter from CEO | Board of Directors' report | Financial statements | CSR | Corporate governance | Board and management | Definitions | Contact | 37 / 99
NORWEGIAN ANNUAL REPORT 2016
Consolidated income statement 1.1 - 31.12Consolidated statement of comprehensive Income 1.1 - 31.12Consolidated statement of financial position at December 31Consolidated statement of changes in equity 1.1 – 31.12Consolidated cash flow statement 1.1 - 31.12Notes to the consolidated financial statementsNote 01: Summary of significant accounting policiesNote 02: Financial riskNote 03: Fair value estimationNote 04: Segment informationNote 05: Operating expensesNote 05A: Other operating expensesNote 06: Payroll expenses and number of employeesNote 07: Remuneration of the Board of Directors
and Executive managementNote 07A: Audit remunerationNote 08: Net financial itemsNote 09: TaxNote 10: Intangible assetsNote 11: Tangible assetsNote 12: Operating leasesNote 13: Trade and other receivablesNote 14: InventoriesNote 15: Equity and shareholder informationNote 16: Earnings per shareNote 17: OptionsNote 18: PensionsNote 19: Provisions and other long-term liabilitiesNote 20: Financial instrumentsNote 21: Trade and other payablesNote 22: BorrowingsNote 23: Assets pledged as collaterals and
guaranteesNote 24: Bank depositsNote 25: Investments in other entitiesNote 26: Related party transactionsNote 27: Contingencies and legal claimsNote 28: CommitmentsNote 29: Events after the reporting period INDEPENDENT AUDITOR’S REPORT
GROUP FINANCIAL STATEMENT

2016-NorwegiaN.iNdd • Created: 09.10.2014 • Modified: 06.04.2017 : 19:44 all rigths reserved © 2017 teigeNs desigN
organizations. The Board determines the remuneration of the CEO, and the guidelines for remu-neration of the Executive Management. The remuneration of the Board and the Executive Manage-ment must not have negative effects on the Group, nor damage the reputation and standing of the Group in the public eye.
There were made no changes to the guidelines or principles of Management remuneration during the 2016. The actual remuneration in 2016 was consistent with the guidelines and principles.
Compensation made to the Executive Management going forward will have its basis in Norwe-gian’s performance oriented culture, and should primarily consist of a fixed yearly salary with addi-tional compensations e.g. a company car, free telephone, internet and newspapers, and a standard
pension and insurance plan. The Executive Management is also a part of the Group’s stock option plan. The Board can also award key position holders with stock options.
The CEO does not receive compensation in form of performance-based salary or bonuses, ex-cept for options in the stock option plan. The Executive Management can on an individual level be awarded with a special compensation for profit enhancing projects. The Executive Management is a part of the Group’s collective pension plan for salaries up to 12 G, which applies to all employ-ees. The Executive Management has not been given any specific rights in case of terminated em-ployment.
Total compensation year 2016:
NOK 1 000 Fee Salary Bonus Other
benefits2Total
CompensationPension
expense3
The Board of DirectorsBjørn Kise, Chair of the Board 500 - - - 500 - Liv Berstad, Deputy Chair 300 - - - 300 - Christian Fredrik Stray, Director 275 - - - 275 - Ada Kjeseth, Director 275 - - - 275 - Thor Espen Bråthen, Director (elected by the employees) until October 2016 1 50 - - - 50 - Kenneth Utsikt, Director (elected by the employees) until October 2016 1 50 - - - 50 - Linda Olsen, Director (elected by the employees) 1 50 - - - 50 - Geir Olav Øien, Director (elected by the employees) from October 2016 1 - - - - - - Marcus Daniel Hall, Director (elected by the employees) from October 2016 1 - - - - - - Total board of directors 1 500 - - - 1 500 -
Executive managementBjørn Kjos (Chief Executive Officer) - 1 997 - 159 2 156 68Frode Foss (Chief Financial Officer) - 2 385 - 159 2 544 71Asgeir Nyseth (Chief Operating Officer) - 2 341 - 182 2 523 74Anne-Sissel Skånvik (Chief Communications Officer) - 1 722 - 121 1 843 79Thomas Ramdahl (Chief Commercial Officer) - 1 722 - 159 1 881 72Jan Dahm-Simonsen (Chief Human Resources Officer from September 2016) - 577 - 284 861 - Frode Berg (Chief Legal Officer) - 1 796 - 155 1 951 73Dag Skage (Chief Information Officer) - 1 722 - 160 1 882 72Tore Jenssen (CEO Norwegian Air International Ltd) - 1 823 - 155 1 978 71Edward Thorstad (Chief Customer Officer) - 1 617 - 167 1 784 72Bjørn Erik Barman-Jenssen (Managing Director - Norwegian Air Resources from September 2016) - 525 - 35 560 22Lennart Ceder (Chief Operating Officer -Norwegian Air UK Ltd) - 1 247 - 11 1 258 77Gunnar Martinsen (Senior Vice President HR and Organisation until August 2016) - 1 419 - 114 1 533 46Geir Steiro (Chief Operating Officer until August 2016) - 1 759 - 105 1 864 53Total Executive management - 22 652 - 1 966 24 618 850
1) For the employee representatives in the Board of Directors, only their fee for serving on the Board of Directors is stated. 2) Other benefits include company car, telephone, internet, etc.3) Pension expense reflects paid pension premium less employee contribution.
No share options were exercised by the Management in 2016. Refer to Note 15 for an overview of shares held by Management.
Help | Contents | Highlights | Letter from CEO | Board of Directors' report | Financial statements | CSR | Corporate governance | Board and management | Definitions | Contact | 38 / 99
NORWEGIAN ANNUAL REPORT 2016
Consolidated income statement 1.1 - 31.12Consolidated statement of comprehensive Income 1.1 - 31.12Consolidated statement of financial position at December 31Consolidated statement of changes in equity 1.1 – 31.12Consolidated cash flow statement 1.1 - 31.12Notes to the consolidated financial statementsNote 01: Summary of significant accounting policiesNote 02: Financial riskNote 03: Fair value estimationNote 04: Segment informationNote 05: Operating expensesNote 05A: Other operating expensesNote 06: Payroll expenses and number of employeesNote 07: Remuneration of the Board of Directors
and Executive managementNote 07A: Audit remunerationNote 08: Net financial itemsNote 09: TaxNote 10: Intangible assetsNote 11: Tangible assetsNote 12: Operating leasesNote 13: Trade and other receivablesNote 14: InventoriesNote 15: Equity and shareholder informationNote 16: Earnings per shareNote 17: OptionsNote 18: PensionsNote 19: Provisions and other long-term liabilitiesNote 20: Financial instrumentsNote 21: Trade and other payablesNote 22: BorrowingsNote 23: Assets pledged as collaterals and
guaranteesNote 24: Bank depositsNote 25: Investments in other entitiesNote 26: Related party transactionsNote 27: Contingencies and legal claimsNote 28: CommitmentsNote 29: Events after the reporting period INDEPENDENT AUDITOR’S REPORT
GROUP FINANCIAL STATEMENT
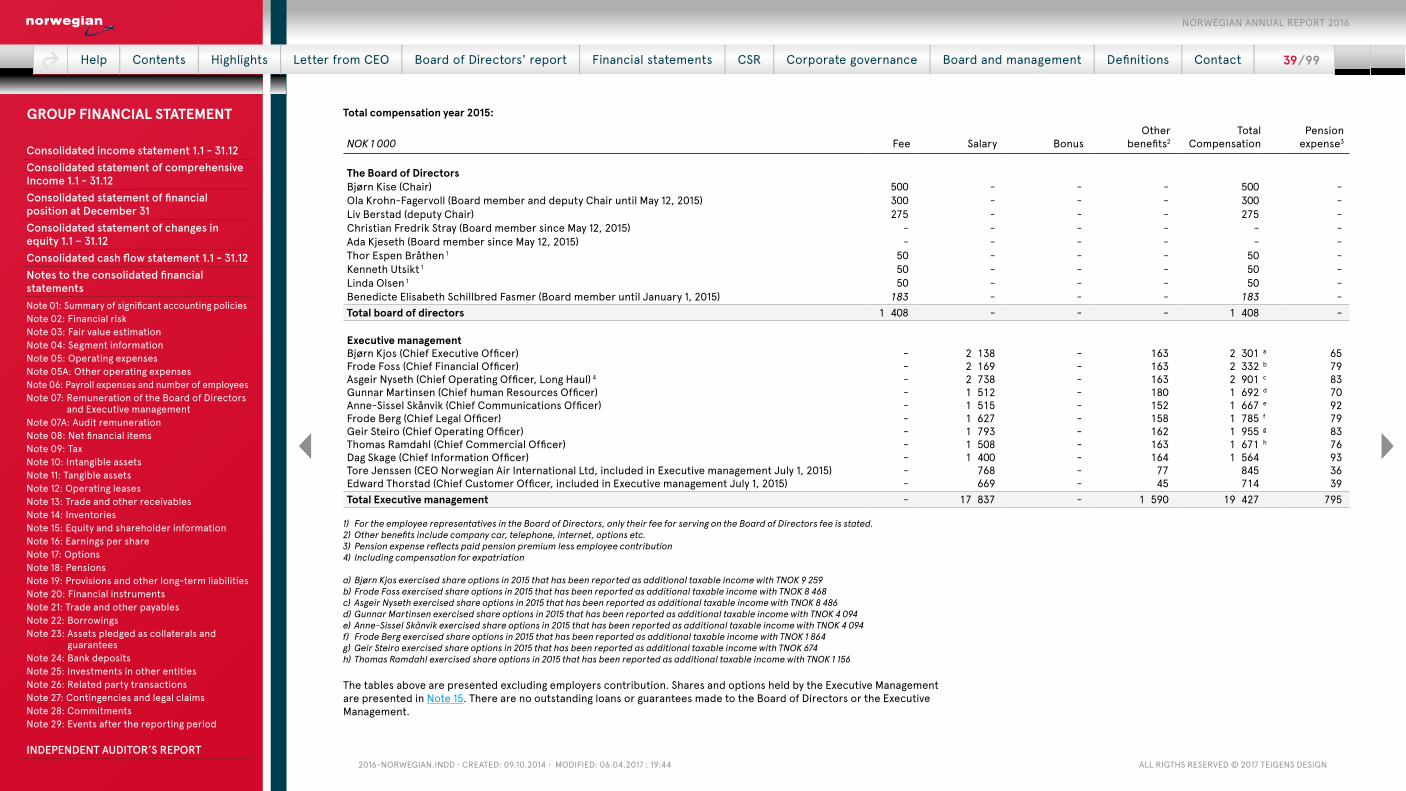
2016-NorwegiaN.iNdd • Created: 09.10.2014 • Modified: 06.04.2017 : 19:44 all rigths reserved © 2017 teigeNs desigN
Total compensation year 2015:
NOK 1 000 Fee Salary Bonus Other
benefits2Total
CompensationPension
expense3
The Board of DirectorsBjørn Kise (Chair) 500 - - - 500 -Ola Krohn-Fagervoll (Board member and deputy Chair until May 12, 2015) 300 - - - 300 -Liv Berstad (deputy Chair) 275 - - - 275 -Christian Fredrik Stray (Board member since May 12, 2015) - - - - - -Ada Kjeseth (Board member since May 12, 2015) - - - - - -Thor Espen Bråthen 1 50 - - - 50 -Kenneth Utsikt 1 50 - - - 50 -Linda Olsen 1 50 - - - 50 -Benedicte Elisabeth Schillbred Fasmer (Board member until January 1, 2015) 183 - - - 183 -Total board of directors 1 408 - - - 1 408 -
Executive managementBjørn Kjos (Chief Executive Officer) - 2 138 - 163 2 301 a 65Frode Foss (Chief Financial Officer) - 2 169 - 163 2 332 b 79Asgeir Nyseth (Chief Operating Officer, Long Haul) 4 - 2 738 - 163 2 901 c 83Gunnar Martinsen (Chief human Resources Officer) - 1 512 - 180 1 692 d 70Anne-Sissel Skånvik (Chief Communications Officer) - 1 515 - 152 1 667 e 92Frode Berg (Chief Legal Officer) - 1 627 - 158 1 785 f 79Geir Steiro (Chief Operating Officer) - 1 793 - 162 1 955 g 83Thomas Ramdahl (Chief Commercial Officer) - 1 508 - 163 1 671 h 76Dag Skage (Chief Information Officer) - 1 400 - 164 1 564 93Tore Jenssen (CEO Norwegian Air International Ltd, included in Executive management July 1, 2015) - 768 - 77 845 36Edward Thorstad (Chief Customer Officer, included in Executive management July 1, 2015) - 669 - 45 714 39Total Executive management - 17 837 - 1 590 19 427 795
1) For the employee representatives in the Board of Directors, only their fee for serving on the Board of Directors fee is stated. 2) Other benefits include company car, telephone, internet, options etc.3) Pension expense reflects paid pension premium less employee contribution4) Including compensation for expatriation
a) Bjørn Kjos exercised share options in 2015 that has been reported as additional taxable income with TNOK 9 259b) Frode Foss exercised share options in 2015 that has been reported as additional taxable income with TNOK 8 468c) Asgeir Nyseth exercised share options in 2015 that has been reported as additional taxable income with TNOK 8 486d) Gunnar Martinsen exercised share options in 2015 that has been reported as additional taxable income with TNOK 4 094e) Anne-Sissel Skånvik exercised share options in 2015 that has been reported as additional taxable income with TNOK 4 094f) Frode Berg exercised share options in 2015 that has been reported as additional taxable income with TNOK 1 864g) Geir Steiro exercised share options in 2015 that has been reported as additional taxable income with TNOK 674h) Thomas Ramdahl exercised share options in 2015 that has been reported as additional taxable income with TNOK 1 156 The tables above are presented excluding employers contribution. Shares and options held by the Executive Management are presented in Note 15. There are no outstanding loans or guarantees made to the Board of Directors or the Executive Management.
Help | Contents | Highlights | Letter from CEO | Board of Directors' report | Financial statements | CSR | Corporate governance | Board and management | Definitions | Contact | 39 / 99
NORWEGIAN ANNUAL REPORT 2016
Consolidated income statement 1.1 - 31.12Consolidated statement of comprehensive Income 1.1 - 31.12Consolidated statement of financial position at December 31Consolidated statement of changes in equity 1.1 – 31.12Consolidated cash flow statement 1.1 - 31.12Notes to the consolidated financial statementsNote 01: Summary of significant accounting policiesNote 02: Financial riskNote 03: Fair value estimationNote 04: Segment informationNote 05: Operating expensesNote 05A: Other operating expensesNote 06: Payroll expenses and number of employeesNote 07: Remuneration of the Board of Directors
and Executive managementNote 07A: Audit remunerationNote 08: Net financial itemsNote 09: TaxNote 10: Intangible assetsNote 11: Tangible assetsNote 12: Operating leasesNote 13: Trade and other receivablesNote 14: InventoriesNote 15: Equity and shareholder informationNote 16: Earnings per shareNote 17: OptionsNote 18: PensionsNote 19: Provisions and other long-term liabilitiesNote 20: Financial instrumentsNote 21: Trade and other payablesNote 22: BorrowingsNote 23: Assets pledged as collaterals and
guaranteesNote 24: Bank depositsNote 25: Investments in other entitiesNote 26: Related party transactionsNote 27: Contingencies and legal claimsNote 28: CommitmentsNote 29: Events after the reporting period INDEPENDENT AUDITOR’S REPORT
GROUP FINANCIAL STATEMENT

2016-NorwegiaN.iNdd • Created: 09.10.2014 • Modified: 06.04.2017 : 19:44 all rigths reserved © 2017 teigeNs desigN
NOTE 07A: AUDIT REMUNERATION
Audit remuneration (excl. VAT)NOK 1 000 2016 2015
Audit fee 7 738 5 525Other audit related services 2 440 474Tax advisory 99 - Other services 828 2 072Total 11 105 8 071
All amounts stated exclude VAT. Deloitte has been the Group’s auditor since June 21, 2013.
NOTE 08: NET FINANCIAL ITEMS
NOK 1 000 2016 2015
Interest income 43 625 74 181Interest expense (685 990) (463 348)Net foreign exchange (loss) or gain 116 476 26 503Appreciation cash equivalents 5 418 (2 122)Other financial items (4 383) (11 392)Net financial items (524 854) (376 178)
Foreign exchange derivatives and fuel derivatives are categorized as financial assets or finan-cial liabilities at fair value through profit or loss and are measured at fair value at each reporting date with changes in fair value recognized as other gains and losses within operating expenses.
Net foreign exchange gain of NOK 116.5 million is recognized in 2016 (2015: NOK 26.5 million gain). Non-interest bearing deposits for aircraft leases are initially measured at fair value and a periodic interest income is calculated using the same interest rate as for fair value calculation.
See Note 3 for fair value estimation and Note 20 for further information concerning available-for-sale financial assets.
Interest expenses include amortized cost on borrowings. Capitalized interests reduce interest expenses (Note 11).
NOTE 09: TAX
This year's tax expense consists of:
NOK 1 000 2016 2015
Tax payable 21 035 4 393 Adjustments from previous year (75 824) (127 141)Change in deferred tax 428 142 (48 366)Income tax expense 373 353 (171 114)
Tax expense adjustments from previous years recognized in 2016 consists of changes in de-ferred tax from previous years. Tax expense adjustments from previous years recognized in 2015 consists of both taxes paid in 2015 related to earlier year’s tax assessments, and changes in de-ferred tax from previous years. Tax payable of NOK 21 million in 2016 consist of estimated tax payable for current year income, of which NOK 113 million has already been paid in 2016, leaving an estimated tax payable balance of NOK 8 million at 31 December, 2016. Reconciliation from nominal to effective tax rate:
NOK 1 000 2016 2015
Profit before tax 1 508 333 75 038
Expected tax expense (income) using nominal tax rate (25%) 377 083 20 260
Tax effect of the following items:Non deductible expenses/income 3 637 (31 889)Adjustments from previous year (62 495) (127 141)Tax rate outside Norway other than 25% 40 835 (66 522)Change in tax rate 13 128 46 336 Other items 1 165 (12 158)Tax expense 373 353 (171 114)Effective tax rate 24.75% (228.04%)
Help | Contents | Highlights | Letter from CEO | Board of Directors' report | Financial statements | CSR | Corporate governance | Board and management | Definitions | Contact | 40 / 99
NORWEGIAN ANNUAL REPORT 2016
Consolidated income statement 1.1 - 31.12Consolidated statement of comprehensive Income 1.1 - 31.12Consolidated statement of financial position at December 31Consolidated statement of changes in equity 1.1 – 31.12Consolidated cash flow statement 1.1 - 31.12Notes to the consolidated financial statementsNote 01: Summary of significant accounting policiesNote 02: Financial riskNote 03: Fair value estimationNote 04: Segment informationNote 05: Operating expensesNote 05A: Other operating expensesNote 06: Payroll expenses and number of employeesNote 07: Remuneration of the Board of Directors
and Executive managementNote 07A: Audit remunerationNote 08: Net financial itemsNote 09: TaxNote 10: Intangible assetsNote 11: Tangible assetsNote 12: Operating leasesNote 13: Trade and other receivablesNote 14: InventoriesNote 15: Equity and shareholder informationNote 16: Earnings per shareNote 17: OptionsNote 18: PensionsNote 19: Provisions and other long-term liabilitiesNote 20: Financial instrumentsNote 21: Trade and other payablesNote 22: BorrowingsNote 23: Assets pledged as collaterals and
guaranteesNote 24: Bank depositsNote 25: Investments in other entitiesNote 26: Related party transactionsNote 27: Contingencies and legal claimsNote 28: CommitmentsNote 29: Events after the reporting period INDEPENDENT AUDITOR’S REPORT
GROUP FINANCIAL STATEMENT
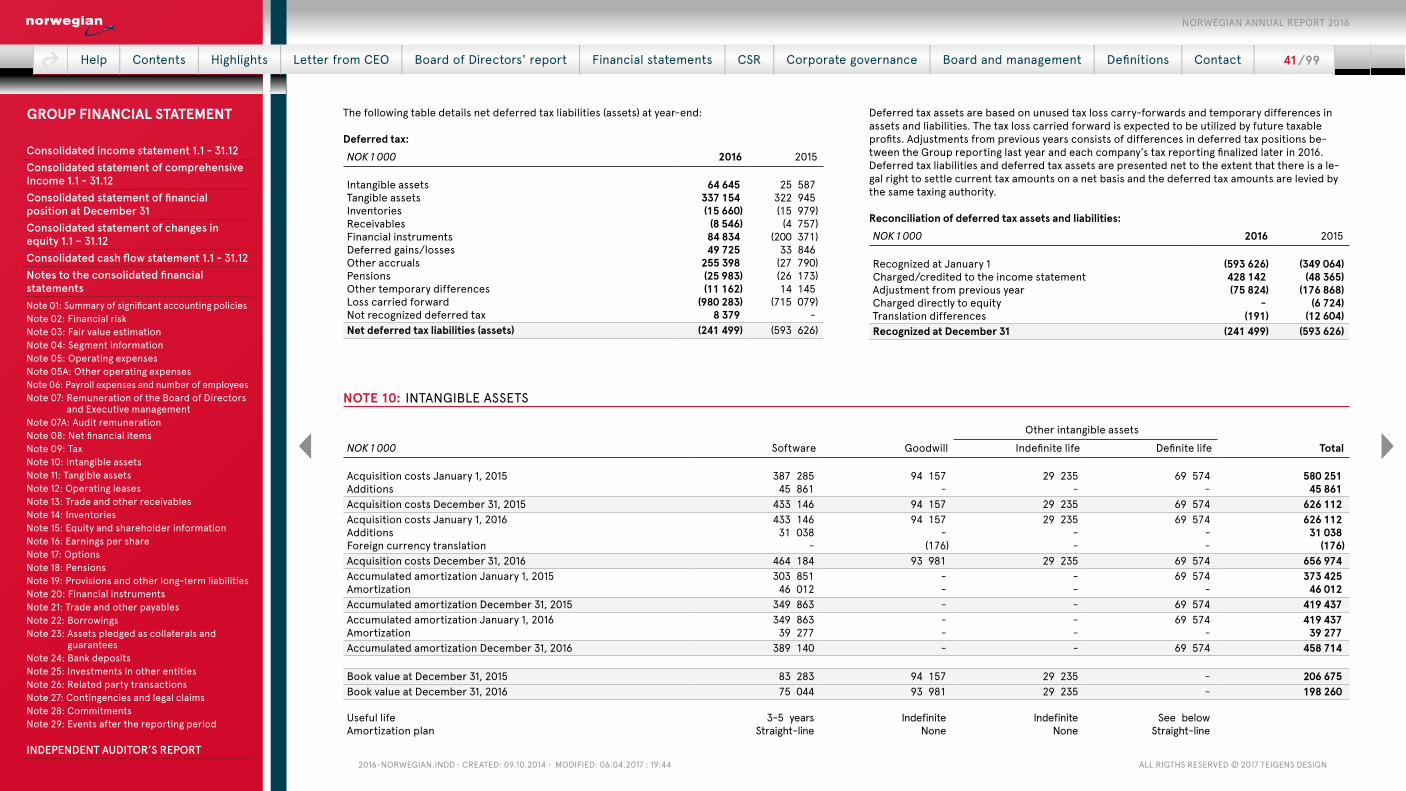
2016-NorwegiaN.iNdd • Created: 09.10.2014 • Modified: 06.04.2017 : 19:44 all rigths reserved © 2017 teigeNs desigN
The following table details net deferred tax liabilities (assets) at year-end:
Deferred tax:NOK 1 000 2016 2015
Intangible assets 64 645 25 587 Tangible assets 337 154 322 945 Inventories (15 660) (15 979)Receivables (8 546) (4 757)Financial instruments 84 834 (200 371)Deferred gains/losses 49 725 33 846 Other accruals 255 398 (27 790)Pensions (25 983) (26 173)Other temporary differences (11 162) 14 145 Loss carried forward (980 283) (715 079)Not recognized deferred tax 8 379 - Net deferred tax liabilities (assets) (241 499) (593 626)
NOTE 10: INTANGIBLE ASSETS
Other intangible assetsNOK 1 000 Software Goodwill Indefinite life Definite life Total
Acquisition costs January 1, 2015 387 285 94 157 29 235 69 574 580 251 Additions 45 861 - - - 45 861 Acquisition costs December 31, 2015 433 146 94 157 29 235 69 574 626 112Acquisition costs January 1, 2016 433 146 94 157 29 235 69 574 626 112 Additions 31 038 - - - 31 038 Foreign currency translation - (176) - - (176)Acquisition costs December 31, 2016 464 184 93 981 29 235 69 574 656 974Accumulated amortization January 1, 2015 303 851 - - 69 574 373 425 Amortization 46 012 - - - 46 012 Accumulated amortization December 31, 2015 349 863 - - 69 574 419 437Accumulated amortization January 1, 2016 349 863 - - 69 574 419 437 Amortization 39 277 - - - 39 277 Accumulated amortization December 31, 2016 389 140 - - 69 574 458 714
Book value at December 31, 2015 83 283 94 157 29 235 - 206 675Book value at December 31, 2016 75 044 93 981 29 235 - 198 260
Useful life 3-5 years Indefinite Indefinite See below Amortization plan Straight-line None None Straight-line
Deferred tax assets are based on unused tax loss carry-forwards and temporary differences in assets and liabilities. The tax loss carried forward is expected to be utilized by future taxable profits. Adjustments from previous years consists of differences in deferred tax positions be-tween the Group reporting last year and each company’s tax reporting finalized later in 2016. Deferred tax liabilities and deferred tax assets are presented net to the extent that there is a le-gal right to settle current tax amounts on a net basis and the deferred tax amounts are levied by the same taxing authority.
Reconciliation of deferred tax assets and liabilities:NOK 1 000 2016 2015
Recognized at January 1 (593 626) (349 064)Charged/credited to the income statement 428 142 (48 365)Adjustment from previous year (75 824) (176 868)Charged directly to equity - (6 724)Translation differences (191) (12 604)Recognized at December 31 (241 499) (593 626)
Help | Contents | Highlights | Letter from CEO | Board of Directors' report | Financial statements | CSR | Corporate governance | Board and management | Definitions | Contact | 41 / 99
NORWEGIAN ANNUAL REPORT 2016
Consolidated income statement 1.1 - 31.12Consolidated statement of comprehensive Income 1.1 - 31.12Consolidated statement of financial position at December 31Consolidated statement of changes in equity 1.1 – 31.12Consolidated cash flow statement 1.1 - 31.12Notes to the consolidated financial statementsNote 01: Summary of significant accounting policiesNote 02: Financial riskNote 03: Fair value estimationNote 04: Segment informationNote 05: Operating expensesNote 05A: Other operating expensesNote 06: Payroll expenses and number of employeesNote 07: Remuneration of the Board of Directors
and Executive managementNote 07A: Audit remunerationNote 08: Net financial itemsNote 09: TaxNote 10: Intangible assetsNote 11: Tangible assetsNote 12: Operating leasesNote 13: Trade and other receivablesNote 14: InventoriesNote 15: Equity and shareholder informationNote 16: Earnings per shareNote 17: OptionsNote 18: PensionsNote 19: Provisions and other long-term liabilitiesNote 20: Financial instrumentsNote 21: Trade and other payablesNote 22: BorrowingsNote 23: Assets pledged as collaterals and
guaranteesNote 24: Bank depositsNote 25: Investments in other entitiesNote 26: Related party transactionsNote 27: Contingencies and legal claimsNote 28: CommitmentsNote 29: Events after the reporting period INDEPENDENT AUDITOR’S REPORT
GROUP FINANCIAL STATEMENT
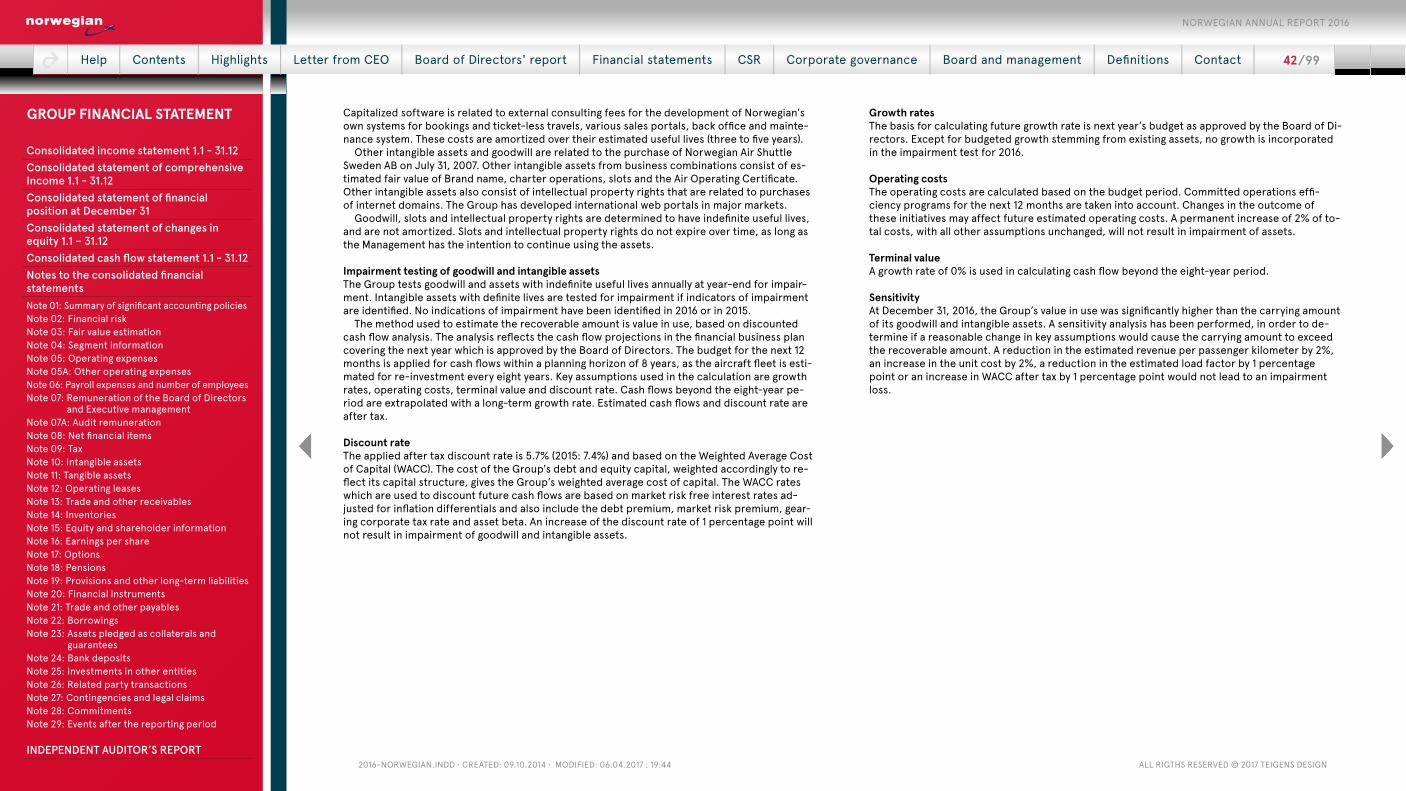
2016-NorwegiaN.iNdd • Created: 09.10.2014 • Modified: 06.04.2017 : 19:44 all rigths reserved © 2017 teigeNs desigN
Capitalized software is related to external consulting fees for the development of Norwegian's own systems for bookings and ticket-less travels, various sales portals, back office and mainte-nance system. These costs are amortized over their estimated useful lives (three to five years).
Other intangible assets and goodwill are related to the purchase of Norwegian Air Shuttle Sweden AB on July 31, 2007. Other intangible assets from business combinations consist of es-timated fair value of Brand name, charter operations, slots and the Air Operating Certificate. Other intangible assets also consist of intellectual property rights that are related to purchases of internet domains. The Group has developed international web portals in major markets.
Goodwill, slots and intellectual property rights are determined to have indefinite useful lives, and are not amortized. Slots and intellectual property rights do not expire over time, as long as the Management has the intention to continue using the assets.
Impairment testing of goodwill and intangible assets The Group tests goodwill and assets with indefinite useful lives annually at year-end for impair-ment. Intangible assets with definite lives are tested for impairment if indicators of impairment are identified. No indications of impairment have been identified in 2016 or in 2015.
The method used to estimate the recoverable amount is value in use, based on discounted cash flow analysis. The analysis reflects the cash flow projections in the financial business plan covering the next year which is approved by the Board of Directors. The budget for the next 12 months is applied for cash flows within a planning horizon of 8 years, as the aircraft fleet is esti-mated for re-investment every eight years. Key assumptions used in the calculation are growth rates, operating costs, terminal value and discount rate. Cash flows beyond the eight-year pe-riod are extrapolated with a long-term growth rate. Estimated cash flows and discount rate are after tax.
Discount rateThe applied after tax discount rate is 5.7% (2015: 7.4%) and based on the Weighted Average Cost of Capital (WACC). The cost of the Group's debt and equity capital, weighted accordingly to re-flect its capital structure, gives the Group’s weighted average cost of capital. The WACC rates which are used to discount future cash flows are based on market risk free interest rates ad-justed for inflation differentials and also include the debt premium, market risk premium, gear-ing corporate tax rate and asset beta. An increase of the discount rate of 1 percentage point will not result in impairment of goodwill and intangible assets.
Growth ratesThe basis for calculating future growth rate is next year’s budget as approved by the Board of Di-rectors. Except for budgeted growth stemming from existing assets, no growth is incorporated in the impairment test for 2016.
Operating costsThe operating costs are calculated based on the budget period. Committed operations effi-ciency programs for the next 12 months are taken into account. Changes in the outcome of these initiatives may affect future estimated operating costs. A permanent increase of 2% of to-tal costs, with all other assumptions unchanged, will not result in impairment of assets.
Terminal valueA growth rate of 0% is used in calculating cash flow beyond the eight-year period.
SensitivityAt December 31, 2016, the Group’s value in use was significantly higher than the carrying amount of its goodwill and intangible assets. A sensitivity analysis has been performed, in order to de-termine if a reasonable change in key assumptions would cause the carrying amount to exceed the recoverable amount. A reduction in the estimated revenue per passenger kilometer by 2%, an increase in the unit cost by 2%, a reduction in the estimated load factor by 1 percentage point or an increase in WACC after tax by 1 percentage point would not lead to an impairment loss.
Help | Contents | Highlights | Letter from CEO | Board of Directors' report | Financial statements | CSR | Corporate governance | Board and management | Definitions | Contact | 42 / 99
NORWEGIAN ANNUAL REPORT 2016
Consolidated income statement 1.1 - 31.12Consolidated statement of comprehensive Income 1.1 - 31.12Consolidated statement of financial position at December 31Consolidated statement of changes in equity 1.1 – 31.12Consolidated cash flow statement 1.1 - 31.12Notes to the consolidated financial statementsNote 01: Summary of significant accounting policiesNote 02: Financial riskNote 03: Fair value estimationNote 04: Segment informationNote 05: Operating expensesNote 05A: Other operating expensesNote 06: Payroll expenses and number of employeesNote 07: Remuneration of the Board of Directors
and Executive managementNote 07A: Audit remunerationNote 08: Net financial itemsNote 09: TaxNote 10: Intangible assetsNote 11: Tangible assetsNote 12: Operating leasesNote 13: Trade and other receivablesNote 14: InventoriesNote 15: Equity and shareholder informationNote 16: Earnings per shareNote 17: OptionsNote 18: PensionsNote 19: Provisions and other long-term liabilitiesNote 20: Financial instrumentsNote 21: Trade and other payablesNote 22: BorrowingsNote 23: Assets pledged as collaterals and
guaranteesNote 24: Bank depositsNote 25: Investments in other entitiesNote 26: Related party transactionsNote 27: Contingencies and legal claimsNote 28: CommitmentsNote 29: Events after the reporting period INDEPENDENT AUDITOR’S REPORT
GROUP FINANCIAL STATEMENT
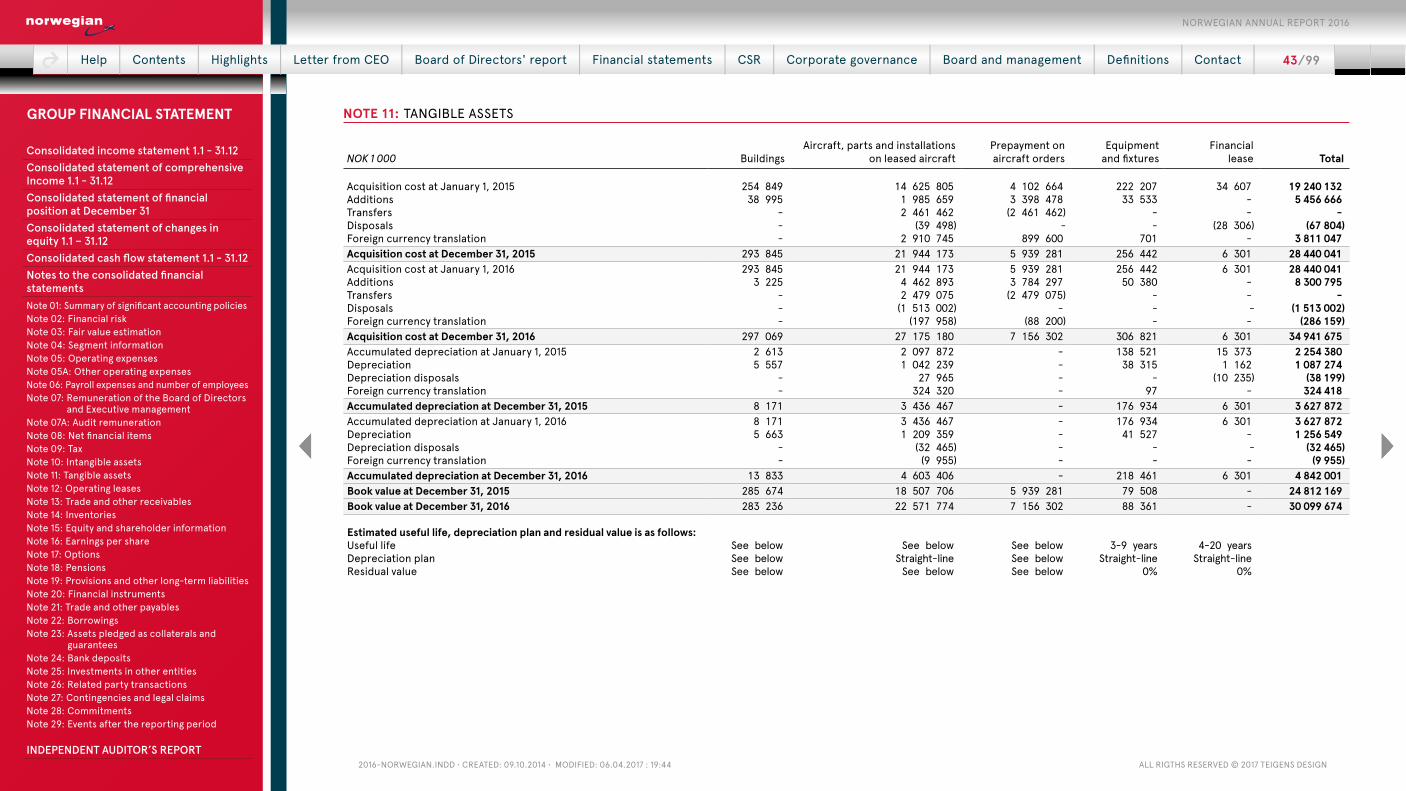
2016-NorwegiaN.iNdd • Created: 09.10.2014 • Modified: 06.04.2017 : 19:44 all rigths reserved © 2017 teigeNs desigN
NOTE 11: TANGIBLE ASSETS
NOK 1 000 BuildingsAircraft, parts and installations
on leased aircraftPrepayment on aircraft orders
Equipment and fixtures
Financial lease Total
Acquisition cost at January 1, 2015 254 849 14 625 805 4 102 664 222 207 34 607 19 240 132Additions 38 995 1 985 659 3 398 478 33 533 - 5 456 666Transfers - 2 461 462 (2 461 462) - - - Disposals - (39 498) - - (28 306) (67 804)Foreign currency translation - 2 910 745 899 600 701 - 3 811 047Acquisition cost at December 31, 2015 293 845 21 944 173 5 939 281 256 442 6 301 28 440 041Acquisition cost at January 1, 2016 293 845 21 944 173 5 939 281 256 442 6 301 28 440 041Additions 3 225 4 462 893 3 784 297 50 380 - 8 300 795Transfers - 2 479 075 (2 479 075) - - - Disposals - (1 513 002) - - - (1 513 002)Foreign currency translation - (197 958) (88 200) - - (286 159)Acquisition cost at December 31, 2016 297 069 27 175 180 7 156 302 306 821 6 301 34 941 675Accumulated depreciation at January 1, 2015 2 613 2 097 872 - 138 521 15 373 2 254 380Depreciation 5 557 1 042 239 - 38 315 1 162 1 087 274Depreciation disposals - 27 965 - - (10 235) (38 199)Foreign currency translation - 324 320 - 97 - 324 418Accumulated depreciation at December 31, 2015 8 171 3 436 467 - 176 934 6 301 3 627 872Accumulated depreciation at January 1, 2016 8 171 3 436 467 - 176 934 6 301 3 627 872Depreciation 5 663 1 209 359 - 41 527 - 1 256 549Depreciation disposals - (32 465) - - - (32 465)Foreign currency translation - (9 955) - - - (9 955)Accumulated depreciation at December 31, 2016 13 833 4 603 406 - 218 461 6 301 4 842 001Book value at December 31, 2015 285 674 18 507 706 5 939 281 79 508 - 24 812 169Book value at December 31, 2016 283 236 22 571 774 7 156 302 88 361 - 30 099 674
Estimated useful life, depreciation plan and residual value is as follows:Useful life See below See below See below 3-9 years 4-20 yearsDepreciation plan See below Straight-line See below Straight-line Straight-lineResidual value See below See below See below 0% 0%
Help | Contents | Highlights | Letter from CEO | Board of Directors' report | Financial statements | CSR | Corporate governance | Board and management | Definitions | Contact | 43 / 99
NORWEGIAN ANNUAL REPORT 2016
Consolidated income statement 1.1 - 31.12Consolidated statement of comprehensive Income 1.1 - 31.12Consolidated statement of financial position at December 31Consolidated statement of changes in equity 1.1 – 31.12Consolidated cash flow statement 1.1 - 31.12Notes to the consolidated financial statementsNote 01: Summary of significant accounting policiesNote 02: Financial riskNote 03: Fair value estimationNote 04: Segment informationNote 05: Operating expensesNote 05A: Other operating expensesNote 06: Payroll expenses and number of employeesNote 07: Remuneration of the Board of Directors
and Executive managementNote 07A: Audit remunerationNote 08: Net financial itemsNote 09: TaxNote 10: Intangible assetsNote 11: Tangible assetsNote 12: Operating leasesNote 13: Trade and other receivablesNote 14: InventoriesNote 15: Equity and shareholder informationNote 16: Earnings per shareNote 17: OptionsNote 18: PensionsNote 19: Provisions and other long-term liabilitiesNote 20: Financial instrumentsNote 21: Trade and other payablesNote 22: BorrowingsNote 23: Assets pledged as collaterals and
guaranteesNote 24: Bank depositsNote 25: Investments in other entitiesNote 26: Related party transactionsNote 27: Contingencies and legal claimsNote 28: CommitmentsNote 29: Events after the reporting period INDEPENDENT AUDITOR’S REPORT
GROUP FINANCIAL STATEMENT
2016-NorwegiaN.iNdd • Created: 09.10.2014 • Modified: 06.04.2017 : 19:44 all rigths reserved © 2017 teigeNs desigN
As at December 31, 2016, the Group operated a total of 118 aircraft (2015: 101), whereas 69 (2015: 54) were owned and 49 (2015: 47) were leased under operational leases. See Note 12 for details about operational leases.
AircraftThe Group acquired 17 Boeing 737-800 (2015: 10) and 2 Airbus 320neos (2015: 0) during 2016. In 2015, the Group acquired one Boeing 787-8 aircraft.
The residual value is NOK 7 000 million (2015: NOK 5 770 million) in total for all owned aircraft and deducted from the depreciable amount of the body of the aircraft. The life expectancy of the body of the aircraft is 25 years for the 737, 787 and A320neo aircraft, and the economic life of the owned aircraft is 25 years less the age of the aircraft at time of purchase.
The majority of the aircraft in the Group are accounted for in USD by the Groups subsidiary in Ireland, after transfers at December 31, 2013 and during 2014. Hence, the values in consolidated accounts as per December 31, 2016 include effects from currency translation.
Installations on leased aircraftThe installations on the leased aircraft include cabin interior modifications and other improve-ments to the aircraft after lease commencement. The capitalized value is depreciated over the remainder of the aircraft lease, which is between 1-10 years. Linear depreciation is applied and residual value is NOK 0. In 2016 and 2015 several engines on the leased aircraft were in overhaul, and replacement costs for life limited parts were capitalized to the extent that the costs were improvements to the engines and therefore exceeding the requirements that were specified in the leasing contracts. These components are depreciated at a defined rate per engine cycle, limited to the remainder of the aircraft lease.
Spare partsSpare parts consist of rotable parts for the aircraft and are depreciated over their useful life. The useful life of spare parts ranges between 5-8 years. Straight-line depreciation is applied and 25% of the acquisition cost is calculated as residual value.
BuildingsBuildings consist of 3 apartments in Berlin, purchased in 2007 for the purpose of housing crew and trainees stationed in Berlin on a temporary basis. In 2010, the Group purchased an apart-ment in Seattle, and in 2013 purchased and apartment in Florida, for the purpose of housing personnel stationed in the United States in respect of the delivery of new 737-800 aircraft and opening new destinations. The apartments are carried at acquisition cost. The residual value is estimated to equal the acquisition cost. In 2014, a new hangar at Gardermoen airport was con-structed. Additions in 2016 consist of improvements and upgrades to the hangar. The hangar is estimated to have a useful life of 50 years, and is depreciated linearly over its useful economic life. Residual value is NOK 0.
Prepayments to aircraft manufacturersIn 2007 the Group entered a purchase contract with Boeing Commercial Airplanes concerning 42 new 737-800 aircraft, with an option of purchasing 42 additional aircraft. The contract was extended in June 2011 for an additional 15 Boeing 737-800. In 2011, the Group entered a pur-chase contract with Icelandair for the right to acquire 3 Boeing 787-8 Dreamliner aircraft, which Icelandair had on order with Boeing Commercial Airplanes. In January 2012, the Group entered into additional purchase contracts with Boeing Commercial airplanes and Airbus S.A.S. com-
prising a total of 372 aircraft, of which 222 were firm orders. On October 22, 2015, the subsidi-ary Arctic Aviation Assets Ltd entered into a purchase contract for 19 new 787-9 Dreamliner air-craft, with an additional purchase option of 10 aircraft. Note 2.6 includes a table showing the timeline of future deliveries.
At December 31, 2016, 69 owned and 17 sale and lease backs had been delivered (2015: 54 and 13). Until delivery of the aircraft, the Group will make prepayments to aircraft manufactur-ers, following a defined prepayment schedule. The Group capitalizes borrowing costs incurred for the construction of qualifying assets during the period of time which is required to complete the aircraft. Borrowing costs of NOK 262.1 million (2015: NOK 268.6 million) have been capital-ized during the year. An average capitalization rate of 4.7% (2015: 4.1%) was used.
Financial lease assetsIn 2009, the Group entered into lease agreements concerning de-icing equipment and elec-tronic flight bag equipment. The lease agreements are classified as financial leases as all risks and rewards are transferred to the Group after the end of the lease agreement. The financial lease assets are depreciated over their useful lives. De-icing equipment is depreciated over 20 years, while electronic flight bag equipment is depreciated over 4 years. Residual value of finan-cial lease assets is 0. In 2015, the Group sold the de-icing equipment at book value.
Impairment of tangible assetsTangible assets are tested for impairment if there are indicators that impairment may exist. No such indicators were identified in 2016 or 2015, and as such no impairment losses have been recognized.
For information regarding assets pledged as collateral for debt, see Note 23.
NOTE 12: OPERATING LEASES
The lease agreements on the Boeing 737 aircraft last between 3 and 12 years from the date of agreement, with some extension options. The lease agreements on the Boeing 787 aircraft last for 12 years with an option for extension. From 2002 to 2014, 71 aircraft were delivered. In 2016 8 aircraft (2015: 0) were delivered including 4 787-9 Dreamliners and sale leaseback. During 2016, operational lease contracts for 4 additional 787-9 Dreamliners were signed, bringing the total commitment for new deliveries of 787-9 Dreamliners to 11 at the end of 2016, with expected de-liveries in 2017 and 2018.
Renegotiations have resulted in the extension of some of the shorter leases. In 2016, 6 (2015: 4) aircraft were redelivered to the lessor. Contracts for 4 of the aircraft will expire in 2017. The remaining contracts expire in 2018 or later.
Leasing costs expensed on aircraft lease within operational expenses was NOK 2 841.9 million in 2016 (2015: NOK 2 213.3 million). Included in leasing costs are operating lease costs on aircraft from sale-and-leaseback transactions.
In addition, the Group leases 1 (2015: 1) car and 46 (2015: 37) properties in Oslo, Dublin and London in addition to properties in all the operating bases world-wide. Leasing costs related to cars and properties expensed in other operating expenses in 2016 was NOK 73.8 million. (2015: NOK 63.1 million).
Help | Contents | Highlights | Letter from CEO | Board of Directors' report | Financial statements | CSR | Corporate governance | Board and management | Definitions | Contact | 44 / 99
NORWEGIAN ANNUAL REPORT 2016
Consolidated income statement 1.1 - 31.12Consolidated statement of comprehensive Income 1.1 - 31.12Consolidated statement of financial position at December 31Consolidated statement of changes in equity 1.1 – 31.12Consolidated cash flow statement 1.1 - 31.12Notes to the consolidated financial statementsNote 01: Summary of significant accounting policiesNote 02: Financial riskNote 03: Fair value estimationNote 04: Segment informationNote 05: Operating expensesNote 05A: Other operating expensesNote 06: Payroll expenses and number of employeesNote 07: Remuneration of the Board of Directors
and Executive managementNote 07A: Audit remunerationNote 08: Net financial itemsNote 09: TaxNote 10: Intangible assetsNote 11: Tangible assetsNote 12: Operating leasesNote 13: Trade and other receivablesNote 14: InventoriesNote 15: Equity and shareholder informationNote 16: Earnings per shareNote 17: OptionsNote 18: PensionsNote 19: Provisions and other long-term liabilitiesNote 20: Financial instrumentsNote 21: Trade and other payablesNote 22: BorrowingsNote 23: Assets pledged as collaterals and
guaranteesNote 24: Bank depositsNote 25: Investments in other entitiesNote 26: Related party transactionsNote 27: Contingencies and legal claimsNote 28: CommitmentsNote 29: Events after the reporting period INDEPENDENT AUDITOR’S REPORT
GROUP FINANCIAL STATEMENT
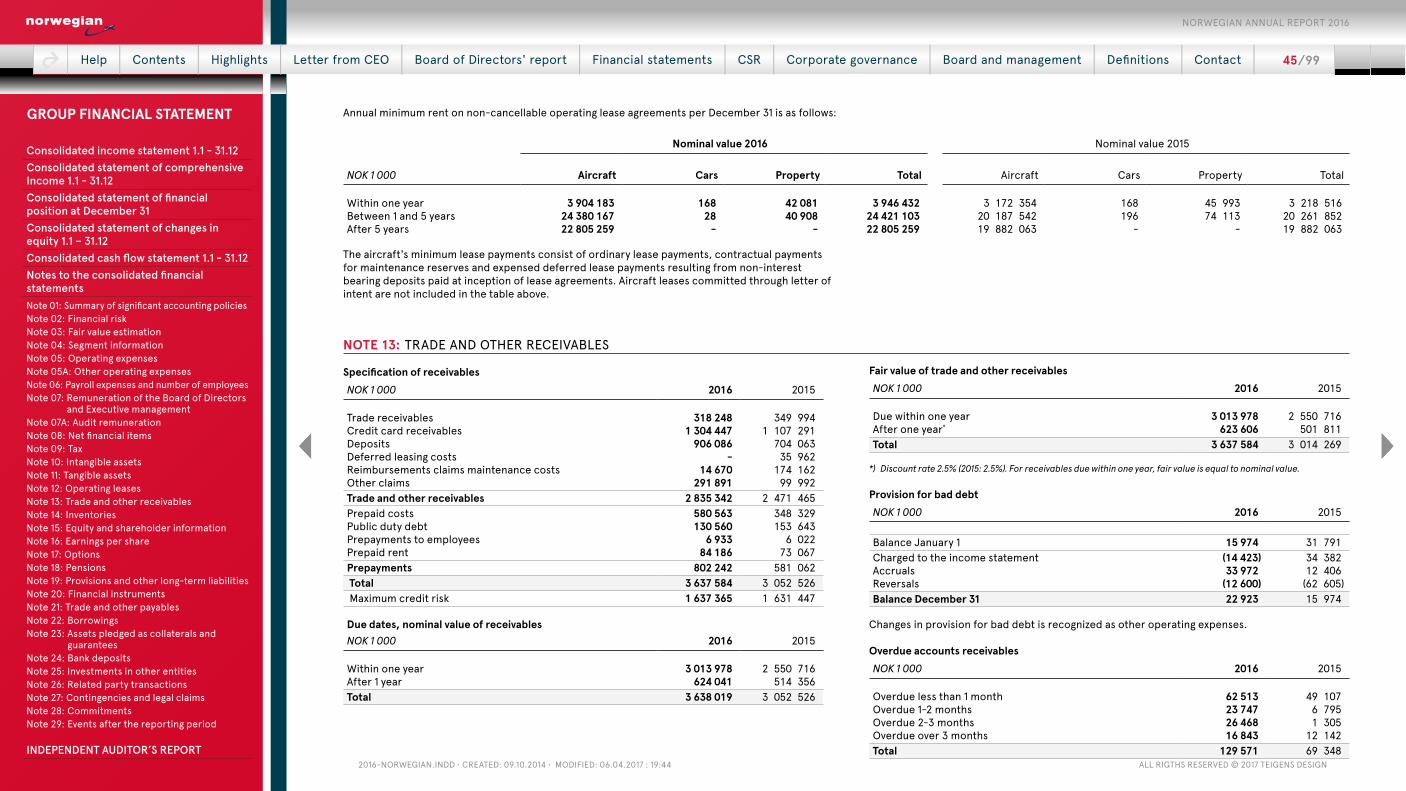
2016-NorwegiaN.iNdd • Created: 09.10.2014 • Modified: 06.04.2017 : 19:44 all rigths reserved © 2017 teigeNs desigN
Annual minimum rent on non-cancellable operating lease agreements per December 31 is as follows:
Nominal value 2016 Nominal value 2015
NOK 1 000 Aircraft Cars Property Total Aircraft Cars Property Total
Within one year 3 904 183 168 42 081 3 946 432 3 172 354 168 45 993 3 218 516 Between 1 and 5 years 24 380 167 28 40 908 24 421 103 20 187 542 196 74 113 20 261 852 After 5 years 22 805 259 - - 22 805 259 19 882 063 - - 19 882 063
The aircraft's minimum lease payments consist of ordinary lease payments, contractual payments for maintenance reserves and expensed deferred lease payments resulting from non-interest bearing deposits paid at inception of lease agreements. Aircraft leases committed through letter of intent are not included in the table above.
NOTE 13: TRADE AND OTHER RECEIVABLES
Specification of receivablesNOK 1 000 2016 2015
Trade receivables 318 248 349 994 Credit card receivables 1 304 447 1 107 291 Deposits 906 086 704 063 Deferred leasing costs - 35 962 Reimbursements claims maintenance costs 14 670 174 162 Other claims 291 891 99 992 Trade and other receivables 2 835 342 2 471 465 Prepaid costs 580 563 348 329 Public duty debt 130 560 153 643 Prepayments to employees 6 933 6 022 Prepaid rent 84 186 73 067 Prepayments 802 242 581 062 Total 3 637 584 3 052 526 Maximum credit risk 1 637 365 1 631 447
Due dates, nominal value of receivablesNOK 1 000 2016 2015
Within one year 3 013 978 2 550 716 After 1 year 624 041 514 356 Total 3 638 019 3 052 526
Fair value of trade and other receivables NOK 1 000 2016 2015
Due within one year 3 013 978 2 550 716 After one year* 623 606 501 811 Total 3 637 584 3 014 269
*) Discount rate 2.5% (2015: 2.5%). For receivables due within one year, fair value is equal to nominal value.
Provision for bad debt NOK 1 000 2016 2015
Balance January 1 15 974 31 791 Charged to the income statement (14 423) 34 382 Accruals 33 972 12 406 Reversals (12 600) (62 605)Balance December 31 22 923 15 974
Changes in provision for bad debt is recognized as other operating expenses. Overdue accounts receivables NOK 1 000 2016 2015
Overdue less than 1 month 62 513 49 107 Overdue 1-2 months 23 747 6 795 Overdue 2-3 months 26 468 1 305 Overdue over 3 months 16 843 12 142 Total 129 571 69 348
Help | Contents | Highlights | Letter from CEO | Board of Directors' report | Financial statements | CSR | Corporate governance | Board and management | Definitions | Contact | 45 / 99
NORWEGIAN ANNUAL REPORT 2016
Consolidated income statement 1.1 - 31.12Consolidated statement of comprehensive Income 1.1 - 31.12Consolidated statement of financial position at December 31Consolidated statement of changes in equity 1.1 – 31.12Consolidated cash flow statement 1.1 - 31.12Notes to the consolidated financial statementsNote 01: Summary of significant accounting policiesNote 02: Financial riskNote 03: Fair value estimationNote 04: Segment informationNote 05: Operating expensesNote 05A: Other operating expensesNote 06: Payroll expenses and number of employeesNote 07: Remuneration of the Board of Directors
and Executive managementNote 07A: Audit remunerationNote 08: Net financial itemsNote 09: TaxNote 10: Intangible assetsNote 11: Tangible assetsNote 12: Operating leasesNote 13: Trade and other receivablesNote 14: InventoriesNote 15: Equity and shareholder informationNote 16: Earnings per shareNote 17: OptionsNote 18: PensionsNote 19: Provisions and other long-term liabilitiesNote 20: Financial instrumentsNote 21: Trade and other payablesNote 22: BorrowingsNote 23: Assets pledged as collaterals and
guaranteesNote 24: Bank depositsNote 25: Investments in other entitiesNote 26: Related party transactionsNote 27: Contingencies and legal claimsNote 28: CommitmentsNote 29: Events after the reporting period INDEPENDENT AUDITOR’S REPORT
GROUP FINANCIAL STATEMENT

2016-NorwegiaN.iNdd • Created: 09.10.2014 • Modified: 06.04.2017 : 19:44 all rigths reserved © 2017 teigeNs desigN
Provisions for bad debt include trade – and credit card receivables. The provisions for bad debts on trade receivables relates to provisions for overdue receivables that are not impaired at December 31. Overdue accounts receivables include trade receivables and credit card receiv-ables.
Non-interest bearing deposits are measured at amortized cost in the statement of financial po-sition. Deposits denominated in foreign currencies are converted using the prevailing exchange rates on the reporting date.
NOTE 14: INVENTORIES
NOK 1 000 2016 2015
Consumables 89 267 90 943 Parts for heavy maintenance 13 198 13 198 Total 102 465 104 141
In 2016 and 2015 the Group removed stock parts from aircraft engines in relation to heavy main-tenance. These parts are held for sale and sold in secondary markets. Charges for obsolete parts in 2016 were NOK 39.4 million (2015: NOK 33.9 million).
NOTE 15: EQUITY AND SHAREHOLDER INFORMATION
Shares and share issues in 2015 and 2016:
NOK 1 000
Number of ordinary
sharesShare
capital Share
premium Total
January 1, 2015 35 162 139 3 516 1 093 549 1 097 065Share issue May 7, 2015 252 500 25 58 353 58 378Share issue July 23, 2015 183 500 18 42 407 42 425Share issue September 18, 2015 161 500 16 37 323 37 339December 31, 2015 35 759 639 3 576 1 231 631 1 235 207
There were no shares issued in 2016December 31, 2016 35 759 639 3 576 1 231 631 1 235 207
All issued shares are fully paid with a par value of 0.1 NOK per share (2015: 0.1 NOK per share). There is only one category of shares, and all shares have equal rights. For information about em-ployee share options, see Note 17.
DESCRIPTION OF ITEMS BOOKED DIRECTLY ON SHAREHOLDER’S EQUITY:Other comprehensive incomeNOK -103.0 million has been booked as exchange rate differences under comprehensive income in 2016 (2015: NOK 421.1 million). The exchange differences arise from translating the non-Nor-wegian subsidiaries from functional currency to presentation currency. In addition, the compa-ny’s share of other comprehensive income in associated companies during 2016 amount to NOK 1.2 million.
Actuarial gains and lossesDuring 2016, NOK 24.5 million in actuarial loss arising from defined benefit pension plans was booked directly to equity (2015: 44.5). Stock option plan Share options were granted in 2013, under which a total of 625 000 share options were granted to the Management and to key personnel. The options had an exercise price 10% above the weighted average price on March 20, 2013 which is equal to NOK 231.20. The options granted were to be exercised two years after the grant, and the exercise window were set to six months. In 2015, the stock options granted in 2013 were either exercised or terminated. No new share op-tions were granted in 2015.
A total of 625 000 share options were granted to Management and key personnel in 2016. The options have an exercise price 10% above the weighted average price the 10 last trading days as of July 13, 2016, which is equal to NOK 321.00. The options granted may be exercised two years after the grant. The exercise window is six months. The potential gain on the options has a maxi-mum cap of three times basic salary per year minus employer contribution tax, (effectively, 5 154 times basic salary).
Total share option expense in 2016 was NOK 12.6 million (2015: NOK 7.1). See Note 17 for further details.
Help | Contents | Highlights | Letter from CEO | Board of Directors' report | Financial statements | CSR | Corporate governance | Board and management | Definitions | Contact | 46 / 99
NORWEGIAN ANNUAL REPORT 2016
Consolidated income statement 1.1 - 31.12Consolidated statement of comprehensive Income 1.1 - 31.12Consolidated statement of financial position at December 31Consolidated statement of changes in equity 1.1 – 31.12Consolidated cash flow statement 1.1 - 31.12Notes to the consolidated financial statementsNote 01: Summary of significant accounting policiesNote 02: Financial riskNote 03: Fair value estimationNote 04: Segment informationNote 05: Operating expensesNote 05A: Other operating expensesNote 06: Payroll expenses and number of employeesNote 07: Remuneration of the Board of Directors
and Executive managementNote 07A: Audit remunerationNote 08: Net financial itemsNote 09: TaxNote 10: Intangible assetsNote 11: Tangible assetsNote 12: Operating leasesNote 13: Trade and other receivablesNote 14: InventoriesNote 15: Equity and shareholder informationNote 16: Earnings per shareNote 17: OptionsNote 18: PensionsNote 19: Provisions and other long-term liabilitiesNote 20: Financial instrumentsNote 21: Trade and other payablesNote 22: BorrowingsNote 23: Assets pledged as collaterals and
guaranteesNote 24: Bank depositsNote 25: Investments in other entitiesNote 26: Related party transactionsNote 27: Contingencies and legal claimsNote 28: CommitmentsNote 29: Events after the reporting period INDEPENDENT AUDITOR’S REPORT
GROUP FINANCIAL STATEMENT
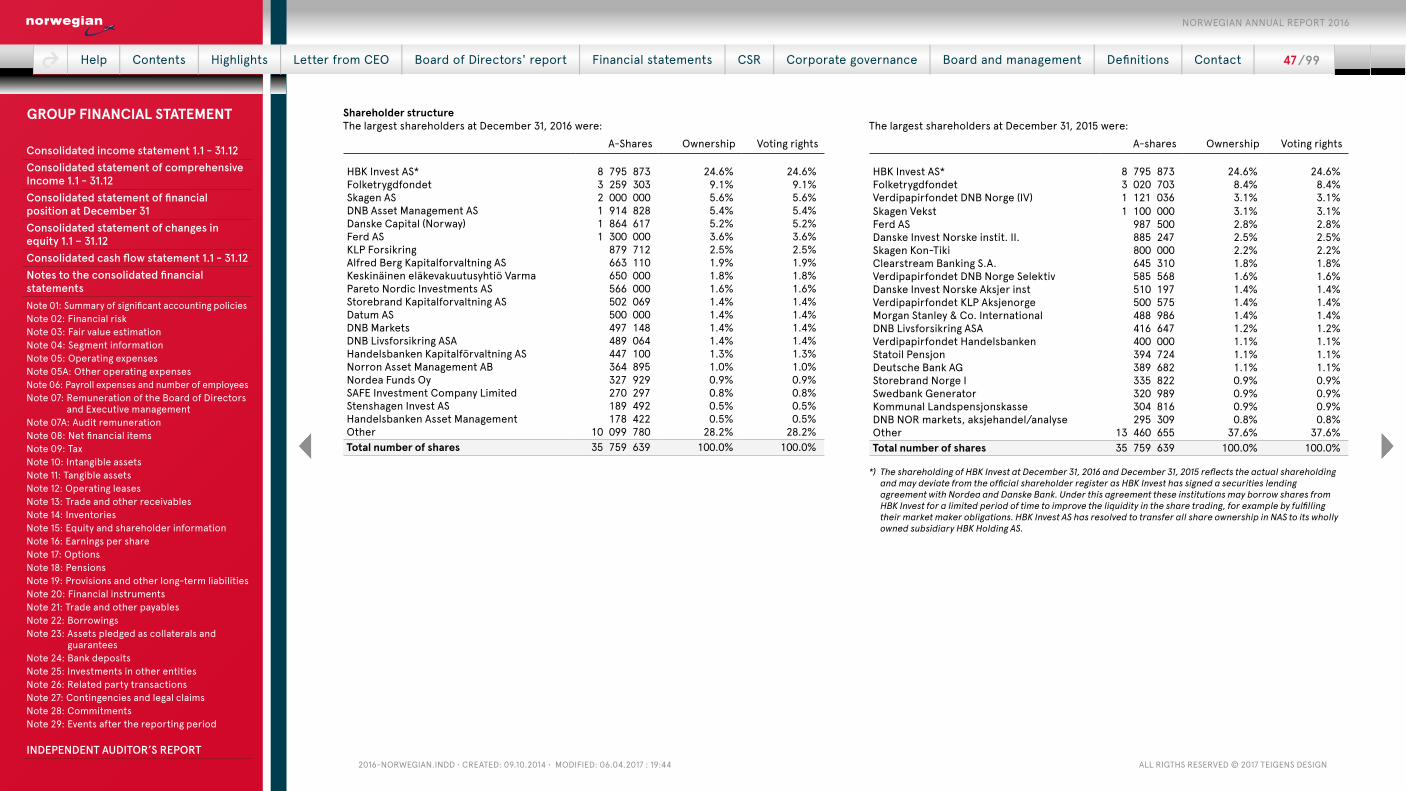
2016-NorwegiaN.iNdd • Created: 09.10.2014 • Modified: 06.04.2017 : 19:44 all rigths reserved © 2017 teigeNs desigN
Shareholder structureThe largest shareholders at December 31, 2016 were:
A-Shares Ownership Voting rights
HBK Invest AS* 8 795 873 24.6% 24.6%Folketrygdfondet 3 259 303 9.1% 9.1%Skagen AS 2 000 000 5.6% 5.6%DNB Asset Management AS 1 914 828 5.4% 5.4%Danske Capital (Norway) 1 864 617 5.2% 5.2%Ferd AS 1 300 000 3.6% 3.6%KLP Forsikring 879 712 2.5% 2.5%Alfred Berg Kapitalforvaltning AS 663 110 1.9% 1.9%Keskinäinen eläkevakuutusyhtiö Varma 650 000 1.8% 1.8%Pareto Nordic Investments AS 566 000 1.6% 1.6%Storebrand Kapitalforvaltning AS 502 069 1.4% 1.4%Datum AS 500 000 1.4% 1.4%DNB Markets 497 148 1.4% 1.4%DNB Livsforsikring ASA 489 064 1.4% 1.4%Handelsbanken Kapitalförvaltning AS 447 100 1.3% 1.3%Norron Asset Management AB 364 895 1.0% 1.0%Nordea Funds Oy 327 929 0.9% 0.9%SAFE Investment Company Limited 270 297 0.8% 0.8%Stenshagen Invest AS 189 492 0.5% 0.5%Handelsbanken Asset Management 178 422 0.5% 0.5%Other 10 099 780 28.2% 28.2%Total number of shares 35 759 639 100.0% 100.0%
The largest shareholders at December 31, 2015 were:
A-shares Ownership Voting rights
HBK Invest AS* 8 795 873 24.6% 24.6%Folketrygdfondet 3 020 703 8.4% 8.4%Verdipapirfondet DNB Norge (IV) 1 121 036 3.1% 3.1%Skagen Vekst 1 100 000 3.1% 3.1%Ferd AS 987 500 2.8% 2.8%Danske Invest Norske instit. II. 885 247 2.5% 2.5%Skagen Kon-Tiki 800 000 2.2% 2.2%Clearstream Banking S.A. 645 310 1.8% 1.8%Verdipapirfondet DNB Norge Selektiv 585 568 1.6% 1.6%Danske Invest Norske Aksjer inst 510 197 1.4% 1.4%Verdipapirfondet KLP Aksjenorge 500 575 1.4% 1.4%Morgan Stanley & Co. International 488 986 1.4% 1.4%DNB Livsforsikring ASA 416 647 1.2% 1.2%Verdipapirfondet Handelsbanken 400 000 1.1% 1.1%Statoil Pensjon 394 724 1.1% 1.1%Deutsche Bank AG 389 682 1.1% 1.1%Storebrand Norge I 335 822 0.9% 0.9%Swedbank Generator 320 989 0.9% 0.9%Kommunal Landspensjonskasse 304 816 0.9% 0.9%DNB NOR markets, aksjehandel/analyse 295 309 0.8% 0.8%Other 13 460 655 37.6% 37.6%Total number of shares 35 759 639 100.0% 100.0%
*) The shareholding of HBK Invest at December 31, 2016 and December 31, 2015 reflects the actual shareholding and may deviate from the official shareholder register as HBK Invest has signed a securities lending agreement with Nordea and Danske Bank. Under this agreement these institutions may borrow shares from HBK Invest for a limited period of time to improve the liquidity in the share trading, for example by fulfilling their market maker obligations. HBK Invest AS has resolved to transfer all share ownership in NAS to its wholly owned subsidiary HBK Holding AS.
Help | Contents | Highlights | Letter from CEO | Board of Directors' report | Financial statements | CSR | Corporate governance | Board and management | Definitions | Contact | 47 / 99
NORWEGIAN ANNUAL REPORT 2016
Consolidated income statement 1.1 - 31.12Consolidated statement of comprehensive Income 1.1 - 31.12Consolidated statement of financial position at December 31Consolidated statement of changes in equity 1.1 – 31.12Consolidated cash flow statement 1.1 - 31.12Notes to the consolidated financial statementsNote 01: Summary of significant accounting policiesNote 02: Financial riskNote 03: Fair value estimationNote 04: Segment informationNote 05: Operating expensesNote 05A: Other operating expensesNote 06: Payroll expenses and number of employeesNote 07: Remuneration of the Board of Directors
and Executive managementNote 07A: Audit remunerationNote 08: Net financial itemsNote 09: TaxNote 10: Intangible assetsNote 11: Tangible assetsNote 12: Operating leasesNote 13: Trade and other receivablesNote 14: InventoriesNote 15: Equity and shareholder informationNote 16: Earnings per shareNote 17: OptionsNote 18: PensionsNote 19: Provisions and other long-term liabilitiesNote 20: Financial instrumentsNote 21: Trade and other payablesNote 22: BorrowingsNote 23: Assets pledged as collaterals and
guaranteesNote 24: Bank depositsNote 25: Investments in other entitiesNote 26: Related party transactionsNote 27: Contingencies and legal claimsNote 28: CommitmentsNote 29: Events after the reporting period INDEPENDENT AUDITOR’S REPORT
GROUP FINANCIAL STATEMENT
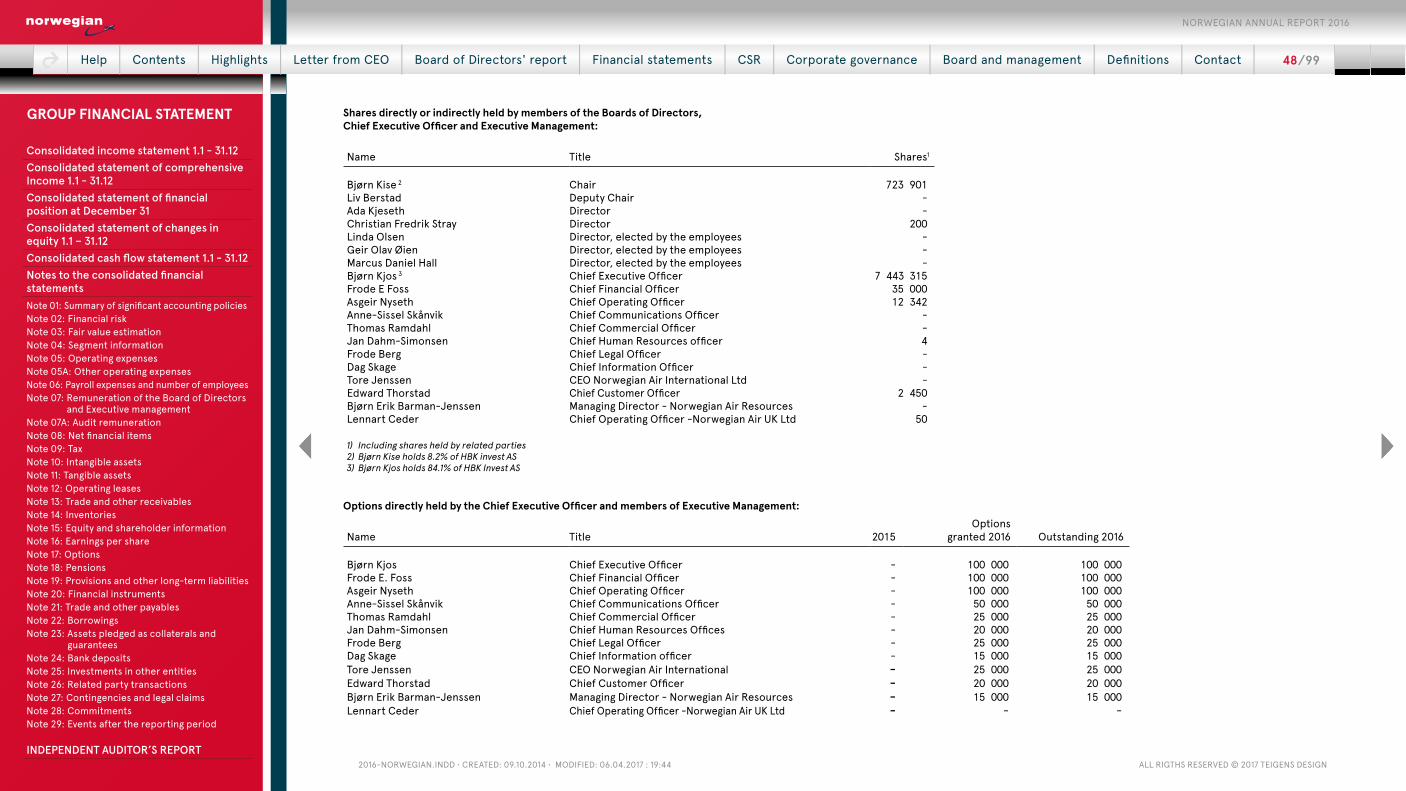
2016-NorwegiaN.iNdd • Created: 09.10.2014 • Modified: 06.04.2017 : 19:44 all rigths reserved © 2017 teigeNs desigN
Shares directly or indirectly held by members of the Boards of Directors, Chief Executive Officer and Executive Management:
Name Title Shares1
Bjørn Kise 2 Chair 723 901 Liv Berstad Deputy Chair - Ada Kjeseth Director - Christian Fredrik Stray Director 200 Linda Olsen Director, elected by the employees - Geir Olav Øien Director, elected by the employees - Marcus Daniel Hall Director, elected by the employees - Bjørn Kjos 3 Chief Executive Officer 7 443 315 Frode E Foss Chief Financial Officer 35 000 Asgeir Nyseth Chief Operating Officer 12 342 Anne-Sissel Skånvik Chief Communications Officer - Thomas Ramdahl Chief Commercial Officer - Jan Dahm-Simonsen Chief Human Resources officer 4 Frode Berg Chief Legal Officer - Dag Skage Chief Information Officer - Tore Jenssen CEO Norwegian Air International Ltd - Edward Thorstad Chief Customer Officer 2 450 Bjørn Erik Barman-Jenssen Managing Director - Norwegian Air Resources - Lennart Ceder Chief Operating Officer -Norwegian Air UK Ltd 50
1) Including shares held by related parties2) Bjørn Kise holds 8.2% of HBK invest AS3) Bjørn Kjos holds 84.1% of HBK Invest AS
Options directly held by the Chief Executive Officer and members of Executive Management:
Name Title 2015Options
granted 2016 Outstan ding 2016
Bjørn Kjos Chief Executive Officer - 100 000 100 000 Frode E. Foss Chief Financial Officer - 100 000 100 000 Asgeir Nyseth Chief Operating Officer - 100 000 100 000 Anne-Sissel Skånvik Chief Communications Officer - 50 000 50 000 Thomas Ramdahl Chief Commercial Officer - 25 000 25 000 Jan Dahm-Simonsen Chief Human Resources Offices - 20 000 20 000 Frode Berg Chief Legal Officer - 25 000 25 000 Dag Skage Chief Information officer - 15 000 15 000 Tore Jenssen CEO Norwegian Air International - 25 000 25 000 Edward Thorstad Chief Customer Officer - 20 000 20 000 Bjørn Erik Barman-Jenssen Managing Director - Norwegian Air Resources - 15 000 15 000 Lennart Ceder Chief Operating Officer -Norwegian Air UK Ltd - - -
Help | Contents | Highlights | Letter from CEO | Board of Directors' report | Financial statements | CSR | Corporate governance | Board and management | Definitions | Contact | 48 / 99
NORWEGIAN ANNUAL REPORT 2016
Consolidated income statement 1.1 - 31.12Consolidated statement of comprehensive Income 1.1 - 31.12Consolidated statement of financial position at December 31Consolidated statement of changes in equity 1.1 – 31.12Consolidated cash flow statement 1.1 - 31.12Notes to the consolidated financial statementsNote 01: Summary of significant accounting policiesNote 02: Financial riskNote 03: Fair value estimationNote 04: Segment informationNote 05: Operating expensesNote 05A: Other operating expensesNote 06: Payroll expenses and number of employeesNote 07: Remuneration of the Board of Directors
and Executive managementNote 07A: Audit remunerationNote 08: Net financial itemsNote 09: TaxNote 10: Intangible assetsNote 11: Tangible assetsNote 12: Operating leasesNote 13: Trade and other receivablesNote 14: InventoriesNote 15: Equity and shareholder informationNote 16: Earnings per shareNote 17: OptionsNote 18: PensionsNote 19: Provisions and other long-term liabilitiesNote 20: Financial instrumentsNote 21: Trade and other payablesNote 22: BorrowingsNote 23: Assets pledged as collaterals and
guaranteesNote 24: Bank depositsNote 25: Investments in other entitiesNote 26: Related party transactionsNote 27: Contingencies and legal claimsNote 28: CommitmentsNote 29: Events after the reporting period INDEPENDENT AUDITOR’S REPORT
GROUP FINANCIAL STATEMENT
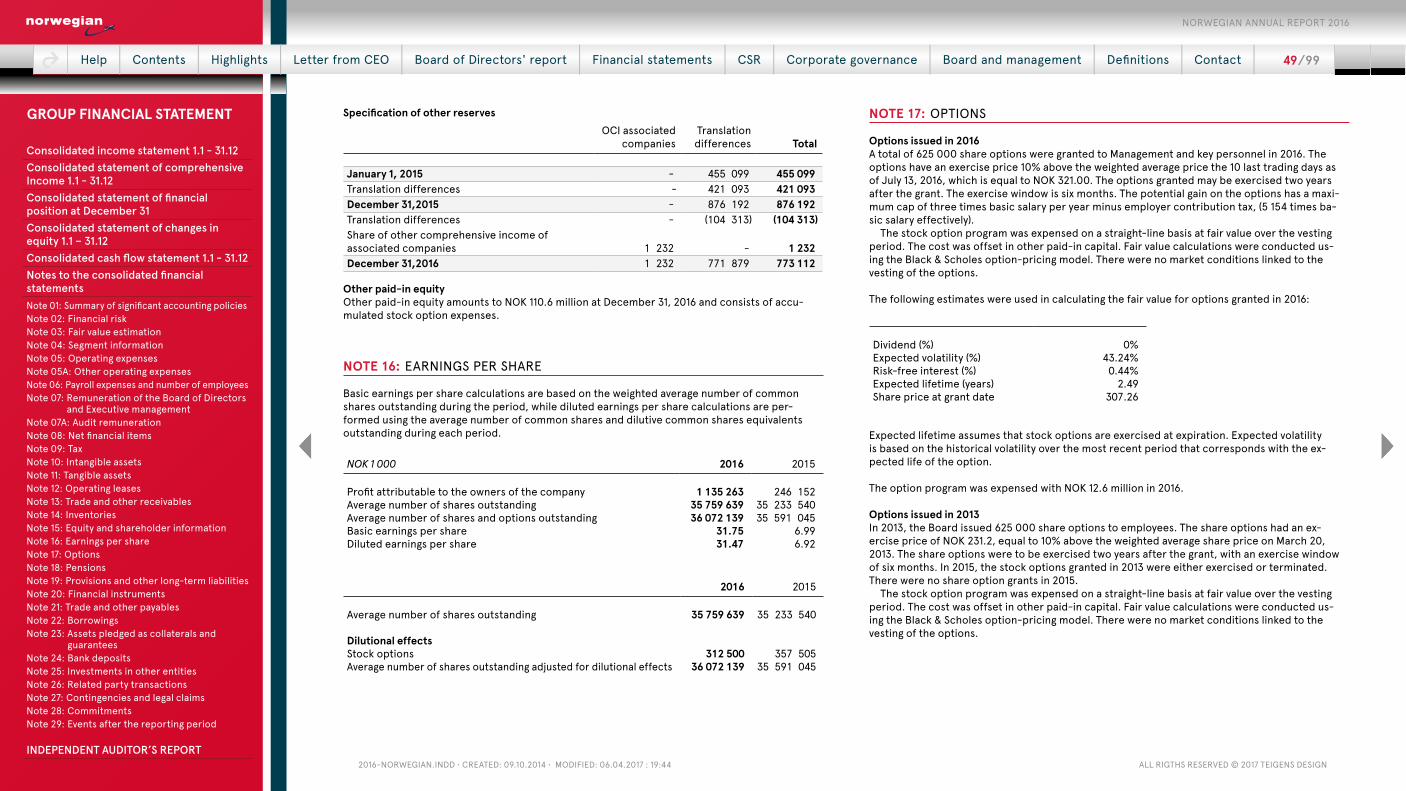
2016-NorwegiaN.iNdd • Created: 09.10.2014 • Modified: 06.04.2017 : 19:44 all rigths reserved © 2017 teigeNs desigN
Specification of other reserves OCI associated
companiesTranslation differences Total
January 1, 2015 - 455 099 455 099 Translation differences - 421 093 421 093 December 31,2015 - 876 192 876 192 Translation differences - (104 313) (104 313)Share of other comprehensive income of associated companies 1 232 - 1 232 December 31,2016 1 232 771 879 773 112
Other paid-in equityOther paid-in equity amounts to NOK 110.6 million at December 31, 2016 and consists of accu-mulated stock option expenses.
NOTE 16: EARNINGS PER SHARE
Basic earnings per share calculations are based on the weighted average number of common shares outstanding during the period, while diluted earnings per share calculations are per-formed using the average number of common shares and dilutive common shares equivalents outstanding during each period.
NOK 1 000 2016 2015
Profit attributable to the owners of the company 1 135 263 246 152Average number of shares outstanding 35 759 639 35 233 540Average number of shares and options outstanding 36 072 139 35 591 045Basic earnings per share 31.75 6.99Diluted earnings per share 31.47 6.92
2016 2015
Average number of shares outstanding 35 759 639 35 233 540
Dilutional effectsStock options 312 500 357 505Average number of shares outstanding adjusted for dilutional effects 36 072 139 35 591 045
NOTE 17: OPTIONS
Options issued in 2016A total of 625 000 share options were granted to Management and key personnel in 2016. The options have an exercise price 10% above the weighted average price the 10 last trading days as of July 13, 2016, which is equal to NOK 321.00. The options granted may be exercised two years after the grant. The exercise window is six months. The potential gain on the options has a maxi-mum cap of three times basic salary per year minus employer contribution tax, (5 154 times ba-sic salary effectively).
The stock option program was expensed on a straight-line basis at fair value over the vesting period. The cost was offset in other paid-in capital. Fair value calculations were conducted us-ing the Black & Scholes option-pricing model. There were no market conditions linked to the vesting of the options.
The following estimates were used in calculating the fair value for options granted in 2016:
Dividend (%) 0%Expected volatility (%) 43.24%Risk-free interest (%) 0.44%Expected lifetime (years) 2.49Share price at grant date 307.26
Expected lifetime assumes that stock options are exercised at expiration. Expected volatility is based on the historical volatility over the most recent period that corresponds with the ex-pected life of the option.
The option program was expensed with NOK 12.6 million in 2016.
Options issued in 2013In 2013, the Board issued 625 000 share options to employees. The share options had an ex-ercise price of NOK 231.2, equal to 10% above the weighted average share price on March 20, 2013. The share options were to be exercised two years after the grant, with an exercise window of six months. In 2015, the stock options granted in 2013 were either exercised or terminated. There were no share option grants in 2015.
The stock option program was expensed on a straight-line basis at fair value over the vesting period. The cost was offset in other paid-in capital. Fair value calculations were conducted us-ing the Black & Scholes option-pricing model. There were no market conditions linked to the vesting of the options.
Help | Contents | Highlights | Letter from CEO | Board of Directors' report | Financial statements | CSR | Corporate governance | Board and management | Definitions | Contact | 49 / 99
NORWEGIAN ANNUAL REPORT 2016
Consolidated income statement 1.1 - 31.12Consolidated statement of comprehensive Income 1.1 - 31.12Consolidated statement of financial position at December 31Consolidated statement of changes in equity 1.1 – 31.12Consolidated cash flow statement 1.1 - 31.12Notes to the consolidated financial statementsNote 01: Summary of significant accounting policiesNote 02: Financial riskNote 03: Fair value estimationNote 04: Segment informationNote 05: Operating expensesNote 05A: Other operating expensesNote 06: Payroll expenses and number of employeesNote 07: Remuneration of the Board of Directors
and Executive managementNote 07A: Audit remunerationNote 08: Net financial itemsNote 09: TaxNote 10: Intangible assetsNote 11: Tangible assetsNote 12: Operating leasesNote 13: Trade and other receivablesNote 14: InventoriesNote 15: Equity and shareholder informationNote 16: Earnings per shareNote 17: OptionsNote 18: PensionsNote 19: Provisions and other long-term liabilitiesNote 20: Financial instrumentsNote 21: Trade and other payablesNote 22: BorrowingsNote 23: Assets pledged as collaterals and
guaranteesNote 24: Bank depositsNote 25: Investments in other entitiesNote 26: Related party transactionsNote 27: Contingencies and legal claimsNote 28: CommitmentsNote 29: Events after the reporting period INDEPENDENT AUDITOR’S REPORT
GROUP FINANCIAL STATEMENT
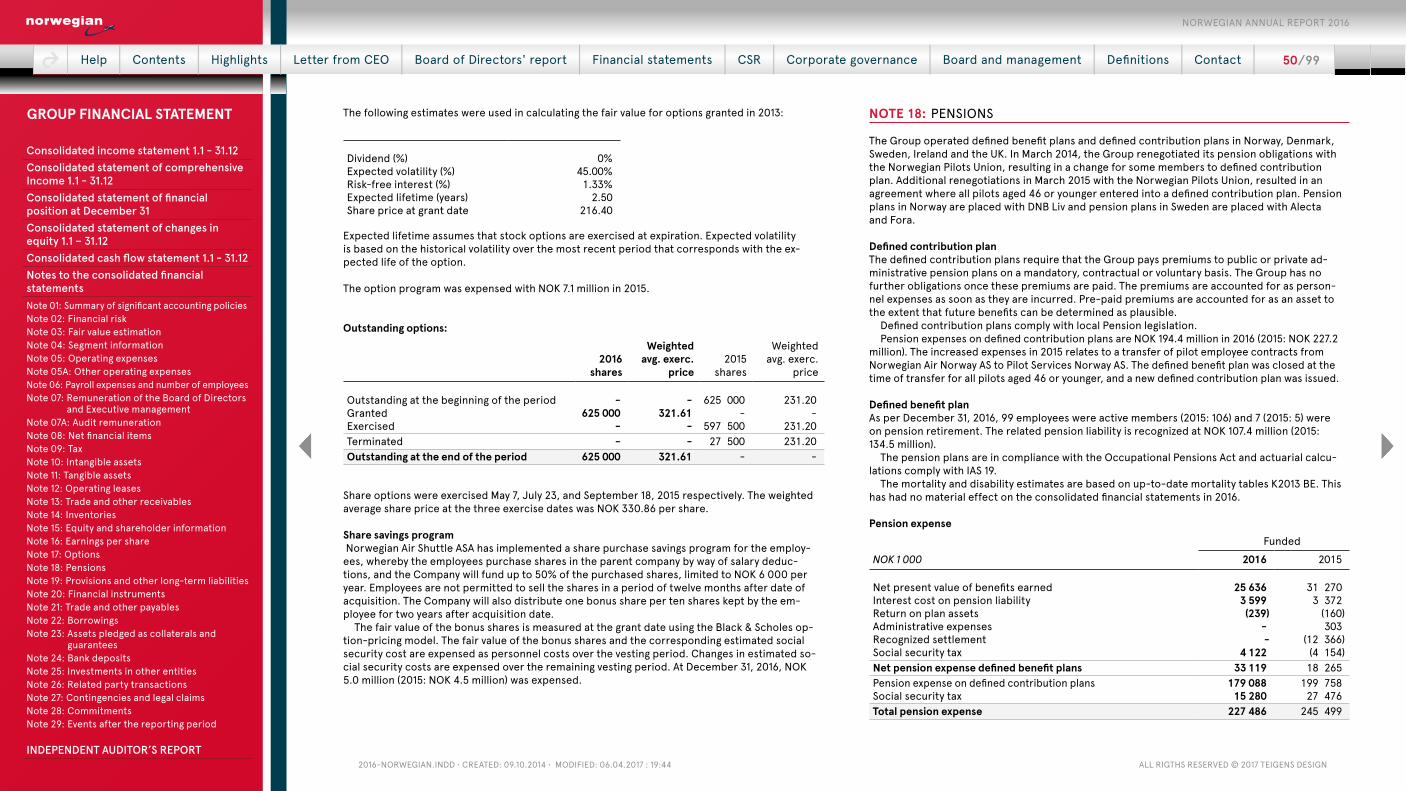
2016-NorwegiaN.iNdd • Created: 09.10.2014 • Modified: 06.04.2017 : 19:44 all rigths reserved © 2017 teigeNs desigN
The following estimates were used in calculating the fair value for options granted in 2013:
Dividend (%) 0%Expected volatility (%) 45.00%Risk-free interest (%) 1.33%Expected lifetime (years) 2.50Share price at grant date 216.40
Expected lifetime assumes that stock options are exercised at expiration. Expected volatility is based on the historical volatility over the most recent period that corresponds with the ex-pected life of the option.
The option program was expensed with NOK 7.1 million in 2015.
Outstanding options:
2016shares
Weighted avg. exerc.
price 2015
shares
Weighted avg. exerc.
price
Outstanding at the beginning of the period - - 625 000 231.20Granted 625 000 321.61 - - Exercised - - 597 500 231.20Terminated - - 27 500 231.20Outstanding at the end of the period 625 000 321.61 - -
Share options were exercised May 7, July 23, and September 18, 2015 respectively. The weighted average share price at the three exercise dates was NOK 330.86 per share.
Share savings program Norwegian Air Shuttle ASA has implemented a share purchase savings program for the employ-ees, whereby the employees purchase shares in the parent company by way of salary deduc-tions, and the Company will fund up to 50% of the purchased shares, limited to NOK 6 000 per year. Employees are not permitted to sell the shares in a period of twelve months after date of acquisition. The Company will also distribute one bonus share per ten shares kept by the em-ployee for two years after acquisition date.
The fair value of the bonus shares is measured at the grant date using the Black & Scholes op-tion-pricing model. The fair value of the bonus shares and the corresponding estimated social security cost are expensed as personnel costs over the vesting period. Changes in estimated so-cial security costs are expensed over the remaining vesting period. At December 31, 2016, NOK 5.0 million (2015: NOK 4.5 million) was expensed.
NOTE 18: PENSIONS
The Group operated defined benefit plans and defined contribution plans in Norway, Denmark, Sweden, Ireland and the UK. In March 2014, the Group renegotiated its pension obligations with the Norwegian Pilots Union, resulting in a change for some members to defined contribution plan. Additional renegotiations in March 2015 with the Norwegian Pilots Union, resulted in an agreement where all pilots aged 46 or younger entered into a defined contribution plan. Pension plans in Norway are placed with DNB Liv and pension plans in Sweden are placed with Alecta and Fora.
Defined contribution planThe defined contribution plans require that the Group pays premiums to public or private ad-ministrative pension plans on a mandatory, contractual or voluntary basis. The Group has no further obligations once these premiums are paid. The premiums are accounted for as person-nel expenses as soon as they are incurred. Pre-paid premiums are accounted for as an asset to the extent that future benefits can be determined as plausible.
Defined contribution plans comply with local Pension legislation.Pension expenses on defined contribution plans are NOK 194.4 million in 2016 (2015: NOK 227.2
million). The increased expenses in 2015 relates to a transfer of pilot employee contracts from Norwegian Air Norway AS to Pilot Services Norway AS. The defined benefit plan was closed at the time of transfer for all pilots aged 46 or younger, and a new defined contribution plan was issued.
Defined benefit plan As per December 31, 2016, 99 employees were active members (2015: 106) and 7 (2015: 5) were on pension retirement. The related pension liability is recognized at NOK 107.4 million (2015: 134.5 million).
The pension plans are in compliance with the Occupational Pensions Act and actuarial calcu-lations comply with IAS 19.
The mortality and disability estimates are based on up-to-date mortality tables K2013 BE. This has had no material effect on the consolidated financial statements in 2016.
Pension expense Funded
NOK 1 000 2016 2015
Net present value of benefits earned 25 636 31 270Interest cost on pension liability 3 599 3 372Return on plan assets (239) (160)Administrative expenses - 303Recognized settlement - (12 366)Social security tax 4 122 (4 154)Net pension expense defined benefit plans 33 119 18 265Pension expense on defined contribution plans 179 088 199 758Social security tax 15 280 27 476Total pension expense 227 486 245 499
Help | Contents | Highlights | Letter from CEO | Board of Directors' report | Financial statements | CSR | Corporate governance | Board and management | Definitions | Contact | 50 / 99
NORWEGIAN ANNUAL REPORT 2016
Consolidated income statement 1.1 - 31.12Consolidated statement of comprehensive Income 1.1 - 31.12Consolidated statement of financial position at December 31Consolidated statement of changes in equity 1.1 – 31.12Consolidated cash flow statement 1.1 - 31.12Notes to the consolidated financial statementsNote 01: Summary of significant accounting policiesNote 02: Financial riskNote 03: Fair value estimationNote 04: Segment informationNote 05: Operating expensesNote 05A: Other operating expensesNote 06: Payroll expenses and number of employeesNote 07: Remuneration of the Board of Directors
and Executive managementNote 07A: Audit remunerationNote 08: Net financial itemsNote 09: TaxNote 10: Intangible assetsNote 11: Tangible assetsNote 12: Operating leasesNote 13: Trade and other receivablesNote 14: InventoriesNote 15: Equity and shareholder informationNote 16: Earnings per shareNote 17: OptionsNote 18: PensionsNote 19: Provisions and other long-term liabilitiesNote 20: Financial instrumentsNote 21: Trade and other payablesNote 22: BorrowingsNote 23: Assets pledged as collaterals and
guaranteesNote 24: Bank depositsNote 25: Investments in other entitiesNote 26: Related party transactionsNote 27: Contingencies and legal claimsNote 28: CommitmentsNote 29: Events after the reporting period INDEPENDENT AUDITOR’S REPORT
GROUP FINANCIAL STATEMENT

2016-NorwegiaN.iNdd • Created: 09.10.2014 • Modified: 06.04.2017 : 19:44 all rigths reserved © 2017 teigeNs desigN
Defined benefit liability and fund Funded
NOK 1 000 2016 2015
Change in present value of defined benefit liability:Gross pension liability January 1 193 582 243 243Current service costs 28 791 36 499Interest cost 5 032 4 206Actuarial gains/losses (26 210) (86 010)Effect of new disability plan (2 575) - Settlement (394) - Benefits paid - (9)Social security on payments to plan (4 173) (4 348)Gross pension liability 31.12 194 053 193 582
Change in fair value of plan assets:Fair value of pension assets January 1 59 066 65 613Expected return 1 467 801Actuarial gains/losses (1 758) (38 176)Effect of new disability plan (1 300) - Contributions paid 33 765 35 185Benefits paid (394) (9)Social security on payments to plan (4 173) (4 348)Fair value of plan assets December 31 86 675 59 066Net pension liability 107 379 134 516Social security tax - - Net recognized pension liability December 31 107 379 134 516
2016 2015
Actual return on pension funds* 3.60% 4.80%Expected contribution to be paid next year (NOK 1 000) 37 885 15 535
*) Actual return on pension funds is based on reported amounts per first quarter each year.
The net pension liability was based on several assumptions. The discount rate was based on long-term government bonds in Norway, with adjustments for duration. The pension liability's average duration was 25 years. Wage adjustments, pension adjustments and the expected in-crease in state pensions were based on historical observations for the Group, and an expected long-term inflation rate of 2.5%.
2016 2015
Discount rate 2.10% 2.70%Expected return on pension funds 2.10% 2.70%Wage adjustments 2.00% 2.25%Increase of social security base amount (G) 2.00% 2.25%Future pension increase 0.00% 0.00%Average turnover 2-8% 2-8%
The Group’s pension fund was invested in the following instruments:
2016 2015
Equity 5.1% 6.1%Alternative investments 0.0% 4.0%Bonds 12.1% 13.6%Money market funds 25.3% 25.2%Hold-to maturity bonds 30.7% 33.9%Real estate 6.4% 14.7%Various 20.4% 2.6%
The table shows actual distribution of plan assets at December 31, 2016 and 2015.
Historical informationNOK 1 000 2016 2015 2014 2013 2012
Present value of defined benefit obligation 194 053 193 582 243 243 124 671 - Fair value of plan assets 86 675 59 066 65 613 14 204 - Deficit/(surplus) in the plan 107 379 134 516 177 630 110 468 - Experience adjustments on plan liabilities (26 210) (86 010) 45 654 - - Experience adjustments on plan assets (1 758) (38 176) 6 839 - -
Help | Contents | Highlights | Letter from CEO | Board of Directors' report | Financial statements | CSR | Corporate governance | Board and management | Definitions | Contact | 51 / 99
NORWEGIAN ANNUAL REPORT 2016
Consolidated income statement 1.1 - 31.12Consolidated statement of comprehensive Income 1.1 - 31.12Consolidated statement of financial position at December 31Consolidated statement of changes in equity 1.1 – 31.12Consolidated cash flow statement 1.1 - 31.12Notes to the consolidated financial statementsNote 01: Summary of significant accounting policiesNote 02: Financial riskNote 03: Fair value estimationNote 04: Segment informationNote 05: Operating expensesNote 05A: Other operating expensesNote 06: Payroll expenses and number of employeesNote 07: Remuneration of the Board of Directors
and Executive managementNote 07A: Audit remunerationNote 08: Net financial itemsNote 09: TaxNote 10: Intangible assetsNote 11: Tangible assetsNote 12: Operating leasesNote 13: Trade and other receivablesNote 14: InventoriesNote 15: Equity and shareholder informationNote 16: Earnings per shareNote 17: OptionsNote 18: PensionsNote 19: Provisions and other long-term liabilitiesNote 20: Financial instrumentsNote 21: Trade and other payablesNote 22: BorrowingsNote 23: Assets pledged as collaterals and
guaranteesNote 24: Bank depositsNote 25: Investments in other entitiesNote 26: Related party transactionsNote 27: Contingencies and legal claimsNote 28: CommitmentsNote 29: Events after the reporting period INDEPENDENT AUDITOR’S REPORT
GROUP FINANCIAL STATEMENT

2016-NorwegiaN.iNdd • Created: 09.10.2014 • Modified: 06.04.2017 : 19:44 all rigths reserved © 2017 teigeNs desigN
NOTE 19: PROVISIONS AND OTHER LONG-TERM LIABILITIES
Periodic maintenance on leased aircraft:
NOK 1 000 2016 2015
Opening balance 1 263 688 919 237Charges to the income statement (1 302 396) (1 148 975)Accruals 1 501 348 1 493 424Closing balance 1 462 640 1 263 688Classified as short term liabilities 86 174 86 174Classified as long term provision 1 376 465 1 177 513
For aircraft held under operating lease agreements, Norwegian is contractually committed to either return the aircraft in a certain condition or to compensate the lessor based on the actual condition of the airframe, engines, and life-limited parts upon return. In addition, during the lease term the Group is obliged to follow the maintenance program as defined by Boeing. In or-der to fulfil the conditions of the lease and maintenance obligations, maintenance, in the form of major airframe overhaul, engine maintenance checks, and restitution of major life-limited parts, is required to be performed during the period of the lease and upon return of the aircraft to the lessor. The estimated maintenance costs are accrued and charged to profit or loss over the lease term for this contractual obligation, based on the estimated current cost of the major airframe overhaul, engine maintenance checks and restitution of major life-limited parts, cal-culated by either reference to the number of hours flown or cycles operated since last mainte-nance event or since the aircraft was new, or the age of the aircraft.
The estimated costs of overhauls and maintenance are based on the Group’s maintenance program, the Group’s and industry experience, and contractual and catalog prices. Changes in estimated maintenance event costs over time are charged to the income statement as incurred with reference to number of hours flown or cycles operated during the period since the last maintenance event or since the aircraft was new. Additional provisions are also set to meet spe-cific redelivery conditions if these are deemed to be other or higher than the estimated mainte-nance costs. The Group’s aircraft leases are typically between 8-12 years in length, and several of the maintenance events will occur within the leasing period.
For some of the operating leases, the Group is invoiced by the lessor for Maintenance Re-serve Contribution (MRC), which is reclaimable at time of actual maintenance event, or forfeited if the maintenance event occurs after leasing period ends. Paid and unclaimed MRC is offset against the accumulated accrual balances in the Statement of Financial Position. For these lease contracts, the accrual and charge to the income statement is based on the larger of the Main-tenance Reserve Contribution and the estimated maintenance cost. In case of lease extension, estimates on maintenance costs will be revised.
Parts of the periodic maintenance will be conducted in 2017, and NOK 86.2 million is classified as a short-term liability for periodic maintenance (2015: NOK 86.2 million). The short-term part of periodic maintenance is estimated based on the planned maintenance in 2017.
Other long-term liabilitiesOther long-term liabilities consist of deposits on future aircraft leases from external parties.
NOTE 20: FINANCIAL INSTRUMENTS
Financial instruments by category:2016
NOK 1 000Loans and
receivables
Fair value through
profit or lossAvailable-
for-sale Total
Assets as per balance sheetAvailable-for-sale financial assets - - 82 689 82 689 Derivative financial instruments - 467 722 - 467 722 Trade and other receivables *) 2 835 342 - - 2 835 342 Cash and cash equivalents 2 323 647 - - 2 323 647 Total 5 158 989 467 722 82 689 5 709 401
*) Prepayments not included in trade and other receivables 802 242
2015
NOK 1 000Loans and
receivables
Fair value through
profit or lossAvailable-
for-sale Total
Assets as per balance sheetAvailable-for-sale financial assets - - 82 689 82 689 Trade and other receivables *) 2 471 465 - - 2 471 465 Cash and cash equivalents 2 454 160 - - 2 454 160 Total 4 925 625 - 82 689 5 008 314
*) Prepayments not included in trade and other receivables 581 062
2016
NOK 1 000
Fair value through profit
or loss
Other financial
liabilities Total
Liabilities per balance sheetBorrowings - 23 474 875 23 474 875 Derivative financial instruments 114 245 - 114 245 Trade and other payables* - 3 725 276 3 725 276 Total 114 245 27 200 151 27 314 396
*) Public duties not included in trade and other payables 156 408
Help | Contents | Highlights | Letter from CEO | Board of Directors' report | Financial statements | CSR | Corporate governance | Board and management | Definitions | Contact | 52 / 99
NORWEGIAN ANNUAL REPORT 2016
Consolidated income statement 1.1 - 31.12Consolidated statement of comprehensive Income 1.1 - 31.12Consolidated statement of financial position at December 31Consolidated statement of changes in equity 1.1 – 31.12Consolidated cash flow statement 1.1 - 31.12Notes to the consolidated financial statementsNote 01: Summary of significant accounting policiesNote 02: Financial riskNote 03: Fair value estimationNote 04: Segment informationNote 05: Operating expensesNote 05A: Other operating expensesNote 06: Payroll expenses and number of employeesNote 07: Remuneration of the Board of Directors
and Executive managementNote 07A: Audit remunerationNote 08: Net financial itemsNote 09: TaxNote 10: Intangible assetsNote 11: Tangible assetsNote 12: Operating leasesNote 13: Trade and other receivablesNote 14: InventoriesNote 15: Equity and shareholder informationNote 16: Earnings per shareNote 17: OptionsNote 18: PensionsNote 19: Provisions and other long-term liabilitiesNote 20: Financial instrumentsNote 21: Trade and other payablesNote 22: BorrowingsNote 23: Assets pledged as collaterals and
guaranteesNote 24: Bank depositsNote 25: Investments in other entitiesNote 26: Related party transactionsNote 27: Contingencies and legal claimsNote 28: CommitmentsNote 29: Events after the reporting period INDEPENDENT AUDITOR’S REPORT
GROUP FINANCIAL STATEMENT
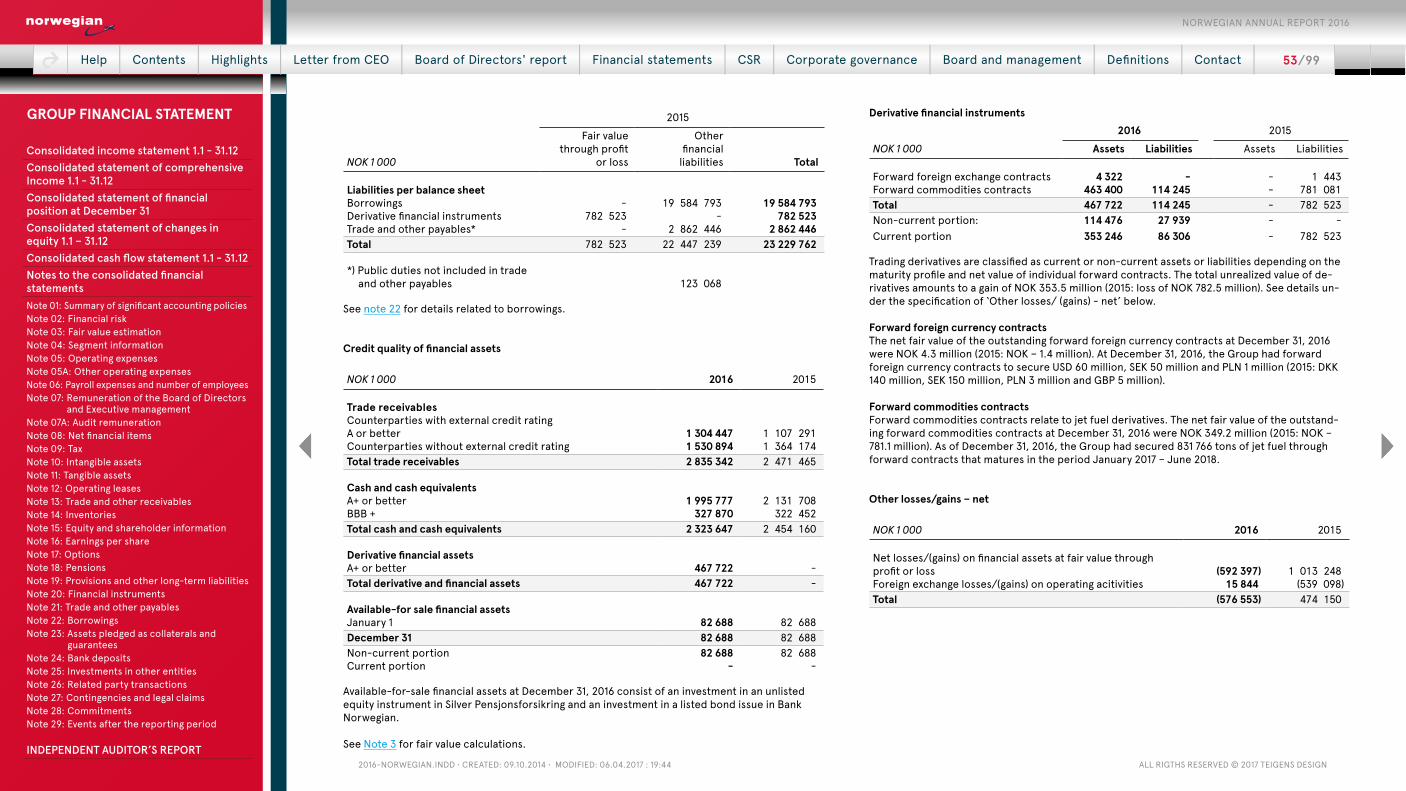
2016-NorwegiaN.iNdd • Created: 09.10.2014 • Modified: 06.04.2017 : 19:44 all rigths reserved © 2017 teigeNs desigN
2015
NOK 1 000
Fair value through profit
or loss
Other financial
liabilities Total
Liabilities per balance sheetBorrowings - 19 584 793 19 584 793 Derivative financial instruments 782 523 - 782 523 Trade and other payables* - 2 862 446 2 862 446 Total 782 523 22 447 239 23 229 762
*) Public duties not included in trade and other payables 123 068
See note 22 for details related to borrowings.
Credit quality of financial assets
NOK 1 000 2016 2015
Trade receivablesCounterparties with external credit rating A or better 1 304 447 1 107 291 Counterparties without external credit rating 1 530 894 1 364 174 Total trade receivables 2 835 342 2 471 465
Cash and cash equivalentsA+ or better 1 995 777 2 131 708 BBB + 327 870 322 452 Total cash and cash equivalents 2 323 647 2 454 160
Derivative financial assetsA+ or better 467 722 - Total derivative and financial assets 467 722 -
Available-for sale financial assetsJanuary 1 82 688 82 688 December 31 82 688 82 688 Non-current portion 82 688 82 688 Current portion - -
Available-for-sale financial assets at December 31, 2016 consist of an investment in an unlisted equity instrument in Silver Pensjonsforsikring and an investment in a listed bond issue in Bank Norwegian.
See Note 3 for fair value calculations.
Derivative financial instruments2016 2015
NOK 1 000 Assets Liabilities Assets Liabilities
Forward foreign exchange contracts 4 322 - - 1 443 Forward commodities contracts 463 400 114 245 - 781 081 Total 467 722 114 245 - 782 523 Non-current portion: 114 476 27 939 - - Current portion 353 246 86 306 - 782 523
Trading derivatives are classified as current or non-current assets or liabilities depending on the maturity profile and net value of individual forward contracts. The total unrealized value of de-rivatives amounts to a gain of NOK 353.5 million (2015: loss of NOK 782.5 million). See details un-der the specification of ‘Other losses/ (gains) - net’ below.
Forward foreign currency contractsThe net fair value of the outstanding forward foreign currency contracts at December 31, 2016 were NOK 4.3 million (2015: NOK – 1.4 million). At December 31, 2016, the Group had forward foreign currency contracts to secure USD 60 million, SEK 50 million and PLN 1 million (2015: DKK 140 million, SEK 150 million, PLN 3 million and GBP 5 million).
Forward commodities contractsForward commodities contracts relate to jet fuel derivatives. The net fair value of the outstand-ing forward commodities contracts at December 31, 2016 were NOK 349.2 million (2015: NOK – 781.1 million). As of December 31, 2016, the Group had secured 831 766 tons of jet fuel through forward contracts that matures in the period January 2017 – June 2018.
Other losses/gains – net
NOK 1 000 2016 2015
Net losses/(gains) on financial assets at fair value through profit or loss (592 397) 1 013 248 Foreign exchange losses/(gains) on operating acitivities 15 844 (539 098)Total (576 553) 474 150
Help | Contents | Highlights | Letter from CEO | Board of Directors' report | Financial statements | CSR | Corporate governance | Board and management | Definitions | Contact | 53 / 99
NORWEGIAN ANNUAL REPORT 2016
Consolidated income statement 1.1 - 31.12Consolidated statement of comprehensive Income 1.1 - 31.12Consolidated statement of financial position at December 31Consolidated statement of changes in equity 1.1 – 31.12Consolidated cash flow statement 1.1 - 31.12Notes to the consolidated financial statementsNote 01: Summary of significant accounting policiesNote 02: Financial riskNote 03: Fair value estimationNote 04: Segment informationNote 05: Operating expensesNote 05A: Other operating expensesNote 06: Payroll expenses and number of employeesNote 07: Remuneration of the Board of Directors
and Executive managementNote 07A: Audit remunerationNote 08: Net financial itemsNote 09: TaxNote 10: Intangible assetsNote 11: Tangible assetsNote 12: Operating leasesNote 13: Trade and other receivablesNote 14: InventoriesNote 15: Equity and shareholder informationNote 16: Earnings per shareNote 17: OptionsNote 18: PensionsNote 19: Provisions and other long-term liabilitiesNote 20: Financial instrumentsNote 21: Trade and other payablesNote 22: BorrowingsNote 23: Assets pledged as collaterals and
guaranteesNote 24: Bank depositsNote 25: Investments in other entitiesNote 26: Related party transactionsNote 27: Contingencies and legal claimsNote 28: CommitmentsNote 29: Events after the reporting period INDEPENDENT AUDITOR’S REPORT
GROUP FINANCIAL STATEMENT
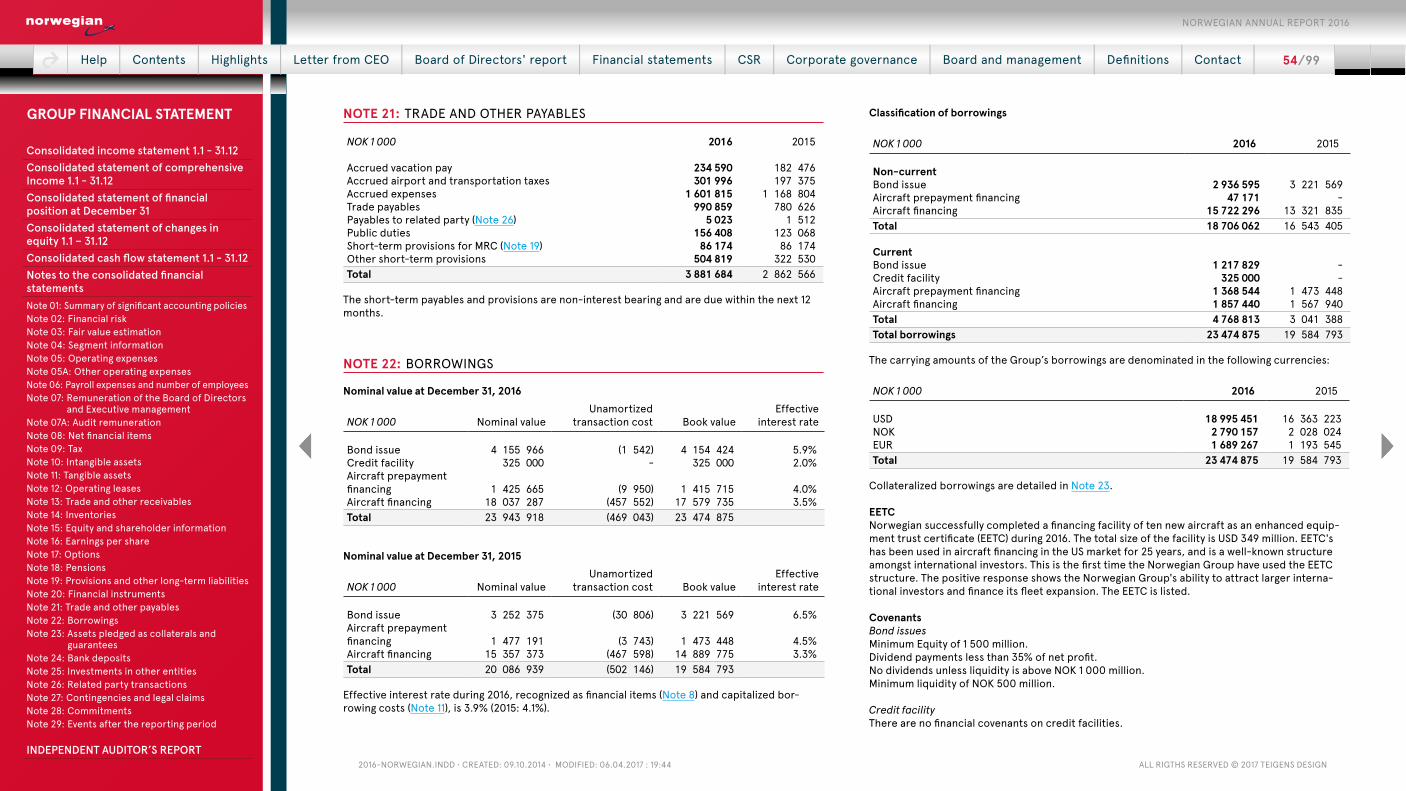
2016-NorwegiaN.iNdd • Created: 09.10.2014 • Modified: 06.04.2017 : 19:44 all rigths reserved © 2017 teigeNs desigN
NOTE 21: TRADE AND OTHER PAYABLES
NOK 1 000 2016 2015
Accrued vacation pay 234 590 182 476Accrued airport and transportation taxes 301 996 197 375Accrued expenses 1 601 815 1 168 804Trade payables 990 859 780 626Payables to related party (Note 26) 5 023 1 512Public duties 156 408 123 068Short-term provisions for MRC (Note 19) 86 174 86 174Other short-term provisions 504 819 322 530Total 3 881 684 2 862 566
The short-term payables and provisions are non-interest bearing and are due within the next 12 months.
NOTE 22: BORROWINGS
Nominal value at December 31, 2016
NOK 1 000 Nominal valueUnamortized
transaction cost Book valueEffective
interest rate
Bond issue 4 155 966 (1 542) 4 154 424 5.9%Credit facility 325 000 - 325 000 2.0%Aircraft prepayment financing 1 425 665 (9 950) 1 415 715 4.0%Aircraft financing 18 037 287 (457 552) 17 579 735 3.5%Total 23 943 918 (469 043) 23 474 875
Nominal value at December 31, 2015
NOK 1 000 Nominal valueUnamortized
transaction cost Book valueEffective
interest rate
Bond issue 3 252 375 (30 806) 3 221 569 6.5%Aircraft prepayment financing 1 477 191 (3 743) 1 473 448 4.5%Aircraft financing 15 357 373 (467 598) 14 889 775 3.3%Total 20 086 939 (502 146) 19 584 793
Effective interest rate during 2016, recognized as financial items (Note 8) and capitalized bor-rowing costs (Note 11), is 3.9% (2015: 4.1%).
Classification of borrowings
NOK 1 000 2016 2015
Non-currentBond issue 2 936 595 3 221 569Aircraft prepayment financing 47 171 - Aircraft financing 15 722 296 13 321 835Total 18 706 062 16 543 405
CurrentBond issue 1 217 829 - Credit facility 325 000 - Aircraft prepayment financing 1 368 544 1 473 448Aircraft financing 1 857 440 1 567 940Total 4 768 813 3 041 388Total borrowings 23 474 875 19 584 793
The carrying amounts of the Group’s borrowings are denominated in the following currencies:
NOK 1 000 2016 2015
USD 18 995 451 16 363 223NOK 2 790 157 2 028 024EUR 1 689 267 1 193 545Total 23 474 875 19 584 793
Collateralized borrowings are detailed in Note 23.
EETCNorwegian successfully completed a financing facility of ten new aircraft as an enhanced equip-ment trust certificate (EETC) during 2016. The total size of the facility is USD 349 million. EETC's has been used in aircraft financing in the US market for 25 years, and is a well-known structure amongst international investors. This is the first time the Norwegian Group have used the EETC structure. The positive response shows the Norwegian Group's ability to attract larger interna-tional investors and finance its fleet expansion. The EETC is listed.
CovenantsBond issuesMinimum Equity of 1 500 million.Dividend payments less than 35% of net profit.No dividends unless liquidity is above NOK 1 000 million.Minimum liquidity of NOK 500 million.
Credit facilityThere are no financial covenants on credit facilities.
Help | Contents | Highlights | Letter from CEO | Board of Directors' report | Financial statements | CSR | Corporate governance | Board and management | Definitions | Contact | 54 / 99
NORWEGIAN ANNUAL REPORT 2016
Consolidated income statement 1.1 - 31.12Consolidated statement of comprehensive Income 1.1 - 31.12Consolidated statement of financial position at December 31Consolidated statement of changes in equity 1.1 – 31.12Consolidated cash flow statement 1.1 - 31.12Notes to the consolidated financial statementsNote 01: Summary of significant accounting policiesNote 02: Financial riskNote 03: Fair value estimationNote 04: Segment informationNote 05: Operating expensesNote 05A: Other operating expensesNote 06: Payroll expenses and number of employeesNote 07: Remuneration of the Board of Directors
and Executive managementNote 07A: Audit remunerationNote 08: Net financial itemsNote 09: TaxNote 10: Intangible assetsNote 11: Tangible assetsNote 12: Operating leasesNote 13: Trade and other receivablesNote 14: InventoriesNote 15: Equity and shareholder informationNote 16: Earnings per shareNote 17: OptionsNote 18: PensionsNote 19: Provisions and other long-term liabilitiesNote 20: Financial instrumentsNote 21: Trade and other payablesNote 22: BorrowingsNote 23: Assets pledged as collaterals and
guaranteesNote 24: Bank depositsNote 25: Investments in other entitiesNote 26: Related party transactionsNote 27: Contingencies and legal claimsNote 28: CommitmentsNote 29: Events after the reporting period INDEPENDENT AUDITOR’S REPORT
GROUP FINANCIAL STATEMENT
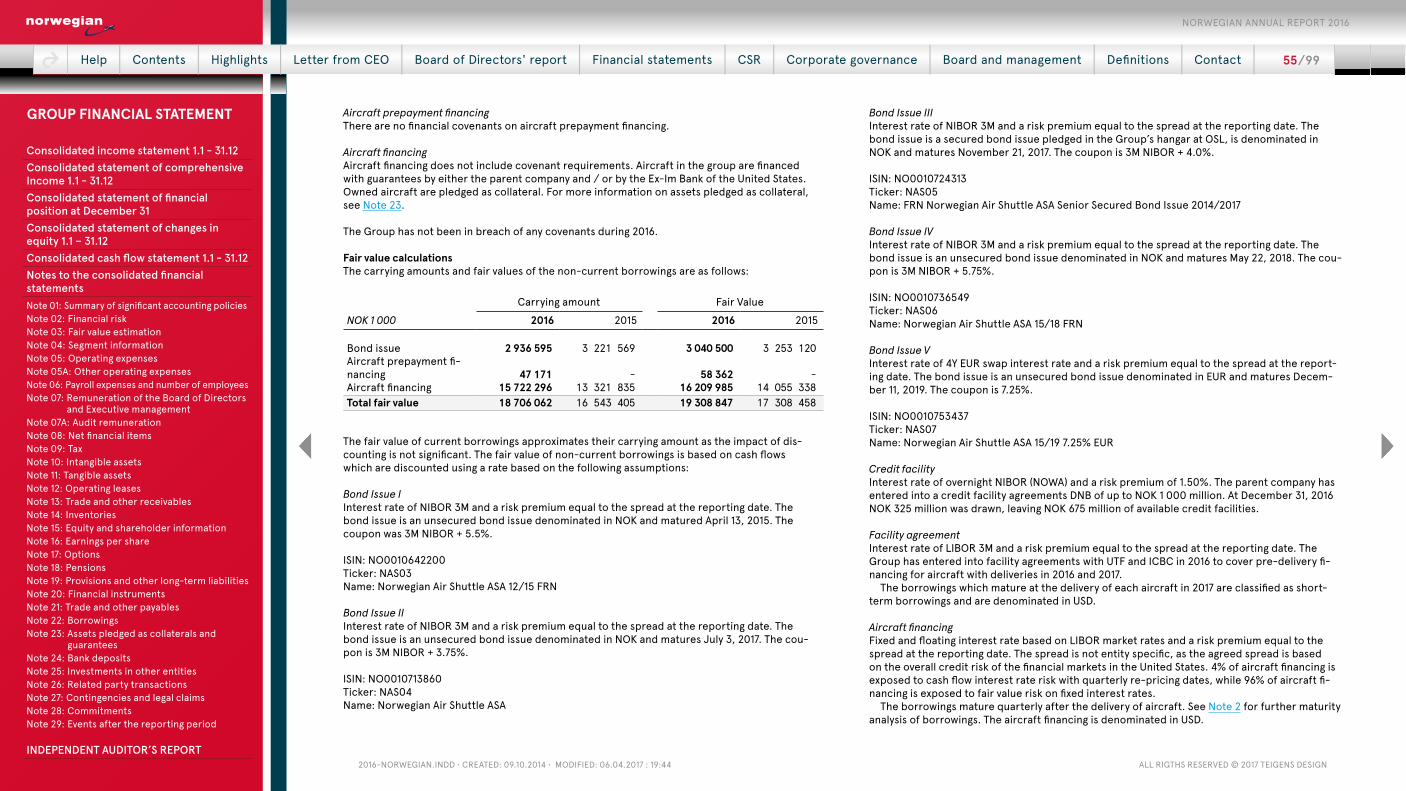
2016-NorwegiaN.iNdd • Created: 09.10.2014 • Modified: 06.04.2017 : 19:44 all rigths reserved © 2017 teigeNs desigN
Aircraft prepayment financing There are no financial covenants on aircraft prepayment financing.
Aircraft financingAircraft financing does not include covenant requirements. Aircraft in the group are financed with guarantees by either the parent company and / or by the Ex-Im Bank of the United States. Owned aircraft are pledged as collateral. For more information on assets pledged as collateral, see Note 23.
The Group has not been in breach of any covenants during 2016.
Fair value calculationsThe carrying amounts and fair values of the non-current borrowings are as follows:
Carrying amount Fair ValueNOK 1 000 2016 2015 2016 2015
Bond issue 2 936 595 3 221 569 3 040 500 3 253 120Aircraft prepayment fi-nancing 47 171 - 58 362 - Aircraft financing 15 722 296 13 321 835 16 209 985 14 055 338Total fair value 18 706 062 16 543 405 19 308 847 17 308 458
The fair value of current borrowings approximates their carrying amount as the impact of dis-counting is not significant. The fair value of non-current borrowings is based on cash flows which are discounted using a rate based on the following assumptions:
Bond Issue I Interest rate of NIBOR 3M and a risk premium equal to the spread at the reporting date. The bond issue is an unsecured bond issue denominated in NOK and matured April 13, 2015. The coupon was 3M NIBOR + 5.5%.
ISIN: NO0010642200Ticker: NAS03Name: Norwegian Air Shuttle ASA 12/15 FRN
Bond Issue II Interest rate of NIBOR 3M and a risk premium equal to the spread at the reporting date. The bond issue is an unsecured bond issue denominated in NOK and matures July 3, 2017. The cou-pon is 3M NIBOR + 3.75%.
ISIN: NO0010713860Ticker: NAS04Name: Norwegian Air Shuttle ASA
Bond Issue III Interest rate of NIBOR 3M and a risk premium equal to the spread at the reporting date. The bond issue is a secured bond issue pledged in the Group’s hangar at OSL, is denominated in NOK and matures November 21, 2017. The coupon is 3M NIBOR + 4.0%.
ISIN: NO0010724313Ticker: NAS05Name: FRN Norwegian Air Shuttle ASA Senior Secured Bond Issue 2014/2017
Bond Issue IVInterest rate of NIBOR 3M and a risk premium equal to the spread at the reporting date. The bond issue is an unsecured bond issue denominated in NOK and matures May 22, 2018. The cou-pon is 3M NIBOR + 5.75%.
ISIN: NO0010736549Ticker: NAS06Name: Norwegian Air Shuttle ASA 15/18 FRN
Bond Issue VInterest rate of 4Y EUR swap interest rate and a risk premium equal to the spread at the report-ing date. The bond issue is an unsecured bond issue denominated in EUR and matures Decem-ber 11, 2019. The coupon is 7.25%.
ISIN: NO0010753437Ticker: NAS07Name: Norwegian Air Shuttle ASA 15/19 7.25% EUR
Credit facilityInterest rate of overnight NIBOR (NOWA) and a risk premium of 1.50%. The parent company has entered into a credit facility agreements DNB of up to NOK 1 000 million. At December 31, 2016 NOK 325 million was drawn, leaving NOK 675 million of available credit facilities.
Facility agreementInterest rate of LIBOR 3M and a risk premium equal to the spread at the reporting date. The Group has entered into facility agreements with UTF and ICBC in 2016 to cover pre-delivery fi-nancing for aircraft with deliveries in 2016 and 2017.
The borrowings which mature at the delivery of each aircraft in 2017 are classified as short-term borrowings and are denominated in USD.
Aircraft financingFixed and floating interest rate based on LIBOR market rates and a risk premium equal to the spread at the reporting date. The spread is not entity specific, as the agreed spread is based on the overall credit risk of the financial markets in the United States. 4% of aircraft financing is exposed to cash flow interest rate risk with quarterly re-pricing dates, while 96% of aircraft fi-nancing is exposed to fair value risk on fixed interest rates.
The borrowings mature quarterly after the delivery of aircraft. See Note 2 for further maturity analysis of borrowings. The aircraft financing is denominated in USD.
Help | Contents | Highlights | Letter from CEO | Board of Directors' report | Financial statements | CSR | Corporate governance | Board and management | Definitions | Contact | 55 / 99
NORWEGIAN ANNUAL REPORT 2016
Consolidated income statement 1.1 - 31.12Consolidated statement of comprehensive Income 1.1 - 31.12Consolidated statement of financial position at December 31Consolidated statement of changes in equity 1.1 – 31.12Consolidated cash flow statement 1.1 - 31.12Notes to the consolidated financial statementsNote 01: Summary of significant accounting policiesNote 02: Financial riskNote 03: Fair value estimationNote 04: Segment informationNote 05: Operating expensesNote 05A: Other operating expensesNote 06: Payroll expenses and number of employeesNote 07: Remuneration of the Board of Directors
and Executive managementNote 07A: Audit remunerationNote 08: Net financial itemsNote 09: TaxNote 10: Intangible assetsNote 11: Tangible assetsNote 12: Operating leasesNote 13: Trade and other receivablesNote 14: InventoriesNote 15: Equity and shareholder informationNote 16: Earnings per shareNote 17: OptionsNote 18: PensionsNote 19: Provisions and other long-term liabilitiesNote 20: Financial instrumentsNote 21: Trade and other payablesNote 22: BorrowingsNote 23: Assets pledged as collaterals and
guaranteesNote 24: Bank depositsNote 25: Investments in other entitiesNote 26: Related party transactionsNote 27: Contingencies and legal claimsNote 28: CommitmentsNote 29: Events after the reporting period INDEPENDENT AUDITOR’S REPORT
GROUP FINANCIAL STATEMENT
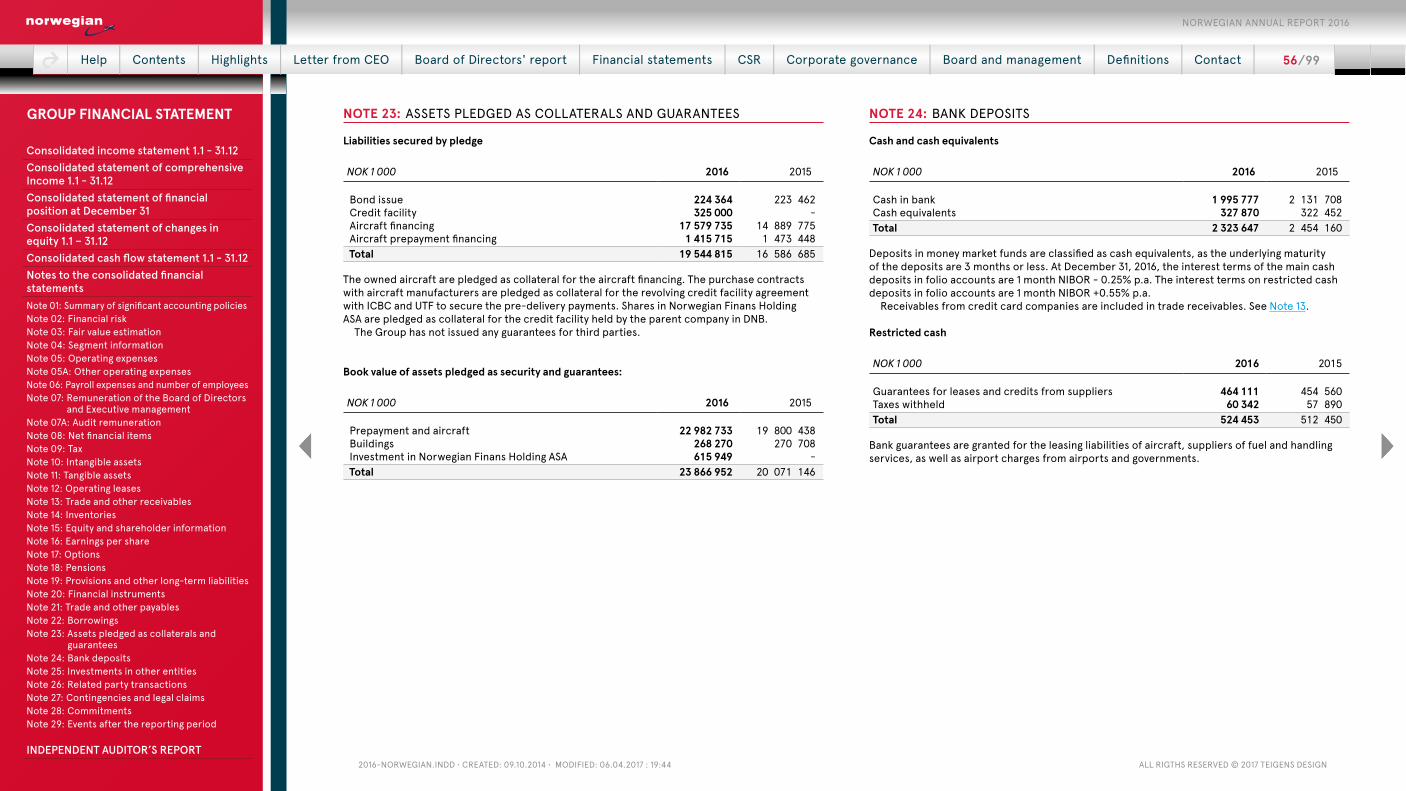
2016-NorwegiaN.iNdd • Created: 09.10.2014 • Modified: 06.04.2017 : 19:44 all rigths reserved © 2017 teigeNs desigN
NOTE 23: ASSETS PLEDGED AS COLLATERALS AND GUARANTEES
Liabilities secured by pledge
NOK 1 000 2016 2015
Bond issue 224 364 223 462 Credit facility 325 000 - Aircraft financing 17 579 735 14 889 775 Aircraft prepayment financing 1 415 715 1 473 448 Total 19 544 815 16 586 685
The owned aircraft are pledged as collateral for the aircraft financing. The purchase contracts with aircraft manufacturers are pledged as collateral for the revolving credit facility agreement with ICBC and UTF to secure the pre-delivery payments. Shares in Norwegian Finans Holding ASA are pledged as collateral for the credit facility held by the parent company in DNB.
The Group has not issued any guarantees for third parties.
Book value of assets pledged as security and guarantees:
NOK 1 000 2016 2015
Prepayment and aircraft 22 982 733 19 800 438 Buildings 268 270 270 708 Investment in Norwegian Finans Holding ASA 615 949 - Total 23 866 952 20 071 146
NOTE 24: BANK DEPOSITS
Cash and cash equivalents
NOK 1 000 2016 2015
Cash in bank 1 995 777 2 131 708Cash equivalents 327 870 322 452Total 2 323 647 2 454 160
Deposits in money market funds are classified as cash equivalents, as the underlying maturity of the deposits are 3 months or less. At December 31, 2016, the interest terms of the main cash deposits in folio accounts are 1 month NIBOR - 0.25% p.a. The interest terms on restricted cash deposits in folio accounts are 1 month NIBOR +0.55% p.a.
Receivables from credit card companies are included in trade receivables. See Note 13.
Restricted cash
NOK 1 000 2016 2015
Guarantees for leases and credits from suppliers 464 111 454 560Taxes withheld 60 342 57 890Total 524 453 512 450
Bank guarantees are granted for the leasing liabilities of aircraft, suppliers of fuel and handling services, as well as airport charges from airports and governments.
Help | Contents | Highlights | Letter from CEO | Board of Directors' report | Financial statements | CSR | Corporate governance | Board and management | Definitions | Contact | 56 / 99
NORWEGIAN ANNUAL REPORT 2016
Consolidated income statement 1.1 - 31.12Consolidated statement of comprehensive Income 1.1 - 31.12Consolidated statement of financial position at December 31Consolidated statement of changes in equity 1.1 – 31.12Consolidated cash flow statement 1.1 - 31.12Notes to the consolidated financial statementsNote 01: Summary of significant accounting policiesNote 02: Financial riskNote 03: Fair value estimationNote 04: Segment informationNote 05: Operating expensesNote 05A: Other operating expensesNote 06: Payroll expenses and number of employeesNote 07: Remuneration of the Board of Directors
and Executive managementNote 07A: Audit remunerationNote 08: Net financial itemsNote 09: TaxNote 10: Intangible assetsNote 11: Tangible assetsNote 12: Operating leasesNote 13: Trade and other receivablesNote 14: InventoriesNote 15: Equity and shareholder informationNote 16: Earnings per shareNote 17: OptionsNote 18: PensionsNote 19: Provisions and other long-term liabilitiesNote 20: Financial instrumentsNote 21: Trade and other payablesNote 22: BorrowingsNote 23: Assets pledged as collaterals and
guaranteesNote 24: Bank depositsNote 25: Investments in other entitiesNote 26: Related party transactionsNote 27: Contingencies and legal claimsNote 28: CommitmentsNote 29: Events after the reporting period INDEPENDENT AUDITOR’S REPORT
GROUP FINANCIAL STATEMENT

2016-NorwegiaN.iNdd • Created: 09.10.2014 • Modified: 06.04.2017 : 19:44 all rigths reserved © 2017 teigeNs desigN
NOTE 25: INVESTMENTS IN OTHER ENTITIES
Norwegian Air Shuttle ASA has the following investments in associates and joint ventures accounted for using the equity method (NOK 1 000):
Entity Country IndustryOwnership
interestType of
investment
Share of profit recognized
in 2016
Share of OCI recognized
in 2016Investment
20161
Carrying amount
31.12.2016Fair value
31.12.20162
Norwegian Finans Holding ASA NorwayFinancial
Institution 20%Associated
company 210 384 3 133 74 306 615 949 2 656 535
OSM Aviation Ltd. CyprusAviation crew management 50%
Joint venture 2 417 (1 900) (7 356) (6 839) N/A
Entity Country IndustryOwnership
interestType of
investment
Share of profit recognized
in 2015
Share of OCI recognized
in 2015Investment
2015Carrying amount
31.12.2015Fair value 31.12.2015
Norwegian Finans Holding ASA NorwayFinancial
Institution 20%Associated
company 103 441 - 1 092 328 127 1 725 019
1) Investments recognized for Norwegian Finans Holding ASA relates to share issues by the associated company. Investments in OSM Aviation Ltd. includes investment in the joint venture net of proceeds from sale of shares in subsidiaries to the joint venture. Norwegian Air Shuttle is not liable for any deficit in the joint venture.
2) The fair value of the investment in Norwegian Finans Holding ASA is based on observed market value of owned shares as the last recorded trade on Oslo Stock Exchange in 2016. In 2015, the shares were publicly traded on the OTC marketplace at Oslo Stock Exchange. OSM Aviation Ltd. is not publicly traded, and no quoted market price for the investment is available.
The associated company, Norwegian Finans Holding ASA, owns 100% of the shares in Bank Norwegian AS. Norwegian Air Shuttle ASA holds 20% of the shares and voting power in Norwegian Finans Holding ASA. The Company is situated in Oslo, Norway. The equity method is applied when accounting for the investment, and the Group’s share of the associated company’s profit and loss is included in the carrying amount.
On September 1, 2016, Norwegian Air Shuttle entered into a joint venture by acquiring 50% of the shares in OSM Aviation Ltd. from OSM Aviation Group. OSM Aviation Group retains the remaining 50% of the shares in OSM Aviation Ltd. The shares were acquired by fully owned subsidiary Norwegian Air Resources Ltd. with a cash consideration of USD 0.2 million. Shares, voting rights and board representation is divided equally among the two owning parties, and important decisions require consensus between the owners. The investment is classified as a joint venture according to IFRS 11, and is accounted for using the equity method from September 1 onwards.
On November 1, 2016, Norwegian Air Resources Ltd. sold 49% of the shares in Norwegian Air Resources Spain S.L and AB Norwegian Air Resources Finland Ltd. The proceeds from the sale of shares is recognized as a reduction in the carrying amount of the investment in the joint venture. Further, 100% of the shares in Norwegian Air Resources Asia PTE Limited and Norwegian Air Resources UK Limited were sold to the joint venture. The total proceeds from sale of shares to the joint venture was NOK 15.2 million. The transactions did not result in any significant effect on the consolidated income statement. On November 1, 2016, Norwegian Air Resources Ltd. acquired 51% of the shares in OSM Aviation UK Ltd. from the joint venture at a purchase price of GBP 1 020.
A shareholder’s agreement is in place between OSM Aviation and Norwegian Air Resources Ltd. stating that all dividends from Norwegian Air Resources Spain S.L, Norwegian Air Resources Finland Ltd., and OSM Aviation UK Ltd. are distributed to the joint venture OSM Aviation Ltd. Non-controlling interests are recognized at 50% of the equity of these companies, in total NOK 10.8 million at the end of 2016. The three subsidiaries are not material to the consolidated financial statements neither individually nor aggregated.
Help | Contents | Highlights | Letter from CEO | Board of Directors' report | Financial statements | CSR | Corporate governance | Board and management | Definitions | Contact | 57 / 99
NORWEGIAN ANNUAL REPORT 2016
Consolidated income statement 1.1 - 31.12Consolidated statement of comprehensive Income 1.1 - 31.12Consolidated statement of financial position at December 31Consolidated statement of changes in equity 1.1 – 31.12Consolidated cash flow statement 1.1 - 31.12Notes to the consolidated financial statementsNote 01: Summary of significant accounting policiesNote 02: Financial riskNote 03: Fair value estimationNote 04: Segment informationNote 05: Operating expensesNote 05A: Other operating expensesNote 06: Payroll expenses and number of employeesNote 07: Remuneration of the Board of Directors
and Executive managementNote 07A: Audit remunerationNote 08: Net financial itemsNote 09: TaxNote 10: Intangible assetsNote 11: Tangible assetsNote 12: Operating leasesNote 13: Trade and other receivablesNote 14: InventoriesNote 15: Equity and shareholder informationNote 16: Earnings per shareNote 17: OptionsNote 18: PensionsNote 19: Provisions and other long-term liabilitiesNote 20: Financial instrumentsNote 21: Trade and other payablesNote 22: BorrowingsNote 23: Assets pledged as collaterals and
guaranteesNote 24: Bank depositsNote 25: Investments in other entitiesNote 26: Related party transactionsNote 27: Contingencies and legal claimsNote 28: CommitmentsNote 29: Events after the reporting period INDEPENDENT AUDITOR’S REPORT
GROUP FINANCIAL STATEMENT

2016-NorwegiaN.iNdd • Created: 09.10.2014 • Modified: 06.04.2017 : 19:44 all rigths reserved © 2017 teigeNs desigN
Summarized financial information for material associated companies:
NOK 1 000 2016 2015
Norwegian Finans Holding ASATotal assets 30 402 252 17 618 198Total liabilities 27 066 976 15 746 916Total income 2 702 038 1 520 239Profit on ordinary activities before tax 1 257 808 740 391Profit on ordinary activities after tax 959 437 543 722Other comprehensive income (35 433) 59 992Comprehensive income for the period 924 005 603 714
Summarized financial information for immaterial joint ventures:
NOK 1 000 2016
Profit or loss from continuing operations 40 086Other comprehensive income (4 689)Total comprehensive income 35 397
NOTE 26: RELATED PARTY TRANSACTIONS
The Chief Executive Officer is the principal shareholder in Norwegian Air Shuttle ASA with an ownership share of 24.6% through the controlling ownership of HBK Invest AS*. This ownership share is the actual shareholding, and may deviate from the official shareholder register, as HBK Invest has entered into a security agreement with Nordea and Danske Bank. Under this agree-ment, these institutions may borrow shares from HBK Invest for a limited period of time to im-prove the liquidity in the share trading, for example by fulfilling their market maker obligation. The Chair of the Board owns a minority of shares in HBK Invest AS. There have been no financial transactions between HBK Invest AS and Norwegian Air Shuttle ASA in 2016 or 2015, except for indirect transactions through Fornebu Næringseiendom.
The Chair of the Board, Bjørn Kise, is a partner, and the CEO is a former partner, of the law firm Simonsen Vogt Wiig which operates as the legal advisor for Norwegian Air Shuttle ASA.
The Group leases its property at Fornebu from Fornebu Næringseiendom AS, which is a fully owned subsidiary of HBK Invest AS. The leasing agreement entitles the Group to lease Ok-senøyveien 3 at Fornebu until 2030, with an option to extend the lease for another five years.
The parent company has received commissions from the associated company Norwegian Fi-nans Holding ASA (Bank Norwegian) in 2016 and 2015. The commissions relate to sales made by the parent company's customers by using the 'Bank Norwegian' credit cards. In addition, the subsidiary Norwegian Brand Ltd receives license fees from Norwegian Finans Holding ASA for the use of the Norwegian Brand. The total commission and license fee is enclosed in the table below. Receivables and payables to related parties are included below.
No loans or guarantees have been issued to related parties in 2016 or 2015.
See Note 7 for details on key Management compensations and Note 15 for shares and options held directly or indirectly by members of the Board of Directors, the CEO and the Executive Management.
The following transactions were carried out with related parties:
NOK 1 000 2016 2015
Sales (-) and purchases (+) of goods and services (excl VAT)- Simonsen Vogt Wiig (legal services) 11 397 18 681 - Associate (commission and licence fee) (208 978) (127 908)- Associate (interests on subordinated loan) (3 661) (3 850)- Fornebu Næringseiendom (property rent) 15 559 15 295
Year-end balances arising from sales/purchases of goods/services (incl VAT)Receivables from related parties (note 13)- Associate (commission) 11 118 9 506
Payables from related parties (note 21)- Simonsen Vogt Wiig (legal services) 252 1 512 - Fornebu Næringseiendom (property rent) 4 771 -
Investment in related parties - Associate (subordinated loan) 80 000 80 000
Transactions between Group companies have been eliminated in the consolidated financial statements and do not represent related party transactions. See Notes 25 Related Parties and 23 Shares in Subsidiaries in the financial statements of Norwegian Air Shuttle ASA for further details.
*) HBK Invest AS has, after close of trading on 16 December 2016, resolved to transfer 8 795 873 shares in Norwegian Air Shuttle ASA, equal to 24.6% of the outstanding shares and voting rights in the Company, to its wholly owned subsidiary, HBK Holding AS.
NOTE 27: CONTINGENCIES AND LEGAL CLAIMS
Through their respective unions, pilots and cabin crew that have been subject to business transfers from Norwegian Air Shuttle ASA (NAS) to Norwegian Air Norway AS (NAN) and from NAN to local national resourcing entities for pilots and cabin crew in Norway, have raised claims that NAS primarily, NAN alternatively shall be considered employer. The District Court has issued a ruling, which Norwegian will appeal. Financial exposure from the ruling is limited.
The Norwegian Group has, since the end of 2013, continuously reorganized its operations, and in 2013 and 2014, Norwegian transferred parts of its business to Irish group companies as a natural part of this international reorganization process. The internal group reorganization was carried out under the tax rules on contingent tax-free transfers within a group and the freedom
Help | Contents | Highlights | Letter from CEO | Board of Directors' report | Financial statements | CSR | Corporate governance | Board and management | Definitions | Contact | 58 / 99
NORWEGIAN ANNUAL REPORT 2016
Consolidated income statement 1.1 - 31.12Consolidated statement of comprehensive Income 1.1 - 31.12Consolidated statement of financial position at December 31Consolidated statement of changes in equity 1.1 – 31.12Consolidated cash flow statement 1.1 - 31.12Notes to the consolidated financial statementsNote 01: Summary of significant accounting policiesNote 02: Financial riskNote 03: Fair value estimationNote 04: Segment informationNote 05: Operating expensesNote 05A: Other operating expensesNote 06: Payroll expenses and number of employeesNote 07: Remuneration of the Board of Directors
and Executive managementNote 07A: Audit remunerationNote 08: Net financial itemsNote 09: TaxNote 10: Intangible assetsNote 11: Tangible assetsNote 12: Operating leasesNote 13: Trade and other receivablesNote 14: InventoriesNote 15: Equity and shareholder informationNote 16: Earnings per shareNote 17: OptionsNote 18: PensionsNote 19: Provisions and other long-term liabilitiesNote 20: Financial instrumentsNote 21: Trade and other payablesNote 22: BorrowingsNote 23: Assets pledged as collaterals and
guaranteesNote 24: Bank depositsNote 25: Investments in other entitiesNote 26: Related party transactionsNote 27: Contingencies and legal claimsNote 28: CommitmentsNote 29: Events after the reporting period INDEPENDENT AUDITOR’S REPORT
GROUP FINANCIAL STATEMENT
2016-NorwegiaN.iNdd • Created: 09.10.2014 • Modified: 06.04.2017 : 19:44 all rigths reserved © 2017 teigeNs desigN
of establishment under the EEA-agreement. In March 2017, Norwegian received a reassessment from the Central Tax Office for Large Enterprises in which the tax office argues that the rules on contingent tax free transfers within a group does not apply to the transfer of the business in 2013. The reassessment resulted in increased taxable income in 2013. In addition, the tax office has indicated that the rules on contingent tax-free transfers within a group nor applies to the transfer of business in 2014.
Norwegian and its tax advisor are of the opinion that the reassessment by the tax office is without merit and has thus not made any provision for any potential tax claim in its 2016 finan-cial statement. This view is especially supported by the fact that the superior assessment board at the same tax office in 2013 issued a principle decision in another case to the effect that the rules on contingent tax-free transfers within a group when read in conjunction with the freedom of establishment under the EEA-agreement indeed applies to transfer of a business from a Nor-wegian group company to a group company within the EU.
NOTE 28: COMMITMENTS
In August 2007, Norwegian Air Shuttle ASA entered into a purchase agreement for 42 new Boe-ing 737-800 aircraft with Blended Winglets and purchase rights for additional 42 aircraft of the same model from Boeing. The order of 42 aircraft has a list price of USD 3.1 billion. Between 2008 and 2011, the Group extended its aircraft order and exercised purchase rights for an addi-tional 36 aircraft, bringing the total order of Boeing 737-800 to 78 aircraft.
In January 2012, the Group entered into additional purchase contracts with Boeing Commer-cial airplanes and Airbus S.A.S. comprising a total of 372 aircraft, of which 222 were firm orders. The firm orders were for 22 Boeing 737-800, 100 Boeing 737 MAX8 and 100 Airbus A320neo. The agreements also include purchase rights for an additional 100 Boeing 737 MAX8 and 50 Airbus A320neo. The firm orders have an aggregated value at list price of approximately NOK 127 billion. The aircraft purchase is supported by the Export-Import Bank of the United States (Ex-Im) and European Export Credit Agencies. The delivery of aircraft started in 2016 with 2 Air-bus A320Neo. Of the additional purchase rights for Boeing 737 MAX8, 8 were exercised in 2016, bringing the amount of firm commitments up to 108 aircraft.
In August 2015, the Group entered into a letter of intent for operational lease for two Boe-ing 787-9 Dreamliner with delivery in 2017. The two aircraft will be leased for a 12-year period from delivery. The 787-9 is a stretch version of the 787-8 with longer range, and with 344 seats (+18%) based on Norwegian's configuration. At December 31, 2016, the Group has 7 Boeing 787-9 Dreamliner lease orders with expected delivery in 2017 and 2018.
In October 2015, the Group entered into purchase contracts with Boeing Commercial air-planes for 19 Boeing 787-9 Dreamliner to be delivered over the years 2017 through 2019. All air-craft will be operated by Norwegian. The agreement includes purchase options for an additional 10 aircraft of the same type.
In July 2016, the Group placed an order for 30 A321LRs with Airbus, representing a switch from a commitment to purchase 30 A320neo aircraft originally signed in 2012. Deliveries of A321LRs will start with eight aircraft in 2019, followed by eleven in 2020 and 2021.
The Group presents list prices on aircraft purchase contracts. Discounts are achieved on the aircraft purchase contracts; hence the actual committed purchase prices are lower than the presented list prices. Actual committed purchase prices are regarded as contractual and busi-ness sensitive information.
For details on commitments for aircraft leases, see Note 12.Norwegian Air Shuttle ASA has selected the Rolls-Royce Trent 1000 engine to power up to 9
new 787-8 Dreamliners. The contract, signed with Rolls-Royce, includes "Total Care" long-term support agreements which include all maintenance, spare parts and other support services. The contract value quoted at list price is USD 450 million when comprising 18 engines.
Norwegian Air Shuttle ASA has entered into a maintenance agreement with Boeing comprising all long-haul aircraft on order. The agreement secures cost efficient maintenance and has a du-ration of 12 years.
At December 18, 2015, the Group signed an agreement to lease out 12 Airbus 320neo aircraft to airline HK Express. The first 2 aircraft were delivered in December 2016 and the remaining 10 aircraft are scheduled to be delivered in 2017 and 2018.
NOTE 29: EVENTS AFTER THE REPORTING PERIOD
On January 25, 2017, Norwegian Air Shuttle ASA successfully completed a new unsecured bond issue of SEK 800 million with maturity date August 7, 2020 at Stibor +500 bp. The settlement date for the bond was February 7, 2017. The net proceeds from the bonds shall be employed for general corporate purposes in support of the growth of the Group. An application will be made for listing of the bonds on Oslo Børs (Oslo Stock Exchange).
On February 13, 2017, Norwegian Air Shuttle subscribed for 1 302,931 new shares in Norwe-gian Finans Holding ASA (NOFI) at a subscription price of NOK 76.75. The investment of NOK 100 million corresponds to 20% of the private placement as publicly announced by NOFI on 13 Feb-ruary. After the transaction, Norwegian Air Shuttle AS owns 37 323,739 shares in NOFI equal to 20% of the shares issued.
On March 15, Norwegian Air Shuttle ASA successfully completed a tap issue of SEK 200 million in the unsecured bond expected to be listed on Oslo Stock Exchange under the ticker 'NAS08' (ISIN NO 0010783459, maturity 7 August 2020). Following the tap issue the total nominal amount outstanding in 'NAS08' will be SEK 1 000 million. The settlement date for the tap issue is ex-pected to be 21 March 2017. Net proceeds from the tap issue will be used for general corporate purposes.
Norwegian is the launch customer in Europe of the new Boeing 737MAX and has announced 12 new trans-Atlantic routes, which will be served with the new aircraft from the summer 2017.
In March 2017, Norwegian received a reassessment of the tax return for Norwegian Air Shut-tle ASA from the Central Tax Office for Large Enterprises, in which the tax office argues that the rules on contingent tax free transfers within a group does not apply to the transfer of the busi-ness in 2013, see note 27 for further details.
Help | Contents | Highlights | Letter from CEO | Board of Directors' report | Financial statements | CSR | Corporate governance | Board and management | Definitions | Contact | 59 / 99
NORWEGIAN ANNUAL REPORT 2016
Consolidated income statement 1.1 - 31.12Consolidated statement of comprehensive Income 1.1 - 31.12Consolidated statement of financial position at December 31Consolidated statement of changes in equity 1.1 – 31.12Consolidated cash flow statement 1.1 - 31.12Notes to the consolidated financial statementsNote 01: Summary of significant accounting policiesNote 02: Financial riskNote 03: Fair value estimationNote 04: Segment informationNote 05: Operating expensesNote 05A: Other operating expensesNote 06: Payroll expenses and number of employeesNote 07: Remuneration of the Board of Directors
and Executive managementNote 07A: Audit remunerationNote 08: Net financial itemsNote 09: TaxNote 10: Intangible assetsNote 11: Tangible assetsNote 12: Operating leasesNote 13: Trade and other receivablesNote 14: InventoriesNote 15: Equity and shareholder informationNote 16: Earnings per shareNote 17: OptionsNote 18: PensionsNote 19: Provisions and other long-term liabilitiesNote 20: Financial instrumentsNote 21: Trade and other payablesNote 22: BorrowingsNote 23: Assets pledged as collaterals and
guaranteesNote 24: Bank depositsNote 25: Investments in other entitiesNote 26: Related party transactionsNote 27: Contingencies and legal claimsNote 28: CommitmentsNote 29: Events after the reporting period INDEPENDENT AUDITOR’S REPORT
GROUP FINANCIAL STATEMENT

2016-NorwegiaN.iNdd • Created: 09.10.2014 • Modified: 06.04.2017 : 19:44 all rigths reserved © 2017 teigeNs desigN
FINANCIAL STATEMENTS FOR THE PARENT COMPANYINCOME STATEMENT
NOK 1 000 Note 2016 2015
Revenue 3 14 825 514 17 738 257Other income 3 14 028 1 110 795Total operating revenue and income 14 839 542 18 849 052
Operational expenses 4 10 267 364 14 844 337Payroll 5, 6 2 716 622 2 640 489Depreciation, amortization and impairment 9, 10 144 459 262 748Other operating expenses 4a 1 353 225 1 165 532Other losses/(gains) - net 19 (555 753) 772 281Total operating expenses 13 925 917 19 685 387Operating profit (loss) 913 625 (836 335)
Net financial items 7 214 944 (154 488)
Profit (loss) before tax 1 128 569 (990 823)Income tax expense (income) 8 344 347 (128 634)Profit (loss) for the year 784 222 (862 189)
STATEMENT OF COMPREHENSIVE INCOME
NOK 1 000 Note 2016 2015
Profit for the year 784 222 (862 189)
Reversible income and losses:Other comprehensive income that may be reclassified to profit or loss in subsequent periods:
Available-for-sale financial assets 19 857 209 1 042 307Total comprehensive income for the period 1 641 432 180 118
Help | Contents | Highlights | Letter from CEO | Board of Directors' report | Financial statements | CSR | Corporate governance | Board and management | Definitions | Contact | 60 / 99
NORWEGIAN ANNUAL REPORT 2016
Income statementstatement of comprehensive incomeStatement of financial position at December 31Statement of changes in Equity Cash flow statementNotes to financial statements of the parent companyNote 01: General information and summary of
significant accounting principlesNote 02: Financial riskNote 03: Operating revenue and incomeNote 04: Operational expensesNote 04A: Other operating expensesNote 05: Payroll expenses and number of
employeesNote 06: Remuneration to the Board of Directors
and Executive managementNote 06A: Auditor remunerationNote 07: Net financial itemsNote 08: TaxesNote 09: Intangible assetsNote 10: Tangible assetsNote 11: LeasingNote 12: ReceivablesNote 13: InventoriesNote 14: Shareholder’s equity and shareholder
informationNote 15: PensionsNote 16: OptionsNote 17: Provisions for periodic maintenanceNote 18: Trade and other payablesNote 19: Financial instrumentsNote 20: Assets pledged as collateral and
guaranteesNote 21: Bank depositsNote 22: BorrowingsNote 23: Investments in subsidiariesNote 24: Investment in asssociatesNote 25: Related partiesNote 26: Contingencies and legal claimsNote 27: CommitmentsNote 28: Events after the reporting period
PARENT COMPANY FINANCIAL STATEMENT
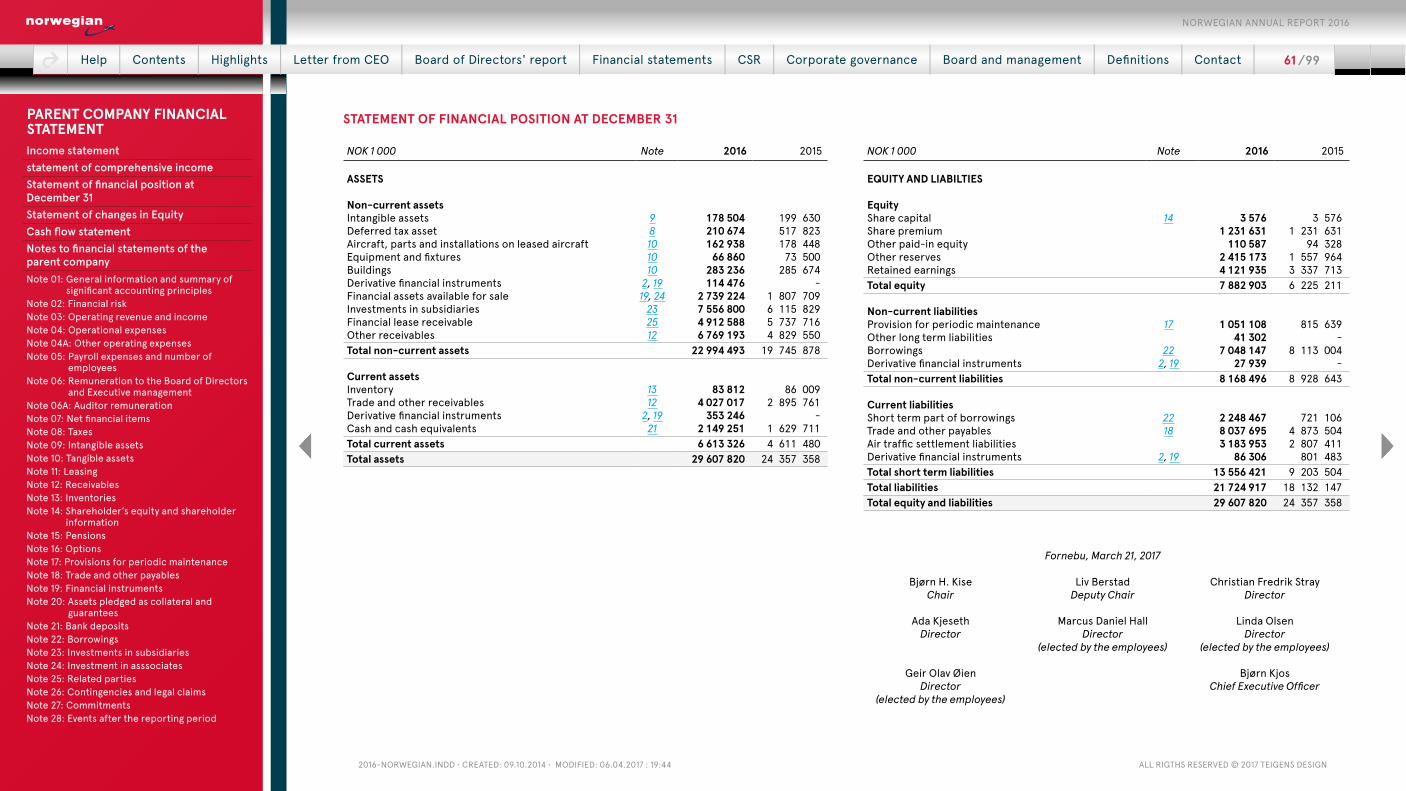
2016-NorwegiaN.iNdd • Created: 09.10.2014 • Modified: 06.04.2017 : 19:44 all rigths reserved © 2017 teigeNs desigN
STATEMENT OF FINANCIAL POSITION AT DECEMBER 31
NOK 1 000 Note 2016 2015
ASSETS
Non-current assetsIntangible assets 9 178 504 199 630Deferred tax asset 8 210 674 517 823Aircraft, parts and installations on leased aircraft 10 162 938 178 448Equipment and fixtures 10 66 860 73 500Buildings 10 283 236 285 674Derivative financial instruments 2, 19 114 476 -Financial assets available for sale 19, 24 2 739 224 1 807 709Investments in subsidiaries 23 7 556 800 6 115 829Financial lease receivable 25 4 912 588 5 737 716Other receivables 12 6 769 193 4 829 550Total non-current assets 22 994 493 19 745 878
Current assetsInventory 13 83 812 86 009Trade and other receivables 12 4 027 017 2 895 761Derivative financial instruments 2, 19 353 246 -Cash and cash equivalents 21 2 149 251 1 629 711Total current assets 6 613 326 4 611 480Total assets 29 607 820 24 357 358
NOK 1 000 Note 2016 2015
EQUITY AND LIABILTIES
EquityShare capital 14 3 576 3 576Share premium 1 231 631 1 231 631Other paid-in equity 110 587 94 328Other reserves 2 415 173 1 557 964Retained earnings 4 121 935 3 337 713Total equity 7 882 903 6 225 211
Non-current liabilitiesProvision for periodic maintenance 17 1 051 108 815 639Other long term liabilities 41 302 - Borrowings 22 7 048 147 8 113 004Derivative financial instruments 2, 19 27 939 - Total non-current liabilities 8 168 496 8 928 643
Current liabilitiesShort term part of borrowings 22 2 248 467 721 106Trade and other payables 18 8 037 695 4 873 504Air traffic settlement liabilities 3 183 953 2 807 411Derivative financial instruments 2, 19 86 306 801 483Total short term liabilities 13 556 421 9 203 504Total liabilities 21 724 917 18 132 147Total equity and liabilities 29 607 820 24 357 358
Fornebu, March 21, 2017
Bjørn H. Kise Liv Berstad Christian Fredrik Stray Chair Deputy Chair Director
Ada Kjeseth Marcus Daniel Hall Linda OlsenDirector Director
(elected by the employees)Director
(elected by the employees)
Geir Olav Øien Bjørn KjosDirector
(elected by the employees)Chief Executive Officer
Help | Contents | Highlights | Letter from CEO | Board of Directors' report | Financial statements | CSR | Corporate governance | Board and management | Definitions | Contact | 61 / 99
NORWEGIAN ANNUAL REPORT 2016
Income statementstatement of comprehensive incomeStatement of financial position at December 31Statement of changes in Equity Cash flow statementNotes to financial statements of the parent companyNote 01: General information and summary of
significant accounting principlesNote 02: Financial riskNote 03: Operating revenue and incomeNote 04: Operational expensesNote 04A: Other operating expensesNote 05: Payroll expenses and number of
employeesNote 06: Remuneration to the Board of Directors
and Executive managementNote 06A: Auditor remunerationNote 07: Net financial itemsNote 08: TaxesNote 09: Intangible assetsNote 10: Tangible assetsNote 11: LeasingNote 12: ReceivablesNote 13: InventoriesNote 14: Shareholder’s equity and shareholder
informationNote 15: PensionsNote 16: OptionsNote 17: Provisions for periodic maintenanceNote 18: Trade and other payablesNote 19: Financial instrumentsNote 20: Assets pledged as collateral and
guaranteesNote 21: Bank depositsNote 22: BorrowingsNote 23: Investments in subsidiariesNote 24: Investment in asssociatesNote 25: Related partiesNote 26: Contingencies and legal claimsNote 27: CommitmentsNote 28: Events after the reporting period
PARENT COMPANY FINANCIAL STATEMENT
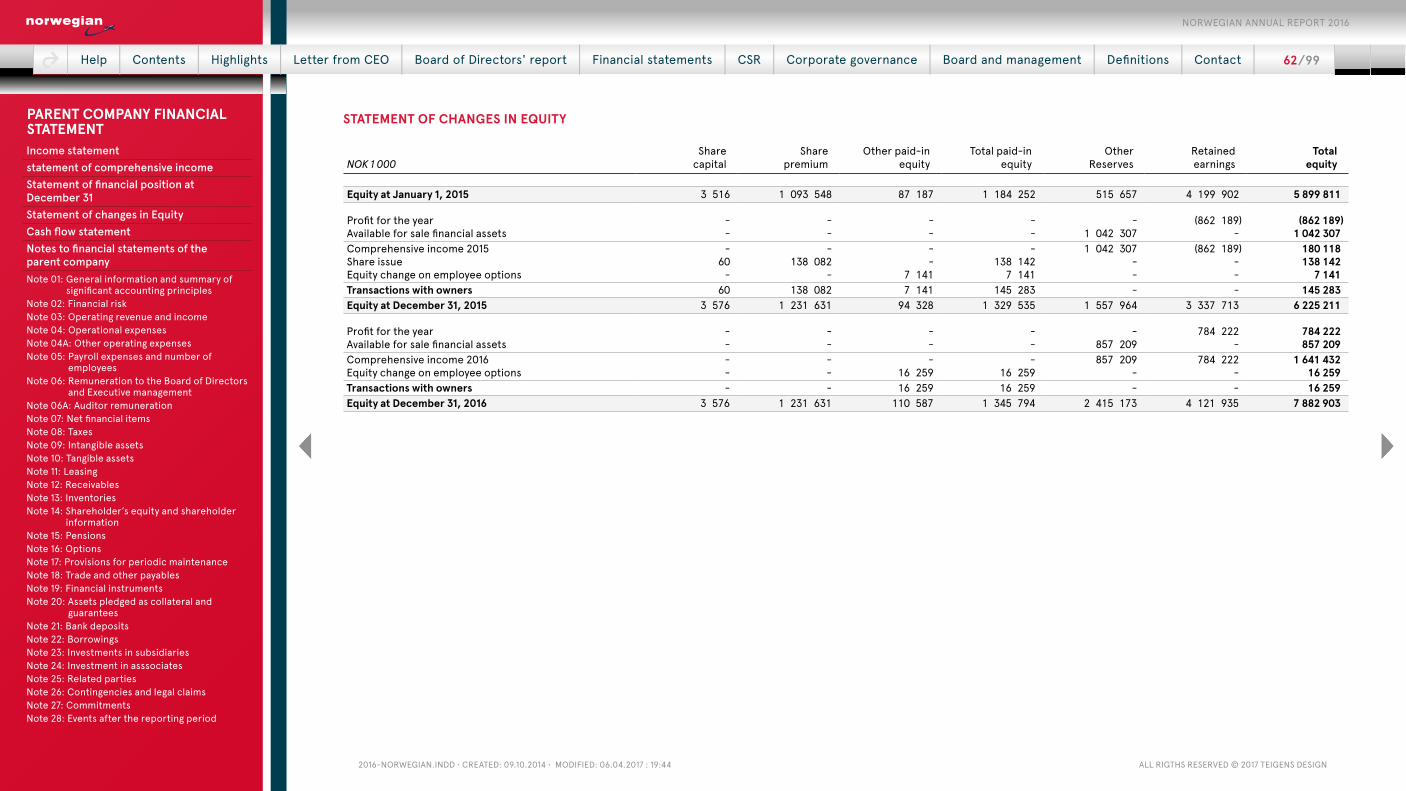
2016-NorwegiaN.iNdd • Created: 09.10.2014 • Modified: 06.04.2017 : 19:44 all rigths reserved © 2017 teigeNs desigN
STATEMENT OF CHANGES IN EQUITY
NOK 1 000Share
capitalShare
premiumOther paid-in
equityTotal paid-in
equityOther
ReservesRetainedearnings
Totalequity
Equity at January 1, 2015 3 516 1 093 548 87 187 1 184 252 515 657 4 199 902 5 899 811
Profit for the year - - - - - (862 189) (862 189)Available for sale financial assets - - - - 1 042 307 - 1 042 307Comprehensive income 2015 - - - - 1 042 307 (862 189) 180 118Share issue 60 138 082 - 138 142 - - 138 142Equity change on employee options - - 7 141 7 141 - - 7 141Transactions with owners 60 138 082 7 141 145 283 - - 145 283Equity at December 31, 2015 3 576 1 231 631 94 328 1 329 535 1 557 964 3 337 713 6 225 211
Profit for the year - - - - - 784 222 784 222Available for sale financial assets - - - - 857 209 - 857 209Comprehensive income 2016 - - - - 857 209 784 222 1 641 432Equity change on employee options - - 16 259 16 259 - - 16 259Transactions with owners - - 16 259 16 259 - - 16 259Equity at December 31, 2016 3 576 1 231 631 110 587 1 345 794 2 415 173 4 121 935 7 882 903
Help | Contents | Highlights | Letter from CEO | Board of Directors' report | Financial statements | CSR | Corporate governance | Board and management | Definitions | Contact | 62 / 99
NORWEGIAN ANNUAL REPORT 2016
Income statementstatement of comprehensive incomeStatement of financial position at December 31Statement of changes in Equity Cash flow statementNotes to financial statements of the parent companyNote 01: General information and summary of
significant accounting principlesNote 02: Financial riskNote 03: Operating revenue and incomeNote 04: Operational expensesNote 04A: Other operating expensesNote 05: Payroll expenses and number of
employeesNote 06: Remuneration to the Board of Directors
and Executive managementNote 06A: Auditor remunerationNote 07: Net financial itemsNote 08: TaxesNote 09: Intangible assetsNote 10: Tangible assetsNote 11: LeasingNote 12: ReceivablesNote 13: InventoriesNote 14: Shareholder’s equity and shareholder
informationNote 15: PensionsNote 16: OptionsNote 17: Provisions for periodic maintenanceNote 18: Trade and other payablesNote 19: Financial instrumentsNote 20: Assets pledged as collateral and
guaranteesNote 21: Bank depositsNote 22: BorrowingsNote 23: Investments in subsidiariesNote 24: Investment in asssociatesNote 25: Related partiesNote 26: Contingencies and legal claimsNote 27: CommitmentsNote 28: Events after the reporting period
PARENT COMPANY FINANCIAL STATEMENT
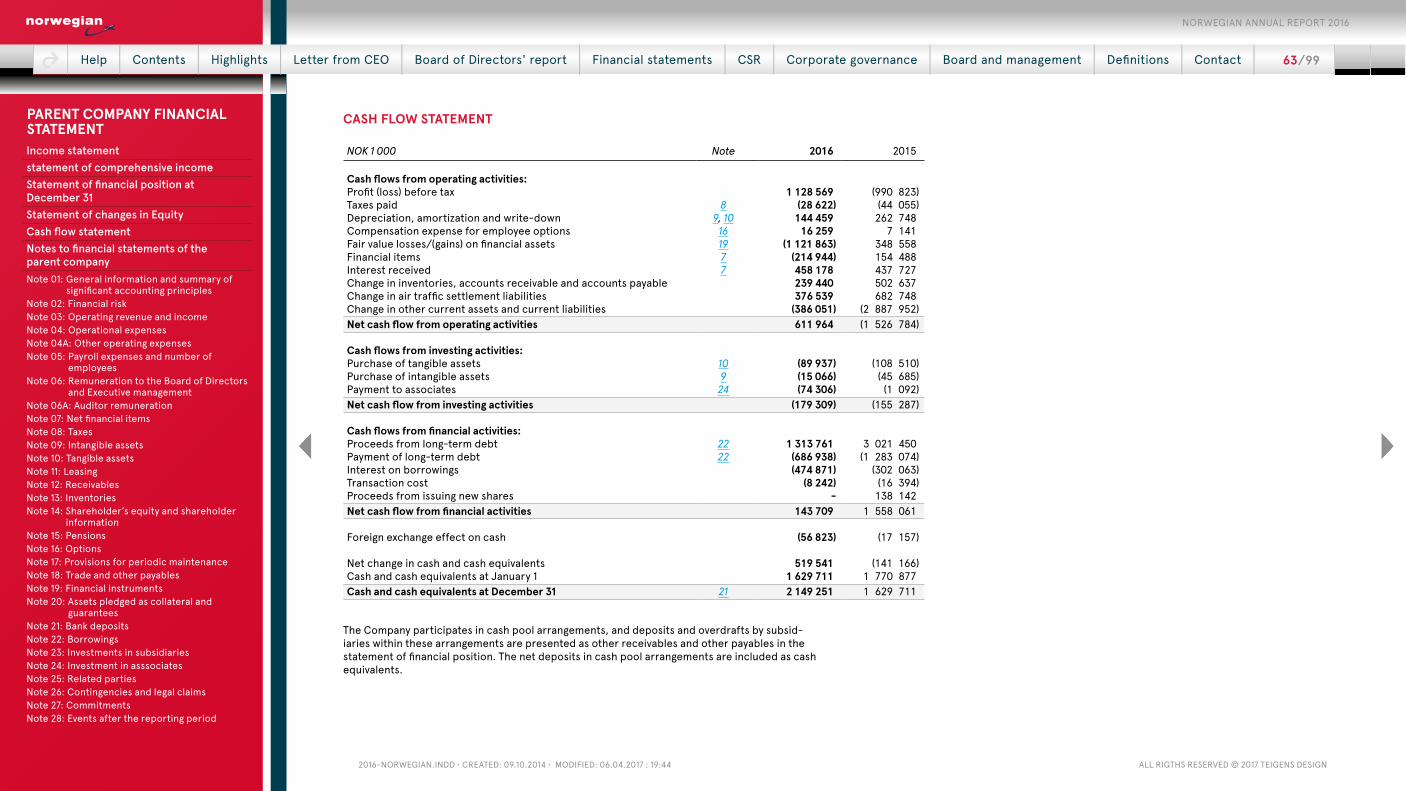
2016-NorwegiaN.iNdd • Created: 09.10.2014 • Modified: 06.04.2017 : 19:44 all rigths reserved © 2017 teigeNs desigN
CASH FLOW STATEMENT
NOK 1 000 Note 2016 2015
Cash flows from operating activities:Profit (loss) before tax 1 128 569 (990 823)Taxes paid 8 (28 622) (44 055)Depreciation, amortization and write-down 9, 10 144 459 262 748Compensation expense for employee options 16 16 259 7 141Fair value losses/(gains) on financial assets 19 (1 121 863) 348 558Financial items 7 (214 944) 154 488Interest received 7 458 178 437 727Change in inventories, accounts receivable and accounts payable 239 440 502 637Change in air traffic settlement liabilities 376 539 682 748Change in other current assets and current liabilities (386 051) (2 887 952)Net cash flow from operating activities 611 964 (1 526 784)
Cash flows from investing activities:Purchase of tangible assets 10 (89 937) (108 510)Purchase of intangible assets 9 (15 066) (45 685)Payment to associates 24 (74 306) (1 092)Net cash flow from investing activities (179 309) (155 287)
Cash flows from financial activities:Proceeds from long-term debt 22 1 313 761 3 021 450Payment of long-term debt 22 (686 938) (1 283 074)Interest on borrowings (474 871) (302 063)Transaction cost (8 242) (16 394)Proceeds from issuing new shares - 138 142Net cash flow from financial activities 143 709 1 558 061
Foreign exchange effect on cash (56 823) (17 157)
Net change in cash and cash equivalents 519 541 (141 166)Cash and cash equivalents at January 1 1 629 711 1 770 877Cash and cash equivalents at December 31 21 2 149 251 1 629 711
The Company participates in cash pool arrangements, and deposits and overdrafts by subsid-iaries within these arrangements are presented as other receivables and other payables in the statement of financial position. The net deposits in cash pool arrangements are included as cash equivalents.
Help | Contents | Highlights | Letter from CEO | Board of Directors' report | Financial statements | CSR | Corporate governance | Board and management | Definitions | Contact | 63 / 99
NORWEGIAN ANNUAL REPORT 2016
Income statementstatement of comprehensive incomeStatement of financial position at December 31Statement of changes in Equity Cash flow statementNotes to financial statements of the parent companyNote 01: General information and summary of
significant accounting principlesNote 02: Financial riskNote 03: Operating revenue and incomeNote 04: Operational expensesNote 04A: Other operating expensesNote 05: Payroll expenses and number of
employeesNote 06: Remuneration to the Board of Directors
and Executive managementNote 06A: Auditor remunerationNote 07: Net financial itemsNote 08: TaxesNote 09: Intangible assetsNote 10: Tangible assetsNote 11: LeasingNote 12: ReceivablesNote 13: InventoriesNote 14: Shareholder’s equity and shareholder
informationNote 15: PensionsNote 16: OptionsNote 17: Provisions for periodic maintenanceNote 18: Trade and other payablesNote 19: Financial instrumentsNote 20: Assets pledged as collateral and
guaranteesNote 21: Bank depositsNote 22: BorrowingsNote 23: Investments in subsidiariesNote 24: Investment in asssociatesNote 25: Related partiesNote 26: Contingencies and legal claimsNote 27: CommitmentsNote 28: Events after the reporting period
PARENT COMPANY FINANCIAL STATEMENT

2016-NorwegiaN.iNdd • Created: 09.10.2014 • Modified: 06.04.2017 : 19:44 all rigths reserved © 2017 teigeNs desigN
NOTES TO FINANCIAL STATEMENTS OF THE PARENT COMPANY
NOTE 01: GENERAL INFORMATION AND SUMMARY OF SIGNIFICANT ACCOUNTING PRINCIPLES
Norwegian Air Shuttle ASA is the parent in the Norwegian ASA Group. Besides being an op-erative airline it also serves the purpose of holding company in the Norwegian Group, and contains the Group Management and Corporate Functions, in addition to serving other Group airlines and other business ar-eas with shared services. The information provided in the consolidated financial state-ments covers the company to a significant degree. Please refer to the consolidated fi-nancial statement of the Group for a descrip-tion of the operative activities of Norwegian Air Shuttle ASA.
The financial statements of Norwegian Air Shuttle ASA for the year ended December 31, 2016 were authorized for issue by the Board of Directors on March 21, 2017. The annual shareholders meeting, to be held May 9, 2017, have the power to amend and reissue the fi-nancial statements.
The financial statement of the company has been prepared in accordance with simplified IFRS pursuant to the Norwegian Accounting Act § 3-9, and regulations regarding simpli-fied application of IFRS issued by the Ministry of Finance on January 21, 2008. The first time simplified IFRS was adopted by the parent company was the company’s annual financial statements for 2015. The date of transition was January 1, 2014. The effects of the transi-tion are shown in Note 28 to the annual finan-cial statements of 2015.
The company’s significant accounting principles are consistent with the account-ing principles of the Group, as described in Note 1 of the consolidated financial state-ment. Where the notes for the parent com-pany are substantially different from the notes for the Group, these are shown below. Otherwise, refer to the notes to the Group’s
Consolidated Financial Statements (herein-after referred to as the Group’s Consolidated Financial Statements).
The option in the regulation for simplified IFRS which the company has utilized in rec-ognition, and measurement and which differ from the consolidated financial statements are:
● Dividends and group contribution Dividend and group contributions are rec-ognized in accordance with the Account-ing Act and recognized in the reporting period to which they relate.
● Investments in subsidiaries and associates Shares in subsidiaries are valued at cost and tested for impairment. Any impair-ment losses and reversal of impairment losses are classified as net gains (loss and impairment) on investments in subsidiar-ies in the income statement. Loans pro-vided to subsidiaries are measured at cost according to IAS 39.
Norwegian’s investment in Bank Norwegian is considered as an investment in an associate in accordance with the definitions of IAS 28 Investments in Associates and Joint Ventures. In accordance with IAS 28 and IAS 27 Separate Financial Statements Norwegian has chosen to account for the investment in accordance with IAS 39 Financial instruments: Recogni-tion and Measurement. Under IAS 39 the in-vestment is classified as an available-for-sale financial asset, and hence measured at fair value with gains and losses from changes in fair value recognized in other comprehensive income.
NOTE 02: FINANCIAL RISK
The company’s exposure to, and management of, financial risk is primarily the same as dis-closed for the Group. For further information, please refer to Note 3 in the consolidated finan-cial statements.
NOTE 03: OPERATING REVENUE AND INCOME
Other income amounts to NOK 14.0 million (2015: NOK 1 110.8 million) and include gains from sale of assets.
NOK 1 000 2016 2015
By activity:Passenger transport 10 814 605 14 541 499Ancillary revenue 2 000 792 2 470 609Other revenue and other income 2 024 145 1 836 944Total operating revenue and income 14 839 542 18 849 052
By geographic market:Domestic 5 393 964 5 367 079International 9 445 578 13 481 973Total operating revenue and income 14 839 542 18 849 052
The Company is a low-cost airline, using its fleet of aircraft. Revenues from this business are specified in the table above. Passenger revenue consists of revenue generated from sales of airline tickets, while ancillary revenue consists of other services directly generated from ticket sales. Other revenue consists of sales that are not directly related to an airline ticket, e.g. cargo and sales of third-party products.
Help | Contents | Highlights | Letter from CEO | Board of Directors' report | Financial statements | CSR | Corporate governance | Board and management | Definitions | Contact | 64 / 99
NORWEGIAN ANNUAL REPORT 2016
Income statementstatement of comprehensive incomeStatement of financial position at December 31Statement of changes in Equity Cash flow statementNotes to financial statements of the parent companyNote 01: General information and summary of
significant accounting principlesNote 02: Financial riskNote 03: Operating revenue and incomeNote 04: Operational expensesNote 04A: Other operating expensesNote 05: Payroll expenses and number of
employeesNote 06: Remuneration to the Board of Directors
and Executive managementNote 06A: Auditor remunerationNote 07: Net financial itemsNote 08: TaxesNote 09: Intangible assetsNote 10: Tangible assetsNote 11: LeasingNote 12: ReceivablesNote 13: InventoriesNote 14: Shareholder’s equity and shareholder
informationNote 15: PensionsNote 16: OptionsNote 17: Provisions for periodic maintenanceNote 18: Trade and other payablesNote 19: Financial instrumentsNote 20: Assets pledged as collateral and
guaranteesNote 21: Bank depositsNote 22: BorrowingsNote 23: Investments in subsidiariesNote 24: Investment in asssociatesNote 25: Related partiesNote 26: Contingencies and legal claimsNote 27: CommitmentsNote 28: Events after the reporting period
PARENT COMPANY FINANCIAL STATEMENT
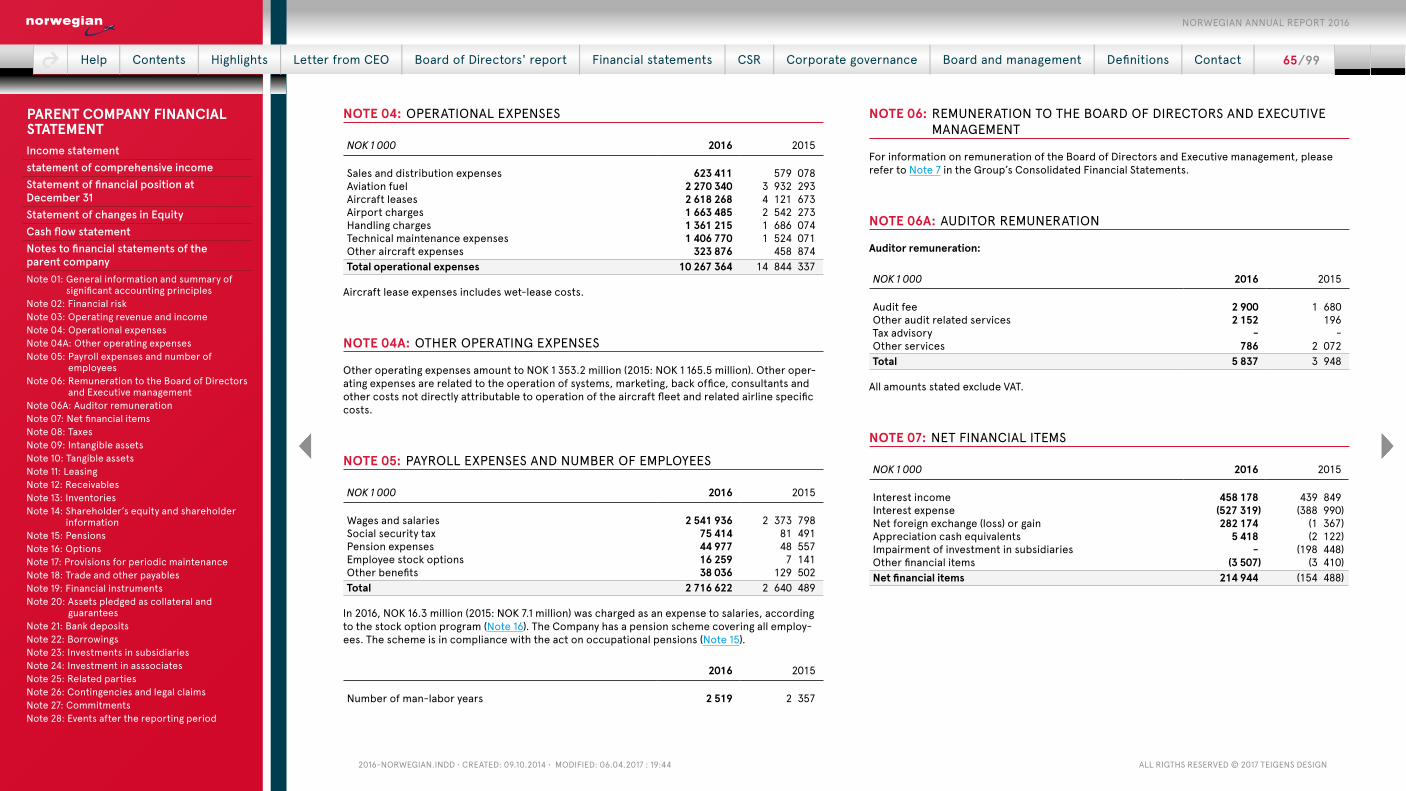
2016-NorwegiaN.iNdd • Created: 09.10.2014 • Modified: 06.04.2017 : 19:44 all rigths reserved © 2017 teigeNs desigN
NOTE 04: OPERATIONAL EXPENSES
NOK 1 000 2016 2015
Sales and distribution expenses 623 411 579 078Aviation fuel 2 270 340 3 932 293Aircraft leases 2 618 268 4 121 673Airport charges 1 663 485 2 542 273Handling charges 1 361 215 1 686 074Technical maintenance expenses 1 406 770 1 524 071Other aircraft expenses 323 876 458 874Total operational expenses 10 267 364 14 844 337
Aircraft lease expenses includes wet-lease costs.
NOTE 04A: OTHER OPERATING EXPENSES
Other operating expenses amount to NOK 1 353.2 million (2015: NOK 1 165.5 million). Other oper-ating expenses are related to the operation of systems, marketing, back office, consultants and other costs not directly attributable to operation of the aircraft fleet and related airline specific costs.
NOTE 05: PAYROLL EXPENSES AND NUMBER OF EMPLOYEES
NOK 1 000 2016 2015
Wages and salaries 2 541 936 2 373 798Social security tax 75 414 81 491Pension expenses 44 977 48 557Employee stock options 16 259 7 141Other benefits 38 036 129 502Total 2 716 622 2 640 489
In 2016, NOK 16.3 million (2015: NOK 7.1 million) was charged as an expense to salaries, according to the stock option program (Note 16). The Company has a pension scheme covering all employ-ees. The scheme is in compliance with the act on occupational pensions (Note 15).
2016 2015
Number of man-labor years 2 519 2 357
NOTE 06: REMUNERATION TO THE BOARD OF DIRECTORS AND EXECUTIVE MANAGEMENT
For information on remuneration of the Board of Directors and Executive management, please refer to Note 7 in the Group’s Consolidated Financial Statements.
NOTE 06A: AUDITOR REMUNERATION
Auditor remuneration:
NOK 1 000 2016 2015
Audit fee 2 900 1 680 Other audit related services 2 152 196 Tax advisory - - Other services 786 2 072 Total 5 837 3 948
All amounts stated exclude VAT.
NOTE 07: NET FINANCIAL ITEMS
NOK 1 000 2016 2015
Interest income 458 178 439 849 Interest expense (527 319) (388 990)Net foreign exchange (loss) or gain 282 174 (1 367)Appreciation cash equivalents 5 418 (2 122)Impairment of investment in subsidiaries - (198 448)Other financial items (3 507) (3 410)Net financial items 214 944 (154 488)
Help | Contents | Highlights | Letter from CEO | Board of Directors' report | Financial statements | CSR | Corporate governance | Board and management | Definitions | Contact | 65 / 99
NORWEGIAN ANNUAL REPORT 2016
Income statementstatement of comprehensive incomeStatement of financial position at December 31Statement of changes in Equity Cash flow statementNotes to financial statements of the parent companyNote 01: General information and summary of
significant accounting principlesNote 02: Financial riskNote 03: Operating revenue and incomeNote 04: Operational expensesNote 04A: Other operating expensesNote 05: Payroll expenses and number of
employeesNote 06: Remuneration to the Board of Directors
and Executive managementNote 06A: Auditor remunerationNote 07: Net financial itemsNote 08: TaxesNote 09: Intangible assetsNote 10: Tangible assetsNote 11: LeasingNote 12: ReceivablesNote 13: InventoriesNote 14: Shareholder’s equity and shareholder
informationNote 15: PensionsNote 16: OptionsNote 17: Provisions for periodic maintenanceNote 18: Trade and other payablesNote 19: Financial instrumentsNote 20: Assets pledged as collateral and
guaranteesNote 21: Bank depositsNote 22: BorrowingsNote 23: Investments in subsidiariesNote 24: Investment in asssociatesNote 25: Related partiesNote 26: Contingencies and legal claimsNote 27: CommitmentsNote 28: Events after the reporting period
PARENT COMPANY FINANCIAL STATEMENT

2016-NorwegiaN.iNdd • Created: 09.10.2014 • Modified: 06.04.2017 : 19:44 all rigths reserved © 2017 teigeNs desigN
NOTE 08: TAXES
This year's tax expense consists of:NOK 1 000 2016 2015
Adjustments from previous year 53 086 41 778 Change in deferred tax 291 261 (170 411)Income tax expense 344 347 (128 634)
Adjustments from previous years consist of both taxes paid in 2016 related to earlier years’ tax as-sessments, and changes in deferred tax from previous years.
Reconciliation from nominal to effective tax rate: NOK 1 000 2016 2015
Profit before tax 1 128 569 (990 823)
Expected tax expense (income) using nominal tax rate (25%) 282 142 (267 522)
Tax effect of the following items:Non deductible expenses/income 341 55 781 Adjustments from previous year 53 086 41 778 Change in tax rate 8 778 41 426 Other items - (96)Tax expense 344 347 (128 634)Effective tax rate 30.51% 12.98%
Details of deferred tax assets in the balance sheet:
Deferred tax (assets)NOK 1 000 2016 2015
Intangible assets 26 162 - Tangible assets (54 382) 6 201 Inventories (15 660) (15 979)Receivables (7 987) (4 757)Financial instruments 84 834 (200 371)Deferred gains/losses 57 905 33 846 Other accruals (229 633) (198 424)Other temporary differences - 41 445 Loss carried forward (71 915) (179 785)Net deferred tax assets (210 674) (517 823)
Reconciliation of deferred tax assets and liabilities:
Reconciliation of deferred tax (assets)NOK 1 000 2016 2015
Recognized at January 1 (517 823) (345 134)Charged/credited to the income statement 291 261 (170 411)Adjustment from previous year 15 888 (2 278)Recognized at December 31 (210 674) (517 823)
Deferred tax assets are based on unused tax loss carry forwards and temporary differences in as-sets and liabilities. The tax loss carried forward is expected to be utilized by future taxable profits. Adjustments from previous years consists of differences in deferred tax positions between the Fi-nancial Statement release last year and the company’s tax reporting finalized later in the year.
Help | Contents | Highlights | Letter from CEO | Board of Directors' report | Financial statements | CSR | Corporate governance | Board and management | Definitions | Contact | 66 / 99
NORWEGIAN ANNUAL REPORT 2016
Income statementstatement of comprehensive incomeStatement of financial position at December 31Statement of changes in Equity Cash flow statementNotes to financial statements of the parent companyNote 01: General information and summary of
significant accounting principlesNote 02: Financial riskNote 03: Operating revenue and incomeNote 04: Operational expensesNote 04A: Other operating expensesNote 05: Payroll expenses and number of
employeesNote 06: Remuneration to the Board of Directors
and Executive managementNote 06A: Auditor remunerationNote 07: Net financial itemsNote 08: TaxesNote 09: Intangible assetsNote 10: Tangible assetsNote 11: LeasingNote 12: ReceivablesNote 13: InventoriesNote 14: Shareholder’s equity and shareholder
informationNote 15: PensionsNote 16: OptionsNote 17: Provisions for periodic maintenanceNote 18: Trade and other payablesNote 19: Financial instrumentsNote 20: Assets pledged as collateral and
guaranteesNote 21: Bank depositsNote 22: BorrowingsNote 23: Investments in subsidiariesNote 24: Investment in asssociatesNote 25: Related partiesNote 26: Contingencies and legal claimsNote 27: CommitmentsNote 28: Events after the reporting period
PARENT COMPANY FINANCIAL STATEMENT

2016-NorwegiaN.iNdd • Created: 09.10.2014 • Modified: 06.04.2017 : 19:44 all rigths reserved © 2017 teigeNs desigN
NOTE 09: INTANGIBLE ASSETS
NOK 1 000 Software GoodwillOther
intangible assets Total
Acquisition cost at January 1, 2015 360 532 94 157 26 998 481 686 Additions 45 685 - - 45 685 Acquisition cost at December 31, 2015 406 216 94 157 26 998 527 371 Acquisition cost at January 1, 2016 406 216 94 157 26 998 527 371 Additions 15 066 - - 15 066 Acquisition cost at December 31, 2016 421 282 94 157 26 998 542 436
Accumulated amortization and write-down at January 1, 2015 277 137 - 4 591 281 729Amortization in 2015 46 012 - - 46 012Accumulated amortization and write-down at December 31, 2015 323 149 - 4 591 327 740Accumulated amortization and write-down at January 1, 2016 323 149 - 4 591 327 740Amortization in 2016 36 192 - - 36 192Accumulated amortization and write-down at December 31, 2016 359 340 - 4 591 363 932
Book value at December 31, 2015 83 067 94 157 22 406 199 630 Book value at December 31, 2016 61 942 94 157 22 406 178 504
Useful life 3-5 years Indefinite Indefinite Amortization plan Straight-line None None
Capitalized software is related to external consulting fees for the development of Norwegian's own systems for bookings and ticket-less travels, various sales portals, back office and maintenance system. These costs are amortized over their estimated useful lives (three to five years).
Other intangible assets and goodwill are related to the purchase of Norwegian Air Shuttle Swe-den AB on July 31, 2007. Other intangible assets from business combinations consist of estimated fair value of Brand name, charter operations, slots and the Air Operating Certificate. Other intangi-ble assets also consist of intellectual property rights that are related to purchases of internet do-mains. The Group has developed international web portals in major markets.
Goodwill, slots and intellectual property rights are determined to have indefinite useful lives, and are not amortized. Slots and intellectual property rights do not expire over time, as long as the Management has the intention to continue using the assets.
Impairment testing of goodwill and intangible assets The company tests goodwill and assets with indefinite useful lives annually at year-end for impair-ment. Intangible assets with definite lives are tested for impairment if indicators of impairment are identified. No indications of impairment have been identified in 2016 or in 2015.
The method used to estimate the recoverable amount is value in use, based on discounted cash flow analysis. The analysis reflects the cash flow projections in the financial business plan covering the next year which is approved by the Board of Directors. The budget for the next 12 months is ap-plied for cash flows within a planning horizon of 8 years, as the aircraft fleet is estimated for re-in-
vestment every eight years. Key assumptions used in the calculation are growth rates, operating costs, terminal value and discount rate. Cash flows beyond the eight-year period are extrapolated with a long-term growth rate. Estimated cash flows and discount rate are after tax.
Discount rateThe applied after tax discount rate is 5.7% (2015: 7.4%) and based on the Weighted Average Cost of Capital (WACC). The cost of the Group's debt and equity capital, weighted accordingly to reflect its capital structure, gives the Group’s weighted average cost of capital. The WACC rates which are used to discount future cash flows are based on market risk free interest rates adjusted for infla-tion differentials and also include the debt premium, market risk premium, gearing corporate tax rate and asset beta. An increase of the discount rate of 1 percentage point will not result in impair-ment of goodwill and intangible assets.
Growth ratesThe basis for calculating future growth rate is next year management approved budget. Except for budgeted growth stemming from existing assets, no growth is incorporated in the impairment test for 2016.
Operating costsThe operating costs are calculated based on the budget period. Committed operations efficiency
Help | Contents | Highlights | Letter from CEO | Board of Directors' report | Financial statements | CSR | Corporate governance | Board and management | Definitions | Contact | 67 / 99
NORWEGIAN ANNUAL REPORT 2016
Income statementstatement of comprehensive incomeStatement of financial position at December 31Statement of changes in Equity Cash flow statementNotes to financial statements of the parent companyNote 01: General information and summary of
significant accounting principlesNote 02: Financial riskNote 03: Operating revenue and incomeNote 04: Operational expensesNote 04A: Other operating expensesNote 05: Payroll expenses and number of
employeesNote 06: Remuneration to the Board of Directors
and Executive managementNote 06A: Auditor remunerationNote 07: Net financial itemsNote 08: TaxesNote 09: Intangible assetsNote 10: Tangible assetsNote 11: LeasingNote 12: ReceivablesNote 13: InventoriesNote 14: Shareholder’s equity and shareholder
informationNote 15: PensionsNote 16: OptionsNote 17: Provisions for periodic maintenanceNote 18: Trade and other payablesNote 19: Financial instrumentsNote 20: Assets pledged as collateral and
guaranteesNote 21: Bank depositsNote 22: BorrowingsNote 23: Investments in subsidiariesNote 24: Investment in asssociatesNote 25: Related partiesNote 26: Contingencies and legal claimsNote 27: CommitmentsNote 28: Events after the reporting period
PARENT COMPANY FINANCIAL STATEMENT

2016-NorwegiaN.iNdd • Created: 09.10.2014 • Modified: 06.04.2017 : 19:44 all rigths reserved © 2017 teigeNs desigN
programs for the next 12 months are taken into account. Changes in the outcome of these ini-tiatives may affect future estimated operating costs. A permanent increase of 2% of total costs, with all other assumptions unchanged, will not result in impairment of assets.
Terminal valueA growth rate of 0% is used in calculating cash flow beyond the eight-year period.
SensitivityAt December 31, 2016, the Group’s value in use was significantly higher than the carrying amount of its goodwill and intangible assets. A sensitivity analysis has been performed in order to deter-mine if a reasonable change in key assumptions would cause the carrying amount to exceed the recoverable amount. A reduction in the estimated revenue per passenger kilometre by 2%, an increase in the unit cost by 2%, a reduction in the estimated load factor by 1 percentage point or an increase in WACC after tax by 1 percentage point would not lead to an impairment loss.
NOTE 10: TANGIBLE ASSETS
NOK 1 000 Buildings Aircraft Equipment and fixtures Financial lease Total
Acquisition cost at January 1, 2015 254 849 894 126 211 961 34 607 1 395 543 Additions 38 995 54 788 32 797 - 126 580 Disposals - - - (34 607) (34 607)Acquisition cost at December 31, 2015 293 845 948 914 244 758 - 1 487 517
Acquisition cost at January 1, 2016 293 845 948 914 244 758 - 1 487 517 Additions 3 225 45 870 34 586 - 83 680 Acquisition cost at December 31, 2016 297 069 994 784 279 343 - 1 571 197
Accumulated depreciation at January 1, 2015 2 613 596 239 135 470 15 374 749 695 Depreciation 5 557 174 228 35 788 1 163 216 737 Depreciation on disposals - - - (16 537) (16 537)Accumulated depreciation at December 31, 2015 8 171 770 466 171 258 - 949 895
Accumulated depreciation at January 1, 2016 8 171 770 466 171 258 - 949 895 Depreciation 5 663 61 380 41 225 - 108 268 Accumulated depreciation at December 31, 2016 13 833 831 846 212 483 - 1 058 163
Book value at December 31, 2015 285 674 178 448 73 500 - 537 622 Book value at December 31, 2016 283 236 162 938 66 860 - 513 034
Economic life See below See below See below 4-20 yearsDepreciation plan See below See below Linear LinearResidual value See below See below See below NOK million 0
At December 31, 2016, the Company operated a total of 59 aircraft, 10 were leased under op-erational leases from external lessors and 45 were leased under internal operating leases, and 4 were owned. For comparison, the Company operated a total of 72 aircraft at December 31, 2015, 23 were leased under operational leases from external lessors, while 45 were leased un-der internal operating leases, and 4 were owned. In addition, the company had one wet lease aircraft from subsidiary Norwegian Air Norway AS at year end 2016 (year end 2015: one).
AircraftAircraft consist of purchased aircraft. The Company owns four aircraft per December 31, 2016 (2015: 4 aircraft) and the total residual value for these aircraft was NOK 4.1 million (2015: NOK 4.1 million). The residual value is deducted from the depreciable amount of the remainder of the aircraft. The life expectancy is 25 years on all the 737 aircraft, and the economic life of the owned aircraft is 25 years less the age of the aircraft at time of purchase.
Help | Contents | Highlights | Letter from CEO | Board of Directors' report | Financial statements | CSR | Corporate governance | Board and management | Definitions | Contact | 68 / 99
NORWEGIAN ANNUAL REPORT 2016
Income statementstatement of comprehensive incomeStatement of financial position at December 31Statement of changes in Equity Cash flow statementNotes to financial statements of the parent companyNote 01: General information and summary of
significant accounting principlesNote 02: Financial riskNote 03: Operating revenue and incomeNote 04: Operational expensesNote 04A: Other operating expensesNote 05: Payroll expenses and number of
employeesNote 06: Remuneration to the Board of Directors
and Executive managementNote 06A: Auditor remunerationNote 07: Net financial itemsNote 08: TaxesNote 09: Intangible assetsNote 10: Tangible assetsNote 11: LeasingNote 12: ReceivablesNote 13: InventoriesNote 14: Shareholder’s equity and shareholder
informationNote 15: PensionsNote 16: OptionsNote 17: Provisions for periodic maintenanceNote 18: Trade and other payablesNote 19: Financial instrumentsNote 20: Assets pledged as collateral and
guaranteesNote 21: Bank depositsNote 22: BorrowingsNote 23: Investments in subsidiariesNote 24: Investment in asssociatesNote 25: Related partiesNote 26: Contingencies and legal claimsNote 27: CommitmentsNote 28: Events after the reporting period
PARENT COMPANY FINANCIAL STATEMENT
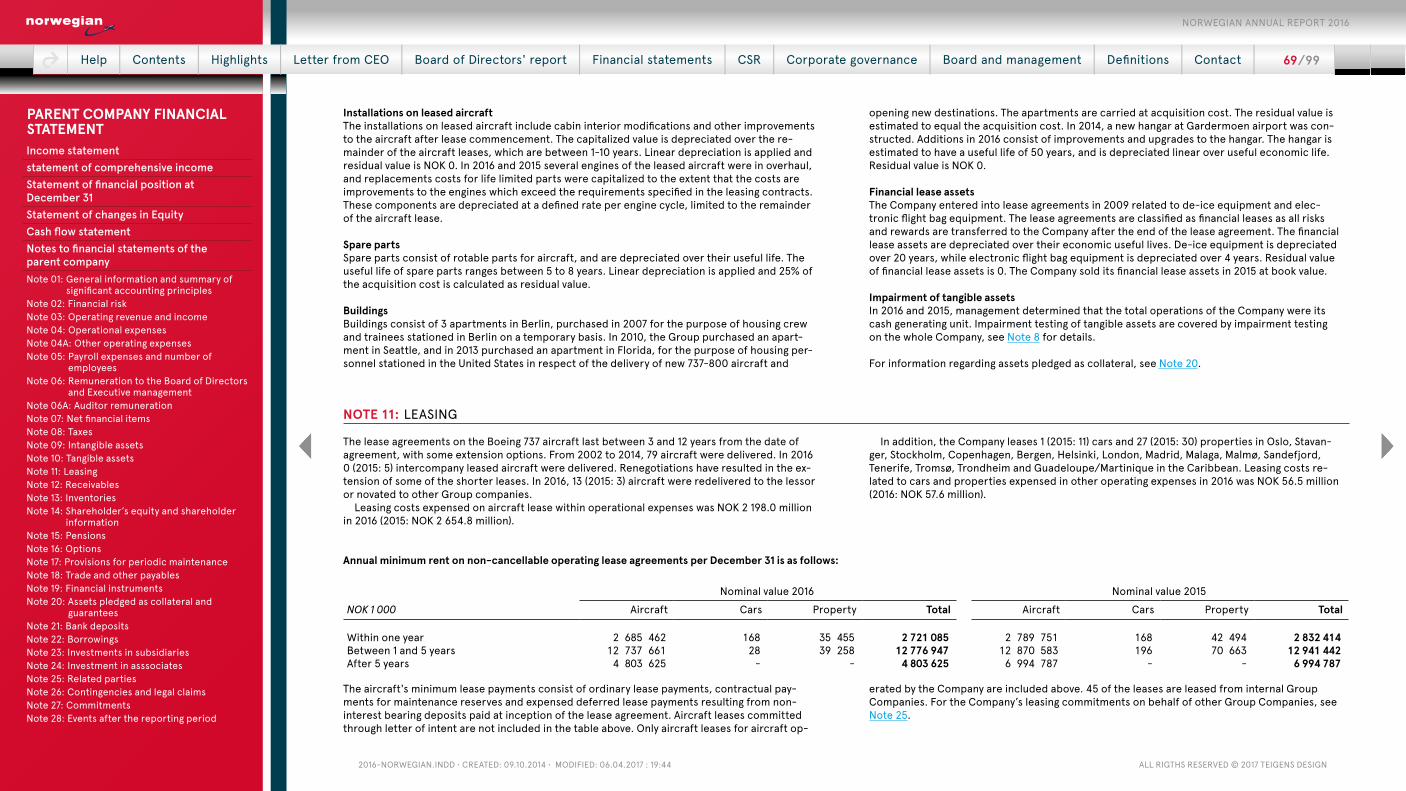
2016-NorwegiaN.iNdd • Created: 09.10.2014 • Modified: 06.04.2017 : 19:44 all rigths reserved © 2017 teigeNs desigN
Installations on leased aircraftThe installations on leased aircraft include cabin interior modifications and other improvements to the aircraft after lease commencement. The capitalized value is depreciated over the re-mainder of the aircraft leases, which are between 1-10 years. Linear depreciation is applied and residual value is NOK 0. In 2016 and 2015 several engines of the leased aircraft were in overhaul, and replacements costs for life limited parts were capitalized to the extent that the costs are improvements to the engines which exceed the requirements specified in the leasing contracts. These components are depreciated at a defined rate per engine cycle, limited to the remainder of the aircraft lease. Spare partsSpare parts consist of rotable parts for aircraft, and are depreciated over their useful life. The useful life of spare parts ranges between 5 to 8 years. Linear depreciation is applied and 25% of the acquisition cost is calculated as residual value.
BuildingsBuildings consist of 3 apartments in Berlin, purchased in 2007 for the purpose of housing crew and trainees stationed in Berlin on a temporary basis. In 2010, the Group purchased an apart-ment in Seattle, and in 2013 purchased an apartment in Florida, for the purpose of housing per-sonnel stationed in the United States in respect of the delivery of new 737-800 aircraft and
opening new destinations. The apartments are carried at acquisition cost. The residual value is estimated to equal the acquisition cost. In 2014, a new hangar at Gardermoen airport was con-structed. Additions in 2016 consist of improvements and upgrades to the hangar. The hangar is estimated to have a useful life of 50 years, and is depreciated linear over useful economic life. Residual value is NOK 0.
Financial lease assetsThe Company entered into lease agreements in 2009 related to de-ice equipment and elec-tronic flight bag equipment. The lease agreements are classified as financial leases as all risks and rewards are transferred to the Company after the end of the lease agreement. The financial lease assets are depreciated over their economic useful lives. De-ice equipment is depreciated over 20 years, while electronic flight bag equipment is depreciated over 4 years. Residual value of financial lease assets is 0. The Company sold its financial lease assets in 2015 at book value.
Impairment of tangible assetsIn 2016 and 2015, management determined that the total operations of the Company were its cash generating unit. Impairment testing of tangible assets are covered by impairment testing on the whole Company, see Note 8 for details.
For information regarding assets pledged as collateral, see Note 20.
NOTE 11: LEASING
The lease agreements on the Boeing 737 aircraft last between 3 and 12 years from the date of agreement, with some extension options. From 2002 to 2014, 79 aircraft were delivered. In 2016 0 (2015: 5) intercompany leased aircraft were delivered. Renegotiations have resulted in the ex-tension of some of the shorter leases. In 2016, 13 (2015: 3) aircraft were redelivered to the lessor or novated to other Group companies.
Leasing costs expensed on aircraft lease within operational expenses was NOK 2 198.0 million in 2016 (2015: NOK 2 654.8 million).
In addition, the Company leases 1 (2015: 11) cars and 27 (2015: 30) properties in Oslo, Stavan-ger, Stockholm, Copenhagen, Bergen, Helsinki, London, Madrid, Malaga, Malmø, Sandefjord, Tenerife, Tromsø, Trondheim and Guadeloupe/Martinique in the Caribbean. Leasing costs re-lated to cars and properties expensed in other operating expenses in 2016 was NOK 56.5 million (2016: NOK 57.6 million).
Annual minimum rent on non-cancellable operating lease agreements per December 31 is as follows:
Nominal value 2016 Nominal value 2015NOK 1 000 Aircraft Cars Property Total Aircraft Cars Property Total
Within one year 2 685 462 168 35 455 2 721 085 2 789 751 168 42 494 2 832 414 Between 1 and 5 years 12 737 661 28 39 258 12 776 947 12 870 583 196 70 663 12 941 442 After 5 years 4 803 625 - - 4 803 625 6 994 787 - - 6 994 787
The aircraft's minimum lease payments consist of ordinary lease payments, contractual pay-ments for maintenance reserves and expensed deferred lease payments resulting from non- interest bearing deposits paid at inception of the lease agreement. Aircraft leases committed through letter of intent are not included in the table above. Only aircraft leases for aircraft op-
erated by the Company are included above. 45 of the leases are leased from internal Group Companies. For the Company’s leasing commitments on behalf of other Group Companies, see Note 25.
Help | Contents | Highlights | Letter from CEO | Board of Directors' report | Financial statements | CSR | Corporate governance | Board and management | Definitions | Contact | 69 / 99
NORWEGIAN ANNUAL REPORT 2016
Income statementstatement of comprehensive incomeStatement of financial position at December 31Statement of changes in Equity Cash flow statementNotes to financial statements of the parent companyNote 01: General information and summary of
significant accounting principlesNote 02: Financial riskNote 03: Operating revenue and incomeNote 04: Operational expensesNote 04A: Other operating expensesNote 05: Payroll expenses and number of
employeesNote 06: Remuneration to the Board of Directors
and Executive managementNote 06A: Auditor remunerationNote 07: Net financial itemsNote 08: TaxesNote 09: Intangible assetsNote 10: Tangible assetsNote 11: LeasingNote 12: ReceivablesNote 13: InventoriesNote 14: Shareholder’s equity and shareholder
informationNote 15: PensionsNote 16: OptionsNote 17: Provisions for periodic maintenanceNote 18: Trade and other payablesNote 19: Financial instrumentsNote 20: Assets pledged as collateral and
guaranteesNote 21: Bank depositsNote 22: BorrowingsNote 23: Investments in subsidiariesNote 24: Investment in asssociatesNote 25: Related partiesNote 26: Contingencies and legal claimsNote 27: CommitmentsNote 28: Events after the reporting period
PARENT COMPANY FINANCIAL STATEMENT

2016-NorwegiaN.iNdd • Created: 09.10.2014 • Modified: 06.04.2017 : 19:44 all rigths reserved © 2017 teigeNs desigN
NOTE 12: RECEIVABLES
Specification of receivables:NOK 1 000 2016 2015
Trade receivables 227 590 587 690 Intercompany receivables 8 240 422 5 065 175 Credit card receivables 1 298 020 1 102 244 Deposits 499 248 450 462 Deferred leasing costs - 35 962 Reimbursements claims maintenance costs 5 724 67 299 Other claims 218 504 97 712 Trade and other receivables 10 489 508 7 406 544 Prepaid costs 201 912 104 151 Public duty debt 50 440 151 055 Prepayments to employees 5 847 5 141 Prepaid rent 48 504 58 419 Prepayments 306 702 318 766 Total 10 796 211 7 725 310
Due dates:NOK 1 000 2016 2015
Within one year 4 027 017 2 895 761 After 1 year 6 769 193 4 829 550 Total 10 796 211 7 725 310
The Company pays deposits on aircraft leases. Non-interest bearing deposits are measured at amortized cost in the statement of financial position. Receivables denominated in foreign cur-rency are converted using the prevailing exchange rates on the reporting date. Refer to Note 25 for further information on transactions and outstanding balances with other group companies.
NOTE 13: INVENTORIES
NOK 1 000 2016 2015
Consumables 70 614 72 811Parts for heavy maintenance 13 198 13 198Total 83 812 86 009
In 2016 and 2015 the Company removed stock parts from aircraft engines in relation to heavy maintenance. These parts are held for sale and sold in secondary markets. Charges for obsolete parts in 2016 were NOK 39.4 million (2015: NOK 33.9 million).
NOTE 14: SHAREHOLDER’S EQUITY AND SHAREHOLDER INFORMATION
Refer to Note 15 in the Group’s consolidated financial statements.
NOTE 15: PENSIONS
The Company operates defined contribution plans. Pension plans are placed with DNB Liv.
Defined contribution planThe defined contribution plans require that the Company pays premiums to public or private administrative pension plans on mandatory, contractual or voluntary basis. The Company has no further obligations once these premiums are paid. The premiums are accounted for as payroll expenses as soon as they are incurred. Pre-paid premiums are accounted for as an asset to the extent that future benefits can be determined as plausible.
Defined contribution plans comply with Norwegian Pension legislation.Pension expenses on defined contribution plans were NOK 44.2 million in 2016 (2015: NOK
48.6 million). In addition, employees are included in the early retirement scheme (AFP), with the right to
retire at the age of 62. The AFP is a multi-employer plan, where the Norwegian government fi-nances 1/3 of the contribution to plans. The AFP pension plan is a defined benefit plan adminis-tered by a separate legal entity (Fellesordningen). The plan is temporarily accounted for as a de-fined contribution plan, as the plan’s administrators have not been able to calculate the pension obligation for each entity participating in the plan.
The scheme is in compliance with the Occupational Pensions Act.
NOTE 16: OPTIONS
Refer to Note 17 in the Group’s consolidated financial statements.
NOTE 17: PROVISIONS FOR PERIODIC MAINTENANCE
The Company pays a fee to maintenance funds held by the lessor on leased aircraft. The ac-crued provisions in the accounts are estimated payments for periodic maintenances in excess of payments to the maintenance funds, and are provided on the basis of aircraft utilization and estimates of current maintenance costs. For some of the contracts, there is a degree of uncer-tainty about what kind of maintenance is covered by the maintenance funds, and the provision for this increase in expenses for the Company is distributed over the period until the mainte-nance is performed.
On December 31, 2016, the company had NOK 1 137.3 million (2015: NOK 899.5 million) in pro-vision for maintenance reserves. Parts of the periodic maintenances will be conducted in 2017, and NOK 86.2 million (2015: NOK 86.2 million) is classified as short term liability for periodic maintenances. The short-term part of periodic maintenance is estimated based on planned maintenance in 2017.
Help | Contents | Highlights | Letter from CEO | Board of Directors' report | Financial statements | CSR | Corporate governance | Board and management | Definitions | Contact | 70 / 99
NORWEGIAN ANNUAL REPORT 2016
Income statementstatement of comprehensive incomeStatement of financial position at December 31Statement of changes in Equity Cash flow statementNotes to financial statements of the parent companyNote 01: General information and summary of
significant accounting principlesNote 02: Financial riskNote 03: Operating revenue and incomeNote 04: Operational expensesNote 04A: Other operating expensesNote 05: Payroll expenses and number of
employeesNote 06: Remuneration to the Board of Directors
and Executive managementNote 06A: Auditor remunerationNote 07: Net financial itemsNote 08: TaxesNote 09: Intangible assetsNote 10: Tangible assetsNote 11: LeasingNote 12: ReceivablesNote 13: InventoriesNote 14: Shareholder’s equity and shareholder
informationNote 15: PensionsNote 16: OptionsNote 17: Provisions for periodic maintenanceNote 18: Trade and other payablesNote 19: Financial instrumentsNote 20: Assets pledged as collateral and
guaranteesNote 21: Bank depositsNote 22: BorrowingsNote 23: Investments in subsidiariesNote 24: Investment in asssociatesNote 25: Related partiesNote 26: Contingencies and legal claimsNote 27: CommitmentsNote 28: Events after the reporting period
PARENT COMPANY FINANCIAL STATEMENT
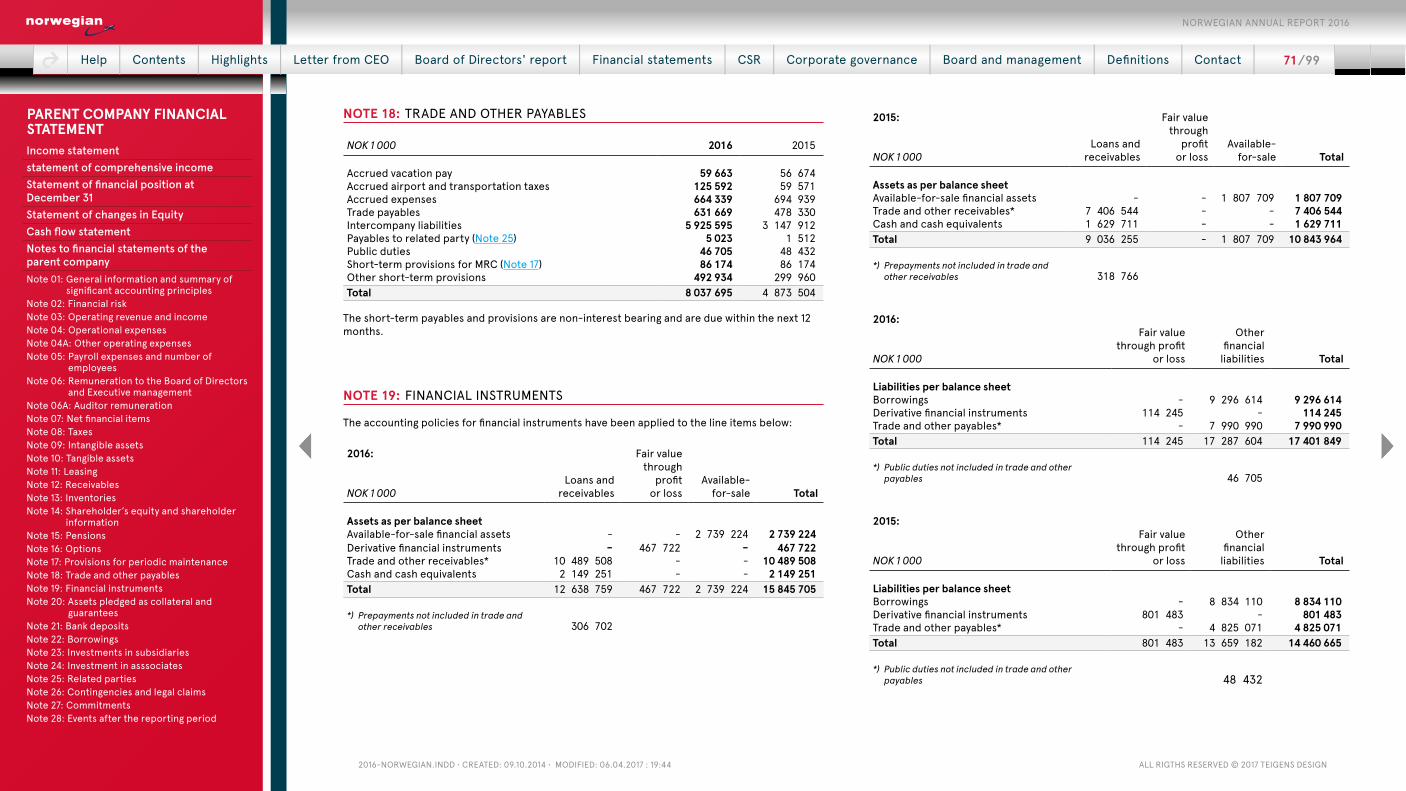
2016-NorwegiaN.iNdd • Created: 09.10.2014 • Modified: 06.04.2017 : 19:44 all rigths reserved © 2017 teigeNs desigN
NOTE 18: TRADE AND OTHER PAYABLES
NOK 1 000 2016 2015
Accrued vacation pay 59 663 56 674Accrued airport and transportation taxes 125 592 59 571Accrued expenses 664 339 694 939Trade payables 631 669 478 330Intercompany liabilities 5 925 595 3 147 912Payables to related party (Note 25) 5 023 1 512Public duties 46 705 48 432Short-term provisions for MRC (Note 17) 86 174 86 174Other short-term provisions 492 934 299 960Total 8 037 695 4 873 504
The short-term payables and provisions are non-interest bearing and are due within the next 12 months.
NOTE 19: FINANCIAL INSTRUMENTS
The accounting policies for financial instruments have been applied to the line items below:
2016:
NOK 1 000Loans and
receivables
Fair value through
profit or loss
Available-for-sale Total
Assets as per balance sheetAvailable-for-sale financial assets - - 2 739 224 2 739 224 Derivative financial instruments - 467 722 - 467 722 Trade and other receivables* 10 489 508 - - 10 489 508 Cash and cash equivalents 2 149 251 - - 2 149 251 Total 12 638 759 467 722 2 739 224 15 845 705
*) Prepayments not included in trade and other receivables 306 702
2015:
NOK 1 000Loans and
receivables
Fair value through
profit or loss
Available-for-sale Total
Assets as per balance sheetAvailable-for-sale financial assets - - 1 807 709 1 807 709 Trade and other receivables* 7 406 544 - - 7 406 544 Cash and cash equivalents 1 629 711 - - 1 629 711 Total 9 036 255 - 1 807 709 10 843 964
*) Prepayments not included in trade and other receivables 318 766
2016:
NOK 1 000
Fair value through profit
or loss
Other financial liabilities Total
Liabilities per balance sheetBorrowings - 9 296 614 9 296 614 Derivative financial instruments 114 245 - 114 245 Trade and other payables* - 7 990 990 7 990 990 Total 114 245 17 287 604 17 401 849
*) Public duties not included in trade and other payables 46 705
2015:
NOK 1 000
Fair value through profit
or loss
Other financial liabilities Total
Liabilities per balance sheetBorrowings - 8 834 110 8 834 110 Derivative financial instruments 801 483 - 801 483 Trade and other payables* - 4 825 071 4 825 071 Total 801 483 13 659 182 14 460 665
*) Public duties not included in trade and other payables 48 432
Help | Contents | Highlights | Letter from CEO | Board of Directors' report | Financial statements | CSR | Corporate governance | Board and management | Definitions | Contact | 71 / 99
NORWEGIAN ANNUAL REPORT 2016
Income statementstatement of comprehensive incomeStatement of financial position at December 31Statement of changes in Equity Cash flow statementNotes to financial statements of the parent companyNote 01: General information and summary of
significant accounting principlesNote 02: Financial riskNote 03: Operating revenue and incomeNote 04: Operational expensesNote 04A: Other operating expensesNote 05: Payroll expenses and number of
employeesNote 06: Remuneration to the Board of Directors
and Executive managementNote 06A: Auditor remunerationNote 07: Net financial itemsNote 08: TaxesNote 09: Intangible assetsNote 10: Tangible assetsNote 11: LeasingNote 12: ReceivablesNote 13: InventoriesNote 14: Shareholder’s equity and shareholder
informationNote 15: PensionsNote 16: OptionsNote 17: Provisions for periodic maintenanceNote 18: Trade and other payablesNote 19: Financial instrumentsNote 20: Assets pledged as collateral and
guaranteesNote 21: Bank depositsNote 22: BorrowingsNote 23: Investments in subsidiariesNote 24: Investment in asssociatesNote 25: Related partiesNote 26: Contingencies and legal claimsNote 27: CommitmentsNote 28: Events after the reporting period
PARENT COMPANY FINANCIAL STATEMENT
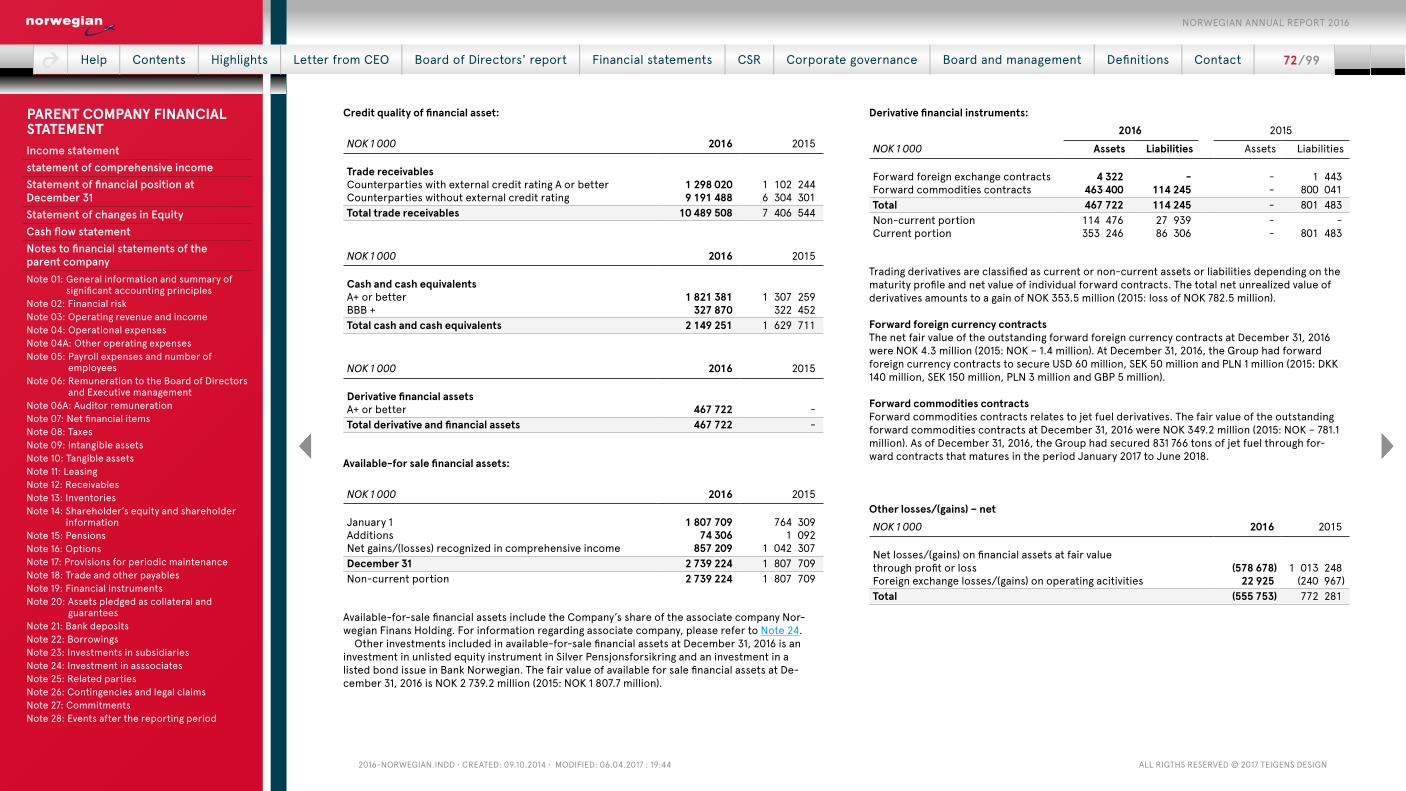
2016-NorwegiaN.iNdd • Created: 09.10.2014 • Modified: 06.04.2017 : 19:44 all rigths reserved © 2017 teigeNs desigN
Credit quality of financial asset:
NOK 1 000 2016 2015
Trade receivablesCounterparties with external credit rating A or better 1 298 020 1 102 244 Counterparties without external credit rating 9 191 488 6 304 301 Total trade receivables 10 489 508 7 406 544
NOK 1 000 2016 2015
Cash and cash equivalentsA+ or better 1 821 381 1 307 259 BBB + 327 870 322 452 Total cash and cash equivalents 2 149 251 1 629 711
NOK 1 000 2016 2015
Derivative financial assetsA+ or better 467 722 - Total derivative and financial assets 467 722 -
Available-for sale financial assets:
NOK 1 000 2016 2015
January 1 1 807 709 764 309Additions 74 306 1 092Net gains/(losses) recognized in comprehensive income 857 209 1 042 307December 31 2 739 224 1 807 709Non-current portion 2 739 224 1 807 709
Available-for-sale financial assets include the Company’s share of the associate company Nor-wegian Finans Holding. For information regarding associate company, please refer to Note 24.
Other investments included in available-for-sale financial assets at December 31, 2016 is an investment in unlisted equity instrument in Silver Pensjonsforsikring and an investment in a listed bond issue in Bank Norwegian. The fair value of available for sale financial assets at De-cember 31, 2016 is NOK 2 739.2 million (2015: NOK 1 807.7 million).
Derivative financial instruments: 2016 2015
NOK 1 000 Assets Liabilities Assets Liabilities
Forward foreign exchange contracts 4 322 - - 1 443 Forward commodities contracts 463 400 114 245 - 800 041 Total 467 722 114 245 - 801 483 Non-current portion 114 476 27 939 - - Current portion 353 246 86 306 - 801 483
Trading derivatives are classified as current or non-current assets or liabilities depending on the maturity profile and net value of individual forward contracts. The total net unrealized value of derivatives amounts to a gain of NOK 353.5 million (2015: loss of NOK 782.5 million).
Forward foreign currency contractsThe net fair value of the outstanding forward foreign currency contracts at December 31, 2016 were NOK 4.3 million (2015: NOK – 1.4 million). At December 31, 2016, the Group had forward foreign currency contracts to secure USD 60 million, SEK 50 million and PLN 1 million (2015: DKK 140 million, SEK 150 million, PLN 3 million and GBP 5 million).
Forward commodities contractsForward commodities contracts relates to jet fuel derivatives. The fair value of the outstanding forward commodities contracts at December 31, 2016 were NOK 349.2 million (2015: NOK – 781.1 million). As of December 31, 2016, the Group had secured 831 766 tons of jet fuel through for-ward contracts that matures in the period January 2017 to June 2018.
Other losses/(gains) – netNOK 1 000 2016 2015
Net losses/(gains) on financial assets at fair value through profit or loss (578 678) 1 013 248 Foreign exchange losses/(gains) on operating acitivities 22 925 (240 967)Total (555 753) 772 281
Help | Contents | Highlights | Letter from CEO | Board of Directors' report | Financial statements | CSR | Corporate governance | Board and management | Definitions | Contact | 72 / 99
NORWEGIAN ANNUAL REPORT 2016
Income statementstatement of comprehensive incomeStatement of financial position at December 31Statement of changes in Equity Cash flow statementNotes to financial statements of the parent companyNote 01: General information and summary of
significant accounting principlesNote 02: Financial riskNote 03: Operating revenue and incomeNote 04: Operational expensesNote 04A: Other operating expensesNote 05: Payroll expenses and number of
employeesNote 06: Remuneration to the Board of Directors
and Executive managementNote 06A: Auditor remunerationNote 07: Net financial itemsNote 08: TaxesNote 09: Intangible assetsNote 10: Tangible assetsNote 11: LeasingNote 12: ReceivablesNote 13: InventoriesNote 14: Shareholder’s equity and shareholder
informationNote 15: PensionsNote 16: OptionsNote 17: Provisions for periodic maintenanceNote 18: Trade and other payablesNote 19: Financial instrumentsNote 20: Assets pledged as collateral and
guaranteesNote 21: Bank depositsNote 22: BorrowingsNote 23: Investments in subsidiariesNote 24: Investment in asssociatesNote 25: Related partiesNote 26: Contingencies and legal claimsNote 27: CommitmentsNote 28: Events after the reporting period
PARENT COMPANY FINANCIAL STATEMENT
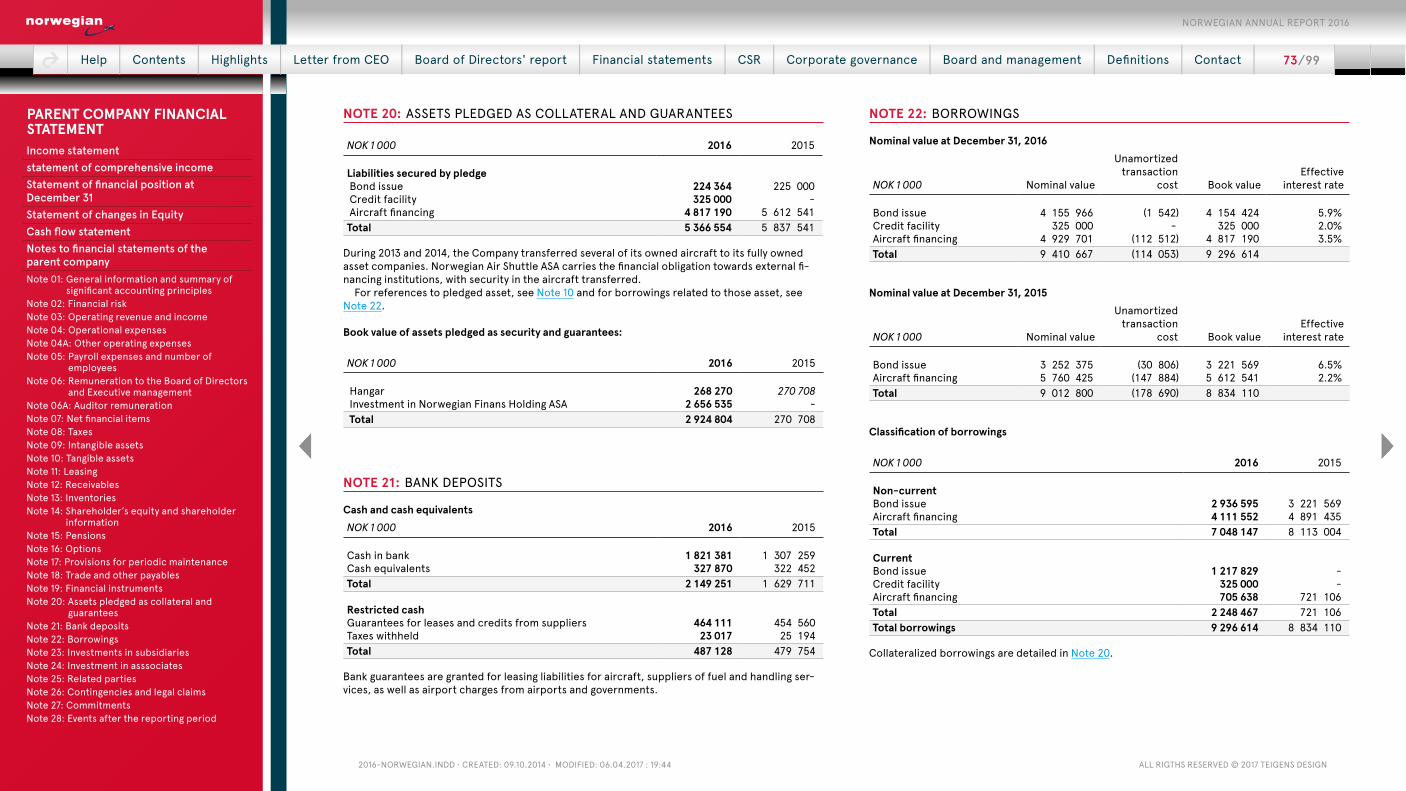
2016-NorwegiaN.iNdd • Created: 09.10.2014 • Modified: 06.04.2017 : 19:44 all rigths reserved © 2017 teigeNs desigN
NOTE 20: ASSETS PLEDGED AS COLLATERAL AND GUARANTEES
NOK 1 000 2016 2015
Liabilities secured by pledge Bond issue 224 364 225 000 Credit facility 325 000 - Aircraft financing 4 817 190 5 612 541 Total 5 366 554 5 837 541
During 2013 and 2014, the Company transferred several of its owned aircraft to its fully owned asset companies. Norwegian Air Shuttle ASA carries the financial obligation towards external fi-nancing institutions, with security in the aircraft transferred.
For references to pledged asset, see Note 10 and for borrowings related to those asset, see Note 22.
Book value of assets pledged as security and guarantees: NOK 1 000 2016 2015
Hangar 268 270 270 708 Investment in Norwegian Finans Holding ASA 2 656 535 - Total 2 924 804 270 708
NOTE 21: BANK DEPOSITS
Cash and cash equivalentsNOK 1 000 2016 2015
Cash in bank 1 821 381 1 307 259Cash equivalents 327 870 322 452Total 2 149 251 1 629 711
Restricted cashGuarantees for leases and credits from suppliers 464 111 454 560Taxes withheld 23 017 25 194Total 487 128 479 754
Bank guarantees are granted for leasing liabilities for aircraft, suppliers of fuel and handling ser-vices, as well as airport charges from airports and governments.
NOTE 22: BORROWINGS
Nominal value at December 31, 2016
NOK 1 000 Nominal value
Unamortized transaction
cost Book valueEffective
interest rate
Bond issue 4 155 966 (1 542) 4 154 424 5.9%Credit facility 325 000 - 325 000 2.0%Aircraft financing 4 929 701 (112 512) 4 817 190 3.5%Total 9 410 667 (114 053) 9 296 614
Nominal value at December 31, 2015
NOK 1 000 Nominal value
Unamortized transaction
cost Book valueEffective
interest rate
Bond issue 3 252 375 (30 806) 3 221 569 6.5%Aircraft financing 5 760 425 (147 884) 5 612 541 2.2%Total 9 012 800 (178 690) 8 834 110
Classification of borrowings
NOK 1 000 2016 2015
Non-currentBond issue 2 936 595 3 221 569 Aircraft financing 4 111 552 4 891 435 Total 7 048 147 8 113 004
CurrentBond issue 1 217 829 - Credit facility 325 000 - Aircraft financing 705 638 721 106 Total 2 248 467 721 106 Total borrowings 9 296 614 8 834 110
Collateralized borrowings are detailed in Note 20.
Help | Contents | Highlights | Letter from CEO | Board of Directors' report | Financial statements | CSR | Corporate governance | Board and management | Definitions | Contact | 73 / 99
NORWEGIAN ANNUAL REPORT 2016
Income statementstatement of comprehensive incomeStatement of financial position at December 31Statement of changes in Equity Cash flow statementNotes to financial statements of the parent companyNote 01: General information and summary of
significant accounting principlesNote 02: Financial riskNote 03: Operating revenue and incomeNote 04: Operational expensesNote 04A: Other operating expensesNote 05: Payroll expenses and number of
employeesNote 06: Remuneration to the Board of Directors
and Executive managementNote 06A: Auditor remunerationNote 07: Net financial itemsNote 08: TaxesNote 09: Intangible assetsNote 10: Tangible assetsNote 11: LeasingNote 12: ReceivablesNote 13: InventoriesNote 14: Shareholder’s equity and shareholder
informationNote 15: PensionsNote 16: OptionsNote 17: Provisions for periodic maintenanceNote 18: Trade and other payablesNote 19: Financial instrumentsNote 20: Assets pledged as collateral and
guaranteesNote 21: Bank depositsNote 22: BorrowingsNote 23: Investments in subsidiariesNote 24: Investment in asssociatesNote 25: Related partiesNote 26: Contingencies and legal claimsNote 27: CommitmentsNote 28: Events after the reporting period
PARENT COMPANY FINANCIAL STATEMENT

2016-NorwegiaN.iNdd • Created: 09.10.2014 • Modified: 06.04.2017 : 19:44 all rigths reserved © 2017 teigeNs desigN
Covenants
Bond issuesMinimum Equity of NOK 1 500 million.Dividend payments less than 35% of net profit.No dividends unless liquidity is above NOK 1 000 million.Minimum liquidity of NOK 500 million.
Credit facilityNo financial covenants.
Aircraft financingAircraft financing does not include covenant requirements. Aircraft in the group are financed with guarantees by either the parent company and / or by the Ex-Im Bank of the United States. Owned aircraft are pledged as collateral. For more information on assets pledged as collateral, see Note 20.
The Company has not been in breach of any covenants during 2016.
Maturity of borrowings
NOK 1 000Less than
1 yearBetween
1 and 2 yearsBetween
2 and 5 yearsOver
5 years
At December 31, 2016Borrowings 2 255 482 4 341 929 2 721 364 93 541Total liabilities 2 255 482 4 341 929 2 721 364 93 541
NOK 1 000Less than
1 yearBetween
1 and 2 yearsBetween
2 and 5 yearsOver
5 years
At December 31, 2015Borrowings 720 950 1 770 950 4 365 226 2 155 674Total liabilities 720 950 1 770 950 4 365 226 2 155 674
Help | Contents | Highlights | Letter from CEO | Board of Directors' report | Financial statements | CSR | Corporate governance | Board and management | Definitions | Contact | 74 / 99
NORWEGIAN ANNUAL REPORT 2016
Income statementstatement of comprehensive incomeStatement of financial position at December 31Statement of changes in Equity Cash flow statementNotes to financial statements of the parent companyNote 01: General information and summary of
significant accounting principlesNote 02: Financial riskNote 03: Operating revenue and incomeNote 04: Operational expensesNote 04A: Other operating expensesNote 05: Payroll expenses and number of
employeesNote 06: Remuneration to the Board of Directors
and Executive managementNote 06A: Auditor remunerationNote 07: Net financial itemsNote 08: TaxesNote 09: Intangible assetsNote 10: Tangible assetsNote 11: LeasingNote 12: ReceivablesNote 13: InventoriesNote 14: Shareholder’s equity and shareholder
informationNote 15: PensionsNote 16: OptionsNote 17: Provisions for periodic maintenanceNote 18: Trade and other payablesNote 19: Financial instrumentsNote 20: Assets pledged as collateral and
guaranteesNote 21: Bank depositsNote 22: BorrowingsNote 23: Investments in subsidiariesNote 24: Investment in asssociatesNote 25: Related partiesNote 26: Contingencies and legal claimsNote 27: CommitmentsNote 28: Events after the reporting period
PARENT COMPANY FINANCIAL STATEMENT

2016-NorwegiaN.iNdd • Created: 09.10.2014 • Modified: 06.04.2017 : 19:44 all rigths reserved © 2017 teigeNs desigN
NOTE 23: INVESTMENTS IN SUBSIDIARIES
Name Date of establishment Office Number of shares Ownership
Norwegian Air Shuttle Sweden AB August 31, 2007 Stockholm, Sweden 20 000 100%Call Norwegian AS January 14, 2008 Fornebu, Norway 1 000 000 100%Norwegian Holiday AS August 4, 2008 Fornebu, Norway 100 100%Norwegian Long Haul AS January 1, 2012 Fornebu, Norway 20 000 100%
Norwegian Red Handling Spain S.L. June 11, 2015 Madrid, Spain 3 000 100%Red Handling UK Ltd October 6, 2016 Gatwick Airport, UK 500 000 100%
Norwegian Air Norway AS May 28, 2013 Fornebu, Norway 155 100%Pilot Services Sweden AB August 30, 2013 Stockholm, Sweden 50 000 100%Pilot Services Norway AS November 11, 2014 Fornebu, Norway 30 100%Pilot Services Denmark Aps February 20, 2015 Copenhagen, Denmark 497 100%
Norwegian Cargo AS April 16, 2013 Fornebu, Norway 100 000 100%Norwegian Brand Limited December 9, 2013 Dublin, Ireland 151 711 820 100%Arctic Aviation Assets DAC August 9, 2013 Dublin, Ireland 479 603 659 100%
Oslofjorden Limited August 22, 2013 Dublin, Ireland 1 100%Drammensfjorden Leasing Limited September 24, 2013 Dublin, Ireland 1 100%Geirangerfjorden Limited November 26, 2013 Dublin, Ireland 1 100%Boknafjorden Limited March 14, 2014 Dublin, Ireland 1 100%DY1 Aviation Ireland Limited November 26, 2013 Dublin, Ireland 1 100%DY2 Aviation Ireland Limited November 26, 2013 Dublin, Ireland 1 100%DY3 Aviation Ireland Limited November 26, 2013 Dublin, Ireland 1 100%DY4 Aviation Ireland Limited November 26, 2013 Dublin, Ireland 1 100%DY5 Aviation Ireland Limited November 26, 2013 Dublin, Ireland 1 100%DY6 Aviation Ireland Limited November 26, 2013 Dublin, Ireland 1 100%DY7 Aviation Ireland Limited August 2, 2013 Dublin, Ireland 1 100%DY9 Aviation Ireland Limited November 27, 2014 Dublin, Ireland 1 100%Fedjefjorden Limited June 23, 2015 Dublin, Ireland 1 100%Larviksfjorden Limited September 4, 2015 Dublin, Ireland 1 100%Torskefjorden Limited April 23, 2015 Dublin, Ireland 1 100%Torefjorden Limited November 12, 2015 Dublin, Ireland 1 100%Larviksfjorden II Limited January 1, 2016 Dublin, Ireland 1 100%Lysakerfjorden Leasing Limited July 5, 2016 Dublin, Ireland 1 100%Arctic Leasing No.1 Limited September 10, 2015 Dublin, Ireland 1 100%
Norwegian Air International Limited April 3, 2013 Dublin, Ireland 171 449 337 100%Norwegian Air Resources Limited September 20, 2013 Dublin, Ireland 1 100%
Norwegian Air Resources Sweden AB August 28, 2013 St.holm Arl., Sweden 50 000 100%Norwegian Resources Denmark ApS September 5, 2013 Hellerup, Danmark 80 000 100%Norwegian Air Resources Technical AB February 7, 2014 St.holm Arl., Sweden 50 000 100%Norwegian Air Resources Spain S.L October 6, 2014 Madrid, Spain 3 000 51%AB Norwegian Air Resources Finland Ltd June 14, 2011 Helsinki, Finland 200 51%OSM Aviation UK Limited November 1, 2016 London, UK 2 000 51%
Cabin Services Norge AS January 27, 2014 Fornebu, Norway 30 100%Cabin Services Denmark Aps February 20, 2014 Hellerup, Denmark 50 100%Norwegian Air Resources SSC AS November 15, 2012 Fornebu, Norway 30 100%Norwegian Air UK Limited December 18, 2015 London, UK 8 999 998 100%
Help | Contents | Highlights | Letter from CEO | Board of Directors' report | Financial statements | CSR | Corporate governance | Board and management | Definitions | Contact | 75 / 99
NORWEGIAN ANNUAL REPORT 2016
Income statementstatement of comprehensive incomeStatement of financial position at December 31Statement of changes in Equity Cash flow statementNotes to financial statements of the parent companyNote 01: General information and summary of
significant accounting principlesNote 02: Financial riskNote 03: Operating revenue and incomeNote 04: Operational expensesNote 04A: Other operating expensesNote 05: Payroll expenses and number of
employeesNote 06: Remuneration to the Board of Directors
and Executive managementNote 06A: Auditor remunerationNote 07: Net financial itemsNote 08: TaxesNote 09: Intangible assetsNote 10: Tangible assetsNote 11: LeasingNote 12: ReceivablesNote 13: InventoriesNote 14: Shareholder’s equity and shareholder
informationNote 15: PensionsNote 16: OptionsNote 17: Provisions for periodic maintenanceNote 18: Trade and other payablesNote 19: Financial instrumentsNote 20: Assets pledged as collateral and
guaranteesNote 21: Bank depositsNote 22: BorrowingsNote 23: Investments in subsidiariesNote 24: Investment in asssociatesNote 25: Related partiesNote 26: Contingencies and legal claimsNote 27: CommitmentsNote 28: Events after the reporting period
PARENT COMPANY FINANCIAL STATEMENT

2016-NorwegiaN.iNdd • Created: 09.10.2014 • Modified: 06.04.2017 : 19:44 all rigths reserved © 2017 teigeNs desigN
Transactions during the yearDuring 2016, the following transactions were carried out:
● Norwegian Air Resources Limited sold 49% of the shares in Norwegian Air Resources Spain S.L. and Norwegian Air Resources Finland Ltd on November 1.
● Norwegian Air Resources Limited acquired 51% of the shares in OSM Aviation UK on November 1. ● Larviksfjorden II Limited, Lysakerfjorden Leasing Limited and RED Handling UK Ltd were estab-
lished during 2016. ● Arctic Leasing No.1 was established in 2015 but dormant until December 1, 2016.
Neither of the transactions listed above had any significant impact on the financial statements of the parent company nor the Group in 2016.
NOTE 24: INVESTMENT IN ASSSOCIATES
Norwegian Air Shuttle ASA has the following investments in associates:
NOK 1 000 Country IndustryOwnership
interestFair value 31.12.2015
Investment 2016
Net gain in OCI 2016
Fair value 31.12.2016
Entity:Norwegian Finans Holding ASA Norway Financial Institution 20% 1 725 019 74 306 857 210 2 656 535
The associated company, Norwegian Finans Holding ASA, owns 100% of the shares in Bank Norwe-gian AS. Norwegian Air Shuttle ASA owns 20% of the shares in Norwegian Finans Holding ASA. Nor-wegian Finans Holding’s shares are publicly at Oslo Stock Exchange. The company is situated in Oslo, Norway. The investment is accounted for as financial instrument according to IAS 39, classi-fied as available-for-sale (Note 19). The carrying amount is equivalent to market value based on last trade on December 31, 2016.
NOTE 25: RELATED PARTIES
The company’s related parties are:Key management personnel, close members of the family of a person and entities that are con-trolled or jointly controlled by any of these and owners with significant influence. The company’s subsidiaries, and associates. Please refer to Note 7 to the Group’s consolidated financial state-ments for information on transactions with and remuneration to key management personnel and owners with significant influence.
Help | Contents | Highlights | Letter from CEO | Board of Directors' report | Financial statements | CSR | Corporate governance | Board and management | Definitions | Contact | 76 / 99
NORWEGIAN ANNUAL REPORT 2016
Income statementstatement of comprehensive incomeStatement of financial position at December 31Statement of changes in Equity Cash flow statementNotes to financial statements of the parent companyNote 01: General information and summary of
significant accounting principlesNote 02: Financial riskNote 03: Operating revenue and incomeNote 04: Operational expensesNote 04A: Other operating expensesNote 05: Payroll expenses and number of
employeesNote 06: Remuneration to the Board of Directors
and Executive managementNote 06A: Auditor remunerationNote 07: Net financial itemsNote 08: TaxesNote 09: Intangible assetsNote 10: Tangible assetsNote 11: LeasingNote 12: ReceivablesNote 13: InventoriesNote 14: Shareholder’s equity and shareholder
informationNote 15: PensionsNote 16: OptionsNote 17: Provisions for periodic maintenanceNote 18: Trade and other payablesNote 19: Financial instrumentsNote 20: Assets pledged as collateral and
guaranteesNote 21: Bank depositsNote 22: BorrowingsNote 23: Investments in subsidiariesNote 24: Investment in asssociatesNote 25: Related partiesNote 26: Contingencies and legal claimsNote 27: CommitmentsNote 28: Events after the reporting period
PARENT COMPANY FINANCIAL STATEMENT

2016-NorwegiaN.iNdd • Created: 09.10.2014 • Modified: 06.04.2017 : 19:44 all rigths reserved © 2017 teigeNs desigN
Transactions with subsidiaries:
Intercompany balances December 31, 2016 Short term Long term
Financial lease receivables - 4 912 588 Other receivables 1 895 769 6 344 653 Payables 5 925 595 41 302
Intercompany balances December 31, 2015 Short term Long term
Financial lease receivables - 5 737 716 Other receivables 596 340 4 468 835Payables 2 473 755 674 156
Intercompany sales (-) and Purchases (+) 2016 2015
Sales and financial revenue 1 804 489 1 425 534 Purchases and financial expenses 4 254 019 5 704 621 Dividend - -
Norwegian Air Shuttle ASA has provided some of the Group’s external stakeholders with par-ent company guarantees for some of the obligations of subsidiaries. The issued guarantees are mainly in relation to purchase contracts, aircraft financing and leasing contracts. To the extent subsidiaries receive an economic benefit from the issued guarantees, the guarantee is priced according to the risk undertaken by the parent company. Guarantee fees are included in the above intercompany transactions.
Transactions with other related partiesThe Chief Executive Officer is the principal shareholder in Norwegian Air Shuttle ASA with an ownership share of 24.6% through controlling ownership of HBK Invest AS*. This ownership share is the actual shareholding, and may deviate from the official shareholder register, as HBK Invest has entered into a security agreement with Nordea and Danske Bank. Under this agree-ment, these institutions may borrow shares from HBK Invest for a limited period of time to im-prove the liquidity in the share trading, for example by fulfilling their market maker obligation. The Chair of the Board owns a minority of shares in HBK Invest AS. There have been no financial transactions between HBK Invest AS and Norwegian Air Shuttle ASA in 2016 or 2015, except for indirect transactions through Fornebu Næringseiendom AS.
The Chair of the Board, Bjørn Kise, is a partner, and the CEO is a former partner, of the law firm Simonsen Vogt Wiig which operates as the legal advisor for Norwegian Air Shuttle ASA.
The company leases its property at Fornebu from Fornebu Næringseiendom AS, which is a wholly owned subsidiary of HBK Invest AS. The leasing agreement entitles the company to lease Oksenøyveien 3 at Fornebu until 2030, with an option to extend the lease for another five years.
Norwegian Air Shuttle ASA has received commissions from the associated company Norwegian Finans Holding ASA (Bank Norwegian) in 2016 and 2015. The commissions relate to sales made by the parent company's customers by using the 'Bank Norwegian' credit cards. The total commission is enclosed in the table below. Receivables and payables to related parties are included below.
No loans or guarantees have been issued to related parties in 2016 or 2015. See Note 7 in the Consolidated Financial Statements for details on key management compen-
sations and Note 15 in the Consolidated Financial Statements for shares and options held di-rectly or indirectly by members of the Board of Directors, the CEO and the Executive Manage-ment.
The following transactions were carried out with related parties:
NOK 1 000 2016 2015
Sales (-) and purchases (+) of goods and services (excl VAT)- Simonsen Vogt Wiig (legal services) 10 964 17 471 - Associate (commission and licence fee) (199 325) (118 402)- Associate (interests on subordinated loan) (3 661) (3 850)- Fornebu Næringseiendom (property rent) 15 559 15 295
Year-end balances arising from sales/purchases of goods/services (incl VAT):
Receivables from related parties (note 13)- Associate (commission) 11 118 -
Payables to related parties (note 21)- Simonsen Vogt Wiig (legal services) 252 1 512 - Fornebu Næringseiendom (property rent) 4 771 -
Investment in related parties - Associate (subordinated loan) 80 000 80 000
*) HBK Invest AS has, after close of trading on 16 December 2016, resolved to transfer 8 795 873 shares in Norwegian Air Shuttle ASA, equal to 24.6% of the outstanding shares and voting rights in the company, to its wholly owned subsidiary, HBK Holding AS.
NOTE 26: CONTINGENCIES AND LEGAL CLAIMS
Through their respective unions, pilots and cabin crew that have been subject to business transfers from Norwegian Air Shuttle ASA (NAS) to Norwegian Air Norway AS (NAN) and from NAN to local national resourcing entities for pilots and cabin crew in Norway, have raised claims that NAS primarily, NAN alternatively shall be considered employer. The District Court has issued a ruling, which Norwegian will appeal. Financial exposure from the ruling is limited.
The Norwegian Group has, since the end of 2013, continuously reorganized its operations, and in 2013 and 2014, Norwegian transferred parts of its business to Irish group companies as a natural part of this international reorganization process. The internal group reorganization was carried out under the tax rules on contingent tax-free transfers within a group and the freedom of establishment under the EEA-agreement. In March 2017, Norwegian received a reassessment
Help | Contents | Highlights | Letter from CEO | Board of Directors' report | Financial statements | CSR | Corporate governance | Board and management | Definitions | Contact | 77 / 99
NORWEGIAN ANNUAL REPORT 2016
Income statementstatement of comprehensive incomeStatement of financial position at December 31Statement of changes in Equity Cash flow statementNotes to financial statements of the parent companyNote 01: General information and summary of
significant accounting principlesNote 02: Financial riskNote 03: Operating revenue and incomeNote 04: Operational expensesNote 04A: Other operating expensesNote 05: Payroll expenses and number of
employeesNote 06: Remuneration to the Board of Directors
and Executive managementNote 06A: Auditor remunerationNote 07: Net financial itemsNote 08: TaxesNote 09: Intangible assetsNote 10: Tangible assetsNote 11: LeasingNote 12: ReceivablesNote 13: InventoriesNote 14: Shareholder’s equity and shareholder
informationNote 15: PensionsNote 16: OptionsNote 17: Provisions for periodic maintenanceNote 18: Trade and other payablesNote 19: Financial instrumentsNote 20: Assets pledged as collateral and
guaranteesNote 21: Bank depositsNote 22: BorrowingsNote 23: Investments in subsidiariesNote 24: Investment in asssociatesNote 25: Related partiesNote 26: Contingencies and legal claimsNote 27: CommitmentsNote 28: Events after the reporting period
PARENT COMPANY FINANCIAL STATEMENT
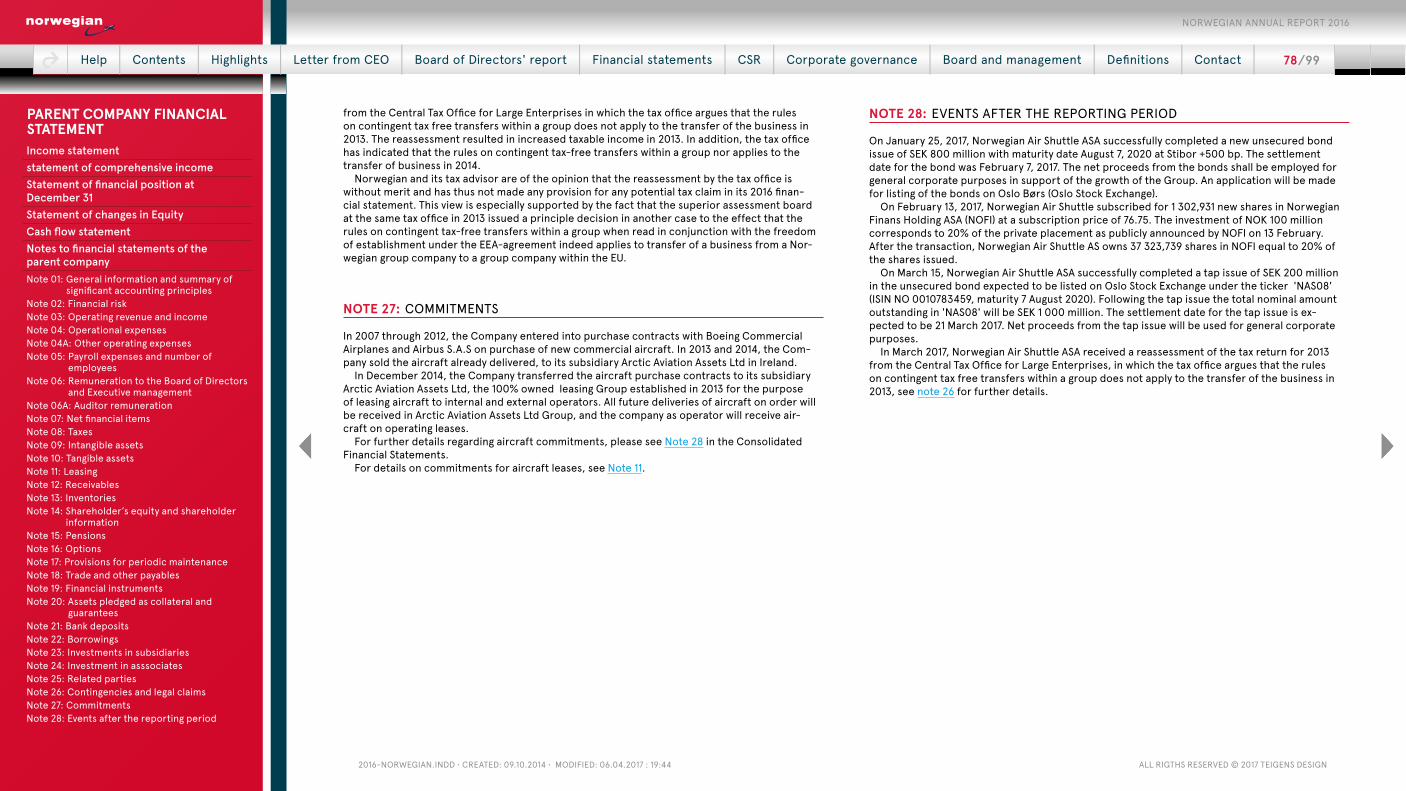
2016-NorwegiaN.iNdd • Created: 09.10.2014 • Modified: 06.04.2017 : 19:44 all rigths reserved © 2017 teigeNs desigN
from the Central Tax Office for Large Enterprises in which the tax office argues that the rules on contingent tax free transfers within a group does not apply to the transfer of the business in 2013. The reassessment resulted in increased taxable income in 2013. In addition, the tax office has indicated that the rules on contingent tax-free transfers within a group nor applies to the transfer of business in 2014.
Norwegian and its tax advisor are of the opinion that the reassessment by the tax office is without merit and has thus not made any provision for any potential tax claim in its 2016 finan-cial statement. This view is especially supported by the fact that the superior assessment board at the same tax office in 2013 issued a principle decision in another case to the effect that the rules on contingent tax-free transfers within a group when read in conjunction with the freedom of establishment under the EEA-agreement indeed applies to transfer of a business from a Nor-wegian group company to a group company within the EU.
NOTE 27: COMMITMENTS
In 2007 through 2012, the Company entered into purchase contracts with Boeing Commercial Airplanes and Airbus S.A.S on purchase of new commercial aircraft. In 2013 and 2014, the Com-pany sold the aircraft already delivered, to its subsidiary Arctic Aviation Assets Ltd in Ireland.
In December 2014, the Company transferred the aircraft purchase contracts to its subsidiary Arctic Aviation Assets Ltd, the 100% owned leasing Group established in 2013 for the purpose of leasing aircraft to internal and external operators. All future deliveries of aircraft on order will be received in Arctic Aviation Assets Ltd Group, and the company as operator will receive air-craft on operating leases.
For further details regarding aircraft commitments, please see Note 28 in the Consolidated Financial Statements.
For details on commitments for aircraft leases, see Note 11.
NOTE 28: EVENTS AFTER THE REPORTING PERIOD
On January 25, 2017, Norwegian Air Shuttle ASA successfully completed a new unsecured bond issue of SEK 800 million with maturity date August 7, 2020 at Stibor +500 bp. The settlement date for the bond was February 7, 2017. The net proceeds from the bonds shall be employed for general corporate purposes in support of the growth of the Group. An application will be made for listing of the bonds on Oslo Børs (Oslo Stock Exchange).
On February 13, 2017, Norwegian Air Shuttle subscribed for 1 302,931 new shares in Norwegian Finans Holding ASA (NOFI) at a subscription price of 76.75. The investment of NOK 100 million corresponds to 20% of the private placement as publicly announced by NOFI on 13 February. After the transaction, Norwegian Air Shuttle AS owns 37 323,739 shares in NOFI equal to 20% of the shares issued.
On March 15, Norwegian Air Shuttle ASA successfully completed a tap issue of SEK 200 million in the unsecured bond expected to be listed on Oslo Stock Exchange under the ticker 'NAS08' (ISIN NO 0010783459, maturity 7 August 2020). Following the tap issue the total nominal amount outstanding in 'NAS08' will be SEK 1 000 million. The settlement date for the tap issue is ex-pected to be 21 March 2017. Net proceeds from the tap issue will be used for general corporate purposes.
In March 2017, Norwegian Air Shuttle ASA received a reassessment of the tax return for 2013 from the Central Tax Office for Large Enterprises, in which the tax office argues that the rules on contingent tax free transfers within a group does not apply to the transfer of the business in 2013, see note 26 for further details.
Help | Contents | Highlights | Letter from CEO | Board of Directors' report | Financial statements | CSR | Corporate governance | Board and management | Definitions | Contact | 78 / 99
NORWEGIAN ANNUAL REPORT 2016
Income statementstatement of comprehensive incomeStatement of financial position at December 31Statement of changes in Equity Cash flow statementNotes to financial statements of the parent companyNote 01: General information and summary of
significant accounting principlesNote 02: Financial riskNote 03: Operating revenue and incomeNote 04: Operational expensesNote 04A: Other operating expensesNote 05: Payroll expenses and number of
employeesNote 06: Remuneration to the Board of Directors
and Executive managementNote 06A: Auditor remunerationNote 07: Net financial itemsNote 08: TaxesNote 09: Intangible assetsNote 10: Tangible assetsNote 11: LeasingNote 12: ReceivablesNote 13: InventoriesNote 14: Shareholder’s equity and shareholder
informationNote 15: PensionsNote 16: OptionsNote 17: Provisions for periodic maintenanceNote 18: Trade and other payablesNote 19: Financial instrumentsNote 20: Assets pledged as collateral and
guaranteesNote 21: Bank depositsNote 22: BorrowingsNote 23: Investments in subsidiariesNote 24: Investment in asssociatesNote 25: Related partiesNote 26: Contingencies and legal claimsNote 27: CommitmentsNote 28: Events after the reporting period
PARENT COMPANY FINANCIAL STATEMENT
2016-NorwegiaN.iNdd • Created: 09.10.2014 • Modified: 06.04.2017 : 19:44 all rigths reserved © 2017 teigeNs desigN
INDEPENDENT AUDITOR’S REPORTTo the General Meeting of Norwegian Air Shuttle ASA:
INDEPENDENT AUDITOR’S REPORT
REPORT ON THE AUDIT OF THE FINANCIAL STATEMENTS
OpinionWe have audited the financial statements of Norwegian Air Shuttle ASA. The finan-cial statements comprise:
● The financial statements of the par-ent company, which comprise the statement of financial position as at 31 December 2016, and income state-ment, statement of comprehensive income, statement of changes in eq-uity, cash flow statement for the year then ended, and notes to the financial statements, including a summary of significant accounting policies, and
● The financial statements of the group, which comprise the statement of fi-nancial position as at 31 December 2016, and income statement, state-ment of comprehensive income, state-ment of changes in equity, cash flow statement for the year then ended, and notes to the financial statements, including a summary of significant ac-counting policies.
In our opinion: ● The financial statements are prepared
in accordance with the law and regulations.
● The accompanying financial statements give a true and fair view of the financial position of the
parent company as at 31 December 2016, and its financial performance and its cash flows for the year then ended in accordance with simplified application of international accounting standards according to § 3-9 of the Norwegian Accounting Act.
● The accompanying financial statements give a true and fair view of the financial position of the group as at 31 December 2016, and its financial performance and its cash flows for the year then ended in accordance with International Financial Reporting Standards as adopted by the EU.
Basis for OpinionWe conducted our audit in accordance with laws, regulations, and auditing stan-dards and practices generally accepted in Norway, included International Stan-dards on Auditing (ISAs). Our responsibil-ities under those standards are further described in the Auditor’s Responsibili-ties for the Audit of the Financial State-ments section of our report. We are in-dependent of the Company as required by laws and regulations, and we have ful-filled our other ethical responsibilities in accordance with these requirements. We believe that the audit evidence we have obtained is sufficient and appropriate to provide a basis for our opinion.
Key Audit Matters Key audit matters are those matters that, in our professional judgment, were of most significance in our audit of the fi-nancial statements of the current pe-riod. These matters were addressed in the context of our audit of the financial statements as a whole, and in forming our opinion thereon, and we do not pro-vide a separate opinion on these matters.
The key audit matters identified in our audit are:
● Carrying value of aircraft and value of future committed aircraft purchases
● Provision for periodic maintenance of aircraft
● Uncertain tax positions
● Financing of future committed aircraft purchases
(Continues on the following pages)
Deloitte ASDronning Eufemias gate 14Postboks 221 SentrumNO-0103 OsloTel: +47 23 27 90 00Fax: +4723 27 90 01www.deloitte.no
Translation from the original Norwegian version has been made for information purposes only.
Deloitte refers to one or more of Deloitte Touche Tohmatsu Limited, a UK private company limited by guarantee ("DTTL"), its network of member firms, and their related entities. DTTL and each of its member firms are legally separate and independent entities. DTTL (also referred to as "Deloitte Global") does not provide services to clients. Please see www.deloitte.no for a more detailed description of DTTL and its member firms.
Registrert i Foretaksregisteret Medlemmer av Den norske RevisorforeningOrganisasjonsnummer: 980 211 282
Help | Contents | Highlights | Letter from CEO | Board of Directors' report | Financial statements | CSR | Corporate governance | Board and management | Definitions | Contact | 79 / 99
NORWEGIAN ANNUAL REPORT 2016

2016-NorwegiaN.iNdd • Created: 09.10.2014 • Modified: 06.04.2017 : 19:44 all rigths reserved © 2017 teigeNs desigN
CARRYING VALUE OF AIRCRAFT AND VALUE OF FUTURE COMMITTED AIRCRAFT PURCHASES
Key audit matter How the matter was addressed in the audit
Refer to note 1.23 and note 11 for description of the Group’s impairment assessments.
The Group has aircraft and associated spare parts with a carrying value of NOK 22, 6 billion as of 31 December 2016.
In addition, the Group has entered into several purchase contracts for future delivery of aircraft at fixed prices. As described in note 28, these contracts consist of upfront prepayments to manufactures with a car-rying value of NOK 7, 2 billion, and future committed payments.
As described in note 2, macro-economic factors can have a significant impact on the profitability of the existing aircraft assets and the future committed aircraft purchases.
The evaluation of residual value and impairment of existing aircraft and assessment of whether onerous contracts exist related to the future committed aircraft purchases requires a significant degree of manage-ment judgement, and as such, this has been identified as a key audit matter.
To assess the carrying value of the existing aircraft and the value of future committed aircraft purchases, we:
● Assessed the design and the implementation of controls management has established related to the impairment process for aircraft.
● Challenged the impairment indicator assessment.
● Challenged the identified cash generating units.
● Tested the consistency of input used in the calculation of the depreciation charge, to input used in the provision for periodic maintenance of the aircraft.
● Assessed the allocation of purchase price to the various components of the aircraft.
● Compared the Group’s estimates of expected useful life and residual value to manufactures’ recommendations and to published estimates of other international airlines.
● Agreed the fair values of the aircraft types to independent third party valuation reports prepared by aircraft valuation experts to assess the accuracy of the residual value estimate on existing aircraft and the value on future committed aircraft purchases.
● Assessed the adequacy of the related disclosures.
PROVISION FOR PERIODIC MAINTENANCE OF AIRCRAFT
Key audit matter How the matter was addressed in the audit
Refer to note 1.23 and 19 for description of Norwegian’s maintenance provision process and key assessments.
The Group has maintenance provision with a carrying value of NOK 1, 5 billion as of 31 December 2016.
The Group operates aircraft that are owned or held under operating lease arrangements. Under the terms of operating lease agreements, the Group is contractually committed either to return the aircraft in a certain condition or to compensate the lessor based on the actual con-dition of the aircraft.
The maintenance provision is calculated by using a model that incor-porates a number of assumptions, including the lifespan of life-limited parts, utilisation of the aircraft by references to the number of hours flown or cycles operated and the expected cost of the heavy mainte-nance at the time the overhaul is expected to occur.
We focused on this area because of the complexity and the inherent level of management judgement required in calculating the provision.
To assess the aircraft maintenance provisions, we:
● Assessed the design and implementation of controls management has established related to the maintenance provision process.
● Assessed the appropriateness of the methodology applied in calculating the maintenance provision.
● Tested the mathematical accuracy of the model used to calculate the provisions.
● Assessed the key assumptions made by management in estimating maintenance provisions, including anticipated maintenance intervals of the aircraft components and the expected cost of maintenance. This included:
– Agreed and re-calculated the rates for maintenance costs to available internal and external information and lease contracts.
– Agreed maintenance intervals to available internal and external information and lease contracts.
– Agreed the accuracy of historical use of aircrafts in calculations of maintenance provisions.
– Assessed the adequacy of the related disclosures.
Help | Contents | Highlights | Letter from CEO | Board of Directors' report | Financial statements | CSR | Corporate governance | Board and management | Definitions | Contact | 80 / 99
NORWEGIAN ANNUAL REPORT 2016

2016-NorwegiaN.iNdd • Created: 09.10.2014 • Modified: 06.04.2017 : 19:44 all rigths reserved © 2017 teigeNs desigN
UNCERTAIN TAX POSITIONS
Key audit matter How the matter was addressed in the audit
Refer to notes 1.23, 9, 27 and 29 for description of the Group’s tax posi-tion as at 31 December 2016.
The Group’s worldwide operations are highly integrated and involve cross border transactions. As a result, there is complexity and judge-ment regarding the valuation of tax liabilities, including transfer pricing considerations.
Due to the level of complexity in assessing the appropriate accounting for taxes, this has been identified as a key audit matter.
To assess the tax position as of year-end, we:
● Assessed the design and the implementation of controls the Group has established to identify and assess the tax position.
● Communicated with external legal counsels.
● Evaluated the appropriateness of the provision for uncertain tax positions, including:
– Obtained latest correspondence between the Group and the relevant authorities.
– Evaluated and challenged the key assumptions and documentation prepared by management related to critical estimates and judgements made by the Group in determining its tax liabilities. This included evaluation of certain third party tax opinions that the Group has obtained to assess the appropriateness of assumptions used.
● Engaged Deloitte tax specialists, as appropriate, to assist with our audit of the Group’s tax obligations.
● Assessed the adequacy of the related disclosures.
FINANCING OF FUTURE COMMITTED AIRCRAFT PURCHASES
Key audit matter How the matter was addressed in the audit
The Group has entered into several purchase agreements for future de-liveries of aircraft (reference made to notes 2.6 and 28). To meet the future committed aircraft purchases the Group is dependent upon its ability to generate sufficient cash flows or to raise other means of fund-ing to meet scheduled cash outflows in relation to these purchases.
Due to the significant value of the purchase agreements for future de-liveries of aircraft, this has been identified as a key audit matter.
To assess the liquidity forecast to meet future obligations, we:
● Assessed the design and the implementation of controls the Group has established related to estimate future liquidity forecasts.
● Evaluated the accuracy of management forecasting by comparing cash flows forecasts for prior periods to actual outcomes.
● Reviewed the cash flow requirements over the next 12 months based on committed aircraft purchases and loan repayment schedules.
● Verified the consistency of forecast used in the liquidity forecast assessment with assumptions used in the budget and on other areas of the financial statements.
● Tested the arithmetic integrity of the calculations.
● Assessed the description of available financing sources.
● Assessed the adequacy of the related disclosures.
Other informationManagement is responsible for the other in-formation. The other information comprises the annual report, but does not include the fi-nancial statements and our auditor's report thereon.
Our opinion on the financial statements does not cover the other information and we do not express any form of assurance conclusion thereon.
In connection with our audit of the financial statements, our responsibility is to read the other information and, in doing so, consider whether the other information is materially in-consistent with the financial statements or our
knowledge obtained in the audit or otherwise appears to be materially misstated.
If, based on the work we have performed, we conclude that there is a material misstatement
Help | Contents | Highlights | Letter from CEO | Board of Directors' report | Financial statements | CSR | Corporate governance | Board and management | Definitions | Contact | 81 / 99
NORWEGIAN ANNUAL REPORT 2016
2016-NorwegiaN.iNdd • Created: 09.10.2014 • Modified: 06.04.2017 : 19:44 all rigths reserved © 2017 teigeNs desigN
of this other information, we are required to report that fact. We have nothing to report in this regard.
Responsibilities of the Board of Directors and the Managing Director for the Financial StatementsThe Board of Directors and the Managing Di-rector (management) are responsible for the preparation and fair presentation of the finan-cial statements of the parent company in ac-cordance with simplified application of inter-national accounting standards according to the Norwegian Accounting Act section 3-9, and for the preparation and fair presentation of the fi-nancial statements of the group in accordance with International Financial Reporting Stan-dards as adopted by the EU, and for such inter-nal control as management determines is nec-essary to enable the preparation of financial statements that are free from material mis-statement, whether due to fraud or error.
In preparing the financial statements, manage-ment is responsible for assessing the Compa-ny’s and the Group’s ability to continue as a go-ing concern, disclosing, as applicable, matters related to going concern and using the going concern basis of accounting unless manage-ment either intends to liquidate the Group or to cease operations, or has no realistic alter-native but to do so.
Auditor’s Responsibilities for the Audit of the Financial Statements Our objectives are to obtain reasonable assur-ance about whether the financial statements as a whole are free from material misstatement, whether due to fraud or error, and to issue an auditor’s report that includes our opinion. Reasonable assurance is a high level of assur-ance, but is not a guarantee that an audit con-ducted in accordance with laws, regulations, and auditing standards and practices gener-ally accepted in Norway, including ISAs will al-ways detect a material misstatement when it exists. Misstatements can arise from fraud or error and are considered material if, individu-
ally or in aggregate, they could reasonably be expected to influence the economic decisions of users taken on the basis of these financial statements.
As part of an audit in accordance with laws, regulations, and auditing standards and prac-tices generally accepted in Norway, included International Standards on Auditing (ISAs), we exercise professional judgment and maintain professional scepticism throughout the audit. We also:
● identify and assess the risks of material misstatement of the financial statements, whether due to fraud or error. We design and perform audit procedures responsive to those risks, and obtain audit evidence that is sufficient and appropriate to provide a ba-sis for our opinion. The risk of not detecting a material misstatement resulting from fraud is higher than for one resulting from error, as fraud may involve collusion, forgery, in-tentional omissions, misrepresentations, or the override of internal control.
● obtain an understanding of internal control relevant to the audit in order to design audit procedures that are appropriate in the cir-cumstances, but not for the purpose of ex-pressing an opinion on the effectiveness of the Company’s internal control.
● evaluate the appropriateness of accounting policies used and the reasonableness of ac-counting estimates and related disclosures made by management.
● conclude on the appropriateness of man-agement’s use of the going concern basis of accounting and, based on the audit evidence obtained, whether a material uncertainty exists related to events or conditions that may cast significant doubt on the Compa-ny’s ability to continue as a going concern. If we conclude that a material uncertainty ex-ists, we are required to draw attention in our
auditor’s report to the related disclosures in the financial statements or, if such disclo-sures are inadequate, to modify our opinion. Our conclusions are based on the audit ev-idence obtained up to the date of our audi-tor’s report. However, future events or con-ditions may cause the Company to cease to continue as a going concern.
● evaluate the overall presentation, structure and content of the financial statements, in-cluding the disclosures, and whether the financial statements represent the underly-ing transactions and events in a manner that achieves fair presentation.
● obtain sufficient appropriate audit evi-dence regarding the financial information of the entities or business activities within the Group to express an opinion on the con-solidated financial statements. We are re-sponsible for the direction, supervision and performance of the group audit. We remain solely responsible for our audit opinion.
We communicate with those charged with gov-ernance regarding, among other matters, the planned scope and timing of the audit and sig-nificant audit findings, including any significant deficiencies in internal control that we identify during our audit
We also provide those charged with gover-nance with a statement that we have complied with relevant ethical requirements regarding independence, and to communicate with them all relationships and other matters that may reasonably be thought to bear on our inde-pendence, and where applicable, related safe-guards.
From the matters communicated with those charged with governance, we determine those matters that were of most significance in the audit of the financial statements of the current period and are therefore the key audit matters. We describe these matters in our auditor’s re-
port unless law or regulation precludes pub-lic disclosure about the matter or when, in ex-tremely rare circumstances, we determine that a matter should not be communicated in our report because the adverse consequences of doing so would reasonably be expected to out-weigh the public interest benefits of such com-munication.
REPORT ON OTHER LEGAL AND REGULATORY REQUIREMENTSOpinion on the Board of Directors’ report and on statements on Corporate Governance and Corporate Social ResponsibilityBased on our audit of the financial statements as described above, it is our opinion that the information presented in the Board of Direc-tors’ report and in the statements on Corpo-rate Governance and Corporate Social Re-sponsibility concerning the financial state-ments, the going concern assumption, and the proposal for the allocation of the profit is con-sistent with the financial statements and com-plies with the law and regulations.
Opinion on Registration and DocumentationBased on our audit of the financial statements as described above, and control procedures we have considered necessary in accordance with the International Standard on Assurance Engagements (ISAE) 3000, Assurance Engage-ments Other than Audits or Reviews of His-torical Financial Information, it is our opinion that management has fulfilled its duty to pro-duce a proper and clearly set out registration and documentation of the company’s account-ing information in accordance with the law and bookkeeping standards and practices generally accepted in Norway.
Oslo, March 24, 2017Deloitte AS
Jørn Borchgrevink State Authorized Public Accountant (Norway)
Help | Contents | Highlights | Letter from CEO | Board of Directors' report | Financial statements | CSR | Corporate governance | Board and management | Definitions | Contact | 82 / 99
NORWEGIAN ANNUAL REPORT 2016

2016-NorwegiaN.iNdd • Created: 09.10.2014 • Modified: 06.04.2017 : 19:44 all rigths reserved © 2017 teigeNs desigN
CORPORATE SOCIAL RESPONSIBILITY AT NORWEGIANNorwegian strives to be a good corporate citizen in every area of operation. The Company is committed to operate in accordance with responsible, ethical, sustainable and sound business principles, with respect for people, the environment and the society.
Norwegian’s international business activ-ities, powered by the vision of “affordable fares for all”, brings people, cultures and economies together.
Global expansion and new routes boost local tourism, create new jobs, drive eco-nomic growth and social progress.
A growing population in an increasingly globalized world will lead to more mobility and increased need for air transportation. Norwegian acknowledges its responsibilities as a significant market player and takes ac-tion to reduce emissions per passenger and make aviation more environmentally friendly. The Company operates one of the world’s newest and most modern aircraft fleets.
As a global low-cost airline, Norwegian employs 6 285 people in Europe, North and South America and Asia. Diversity makes the organization richer and better. Regard-less of location, workers’ rights, equality, non-discrimination, business ethics and anticorruption are key priorities.
Since 2002, Norwegian has safely car-ried about 185 million passengers. Safety is the number one priority and at the heart of the operation. It is essential for custom-ers and staff, as well as imperative for the sustainability of air transport. All of the Group’s operations are subject to exten-sive safety controls and certification. They meet the strictest standards and the high-est level of regulations in the industry (The European Aviation Safety Agency, EASA).
The way we work with safety at Nor-wegian – both in terms of systems and culture – are used as examples in the healthcare industry.
THE THREE PILLARS OF CORPORATE RESPONSIBILITY AT NORWEGIAN To integrate Corporate Responsibil-ity (CR) efforts into the daily opera-tions, Norwegian’s CR approach is con-centrated around three distinct pillars. All corporate responsibility activities should be relevant, simple and direct. Within the three pillars, Norwegian has certain overall ambitions that are the fun-dament of the group’s CR efforts:
● Environment: Norwegian has an ambition to continue reducing emissions per passenger and help make aviation carbon neutral by 2050. We want to reduce the environmental footprint by flying the most modern and fuel-efficient aircraft in the skies. Norwegian also encourages the development and production of sustainable bio fuels.
● Local development and humanitarian engagement: Norwegian’s goal is to create economic and social value at our bases and destinations. We want to help children in need through our Signature
Partnership with the humanitarian organization UNICEF. Locally, our goal is to involve our staff in their local communities, as we believe that involvement creates greater quality of work life for staff.
● Responsible people culture: Norwegian’s goal is to create a good working environment and develop a sound corporate culture marked by openness, tolerance and high ethical standards. At Norwegian, we want to promote an environment free from any discrimination.
2016 ACTIVITIES AND RESULTS Norwegian is committed to deliver results within the company’s Corporate Respon-
sibility framework. The following is a rep-resentation of the key CR activities per-formed during 2016 within Norwegian’s three pillars of CR.
The EnvironmentNorwegian is committed to actively engage in and support a sustainable environmen-tal policy, and to continue reducing emis-sions from aviation. The single most im-portant action an airline can take to reduce its environmental footprint is to invest in new aircraft, consequently reducing emis-sions considerably.
One of the greenest fleets in the worldIn 2016, Norwegian took delivery of 17 Boeing 737-800s and four Boeing 787-9s. It also phased out seven Boeing 737-800s.
Help | Contents | Highlights | Letter from CEO | Board of Directors' report | Financial statements | CSR | Corporate governance | Board and management | Definitions | Contact | 83 / 99
NORWEGIAN ANNUAL REPORT 2016
CSR AT NORWEGIAN
The three pillars of Corporate Responsibility at Norwegian 2016 Activities and Results Local development and humanitarian engagementResponsible people cultureAmbitions and plans for 2017
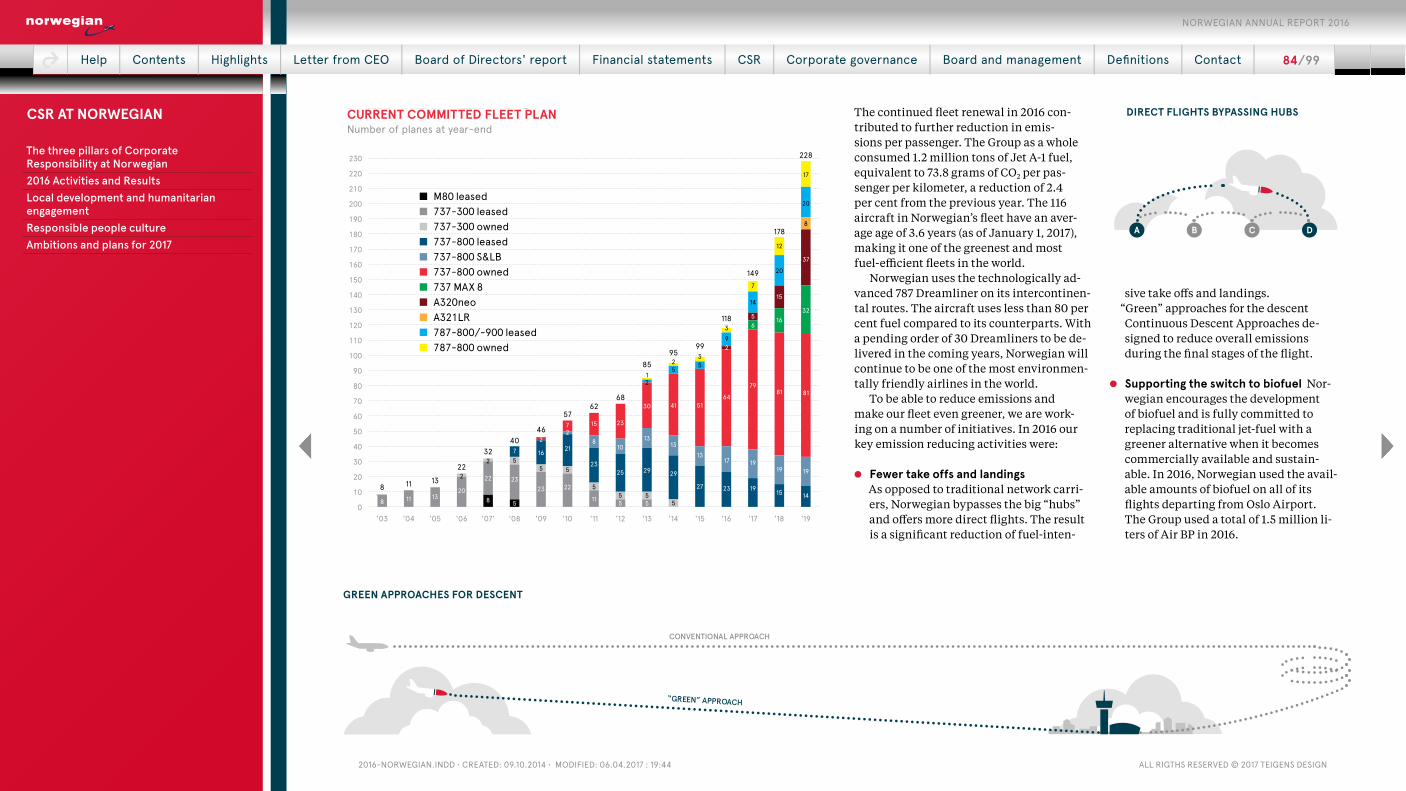
2016-NorwegiaN.iNdd • Created: 09.10.2014 • Modified: 06.04.2017 : 19:44 all rigths reserved © 2017 teigeNs desigN
LEVEL TWO HEADING
The continued fleet renewal in 2016 con-tributed to further reduction in emis-sions per passenger. The Group as a whole consumed 1.2 million tons of Jet A-1 fuel, equivalent to 73.8 grams of CO2 per pas-senger per kilometer, a reduction of 2.4 per cent from the previous year. The 116 aircraft in Norwegian’s fleet have an aver-age age of 3.6 years (as of January 1, 2017), making it one of the greenest and most fuel-efficient fleets in the world.
Norwegian uses the technologically ad-vanced 787 Dreamliner on its intercontinen-tal routes. The aircraft uses less than 80 per cent fuel compared to its counterparts. With a pending order of 30 Dreamliners to be de-livered in the coming years, Norwegian will continue to be one of the most environmen-tally friendly airlines in the world.
To be able to reduce emissions and make our fleet even greener, we are work-ing on a number of initiatives. In 2016 our key emission reducing activities were:
● Fewer take offs and landings As opposed to traditional network carri-ers, Norwegian bypasses the big “hubs” and offers more direct flights. The result is a significant reduction of fuel-inten-
sive take offs and landings. “Green” approaches for the descent Continuous Descent Approaches de-signed to reduce overall emissions during the final stages of the flight.
● Supporting the switch to biofuel Nor-wegian encourages the development of biofuel and is fully committed to replacing traditional jet-fuel with a greener alternative when it becomes commercially available and sustain-able. In 2016, Norwegian used the avail-able amounts of biofuel on all of its flights departing from Oslo Airport. The Group used a total of 1.5 million li-ters of Air BP in 2016.
CURRENT COMMITTED FLEET PLANNumber of planes at year-end
0
10
20
30
40
50
60
70
80
90
100
110
120
130
140
150
160
170
180
190
200
210
220
230
'19'18'17'16'15'14'13'12'11'10'09'08'07''06'05'04'03
■ M80 leased■ 737-300 leased■ 737-300 owned■ 737-800 leased■ 737-800 S&LB■ 737-800 owned■ 737 MAX 8■ A320neo■ A321LR■ 787-800/-900 leased■ 787-800 owned
1
30
29
85
13
55
2
25
10
23
55
68
21
5772
22
523
62
8
15
11
5
40
5
23
75
16
246
5
23
22
20
2
32
8
22
2
13
13
11
11
8
8
952
13
5
5
41
29
35
13
99
27
51
39
17
118
23
2
64
20
17
14
32
37
81
19
8
228
12
15
16
15
81
19
20
178
7
19
65
79
19
14
149
GREEN APPROACHES FOR DESCENT
CONVENTIONAL APPROACH
“GREEN” APPROACH
Help | Contents | Highlights | Letter from CEO | Board of Directors' report | Financial statements | CSR | Corporate governance | Board and management | Definitions | Contact | 84 / 99
NORWEGIAN ANNUAL REPORT 2016
CSR AT NORWEGIAN
The three pillars of Corporate Responsibility at Norwegian 2016 Activities and Results Local development and humanitarian engagementResponsible people cultureAmbitions and plans for 2017
DIRECT FLIGHTS BYPASSING HUBS
A DCB
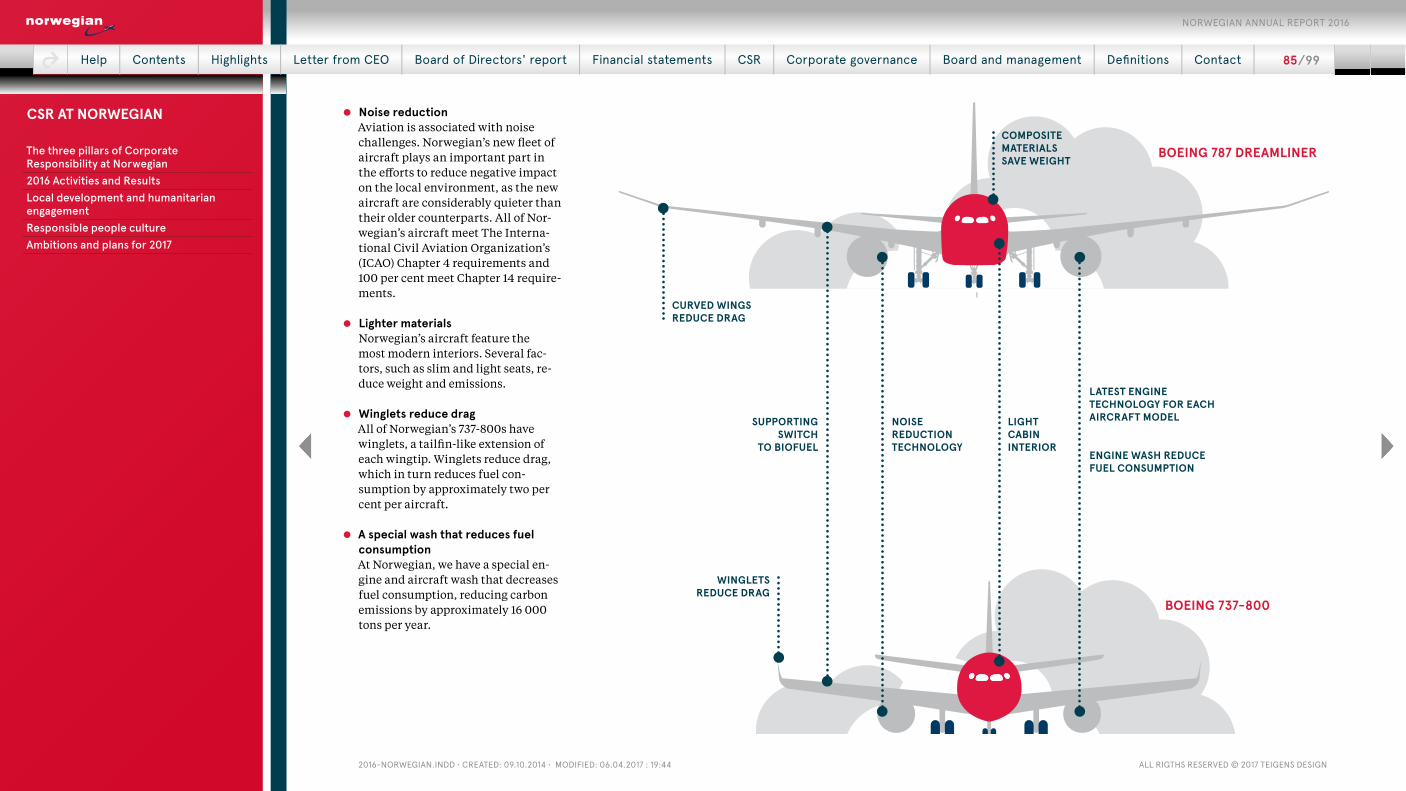
2016-NorwegiaN.iNdd • Created: 09.10.2014 • Modified: 06.04.2017 : 19:44 all rigths reserved © 2017 teigeNs desigN
NOISEREDUCTIONTECHNOLOGY
COMPOSITEMATERIALSSAVE WEIGHT
LIGHTCABININTERIOR
CURVED WINGS REDUCE DRAG
LATEST ENGINE TECHNOLOGY FOR EACH AIRCRAFT MODEL
ENGINE WASH REDUCE FUEL CONSUMPTION
WINGLETSREDUCE DRAG
SUPPORTING SWITCH
TO BIOFUEL
● Noise reduction Aviation is associated with noise challenges. Norwegian’s new fleet of aircraft plays an important part in the efforts to reduce negative impact on the local environment, as the new aircraft are considerably quieter than their older counterparts. All of Nor-wegian’s aircraft meet The Interna-tional Civil Aviation Organization’s (ICAO) Chapter 4 requirements and 100 per cent meet Chapter 14 require-ments.
● Lighter materials Norwegian’s aircraft feature the most modern interiors. Several fac-tors, such as slim and light seats, re-duce weight and emissions.
● Winglets reduce drag All of Norwegian’s 737-800s have winglets, a tailfin-like extension of each wingtip. Winglets reduce drag, which in turn reduces fuel con-sumption by approximately two per cent per aircraft.
● A special wash that reduces fuel consumption At Norwegian, we have a special en-gine and aircraft wash that decreases fuel consumption, reducing carbon emissions by approximately 16 000 tons per year.
BOEING 787 DREAMLINER
BOEING 737-800
Help | Contents | Highlights | Letter from CEO | Board of Directors' report | Financial statements | CSR | Corporate governance | Board and management | Definitions | Contact | 85 / 99
NORWEGIAN ANNUAL REPORT 2016
CSR AT NORWEGIAN
The three pillars of Corporate Responsibility at Norwegian 2016 Activities and Results Local development and humanitarian engagementResponsible people cultureAmbitions and plans for 2017

2016-NorwegiaN.iNdd • Created: 09.10.2014 • Modified: 06.04.2017 : 19:44 all rigths reserved © 2017 teigeNs desigN
LOCAL DEVELOPMENT AND HUMANITARIAN ENGAGEMENTCreating economic and social value at our bases and destinations are important ob-jectives that underlines Norwegian’s ambi-tion to be a good corporate citizen. Another side of this ambition is expressed through the Signature Partnership with the human-itarian organization UNICEF, with the ob-jective of helping children in need.
Boosting local economies and creating new jobs Global expansion and new routes boost local tourism, create new jobs, drive eco-nomic growth and social progress. In 2016, we continued to create economic and social value at our existing and new bases as well as at current and new desti-nations.
Norwegian’s contribution to the Scan-dinavian tourism industry is substantial, according to a recent report from the eco-nomic analysis company Menon. Foreign tourists visiting Norway, Sweden and Den-mark through Norwegian contribute to sustaining 41 500 jobs in the tourism in-dustry (Norway: 16 000; Sweden: 13 000; Denmark: 12 500).
Norwegian’s contribution to the US econ-omy is also considerable. Since 2013, Nor-wegian has carried more than 2.5 million foreign visitors to the USA on its 34 trans-atlantic routes, significantly boosting the creation of American jobs in the travel and tourism industry, not least in Fort Lauder-dale and Oakland/San Francisco, where in-ternational flights have been scarce. Nor-wegian is one of the largest customers of Boeing, an American aircraft manufacturer. With a firm order of 149 Boeing 737s and 787s valued at more than USD 18.5 billion at cur-
rent list prices, Norwegian is consequently helping to create and support up to 100 000 American jobs, according to calculations from the US Commerce Department.
In addition, Norwegian’s own work force increased by 23 per cent in 2016, with the highest growth in Spain and the UK.
Partnership with UNICEF“The children are the future and we should do everything we can to make the world a better place for the ones who need it the most,” says Norwegian’s CEO Bjørn Kjos. That is why Norwegian has a collaboration with UNICEF, the United Nation’s Children Fund. We also believe that it is important to enable our staff and customers to make a difference. Through fundraisers, internal
activities, relief flights and other activities we are committed to supporting UNICEF and the important work the organization does for children in need all over the world. Norwegian and UNICEF have had a Signa-ture Partnership since 2007.
The partnership is enabling Norwe-gian and our passengers to contribute to UNICEF’s work through several initiatives. UNICEF Norway’s employees fly for free with Norwegian.
Throughout 2016, our customers do-nated more than NOK 5.2 million to UNICEF’s work for children when booking their next flight on our website. In addition, Norwegian decided to donate money to UNICEF Instead of giving its staff a Christ-mas present.
5.2MILLIONIn 2016, Norwegian’s passengers donated more than NOK 5.2 million to UNICEF’s work for children when booking their next flight on our website. This amount may contribute to the following:
● Fully finance about five schools: Construction, furniture, training of teachers, etc.
● Installing approximately 1 500 wells equipped with water pumps that can supply an entire village or refugee camp with clean water. Often it is the girls' job to fetch water, which may mean that they do not have time to go to school. If the water pump is located near the school, it increases the girls’ chance to get an education.
● 1.5 million emergency food kits, providing approximately 34 000 malnourished children food for two weeks.
● Provide approximately 1 million children with polio vaccinations.
Help | Contents | Highlights | Letter from CEO | Board of Directors' report | Financial statements | CSR | Corporate governance | Board and management | Definitions | Contact | 86 / 99
NORWEGIAN ANNUAL REPORT 2016
CSR AT NORWEGIAN
The three pillars of Corporate Responsibility at Norwegian 2016 Activities and Results Local development and humanitarian engagementResponsible people cultureAmbitions and plans for 2017
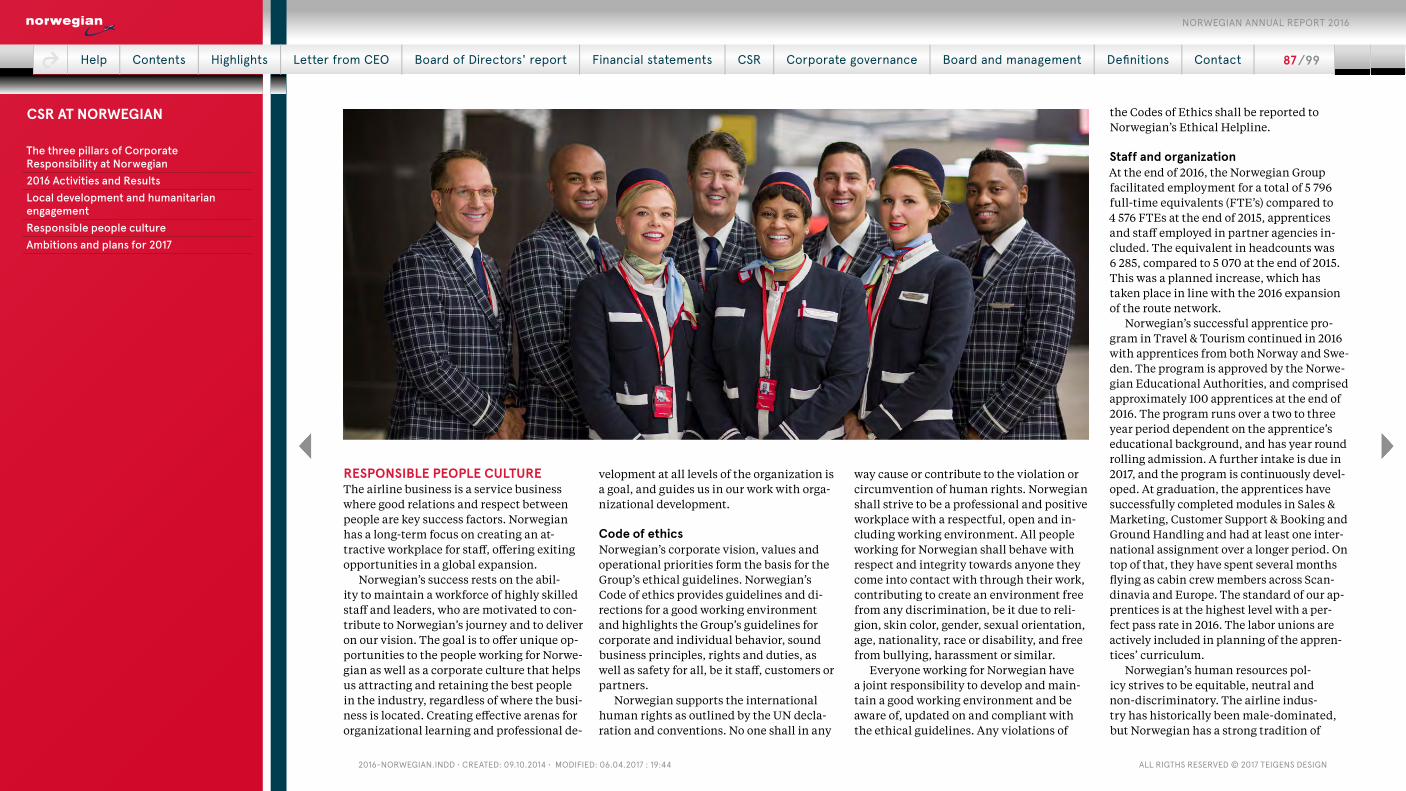
2016-NorwegiaN.iNdd • Created: 09.10.2014 • Modified: 06.04.2017 : 19:44 all rigths reserved © 2017 teigeNs desigN
RESPONSIBLE PEOPLE CULTUREThe airline business is a service business where good relations and respect between people are key success factors. Norwegian has a long-term focus on creating an at-tractive workplace for staff, offering exiting opportunities in a global expansion.
Norwegian’s success rests on the abil-ity to maintain a workforce of highly skilled staff and leaders, who are motivated to con-tribute to Norwegian’s journey and to deliver on our vision. The goal is to offer unique op-portunities to the people working for Norwe-gian as well as a corporate culture that helps us attracting and retaining the best people in the industry, regardless of where the busi-ness is located. Creating effective arenas for organizational learning and professional de-
velopment at all levels of the organization is a goal, and guides us in our work with orga-nizational development.
Code of ethicsNorwegian’s corporate vision, values and operational priorities form the basis for the Group’s ethical guidelines. Norwegian’s Code of ethics provides guidelines and di-rections for a good working environment and highlights the Group’s guidelines for corporate and individual behavior, sound business principles, rights and duties, as well as safety for all, be it staff, customers or partners.
Norwegian supports the international human rights as outlined by the UN decla-ration and conventions. No one shall in any
way cause or contribute to the violation or circumvention of human rights. Norwegian shall strive to be a professional and positive workplace with a respectful, open and in-cluding working environment. All people working for Norwegian shall behave with respect and integrity towards anyone they come into contact with through their work, contributing to create an environment free from any discrimination, be it due to reli-gion, skin color, gender, sexual orientation, age, nationality, race or disability, and free from bullying, harassment or similar.
Everyone working for Norwegian have a joint responsibility to develop and main-tain a good working environment and be aware of, updated on and compliant with the ethical guidelines. Any violations of
the Codes of Ethics shall be reported to Norwegian’s Ethical Helpline.
Staff and organizationAt the end of 2016, the Norwegian Group facilitated employment for a total of 5 796 full-time equivalents (FTE’s) compared to 4 576 FTEs at the end of 2015, apprentices and staff employed in partner agencies in-cluded. The equivalent in headcounts was 6 285, compared to 5 070 at the end of 2015. This was a planned increase, which has taken place in line with the 2016 expansion of the route network.
Norwegian’s successful apprentice pro-gram in Travel & Tourism continued in 2016 with apprentices from both Norway and Swe-den. The program is approved by the Norwe-gian Educational Authorities, and comprised approximately 100 apprentices at the end of 2016. The program runs over a two to three year period dependent on the apprentice’s educational background, and has year round rolling admission. A further intake is due in 2017, and the program is continuously devel-oped. At graduation, the apprentices have successfully completed modules in Sales & Marketing, Customer Support & Booking and Ground Handling and had at least one inter-national assignment over a longer period. On top of that, they have spent several months flying as cabin crew members across Scan-dinavia and Europe. The standard of our ap-prentices is at the highest level with a per-fect pass rate in 2016. The labor unions are actively included in planning of the appren-tices’ curriculum.
Norwegian’s human resources pol-icy strives to be equitable, neutral and non-discriminatory. The airline indus-try has historically been male-dominated, but Norwegian has a strong tradition of
Help | Contents | Highlights | Letter from CEO | Board of Directors' report | Financial statements | CSR | Corporate governance | Board and management | Definitions | Contact | 87 / 99
NORWEGIAN ANNUAL REPORT 2016
CSR AT NORWEGIAN
The three pillars of Corporate Responsibility at Norwegian 2016 Activities and Results Local development and humanitarian engagementResponsible people cultureAmbitions and plans for 2017

2016-NorwegiaN.iNdd • Created: 09.10.2014 • Modified: 06.04.2017 : 19:44 all rigths reserved © 2017 teigeNs desigN
practicing equality since its inception in 2002. Norwegian gives weight to having staff with expertise related to tip tasks and is committed to recruit both women and men to these positions. In 2016, 45 (47) per cent of the staff were women and 55 (53) per cent were men. Most of the pilots are men. The share of female pilots is around 4 (4) per cent. The majority of the cabin per-sonnel are women, while men account for
approximately 31 (23) per cent. Among ad-ministrative staff, there is more or less an equal spread between women and men. Among staff in technical positions as tech-nicians and engineers there has histori-cally been a predominance of men, but this has changed in last few years with an in-creasing share of female staff. The Group’s Board of Directors has above 40 (40) per cent female representation.
Active monitoring of HSE (Health, Safety and Environment) indicators, corporate health insurance policies and continuing co-operation with protective services will con-tribute to ensure that reduction of sickness leave remains a priority. A number of key HSE activities are conducted in compliance with labor laws and corporate guidelines, such as risk assessments, audits, handling of occurrence reports, work environment surveys and following up with group pro-cesses on base meetings for crew and techni-cal staff. Activities also include participation in ERM-organization, FRSAG (Fatigue Risk Safety Action Group), SAG (Safety Action Group), Non-SAG and in several HSE-related projects. HSE information is also provided in connection with training of crew, pilots and technical staff. The Group HSE function also ensures HSE supervision, leading the work with preventing addiction and abuse prob-lems, Work Environment committees (WEC) and safety representative meetings. There is ongoing work establishing WEC throughout the organization, as part of implementing HSE aligned with global requirements.
Norwegian Air Shuttle ASA is a mem-ber of NHO Aviation, which is a member of NHO, The Confederation of Norwegian Enterprise. Salary reviews are conducted through local union negotiations or accord-ing to local laws, regulations and CBA (col-
lective bargaining agreements). The sal-ary development reflects the social situa-tion and market requirements, and was in 2016 moderate according to the consumer price index. People working in Norwegian are employed in the country where they are based, and follow the laws and regulations for the respective country. However, Nor-wegian’s policies and guidelines are based upon a Scandinavian approach according to our legacy and organizational culture.
Sickness leave for the Norwegian Group across all units for our employees (not includ-ing agency staff) was 6.5 per cent for 2016.
AMBITIONS AND PLANS FOR 2017Norwegian will continue its commitment to operate in accordance with responsible, ethical, sustainable and sound business principles, with respect for people and the environment. The Group’s global expan-sion will continue to boost local tourism, create new jobs, drive economic growth and social progress, and it will be a driver for continued development of efforts that safeguard the sustainability and responsi-bility aspects of our growth.
The environment will be high on the agenda also in 2017. Our fleet renewal pro-gram with the introduction of nine 787-9 Dreamliners, six 737 MAX 8, 17 new Boeing 737-800s and the use of biofuel, will contrib-ute to reduce the emission per passenger.
In addition, we will launch a new envi-ronmental program in 2017: “Plant a Tree”. Norwegian will plant tens of thousands of trees that will contribute to absorb large amounts of CO2. The new initiative will also play an important part in staff engage-ment locally, an overall key priority in 2017 both through “Plant a Tree” and UNICEF. We believe that involving our staff in their
local communities, creates greater quality of work life.
The UNICEF partnership will see en-hanced activity in 2017, as it will include Sweden, Denmark and the USA in addition to Norway. This creates new opportunities to launch fundraising campaigns and staff engagement both globally and locally.
Norwegian aims to join the U.N. Global Compact, which is the United Nation’s cor-porate sustainability initiative. This step will help enable us further to improve our approach to Corporate Responsibility, through access to best practice, standards and other initiatives.
GENDER DISTRIBUTION 2016■ Male ■ Female
0%
10%
20%
30%
40%
50%
60%
70%
80%
90%
100%
Board of directors
AdministrationCabin TotalSta�
NUMBER OF STAFF
0
1 000
2 000
3 000
4 000
5 000
6 000
7 000
8 000
'16'15'14'13'12'11
Help | Contents | Highlights | Letter from CEO | Board of Directors' report | Financial statements | CSR | Corporate governance | Board and management | Definitions | Contact | 88 / 99
NORWEGIAN ANNUAL REPORT 2016
CSR AT NORWEGIAN
The three pillars of Corporate Responsibility at Norwegian 2016 Activities and Results Local development and humanitarian engagementResponsible people cultureAmbitions and plans for 2017
2016-NorwegiaN.iNdd • Created: 09.10.2014 • Modified: 06.04.2017 : 19:44 all rigths reserved © 2017 teigeNs desigN
ANNUAL CORPORATE GOVERNANCE STATEMENTNorwegian’s objective for corporate governance is based on accountability, transparency, fairness and simplicity with the ultimate goal of maximizing shareholder value while creating added value for all stakeholders. The principles are designed in compliance with laws, regulations and ethical standards. Norwegian’s core values are simplicity, directness and relevance, but no business conduct within the Group should under any circumstances jeopardize safety and quality.
1. HOW WE UNDERSTAND THE CONCEPT
The description of the main features is gen-erally structured like the Code of Practice. As recommended, more details are pro-vided on the individual points.
The topic of corporate governance is subject to annual evaluation and discus-sion by the Board. The annual evaluation was carried at the Board meeting on 16 March 2017.
The Group's core values and corporate code of ethics are the fundamentals of Nor-wegian’s corporate governance. Corporate governance deals with issues and princi-ples associated with the distribution of roles between the governing bodies of a company, and the responsibilities and au-thorities assigned to each body. Good cor-porate governance is distinguished by re-sponsible interaction between the own-ers, the Board and the Management in a long-term, productive and sustainable per-spective. It calls for effective cooperation, which means a defined division of respon-sibilities and roles between the sharehold-ers, the Board and the Management, and also respect for the Group's other stake-holders as well as open and honest commu-
nication with the communities in which the Group operates.
In line with the Norwegian Code of Practice for Corporate Governance, a re-view of the major aspects of Norwegian Air Shuttle ASA’s governance structure follows below.
2. BUSINESSNorwegian’s business is clearly defined in paragraph 3 of its articles of association:
“The Group’s objective is to be engaged in aviation, other transport and travel re-lated business activities as well as activi-ties connected therewith. The Group may also be engaged directly or indirectly in other forms of Internet-based provision of goods and services, including car rental, hotel booking, payment services, finan-cial services and services related to credit cards. Participation in such activities as mentioned may take place through co-op-eration agreements, ownership interests or by any other means.”
The Group has clear goals and strategies for its business. These are presented in the Groups quality manual and are also made available to the public in the annual report and on the website www.norwegian.com.
3. EQUITY AND DIVIDENDSThe Group’s equity at year-end 2016 was NOK 4 049 million equivalent to an equity ratio of 11 per cent. The Board deems this to be adequate considering the Group’s strat-egy and risk profile.
Dividend policyNorwegian is a growth company with con-tinuous investment plans. The Board of Di-rectors recommends not to distribute div-idends as it is considered to be in the best interest of the shareholders to retain funds for investments in expansion and for other investment opportunities as stated in the articles of association, thereby enhancing profitability and shareholder value. Divi-dends should under no circumstances be paid if equity is below what is considered to be an appropriate level. A financial cov-enant to the bond agreements entered into in July 2014, November 2014, May 2015 and December 2015 restricts dividend pay-ments, and repurchase of shares (except for the benefit of the employees and/or Man-agement and/or Directors for any Group Company) until maturity of the last bond in December 2019.
Board authorizationsAs a consequence of Norwegian’s high growth rate, competitive position and asso-ciated need for flexibility, the general meet-ing has granted the Board a two year autho-rization to increase the Company’s share capital by 10 per cent. This mandate can be used for utilization of commercial opportu-nities and as an instrument to execute the
employee incentive program. The mandate granted to the Board is limited to a total of 3 516 213 shares and is valid until May 2018.
The general meeting has granted the Board of Directors a mandate to acquire treasury shares for a period of 18 months reckoned from the date of the general meeting’s resolution. Further, it is in keep-ing with applicable corporate governance policies that such authorizations are eval-uated by the general meeting on an annual basis. The mandate granted to the Board is limited to a total of 3 516 213 shares.
4. EQUAL TREATMENT OF SHAREHOLDERS AND TRANSACTIONS WITH CLOSE ASSOCIATES
Class of sharesNorwegian Air Shuttle ASA has only one class of shares and all shares have equal rights in the Company. The articles of asso-ciation impose no voting restrictions.
Restrictions on shareholders that are not being domiciled within EEAThe Norwegian Civil Aviation Act (“Luft-fartsloven”) with accompanying regulations pertaining to adoption of the EC Regula-tion NO. 1008/2008 set forth a requirement that non-EEA nationals may not own more than 50 per cent of the shares in companies that are subject to said regulation. In the general meeting in May 2016, the Articles of association was amended in order to en-sure that the Company in an efficient man-ner could intervene if it is a risk that the li-cense(s) of the Company may be revoked.
Help | Contents | Highlights | Letter from CEO | Board of Directors' report | Financial statements | CSR | Corporate governance | Board and management | Definitions | Contact | 89 / 99
NORWEGIAN ANNUAL REPORT 2016
1. How we understand the concept2. Business3. Equity and Dividends4. Equal Treatment of Shareholders and Transactions with Close Associates5. Freely Negotiated Shares6. General Meetings 7. Election Committee8. Corporate Assembly and Board of Directors, Composition and Independence9. The Work of the Board of Directors10. Risk Management and Internal Control11. Remuneration of the Board of Directors12. Remuneration of Executive personnel13. Information and Communications14. Takeovers15. Auditor
CORPORATE GOVERNANCE

2016-NorwegiaN.iNdd • Created: 09.10.2014 • Modified: 06.04.2017 : 19:44 all rigths reserved © 2017 teigeNs desigN
Trading in treasury sharesShare buy-back transactions are generally carried out via stock exchanges. Buy-backs of treasury shares are carried out at mar-ket prices. Employee share allocations are granted at a discount to market value. Nor-wegian did not purchase or sell any of its own shares in 2016.
Transactions with related partiesMaterial transactions between the Group and key stakeholders, in particular the shareholders, the members of the Board and the Executive Management, are subject to
the approval of the Board of Directors. Such transactions are duly noted in the minutes from the Board meeting and are also explic-itly stated in the notes to the consolidated accounts. At present, the Chair of the Board is partner of the law firm Simonsen Vogt Wiig, which is the legal advisor to Norwe-gian Air Shuttle ASA. Norwegian has leased its head office from Fornebu Næringseien-dom 1 AS, which is controlled by the Chair and the CEO. In cases where members of the Board of Directors or the Executive Manage-ment have other direct or indirect material interests in transactions entered into by the
Group, this is stated in the notes to the con-solidated accounts. Note 26 to the consoli-dated financial statements describes trans-actions with close associates (related par-ties). Financial relationships related to the Directors and Executive personnel are de-scribed in note 7 and 15.
Guidelines for Directors and ExecutivesNorwegian’s code of ethics includes guide-lines for handling possible conflicts of in-terest. The code applies to all Board mem-bers and Norwegian staff. In addition the Board has drawn up specific procedures for
handling of conflicts of interest for Board members and members of the corporate Management Board.
5. FREELY NEGOTIATED SHARESThere are no restrictions on trading of the Company’s shares in the articles of associa-tion or elsewhere.
6. GENERAL MEETINGS The Board of Directors has ensured that the shareholders may exercise their rights at the general assembly, making the sum-mons and related documentation available on the website.
NotificationAt least three weeks written notice must be given to call the annual general meeting. The relevant documents, including the election committee's justified slate of nominees when new members are up for election or existing ones are up for re-election, are available at the Group's website at least 21 days prior to the date of the general meeting. The general meet-ing in May 2016 decided that “An extraordi-nary general meeting may be called with four-teen days’ notice if the Board decides that the shareholders may attend the general meeting with the aid of electronic devices, cf. Section 5-8a of the public Limited Companies Act”. The Board of Directors, election committee and the auditor are required to be present. The Management is represented by the Chief Ex-ecutive Officer and the Chief Financial Officer and other key personnel on specific topics. Agenda and executionThe agenda is set by the Board, and the main items are specified in Article 7 of the Article of Association.
According to the Company’s Articles of
Help | Contents | Highlights | Letter from CEO | Board of Directors' report | Financial statements | CSR | Corporate governance | Board and management | Definitions | Contact | 90 / 99
NORWEGIAN ANNUAL REPORT 2016
1. How we understand the concept2. Business3. Equity and Dividends4. Equal Treatment of Shareholders and Transactions with Close Associates5. Freely Negotiated Shares6. General Meetings 7. Election Committee8. Corporate Assembly and Board of Directors, Composition and Independence9. The Work of the Board of Directors10. Risk Management and Internal Control11. Remuneration of the Board of Directors12. Remuneration of Executive personnel13. Information and Communications14. Takeovers15. Auditor
CORPORATE GOVERNANCE

2016-NorwegiaN.iNdd • Created: 09.10.2014 • Modified: 06.04.2017 : 19:44 all rigths reserved © 2017 teigeNs desigN
Association the General Meeting shall be chaired by the Chair of the Board. The min-utes of the general meeting are available on the Group's website.
7. ELECTION COMMITTEEThe election committee's task is to nomi-nate candidates to the general meeting for the shareholder-elected Directors' seats. The articles of association state that the commit-tee shall have four members, and the Chair of the committee is the Chair of the Board. The remaining three members are elected by the general meeting every second year. The next election is due in 2018.
The guidelines for the election commit-tee are included in the Company’s articles of association and were last approved by the general meeting in May 2011. To ensure that nominees meet the requirements for exper-tise, capacity and diversity set forth by the Board members, the Chair of the Board is a permanent member of the committee.
As described in the guidelines, the elec-tion committee should have contact with shareholders, the Board of Directors and the Company’s Executive personnel as part of its work on proposing candidates for election to the Board.
CompositionThe election committee currently consists of the Chair of the Board, one employee and two external members representing major shareholders in the Company. The current composition of the committee was elected by the Annual General Meeting on 10 May 2016 and consist of;
● Geir Tjetland, portfolio manager Skagen Fondene.
● Mr Jørgen Stenshagen, CEO Stenshagen
Invest AS. ● Sven Fermann Hermansen, pilot and
shareholder in the Company.
None of the members of the election com-mittee represent Norwegian's Manage-ment. The majority of the members are considered as independent of the Manage-ment and the Board. The composition of the election committee is regarded as re-flecting the common interests of the com-munity of shareholders.
8. CORPORATE ASSEMBLY AND BOARD OF DIRECTORS, COMPOSITION AND INDEPENDENCE
Norwegian Air Shuttle ASA has, in agree-ment with the employee unions and as warranted by Norwegian law, no corporate assembly. Instead, the Company has three Directors elected by the employees on the Board of Directors. According to the arti-cles of association, the Board must consist of between six and eight members. At year end there were seven members.
Election of the Board of DirectorsThe shareholder-elected members of the Board of Directors have been nominated by the election committee to ensure that the Board of Directors possesses the necessary expertise, capacity and diversity. The Board members have competencies in and expe-riences from the transport sector and other competitive consumer sectors, relevant net-work connections and experiences from businesses, finance, capital markets and marketing. The Chair and deputy Chair are elected by the Board. The Board members are elected for a period of two years.
The Board’s independenceThe majority of the shareholder elected members of the Board are considered to be autonomous and independent of the Com-pany’s Executive personnel and material business contacts. At least two of the mem-bers of the Board, who are elected by share-holders, are considered autonomous and independent of the Company’s main share-holder(s). Among the shareholder-elected Directors, there are one men and two women. Detailed information on the indi-vidual director can be found on the website at www.norwegian.com.
The CEO is not a member of the Board of Directors.
9. THE WORK OF THE BOARD OF DIRECTORS
The Board of Directors’ work is in accor-dance with the rules of Norwegian law. The Board has an annual plan for its work, which particularly emphasizes objectives, strategies and implementations. The Board holds annual strategy seminars, in which objectives, strategies and implementations are being addressed.
Instructions for the Board of DirectorsThe Board of Directors issues instructions for its own work.
If the Chair of the Board of Directors is or has been actively engaged in a given case, another Board member will normally lead discussions concerning that particu-lar case.
Instructions for the CEOThere is a clear division of responsibil-ities between the Board and the Execu-tive Management. The Chair is responsi-ble for ensuring that the Board's work is
conducted in an efficient, correct manner and in accordance with the Board's terms of reference. The CEO is responsible for the Group's operational Management. The Board has drawn up special instructions for the CEO.
The Board’s Audit CommitteeThe audit committee was established by the general meeting in 2010. To ensure that nominees meet the requirements of exper-tise, capacity and diversity set forth by the Board members, the Board of Directors acts as the Company’s audit committee.
The Board of Directors conducts an an-nual self-assessment of its work competence and cooperation with the Management and a separate assessment of the Chair.
10. RISK MANAGEMENT AND INTERNAL CONTROL
The Management issues monthly perfor-mance reports to the Board of Directors for review. Quarterly financial reports are prepared and made available to the capital market in accordance with the reporting requirements applicable to listed compa-nies on Oslo Børs. The quarterly financial reports are reviewed by the audit commit-tee prior to Board approval and disclosure. Moreover, financial reports, risk reports and safety reports are drawn up, all of which are subject to review at Board meet-ings. The auditor meets with the entire Board in connection with the presentation of the interim annual financial statements, and when otherwise required.
Policies and procedures have been es-tablished to manage risks. The Group’s Board of Directors reviews and evalu-ates the overall risk Management systems and environment in the Group on a reg-
Help | Contents | Highlights | Letter from CEO | Board of Directors' report | Financial statements | CSR | Corporate governance | Board and management | Definitions | Contact | 91 / 99
NORWEGIAN ANNUAL REPORT 2016
1. How we understand the concept2. Business3. Equity and Dividends4. Equal Treatment of Shareholders and Transactions with Close Associates5. Freely Negotiated Shares6. General Meetings 7. Election Committee8. Corporate Assembly and Board of Directors, Composition and Independence9. The Work of the Board of Directors10. Risk Management and Internal Control11. Remuneration of the Board of Directors12. Remuneration of Executive personnel13. Information and Communications14. Takeovers15. Auditor
CORPORATE GOVERNANCE
2016-NorwegiaN.iNdd • Created: 09.10.2014 • Modified: 06.04.2017 : 19:44 all rigths reserved © 2017 teigeNs desigN
ular basis. The Board ensures sound in-ternal controls and systems for risk Man-agement through, for example, annual Board reviews of the most important risk factors and internal controls. Risk assess-ment and the status of the Group’s compli-ance and corporate social responsibility are reported to the Board annually. The Group’s financial position and risks are thoroughly described in the Board of Di-rectors’ Report.
11. REMUNERATION OF THE BOARD OF DIRECTORS
Based on the consent of the general meet-ing, it is assumed that the remuneration of Board members reflects the respective members’ responsibilities, expertise, time commitments and the complexities of the Group’s activities.
In cases where Board members take on specific assignments for the Group, which are not taken on as part of their office, the other Board members must be notified im-mediately and if the transaction is of a sub-stantial nature this will be explicitly stated in the notes to the consolidated accounts.
Details of the remuneration of individ-ual Board members are available in the notes to the consolidated accounts.
12. REMUNERATION OF EXECUTIVE PERSONNEL
The Board’s statement on Management compensation policy is prepared in accor-dance with the public limited companies act 6-16a and includes the Company’s share option program, if any. The statement is presented at the Annual General Meeting.
The principles of leadership remuner-ation in Norwegian Air Shuttle ASA are to stimulate a strong and lasting profit ori-
ented culture. The total compensation level should be competitive, however, not market leading compared to similar orga-nizations. The Board determines the re-muneration of the CEO, and the guidelines for remuneration of the Executive Manage-ment. The remuneration of the Board and the Executive Management must not have negative effects on the Group, nor damage the reputation and standing of the Group in the public eye
The Executive Management has not been given any specific rights in case of ter-minated employment.
Details of the remuneration of individ-ual members of the Executive Management are available in the notes to the consoli-dated accounts.
13. INFORMATION AND COMMUNICATIONS
Norwegian has established guidelines for the Company’s reporting of financial and other information based on transpar-ency and with regard to the requirement of equal treatment of all parties in the securi-ties market. The Board of Directors annu-ally reviews these guidelines.
A financial calendar is prepared and published on the Group’s website and is also distributed in accordance with the rules of the Public Companies Act and the rules applicable to companies listed on the Oslo Stock Exchange.
Information distributed to the share-holders is also published on the Group’s website. The Group holds regular investor meetings and public interim results pre-sentations, and has an investor relations department.
Norwegian has separate instructions for investor relations regarding communi-
cation with investors and how insider in-formation shall be treated. The Board of Directors has prepared guidelines for the Group’s contact with shareholders outside the general meeting.
The Board considers that these mea-sures enable and ensure continuous infor-mative interactions between the Company and the shareholders.
14. TAKEOVERSThere are no limitations with respect to the purchases of shares in the Company. In the event of a take-over bid the Board of Directors will act in the best interest of the shareholders and in compliance with all the rules and regulations applicable for such an event. In the case of a take-over bid, the Board will refrain from taking any obstructive action unless agreed upon by the general meeting. The Company’s bond issue has a change of control clause that al-lows bondholders to call for redemption of the bonds at 101 per cent of par in the event of a change of control.
15. AUDITORThe auditor annually presents the main features of the audit plan for the Group to the audit committee.
The auditor participates in the meetings of the Board of Directors that deal with the annual accounts. At these meetings the au-ditor reviews any material changes in the Group’s accounting principles, comments on any material estimated accounting fig-ures and reports all material matters on which there has been a disagreement be-tween the auditor and the Executive Man-agement of the Company.
The auditor presents a review of the Group’s internal control procedures at least
once a year to the audit committee, includ-ing identified weaknesses and proposals for improvements.
The auditor participates in meetings with the audit committee and present the report from the auditor that addresses the Group’s accounting policy, risk areas and internal control routines.
The CEO and the CFO are present at all meetings with the Board of Directors and the auditor, except for one meeting a year, in which only the auditor, the Board and the audit committee are present. The Man-agement and the Board of Directors evalu-ate the use of the auditor for services other than auditing.
The Board receives annual confirmation that the auditor continues to meet the re-quirement of independence.
The Board of Directors reports the remu-neration paid to the auditor at the annual general meeting, including details of the fee paid for audit work and any fees paid for other specific services.
Help | Contents | Highlights | Letter from CEO | Board of Directors' report | Financial statements | CSR | Corporate governance | Board and management | Definitions | Contact | 92 / 99
NORWEGIAN ANNUAL REPORT 2016
1. How we understand the concept2. Business3. Equity and Dividends4. Equal Treatment of Shareholders and Transactions with Close Associates5. Freely Negotiated Shares6. General Meetings 7. Election Committee8. Corporate Assembly and Board of Directors, Composition and Independence9. The Work of the Board of Directors10. Risk Management and Internal Control11. Remuneration of the Board of Directors12. Remuneration of Executive personnel13. Information and Communications14. Takeovers15. Auditor
CORPORATE GOVERNANCE
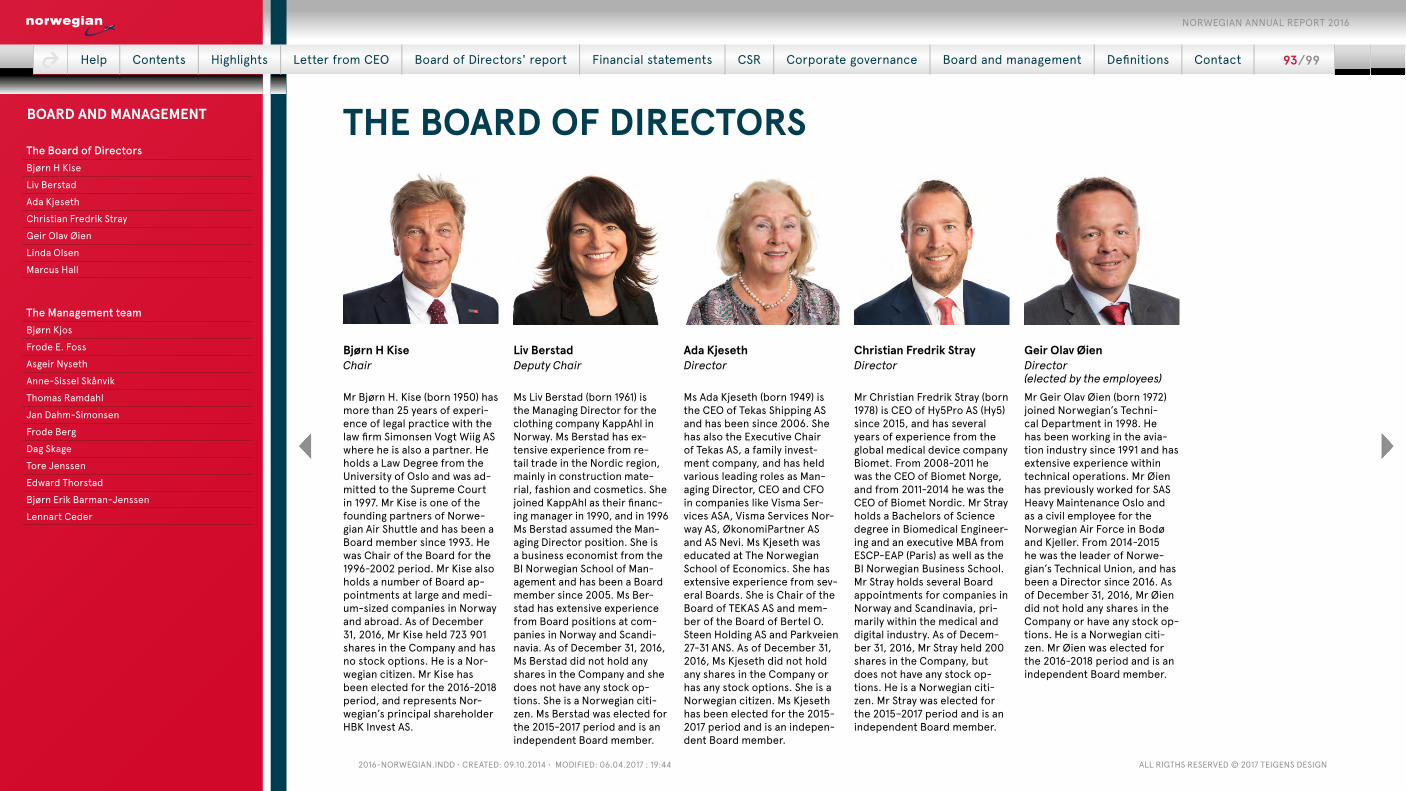
2016-NorwegiaN.iNdd • Created: 09.10.2014 • Modified: 06.04.2017 : 19:44 all rigths reserved © 2017 teigeNs desigN
THE BOARD OF DIRECTORS
Bjørn H KiseChair
Mr Bjørn H. Kise (born 1950) has more than 25 years of experi-ence of legal practice with the law firm Simonsen Vogt Wiig AS where he is also a partner. He holds a Law Degree from the University of Oslo and was ad-mitted to the Supreme Court in 1997. Mr Kise is one of the founding partners of Norwe-gian Air Shuttle and has been a Board member since 1993. He was Chair of the Board for the 1996-2002 period. Mr Kise also holds a number of Board ap-pointments at large and medi-um-sized companies in Norway and abroad. As of December 31, 2016, Mr Kise held 723 901 shares in the Company and has no stock options. He is a Nor-wegian citizen. Mr Kise has been elected for the 2016-2018 period, and represents Nor-wegian’s principal shareholder HBK Invest AS.
Liv BerstadDeputy Chair
Ms Liv Berstad (born 1961) is the Managing Director for the clothing company KappAhl in Norway. Ms Berstad has ex-tensive experience from re-tail trade in the Nordic region, mainly in construction mate-rial, fashion and cosmetics. She joined KappAhl as their financ-ing manager in 1990, and in 1996 Ms Berstad assumed the Man-aging Director position. She is a business economist from the BI Norwegian School of Man-agement and has been a Board member since 2005. Ms Ber-stad has extensive experience from Board positions at com-panies in Norway and Scandi-navia. As of December 31, 2016, Ms Berstad did not hold any shares in the Company and she does not have any stock op-tions. She is a Norwegian citi-zen. Ms Berstad was elected for the 2015-2017 period and is an independent Board member.
Ada KjesethDirector
Ms Ada Kjeseth (born 1949) is the CEO of Tekas Shipping AS and has been since 2006. She has also the Executive Chair of Tekas AS, a family invest-ment company, and has held various leading roles as Man-aging Director, CEO and CFO in companies like Visma Ser-vices ASA, Visma Services Nor-way AS, ØkonomiPartner AS and AS Nevi. Ms Kjeseth was educated at The Norwegian School of Economics. She has extensive experience from sev-eral Boards. She is Chair of the Board of TEKAS AS and mem-ber of the Board of Bertel O. Steen Holding AS and Parkveien 27-31 ANS. As of December 31, 2016, Ms Kjeseth did not hold any shares in the Company or has any stock options. She is a Norwegian citizen. Ms Kjeseth has been elected for the 2015-2017 period and is an indepen-dent Board member.
Christian Fredrik StrayDirector
Mr Christian Fredrik Stray (born 1978) is CEO of Hy5Pro AS (Hy5) since 2015, and has several years of experience from the global medical device company Biomet. From 2008-2011 he was the CEO of Biomet Norge, and from 2011-2014 he was the CEO of Biomet Nordic. Mr Stray holds a Bachelors of Science degree in Biomedical Engineer-ing and an executive MBA from ESCP-EAP (Paris) as well as the BI Norwegian Business School. Mr Stray holds several Board appointments for companies in Norway and Scandinavia, pri-marily within the medical and digital industry. As of Decem-ber 31, 2016, Mr Stray held 200 shares in the Company, but does not have any stock op-tions. He is a Norwegian citi-zen. Mr Stray was elected for the 2015–2017 period and is anindependent Board member.
Geir Olav ØienDirector (elected by the employees)Mr Geir Olav Øien (born 1972) joined Norwegian’s Techni-cal Department in 1998. He has been working in the avia-tion industry since 1991 and has extensive experience within technical operations. Mr Øien has previously worked for SAS Heavy Maintenance Oslo and as a civil employee for the Norwegian Air Force in Bodø and Kjeller. From 2014-2015 he was the leader of Norwe-gian’s Technical Union, and has been a Director since 2016. As of December 31, 2016, Mr Øien did not hold any shares in the Company or have any stock op-tions. He is a Norwegian citi-zen. Mr Øien was elected for the 2016-2018 period and is an independent Board member.
Help | Contents | Highlights | Letter from CEO | Board of Directors' report | Financial statements | CSR | Corporate governance | Board and management | Definitions | Contact | 93 / 99
NORWEGIAN ANNUAL REPORT 2016
The Board of DirectorsBjørn H KiseLiv BerstadAda KjesethChristian Fredrik StrayGeir Olav ØienLinda OlsenMarcus Hall The Management teamBjørn KjosFrode E. FossAsgeir NysethAnne-Sissel SkånvikThomas RamdahlJan Dahm-SimonsenFrode BergDag SkageTore JenssenEdward ThorstadBjørn Erik Barman-JenssenLennart Ceder
BOARD AND MANAGEMENT
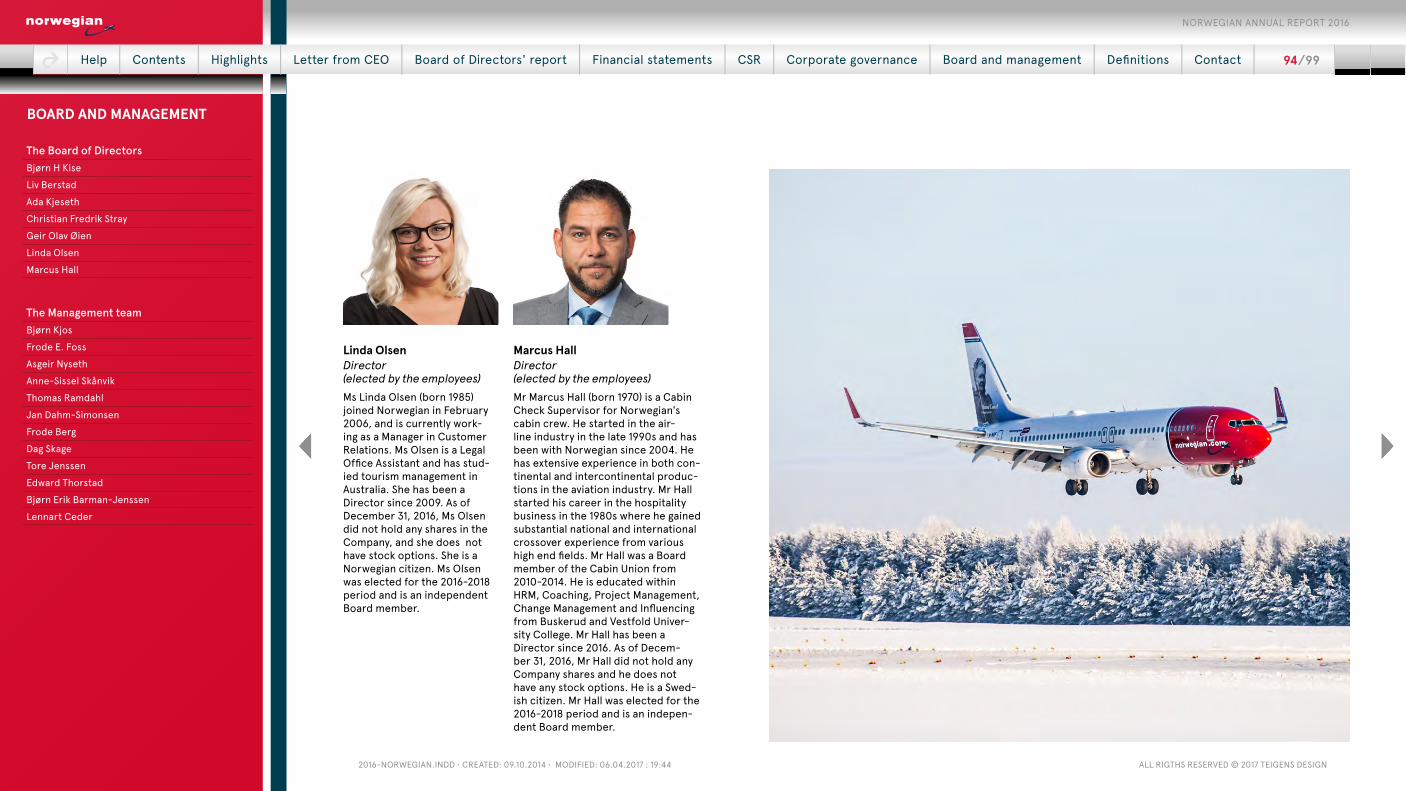
2016-NorwegiaN.iNdd • Created: 09.10.2014 • Modified: 06.04.2017 : 19:44 all rigths reserved © 2017 teigeNs desigN
Linda OlsenDirector (elected by the employees)Ms Linda Olsen (born 1985) joined Norwegian in February 2006, and is currently work-ing as a Manager in Customer Relations. Ms Olsen is a Legal Office Assistant and has stud-ied tourism management in Australia. She has been a Director since 2009. As of December 31, 2016, Ms Olsen did not hold any shares in the Company, and she does not have stock options. She is a Norwegian citizen. Ms Olsen was elected for the 2016-2018 period and is an independent Board member.
Marcus HallDirector (elected by the employees)Mr Marcus Hall (born 1970) is a Cabin Check Supervisor for Norwegian's cabin crew. He started in the air-line industry in the late 1990s and has been with Norwegian since 2004. He has extensive experience in both con-tinental and intercontinental produc-tions in the aviation industry. Mr Hall started his career in the hospitality business in the 1980s where he gained substantial national and international crossover experience from various high end fields. Mr Hall was a Board member of the Cabin Union from 2010-2014. He is educated within HRM, Coaching, Project Management, Change Management and Influencing from Buskerud and Vestfold Univer-sity College. Mr Hall has been a Director since 2016. As of Decem-ber 31, 2016, Mr Hall did not hold any Company shares and he does not have any stock options. He is a Swed-ish citizen. Mr Hall was elected for the 2016-2018 period and is an indepen-dent Board member.
Help | Contents | Highlights | Letter from CEO | Board of Directors' report | Financial statements | CSR | Corporate governance | Board and management | Definitions | Contact | 94 / 99
NORWEGIAN ANNUAL REPORT 2016
The Board of DirectorsBjørn H KiseLiv BerstadAda KjesethChristian Fredrik StrayGeir Olav ØienLinda OlsenMarcus Hall The Management teamBjørn KjosFrode E. FossAsgeir NysethAnne-Sissel SkånvikThomas RamdahlJan Dahm-SimonsenFrode BergDag SkageTore JenssenEdward ThorstadBjørn Erik Barman-JenssenLennart Ceder
BOARD AND MANAGEMENT
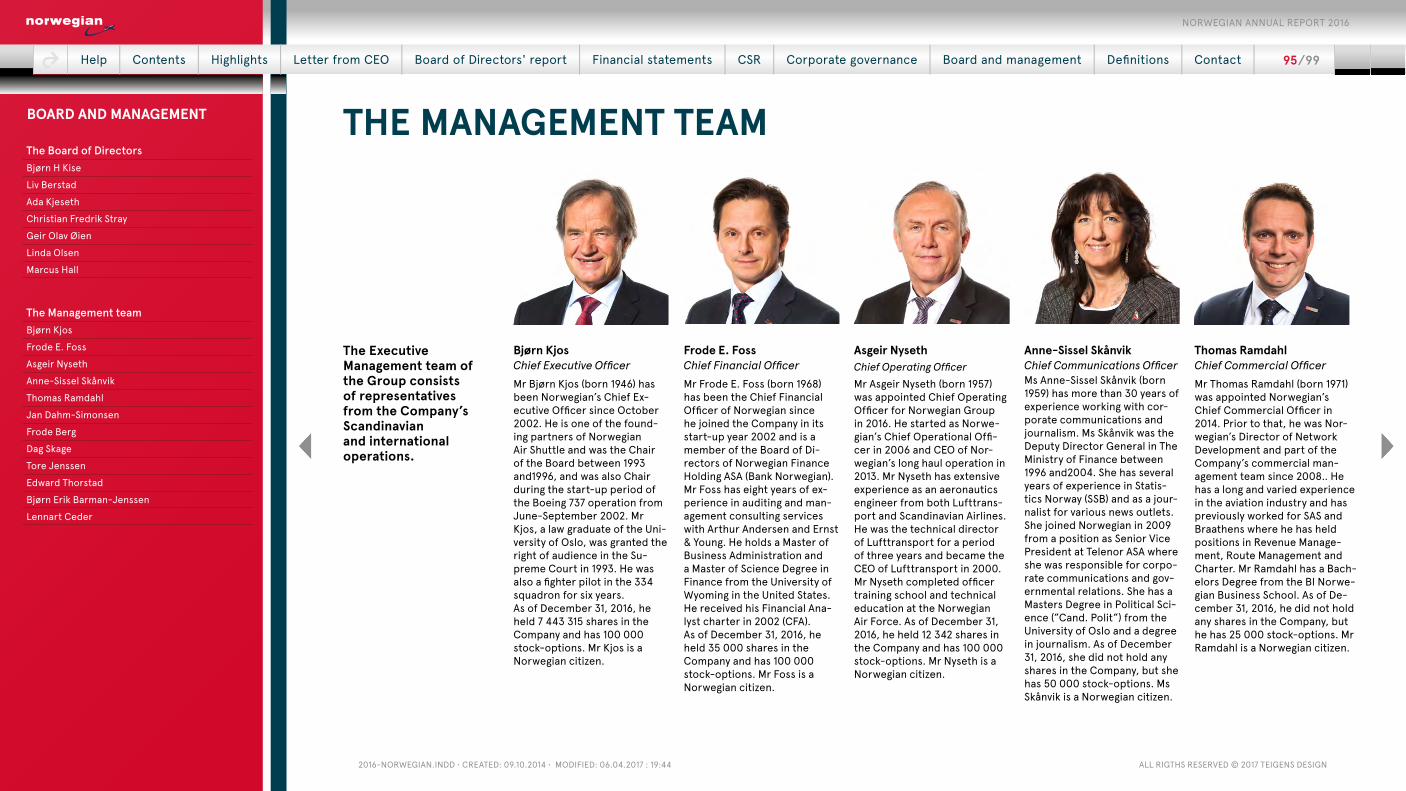
2016-NorwegiaN.iNdd • Created: 09.10.2014 • Modified: 06.04.2017 : 19:44 all rigths reserved © 2017 teigeNs desigN
THE MANAGEMENT TEAM
Bjørn KjosChief Executive OfficerMr Bjørn Kjos (born 1946) has been Norwegian’s Chief Ex-ecutive Officer since October 2002. He is one of the found-ing partners of Norwegian Air Shuttle and was the Chair of the Board between 1993 and1996, and was also Chair during the start-up period of the Boeing 737 operation from June-September 2002. Mr Kjos, a law graduate of the Uni-versity of Oslo, was granted the right of audience in the Su-preme Court in 1993. He was also a fighter pilot in the 334 squadron for six years. As of December 31, 2016, he held 7 443 315 shares in the Company and has 100 000 stock-options. Mr Kjos is a Norwegian citizen.
The Executive Management team of the Group consists of representatives from the Company’s Scandinavian and international operations.
Frode E. FossChief Financial OfficerMr Frode E. Foss (born 1968) has been the Chief Financial Officer of Norwegian since he joined the Company in its start-up year 2002 and is a member of the Board of Di-rectors of Norwegian Finance Holding ASA (Bank Norwegian). Mr Foss has eight years of ex-perience in auditing and man-agement consulting services with Arthur Andersen and Ernst & Young. He holds a Master of Business Administration and a Master of Science Degree in Finance from the University of Wyoming in the United States. He received his Financial Ana-lyst charter in 2002 (CFA). As of December 31, 2016, he held 35 000 shares in the Company and has 100 000 stock-options. Mr Foss is a Norwegian citizen.
Asgeir NysethChief Operating OfficerMr Asgeir Nyseth (born 1957) was appointed Chief Operating Officer for Norwegian Group in 2016. He started as Norwe-gian’s Chief Operational Offi-cer in 2006 and CEO of Nor-wegian’s long haul operation in 2013. Mr Nyseth has extensive experience as an aeronautics engineer from both Lufttrans-port and Scandinavian Airlines. He was the technical director of Lufttransport for a period of three years and became the CEO of Lufttransport in 2000. Mr Nyseth completed officer training school and technical education at the Norwegian Air Force. As of December 31, 2016, he held 12 342 shares in the Company and has 100 000 stock-options. Mr Nyseth is a Norwegian citizen.
Anne-Sissel SkånvikChief Communications OfficerMs Anne-Sissel Skånvik (born 1959) has more than 30 years of experience working with cor-porate communications and journalism. Ms Skånvik was the Deputy Director General in The Ministry of Finance between 1996 and2004. She has several years of experience in Statis-tics Norway (SSB) and as a jour-nalist for various news outlets. She joined Norwegian in 2009 from a position as Senior Vice President at Telenor ASA where she was responsible for corpo-rate communications and gov-ernmental relations. She has a Masters Degree in Political Sci-ence (”Cand. Polit”) from the University of Oslo and a degree in journalism. As of December 31, 2016, she did not hold any shares in the Company, but she has 50 000 stock-options. Ms Skånvik is a Norwegian citizen.
Thomas RamdahlChief Commercial Officer Mr Thomas Ramdahl (born 1971) was appointed Norwegian’s Chief Commercial Officer in 2014. Prior to that, he was Nor-wegian’s Director of Network Development and part of the Company’s commercial man-agement team since 2008.. He has a long and varied experience in the aviation industry and has previously worked for SAS and Braathens where he has held positions in Revenue Manage-ment, Route Management and Charter. Mr Ramdahl has a Bach-elors Degree from the BI Norwe-gian Business School. As of De-cember 31, 2016, he did not hold any shares in the Company, but he has 25 000 stock-options. Mr Ramdahl is a Norwegian citizen.
Help | Contents | Highlights | Letter from CEO | Board of Directors' report | Financial statements | CSR | Corporate governance | Board and management | Definitions | Contact | 95 / 99
NORWEGIAN ANNUAL REPORT 2016
The Board of DirectorsBjørn H KiseLiv BerstadAda KjesethChristian Fredrik StrayGeir Olav ØienLinda OlsenMarcus Hall The Management teamBjørn KjosFrode E. FossAsgeir NysethAnne-Sissel SkånvikThomas RamdahlJan Dahm-SimonsenFrode BergDag SkageTore JenssenEdward ThorstadBjørn Erik Barman-JenssenLennart Ceder
BOARD AND MANAGEMENT

2016-NorwegiaN.iNdd • Created: 09.10.2014 • Modified: 06.04.2017 : 19:44 all rigths reserved © 2017 teigeNs desigN
Jan Dahm-Simonsen Chief Human Resources Officer Mr Jan Dahm-Simonsen (born 1969) was appointed as the Chief Human Resources Officer at Norwegian in September 2016. Before joining Norwegian, he was employed as Vice President in Statoil’s HR division where he held various roles within the line as well as in the corporate orga-nization. Mr Dahm-Simonsen has a broad background within hu-man resources and experience from several international com-panies. He has held the position as Executive Vice President HR & Staffs at Statoil Fuel & Retail ASA, in addition to broad human resources roles at both General Electric and Aker Solutions. Mr Dahm-Simonsen holds a Master Degree in Organizational Be-havior and Human Resources from the University of Wales. As of December 31, 2016 he held four shares in the Company and has 20 000 stock-options. Mr Dahm-Simonsen is a Norwegian citizen.
Frode BergChief Legal OfficerMr Frode Berg (born 1968) has been Norwegian’s Chief Legal Officer since February 2013. A law practitioner since 1997, he was as a partner at the law firm Simonsen Vogt Wiig from 2007. As a lawyer Mr Berg’s main fields have been corporate law, transactions and interna-tional contracts. He was legal advisor to Norwegian during the start-up phase as well as during the establishment of Bank Norwegian. Mr Berg holds a Law Degree and a Bachelor Degree in Economics from the University of Tromsø, Norway, and a Master’s Degree (LL.M) from the University of Cam-bridge, England. As of Decem-ber 31, 2016, he did not hold any shares in the Company, but he has 25 000 stock-options. Mr Berg is a Norwegian citizen.
Dag SkageChief Information OfficerMr Dag Skage (born 1972) has been Norwegian’s Chief In-formation Officer since Octo-ber 2014. Prior to that, he was an Executive Director within Ernst Young’s IT advisory unit. He also has consulting- and management experience from roles at BearingPoint and An-dersen Business Consulting. Mr Skage has extensive experi-ence in IT management, port-folio management, sourcing- and change management. He holds a Master of Science in Business from the BI Norwe-gian Business School with ad-ditional education in IT Man-agement and Project Manage-ment. As of December 31, 2016, he did not hold any shares in the Company, but he did have 15 000 stock-options. Mr Skage is a Norwegian citizen.
Tore JenssenCEO Norwegian Air International LtdMr Tore Jenssen (born 1978) is the Chief Executive Officer of Norwegian Air International and Chief Executive Officer of the wholly-owned asset com-pany, Arctic Aviation Assets (AAA). He was initially hired in 2007 as Norwegian’s cost con-troller in the technical depart-ment. Since 2010, Mr Jenssen worked as an asset manager, and in 2013 he moved to Ireland when he was appointed CEO for AAA. Before starting his ca-reer at Norwegian, he worked for Grilstad. Mr Jenssen has a Business Degree from Bodø Graduate School of Business. As of December 31, 2016, he did not hold any shares in the Company, but he has 25 000 stock-options. Mr Jenssen is a Norwegian citizen.
Edward ThorstadChief Customer OfficerMr Edward Thorstad (born 1969) is Norwegian’s Chief Cus-tomer Officer and has been part of the commercial man-agement and led the Norwe-gian's customer service de-partment since 2005. Mr Thorstad has worked in avia-tion since 1996, and he pre-viously worked for Delta Air Lines where he helped to build their European contact center in London. He has a Bachelors Degree from University College in London. As of December 31, 2016, he held 2 450 shares in the Company and has 20 000 stock-options. Mr Thorstad is a British citizen.
Help | Contents | Highlights | Letter from CEO | Board of Directors' report | Financial statements | CSR | Corporate governance | Board and management | Definitions | Contact | 96 / 99
NORWEGIAN ANNUAL REPORT 2016
The Board of DirectorsBjørn H KiseLiv BerstadAda KjesethChristian Fredrik StrayGeir Olav ØienLinda OlsenMarcus Hall The Management teamBjørn KjosFrode E. FossAsgeir NysethAnne-Sissel SkånvikThomas RamdahlJan Dahm-SimonsenFrode BergDag SkageTore JenssenEdward ThorstadBjørn Erik Barman-JenssenLennart Ceder
BOARD AND MANAGEMENT

2016-NorwegiaN.iNdd • Created: 09.10.2014 • Modified: 06.04.2017 : 19:44 all rigths reserved © 2017 teigeNs desigN
Bjørn Erik Barman-JenssenManaging Director Norwegian Air ResourcesMr Bjørn Erik Barman-Jenssen (born 1963) was appointed as the Managing Director of Nor-wegian Air Resources (NAR) in September 2016. A member of the Company’s operational management team since 2007, he was previously Norwegian’s Director of Ground Opera-tions and In-Flight Services. In 2013, Mr Barman-Jenssen founded Norwegian Cargo, and is currently the Manag-ing Director. Additionally, Mr Barman-Jenssen has almost 30 years of operational and commercial positions from roles held at Braathens and SAS. As of December 31, 2016, he does not hold any shares in the Company, but he has 15 000 stock-options. Mr Bar-man-Jenssen is a Norwegian citizen.
Lennart CederChief Operating Officer Norwegian Air UK LtdMr Lennart Ceder (born 1955) is currently the Chief Operating Officer for Norwegian Air UK, a position he’s held since2016. He joined the the Company in 2006 as a Base Maintenance Manager with a wealth experience from airlines in Sweden. Over the next 10 years, Mr Ceder gained extensive experience within the Norwegian Group as a Technical Director for Norwegian’s long-haul operation, Norwegian Air UK and Norwegian Air Interna-tional Ireland. Additionally, he is well versed in establishing and managing Air Operator Cer-tificates in Norway, England, Ireland and Sweden. Mr Ceder studied Aircraft technical edu-cation at the Mälardalen Univer-sity Sweden.As of December 31, 2016, he held 50 shares in the Company, but he does not have any stock-options. Mr Ceder is a Swedish citizen.
Help | Contents | Highlights | Letter from CEO | Board of Directors' report | Financial statements | CSR | Corporate governance | Board and management | Definitions | Contact | 97 / 99
NORWEGIAN ANNUAL REPORT 2016
The Board of DirectorsBjørn H KiseLiv BerstadAda KjesethChristian Fredrik StrayGeir Olav ØienLinda OlsenMarcus Hall The Management teamBjørn KjosFrode E. FossAsgeir NysethAnne-Sissel SkånvikThomas RamdahlJan Dahm-SimonsenFrode BergDag SkageTore JenssenEdward ThorstadBjørn Erik Barman-JenssenLennart Ceder
BOARD AND MANAGEMENT
2016-NorwegiaN.iNdd • Created: 09.10.2014 • Modified: 06.04.2017 : 19:44 all rigths reserved © 2017 teigeNs desigN
DEFINITIONSALTERNATIVE PERFORMANCE MEASURES Norwegian Air Shuttle’s financial informa-tion is prepared in accordance with Inter-national Financial Reporting Standards (IFRS). In addition, the company presents alternative performance measures (APM). The APMs are regularly reviewed by man-agement and their aim is to enhance stake-holders’ understanding of the Company’s performance. APMs are calculated consis-tently over time and are based on financial data presented in accordance with IFRS and other operational data as described in the table below.
● Aircraft lease expense Lease and rental expenses on aircraft including both dry leases and wet leases.
● Ancillary revenue / PAX Ancillary
passenger revenue divided by passengers.
● ASK Available seat kilometers. Number of available passenger seats multiplied by flight distance.
● Average sector length Total flown distance divided by number of flights.
● Book equity per share Total equity divided by number of shares outstanding.
● CO2 per RPK Amount of CO2 emissions divided by RPK.
● Constant currency A currency exchange rate that excludes the impact of exchange rate fluctuations from comparable period, e.g last year as comparable period.
● EBIT Earnings before net financial items, income tax expense (income) and share of profit (loss) from associated companies. Equivalent to operating profit in the consolidated income statement in the annual report.
● EBIT margin EBIT divided by total operating revenue.
● EBITDA Earnings before net financial items, income tax expense (income), depreciation, amortization and impairment and share of profit (loss) from associated companies.
● EBITDAR Earnings before net financial items, income tax expense (income), depreciation, amortization and impairment, restructuring, aircraft leasing expense and share of profit (loss) from associated companies.
● EBITDAR ex other losses/(gains) Earnings before net financial items, income tax expense (income), depreciation, amortization, restructuring, rent/leasing, and share of profit (loss) from associated companies, adjusted for other losses/(gains)-net.
● EBITDAR margin EBITDAR divided by total operating revenue.
● EBT Earnings before income tax expense (income). Equivalent to profit (loss) before income tax expense (income) in the Consolidated Income Statement in the annual report.
● Equity ratio Book equity divided by total assets.
● Fixed asset investment Consists of the following items presented in the statement of financial position in the annual report: Financial assets available for sale, investment in associate and other receivables.
● Fuel consumption Aviation fuel consumed, presented in metric tonnes.
● Load factor RPK divided by ASK. Describes the utilization of available seats.
● Net interest bearing debt Long term borrowings plus short term borrowings less cash and cash equivalents.
● Other losses/(gains)-net Consist of fair value losses/(gains) on financial assets at fair value through profit or loss and foreign exchange losses/(gains) on operating activities.
● Passengers Number of passengers flown.
● RPK Revenue passenger kilometers. Number of sold seats multiplied by flight distance.
● Total operating expenses Total operating expenses not including aircraft lease expenses, depreciation, amortization and impairment.
● Total operating expenses incl lease Total operating expenses not including depreciation, amortization and impairment.
● Unit cost Total operating expenses plus leasing, excluding other losses/(gains)-net, divided by ASK.
● Unit cost ex fuel Total operating expenses plus leasing, excluding other losses/(gains)-net and aviation fuel expense, divided by ASK.
● Unit revenue Passenger revenue divided by ASK.
● Yield Passenger revenue divided by RPK. A measure of average fare per kilometer.
Help | Contents | Highlights | Letter from CEO | Board of Directors' report | Financial statements | CSR | Corporate governance | Board and management | Definitions | Contact | 98 / 99
NORWEGIAN ANNUAL REPORT 2016

2016-NorwegiaN.iNdd • Created: 09.10.2014 • Modified: 06.04.2017 : 19:44 all rigths reserved © 2017 teigeNs desigN
Design/layout: H
augvar AS
Norwegian Air Shuttle ASA
Visiting address:Oksenøyveien 3NO-1366 Lysaker
Postal address:P.O. Box 115NO-1330 Fornebu
Switchboard: +47 67 59 30 00Telefax: +47 67 59 30 01
www.norwegian.no
Investor relations contact:Tore Østby, Vice President Investor RelationsTel +47 45 80 48 98 / +47 67 59 31 34E-mail: [email protected]
Help | Contents | Highlights | Letter from CEO | Board of Directors' report | Financial statements | CSR | Corporate governance | Board and management | Definitions | Contact | 99 / 99
NORWEGIAN ANNUAL REPORT 2016