Annual report 2015 edited
36
1
-
Upload
valerie-alarcon -
Category
Government & Nonprofit
-
view
103 -
download
3
Transcript of Annual report 2015 edited
1
2
CONTENTS
Regional Manager’s Report 3 D. Inter Agency Project
Status of Irrigation Development—CY2015 4 CARP-IC Phase III 21-22
Engineering and Operation ARISP 3 (under JBIC loan) 23-28
Project Development and Implemetation Operation and Maintenance Activities
A.1 Locally funded Projects A. National Irrigation Systems (NIS) 29
CY2014 Accomplishment 5-7 Cropping Intensity (CI) 30
CY2015 8-9 Collection Efficiency (CE) 30
A.2 Line Projects (SRIP) Viability Index (VI) 31
Ibingan SRIP 10-14 B. Communal Irrigation System (CIS) 31
Sibagat SRIP 15 C. Institutional Development Program 32
B. Foreign Assisted Projects 16 Financial Management 33-34
THIRIS 17-20 HR Management 35
RIIS 20 Success Factors 36
C. Repair, Operation and Maintenance Hindering Factors 36
of NIS Pump Irrigation Systems 21
No. Title Page
1 Status of Project Implementation of Operations Department
- Monitored Lumpsum Projects for CY 2014 6-7
2 Status of Project Implementation of Operations Department
- Monitored Lumpsum Projects for CY 2015 9
3 NIS - Cropping Intensity 30
4 NIS - Collection Effeciency 30
5 NIS - Viabilty Index 31
6 Service Area of CIS 31
7 No. of IA’s and Farmers 32
8 Summary of Financial Status 34
9 CY2015 Total Personnel Complement 35
LIST OF TABLES

3
REGIONAL MANAGER’S REPORT
I n 2015, NIA implemented a total of 158 projects
with an approved allocation of P490.2 million.
Out of these, 77 projects were completed as of
December 31, 2015, which generated 197 hectares
of new areas, restored irrigation service to 1,082 hec-
tares and rehabilitated irrigation facilities and struc-
tures covering 1,576 hectares benefitting a total of
2,322 farmers.
Aside from the 78 completed projects, 78 projects are still ongoing construction and expected to be finished by end of March 2016, while works in 2 projects have not yet started due to right-of-way and peace and order problems.
NIA Bicol’s physical accomplishment of 74.24 per-cent in 2015 is higher than the 62.06 percent accom-plishment in 2014.
These construction and rehabilitation activities both
in National and communal irrigation systems (NIS/
CIS) were geared towards the expansion of irrigated
areas to increase palay production in the region in
support of the national government’s food self-
sufficiency program.
In terms of 2015 financial accomplishment, NIA Bicol earned a total income of P56.7 million consisting of: P37.9 million in irrigation service fees (ISF); P7.5 mil-lion in amortizations from communal and pump irriga-tion systems (CIS/PIS); P2.3 million in farmers’ equity contributions; P120,000.00 in equipment rental; and P11 million in bidding documents. Last year’s ISF collection of P37.9 million is higher by 6.8 percent compared to 2014 collection of P35.5 million, while CIS/PIS amortization posted an in-crease of 9 percent from P6.9 million in 2014 to P7.5 million in 2015. As far as the operations of 10 NIS in the region are concerned, NIA irrigated a total area of 34,520 hec-tares benefiting some 33,992 farmers in 2015 with a cropping intensity (CI) of 163.68 percent. For CIS, the total irrigated area in the same year totaled to 66,381 hectares serving 46,630 farmers with a CI of 162.71. Overall, the level of irrigation development in the Bicol region increased from 56.84 percent in 2014 to 57.64 percent in 2015.
ENGR. VICENTE R. VICMUDO, Ph.D.
4
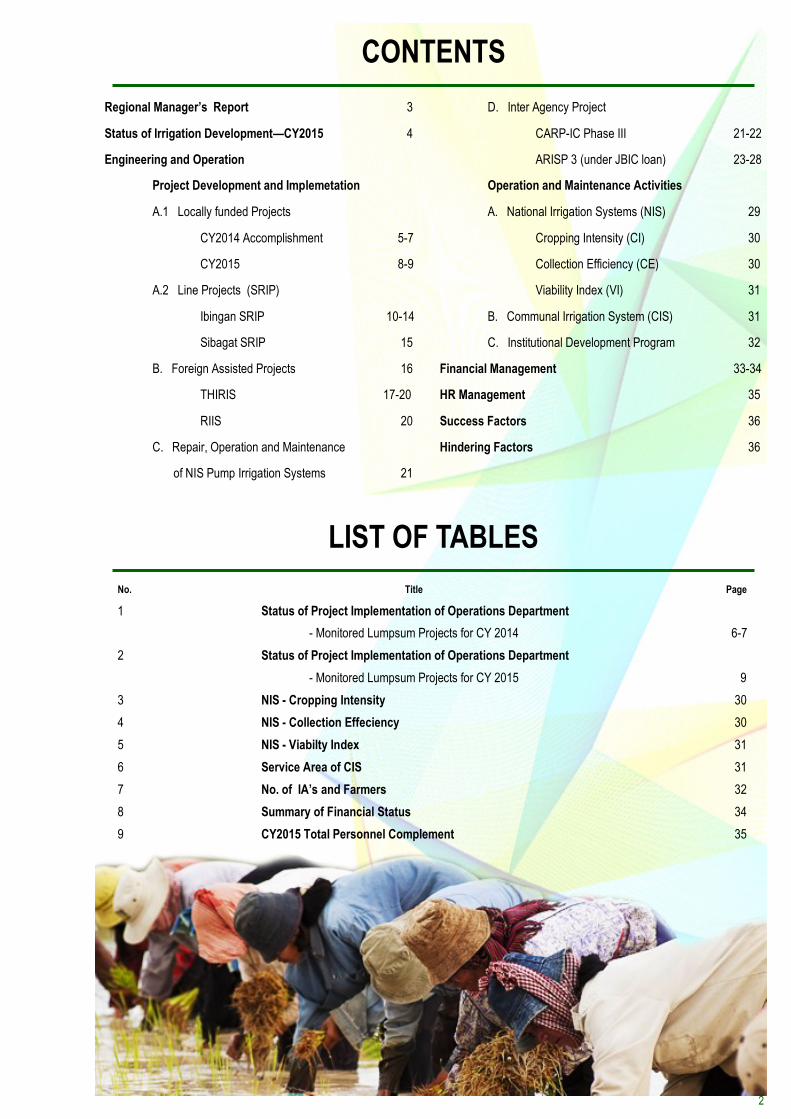
Irrigation Development as of CY 2015
South Quinale Dam, Libon, Albay
STATUS OF IRRIGATION DEVELOPMENT

5
Project Development and Implementation
A.1 Locally funded Projects (Lump Sum Appropriation)
CY 2014 ACCOMPLISHMENTS
Lump Sum Appropriation includes projects funded under the General Appropriation
Act which are categorized as Small Irrigation Projects (SIPs), Restoration /Rehabilitation of
Existing Irrigation Systems (RREIS), NIS/CIS Extension, Repair of Groundwater Pump
Irrigation System (RGPIS). For the CY 2014 projects, the total direct cost (DBM Bar Code)
is Php 599,680.00 and allotment released is 100% of the approved budget.
A physical target for area generation is 2,570 hectares, 20 hectares for area restora-
tion and 1,114 hectares for rehabilitation
As of December 31, 2015, actual accomplishments for area generation is 1,985
hectares, for area restoration is 10 hectares and for area rehabilitation is 1,074 hectares,
equivalent to 77.24%, 50.00% and 96.41% respectively of the total target for area genera-
tion, restoration and rehabilitation. The Physical accomplishment is 91.42%.
With respect to other fund sources particularly Small Reservoir Irrigation Projects
(SRIP), there is no accomplishment yet since the design of the impounding dam for Ibingan
is submitted to DSD in November 2015. While, the design of Sibagat SRIP is still subject
for finalization the Central office.
ENGINEERING AND OPERATIONS

6
TA
BL
E 1
: ST
AT
US
OF
PR
OJE
CT
IM
PL
EM
EN
TA
TIO
N O
F O
PE
RA
TIO
NS
DE
PA
RT
ME
NT
—
MO
NIT
OR
ED
LU
MP
SU
M P
RO
JEC
TS
FO
R C
Y 2
01
4
AS
OF
DE
CE
MB
ER
31,
201
5
FU
ND
SO
UR
CE
PARTICULAR
AP
PR
OV
ED
PO
W/
PO
W D
IRE
CT
CO
ST
(P
)
AL
LO
CA
TIO
N
(DB
M B
AR
CO
DE
) (P
)
NO
. OF
PR
OJE
CT
S
PH
YS
ICA
L T
AR
GE
T/ A
CT
UA
L A
CC
OM
PL
ISH
ME
NT
A
CC
OM
PL
ISH
ME
NT
A
RE
A (
has
)
FB
s JO
B
GE
N
TOTAL
ON-GOING
COMPLETED
NEW
REH
RES
AR
EA
(h
as)
FB
s
JOB GENERATED
PHYSICAL STATUS %
FINANCIAL STATUS %
NE
W
RE
HA
B
RE-STORE
SM
AL
L IR
RIG
A-
TIO
N P
RO
JEC
TS
(S
IP)
NIS
- -
- -
- -
- -
- -
- -
- -
- -
-
- -
- -
- -
- -
- -
- -
- -
- -
-
CIS
400,
000,
000.
00
400,
000,
000.
00
46
7 39
2,
056
- -
3,87
0 2,
400
1,47
7
3,
236
2,10
1 87
.54
63.0
2
400,
000,
000.
00
- -
- -
- -
- -
- -
- -
- -
- -
TOTAL
400,
000,
000.
00
400,
000,
000.
00
46
7 39
2,
056
- -
3,87
0 2,
400
1,47
7
3,
236
2,10
1 87
.54
63.0
2
400,
000,
000.
00
- -
- -
- -
- -
- -
- -
- -
- -
RE
ST
OR
AT
ION
/R
EH
AB
ILA
TIO
N
OF
E
XIS
TIN
G IR
RI-
GA
TIO
N S
YS
TE
M
(RR
EIS
)
NIS
4,32
0,00
0.00
-
- -
- -
- -
- -
- -
- -
- -
-
4,00
0,00
0.00
4,
000,
000.
00
2
2 -
100
- 70
24
100
70
24
10
0.00
84
.75
CIS
33,0
48,0
00.0
0 -
- -
- -
- -
- -
- -
- -
- -
-
30,6
00,0
00.0
0 30
,600
,000
.00
17
1 16
-
1,01
4 -
680
184
97
4
613
178
96.7
3 50
.08
TOTAL
37,3
68,0
00.0
0 -
- -
- -
- -
- -
- -
- -
- -
-
34,6
00,0
00.0
0 34
,600
,000
.00
19
1 18
-
1,11
4 -
750
208
1,
074
68
3 20
2 97
.11
54.0
9
NA
TIO
NA
L/
CO
MM
UN
AL
IR
RIG
AT
ION
S
YS
TE
M E
XT
EN
-S
ION
PR
OJE
CT
(N
IS/C
IS E
XT
EN
-S
ION
)
NIS
18,9
00,0
00.0
0 -
- -
- -
- -
- -
- -
- -
- -
-
17,5
00,0
00.0
0 17
,500
,000
.00
1
1 80
-
- 13
4 10
5 80
13
4 10
5 10
0.00
58
.11
CIS
105,
386,
400.
00
- -
- -
- -
- -
- -
- -
- -
- -
97,5
80,0
00.0
0 97
,580
,000
.00
16
1 15
43
4 -
20
838
585
428
10
95
8 58
2 99
.35
77.4
2
TOTAL
124,
286,
400.
00
- -
1 -
- -
- -
- -
- -
- -
- -
115,
080,
000.
00
115,
080,
000.
00
17
16
51
4 -
20
972
690
508
10
1,
092
687
99.4
5 74
.48
RE
PA
IR O
F
GR
OU
ND
WA
TE
R
PU
MP
IR
RIG
AT
ION
S
YS
TE
M
(RG
PIS
)
NIS
54,0
00,0
00.0
0 -
- -
- -
- -
- -
- -
- -
- -
-
50,0
00,0
00.0
0 50
,000
,000
.00
13
13
-
- -
- 30
0
30
0 10
0.00
85
.07
TOTAL
54,0
00,0
00.0
0 -
- -
- -
- -
- -
- -
- -
- -
-
50,0
00,0
00.0
0 50
,000
,000
.00
13
13
-
- -
- 30
0
30
0 10
0.00
85
.07

7
AS
OF
DE
CE
MB
ER
31,
201
5
FU
ND
SO
UR
CE
PARTICULAR
AP
PR
OV
ED
P
OW
/ P
OW
DIR
EC
T
CO
ST
(P
)
AL
LO
CA
TIO
N
(DB
M B
AR
C
OD
E)
(P)
NO
. OF
PR
OJE
CT
S
PH
YS
ICA
L T
AR
GE
T/ A
CT
UA
L A
CC
OM
PL
ISH
ME
NT
AC
CO
MP
LIS
HM
EN
T
AR
EA
(h
as)
FB
s JO
B
GE
N
TO
-T
AL
O N-
G OI
N G
CO
MP
LE
TE
D
NE
W
RE
H
RE
S
AR
EA
(h
as)
FB
s JO
B
GE
N
PHYSICAL STATUS %
FINANCIAL STATUS %
NE
W
RE
-H
AB
RESTORE
SU
MM
AR
Y F
OR
201
4 P
RO
JEC
TS
TO
TA
L
N I S
23,2
20,0
00.0
0
- -
- -
- -
-
- -
- -
- -
- -
21,5
00,0
00.0
0
21,5
00,0
00.0
0
3
3 80
10
0
- 20
4
129
80
10
0
20
4
129
10
0.00
63
.07
TO
TA
L
C I S
592,
434,
400
.00
-
- -
- -
- -
- -
- -
- -
- -
-
578,
180,
000
.00
57
8,18
0,00
0.0
0
92
9 83
2,
490
1,
014
20
5,
388
3,
469
1,
905
97
4
10
4,80
7
3,16
0
91.1
0
66.6
8
SU
B T
OT
AL
FO
R
LU
MP
SU
M P
RO
-JE
CT
S
T
O
T
A L
615,
654,
400
.00
599,
680,
000
.00
95
9
86
2,57
0
1,11
4
20
5,59
2
3,59
8
1,98
5
1,07
4
10
5,01
1
3,28
9
91.4
2
66.5
5
599,
680,
000
.00
TA
BL
E 1
—S
TA
TU
S O
F P
RO
JEC
T I
MP
LE
ME
NT
AT
ION
OF
OP
ER
AT
ION
S D
EP
AR
TM
EN
T—
MO
NIT
OR
ED
LU
MP
SU
M P
RO
JEC
TS
FO
R C
Y 2
01
4

8
ENGI-CY 2015 ACCOMPLISHMENTS
Under the CY 2015 lump sum allocation, only Restoration /Rehabilitation of Existing Irri-
gation Systems (RREIS), NIS/CIS Extension, and Comprehensive Agrarian Reform Program-
Irrigation Component (CARP-IC) were implemented with a total direct cost (DBM Bar Code)
of Php490,200.00 and allotment released is 97.12% of the approved budget.
As of December 31, 2015, out of the 158 projects for implementation, 78 projects have
been completed, 2 project awaits fund releases and 78 are still on-going. Out of this, a total of
2,322 farmers were benefited and 2,159 jobs were generated.
Physical targets for area generation is 388 hectares, 1670 hectares for area restoration
and 2,442 hectares for rehabilitation. As of December 31, 2015, actual accomplishments for
area generation is 231 hectares, for area restoration is 1,092 hectares and for area rehabilita-
tion is 1,576 hectares, equivalent to 59.54%, 65.41% and 64.52% respectively of the total
target for area generation, restoration and rehabilitation with a 74.24% physical accomplish-
ment.
With respect to other fund sources particularly Small Reservoir Irrigation Projects
(SRIP), there is no accomplishment yet since the design works are still at the NIA Central Of-
fice.
Matagbac CIS, Milagros, Masbate

9
TA
BL
E 2
: ST
AT
US
OF
PR
OJE
CT
IM
PL
EM
EN
TA
TIO
N O
F O
PE
RA
TIO
NS
DE
PA
RT
ME
NT
—
MO
NIT
OR
ED
LU
MP
SU
M P
RO
JEC
TS
FO
R C
Y 2
01
5
AS
OF
DE
CE
MB
ER
31,
201
5
FUN
D S
OU
RC
E P
AR
TIC
-
ULA
R
ALL
OC
ATI
ON
(DB
M B
AR
CO
DE)
(P)
NO
. OF
PR
OJE
CTS
C
Y T
AR
GET
/AC
TUA
L A
CC
OM
PLI
SHM
ENT
TOTA
L
ON
-
GO
-
ING
NO
T
YET
STA
R
TED
CO
MP
LETE
D
AR
EA (
has
)
FBs
JOB
GEN
ER-
ATI
ON
VA
LUE
OF
AC
CO
M-
PLI
SHM
ENT
(P)
CA
SH
DIS
BU
RSE
MEN
T
PH
YS-
ICA
L
STA
-
TUS
(%)
FIN
AN
-
CIA
L
STA
TUS
NEW
R
EHA
B
RE-
STO
RE
RES
TOR
ATI
ON
/
REH
AB
ILIT
ATI
ON
OF
EXIS
TIN
G IR
RIG
ATI
ON
SYST
EMS
(RR
EIS)
NIS
1
61
,60
0,0
00
.00
24
18
- 6
-
58
8 8
87
1,6
73
97
0 1
19
,88
6,5
81
.70
18
,262
,561
.92
74
.19
11
.30
- 5
22
50
7 7
58
71
9
CIS
2
34
,37
7,0
00
.00
11
5 4
9 -
66
1
,51
4 6
55
2,7
30
1,4
06
17
9,7
81
,38
3.5
0 2
0,4
16,1
64.8
2 7
6.7
1 8
.71
- 8
38
48
5 1
,31
1 1
,07
9
TOTA
L 3
95
,97
7,0
00
.00
13
9 6
7 -
72
- 2
,10
2 1
,54
2 4
,40
3 2
,37
6 2
99
,66
7,9
65
.20
38
,678
,726
.74
75
.68
9.7
7 -
1,3
60
99
2 2
,06
9 1
,79
8
NA
TIO
NA
L/C
OM
MU
NA
L
IRR
IGA
TIO
N S
YST
EM E
X-
TEN
SIO
N
PR
OJE
CT
(NIS
/CIS
EX
TEN
SIO
N)
NIS
1
7,7
14,0
00.0
0 1
1
-
- 5
0 2
50
20
35
0 1
06
12
,821
,393
.20
- 7
2.3
8 -
15
15
0 1
0 1
35
53
CIS
6
5,5
09,0
00.0
0 1
5 8
2
5
3
28
90
58
44
0 3
93
44
,567
,122
.00
7,4
01,
96
3.3
5 6
8.0
3 1
1.3
0 2
16
66
50
12
4 2
66
TOTA
L 8
3,2
23,0
00.0
0 1
6 9
2
5
3
78
34
0 7
8 7
90
49
9 5
7.3
88,
515
.20
7,4
01,
96
3.3
5 6
8.9
6 8
.89
23
1 2
16
60
25
9 3
19
CO
MP
REH
ENSI
VE
AG
RA
RI-
AN
REF
OR
M
PR
OG
RA
M –
IRR
IGA
TIO
N
CO
MP
ON
ENT
(CA
RP
-IC
)
NIS
1
1,0
00,0
00.0
0 3
2
1
10
- 5
0 -
66
6,8
68,
00
0.0
0 -
62
.44
-
- 4
0 -
41
CIS
1
1,0
00,0
00.0
0 3
2
1
10
- 5
0 -
66
6,8
68,
00
0.0
0 -
- -
-
40
- 4
1
SUM
MA
RY
FO
R 2
01
5 P
RO
JEC
TS
TOTA
L FO
R N
IS
NIS
1
79
,31
4,0
00
.00
25
19
- 6
5
0 8
38
90
7 2
.02
3 1
,07
6 1
32
,70
7,9
74
.90
18
,262
,561
.92
74
.01
10
.18
15
67
2 5
17
89
3 7
73
TOTA
L FO
R C
IS
CIS
3
10
,88
6,0
00
.00
13
3 5
9 2
7
2 3
38
1,6
04
76
3 3
,17
0 1
,86
5 2
31
,21
6,5
05
.50
27
,818
,128
.17
74
.37
8.9
5 2
16
90
4 5
75
1,4
35
1,3
86
SUB
TO
TAL
FOR
LU
MP
SUM
PR
OJE
CTS
TO
TAL
49
0,2
00,0
00
.00
15
8 7
8 2
7
8
38
8 2
,44
2 1
,67
0 5
,19
3 2
,94
1
36
3,9
24,4
80
.40
46
,08
0,6
90
.09
74
.24
9.4
0
23
1 1
,57
6 1
,09
2 2
,32
8 2
,15
9

10
A.2 Line Projects
SMALL RESERVOIR IRRIGATION PROJECTS
The Small Reservoir Irrigation Project (SRIP) is a locally funded project implemented
nationwide. The project requires the identification, investigation, validation, feasibility stud-
ies, detailed engineering and construction of dam and reservoir and irrigation facilities to pro-
vide a year round irrigation.
NIA REGION 5 IS IMPLEMENTING THE FOLLOWING SUB-PROJECTS/ACTIVITIES:
A. Ibingan SRIP, Prieto Diaz, Sorsogon
The project aims to develop the full potential of water to be impounded for irrigation to
provide adequate irrigation water supply to about 255 hectares of agricultural land that
covers the municipality of Prieto Diaz in Sorsogon in Region 5, with 329 farmer benefi-
ciaries. The overall accomplishment for the CY2012 and CY2013 Projects is 94.11%as of
December 2015.
Pictures of Accomplishment for CY2012 and CY2013
Access Road Station 0+000 – 1+240.00
PACKAGE 1
CONST. OF ACCESS & SERVICE ROAD & ROAD STRUCTURES

11
PACKAGE 2
CANALIZATION & CANAL STRUCTURES
Elevated Flume
Station 3+372.50 – 3+623.00 MC

12
15 cm. CHB Canal Lining with Removable Cover Station 0+676.90 – 0+691.78 MC
0+755.37 – 0+780.00 MC 0+789.00 – 0+906.40 MC
Canalization Station 0+000.00 – 4+890.00 MC
13
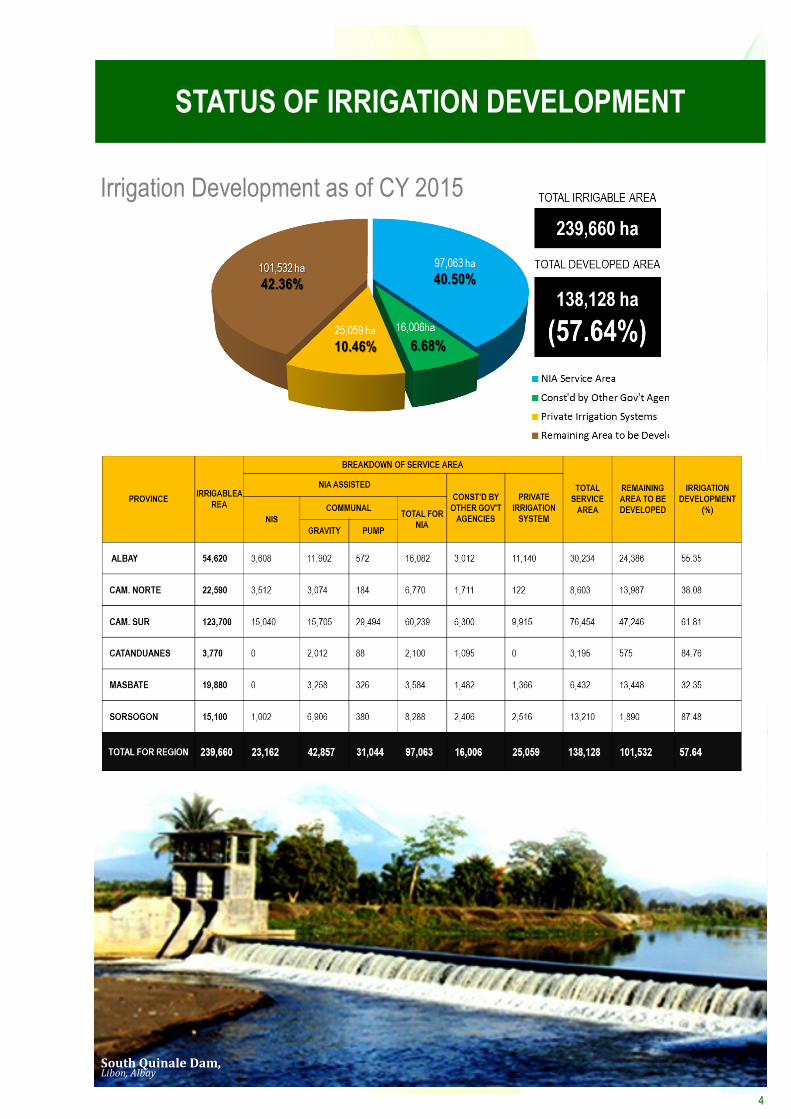
PACKAGE 3
CONSTRUCTION OF SERVICE ROAD
Service Road
Station 4+253 – 8+400
14
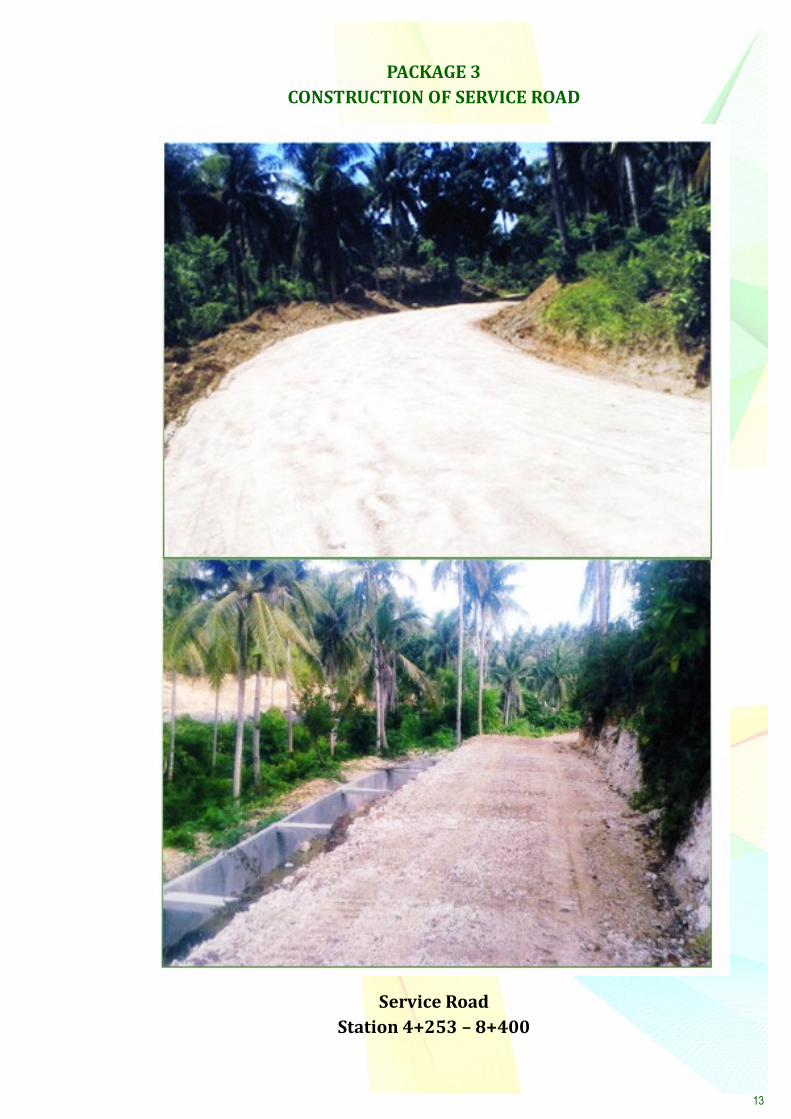
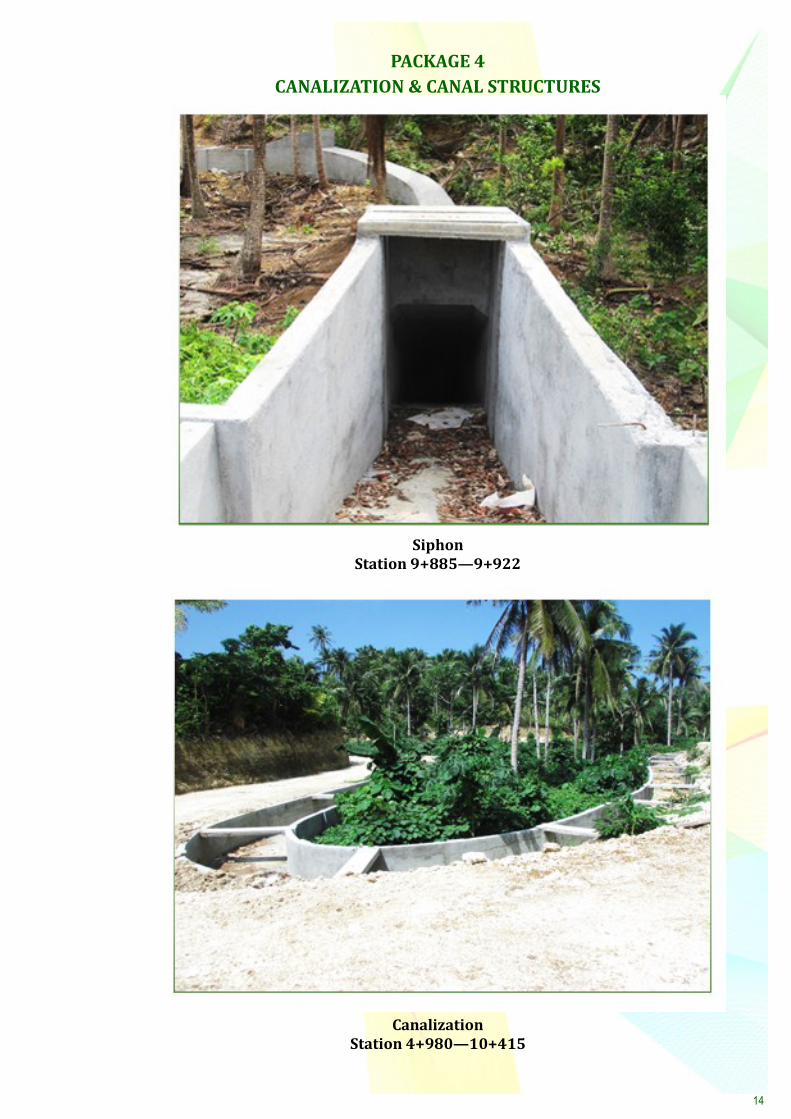
Canalization Station 4+980—10+415
PACKAGE 4
CANALIZATION & CANAL STRUCTURES
Siphon Station 9+885—9+922

15
B. SIBAGAT SRIP, Minalabac, Camarines Sur
This ongoing project is located in Brgy. Magadap, Minalabac, Camarines Sur. It is
designed to irrigate 350 hectares of rice lands, broken down as follows: new area = 250 hec-
tares; and rehab area = 100 hectares. This project will benefit 323 farmer beneficiaries.
As of December 2015, the overall accomplishment for civil works contract for CY
2012 and CY 2013 Programs is 83.51%.
Pictures of Accomplishment for CY2012 and CY2013
TURN OUT NO. 1, LATERAL B-2 Sta. 0+120
TURNOUT NO. 3, LATERAL A Sta. 0+480
LATERAL B-2
STA. 0+970-1+040

16
B. Foreign Assisted Projects
PARTICIPATORY IRRIGATION DEVELOPMENT PROJECT
The Participatory Irrigation Development Project (PIDP) constitutes the first phase of a long-
term program supporting irrigation reforms in the Philippines. The World Bank loan was
approved on November 3, 2009.
The development objective of the overall PIDP Applicable Program Loan (APL 1,2 &3) is to
improve irrigation service delivery on a financially and technically sustainable basis that will
contribute to increased agricultural production and productivity among beneficiary farmers in
irrigation areas.
The projects consist of the following parts:
Part 1 Irrigation Sector Restructuring and Reform
1.1 Implementation of the NIA Rationalization Plan
1.2 NIA Institutional Strengthening and Irrigation Management Transfer
Program
Part 2 Irrigation Infrastructure Development
2.1 Rehabilitation and Modernization of Irrigation Systems
Rehabilitation and modernization of 58 existing National irrigation Systems(14
Core A and 44 Core B NISs) nationwide. In Region 5, the Core A project is be-
ing implemented at Tigman-Hinagyanan-Inarihan River Irrigation System
(THIRIS) and 2 Core B projects, Matogdon RIS in Camarines Norte and Barit
RIS in Nabua, Camarines Sur. The Core B civil works was completed in May
14, 2012 for Barit and the activities being undertaken is focus on the institutional
strengthening, capability training for IA leaders, second line leaders and mem-
bers and the Irrigation Management transfer program.
The Tigman-Hinagyanan Inarihan Rivers Irrigation System is a Core-A project
being implemented in the municipalities of Canaman, Magarao, Bombon and
Calabanga, all in the province of Camarines Sur, in the contract amount of P
87,524,235.41
The project is on-going and the contractor is obliged to observe the Social and
Environmental Management Plan to address the existing and potential environ-
mental impacts that may arise from the rehabilitation of Tigman-Hinagyanan- In-
arihan Rivers Irrigation System.
The contractor, R.D. Policarpio Co. Inc. /TGV Builders (JV) is at present conduct-
ing repair of damaged canal lining, road surfacing and repair of office buildings,
water masters’ and gate keepers’ quarters.
The irrigators’ associations are involved in the community participation aspects of
the project. The nine associations, namely: Hi-Farm IA, Division A IA, Division B
IA, Bombon-Quipayo IA, Centro-Magarao IA, Limbuan IA, Bombon-Habagatan
IA, Canaman-Magarao IA and Franc-Bel-Cas IA, had already completed with
their respective work packages. Desilting works will ensure efficient distribution
of irrigation water within the IA coverage service areas.
B. Foreign Assisted Projects

17
For CY 2015, the activities that were accomplished are the following:
1. Hauling of Road surfacing materials at service roads of main canals and laterals,
2. Repair of concrete canal lining of main canals and laterals,
3. Construction of grouted riprap at approaches of Tigman Dam,
4. Manual de silting works at main canals and laterals and mechanized de silting
works at main canals with higher depth, and;
5. Repair of 6 NIA Buildings and
6. 6. Delivery of steel gates for turn –outs. The actual physical accomplishment as of
December 31, 2015 is 44.52%.
Road surfacing works at Lateral B, Hinagyanan
On-going repair of Concrete canal lining at Tigman Line.
TIGMAN-HINAGYANAN-INARIHAN RIVER IRRIGATION SYSTEM (THIRIS)

18
Completed Grouted Riprap at Tigman dam
Desilting works of Main canals at Inarihan and Hinagyanan

19
Completed Grouted Riprap at Tigman dam
Rehabilitation Field Office (THIRIS)

20
For CY 2015 the activities centered on the conduct of TSA meetings, seminars
and conferences focused on the discussion of the Operations plan for Barit RIS geared
towards improvement of cropping intensity and commitment of IA leaders on ISF
collection efficiency and participation of the Irrigators’ Association in the pre-Irrigation,
Irrigation and Post Irrigation period. Series of meetings and trainings were conducted to
fully inform the farmer beneficiaries of the current NIA Programs making them a sustain-
able and viable irrigators association. Women leaders and members were also trained
through a Livelihood seminar on food processing as an additional income to uplift the
quality life of farmers.
RINCONADA INTEGRATED IRRIGATION SYSTEM (RIIS)
Livelihood Seminar on Food Processing (November 27, 2015)
IA Performance Assessment for Barit IA Leaders (December 23, 2015)

21
D. Inter Agency Project
NIA5 continued the implementation of locally funded projects which is Repair, Opera-
tion & Maintenance of NIS Pump Irrigation System during the year. For CY 2015, a direct
cost of P 4.7 Million was programmed for the operation of Libmanan—Cabusao Pump Irriga-
tion System in Camarines Sur. Allotment released to NIA5was 100% of the approved budget.
By the end of the year, the project was 100.00% completed.
In addition to its regular program, NIA 5 continued the implementation of inter-agency pro-
jects.
C. Repair, Operation & Maintenance of NIS Pump Irrigation Systems
I. Comprehensive Agrarian Reform Program-Irrigation Component (CARP-IC)
Phase III
The CY 2015 CARP Phase III for NIA 5 has a total project allocation of P11 Million. It
is composed of three (3) projects that will restore 10 hectares and a target new area of
10 hectares. This will also rehabilitate 163 hectares of riceland when completed.
Of the three projects that were implemented, only one (1) project was completed
restoring 10 hectares and rehabilitating 55 hectares of Riceland.
Shown is the completed desilting works at the Diversion Dam of Hinipaan CIS, Taken October 20, 2015
Proposed desilting works at Diversion dam of Hinipaan CIS, taken June 18, 2015

22
COMPLETED CHB LINING OF HINIPAAN CIS
Shown is the completed construction of CHB Lining at portion of right main canal
Sta. 0+214.56—0+267
Shown is the completed construction of CHB Lining at portion of right main canal
Sta. 0+214.56—0+267
23
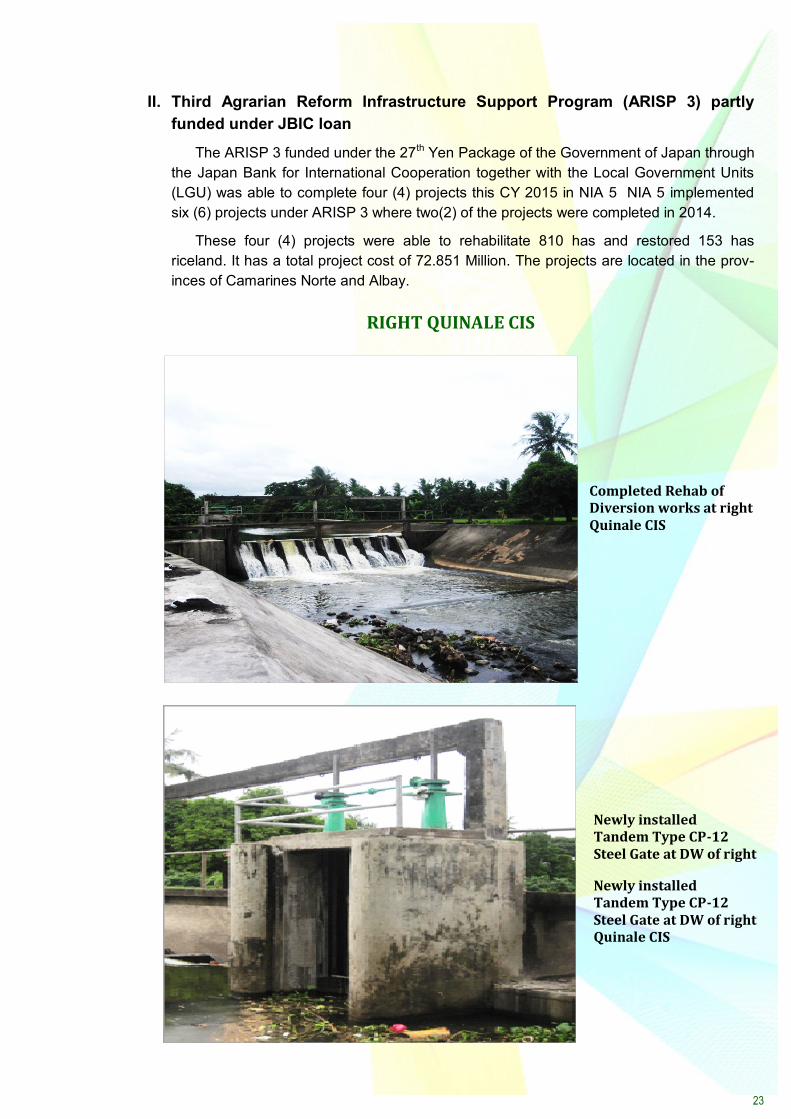
Completed Rehab of Diversion works at right Quinale CIS
II. Third Agrarian Reform Infrastructure Support Program (ARISP 3) partly
funded under JBIC loan
The ARISP 3 funded under the 27th Yen Package of the Government of Japan through
the Japan Bank for International Cooperation together with the Local Government Units
(LGU) was able to complete four (4) projects this CY 2015 in NIA 5 NIA 5 implemented
six (6) projects under ARISP 3 where two(2) of the projects were completed in 2014.
These four (4) projects were able to rehabilitate 810 has and restored 153 has
riceland. It has a total project cost of 72.851 Million. The projects are located in the prov-
inces of Camarines Norte and Albay.
Newly installed Tandem Type CP-12 Steel Gate at DW of right
Newly installed Tandem Type CP-12 Steel Gate at DW of right Quinale CIS
RIGHT QUINALE CIS

24
Completed CHB Lining at Lateral B of right Quinale CIS
Completed CHB Lining at Lateral C of right Quinale CIS
Completed CHB Lining at Main Canal of right Quinale CIS

25
Completed CHB Lining at Lateral B of San Agustin CIS
Completed CHB Lining at Lateral B of right Quinale CIS
Completed Embankment Protection at D/S portion of the Diversion Works of San Agustin CIS
SAN AGUSTIN CIS

26
Completed CHB Canal Lining at Main Canal # 1 of Minasag CIS
Completed CHB Lining at Lateral A of Minasag CIS
Completed CHB Lining at Lateral A of Minasag CIS
MINASAG CIS

27
Newly installed Steel Gate at Santol Ilaya Dam
Completed Gabion D/S left and right Slide Slope Protection
Newly installed Steel Gate at Santol Ilaya Dam
SANTOL CIS
28
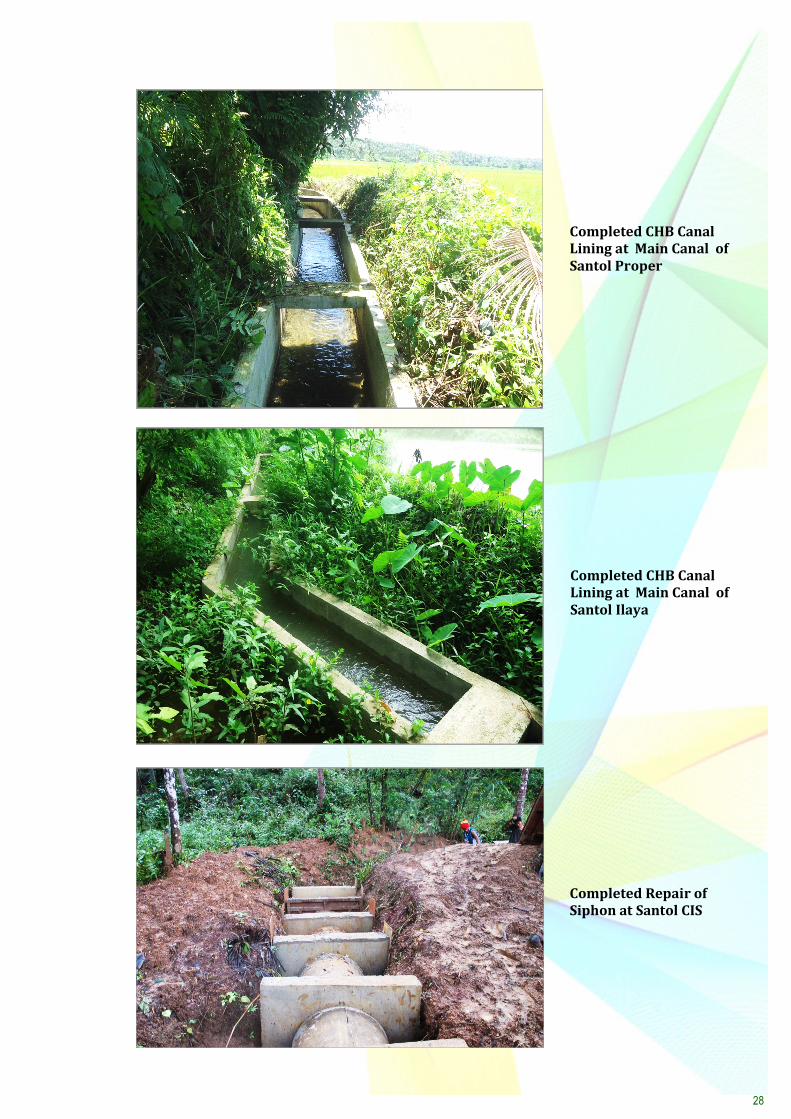
Completed CHB Canal Lining at Main Canal of Santol Ilaya
Completed Repair of Siphon at Santol CIS
Completed CHB Canal Lining at Main Canal of Santol Proper
29
Operation and Maintenance Activities
A. National Irrigation Systems (NIS)
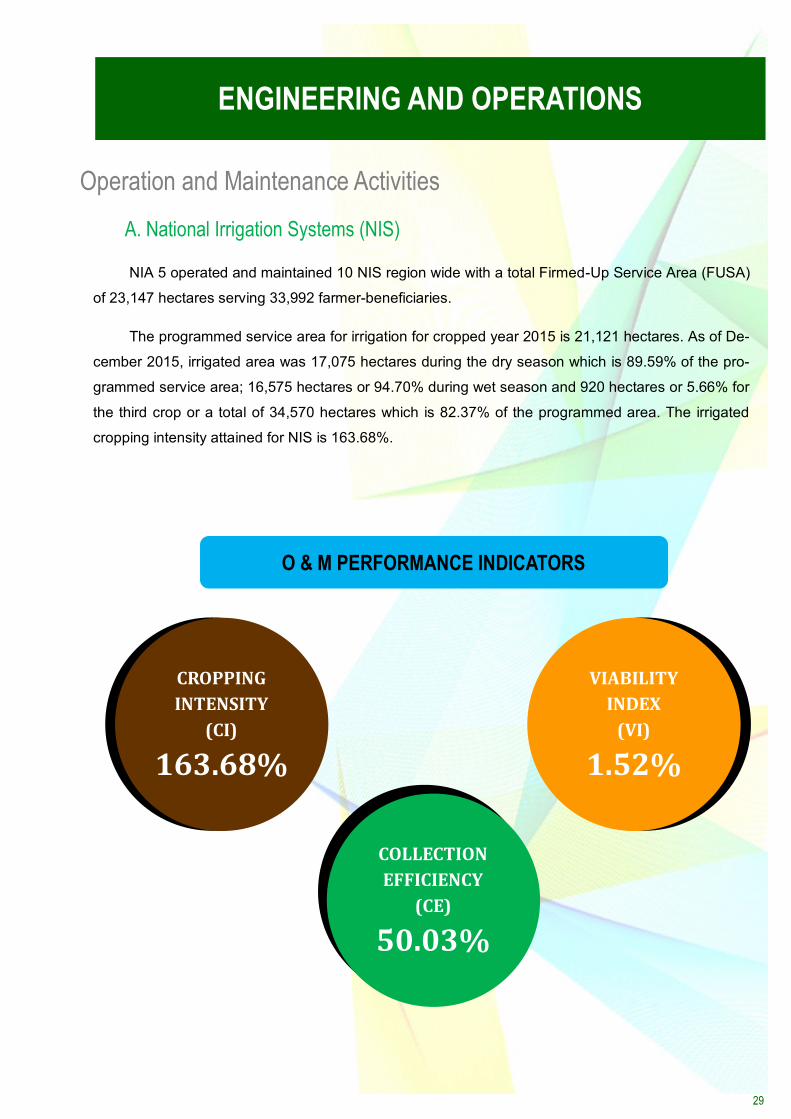
NIA 5 operated and maintained 10 NIS region wide with a total Firmed-Up Service Area (FUSA)
of 23,147 hectares serving 33,992 farmer-beneficiaries.
The programmed service area for irrigation for cropped year 2015 is 21,121 hectares. As of De-
cember 2015, irrigated area was 17,075 hectares during the dry season which is 89.59% of the pro-
grammed service area; 16,575 hectares or 94.70% during wet season and 920 hectares or 5.66% for
the third crop or a total of 34,570 hectares which is 82.37% of the programmed area. The irrigated
cropping intensity attained for NIS is 163.68%.
ENGINEERING AND OPERATIONS
ENGI- O & M PERFORMANCE INDICATORS
CROPPING
INTENSITY
(CI)
163.68%
COLLECTION
EFFICIENCY
(CE)
50.03%
VIABILITY
INDEX
(VI)
1.52%

30
NAME OF NIS
NO. OF
FARMERS
BENEF.
FUSA OPERT’L
AREA
IRRIGATED AREA BENEFITED AREA CROPPING
INTENSITY
WET DRY QTA RATOON WET DRY OPERT’L
AREA
MAHABA-NASISI- OGSONG-HIBIGA RIS
2,475 2,065 2,065 P 2,010 2,060 108 607 2,010 2,060 231.72
A 2,052 2,052 0 840 2,052 2,052 239.42
SOUTH QUINALE RIS 990 750 750 P 750 750 0 225 750 750 230.00
A 750 750 0 80 750 750 210.67
CABILOG-SAN JUAN 963 793 793 P 340 380 0 0 340 380 90.79
A 150 150 0 0 117.69 144 37.83
ALBAY SUB TOTAL
4,428 3,608 3,608 P 3,100 3,190 108 832 3,100 3,190 200.39
A 2,952 2,952 0 920 2,920 2,946 189.14
DAET-TALISAY RIS 3,557 3,026 2,810 P 2,400 2,760 92 850 2,400 2,760 217.15
A 2,320 2,431 0 0 2,095 2,431 169.07
MATOGDON RIS 269 471 293 P 230 230 0 0 230 230 157.00
A 230 231 0 0 212 231 157.34
CAM NORTE SUB TOTAL
3,826 3,497 3,103 P 2,630 2,990 92 850 2,630 2,990 211.47
A 2,550 2,662 0 0 2,307 2,662 167.97
TIGMAN-HINAGYANAN- INARIHAN RIS
3,765 3,542 3,122 P 2,750 2,900 107 720 2,750 2,900 207.46
A 2,660 2,618 0 0 2,265 2,618 169.06
CAGAYCAY RIS 2,289 2,095 1,915 P 1,520 1,574 63 425 1,520 1,574 187.05
A 1,504 1,528 0 0 1,248 1,528 158.33
RINCONADA INTEG.RATION IRRIGATION SYSTEM
16,556 7,208 6,295 P 5,402 5,800 300 1,529 5,402 5,800 207.01
A 5,049 5,176 0 0 4,852 4,951 162.43
LIBMANAN-CABUSAO PIS 1,593 2,195 2,076 P 1,150 1,635 0 0 1.150 1,635 134.15
A 920 1,171 0 0 897 843 100.72
CAM SUR SUB TOTAL
24,203 15,040 13,408 P 10,822 11,909 470 2,674 10,822 11,909 192.98
A 10,133 10,493 0 0 9,261 9,940 153.83
SAN RAMON-SAN FRANCISCO RIS
1,535 1,002 1,002 P 950 970 30 350 950 970 229.54
A 940 968 0 0 940 968 190.42
SORSOGON SUB TOTAL
1,535 1,002 1,002 P 950 970 30 350 950 970 229.54
A 940 968 0 0 940 968 190.42
TOTAL 33,992 23,147 21, 121 P 17,502 19,059 700 4,706 17,502 19,059 198.70
A 16,575 17,075 0 920 15,428 16,516 163.68
NAME OF NIS
CA COLLECTIBLES (P’000) CE (%) COLLECTIONS (P’000)
WET CROP
DRY CROP
TOTAL CA (ISF) (P’000)
BA (P’000)
E.R. (P’000)
OTHER INCOME
PROG. ACTUAL
BASED ON BEN. AREA
ACTUAL
MAHABA-NASISI- OGSONG-HIBIGA RIS
P 228.645 342.967 571.612 571.612 - 20.000 20.000 100.00 -
A 228.645 342.967 571.612 460.260 69.117 30.341 51.861 80.52 80.52
SOUTH QUINALE RIS P 1,275.000 1,912.500 3,187.500 2,043.563 - - - 64.11 -
A 1,275.000 1,912.500 3,187.500 1,484.380 86.108 - - 46.57 46.57
CABILOG-SAN JUAN P 578.000 969.000 1,547.000 922.320 - - - 59.62 -
A 200.072 367.967 568.039 349.139 60.507 - - 22.57 61.46
ALBAY SUB TOTAL
P 2,081.645 3,224.467 5,306.112 3,537.495 - 20.000 20.000 66.67 -
A 1,703.717 2,623.434 4,327.150 2,293.779 215.732 30.341 51.861 43.23 53.01
DAET-TALISAY RIS P 4,080.000 7,038.000 11,118.000 7,226.700 1,700.000 - 10.000 65.00 -
A 3,561.180 6,199.050 9,760.230 5,446.472 3,186.291 - 306.928 48.99 55.80
MATOGDON RIS P 391.000 586.500 977.500 635.375 200.000 - - 65.00 -
A 359.878 589.050 948.928 335.536 110.104 - 77.300 34.33 35.36
CAM NORTE SUB TOTAL
P 4,471.000 7,624.500 12,095.500 7,862.075 1,900.000 - 10.000 65.00 -
A 3,921.057 6,788.100 10,709.157 5,782.008 3,296.394 - 384.228 47.80 53.99
TIGMAN-HINAGYANAN- INARIHAN RIS
P 4,675.000 7,395.000 12,070.000 7,395.000 1,000.000 - - 61.27 -
A 3,849.782 6,676.425 10,526.207 5,347.638 1,197.025 - 2.270 44.31 50.80
CAGAYCAY RIS P 2,584.000 4,013.700 6,597.700 3,951.088 300.000 - - 59.89 -
A 2,121.240 3,896.400 6,017.640 2,390.941 477.666 - 5.000 36.24 39.73
RINCONADA INTEG.RATION IRRIGATION SYSTEM
P 9,183.400 14,790.000 23,973.400 14,384.040 500.000 - - 60.00 -
A 8,248.359 12,624.831 20,873.190 10,984.994 1,639.128 - 1.200 45.82 52.63
LIBMANAN-CABUSAO PIS P 2,932.500 4,169.250 7,101.750 4,370.600 200.000 - - 61.54 -
A 2,287.526 2,148.375 4,435.901 2,214.083 386.999 - - 31.18 49.91
CAM SUR SUB TOTAL
P 19,374.900 30,367.950 49,742.850 30,100.728 2,000.000 - - 60.51 -
A 16,506.908 25,346.031 41,852.939 20,937.655 3,967.818 - 8.470 42.09 50.03
SAN RAMON-SAN FRANCISCO RIS
P 1,615.000 2,473.500 4,088.500 2,657.525 30.000 - - 65.00 -
A 1,598.000 2,430.150 4,028.150 1,461.180 176.655 - 39.025 35.47 36.27
SORSOGON SUB TOTAL
P 1,615.000 2,473.500 4,088.500 44,157.823 30.000 - - 65.00 -
A 1,598.000 2,430.150 4,028.150 30,474.622 176.655 - 39.025 35.74 36.27
TOTAL P 27,542.545 43,690.417 71,232.962 44,,157.823 3,930.000 20.000 30.000 61.99 -
A 23,729.682 37,187.715 60,917.397 30,474.622 7,656.599 30.341 483.584 42.78 50.03
TABLE 3: CROPPING INTENSITY (CI)
TABLE 4: COLLECTION EFFICIENCY (CE)

31
B. Communal Irrigation System (CIS)
NIA Region 5 assisted 433 CIS regionwide with a total Firmed-up Service Area (FUSA) of
71,746 hectares serving 46,630 farmer-beneficiaries.
As of December 2015, irrigated area was 32,479 hectares during the dry season (November
2014 to April 2015), 31,683 hectares during the wet season (May 2015 to October 2015). The irrigat-
ed cropping intensity attained for CIS was 162.71%.
PROVINCE NO. OF CIS
NO. OF FBs
WET DRY
Irrigated/ Planted Area
(ha)
Ave. Yield per ha
Irrigated/ Planted
Area (ha)
Ave. Yield per
ha
ALBAY 62 10,922 7,569 88.20 7,047 80.72
CAMARINES NORTE 43 2,267 1,260 67.80 1,922 71.00
CAMARINES SUR 189 20,043 15,071 86.00 14,658 85.00
CATANDUANES 38 2,993 1,024 79.00 1,038 77.74
MASBATE 27 2,004 1,138 52.04 1,756 58.02
SORSOGON 74 8,401 5,621 74.00 5.698 75.44
TOTAL 433 46,630 31,683 74.51 32,119 74.65
TABLE 5: VIABILITY INDEX (VI)
NAME OF NIS O&M EXPENSES
(P’000) NET INCOME
(P’000) VIABILITY INDEX
TOTAL INCOME (P’000)
MAHABA-NASISI- OGSONG-HIBIGA RIS
P 611.612 2,799.480 (2,187.868) 0.22
A 611.579 1,033.458 (421.879) 0.59
SOUTH QUINALE RIS P 2,043.563 - 2,043.563 -
A 1,570.488 165.312 1,405.176 -
CABILOG-SAN JUAN P 922.320 - 922.320 -
A 409.646 112.266 297.379 -
ALBAY SUB TOTAL
P 3,577.495 2,799.480 778.015 1.28
A 2,591.713 1,311.036 1,280.676 1.98
DAET-TALISAY RIS P 8,963.700 8,047.671 889.029 1.11
A 8,939.691 6,031.105 2,908.586 1.48
MATOGDON RIS P 835.375 - 835.375 -
A 522.940 24.113 498.827 21.69
CAM NORTE SUB TOTAL
P 9,772.075 8,047.671 1,724.40 1.21
A 9,462.631 6,055.218 3,407.413 1.56
TIGMAN-HINAGYANAN- INARIHAN RIS
P 8,395.000 7,000.000 1,395.000 1.20
A 6,546.933 5,559.014 987.918 1.18
CAGAYCAY RIS P 4,251.088 2,054.061 2,197.027 2.07
A 3,140.607 1,487.419 1,653.188 2.11
RINCONADA INTEG.RATION IRRIGATION SYSTEM
P 14,884.040 13,178.835 1,705.205 1.13
A 12,625.322 8,023.045 4,602.277 1.57
LIBMANAN-CABUSAO PIS P 4,570.600 3,562.424 1,008.176 1.28
A 2,601.081 1,611.614 989.4568 1.61
CAM SUR SUB TOTAL
P 32,100.728 25,795.320 6,305.408 1.24
A 24,913.943 16,681.092 8,232.851 1.49
SAN RAMON-SAN FRANCISCO RIS
P 2,687.525 1,150.000 1,537.53 2.34
A 1,676.859 1,294.409 382.450 1.30
SORSOGON SUB TOTAL
P 2,687.525 1,150.000 1,537.525 2.34
A 1,676.859 1,294.409 382.450 1.30
TOTAL P 48,137.823 37,792.471 10,345.352 1.27
A 38,645.146 25,341.756 13,303.391 1.52
TABLE 6: SERVICE AREA OF CIS

32
ENC. Institutional Development Program
A total of 466 IAs regionwide had been organized reorganized/strengthened covering a
total of 71,311.11 hectares with 74,689.00 farmer-beneficiaries. Capability-building program for
NIA staff were conducted to enhance their capability of working harmoniously with the farmers
and of carrying out their O&M responsibilities. On the other hand, farmers are trained on IA
management, operation and maintenance of the irrigation system and IA financial manage-
ment. Linkages with other government agencies engaged in agricultural production were
strengthened.
PROVINCE
CIS NIS
NO. OF IA AREA FARMERS NO. OF IA AREA FARMERS
ALBAY 98 11,277.00 10,230 8 3,608 4,465
CAMARINES NORTE 47 3,074.00 2,156 10 3,496.73 3,908
CAMARINES SUR 155 21,855.00 14,736 57 15,040.38 24,303
LCPIS 0 0 0 6 2,195.38 1,693
THIRIS 0 0 0 9 3,542.00 3,765
CRIS 0 0 0 9 2,095.00 2,289
RIIS 0 0 0 33 7,208.00 16,556
CATANDUANES 49 2,007.00 3,000 0 0 0
MASBATE 36 3,058.00 2,148 0 0 0
SORSOGON 81 6,893.00 8,131 5 1,002 1,612
TOTAL 466 48,164.00 40,401 80 23,147.11 34,288
TABLE 7: NO. OF IA’s AND FARMERS
33
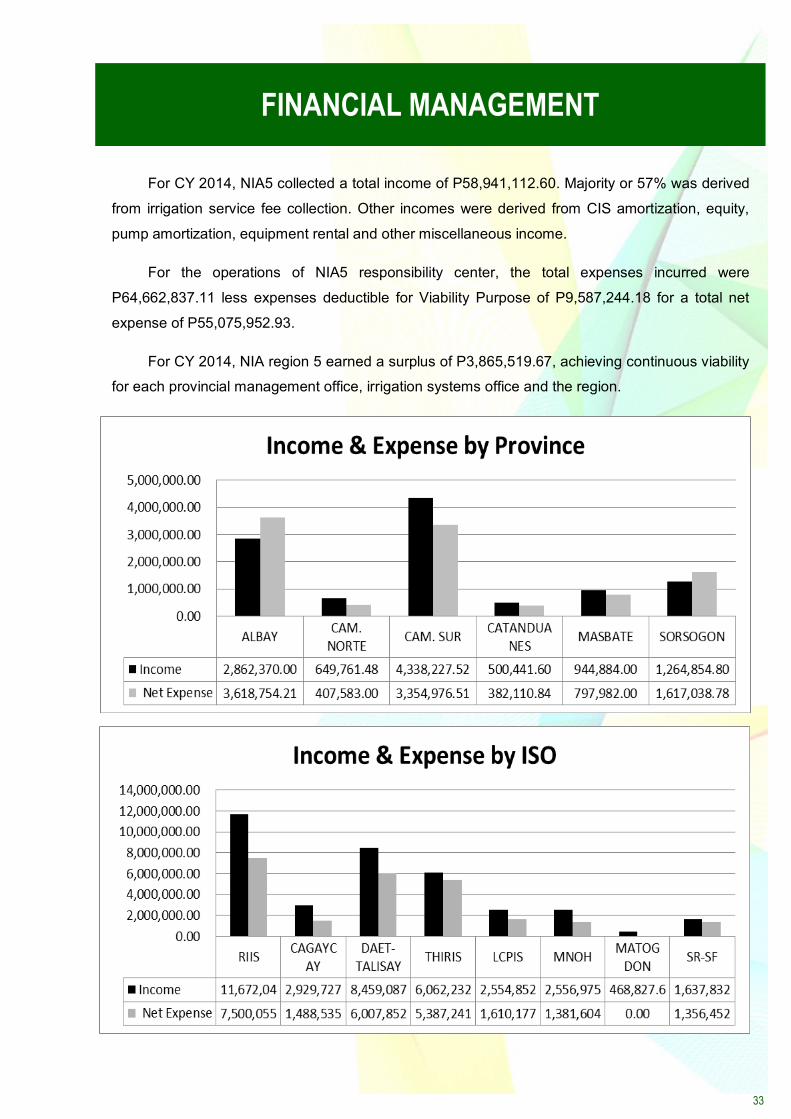
For CY 2014, NIA5 collected a total income of P58,941,112.60. Majority or 57% was derived
from irrigation service fee collection. Other incomes were derived from CIS amortization, equity,
pump amortization, equipment rental and other miscellaneous income.
For the operations of NIA5 responsibility center, the total expenses incurred were
P64,662,837.11 less expenses deductible for Viability Purpose of P9,587,244.18 for a total net
expense of P55,075,952.93.
For CY 2014, NIA region 5 earned a surplus of P3,865,519.67, achieving continuous viability
for each provincial management office, irrigation systems office and the region.
FINANCIAL MANAGEMENT

34
CY 2014
RESPONSIBILITY CENTER
INCOME Irrigation Service
Fee Equipment Rental CIS Amortization & Equity Pump Amort & Equity Other Income Total Income
ALBAY 63,288.00 2,715,982.00 83,100.00 2,862,370.00 CAM. NORTE 369,771.48 279,990.00 649,761.48 CAM. SUR 8,441.02 4,250,183.50 79,603.00 4,338,227.52 CATANDUANES 13,000.00 462,791.60 12,650.00 12,000.00 500,441.60 MASBATE 804,584.00 140,300.00 944,884.00 SORSOGON 1,243,454.80 21,400.00 1,264,854.80 TOTAL PIOs - 84,729.02 9,846,767.38 12,650.00 616,393.00 10,560,539.40 RIIS 12,634,023.42 1,298.60 12,635,322.02 CAGAYCAY 3,127,669.65 12,937.51 3,140,607.16 DAET-TALISAY 8,580,749.26 359,842.11 8,940,591.37 THIRIS 6,435,321.07 111,611.76 6,546,932.83 LCPIS 2,598,258.02 2,823.45 2,601,081.47 MNOH 2,506,114.57 30,341.00 20,520.00 2,556,975.57 MATOGDON 443,346.20 79,593.67 522,939.87 SR-SF 1,637,398.52 39,460.57 1,676,859.09 TOTAL NIS 37,962,880.71 30,341.00 - - 628,087.67 38,621,309.38 REGIONAL OFFICE 5,354.40 9,753,909.42 9,759,263.82 GRAND TOTAL 37,962,880.71 120,424.42 9,846,767.38 12,650.00 10,998,390.09 58,941,112.60
RESPONSIBILITY CENTER
EXPENSES Less Expenses Deduct-ible for Viability Pur-
pose Net Expense Net Income/Loss
Personal Services Maintenance & Other Operating Total Expenses
ALBAY 3,339,291.21 279,463.00 3,618,754.21 966,666.67 2,652,087.54 210,282.46
CAM. NORTE 407,583.00 407,583.00 25,000.00 382,583.00 267,178.48
CAM. SUR 2,984,753.80 370,222.71 3,354,976.51 708,333.33 2,646,643.18 1,691,584.34
CATANDUANES 288,050.84 94,060.00 382,110.84 382,110.84 118,330.76
MASBATE 728,768.32 69,213.68 797,982.00 300,000.00 497,982.00 446,902.00 SORSOGON 1,309,822.64 307,216.14 1,617,038.78 737,500.00 879,538.78 385,316.02 TOTAL PIOs 9,058,269.81 1,120,175.53 10,178,445.34 2,737,500.00 7,440,945.34 3,119,594.06 RIIS 4,841,070.14 3,622,265.53 8,463,335.67 468,749.94 7,994,585.73 4,640,736.29 CAGAYCAY 809,173.90 890,241.21 1,699,415.11 212,499.96 1,486,915.15 1,653,692.01 DAET-TALISAY 5,208,522.61 1,280,832.88 6,489,355.49 440,729.15 6,048,626.34 2,891,965.03 THIRIS 3,549,666.34 2,322,276.40 5,871,942.74 506,250.00 5,365,692.74 1,181,240.09 LCPIS 1,153,368.29 503,037.27 1,656,405.56 44,791.67 1,611,613.89 989,467.58
MNOH 575,237.44 806,367.34 1,381,604.78 1,381,604.78 1,175,370.79
MATOGDON 54,112.24 54,112.24 54,112.24 468,827.63
SR-SF 1,203,394.43 192,085.14 1,395,479.57 150,000.00 1,245,479.57 431,379.52 TOTAL NIS 17,340,433.15 9,671,218.01 27,011,651.16 1,823,020.72 25,188,630.44 13,432,678.94 REGIONAL OFFICE 23,953,370.71 3,519,369.90 27,472,740.61 5,026,723.46 22,446,017.15 (12,686,753.33) GRAND TOTAL 50,352,073.67 14,310,763.44 64,662,837.11 9,587,244.18 55,075,592.93 3,865,519.67
TABLE 8: SUMMARY OF FINANCIAL STATUS
35
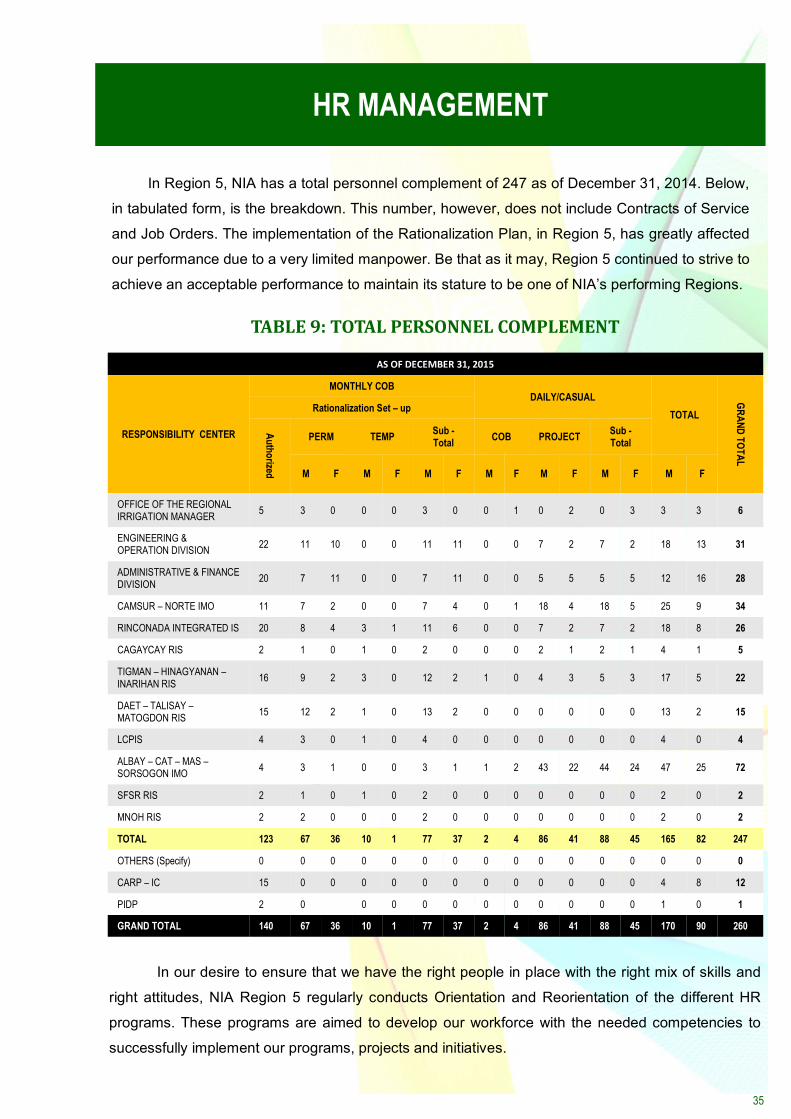
In Region 5, NIA has a total personnel complement of 247 as of December 31, 2014. Below,
in tabulated form, is the breakdown. This number, however, does not include Contracts of Service
and Job Orders. The implementation of the Rationalization Plan, in Region 5, has greatly affected
our performance due to a very limited manpower. Be that as it may, Region 5 continued to strive to
achieve an acceptable performance to maintain its stature to be one of NIA’s performing Regions.
HR MANAGEMENT
AS OF DECEMBER 31, 2015
RESPONSIBILITY CENTER
MONTHLY COB DAILY/CASUAL
TOTAL
GR
AN
D T
OT
AL
Rationalization Set – up
Au
tho
rized
PERM TEMP Sub - Total
COB PROJECT Sub - Total
M F M F M F M F M F M F M F
OFFICE OF THE REGIONAL IRRIGATION MANAGER
5 3 0 0 0 3 0 0 1 0 2 0 3 3 3 6
ENGINEERING & OPERATION DIVISION
22 11 10 0 0 11 11 0 0 7 2 7 2 18 13 31
ADMINISTRATIVE & FINANCE DIVISION
20 7 11 0 0 7 11 0 0 5 5 5 5 12 16 28
CAMSUR – NORTE IMO 11 7 2 0 0 7 4 0 1 18 4 18 5 25 9 34
RINCONADA INTEGRATED IS 20 8 4 3 1 11 6 0 0 7 2 7 2 18 8 26
CAGAYCAY RIS 2 1 0 1 0 2 0 0 0 2 1 2 1 4 1 5
TIGMAN – HINAGYANAN –INARIHAN RIS
16 9 2 3 0 12 2 1 0 4 3 5 3 17 5 22
DAET – TALISAY – MATOGDON RIS
15 12 2 1 0 13 2 0 0 0 0 0 0 13 2 15
LCPIS 4 3 0 1 0 4 0 0 0 0 0 0 0 4 0 4
ALBAY – CAT – MAS – SORSOGON IMO
4 3 1 0 0 3 1 1 2 43 22 44 24 47 25 72
SFSR RIS 2 1 0 1 0 2 0 0 0 0 0 0 0 2 0 2
MNOH RIS 2 2 0 0 0 2 0 0 0 0 0 0 0 2 0 2
TOTAL 123 67 36 10 1 77 37 2 4 86 41 88 45 165 82 247
OTHERS (Specify) 0 0 0 0 0 0 0 0 0 0 0 0 0 0 0 0
CARP – IC 15 0 0 0 0 0 0 0 0 0 0 0 0 4 8 12
PIDP 2 0 0 0 0 0 0 0 0 0 0 0 1 0 1
GRAND TOTAL 140 67 36 10 1 77 37 2 4 86 41 88 45 170 90 260
In our desire to ensure that we have the right people in place with the right mix of skills and
right attitudes, NIA Region 5 regularly conducts Orientation and Reorientation of the different HR
programs. These programs are aimed to develop our workforce with the needed competencies to
successfully implement our programs, projects and initiatives.
TABLE 9: TOTAL PERSONNEL COMPLEMENT

36
SUCCESS FACTORS
Properly maintained irrigation and drainage facilities
Prompt payment of Irrigation Service Fee (ISF)
Prompt/Early release of fund
Functional and strengthened IAs (even without the
assistance of NIA)
Efficient implementation of operations plan for NISs/
CISs
On schedule completion of project implementation
HINDERING FACTORS
Right of Way Problems
Inclement Weather Condition
Presence of Standing Crops
Peace and Order Situation
Clearances from Line Agencies
Hauling of Construction Materials
Ordinances on Procurement