ANNUAL REPORT 2015 - cellohealthplc.com · 5 Cello Annual Report 2015 CHAIRMAN S STATEMENT OVERVIEW...
52
ANNUAL REPORT 2015
Transcript of ANNUAL REPORT 2015 - cellohealthplc.com · 5 Cello Annual Report 2015 CHAIRMAN S STATEMENT OVERVIEW...

ANNUAL REPORT2015


Highlights 2
Chairman’s Statement 4
Cello Health 10
Cello Signal 20
Cello People 28
Strategic Report 32
Directors’ Report 33
Corporate Governance 36
Report of the Remuneration Committee 38
Consolidated Financial Statements Independent Auditors’ Report 40 Financial Statements 42 Accounting Policies 47 Notes 52
Company Financial Statements Independent Auditors’ Report 76 Financial Statements 78 Accounting Policies 80 Notes 83
Notice of Annual General Meeting 88
Directors 92
Group Directory 94
Advisors 96
Contents
2015 Highlights

£86,681,000
£10,026,000
9292.86p
8.61p
Gross profit
Headline profit before tax
Full year dividend paid (per share) Headcount
Headline basic earnings (per share)
41.6%
Overseas turnover as a % of total
4
Cel
lo A
nnua
l Rep
ort 2
015
CH
AIR
MA
N’S
ST
AT
EM
EN
T
Building a global organisation delivering world-class client solutions
5
Cello A
nnual Report 2015
CH
AIR
MA
N’S ST
AT
EM
EN
T
OVERVIEW
2015 saw a continued strong financial and operational performance. The Group reported a 7.0% increase in gross profit to £86.7m (2014: £81.0m) with headline1 profit before tax up 7.1% to £10.0m (2014: £9.4m).
Both Cello Health and Cello Signal have continued to make great strides towards establishing themselves as leaders in their respective fields. Cello Health completed its integration behind a single brand almost two years ago and the benefits of this have visibly fed into growth prospects for the company. Whilst Cello Health continued to trade well in the UK and in the USA in 2015, the key features of the year were the development of new sources of future global growth based on the Cello Health brand. 2015 saw significant growth from the emerging client base on the West Coast of the USA. It also saw a marked increase in collaboration between the different capabilities of Cello Health to secure new client briefs. In order to secure future growth, the Group continued its significant investment in the development of its biotech offer in Boston, USA.
Cello Signal made significant progress in integrating its offer behind the client-facing Signal brand. By the end of the year a number of larger clients had been won on the basis of the integrated Signal proposition. The fruits of this process also began to show through in revenue growth and margin improvement.
The Group ended the year with a strong balance sheet, with net debt2 at £4.2m. As a result, the Board has raised the full year dividend by 10.0%, reflecting confidence in the Group’s cash flow potential.
Regarding the VAT issue relating to charitable clients of Signal, following the £1.1m provision taken at the half year stage, the Board continues to believe that the total provision of £3.2m is appropriate.
The New Year has started well, with good income visibility and a solid order book from 2015.
The Group reports a7.0% increase in gross
profit to £86.7m
1 Headline measures exclude, where applicable, restructuring costs, amortisation of intangibles, impairment charges, acquisition accounting adjustments, start-up losses and the charge for VAT payable and related costs.
2 Net debt is defined in note 26.
6
Cel
lo A
nnua
l Rep
ort 2
015
CH
AIR
MA
N’S
ST
AT
EM
EN
T
3 Like-for-like measures exclude the results from companies acquired in the year and start-ups, which are defined in note 7.4 Operating margin is calculated by expressing operating profit as a percentage of gross profit.5 Headline earnings per share is defined in note 11.
FINANCIAL REVIEW
Total Group gross profit was £86.7m (2014: £81.0m) on revenues of £157.3m (2014: £169.9m). Headline profit before tax was £10.0m (2014: £9.4m). The Group’s results reflect a strong performance by Cello Health and an improved performance by Cello Signal, especially in the second half of the year. Like-for-like3 gross profit growth for the whole Group was 4.2%.
The Group’s headline operating margin4 was 12.1% (2014: 12.3%) with a headline operating margin of 19.7% in Cello Health (2014: 21.2%), and 9.5% in Cello Signal (2014: 8.7%).
Headline finance costs were £0.4m (2014: £0.4m).
The Group’s tax charge was £1.7m (2014: £1.5m) with a headline tax rate of 26.1% (2014: 26.5%). The
headline tax rate is dropping as the UK Corporation Tax rate drops.
Headline basic earnings per share5 was up 5.8% to 8.61p (2014: 8.14p).
Statutory profit before tax was £4.8m (2014: £3.8m) after the impact of acquisition-related costs of £1.6m (2014: £1.3m); restructuring costs of £0.7m (2014: £0.5m); amortisation of £0.4m (2014: £1.0m); start-up losses of £1.0m (2014: £0.4m); and the £1.3m charge for VAT payable and related costs.
Total Group estimated future acquisition-related obligations are £3.3m, payable from 2016 to 2017, with a maximum of £0.9m payable in new ordinary shares.
Cello Health produced headline operating profit growth of 3.7% on an increase in gross profit of 11.3%, reflecting continued robust demand
from global clients for its highly specialist range of clinically led services. Like-for-like gross profit in Cello Health grew by 4.7%. Operating margins fell slightly to 19.7% (2014: 21.2%). This reflects the tougher trading environment within the consumer offering of Cello Health, where some projects were deferred or cancelled during the year.
Cello Signal continued to make solid progress in 2015. Headline operating profit grew by 15.1% to £4.0m (2014: £3.4m) on gross profits of £41.6m (2014: £39.5m). Like-for-like gross profit growth was 3.7%. Operating margins therefore improved from 8.7% to 9.5%. There was particular strength in the financial services and charity client base. Operating margins were reduced by continued investment in expansion of the business in the USA and in Pulsar.
Robustlike-for-like growth
7
Cello A
nnual Report 2015
CH
AIR
MA
N’S ST
AT
EM
EN
T
These areas are currently delivering lower operating margins as they continue to be expanded.
Pulsar continued to grow impressively, with 191 clients at the end of 2015 (2014: 88). The product continues to evolve. During 2015, Facebook data was incorporated for the first time, vastly increasing the size of the dataset that is analysed. Operating losses of £0.2m for 2015 are absorbed within headline operating profit. Pulsar achieved
break-even on a monthly basis from November 2015. Sales and renewal rates have been strong so far in 2016.
The Group benefitted from a stronger dollar in 2015 compared with 2014, with average US$:£ exchange rates strengthening from 1.65 in 2014 to 1.53 in 2015. The Group currently generates around $3.5m of headline operating profit in the USA. So far in 2016 the dollar has continued to strengthen to around 1.40.
The Board is proposing a final dividend of 2.02p per share (2014: 1.80p), giving a total dividend for the year of 2.86p per share (2014: 2.60p) representing an increase of 10.0%. The dividend has grown every year since 2006 and has grown by 10.0% or more for the past six years. Subject to shareholder approval, the final dividend will be paid on 27 May 2016 to all shareholders on the register at 6 May 2016, and will be recognised in the year ending 31 December 2016.
*No cash flow impact.6 ebitda is defined as headline operating profit before depreciation and amortisation.
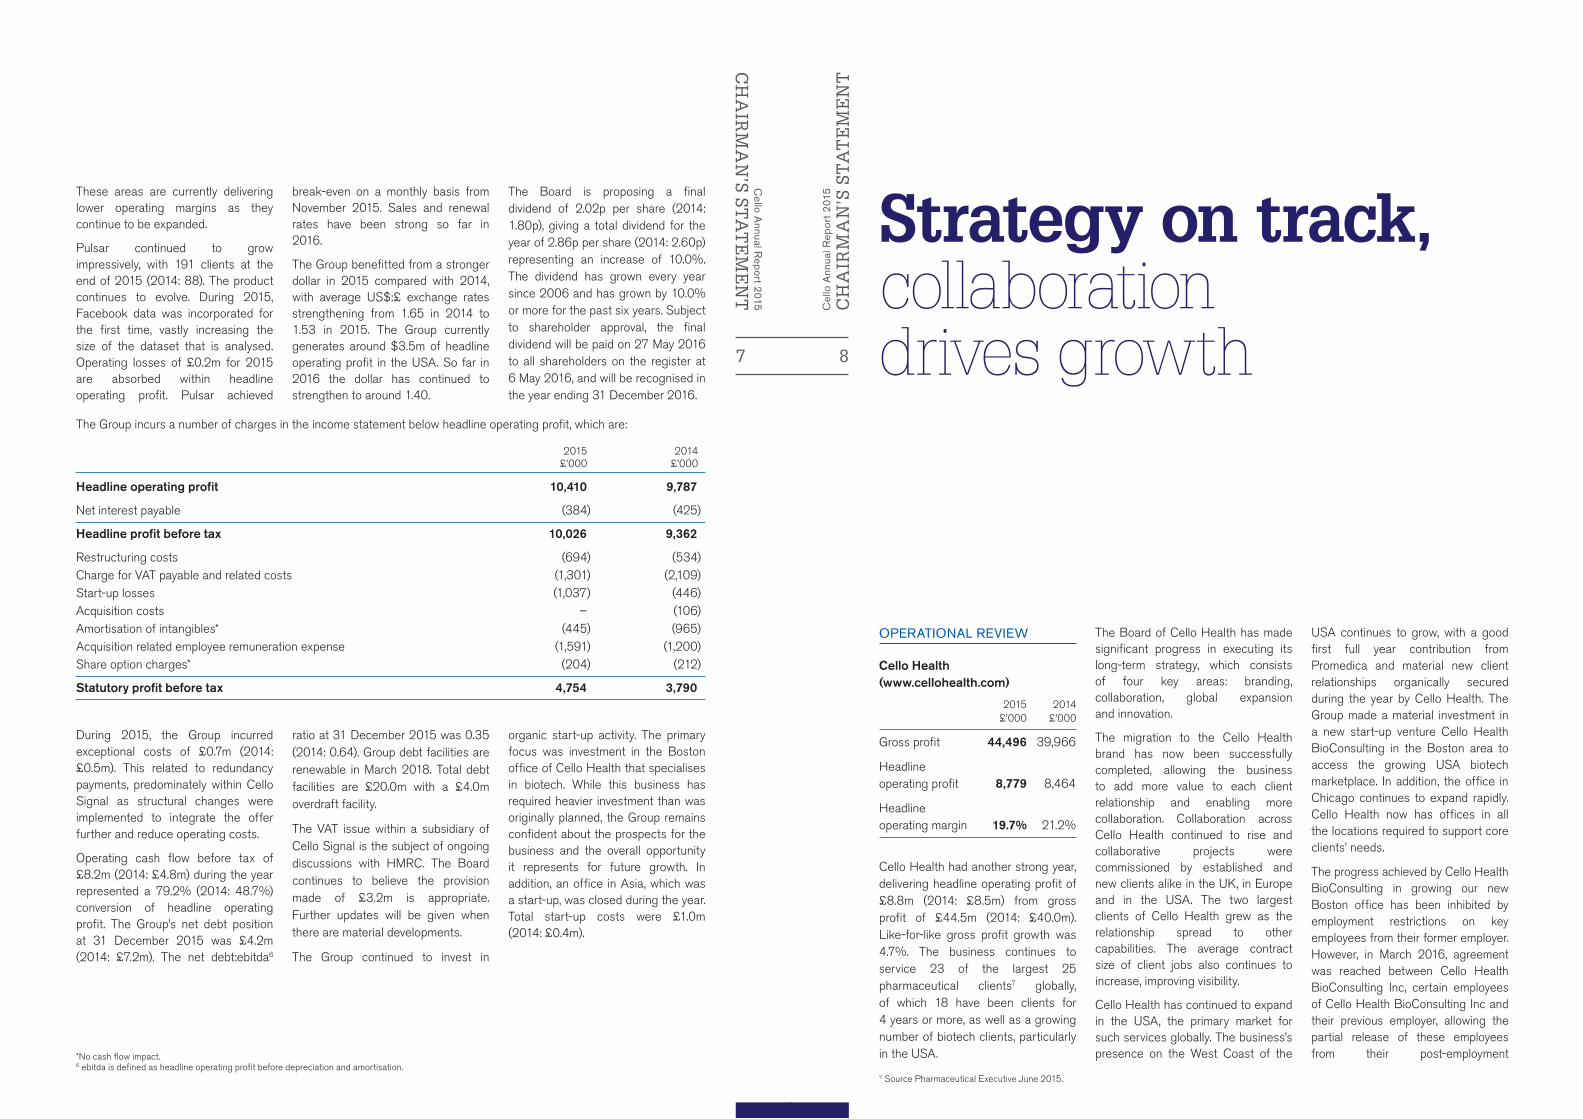
The Group incurs a number of charges in the income statement below headline operating profit, which are:
2015 £’000
2014 £’000
Headline operating profit 10,410 9,787
Net interest payable (384) (425)
Headline profit before tax 10,026 9,362
Restructuring costs (694) (534)Charge for VAT payable and related costs (1,301) (2,109)Start-up losses (1,037) (446)Acquisition costs – (106)Amortisation of intangibles* (445) (965)Acquisition related employee remuneration expense (1,591) (1,200)Share option charges* (204) (212)
Statutory profit before tax 4,754 3,790
During 2015, the Group incurred exceptional costs of £0.7m (2014: £0.5m). This related to redundancy payments, predominately within Cello Signal as structural changes were implemented to integrate the offer further and reduce operating costs.
Operating cash flow before tax of £8.2m (2014: £4.8m) during the year represented a 79.2% (2014: 48.7%) conversion of headline operating profit. The Group’s net debt position at 31 December 2015 was £4.2m (2014: £7.2m). The net debt:ebitda6
ratio at 31 December 2015 was 0.35 (2014: 0.64). Group debt facilities are renewable in March 2018. Total debt facilities are £20.0m with a £4.0m overdraft facility.
The VAT issue within a subsidiary of Cello Signal is the subject of ongoing discussions with HMRC. The Board continues to believe the provision made of £3.2m is appropriate. Further updates will be given when there are material developments.
The Group continued to invest in
organic start-up activity. The primary focus was investment in the Boston office of Cello Health that specialises in biotech. While this business has required heavier investment than was originally planned, the Group remains confident about the prospects for the business and the overall opportunity it represents for future growth. In addition, an office in Asia, which was a start-up, was closed during the year. Total start-up costs were £1.0m (2014: £0.4m).
8
Cel
lo A
nnua
l Rep
ort 2
015
CH
AIR
MA
N’S
ST
AT
EM
EN
T
OPERATIONAL REVIEW
Cello Health (www.cellohealth.com)
2015 2014 £’000 £’000
Gross profit 44,496 39,966
Headline operating profit 8,779 8,464
Headline operating margin 19.7% 21.2%
Cello Health had another strong year, delivering headline operating profit of £8.8m (2014: £8.5m) from gross profit of £44.5m (2014: £40.0m). Like-for-like gross profit growth was 4.7%. The business continues to service 23 of the largest 25 pharmaceutical clients7 globally, of which 18 have been clients for 4 years or more, as well as a growing number of biotech clients, particularly in the USA.
The Board of Cello Health has made significant progress in executing its long-term strategy, which consists of four key areas: branding, collaboration, global expansion and innovation.
The migration to the Cello Health brand has now been successfully completed, allowing the business to add more value to each client relationship and enabling more collaboration. Collaboration across Cello Health continued to rise and collaborative projects were commissioned by established and new clients alike in the UK, in Europe and in the USA. The two largest clients of Cello Health grew as the relationship spread to other capabilities. The average contract size of client jobs also continues to increase, improving visibility.
Cello Health has continued to expand in the USA, the primary market for such services globally. The business’s presence on the West Coast of the
USA continues to grow, with a good first full year contribution from Promedica and material new client relationships organically secured during the year by Cello Health. The Group made a material investment in a new start-up venture Cello Health BioConsulting in the Boston area to access the growing USA biotech marketplace. In addition, the office in Chicago continues to expand rapidly. Cello Health now has offices in all the locations required to support core clients’ needs.
The progress achieved by Cello Health BioConsulting in growing our new Boston office has been inhibited by employment restrictions on key employees from their former employer. However, in March 2016, agreement was reached between Cello Health BioConsulting Inc, certain employees of Cello Health BioConsulting Inc and their previous employer, allowing the partial release of these employees from their post-employment
Strategy on track,collaboration drives growth
7 Source Pharmaceutical Executive June 2015.

9
Cello A
nnual Report 2015
CH
AIR
MA
N’S ST
AT
EM
EN
T
restrictions. When this agreement is formally completed, a payment of £0.9m will be made, with additional payments contingent on the financial performance of the Cello Health BioConsulting business over the next 12 months. The Group believe this represents a sensible investment in an important growth area for Cello Health.
The Cello Health product range has continued to expand and develop. ‘IQ’, Cello Health’s quantitative research offering, has grown significantly. eVillage®, Cello Health’s digital research community platform is rapidly becoming a material component of the client proposition. The business is expected to launch Pulsar Health as a social media based solution for clients requiring large datasets in 2016.
Areas of Cello Health’s consumer business experienced a slower year due to deferral of key projects, negatively impacting the overall margin of Cello Health. Excluding this effect, Cello Health’s operating margin was sustained at 20.9% for 2015 (2014: 21.8%) and like-for-like gross profit growth was 7.6%. Appropriate actions have already been taken to address exposure to slower areas of the consumer market.
Notable project wins in 2015 included the following: AbbVie, Abellio, Age UK, Ahlstrom, Algeos, Barchester Healthcare, Bellis-Jones Hill, Boehringer Ingelheim, Boston Scientific, British Lung Foundation, Cancer Research UK, Care Quality Commission, Clark Research, Cooper Vision, Gilead Sciences, Johnson & Johnson, Janssen, Lundbeck, Merz Pharma, NHS Leadership Academy, Reckitt Benckiser, Sanofi, Sennheiser, Sustrans, Symbiota, Tovera and Vertex Pharmaceuticals.
2016 will see further development of Cello Health’s client offer. The business starts the year with a robust order book and is confident about the future growth prospects of the business as it pursues its focused investment strategy.
Cello Signal (www.cellosignal.com)
2015 2014 £’000 £’000
Gross profit 41,555 39,469
Headline operating profit 3,952 3,433
Headline operating margin 9.5% 8.7%
Cello Signal had a good year, with a strong second half. Cello Signal is traditionally a second half weighted business due to its presence in the charity sector whose activity is more weighted towards Christmas. The business delivered headline operating profit of £4.0m (2014: £3.4m) on gross profit of £41.6m (2014: £39.5m) and like-for-like gross profit growth of 3.7%. Operating margins improved from 8.7% to 9.5%.
Cello Signal is following the same path as Cello Health of integrating the core proposition behind a single client-facing brand. This has already begun to bear fruit in the form of material new client wins in late 2015 in the financial services and utility sectors under the Cello Signal banner, underpinned by a digitally-led proposition to clients. Growth in these sectors can be attributed to Cello Signal’s increasing expertise in complex databases and regulated client markets. These sectors have a common requirement to communicate regularly to their large customer bases.
The connectivity of Cello Signal will take a major step forward in 2016 as the majority of the Cello Signal businesses will become connected under a single P&L and single senior bonus structure. This will enable the business to compete more effectively against its large technology-led competitors, as well as other agency groups.
A particularly exciting element of Cello Signal’s 2015 performance was the strengthening of licence sales and renewals for Pulsar, Cello Signal’s social media monitoring and analytics
software platform. The business grew its software licence client base to 191 at the end of 2015 (2014: 88). While there was a headline operating loss of £0.2m, the business is not expected to make losses going forwards. A growing strategic relationship with Facebook may have a significant positive impact on the competitive advantage enjoyed by Pulsar.
In addition, a key strategic imperative for Cello Signal will be to partner with Cello Health to build on its expertise in the public health area, where Cello Signal has produced campaigns relating to cancer screening, alcohol abuse and healthy eating. This will include the application of Cello Signal’s expertise in digital media, which can be readily applied to pharmaceutical solutions for clients. Cello Signal also intends to adapt the Pulsar Platform as a dedicated offer to the healthcare client community.
Major clients wins in 2015 included: AC Hotels (Marriott), Adidas, Autograph Hotels, Bowers & Wilkins, Coty, Courtyard Hotels, De Beers, Drinkaware, EDI Group, Famous Grouse Global BTL, Havas Media, Hershey’s (China), Holiday Inn Express, Home Retail Group, HP, IHG Hotels Group, Jim Beam, Kinross House, Leprino Foods, Marriott, Maxxium Midori, Mazda, Microsoft, Musgrave Group, Nairn's, Prostate Cancer UK, RBS, Renaissance Hotels, Thames Water, The London Clinic, UK2, Unilever and Visit Scotland.
CURRENT TRADING AND OUTLOOK
The Group began 2016 with a robust level of secured forward bookings. It has also seen encouraging levels of new business wins so far this year. At this relatively early stage of the year, the Board is confident that expectations for 2016 will be met.
Allan RichNon-Executive Chairman16 March 2016
10
Cel
lo A
nnua
l Rep
ort 2
015
CE
LL
O H
EA
LTH

11
Cello A
nnual Report 2015
CE
LL
O H
EA
LTH
Healthcare – our future2015 saw significant progress being made in executing our long-term strategy which consists of four key building blocks:
• Branding – The unification of our business under a core brand to allow us to add more service value to our client relationships and to enable our people to collaborate more readily.
• Global Expansion – To focus on expanding our global footprint, specifically our presence within the US market.
• Innovation – To continue to innovate, develop services and products that our clients need, capitalising wherever possible on the range of technical and digital advances being made.
• Collaboration – To leverage the different assets across Cello Health in terms of product development and meeting clients’ needs.
In 2015 significant progress has been made across all these four areas.
12
Cel
lo A
nnua
l Rep
ort 2
015
CE
LL
O H
EA
LTH
BRANDING
Back in 2013 the core Health Division consisted of eight different businesses. Client feedback at the time told us very clearly that this did not make sense, especially when the client needed a truly blended set of skills and expertise in the agency team. Cello’s unification of its health businesses under the Cello Health brand was more than skin deep.
Unification involved change in organisation structure, creation of a Board and leadership teams and development of new ways of working to manage the range of services that we provide our clients. This change has taken time to implement. However, the migration to the Cello Health brand represented by our three core capabilities (Consulting, Research and Communications) has now been successfully established.
Customers now have the best of both worlds: best in class capabilities and blended teams that offer powerful integrated solutions, delivered through an organisation that has the bandwidth of a large agency, with the flexibility, tailoring and care of a boutique.
GLOBAL EXPANSION
With the opening up of a new office in Boston and the investment made in a new start-up venture ‘Cello Health BioConsulting’, we have doubled our consulting presence on the East Coast of the USA. Given the importance of the Orphan, Rare and Specialist Disease market, and that over 40% of our consulting revenues are generated from the USA, this will continue to be a focus area for us.
Importantly, with the opening of the Boston office, combined with our existing offices in Chicago, San Francisco, Manhattan and Yardley (PA), we now have offices in all of the important locations in the USA to service our clients’ needs.
The research firm Promedica, acquired at the end of 2014, has performed to expectations in its first full year of contribution within Cello Health.
INNOVATION
Over the last few years we have invested in a range of innovative digital solutions, for example eVillage®, our digital research community platform, IQ our Intelligent Quant offering and the development of mobile apps for research purposes. We are seeing continued success and growth from these initiatives.
Our consulting practice continues to consolidate its IP in a number of areas. Specifically CompetitoRoom™, consisting of competitive management programs and simulations and RedThread Planning™, our cloud-based Strategic Planning software, both have shown growth during 2015. In addition we have further developed FUTURESCOPE™, a key service to help clients reduce commercial uncertainty in early product development.
COLLABORATION
In excess of £5.0m revenue was generated by collaborative projects in 2015 across Cello Health. Collaborative projects were commissioned by both established and completely new clients, confirming that the blended approach we now provide has opened up new opportunities.
SUMMARY
In summary, in 2015 Cello Health made significant progress in executing our long-term strategy. Our client base remains strong, we continue to attract the best people and are successful in developing and retaining talent. Operating performance for our core health operations was in line with expectations.
Our Consumer Health business, which provides services to the wider health and wellbeing market amongst other industry sectors, had a challenging year due to client restructuring and slowness in the commissioning of projects across its non-health client portfolio. Despite this, the business has successfully retained the majority of its well-established blue-chip clients and attracted a range of new clients that should put it back on course for 2016. Importantly, Cello Health in 2015 has established a solid foundation on which we can build long-term growth.
In 2015 significant progress has been made across all these four areas.

13
Cello A
nnual Report 2015
CE
LL
O H
EA
LTH
THE FUTURE
In 2014, Americans alone spent $3 trillion on healthcare and other related products and services.1 Evaluate Pharma is predicting that the worldwide pharmaceutical market in itself will be worth $1 trillion2 in sales by 2020. Continuing major scientific and technological advances, coupled with sociodemographic changes, increasing demand for medicines and the increase in novel new drugs being approved, suggest that this forecast is likely to be exceeded. The clients we serve represent a substantial industry sector and have a healthy future.
The healthcare market is also changing rapidly. A recent PwC paper3 highlighted that 24 of 2013’s Fortune 500 companies are new entrants to healthcare. What is remarkable is their makeup. Eight are technology and telecommunications companies. Seven are retailers. Two are automakers, including Ford Motor Co, which is developing services for chronic condition management while driving.
The market for Cello Health’s services continues to expand at a rapid rate, driven not only by our traditional healthcare client base but also by the vast array of new entrants into the healthcare space. The role of gene therapy, genomics, smart diagnostics, biomarkers, the use of wearable devices, mobile health apps and digital channels and social platforms are changing the market we and our clients operate in.
Our clients still face many challenges. Last year we commented that costs of bringing products to market run into the billions, with many new drugs failing to meet pre-launch expectations. Our clients need to improve on this success rate. They need to progress the right molecules through the R&D process, ensure trials are configured appropriately, and produce the right evidence to support the positioning of the brand with the right commercial strategy to optimise commercial success. Our clients need to get it right first time, which is why they need and see the value in the services we provide.
With their iPhones, iPads, access to apps, websites, and all the various forms of social media, consumers are ever more active and self-directive in how they engage with health issues. This has a major impact on how our clients need to shape how they communicate the value of their brands. This is a key strength of Cello Signal. Cello Signal works across household names in financial services, energy, the public sector and charities helping clients understand how consumers interact with the digital environment. Our healthcare clients share this same need to understand their customers in an increasingly digital world.
The combination of Cello Health’s technical marketing advisory skills, combined with Cello Signal’s digital expertise, we believe sets us apart from our peer set. In 2016, it is our intention to capitalise on this unique combination of skills for the benefit of our healthcare clients and the continued success of Cello Health.
A recent PwC paper highlighted that
24 of 2013’s Fortune 500 companies
are new entrants to healthcare
,,
1 CMS.gov2 World Preview 2015, Outlook to 20203 PwC: Healthcare’s new entrants: Who will be the industry’s Amazon.com
14
Cel
lo A
nnua
l Rep
ort 2
015
CE
LL
O H
EA
LTH
Cello HealthKey highlights of 2015
CELLO HEALTH INSIGHT
• Strong overall growth in GP and OP vs 2014 with addition of 20 new clients.
• Significant broadening of the USA client base and types of work commissioned.
• Growth in early stage commercial opportunity assessment, doubling the number of engagements in 2015 and setting the stage for continued growth in 2016.
• The IQ quantitative practice delivered 22% year-on-year increase in revenue with investment throughout 2015 allowing the team to expand, bring on board senior analytics expertise and roll-out advanced new software.
• IQ now represents 27% of Cello Health Insight’s revenue, with 25 clients commissioning IQ during 2015.
• Digital offering continued to strengthen, with 11 mobile projects (utilising proprietary app ‘inthemo’) and 33 eVillage® online community platforms commissioned.
CELLO HEALTH CONSULTING
• Continued success across a range of pharmaceutical and biotechnology companies with increasing presence within small to mid-cap biotech companies, building on their developing expertise in biologicals, rare diseases and specialist medicine.
• Remain preferred strategic partner for one of the world’s largest pharmaceutical brands, working with their global and USA commercial teams as they manage new competitive threats as well as developing new indications and pipeline.
• USA continues to be the major growth initiative for Consulting with over 40% of the revenues generated here. 2015 saw Consulting start-up Cello Health BioConsulting, with a doubling of its presence on the East Coast, opening up a new office in Boston.
• One in five consulting projects now delivered collaboratively with Cello Health Insight and Communications, with clients benefiting from their fusion of expertise.
• Continued to consolidate IP, with new extensions to services such as FUTURESCOPE™, CompetitoRoom™ and RedThread Planning™ sold across significantly more clients.
15
Cello A
nnual Report 2015
CE
LL
O H
EA
LTH
CELLO HEALTH COMMUNICATIONS
• A growth year, with 135 communication specialists providing a range of medical and marketing communications transatlantically.
• An increase in collaborative accounts, with 13 new clients added to the Communications roster as a result of partnering with Cello Health Consulting and Insight colleagues.
• Continued focus on leveraging the technical scientific and health outcomes expertise to further deepen and differentiate service offering globally.
• New projects have been won and successfully delivered across territories including Asia, Africa, Eastern Europe and Australia.
• Cello Health Communications projects included innovative digital advisory boards enabling medical experts to discuss, learn and work collaboratively via an online platform from geographically disparate sites. Providing clients with increasing digital solutions offers a key area of growth for 2016.
CELLO HEALTH CONSUMER
Kudos
• A very strong year with substantial growth in revenues.
• Continued growth in B2B research amongst hard-to-reach and C-Suite audiences.
• Continued focus on corporate reputation and thought leadership research for large global consultancies.
• High level of repeat and referred third-party business. Kudos now undertakes specialist B2B data collection for 25% of the UK top 40 market research agencies.
• Further development of qualitative offering this year, with Kudos being awarded Best Qualitative Research 2015 by data-collection industry benchmark quality standards IQCS (Interviewer Quality Control Scheme).
Breaking Blue
• Significant repeat business within core client base despite some budget delays.
• Re-branded and consolidated four sub-brands under one leading brand Breaking Blue – engendering greater market presence and stronger positioning as well as more flexible utilisation of internal resources.
• Tracking business goes from strength to strength, spanning a full range of client sectors.
• Significant new clients in 2015 included: Care Quality Commission, Cancer Research UK, Money Advice Service and NHS Leadership Academy.
The Value Engineers
• A slower year due to a number of key clients undergoing re-structure and budget deferrals.
• The USA office continued to experience high double digit growth, building a strong working relationship with a leading medical device supply company.
• Significant new business wins as a result of concerted business development drive in the UK and USA.
• Growth of B2B brand practice, attracting the likes of Ark Data Centres, Land Securities and Signium.
16
Cel
lo A
nnua
l Rep
ort 2
015
CE
LL
O H
EA
LTH
CELLO HEALTH CONSULTING
Commercialisation of a phase II biotech asset
CLIENTUS client, a global biotech joint venture on a new personalised oncology asset.
CLIENT CHALLENGETo work with two biotech organisations to understand what it will take to bring their Phase II asset to market given the shift in market and competitive dynamics.
OUR APPROACHAt its core this project was about developing the right Target Product Profile (TPP) for a new asset targeted at a rare oncology population. We quickly recognised that these two clients had a lot less market, competitive and customer insight than we had anticipated and there was a lack of alignment around objectives and ways of working across the joint venture.
We combined two of our proprietary approaches, FUTURESCOPE™ and CompetitoRoom™ in order to achieve the objectives. The first step was to map out the future environment. We enhanced our desk research
using our scientific and research teams from our Communications and Insight capabilities before developing detailed, engaging and tangible potential future scenarios.
Through this process we anticipated the impact of competition. There were meaningful threats posed by one competitor in particular that required focus and planned response. We used another workshop-led process to help teams get under the skin of their competitor to understand what it would take to bring a meaningful innovation to patients and yield business return.
THE RESULTUltimately, our fusion of expertise and proprietary processes forged a stronger partnership between this joint venture, identified areas where they could streamline ways of working, develop new capabilities and also refine clinical trial outcomes to improve market access. Cello Health is now set to work further with this biotech joint venture as the companies build commercial capabilities and move from clinical to commercial.
CELLO HEALTH COMMUNICATIONS
Empowering pharmacies to make a difference to consumer’s health through weight loss/management
CLIENTOmega Pharma (Product: XLS-Medical a weight loss aid, OTC).
CLIENT CHALLENGEFor XLS medical to become the preferred weight management service within pharmacy. Enabling and empowering pharmacies to make a difference to consumer’s health via weight loss/management. The client wanted to promote its brand whilst also achieving its overarching objective of becoming leaders in pharmacy education and support.
OUR APPROACHThe project aimed to design a three-pronged approach to weight loss, including education on a healthy lifestyle and ongoing support delivered via an in-pharmacy weight loss consultation service, positioning the new weight loss
product as a helping hand.
Our goal was to provide pharmacists with the knowledge and tools to launch the in-pharmacy weight loss consultation service in partnership with a well-known retail pharmacy chain.
We did so by creating a suite of resources that gave them the motivation, the knowledge and the tools to deliver against objectives as well as pilot the materials and programme prior to national roll-out.
THE RESULTPilot programme adopted by 18 pharmacies with materials receiving excellent feedback – 80% felt confident at being able to launch an in-pharmacy weight loss consultation service. The client has plans to extend the service to more pharmacies in 2016.
Our work
17
Cello A
nnual Report 2015
CE
LL
O H
EA
LTH
CELLO HEALTH INSIGHT
Understanding the ways in which doctors use digital channels to exchange information and communicate with peers, pharmaceutical sales representatives and their patients
CLIENTSelf-funded study to assess digital engagement among healthcare professionals across the globe.
CLIENT CHALLENGEAdvances in digital technology are delivering breakthroughs in diagnosis through initiatives such as ‘Watson’ from IBM, which claims to combine advanced image analytics with cognitive capabilities to ‘see’ and interpret medical images more like a human would. Advances in smart technology are also providing new ways to manage patients’ treatment through myriad health apps and wearable technologies that promise to include such innovations as Google’s ‘Smart Contact Lens’ that will measure blood glucose levels for people with diabetes. We are all now familiar with an array of digital devices including smartphones, smart watches and tablets that are in turn opening up new digital channels of communication though messenger apps, software applications like Skype and various social media.
Clients in the pharmaceutical industry are increasingly interested in understanding the potential impact that these developments might have on consumers as well as the opportunities they present for marketing pharmaceutical assets.
APPROACHCello Health Insight undertook a self-funded online research project involving over 1,000 doctors across eight global markets to explore in greater depth the ways in which doctors are using digital channels to exchange information and communicate with peers, pharmaceutical sales representatives and their patients. This study went far further than other studies conducted elsewhere as it
looked not just at what was currently happening but the preferences driving this behaviour and expectations for the future.
THE RESULTThe study found that in spite of digital advances, face-to-face information from peers, Key Opinion Leaders (KOLs) and rep visits retain the biggest influence on doctors’ prescribing behaviour. Pharmaceutical companies should not therefore rush to phase out their sales force. Rather they need to look at how digital technologies can be used in tandem to optimise message delivery.
Almost half of physicians regularly share information online across specialist websites such as patient.co.uk and webMD and they are also utilising general consumer social media channels like Facebook and Twitter to share with their peers in a professional capacity. Markets such as Brazil and China are ahead of the curve in their usage of platforms such as WhatsApp to interact with patients and it seems likely this trend will become apparent in other markets. This will provide patients with more immediate interaction with their physicians but will also raise expectations regarding immediacy of response, bringing added pressure to healthcare providers.
Cello Health Insight found that these doctors are sharing precisely the type of information that other doctors are interested in seeing, which makes them highly influential as online KOLs. They should also be a key focus for pharmaceutical marketers, who must now give consideration as to whether the nature of the messages communicated should be the same for online KOLs as it is for offline KOLs.
18
Cel
lo A
nnua
l Rep
ort 2
015
CE
LL
O H
EA
LTH
CELLO HEALTH INSIGHT
Uncovering and harnessing drivers in ADHD
CLIENTA European based pharmaceutical company.
CLIENT CHALLENGEDespite clinical advantages over the competition, our client’s product had not achieved the expected sales 18 months post-launch. The key objective was to understand psychiatrists’ deeper beliefs and emotions when treating ADHD and the key factors truly driving brand choice.
APPROACHWe utilised our unique psychology-based Kaleidoscope methodology to facilitate our access to participants’ out-of-conscious beliefs and emotional drivers and go beyond rational and clinical thinking. This was moderated by our expert Master Practitioners during a series of interactive groups utilising unusual but highly informative techniques,
the results of which were then interpreted using established psychological models.
THE RESULTThe research clearly showed that a one-size-fits-all approach across different markets was not going to work for the positioning and messaging around the brand. A complex dynamic was shown to be at play between physicians and parents, with physicians locked into a pattern of behaviour driven by previous interactions. We provided the client with clear recommendations on how to support the physicians in these difficult conversations and how to respond with confidence to the challenges the parent may raise. Our insights enabled the client to help develop a revised communication strategy that would more effectively pull physicians towards the brand.
THE VALUE ENGINEERS
Sharpening global brand proposition in the medical devices market
CLIENTGlobal medical device manufacturer.
CLIENT CHALLENGEDuring 2015 we were retained by one of the world’s biggest medical device manufacturers to help sharpen the definition and clarity of its corporate brand proposition. Historically, the company had been a salesforce powerhouse. Deep personal relationships between reps and physicians have served as the bedrock of the company’s reputation and success. However, changes in the healthcare sector are seeing more purchase decisions in the hands of groups like hospital administrators and even patients, who might have limited, or no exposure to sales reps. Consequently, the company needed to deploy a brand with depth and dimension, that connects with a larger and more diverse audience, and that shapes multi-channel communications efforts moving forward. In short, its brand needed to be as strong as its sales team.
APPROACHThe strongest brands play meaningful roles in the lives of their customers. Our client needed to identify the role it sought to play beyond simply supplying great medical devices. Through research we uncovered an insight into what truly motivated healthcare professionals to become physicians, nurses, hospital administrators or medical engineers in the first place, and through the brand development process, positioned our client’s brand in the role of helping them feel they are living up to that higher professional purpose.
RESULTDiscovering a powerful, unifying insight was just one element in crafting a compelling role and story for its brand. We also created a purpose-built brand model, along with a brand architecture designed to provide flexibility for business units to respond to their unique market demands, while at the same time continually building the more enduring aspects of the brand.
Our work

19
Cello A
nnual Report 2015
CE
LL
O H
EA
LTH
BREAKING BLUE
Establishing the hard facts to set the social care agenda for people living with cancer
CLIENTMacmillan Cancer Support.
THE CLIENT CHALLENGEMacmillan was concerned that many people affected by cancer receive inadequate care, relying on informal care networks – family and friends who often lack the time, energy or skills to give them appropriate support. Macmillan needs a robust understanding of the needs of people living with cancer to inform the Macmillan research team, and its policy, campaigning and service delivery workstreams.
OUR APPROACHIt was crucial that we provided insights that were not only robust, but that communicated the ‘human’ dimension, giving people the opportunity to tell their story. We began by conducting a programme of deliberative cognitive testing, working iteratively through proposed terminology and question wordings with different audiences affected by cancer. We structured the quantitative questionnaire in a way that would traditionally be considered unorthodox starting with open-ended questions to allow people to share those issues that were most top-of-mind, before going on to ask questions that would later allow us to
model data quantitatively.
We followed the quantitative phase with in-home depth interviews with representatives of each of the segments combined with an online diary using our platform e-luminate™, where people logged their care needs over a week and also uploaded photos and video clips talking about their experiences. The depth interviews were critical in identifying the inter-relationship between medical and social needs and the need to treat these in tandem.
THE RESULTThe research showed for the first time a full picture of the social care needs of people with cancer. For the first time, Macmillan can quote the proportion of people with unmet needs, and can quantify the impact. Macmillan is now beginning a programme of strategic partnerships with local authorities that will deliver crucial services to those with cancer. The findings were published in March 2015, in a ground-breaking report, Hidden at Home, to extensive media comment. The research won a prize at the National Cancer Intelligence Network (NCIN) 2015 Cancer Outcomes Conference and was a finalist for the MRS Award for Public Policy/Social Research 2015.
20
Cel
lo A
nnua
l Rep
ort 2
015
CE
LL
O S
IGN
AL

21
Cello A
nnual Report 2015
CE
LL
O SIG
NA
L
Making brands more humanSignal is poised to become a properly integrated business behind a united brand:
We use technology to help clients unlock the value of their brands by achieving more customised and iterative engagement with customers. The combination of technical and communication skills gives Signal a unique advantage globally as we compete to service the world’s leading brands.
22
Cel
lo A
nnua
l Rep
ort 2
015
CE
LL
O S
IGN
AL
The most important development as we enter 2016 is the migration of our core agency businesses into a unified structure behind the Signal brand as the client-facing proposition. This will also involve a migration to a single P&L for Signal. We have seen the success achieved by Cello Health over the past two years as a result of the same integration process and we are confident Signal will enjoy similar success.
A further key ambition for 2016 will be to partner with Cello Health in developing our existing health-orientated activity into a larger and more developed aspect of our offering. We are already producing campaigns in public health in areas such as cancer screening, alcohol abuse and healthy eating as well as working with a variety of health-related charities. This experience will form the basis of creating stronger links with Cello Health and as a start point for marketing to the Consumer Health and Wellbeing sector.
Given our experience in complex databases and regulated markets it was particularly gratifying to see our utility client base grow across the UK in 2015. This sector, like the Financial Services industry, have a requirement to regularly communicate to their extensive customer base and are acutely aware of their need to be more customer centric. We have now established significant remits and retained relationships with three of the UK’s largest energy providers, across each of our UK offices. Utilities now have the potential to sit alongside Charities and Financial Services as one of our largest and strongest performing sectors.
A significant investment task remains in the USA where we have established offices in New York, San Francisco and Los Angeles. We have an enviable client base and recruited a strong senior team. However, getting to the point of ‘critical mass’ for our US operations has held back our profit delivery. With the team and office network in place, 2016 should see our US profit performance improve and help improve Signal’s overall margin.
Our investment in building our social media software offering, Pulsar, has created a cutting edge lead product for Signal. Pulsar’s client base grew to over 200 by year end. Our close relationship with Facebook opens up exciting opportunities for 2016 and beyond.
INSIGHT AND INNOVATION
Collectively, our Insight and Innovation businesses increased their profit delivery by more than 20%. This profit growth was at its strongest in our UK operations, a particularly exciting element of which was the strengthening performance of the licence sales and renewals for the Pulsar Social Media Monitoring platform. In the closing stages of the year Pulsar started delivering small monthly profits and is set to be a net contributor to our profit performance in 2016.
Another highlight in terms of year-on-year performance was Human Innovation, which enjoyed a full year of activity from the US Hotel and Technology clients it secured in 2014. Its work also resulted in the passing through of a significant web build project for a US Hotel client that will result in further work in 2016.
MARKETING TECHNOLOGY AND DIGITAL BUILD
Our delivery of large digital-build projects that give clients far greater scope to use marketing content in CRM, Web and Mobile has become a key foundation stone of our proposition. The dominating objective of these projects is to deliver a customer centric approach as Banks, Charities and Utilities have clearly learnt the pitfalls of over investing in crude, volume sales techniques. Increasingly, we see our future in helping client brands establish a more empathetic, personalised and intelligent relationship with their audiences.

23
Cello A
nnual Report 2015
CE
LL
O SIG
NA
L
CAMPAIGNS AND CONTENT
Some of the biggest gains in client activity took place in our creative agencies where Edinburgh (Leith) and Cheltenham (Tangible) enjoyed a ‘purple patch’ in the second half of the year, winning new contracts and extended remits from major Banks and Utilities. Leith was also appointed on a global basis to deliver integrated communications for the Edrington Group’s Famous Grouse brand.
Based on the increased client activity out of London, Stripe has opened a London office and taken space with the 2CV offices in Flitcroft Street.
Our skills in Experiential Marketing were recognised by a gold at the MCI European awards for sponsorship for the Bru Store, which was the centrepiece of sponsor activity during the 2014 Commonwealth Games.
PRODUCT DEVELOPMENT
Pulsar Platform is a leading element in our initiative to drive strong health-related revenues through Signal. Pulsar Health will launch in H1 of 2016 as a dedicated offer to pharmaceutical clients who want more insight into how certain conditions are being discussed in social channels.
The learning from Pulsar in terms of shaping and selling a distinct product proposition is also informing the packaging and sales of our CRM automation, UX and Social Media propositions. Centralising our marketing and sales teams is a significant step towards being able to promote our product range more coherently and aggressively in 2016.
THE FUTURE
We have made a major effort over the last three years to drive greater connectivity between our agencies and across our geographies. This will take a major step forward in 2016 when we connect five of our agencies in a single P&L that allows us to access resource and digital expertise more freely, encouraging a single-minded investment strategy and focusing the senior executive team on the overall global outcome.
A significant element of that investment strategy will be putting in place a more clearly demarcated health strategy for Signal with the objective of seeing Health and Wellbeing take up equal prominence to our established sector expertise in Financial Services, Utilities, Charities and Leisure and Travel.
Our skills in
Experiential Marketingwere recognised by a gold at the
MCI European awards for sponsorship for the
Bru Store
,,
24
Cel
lo A
nnua
l Rep
ort 2
015
CE
LL
O S
IGN
AL
Cello SignalKey highlights of 2015
FACE AND PULSAR
• A healthy profit was maintained in the core Face business and Pulsar passed the break-even barrier in its second full year of trading.
• Pulsar CORE was launched, an analytics tool for measuring the impact of brands owned social media channels, with 50+ clients using the product within 6 months.
• The Department of Health selected Face to help monitor social media feedback from the public around healthcare policies and tracking conversations surrounding clinical diseases.
• Pulsar launched Facebook Topic Data Analytics to enable its hundreds of customers to understand what people share and engage in on the world’s largest social network.
BRIGHTSOURCE
• 14th consecutive year of gross profit growth fuelled by strong organic growth across 18 of 20 largest clients.
• 2014 investment in senior management and digital/tech capability, and focus on larger clients, delivered strong results with operating margin increasing to 14.2%.
• Growth driven by launch of multi-channel communications platforms, TriggerHub and Helios, aimed at brands with complex CRM priorities.
• Helios platform used to deliver the UK’s single largest campaign, to 28 million customers, for one of the UK’s largest regulated brands.
• Instinctiv division won significant new behavioural-planning workstream for British Heart Foundation.
LEITH AGENCY
• A strong year of growth, with three major client wins this year: RBS, ScottishPower and The Famous Grouse global integrated account.
• Excellent year for industry awards. Work for First Great Western (now GWR) picked up CIM Marketing Excellence Marketing Campaign of the Year, Gold at the UK Marketing Society for Effective Marketing, Gold at the Rail Business Awards and Silver at the Travel Marketing Awards.
• IRN-BRU’s sponsorship of the Commonwealth Games lauded across Europe, with major awards including: IMC European Partnerships Gold, IPM Grand Prix, European Sponsorship Awards Excellence Gold, UK Marketing Society Gold, UK Sports Industry Awards Gold, and UK Sponsorship Awards Sponsorship of the Year.
• Another strong year for partnerships/experiential arm, Leith Links, which achieved strong growth following success at the Commonwealth Games.
2CV
• Continued strong growth across the global network, with significant new contract wins.
• Strong performance in the West Coast USA offices, underpinned by dominance in the electronic games sector.
• Strong performance in Asia, with growth in the Singapore office serving multi-national clients.
• Successful retention of the core TfL account through competitive retender.

25
Cello A
nnual Report 2015
CE
LL
O SIG
NA
L
BLONDE
• A strong year of new business, including a number of enterprise scale projects which will define the future shape of Blonde.
• Large scale enterprise builds for organisations including Williams & Glyn Bank, Nando’s, BASF and Scottish National Galleries.
• Closer integration with Tangible, Leith and Brightsource as the core of the new Signal Agency proposition.
STRIPE COMMUNICATIONS
• Continued evolution as a digitally focused PR and Communications Agency – doubling the number of digital accounts through the recruitment of a specialist digital team and upskilling of the agency.
• Won 15 industry awards this year including: Gold Awards at the Social Buzz Awards, CIPR Pride Awards, Marketing Society Excellence Awards including Agency Employer Brand of the Year and the PRCA Dare Awards.
• New material clients secured in 2015 include: BESA, MacSween, Magners, Napiers, Midori, Brodies, Turcan Connell, Scottish Wildlife Trust, Zero Waste Scotland and Robertson Trust.
HUMAN INNOVATION
• Expanded footprint within both IHG and Marriott Group with new brand wins including: Courtyard Hotels, Autograph Hotels, Intercontinental Hotels, Hotel Indigo, Holiday Inn Express, AC Hotels and Moxy Hotels.
• Won a very high profile engagement with Marriott Group to design their new corporate brand architecture across all brands.
• Successfully launched new IP in ‘competitive war gaming and scenario planning’ and successfully delivered a corporate level engagement with HPs senior management team in Europe.
TANGIBLE
• DMA Gold for The Royal British Legion ‘Everyman Remembered Campaign’.
• Four major pitch wins including: npower, Vanguard, EDF, PCUK and retention of The Royal British Legion.
• Two Nudge Awards for application of Behavioural Economics for Lloyds Banking Group.
• Extended remit from Sainsbury’s Bank, following competitive tender.
OPTICOMM
• Won two new clients in two key verticals; not for profit Tearfund and learning Pearson – both with sizeable campaigns running in 2016.
• Won Luton Airport media account, bolstering travel vertical.
• Developed role with NFUM to go beyond econometric modelling and into media planning and management.
TMI
• Commissioned by NHS to help equip its organisations with skills, knowledge and behaviours to revolutionise patient and customer service experience.
• Developed proposition for Travelodge business to improve customer experience. This will now be rolled out across a further 100 hotels.
• Designed and delivered behavioural training for Thames Water throughout 2015 to support its move to end-to-end customer management.
• Designed and delivered a series of workshops for c2c Rail as part of a 3-year behavioural change programme. c2c was awarded Passenger Operator of the Year at this year’s National Rail Awards.
26
Cel
lo A
nnua
l Rep
ort 2
015
CE
LL
O S
IGN
AL
Our work
FACE AND PULSAR
Understanding female car purchasing behaviour …. using Facebook Topic Data
Aggregated and anonymised Facebook Topic Data allowed us to glean insights from 1.44bn people: an unprecedented scale. We used a Facebook dataset that covered the discussion around BMW, Ford and Honda in the US and UK across 2015. This coincided with the launch of Pulsar’s Audience dashboard, which meant we were able to identify demographic trends within this topic.
One of most interesting insights from our report was that a higher proportion of females discussed the style of cars than males (39% of discussion from women posted or shared content about the attribute, compared to just 28% of men). We also discovered that conversation around style becomes increasingly female-centric through lifestages, with the hypothesis being that as children leave the family home, the choice of cars is less based on functionality and more on aesthetics – particularly as disposable income rises.
2CV
Helping make every journey matter at Transport for London
Everyday more than 30 million journeys are made across the Transport for London network. Over the last few years, TfL has undergone a strategic and cultural change in order to become more focused on the customer and empower staff to embrace the idea that every journey matters. This represents a significant cultural change, from an organisation that historically focused on getting people from A to B in the quickest time possible, to thinking about every aspect of the customer experience.
2CV designed and delivered a pivotal piece of deliberative qualitative research that discovered five levers of the TfL reputation: What It Stands For, Experience, Value for Money, Progress/Innovation and Trust. We worked closely with the TfL Customer Research and Insights team to ensure research built on what was already known (for example ensuring value for money) as well as add fresh customer viewpoints to create a model that worked for both TfL and customers. This model now sits at the heart of the business and continues to evolve with every piece of work we do for TfL.
With the model in place, TfL has been able to focus its efforts on the things that matter to customers: communicating openly and honestly and delivering changes that improve experiences. TfL’s reputation is now at an all-time high.

27
Cello A
nnual Report 2015
CE
LL
O SIG
NA
L
BRIGHTSOURCE
Creating a more personal experience for British Heart Foundation supporters
Many of British Heart Foundation’s new supporters were cancelling their donations within the first year. So BHF set us the challenge of increasing engagement in the crucial early months.
Combining supporter-led planning, with our TriggerHub communications platform, allowed us to transform the experience for BHF’s new supporters – leaving behind the tired, one-size-fits–all direct mail approach that charities have typically relied upon.
We designed the journey around supporter behaviours, using triggers such as direct debit payments as opportunities to be more human, to say ‘thank you’ and learn about their motivations. From there, every subsequent communication builds on the last, providing increasingly tailored content to reflect their interests and improve relevancy.
Additionally, the new welcome message arrives in real-time, rather than taking a month. Content is individualised around location, demographics and direct debit value and points supporters to personalised online surveys to help us gain insight into their interests and preferences.
Using TriggerHub allows dynamic email, personalised landing pages and offline messaging to work together seamlessly, creating a rich, personalised experience where the supporter feels in control. This, in turn, allows British Heart Foundation to enjoy a steeper, more profitable growth trajectory.
LEITH
An integrated approach to promoting Drinkaware
The Leith Agency has been proud to work with Drinkaware on a variety of strategic and creative briefs over the last 12 months. Most recently, Leith successfully delivered fully revised brand guidelines that will act as the foundation reference for all future communications. Included in these guidelines were important tonal references that were developed from the wealth of in-depth knowledge that Leith has on both the Drinkaware brand, as well as the full spectrum of different consumer and health profession audiences.
Each comms brief contains a strong health message, but the key challenge is nailing the tone of the communications to come across in an empathetic, understanding and ultimately human way. Often the lead creative idea will then carry through into a wide variety of compelling digital formats. On the digital front, Leith also teamed up with Blonde to do a full UX review and redesign of the website, the UK’s number one source of alcohol facts and advice online. A fine example of Cello agencies working together to achieve a greater good.
STRIPE COMMUNICATIONS
Social Media solutions for Maxxium
Maxxium tasked Stripe to reinvigorate the Midori UK audience following a period of silence from the brand and in the run up to new branding activity taking place in 2016. The solution was a mix of digital and social strategy development, community management, CRM and influencer outreach as well as traditional consumer and trade PR and communications.
From waking the sleeping giants of its Facebook page, reigniting the Instagram activity and kicking off a new Twitter account, we have used a combination of fan and influencer activity, supported by a strategic paid social approach, to get people re-engaging and discussing the brand.
Recently reporting on our 8th month of activity, the results have been extremely successful with fans increasing steadily across all channels. Specifically we’ve seen Facebook engagements surpassing their 12-month KPI – increasing by 13,000 over just four months.
28
Cel
lo A
nnua
l Rep
ort 2
015
CE
LL
O P
EO
PL
E

29
Cello A
nnual Report 2015
CE
LL
O P
EO
PL
E
Strong and effective talent management is critical to the success of any organisation. Cello has always recognised that the strength and quality of our people is one of our key differentiators from our competitors. To maintain this competitive advantage, we continue to invest in our people, to build ways to not only attract the best people to the Cello Group, but also to retain the best people within our business.
Over the years we have grown a number of initiatives that focus on the development of employees at different stages of their career, and we will continue to do so moving forward.
We continue to invest in Cello Academy, our flagship programme now in its 11th year. Cello Academy aims to give our new managers access to expert training in key areas. This is fundamentally important to build client service delivery skills and prepare our managers for future senior roles in the organisation. Of particular importance has been the expansion of the programme to cover our US operations. We have also expanded the Academy brand, launching a number of new MasterClasses for Academy Alumni, to continue the training they are exposed to as their careers develop. In total, over 150 people have been through our Academy training programme this year, over 15% of our total employees.
In 2015 we continued the successful BiteSize training sessions – aimed at employees across the Group who want to learn more about topical management issues.
Across the Group we recruit a significant number of
graduates each year. Cello sees this intake as critical to the long-term success of the organisation. In addition, we value the fresh perspective bright young talent can provide in helping improve our services and how we deliver those services to clients. To that end, we will continue to invest in our graduate events each year, aiming to foster collaboration across the Group from their early days in the business.
THE FUTURE
We are constantly reviewing the focus of our training programmes to ensure they are future focused and valuable for the relevant audiences. In 2016 we plan to make a number of changes to the current content, by introducing a range of new initiatives.
A key focus for 2016 will be a focus on continual development of our senior employees. We will be launching a senior leadership development initiative, encompassing a number of modules designed around building the necessary skills and to prepare them for more senior management and leadership roles in the Group.
As well as allowing for continued development, our training also allows us to facilitate networking and collaboration across the Group. 2015 saw significant growth in the level of collaborative projects commissioned by our clients and this will continue to increase. The benefits of investing in our people are clear. In 2016 we are committed to continuing this focus as we move forward and ensuring we attract and retain the best people to best serve our expanding client base.
Investment in professional developmentContinuing to invest in our people
30
Cel
lo A
nnua
l Rep
ort 2
015
CE
LL
O P
EO
PL
E
Cello TalentSuccess stories
Alex KempResearch Executive
I started working at Cello Health Insight in September 2015. After completing my BSc in Pharmacology, I knew (and hoped) that my career path would lead me into the pharmaceutical industry. After deciding that I wanted to work for an agency, Cello Health Insight seemed like the perfect choice for me. I was particularly impressed by the prestige and diversity of its clients, which included all of the top 10 pharmaceutical companies. Immediately, I knew this was a company that I wanted to be a part of. The sheer breadth and variety of the work we do in terms of therapy areas, products and research methodologies has kept me captivated since day one. You are given exciting opportunities early on and there is a great atmosphere which helps you to learn and develop as a researcher.
Lydia JenkinsProject Manager
In July 2014, a month after graduating from Boston University with a degree in Public Relations and Psychology, I uprooted my life to move across the pond as a Project Executive at iS Health in Farnham. I was always fascinated with the pharmaceutical industry and I saw the opportunity to join a medical education company as a great starting point. After 9 months at iS, I was promoted to Project Manager. iS Health offered me the opportunity to learn all about the ins and outs of the industry, get involved with clients of varied functions and work on a multitude of projects, along with bringing my expertise from a different background to build new areas of the business. I couldn’t have pictured a better place to start my career.

31
Cello A
nnual Report 2015
CE
LL
O P
EO
PL
E
Patrick GannonMedical Writer
After completing my PhD in Pharmacology at the University of Pennsylvania, I was resolved to trade in my lab coat and gloves for a suit and tie. My objective was to find a position in the business side of science – one where I would continue to utilise the critical thinking skills and scientific knowledge I had acquired as a graduate student. Rather than devoting my career to the understanding of one disease, I sought knowledge in a wide range of therapeutic areas. Hence, the reason I joined MedErgy.
I was immediately impressed by MedErgy’s dedication to the training of new medical writers, which reinforced their commitment to delivering the highest quality medical communications, while establishing themselves as invaluable strategic partners among their clients. On a more personal level, MedErgy’s commitment to people, both in terms of their happiness and their opportunities to advance within the company, was even more impressive. I look forward to growing within the Cello Health community for years to come.
Megan GoodheadPlanner
I started at Brightsource in January 2012, and moved to Instinctiv in January 2013. I chose the company because it had a good graduate scheme that offered a range of different career paths.
What is great about working here? The diverse range of projects we work on. Being part of the great work we produce for our clients. The trust that is invested in staff. The opportunities to draw on the experience of talented people across the Signal network. An atmosphere that is simultaneously challenging and supportive. The innovative culture. Above all, the people.
Emma PaulAccount Manager
I joined Stripe Communications in 2012 as part of its Stars and Stripes graduate scheme. An ardent English Lit scholar, I was keen to find a profession where I could utilise my skillset; and after a tumultuous time teaching English in Indonesia, I was ready to start a career with a solid future.
I was impressed by Stripe’s client list, but slightly apprehensive about the industry as I’d completed a couple of PR internships at uni, which frankly bored me to tears…but how wrong I was! From day one, Stripe was fast-paced, future focused and bursting at the seams with creativity – exactly what I was looking for.
I’ve worked for a host of high-profile clients including John Lewis, Pizza Express and ScottishPower. Despite our exciting client roster and multiple award wins, for me what’s great about Stripe is the people – we’re young, ambitious and work together to create the best campaigns in the business.
32
Cel
lo A
nnua
l Rep
ort 2
015
FIN
AN
CIA
LS
Strategic Reportfor the year ended 31 December 2015
The Directors present their strategic report on the Group for the year to 31 December 2015.
GENERAL INFORMATION
Cello Group plc (“The Group”) is a healthcare and consumer strategic marketing group of companies. The Group is AIM quoted and is domiciled and registered in the United Kingdom. The Group has offices in the United Kingdom, the United States of America, Singapore and Hong Kong.
REVIEW OF THE BUSINESS AND FUTURE DEVELOPMENTS
The results for the year ended 31 December 2015 are set out in the consolidated income statement on page 42. These show a profit for the year of £3.0m (2014: £2.3m). An interim dividend of 0.84p per share was paid in November 2015 (2014: 0.80p) and a final dividend of 2.02p per share is proposed (2014: 1.80p).
The Directors are required by the Companies Act to present a business review, reporting on the development and performance of the Group and the Company during the year and their positions at the end of the year. A review of the development and future prospects of the business and key performance indicators (“KPIs”) are given in the Chairman’s Statement on pages 4 to 9 which are incorporated in this report by reference.
The Group’s KPIs are outlined in various sections of this review. Whilst there are many financial measures that the Group monitors on a regular basis our core financial objectives are:
• Headline profit before tax
• Headline operating profit
• Headline operating margin
• Like-for-like gross profit
• Headline operating cash flow conversion
• Headline basic earnings per share
RISKS AND UNCERTAINTIES
The Company regularly reviews the risks and uncertainties facing the business through a regular series of board and operational meetings. The Directors believe the current largest risks are as follows:
1. Economic conditionsThe Group’s business is domiciled in the UK but 41% of the Group’s revenues are from clients based overseas. It is clear that income from clients is impacted by the prevailing economic conditions. However, the broad spread of clients across sector and geography mitigates this risk.
2. Loss of the Group’s key clientsClient relationships are crucial to the Group and the strength of them is key to its continued success. The risk is mitigated by our client base being broadly spread and by several of our pharmaceutical clients being subject to longer term master service agreements. The loss of any large client would require replacement. The Group’s client review programmes help mitigate this risk.
3. Loss of key staffThe Group’s Directors and staff are critical to the servicing of existing business and the winning of new accounts and the departure of key staff could be a risk to maintaining client service. With that risk in mind all senior staff are subject to financial lock-ins and long-term incentive arrangements, as well as being under contractual non-compete and non-solicit clauses.
By order of the Board
Mark Bentley Company Secretary 16 March 2016

33
Cello A
nnual Report 2015
FIN
AN
CIA
LS
Directors’ Report
The Directors present their report and audited financial statements for the year ended 31 December 2015.
Information covering the legal constitution of the Group; the location of its branches; dividends, and comments on future developments can be found within the strategic report on page 32.
DIRECTORS
The Directors of the Company who were in office during the year and up to the date of signing the financial statements were:
Mark Scott
Mark Bentley
Stephen Highley
Paul Hamilton
Will David
Allan Rich
Biographical details of the Directors at the date of this report are set out on pages 92 to 93.
DIRECTORS’ INTERESTS IN SHARES AND OPTIONS
Directors’ interests in the shares of the Company were as follows:
Number of ordinary shares of 10p each Number of ordinary shares of 10p each At 31 December 2015 At 31 December 2014
Mark Scott 964,379 964,379
Mark Bentley 285,479 285,479
Stephen Highley 2,046,889 2,046,889
Paul Hamilton 50,000 50,000
Will David 15,000 15,000
Allan Rich 977,785 977,785
Under the rules of the EMI Share Option Scheme (the “EMI Scheme”), the Unapproved Share Option Scheme 2004 (the “Unapproved Scheme 2004”), the PSP Option Scheme 2010 (the “PSP 2010”) and the Approved Share Option Plan 2009 (the “Approved Plan 2009”), the Executive Directors have been granted an interest in options over ordinary shares of 10p each as follows:
At 1 January 2015
Granted during the
year
Exercised during
the year
Lapsed during
the year
At 31 December
2015
Exercise price
(pence)
Earliest exercise
date Expiry date
Mark Scott
PSP 2010 430,000 – – – 430,000 10.00 June 2013 June 2020
PSP 2010 170,000 – – – 170,000 10.00 June 2014 June 2021
PSP 2010 170,000 – – – 170,000 10.00 July 2015 July 2022
PSP 2010 210,000 – – – 210,000 10.00 July 2016 July 2023
PSP 2010 120,000 – – – 120,000 10.00 June 2017 June 2024
Approved Plan 2009 72,000 – – – 72,000 31.50 June 2013 June 2020
Total Mark Scott 1,172,000 – – – 1,172,000
34
Cel
lo A
nnua
l Rep
ort 2
015
FIN
AN
CIA
LS
Directors’ Report
At 1 January 2015
Granted during the
year
Exercised during
the year
Lapsed during
the year
At 31 December
2015
Exercise price
(pence)
Earliest exercise
date Expiry date
Mark Bentley
EMI Scheme 81,633 – – (81,633) – 122.50 June 2005 June 2015
Unapproved Scheme 2004 81,633 – – (81,633) – 122.50 June 2005 June 2015
PSP 2010 130,000 – – – 130,000 10.00 July 2015 July 2022
PSP 2010 165,000 – – – 165,000 10.00 July 2016 July 2023
PSP 2010 90,000 – – – 90,000 10.00 June 2017 June 2024
Total Mark Bentley 548,266 – – (163,266) 385,000
Stephen Highley
PSP 2010 20,000 – – – 20,000 10.00 July 2015 July 2022
PSP 2010 100,000 – – – 100,000 10.00 July 2016 July 2023
PSP 2010 50,000 – – – 50,000 10.00 June 2017 June 2024
Approved Plan 2009 30,000 – – – 30,000 33.25 July 2015 July 2022
Total Stephen Highley 200,000 – – – 200,000
There were no changes in Directors’ interests between the year end and the date of signing the Group’s accounts.
RESEARCH AND DEVELOPMENT ACTIVITIES
During the year the Group spent £366,000 (2014: £374,000) on the development of new software products which are expected to generate economic benefits in the future. These amounts were capitalised as intangible assets. £373,000 (2014: £309,000) of amortisation on research and development expenditure was charged to the income statement during the year.
DIRECTORS’ THIRD PARTY INDEMNITY PROVISIONS
A qualifying third-party indemnity provision was in place for Directors throughout the year and at the date of approval of the financial statements.
EMPLOYEES
It is the Company’s policy not to discriminate between employees or potential employees on any grounds. Full and fair consideration is given to the recruitment, training and promotion of disabled people and, should staff become disabled during the course of their employment, efforts are made to provide appropriate re-training. The Company places enormous importance on the
contributions of its employees and aims to keep them informed of developments in the Company through a combination of meetings and electronic communication.
TREASURY SHARES
The total number of shares in treasury at 31 December 2015 was 453,000 (2014: 453,000), which represents 0.53% (2014: 0.53%) of the issued share capital. The purpose of the treasury shares is to satisfy future earn out payments and/or share option awards.
SUBSTANTIAL SHAREHOLDINGS
Other than the Directors’ interests disclosed on the previous pages, the Company is aware of the following shareholdings of 3.0% or more in the issued share capital at 31 December 2015:
No. of shares %
Ennismore Fund Management 7,279,830 8.53
Hargreave Hale 6,525,000 7.65
Octopus Asset Management 4,926,001 5.77
Milton Asset Management 6,856,242 8.04
Close Brothers Asset Management 3,530,971 4.14

35
Cello A
nnual Report 2015
FIN
AN
CIA
LS
Directors’ Report
SHARE CAPITAL
Changes to the Company’s share capital during the year are given in note 23 to the consolidated financial statements.
STATEMENT OF DIRECTORS’ RESPONSIBILITIES
The Directors are responsible for preparing the Annual Report, the Directors’ Remuneration Report and the financial statements in accordance with applicable law and regulations.
Company law requires the Directors to prepare financial statements for each financial year. Under that law the Directors have prepared the Group financial statements in accordance with International Financial Reporting Standards (IFRSs) as adopted by the European Union, and the Company financial statements in accordance with United Kingdom Generally Accepted Accounting Practice (United Kingdom Accounting Standards and applicable law). Under company law the Directors must not approve the financial statements unless they are satisfied that they give a true and fair view of the state of affairs of the Group and the Company and of the profit or loss of the Group for that period. In preparing these financial statements, the Directors are required to:
• select suitable accounting policies and then apply them consistently;
• make judgements and accounting estimates that are reasonable and prudent;
• state whether IFRSs as adopted by the European Union and applicable UK Accounting Standards have been followed, subject to any material departures disclosed and explained in the Group and Company financial statements respectively;
• prepare the financial statements on the going concern basis unless it is inappropriate to presume that the Company will continue in business.
The Directors are responsible for keeping adequate accounting records that are sufficient to show and explain the Company’s transactions and disclose with reasonable accuracy at any time the financial position of the Company and the Group and enable them to ensure that the financial statements and the Directors’ Remuneration Report comply with the Companies Act 2006 and, as regards the Group financial statements, Article 4 of the IAS Regulation. They are also responsible for safeguarding the assets of the Company and the Group and hence for taking reasonable steps for the prevention and detection of fraud and other irregularities.
The Directors are responsible for the maintenance and integrity of the Company’s website. Legislation in the
United Kingdom governing the preparation and dissemination of financial statements may differ from legislation in other jurisdictions.
The Directors consider that the Annual Report and accounts, taken as a whole, is fair, balanced and understandable and provides the information necessary for shareholders to assess a Company’s performance, business model and strategy.
Each of the Directors, whose names and functions are listed in the Directors’ report confirm that, to the best of their knowledge:
• the Group financial statements, which have been prepared in accordance with IFRSs as adopted by the EU, give a true and fair view of the assets, liabilities, financial position and profit of the Group; and
• the Directors’ report contained in the Annual Report includes a fair review of the development and performance of the business and the position of the Group, together with a description of the principal risks and uncertainties that it faces.
STATEMENT AS TO DISCLOSURE OF INFORMATION TO THE AUDITORS
The Directors who were in office on the date of approval of these financial statements have confirmed that, as far as they are aware, there is no relevant audit information of which the auditors are unaware. Each of the Directors has confirmed that he, as far as he is aware, has taken all the steps that he ought to have taken as a Director in order to make him aware of any relevant audit information and to establish that the Company’s auditors are aware of the information.
INDEPENDENT AUDITORS
A resolution to reappoint PricewaterhouseCoopers LLP, Chartered Accountants, as auditors will be proposed at the forthcoming Annual General Meeting.
CORPORATE GOVERNANCE
The Company’s statement on corporate governance can be found in the corporate governance report on pages 36 to 37 of the financial statements. The corporate governance report forms part of this Directors’ report and is incorporated into it by cross reference.
By order of the Board
Mark Bentley Company Secretary 16 March 2016
36
Cel
lo A
nnua
l Rep
ort 2
015
FIN
AN
CIA
LS
Corporate Governance
The Board of Cello Group plc appreciates the value of good corporate governance not only in the areas of accountability and risk management but also as a positive contribution to the business. The Board considers that the Company, whilst trading on the AIM Market, has adopted those requirements of the UK Corporate Governance Code (September 2012) (the “Code”) as best applicable to the Company given its current size. The full requirements of the code have not been adopted.
BOARD STRUCTURE
The Board comprises three Executive Directors and three Non-Executive Directors. The roles of Chairman and Chief Executive are separate. The Non-Executive Directors are independent of management and free from any business or other relationship with the Company other than owning shares. The Directors’ biographies appear on pages 92 to 93.
The Board is scheduled to meet at least six times a year and additionally when necessary. At each scheduled meeting of the Board, the Chief Executive, Finance Director and Group Chief Operating Officer report on the Group’s operations. The Board is satisfied that it is provided with information in an appropriate form and quality to enable it to discharge its duties. All Directors are subject to re-election by shareholders at the first opportunity after their appointment. All Directors are required to retire by rotation and one-third of the Board is required to seek re-election each year. The Chairman ensures that the Directors are permitted to take independent professional advice as required.
All Directors have access to the advice and services of the Company Secretary, who is responsible to the Board for ensuring that Board procedures are followed and that applicable rules and regulations are complied with.
The following committees of the Board have been established to deal with specific aspects of the Company’s affairs.
AUDIT COMMITTEE
The Audit Committee consists of two Non-Executive Directors; Will David as Chairman and Paul Hamilton. Will David is considered to have relevant financial experience to chair this Committee. The Committee considers matters relating to the financial accounting controls, the reporting of results, and the effectiveness and cost of the external audit. It aims to meet at least twice a year with the Company’s auditors in attendance. Other Directors attend as required. The Company Secretary provides secretarial support to the Committee. The terms of reference of the Committee are available on request.
NOMINATION COMMITTEE
The Nomination Committee consists of two Independent Non-Executive Directors; Paul Hamilton and Will David. The Committee is chaired by Paul Hamilton and meets as necessary. The Committee is formally constituted with written terms of reference and is responsible for reviewing and making proposals to the Board on the appointment of Directors. The Company Secretary provides secretarial support to the Committee. The terms of reference of the Nominations Committee are available on request.
REMUNERATION COMMITTEE
The Remuneration Committee is formally constituted with written terms of reference and makes recommendations to the Board with regard to remuneration policy and related matters. The Remuneration Committee consists solely of two of the Independent Non-Executive Directors, Paul Hamilton, who chairs the Committee and Will David. However, the Chief Executive attends as required and has the right to address the Committee. The Committee aims to meet at least twice a year. The terms of reference of the Committee are available on request.
Further details of the Company’s policies on remuneration, including details of Directors’ share options are given in the Report of the Remuneration Committee on pages 38 to 39.
SHAREHOLDER COMMUNICATIONS
The Group believes in maintaining good communications with shareholders. The Chief Executive and Finance Director meet analysts and institutional shareholders regularly with a view to ensuring that the strategies and objectives of the Group are well understood. The Senior Independent Director will not ordinarily attend such meetings other than at the request of the relevant shareholder. However, he is available to shareholders if they have concerns which the Chairman, Chief Executive or the Finance Director have failed to resolve or for which such contact is inappropriate.
GOING CONCERN
The Directors have satisfied themselves that the Company and Group have adequate resources to continue in operational existence for the foreseeable future, and for this reason the financial statements continue to be prepared on a going concern basis.
37
Cello A
nnual Report 2015
FIN
AN
CIA
LS
Corporate Governance
INTERNAL CONTROL
The Board is responsible for ensuring that the Group maintains a system of internal controls and risk management, including suitable monitoring procedures. The objective of the system is to safeguard Group assets, ensure proper accounting records are maintained and that the financial information used within the business and for publication is reliable. Any such system can only provide reasonable, but not absolute, assurance against material misstatement or loss.
Given the Group’s size and the nature of its business, the Board does not consider it would be appropriate to have its own internal audit function. An internal audit function will be established as and when the Group is of an appropriate size but meanwhile the audit of internal financial controls forms part of the responsibilities of the Group’s finance function.
All the day-to-day operational decisions are taken initially by the Executive Directors or subsidiary Directors, in accordance with the Group’s strategy. Where appropriate, the Board or subsidiary Directors approve such decisions. The Executive Directors or subsidiary Directors are also responsible for initiating all transactions and authorising all payments, save for those relating to their employment. As such, the internal controls primarily comprise:
• the segregation of duties;
• the review of pertinent financial and other information by the Board on a regular basis;
• the prior approval of all significant strategic decisions;
• having a formal strategy for business activities.
THE ENVIRONMENT
The activities of the Group do not have a high impact on the environment. However, the Group aims to ensure that where waste can be reduced, this is done efficiently, by recycling where viable.
EMPLOYEES
The Group employs over 900 employees and places a great deal of emphasis on their training and retention. The central programme for rising talent, “Cello Academy”, is now a well-established feature of the Group’s staff development initiatives.
On behalf of the Board
Mark BentleyCompany Secretary16 March 2016
38
Cel
lo A
nnua
l Rep
ort 2
015
FIN
AN
CIA
LS
Report of the Remuneration CommitteeThe Directors have applied the principles of good governance relating to Directors’ remuneration as described below:
REMUNERATION COMMITTEE
The Remuneration Committee is authorised on behalf of the Board to determine the Company’s remuneration policy on Executive Directors’ remuneration, including pension rights and share option awards, and the terms of their service contracts. The Committee aims to meet at least twice a year and supervises the operation of share schemes and other employee incentive schemes. The remuneration and terms and conditions of appointment of the Non-Executive Directors will be set by the Board. No Director shall participate in discussions relating to his own remuneration. The Remuneration Committee consists of two Independent Non-Executive Directors; Paul Hamilton, who chairs the Committee, and Will David.
REMUNERATION POLICY
The policy of the Board is to provide executive remuneration packages designed to attract, motivate and retain Directors of the calibre necessary to maintain the Group’s position as a market leader and to reward them for enhancing shareholder value and return on investment. The remuneration should also reflect the Directors’ responsibilities and contain incentives to deliver the Group’s objectives.
The main elements of the Executive Directors’ remuneration packages are as follows:
• basic salary;
• performance-related bonus;
• benefit package – car allowance and healthcare insurance;
• share option incentives – details of share options granted to the Executive Directors are shown on pages 33 to 34;
• contributions to Directors’ individual defined contribution pension schemes.
The Remuneration Committee reviews the components of each Executive Director’s remuneration package annually.
DIRECTORS’ REMUNERATION
2015 (£’000) Salary Bonus BenefitsTotal
Emoluments Pension Total
Mark Scott 295 88 14 397 44 441
Mark Bentley 219 64 9 292 33 325
Stephen Highley 236 64 14 314 35 349
Allan Rich 55 – – 55 – 55
Will David 35 – – 35 – 35
Paul Hamilton 35 – – 35 – 35
Total 875 216 37 1,128 112 1,240
2014 (£’000) Salary Bonus BenefitsTotal
Emoluments Pension Total
Mark Scott 281 87 14 382 42 424
Mark Bentley 208 65 9 282 31 313
Stephen Highley 208 65 14 287 31 318
Allan Rich 55 – – 55 – 55
Will David 35 – – 35 – 35
Paul Hamilton 35 – – 35 – 35
Total 822 217 37 1,076 104 1,180

39
Cello A
nnual Report 2015
FIN
AN
CIA
LS
Report of the Remuneration CommitteeDIRECTORS’ TITLES AND SERVICE ARRANGEMENTS
Name Title Date of appointment Notice period
Allan Rich Non-Executive Chairman 5 April 2005 6 months
Mark Scott Chief Executive 5 May 2004 12 months
Mark Bentley Group Finance Director 1 May 2005 12 months
Stephen Highley Group Chief Operating Officer 13 May 2013 6 months
Paul Hamilton Senior Non-Executive Director 8 October 2004 6 months
Will David Non-Executive Director 8 October 2004 6 months
LONG-TERM INCENTIVE ARRANGEMENTS
On 17 November 2009 the Board adopted the Cello Group plc HM Revenue & Customs Approved Share Option Plan 2009 (the “Approved Plan 2009”) and on 15 March 2010 adopted the Cello Group plc Unapproved Option Plan 2010 (the “Unapproved Plan 2010”). Under the Approved Plan 2009 and the Unapproved Plan 2010 (the “Option Plans”) performance conditions will be tailored to each participant according to his or her seniority and responsibilities and will be based on performance as measured against an appropriate combination of Company, Division and Group targets and the extent to which these are achieved or exceeded over the performance period will determine the proportion of each participant’s options which vest. Awards under the Option Plans to main Board Directors will be subject to the performance conditions which apply to awards under the PSP 2010. The Committee will review the Option Plans on a regular basis and may amend the performance conditions from time to time.
On 4 June 2010 the Board adopted the Cello Group plc Performance Share Plan 2010 (the “PSP 2010”), as the principal long-term incentive plan for the Group’s most senior executives. The performance measure for the PSP 2010 is Total Shareholder Return (“TSR”) relative to a comparator group of the Company’s peers over the 3 years following the date of the award. The proportion of PSP 2010 awards which vest will be calculated as follows:
Cello relative TSR performance Proportion of award vesting
Below median Nil
Median 25%
Upper quartile 100%
Between median Interpolation betweenand upper quartile 25% and 100%
MARKET VALUE OF SHARES
The market value of the shares at 31 December 2015 was 88.0p and the high and low prices during the year were 104.5p and 80.5p respectively.
On behalf of the Board
Paul HamiltonChairman – Remuneration Committee16 March 2016
40
Cel
lo A
nnua
l Rep
ort 2
015
FIN
AN
CIA
LS
Consolidated Financial Statements – Independent Auditors’ Reportfor the year ended 31 December 2015
INDEPENDENT AUDITORS’ REPORT TO THE MEMBERS OF CELLO GROUP PLCREPORT ON THE GROUP FINANCIAL STATEMENTS
Our opinion
In our opinion, Cello Group plc’s group financial statements (the “financial statements”):
• give a true and fair view of the state of the Group’s affairs as at 31 December 2015 and of its profit and cash flows for the year then ended;
• have been properly prepared in accordance with International Financial Reporting Standards (IFRSs) as adopted by the European Union; and
• have been prepared in accordance with the requirements of the Companies Act 2006.
What we have audited
The financial statements, included within the Annual Report, comprise:
• the Consolidated Balance Sheet as at 31 December 2015;
• the Consolidated Income Statement and Consolidated Statement of Comprehensive Income for the year then ended;
• the Consolidated Cash Flow Statement for the year then ended;
• the Consolidated Statement of Changes in Equity for the year then ended;
• the accounting policies; and
• the notes to the financial statements, which include other explanatory information.
The financial reporting framework that has been applied in the preparation of the financial statements is IFRSs as adopted by the European Union, and applicable law.
In applying the financial reporting framework, the Directors have made a number of subjective judgements, for example in respect of significant accounting estimates. In making such estimates, they have made assumptions and considered future events.
Opinion on other matter prescribed by the Companies Act 2006
In our opinion, the information given in the Strategic Report and the Directors’ Report for the financial year for which the financial statements are prepared is consistent with the financial statements.
Other matters on which we are required to report by exception
Adequacy of information and explanations received
Under the Companies Act 2006 we are required to report to you if, in our opinion, we have not received all the information and explanations we require for our audit. We have no exceptions to report arising from this responsibility.
Directors’ remuneration
Under the Companies Act 2006 we are required to report to you if, in our opinion, certain disclosures of directors’ remuneration specified by law are not made. We have no exceptions to report arising from this responsibility.
Responsibilities for the financial statements and the audit
Our responsibilities and those of the Directors
As explained more fully in the Statement of Directors’ Responsibilities, the Directors are responsible for the preparation of the financial statements and for being satisfied that they give a true and fair view.
Our responsibility is to audit and express an opinion on the financial statements in accordance with applicable law and International Standards on Auditing (UK and Ireland) (“ISAs (UK & Ireland)”). Those standards require us to comply with the Auditing Practices Board’s Ethical Standards for Auditors.
This report, including the opinions, has been prepared for and only for the company’s members as a body in accordance with Chapter 3 of Part 16 of the Companies Act 2006 and for no other purpose. We do not, in giving these opinions, accept or assume responsibility for any other purpose or to any other person to whom this report is shown or into whose hands it may come save where expressly agreed by our prior consent in writing.

41
Cello A
nnual Report 2015
FIN
AN
CIA
LS
Consolidated Financial Statements – Independent Auditors’ Reportfor the year ended 31 December 2015
What an audit of financial statements involves
We conducted our audit in accordance with ISAs (UK & Ireland). An audit involves obtaining evidence about the amounts and disclosures in the financial statements sufficient to give reasonable assurance that the financial statements are free from material misstatement, whether caused by fraud or error. This includes an assessment of:
• whether the accounting policies are appropriate to the Group’s circumstances and have been consistently applied and adequately disclosed;
• the reasonableness of significant accounting estimates made by the directors; and
• the overall presentation of the financial statements.
We primarily focus our work in these areas by assessing the Directors’ judgements against available evidence, forming our own judgements, and evaluating the disclosures in the financial statements.
We test and examine information, using sampling and other auditing techniques, to the extent we consider necessary to provide a reasonable basis for us to draw conclusions. We obtain audit evidence through testing the effectiveness of controls, substantive procedures or a combination of both.
In addition, we read all the financial and non-financial information in the Annual Report to identify material inconsistencies with the audited financial statements and to identify any information that is apparently materially incorrect based on, or materially inconsistent with, the knowledge acquired by us in the course of performing the audit. If we become aware of any apparent material misstatements or inconsistencies we consider the implications for our report.
Other matter
We have reported separately on the parent company financial statements of Cello Group plc for the year ended 31 December 2015.
Simon O’Brien (Senior Statutory Auditor)
For and on behalf of PricewaterhouseCoopers LLPChartered Accountants and Statutory AuditorsLondon16 March 2016
42
Cel
lo A
nnua
l Rep
ort 2
015
FIN
AN
CIA
LS
Consolidated Income Statementfor the year ended 31 December 2015
Notes
Year ended 31 December 2015
£’000
Year ended 31 December 2014
£’000
Revenue 2 157,315 169,866Cost of sales (70,634) (88,882)
Gross profit 2 86,681 80,984Administrative expenses 4 (81,543) (76,769)
Operating profit 2 5,138 4,215Finance income 3 3 5Finance costs 3 (387) (430)
Profit before taxation 1 4,754 3,790Taxation 9 (1,707) (1,508)
Profit for the financial year 3,047 2,282
Attributable to:Owners of the parent 3,042 2,283Non-controlling interests 5 (1)
3,047 2,282
NotesYear ended
31 December 2015 Year ended
31 December 2014
Basic earnings per share 11 3.54p 2.70p
Diluted earnings per share 11 3.44p 2.63p
Profit for the financial year arises from continuing operations.
The notes on pages 47 to 75 are an integral part of these consolidated financial statements.
43
Cello A
nnual Report 2015
FIN
AN
CIA
LS
Consolidated Statement of Comprehensive Incomefor the year ended 31 December 2015
Year ended 31 December 2015
£’000
Year ended 31 December 2014
£’000
Profit for the financial year 3,047 2,282
Other comprehensive income:Items that may be subsequently reclassified to profit or lossExchange differences on translation of foreign operations 89 75
Total comprehensive income for the year 3,136 2,357
Total comprehensive income/(loss) attributable to:
Owners of the parent 3,131 2,358Non-controlling interest 5 (1)
Total comprehensive income for the year 3,136 2,357
Total comprehensive income for the year arises from continuing operations.
The notes on pages 47 to 75 are an integral part of these financial statements.
44
Cel
lo A
nnua
l Rep
ort 2
015
FIN
AN
CIA
LS
Consolidated Balance Sheetfor the year ended 31 December 2015
Notes31 December 2015
£’00031 December 2014
£’000
Goodwill 12 73,673 73,396Intangible assets 13 1,050 1,492Property, plant and equipment 14 1,950 2,321Deferred tax assets 22 879 898
Non-current assets 77,552 78,107
Trade and other receivables 16 43,683 40,044Cash and cash equivalents 17 5,249 5,566
Current assets 48,932 45,610
Trade and other payables 18 (39,392) (37,181)Current tax liabilities (1,823) (1,241)Borrowings 19 (232) (300)Provisions 20 (3,209) (2,109)Obligations under finance leases 21 (24) (34)
Current liabilities (44,680) (40,865)
Net current assets 4,252 4,745
Total assets less current liabilities 81,804 82,852
Trade and other payables 18 (1,693) (700)Borrowings 19 (9,127) (12,359)Obligations under finance leases 21 (33) (65)Deferred tax liabilities 22 (133) (249)
Non-current liabilities (10,986) (13,373)
Net assets 70,818 69,479
EquityShare capital 23 8,576 8,530Share premium 18,834 18,663Merger reserve 28,807 28,807Capital redemption reserve 50 50Retained earnings 13,860 12,923Share-based payment reserve 635 544Foreign currency reserve 6 (83)
Equity attributable to owners of the parent 70,768 69,434Non-controlling interests 50 45
Total equity 70,818 69,479
The notes on pages 47 to 75 are an integral part of these financial statements.
The financial statements on pages 42 to 75 were approved by the Board of Directors on 16 March 2016 and signed on its behalf by:
Mark Scott Director
Mark Bentley Director

45
Cello A
nnual Report 2015
FIN
AN
CIA
LS
Consolidated Cash Flow Statementfor the year ended 31 December 2015
Notes
Year ended 31 December 2015
£’000
Year ended 31 December 2014
£’000
Net cash generated from operating activities before taxation 25 8,247 4,763Tax paid (1,220) (2,372)
Net cash generated from operating activities after taxation 7,027 2,391
Investing activitiesInterest received 3 5Purchase of property, plant and equipment (814) (1,103)Sale of property, plant and equipment 16 29Purchase of intangible assets 13 (366) (374)Purchase of subsidiary undertakings (200) (1,549)
Net cash used in investing activities (1,361) (2,992)
Financing activitiesProceeds from issuance of shares 117 330Dividends paid to equity holders of the parent 10 (2,244) (2,559)Repayment of borrowings (12,749) (4,000)Repayment of loan notes (68) (73)Drawdown of borrowings 9,165 6,800Capital element of finance lease payments (42) (36)Interest paid (325) (449)
Net cash generated (used in)/from financing activities (6,146) 13
Net decrease in cash and cash equivalents (480) (588)Exchange losses on cash and cash equivalents 163 170Cash and cash equivalents at the beginning of the year 5,566 5,984
Cash and cash equivalents at the end of the year 17 5,249 5,566
The notes on pages 47 to 75 are an integral part of these financial statements.
46
Cel
lo A
nnua
l Rep
ort 2
015
FIN
AN
CIA
LS
Consolidated Statement of Changes in Equityfor the year ended 31 December 2015
Share capital £’000
Share premium
£’000
Merger reserve
£’000
Capital redemption
reserve £’000
Retained earnings
£’000
Share-based
payment reserve
£’000
Foreign currency
exchange reserve
£’000
Equity attributable
to the owners of the parent
£’000
Non- controlling
interest £’000
Total equity £’000
At 1 January 2014 8,348 18,368 28,345 50 12,810 455 (158) 68,218 46 68,264
Comprehensive income:Profit for the financial year – – – – 2,283 – – 2,283 (1) 2,282Other comprehensive income:Currency translation – – – – – – 75 75 – 75
Total comprehensive income for the year – – – – 2,283 – 75 2,358 (1) 2,357
Transactions with owners:Shares issued (note 23) 182 295 462 – – – – 939 – 939Credit for share-based incentives – – – – – 212 – 212 – 212 Tax on share-based payments recognised directly in equity – – – – 266 – – 266 – 266Transfer between reserves in respect of share options – – – – 123 (123) – – – –Dividends (note 10) – – – – (2,559) – – (2,559) – (2,559)
Total transactions with owners 182 295 462 – (2,170) 89 – (1,142) – (1,142)
As at 31 December 2014 8,530 18,663 28,807 50 12,923 544 (83) 69,434 45 69,479
Comprehensive income:Profit for the financial year – – – – 3,042 – – 3,042 5 3,047Other comprehensive income:Currency translation – – – – – – 89 89 – 89
Total comprehensive incomefor the year – – – – 3,042 – 89 3,131 5 3,136
Transactions with owners:Shares issued (note 23) 46 171 – – – – – 217 – 217Credit for share-based incentives – – – – – 204 – 204 – 204Tax on share-based payments recognised directly in equity – – – – 26 – – 26 – 26Transfer between reserves in respect of share options – – – – 113 (113) – – – –Dividends (note 10) – – – – (2,244) – – (2,244) – (2,244)
Total transactions with owners 46 171 – – (2,105) 91 – (1,797) – (1,797)
As at 31 December 2015 8,576 18,834 28,807 50 13,860 635 6 70,768 50 70,818
The notes on pages 47 to 75 are an integral part of these financial statements.

47
Cello A
nnual Report 2015
FIN
AN
CIA
LS
Accounting Policiesfor the year ended 31 December 2015
SIGNIFICANT ACCOUNTING POLICIES
(1) Basis of PreparationThe consolidated financial statements of Cello Group plc have been prepared in accordance with International Financial Reporting Standards as adopted by the European Union (“IFRSs”), interpretations issued by the IFRS Interpretations Committee (“IFRS IC”) and the Companies Act 2006 applicable to companies reporting under IFRSs. The consolidated financial statements have been prepared under the historical cost convention, as modified by the revaluation of financial assets and financial liabilities (including derivative instruments) at fair value through profit or loss. The Group’s principle accounting policies have been applied consistently throughout the year.
The Group’s business activities, performance and position are set out in the Chairman’s Statement on pages 4 to 9. An assessment of the risks and uncertainties is set out in the Strategic Report on page 32 and an assessment of the critical accounting estimates and judgements are set out in accounting policy 19 on page 51.
(2) Going ConcernDuring the year the Group generated a profit before tax on continuing activities of £4.8m and excluding non-recurring restructuring costs and other non-headline charges the Group generated a profit before tax of £10.0m.
The Group meets its day-to-day working capital requirements through its bank facilities. At 31 December 2015 the Group’s bank facilities consisted of a £4.0m overdraft facility and a £20.0m revolving credit facility (“RCF”). The RCF is committed to March 2018. £10.9m of the RCF is undrawn at 31 December 2015 and the Groups forecasts and projections show that the Group is able to operate within the level of its current facilities and its covenants.
After reviewing the Group’s performance and forecast future cash flows, the Directors consider the Group has adequate resources to continue in operational existence for the foreseeable future. The Group therefore continues to adopt the going concern basis in preparing the Group’s financial statements.
(3) Basis of ConsolidationThe Group’s financial statements consolidate the financial statements of the Company and all of its subsidiary undertakings. Subsidiaries are all entities over which the Group has control. The Group controls an entity when the Group is exposed to, or has rights to, variable returns from its involvement with the entity and has the ability to affect those returns through its power over the entity. Subsidiaries are fully consolidated from the date on
which control is transferred to the Group and are de-consolidated from the date that control ceases.
The Group uses the acquisition method of accounting to account for business combinations. The consideration transferred is measured as the fair value of the assets given, equity instruments issued and liabilities incurred to former owners of the acquire at the date of acquisition. Identifiable assets and liabilities acquired and contingent liabilities assumed in a business combination are measured initially at their fair values at the acquisition date, irrespective of the extent of any non-controlling interest. The excess of the cost of acquisition over the fair value of the Group’s share of the identifiable net assets acquired is recorded as goodwill.
Acquisition-related costs are expensed as incurred.
Inter-company transactions, balances and unrealised gains are eliminated on consolidation. Accounting policies of subsidiaries have been changed where necessary to ensure consistency with the policies adopted by the Group.
The Group treats transactions with non-controlling interests as transactions with equity owners. For purchases of non-controlling interests, the difference between any consideration paid and the relevant share acquired of the carrying value of net assets of the subsidiary is recorded in equity. Gains and losses of disposal to non-controlling interests are also recorded in equity.
(4) Foreign CurrenciesSterling is the functional currency of the Company and the presentational currency of the Group. The functional currency of subsidiaries is the local currency of the primary economic environment in which the entity operates.
Foreign currency transactions are translated into the functional currency using the exchange rate prevailing at the date of the transaction. Foreign exchange gains or losses on monetary assets and liabilities denominated in foreign currencies resulting from the settlement of such transactions and from the translation to the rate prevailing at the year end are recognised in the income statement.
The financial statements of subsidiaries whose functional currency is different to the presentational currency of the Group are translated into the presentational currency of the Group on consolidation. Assets and liabilities are translated at the exchange rate prevailing at the balance sheet date. Income and expenses are translated at the average exchange rate for the year, unless exchange rates fluctuate significantly during the year, in which case the exchange rates at the transaction date are used. Exchange differences arising on consolidation are recognised in other comprehensive income and the cumulative effect of these as a separate component in equity.
48
Cel
lo A
nnua
l Rep
ort 2
015
FIN
AN
CIA
LS
Accounting Policiesfor the year ended 31 December 2015
(5) Revenue, Cost of Sales and Revenue RecognitionRevenue comprises the fair value of the consideration received or receivable from services, provided by the Group in the ordinary course of the Group’s activities. Services include fees, commissions, rechargeable expenses and sales of materials provided by the Group. Revenue is shown net of Value Added Tax and discounts.
Revenue derived from fees is recognised as contract activity progresses, in accordance with the terms of the contractual agreement and the stage of completion of the work. The stage of completion is assessed based on the proportion of costs incurred or milestone completed, as appropriate to the contract. Where recorded revenue exceeds amounts invoiced to clients, the excess is classified as accrued income and where recorded revenue is less than amounts invoiced to clients, the difference is classified as deferred income.
Revenue derived from retainers is recognised evenly over the contract period.
Revenue derived from commissions, rechargeable expenses and sale of materials is recognised when the risk and rewards have been transferred to the client in line with the individual contract.
Cost of sales include amounts payable to external suppliers where they are retained at the Group’s discretion to perform part of a specific client project or service where the Group has full exposure to the benefits and risks of the contract with the client. Cost of sales does not include direct labour costs.
(6) Pension ContributionsThe Group operates defined contribution pension schemes and contributes to the personal pension schemes of certain employees or to a Group personal pension plan. The assets of the schemes are held separately from those of the Group in independently administered funds. The amount charged against profits represents the contributions payable to the schemes in respect of the accounting period.
(7) Share-based PaymentsThe Group has applied the requirements of IFRS 2 Share-based payment to both cash-settled and equity-settled share-based employee compensation schemes.
This standard has been applied to various types of share-based payments as follows:
i. Share options Certain employees receive remuneration in the form
of share options. The fair value of the share options granted is measured at the date of grant and expensed to the income statement over the appropriate vesting period, with a corresponding adjustment to equity.
The fair value of the share options takes into account market vesting conditions and non-vesting conditions. Non-market vesting conditions are included in assumptions of the number of options expected to vest. At the end of each reporting period the Group revises its estimate of the number of share options expected to vest and recognises the impact of the revisions to previous estimates in the income statement, with a corresponding adjustment to equity.
ii. Acquisition-related employee remuneration expenses In accordance with IFRS 3 (revised) Business
combinations and IFRS 2 Share-based payment, certain payments to employees in respect of acquisition arrangements are treated as remuneration within the income statement. These payments are typically payable in cash or shares at the option of the Group so are treated as cash-settled share-based payments. The amount expected to be payable is expensed in the income statement over the appropriate period, with a corresponding adjustment made to amounts payable in respect of acquisitions.
(8) Headline MeasuresThe Group believes that reporting non-GAAP or headline measures provides a useful comparison of business performance and this reflects the way the business is reported internally and controlled. Accordingly, headline measures of operating profit, finance income, finance costs, profit before taxation and earnings per share exclude, where applicable, restructuring costs, amortisation of intangible assets, impairment charges, acquisition accounting adjustments, start-up losses, share option charges, fair value gains and losses on derivative financial instruments and the provision for VAT payable. These are items that, in the opinion of the Directors, are required to be disclosed separately, by virtue of their size or incidence, to enable a full understanding of the Group’s financial performance.
A reconciliation between reported and headline profit before taxation is presented in note 1. In addition to this, a reconciliation between reported and headline operating profit is presented in note 2, a reconciliation between reported and headline finance income and costs is presented in note 3 and a reconciliation between reported and headline earnings per share is presented in note 11. Headline measures in this report are not defined terms under IFRSs and may not be comparable with similarly titled measures reported by other companies.
(9) Segment ReportingOperating segments are reported in a manner consistent with the internal reporting provided to the chief operating decision maker. The chief operating decision maker, which is responsible for allocating resources and assessing
49
Cello A
nnual Report 2015
FIN
AN
CIA
LS
Accounting Policiesfor the year ended 31 December 2015
performance of the operating segments, has been identified as the Board of Directors.
(10) Goodwill Goodwill represents the excess of consideration over the fair value of the Group’s share of the identifiable net assets acquired at the date of acquisition. Goodwill is carried at cost less accumulated impairment losses. Impairment losses are recognised in the income statement and cannot subsequently be reversed.
Goodwill is allocated to cash-generating units (“CGUs”) for the purposes of impairment testing. The allocation is made to those cash-generating units that are expected to benefit from the business combination in which the goodwill arose.
The carrying value of goodwill for each CGU is reviewed annually for impairment, or more frequently if the events or changes in circumstances indicate a potential impairment. An impairment loss is recognised for the amount by which the assets carrying amount exceeds its recoverable amount. The recoverable amount is the higher of an assets fair value less costs to sell and its value-in-use.
(11) Intangible Assets Acquired as Part of a Business CombinationIn accordance with IFRS 3 (revised) Business combinations, intangible assets acquired in a business combination are recognised at fair value at the acquisition date. Identified intangible assets acquired as part of a business combination are client contracts and licences. These intangible assets have a finite useful economic life and are carried at cost less accumulated amortisation. Amortisation is calculated using the straight line method over the expected life of the asset, which vary from 3 months to 8 years.
Intangible assets acquired as part of a business combination are reviewed for impairment annually or whenever events or changes in circumstances indicate that the carrying value may not be fully recoverable. An impairment loss is recognised for the amount by which the assets carrying amount exceeds its recoverable amount. The recoverable amount is the higher of an asset’s fair value less costs to sell and its value-in-use. Intangible assets acquired as part of a business combination which have suffered an impairment are reviewed for possible reversal of the impairment at each reporting date. Impairment losses and reversal of impairment losses are recognised in the income statement.
(12) Internally Generated Intangible Assets – Research and Development ExpenditureExpenditure on research activities is recognised as an expense in the period in which it is incurred.
An internally generated intangible asset arising from the Group’s development expenditure is recognised only when the following conditions are met:
i. an asset is created that can be identified (such as software or a new process);
ii. it is probable that the asset created will generate future economic benefit;
iii. the development cost of the asset can be measured reliably;
iv. there is the availability of adequate technical, financial or other resources and an intention to complete the development and to use or sell the development.
Internally generated assets are carried at cost less accumulated amortisation. Amortisation is calculated using the straight line method over the expected life of the asset. The expected life of internally generated intangible assets are between 3 and 5 years. Where no internally generated intangible asset can be recognised, the development expenditure is recognised as an expense in the period in which it is incurred.
Internally generated intangible assets are reviewed for impairment annually or whenever events or changes in circumstances indicate that the carrying value may not be fully recoverable. An impairment loss is recognised for the amount by which the assets carrying amount exceeds its recoverable amount. The recoverable amount is the higher of an assets fair value less costs to sell and its value-in-use. Internally generated intangible assets which have suffered an impairment are reviewed for possible reversal of impairment at each reporting date.
(13) Property, Plant and EquipmentProperty, plant and equipment is stated at historical cost less accumulated depreciation. Cost includes the original purchase price of the asset and the costs attributable to bringing the asset to its working condition for its intended use. Depreciation is provided at rates calculated to write off the cost, less estimated residual value, of each asset, over their estimated useful economic lives as follows:
Leasehold improvements Over the remaining term of the lease
Motor vehicles 25% pa. straight line
Computer equipment 33% pa. straight line
Fixtures, fittings and office equipment 25% pa. straight line
Property, plant and equipment are reviewed for impairment annually or whenever events or changes in circumstances indicate that the carrying amount may not be recoverable.
50
Cel
lo A
nnua
l Rep
ort 2
015
FIN
AN
CIA
LS
Accounting Policiesfor the year ended 31 December 2015
Any property, plant and equipment that has suffered an impairment is reviewed for possible reversal of the impairment at each reporting date.
(14) Current and Deferred TaxationTax on the profit or loss for the year comprises current and deferred tax. Tax is recognised in the income statement, except to the extent that it relates to items recognised in other comprehensive income or directly in equity.
Current tax is calculated on the basis of the tax laws enacted or substantively enacted at the balance sheet date. Management periodically evaluates positions taken in tax returns with respect to situations in which the applicable tax regulation is subject to interpretation. It establishes provisions where appropriate on the basis of amounts expected to be paid to the tax authorities.
Deferred tax is income tax recognised, using the liability method, on temporary differences arising between the tax bases of assets and liabilities and their carrying value in the consolidated financial statements. However, deferred tax liabilities are not recognised if they arise from the initial recognition of goodwill nor from the initial recognition of an asset or liability, other than resulting from a business combination that does not affect the accounting profit or loss or the taxable profit or loss.
Deferred tax assets are only recognised to the extent that it is probable that they can be utilised against future taxable profits.
Deferred tax is calculated at the tax rates that are enacted or substantially enacted and expected to apply in the period when the liability is settled or the asset is realised.
Deferred tax assets and liabilities are offset when there is a legally enforceable right to offset current tax assets and liabilities and when the deferred tax assets and liabilities relate to income taxes levied by the same tax authority on either the taxable entity or different taxable entities where there is an intention to settle the balances on a net basis.
(15) LeasesWhen the Group enters into a lease which entails taking substantially all the risks and rewards of ownership of an asset, the lease is treated as a finance lease. The asset is recorded at fair value (or present value of minimum lease payments if lower) in the balance sheet as property, plant and equipment and is depreciated over the estimated useful life or the term of the lease, whichever is shorter. Future instalments under such leases, net of finance charges, are included as a liability. Rentals payable are apportioned between the finance element, which is charged to the income statement, and the capital element which reduces the outstanding obligation for future instalments.
All other leases are treated as operating leases and
rentals payable are charged to the income statement on a straight line basis over the lease term.
(16) ProvisionsProvisions are recognised when the Group has a present obligation (legal or constructive) as a result of a past event, it is probable that an outflow of resources will be required to settle this obligation and a reliable estimate can be made of the amount of the obligation. Expected future cash flows to settle provisions are discounted to present value.
(17) Financial InstrumentsFinancial assets and financial liabilities are recognised on the Group’s balance sheet when the Group has become a party to the contractual provisions of the instrument.
i. Trade receivables Trade receivables are classified as loans and
receivables and are initially recognised at fair value and subsequently measured at amortised cost in accordance with IAS 39 Financial instruments: Recognition and measurement. A provision for impairment is made where there is objective evidence (including customers with financial difficulties or in default on payments) that amounts will not be recovered in accordance with original terms of the agreement. A provision for impairment is established when the carrying value of the receivable exceeds the present value of the future cash flow discounted using the original effective interest rate. The carrying value of the receivable is reduced through the use of an allowance account and any impairment loss is recognised in the income statement.
ii. Cash and cash equivalents Cash and cash equivalents comprise cash in hand
and at bank and other short-term deposits held by the Group with original maturities of less than 3 months.
iii. Financial liabilities and equity A financial liability is a contractual obligation to
deliver cash or another financial instrument. Financial liabilities and equity instruments are classified according to the substance of the contractual arrangements entered into. An equity instrument is any contract that evidences a residual interest in the assets of the Group after deducting all of its liabilities.
iv. Bank borrowings Interest bearing bank loans and overdrafts are
recorded initially at their fair value, net of direct transaction costs. Such instruments are subsequently carried at their amortised cost and
51
Cello A
nnual Report 2015
FIN
AN
CIA
LS
Accounting Policiesfor the year ended 31 December 2015
finance charges, including premiums payable on settlement or redemption, are recognised in the income statement over the term of the instrument using an effective rate of interest.
v. Trade payables Trade payables are initially recognised at fair value
and subsequently measured at amortised cost.
(18) Share Capital Ordinary shares are classified as equity.
Incremental costs directly attributable to the issue of new ordinary shares are shown in equity as a deduction, net of tax, from the proceeds.
Where any Group company purchases the Company’s equity share capital (treasury shares), the consideration paid, including any directly attributable incremental costs, net of tax, is deducted from equity until the shares are cancelled or revised. Where such shares are reissued, any consideration received, net of any direct attributable incremental costs and related income tax effects, are included in equity.
(19) Accounting Estimates and JudgementsThe Group makes estimates and judgements concerning the application of the Group’s accounting policies and concerning the future. The resulting estimates may, by definition, vary from the actual results. Estimates are based on historical experience and various other assumptions that management and the Board of Directors believe are reasonable.
The Directors consider the critical accounting estimates and judgements used in the financial statements and concluded that the main areas of judgements are:
i. Revenue recognition policies in respect of contracts which straddle the year end.
The Group is required to make an estimate of the project completion levels in respect of contracts which straddle the year end for income recognition purposes. Estimates are based on expected total costs and revenues from each contract. This involves a level of judgement and therefore differences may arise between the actual and estimated result. Where immaterial differences arise they are recognised in the income statement for the following reporting period. Any material changes to these estimates would affect revenue recognised in the financial statements and the level of deferred or accrued income on the balance sheet.
ii. Contingent deferred consideration payments in respect of acquisitions and acquisition-related employee remuneration.
The Group has estimated the value of future amounts payable in respect of acquisitions. The estimate is based on management’s estimates of the relevant entity’s future performance. If these estimates change in the future as the earn out progresses, the amount of the provision will vary. Any changes to the carrying value of the provision are recognised in the income statement.
As part of a typical acquisition an amount is also payable to the employees of the acquired company. These acquisition-related employee remuneration costs are calculated using the same estimates of the relevant entity’s future performance as the deferred consideration payable. If these estimates change in the future, as the earn out progresses, the amount of the employee liability, which is recognised over the earn out period, will vary. Any changes to the carrying value of these liabilities are recognised in the income statement.
iii. Valuation and amortisation period of separately identifiable intangible assets on acquisitions.
The Group is required to value the separately identifiable intangible assets acquired as part of a business combination. In order to value some of these intangible assets, the Group must make assumptions as to future cash flows derived from these costs and estimate the expected lives of these assets. Changes to these estimates would affect the resulting valuation of goodwill and the amortisation charge recognised in the financial statements.
iv. Impairment of goodwill and intangible assets acquired as part of a business combination.
The Group tests goodwill and intangible assets acquired as part of a business combination annually for impairment, in accordance with the Group’s accounting policies. The recoverable amount is based on value-in-use calculations, which requires estimates of future cash flows and the discount rate to apply in order to calculate the present values of these cash flows. The estimates used and sensitivity of these assumptions is disclosed in note 12.
v. Provision for VAT payable.
The Group has recognised a £3.2m provision in relation to VAT payable in respect of supplies to some of its charity clients by one of its subsidiaries, Brightsource. Discussions with HMRC continue. Further details in relation to this provision and a contingent liability in relation to additional VAT payable, are disclosed in note 20.
52
Cel
lo A
nnua
l Rep
ort 2
015
FIN
AN
CIA
LS
Notes to the Consolidated Financial Statementsfor the year ended 31 December 2015
GENERAL INFORMATION
Cello Group plc and its subsidiaries (the “Group”) provides market research, consulting and direct marketing services.
Cello Group plc is incorporated in England and Wales under the Companies Act 2006 and is domiciled in the United Kingdom. The Company is a public limited company, which is listed on the Alternative Investment Market (“AIM”) of the London Stock Exchange. The address of the Company’s registered office is 11-13 Charterhouse Buildings, London, EC1M 7AP.
The consolidated financial statements are presented in UK sterling, which is also the functional currency of the Parent Company.
The following new and revised standards and interpretations have been adopted for the financial year beginning 1 January 2014 but do not have a material impact on the Group:
• IFRS 1 (amendment) First time adoption – new standards not yet adopted
• IFRS 3 (amendment) Business combinations – joint arrangements
• IFRS 13 (amendment) Fair value measurement – portfolio exemption
• IAS 40 (amendment) Investment property – interaction with IFRS 3 Business combinations
A number of new standards, amendments to standards and interpretations are effective for annual periods beginning after 1 January 2015, and have not been applied in preparing these consolidated financial statements. None of these are expected to have a significant effect on the consolidated financial statements of the Group, except for the following set out below:
• IFRS 15 Revenue from contracts with customers (effective 1 January 2018)
• IFRS 16 Leases (effective 1 January 2019)
The Group is assessing the impact of adopting these standards.
There are no other IFRS’s or IFRS IC interpretations that are not yet effective that would be expected to have a material impact on the Group.
1 RECONCILIATION OF PROFIT BEFORE TAXATION TO HEADLINE PROFIT BEFORE TAX
Notes
Year ended 31 December 2015
£’000
Year ended 31 December 2014
£’000
Profit on continuing operations before taxation 4,754 3,790Restructuring costs 6 694 534Charge for VAT payable and related costs 20 1,301 2,109Start-up losses 7 1,037 446Acquisition costs 4 – 106Amortisation of intangible assets 13 445 965Acquisition related employee remuneration expense 4 1,591 1,200Share option charges 4 204 212
Headline profit before taxation 10,026 9,362
Headline profit before taxation is made up as follows:Headline operating profit 2 10,410 9,787Headline finance income 3 3 5Headline finance costs 3 (387) (430)
10,026 9,362
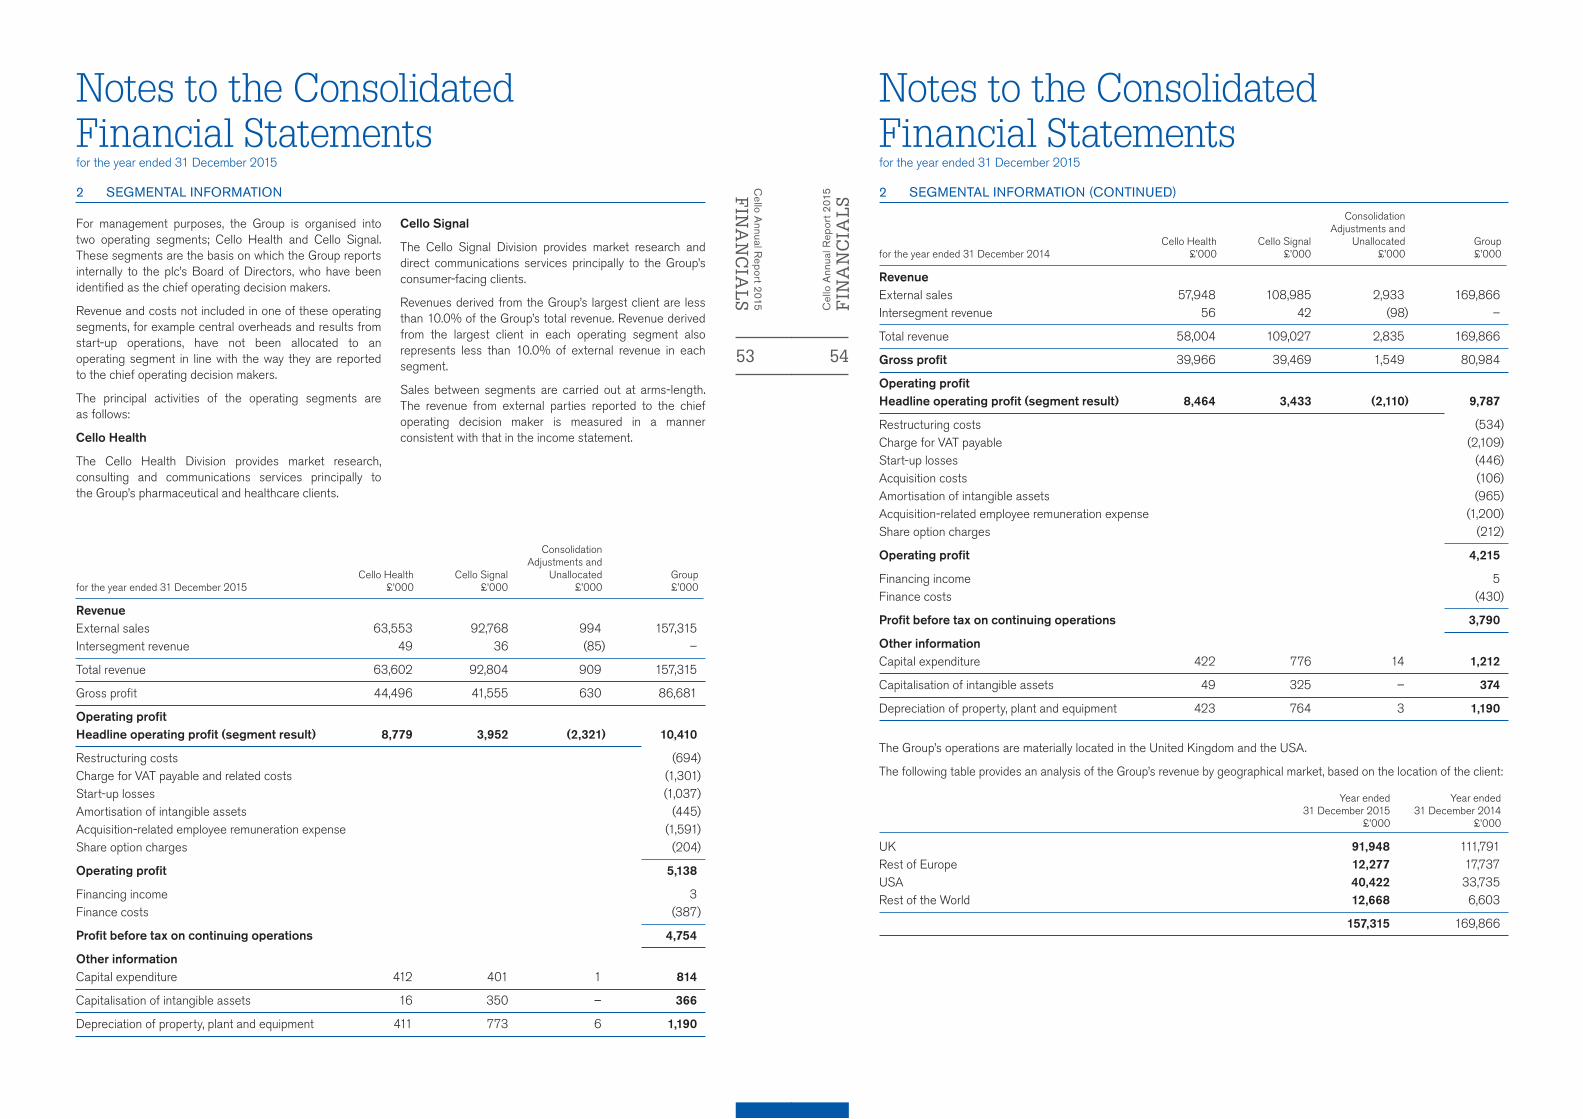
53
Cello A
nnual Report 2015
FIN
AN
CIA
LS
Notes to the Consolidated Financial Statementsfor the year ended 31 December 2015
2 SEGMENTAL INFORMATION
For management purposes, the Group is organised into two operating segments; Cello Health and Cello Signal. These segments are the basis on which the Group reports internally to the plc’s Board of Directors, who have been identified as the chief operating decision makers.
Revenue and costs not included in one of these operating segments, for example central overheads and results from start-up operations, have not been allocated to an operating segment in line with the way they are reported to the chief operating decision makers.
The principal activities of the operating segments are as follows:
Cello Health
The Cello Health Division provides market research, consulting and communications services principally to the Group’s pharmaceutical and healthcare clients.
Cello Signal
The Cello Signal Division provides market research and direct communications services principally to the Group’s consumer-facing clients.
Revenues derived from the Group’s largest client are less than 10.0% of the Group’s total revenue. Revenue derived from the largest client in each operating segment also represents less than 10.0% of external revenue in each segment.
Sales between segments are carried out at arms-length. The revenue from external parties reported to the chief operating decision maker is measured in a manner consistent with that in the income statement.
for the year ended 31 December 2015Cello Health
£’000Cello Signal
£’000
Consolidation Adjustments and
Unallocated£’000
Group£’000
RevenueExternal sales 63,553 92,768 994 157,315Intersegment revenue 49 36 (85) –
Total revenue 63,602 92,804 909 157,315
Gross profit 44,496 41,555 630 86,681
Operating profit Headline operating profit (segment result) 8,779 3,952 (2,321) 10,410
Restructuring costs (694)Charge for VAT payable and related costs (1,301)Start-up losses (1,037)Amortisation of intangible assets (445)Acquisition-related employee remuneration expense (1,591)Share option charges (204)
Operating profit 5,138
Financing income 3Finance costs (387)
Profit before tax on continuing operations 4,754
Other information Capital expenditure 412 401 1 814
Capitalisation of intangible assets 16 350 – 366
Depreciation of property, plant and equipment 411 773 6 1,190
54
Cel
lo A
nnua
l Rep
ort 2
015
FIN
AN
CIA
LS
Notes to the Consolidated Financial Statementsfor the year ended 31 December 2015
2 SEGMENTAL INFORMATION (CONTINUED)
for the year ended 31 December 2014Cello Health
£’000Cello Signal
£’000
Consolidation Adjustments and
Unallocated£’000
Group£’000
RevenueExternal sales 57,948 108,985 2,933 169,866Intersegment revenue 56 42 (98) –
Total revenue 58,004 109,027 2,835 169,866
Gross profit 39,966 39,469 1,549 80,984
Operating profit Headline operating profit (segment result) 8,464 3,433 (2,110) 9,787
Restructuring costs (534)Charge for VAT payable (2,109)Start-up losses (446)Acquisition costs (106)Amortisation of intangible assets (965)Acquisition-related employee remuneration expense (1,200)Share option charges (212)
Operating profit 4,215
Financing income 5Finance costs (430)
Profit before tax on continuing operations 3,790
Other informationCapital expenditure 422 776 14 1,212
Capitalisation of intangible assets 49 325 – 374
Depreciation of property, plant and equipment 423 764 3 1,190
The Group’s operations are materially located in the United Kingdom and the USA.
The following table provides an analysis of the Group’s revenue by geographical market, based on the location of the client:
Year ended 31 December 2015
£’000
Year ended 31 December 2014
£’000
UK 91,948 111,791Rest of Europe 12,277 17,737USA 40,422 33,735Rest of the World 12,668 6,603
157,315 169,866

55
Cello A
nnual Report 2015
FIN
AN
CIA
LS
Notes to the Consolidated Financial Statementsfor the year ended 31 December 2015
3 FINANCE INCOME AND COSTS
Year ended 31 December 2015
£’000
Year ended 31 December 2014
£’000
Finance income:Interest received on bank deposits 3 5
Total and headline finance income 3 5
Finance costs:Interest payable on bank loans and overdrafts 383 425Interest payable in respect of finance leases 4 5Finance costs paid on derivative financial instruments – –
Total and headline finance costs 387 430
4 ADMINISTRATIVE EXPENSES
Profit for the financial year is stated after charging/(crediting):
Notes
Year ended 31 December 2015
£’000
Year ended 31 December 2014
£’000
Headline administrative costs:Staff costs 8 57,059 53,149Operating lease rentals 2,930 2,752Depreciation of property, plant and equipment 14 1,190 1,190Profit on disposal of property, plant and equipment (6) (8)Amortisation of intangibles 13 373 309Auditors’ remuneration 5 497 381Net foreign exchange (gain)/loss (115) 132Other property costs 1,597 1,464Other administration costs 12,116 10,279
Non-headline administrative costs:Restructuring costs 6 694 534Charge for VAT payable and related costs 20 1,301 2,109Start-up costs 7 1,667 1,995Acquisition costs – 106Amortisation of intangibles 13 445 965Acquisition-related employee remuneration 8 1,591 1,200Share option costs 8 204 212
81,543 76,769
56
Cel
lo A
nnua
l Rep
ort 2
015
FIN
AN
CIA
LS
Notes to the Consolidated Financial Statementsfor the year ended 31 December 2015
5 AUDITORS’ REMUNERATION
Year ended 31 December 2015
£’000
Year ended 31 December 2014
£’000
Fees payable to PricewaterhouseCoopers LLP for:
Audit of Group’s annual report and financial statements 51 49Audit of subsidiaries 226 222
Total audit fees 277 271
Non-audit fees: Audit-related assurance services 14 13Tax compliance services 74 75Tax advisory services 131 8Other assurance services 1 14
Total non-audit fees 220 110
Total auditors’ remuneration 497 381
6 RESTRUCTURING COSTS
Restructuring costs comprise of cost-saving initiatives including severance payments, property and other contract termination costs. They are included within administrative costs and have been separately identified as a non-headline item because of their size or their nature or because they are non-recurring. In the opinion of the Directors, these costs are required to be separately identified, to enable a full understanding of the Group’s financial performance.
An analysis of restructuring costs incurred is as follows:
Year ended 31 December 2015
£’000
Year ended 31 December 2014
£’000
Staff redundancies 694 510Property costs – 24
Total restructuring costs 694 534
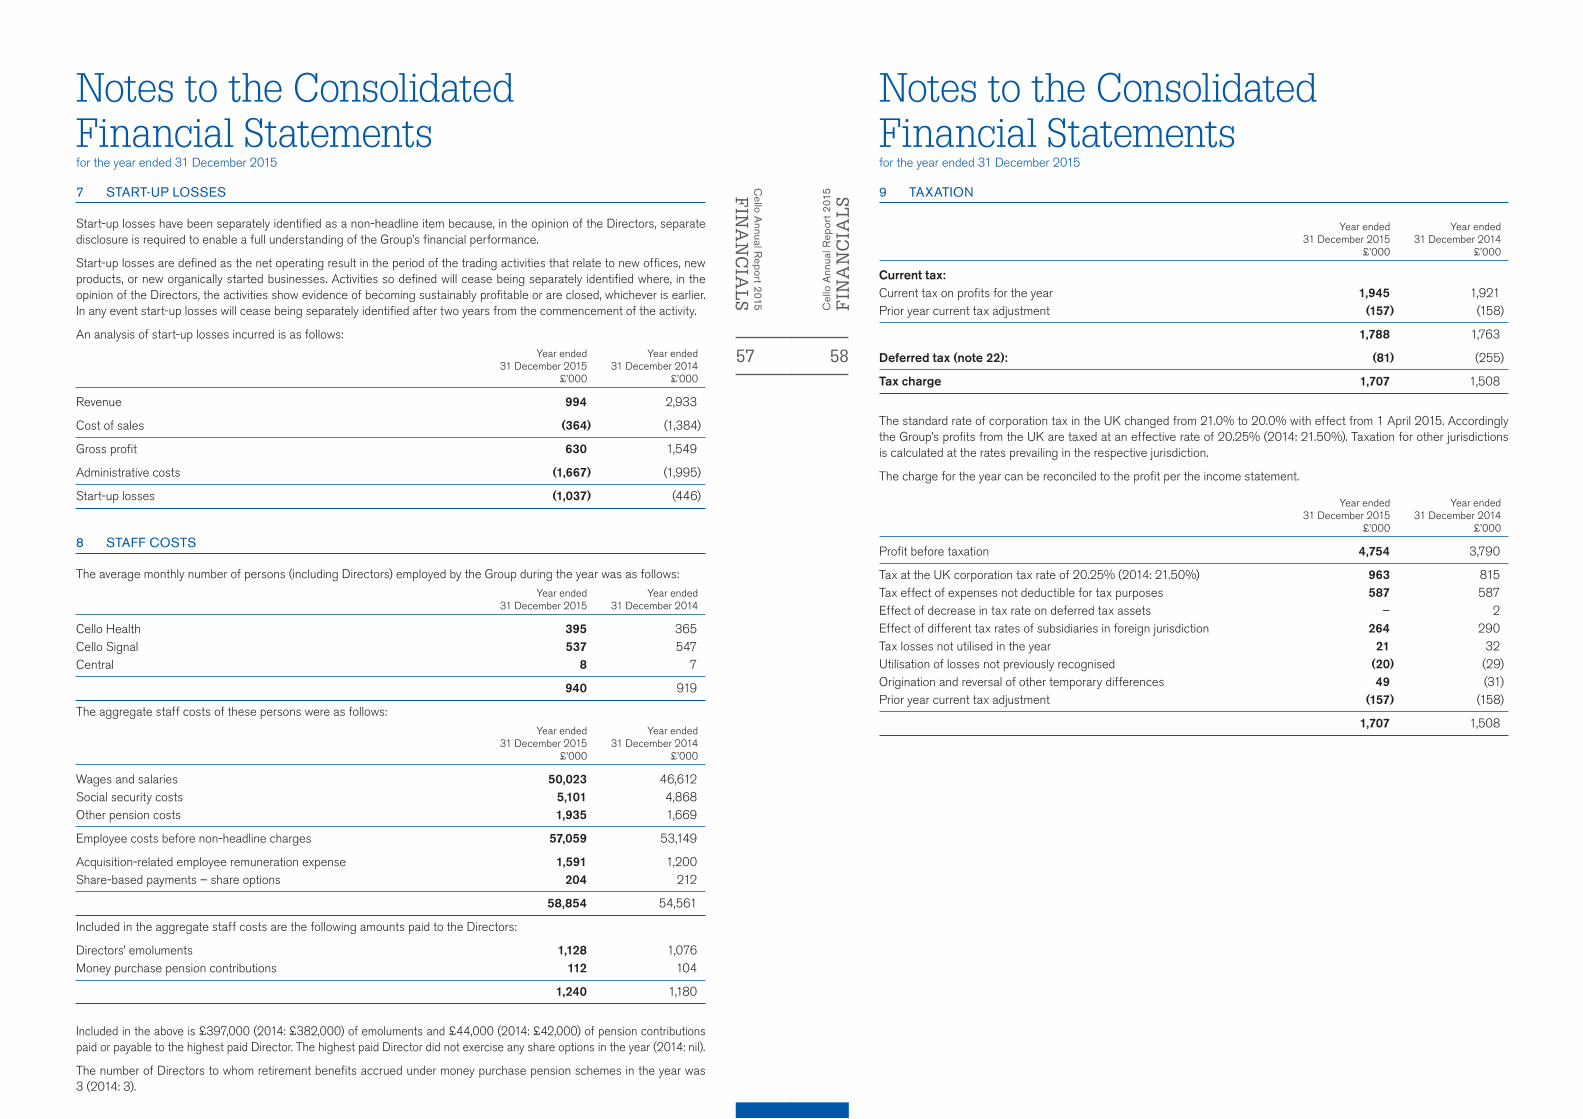
57
Cello A
nnual Report 2015
FIN
AN
CIA
LS
Notes to the Consolidated Financial Statementsfor the year ended 31 December 2015
7 START-UP LOSSES
Start-up losses have been separately identified as a non-headline item because, in the opinion of the Directors, separate disclosure is required to enable a full understanding of the Group’s financial performance.
Start-up losses are defined as the net operating result in the period of the trading activities that relate to new offices, new products, or new organically started businesses. Activities so defined will cease being separately identified where, in the opinion of the Directors, the activities show evidence of becoming sustainably profitable or are closed, whichever is earlier. In any event start-up losses will cease being separately identified after two years from the commencement of the activity.
An analysis of start-up losses incurred is as follows:
Year ended 31 December 2015
£’000
Year ended 31 December 2014
£’000
Revenue 994 2,933
Cost of sales (364) (1,384)
Gross profit 630 1,549
Administrative costs (1,667) (1,995)
Start-up losses (1,037) (446)
8 STAFF COSTS
The average monthly number of persons (including Directors) employed by the Group during the year was as follows:
Year ended 31 December 2015
Year ended 31 December 2014
Cello Health 395 365Cello Signal 537 547Central 8 7
940 919
The aggregate staff costs of these persons were as follows:
Year ended 31 December 2015
£’000
Year ended 31 December 2014
£’000
Wages and salaries 50,023 46,612Social security costs 5,101 4,868Other pension costs 1,935 1,669
Employee costs before non-headline charges 57,059 53,149
Acquisition-related employee remuneration expense 1,591 1,200Share-based payments – share options 204 212
58,854 54,561
Included in the aggregate staff costs are the following amounts paid to the Directors:
Directors’ emoluments 1,128 1,076Money purchase pension contributions 112 104
1,240 1,180
Included in the above is £397,000 (2014: £382,000) of emoluments and £44,000 (2014: £42,000) of pension contributions paid or payable to the highest paid Director. The highest paid Director did not exercise any share options in the year (2014: nil).
The number of Directors to whom retirement benefits accrued under money purchase pension schemes in the year was 3 (2014: 3).
58
Cel
lo A
nnua
l Rep
ort 2
015
FIN
AN
CIA
LS
Notes to the Consolidated Financial Statementsfor the year ended 31 December 2015
9 TAXATION
Year ended 31 December 2015
£’000
Year ended 31 December 2014
£’000
Current tax:Current tax on profits for the year 1,945 1,921Prior year current tax adjustment (157) (158)
1,788 1,763
Deferred tax (note 22): (81) (255)
Tax charge 1,707 1,508
The standard rate of corporation tax in the UK changed from 21.0% to 20.0% with effect from 1 April 2015. Accordingly the Group’s profits from the UK are taxed at an effective rate of 20.25% (2014: 21.50%). Taxation for other jurisdictions is calculated at the rates prevailing in the respective jurisdiction.
The charge for the year can be reconciled to the profit per the income statement.
Year ended 31 December 2015
£’000
Year ended 31 December 2014
£’000
Profit before taxation 4,754 3,790
Tax at the UK corporation tax rate of 20.25% (2014: 21.50%) 963 815Tax effect of expenses not deductible for tax purposes 587 587Effect of decrease in tax rate on deferred tax assets – 2Effect of different tax rates of subsidiaries in foreign jurisdiction 264 290Tax losses not utilised in the year 21 32Utilisation of losses not previously recognised (20) (29)Origination and reversal of other temporary differences 49 (31)Prior year current tax adjustment (157) (158)
1,707 1,508
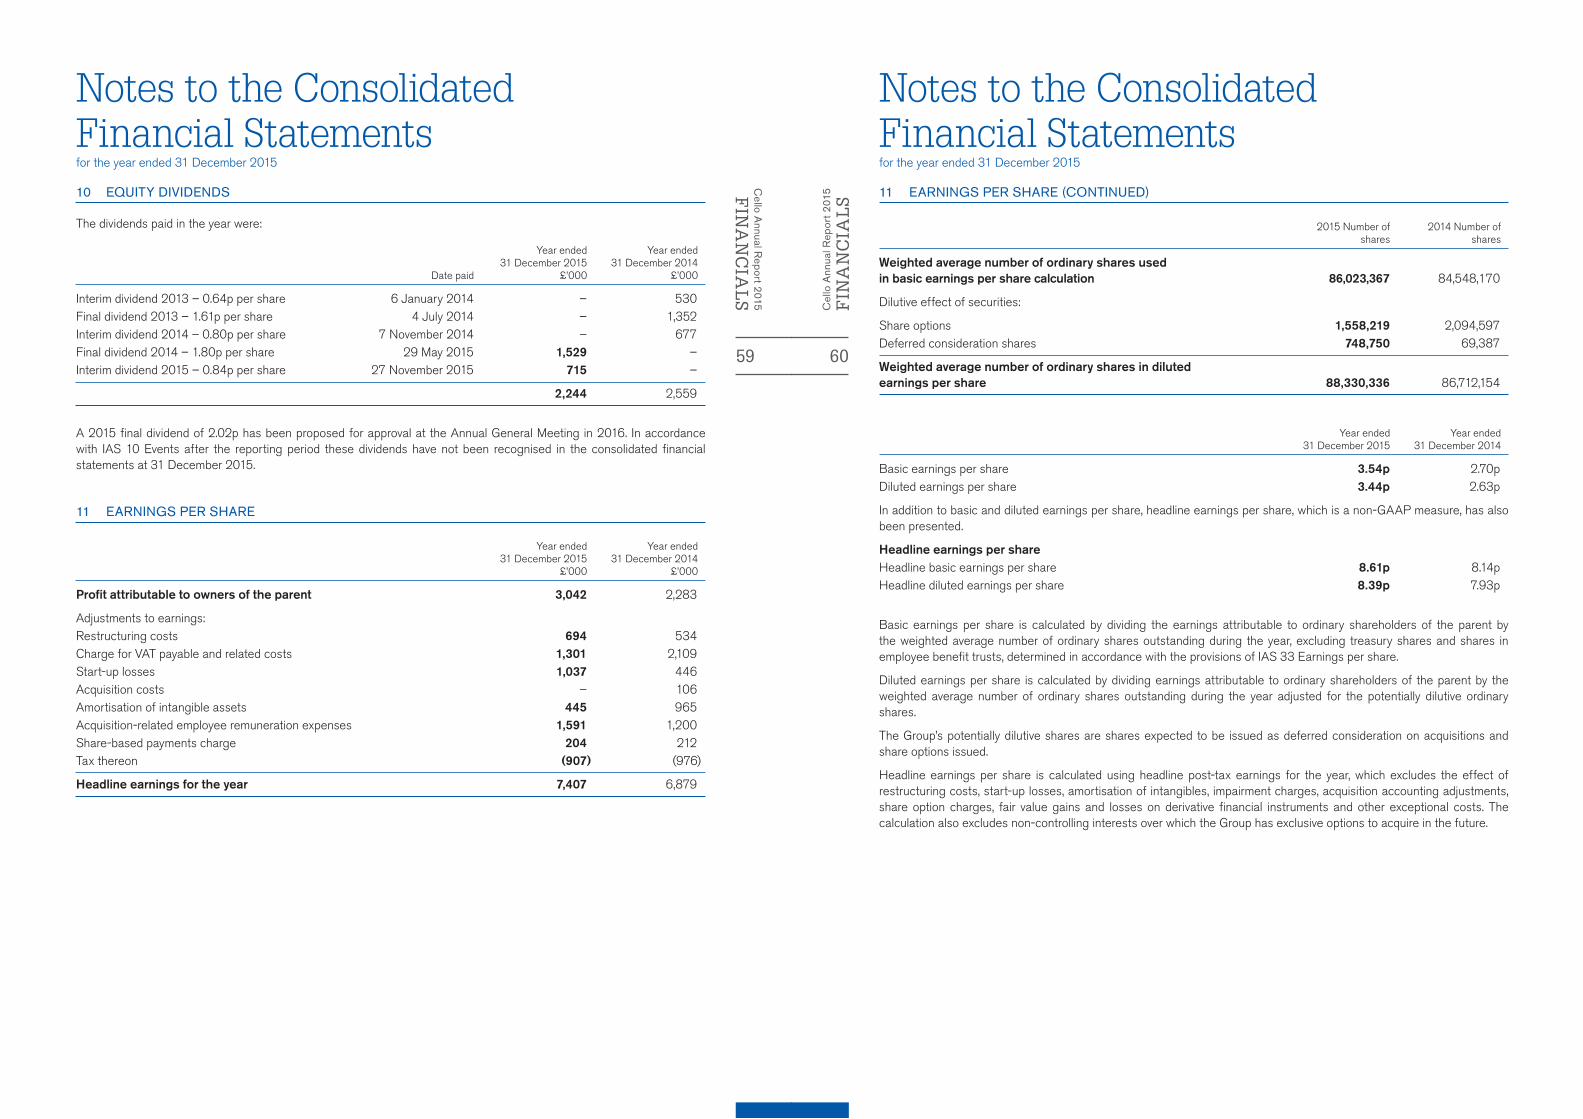
59
Cello A
nnual Report 2015
FIN
AN
CIA
LS
Notes to the Consolidated Financial Statementsfor the year ended 31 December 2015
10 EQUITY DIVIDENDS
The dividends paid in the year were:
Date paid
Year ended 31 December 2015
£’000
Year ended 31 December 2014
£’000
Interim dividend 2013 – 0.64p per share 6 January 2014 – 530Final dividend 2013 – 1.61p per share 4 July 2014 – 1,352Interim dividend 2014 – 0.80p per share 7 November 2014 – 677Final dividend 2014 – 1.80p per share 29 May 2015 1,529 –Interim dividend 2015 – 0.84p per share 27 November 2015 715 –
2,244 2,559
A 2015 final dividend of 2.02p has been proposed for approval at the Annual General Meeting in 2016. In accordance with IAS 10 Events after the reporting period these dividends have not been recognised in the consolidated financial statements at 31 December 2015.
11 EARNINGS PER SHARE
Year ended 31 December 2015
£’000
Year ended 31 December 2014
£’000
Profit attributable to owners of the parent 3,042 2,283
Adjustments to earnings: Restructuring costs 694 534Charge for VAT payable and related costs 1,301 2,109Start-up losses 1,037 446Acquisition costs – 106Amortisation of intangible assets 445 965Acquisition-related employee remuneration expenses 1,591 1,200Share-based payments charge 204 212Tax thereon (907) (976)
Headline earnings for the year 7,407 6,879
60
Cel
lo A
nnua
l Rep
ort 2
015
FIN
AN
CIA
LS
Notes to the Consolidated Financial Statementsfor the year ended 31 December 2015
11 EARNINGS PER SHARE (CONTINUED)
2015 Number of shares
2014 Number of shares
Weighted average number of ordinary shares used in basic earnings per share calculation 86,023,367 84,548,170
Dilutive effect of securities:
Share options 1,558,219 2,094,597Deferred consideration shares 748,750 69,387
Weighted average number of ordinary shares in diluted earnings per share 88,330,336 86,712,154
Year ended 31 December 2015
Year ended 31 December 2014
Basic earnings per share 3.54p 2.70pDiluted earnings per share 3.44p 2.63p
In addition to basic and diluted earnings per share, headline earnings per share, which is a non-GAAP measure, has also been presented.
Headline earnings per shareHeadline basic earnings per share 8.61p 8.14pHeadline diluted earnings per share 8.39p 7.93p
Basic earnings per share is calculated by dividing the earnings attributable to ordinary shareholders of the parent by the weighted average number of ordinary shares outstanding during the year, excluding treasury shares and shares in employee benefit trusts, determined in accordance with the provisions of IAS 33 Earnings per share.
Diluted earnings per share is calculated by dividing earnings attributable to ordinary shareholders of the parent by the weighted average number of ordinary shares outstanding during the year adjusted for the potentially dilutive ordinary shares.
The Group’s potentially dilutive shares are shares expected to be issued as deferred consideration on acquisitions and share options issued.
Headline earnings per share is calculated using headline post-tax earnings for the year, which excludes the effect of restructuring costs, start-up losses, amortisation of intangibles, impairment charges, acquisition accounting adjustments, share option charges, fair value gains and losses on derivative financial instruments and other exceptional costs. The calculation also excludes non-controlling interests over which the Group has exclusive options to acquire in the future.

61
Cello A
nnual Report 2015
FIN
AN
CIA
LS
Notes to the Consolidated Financial Statementsfor the year ended 31 December 2015
12 GOODWILL
£’000
Cost
At 1 January 2014 83,571Additions 1,911Exchange differences 293
At 31 December 2014 85,775Additions –Exchange differences 277
At 31 December 2015 86,052
Amortisation At 1 January 2014, 31 December 2014 and 31 December 2015 12,379
Net book valueAt 31 December 2015 73,673
At 31 December 2014 73,396
At 1 January 2014 71,192
Goodwill represents the excess of consideration over the fair value of the Group’s share of the net identifiable assets of the acquired subsidiary at the date of acquisition.
Goodwill acquired through business combinations is allocated to CGUs for impairment testing. The goodwill balance was allocated to the following CGUs:
2015£’000
2014£’000
Cello Health Insight 10,224 10,224Cello Health Consulting 7,666 7,666MedErgy 5,138 4,861Mash 248 248iS Health 1,425 1,425Promedica 257 257The Value Engineers 9,526 9,526RS Consulting 4,305 4,305Tangible UK 23,118 23,1182CV 8,276 8,276Face 3,442 3,442Opticomm 48 48
Total 73,673 73,396
62
Cel
lo A
nnua
l Rep
ort 2
015
FIN
AN
CIA
LS
Notes to the Consolidated Financial Statementsfor the year ended 31 December 2015
12 GOODWILL (CONTINUED)
The recoverable amount for each CGU is determined using a value-in-use calculation. This calculation uses pre-tax cash flow projections derived from 2016 budgets, as approved by management, with an underlying growth rate of 2.5% per annum in years 2 to 5. After year 5 a terminal value has been applied using an underlying long-term growth rate of 2.5%. No additional Cello specific growth has been assumed beyond year 1. The pre-tax cash flows are discounted to present value using the Group’s pre-tax weighted average cost of capital (“WACC”), which was 9.1% for 2015 (2014: 9.3%). This rate was calculated using the Capital Asset Pricing Model with an estimated cost of debt and equity, with appropriate small company risk factors.
Sensitivity to changes in assumptions
The value-in-use exceeds the total goodwill value across the Group by £122.1m.
The impairment review of the Group is sensitive to changes in the key assumptions, most notably the pre-tax discount rate, the terminal growth rate and projected operating cash flows. Reasonable changes to these assumptions are considered to be:
• 1.0% increase in the pre-tax discount rate.
• 1.0% decrease in the terminal growth rate.
• 10.0% decrease in projected operating cash flows.
Reasonable changes to the assumptions used, considered in isolation, would not result in an impairment to goodwill for any of the Groups CGUs.
13 INTANGIBLE ASSETS
Software development costs
£’000Client contracts
£’000Licences
£’000Total
£’000
CostAt 1 January 2014 1,362 4,245 3,209 8,816Expenditure on development 374 – – 374On acquisition of subsidiaries – 1,106 – 1,106Exchange differences – 11 – 11
At 31 December 2014 1,736 5,362 3,209 10,307Expenditure on development 366 – – 366Exchange differences – 10 – 10
At 31 December 2015 2,102 5,372 3,209 10,683
Accumulated amortisation At 1 January 2014 785 3,547 3,209 7,541Charge for the year 309 965 – 1,274
At 31 December 2014 1,094 4,512 3,209 8,815Charge for the year 373 445 – 818
At 31 December 2015 1,467 4,957 3,209 9,633
Net book value
At 31 December 2015 635 415 – 1,050
At 31 December 2014 642 850 – 1,492
At 1 January 2014 577 698 – 1,275
Amortisation of intangible assets is included in administrative expenses within the consolidated income statement.

63
Cello A
nnual Report 2015
FIN
AN
CIA
LS
Notes to the Consolidated Financial Statementsfor the year ended 31 December 2015
14 PROPERTY, PLANT AND EQUIPMENT
Leasehold improvements
£’000
Computer equipment
£’000
Fixtures, fittings and office equipment
£’000Motor vehicles
£’000Total
£’000
CostAt 1 January 2014 2,186 4,422 1,105 204 7,917Additions 161 630 404 17 1,212On acquisition of subsidiaries 1 71 2 16 90Disposals – (25) (39) – (64)Exchange differences 10 33 35 2 80
At 31 December 2014 2,358 5,131 1,507 239 9,235Additions 111 623 60 20 814Disposals – (4) (6) (50) (60)Exchange differences (4) 31 26 – 53
At 31 December 2015 2,465 5,781 1,587 209 10,042
Accumulated depreciationAt 1 January 2014 1,425 3,590 560 130 5,705Charge for the year 292 579 280 39 1,190Disposals – (24) (19) – (43)Exchange differences 15 26 19 2 62
At 31 December 2014 1,732 4,171 840 171 6,914Charge for the year 256 615 280 39 1,190Disposals – (1) (2) (47) (50)Exchange differences 4 23 11 – 38
At 31 December 2015 1,992 4,808 1,129 163 8,092
Net book value
At 31 December 2015 473 973 458 46 1,950
At 31 December 2014 626 960 667 68 2,321
At 1 January 2014 761 832 545 74 2,212
The net book value of property, plant and equipment of the Group includes £31,000 (2014: £39,000) of motor vehicles and £39,000 (2014: £57,000) of fixtures, fittings and office equipment in respect of assets held under finance leases.
64
Cel
lo A
nnua
l Rep
ort 2
015
FIN
AN
CIA
LS
Notes to the Consolidated Financial Statementsfor the year ended 31 December 2015
15 SUBSIDIARIES
Details of the Company’s subsidiary undertakings as at 31 December 2015 are as follows:
Company nameCountry of incorporation/
principal operation Class of shareProportion of
shares held 2015
Held directly:2CV Limited England Ordinary 100%Cello Group Inc USA Ordinary 100%Cello Signal Group Limited England Ordinary 100%Chiaros Holdings Limited England Ordinary 100%Farm Communications Limited England Ordinary 100%Fenix Media Limited England Ordinary 97%Insight Medical Research Limited England Ordinary 100%iS Healthcare Dynamic Limited England Ordinary 100%Mash Health Limited England Ordinary 100%Market Research International Limited England Ordinary 100%MedErgy Europe Limited England Ordinary 100%Opticomm Media Limited England Ordinary 51%RS Consulting Group Limited England Ordinary 100%The MSI Consultancy Limited England Ordinary 100%The Value Engineers Limited England Ordinary 100%
Held indirectly:2CV Hong Kong Limited Hong Kong Ordinary 100%2CV Pte Limited Singapore Ordinary 100%2CV Inc USA Ordinary 100%Blonde Digital Limited Scotland Ordinary 100%Brightgroup Limited England Ordinary 100%Brightsource Limited England Ordinary 100%Cello 123 Limited Scotland Ordinary 100%Cello Health BioConsulting Inc USA Ordinary 100%Cello Health Consulting Inc USA Ordinary 100%Cello (Research and Consulting) Limited England Ordinary 100%Cello MRUK Limited England Ordinary 100%Cello Signal Limited Scotland Ordinary 100%Consensus Research International Limited England Ordinary 100%Human Innovation Limited England Ordinary 100%Insight Research Group USA Inc USA Ordinary 100%Intangibles Measurement and Management Limited England Ordinary 100%iS Academy Limited England Ordinary 100%iS Health Group Limited England Ordinary 100%iS Lifesciences Limited England Ordinary 100%Kudos Research Limited England Ordinary 100%Labinah Management Training Limited England Ordinary 100%Leapfrog in America Inc USA Ordinary 100%Line Digital Limited England Ordinary 100%Mash Health Inc USA Ordinary 100%MedErgy Communications Inc USA Ordinary 100%MedErgy Healthcare Group USA Ordinary 100%MedErgy Marketing Inc USA Ordinary 100%Mighty Blast Limited England Ordinary 100%Navigator Responsive Advertising Limited Scotland Ordinary 100%RS Consulting Limited England Ordinary 100%Scifluent Communications Inc USA Ordinary 100%Stripe PR and Communications Limited Scotland Ordinary 100%The Leith Agency Limited Scotland Ordinary 100%Worldwide Promedica Inc USA Ordinary 100%

65
Cello A
nnual Report 2015
FIN
AN
CIA
LS
16 TRADE AND OTHER RECEIVABLES
2015£’000
2014£’000
Trade receivables 35,216 29,866Other receivables 1,435 1,331Prepayments and accrued income 7,032 8,847
43,683 40,044
The average credit period taken on the provision of services was 60 days (2014: 55 days).
The Directors consider that the carrying value of trade and other receivables approximates to fair value.
17 CASH AND CASH EQUIVALENTS
2015£’000
2014£’000
Cash at bank and in hand 5,249 5,566
18 TRADE AND OTHER PAYABLES
The following are included in trade and other payables falling due within one year:
2015£’000
2014£’000
Trade payables 14,104 16,871Other taxation and social security costs 2,112 720Accruals and deferred income 22,228 18,158Deferred consideration for acquisitions 35 235Acquisition-related employee remuneration liability 446 500Other payables 467 697
39,392 37,181
The following are included in trade and other payables falling due after one year:
Acquisition-related employee remuneration liability 1,693 700
The Directors consider that the carrying value of trade and other payables approximates to fair value.
Notes to the Consolidated Financial Statementsfor the year ended 31 December 2015
66
Cel
lo A
nnua
l Rep
ort 2
015
FIN
AN
CIA
LS
Notes to the Consolidated Financial Statementsfor the year ended 31 December 2015
19 BORROWINGS
2015£’000
2014£’000
Bank loans 9,127 12,359Loan notes 232 300
9,359 12,659
The borrowings are repayable as follows:– on demand or within 1 year 232 300– within 2 to 5 years 9,127 12,359
9,359 12,659
Bank loans
The Group has a multi-currency debt facility with the Royal Bank of Scotland plc (“RBS”). At 31 December 2015 this facility consisted of a £20.0m revolving credit facility (“RCF”). The RCF bears interest at a variable rate of 1.25% to 2.30% over LIBOR and is committed to March 2018. The average interest rate on the Group’s bank loans in the year was 2.2% (2014: 2.4%). The debt facility is secured by a debenture held by RBS over the assets of the Group.
At 31 December 2015, the Group has drawn £9.1m (2014: £12.4m) under the RCF.
Loan notes
Loan notes have been issued as part of the consideration for certain acquisitions. Loan notes are initially secured by way of cash deposits and by guarantee. This security expires after a period of between 2 and 5 years in accordance with the terms of the relevant acquisition agreement. After this period the loan notes are unsecured. Loan notes bear interest at the following rates:
2015£’000
2014£’000
UnsecuredLIBOR less 2.0% 198 249LIBOR 34 51
232 300
20 PROVISIONS
VAT provision£’000
At 1 January 2014 –Utilisation of provisions 2,109
At 31 December 2014 2,109Additions in the year 1,100
At 31 December 2015 3,209
The provision for VAT payable is in relation to amounts payable, including an estimate for interest and penalties, to HMRC in respect of certain supplies to charity clients. In accordance with IAS 37 Provisions, contingent liabilities and contingent assets, potential recovery from clients has not been recognised.
In addition to the provision, the Group incurred £201,000 (2014: nil) of legal and professional fees in relation to the ongoing discussions with HMRC on this matter.
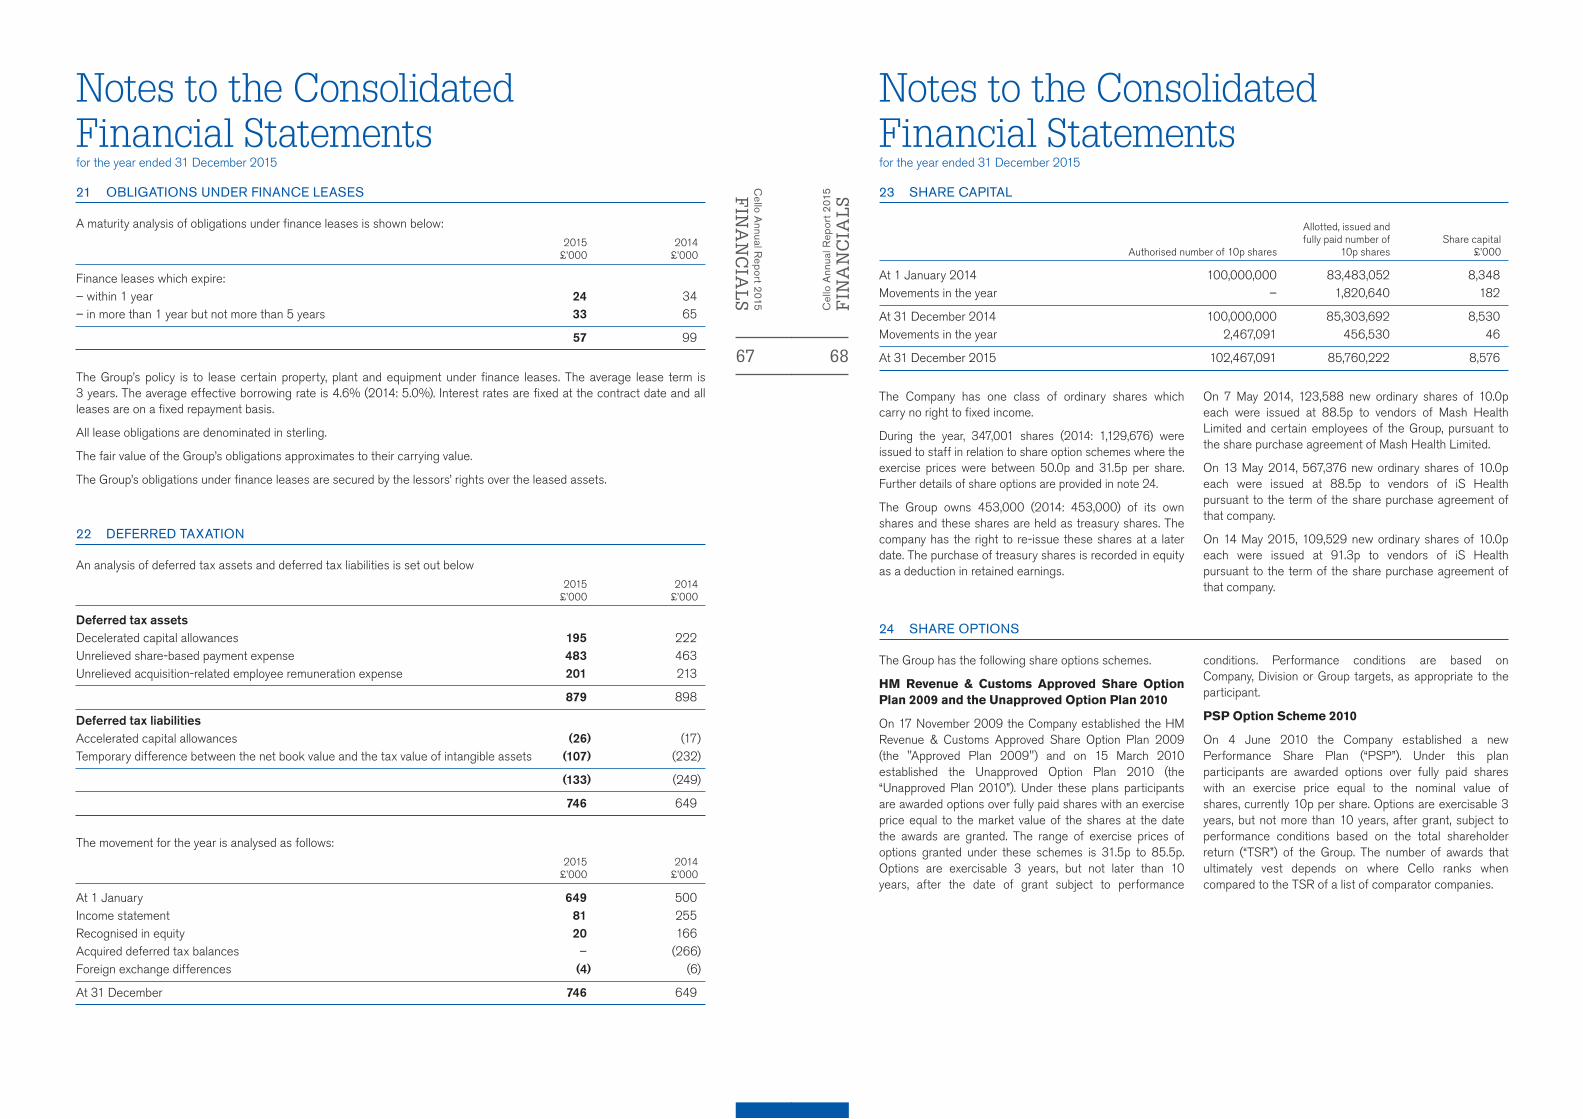
67
Cello A
nnual Report 2015
FIN
AN
CIA
LS
Notes to the Consolidated Financial Statementsfor the year ended 31 December 2015
21 OBLIGATIONS UNDER FINANCE LEASES
A maturity analysis of obligations under finance leases is shown below:
2015£’000
2014£’000
Finance leases which expire:– within 1 year 24 34– in more than 1 year but not more than 5 years 33 65
57 99
The Group’s policy is to lease certain property, plant and equipment under finance leases. The average lease term is 3 years. The average effective borrowing rate is 4.6% (2014: 5.0%). Interest rates are fixed at the contract date and all leases are on a fixed repayment basis.
All lease obligations are denominated in sterling.
The fair value of the Group’s obligations approximates to their carrying value.
The Group’s obligations under finance leases are secured by the lessors’ rights over the leased assets.
22 DEFERRED TAXATION
An analysis of deferred tax assets and deferred tax liabilities is set out below
2015£’000
2014£’000
Deferred tax assetsDecelerated capital allowances 195 222Unrelieved share-based payment expense 483 463Unrelieved acquisition-related employee remuneration expense 201 213
879 898
Deferred tax liabilitiesAccelerated capital allowances (26) (17)Temporary difference between the net book value and the tax value of intangible assets (107) (232)
(133) (249)
746 649
The movement for the year is analysed as follows:
2015£’000
2014£’000
At 1 January 649 500Income statement 81 255Recognised in equity 20 166Acquired deferred tax balances – (266)Foreign exchange differences (4) (6)
At 31 December 746 649
68
Cel
lo A
nnua
l Rep
ort 2
015
FIN
AN
CIA
LS
Notes to the Consolidated Financial Statementsfor the year ended 31 December 2015
24 SHARE OPTIONS
The Group has the following share options schemes.
HM Revenue & Customs Approved Share Option Plan 2009 and the Unapproved Option Plan 2010
On 17 November 2009 the Company established the HM Revenue & Customs Approved Share Option Plan 2009 (the "Approved Plan 2009") and on 15 March 2010 established the Unapproved Option Plan 2010 (the “Unapproved Plan 2010”). Under these plans participants are awarded options over fully paid shares with an exercise price equal to the market value of the shares at the date the awards are granted. The range of exercise prices of options granted under these schemes is 31.5p to 85.5p. Options are exercisable 3 years, but not later than 10 years, after the date of grant subject to performance
conditions. Performance conditions are based on Company, Division or Group targets, as appropriate to the participant.
PSP Option Scheme 2010
On 4 June 2010 the Company established a new Performance Share Plan (“PSP”). Under this plan participants are awarded options over fully paid shares with an exercise price equal to the nominal value of shares, currently 10p per share. Options are exercisable 3 years, but not more than 10 years, after grant, subject to performance conditions based on the total shareholder return (“TSR”) of the Group. The number of awards that ultimately vest depends on where Cello ranks when compared to the TSR of a list of comparator companies.
23 SHARE CAPITAL
Authorised number of 10p shares
Allotted, issued and fully paid number of
10p sharesShare capital
£’000
At 1 January 2014 100,000,000 83,483,052 8,348Movements in the year – 1,820,640 182
At 31 December 2014 100,000,000 85,303,692 8,530Movements in the year 2,467,091 456,530 46
At 31 December 2015 102,467,091 85,760,222 8,576
The Company has one class of ordinary shares which carry no right to fixed income.
During the year, 347,001 shares (2014: 1,129,676) were issued to staff in relation to share option schemes where the exercise prices were between 50.0p and 31.5p per share. Further details of share options are provided in note 24.
The Group owns 453,000 (2014: 453,000) of its own shares and these shares are held as treasury shares. The company has the right to re-issue these shares at a later date. The purchase of treasury shares is recorded in equity as a deduction in retained earnings.
On 7 May 2014, 123,588 new ordinary shares of 10.0p each were issued at 88.5p to vendors of Mash Health Limited and certain employees of the Group, pursuant to the share purchase agreement of Mash Health Limited.
On 13 May 2014, 567,376 new ordinary shares of 10.0p each were issued at 88.5p to vendors of iS Health pursuant to the term of the share purchase agreement of that company.
On 14 May 2015, 109,529 new ordinary shares of 10.0p each were issued at 91.3p to vendors of iS Health pursuant to the term of the share purchase agreement of that company.

69
Cello A
nnual Report 2015
FIN
AN
CIA
LS
Notes to the Consolidated Financial Statementsfor the year ended 31 December 2015
24 SHARE OPTIONS (CONTINUED)
The following share options were outstanding under these share option schemes at 31 December 2015 and 31 December 2014:
Number of share options
31 December 2015
Weighted average exercise price
(pence)Number of share
options
31 December 2014
Weighted average exercise price
(pence)
Outstanding at the beginning of the year 5,395,740 33 6,096,420 33Granted during the year – – 957,607 49Exercised during the year (347,001) 34 (1,129,676) 29Lapsed during the year (466,634) 78 (528,611) 71
Outstanding at the end of the year 4,582,105 28 5,395,740 33
Exercisable at the end of the year 2,324,644 22 1,656,014 32
The options outstanding at the end of the year under the PSP, Approved Plan 2009 and the Unapproved Plan 2010 have a weighted average remaining life of 5.7 years (2014: 7.5 years).
The Group uses a Black Scholes model to calculate the fair value of options. The key inputs for share options granted in the year ended 31 December 2014 (no options granted in 2015):
2014
Weighted average share price 85.5pWeighted average exercise price 49.0pExpected volatility 31.4%Expected life 10 yearsRisk-free rate 2.83%Dividend yield 2.63%
Expected volatility has been determined by calculating the historical volatility of the Group’s share price over the previous 10 years. The expected life used in the model has been adjusted, based on management’s best estimates, for the effects of the non-transferability, exercise restrictions and behavioural considerations.
The following options have vested and are unexercised at 31 December 2015 and 31 December 2014:
2015 Number
2014Number
EMI Scheme – 81,633Unapproved Scheme – 81,633PSP 1,284,000 804,000Approved plan 2010 747,579 638,460Unapproved plan 2011 293,065 50,288
2,324,644 1,656,014
The fair value of all options granted in the year was £nil (2014: £394,000).
70
Cel
lo A
nnua
l Rep
ort 2
015
FIN
AN
CIA
LS
Notes to the Consolidated Financial Statementsfor the year ended 31 December 2015
25 CASH GENERATED FROM OPERATIONS
Year ended 31 December 2015
£’000
Year ended 31 December 2014
£’000
Profit on before taxation 4,754 3,790
Financing income (3) (5)Finance costs 387 430Depreciation of property, plant and equipment 1,190 1,190Amortisation of intangible assets 818 1,274Share-based payment expense 204 212Profit on disposal of property, plant and equipment (6) (8)Increase in acquisition-related employee remuneration payable 1,039 820Increase in provisions 1,100 2,109
Operating cash flow before movements in working capital 9,483 9,812
Increase in trade and other receivables (3,693) (2,102)Increase/(decrease) in trade and other payables 2,457 (2,947)
Net cash inflow from operating activities 8,247 4,763
26 NET DEBT
Net debt at 31 December 2015 and 31 December 2014 comprises of:
2015£’000
2014£’000
Bank loans 9,127 12,359Loan notes 232 300Finance leases 57 99Cash and cash equivalents (5,249) (5,566)
Net debt 4,167 7,192
Changes in net debt can be analysed as follows:
2015£’000
2014£’000
Net decrease in cash and cash equivalents 480 588
Changes in net debt as a result of cash flow: Repayment of bank loans (12,749) (4,000)Repayment of loan notes (68) (73)Draw down of borrowings 9,165 6,800Capital element of finance lease payments (42) (36)
Other movements:Foreign exchange differences 189 243New finance leases – 109
Movement in net debt in the year (3,025) 3,631Net debt at the beginning of the year 7,192 3,561
Net debt at the end of the year 4,167 7,192

71
Cello A
nnual Report 2015
FIN
AN
CIA
LS
Notes to the Consolidated Financial Statementsfor the year ended 31 December 2015
27 COMMITMENTS UNDER OPERATING LEASES
The future aggregate minimum lease payments under non-cancellable operating leases are as follows:Land and
buildings 2015£’000
Land and buildings 2014
£’000Other 2015
£’000Other 2014
£’000
No later than 1 year 2,437 2,536 122 121Later than 1 year and no later than 5 years 5,824 5,933 136 154Later than 5 years 1,397 1,776 – –
9,658 10,245 258 275
28 RELATED PARTY TRANSACTIONS
The ultimate controlling party of the Group is Cello Group plc, a company incorporated in England and Wales. The Group has related party relationships with its subsidiaries and its Directors.
Transactions between the Company and its subsidiaries have been eliminated on consolidation and are not disclosed in this note.
Remuneration of key management personnel
The key management personnel of the Group are considered to be the Directors (Executive and Non-Executive). The remuneration paid to the key management personnel is shown below:
Year ended 31 December 2015
£’000
Year ended 31 December 2014
£’000
Salaries and other short-term benefits 1,268 1,217Post-employment benefits 112 104Share-based payments – share options 98 93
1,478 1,414
Further information about the remuneration of the Directors is provided in the Report of the Remuneration Committee on pages 38 to 39, and in note 8 to the consolidated financial statements.
29 POST BALANCE SHEET EVENTS
In March 2016, agreement was reached between Cello Health BioConsulting Inc, certain employees of Cello Health BioConsulting Inc (“the employees”), and their previous employer, in relation to the partial release of the employees from ongoing post-employment restrictions. When this agreement is formally completed, a payment of £0.9m will be made, with additional payments contingent on the financial performance of the business over the next 12 months.
72
Cel
lo A
nnua
l Rep
ort 2
015
FIN
AN
CIA
LS
Notes to the Consolidated Financial Statementsfor the year ended 31 December 2015
30 FINANCIAL INSTRUMENTS
The Group’s principal financial instruments comprise of bank loans, bank overdrafts, loan notes, finance leases, deferred consideration for acquisitions under IFRS 3 (Revised), trade receivables, trade payables and cash. The main purpose of these financial instruments is to provide finance for the Group operations. The Group has other financial assets and liabilities which arise directly from operations.
The following table provides an analysis of the Group’s non-derivative financial assets and liabilities at 31 December 2015 and 31 December 2014:
2015£’000
2014£’000
Financial assets:Cash and cash equivalents 5,249 5,566Trade receivables 35,216 29,866Other receivables 1,435 1,331Accrued income 5,076 6,863
Total financial assets 46,976 43,626
Financial liabilities:Bank loans 9,127 12,359Loan notes 232 300Finance leases 57 99Amounts payable in respect of acquisitions 2,174 1,435Trade payables 14,104 16,871Accruals 13,846 11,617Other payables 467 697
Total financial liabilities 40,007 43,378
All non-derivative financial assets are categorised as loans and receivables and all non-derivative financial liabilities are categorised as other financial liabilities at amortised cost.
Derivative financial instruments are recognised in the balance sheet at fair value. All other financial assets and liabilities are recognised in the balance sheet at amortised cost.
Risk management objectives and policies
The main risks arising from the Group’s financial instruments are interest rate risk, liquidity risk, credit risk and foreign exchange risk.
Interest rate risk
The Group’s exposure to interest rate risk arises from the Group’s long-term debt obligations with floating and fixed interest rates. Floating rate financial instruments comprise of the Group’s cash and cash equivalents and borrowings. Fixed rate financial instruments comprise of obligations under finance leases.
£6.9m (2014: £6.9m) of the Group’s borrowings are denominated in USA dollars and £0.7m (2014: nil) are denominated in euros. All of the Group’s other borrowings and obligations under finance leases are denominated in sterling. Details of the Group’s borrowings are set out in note 19 and details of the Groups obligations under finance leases are set out in note 21.

73
Cello A
nnual Report 2015
FIN
AN
CIA
LS
Notes to the Consolidated Financial Statementsfor the year ended 31 December 2015
30 FINANCIAL INSTRUMENTS (CONTINUED)
The following table demonstrates the sensitivity to reasonable possible changes in interest rates, with all other variables held constant, on the Group’s profit before tax and equity:
2015£’000
2014£’000
Increase in rates of 100 basis points Effect on profit before tax and equity (132) (134)
Decrease in rates of 50 basis pointsEffect on profit before tax and equity 66 67
Liquidity risk
The Group manages liquidity risk by maintaining adequate reserves on its available bank facilities and by continuously monitoring forecast and actual cash flows.
At 31 December 2015 the Group has an agreed committed RCF of £20.0m with RBS, which is committed to March 2018.
In addition to the RCF the Group has an overdraft facility of £4.0m with RBS, which is committed to March 2018.
At 31 December 2015 the Group had an undrawn facility of £10.9m (2014: £7.6m) on the RCF and cash and cash equivalents of £5.2m (2014: £5.6m).
The table below summarises the maturity profile of the Group’s non-derivative financial liabilities at 31 December 2015 and 31 December 2014 based on contractual undiscounted payments, including estimated interest payments where applicable:
2015Less than 6 months
£’000
Between 6 months and 1 year
£’000
Between 1 and 5 years £’000
Total £’000
Bank loans 67 50 9,352 9,469Loan notes 232 – – 232Finance leases 11 11 40 62Amounts payable in respect of acquisitions 481 – 1,693 2,174Trade payables 14,104 – – 14,104Accruals 13,846 – – 13,846Other payables 467 – – 467
Total 29,208 61 11,085 40,354
2014Less than 6 months
£’000
Between 6 months and 1 year
£’000
Between 1 and 5 years £’000
Total £’000
Bank loans 85 70 12,674 12,829Loan notes 300 – – 300Finance leases 19 18 69 106Amounts payable in respect of acquisitions 735 – 700 1,435Trade payables 16,871 – – 16,871Accruals 11,617 – – 11,617Other payables 697 – – 697
Total 30,324 88 13,443 43,855
74
Cel
lo A
nnua
l Rep
ort 2
015
FIN
AN
CIA
LS
Notes to the Consolidated Financial Statementsfor the year ended 31 December 2015
30 FINANCIAL INSTRUMENTS (CONTINUED)
Credit risk
Credit risk predominately arises from trade receivables.
The Group only trades with recognised creditworthy third parties. Customers who wish to trade on credit terms are generally subject to credit verification procedures. In addition, trade receivable balances are monitored on a continuous basis with the result that the Group’s exposure to bad debt is considered limited.
The Group considers the maximum exposure to credit risk is as follows:
2015£’000
2014£’000
Trade receivables 35,216 29,866Accrued income 5,076 6,863
40,292 36,729
The following table provides an analysis of trade and other receivables that were past due, but not impaired, at 31 December 2015 and 31 December 2014. The Group believes that the balances are ultimately recoverable based on a review of past payment history and the current financial status of customers. There are no material bad debt provisions at either 31 December 2015 or 31 December 2014.
2015£’000
2014£’000
Up to 3 months 5,152 4,048Up to 6 months 316 703
5,468 4,751
The credit risk from other financial instruments arises from default of the counterparty, with a maximum exposure equal to the carrying value of the asset.

75
Cello A
nnual Report 2015
FIN
AN
CIA
LS
Notes to the Consolidated Financial Statementsfor the year ended 31 December 2015
30 FINANCIAL INSTRUMENTS (CONTINUED)
Foreign exchange risk
The Group operates in a number of markets across the world and is exposed to foreign exchange risk arising from various currency exposures in respect of cash and cash equivalents, trade receivables and trade payables, in particular with respect to the USA dollar and the euro. The Group mitigates its foreign exchange risk with bank loans and overdrafts denominated in foreign currency under its debt facilities.
The Group also has foreign subsidiaries located in the USA. At 31 December 2015 the net foreign assets were £1.9m (2014: £1.9m). Differences that arise from the translation of these assets from USA dollar to sterling are recognised in other comprehensive income in the year and the cumulative effect as a separate component in equity. The Group does not hedge this translation exposure to its equity.
The following table demonstrates the Group’s sensitivity to a 10.0% increase and decrease in sterling against the USA dollar and euro, on the Group’s profit for the year and on the Group’s equity. This sensitivity represents management’s assessment of the reasonably possible change in foreign exchange rates.
US Dollar Euro
2015 2014 2015 2014
Strengthening of sterling by 10.0%On profit for the year (132) (65) 4 (134)On equity (306) (654) 4 (134)
Weakening of sterling by 10.0%On profit for the year 161 79 (5) 163On equity 373 800 (5) 163
Capital management
The Group’s objectives when managing capital are to safeguard the Group’s ability to continue as a going concern in order to provide returns for shareholders through the optimisation of the debt and equity balance.
The Group considers its capital to be total equity attributable to owners of the parent and net debt. Equity attributable to the owners of the parent comprises of issued share capital, reserves and retained earnings and is disclosed in the balance sheet and in the consolidated statement of changes in equity. Net debt comprises short and long-term borrowings (including overdrafts and obligations under finance leases) net of cash and cash equivalents.
The ratio of debt to capital ratio at 31 December 2015 and 31 December 2014 is as follows:
2015£’000
2014£’000
Total debt 9,416 12,758Less cash and cash equivalents (5,249) (5,566)
Net debt 4,167 7,192
Total equity attributable to owners of the parent 70,768 69,434
Debt to capital ratio 5.9% 10.4%
The Group has various financial covenants in connection with its current bank facilities. During the year ended 31 December 2015, the Group was compliant with its covenants.
76
Cel
lo A
nnua
l Rep
ort 2
015
FIN
AN
CIA
LS
Company Financial Statements –Independent Auditors’ Reportfor the year ended 31 December 2015
INDEPENDENT AUDITORS’ REPORT TO THE MEMBERS OF CELLO GROUP PLCREPORT ON THE COMPANY FINANCIAL STATEMENTS
Our opinion
In our opinion, Cello Group plc’s Company financial statements (the “financial statements”):
• give a true and fair view of the state of the Company’s affairs as at 31 December 2015;
• have been properly prepared in accordance with United Kingdom Generally Accepted Accounting Practice; and
• have been prepared in accordance with the requirements of the Companies Act 2006.
What we have audited
The financial statements, included within the Annual Report, comprise:
• the Company balance sheet as at 31 December 2015;
• the Company statement of changes in equity for the year then ended;
• the accounting policies; and
• the notes to the financial statements, which include other explanatory information.
The financial reporting framework that has been applied in the preparation of the financial statements is United Kingdom Accounting Standards, comprising FRS101 “Reduced Disclosure Framework”, and applicable law (United Kingdom Generally Accepted Accounting Practice).
In applying the financial reporting framework, the directors have made a number of subjective judgements, for example in respect of significant accounting estimates. In making such estimates, they have made assumptions and considered future events.
Opinion on other matter prescribed by the Companies Act 2006
In our opinion, the information given in the Strategic Report and the Directors’ Report for the financial year for which the financial statements are prepared is consistent with the financial statements.
Other matters on which we are required to report by exception
Adequacy of accounting records and information and explanations received
Under the Companies Act 2006 we are required to report to you if, in our opinion:
• we have not received all the information and explanations we require for our audit; or
• adequate accounting records have not been kept by the Company, or returns adequate for our audit have not been received from branches not visited by us; or
• the financial statements are not in agreement with the accounting records and returns.
We have no exceptions to report arising from this responsibility.
Directors’ remuneration
Under the Companies Act 2006 we are required to report to you if, in our opinion, certain disclosures of Directors’ remuneration specified by law are not made. We have no exceptions to report arising from this responsibility.
Responsibilities for the financial statements and the audit
Our responsibilities and those of the Directors
As explained more fully in the Statement of Directors’ Responsibilities, the directors are responsible for the preparation of the financial statements and for being satisfied that they give a true and fair view.
Our responsibility is to audit and express an opinion on the financial statements in accordance with applicable law and International Standards on Auditing (UK and Ireland) (“ISAs (UK & Ireland)”). Those standards require us to comply with the Auditing Practices Board’s Ethical Standards for Auditors.
This report, including the opinions, has been prepared for and only for the company’s members as a body in accordance with Chapter 3 of Part 16 of the Companies Act 2006 and for no other purpose. We do not, in giving these opinions, accept or assume responsibility for any other purpose or to any other person to whom this report is shown or into whose hands it may come save where expressly agreed by our prior consent in writing.

77
Cello A
nnual Report 2015
FIN
AN
CIA
LS
Company Financial Statements –Independent Auditors’ Reportfor the year ended 31 December 2015
What an audit of financial statements involves
We conducted our audit in accordance with ISAs (UK & Ireland). An audit involves obtaining evidence about the amounts and disclosures in the financial statements sufficient to give reasonable assurance that the financial statements are free from material misstatement, whether caused by fraud or error. This includes an assessment of:
• whether the accounting policies are appropriate to the parent company’s circumstances and have been consistently applied and adequately disclosed;
• the reasonableness of significant accounting estimates made by the Directors; and
• the overall presentation of the financial statements.
We primarily focus our work in these areas by assessing the directors’ judgements against available evidence, forming our own judgements, and evaluating the disclosures in the financial statements.
We test and examine information, using sampling and other auditing techniques, to the extent we consider necessary to provide a reasonable basis for us to draw conclusions. We obtain audit evidence through testing the effectiveness of controls, substantive procedures or a combination of both.
In addition, we read all the financial and non-financial information in the Annual Report to identify material inconsistencies with the audited financial statements and to identify any information that is apparently materially incorrect based on, or materially inconsistent with, the knowledge acquired by us in the course of performing the audit. If we become aware of any apparent material misstatements or inconsistencies we consider the implications for our report.
Other matter
We have reported separately on the Group financial statements of Cello Group plc for the year ended 31 December 2015.
Simon O’Brien (Senior Statutory Auditor)
For and on behalf of PricewaterhouseCoopers LLPChartered Accountants and Statutory AuditorsLondon16 March 2016
78
Cel
lo A
nnua
l Rep
ort 2
015
FIN
AN
CIA
LS
Company Balance Sheetat 31 December 2015
Notes31 December 2015
£’000
31 December 2014 (as restated)
£’000
FIXED ASSETSTangible assets 1 9 13Investments 2 86,863 86,803
86,872 86,816
CURRENT ASSETS
Debtors 3 10,628 11,643
CREDITORS: Amounts falling due within one year 4 (23,071) (18,899)
NET CURRENT LIABILITIES (12,443) (7,256)
TOTAL ASSETS LESS CURRENT LIABILITIES 74,429 79,560
CREDITORS: Amounts falling due after more than one year 5 (9,127) (12,359)
NET ASSETS 65,302 67,201
CAPITAL AND RESERVESCalled up share capital 7 8,576 8,530Share premium account 18,834 18,663Merger reserve 28,807 28,807Capital redemption reserve 50 50Share-based payment reserve 635 544Profit and loss account 8,400 10,607
TOTAL SHAREHOLDERS’ FUNDS 65,302 67,201
The notes on pages 80 to 87 are an integral part of these company financial statements.
The company financial statements on pages 78 to 87 were approved by the Board of Directors on 16 March 2016 and signed on its behalf by:
Mark Scott Director
Mark Bentley Director

79
Cello A
nnual Report 2015
FIN
AN
CIA
LS
Company Statement of Changes in Equityfor the year ended 31 December 2015
Called-up share capital
£’000
Share premium account
£’000
Merger reserve£’000
Capital redemption
reserve£’000
Profit and loss account (as restated)
£’000
Share-based payment reserve£’000
Attributable to equity
shareholders(as restated)
£’000
At 1 January 2014 8,348 18,368 28,345 50 10,927 455 66,493
Profit for the financial year – – – – 2,092 – 2,092
Total comprehensive income in the year – – – – 2,092 – 2,092
Transactions with owners:
Shares issued 182 295 462 – – – 939
Credit for share-based incentives – – – – – 100 100
Deferred tax on share-based payments recognised directly in equity – – – – 104 – 104
Transfer between reserves in respect of share options – – – – 43 (43) –
Share-based payments in subsidiaries – – – – – 32 32
Dividends paid (note 9) – – – – (2,559) – (2,559)
Total transactions with owners 182 295 462 – (2,412) 89 (1,384)
At 31 December 2014 8,530 18,663 28,807 50 10,607 544 67,201
Loss for the financial year – – – – (61) – (61)
Total comprehensive expense in the year – – – – (61) – (61)
Transactions with owners:
Shares issued 46 171 – – – – 217
Credit for share-based incentives – – – – – 105 105
Deferred tax on share-based payments recognised directly in equity – – – – 24 – 24
Transfer between reserves in respect of share options – – – – 74 (74) –
Share-based payments in subsidiaries – – – – – 60 60
Dividends paid (note 9) – – – – (2,244) – (2,244)
Total transactions with owners 46 171 – – (2,146) 91 (1,838)
At 31 December 2015 8,576 18,834 28,807 50 8,400 635 65,302
The notes on pages 80 to 87 are an integral part of these company financial statements.
80
Cel
lo A
nnua
l Rep
ort 2
015
FIN
AN
CIA
LS
Company Financial Statements –Accounting Policiesfor the year ended 31 December 2015
(1) Basis of Accounting
The financial statements have been prepared on a going concern basis and under the historical cost convention and in accordance with Financial Reporting Standard 101 ‘Reduced Disclosure Framework’ and the Companies Act 2006, as applicable to companies using FRS 101.
Details of new standard, amendments to standards and interpretations that have been adopted in the year or are effective for annual periods beginning after 1 January 2015, but have not been applied, are disclosed in the consolidated financial statements on page 52.
Information on the impact of first-time adoption of FRS 101 is given in note 11.
First time application of FRS 100 and FRS 101
In the current year the Group has adopted FRS 100 and FRS 101. In previous years the financial statements were prepared in accordance with applicable UK accounting standards.
This change in the basis of preparation has not materially altered the recognition and measurement requirements previously applied in accordance with UK GAAP. Consequently the principal accounting policies are unchanged from the prior year. The change in basis of preparation has enabled the Group to take advantage of all of the available disclosure exemptions permitted by FRS 101 in the financial statements, the most significant of which are summarised below. There have been no other material amendments to the disclosure requirements previously applied in accordance with UK GAAP.
FINANCIAL REPORTING STANDARD 101 – REDUCED DISCLOSURE EXEMPTIONS
The company has taken advantage of the following disclosure exemptions under FRS 101:
• the requirements of paragraphs 45(b) and 46-52 of IFRS 2 Share-based payment
• the requirements of paragraphs 62, B64(d), B64(e), B64(g), B64(h), B64(j) to B64(m), B64(n)(ii), B64(o)(ii), B64(p), B64(q)(ii), B66 and B67 of IFRS 3 Business Combinations
• the requirements of paragraph 33(c) of IFRS 5 Non-Current Assets Held For Sale and Discontinued Operations
• the requirements of IFRS 7 Financial Instruments: Disclosures
• the requirements of paragraphs 91-99 of IFRS 13 Fair Value Measurement
• the requirement in paragraph 38 of IAS 1 'Presentation of Financial Statements' to present comparative information in respect of:
– paragraph 79(a)(iv) of IAS 1;
– paragraph 73(e) of IAS 16 Property, Plant and Equipment;
– paragraph 118(e) of IAS 38 Intangible Assets;
– paragraphs 76 and 79(d) of IAS 40 Investment Property; and
– paragraph 50 of IAS 41 Agriculture
• the requirements of paragraphs 10(d), 10(f), 16, 38A, 38B, 38C, 38D, 40A, 40B, 40C, 40D, 111 and 134-136 of IAS 1 Presentation of Financial Statements
• the requirements of IAS 7 Statement of Cash Flows
• the requirements of paragraphs 30 and 31 of IAS 8 Accounting Policies, Changes in Accounting Estimates and Errors
• the requirements of paragraph 17 of IAS 24 Related Party Disclosures
• the requirements in IAS 24 Related Party Disclosures to disclose related party transactions entered into between two or more members of a group, provided that any subsidiary which is a party to the transaction is wholly owned by such a member
• the requirements of paragraphs 134(d)-134(f) and 135(c)-135(e) of IAS 36 Impairment of Assets.
81
Cello A
nnual Report 2015
FIN
AN
CIA
LS
Company Financial Statements –Accounting Policiesfor the year ended 31 December 2015
(2) Profit and Loss Account
As permitted by section 408 of the Companies Act 2006, the Company’s profit and loss account has not been presented. The Company reported a loss in the financial year of £61,000 (2014: profit £2,096,000).
The auditors’ remuneration for the audit of the Company’s financial statements was £11,000 (2014: £10,000). The auditors’ remuneration for the audit and other services is disclosed in note 5 to the consolidated financial statements.
(3) Turnover
Turnover is derived from management charges to subsidiary companies. Turnover is recognised on an accruals basis, net of VAT.
(4) Pensions
The Company operates a defined contribution scheme. The amount charged to the profit and loss account in respect of pensions is the contributions payable in the year. Differences between contributions payable in the year and contributions paid are shown as either other debtors or other creditors.
(5) Dividends
Equity dividends are recognised when they become legally payable. Interim equity dividends are recognised when paid. Final equity dividends are recognised when approved by the shareholders at an annual general meeting.
(6) Tangible Fixed Assets
Tangible fixed assets are stated at historical cost less accumulated depreciation. Cost includes the original purchase price of the asset and the costs attributable to bringing the asset to its working condition for its intended use. Depreciation is provided at rates calculated to write off the cost, less estimated residual value, of each asset, over their estimated useful economic lives as follows:
Computer equipment 33% pa. straight line
Fixtures, fittings and office equipment 25% pa. straight line
(7) Investments
Fixed asset investments are stated at cost less provision for any impairment in value.
(8) Deferred Taxation
Tax on the profit or loss for the year comprises current and deferred tax. Tax is recognised in the income statement, except to the extent that it relates to items recognised in other comprehensive income or directly in equity.
Current tax is calculated on the basis of the tax laws enacted or substantively enacted at the balance sheet date. Management periodically evaluates positions taken in tax returns with respect to situations in which the applicable tax regulation is subject to interpretation. It establishes provisions where appropriate on the basis of amounts expected to be paid to the tax authorities.
Deferred tax is income tax recognised, using the liability method, on temporary differences arising between the tax bases of assets and liabilities and their carrying value in the consolidated financial statements. However, deferred tax liabilities are not recognised if they arise from the initial recognition of goodwill nor from the initial recognition of an asset or liability, other than resulting from a business combination that does not affect the accounting profit or loss or the taxable profit or loss.
Deferred tax assets are only recognised to the extent that it is probable that they can be utilised against future taxable profits.
Deferred tax is calculated at the tax rates that are enacted or substantially enacted and expected to apply in the period when the liability is settled or the asset is realised.
Deferred tax assets and liabilities are offset when there is a legally enforceable right to offset current tax assets and liabilities and when the deferred tax assets and liabilities relate to income taxes levied by the same tax authority on either the taxable entity or different taxable entities where there is an intention to settle the balances on a net basis.
(9) Foreign Currency
Transactions denominated in foreign currencies are initially translated at the exchange rate ruling at the date of the transaction. Monetary assets and liabilities denominated in foreign currencies are retranslated at the rate of exchange ruling at the balance sheet date and the resulting gains and losses are recorded in the profit and loss account.
82
Cel
lo A
nnua
l Rep
ort 2
015
FIN
AN
CIA
LS
Company Financial Statements –Accounting Policiesfor the year ended 31 December 2015
(10) Share-based Payments
Certain employees of the Company receive remuneration in the form of share options. The fair value of the share options granted is measured at the date of grant and expensed to the profit and loss account over the appropriate vesting period, with a corresponding adjustment to reserves.
The fair value of the share options takes into account market vesting conditions and non-vesting conditions. Non-market vesting conditions are included in assumptions of the number of options expected to vest. At the end of each reporting period the Company revises its estimate of the number of share options expected to vest and recognises the impact of the revisions to previous estimates in the profit and loss account, with a corresponding adjustment to reserves.
The grant of share options to the employees of subsidiary undertakings is treated as a capital contribution. The fair value of the share options granted is measured at the date of grant and recognised as an increase of cost of investment over the appropriate vesting period, with a corresponding adjustment to reserves.
(11) Financial Instruments
Financial assets and financial liabilities are recognised on the Group’s balance sheet when the Group has become a party to the contractual provisions of the instrument.
i. Debtors Short-term debtors are measured at transaction price,
less any impairment. Loans receivable are measured initially at fair value, net of transaction costs, and are measured subsequently at amortised cost using the effective interest method, less any impairment.
ii. Cash and cash equivalents Cash and cash equivalents comprise cash in hand and
at bank and other short-term deposits held by the Group with original maturities of less than 3 months.
iii. Creditors Creditors are obligations to pay for goods or services
that have been acquired in the ordinary course of business from suppliers
Creditors are recognised initially at fair value and subsequently measured at amortised cost using the effective interest method.
iv. Bank borrowings Interest bearing bank loans and overdrafts are recorded
initially at their fair value, net of direct transaction costs. Such instruments are subsequently carried at their amortised cost and finance charges, including premiums payable on settlement or redemption, are recognised in the income statement over the term of the instrument using an effective rate of interest.
(12) Accounting Estimates and Judgements
The Company makes estimates and judgements concerning the application of the Company’s accounting policies and concerning the future. The resulting estimates may, by definition, vary from the actual results. Estimates are based on historical experience and various other assumptions that management and the Board of Directors believe are reasonable. The Directors consider the critical accounting estimates and judgements used in the financial statements and concluded the main area of judgement to be impairment of investments.
The Company tests the carrying value of investments annually for impairment. The recoverable amount is based on value-in-use calculations, which requires extensions of future cash flows and the discount rate to apply in order to calculate the present values of these cash flows. The estimates and sensitivities are disclosed in note 12 of the consolidated financial statements.

83
Cello A
nnual Report 2015
FIN
AN
CIA
LS
Notes to the Company Financial Statementsfor the year ended 31 December 2015
1 TANGIBLE FIXED ASSETS
Computer equipment £’000
Fixtures, fittings and office equipment
£’000Total
£’000
CostAt 1 January 2015 54 47 101Additions – 2 2
At 31 December 2015 54 49 103
Accumulated depreciationAt 1 January 2015 43 45 88Charged for the year 5 1 6
At 31 December 2015 48 46 94
Net book valueAt 31 December 2015 6 3 9
At 31 December 2014 11 2 13
2 INVESTMENTS
Subsidiaries£’000
CostAt 1 January 2015 100,481Capital contribution in relation to share-based payments 60
At 31 December 2015 100,541
Accumulated amortisation At 1 January 2015 and 31 December 2015 13,678
Net book valueAt 31 December 2015 86,863
At 31 December 2014 86,803
The Company’s principal trading subsidiaries are listed in note 15 to the consolidated financial statements.
The Directors believe that the carrying value of the investments is supported by their underlying net assets.
84
Cel
lo A
nnua
l Rep
ort 2
015
FIN
AN
CIA
LS
Notes to the Company Financial Statementsfor the year ended 31 December 2015
3 DEBTORS
Notes2015
£’000
2014 (as restated)
£’000
Amounts falling due within 1 year:Amounts owed by Group undertakings 9,782 10,972Other debtors 241 85Deferred tax asset 6 251 222Corporation tax 198 160Prepayments 156 204
10,628 11,643
Amounts owed by Group undertakings are unsecured and repayable on demand. Balances with subsidiaries outside of normal trading terms bear an interest rate of 1.5% (2014: 1.5%).
4 CREDITORS: AMOUNTS FALLING DUE WITHIN ONE YEAR
2015 £’000
2014 £’000
Bank overdraft 9,644 13,059Loan notes 232 300Trade creditors 160 187Amounts owed to Group undertakings 11,966 4,358Other taxation and social security costs 404 419Other creditors 106 57Accruals 559 519
23,071 18,899
Amounts owed to Group undertakings are unsecured and repayable on demand. Balances with subsidiaries outside of normal trading terms bear an interest rate of 1.5% (2014: 1.5%).
Bank overdraft
The bank overdraft is part of the Group-wide overdraft facility with RBS, which holds a debenture over the assets of the Company and the majority of its subsidiaries. There is also a cross-guarantee between the Company and the majority of its subsidiaries. The bank overdraft bears interest at a variable rate of 1.25% to 2.30% over LIBOR and is repayable on demand.
Loan notes
Loan notes have been issued as part of the consideration for certain acquisitions. Loan notes are initially secured by way of cash deposits and by guarantee. This security expires after a period of between 2 and 5 years in accordance with the terms of the relevant acquisition agreement. After this period the loan notes are unsecured. Loan notes bear interest at the following rates:
2015 £’000
2014 £’000
Unsecured
LIBOR less 2.0% 181 249
LIBOR 51 51
232 300
85
Cello A
nnual Report 2015
FIN
AN
CIA
LS
Notes to the Company Financial Statementsfor the year ended 31 December 2015
5 CREDITORS: AMOUNTS FALLING DUE AFTER MORE THAN ONE YEAR
2015 £’000
2014 £’000
Bank loans 9,127 12,359
The Company has a debt facility with RBS. At 31 December 2015 the debt facility consists of a £20.0m RCF. The RCF bears interest at a variable rate of 1.25% to 2.30% over LIBOR and is committed to March 2018. The security over the RCF is the same as for the bank overdraft (note 4).
6 DEFERRED TAXATION
2015 £’000
2014 £’000
Deferred tax assets:
Unrelieved share-based payment expense 247 219
Other timing differences 4 3
251 222
Movement in deferred tax in the year can be analysed as follows: £’000
At 1 January 2015 222
Income statement 5
Tax charged directly to equity 24
251
7 CALLED UP SHARE CAPITAL
2015 £’000
2014 £’000
Allotted, issued and fully paid:
85,760,222 (2014: 85,303,692) ordinary shares of 10p each 8,576 8,530
The Company has one class of ordinary shares which carry no right to fixed income.
Details of shares issued in the year are given in note 23 to the consolidated financial statements.
8 SHARE-BASED PAYMENTS
Details of share option awards and key inputs into the Black Scholes model to calculate the fair value of options are given in note 24 to the consolidated financial statements.
For the year ended 31 December 2015, the Company recognised an expense of £105,000 in the profit and loss account (2014: £100,000) in relation to equity settled share-based payment transactions.
9 DIVIDENDS
For details of dividends paid in the year, please refer to note 10 in the consolidated financial statements.
86
Cel
lo A
nnua
l Rep
ort 2
015
FIN
AN
CIA
LS
Notes to the Company Financial Statementsfor the year ended 31 December 2015
10 RELATED PARTY TRANSACTIONS
Transactions with the Company’s Directors are disclosed in note 28 to the consolidated financial statements. Further information about the remuneration of the Directors is provided in the Report of the Remuneration Committee on pages 38 to 39 and in note 8 to the consolidated financial statements.
During the year ended 31 December 2015, the Company earned £61,000 (2014: £50,000) of turnover from Fenix Media Limited, a subsidiary which is not 100% owned.
The Company has applied the exemption available under FRS 8 Related party disclosures not to disclose transactions with its wholly owned subsidiaries.
11 FIRST TIME ADOPTION OF FRS 101
Reconciliation of Balance Sheet at date of transition, 1 January 2014
As previously stated 1 January 2014
£’000
Effect of transition 1 January 2014
£’000
FRS 101 (as restated) 1 January 2014
£’000
FIXED ASSETSTangible assets 2 – 2Investments 82,840 – 82,840
82,842 – 82,842
CURRENT ASSETSDebtors 9,482 91 9,573Cash at bank and in hand 531 – 531
10,013 91 10,104
CREDITORS: Amounts falling due within one year (17,307) – (17,307)
NET CURRENT LIABILITIES (7,294) 91 (7,203)
TOTAL ASSETS LESS CURRENT LIABILITIES 75,548 91 75,639
CREDITORS: Amounts falling due after more than one year (9,146) – (9,146)
NET ASSETS 66,402 91 66,493
CAPITAL AND RESERVES Share capital 8,348 – 8,348Share premium 18,368 – 18,368Merger reserve 28,345 – 28,345Capital redemption reserve 50 – 50Share-based payment reserve 455 – 455Profit and loss account 10,836 91 10,927
EQUITY SHAREHOLDERS FUNDS 66,402 91 66,493

87
Cello A
nnual Report 2015
FIN
AN
CIA
LS
Notes to the Company Financial Statementsfor the year ended 31 December 2015
11 FIRST TIME ADOPTION OF FRS 101 (CONTINUED)
Reconciliation of Balance Sheet at date of transition, 31 December 2014
As previously stated 31 December 2014
£’000
Effect of transition 31 December 2014
£’000
FRS 101 (as restated) 31 December 2014
£’000
FIXED ASSETSTangible assets 13 – 13Investments 86,803 – 86,803
86,816 – 86,816
CURRENT ASSETSDebtors 11,474 169 11,643
11,474 169 11,643
CREDITORS: Amounts falling due within one year (18,899) – (18,899)
NET CURRENT LIABILITIES (7,425) 169 (7,256)
TOTAL ASSETS LESS CURRENT LIABILITIES 79,391 169 79,560
CREDITORS: Amounts falling due after more than one year (12,359) – (12,359)
NET ASSETS 67,032 169 67,201
CAPITAL AND RESERVESShare capital 8,530 – 8,530Share premium 18,663 – 18,663Merger reserve 28,807 – 28,807Capital redemption reserve 50 – 50Share-based payment reserve 544 – 544Profit and loss account 10,438 169 10,607
EQUITY SHAREHOLDERS FUNDS 67,032 169 67,201
88
Cel
lo A
nnua
l Rep
ort 2
015
NO
TIC
E O
F A
GM
Notice of Annual General MeetingNotice is hereby given that the Twelfth Annual General Meeting of the Company will be held at Buchanan, 107 Cheapside, London EC2V 6DN on 10 May 2016 at 12.30pm, for the transaction of the following business:
ORDINARY BUSINESS
1. To receive and adopt the Directors’ Report and Financial Statements for the year ended 31 December 2015, together with the auditors’ report thereon.
2. To declare a final dividend of 2.02p per ordinary share for the year ended 31 December 2015.
3. To receive and approve the Directors’ Remuneration Report for the year ended 31 December 2015.
4. To re-elect Mark Scott as a Director, who resigns in accordance with the Company’s Articles of Association.
5. To re-elect Allan Rich as a Director, who resigns in accordance with the Company’s Articles of Association.
6. To re-appoint PricewaterhouseCoopers as auditors of the Company to hold office until the next General Meeting at which accounts are laid and to authorise the Directors to fix their remuneration.
SPECIAL BUSINESS
To consider and, if thought fit, pass the following resolutions of which resolution 7 is an ordinary resolution and resolutions 8 and 9 are special resolutions.
ORDINARY RESOLUTION
7. That, in substitution for existing authorities to the extent unutilised, the directors be and are hereby generally and unconditionally authorised pursuant to section 551 of the Companies Act 2006 (the “Act”) to exercise all powers of the Company to allot shares or grant rights to subscribe for or convert any security into shares up to an aggregate nominal amount of £1,715,648 to such persons, at such times and on such terms and conditions as the directors determine, during the period expiring (unless previously renewed, varied or revoked by the Company in General Meeting) on whichever is the earlier of the conclusion of the Annual General Meeting of the Company held in 2017 and the date falling 15 months after the date of the passing of this resolution, but the Company may make an offer or agreement before the expiry of this authority which would or might require shares to be allotted or rights to subscribe for or convert any security into shares to be granted after expiry of this authority and the directors may allot shares or grant rights to subscribe for or convert any security into shares in pursuance of that offer or agreement.

SPECIAL RESOLUTIONS
8. That, subject to the passing of resolution 7 set out in the notice convening this meeting, the directors be empowered pursuant to section 570 of the Companies Act 2006 (the “Act”), to allot equity securities (within the meaning of the Act) of the Company for cash pursuant to the general authority conferred on them by the said resolution 7 as if section 561(1) of the Act did not apply to any such allotment provided that this power shall be limited to:
(a) the allotment of equity securities in connection with an offer of equity securities (whether by way of a rights issue, open offer or otherwise), open for acceptance for a period fixed by the directors, to holders of ordinary shares on the register on any fixed record date in proportion (as nearly as practicable) to their holdings of ordinary shares, subject to such exclusions or other such arrangements as the directors may deem necessary or expedient in relation to fractional entitlements or legal or practical problems arising under the laws of, or the requirements of, any regulatory body or any stock exchange in, any territory; and/or
(b) the allotment (otherwise than pursuant to paragraph (a) above) of equity securities up to an aggregate nominal amount of £857,824,
and the power hereby conferred shall operate in substitution for and to the exclusion of any previous power given to the directors pursuant to section 570 of the Act and shall expire on whichever is the earlier of the conclusion of the Annual General Meeting of the Company held in 2017 and the date falling 15 months after the date of the passing of this resolution, unless such power is renewed or extended prior to such expiry, except that the Company may before the expiry of any power conferred by this resolution make an offer or agreement which would or might require equity securities to be allotted after such expiry and the directors may allot equity securities in pursuance of such offer or agreement as if the power conferred hereby had not expired.
This power applies in relation to a sale of shares which is an allotment of equity securities by virtue of Section 560(2) of the Act as if in the first paragraph of this resolution the words “pursuant to the general authority conferred on them by the said resolution 7” were omitted.
9. That the Company be and is hereby granted general and unconditional authority (pursuant to section 701 of the Companies Act 2006 (the “Act”)) to make market purchases (as defined in section 693 of the Act) of any of its own ordinary shares of 10p each on such terms and in such manner as the Board of Directors of the Company may from time to time determine provided that:
(a) the maximum number of shares authorised to be purchased is 4,289,121 ordinary shares of 10p each, being 5% of the shares in issue as at 29 February 2016.
(b) the maximum price which may be paid for a share is an amount equal to not more than 105% of the average of the middle market quotations for the shares taken from the London Stock Exchange Daily Official List for the five business days before the day on which the purchase is made;
(c) the minimum price which may be paid for a share is 10p exclusive of any attributable expenses payable by the Company; and
(d) the authority conferred by this resolution shall expire on whichever is the earlier of the conclusion of the Annual General Meeting of the Company held in 2017 and the date falling 15 months after the date of the passing of this resolution, unless such authority is renewed or extended prior to such expiry, whichever is the earlier, except that the Company may, before such expiry, enter into a contract for the purchase of its own shares which may be completed by or executed wholly or partly after the expiration of this authority.
By order of the Board
Mark BentleyCompany Secretary15 April 2016
Registered Office11-13 Charterhouse BuildingsLondonEC1M 7AP
Notice of Annual General Meeting
89
Cello A
nnual Report 2015
NO
TIC
E O
F A
GM
NOTES TO THE NOTICE OF ANNUAL GENERAL MEETING
1. As a member of the Company, you are entitled to appoint a proxy to exercise all or any of your rights to attend, speak and vote at the Annual General Meeting and you should have received a proxy form with this notice of meeting. You can only appoint a proxy using the procedures set out in these notes and the notes to the proxy form.
2. A proxy does not need to be a member of the Company but must attend the Annual General Meeting to represent you. Details of how to appoint the Chairman of the Annual General Meeting or another person as your proxy using the proxy form are set out in the notes to the proxy form. If you wish your proxy to speak on your behalf at the Annual General Meeting you will need to appoint your own choice of proxy (not the Chairman) and give your instructions directly to him/her.
3. You may appoint more than one proxy provided each proxy is appointed to exercise rights attached to different shares. You may not appoint more than one proxy to exercise rights attached to any one share.
4. As permitted by Regulation 41 of the Uncertificated Securities Regulations 2001, Shareholders who hold their shares in uncertificated form must be entered on the Company’s share register by 12.30pm on 6 May 2016 in order to be entitled to attend and vote at the Annual General Meeting. Such Shareholders may only cast votes in respect of shares held at such time. Changes to entries on the register of members after such time on such date will be disregarded in determining the rights of any person to attend and vote at the Annual General Meeting.
5. To be effective, a proxy form must be duly completed, executed and returned, together with the power of attorney or other authority, if any, under which it is signed, or a notarially certified copy or a copy certified in accordance with the Powers of Attorney Act 1971 of such power of attorney or authority, so as to reach the Company’s registrars, Computershare Investor Services PLC, The Pavilions, Bridgwater Road, Bristol, BS99 6ZY by 12.30pm on 6 May 2016, being 48 hours (excluding any part of a day that is not a working day) prior to the time fixed for the meeting or, in the case of an adjournment, as at 48 hours (excluding any part of a day that is not a working day) prior to the time of the adjourned meeting.
6. In the case of joint holders, where more than one of the joint holders purports to appoint a proxy, only the appointment submitted by the most senior holder will be accepted. Seniority is determined by the order in which the names of the joint holders appear in the Company’s register of members in respect of the joint holding (the first-named being the most senior).
7. If multiple corporate representatives are appointed, in order to facilitate voting by corporate representatives at the Annual General Meeting, arrangements will be put in place at the Annual General Meeting so that:
(i) if a corporate member has appointed the Chairman of the Annual General Meeting as its corporate representative with instructions to vote on a poll in accordance with the directions of all the other corporate representatives for that member at the Annual General Meeting, then, on a poll, those corporate representatives will give voting directions to the Chairman and the Chairman will vote (or withhold a vote) as corporate representative in accordance with those directions; and
(ii) if more than one corporate representative for the same corporate member attends the Annual General Meeting but the corporate member has not appointed the Chairman of the Annual General Meeting as its corporate representative, a designated corporate representative will be nominated, from those corporate representatives who attend, who will vote on a poll and the other corporate representatives will give voting directions to that designated corporate representative.
8. The following documents will be available at the registered office of the Company on any weekday (except Saturday) during normal business hours from the date of this notice until the date of the Annual General Meeting:
- a copy of the service agreements for the Executive Directors;
- a copy of the letters of appointment for the Non Executive Directors;
- the Articles of Association of the Company; and
- the register of interests of the directors (and their families) in the share capital of the Company.
These documents will also be available for inspection during the Annual General Meeting and for at least 15 minutes before it begins.
Notice of Annual General Meeting
90
Cel
lo A
nnua
l Rep
ort 2
015
NO
TIC
E O
F A
GM
EXPLANATION OF SPECIAL BUSINESS AT THE ANNUAL GENERAL MEETING
Explanation of Resolution 7 (Authority to allot securities)
Resolution 7, which will be proposed as an ordinary resolution, would give the directors authority to allot shares up to a maximum nominal amount of £1,715,648 being approximately 20% of the Company’s issued share capital as at 29 February 2016. The existing authority would be revoked and this new authority would expire on the date of the 2017 Annual General Meeting or 10 August 2017, whichever is the earlier.
Explanation of Resolution 8 (Disapplication of pre-emption rights)
Resolution 8, which will be proposed as a special resolution, would renew the power of the directors to allot shares for cash as though the rights of pre-emption conferred by section 561(1) of the Act did not apply:
(a) in connection with an offer to existing shareholders in proportion to their existing holdings save that the directors are allowed to offer shares to existing shareholders otherwise than strictly in proportion to their holdings where, for example, overseas regulations make it difficult to offer shares pro rata to existing overseas shareholders or when dealing with fractions of shares, and/or
(b) up to a nominal amount of £857,824 being approximately 10%, of the issued share capital of the Company as at 29 February 2016 (to give the directors some flexibility in financing business opportunities as they arise).
This power would expire on the date of the 2017 Annual General Meeting or 10 August 2017, whichever is the earlier.
Explanation of Resolution 9 (Authority to purchase own shares)
In certain circumstances it may be advantageous for the Company to purchase its own shares. Resolution 9, which will be proposed as a special resolution, seeks authority from shareholders to do so, such authority to expire on the date of the 2017 Annual General Meeting or 10 August 2017, whichever is the earlier. The directors intend to exercise this power only if and when, in the light of market conditions prevailing at the time, they believe that the effect of such purchases will be to increase earnings per share and is in the best interests of shareholders generally. Other investment opportunities, appropriate gearing levels and the overall position of the Company will be taken into account before deciding upon this course of action. Any shares purchased in this way will be cancelled and the number of shares in issue will be accordingly reduced.
This resolution specifies the maximum number of shares which may be acquired (being 4,289,121 ordinary shares, which is approximately 5% of the Company’s issued share capital as at 29 February 2016 of 85,782,430 ordinary shares) and the maximum and minimum prices at which they may be bought.
Notice of Annual General Meeting
91
Cello A
nnual Report 2015
NO
TIC
E O
F A
GM
92
Cel
lo A
nnua
l Rep
ort 2
015
DIR
EC
TO
RS
Allan Rich – Non-Executive Chairman
Allan Rich has spent all his working life in the advertising business. He co-founded Davidson Pearce Berry and Spottiswood, which became one of the most successful agencies in the UK during the late 60s and early 70s. In 1975 he founded the first independent media planning and buying company in the UK, which he called The Media Business. In 1995 he took the company to the London Stock Market and in 1998 sold his Group to Grey Advertising New York in order to create a truly global media organisation, MediaCom. Over the following four years MediaCom became the largest media company in the UK and remains so to this day.
Mark Scott – Chief Executive
From 1994 to 1998 Mark Scott was a senior executive at WPP Group plc, latterly being appointed Operations Director for the Group with responsibility for the Group’s European and Asian acquisition programme. Post WPP he became Executive Vice President of Lighthouse Global Network LLC where he helped acquire and consolidate more than 15 marketing services companies. From 2000 to 2002 he was appointed a senior executive of Lake Capital Management, a private equity firm, where he was responsible for a range of investments in marketing service firms. He has been a member of the boards of a number of public companies in the sector including Watermark Group plc, Chime Communications Group plc, Chemistry Communications Group plc and Fitch plc. He obtained his MBA from Harvard Business School and a first class honours degree in English Literature from Oxford University.
Mark Bentley – Group Finance Director
Mark Bentley joined Cello Group as Group Finance Director in May 2005. He is also Company Secretary. Mark previously worked for Citigate Dewe Rogerson, which he joined in 2000 as Financial Controller and spent the next five years in various senior finance roles within Incepta Group plc, including Finance Director of Citigate Dewe Rogerson from February 2001. Whilst maintaining the Finance Director role, he took on wider operational responsibilities when he was appointed Chief Operating Officer in November 2003. From June 2002 he also had the parallel role of Finance Director of the Citigate SMARTS regional network of offices. Prior to Citigate he was Financial Projects Manager at Hodder Headline plc. Mark qualified as a chartered accountant with Coopers & Lybrand in 1996.

93
Cello A
nnual Report 2015
DIR
EC
TO
RS
Stephen Highley – Group Chief Operating Officer
Stephen started his career in the Retail and FMCG sector before moving into healthcare. His extensive healthcare career includes working for Baxter Healthcare and a London-based consultancy company where he was Director of the Healthcare Division. In 1994 Stephen was a founding Director of MSI and subsequently spent 17 years as Managing Director. Since early 2011 Stephen has performed in a number of wider Cello roles, specifically Chairman of Cello Health and Group Chief Operating Officer, responsibilities he currently retains. As Chairman of Cello Health, Stephen’s key role is to harness the considerable talent within the Cello Health capabilities to build on the success to date in the healthcare sector.
Paul Hamilton – Non-Executive Director and Senior Independent Director
Paul Hamilton was Senior Independent Director of Wellington Underwriting plc until 31 December 2006. Prior to this Paul worked in both corporate finance at UBS Warburg where he was a Managing Director, and in corporate broking at Rowe & Pitman where he was a Partner. Paul has also been Chairman of the FSA Listing Rules Committee and a member of the FSA Listing Authority Advisory Committee and London Stock Exchange Primary Markets Committee. Paul chairs both the Nomination and Remuneration Committee and is a member of the Audit Committee.
Will David – Independent Non-Executive Director
Will David was previously Non-Executive Chairman of Polaron plc, Orca Interactive Limited and Advanced power Components plc and is currently a Non-Executive Director of Winlogic plc. He has more than 20 years experience working in corporate advisory and broking roles for small and mid cap companies and has worked at Investec Henderson Crosthwaite, PricewaterhouseCoopers, Hoare Govett & Co and The London Stock Exchange. During his professional career Will has worked on over 20 flotations for clients across a range of sectors. His experience also includes acquisitions and disposals, public takeovers and secondary fundraisings and provision of advice on corporate governance matters. Will chairs the Audit Committee and is a member of both the Nomination and Remuneration Committees.
94
Cel
lo A
nnua
l Rep
ort 2
015
GR
OU
P D
IRE
CT
OR
Y
HEAD OFFICE
11-13 Charterhouse Buildings, London EC1M 7APTel: +44 (0)20 7812 8460 www.cellogroup.comContact: Mark Scott
CELLO HEALTH
Cello Health 11-13 Charterhouse Buildings, London EC1M 7APTel: +44 (0)20 7812 8460 www.cellohealth.comContact: Stephen Highley
Breaking Blue ResearchPriory House, 8 Battersea Park Road, London SW8 4BGTel: +44 (0)20 7627 7700 www.breakingblueresearch.comContact: Chris Stead, Kate Anderson
Cello Health Insight11-13 Charterhouse Buildings, London EC1M 7APTel: +44 (0)20 7608 9300 www.cellohealthinsight.comContact: Jane Shirley, Nicola Cowland
Cello Health Insight – New York256 W 38th Street, 15th Floor, New York, NY 10018 Tel: +1 646 837 8151 www.cellohealthinsight.comContact: Kathryn Gallant
Cello Health Insight – Chicago5250 Old Orchard Rd, Suite 300, Skokie, Illinois 60077 Tel: +1 847 983 3686 www.cellohealthinsight.comContact: Angela Wheeler
Cello Health Communications (MedErgy and SciFluent)790 Township Line Road, Suite 200, Yardley, PA 19067 Tel: +1 215 504 5082 www.medergygroup.comContact: Julia Ralston
Cello Health Communications (Mash)Harlequin House, 7 High Street, Teddington, Middlesex, TW11 8EETel: +44 (0)20 8977 6364 www.mashhealth.comContact: Emma Yates, Simon Oldridge
Cello Health Communications(iS) Cheyenne House, West Street, Farnham, Surrey GU9 7EQTel: +44 (0)1252 733 353 www.is-health.co.ukContact: Isaac Batley, Steve Smith
Cello Health Consulting Weaver’s Yard, West Street, Farnham, Surrey GU9 7DNTel: +44 (0)1252 748 600 www.cellohealthconsulting.comContact: Jon Bircher
Kudos Research9 Northburgh St, London EC1V 0AHTel: +44(0)20 7490 7888www.kudosresearch.comContact: Chris Smith
Promedica Inc 577 Airport Boulevard, Suite 130, Burlingame, CA 94010 USATel: +1 650 344 6242www.promedicainc.comContact: Joan Day, Susan Rowen
The Value EngineersWendover House, 24 London End, Beaconsfield, Buckinghamshire HP9 2JHTel: +44 (0)1494 680 999 www.thevalueengineers.comContact: Owen Williams
The Value Engineers – North America256 W 38th Street, 15th Floor, New York, NY 10018 Tel: +1 646 837 8170 www.thevalueengineers.comContact: Alex Waters

95
Cello A
nnual Report 2015
GR
OU
P D
IRE
CT
OR
Y
CELLO SIGNAL
Cello Signal 86/3 Commercial Quay, Commercial Street, Edinburgh EH6 6LXTel: +44 (0)131 526 3030 www.cellosignal.comContact: John Rowley
2CV 12 Flitcroft Street, London WC2H 8DLTel: +44 (0)20 7655 9900 www.2cv.comContact: Doug Edmonds
2CV – San Francisco180 Montgomery Street, Suite 1550San Francisco CA 94108Tel: +1 415 956 1004 www.2cv.comContact: Sammy Dunne
2CV – Los Angeles13441 Beach Avenue, Marina Del Rey, Los Angeles, CA 90292Tel: +1 310 301 8041 www.2cv.comContact: Ollie Willis
2CV – New York401 Park Ave South, 8th Floor, New York, NY 10016 USA Tel: +1 917 551 6727 www. 2cv.com Contact: Doug Edmonds
2CV – Singapore78b Tras Street, Singapore, 079010Tel: +65 6225 4143 www.2cv.comContact: James Redden
2CV – Hong KongUnit 1901, 19th Floor, A T Tower, 180 Electric Road, North Point, Hong KongTel: +852 3565 5124 www.2cv.comContact: Andrew Lam
BrightsourceSt James’s House, St James Square, Cheltenham, Gloucestershire GL50 3PRtel: +44 (0)1242 534200 www.brightsource.co.ukContact: Barney Hosey
Face7 Midford Place, London W1T 5BGTel: +44 (0)20 7874 6599 www.facegroup.comContact: Job Muscroft
Face – New YorkFloor 2, 79 Madison AvenueNew York, NY 10016 Tel: +1 646 902 9349www.facegroup.com Contact: Andrew Ho
Human Innovation – London7 Midford Place, London W1T 5BGTel: +44 (0)207 881 3260 www.humaninnovation.comContact: Lee Powney
Leith 37 The Shore, Edinburgh EH6 6QUTel: +44 (0)131 561 8600 www.leith.co.ukContact: Richard Marsham
Opticomm Media7 Midford Place, London W1T 5BGTel: +44 (0)20 7874 6567 www.opticomm.co.ukContact: Spencer Stratford
Pulsar 7 Midford Place, London W1T 5BGTel: +44 (0)20 7874 6577 www.pulsarplatform.comContact: Francesco D’Orazio
Signal – Edinburgh86/3 Commercial Quay, Commercial Street, Edinburgh, EH6 6LXtel: +44 (0)131 526 3030 www.cellosignal.comContact: Olly Guest
Signal – CheltenhamSt James’s House, St James Square, Cheltenham, Gloucestershire GL50 3PRtel: +44 (0)1242 534200 www.cellosignal.comContact: Barney Hosey
Signal – London7 Midford Place, London W1T 5BGtel: +44 (0)20 7874 6599 www.cellosignal.comContact: Olly Guest
Stripe Communications – Edinburgh86/3 Commercial Quay, Commercial Street, Edinburgh EH6 6LXtel: +44 (0)131 561 8628 www.stripecom.co.ukContact: Juliet Simpson
Stripe Communications – GlasgowStudio 10, 4th Floor, The Whisky Bond, 2 Dawson Road, Glasgow G4 9SStel: +44 (0)141 378 0082 www.stripecom.co.ukContact: Alison Downs
Stripe Communications – London12 Flitcroft Street, London WC2H 8DLtel: +44 (0)20 7655 9960 www.stripecom.co.ukContact: Chris Stevenson
TMI7 Clarendon Place, Royal Leamington Spa, Warwickshire CV32 5QLtel: +44 (0)1926 462998 www.tmi.co.ukContact: Gillian James
96
Cel
lo A
nnua
l Rep
ort 2
015
AD
VIS
OR
S
COMPANY SECRETARY
Mark Bentley
REGISTERED OFFICE
11-13 Charterhouse BuildingsLondon EC1M 7AP
INDEPENDENT AUDITORS
PricewaterhouseCoopers LLPChartered Accountants and Statutory Auditors1 Embankment PlaceLondonWC2N 6RH
NOMINATED ADVISER AND BROKER
Cenkos Securities plc6.7.8 Tokenhouse YardLondon EC2R 7AS
SOLICITORS
Marriott Harrison LLP11 Staple Inn LondonWC1V 7QH
PRINCIPAL BANKER
The Royal Bank of Scotland plc280 BishopsgateLondon EC2M 4RB
REGISTRARS
Computershare Investor Services plcPO Box 82The PavilionsBridgwater RoadBristol BS99 7NH