ANNUAL REPORT 2014 - Kohinoor Millskohinoormills.com/.../KMLAnnualReport2014.pdf2 Kohinoor Mills...
136
ANNUAL REPORT 2014
Transcript of ANNUAL REPORT 2014 - Kohinoor Millskohinoormills.com/.../KMLAnnualReport2014.pdf2 Kohinoor Mills...

A N N U A L R E P O R T 2 0 1 4

1
Kohinoor Mills Limited
CONTENTS
Company Pro!le ...................................................................................................................................02Company Information .......................................................................................................................03Mission & Vision Statement ..............................................................................................................04Code of Conduct ..................................................................................................................................05Notice of 27th Annual General Meeting ......................................................................................07Directors’ Report ...................................................................................................................................08Performance Overview .....................................................................................................................16Statement of Compliance with the Code of Corporate Governance ................................20Review Report to the Members on Statements of Compliance with Best Practices of Code of Corporate Governance ...........................................................22Auditors’ Report to the Members ...................................................................................................25Financial Statements .................................................................................................................... 26-75
Kohinoor Mills Limited and its subsidiaryDirectors’ Report ...................................................................................................................................78Auditors’ Report to the Members ...................................................................................................79Consolidated Financial Statements ......................................................................................80-129
Pattern of Shareholding .................................................................................................................. 130Form of Proxy

2
Kohinoor Mills Limited’s vision is to achieve and then remain as the most progressive and pro!table textile organization in Pakistan. Incorporated in 1987 as a small weaving mill, today Kohinoor Mills broadly undertakes three major businesses, weaving, dyeing and power generation. It has, and continues to develop, a portfolio of businesses that are major players within their respective industries. Bringing together outstanding knowledge of customer needs with leading edge technology platforms your Company undertakes to provide superior products to its customers.
With an annual turnover of over Rs. 7 billion, today Kohinoor Mills Limited employs over 1,400 employees. It aims to create superior value for Kohinoor’s customers and stakeholders without compromising its commitment to safety, environment and health for the communities in which it operates. Its products range from greige fabric to processed fabric.
COMPANY PROFILE

3
Board of DirectorsMr. Rashid Ahmed ...................................... ChairmanMr. Aamir Fayyaz Sheikh ...............Chief ExecutiveMr. Asad Fayyaz Sheikh ............................... DirectorMr. Ali Fayyaz Sheikh .................................... DirectorMr. Riaz Ahmed .............................................. DirectorMr. Aamir Amin ................ Director (NIT Nominee)Mr. Shahbaz Munir ........................................ Director
Audit CommitteeMr. Riaz Ahmed ........................................... ChairmanMr. Rashid Ahmed .........................................MemberMr. Shahbaz Munir ........................................MemberMr. Ali Fayyaz Sheikh ....................................Member
Human Resource & Remuneration CommitteeMr. Rashid Ahmed ...................................... ChairmanMr. Asad Fayyaz Sheikh ...............................MemberMr. Shahbaz Munir ........................................Member
Chief Financial O!cer Mr. Kamran Shahid
Head of Internal AuditMr. Faisal Sharif
Legal Advisors
Advocate & Legal Consultants, Lahore.
Company SecretaryMr. Muhammad Rizwan Khan
AuditorsM/s. Riaz Ahmad & Co.,Chartered Accountants
Bankers
Registered O!ce & Mills 8th K.M. Manga Raiwind Road, District Kasur.
Shares Registrar
Stock Exchange Kohinoor Mills Limited is a public limited Company and its shares are traded under personal goods sector at all three Stock Exchanges of Pakistan.
COMPANY INFORMATION

4
The Kohinoor Mills Limited’s stated mission is to become and then remain as the most progressive and pro!table
company in Pakistan in terms of industry standards and stakeholders interest.
The Company shall achieve its mission through a continuous process of having sourced, developed, implemented and managed the best leading edge
technology, industry best practices, human resource and innovative products and services and sold these to its
customers, suppliers and stakeholders
The Company is principally engaged in the business of textile manufacturing covering weaving, bleaching, dyeing, buying
and selling and otherwise dealing in yarn, cloth and other goods and fabrics made from raw cotton and synthetic !ber and to
generate, distribute, supply and sell electricity.
MISSION & VISION STATEMENT

5
Introduction to the Code
This code has been formulated to ensure that directors and employees of the Company operate within acceptable standards of conduct and sound business principles which strive for development and growth. The Company takes pride in adherence to its principles and continues to serve its customers, stakeholders and society.
Contents
Core values
The credibility, goodwill and repute earned over the years can be maintained through continued conviction in our corporate values of honesty, justice, integrity, and respect. The Company strongly believes in democratic leadership style with fair, transparent, ethical and high professional standards of conduct in all areas of business activities.
Business culture
Operations
The Company shall formulate and monitor its objectives, strategies and overall business plan of the organization.
The Company shall be continuously involved in the research and development of new products
every stage of its operations. Creativity and innovation must prevail at all levels of hierarchy to achieve organizational excellence.
Abidance of Law
It is Company’s prime object to comply with all applicable laws and regulations and to co-operate with all governmental and regulatory bodies.
Corporate Reporting and Internal Controls
The Company maintains e!ective, transparent and secure "nancial reporting and internal control systems so as to ensure reliable performance measurement and compliance with local regulations and international accounting standards as applicable.
The Company strictly adheres to the principles of good corporate governance and is committed to high standards of corporate governance.

6
The Company regularly updates and upgrades manufacturing and reporting systems so as to keep abreast with technological advancements and achieve economies of production.
Integrity and Con!dentiality
The Company believes in uprightness and expects it to be a fundamental responsibility of employees to act in Company’s best interest while holding con!dential information and neither to solicit internal information from others nor to disclose Company’s !gures, data or any material information to any unauthorized person/body.
Inside information about the Company, its customers, vendors, employees shall not be used for their own gain or for that of others directly or indirectly.
Responsibilities
Shareholders
The Company believes in maximizing shareholders value by providing consistent growth and fair return on their investment.
Customers
The Company considers it imperative to maintain cordial relationship with the customers as integral to
that conform to highest international standards.
Employees
gender, age, ethnicity and religious beliefs and its promotional policies are free of any discrimination.
The Company ensures that employees work towards achievement of corporate objectives, individually and collectively as a team and conduct themselves at work and in society as respectable employees and good citizens.
The Company believes in continuous development and training of its employees.
The Company has set high standards of performance and recognizes employees’ contribution towards its growth and rewards them based on their performance. The Company believes development, growth and recognition result in motivated employees.
All employees of the Company are part of Kohinoor family and the families of all members are also part and parcel of Kohinoor family. The Company believes that the sense of belonging to Kohinoor ful!ls an essential need of its employees and the organization and as such will always be nurtured.
Environment and Social Responsibility
Protecting the environment in which we live is an important element. The Company uses all means to ensure a clean, safe, healthy and pollution free environment not only for its workers and employees but also for the well being of all people who live in and around any of the production and manufacturing facilities. The Company will always employ such technology as may be bene!cial in maintaining a healthy and hygienic working environment. It also believes in community development without political a"liations with any person or group of persons and contributes part of its resources for a better environment with an unprejudiced approach.

7
Notice is hereby given that the 27th Annual General Meeting (AGM) of the members of Kohinoor Mills LimitedRegistered O!ce of the Company situated at 8th Kilometer, Manga Raiwind Road, District Kasur, to
1. To con"rm the minutes of Annual General Meeting held on October 31, 2013.2. To receive, consider and adopt the Annual Audited Accounts of the Company for the year ended
June 30, 2014, together with Directors’ and Auditors’ Reports thereon.3. To appoint auditors for the year ending June 30, 2015 and "x their remuneration.4. To transact any other Ordinary business with the permission of the Chair.
By Order of the Board
08 October 2014 Company Secretary NOTES 1. The shares transfer books of the Company will remain closed from October 23, 2014 to October
30, 2014 (both days inclusive). Physical transfers/CDS Transaction IDs received in order at Shares
Lahore, up to October 22, 2014, will be considered in time.
2. A member entitled to attend and vote at AGM may appoint another member as proxy to vote in place of member at the meeting. Proxies in order to be e#ective must be received at the Company’s Registered O!ce duly stamped and signed not later than 48 hours before the time of holding meeting. A member may not appoint more than one proxy. A copy of shareholder’s attested Computerized National Identity Card (CNIC) must be attached with the proxy form.
3.with participant(s) ID numbers and their account numbers at the time of attending the meeting in order to facilitate identi"cation of the respective shareholders. In case of corporate entity, the Board of Directors’ resolution/Power of Attorney with specimen signature of the nominee shall be produced (unless it has been provided earlier) at the time of the meeting.
4.to send the same at earliest.
5.of the Company.

8
The Directors of the Company are pleased to present the audited !nancial statements for the year ended
Companies Ordinance, 1984.
Textile Industry Outlook
2014 left FCY positions of all exporters uncovered and resulted in heavy exchange losses in already booked orders.
Operating & Financial Results
During the !nancial year ended June 30, 2014, your Company earned a gross pro!t of Rs. 1,045 million on sales of Rs. 7,772 million compared to gross pro!t of Rs. 1,378 million on sales of Rs. 8,452 million for the previous !nancial year 2012-13. Gross margin was 13.4% compared to 16.3% in the previous year. During FY 2013-14, your Company recorded a net pro!t of Rs. 202 million, compared to net pro!t of Rs. 1,009 million in the previous !nancial year, which included Rs. 824 million as one-time gain on recognition of !nancial liabilities at fair value under IAS 39. The Earnings per share was Rs. 3.97 per share compared to Rs.19.81 for previous !nancial year.
review resulted in decline in turnover and reduction in margins.
Dividend
In order to rebuild the working capital of the Company, your directors have regrettably decided to omit dividend this year.
Performance Overview
A brief overview of performance of your Company for the year ended June 30, 2014 is discussed below. Please also refer page no.18 of this Annual Report for six years’ performance overview of your Company.
DIRECTORS’ REPORT

9
Weaving Division
The capacity utilization and volume were maintained in this division during the year under review.
good order position, the management is con!dent that the performance in this division will be improved in the ensuing period.
Dyeing Division
Continuing depressed consumer demand in overseas apparel-brand sales coupled with sharp decline is
fabric business, the management is intensifying its product development and marketing e"orts. Further, the additional production from capacity expansion last year is also expected to yield positive results in the ensuing period thus driving up the overall performance.
Genertek Division
The induction of bio-fuel based boiler and improved, though inconsistent, supplies of Natural Gas by SNGPL and electricity by LESCO resulted in savings in Fuel and energy costs during the year under review.
In view of the unreliable gas and electricity supply situation in the country in the long run, the management is earnestly considering various alternate bio-fuel based energy options.
Q Mart Corporation (Pvt) Ltd (a wholly owned subsidiary of your Company)
The Company, in line with its decision to focus on its core fabric business, decided to pull out of retail business during the last !nancial year and accordingly shut-down all its Q-Mart retail stores. The management is currently in the process of disposing of the !xed assets of this Company.
Information Technology
Your Company is making continuous e"orts to have e#cient IT systems supporting timely and e"ective decisions. It has provided its employees, the most modern facilities to achieve optimum e#ciency
technologically advanced software providing on-line real time information for most of the production processes.
The Company’s intranet acts as a useful resource base providing in depth information on the Company’s policies and procedures along with other information for bene!cial use to the employees of the Company.
Human Resource & Training
With a human capital of about 1,500 employees, the Company believes that the employees are vital ingredient in shaping Company’s future where each individual contributes directly to the success of the organization.

10
with business teams to design e!cient people solutions that will e"ectively meet the business goals.
on merit, e"ective communication, and the development of high performance culture. The Company takes pride in continuous improvement at all levels and strives to ensure that opportunity for growth and varied career experiences are provided to all employees.
business activities including recruitment and employment.
environment within which individuals can achieve their professional and personal dreams.
Training & Development
Your Company believes in human resource development through training and development and places due emphasis on training in all spheres of its production process. The Company made e"orts during the year with more focused and cost e"ective training programs for the major technical categories such as
Candidates are engaged through a Trainee Scheme and trained in-house over a period of 6 months through a career path. This has helped Company in preparing a highly skilled workforce and also provides replacements to cover turnover.
In-house training sessions are regularly conducted in general management, #re #ghting, #rst aid, health and safety, computer and technical disciplines.
Safety, Health & Environment
Your Company has provided safe & healthy workplace for both sta" & contractors and will act responsibly towards the communities and environment in which we operate. This will be achieved by continuous improvement of our safety, health and environment performance through corporate leadership, dedication of sta" and the application of the highest professional standards at workplace.
Corporate Social Responsibility
Your Company has very distinct Corporate and Social Responsibility (CSR) policy in ful#lling its responsibilities of securing the community within which it operates.
Your Company through its directors is actively involved in the various social responsibility initiatives in the #eld of primary education and health care. During the year under review, your Company donated Rs. 7.5 million to The Citizens Foundation Schools for construction of schools for under-privileged children in remote areas. In addition the Company is taking an active part through APTMA initiatives for Clean Water for remote areas.
11
Compliance with the Code of Corporate Governance
The Board reviews the Company’s strategic direction on regular basis. The business plans and budgetary targets, set by the Board are also reviewed regularly. The Sub-Committees are empowered for e!ective compliance of Code of Corporate Governance. The Board is committed to maintain a high standard of good Corporate Governance.
Corporate & Financial Reporting Frame Work
The Board of Directors of the Company is fully cognizant of its responsibility as laid down in the Code of Corporate Governance issued by the Securities & Exchange Commission of Pakistan. The following statements are a manifestation of its commitment towards compliance with best practices of Code of Corporate Governance.
a. The "nancial statements together with the notes thereon have been drawn up in conformity with the Companies Ordinance, 1984. These Statements, prepared by the management of the Company,
b.1984.
c. Appropriate accounting policies have been consistently applied in preparation of "nancial statements. Accounting estimates are based on reasonable and prudent judgment.
d. International Financial Reporting Standards, as applicable in Pakistan, have been followed in preparation of "nancial statements.
e. The system of internal control is sound in design and has been e!ectively implemented and monitored.
f. There are no signi"cant doubts upon the Company’s ability to continue as a going concern.
g. There has been no material departure from the best practices of Corporate Governance as detailed in the Listing Regulations of the stock exchanges where the Company is listed.
h. There are no signi"cant plans for any corporate restructuring, business expansion or discontinuation of any part of the Company’s operations.
i. Information regarding statutory payments on account of outstanding taxes, duties, levies and other charges (if any) has been given in related note(s) to the audited accounts.
j. The Company strictly complies with the standard of safety rules & regulations. It also follows environmental friendly policies.
k. The valuation of investment made by the sta! retirement bene"t fund (Provident Fund), based on

12
June 30, 2014 Rs. 105.57 million June 30, 2013 Rs. 85.45 million
Board of Directors
The Board of Directors is responsible for the overall governance and administration of the Company. All directors are aware of their duties and powers conferred by the Companies Ordinance, 1984, Code of Corporate Governance and the Company’s Memorandum and Articles of Association. They exercise
approving the adoption of the Company’s !nancial statements in addition to review and adoption of Company’s signi!cant plans and decisions, projections, forecasts, and budgets having regard to the recommendations of the Sub-committees. The responsibilities include establishing the Company’s strategic objectives, providing leadership, supervising the management of the business and reporting to shareholders on their stewardship.
During the year under review !ve (5) meetings of the Board of Directors were held. The attendance by
Name of the Directors No. of meetings attended
Mr. Rashid Ahmed 5 Mr. Aamir Fayyaz Sheikh 4 Mr. Asad Fayyaz Sheikh 3 Mr. Ali Fayyaz Sheikh 4 Mr. Riaz Ahmed 5 Mr. Aamir Amin 4 Mr. Shahbaz Munir 5
Leave of absence was granted to the directors unable to attend the meeting.
Other than those set out below, there has been no trading during the year under review by the Directors,
Name Designation Purchased Sold No. of Shares
Mrs. Muneeza Asad Wife of Mr. Asad Fayyaz Sheikh (Director) 6,000 -

13
Audit Committee
The Audit Committee operates according to the terms of reference determined by the Board of Directors of the Company. It focuses on monitoring compliance with the best practices of the Code of Corporate
compliance with applicable accounting standards and listing regulations.
It recommends to the Board of Directors the terms of appointment of external auditors and reviews their recommendations relating to audit. Other responsibilities include monitoring the internal audit function, safeguarding the Company’s assets through appropriate internal control systems including !nancial and operational controls, accounting system and reporting structure, preliminary review of business plans
During the year under review !ve (5) meetings of the Audit Committee were held. The attendance by
Name of the Members No. of meetings attended Mr. Riaz Ahmed 5 Mr. Rashid Ahmed 4 Mr. Ali Fayyaz Sheikh 4 Mr. Shahbaz Munir 5
Leave of absence was granted to the members unable to attend the meeting.
Human Resource and Remuneration Committee
approved by the Board of Directors and is responsible for recommending human resource management policies to the board, selection, evaluation, compensation (including retirement bene!ts) and succession
of Internal Audit; and consideration and approval on recommendations of CEO on such matters for key management positions who report directly to CEO.
Name of the members Attendance Mr. Rashid Ahmed - Mr. Asad Fayyaz Sheikh 1 Mr. Shahbaz Munir 1
Leave of absence was granted to the member unable to attend the meeting.
14
Code of Conduct
In order to promote integrity for the Board, senior management and other employees of the Company, the Board has prepared and disseminated Code of Conduct on the Company’s website for information of his/her understanding of the professional standards and corporate values for everybody associated or dealing with the Company.
Pattern of Shareholding
The Statement of Pattern of Shareholding along with categories of shareholders of the Company as at
Governance is annexed with this report.
Future Prospects
Economic growth needs predictable economic policies rooted in a stable political system. After witnessing the !rst democratic transition last year, Pakistan once again is headed towards political confrontation. This does not augur well for the "edgling Pakistani economy which registered small recovery last year after years of massive power-crisis, sharp decline in the value of Pak Rupee, "ight of foreign capital, “war on terror”, recurring natural calamities and excessive reliance on assistance from multilateral agencies. With continuing political uncertainty, these problems may exacerbate further, thus adding to the woes of the export-based textile industry, already facing continuing global recession and increasing competition from regional players in value-added sector.
Increasing revenues by better selling and improving margins by driving down costs is the prescription for a successful and pro!table business in any economic environment. Likewise, your management, keeping in view the di#cult politico-economic situation, is pursuing a two-pronged strategy. The increased revenues and better margins shall be ensured with higher productive capacity by intensive marketing e$orts focusing on market development and penetration, product development, especially niche products for famous brands and technical textiles. On cost side, better supply-chain management for raw materials and increased reliance on alternate fuels for power-generation shall remain pivotal parts of the strategy. The current order book of the Company is healthy and it has con!rmed orders up to December 2014 at full capacity. Therefore, the management is con!dent that the Company shall be able to improve its operational performance, going forward.
Auditors
The external auditors of the Company, M/s Riaz Ahmad & Company, Chartered Accountants shall retire on the conclusion of forthcoming Annual General Meeting. Being eligible for re-appointment under the Companies Ordinance, 1984, they have o$ered their services as auditors of the Company for the year ending June 30, 2015. The Board of Directors endorsed its recommendations of Audit Committee for their re-appointment.
The auditors have conveyed that they have been assigned satisfactory rating under the Quality Control Review Program of the Institute of Chartered Accountants of Pakistan and the !rm is fully compliant with

15
the code of ethics issued by International Federation of Accountants (IFAC). Further they are also not rendering any related services to the Company. The auditors have also con!rmed that neither the !rm nor any of their partners, their spouses or minor children at any time during the year held or traded in the shares of the Company.
Acknowledgment
The board places on record its profound gratitude for its valued shareholders, banks, !nancial institutions and customers, whose cooperation, continued support and patronage have enabled the Company to strive for constant improvement. During the period under review, relations between the management and employees remained cordial and we wish to place on record our appreciation for the dedication, perseverance and diligence of the sta" and workers of the Company.
For and on behalf of the Board
25 September 2014 Chief Executive

16
PERFORMANCE OVERVIEW
202546
5.10%

17
775636
2013-14
3.97
2013-14
1.19
2013-14
2013-142013-14
15.23

18
2013-14 2012-13 2011-12 2010-11 2009-10 2008-09
OPERATING Gross Margin % 13.45 16.31 14.67 (1.81) 5.23 8.70 Pre Tax Margin % 1.92 12.86 11.00 (23.32) (17.50) (8.73)Net Margin % 2.60 11.93 10.05 (26.79) (18.30) (9.53) PERFORMANCE Return on Long Term Assets % 5.70 29.17 17.58 (41.38) (20.73) (12.74)Total Assets Turnover x 1.30 1.44 1.08 0.90 0.71 0.84 Fixed Assets Turnover x 2.26 2.52 1.83 1.70 1.20 1.40 Inventory Turnover Days 52.80 45.36 53.41 63.84 84.00 74.00
Return on Capital Employed % 17.22 48.03 36.36 nm (103.72) 2.34 Retention % 100 100 100 - - - LEVERAGE
LIQUIDITY Current 1.19 1.33 1.06 0.38 0.44 0.55 Quick 0.70 0.82 0.67 0.26 0.24 0.30 VALUATION Earning per share (pre tax) Rs. 2.93 21.36 13.53 (23.87) (21.36) (13.00)Earning per share (after tax) Rs. 3.97 19.81 12.36 (27.42) (22.32) (14.19)Breakup value Rs. 15.23 10.24 (11.21) (24.69) (1.74) 17.43 Dividend payout - Cash Rs. - - - - - - Bonus issue % - - - - - - Payout ratio - Cash (after tax) % - - - - - - Price earning ratio Rs. 3.15 0.82 0.19 (0.04) (0.14) (0.34)Market price to breakup value Rs. 0.82 1.58 (0.21) (0.04) (1.79) 0.28 Dividend yield % - - - - - - Market value per share Rs. 12.49 16.20 2.36 1.06 3.11 4.86 Market capitalization Rs. In million 636 825 120 54 158 247 HISTORICAL TRENDS Turnover Rs. In million 7,772 8,452 6,262 5,210 6,214 7,578 Gross pro!t Rs. In million 1,045 1,378 919 (95) 325 659 Pro!t/(Loss) before tax Rs. In million 149 1,087 689 (1,215) (1,088) (662)Pro!t/(Loss) after tax Rs. In million 202 1,009 629 (1,396) (1,137) (723) FINANCIAL POSITION Shareholder’s funds Rs. In million 775 521 (571) (1,257) (88) 887
Current assets Rs. In million 2,445 2,403 2,243 2,414 3,200 3,379 Current liabilities Rs. In million 2,047 1,804 2,116 6,345 7,317 6,110 Long term assets Rs. In million 3,542 3,457 3,580 3,373 5,492 5,672 Long term liabilities Rs. In million 2,396 2,794 3,423 31 439 1,017
SIX YEARS’ PERFORMANCE

19
2014 2013 %age Rupees (000) %age Rupees (000)Value Added Local Sales 12.96% 1,007,047 13.42% 1,134,504
Export Sales 87.04% 6,765,384 86.58% 7,317,266
Total Sales 100% 7,772,431 100% 8,451,771
Value Allocated
Materials 57.91% 4,501,050 57.49% 4,859,232
Other Manufacturing Cost 22.10% 1,717,470 20.70% 1,749,765
Sta! cost 3.91% 304,272 3.07% 259,363
Depreciation & Amortization 2.63% 204,470 2.43% 205,098
Operating Expenses 7.88% 612,470 7.21% 609,423
Financial Expenses 3.65% 283,352 (3.77%) (318,321)
Pre-tax Pro"t 1.92% 149,347 12.86% 1,087,212
100% 7,772,431 100% 8,451,771

20
CODE OF CORPORATE GOVERNANCE
This statement is being presented to comply with the Code of Corporate Governance (CCG) contained in Regulation No. 35 of the listing regulations of the Stock Exchanges for the purpose of establishing a framework of good governance, whereby a listed company is managed in compliance with the best practices of corporate governance.
1. The Company encourages representation of independent non-executive directors and directors
Category Names
Independent Director Mr. Riaz Ahmed
Executive Directors Mr. Aamir Fayyaz Sheikh Mr. Asad Fayyaz Sheikh
Non-Executive Directors Mr. Ali Fayyaz Sheikh Mr. Rashid Ahmed Mr. Shahbaz Munir Mr. Aamir Amin
The above named independent director meets the criteria of independence under clause i (b) of the CCG.
2. The directors have con!rmed that none of them is serving as a director on more than seven listed companies, including this company.
3. All the resident directors of the company are registered as taxpayers and none of them has defaulted in payment of any loan to a banking company, a DFI or an NBFI or, being a member of a stock exchange, has been declared as a defaulter by that stock exchange.
4. No casual vacancy occurred on the board during the year ended June 30, 2014.
5. The company prepared a ‘Code of Conduct’ and has ensured that appropriate steps have been taken to disseminate it throughout the company along with its supporting policies and procedures.
6. The board has developed a vision/mission statement, overall corporate strategy and signi!cant policies of the company. A complete record of particulars of signi!cant policies along with the dates on which they were approved or amended has been maintained.
7. All the powers of the board have been duly exercised and decisions on material transactions, including appointment and determination of remuneration and terms and conditions of employment of the CEO, other executive and non-executive directors, have been taken by the board/shareholders.
8. The meetings of the board were presided over by the Chairman and, in his absence, by a director
notices of the board meetings, along with agenda and working papers, were circulated at least seven days before the meetings. The minutes of meetings were appropriately recorded and circulated.
9. During the year under review, Mr. Shahbaz Munir, non-executive director of the company successfully completed directors training programme conducted by Institute of Chartered Accountants of Pakistan held at Lahore in May 2014.

21
10.
policy approved by the board.
11.
12. The !nancial statements of the company were duly endorsed by CEO and CFO before approval of the board.
13. The directors, CEO and executives do not hold any interest in the shares of the company other than that disclosed in the pattern of shareholding.
14.
15. The board has formed an Audit Committee. It comprises four members, of whom three are non-executive directors and the chairman of the committee is an independent director.
16.
committee have been formed and advised to the committee for compliance.
17. members of whom majority are non-executive directors including chairman of the meeting.
18.experienced personnel who are conversant with the policies and procedures of the company.
19. The statutory auditors of the Company have con!rmed that they have been given a satisfactory
(ICAP), that they or any of the partners of the !rm, their spouses and minor children do not hold shares of the Company and that the !rm and all its partners are in compliance with International Federation of Accountants (IFAC) guidelines on code of ethics as adopted by ICAP.
20. The statutory auditors or the persons associated with them have not been appointed to provide other services except in accordance with the listing regulations and the auditors have con!rmed that they have observed IFAC guidelines in this regard.
21. The ‘closed period’, prior to the announcement of interim/!nal results, and business decisions, which may materially a"ect the market price of the company’s securities, was determined and intimated to directors, employees and stock exchange(s).
22. Material/price sensitive information has been disseminated among all market participants at once through Stock Exchanges.
23. We con!rm that all other material principles contained in the CCG have been complied with.
For and on behalf of the Board
Chief Executive
22
We have reviewed the enclosed Statement of Compliance with the best practices contained in the Code
No. 35 of the Karachi, Lahore and Islamabad Stock Exchanges where the Company is listed.
The responsibility for compliance with the Code is that of the Board of Directors of the Company. Our responsibility is to review, to the extent where such compliance can be objectively veri!ed, whether the Statement of Compliance re"ects the status of the Company’s compliance with the provisions of the
prepared by the Company to comply with the Code.
accounting and internal control systems su#cient to plan the audit and develop an e$ective audit
covers all risks and controls or to form an opinion on the e$ectiveness of such internal controls, the Company’s corporate governance procedures and risks.
the Audit Committee, place before the Board of Directors for their review and approval its related party
in arm’s length transactions and transactions which are not executed at arm’s length price and recording
of Directors upon recommendation of the Audit Committee. We have not carried out any procedures to determine whether the related party transactions were undertaken at arm’s length price or not.
Based on our review, nothing has come to our attention which causes us to believe that the Statement of Compliance does not appropriately re"ect the Company’s compliance, in all material respects, with the best practices contained in the Code as applicable to the Company for the year ended 30 June 2014.
Chartered Accountants
Mubashar Mehmood
25 Septermber 2014
23
Financial StatmentsFor the year ended 30 June 2014

24

25
We have audited the annexed balance sheet of KOHINOOR MILLS LIMITED as at 30 June 2014 and the related pro!t and loss account, statement of comprehensive income, cash "ow statement and statement of changes in equity together with the notes forming part thereof, for the year then ended and we state that we have obtained all the information and explanations which, to the best of our knowledge and belief, were necessary for the purposes of our audit.
It is the responsibility of the company’s management to establish and maintain a system of internal control, and prepare and present the above said statements in conformity with the approved accounting standards and the requirements of the Companies Ordinance, 1984. Our responsibility is to express an opinion on these statements based on our audit.
We conducted our audit in accordance with the auditing standards as applicable in Pakistan. These standards require that we plan and perform the audit to obtain reasonable assurance about whether the above said statements are free of any material misstatement. An audit includes examining, on a test basis, evidence supporting the amounts and disclosures in the above said statements. An audit also includes assessing the accounting policies and signi!cant estimates made by management, as well as, evaluating the overall presentation of the above said statements. We believe that our audit provides a reasonable basis for our opinion and, after due veri!cation, we report that:
(a) in our opinion, proper books of account have been kept by the company as required by the Companies Ordinance, 1984;
(b) in our opinion:
i) the balance sheet and pro!t and loss account together with the notes thereon have been drawn up in conformity with the Companies Ordinance, 1984, and are in agreement with the books of account and are further in accordance with accounting policies consistently applied;
ii) the expenditure incurred during the year was for the purpose of the company’s business;
and iii) the business conducted, investments made and the expenditure incurred during the year
were in accordance with the objects of the company;
(c) in our opinion and to the best of our information and according to the explanations given to us, the balance sheet, pro!t and loss account, statement of comprehensive income, cash "ow statement and statement of changes in equity together with the notes forming part thereof conform with approved accounting standards as applicable in Pakistan, and, give the information required by the Companies Ordinance, 1984, in the manner so required and respectively give a true and fair view of the state of the company’s a#airs as at 30 June 2014 and of the pro!t, its comprehensive income, its cash "ows and changes in equity for the year then ended; and
(d) in our opinion, no Zakat was deductible at source under the Zakat and Ushr Ordinance, 1980 (XVIII
of 1980).
RIAZ AHMAD & COMPANYChartered Accountants Name of engagement partner:Mubashar Mehmood
DATE: 25 September 2014
LAHORE
AUDITORS’ REPORT TO THE MEMBERS

26
Note 2014 2013 Rupees Rupees
EQUITY AND LIABILITIES Share capital and reserves Authorized share capital 3 1,100,000,000 1,100,000,000 Issued, subscribed and paid-up share capital 4 509,110,110 509,110,110 Reserves 5 266,153,612 12,324,332 Total equity 775,263,722 521,434,442 Surplus on revaluation of operating !xed assets 6 768,718,932 785,458,501 - net of deferred income tax LIABILITIES Non-current liabilities Long term !nancing - secured 7 1,711,379,960 1,994,125,496 Sponsor’s loan 8 176,742,116 272,000,000 Deferred liabilities 9 507,523,537 483,022,877
2,395,645,613 2,749,148,373 Current liabilities Trade and other payables 10 801,965,767 814,538,309 Accrued markup 11 132,581,524 110,743,721 Short term borrowings - secured 12 814,194,999 671,405,785 Current portion of long term !nancing 7 249,682,994 127,360,657 Provision for taxation 49,029,133 79,975,000
2,047,454,417 1,804,023,472
Total liabilities 4,443,100,030 4,553,171,845 Contingencies and commitments 13 TOTAL EQUITY AND LIABILITIES 5,987,082,684 5,860,064,788 The annexed notes form an integral part of these !nancial statements.
BALANCE SHEET AS AT 30 JUNE 2014
AAMIR FAYYAZ SHEIKH Chief Executive

27
Note 2014 2013 Rupees Rupees
ASSETS Non-current assets Fixed assets 14 3,440,654,126 3,354,568,091 Long term investments 15 81,013,995 82,235,864 Long term security deposits 20,587,740 20,587,740
3,542,255,861 3,457,391,695 Current assets Stores, spares and loose tools 16 317,766,166 315,856,083 Stock-in-trade 17 698,231,702 614,534,124 Trade debts 18 533,484,347 679,533,395 Advances 19 87,643,135 90,306,682 Trade deposits and short term prepayments 20 19,413,286 7,595,341 Other receivables 21 253,595,350 237,728,166 Sales tax recoverable 22 202,338,744 195,540,934 Short term investment 23 176,879,692 132,357,244 Cash and bank balances 24 155,474,401 129,221,124
2,444,826,823 2,402,673,093 TOTAL ASSETS 5,987,082,684 5,860,064,788
AAMIR AMIN Director

28
Note 2014 2013 Rupees Rupees
SALES 25 7,772,431,497 8,451,770,781 COST OF SALES 26 (6,727,262,092) (7,073,457,332) GROSS PROFIT 1,045,169,405 1,378,313,449 DISTRIBUTION COST 27 (431,562,084) (618,804,629)ADMINISTRATIVE EXPENSES 28 (210,814,760) (195,040,088)OTHER EXPENSES 29 (93,859,958) (176,879,315) (736,236,802) (990,724,032) 308,932,603 387,589,417 OTHER INCOME 30 237,082,706 1,205,045,128 PROFIT FROM OPERATIONS 546,015,309 1,592,634,545 FINANCE COST 31 (396,667,996) (505,422,696) PROFIT BEFORE TAXATION 149,347,313 1,087,211,849 TAXATION 32 52,540,332 (78,545,167)
PROFIT AFTER TAXATION 201,887,645 1,008,666,682
EARNINGS PER SHARE - BASIC AND DILUTED 33 3.97 19.81 The annexed notes form an integral part of these !nancial statements.
PROFIT AND LOSS ACCOUNTFOR THE YEAR ENDED 30 JUNE 2014
AAMIR FAYYAZ SHEIKH AAMIR AMIN Chief Executive Director

29
2014 2013 Rupees Rupees
PROFIT AFTER TAXATION 201,887,645 1,008,666,682 OTHER COMPREHENSIVE INCOME Items that will not be reclassi!ed to pro!t or loss - - Items that may be reclassi!ed subsequently to pro!t or loss: Surplus arising on re-measurement of available for sale investment to fair value 44,522,448 54,904,794 Reclassi!cation adjustment relating to disposal of available for sale investment - (28,915,070) Deferred income tax relating to surplus on re-measurement of available for sale investment to fair value (10,031,907) (13,425,111) Other comprehensive income for the year - net of tax 34,490,541 12,564,613 TOTAL COMPREHENSIVE INCOME FOR THE YEAR 236,378,186 1,021,231,295 The annexed notes form an integral part of these !nancial statements.
STATEMENT OF COMPREHENSIVE INCOME FOR THE YEAR ENDED 30 JUNE 2014
AAMIR FAYYAZ SHEIKH AAMIR AMIN Chief Executive Director

30
Note 2014 2013 Rupees Rupees
CASH FLOWS FROM OPERATING ACTIVITIES CASH GENERATED FROM OPERATIONS 34 734,321,814 833,861,011 Income tax paid (100,404,325) (93,007,155)Net decrease in long term security deposits - 195,000 Finance cost paid (180,808,247) (242,275,885)
NET CASH GENERATED FROM OPERATING ACTIVITIES 453,109,242 498,772,971 CASH FLOWS FROM INVESTING ACTIVITIES Capital expenditure on property, plant and equipment (322,403,826) (244,961,046)Proceeds from disposal of operating !xed assets 17,186,480 6,686,775 Proceed from disposal of short term investment - 145,677,342 Dividend received 3,540,168 2,574,668 NET CASH USED IN INVESTING ACTIVITIES (301,677,178) (90,022,261) CASH FLOWS FROM FINANCING ACTIVITIES Repayment of long term !nancing (267,968,001) (198,073,490)Short term borrowings - net 142,789,214 (189,582,631)
NET CASH USED IN FINANCING ACTIVITIES (125,178,787) (387,656,121) NET INCREASE IN CASH AND CASH EQUIVALENTS 26,253,277 21,094,589 CASH AND CASH EQUIVALENTS AT THE BEGINNING OF THE YEAR 129,221,124 108,126,535 CASH AND CASH EQUIVALENTS AT THE END OF THE YEAR 155,474,401 129,221,124 The annexed notes form an integral part of these !nancial statements.
CASH FLOW STATEMENTFOR THE YEAR ENDED 30 JUNE 2014
AAMIR FAYYAZ SHEIKH AAMIR AMIN Chief Executive Director

31
STAT
EMEN
T O
F CH
ANG
ES IN
EQ
UIT
Y FO
R TH
E YE
AR E
ND
ED 3
0 JU
NE
2014
RE
SERV
ES
CA
PITA
L RE
SERV
ES
REV
ENU
E RE
SERV
ES
Sh
are
prem
ium
Fa
ir v
alue
Gen
eral
A
ccum
ulat
ed
To
tal
Tota
l
rese
rves
re
serv
es
Su
b-To
tal
rese
rve
los
s
Su
b-To
tal
rese
rves
---
----
----
----
----
----
----
----
----
----
----
----
----
- R
UP
EE
S -
----
----
----
----
----
----
----
----
----
----
----
----
---
Bala
nce
as a
t 30
June
201
2 5
09,1
10,1
10
213
,406
,310
8
5,51
6,92
6
298
,923
,236
1
,058
,027
,640
(2
,436
,586
,888
) (1
,378
,559
,248
) (1
,079
,636
,012
) (5
70,5
25,9
02)
Tr
ansf
erre
d fro
m su
rplu
s on
reva
luat
ion
of o
pera
ting
!xed
as
sets
in re
spec
t of i
ncre
men
tal d
epre
ciat
ion
- net
of
defe
rred
inco
me
tax
-
-
-
-
-
18,
369,
573
1
8,36
9,57
3
18,
369,
573
1
8,36
9,57
3
Surp
lus o
n re
valu
atio
n re
aliz
ed o
n di
spos
al o
f ope
ratin
g !x
ed a
sset
-
-
-
-
-
5
2,35
9,47
6
52,
359,
476
5
2,35
9,47
6
52,
359,
476
Pr
o!t f
or th
e ye
ar
-
-
-
-
-
1,0
08,6
66,6
82
1,0
08,6
66,6
82
1,0
08,6
66,6
82
1,0
08,6
66,6
82
Oth
er c
ompr
ehen
sive
inco
me
for t
he y
ear
-
-
12,
564,
613
1
2,56
4,61
3
-
-
-
12,
564,
613
1
2,56
4,61
3
Tota
l com
preh
ensiv
e in
com
e fo
r the
yea
r end
ed 3
0 Ju
ne 2
013
-
-
12,
564,
613
1
2,56
4,61
3
-
1,0
08,6
66,6
82
1,0
08,6
66,6
82
1,0
21,2
31,2
95
1,0
21,2
31,2
95
Ba
lanc
e as
at 3
0 Ju
ne 2
013
509
,110
,110
2
13,4
06,3
10
98,
081,
539
3
11,4
87,8
49
1,0
58,0
27,6
40
(1,3
57,1
91,1
57)
(299
,163
,517
) 1
2,32
4,33
2
521
,434
,442
Tran
sfer
red
from
surp
lus o
n re
valu
atio
n of
ope
ratin
g !x
ed
asse
ts in
resp
ect o
f inc
rem
enta
l dep
reci
atio
n - n
et o
f de
ferr
ed in
com
e ta
x -
-
-
-
-
1
7,45
1,09
4
17,
451,
094
1
7,45
1,09
4
17,
451,
094
Pr
o!t f
or th
e ye
ar
-
-
-
-
-
201
,887
,645
2
01,8
87,6
45
201
,887
,645
2
01,8
87,6
45
Oth
er c
ompr
ehen
sive
inco
me
for t
he y
ear
-
-
34,
490,
541
3
4,49
0,54
1
-
-
-
34,
490,
541
3
4,49
0,54
1
Tota
l com
preh
ensiv
e in
com
e fo
r the
yea
r end
ed 3
0 Ju
ne 2
014
-
-
34,
490,
541
3
4,49
0,54
1
-
201
,887
,645
2
01,8
87,6
45
236
,378
,186
2
36,3
78,1
86
Ba
lanc
e as
at 3
0 Ju
ne 2
014
509
,110
,110
2
13,4
06,3
10
132
,572
,080
3
45,9
78,3
90
1,0
58,0
27,6
40
(1,1
37,8
52,4
18)
(79,
824,
778)
2
66,1
53,6
12
775
,263
,722
Th
e an
nexe
d no
tes f
orm
an
inte
gral
par
t of t
hese
!na
ncia
l sta
tem
ents
.
SHA
RE
CAPI
TAL
TOTA
LEQ
UIT
Y
AA
MIR
FAY
YAZ
SHEI
KH
AAM
IR A
MIN
Ch
ief E
xecu
tive
D
irect
or

32
NOTES TO THE FINANCIAL STATEMENTSFOR THE YEAR ENDED 30 JUNE 2014
1. THE COMPANY AND ITS OPERATIONS
Kohinoor Mills Limited (“the Company”) is a public limited company incorporated on 21 December 1987 in Pakistan under the Companies Ordinance, 1984 and its shares are quoted on Karachi, Lahore and Islamabad Stock Exchanges of Pakistan. The registered o!ce of the Company is situated at 8-K.M., Manga Raiwind Road, District Kasur. The Company is principally engaged in the business of textile manufacturing covering weaving, bleaching, dyeing, buying, selling and otherwise dealing in yarn, cloth and other goods and fabrics made from raw cotton and synthetic "ber and to generate, and supply electricity.
2. SUMMARY OF SIGNIFICANT ACCOUNTING POLICIES The signi"cant accounting policies applied in the preparation of these "nancial statements are set
out below. These policies have been consistently applied to all years presented, unless otherwise stated:
2.1 Basis of preparation a) Statement of compliance These "nancial statements have been prepared in accordance with approved accounting
standards as applicable in Pakistan. Approved accounting standards comprise of such International Financial Reporting Standards (IFRS) issued by the International Accounting Standards Board as are noti"ed under the Companies Ordinance, 1984, provisions of and directives issued under the Companies Ordinance, 1984. In case requirements di#er, the provisions or directives of the Companies Ordinance, 1984 shall prevail.
b) Accounting convention These "nancial statements have been prepared under the historical cost convention,
except for freehold land and buildings which are carried at revalued amounts and certain "nancial instruments which are carried at their fair value.
c) Critical accounting estimates and judgments The preparation of "nancial statements in conformity with the approved accounting
standards requires the use of certain critical accounting estimates. It also requires the management to exercise its judgment in the process of applying the Company’s accounting policies. Estimates and judgments are continually evaluated and are based on historical experience and other factors, including expectations of future events that are believed to be reasonable under the circumstances. The areas where various assumptions and estimates are signi"cant to the Company’s "nancial statements or where judgments were exercised in application of accounting policies are as follows:
Financial instruments The fair value of "nancial instruments that are not traded in an active market is determined
by using valuation techniques based on assumptions that are dependent on conditions existing at the balance sheet date.

33
Useful lives, patterns of economic bene!ts and impairments Estimates with respect to residual values and useful lives and pattern of !ow of economic bene"ts
are based on the analysis of the management of the Company. Further, the Company reviews the value of assets for possible impairments on an annual basis. Any change in the estimates in the future might a#ect the carrying amount of respective item of property, plant and equipment, with a corresponding e#ect on the depreciation charge and impairment.
Taxation In making the estimates for income tax currently payable by the Company, the management takes
into account the current income tax law and the decisions of appellate authorities on certain issues in the past.
Provision for doubtful debts The Company reviews its receivable against any provision required for any doubtful balances on an
ongoing basis. The provision is made while taking into consideration expected recoveries, if any. Inventories Net realizable value of inventories is determined with reference to currently prevailing selling
prices less estimated expenditure to make sales. Provision for obsolescence of stores, spares and loose tools Provision for obsolescence of items of stores, spares and loose tools is made on the basis of
management’s estimate of net realizable value and ageing analysis prepared on an item-by-item basis.
d) Amendments to published approved standards that are e"ective in current year and are
relevant to the Company The following amendments to published approved standards are mandatory for the Company’s
accounting periods beginning on or after 01 July 2013: IFRS 7 (Amendment) ‘Financial Instruments: Disclosures’ (e#ective for annual periods beginning
on or after 01 January 2013). The International Accounting Standards Board (IASB) has amended the accounting requirements and disclosures related to o#setting of "nancial assets and "nancial liabilities by issuing amendments to IAS 32 ‘Financial Instruments: Presentation’ and IFRS 7. These amendments are the result of IASB and US Financial Accounting Standard Board undertaking a joint project to address the di#erences in their respective accounting standards regarding o#setting of "nancial instruments. The application of the amendments does not result in any impact on pro"t or loss, other comprehensive income and total comprehensive income.
On 17 May 2012, IASB issued Annual Improvements to IFRS: 2009 – 2011 Cycle, incorporating
amendments to "ve IFRS more speci"cally in IAS 1 ‘Presentation of Financial Statements’ and IAS 32 ‘Financial instruments: Presentation’ that are considered relevant to the Company’s "nancial statements. These amendments are e#ective for annual periods beginning on or after 01 January 2013. The application of the amendments does not result in any impact on pro"t or loss, other comprehensive income and total comprehensive income.

34
e) Standards, interpretation and amendments to published approved standards that are e!ective in current year but not relevant to the Company
There are other standards, new interpretation and amendments to published standards that are
mandatory for accounting periods beginning on or after 01 July 2013 but are considered not to be relevant or do not have any signi!cant impact on the Company’s !nancial statements and are therefore not detailed in these !nancial statements.
f) Standards, interpretation and amendments to published standards that are not yet e!ective
but relevant to the Company Following standards, interpretation and amendments to existing standards have been published
and are mandatory for the Company’s accounting periods beginning on or after 01 July 2014 or later periods:
IFRS 9 ‘Financial Instruments’ (e"ective for annual periods beginning on or after 01 January 2018).
A !nalized version of IFRS 9 which contains accounting requirements for !nancial instruments, replacing IAS 39 ‘Financial Instruments: Recognition and Measurement’. Financial assets are classi!ed by reference to the business model within which they are held and their contractual cash #ow characteristics. The 2014 version of IFRS 9 introduces a ‘fair value through other comprehensive income’ category for certain debt instruments. Financial liabilities are classi!ed in a similar manner to under IAS 39, however there are di"erences in the requirements applying to the measurement of an entity’s own credit risk. The 2014 version of IFRS 9 introduces an ‘expected credit loss’ model for the measurement of the impairment of !nancial assets, so it is no longer necessary for a credit event to have occurred before a credit loss is recognized. It introduces a new hedge accounting model that is designed to be more closely aligned with how entities undertake risk management activities when hedging !nancial and non-!nancial risk exposures. The requirements for the derecognition of !nancial assets and liabilities are carried forward from IAS 39. The management of the Company is in the process of evaluating the impacts of the aforesaid standard on the Company’s !nancial statements.
IFRS 10 ‘Consolidated Financial Statements’ (e"ective for annual periods beginning on or after
01 January 2015). Concurrent with the issuance of IFRS 10, the IASB has also issued IFRS 11 ‘Joint Arrangements’, IFRS 12 ‘Disclosure of Interests in Other Entities’, IAS 27 (revised 2011) ‘Consolidated and Separate Financial Statements’ and IAS 28 (revised 2011) ‘Investments in Associates’. The objective of IFRS 10 is to have a single basis for consolidation for all entities, regardless of the nature of the investee, and that basis is control. The de!nition of control includes three elements: power over an investee, exposure or rights to variable returns of the investee and the ability to use power over the investee to a"ect the investor’s returns. IFRS 10 replaces those parts of IAS 27 ‘Consolidated and Separate Financial Statements’ that address when and how an investor should prepare consolidated !nancial statements and replaces Standing Interpretations Committee (SIC) 12 ‘Consolidation – Special Purpose Entities’ in its entirety. The management of the Company is in the process of evaluating the impacts of the aforesaid standard on the Company’s !nancial statements.
Amendments to IFRS 10, IFRS 11 and IFRS 12 (e"ective for annual periods beginning on or after
01 January 2015) provide additional transition relief in by limiting the requirement to provide adjusted comparative information to only the preceding comparative period. Also, amendments to IFRS 12 eliminate the requirement to provide comparative information for periods prior to the immediately preceding period.

35
Amendments to IFRS 10, IFRS 12 and IAS 27 (e!ective for annual periods beginning on or after 01 January 2015) provide ‘investment entities’ an exemption from the consolidation of particular subsidiaries and instead require that: an investment entity measure the investment in each eligible subsidiary at fair value through pro"t or loss; requires additional disclosures; and require an investment entity to account for its investment in a relevant subsidiary in the same way in its consolidated and separate "nancial statements. The management of the Company is in the process of evaluating the impacts of the aforesaid amendments on the Company’s "nancial statements.
IFRS 12 ‘Disclosures of Interests in Other Entities’ (e!ective for annual periods beginning on or after
01 January 2015). This standard includes the disclosure requirements for all forms of interests in other entities, including joint arrangements, associates, special purpose vehicles and other o!-balance sheet vehicles. This standard is not expected to have a material impact on the Company’s "nancial statements.
IFRS 13 ‘Fair value Measurement’ (e!ective for annual periods beginning on or after 01 January
2015). This standard aims to improve consistency and reduce complexity by providing a precise de"nition of fair value and a single source of fair value measurement and disclosure requirements for use across IFRSs. The requirements, which are largely aligned between IFRSs and US GAAP, do not extend the use of fair value accounting but provide guidance on how it should be applied where its use is already required or permitted by other standards within IFRSs or US GAAP. This standard is not expected to have a material impact on the Company’s "nancial statements.
IFRS 15 ‘Revenue from Contracts with Customers’ (e!ective for annual periods beginning on or after 01 January 2017). IFRS 15 provides a single, principles based "ve-step model to be applied to all contracts with customers. The "ve steps in the model are: identify the contract with the customer; identify the performance obligations in the contract; determine the transaction price; allocate the transaction price to the performance obligations in the contracts; and recognize revenue when (or as) the entity satis"es a performance obligation. Guidance is provided on topics such as the point in which revenue is recognized, accounting for variable consideration, costs of ful"lling and obtaining a contract and various related matters. New disclosures about revenue are also introduced. The management of the Company is in the process of evaluating the impacts of the aforesaid standard on the Company’s "nancial statements.
IAS 16 (Amendments) ‘Property, Plant and Equipment’ (e!ective for annual periods beginning on
or after 01 January 2016). The amendments clarify that a depreciation method that is based on revenue that is generated by an activity that includes the use of an asset is not appropriate for property, plant and equipment; and add guidance that expected future reductions in the selling price of an item that was produced using an asset could indicate the expectation of technological or commercial obsolescence of the asset, which, in turn, might re#ect a reduction of the future economic bene"ts embodied in the asset. However, the amendments are not expected to have a material impact on the Company’s "nancial statements.
IAS 32 (Amendments) ‘Financial Instruments: Presentation’ (e!ective for annual periods beginning
on or after 01 January 2014). Amendments have been made to clarify certain aspects because of diversity in application of the requirements on o!setting, focused on four main areas: the meaning of ‘currently has a legally enforceable right of set-o! ’; the application of simultaneous realization and settlement; the o!setting of collateral amounts and the unit of account for applying the o!setting requirements. However, the amendments are not expected to have a material impact on the Company’s "nancial statements.

36
IAS 36 (Amendments) ‘Impairment of Assets’ (e!ective for annual periods beginning on or after 01 January 2014). Amendments have been made in IAS 36 to reduce the circumstances in which the recoverable amount of assets or cash- generating units is required to be disclosed, clarify the disclosures required and to introduce an explicit requirement to disclose the discount rate used in determining impairment (or reversals) where recoverable amount (based on fair value less costs of disposal) is determined using a present value technique. However, the amendments are not expected to have a material impact on the Company’s "nancial statements.
On 12 December 2013, IASB issued Annual Improvements to IFRSs: 2010 – 2012 Cycle, incorporating
amendments to seven IFRSs more speci"cally in IFRS 8 ‘Operating Segments’, IFRS 13 ‘Fair Value Measurement’ and IAS 16 ‘Property, Plant and Equipment’, which are considered relevant to the Company’s "nancial statements. These amendments are e!ective for annual periods beginning on or after 01 July 2014. These amendments are unlikely to have a signi"cant impact on the Company’s "nancial statements and have therefore not been analyzed in detail.
On 12 December 2013, IASB issued Annual Improvements to IFRSs: 2011 – 2013 Cycle, incorporating
amendments to four IFRSs more speci"cally in IFRS 13 ‘Fair Value Measurement’, that is considered relevant to the Company’s "nancial statements. These amendments are e!ective for annual periods beginning on or after 01 July 2014. These amendments are unlikely to have a signi"cant impact on the Company’s "nancial statements and have therefore not been analyzed in detail.
IFRIC 21 ‘Levies’ (e!ective for annual periods beginning on or after 01 January 2014). The
interpretation provides guidance on when to recognize a liability for a levy imposed by a government, both for levies that are accounted for in accordance with IAS 37 ‘Provisions, Contingent Liabilities and Contingent Assets’ and those where the timing and amount of the levy is certain. The interpretation identi"es the obligating event for the recognition of a liability as the activity that triggers the payment of the levy in accordance with the relevant legislation. However, the interpretation is not expected to have a material impact on the Company’s "nancial statements.
g) Standard and amendments to published approved standards that are not yet e!ective and
not considered relevant to the Company There are other standard and amendments to published approved standards that are mandatory
for accounting periods beginning on or after 01 July 2014 but are considered not to be relevant or do not have any signi"cant impact on the Company’s "nancial statements and are therefore not detailed in these "nancial statements.
2.2 Employee bene"t The Company operates a funded contributory provident fund scheme for its permanent employees.
The Company and employees make equal monthly contributions of 8.33 percent of the basic salary, towards the fund. The Company’s contribution is charged to the pro"t and loss account.
2.3 Provisions Provisions are recognized in the balance sheet when the Company has a legal or constructive
obligation as a result of past events and it is probable that out#ow of economic bene"ts will be

37
required to settle the obligation and a reliable estimate can be made of the amount of obligation. However, provisions are reviewed at each balance sheet date and adjusted to re!ect current best estimate.
2.4 Taxation Current Provision for current tax is based on the taxable income for the year determined in accordance with
the prevailing law for taxation of income. The charge for current tax is calculated using prevailing tax rates or tax rates expected to apply to the pro"t for the year if enacted. The charge for current tax also includes adjustments, where considered necessary, to provision for tax made in previous years arising from assessments framed during the year for such years.
Deferred Deferred tax is accounted for using the balance sheet liability method in respect of all temporary
di#erences arising from di#erences between the carrying amount of assets and liabilities in the "nancial statements and the corresponding tax bases used in the computation of the taxable pro"t. Deferred tax liabilities are generally recognized for all taxable temporary di#erences and deferred tax assets to the extent that it is probable that taxable pro"ts will be available against which the deductible temporary di#erences, unused tax losses and tax credits can be utilized.
Deferred tax is calculated at the rates that are expected to apply to the period when the di#erences
reverse based on tax rates that have been enacted or substantively enacted by the balance sheet date. Deferred tax is charged or credited in the pro"t and loss account, except to the extent that it relates to items recognized in other comprehensive income or directly in equity. In this case the tax is also recognized in statement of comprehensive income or directly in equity, respectively.
2.5 Foreign currencies The "nancial statements are presented in Pak Rupees, which is the Company’s functional. All
monetary assets and liabilities in foreign currencies are translated into Pak Rupees at exchange rates prevailing at the balance sheet date. Transactions in foreign currencies are translated into Pak Rupees at the spot rate. All non-monetary items are translated into Pak Rupees at exchange rates prevailing on the date of transaction or on the date when fair values are determined. Exchange gains and losses, where applicable, are recognized in the pro"t and loss account.
2.6 Fixed assets 2.6.1 Property, plant and equipment and depreciation Owned a) Cost
Property, plant and equipment except freehold land and buildings are stated at cost less accumulated depreciation and any identi"ed impairment loss. Freehold land is stated at revalued amount less any identi"ed impairment loss, buildings are stated at revalued amount less accumulated depreciation and any identi"ed impairment loss, while capital work-in-progress is stated at cost less any identi"ed impairment loss.

38
Subsequent costs are included in the asset’s carrying amount or recognized as a separate asset, as appropriate, only when it is probable that future economic bene!ts associated with the item will "ow to the Company and the cost of the item can be measured reliably. All other repair and maintenance costs are charged to income during the period in which they are incurred.
Increases in the carrying amount arising on revaluation of operating !xed assets are credited
to surplus on revaluation of operating !xed assets. Decreases that o#set previous increases of the same assets are charged against this surplus, all other decreases are charged to income. Each year the di#erence between depreciation based on revalued carrying amount of the asset (the depreciation charged to the income) and depreciation based on the assets’ original cost is transferred from surplus on revaluation of operating !xed assets to retained earnings. All transfers to / from surplus on revaluation of operating !xed assets are net of applicable deferred income tax.
b) Depreciation Depreciation on all operating !xed assets is charged to income on a reducing balance method so
as to write o# cost / depreciable amount of an asset over its estimated useful life at the rates as disclosed in note 14.1. Depreciation on additions is charged from the month in which the asset is put to use and on disposal up to the month of disposal. The residual values and useful lives are reviewed by the management, at each !nancial year end and adjusted if impact on depreciation is signi!cant.
c) Derecognition An item of property, plant and equipment is derecognized on disposal or when no future economic
bene!ts are expected from its use or disposal. Any gain or loss arising on derecognition of the asset (calculated as the di#erence between the net disposal proceeds and carrying amount of the asset) is included in the pro!t and loss account in the year the asset is derecognized.
Leased a) Finance leases Leases where the Company has substantially all the risk and rewards of ownership are classi!ed
as !nance lease. Assets subject to !nance lease are capitalized at the commencement of the lease term at the lower of present value of minimum lease payments under the lease agreements and the fair value of the leased assets, each determined at the inception of the lease.
The related rental obligation net of !nance cost, is included in liabilities against assets subject to
!nance lease. The liabilities are classi!ed as current and long term depending upon the timing of payments.
Each lease payment is allocated between the liability and !nance cost so as to achieve a constant
rate on the balance outstanding. The !nance cost is charged to income over the lease term. Depreciation of assets subject to !nance lease is recognized in the same manner as for owned
assets. Depreciation of the leased assets is charged to income.

39
b) Operating leases Leases where signi!cant portion of the risk and rewards of ownership are retained by
the lessor are classi!ed as operating leases. Payments made under operating leases are charged to the income on a straight-line basis over the period of lease.
2.6.2 Intangible assets Intangible assets, which are non-monetary assets without physical substance, are recognized at
cost, which comprise purchase price, non-refundable purchase taxes and other directly attributable expenditures relating to their implementation and customization. After initial recognition an intangible asset is carried at cost less accumulated amortization and impairment losses, if any. Intangible assets are amortized from the month, when these assets are available for use, using the straight line method, whereby the cost of the intangible asset is amortized over its estimated useful life over which economic bene!ts are expected to "ow to the Company. The useful life and amortization method is reviewed and adjusted, if appropriate, at each balance sheet date.
2.7 Investments Classi!cation of an investment is made on the basis of intended purpose for holding such
investment. Management determines the appropriate classi!cation of its investments at the time of purchase and re-evaluates such designation on regular basis.
Investments are initially measured at fair value plus transaction costs directly attributable to
acquisition, except for “Investment at fair value through pro!t or loss” which is initially measured at fair value.
The Company assesses at the end of each reporting period whether there is any objective evidence
that investments are impaired. If any such evidence exists, the Company applies the provisions of IAS 39 ‘Financial Instruments: Recognition and Measurement’ to all investments, except investment in subsidiary company, which is tested for impairment in accordance with the provisions of IAS 36 ‘Impairment of Assets’.
a) Investments at fair value through pro"t or loss Investments classi!ed as held-for-trading and those designated as such are included in this
category. Investments are classi!ed as held-for-trading if they are acquired for the purpose of selling in the short term. Gains or losses on investments held-for-trading are recognized in pro!t and loss account.
b) Held-to-maturity Investments with !xed or determinable payments and !xed maturity are classi!ed as held-to-
maturity when the Company has the positive intention and ability to hold to maturity. Investments intended to be held for an unde!ned period are not included in this classi!cation. Other long term investments that are intended to be held to maturity are subsequently measured at amortized cost. This cost is computed as the amount initially recognized minus principal repayments, plus or minus the cumulative amortization using the e#ective interest method of any di#erence between the initially recognized amount and the maturity amount. For investments carried at amortized cost, gains and losses are recognized in pro!t and loss account when the investments are derecognized or impaired, as well as through the amortization process.

40
c) Available-for-sale Investments intended to be held for an inde!nite period of time, which may be sold in response
to need for liquidity, or changes to interest rates or equity prices are classi!ed as available-for-sale. After initial recognition, investments which are classi!ed as available-for-sale are measured at fair value. Gains or losses on available-for-sale investments are recognized directly in statement of comprehensive income until the investment is sold, de-recognized or is determined to be impaired, at which time the cumulative gain or loss previously reported in statement of comprehensive income is included in pro!t and loss account. These are sub-categorized as under:
Quoted For investments that are actively traded in organized capital markets, fair value is determined by
reference to stock exchange quoted market bids at the close of business on the balance sheet date. Unquoted Fair value of unquoted investments is determined on the basis of appropriate valuation techniques
as allowed by IAS 39 ‘Financial Instruments: Recognition and Measurement’. d) Equity investments in associated companies The investments in associates in which the Company does not have signi!cant in"uence are
classi!ed as “Available-for-Sale”. e) Investment in subsidiary company Investment in subsidiary company is accounted for at cost less impairment loss, if any, in accordance
with IAS 27 ‘Consolidated and Separate Financial Statements’. 2.8 Inventories Inventories, except for stock in transit, waste stock and rejected goods are stated at lower of cost
and net realizable value. Cost is determined as follows: Stores, spares and loose tools Useable stores and spares are valued principally at moving average cost, while items considered
obsolete are carried at nil value. In transit stores and spares are valued at cost comprising invoice value plus other charges paid thereon.
Stock in trade Cost of raw material is based on weighted average cost. Cost of work in process and !nished goods comprises prime cost and appropriate production
overheads determined on weighted average cost. Cost of goods purchased for resale are valued at their respective purchase price by using !rst-in-!rst-out method.

41
Materials in transit are valued at cost comprising invoice value plus other charges paid thereon. Waste stock and rejected goods are valued at net realizable value.
Net realizable value signi!es the estimated selling price in the ordinary course of business less the
estimated costs of completion and the estimated costs necessary to make a sale. 2.9 Non-current assets held for sale Non-current assets classi!ed as assets held for sale are stated at the lower of carrying amount
and fair value less costs to sell if their carrying amount is recoverable principally through a sale transaction rather than through continuing use.
2.10 Borrowing costs Borrowing costs are recognized as expense in the period in which these are incurred except to
the extent of borrowing costs that are directly attributable to the acquisition, construction or production of a qualifying asset. Such borrowing cost, if any, are capitalized as part of the cost of that asset.
2.11 Revenue recognition Revenue from di"erent sources is recognized as under. (a) Revenue from sale of goods is recognized on dispatch of goods to customer. (b) Dividend on equity investments is recognized as income when right to receive payment
is established. (c) Pro!t on bank deposits is recognized on a time proportion basis taking into account, the
principal outstanding and rates of pro!ts applicable thereon. 2.12 Impairment a) Financial assets A !nancial asset is considered to be impaired if objective evidence indicate that one or
more events had a negative e"ect on the estimated future cash $ow of that asset. An impairment loss in respect of a !nancial asset measured at amortized cost is calculated
as a di"erence between its carrying amount and the present value of estimated future cash $ows discounted at the original e"ective interest rate. An impairment loss in respect of available for sale !nancial asset is calculated with reference to its current fair value.
Individually signi!cant !nancial assets are tested for impairment on an individual basis.
The remaining !nancial assets are assessed collectively in groups that share similar credit risk characteristics.

42
b) Non-"nancial assets The carrying amounts of the Company’s non-!nancial assets are reviewed at each balance
sheet date to determine whether there is any indication of impairment. If such indication exists, the recoverable amount of such asset is estimated. An impairment loss is recognized wherever the carrying amount of the asset exceeds its recoverable amount. Impairment losses are recognized in pro!t and loss account. A previously recognized impairment loss is reversed only if there has been a change in the estimates used to determine the asset’s recoverable amount since the last impairment loss was recognized. If that is the case, the carrying amount of the asset is increased to its recoverable amount. That increased amount cannot exceed the carrying amount that would have been determined, net of depreciation, had no impairment loss been recognized for the asset in prior years. Such reversal is recognized in pro!t and loss account.
2.13 Share capital Ordinary shares are classi!ed as equity and recognized at their face value. Incremental costs directly
attributable to the issue of new shares are shown in equity as a deduction, net of tax, if any. 2.14 Financial instruments Financial instruments are recognized at fair value when the Company becomes party to the
contractual provisions of the instrument by following trade date accounting. Any gain or loss on the subsequent measurement is charged to the pro!t and loss account except for available for sale investments. The Company derecognizes a !nancial asset or a portion of !nancial asset when, and only when, the enterprise loses the control over contractual right that comprises the !nancial asset or a portion of !nancial asset. While a !nancial liability or a part of !nancial liability is derecognized from the balance sheet when, and only when, it is extinguished, i.e., when the obligation speci!ed in contract is discharged, cancelled or expired.
The particular measurement methods adopted are disclosed in the individual policy statements
associated with each item. Financial assets are investments, trade debts, deposits, advances, other receivables and cash and
bank balances. Financial liabilities are classi!ed according to the substance of the contractual agreements entered
into. Signi!cant !nancial liabilities are long term !nancing, short term borrowings, sponsor’s loan, accrued markup and trade and other payables.
2.14.1 Trade debts and other receivables Trade debts and other receivable are initially measured at fair value and subsequently
at amortized cost using e"ective interest rate method less provision for impairment. A provision is established when there is objective evidence that the Company will not be able to collect all amounts due according to the original terms of receivables. Trade debts and other receivables considered irrecoverable are written o".
43
2.14.2 Trade and other payables Liabilities for trade and other amounts payable are initially recognized at fair value
which is normally the transaction cost. 2.14.3 Markup bearing borrowings Borrowings are recognized initially at fair value and are subsequently stated at amortized
cost, any di!erence between the proceeds and the redemption value is recognized in the pro"t and loss account over the period of the borrowing using the e!ective interest rate method.
2.14.4 Cash and cash equivalents Cash and cash equivalents comprise cash in hand, cash at banks on current accounts,
saving and deposit accounts and other short term highly liquid instruments that are readily convertible into known amounts of cash and which are subject to insigni"cant risk of changes in values.
2.15 Derivative !nancial instruments Derivative "nancial instruments are initially recognized at fair value on the date a derivative
contract is entered into and are remeasured to fair value at subsequent reporting dates. The method of recognizing the resulting gain or loss depends on whether the derivative is designated as a hedging instrument, and if so, the nature of the item being hedged. The Company designates certain derivatives as cash #ow hedges.
The Company documents at the inception of the transaction the relationship between the
hedging instruments and hedged items, as well as its risk management objective and strategy for undertaking various hedge transactions. The Company also documents its assessment, both at hedge inception and on an ongoing basis, of whether the derivatives that are used in hedging transactions are highly e!ective in o!setting changes in cash #ow of hedged items.
The e!ective portion of changes in the fair value of derivatives that are designated and qualify as
cash #ow hedges are recognized in statement of other comprehensive income. The gain or loss relating to the ine!ective portion is recognized immediately in the pro"t and loss account.
Amounts accumulated in equity are recognized in pro"t and loss account in the periods when the
hedged item will a!ect pro"t or loss.

44
2.16 Segment reporting Segment reporting is based on the operating (business) segments of the Company. An operating
segment is a component of the Company that engages in business activities from which it may earn revenues and incur expenses, including revenues and expenses that relate to the transactions with any of the Company’s other components. An operating segment’s operating results are reviewed regularly by the chief executive to make decisions about resources to be allocated to the segment and assess its performance, and for which discrete !nancial information is available.
Segment results that are reported to the chief executive include items directly attributable to a
segment as well as those that can be allocated on a reasonable basis. Those income, expenses, assets, liabilities and other balances which can not be allocated to a particular segment on a reasonable basis are reported as unallocated.
The Company has three reportable business segments. Weaving (Producing di"erent quality
of greige fabric using yarn), Dyeing (Converting greige into dyed fabric) and Power Generation (Generating and distributing power).
Transactions among the business segments are recorded at arm’s length prices using admissible
valuation methods. Inter segment sales and purchases are eliminated from the total. 2.17 O! setting of "nancial assets and liabilities Financial assets and liabilities are set o" and the net amount is reported in the !nancial statements
when there is legally enforceable right to set o" and the Company intends either to settle on a net basis, or to realize the asset and settle the liability simultaneously.
2.18 Dividend and other appropriations Dividend to the shareholders is recognized in the period in which it is declared and other
appropriations are recognized in the period in which these are approved by the Board of Directors.
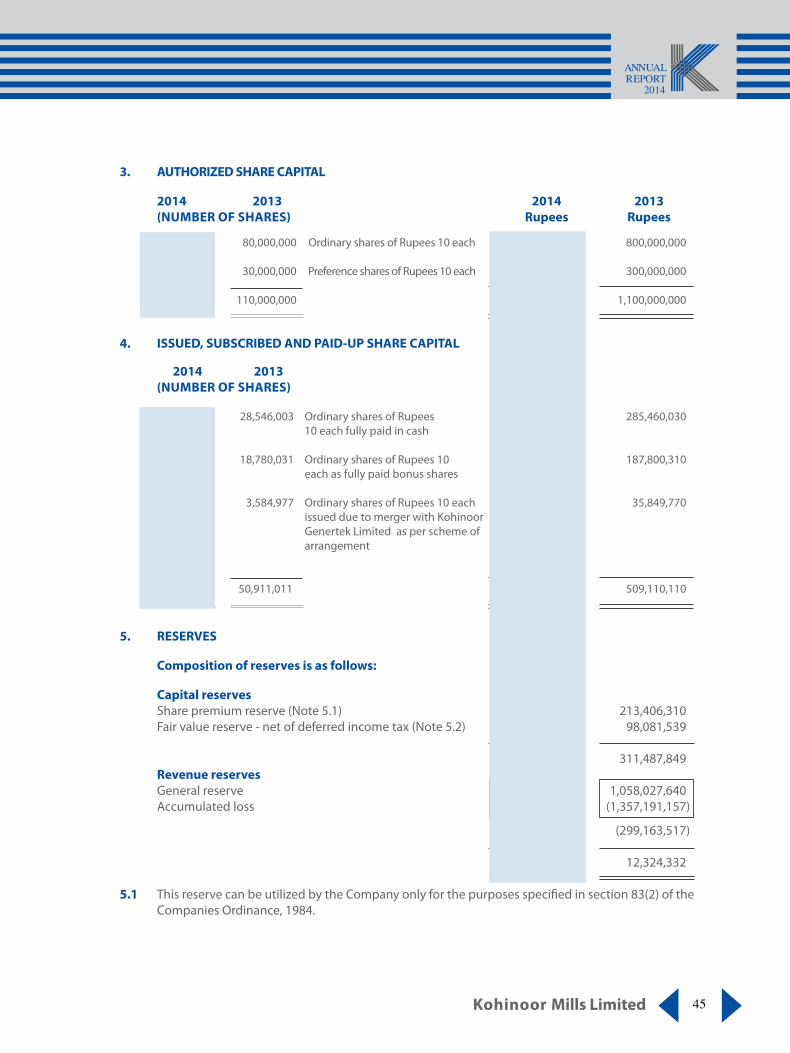
45
3. AUTHORIZED SHARE CAPITAL 2014 2013 2014 2013 (NUMBER OF SHARES) Rupees Rupees
80,000,000 80,000,000 Ordinary shares of Rupees 10 each 800,000,000 800,000,000 30,000,000 30,000,000 Preference shares of Rupees 10 each 300,000,000 300,000,000
110,000,000 110,000,000 1,100,000,000 1,100,000,000
4. ISSUED, SUBSCRIBED AND PAID-UP SHARE CAPITAL 2014 2013 (NUMBER OF SHARES)
28,546,003 28,546,003 Ordinary shares of Rupees 285,460,030 285,460,030 10 each fully paid in cash 18,780,031 18,780,031 Ordinary shares of Rupees 10 187,800,310 187,800,310 each as fully paid bonus shares 3,584,977 3,584,977 Ordinary shares of Rupees 10 each 35,849,770 35,849,770 issued due to merger with Kohinoor Genertek Limited as per scheme of arrangement 50,911,011 50,911,011 509,110,110 509,110,110
5. RESERVES
Composition of reserves is as follows:
Capital reserves Share premium reserve (Note 5.1) 213,406,310 213,406,310 Fair value reserve - net of deferred income tax (Note 5.2) 132,572,080 98,081,539
345,978,390 311,487,849 Revenue reserves General reserve 1,058,027,640 1,058,027,640 Accumulated loss (1,137,852,418) (1,357,191,157)
(79,824,778) (299,163,517) 266,153,612 12,324,332
5.1 This reserve can be utilized by the Company only for the purposes speci!ed in section 83(2) of the Companies Ordinance, 1984.

46
2014 2013 Rupees Rupees
5.2 Fair value reserve - net of deferred income tax
Balance as at 01 July 131,653,073 105,663,349 Fair value adjustment on investment: Impact of revaluation of investment 44,522,448 54,904,794 Fair value gain realized on disposal of investment - (28,915,070)
44,522,448 25,989,724
Balance as at 30 June 176,175,521 131,653,073 Less: Related deferred income tax liability 43,603,441 33,571,534 Balance as at 30 June - net of deferred income tax 132,572,080 98,081,539
5.2.1 This represents the unrealized gain on re-measurement of available for sale investment at fair value and is not available for distribution. This will be transferred to pro!t and loss account on realization.
2014 2013 Rupees Rupees6. SURPLUS ON REVALUATION OF OPERATING FIXED ASSETS - NET OF DEFERRED INCOME TAX Balance as at 01 July 810,923,617 882,992,935 Less: Surplus on revaluation realized on disposal of land - 52,359,476 Less: Incremental depreciation 18,724,350 19,709,842
Balance as at 30 June 792,199,267 810,923,617 Less: Related deferred income tax liability 23,480,335 25,465,116 Balance as at 30 June - net of deferred income tax 768,718,932 785,458,501

47
Nat
iona
l Ban
k of
Pak
istan
Uni
ted
Bank
Lim
ited
The
Bank
of P
unja
b
Fays
al B
ank
Lim
ited
NIB
Ban
k Li
mite
d
489
,734
,357
214
,464
,815
409
,340
,592
205
,741
,736
218
,726
,109
487
,495
,119
251
,941
,542
441
,757
,486
219
,970
,172
252
,933
,209
This
loan
is
repa
yabl
e in
32
st
eppe
d up
qu
arte
rly
inst
allm
ents
com
men
ced
from
30
Sept
embe
r 20
13 a
nd
endi
ng o
n 30
June
202
1. Th
is lo
an ca
rrie
s mar
kup
at th
e ra
te
of 7
.70%
per
ann
um b
ased
on
the
aver
age
cost
of f
unds
of
the
bank
whi
ch w
ill b
e re
view
ed a
nnua
lly. M
arku
p w
ill b
e ac
crue
d ov
er n
ine
year
s du
ring
whi
ch th
e pr
inci
pal w
ill b
e re
paid
. The
acc
rued
mar
kup
will
be
repa
id in
twel
ve e
qual
qu
arte
rly in
stal
lmen
ts co
mm
enci
ng o
n 30
Sep
tem
ber 2
021
and
endi
ng o
n 30
June
202
4.
This
loan
is re
paya
ble
in 2
8 eq
ual q
uart
erly
inst
allm
ents
of
Rupe
es 1
3.54
0 m
illio
n ea
ch c
omm
ence
d fro
m 0
9 Fe
brua
ry
2012
and
end
ing
on 0
9 N
ovem
ber 2
018.
Mar
kup
is pa
yabl
e qu
arte
rly a
t the
rate
of 5
.00%
per
ann
um.
This
loan
is
repa
yabl
e in
31
st
eppe
d up
qu
arte
rly
inst
allm
ents
com
men
ced
from
30
June
201
1 an
d en
ding
on
31
Dec
embe
r 201
8. T
his l
oan
carr
ied
mar
kup
at th
e ra
te
of 9
.55%
per
ann
um b
ased
on
the
cost
of f
unds
of t
he b
ank
appr
oved
by
SBP
upto
31
Mar
ch 2
013
and
ther
eafte
r car
ries
mar
kup
at 5
.00%
per
ann
um. M
arku
p is
paya
ble
quar
terly
. M
arku
p ac
crue
d up
to 3
1 M
arch
201
3 w
ill b
e re
paid
in th
ree
equa
l qu
arte
rly i
nsta
llmen
ts c
omm
enci
ng o
n 31
Mar
ch
2019
and
end
ing
on 3
0 Se
ptem
ber 2
019.
This
loan
is
repa
yabl
e in
31
st
eppe
d up
qu
arte
rly
inst
allm
ents
com
men
ced
from
31
Mar
ch 2
013
and
endi
ng
on 3
0 Se
ptem
ber 2
020.
Mar
kup
is pa
yabl
e qu
arte
rly a
t the
ra
te o
f 5.0
0% p
er a
nnum
. Mar
kup
upt
o 30
Sep
tem
ber 2
011
is re
calc
ulat
ed a
t th
e ra
te o
f 8.5
% p
er a
nnum
and
will
be
repa
id o
n 30
Sep
tem
ber 2
020.
This
loan
is
repa
yabl
e in
36
st
eppe
d up
qu
arte
rly
inst
allm
ents
com
men
ced
from
30
Sept
embe
r 20
11 a
nd
endi
ng o
n 30
June
202
0. M
arku
p is
paya
ble
quar
terly
at t
he
rate
of 5
.00%
per
ann
um.
Firs
t jo
int
pari
pass
u ch
arge
of R
upee
s 62
8.39
4 m
illio
n ov
er !
xed
asse
ts a
nd R
upee
s 42.
424
mill
ion
ove
r cur
rent
as
sets
of t
he C
ompa
ny w
ith 2
5% m
argi
n.
Firs
t par
i pas
su c
harg
e of
Rup
ees
606.
000
mill
ion
(with
25
% m
argi
n) o
ver a
ll pr
esen
t and
futu
re c
urre
nt a
sset
s an
d Ru
pees
200
.000
mill
ion
over
!xe
d as
sets
of
the
Com
pany
. Per
sona
l gua
rant
ees o
f tw
o di
rect
ors.
Join
t par
i pas
su c
harg
e of
Rup
ees
566.
667
mill
ion
over
!x
ed a
sset
s, pa
ri pa
ssu
char
ge o
f Rup
ees 5
34.0
00 m
illio
n an
d ra
nkin
g ch
arge
of
Rupe
es 2
68.0
00 m
illio
n on
all
pres
ent a
nd fu
ture
cur
rent
ass
ets o
f the
Com
pany
.
Firs
t pa
ri pa
ssu
char
ge o
f Rup
ees
266.
800
mill
ion
over
cu
rren
t ass
ets,
rank
ing
char
ge o
f Rup
ees 2
40.0
00 m
illio
n ov
er c
urre
nt a
sset
s an
d ex
clus
ive
char
ge o
f Ru
pees
94
.000
mill
ion
on p
ower
gen
erat
ors o
f the
Com
pany
.
Firs
t pa
ri pa
ssu
char
ge o
f Rup
ees
107.
000
mill
ion
over
Co
mpa
ny’s
mac
hine
ry a
nd j
oint
par
i pa
ssu
char
ge
of R
upee
s 80
0.00
0 m
illio
n ov
er c
urre
nt a
sset
s of
the
Co
mpa
ny.
-----
--- R
upee
s ----
----
7.1
Lend
er20
1420
13Se
curi
tyRe
vise
d te
rms a
fter
rest
ruct
urin
g
2014
20
13
Ru
pees
Ru
pees
7.
LON
G T
ERM
FIN
AN
CIN
G -
SECU
RED
Fi
nanc
ing
from
ban
king
com
pani
es (N
ote
7.1
and
7.2)
1,9
61,0
62,9
54
2,1
21,4
86,1
53
Le
ss: C
urre
nt p
ortio
n sh
own
unde
r cur
rent
liab
ilitie
s
249
,682
,994
1
27,3
60,6
57
1,7
11,3
79,9
60
1,9
94,1
25,4
96

48
Aska
ri Ba
nk L
imite
d
Bank
Alfa
lah
Lim
ited
Hab
ib B
ank
Lim
ited
111
,961
,715
112
,768
,035
198
,325
,595
1,9
61,0
62,9
54
119
,926
,696
124
,578
,593
222
,883
,336
2,1
21,4
86,1
53
This
loan
is re
paya
ble
in 3
2 qu
arte
rly in
stal
lmen
ts o
f Rup
ees
5.28
2 m
illio
n ea
ch co
mm
ence
d fro
m 3
0 Ju
ne 2
013
and
endi
ng
on 3
1 M
arch
202
1. M
arku
p is
paya
ble
quar
terly
at t
he ra
te o
f 5.
00%
per
ann
um.
This
loan
is re
paya
ble
in 3
2 st
eppe
d up
qua
rter
ly in
stal
lmen
ts
com
men
ced
from
01
July
201
2 an
d en
ding
on
01 A
pril
2020
. Th
is lo
an c
arrie
s m
arku
p at
the
rat
e of
8.3
0% p
er a
nnum
ba
sed
on th
e co
st o
f fun
ds o
f the
ban
k w
hich
will
be
revi
ewed
m
onth
ly. M
arku
p w
ill b
e ac
crue
d ov
er n
ine
year
s dur
ing
whi
ch
the
prin
cipa
l will
be
repa
id. T
he a
ccru
ed m
arku
p w
ill b
e pa
id in
th
irty
six e
qual
mon
thly
inst
allm
ents
com
men
cing
on
01 M
ay
2020
and
end
ing
on 0
1 Ap
ril 2
023.
This
loan
is re
paya
ble
in 3
2 st
eppe
d up
qua
rter
ly in
stal
lmen
ts
com
men
ced
from
30
June
201
2 an
d en
ding
on
31 M
arch
202
0.
Mar
kup
is pa
yabl
e qu
arte
rly a
t the
rate
of 5
.00%
per
ann
um.
Firs
t jo
int
pari
pass
u ch
arge
of R
upee
s 50
6.66
7 m
illio
n ov
er cu
rren
t ass
ets b
y way
of h
ypot
heca
tion
and
rank
ing
char
ge o
f Rup
ees 1
69.0
00 m
illio
n ov
er !
xed
asse
ts o
f the
Co
mpa
ny b
y w
ay o
f hyp
othe
catio
n.
Firs
t jo
int
pari
pass
u ch
arge
of R
upee
s 41
0.00
0 m
illio
n ov
er
all
pres
ent
and
futu
re
curr
ent
asse
ts
of
the
Com
pany
.
Firs
t joi
nt p
ari p
assu
cha
rge
of R
upee
s 1,1
60.0
00 m
illio
n ov
er c
urre
nt a
sset
s, jo
int
pari
pass
u ch
arge
of
Rupe
es
146.
600
mill
ion
and
rank
ing
char
ge o
f Rup
ees
362.
000
mill
ion
over
!xe
d as
sets
of
the
Com
pany
. Pe
rson
al
guar
ante
es o
f tw
o di
rect
ors.
7.2
Fair
valu
e of
long
term
!na
ncin
g w
as e
stim
ated
at t
he p
rese
nt v
alue
of f
utur
e ca
sh "
ows
disc
ount
ed a
t the
e#e
ctiv
e in
tere
st ra
tes
rang
ing
from
9.3
1 %
to 1
3.56
% p
er
annu
m. R
ecog
nitio
n of
long
term
!na
ncin
g at
fair
valu
e re
sulte
d in
gai
n of
Rup
ees 8
23.7
44 m
illio
n.
-----
--- R
upee
s ----
----
Lend
er20
1420
13Se
curi
tyRe
vise
d te
rms a
fter
rest
ruct
urin
g

49
8. SPONSOR’S LOAN This represents unsecured interest free loan obtained from director of the Company. This is
repayable on 30 June 2018. Fair value of sponsor’s loan has been estimated at the present value of future cash !ows discounted at the e"ective interest rate of 11.38% per annum. Recognition of sponsor’s loan at fair value has resulted in gain of Rupees 113.316 million.
2014 2013 Rupees Rupees9. DEFERRED LIABILITIES Deferred accrued markup (Note 9.1) 492,405,144 423,986,227 Deferred income tax liability (Note 9.2) 15,118,393 59,036,650
507,523,537 483,022,877 9.1 Deferred accrued markup National Bank of Pakistan 231,605,284 179,959,921 The Bank of Punjab 139,309,000 139,309,000 Bank Alfalah Limited 54,872,432 38,098,878 Faysal Bank Limited 66,618,428 66,618,428
492,405,144 423,986,227 9.1.1 This represents accrued markup on long term #nancing deferred in accordance with the terms of
restructuring disclosed in note 7.1 to these #nancial statements. 2014 2013 Rupees Rupees9.2 Deferred income tax liability The liability / (asset) for deferred taxation originated due to temporary di"erences relating to: Taxable temporary di!erences on:
Accelerated tax depreciation and amortization 97,785,215 91,210,286 Surplus on revaluation of operating #xed assets 23,480,335 25,465,116 Surplus on revaluation of investment - available for sale 43,603,441 33,571,534
164,868,991 150,246,936 Deductible temporary di!erence on:
Accumulated tax losses (149,750,598) (323,523,385)
Net deferred income tax liability / (asset) 15,118,393 (173,276,449) Less: Deferred income tax asset not recognized - 232,313,099
Deferred income tax liability recognized 15,118,393 59,036,650 9.2.1 As at 30 June 2013, deferred income tax liability on surplus on revaluation of operating #xed assets
and surplus on revaluation of investment available for sale was recognized. Remaining net deferred income tax asset of Rupees 232.313 million relating to accelerated tax depreciation / amortization and accumulated tax losses was not recognized.
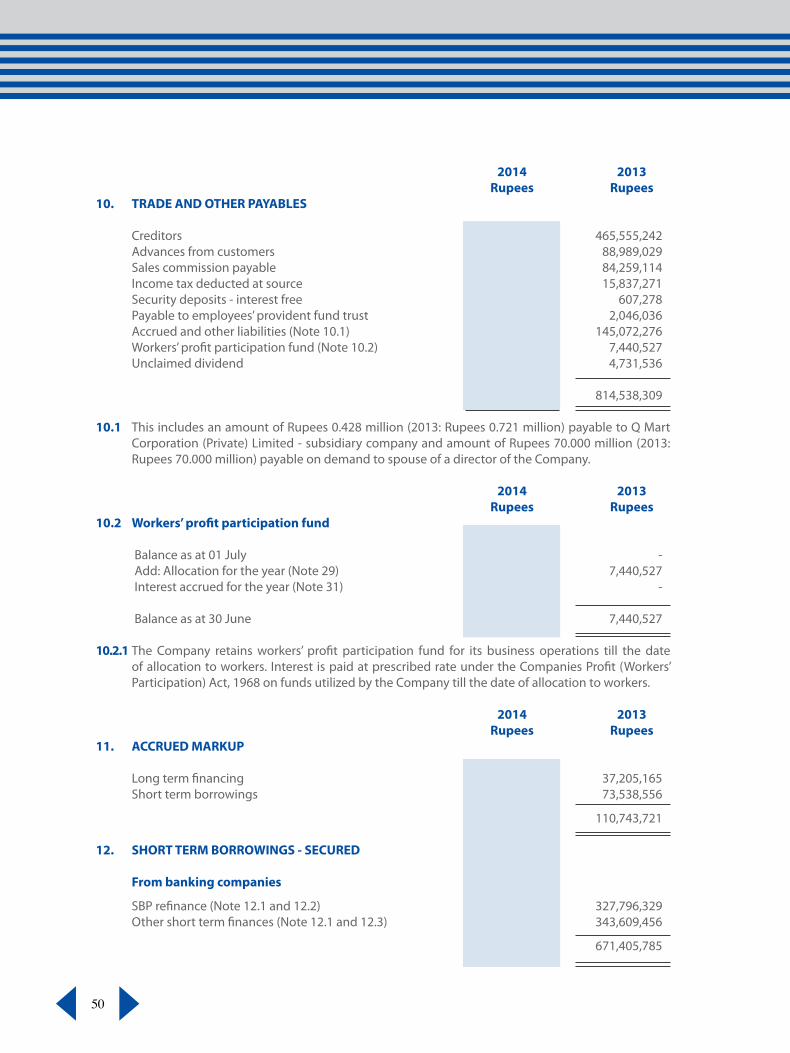
50
2014 2013 Rupees Rupees10. TRADE AND OTHER PAYABLES Creditors 477,886,704 465,555,242 Advances from customers 49,297,007 88,989,029 Sales commission payable 98,666,906 84,259,114 Income tax deducted at source 14,596,814 15,837,271 Security deposits - interest free 602,278 607,278 Payable to employees’ provident fund trust 675,555 2,046,036 Accrued and other liabilities (Note 10.1) 138,674,693 145,072,276 Workers’ pro!t participation fund (Note 10.2) 16,834,274 7,440,527 Unclaimed dividend 4,731,536 4,731,536
801,965,767 814,538,309 10.1 This includes an amount of Rupees 0.428 million (2013: Rupees 0.721 million) payable to Q Mart
Corporation (Private) Limited - subsidiary company and amount of Rupees 70.000 million (2013: Rupees 70.000 million) payable on demand to spouse of a director of the Company.
2014 2013 Rupees Rupees10.2 Workers’ pro!t participation fund Balance as at 01 July 7,440,527 - Add: Allocation for the year (Note 29) 8,612,492 7,440,527 Interest accrued for the year (Note 31) 781,255 - Balance as at 30 June 16,834,274 7,440,527 10.2.1 The Company retains workers’ pro!t participation fund for its business operations till the date
of allocation to workers. Interest is paid at prescribed rate under the Companies Pro!t (Workers’ Participation) Act, 1968 on funds utilized by the Company till the date of allocation to workers.
2014 2013 Rupees Rupees11. ACCRUED MARKUP Long term !nancing 32,622,881 37,205,165 Short term borrowings 99,958,643 73,538,556
132,581,524 110,743,721 12. SHORT TERM BORROWINGS - SECURED From banking companies
SBP re!nance (Note 12.1 and 12.2) 304,229,000 327,796,329 Other short term !nances (Note 12.1 and 12.3) 509,965,999 343,609,456
814,194,999 671,405,785

51
12.1 These facilities are secured against hypothecation charge on current assets, lien on export contracts / letters of credit, !rst and second pari passu charge on !xed and current assets, personal guarantees of directors and ranking charge on current assets of the Company.
12.2 These carry markup at 9.4% per annum (2013: 9.2% to 11% per annum). 12.3 The rates of markup range from 5% to 13.73% per annum (2013: 5% to 13.25% per annum).
13. CONTINGENCIES AND COMMITMENTS 13.1 Contingencies 13.1.1 The Deputy Collector (Refund – Gold) by order dated 19 June 2007 rejected the input tax claim
of the Company, for the month of June 2005, amounting to Rupees 10.345 million incurred in zero rated local supplies of textile and articles thereof on the grounds that the input tax claim is in contravention of SRO 992(I)/2005 which states that no registered person engaged in the export of speci!ed goods (including textile and articles thereof ) shall, either through zero-rating or otherwise, be entitled to deduct or reclaim input tax paid in respect of stocks of such goods acquired up to 05 June 2005, if not used for the purpose of exports made up to the 31 December 2005. Consequently, the Company !led an appeal before the Appellate Tribunal Inland Revenue (ATIR). ATIR has decided this appeal in favour of the Company subject to necessary veri!cation. Pending the outcome of necessary veri!cation, no provision for inadmissible input tax has been recognized in these !nancial statements, since the Company is con!dent of the favourable outcome of veri!cation.
13.1.2 The Additional Collector, Sales Tax Department has raised sales tax demand amounting to
Rupees 8.956 million alongwith additional tax and penalty, as a result of sales tax audit for the year 1999-2000 conducted by the Sales Tax Department. The Company is contesting the demand and management is con!dent that decision will be in favour of the Company, hence, no provision there against has been made in these !nancial statements.
13.1.3 As a result of sales tax audit for the year 2009-2010 conducted by Regional Tax O"ce, Lahore,
Assistant Commissioner Inland Revenue, Sales Tax Department has raised sales tax demand amounting to Rupees 9.975 million along with additional tax and penalty. Currently, the case is pending for hearing at Appellate Tribunal Inland Revenue, Lahore and the management is con!dent that decision will be in favour of the Company, hence, no provision their against has been made in these !nancial statements.
13.1.4 Pursuant to the sale of assets agreement with M/s Interloop Limited, the Company is contingently
liable for Rupees 31.958 million against payment of certain outstanding dues to Employees’ Old-Age Bene!ts Institution (EOBI) and bifurcation of gas connections in favour of M/s Interloop Limited. To secure the performance of aforesaid conditions, the Company has pledged equity investment (note 23.1) and bank balance (note 24.4) with Allied Bank Limited. However, no provision has been recognized in these !nancial statements as the management is con!dent to ful!ll the conditions in accordance with the sale of assets agreement.
13.1.5 Bank guarantees of Rupees 81.66 million (2013: Rupees 70.15 million) are given by the banks of
the Company in favour of Sui Northern Gas Pipelines Limited against gas connections.
13.1.6 Bank guarantee of Rupees 6.5 million (2013: Rupees 6.5 million) is given by the bank of the Company in favour of Director, Excise and Taxation to cover the disputed amount of infrastructure cess.

52
13.1.7 Bank guarantees of Rupees 8.164 million (2013: Rupees 8.331 million) are given by the bank of the Company in favour of Lahore Electric Supply Company Limited against electricity connections.
13.1.8 Lahore Electric Supply Company Limited (LESCO) has served a notice to the Company in connection with violation of Power Purchase Agreement. According to the aforesaid notice, the Company was using gas alongwith Re!ned Furnace Oil (RFO) in the ratio of 50:50 as co-fuel in order to generate electric power for sale to LESCO whereas tari" was charged to LESCO on the basis of RFO. The matter is being resolved under the provisions of above said Power Purchase Agreement and referred to Mr. Justice (Retd.) Syed Jamshed Ali Shah for arbitration. The proceedings of arbitration are in process. An amount of Rupees 86.833 million receivable by the Company from LESCO is still unpaid. Full provision was made in these !nancial statements against this receivable. However, the Company is con!dent that the said amount will be recovered.
13.2 Commitments 13.2.1 Aggregate commitments for capital expenditures and revenue expenditures are amounting to
Rupees Nil and Rupees 23.481 million (2013: Rupees 51.450 million and Rupees 39.562 million) respectively.
13.2.2 Post dated cheques issued to suppliers are amounting to Rupees 118.809 million (2013: Rupees
46.016 million).
2014 2013 Rupees Rupees
14. FIXED ASSETS
Property, plant and equipment Operating !xed assets (Note 14.1) 3,405,900,787 3,199,125,210 Capital work-in-progress (Note 14.2) 34,753,339 154,776,302
3,440,654,126 3,353,901,512 Intangible asset - computer software (Note 14.1 and 14.1.6) - 666,579
3,440,654,126 3,354,568,091

53
14.1
Re
conc
iliat
ion
of c
arry
ing
amou
nts
of o
pera
ting
!xe
d as
sets
and
inta
ngib
le a
sset
at t
he b
egin
ning
and
end
of t
he y
ear a
re a
s fo
llow
s:
O
pera
ting
!xe
d as
sets
Des
crip
tion
Fr
eeho
ld
Resi
dent
ial
Fact
ory
Plan
t and
St
and-
by
Elec
tric
Fu
rnit
ure,
Mot
or
In
tang
ible
la
nd
Build
ing
Bu
ildin
g m
achi
nery
eq
uipm
ent
Inst
alla
tion
s !x
ture
s an
d
Com
pute
rs
vehi
cles
To
tal
asse
t
eq
uipm
ent
-
----
----
----
----
----
----
----
----
----
----
----
----
---
(RU
PE
ES
) --
----
----
----
----
----
----
----
----
----
----
----
----
--
As a
t 30
June
201
2
Co
st /
reva
lued
am
ount
5
63,8
27,0
00
211
,461
,578
6
19,0
91,9
64
3,7
47,2
52,5
98
-
123
,122
,001
9
4,58
7,97
5
39,
444,
442
6
5,46
9,16
2
5,4
64,2
56,7
20
9,2
96,8
99
Accu
mul
ated
dep
reci
atio
n / a
mor
tizat
ion
-
(46,
291,
579)
(1
96,0
19,9
64)
(1,6
78,7
80,9
16)
-
(56,
733,
739)
(5
1,08
9,93
3)
(29,
411,
441)
(3
3,65
3,20
9)
(2,0
91,9
80,7
81)
(7,7
65,6
31)
Net
boo
k va
lue
563
,827
,000
1
65,1
69,9
99
423
,072
,000
2
,068
,471
,682
-
6
6,38
8,26
2
43,
498,
042
1
0,03
3,00
1
31,
815,
953
3
,372
,275
,939
1
,531
,268
Year
end
ed 3
0 Ju
ne 2
013
Ope
ning
net
boo
k va
lue
563
,827
,000
1
65,1
69,9
99
423
,072
,000
2
,068
,471
,682
-
6
6,38
8,26
2
43,
498,
042
1
0,03
3,00
1
31,
815,
953
3
,372
,275
,939
1
,531
,268
Ad
ditio
ns
-
370
,400
2
,941
,461
1
02,4
56,2
94
1,6
15,6
59
5,3
23,8
40
638
,872
3
,257
,565
1
2,45
6,06
9
129
,060
,160
-
Disp
osal
s:
C
ost /
reva
lued
am
ount
(7
9,73
4,37
5)
-
-
-
-
-
(3,3
40,1
26)
(57,
326)
(7
,202
,857
) (9
0,33
4,68
4)
-
Acc
umul
ated
dep
reci
atio
n -
-
-
-
-
-
1
,499
,302
3
1,30
8
4,1
83,0
25
5,7
13,6
35
-
(7
9,73
4,37
5)
-
-
-
-
-
(1,8
40,8
24)
(26,
018)
(3
,019
,832
) (8
4,62
1,04
9)
-
Dep
reci
atio
n ch
arge
/ a
mor
tizat
ion
-
(8,2
74,5
26)
(21,
196,
364)
(1
68,5
19,2
30)
(105
,847
) (6
,789
,124
) (4
,323
,152
) (3
,488
,773
) (4
,892
,824
) (2
17,5
89,8
40)
(864
,689
)
Clos
ing
net b
ook
valu
e 4
84,0
92,6
25
157
,265
,873
4
04,8
17,0
97
2,0
02,4
08,7
46
1,5
09,8
12
64,
922,
978
3
7,97
2,93
8
9,7
75,7
75
36,
359,
366
3
,199
,125
,210
6
66,5
79
A
s at 3
0 Ju
ne 2
013
Cost
/ re
valu
ed a
mou
nt
484
,092
,625
2
11,8
31,9
78
622
,033
,425
3
,849
,708
,892
1
,615
,659
1
28,4
45,8
41
91,
886,
721
4
2,64
4,68
1
70,
722,
374
5
,502
,982
,196
9
,296
,899
Ac
cum
ulat
ed d
epre
ciat
ion
/ am
ortiz
atio
n -
(5
4,56
6,10
5)
(217
,216
,328
) (1
,847
,300
,146
) (1
05,8
47)
(63,
522,
863)
(5
3,91
3,78
3)
(32,
868,
906)
(3
4,36
3,00
8)
(2,3
03,8
56,9
86)
(8,6
30,3
20)
Net
boo
k va
lue
484
,092
,625
1
57,2
65,8
73
404
,817
,097
2
,002
,408
,746
1
,509
,812
6
4,92
2,97
8
37,
972,
938
9
,775
,775
3
6,35
9,36
6
3,1
99,1
25,2
10
666
,579
Year
end
ed 3
0 Ju
ne 2
014
Ope
ning
net
boo
k va
lue
484
,092
,625
1
57,2
65,8
73
404
,817
,097
2
,002
,408
,746
1
,509
,812
6
4,92
2,97
8
37,
972,
938
9
,775
,775
3
6,35
9,36
6
3,1
99,1
25,2
10
666
,579
Ad
ditio
ns
-
-
69,
812,
974
2
78,8
03,0
61
-
8,9
53,3
18
709
,904
4
,252
,222
7
9,89
5,31
0
442
,426
,789
-
Disp
osal
s:
C
ost
-
-
-
(16,
359,
136)
-
-
-
-
(9
,073
,417
) (2
5,43
2,55
3)
-
Acc
umul
ated
dep
reci
atio
n -
-
-
5
,434
,360
-
-
-
-
5
,267
,472
1
0,70
1,83
2
-
-
-
-
(1
0,92
4,77
6)
-
-
-
-
(3,8
05,9
45)
(14,
730,
721)
-
Dep
reci
atio
n ch
arge
/ a
mor
tizat
ion
-
(7,8
63,2
94)
(22,
310,
637)
(1
65,2
00,0
92)
(91,
426)
(7
,016
,718
) (3
,833
,457
) (3
,676
,462
) (1
0,92
8,40
5)
(220
,920
,491
) (6
66,5
79)
Cl
osin
g ne
t boo
k va
lue
484
,092
,625
1
49,4
02,5
79
452
,319
,434
2
,105
,086
,939
1
,418
,386
6
6,85
9,57
8
34,
849,
385
1
0,35
1,53
5
101
,520
,326
3
,405
,900
,787
-
As a
t 30
June
201
4
Co
st /
reva
lued
am
ount
4
84,0
92,6
25
211
,831
,978
6
91,8
46,3
99
4,1
12,1
52,8
17
1,6
15,6
59
137
,399
,159
9
2,59
6,62
5
46,
896,
903
1
41,5
44,2
67
5,9
19,9
76,4
32
9,2
96,8
99
Accu
mul
ated
dep
reci
atio
n / a
mor
tizat
ion
-
(62,
429,
399)
(2
39,5
26,9
65)
(2,0
07,0
65,8
78)
(197
,273
) (7
0,53
9,58
1)
(57,
747,
240)
(3
6,54
5,36
8)
(40,
023,
941)
(2
,514
,075
,645
) (9
,296
,899
)
Net
boo
k va
lue
484
,092
,625
1
49,4
02,5
79
452
,319
,434
2
,105
,086
,939
1
,418
,386
6
6,85
9,57
8
34,
849,
385
1
0,35
1,53
5
101
,520
,326
3
,405
,900
,787
-
Dep
reci
atio
n / a
mor
tizat
ion
rate
% p
er a
nnum
-
5 5
10
10
10
10
30
20
20

54
Particulars Cost Accumulated Net book Consider- Gain / Mode of
Particulars of purchasers depreciation value ation (loss) disposal
- - - - - - - - - - - - - - - - - - - - - - ( R U P E E S ) - - - - - - - - - - - - - - - - - - - - - - - - -
Plant and machinery Sewing Machines 7,678,046 2,437,442 5,240,604 5,037,026 (203,578) Negotiation Jeans Company (Private) Limited - LahoreSewing Machines 1,341,632 442,721 898,911 934,000 35,089 Negotiation Amin Corporation - LahoreSewing Machines 710,801 255,833 454,968 470,000 15,032 Negotiation Arshad Corporation (Private) Limited - LahoreSewing Machines 4,735,688 1,713,665 3,022,023 1,905,454 (1,116,569) Negotiation Jeans Company (Private) Limited - LahoreSewing Machines 1,892,969 584,699 1,308,270 1,170,000 (138,270) Negotiation Reliance Apparel (Private) Limited - Lahore
16,359,136 5,434,360 10,924,776 9,516,480 (1,408,296) Motor vehicles Suzuki Cultus LEE-08-3345 616,230 352,668 263,562 455,000 191,438 Negotiation Mr. Hassan Kamal - Lahore Suzuki Cultus LEE-8496 339,154 165,051 174,103 600,000 425,897 Negotiation Mr. Imran Kamal - Lahore Toyota Corolla LEC-07-9881 896,700 574,441 322,259 800,000 477,741 Negotiation Mr. Aamir Qureshi - Lahore Suzuki Cultus LED-08-7348 430,207 212,593 217,614 470,000 252,386 Negotiation Mr. Imran Kamal - Lahore Toyota Corolla LEA-9675 1,434,000 626,402 807,598 1,275,000 467,402 Negotiation Mr. Kamran Shahid - Lahore Hyundai Santro LZZ-540 263,118 119,965 143,153 375,000 231,847 Negotiation Mr. Mansoor Ijaz - Lahore Toyota Corolla LEB-1700 961,000 605,895 355,105 630,000 274,895 Company’s policy Mr. Shahryar Bokhari (Ex-employee) Toyota Corolla LEF-07-650 1,391,638 813,304 578,334 850,000 271,666 Negotiation Mr. Kamran Shahid - Lahore Honda City LWH-6662 906,910 597,676 309,234 800,000 490,766 Negotiation M/s Adamjee Insurance Company Limited (Insurance claim) Suzuki Cultus LZU-6173 575,000 380,413 194,587 450,000 255,413 Negotiation Mr. Imran Kamal - Lahore Suzuki Cultus LZV-3034 678,150 443,162 234,988 460,000 225,012 Negotiation Mr. Imran Kamal - Lahore Suzuki Cultus LEA-07-2636 581,310 375,902 205,408 505,000 299,592 Negotiation Mr. Imran Kamal - Lahore
9,073,417 5,267,472 3,805,945 7,670,000 3,864,055
25,432,553 10,701,832 14,730,721 17,186,480 2,455,759
14.1.1 Freehold land and buildings of the Company were revalued as at 30 June 2009 by an independent valuer. The latest revaluation as at 30 June 2012 was carried out by Messrs Hamid Mukhtar and Company (Private) Limited, the approved valuer. Had there been no revaluation, the value of the assets would have been lower by Rupees 792.199 million (2013: Rupees 810.924 million).
14.1.2 The book value of freehold land and buildings on cost basis is Rupees 47.656 million and Rupees
245.959 million (2013: Rupees 47.656 million and Rupees 187.596 million) respectively. 14.1.3 Detail of operating !xed assets exceeding book value of Rupees 50,000 disposed of during the
year is as follows:
2014 2013 Rupees Rupees14.1.4 The depreciation charge for the year has been allocated as follows: Cost of sales (Note 26) 206,837,084 203,016,481 Distribution cost (Note 27) 1,345,126 1,135,705 Administrative expenses (Note 28) 12,738,281 13,437,654
220,920,491 217,589,840 14.1.5 The amortization of intangible asset amounting to Rupees 0.667 million (2013: Rupees 0.865
million) is included in administrative expenses. 14.1.6 Intangible asset - computer software has been fully amortized but still in the use of the Company.

55
2014 2013 Rupees Rupees14.2 Capital work-in-progress Plant and machinery 3,657,835 67,673,320 Civil works 30,192,943 40,494,914 Electric installations 902,561 - Advances for capital expenditures - 46,608,068
34,753,339 154,776,302 15. LONG TERM INVESTMENTS
Investment in subsidiary company - at cost Q Mart Corporation (Private) Limited - unquoted 30,000,000 (2013: 30,000,000) ordinary shares of Rupees 10 each 300,000,000 300,000,000 Less: Impairment loss (Note 15.1) 218,986,005 217,764,136
81,013,995 82,235,864 Available for sale Associated company (without signi!cant in"uence) K-2 Hosiery (Private) Limited - unquoted 1,194,000 (2013: 1,194,000) ordinary shares of Rupees 10 each (Note 15.2) - -
81,013,995 82,235,864
15.1 Impairment loss Balance as at 01 July 217,764,136 153,300,000 Add: Provision for the year (Note 29) 1,221,869 64,464,136
Balance as at 30 June 218,986,005 217,764,136 15.2 Investment in K-2 Hosiery (Private) Limited has been impaired and written o! against provision.
2014 2013 Rupees Rupees16. STORES, SPARES AND LOOSE TOOLS Stores and spares 330,568,211 312,280,156 Loose tools 3,826,963 3,575,927 334,395,174 315,856,083 Less: Provision for slow moving, obsolete and damaged store items (Note 29) 16,629,008 -
317,766,166 315,856,083

56
2014 2013 Rupees Rupees17. STOCK-IN-TRADE Raw material 148,615,983 147,672,090 Work-in-process 128,250,466 152,308,086 Finished goods (Note 17.1 and 17.2) 421,365,253 314,553,948
698,231,702 614,534,124
17.1 This includes !nished goods of Rupees 125.986 million (2013: Rupees 7.528 million) valued at net realizable value.
17.2 Finished goods include stock-in-transit amounting to Rupees 63.209 million (2013: Rupees 4.992
million). 2014 2013 Rupees Rupees18. TRADE DEBTS Considered good: Secured (against letters of credit) 451,417,353 500,684,703 Unsecured 82,066,994 178,848,692 533,484,347 679,533,395 Considered doubtful: Others - unsecured 88,358,572 88,358,572 Less: Provision for doubtful trade debts Balance as at 01 July 88,358,572 1,525,385 Add: Provision for the year (Note 29) - 86,833,187
Balance as at 30 June 88,358,572 88,358,572 - - 18.1 As on 30 June 2014, trade debts of Rupees 37.698 million (2013: Rupees 54.434 million) were past
due but not impaired. These relate to a number of independent customers from whom there is no recent history of default. The age analysis of these trade debts is as follows:
2014 2013 Rupees Rupees
Upto 1 month 2,467,635 7,664,632 1 to 6 months 1,307,875 5,592,468 More than 6 months 33,922,649 41,176,795 37,698,159 54,433,895

57
18.2 As at 30 June 2014, trade debts of Rupees 88.359 million (2013: Rupees 88.359 million) were impaired. The aging of these trade debts was more than three years. These trade debts have been provided for in the books of account.
2014 2013 Rupees Rupees19. ADVANCES Considered good: Advances to: - sta! (Note 19.1) 9,976,757 8,445,589 - suppliers 76,680,667 78,103,547 Letters of credit 985,711 3,757,546 87,643,135 90,306,682 19.1 This includes interest free advances to executives amounting to Rupees 0.849 million (2013: Rupees
3.374 million). 2014 2013 Rupees Rupees20. TRADE DEPOSITS AND SHORT TERM PREPAYMENTS Security deposits 14,973,046 7,468,101 Short term prepayments 4,440,240 127,240 19,413,286 7,595,341 21. OTHER RECEIVABLES Considered good: Advance income tax 206,620,647 137,860,496 Export rebate and claims (Note 21.1) 46,063,417 82,291,725 Miscellaneous 911,286 17,575,945 253,595,350 237,728,166

58
2014 2013 Rupees Rupees21.1 Export rebate and claims Considered good 46,063,417 82,291,725 Considered doubtful 30,514,452 - Less: Provision for doubtful export rebate and claims (Note 29) 30,514,452 - - - 46,063,417 82,291,725 22. SALES TAX RECOVERABLE Sales tax recoverable 227,496,020 195,540,934 Less: Provision for doubtful sales tax recoverable (Note 29) 25,157,276 - 202,338,744 195,540,934 23. SHORT TERM INVESTMENT Available for sale - unquoted Security General Insurance Company Limited (Note 23.1) 643,667 (2013: 643,667) fully paid ordinary shares of Rupees 10 each 704,171 704,171 Add: Fair value adjustment 176,175,521 131,653,073 176,879,692 132,357,244
23.1 Ordinary shares of Security General Insurance Company Limited have been valued by the management at Rupees 274.80 (2013: Rupees 205.63) per share using the net assets based valuation method. 640,000 ordinary shares of Security General Insurance Company Limited have been pledged in favour of Allied Bank Limited to serve the performance of certain conditions of sale of assets agreement with M/s Interloop Limited.
2014 2013 Rupees Rupees24. CASH AND BANK BALANCES Cash in hand (Note 24.1) 2,999,860 3,581,704 Cash with banks: On current accounts (Note 24.2 and 24.4) 76,737,180 20,564,655 On deposit accounts (Note 24.3 and 24.5) 75,737,361 105,074,765 152,474,541 125,639,420 155,474,401 129,221,124
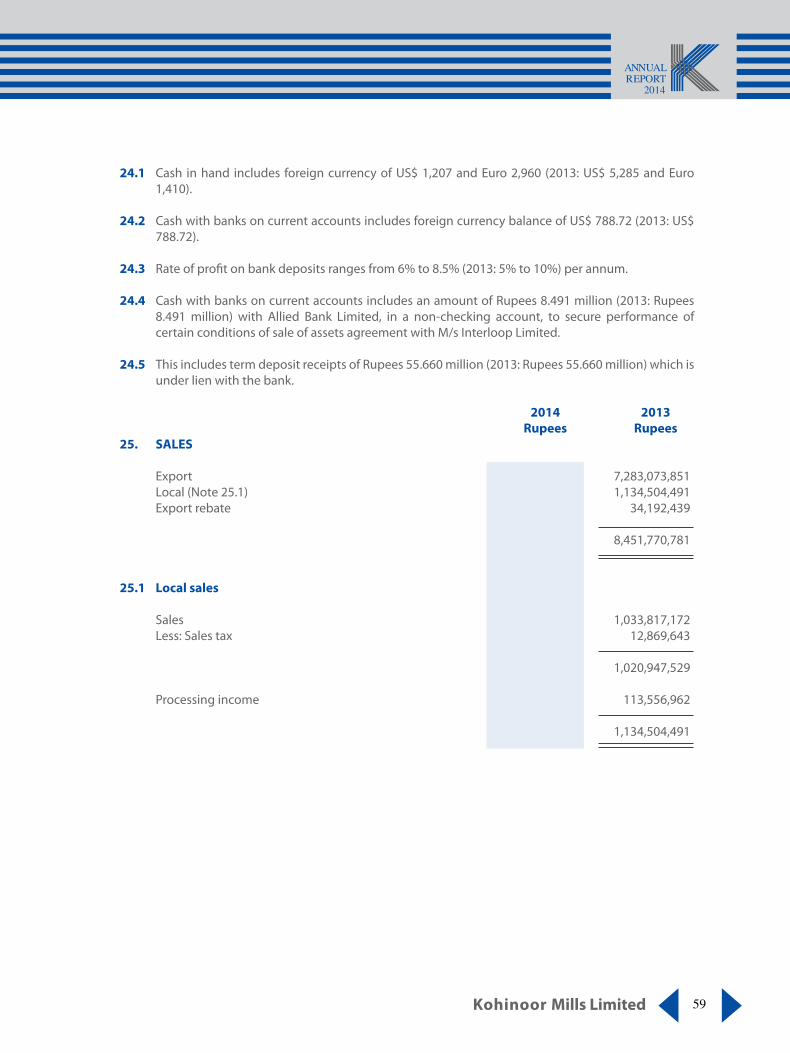
59
24.1 Cash in hand includes foreign currency of US$ 1,207 and Euro 2,960 (2013: US$ 5,285 and Euro 1,410).
24.2 Cash with banks on current accounts includes foreign currency balance of US$ 788.72 (2013: US$
788.72). 24.3 Rate of pro!t on bank deposits ranges from 6% to 8.5% (2013: 5% to 10%) per annum.
24.4 Cash with banks on current accounts includes an amount of Rupees 8.491 million (2013: Rupees
8.491 million) with Allied Bank Limited, in a non-checking account, to secure performance of certain conditions of sale of assets agreement with M/s Interloop Limited.
24.5 This includes term deposit receipts of Rupees 55.660 million (2013: Rupees 55.660 million) which is
under lien with the bank. 2014 2013 Rupees Rupees25. SALES Export 6,737,139,053 7,283,073,851 Local (Note 25.1) 1,007,047,284 1,134,504,491 Export rebate 28,245,160 34,192,439
7,772,431,497 8,451,770,781 25.1 Local sales Sales 886,827,027 1,033,817,172 Less: Sales tax 39,498,998 12,869,643
847,328,029 1,020,947,529 Processing income 159,719,255 113,556,962 1,007,047,284 1,134,504,491

60
2014 2013 Rupees Rupees26. COST OF SALES Raw material consumed (Note 26.1) 4,548,271,790 4,729,503,889 Chemicals consumed 621,209,385 645,678,812 Salaries, wages and other bene!ts 296,958,350 247,735,902 Employees’ provident fund contributions 10,836,009 8,993,774 Cloth conversion and processing charges 11,929,378 29,656,816 Fuel, oil and power 842,232,104 907,188,093 Stores, spares and loose tools consumed 110,333,784 85,843,381 Packing materials consumed 51,301,455 49,854,115 Repair and maintenance 43,047,916 31,678,204 Insurance 8,003,912 6,275,542 Other manufacturing expenses 54,173,781 56,229,898 Depreciation on operating !xed assets (Note 14.1.4) 206,837,084 203,016,481 6,805,134,948 7,001,654,907 Work-in-process inventory As on 01 July 152,308,086 123,171,757 As on 30 June (128,250,466) (152,308,086)
24,057,620 (29,136,329)
Cost of goods manufactured 6,829,192,568 6,972,518,578 Cost of yarn and cloth purchased for resale 4,880,829 80,402,397
6,834,073,397 7,052,920,975 Finished goods inventory As on 01 July 314,553,948 335,090,305 As on 30 June (421,365,253) (314,553,948)
(106,811,305) 20,536,357
6,727,262,092 7,073,457,332 26.1 Raw material consumed Opening stock 147,672,090 117,407,790 Purchased during the year 4,549,215,683 4,759,768,189 4,696,887,773 4,877,175,979 Less: Closing stock 148,615,983 147,672,090
4,548,271,790 4,729,503,889

61
2014 2013 Rupees Rupees27. DISTRIBUTION COST Salaries and other bene!ts 47,173,850 43,143,544 Employees’ provident fund contributions 1,957,625 1,651,696 Travelling, conveyance and entertainment 22,060,895 19,454,158 Printing and stationery 173,306 179,646 Communications 25,839,722 24,295,081 Vehicles’ running 4,026,533 3,469,907 Insurance 1,843,096 1,861,604 Repair and maintenance 17,205 46,045 Commission to selling agents 167,679,415 285,328,260 Outward freight and handling 118,037,930 194,594,509 Clearing and forwarding 36,410,972 36,150,774 Sales promotion and advertising 3,756,960 6,004,427 Depreciation on operating !xed assets (Note 14.1.4) 1,345,126 1,135,705 Miscellaneous 1,239,449 1,489,273 431,562,084 618,804,629 28. ADMINISTRATIVE EXPENSES Salaries and other bene!ts 98,360,659 89,061,525 Employees’ provident fund contributions 2,622,144 1,798,324 Travelling, conveyance and entertainment 28,429,134 34,812,432 Printing and stationery 3,719,215 3,937,628 Communications 3,662,017 3,585,075 Vehicles’ running 10,259,466 8,970,140 Legal and professional 5,735,471 6,539,493 Insurance 4,842,176 5,127,359 Fee, subscription and taxes 1,919,221 879,108 Rent - 747,920 Repair and maintenance 5,761,490 6,777,971 Electricity, gas and water 608,381 213,822 Auditors’ remuneration (Note 28.1) 1,300,000 1,275,000 Depreciation on operating !xed assets (Note 14.1.4) 12,738,281 13,437,654 Amortization on intangible asset (Note 14.1.5) 666,579 864,689 Miscellaneous 30,190,526 17,011,948 210,814,760 195,040,088 28.1 Auditors’ remuneration Audit fee 1,050,000 1,050,000 Half yearly review and other certi!cations 200,000 200,000 Reimbursable expenses 50,000 25,000 1,300,000 1,275,000

62
2014 2013 Rupees Rupees29. OTHER EXPENSES Workers’ pro!t participation fund (Note 10.2) 8,612,492 7,440,527 Donations (Note 29.1) 11,721,764 3,922,940 Loss on sale of operating !xed assets - 4,389,325 Impairment loss on investment in subsidiary company (Note 15.1) 1,221,869 64,464,136 Provision for doubtful trade debts (Note 18) - 86,833,187 Irrecoverable trade debts written o" - 2,148,015 Advances written o" - 6,036,407 Provision for slow moving, obsolete and damaged store items (Note 16) 16,629,008 - Provision for doubtful export rebate and claims (Note 21.1) 30,514,452 - Provision for doubtful sales tax recoverable (Note 22) 25,157,276 - Miscellaneous 3,097 1,644,778
93,859,958 176,879,315 29.1 There is no interest of any director or his spouse in donees’ fund.
30. OTHER INCOME Income from !nancial assets Gain on sale of investment - available for sale - 173,527,189 Dividend on equity investment 3,540,168 2,574,668 Exchange gain - net 8,951,423 7,960,894 Return on bank deposits 6,242,223 6,336,038 Credit balances written back 68,770,646 - Accrued markup written back - 61,161,270 Gain on recognition of long term !nancing at fair value (Note 7.2) - 823,743,568 Bad debts recovered - 96,013,984 Gain on recognition of sponsor’s loan at fair value (Note 8) 113,316,111 -
Income from non-!nancial assets Scrap sales 33,806,376 33,028,569 Gain on sale of operating !xed assets 2,455,759 - Others - 698,948
237,082,706 1,205,045,128

63
2014 2013 Rupees Rupees31. FINANCE COST Markup on long term !nancing 159,918,998 199,644,025 Mark up on short term borrowings 75,988,621 75,217,795 Adjustment due to impact of IAS - 39 125,603,029 112,590,198 Bank commission and other !nancial charges 34,376,093 117,970,678 Interest on workers’ pro!t participation fund (Note 10.2) 781,255 -
396,667,996 505,422,696 32. TAXATION Current (Note 32.1) 49,029,133 79,975,000 Prior year adjustment (48,330,826) (89,564) Deferred tax (53,238,639) (1,340,269)
(52,540,332) 78,545,167 32.1 Provision for current tax represents !nal tax on export sales under section 169 and minimum tax on
local sales under section 113 of the Income Tax Ordinance, 2001. Further, provision against income from other sources is made under the relevant provisions of the Income Tax Ordinance, 2001.
32.2 Reconciliation of tax expense and product of accounting pro!t multiplied by the applicable tax rate is not required in view of !nal and minimum taxation.
33. EARNINGS PER SHARE - BASIC AND DILUTED
There is no dilutive e"ect on the basic earnings per share, which is based on:
2014 2013 Pro!t attributable to ordinary shareholders (Rupees) 201,887,645 1,008,666,682 Weighted average number of ordinary shares (Numbers) 50,911,011 50,911,011 Earnings per share (Rupees) 3.97 19.81

64
2014 2013 Rupees Rupees34. CASH GENERATED FROM OPERATIONS Pro!t before taxation 149,347,313 1,087,211,849 Adjustment for non-cash charges and other items: Depreciation on operating !xed assets 220,920,491 217,589,840 Amortization on intangible asset 666,579 864,689 Dividend income (3,540,168) (2,574,668) Loss / (gain) on sale of operating !xed assets (2,455,759) 4,389,325 Gain on sale of investment - (173,527,189) Impairment loss on investment in subsidiary company 1,221,869 64,464,136 Gain on recognition of long term !nancing at fair value - (823,743,568) Gain on recognition of sponsor’s loan at fair value (113,316,111) - Adjustment due to impact of IAS - 39 125,603,029 112,590,198 Provision for doubtful trade debts - 86,833,187 Provision for slow moving, obsolete and damaged store items 16,629,008 - Provision for doubtful export rebate and claims 30,514,452 - Provision for doubtful sales tax recoverable 25,157,276 - Credit balances written back (68,770,646) - Irrecoverable trade debts written o" - 2,148,015 Advances written o" - 6,036,407 Accrued markup written back - (61,161,270) Finance cost 271,064,967 392,832,498 Working capital changes (Note 34.1) 81,279,514 (80,092,438)
734,321,814 833,861,011 34.1 Working capital changes (Increase) / decrease in current assets Stores, spares and loose tools (18,539,091) (63,729,405) Stock-in-trade (83,697,578) (38,864,272) Trade debts 146,049,048 (13,571,748) Advances 2,663,547 29,349,761 Trade deposits and short term prepayments (11,817,945) 5,444,062 Other receivables 22,378,515 (16,892,557) Sales tax recoverable (31,955,086) (102,201,325)
25,081,410 (200,465,484) Increase in trade and other payables 56,198,104 120,373,046
81,279,514 (80,092,438)

65
35. REMUNERATION TO CHIEF EXECUTIVE, DIRECTORS AND EXECUTIVES
Aggregate amounts charged in these !nancial statements for remuneration, including all bene!ts to chief executive, directors and other executives are as follows:
2014 2013 Chief Chief
Executive Directors Executives Executive Directors Executives
---------------------------------------------- (Rupees) -------------------------------------------------
Managerial remuneration 4,620,000 3,300,000 35,517,900 3,135,000 3,217,500 26,385,210 House rent 1,155,000 1,485,000 8,461,267 783,750 969,375 6,769,145 Utilities 462,000 330,000 4,085,472 313,500 321,750 2,638,124 Special allowance 924,000 - 6,880,500 627,000 478,500 4,836,327 Contribution to provident fund 384,846 274,896 2,958,632 261,147 268,015 2,197,898 Other allowances 1,239,000 885,000 9,706,789 840,750 862,875 5,190,965 8,784,846 6,274,896 67,610,560 5,961,147 6,118,015 48,017,669 Number of persons 1 1 34 1 2 24
35.1 Chief executive, directors and executives of the Company are provided with free use of the Company’s owned and maintained cars.
35.2 Meeting fee of Rupees 875,000 (2013: Rupees 330,000) was paid to the non-executive directors for
attending meetings. 35.3 No remuneration was paid to non-executive directors of the Company. 36. TRANSACTIONS WITH RELATED PARTIES Related parties comprise of subsidiary company, other related parties, key management personnel
and provident fund trust. The Company in the normal course of business carries out transactions with related parties. Detail of transactions with related parties, other than those which have been speci!cally disclosed elsewhere in these !nancial statements are as follows:
2014 2013 Rupees Rupees Q Mart Corporation (Private) Limited - Subsidiary company Purchase of operating !xed assets - 2,518,104 Purchase of goods - 4,068,868 Purchase of operating !xed assets as a part of settlement of loan from Silk Bank Limited - 12,000,000 Rent - 240,000

66
37. PROVIDENT FUND RELATED DISCLOSURES The following information is based on un-audited !nancial statements of the provident fund for
the year ended 30 June 2014 and 30 June 2013:
2014 2013 Rupees Rupees
Size of the fund - Total assets 111,391,188 91,622,193 Cost of investments 93,890,176 84,257,836 Percentage of investments made 94.77% 93.26% Fair value of investments 105,570,043 85,449,542 37.1 The break-up of fair value of investments is as follows: 2014 2013 2014 2013 Percentage Rupees Rupees Deposits 45.82 37.23 48,370,256 31,812,872 Mutual funds 34.27 37.21 36,173,882 31,795,742 Listed securities 19.92 25.56 21,025,905 21,840,928 100.00 100.00 105,570,043 85,449,542 37.2 Investments, out of provident fund, have been made in accordance with the provisions of section
227 of the Companies Ordinance, 1984 and the rules formulated for this purpose.
2014 2013
38. NUMBER OF EMPLOYEES Number of employees as on June 30 Permanent 1,434 1,393 Contractual 31 43 Average number of employees during the year Permanent 1,423 1,369 Contractual 30 42

67
Wea
ving
D
yein
g
Pow
er
Elim
inat
ion
of in
ter-
To
tal-
Com
pany
G
ener
atio
n
s
egm
ent t
rans
actio
ns
2014
20
13
2014
20
13
2014
20
13
2014
20
13
2014
20
13
---
------
------
------
------
------
------
------
------
------
-- ( R
u p
e e
s ) -
------
------
------
------
------
------
------
------
------
------
Sale
s
-Ext
erna
l 2
,102
,918
,863
1
,729
,562
,680
5
,669
,512
,634
6
,722
,208
,101
-
-
-
-
7
,772
,431
,497
8
,451
,770
,781
-In
ters
egm
ent
2,0
41,0
89,3
15
2,4
39,1
72,6
33
40,
212,
997
2
5,41
6,98
6
668
,345
,298
7
92,5
41,5
30
(2,7
49,6
47,6
10)
(3,2
57,1
31,1
49)
-
-
4
,144
,008
,178
4
,168
,735
,313
5
,709
,725
,631
6
,747
,625
,087
6
68,3
45,2
98
792
,541
,530
(2
,749
,647
,610
) (3
,257
,131
,149
) 7
,772
,431
,497
8
,451
,770
,781
Co
st o
f sal
es
(3,7
75,1
82,7
58)
(3,7
93,3
91,9
71)
(5,0
44,2
96,4
98)
(5,7
57,1
25,3
65)
(657
,430
,446
) (7
80,0
71,1
45)
2,7
49,6
47,6
10
3,2
57,1
31,1
49
(6,7
27,2
62,0
92)
(7,0
73,4
57,3
32)
Gro
ss p
ro!t
3
68,8
25,4
20
375
,343
,342
6
65,4
29,1
33
990
,499
,722
1
0,91
4,85
2
12,
470,
385
-
-
1
,045
,169
,405
1
,378
,313
,449
D
istrib
utio
n co
st
(115
,755
,786
) (1
01,7
66,3
28)
(315
,795
,798
) (5
17,0
38,3
01)
(10,
500)
-
-
-
(4
31,5
62,0
84)
(618
,804
,629
)Ad
min
istra
tive
expe
nses
(9
7,89
3,88
6)
(90,
063,
538)
(1
03,3
55,5
59)
(95,
277,
003)
(9
,565
,315
) (9
,699
,547
) -
-
(2
10,8
14,7
60)
(195
,040
,088
)
(2
13,6
49,6
72)
(191
,829
,866
) (4
19,1
51,3
57)
(612
,315
,304
) (9
,575
,815
) (9
,699
,547
) -
-
(6
42,3
76,8
44)
(813
,844
,717
)
Pro!
t bef
ore
taxa
tion
and
unal
loca
ted
inco
me
/ exp
ense
s 1
55,1
75,7
48
183
,513
,476
2
46,2
77,7
76
378
,184
,418
1
,339
,037
2
,770
,838
-
-
4
02,7
92,5
61
564
,468
,732
Una
lloca
ted
inco
me
and
expe
nses
:
Fina
nce
cost
(3
96,6
67,9
96)
(505
,422
,696
)O
ther
exp
ense
s
(9
3,85
9,95
8)
(176
,879
,315
)O
ther
inco
me
237
,082
,706
1
,205
,045
,128
Ta
xatio
n
5
2,54
0,33
2
(78,
545,
167)
(2
00,9
04,9
16)
444
,197
,950
Pro!
t afte
r tax
atio
n
2
01,8
87,6
45
1,0
08,6
66,6
82
Wea
ving
Dye
ing
P
ower
Tota
l - C
ompa
ny
Gen
erat
ion
20
14
2013
20
14
2013
20
14
2013
20
14
2013
-
------
------
------
------
------
------
---- (
R u
p e
e s
) ----
------
------
------
------
------
------
------
--
Segm
ent a
sset
s 1
,929
,414
,907
1
,883
,209
,663
2
,358
,316
,137
2
,507
,593
,247
8
37,3
36,9
96
800
,653
,779
5
,125
,068
,040
5
,191
,456
,689
Lo
ng te
rm in
vest
men
ts
81,
013,
995
8
2,23
5,86
4 Sh
ort t
erm
inve
stm
ent
176
,879
,692
1
32,3
57,2
44
Una
lloca
ted
asse
ts
604
,120
,957
4
54,0
14,9
91 To
tal a
sset
s as p
er b
alan
ce sh
eet
5,9
87,0
82,6
84
5,8
60,0
64,7
88
Segm
ent l
iabi
litie
s 2
99,2
47,6
02
241
,238
,767
3
68,2
16,1
77
362
,643
,302
6
0,01
0,29
9
64,
517,
633
7
27,4
74,0
78
668
,399
,702
Long
term
!na
ncin
g - s
ecur
ed
1,9
61,0
62,9
54
2,1
21,4
86,1
53
Spon
sor’s
loan
1
76,7
42,1
16
272
,000
,000
Ac
crue
d m
arku
p
1
32,5
81,5
24
110
,743
,721
Sh
ort t
erm
bor
row
ings
- se
cure
d
8
14,1
94,9
99
671
,405
,785
D
efer
red
liabi
litie
s
5
07,5
23,5
37
483
,022
,877
Pr
ovisi
on fo
r tax
atio
n
4
9,02
9,13
3
79,
975,
000
Una
lloca
ted
liabi
litie
s
7
4,49
1,68
9
146
,138
,607
Tota
l lia
bilit
ies a
s per
bal
ance
shee
t
4
,443
,100
,030
4
,553
,171
,845
39.2
Re
conc
iliat
ion
of re
port
able
segm
ent a
sset
s and
liab
ilitie
s
39.
SEG
MEN
T IN
FORM
ATIO
N
39.1
Th
e Co
mpa
ny h
as th
ree
repo
rtab
le se
gmen
ts. T
he fo
llow
ing
sum
mar
y de
scrib
es th
e op
erat
ion
in e
ach
of th
e Co
mpa
ny’s
repo
rtab
le se
gmen
ts:
W
eavi
ng
Prod
uctio
n of
di"
eren
t qua
litie
s of g
reig
e fa
bric
usin
g ya
rn
Dye
ing
Proc
essin
g of
gre
ige
fabr
ic fo
r pro
duct
ion
of d
yed
fabr
ic
Pow
er G
ener
atio
n G
ener
atio
n an
d di
strib
utio
n of
pow
er u
sing
gas,
oil a
nd st
eam

68
39.3 Geographical information The Company’s revenue from external customers by geographical location is detailed below: 2014 2013 Rupees Rupees Australia 359,378,990 371,954,125 Asia 4,039,513,666 4,320,231,205 Europe 1,622,781,899 1,232,086,726 United States of America and Canada 179,185,932 266,600,639 Africa 564,523,726 1,126,393,595 Pakistan 1,007,047,284 1,134,504,491 7,772,431,497 8,451,770,781 39.4 All non-current assets of the Company as at reporting date are located and operating in Pakistan.
39.5 Revenue from major customers The Company’s revenue is earned from a large mix of customers.
2014 201340. PLANT CAPACITY AND PRODUCTION Weaving Number of looms in operation 174 174 Rated capacity of operative looms converted to 60 picks (square meter) 48,892,878 48,892,878 Actual production converted to 60 picks (square meter) 48,081,074 47,933,566 Number of days worked during the year (3 shifts per day) 365 365 Dyeing Rated capacity in 3 shifts (linear meter) 30,000,000 30,000,000 Actual production for 3 shifts (linear meter) 24,615,240 29,586,279 No. of days worked during the year (3 shifts per day) 344 365 Power generation Number of generators installed 9 9 Installed capacity (Mega Watt Hours) 300,381 300,381 Actual generation (Mega Watt Hours) 19,395 27,023 40.1 Under utilization of available capacity for weaving and dyeing divisions is due to normal
maintenance. 40.2 Actual power generation in comparison to installed is low due to periodical scheduled and
unscheduled maintenance of generators and low demand.

69
41. FINANCIAL RISK MANAGEMENT 41.1 Financial risk factors The Company’s activities expose it to a variety of !nancial risks: market risk (including currency
risk, other price risk and interest rate risk), credit risk and liquidity risk. The Company’s overall risk management programme focuses on the unpredictability of !nancial markets and seeks to minimize potential adverse e"ects on the !nancial performance.
Risk management is carried out by the Company’s !nance department under policies approved
by the Board of Directors (the Board). The Company’s !nance department evaluates and hedges !nancial risk. The Board provides principles for overall risk management, as well as policies covering speci!c areas such as currency risk, other price risk, interest rate risk, credit risk and liquidity risk.
(a) Market risk (i) Currency risk Currency risk is the risk that the fair value or future cash #ows of a !nancial instrument will
#uctuate because of changes in foreign exchange rates. Currency risk arises mainly from future commercial transactions or receivables and payables that exist due to transactions in foreign currencies.
The Company is exposed to currency risk arising from various currency exposures,
primarily with respect to the United States Dollar (USD) and Euro. Currently, the Company’s foreign exchange risk exposure is restricted to foreign currency bank balances and the amounts receivable from / payable to the foreign entities. The Company uses forward exchange contracts to hedge its foreign currency risk, when considered appropriate. The Company’s exposure to currency risk was as follows:
2014 2013 Cash in hand - USD 1,207 5,285 Cash in hand - Euro 2,960 1,410 Cash at banks - USD 789 789 Trade debts - USD 10,890,817 13,375,230 Trade debts - Euro 115,833 - Trade and other payable - USD (1,341,000) (1,420,262) Net exposure - USD 9,551,813 11,961,042 Net exposure - Euro 118,793 1,410 The following signi!cant exchange rates were applied during the year:
Rupees per US Dollar Average rate 102.50 96.32 Reporting date rate 98.35 98.95 Rupees per Euro Average rate 138.43 124.62 Reporting date rate 134.19 129.25

70
Sensitivity analysis If the functional currency, at reporting date, had weakened / strengthened by 5% against
the USD and Euro with all other variables held constant, the impact on pro!t after taxation for the year would have been higher / lower by Rupees 45.947 million (2013: Rupees 55.705 million) mainly as a result of exchange gains / losses on translation of foreign exchange denominated !nancial instruments. Currency risk sensitivity to foreign exchange movements has been calculated on a symmetric basis. In management’s opinion, the sensitivity analysis is unrepresentative of inherent currency risk as the year end exposure does not re"ect the exposure during the year.
(ii) Other price risk Other price risk represents the risk that the fair value or future cash "ows of a !nancial
instrument will "uctuate because of changes in market prices (other than those arising from interest rate risk or currency risk), whether those changes are caused by factors speci!c to the individual !nancial instrument or its issuer, or factors a#ecting all similar !nancial instruments traded in the market. The Company is not exposed to other price risk.
(iii) Interest rate risk This represents the risk that the fair value or future cash "ows of a !nancial instrument will
"uctuate because of changes in market interest rates. The Company has no signi!cant long-term interest-bearing assets except for bank balances
on saving accounts. The Company’s interest rate risk arises from long term !nancing and short term borrowings. Borrowings obtained at variable rates expose the Company to cash "ow interest rate risk. Borrowings obtained at !xed rate expose the Company to fair value interest rate risk.

71
At the reporting date the interest rate pro!le of the Company’s interest bearing !nancial instruments was:
2014 2013 Rupees Rupees Fixed rate instruments Financial liabilities Long term !nancing 1,358,560,561 1,509,412,441 Sponsor’s loan 176,742,116 272,000,000 Floating rate instruments Financial assets Bank balances - saving accounts 75,737,361 105,074,765 Financial liabilities Long term !nancing 602,502,393 612,073,712 Short term borrowings 814,194,999 671,405,785 Fair value sensitivity analysis for !xed rate instruments The Company does not account for any !xed rate !nancial assets and liabilities at fair value through
pro!t or loss. Therefore, a change in interest rate at the balance sheet date would not a"ect pro!t or loss of the Company.
Cash "ow sensitivity analysis for variable rate instruments If interest rates at the year end date, #uctuate by 1% higher / lower with all other variables held
constant, pro!t for the year would have been Rupees 12.739 million lower / higher (2013: Rupees 11.195 million), mainly as a result of higher / lower interest expense on #oating rate borrowings. This analysis is prepared assuming the amounts of liabilities outstanding at reporting dates were outstanding for the whole year.
(b) Credit risk Credit risk represents the risk that one party to a !nancial instrument will cause a !nancial loss
for the other party by failing to discharge an obligation. The carrying amount of !nancial assets represents the maximum credit exposure. The maximum exposure to credit risk at the reporting date was as follows:

72
2014 2013 Rupees Rupees Investments 176,879,692 132,357,244 Advances 9,976,757 8,445,589 Deposits 35,560,786 28,055,841 Trade debts 533,484,347 679,533,395 Other receivables 911,286 17,575,945 Bank balances 152,474,541 125,639,420
909,287,409 991,607,434
The credit quality of !nancial assets that are neither past due nor impaired can be assessed by reference to external credit ratings (If available) or to historical information about counterparty default rate:
Rating 2014 2013
Banks Short Long Agency Rupees Rupees Term Term National Bank of Pakistan A-1+ AAA JCR-VIS 150,344 150,744 Allied Bank Limited A1+ AA+ PACRA 9,763,052 6,897,060 Askari Bank Limited A1+ AA PACRA 154,146 719,627 Bank Alfalah Limited A1+ AA PACRA 214,008 39,796 Faysal Bank Limited A1+ AA PACRA 430,344 406,216 Habib Bank Limited A-1+ AAA JCR-VIS 3,524,607 13,008,561 Habib Metropolitan Bank Limited A1+ AA+ PACRA 56,430,665 55,879,362 The Bank of Punjab A1+ AA- PACRA 276,717 115,621 MCB Bank Limited A1+ AAA PACRA 92,764 976,796 NIB Bank Limited A1+ AA - PACRA 56,788,522 30,325,384 Silk Bank Limited A-2 A - JCR-VIS 624,015 905,410 Standard Chartered Bank (Pakistan) Limited A1+ AAA PACRA 3,382,533 4,669,868 United Bank Limited A-1+ AA+ JCR-VIS 1,590,017 11,469,979 Al-Baraka Bank (Pakistan) Limited A1 A PACRA 19,052,807 74,996 152,474,541 125,639,420 Investment Security General Insurance Company Limited AA- JCR-VIS 176,879,692 132,357,244 329,354,233 257,996,664
The Company’s exposure to credit risk and impairment losses related to trade debts is disclosed in note 18.
Due to the Company’s long standing business relationships with these counter parties and after
giving due consideration to their strong !nancial standing, management does not expect non-performance by these counter parties on their obligations to the Company. Accordingly the credit risk is minimal.

73
(c) Liquidity risk
Liquidity risk is the risk that an entity will encounter di!culty in meeting obligations associated with "nancial liabilities.
The Company manages liquidity risk by maintaining su!cient cash. At 30 June 2014, the
Company has Rupees 155.474 million (2013: Rupees 129.221 million) cash and bank balances. The management believes the liquidity risk to be manageable. Following are the contractual maturities of "nancial liabilities, including interest payments. The amount disclosed in the table are undiscounted cash #ows:
Contractual maturities of "nancial liabilities as at 30 June 2014 Carrying Contractual 6 month 6-12 1-2 More than
amount cash !ows or less month Year 2 Years
------------------------------------ (Rupees) ------------------------------------- Long term "nancing 1,961,062,954 2,342,944,850 156,508,103 60,379,517 205,819,295 1,920,237,935 Sponsor’s loan 176,742,116 272,000,000 - 20,113,253 22,402,141 229,484,606 Trade and other payables 720,562,117 720,562,117 720,562,117 - - - Accrued markup 624,986,668 624,986,668 132,581,524 - - 492,405,144 Short term borrowings 814,194,999 854,912,448 854,912,448 - - - 4,297,548,854 4,815,406,083 1,864,564,192 80,492,770 228,221,436 2,642,127,685
Contractual maturities of "nancial liabilities as at 30 June 2013 Carrying Contractual 6 month 6-12 1-2 More than
amount cash !ows or less month Year 2 Years
------------------------------------ (Rupees) ------------------------------------- Long term "nancing 2,121,486,153 2,435,899,755 76,955,117 50,405,540 165,283,931 2,143,255,167 Sponsor’s loan 272,000,000 272,000,000 - - - 272,000,000 Trade and other payables 700,225,446 700,225,446 700,225,446 - - - Accrued markup 534,729,948 534,729,948 110,743,721 - - 423,986,227 Short term borrowings 671,405,785 689,269,929 689,269,929 - - - 4,299,847,332 4,632,125,078 1,577,194,213 50,405,540 165,283,931 2,839,241,394
The contractual cash #ows relating to the above "nancial liabilities have been determined on the basis of interest rates / mark up rates e$ective as at 30 June. The rates of interest / mark up have been disclosed in note 7 and note 12 to these "nancial statements.

74
41.2 Fair values of !nancial assets and liabilities
The carrying values of all !nancial assets and liabilities re"ected in !nancial statements approximate their fair values. Fair value is determined on the basis of objective evidence at each reporting date. The following table provides an analysis of !nancial instruments that are measured subsequent to initial recognition at fair value, grouped into levels 1 to 3 based on the degree to which fair value is observable:
Level 1 Level 2 Level 3 Total
................................... Rupees................................... As at 30 June 2014 Assets Available for sale !nancial assets - - 176,879,692 176,879,692 As at 30 June 2013 Assets Available for sale !nancial assets - - 132,357,244 132,357,244
The fair value of !nancial instruments traded in active markets is based on quoted market prices at the balance sheet date. The quoted market price used for !nancial instruments held by the company is the current bid price. These !nancial instruments are classi!ed under level 1 in above referred table. The Company has no such type of !nancial instrument as at 30 June 2014.
The fair value of !nancial instruments that are not traded in active market is determined by
using valuation techniques. These valuation techniques maximize the use of observable market data where it is available and rely as little as possible on entity speci!c estimate. If all signi!cant inputs required to fair value a !nancial instrument are observable, those !nancial instruments are classi!ed under level 2. The Company has no such type of !nancial instruments as at 30 June 2014.
If one or more of the signi!cant inputs is not based on observable market data, the !nancial
instrument is classi!ed under level 3. The carrying amount less impairment provision of trade receivables and payables are assumed to approximate their fair values. The fair value of !nancial liabilities for disclosure purposes is estimated by discounting the future contractual cash "ows at the current market interest rate that is available to the company for similar !nancial instruments.
41.3 Financial instruments by categories
Assets as per balance sheet
2014 2013
Loans and Available Total Loans and Available Total receivables for sale receivables for sale
- -- - - - - - - - Rupees - - - - - - -- - - - - - - -- - - Rupees - - - - - -- - -
Investments - 176,879,692 176,879,692 - 132,357,244 132,357,244 Advances 9,976,757 - 9,976,757 8,445,589 - 8,445,589 Deposits 35,560,786 - 35,560,786 28,055,841 - 28,055,841 Trade debts 533,484,347 - 533,484,347 679,533,395 - 679,533,395 Other receivables 911,286 - 911,286 17,575,945 - 17,575,945 Cash and bank balances 155,474,401 - 155,474,401 129,221,124 - 129,221,124
735,407,577 176,879,692 912,287,269 862,831,894 132,357,244 995,189,138

75
2014 2013 Rupees Rupees Financial liabilities at amortized cost Sponsor’s loan 176,742,116 272,000,000 Long term !nancing 1,961,062,954 2,121,486,153 Accrued markup 624,986,668 534,729,948 Short term borrowings 814,194,999 671,405,785 Trade and other payables 720,562,117 700,225,446 4,297,548,854 4,299,847,332 41.4 Capital risk management The Company’s objectives when managing capital are to safeguard the Company’s ability to
continue as a going concern in order to provide returns for shareholders and bene!ts for other stake holders and to maintain an optimal capital structure to reduce the cost of capital. In order to maintain or adjust the capital structure, the Company may adjust the amount of dividends paid to share holders, issue new shares or sell assets to reduce debt.
42. AUTHORIZATION OF FINANCIAL STATEMENTS These !nancial statements were authorized for issue by the Board of Directors of the Company on
25 September 2014 . 43. CORRESPONDING FIGURES Corresponding !gures have been rearranged / regrouped, wherever necessary, for the purpose of
comparison. However, no signi!cant rearrangements / regroupings have been made. 44. GENERAL Figures have been rounded o" to nearest of Rupee.
AAMIR FAYYAZ SHEIKH AAMIR AMIN Chief Executive Director

76

77Kohinoor Mills Limited and its Subsidiary
CONSOLIDATED FINANCIAL STATEMENTS

78
The Directors are pleased to present the consolidated audited results of Kohinoor Mills Limited and
its subsidiary Q-Mart Corporation (Private) Limited (the Group) for the year ended 30 June 2014. The
Group results are being presented as required by section 237 of the Companies Ordinance, 1984.
During the !nancial year ended 30 June 2014, the Group earned a net pro!t after tax of Rs. 201.888
million, compared to net pro!t of Rs. 1.009 million during the preceding !nancial year, which included
Rs. 824 million as one-time gain on recognition of !nancial liabilities at fair value under IAS 39.
Sharp unexpected decline in the value of US Dollar in later half of the year, slow-down in high-street
retail sector sales in the US and European markets and increasing regional competition during the year
under review resulted in decline in turnover and reduction in margins in the parent company’s results.
The current order book of the parent company is healthy and it has con!rmed orders up to December
2014 at full capacity. Thus the management is con!dent that the parent company shall be able to build
on its performance, going forward. Further, the Group, in line with divestment plan, is in the process of
disposing of the remaining !xed assets of the subsidiary company.
The Directors’ Report giving a detailed analysis of the performance of the parent company for the year
ended 30 June 2014, has also been presented separately.
On behalf of the Board
Aamir Fayyaz SheikhChief Executive
Lahore:25 September 2014
DIRECTORS’ REPORT
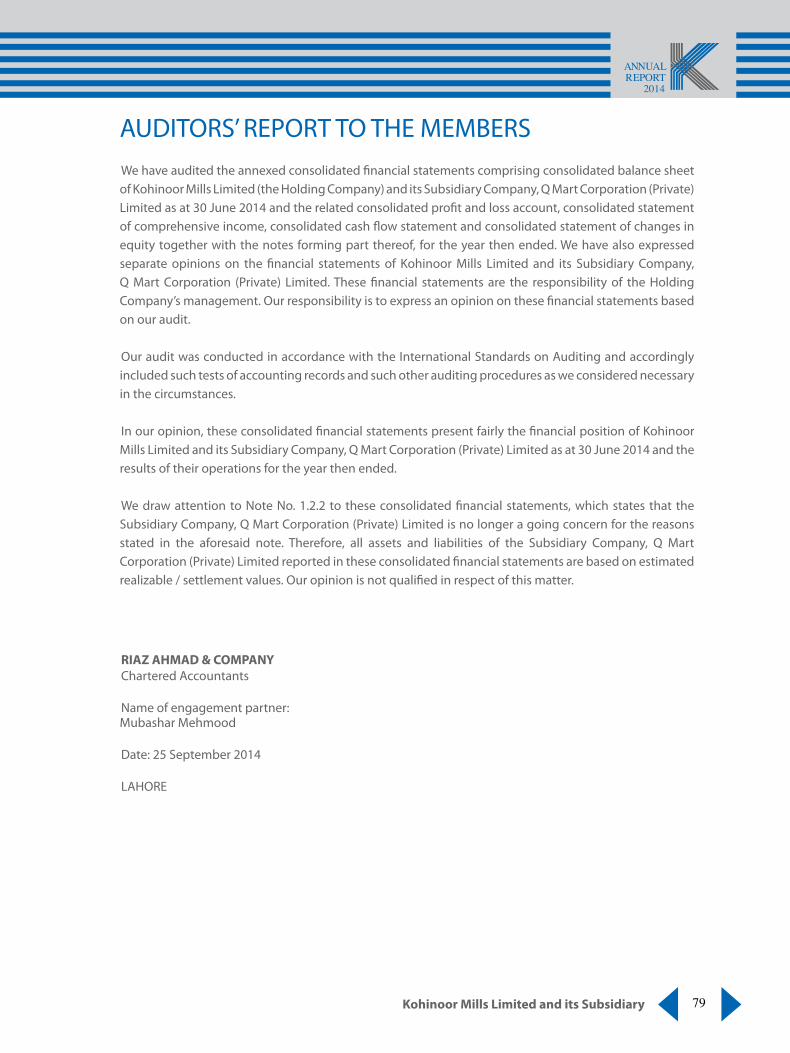
79Kohinoor Mills Limited and its Subsidiary
We have audited the annexed consolidated !nancial statements comprising consolidated balance sheet of Kohinoor Mills Limited (the Holding Company) and its Subsidiary Company, Q Mart Corporation (Private) Limited as at 30 June 2014 and the related consolidated pro!t and loss account, consolidated statement of comprehensive income, consolidated cash "ow statement and consolidated statement of changes in equity together with the notes forming part thereof, for the year then ended. We have also expressed separate opinions on the !nancial statements of Kohinoor Mills Limited and its Subsidiary Company, Q Mart Corporation (Private) Limited. These !nancial statements are the responsibility of the Holding Company’s management. Our responsibility is to express an opinion on these !nancial statements based on our audit. Our audit was conducted in accordance with the International Standards on Auditing and accordingly included such tests of accounting records and such other auditing procedures as we considered necessary in the circumstances.
In our opinion, these consolidated !nancial statements present fairly the !nancial position of Kohinoor Mills Limited and its Subsidiary Company, Q Mart Corporation (Private) Limited as at 30 June 2014 and the results of their operations for the year then ended.
We draw attention to Note No. 1.2.2 to these consolidated !nancial statements, which states that the Subsidiary Company, Q Mart Corporation (Private) Limited is no longer a going concern for the reasons stated in the aforesaid note. Therefore, all assets and liabilities of the Subsidiary Company, Q Mart Corporation (Private) Limited reported in these consolidated !nancial statements are based on estimated realizable / settlement values. Our opinion is not quali!ed in respect of this matter.
RIAZ AHMAD & COMPANYChartered Accountants
Name of engagement partner:Mubashar Mehmood
Date: 25 September 2014
LAHORE
AUDITORS’ REPORT TO THE MEMBERS
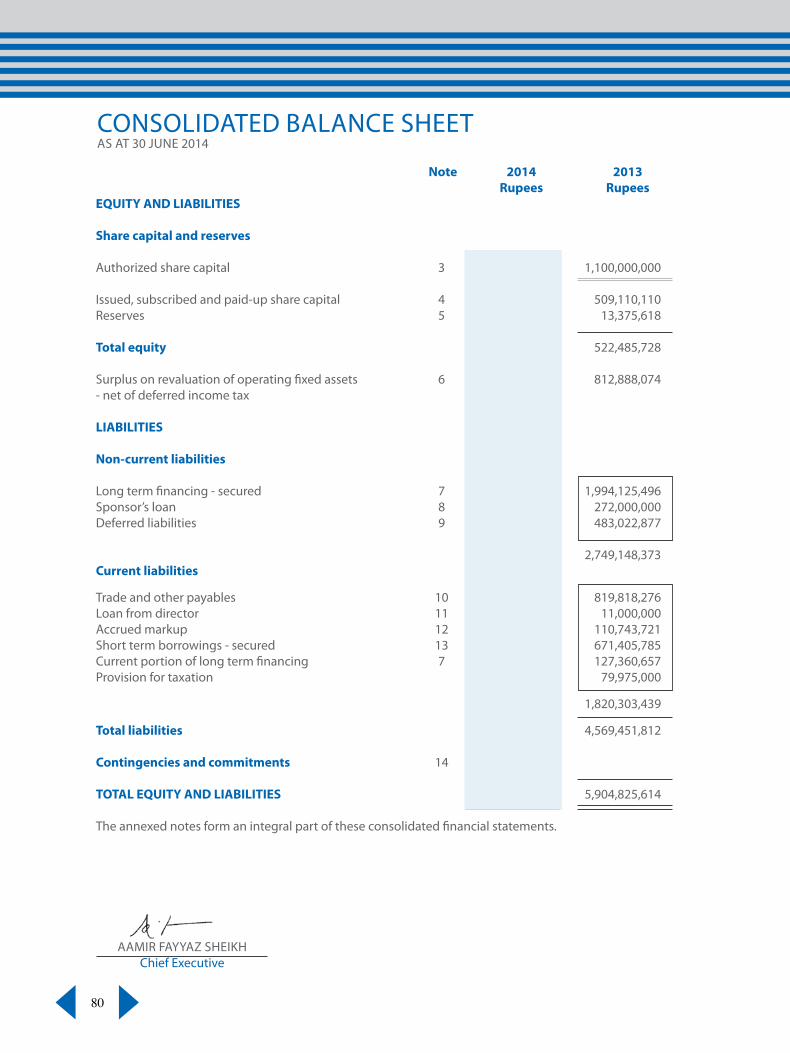
80
Note 2014 2013 Rupees Rupees
EQUITY AND LIABILITIES Share capital and reserves Authorized share capital 3 1,100,000,000 1,100,000,000 Issued, subscribed and paid-up share capital 4 509,110,110 509,110,110 Reserves 5 268,044,998 13,375,618 Total equity 777,155,108 522,485,728 Surplus on revaluation of operating !xed assets 6 795,559,181 812,888,074 - net of deferred income tax LIABILITIES Non-current liabilities Long term !nancing - secured 7 1,711,379,960 1,994,125,496 Sponsor’s loan 8 176,742,116 272,000,000 Deferred liabilities 9 507,523,537 483,022,877
2,395,645,613 2,749,148,373 Current liabilities Trade and other payables 10 802,949,466 819,818,276 Loan from director 11 11,000,000 11,000,000 Accrued markup 12 132,581,524 110,743,721 Short term borrowings - secured 13 814,194,999 671,405,785 Current portion of long term !nancing 7 249,682,994 127,360,657 Provision for taxation 49,029,133 79,975,000 2,059,438,116 1,820,303,439 Total liabilities 4,455,083,729 4,569,451,812 Contingencies and commitments 14 TOTAL EQUITY AND LIABILITIES 6,027,798,018 5,904,825,614 The annexed notes form an integral part of these consolidated !nancial statements.
CONSOLIDATED BALANCE SHEET AS AT 30 JUNE 2014
AAMIR FAYYAZ SHEIKH Chief Executive

81Kohinoor Mills Limited and its Subsidiary
Note 2014 2013 Rupees Rupees
ASSETS Non-current assets Fixed assets 15 3,560,898,995 3,479,531,750 Long term investment 16 - - Long term security deposits 20,587,740 20,587,740
3,581,486,735 3,500,119,490 Current assets Stores, spares and loose tools 17 317,766,166 315,856,083 Stock-in-trade 18 698,231,702 614,534,124 Trade debts 19 533,484,347 679,533,395 Advances 20 87,643,135 90,306,682 Trade deposits and short term prepayments 21 19,413,286 7,595,341 Other receivables 22 254,936,841 239,292,847 Sales tax recoverable 23 202,338,744 195,174,232 Short term investment 24 176,879,692 132,357,244 Cash and bank balances 25 155,617,370 130,056,176
2,446,311,283 2,404,706,124
TOTAL ASSETS 6,027,798,018 5,904,825,614
AAMIR AMIN Director

82
Note 2014 2013 Rupees Rupees
SALES 26 7,772,431,497 8,545,474,609 COST OF SALES 27 (6,727,262,092) (7,185,347,408) GROSS PROFIT 1,045,169,405 1,360,127,201 DISTRIBUTION COST 28 (431,562,084) (618,804,629)ADMINISTRATIVE EXPENSES 29 (216,113,901) (200,296,971)OTHER EXPENSES 30 (92,820,340) (150,086,883) (740,496,325) (969,188,483) 304,673,080 390,938,718 OTHER INCOME 31 241,664,174 1,215,117,892 PROFIT FROM OPERATIONS 546,337,254 1,606,056,610 FINANCE COST 32 (396,669,964) (505,571,051) PROFIT BEFORE TAXATION 149,667,290 1,100,485,559 TAXATION 33 52,220,355 (91,818,876)
PROFIT AFTER TAXATION 201,887,645 1,008,666,683
EARNINGS PER SHARE - BASIC AND DILUTED 34 3.97 19.81 The annexed notes form an integral part of these consolidated !nancial statements.
CONSOLIDATED PROFIT AND LOSS ACCOUNTFOR THE YEAR ENDED 30 JUNE 2014
AAMIR FAYYAZ SHEIKH AAMIR AMIN Chief Executive Director

83Kohinoor Mills Limited and its Subsidiary
2014 2013 Rupees Rupees
PROFIT AFTER TAXATION 201,887,645 1,008,666,683 OTHER COMPREHENSIVE INCOME Items that will not be reclassi!ed to pro!t or loss - - Items that may be reclassi!ed subsequently to pro!t or loss: Surplus arising on re-measurement of available for sale investment to fair value 44,522,448 54,904,794 Reclassi!cation adjustment relating to disposal of available for sale investment - (28,915,070) Deferred income tax relating to surplus on re-measurement of available for sale investment to fair value (10,031,907) (13,425,111) Other comprehensive income for the year - net of tax 34,490,541 12,564,613 TOTAL COMPREHENSIVE INCOME FOR THE YEAR 236,378,186 1,021,231,296 The annexed notes form an integral part of these consolidated !nancial statements.
CONSOLIDATED STATEMENT OF COMPREHENSIVE INCOME FOR THE YEAR ENDED 30 JUNE 2014
AAMIR FAYYAZ SHEIKH AAMIR AMIN Chief Executive Director

84
Note 2014 2013 Rupees Rupees
CASH FLOWS FROM OPERATING ACTIVITIES CASH GENERATED FROM OPERATIONS 35 733,668,962 810,671,409 Income tax paid (100,441,588) (93,151,898)Net decrease in long term security deposits - 876,000 Finance cost paid (180,810,215) (242,424,240) NET CASH GENERATED FROM OPERATING ACTIVITIES 452,417,159 475,971,271 CASH FLOWS FROM INVESTING ACTIVITIES Capital expenditure on property, plant and equipment (322,403,826) (252,604,868)Proceeds from disposal of operating !xed assets 17,186,480 30,845,748 Proceed from disposal of short term investment - 145,677,342 Dividend received 3,540,168 2,574,668 NET CASH USED IN INVESTING ACTIVITIES (301,677,178) (73,507,110) CASH FLOWS FROM FINANCING ACTIVITIES Repayment of long term !nancing (267,968,001) (198,073,490)Loan from director - 6,000,000 Short term borrowings - net 142,789,214 (189,582,631) NET CASH USED IN FINANCING ACTIVITIES (125,178,787) (381,656,121) NET INCREASE IN CASH AND CASH EQUIVALENTS 25,561,194 20,808,040 CASH AND CASH EQUIVALENTS AT THE BEGINNING OF THE YEAR 130,056,176 109,248,136 CASH AND CASH EQUIVALENTS AT THE END OF THE YEAR 155,617,370 130,056,176 The annexed notes form an integral part of these consolidated !nancial statements.
CONSOLIDATED CASH FLOW STATEMENTFOR THE YEAR ENDED 30 JUNE 2014
AAMIR FAYYAZ SHEIKH AAMIR AMIN Chief Executive Director

85Kohinoor Mills Limited and its Subsidiary
CON
SOLI
DAT
ED S
TATE
MEN
T O
F CH
ANG
ES IN
EQ
UIT
Y FO
R TH
E YE
AR E
ND
ED 3
0 JU
NE
2014
RE
SERV
ES
CA
PITA
L RE
SERV
ES
REV
ENU
E RE
SERV
ES
Sh
are
prem
ium
Fa
ir v
alue
Gen
eral
A
ccum
ulat
ed
To
tal
Tota
l
rese
rves
re
serv
es
Su
b-To
tal
rese
rve
los
s
Su
b-To
tal
rese
rves
---
----
----
----
----
----
----
----
----
----
----
----
----
- R
UP
EE
S -
----
----
----
----
----
----
----
----
----
----
----
----
---
Bala
nce
as a
t 30
June
201
2 5
09,1
10,1
10
213
,406
,310
8
5,51
6,92
6
298
,923
,236
1
,058
,027
,640
(2
,436
,406
,720
) (1
,378
,379
,080
) (1
,079
,455
,844
) (5
70,3
45,7
34)
Tr
ansf
erre
d fro
m su
rplu
s on
reva
luat
ion
of o
pera
ting
!xed
ass
ets
in
resp
ect o
f inc
rem
enta
l dep
reci
atio
n - n
et o
f def
erre
d in
com
e ta
x -
-
-
-
-
1
9,24
0,69
0
19,
240,
690
1
9,24
0,69
0
19,
240,
690
Su
rplu
s rea
lized
on
disp
osal
of o
pera
ting
!xed
ass
ets
-
-
-
-
-
52,
359,
476
5
2,35
9,47
6
52,
359,
476
5
2,35
9,47
6
Pro!
t for
the
year
-
-
-
-
-
1
,008
,666
,683
1
,008
,666
,683
1
,008
,666
,683
1
,008
,666
,683
O
ther
com
preh
ensiv
e in
com
e fo
r the
yea
r -
-
1
2,56
4,61
3
12,
564,
613
-
-
-
1
2,56
4,61
3
12,
564,
613
To
tal c
ompr
ehen
sive
inco
me
for t
he y
ear e
nded
30
June
201
3 -
-
1
2,56
4,61
3
12,
564,
613
-
1
,008
,666
,683
1
,008
,666
,683
1
,021
,231
,296
1
,021
,231
,296
Bala
nce
as a
t 30
June
201
3 5
09,1
10,1
10
213
,406
,310
9
8,08
1,53
9
311
,487
,849
1
,058
,027
,640
(1
,356
,139
,871
) (2
98,1
12,2
31)
13,
375,
618
5
22,4
85,7
28
Tr
ansf
erre
d fro
m su
rplu
s on
reva
luat
ion
of o
pera
ting
!xed
ass
ets
in
resp
ect o
f inc
rem
enta
l dep
reci
atio
n - n
et o
f def
erre
d in
com
e ta
x -
-
-
-
-
1
8,29
1,19
4
18,
291,
194
1
8,29
1,19
4
18,
291,
194
Pr
o!t f
or th
e ye
ar
-
-
-
-
-
201
,887
,645
2
01,8
87,6
45
201
,887
,645
2
01,8
87,6
45
Oth
er c
ompr
ehen
sive
inco
me
for t
he y
ear
-
-
34,
490,
541
3
4,49
0,54
1
-
-
-
34,
490,
541
3
4,49
0,54
1
Tota
l com
preh
ensiv
e in
com
e fo
r the
yea
r end
ed 3
0 Ju
ne 2
014
-
-
34,
490,
541
3
4,49
0,54
1
-
201
,887
,645
2
01,8
87,6
45
236
,378
,186
2
36,3
78,1
86
Bala
nce
as a
t 30
June
201
4 5
09,1
10,1
10
213
,406
,310
1
32,5
72,0
80
345
,978
,390
1
,058
,027
,640
(1
,135
,961
,032
) (7
7,93
3,39
2)
268
,044
,998
7
77,1
55,1
08
The
anne
xed
note
s for
m a
n in
tegr
al p
art o
f the
se c
onso
lidat
ed !
nanc
ial s
tate
men
ts.
SHA
RE
CAPI
TAL
TOTA
LEQ
UIT
y
AA
MIR
FAY
YAZ
SHEI
KH
AAM
IR A
MIN
Ch
ief E
xecu
tive
D
irect
or

86
NOTES TO THE CONSOLIDATED FINANCIAL STATEMENTSFOR THE YEAR ENDED 30 JUNE 2014
1. LEGAL STATUS AND NATURE OF BUSINESS THE GROUP The Group consists of: Holding Company - Kohinoor Mills Limited Subsidiary Company (wholly owned) - Q Mart Corporation (Private) Limited 1.1 Kohinoor Mills Limited Kohinoor Mills Limited (“the Holding Company”) is a public limited company incorporated on 21
December 1987 in Pakistan under the Companies Ordinance, 1984 and its shares are quoted on Karachi, Lahore and Islamabad Stock Exchanges of Pakistan. The registered o!ce of the Holding Company is situated at 8-K.M., Manga Raiwind Road, District Kasur. The Holding Company is principally engaged in the business of textile manufacturing covering weaving, bleaching, dyeing, buying, selling and otherwise dealing in yarn, cloth and other goods and fabrics made from raw cotton and synthetic "ber and to generate and supply electricity.
1.2 Q Mart Corporation (Private) Limited
1.2.1 Q Mart Corporation (Private) Limited (“the Subsidiary Company”), a wholly owned subsidiary of Kohinoor Mills Limited was incorporated in Pakistan on 18 July 2005 as a private limited company under the Companies Ordinance, 1984. The registered o!ce of the Subsidiary Company is situated at 8-K.M., Manga Raiwind Road, District Kasur. The principal activity of the Subsidiary Company was to carry on business as a retailer in all types of general merchandise.
1.2.2 During the year ended 30 June 2013, the Holding Company, in line with its decision to focus
on its core fabric business, has decided to pull out of retail business and has accordingly shut-down all Q-Mart retail stores. The Subsidiary Company has disposed of all assets except for freehold land and building on freehold land. A large number of receivables and payables have been settled. As the Subsidiary Company has ceased trading and disposed of majority of its assets, hence, the Subsidiary Company is not considered a going concern. All assets and liabilities of the Subsidiary Company reported in these consolidated "nancial statements are based on estimated realizable / settlement values.
2. SUMMARY OF SIGNIFICANT ACCOUNTING POLICIES The signi"cant accounting policies applied in the preparation of these consolidated "nancial
statements are set out below. These policies have been consistently applied to all years presented, unless otherwise stated:
2.1 Basis of preparation a) Statement of compliance These consolidated "nancial statements have been prepared in accordance with approved
accounting standards as applicable in Pakistan. Approved accounting standards comprise of such International Financial Reporting Standards (IFRS) issued by the International

87Kohinoor Mills Limited and its Subsidiary
Accounting Standards Board as are noti!ed under the Companies Ordinance, 1984, provisions of and directives issued under the Companies Ordinance, 1984. In case requirements di"er, the provisions or directives of the Companies Ordinance, 1984 shall prevail.
b) Accounting convention These consolidated !nancial statements have been prepared under the historical cost convention,
except for lands and buildings which are carried at revalued amounts and certain !nancial instruments which are carried at their fair value.
c) Critical accounting estimates and judgments The preparation of these consolidated !nancial statements in conformity with the approved
accounting standards requires the use of certain critical accounting estimates. It also requires the management to exercise its judgment in the process of applying accounting policies. Estimates and judgments are continually evaluated and are based on historical experience and other factors, including expectations of future events that are believed to be reasonable under the circumstances. The areas where various assumptions and estimates are signi!cant to these consolidated !nancial statements or where judgments were exercised in application of accounting policies are as follows:
Financial instruments The fair value of !nancial instruments that are not traded in an active market is determined by
using valuation techniques based on assumptions that are dependent on conditions existing at the balance sheet date.
Useful lives, patterns of economic bene!ts and impairments Estimates with respect to residual values and useful lives and pattern of #ow of economic bene!ts
are based on the analysis of the management. Further, the values of assets are reviewed for possible impairments on an annual basis. Any change in the estimates in the future might a"ect the carrying amount of respective item of property, plant and equipment, with a corresponding e"ect on the depreciation charge and impairment.
Taxation In making the estimates for income tax liability, the management takes into account the current
income tax law and the decisions of appellate authorities on certain issues in the past. Provision for doubtful debts Receivables are reviewed against any provision required for any doubtful balances on an ongoing
basis. The provision is made while taking into consideration expected recoveries, if any. Inventories Net realizable value of inventories is determined with reference to currently prevailing selling
prices less estimated expenditure to make sales.
88
Provision for obsolescence of stores, spares and loose tools Provision for obsolescence of items of stores, spares and loose tools is made on the basis of
management’s estimate of net realizable value and ageing analysis prepared on an item-by-item basis.
d) Amendments to published approved standards that are e"ective in current year and are
relevant to the Group The following amendments to published approved standards are mandatory for the Group’s
accounting periods beginning on or after 01 July 2013: IFRS 7 (Amendment) ‘Financial Instruments: Disclosures’ (e!ective for annual periods beginning
on or after 01 January 2013). The International Accounting Standards Board (IASB) has amended the accounting requirements and disclosures related to o!setting of "nancial assets and "nancial liabilities by issuing amendments to IAS 32 ‘Financial Instruments: Presentation’ and IFRS 7. These amendments are the result of IASB and US Financial Accounting Standard Board undertaking a joint project to address the di!erences in their respective accounting standards regarding o!setting of "nancial instruments. The application of the amendments does not result in any impact on pro"t or loss, other comprehensive income and total comprehensive income.
On 17 May 2012, IASB issued Annual Improvements to IFRS: 2009 – 2011 Cycle, incorporating
amendments to "ve IFRS more speci"cally in IAS 1 ‘Presentation of Financial Statements’ and IAS 32 ‘Financial instruments: Presentation’ that are considered relevant to the consolidated "nancial statements. These amendments are e!ective for annual periods beginning on or after 01 January 2013. The application of the amendments does not result in any impact on consolidated pro"t or loss, consolidated other comprehensive income and consolidated total comprehensive income.
e) Standards, interpretation and amendments to published approved standards that are
e"ective in current year but not relevant to the Group There are other standards, new interpretation and amendments to published standards that are
mandatory for accounting periods beginning on or after 01 July 2013 but are considered not to be relevant or do not have any signi"cant impact on the consolidated "nancial statements and are therefore not detailed in these consolidated "nancial statements.
f) Standards, interpretation and amendments to published standards that are not yet e"ective
but relevant to the Group Following standards, interpretation and amendments to existing standards have been published
and are mandatory for the Group’s accounting periods beginning on or after 01 July 2014 or later periods:
IFRS 9 ‘Financial Instruments’ (e!ective for annual periods beginning on or after 01 January 2018).
A "nalized version of IFRS 9 which contains accounting requirements for "nancial instruments, replacing IAS 39 ‘Financial Instruments: Recognition and Measurement’. Financial assets are classi"ed by reference to the business model within which they are held and their contractual cash #ow characteristics. The 2014 version of IFRS 9 introduces a ‘fair value through other comprehensive income’ category for certain debt instruments. Financial liabilities are classi"ed in a similar manner to under IAS 39, however there are di!erences in the requirements applying to the measurement

89Kohinoor Mills Limited and its Subsidiary
of an entity’s own credit risk. The 2014 version of IFRS 9 introduces an ‘expected credit loss’ model for the measurement of the impairment of !nancial assets, so it is no longer necessary for a credit event to have occurred before a credit loss is recognized. It introduces a new hedge accounting model that is designed to be more closely aligned with how entities undertake risk management activities when hedging !nancial and non-!nancial risk exposures. The requirements for the derecognition of !nancial assets and liabilities are carried forward from IAS 39. The management of the Group is in the process of evaluating the impacts of the aforesaid standard on the consolidated !nancial statements.
IFRS 10 ‘Consolidated Financial Statements’ (e"ective for annual periods beginning on or after
01 January 2015). Concurrent with the issuance of IFRS 10, the IASB has also issued IFRS 11 ‘Joint Arrangements’, IFRS 12 ‘Disclosure of Interests in Other Entities’, IAS 27 (revised 2011) ‘Consolidated and Separate Financial Statements’ and IAS 28 (revised 2011) ‘Investments in Associates’. The objective of IFRS 10 is to have a single basis for consolidation for all entities, regardless of the nature of the investee, and that basis is control. The de!nition of control includes three elements: power over an investee, exposure or rights to variable returns of the investee and the ability to use power over the investee to a"ect the investor’s returns. IFRS 10 replaces those parts of IAS 27 ‘Consolidated and Separate Financial Statements’ that address when and how an investor should prepare consolidated !nancial statements and replaces Standing Interpretations Committee (SIC) 12 ‘Consolidation – Special Purpose Entities’ in its entirety. The management of the Group is in the process of evaluating the impacts of the aforesaid standard on the consolidated !nancial statements.
Amendments to IFRS 10, IFRS 11 and IFRS 12 (e"ective for annual periods beginning on or after
01 January 2015) provide additional transition relief in by limiting the requirement to provide adjusted comparative information to only the preceding comparative period. Also, amendments to IFRS 12 eliminate the requirement to provide comparative information for periods prior to the immediately preceding period.
Amendments to IFRS 10, IFRS 12 and IAS 27 (e"ective for annual periods beginning on or after
01 January 2015) provide ‘investment entities’ an exemption from the consolidation of particular subsidiaries and instead require that: an investment entity measure the investment in each eligible subsidiary at fair value through pro!t or loss; requires additional disclosures; and require an investment entity to account for its investment in a relevant subsidiary in the same way in its consolidated and separate !nancial statements. The management of the Group is in the process of evaluating the impacts of the aforesaid amendments on the Group’s !nancial statements.
IFRS 12 ‘Disclosures of Interests in Other Entities’ (e"ective for annual periods beginning on or after
01 January 2015). This standard includes the disclosure requirements for all forms of interests in other entities, including joint arrangements, associates, special purpose vehicles and other o"-balance sheet vehicles. This standard is not expected to have a material impact on the consolidated !nancial statements.
IFRS 13 ‘Fair value Measurement’ (e"ective for annual periods beginning on or after 01 January
2015). This standard aims to improve consistency and reduce complexity by providing a precise de!nition of fair value and a single source of fair value measurement and disclosure requirements for use across IFRSs. The requirements, which are largely aligned between IFRSs and US GAAP, do not extend the use of fair value accounting but provide guidance on how it should be applied where its use is already required or permitted by other standards within IFRSs or US GAAP. This standard is not expected to have a material impact on the consolidated !nancial statements.

90
IFRS 15 ‘Revenue from Contracts with Customers’ (e!ective for annual periods beginning on or after 01 January 2017). IFRS 15 provides a single, principles based "ve-step model to be applied to all contracts with customers. The "ve steps in the model are: identify the contract with the customer; identify the performance obligations in the contract; determine the transaction price; allocate the transaction price to the performance obligations in the contracts; and recognize revenue when (or as) the entity satis"es a performance obligation. Guidance is provided on topics such as the point in which revenue is recognized, accounting for variable consideration, costs of ful"lling and obtaining a contract and various related matters. New disclosures about revenue are also introduced. The management of the Group is in the process of evaluating the impacts of the aforesaid standard on the consolidated "nancial statements.
IAS 16 (Amendments) ‘Property, Plant and Equipment’ (e!ective for annual periods beginning on
or after 01 January 2016). The amendments clarify that a depreciation method that is based on revenue that is generated by an activity that includes the use of an asset is not appropriate for property, plant and equipment; and add guidance that expected future reductions in the selling price of an item that was produced using an asset could indicate the expectation of technological or commercial obsolescence of the asset, which, in turn, might re#ect a reduction of the future economic bene"ts embodied in the asset. However, the amendments are not expected to have a material impact on the consolidated "nancial statements.
IAS 32 (Amendments) ‘Financial Instruments: Presentation’ (e!ective for annual periods beginning
on or after 01 January 2014). Amendments have been made to clarify certain aspects because of diversity in application of the requirements on o!setting, focused on four main areas: the meaning of ‘currently has a legally enforceable right of set-o! ’; the application of simultaneous realization and settlement; the o!setting of collateral amounts and the unit of account for applying the o!setting requirements. However, the amendments are not expected to have a material impact on the consolidated "nancial statements.
IAS 36 (Amendments) ‘Impairment of Assets’ (e!ective for annual periods beginning on or after
01 January 2014). Amendments have been made in IAS 36 to reduce the circumstances in which the recoverable amount of assets or cash- generating units is required to be disclosed, clarify the disclosures required and to introduce an explicit requirement to disclose the discount rate used in determining impairment (or reversals) where recoverable amount (based on fair value less costs of disposal) is determined using a present value technique. However, the amendments are not expected to have a material impact on the consolidated "nancial statements.
On 12 December 2013, IASB issued Annual Improvements to IFRSs: 2010 – 2012 Cycle, incorporating
amendments to seven IFRSs more speci"cally in IFRS 8 ‘Operating Segments’, IFRS 13 ‘Fair Value Measurement’ and IAS 16 ‘Property, Plant and Equipment’, which are considered relevant to the consolidated "nancial statements. These amendments are e!ective for annual periods beginning on or after 01 July 2014. These amendments are unlikely to have a signi"cant impact on the consolidated "nancial statements and have therefore not been analyzed in detail.
On 12 December 2013, IASB issued Annual Improvements to IFRSs: 2011 – 2013 Cycle, incorporating
amendments to four IFRSs more speci"cally in IFRS 13 ‘Fair Value Measurement’, that is considered relevant to the consolidated "nancial statements. These amendments are e!ective for annual periods beginning on or after 01 July 2014. These amendments are unlikely to have a signi"cant impact on the consolidated "nancial statements and have therefore not been analyzed in detail.

91Kohinoor Mills Limited and its Subsidiary
IFRIC 21 ‘Levies’ (e!ective for annual periods beginning on or after 01 January 2014). The interpretation provides guidance on when to recognize a liability for a levy imposed by a government, both for levies that are accounted for in accordance with IAS 37 ‘Provisions, Contingent Liabilities and Contingent Assets’ and those where the timing and amount of the levy is certain. The interpretation identi"es the obligating event for the recognition of a liability as the activity that triggers the payment of the levy in accordance with the relevant legislation. However, the interpretation is not expected to have a material impact on the consolidated "nancial statements.
g) Standard and amendments to published approved standards that are not yet e!ective and
not considered relevant to the Group There are other standard and amendments to published approved standards that are mandatory
for accounting periods beginning on or after 01 July 2014 but are considered not to be relevant or do not have any signi"cant impact on the consolidated "nancial statements and are therefore not detailed in these consolidated "nancial statements.
2.2 Consolidation Subsidiary
Subsidiaries are those entities in which the Holding Company directly or indirectly controls, bene"cially owns or holds more than 50% of the voting securities or otherwise has power to elect and appoint more than 50% of its directors. The "nancial statements of the Subsidiary Company are included in the consolidated "nancial statements from the date control commences until the date that control ceases.
The assets and liabilities of Subsidiary Company have been consolidated on a line by line basis
and the carrying value of investment held by the Holding Company is eliminated against Holding Company’s share in paid up capital of the Subsidiary Company.
Inter Group balances and transactions have been eliminated. Non-controlling interests are that part of net results of the operations and of net assets of the
Subsidiary Company attributable to interest which are not owned by the Holding Company. Non-controlling interests are presented as a separate item in the consolidated "nancial statements.
2.3 Employee bene"t The Holding Company operates a funded contributory provident fund scheme for its permanent
employees. The Holding Company and employees make equal monthly contributions of 8.33 percent of the basic salary, towards the fund. The Holding Company’s contribution is charged to the pro"t and loss account.
2.4 Provisions Provisions are recognized in the balance sheet when the Group has a legal or constructive
obligation as a result of past events and it is probable that out#ow of economic bene"ts will be required to settle the obligation and a reliable estimate can be made of the amount of obligation. However, provisions are reviewed at each balance sheet date and adjusted to re#ect current best estimate.

92
2.5 Taxation Current Provision for current tax is based on the taxable income for the year determined in accordance with
the prevailing law for taxation of income. The charge for current tax is calculated using prevailing tax rates or tax rates expected to apply to the pro!t for the year if enacted. The charge for current tax also includes adjustments, where considered necessary, to provision for tax made in previous years arising from assessments framed during the year for such years.
Deferred Deferred tax is accounted for using the balance sheet liability method in respect of all temporary
di"erences arising from di"erences between the carrying amount of assets and liabilities in the !nancial statements and the corresponding tax bases used in the computation of the taxable pro!t. Deferred tax liabilities are generally recognized for all taxable temporary di"erences and deferred tax assets to the extent that it is probable that taxable pro!ts will be available against which the deductible temporary di"erences, unused tax losses and tax credits can be utilized.
Deferred tax is calculated at the rates that are expected to apply to the period when the di"erences
reverse based on tax rates that have been enacted or substantively enacted by the balance sheet date. Deferred tax is charged or credited in the consolidated pro!t and loss account, except to the extent that it relates to items recognized in other comprehensive income or directly in equity. In this case the tax is also recognized in statement comprehensive income or directly in equity, respectively.
2.6 Foreign currencies
These consolidated !nancial statements are presented in Pak Rupees, which is the Group’s functional currency. All monetary assets and liabilities in foreign currencies are translated into Pak Rupees at exchange rates prevailing at the balance sheet date. Transactions in foreign currencies are translated into Pak Rupees at the spot rate. All non-monetary items are translated into Pak Rupees at exchange rates prevailing on the date of transaction or on the date when fair values are determined. Exchange gains and losses, where applicable, are recognized in the consolidated pro!t and loss account.
2.7 Fixed assets 2.7.1 Property, plant and equipment and depreciation Owned a) Cost
Property, plant and equipment except freehold land and buildings are stated at cost less accumulated depreciation and any identi!ed impairment loss. Freehold land is stated at revalued amount less any identi!ed impairment loss, buildings are stated at revalued amount less accumulated depreciation and any identi!ed impairment loss, while capital work-in-progress is stated at cost less any identi!ed impairment loss.

93Kohinoor Mills Limited and its Subsidiary
Subsequent costs are included in the asset’s carrying amount or recognized as a separate asset, as appropriate, only when it is probable that future economic bene!ts associated with the item will "ow to the Group and the cost of the item can be measured reliably. All other repair and maintenance costs are charged to income during the period in which they are incurred.
Increases in the carrying amount arising on revaluation of operating !xed assets are credited
to surplus on revaluation of operating !xed assets. Decreases that o#set previous increases of the same assets are charged against this surplus, all other decreases are charged to income. Each year the di#erence between depreciation based on revalued carrying amount of the asset (the depreciation charged to the income) and depreciation based on the assets’ original cost is transferred from surplus on revaluation of operating !xed assets to accumulated loss. All transfers to / from surplus on revaluation of operating !xed assets are net of applicable deferred income tax.
b) Depreciation Depreciation on all operating !xed assets is charged to income on a reducing balance method so as
to write o# cost / depreciable amount of an asset over its estimated useful life at the rates as disclosed in note 15.1. Depreciation on additions is charged from the month in which the asset is put to use and on disposal up to the month of disposal. The residual values and useful lives are reviewed by the management, at each !nancial year end and adjusted if impact on depreciation is signi!cant.
c) Derecognition An item of property, plant and equipment is derecognized on disposal or when no future economic
bene!ts are expected from its use or disposal. Any gain or loss arising on derecognition of the asset (calculated as the di#erence between the net disposal proceeds and carrying amount of the asset) is included in the consolidated pro!t and loss account in the year the asset is derecognized.
Leased a) Finance leases Leases where the Group has substantially all the risk and rewards of ownership are classi!ed as
!nance lease. Assets subject to !nance lease are capitalized at the commencement of the lease term at the lower of present value of minimum lease payments under the lease agreements and the fair value of the leased assets, each determined at the inception of the lease.
The related rental obligation net of !nance cost, is included in liabilities against assets subject to
!nance lease. The liabilities are classi!ed as current and long term depending upon the timing of payments.
Each lease payment is allocated between the liability and !nance cost so as to achieve a constant
rate on the balance outstanding. The !nance cost is charged to income over the lease term. Depreciation of assets subject to !nance lease is recognized in the same manner as for owned
assets. Depreciation of the leased assets is charged to income. b) Operating leases Leases where signi!cant portion of the risk and rewards of ownership are retained by the lessor are
classi!ed as operating leases. Payments made under operating leases are charged to the income on a straight-line basis over the period of lease.

94
2.7.2 Intangible assets Intangible assets, which are non-monetary assets without physical substance, are recognized at
cost, which comprise purchase price, non-refundable purchase taxes and other directly attributable expenditures relating to their implementation and customization. After initial recognition an intangible asset is carried at cost less accumulated amortization and impairment losses, if any. Intangible assets are amortized from the month, when these assets are available for use, using the straight line method, whereby the cost of the intangible asset is amortized over its estimated useful life over which economic bene!ts are expected to "ow to the Group. The useful life and amortization method are reviewed and adjusted, if appropriate, at each balance sheet date.
2.8 Investments Classi!cation of an investment is made on the basis of intended purpose for holding such
investment. Management determines the appropriate classi!cation of its investments at the time of purchase and re-evaluates such designation on regular basis.
Investments are initially measured at fair value plus transaction costs directly attributable to acquisition,
except for “Investment at fair value through pro!t or loss” which is initially measured at fair value. a) Investments at fair value through pro"t or loss Investments classi!ed as held-for-trading and those designated as such are included in
this category. Investments are classi!ed as held-for-trading if they are acquired for the purpose of selling in the short term. Gains or losses on investments held-for-trading are recognized in the consolidated pro!t and loss account.
b) Held-to-maturity Investments with !xed or determinable payments and !xed maturity are classi!ed
as held-to-maturity when the Group has the positive intention and ability to hold to maturity. Investments intended to be held for an unde!ned period are not included in this classi!cation. Other long term investments that are intended to be held to maturity are subsequently measured at amortized cost. This cost is computed as the amount initially recognized minus principal repayments, plus or minus the cumulative amortization using the e#ective interest method of any di#erence between the initially recognized amount and the maturity amount. For investments carried at amortized cost, gains and losses are recognized in pro!t and loss account when the investments are derecognized or impaired, as well as through the amortization process.
c) Available-for-sale Investments intended to be held for an inde!nite period of time, which may be sold
in response to need for liquidity, or changes to interest rates or equity prices are classi!ed as available-for-sale. After initial recognition, investments which are classi!ed as available-for-sale are measured at fair value. Gains or losses on available-for-sale investments are recognized directly in consolidated statement of comprehensive income until the investment is sold, de-recognized or is determined to be impaired, at which time the cumulative gain or loss previously reported in the consolidated statement of comprehensive income is included in the consolidated pro!t and loss account. These are sub-categorized as under:

95Kohinoor Mills Limited and its Subsidiary
Quoted For investments that are actively traded in organized capital markets, fair value is
determined by reference to stock exchange quoted market bids at the close of business on the balance sheet date.
Unquoted Fair value of unquoted investments is determined on the basis of appropriate valuation
techniques as allowed by IAS 39 ‘Financial Instruments: Recognition and Measurement’. d) Equity investments in associated companies The investments in associates in which the Group does not have signi!cant in"uence are
classi!ed as “Available-for-Sale”. 2.9 Inventories Inventories, except for stock in transit, waste stock and rejected goods are stated at lower of cost
and net realizable value. Cost is determined as follows: Stores, spares and loose tools Useable stores and spares are valued principally at moving average cost, while items considered
obsolete are carried at nil value. In transit stores and spares are valued at cost comprising invoice value plus other charges paid thereon.
Stock-in-trade Cost of raw material is based on weighted average cost. Cost of work in process and !nished goods comprises prime cost and appropriate production
overheads determined on weighted average cost. Cost of goods purchased for resale are valued at their respective purchase price by using !rst-in-!rst-out method.
Materials in transit are valued at cost comprising invoice value plus other charges paid thereon.
Waste stock and rejected goods are valued at net realizable value. Net realizable value signi!es the estimated selling price in the ordinary course of business less the
estimated costs of completion and the estimated costs necessary to make a sale. 2.10 Non-current assets held for sale Non-current assets classi!ed as assets held for sale are stated at the lower of carrying amount
and fair value less costs to sell if their carrying amount is recoverable principally through a sale transaction rather than through continuing use.
2.11 Borrowing costs Borrowing costs are recognized as expense in the period in which these are incurred except to
the extent of borrowing costs that are directly attributable to the acquisition, construction or production of a qualifying asset. Such borrowing cost, if any, are capitalized as part of the cost of that asset.

96
2.12 Revenue recognition Revenue from di!erent sources is recognized as under. (a) Revenue is recognized when the Group has transferred signi#cant risks and rewards
associated with ownership of the goods to the buyers. Export sales and local sales are recognized on shipment and dispatch of goods to the customers respectively.
(b) Dividend on equity investments is recognized as income when right to receive payment
is established. (c) Pro#t on bank deposits is recognized on a time proportion basis taking into account, the
principal outstanding and rates of pro#ts applicable thereon. 2.13 Impairment a) Financial assets A #nancial asset is considered to be impaired if objective evidence indicate that one or
more events had a negative e!ect on the estimated future cash $ow of that asset. An impairment loss in respect of a #nancial asset measured at amortized cost is calculated
as a di!erence between its carrying amount and the present value of estimated future cash $ows discounted at the original e!ective interest rate. An impairment loss in respect of available for sale #nancial asset is calculated with reference to its current fair value.
Individually signi#cant #nancial assets are tested for impairment on an individual basis.
The remaining #nancial assets are assessed collectively in groups that share similar credit risk characteristics.
b) Non-"nancial assets The carrying amounts of the Group’s non-#nancial assets are reviewed at each balance
sheet date to determine whether there is any indication of impairment. If such indication exists, the recoverable amount of such asset is estimated. An impairment loss is recognized wherever the carrying amount of the asset exceeds its recoverable amount. Impairment losses are recognized in consolidated pro#t and loss account. A previously recognized impairment loss is reversed only if there has been a change in the estimates used to determine the asset’s recoverable amount since the last impairment loss was recognized. If that is the case, the carrying amount of the asset is increased to its recoverable amount. That increased amount cannot exceed the carrying amount that would have been determined, net of depreciation, had no impairment loss been recognized for the assets in prior years. Such reversal is recognized in consolidated pro#t and loss account.
2.14 Share capital Ordinary shares are classi#ed as equity and recognized at their face value. Incremental costs directly
attributable to the issue of new shares are shown in equity as a deduction, net of tax, if any.

97Kohinoor Mills Limited and its Subsidiary
2.15 Financial instruments Financial instruments are recognized at fair value when the Group becomes party to the contractual
provisions of the instrument by following trade date accounting. Any gain or loss on the subsequent measurement is charged to the consolidated pro!t and loss account except for available for sale investments. The Group derecognizes a !nancial asset or a portion of !nancial asset when, and only when, the enterprise loses the control over contractual right that comprises the !nancial asset or a portion of !nancial asset. While a !nancial liability or a part of !nancial liability is derecognized from the consolidated balance sheet when, and only when, it is extinguished, i.e., when the obligation speci!ed in contract is discharged, cancelled or expired.
The particular measurement methods adopted are disclosed in the individual policy statements
associated with each item.
Financial assets are investments, trade debts, deposits, advances, other receivables and cash and bank balances.
Financial liabilities are classi!ed according to the substance of the contractual agreements entered
into. Signi!cant !nancial liabilities are long term !nancing, short term borrowings, accrued markup, sponsors’ loan, loan from director and trade and other payables.
2.15.1 Trade debts and other receivables Trade debts and other receivable are initially measured at fair value and subsequently
at amortized cost using e"ective interest rate method less provision for impairment. A provision is established when there is objective evidence that the Group will not be able to collect all amounts due according to the original terms of receivables. Trade debts and other receivables considered irrecoverable are written o".
2.15.2 Trade and other payables Liabilities for trade and other amounts payable are initially recognized at fair value which
is normally the transaction cost. 2.15.3 Markup bearing borrowings Borrowings are recognized initially at fair value and are subsequently stated at amortized
cost, any di"erence between the proceeds and the redemption value is recognized in the consolidated pro!t and loss account over the period of the borrowing using the e"ective interest rate method.
2.15.4 Cash and cash equivalents Cash and cash equivalents comprise cash in hand, cash at banks on current accounts,
saving and deposit accounts and other short term highly liquid instruments that are readily convertible into known amounts of cash and which are subject to insigni!cant risk of changes in values.
2.16 Derivative !nancial instruments Derivative !nancial instruments are initially recognized at fair value on the date a derivative
contract is entered into and are remeasured to fair value at subsequent reporting dates. The method of recognizing the resulting gain or loss depends on whether the derivative is designated as a hedging instrument, and if so, the nature of the item being hedged. The Group designates certain derivatives as cash #ow hedges.

98
The Group documents at the inception of the transaction the relationship between the hedging instruments and hedged items, as well as its risk management objective and strategy for undertaking various hedge transactions. The Group also documents its assessment, both at hedge inception and on an ongoing basis, of whether the derivatives that are used in hedging transactions are highly e!ective in o!setting changes in cash "ow of hedged items.
The e!ective portion of changes in the fair value of derivatives that are designated and qualify as
cash "ow hedges are recognized in the consolidated statement of comprehensive income. The gain or loss relating to the ine!ective portion is recognized immediately in the consolidated pro#t and loss account.
Amounts accumulated in equity are recognized in the consolidated pro#t and loss account in the
periods when the hedged item will a!ect pro#t or loss. 2.17 Segment reporting Segment reporting is based on the operating (business) segments of the Group. An operating
segment is a component of the Group that engages in business activities from which it may earn revenues and incur expenses, including revenues and expenses that relate to the transactions with any of the Group’s other components. An operating segment’s operating results are reviewed regularly by the Group’s Chief Operating Decision Maker to make decisions about resources to be allocated to the segment and assess its performance, and for which discrete #nancial information is available.
Segment results that are reported to the Group’s Chief Operating Decision Maker include items
directly attributable to a segment as well as those that can be allocated on a reasonable basis. Those incomes, expenses, assets, liabilities and other balances which can not be allocated to a particular segment on a reasonable basis are reported as unallocated.
The Group has four reportable business segments. Weaving (Producing di!erent quality of greige
fabric using yarn), Dyeing (Converting greige into dyed fabric), Power Generation (Generating and distributing power) and Retail (Selling all type of general merchandise).
Transactions among the business segments are recorded at arm’s length prices using admissible
valuation methods. Inter segment sales and purchases are eliminated from the total. 2.18 O! setting of "nancial assets and liabilities Financial assets and liabilities are set o! and the net amount is reported in the consolidated
#nancial statements when there is legally enforceable right to set o! and the Group intends either to settle on a net basis, or to realize the asset and settle the liability simultaneously.
2.19 Dividend and other appropriations Dividend to the shareholders is recognized in the period in which it is declared and other
appropriations are recognized in the period in which these are approved by the Board of Directors. 2.20 Goodwill
Goodwill represents the excess of the cost of an acquisition over the fair value of the Group’s share of the identi#able net assets acquired. Goodwill is tested annually for impairment and carried at cost less accumulated impairment losses. Any impairment is recognized immediately through the consolidated pro#t and loss account and is not subsequently reversed.

99Kohinoor Mills Limited and its Subsidiary
3. AUTHORIZED SHARE CAPITAL 2014 2013 2014 2013 (NUMBER OF SHARES) Rupees Rupees
80,000,000 80,000,000 Ordinary shares of Rupees 10 each 800,000,000 800,000,000 30,000,000 30,000,000 Preference shares of Rupees 10 each 300,000,000 300,000,000
110,000,000 110,000,000 1,100,000,000 1,100,000,000
4. ISSUED, SUBSCRIBED AND PAID-UP SHARE CAPITAL 2014 2013 (NUMBER OF SHARES)
28,546,003 28,546,003 Ordinary shares of Rupees 285,460,030 285,460,030 10 each fully paid in cash 18,780,031 18,780,031 Ordinary shares of Rupees 10 187,800,310 187,800,310 each as fully paid bonus shares 3,584,977 3,584,977 Ordinary shares of Rupees 10 each 35,849,770 35,849,770 issued due to merger with Kohinoor Genertek Limited as per scheme of arrangement 50,911,011 50,911,011 509,110,110 509,110,110
5. RESERVES
Composition of reserves is as follows:
Capital reserves Share premium reserve (Note 5.1) 213,406,310 213,406,310 Fair value reserve - net of deferred income tax (Note 5.2) 132,572,080 98,081,539
345,978,390 311,487,849 Revenue reserves General reserve 1,058,027,640 1,058,027,640 Accumulated loss (1,135,961,032) (1,356,139,871)
(77,933,392) (298,112,231) 268,044,998 13,375,618
5.1 This reserve can be utilized only for the purposes speci!ed in section 83(2) of the Companies Ordinance, 1984.

100
2014 2013 Rupees Rupees
5.2 Fair value reserve - net of deferred income tax
Balance as at 01 July 131,653,073 105,663,349 Fair value adjustment on investment: Impact of revaluation of investment 44,522,448 54,904,794 Fair value gain realized on disposal of investment - (28,915,070)
44,522,448 25,989,724
Balance as at 30 June 176,175,521 131,653,073 Less: Related deferred income tax liability 43,603,441 33,571,534 Balance as at 30 June - net of deferred income tax 132,572,080 98,081,539 5.2.1 This represents the unrealized gain on re-measurement of available for sale investment at fair
value and is not available for distribution. This will be transferred to pro!t and loss account on realization.
2014 2013 Rupees Rupees6. SURPLUS ON REVALUATION OF OPERATING FIXED ASSETS - NET OF DEFERRED INCOME TAX Balance as at 01 July 846,879,581 920,268,774 Less: Surplus on revaluation realized on disposal of land - 52,359,476 Less: Incremental depreciation 19,978,231 21,029,717 Balance as at 30 June 826,901,350 846,879,581 Less: Related deferred income tax liability 31,342,169 33,991,507 Balance as at 30 June - net of deferred income tax 795,559,181 812,888,074

101Kohinoor Mills Limited and its Subsidiary
Nat
iona
l Ban
k of
Pak
istan
Uni
ted
Bank
Lim
ited
The
Bank
of P
unja
b
Fays
al B
ank
Lim
ited
489
,734
,357
214
,464
,815
409
,340
,592
205
,741
,736
487
,495
,119
251
,941
,542
441
,757
,486
219
,970
,172
This
loan
is
repa
yabl
e in
32
st
eppe
d up
qu
arte
rly
inst
allm
ents
com
men
ced
from
30
Sept
embe
r 20
13 a
nd
endi
ng o
n 30
June
202
1. Th
is lo
an ca
rrie
s mar
kup
at th
e ra
te
of 7
.70%
per
ann
um b
ased
on
the
aver
age
cost
of f
unds
of
the
bank
whi
ch w
ill b
e re
view
ed a
nnua
lly. M
arku
p w
ill b
e ac
crue
d ov
er n
ine
year
s du
ring
whi
ch th
e pr
inci
pal w
ill b
e re
paid
. The
acc
rued
mar
kup
will
be
repa
id in
twel
ve e
qual
qu
arte
rly in
stal
lmen
ts co
mm
enci
ng o
n 30
Sep
tem
ber 2
021
and
endi
ng o
n 30
June
202
4.
This
loan
is re
paya
ble
in 2
8 eq
ual q
uart
erly
inst
allm
ents
of
Rupe
es 1
3.54
0 m
illio
n ea
ch c
omm
ence
d fro
m 0
9 Fe
brua
ry
2012
and
end
ing
on 0
9 N
ovem
ber 2
018.
Mar
kup
is pa
yabl
e qu
arte
rly a
t the
rate
of 5
.00%
per
ann
um.
This
loan
is
repa
yabl
e in
31
st
eppe
d up
qu
arte
rly
inst
allm
ents
com
men
ced
from
30
June
201
1 an
d en
ding
on
31
Dec
embe
r 201
8. T
his l
oan
carr
ied
mar
kup
at th
e ra
te
of 9
.55%
per
ann
um b
ased
on
the
cost
of f
unds
of t
he b
ank
appr
oved
by
SBP
upto
31
Mar
ch 2
013
and
ther
eafte
r car
ries
mar
kup
at 5
.00%
per
ann
um. M
arku
p is
paya
ble
quar
terly
. M
arku
p ac
crue
d up
to 3
1 M
arch
201
3 w
ill b
e re
paid
in th
ree
equa
l qu
arte
rly i
nsta
llmen
ts c
omm
enci
ng o
n 31
Mar
ch
2019
and
end
ing
on 3
0 Se
ptem
ber 2
019.
This
loan
is
repa
yabl
e in
31
st
eppe
d up
qu
arte
rly
inst
allm
ents
com
men
ced
from
31
Mar
ch 2
013
and
endi
ng
on 3
0 Se
ptem
ber 2
020.
Mar
kup
is pa
yabl
e qu
arte
rly a
t the
ra
te o
f 5.0
0% p
er a
nnum
. Mar
kup
upt
o 30
Sep
tem
ber 2
011
is re
calc
ulat
ed a
t th
e ra
te o
f 8.5
% p
er a
nnum
and
will
be
repa
id o
n 30
Sep
tem
ber 2
020.
Firs
t jo
int
pari
pass
u ch
arge
of R
upee
s 62
8.39
4 m
illio
n ov
er !
xed
asse
ts a
nd R
upee
s 42.
424
mill
ion
ove
r cur
rent
as
sets
of t
he H
oldi
ng C
ompa
ny w
ith 2
5% m
argi
n.
Firs
t par
i pas
su c
harg
e of
Rup
ees
606.
000
mill
ion
(with
25
% m
argi
n) o
ver a
ll pr
esen
t and
futu
re c
urre
nt a
sset
s an
d Ru
pees
200
.000
mill
ion
over
!xe
d as
sets
of
the
Hol
ding
Com
pany
. Per
sona
l gua
rant
ees o
f tw
o di
rect
ors.
of th
e H
oldi
ng C
ompa
ny
Join
t pa
ri pa
ssu
char
ge o
f Ru
pees
566
.667
mill
ion
over
!xe
d as
sets
, par
i pas
su c
harg
e of
Rup
ees
534.
000
mill
ion
and
rank
ing
char
ge o
f Ru
pees
268
.000
mill
ion
on a
ll pr
esen
t and
futu
re c
urre
nt a
sset
s of
the
Hol
ding
Co
mpa
ny.
Firs
t pa
ri pa
ssu
char
ge o
f Rup
ees
266.
800
mill
ion
over
cu
rren
t ass
ets,
rank
ing
char
ge o
f Rup
ees 2
40.0
00 m
illio
n ov
er c
urre
nt a
sset
s an
d ex
clus
ive
char
ge o
f Ru
pees
94
.000
mill
ion
on p
ower
gen
erat
ors
of t
he H
oldi
ng
Com
pany
.
-----
--- R
upee
s ----
----
2014
20
13
Ru
pees
Ru
pees
7.
LON
G T
ERM
FIN
AN
CIN
G -
SECU
RED
O
btai
ned
by th
e H
oldi
ng C
ompa
ny
Fi
nanc
ing
from
ban
king
com
pani
es (N
ote
7.1
and
7.2)
1,9
61,0
62,9
54
2,1
21,4
86,1
53
Le
ss: C
urre
nt p
ortio
n sh
own
unde
r cur
rent
liab
ilitie
s
249
,682
,994
1
27,3
60,6
57
1,7
11,3
79,9
60
1,9
94,1
25,4
96
7.1
Lend
er20
1420
13Se
curi
tyRe
vise
d te
rms a
fter
rest
ruct
urin
g

102
NIB
Ban
k Li
mite
d
Aska
ri Ba
nk L
imite
d
Bank
Alfa
lah
Lim
ited
Hab
ib B
ank
Lim
ited
218
,726
,109
111
,961
,715
112
,768
,035
198
,325
,595
1,9
61,0
62,9
54
252
,933
,209
119
,926
,696
124
,578
,593
222
,883
,336
2,1
21,4
86,1
53
This
loan
is re
paya
ble
in 3
6 st
eppe
d up
qua
rter
ly in
stal
lmen
ts
com
men
ced
from
30
Sept
embe
r 201
1 an
d en
ding
on
30 Ju
ne
2020
. Mar
kup
is pa
yabl
e qu
arte
rly a
t th
e ra
te o
f 5.
00%
per
an
num
.
This
loan
is re
paya
ble
in 3
2 qu
arte
rly in
stal
lmen
ts o
f Rup
ees
5.28
2 m
illio
n ea
ch co
mm
ence
d fro
m 3
0 Ju
ne 2
013
and
endi
ng
on 3
1 M
arch
202
1. M
arku
p is
paya
ble
quar
terly
at t
he ra
te o
f 5.
00%
per
ann
um.
This
loan
is re
paya
ble
in 3
2 st
eppe
d up
qua
rter
ly in
stal
lmen
ts
com
men
ced
from
01
July
201
2 an
d en
ding
on
01 A
pril
2020
. Th
is lo
an c
arrie
s m
arku
p at
the
rat
e of
8.3
0% p
er a
nnum
ba
sed
on th
e co
st o
f fun
ds o
f the
ban
k w
hich
will
be
revi
ewed
m
onth
ly. M
arku
p w
ill b
e ac
crue
d ov
er n
ine
year
s dur
ing
whi
ch
the
prin
cipa
l will
be
repa
id. T
he a
ccru
ed m
arku
p w
ill b
e pa
id in
th
irty
six e
qual
mon
thly
inst
allm
ents
com
men
cing
on
01 M
ay
2020
and
end
ing
on 0
1 Ap
ril 2
023.
This
loan
is re
paya
ble
in 3
2 st
eppe
d up
qua
rter
ly in
stal
lmen
ts
com
men
ced
from
30
June
201
2 an
d en
ding
on
31 M
arch
202
0.
Mar
kup
is pa
yabl
e qu
arte
rly a
t the
rate
of 5
.00%
per
ann
um.
Firs
t pa
ri pa
ssu
char
ge o
f Rup
ees
107.
000
mill
ion
over
th
e H
oldi
ng C
ompa
ny’s
mac
hine
ry a
nd jo
int p
ari p
assu
ch
arge
of R
upee
s 80
0.00
0 m
illio
n ov
er c
urre
nt a
sset
s of
th
e H
oldi
ng C
ompa
ny.
Firs
t jo
int
pari
pass
u ch
arge
of R
upee
s 50
6.66
7 m
illio
n ov
er cu
rren
t ass
ets b
y way
of h
ypot
heca
tion
and
rank
ing
char
ge o
f Rup
ees 1
69.0
00 m
illio
n ov
er !
xed
asse
ts o
f the
H
oldi
ng C
ompa
ny b
y w
ay o
f hyp
othe
catio
n.
Firs
t jo
int
pari
pass
u ch
arge
of R
upee
s 41
0.00
0 m
illio
n ov
er a
ll pr
esen
t and
futu
re c
urre
nt a
sset
s of t
he H
oldi
ng
Com
pany
.
Firs
t joi
nt p
ari p
assu
cha
rge
of R
upee
s 1,1
60.0
00 m
illio
n ov
er c
urre
nt a
sset
s, jo
int
pari
pass
u ch
arge
of
Rupe
es
146.
600
mill
ion
and
rank
ing
char
ge o
f Rup
ees
362.
000
mill
ion
over
!xe
d as
sets
of
the
Hol
ding
Com
pany
. Pe
rson
al g
uara
ntee
s of
tw
o di
rect
ors
of t
he H
oldi
ng
Com
pany
.
7.2
Fair
valu
e of
long
term
!na
ncin
g w
as e
stim
ated
at t
he p
rese
nt v
alue
of f
utur
e ca
sh "
ows
disc
ount
ed a
t the
e#e
ctiv
e in
tere
st ra
tes
rang
ing
from
9.3
1 %
to 1
3.56
% p
er
annu
m. R
ecog
nitio
n of
long
term
!na
ncin
g at
fair
valu
e re
sulte
d in
gai
n of
Rup
ees 8
23.7
44 m
illio
n.
-----
--- R
upee
s ----
----
Lend
er20
1420
13Se
curi
tyRe
vise
d te
rms a
fter
rest
ruct
urin
g

103Kohinoor Mills Limited and its Subsidiary
8. SPONSOR’S LOAN This represents unsecured interest free loan obtained from director of the Holding Company. This
is repayable on 30 June 2018. Fair value of sponsor’s loan has been estimated at the present value of future cash !ows discounted at the e"ective interest rate of 11.38% per annum. Recognition of sponsor’s loan at fair value has resulted in gain of Rupees 113.316 million.
2014 2013 Rupees Rupees9. DEFERRED LIABILITIES Deferred accrued markup (Note 9.1) 492,405,144 423,986,227 Deferred income tax liability (Note 9.2) 15,118,393 59,036,650
507,523,537 483,022,877 9.1 Deferred accrued markup National Bank of Pakistan 231,605,284 179,959,921 The Bank of Punjab 139,309,000 139,309,000 Bank Alfalah Limited 54,872,432 38,098,878 Faysal Bank Limited 66,618,428 66,618,428
492,405,144 423,986,227 9.1.1 This represents accrued markup on long term #nancing (obtained by the Holding Company)
deferred in accordance with the terms of restructuring disclosed in Note 7.1 to these consolidated #nancial statements.
2014 2013 Rupees Rupees9.2 Deferred income tax liability The liability / (asset) for deferred taxation originated due to temporary di"erences relating to:
Taxable temporary di!erences:
Accelerated tax depreciation and amortization 112,797,242 105,681,512 Surplus on revaluation of operating #xed assets 31,342,169 33,991,507 Surplus on revaluation of investment - available for sale 43,603,441 33,571,534 187,742,852 173,244,553 Deductible temporary di!erences:
Accumulated tax losses (223,934,663) (408,420,503)
Net deferred income tax liability / (asset) (36,191,811) (235,175,950) Less: Deferred income tax asset not recognized 51,310,204 294,212,600
Deferred income tax liability recognized 15,118,393 59,036,650 9.2.1 As at 30 June 2013, deferred income tax liability on surplus on revaluation of operating #xed assets
and surplus on revaluation of investment available for sale relating to the Holding Company was recognized. Remaining net deferred income tax asset of Rupees Nil and Rupees 51.310 million (2013: Rupees 232.313 million and Rupees 61.900 million) relating to the Holding Company and the Subsidiary Company respectively was not recognized.

104
2014 2013 Rupees Rupees10. TRADE AND OTHER PAYABLES Creditors 478,441,474 470,725,393 Advances from customers 49,297,007 88,989,029 Sales commission payable 98,666,906 84,259,114 Income tax deducted at source 14,649,646 15,890,103 Security deposits - interest free 602,278 607,278 Payable to employees’ provident fund trust 675,555 2,046,036 Accrued and other liabilities (Note 10.1) 139,050,790 145,129,260 Workers’ pro!t participation fund (Note 10.2) 16,834,274 7,440,527 Unclaimed dividend 4,731,536 4,731,536 802,949,466 819,818,276 10.1 This includes an amount of Rupees 70.000 million (2013: Rupees 70.000) payable on demand to
spouse of a director of the Holding Company. 2014 2013 Rupees Rupees10.2 Workers’ pro!t participation fund Balance as at 01 July 7,440,527 - Add: Allocation for the year (Note 30) 8,612,492 7,440,527 Interest accrued for the year (Note 32) 781,255 - Balance as at 30 June 16,834,274 7,440,527 10.2.1 The Holding Company has retained workers’ pro!t participation fund for its business operations
till the date of allocation to workers. Interest is paid at prescribed rate under the Companies Pro!t (Workers’ Participation) Act, 1968 on funds utilized by the Holding Company till the date of allocation to workers.
11. LOAN FROM DIRECTOR
This represents unsecured and interest free loan obtained by the Subsidiary Company from its director. This loan is repayable on demand.
2014 2013 Rupees Rupees12. ACCRUED MARKUP Long term !nancing 32,622,881 37,205,165 Short term borrowings 99,958,643 73,538,556
132,581,524 110,743,721 13. SHORT TERM BORROWINGS - SECURED Obtained by the Holding Company From banking companies
SBP re!nance (Note 13.1 and 13.2) 304,229,000 327,796,329 Other short term !nances (Note 13.1 and 13.3) 509,965,999 343,609,456
814,194,999 671,405,785

105Kohinoor Mills Limited and its Subsidiary
13.1 These facilities are secured against hypothecation charge on current assets, lien on export contracts / letters of credit, !rst and second pari passu charge on !xed and current assets of the Holding Company, personal guarantees of directors of Holding Company and ranking charge on current assets of the Holding Company.
13.2 These carry markup at 9.4% per annum (2013: 9.2% to 11% per annum). 13.3 The rates of markup range from 5% to 13.73% per annum (2013: 5% to 13.25% per annum). 14. CONTINGENCIES AND COMMITMENTS 14.1 Contingencies
Holding Company 14.1.1 The Deputy Collector (Refund – Gold) by order dated 19 June 2007 rejected the input tax claim
of the Holding Company, for the month of June 2005, amounting to Rupees 10.345 million incurred in zero rated local supplies of textile and articles thereof on the grounds that the input tax claim is in contravention of SRO 992(I)/2005 which states that no registered person engaged in the export of speci!ed goods (including textile and articles thereof ) shall, either through zero-rating or otherwise, be entitled to deduct or reclaim input tax paid in respect of stocks of such goods acquired up to 05 June 2005, if not used for the purpose of exports made up to the 31 December 2005. Consequently, the Holding Company !led an appeal before the Appellate Tribunal Inland Revenue (ATIR). ATIR has decided this appeal in favour of the Holding Company subject to necessary veri!cation. Pending the outcome of necessary veri!cation, no provision for inadmissible input tax has been recognized in these consolidated !nancial statements, since the Holding Company is con!dent of the favourable outcome of veri!cation.
14.1.2 The Additional Collector, Sales Tax Department has raised sales tax demand amounting to
Rupees 8.956 million along with additional tax and penalty, as a result of sales tax audit for the year 1999-2000 conducted by the Sales Tax Department. The Holding Company is contesting the demand and management is con!dent that decision will be in favour of the Holding Company, hence, no provision there against has been made in these consolidated !nancial statements.
14.1.3 As a result of sales tax audit for the year 2009-2010 conducted by Regional Tax O"ce, Lahore,
Assistant Commissioner Inland Revenue, Sales Tax Department has raised sales tax demand amounting to Rupees 9.975 million along with additional tax and penalty. Currently, the case is pending for hearing at Appellate Tribunal Inland Revenue, Lahore and the management is con!dent that decision will be in favour of the Holding Company, hence, no provision there against has been made in these consolidated !nancial statements.
14.1.4 Pursuant to the sale of assets agreement with M/s Interloop Limited, the Holding Company is
contingently liable for Rupees 31.958 million against payment of certain outstanding dues to Employees’ Old-Age Bene!ts Institution (EOBI) and bifurcation of gas connections in favour of M/s Interloop Limited. To secure the performance of aforesaid conditions, the Holding Company has pledged equity investment (note 24.1) and bank balance (note 25.4) with Allied Bank Limited. However, no provision has been recognized in these !nancial statements as the management is con!dent to ful!l the conditions in accordance with the sale of assets agreement.

106
14.1.5 Bank guarantees of Rupees 81.66 million (2013: Rupees 70.15 million) are given by the banks of the Holding Company in favour of Sui Northern Gas Pipelines Limited against gas connections.
14.1.6 Bank guarantee of Rupees 6.5 million (2013: Rupees 6.5 million) is given by the bank of the
Holding Company in favour of Director, Excise and Taxation to cover the disputed amount of infrastructure cess.
14.1.7 Bank guarantees of Rupees 8.164 million (2013: Rupees 8.331 million) are given by the bank of the
Holding Company in favour of Lahore Electric Supply Company Limited against electricity connections. 14.1.8 Lahore Electric Supply Company Limited (LESCO) has served a notice to the Holding Company
in connection with violation of Power Purchase Agreement. According to the aforesaid notice, the Holding Company was using gas along with Re!ned Furnace Oil (RFO) in the ratio of 50:50 as co-fuel in order to generate electric power for sale to LESCO whereas tari" was charged to LESCO on the basis of RFO. The matter is being resolved under the provisions of above said Power Purchase Agreement and referred to Mr. Justice (Retd.) Syed Jamshed Ali Shah for arbitration. The proceedings of arbitration are in process. An amount of Rupees 86.833 million receivable by the Holding Company from LESCO is still unpaid. Full provision has been made in these consolidated !nancial statements against this receivable. However, the Holding Company is con!dent that the said amount will be recovered.
2014 2013 Rupees Rupees
Subsidiary Company Nil Nil
14.2 Commitments Holding Company 14.2.1 Aggregate commitments for capital expenditures and revenue expenditures are
amounting to Rupees Nil and Rupees 23.481 million (2013: Rupees 51.450 million and Rupees 39.562 million) respectively.
14.2.2 Post dated cheques issued to suppliers are amounting to Rupees 118.809 million (2013:
Rupees 46.016 million). Subsidiary Company Nil Nil
2014 2013 Rupees Rupees15. FIXED ASSETS
Property, plant and equipment Operating !xed assets (Note 15.1) 3,526,145,656 3,324,088,869 Capital work-in-progress (Note 15.2) 34,753,339 154,776,302
3,560,898,995 3,478,865,171 Intangible asset - computer software (Note 15.1 and 15.1.7) - 666,579
3,560,898,995 3,479,531,750

107Kohinoor Mills Limited and its Subsidiary
15.1
Re
conc
iliat
ion
of c
arry
ing
amou
nts o
f ope
ratin
g !x
ed a
nd in
tang
ible
ass
ets a
t the
beg
inni
ng a
nd e
nd o
f the
yea
r is a
s fol
low
s:
O
pera
ting
!xed
ass
ets
D
escr
iptio
n F
reeh
old
Resi
dent
ial
Fact
ory
Build
ing
on
Plan
t and
St
and-
by
Elec
tric
Fu
rnitu
re,
M
otor
Inta
ngib
le
la
nd
Build
ing
Bu
ildin
g le
aseh
old
land
m
achi
nery
eq
uipm
ent
Inst
alla
tions
!x
ture
s and
Co
mpu
ters
ve
hicl
es
Tota
l as
set
eq
uipm
ent
----
----
----
----
----
----
----
----
----
----
----
----
----
----
----
----
----
----
----
- (R
UP
EE
S)
----
----
----
----
----
----
----
----
----
----
----
----
----
----
----
----
----
----
----
---
As a
t 30
June
201
2
Cost
/ re
valu
ed a
mou
nt
594
,414
,850
3
37,1
93,6
45
619
,091
,964
1
3,69
7,38
2
3,7
47,2
52,5
98
-
145
,583
,109
1
27,5
15,2
08
46,
422,
870
6
9,13
4,26
9
5,7
00,3
05,8
95
15,
421,
445
Accu
mul
ated
dep
recia
tion
/ am
ortiz
atio
n -
(7
2,68
0,68
9)
(196
,019
,964
) (9
,900
,550
) (1
,678
,780
,916
) -
(6
4,84
3,44
9)
(63,
812,
476)
(3
4,29
3,18
8)
(35,
433,
422)
(2
,155
,764
,654
) (1
3,29
4,05
2)
Net b
ook v
alue
5
94,4
14,8
50
264
,512
,956
4
23,0
72,0
00
3,7
96,8
32
2,0
68,4
71,6
82
-
80,
739,
660
6
3,70
2,73
2
12,
129,
682
3
3,70
0,84
7
3,5
44,5
41,2
41
2,1
27,3
93
Year
end
ed 3
0 Ju
ne 2
013
O
peni
ng n
et b
ook v
alue
5
94,4
14,8
50
264
,512
,956
4
23,0
72,0
00
3,7
96,8
32
2,0
68,4
71,6
82
-
80,
739,
660
6
3,70
2,73
2
12,
129,
682
3
3,70
0,84
7
3,5
44,5
41,2
41
2,1
27,3
93
Addi
tions
-
3
70,4
00
2,9
41,4
61
3,9
36,4
13
102
,456
,294
1
,615
,659
4
,599
,840
5
,280
,494
3
,257
,565
1
2,15
9,13
6
136
,617
,262
-
D
ispos
als:
C
ost /
reva
lued
am
ount
(7
9,73
4,37
5)
-
-
(13,
713,
784)
-
-
(2
2,36
3,13
8)
(51,
142,
475)
(5
7,32
6)
(10,
570,
173)
(1
77,5
81,2
71)
-
Acc
umul
ated
dep
recia
tion
-
-
-
10,
657,
288
-
-
9
,506
,473
2
4,06
2,48
6
31,
308
6
,150
,952
5
0,40
8,50
7
-
(79,
734,
375)
-
-
(3
,056
,496
) -
-
(1
2,85
6,66
5)
(27,
079,
989)
(2
6,01
8)
(4,4
19,2
21)
(127
,172
,764
) -
Dep
recia
tion
/ am
ortiz
atio
n ch
arge
-
(1
3,24
1,67
5)
(21,
196,
364)
(7
56,7
38)
(168
,519
,230
) (1
05,8
47)
(7,5
59,8
58)
(6,0
26,9
78)
(3,4
88,7
73)
(5,0
81,3
96)
(225
,976
,859
) (1
,460
,814
)As
sets
writ
ten
o! -
net b
ook v
alue
-
-
-
(3
,920
,011
) -
-
-
-
-
-
(3
,920
,011
) -
Clos
ing
net b
ook v
alue
5
14,6
80,4
75
251
,641
,681
4
04,8
17,0
97
-
2,0
02,4
08,7
46
1,5
09,8
12
64,
922,
977
3
5,87
6,25
9
11,
872,
456
3
6,35
9,36
6
3,3
24,0
88,8
69
666
,579
As a
t 30
June
201
3
Cost
/ re
valu
ed a
mou
nt
514
,680
,475
3
37,5
64,0
45
622
,033
,425
-
3
,849
,708
,892
1
,615
,659
1
27,8
19,8
11
81,
653,
227
4
9,62
3,10
9
70,
723,
232
5
,655
,421
,875
1
5,42
1,44
5 Ac
cum
ulat
ed d
epre
ciatio
n / a
mor
tizat
ion
-
(85,
922,
364)
(2
17,2
16,3
28)
-
(1,8
47,3
00,1
46)
(105
,847
) (6
2,89
6,83
4)
(45,
776,
968)
(3
7,75
0,65
3)
(34,
363,
866)
(2
,331
,333
,006
) (1
4,75
4,86
6)
Net
boo
k va
lue
514
,680
,475
2
51,6
41,6
81
404
,817
,097
-
2
,002
,408
,746
1
,509
,812
6
4,92
2,97
7
35,
876,
259
1
1,87
2,45
6
36,
359,
366
3
,324
,088
,869
6
66,5
79
Year
end
ed 3
0 Ju
ne 2
014
O
peni
ng n
et b
ook v
alue
5
14,6
80,4
75
251
,641
,681
4
04,8
17,0
97
-
2,0
02,4
08,7
46
1,5
09,8
12
64,
922,
977
3
5,87
6,25
9
11,
872,
456
3
6,35
9,36
6
3,3
24,0
88,8
69
666
,579
Ad
ditio
ns
-
-
69,
812,
974
-
2
78,8
03,0
61
-
8,9
53,3
18
709
,904
4
,252
,222
7
9,89
5,31
0
442
,426
,789
-
D
ispos
als:
C
ost
-
-
-
-
(16,
359,
136)
-
-
-
-
(9
,073
,417
) (2
5,43
2,55
3)
-
Acc
umul
ated
dep
recia
tion
-
-
-
-
5,4
34,3
60
-
-
-
-
5,2
67,4
72
10,
701,
832
-
-
-
-
-
(10,
924,
776)
-
-
-
-
(3
,805
,945
) (1
4,73
0,72
1)
-
Dep
recia
tion
/ am
ortiz
atio
n ch
arge
-
(1
2,58
2,08
4)
(22,
310,
637)
-
(1
65,2
00,0
92)
(91,
426)
(7
,016
,718
) (3
,833
,457
) (3
,676
,462
) (1
0,92
8,40
5)
(225
,639
,281
) (6
66,5
79)
Clos
ing
net b
ook v
alue
5
14,6
80,4
75
239
,059
,597
4
52,3
19,4
34
-
2,1
05,0
86,9
39
1,4
18,3
86
66,
859,
577
3
2,75
2,70
6
12,
448,
216
1
01,5
20,3
26
3,5
26,1
45,6
56
-
As a
t 30
June
201
4
Cost
/ re
valu
ed a
mou
nt
514
,680
,475
3
37,5
64,0
45
691
,846
,399
-
4
,112
,152
,817
1
,615
,659
1
36,7
73,1
29
82,
363,
131
5
3,87
5,33
1
141
,545
,125
6
,072
,416
,111
1
5,42
1,44
5 Ac
cum
ulat
ed d
epre
ciatio
n / a
mor
tizat
ion
-
(98,
504,
448)
(2
39,5
26,9
65)
-
(2,0
07,0
65,8
78)
(197
,273
) (6
9,91
3,55
2)
(49,
610,
425)
(4
1,42
7,11
5)
(40,
024,
799)
(2
,546
,270
,455
) (1
5,42
1,44
5)
Net
boo
k va
lue
514
,680
,475
2
39,0
59,5
97
452
,319
,434
-
2
,105
,086
,939
1
,418
,386
6
6,85
9,57
7
32,
752,
706
1
2,44
8,21
6
101
,520
,326
3
,526
,145
,656
-
Dep
recia
tion
/ am
ortiz
atio
n ra
te %
per
ann
um
- 5
5 33
10
10
10
10
30
20
20
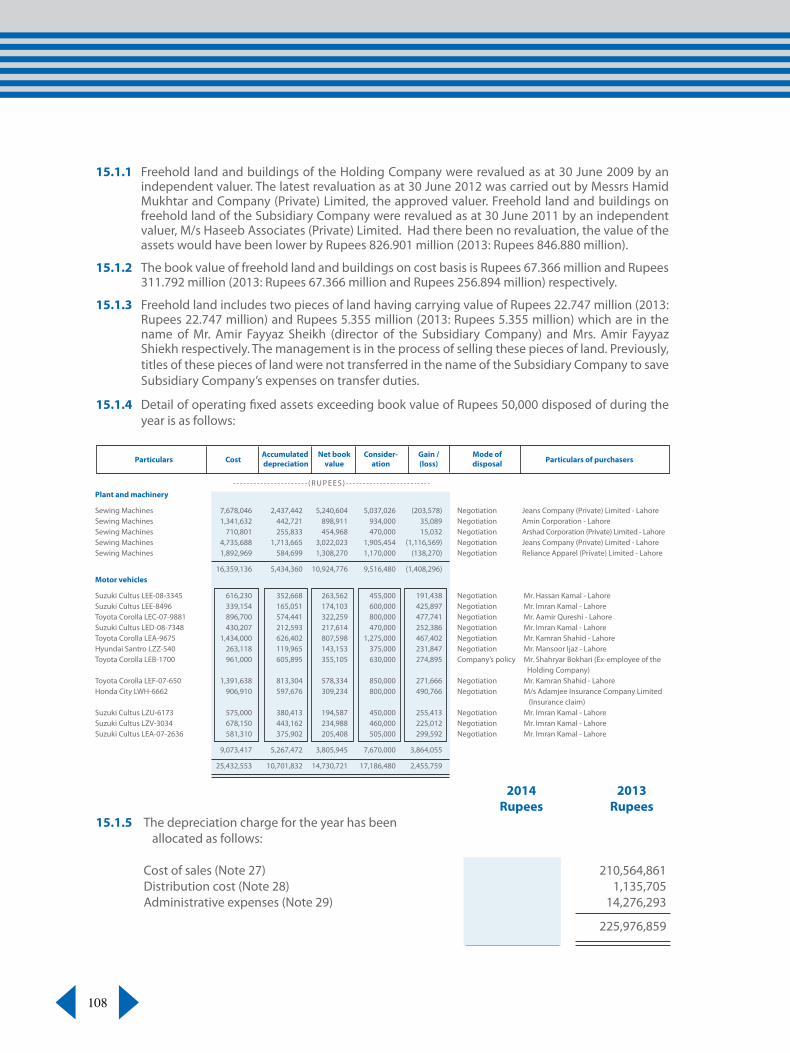
108
2014 2013 Rupees Rupees15.1.5 The depreciation charge for the year has been allocated as follows: Cost of sales (Note 27) 206,837,084 210,564,861 Distribution cost (Note 28) 1,345,126 1,135,705 Administrative expenses (Note 29) 17,457,071 14,276,293
225,639,281 225,976,859
Particulars Cost Accumulated Net book Consider- Gain / Mode of
Particulars of purchasers depreciation value ation (loss) disposal
- - - - - - - - - - - - - - - - - - - - - - ( R U P E E S ) - - - - - - - - - - - - - - - - - - - - - - - - - Plant and machinery
Sewing Machines 7,678,046 2,437,442 5,240,604 5,037,026 (203,578) Negotiation Jeans Company (Private) Limited - LahoreSewing Machines 1,341,632 442,721 898,911 934,000 35,089 Negotiation Amin Corporation - LahoreSewing Machines 710,801 255,833 454,968 470,000 15,032 Negotiation Arshad Corporation (Private) Limited - LahoreSewing Machines 4,735,688 1,713,665 3,022,023 1,905,454 (1,116,569) Negotiation Jeans Company (Private) Limited - LahoreSewing Machines 1,892,969 584,699 1,308,270 1,170,000 (138,270) Negotiation Reliance Apparel (Private) Limited - Lahore
16,359,136 5,434,360 10,924,776 9,516,480 (1,408,296) Motor vehicles
Suzuki Cultus LEE-08-3345 616,230 352,668 263,562 455,000 191,438 Negotiation Mr. Hassan Kamal - Lahore Suzuki Cultus LEE-8496 339,154 165,051 174,103 600,000 425,897 Negotiation Mr. Imran Kamal - Lahore Toyota Corolla LEC-07-9881 896,700 574,441 322,259 800,000 477,741 Negotiation Mr. Aamir Qureshi - Lahore Suzuki Cultus LED-08-7348 430,207 212,593 217,614 470,000 252,386 Negotiation Mr. Imran Kamal - Lahore Toyota Corolla LEA-9675 1,434,000 626,402 807,598 1,275,000 467,402 Negotiation Mr. Kamran Shahid - Lahore Hyundai Santro LZZ-540 263,118 119,965 143,153 375,000 231,847 Negotiation Mr. Mansoor Ijaz - Lahore Toyota Corolla LEB-1700 961,000 605,895 355,105 630,000 274,895 Company’s policy Mr. Shahryar Bokhari (Ex-employee of the Holding Company) Toyota Corolla LEF-07-650 1,391,638 813,304 578,334 850,000 271,666 Negotiation Mr. Kamran Shahid - Lahore Honda City LWH-6662 906,910 597,676 309,234 800,000 490,766 Negotiation M/s Adamjee Insurance Company Limited (Insurance claim) Suzuki Cultus LZU-6173 575,000 380,413 194,587 450,000 255,413 Negotiation Mr. Imran Kamal - Lahore Suzuki Cultus LZV-3034 678,150 443,162 234,988 460,000 225,012 Negotiation Mr. Imran Kamal - Lahore Suzuki Cultus LEA-07-2636 581,310 375,902 205,408 505,000 299,592 Negotiation Mr. Imran Kamal - Lahore
9,073,417 5,267,472 3,805,945 7,670,000 3,864,055
25,432,553 10,701,832 14,730,721 17,186,480 2,455,759
15.1.1 Freehold land and buildings of the Holding Company were revalued as at 30 June 2009 by an independent valuer. The latest revaluation as at 30 June 2012 was carried out by Messrs Hamid Mukhtar and Company (Private) Limited, the approved valuer. Freehold land and buildings on freehold land of the Subsidiary Company were revalued as at 30 June 2011 by an independent valuer, M/s Haseeb Associates (Private) Limited. Had there been no revaluation, the value of the assets would have been lower by Rupees 826.901 million (2013: Rupees 846.880 million).
15.1.2 The book value of freehold land and buildings on cost basis is Rupees 67.366 million and Rupees 311.792 million (2013: Rupees 67.366 million and Rupees 256.894 million) respectively.
15.1.3 Freehold land includes two pieces of land having carrying value of Rupees 22.747 million (2013: Rupees 22.747 million) and Rupees 5.355 million (2013: Rupees 5.355 million) which are in the name of Mr. Amir Fayyaz Sheikh (director of the Subsidiary Company) and Mrs. Amir Fayyaz Shiekh respectively. The management is in the process of selling these pieces of land. Previously, titles of these pieces of land were not transferred in the name of the Subsidiary Company to save Subsidiary Company’s expenses on transfer duties.
15.1.4 Detail of operating !xed assets exceeding book value of Rupees 50,000 disposed of during the year is as follows:

109Kohinoor Mills Limited and its Subsidiary
2014 2013 Rupees Rupees15.1.6 The amortization charge for the year has been allocated as follows: Cost of sales (Note 27) - 536,513 Administrative expenses (Note 29) 666,579 924,301 666,579 1,460,814 15.1.7 Intangible asset - computer softwares have been fully amortized but still in the use of the Group. 15.2 Capital work-in-progress Plant and machinery 3,657,835 67,673,320 Civil works 30,192,943 40,494,914 Electric installations 902,561 - Advances for capital expenditures - 46,608,068 34,753,339 154,776,302 16. LONG TERM INVESTMENTS Available for sale Associated company (without signi!cant in"uence) K-2 Hosiery (Private) Limited - unquoted 1,194,000 (2013: 1,194,000) ordinary shares of Rupees 10 each (Note 16.1) - -
- -
16.1 Investment in K-2 Hosiery (Private) Limited has been impaired and written o! against provision.
2014 2013 Rupees Rupees17. STORES, SPARES AND LOOSE TOOLS Stores and spares 330,568,211 312,280,156 Loose tools 3,826,963 3,575,927 334,395,174 315,856,083 Less: Provision for slow moving, obsolete and damaged store items (Note 30) 16,629,008 -
317,766,166 315,856,083

110
2014 2013 Rupees Rupees18. STOCK-IN-TRADE Raw material 148,615,983 147,672,090 Work-in-process 128,250,466 152,308,086 Finished goods (Note 18.1 and 18.2) 421,365,253 314,553,948
698,231,702 614,534,124
18.1 This includes !nished goods of Rupees 125.986 million (2013: Rupees 7.528 million) valued at net realizable value.
18.2 Finished goods include stock-in-transit amounting to Rupees 63.209 million (2013: Rupees 4.992
million). 2014 2013 Rupees Rupees19. TRADE DEBTS Considered good: Secured (against letters of credit) 451,417,353 500,684,703 Unsecured 82,066,994 178,848,692 533,484,347 679,533,395 Considered doubtful: Others - unsecured 88,358,572 88,358,572 Less: Provision for doubtful trade debts Balance as at 01 July 88,358,572 1,525,385 Add: Provision for the year (Note 29) - 86,833,187
Balance as at 30 June 88,358,572 88,358,572 - - 19.1 As on 30 June 2014, trade debts of Rupees 37.698 million (2013: Rupees 54.434 million) were past
due but not impaired. These relate to a number of independent customers from whom there is no recent history of default. The age analysis of these trade debts is as follows:
2014 2013 Rupees Rupees
Upto 1 month 2,467,635 7,664,632 1 to 6 months 1,307,875 5,592,468 More than 6 months 33,922,649 41,176,795 37,698,159 54,433,895

111Kohinoor Mills Limited and its Subsidiary
19.2 As at 30 June 2014, trade debts of Rupees 88.359 million (2013: Rupees 88.359 million) were impaired. The aging of these trade debts was more than three years. These trade debts have been provided for in the books of account of the Holding Company.
2014 2013 Rupees Rupees20. ADVANCES Considered good: Advances to: - sta! (Note 20.1) 9,976,757 8,445,589 - suppliers 76,680,667 78,103,547 Letters of credit 985,711 3,757,546 87,643,135 90,306,682
20.1 This includes interest free advances to executives of the Holding Company amounting to Rupees 0.849 million (2013: Rupees 3.374 million).
2014 2013 Rupees Rupees21. TRADE DEPOSITS AND SHORT TERM PREPAYMENTS Security deposits 14,973,046 7,468,101 Short term prepayments 4,440,240 127,240 19,413,286 7,595,341 22. OTHER RECEIVABLES Considered good: Advance income tax 207,769,117 139,040,904 Export rebate and claims (Note 22.1) 46,063,417 82,291,725 Miscellaneous 1,104,307 17,960,218
254,936,841 239,292,847

112
2014 2013 Rupees Rupees22.1 Export rebate and claims Considered good 46,063,417 82,291,725 Considered doubtful 30,514,452 - Less: Provision for doubtful export rebate and claims (Note 30) 30,514,452 - - - 46,063,417 82,291,725 23. SALES TAX RECOVERABLE Sales tax recoverable 227,496,020 195,174,232 Less: Provision for doubtful sales tax recoverable (Note 30) 25,157,276 - 202,338,744 195,174,232 24. SHORT TERM INVESTMENT Available for sale - unquoted Security General Insurance Company Limited (Note 24.1) 643,667 (2013: 643,667) fully paid ordinary shares of Rupees 10 each 704,171 704,171 Add: Fair value adjustment 176,175,521 131,653,073 176,879,692 132,357,244
24.1 Ordinary shares of Security General Insurance Company Limited have been valued by the management at Rupees 274.80 (2013: Rupees 205.63) per share using the net assets based valuation method. 640,000 ordinary shares of Security General Insurance Company Limited are pledged in favour of Allied Bank Limited to secure the performance of certain conditions of sale of assets agreement with M/s Interloop Limited.
2014 2013 Rupees Rupees25. CASH AND BANK BALANCES Cash in hand (Note 25.1) 2,999,860 3,581,704 Cash with banks: On current accounts (Note 25.2, 25.4 and 25.6) 76,853,486 21,373,474 On deposit accounts (Note 25.3 and 25.5) 75,764,024 105,100,998 152,617,510 126,474,472
155,617,370 130,056,176
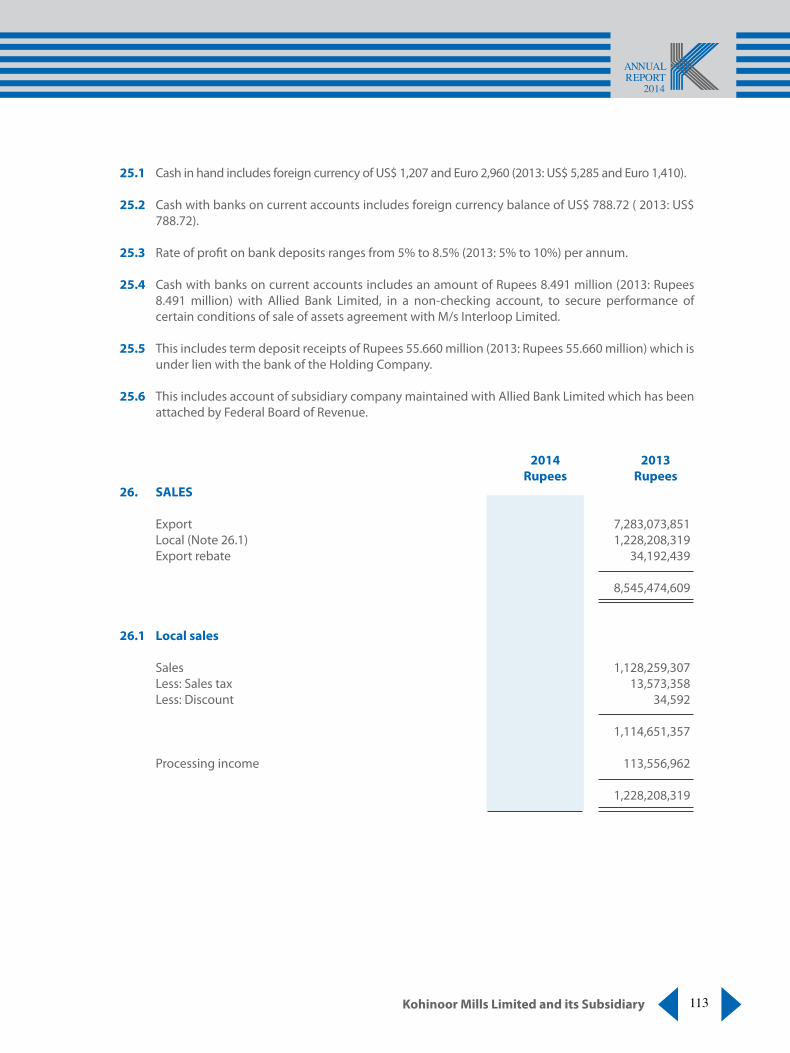
113Kohinoor Mills Limited and its Subsidiary
25.1 Cash in hand includes foreign currency of US$ 1,207 and Euro 2,960 (2013: US$ 5,285 and Euro 1,410).
25.2 Cash with banks on current accounts includes foreign currency balance of US$ 788.72 ( 2013: US$ 788.72).
25.3 Rate of pro!t on bank deposits ranges from 5% to 8.5% (2013: 5% to 10%) per annum.
25.4 Cash with banks on current accounts includes an amount of Rupees 8.491 million (2013: Rupees
8.491 million) with Allied Bank Limited, in a non-checking account, to secure performance of certain conditions of sale of assets agreement with M/s Interloop Limited.
25.5 This includes term deposit receipts of Rupees 55.660 million (2013: Rupees 55.660 million) which is
under lien with the bank of the Holding Company. 25.6 This includes account of subsidiary company maintained with Allied Bank Limited which has been
attached by Federal Board of Revenue.
2014 2013 Rupees Rupees26. SALES Export 6,737,139,053 7,283,073,851 Local (Note 26.1) 1,007,047,284 1,228,208,319 Export rebate 28,245,160 34,192,439
7,772,431,497 8,545,474,609 26.1 Local sales Sales 886,827,027 1,128,259,307 Less: Sales tax 39,498,998 13,573,358 Less: Discount - 34,592 847,328,029 1,114,651,357 Processing income 159,719,255 113,556,962 1,007,047,284 1,228,208,319

114
2014 2013 Rupees Rupees27. COST OF SALES Raw material consumed (Note 27.1) 4,548,271,790 4,729,503,889 Stock consumed (Note 27.2) - 90,742,098 Chemicals consumed 621,209,385 645,678,812 Salaries, wages and other bene!ts 296,958,350 255,737,213 Employees’ provident fund contributions 10,836,009 8,993,774 Travelling, conveyance and entertainment - 282,581 Printing and stationery - 55,727 Communications - 445,573 Vehicles’ running - 223,855 Fee and subscription - 67,950 Rent, rates and taxes - 1,489,200 Cloth conversion and processing charges 11,929,378 29,656,816 Fuel, oil and power 842,232,104 910,167,420 Security - 511,885 Freight and carriage - 303,381 Stores, spares and loose tools consumed 110,333,784 81,774,513 Packing materials consumed 51,301,455 49,854,115 Repair and maintenance 43,047,916 33,486,365 Insurance 8,003,912 7,042,282 Other manufacturing expenses 54,173,781 56,229,898 Depreciation on operating !xed assets (Note 15.1.5) 206,837,084 210,564,861 Amortization on intangible asset (Note 15.1.6) - 536,513 Miscellaneous - 196,262
6,805,134,948 7,113,544,983 Work-in-process inventory As on 01 July 152,308,086 123,171,757 As on 30 June (128,250,466) (152,308,086)
24,057,620 (29,136,329)
Cost of goods manufactured 6,829,192,568 7,084,408,654 Cost of yarn and cloth purchased for resale 4,880,829 80,402,397
6,834,073,397 7,164,811,051 Finished goods inventory As on 01 July 314,553,948 335,090,305 As on 30 June (421,365,253) (314,553,948)
(106,811,305) 20,536,357 6,727,262,092 7,185,347,408 27.1 Raw material consumed Opening stock 147,672,090 117,407,790 Add: Purchases during the year 4,549,215,683 4,759,768,189 4,696,887,773 4,877,175,979 Less: Closing stock (148,615,983) (147,672,090)
4,548,271,790 4,729,503,889
27.2 Stock consumed - the Subsidiary Company Opening stock - 21,598,991 Add: Purchases - 69,143,107
- 90,742,098

115Kohinoor Mills Limited and its Subsidiary
2014 2013 Rupees Rupees28. DISTRIBUTION COST Salaries and other bene!ts 47,173,850 43,143,544 Employees’ provident fund contributions 1,957,625 1,651,696 Travelling, conveyance and entertainment 22,060,895 19,454,158 Printing and stationery 173,306 179,646 Communications 25,839,722 24,295,081 Vehicles’ running 4,026,533 3,469,907 Insurance 1,843,096 1,861,604 Repair and maintenance 17,205 46,045 Commission to selling agents 167,679,415 285,328,260 Outward freight and handling 118,037,930 194,594,509 Clearing and forwarding 36,410,972 36,150,774 Sales promotion and advertising 3,756,960 6,004,427 Depreciation on operating !xed assets (Note 15.1.5) 1,345,126 1,135,705 Miscellaneous 1,239,449 1,489,273 431,562,084 618,804,629 29. ADMINISTRATIVE EXPENSES Salaries and other bene!ts 98,588,659 91,749,382 Employees’ provident fund contributions 2,622,144 1,798,324 Travelling, conveyance and entertainment 28,429,134 35,465,415 Printing and stationery 3,725,623 4,002,816 Communications 3,663,857 3,820,163 Vehicles’ running 10,259,466 9,276,418 Legal and professional 5,747,471 6,539,493 Insurance 4,842,176 5,184,100 Fee, subscription and taxes 1,919,221 879,108 Rent - 510,800 Repair and maintenance 5,783,569 6,941,957 Electricity, gas and water 608,381 213,822 Auditors’ remuneration (Note 29.1) 1,562,000 1,537,000 Depreciation on operating !xed assets (Note 15.1.5) 17,457,071 14,276,293 Amortization on intangible asset (Note 15.1.6) 666,579 924,301 Miscellaneous 30,238,550 17,177,579 216,113,901 200,296,971 29.1 Auditors’ remuneration Audit fee 1,300,000 1,300,000 Half yearly review and other certi!cations 200,000 200,000 Reimbursable expenses 62,000 37,000
1,562,000 1,537,000

116
2014 2013 Rupees Rupees30. OTHER EXPENSES Workers’ pro!t participation fund (Note 10.2) 8,612,492 7,440,527 Donations (Note 30.1) 11,721,764 3,922,940 Loss on sale of operating !xed assets - 22,782,067 Operating !xed assets written o" - 3,920,011 Capital work-in-progress written o" - 156,220 Provision for doubtful trade debts (Note 19) - 86,833,187 Pilferage / expiry - 8,055,139 Irrecoverable trade debts written o" - 2,148,015 Advances written o" 182,251 12,563,576 Provision for slow moving, obsolete and damaged store items (Note 17) 16,629,008 - Provision for doubtful export rebate and claims (Note 22.1) 30,514,452 - Provision for doubtful sales tax recoverable (Note 23) 25,157,276 - Security deposits written o" - 417,922 Insurance claim receivable written o" - 202,501 Others 3,097 1,644,778
92,820,340 150,086,883 30.1 There is no interest of any director or his spouse in donees’ fund. 31. OTHER INCOME Income from !nancial assets Gain on sale of available for sale investment - 173,527,189 Dividend on equity investment 3,540,168 2,574,668 Exchange gain - net 8,951,423 7,960,894 Return on bank deposits 6,242,701 6,370,235 Accrued markup written back - 61,161,270 Gain on initial recognition of long term !nancing at fair value (Note 7.2) - 823,743,568 Bad debts recovered - 96,013,984 Credit balances written back 73,351,636 7,501,580 Gain on recognition of sponsor’s loan at fair value (Note 8) 113,316,111 - Income from non-!nancial assets Scrap sales 33,806,376 35,491,569 Gain on sale of operating !xed assets 2,455,759 - Rental income (Note 31.1) - 73,987 Others - 698,948 241,664,174 1,215,117,892 31.1 This included income earned from provisions of prominent places to suppliers for display of their
products in the Subsidiary Company’s stores.

117Kohinoor Mills Limited and its Subsidiary
2014 2013 Rupees Rupees32. FINANCE COST Markup on long term !nancing 159,918,998 199,644,025 Markup on short term borrowings 75,988,621 75,217,795 Adjustment due to impact of IAS - 39 125,603,029 112,590,198 Bank commission and other !nancial charges 34,378,061 118,119,033 Interest on workers’ pro!t participation fund (Note 10.2) 781,255 -
396,669,964 505,571,051 33. TAXATION Current (Note 33.1) 49,029,133 79,975,000 Prior year adjustment (48,261,625) (89,564) Deferred tax (52,987,863) 11,933,440
(52,220,355) 91,818,876 33.1 The Holding Company’s provision for current tax represents !nal tax on export sales under section
169 and minimum tax on local sales under section 113 of the Income Tax Ordinance, 2001. Further, provision against income from other sources of the Holding Company is made under the relevant provisions of the Income Tax Ordinance, 2001. The Subsidiary Company has discontinued its operations and served a notice of discontinuation of business under section 117 of the Income Tax Ordinance, 2001 to the concerned tax authorities.
33.2 Reconciliation of tax expense and product of accounting pro!t multiplied by the applicable tax
rate is not required in view of !nal and minimum taxation. 34. EARNINGS PER SHARE - BASIC AND DILUTED
There is no dilutive e"ect on the basic earnings per share, which is based on:
2014 2013 Pro!t attributable to ordinary shareholders (Rupees) 201,887,645 1,008,666,683 Weighted average number of ordinary shares (Numbers) 50,911,011 50,911,011 Earnings per share (Rupees) 3.97 19.81

118
2014 2013 Rupees Rupees35. CASH GENERATED FROM OPERATIONS Pro!t before taxation 149,667,290 1,100,485,559 Adjustments for non-cash charges and other items: Depreciation on operating !xed assets 225,639,281 225,976,859 Amortization on intangible asset 666,579 1,460,814 Dividend income (3,540,168) (2,574,668) Loss / (gain) on sale of operating !xed assets (2,455,759) 22,782,067 Gain on sale of investment - (173,527,189) Gain on recognition of long term !nancing at fair value - (823,743,568) Gain on recognition of sponsor’s loan at fair value (113,316,111) - Adjustment due to impact of IAS - 39 125,603,029 112,590,198 Provision for doubtful debts - 86,833,187 Irrecoverable trade debts written o" - 2,148,015 Operating !xed assets written o" - 3,920,011 Capital work-in-progress written o" - 156,220 Advances written o" 182,251 12,563,576 Credit balances written back (73,351,636) (7,501,580) Provision for slow moving, obsolete and damaged store items 16,629,008 - Provision for doubtful export rebate and claims 30,514,452 - Provision for doubtful sales tax recoverable 25,157,276 - Accrued markup written back - (61,161,270) Security deposits written o" - 417,922 Insurance claim receivable written o" - 202,501 Finance cost 271,066,935 392,980,853 Working capital changes (Note 35.1) 81,206,535 (83,338,098)
733,668,962 810,671,409 35.1 Working capital changes (Increase) / decrease in current assets Stores, spares and loose tools (18,539,091) (63,729,405) Stock-in-trade (83,697,578) (17,265,281) Trade debts 146,049,048 (13,571,748) Advances 2,481,296 18,510,747 Trade deposits and short term prepayments (11,817,945) 5,894,062 Other receivables 22,569,767 (17,161,777) Sales tax recoverable (32,321,788) (101,834,623) 24,723,709 (189,158,025) Increase in trade and other payables 56,482,826 105,819,927 81,206,535 (83,338,098)

119Kohinoor Mills Limited and its Subsidiary
36. REMUNERATION TO CHIEF EXECUTIVE, DIRECTORS AND EXECUTIVES
Aggregate amounts charged in these consolidated !nancial statements for remuneration, including all bene!ts to chief executive, directors and other executives of the Holding Company are as follows:
2014 2013 Chief Chief
Executive Directors Executives Executive Directors Executives
---------------------------------------------- (Rupees) -------------------------------------------------
Managerial remuneration 4,620,000 3,300,000 35,517,900 3,135,000 3,217,500 26,385,210 House rent 1,155,000 1,485,000 8,461,267 783,750 969,375 6,769,145 Utilities 462,000 330,000 4,085,472 313,500 321,750 2,638,124 Special allowance 924,000 - 6,880,500 627,000 478,500 4,836,327 Contribution to provident fund 384,846 274,896 2,958,632 261,147 268,015 2,197,898 Other allowances 1,239,000 885,000 9,706,789 840,750 862,875 5,190,965 8,784,846 6,274,896 67,610,560 5,961,147 6,118,015 48,017,669 Number of persons 1 1 34 1 2 24
36.1 Chief executive, directors and executives of the Holding Company are provided with free use of Company’s owned and maintained cars.
36.2 Meeting fee of Rupees 875,000 (2013: Rupees 330,000) was paid to the non-executive directors of
the Holding Company for attending meetings. 36.3 No remuneration was paid to non-executive directors of the Holding Company. 36.4 No remuneration was paid to the chief executive or any director of the Subsidiary Company. 37. TRANSACTIONS WITH RELATED PARTIES Related parties comprise of other related parties, key management personnel and provident fund
trust. The Group in the normal course of business carries out transactions with related parties. There are no other transaction with related parties, other than those which have been speci!cally disclosed elsewhere in these consolidated !nancial statements.

120
38. PROVIDENT FUND RELATED DISCLOSURES The following information is based on un-audited !nancial statements of the provident fund of the
Holding Company: 2014 2013 Rupees Rupees
Size of the fund - Total assets 111,391,188 91,622,193 Cost of investments 93,890,176 84,257,836 Percentage of investments made 94.77% 93.26% Fair value of investments 105,570,043 85,449,542 38.1 The break-up of fair value of investments is as follows: 2014 2013 2014 2013 Percentage Rupees Rupees Deposits 45.82 37.23 48,370,256 31,812,872 Mutual funds 34.27 37.21 36,173,882 31,795,742 Listed securities 19.92 25.56 21,025,905 21,840,928 100.00 100.00 105,570,043 85,449,542 38.2 Investments, out of provident fund of the Holding Company, have been made in accordance with
the provisions of section 227 of the Companies Ordinance, 1984 and the rules formulated for this purpose.
2014 201339. NUMBER OF EMPLOYEES Number of employees as on June 30 Permanent 1,436 1,395 Contractual 31 43 Average number of employees during the year Permanent 1,425 1,417 Contractual 30 42
40. SEGMENT INFORMATION
40.1 The Group has four reportable segments. The following summary describes the operation in each of the Group’s reportable segments:
Weaving Production of di"erent qualities of greige fabric using yarn Dyeing Processing of greige fabric for production of dyed fabric Power Generation Generation and distribution of power using gas, oil and steam Retail Selling all types of general merchandise

121Kohinoor Mills Limited and its Subsidiary
W
eavi
ng
Dye
ing
Pow
er
Reta
il El
imin
atio
n of
inte
r-
Tota
l- G
roup
G
ener
atio
n
segm
ent t
rans
actio
ns
20
14
2013
20
14
2013
20
14
2013
20
14
2013
20
14
2013
20
14
2013
-
------
------
------
------
------
------
------
------
------
------
------
------
------
-----
(R u
p e
e s)
-----
------
------
------
------
------
------
------
------
------
------
------
------
------
-Sa
les
-E
xter
nal
2,1
02,9
18,8
63
1,7
29,5
62,6
80
5,6
69,5
12,6
34
6,7
22,2
08,1
01
-
-
-
93,
703,
828
-
-
7
,772
,431
,497
8
,545
,474
,609
-In
ters
egm
ent
2,0
41,0
89,3
15
2,4
39,1
72,6
33
40,
212,
997
2
5,41
6,98
6
668
,345
,298
7
92,5
41,5
30
-
4,0
68,8
68
(2,7
49,6
47,6
10)
(3,2
61,2
00,0
17)
-
-
4
,144
,008
,178
4
,168
,735
,313
5
,709
,725
,631
6
,747
,625
,087
6
68,3
45,2
98
792
,541
,530
-
9
7,77
2,69
6
(2,7
49,6
47,6
10)
(3,2
61,2
00,0
17)
7,7
72,4
31,4
97
8,5
45,4
74,6
09
Cost
of s
ales
(3
,775
,182
,758
) (3
,793
,391
,971
) (5
,044
,296
,498
) (5
,757
,125
,365
) (6
57,4
30,4
46)
(780
,071
,145
) -
(1
15,9
58,9
44)
2,7
49,6
47,6
10
3,2
61,2
00,0
17
(6,7
27,2
62,0
92)
(7,1
85,3
47,4
08)
Gro
ss p
ro!t
/ (lo
ss)
368
,825
,420
3
75,3
43,3
42
665
,429
,133
9
90,4
99,7
22
10,
914,
852
1
2,47
0,38
5
-
(18,
186,
248)
-
-
1
,045
,169
,405
1
,360
,127
,201
D
istrib
utio
n co
st
(115
,755
,786
) (1
01,7
66,3
28)
(315
,795
,798
) (5
17,0
38,3
01)
(10,
500)
-
-
-
-
-
(4
31,5
62,0
84)
(618
,804
,629
)Ad
min
istra
tive
expe
nses
(9
7,89
3,88
6)
(90,
063,
538)
(1
03,3
55,5
59)
(95,
277,
003)
(9
,565
,315
) (9
,699
,547
) (5
,299
,141
) (5
,496
,883
) -
24
0,00
0 (2
16,1
13,9
01)
(200
,296
,971
)
(2
13,6
49,6
72)
(191
,829
,866
) (4
19,1
51,3
57)
(612
,315
,304
) (9
,575
,815
) (9
,699
,547
) (5
,299
,141
) (5
,496
,883
) -
2
40,0
00
(647
,675
,985
) (8
19,1
01,6
00)
Pro!
t / (l
oss)
bef
ore
taxa
tion
and
unal
loca
ted
in
com
e / e
xpen
ses
155
,175
,748
1
83,5
13,4
76
246
,277
,776
3
78,1
84,4
18
1,3
39,0
37
2,7
70,8
38
(5,2
99,1
41)
(23,
683,
131)
-
2
40,0
00
397
,493
,420
5
41,0
25,6
01
Una
lloca
ted
inco
me
and
expe
nses
:
Fina
nce
cost
(3
96,6
69,9
64)
(505
,571
,051
)O
ther
exp
ense
s
(9
2,82
0,34
0)
(150
,086
,883
)O
ther
inco
me
241
,664
,174
1
,215
,117
,892
Ta
xatio
n
(5
2,22
0,35
5)
(91,
818,
876)
(1
95,6
05,7
75)
467
,641
,082
Pro!
t afte
r tax
atio
n
2
01,8
87,6
45
1,0
08,6
66,6
83
40.2
R
econ
cilia
tion
of re
port
able
segm
ent a
sset
s and
liab
ilitie
s
W
eavi
ng
Dye
ing
Pow
er
Reta
il T
otal
- Gro
up
Gen
erat
ion
20
14
2013
20
14
2013
20
14
2013
20
14
2013
20
14
2013
----
------
------
------
------
------
------
------
------
------
------
-- (R
u p
e e
s) --
------
------
------
------
------
------
------
------
------
------
----
Segm
ent a
sset
s 1
,929
,414
,907
1
,883
,209
,663
2
,358
,316
,137
2
,507
,593
,247
8
37,3
36,9
96
800
,653
,779
1
21,7
29,3
28
127
,363
,391
5
,246
,797
,368
5
,318
,820
,080
Shor
t ter
m in
vest
men
t
1
76,8
79,6
92
132
,357
,244
U
nallo
cate
d as
sets
6
04,1
20,9
58
453
,648
,290
Tota
l ass
ets a
s per
bal
ance
shee
t
6
,027
,798
,018
5
,904
,825
,614
Segm
ent l
iabi
litie
s 2
99,2
47,6
02
241
,238
,767
3
68,2
16,1
77
362
,643
,302
6
0,01
0,29
9
64,
517,
633
1
2,41
1,69
8
17,
368,
145
7
39,8
85,7
76
685
,767
,847
Lo
ng te
rm !
nanc
ing
- sec
ured
1
,961
,062
,954
2
,121
,486
,153
Sp
onso
r’s lo
an
176
,742
,116
2
72,0
00,0
00
Accr
ued
mar
kup
132
,581
,524
1
10,7
43,7
21
Shor
t ter
m b
orro
win
gs -
secu
red
814
,194
,999
6
71,4
05,7
85
Def
erre
d lia
bilit
ies
507
,523
,537
4
83,0
22,8
77
Prov
ision
for t
axat
ion
49,
029,
133
7
9,97
5,00
0 U
nallo
cate
d lia
bilit
ies
74,
063,
690
1
45,0
50,4
29
Tota
l lia
bilit
ies a
s per
bal
ance
shee
t
4
,455
,083
,729
4
,569
,451
,812

122
40.3 Geographical information The Group’s revenue from external customers by geographical location is detailed below: 2014 2013 Rupees Rupees Australia 359,378,990 371,954,125 Asia 4,039,513,666 4,320,231,205 Europe 1,622,781,899 1,232,086,726 United States of America and Canada 179,185,932 266,600,639 Africa 564,523,726 1,126,393,595 Pakistan 1,007,047,284 1,1228,208,319 7,772,431,497 8,545,474,609 40.4 All non-current assets of the Group as at reporting date are located and operating in Pakistan.
40.5 Revenue from major customers The Group’s revenue is earned from a large mix of customers.
2014 201341. PLANT CAPACITY AND PRODUCTION Weaving Number of looms in operation 174 174 Rated capacity of operative looms converted to 60 picks (square meter) 48,892,878 48,892,878 Actual production converted to 60 picks (square meter) 48,081,074 47,933,566 Number of days worked during the year (3 shifts per day) 365 365 Dyeing Rated capacity in 3 shifts (linear meter) 30,000,000 30,000,000 Actual production for 3 shifts (linear meter) 24,615,240 29,586,279 No. of days worked during the year (3 shifts per day) 344 365 Power generation Number of generators installed 9 9 Installed capacity (Mega Watt Hours) 300,381 300,381 Actual generation (Mega Watt Hours) 19,395 27,023 41.1 Under utilization of available capacity for weaving and dyeing divisions is due to normal
maintenance. 41.2 Actual power generation in comparison to installed is low due to periodical scheduled and
unscheduled maintenance of generators and low demand.

123Kohinoor Mills Limited and its Subsidiary
42. FINANCIAL RISK MANAGEMENT 42.1 Financial risk factors The Group’s activities expose it to a variety of !nancial risks: market risk (including currency risk, other
price risk and interest rate risk), credit risk and liquidity risk. The Group’s overall risk management programme focuses on the unpredictability of !nancial markets and seeks to minimize potential adverse e"ects on the !nancial performance.
Risk management is carried out by the Board of Directors of the Holding Company and the Subsidiary
Company (the respective Board). The Board provides principles for overall risk management, as well as policies covering speci!c areas such as currency risk, other price risk, interest rate risk, credit risk and liquidity risk.
(a) Market risk (i) Currency risk Currency risk is the risk that the fair value or future cash #ows of a !nancial instrument will
#uctuate because of changes in foreign exchange rates. Currency risk arises mainly from future commercial transactions or receivables and payables that exist due to transactions in foreign currencies.
The Group is exposed to currency risk arising from various currency exposures, primarily
with respect to the United States Dollar (USD) and Euro. Currently, the Group’s foreign exchange risk exposure is restricted to foreign currency bank balances and the amounts receivable from / payable to the foreign entities. The Group uses forward exchange contracts to hedge its foreign currency risk, when considered appropriate. The Group’s exposure to currency risk was as follows:
2014 2013 Cash in hand - USD 1,207 5,285 Cash in hand - Euro 2,960 1,410 Cash at banks - USD 789 789 Trade debts - USD 10,890,817 13,375,230 Trade debts - Euro 115,833 - Trade and other payable - USD (1,341,000) (1,420,262) Net exposure - USD 9,551,813 11,961,042 Net exposure - Euro 118,793 1,410 The following signi!cant exchange rates were applied during the year:
Rupees per US Dollar Average rate 102.50 96.32 Reporting date rate 98.35 98.95 Rupees per Euro Average rate 138.43 124.62 Reporting date rate 134.19 129.25

124
Sensitivity analysis If the functional currency, at reporting date, had weakened / strengthened by 5% against
the USD and Euro with all other variables held constant, the impact on pro!t after taxation for the year would have been higher / lower by Rupees 45.947 million (2013: Rupees 55.705 million) mainly as a result of exchange gains / losses on translation of foreign exchange denominated !nancial instruments. Currency risk sensitivity to foreign exchange movements has been calculated on a symmetric basis. In management’s opinion, the sensitivity analysis is unrepresentative of inherent currency risk as the year end exposure does not re"ect the exposure during the year.
(ii) Other price risk Other price risk represents the risk that the fair value or future cash "ows of a !nancial
instrument will "uctuate because of changes in market prices (other than those arising from interest rate risk or currency risk), whether those changes are caused by factors speci!c to the individual !nancial instrument or its issuer, or factors a#ecting all similar !nancial instruments traded in the market. The Group is not exposed to commodity price risk.
(iii) Interest rate risk This represents the risk that the fair value or future cash "ows of a !nancial instrument will
"uctuate because of changes in market interest rates. The Group has no signi!cant long-term interest-bearing assets except for bank balances
on saving accounts. The Group’s interest rate risk arises from long term !nancing and short term borrowings. Borrowings obtained at variable rates expose the Group to cash "ow interest rate risk. Borrowings obtained at !xed rate expose the Group to fair value interest rate risk.

125Kohinoor Mills Limited and its Subsidiary
At the balance sheet date the interest rate pro!le of the Group’s interest bearing !nancial instruments was:
2014 2013 Rupees Rupees Fixed rate instruments Financial liabilities Long term !nancing 1,358,560,561 1,509,412,441 Sponsor’s loan 176,742,116 272,000,000 Floating rate instruments Financial assets Bank balances - saving accounts 75,764,024 105,100,998 Financial liabilities Long term !nancing 602,502,393 612,073,712 Short term borrowings 814,194,999 671,405,785 Fair value sensitivity analysis for !xed rate instruments The Group does not account for any !xed rate !nancial assets and liabilities at fair value through
pro!t or loss. Therefore, a change in interest rate at the balance sheet date would not a"ect pro!t or loss for the period.
Cash "ow sensitivity analysis for variable rate instruments If interest rates at the year end date, #uctuate by 1% higher / lower with all other variables held
constant, pro!t for the year would have been Rupees 12.739 million lower / higher (2013: Rupees 11.195 million), mainly as a result of higher / lower interest expense on #oating rate borrowings. This analysis is prepared assuming the amounts of liabilities outstanding at balance sheet dates were outstanding for the whole year.
(b) Credit risk Credit risk represents the risk that one party to a !nancial instrument will cause a !nancial loss
for the other party by failing to discharge an obligation. The carrying amount of !nancial assets represents the maximum credit exposure. The maximum exposure to credit risk at the reporting date was as follows:

126
2014 2013 Rupees Rupees Investments 176,879,692 132,357,244 Advances 9,976,757 8,445,589 Deposits 35,560,786 28,055,841 Trade debts 533,484,347 679,533,395 Other receivables 1,104,307 17,960,218 Bank balances 152,617,510 126,474,472
909,623,399 992,826,759 The credit quality of !nancial assets that are neither past due nor impaired can be assessed by
reference to external credit ratings (If available) or to historical information about counterparty default rate:
Rating 2014 2013
Banks Short Term Long Term Agency Rupees Rupees National Bank of Pakistan A-1+ AAA JCR-VIS 150,344 150,744 Allied Bank Limited A1+ AA+ PACRA 9,780,724 6,931,915 Askari Bank Limited A1+ AA PACRA 154,146 719,627 Bank Alfalah Limited A1+ AA PACRA 221,134 146,434 Faysal Bank Limited A1+ AA PACRA 514,906 490,778 Habib Bank Limited A-1+ AAA JCR-VIS 3,524,607 13,008,561 Habib Metropolitan Bank Limited A1+ AA+ PACRA 56,430,665 55,879,362 The Bank of Punjab A1+ AA- PACRA 276,717 115,621 MCB Bank Limited A1+ AAA PACRA 92,764 976,796 NIB Bank Limited A1+ AA - PACRA 56,788,522 30,325,384 Silk Bank Limited A-2 A - JCR-VIS 624,015 905,410 Standard Chartered Bank (Pakistan) Limited A1+ AAA PACRA 3,416,142 5,278,865 United Bank Limited A-1+ AA+ JCR-VIS 1,590,017 11,469,979 Al-Baraka Bank (Pakistan) Limited A1 A PACRA 19,052,807 74,996
152,617,510 126,474,472 Investment
Security General Insurance Company Limited A+ JCR-VIS 176,879,692 132,357,244 329,497,202 258,831,716
The Group’s exposure to credit risk and impairment losses related to trade debts is disclosed in Note 19.
Due to the Group’s long standing business relationships with these counter parties and after giving due consideration to their strong !nancial standing, management does not expect non-performance by these counter parties on their obligations to the group. Accordingly the credit risk is minimal.
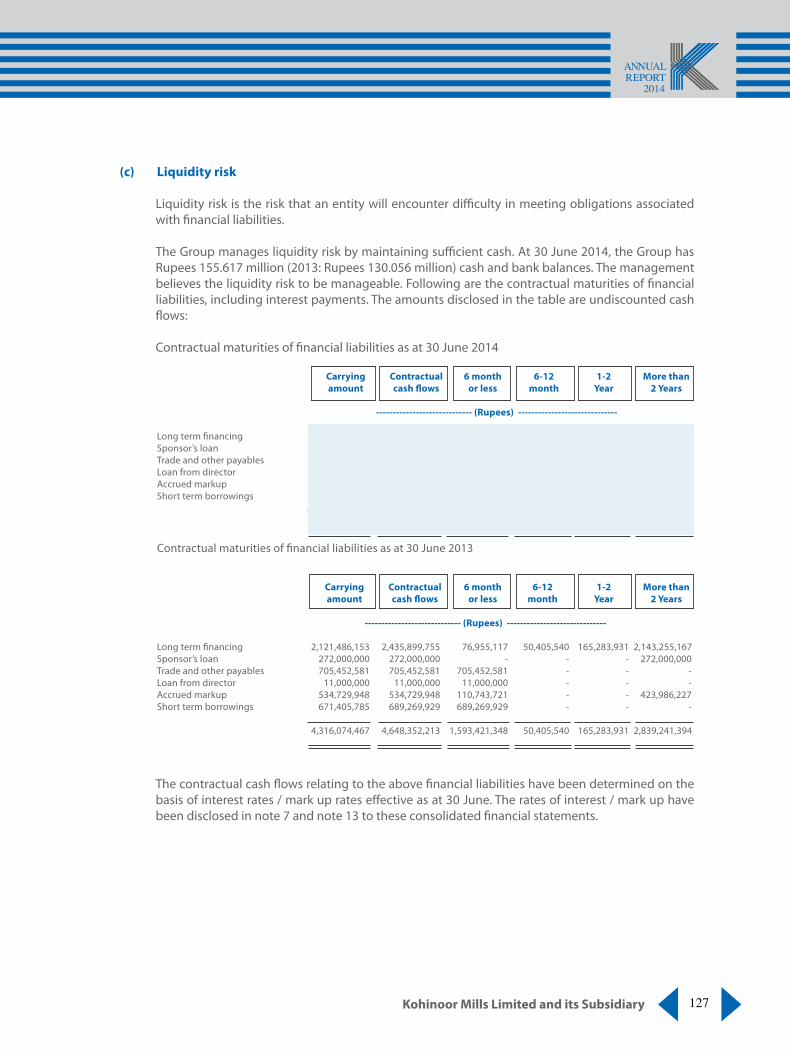
127Kohinoor Mills Limited and its Subsidiary
(c) Liquidity risk
Liquidity risk is the risk that an entity will encounter di!culty in meeting obligations associated with "nancial liabilities.
The Group manages liquidity risk by maintaining su!cient cash. At 30 June 2014, the Group has
Rupees 155.617 million (2013: Rupees 130.056 million) cash and bank balances. The management believes the liquidity risk to be manageable. Following are the contractual maturities of "nancial liabilities, including interest payments. The amounts disclosed in the table are undiscounted cash #ows:
Contractual maturities of "nancial liabilities as at 30 June 2014 Carrying Contractual 6 month 6-12 1-2 More than
amount cash !ows or less month Year 2 Years
----------------------------- (Rupees) ------------------------------ Long term "nancing 1,961,062,954 2,342,944,851 156,508,103 60,379,517 205,819,296 1,920,237,935 Sponsor’s loan 176,742,116 272,000,000 - 20,113,253 22,402,141 229,484,606 Trade and other payables 721,492,984 721,492,984 721,492,984 - - - Loan from director 11,000,000 11,000,000 11,000,000 - - - Accrued markup 624,986,668 624,986,668 132,581,524 - - 492,405,144 Short term borrowings 814,194,999 854,912,448 854,912,448 - - -
4,309,479,721 4,827,336,951 1,876,495,059 80,492,770 228,221,437 2,642,127,685
Contractual maturities of "nancial liabilities as at 30 June 2013 Carrying Contractual 6 month 6-12 1-2 More than
amount cash !ows or less month Year 2 Years
----------------------------- (Rupees) ------------------------------ Long term "nancing 2,121,486,153 2,435,899,755 76,955,117 50,405,540 165,283,931 2,143,255,167 Sponsor’s loan 272,000,000 272,000,000 - - - 272,000,000 Trade and other payables 705,452,581 705,452,581 705,452,581 - - - Loan from director 11,000,000 11,000,000 11,000,000 - - - Accrued markup 534,729,948 534,729,948 110,743,721 - - 423,986,227 Short term borrowings 671,405,785 689,269,929 689,269,929 - - -
4,316,074,467 4,648,352,213 1,593,421,348 50,405,540 165,283,931 2,839,241,394
The contractual cash #ows relating to the above "nancial liabilities have been determined on the basis of interest rates / mark up rates e$ective as at 30 June. The rates of interest / mark up have been disclosed in note 7 and note 13 to these consolidated "nancial statements.

128
42.2 Fair values of !nancial assets and liabilities
The carrying values of all !nancial assets and liabilities re"ected in theses consolidated !nancial statements approximate their fair values. Fair value is determined on the basis of objective evidence at each reporting date. The following table provides an analysis of !nancial instruments that are measured subsequent to initial recognition at fair value, grouped into levels 1 to 3 based on the degree to which fair value is observable:
Level 1 Level 2 Level 3 Total
................................... Rupees................................... As at 30 June 2014 Assets Available for sale !nancial assets - - 176,879,692 176,879,692 As at 30 June 2013 Assets Available for sale !nancial assets - - 132,357,244 132,357,244
The fair value of !nancial instruments traded in active markets is based on quoted market prices at the balance sheet date. The quoted market price used for !nancial instruments held by the Group is the current bid price. These !nancial instruments are classi!ed under level 1 in above referred table. The Group has no such type of !nancial isntrument as at 30 June 2014.
The fair value of !nancial instruments that are not traded in active market is determined by
using valuation techniques. These valuation techniques maximize the use of observable market data where it is available and rely as little as possible on entity speci!c estimate. If all signi!cant inputs required to fair value a !nancial instrument are observable, those !nancial instruments are classi!ed under level 2. The Group has no such type of !nancial instruments as at 30 June 2014.
If one or more of the signi!cant inputs is not based on observable market data, the !nancial
instrument is classi!ed under level 3. The carrying amount less impairment provision of trade receivables and payables are assumed to approximate their fair values. The fair value of !nancial liabilities for disclosure purposes is estimated by discounting the future contractual cash "ows at the current market interest rate that is available to the Group for similar !nancial instruments.
42.3 Financial instruments by categories
Assets as per balance sheet
2014 2013
Loans and Available Total Loans and Available Total receivables for sale receivables for sale
- -- - - - - - - - Rupees - - - - - - -- - - - - - - -- - - Rupees - - - - - -- - -
Investments - 176,879,692 176,879,692 - 132,357,244 132,357,244 Advances 9,976,757 - 9,976,757 8,445,589 - 8,445,589 Deposits 35,560,786 - 35,560,786 28,055,841 - 28,055,841 Trade debts 533,484,347 - 533,484,347 679,533,395 - 679,533,395 Other receivables 1,104,307 - 1,104,307 17,960,218 - 17,960,218 Cash and bank balances 155,617,370 - 155,617,370 130,056,176 - 130,056,176
735,743,567 176,879,692 912,623,259 864,051,219 132,357,244 996,408,463

129Kohinoor Mills Limited and its Subsidiary
2014 2013 Rupees Rupees Financial liabilities at amortized cost Long term !nancing 1,961,062,954 2,121,486,153 Sponsor’s loan 176,742,116 272,000,000 Accrued markup 624,986,668 534,729,948 Loan from director 11,000,000 11,000,000 Short term borrowings 814,194,999 671,405,785 Trade and other payables 721,492,984 705,452,581 4,309,479,721 4,316,074,467 42.4 Capital risk management The Group’s objectives when managing capital are to safeguard the Group’s ability to continue as a
going concern in order to provide returns for shareholders and bene!ts for other stake holders and to maintain an optimal capital structure to reduce the cost of capital. In order to maintain or adjust the capital structure, the Group may adjust the amount of dividends paid to share holders, issue new shares or sell assets to reduce debt.
43. AUTHORIZATION OF FINANCIAL STATEMENTS These consolidated !nancial statements were authorized for issue by the Board of Directors of the
Holding Company on 25 September 2014. 44. CORRESPONDING FIGURES Corresponding !gures have been rearranged / regrouped, wherever necessary, for the purpose of
comparison. However, no signi!cant rearrangements / regroupings have been made. 45. GENERAL Figures have been rounded o" to nearest of Rupee.
AAMIR FAYYAZ SHEIKH AAMIR AMIN Chief Executive Director

130
The Companies Ordinance, 1984 (Section 236(1) and 464)
PATTERN OF SHAREHOLDING 1. CUI Number 17194 2. Name of Company KOHINOOR MILLS LIMITED 3. Pattern of holding of shares held by the shareholders as at June 30, 2014
4. Number of Shares held Range Total Shareholders From To Shares held Percentage 347 1 - 100 6,931 0.01 772 101 - 500 169,656 0.33 155 501 - 1000 126,152 0.25 269 1001 - 5000 701,704 1.38 59 5001 - 10000 451,874 0.89 18 10001 - 15000 235,422 0.46 21 15001 - 20000 369,297 0.73 9 20001 - 25000 206,925 0.41 2 25001 - 30000 54,501 0.11 2 30001 - 35000 68,365 0.13 1 35001 - 40000 40,000 0.08 1 40001 - 45000 41,500 0.08 1 45001 - 50000 45,003 0.09 1 50001 - 55000 50,500 0.10 1 55001 - 60000 55,500 0.11 1 60001 - 65000 63,500 0.12 1 80001 - 85000 81,367 0.16 3 95001 - 100000 298,000 0.59 2 100001 - 105000 201,826 0.40 1 105001 - 110000 110,000 0.22 1 110001 - 115000 112,500 0.22 1 115001 - 120000 118,500 0.23 2 140001 - 145000 283,501 0.56 1 150001 - 155000 153,500 0.30 1 220001 - 225000 222,467 0.44 1 330001 - 335000 333,500 0.66 1 390001 - 395000 392,166 0.77 1 415001 - 420000 417,155 0.82 1 510001 - 515000 511,350 1.00 1 545001 - 550000 545,683 1.07 1 765001 - 770000 768,500 1.51 1 1005001 - 1010000 1,009,161 1.98 1 1230001 - 1235000 1,232,257 2.42 1 2760001 - 2765000 2,762,357 5.43 1 4450001 - 4455000 4,452,059 8.74 1 10870001 - 10875000 10,870,564 21.35 1 10905001 - 10910000 10,906,678 21.42 1 12440001 - 12445000 12,441,090 24.44 1,686 T o t a l 50,911,011 100.00
Note: The slabs not applicable, have not been shown.

131Kohinoor Mills Limited and its Subsidiary
5. Categories of Shareholders Shares held G.Total Percentage 5.1 Directors, Chief Executive O!cer, their Spouse(s) and Minor Children Mr. Aamir Fayyaz Sheikh (Chief Executive/Director) 12,441,090 24.4369 Mr. Rashid Ahmed (Chairman/Director) 142,501 0.2799 Mr. Asad Fayyaz Sheikh (Director) 10,906,678 21.4230 Mr. Ali Fayyaz Sheikh (Director) 10,870,564 21.3521 Mr. Riaz Ahmed (Director) 15,000 0.0295 Mr. Shahbaz Munir (Director) 3,000 0.0059 Mr. Aamir Amin (NIT Nominee) - Mrs. Muneeza Asad Fayyaz (Wife of Mr. Asad Fayyaz Sheikh) 6,000 0.0118
8 34,384,833 5.2 Associated Companies, Undertakings and Related Parties - - 5.3 NIT and ICP National Bank of Pakistan-Trustee Department NI(U)T Fund 4,452,059 8.7448 National Bank of Pakistan 600 0.0012 Investment Corporation of Pakistan 2,200 0.0043 IDBL (ICP UNIT) 277 0.0005 4 4,455,136 5.4 Banks, Development Finance institutions, Non-Banking Finance Companies 8 958,253 958,253 1.8822 5.5 Insurance Companies 1 125 125 0.0002 5.6 Takaful, Modarabas, Pension Funds & Mutual Funds 2 879 879 0.0017 5.7 Share holders holding 5% or more Refer 5.1, 5.3 5.8 General Public a. Local 1,622 9,692,384 19.0379 b. Foreign 4 82,636 0.1623 c. Joint Stock Companies 29 151,131 0.2969 9,926,151 5.9 Others Lahore Stock Exchange 680 0.0013 Trustee-Kohinoor Mills Limited - Sta! Provident Fund 909,500 1.7865 Trustees Al-Mal Group Sta! Provident Fund 1,695 0.0033 Trustee National Bank of Pakistan Employees Pension Fund 222,467 0.4370 Trustee National Bank of Pakistan Employee Benevolent Fund 7,806 0.0153 Trustees Moosa Lawai Foundation 9,015 0.0177 Trustees Saeeda Amin Wakf 11,180 0.0220 Trustees Mohamad Amin Wakf Estate 23,291 0.0457 8 1,185,634 Total : 1,686 50,911,011 100.00

132

133Kohinoor Mills Limited and its Subsidiary
FORM OF PROXY
I/We __________________________________________________________________________________
of _____________________ in the district of ________________________________ being a member of
KOHINOOR MILLS LIMITED hereby appoint ________________________________________________
____________________________ of _____________another member of the Company or failing him/her
appoint _______________________________________________________________________________
of _________________________________________ another member of the Company as my / our proxy
to vote for me/us and on my/our behalf, at the 27th Annual General Meeting of the Company to be held
on Thursday, October 30, 2014 at 03:00 p.m. and at any adjournment thereof.
As witness my/our hand seal this ______________________ day of ____________________, 2014
CDC Account Holders No. of Ordinary Folio No. Participant I.D. No. Account / Sub-Account No. Shares held
Witness 1 Witness 2
Signature Signature
Name Name
CNIC No. CNIC No.
Address Address
Important Notes:
1. Proxies, in order to be e!ective, must be received at the Company’s Registered O"ce situated at 8th K.M. Manga Raiwind Road, District Kasur, not later than 48 hours before the time for holding the meeting and must be duly stamped, signed and witnessed.
2. If a member appoints more than one proxy and more than one instruments of proxies are deposited by a member with the Company, all such instruments of proxy shall be rendered invalid.
3. No person can act as proxy unless he / she is member of the Company, except that a corporation may appoint a person who is not a member.
For CDC Account Holders / Corporate entities
In addition to the above, the following requirements have to be met.
a) The proxy form shall be witnessed by two persons whose name, address and computerized National Identity Card (CNIC) number shall be mentioned on the form.
b) Attested copies of CNIC or the passport of the bene#cial owners and the proxy shall be provided with the proxy form. c) The proxy shall produce original CNIC or passport at the time of attending the meeting. d) In case of the Corporate entity, the Board of Directors’ Resolution / Power of Attorney with specimen signature shall be
submitted (unless it has been provided earlier) along with proxy form to the Company.
Signatures onFive Rupees
Revenue Stamp
The Signature should agree with the specimen registered with the Company
27th Annual General Meeting 2014

134
AFFIX
CORRECT
POSTAGEThe Company Secretary
KOHINOOR MILLS LIMITED8-Km, Manga Raiwind Road, Distt. Kasur,Pakistan.