Annual Report 2014 KMD A/S - edlund.dk
94
CVR DK 26 91 17 45 ANNUAL REPORT 2014 KMD A/S
Transcript of Annual Report 2014 KMD A/S - edlund.dk

CVR DK 26 91 17 45
ANNUAL REPORT 2014KMD A/S

KMD A/S
Ballerup
CVR no. 26 91 17 45
Annual Report for 2014
13th financial year
MANAGEMENT’S REVIEW
PROFILE
03_KMD – IT with insight
RESULTS
04_An eventful year
05_Revenue and earnings
06_Financial highlights
07_Expenses
07_Outlook
KMD’S MARKETS
09_Local government
12_Central government
13_Private sector
CORPORATE COMPLIANCE AND GOVERNANCE
14_Corporate governance
16_Special risks
17_Control and risk management
STRATEGY AND ORGANIZATION
18_KMD’s strategy
20_KMD’s employees
22_Subsidiaries
24_Board of Directors
26_Management
CORPORATE SOCIAL RESPONSIBILITY
REPORT
30_Digital Welfare
33_Employees
35_Climate & Environment
37_Supply Chain
FINANCIAL STATEMENTS
CONSOLIDATED FINANCIAL STATEMENTS
40_Consolidated income statement
40_Consolidated statement of comprehensive
income
41_Consolidated balance sheet
43_Consolidated statement of changes in equity
44_Consolidated statement of cash flows
45_Notes to the consolidated financial
statements
74_Explanation of financial ratios
PARENT COMPANY FINANCIAL STATEMENTS
75_Parent Company income statement
76_Parent Company balance sheet
78_Parent Company statement of changes in
equity
79_Notes to the Parent Company financial
statements
STATEMENTS
89_Statement by the Executive Board and Board
of Directors
90_ Independent auditor’s report
CONTENTS
PROFILE
3
KMD's position as one of Denmark’s leading IT and
software companies is founded on insight – insight
rooted in the public sector but now benefiting the
private sector too.
The majority of our business revolves around software
development, creating and delivering IT solutions for
the local government, central government and private
markets. With main sites in Copenhagen, Aarhus,
Odense and Aalborg, KMD is one of Denmark’s largest
IT companies, has some 3,000 employees and
generated revenue of DKK 4.8 billion in 2014.
KMD is majority-owned by funds managed by private
equity firm Advent International, while Danish pension
fund Sampension and KMD’s management hold the
remainder of its stock.
SUPPORTING THE WELFARE STATE
For more than 40 years, KMD has played a key role
in digitizing the Danish welfare state, helping make
Denmark’s public sector one of the best run, most
efficient and highly digitized in the world.
KMD has developed and currently operates more than
400 IT systems that support the Danish welfare state
and accompany Danes from cradle to grave. Each year
our systems handle billions of kroner, equivalent to
more than 20% of Denmark’s GDP. Key social security
benefits such as family allowance, maternity/paternity
pay, sickness benefit, state pensions and cash benefits
are paid through systems developed by KMD.
Our enterprise management systems also handle the
finances of many local governments, and each month
a million workers in the public and private sectors
receive their salary through our payroll systems. Many
local governments and private companies have also
chosen to have KMD handle parts of their administrative
burden, such as payroll and human resources.
THE FUTURE IS DIGITAL
KMD consistently strives to create new digital shortcuts,
and we see it as our responsibility to contribute
initiatives and solutions that support and develop
Denmark’s welfare system.
The public sector faces significant challenges: a smaller
number of workers need to help a larger number of
people, and budgets need to stretch even further.
KMD views welfare technology and digitization as an
important part of the solution, simultaneously improving
public services and freeing up resources in the sector.
PARTNER FOR THE PRIVATE SECTOR
Decades of experience and expertise in the public sector
mean that KMD is also able to handle even the most
complex IT projects the private sector can muster. We
now offer a wide range of services to private companies
and organizations.
By outsourcing tasks such as operation and
maintenance of IT systems, payroll and HR
administration, and printing to KMD, companies can
focus on their core business, strategic development
and innovation.
In recent years, KMD has built up a solid portfolio of
customers in the private sector and now carries out
tasks for a number of Denmark’s largest companies.
AN ATTRACTIVE WORKPLACE
KMD’s 3,000 employees are its key asset. Our IT
experts and business specialists are national leaders
in translating complex processes and legislation into
simple and effective IT solutions that make life easier
for citizens and for employees and customers in the
public and private sectors.
KMD wants to maintain its reputation as a great place to
work. So that we continue to live up to our customers’
requirements, we aim to remain one of Denmark’s most
attractive IT employers with the strongest specialist
teams and the most challenging projects.
PROFILE
KMD – IT WITH INSIGHT

RESULTS
4
2014 has been an eventful year for KMD, both on the
customer side and internally.
Despite continuation of the fierce competition seen in
2013, KMD was able to achieve revenue growth, which
must be considered satisfactory in the current market.
KMD still has ambitions to grow and adjusted its
business strategy during the year. The updated strategy
– "KMD on more markets” – covers the period through
2020 and sets a goal of strengthening KMD to become a
leading IT player in both the public and private markets.
As well as working to create organic growth, KMD
made acquisitions in 2014 that brought new customers,
products and competencies. In the fall of 2014, KMD
bought the companies ScanJour, Cenza and Capevo
– all among the leaders in their respective business
areas and with their main customers in the central
government and business markets. The acquisitions
serve to underline KMD's growth ambitions.
There were several encouraging events on the customer
side too.
Expansion of the cooperation with Q8 to include the
entire Scandinavian company was an important contract
for KMD in the private market.
Developing cooperation in the central government
market is a priority for KMD, and in 2014 we started
new projects with the Danish tax authority SKAT and
the Ministries of Education and Health.
The Danish Digitisation Agency also awarded KMD the
strategically important task of developing and operating
the Data Distributor, which from 2015 will distribute all
common public-sector basic data.
There were a number of strategically important tenders
from KOMBIT – the IT company owned by the local
governments – and Payments Denmark. We acquitted
ourselves well, winning the contract to develop the
support systems and being reawarded the contract to
develop and operate NemRefusion, KOMBIT’s
system for reimbursement of sickness benefits
and maternity/paternity pay.
For KMD Opus, 2014 brought both new customers
and product innovations. Among other things, KMD
was awarded the contract to replace the City of
Copenhagen’s payroll system, which calculates and
pays the salaries of more than 45,000 employees.
The way payments are made is changing, and KMD
wants to play a positive part in this. In the fall, KMD
and Danske Bank announced they had joined forces
to expand the use of mobile payments in the local
government sector.
Employment policy is experiencing radical change,
and KMD is consolidating the new job center
environment in its new solution concept, Momentum.
As the new legislation comes into force, Momentum
will replace the current solutions KMD Opera and
Workbase from Medialogic.
KMD has ambitions to be the most complete IT provider
in the school sector and over the years has built up an
effective unit that is now an important player within
learning platforms as well as administrative systems for
schools.
KMD Education is now used in schools throughout
Denmark and, in tandem with this expansion, an
increasing number of local governments have adopted
the pupil record tool KMD Vokal.
The subsidiary KMD BPO won a number of new
contracts, including with GN Store Nord, Lemvigh–Müller
and Tican Fresh Meat. The biggest prize of all, however,
was the contract entered into with A.P. Møller - Mærsk.
KMD also further underlined its prominent role in Danish
elections, supporting the referendum and European
parliamentary elections in May 2014, as well as taking
on new tasks. KMD is to develop the system that from
2015 will make it easier for new parties to stand in
parliamentary elections in Denmark.
Security has been part of KMD’s DNA for many years,
and today just over 100 people at KMD work on security
on a daily basis. At a time dominated by a number of
security-related issues in the IT industry, in 2014 KMD
was the first company in Denmark to open its own
Security Analytics Center (SAC).
There have also been some changes to KMD’s
organization during 2014. At the start of the year, Lars
Monrad-Gylling stepped down after 15 years as CEO
and was succeeded by Eva Berneke, and Jannich Kiholm
Lund joined the Executive Board as CFO.
As a consequence of lack of organic growth KMD
decided in 2014 to downscale its organization in
Sweden.
RESULTS
[OVERSKRIFT 2] [Tekst der skal gengives i sidehoved]
[Tekst]
THE PAST YEAR
5
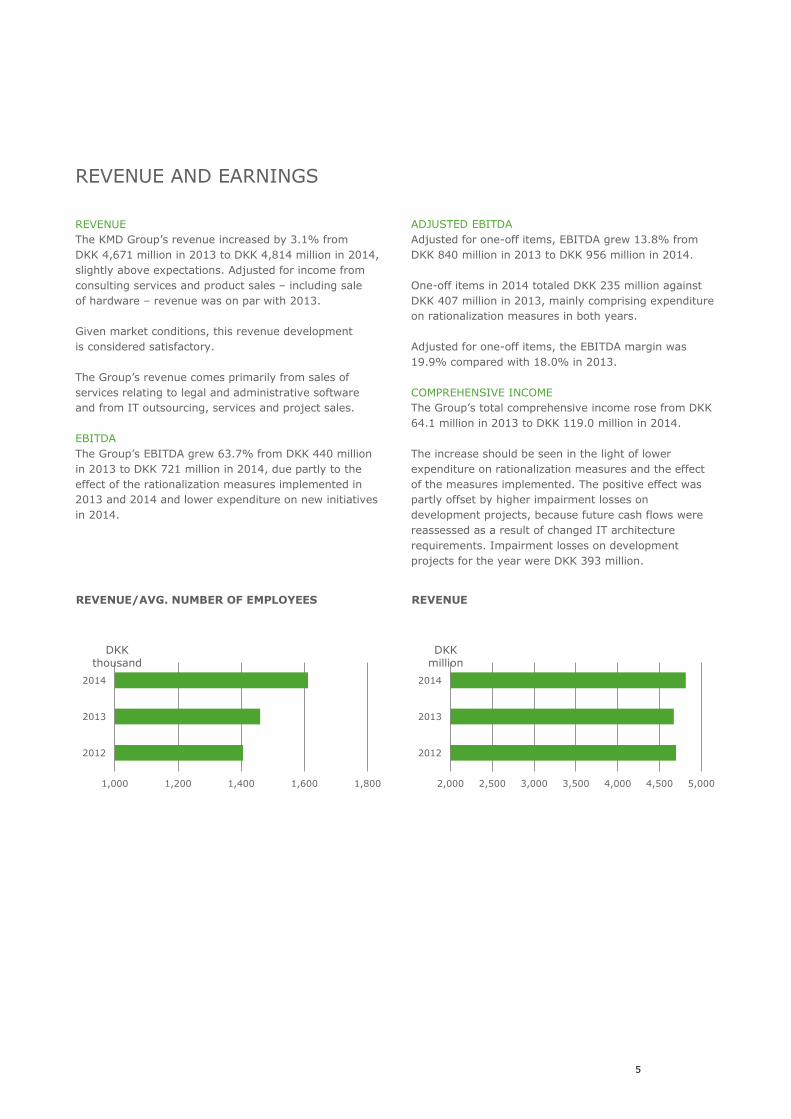
REVENUE
The KMD Group’s revenue increased by 3.1% from
DKK 4,671 million in 2013 to DKK 4,814 million in 2014,
slightly above expectations. Adjusted for income from
consulting services and product sales – including sale
of hardware – revenue was on par with 2013.
Given market conditions, this revenue development
is considered satisfactory.
The Group’s revenue comes primarily from sales of
services relating to legal and administrative software
and from IT outsourcing, services and project sales.
EBITDA
The Group’s EBITDA grew 63.7% from DKK 440 million
in 2013 to DKK 721 million in 2014, due partly to the
effect of the rationalization measures implemented in
2013 and 2014 and lower expenditure on new initiatives
in 2014.
ADJUSTED EBITDA
Adjusted for one-off items, EBITDA grew 13.8% from
DKK 840 million in 2013 to DKK 956 million in 2014.
One-off items in 2014 totaled DKK 235 million against
DKK 407 million in 2013, mainly comprising expenditure
on rationalization measures in both years.
Adjusted for one-off items, the EBITDA margin was
19.9% compared with 18.0% in 2013.
COMPREHENSIVE INCOME
The Group’s total comprehensive income rose from DKK
64.1 million in 2013 to DKK 119.0 million in 2014.
The increase should be seen in the light of lower
expenditure on rationalization measures and the effect
of the measures implemented. The positive effect was
partly offset by higher impairment losses on
development projects, because future cash flows were
reassessed as a result of changed IT architecture
requirements. Impairment losses on development
projects for the year were DKK 393 million.
REVENUE AND EARNINGS
REVENUE/AVG. NUMBER OF EMPLOYEES
REVENUE
1,000 1,200 1,400 1,600 1,800
2012
2013
2014
DKK thousand
2,000 2,500 3,000 3,500 4,000 4,500 5,000
2012
2013
2014
DKK million
6
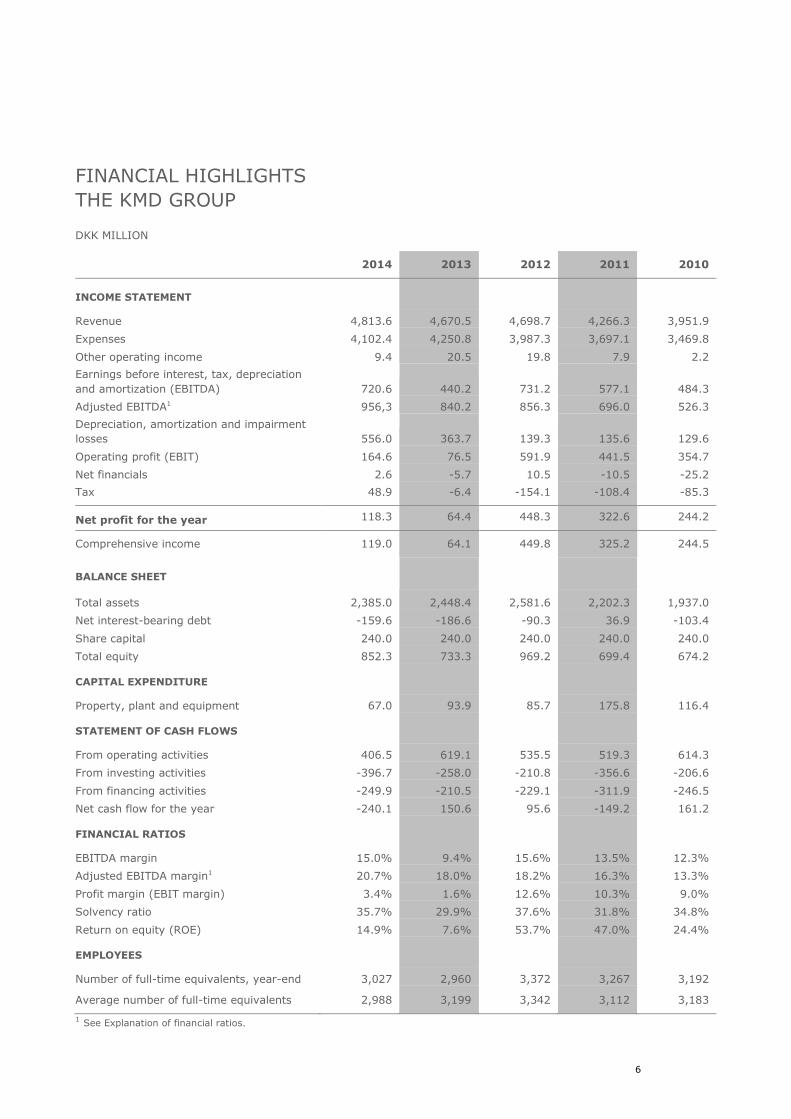
FINANCIAL HIGHLIGHTS
THE KMD GROUP
DKK MILLION
2014 2013 2012 2011 2010
INCOME STATEMENT
Revenue 4,813.6 4,670.5 4,698.7 4,266.3 3,951.9
Expenses 4,102.4 4,250.8 3,987.3 3,697.1 3,469.8
Other operating income 9.4 20.5 19.8 7.9 2.2
Earnings before interest, tax, depreciation
and amortization (EBITDA) 720.6 440.2 731.2 577.1 484.3
Adjusted EBITDA1 956,3 840.2 856.3 696.0 526.3
Depreciation, amortization and impairment
losses 556.0 363.7 139.3 135.6 129.6
Operating profit (EBIT) 164.6 76.5 591.9 441.5 354.7
Net financials 2.6 -5.7 10.5 -10.5 -25.2
Tax 48.9 -6.4 -154.1 -108.4 -85.3
Net profit for the year 118.3 64.4 448.3 322.6 244.2
Comprehensive income 119.0 64.1 449.8 325.2 244.5
BALANCE SHEET
Total assets 2,385.0 2,448.4 2,581.6 2,202.3 1,937.0
Net interest-bearing debt -159.6 -186.6 -90.3 36.9 -103.4
Share capital 240.0 240.0 240.0 240.0 240.0
Total equity 852.3 733.3 969.2 699.4 674.2
CAPITAL EXPENDITURE
Property, plant and equipment 67.0 93.9 85.7 175.8 116.4
STATEMENT OF CASH FLOWS
From operating activities 406.5 619.1 535.5 519.3 614.3
From investing activities -396.7 -258.0 -210.8 -356.6 -206.6
From financing activities -249.9 -210.5 -229.1 -311.9 -246.5
Net cash flow for the year -240.1 150.6 95.6 -149.2 161.2
FINANCIAL RATIOS
EBITDA margin 15.0% 9.4% 15.6% 13.5% 12.3%
Adjusted EBITDA margin1 20.7% 18.0% 18.2% 16.3% 13.3%
Profit margin (EBIT margin) 3.4% 1.6% 12.6% 10.3% 9.0%
Solvency ratio 35.7% 29.9% 37.6% 31.8% 34.8%
Return on equity (ROE) 14.9% 7.6% 53.7% 47.0% 24.4%
EMPLOYEES
Number of full-time equivalents, year-end 3,027 2,960 3,372 3,267 3,192
Average number of full-time equivalents 2,988 3,199 3,342 3,112 3,183
1 See Explanation of financial ratios.

7
EXPENSES
COST MANAGEMENT
Staff costs and other external expenses fell 3.5% to
DKK 4,102 million, due largely to the fall in expenditure
on rationalization measures in 2014.
One-off items were DKK 235 million, against DKK 407
million in 2013, and related mainly to rationalization
measures.
Adjusted for one-off items, expenses totaled DKK 3,867
million, a marginal increase of 0.6% on 2013.
Staff costs fell DKK 287 million, or 12%, due partly
to a significant reduction in the average number of
employees and partly to lower restructuring expenses.
Adjusted for one-off items, staff costs and other external
expenses fell 5%.
This development is considered satisfactory.
OUTLOOK
OUTLOOK FOR 2014
The outlook for the KMD Group in 2014 was for revenue
to fall 4% compared with 2013 and earnings (EBITDA)
to grow, driven by operational optimizations.
In 2014, KMD delivered revenue growth of 3% and
improved earnings. However, the growth was driven
by income from consulting services and product sales,
including sale of hardware. Excluding these, revenue
fell 1%.
OUTLOOK FOR 2015
For 2015, KMD expects revenue on par with 2014 and
continued growth in earnings.
The critical factors that could affect KMD's financial
performance both positively and negatively are new
sales to local governments and the development in
sales to the private and central government markets.
With the new strategy, KMD expects to be able to
retain its position as one of the top three software
and IT service providers in Denmark.
EVENTS AFTER THE BALANCE SHEET DATE
The company acquired the shares in Avaleo A/S after
the balance sheet date.
There have not been any other events after the balance
sheet date with a material impact on the Company’s
financial position as of 31 December 2014.

8

9
KMD's largest customer segment is Denmark’s 98 local
governments, which account for around 66% of
revenue. Revenue in this market in 2014 was on par
with 2013.
We are pleased that our market share remains strong
in the segment and that the market is constantly
developing with new product launches and business
opportunities.
THE TRANSITION AGREEMENT AND NEW TENDERS
In spring 2014, KMD and KOMBIT came to the end of
the fifth year of the transition agreement. KMD is
pleased to have been able to maintain the agreed
service targets throughout the period of the agreement.
At the start of 2014, KMD and KOMBIT laid the ground
for the big KOMBIT tenders with a number of phase-out
agreements.
Moreover, KMD has prepared thoroughly for the
strategically important tenders from KOMBIT and
Payments Denmark. To ensure the best possible bids,
KMD has established a dedicated Bid Excellence unit,
which coordinates and brings together KMD's many
competencies in these areas.
We acquitted ourselves well and were awarded the
contract to develop the support systems, as well as
being reawarded the contract to develop and operate
KOMBIT’s NemRefusion reimbursement system.
STRONG DEVELOPMENT IN THE FINANCIAL AREA
The local governments continue to focus on effective
enterprise management.
For a number of years, KMD has offered local
governments support in this area via KMD Opus and
a number of associated IT solutions and services. In
2014, there were both new customers for KMD Opus
and product innovations.
One of the contracts awarded to KMD was to replace the
City of Copenhagen’s payroll system, which calculates
and pays the salaries of more than 45,000 employees.
Among other things, the new system offers the local
government new salary simulation and management
information options.
But it is not just the local governments that are
investing in IT systems from KMD – it goes both ways.
In 2014, KMD purchased Aarhus local government’s
NemØkonomi system. The system complements the
Opus portfolio and is now being offered to other local
governments.
The year also saw the launch of a new rota-planning
system, KMD Opus Vagtplan, which has been developed
in close collaboration with a number of local
governments and will come on stream early in 2015.
PAYMENTS CHANGING
More than DKK 400 billion passes through KMD's
systems each year, with the payment systems KMD
Udbetaling and KMD Opus Debitor serving as the
backbone of many of the Group’s IT solutions.
The way payments are made is changing, and KMD
wants to play a positive part in this. In the fall of 2014,
KMD and Danske Bank announced they had joined
forces to expand the use of mobile payments in the
local government sector.
KMD sees good prospects for this partnership, which has
the potential to make the local governments’ enterprise
management more efficient and, not least, to make life
easier for citizens.
KMD'S MARKETS
LOCAL GOVERNMENT

10
ELEVATING PARTNERSHIPS IN LOCAL GOVERNMENT
Rising demand for digital cooperation resources in the
local governments was the impetus behind KMD Nova
Dialog, which KMD launched in 2014.
As well as enabling local governments to work more
smoothly and quickly on cases involving multiple
parties, KMD Nova Dialog also allows citizens to keep
tabs on their own cases.
The market potential is huge because the solution is
the only one on the market built on a secure platform;
it can hence be used for everything from local planning
consultations to rehabilitation cases.
PARADIGM SHIFT IN FOCUS OF JOB CENTERS
Employment policy is undergoing radical change, and
the employment reform outlines an actual paradigm
shift in the focus of job centers from timeliness to
outcome.
KMD’s new solution concept Momentum consolidates
the new job center environment. As the new legislation
comes into force, Momentum will replace the current
solutions KMD Opera and Workbase from Medialogic.
2014 also saw the launch of KMD Effekt og Progression,
which among other things provides an overview of the
tenders within the local government and experiences
with these.
INTEREST IN ONE-OFF BENEFITS
An area that has attracted increasing attention from
politicians and administrators in recent years is
one-off benefits, and here there is potential for further
rationalization of processes and payments.
KMD has previously developed a number of IT solutions
in the LEX range, which handles various healthcare
services, an area that has until now been supported by
a number of manual processes.
At the end of 2014, KMD put the finishing touches
to a new system to handle travel allowances. KMD
Befordring will help to rationalize processing and,
among other things, eliminate the large number of
wasted journeys. KMD Befordring will be launched
widely in the market early in 2015.
CONTINUED DIGITIZATION OF PUBLIC SCHOOLS
Public schools are on the brink of sweeping digitization
in the wake of the new agreement to reform public
schools and the government’s digital welfare strategy.
By the end of 2017, every public school in Denmark
must have started using the new user portal. This
comprises a number of standalone elements such
as learning platform, cooperation platform and the
”Dash Board.”
KMD has ambitions to be the most complete IT provider
in the school sector and has, over the years, built up
an effective unit that is now a solid player in learning
platforms as well as administrative systems for schools.
11
KMD Education is now used in schools throughout
Denmark, and in Vejle alone, the system is used in over
20 schools with more than 3,000 pupils being taught
via the platform. In tandem with the expansion of KMD
Education, an increasing number of local governments
have adopted the pupil record system KMD Vokal.
ONLINE MEETINGS WITH NEW CITIZEN GROUPS
In 2014, KMD changed the name of its online health
solution from KMD Online Omsorg to KMD Viva. At the
same time, the solution has been further developed to
function as the hub for all the digital welfare services
provided to citizens in the health, care and social areas.
KMD Viva gained a handful of new customers in 2014,
and a number of existing customers increased their
usage – measured by number of citizens. Horsens
municipality has achieved such positive results that,
following a trial period of virtual treatment for citizens
with disabilities and alcohol problems, the local
government has now decided to expand use of KMD
Viva to close on 200 citizens. Something completely
new is that it now also covers children and young people
in local-authority and foster care.
Administrative systems in the health, care and social
areas also experienced a high level of activity in 2014.
Using its KMD CARE platform, KMD has developed and
provided access to "Det Fælles Medicinkort," a system
that enables individuals and healthcare professionals to
gain access to medical records. KMD SmartCARE, the
new mobile tool for municipal healthcare professionals
making home visits, has been implemented by a large
proportion of customers. We have also gained a number
of new customers for KMD EKJ, a system for keeping
electronic records of social care clients.
SECURITY AT A PREMIUM
At KMD, security has been part of our DNA for many
years. Today, just over 100 people in KMD work on
IT security on a daily basis, and KMD has the latest
international certifications in the area, including ISO
27001.
At a time dominated by a number of security-related
issues in the IT industry, in 2014 KMD was the first
company in Denmark to open its own Security Analytics
Center (SAC).
SAC is a Danish security center set up in response to
the large number of sophisticated and damaging IT
attacks that Danish companies have experienced in
recent years. The Center’s main task is to provide
surveillance and defensive measures against any form
of cybercrime directed at KMD's customers and its own
infrastructure.
In order to stay a step ahead regarding the current
threat assessment, SAC combines sophisticated, state-
of-the-art technology with the virtues of old-fashioned
scrutiny.
Alongside SAC, KMD offers customers a whole series
of security solutions such as Identity Management,
Log Management, etc. In particular, customers seek
KMD's assistance to address employees’ IT behavior,
creating balance between control and the freedom to
generate innovation.
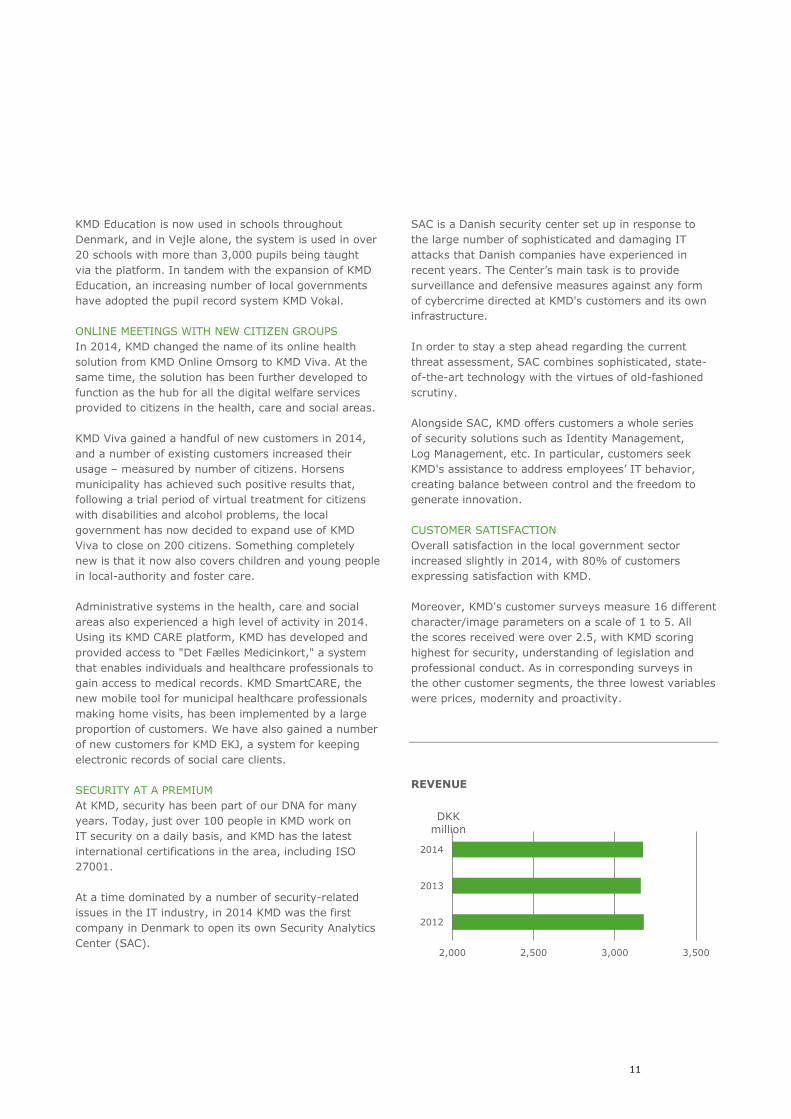
CUSTOMER SATISFACTION
Overall satisfaction in the local government sector
increased slightly in 2014, with 80% of customers
expressing satisfaction with KMD.
Moreover, KMD's customer surveys measure 16 different
character/image parameters on a scale of 1 to 5. All
the scores received were over 2.5, with KMD scoring
highest for security, understanding of legislation and
professional conduct. As in corresponding surveys in
the other customer segments, the three lowest variables
were prices, modernity and proactivity.
REVENUE
2,000 2,500 3,000 3,500
2012
2013
2014
DKK million

12
KMD’s revenue in the central government market fell
15% in 2014 due to the closing of a number of major
projects and activities in previous financial years.
DEVELOPING COOPERATION WITH CENTRAL
GOVERNMENT
Developing cooperation in the central government
market is a priority for KMD.
2014 was a good year on several fronts, with KMD
entering into new contracts with the Danish tax
authority SKAT and the Ministries of Education and
Health.
KMD TO DEVELOP DATA DISTRIBUTOR
The Danish Digitisation Authority awarded KMD the
contract to develop and operate the Data Distributor,
which from 2015 will provide authorities and private
companies with a single point of access to updated basic
data on companies, properties, individuals, addresses
and maps.
The Data Distributor will replace a number of public-
sector distribution solutions, and guarantee authorities
and companies easy and secure access to basic data
in a single system rather than across many different
systems and interfaces. The plan is for the Data
Distributor to be up and running for users to start
accessing data during 2015.
A DIGITAL CORNERSTONE
KMD has been a digital hub at election time in Denmark
for many years. KMD is responsible for the technology
used for election-related printing, including polling
cards. KMD is also behind the digital infrastructure used
on election day for voting via digital electoral registers
and counting the votes in the evening.
KMD has now also been tasked with developing a
system – for launch in 2015 – that will make it easier
for new parties to stand in national elections in
Denmark, and easier for citizens to support them.
KMD is proud to do this and continue to be a digital
cornerstone of one of the most significant elements
of Danish society.
CUSTOMER SATISFACTION
KMD's surveys show that customer satisfaction in the
central government sector increased in 2014. 91% of
customers said they were satisfied with KMD, continuing
the progress of previous years.
Moreover, KMD's customer surveys measure 16 different
character/image parameters on a scale of 1 to 5. All
the scores received were over 3.0, with – as in the local
government sector – KMD scoring highest for security,
understanding of legislation and professional conduct.
As in corresponding surveys in the other customer
segments, the three lowest variables were prices,
modernity and proactivity.
REVENUE
0 100 200 300 400 500 600
2012
2013
2014
DKK million
CENTRAL GOVERNMENT
13
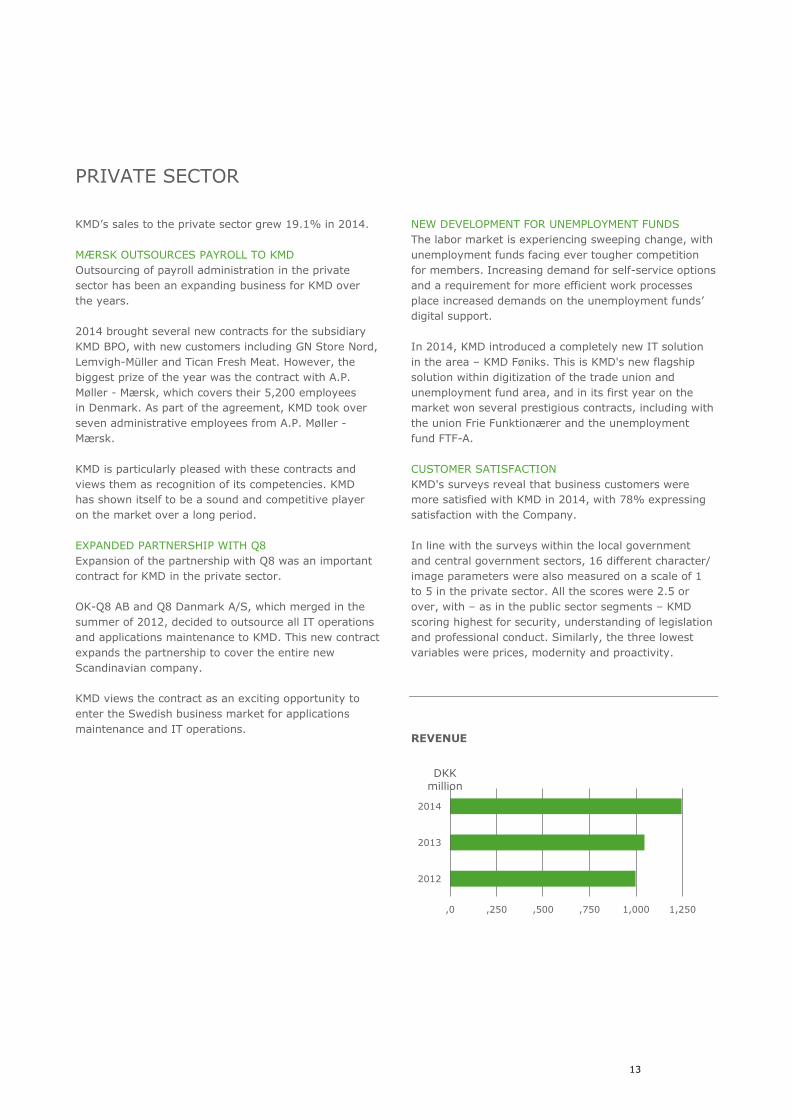
KMD’s sales to the private sector grew 19.1% in 2014.
MÆRSK OUTSOURCES PAYROLL TO KMD
Outsourcing of payroll administration in the private
sector has been an expanding business for KMD over
the years.
2014 brought several new contracts for the subsidiary
KMD BPO, with new customers including GN Store Nord,
Lemvigh-Müller and Tican Fresh Meat. However, the
biggest prize of the year was the contract with A.P.
Møller - Mærsk, which covers their 5,200 employees
in Denmark. As part of the agreement, KMD took over
seven administrative employees from A.P. Møller -
Mærsk.
KMD is particularly pleased with these contracts and
views them as recognition of its competencies. KMD
has shown itself to be a sound and competitive player
on the market over a long period.
EXPANDED PARTNERSHIP WITH Q8
Expansion of the partnership with Q8 was an important
contract for KMD in the private sector.
OK-Q8 AB and Q8 Danmark A/S, which merged in the
summer of 2012, decided to outsource all IT operations
and applications maintenance to KMD. This new contract
expands the partnership to cover the entire new
Scandinavian company.
KMD views the contract as an exciting opportunity to
enter the Swedish business market for applications
maintenance and IT operations.
NEW DEVELOPMENT FOR UNEMPLOYMENT FUNDS
The labor market is experiencing sweeping change, with
unemployment funds facing ever tougher competition
for members. Increasing demand for self-service options
and a requirement for more efficient work processes
place increased demands on the unemployment funds’
digital support.
In 2014, KMD introduced a completely new IT solution
in the area – KMD Føniks. This is KMD's new flagship
solution within digitization of the trade union and
unemployment fund area, and in its first year on the
market won several prestigious contracts, including with
the union Frie Funktionærer and the unemployment
fund FTF-A.
CUSTOMER SATISFACTION
KMD's surveys reveal that business customers were
more satisfied with KMD in 2014, with 78% expressing
satisfaction with the Company.
In line with the surveys within the local government
and central government sectors, 16 different character/
image parameters were also measured on a scale of 1
to 5 in the private sector. All the scores were 2.5 or
over, with – as in the public sector segments – KMD
scoring highest for security, understanding of legislation
and professional conduct. Similarly, the three lowest
variables were prices, modernity and proactivity.
REVENUE
,0 ,250 ,500 ,750 1,000 1,250
2012
2013
2014
DKK million
PRIVATE SECTOR

14
The Board of Directors and Executive Board of KMD A/S
are responsible for ensuring that the Company’s
management structure and control systems are
appropriate and function satisfactorily. The basis for
management’s work includes the Danish Companies Act,
the Danish Financial Statements Act, the Company’s
bylaws and rules of procedure for the Board of Directors
and Executive Board, and good practice for companies
of the same size as KMD.
Management’s review has been drawn up on the basis
of the Danish Venture Capital and Private Equity
Association’s guidelines for active ownership and
transparency in private equity funds (see www.dvca.dk).
OWNERSHIP AND CAPITAL STRUCTURE As of 31 December 2014, the entire share capital of
DKK 240 million (240,000 shares) in KMD A/S was
owned by the parent company KMD Holding A/S. All
the other companies in the KMD Group – with the
exception of AI Keyemde Aps – are also 100% owned
by their parent company. AI Keyemde ApS is owned
by AI Keyemde & Cy SCA and the limited partnerships
AI Keyemde B K/S, AI Keyemde B2 K/S and AI
Keyemde C K/S.
The company structure is illustrated below. The share
capital of KMD A/S is not divided into share classes.
DIVIDEND The Company’s bylaws authorize the Board of Directors
to take decisions on distribution of extraordinary
dividends where the financial situation of the Company
and the Group allows.
No extraordinary dividend was distributed by KMD A/S
in 2014.
THE WORK OF THE BOARD OF DIRECTORS The Board of Directors held 10 meetings in 2014. It
worked on the revision of the Group’s business strategy,
followed up the implementation of KMD's strategy and
action plans, and was briefed monthly by the Executive
Board on the Company’s financial performance.
REMUNERATION OF THE BOARD OF DIRECTORS AND
EXECUTIVE BOARD
Total remuneration of DKK 36.7 million was paid to
the Board of Directors and the Executive Board in 2014,
including severance pay to members of the Executive
Board. See Note 6 to the consolidated financial
statements for further information.
REMUNERATION
Board of Directors DKK 0.2 million
Executive Board DKK 36.5 million
Total DKK 36.7 million
CORPORATE COMPLIANCE AND GOVERNANCE
CORPORATE GOVERNANCE
15
CORPORATE COMPLIANCE
In 2014, KMD maintained focus on its work on
regulatory compliance, especially with UK and US
anticorruption rules in light of KMD’s ownership.
With assistance from external consultants, KMD has
produced a gap analysis and a risk analysis based
on Transparency International’s recommendations
to optimize the prioritization of future compliance
measures.
Based on this prioritization, in 2014 KMD focused on
establishing a supplier evaluation system to address
CSR and anticorruption. After thorough market testing,
KMD has entered into a contract with Eco Vadis SAS and
implemented its IT system to evaluate KMD's high-risk
suppliers, based on revenue, product, industry and the
relevant country’s risk level pursuant to Transparency
International’s Corruption Perception Index.
The program will be rolled out on an ongoing basis
over the next three years, with the aim of evaluating
all identified high-risk suppliers.
Moreover, audit processes for the compliance area with
fixed audit intervals have been drawn up in conjunction
with KMD's Internal Audit function.
As KMD does business mainly with the public sector,
we have decided to strengthen the training of customer-
facing employees in anticorruption. Besides the general
introduction to compliance given to all new employees,
in 2014 KMD developed and implemented a specific
e-learning program on anticorruption for customer-
facing employees. Completion of the program is
compulsory, and at year-end 2014 more than 1,700
employees had completed it.
The introduction of a whistleblower program in 2012
has given all employees and members of the Executive
Board and the Board of Directors an alternative to the
regular reporting pathways when reporting breaches
of legislation and KMD’s internal rules.
The whistleblower program covers the seven key
compliance areas at KMD: anticorruption, IT security,
authorizations, competition law, intellectual property
rights, contractual risk management and document
management/storage. Two cases were reported and
dealt with through the program in 2014.
In 2015, KMD will continue to implement the prioritized
compliance measures, which include having notification
of extension of the whistleblower program – to cover
external reporters, updates to the e-learning program
and general updates to policies on the compliance site
–approved by the Danish Data Protection Agency.
We also work continuously on IT security policies and
programs to support our objective of secure and
compliant data processing.
KMD was certified under the Danish security standard
DS 484:2005 in 2010, and recertified for quality (ISO
9001) and IT service management (ISO 20000) in 2012.
We were also certified under the international
information security management standard ISO 27001
in 2013.
16
BUSINESS RISKS
Like all other IT companies, KMD is exposed to
a number of business risks relating to market
developments, customer demand, technological
changes, employee recruitment, project management,
etc.
KMD works systematically with risks via an Enterprise
Risk Management function, which operates within the
frameworks defined by the Board of Directors and
provides KMD's Board of Directors and Executive Board
with an overview of the Group’s key risks and how they
are managed.
Work on early identification and evaluation of risks and
on planning how to handle known risks and incorporate
them into strategies and targets is an integrated part of
managing the business.
A significant part of KMD’s business involves legal IT
systems, which currently come under the transition
agreement entered into with Denmark’s local
governments and KOMBIT in connection with the
privatization of KMD in 2009.
All of these specialist areas are opened up to
competition via KOMBIT and Payments Denmark, which
have taken over some of the tasks from the local
governments. The first tenders were completed during
2014.
KMD views free competition as positive for both
customers and the IT sector.
The change of business model will, of course, present a
commercial challenge.
We acquitted ourselves well in 2014 and were awarded
the contract to develop the support systems, as well as
being reawarded the contract to develop and operate
KOMBIT’s NemRefusion reimbursement system.
SPECIAL RISKS
17
KMD has established a number of control and risk
management systems in connection with financial
reporting, the purpose of which is:
_ To ensure timely, accurate and informative financial
reporting in accordance with applicable accounting
legislation.
_ To create a basis for internal financial control and
budget follow-up.
The control and risk management systems established
are improved continuously and are designed to ensure
that errors and irregularities are detected and corrected
in time. These systems can be divided into:
_ Control environment
_ Risk assessment
_ Control activities
_ Information and communication
_ Monitoring
CONTROL ENVIRONMENT
Responsibilities and authorities are defined in the Board
of Directors’ instructions for the Executive Board,
policies, procedures and codes. The Board of Directors
approves KMD's main treasury, finance and risk
management policies, while the Executive Board
approves other policies and procedures, and the
responsible functions issue guidelines and supervise the
application of all policies and procedures. Systems have
been established to ensure correct functional separation
in the accounting department. The organizational
structure and the internal guidelines define the control
environment in conjunction with laws and other rules
and regulations.
RISK EVALUATION
Calculation of a number of items in the financial
reporting is based on estimates, some of which are
generated through processes based on complex
assumptions. The ongoing process for risk assessment
of contracts and projects in progress identifies these
items, and the scope of the risks associated with them
is determined by the controllers responsible for the
business in close collaboration with the accounting
department.
CONTROL ACTIVITIES
The aim of control activities is to prevent, detect and
correct any errors and irregularities. These activities
are integrated into KMD's accounting and reporting
procedures and include procedures for certification,
authorization, approval, reconciliation, analysis of
results, separation of incompatible functions, controls
relating to IT applications and general IT controls.
All risk assessments and associated controls are
consistent with KMD’s strategy and targets.
INFORMATION AND COMMUNICATION
KMD maintains information and communication systems
to ensure that financial reporting is reliable and
complete. KMD's bookkeeping rules and procedures for
financial reporting are set out in an accounting manual.
This and other reporting instructions, including budget
and month-end procedures, are updated as necessary.
Together with other policies relevant to internal control
of financial reporting, these are available to all finance
employees and other relevant employees on KMD's
intranet.
MONITORING
KMD uses a comprehensive enterprise system to
monitor the Company’s results, making it possible
to detect and correct any errors and irregularities
in financial reporting at an early stage, including
weaknesses in internal controls and non-compliance
with procedures and policies.
Compliance with the accounting manual is monitored
on an ongoing basis at Group level.
CONTROL AND RISK MANAGEMENT

18
2014 saw some changes to KMD’s organization. At the
start of the year, Eva Berneke succeeded Lars Monrad-
Gylling as CEO when he stepped down after 15 years at
the helm, and Jannich Kiholm Lund joined the Executive
Board as CFO. In addition, new people were appointed
to head up a number of newly established units in KMD.
NEW ORGANIZATION IN PLACE
KMD underwent major organizational change in 2014.
Within the main business areas Public Sector, Central
Government, Administrative Software Solutions, Citizen
Centered Software Solutions and Business &
Infrastructure, 17 business units were given greater
independent responsibility for everyday customer-facing
activities.
At the same time, KMD established two larger internal
units to handle software development and operations:
Software Center and Operations.
STRATEGY 2020
KMD launched a new strategy named "KMD on more
markets," covering the period through 2020. The
strategy’s overall aim is to strengthen KMD so that the
company becomes a leading player in both the public
and private sectors.
The strategy has three main focus areas:
_ KMD is to strengthen its engagement on more
markets. KMD has a clear growth strategy for central
government, business, regions and the new citizen-
centered areas in the local governments. Growth in
the business and central government markets will
ensure better balance and a broader market footprint.
_ KMD is to increase customer focus. Customers are to
be satisfied, such that they become increasingly loyal
to KMD and recommend us to others.
_ KMD is to be more efficient. KMD maintains its cost
focus to make the business as competitive as possible.
KMD ON MORE MARKETS
KMD has a clear ambition to grow the business
significantly outside the local government segment,
where it has a strong legacy.
As well as working to generate organic growth, KMD
made acquisitions in 2014 that brought new customers,
products and competencies.
In the fall, KMD bought the companies ScanJour, Cenza
and Capevo – all among the leaders in their respective
business areas and with their main customers in the
central government and business markets. The purchase
of Avaleo, one of Denmark’s leading companies within IT
systems for local authority healthcare provision,
followed in January 2015.
STRATEGY AND ORGANIZATION
KMD'S STRATEGY

19
SATISFIED CUSTOMERS > STRONGER BUSINESS
Customer understanding and satisfaction are the key
to KMD's success, which is why we launched a major
culture project in 2014 focusing on customer culture
and satisfaction.
The project "Satisfied customers > Stronger business"
is intended to help all employees be even more aware
of how KMD should act in a competitive market.
As part of the project, KMD revised its customer
philosophy.
GLOBAL DELIVERY STRENGTHENED
With continued focus on strengthening competitiveness,
Global Delivery has become an important parameter for
KMD.
Increased competition on the market for IT solutions
has led to growing use of offshoring. The combination of
local and foreign resources is often a prerequisite for
KMD being able to win contracts and, subsequently,
ensure delivery at the agreed time, price and quality.
At the end of 2014, KMD initiated the establishment
of a KMD development center in Poland.
CONTINUED FOREIGN AMBITIONS
KMD Sverige AB has been working for many years to
gain a sound footing in the Swedish software market.
After the Swedish National Financial Management
Authority (ESV) appointed KMD Sverige AB to supply
enterprise management systems to Sweden’s public
sector, it was not possible to bring enough additional
customers on board. Accordingly, in 2014 KMD decided
to downscale the organization in Sweden.
KMD still has activities in Sweden, in connection with
OK-Q8 AB and Q8 Danmark A/S choosing KMD as
operations partner in both Denmark and Sweden.

20
People are the most important success factor for a
knowledge-intensive company such as KMD, and the
Company strives continuously to improve in areas such
as recruitment, employee development, leadership
and organization development.
The market and KMD’s position in it are undergoing
a series of sweeping changes, reflected in a number
of parameters on the employee side.
STIFFER COMPETITION
Being competitive on price is one of the fundamental
requirements to be an attractive supplier in today’s IT
market.
KMD experienced further pressure on prices in the
market in 2014. Being an attractive supplier in a market
characterized by a long series of large and intensely
competitive tenders requires KMD to be able to match
competitors’ prices. On this basis, KMD trimmed its
organization and cut 109 jobs mid-year.
KMD has also adjusted a series of local agreements to
bring them into line with the market from 2015. Among
other things, all employees have been transferred to
function-based salaries, and paid lunch breaks have
been abolished.
CHANGES HAVE AN IMPACT
The many measures continuously being implemented to
adjust the business have an impact – both positive and
negative – on employees’ perception of KMD as a place
to work.
The overall tendency has been for satisfaction with KMD
as an employer to fall, with KMD employees reporting
a level slightly below the average for comparable
companies in 2014. Employees point to job security as
the key factor in the reduced level of job satisfaction.
KMD sees these results as a consequence of the many
changes the Company is going through.
On the other hand, the survey revealed that employees
are satisfied with senior management’s communication
of KMD's strategy and goals, and high level of customer
focus.
Finally, the survey showed commitment is high among
employees, and a relatively high proportion remain loyal
to KMD. In addition, there is a high level of satisfaction
with line managers and the day-to-day work.
Nevertheless, it is crucial for management that falling
levels of employee satisfaction do not become a lasting
trend. The decisive factor will be KMD’s ability to deliver
good results in the years ahead. KMD’s employees must
also see a positive role for themselves in the KMD of the
future.
Although KMD is in constant flux, we still aim to be
among the best IT employers in Denmark.
KMD GRADUATE
KMD is keen to take responsibility for developing the
pool of talent in Denmark’s IT sector and in 2014
launched a new two-year graduate program. There are
three strands to the program: IT, project management
and a broader business strand.
Graduates are an important parameter in attracting and
supporting business-critical competencies going forward.
NEW PENSION AND HEALTH INSURANCE SCHEMES
In 2014, KMD brought its company pension schemes
together under the umbrella of the Danish pension fund
Sampension. As well as gaining an overall picture of
the financial situation and contractual terms, it was
important for KMD to have a single provider of pension
and health insurance schemes.
Another deciding factor was KMD’s ability going forward
to offer employees a completely new insurance scheme
in the event of loss of working capacity and a health
insurance scheme with the emphasis on preventive
measures.
KMD'S EMPLOYEES

21
IRONMAN CONTINUES
KMD IRONMAN Copenhagen is northern Europe’s biggest
event of its kind with over 3,000 entrants from more
than 50 countries. The race attracts more than 200,000
spectators, making it one of Denmark’s largest spectator
events.
KMD and IRONMAN Denmark also sponsor KMD
IRONMAN 70.3 Aarhus and KMD IRONMAN 70.3
Kronborg, two popular events in Aarhus and Elsinore
covering half the traditional ironman distance.
Finally, the two parties are also behind the less extreme
KMD 4:18:4, a triathlon for all fitness enthusiasts
wanting to test themselves over the three disciplines:
swimming, cycling and running. It’s about exercise,
wellbeing and teamwork rather than speed,
equipment and rigorous training, and events are
held in Aalborg, Odense, Aarhus and Copenhagen.
KMD is delighted to be lead sponsor of these events,
together with IRONMAN Denmark, and in 2014 decided
to extend the agreement. The races offer a good
branding platform but have also become increasingly
popular among KMD’s employees, with more than 400
taking part in the various events in 2014.
22
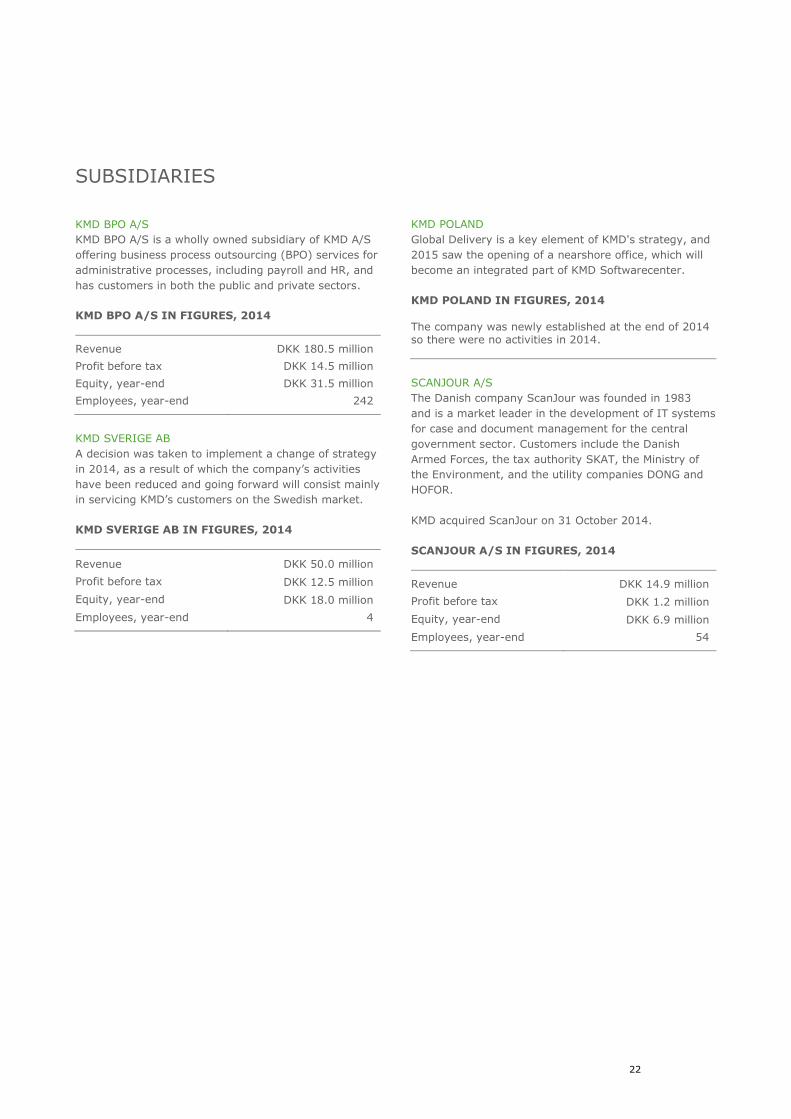
KMD BPO A/S
KMD BPO A/S is a wholly owned subsidiary of KMD A/S
offering business process outsourcing (BPO) services for
administrative processes, including payroll and HR, and
has customers in both the public and private sectors.
KMD BPO A/S IN FIGURES, 2014
Revenue DKK 180.5 million
Profit before tax DKK 14.5 million
Equity, year-end DKK 31.5 million
Employees, year-end 242
KMD SVERIGE AB
A decision was taken to implement a change of strategy
in 2014, as a result of which the company’s activities
have been reduced and going forward will consist mainly
in servicing KMD’s customers on the Swedish market.
KMD SVERIGE AB IN FIGURES, 2014
Revenue DKK 50.0 million
Profit before tax DKK 12.5 million
Equity, year-end DKK 18.0 million
Employees, year-end 4
KMD POLAND
Global Delivery is a key element of KMD's strategy, and
2015 saw the opening of a nearshore office, which will
become an integrated part of KMD Softwarecenter.
KMD POLAND IN FIGURES, 2014
The company was newly established at the end of 2014 so there were no activities in 2014.
SCANJOUR A/S
The Danish company ScanJour was founded in 1983
and is a market leader in the development of IT systems
for case and document management for the central
government sector. Customers include the Danish
Armed Forces, the tax authority SKAT, the Ministry of
the Environment, and the utility companies DONG and
HOFOR.
KMD acquired ScanJour on 31 October 2014.
SCANJOUR A/S IN FIGURES, 2014
Revenue DKK 14.9 million
Profit before tax DKK 1.2 million
Equity, year-end DKK 6.9 million
Employees, year-end 54
SUBSIDIARIES

23
AXAPOINT APS
Axapoint ApS, the Danish leader in architectural
frameworks, was acquired by KMD in 2013 and is behind
the organization and classification solution APOS2 for
Danish local governments.
AXAPOINT APS IN FIGURES, 2014
Revenue DKK 4.4 million
Profit before tax DKK -1.7 million
Equity, year-end DKK 0.6 million
Employees, year-end 6
CENZA APS
Cenza supplies digital HR and teaching platforms to
the financial sector in Denmark, and is behind
LæringsPortalen – the learning portal – which is an IT
system for both LMS (Learning Management Systems)
and HCM (Human Capital Management) used by several
financial institutions in Denmark.
KMD acquired Cenza on 31 October 2014.
CENZA APS IN FIGURES, 2014
Revenue DKK 0
Profit before tax DKK 0
Equity, year-end DKK 0
Employees, year-end 0
CAPEVO APS
Capevo is a Danish development and consulting
company that specializes in digital reporting and self-
service solutions. The company’s expertise covers
analysis, development and implementation as well as
maintenance and operation of digital reporting and
self-service solutions. Capevo has customers in both
the public and private sectors, including the Danish
Immigration Service, Sund & Bælt – the company
responsible for operating the road and rail link between
Denmark and Sweden – and Folkekirkens IT, which
provides IT support to the Evangelical Lutheran Church
in Denmark.
KMD acquired Capevo on 5 December 2014.
CAPEVO APS IN FIGURES, 2014
Revenue DKK 1.0 million
Profit before tax DKK 0.2 million
Equity, year-end DKK 5.3 million
Employees, year-end 20

24
CHAIRMAN
LÉO APOTHEKER
Born 1953
BA Economics & International Relations, Hebrew
University, Jerusalem
Chairman since 2012
Other positions:
Vice chairman, Schneider Electric SA
OTHER MEMBERS
JOHN WOYTON
Born 1978
BSc Economics, London School of Economics
Director, Advent International Corporation
Member since 2012
FRED WAKEMAN
Born 1962
BA Economics and History, University of California,
Berkeley, and MBA, Georgetown University School of
Business
Managing Partner, Advent International Corporation
Member since 2012
Other positions:
Director, DFS and Oberthur Technologies
MICHAEL CHRISTIANSEN
Born 1945
LLB, University of Copenhagen
Member since 2010
Other positions:
Chairman, DR, Dansk Retursystem A/S, Aarhus
University, Kraft & Partners A/S, Lead Agency A/S
and SHL A/S
Director, the Norwegian National Opera and Ballet, the
Royal Opera in Stockholm, CEJ A/S and Capnova A/S
BRET BOLIN
Born 1968
BBA Finance, Texas Tech University
Operating Partner, Advent International Corporation
Member since 2014
Other positions:
Director, UNIT4 and The Oil and Gas Clearinghouse
EVA BERNEKE
Born 1969
MSc Mechanical Engineering, Technical University of
Denmark, and MBA, INSEAD
CEO, KMD A/S
Employed in KMD since 2014
Member since 2014
Other positions:
Vice chairman, Copenhagen Business School
Director, LEGO A/S and Schibsted ASA
JANNICH KIHOLM LUND
Born 1970
MSc Economics, University of Copenhagen
CFO, KMD A/S
Employed in KMD since 2014
Member since 2014
BOARD OF DIRECTORS

25
ELSE BERGMAN
Born 1954
Technical consultant, KMD A/S
Employed in KMD since 1980
Member since 2012
Other positions:
Employee representative, KMD
KIM SKOVGAARD
Born 1962
Service consultant, KMD A/S
Employed in KMD since 1987
Member since 2014
Other positions:
HK union representative, KMD A/S
THOMAS BISBALLE JENSEN
Born 1970
Process operator, KMD A/S
Employed in KMD since 2004
Member since 2014
Other positions:
Employee representative, KMD
Working environment representative, KMD
Chairman, Samdata/HK
HENRIK HARDER OLSEN
Born 1972
Service consultant, KMD A/S
Employed in KMD since 2003
Member since 2014
Other positions:
Employee representative, KMD
Director, ITMK HK Østjylland

26
EXECUTIVE BOARD
EVA BERNEKE
CEO
JANNICH KIHOLM LUND
CFO, Finance & Sales Support
BUSINESS MANAGEMENT
OLE N.J. JENSEN
Senior Vice President, Public Sector. Cases & Benefits
BJARNE GRØN
Senior Vice President, Local Governments & Regions.
Citizen Centered Software Solutions
HELLE HUSS
Senior Vice President, Local Governments & Regions.
Administrative Software Solutions
SØREN AMUND HENRIKSEN
Senior Vice President, Central Government
JESPER KRYHLMAND
Senior Vice President, Business & Infrastructure
MICHAEL HOLMBERG ANDERSEN
Senior Vice President, Software Center
FRANK OLESEN
Senior Vice President, Operations
FUNCTIONS
LISBETH HALD
Senior Vice President, HR & Facility Management
MORTEN LANGAGER
Senior Vice President, Communication & Marketing
CHRISTOFFER HOLTEN
Senior Vice President, Strategy & Business Development
MARK SKRIVER NIELSEN
Senior Vice President, Legal & Business Support
HANS HENRIK KNUDSEN
Senior Vice President, Business Transformation
HENRIK ULSØ
Senior Vice President, Procurement
RASMUS THEEDE
Head of Group Security, Group Quality & Security
FINN CONRADSEN
Area Director, Bid Excellence
MANAGEMENT

27
CORPORATE SOCIAL RESPONSIBILITY REPORT

28
Dear Reader
KMD has been an integral part of Denmark’s public
sector for more than 40 years. Our IT systems bring
us into contact with thousands of Danes every single
day. Almost one million Danes receive their salaries
via KMD’s systems, and our systems pay government
benefits equivalent to more than 20% of Denmark’s
GDP. At the same time, we are upping the ante for IT
and making life easier for thousands of users in the
public and private sectors, schools, home care and
healthcare.
We are in other words a cornerstone of the Danish
welfare state, and our commitment to corporate social
responsibility (CSR) is part of our DNA. Our CSR
strategy covers four main areas: digital welfare,
employees, climate & environment and supply chain.
In 2014, we focused on building partnerships and
developing projects in these four areas. For us, CSR
is about making an active contribution, rather than
presenting a barrier, to social, economic and
environmental sustainability. This is set out in our
CSR policy introduced in 2011 and our CSR strategy
launched in 2012. KMD will review its CSR strategy
in 2015 and expects to present a revised strategy in
the first half of the year.
The starting point is KMD's position as an IT company
with the vision of creating digital shortcuts for
customers and society. As regards CSR, this means
that KMD will create digital shortcuts that contribute
to a richer, safer and more sustainable society.
Our work in these four main areas is described in more
detail below.
KMD first made a commitment to apply the UN Global
Compact's 10 principles in 2011. We are proud and
pleased to uphold this commitment and supported the
Global Compact with a donation of USD 5,000 in 2014.
The Global Compact provides KMD with a general
framework for its CSR work. This work is coordinated
by the Company's CSR Board, chaired by the CEO and
otherwise comprising the Senior Vice Presidents for
Citizen Centered Software Solutions, Legal & Business
Support, HR & Facility Management and Communication
& Marketing. The CSR Board issues guidelines for the
Company’s CSR efforts, and monitors and ensures
progress on the targets set for the various focus areas.
In addition, KMD's works council serves as a reference
group for the development of CSR work.
KMD considers its overall CSR efforts to be satisfactory.
Best wishes
Eva Berneke
CEO, KMD A/S
STATUTORY REPORT
This report constitutes the statutory report on
corporate social responsibility for KMD A/S
pursuant to section 99a of the Danish Financial
Statements Act. The report provides an
overview of KMD's work as a socially
responsible business. Further information about
KMD's CSR efforts can be found on its website
at www.kmd.dk/csr. However, that additional
information does not form part of the
Company’s reporting pursuant to section 99a.

29

30
For many years, KMD’s CSR relating to digital welfare
has focused in particular on health and education.
KMD sees real potential for digital solutions to the
demographic and economic challenges facing the Danish
welfare model and aims to support this process in a
responsible manner. We are therefore concentrating on
sharing solutions and knowledge, while remaining aware
of the challenges increased digitization may present for
some groups in society.
EDUCATION
The digitization of schools and training for young people
is a focus area for KMD, and was supported by the
following four initiatives in 2014:
HOMEWORK HELP ONLINE
KMD partnered with the State and University Library
in 2012 to establish three online homework cafés at our
sites in Ballerup, Odense and Aalborg. The main target
group is children and young people from disadvantaged
areas, who are typically unable to get help with
homework from their parents. Boys in particular tend
not to use the physical homework cafés in their local
communities1.
We were able to provide help on just under 1,200
occasions in 20142.
Besides providing help with homework, KMD also
worked with the library on further developing the digital
platform for the project. In 2014, KMD and the State
and University Library increased the target group for
homework help by launching Lektier Online Gym, which
is available to all upper-secondary schools in Denmark,
and entering into an agreement with three local
governments, which now offer online homework help
to all pupils in their areas.
Read more at www.statsbiblioteket.dk/lektier-online
(in Danish).
LØKKEFONDEN AND KHAN ACADEMY
KMD has been working with LøkkeFonden – a charity
founded by former prime minister Lars Løkke
Rasmussen “to bring boys back from the edge to
become useful members of society” – since 2012 on
creating a Danish version of the world’s most widely
1 State and University Library, Study of pupils’ opportunities for
help with homework, 2010. 2 KMD’s employees are able to swap their normal working hours
for shifts as online helpers. All of the helpers are given introductory training and are then offered further training in homework help on an ongoing basis.
used online educational resource, the much-praised
Khan Academy.
Khan Academy is a platform that enables students to
improve their skills, particularly in the natural sciences.
At the heart of the platform are a number of exercises,
tests and instructional videos, which have previously
been available only in English. KMD and LøkkeFonden
are in the process of translating the whole platform so
that Danish students and teachers can access the entire
public school curriculum via Khan Academy.
As of the end of 2014, a total of 892 mathematics
videos had been recorded and uploaded to Khan
Academy Denmark’s YouTube channel, and a beta
version of the entire platform had been launched at
da-dk.khanacademy.org/. KMD expects to launch a full
version of the platform in the first half of 2015.
DIGIGUIDES
KMD joined forces with the teacher training programs at
University College Copenhagen (UCC) in 2013 to set up
a corps of DigiGuides – teaching students with a special
interest in IT and digital learning tools who can help
teachers and students with digital solutions. In 2014,
KMD supplied iPads and enabled DigiGuides to extend
their subject knowledge by attending conferences.
KMD EDUCATION AWARD
In 2014, KMD established the KMD Education Award,
presented to an individual or group of teaching students
who has/have taught material based on digital resources
during their teaching practice. Only teaching students
from UCC were eligible to take part in 2014, but from
2015 the competition will be open to all seven university
colleges, enabling all teaching students to take part.
Each university college will nominate its own winner,
and the national winner will then be chosen from the
seven regional entries and announced at the Schools
Fair in Aarhus on 23 April 2015.
The competition reflects KMD’s wish to put the use of
digital resources in public schools in focus and to create
a positive attitude to this at Denmark’s teacher-training
colleges. In this way, we can support the training of the
teachers of the future using the teaching tools of the
future.
HEALTH AND SOCIAL CARE
KMD views health and social care as an important area
of the welfare state where digital solutions have great
potential to reduce costs and improve quality of life for
both patients and the wider public.
DIGITAL WELFARE
RESULTS IN 2014
31
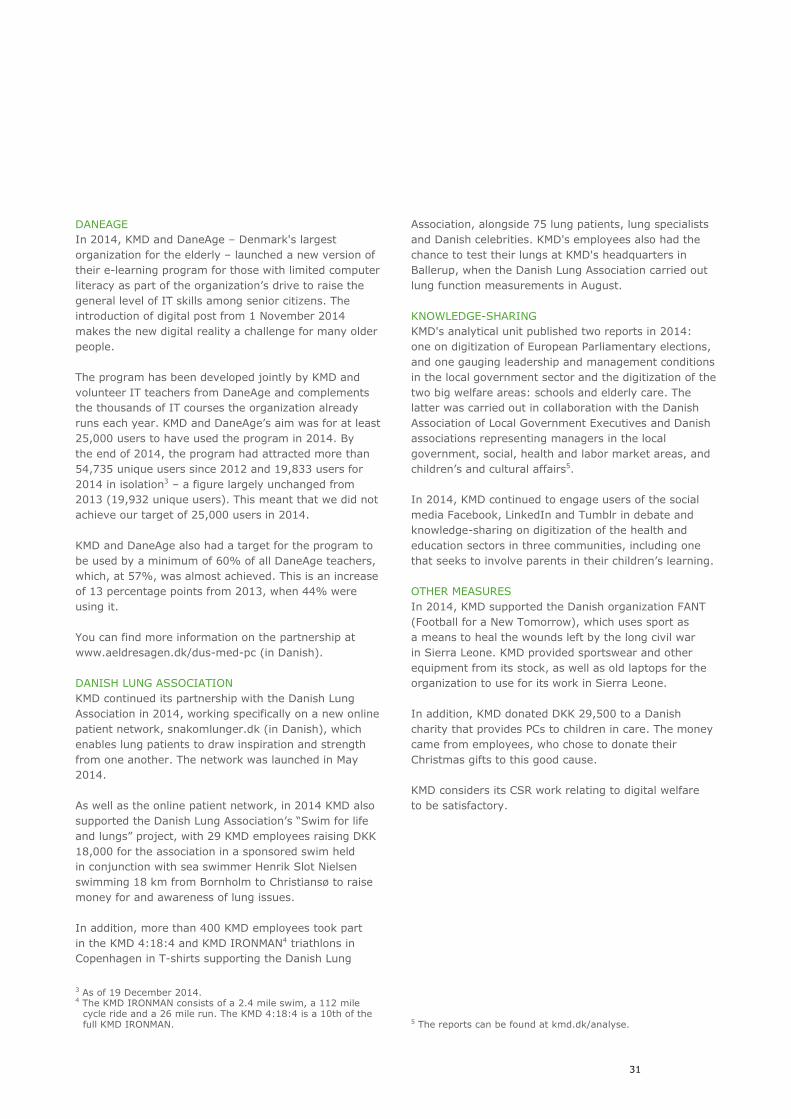
DANEAGE
In 2014, KMD and DaneAge – Denmark's largest
organization for the elderly – launched a new version of
their e-learning program for those with limited computer
literacy as part of the organization’s drive to raise the
general level of IT skills among senior citizens. The
introduction of digital post from 1 November 2014
makes the new digital reality a challenge for many older
people.
The program has been developed jointly by KMD and
volunteer IT teachers from DaneAge and complements
the thousands of IT courses the organization already
runs each year. KMD and DaneAge’s aim was for at least
25,000 users to have used the program in 2014. By
the end of 2014, the program had attracted more than
54,735 unique users since 2012 and 19,833 users for
2014 in isolation3 – a figure largely unchanged from
2013 (19,932 unique users). This meant that we did not
achieve our target of 25,000 users in 2014.
KMD and DaneAge also had a target for the program to
be used by a minimum of 60% of all DaneAge teachers,
which, at 57%, was almost achieved. This is an increase
of 13 percentage points from 2013, when 44% were
using it.
You can find more information on the partnership at
www.aeldresagen.dk/dus-med-pc (in Danish).
DANISH LUNG ASSOCIATION
KMD continued its partnership with the Danish Lung
Association in 2014, working specifically on a new online
patient network, snakomlunger.dk (in Danish), which
enables lung patients to draw inspiration and strength
from one another. The network was launched in May
2014.
As well as the online patient network, in 2014 KMD also
supported the Danish Lung Association’s “Swim for life
and lungs” project, with 29 KMD employees raising DKK
18,000 for the association in a sponsored swim held
in conjunction with sea swimmer Henrik Slot Nielsen
swimming 18 km from Bornholm to Christiansø to raise
money for and awareness of lung issues.
In addition, more than 400 KMD employees took part
in the KMD 4:18:4 and KMD IRONMAN4 triathlons in
Copenhagen in T-shirts supporting the Danish Lung
3 As of 19 December 2014. 4 The KMD IRONMAN consists of a 2.4 mile swim, a 112 mile
cycle ride and a 26 mile run. The KMD 4:18:4 is a 10th of the full KMD IRONMAN.
Association, alongside 75 lung patients, lung specialists
and Danish celebrities. KMD's employees also had the
chance to test their lungs at KMD's headquarters in
Ballerup, when the Danish Lung Association carried out
lung function measurements in August.
KNOWLEDGE-SHARING
KMD's analytical unit published two reports in 2014:
one on digitization of European Parliamentary elections,
and one gauging leadership and management conditions
in the local government sector and the digitization of the
two big welfare areas: schools and elderly care. The
latter was carried out in collaboration with the Danish
Association of Local Government Executives and Danish
associations representing managers in the local
government, social, health and labor market areas, and
children’s and cultural affairs5.
In 2014, KMD continued to engage users of the social
media Facebook, LinkedIn and Tumblr in debate and
knowledge-sharing on digitization of the health and
education sectors in three communities, including one
that seeks to involve parents in their children’s learning.
OTHER MEASURES
In 2014, KMD supported the Danish organization FANT
(Football for a New Tomorrow), which uses sport as
a means to heal the wounds left by the long civil war
in Sierra Leone. KMD provided sportswear and other
equipment from its stock, as well as old laptops for the
organization to use for its work in Sierra Leone.
In addition, KMD donated DKK 29,500 to a Danish
charity that provides PCs to children in care. The money
came from employees, who chose to donate their
Christmas gifts to this good cause.
KMD considers its CSR work relating to digital welfare
to be satisfactory.
5 The reports can be found at kmd.dk/analyse.

32
GOALS FOR 2015
EDUCATION
Homework help: KMD will continue to offer help with
homework online. The goal is for KMD's employees
to provide help on at least 1,200 occasions.
Khan Academy: Together with LøkkeFonden, KMD will
launch a full Danish version of Khan Academy.
DigiGuides: KMD will continue to support the DigiGuides
project.
KMD Education Award: KMD will present KMD Education
Awards at all seven university colleges across Denmark
before selecting a national winner in April.
HEALTH AND ELDERLY CARE
DaneAge: KMD and DaneAge will achieve a minimum
of 30,000 unique users for its e-learning program, with
at least 60% of DaneAge’s IT volunteers using the
program in their teaching.
Danish Lung Association: KMD and the Danish Lung
Association will join forces to offer lung function tests
to all KMD employees, as well as raising awareness of
lung issues by means of joint participation and activities
in connection with the KMD 4:18:4 and KMD IRONMAN
triathlons.

33
KMD wants to be an attractive workplace where
employees are proud of the contribution we make
to society – by virtue of both our products and our
behavior and knowledge.
We believe that we will remain strong as a company if
we create clear structures for our employees and give
them scope for personal and professional development.
KMD operates in a highly competitive market, requiring
us to manage costs so as to match competitors’ prices,
and in 2014 this meant having to say goodbye to
talented colleagues. A total of 109 job losses were
originally announced in August, but positive and
constructive dialogue with employee representatives on
the redundancy process reduced the number of layoffs
to 66.
New local agreements were negotiated in the spring to
bring KMD’s employment terms in line with the market.
The changes, which came into effect on 1 January 2015,
include employees being transferred to function-based
salaries and a standard 37-hour working week
compared with 34.5 previously. On the other hand, we
now offer an improved bonus scheme and a new health
insurance agreement for all employees.
As a consequence of the adjustments, satisfaction with
KMD as an employer has declined, with KMD employees
reporting a level slightly below the average for
comparable companies in 2014.
DIVERSITY
In 2014, KMD adopted a diversity policy addressing
issues such as the representation of women in
management and attracting more new graduates.
Our goal is for the most promising prospective
employees in the Danish labor market to choose KMD
regardless of gender, ethnicity, age, religion or sexual
orientation.
In 2015, we will increase the number of graduates
and allocate at least 25% of new appointments to this
group. One of the means to achieve this is the KMD
Graduate Program, which started recruitment in October
2014. A total of 25-30 graduates are expected to join
KMD in 2015.
KMD launched a policy in 2013 for the representation of
women on the Board of Directors, including a target of
17% by the end of 2016. With a share of 14.3%, this
target has not yet been achieved.
In addition, KMD has set a target of having a number
of female managers proportionate to the number of
female employees. In 2014, 34% of KMD’s employees
were women and the share of women at all levels of
management was 27%.
HEALTHY EMPLOYEES
KMD conducted a workplace assessment in 2014, which
showed that the working environment – both
psychological and physical – is generally good. Some
areas require extra focus, however. For example,
6.3% of employees reported that they had been signed
off work with stress or stress-related symptoms. In
addition, 102 employees (3.6%) stated they have
experienced workplace bullying. We are very alert to
the need to reduce bullying and protect employees
from stress, and this will be a focus area in 2015, taking
as its starting point the existing antibullying policy that
forms part of our employee policy.
Average sickness absence was 6.37 days in 2014, which
is 12.3% below the national average for private
companies with office-based activities. This is on a par
with KMD's performance in 2013 (6.4 days), and KMD
aims to maintain this level in 2015.
With this in mind, KMD has established a health
insurance scheme for all employees that provides access
to advice in the case of sickness absence, preventive
measures, cross-disciplinary treatment, treatment
insurance guaranteeing quick and efficient treatment,
and, not least, initiatives to counter long-term sickness
absence, and the opportunity to obtain confidential
advice on everything from personal to workplace-related
issues. The entire package is geared toward preventing
long-term sickness absence, benefiting both individuals
and KMD.
More than 400 employees took part in the KMD 4:18:4
and KMD IRONMAN triathlons in 2014 – both the half-
and full-length versions – with training organized at
KMD’s sites. In addition, more than 800 employees took
part in the DHL 5x5 km relay race.
KMD considers the overall results of its CSR work in
relation to employees to be satisfactory.
EMPLOYEES
RESULTS IN 2014

34
GOALS FOR 2015
DIVERSITY
KMD wants to maintain a share of female managers that
is proportionate to the number of women employees
(27% as of 31 December 2014).
KMD also wants to increase the proportion of new
graduates.
HEALTHY EMPLOYEES
KMD will maintain focus on a healthy workplace based
on its already successful sports clubs. Special training
programs for employees wanting to take part in the
KMD 4:18:4 and KMD IRONMAN triathlons will continue
across the business. KMD expects more than 500
employees to take part in one of these events.
KMD will also seek to maintain low levels of sickness
absence and reduce the proportion of employees with
stress or stress-related symptoms to below 5%.

35
As one of Denmark’s largest IT companies with around
3,000 employees plus large data centers and Denmark’s
largest print center, each year KMD uses a similar
amount of electricity to a town of 18,000 people, while
our print center and office printers print the equivalent
of 280 million pages.
We are very aware of our environmental footprint,
and in 2013 we were certified under the international
environmental management standard ISO 14001.
In 2014, we conducted an audit of our environmental
management system. Our structured approach to
environmental work, which has been developed over
many years, and is now certified, proved to have a
positive effect on a wide range of parameters in our
environmental policy, which focuses on energy
consumption, transport and waste management.
In 2015, KMD will launch a strategy and policy to ensure
progress in environmental work.
ENERGY CONSUMPTION
KMD's electricity consumption totaled 30,356,802
million kWh, a slight increase of just under 1 million
kWh compared with 2013 (3.4%). This was mainly
because KMD gained a whole series of major
outsourcing customers in 2014, which has increased
production in our data centers.
Since 2009, KMD has identified 97 different energy-
saving projects and realized 86% of their potential. As
a result, since 2008 we have made savings of 8.6
million kWh, equivalent to the annual consumption of
more than 1,600 detached houses6 or 28.1% of our
total energy consumption in 2008. In addition, our total
consumption of heating fell by 612.4 MWh in 2014.
As part of KMD's climate partnership with energy
supplier DONG Energy, since 2009 we have purchased
renewable energy certificates from DONG Energy’s
Horns Rev 2 wind farm equivalent to our total carbon
emissions from direct energy consumption. KMD also
purchases CO2 quotas to compensate for heating
consumption.
KMD's total carbon emissions from direct energy
consumption totaled 12,354 tons in 2014, up 13.7%
on 2013. The majority of this increase was due to a less
green overall energy mix in Denmark. There was also
a slight increase in carbon emissions from heating
6 An average detached home with four inhabitants consumes
5,181 kWh per year. Source: DONG Energy.
consumption despite a fall in total energy consumption.
This is due to an increase in the CO2-equivalent for
district heating of more than 26%.
Since 2008, KMD has cut its carbon emissions from
17,796 to 10,864 tons, a reduction of 38.9%.
TRANSPORT
Since 2010, KMD has worked hard to reduce carbon
emissions from transport between its sites. Having
reduced transport by 5.5% in 2013, carbon emissions
from transport rose by 1.3% in 2014. Among other
things, this is because KMD’s new organization has
increased the need for coordination and management
of employees at multiple locations – particularly
between headquarters in Ballerup and the site in
Aalborg – and the result has been an increase in air
travel. The goal of reducing internal transport between
sites by 10% by the end of 2014 has thus not been
achieved.
WASTE
Another focus area during the year was increasing the
recycling rate and gaining a picture of the carbon
emissions associated with waste collection as a first step
in mapping our carbon footprint from cradle to grave.
KMD increased the proportion of waste recycled at its
print and data centers from 72.2% in 2013 to 84% in
2014. This means we have increased the proportion of
waste recycled from 68.8% in 2012 and are therefore
far above the target of a 5% increase in the recycling
rate by the end of 2014. Focus has now shifted to
overall recycling at all sites, with a recycling rate of
62.9% achieved in 2014. KMD will increase this by 5%
by the end of 20167.
Together with our waste management supplier, Henrik
Tofteng A/S, we have launched a project to build a
picture of the total environmental impact from the
collection and disposal of the waste we generate.
KMD considers the overall results of its environmental
efforts to be satisfactory.
7 The recycling rate excludes waste from the sites in Aalborg and
Odense, which is measured by collection and not by weight. The bulk of KMD’s waste is generated at the site in Ballerup, Copenhagen, which is home to KMD’s print center and more than 50% of its employees.
CLIMATE & ENVIRONMENT
RESULTS IN 2014
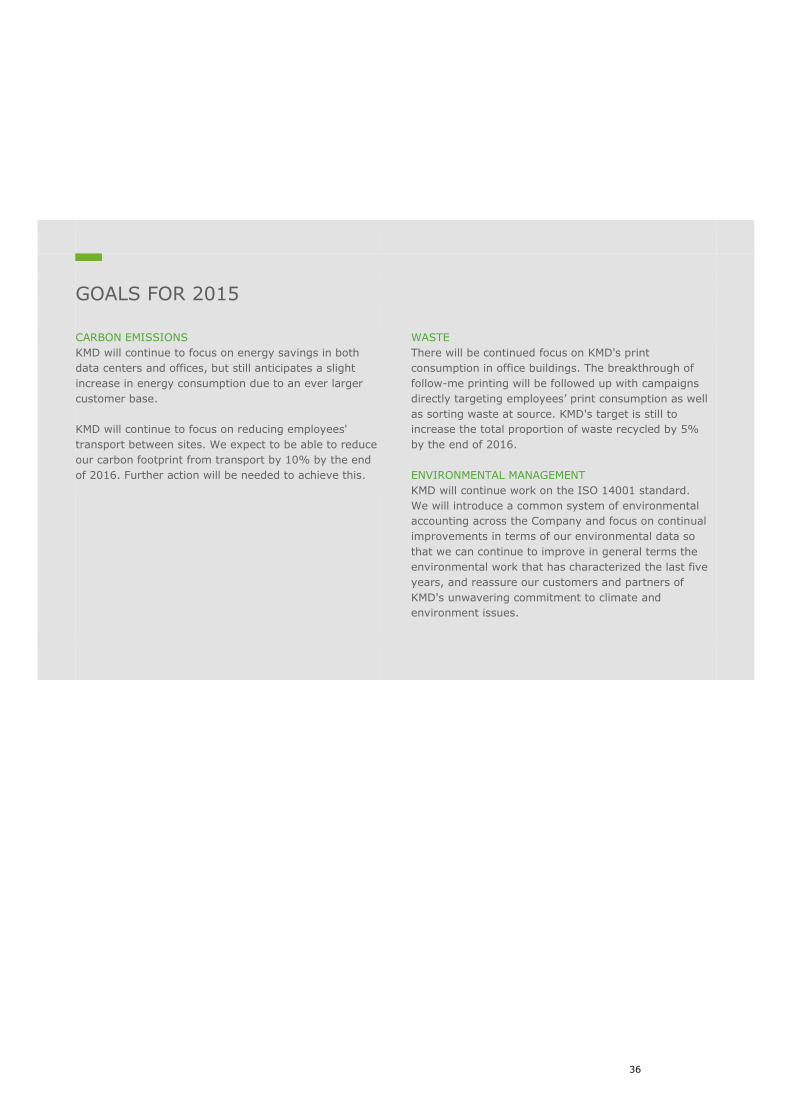
36
GOALS FOR 2015
CARBON EMISSIONS
KMD will continue to focus on energy savings in both
data centers and offices, but still anticipates a slight
increase in energy consumption due to an ever larger
customer base.
KMD will continue to focus on reducing employees'
transport between sites. We expect to be able to reduce
our carbon footprint from transport by 10% by the end
of 2016. Further action will be needed to achieve this.
WASTE
There will be continued focus on KMD's print
consumption in office buildings. The breakthrough of
follow-me printing will be followed up with campaigns
directly targeting employees’ print consumption as well
as sorting waste at source. KMD's target is still to
increase the total proportion of waste recycled by 5%
by the end of 2016.
ENVIRONMENTAL MANAGEMENT
KMD will continue work on the ISO 14001 standard.
We will introduce a common system of environmental
accounting across the Company and focus on continual
improvements in terms of our environmental data so
that we can continue to improve in general terms the
environmental work that has characterized the last five
years, and reassure our customers and partners of
KMD's unwavering commitment to climate and
environment issues.

37
Signing the UN Global Compact has committed KMD
to 10 fundamental principles relating to protection of
human and labor rights, climate and environmental
issues, and anticorruption measures. This provides KMD
with a concrete framework for the requirements the
Company makes of itself and its suppliers.
At the same time, KMD wants to keep tight control of
its own processes to ensure that the Company complies
with relevant legislation and its commitments under the
Global Compact, and sets requirements for its own
suppliers that support these commitments.
Accordingly, in 2014 KMD entered into an agreement
with the internationally renowned EcoVadis SAS, which
carries out online screenings of suppliers. This work will
be anchored in KMD's new central procurement
department under KMD's first Senior Vice President,
Procurement. This step will strengthen KMD’s control
of its supplier portfolio and ensure a more uniform
approach to suppliers in general and high-risk suppliers
in particular.
PARTNERSHIPS
In 2014, KMD implemented a new screening tool from
EcoVadis SAS. Over the next few years, KMD will screen
all high-risk suppliers on an annual basis. Suppliers are
identified on the basis of criteria such as revenue,
geography and industry. The screening facilitates fact-
based dialogue with our suppliers about their CSR work,
while placing our Supplier Code of Conduct in a concrete
context. This will help us reach our goal of all key
suppliers working in accordance with the principles of
the UN Global Compact by the end of 2015.
KMD intends to work with suppliers to draw up action
plans to help them improve their work in selected areas.
KMD has also started working with its waste
management supplier, Henrik Tofteng A/S, on mapping
the environmental impact of the collection and disposal
of the waste we generate.
CORPORATE COMPLIANCE
In 2014, KMD reviewed its policies in relation to the
10 principles of the UN Global Compact and the OECD
Guidelines for Multinational Enterprises. As a result,
we have revised our CSR policy so that it refers more
explicitly to human rights and drawn up a new diversity
policy. We have also revised our employee policy such
that it now refers to the other policies in the relevant
areas.
We also maintained focus on our work on regulatory
compliance, especially with UK and US anticorruption
rules in light of KMD’s ownership.
With assistance from external consultants, KMD has
produced a gap analysis and a risk analysis based on
Transparency International’s recommendations to
optimize the prioritization of future compliance
measures.
As KMD does business mainly with the public sector,
however, we have decided to strengthen the training
of customer-facing employees in anticorruption. Besides
the general introduction to compliance given to all
new employees, in 2014 KMD therefore developed
and implemented a specific e-learning program on
anticorruption for customer-facing employees.
Completion of the program is compulsory, and at year-
end 2014 more than 1,700 employees had completed it.
The introduction of a whistleblower program in 2012
has given all employees and members of the Executive
Board and the Board of Directors an alternative to the
regular reporting pathways when reporting breaches
of legislation and KMD's internal rules.
The whistleblower program covers the seven key
compliance areas at KMD: anticorruption, IT security,
authorizations, competition law, intellectual property
rights, contractual risk management and document
management/storage. Two cases were reported and
dealt with through the program in 2014.
KMD considers its work on CSR in the supply chain to
be satisfactory.
SUPPLY CHAIN
RESULTS IN 2014

38
GOALS FOR 2015
PARTNERSHIPS
KMD will draw up relevant action plans for selected
suppliers identified via screenings in the EcoVadis
system.
KMD will also continue to work with suppliers to map our
environmental footprint throughout the value chain.
CORPORATE COMPLIANCE
KMD will continue the screening of high-risk suppliers
using the EcoVadis tool.
KMD will also continue implementation of the prioritized
compliance measures, which include having notification
of extension of the whistleblower program – to cover
external reporters, updates to the e-learning program
and general updates to policies in the compliance area
– approved by the Danish Data Protection Agency.

DOKUMENT INFORMATION 39
CONSOLIDATED FINANCIAL STATEMENTS
40_Consolidated income statement
40_Consolidated statement of comprehensive
income
41_Consolidated balance sheet
43_Consolidated statement of changes in equity
44_Consolidated statement of cash flows
45_Notes to the consolidated financial
statements
74_Explanation of financial ratios
PARENT COMPANY FINANCIAL STATEMENTS
75_Parent Company income statement
76_Parent Company balance sheet
78_Parent Company statement of changes in
equity
79_Notes to the Parent Company financial
statements
STATEMENTS
89_Statement by the Executive Board and Board
of Directors
90_ Independent auditor’s report
FINANCIAL STATEMENTS

40
DKK million
Note 2014 2013
4 Revenue 4,813.6 4,670.5
5 Other external expenses 2,023.9 1,885.7
6 Staff costs 2,078.5 2,365.1
Other operating income 9.4 20.5
Earnings before interest, tax, depreciation and amortization (EBITDA) 720.6 440.2
8,9 Depreciation and amortization 556.0 363.7
Operating profit (EBIT) 164.6 76.5
7 Financial income 15.8 8.0
7 Financial expenses 13.2 13.7
Earnings before tax (EBT) 167.2 70.8
15 Tax on profit for the year 48.9 6.4
Net profit for the year 118.3 64.4
CONSOLIDATED STATEMENT OF COMPREHENSIVE INCOME
DKK million
Note 2014 2013
Net profit for the year 118.3 64.4
Other comprehensive income
Value adjustments of hedging transactions before tax -0.6 -1.3
Value adjustments of hedging transactions included in financial items 0.5 0.6
Foreign currency translation adjustment of foreign enterprises 0.7 0.2
Tax on comprehensive income 0.1 0.2
Other comprehensive income after tax 0.7 -0.3
Comprehensive income 119.0 64.1
Attributable to:
Shareholders in the Parent Company 119.0 64.1
Non-controlling interests 0.0 0.0
Total comprehensive income 119.0 64.1
CONSOLIDATED FINANCIAL STATEMENTS
CONSOLIDATED INCOME STATEMENT
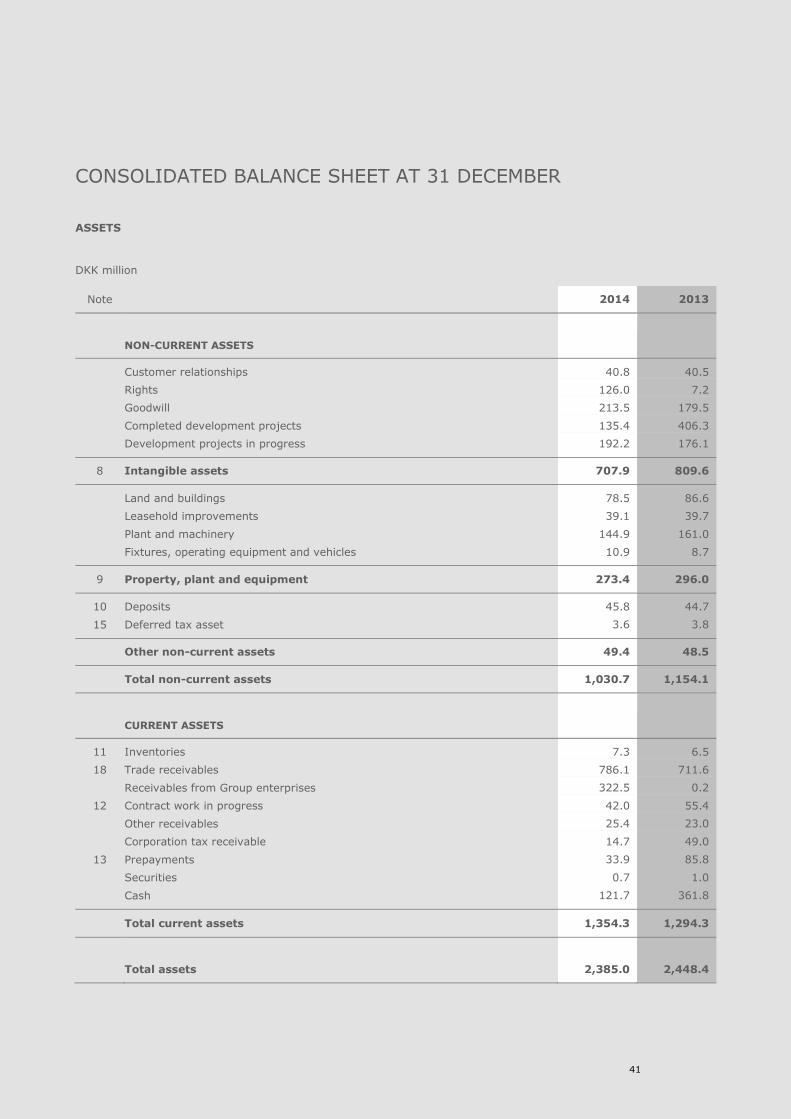
41
ASSETS
DKK million
Note 2014 2013
NON-CURRENT ASSETS
Customer relationships 40.8 40.5
Rights 126.0 7.2
Goodwill 213.5 179.5
Completed development projects 135.4 406.3
Development projects in progress 192.2 176.1
8 Intangible assets 707.9 809.6
Land and buildings 78.5 86.6
Leasehold improvements 39.1 39.7
Plant and machinery 144.9 161.0
Fixtures, operating equipment and vehicles 10.9 8.7
9 Property, plant and equipment 273.4 296.0
10 Deposits 45.8 44.7
15 Deferred tax asset 3.6 3.8
Other non-current assets 49.4 48.5
Total non-current assets 1,030.7 1,154.1
CURRENT ASSETS
11 Inventories 7.3 6.5
18 Trade receivables 786.1 711.6
Receivables from Group enterprises 322.5 0.2
12 Contract work in progress 42.0 55.4
Other receivables 25.4 23.0
Corporation tax receivable 14.7 49.0
13 Prepayments 33.9 85.8
Securities 0.7 1.0
Cash 121.7 361.8
Total current assets 1,354.3 1,294.3
Total assets 2,385.0 2,448.4
CONSOLIDATED BALANCE SHEET AT 31 DECEMBER

42
EQUITY AND LIABILITIES
DKK million
Note 2014 2013
EQUITY
14 Share capital 240.0 240.0
Hedging reserve -0.5 -0.5
Reserve for foreign currency translation adjustments 1.5 0.8
Retained earnings 611.3 493.0
Proposed dividend 0.0 0.0
Total equity 852.3 733.3
LIABILITIES
15 Provision for deferred tax 16.3 58.2
16 Provisions 9.5 9.2
18 Credit institutions 243.9 140.4
Other payables 26.8 35.8
Non-current liabilities 296.5 243.6
18 Credit institutions 41.4 6.6
Prepayments from customers 32.3 62.3
Trade payables 380.0 474.3
Payables to Group enterprises 0.0 29.2
17 Other payables 572.8 671.5
Derivative financial instruments 0.7 0.6
Corporation tax payable 3.7 4.6
16 Provisions 78.1 96.8
Deferred income 127.2 125.6
Current liabilities 1,236.2 1,471.5
Total liabilities 1,532.7 1,715.1
Total equity and liabilities 2,385.0 2,448.4
CONSOLIDATED BALANCE SHEET AT 31 DECEMBER

43
DKK million
Share
capital
Hedging
reserve
Reserve for
foreign
currency
translation
adjustments
Retained
earnings
Proposed
dividend Total
Equity at 1 January 2013 240.0 0.0 0.6 728.6 0.0 969.2
Comprehensive income for the year
Realized hedging transactions -0.5 0.2 64.4 64.1
Extraordinary dividend -300.0 300.0 0.0
Dividend paid -300.0 -300.0
Equity at 31 December 2013 240.0 -0.5 0.8 493.0 0.0 733.3
Issue of warrants
Comprehensive income for the year 0.0 0.7 118.3 119.0
Extraordinary dividend 0.0 0.0 0.0
Dividend paid 0.0 0.0
Balance at 31 December 2014 240.0 -0.5 1.5 611.3 0.0 852.3
The reserve for foreign currency translation adjustments
relates to translation adjustment of profit and net assets
for Group enterprises with a functional currency other than
the presentation currency.
The dividend paid in 2014 was DKK 0 per share against
DKK 1.25 per share in 2013.
CONSOLIDATED STATEMENT OF CHANGES IN EQUITY

44
DKK million
Note 2014 2013
Earnings before interest, tax, depreciation and amortization (EBITDA) 720.6 440.2
19 Adjustments of non-cash items 0.5 -5.9
20 Change in working capital -265.4 295.0
Corporation tax paid -51.7 -98.3
Financial income 15.7 1.8
Financial expenses -13.2 -13.7
Total cash flow from operating activities 406.5 619.1
8 Investments in intangible assets -296.6 -157.5
9 Investments in property, plant and equipment -67.0 -93.9
Sale of property, plant and equipment 0.9 39.3
Sale of Group enterprises 0.0 5.6
21 Investment in enterprises -34.3 -52.0
Sale of securities 0.3 0.5
Total cash flow from investing activities -396.7 -258.0
Repayments of loans -33.1 -3.1
Raising of loans 145.1 150.0
Other payables, non-current -11.0 35.8
Repayments of loans to Group enterprises -29.2 -93.2
Loans to Group enterprises -321.7 0.0
Dividend paid 0.0 -300.0
Total cash flow from financing activities -249.9 -210.5
Total cash flow -240.1 150.6
Cash and cash equivalents at 1 January 361.8 211.2
Cash and cash equivalents at 31 December 121.7 361.8
CONSOLIDATED STATEMENT OF CASH FLOWS

45
OVERVIEW
01_Accounting policies
02_Significant accounting assessments and estimates
03_New financial reporting standards
04_Revenue
05_Audit fee
06_Staff costs
07_Financial income/expenses
08_Intangible assets
09_Property, plant and equipment
10_Deposits
11_Inventories
12_Contract work in progress
13_Prepayments
14_Share capital
15_Tax on profit for the year
16_Provisions
17_Other current payables
18_Financial instruments, etc.
19_Adjustments of non-cash items
20_Change in working capital
21_Investments in enterprises
22_Contingent assets and liabilities
23_Related parties
24_Events after the balance sheet date
NOTES TO THE CONSOLIDATED FINANCIAL STATEMENTS

46
NOTE 01_ACCOUNTING POLICIES
The annual report for KMD A/S is presented in
accordance with International Financial Reporting
Standards (IFRS) as endorsed by the EU at 31
December 2014 and the additional Danish disclosure
requirements contained in the IFRS Order issued by
the Danish Business Authority.
BASIS OF PREPARATION
The accounting figures have been prepared using the
historical cost convention, except where IFRS explicitly
requires use of other values.
CONSOLIDATION
The consolidated financial statements cover the Parent
Company KMD A/S and subsidiaries in which the Parent
Company directly or indirectly owns more than 50% of
the voting rights or otherwise has control.
The consolidated financial statements have been
prepared by combining the financial statements of the
Parent Company and the subsidiaries by adding together
items of a uniform nature. The financial statements used
in the consolidated financial statements are presented in
accordance with the Group's accounting policies.
Intercompany income, expenditure, shareholdings,
dividends and balances are eliminated, as are realized
and unrealized internal gains and losses on transactions
between the consolidated enterprises.
The subsidiaries’ accounting items are recognized 100%
in the consolidated financial statements.
Enterprises in which the Parent Company directly or
indirectly owns between 20% and 50% of the voting
rights or otherwise exercises significant influence are
considered associates.
BUSINESS COMBINATIONS
Newly acquired or newly established subsidiaries are
recognized from the time control is acquired over the
acquired enterprise (acquisition date). The purchase
method is applied to acquisition of subsidiaries.
The cost of acquisitions is calculated as the fair value
of the acquired assets and liabilities and shares issued.
The cost incorporates the fair value of any contingent
considerations (earn-outs). Expenses in connection with
the acquisition are charged to the income statement in
the period in which they are incurred.
Identifiable assets, liabilities and contingent liabilities
(net assets) relating to the acquired enterprise are
recognized at fair value on the acquisition date.
In connection with each acquisition, goodwill and non-
controlling interests are recognized in accordance with
one of the following methods:
_ Goodwill related to the acquired enterprise is made
up of any positive difference between the total fair
value of the acquired enterprise and the fair value
of the total net assets for accounting purposes. Non-
controlling interests are recognized at the share of the
acquired enterprise’s total fair value (full goodwill).
_ Goodwill related to the acquired enterprise is made up
of any positive difference between the purchase price
and the fair value of the Group’s share of the acquired
enterprise’s total net assets for accounting purposes
at the acquisition date. Non-controlling interests are
recognized at the proportionate share of the acquired
net assets (proportionate goodwill).
Goodwill is recognized under intangible assets. Goodwill
is not amortized but is assessed on an annual basis,
or where there are indications of a decrease in value,
in order to determine whether it has been subject to
a decrease in value. If this is the case, it is written down
to the asset’s lower recoverable value.
Enterprises that are sold or wound up are recognized
until the date of disposal. Any gain or loss relative to the
carrying amount at the disposal date is taken to income
at the time of sale where control of the subsidiary is also
being relinquished.
The difference between cost and carrying amount of
acquired non-controlling interests is recognized in
equity. Profit or loss on sale of non-controlling interests
is also recognized in equity.
Comparative figures are not restated for enterprises that
are newly acquired, sold or wound up.
FOREIGN CURRENCY TRANSLATION
The consolidated financial statements are presented in
Danish kroner (DKK).
Transactions in foreign currencies are translated during
the year at the rate prevailing on the transaction date.
Gains and losses that arise between the rate on the
transaction date and the payment date are recognized
in the income statement.
Receivables, payables and other monetary items in
foreign currencies that have not been settled on the
balance sheet date are translated at the rate prevailing
on the balance sheet date. The difference between the
rate on the balance sheet date and the transaction date
is recognized in the income statement under financial
items.
47
Balance sheets of foreign subsidiaries with a functional
currency other than DKK are translated at the rate
prevailing on the balance sheet date. The subsidiaries’
income statements and statements of cash flows are
translated at average rates approximately equivalent
to the rate prevailing on the transaction date. Foreign
currency translation adjustments that arise on
translation of foreign subsidiaries’ equity at 1 January
and foreign currency translation adjustments that arise
as a result of the income statement being translated at
an average exchange rate and the balance sheet being
translated at the rate prevailing on the balance sheet
date are recognized in the statement of comprehensive
income.
DERIVATIVE FINANCIAL INSTRUMENTS
Derivative financial contracts considered to satisfy
the conditions for recognition as cash flow hedges
are termed ‘effective,’ while hedging instruments not
considered to satisfy these conditions are termed
‘ineffective.’
Changes in the fair value of effective derivative financial
contracts are recognized in comprehensive income and
accumulated as a reserve in equity under Hedging
reserve.
Changes in the fair value of ineffective derivative
financial contracts are recognized directly in the income
statement under financial items.
Derivative financial instruments are recognized in the
balance sheet at fair value on the trade date and
subsequently measured at fair value. Positive and
negative fair values of derivative financial contracts
are included under Other receivables and Derivative
financial instruments respectively.
The fair value of derivative financial instruments is
calculated using standard valuation methods for such
contracts based on observable market data. The fair
value of interest-rate hedging contracts is calculated
as the present value of expected future cash flows.
For both effective and ineffective derivative financial
contracts, the part of the fair value adjustment that can
be attributed to time value is always recognized directly
in the income statement.
All fair values are based on prices calculated at market
value or using standard pricing models.
INCOME STATEMENT
REVENUE
Income from the sale of services is recognized when the
service is provided.
Income from the disposal of goods for resale is included
in revenue at the time of delivery and risk transfer
where the income is considered reliable. Revenue is
stated net of VAT, charges and discounts.
Income from consultancy services is taken to income as
the work is performed, with the revenue corresponding
to the selling price of the work performed for the year.
License and royalty income is recognized at the time
of delivery.
OTHER EXTERNAL EXPENSES
Other external expenses include accounting items
incurred to achieve the revenue for the year, including
cost of sales in connection with the disposal of goods
for resale, and other external expenses for distribution,
sales, advertising, administration, premises, bad debts,
operating lease payments, etc.
OTHER OPERATING INCOME AND EXPENSES
Gains and losses in connection with disposal of non-
current assets are recognized under Other operating
income or Other operating expenses.
STAFF COSTS
Staff costs cover wages, salaries and pensions to the
Group’s staff and other staff costs.
SHARE-BASED PAYMENT
Share options are measured at the fair value of the
granted share options at the grant date minus any
amount paid by the employees. If the fair value exceeds
the amount paid by the employees, the excess amount
is considered as payment for services received from
employees. The excess amount is therefore recognized
in the income statement under staff costs over the
period in which the final entitlement to the options is
earned. The set-off is recognized directly in equity in
the case of equity-settled schemes.
FINANCIAL ITEMS
Financial income and expenses are recognized in the
income statement at the amounts relating to the
financial year. Financial items cover interest income
and expenses, share dividends, financial expenses in
connection with finance leases, realized and unrealized
exchange gains and losses relating to securities and
transactions in foreign currencies, amortization of
exchange losses, and borrowing costs. Borrowing costs
that can be attributed directly to purchase, construction
or production of a qualifying asset are included as part
of the cost of the asset. A qualifying asset is an asset
that it necessarily takes a significant period to make
ready for its intended use or sale.

48
TAX
Tax on the profit for the year comprises current tax and
deferred tax for the year, the effect on deferred tax of
changes in tax rates, and prior-year adjustments. The
part of tax for the year that can be attributed to entries
made directly in the statement of comprehensive
income is recognized directly therein.
Current tax is calculated at the tax rate applicable for
the year. Deferred tax is calculated on the basis of the
tax rules and tax rates in the respective countries that
will be applicable by law on the balance sheet date
where the deferred tax is expected to give rise to
current tax.
BALANCE SHEET
INTANGIBLE ASSETS
Goodwill is recognized at cost minus any accumulated
impairment losses.
Goodwill is tested for impairment each year if there are
indications of a decrease in value. The impairment test
is carried out for the activity or business area to which
the goodwill relates. Goodwill is written down to the
higher of the value in use and the net selling price for
the activity or business area to which the goodwill
relates (recoverable value) where this is lower than the
carrying amount.
Intangible assets also include acquired intellectual
property rights and development projects that meet the
criteria for capitalization.
Customer-related assets are measured at cost less
accumulated amortization and impairment losses based
on the expected consumption pattern for future
economic benefits.
Development projects that are clearly defined and
identifiable, where the technical rate of utilization,
adequate resources and a potential future market
or development opportunity in the enterprise can be
demonstrated, and where the intention is to
manufacture, market or use the product or process,
are recognized as intangible assets where there is
sufficient assurance that future earnings will cover the
costs of production, sales and administrative expenses,
and total development costs. Other development costs
are recognized as expenses in the income statement as
they are incurred.
Development costs are calculated as directly incurred
expenses plus a proportion of other expenses that can
indirectly be attributed to the individual development
projects.
Amortization of intangible assets excl. goodwill is carried
out on a straight-line basis over a period of up to 20
years based on experience of the period of use.
The useful life of the assets is assessed and adjusted
if necessary on each balance sheet date. The main
amortization periods are:
AMORTIZATION PERIOD
Acquired software rights 3-5 years
Development projects 5-15 years
Customer relationships 10-15 years
Other rights 3-20 years
Acquired intellectual property rights and completed
development projects are tested for impairment where
there are indications of a decrease in value.
Development projects in progress are also subject to
an annual impairment test.
The impairment test is carried out for each individual
asset or group of assets. The assets are written down
to the higher of the asset’s or the asset group’s value
in use or net selling price (recoverable value) where this
is lower than the carrying amount.
PROPERTY, PLANT AND EQUIPMENT
Property, plant and equipment includes land and
buildings, plant and machinery, and fixtures, operating
equipment and vehicles. Property, plant and equipment
is measured at cost plus any revaluations and minus
any accumulated depreciation and impairment losses.
Property, plant and equipment is depreciated on a
straight-line basis over the expected useful life of the
individual assets. The main depreciation periods are:
DEPRECIATION PERIOD
Land and buildings 50 years
Leasehold improvements 10-30 years
Major installations 10 years
Plant and machinery 2-5 years
Fixtures, operating equipment and
vehicles 2-5 years
Assets held under finance leases are measured at the
lower of the fair value pursuant to the lease and the
present value of the lease payments, calculated on the
basis of the internal interest on the lease minus any
accumulated depreciation and impairment losses.

49
Property, plant and equipment is tested for impairment
where there are indications of a decrease in value.
The impairment test is carried out for each individual
asset or group of assets. The assets are written down
to the higher of the value in use and the net selling price
(recoverable value) of the asset or group of assets
where this is lower than the carrying amount.
INVESTMENTS
Equity investments in associates are measured using the
equity method and recognized in the income statement
at the proportionate share of the equity value in the
enterprises calculated in accordance with the Group’s
accounting policies, plus goodwill.
In the balance sheet equity investments in associates
are recognized at the proportionate share of the equity
owned in the enterprises calculated in accordance with
the Group’s accounting policies, plus goodwill.
Associates with negative equity are measured at DKK 0,
and any receivables from these enterprises are written
down where an individual assessment shows this to be
necessary. Where there is a legal or constructive
obligation to cover the associate’s negative value, a
liability is recognized for this.
INVENTORIES
Inventories are recognized at cost calculated on the
basis of average cost. Where the cost exceeds the
expected selling price minus costs of completion and
sale, inventories are written down to the lower net
realizable value.
RECEIVABLES
Receivables and loans cover receivables that have arisen
in connection with sales. Such receivables are classified
as current with the exception of the part falling due
more than 12 months from the balance sheet date. The
amounts are included in the items Trade receivables and
Other receivables.
Receivables are recognized in the balance sheet at fair
value and subsequently measured at amortized cost. In
the case of current non-interest-bearing receivables and
receivables at variable rates of interest, this will usually
correspond to nominal value.
On each balance sheet date the Company assesses
whether there are circumstances indicating that
significant individual receivables have been subject to
a decrease in value. This is assessed on the basis of
an age criterion and objective indications of financial
problems on the part of debtors. If it is assessed that
the receivable will not be paid in full, amortized cost
is calculated on the basis of these expected lower
payments. It is further assessed whether groups of
receivables that are not significant receivables
individually have been subject to a decrease in value.
These receivables are then written down by group on
the basis of the Group’s past experiences.
CONSULTANCY SERVICES IN PROGRESS
Consultancy services in progress are measured at the
selling price of the work performed. The stage of
completion is calculated on the basis of the direct and
indirect expenses incurred in relation to the expected
total expenses.
The value of the individual items of work in progress
minus invoicing on account is classified as receivables
where the amounts are positive and as payables where
the amounts are negative.
Provision is made for expected losses on work in
progress based on an individual assessment of the
loss until completion of the work.
PREPAYMENTS (ASSET)
Prepayments recognized under assets include prepaid
expenses relating to subsequent financial years and
are measured at amortized cost.
EQUITY
Dividends are recognized as a liability at the date of
adoption by the general meeting.
PROVISIONS
Provisions are recognized where, as a result of an event
that has occurred before or on the balance sheet date,
the Group has a legal or constructive obligation and it is
likely that an outflow of funds will be required to settle
the liability.
CORPORATION TAX
Current tax liabilities are recognized in the balance
sheet as tax calculated on the expected taxable income
for the year, adjusted for tax on taxable income in
previous years and taxes paid on account.
Deferred tax is calculated on the basis of the tax rules
and tax rates in the respective countries that will be
applicable by law on the balance sheet date where the
deferred tax is expected to give rise to current tax.
Changes in deferred tax as a result of changes in tax
rates are recognized in the income statement, with the
exception of the effect concerning items recognized in
Other comprehensive income.
50
Provision for deferred tax is calculated on all temporary
differences between carrying amount and tax base.
Deferred tax assets are recognized at the value that is
expected to be utilized, either by elimination in tax on
future earnings or by offsetting against deferred tax
liabilities.
Deferred tax assets and liabilities are offset within the
same legal tax entity and jurisdiction.
LEASE COMMITMENTS
Finance lease commitments are measured at the
present value of the remaining lease payments,
including any guaranteed residual value based on the
internal rate of interest on the individual leases.
FINANCIAL LIABILITIES
Financial liabilities are recognized at the time of
borrowing at the proceeds received minus transaction
costs incurred, and subsequently measured at amortized
cost calculated on the basis of the effective rate of
interest on the borrowing date.
DEFERRED INCOME (LIABILITY)
Deferred income recognized under liabilities includes
payments received relating to income in subsequent
years and is measured at amortized cost.
STATEMENT OF CASH FLOWS
The statement of cash flows shows the enterprise’s cash
flows for the year, change in cash and cash equivalents
for the year, and the enterprise’s cash and cash
equivalents at the beginning and end of the year.
Cash flow from operating activities is shown using the
indirect method and is calculated as the net profit for
the year adjusted for non-cash operating items, change
in working capital, financial items paid and corporation
tax paid.
Cash flow from investing activities includes payments
in connection with purchase and sale of non-current
assets, securities attributed to investing activities, and
dividends received from subsidiaries and associates.
Cash flow from financing activities includes dividend
payments to shareholders, capital increases and
reductions, plus the raising of loans and repayments
of interest-bearing debt.
Cash and cash equivalents includes cash at bank and
in hand, and highly liquid securities with an insignificant
risk of changes in value.

51
NOTE 02_SIGNIFICANT ACCOUNTING
ASSESSMENTS AND ESTIMATES
In preparing KMD’s annual report, the Company’s
management makes a number of accounting
assessments and estimates that form the basis for
recognition and measurement of the Group’s assets
and liabilities. The most important accounting
assessments and estimates are set out below. The
Group's accounting policies are described in detail
in Note 1 to the consolidated financial statements.
ACCOUNTING ASSESSMENTS
ACQUISITION OF ENTERPRISES
On acquisition of enterprises the Company’s
management assesses whether, for accounting
purposes, it is acquiring an enterprise or individual
assets and liabilities. The assessment is based on
whether the acquired enterprise constitutes integrated
activities or assets.
APPLICATION OF THE PERCENTAGE OF COMPLETION
METHOD
The Company’s management makes significant
accounting assessments in connection with income
recognition. If a project is customized to a high degree,
revenue relating to projects in progress is recognized
under the percentage of completion method,
corresponding to the selling price of the work carried
out based on the stage of completion. If a project does
not qualify for recognition under the percentage of
completion method, revenue is not recognized until
risk is transferred to the purchaser. Delays, etc. can
cause significant fluctuations in the timing of the
Group’s recognition of revenue and thus earnings
relative to expectations.
ESTIMATION UNCERTAINTIES
Calculation of the carrying amount of certain assets
and liabilities requires assessments, estimates and
assumptions on future events. The estimates made
are based on historical experiences and other factors
that management considers appropriate in the
circumstances, but that by their very nature are
uncertain and unpredictable. The assumptions may
be incomplete or inaccurate, and unexpected events
or circumstances may arise. Moreover, the enterprise
is subject to risks and uncertainties that may result
in actual results differing from these estimates. It may
be necessary to change estimates made previously as
a result of changes in the circumstances that formed the
basis of the previous estimates or on the basis of new
knowledge or subsequent events.
IMPAIRMENT OF ASSETS
GOODWILL
In performing the annual impairment test, an estimate
is made as to whether the individual units of the
enterprise (cash-generating units) to which goodwill
relates will be able to generate sufficient positive net
cash flows in the future to support the value of goodwill
and other necessary investments. The estimate of future
net cash flows is based on budgets and business plans
for the coming year and projections for subsequent
years. Key parameters are revenue development, profit
margin, investments in net working capital and growth
expectations for the years ahead. Budgets and business
plans for the coming year are based on concrete future
business measures, with risks in the key parameters
being assessed and recognized in the future expected
cash flows. Projections beyond this first year are based
on general expectations and risks. The discount rates
used to calculate the recoverable value are before tax
and reflect the risk-free interest plus specific risks in the
individual business areas.
The cash flows used incorporate the effect of the future
risks associated with this, which is why such risks are
not incorporated in the discount rates used. See Note 8
for a description of the impairment test for intangible
assets. The carrying amount of goodwill at 31 December
2014 is DKK 213.5 million (31 December 2013: DKK
179.5 million).
DEVELOPMENT COSTS
Completed development projects are reviewed annually
for indications of impairment. Where indications of
impairment are identified, an impairment test is carried
out for the individual development projects. Completed
development projects were written down for impairment
by DKK 213.1 million in 2014. These write-downs arose
from closure of various software projects under
development following a change of technology and
consequent reassessment of future cash flows.
The carrying amount of completed development projects
at 31 December 2014 is DKK 135.4 million (31
December 2013: DKK 406.3 million).
In the case of development projects in progress, an
actual impairment test is carried out each year. The
impairment test is based on various factors, including
future use of the projects, the present value of expected
future earnings, plus interest rate and other risks.
Write-downs of DKK 110.1 million were made in 2014
on development projects in progress linked to the
written-down development projects described above.
These write-downs arose from a change of technology in
the systems the development was intended to support,
and consequent reassessment of future cash flows.

52
For KMD the measurement of development projects
in progress could be significantly impacted by material
changes in estimates and assumptions, including
developments in technologies and interest rates,
underlying the calculated values.
The carrying amount of development projects in
progress at 31 December 2014 is DKK 192.2 million
(31 December 2013: DKK 176.1 million).
CONSULTANCY SERVICES IN PROGRESS
Consultancy services in progress are measured at
the selling price of the work performed. The stage of
completion is calculated on the basis of the direct and
indirect expenses incurred in relation to the expected
total expenses. Provision is made for expected losses
on work in progress based on an individual assessment
of the loss until completion of the work.
The carrying amount of consultancy services in progress
at 31 December 2014 is DKK 42,0 million (31 December
2013: DKK 55.4 million).
PROPERTY, PLANT AND EQUIPMENT
Impairment testing of property, plant and equipment
is carried out if events or circumstances indicate the
assets have been impaired.
The value in use is determined using the same method
as for impairment losses relating to goodwill. Calculation
of the impairment loss is therefore associated with the
same degree of uncertainty for property, plant and
equipment as for goodwill.
The carrying amount of property, plant and equipment
at 31 December 2014 is DKK 273.4 million (31
December 2013: DKK 296.0 million).

53
NOTE 03_NEW FINANCIAL REPORTING
STANDARDS
CHANGE IN ACCOUNTING POLICIES, INCLUDING
PRESENTATION AND IMPLEMENTATION OF
ACCOUNTING STANDARDS
The accounting policies for the financial statements for
the Group and the Parent Company are unchanged from
last year.
MOST RECENTLY ADOPTED INTERNATIONAL FINANCIAL
REPORTING STANDARDS (IFRS) AND
INTERPRETATIONS (IFRIC)
KMD has implemented the financial reporting
standards, and amendments to these, and the
interpretations that have been endorsed by the
IASB and the EU and entered into force in the
2014 financial year. These are as follows for
KMD:
_Amendment to IAS 36 "Impairment of Assets"
_IAS 32 Financial Instruments: Presentation
_Amendments to IFRS 10, IFRS 12 and IAS 27
_Amendment to IAS 39 "Financial Instruments:
Recognition and Measurement"
_IFRIC 21 "Levies"
KMD has assessed the effect of the new IFRS standards and interpretations, and has concluded that all the standards and interpretations that have come into force for financial years beginning 1 January 2014, are either not relevant to KMD or do not have a material impact on the consolidated financial statements.
NEW FINANCIAL REPORTING STANDARDS (IAS/IFRS)
AND INTERPRETATIONS (IFRIC) ADOPTED – BUT NOT
APPLICABLE TO THE FINANCIAL YEAR UNDER REVIEW
The following amended financial reporting standards and interpretations that may be relevant to KMD have been adopted by the IASB and endorsed by the EU. The standards come into force at a later date, which is why they will not be implemented until the annual reports for 2015 and 2016.
_Amendment to IAS 19 "Employee Benefits"
_Annual Improvements 2010-2012. Clarifications
and minor revisions to IFRS 2, IFRS 3, IFRS 8,
IFRS 13, IAS 1, IAS 7, IAS 12, IAS 16, IAS 24
and IAS 36
_ Annual Improvements 2011-2013.
Clarifications and minor revisions to IAS 1,
IFRS 1, IFRS 13 and IAS 40
KMD has assessed the effect of the new IFRS
standards and interpretations.
KMD has concluded that all the standards and
interpretations that have come into force for
financial years beginning 1 January 2015, are
either not relevant to the KMD Group or are not
expected to have a material impact on the
financial statements.
IASB has issued the folllowing amendments to
standards and new interpretations that could be
relevant to KMD but have not yet been endorsed
by the EU:
_IFRS 9 "Financial Instruments – Phase 1:
Classification and Measurement"
_IFRS 11 "Joint Arrangements"
_IFRS 14 "Regulatory Deferral Accounts"
_IFRS 15 "Revenue from Contracts with
Customers"
_Amendment to IAS 1
_IAS 16 "Property, Plant and Equipment"
_IAS 38 "Intangible Assets"
_IAS 27 "Consolidated and Separate Financial
Statements"
_Amendments to IFRS 10, 11 and 12, and IAS 28
_Clarifications and minor revisions to IFRS 5,
IFRS 7, IAS 19 and IAS 34
None of the above standards are currently
expected to have a material impact on KMD, but
this will be monitored on an ongoing basis until
the implementation date.
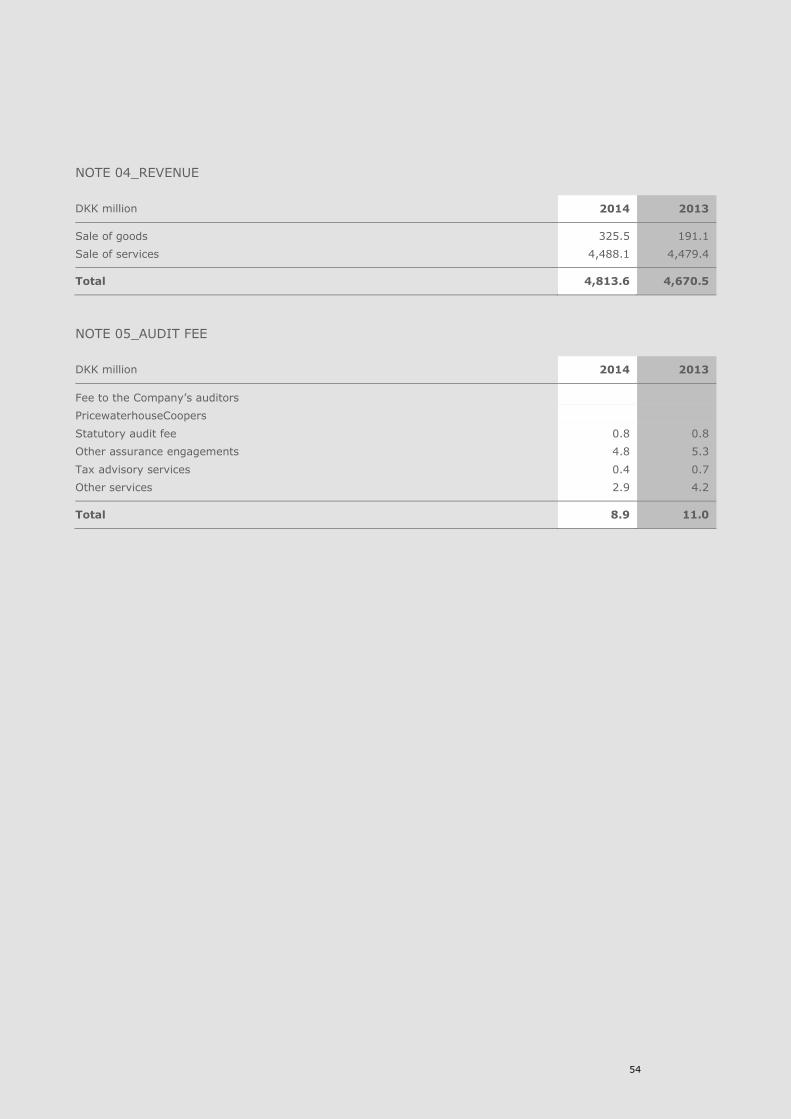
54
NOTE 04_REVENUE
DKK million 2014 2013
Sale of goods 325.5 191.1
Sale of services 4,488.1 4,479.4
Total 4,813.6 4,670.5
NOTE 05_AUDIT FEE
DKK million 2014 2013
Fee to the Company’s auditors
PricewaterhouseCoopers
Statutory audit fee 0.8 0.8
Other assurance engagements 4.8 5.3
Tax advisory services 0.4 0.7
Other services 2.9 4.2
Total 8.9 11.0
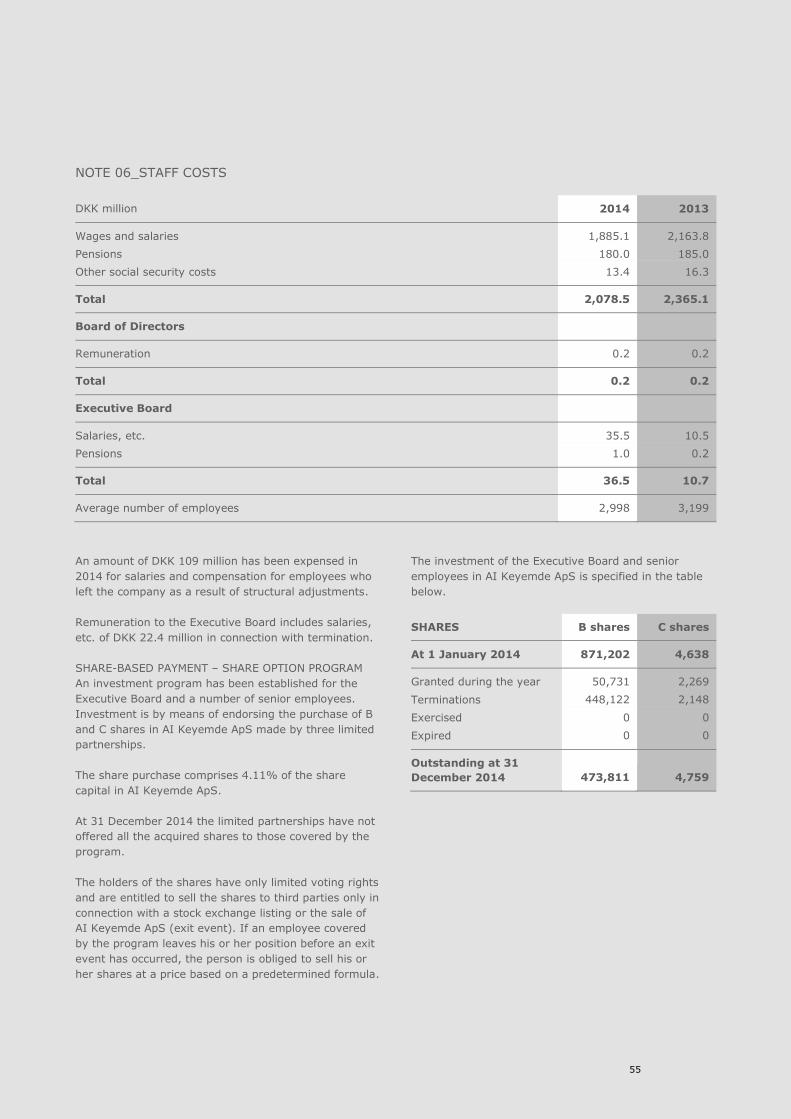
55
NOTE 06_STAFF COSTS
DKK million 2014 2013
Wages and salaries 1,885.1 2,163.8
Pensions 180.0 185.0
Other social security costs 13.4 16.3
Total 2,078.5 2,365.1
Board of Directors
Remuneration 0.2 0.2
Total 0.2 0.2
Executive Board
Salaries, etc. 35.5 10.5
Pensions 1.0 0.2
Total 36.5 10.7
Average number of employees 2,998 3,199
An amount of DKK 109 million has been expensed in
2014 for salaries and compensation for employees who
left the company as a result of structural adjustments.
Remuneration to the Executive Board includes salaries,
etc. of DKK 22.4 million in connection with termination.
SHARE-BASED PAYMENT – SHARE OPTION PROGRAM
An investment program has been established for the
Executive Board and a number of senior employees.
Investment is by means of endorsing the purchase of B
and C shares in AI Keyemde ApS made by three limited
partnerships.
The share purchase comprises 4.11% of the share
capital in AI Keyemde ApS.
At 31 December 2014 the limited partnerships have not
offered all the acquired shares to those covered by the
program.
The holders of the shares have only limited voting rights
and are entitled to sell the shares to third parties only in
connection with a stock exchange listing or the sale of
AI Keyemde ApS (exit event). If an employee covered
by the program leaves his or her position before an exit
event has occurred, the person is obliged to sell his or
her shares at a price based on a predetermined formula.
The investment of the Executive Board and senior
employees in AI Keyemde ApS is specified in the table
below.
SHARES B shares C shares
At 1 January 2014 871,202 4,638
Granted during the year 50,731 2,269
Terminations 448,122 2,148
Exercised 0 0
Expired 0 0
Outstanding at 31
December 2014 473,811 4,759

56
NOTE 07_FINANCIAL INCOME/EXPENSES
2013
DKK million
Interest Foreign
currency
translation
adjustments
Fair value
adjustments
Total
Income
Loans and receivables 8.0 8.0
Financial liabilities measured at amortized cost 0.0 0.0
Total 8.0 0.0 0.0 8.0
Expenses
Loans and receivables 13.7 13.7
Financial liabilities measured at amortized cost 0.0 0.0
Total 13.7 0.0 0.0 13.7
2014
DKK million
Interest Foreign
currency
translation
adjustments
Fair value
adjustments
Total
Income
Loans and receivables 15.8 15.8
Financial liabilities measured at amortized cost 0.0 0.0
Total 15.8 0.0 0.0 15.8
Expenses
Loans and receivables 13.2 13.2
Financial liabilities measured at amortized cost 0 0.0
Total 13.2 0.0 0.0 13.2

57
NOTE 08_INTANGIBLE ASSETS
2013
DKK million
Customer
relation-
ships Rights Goodwill
Develop-
ment
projects
in progress
Completed
develop-
ment
projects Total
Cost at 1 January 58.5 44.3 138.5 620.9 56.9 919.1
Acquisitions 8.1 41.0 48.2 97.3
Additions during the year
3.5 123.9 36.3 163.7
Disposals during the year 0.0 -2.2 -1.4 0.0 -3.6
Transfers -567.3 567.3 0.0
Cost at 31 December 66.6 45.6 179.5 176.1 708.7 1.176.5
Amortization and impairment losses
at 1 January 14.7 36.2 0.0 0.0 24.1 75.0
Acquisitions 29.4 29.4
Impairment losses 212.2 212.2
Amortization for the year 11.4 4.4 36.7 52.5
Disposals during the year -2.2 -2.2
Amortization and impairment losses
at 31 December 26.1 38.4 0.0 0.0 302.4 366.9
Carrying amount
at 31 December 40.5 7.2 179.5 176.1 406.3 809.6
Carrying amount of capitalized
interest at 31 December 0.0 0.0 0.0 7.0 1.4 8.4
Of which assets held under finance
leases 0.0 0.0

58
2014
DKK million
Customer
relation-
ships Rights Goodwill
Develop-
ment
projects
in progress
Completed
develop-
ment
projects Total
Cost at 1 January 66.6 45.6 179.5 176.1 708.7 1,176.5
Acquisitions 12.8 34.0 90.4 137.2
Additions during the year
126.8 146.0 23.8 296.6
Disposals during the year
0.0
Transfers -19.8 19.8 0.0
Cost at 31 December 79.4 172.4 213.5 302.3 842.7 1,610.3
Amortization and impairment losses
at 1 January 26.1 38.4 0.0 0.0 302.4 366.9
Acquisitions 69.5 69.5
Impairment losses 110.1 283.1 393.2
Amortization for the year 12.5 8.0 52.3 72.8
Disposals during the year
0.0
Amortization and impairment losses
at 31 December 38.6 46.4 0.0 110.1 707.3 902.4
Carrying amount
at 31 December 40.8 126.0 213.5 192.2 135.4 707.9
Carrying amount of capitalized
interest at 31 December 0.0 0.0 0.0 10.2 0.3 10.5
Of which assets held under finance
leases 120.2 120.2
The carrying amount of goodwill in 2014 was DKK 213.5
million against DKK 179.5 million in 2013.
The key part of goodwill has arisen in connection with
the acquisition of KMD Informatik A/S (previously
Rambøll Informatik A/S) in 2011 and relates to the
business area Citizen Centered Software Solutions.
The carrying amount of intangible assets excluding
goodwill was DKK 494.4 million in 2014 against 630.1
million in 2013 and relates primarily to software
development.
Capitalized interest in 2014 was DKK 10.5 million
against DKK 8.4 million in 2013.
IMPAIRMENT TEST FOR GOODWILL AND OTHER
INTANGIBLE ASSETS
The carrying amount of goodwill and other intangible
assets is impairment-tested annually.
The impairment test for cash-generating units compares
the recoverable value, calculated as the discounted
value of expected future cash flows, with the carrying
amount of the individual cash-generating units.
For all areas, the key parameters in the impairment test
are revenue, EBITDA, funds tied up in working capital,
growth assumptions and the discount rate.
Budgets and business plans for the next four years are
based on KMD’s known and expected events and risks
in the key parameters, and are recognized in future
expected cash flows.
The first year is based on the budget approved by
management. Projections for years two and thereafter
are based on general expectations of the market and
risks.

59
For intangible assets with an indefinite useful life, the
terminal value is determined taking into account general
growth expectations. The growth in the terminal period
is set at 1% p.a.
The discount rate of 9.8% applied in calculating the
recoverable value in both 2014 and 2013 is calculated
before tax and reflects the risk-free interest and risk
premium in the selected segments. The cash flows used
incorporate the effect of future risks linked to this, which
is why such risks are not added to the discount rates
used.
The value in use is impacted mainly by changes in profit
margin and discount rate.
DEVELOPMENT PROJECTS
At 31 December 2014 management performed an
impairment test on the carrying amount of development
projects.
Recognized development projects in progress and
completed development projects cover development
primarily focused on solutions within Citizen Centered
Software Solutions.
The value of the recognized development projects is
compared with expected earnings from the products.
A write-down of DKK 393.2 million has been made in
2014 further to closure of various software projects
under development, partly due to a change of
technology, and consequent reassessment of future
cash flows.
The Company does not have any research costs.
Development costs charged to the income statement
in 2014 are DKK 104 million against DKK 117 million
in 2013.
GOODWILL
At 31 December 2014 management performed an
impairment test on the carrying amount of goodwill.
Goodwill in KMD relates to the following cash-generating
units:
DKK million 2014 2013
Local Government Citizen Services 145.3 143.8
Central Government 53.6 21.1
Private & Infrastructure 14.6 14.6
Total 213.5 179.5
The impairment test was carried out in the fourth
quarter of the 2014 financial year on the basis of the
budgets and business plans approved by the Executive
Board and Board of Directors and other information.
The discount rate of 9.8% applied, is calculated before
tax.
The tests carried out in 2014 and 2013 did not indicate
any impairment.
Management does not consider that likely changes in
the underlying assumptions would result in the carrying
amounts exceeding the recoverable value. The value is
mainly affected by changes in profit margin and
discount rate.

60
NOTE 09_PROPERTY, PLANT AND EQUIPMENT
2013
DKK million
Land
and
buildings
Leasehold
improve-
ments
Plant and
machinery
Fixtures,
operating
equipment and
vehicles Total
Cost at 1 January 143.9 47.6 627.2 149.6 968.3
Acquisitions 0.0 2.0 2.0
Additions during the year 3.5 88.5 1.9 93.9
Disposals during the year -0.7 -196.9 -0.3 -197.9
Cost at 31 December 143.2 51.1 518.8 153.2 866.3
Depreciation at 1 January 48.8 7.5 437.8 135.5 629.6
Acquisitions 1.6 1.6
Depreciation for the year 8.0 3.9 79.4 7.7 99.0
Depreciation eliminated on disposals -0.2 -159.4 -0.3 -159.9
Depreciation at 31 December 56.6 11.4 357.8 144.5 570.3
Carrying amount at 31 December 86.6 39.7 161.0 8.7 296.0
2014
DKK million
Land
and
buildings
Leasehold
improve-
ments
Plant and
machinery
Fixtures,
operating
equipment and
vehicles Total
Cost at 1 January 143.2 51.1 518.8 153.2 866.3
Acquisitions 3.6 0.0 12.0 15.6
Additions during the year 3.0 57.0 7.0 67.0
Disposals during the year
-12.0 -3.2 -15.2
Cost at 31 December 143.2 57.7 563.8 169.0 933.7
Depreciation at 1 January 56.6 11.4 357.8 144.5 570.3
Acquisitions 3.3 11.0 14.3
Depreciation for the year 8.1 3.9 73.0 5.0 90.0
Depreciation eliminated on disposals
-11.9 -2.4 -14.3
Depreciation at 31 December 64.7 18.6 418.9 158.1 660.3
Carrying amount at 31 December 78.5 39.1 144.9 10.9 273.4
Of which assets held under finance leases 24.1 24.1

61
NOTE 10_DEPOSITS
DKK million 2014 2013
Cost at 1 January 44.7 43.8
Additions during the year 2.6 1.0
Disposals during the year -1.5 -0.1
Cost at 31 December 45.8 44.7
Carrying amount at 31 December 45.8 44.7
NOTE 11_INVENTORIES
DKK million 2014 2013
Hardware and software for resale 3.0 3.6
Raw materials and consumables 4.3 2.9
Carrying amount at 31 December 7.3 6.5
Cost of goods sold charged to the income statement
under other external expenses was DKK 616 million
in 2014 against DKK 455 million in 2013.
Inventories expected to be sold after more than one
year were DKK 0 million at 31 December 2014 against
DKK 0 million in 2013.
Write-downs on inventories for the year were DKK 0.4
million in 2014 against DKK 2.2 million in 2013,
No write-downs were reversed in 2014 or 2013.
NOTE 12_CONTRACT WORK IN PROGRESS
DKK million 2014 2013
Work in progress 31 of December at selling price 379.9 302.3
Work in progress invoiced on account -337.9 -246.9
Work in progress, net 42.0 55.4
Recognized as follows:
Work in progress (assets) 42.0 55.4
Work in progress (liabilities) 0.0 0.0
Revenue recognized via work in progress 379.9 239.7
Write-downs on work in progress were DKK 0 million in 2014 against DKK 14 million in 2013.

62
NOTE 13_PREPAYMENTS
DKK million 2014 2013
Prepaid salaries 3.8 36.4
Other prepayments 30.1 49.4
Carrying amount at 31 December 33.9 85.8
Other prepayments mainly include prepayments relating
to third-party software/maintenance subscriptions.
NOTE 14_SHARE CAPITAL
DKK million 2014 2013
The Parent Company’s capital is made up as follows:
One share class with 240,000 A shares of DKK 1,000 240.0 240.0
Total 240.0 240.0
The share capital has been unchanged at DKK 240.0 million for the last five financial years.
The Company’s shares are registered by name and are not negotiable papers.
NOTE 15_TAX ON PROFIT FOR THE YEAR
DKK million 2014 2013
Current tax 80.2 47.0
Change in deferred tax -31.6 -40.8
Prior-year adjustment 0.4 -0.2
Total 49.0 6.0
Made up as follows:
Tax on profit for the year 48.9 6.4
Tax relating to other comprehensive income 0.1 -0.2
Total 49.0 6.2
Reconciliation of effective tax rate for the year
Corporation tax rate in Denmark (%) 24.5 25.0
Other non-taxable income and non-deductible expenses 2.8 3.5
Adjustment of depreciation and amortization base as a result of tax correction 0.0 -3.4
Increased depreciation and amortization for tax purposes 0.0 -6.2
Adjustment to deferred tax as a result of change in tax rates 2.3 -10.1
Prior-year adjustment -0.3 0.0
Effective tax rate for the year (%) 29.3 8.8

63
DEVELOPMENT IN DEFERRED TAX CAN BE SPECIFIED AS FOLLOWS:
DKK million 2014 2013
Balance at 1 January 58.2 91.4
Adjustment of deferred tax, 1 January -6.6 -1.8
Adjustment of deferred tax in connection with acquisitions -0.6 6.1
Adjustment of tax assets -3.1 3.3
Adjustment for the year -31.6 -40.8
Balance at 31 December 16.3 58.2
Deferred tax is made up as follows:
Intangible assets 107.1 140.1
Property, plant and equipment -51.6 -51.1
Other liabilities -14.7 -11.2
Non-current portion 40.8 77.8
Current assets 3.6 2.6
Other liabilities -28.1 -22.2
Current portion -24.5 -19.6
Carrying amount at 31 December 16.3 58.2
Deferred tax assets not recognized in the balance sheet 2014 2013
Temporary differences -4.6 0.0
Tax loss 15.7 0.0
Carrying amount at 31 December 11.1 0.0
NOTE 16_PROVISIONS
DKK million 2014 2013
Provisions at 1 January 106.0 136.5
Additions during the year 45.5 89.1
Used during the year -63.9 -119.6
Reversed during the year 0.0 0.0
Carrying amount at 31 December 87.6 106.0
Provisions mainly relate to expected expenses in
connection with customer projects.
There is some uncertainty regarding the size of the
actual amounts and the time they fall due. In the case
of onerous contracts, the lack of certainty relates
primarily to the number of hours that will be used to
fulfill contracts, including fulfillment of service targets
and interpretation of framework agreements, etc.

64
NOTE 17_OTHER CURRENT PAYABLES
DKK million 2014 2013
Holiday pay obligations 281.1 320.9
Other staff-related items 223.2 298.1
VAT, A tax (PAYE), social security contributions and ATP supplementary pension 68.4 52.5
Other payables 0.1 0.0
Balance at 31 December 572.8 671.5
NOTE 18_FINANCIAL INSTRUMENTS, ETC.
THE GROUP’S RISK MANAGEMENT POLICY
The Group is not particularly exposed to financial risks
as a result of its operations, investments and financing.
The Group’s revenue essentially comes from the local
government market, which is less subject to cyclical
impacts than the private market.
The Group’s policy is not to speculate in financial risks.
The Group follows a Board-approved finance policy that
operates with a low risk profile, such that interest rate
and credit risks primarily arise from commercial
matters.
CREDIT RISK
The Group is exposed to credit risks on receivables and
bank deposits. The maximum credit risk is equivalent to
the carrying amount. The credit risk on receivables
is considered minimal as a result of KMD’s customer
segment.
The Group strives to spread bank deposits across
several different banks with high credit ratings.
Outstanding receivables are followed up centrally on an
ongoing basis in accordance with the Company's credit
procedures. Credit ratings are carried out for major new
customers outside the public sector.
Where there is uncertainty as to a customer’s ability or
willingness to pay a receivable, and the claim is judged
to be risky, the receivable is written down.
TRADE RECEIVABLES
DKK million 2014 2013
Trade receivables 786.3 712.0
Write-downs -0.2 -0.4
Trade receivables, net 786.1 711.6
Receivables from Group enterprises 0.0 0.0
Total 786.1 711.6
Receivables past due that have been impaired 0.2 0.4
Receivables past due that have not been impaired can be specified as follows:
Receivables past due, less than 6 months 42.4 42.8
Receivables past due, between 6 and 12 months 2.1 4.2
Receivables past due, more than 12 months 11.5 2.3
Total 56.2 50.9

65
NON-CURRENT RECEIVABLES
DKK million 2014 2013
Receivables due after 12 months 0.4 2.4
LIQUIDITY RISK
The required liquidity in the Group’s entities is ensured
on the basis of the Company's credit facilities and the
liquidity generated by operations. The Group’s liquidity
management is the responsibility of the finance
function, and entities in the Group are guaranteed
access to liquidity via internal loans.
The maturity analysis is shown by category and class
broken down by maturity period. Calculation of interest
payments on liabilities at variable rates of interest is
based on the rate prevailing on the balance sheet date.
The Group’s loans are subject to specific covenants and
can therefore only be canceled early on the lender’s part
in the event of breach of the covenants specified in the
loan agreements.
Cash outflows are expected to be covered by the current
excess liquidity and unutilized credits.
The calculation of fair value of hedging instruments is
based on observable assumptions such as forward
interest rates, etc. (Level 2 in the fair value hierarchy).

66
2013
DKK million < 1 yr 1-3 yrs 3-5 yrs > 5 yrs
No
agreed
settle-
ment Total
Carrying
amount
Fair
value
Measured at fair value via
the income statement and
hedging instruments:
Interest rate swap 0.5 0.5
1.0 0.6 0.6
Measured at amortized cost:
Borrowings 13.4 32.5 38.9 101.9 186.7 147.0 147.0
Prepayments from customers 62.3 62.3 62.3 62.3
Payables to Group enterprises 29.2 29.2 29.2 29.2
Trade payables 474.3 474.3 474.3 474.3
Other current liabilities 671.5 671.5 671.5 671.5
Financial liabilities 1,222.0 33.0 38.9 101.9 29.2 1,425.0 1,384.9 1,384.9
Measured at fair value via
the income statement and
hedging instruments:
Interest rate swap 0.0 0.0 0.0
Loans and receivables:
Deposits 44.7 44.7 44.7 44.7
Trade receivables 709.2 2.4 711.6 711.6 711.6
Contract work in progress 55.4 55.4 55.4 55.4
Other receivables – current 23.0 23.0 23.0 23.0
Securities 0.0 1.0 1.0 1.0 1.0
Cash and cash equivalents 361.8 361.8 361.8 361.8
Financial assets 1,149.4 2.4 0.0 1.0 44.7 1,197.5 1,197.5 1,197.5
Net cash outflow 72.6 30.6 38.9 100.9 -15.5 227.5 187.4 187.4
Unutilized credits were DKK 250 million.

67
2014
DKK million < 1 yr 1-3 yrs 3-5 yrs > 5 yrs
No
agreed
settle-
ment Total
Carrying
amount
Fair
value
Measured at fair value via the
income statement and hedging
instruments:
Interest rate swap 0.2 0.8 1.0 0.7 0.7
Measured at amortized cost:
Borrowings 38.3 80.3 141.7 47.6 307.9 285.3 285.3
Prepayments from customers 32.3 32.3 32.3 32.3
Payables to Group enterprises
0.0 0.0
Trade payables 380.0 380.0 380.0 380.0
Other current liabilities 572.8 572.8 572.8 572.8
Financial liabilities 1,023.6 81.1 141.7 47.6 0.0 1,294.0 1,271.1 1,271.1
Measured at fair value via the
income statement and hedging
instruments:
Interest rate swap 0.0 0.0 0.0
Loans and receivables:
Deposits 45.8 45.8 45.8 45.8
Trade receivables 785.7 0.4 786.1 786.1 786.1
Receivables from associates 322.5 322.5 322.5 322.5
Contract work in progress 42.0 42.0 42.0 42.0
Other receivables – current 25.4 25.4 25.4 25.4
Securities 0.1 0.1 0.1 0.5 0.8 0.7 0.7
Cash and cash equivalents 121.7 121.7 121.7 121.7
Financial assets 974.9 0.5 0.1 0.5 368.3 1,344.3 1,344.2 1,344.2
Net cash outflow 48.7 80.6 141.6 47.1 -368.3 -50.3 -73.1 -73.1
Unutilized credits were DKK 250 million.

68
MARKET RISK
The Group’s loans on the balance sheet date are
exclusively to Group enterprises and are at variable
rates of interest. The Group does not hedge loans to
Group enterprises. The interest rate risk is, however,
limited as a result of the Group’s low financial gearing,
which is why an increase of 1% in the market rate is
solely estimated to have an earnings impact before tax
of DKK -1.1 million and to impact equity by DKK -0.9
million. The corresponding figures for 2013 were
DKK -0.5 million and DKK -0.3 million respectively.
CURRENCY
The Group’s currency policy is to allow subsidiaries to
operate in their own currency wherever possible and for
contracts with foreign suppliers primarily to be entered
into in the Group enterprises’ local currencies or the
euro.
In total, 99.7% of the Group’s revenue in 2014 was
earned in DKK, on a par with 2013.
The Group’s foreign enterprises are as such not
significantly affected by currency fluctuations, as both
income and expenses are denominated in local
currencies.
CAPITAL MANAGEMENT
The Company’s capital management is partly governed
by the loan agreements entered into in the Group, which
contain specifications for financial ratios. The Group’s
gearing, defined as net interest-bearing debt to EBITDA,
is monitored on a monthly basis as part of managing the
Group’s capital structure. At year-end 2014 the
maximum gearing was not permitted to exceed 6.15.
At 31 December 2014 it was 3.96.
NOTE 19_ADJUSTMENT OF NON-CASH ITEMS
DKK million 2014 2013
Gain on disposal of non-current assets 0.0 -5.3
Other adjustments 0.5 -0.6
Total adjustments 0.5 -5.9
NOTE 20_CHANGES IN WORKING CAPITAL
DKK million 2014 2014
Change in inventories -0.8 2.8
Change in receivables -64.3 236.5
Change in contract work in progress 13.4 8.1
Change in trade payables -94.3 -46.1
Change in other items, net -117.3 93.7
Total change in working capital -265.4 295.0

69
NOTE 21_INVESTMENTS IN ENTERPRISES
2014
In 2014 KMD acquired all the shares in ScanJour A/S,
Capevo A/S and Cenza ApS. At the end of 2014 a
preliminary assessment of allocation of the purchase
price to the assets and liabilities acquired in connection
with the acquisitions was carried out. The figures for
assets and liabilities on the acquisition dates represent
the preliminary allocation recognized in 2014.
2014
DKK million ScanJour A/S Capevo A/S Cenza ApS Total
Property, plant and equipment 29.1 5.9
35.0
Inventories and receivables 9.8 2.7
12.5
Deferred liabilities, net 3.5 0.8 0.5 4.8
Non-current payables 0.0 0.0
0.0
Current payables -45.4 -4.6 -2.0 -52.0
Corporation tax payable, net 0.0 0.0
0.0
Acquired net assets -3.0 4.8 -1.5 0.3
Goodwill 22.5 10.0 1.5 32.5
Net cash flow arising from acquisition 19.5 14.8 0.0 32.8
Cash and cash equivalents in acquired subsidiary 4.2 1.4 0.0 5.6
Acquisition cost 23.7 16.2 0.0 38.4
SCANJOUR A/S
The activities in ScanJour A/S were acquired on 31
October 2014 and recognized in the financial statements
from this date.
ScanJour is a market leader in the development of IT
systems for case and document management for the
central government sector.
If the enterprise had been owned for the entire
reporting period, recognized revenue and net profit
would have been DKK 78 million and DKK 3.6 million
respectively.
Revenue relating to ScanJour A/S has been recognized
in the income statement and statement of
comprehensive income since the acquisition, and
amounted to DKK 14.5 million in 2014.
Goodwill mainly comprises intangible assets in the form
of know-how and existing staff. The calculated goodwill
is not amortizable for tax purposes.
Transaction costs of DKK 0.6 million have been
recognized in other external expenses.
CAPEVO A/S
The enterprise was acquired on 5 December 2014 and
recognized in the financial statements from this date.
Capevo is a Danish development and consulting
company that specializes in digital reporting and self-
service solutions. The company’s expertise covers
analysis, development and implementation as well
as maintenance and operation of digital reporting
and self-service solutions.
If the enterprise had been owned for the entire
reporting period, recognized revenue and net profit
would have been DKK 13.8 million and DKK 0.6 million
respectively.
Revenue relating to Capevo A/S has been recognized in
the income statement and statement of comprehensive

70
income since the acquisition, and amounted to DKK 1.0
million in 2014.
Goodwill represents the value of existing staff and
know-how. The calculated goodwill is not amortizable
for tax purposes.
Transaction costs of DKK 0.4 million have been
recognized in other external expenses.
CENZA APS
The enterprise was acquired on 31 October 2014 and
recognized in the financial statements from this date.
Cenza supplies digital HR and teaching platforms to the
financial sector in Denmark.
There has not been any activity in 2014. The company
was merged with KMD A/S with retroactive effect from
2014.
Goodwill represents the value of existing staff and
know-how. The calculated goodwill is not amortizable for
tax purposes.
Transaction costs of DKK 0.1 million have been
recognized in other external expenses.
2013
KMD acquired all the shares in Medialogic A/S and
Axapoint ApS in 2013.
At the end of 2013 KMD carried out a preliminary
assessment of allocation of the purchase price to the
assets and liabilities acquired in connection with the
acquisition of Medialogic A/S and Axapoint APS. The
figures for assets
and liabilities on the acquisition dates below represent
the final allocation recognized in 2013.
FAIR VALUE AT ACQUISITION DATE
2013
DKK million Medialogic A/S Axapoint ApS Total
Property, plant and equipment 15.6 11.8 27.4
Inventories and receivables 7.4 3.2 10.6
Deferred liabilities, net -3.3 -2.7 -6.0
Non-current payables 0.0 0.0 0.0
Current payables -17.6 -1.5 -19.1
Corporation tax payable, net -1.3 -0.5 -1.8
Acquired net assets 0.8 10.3 11.1
Goodwill 28.2 12.7 40.9
Net cash flow arising from acquisition 29.0 23.0 52.0
Cash and cash equivalents in acquired subsidiaries 14.3 0.6 14.9
Acquisition cost 43.3 23.6 66.9
MEDIALOGIC A/S
The activities in Medialogic A/S were acquired on 14
August 2013 and recognized in the financial statements
from this date. Medialogic A/S primarily develops
software for the labor market.
If the enterprise had been owned for the entire
reporting period, recognized revenue and net profit
would have been DKK 49.0 million and DKK 5.4 million
respectively.

71
Revenue relating to Medialogic A/S has been
recognized in the income statement and statement
of comprehensive income since the acquisition, and
amounted to DKK 20.6 million in 2013.
Goodwill mainly comprises intangible assets in the form
of know-how and existing staff. The calculated goodwill
is not amortizable for tax purposes.
The company was merged with KMD A/S in 2014.
Transaction costs of DKK 0.5 million have been
recognized in other external expenses.
AXAPOINT APS
Axapoint ApS was acquired at the end of December
2013 and recognized from 31 December 2013. There
was as such no earnings impact from this acquisition
in 2013. Axapoint ApS primarily delivers architectural
frameworks for Danish local-government payment
systems.
If the enterprise had been owned for the entire
reporting period, recognized EBITDA and net profit
would have been DKK 2.7 million and DKK 1.5 million
respectively.
Goodwill represents the value of existing staff and
know-how. The calculated goodwill is not amortizable
for tax purposes.
Transaction costs of DKK 0.1 million have been
recognized in other external expenses.

72
NOTE 22_CONTINGENT ASSETS AND LIABILITIES
The Group has entered into leases and operating leases
that are non-cancelable on the part of the Group beyond
1 year. The value of the total rental and lease commitments
is as follows:
RENTAL COMMITMENTS
DKK million 2014 2013
Rental commitments due within 1 year 108.3 107.4
Rental commitments due within 2 to 5 years 399.7 407.6
Rental commitments due after 5 years 425.4 652.4
Total 933.4 1,167.4
Lease commitments relate primarily to the Group’s
owner-occupied properties where contracts have been
entered into that are non-cancelable until 1 January
2024.
LEASE COMMITMENTS
DKK million 2014 2013
Lease commitments due within 1 year 192.9 227.7
Lease commitments due within 2 to 5 years 124.2 443.2
Lease commitments due after 5 years 76.6 212.5
Total 393.7 883.4
Lease commitments mainly comprise lease
commitments concerning third-party
software/maintenance subscriptions.
OTHER LIABILITIES AND CONTINGENT LIABILITIES
The Group is involved in normal commercial disputes.
Although the final outcome of these matters cannot be
predicted, management does not consider that they will
have a material impact on the Company’s results or
financial position.
The senior loan agreement is a loan facility comprising
two loan facilities and a revolving credit facility.
On 31 December 2014 the nominal debt in relation to
the loan agreement was DKK 4,118 million.
The shares in KMD A/S and its subsidiaries have been
pledged as security for the senior loan agreement.
KMD has entered into an agreement with KL (Local
Government Denmark) concerning adjustment of price
development and service level in certain IT systems
critical in relation to local governments’ administration
of legislation in the welfare area.
KMD A/S and its Danish subsidiaries are jointly taxed
with the other Danish companies in the Keyemde Group.
The joint taxation also covers withholding tax in the
form of tax on dividends, royalties and interest. The
Danish companies are jointly and severally liable for the
joint taxation. Any subsequent corrections to the taxable
income subject to joint taxation or withholding taxes
may lead to a higher liability.
The tax for the individual companies is fully allocated
on the basis of the expected taxable income.

73
NOTE 23_RELATED PARTIES
The Company’s related parties are: Domicile Relationship
Ownership
interest
AI Keyemde & Cy SCA Luxembourg Shareholder in AI Keyemde ApS 95.89%
AI Keyemde B K/S Ballerup Shareholder in AI Keyemde ApS 3.85%
AI Keyemde B2 K/S Ballerup Shareholder in AI Keyemde ApS 0.24%
AI Keyemde C K/S Ballerup Shareholder in AI Keyemde ApS 0.02%
AI Keyemde ApS Ballerup Shareholder in AI Keyemde 2 ApS 100.0%
AI Keyemde 2 ApS Ballerup Shareholder in AI Keyemde 3 ApS 100.0%
AI Keyemde 3 ApS Ballerup Shareholder in KMD Holding A/S 100.0%
KMD Holding A/S Ballerup Shareholder in KMD A/S 100.0%
KMD Sverige AB Stockholm Subsidiary of KMD A/S 100.0%
KMD BPO A/S Ballerup Subsidiary of KMD A/S 100.0%
Axapoint ApS Skanderborg Subsidiary of KMD A/S 100.0%
ScanJour A/S Ballerup Subsidiary of KMD A/S 100.0%
Cenza ApS Ballerup Subsidiary of KMD A/S 100.0%
Capevo Ballerup Subsidiary of KMD A/S 100.0%
KMD Poland sp. z o.o. Warsaw Subsidiary of KMD A/S 100.0%
AI Keyemde & Cy SCA owns 95.89% of the shares in
AI Keyemde ApS. The ultimate owner of AI Keyemde
& Cy SCA is funds managed by Advent International
Corporation. These funds, which own more than 25%
of the shares in AI Keyemde & Cy SCA, are Advent
International GPE VII-B Limited Partnership (29%)
and Advent International GPE VII-E Limited Partnership
(20%). No other Advent funds own or manage more
than 15% of the shares.
More information about Advent International is available
at www.adventinternational.com.
AI Keyemde ApS is included as a subsidiary in the
financial statements of AI Keyemde & Cy SCA. The
parent company can be contacted at the company’s
address: 2-4, rue Beck, 1222 Luxembourg, Grand
Duchy of Luxembourg.
KMD A/S is 100% owned by KMD Holding A/S. KMD A/S
is included in the consolidated financial statements of
AI Keyemde ApS. A copy of the consolidated financial
statements is available by contacting the Group
Secretariat, Lautrupparken 40, 2750 Ballerup, Denmark.
RELATED PARTY TRANSACTIONS
The Company's related parties comprise the companies’
boards of directors, executive boards and senior
employees, and family members of these persons.
Related parties also comprise companies in which the
specified group of people have significant influence.
Remuneration and shareholdings of the Board of
Directors and Executive Board are described in Note 6.
There have not been any other transactions with the
Board of Directors, Executive Board or other related
parties during the year.
NOTE 24_EVENTS AFTER
THE BALANCE SHEET DATE
The Company acquired the shares in Avaleo A/S after
the balance sheet date.
No other events have occurred since the balance sheet
date that have a material impact on the Company’s
financial position at 31 December 2014.

74
The financial ratios have been prepared in accordance
with Recommendations and Key Ratios 2010, issued
by the Danish Society of Financial Analysts.
The financial ratios cited in the Financial highlights have
been calculated as follows:
Profit margin (EBIT margin) Operating profit
Revenue
EBITDA margin Earnings before interest, tax, depreciation and amortization (EBITDA)
Revenue
Solvency ratio Equity x 100
Total assets
Return on equity (ROE) Net profit for the year
Average equity
Interest-bearing debt Debt to credit institutions + deposits + bonds + subordinated debt
Adjusted EBITDA EBITDA in accordance with the consolidated financial statements adjusted for share of the accounting items Other operating income and expenses (gains and losses on sale of non-current assets plus profit on sale of companies) and Restructuring costs of a one-off nature
EXPLANATION OF FINANCIAL RATIOS

75
DKK million
Note 2014 2013
2 Revenue 4,659.5 4,500.0
Other external costs 2,057.7 1,882.7
3 Staff costs 1,921.5 2,199.7
Other operating income 9.8 16.7
Earnings before tax, interest, depreciation and amortization (EBITDA) 690.2 434.3
7, 8 Depreciation and amortization 568.5 371.1
Operating profit (EBIT) 121.7 63.2
Income from equity investments in Group enterprises 0.0 1.6
4 Financial income 15.9 7.9
5 Financial expenses 13.0 13.7
Earnings before tax (EBT) 124.6 59.0
6 Tax on profit for the year 42.8 5.9
Net profit for the year 81.8 53.1
Allocated as follows:
Dividend 0.0 0.0
Retained earnings 81.8 53.1
PARENT COMPANY FINANCIAL STATEMENTS
PARENT COMPANY INCOME STATEMENT

76
ASSETS
DKK million
Note 2014 2013
NON-CURRENT ASSETS
Customer relationships 28.4 32.9
Rights 126.0 7.2
Goodwill 131.0 113.9
Completed development projects 105.1 387.9
Development projects in progress 192.2 181.9
7 Intangible assets 582.7 723.8
Land and buildings 78.5 86.6
Leasehold improvements 38.8 39.7
Plant and machinery 144.9 160.8
Fixtures, operating equipment and vehicles 10.0 8.3
8 Property, plant and equipment 272.2 295.4
9 Equity investments in subsidiaries 84.4 90.8
Deposits 44.5 44.6
Other non-current assets 128.9 135.4
Total non-current assets 983.8 1,154.6
CURRENT ASSETS
Inventories 7.3 6.5
10 Trade receivables 733.3 676.3
Receivables from Group enterprises 352.2 8.1
11 Contract work in progress 44.5 56.8
Other receivables 25.4 22.6
Corporation tax receivable 13.3 49.0
12 Prepayments 30.9 82.6
Securities 0.7 0.7
Cash 94.8 313.1
Total current assets 1,301.7 1,215.0
Total assets 2,285.5 2,369.6
PARENT COMPANY BALANCE SHEET AT 31 DECEMBER

77
EQUITY AND LIABILITIES
DKK million
Note 2014 2013
EQUITY
13 Share capital 240.0 240.0
Hedging reserve -0.5 -0.5
Retained earnings 548.7 465.1
Proposed dividend 0.0 0.0
Total equity 788.2 704.6
LIABILITIES
6 Provision for deferred tax 14.7 52.6
14 Provisions 9.5 9.2
Other payables 26.8 35.8
Credit institutions 250.7 140.4
15 Non-current liabilities 301.7 238.0
Credit institutions 34.6 6.6
Prepayments from customers 32.3 62.3
Trade payables 373.3 469.6
Payables to Group enterprises 19.5 34.2
16 Other payables 534.7 637.4
Derivative financial instruments 0.7 0.6
Corporation tax payable 0.0 0.0
14 Provisions 76.2 95.7
Deferred income 124.3 120.6
Current liabilities 1,195.6 1,427.0
Total liabilities 1,497.3 1,665.0
Total equity and liabilities 2,285.5 2,369.6
PARENT COMPANY BALANCE SHEET AT 31 DECEMBER
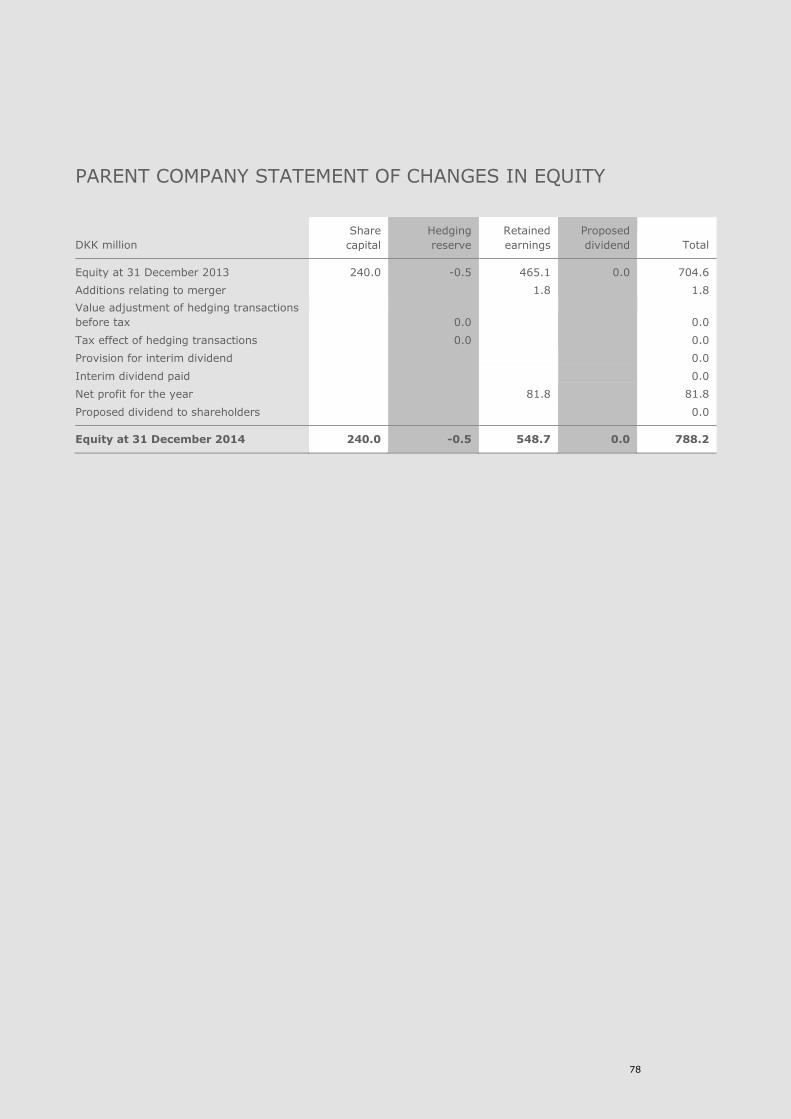
78
DKK million
Share
capital
Hedging
reserve
Retained
earnings
Proposed
dividend Total
Equity at 31 December 2013 240.0 -0.5 465.1 0.0 704.6
Additions relating to merger 1.8 1.8
Value adjustment of hedging transactions
before tax 0.0 0.0
Tax effect of hedging transactions 0.0 0.0
Provision for interim dividend
0.0
Interim dividend paid
0.0
Net profit for the year 81.8 81.8
Proposed dividend to shareholders 0.0
Equity at 31 December 2014 240.0 -0.5 548.7 0.0 788.2
PARENT COMPANY STATEMENT OF CHANGES IN EQUITY

79
OVERVIEW
01_Accounting policies
02_Revenue
03_Staff costs
04_Financial income
05_Financial expenses
06_Tax on profit for the year
07_Intangible assets
08_Property, plant and equipment
09_Equity interests in Group enterprises
10_Non-current receivables
11_Contract work in progress
12_Prepayments
13_Share capital
14_Provisions
15_Non-current liabilities
16_Other payables
17_Contingent assets and liabilities
18_Related parties
19_Events after the balance sheet date
NOTES TO THE PARENT COMPANY FINANCIAL STATEMENTS

80
NOTE 01_ACCOUNTING POLICIES
The financial statements for the Parent Company have
been prepared in accordance with the provisions of the
Danish Financial Statements Act for large companies in
accounting class C.
The Group’s accounting policies are set out in the
consolidated financial statements. The accounting
policies for the Parent Company are the same as for
the Group with the adjustments set out below.
SUPPLEMENTARY ACCOUNTING POLICIES FOR THE
PARENT COMPANY
DIVIDENDS AND INCOME FROM EQUITY INVESTMENTS
IN SUBSIDIARIES
In the Parent Company financial statements this
accounting item comprises dividends from subsidiaries.
A dividend is recognized when the shareholders'
entitlement to receive a dividend has been approved
by the competent company bodies.
If the dividend exceeds total earnings after the
acquisition date, it is recognized as a write-down
of the cost of the investment.
INVESTMENTS
Equity investments in subsidiaries are measured in the
Parent Company financial statements at cost minus any
write-down for impairment.
Loans to subsidiaries are recognized under non-current
assets in the Parent Company financial statements if
these are considered part of the investment.
STATEMENT OF CASH FLOWS
Pursuant to section 86 para. 4 of the Danish Financial
Statements Act, the Parent Company does not prepare
a separate statement of cash flows; please refer to the
consolidated statement of cash flows.
NOTE 02_REVENUE
KMD A/S operates within the IT and IT-related services
segment in the Danish market.

81
NOTE 03_STAFF COSTS
DKK million 2014 2013
Wages, salaries and remuneration 1,747.2 2,020.9
Pensions 167.6 171.3
Other social security costs 6.7 7.5
Total 1,921.5 2,199.7
Board of Directors
Remuneration 0.2 0.2
Total 0.2 0.2
Executive Board
Salaries, etc. 35.5 10.5
Pensions 1.0 0.2
Total 36.5 10.7
Average number of employees 2,733 2,654
An amount of DKK 109 million has been expensed in
2014 for salaries and compensation for employees who
left the company as a result of structural adjustments.
Remuneration to the Executive Board includes salaries,
etc. of DKK 22.4 million in connection with termination.
A new share investment program was established
on 20 December 2012 for the Executive Board and
a number of senior employees. Investment is by means
of endorsing three limited partnerships, which together
have purchased 4.11% of the share capital in AI
Keyemde ApS. See Note 6 to the consolidated financial
statements for further information.
NOTE 04_FINANCIAL INCOME
DKK million 2014 2013
Interest income 9.0 7.8
Interest income, Group enterprises 6.9 0.1
Carrying amount at 31 December 15.9 7.9
NOTE 05_FINANCIAL EXPENSES
DKK million 2014 2013
Interest expenses 12.6 10.4
Interest expenses, Group enterprises 0.4 3.3
Total 13.0 13.7

82
NOTE 06_TAX ON PROFIT FOR THE YEAR
DKK million 2014 2013
Current tax 76.7 43.1
Change in deferred tax -37.4 -37.4
Total 42.4 5.7
Prior-year adjustments 0.4 0.0
Total 42.8 5.7
Made up as follows:
Tax on profit for the year 42.8 5.9
Tax on changes in equity 0.0 -0.2
Total 42.8 5.7
Development in deferred tax can be specified as follows:
DKK million 2014 2013
Balance at 1 January 52.6 91.4
Adjustment of deferred tax, 1 January -6.4 -1.4
Additions relating to merger 2.8 0.0
Provisions for the year -34.3 -37.4
Balance at 31 December 14.7 52.6
Deferred tax is made up as follows:
Intangible assets 105.5 134.4
Property, plant and equipment -51.6 -51.0
Other liabilities -14.7 -11.2
Non-current portion 39.2 72.2
Current assets 3.6 2.6
Other liabilities -28.1 -22.2
Current portion -24.5 -19.6
Balance at 31 December 14.7 52.6

83
NOTE 07_INTANGIBLE ASSETS
2014
DKK million
Customer
relation-
ships Rights Goodwill
Develop-
ment
projects in
progress
Completed
develop-
ment
projects Total
Cost at 1 January 58.5 45.6 154.3 181.9 658.8 1,099.1
Additions relating to merger 8.1
29.7
38.2 76.0
Additions during the year 126.8 146.0 21.1 293.9
Transfers -19.8 19.8 0.0
Disposals during the year 0.0
Cost at 31 December 66.6 172.4 184.0 308.1 737.9 1,469.0
Amortization and impairment
losses at 1 January 25.6 38.4 40.4 0.0 270.9 375.3
Additions relating to merger 0.5 31.6 32.1
Impairment losses 115.9 283.1 399.0
Amortization for the year 12.1 8.0 12.6 47.2 79.9
Amortization and impairment
losses at 31 December 38.2 46.4 53.0 115.9 632.8 886.3
Carrying amount
at 31 December 28.4 126.0 131.0 192.2 105.1 582.7
Carrying amount of capitalized
interest at 31 December 0.0 0.0 0.0 7.0 1.4 8.4
Of which assets held under finance
leases 120.2 120.2
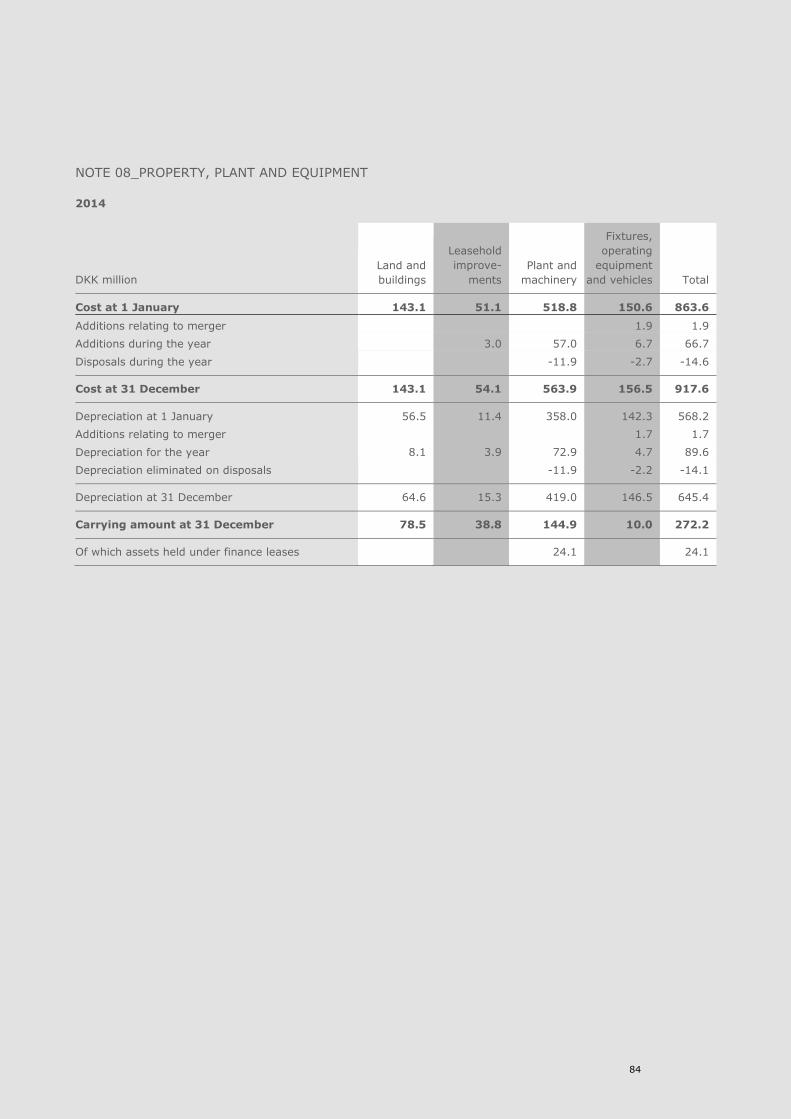
84
NOTE 08_PROPERTY, PLANT AND EQUIPMENT
2014
DKK million
Land and
buildings
Leasehold
improve-
ments
Plant and
machinery
Fixtures,
operating
equipment
and vehicles Total
Cost at 1 January 143.1 51.1 518.8 150.6 863.6
Additions relating to merger 1.9 1.9
Additions during the year 3.0 57.0 6.7 66.7
Disposals during the year
-11.9 -2.7 -14.6
Cost at 31 December 143.1 54.1 563.9 156.5 917.6
Depreciation at 1 January 56.5 11.4 358.0 142.3 568.2
Additions relating to merger 1.7 1.7
Depreciation for the year 8.1 3.9 72.9 4.7 89.6
Depreciation eliminated on disposals
-11.9 -2.2 -14.1
Depreciation at 31 December 64.6 15.3 419.0 146.5 645.4
Carrying amount at 31 December 78.5 38.8 144.9 10.0 272.2
Of which assets held under finance leases 24.1 24.1
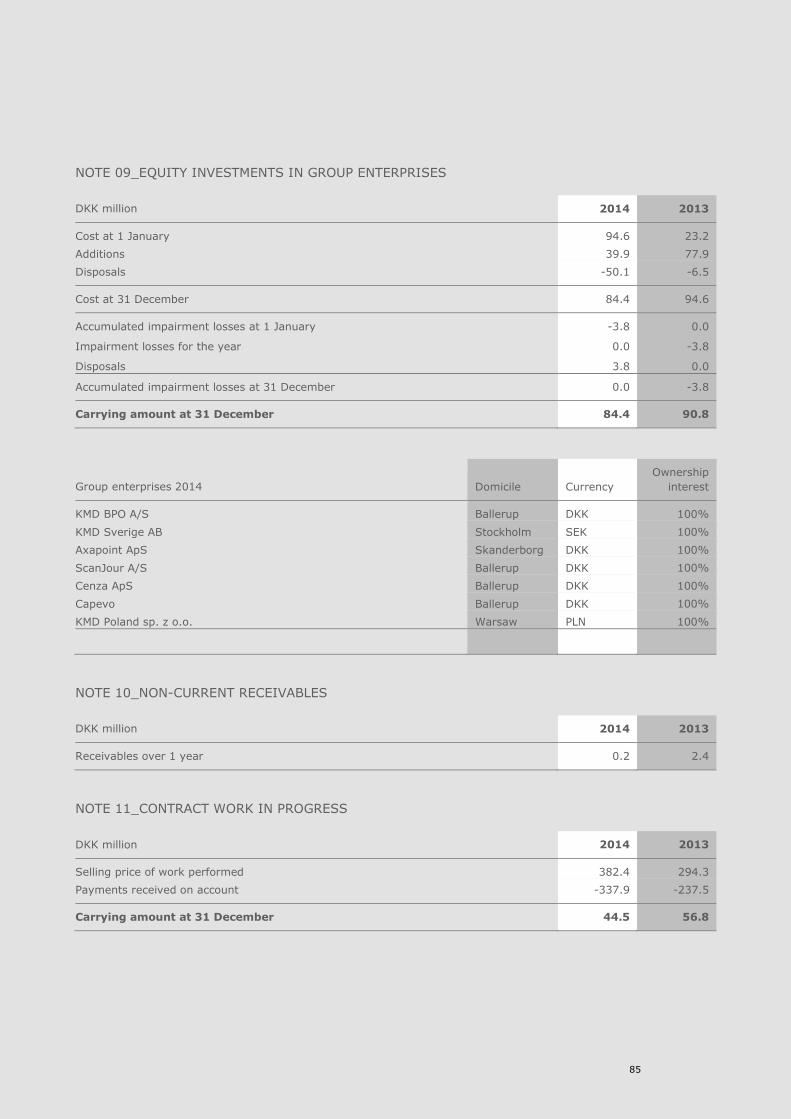
85
NOTE 09_EQUITY INVESTMENTS IN GROUP ENTERPRISES
DKK million 2014 2013
Cost at 1 January 94.6 23.2
Additions 39.9 77.9
Disposals -50.1 -6.5
Cost at 31 December 84.4 94.6
Accumulated impairment losses at 1 January -3.8 0.0
Impairment losses for the year 0.0 -3.8
Disposals 3.8 0.0
Accumulated impairment losses at 31 December 0.0 -3.8
Carrying amount at 31 December 84.4 90.8
Group enterprises 2014 Domicile Currency
Ownership
interest
KMD BPO A/S Ballerup DKK 100%
KMD Sverige AB Stockholm SEK 100%
Axapoint ApS Skanderborg DKK 100%
ScanJour A/S Ballerup DKK 100%
Cenza ApS Ballerup DKK 100%
Capevo Ballerup DKK 100%
KMD Poland sp. z o.o. Warsaw PLN 100%
NOTE 10_NON-CURRENT RECEIVABLES
DKK million 2014 2013
Receivables over 1 year 0.2 2.4
NOTE 11_CONTRACT WORK IN PROGRESS
DKK million 2014 2013
Selling price of work performed 382.4 294.3
Payments received on account -337.9 -237.5
Carrying amount at 31 December 44.5 56.8
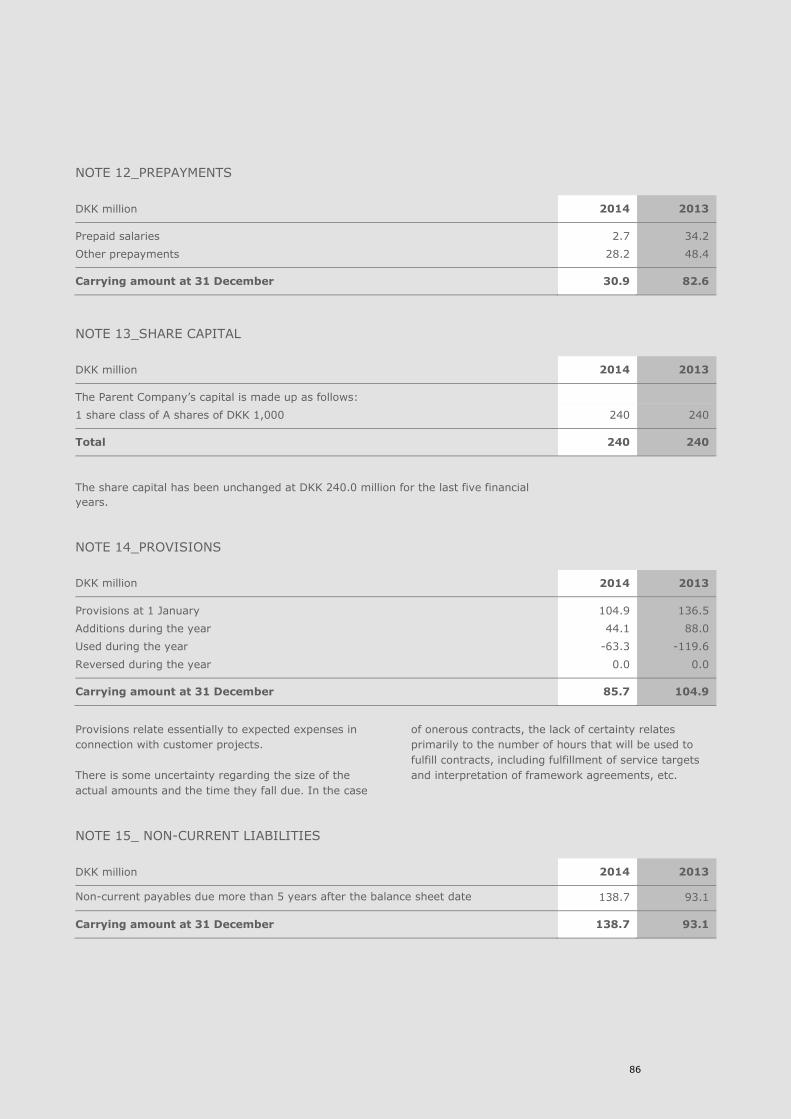
86
NOTE 12_PREPAYMENTS
DKK million 2014 2013
Prepaid salaries 2.7 34.2
Other prepayments 28.2 48.4
Carrying amount at 31 December 30.9 82.6
NOTE 13_SHARE CAPITAL
DKK million 2014 2013
The Parent Company’s capital is made up as follows:
1 share class of A shares of DKK 1,000 240 240
Total 240 240
The share capital has been unchanged at DKK 240.0 million for the last five financial
years.
NOTE 14_PROVISIONS
DKK million 2014 2013
Provisions at 1 January 104.9 136.5
Additions during the year 44.1 88.0
Used during the year -63.3 -119.6
Reversed during the year 0.0 0.0
Carrying amount at 31 December 85.7 104.9
Provisions relate essentially to expected expenses in
connection with customer projects.
There is some uncertainty regarding the size of the
actual amounts and the time they fall due. In the case
of onerous contracts, the lack of certainty relates
primarily to the number of hours that will be used to
fulfill contracts, including fulfillment of service targets
and interpretation of framework agreements, etc.
NOTE 15_ NON-CURRENT LIABILITIES
DKK million 2014 2013
Non-current payables due more than 5 years after the balance sheet date 138.7 93.1
Carrying amount at 31 December 138.7 93.1
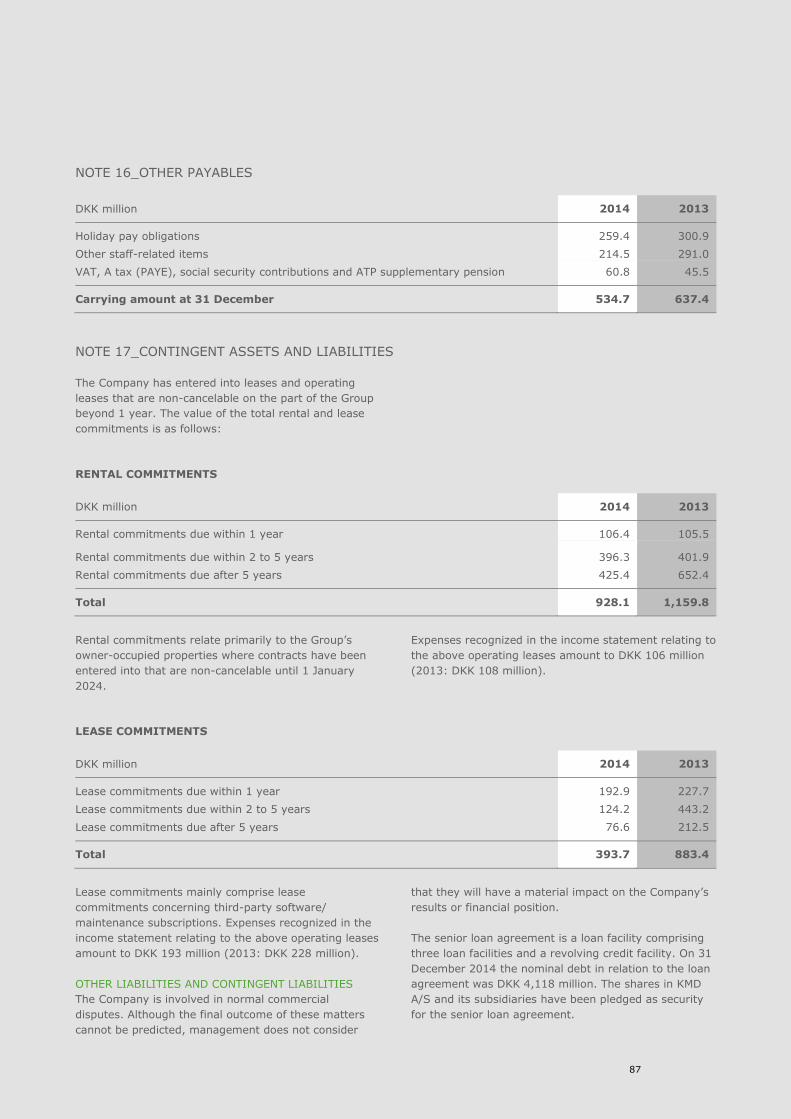
87
NOTE 16_OTHER PAYABLES
DKK million 2014 2013
Holiday pay obligations 259.4 300.9
Other staff-related items 214.5 291.0
VAT, A tax (PAYE), social security contributions and ATP supplementary pension 60.8 45.5
Carrying amount at 31 December 534.7 637.4
NOTE 17_CONTINGENT ASSETS AND LIABILITIES
The Company has entered into leases and operating
leases that are non-cancelable on the part of the Group
beyond 1 year. The value of the total rental and lease
commitments is as follows:
RENTAL COMMITMENTS
DKK million 2014 2013
Rental commitments due within 1 year 106.4 105.5
Rental commitments due within 2 to 5 years 396.3 401.9
Rental commitments due after 5 years 425.4 652.4
Total 928.1 1,159.8
Rental commitments relate primarily to the Group’s
owner-occupied properties where contracts have been
entered into that are non-cancelable until 1 January
2024.
Expenses recognized in the income statement relating to
the above operating leases amount to DKK 106 million
(2013: DKK 108 million).
LEASE COMMITMENTS
DKK million 2014 2013
Lease commitments due within 1 year 192.9 227.7
Lease commitments due within 2 to 5 years 124.2 443.2
Lease commitments due after 5 years 76.6 212.5
Total 393.7 883.4
Lease commitments mainly comprise lease
commitments concerning third-party software/
maintenance subscriptions. Expenses recognized in the
income statement relating to the above operating leases
amount to DKK 193 million (2013: DKK 228 million).
OTHER LIABILITIES AND CONTINGENT LIABILITIES
The Company is involved in normal commercial
disputes. Although the final outcome of these matters
cannot be predicted, management does not consider
that they will have a material impact on the Company’s
results or financial position.
The senior loan agreement is a loan facility comprising
three loan facilities and a revolving credit facility. On 31
December 2014 the nominal debt in relation to the loan
agreement was DKK 4,118 million. The shares in KMD
A/S and its subsidiaries have been pledged as security
for the senior loan agreement.

88
KMD A/S is jointly taxed with the other Danish
companies in the Keyemde Group. The joint taxation
also covers withholding tax in the form of tax on
dividends, royalties and interest. The Danish companies
are jointly and severally liable for the joint taxation. Any
subsequent corrections to the taxable income subject to
joint taxation or withholding taxes may lead to a higher
liability.
KMD has entered into an agreement with KL (Local
Government Denmark) concerning adjustment of price
development and service level in certain IT systems
critical in relation to local governments’ administration
of legislation in the welfare area.
See Note 23 to the consolidated financial statements
for more information on related parties.
NOTE 19_EVENTS AFTER THE
BALANCE SHEET DATE
The shares in Avaleo A/S were acquired after the
balance sheet date.
No events have occurred since the balance sheet date
that have a material impact on the Company’s financial
position at 31 December 2014.
NOTE 18_RELATED PARTIES
The Company has had the following transactions with related parties:
DKK million 2014 2013
Trading and balances with related parties comprise:
Sale of goods and services, Group enterprises 41.5 43.7
Purchase of goods and services, Group enterprises 54.9 21.2
Interest income from Group enterprises 6.9 0.1
Interest expenses to Group enterprises 0.4 3.3
Receivables from Group enterprises 352.2 8.1
Payables to Group enterprises 19.5 34.2
89
The Board of Directors and the Executive Board have
today discussed and approved the annual report for the
financial year 1 January – 31 December 2014 for KMD
A/S.
The consolidated financial statements have been
prepared in accordance with International Financial
Reporting Standards as endorsed by the EU, and the
Parent Company financial statements have been
prepared in accordance with the Danish Financial
Statements Act. The consolidated financial statements
and the Parent Company financial statements have
also been prepared in accordance with additional
Danish disclosure requirements for annual reports.
Management’s review, which is not included in the
audit, has been prepared in accordance with the Danish
Financial Statements Act.
In our opinion the consolidated financial statements
provide a fair presentation of the Group’s assets, equity,
liabilities and financial position at 31 December 2014
and of the results of the Group’s operations and cash
flows for the financial year 1 January – 31 December
2014.
In our opinion the Parent Company financial statements
provide a fair presentation of the Company’s assets,
liabilities and financial position at 31 December 2014
and of the results of the Company’s operations for the
financial year 1 January – 31 December 2014.
In our opinion Management’s review provides a fair
account of the development in the Group’s and the
Company’s operations and financial circumstances, net
profit for the year, and the Group’s and the Company’s
financial position, plus a description of the key risks and
elements of uncertainty to which the Group and the
Company are subject.
It is recommended that the annual report be approved
by the Annual General Meeting.
STATEMENTS
STATEMENT BY THE EXECUTIVE BOARD AND BOARD OF
DIRECTORS
Ballerup, 4 March 2015 EXECUTIVE BOARD
Eva Berneke CEO
Jannich Kiholm Lund CFO
BOARD OF DIRECTORS
Léo Apotheker Chairman
John Woyton Fred Wakeman
Michael Christiansen Bret Bolin Eva Berneke
Jannich Kiholm Lund Else Bergman Kim Skovgaard
Thomas Bisballe Jensen

90
STATEMENT ON CONSOLIDATED FINANCIAL
STATEMENTS AND PARENT COMPANY FINANCIAL
STATEMENTS
We have audited the Consolidated Financial Statements
and Parent Company Financial Statements of KMD A/S
for the financial year 1 January to 31 December 2014,
which comprise income statement, balance sheet,
statement of changes in equity, notes and accounting
policies for both the Group and the Parent Company,
as well as statement of comprehensive income and
statement of cash flows for the Group. The Consolidated
Financial Statements are prepared in accordance with
International Financial Reporting Standards as adopted
by the EU, and the Parent Company Financial
Statements are prepared under the Danish Financial
Statements Act. Moreover, the Consolidated Financial
Statements and the Parent Company Financial
Statements are prepared in accordance with additional
Danish disclosure requirements.
MANAGEMENT’S RESPONSIBILITY FOR THE
CONSOLIDATED FINANCIAL STATEMENTS AND THE
PARENT COMPANY FINANCIAL STATEMENTS
Management is responsible for the preparation of
Consolidated Financial Statements that give a true and
fair view in accordance with International Financial
Reporting Standards as adopted by the EU and Danish
disclosure requirements and for preparing Parent
Company Financial Statements that give a true and fair
view in accordance with the Danish Financial Statements
Act and Danish disclosure requirements and for such
internal control as Management determines is necessary
to enable the preparation of Consolidated Financial
Statements and Parent Company Financial Statements
that are free from material misstatement, whether due
to fraud or error.
AUDITOR’S RESPONSIBILITY
Our responsibility is to express an opinion on the
Consolidated Financial Statements and Parent Company
Financial Statements based on our audit. We conducted
our audit in accordance with International Standards on
Auditing and additional requirements under Danish audit
regulation. This requires that we comply with ethical
requirements and plan and perform the audit to obtain
reasonable assurance as to whether the Consolidated
Financial Statements and the Parent Company Financial
Statements are free from material misstatement.
An audit involves performing procedures to obtain audit
evidence about the amounts and disclosures in the
Consolidated Financial Statements and the Parent
Company Financial Statements. The procedures selected
depend on the auditor’s judgment, including the
assessment of the risks of material misstatement of
the Consolidated Financial Statements and the Parent
Company Financial Statements, whether due to fraud
or error. In making those risk assessments, the auditor
considers internal controls relevant to the Company’s
preparation of Consolidated Financial Statements and
Parent Company Financial Statements that give a true
and fair view in order to design audit procedures that
are appropriate in the circumstances, but not for the
purpose of expressing an opinion on the effectiveness
of the Company’s internal control. An audit also includes
evaluating the appropriateness of accounting policies
used and the reasonableness of accounting estimates
made by Management, as well as evaluating the overall
presentation of the Consolidated Financial Statements
and Parent Company Financial Statements.
We believe that the audit evidence we have obtained is
sufficient and appropriate to provide a basis for our
audit opinion.
The audit has not resulted in any qualification.
INDEPENDENT AUDITOR’S REPORT
TO THE SHAREHOLDERS OF KMD A/S

91
OPINION
In our opinion, the Consolidated Financial Statements
give a true and fair view of the Group’s assets, liabilities
and financial position at 31 December 2014 and of the
results of the Group’s operations and cash flows for
the financial year 1 January to 31 December 2014 in
accordance with International Financial Reporting
Standards as adopted by the EU and Danish disclosure
requirements.
Moreover, in our opinion, the Parent Company Financial
Statements give a true and fair view of the Parent
Company’s assets, liabilities and financial position at
31 December 2014 and of the results of the Parent
Company’s operations for the financial year 1 January
to 31 December 2014 in accordance with the Danish
Financial Statements Act and Danish disclosure
requirements.
STATEMENT ON MANAGEMENT’S REVIEW
We have in accordance with the Danish Financial
Statements Act read Management’s Review. We have
not performed any procedures additional to the audit
of the Consolidated Financial Statements and the Parent
Company Financial Statements. On this basis, in our
opinion, the information provided in Management’s
Review is consistent with the Consolidated Financial
Statements and the Parent Company Financial
Statements.
Copenhagen, 4 March 2015 PricewaterhouseCoopers Statsautoriseret Revisionspartnerselskab
Fin T. Nielsen State Authorized Public Accountant
Leif Ulbæk Jensen State Authorized Public Accountant

KMD'S ANNUAL REPORT 2014
Editors: KMD Corporate Communications
and Finance
Design: BGRAPHIC
Proofreading and English translation: Borella projects

KMD'S ANNUAL REPORT 2014
Editors: KMD Corporate Communications
and Finance
Design: BGRAPHIC
Proofreading and English translation: Borella projects

KMD
Tel. +45 44 60 10 00
www.kmd.dk
www.kundenet.dk
BALLERUP
Lautrupparken 40-42
2750 Ballerup
HERLEV
Hørkær 18, 3
2730 Herlev
ODENSE
Niels Bohrs Allé 185
5220 Odense SØ
AARHUS
Dusager 18
8200 Aarhus N
AALBORG
Lauritzens Plads 1
9000 Aalborg