Annual Report 2013 (03-10-13) - Resham Textile … spent Rs. 200.42 million on this project from own...
49
R E S H A 1 CONTENTS 17 STATEMENT OF COMPREHENSIVE INCOME 18 CASH FLOW STATEMENT 19 STATEMENT OF CHANGES IN EQUITY 20 NOTES TO THE FINANCIAL STATEMENTS 47 PATTERN OF SHAREHOLDING FORM OF PROXY 13 AUDITORS’ REPORT TO THE MEMBERS 14 BALANCE SHEET 16 PROFIT AND LOSS ACCOUNT 3 MISSION 2 COMPANY INFORMATION 9 STATEMENT OF ETHICS AND BUSINESS PRACTICES 10 STATEMENT OF COMPLIANCE WITH THE CODE OF CORPORATE GOVERNANCE 5 DIRECTORS’ REPORT 8 FINANCIAL SUMMARY 4 NOTICE OF ANNUAL GENERAL MEETING 12 REVIEW REPORT TO THE MEMBERS ON THE STATEMENT OF COMPLIANCE WITH THE BEST PRACTICES OF THE CODE OF CORPORATE GOVERNANCE
-
Upload
duongthien -
Category
Documents
-
view
213 -
download
0
Transcript of Annual Report 2013 (03-10-13) - Resham Textile … spent Rs. 200.42 million on this project from own...

R E S H A
1
C O N T E N T S
17STATEMENT OF COMPREHENSIVE INCOME
18CASH FLOW STATEMENT
19STATEMENT OF CHANGES IN EQUITY
20NOTES TO THE FINANCIAL STATEMENTS
47PATTERN OF SHAREHOLDING
FORM OF PROXY
13AUDITORS’ REPORT TO THE MEMBERS
14BALANCE SHEET
16PROFIT AND LOSS ACCOUNT
3MISSION
2COMPANY INFORMATION
9STATEMENT OF ETHICS AND BUSINESS PRACTICES
10
STATEMENT OF COMPLIANCE WITH THE CODE
OF CORPORATE GOVERNANCE
5DIRECTORS’ REPORT
8FINANCIAL SUMMARY
4NOTICE OF ANNUAL GENERAL MEETING
12
REVIEW REPORT TO THE MEMBERS ON THE STATEMENT
OF COMPLIANCE WITH THE BEST PRACTICES OF THE
CODE OF CORPORATE GOVERNANCE

CHIEF EXECUTIVE OFFICER : Ch. Muhammad Khurshid
CHIEF FINANCIAL OFFICER : Mr. Muhammad Ali Chaudhry
COMPANY SECRETARY : Mr. Muhammad Ali Chaudhry
AUDITORS : M/s Ernst & Young Ford Rhodes Sidat Hyder
Chartered Accountants
Lahore.
DIRECTORS : Ch. Rahman Bakhsh
Mrs. Salma Aziz
Mr. Kamran Ilyas
Mr. Azhar Khurshid Chaudhry
Ms. Kiran A. Chaudhry
Mr. Muhammad Ali Chaudhry
HR - COMMITTEE :
Mr. Kamran Ilyas
Mr. Azhar Khurshid Chaudhry
Mrs. Salma Aziz
Chairman
Member
Member
BANKERS : National Bank of Pakistan
Faysal Bank Limited
Al Baraka Bank (Pakistan) Ltd.
Orix Leasing Pakistan Limited
Bank Alfalah Limited
First National Bank Modaraba
SHARE REGISTRAR : Corplink (Pvt.) Ltd.
LEGAL ADVISORS : Mr. Shaukat Haroon (Advocate)
Barrister Salman Rahim (Advocate High Court)
REGISTERED OFFICE : 314-Upper Mall, Lahore.
MILLS : 1.5 Kilometer Habibabad,
Chunian Road, Tehsil Chunian,
District Kasur.
Annual Report
2
COMPANY INFORMATION
AUDIT COMMITTEE :
Mr. Kamran Ilyas
Mr. Muhammad Ali Chaudhry
Ms. Kiran A. Chaudhry
Chairman
Secretary
Member

MISSION
The management is committed to excellence in operations with the aim of achieving highest
standards in product quality, customer satisfaction, Company growth, employees welfare and
social responsibilities and is constantly striving to meet these objectives.
R E S H A
3

NOTICE OF ANNUAL GENERAL MEETING
thNotice is hereby given that the 24 Annual General Meeting of the Shareholders of Resham Textile
Industries Limited will be held on Thursday 31 October 2013 at 11:00 a.m. at the Registered Office of
the Company i.e. 314 Upper Mall, Lahore to transact the following business:
rd th1. To confirm the minutes of the 23 Annual General Meeting held on 17 October 2012.
2. To receive and adopt the audited accounts of the Company for the year ended 30 June 2013 and
reports of the Directors' and Auditors' thereon.
3. To appoint auditors and to fix their remuneration for the year ending 30 June 2014. The auditors
M/s Ernst & Young Ford Rhodes Sidat Hyder, Chartered Accountants, Lahore retire and being
eligible, offer themselves for reappointment.
4. To transact such other business as may be placed before the meeting with the permission of the
Chair.
By Order of the Board
(MUHAMMAD ALI CHAUDHRY)
Lahore: 10 October 2013. Company Secretary
NOTES:
1. The Share Transfer Books of the Company will remain closed from 25 October 2013 to 31 October 2013 (both days inclusive).
2. A member entitled to attend and vote at the meeting may appoint another member of the Company as a proxy to attend and vote instead of him. A proxy form duly signed and stamped must be deposited at the Registered Office of the Company not less than 48 hours before the time fixed for holding the meeting.
3. The account holders of CDC are requested to bring their original CNIC/ Passport for the purpose of identification at the meeting.
4. Shareholders are requested to immediately notify the Company of any changes in their registered address.
Annual Report
4

DIRECTORS’ REPORT
It is my pleasure to present the Directors' Report and the audited accounts for the financial year ended June 30, 2013 along with the Auditors' Report.
By the grace of Allah, (s,w,t), the Company operations during the year under review further improved. Profit before taxation increased from Rs. 232.53 million to Rs. 349.02 million (s.p.l.y.). The improvement was mainly on account of increase in yarn rates by 3.52% and more efficient technical, marketing and financial operations, as also relatively lower prices of cotton.
The best news for the shareholders is that a long-term loan of Rs. 112.80 million due for payment till 2018 to National Bank of Pakistan and Rs. 25.63 million to other Banks / DFIs stands prepaid and now only Rs. 17.63 million represented in the current maturity of long-term financing (LTF) from Faysal Bank Limited for the Power House, remains to be paid. The other good news for the shareholders is increase in earnings per share, basic and diluted, improved to Rs. 6.97 from Rs. 4.11 (s.p.l.y.). As a result, shareholders were paid dividends, two interim and one final, amounting to Rs. 90 million. It is also worth mentioning that the Company undertook BMR, increasing the production capacity of the project by approximately 35-38%. The Company spent Rs. 200.42 million on this project from own sources in spite of offers by the banks to finance this BMR, expressing faith and trust of the banks in the Company. Further, the banks have enhanced cash finance limits of the Company from Rs. 0.615 billion to Rs. 1.06 billion, representing a 73% increase. The Company also wishes to highlight its commitment to generously contribute towards charity and welfare of the needy and the poor, and donations worth Rs. 23.43 million were made during the year, compared to Rs. 10.65 million (s.p.l.y.), representing an increase of 120%.
The Equity in the Balance Sheet increased to Rs. 738.79 million from Rs. 566.71 million (s.p.l.y) as a result of the overall performance of the Company.
The above performance, by any standard, deserves appreciation of the shareholders and needless to say that this is in spite of overall adverse economic condition in the country and high inflation which resulted in increase in prices, especially energy cost as also energy shortage due to which the project had to be closed for several days, contrary to the practice of complete year running.
The summarized financial results are given below and details may be perused in other sections of this report.:-
Performance Review
R E S H A
5
2013 2012Rupees (‘000)
Sales
Cost of sales
Gross profit
Administrative expenses
Distribution cost
Operating profit
Other operating expenses
Other operating income
3,501,701
2,994,486
507,215
52,815
19,757
72,572
434,643
24,388
410,255
7,921
418,176
3,245,032
2,867,911
377,121
32,664
26,236
58,900
318,221
18,841
299,380
6,585
305,965
Finance cost
Profit before taxation
Taxation
Profit after taxation
69,155
349,021
98,233
250,788
73,434
232,531
84,604
147,927

Future Prospects
Although the performance of the Company is likely to stay good and improve, there are certainly some factors which need to be highlighted, being outside the control of the Management, such as increasing cost of electricity which is unprecedented and threatened stoppage of gas to the Captive Power Plants by SNGPL. APTMA and other stakeholders are working with the Government agencies to reduce and limit the damage and somehow ensure uninterrupted supply of electricity. We appreciate these efforts of APTMA and hope for the best. Another important factor to be highlighted is the shortage of domestic cotton crop and increase in cotton prices this year in the face of depressed demand for yarn and fabric. On the whole, the Management is hopeful that the next year will be another good year in the history of the Company.
Corporate Social Responsibilities
The Management is well aware of the social responsibilities and is sensitive to the needs of the employees, industry and society at large. A school is run for children of the employees at mill premises while transport and other facilities are provided for senior students. A dispensary provides health care in addition to the Social Security medical facilities and medicines are provided free. In cases of hardship financial help is provided to the employees on case to case basis. Also under a scheme of provision of transport, middle level employees have been provided with motorcycles which are for use by them during service in the Company. Liberal rewards and bonuses are given to the employees in recognition of their outstanding work. Additionally, an amount of Rs. 23.43 million was donated to charitable causes during the year.
Corporate and Financial Reporting Framework
As required by the code of corporate governance, Directors are pleased to report that:
- The financial statements, prepared by the management of the Company present fairly its state of affairs, the result of its operations, cash flows and changes in equity.
- Proper books of accounts of the Company have been maintained.
- Accounting policies have been consistently applied in preparation of financial statements and the accounting estimates are based on reasonable and prudent judgment.
- International Accounting Standards, as applicable in Pakistan, have been followed in the preparation of financial statements.
- The system of internal control, which is in place, is being continuously reviewed by internal audit. The process of review will continue and any weakness in controls will be removed.
- There are no doubts about the Company's ability to continue as a going concern.
- There has been no departure from the best practices of corporate governance as detailed in the listing regulations.
- Outstanding taxes and other Government levies are given in related note(s) to the audited accounts.
There have been no changes in the accounting policies of the Company during the year.
Annual Report
6
Earning per share
- Basic & diluted (Rupees)
Debt Equity
Current Ratio
6.97
00:100
1.15
4.11
14:86
1.58
2013 2012

- During the last financial year, four (4) meetings of the Board of Directors were held. Attendance of these meetings was as follows.
- Key operations and financial data for last six (6) years is annexed.
- No trade in the shares of the Company was carried out by the Directors, CEO, CFO, Company Secretary, Executives, their spouses and minor children.
Pattern of Shareholding
A statement reflecting the pattern of shareholding is attached to the Annual report.
Related Party Transactions
The Directors confirm the following related party transactions:
1. that the transactions with related parties during the financial year have been ratified by the Audit Committee and approved by the Board of Directors.
2. that the transactions have been carried out at arm’s length.
Audit Committee Meetings
The Audit Committee met four times during the year under reference.
Auditors
The retiring auditors M/s Ernst & Young Ford Rhodes Sidat Hyder Chartered Accountants, being eligible, offer themselves for re-appointment. The Board of Directors, on recommendations of the audit committee, proposes the appointment of M/s Ernst & Young Ford Rhodes Sidat Hyder Chartered Accountants, for the year ending 30 June 2014.
Statement of Compliance with Best Practices on Transfer Pricing
The Company has fully complied with the best practices on transfer pricing as contained in the listing regulations of the stock exchanges.
Acknowledgements
The Directors take this opportunity to thank the Company's bankers, particularly National Bank of Pakistan, Bank Alfalah Limited, Faysal Bank Limited, Al Baraka Bank, Orix Leasing Pakistan Limited and other financial Institutions for their confidence in the Company and strong financial support. The Directors feel pleasure in expressing appreciation for the continued interest and support of all the shareholders of the Company. The Directors would also like to particularly mention the dedication and devotion displayed by the employees while performing their duties during the period and hope that the same spirit will prevail in the future as well.
CH. MUHAMMAD KHURSHID
R E S H A
7
10 October 2013.LAHORE:
For and on behalf of the Board
Name of Director Attendance
Ch. Muhammad KhurshidCh. Rahman BakhshMrs. Salma AzizMr. Kamran IlyasMr. Azhar Khurshid ChaudhryMs. Kiran A ChaudhryMr. Muhammad Ali Chaudhry
4444444

Financial Summary
Annual Report
8
2013 2012 2011 2010 2009 2008
BALANCE SHEET
(Rupees in thousand)
Paid up Share Capital 360,000 360,000 360,000 360,000 360,000 360,000
Unappropriated Profit & (Loss) 378,798 206,719 154,507 110,821 (69,104) (61,475)
Total Equity 738,798 566,719 514,507 470,821 290,896 298,525
Surplus on Revaluation of Fixed Assets 132,850 144,907 156,914 173,150 89,422 96,544
Long Term Liabilities - 120,184 166,327 195,436 219,139 243,794
Deferred Liabilities 254,937 233,836 210,580 163,777 23,716 26,662
Long Term Deposits 389 269 143 79 53 65
Current Liabilities 672,316 275,740 487,665 207,819 420,836 339,082
1,799,290 1,341,655 1,566,461 1,284,068 1,180,806 1,169,153
Represented by:
Fixed Assets 1,019,514 893,579 925,417 898,508 821,228 882,840
Capital work in progress 1,420 8,431 - 8,631 - -
Other Assets 3,678 3,669 3,667 3,673 3,682 3,682
Current Assets 774,678 435,976 637,377 373,256 355,896 282,631
1,799,290 1,341,655 1,566,461 1,284,068 1,180,806 1,169,153
PROFIT AND LOSS
Sales 3,501,701 3,245,032 3,704,951 2,232,455 1,542,141 1,302,115
Cost of Sales 2,994,486 2,867,911 3,409,780 1,811,714 1,419,120 1,261,697
Gross Profit 507,215 377,121 295,171 420,741 123,021 40,418
Operating Profit 434,643 318,221 249,585 385,690 99,728 19,039
Profit / (Loss) Before Taxation 349,021 232,531 142,334 277,176 (13,737) (54,187)
Profit / (Loss) After Taxation 250,788 147,927 65,792 173,768 (15,047) (34,702)
EPS 6.97 4.11 1.83 4.83 (0.42) (1.15)
Dividend % 20 20 15 10 - -
PERCENTAGE TO SALES
Gross Profit %age 14.48 11.62 7.97 18.85 7.98 3.10
Profit Before Taxation %age 9.97 7.17 3.84 12.42 (0.89) (4.17)
Profit After Taxation %age 7.16 4.56 1.78 7.78 (0.98) (2.67)
Admin & Selling Expenses %age 2.07 1.82 1.23 1.57 1.51 1.33
Liabilities against assets subject to finance
lease - - 30,325 72,986 136,744 164,481
Rupees

R E S H A
9
This Statement of Ethics and Business Practices is intended to document the principles of conduct and ethics to be followed by Resham Textile Industries Limited (the "Company") and its employees, officers and directors. Its purpose is to promote honest and ethical conduct, including the ethical handling of actual or apparent conflicts of interest.
CONFLICTS OF INTEREST- Directors, officers and employees of the Company shall act at all times honestly and ethically, and shall avoid situations where their personal or outside business interests could conflict with the interests of the Company and its shareholders.
DEALING WITH BUSINESS PARTNERS - All purchases of goods and services by the Company will be made exclusively on the basis of price, quality, service and suitability to the Company's needs and in the interest of the Company alone. Directors, officers and employees are prohibited from accepting gifts from sellers or buyers in any form whatsoever.
DISCLOSURE - Each senior executive officer must provide full, fair, accurate and understandable information whenever communicating with the Company's stockholders or the general public.
COMPLIANCE WITH LAWS, RULES AND REGULATIONS - All directors, officers and employees must conduct Company business in compliance with all applicable laws, rules and regulations.
HEALTH, SAFETY, AND ENVIRONMENTAL PROTECTION - It is the Company's policy to ensure the safety of its employees, be extra careful in protecting Company property from fire and other hazards, and to maintain the state of environment.
REPORTING OF VIOLATIONS - It is each employee's responsibility to notify promptly his or her supervisor regarding any actual or potential violation of this Code and any applicable laws, rules and regulations by anyone in the Company.
FAIR DEALING - It is our policy that each director, officer and employee will endeavor to deal fairly with the Company's customers, suppliers, competitors and employees.
CONFIDENTIALITY - All Directors, officers and employees are prohibited from revealing confidential information of the Company acquired by virtue of their association with the Company or in any other manner, disclosure of which may hurt the interests of the Company. This does not apply to disclosures required by laws, rules and regulations.
PROPER USE OF COMPANY ASSETS - All Directors, officers and employees should protect the Company's assets and ensure their efficient use. Employees must not participate in, or arrange, any activity that is not commensurate with Company interests.
STATEMENT OF ETHICS AND BUSINESS PRACTICE

10
This statement is being presented to comply with the Code of Corporate Governance ('the Code') contained in Listing Regulations of Karachi and Lahore Stock Exchange for the purpose of establishing a framework of good governance, whereby a listed entity is managed in compliance with the best practices of corporate governance.
The Company has applied the principles contained in the Code in the following manner:
1. The Company encourages representation of non-executive directors and directors representing minority interests on its Board of Directors. At present the Board includes:
Annual Report
Category Names
Executive Directors Ch. Muhammad KhurshidCh. Rahman BakhshMr. Muhammad Ali Chaudhry
Non-Executive Directors Mrs. Salma AzizMr. Kamran IlyasMr. Azhar Khurshid ChaudhryMs. Kiran A Chaudhry
2. The directors of the Company have confirmed that none of them is serving as a director on more than seven listed companies, including this Company.
3. All the resident directors of the Company are registered as taxpayers and none of them has defaulted in payment of any loan to a banking company, a DFI or an NBFI or, being a member of a stock exchange, has been declared as a defaulter by that stock exchange.
4. On 29 October 2011 at the Annual General Meeting, seven persons were elected as Directors for a three year term, under the provisions of Companies Ordinance, 1984.
5. No casual vacancy in the Board of the Company occurred during the year.
6. The Company has prepared a “Code of Conduct” and has ensured that appropriate steps have been taken to disseminate it throughout the Company along with its supporting policies and procedures.
7. The Board of Company has developed a vision / mission statement, overall corporate strategy and significant policies of the Company. A complete record of particulars of significant policies along with the dates on which they were approved or amended has been maintained.
8. All the powers of the Board have been duly exercised and decisions on material transactions, including appointment and determination of remuneration and terms and conditions of employment of the CEO, other executive and non-executive directors, have been taken by the Board/ shareholders.
9. The meetings of the Board were presided over by the Chairman and the Board met at least once in every quarter. Written notices of the Board meetings, along with agenda and working papers, were circulated at least seven days before the meetings. The minutes of the meetings were appropriately recorded and circulated.
10. As per criteria specified in clause (xi) of the Code, the Board has made arrangements for its Directors to obtain certifications under directors' training programs in order to comply with requirements of the Code. Four out of seven current Directors of the Company are exempt from this requirement of the Code.
STATEMENT OF COMPLIANCE WITH THE CODE OF CORPORATE GOVERNANCEFOR THE YEAR ENDED 30 JUNE 2013

11
R E S H A
11. The Board of the Company approves appointment of Chief Financial Officer / Company Secretary and Head of Internal Audit including their remuneration and terms and conditions of employment during the year.
12. The Directors' Report for this year has been prepared in compliance with the requirements of the Code and fully describes the salient matters required to be disclosed.
13. The financial statements of the Company were duly endorsed by Chief Executive Officer and Chief Financial Officer before approval of the Board.
14. The Directors, Chief Executive Officer and Executives do not hold any interest in the shares of the Company other than those disclosed in the pattern of shareholding.
15. The Company has complied with all the corporate and financial reporting requirements of the Code.
16. The Board has formed an Audit Committee. It comprises three members, all of whom are non-executive directors.
17. The meetings of the Audit Committee were held at least once every quarter prior to approval of interim and final results of the Company. The terms of reference of the committee have been formed and advised to the committee for compliance.
18. The Board has formed a Human Resource and Remuneration Committee. It comprises of three members, two of them are non-executive directors including the Chairman.
19. The Board has set up an effective internal audit function. The staff is considered to be suitably qualified and experienced for the purpose and is conversant with the policies and procedures of the Company.
20. The statutory auditors of the Company have confirmed that they have been given a satisfactory rating under the quality control review program of the ICAP, that they or any of the partners of the firm, their spouses and minor children do not hold shares of the Company or any of its associated companies or undertakings and that the firm and all its partners are in compliance with International Federation of Accountants (IFAC) guidelines on Code of Ethics as adopted by the ICAP.
21. The statutory auditors or the persons associated with them have not been appointed to provide other services except in accordance with the listing regulations and the auditors have confirmed that they have observed IFAC guidelines in this regard.
22. The 'closed period', prior to the announcement of interim / final results, and business decisions, which may materially affect the share price of Company was determined and intimated to directors, employees and stock exchange.
23. Material / price sensitive information has been disseminated among all market participants at once through stock exchange.
24. We confirm that all other material principles enshrined in the Code have been complied with except for the changes not effective immediately, which shall be complied with upon the next election of directors.
CH. MUHAMMAD KHURSHIDChief Executive Officer
For and on behalf of the Board
10 October 2013.LAHORE:

12
We have reviewed the Statement of Compliance with the best practices (the Statement) contained in the
Code of Corporate Governance (the Code) for the year ended 30 June 2013 prepared by the Board of
Directors of Resham Textile Industries Limited (the Company) to comply with the Listing Regulation No.
35 of the Karachi Stock Exchange Limited and Lahore Stock Exchange Limited, where the Company is
listed.
The responsibility for compliance with the Code is that of the Board of Directors of the Company. Our
responsibility is to review, to the extent where such compliance can be objectively verified, whether the
Statement reflects the status of the Company's compliance with the provisions of the Code and report if it
does not. A review is limited primarily to inquiries of the Company's personnel and review of various
documents prepared by the Company to comply with the Code.
As part of our audit of financial statements, we are required to obtain an understanding of the accounting
and internal control systems sufficient to plan the audit and develop an effective audit approach. We are not
required to consider whether the Board's statement on internal control covers all risks and controls, or to
form an opinion on the effectiveness of such internal controls, the Company's corporate governance
procedures and risks.
Further, the Listing Regulations of the Karachi Stock Exchange Limited and Lahore Stock Exchange
Limited requires the company to place before the Board of Directors for their consideration and approval of
related party transactions, distinguishing between transactions carried out on terms equivalent to those
that prevail in arm's length transactions and transactions which are not executed at arm's length price
recording proper justification for using such alternate pricing mechanism. Further, all such transactions are
also required to be separately placed before the audit committee. We are only required and have ensured
compliance of requirement to the extent of approval of related party transactions by the board of directors
and placement of such transactions before the audit committee. We have not carried out any procedures to
determine whether the related party transactions were undertaken at arm's length price or not.
Based on our review, nothing has come to our attention, which causes us to believe that the Statement
does not appropriately reflect the status of the Company's compliance, in all material respects, with the
best practices contained in the Code, for the year ended 30 June 2013.
Name of Audit Engagement Partner: Farooq Hameed
Annual Report
REVIEW REPORT TO THE MEMBERS ON THE STATEMENT OF COMPLIANCE WITH THE BEST PRACTICES OF THE CODE OF CORPORATE GOVERNANCE
10 October 2013.LAHORE:
(ERNST & YOUNG FORD RHODES SIDAT HYDER)
CHARTERED ACCOUNTANTS

13
Audit Engagement Partner: Farooq Hameed
We have audited the annexed balance sheet of Resham Textile Industries Limited (the Company) as at 30 June 2013 and the related profit and loss account, statement of comprehensive income, cash flow statement and statement of changes in equity together with the notes forming part thereof, for the year then ended and we state that we have obtained all the information and explanations which, to the best of our knowledge and belief, were necessary for the purposes of our audit.
It is the responsibility of the Company's management to establish and maintain a system of internal control, and prepare and present the above said statements in conformity with the approved accounting standards and the requirements of the Companies Ordinance, 1984. Our responsibility is to express an opinion on these statements based on our audit.
We conduct our audit in accordance with the auditing standards as applicable in Pakistan. These standards require that we plan and perform the audit to obtain reasonable assurance about whether the above said statements are free of any material misstatement. An audit includes examining, on a test basis, evidence supporting the amounts and disclosures in the above said statements. An audit also includes assessing the accounting policies and significant estimates made by management, as well as, evaluating the overall presentation of the above said statements. We believe that our audit provides a reasonable basis for our opinion and, after due verification, we report that:
a) in our opinion, proper books of account have been kept by the Company as required by the Companies Ordinance, 1984;
b) in our opinion:(i) the balance sheet and profit and loss account together with the notes thereon have been
drawn up in conformity with the Companies Ordinance, 1984, and are in agreement with the books of account and are further in accordance with accounting policies consistently applied;
(ii) the expenditure incurred during the year was for the purpose of the Company's business; and
(iii) the business conducted, investments made and the expenditure incurred during the year were in accordance with the objects of the Company.
c) in our opinion and to the best of our information and according to the explanations given to us, the balance sheet, profit and loss account, statement of comprehensive income, cash flow statement and statement of changes in equity together with the notes forming part thereof conform with approved accounting standards as applicable in Pakistan, and, give the information required by the Companies Ordinance, 1984, in the manner so required and respectively give a true and fair view of the state of the Company's affairs as at 30 June 2013 and of the profit, its comprehensive income, cash flows and changes in equity for the year then ended; and
d) in our opinion, Zakat deductible at source under the Zakat and Ushr ordinance, 1980 (XVIII of 1980), was deducted by the Company and deposited in the Central Zakat Fund established under section 7 of that Ordinance.
(ERNST & YOUNG FORD RHODES SIDAT HYDER)
R E S H A
10 October 2013.LAHORE:
AUDITORS’ REPORT TO THE MEMBERS

2013 2012
Note Rupees Rupees
EQUITY AND LIABILITIES
Equity
Authorized capital
36,000,000 (2012: 36,000,000) ordinary shares of Rupees 10/- each
Issued, subscribed and paid up capital 5
Unappropriated profit
Total equity
Surplus on revaluation of fixed assets 6
Non-current liabilities
Long term financing 7
Long term deposits 8
Deferred liabilities 9
Current liabilities
Trade and other payables 10
Mark-up accrued on financing 11
Current portion of non-current liabilities
Short term borrowings 12
Provision for taxation
13
Total liabilities
TOTAL EQUITY AND LIABILITIES
CONTINGENCIES AND COMMITMENTS 14
The annexed notes from 1 to 38 form an integral part of these financial statements.
(Chief Executive Officer)
BALANCE SHEET AS AT
14
Annual Report
360,000,000
360,000,000
360,000,000
360,000,000
206,719,139
566,719,139
144,907,169
120,184,000
269,441
233,835,585
354,289,026
151,774,460
8,938,104
13,379,870
63,326,412
38,321,255
275,740,101
630,029,127
1,341,655,435
378,798,050
738,798,050
132,849,721
-
388,888
254,936,859
255,325,747
145,598,585
16,275,744
412,762,986
17,634,500
80,044,927
672,316,742
927,642,489
1,799,290,260

2013 2012
Note Rupees Rupees
ASSETS
Non-current assets
Property, plant and equipment 15 Long term deposits
Current assets
Stores and spare parts 16
Stock in trade 17
Trade debts 18
Advances 19
Trade deposits and short term
prepayments 20
Other receivables
21
Advance income tax - net
Tax refunds due from the Government
22Cash and bank balances
(Director)
30 JUNE 2013
15
R E S H A
TOTAL ASSETS
-
902,010,474 3,669,060
905,679,534
28,035,249
242,507,425
12,098,646
14,449,684
2,725,778
588,230
40,979,074
10,952,054
83,639,761
435,975,901
1,341,655,435
1,024,612,060
1,020,934,500 3,677,560
15,197,473
608,138,858
14,510,466
4,776,477
2,674,172
62,372,076
7,811,517
59,197,161
774,678,200
1,799,290,260

PROFIT AND LOSS ACCOUNT FOR THE YEAR ENDED 30 JUNE 2013
2013 2012
Note Rupees Rupees
Sales 23
Cost of sales 24
Gross profit
Operating expenses:
Distribution cost 25
Administrative expenses 26
Operating profit
Other operating expenses 27
Other operating income 28
Finance cost 29
Profit before taxation
Taxation 30
Profit after taxation
Earnings per share - Basic & diluted
The annexed notes from 1 to 38 form an integral part of these financial statements.
(Chief Executive Officer) (Director)
16
Annual Report
3,245,032,903
2,867,911,491
377,121,412
26,236,138
32,664,045
58,900,183
318,221,229
18,840,755
299,380,474
6,584,977
305,965,451
73,434,392
232,531,059
84,604,471
147,926,588
4.11
3,501,701,168
2,994,485,588
507,215,580
19,757,164
52,815,015
72,572,179
434,643,401
24,388,480
410,254,921
7,920,636
418,175,557
69,154,389
349,021,168
98,233,141
250,788,027
6.97

STATEMENT OF COMPREHENSIVE INCOMEFOR THE YEAR ENDED 30 JUNE 2013
2013 2012
Rupees Rupees
(Chief Executive Officer) (Director)
R E S H A
The annexed notes from 1 to 38 form an integral part of these financial statements.
17
Profit after taxation for the year 250,788,027 147,926,588
11,290,884 12,285,988
Total comprehensive income for the year 262,078,911 160,212,576
Net other comprehensive income not being reclassified
to profit or loss in subsequent periods
Transferred from surplus on revaluation of fixed assets onaccount of Incremental depreciation -net of deferred tax

CASH FLOWS FROM OPERATING ACTIVITIESProfit before taxation 349,021,168 232,531,059
Adjustment for non-cash charges and other items:
Depreciation 72,018,315 70,074,811
(Gain) / Loss on sale of property, plant and equipment (327,659) 1,606,981
Exchange gain - (620,887)
Provision for gratuity 11,888,944 9,641,813
Finance cost 69,154,389 73,434,392
Provision against Workers' Welfare Fund 5,717,998 4,745,532
Provision against Workers' Profit Participation Fund 18,670,482 12,488,242
177,122,469 171,370,884
Profit before working capital changes 526,143,637 403,901,943Effect on cash flows due to working capital changes(Increase)/ decrease in current assets: Stores and spare parts 12,837,776 5,143,192
Stock in trade (365,631,433) 116,089,998
Trade debts (2,411,820) 73,161,594
Advances 9,673,207 (9,643,707)
Trade deposits and short term prepayments 51,606 (375,158)
Tax refunds due from the Government 3,140,537 4,018,947
Other receivables 588,230 (588,230)
Increase/(decrease) in current liabilities:
Trade and other payables (30,564,355) (6,224,519)
(372,316,252) 181,582,117
Cash used in operations 153,827,385 585,484,060
Finance cost paid (61,816,749) (86,314,157)Income tax paid (84,719,413) (37,827,275)Gratuity paid (6,648,111) (7,386,123)
Net cash generated from operating activities 643,112 453,956,505
CASH FLOWS FROM INVESTING ACTIVITIESCapital expenditure incurred on property,plant and equipment (200,427,800) (49,384,413)
Proceeds from disposal of property, plant and equipment 6,718,780 1,109,373
Increase in long term deposits (8,500) (1,500)
Net cash (used in)/generated from investing activities (193,717,520) (48,276,540)
CASH FLOWS FROM FINANCING ACTIVITIESRepayment of long term financing - net (138,438,000) (32,388,500)
Increase in long term deposits 119,447 126,725
Repayment of finance lease liabilities - net (2,432,755) (71,219,629)
Increase in short term borrowings - net 399,383,116 (209,191,316)
Dividend paid (90,000,000) (108,000,000)
Net cash generated from financing activities 168,631,808 (420,672,720)
Net decrease in cash and cash equivalents (24,442,600) (14,992,755)Cash and cash equivalents at the beginning of the year 83,639,761 98,632,516
Cash and cash equivalents at the end of the year 59,197,161 83,639,761
The annexed notes from 1 to 38 form an integral part of these financial statements.
(Chief Executive Officer) (Director)
CASH FLOW STATEMENT FOR THE YEAR ENDED 30 JUNE 2013
18
2013 2012Rupees Rupees
Annual Report

STATEMENT OF CHANGES IN EQUITYFOR THE YEAR ENDED 30 JUNE 2013
The annexed notes from 1 to 38 form an integral part of these financial statements.
(Chief Executive Officer) (Director)
19
R E S H A
Total equityShare capitalUn-appropriated
profit
Balance as at 01 July 2011 360,000,000 154,506,563 514,506,563
Profit after taxation for the year - 147,926,588 147,926,588
Transferred from surplus on revaluation of
fixed assets on account of
Incremental depreciation -net of deferred tax - 12,285,988 12,285,988
Total comprehensive income for the year - 160,212,576 160,212,576
Final dividend paid for the year 2010-11 at the rate of Rs. 1.5 per share - (54,000,000) (54,000,000)
Interim dividend paid for the year 2011-12 at the rate of Rs. 1.5 per share - (54,000,000) (54,000,000)
Balance as at 30 June 2012 360,000,000 206,719,139 566,719,139
Balance as at 01 July 2012 360,000,000 206,719,139 566,719,139
Profit after taxation for the year - 250,788,027 250,788,027
Transferred from surplus on revaluation of
fixed assets on account of
Incremental depreciation -net of deferred tax - 11,290,884 11,290,884
Total comprehensive income for the year - 262,078,911 262,078,911
Final dividend paid for the year 2011-12 at the rate Rs. 0.5 per share - (18,000,000) (18,000,000)
Interim dividend paid for the year 2012-13 at the rate Rs. 1 per share - (36,000,000) (36,000,000)
2nd-Interim dividend paid for the year 2012-13 at the rate Rs. 1 per share - (36,000,000) (36,000,000)
Balance as at 30 June 2013 360,000,000 378,798,050 738,798,050

NOTES TO THE FINANCIAL STATEMENTSFOR THE YEAR ENDED 30 JUNE 2013
1. THE COMPANY AND ITS OPERATIONS
2. STATEMENT OF COMPLIANCE
20
Standard or Interpretation beginning on or after)
2.1
Effective date(accounting periods
The following revised standards, amendments and interpretations with respect to the approved accounting standards as applicable in Pakistan would be effective from the dates mentioned below against the respective standard or interpretation:
Standards, interpretations and amendments to published approved accounting standards that are not yet effective
Resham Textile Industries Limited (the Company) is a public limited company incorporated in Pakistan on 06 June 1990 under the Companies Ordinance, 1984 and quoted on the Lahore and Karachi stock exchanges. The registered office of the Company is situated at 314- Upper Mall, Lahore. The Company is principally engaged in the business of manufacturing and selling of yarn.
These financial statements have been prepared in accordance with approved accounting standards as applicable in Pakistan. Approved accounting standards comprise of such International Financial Reporting Standards (IFRS) issued by the International Accounting Standards Board as are notified under the Companies Ordinance, 1984, provisions of and directives issued under the Companies Ordinance, 1984. Wherever, the requirements of the Companies Ordinance, 1984 or directives issued by the Securities and Exchange Commission of Pakistan (SECP) differ with the requirement of these standards, the requirements of Companies Ordinance, 1984 or the requirements of the said directives take precedence.
IAS 19 – Employee Benefits - (Revised)
IFRS 7 – Financial Instruments : Disclosures - Amendments enhancing disclosures about offsetting of financial assets and financial liabilities
IAS 32 – Offsetting Financial Assets and Financial liabilities – (Amendment)
IFRIC 20 – Stripping Costs in the Production Phase of a Surface Mine 01-January-2013
The Company expects that the adoption of the above revisions and amendments of the standards will not materially affect the Company's financial statements in the period of initial application other than the amendments to IAS-19 ' Employee Benefits'. Such amendments range from fundamental changes to simple clarifications and re-wording. The siginificant changes include the following:
- For defined benefit plans, the ability to defer recognition of actuarial gains and losses (i.e, the corridor approach) has been removed. As revised, actuarial gains and losses are recognised in other comprehensive income when they occur. Amounts recorded in profit and loss are limited to current and past service costs, gains or losses on settlements, and net interest income (expense). All other changes in the net defined benefit asset (liability) are recognised in other comprehensive income with no subsequent recycling to profit and loss.
- Objectives for disclosures of defined benefit plans are explicitly stated in the revised standard, along with new or revised disclosure requirements. These new disclosures include quantitative information of the
Annual Report
01-January-2013
01-January-2013
01-January-2014

21
R E S H A
3. BASIS OF PREPARATION
IASB Effective Date(annual periods
IFRS 9 - Financial Instruments: Classification and Measurement 01-January-2015
IFRS 10 - Consolidated Financial Statements 01-January-2013
Standard or Interpretation beginning on or after)
IFRS 11 - Joint Arrangements 01-January-2013
IFRS 12 - Disclosure of Interests in Other Entities 01-January-2013
IFRS 13 - Fair Value Measurement 01-January-2013
2.2 Standards, interpretations and amendments to published approved accounting standards effective in 2013
The accounting policies adopted in the preparation of these financial statements are consistent with those of the previous financial year except as describe below:
The Company has adopted the following amendments to IFRSs which became effective for the current year:
IAS 1 – Presentation of Financial Statements – Presentation of items of other comprehensive income (Amendment)
IAS 12 – Income Taxes - Recovery of Underlying Assets (Amendment)
The adoption of the above amendments did not have any significant impact on the financial statements.
3.1 BASIS OF MEASUREMENT
These financial statements have been prepared under the historical cost convention, except for recognition of certain employee benefits at present value and certain items of property, plant and equipment which are measured at revalued amounts.
3.2 PRESENTATION CURRENCY
These financial statements are presented in Pak Rupee, which is the Company's functional currency.
sensitivity of the defined benefit obligation to a reasonably possible change in each significant actuarial assumption.
The Company is currently assessing the impact of the above amendments which are effective from 1 January 2013 on the financial statements . However, it is expected that the adoption of the said amendments will result in change in the Company's accounting policy related to recognition of actuarial gains and losses as referred to in note 9 to the financial statements.
In addition to the above, the following new standards have been issued by IASB which are yet to be notified by the SECP for the purpose of applicability in Pakistan.

22
4. SUMMARY OF SIGNIFICANT ACCOUNTING POLICIES
4.2 Critical accounting estimates and judgments
The preparation of financial statements in conformity with the approved accounting standards requires the use of certain critical accounting estimates. It also requires the management to exercise its judgment in the process of applying the Company's accounting policies. Estimates and judgments are continually evaluated and are based on historical experience, including expectation of future events that are believed to be reasonable under the circumstances. The areas where various assumptions and estimates are significant to the Company's financial statements or where judgments were exercised in application of accounting policies are as follows:
- Employee benefits (Note 4.7);- Taxation (Note 4.10);- Useful lives and residual value of property, plant and equipment (Note 4.13)
4.3 Surplus on revaluation of property, plant and equipment
This represents the surplus arising on the revaluation of operating property, plant and equipment of the Company. Revaluation surplus is credited to the "surplus on revaluation of property, plant and equipment" presented below equity (in accordance with the requirements of section 235 of Companies Ordinance, 1984) except to the extent that it reverses a revaluation decrease of the same asset previously recognized in profit and loss and in which case the increase is recognized in profit and loss account. An annual transfer from the surplus on revaluation of property, plant and equipment (net of deferred tax) to un-appropriated profit is made for the difference between depreciation based on the revalued carrying amount of the assets and depreciation based on the assets' original cost. Additionally, accumulated depreciation as at the revaluation date is eliminated against the gross carrying amount of the asset and the net amount is restated to the revalued amount of the asset.
This surplus is not free for setting-off or reducing any deficit of the Company. However, it can only be utilized:
i) to the extent actually realized on disposal of the assets which are revalued;ii) to the extent of incremental depreciation arising out of revaluation of property, plant and equipment; oriii) setting-off or in diminution of any deficit arising from the revaluation of any other property, plant and
equipment of the Company.
4.4 Interest bearing loans and borrowings
All loans and borrowings are initially recognized at the fair value of amount received less directly attributable transaction costs. After initial recognition, long term interest-bearing loans and borrowings are measured at amortized cost using the effective interest method while short term borrowings are measured at fair value. Gains and losses are recognized in profit and loss account when the liabilities are derecognized as well as through the amortization process.
4.5 Liabilities against assets subject to finance lease
Leases, where the Company has substantially all the risks and rewards of ownership of assets, are classified as finance leases. At inception, finance leases are recorded at the lower of present value of minimum lease payments under the lease agreement and the fair value of the assets. The related rental obligations, net of finance cost, are included in liabilities against assets subject to finance lease. The liabilities are classified as current and non-current depending upon the timing of the payment. Each lease payment is allocated between the liability and finance cost so as to achieve a constant rate on the balance outstanding. The interest element of the rental is charged to profit and loss account over the lease term.
4.6 Ijarah assets
The Company recognizes ijarah payments under an Ijarah agreement as an expense in the profit and loss account on a straight line basis over the Ijarah term.
Annual Report
4.1 The accounting policies adopted in the preparation of these financial statements are consistent with those of the previous financial year except as mentioned in note 2.2.

23
4.7 Employee benefits
The Company operates an unfunded gratuity scheme for its permanent employees. The latest valuation was carried out as at 30 June 2012 using the projected unit credit method. Actuarial gains and losses on defined benefit plans are recognized on the basis of corridor approach as per IAS 19. The future contribution rates of this plan include allowances for deficit and surplus. Following significant assumptions were used for valuation of this scheme:
- Expected rate of increase in salary level is 12 % (2011: 11 %) per annum.- Discount rate of 13% (2011: 12%) per annum.- Average remaining working lives of employees: 5 years (2011: 5 years)
Actuarial gains and losses in excess of corridor limit as of the balance sheet date are recognized over the remaining service lives of employees.
4.8 Provisions
Provisions are recognized in the balance sheet when the Company has legal or constructive obligation as a result of past events, and it is probable that outflow of economic benefits will be required to settle the obligation and a reliable estimate of the amount can be made. However, provisions are reviewed at each balance sheet date and adjusted to reflect current best estimate.
4.9 Dividend
Dividend distribution to the Company’s shareholders and appropriation to reserve are recognized in the period in which these are approved.
4.10 Taxation
Current
Deferred
Provision for current tax is based on taxable income for the year determined in accordance with the prevailing law for taxation of income. The charge for current tax is calculated using current rate of tax after taking into account rebates and tax credits, if any. The charge for current tax also includes adjustments, where considered necessary, to provision for tax made in previous years arising from assessments framed during the year for such years.
Deferred tax is accounted for by using the liability method on all timing differences between carrying amounts of assets and liabilities in the financial statements and their tax base. Deferred tax liabilities are recognized for all taxable temporary differences. The Company recognizes deferred tax assets on all deductible temporary differences to the extent it is probable that future taxable profits will be available against which these deductible temporary differences can be utilized.
Deferred tax asset is also recognized for the carry forward of unused tax losses and unused tax credits to the extent it is probable that future taxable profits will be available against which the unused tax losses and unused tax credits can be utilized. Deferred tax is charged to / credited in the profit and loss account except in case of items credited or charged to equity in which case it is included in equity.
The carrying amount of all deferred tax assets is reviewed at each balance sheet date and adjusted to the appropriate extent, if it is no longer probable that sufficient taxable profits will be available to allow all or part of the deferred tax assets to be utilized.
Deferred tax assets and liabilities are measured at the tax rates that are expected to apply to the year when the asset is realized or liability is settled, based on the tax rates that have been enacted or substantively enacted at the balance sheet date.
R E S H A
24
4.11 Trade and other payables
Liabilities for trade and other amounts payable are initially recognized at fair value which is normally the transaction cost.
4.13 Property, plant and equipment
4.13.1
a)
b)
c)
Operating fixed assets and depreciation
Cost
Depreciation
Derecognition
Operating fixed assets except land, building and plant and machinery are stated at cost less accumulated depreciation and accumulated impairment losses, if any. Such cost includes the cost of replacing a part of such assets when that cost is incurred if the recognition criteria are met. Capital work-in-progress is stated at cost less accumulated impairment loss, if any. Building and plant and machinery are stated at revalued amount less accumulated depreciation, while land is stated at revalued amount.
Subsequent costs are included in the asset's carrying amount or recognized as a separate asset, as appropriate, only when it is probable that future economic benefits associated with the item will flow to the Company and the cost of the item can be measured reliably. All other repair and maintenance costs are charged to profit and loss account during the period in which they are incurred.
The carrying values of plant and equipment are reviewed for impairment when events or changes in circumstances indicate that the carrying value may not be recoverable.
Depreciation is charged to profit and loss account on reducing balance method to write off the cost of operating fixed assets less their residual values over their expected useful lives at the rates mentioned in Note 15.1.
Depreciation on assets is charged from the month in which an asset is acquired while no depreciation is charged for the month in which the asset is disposed off.
The assets’ residual values, useful lives and methods of depreciation are reviewed, and adjusted if appropriate, at each financial year end.
An item of property, plant and equipment is derecognized upon disposal or when no future economic benefits are expected from its use or disposal. Any gain or loss arising on derecognition of the asset (calculated as the difference between the net disposal proceeds and carrying amount of the asset) is included in profit and loss account in the year the asset is derecognized.
4.13.2 Assets subject to finance lease
These are stated at lower of present value of minimum lease payments under the lease agreements and fair value of assets. Assets so acquired are depreciated over their expected useful lives at the rates mentioned in Note 15.1. Depreciation of leased assets is charged to current year's profit and loss account.
The carrying values of plant and equipment are reviewed for impairment when events or changes in circumstances indicate that the carrying value may not be recoverable.
Depreciation on additions to leased assets is charged from the month in which an asset is acquired while no depreciation is charged for the month in which the asset is disposed off.
Annual Report
4.12 Operating segments
Operating segments are reported in a manner consistent with the internal reporting provided to the chief operating decision maker. The chief operating decision maker, who is responsible for allocating resources and assessing performance of the operating segments, has been identified as the Board of Directors that makes strategic decision. The management has determined that the Company has a single reportable segment as Board of Directors views the Company's operations as one reportable segment.

These are valued at lower of cost and net realizable value. Basis of determining cost is as follows: -
Raw material - First in first out (FIFO)Raw material in transit - Invoice value plus other charges paid thereonPacking materialWork in process -
- Moving averageAverage manufacturing cost
Finished goods - Average manufacturing costWaste - Net realizable value
25
4.14 Stores and spare parts
These are valued at lower of moving average cost and net realizable value. Items in transit are valued at cost comprising invoice value plus other charges paid thereon. Provision is made for slow moving items based on management estimate.
Trade debts originated by the Company are recognized and carried at original invoice amount less an allowance for any uncollectible amounts. Known bad debts are written off and provision is made against debts considered doubtful when collection of the full amount is no longer probable.
Cash and cash equivalents comprise cash in hand, cash at banks in current, saving and deposit accounts and other short term highly liquid instruments that are readily convertible into known amounts of cash and which are subject to an insignificant risk of changes in value.
Financial instruments comprise long term deposits, trade debts, other receivables, cash and bank balances, long term financings, short term borrowings and trade and other payables.
Financial assets and liabilities are recognized at the time the Company becomes a party to contractual provisions of the instruments.
The particular recognition methods adopted are disclosed in the individual policy statements associated with each item.
Financial assets are derecognized when the Company loses control of the contractual rights that comprise the financial asset. The Company loses such control if it realizes the rights to benefits specified in contract, the rights expire or the Company surrenders those rights. Financial liabilities are derecognized when the obligation specified in the contract is discharged, cancelled or expired.
Financial assets and liabilities are offset when the Company has a legally enforceable right to offset and intends to settle either on a net basis or to realize the asset and settle the liability simultaneously.
4.15 Stock in trade
Average manufacturing cost in relation to work in process and finished goods signifies cost including a portion of related direct overheads.
Net realizable value signifies the estimated selling price in the ordinary course of business less costs necessary to be incurred in order to make such sale.
4.16 Trade debts
4.17 Cash and cash equivalents
4.18 Financial instruments
R E S H A

26
The carrying amounts of the Company's assets are reviewed at each balance sheet date to determine whether there is any indication of impairment. If such indication exists, the recoverable amount of such asset is estimated. An impairment loss is recognized wherever the carrying amount of the asset exceeds its recoverable amount. Impairment losses are recognized in profit and loss account. A previously recognized impairment loss is reversed only if there has been a change in the estimates used to determine the asset's recoverable amount since the last impairment loss was recognized. If that is the case, the carrying amount of the asset is increased to its recoverable amount. That increased amount cannot exceed the carrying amount that would have been determined, net of depreciation, had no impairment loss been recognized for the asset in prior years. Such reversal is recognized in profit or loss account.
Borrowing costs directly attributable to the acquisition, construction or production of qualifying assets, which are assets that necessarily take a substantial period of time to get ready for their intended use or sale, are added to the cost of those assets, until such time as the assets are substantially ready for their intended use or sale. All other borrowing costs are charged to profit and loss account whenever incurred.
Transactions and contracts with related parties are carried out at arms length prices determined in accordance with comparable uncontrolled price method. Parties are said to be related if they are able to influence the operating and financial decisions of the Company and vice versa.
Transactions in foreign currency during the year are initially recorded in the functional currency at the rate prevailing at the date of transaction. Monetary assets and liabilities denominated in foreign currencies are retranslated at functional currency rate of exchange prevailing at the balance sheet date. All differences are taken to the profit and loss account.
Revenue is recognized when the significant risks and rewards of ownership of the goods have passed to the buyer which generally coincides with the delivery of goods to customers. Export goods are considered dispatched when shipped on board.
Return on bank deposit is accrued on a time proportion basis by reference to the principal outstanding on the applicable rate of return.
4.19 Impairment
4.20 Revenue recognition
a) Sale of goods
b) Interest income
4.21 Borrowing costs
4.22 Foreign currencies
4.23 Related party transactions
2013 2012
5. ISSUED, SUBSCRIBED AND PAID UP SHARE CAPITAL Rupees Rupees
2012
Ordinary shares of Rs.10
each fully paid in cash
36,000,000
2013
( Number of shares)
36,000,000 360,000,000 360,000,000
Annual Report

6. SURPLUS ON REVALUATION OF FIXED ASSETS
27
2013 2012Rupees Rupees
7. LONG TERM FINANCING
From banking companies and otherfinancial institution - Secured
National Bank of Pakistan 7.1
Orix Investment Bank Pakistan Limited
Faysal Bank Limited
Less: Current portion 13
-
-
17,634,500
17,634,500
17,634,500 -
112,803,500
8,000,000
35,269,000
156,072,500
35,888,500
120,184,000
7.1
The Company had revalued its freehold land, factory building, office building and plant and machinery on 30 June 2010. The revaluation exercise was carried out by M/s Harvest (Pvt.) Ltd to replace the carrying amount of freehold land with current market value and other assets with their depreciated market values. The surplus arisen on the revaluation aggregating to Rs. 136,707,417 was credited to this account to comply with the requirements of section 235 of the Companies Ordinance, 1984.
The facility was obtained for purchase of gas generators. The loan is repayable in six years, including two years grace period, in 8 equal half yearly principal installments which started from 26 October 2010. The rate of mark-up is State Bank of Pakistan rate plus 2% (2012: State Bank of Pakistan rate plus 2%) per annum. Security of the loan is ranking charge on fixed assets of the Company amounting to Rs. 92 million. The loan is further secured by personal guarantee of the directors.
2013 2012
Rupees RupeesNote
R E S H A
Surplus on revaluation of fixed assets as at 01 July
Surplus on revalued assets disposed off
Additions during the year
Surplus relating to incremental depreciation charge on
related assets - transferred to unappropriated profit
Surplus on revaluation of fixed assets as at 30 June
Less: Related deferred tax liability on:
- Balance as at 01 July
- Decrease / (increase) due to change in proportionate local sales
- Fixed assets disposed off during the year
- Incremental depreciation charged during the year
207,533,325
(3,094,336)
(16,977,956)
187,461,033
(62,626,156) 1,291,268 1,036,504
5,687,072
(54,611,312)
132,849,721
226,254,402
-
-
(18,721,077)
207,533,325
(69,339,952) 278,707
-
6,435,089
(62,626,156) 144,907,169
8. LONG TERM DEPOSITS
These represent deposits taken from employees against future transfer of Company owned vehicles to them.
9. DEFERRED LIABILITIES
Deferred taxation 9.1
Gratuity - unfunded 9.2
234,407,434 218,546,993
20,529,425 15,288,592
254,936,859 233,835,585
Note
2013
Rupees
2012
Rupees

28
9.1 Deferred taxation
Taxable temporary differences
Surplus on revaluation of fixed assets
Accelerated tax depreciation
Assets subject to finance lease
Deductible temporary differences
Unapproved gratuity (6,876,700)
54,611,311
186,672,823
-
241,284,134
234,407,434
Annual Report
2013
Rupees
2012
Rupees
9.2 Gratuity - unfunded defined benefit scheme
The amount recognized in balance sheet is as follows:Present value of defined benefit obligationUnrecognized actuarial losses
Liability recognized in the balance sheet
Note
9.3 Movement in net liability recognized in the balance sheetLiability at the beginning of the yearCharge for the year
Paid during the yearLiability at the end of the year
9.5 The charge for the year has been allocated as follows:
Cost of sales 24Distribution cost 25Administrative expenses 26
9.4 Charge for the year
Current service cost
Interest cost
Charge for the year
Actuarial losses recognized
Present value of defined benefit obligations at the end of the year
Experience adjustment arising on plan liabilities losses
4,010,841
-9%
8,062,722
-19%
20,529,425
-18%
15,288,592
-12%
13,032,902
-11%
2013 2012 2011 2010 2009
9.6 Historical information
(5,255,224)
62,626,155
157,323,315
3,852,747
223,802,217
218,546,993
19,396,479(4,107,887)15,288,592
13,032,9029,641,813
22,674,715(7,386,123)15,288,592
8,498,265249,016894,532
9,641,813
7,905,972
1,735,841
9,641,813
-
24,203,663 (3,674,238)
20,529,425
15,288,592 11,888,944 27,177,536 (6,648,111)
20,529,425
8,933,751
2,521,544
433,649
11,888,944
9,755,568 728,124
1,405,252 11,888,944

29
R E S H A
10. TRADE AND OTHER PAYABLES
Creditors
Morabaha finance 10.1
Accrued liabilities
Advances from customers 10.2
10.3
10.4
Advance from brokers against customers
Workers' Profit Participation Fund
Unclaimed dividend
Others
Ijarah rental payable
Unclaimed WPPF
Workers' Welfare Fund
Note2012
Rupees2013
Rupees
18,726,774
10,000,000
39,411,294
56,742,929
6,729,665
1,638,334
783,523
12,488,242
4,745,532
408,167
100,000
151,774,460
10.2 These represent advances against sale of yarn and carry no mark-up.
10.1 This facility has been obtained against sanctioned limit of Rs. 10 million (2012: Rs. 10 million) to finance working capital requirements of the Company for purchase of raw material and is renewable quarterly. The rate of mark-up is 3 months KIBOR plus 2.75% per annum (2012: 3 months KIBOR plus 2.75% per annum). This is secured against first pari passu charge on all current assets of the Company amounting to Rs. 14 million and personal guarantees of all the directors except employee directors of the Company.
Note
2013
Rupees
2012
Rupees
10.3 Workers' Profit Participation Fund Balance at the beginning of the yearCharge for the year
Less: Payments made during the yearClosing balance
10.4 Workers' Welfare FundBalance at the beginning of the yearCharge for the year
Less: Payments made during the yearClosing balance
12. SHORT TERM BORROWINGS
Secured:
Cash finance 12.1
27
27
11. ACCRUED MARK-UP ON FINANCING
Long term financingShort term borrowings and morabaha financeLiabilities against assets subject to finance lease
7,644,124 12,488,242 20,132,366 7,644,124
12,488,242
2,904,880 4,745,532 7,650,412 2,904,880 4,745,532
4,794,258 4,136,184
7,662 8,938,104
13,379,870
24,734,590
10,000,000
53,705,354
21,082,676
9,900,165
318,604
783,523
18,670,482
5,717,998
585,193
100,000
145,598,585
12,488,242 18,670,482 31,158,724 12,488,242 18,670,482
4,745,532 5,717,998
10,463,530 4,745,532 5,717,998
368,634 15,900,934
6,176 16,275,744
412,762,986

30
12.1 The aggregate facility of short term finances from commercial banks available at year end is Rs. 1,065 million (2012: Rs. 715 million). The rates of mark-up range from 3 months KIBOR plus 1.5% to 3 months KIBOR plus 2.75% per annum (2012: 3 months KIBOR plus 1.5% to 3 months KIBOR plus 2.75% per annum). These facilities are secured against pledge of cotton bales (with 10% for local and imported cotton), yarn bags, first pari passu charge of Rs. 25 million on all current assets of the Company and personal guarantee of the directors of the Company.
Annual Report
14. CONTINGENCIES AND COMMITMENTS
Contingencies:
Order under section 122(5A) of the Income Tax Ordinance, 2001 (ITO 2001) for tax year 2005 was issued by CIR(A), which raised a demand amounting to Rs. 74,047,800 against the Company. The CIR(A) set aside the order and directed the assessing officer to decide the case on merit in the light of the submissions of the Company's lawyers, vide order dated 31 March 2012 and the decision was taken in favor of the Company. The department has now filed an appeal against CIR(A) before the ATIR which is pending adjudication.
Order under section 122(5A) of the Income Tax Ordinance, 2001 (ITO 2001) for tax year 2006 was issued by CIR(A), which raised a demand amounting to Rs. 667,372 against the Company. The CIR(A) granted partial relief vide order dated 23 October 2012 and deleted the addition under section 21(C). Against the order of the CIR(A), the Company has filed appeal before the ATIR, which is pending adjudication
No provision has been made in these financial statements against the above as the tax consultant of the Company, in view of the merits of the submissions of the Company, is confident that the decisions will be taken in favor of the Company.
Commitments:
Ijarah commitments
The Company has entered into Ijarah arrangement for plant and machinery with an Islamic Bank. These arrangements have remaining term of less than one year. Such arrangements also include a clause to enable upward revision of the rental charge on an annual basis according to prevailing market conditions.
Future Ijarah payments due under these arrangements, as at 30 June are as follows:
Within one year
After one year but not more than five years
2013
Rupees
2012
Rupees
2,617,270
2,617,270
10,607,516
- 2,651,87913,259,395
13. CURRENT PORTION OF NON-CURRENT LIABILITIES
Long term financing 7
Liabilities against assets subject to finance lease
17,634,500
17,634,500
35,888,500
- 2,432,755 38,321,255
Note
2013
Rupees
2012
Rupees
The bank guarantees aggregating to Rs. 40,943,000 (2012: Rs. 40,943,000) issued on behalf of the Company were outstanding on balance sheet date against which margins amounting to Rs. 1,011,565 (2012: Rs. 1,011,565) have been deposited with the respective banks.
Other commitments
Operating assets
Capital work-in-progress
1,019,514,692 893,578,782
1,420,205 8,431,6921,020,934,500 902,010,474
15. PROPERTY, PLANT AND EQUIPMENT
15.1
15.6
2013
Rupees
2012
Rupees

31
R E S H A
15.1
Op
erat
ing
ass
ets
DE
LE
TIO
NS
Tran
sfer
s
(Co
st /
reva
lued
amo
un
t) /
Acc
um
ula
ted
Dep
reci
atio
n
Co
st/
(Acc
um
ula
ted
Dep
reci
atio
n)
Ow
ned
ass
ets
Fre
e ho
ld la
nd
30,4
55,1
00-
30,4
55,1
0030
,455
,100
-30
,455
,100
-B
uild
ing
-F
acto
ry13
1,94
0,61
624
,923
,027
107,
017,
589
27,6
81,0
49-
-10
,932
,434
159,
621,
665
35,8
55,4
6112
3,76
6,20
410
-R
esid
entia
l30
,349
,849
2,95
9,11
527
,390
,734
9,00
2,72
0-
-1,
407,
047
39,3
52,5
694,
366,
162
34,9
86,4
075
Pla
nt a
nd m
achi
nery
615,
190,
326
73,5
64,0
7654
1,62
6,24
915
5,67
1,38
8(7
,924
,619
)21
1,79
7,10
842
,943
,818
976,
072,
356
203,
114,
100
772,
958,
256
101,
338,
153
(86,
606,
206)
Ele
ctric
inst
alla
tions
28,5
84,6
4410
,735
,337
17,8
49,3
07-
--
1,21
4,92
828
,584
,644
11,9
50,2
6516
,634
,379
10
Mill
s eq
uipm
ent
8,87
4,40
53,
131,
768
5,74
2,63
78,
622,
657
(35,
800)
21,2
41,6
4645
8,54
338
,713
,298
12,2
78,3
4226
,434
,956
1010
,390
(8,6
88,0
31)
Offi
ce e
quip
men
t2,
357,
529
603,
386
1,75
4,14
314
9,53
3-
-18
2,78
42,
507,
062
786,
170
1,72
0,89
210
Fur
nitu
re a
nd fi
xtur
es1,
121,
360
606,
845
514,
515
--
-33
,276
1,12
1,36
064
0,12
148
1,23
910
Veh
icle
s15
,515
,216
5,91
9,13
09,
596,
086
6,31
1,94
0(3
,895
,159
)-
977,
663
18,9
53,5
726,
896,
793
12,0
56,7
7920
1,02
1,57
5A
rms
and
amm
uniti
on43
,620
21,9
0921
,711
--
-1,
628
43,6
2023
,537
20,0
8310
864,
432,
665
122,
464,
593
741,
968,
072
207,
439,
287
(11,
855,
578)
233,
038,
754
58,1
52,1
211,
295,
425,
246
275,
910,
951
1,01
9,51
4,29
52,
370,
118
(95,
294,
237)
Ass
ets
sub
ject
to
fin
ance
leas
e -
Pla
nt a
nd m
achi
nery
211,
797,
108
74,0
06,8
9313
7,79
0,21
5-
-(2
11,7
97,1
08)
12,5
99,3
13-
--
1086
,606
,206
- E
lect
ric In
stal
latio
n21
,241
,646
7,42
1,15
113
,820
,495
--
(21,
241,
646)
1,26
6,88
1-
--
108,
688,
031
233,
038,
754
81,4
28,0
4415
1,61
0,71
0-
-(2
33,0
38,7
54)
13,8
66,1
94-
--
95,2
94,2
37
1,09
7,47
1,41
920
3,89
2,63
789
3,57
8,78
220
7,43
9,28
7(1
1,85
5,57
8)-
72,0
18,3
151,
295,
425,
246
275,
910,
951
1,01
9,51
4,29
5
2,37
0,11
8-
2013
BA
LA
NC
E A
S A
T 0
1 JU
LY 2
012
RE
CO
NC
ILIA
TIO
NB
AL
AN
CE
AS
AT
30
JUN
E 2
013
PA
RT
ICU
LA
RS
Co
st/
reva
lued
amo
un
t
Acc
um
ula
ted
dep
reci
atio
n
Net
bo
ok
valu
eA
dd
itio
ns
Dep
reci
atio
n
char
ge
for
the
year
Co
st /
reva
lued
amo
un
t
Acc
um
ula
ted
dep
reci
atio
n
Net
bo
ok
valu
eR
AT
E (
%)
R
U
P
E
E
S

32
Annual Report
DE
LE
TIO
NS
Tran
sfer
s
(Co
st /
reva
lued
amo
un
t) /
Acc
um
ula
ted
Dep
reci
atio
n
Co
st/
(Acc
um
ula
ted
Dep
reci
atio
n)
Ow
ned
ass
ets
Fre
e ho
ld la
nd
30,4
55,1
00-
30,4
55,1
00-
--
-30
,455
,100
-30
,455
,100
-B
uild
ing
-F
acto
ry13
1,94
0,61
613
,032
,180
118,
908,
436
--
-11
,890
,847
131,
940,
616
24,9
23,0
2710
7,01
7,58
910
-R
esid
entia
l30
,349
,849
1,51
7,49
528
,832
,354
--
-1,
441,
620
30,3
49,8
492,
959,
115
27,3
90,7
345
Pla
nt a
nd m
achi
nery
582,
019,
140
36,7
19,4
6754
5,29
9,67
335
,056
,156
(1,8
84,9
70)
-37
,054
,901
615,
190,
326
73,5
64,0
7654
1,62
6,25
010
210,
292
Ele
ctric
inst
alla
tions
26,4
09,6
449,
561,
681
16,8
47,9
632,
175,
000
--
1,17
3,65
628
,584
,644
10,7
35,3
3717
,849
,307
10
Mill
s eq
uipm
ent
7,53
6,78
22,
794,
732
4,74
2,05
01,
337,
623
--
337,
036
8,87
4,40
53,
131,
768
5,74
2,63
710
Offi
ce e
quip
men
t1,
736,
947
451,
032
1,28
5,91
562
0,58
2-
-15
2,35
42,
357,
529
603,
386
1,75
4,14
310
Fur
nitu
re a
nd fi
xtur
es1,
085,
360
571,
899
513,
461
36,0
00-
-34
,946
1,12
1,36
060
6,84
551
4,51
510
Veh
icle
s15
,456
,733
5,40
3,93
210
,052
,801
1,72
7,36
0(1
,668
,877
)-
1,14
2,39
915
,515
,216
5,91
9,13
09,
596,
086
2062
7,20
1A
rms
and
amm
uniti
on43
,620
20,4
9323
,127
--
-1,
416
43,6
2021
,909
21,7
1110
827,
033,
791
70,0
72,9
1175
6,96
0,88
040
,952
,721
(3,5
53,8
47)
-53
,229
,175
864,
432,
665
122,
464,
593
741,
968,
072
837,
493
-A
sset
s su
bje
ct t
o f
inan
cele
ase
- P
lant
and
mac
hine
ry21
1,79
7,10
858
,696
,872
153,
100,
236
--
-15
,310
,021
211,
797,
108
74,0
06,8
9313
7,79
0,21
510
- E
lect
ric In
stal
latio
n21
,241
,646
5,88
5,53
615
,356
,110
--
-1,
535,
615
21,2
41,6
467,
421,
151
13,8
20,4
9510
-
233,
038,
754
64,5
82,4
0816
8,45
6,34
6-
--
16,8
45,6
3623
3,03
8,75
481
,428
,044
151,
610,
710
1,06
0,07
2,54
513
4,65
5,31
992
5,41
7,22
640
,952
,721
(3,5
53,8
47)
-70
,074
,811
1,09
7,47
1,41
920
3,89
2,63
789
3,57
8,78
283
7,49
3
Acc
um
ula
ted
dep
reci
atio
n
Net
bo
ok
valu
eR
AT
E (
%)
R
U
P
E
E
S
BA
LA
NC
E A
S A
T 0
1 JU
LY 2
011
RE
CO
NC
ILIA
TIO
NB
AL
AN
CE
AS
AT
30
JUN
E 2
012
Dep
reci
atio
n
char
ge
for
the
year
Co
st /
reva
lued
amo
un
t
PA
RT
ICU
LA
RS
Co
st/
reva
lued
amo
un
t
Acc
um
ula
ted
dep
reci
atio
n
Net
bo
ok
valu
eA
dd
itio
ns
2012

33
R E S H A
20
13
20
12
15
.3 D
ep
reci
atio
n c
ha
rge
fo
r th
e y
ea
r h
as
be
en
allo
cate
d a
s fo
llow
s:N
ote
Ru
pe
es
Ru
pe
es
C
ost
of sa
les
24
70
,82
2,9
64
68
,74
3,6
96
A
dm
inis
tra
tive
exp
en
ses
26
1,1
95
,35
11
,33
1,1
15
72
,01
8,3
15
70
,07
4,8
11
15
.4
Ow
ne
d A
ss
ets
:
Fre
e h
old
La
nd
6,0
28
,47
9-
6,0
28
,47
96
,02
8,4
79
-6
,02
8,4
79
Bu
ildin
g F
act
ory
1
68
,01
5,4
31
10
0,5
97
,57
46
7,4
17
,85
71
40
,33
4,3
82
89
,66
5,1
40
50
,66
9,2
42
R
esi
de
ntia
l2
0,0
03
,88
47
,26
4,8
67
12
,73
9,0
17
11,0
01
,16
45
,85
7,8
20
5,1
43
,34
4P
lan
t a
nd
Ma
chin
ery
1,1
81
,56
3,9
97
53
0,2
76
,52
46
51
,28
7,4
73
82
2,0
20
,12
04
02
,06
4,6
53
41
9,9
55
,46
71
,37
5,6
11,7
91
63
8,1
38
,96
57
37
,47
2,8
26
97
9,3
84
,14
54
97
,58
7,6
13
48
1,7
96
,53
2
15
.2A
dd
itio
ns
to p
lan
t a
nd
ma
chin
ery
incl
ud
es
tra
nsf
er
fro
m le
ase
d a
sse
ts h
avi
ng
ne
t b
oo
k va
lue
of R
s. 1
37
,74
4,5
17
(2
01
2: N
il) r
ep
rese
ntin
g c
ost
of
Rs.
23
3,0
38
,75
4 (
20
12
: N
il) le
ss a
ccu
mu
late
d d
ep
reci
atio
n o
f R
s. 9
5,2
94
,23
7 (
20
12
: N
il).
Ha
d th
ere
be
en
no
re
valu
atio
n, th
e r
ela
ted
fig
ure
s o
f fr
ee
ho
ld la
nd
, b
uild
ing
, p
lan
t a
nd
ma
chin
ery
at 3
0 J
un
e w
ou
ld h
ave
be
en
as
follo
ws:
Pa
rtic
ula
rsB
ala
nc
e A
s a
t 3
0 J
un
e 2
01
3B
ala
nc
e A
s a
t 3
0 J
un
e 2
01
2
Co
st
Ac
cu
mu
late
d
De
pre
cia
tio
n
Ne
t B
oo
k
Va
lue
Co
st
Ac
cu
mu
late
d
De
pre
cia
tio
n
Ne
t B
oo
k V
alu
e
R U
P
E
E
S

34
Annual Report
15
.5D
eta
il o
f th
e a
sse
ts d
isp
ose
d o
ff d
urin
g th
e y
ea
r is
as
follo
ws:
De
sc
rip
tio
nC
os
t/ r
ev
alu
ed
a
mo
un
tA
cc
um
ula
ted
D
ep
rec
iati
on
Bo
ok
Va
lue
Sa
le
Pro
ce
ed
s
Pla
nt
an
d M
ac
hin
ery
Ust
er
Test
er-
III
2
,25
0,0
00
3
43
,40
6
1
,90
6,5
94
1
,65
0,0
00
A
cro
Sp
inn
ing
& W
ea
vin
g
Au
to P
luck
er
(Ch
ina
) 7
18
,40
3
1
24
,19
4
5
94
,20
9
5
1,7
24
G
ha
ni &
Co
mp
an
y
MP
M-6
(T
rutz
sch
ler)
1
,25
1,8
63
2
16
,41
6
1
,03
5,4
47
1
,11
7,2
41
S
ha
dm
an
Co
tto
n M
ills
Ltd
BO
B &
Pa
rts
(Tru
tzsc
hle
r) 6
72
,29
7
11
8,4
70
5
53
,82
7
1
23
,61
0
AS
TA
(T
rutz
sch
ler)
2
01
,68
9
3
4,8
67
1
66
,82
2
1
6,3
79
G
ha
ni &
Co
mp
an
y
Au
to P
luck
er
(Ch
ina
) 3
33
,33
3
5
7,6
25
2
75
,70
8
2
5,8
62
G
ha
ni &
Co
mp
an
y
Au
to P
luck
er
(Ch
ina
) 3
33
,33
3
5
9,3
12
2
74
,02
1
2
5,8
62
G
ha
ni &
Co
mp
an
y
Au
to P
luck
er
(Ch
ina
) 3
33
,33
3
6
1,0
00
2
72
,33
3
2
5,8
62
G
ha
ni &
Co
mp
an
y
La
b E
qu
ipm
en
t's 7
50
,00
0
1
33
,45
3
6
16
,54
7
3
50
,00
0
H.A
Ha
q S
pin
nin
g M
ills
AS
TA
(T
rutz
sch
ler)
5
21
,62
4
9
2,8
17
4
28
,80
7
5
0,0
00
H
.A H
aq
Sp
inn
ing
Mill
s
AS
TA
(T
rutz
sch
ler)
5
58
,74
4
9
6,5
93
4
62
,15
1
1
6,3
80
G
ha
ni &
Co
mp
an
y
Mill E
qu
ipm
en
t
PE
L W
ind
ow
AC
3
5,8
00
1
0,3
90
2
5,4
10
8
,50
0
Op
en
Ma
rke
t
Ve
hic
les
LR
U -
39
0 8
53
,37
0
5
3,3
12
8
00
,05
8
8
00
,00
0
Ha
ssa
n B
ad
ar
LWQ
- 7
86
0 1
,10
9,5
97
6
31
,76
7
4
77
,83
0
8
00
,00
0
Jam
she
ed
Hu
ssa
in
LO
T -
99
89
2
72
,90
2
2
54
,56
9
1
8,3
33
8
0,0
00
M
. S
ulta
n M
eh
bo
ob
Sh
ah
LE
C -
12
- 7
86
0 1
,65
9,2
90
8
1,9
27
1
,57
7,3
63
1
,57
7,3
60
M
s. S
ha
he
en
Ars
ha
d
11,8
55
,57
82
,37
0,1
18
9,4
85
,46
06
,71
8,7
80
Mo
de
of
Dis
po
sa
lP
art
icu
lars
of
Pu
rch
as
er
……
……
……
…...…
……
… R
up
ee
s …
……
……
……
.……
….…
……
...
Ma
rke
t (N
eg
otia
tion
)
Ma
rke
t (N
eg
otia
tion
)
Ma
rke
t (N
eg
otia
tion
)
Ma
rke
t (N
eg
otia
tion
)
Ma
rke
t (N
eg
otia
tion
)
Alta
f E
ng
ine
erin
g &
Gh
an
i &
Co
mp
an
y
Ma
rke
t N
eg
otia
tion
Ma
rke
t (N
eg
otia
tion
)
Ma
rke
t N
eg
otia
tion
Ma
rke
t N
eg
otia
tion
Ma
rke
t N
eg
otia
tion
Ma
rke
t N
eg
otia
tion
Ma
rke
t (N
eg
otia
tion
)
Ma
rke
t (N
eg
otia
tion
)
Ma
rke
t (N
eg
otia
tion
)
Ma
rke
t (N
eg
otia
tion
)
Ma
rke
t (N
eg
otia
tion
)

35
15.6
16.
Capital work in progress
STORES AND SPARES
Note2013
Rupees2012
Rupees
Opening
Stores
Additions
Spares
TransfersClosing
Stores in transit
17. STOCK IN TRADE
Raw material
Work in process
Finished goods
Packing material
Waste
18. TRADE DEBTS - considered good
19. ADVANCES
Suppliers
Considered good - unsecured
Employees
19.3 No advances were given to the Chief Executive Officer, Directors and Executives of the Company.
-
8,431,692
8,431,692
-
R E S H A
This represents expenses incurred and advances given in relation to mill building and import of machinery.
Unsecured
Trade debts - considered good
Trade debts - considered doubtful
18.1 Trade debts - considered doubtful
Opening balance
Provision made during the year
Trade debts written off
Closing balance
19.1 Advances to suppliers - unsecured
Advance to staff, unsecured - considered good
Advance to staff, unsecured - considered doubtful
19.2 Advances to suppliers, unsecured - considered doubtful
Opening balance
Provision made during the year
Trade debts written off
Closing balance
8,431,692
34,645,572
(41,657,059) 1,420,205
639,376
14,394,202
163,895 15,197,473
528,539,854
20,014,761
54,306,159
4,772,465
505,619 608,138,858
14,510,466
14,510,466
2,519,388
2,257,089 4,776,477
-
-
10,935
(10,935) -
3,262,992
(743,604) 2,519,388
-
3,001,804
(2,258,200)
743,604
370,642
24,244,798
3,419,809 28,035,249
137,412,680
19,487,493
81,772,621
3,641,592
193,039 242,507,425
12,098,646
- 12,098,646
-
-
- -
12,054,194
2,395,490 14,449,684
-
- -
-
-
-
-

3,484,622,602
41,835,149
3,526,457,751
24,756,583
3,501,701,168
137,412,680
2,780,457,159
2,917,869,839
(528,539,854)
2,389,329,985
168,164,659
218,131,787
37,422,259
63,840,889
8,621,167
4,294,341
5,320,677
70,822,964
1,910,246
2,967,858,974
-
3,128,933,798
41,170,624
3,245,032,903
-
3,245,032,903
267,296,912
2,277,118,139
2,544,415,051
(137,412,680)
2,407,002,371
124,698,701
167,810,971
33,136,974
56,189,000
8,866,972
3,809,037
7,955,803
68,743,696
1,894,562
2,880,108,087
74,928,481
Note2013
Rupees2012
Rupees
36
Annual Report
23. SALES
Local
Export
Waste
Less: Sales tax
24. COST OF SALES
Opening raw material
Add: Purchases
Available for consumption
Less: Closing stock
24.1
Raw material consumed
Salaries, wages and benefits
Fuel and power
Packing material consumed
Stores and spare parts consumed
Ijarah rentals
Insurance
Repairs and maintenance
Depreciation 15.3
Others
20. TRADE DEPOSITS AND SHORT TERM PREPAYMENTS
Bank guarantee margin Prepayments
21. TAX REFUNDS DUE FROM THE GOVERNMENT
This represents sales tax refundable
22. CASH AND BANK BALANCES
Cash in hand
Cash at bank:
- Current accounts
- Deposit accounts 22.1
22.1 These carry profit at the rate ranging from 5% to 10.75% (2012: 5% to 10.75%) per annum.
1,011,565 1,011,565
1,662,607 1,714,213
2,674,172 2,725,778
856,856 590,066
11,593,728 659,016
46,746,577 82,390,679
58,340,305 83,049,695 59,197,161 83,639,761

25. DISTRIBUTION COST
Salaries and other benefits 25.1
Commission on sales
Freight and forwarding
Export development surcharge
Other expenses
24.1 This includes an amount of Rs. 9,755,568 (2012: Rs. 8,498,265) representing gratuity expense for the year.
25.1 This includes an amount of Rs. 728,124 (2012: Rs. 249,016) representing gratuity expense for the year.
2,572,416
19,161,442
3,652,661
187,417
662,202
26,236,138
Add: Opening finished goods and waste
Less: Closing finished goods and waste
(20,014,761)
(54,811,778)
(527,268)
3,582,682
15,912,943
70,650
-
190,889
19,757,164
19,487,493
2,967,331,706
81,965,660
2,994,485,588
27,153,882
24,131,087
(19,487,493)
4,643,594
2,884,751,681
65,125,470
(81,965,660)
(16,840,190)
2,867,911,491
Add: Opening work in process
Less: Closing work in process
Cost of goods manufactured
37
Note
2013
Rupees
2012
Rupees
R E S H A
26. ADMINISTRATIVE EXPENSES
Directors' remuneration
Salaries and other benefits 26.1
Electricity, gas and water
Postage, telephone and telex
Rent, rates and taxes
Insurance
Advertisement
Traveling and conveyance
Auditors' remuneration 26.2
26.3
Legal and professional
Fees and subscription
Printing and stationery
Entertainment
Charity and donations
Books and periodicals
Repairs and maintenance
Bad debts
Vehicle running and maintenance
Advances written off
Depreciation
Provision for doubtful advances
15.3
18.1
19.2
19.2
Others
26.1 This includes an amount of Rs. 1,405,252 (2012: Rs. 894,532) representing gratuity expense for the year.
3,650,688
11,562,516
362,358
898,833
1,288,517
328,456
68,872
216,163
630,000
535,800
894,324
310,132
753,545
23,430,000
70,313
394,836
1,775,064
1,195,351
2,258,200
743,604
1,436,508
52,815,015
10,935
2,905,168
8,806,114
537,175
923,562
1,410,617
275,942
66,014
177,761
630,000
355,560
1,220,560
292,909
687,550
10,650,000
52,847
386,491
1,551,750
1,331,115
-
402,910
32,664,045
-
-

38
2013 2012Note Rupees Rupees
Annual Report
28. OTHER OPERATING INCOME
Income from financial assets 28.1
Income from assets other than financial assets 28.2
28.1 Income from financial assets:
Return on bank deposits
28.2 Income from assets other than financial assets:
Net gain on disposal of property, plant and equipment
Sale of scrap and miscellaneous Income
29. FINANCE COST
Interest / mark-up on:
Liabilities against assets subject to finance lease
Loans from directors
Long term financing
Short term borrowings and morabaha finance
Mark up paid on WPPF
Bank charges and commission
Creditors written back
Exchange gain
Mark-up on finance lease received due to subsidized rate
26.2 Auditors' remuneration
Statutory audit
Half yearly review
Other certifications
Out of pocket expenses
27. OTHER OPERATING EXPENSES
Workers' Profit Participation Fund
Workers' Welfare Fund
Loss on sale of property, plant and equipment
500,000
75,000
25,000
30,000
630,000
500,000
75,000
25,000
30,000
630,000
26.3 Donations
None of the directors or their spouses had any interest in any of the donees.
18,670,482
5,717,998
24,388,480
4,029,463
3,891,173
7,920,636
2,581,915
4,029,463
3,563,514
3,891,173
170,766 12,122,142
1,051,934
53,392,213
67,345,013
1,809,376
69,154,389
-
252,738
-
1,194,810
327,659
607,958
12,488,242
4,745,532
1,606,981
18,840,755
3,269,501
3,315,476
6,584,977
2,648,614
-
620,887
-
3,269,501
-
3,315,476
3,315,476
6,271,788 22,078,694
1,268,597
41,615,667
419,616
71,654,362
1,780,030
73,434,392

39
31. EARNING PER SHARE - BASIC AND DILUTED
Net profit for the year Rupees
Weighted average number of shares Number
Basic earning per share Rupees
250,788,027 147,926,588
36,000,000 36,000,000
6.97 4.11
No figure for diluted earnings per share has been presented as the Company has not issued any instrument carrying options which would have an impact on the basic earnings per share, when exercised.
R E S H A
30. TAXATION
Current
- for the year
- for the year
30.1
Deferred
- due to reduction in tax rate
30.1 Relationship between tax expenses and accounting profit
Tax at applicable tax rate of 35% (2012:35%)
Tax effect of expenses that are not deductible in determining taxable income charged to profit and loss account
Tax effect of expenses that are deductible in determining taxable income not charged to profit and loss account
Tax effect of income under presumptive tax regime
Effect of tax credits
Profit before taxation
2013 2012Note Rupees Rupees
Current Taxation:
80,044,927
24,432,414
18,188,214
98,233,141
349,021,168
122,157,409
31,313,927
(55,407,678)
80,044,927
(6,244,200)
-
(18,018,730)
63,326,412
21,278,059
-
21,278,059
84,604,471
232,531,059
81,385,871
29,972,201
(48,776,347)
(916,249)
1,660,936
63,326,412

40
32
.R
EM
UN
ER
AT
ION
OF
CH
IEF
EX
EC
UT
IVE
OF
FIC
ER
, D
IRE
CT
OR
S A
ND
EX
EC
UT
IVE
S
Annual Report
Man
ager
ial
rem
uner
atio
n89
3,30
11,
540,
490
4,02
3,08
081
2,09
31,
124,
685
3,60
2,45
2
Util
ities
89,3
3015
4,04
940
2,30
881
,209
112,
469
360,
244
Hou
se r
ent
357,
321
616,
197
1,60
9,23
132
4,83
844
9,87
41,
440,
982
1,33
9,95
22,
310,
736
6,03
4,61
91,
218,
140
-1,
687,
028
5,40
3,67
8
Num
ber
of p
erso
ns1
25
12
5
32.1
In a
dditi
on, t
he a
bove
per
sons
hav
e be
en p
rovi
ded
with
the
Com
pany
mai
ntai
ned
cars
.
32.2
No
fee
is p
aid
to th
e C
hief
Exe
cutiv
e O
ffice
r or
any
dire
ctor
of t
he C
ompa
ny fo
r at
tend
ing
the
mee
tings
.
33.
TR
AN
SA
CT
ION
S W
ITH
RE
LA
TE
D P
AR
TIE
S
Rel
atio
nsh
ip w
ith
th
e C
om
pan
yN
atu
re o
f tr
ansa
ctio
n
Dire
ctor
sLo
an r
ecei
ved
durin
g th
e ye
arLo
ng te
rm lo
an r
epai
dIn
tere
st o
n lo
ans
Ren
t pai
d du
ring
the
year
---
----
----
----
----
----
----
-- R
u p
e e
s -
----
----
----
----
----
----
The
rela
ted
part
ies
incl
ude
dire
ctor
sof
the
Com
pany
and
key
man
agem
ent
pers
onne
l.
The
rear
eno
tran
sact
ions
with
key
man
agem
ent
exce
ptth
ose
inac
cord
ance
with
the
term
s of
thei
r em
ploy
men
t.
2013
2012
Ch
ief
Exe
cuti
veD
irec
tors
Exe
cuti
ves
Chi
ef E
xecu
tive
Dire
ctor
sE
xecu
tives
2013
2012
Ru
pee
sR
upee
s
74,8
44,0
0029
,063
,000
74,8
44,0
0029
,063
,000
1,05
1,93
41,
268,
597
487,
320
487,
320

41
34. FINANCIAL RISK MANAGEMENT
34.1 Financial risk factors
a) Market risk
i) Currency risk
ii) Other price risk
The Company's financial liabilities comprise long term financing, short term borrowings and trade and other payables. The main purpose of these financial liabilities is to raise finances for Company's operations. The Company has trade debts, short term loans and advances, other receivables and short term bank deposits that arrive directly from its operations. The Company's activities expose it to a variety of financial risks: market risk (including currency risk, price risk and interest rate risk), credit risk and liquidity risk. The Company's overall risk management program focuses on the unpredictability of financial markets and seeks to minimize potential adverse effects on the financial performance.
Risk management is carried out by the Board of Directors (the Board). The Board provides principles for overall risk management, as well as policies covering specific areas such as currency risk, price risk, interest rate risk, credit risk and liquidity risk.
Currency risk is the risk that the fair value or future cash flows of a financial instrument will fluctuate because of changes in foreign exchange rates. Currency risk arises mainly from future commercial transactions or receivables and payables that exist due to transactions in foreign currencies. The Company has no significant transactions in foreign currency therefore, it is not exposed to currency risk.
Other price risk represents the risk that the fair value or future cash flows of a financial instrument will fluctuate because of changes in market prices (other than those arising from interest rate risk or currency risk), whether those changes are caused by factors specific to the individual financial instrument or its issuer, or factors affecting all similar financial instruments traded in the market. The Company is not exposed to equity price risk however there is a significant commodity price risk. Following analysis shows the impact of change in commodity price.
iii) Interest rate risk
This represents the risk that the fair value or future cash flows of a financial instrument will fluctuate because of changes in market interest rates.
The Company has no significant interest-bearing assets. The Company's interest rate risk arises from long term financing, short term borrowings and liabilities against assets subject to finance lease. Borrowings obtained at variable rates expose the Company to cash flow interest rate risk. Borrowings obtained at fixed rate expose the Company to fair value interest rate risk.
Raw material consumed 2013
2012
+10% (238,932,999)
-10% 238,932,999
+10% (240,700,237)
-10% 240,700,237
Change in
Commodity Price
Effects on Profit
Before Tax
R E S H A

42
Annual Report
2013 2012
Fixed rate instrumentsRupees Rupees
Financial liabilities
Long term financing
Floating rate instruments
Financial assets
Bank balances - deposit accounts
Financial liabilities
Long term financing
Liabilities against assets subject to finance lease
Short term borrowings
- 35,269,000
46,746,577 82,390,679
17,634,500 120,803,500
- 2,432,755
412,762,986 13,379,870
Fair value sensitivity analysis for fixed rate instruments
The Company does not account for any fixed rate financial assets and liabilities at fair value through profit or loss. Therefore, a change in interest rate at the balance sheet date would not affect profit or loss of the Company.
The following analysis demonstrates the sensitivity to a reasonably possible change in interest rates, with all other variables held constant, of the Company's profit before tax. This analysis is prepared assuming the amounts of floating rate instruments outstanding at balance sheet dates were outstanding for the whole year.
Cash flow sensitivity analysis for variable rate instruments
Bank balances - deposit accounts
Changes in
Interest Rate
Effects on Profit
Before Tax
+1.00
+1.00
-1.00
-1.00
2013
2013
2012
2012
Long term financing+1.50-1.50
+1.50-1.50
Liabilities against assets subject to finance lease
Short term borrowings
2013
2013
2012
2012
+1.50-1.50
+1.50-1.50
+1.50-1.50
+1.50-1.50
(467,466)467,466
(823,907) 823,907
(264,518)
264,518
(1,812,053)
1,812,053
- -
(36,491)
36,491
(6,191,445)6,191,445
(200,698)
200,698
At the balance sheet date the interest rate profile of the Company’s interest bearing financial instruments was:

43
2013 2012Rupees Rupees
Trade debtsOther receivablesBank balances
12,098,646
The credit quality of financial assets that are neither past due nor impaired can be assessed by reference to external credit ratings or to historical information about counterparty default rate. The table below shows the bank balances held with some major counterparties at the balance sheet date:
Credit risk related to trade receivables is managed by established policies, procedures and controls relating to customers credit risk management. Outstanding receivables are regularly monitored and shipments to foreign customers are covered by letters of credit.
At 30 June 2013 the Company had 4 customers (2012: 10 customers) that owed the Company more than Rs. 1 million each and accounted for approximately 90.5% (2012: 96%) of all receivables owing.
Due to the Company's long standing business relationships with these counterparties and after giving due consideration to their strong financial standing, management does not expect non-performance by these counter parties on their obligations to the Company. Accordingly the credit risk is minimal.
Liquidity risk is the risk that an entity will encounter difficulty in meeting obligations associated with financial liabilities.
The Company's approach to managing liquidity is to ensure, as far as possible, that it will always have sufficient liquidity to meet its liabilities when due, under both normal and stressed conditions, without incurring unacceptable losses or risking damage to the Company's reputation. The management believes the liquidity risk to be low.
Banks
2013Rupees
2012Rupees
A1 AA-1 A
JCR - VIS
JCR - VIS
JCR - VIS
JCR - VISP1 A1 Moody’sA1+ AA PACRAA-1+ AA PACRAA1+ AA- PACRAA1+ AA+ PACRAA-1+ AAAA1+A-1+
AA+AA+
PACRA
Trade debts
2013 2012The age of trade receivables at balance sheet date was: Rupees Rupees
Not past due
Past due 0 - 180 daysPast due 180 - 365 days1 - 2 years
Rating
Short Term
Long Term
Agency
c) Liquidity risk
R E S H A
14,510,466 - 588,230
58,340,305 83,049,695 72,850,771 95,736,571
-
99,823 14,009
74,777,780 5,162,364
34,532 2,682,426
90,311 6,317
182,133
83,049,695
- 14,227,845
120,124
162,497
14,510,466
- 12,098,646
-
-
12,098,646
b) Credit risk
Credit risk represents the risk that one party to a financial instrument will cause a financial loss to the other party by failing to discharge an obligation. The carrying amount of financial assets represents the maximum credit exposure. The maximum exposure to credit risk at the reporting date was as follows:
- 106,875
-
43,910,180 5,634,473
34,462 6,361,140
612,730 6,247
1,674,198
58,340,305

44
Annual Report
34.2 Fair values of financial assets and liabilities
The carrying values of all financial assets and liabilities reflected in financial statements approximate their fair values. Fair value is determined on the basis of objective evidence at each reporting date.
The contractual cash flows relating to the above financial liabilities have been determined on the basis of markup rates effective as at 30 June. The rates of mark up have been disclosed in respective notes to the financial statements.
34.3 Financial instruments by categories
Cash and cash
equivalents
Loans and
advancesTotal
As at 30 June 2013Assets as per balance sheetLong term deposits - 3,667,560 3,667,560Trade debts - 14,510,466 14,510,466
Deposits - 1,011,565 1,011,565Cash and bank balances 59,197,161 59,197,161
59,197,161-
19,199,591 78,396,752
----------------------- Rupees ----------------------
Carrying Amount
Contractual cash flows
Less than 1 year
Between 1 and 5 years
Over 5 years
Long term financing
-
Trade and other payables
Accrued markup on financing
Post employment benefits - Gratuity
-
-
Short term borrowings
-
-
-
-------------------------------------------------- Rupees ------------------------------------------------30 June 2013
Carrying Amount
Contractual cash flows
Less than 1 year
Between 1 and 5 years
Over 5 years
Long term financing
-
Liabilities against assets subject to finance lease
-
Trade and other payables
Accrued markup on financing
Post employment benefits - Gratuity
-
-
Short term borrowings
-
-
-
-------------------------------------------------- Rupees ------------------------------------------------30 June 2012
156,072,500
2,432,755 88,301,866
8,938,104
15,288,592
13,379,870 284,413,687
156,072,500
2,432,755 88,301,866
8,938,104
15,288,592
13,379,870 284,413,687
35,888,500
2,432,755 88,301,866
8,938,104
-
13,379,870 148,941,095
120,184,000
- -
-
15,288,592
- 135,472,592
The table below analyses the Company's financial liabilities into relevant maturity groupings based on the remaining period at the balance sheet to the contractual maturity date. The amounts disclosed in the table are the contractual undiscounted cash flows. Balances due within 12 months equate to their carrying balances as the impact of discounting is not significant.
17,634,500
90,227,264
16,275,744
20,529,425
412,762,986 557,429,919
-
90,227,264
16,275,744
20,529,425
412,762,986 539,795,418
-
90,227,264
16,275,744
-
412,762,986 519,265,993
-
-
-
20,529,425
- 20,529,425
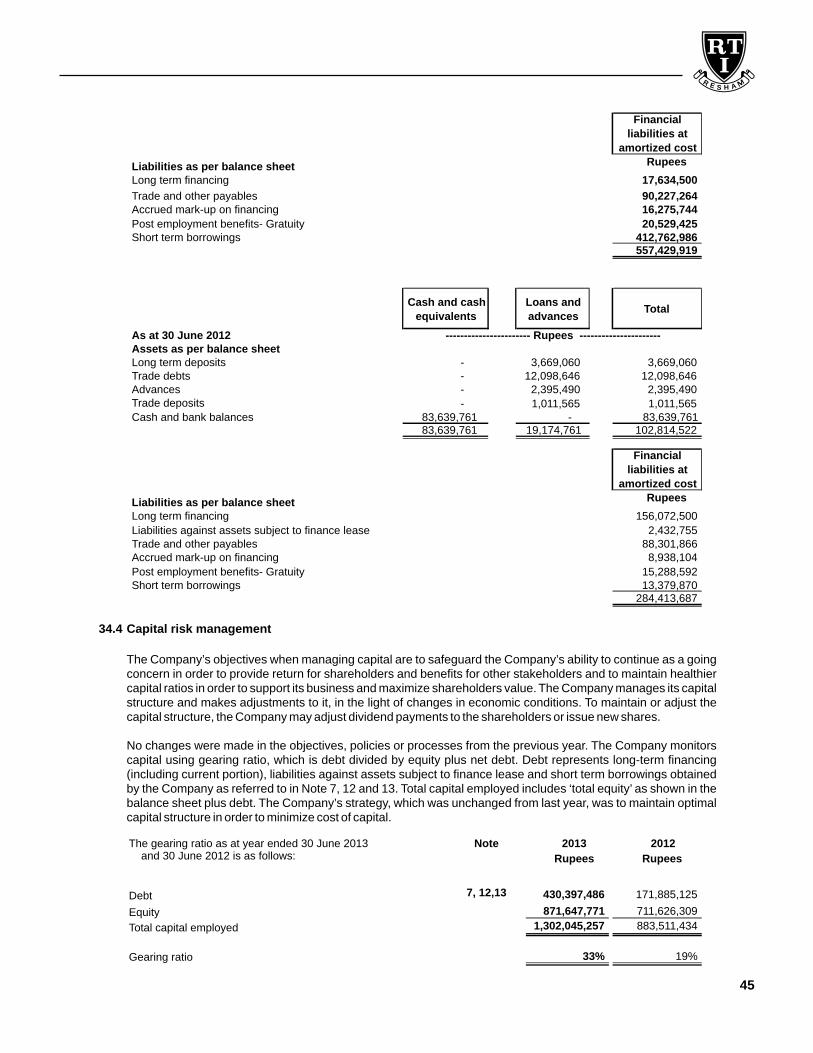
45
R E S H A
The Company’s objectives when managing capital are to safeguard the Company’s ability to continue as a going concern in order to provide return for shareholders and benefits for other stakeholders and to maintain healthier capital ratios in order to support its business and maximize shareholders value. The Company manages its capital structure and makes adjustments to it, in the light of changes in economic conditions. To maintain or adjust the capital structure, the Company may adjust dividend payments to the shareholders or issue new shares.
No changes were made in the objectives, policies or processes from the previous year. The Company monitors capital using gearing ratio, which is debt divided by equity plus net debt. Debt represents long-term financing (including current portion), liabilities against assets subject to finance lease and short term borrowings obtained by the Company as referred to in Note 7, 12 and 13. Total capital employed includes ‘total equity’ as shown in the balance sheet plus debt. The Company’s strategy, which was unchanged from last year, was to maintain optimal capital structure in order to minimize cost of capital.
34.4 Capital risk management
The gearing ratio as at year ended 30 June 2013 and 30 June 2012 is as follows:
Note 2012
Rupees
7, 12,13
Gearing ratio
Debt
Equity
Total capital employed
2013
Rupees
430,397,486 171,885,125
871,647,771 711,626,309
1,302,045,257 883,511,434
33% 19%
Liabilities as per balance sheet Rupees
Long term financing 17,634,500
Trade and other payables 90,227,264Accrued mark-up on financing
Post employment benefits- Gratuity
16,275,744
20,529,425Short term borrowings 412,762,986
557,429,919
Financial
liabilities at
amortized cost
Cash and cash
equivalents
Loans and
advancesTotal
As at 30 June 2012Assets as per balance sheetLong term deposits - 3,669,060 3,669,060Trade debts - 12,098,646 12,098,646Advances -
2,395,490 2,395,490
Trade deposits - 1,011,565 1,011,565Cash and bank balances 83,639,761 83,639,761
83,639,761-
19,174,761 102,814,522
Liabilities as per balance sheet Rupees
Long term financing
Liabilities against assets subject to finance lease
156,072,500
2,432,755Trade and other payables 88,301,866Accrued mark-up on financing
Post employment benefits- Gratuity
8,938,104
15,288,592Short term borrowings 13,379,870
284,413,687
Financial
liabilities at
amortized cost
----------------------- Rupees ----------------------

46
Annual Report
35.1 Reason for Low Production
Under utilization of available capacity is due to normal maintenance down time and change over in production mix.
37. DATE OF AUTHORIZATION
These financial statements have been authorized for issue by Board of Directors of the Company on 10 October 2013.
(Chief Executive Officer) (Director)
38. GENERAL
Figures in these financial statements have been rounded off to the nearest rupee.
35. PLANT CAPACITY AND ACTUAL PRODUCTION
Spindles installed/ worked Nos. 38,448
Production at normal capacity in 20/S count
based on 3 shifts per day Kgs 14,102,609
Actual production converted to 20/S count
based on 3 shifts per day Kgs 11,951,901
38,448
14,102,609
10,117,639
At year end 980
Average during the year 885
969
955
36. NUMBER OF EMPLOYEES
20122013

PATTERN OF SHAREHOLDING
47
R E S H A
119
From
1101501
1,0015,001
15,00125,00130,00150,00165,00170,001
100,001140,001150,001165,001195,001275,001285,001345,001440,001495,001735,001765,001795,001815,001840,001
1,140,0011,240,0011,250,0011,390,0011,555,0012,155,0012,265,001
17,395,001
To
100500
1,0005,000
10,00020,00030,00035,00055,00070,00075,000
105,000145,000155,000170,000
Total Shares Held
36,000,000
1. Incorporation Number 0021882
2. Name of the Company RESHAM TEXTILE INDUSTRIES LIMITED
3. Pattern of holding of the shares held by the shareholders as at 30 June 2013
------Shareholding------4. No. of Shareholders
5. Categories of shareholders Shares held Percentage
9,658,152 26.8282%
119 0.0003%
18,538,440 51.4957%
26,321,624 73.1156%
5.1 Directors, Chief Executive Officer and their spouse and minor children
5.2 Banks Development Financial Institutions,
Non Banking Financial Institutions.
5.3 Share holders holding 10% or more
5.4 General Public a. Local b. Foreign
5.5 Others (to be specified) 1- Joint Stock Companies2- Pension Funds3- Others
519,419
681
0.0000%0.0539%0.0019%
2437
813
511121111111131111111111111111
200,000280,000290,000350,000445,000500,000740,000770,000800,000820,000845,000
1,145,0001,245,0001,255,0001,395,0001,560,0002,160,0002,270,000
17,400,000
18817,786
6,84133,90739,96019,41929,10035,000
105,20066,00073,006
100,500143,846153,968166,452200,000276,839863,073346,000444,620499,691738,350765,481798,800820,000843,481
1,140,5151,240,5461,254,0211,391,9751,558,9982,158,9522,269,560
17,397,925
Nil Nil

48
CATEGORIES OF SHAREHOLDERS REQUIRED UNDER C.C.G.
AS AT 30 JUNE 2013
Name
Number of
PercentageShares
Held
Annual Report
Associated Companies, Undertakings and Related Parties: - -
Mutual Funds (Name Wise Detail): - -
Directors and their Spouse and Minor Children : (Name Wise Detail)
1 CH. MUHAMMAD KHURSHID
CH. MUHAMMAD KHURSHID
2 CH. RAHMAN BAKHSH
3 MR. AZHAR KHURSHID CHAUDHRY
MR. AZHAR KHURSHID CHAUDHRY
4 MS. KIRAN ARSHAD CHAUDHRY
MS. KIRAN ARSHAD CHAUDHRY
5 MR. MUHAMMAD ALI CHAUDHRY
6 MRS. SALMA AZIZ
7 MR. KAMRAN ILYAS
MR. KAMRAN ILYAS
8 MRS. RAZIA SULTANA BEGUM
MRS. RAZIA SULTANA BEGUM
Executives: - -
Public Sector Companies & Corporations: - -
Banks, Development Finance Institutions, Non Banking Finance Companies, Insurance Companies, Takaful, Modarabas and Pension Funds: 19,538 0.0543%
Shareholders holding five percent or more voting intrest in the listed company (Name Wise Detail)
1 MR. MUHAMMAD ARSHAD SAEED
2
3
All trades in the shares of the listed company, carried out by its Directors, Executives and theirspouse and minor children shall also be disclosed:
2,924,433
82,164
200,000
3,089,560
843,481
1,668,814
50,900
798,800
8.1234%
0.2282%
0.5556%
8.5821%
2.3430%
4.6356%
0.1414%
2.2189%
1 623,198
2 -do-
-do-
-do-
-do-
3
4
CH. RAHMAN BAKHSH
5
CH. MUHAMMAD KHURSHID
Sr. No. Name Transferred Gifted
18,538,440
3,089,560
2,924,433
51.4957%
8.5821%
8.1234%
-
2,344,816
551,998
4,127,565
141,200

Thursday 31 October 2013
2013
th24
11.00 a.m.
R E S H A