Annual Report - 2012 SAPPHIRE TEXTILE MILLS LIMITED · Sapphire Textile Mills Limited Annual Report...
118
02 03 04 07 11 12 13 15 16 17 19 20 21 62 65 18 Contents SAPPHIRE TEXTILE MILLS LIMITED CORPORATE INFORMATION VISION/MISSION NOTICE OF ANNUAL GENERAL MEETING DIRECTORS’ REPORT SIX YEAR GROWTH AT A GLANCE REVIEW REPORT AUDITORS’ REPORT BALANCE SHEET PROFIT & LOSS ACCOUNT STATEMENT OF COMPREHENSIVE INCOME CASH FLOW STATEMENT STATEMENT OF CHANGES IN EQUITY NOTES TO THE FINANCIAL STATEMENTS PATTERN OF SHARE HOLDINGS CONSOLIDATED ACCOUNTS STATEMENT OF COMPLIANCE
Transcript of Annual Report - 2012 SAPPHIRE TEXTILE MILLS LIMITED · Sapphire Textile Mills Limited Annual Report...

Sapphire Textile Mills Limited
Annual Report - 2012
02
03
04
07
11
12
13
15
16
17
19
20
21
62
65
18
Contents
SAPPHIRE TEXTILE MILLS LIMITED
CORPORATE INFORMATION
VISION/MISSION
NOTICE OF ANNUAL GENERAL MEETING
DIRECTORS’ REPORT
SIX YEAR GROWTH AT A GLANCE
REVIEW REPORT
AUDITORS’ REPORT
BALANCE SHEET
PROFIT & LOSS ACCOUNT
STATEMENT OF COMPREHENSIVE INCOME
CASH FLOW STATEMENT
STATEMENT OF CHANGES IN EQUITY
NOTES TO THE FINANCIAL STATEMENTS
PATTERN OF SHARE HOLDINGS
CONSOLIDATED ACCOUNTS
STATEMENT OF COMPLIANCE

Sapphire Textile Mills Limited
Annual Report - 2012
Company ProfileBOARD OF DIRECTORS
CHAIRMAN : MR. MOHAMMAD ABDULLAH
CHIEF EXECUTIVE : MR. NADEEM ABDULLAH
DIRECTOR : MR. AMER ABDULLAH
MR. YOUSUF ABDULLAH
MR. NABEEL ABDULLAH
MR. SHAYAN ABDULLAH
MR. MOHAMMAD YOUNUS
MR. HASAN ABDULLAH
AUDIT COMMITTEE
CHAIRMAN : MR. YOUSUF ABDULLAH
MEMBER : MR. NABEEL ABDULLAH
MEMBER : MR. SHAYAN ABDULLAH
HUMAN RESOURCE & REMUNERATION COMMITTEE
CHAIRMAN : MR. AMER ABDULLAH
MEMBER : MR. NABEEL ABDULLAH
MEMBER : MR. MOHAMMAD YOUNUS
CHIEF FINANCIAL OFFICER : MR. ABDUL SATTAR
SECRETARY : MR. ZEESHAN
AUDITORS : MUSHTAQ & COMPANY
CHARTERED ACCOUNTANTS
MANAGEMENT CONSULTANT : M. YOUSUF ADIL SALEEM & COMPANY
CHARTERED ACCOUNTANTS
TAX CONSULTANTS : MUSHTAQ & COMPANY
CHARTERED ACCOUNTANTS
LEGAL ADVISOR : A. K. BROHI & COMPANY
BANKERS : ALLIED BANK LIMITED
HABIB BANK LIMITED
STANDARD CHARTERED BANK (PAKISTAN) LIMITED
UNITED BANK LIMITED
MCB BANK LIMITED
CITIBANK N.A.
SHARE REGISTRAR : HAMEED MAJEED ASSOCIATES (PVT) LTD
REGISTERED OFFICE : 212, COTTON EXCHANGE BUILDING,
I.I.CHUNDRIGAR ROAD,
KARACHI.
MILLS : S.I.T.E KOTRI, S.I.T.E NOORIABAD
CHUNIAN, DISTRICT KASUR
FEROZE WATWAN
BHOPATTIAN, LAHORE.
.
2

Sapphire Textile Mills Limited
Annual Report - 2012
To be one of the premier textile company recognized for leadership in technology, flexibility, responsiveness and quality.
Our customers will share in our success through innovative manufacturing, certifiable quality, exceptional services and creative alliances. Structured to maintain in depth competence and knowledge about our business, our customers and worldwide markets.
Our workforce will be the most efficient in industry through multiple skill learning, the fostering of learning and the fostering of teamwork and the security of the safest work enviornment possible recognized as excellent citizen in the local and regional community through our financial and human resources support and our sensitivity to the enviornment.
Vision
Our mission is to be recognized as premier supplier to the markets we serve by providing quality yarns, fabrics and other textile products to satisfy the needs of our customers.
Our mission will be accomplished through excellence in customer service, sales and manufacturing supported by teamwork of all associates.
We will continue our tradition of honesty, fairness and integrity in relationship with our customers, associates, shareholders, community and stakeholders.
Mission
3

Sapphire Textile Mills Limited
Annual Report - 2012
Notice of Annual General Meeting
NOTICE IS HEREBY GIVEN THAT 44th Annual General Meeting of SAPPHIRE TEXTILE MILLS LIMITED will be held on Tuesday the 30th day of October, 2012 at 7:30 p.m. at Trading Hall, Cotton Exchange Building, I.I.Chundrigar Road, Karachi to transact the following business:
ORDINARY BUSINESS:
1. To confirm the minutes of the last General Meeting.
2. To receive, consider and adopt the Audited Accounts together with Directors’ and Auditors’ Reports for the year ended 30th June, 2012.
3. To approve final cash dividend of Rs.5.00 per share i.e. 50% for the year ended June 30, 2012 as recommended by the Board of Directors.
4. To appoint auditors for the year ending 30th June, 2013 and fix their remuneration. The present Auditors, M/s Mushtaq & Company, Chartered Accountants retire and being eligible offer themselves for reappointment.
SPECIAL BUSINESS:
5. To consider and, if thought fit, pass the following Special Resolution with or without modification(s):-
“Resolved that pursuant to the requirements of Section 208 of the Companies Ordinance, 1984, the Company be and is hereby authorized to make further investment up to Rs.150 Million (Rupees One Hundred Fifty Million Only) by way of Long Term Equity Investment in the Shares of Sapphire Dairies (Private) Limited (SDPL) an associated company at par from time to time as per the requirements of the Company. This fresh investment will enhance the equity investment of the Company in SDPL up to Rs. 300 Million”
“Further Resolved that the above said resolution shall be valid for 3 years and the Chief Executive of the Company be and is hereby authorized to make necessary decision to disinvest all or certain part of the investments made by the Company from time to time as and when deemed appropriate and necessary, but not less than par or at breakup value whichever is higher.”
A Statement under Section 160(1) (b) of the Companies Ordinance, 1984, along with the information required under Clause (a) of sub-regulation (1) of Regulation 3 of Companies (Investment in Associated Companies or Associated Undertakings) Regulations, 2012 is annexed to the Notice of the Meeting send to the shareholders.
OTHER BUSINESS:
6. To transact any other business with the permission of the Chair.
By Order of the Board
Karachi. (ZEESHAN)
Dated : 05th October, 2012 Secretary
NOTES
1. The share transfer books of the Company shall remain closed for entitlement of Dividend from 23rd October, 2012 to 30th October, 2012 (both days inclusive). Transfers received in order, by the Hameed Majeed Associates (Private) Limited, 5th Floor, Karachi Chambers, Hasrat Mohani Road, Karachi, up to 22nd October, 2012, will be considered in time for the payment of dividend.
2. A member entitled to attend and vote at this meeting may appoint another member as his/her proxy to attend and vote on his/her behalf. Proxies in order, to be valid must be deposited at the Registered Office of the Company not less than 48 hours before the time of the meeting.
3. CDC shareholders desiring to attend the meeting are requested to bring their original National Identity Cards, Account/Sub Account and particular of participants I.D. numbers and account numbers in CDS, for identification purpose, and in case of proxy, to enclose an attested copy of his/her National Identity Card.
4. Shareholders are requested to notify the Company of any change in their addresses.
5. Members who have not yet submitted photocopy of their Computerized Identity Cards (CNIC) are requested to send the same to our Share Registrars at the earliest.
4
Sapphire Textile Mills Limited
Annual Report - 2012
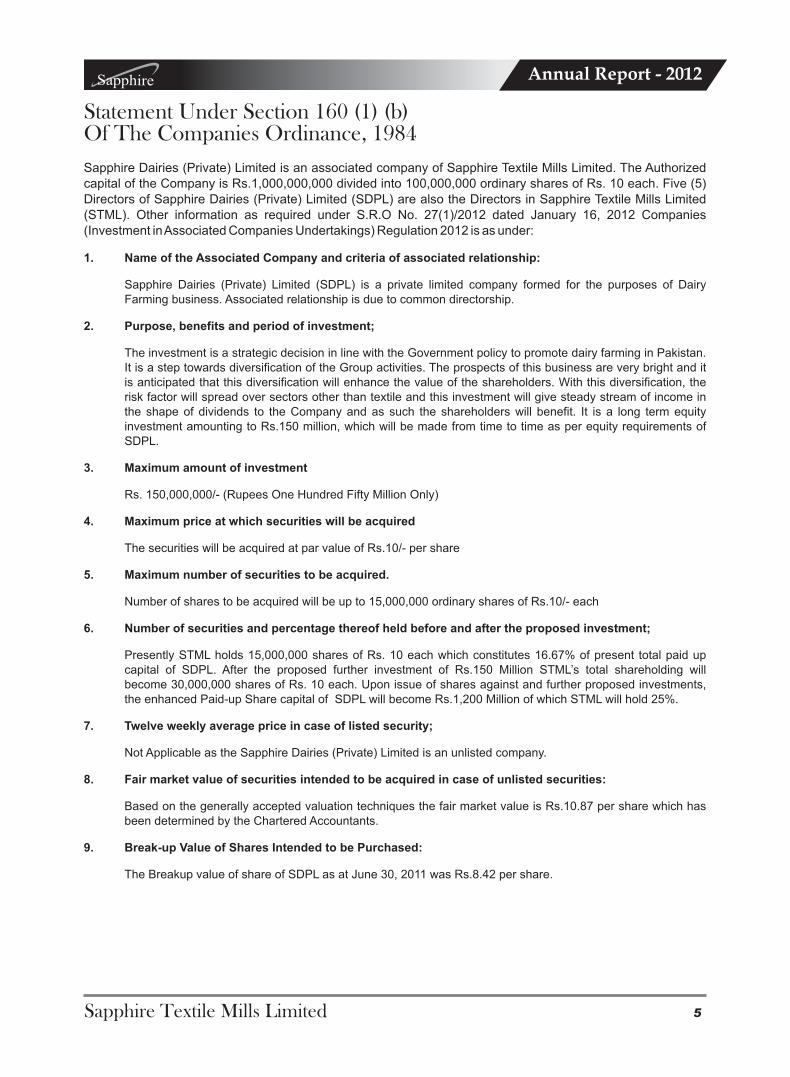
Sapphire Dairies (Private) Limited is an associated company of Sapphire Textile Mills Limited. The Authorized capital of the Company is Rs.1,000,000,000 divided into 100,000,000 ordinary shares of Rs. 10 each. Five (5) Directors of Sapphire Dairies (Private) Limited (SDPL) are also the Directors in Sapphire Textile Mills Limited (STML). Other information as required under S.R.O No. 27(1)/2012 dated January 16, 2012 Companies (Investment in Associated Companies Undertakings) Regulation 2012 is as under:
1. Name of the Associated Company and criteria of associated relationship:
Sapphire Dairies (Private) Limited (SDPL) is a private limited company formed for the purposes of Dairy Farming business. Associated relationship is due to common directorship.
2. Purpose, benefits and period of investment;
The investment is a strategic decision in line with the Government policy to promote dairy farming in Pakistan. It is a step towards diversification of the Group activities. The prospects of this business are very bright and it is anticipated that this diversification will enhance the value of the shareholders. With this diversification, the risk factor will spread over sectors other than textile and this investment will give steady stream of income in the shape of dividends to the Company and as such the shareholders will benefit. It is a long term equity investment amounting to Rs.150 million, which will be made from time to time as per equity requirements of SDPL.
3. Maximum amount of investment
Rs. 150,000,000/- (Rupees One Hundred Fifty Million Only)
4. Maximum price at which securities will be acquired
The securities will be acquired at par value of Rs.10/- per share
5. Maximum number of securities to be acquired.
Number of shares to be acquired will be up to 15,000,000 ordinary shares of Rs.10/- each
6. Number of securities and percentage thereof held before and after the proposed investment;
Presently STML holds 15,000,000 shares of Rs. 10 each which constitutes 16.67% of present total paid up capital of SDPL. After the proposed further investment of Rs.150 Million STML’s total shareholding will become 30,000,000 shares of Rs. 10 each. Upon issue of shares against and further proposed investments, the enhanced Paid-up Share capital of SDPL will become Rs.1,200 Million of which STML will hold 25%.
7. Twelve weekly average price in case of listed security;
Not Applicable as the Sapphire Dairies (Private) Limited is an unlisted company.
8. Fair market value of securities intended to be acquired in case of unlisted securities:
Based on the generally accepted valuation techniques the fair market value is Rs.10.87 per share which has been determined by the Chartered Accountants.
9. Break-up Value of Shares Intended to be Purchased:
The Breakup value of share of SDPL as at June 30, 2011 was Rs.8.42 per share.
Statement Under Section 160 (1) (b) Of The Companies Ordinance, 1984
5

Sapphire Textile Mills Limited
Annual Report - 2012
10. Earnings per share of last three years of associated company;
Year Profit/(Loss) Earnings per share.
30 June, 2009 Rs.311,336 Rs.124.53
30 June, 2010 (Rs.17,888,371) (Rs.0.57)
30 June, 2011 (Rs.31,841,675) (Rs.1.01)
11. Source of Funds from which Securities will be acquired:
Shares will be purchased from Company’s own sources.
12. Salient features of the agreement(s) if any, regarding proposed investment:
There is no agreement, this is a Long Term equity Investment.
13. Direct or indirect interest of directors, sponsors, majority shareholders and their relatives , if any, in associated undertaking or transaction under consideration:
The Common Directors are:
i. Mr. Mohammad Abdullah
ii. Mr. Nadeem Abdullah
iii. Mr. Amer Abdullah
iv. Mr. Yousuf Abdullah
v. Mr. Shayan Abdullah
Each director holds 500 shares which are necessary to qualify as director of the Company, hence the total investments of these Directors is 2,500 Ordinary shares in SDPL. The Directors interest in the Company is to the extent of their shareholding in the Company. Remaining capital of the company has been invested by the group companies and their interest in the Company is up to their shareholding in the Company.
14. Any other important details necessary for the members to understand the transaction:
The proposed investment is being made to enhance the production capacity of the farm which is expected to result in higher profits in future.
By order of the Board
Karachi: October 05, 2012 Company Secretary
6

Sapphire Textile Mills Limited
Annual Report - 2012
The Directors of the Company have pleasure in submitting their Report together with the audited financial statements of the Company for the year ended June 30, 2012.
FINANCIAL HIGHLIGHTS
REVIEW OF OPERATIONS
Sales during the year under review reduced to Rs.21.491 billion from Rs.22.937 billion in the previous year. This was primarily due to lower raw material prices and consequently lower sale price of goods manufactured by the Company in the current year compared to previous year. The Gross profit reduced from 14.90% in the previous year of sales to 12.90% of sales in the current year. The biggest impact is due to higher cost of energy. The increase in cost of energy was due to increase in tariffs of gas and electricity, as well as increase in price of furnace oil. Further due to increased gas curtailment, the company had to shift to more expensive sources of power. The total cost of power increased from Rs.1.006 billion to Rs.1.424 billion. Energy cost increased from 4.38% of sales to 6.63% of sales.
Financial cost decreased from Rs.812.051 million which was 3.54% of sales compared to Rs.713.188 million which is 3.32% of sales in the current year. Other income during the year reduced to Rs.407.631 million as against Rs.451.661 million in the previous year.
Appropriation of Profit
Rupees in Thousand
Profit Before Taxation 1,129,942
Less: Taxation
For the year (220,398)
Prior year 28,743
Deferred 135,392
(56,263)
Profit after taxation 1,073,679
Add: Unappropriated profit brought forward 4,192,551
Profit available for appropriation 5,266,230
AppropriationProposed cash dividend @ 50% i.e Rs.5/= per share (2011: 50%) 100,416
Unappropirated profit carried forward 5,165,814
Directors’ Reportto the Shareholders
2012 2011
Rupees in Thousand
Sales & Services 21,490,830 22,937,176
Gross Profit 2,773,398 3,417,774
Profit from Operations 1,843,130 2,586,086
Other Operating Income 407,631 451,661
Profit before taxation 1,129,942 1,774,035
Profit after taxation 1,073,679 1,607,405
7

Sapphire Textile Mills Limited
Annual Report - 2012
DIVIDEND
The Board of Directors of the company is pleased to recommend a cash dividend of 50% i.e. Rs.5/= per share for the year ended June 30, 2012 (2011:50%).
EARNING PER SHARE
The earnings per share for the year ended June 30, 2012 is Rs.53.46 as compared to Rs.80.04 for last year ended June 30, 2011.
FUTURE PROSPECTS
Pakistan is expecting a good crop of raw cotton. The international demand is also robust. In addition the interest rates are also being reduced. These conditions are very favourable for the textile industry. The biggest, challenge however, remains the availability and cost of energy. The Company has done its best to build alternate energy supplies. Although the alternative supplies are expensive, but at least the company is able to keep production process running. Inspite of the challenges on the energy front, we are optimistic that the Company will continue doing well.
SUBSIDIARIES OF SAPPHIRE TEXTILE MILLS LIMITED
There are two subsidiaries with 100% equity of Sapphire Textile Mills Limited.
SAPPHIRE WIND POWER COMPANY LIMITED
1. The Company obtained a LOI for developing a 50 MW wind farm at Jhumpir and was allocated 1372 acres of land for the purpose by AEDB. Wind resource assessment and detailed project feasibility were completed and approved by AEDB. The Company followed a transparent tendering process and selected GE wind turbines and signed an EPC contract and a 10 years O&M contract. The company has obtained a Tariff determination from NEPRA and is working towards achieving financial close on the project.
SAPPHIRE HOME INCORPORATION
2. Sapphire Home Incorporation is incorporated under the laws of the State of New York in United States of America (USA). There are certain customers in the USA which need goods on landed duty paid basis. Sapphire Home Inc. provides this service for the home textile products for these customers.
RELATED PARTIES
The Company has fully complied with the best practices on transfer pricing as contained in the listing regulation of stock exchange in Pakistan. The transactions with related parities were carried out at arm’s length prices determined in accordance with the comparable uncontrolled prices method.
Corporate Environment, Health & Social Responsibility
The Company maintains working conditions which are safe and without risk to the health of all employees and public at large. Our focus remains on improving all aspects of safety especially with regards to the safe, production, delivery, storage and handling of the materials. Your company always ensures environment preservation and adopts all possible means for environment protection.
We maintain our commitment to raise the educational, health and environment standards of the community & made generous donations for health, education and social welfare projects.
Directors’ Reportto the Shareholders
8

Sapphire Textile Mills Limited
Annual Report - 2012
STATEMENT ON CORPORATE AND FINANCIAL REPORTING FRAME WORK
The Board of Directors periodically reviews the Company’s strategic direction. Business plans and targets are set by the Chief Executive and reviewed by the Board. The Board is committed to maintain a high standard of corporate governance. The Board has reviewed the Code of Corporate Governance and confirms that:
1. The financial statements, prepared by the management of the Company, present fairly its state of affairs, the result of its operations, its cash flows and its changes in equity.
2. The company has maintained proper books of accounts.
3. Appropriate accounting policies have been consistently applied in preparation of financial statements and accounting estimates are based on reasonable and prudent judgment.
4. International Accounting Standards, as applicable in Pakistan, have been followed in preparation of financial statements.
5. The system of internal control, which was in place, is being continuously reviewed by the internal audit and other such procedures. The process of review and monitoring will continue with the object to improve it further.
6. All liabilities in regard to the payment on account of taxes, duties, levies and charges have been fully provided and will be paid in due course or where claim was not acknowledged as debt the same is disclosed as contingent liabilities in the notes to the accounts.
7. There is no doubt about the company’s ability to continue as a going concern.
8. There has been no material departure from the best practice of corporate governance, as detailed in listing regulations
9. The Board in compliance to the Code of Corporate Governance has formed a HR & R Committee and the following directors are its members:
Mr. Amer Abdullah ChairmanMr. Nabeel Abdullah MemberMr. Mohammad Younus Member
10. Operating and financial data and key rations of six years are annexed.
11. The Company established Management Staff Gratuity Fund from July 1, 2005 which is initially for the Head office and will gradually applicable to the other units/mills of the Company. The company has also introduced Employees’ Provident Fund for the staff from July 1, 2006. The persons join the Provident Fund will not be eligible for gratuity fund. Provision has been made in the accounts accordingly. The value of investment of Gratuity and Provident Fund as at June 30, 2012 is Rs.27.519 million and Rs.67.373 million respectively.
12. No trade in the shares of the Company were carried out by the Directors, Chief Executive Officer, Chief financial Officer, Company Secretary, their spouses and minor children:
13. During the Year =19= meetings of the Board of Directors were held. Attendance by each Directors is as follow:
Mr.Muhammad Abdullah 15Mr.Nadeem Abdullah 13Mr.Shahid Abdullah 3Mr.Amer Abdullah 10Mr.Yousuf Abdullah 10Mr.Mohammad Younus 10Mr.Nabeel Abdullah 10Mr.Shayan Abdullah 10Mr. Hasan Abdullah 7
Directors’ Reportto the Shareholders
9

Sapphire Textile Mills Limited
Annual Report - 2012
14. The Audit Committee held 4 meetings during the year. Attendance by each member was as follows:
Mr.Yousuf Abdullah 4Mr.Nabeel Abdullah 4Mr.Shayan Abdullah 4
15. Code of Ethics and Business Practices has been developed and are communicated and acknowledged by each Director and employee of the company.
PATTERN OF SHAREHOLDING:
The Pattern of share holding of the company as at June 30, 2012 is annexed. This statement is prepared in accordance with the Code of Corporate Governance and the Companies Ordinance, 1984.
AUDITORS:
The present Auditors, M/s. Mushtaq & Company (Chartered Accountants) retire and being eligible, offer themselves for re-appointment for the year 2012-2013. Audit Committee and Board of Directors have also recommended their appointment as Auditor for the year ended June 30, 2013.
ACKNOWLEDEMENT
The Management would like to place on record its appreciation for the support of Board of Directors, regulatory authorities, shareholders, customers, financial institutions, suppliers and dedication and hard work of the Staff and Workers.
On behalf of the Board
Karachi NADEEM ABDULLAHDated: 05th October, 2012 Chief Executive
Directors’ Reportto the Shareholders
10

Sapphire Textile Mills Limited
Annual Report - 2012
Six Years Growth At A Glance
(Rupees in Million)
YEARS 2012 2011 2010 2009 2008 2007
Sales 21,490.83 22,937.18 14,428.08 11,744.25 9,769.32 9,152.46
Gross Profit 2,773.40 3,417.77 2,736.05 1,731.37 1,128.03 1,191.20
Profit Before Tax 1,129.94 1,774.04 1,115.61 274.06 670.60 319.71
Profit After Tax 1,073.68 1,607.41 1,015.54 179.84 617.73 216.26
Share Capital 200.83 200.83 200.83 200.83 200.83 200.83
Shareholder's Equity 8,327.12 7,520.94 5,992.07 4,459.86 5,577.49 6,018.87
Fixed Assets - Net 5,357.00 4,900.07 4,029.81 4,092.60 4,214.72 4,104.84
Total Assets 14,056.51 14,393.19 11,579.97 10,189.53 12,324.27 11,126.00
DIVIDEND - Cash % 50.00 50.00 50.00 15.00 15.00
DIVIDEND - Specie % - - - - -
RATIOS:
Profitability
Gross Profit % 12.91 14.90 18.96 14.74 11.55 13.02
Profit Before Tax % 5.26 7.73 7.73 2.33 6.86 3.49
Profit After Tax % 5.00 7.01 7.04 1.53 6.32 2.36
Return To Shareholders
R.O.E-Before Tax % 13.57 23.59 18.62 6.15 12.02 5.31
R.O.E After Tax % 12.89 21.37 16.95 4.03 11.08 3.59
Basic E.P.S-After Tax Rs. 53.46 80.04 50.57 8.95 30.76 10.77
Activity
Sales To Total Assets Times 1.53 1.59 1.25 1.15 0.79 0.82
Sales To Fixed Assets Times 4.01 4.68 3.58 2.87 2.32 2.23
Liquidity/Leverage
Current Ratio 1.44:1 1.27:1 1.09:1 1.91 1.28:1 1.66:1
Debt Equity Ratio Times 0.13 0.13 0.09 0.16 0.08 0.12
Total Liabilities to Equity. Times 0.69 0.91 0.93 1.28 1.21 0.85
Break up value per share Rs. 414.63 374.49 298.36 222.07 277.72 299.70
7.50
4.50
11

Sapphire Textile Mills Limited
Annual Report - 2012
Statement of Compliance with the code of corporate governance
Name of Company SAPPHIRE TEXTILE MILLS LIMITED year ended June 30, 2012.
This statement is being presented to comply with the Code of Corporate Governance contained in Regulation No.35 of the Karachi Stock Exchange for the purpose of establishing a framework of good governance, whereby a listed company is managed in compliance with the best practices of corporate governance.
The company has applied the principles contained in the CCG in the following manner:
1. The Company encourages representation of independent non-executive directors and directors representing minority interests on its board of directors. At present the board includes:
Category Names
Independent Directors Nil
Executive Directors Mr. Mohammad Abdullah
Mr. Nadeem Abdullah
Mr. Nabeel Abdullah
Non-Executive Directors Mr. Amer Abdullah
Mr. Yousuf Abdullah
Mr. Shayan Abdullah
Mr. Hasan Abdullah
Mr. Mohammad Younus
The condition of clause 1(b) of the CCG in relation to independent director will be applicable after election of next Board of Directors of the Company in April 2014.
2. The directors have confirmed that none of them is serving as a director on more than seven listed companies, including this company.
3. All the resident directors of the company are registered as taxpayers and none of them has defaulted in payment of any loan to a banking company, a DFI or a NBFI. None of the Directors is a member of a stock exchange.
4. During the year no casual vacancies occurred in the board of directors.
5. The company has prepared a “Code of Conduct” and has ensured that appropriate steps have been taken to disseminate it throughout the company along with its supporting policies and procedures.
6. The board has developed a vision/mission statement, overall corporate strategy and significant policies of the company. A complete record of particulars of significant policies along with the dates on which they were approved or amended has been maintained.
7. All the power of board have been duly exercised and decisions on material transactions, including appointment and determination of remuneration and terms and conditions of employment of the CEO and other executive and non-executive directors, have been taken by the board.
8. The meetings of the board were presided over by the Chairman and, in his absence, by a director elected by the board for this purpose and board met at least once in every quarter. Written notice of the board meetings, along with agenda and working papers, were circulated at least seven days before the meetings. The minutes of the meetings were appropriately recorded and circulated.
12

Sapphire Textile Mills Limited
Annual Report - 2012
9. In accordance with the criteria specified on clause (xi) of CCG, majority of Directors of the Company are exempted from the requirement of directors’ training program and the rest of the Directors to be trained within specified time.
10. There was no new appointment of CFO/Company Secretary during the year.
11. The Directors’ Report for this year has been prepared in compliance with the requirements of the CCG and fully describes the salient matters required to be disclosed.
12. The financial statements of the Company were duly endorsed by CEO and CFO before approval of the Board.
13. The Directors, CEO and executives do not hold any interest in the shares of the Company other than that disclosed in the pattern of shareholding.
14. The Company has complied with all the corporate and financial reporting requirements of the CCG.
15. The Board has formed an Audit Committee. It comprises three members, of whom two are non-executive Directors.
16. The meetings of the Audit Committee were held at least once every quarter prior to approval of interim and final results of the Company and as required by the Code. The terms of reference of the committee have been formed and advised to the committee for compliance.
17. The board has formed an HR and Remuneration Committee. It comprises three members, of whom two are non-executive directors and the chairman of the committee is a non-executive director.
18. The Board has set up an effective Internal Audit Function.
19. The statutory auditors of the Company have confirmed that they have been given a satisfactory rating under the quality control review program of the Institute of Chartered Accountants of Pakistan, that they or any of the partners of the firm, their spouses and minor children do not hold shares of the company and that the firm and all its partners are in compliance with International Federation of Accountants (IFAC) guidelines on code of ethics as adopted by Institute of Chartered Accountants of Pakistan.
20. The statutory auditors or the persons associated with them have not been appointed to provide other services except in accordance with the listing regulations and the auditors have confirmed that they have observed IFAC guidelines in this regard.
21. The closed period prior to the announcement of interim/final results, and business decisions, which may materially affect the market price of company’s securities, was determined and intimated to directors, employees and stock exchange(s).
22. Material/price sensitive information has been disseminated among all market participants at once through stock exchange(s).
23. We confirm that all other material principles enshrined in the CCG have been complied with.
For and on behalf of the Board
Karachi NADEEM ABDULLAHDated: 05th October, 2012 Chief Executive
Statement of Compliance with the code of corporate governance
13

Sapphire Textile Mills Limited
Annual Report - 2012
Review report to the MembersOn the Statement of Compliance with Best Practices of the Code of Corporate Governance
We have reviewed the statement of compliance with the best practices contained in the Code of Corporate Governance prepared by the Board of Directors of Sapphire Textile Mills Limited to comply with the Listing Regulation No. 35 (previously Regulation No. 37) of the Karachi Stock Exchange (Guarantee) Limited, where the company is listed.
The responsibility for compliance with the Code of Corporate Governance is that of the Board of Directors of the company. Our responsibility is to review, to the extent where such compliance can be objectively verified, whether the statement of compliance reflects the status of the company’s compliance with the provisions of the Code of Corporate Governance and report if it does not. A review is limited primarily to inquiries of the company personnel and review of various documents prepared by the company to comply with the Code.
As part of our audit of financial statements we are required to obtain an understanding of the accounting and internal control system sufficient to plan the audit and develop an effective audit approach. We have not carried out any special review of the internal control system to enable us to express an opinion as to whether the Board’s statement on internal control covers all controls and the effectiveness of such internal controls.
Further, Sub- Regulation (xiii a) of Listing Regulation No. 35 (previously Regulation No. 37) notified by The Karachi Stock Exchange (Guarantee) Limited vide circular KSE/N-269 dated 19 January 2009 requires the Company to place before the Board of Directors for their consideration and approval related party transactions distinguishing between transactions carried out on terms equivalent to those that prevail in arm’s length transactions and transactions which are not executed at arm’s length price recording proper justification for using such alternate pricing mechanism. Further, all such transactions are also required to be separately placed before the audit committee. We are only required and have ensured compliance of requirement to the extent of approval of related party transactions by the Board of Directors and placement of such transactions before the audit committee. We have not carried out any procedures to determine whether the related party transactions were under taken at arm’s length price.
Based on our review, nothing has come to our attention which causes us to believe that the statement of compliance does not appropriately reflect the company’s compliance, in all material respect, with the best practices contained in the Code of Corporate Governance as applicable to the company for the year ended June 30, 2012.
MUSHTAQ & COMPANY
KARACHI: Chartered Accountants
Date: October 05, 2012 Engagement Partner:
Shahabuddin A. Siddiqui
F.C.A
14
Sapphire Textile Mills Limited
Annual Report - 2012
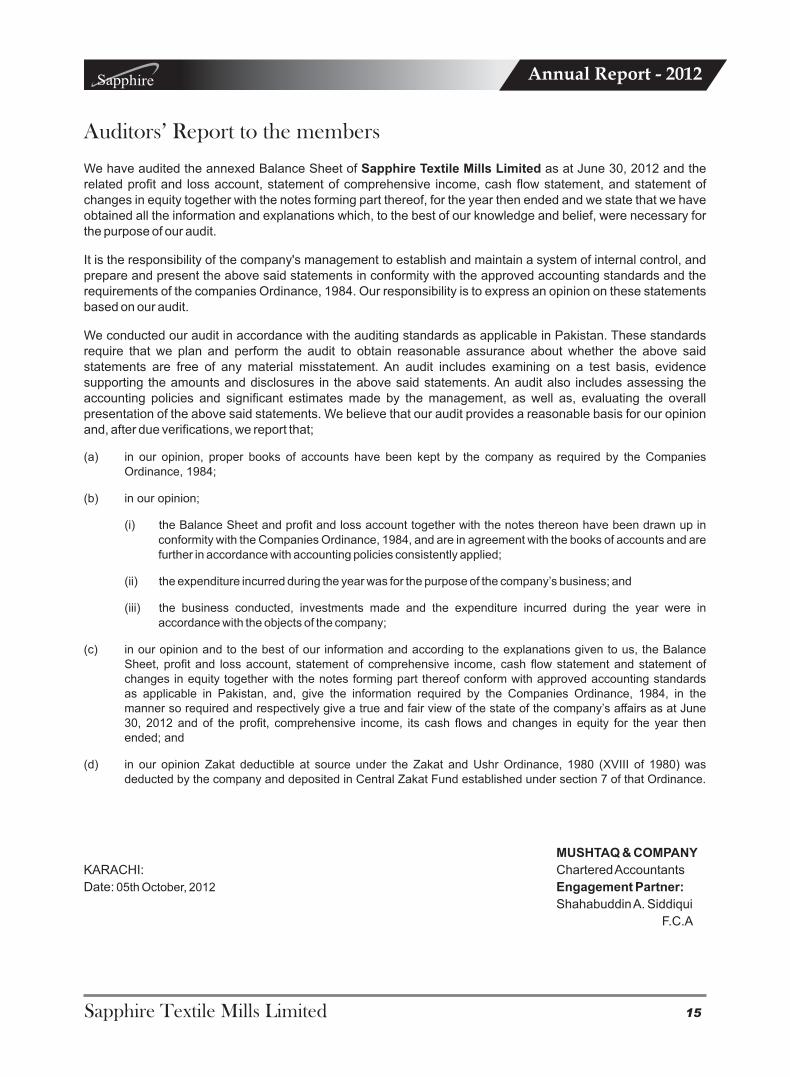
Auditors’ Report to the members
We have audited the annexed Balance Sheet of Sapphire Textile Mills Limited as at June 30, 2012 and the related profit and loss account, statement of comprehensive income, cash flow statement, and statement of changes in equity together with the notes forming part thereof, for the year then ended and we state that we have obtained all the information and explanations which, to the best of our knowledge and belief, were necessary for the purpose of our audit.
It is the responsibility of the company's management to establish and maintain a system of internal control, and prepare and present the above said statements in conformity with the approved accounting standards and the requirements of the companies Ordinance, 1984. Our responsibility is to express an opinion on these statements based on our audit.
We conducted our audit in accordance with the auditing standards as applicable in Pakistan. These standards require that we plan and perform the audit to obtain reasonable assurance about whether the above said statements are free of any material misstatement. An audit includes examining on a test basis, evidence supporting the amounts and disclosures in the above said statements. An audit also includes assessing the accounting policies and significant estimates made by the management, as well as, evaluating the overall presentation of the above said statements. We believe that our audit provides a reasonable basis for our opinion and, after due verifications, we report that;
(a) in our opinion, proper books of accounts have been kept by the company as required by the Companies Ordinance, 1984;
(b) in our opinion;
(i) the Balance Sheet and profit and loss account together with the notes thereon have been drawn up in conformity with the Companies Ordinance, 1984, and are in agreement with the books of accounts and are further in accordance with accounting policies consistently applied;
(ii) the expenditure incurred during the year was for the purpose of the company’s business; and
(iii) the business conducted, investments made and the expenditure incurred during the year were in accordance with the objects of the company;
(c) in our opinion and to the best of our information and according to the explanations given to us, the Balance Sheet, profit and loss account, statement of comprehensive income, cash flow statement and statement of changes in equity together with the notes forming part thereof conform with approved accounting standards as applicable in Pakistan, and, give the information required by the Companies Ordinance, 1984, in the manner so required and respectively give a true and fair view of the state of the company’s affairs as at June 30, 2012 and of the profit, comprehensive income, its cash flows and changes in equity for the year then ended; and
(d) in our opinion Zakat deductible at source under the Zakat and Ushr Ordinance, 1980 (XVIII of 1980) was deducted by the company and deposited in Central Zakat Fund established under section 7 of that Ordinance.
MUSHTAQ & COMPANY
KARACHI: Chartered Accountants
Date: 05th October, 2012 Engagement Partner:
Shahabuddin A. Siddiqui
F.C.A
15
Sapphire Textile Mills Limited
Annual Report - 2012
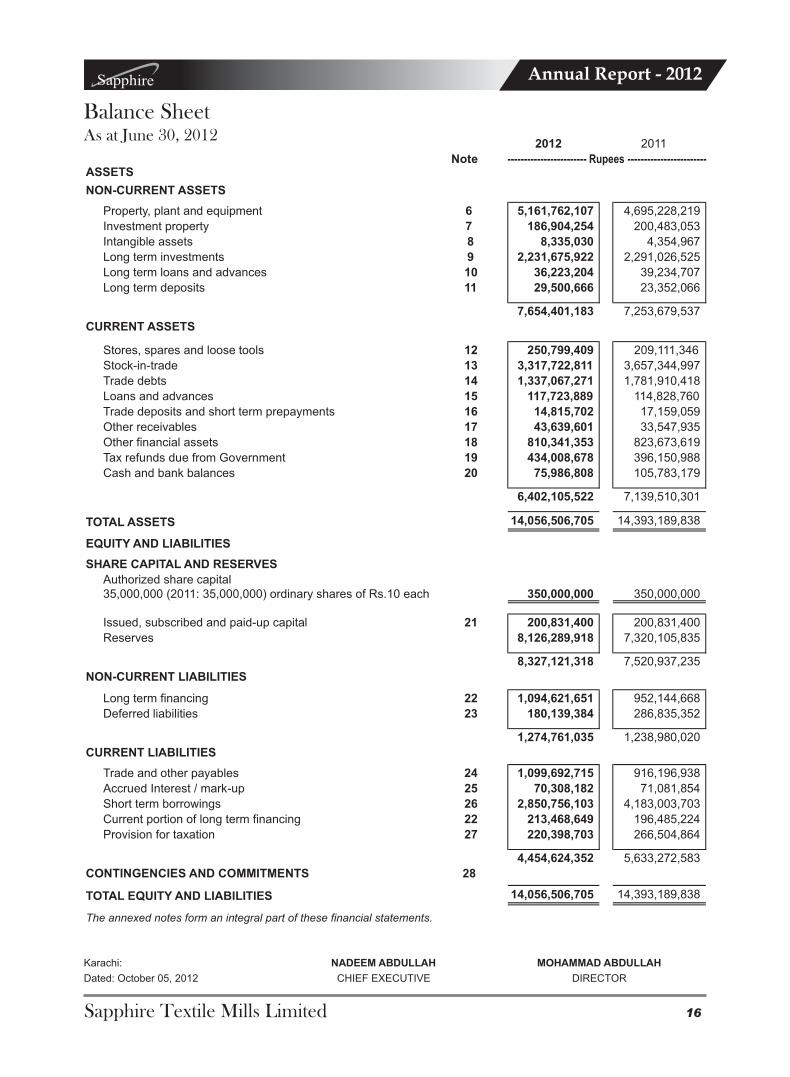
Balance SheetAs at June 30, 2012
2012 2011
NoteASSETS
NON-CURRENT ASSETS
Property, plant and equipment 6 5,161,762,107 4,695,228,219
Investment property 7 186,904,254 200,483,053
Intangible assets 8 8,335,030 4,354,967
Long term investments 9 2,231,675,922 2,291,026,525
Long term loans and advances 10 36,223,204 39,234,707
Long term deposits 11 29,500,666 23,352,066
7,654,401,183 7,253,679,537
CURRENT ASSETS
Stores, spares and loose tools 12 250,799,409 209,111,346
Stock-in-trade 13 3,317,722,811 3,657,344,997
Trade debts 14 1,337,067,271 1,781,910,418
Loans and advances 15 117,723,889 114,828,760
Trade deposits and short term prepayments 16 14,815,702 17,159,059
Other receivables 17 43,639,601 33,547,935
Other financial assets 18 810,341,353 823,673,619
Tax refunds due from Government 19 434,008,678 396,150,988
Cash and bank balances 20 75,986,808 105,783,179
6,402,105,522 7,139,510,301
TOTAL ASSETS 14,056,506,705 14,393,189,838
EQUITY AND LIABILITIES
SHARE CAPITAL AND RESERVES
Authorized share capital35,000,000 (2011: 35,000,000) ordinary shares of Rs.10 each 350,000,000 350,000,000
Issued, subscribed and paid-up capital 21 200,831,400 200,831,400
Reserves 8,126,289,918 7,320,105,835
8,327,121,318 7,520,937,235
NON-CURRENT LIABILITIES
Long term financing 22 1,094,621,651 952,144,668
Deferred liabilities 23 180,139,384 286,835,352
1,274,761,035 1,238,980,020
CURRENT LIABILITIES
Trade and other payables 24 1,099,692,715 916,196,938
Accrued Interest / mark-up 25 70,308,182 71,081,854
Short term borrowings 26 2,850,756,103 4,183,003,703
Current portion of long term financing 22 213,468,649 196,485,224
Provision for taxation 27 220,398,703 266,504,864
4,454,624,352 5,633,272,583
CONTINGENCIES AND COMMITMENTS 28
TOTAL EQUITY AND LIABILITIES 14,056,506,705 14,393,189,838
The annexed notes form an integral part of these financial statements.
Karachi:
Dated: October 05, 2012
NADEEM ABDULLAH MOHAMMAD ABDULLAH
DIRECTORCHIEF EXECUTIVE
------------------------ Rupees ------------------------
16
Sapphire Textile Mills Limited
Annual Report - 2012
The annexed notes form an integral part of these financial statements.
Karachi:
Dated: October 05, 2012
NADEEM ABDULLAH MOHAMMAD ABDULLAH
DIRECTORCHIEF EXECUTIVE
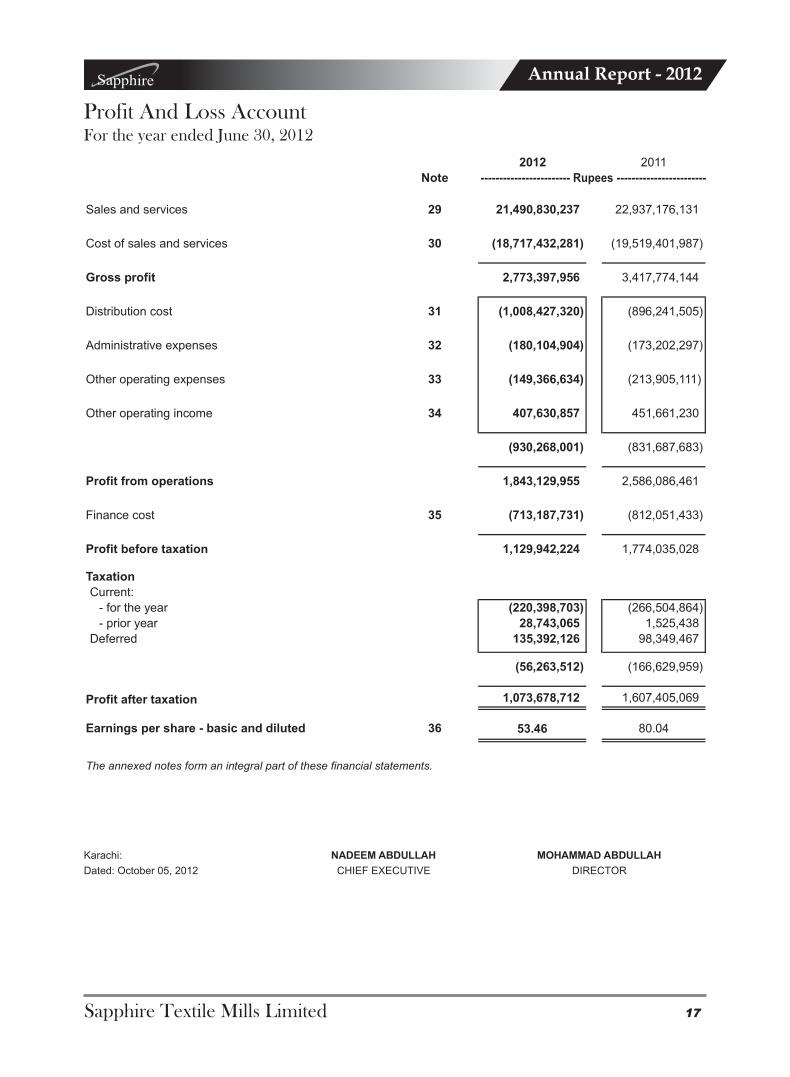
Profit And Loss AccountFor the year ended June 30, 2012
2012 2011
Note
Sales and services 29 21,490,830,237
22,937,176,131
Cost of sales and services 30 (18,717,432,281)
(19,519,401,987)
Gross profit 2,773,397,956
3,417,774,144
Distribution cost 31 (1,008,427,320)
(896,241,505)
Administrative expenses 32 (180,104,904)
(173,202,297)
Other operating expenses 33 (149,366,634)
(213,905,111)
Other operating income 34 407,630,857
451,661,230
(930,268,001)
(831,687,683)
Profit from operations 1,843,129,955
2,586,086,461
Finance cost 35 (713,187,731)
(812,051,433)
Profit before taxation 1,129,942,224
1,774,035,028
Taxation
Current:
- for the year (220,398,703)
(266,504,864)
- prior year 28,743,065
1,525,438
Deferred 135,392,126
98,349,467
(56,263,512)
(166,629,959)
Profit after taxation 1,073,678,712
1,607,405,069
Earnings per share - basic and diluted 36 53.46 80.04
------------------------ Rupees ------------------------
17

Sapphire Textile Mills Limited
Annual Report - 2012
The annexed notes form an integral part of these financial statements.
Karachi:
Dated: October 05, 2012
NADEEM ABDULLAH MOHAMMAD ABDULLAH
DIRECTORCHIEF EXECUTIVE
Statement of Comprehensive IncomeFor the year ended June 30, 2012
2012 2011
Profit after taxation 1,073,678,712 1,607,405,069
Other comprehensive income:
Available for sale investments
(65,134,189) 409,513,482
(73,146,239) (23,933,260)
(138,280,428) 385,580,222
Forward foreign currency contracts
(26,899,054) 1,899,447
(1,899,447) (1,515,818)
(28,798,501) 383,629
Other comprehensive (loss) / income for the year (167,078,929) 385,963,851
Total comprehensive income for the year 906,599,783 1,993,368,920
Unrealized (loss) / gain on remeasurement of available for sale investments
Unrealized (loss) / gain on remeasurement of forward foreign currency contracts
Reclassification adjustments relating to gain realized on disposal of available for sale investments
Reclassification adjustments relating to gain realized on settlement of foreign currency contracts
------------------ Rupees ------------------
18

Sapphire Textile Mills Limited
Annual Report - 2012
The annexed notes form an integral part of these financial statements.
Karachi:
Dated: October 05, 2012
NADEEM ABDULLAH MOHAMMAD ABDULLAH
DIRECTORCHIEF EXECUTIVE
Cash Flow StatementFor the year ended June 30, 2012
2012 2011
Note
CASH FLOWS FROM OPERATING ACTIVITIES
Cash generated from operations 37 2,900,500,912 1,385,322,733
Long term loans and deposits (3,137,097) (25,490,626)
Finance cost paid (714,178,935) (816,808,826)
Staff retirement benefits - gratuity paid (36,525,855) (23,853,339)
Taxes paid (275,619,489) (379,983,475)
(1,029,461,376) (1,246,136,266)
Net cash generated from operating activities 1,871,039,536 139,186,467
CASH FLOWS FROM INVESTING ACTIVITIES
Purchase of property, plant and equipment (963,638,584) (1,293,041,887)
Purchase of investment property - (52,950,000)
Purchase of intangible assets (5,983,770) -
Investment in associated undertakings / subsidiaries (122,660,679) (49,073,025)
Investment others (254,158,149) (385,443,061)
Proceeds from disposal of property, plant and equipment 124,145,557 254,500,054
Proceeds from disposal of investment property 13,300,000 -
Proceeds from sale of investments 357,295,214 264,466,834
Proceeds from derivative financial instruments 2,081,475 (897,069)
Dividend received 228,504,056 169,197,044
Profit received 169,998 135,444
Rental income received 12,720,000 12,603,123
Net cash used in investing activities (608,224,882) (1,080,502,543)
CASH FLOWS FROM FINANCING ACTIVITIES
Short term borrowings - net (1,351,870,309) 699,322,488
Proceeds from long term financing 352,821,000 604,184,000
Repayment of long term financing (193,360,592) (273,423,393)
Dividend paid (99,751,393) (99,759,560)
Net cash (used in) / generate from financing activities (1,292,161,294) 930,323,535
Net decrease in cash and cash equivalents (29,346,640) (10,992,541)
Cash and cash equivalents at the beginning of the year 104,833,860 115,826,401
Cash and cash equivalents at the end of the year 75,487,220 104,833,860
Cash and cash equivalents
Cash and bank balances 75,986,808 105,783,179
Temporary overdraft - unsecured (499,588) (949,319)
Cash and cash equivalents at the end of the year 75,487,220 104,833,860
------------------------ Rupees ------------------------
19

Sapphire Textile Mills Limited
Annual Report - 2012
The
annexe
d n
ote
s fo
rm a
n in
tegra
l part
of th
ese
fin
anci
al s
tate
ments
.
Kara
chi:
Date
d: O
ctober
05, 2012
NA
DE
EM
AB
DU
LL
AH
MO
HA
MM
AD
AB
DU
LL
AH
DIR
EC
TO
RC
HIE
F E
XE
CU
TIV
E
Sta
tem
ent
of
Ch
ange
s in
Eq
uit
yF
or
the
year
en
ded
Ju
ne
30, 2
012
Ca
pit
al
Ba
lan
ce
as
at
Ju
ly 0
1, 2
01
02
00
,83
1,4
00
15
6,2
02
,20
06
5,0
00
,00
03
30
,00
0,0
00
4,1
50
,06
5,1
30
4,7
01
,26
7,3
30
1,0
88
,45
6,3
90
1,5
15
,81
81
,08
9,9
72
,20
85
,99
2,0
70
,93
8
--
--
(36
4,0
86
,92
3)
(36
4,0
86
,92
3)
--
-(3
64
,08
6,9
23
)
Tra
nsfe
r to
ge
ne
ral r
ese
rve
--
-1
,00
0,0
00
,00
0(1
,00
0,0
00
,00
0)
--
--
-
To
tal c
om
pre
he
ns
ive
in
co
me
fo
r th
e
Ye
ar
en
de
d J
un
e 3
0, 2
011
Pro
fit a
fter
taxa
tion
--
--
1,6
07
,40
5,0
69
1,6
07
,40
5,0
69
--
-1
,60
7,4
05
,06
9
Oth
er
co
mp
reh
en
siv
e in
co
me
--
--
--
38
5,5
80
,22
23
83
,62
93
85
,96
3,8
51
38
5,9
63
,85
1
--
--
1,6
07
,40
5,0
69
1,6
07
,40
5,0
69
38
5,5
80
,22
23
83
,62
93
85
,96
3,8
51
1,9
93
,36
8,9
20
Tra
ns
ac
tio
ns
wit
h o
wn
ers
Fin
al d
ivid
en
d fo
r th
e y
ea
r e
nd
ed
Ju
ne
30
, 2
01
0
@ R
s. 5
pe
r sh
are
--
--
(10
0,4
15
,70
0)
(10
0,4
15
,70
0)
--
-(1
00
,41
5,7
00
)
Ba
lan
ce
as
at
Ju
ne
30
, 2
011
20
0,8
31
,40
01
56
,20
2,2
00
65
,00
0,0
00
1,3
30
,00
0,0
00
4,2
92
,96
7,5
76
5,8
44
,16
9,7
76
1,4
74
,03
6,6
12
1,8
99
,44
71
,47
5,9
36
,05
97
,52
0,9
37
,23
5
To
tal c
om
pre
he
ns
ive
in
co
me
fo
r th
e
Ye
ar
en
de
d J
un
e 3
0, 2
01
2
Pro
fit a
fter
taxa
tion
--
--
1,0
73
,67
8,7
12
1,0
73
,67
8,7
12
--
-1
,07
3,6
78
,71
2
Oth
er
co
mp
reh
en
siv
e lo
ss
--
--
--
(13
8,2
80
,42
8)
(28
,79
8,5
01
)(1
67
,07
8,9
29
)(1
67
,07
8,9
29
)
--
--
1,0
73
,67
8,7
12
1,0
73
,67
8,7
12
(13
8,2
80
,42
8)
(28
,79
8,5
01
)(1
67
,07
8,9
29
)9
06
,59
9,7
83
Tra
ns
ac
tio
ns
wit
h o
wn
ers
Fin
al d
ivid
en
d fo
r th
e y
ea
r e
nd
ed
Ju
ne
30
, 2
011
@ R
s. 5
pe
r sh
are
--
--
(10
0,4
15
,70
0)
(10
0,4
15
,70
0)
--
-(1
00
,41
5,7
00
)
Ba
lan
ce
as
at
Ju
ne
30
, 2
01
22
00
,83
1,4
00
15
6,2
02
,20
06
5,0
00
,00
01
,33
0,0
00
,00
05
,26
6,2
30
,58
86
,81
7,4
32
,78
81
,33
5,7
56
,18
4(2
6,8
99
,05
4)
1,3
08
,85
7,1
30
8,3
27
,12
1,3
18
On
fo
rwa
rd
fore
ign
ex
ch
an
ge
co
ntr
ac
ts
Ge
ne
ral
res
erv
es
SU
B T
OTA
LS
UB
TO
TA
LF
ixed
Assets
Re
pla
ce
me
nt
Tra
nsfe
r to
Sa
pp
hir
e H
old
ing
Lim
ite
d o
n d
e-
me
rge
r sch
em
e
On
av
ail
ab
le f
or
sa
le in
ve
stm
en
ts
Sh
are
Ca
pit
al
Un
rea
lize
d g
ain
/ (
los
s)
Re
se
rve
s
Re
ve
nu
e
Oth
er
Co
mp
on
en
ts o
f e
qu
ity
To
tal E
qu
ity
Un
ap
pro
pri
ate
d
Pro
fit
R u
p e
e s
Sh
are
Pre
miu
m
20

Sapphire Textile Mills Limited
Annual Report - 2012
1 LEGAL STATUS AND NATURE OF BUSINESS
Sapphire Textile Mills Limited (the Company) was incorporated in Pakistan on March 11, 1969 as a public limited company under the Companies Act, 1913 (Now the Companies Ordinance, 1984). The shares of the Company are listed on Karachi Stock Exchange. The registered office of the Company is located at 212, Cotton Exchange Building, I.I. Chundrigar Road, Karachi and its mills are located at Kotri, Nooriabad, Chunian, Feroze Watwan and Bhopattian Lahore. The Company is principally engaged in manufacturing and sale of yarn, fabrics and home textile products.
2 BASIS OF PREPARATION
2.1 Statement of compliance
These financial statements have been prepared in accordance with the requirements of the Companies Ordinance, 1984 (the Ordinance) and the approved accounting standards as applicable in Pakistan. Approved accounting standards comprise of such International Financial Reporting Standards (IFRS) issued by the International Accounting Standard Board and Islamic Financial Accounting Standards (IFAS) issued by the institute of Chartered Accountants of Pakistan as are notified under the Companies Ordinance, 1984, provisions of and directives issued under the Companies Ordinance, 1984. Wherever the requirements of The Companies Ordinance, 1984 or directives issued by Securities and Exchange Commission of Pakistan differ with the requirements of IFRS or IFAS, the requirements of the Companies Ordinance, 1984 or the requirements of the said directives prevail.
2.2 Basis of preparation
These financial statements have been prepared under the historical cost convention except for measurement of certain financial assets and financial liabilities at fair value and recognition of employee benefits at present value.
2.3 Functional and presentation currency
These financial statements are presented in Pakistan Rupees which is also the Company's functional currency. All financial information presented in Pakistan Rupees has been rounded off to the nearest rupee.
3 ACCOUNTING ESTIMATES, JUDGMENTS AND FINANCIAL RISK MANAGEMENT
The estimates / judgments and associated assumptions used in the preparation of the financial statements are based on historical experience and other factors, including expectations of future events that are believed to be reasonable under the circumstances. The Company makes estimates and assumptions concerning the future. The resulting accounting estimates will, by definition, seldom equal the related actual results. The estimates and assumptions that have a significant risk of causing a material adjustment to the carrying amounts of assets and liabilities within the next financial year are as follows:
- Residual values and useful life of property, plant and equipment;
- Provision for slow moving and obsolete stores & spares and stock-in-trade;
- Estimates of liability in respect of employee retirement benefits - gratuity and compensated absences;
- Provision for current and deferred taxation;
- Classification of investment; and
- Valuation at fair value of derivative financial instruments.
4 STANDARDS, INTERPRETATIONS AND AMENDMENTS TO PUBLISHED APPROVED ACCOUNTING STANDARDS
4.1 Amendments to published standards that are effective in current financial year and are relevant to the Company
The following amendments to published standards are mandatory for the financial year beginning 01 July, 2011:
Notes To The Financial StatementsFor the year ended June 30, 2012
21

Sapphire Textile Mills Limited
Annual Report - 2012
Notes To The Financial Statements
IFRS 7 (Amendment), ‘Financial Instruments: Disclosures’ (effective for the periods beginning on or after 01 January, 2011). The amendment emphasizes the interaction between quantitative and qualitative disclosures about the nature and extent of risks associated with a financial instrument. The amendment will only affect the disclosures in the Company’s financial statements.
IAS 1 (Amendment), ‘Presentation of Financial Statements’ (effective for the periods beginning on or after 01 January, 2011). The amendment clarifies that an entity will present an analysis of other comprehensive income for each component of equity, either in the statement of changes in equity or in the notes to the financial statements. The amendment will only affect the disclosures in the Company’s financial statements.
IAS 24 (Revised), ‘Related Party Disclosures’ (effective for the periods beginning on or after 01 January, 2011). The revised standard clarifies and simplifies the definition of a related party and removes the requirement for government-related entities to disclose details of all transactions with the government and other government-related entities. The application of the revised standard has no material impact on the Company's financial statements.
IAS 34 (Amendment), ‘Interim Financial Reporting’ (effective for periods beginning on or after 01 January, 2011). This amendment provides guidance to illustrate how to apply disclosure principles in IAS 34 and add disclosure requirements around the circumstances likely to affect fair values of financial instruments and their classification, transfers of financial instruments between different levels of the fair value hierarchy, changes in classification of financial assets and changes in contingent liabilities and assets. The amendment will only affect the disclosures in the Company’s condensed interim financial information.
4.2 New accounting standards, amendments to existing approved accounting standards and interpretations that are effective in current financial year but are not relevant to the Company
The other new standards, amendments to existing approved accounting standards and interpretations are mandatory for the periods beginning on or after 01 July, 2011 are considered not to be currently relevant as these do not have any significant effect on the Company’s current financial reporting and operations; however, these may affect the accounting for future transactions and events.
4.3 New accounting standards, amendments to existing approved accounting standards and interpretations that are issued but not yet effective and have not been early adopted by the Company
IAS 1,‘Financial Statement Presentation’ (effective for the periods beginning on or after January 1, 2012). The main change resulting from these amendments is a requirement for entities to group items presented in 'Other Comprehensive Income on the basis of whether they are potentially reclassifiable to profit or loss subsequently (reclassification adjustments).
IFRS 9, ‘Financial Instruments’ (effective for periods beginning on or after January 1, 2013). This is the first part of a new standard on classification and measurement of financial assets that will replace IAS 39. IFRS 9 has two measurement categories: amortized cost and fair value. All equity instruments are measured at fair value. A debt instrument is at amortized cost only if the entity is holding it to collect contractual cash flows and the cash flows represent principal and interest.
IAS 32, ‘Financial Instruments: Presentation’ (effective for the periods beginning on or after 01 January, 2014). This amendment clarifies some of the requirements for offsetting financial assets and financial liabilities on the balance sheet. The management of the Company is in the process of assessing the impact of this amendment on the Company's financial statements.
IFRS 12, ‘Disclosure of interests in other entities’ (effective for the periods beginning on or after 01 January, 2013). This standard includes the disclosure requirements for all forms of interests in other entities, including joint arrangements, associates, special purpose vehicles and other off balance sheet vehicles.
IFRS 13, ‘Fair Value Measurement’ (effective for periods beginning on or after 01 January, 2012). This standard applies to IFRS that require or permit fair value measurement or disclosures and provides a single IFRS framework for measuring fair value and requires disclosures about fair value measurement . The standard defines fair value on the basis of an exit price notion and uses 'a fair value hierarchy'. which results in a market-based, rather than entity-specific measurement.
For the year ended June 30, 2012
22

Sapphire Textile Mills Limited
Annual Report - 2012
IAS 19 (Revised), ‘Employee benefits’ (effective for the periods beginning on or after 01 January, 2013). The amendments will make significant changes to the recognition and measurement of defined benefit plan expense. The amendments requires actuarial gains and losses to be recognised immediately in other comprehensive income. This change will remove the corridor method and eliminate the ability for entities to recognise all changes in defined benefit obligation and in plan assets in profit or loss, which currently is allowed under IAS 19, and that the expected return on plan assets recognised in profit or loss is calculated based on the rate used to discount the defined benefit obligation. The Company is in process of reviewing the implications of the revised standard on its financial statements.
There are a number of other minor amendments and interpretations to other approved accounting standards that are not yet effective and are also not relevant to the Company and therefore have not been presented here.
5 SUMMARY OF SIGNIFICANT ACCOUNTING POLICIES
The significant accounting policies adopted in the preparation of these financial statements are set-out below. These policies have been consistently applied to all the years presented, unless otherwise stated.
5.1 Property, plant and equipment
Owned assets
Property, plant and equipment are stated at cost less accumulated depreciation except freehold land and leasehold land, which are stated at cost less impairment losses, if any. Cost comprises acquisition and other directly attributable costs.
Depreciation is provided on a reducing balance method and charged to profit and loss account to write off the depreciable amount of each asset over its estimated useful life at the rates specified in note 6.1. Depreciation on addition in property, plant and equipment is charged from the month of addition while no depreciation is charged in the month of disposal.
The cost of replacing part of an item of property, plant and equipment is recognized in the carrying amount of the item if it is probable that the future economic benefits embodied within the part will flow to the Company and its cost can be measured reliably. The carrying amount of the replaced part is derecognized, if any. The costs of the day-to-day servicing of property, plant and equipment are recognized in profit and loss as incurred.
Gains and losses on disposal of an item of property, plant and equipment are determined by comparing the proceeds from disposal with the carrying amount of property, plant and equipment, and are recognized in the profit and loss account.
The Company reviews the useful life and residual value of property, plant and equipment on a regular basis. Any change in estimates in future years might affect the carrying amounts of the respective items of property, plant and equipment with a corresponding effect on depreciation charge.
Leased assets
Leases in terms of which the Company assumes substantially all the risks and rewards of ownership, are classified as finance lease. Upon initial recognition, the leased asset is measured at an amount equal to the lower of its fair value and present value of minimum lease payments. Subsequent to initial recognition, the asset is accounted for in accordance with the accounting policy applicable to that asset. Outstanding obligations under the lease less finance cost allocated to future periods are shown as a liability.
Finance cost under lease agreements are allocated to the periods during the lease term so as to produce a constant periodic rate of finance cost on the remaining balance of principal liability for each period.
Leased assets are depreciated over the shorter of the lease term and their useful lives unless it is reasonably certain that the Company will obtain ownership by the end of the lease term.
Notes To The Financial StatementsFor the year ended June 30, 2012
23

Sapphire Textile Mills Limited
Annual Report - 2012
Capital work-in-progress
Capital work-in-progress is stated at cost accumulated up to the balance sheet date less accumulated impairment losses, if any. Capital work-in-progress is recognized as an operating fixed asset when it is made available for intended use.
5.2 Investment property
Property held for capital appreciation and rental yield, which is not in the use of the Company is classified as investment property. Investment Property comprises of land and buildings. The company has adopted cost model for its investment property using the same basis as disclosed for measurement of the Company's owned assets.
5.3 Intangible assets
Intangible assets acquired by the company are stated at cost less accumulated amortization and impairment losses, if any.
Subsequent expenditure on capitalized intangible assets is capitalized only when it increases the future economic benefits embodied in the specific assets to which it relates. All other expenditures are expensed as incurred.
Amortization is charged to profit and loss account on straight line basis over a period of five years. Amortization on addition is charged from the date the asset is put to use while no amortization is charged from the date the asset is disposed off.
5.4 Investments
Investments intended to be held for less than twelve months from the reporting date or to be sold to raise operating capital, are included in current assets, all other investments are classified as non-current. Management determines the appropriate classification of its investments at the time of the purchase and re-evaluates such designation on a regular basis.
Investment in subsidiary and associated companies
Investments in subsidiaries and associates are recognized at cost less impairment loss, if any. At each balance sheet date, the recoverable amounts are estimated to determine the extent of impairment losses, if any, and carrying amounts of investments are adjusted accordingly. Impairment losses are recognized as expense. Where impairment losses subsequently reverse, the carrying amounts of the investments are increased to the revised recoverable amounts but limited to the extent of initial cost of investments. A reversal of impairment loss is recognized in the profit and loss account.
Investment - available for sale
Investments that are intended to be held for an indefinite period of time or may be sold in response to the need for liquidity are classified as available for sale.
Investments classified as available for sale are initially measured at cost, being the fair value of consideration given. At subsequent reporting dates, these investments are remeasured at fair value (quoted market price), unless fair value cannot be reliably measured. The investments for which a quoted market price is not available, are measured at cost as it is not possible to apply any other valuation methodology. Unrealised gains and losses arising from the changes in the fair value are included in fair value reserves in the period in which they arise.
At each balance sheet date, the company reviews the carrying amounts of the investments to assess whether there is any indication that such investments have suffered an impairment loss. If any such indication exists, the recoverable amount is estimated in order to determine the extent of the impairment loss, if any. Impairment losses are recognised as expense. In respect of available for sale investments, cumulative impairment loss less any impairment loss previously recognised in profit and loss account, is removed from equity and recognised in the profit and loss accounts. Impairment losses recognised in the profit and loss account on equity instruments are not reversed through the profit and loss accounts.
Notes To The Financial StatementsFor the year ended June 30, 2012
24

Sapphire Textile Mills Limited
Annual Report - 2012
Notes To The Financial Statements
All purchases and sales are recognised on the trade date which is the date that the company commits to purchase or sell the investment, except for sale and purchase of securities in future market which are accounted for at settlement date. Cost of purchase includes transaction cost.
5.5 Stores, spares and loose tools
Stores, spares and loose tools are valued at lower of weighted average cost and net realizable value, less provision for impairment if any. Items in transit are valued at cost accumulated to balance sheet date. Provision for obsolete and slow moving stores, spares and loose tools is determined based on management estimate regarding their future usability.
5.6 Stock in trade
Stock-in-trade is stated at the lower of cost and net realizable value, except waste which is valued at net realizable value. Cost is arrived at on a weighted average basis. Cost of work-in-process and finished goods include cost of raw materials and appropriate portion of production overheads. Net realizable value is the estimated selling price in the ordinary course of business less cost of completion and selling expenses.
Provision for obsolete and slow moving stock in trade is determined based on management estimate regarding their future usability.
5.7 Trade debts and other receivables
Trade debts are initially recognized at fair value and subsequently measured at cost less provision for doubtful debts. A provision for doubtful debts is established when there is objective evidence that the Company will not be able to collect all amounts due according to the original terms of the trade debts. Significant financial difficulties of the debtor, probability that the debtor will enter bankruptcy of financial reorganization, and default or delinquency in making payments are considered indicators that the trade debt is doubtful and the provision is recognized in the profit and loss account. When a trade debt in uncollectible, it is written off against the provision.
5.8 Cash and cash equivalents
Cash and cash equivalents are carried in the balance sheet at cost. For the purpose of cash flow statement, cash and cash equivalents consist of cash-in-hand and balances with banks, net of temporary overdrawn bank balances.
5.9 Borrowings
Borrowings are initially recorded at the proceeds received. In subsequent periods, borrowings are stated at amortized cost using the effective yield method. Finance costs are accounted for on an accrual basis and are included in current liabilities to the extent of the amount remaining unpaid.
5.10 Employees' benefits
Compensated absences
The company accounts for all accumulated compensated absences in the period in which absences accrue.
Defined benefits plans
The company operates an unfunded gratuity scheme for its permanent employees as per terms of employment who have completed minimum qualifying period of service as defined under the scheme.
The cost of providing benefits is determined using the projected unit credit method, with actuarial valuations being carried out at each balance sheet date. Actuarial gains and losses which exceed 10 percent of the greater of the present value of the company's obligation are amortized over the expected average remaining working lives of the eligible employees. Past service cost is recognized immediately to the extent that the benefits are already vested. For non-vested benefits past service cost is amortized on a straight line basis over the average period until the amended benefits become vested.Amounts recognized in the balance sheet represent the present value of the defined benefit obligation as adjusted for unrecognized actuarial gains and losses and unrecognized past service cost.
For the year ended June 30, 2012
25
Sapphire Textile Mills Limited
Annual Report - 2012
Notes To The Financial Statements
Defined Contribution Plan
There is an approved contributory provident fund for management staff for which contributions are charged to income for the year.
The Company and the employees make equal monthly contributions to the fund at the rate of 8.33% of basic salary in the case of management staff, and 8.33% of basic salary and cost of living allowance in case of non-management staff. The assets of the fund are held separately under the control of trustees.
5.11 Trade and other payables
Liabilities for trade and other amounts payable are measured at cost which is the fair value of the consideration to be paid in future for goods and services received.
5.12 Taxation
Current year
The charge for current taxation is based on taxable income at the current rate of taxation after taking into account applicable tax credit, rebates and exemption available, if any. However, for income covered under final tax regime, taxation is based on applicable tax rates under such regime.
Deferred tax
Deferred tax is provided using the balance sheet liability method for all temporary differences at the balance sheet date between tax bases of assets and liabilities and their carrying amounts for financial reporting purposes. In this regards, the effects on deferred taxation of the portion of income subject to final tax regime is also considered in accordance with the requirement of Technical Release - 27 of Institute of Chartered Accountants of Pakistan.
Deferred tax asset is recognized for all deductible temporary differences and carry forward of unused tax losses, if any, to the extent that it is probable that taxable profit will be available against which such temporary differences and tax losses can be utilized.
Deferred tax assets and liabilities are measured at the tax rate that are expected to apply to the period when the asset is realized or the liability is settled, based on tax rates that have been enacted or substantively enacted at the each reporting date.
5.13 Dividend and appropriation to reserves
Dividend and appropriation to reserves are recognised in the financial statements in the period in which they are approved by the shareholders and therefore, they are accounted for as non-adjusting post balance sheet event.
5.14 Provisions
Provisions are recognized when the Company has a present legal or constructive obligation as a result of past events, it is probable that an outflow of resources embodying economic benefits will be required to settle the obligation and reliable estimate of the amount can be made. Provisions are reviewed at each balance sheet date and adjusted to reflect the current best estimate.
5.15 Revenue recognition
Revenue from sale of goods is recognized when goods are dispatched to customers and invoices raised.
Return on bank balances is accrued on a time proportion basis by reference to the principal outstanding and the applicable rate of return.
Dividend income and entitlement of bonus shares are recognized when right to receive such dividend and bonus shares is established.
For the year ended June 30, 2012
26

Sapphire Textile Mills Limited
Annual Report - 2012
Notes To The Financial Statements
5.16 Government grant
These represent transfer of resources from government, government agencies and similar bodies, in return for the past or future compliances with certain conditions relating to the operating activities of the entity.
The grants are disclosed as a deduction from the related expense.
5.17 Borrowing cost
Borrowing costs are recognized as an expense in the period in which these are incurred except to the extent of borrowing costs that are directly attributable to the acquisition, construction or production of a qualifying asset. Such borrowing costs are capitalized as part of the cost of that asset up to the date of its’ commencing.
5.18 Foreign currency transactions and translation
Foreign currency transactions are translated into Pak Rupees using the exchange rates prevailing at the dates of the transactions. All monetary assets and liabilities in foreign currencies are translated into Pak Rupees at the rates of exchange prevailing at the balance sheet date. Foreign exchange gains and losses on translation are recognized in the profit and loss account. All non-monetary items are translated into rupees at exchange rates prevailing on the date of transaction or on the date when fair values are determined.
5.19 Impairment
The carrying amount of the company’s assets are reviewed at each reporting date to determine whether there is any indication of impairment. If such indications exist, the asset’s recoverable amount is estimated in order to determine the extent of the impairment loss, if any. Impairment loss is recognized as expense in the profit and loss account.
5.20 Financial instruments
Financial assets
5.20.1 Classification
The Company classifies its financial assets in the following categories: at fair value through profit or loss, loans and receivables, held to maturity and available-for-sale. The classification depends on the purpose for which the financial assets were acquired. Management determines the classification of its financial assets at initial recognition.
a) Financial assets at fair value through profit or loss
Financial assets at fair value through profit or loss are financial assets held for trading. A financial asset is classified in this category if acquired principally for the purpose of selling in the short-term. Derivatives are also categorized as held for trading unless they are designated as hedges. Assets in this category are classified as current assets.
b) Loans and receivables
Loans and receivables are non-derivative financial assets with fixed or determinable payments that are not quoted in an active market. They are included in current assets, except for maturities greater than 12 months after the end of the reporting period. These are classified as non-current assets.
c) Held to maturity financial assets
These are securities with fixed or determinable payments and fixed maturity in respect of which the Company has the positive intent and ability to hold to maturity. There were no held to maturity investments as at balance sheet date.
d) Available-for-sale financial assets
Available-for-sale financial assets are non-derivatives that are either designated in this category or not classified in any of the other categories. They are included in non-current assets unless the investment matures or management intends to dispose off within 12 months of the end of the reporting date.
For the year ended June 30, 2012
27
Sapphire Textile Mills Limited
Annual Report - 2012
Notes To The Financial Statements
5.20.2 Recognition
Regular purchases and sales of financial assets are recognized on the trade-date – the date on which the Company commits to purchase or sell the asset. All financial assets are initially recognized at fair value plus transaction costs except for those financial assets which are designated as ‘financial assets at fair value through profit or loss’. ‘Financial assets carried at fair value through profit or loss’ are initially recognized at fair value and transaction costs are charged to the profit and loss account. Financial assets are derecognized when the right to receive cash flows from such assets has expired or have been transferred and the Company has transferred substantially all risks and rewards, incidental to the ownership of such financial assets.
Dividend income from ‘financial assets at fair value through profit or loss’ and ‘available-for-sale financial assets’ is recognized in the profit and loss account when the Company’s right to receive payments is established.
Equity instruments that do not have a quoted market price in an active market and whose fair values cannot be reliably measured or determined are stated at cost.
5.20.3 Measurement
Available-for-sale financial assets’ and ‘financial assets at fair value through profit or loss’ are subsequently measured at fair value whereas ‘held to maturity financial assets’ and ‘loans and receivables’ are subsequently measured at amortized cost using the effective interest method.
Gains or losses arising from changes in the fair value of the ‘financial assets at fair value through profit or loss’ are recognized in the profit and loss account in the period in which they arise.
Changes in the fair value of ‘available-for-sale financial assets’ are recognized in other comprehensive income. When financial assets classified as available-for-sale are sold or impaired, the accumulative fair value adjustments recognized in other comprehensive income till the time of disposal or impairment are charged to the profit and loss account.
5.20.4 Impairment
The Company assesses at the end of each reporting period whether there is objective evidence that a financial asset or group of financial assets is impaired. A financial asset or a group of financial assets is impaired if there is objective evidence of impairment as a result of one or more events that occurred after the initial recognition of the asset (a ‘loss event’) and that loss event (or events) has an impact on the estimated future cash flows of the financial asset or group of financial assets that can be reliably estimated. If such evidence is identified to exist, the said financial asset or group of financial assets are impaired and an impairment loss is recognized in the profit and loss account for the amount by which the assets’ carrying amount exceed their recoverable amount. Impairment losses of equity instruments, once recognized, are not reversed through the profit and loss account.
5.20.5 Off-setting of financial assets and liabilities
Financial assets and liabilities are offset and the net amount is reported in the balance sheet when there is a legally enforceable right to offset the recognized amounts and there is an intention to settle either on a net basis, or to realize the asset and settle the liability simultaneously.
5.20.6 Derivative financial instruments
The Company designates derivative financial instruments as either fair value hedge or cash flow hedge.
a) Cash flow Hedges
Cash flow hedge represents hedges of a highly probable forecast transaction. The effective portion of changes in the fair value of derivatives that are designated and qualify as cash flow hedges are recognized in other comprehensive income. The gain or loss relating to the ineffective portion is recognized immediately in the profit and loss account. Amounts accumulated in equity are reclassified to the profit and loss account in the periods in which the hedged item will affect the profit and loss account.
For the year ended June 30, 2012
28

Sapphire Textile Mills Limited
Annual Report - 2012
b) Fair value hedge and other non-trading derivatives
Fair value hedge represents hedges of the fair value of recognized assets or liabilities or a firm commitment. Changes in the fair value of derivate that are designated and qualify as fair value hedges are recorded in the profit and loss account, together with any changes in the fair value of the hedged asset or liability that are attributable to the hedged risk. The carrying value of the hedged item is adjusted accordingly. When a derivative financial instrument is not designated in a qualifying hedge relationship, it is accounted for as held for trading and accordingly is categorized as ‘financial asset at fair value through profit or loss’.
5.20.7 Financial liabilities
These are initially recognized at cost, which is the fair value of the considered expected to be paid. All financial liabilities are recognized at the time when the Company becomes a party to the contractual provisions of the obliging instrument/ contract.
A financial liability is derecognized when the obligation under the liability is discharged, cancelled or expired. Where an existing financial liability is replaced by another from the same lender on substantially different terms, or the terms of an existing liability are substantially modified, such an exchange or modification is treated as a derecognising of the original liability and the recognition of a new liability, and the difference in respective carrying amounts is recognized in the profit and loss account.
5.21 Earnings per share - basic and diluted
The Company presents basic and diluted earnings per share (EPS) for its ordinary shares. Basic EPS is calculated by dividing the profit or loss attributable to ordinary shareholders of the Company by the weighted average number of ordinary shares outstanding during the year. Diluted EPS is determined by adjusting the profit or loss attributable to ordinary shareholders of the Company and the weighted average number of ordinary shares outstanding for the effects of all dilutive potential ordinary shares.
5.22 Related party transactions
All transactions with related parties are carried out by the Company at arms' length price using the method prescribed under the Companies Ordinance 1984.
Nature of the related party relationship as well as information about the transactions and outstanding balances are disclosed in the relevant notes to the financial statements.
Notes To The Financial StatementsFor the year ended June 30, 2012
2012 2011
Note
6 PROPERTY, PLANT AND EQUIPMENT
Operating fixed assets 6.1 4,736,656,581 3,815,060,093
Capital work-in-progress 6.4 425,105,526 880,168,126
5,161,762,107 4,695,228,219
------------- Rupees -------------
29

Sapphire Textile Mills Limited
Annual Report - 20126.
1O
pera
ting
fixed
ass
ets
Free
- ho
ldLe
ase
- hol
dFa
ctor
y
build
ing
Labo
ur, s
taff
colo
ny a
nd
othe
rs
Fact
ory
build
ing
Labo
ur, s
taff
colo
ny a
nd
othe
rs
Leas
ed
build
ing
impr
ovem
ents
At J
uly
01, 2
011
Cos
t13
8,70
5,78
29,
180,
416
858,
353,
165
243,
214,
833
220,
982,
998
30,1
53,5
7432
,867
,062
5,84
9,65
8,34
310
1,88
8,28
81,
704,
940
27,9
82,3
5116
,343
,104
35,2
92,7
0534
,527
,715
18,1
93,6
0416
0,71
0,76
87,
779,
759,
648
Acc
umul
ated
dep
reci
atio
n-
-(4
24,9
73,5
49)
(76,
972,
359)
(130
,033
,273
)(1
3,41
4,95
9)(2
0,18
8,74
9)(3
,117
,849
,675
)(4
0,63
1,02
8)(4
72,9
45)
(7,6
22,3
32)
(9,2
55,9
72)
(21,
044,
583)
(21,
126,
579)
(8,4
37,1
15)
(72,
676,
437)
(3,9
64,6
99,5
55)
Net
boo
k va
lue
138,
705,
782
9,18
0,41
643
3,37
9,61
616
6,24
2,47
490
,949
,725
16,7
38,6
1512
,678
,313
2,73
1,80
8,66
861
,257
,260
1,23
1,99
520
,360
,019
7,08
7,13
214
,248
,122
13,4
01,1
369,
756,
489
88,0
34,3
313,
815,
060,
093
Year
end
ed J
une
30, 2
012
Add
ition
s15
,029
,632
-24
3,44
3,96
918
,726
,475
11,2
55,9
86-
15,3
07,8
5294
1,36
5,08
293
,571
,835
214,
400
15,9
79,1
002,
751,
369
393,
707
9,83
8,89
55,
461,
846
45,3
61,0
361,
418,
701,
184
Dis
posa
ls:
- C
ost
33,1
42,1
31-
--
--
-77
,560
,067
--
--
76,0
00-
-21
,101
,003
131,
879,
201
- D
epre
ciat
ion
--
--
--
-(6
7,57
5,55
8)-
--
-(3
5,14
9)-
-(1
2,89
4,65
3)(8
0,50
5,36
0)33
,142
,131
--
--
--
9,98
4,50
9-
--
-40
,851
--
8,20
6,35
051
,373
,841
Dep
reci
atio
n ch
arge
for
the
year
--
(54,
843,
938)
(8,9
17,0
11)
(10,
088,
070)
(1,1
62,7
24)
(2,9
46,1
36)
(326
,180
,803
)(9
,914
,929
)(1
29,3
31)
(2,6
76,5
03)
(2,6
68,2
05)
(1,4
35,0
27)
(1,8
81,2
65)
(1,1
88,6
27)
(21,
698,
286)
(445
,730
,855
)
Clo
sing
net
boo
k va
lue
- 201
212
0,59
3,28
39,
180,
416
621,
979,
647
176,
051,
938
92,1
17,6
4115
,575
,891
25,0
40,0
293,
337,
008,
438
144,
914,
166
1,31
7,06
433
,662
,616
7,17
0,29
613
,165
,951
21,3
58,7
6614
,029
,708
103,
490,
731
4,73
6,65
6,58
1
At J
une
30, 2
012
Cos
t12
0,59
3,28
39,
180,
416
1,10
1,79
7,13
426
1,94
1,30
823
2,23
8,98
430
,153
,574
48,1
74,9
146,
713,
463,
358
195,
460,
123
1,91
9,34
043
,961
,451
19,0
94,4
7335
,610
,412
44,3
66,6
1023
,655
,450
184,
970,
801
9,06
6,58
1,63
1A
ccum
ulat
ed d
epre
ciat
ion
--
(479
,817
,487
)(8
5,88
9,37
0)(1
40,1
21,3
43)
(14,
577,
683)
(23,
134,
885)
(3,3
76,4
54,9
20)
(50,
545,
957)
(602
,276
)(1
0,29
8,83
5)(1
1,92
4,17
7)(2
2,44
4,46
1)(2
3,00
7,84
4)(9
,625
,742
)(8
1,48
0,07
0)(4
,329
,925
,050
)
Net
boo
k va
lue
- 201
212
0,59
3,28
39,
180,
416
621,
979,
647
176,
051,
938
92,1
17,6
4115
,575
,891
25,0
40,0
293,
337,
008,
438
144,
914,
166
1,31
7,06
433
,662
,616
7,17
0,29
613
,165
,951
21,3
58,7
6614
,029
,708
103,
490,
731
4,73
6,65
6,58
1
Dep
reci
atio
n ra
te %
per
ann
um-
-10
510
520
1010
1010
3010
1010
20
Free
- ho
ldLe
ase
- hol
dFa
ctor
y bu
ildin
gLa
bour
, sta
ff
colo
ny a
nd
othe
rs
Fact
ory
build
ing
Labo
ur, s
taff
colo
ny a
nd
othe
rs
Leas
ed
build
ing
impr
ovem
ents
At J
uly
01, 2
010
Cos
t10
4,69
5,38
214
,554
,430
825,
328,
678
221,
916,
882
245,
378,
479
63,1
77,7
9032
,783
,660
5,57
0,49
0,02
993
,071
,434
1,72
6,96
530
,144
,915
14,4
46,9
0435
,202
,961
32,6
77,0
4021
,246
,631
143,
493,
182
7,45
0,33
5,36
2A
ccum
ulat
ed d
epre
ciat
ion
--
(378
,214
,580
)(6
8,56
2,80
4)(1
53,0
35,8
13)
(33,
960,
684)
(17,
027,
616)
(2,9
60,4
07,4
57)
(36,
419,
151)
(356
,853
)(5
,671
,177
)(6
,766
,132
)(1
9,49
2,56
1)(1
9,81
4,69
4)(9
,955
,922
)(6
0,67
9,98
3)(3
,770
,365
,427
)N
et b
ook
valu
e10
4,69
5,38
214
,554
,430
447,
114,
098
153,
354,
078
92,3
42,6
6629
,217
,106
15,7
56,0
442,
610,
082,
572
56,6
52,2
831,
370,
112
24,4
73,7
387,
680,
772
15,7
10,4
0012
,862
,346
11,2
90,7
0982
,813
,199
3,67
9,96
9,93
5
Year
end
ed J
une
30, 2
011
Add
ition
s34
,010
,400
-33
,024
,487
21,2
97,9
5116
,420
,826
-83
,402
457,
859,
666
11,1
94,4
36-
67,8
002,
191,
135
89,7
441,
938,
000
290,
349
28,5
46,7
2460
7,01
4,92
0
Dis
posa
ls:
- C
ost
-5,
374,
014
--
40,8
16,3
0733
,024
,216
-17
8,69
1,35
22,
377,
582
22,0
252,
230,
364
294,
935
-87
,325
3,34
3,37
611
,329
,138
277,
590,
634
- D
epre
ciat
ion
--
--
(32,
939,
182)
(21,
769,
644)
-(1
28,0
83,6
99)
(2,1
97,9
99)
(20,
909)
(483
,013
)(2
29,8
40)
-(8
1,82
4)(2
,652
,618
)(6
,886
,898
)(1
95,3
45,6
26)
-5,
374,
014
--
7,87
7,12
511
,254
,572
-50
,607
,653
179,
583
1,11
61,
747,
351
65,0
95-
5,50
169
0,75
84,
442,
240
82,2
45,0
08
--
(46,
758,
969)
(8,4
09,5
55)
(9,9
36,6
42)
(1,2
23,9
19)
(3,1
61,1
33)
(285
,525
,917
)(6
,409
,876
)(1
37,0
01)
(2,4
34,1
68)
(2,7
19,6
80)
(1,5
52,0
22)
(1,3
93,7
09)
(1,1
33,8
11)
(18,
883,
352)
(389
,679
,754
)
Clo
sing
net
boo
k va
lue
- 201
113
8,70
5,78
29,
180,
416
433,
379,
616
166,
242,
474
90,9
49,7
2516
,738
,615
12,6
78,3
132,
731,
808,
668
61,2
57,2
601,
231,
995
20,3
60,0
197,
087,
132
14,2
48,1
2213
,401
,136
9,75
6,48
988
,034
,331
3,81
5,06
0,09
3
At J
une
30, 2
011
Cos
t13
8,70
5,78
29,
180,
416
858,
353,
165
243,
214,
833
220,
982,
998
30,1
53,5
7432
,867
,062
5,84
9,65
8,34
310
1,88
8,28
81,
704,
940
27,9
82,3
5116
,343
,104
35,2
92,7
0534
,527
,715
18,1
93,6
0416
0,71
0,76
87,
779,
759,
648
Acc
umul
ated
dep
reci
atio
n-
-(4
24,9
73,5
49)
(76,
972,
359)
(130
,033
,273
)(1
3,41
4,95
9)(2
0,18
8,74
9)(3
,117
,849
,675
)(4
0,63
1,02
8)(4
72,9
45)
(7,6
22,3
32)
(9,2
55,9
72)
(21,
044,
583)
(21,
126,
579)
(8,4
37,1
15)
(72,
676,
437)
(3,9
64,6
99,5
55)
Net
boo
k va
lue
- 201
113
8,70
5,78
29,
180,
416
433,
379,
616
166,
242,
474
90,9
49,7
2516
,738
,615
12,6
78,3
132,
731,
808,
668
61,2
57,2
601,
231,
995
20,3
60,0
197,
087,
132
14,2
48,1
2213
,401
,136
9,75
6,48
988
,034
,331
3,81
5,06
0,09
3
--
105
105
2010
1010
1030
1010
1020
Vehi
cles
Pla
nt &
mac
hine
ry
2012
Off
ice
equi
pmen
ts
Mill
s
equi
pmen
ts
Furn
iture
&
fixtu
res
Ele
ctri
c
equi
pmen
ts
Offi
ce
equi
pmen
tsTo
tal
Fire
figh
ting
equi
pmen
t
Fire
figh
ting
equi
pmen
t
Tota
l
Dep
reci
atio
n ch
arge
for t
he y
ear
On
leas
e - h
old
Rup
ees
Mill
s
equi
pmen
ts
Furn
iture
&
fixtu
res
Vehi
cles
Ele
ctric
inst
alla
tions
Land
Ele
ctric
equi
pmen
ts
2011
Com
pute
rs
On
free
- ho
ld
On
free
- hol
d
Com
pute
rs
On
leas
e - h
old
Land
Ele
ctri
c
inst
alla
tions
Pla
nt &
mac
hine
ry
Rup
ees
Notes To The Financial StatementsFor the year ended June 30, 2012
30

Sapphire Textile Mills Limited
Annual Report - 2012
Notes To The Financial Statements
6.3 Particular of Disposal of operating fixed assets during the year are as follows:
Land
Free hold Land 33,142,131 - 33,142,131 97,387,500 64,245,369 Negotiation Sapphire Finishing Mills Limited
Plant and Machinery
Ring Frame 3,983,218 3,580,066 403,152 387,931 (15,221) Negotiation Muhammad Latif, Faisalabad.
Match Coner (Auto Cone) 2,551,036 2,309,712 241,324 689,655 448,331 Negotiation Muhammad Khalid, Faisalabad.
Ring Frame 5,099,484 4,630,367 469,117 948,276 479,159 Negotiation Malik Abdul Hafeez, Faisalabad.Ring Frame 2,655,478 2,388,950 266,528 387,931 121,403 Negotiation Abdul Hameed, Faisalabad.
Howa Card-1990 321,675 222,249 99,426 387,931 288,505 Negotiation Akbar Ali Brothers, Karachi.
Cone Winder 48 Spindle (Gilbos) 2,085,148 1,985,848 99,300 51,724 (47,576) Negotiation Mirza Lal Muhammad, Hyderabad.Howa Card-1990 575,000 399,126 175,874 387,931 212,057 Negotiation Akbar Ali Brothers, Karachi.
Rotary Filter 79,539 76,332 3,207 50,000 46,793 Negotiation Abdul Latif, Hyderabad.Drawing Toyoda TY2 2,303,165 2,056,161 247,004 312,069 65,065 Negotiation Abdul Latif, Hyderabad.
Drawing RSB-1 Reiter 1,588,765 1,386,116 202,649 150,000 (52,649) Negotiation Abdul Latif, Hyderabad.
Blow room RN-Beter-1982 433,058 316,780 116,278 133,000 16,722 Negotiation Abdul Latif, Hyderabad.Bale Opener-1972 313,701 237,894 75,807 100,000 24,193 Negotiation Abdul Latif, Hyderabad.
Rotary 10,200 4,423 5,777 43,103 37,326 Negotiation Rajab Enterprise, Karachi
Comber CM-10 1,710,859 1,504,207 206,652 320,000 113,348 Negotiation Sajid Textile Mills Limited, Lahore.Comber & Lap Former 7,082,347 6,226,880 855,467 1,310,172 454,705 Negotiation Sajid Textile Mills Limited, Lahore.
Comber 4,721,565 4,151,251 570,314 640,000 69,686 Negotiation Sajid Textile Mills Limited, Lahore.
Ring Frames 2,931,749 2,663,950 267,799 517,241 249,442 Negotiation Habib ur Rehman, Faisalabad.
Rupees
Mode of
disposalNet Book
ValueCost Accumulated
DepreciationParticulars of Buyers
Sale
ProceedsProfit / (loss)
Comber 13,273,058 12,110,735 1,162,323 1,175,000 12,677 Negotiation Ahsan Elahi, Faisalabad
Draw Frame 2,366,671 2,092,450 274,221 273,103 (1,118) Negotiation Ahsan Elahi, Faisalabad
Crosrol Card 1,998,452 1,823,911 174,541 517,241 342,700 Negotiation Bajaj Enterprises, SheikhupuraWaukesha Gas Gen Set 14,470,770 11,185,683 3,285,087 3,325,000 39,913 Negotiation Encon Power Engineering, Karachi.
High Speed Cards CMK-3 Howa 6,506,257 5,927,755 578,502 1,206,893 628,391 Negotiation S.A Traders, Faisalabad
Todo Beam 498,872 294,712 204,160 196,552 (7,608) Negotiation Asher Hashmi, Karachi.
77,560,067 67,575,558 9,984,509 13,510,753 3,526,244
6.2 The depreciation charge for the year has been allocated as follows:
Cost of sales
Administrative expenses
Income from power generation
30 440,199,940 378,558,511
32 5,530,915 4,791,968
34.2 - 6,329,275
445,730,855 389,679,754
For the year ended June 30, 2012
Office Equipment
Laptop 76,000 35,149 40,851 2,759 (38,092) Negotiation Muhammad Ameen, Shaikhupura
Vehicles
Toyota Corolla 1,295,882 738,741 557,141 650,000 92,859 Negotiation Zahid Ikram, Karachi
Suzuki Alto 496,000 410,531 85,469 260,000 174,531 Negotiation Rashid Ali Khan, Karachi
Honda Civic 1,003,000 709,711 293,289 1,003,000 709,711 Insurance Claim Adamjee Insurance Co. Ltd. KarachiHonda Civic 1,247,500 1,123,216 124,284 700,000 575,716 Negotiation M.Farooq Baig, Karachi
Suzuki Alto 496,000 388,412 107,588 280,000 172,412 Negotiation Malik Muhammad Athar, Lahore
Suzuki Cultus 560,000 404,972 155,028 420,000 264,972 Negotiation Muhammad Nadeem, KarachiSuzuki Alto 504,000 362,548 141,452 340,000 198,548 Negotiation Muhammad Faisal Mehmood, Lahore
Suzuki Cultus 600,000 429,224 170,776 410,000 239,224 Negotiation Muhammad Tariq, Karachi
Suzuki Cultus 560,000 459,167 100,833 400,000 299,167 Negotiation Jahanzaib Tariq, Lahore.Daihatsu Cuore 464,000 346,040 117,960 385,000 267,040 Negotiation Asif Ali, Kasur.
Daihatsu Cuore 709,000 160,549 548,451 700,540 152,089 Insurance Claim Adamjee Insurance Co. Ltd. KarachiHyundai Grace Van 1,378,238 1,201,347 176,891 480,000 303,109 Negotiation Javaid Khan, Lahore.
Suzuki Cultus 795,000 298,920 496,080 650,000 153,920 Negotiation Ashfaq Ahmed, Lahore
Toyota Parado 5,803,100 2,321,240 3,481,860 3,700,000 218,140 Negotiation Mrs Anjum Javaid, Multan.Honda Civic 1,718,000 941,006 776,994 960,000 183,006 Negotiation Nadeem Ahmed, Lahore.
Tractor 150,000 75,200 74,800 80,000 5,200 Negotiation Riasat Ali, Shaikhupura.
Daihatsu Cuore 474,000 326,014 147,986 380,000 232,014 Negotiation Daoud Aslam, Sahiwal.Daihatsu Cuore 580,311 429,454 150,857 295,000 144,143 Negotiation Miss Ayesha, Lahore
Honda Citi 880,500 649,456 231,044 540,000 308,956 Negotiation Tahir Manzoor, Lahore.
Daihatsu Cuore 474,000 339,227 134,773 137,000 2,227 Negotiation Ashfaq Nadeem, Lahore.Daihatsu Cuore 413,472 345,908 67,564 300,000 232,436 Negotiation Tanveer Hussain, Nankana.
Hyundai Santro 499,000 433,770 65,230 285,000 219,770 Negotiation Afzal Hussain, Lahore.
21,101,003 12,894,653 8,206,350 13,355,540 5,149,190
131,879,201 80,505,360 51,373,841 124,256,552 72,882,711
2012 2011------------- Rupees -------------Note
31

Sapphire Textile Mills Limited
Annual Report - 2012
Notes To The Financial Statements
2012 2011
6.4 Capital work-in-progress
Civil works and Buildings 247,521,068 402,846,565
Plant and machinery 78,228,765 402,125,560
Electric installations 99,008,103 75,196,001
Office equipments 100,000 -Mills equipments 247,590 -
------------- Rupees -------------
425,105,526 880,168,126
6.5 During the current year, the borrowing cost amounting Rs.8.05 million (2011: Rs.8.88 million) has been capitalized in the cost of Capital work-in-progress which was charged at rates ranging from 11.20% to 15.01% (2011: 10.50% to 15.05%) per annum.
7 INVESTMENT PROPERTY
Leasehold Freehold Leasehold land Freehold land
Net carrying value as at July 01, 2011
Opening net book value (NBV) 142,360,317 37,890,000 14,215,486 6,017,250 200,483,053Additions - - - - -Disposal - (6,140,000) - (5,866,819) (12,006,819)Depreciation charged - - (1,421,549) (150,431) (1,571,980)
Balance as at Jue 30, 2012 (NBV) 142,360,317 31,750,000 12,793,937 - 186,904,254
Gross carrying value as at June 30, 2012
Cost 142,360,317 31,750,000 19,999,980 - 194,110,297Accumulated depreciation - - (7,206,043) - (7,206,043)
Net book value - 2012 142,360,317 31,750,000 12,793,937 - 186,904,254
Net carrying value as at July 01, 2010
Land Building onTotal
--------------------------------------------------------- Rupees ---------------------------------------------------------
Net carrying value as at July 01, 2010
Opening net book value (NBV) 121,160,317 6,140,000 15,794,984 6,685,833 149,781,134Additions 21,200,000 31,750,000 - - 52,950,000Depreciation charged - - (1,579,498) (668,583) (2,248,081)
Balance as at June 30, 2011 (NBV) 142,360,317 37,890,000 14,215,486 6,017,250 200,483,053
Depreciation rate % per annum - - 10 10
For the year ended June 30, 2012
7.1 The investment property includes company's 50% share valuing Rs.141,160,297 represents cost of jointly controlled leasehold land measuring 8,888.88 square yards with building thereon located at sector 23, Korangi Industrial Area, Korangi Township, Karachi, registered jointly in the name of Company and Sapphire Fibres Limited (an Associated Company).
7.2 In the opinion of the Directors the market value as on June 30, 2012 is not materially different.
32

Sapphire Textile Mills Limited
Annual Report - 2012
Notes To The Financial Statements
8 INTANGIBLE ASSETS 2012 2011(Computer software) Note
Net carrying value as at July 01, 2011
Net book value as July 01, 2011 4,354,967 5,920,410
Additions during the year 5,983,770 -
Amortization (2,003,707) (1,565,443)
Net book value at June 30, 2012 8,335,030 4,354,967
Gross carrying value at June 30, 2012
Cost 17,951,617 11,967,847
Accumulated amortization (9,616,587) (7,612,880)
Net book value - 2012 8,335,030 4,354,967
Amortization rate % per annum 20 20
------------- Rupees -------------
8.1 Amortization charge for the year has been allocated as follows:
Other operating expenses 33 2,003,707 1,565,443
2012 2011
Note 7.3 The depreciation charge for the year has been allocated as follows:
Other operating expenses 33 1,571,980 2,248,081
------------- Rupees -------------
7.4 Particular of Disposal of investment property during the year are as follows:
Land
Free hold Land 6,140,000 - 6,140,000 7,433,181 1,293,181 Negotiation Irfan Kamal, Faisalabad
Building
Building on Free Hold Land 7,100,000 1,233,181 5,866,819 5,866,819 - Negotiation Irfan Kamal, Faisalabad
13,240,000 1,233,181 12,006,819 13,300,000 1,293,181
Rupees
CostAccumulated
Depreciation
Net Book
ValueSale
ProceedsProfit
Mode of
disposalParticulars of Buyers
For the year ended June 30, 2012
33

Sapphire Textile Mills Limited
Annual Report - 2012
Notes To The Financial Statements
2012 2011
Note ------------- Rupees -------------
9 LONG TERM INVESTMENTS
Related parties - at cost:
Subsidiaries - unlisted
- private
- foreign
Associates - listed
- unlisted
other companies - Available for sale
9.1 86,220,000 53,320,000
9.2 - 239,321
9.3 940,000 858,500
87,160,000 54,417,821
9.4 8,461,851 8,461,851
9.5 184,096,566 108,488,500
192,558,417 116,950,351
9.6 1,951,957,505 2,119,658,353
2,231,675,922 2,291,026,525
9.2 Investments in subsidiary company - private
- 900,000 Sapphire Renewable Solutions (Pvt) Limited 9,000,000 9,000,000
(8,760,679) (8,760,679)
Assets transfer to the Company (239,321) -
- 239,321
Equity Interest Held Nil (2011:100%)
Impairment loss on equity investments
Break up value on the basis of audited accountsfor the year ended June 30, 2011 Rs. 0.27 pershare.
All investments have a face value of Rs. 10 per share unless stated otherwise.
2012 2011 2012 2011
9.1 Investments in subsidiary company - unlisted
8,600,000 1,687,000 Sapphire Wind Power Company Limited 86,000,000 16,870,000
Deposit for share application money 220,000 36,450,000
86,220,000 53,320,000
Name of Company
Equity Interest Held 100%
------------- Rupees -------------Number of Shares
Break up value on the basis of audited accountsfor the year ended June 30, 2012 Rs. 8.52(2011: Rs. 5.13) per share.
9.2.1 The Subsidiary company Sapphire Renewable Solutions (Private) Limited (SRS) had filed an application on September 03, 2010 with Securities and Exchange Commission of Pakistan (SECP) for striking off the Name of the Company under Companies easy exit scheme under section 439 of the Companies Ordinances, 1984 (the ordinance), due to continued losses. The Joint Registrar-In charge of Companies Registration Office, Lahore of SECP had issued notice, under subsection 3 of Section 439 of the Ordinance, that unless cause is shown to the contrary; the company shall be considered dissolved after the expiration of three months of the notice. The Deputy Registrar has sent the notification of striking off the name of the SRS for Publication in the Official Gazette. The investment in Sapphire Renewable Solutions (Private) Limited amounting to Rs.8,760,679 had written off during the financial year ended June 30, 2010. Remaining assets were transferred to the Company during the year ended June 30, 2012.
For the year ended June 30, 2012
34

Sapphire Textile Mills Limited
Annual Report - 2012
Notes To The Financial Statements
9.5 Investments in associates - unlisted
1,550,000 1,550,000 Sapphire Power Generation Limited 19,748,000 19,748,000
6,000,000 6,000,000 Sapphire Electric Company Limited 60,000,000 60,000,000
10,000 10,000 Sapphire Holding Limited 100,000 100,000
Break up value on the basis of audited accounts
for the year ended June 30, 2012 Rs. 12.63
(2011: Rs.10.45) per share.
Equity Interest Held 16.54%
Break up value on the basis of audited accountsfor the year ended June 30, 2012 Rs.70.22 (2011:Rs. 65.96) per share.
Equity Interest Held 1.42% (2011: 1.42%)
Equity Interest Held 0.05%
5,000,000 - Sapphire Dairies (Pvt) Ltd 50,000,000 -
Share deposit money 40,000,000 -
Break up value on the basis of audited accountsfor the year ended June 30, 2012 Rs. 19.36(2011: Rs.18.01) per share.
Break up value on the basis of audited accountsfor the year ended June 30, 2012 Rs.10.50 pershare.
Equity Interest Held 7.14%
3,675 3,675 Creadore A/S Denmark 60,017,650 61,372,500
(formerly Beirholms Sapphire A/S Denmark)
(45,769,084) (32,732,000)
14,248,566 28,640,500
184,096,566 108,488,500
Equity Interest Held 49%(2011: 49%)
Impairment loss on equity investments
Break up value on the basis of audited accountsfor the year ended April 30, 2012 DKK 244(2011: DKK Nil) equivalent to Rs.3,875 (2011:Rs. Nil) per share.
3,675 (2011:3,675) shares of Danish Krone (DKK) 1000 per share
9.4 Investments in associates - listed
313,295 313,295 Reliance Cotton Spinning Mills Limited 8,461,851 8,461,851
Equity Interest Held 3.04%Fair value of the ordinary sharesas at June 30,
2012 amounted to Rs.7.174 million (2011: Rs.
8.572 million).
2012 2011 2012 2011
9.3 Investments in subsidiary company - foreign
200 200 940,000 858,500
------------- Rupees -------------
Break up value on the basis of un-auditedaccounts for the year ended June 30, 2012Rs.44,531 (2011: Rs. 5,202) per share.
Number of Shares
Sapphire Home Inc. - USAEquity Interest Held 100%(200 shares ofUSD$50 per share)
Name of Company
For the year ended June 30, 2012
35
Sapphire Textile Mills Limited
Annual Report - 2012
Notes To The Financial Statements
2012 2011
Note ------------- Rupees -------------
728,470,245 728,470,245
1,137,339,024 1,305,039,872
1,865,809,269 2,033,510,117
86,148,236 86,148,236
1,951,957,505 2,119,658,353
9.6 Other companies - Available for sale
Quoted 11,223,588 10,203,262 MCB Bank Limited
Unquoted
7,055,985 7,055,985 Novelty Enterprises (Pvt) Limited
Add: Adjustment arising from measurement at fair value
10.3 35,147,515 31,754,772
19,444,290 21,582,479
54,591,805 53,337,251
15 18,368,601 14,102,544
36,223,204 39,234,707
10 Long term loans and advances
Loan to employees - unsecured (considered good)
Executives
Other employees
Current portion of loans shown under current assets
10.1 All the loans are granted to the employees, free of interest in accordance with their terms of employment.
10.2 Maximum amount due from executives during the year, calculated by reference to month-end balances, was Rs.38,277,183 (2011: Rs. 31,754,772).
11 Long term deposits
Security deposits
- WAPDA
- SNGPL
- PTCL
- Others
27,825,846 21,756,246
545,000 466,000
242,415 242,415
11.1 887,405 887,405
29,500,666 23,352,066
10.3 Movement in loans to executives
Balance at the beginning of the Year
Amount disbursed during the Year
Amount recovered during the Year
Balance at the end of the Year
31,754,772 21,935,184
14,476,593 19,011,525
46,231,365 40,946,709
11,083,850 9,191,937
35,147,515 31,754,772
11.1 It includes an amount of Rs.36,000 (2011: Rs. 36,000) deposit with Yousuf Agencies (Private) Limited - an associated company.
For the year ended June 30, 2012
36

Sapphire Textile Mills Limited
Annual Report - 2012
Note
2012 2011
------------- Rupees -------------
14 Trade debts
Secured - considered good
Foreign debts - against export 14.2 657,895,342 1,067,429,188
Provision for doubtful debts 14.3 (3,878,456) (3,878,456)
654,016,886 1,063,550,732
Unsecured - considered good
Domestic debts 14.1 & 14.2 783,260,859 803,194,274
Waste 23,233,437 22,018,951
Energy - 16,964,285
Others 2,654,302 3,608,585
809,148,598 845,786,095
Provision for doubtful debts 14.3 (126,098,213) (127,426,409)
683,050,385 718,359,686
Balance at the end of the Year 1,337,067,271 1,781,910,418
14.1 Domestic debts include amount of Rs.89,316,554 (2011: Rs.126,823,060) receivable against indirect export sales.
464,979,633 2,251,767,234
- 248,734,523
- 683,661,168
464,979,633 3,184,162,925
1,557,411,960331,899,305
189,260,359-
519,310,691
Cost
Raw material
Work in process
Finished goods
Net Realizable
Raw material
Work in process
Finished goods -
331,899,305 2,265,983,010
Notes To The Financial Statements
12 Stores, spares and loose tools
Stores
Spares - in hand
Spares - in transit
Loose tools
116,299,435 98,663,502
109,927,926 88,387,027
24,231,227 21,595,941
134,159,153 109,982,968
340,821 464,876
250,799,409 209,111,346
13 Stock-in-trade
Raw material - in hand
Raw material - in transit
Work in process
Finished goods
Waste
2,384,449,421 2,056,531,692
12,385,469 408,049,326
2,396,834,890 2,464,581,018
325,046,975 311,539,529
574,476,197 839,329,665
21,364,749 41,894,785
595,840,946 881,224,450
3,317,722,811 3,657,344,997
13.1 Stock in trade as at June 30, 2012 includes item valued at Net Realizable value (NRV) as follows. The write down to NRV amounting Rs.133.080 million (2011: Rs.918.180 million) has been recognised in cost of goods sold and the disclosure is in accordance with the requirements of IAS 2.
For the year ended June 30, 2012
37

Sapphire Textile Mills Limited
Annual Report - 2012
Note
2012 2011
Notes To The Financial Statements
------------- Rupees -------------
14.2 Trade debts include the following amounts due from related parties:
Domestic debts
Amer Cotton Mills Limited 65,608 -
Diamond Fabrics Limited 1,977,600 349,300 349,300
Sapphire Fibres Limited 10,000 -
Sapphire Finishing Mills Limited 37,415,163 -
39,468,371 349,300
Foreign debts
Creadore A/S (Formerly Beirholms Sapphire A/S) 44,953,350 4,211,264
Sapphire Home Inc. 37,513,031 91,255,925
82,466,381 95,467,189
56,330,645 71,434,466
1,063,693 500,000
15.1 36,835,450 28,791,750
5,125,500 2,500,000
99,355,288 103,226,216
15.2 - (2,500,000)
99,355,288 100,726,216
10,320,135 7,007,471
8,048,466 7,095,073
10 18,368,601 14,102,544
117,723,889 114,828,760
15 Loans and advances
Considered good
Advances - unsecured
- to suppliers
- to contractors
- to excise and taxation
- to others
Provision for doubtful advance
Current portion of long term loans
- due from executives
- due from other employees
131,304,865 119,304,865
12,000,000 12,000,000
(13,328,196) -
(1,328,196) 12,000,000
129,976,669 131,304,865
14.3 Provision for doubtful debts
Balance at the beginning of the year
Provision made during the year
Reversal made during the year
Balance at the end of the Year
15.1 This represents 50% payment made to Excise and Taxation Department of Government of Sindh against levy of Infrastructure Fee. (refer note 24.5).
15.2 Provision for doubtful advances
Balance at the beginning of the year 2,500,000 - Provision made during the year - 2,500,000
Written-off during the year against provision (2,500,000) -
(2,500,000) 2,500,000
- 2,500,000
For the year ended June 30, 2012
Balance at the ending of the year
38

Sapphire Textile Mills Limited
Annual Report - 2012
Note
2012 2011
------------- Rupees -------------
Notes To The Financial Statements
16 Trade deposits and short term prepayments
Security deposits 923,133 745,709
Prepayments 16.1 13,892,569 16,413,350
14,815,702 17,159,059
16.1 It includes Rs.1,393,686 (2011: Rs. 1,537,990) prepaid rent with Yousuf Agencies (Private) Limited, an associated company.
17 Other receivables
Claims receivable from an insurance company 776,000 64,500
Receivable from related parties against shared expenses 17.1 11,376,013 3,726,837
Export rebate receivable 31,487,588 24,941,984
Unrealized gain on measurement of forward foreign currency contracts - 1,899,447
Receivable against forward foreign currency contracts - 1,863,943
Receivable against subsidy on mark-up of long term loan - 744,342
Others - 306,882
43,639,601 33,547,935
18 Other financial assets - available for sale
2012 2011 2012 2012 2011
Cost
2,416,497 2,268,740 Bank Al-Habib Limited 58,951,594 68,797,670 66,859,768
8,832,626 5,643,392 Fatima Fertilizer Company Limited 138,741,890 217,900,883 93,906,043
3,023,017 1,500,938 Fauji Fertilizer Company Limited 249,710,165 335,706,038 225,666,028
972,295 972,295 Gulshan Spinning Mills Limited 17,441,370 4,861,475 10,695,245
2,448,944 3,672,986 Hub Power Company Limited 85,483,885 102,586,264 138,104,274
- 2,178,327 International Steel Limited - - 29,647,030
219,352 720,858 Pakistan Oilfields Limited 61,595,187 80,489,023 258,795,231
611,924,091 810,341,353 823,673,619
Number of shares/units
Name of Company Fair value
------------------------ Rupees------------------------
Receivable from related parties against shared expenses
Amer Cotton Mills (Pvt) Limited
Diamond Fabrics Limited
Reliance Cotton Spinning Mills Limited
Sapphire Dairies (Pvt) Limited
Sapphire Fibres Limited
Sapphire Finishing Mills Limited
Sapphire Power Generation Limited
Sapphire Wind Power Company Limited
17.1
196,757 -
81,270 -
227,234 321,863 321,863
24,816 -
3,523,121 3,327,663
828,880 -
89,952 -
6,403,983 77,311
11,376,013 3,726,837
19
347,554,401 291,907,933
75,118,521 92,454,586
11,335,756 11,788,469
434,008,678 396,150,988
Tax refunds due from Government
Income tax
Sales tax receivable
Excise duty receivable
For the year ended June 30, 2012
39

Sapphire Textile Mills Limited
Annual Report - 2012
21 Issued, subscribed and paid-up capital
2012 2011 2012 2011
6,206,740 6,206,740 62,067,400 62,067,400
13,876,400 13,876,400 138,764,000 138,764,000
20,083,140 20,083,140 200,831,400 200,831,400
Number of shares
Ordinary shares of Rs. 10 each allotted for consideration paid in cash
------------- Rupees -------------
Ordinary shares of Rs. 10 each issued as bonus shares
22 Long term financing 2012 2011
Loans from banking companies - secured Note
Habib Bank Limited 22.1 41,666,300 58,333,335
Habib Bank Limited 22.2 - 6,250,000
Habib Bank Limited 22.3 21,124,000 27,376,000
Habib Bank Limited 22.4 34,375,000 46,875,000
Habib Bank Limited 22.5 46,875,000 50,000,000
Habib Bank Limited 22.6 150,000,000 -
Habib Metropolitan Bank Limited 22.7 2,125,000 6,375,000
Habib Metropolitan Bank Limited 22.8 6,375,000 10,625,000
MCB Bank Limited 22.9 24,170,000 32,958,000
Meezan Bank Limited 22.10 200,000,000 300,000,000
National Bank of Pakistan 22.11 - 3,153,557
Samba Bank Limited 22.12 24,375,000 30,000,000
United Bank Limited 22.13 - 12,500,000
United Bank Limited 22.14 - 10,000,000
United Bank Limited 22.15 181,996,000 181,996,000
United Bank Limited 22.16 131,316,000 131,316,000
United Bank Limited 22.17 211,818,000 211,818,000
United Bank Limited 22.18 2,821,000 -
United Bank Limited 22.19 29,054,000 29,054,000
Allied Bank Limited 22.20 100,000,000 -
Allied Bank Limited 22.21 100,000,000 -
1,308,090,300 1,148,629,892
Less: Current portion shown under current liabilities (213,468,649) (196,485,224)
1,094,621,651 952,144,668
------------- Rupees -------------
Note20 Cash and bank balances
With banks on:
- currents accounts
- currents accounts - USD
- currents accounts - Euro
- deposit accounts
Cash in hand
2012 2011
66,305,229 94,915,814
20.1 2,983,612 1,884,612
20.2 2,530,514 5,738,236
20.3 3,285 3,285
71,822,640 102,541,947
4,164,168 3,241,232
75,986,808 105,783,179
------------- Rupees -------------
Notes To The Financial Statements
20.1 Cash at bank on USD account of US$ 31,742 (2011: US$ 21,952).
20.2 Cash at bank on EURO account of EURO 21,400 (2011: EURO 46,053).
20.3 Cash at bank on deposits account and cash at bank on margin account under lien of a bank / financial institution against guarantee issued on behalf of the Company.
21.1 The Company has only one class of shares which carry no right to fixed income.
21.2 5,445,612 (2011: 5,440,269) shares of the Company are held by associated companies as at the balance sheet date.
For the year ended June 30, 2012
40

Sapphire Textile Mills Limited
Annual Report - 2012
Mark-up
rate p.a (%)Lenders
Date of final
repayment
No. of
instalments
outstanding
Security
22.1 HBL - LTF-EOP
22.2 HBL - Non-LTF
22.3 HBL - LTF-EOP
22.4 HBL - Non-LTF
22.5 HBL-Non-LTFF
22.6 HBL-Non-LTFF
22.7 HMBL - LTF-EOP
22.8 HMBL - LTF-EOP
22.9 MCB - Non-LTF
The loan is secured against exclusive charge onspecific plant and machinery of Rs. 23 million ofUnit No. 6 of the Company.
The loan is secured against exclusive charge onspecific plant and machinery of Rs. 23 million ofUnit No. 6 of the Company.
Jan 2016
The loan is secured against first specifichypothecation charge on plant and machinery ofRs. 53.2 million of Unit No. 5 of the Company.
The loan is secured against 1st Specific andexclusive hypothecation charge of Rs. 67 millionoverimported plant and machinery of Unit No.1of the Company.
15 Quarterly
7%
3 Months KIBOR plus
125 bps
7 Semi-annually
7%
Feb 2015
The term loan is secured against hypothecationof plant and machinery at Unit No. 5 of theCompany.
Jan 20173 Months
KIBOR plus 100 bps
The loan is secured by first hypothecationcharge overimported plant and machinery of theCompany to the extent of Rs.67 million.
The term loan is secured against hypothecationof plant and machinery at unit no. 6 of theCompany.
3 Months KIBOR plus
150 bps
3 Months KIBOR plus
150 bps
16 Quarterly
Nov 2011
The loan is secured against 1st registered
3 Semi-annually7% Aug 2013
11 quarterly
Aug 20121 Semi-annually
Sep 20145 Semi-annually
The term loan is secured against hypothecationof plant and machinery at Unit No. 5 of theCompany.
Dec 2015
7%
Paid during the year
22.10 MBL - Non-LTF
22.11 NBP - LTF-EOP
22.12 SAMBA - Non-LTF
22.13 UBL - LTF-EOP
22.14 UBL - Non-LTF
7%
8 quarterly3 Months
KIBOR plus 150 bps
The loan is secured against first specifichypothecation charge on plant and machinery ofRs. 53.33 million of Unit No. 5 of the Company.
Paid during the year
The loan is secured by first hypothecationcharge overimported plant and machinery of theCompany to the extent of Rs. 256 million.
9.7%
The term loan is secured against hypothecationof plant and machinery at Unit No. 6 of theCompany.
The loan is secured against first pari passucharge over fixed assets of amounting to Rs.534 million of Unit No. 6 of the Company.
The term loan is secured against exclusivehypothecation charge over plant and machineryat Unit No. 4 of the Company.
Jan 201511 quarterlyhypothecation charge for Rs. 54 million overpresent & future plant & machinery of Unit No.1of the Company.
13 quarterly
7%
3 Months KIBOR plus
150 bps
3 Months KIBOR plus
1.5%
May 2012
May 2012
Jul 2015
Paid during the year
Paid during the year
Jun 2012
Jun 2014
Notes To The Financial StatementsFor the year ended June 30, 2012
41

Sapphire Textile Mills Limited
Annual Report - 2012
22.15 UBL-LTFF
22.16 UBL-LTFF
22.17 UBL-LTL The loan is secured against first exclusivehypothecation charge of Rs.375 million on
10.50%
The loan is secured against first exclusivehypothecation charge of Rs.185 million onimported machinery of Unit No.6 of theCompany.
20 Quarterly
The loan is secured against first exclusivehypothecation charge of Rs.375 million onimported machinery of Unit No.6 of theCompany.
11.20% 20 Quarterly
11.20%Sep 2018
Jun 2018
20 Quarterly
Dec 2017
imported compressor Unit No.6 of the Company.
22.18 UBL-LTL
22.19 UBL-LTL
22.20 ABL-LTL
22.21 ABL-LTL
12.70%
The loan is secured against first exclusivehypothecation charge of Rs. 200 million overplant and machinery of Unit No.5 of theCompany.
Jun 2016
The loan is secured against first exclusivehypothecation charge of Rs.375 million onimported compressor Unit No.6 of the Company.
20 Quarterly
3 Months KIBOR plus
1.5%
16 Quarterly
The loan is secured against exclusivehypothecation charge of Rs.118 million on thespecific plant & machinery of the Company.
16 Quarterly Apr 2017
The loan is secured against exclusivehypothecation charge of Rs.118 million on thespecific plant & machinery of the Company.
3 Months KIBOR plus
0.75%
Jun 201716 Quarterly
Jul 2018
3 Months KIBOR plus
0.75%
Mark-up
rate p.a (%)Lenders
Date of final
repayment
No. of
instalments
outstanding
Security
Notes To The Financial Statements
23.1 Deferred taxation
Deferred tax credits / (debits) arising in respect of:
Taxable temporary differences (deferred tax liabilities)
Accelerated tax depreciation allowances 198,148,003 230,538,282
Deductible temporary differences (deferred tax assets)
Staff retirement benefits - gratuity (10,960,955) (12,650,788)
Provision for doubtful debts and advances (44,134,375) (45,474,243)
Provision for repair and maintenances (Generator overhauling) (4,913,573) (7,011,238)
Tax credit (64,394,033) -
Tax under section 113 (43,735,180) -
(168,138,116) (65,136,269)
30,009,887 165,402,013
2012 2011
23 Deferred liabilities Note
Deferred taxation23.1 30,009,887 165,402,013
Staff retirement benefits - gratuity23.2 150,129,497 121,433,339
180,139,384 286,835,352
------------- Rupees -------------
For the year ended June 30, 2012
42

Sapphire Textile Mills Limited
Annual Report - 2012
Notes To The Financial Statements
23.1.1 Income for the current year is chargeable to tax under presumptive tax regime of the Income Tax Ordinance, 2001. However, deferred tax liability / (asset) is recognised as management is not certain whether income of subsequent years is chargeable to tax under presumptive tax regime or normal tax regime.
23.2 Staff retirement benefits
Movement in the net liability recognized in the Balance sheet
Opening net liability
Expense for the year
Benefits paid during the year
Closing net liability
Expense recognized in the profit and loss account
Current service cost
Interest cost
Movement in the present value of defined benefit obligation
Present value of defined benefit obligation
Current service cost
Interest cost
Actuarial loss / (gain)
Benefits paid
Historical information
2012 2011 2010 2009 2008
146,055,958 131,743,627 98,840,720 95,723,513 72,530,632
14,383,827 (8,172,015) 6,390,954 (2,262,586) (1,405,429)
% %
13 1412 13
Experience adjustments on planliabilities
- - - - - - - - - - - - - - - - - - - - - R U P E E S- - - - - - - - - - - - - - - - - - - - - Present value of defined benefitobligation
Principal actuarial assumption
Following are a few important actuarial assumption used in the valuation.
Discount rateExpected rate of increase in salary
Reconciliation
Present value of defined benefit obligation
Unrecognized actuarial gain / (loss)
2012 2011
146,055,958 131,743,627
4,073,539 (10,310,288)
150,129,497 121,433,339
------------- Rupees -------------
2012 2011
121,433,339 96,702,447
65,222,013 48,584,231
186,655,352 145,286,678
(36,525,855) (23,853,339)
150,129,497 121,433,339
46,777,905 36,723,345
18,444,108 11,860,886
65,222,013 48,584,231
131,743,627 98,840,720
46,777,905 36,723,345
18,444,108 11,860,886
(14,383,827) 8,172,015
(36,525,855) (23,853,339)
------------- Rupees -------------
146,055,958 131,743,627
General description
The scheme provides for terminal benefits for all of its permanent employees who attain the minimum qualifying period. Annual charges is made using the actuarial technique of Projected Unit Credit Method.
For the year ended June 30, 2012
43

Sapphire Textile Mills Limited
Annual Report - 2012
Notes To The Financial Statements
2012 2011
Note ------------- Rupees -------------
- 700,650
17,500 -
7,581,913 -
10,342,119 1,333,731
2,141,571 2,609,341
20,083,103 4,643,722
24.1 These balances include the following amounts due to related parties:
Amer Cotton Mills (Private) Limited
Neelum Textile Mills Limited
Reliance Cotton Spinning Mills Limited
Sapphire Fibres LimitedSapphire Finishing Mills Limited
35,295,533 23,468,876
32,763 164,150
- 101,750
35,328,296 23,734,776
24.2 These balances include the following amounts due to related parties:
Sapphire Power Generation Limited
Sapphire Fibres Limited
Neelum Textile Mills (Pvt.) Limited
8,645,108 -
92,260,290 58,088,787
33 57,506,205 92,260,290
35 6,526,568 9,131,080
64,032,773 101,391,370
156,293,063 159,480,157
(98,786,858) (67,219,867)
57,506,205 92,260,290
24.3 These balances include the following amounts received from related parties:
Creadore A/S Denmark
24.4 Workers' profit participation fund
Balance at the beginning of the year
Allocation for the year
Interest on fund utilized in the Company's business
Less: Payments during the year
Balance at the end of the year
24.1 201,462,317 186,669,984
24.2 537,634,912 448,118,248
24.3 103,530,497 55,108,474
3,262,068 3,262,068
24.4 57,506,205 92,260,290
59,264,841 36,204,796
24.5 101,585,948 85,730,766
1,736,112 1,071,805
26,899,054 - -
6,810,761 7,770,507
1,099,692,715 916,196,938
24 Trade and other payables
Trade creditors
Accrued liabilities
Advances from customers
Custom duty payable Workers' profit participation fund
Workers' welfare fund
Sindh development and maintenance infrastructure fee
Unclaimed dividend
Unrealized loss on measurement of forward foreign currency contracts
Others
24.5 The Company had filed a suit against levy of Infrastructure fee, decision of the Honourable Sindh High Court dated 17 September 2008 in which the imposition of levy of infrastructure cess before 28 December 2006 had been declared as void and invalid. However, the Excise and Taxation Department had filed an appeal before the Honourable Supreme Court of Pakistan against the order of the Honourable Sindh High Court. During the preceding year, the Honourable Supreme Court of Pakistan had disposed off the appeal with a joint statement of the parties that during the pendency of the appeal, another law i.e. fifth version came into existence which was not the subject matter of in the appeal hence the case was referred back to High Court of Sindh with right to appeal to Supreme Court. On May 31, 2011, the High Court of Sindh had granted an interim relief on an application of petitioners on certain terms including discharge and return of bank guarantees / security furnished on consignment released up to December 27, 2006 and any bank guarantee / security furnished on
For the year ended June 30, 2012
44

Sapphire Textile Mills Limited
Annual Report - 2012
Notes To The Financial Statements
consignment released after December 27, 2006 shall be encashed to extent of 50% of the guaranteed or secured amount only with balance kept intact till the disposal of petition. In case the High Court upholds the applicability of fifth version of the law and its retrospective application the authorities are entitled to claim the amounts due under the said law with the right to appeal available to petitioner. In the light of interim relief the Company has paid 50% of the amount of Infrastructure cess payable from December 27, 2006 to May 31, 2011. Subsequent imports of the Company be released against 50% payment of Infrastructure cess to Excise and Taxation Department and furnishing of bank guarantee of balance amount. However the full amount of Infrastructure Cess form component of cost of imported items and provision recorded in books. Bank guarantees amounting to Rs.39.823 million (2011: Rs.120.223 million) have been provided to the department.
2012 2011
Note
25 Accrued interest / mark-up
Accrued interest / mark-up on secured:
- long term financing 25,897,007 16,626,685
- short term borrowings 44,411,175 54,455,169
70,308,182 71,081,854
------------- Rupees -------------
26 Short term borrowings
Short term loans 2,272,000,000 3,580,732,645
Running finance under mark-up arrangements 578,256,515 601,321,739
2,850,256,515 4,182,054,384 4,182,054,384
Book overdraft 26.2 499,588 949,319
2,850,756,103 4,183,003,703
26.1 Aggregate facilities amounting to Rs.13,440 million (2011: Rs.12,825 million) were available to the Company from banking companies. These are secured against hypothecation charge on stock in trade, book debts, plant & machinery and export bills under collection. These carry mark up ranging from 11% to 14.01% (2011: 1.70% to 15.57%) per annum payable quarterly. These facilities are renewable on expiry dates. It includes Rs.Nil (2011: Rs. 1,331 million ) on account of foreign currency loan translated into local currency at exchange rate prevailing on the reporting date and are payable in foreign currencies.
26.2 This represents cheques issued by the Company in excess of balance at banks which remained unpresented till June 30, 2012.
266,504,864 184,774,226
191,655,638 264,979,426
458,160,502 449,753,652
(237,761,799) (183,248,788)
220,398,703 266,504,864
27 Provision for taxation
Balance at the beginning of the year
Provision made for current year - net
Less: Adjusted advance tax during the year against completed assessments
27.1 Provision for current taxation mainly represents tax payable under section 154 of the Income Tax Ordinance, 2001.
27.2 No numeric tax rate reconciliation is presented in these financial statements as the Company is liable to pay tax mainly due under presumptive tax regime.
For the year ended June 30, 2012
45

Sapphire Textile Mills Limited
Annual Report - 2012
Notes To The Financial Statements
2012 2011------------- Rupees -------------
29 Sales and services
2012 2011 2012 2011 2012 2011
Gross sale of goods
Yarn 29.1 10,157,688,187 12,971,371,048 2,790,520,278 2,565,702,494 12,948,208,465 15,537,073,542
Fabric 29.2 4,849,893,553 4,071,943,396 824,332,367 468,660,009 5,674,225,920 4,540,603,405
Home textile products 2,307,682,974 2,106,304,232 6,213,499 3,468,574 2,313,896,473 2,109,772,806
Raw material - 26,484,248 69,918,171 226,891,939 69,918,171 253,376,187
Waste 29.3 206,971,976 143,550,836 220,021,417 302,004,131 426,993,393 445,554,967
Services 7,723,271 7,635,967 - - 7,723,271 7,635,967
17,529,959,961 19,327,289,727 3,911,005,732 3,566,727,147 21,440,965,693 22,894,016,874
Note
Export Sales Local Sales Total
Rupees
Export rebate 30,502,852 34,172,768
Duty drawback 29.5 9,588,232 7,927,351Processing income 9,773,460 1,059,138
21,490,830,237 22,937,176,131
29.1 Export sales - Yarn
Direct export 7,251,795,449 8,344,371,414In-direct export 2,905,892,738 4,626,999,634
10,157,688,187 12,971,371,048
29.2 Export sales - Fabric
Direct export 4,241,760,942 3,324,607,498
In-direct export 608,132,611 747,335,898
4,849,893,553 4,071,943,396
28 Contingencies and commitments
Contingencies
28.1 Guarantees issued by banks on behalf of the Company 231,707,767 302,109,293
Commitments
28.3 Confirmed letter of credit in respect of:
- plant and machinery 197,159,004 174,806,846
- raw material 17,577,061 20,162,565
- stores and spares 9,268,077 22,569,492
224,004,142 217,538,903
28.2 Post dated Cheques have been issued to Collector of Customs as an indemnity to adequately discharge the liabilities for taxes and duties leviable on imports. As at June 30, 2012 the value of these cheques amounted to Rs.92.227 million (2011: Rs.17 million)
29.3 Waste sales includes comber noil sales Rs.207,108,461 (2011:Rs.132,667,215).
For the year ended June 30, 2012
46

Sapphire Textile Mills Limited
Annual Report - 2012
Notes To The Financial Statements
29.4 Exchange gain due to currency rate fluctuations relating to export sales amounting to Rs.46.585 million (2011: Rs.110.528 million) has been included in export sales.
29.5 The duty drawback has been given by Ministry of Textile Industries from government of Pakistan vide S.R.O 3(1)TID/09-P-I Dated 1st September 2009 in order to encourage the exporters.
30.1 Raw material consumed
Opening balance 2,056,531,692 1,729,916,003
Purchases 14,419,104,533 16,296,470,613
16,475,636,225 18,026,386,616
Closing stock 13 (2,384,449,421) (2,056,531,692)
14,091,186,804 15,969,854,924
2012 2011
30 Cost of sales and services Note
Raw material consumed 30.1 14,091,186,804 15,969,854,924
Packing material consumed 273,374,025 231,656,443
Stores and spares consumed 447,813,954 413,761,411
Salaries, wages and benefits 30.2 & 30.3 1,072,376,566 973,864,605
Fuel, power and water 1,423,972,408 1,005,554,682
Other manufacturing expenses 30.4 445,484,722 436,636,241
Repairs and maintenance 55,392,030 39,061,320
Vehicle running expenses 23,031,505 17,696,032
Travelling and conveyance 24,768,756 17,886,507
Insurance expenses 44,198,064 34,685,748
Rent, rates and taxes 5,275,457 4,732,307
Fees and subscription 2,735,528 2,222,014
Communication expenses 6,576,965 4,489,727
Printing and stationery 1,976,047 1,392,251
Legal and professional charges 2,729,674 1,989,312
Depreciation 6.2 440,199,940 378,558,511
Miscellaneous expenses 5,034,539 4,593,999
18,366,126,984 19,538,636,034
Work in process
Opening stock 311,539,529 196,467,326
Closing stock 13 (325,046,975)
(311,539,529)
(13,507,446)
(115,072,203)
Cost of goods manufactured 18,352,619,538 19,423,563,831
Finished goods
Opening balance 881,224,450 784,520,071
Goods purchased:
------------- Rupees -------------
Cotton purchases 30.5 79,429,239 192,542,535
Closing stock 13 (595,840,946) (881,224,450)
18,717,432,281 19,519,401,987
For the year ended June 30, 2012
47

Sapphire Textile Mills Limited
Annual Report - 2012
Notes To The Financial Statements
30.2 Salaries, wages and benefits include Rs.65,222,013 (2011:Rs.48,584,231) in respect of post employment benefits - gratuity.
30.3 Salaries and benefits include Rs.3,122,456 (2011:Rs.2,832,128) in respect of provident fund contribution.
2012 2011
31 Distribution cost
Note
On export sales
Export development surcharge 36,776,352 31,592,812
Insurance 5,576,109 3,391,776
Commission 360,280,996 333,003,201
Ocean freight and forwarding 402,312,979 339,484,661
804,946,436 707,472,450
On local sales
Inland freight and handling 35,936,211 38,500,206
Commission 18,673,741 27,872,103
54,609,952 66,372,309
Other distribution cost
Salaries and benefits 31.1 64,122,456 56,010,445
Rent and utilities 2,063,935 1,575,054
Communication 14,755,450 10,700,047
Travelling, conveyance and entertainment 46,795,815 35,783,030
Repairs and maintenance 743,341 205,043
Fees and subscription 2,736,317 1,077,392
Samples and advertising 12,170,754 11,090,339
Exhibition expenses 3,854,650 4,275,754
Printing and stationery 1,453,362 1,385,592
Others 174,852 294,050
148,870,932 122,396,746
1,008,427,320 896,241,505
------------- Rupees -------------
30.4 Other manufacturing expenses
Cotton dyeing, bleaching and bale pressing charges 137,418,805
149,076,104
Yarn dyeing and bleaching charges 24,091,814 24,169,454
Fabric dyeing, bleaching, knitted and processing charges 231,828,541 211,186,562
Yarn doubling charges 6,715,155 9,777,255
Stitching and other charges 45,430,407 42,426,866
445,484,722 436,636,241
30.5 It includes Salaries, wages & benefits, Insurance and Finance cost amounting Rs.63,000 (2011:Rs.1,750,387) Rs.53,771 (2011: Rs.3,500,773) and Rs.2,496,518 (2011: Rs.12,252,707) respectively.
31.1 Salaries and benefits include Rs.2,578,721 (2011:Rs.2,227,298) in respect of provident fund contribution.
For the year ended June 30, 2012
48

Sapphire Textile Mills Limited
Annual Report - 2012
Notes To The Financial Statements
1,155,000 1,100,000
332,750 332,750
78,045 78,045
661,826 685,095
13,750 13,750
2,241,371 2,209,640
Auditors' remuneration
Audit fee
Half yearly review fee
Code of corporate governance review fee
Other certification / services
Out of pocket expenses
33.1
32 Administrative expenses
Directors' remuneration 19,800,000 17,000,000
Salaries and benefits 32.1 88,442,878 85,292,496
Rent, rates and utilities 8,698,236 7,721,0737,721,073
Communication 6,289,397 6,815,998
Printing and stationery 1,662,037 4,396,965
Travelling, conveyance and entertainment 15,259,033 13,492,601
Motor vehicle expenses 10,203,688 9,927,219
Repairs and maintenance 3,074,693 5,830,316
Insurance Expense 1,488,827 646,751
Legal and professional charges 14,700,737 10,817,665
Fees and subscription 2,387,600 2,550,068
Computer expenses 2,123,226 3,171,139
Advertisement 120,500 328,500
Depreciation 6.2 5,530,915 4,791,968
Others 323,137 419,538
180,104,904 173,202,297
32.1 Salaries and benefits include Rs.3,338,629 (2011:Rs.2,827,896) in respect of provident fund contribution.
33 Other operating expenses
24.4 57,506,205 92,260,290
23,060,045 36,204,796
33.1 2,241,371 2,209,640
33.2 16,600,452 38,517,190
7.3 1,571,980 2,248,081
8.1 2,003,707 1,565,443
14.3 12,000,000 12,000,000
15.2 - 2,500,000
13,037,084 17,351,880
20,072,440 9,047,791
1,273,350 -
149,366,634 213,905,111
Workers' profit participation fund
Workers' welfare fund
Auditors' remuneration
Donations
Depreciation on investment property
Amortization of intangible asset
Provision for doubtful debts
Provision for doubtful advance
Impairment loss on associated company
Exchange loss on
- short term foreign currency loan
- monetary assets
2012 2011
------------- Rupees -------------
For the year ended June 30, 2012
Note
49

Sapphire Textile Mills Limited
Annual Report - 2012
Notes To The Financial Statements
2012 2011
Note ------------- Rupees -------------
33.2 Donations include the following in which a director is interested:
Name of director Interest in donee Name and address of donee
Mr. Mohammad Abdullah Director Abdullah Foundation 13,550,000 33,900,000
Mr. Yousuf Abdullah Director 312, Cotton Exchange Building,
Mr. Nadeem Abdullah Director I.I. Chundrigar Road, Karachi.
Mr. Amer Abdullah Director
Mr. Mohammad Abdullah Trustee Jamal-ud-din Fatima Charitable Trust 900,000 700,000
Mr. Nadeem Abdullah Trustee 149, Cotton Exchange Building,
I.I. Chundrigar Road, Karachi.
34.2.1 The Company has sold Unit-2 at Kotri along with electric being produced therein.
34.2 Income from power generation
Sales - 189,249,816
Cost of electricity product:
Salaries, wages and benefits - 10,889,488
Stores and spares consumed - 9,790,388
Fuel, power and water - 142,089,073
Insurance expenses - 1,639,398
Rent, rates and taxes - 227,239
Repairs and maintenance - 1,662,129
Vehicle running expenses - 296,515
Travelling and conveyance - 259,765
Communication expenses - 83,110
Fees and subscription - 75,000
Depreciation expenses - 6,329,275
Finance cost - 62,781
Other expenses - 70,536
- 173,474,697
- 15,775,119
34.1 Dividend income from associated companies
Reliance Cotton Spinning Mills Limited 794,718 637,506
Sapphire Fibres Limited - 4,413,588
794,718 5,051,094
34 Other operating income
Income from financial assets / liabilities
Dividend income
- from other companies 227,709,338 164,145,950
- from associates companies 34.1 794,718 5,051,094
Gain on sale of investments 60,384,379 57,294,323
Profit on saving and deposit accounts 169,998 135,444
Rental income 12,720,000 13,560,959
Income from power generation 34.2 - 15,775,119
Exchange gain on
- foreign currency account 68,528 2,053,897
- monetary assets - 5,713,975
Income from non-financial assets
Gain on sale of property, plant and equipment - net 72,771,716 172,255,046
Reversal of provision for doubtful debts 13,328,196 -
Gain on sale of investment property 1,293,181 -Scrap sales 18,390,803 15,675,423
407,630,857 451,661,230
For the year ended June 30, 2012
50

Sapphire Textile Mills Limited
Annual Report - 2012
Notes To The Financial Statements
2012 2011
35 Finance cost
Interest / mark-up on : - short term finances 451,698,827 553,941,401 - long term loans 132,128,025 105,192,434 - Workers' profit participation fund 24.4 6,526,568 9,131,080Bank charges, commission and others charges 123,051,843 144,753,392Realized gain on measurement of derivative financial instruments - net (217,532) (966,874)
713,187,731 812,051,433
36 Earnings per shares
Profit after taxation 1,073,678,712 1,607,405,069
Weighted average number of ordinary shares 20,083,140 20,083,140
Earnings per share - basic and diluted 53.46 80.04
36.1 There is no dilutive effect on basic earnings per share.
37 Cash generated from operations
Profit before taxation 1,129,942,224 1,774,035,028
Adjustments for non-cash charges and other items:Depreciation on operating fixed assets 445,730,855 389,679,754Depreciation on investment property 1,571,980 2,248,081Gain on sale of investments (60,384,379) (57,294,323)Amortization of intangible assets 2,003,707 1,565,443Gain on sale of property, plant and equipment (72,771,716) (172,255,046)Gain on sale of investment property (1,293,181) -Dividend income - others (227,709,338) (164,145,950)Dividend income - associates (794,718) (5,051,094)Provision for gratuity 65,222,013 48,584,231
------------- Rupees -------------
Provision for gratuity 65,222,013 48,584,231Provision for doubtful debts and advances 12,000,000 14,500,000Reversal of provision for doubtful debts (13,328,196) -Exchange differences 21,345,790 3,333,816Realized gain on measurement of derivative financial instrument (217,532) (966,874)Finance cost 713,405,263 813,167,159Profit on deposits (169,998) (135,444)Impairment loss on an associated company 13,037,084 17,351,880Rental income (12,720,000) (13,560,959)
884,927,634 877,020,674
Operating cash flow before changes in working capital 2,014,869,858 2,651,055,702Changes in working capital(Increase) / Decrease in current assetsStores, spare and loose tools (41,688,063) 16,044,519Stock-in-trade 339,622,186 (897,681,989)Trade debts 446,171,343 (542,259,104)Loans and advances (395,129) (93,559,692)Trade deposits and short term prepayments 2,343,357 (7,805,024)Other receivables (16,355,056) 14,909,546
729,698,638 (1,510,351,744)Increase in current liabilitiesTrade and other payables 155,932,416 244,618,775
2,900,500,912 1,385,322,733
For the year ended June 30, 2012
Note
51

Sapphire Textile Mills Limited
Annual Report - 2012
Notes To The Financial Statements
38 Related party disclosures
The related parties comprise associated companies (due to common directorship), wholly owned subsidiaries, directors and key management personnel. Amounts due to/from related parties are shown in the relevant notes to the financial statements. The Company in the normal course of business carries out transactions with various related parties.
Significant balances and transactions with related parties are as follows.
Nature of transaction Relationship with the 2012 2011
Company
Sales, services provided, Rental income and
reimbursement of expenses
Amer Cotton Mills (Private) Limited Related party 763,559 836,640Creadore A/S, Denmark Associate 248,515,610 7,767,831Diamond Fabrics Limited Related party 16,892,516 49,930,985Reliance Cotton Spinning Mills Limited Associate 278,552 5,904Sapphire Fibres Limited Related party 32,284,583 9,314,972Sapphire Finishing Mills Limited Related party 341,598,152 10,219,707Sapphire Home Inc. Subsidiary 105,695,523 105,536,642
746,028,495 183,612,681
Purchases, services received and reimbursement of expenses
Amer Cotton Mills (Private) Limited Related party - 1,132,650Diamond Fabrics Limited Related party 136,000 758,820Neelum Textile Mills (Pvt) Limited Related party 17,500 -Reliance Cotton Spinning Mills Limited Associate 91,353,223 44,414,484Sapphire Fibres Limited Related party 189,869,493 256,973,227Sapphire Finishing Mills Limited Related party 15,101,525 24,005,366Sapphire Power Generation Limited Associate 497,370,998 316,624,233
793,848,739 643,908,780
Sale of property, plant and equipment
Sapphire Finishing Mills Limited Related party 97,387,500 -
Purchase of property, plant and equipment
Sapphire Fibres Limited Related party 870,500 -
Rent and other expenses
Yousuf Agencies (Private) Limited Related party 2,234,835 1,953,000
------------- Rupees -------------
Yousuf Agencies (Private) Limited Related party 2,234,835 1,953,000
Contribution to provident fund
Retirement benefit fund 9,039,806 7,887,322
Expenses charged to
Amer Cotton Mills (Pvt) Limited Related party 196,757 -Diamond Fabrics Limited Related party - 726,080Reliance Cotton Spinning Mills Limited Associate 1,185,826 772,487Sapphire Dairies (Pvt) Limited Associate 41,719 -Sapphire Fibres Limited Related party 8,442,800 6,753,455Sapphire Finishing Mills Limited Related party 1,114,580 -Sapphire Power Generation Limited Associate 89,952 -Sapphire Wind Power Company Limited Subsidiary 5,524,987 77,311
16,596,621 8,329,333
Sapphire Textile Mills Limited - EmployeesProvident Fund
For the year ended June 30, 2012
52

Sapphire Textile Mills Limited
Annual Report - 2012
Nature of transaction Relationship with the 2012 2011
Company ------------- Rupees -------------
Notes To The Financial Statements
122,900,000 20,850,000
Donations
Abdullah Foundation Related party 13,550,000 33,900,000Jamal-ud-din Fatima Charitable Trust Related party 900,000 700,000
14,450,000 34,600,000
Dividend received
Reliance Cotton Spinning Mills Limited Associate 794,718 637,506Sapphire Fibres Limited Related party - 4,413,588
794,718 5,051,094
Expenses charged by
Sapphire Fibres Limited Related party 1,116,780 777,342
Share deposit money
Sapphire Wind Power Company Limited Subsidiary 32,900,000 20,850,000Sapphire Dairies (Pvt) Ltd Associate 90,000,000 -
Dividend paid
Amer Cotton Mills (Private) Limited Related party - 3,375,415
Amer Tex (Pvt) Limited Related party 3,375,415 -
Diamond Fabrics Limited Related party - 668,925
Diamond Limited Related party 668,925 -
Galaxy Agencies (Pvt) Limited Related party 2,523,055 2,523,055
Nadeem Enterprise (Pvt) Limited Related party 2,931,210 2,931,210
Neelum Textile Mills (Private) Limited Related party 1,362,970 1,362,970
Reliance Cotton Spinning Mills Limited Associate 501,115 501,115
Sapphire Agencies (Pvt) Limited Related party 11,608,340 11,577,745
Sapphire Power Generation Limited Related party 1,418,210 1,418,210
24,389,240 24,358,645
39 Plant capacity and actual production 2012 2011
Spinning units
Total number of spindles installed 122,328 120,632
Average number of spindles worked 114,911 117,337
Total number of rotors installed 3,120 3,120
Average number of rotors worked 3,057 2,305
Number of shifts worked per day 3 3
Total days worked 360 360
Installed capacity after conversion into 20/s lbs 86,040,250 84,877,025
Actual production after conversion into 20/s lbs 89,641,405 89,203,609
Weaving unit
Total number of looms installed 292 244
Average number of looms worked 287 233
Number of shifts worked per day 3 3
Total days worked 360 360
Installed capacity at 50 picks per inch of fabric square meters 98,269,741 86,410,095
Actual production converted at 50 picks per inch of fabric square meters 93,024,466 76,616,055
Home Textile Product unit
The capacity of this unit is undeterminable due to multi product involving varying processes of manufacturing and runlength of order lots.
For the year ended June 30, 2012
53

Sapphire Textile Mills Limited
Annual Report - 2012
2012 2011
------------- Rupees -------------
Notes To The Financial Statements
Rent and utilities 3,000,000 3,000,000
9,000,000 9,000,000
Number of person 1 1
Director
Remuneration 7,200,000 5,333,396
Rent and utilities 3,600,000 2,666,604
10,800,000 8,000,000
Number of persons 2 2
Executives
Managerial remuneration 75,004,501 62,743,445
House rent 35,092,446 29,449,939
Cost of living allowance 71,400 97,800
Bonus 13,357,400 13,467,810
Medical 1,700,913 1,950,831
Utilities 4,616,785 3,798,481
Leave encashment and other benefits 7,295,345 8,707,578
137,138,790 120,215,883
Number of persons 75 58
75 58
The Chief Executive and two Directors were also provided with cars maintained by the Company and telephones at
Number of executives provided with the Company maintained cars
residence.
40 Remuneration of chief executive, director and executives
Chief Executive
Remuneration 6,000,000 6,000,000
41 FINANCIAL INSTRUMENTS
The Company has exposures to the following risks from its use of financial instruments:
41.1 - Credit risk41.2 - Liquidity risk41.3 - Market risk
The Company's Board of Directors has overall responsibility for the establishment and oversight of the Company's risk management framework. The Board is also responsible for developing and monitoring the Company's risk management policies.
41.1 Credit risk
41.1.1 Exposure to credit risk
Credit risk is the risk of financial loss to the company if a customer or counterparty to a financial instrument fails to meet its contractual obligations, and arises principally from the trade debts, loans and advances, trade deposits and short term prepayments, other receivables, other financial assets and cash and bank balances. Out of total financial assets of Rs.4,371.876 million (2011:Rs.5,015.893 million), financial assets which are
For the year ended June 30, 2012
54

Sapphire Textile Mills Limited
Annual Report - 2012
Notes To The Financial Statements
subject to credit risk aggregate to Rs.4,295.889 million (2011:Rs.4,910.110 million). The carrying amount of financial assets represents the maximum credit exposure. The maximum exposure to credit risk at the reporting date is as follows.
2012 2011
Long term investments 1,951,957,505 2,119,658,353 Long term loans and advances 54,591,805 53,337,251
Long term deposits 29,500,666 23,352,066 Trade debts 1,337,067,271 1,781,910,418
Loans and advances 99,355,288 100,726,216 Trade deposits and short term prepayments 923,133 745,709
Other receivables 12,152,013 6,706,504 Short term investments 810,341,353 823,673,619
Cash and bank balances 75,986,808 105,783,179
4,371,875,842 5,015,893,315
41.1.2 The maximum exposure to credit risk for trade debts at the reporting date by geographical region is as follows.
Domestic 683,050,385 718,359,686Export 654,016,886 1,063,550,732
1,337,067,271 1,781,910,418
------------- Rupees -------------
1,337,067,271 1,781,910,418
The majority of export debts of the Company are situated in Asia, Europe, Australia and North America.
41.1.3 The maximum exposure to credit risk for debts at the reporting date by type of product is as follows:
Yarn 731,810,667 995,368,253
Fabric 385,609,675 382,858,603Home textile product 178,459,704 356,167,592
Energy - 16,964,285Raw material 21,924 2,633,133
Waste 29,001,429 22,018,951Processing services 9,557,818 4,924,148Others 2,606,054 975,453
1,337,067,271 1,781,910,418
41.1.4 The aging of trade debts at the reporting date is as follows:
Not past due 1,102,174,641 1,352,250,608
Past due 0 - 30 days 186,447,357 345,074,815Past due 31 - 60 days 8,943,587 32,640,740
Past due 61 - 90 days 7,447,290 3,199,964Past due 91 - 1 year 15,768,909 28,484,893
More than one year 16,285,487 20,259,398
1,337,067,271 1,781,910,418
Credit quality of counter parties is assessed based on historical default rates. All receivables past due are considered good. The management believes that allowance for impairment of receivables past due is not necessary, as these comprise amounts due from old customers, which have been re-negotiated from time to time and are also considered good.
For the year ended June 30, 2012
55
Sapphire Textile Mills Limited
Annual Report - 2012
Notes To The Financial Statements
41.2 Liquidity risk
Liquidity risk is the risk that an entity will encounter difficulties in meeting obligations associated with financial liabilities. Prudent liquidity risk management implies maintaining sufficient cash and the availability of funding through an adequate amount of committed credits facilities. The Company's treasury department maintains flexibility in funding by maintaining availability under committed credits lines.
Financial Liabilities in accordance with their contractual maturities are presented below:
Long term financing 1,308,090,300 1,687,335,134 362,180,222 1,325,012,831 142,081
Trade and other payables 832,049,361 832,049,361 832,049,361 - -
Accrued interest / mark-up 70,308,182 70,308,182 70,308,182 - -
Short term borrowings 2,850,256,515 2,869,398,021 2,869,398,021 - -
5,060,704,358 5,459,090,698 4,133,935,786 1,325,012,831 142,081
Long term financing 1,148,629,892 1,582,162,112 337,830,167 1,167,609,714 76,722,231
Trade and other payables 735,890,834 735,890,834 735,890,834 - -
Accrued interest / mark-up 71,081,854 71,081,854 71,081,854 - -
Short term borrowings 4,182,054,384 4,191,594,667 4,191,594,667 - -
6,137,656,964 6,580,729,467 5,336,397,522 1,167,609,714 76,722,231
Rupees
2 0 11
Carrying amount Contractual cash flow Up to 1 yearBetween 1 to 5
years5 years and
above
Carrying amountContractual cash
flowUp to 1 year
Between 1 to 5
years
5 years and
above
Rupees
2 0 1 2
41.2.1 The contractual cash flow relating to the above financial liabilities have been determined on the basis of mark-up / interest rates effective at the respective year-end. The rates of mark-up / interest have been disclosed in the respective notes to these financial statements.
41.3 Market risk
Market risk is the risk that changes in market price, such as foreign exchange rates, interest rates and equity prices will affect the Company's income or the value of its holding of financial instruments.
For the year ended June 30, 2012
56

Sapphire Textile Mills Limited
Annual Report - 2012
Notes To The Financial Statements
41.3.1 Currency risk
The Company is exposed to currency risk on import of raw materials, stores & spares parts and export of goods mainly denominated in US Dollar, Euro, Japanese Yen and Swiss Frank. The Company's exposure to foreign currency risk for US Dollar, Euro, Japanese Yen and Swiss Frank is as follows:
Sensitivity analysis
A 10 percent strengthening of the Rupees against US Dollar and Euro at June 30, would have increase / (decrease) equity and profit and loss account by the amounts shown below. This analysis assumes that all other variables, in particulars interest rates, remain constant. The analysis is performed on the basis for 2012.
The following significant exchange rates have been applied:
2012 2011
US $ to Rupees 94 / 94.20 85.85 / 86.05
Euro to Rupees 118.25 / 118.50 124.60 / 124.89
Reporting date rate
Rupees US $ EURO JPY CHF
Short term borrowings (Foreign currency loan) - - - - -
Accrued mark-up on (Foreign currency loan) - - - - -
- - - - -
Trade debts 654,016,886 (5,905,535) (830,908) - -
Bank balances 5,514,126 (31,742) (21,400) - -
Gross Balance sheet exposure 659,531,012 (5,937,277) (852,308) - -
Outstanding letters of credit 231,707,767 1,423,213 722,154 2,870,000 9,692
Forward exchange contracts 1,262,550,790 10,565,420 2,482,593 - -
Net Exposures 2,153,789,569 6,051,356 2,352,439 2,870,000 9,692
Rupees US $ EURO JPY CHF
Short term borrowings (Foreign currency loan) 1,330,732,645 15,464,644 - - -
Accrued mark-up on (Foreign currency loan) 5,181,536 60,215 - - -
1,335,914,181 15,524,859 - - -
Trade debts (1,063,550,732) (11,257,767) (779,666) - -
Bank balances (7,622,848) (21,952) (46,053) - -
Gross Balance sheet exposure 264,740,601 4,245,140 (825,719) - -
Outstanding letters of credit 217,538,903 344,824 1,085,588 41,577,000 75,340
Forward exchange contracts 2,892,632,474 30,762,500 1,703,970 - -
Net Exposures 3,374,911,978 35,352,464 1,963,839 41,577,000 75,340
2 0 1 2
2 0 1 1
For the year ended June 30, 2012
57

Sapphire Textile Mills Limited
Annual Report - 2012
Notes To The Financial Statements
Equity Profit & loss
As at June 30, 2012
Effect in US Dollar - (55,810,404)
Effect in Euro - (10,099,850)
As at June 30, 2011
Effect in US Dollar - 36,529,430
Effect in Euro - (10,288,459)
2012 2011 2012 2011
Fixed rate instrumentsFinancial liabilities
Long term financing 7.00% to 12.70% 7.00% to 11.20% 723,411,302 464,632,892
Variable rate instruments
Financial liabilities
Long term financing 12.70% to 13.45% 14.73% to 15.04% 584,678,998 683,997,000
Short term borrowings 2.00 % to 15.57% 1.70% 15.57% 2,850,256,515 4,182,054,384
------------- Rupees -------------
Rupees
Effective rate Carrying Amount
Short term borrowings 2.00 % to 15.57% 2,850,256,515 4,182,054,384
10 percent weakening of the Rupees against the above currency at 30 June would have had the equal but opposite effect on the above currencies to the amounts shown above, on the basis that all other variable remain content.
41.3.2 Interest rate risk
At the reporting date, the profit, interest and mark-up rate profile of the Company's significant financial assets and liabilities is as follows:
Fair value sensitivity analysis for fixed rate instruments
The Company does not account for any fixed rate financial assets and liabilities at fair value through profit & loss. Therefore, a change in mark-up / interest rates at the reporting date would not affect profit & loss account.
Cash flow sensitivity analysis for variable rate instruments
A change of 100 basis points in mark-up / interest rates at the balance sheet date would have increased / (decreased) profit for the year by the amounts shown below. This analysis assumes that all other variables, in particular foreign currency rates, remain constant. The analysis is performed on the same basis for 2011.
Increase Decrease
As at June 30, 2012Cash flow sensitivity - variable rate instruments 34,349,355 (34,349,355)
As at June 30, 2011Cash flow sensitivity - variable rate instruments 48,660,514 (48,660,514)
------------- Rupees -------------
Profit and loss 100 bps
The sensitivity analysis prepared is not necessarily indicative of the effects on profit for the year and liabilities of the Company.
For the year ended June 30, 2012
58

Sapphire Textile Mills Limited
Annual Report - 2012
Notes To The Financial Statements
41.3.3 Other price risk
Other price risk is the risk that the fair value or future cash flows of a financial instrument will fluctuate because of changes in market prices (other than those arising from interest rate risk or currency risk). Other price risk arises from the Company's investment in ordinary shares of listed Companies. To manage its price risk arising from aforesaid investments, the company diversify its portfolio and continuously monitor developments in equity markets. In addition the Company actively monitors the key factors that affect stock price movement.
A 10% increase / decrease in share prices of listed companies at the balance sheet date would have increased / decreased the Company's unrealised gain on 'available for sale' investments as follows:
2012 2011
Effect on equity 267,615,062 285,718,374
Effect on investments 267,615,062 285,718,374
------------- Rupees -------------
41.4 Fair value of financial instruments
Carrying values of the financial assets and financial liabilities approximate their fair values. Fair value is the amount for which an asset could be exchanged, or a liability settled, between knowledgeable, willing parties in an arm's length transaction.
41.5 Fair value hierarchy
The carrying value of all financial assets and liabilities reflected in the financial statements approximate their fair value.
The table below analyses financial instruments carried at fair value, by valuation method. The different level have been defined as follows:
Level 1. Quoted market price (unadjusted) in an active market for identical instrument.
Level 2. Inputs other than quoted price included within Level 1 that are observable for the asset or liability, either directly (i.e., as prices) or indirectly (i.e., derived from prices).
Level 3. Inputs for the asset or liability that are not based on observable market data (unobservable inputs).
Level 1 Level 2 Level 3
As at June 30, 2012
Assets carried at fair valueAvailable for sale investments 2,676,150,622 - 86,148,236.00Forward exchange contracts used for hedging - - -
2,676,150,622 - 86,148,236As at June 30, 2011
Assets carried at fair valueAvailable for sale investments 2,857,183,736 86,148,236Forward exchange contracts used for hedging - 1,899,447 -
2,857,183,736 1,899,447 86,148,236As at June 30, 2012Liabilities carried at fair value - 26,899,054 -Forward exchange contracts used for hedging
As at June 30, 2011
-------------------------------- Rupees --------------------------
As at June 30, 2011Liabilities carried at fair valueForward exchange contracts used for hedging - - -
The sensitivity analysis prepared is not necessarily indicative of the effects on equity / investments of the Company.
For the year ended June 30, 2012
59

Sapphire Textile Mills Limited
Annual Report - 2012
Notes To The Financial Statements
41.5 Capital risk management
The Company's prime objective when managing capital is to safeguard its ability to continue as a going concern in order to provide adequate returns for shareholders, benefits for other stakeholders and to maintain an optimal capital structure to reduce the cost of capital.
Consistent with others in the industry, the company manages its capital risk monitoring its debts levels and liquid assets and keeping in view future investment requirements and expectations of the shareholders. Debt is calculated as total borrowings ('long term loans' and 'short term borrowings' as shown in the balance sheet). Total capital comprises shareholders' equity as shown in the balance sheet under 'share capital and reserves'.
2012 2011
Total borrowings 4,158,846,403 5,331,633,595Less: Cash and bank balances 75,986,808 105,783,179
Net debt 4,082,859,595 5,225,850,416
Total equity 8,327,121,318 7,520,937,235
Total capital 12,409,980,913 12,746,787,651
Gearing ratio 32.90 41.00
Percentage
------------- Rupees -------------
42 Non adjusting event after balance sheet date
The board of directors in its meeting held on October 05, 2012 proposed a cash dividend of Rs. 100,415,700 (2011: Rs. 100,415,700) at the rate of Rs. 5 (2011: Rs. 5) per ordinary share of Rs.10 each. Proposed dividend is subject to approval by shareholders at the forthcoming Annual General Meeting and has not been included as a liability in these financial statements. This will be accounted for subsequently in the year of payment.
For the year ended June 30, 2012
60

Sapphire Textile Mills Limited
Annual Report - 2012
44 Date of authorization for issue
These financial statements were approved by the Board of Directors and authorized for issue on October 05, 2012 .
Karachi:
Dated: October 05, 2012
NADEEM ABDULLAH MOHAMMAD ABDULLAH
DIRECTORCHIEF EXECUTIVE
Notes To The Financial Statements
43 Corresponding figures
Corresponding figures has been rearranged and reclassified, wherever necessary, for better presentation and comparison. Significant reclassification includes the following.
Re-classification to component Note Rupees
Balance sheet
Inventories Stores, spares and loose tools 12 209,111,346
Stock-in-trade 13 3,657,344,997
Cash flow statement
Inventories Stores, spares and loose tools 37 16,044,519
Stock-in-trade 37 897,681,989
Cost of sales
Goods purchased : Yarn for processing Purchases 30 123,316,609
Goods purchased : Fabric for processing Purchases 30 53,110,353
Re-classification from component
For the year ended June 30, 2012
61

Sapphire Textile Mills Limited
Annual Report - 2012
Pattern of ShareholdingAs at June 30, 2012
NUMBER OF
SHAREHOLDERSFROM TO TOTAL SHARES HELD
455 1 100 5,291
46 101 500 12,776
34 501 1,000 24,534
39 1,001 5,000 87,282
13 5,001 10,000 96,491
2 10,001 15,000 27,291
2 15,001 20,000 31,251
2 20,001 25,000 42,485
1 25,001 30,000 26,000
2 35,001 40,000 75,283
1 40,001 45,000 41,209
1 45,001 50,000 46,617
2 60,001 65,000 126,624
1 65,001 70,000 65,920
1 70,001 75,000 72,542
1 85,001 90,000 86,642
3 100,000 105,000 300,931
1 115,001 120,000 118,109
1 130,001 135,000 133,785
1 170,001 175,000 170,374
1 175,001 180,000 178,900
1 210,001 215,000 211,100
1 265,001 270,000 268,050
1 270,001 275,000 272,594
1 315,001 320,000 319,746
1 350,001 355,000 351,486
2 375,001 380,000 756,039
1 495,001 500,000 496,183
1 500,001 505,000 504,611
1 560,001 565,000 564,522
1 585,001 590,000 586,242
1 600,000 605,000 600,000
1 605,001 610,000 609,063
1 635,001 640,000 635,506
1 740,001 745,000 743,123
1 921,001 925,000 924,088
1 1,870,001 1,875,000 1,873,289
1 2,075,001 2,080,000 2,077,128
1 2,105,001 2,110,000 2,106,659
1 2,175,001 2,180,000 2,175,106
1 2,235,001 2,240,000 2,238,268
631 20,083,140
62
Note: There is no shareholding in the slab not mentioned.

Sapphire Textile Mills Limited
Annual Report - 2012
Pattern of ShareholdingAs at June 30, 2012
CATEGORIES OF SHAREHOLDERS
Directors, their spouse and minor children 8,894,289 44.29
5,445,612 27.12
NIT & ICP 929,970 4.63
21,974 0.11
Others Companies 113,789 0.57
Modarabas & Mutual Funds 8,890 0.04
General Public (Local) 4,668,616 23.24
20,083,140 100.00
Banks, Development Finance Institutions, Non- Banking Finance Institutions
No. of Shares Held PercentageParticulars
Associated Companies, Undertakings and Related Parties
63

Sapphire Textile Mills Limited
Annual Report - 2012
Pattern of ShareholdingAs at June 30, 2012
A) ASSOCIATED COMPANIES, UNDERTAKINGS AND RELATED PARTIES NO OF SHARES
Reliance Cotton Spinning Mills Limited 100,223Sapphire Agencies (Pvt.) Limited 2,324,910Diamond Limited 133,785Amer Tex (Pvt.) Limited 675,083Sapphire Power Generation Limited 283,642Neelum Textile Mills (Pvt.) Limited 272,594Galaxy Agencies (Pvt.) Limited 504,611Salman Ismail (SMC-PRIVATE) Limited 564,522Nadeem Enterprise (Pvt.) Limited 586,242
B) NIT & ICP
National Bank of Pakistan - Trustee Department NI(U)T Fund 924,088National Investment Trust Limited 5,882
C) DIRECTORS, CHIEF EXECUTIVE OFFICER, THEIR SPOUSESAND MINOR CHILDREN
DIRECTORS & THEIR SPOUSES
Mr. Yousuf Abdullah 2,108,542Mr. Hasan Abdullah 500Mr. Mohammad Younus 20,738Mr. Nabeel Abdullah 100,000Mr. Shayan Abdullah 100,000Mr. Mohammad Abdullah 600,000Mr. Amer Abdullah 2,077,128Mrs. Ambareen Amer 636,506Mrs. Shamshad Begum 618,763
CHIEF EXECUTIVE OFFICER & HIS SPOUSES
Mr. Nadeem Abdullah 1,888,689Mrs. Noshaba Nadeem 743,423
D) BANKS, DEVELOPMENT FINANCIAL INSTITUTIONS, NON BANKING FINANCIAL INSTITUTIONS, INSURANCE COMPANIES,MODARABAS & MUTUAL FUNDS
BANKS
National Bank of Pakistan 21,974
MODARABAS
M/s Guardian Leasing Modaraba 8,890
E) SHAREHOLDERS HOLDING 10% OR MORE
Mr. Amer Abdullah 2,077,128Mrs. Shireen Shahid 2,175,106Mr. Yousuf Abdullah 2,108,542Sapphire Agencies (Pvt.) Limited 2,324,910
F) TRADING IN THE SHARES OF COMPANY DURING THE YEAR BY THEDIRECTORS, CHIEF EXCEUTIVE OFFICER, CHIEF FINANCIAL OFFICER,COMPANY SECRETARY AND THEIR SPOUSES AND MINOR CHILDERN NIL
64

Sapphire Textile Mills Limited
Annual Report - 2012
Contents
Consolidated Accounts
Sapphire Textile Mills Limitedand its subsidiaries
DIRECTORS’ REPORT 66
AUDITORS’ REPORT 67
BALANCE SHEET 68
PROFIT AND LOSS ACCOUNT 69
STATEMENT OF COMPREHENSIVE INCOME 70
CASH FLOW STATEMENT 71
STATEMENT OF CHANGES IN EQUITY 72
NOTES TO THE FINANCIAL STATEMENTS 73
FORM OF PROXY 118
65

Sapphire Textile Mills Limited
Annual Report - 2012
On behalf of Board of Directors of Holding Company of Sapphire Wind Power Company Limited and Sapphire Home Incorporation, it is my pleasure to present Directors’ report with the Audited Consolidated Financial Statements and Auditor’s report thereon for the year ended 30, June, 2012.
SAPPHIRE WIND POWER COMPANY LIMITED
The Company obtained a LOI for developing a 50 MW wind farm at Jhumpir and was allocated 1372 acres of land for the purpose by AEDB. Wind resource assessment and detailed project feasibility were completed and approved by AEDB. The Company followed a transparent tendering process and selected GE wind turbines and signed an EPC contract and a 10 years O&M contact. The company has obtained a tariff determination from NEPRA and is working towards achieving financial close on the project.
SAPPHIRE HOME INCORPORATION
Sapphire Home Incorporation is incorporated under the laws of the State of New York in United States of America (USA). There are certain customers in the USA which need goods on landed duty paid basis. Sapphire Home Inc. provides this service for the home textile products for these customers.
On behalf of the Board
Karachi NADEEM ABDULLAHDated: October 05, 2012 Chief Executive
Directors’ Reportto the Shareholders
66
Sapphire Textile Mills Limited
Annual Report - 2012
Auditors’ Reportto the members
We have examined the annexed consolidated financial statements comprising of consolidated balance sheet of
Sapphire Textile Mills Limited (the holding company) and its subsidiary companies, Sapphire Wind Power
Company Limited and Sapphire Home Inc. as at June 30, 2012 and the related consolidated profit and loss
account, the consolidated statement of comprehensive income, the consolidated cash flow statement, and the
consolidated statement of changes in equity together with the notes forming part thereof, for the year ended June
30, 2012. We have also expressed a separate opinion on the financial statements of Sapphire Textile Mills
Limited. The financial statements of Sapphire Wind Power Company Limited and Sapphire Home Inc. have
been audited by another firm of Chartered Accountants and whose report has been furnished to us. Our opinion in
so far as it relates to the amounts included in respect of the subsidiary companies, is based solely on the report of
such other auditor. These financial statements are the responsibility of the holding company’s management. Our
responsibility is to express an opinion on these financial statements based on our examination.
Our examination was made in accordance with the International Standards on Auditing and accordingly included
such tests of accounting records and such other auditing procedures, as we considered necessary in the
circumstances.
In our opinion the consolidated financial statements examined by us present fairly the financial position of
Sapphire Textile Mills Limited and its subsidiary companies as at June 30, 2012 and the results of their operations
for the year ended June 30, 2012.
MUSHTAQ & COMPANY
KARACHI: Chartered Accountants
Date: October 05, 2012 Engagement Partner:
Shahabuddin A. Siddiqui
F.C.A
67

Sapphire Textile Mills Limited
Annual Report - 2012
2012 2011
NoteASSETS
NON-CURRENT ASSETS
Property, plant and equipment 6 5,237,750,406 4,732,832,917
Investment property 7 186,904,254 200,483,053
Intangible assets 8 8,335,030 4,354,967
Long term investments 9 2,337,996,885 2,389,296,853
Long term loans and advances 10 36,223,204 39,234,707
Long term deposits 11 29,500,666 23,352,066
7,836,710,445 7,389,554,563
CURRENT ASSETS
Stores, spares and loose tools 12 250,799,409 209,111,346
Stock-in-trade 13 3,328,915,934 3,735,227,873
Trade debts 14 1,309,908,251 1,691,268,678
Loans and advances 15 125,446,989 122,551,860
Trade deposits and short term prepayments 16 14,845,992 17,373,512
Other receivables 17 37,235,618 33,470,624
Other financial assets 18 810,341,353 823,673,619
Tax refunds due from Government 19 434,008,678 396,150,988
Cash and bank balances 20 101,542,626 106,694,575
6,413,044,850 7,135,523,075
TOTAL ASSETS 14,249,755,295 14,525,077,638
EQUITY AND LIABILITIES
SHARE CAPITAL AND RESERVES
Authorized share capital35,000,000 (2011: 35,000,000) ordinary shares of Rs.10 each 350,000,000 350,000,000
Issued, subscribed and paid-up capital 21 200,831,400 200,831,400
Reserves 8,313,635,196 7,448,529,430
8,514,466,596 7,649,360,830
NON-CURRENT LIABILITIES
Long term financing 22 1,094,621,651 952,144,668
Deferred liabilities 23 183,243,590 289,841,310
1,277,865,241 1,241,985,978
CURRENT LIABILITIES
Trade and other payables 24 1,102,268,513 916,655,185
Accrued Interest / mark-up 25 70,308,182 71,081,854
Short term borrowings 26 2,850,979,411 4,183,003,703
Current portion of long term financing 22 213,468,649 196,485,224
Provision for taxation 27 220,398,703 266,504,864
4,457,423,458 5,633,730,830
CONTINGENCIES AND COMMITMENTS 28
TOTAL EQUITY AND LIABILITIES 14,249,755,295 14,525,077,638
The annexed notes form an integral part of these financial statements.
Karachi:Dated: October 05, 2012
NADEEM ABDULLAH MOHAMMAD ABDULLAHDIRECTORCHIEF EXECUTIVE
-------------------- Rupees -------------------
Consolidated Balance SheetAs at June 30, 2012
68

Sapphire Textile Mills Limited
Annual Report - 2012
For the year ended June 30, 2012
The annexed notes form an integral part of these financial statements.
Karachi:Dated: October 05, 2012
NADEEM ABDULLAH MOHAMMAD ABDULLAHDIRECTORCHIEF EXECUTIVE
Consolidated Profit and Loss Account
2012 2011
Note
Sales and services 29 21,592,423,719 23,037,623,287
Cost of sales and services 30 (18,791,121,797) (19,614,835,674)
Gross profit 2,801,301,922 3,422,787,613
Distribution cost 31 (1,012,717,269) (896,954,972)
Administrative expenses 32 (184,960,278) (177,192,347)
Other operating expenses 33 (136,461,050) (198,250,719)
Other operating income 34 406,836,139 430,830,517
(927,302,458) (841,567,521)
Profit from operations 1,873,999,464 2,581,220,092
Finance cost 35 (713,276,762) (812,212,461)
Profit before taxation 1,160,722,702 1,769,007,631
Share of profit of Associated Companies 20,941,928 644,160,386
1,181,664,630 2,413,168,017
Taxation
Current:
- for the year (221,144,762) (266,568,716)
- prior year 28,743,065 1,525,438
Deferred 135,293,878 211,773,562
(57,107,819) (53,269,716)
Profit after taxation 1,124,556,811 2,359,898,301
Earnings per share - basic and diluted 36 56.00 117.51
--------------------- Rupees ---------------------
69

Sapphire Textile Mills Limited
Annual Report - 2012
For the year ended June 30, 2012
The annexed notes form an integral part of these financial statements.
Karachi:Dated: October 05, 2012
NADEEM ABDULLAH MOHAMMAD ABDULLAHDIRECTORCHIEF EXECUTIVE
Consolidated Statement of Comprehensive Income
2012 2011
Profit after taxation 1,124,556,811 2,359,898,301
Other comprehensive income:
Available for sale investments
(65,134,189) 409,513,482
(73,146,239) (23,933,260)
906,404 78,301,407
(137,374,024) 463,881,629
Forward foreign currency contracts
(26,899,054) 1,899,447
(1,899,447) (1,515,818)
(69,633) 5,621,470
(28,868,134) 6,005,099
6,771,749 (76,243,539)
Exchange difference on translating foreign operation 435,064 4,773
Other comprehensive (loss) / income for the year (159,035,345) 393,647,962
Total comprehensive income for the year 965,521,466 2,753,546,263
------------------ Rupees ------------------
Unrealized gain on remeasurement of available for sale investments - associates
Unrealized (loss) / gain on remeasurement of forward foreign currency contracts - associates
Shares of increase/(decrease) in reserves of associated companies under equity method
Unrealized (loss) / gain on remeasurement of available for sale investments
Unrealized (loss) / gain on remeasurement of forward foreign currency contracts
Reclassification adjustments relating to gain realized on disposal of available for sale investments
Reclassification adjustments relating to gain realized on settlement of foreign currency contracts
70

Sapphire Textile Mills Limited
Annual Report - 2012
For the year ended June 30, 2012
The annexed notes form an integral part of these financial statements.
Karachi:Dated: October 05, 2012
NADEEM ABDULLAH MOHAMMAD ABDULLAHDIRECTORCHIEF EXECUTIVE
Consolidated Cash Flow Statement
2012 2011
Note
CASH FLOWS FROM OPERATING ACTIVITIES
Cash generated from operations 37 2,931,070,219 1,382,621,091
Long term loans and deposits (3,137,097) (25,490,626)
Finance cost paid (714,267,966) (816,969,854)
Staff retirement benefits - gratuity paid (36,525,855) (23,853,339)
Taxes paid (276,365,548) (380,094,157)
(1,030,296,466) (1,246,407,976)
Net cash generated from operating activities 1,900,773,753 136,213,115
CASH FLOWS FROM INVESTING ACTIVITIES
Purchase of property, plant and equipment (1,002,047,430) (1,311,296,720)
Purchase of investment property - (52,950,000)
Purchase of intangible assets (5,983,770) -
Investment in associated undertakings (89,205,282) (28,250,458)
Investment others (254,158,149) (385,443,061)
Proceeds from disposal of property, plant and equipment 124,145,557 254,500,054
Proceeds from disposal of investment property 13,300,000 -
Proceeds from sale of investments 357,295,214 264,466,834
Proceeds from derivative financial instruments 2,081,475 (897,069)
Dividend received 227,709,338 169,197,044
Profit received 169,998 135,444
Rental income received 12,720,000 12,603,123
Net cash used in investing activities (613,973,049) (1,077,934,809)
CASH FLOWS FROM FINANCING ACTIVITIES
Short term borrowings - net (1,351,870,309) 699,322,488
Proceeds from long term financing 352,821,000 604,184,000
Repayment of long term financing (193,360,592) (273,423,393)
Exchange difference on translating foreign operation 435,064 4,773
Dividend paid (99,751,393) (99,759,560)
Net cash (used in) / generate from financing activities (1,291,726,230) 930,328,308
Net decrease in cash and cash equivalents (4,925,526) (11,393,386)
Cash and cash equivalents at the beginning of the year 105,745,256 117,138,642
Cash and cash equivalents at the end of the year 100,819,730 105,745,256
Cash and cash equivalents
Cash and bank balances 101,542,626 106,694,575
Temporary overdraft - unsecured (722,896) (949,319)
Cash and cash equivalents at the end of the year 100,819,730 105,745,256
-------------------- Rupees -------------------
71

Sapphire Textile Mills Limited
Annual Report - 2012
Kara
chi:
Date
d: O
ctober
05, 2012
NA
DE
EM
AB
DU
LL
AH
MO
HA
MM
AD
AB
DU
LL
AH
DIR
EC
TO
RC
HIE
F E
XE
CU
TIV
E
Co
nso
lidat
ed S
tate
men
t o
f C
han
ges
in E
qu
ity
Fo
r th
e ye
ar e
nd
ed J
un
e 30
, 201
2
Cap
ital
Bala
nce
as
at
Ju
ly 0
1,
2010
200,8
31,4
00
156,2
02,2
00
65,0
00,0
00
330,0
00,0
00
5,8
15
,91
6,8
30
6,3
67
,11
9,0
30
1,7
06
,45
5,5
56
1,6
37
,99
1-
1,7
08
,09
3,5
47
8,2
76
,04
3,9
77
--
--
(2,5
84
,19
5,5
91
)(2
,58
4,1
95
,59
1)
(68
9,8
74
,47
6)
(5,7
43
,64
3)
(69
5,6
18
,11
9)
(3,2
79
,81
3,7
10
)
Tra
nsf
er
to g
enera
l re
serv
e-
--
1,0
00
,00
0,0
00
(1,0
00
,00
0,0
00
)-
--
--
To
tal
co
mp
reh
en
siv
e i
nc
om
e f
or
the
Year
en
ded
Ju
ne
30,
2011
Pro
fit
aft
er
taxa
tio
n-
--
-2
,35
9,8
98
,30
12
,35
9,8
98
,30
1-
--
2,3
59
,89
8,3
01
Oth
er
co
mp
reh
en
siv
e in
co
me
--
--
--
463,8
81,6
29
6,0
05
,09
94,7
73
469,8
91,5
01
469,8
91,5
01
--
--
2,3
59
,89
8,3
01
2,3
59
,89
8,3
01
463,8
81,6
29
6,0
05
,09
94,7
73
469,8
91,5
01
2,8
29
,78
9,8
02
-(7
6,2
43
,53
9)
(76
,24
3,5
39
)-
--
(76
,24
3,5
39
)
Tra
nsacti
on
s w
ith
ow
ners
Fin
al div
idend
for
the
year
ended
June
30,
2010
@ R
s. 5
per
share
--
--
(10
0,4
15
,70
0)
(10
0,4
15
,70
0)
--
-(1
00
,41
5,7
00
)
Bala
nce
as
at
Ju
ne
30,
2011
200,8
31,4
00
156,2
02,2
00
65,0
00,0
00
1,3
30
,00
0,0
00
4,4
14
,96
0,3
01
5,9
66
,16
2,5
01
1,4
80
,46
2,7
09
1,8
99
,44
74,7
73
1,4
82
,36
6,9
29
7,6
49
,36
0,8
30
To
tal
co
mp
reh
en
siv
e i
nc
om
e f
or
the
Year
en
ded
Ju
ne
30,
2012
Pro
fit
aft
er
taxa
tio
n-
--
-1
,12
4,5
56
,811
1,1
24
,55
6,8
11-
--
-1
,12
4,5
56
,811
Oth
er
com
pre
hensi
ve loss
--
--
--
(13
7,3
74
,02
4)
(28
,86
8,1
34
)435,0
64
(16
5,8
07
,09
4)
(16
5,8
07
,09
4)
--
--
1,1
24
,55
6,8
111
,12
4,5
56
,811
(13
7,3
74
,02
4)
(28
,86
8,1
34
)435,0
64
(16
5,8
07
,09
4)
958,7
49,7
17
6,7
71
,74
96
,77
1,7
49
-6
,77
1,7
49
Tra
nsacti
on
s w
ith
ow
ners
Fin
al div
idend
for
the
year
ended
June
30,
2011
@ R
s. 5
per
share
--
--
(10
0,4
15
,70
0)
(10
0,4
15
,70
0)
--
--
(10
0,4
15
,70
0)
Bala
nce
as
at
Ju
ne
30,
2012
200,8
31,4
00
156,2
02,2
00
65,0
00,0
00
1,3
30
,00
0,0
00
5,4
45
,87
3,1
61
6,9
97
,07
5,3
61
1,3
43
,08
8,6
85
(26
,96
8,6
87
)439,8
37
1,3
16
,55
9,8
35
8,5
14
,46
6,5
96
On
fo
rward
fore
ign
exch
an
ge
co
ntr
ac
ts
exch
an
ge
d
iffe
ren
ce
on
tra
nsla
tin
gfo
reig
n
op
era
tio
n
Share
s of
incr
ease
in
rese
rves
of
ass
oci
ate
d
com
panie
s under
equity
meth
od
Share
s of
decr
ease
in
rese
rves
of
ass
oci
ate
d
com
panie
s under
equity
meth
od
Tra
nsf
er
to S
apphire
Hold
ing
Lim
ited
on
de-
me
rge
r sch
em
e
On
av
ail
ab
le f
or
sa
le
inv
es
tme
nts
Sh
are
Cap
ital
Reven
ue
Fix
ed
Assets
Rep
lacem
en
t
Un
realize
d g
ain
/ (
loss)
SU
B T
OTA
L
To
tal
Eq
uit
y
Un
ap
pro
pri
ate
d
Pro
fit
R u
p e
e s
Sh
are
Pre
miu
m
Oth
er
Co
mp
on
en
ts o
f e
qu
ity
SU
B T
OTA
L
Reserv
es
Ge
ne
ral
reserv
es
The
annexe
d n
ote
s fo
rm a
n in
tegra
l part
of th
ese
fin
anci
al s
tate
ments
.
72

Sapphire Textile Mills Limited
Annual Report - 2012
Notes to the Consolidated Financial StatementsFor the year ended June 30, 2012
1 THE GROUP AND ITS OPERATIONS
The Group comprises of:
Sapphire Textile Mills Limited - the Holding Company
Sapphire Textile Mills Limited (the Company) was incorporated in Pakistan on March 11, 1969 as a public limited company under the Companies Act, 1913 (Now the Companies Ordinance, 1984). The shares of the Company are listed on Karachi Stock Exchange. The registered office of the Company is located at 212, Cotton Exchange Building, I.I. Chundrigar Road, Karachi and its mills are located at Kotri, Nooriabad, Chunian, Feroze Watwan and Bhopattian Lahore. The Company is principally engaged in manufacturing and sale of yarn, fabrics and home textile products.
Sapphire Wind Power Company Limited - the subsidiary company
The Company was incorporated as an unlisted public limited on December 27, 2006. The main object of the company is power generation through wind mills and sale of power. The company is developing a 50 MW wind power project at Jhimpir, Sindh. Wind resource assessment and detailed project feasibility were approved by AEDB. The Company signed an EPC contract with CMEC, China and 10 years O&M contract with GE. The Company has also submitted a Tariff Petition to NEPRA in August 2011. The registered office of the company is located at 212, Cotton Exchange Building, Karachi.
Sapphire Home Inc - USA - the subsidiary
The company was incorporated in USA. The company is principally engaged in marketing services in United Sates of America. The registered office of the company is located at 1430, Broadway, Suite 1805, New York, NY 10018.
2 BASIS OF PREPARATION
2.1 Statement of compliance
These financial statements have been prepared in accordance with the requirements of The Companies Ordinance, 1984 (the Ordinance) and the approved accounting standards as applicable in Pakistan. Approved accounting standards comprise of such International Financial Reporting Standards (IFRS) issued by the International Accounting Standard Board and Islamic Financial Accounting Standards (IFAS) issued by the Institute of Chartered Accountants of Pakistan as are notified under The Companies Ordinance, 1984, provisions of and directives issued under under The Companies Ordinance, 1984. Wherever the requirements of The Companies Ordinance, 1984 or directives issued by Securities and Exchange Commission of Pakistan differ with the requirements of IFRS or IFAS, the requirements of The Companies Ordinance, 1984 or the requirements of the said directives prevail.
2.2 Basis of preparation
These financial statements have been prepared under the historical cost convention except for measurement of certain financial assets and financial liabilities at fair value and recognition of employee benefits at present value.
2.3 Functional and presentation currency
These financial statements are presented in Pakistan Rupees which is also the Group's functional currency. All financial information presented in Pakistan Rupees has been rounded off to the nearest rupee.
3 ACCOUNTING ESTIMATES, JUDGMENTS AND FINANCIAL RISK MANAGEMENT
The estimates / judgments and associated assumptions used in the preparation of the financial statements are based on historical experience and other factors, including expectations of future events that are believed
73
Sapphire Textile Mills Limited
Annual Report - 2012
to be reasonable under the circumstances. The Group makes estimates and assumptions concerning the future. The resulting accounting estimates will, by definition, seldom equal the related actual results. The estimates and assumptions that have a significant risk of causing a material adjustment to the carrying amounts of assets and liabilities within the next financial year are as follows:
- Residual values and useful life of property, plant and equipment;
- Provision for slow moving and obsolete stores & spares and stock-in-trade;
- Estimates of liability in respect of employee retirement benefits - gratuity and compensated absences;
- Provision for current and deferred taxation;
- Classification of investment; and
- Valuation at fair value of derivative financial instruments.
4 STANDARDS, INTERPRETATIONS AND AMENDMENTS TO PUBLISHED APPROVED ACCOUNTING STANDARDS
4.1 Amendments to published standards that are effective in current financial year and are relevant to the Group
The following amendments to published standards are mandatory for the financial year beginning 01 July, 2011:
IFRS 7 (Amendment), ‘Financial Instruments: Disclosures’ (effective for the periods beginning on or after 01 January, 2011). The amendment emphasizes the interaction between quantitative and qualitative disclosures about the nature and extent of risks associated with a financial instrument. The amendment will only affect the disclosures in the Group’s financial statements.
IAS 1 (Amendment), ‘Presentation of Financial Statements’ (effective for the periods beginning on or after 01 January, 2011). The amendment clarifies that an entity will present an analysis of other comprehensive income for each component of equity, either in the statement of changes in equity or in the notes to the financial statements. The amendment will only affect the disclosures in the Group's financial statements.
IAS 24 (Revised), ‘Related Party Disclosures’ (effective for the periods beginning on or after 01 January, 2011). The revised standard clarifies and simplifies the definition of a related party and removes the requirement for government-related entities to disclose details of all transactions with the government and other government-related entities. The application of the revised standard has no material impact on the Group's financial statements.
IAS 34 (Amendment), ‘Interim Financial Reporting’ (effective for periods beginning on or after 01 January, 2011). This amendment provides guidance to illustrate how to apply disclosure principles in IAS 34 and add disclosure requirements around the circumstances likely to affect fair values of financial instruments and their classification, transfers of financial instruments between different levels of the fair value hierarchy, changes in classification of financial assets and changes in contingent liabilities and assets. The amendment will only affect the disclosures in the Group's condensed interim financial information.
4.2 New accounting standards, amendments to existing approved accounting standards and interpretations that are effective in current financial year but are not relevant to the Group
The other new standards, amendments to existing approved accounting standards and interpretations are mandatory for the periods beginning on or after 01 July, 2011 are considered not to be currently relevant as these do not have any significant effect on the Group’s current financial reporting and operations; however, these may affect the accounting for future transactions and events.
Notes to the Consolidated Financial StatementsFor the year ended June 30, 2012
74

Sapphire Textile Mills Limited
Annual Report - 2012
4.3 New accounting standards, amendments to existing approved accounting standards and interpretations that are issued but not yet effective and have not been early adopted by the Group
IAS 1,‘Financial Statement Presentation’ (effective for the periods beginning on or after January 1, 2012). The main change resulting from these amendments is a requirement for entities to group items presented in 'Other Comprehensive Income on the basis of whether they are potentially reclassifiable to profit or loss subsequently (reclassification adjustments).
IFRS 9, ‘Financial Instruments’ (effective for periods beginning on or after January 1, 2013). This is the first part of a new standard on classification and measurement of financial assets that will replace IAS 39. IFRS 9 has two measurement categories: amortized cost and fair value. All equity instruments are measured at fair value. A debt instrument is at amortized cost only if the entity is holding it to collect contractual cash flows and the cash flows represent principal and interest.
IAS 32, ‘Financial Instruments: Presentation’ (effective for the periods beginning on or after 01 January, 2014). This amendment clarifies some of the requirements for offsetting financial assets and financial liabilities on the balance sheet. The management of the Group is in the process of assessing the impact of this amendment on the Group's financial statements.
IFRS 12, ‘Disclosure of interests in other entities’ (effective for the periods beginning on or after 01 January, 2013). This standard includes the disclosure requirements for all forms of interests in other entities, including joint arrangements, associates, special purpose vehicles and other off balance sheet vehicles.
IFRS 13, ‘Fair Value Measurement’ (effective for periods beginning on or after 01 January, 2012). This standard applies to IFRS that require or permit fair value measurement or disclosures and provides a single IFRS framework for measuring fair value and requires disclosures about fair value measurement . The standard defines fair value on the basis of an exit price notion and uses 'a fair value hierarchy'. which results in a market-based, rather than entity-specific measurement.
IAS 19 (Revised), ‘Employee benefits’ (effective for the periods beginning on or after 01 January, 2013). The amendments will make significant changes to the recognition and measurement of defined benefit plan expense. The amendments requires actuarial gains and losses to be recognised immediately in other comprehensive income. This change will remove the corridor method and eliminate the ability for entities to recognise all changes in defined benefit obligation and in plan assets in profit or loss, which currently is allowed under IAS 19, and that the expected return on plan assets recognised in profit or loss is calculated based on the rate used to discount the defined benefit obligation. The Group is in process of reviewing the implications of the revised standard on its financial statements.
There are a number of other minor amendments and interpretations to other approved accounting standards that are not yet effective and are also not relevant to the Group and therefore have not been presented here.
5 SUMMARY OF SIGNIFICANT ACCOUNTING POLICIES
The significant accounting policies adopted in the preparation of these financial statements are set-out below. These policies have been consistently applied to all the years presented, unless otherwise stated.
5.1 Basis of Consolidation
Subsidiaries
The consolidated financial statements include the financial statements of the Holding Company and its subsidiary companies.
Subsidiaries are those entities in which the Holding Company directly or indirectly controls, beneficially owns or holds more than 50 percent of its voting securities or otherwise has power to elect and appoint more than 50 percent of its directors. The financial statements of subsidiaries are included in the consolidated financial statements from date of control commences. The financial statements of the subsidiaries are consolidated on
Notes to the Consolidated Financial StatementsFor the year ended June 30, 2012
75

Sapphire Textile Mills Limited
Annual Report - 2012
a line-by-line basis and the carrying value held by the Holding Company is eliminated against the Holding Company's share in paid up capital of the subsidiaries. The Group applies uniform accounting policies for like transactions and events in similar circumstances except where specified otherwise.
All material inter-group balances, transactions and resulting unrealized profits / losses are eliminated.
Investments in associates
Entities in which the Group has significant influence but not control and which are neither subsidiaries nor joint ventures of the members of the Group are associates and are accounted for under the equity method of accounting (equity accounted investees).
These investments are initially recognised at cost. The consolidated financial statements include the associates' share of profit or loss and movements in other comprehensive income, after adjustments to align the accounting policies with those of the Group, from the date that significant influence commences until the date it ceases. Share of post acquisition profit and loss of associates is recognised in the profit and loss account. Distributions received from associates reduce the carrying amount of investment. When the Group's share of losses exceeds its interest in an equity accounted Investee, the carrying amount of that investment is reduced to nil and the recognition of further losses is discontinued.
The carrying amount of investments in associates is reviewed at each balance sheet date to determine whether there is any indication of impairment. If any such indication exists, the recoverable amount of the investments is estimated which is higher of its value in use and its fair value less costs to sell. An impairment loss is recognized if the carrying amount exceeds its recoverable amount and is charged to profit and loss account. An impairment loss is reversed if there has been a change in estimates used to determine the recoverable amount but limited to the extent of initial cost of the investments. A reversal of impairment loss is recognised in the profit and loss account.
Translation of the financial statements of foreign subsidiary
The financial statements of foreign subsidiary of which the functional currency is different from that used in preparing the Group's consolidated financial statements are translated in functional currency of the Group. Balance sheet item are translated at the exchange rate at the balance sheet date and profit and loss account items are converted at the average rate for the period. Any resulting translation differences are recognized under exchange difference on translating foreign operation in consolidated reserves.
5.2 Property, plant and equipment
Owned assets
Property, plant and equipment are stated at cost less accumulated depreciation except freehold land and leasehold land, which are stated at cost less impairment losses, if any. Cost comprises acquisition and other directly attributable costs.
Depreciation is provided on a reducing balance method and charged to profit and loss account to write off the depreciable amount of each asset over its estimated useful life at the rates specified in note 6.1. Depreciation on addition in property, plant and equipment is charged from the month of addition while no depreciation is charged in the month of disposal.
The cost of replacing part of an item of property, plant and equipment is recognized in the carrying amount of the item if it is probable that the future economic benefits embodied within the part will flow to the Company and its cost can be measured reliably. The carrying amount of the replaced part is derecognized, if any. The costs of the day-to-day servicing of property, plant and equipment are recognized in profit and loss as incurred.
Gains and losses on disposal of an item of property, plant and equipment are determined by comparing the proceeds from disposal with the carrying amount of property, plant and equipment, and are recognized in the profit and loss account.
Notes to the Consolidated Financial StatementsFor the year ended June 30, 2012
76

Sapphire Textile Mills Limited
Annual Report - 2012
The Group reviews the useful life and residual value of property, plant and equipment on a regular basis. Any change in estimates in future years might affect the carrying amounts of the respective items of property, plant and equipment with a corresponding effect on depreciation charge.
Leased assets
Leases in terms of which the Group assumes substantially all the risks and rewards of ownership, are classified as finance lease. Upon initial recognition, the leased asset is measured at an amount equal to the lower of its fair value and present value of minimum lease payments. Subsequent to initial recognition, the asset is accounted for in accordance with the accounting policy applicable to that asset. Outstanding obligations under the lease less finance cost allocated to future periods are shown as a liability.
Finance cost under lease agreements are allocated to the periods during the lease term so as to produce a constant periodic rate of finance cost on the remaining balance of principal liability for each period.
Leased assets are depreciated over the shorter of the lease term and their useful lives unless it is reasonably certain that the Group will obtain ownership by the end of the lease term.
Capital work-in-progress
Capital work-in-progress is stated at cost accumulated up to the balance sheet date less accumulated impairment losses, if any. Capital work-in-progress is recognized as an operating fixed asset when it is made available for intended use.
5.3 Investment property
Property held for capital appreciation and rental yield, which is not in the use of the Group is classified as investment property. Investment Property comprises of land and buildings. The company has adopted cost model for its investment property using the same basis as disclosed for measurement of the Company's owned assets.
5.4 Intangible assets
Intangible assets acquired by the Group are stated at cost less accumulated amortization and impairment losses, if any.
Subsequent expenditure on capitalized intangible assets is capitalized only when it increases the future economic benefits embodied in the specific assets to which it relates. All other expenditures are expensed as incurred.
Amortization is charged to profit and loss account on straight line basis over a period of five years. Amortization on addition is charged from the date the asset is put to use while no amortization is charged from the date the asset is disposed off.
5.5 Investments
Investments intended to be held for less than twelve months from the reporting date or to be sold to raise operating capital, are included in current assets, all other investments are classified as non-current. Management determines the appropriate classification of its investments at the time of the purchase and re-evaluates such designation on a regular basis.
Investment - available for sale
Investments that are intended to be held for an indefinite period of time or may be sold in response to the need for liquidity are classified as available for sale.
Investments classified as available for sale are initially measured at cost, being the fair value of consideration
Notes to the Consolidated Financial StatementsFor the year ended June 30, 2012
77
Sapphire Textile Mills Limited
Annual Report - 2012
given. At subsequent reporting dates, these investments are remeasured at fair value (quoted market price), unless fair value cannot be reliably measured. The investments for which a quoted market price is not available, are measured at cost as it is not possible to apply any other valuation methodology. Unrealised gains and losses arising from the changes in the fair value are included in fair value reserves in the period in which they arise.
At each balance sheet date, the Group reviews the carrying amounts of the investments to assess whether there is any indication that such investments have suffered an impairment loss. If any such indication exists, the recoverable amount is estimated in order to determine the extent of the impairment loss, if any. Impairment losses are recognised as expense. In respect of available for sale investments, cumulative impairment loss less any impairment loss previously recognised in profit and loss account, is removed from equity and recognised in the profit and loss accounts. Impairment losses recognised in the profit and loss account on equity instruments are not reversed through the profit and loss accounts.
All purchases and sales are recognised on the trade date which is the date that the company commits to purchase or sell the investment, except for sale and purchase of securities in future market which are accounted for at settlement date. Cost of purchase includes transaction cost.
5.6 Stores, spares and loose tools
Stores, spares and loose tools are valued at lower of weighted average cost and net realizable value, less provision for impairment if any. Items in transit are valued at cost accumulated to balance sheet date. Provision for obsolete and slow moving stores, spares and loose tools is determined based on management estimate regarding their future usability.
5.7 Stock in trade
Stock-in-trade is stated at the lower of cost and net realizable value, except waste which is valued at net realizable value. Cost is arrived at on a weighted average basis. Cost of work-in-process and finished goods include cost of raw materials and appropriate portion of production overheads. Net realizable value is the estimated selling price in the ordinary course of business less cost of completion and selling expenses.
Provision for obsolete and slow moving stock in trade is determined based on management estimate regarding their future usability.
5.8 Trade debts and other receivables
Trade debts are initially recognized at fair value and subsequently measured at cost less provision for doubtful debts. A provision for doubtful debts is established when there is objective evidence that the Company will not be able to collect all amounts due according to the original terms of the trade debts. Significant financial difficulties of the debtor, probability that the debtor will enter bankruptcy of financial reorganization, and default or delinquency in making payments are considered indicators that the trade debt is doubtful and the provision is recognized in the profit and loss account. When a trade debt in uncollectible, it is written off against the provision.
5.9 Cash and cash equivalents
Cash and cash equivalents are carried in the balance sheet at cost. For the purpose of cash flow statement, cash and cash equivalents consist of cash-in-hand and balances with banks, net of temporary overdrawn bank balances.
5.10 Borrowings
Borrowings are initially recorded at the proceeds received. In subsequent periods, borrowings are stated at amortized cost using the effective yield method. Finance costs are accounted for on an accrual basis and are included in current liabilities to the extent of the amount remaining unpaid.
Notes to the Consolidated Financial StatementsFor the year ended June 30, 2012
78

Sapphire Textile Mills Limited
Annual Report - 2012
5.11 Employees' benefits
Compensated absences
The Group accounts for all accumulated compensated absences in the period in which absences accrue.
Defined benefits plans
The Group operates an unfunded gratuity scheme for its permanent employees as per terms of employment who have completed minimum qualifying period of service as defined under the scheme.
The cost of providing benefits is determined using the projected unit credit method, with actuarial valuations being carried out at each balance sheet date. Actuarial gains and losses which exceed 10 percent of the greater of the present value of the company's obligation are amortized over the expected average remaining working lives of the eligible employees. Past service cost is recognized immediately to the extent that the benefits are already vested. For non-vested benefits past service cost is amortized on a straight line basis over the average period until the amended benefits become vested.
Amounts recognized in the balance sheet represent the present value of the defined benefit obligation as adjusted for unrecognized actuarial gains and losses and unrecognized past service cost.
Defined Contribution Plan
There is an approved contributory provident fund for management staff for which contributions are charged to income for the year.
The Group and the employees make equal monthly contributions to the fund at the rate of 8.33% of basic salary in the case of management staff, and 8.33% of basic salary and cost of living allowance in case of non-management staff. The assets of the fund are held separately under the control of trustees.
5.12 Trade and other payables
Liabilities for trade and other amounts payable are measured at cost which is the fair value of the consideration to be paid in future for goods and services received.
5.13 Taxation
Current year
The charge for current taxation is based on taxable income at the current rate of taxation after taking into account applicable tax credit, rebates and exemption available, if any. However, for income covered under final tax regime, taxation is based on applicable tax rates under such regime.
Deferred tax
Deferred tax is provided using the balance sheet liability method for all temporary differences at the balance sheet date between tax bases of assets and liabilities and their carrying amounts for financial reporting purposes. In this regards, the effects on deferred taxation of the portion of income subject to final tax regime is also considered in accordance with the requirement of Technical Release - 27 of Institute of Chartered Accountants of Pakistan.
Deferred tax asset is recognized for all deductible temporary differences and carry forward of unused tax losses, if any, to the extent that it is probable that taxable profit will be available against which such temporary differences and tax losses can be utilized.
Deferred tax assets and liabilities are measured at the tax rate that are expected to apply to the period when the asset is realized or the liability is settled, based on tax rates that have been enacted or substantively enacted at the each reporting date.
Notes to the Consolidated Financial StatementsFor the year ended June 30, 2012
79

Sapphire Textile Mills Limited
Annual Report - 2012
5.14 Dividend and appropriation to reserves
Dividend and appropriation to reserves are recognised in the financial statements in the period in which they are approved by the shareholders and therefore, they are accounted for as non-adjusting post balance sheet event.
5.15 Provisions
Provisions are recognized when the Group has a present legal or constructive obligation as a result of past events, it is probable that an outflow of resources embodying economic benefits will be required to settle the obligation and reliable estimate of the amount can be made. Provisions are reviewed at each balance sheet date and adjusted to reflect the current best estimate.
5.16 Revenue recognition
Revenue from sale of goods is recognized when goods are dispatched to customers and invoices raised.
Return on bank balances is accrued on a time proportion basis by reference to the principal outstanding and the applicable rate of return.
Dividend income and entitlement of bonus shares are recognized when right to receive such dividend and bonus shares is established.
5.17 Government grant
These represent transfer of resources from government, government agencies and similar bodies, in return for the past or future compliances with certain conditions relating to the operating activities of the entity.
The grants are disclosed as a deduction from the related expense.
5.18 Borrowing cost
Borrowing costs are recognized as an expense in the period in which these are incurred except to the extent of borrowing costs that are directly attributable to the acquisition, construction or production of a qualifying asset. Such borrowing costs are capitalized as part of the cost of that asset up to the date of its’ commencing.
5.19 Foreign currency transactions and translation
Foreign currency transactions are translated into Pak Rupees using the exchange rates prevailing at the dates of the transactions. All monetary assets and liabilities in foreign currencies are translated into Pak Rupees at the rates of exchange prevailing at the balance sheet date. Foreign exchange gains and losses on translation are recognized in the profit and loss account. All non-monetary items are translated into rupees at exchange rates prevailing on the date of transaction or on the date when fair values are determined.
5.20 Impairment
The carrying amount of the Group’s assets are reviewed at each reporting date to determine whether there is any indication of impairment. If such indications exist, the asset’s recoverable amount is estimated in order to determine the extent of the impairment loss, if any. Impairment loss is recognized as expense in the profit and loss account.
5.21 Financial instruments
Financial assets
5.21.1 Classification
The Group classifies its financial assets in the following categories: at fair value through profit or loss, loans and receivables, held to maturity and available-for-sale. The classification depends on the purpose for which
Notes to the Consolidated Financial StatementsFor the year ended June 30, 2012
80

Sapphire Textile Mills Limited
Annual Report - 2012
the financial assets were acquired. Management determines the classification of its financial assets at initial recognition.
a) Financial assets at fair value through profit or loss
Financial assets at fair value through profit or loss are financial assets held for trading. A financial asset is classified in this category if acquired principally for the purpose of selling in the short-term. Derivatives are also categorized as held for trading unless they are designated as hedges. Assets in this category are classified as current assets.
b) Loans and receivables
Loans and receivables are non-derivative financial assets with fixed or determinable payments that are not quoted in an active market. They are included in current assets, except for maturities greater than 12 months after the end of the reporting period. These are classified as non-current assets.
c) Held to maturity financial assets
These are securities with fixed or determinable payments and fixed maturity in respect of which the Group has the positive intent and ability to hold to maturity. There were no held to maturity investments as at balance sheet date.
d) Available-for-sale financial assets
Available-for-sale financial assets are non-derivatives that are either designated in this category or not classified in any of the other categories. They are included in non-current assets unless the investment matures or management intends to dispose off within 12 months of the end of the reporting date.
5.21.2 Recognition
Regular purchases and sales of financial assets are recognized on the trade-date – the date on which the Group commits to purchase or sell the asset. All financial assets are initially recognized at fair value plus transaction costs except for those financial assets which are designated as ‘financial assets at fair value through profit or loss’. ‘Financial assets carried at fair value through profit or loss’ are initially recognized at fair value and transaction costs are charged to the profit and loss account. Financial assets are derecognized when the right to receive cash flows from such assets has expired or have been transferred and the Group has transferred substantially all risks and rewards, incidental to the ownership of such financial assets.
Dividend income from ‘financial assets at fair value through profit or loss’ and ‘available-for-sale financial assets’ is recognized in the profit and loss account when the Company’s right to receive payments is established.
Equity instruments that do not have a quoted market price in an active market and whose fair values cannot be reliably measured or determined are stated at cost.
5.21.3 Measurement
‘Available-for-sale financial assets’ and ‘financial assets at fair value through profit or loss’ are subsequently measured at fair value whereas ‘held to maturity financial assets’ and ‘loans and receivables’ are subsequently measured at amortized cost using the effective interest method.
Gains or losses arising from changes in the fair value of the ‘financial assets at fair value through profit or loss’ are recognized in the profit and loss account in the period in which they arise.
Changes in the fair value of ‘available-for-sale financial assets’ are recognized in other comprehensive income. When financial assets classified as available-for-sale are sold or impaired, the accumulative fair value adjustments recognized in other comprehensive income till the time of disposal or impairment are charged to the profit and loss account.
Notes to the Consolidated Financial StatementsFor the year ended June 30, 2012
81

Sapphire Textile Mills Limited
Annual Report - 2012
5.21.4 Impairment
The Group assesses at the end of each reporting period whether there is objective evidence that a financial asset or group of financial assets is impaired. A financial asset or a group of financial assets is impaired if there is objective evidence of impairment as a result of one or more events that occurred after the initial recognition of the asset (a ‘loss event’) and that loss event (or events) has an impact on the estimated future cash flows of the financial asset or group of financial assets that can be reliably estimated. If such evidence is identified to exist, the said financial asset or group of financial assets are impaired and an impairment loss is recognized in the profit and loss account for the amount by which the assets’ carrying amount exceed their recoverable amount. Impairment losses of equity instruments, once recognized, are not reversed through the profit and loss account.
5.21.5 Off-setting of financial assets and liabilities
Financial assets and liabilities are offset and the net amount is reported in the balance sheet when there is a legally enforceable right to offset the recognized amounts and there is an intention to settle either on a net basis, or to realize the asset and settle the liability simultaneously.
5.21.6 Derivative financial instruments
The Group designates derivative financial instruments as either fair value hedge or cash flow hedge.
a) Cash flow Hedges
Cash flow hedge represents hedges of a highly probable forecast transaction. The effective portion of changes in the fair value of derivatives that are designated and qualify as cash flow hedges are recognized in other comprehensive income. The gain or loss relating to the ineffective portion is recognized immediately in the profit and loss account. Amounts accumulated in equity are reclassified to the profit and loss account in the periods in which the hedged item will affect the profit and loss account.
b) Fair value hedge and other non-trading derivatives
Fair value hedge represents hedges of the fair value of recognized assets or liabilities or a firm commitment. Changes in the fair value of derivate that are designated and qualify as fair value hedges are recorded in the profit and loss account, together with any changes in the fair value of the hedged asset or liability that are attributable to the hedged risk. The carrying value of the hedged item is adjusted accordingly. When a derivative financial instrument is not designated in a qualifying hedge relationship, it is accounted for as held for trading and accordingly is categorized as ‘financial asset at fair value through profit or loss’.
5.21.7 Financial liabilities
These are initially recognized at cost, which is the fair value of the considered expected to be paid. All financial liabilities are recognized at the time when the Group becomes a party to the contractual provisions of the obliging instrument/ contract.
A financial liability is derecognized when the obligation under the liability is discharged, cancelled or expired. Where an existing financial liability is replaced by another from the same lender on substantially different terms, or the terms of an existing liability are substantially modified, such an exchange or modification is treated as a derecognising of the original liability and the recognition of a new liability, and the difference in respective carrying amounts is recognized in the profit and loss account.
5.22 Earnings per share - basic and diluted
The Group presents basic and diluted earnings per share (EPS) for its ordinary shares. Basic EPS is calculated by dividing the profit or loss attributable to ordinary shareholders of the Company by the weighted average number of ordinary shares outstanding during the year. Diluted EPS is determined by adjusting the profit or loss attributable to ordinary shareholders of the Company and the weighted average number of ordinary shares outstanding for the effects of all dilutive potential ordinary shares.
Notes to the Consolidated Financial StatementsFor the year ended June 30, 2012
82
Sapphire Textile Mills Limited
Annual Report - 2012
5.23 Segment reporting
Segment reporting is based on the operating (business) segment of the Group. An operating segment is a component of the Group that engages in a business activities from which it may earn revenues and incur expenses, including revenues and expenses that relates to transactions with any of the Group's other component. An operating segment's operating results are reviewed by the CEO to make decision about resources to be allocated to the segment and assess its performance and for which discrete financial information is available.
Segment results that are reported to the CEO includes items directly attributable to a segment as well as those that can be allocated on a reasonable basis. Unallocated items comprises mainly corporate assets, income tax assets, liabilities and related income and expenditure. Segment assets consist primarily of Property, plant and equipment, inventories, trade debts, loans and advances and cash & bank balances. Segment liabilities comprise of operating liabilities and exclude items such as taxation and corporate.
The business segments are engaged in providing products and services which are subject to risks and rewards which differ from the risk and reward of other segment, Segment reported are Spinning, Weaving, Home textile products, Power generation, Energy product and others, which also reflects the management structure of Company.
5.24 Related party transactions
All transactions with related parties are carried out by the Group at arms' length price using the method prescribed under the Companies Ordinance 1984.
Nature of the related party relationship as well as information about the transactions and outstanding balances are disclosed in the relevant notes to the financial statements.
2012 2011
Note
6 PROPERTY, PLANT AND EQUIPMENT
Operating fixed assets 6.1 4,736,750,808 3,815,179,565
Capital work-in-progress 6.4 500,999,598 917,653,352
5,237,750,406 4,732,832,917
------------- Rupees -------------
Notes to the Consolidated Financial StatementsFor the year ended June 30, 2012
83

Sapphire Textile Mills Limited
Annual Report - 20126.
1O
per
atin
g f
ixed
ass
ets
Free
- ho
ldLe
ase
- hol
dFa
ctor
y
build
ing
Labo
ur, s
taff
colo
ny a
nd
othe
rs
Fact
ory
build
ing
Labo
ur, s
taff
colo
ny a
nd
othe
rs
Leas
ed
build
ing
impr
ovem
ents
At J
uly
01, 2
011
Cos
t13
8,70
5,78
29,
180,
416
858,
353,
165
243,
214,
833
220,
982,
998
30,1
53,5
7432
,867
,062
5,84
9,55
3,99
310
1,88
8,28
81,
704,
940
27,9
82,3
5116
,343
,105
35,5
01,4
5534
,527
,715
18,3
15,8
8316
0,71
0,76
87,
779,
986,
328
Acc
umul
ated
dep
reci
atio
n-
-(4
24,9
73,5
49)
(76,
972,
359)
(130
,033
,273
)(1
3,41
4,95
9)(2
0,18
8,74
9)(3
,117
,847
,936
)(4
0,63
1,02
8)(4
72,9
45)
(7,6
22,3
32)
(9,2
55,9
72)
(21,
110,
763)
(21,
126,
579)
(8,4
63,3
75)
(72,
692,
944)
(3,9
64,8
06,7
63)
Net
boo
k va
lue
138,
705,
782
9,18
0,41
643
3,37
9,61
616
6,24
2,47
490
,949
,725
16,7
38,6
1512
,678
,313
2,73
1,70
6,05
761
,257
,260
1,23
1,99
520
,360
,019
7,08
7,13
314
,390
,692
13,4
01,1
369,
852,
508
88,0
17,8
243,
815,
179,
565
Year
end
ed J
une
30, 2
012
Add
ition
s15
,029
,632
-24
3,44
3,96
918
,726
,475
11,2
55,9
86-
15,3
07,8
5294
1,36
5,08
293
,571
,835
214,
400
15,9
79,1
002,
751,
369
393,
707
9,83
8,89
55,
461,
846
45,3
61,0
361,
418,
701,
184
Dis
posa
ls:
- C
ost
33,1
42,1
31-
--
--
-77
,560
,067
--
--
76,0
00-
-21
,101
,003
131,
879,
201
- D
epre
ciat
ion
--
--
--
-(6
7,57
5,55
8)-
--
-(3
5,14
9)-
-(1
2,89
4,65
3)(8
0,50
5,36
0)33
,142
,131
--
--
--
9,98
4,50
9-
--
-40
,851
--
8,20
6,35
051
,373
,841
Dep
reci
atio
n ch
arge
for
the
year
--
(54,
843,
938)
(8,9
17,0
11)
(10,
088,
070)
(1,1
62,7
24)
(2,9
46,1
36)
(326
,180
,803
)(9
,914
,929
)(1
29,3
31)
(2,6
76,5
03)
(2,6
68,2
05)
(1,4
48,3
45)
(1,8
81,2
65)
(1,2
00,5
54)
(21,
698,
286)
(445
,756
,100
)
Clo
sing
net
boo
k va
lue
- 201
212
0,59
3,28
39,
180,
416
621,
979,
647
176,
051,
938
92,1
17,6
4115
,575
,891
25,0
40,0
293,
336,
905,
827
144,
914,
166
1,31
7,06
433
,662
,616
7,17
0,29
713
,295
,203
21,3
58,7
6614
,113
,800
103,
474,
224
4,73
6,75
0,80
8
At J
une
30, 2
012
Cos
t12
0,59
3,28
39,
180,
416
1,10
1,79
7,13
426
1,94
1,30
823
2,23
8,98
430
,153
,574
48,1
74,9
146,
713,
359,
008
195,
460,
123
1,91
9,34
043
,961
,451
19,0
94,4
7435
,819
,162
44,3
66,6
1023
,777
,729
184,
970,
801
9,06
6,80
8,31
1A
ccum
ulat
ed d
epre
ciat
ion
--
(479
,817
,487
)(8
5,88
9,37
0)(1
40,1
21,3
43)
(14,
577,
683)
(23,
134,
885)
(3,3
76,4
53,1
81)
(50,
545,
957)
(602
,276
)(1
0,29
8,83
5)(1
1,92
4,17
7)(2
2,52
3,95
9)(2
3,00
7,84
4)(9
,663
,929
)(8
1,49
6,57
7)(4
,330
,057
,503
)
Net
boo
k va
lue
- 201
212
0,59
3,28
39,
180,
416
621,
979,
647
176,
051,
938
92,1
17,6
4115
,575
,891
25,0
40,0
293,
336,
905,
827
144,
914,
166
1,31
7,06
433
,662
,616
7,17
0,29
713
,295
,203
21,3
58,7
6614
,113
,800
103,
474,
224
4,73
6,75
0,80
8
Dep
reci
atio
n ra
te %
per
ann
um-
-10
510
520
1010
1010
3010
& 3
3.3
1010
& 1
520
Free
- ho
ldLe
ase
- hol
dFa
ctor
y bu
ildin
gLa
bour
, sta
ff
colo
ny a
nd
othe
rs
Fact
ory
build
ing
Labo
ur, s
taff
colo
ny a
nd
othe
rs
Leas
ed
build
ing
impr
ovem
ents
At J
uly
01, 2
010
Cos
t10
4,69
5,38
214
,554
,430
825,
328,
678
221,
916,
882
245,
378,
479
63,1
77,7
9032
,783
,660
5,57
0,38
5,67
993
,071
,434
1,72
6,96
530
,144
,915
14,4
46,9
0535
,411
,711
32,6
77,0
4021
,368
,910
143,
493,
182
7,45
0,56
2,04
2A
ccum
ulat
ed d
epre
ciat
ion
--
(378
,214
,580
)(6
8,56
2,80
4)(1
53,0
35,8
13)
(33,
960,
684)
(17,
027,
616)
(2,9
60,4
05,7
18)
(36,
419,
151)
(356
,853
)(5
,671
,177
)(6
,766
,132
)(1
9,53
8,76
4)(1
9,81
4,69
4)(9
,968
,150
)(6
0,69
6,49
0)(3
,770
,438
,626
)N
et b
ook
valu
e10
4,69
5,38
214
,554
,430
447,
114,
098
153,
354,
078
92,3
42,6
6629
,217
,106
15,7
56,0
442,
609,
979,
961
56,6
52,2
831,
370,
112
24,4
73,7
387,
680,
773
15,8
72,9
4712
,862
,346
11,4
00,7
6082
,796
,692
3,68
0,12
3,41
6
Year
end
ed J
une
30, 2
011
Add
ition
s34
,010
,400
-33
,024
,487
21,2
97,9
5116
,420
,826
-83
,402
457,
859,
666
11,1
94,4
36-
67,8
002,
191,
135
89,7
441,
938,
000
290,
349
28,5
46,7
2460
7,01
4,92
0
Dis
posa
ls:
- C
ost
-5,
374,
014
--
40,8
16,3
0733
,024
,216
-17
8,69
1,35
22,
377,
582
22,0
252,
230,
364
294,
935
-87
,325
3,34
3,37
611
,329
,138
277,
590,
634
- D
epre
ciat
ion
--
--
(32,
939,
182)
(21,
769,
644)
-(1
28,0
83,6
99)
(2,1
97,9
99)
(20,
909)
(483
,013
)(2
29,8
40)
-(8
1,82
4)(2
,652
,618
)(6
,886
,898
)(1
95,3
45,6
26)
-5,
374,
014
--
7,87
7,12
511
,254
,572
-50
,607
,653
179,
583
1,11
61,
747,
351
65,0
95-
5,50
169
0,75
84,
442,
240
82,2
45,0
08
--
(46,
758,
969)
(8,4
09,5
55)
(9,9
36,6
42)
(1,2
23,9
19)
(3,1
61,1
33)
(285
,525
,917
)(6
,409
,876
)(1
37,0
01)
(2,4
34,1
68)
(2,7
19,6
80)
(1,5
71,9
99)
(1,3
93,7
09)
(1,1
47,8
43)
(18,
883,
352)
(389
,713
,763
)
Clo
sing
net
boo
k va
lue
- 201
113
8,70
5,78
29,
180,
416
433,
379,
616
166,
242,
474
90,9
49,7
2516
,738
,615
12,6
78,3
132,
731,
706,
057
61,2
57,2
601,
231,
995
20,3
60,0
197,
087,
133
14,3
90,6
9213
,401
,136
9,85
2,50
888
,017
,824
3,81
5,17
9,56
5
At J
une
30, 2
011
Cos
t13
8,70
5,78
29,
180,
416
858,
353,
165
243,
214,
833
220,
982,
998
30,1
53,5
7432
,867
,062
5,84
9,55
3,99
310
1,88
8,28
81,
704,
940
27,9
82,3
5116
,343
,105
35,5
01,4
5534
,527
,715
18,3
15,8
8316
0,71
0,76
87,
779,
986,
328
Acc
umul
ated
dep
reci
atio
n-
-(4
24,9
73,5
49)
(76,
972,
359)
(130
,033
,273
)(1
3,41
4,95
9)(2
0,18
8,74
9)(3
,117
,847
,936
)(4
0,63
1,02
8)(4
72,9
45)
(7,6
22,3
32)
(9,2
55,9
72)
(21,
110,
763)
(21,
126,
579)
(8,4
63,3
75)
(72,
692,
944)
(3,9
64,8
06,7
63)
Net
boo
k va
lue
- 201
113
8,70
5,78
29,
180,
416
433,
379,
616
166,
242,
474
90,9
49,7
2516
,738
,615
12,6
78,3
132,
731,
706,
057
61,2
57,2
601,
231,
995
20,3
60,0
197,
087,
133
14,3
90,6
9213
,401
,136
9,85
2,50
888
,017
,824
3,81
5,17
9,56
5
--
105
105
2010
1010
1030
10 &
33.
310
10 &
15
20
Land
Com
pute
rs
On
leas
e - h
old
On
free
- ho
ld
Ele
ctri
c
inst
alla
tions
Offi
ce
equi
pmen
ts
Fire
figh
ting
equi
pmen
t
Land
2011
2012
Off
ice
equi
pmen
ts
Mill
s
equi
pmen
ts
Furn
iture
&
fixtu
res
Ele
ctri
c
equi
pmen
ts
Ele
ctric
equi
pmen
tsP
lant
& m
achi
nery
Dep
reci
atio
n ch
arge
for t
he y
ear
On
leas
e - h
old
Rup
ees
Mill
s
equi
pmen
ts
Furn
iture
&
fixtu
res
On
free
- hol
d
Com
pute
rs
Rup
ees
Vehi
cles
Tota
l
Pla
nt &
mac
hine
ry
Fire
figh
ting
equi
pmen
t
Tota
l
Ele
ctric
inst
alla
tions
Vehi
cles
Notes to the Consolidated Financial StatementsFor the year ended June 30, 2012
84
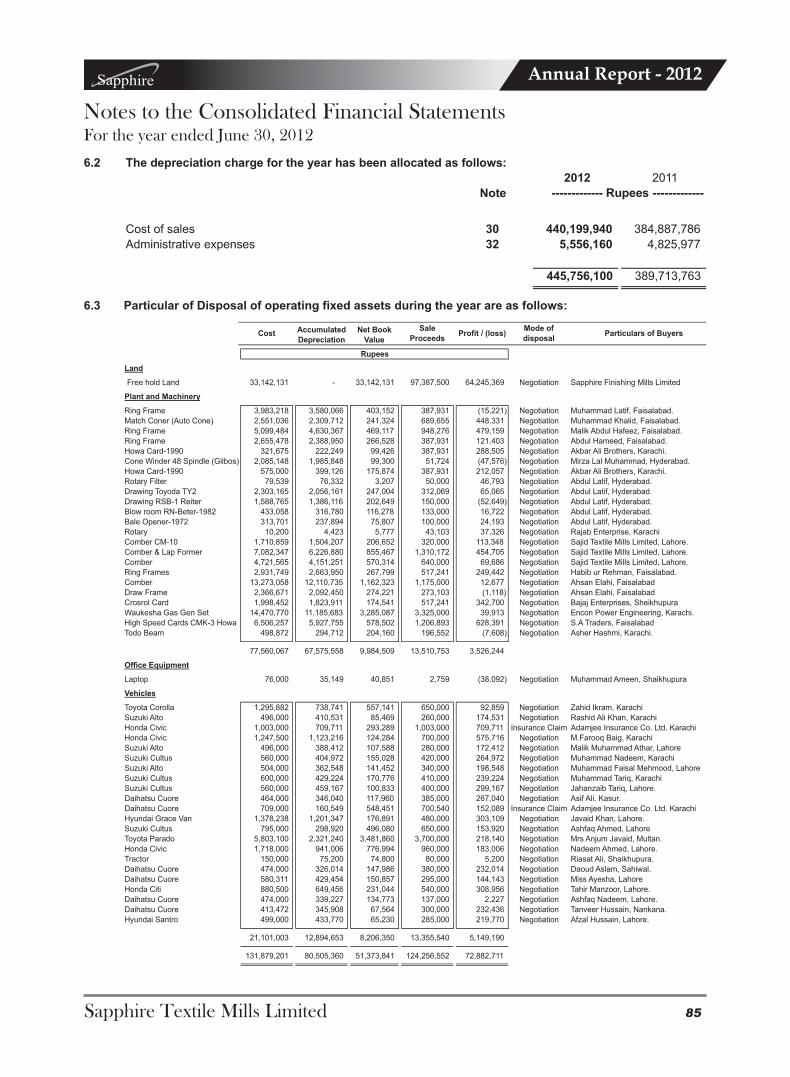
Sapphire Textile Mills Limited
Annual Report - 2012
Land
Free hold Land 33,142,131 - 33,142,131 97,387,500 64,245,369 Negotiation Sapphire Finishing Mills Limited
Plant and Machinery
Ring Frame 3,983,218 3,580,066 403,152 387,931 (15,221) Negotiation Muhammad Latif, Faisalabad.
Match Coner (Auto Cone) 2,551,036 2,309,712 241,324 689,655 448,331 Negotiation Muhammad Khalid, Faisalabad.
Ring Frame 5,099,484 4,630,367 469,117 948,276 479,159 Negotiation Malik Abdul Hafeez, Faisalabad.
Ring Frame 2,655,478 2,388,950 266,528 387,931 121,403 Negotiation Abdul Hameed, Faisalabad.
Howa Card-1990 321,675 222,249 99,426 387,931 288,505 Negotiation Akbar Ali Brothers, Karachi.
Cone Winder 48 Spindle (Gilbos) 2,085,148 1,985,848 99,300 51,724 (47,576) Negotiation Mirza Lal Muhammad, Hyderabad.
Howa Card-1990 575,000 399,126 175,874 387,931 212,057 Negotiation Akbar Ali Brothers, Karachi.
Rotary Filter 79,539 76,332 3,207 50,000 46,793 Negotiation Abdul Latif, Hyderabad.
Drawing Toyoda TY2 2,303,165 2,056,161 247,004 312,069 65,065 Negotiation Abdul Latif, Hyderabad.
Drawing RSB-1 Reiter 1,588,765 1,386,116 202,649 150,000 (52,649) Negotiation Abdul Latif, Hyderabad.
Blow room RN-Beter-1982 433,058 316,780 116,278 133,000 16,722 Negotiation Abdul Latif, Hyderabad.
Bale Opener-1972 313,701 237,894 75,807 100,000 24,193 Negotiation Abdul Latif, Hyderabad.
Rotary 10,200 4,423 5,777 43,103 37,326 Negotiation Rajab Enterprise, Karachi
Comber CM-10 1,710,859 1,504,207 206,652 320,000 113,348 Negotiation Sajid Textile Mills Limited, Lahore.
Comber & Lap Former 7,082,347 6,226,880 855,467 1,310,172 454,705 Negotiation Sajid Textile Mills Limited, Lahore.
Comber 4,721,565 4,151,251 570,314 640,000 69,686 Negotiation Sajid Textile Mills Limited, Lahore.
Ring Frames 2,931,749 2,663,950 267,799 517,241 249,442 Negotiation Habib ur Rehman, Faisalabad.
Comber 13,273,058 12,110,735 1,162,323 1,175,000 12,677 Negotiation Ahsan Elahi, Faisalabad
Draw Frame 2,366,671 2,092,450 274,221 273,103 (1,118) Negotiation Ahsan Elahi, Faisalabad
Crosrol Card 1,998,452 1,823,911 174,541 517,241 342,700 Negotiation Bajaj Enterprises, Sheikhupura
Waukesha Gas Gen Set 14,470,770 11,185,683 3,285,087 3,325,000 39,913 Negotiation Encon Power Engineering, Karachi.
High Speed Cards CMK-3 Howa 6,506,257 5,927,755 578,502 1,206,893 628,391 Negotiation S.A Traders, Faisalabad
Todo Beam 498,872 294,712 204,160 196,552 (7,608) Negotiation Asher Hashmi, Karachi.
77,560,067 67,575,558 9,984,509 13,510,753 3,526,244
Office Equipment
Laptop 76,000 35,149 40,851 2,759 (38,092) Negotiation Muhammad Ameen, Shaikhupura
Vehicles
Toyota Corolla 1,295,882 738,741 557,141 650,000 92,859 Negotiation Zahid Ikram, Karachi
Suzuki Alto 496,000 410,531 85,469 260,000 174,531 Negotiation Rashid Ali Khan, Karachi
Honda Civic 1,003,000 709,711 293,289 1,003,000 709,711 Insurance Claim Adamjee Insurance Co. Ltd. Karachi
Honda Civic 1,247,500 1,123,216 124,284 700,000 575,716 Negotiation M.Farooq Baig, Karachi
Suzuki Alto 496,000 388,412 107,588 280,000 172,412 Negotiation Malik Muhammad Athar, Lahore
Suzuki Cultus 560,000 404,972 155,028 420,000 264,972 Negotiation Muhammad Nadeem, Karachi
Suzuki Alto 504,000 362,548 141,452 340,000 198,548 Negotiation Muhammad Faisal Mehmood, Lahore
Suzuki Cultus 600,000 429,224 170,776 410,000 239,224 Negotiation Muhammad Tariq, Karachi
Suzuki Cultus 560,000 459,167 100,833 400,000 299,167 Negotiation Jahanzaib Tariq, Lahore.
Daihatsu Cuore 464,000 346,040 117,960 385,000 267,040 Negotiation Asif Ali, Kasur.
Daihatsu Cuore 709,000 160,549 548,451 700,540 152,089 Insurance Claim Adamjee Insurance Co. Ltd. Karachi
Hyundai Grace Van 1,378,238 1,201,347 176,891 480,000 303,109 Negotiation Javaid Khan, Lahore.
Suzuki Cultus 795,000 298,920 496,080 650,000 153,920 Negotiation Ashfaq Ahmed, Lahore
Toyota Parado 5,803,100 2,321,240 3,481,860 3,700,000 218,140 Negotiation Mrs Anjum Javaid, Multan.
Honda Civic 1,718,000 941,006 776,994 960,000 183,006 Negotiation Nadeem Ahmed, Lahore.
Tractor 150,000 75,200 74,800 80,000 5,200 Negotiation Riasat Ali, Shaikhupura.
Daihatsu Cuore 474,000 326,014 147,986 380,000 232,014 Negotiation Daoud Aslam, Sahiwal.
Daihatsu Cuore 580,311 429,454 150,857 295,000 144,143 Negotiation Miss Ayesha, Lahore
Honda Citi 880,500 649,456 231,044 540,000 308,956 Negotiation Tahir Manzoor, Lahore.
Daihatsu Cuore 474,000 339,227 134,773 137,000 2,227 Negotiation Ashfaq Nadeem, Lahore.
Daihatsu Cuore 413,472 345,908 67,564 300,000 232,436 Negotiation Tanveer Hussain, Nankana.
Hyundai Santro 499,000 433,770 65,230 285,000 219,770 Negotiation Afzal Hussain, Lahore.
21,101,003 12,894,653 8,206,350 13,355,540 5,149,190
131,879,201 80,505,360 51,373,841 124,256,552 72,882,711
Rupees
Mode of
disposalNet Book
ValueCost Accumulated
DepreciationParticulars of Buyers
Sale
ProceedsProfit / (loss)
2012 2011
Note
6.2 The depreciation charge for the year has been allocated as follows:
Cost of sales 30 440,199,940
384,887,786
Administrative expenses 32 5,556,160
4,825,977
445,756,100 389,713,763
------------- Rupees -------------
6.3 Particular of Disposal of operating fixed assets during the year are as follows:
Notes to the Consolidated Financial StatementsFor the year ended June 30, 2012
85

Sapphire Textile Mills Limited
Annual Report - 2012
2012 2011
6.4 Capital work-in-progress
Civil works and Buildings 247,521,068 402,846,565
Plant and machinery 154,122,837 439,610,786
Electric installations 99,008,103 75,196,001
Office equipments 100,000 -Mills equipments 247,590 -
500,999,598 917,653,352
------------- Rupees -------------
6.5 During the current year, the borrowing cost amounting Rs.8.05 million (2011: Rs.8.88 million) has been capitalized in the cost of Capital work-in-progress which was charged at rates ranging from 11.20% to 15.01% (2011: 10.50% to 15.05%) per annum.
Leasehold Freehold Leasehold land Freehold land
Net carrying value as at July 01, 2011
Opening net book value (NBV) 142,360,317 37,890,000 14,215,486 6,017,250 200,483,053Additions - - - - -Disposal - (6,140,000) - (5,866,819) (12,006,819)Depreciation charged - - (1,421,549) (150,431) (1,571,980)
Balance as at Jue 30, 2012 (NBV) 142,360,317 31,750,000 12,793,937 - 186,904,254
Gross carrying value as at June 30, 2012
Cost 142,360,317 31,750,000 19,999,980 - 194,110,297Accumulated depreciation - - (7,206,043) - (7,206,043)
Net book value - 2012 142,360,317 31,750,000 12,793,937 - 186,904,254
Net carrying value as at July 01, 2010
Opening net book value (NBV) 121,160,317 6,140,000 15,794,984 6,685,833 149,781,134Additions 21,200,000 31,750,000 - - 52,950,000Depreciation charged - - (1,579,498) (668,583) (2,248,081)
Balance as at June 30, 2011 (NBV) 142,360,317 37,890,000 14,215,486 6,017,250 200,483,053
Depreciation rate % per annum - - 10 10
Land Building onTotal
--------------------------------------------------------- Rupees ---------------------------------------------------------
7 INVESTMENT PROPERTY
7.1 The investment property includes company's 50% share valuing Rs.141,160,297 represents cost of jointly controlled leasehold land measuring 8,888.88 square yards with building thereon located at sector 23, Korangi Industrial Area, Korangi Township, Karachi, registered jointly in the name of Holding Company and Sapphire Fibres Limited (an Associated Company).
7.2 In the opinion of the Directors the market value as on June 30, 2012 is not materially different.
2012 2011
Note
7.3 The depreciation charge for the year has been allocated as follows:
Other operating expenses 33 1,571,980 2,248,081
------------- Rupees -------------
Notes to the Consolidated Financial StatementsFor the year ended June 30, 2012
86

Sapphire Textile Mills Limited
Annual Report - 2012
7.4 Particular of Disposal of investment property during the year are as follows:
Land
Free hold Land 6,140,000 - 6,140,000 7,433,181 1,293,181 Negotiation Irfan Kamal, Faisalabad
Building
Building on Free Hold Land 7,100,000
1,233,181
5,866,819
5,866,819
-
Negotiation Irfan Kamal, Faisalabad
13,240,000
1,233,181
12,006,819
13,300,000
1,293,181
Rupees
CostAccumulated
Depreciation
Net Book
ValueSale
ProceedsProfit
Mode of
disposalParticulars of Buyers
2012 2011
Note
8 INTANGIBLE ASSETS
(Computer software)
Net carrying value as at July 01, 2011
Net book value as July 01, 2011 4,354,967 5,920,410
Additions during the year 5,983,770 -
Amortization (2,003,707) (1,565,443)
Net book value at June 30, 2012 8,335,030 4,354,967
Gross carrying value at June 30, 2012
Cost 17,951,617 11,967,847
Accumulated amortization (9,616,587) (7,612,880)
Net book value - 2012 8,335,030 4,354,967
Amortization rate % per annum 20 20
8.1 Amortization charge for the year has been allocated as follows:
Other operating expenses 33 2,003,707 1,565,443
9 LONG TERM INVESTMENTS
Related parties
Associates - listed 9.1 39,503,915 38,521,797
- unlisted 9.2 346,535,465 231,116,703
386,039,380 269,638,500
other companies - Available for sale 9.5 1,951,957,505 2,119,658,353
2,337,996,885 2,389,296,853
------------- Rupees -------------
Notes to the Consolidated Financial StatementsFor the year ended June 30, 2012
87

Sapphire Textile Mills Limited
Annual Report - 2012
All investments have a face value of Rs. 10 per share unless stated otherwise.
2012 2011 2012 2011Name of Company
2012 2011 2012 2011
9.1 Investments in associates - listed
313,295 313,295 Reliance Cotton Spinning Mills Limited (RCML) 8,461,851 8,461,851
Share of post acquisition profit 31,836,782 30,697,452
Less: Dividend received during the year (794,718) (637,506)
39,503,915 38,521,797
9.2 Investments in associates - unlisted
1,550,000 1,550,000 Sapphire Power Generation Limited (SPGL) 19,748,000 19,748,000
Share of post acquisition profit 142,189,406 119,498,337
161,937,406 139,246,337
6,000,000 6,000,000 Sapphire Electric Company Limited (SECL) 60,000,000 60,000,000
Share of post acquisition profit 16,108,036 3,048,880
76,108,036 63,048,880
Name of Company
Break up value on the basis of audited accounts
for the year ended June 30, 2012 Rs. 12.08
(2011: Rs.10.45) per share.
Equity Interest Held 3.04%
Equity Interest Held 16.54%
Equity Interest Held 1.42% (2011: 1.42%)
Fair value of the ordinary shares as at June 30,
2012 amounted to Rs.7.174 million (2011: Rs.
8.572 million).
Number of Shares ------------- Rupees -------------
Break up value on the basis of audited accountsfor the year ended June 30, 2012 Rs.70.22(2011: Rs. 65.96) per share.
10,000 10,000 Sapphire Holding Limited (SHL) 100,000 100,000
Share of post acquisition profit 1,664,020 80,986
1,764,020 180,986
5,000,000 - Sapphire Dairies (Pvt) Limited (SDL) 50,000,000 -
Share of post acquisition profit 2,477,437
Share deposit money 40,000,000 -
92,477,437 -
3,675 3,675 Creadore A/S Denmark (CD) 60,017,650 61,372,500
(formerly Beirholms Sapphire A/S Denmark)
(45,769,084) (32,732,000)
14,248,566 28,640,500
Break up value on the basis of audited accountsfor the year ended June 30, 2012 Rs.10.50 pershare.
Equity Interest Held 49%(2011: 49%)Share of post acquisition loss
Equity Interest Held 0.05%
Equity Interest Held 7.14%
Break up value on the basis of audited accountsfor the year ended April 30, 2012 DKK 244 (2011:
DKK Nil) equivalent to Rs.3,875 (2011: Rs. Nil)
per share.
3,675 (2011:3,675) shares of Danish Krone (DKK) 1000 per share
Break up value on the basis of audited accountsfor the year ended June 30, 2012 Rs.176.40(2011: Rs.18.01 per share).
346,535,465 231,116,703
Notes to the Consolidated Financial StatementsFor the year ended June 30, 2012
88

Sapphire Textile Mills Limited
Annual Report - 2012
9.3 Summarised financial information of equity accounted Investee
2012 2011 2012 2011
9.5 Other companies - Available for sale
Quoted
11,223,588 10,203,262 MCB Bank Limited 728,470,245 728,470,245
1,137,339,024 1,305,039,872
1,865,809,269 2,033,510,117
Unquoted
7,055,985 7,055,985 Novelty Enterprises (Pvt) Limited 86,148,236 86,148,236
1,951,957,505 2,119,658,353
Add: Adjustment arising from measurement at fair value
Name of CompanyNumber of Shares ------------- Rupees -------------
APRIL 30, 2012
RCML SPGL SECL SHL SDL CD
Assets 2,601,956 1,047,115 24,151,539 3,692,025 1,154,143 244,261
Liabilities 1,304,219 68,110 18,796,145 147,555 419,458 215,182
Revenue 2,557,935 854,225 14,640,448 1,085 363,383 284,734
Profit / (loss) after tax 71,803 76,813 922,556 407,398 84,103 (22,076)
APRIL 30, 2011
RCML SPGL SECL SHL SDL CD
Assets 2,400,889 882,894 21,094,614 364,104 N/A 10,591
Liabilities 1,186,506 41,046 16,675,807 2,132 N/A 15,450
Revenue 2,613,863 873,418 6,149,433 - N/A 13,972
Profit / (loss) after tax 476,532 102,413 209,475 (2,155) N/A (31,363)
JUNE 30, 2 0 1 2
----------------------------------- Rupees in thousand -----------------------------------
JUNE 30, 2011
----------------------------------- Rupees in thousand -----------------------------------
9.4 The share of profit / loss after acquisition is recognised based on financial statements as at June 30, 2012 except Creadore A/S whose financial year ended on April 30, 2012.
Note
10 Long term loans and advances
Loan to employees - unsecured (considered good)
Executives 10.3 35,147,515 31,754,772
Other employees 19,444,290 21,582,479
54,591,805 53,337,251
Current portion of loans shown under current assets 15 18,368,601 14,102,544
36,223,204 39,234,707
10.1 All the loans are granted to the employees, free of interest in accordance with their terms of employment.
10.2 Maximum amount due from executives during the year, calculated by reference to month-end balances, was Rs.38,277,183 (2011: Rs. 31,754,772).
Notes to the Consolidated Financial StatementsFor the year ended June 30, 2012
89

Sapphire Textile Mills Limited
Annual Report - 2012
10.3 Movement in loans to executives
Balance at the beginning of the Year 31,754,772 21,935,184
Amount disbursed during the Year 14,476,593 19,011,525
46,231,365 40,946,709
Amount recovered during the Year 11,083,850 9,191,937
Balance at the end of the Year 35,147,515 31,754,772
11 Long term deposits
Security deposits
- WAPDA 27,825,846 21,756,246
- SNGPL 545,000 466,000
- PTCL 242,415 242,415
- Others 11.1 887,405 887,405
29,500,666 23,352,066
11.1 It includes an amount of Rs.36,000 (2011: Rs. 36,000) deposit with Yousuf Agencies (Private) Limited - an associated company.
2012 2011
------------- Rupees -------------
12 Stores, spares and loose tools
Stores 116,299,435 98,663,502
Spares - in hand 109,927,926 88,387,027
Spares - in transit 24,231,227 21,595,941
134,159,153 109,982,968
Loose tools 340,821 464,876
250,799,409 209,111,346
13 Stock-in-trade
Raw material - in hand 2,392,839,065 2,114,971,920
Raw material - in transit 15,188,948 427,491,974
2,408,028,013 2,542,463,894
Work in process 325,046,975 311,539,529
Finished goods 574,476,197 839,329,665
Waste 21,364,749 41,894,785
595,840,946 881,224,450
3,328,915,934 3,735,227,873
13.1 Stock in trade as at June 30, 2012 includes item valued at Net Realizable value (NRV) as follows. The write down to NRV amounting Rs.133.080 million (2011: Rs.918.180 million) has been recognised in cost of goods sold and the disclosure is in accordance with the requirements of IAS 2.
Notes to the Consolidated Financial StatementsFor the year ended June 30, 2012
90
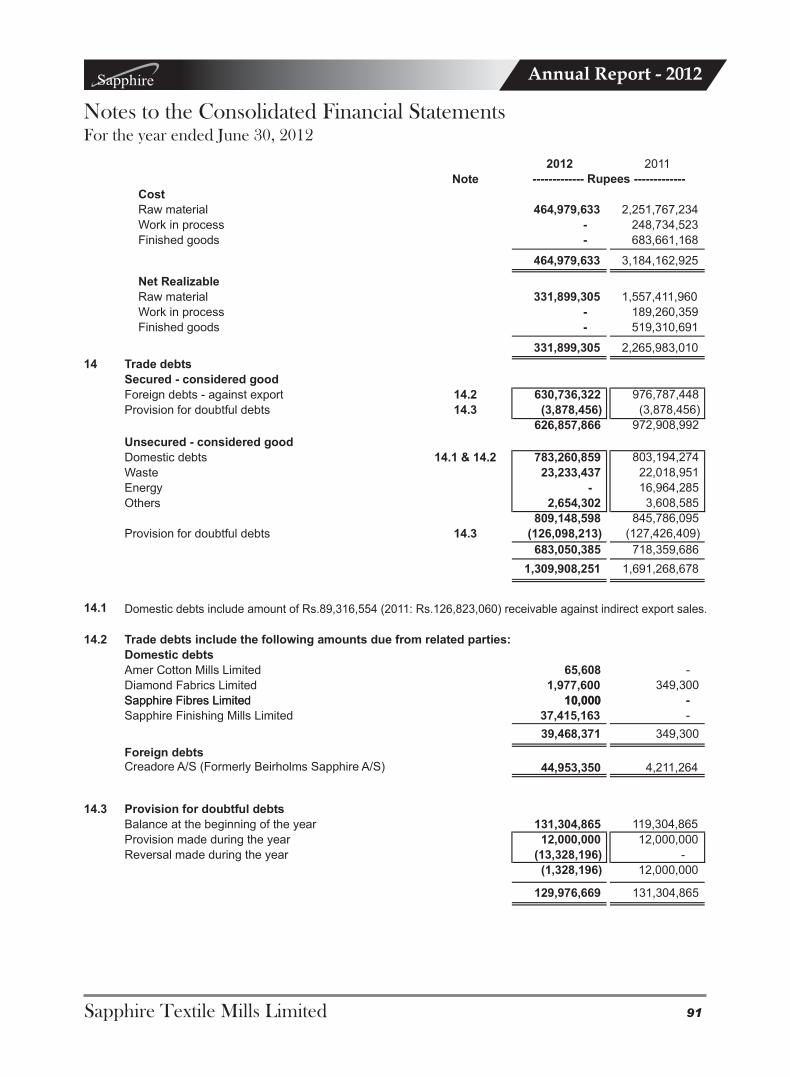
Sapphire Textile Mills Limited
Annual Report - 2012
2012 2011
Note
Cost
Raw material 464,979,633 2,251,767,234
Work in process - 248,734,523
Finished goods - 683,661,168
464,979,633 3,184,162,925
Net Realizable
1,557,411,960Raw material 331,899,305
189,260,359Work in process -
519,310,691Finished goods -
331,899,305 2,265,983,010
14 Trade debts
Secured - considered good
Foreign debts - against export 14.2 630,736,322 976,787,448
Provision for doubtful debts 14.3 (3,878,456) (3,878,456)
626,857,866 972,908,992
Unsecured - considered good
Domestic debts 14.1 & 14.2 783,260,859 803,194,274
Waste 23,233,437 22,018,951
Energy - 16,964,285
Others 2,654,302 3,608,585
809,148,598 845,786,095
Provision for doubtful debts 14.3 (126,098,213) (127,426,409)
683,050,385 718,359,686
1,309,908,251 1,691,268,678
14.1 Domestic debts include amount of Rs.89,316,554 (2011: Rs.126,823,060) receivable against indirect export sales.
14.2 Trade debts include the following amounts due from related parties:
Domestic debts
Amer Cotton Mills Limited 65,608 -
Diamond Fabrics Limited 1,977,600 349,300
Sapphire Fibres Limited 10,000 -
------------- Rupees -------------
Sapphire Fibres Limited 10,000 -
Sapphire Finishing Mills Limited 37,415,163 -
39,468,371 349,300
Foreign debtsCreadore A/S (Formerly Beirholms Sapphire A/S) 44,953,350 4,211,264
14.3 Provision for doubtful debts
Balance at the beginning of the year 131,304,865 119,304,865
Provision made during the year 12,000,000 12,000,000
Reversal made during the year (13,328,196) -
(1,328,196) 12,000,000
129,976,669 131,304,865
Notes to the Consolidated Financial StatementsFor the year ended June 30, 2012
91

Sapphire Textile Mills Limited
Annual Report - 2012
125,446,989 122,551,860
15 Loans and advances
Considered good
Advances - unsecured
- to suppliers 56,330,645 71,434,466
- to contractors 1,063,693 500,000
- to excise and taxation 15.1 36,835,450 28,791,750
- to purchase of land 7,723,100 7,723,100
- to others 5,125,500 2,500,000
107,078,388 110,949,316
Provision for doubtful advance 15.2 - (2,500,000)
107,078,388 108,449,316
Current portion of long term loans
- due from executives 10,320,135 7,007,471
- due from other employees 8,048,466 7,095,073
10 18,368,601 14,102,544
2012 2011
------------- Rupees -------------
15.1 This represents 50% payment made to Excise and Taxation Department of Government of Sindh against levy of Infrastructure Fee. (refer note 24.5)
Note
15.2 Provision for doubtful advances
Balance at the beginning of the year 2,500,000 - Provision made during the year - 2,500,000
Written-off during the year against provision (2,500,000) -
(2,500,000) 2,500,000
- 2,500,000
16 Trade deposits and short term prepayments
Security deposits 923,133 745,709
Prepayments 16.1 13,922,859 16,627,803
14,845,992 17,373,512
16.1 It includes Rs.1,393,686 (2011: Rs. 1,537,990) prepaid rent with Yousuf Agencies (Private) Limited, an associated company.
17 Other receivables
Claims receivable from an insurance company 776,000 64,500
Receivable from related parties against shared expenses 17.1 4,972,030 3,649,526
Export rebate receivable 31,487,588 24,941,984
Unrealized gain on measurement of forward foreign currency contracts - 1,899,447
Receivable against forward foreign currency contracts - 1,863,943
Receivable against subsidy on mark-up of long term loan - 744,342
Others - 306,882
37,235,618 33,470,624
Notes to the Consolidated Financial StatementsFor the year ended June 30, 2012
92

Sapphire Textile Mills Limited
Annual Report - 2012
17.1 Receivable from related parties against shared expenses
Amer Cotton Mills (Pvt) Limited 196,757 -
Diamond Fabrics Limited 81,270 -
Reliance Cotton Spinning Mills Limited 227,234 321,863 Reliance Cotton Spinning Mills Limited 227,234 321,863
Sapphire Dairies (Pvt) Limited 24,816 -
Sapphire Fibres Limited 3,523,121 3,327,663
Sapphire Finishing Mills Limited 828,880 -
Sapphire Power Generation Limited 89,952 -
4,972,030 3,649,526
18 Other financial assets - available for sale
2012 2011 2012 2012 2011
Cost
2,416,497 2,268,740 Bank Al-Habib Limited 58,951,594 68,797,670 66,859,768
8,832,626 5,643,392 Fatima Fertilizer Company Limited 138,741,890 217,900,883 93,906,043
3,023,017 1,500,938 Fauji Fertilizer Company Limited 249,710,165 335,706,038 225,666,028
972,295 972,295 Gulshan Spinning Mills Limited 17,441,370 4,861,475 10,695,245
2,448,944 3,672,986 Hub Power Company Limited 85,483,885 102,586,264 138,104,274
- 2,178,327 International Steel Limited - - 29,647,030
219,352 720,858 Pakistan Oilfields Limited 61,595,187 80,489,023 258,795,231
611,924,091 810,341,353 823,673,619
2012 2011
19 Tax refunds due from Government
Income tax 347,554,401 291,907,933
Sales tax receivable 75,118,521 92,454,586
Excise duty receivable 11,335,756 11,788,469
434,008,678 396,150,988
Number of shares/units
------------- Rupees -------------
Name of Company Fair value
------------------------ Rupees------------------------
20 Cash and bank balances
With banks on:
- currents accounts 66,305,229 95,116,259
- currents accounts - USD 20.1 28,539,430 2,595,563
- currents accounts - Euro 20.2 2,530,514 5,738,236
- deposit accounts 20.3 3,285 3,285
97,378,458 103,453,343
Cash in hand 4,164,168 3,241,232
101,542,626 106,694,575
20.1 Cash at bank on USD account of US$ 303,612 (2011: US$ 30,233).
20.2 Cash at bank on EURO account of EURO 21,400 (2011: EURO 46,053).
20.3 Cash at bank on deposits account and cash at bank on margin account under lien of a bank / financial institution against guarantee issued on behalf of the Group.
Notes to the Consolidated Financial StatementsFor the year ended June 30, 2012
Note
93

Sapphire Textile Mills Limited
Annual Report - 2012
21 Issued, subscribed and paid-up capital
2012 2011 2012 2011
6,206,740 6,206,740 62,067,400 62,067,400
13,876,400 13,876,400 138,764,000 138,764,000
20,083,140 20,083,140 200,831,400 200,831,400
Number of shares
Ordinary shares of Rs. 10 each issued as bonus shares
------------- Rupees -------------
Ordinary shares of Rs. 10 each allotted for consideration paid in cash
21.1 The Holding Company has only one class of shares which carry no right to fixed income.
21.2 5,445,612 (2011: 5,440,269) shares of the Holding Company are held by associated companies as at the balance sheet date.
22 Long term financing 2012 2011
Loans from banking companies - secured Note
Habib Bank Limited 22.1 41,666,300 58,333,335
Habib Bank Limited 22.2 - 6,250,000
Habib Bank Limited 22.3 21,124,000 27,376,000
Habib Bank Limited 22.4 34,375,000 46,875,000
Habib Bank Limited 22.5 46,875,000 50,000,000
Habib Bank Limited 22.6 150,000,000 -
Habib Metropolitan Bank Limited 22.7 2,125,000 6,375,000
Habib Metropolitan Bank Limited 22.8 6,375,000 10,625,000
MCB Bank Limited 22.9 24,170,000 32,958,000
Meezan Bank Limited 22.10 200,000,000 300,000,000
National Bank of Pakistan 22.11 - 3,153,557
Samba Bank Limited 22.12 24,375,000 30,000,000
United Bank Limited 22.13 - 12,500,000
United Bank Limited 22.14 - 10,000,000
United Bank Limited 22.15 181,996,000 181,996,000
United Bank Limited 22.16 131,316,000 131,316,000
United Bank Limited 22.17 211,818,000 211,818,000
United Bank Limited 22.18 2,821,000 -
United Bank Limited 22.19 29,054,000 29,054,000
Allied Bank Limited 22.20 100,000,000 -
Allied Bank Limited 22.21 100,000,000 -
1,308,090,300 1,148,629,892
Less: Current portion shown under current liabilities (213,468,649) (196,485,224)
1,094,621,651 952,144,668
------------- Rupees -------------
Notes to the Consolidated Financial StatementsFor the year ended June 30, 2012
94

Sapphire Textile Mills Limited
Annual Report - 2012
22.1 HBL - LTF-EOP
22.2 HBL - Non-LTF
22.3 HBL - LTF-EOP
22.4 HBL - Non-LTF
22.5 HBL-Non-LTFF
22.6 HBL-Non-LTFF
22.7 HMBL - LTF-EOP
22.8 HMBL - LTF-EOP
22.9 MCB - Non-LTF
The loan is secured against exclusive charge onspecific plant and machinery of Rs. 23 million ofUnit No. 6 of the Group.
15 Quarterly
7%
3 Months KIBOR plus
125 bpsNov 2011
7%
9.7%
The loan is secured against 1st Specific andexclusive hypothecation charge of Rs. 67 millionover imported plant and machinery of Unit No.1 ofthe Group.
The term loan is secured against hypothecation ofplant and machinery at unit no. 6 of the Group.
The loan is secured against first specifichypothecation charge on plant and machinery ofRs. 53.2 million of Unit No. 5 of the Group.
7 Semi-annually
Mark-up
rate p.a (%)
Dec 2015
7%
Date of final
repayment
No. of
installments
outstanding
Lenders
7%
The term loan is secured against hypothecation of
plant and machinery at Unit No. 5 of the Group.
Security
The term loan is secured against hypothecation of
plant and machinery at Unit No. 5 of the Group.
The loan is secured by first hypothecation chargeover imported plant and machinery of the Group tothe extent of Rs.67 million.
The loan is secured against 1st registeredhypothecation charge for Rs. 54 million over
16 Quarterly
1 Semi-annually
11 quarterly
Feb 2015
Jan 2015
The loan is secured against exclusive charge onspecific plant and machinery of Rs. 23 million ofUnit No. 6 of the Group.
Aug 2013
5 Semi-annually
3 Semi-annually
3 Months KIBOR plus
150 bps
Jan 2017
Jan 2016
Aug 2012
3 Months KIBOR plus
100 bps
Sep 2014
Paid during the year
11 quarterly3 Months
KIBOR plus 150 bps
22.10 MBL - Non-LTF
22.11 NBP - LTF-EOP
22.12 SAMBA - Non-LTF
22.13 UBL - LTF-EOP
22.14 UBL - Non-LTF
7%
Jun 2012
May 2012
The loan is secured against first specifichypothecation charge on plant and machinery of
Paid during the year
The loan is secured by first hypothecation chargeover imported plant and machinery of the Group tothe extent of Rs. 256 million.
9.7%
The term loan is secured against hypothecation ofplant and machinery at Unit No. 6 of the Group.
3 Months KIBOR plus
150 bps
The loan is secured against first pari passu chargeover fixed assets of amounting to Rs. 534 millionof Unit No. 6 of the Group.
May 2012
hypothecation charge for Rs. 54 million overpresent & future plant & machinery of Unit No.1 ofthe Group.
The term loan is secured against exclusivehypothecation charge over plant and machinery atUnit No. 4 of the Group.
11 quarterly Jan 2015
Paid during the
3 Months KIBOR plus
150 bps
Jun 20148 quarterly
13 quarterly
7%
Jul 2015
Paid during the year
3 Months KIBOR plus
22.15 UBL-LTFF
22.16 UBL-LTFF
Rs. 53.33 million of Unit No. 5 of the Group.
11.20%
The loan is secured against first exclusive
hypothecation charge of Rs.185 million on
imported machinery of Unit No.6 of the Group.
The loan is secured against first exclusive
hypothecation charge of Rs.375 million on
imported machinery of Unit No.6 of the Group.
10.50%
year
20 Quarterly
20 Quarterly Dec 2017
Jun 2018
1.5%
Notes to the Consolidated Financial StatementsFor the year ended June 30, 2012
95

Sapphire Textile Mills Limited
Annual Report - 2012
22.18
22.19
22.20
22.21
UBL-LTL
UBL-LTL
ABL-LTL
ABL-LTL
The loan is secured against first exclusive
hypothecation charge of Rs. 200 million over plant
and machinery of Unit No.5 of the Group.
20 QuarterlyThe loan is secured against first exclusivehypothecation charge of Rs.375 million onimported compressor Unit No.6 of the Group.
Jun 2016
The loan is secured against exclusivehypothecation charge of Rs.118 million on thespecific plant & machinery of the Group.
Apr 2017
Jun 2017
16 Quarterly
The loan is secured against exclusivehypothecation charge of Rs.118 million on thespecific plant & machinery of the Group.
16 Quarterly
16 Quarterly
No. of
instalments
outstanding
Date of final
repayment
Mark-up
rate p.a (%)
Jul 2018
Lenders Security
22.17 UBL-LTL The loan is secured against first exclusivehypothecation charge of Rs.375 million onimported compressor Unit No.6 of the Group.
20 Quarterly Sep 2018
12.70%
3 Months KIBOR plus
1.5%
3 Months KIBOR plus
0.75%
3 Months KIBOR plus
0.75%
11.20%
2012 2011
23 Deferred liabilities Note
Deferred taxation 23.1 33,114,093 168,407,971
Staff retirement benefits - gratuity 23.2 150,129,497 121,433,339
183,243,590 289,841,310
23.1 Deferred taxation
Deferred tax credits / (debits) arising in respect of:
Taxable temporary differences (deferred tax liabilities)
Accelerated tax depreciation allowances 198,148,003 230,538,282
Investment in associates 3,104,206 3,005,958
201,252,209 233,544,240
Deductible temporary differences (deferred tax assets)
Staff retirement benefits - gratuity (10,960,955) (12,650,788)
Provision for doubtful debts and advances (44,134,375) (45,474,243)
------------- Rupees -------------
Provision for doubtful debts and advances (44,134,375) (45,474,243)
Provision for repair and maintenances (Generator overhauling) (4,913,573) (7,011,238)
Tax credit (64,394,033) -
Tax under section 113 (43,735,180) -
(168,138,116) (65,136,269)
33,114,093 168,407,971
23.1.1 Income for the current year is chargeable to tax under presumptive tax regime of the Income Tax Ordinance, 2001. However, deferred tax liability / (asset) is recognised as management is not certain whether income of subsequent years is chargeable to tax under presumptive tax regime or normal tax regime.
Notes to the Consolidated Financial StatementsFor the year ended June 30, 2012
96

Sapphire Textile Mills Limited
Annual Report - 2012
2012 2011
23.2 Staff retirement benefits
Movement in the net liability recognized in the Balance sheet
Opening net liability 121,433,339 96,702,447
Expense for the year 65,222,013 48,584,231
186,655,352 145,286,678
Benefits paid during the year (36,525,855) (23,853,339)
Closing net liability 150,129,497 121,433,339
Expense recognized in the profit and loss account
Current service cost 46,777,905 36,723,345
Interest cost 18,444,108 11,860,886
65,222,013 48,584,231
Movement in the present value of defined benefit obligation
Present value of defined benefit obligation 131,743,627 98,840,720
Current service cost 46,777,905 36,723,345
Interest cost 18,444,108 11,860,886
Actuarial loss / (gain) (14,383,827) 8,172,015
Benefits paid (36,525,855) (23,853,339)
146,055,958 131,743,627
------------- Rupees -------------
Historical information
2012 2011 2010 2009 2008
146,055,958 131,743,627 98,840,720 95,723,513 72,530,632
14,383,827 (8,172,015) 6,390,954 (2,262,586) (1,405,429)
2012 2011
Reconciliation
Present value of defined benefit obligation 146,055,958 131,743,627
Unrecognized actuarial gain / (loss) 4,073,539 (10,310,288)
150,129,497 121,433,339
------------- Rupees -------------
Present value of defined benefitobligation
- - - - - - - - - - - - - - - - - - - - - R U P E E S- - - - - - - - - - - - - - - - - - - - -
Experience adjustments on planliabilities
General description
The scheme provides for terminal benefits for all of its permanent employees who attain the minimum qualifying period. Annual charges is made using the actuarial technique of Projected Unit Credit Method.
Principal actuarial assumption
Following are a few important actuarial assumption used in the valuation. % %
Discount rate 13 14Expected rate of increase in salary 12 13
Notes to the Consolidated Financial StatementsFor the year ended June 30, 2012
97

Sapphire Textile Mills Limited
Annual Report - 2012
24 Trade and other payables Note
Trade creditors 24.1 201,462,318 186,606,332
Accrued liabilities 24.2 540,210,709 448,566,147
Advances from customers 24.3 103,530,497 55,108,474
Custom duty payable 3,262,068 3,262,068 Workers' profit participation fund 24.4 57,506,205 92,260,290
Workers' welfare fund 59,264,841 36,204,796
Sindh development and maintenance infrastructure fee 24.5 101,585,948 85,730,766
Unclaimed dividend 1,736,112 1,071,805
Unrealized loss on measurement of forward foreign currency contracts 26,899,054 -
------------- Rupees -------------
-
Others 6,810,761 7,844,507
1,102,268,513 916,655,185
24.1 These balances include the following amounts due to related parties:
Amer Cotton Mills (Private) Limited - 700,650
Neelum Textile Mills Limited 17,500 -
Reliance Cotton Spinning Mills Limited 7,581,913 -
Sapphire Fibres Limited 10,342,119 1,333,731 Sapphire Finishing Mills Limited 2,141,571 2,609,341
20,083,103 4,643,722
24.2 These balances include the following amounts due to related parties:
Sapphire Power Generation Limited 35,295,533 23,468,876
Sapphire Fibres Limited 32,763 164,150
Neelum Textile Mills (Pvt.) Limited - 101,750
35,328,296 23,734,776
24.3 These balances include the following amounts received from related parties:
Creadore A/S Denmark 8,645,108 -
24.4 Workers' profit participation fund
Balance at the beginning of the year 92,260,290 58,088,787
Allocation for the year 33 57,506,205 92,260,290
Interest on fund utilized in the Holding Company's business 35 6,526,568 9,131,080
64,032,773 101,391,370
156,293,063 159,480,157
Less: Payments during the year (98,786,858) (67,219,867)
Balance at the end of the year 57,506,205 92,260,290
24.5 The Holding Company had filed a suit against levy of Infrastructure fee, decision of the Honourable Sindh High Court dated 17 September 2008 in which the imposition of levy of infrastructure cess before 28 December 2006 had been declared as void and invalid. However, the Excise and Taxation Department had filed an appeal before the Honourable Supreme Court of Pakistan against the order of the Honourable Sindh High Court. During the preceding year, the Honourable Supreme Court of Pakistan had disposed off the appeal with a joint statement of the parties that during the pendency of the appeal, another law i.e. fifth version came into existence which was not the subject matter of in the appeal hence the case was referred
Notes to the Consolidated Financial StatementsFor the year ended June 30, 2012
2012 2011
98

Sapphire Textile Mills Limited
Annual Report - 2012
back to High Court of Sindh with right to appeal to Supreme Court. On May 31, 2011, the High Court of Sindh had granted an interim relief on an application of petitioners on certain terms including discharge and return of bank guarantees / security furnished on consignment released up to December 27, 2006 and any bank guarantee / security furnished on consignment released after December 27, 2006 shall be encashed to extent of 50% of the guaranteed or secured amount only with balance kept intact till the disposal of petition. In case the High Court upholds the applicability of fifth version of the law and its retrospective application the authorities are entitled to claim the amounts due under the said law with the right to appeal available to petitioner. In the light of interim relief the Company has paid 50% of the amount of Infrastructure cess payable from December 27, 2006 to May 31, 2011. Subsequent imports of the Group be released against 50% payment of Infrastructure cess to Excise and Taxation Department and furnishing of bank guarantee of balance amount. However the full amount of Infrastructure Cess form component of cost of imported items and provision recorded in books. Bank guarantees amounting to Rs.39.823 million (2011: Rs.120.223 million) have been provided to the department.
2012 2011
Note
25 Accrued interest / mark-up
Accrued interest / mark-up on secured:
- long term financing 25,897,007 16,626,685
- short term borrowings 44,411,175 54,455,169
70,308,182 71,081,854
26 Short term borrowings
Short term loans 2,272,000,000 3,580,732,645
Running finance under mark-up arrangements 578,256,515 601,321,739
2,850,256,515 4,182,054,384
------------- Rupees -------------
Book overdraft 26.2 722,896 949,319
2,850,979,411 4,183,003,703
26.1 Aggregate facilities amounting to Rs.13,440 million (2011: Rs.12,825 million) were available to the Group from banking companies. These are secured against hypothecation charge on stock in trade, book debts, plant & machinery and export bills under collection. These carry mark up ranging from 11% to 14.01% (2011: 1.70% to 15.57%) per annum payable quarterly. These facilities are renewable on expiry dates. It includes Rs.Nil (2011: Rs. 1,331 million ) on account of foreign currency loan translated into local currency at exchange rate prevailing on the reporting date and are payable in foreign currencies.
26.2 This represents cheques issued by the Group in excess of balance at banks which remained unpresented till June 30, 2012.
27 Provision for taxation
Balance at the beginning of the year 266,504,864 184,821,056
Provision made for current year - net 192,401,697 265,043,278
458,906,561 449,864,334
Less: Adjusted advance tax during the year against completed assessments (238,507,858) (183,359,470)
220,398,703 266,504,864
Notes to the Consolidated Financial StatementsFor the year ended June 30, 2012
99

Sapphire Textile Mills Limited
Annual Report - 2012
27.1 Provision for current taxation mainly represents tax payable under section 154 of the Income Tax Ordinance, 2001.
27.2 No numeric tax rate reconciliation is presented in these financial statements as the Group is liable to pay tax mainly due under presumptive tax regime.
28 Contingencies and commitments
Contingencies
28.1 Guarantees issued by banks on behalf of the Group 255,257,767 323,621,793
28.2 Post dated Cheques have been issued to Collector of Customs as an indemnity to adequately discharge the liabilities for taxes and duties leviable on imports. As at June 30, 2012 the value of these cheques amounted to Rs.92.227 million (2011: Rs.17 million)
2012 2011
Commitments
28.3 Confirmed letter of credit in respect of:
- plant and machinery 197,159,004 174,806,846
- raw material 17,577,061 20,162,565
- stores and spares 9,268,077 22,569,492
224,004,142 217,538,903
29 Sales and services
------------- Rupees -------------
2012 2011 2012 2011 2012 2011
Gross sale of goods
Yarn 29.1 10,157,688,187 12,971,371,048 2,790,520,278 2,565,702,494 12,948,208,465 15,537,073,542Fabric 29.2 4,849,893,553 4,071,943,396 824,332,367 468,660,009 5,674,225,920 4,540,603,405
Home textile products 2,409,276,456 2,017,501,572 6,213,499 3,468,574 2,415,489,955 2,020,970,146Power generation - - - 189,249,816 - 189,249,816Raw material - 26,484,248 69,918,171 226,891,939 69,918,171 253,376,187
Waste 29.3 206,971,976 143,550,836 220,021,417 302,004,131 426,993,393 445,554,967Services 7,723,271 7,635,967 - - 7,723,271 7,635,967
17,631,553,443 19,238,487,067 3,911,005,732 3,755,976,963 21,542,559,175 22,994,464,030
Note
Export Sales Local Sales Total
Rupees
17,631,553,443 19,238,487,067 3,911,005,732 3,755,976,963 21,542,559,175 22,994,464,030
Export rebate 30,502,852 34,172,768
Duty drawback 29.5 9,588,232 7,927,351Processing income 9,773,460 1,059,138
21,592,423,719 23,037,623,287
Notes to the Consolidated Financial StatementsFor the year ended June 30, 2012
100

Sapphire Textile Mills Limited
Annual Report - 2012
In-direct export 608,132,611 747,335,898
4,849,893,553 4,071,943,396
29.1 Export sales - Yarn
Direct export 7,251,795,449 8,344,371,414In-direct export 2,905,892,738 4,626,999,634
10,157,688,187 12,971,371,048
29.2 Export sales - Fabric
Direct export 4,241,760,942 3,324,607,498
29.3 Waste sales includes comber noil sales Rs.207,108,461 (2011:Rs.132,667,215).
29.4 Exchange gain due to currency rate fluctuations relating to export sales amounting to Rs.46.585 million (2011: Rs.110.528 million) has been included in export sales.
29.5 The duty drawback has been given by Ministry of Textile Industries from government of Pakistan vide S.R.O 3(1)TID/09-P-I Dated 1st September 2009 in order to encourage the exporters.
2012 2011
30 Cost of sales and servicesNote
Raw material consumed 30.1 14,164,876,320 15,891,876,695
Packing material consumed 273,374,025 231,656,443
Stores and spares consumed 447,813,954 423,551,799
Salaries, wages and benefits 30.2 & 30.3 1,072,376,566 984,754,093
Fuel, power and water 1,423,972,408 1,147,643,755
Other manufacturing expenses 30.4 445,484,722 436,636,241
Repairs and maintenance 55,392,030 40,723,449
Vehicle running expenses 23,031,505 17,992,547
Travelling and conveyance 24,768,756 18,146,272
Insurance expenses 44,198,064 36,325,146
Rent, rates and taxes 5,275,457 4,959,546
Fees and subscription 2,735,528 2,297,014
Communication expenses 6,576,965 4,572,837
Printing and stationery 1,976,047 1,392,251
Legal and professional charges 2,729,674 1,989,312
Depreciation 6.2 440,199,940 384,887,786
Miscellaneous expenses 5,034,539 4,664,535
18,439,816,500 19,634,069,721
------------- Rupees -------------
Notes to the Consolidated Financial StatementsFor the year ended June 30, 2012 2012 2011
------------- Rupees -------------
18,791,121,797 19,614,835,674
Work in process
Opening stock 311,539,529 196,467,326
Closing stock 13 (325,046,975) (311,539,529)
(13,507,446) (115,072,203)
Cost of goods manufactured 18,426,309,054 19,518,997,518
Finished goods
Opening balance 881,224,450 784,520,071
Goods purchased:
Cotton purchases 30.5 79,429,239 192,542,535
Closing stock 13 (595,840,946) (881,224,450)
101

Sapphire Textile Mills Limited
Annual Report - 2012
2012 2011
------------- Rupees -------------
30.1 Raw material consumed
Opening balance 2,114,971,920 1,729,916,003
Purchases 14,442,743,465 16,276,932,612
16,557,715,385 18,006,848,615
Closing stock 13 (2,392,839,065) (2,114,971,920)
14,164,876,320 15,891,876,695
30.4 Other manufacturing expenses
Cotton dyeing, bleaching and bale pressing charges 137,418,805 149,076,104
Yarn dyeing and bleaching charges 24,091,814 24,169,454
Fabric dyeing, bleaching, knitted and processing charges 231,828,541 211,186,562
Yarn doubling charges 6,715,155 9,777,255
Stitching and other charges 45,430,407 42,426,866
445,484,722 436,636,241
30.2 Salaries, wages and benefits include Rs.65,222,013 (2011:Rs.48,584,231) in respect of post employment benefits - gratuity.
30.3 Salaries and benefits include Rs.3,122,456 (2011:Rs.2,832,128) in respect of provident fund contribution.
30.5 It includes Salaries, wages & benefits, Insurance and Finance cost amounting Rs.63,000 (2011:Rs.1,750,387) Rs.53,771 (2011: Rs.3,500,773) and Rs.2,496,518 (2011: Rs.12,252,707) respectively.
Notes to the Consolidated Financial StatementsFor the year ended June 30, 2012
31 Distribution cost
On export sales
Export development surcharges 36,776,352 31,592,812
Insurance 5,576,109 3,391,776
Commission 360,280,996 333,003,201
Ocean freight and forwarding 402,312,979 339,484,661
804,946,436 707,472,450
On local sales
Inland freight and handling 35,936,211 38,500,206
Commission 18,673,741 27,872,103
54,609,952 66,372,309
Other distribution cost
Salaries and benefits 31.1 64,122,456 56,010,445
Rent and utilities 6,306,671 2,288,521
Communication 14,755,450 10,700,047
Travelling, conveyance and entertainment 46,843,028 35,783,030
Repairs and maintenance 743,341 205,043
Fees and subscription 2,736,317 1,077,392
Samples and advertising 12,170,754 11,090,339
Exhibition expenses 3,854,650 4,275,754
Printing and stationery 1,453,362 1,385,592
Others 174,852 294,050
153,160,881 123,110,213
1,012,717,269 896,954,972
Note
102

Sapphire Textile Mills Limited
Annual Report - 2012
31.1 Salaries and benefits include Rs.2,578,721 (2011:Rs.2,227,298) in respect of provident fund contribution.
32 Administrative expenses
Directors' remuneration 19,800,000 17,000,000
Salaries and benefits 32.1 88,852,776 85,444,496
Rent, rates and utilities 8,698,236 7,721,073
Communication 6,289,397 6,815,998Communication 6,289,397 6,815,998
Printing and stationery 1,662,037 4,396,965
Travelling, conveyance and entertainment 17,143,134 14,680,451
Motor vehicle expenses 10,203,688 9,927,219
Repairs and maintenance 3,074,693 5,830,316
Insurance Expense 1,680,279 1,006,462
Legal and professional charges 15,541,859 12,102,922
Fees and subscription 2,491,739 2,575,374
Computer expenses 2,123,226 3,171,139
Advertisement 120,500 328,500
Security expenses 836,467 738,534
Depreciation 6.2 5,556,160 4,825,977
Others 886,087 626,921
184,960,278 177,192,347
32.1 Salaries and benefits include Rs.3,338,629 (2011:Rs.2,827,896) in respect of provident fund contribution.
Notes to the Consolidated Financial StatementsFor the year ended June 30, 2012
33 Other operating expenses
Workers' profit participation fund 24.4 57,506,205 92,260,290
Workers' welfare fund 23,060,045 36,204,796
Auditors' remuneration 33.1 2,291,371 2,294,640
Donations 33.2 16,600,452 38,517,190
Depreciation on investment property 7.3 1,571,980 2,248,081
Amortization of intangible asset 8.1 2,003,707 1,565,443
Provision for doubtful debts 14.3 12,000,000 12,000,000
Provision for doubtful advance 15.2 - 2,500,000
Loss on disposal of subsidiary - 1,612,488
Exchange loss on
- short term foreign currency loan 20,072,440 9,047,791
- monetary assets 1,354,850 -
136,461,050 198,250,719
2012 2011
------------- Rupees -------------Note
103

Sapphire Textile Mills Limited
Annual Report - 2012
33.1 Auditors' remuneration
Mushtaq & Co.
Audit fee 1,155,000 1,100,000
Half yearly review fee 332,750 332,750
Code of corporate governance review fee 78,045 78,045
Other certification / services 661,826 685,095
Out of pocket expenses 13,750 13,750
2,241,371 2,209,640
A.F.Ferguson & Co.
Audit fee 50,000 50,000
Other certification / services - 35,000
50,000 85,000
2,291,371 2,294,640
33.2 Donations include the following in which a director is interested:
Name of director Interest in donee Name and address of donee
Mr. Mohammad Abdullah Director Abdullah Foundation 13,550,000 33,900,000
Mr. Yousuf Abdullah Director 312, Cotton Exchange Building,
Mr. Nadeem Abdullah Director I.I. Chundrigar Road, Karachi.
Mr. Amer Abdullah Director
Mr. Mohammad Abdullah Trustee Jamal-ud-din Fatima Charitable Trust 900,000 700,000
Mr. Nadeem Abdullah Trustee 149, Cotton Exchange Building,
I.I. Chundrigar Road, Karachi.
Notes to the Consolidated Financial StatementsFor the year ended June 30, 2012
34 Other operating income
Income from financial assets / liabilities
Dividend income 227,709,338 164,145,950
Gain on sale of investments 60,384,379 57,294,323
Profit on saving and deposit accounts 169,998 135,444
Rental income 12,720,000 13,560,959
Exchange gain on
- foreign currency account 68,528 2,053,897 - foreign currency account 68,528 2,053,897
- monetary assets - 5,709,475
Income from non-financial assets
Gain on sale of property, plant and equipment - net 72,771,716 172,255,046
Reversal of provision for doubtful debts 13,328,196 -
Gain on sale of investment property 1,293,181 -Scrap sales 18,390,803 15,675,423
406,836,139 430,830,517
2012 2011
------------- Rupees -------------Note
35 Finance cost
Interest / mark-up on :
- short term finances 451,698,827 553,941,401
- long term loans 132,128,025 105,192,434
- Workers' profit participation fund 24.4 6,526,568 9,131,080
Bank charges, commission and others charges 123,140,874 144,914,420
Realized gain on measurement of derivative financial instruments - net (217,532) (966,874)
713,276,762 812,212,461
104

Sapphire Textile Mills Limited
Annual Report - 2012
36 Earnings per shares
Profit after taxation 1,124,556,811 2,359,898,301
Weighted average number of ordinary shares 20,083,140 20,083,140
Earnings per share - basic and diluted 56.00 117.51
36.1 There is no dilutive effect on basic earnings per share.
Notes to the Consolidated Financial StatementsFor the year ended June 30, 2012
2012 2011
37 Cash generated from operations
Profit before taxation 1,160,722,702 1,769,007,631
Adjustments for non-cash charges and other items:
Depreciation on operating fixed assets 445,756,100 389,713,763
Depreciation on investment property 1,571,980 2,248,081
Gain on sale of investments (60,384,379) (57,294,323)
Amortization of intangible assets 2,003,707 1,565,443
Gain on sale of property, plant and equipment (72,771,716) (172,255,046)
Gain on sale of investment property (1,293,181) -
Loss on disposal of subsidiary - 1,612,488
Dividend income - others (227,709,338) (164,145,950)
Provision for gratuity 65,222,013 48,584,231
Provision for doubtful debts and advances 12,000,000 14,500,000
Reversal of provision for doubtful debts (13,328,196) -
Exchange differences 21,427,290 3,338,316
Realized gain on measurement of derivative financial instrument (217,532) (966,874)
Finance cost 713,494,294 813,328,187
Profit on deposits (169,998) (135,444)
Rental income (12,720,000) (13,560,959)
872,881,044 866,531,913
Operating cash flow before changes in working capital 2,033,603,746 2,635,539,544
Changes in working capital
(Increase) / Decrease in current assets
Stores, spare and loose tools (41,688,063) 16,044,519
Stock-in-trade 406,311,939 (975,564,865)
Trade debts 382,688,623 (451,617,364)
Loans and advances (395,129) (93,550,343)
Trade deposits and short term prepayments 2,527,520 (8,019,477)
Other receivables (10,028,384) 14,986,857
739,416,506 (1,497,720,673)
Increase in current liabilities
Trade and other payables 158,049,967 244,802,220
------------- Rupees -------------
Trade and other payables 158,049,967 244,802,220
2,931,070,219 1,382,621,091
105
2012 2011
------------- Rupees -------------Note

Sapphire Textile Mills Limited
Annual Report - 2012
Reconciliation of operating results with profit after is as follows:2012 2011
Total results for reportable segments 1,603,624,375 2,348,640,294
Other operating expenses (136,461,050) (198,250,719)
Other operating income 406,836,139 430,830,517
Finance cost (713,276,762) (812,212,461)
Share of profit of associated companies 20,941,928 644,160,386
-----------------Rupees-----------------
38 SEGMENT ANALYSIS
38.1 SEGMENT RESULTS
For the year ended June 30, 2012
Sales and services 14,637,982,965 6,240,534,616 2,632,454,357 - (1,918,548,219) 21,592,423,719
Cost of sales and services (12,928,724,923) (5,650,026,564) (2,130,918,529) - - - 1,918,548,219 (18,791,121,797)
Gross Profit 1,709,258,042 590,508,052 501,535,828 - - - - 2,801,301,922
Distribution cost (551,823,336) (276,080,431) (184,813,502) - (1,012,717,269)
Administrative expenses (138,556,789) (33,898,703) (9,110,535) (3,394,251) (184,960,278)
(690,380,125) (309,979,134) (193,924,037) - - (3,394,251) - (1,197,677,547)
1,018,877,917 280,528,918 307,611,791 - - (3,394,251) - 1,603,624,375
Depreciation 281,803,305 149,309,566 14,617,984 - - 25,245 445,756,100
For the year ended June 30, 2011
Sales and services 16,912,187,452 5,583,916,866 2,055,337,322 189,249,816 (1,703,068,169) 23,037,623,287
Cost of sales and services (14,338,793,139) (4,841,904,014) (1,963,794,774) (173,411,916) - - 1,703,068,169 (19,614,835,674)
Gross Profit 2,573,394,313 742,012,852 91,542,548 15,837,900 - - 3,422,787,613
Distribution cost (544,860,436) (188,658,041) (163,436,495) - (896,954,972)
Administrative expenses (135,330,360) (29,767,376) (9,384,263) (2,710,348) (177,192,347)
(680,190,796) (218,425,417) (172,820,758) - - (2,710,348) - (1,074,147,319)
1,893,203,517 523,587,435 (81,278,210) 15,837,900 - (2,710,348) - 2,348,640,294
Depreciation 260,143,049 108,583,031 14,624,399 6,329,275 - 34,009 389,713,763
Spinning Weaving Home TextilePower
Generation
Profit / (loss) before taxation andunallocated income and expenses
Energy
productOthers
Elimination of
inter segment
transaction
Total
--------------------------------------------------------------------- Rupees ---------------------------------------------------------------------
Profit / (loss) before taxation and
unallocated income and expenses
Profit before taxation 1,181,664,630 2,413,168,017
Taxation (57,107,819) (53,269,716)
Profit for the year 1,124,556,811 2,359,898,301
Notes to the Consolidated Financial StatementsFor the year ended June 30, 2012
106

Sapphire Textile Mills Limited
Annual Report - 2012
38.2 SEGMENT ASSETS AND LIABILITIES
As at June 30, 2012
Segment assets 6,881,820,938 2,677,350,663 792,020,187 0 0 83,741,689 10,434,933,477
Segment Liabilities 10,228,358,340 2,264,087,600 1,063,424,159 0 0 3,813,905 13,559,684,004
As at June 30, 2011
Segment assets 6,525,168,971 2,674,908,356 1,151,298,560 280,743,404 175,669 45,352,574 10,677,647,534
Segment Liabilities 6,900,972,811 2,545,991,492 1,126,681,725 3,169,399,255 0 166,200 13,743,211,483
Reconciliation of segment assets and liabilities with total assets and liabilities in the balance sheet is as follows:
2012 2011
Total for reportable segments assets 10,434,933,477 10,677,647,534Unallocated assets 3,814,821,818 3,847,430,104
Total assets as per balance sheet 14,249,755,295 14,525,077,638
Total for reportable segments liabilities 13,559,684,004 13,743,211,483Unallocated liabilities 690,071,291 781,866,155
Total liabilities as per balance sheet 14,249,755,295 14,525,077,638
Spinning Weaving Home TextilePower
Generation
Energy
productOthers Total
--------------------------------------------------------------------- Rupees ---------------------------------------------------------------------
- - - - - - - Rupees - - - - - - -
38.3 Revenue from major products
The analysis of the Group's revenue from external customers for its products is given in note 29 to these financial statements.
38.4 Information about major customers
Revenue from major customer of Home Textile segment for the year ended June 30, 2012 is Rs.1,422.282 million (2011: Revenue from major customer of Weaving, Home Textile and Power Generation segment represents amount of Rs.741.647 million, Rs.1,831.796 million and Rs.189.250 million respectively), where as in Spinning segment there is no major customer whose revenue accounts for more than 10% of total Spinning segment's revenue.
38.5 Geographical information
The Group's gross revenue from external customers by geographical location is detailed below:
2012 2011
Domestic sales 3,920,779,192 3,757,036,101Export sales 17,671,644,527 19,280,587,186
21,592,423,719 23,037,623,287
The Group mainly exports its products to Asia, Europe, Australia and North America.
- - - - - - - Rupees - - - - - - -
Notes to the Consolidated Financial StatementsFor the year ended June 30, 2012
107

Sapphire Textile Mills Limited
Annual Report - 2012
39 Related party disclosures
The related parties comprise associated companies (due to common directorship), directors and key management personnel. Amounts due to/from related parties are shown in the relevant notes to the financial statements. The Group in the normal course of business carries out transactions with various related parties. Significant balances and transactions with related parties are as follows.
Nature of transaction Relationship with the 2012 2011
Group
Sales, services provided, Rental income and
reimbursement of expenses
Amer Cotton Mills (Private) Limited Related party 763,559 836,640
Creadore A/S, Denmark Associate 248,515,610 7,767,831
Diamond Fabrics Limited Related party 16,892,516 49,930,985
Reliance Cotton Spinning Mills Limited Associate 278,552 5,904
Sapphire Fibres Limited Related party 32,284,583 9,314,972
Sapphire Finishing Mills Limited Related party 341,598,152 10,219,707
640,332,972 78,076,039
Purchases, services received and
reimbursement of expenses
Amer Cotton Mills (Private) Limited Related party - 1,132,650
Diamond Fabrics Limited Related party 136,000 758,820
Neelum Textile Mills (Pvt) Limited Related party 17,500 -
Reliance Cotton Spinning Mills Limited Associate 91,353,223 44,414,484
Sapphire Fibres Limited Related party 189,869,493 256,973,227
Sapphire Finishing Mills Limited Related party 15,101,525 24,005,366
Sapphire Power Generation Limited Associate 497,370,998 316,624,233
793,848,739 643,908,780
Sale of property, plant and equipment
Sapphire Finishing Mills Limited Related party 97,387,500 -
Purchase of property, plant and equipment
Sapphire Fibres Limited Related party 870,500 -
------------- Rupees -------------
-
Rent and other expenses
Yousuf Agencies (Private) Limited Related party 2,234,835 1,953,000
Contribution to provident fund
Retirement benefit fund 9,039,806 7,887,322
Expenses charged to
Amer Cotton Mills (Pvt) Limited Related party 196,757 -
Diamond Fabrics Limited Related party - 726,080
Reliance Cotton Spinning Mills Limited Associate 1,185,826 772,487
Sapphire Dairies (Pvt) Limited Associate 41,719 -
Sapphire Fibres Limited Related party 8,442,800 6,753,455
Sapphire Finishing Mills Limited Related party 1,114,580 -
Sapphire Power Generation Limited Associate 89,952 -
11,071,634 8,252,022
Sapphire Textile Mills Limited - EmployeesProvident Fund
Notes to the Consolidated Financial StatementsFor the year ended June 30, 2012
108

Sapphire Textile Mills Limited
Annual Report - 2012
Nature of transaction Relationship with the 2012 2011
Group ------------- Rupees -------------
Sapphire Fibres Limited Related party - 4,413,588
794,718 5,051,094
Dividend paid
Amer Cotton Mills (Private) Limited Related party - 3,375,415
Amer Tex (Pvt) Limited Related party 3,375,415 -
Diamond Fabrics Limited Related party - 668,925
Diamond Limited Related party 668,925 -
Galaxy Agencies (Pvt) Limited Related party 2,523,055 2,523,055
Nadeem Enterprise (Pvt) Limited Related party 2,931,210 2,931,210
Neelum Textile Mills (Private) Limited Related party 1,362,970 1,362,970
Reliance Cotton Spinning Mills Limited Associate 501,115 501,115
Sapphire Agencies (Pvt) Limited Related party 11,608,340 11,577,745
Sapphire Power Generation Limited Related party 1,418,210 1,418,210
24,389,240 24,358,645
Expenses charged by
Sapphire Fibres Limited Related party 1,116,780 777,342
Share deposit money
Sapphire Dairies (Pvt) Ltd Associate 90,000,000 -
Donations
Abdullah Foundation Related party 13,550,000 33,900,000
Jamal-ud-din Fatima Charitable Trust Related party 900,000 700,000
14,450,000 34,600,000
Dividend received
Reliance Cotton Spinning Mills Limited Associate 794,718 637,506
40 Plant capacity and actual production 2012 2011
Spinning units
Total number of spindles installed 122,328 120,632
Average number of spindles worked 114,911 117,337
Total number of rotors installed 3,120 3,120
Average number of rotors worked 3,057 2,305
Number of shifts worked per day 3 3
Total days worked 360 360
Installed capacity after conversion into 20/s lbs 86,040,250 84,877,025
Actual production after conversion into 20/s lbs 89,641,405 89,203,609
Weaving unit
Total number of looms installed 292 244
Average number of looms worked 287 233
Number of shifts worked per day 3 3
Total days worked 360 360
Installed capacity at 50 picks per inch of fabric square meters 98,269,741 86,410,095
Actual production converted at 50 picks per inch of fabric square meters 93,024,466 76,616,055
Home Textile Product unit
The capacity of this unit is undeterminable due to multi product involving varying processes of manufacturing and run length of order lots.
Notes to the Consolidated Financial StatementsFor the year ended June 30, 2012
109

Sapphire Textile Mills Limited
Annual Report - 2012
41 Remuneration of chief executive, director and executives
Chief Executive
Remuneration 6,000,000 6,000,000
Rent and utilities 3,000,000 3,000,000
9,000,000 9,000,000
Number of person 1 1
Director
Remuneration 7,200,000 5,333,396
Rent and utilities 3,600,000 2,666,604
10,800,000 8,000,000
Number of persons 2 2
Executives
Managerial remuneration 75,004,501 62,743,445
House rent 35,092,446 29,449,939
Cost of living allowance 71,400 97,800
Bonus 13,357,400 13,467,810
Medical 1,700,913 1,950,831
Utilities 4,616,785 3,798,481
Leave encashment and other benefits 7,295,345 8,707,578
137,138,790 120,215,883
Number of persons 75 58
75 58Number of executives provided with the Group maintained cars
The Chief Executive and two Directors were also provided with cars maintained by the Company and telephones at residence.
42 FINANCIAL INSTRUMENTS
The Group has exposures to the following risks from its use of financial instruments:
42.1 - Credit risk
42.2 - Liquidity risk
42.3 - Market risk
The Group's Board of Directors has overall responsibility for the establishment and oversight of the Group's risk management framework. The Board is also responsible for developing and monitoring the Group's risk management policies.
42.1 Credit risk
42.1.1 Exposure to credit risk
Credit risk is the risk of financial loss to the Group if a customer or counterparty to a financial instrument fails to meet its contractual obligations, and arises principally from the trade debts, loans and advances, trade deposits and short term prepayments, other receivables, other financial assets and cash and bank balances. Out of total financial assets of Rs.4,371.592 million (2011:Rs.4,933.809 million), financial assets which are subject to credit risk aggregate to Rs.4,270.049 million (2011:Rs.4,827.114 million). The carrying amount of
Notes to the Consolidated Financial StatementsFor the year ended June 30, 2012
2012 2011
------------- Rupees -------------
110

Sapphire Textile Mills Limited
Annual Report - 2012
financial assets represents the maximum credit exposure. The maximum exposure to credit risk at the reporting date is as follows.
2012 2011
Long term investments 1,951,957,505 2,119,658,353
Long term loans and advances 54,591,805 53,337,251
Long term deposits 29,500,666 23,352,066
Trade debts 1,309,908,251 1,691,268,678
Loans and advances 107,078,388 108,449,316
Trade deposits and short term prepayments 923,133 745,709
Other receivables 5,748,030 6,629,193
Short term investments 810,341,353 823,673,619
Cash and bank balances 101,542,626 106,694,575
4,371,591,757 4,933,808,760
42.1.2 The maximum exposure to credit risk for trade debts at the reporting date by geographical region is as follows.
Domestic 683,050,385 718,359,686
Export 626,857,866 972,908,992
1,309,908,251 1,691,268,678
------------- Rupees -------------
1,309,908,251 1,691,268,678
The majority of export debts of the Group are situated in Asia, Europe, Australia and North America.
42.1.3 The maximum exposure to credit risk for debts at the reporting date by type of product is as follows:
Yarn 727,810,667 995,368,253
Fabric 385,609,675 382,858,603
Home textile product 155,300,684 265,525,852
Energy - 16,964,285
Raw material 21,924 2,633,133
Waste 29,001,429 22,018,951
Processing services 9,557,818 4,924,148
Others 2,606,054 975,453
1,309,908,251 1,691,268,678
42.1.4 The aging of trade debts at the reporting date is as follows:
Not past due 1,079,015,621 1,261,608,868
Past due 0 - 30 days 186,447,357 345,074,815
Past due 31 - 60 days 8,943,587 32,640,740
Past due 61 - 90 days 7,447,290 3,199,964
Past due 91 - 1 year 15,768,909 28,484,893
More than one year 12,285,487 20,259,398
1,309,908,251 1,691,268,678
Credit quality of counter parties is assessed based on historical default rates. All receivables past due are considered good. The management believes that allowance for impairment of receivables past due is not necessary, as these comprise amounts due from old customers, which have been re-negotiated from time to time and are also considered good.
Notes to the Consolidated Financial StatementsFor the year ended June 30, 2012
111

Sapphire Textile Mills Limited
Annual Report - 2012
42.2 Liquidity risk
Liquidity risk is the risk that an entity will encounter difficulties in meeting obligations associated with financial liabilities. Prudent liquidity risk management implies maintaining sufficient cash and the availability of funding through an adequate amount of committed credits facilities. The Group Company's treasury department maintains flexibility in funding by maintaining availability under committed credits lines.
Financial liabilities in accordance with their contractual maturities are presented below:
Long term financing 1,308,090,300 1,687,335,134 362,180,222 1,325,012,831 142,081
Trade and other payables 834,625,159 834,625,159 834,625,159 - -
Accrued interest / mark-up 70,308,182 70,308,182 70,308,182 - -
Short term borrowings 2,850,256,515 2,869,398,021 2,869,398,021 - -
5,063,280,156 5,461,666,496 4,136,511,584 1,325,012,831 142,081
Long term financing 1,148,629,892 1,582,162,112 337,830,167 1,167,609,714 76,722,231
Trade and other payables 736,349,081 736,349,081 736,349,081 - -Accrued interest / mark-up 71,081,854 71,081,854 71,081,854 - -
Short term borrowings 4,182,054,384 4,191,594,667 4,191,594,667 - -
6,138,115,211 6,581,187,714 5,336,855,769 1,167,609,714 76,722,231
Rupees
2 0 11
Carrying amount Contractual cash flow Up to 1 yearBetween 1 to 5
years5 years and
above
Carrying amountContractual cash
flowUp to 1 year
Between 1 to 5
years
5 years and
above
Rupees
2 0 1 2
42.2.1 The contractual cash flow relating to the above financial liabilities have been determined on the basis of mark-up / interest rates effective at the respective year-end. The rates of mark-up / interest have been disclosed in the respective notes to these financial statements.
42.3 Market risk
Market risk is the risk that changes in market price, such as foreign exchange rates, interest rates and equity prices will affect the Group's income or the value of its holding of financial instruments.
42.3.1 Currency risk
The Group is exposed to currency risk on import of raw materials, stores & spares parts and export of goods mainly denominated in US Dollar, Euro, Japanese Yen and Swiss Frank. The Group's exposure to foreign currency risk for US Dollar, Euro, Japanese Yen and Swiss Frank is as follows:
Notes to the Consolidated Financial StatementsFor the year ended June 30, 2012
112

Sapphire Textile Mills Limited
Annual Report - 2012
2 0 1 2
Rupees US $ EURO JPY CHF
Short term borrowings (Foreign currency loan) - - - - -
Accrued mark-up on (Foreign currency loan) - - - - -
- - - - -
Trade debts 626,857,866 (5,616,609) (830,908) - -
Bank balances 31,069,944 (303,612) (21,400) - -
Gross Balance sheet exposure 657,927,810 (5,920,221) (852,308) - -
Outstanding letters of credit 255,257,767 1,423,213 722,154 2,870,000 9,692
Forward exchange contracts 1,262,550,790 10,565,420 2,482,593 - -
Net Exposures 2,175,736,367 6,068,412 2,352,439 2,870,000 9,692
2 0 1 2
The following significant exchange rates have been applied:
2012 2011
US $ to Rupees 94 / 94.20 85.85 / 86.05
Euro to Rupees 118.25 / 118.50 124.60 / 124.89
Reporting date rate
Rupees US $ EURO JPY CHF
Short term borrowings (Foreign currency loan) 1,330,732,645 15,464,644 - - -
Accrued mark-up on (Foreign currency loan) 5,181,536 60,215 - - -
1,335,914,181 15,524,859 - - -
Trade debts (972,908,992) (10,201,952) (779,666) - -
Bank balances (8,333,799) (21,952) (46,053) - -
Gross Balance sheet exposure 354,671,390 5,300,955 (825,719) - -
Outstanding letters of credit 217,538,903 344,824 1,085,588 41,577,000 75,340
Forward exchange contracts 2,892,632,474 30,762,500 1,703,970 - -
Net Exposures 3,464,842,767 36,408,279 1,963,839 41,577,000 75,340
2 0 1 1
Notes to the Consolidated Financial StatementsFor the year ended June 30, 2012
113

Sapphire Textile Mills Limited
Annual Report - 2012
Sensitivity analysis
A 10 percent strengthening of the Rupees against US Dollar and Euro at June 30, would have increase / (decrease) equity and profit and loss account by the amounts shown below. This analysis assumes that all other variables, in particulars interest rates, remain constant. The analysis is performed on the basis for 2012.
Equity Profit & loss
As at June 30, 2012Effect in US Dollar - (55,650,077)Effect in Euro - (10,099,850)
As at June 30, 2011Effect in US Dollar - 45,614,718Effect in Euro - (10,288,459)
2012 2011 2012 2011
Fixed rate instrumentsFinancial liabilities
Long term financing 7.00% to 12.70% 7.00% to 11.20% 723,411,302 464,632,892
Variable rate instruments
Financial liabilities
Long term financing 12.70% to 13.45% 14.73% to 15.04% 584,678,998 683,997,000
Short term borrowings 2.00 % to 15.57% 1.70% 15.57% 2,850,256,515 4,182,054,384
------------- Rupees -------------
Rupees
Effective rate Carrying Amount
Short term borrowings 2.00 % to 15.57% 1.70% 15.57% 2,850,256,515 4,182,054,384
10 percent weakening of the Rupees against the above currency at 30 June would have had the equal but opposite effect on the above currencies to the amounts shown above, on the basis that all other variable remain content.
42.3.2 Interest rate risk
At the reporting date, the profit, interest and mark-up rate profile of the Group's significant financial assets and liabilities is as follows:
Fair value sensitivity analysis for fixed rate instruments
The Group does not account for any fixed rate financial assets and liabilities at fair value through profit & loss. Therefore, a change in mark-up / interest rates at the reporting date would not affect profit & loss account.
Cash flow sensitivity analysis for variable rate instruments
A change of 100 basis points in mark-up / interest rates at the balance sheet date would have increased / (decreased) profit for the year by the amounts shown below. This analysis assumes that all other variables, in particular foreign currency rates, remain constant. The analysis is performed on the same basis for 2011.
Increase Decrease
As at June 30, 2012Cash flow sensitivity - variable rate instruments 34,349,355 (34,349,355)
As at June 30, 2011Cash flow sensitivity - variable rate instruments 48,660,514 (48,660,514)
The sensitivity analysis prepared is not necessarily indicative of the effects on profit for the year and liabilities of the Group.
------------- Rupees -------------
Profit and loss 100 bps
Notes to the Consolidated Financial StatementsFor the year ended June 30, 2012
114

Sapphire Textile Mills Limited
Annual Report - 2012
2012 2011
Effect on equity 267,615,062 285,718,374
Effect on investments 267,615,062 285,718,374
------------- Rupees -------------
42.3.3 Other price risk
Other price risk is the risk that the fair value or future cash flows of a financial instrument will fluctuate because of changes in market prices (other than those arising from interest rate risk or currency risk). Other price risk arises from the Group's investment in ordinary shares of listed Companies. To manage its price risk arising from aforesaid investments, the company diversify its portfolio and continuously monitor developments in equity markets. In addition the Group actively monitors the key factors that affect stock price movement.
A 10% increase / decrease in share prices of listed companies at the balance sheet date would have increased / decreased the Group's unrealised gain on 'available for sale' investments as follows:
The sensitivity analysis prepared is not necessarily indicative of the effects on equity / investments of the Group.
42.4 Fair value of financial instruments
Carrying values of the financial assets and financial liabilities approximate their fair values. Fair value is the amount for which an asset could be exchanged, or a liability settled, between knowledgeable, willing parties in an arm's length transaction.
42.5 Fair value hierarchy
The carrying value of all financial assets and liabilities reflected in the financial statements approximate their fair value.
The table below analyses financial instruments carried at fair value, by valuation method. The different level have been defined as follows:
Level 1. Quoted market price (unadjusted) in an active market for identical instrument.
Level 2. Inputs other than quoted price included within Level 1 that are observable for the asset or liability, either directly (i.e., as prices) or indirectly (i.e., derived from prices).
Level 3. Inputs for the asset or liability that are not based on observable market data (unobservable inputs).
Notes to the Consolidated Financial StatementsFor the year ended June 30, 2012
115

Sapphire Textile Mills Limited
Annual Report - 2012
Level 1 Level 2 Level 3
As at June 30, 2012
Assets carried at fair value
Available for sale investments 2,676,150,622 - 86,148,236.00
Forward exchange contracts used for hedging - - -
2,676,150,622 - 86,148,236
As at June 30, 2011
Assets carried at fair value
Available for sale investments 2,857,183,736 86,148,236
Forward exchange contracts used for hedging - 1,899,447 -
2,857,183,736 1,899,447 86,148,236
As at June 30, 2012
Liabilities carried at fair value - 26,968,687 -
Forward exchange contracts used for hedging
As at June 30, 2011
Liabilities carried at fair value
Forward exchange contracts used for hedging - - -
-------------------------------- Rupees --------------------------------
Forward exchange contracts used for hedging - - -
42.6 Capital risk management
The Group's prime objective when managing capital is to safeguard its ability to continue as a going concern in order to provide adequate returns for shareholders, benefits for other stakeholders and to maintain an optimal capital structure to reduce the cost of capital.
Consistent with others in the industry, the Group manages its capital risk monitoring its debts levels and liquid assets and keeping in view future investment requirements and expectations of the shareholders. Debt is calculated as total borrowings ('long term loans' and 'short term borrowings' as shown in the balance sheet). Total capital comprises shareholders' equity as shown in the balance sheet under 'share capital and reserves'.
2012 2011
Total borrowings 4,159,069,711 5,331,633,595Less: Cash and bank balances 101,542,626 106,694,575
Net debt 4,057,527,085 5,224,939,020
Total equity 8,514,466,596 7,649,360,830
Total capital 12,571,993,681 12,874,299,850
Gearing ratio 32.27 40.58
Percentage
------------- Rupees -------------
Notes to the Consolidated Financial StatementsFor the year ended June 30, 2012
116

Sapphire Textile Mills Limited
Annual Report - 2012
43 Non adjusting event after balance sheet date
The board of directors of Holding Company in its meeting held on October 05, 2012 proposed a cash dividend of Rs.100,415,700 (2011: Rs. 100,415,700) at the rate of Rs.5 (2011: Rs. 5) per ordinary share of Rs.10 each. Proposed dividend is subject to approval by shareholders at the forthcoming Annual General Meeting and has not been included as a liability in these financial statements. This will be accounted for subsequently in the year of payment.
44 Corresponding figures
Corresponding figures has been rearranged and reclassified, wherever necessary, for better presentation and comparison. Significant reclassification includes the following.
Re-classification to component Note Rupees
Balance sheet
Inventories Stores, spares and loose tools 12 209,111,346
Stock-in-trade 13 3,735,227,873
Cash flow statement
Inventories Stores, spares and loose tools 37 16,044,519
Stock-in-trade 37 975,564,865
Cost of sales
Goods purchased : Yarn for processing Purchases 29 123,316,609
Goods purchased : Fabric for processing Purchases 29 53,110,353
Re-classification from component
45 Date of authorization for issue
These financial statements were approved by the Board of Directors of the Holding Company and authorized for issue on October 05, 2012 .
Karachi:Dated: October 05, 2012
NADEEM ABDULLAH MOHAMMAD ABDULLAHDIRECTORCHIEF EXECUTIVE
Notes to the Consolidated Financial StatementsFor the year ended June 30, 2012
117

Sapphire Textile Mills Limited
Annual Report - 2012
Form of Proxy
I/we_______________________________________________________________________________
of_________________________________________________________________________________
a member(s) of SAPPHIRE TEXTILE MILLS LIMITED and a holder of_______________Ordinary Shares,
do hereby appoint____________________________________________________________________
of________________________________________________________________________________
or failing him/her____________________________________________________________________
of________________________________________________________________________________
a member of SAPPHIRE TEXTILE MILLS LIMITED, vide Registered Folio No.________________ as my/ourProxy to act on my/our behalf at 44th Annual General Meeting of the Company to be held on Tuesday the 30th October,2012 at 7:30 p.m. at Trading Hall,Cotton Exchange Building, I.I.Chundrigar Road, Karachi and/or any adjournmentthereof.
Signed this________ day of _____________, 2012
Signature __________________________________
(Signature should agree with the specimen signature registered with the Company)
NOTICE
1. No proxy shall be valid unless it is duly stamped with a revenue stamp of Rs.5/-
2. In the case of Bank or Company, the proxy form must be executed under its Common seal and signed by its authorizedperson.
3. Power of attorney or other authority (if any) under which this proxy form is signed then a certified copy of that power ofattorney must be deposited along with this proxy form.
4. This form of proxy duly completed must be deposited at the Registered Office of the Company atleast 48 hours beforethe time of holding the meeting.
5. In case of CDC account holder :
i) The proxy form shall be witnessed by two persons whose names, addresses and NIC numbers shall be mentioned onthe form.
ii) Attested copies of NIC or passport of the beneficial owners and the proxy shall be furnished with the proxy form.
iii) The proxy shall produce his original NIC or original passport at the time of meeting.
iv) In case of corporate entity, the board of directors’ resolution/power of attorney with specimen signature of the proxyholder shall be submitted (unless it has been provided earlier) along with proxy form to the company.
Witness :
Name _______________________________
Address______________________________
____________________________________ _____________________________________________
NIC No._____________________________
Name_________________________________________
Address_______________________________________
NIC No._______________________________________
REVENUESTAMP OF
RS.5/-
118