annual report 2012 - Avinor · over half of the air passengers in europe now travel via airports...
78
ANNUAL REPORT 2012
Transcript of annual report 2012 - Avinor · over half of the air passengers in europe now travel via airports...

annual report 2012

2
content
4 Introduction 5 Highlights of 2012 8 Annual report of the board of directors 2012 18 Corporate governance in the Avinor group25 Main figures 26 Income statement27 Statement of comprehensive income28 Balance sheet30 Statement of changes in equity32 Statement of cash flows33 Notes to the financial statements74 Responsibility statement from the board of directors and the managing director 75 Auditor’s report

avinor annual report 2012 3
Header

4 avinor annual report 2012
avinor’s role is to own, operate and develop a national network of airports and a joint air navigation service for the civilian and military sectors. We shall fulfil these responsibilities in a safe, efficient and environmentally friendly manner - for the benefit of the customers and society at large.
avinor is one of a small number of companies in europe that manage such a joint national system of airports and air navigation services. Several countries are discussing whether to separate the areas of responsibility, and to sell off individual airports. the norwegian system has been chosen based on a desire to manage a unified system free of operating support from the state – where the profit from the larger airports funds the operations of the others. a unified system entails operating and purchasing benefits, provides opportunities for development and innovation and the strength to realise major investments. It safeguards quality services across the country and it supports regional and commercial development in a long, sparsely populated country exposed to the elements.
We welcome a discussion on the structure of the domestic aviation industry, and aim to actively participate in such a debate. our most important contributions are good service deliveries and a clearly communicated vision of which conditions will influence our role in society and our results in the coming years.during the last year, avinor’s organisation and employees delivered strong results. the financial results and the planned investments were delivered as forecast. our largest project, the expansion of terminal 2 at oslo airport Gardermoen, has a budget of noK 12.5 billion. With
four years remaining until the project is scheduled to be completed, it is on time and on budget. at the same time, major investments were carried out in Stavanger, trondheim, Molde and Kristiansund airports in 2012. there have not been any accidents within commercial aviation and the growth in traffic has been managed with high punctuality.
a demanding staffing situation in the air navigation service division in eastern norway unfortunately caused problems for our customers during the summer. this situation must not be allowed to repeat itself. I am therefore pleased about the good and constructive collaboration which has been established between management, employees and their employee representatives to create sufficient robustness in our service deliveries.
avinor has extensive plans to improve and expand our services to airlines and travellers, and we actively participate in local and regional business development through investments of billions of Kroner each year. In 2013 we are also implementing adjustments that will result in a more efficient and unified avinor. We are convinced that the Group is strongest and delivers its best services when the various business areas have clear, common goals and support each other, and when collaboration and skills development are facilitated across organisational lines. avinor’s position shall be clarified and strengthened, and our national operations and organisation will be linked more closely together. together we will develop an efficient and well-functioning avinor, organised such that the resources are used optimally.
unIfIed and effIcIent – for SocIety and cuStoMerSdaG falK-peterSen, ceo avInor aS
avinor has extensive plans to improve and expand
our services to airlines and travellers.
dag falk-petersenceo avinor aS

avinor annual report 2012 5
HIGHlIGHtS of 2012
JanuaryPuNCtuAlIty PRIzeoslo airport Gardermoen, oSl, is named the most punctual of the large airports in europe by flightstat.com. oSl airport had a punctuality in departures of over 87 per cent in 2011. Stavanger airport, Sola, and trondheim airport, værnes, reached the final in the category for regional airports. SuBMItted eNvIRoNMeNtAl RePoRt to KlIfat its own initiative, avinor has mapped the extent of contaminated soil at the company’s airports, and the report is submitted to the climate and pollution agency (Klif).
feBruaryCHeCK IN uSINg AvINoR MACHINeSnew self-service check in-machines from avinor are launched. these will improve passenger throughput at the country’s largest airports.
AMBItIouS eNvIRoNMeNtAl PRogRAMMeover half of the air passengers in europe now travel via airports that have qualified for an extensive environmental programme under the direction of airports council International (acI), including three avinor airports.
NAtIoNAl tRANSPoRt PlAN 2014-2023: Capacity increases and development of the airport structureavinor submits proposals to ntp and prepares for a number of substantial investments in the next ntp period, both to increase capacity and facilitate a forward-looking nationwide airport structure. an extensive programme of investments is proposed to be implemented during the plan period, totalling noK 24 billion across the entire airport network and the air navigation services.
MarcHCut IN tHe SeCuRIty feethe security fee is reduced from noK 54 to noK 47 from 1 april 2012 following the decision by the Ministry of transport and communications. the security fee is charged per passenger, and the proceeds go to covering the security costs at avinor’s airports.
aprIlMoRe woMeN ARe APPlyINg536 persons applied for air traffic controller training in 2012. the proportion of women is rising, from 38 per cent in 2011 to 40 per cent in 2012.
IPAd MAP foR PRIvAte PIlotS avinor has developed an electronic map for ipads that will be available from 15 June via itunes. a solution for android will be launched at the same time.
AIRPoRt CItyavinor signs a contract with a group of companies that will assist in the work of realising property development plans on the land side of the largest airports. the group that won the public procurement contract was faveo, BaHr and dnB næringsmegling aS .
CoNtINued ReduCtIoN IN AIRCRAft NoISe new reports indicate that the noise from norwegian aviation has fallen by almost 20 per cent since 1999, despite a significant growth in traffic.
nuMBer of paSSenGerS
46 357 0002011: 44 278 0002010: 40 112 000
operatInG IncoMe
91522011: 86222010: 7871 MnoK

6 avinor annual report 2012
MayStRIKe AffeCtS AIR tRAffICthe security guards strike at the airports leads to major air traffic delays. the strike ends in early June.
JuneMASteR PlAN foR oSlo AIRPoRt gARdeRMoeNa new long-term development plan - Master plan for oslo airport 2012 - 2050 - is submitted to the Ministry of transport and communications.
teStINg ReMotely oPeRAted toweRS avinor selects røst airport and værøy heliport to be test locations for remotely operated towers. the purpose is to uncover the technical challenges and business-related opportunities that arise from remotely operating one or more towers. from december pilots landing at værøy will receive detailed information about traffic, weather and landing conditions from afIS authorised personnel in Bodø.
AvINoR SIgNS AgReeMeNtS oN StReNgtHeNed euRoPeAN CooPeRAtIoN two important agreements within european airspace cooperation are signed. the north european functional airspace Block agreement and the Borealis alliance agreement will both be important to avinor’s air navigation service operations in coming years.
fIgHteR PlANe BASe to ØRlANdthe decision to move the main fighter plane base from Bodø to Ørland and establish an advanced base in evenes, will have consequences for avinor and civil aviation.
JulyStAffINg SHoRtAgethe lack of available air traffic controllers during holiday periods is leading to regulation of traffic at several airports. the traffic regulation causes delays for some aircraft, especially during rush hours in the morning and afternoon. for the most part, the scarcity of air traffic controllers does not result in cancellations.
PIoNeeRINg PRojeCt At KjevIKKristiansand airport, Kjevik, becomes the first airport in norway to install a safety system that will be able to bring an aircraft to a halt in a controlled manner, if the aircraft is unable to stop before the end of the runway for any reason.
octoBerNew MeASuRINg MetHodS wIll PRovIde IMPRoved NotIfICAtIoN of volCANIC ASHthe Ministry of transport and communications and avinor sign a project contract with the norwegian Meteorological Institute to develop improved methods for notification of volcanic ash in norwegian airspace. the Meteorological Institute, in collaboration with the norwegian Institute for air research will develop new measurement methods and model calculations for the spread of volcanic ash in the airspace.
AvINoR ANd tHe NoRwegIAN ARMed foRCeS SIgN AN AgReeMeNt foR tHe delIveRy of AIR NAvIgAtIoN SeRvICeSavinor and the norwegian armed forces sign an agreement for the delivery of air navigation services from avinor to the norwegian armed forces.
nuMBer of aIrcraft departureS
6692011: 648 2010: 619
profIt for tHe year
9402011: 844
2010: 1008 MnoK

avinor annual report 2012 7
AIR fReIgHt IS gRowINgSince 1999 air freight volumes have increased tremendously and currently account for 6 per cent of the value of norwegian foreign exports.
“tuRBuleNt tIMeS” tHeMe At tHe AvINoR CoNfeReNCe IN 2012With the global financial crisis as a backdrop, this year’s avinor conference will focus on the numerous challenges the aviation industry as a whole is facing. a record number - 160 - participate in the conference.
SPeKteR’S CoNteNtIoN IS uPHeld IN tHe INduStRIAl dISPuteS CouRt the Industrial disputes court upheld the employer organisation Spekter’s contention that one of the norwegian air traffic controllers association’s representatives must resign. Spekter was also awarded costs. the summons was issued in august.
deceMBerPRePARINg tHe New teRMINAl At fleSlANdthe Board of avinor resolve to begin preparatory work in connection with the construction of a new terminal at Bergen airport, flesland. the work will cost about noK 300 million.
NoRwAy’S MoSt effICIeNt SeCuRIty CHeCKPoINtStavanger airport, Sola launches norway’s most efficient and modern security checkpoint. a total of 1,800 persons can pass through 6 new checkpoints in one hour.
CHeAP AIRSPACethe price of flying through norwegian airspace is significantly lower than in our neighbouring countries. While the unit rate in Sweden is just under eur 80, it is under eur 60 in norway. avinor has managed to hold the costs of deliveries down despite a growth in the number of aircraft movements of 4.1 per cent in 2012. the number of “units” is determined by the aircraft’s weight and distance flown.
CHRIStMAS PReSeNt to tHe CHuRCH CIty MISSIoNfor the second year in a row, avinor’s christmas present for the year goes to the church city Mission and the campaign “Gled en som gruer seg til jul! (Make someone happy who is dreading christmas!)”. avinor also supports “nabosamarbeidet i Bjørvika (the neighbour partnership in Bjørvika)” under the auspices of the church city Mission
gReAteR uSe of PuBlIC tRANSPoRta new study from the Institute of transport economics shows that about 36 per cent of air passengers who travel to and from avinor’s four largest airports used public transport. this figure should be higher.
All tIMe HIgH22.1 million passengers travelled through oslo airport in 2012. this is an increase of 4.6 per cent or 980,000 compared with 2011, and the highest number ever recorded.
nuMBer of eMployeeS
31092011: 3077 2010: 2941
nuMBer of ServIce unItS
18452011: 1713 2010: 1583

8 avinor annual report 2012
fACtS ABout AvINoR ASavinor’s goal is to facilitate safe, environmentally friendly and efficient aviation in all parts of the country. financially, the airport operations are managed as a single unit, which means that the financially profitable airports finance the financially unprofitable airports. the air navigation service is self-financed through fixed pricing for its services. In 2012 a performance-based price system was introduced in europe, with risk sharing with the customers. In autumn 2012 the Ministry of transport and communications resolved to extend the contract with avinor as the provider of air traffic services in norwegian air space for two years, until 26 September 2014.
avinor has two primary business areas, the operation of a nationwide network of airports and the national air navigation service for civilian and military aviation. this encompasses 46 airports in norway, as well as control towers, control centres and technical infrastructure. twelve of the airports are operated in cooperation with the norwegian armed forces. arrangements are being made to facilitate commercial revenue streams from airport hotels, car parks, duty free shops, food and beverage services and other services for air passengers.
the shares in avinor aS are wholly-owned by the norwegian state as represented by the Ministry of transport and communications. the Ministry of transport and communications manages the norwegian state’s ownership of avinor, and determines, for example, special duties imposed on the Group by society, the required rate of return and dividends. In addition, the Ministry of transport and communications regulates the aviation fees. the Ministry of transport and communications is the highest authority for norwegian aviation and also lays down the civil aviation authority’s regulations that have consequences for avinor’s operations. avinor’s head office is located in oslo.
AvINoR’S SoCIAl BeNefItaviation is of great social benefit in norway. two out of every three norwegians have access to an airport within an hour’s drive, and 99.5 per cent of the population can manage a visit to oslo and be back home on the same day. aviation employs between 60,000 and 65,000 people and is in general of great importance to regional growth and accessibility to regional centres. overall, the impact of aviation is equivalent to 2 per cent of norway’s Gdp. there are over 200 direct connections between avinor’s airports and international destinations, and the number of direct intercontinental routes is expected to treble over the next ten years. of all domestic trips 13 per cent are related to the oil and gas sector. around 600,000 helicopter flights are completed each year to installations on the norwegian continental shelf. the importance of aviation to norwegian tourism is substantial and increasing: of all tourists who visit norway 34 per cent arrive by air, and this is the form of transport that is increasing the most. Spending by air tourists in norway amounts to around noK 13 billion. aviation is also of vital importance to the health sector in norway: around 400,000 patients are transported on scheduled flights and there are 30,000 air ambulance movements each year.
In addition, around 150,000 journeys are completed each year with assistance for passengers with reduced mobility. aviation’s importance to the health sector is greatest in north norway, and the structure of hospitals is partly based on the availability of air transport. avinor will conduct a new analysis of aviation’s social benefit in 2013 in order to improve and update the documentation.
eCoNoMy ANd fINANCefinancial results for the groupthe Group’s operating income in 2012 was noK 9,152 million, and the profit after tax was noK 927 million. the Group profit figures have improved in 2012, with an operating margin of 18.2 per cent compared with 17.2 per cent in 2011. return on total capital after tax was 5.8 per cent compared with 5.7 per cent in 2011. return on equity in 2012 was 9.0 per cent compared with 7.9 per cent in 2011.
Within airport operations, operating income in 2012 grew by 6.3 per cent to noK 8,256 million with an operating margin at the same level as the year before. the total number of passengers increased by 4.7 per cent to 46.4 million. consolidated operating income per passenger rose by 1.5 per cent from 2011 to 2012. traffic income per passenger increased by 2.5 per cent while commercial income per passenger grew by 6.3 per cent. due to the reduction in security fees from 1 april 2012, the income from security in 2012 was 13.2 per cent lower than the previous year. commercial income accounted for 50.8 per cent of total operating income in 2012, an increase of 2.3 percentage points from the previous year.
the air navigation service reported an increase in operating income in 2012 of 2.6 per cent to noK 1,837 million with an operating margin of 3.4 per cent. the operating margin in 2011 was 5.3 per cent. the traffic volume in 2012 measured in terms of service units and aircraft movements increased by 7.8 per cent and 3.8 per cent, respectively.Group combined operating expenses in 2012 amounted to noK 7,470 million, comprising noK 3,073 million in payroll and other personnel costs, noK 2,919 million in other operating expenses, noK 1,336 million in depreciation and write-downs and noK 143 million in cost of sales. total cost growth from the previous year was 5.2 per cent. the cost growth must be viewed in relation to, for example, the above mentioned growth in traffic of 4.7 per cent. the group focus on cost cost effective management
Within airport operations, combined operating expenses including depreciation increased by 6.5 per cent from 2011 to 2012, while combined operating expenses per passenger rose by 1.7 per cent. combined operating expenses increased by 4.6 per cent within the air navigation service.
the net financial result was minus noK 356 million, compared with minus noK 295 million in the previous year. the change was largely due to an increase in interest-bearing liabilities and the recognition of expenses associated with interest rate hedging instruments.the income tax expense for the year amounted to noK 380 million.
annual report of tHe Board of dIrectorS 2012(laSt year’S fIGureS In parentHeSeS)
avinor annual report 2012 9
Cash flow and capital structurethe Group had a net cash flow of minus noK 794 million in 2012, compared with a net positive cash flow of noK 539 million in 2011. the change is principally due to increased investments in property, plant and equipment. the Group acquired noK 1,436 million in new net interest-bearing debt in 2012 compared with noK 1,103 million in 2011. cash flow from operating activities amounted to noK 2,714 million, while net investments, interest and dividends totalled noK 4,950 million. Significant accounting items with no cash flow effect are depreciation charges of noK 1,336 million.
the Group’s total equity as at 31 december 2012 amounted to noK 28.1 billion, up 7.5 per cent from the previous year. equity as a percentage of equity and interest-bearing debt totalled 48.1 per cent as at 31 december 2012 compared with 51.6 per cent in the previous year. at year end the Group had long-term liabilities of noK 10.1 billion, current liabilities were noK 3.5 billion and provisions for pension obligations and other obligations were noK 4.1 billion. liquid assets as at 31 december 2012 were noK 1.3 billion. In order to ensure the companys corporate social responsibility, the Group is taking on large infrastructural investments, and has requested emission of noK 2.5 billion from the owner.
financial results for Avinor ASthe parent company’s profit after tax was noK 459 million in 2012, compared with noK 785 million in the previous year. the change in the profit is attributed primarily to reduced dividends and group contributions from subsidiaries.
operating income increased by 5.7 per cent to noK 5,318 million, while operating costs increased by 4.6 per cent to noK 5,242 million. the operating profit was noK 62 million, compared with a loss of noK 4 million in 2011.
the parent company had a net cash flow of minus noK 775 million, compared with a positive cash flow of noK 569 million in 2011. the change is principally due to increased investments and loans to subsidiaries. the parent company acquired noK 1,953 million in net new debt in 2012 compared with noK 1,506 million in 2011. cash flow from operating activities amounted to noK 1,280 million in 2012, while net investments, interest and dividends totalled noK 4,008 million. Significant accounting items with no cash flow effect are depreciation charges of noK 624 million.
the parent company’s total equity as at 31 december 2012 amounted to noK 19.5 billion, up 13.5 per cent from the previous year.
Allocation of the profit for the yearthe Board proposes the following allocation of the profit for the year:dividend: noK 463.4 millionto other reserves: noK -4.9 milliondistributable equity as at 31 december 2012 was noK 928.6 million.
going concernthe 2012 financial statements have been prepared under the assumption that the company will continue as a going concern (cf. Section 3-3 of the accounting act) on the basis of forecasts and the calculated present value of estimated future cash flow. See note 6 to the annual accounts for further details.
financial riskthe Group’s operations are focused on safe air traffic management with procedures and measures to minimise both the risks and consequences of accidents and serious incidents. In addition to aviation-related operating conditions, the business is exposed to financial risk.
regulatory provisions for aviation are subject to ongoing national and international development. the Group’s continuous updating of operations to comply with new provisions has financial consequences.the norwegian state has defined avinor as a “category 4” company, i.e. a company with national sectoral policy objectives. this entails, for example, that the norwegian state sets guidelines for a number of conditions, including airport structure, emergency preparedness, aviation fees and duties imposed by society. depending on the various political priorities, the scope and organisation of sectoral policy guidelines may change over time.
avinor’s operations are characterised by long-term investments in infrastructure. the management of operations and emergency preparedness are largely regulated by provisions and regulations. the Group therefore has a high percentage of fixed operating costs that vary to a limited extent with changes in traffic volumes. the Group’s financial earnings and value are therefore sensitive to traffic fluctuations, and there is a risk of an impairment in value with regard to property, plant and equipment on the Group’s balance sheet. experience has shown that there is a correlation between the general economic development and the demand for air travel over time, while there may be significant deviations in the short term.
oslo airport Gardermoen accounts for almost 50 per cent of the Group’s operating income and is a key source of funding for the rest of the airport network in norway. the airport’s earnings are exposed to economic cycles and competition from other airports.
the Group’s traffic income and earnings are exposed to future changes in the airlines’ schedules and production. the majority of the Group’s receivables are from the airlines and are not hedged.revenues from commercial offerings at the airports are very important to the Group’s funding. changes in the framework conditions for these activities will have a major impact on the Group’s earnings and financial value.
the Group has financial risk in connection with foreign currency, interest rates and energy prices. financial hedging instruments (derivatives) are used to curtail risk. the Group’s long-term debt to the

10 avinor annual report 2012
olA MØRKved RINNAN
Born: 1949role: chairman
occupation: ceo eidsiva energi aS
Member of the board since: 2010
education: Sivilingeniør fra ntnu 1972 og Bachelor
økonomi nHH 1985.
KRIStIN vANgdAl
Born: 1964role: vice chairman
occupation: leder forretningsstøtte SpareBank1
nord-norgeMember of the board since:
2002
education: revisorstudiet ved trondheim Økonomiske Høgskole 1991 og Master-
program i Samspill og ledelse BI oslo 2009
olA H. StRANd
Born: 1957role: Member of the board
occupation: adm. direktør coop norge aS
Member of the board since: 2012
education: trondheim Økono-miske Høgskole 1980 og
MBa Strategisk ledelse ved nHH 1998.
norwegian state is exposed to changes in the interest rate on long-term government bonds. a significant portion of the Group’s other debt has fixed interest rates or is hedged by means of financial derivatives.When investing the Group’s surplus cash, emphasis is given to the issuer’s solidity and the liquidity of the investment. the Group’s liquid assets are deposited in a bank on negotiated terms.
on 18 february 2011 a cooperation agreement was signed between the norwegian armed forces and avinor, which, with effect from 2 January 2010 will regulate the distribution of costs and other conditions between the parties where the norwegian armed forces and avinor operate jointly. the cooperation agreement presupposed that within six months after the agreement was singed, local supplemental agreements will be established for the airports as well as an air navigation services agreement. on 10 october 2012 the norwegian armed forces and avinor signed a new air navigation services agreement that regulates avinor’s delivery of air navigation services to the norwegian armed forces’ airports at andøya, Bardufoss, Bodø, rygge and Ørland. With respect to the airports, there is disagreement between the norwegian armed forces and avinor about the interpretation of key points in the cooperation agreement, and the negotiations on local supplemental agreements have not been resolved. In accordance with the provisions of the cooperation agreement, disagreement may entail that the matter will go to arbitration.
a legal discretionary assessment to determine the purchase price or an annual user fee for aviation-critical areas that are owned by the norwegian armed forces at Bergen airport, flesland and trondheim airport, værnes is still in preparation. the parties have differing views about how the attorney General’s guidelines relating to the ownership of historic investments are to be understood. the outcome from different interpretations may entail significant financial differences. a legal discretionary assessment may also be relevant for the use of aviation-critical areas that are owned by the norwegian armed forces at andøya and Bardufoss and in Bodø. there is a great deal of uncertainty related to the size of the considerations.
following the recommendation from the Government (proposition 73 S (2011-2012)), the Storting resolved in June 2012 that new fighter planes are to be based in Ørland with the advanced base in evenes. It has been resolved to close down Bodø’s main air station. the change in the norwegian armed forces’ base structure alters the present joint operations between civil and military aviation in Bodø, and could have significant financial consequences for avinor’s future operating and investment costs.
In connection with capacity expansions at oslo airport Gardermoen, there is disagreement between the norwegian national rail administration and avinor regarding the development of the railways and the principles for distribution of costs.

avinor annual report 2012 11
elI SKRØvSet
Born: 1965role: Member of the board
occupation: cfo eksport-kreditt norge
Member of the board since: 2011
education: Siviløkonom nHH 1990 og aMp ved Hardvard
Buisness School 2008
ANNe BReIBy
Born: 1956role: Member of the board
occupation: Self employedMember of the board since:
2012
education: lærerskolen Hamar 1979 og cand. Scient i
fiskeribiologi universitetet i tromsø 1985
dAg Helge HåRStAd
Born: 1962role: Member of the board
occupation: ceo of the treatment centre for Substance
abuse at central norway regional Health authority
Member of the board since: 2007
education: flyvelederskolen 1984 og luftfartsverkets lederut-
viklingsprogram (lup) 2002.
the airports have discharge permits that require risk assessments to identify potential sources of acute pollution that represent a risk of damage to the external environment. Work is continuing on reducing the risk of incidents that harm the environment occurring, at the same time as existing pollution is being surveyed and cleaned up.
environmentally hazardous additives in fire extinguishing foam that was used previously and which has spread to the natural environment have been detected at all the airports. Work is currently being conducted to clarify the scope of measures that will need to be implemented. as a basis for this work, risk assessments have been conducted of the potential harm to persons and the external environment from these pollutants. the economic consequences of this work depend on the extent of the localities that require measures to be implemented, as well as the authorities’ requirements and the measures available.
CoRPoRAte goveRNANCethe Board of directors has prepared a separate statement on corporate governance in accordance with the norwegian code of practice for corporate Governance (nueS). this statement is enclosed as an annex to this report.
the Group’s subsidiaries have their own boards comprised of external participants, intra-group managers and employees. the appointment of the Board of directors and the Board’s work in subsidiaries shall be in accordance with the Group’s principles of good corporate governance.
tRAffIC develoPMeNt, PuNCtuAlIty ANd RegulARItythe growth in air traffic at avinor’s airports continued in 2012. the number of passengers increased by 4.7 per cent (10.4 per cent) to 46.4 million passengers.
the greatest growth was in international traffic which rose by 7.2 per cent to 17 million passengers. domestic traffic increased by 3.3 per cent to 28.7 million passengers. International traffic represented 38 per cent of avinor’s total number of passengers, an increase of one percentage point from 2011.
the number of offshore passengers totalled 644,000 in 2012, an increase of 5 per cent.
the number of commercial aircraft movements in 2012 was up 3.5 per cent compared with 2011, amounting to 719,000 in 2012. domestic and international grew by 3.4 per cent and 3.3 per cent, respectively. the number of helicopter movements increased by 6.4 per cent and totalled 49,500 at year end. the total number of movements at avinor’s airports was 815,000 in 2012.
the number of flyovers in norwegian airspace rose by just over five per cent to 69,000. the total number of aircraft movements increased by 3.75 per cent to 582,000. the number of invoiced service units for en route traffic rose by 7.8 per cent compared with 2011.

12 avinor annual report 2012
In 2012 there were no major national or international incidents that affected air traffic in a negative direction.
during the summer avinor had considerable challenges with staffing at the røyken approach control and Garermoen tower. this had negative impact on punctuality in this period and affected avinor’s customers and society at large. a number of measures have been implemented to improve resource capacities. the most important factor is to train and transfer as many air traffic controllers as possible to the units that are facing challenges. there has been no delays in the air traffic caused by these factors since September.
the Group’s internal target for punctuality and regularity is 88 per cent and 98 per cent, respectively. achieving this target depends on the concerted efforts of the airports, airlines and providers of airport-related services, as well as the weather conditions. regularity, which measures the percentage of scheduled flights that are actually operated, was 98.4 per cent (98.6 per cent). punctuality was 87 per cent (88 per cent).
AIR SAfety ANd HSethe regulatory requirements in the area of air safety follow from norway’s international obligations through the eea and Icao (the un’s International civil aviation organisation). the norwegian civil aviation authority implements provisions that avinor is required to comply with based on these obligations. the concept of air safety encompasses both safety and security.
avinor participates actively in international work, such as the development of new aviation-related regulations in europe and airport regulations in particular. the primary aim in terms of air safety is for avinor to develop a highly qualified and effective level of safety in all of
its activities in order to avoid accidents and serious incidents.the degree of reporting in the Group is consistently high, and following up irregularities is given a strong focus in all parts of the Group. In december a safety culture survey was conducted in the Group. the results from the survey will be followed up in 2013.
Several internal and external audits of various suppliers and business partners have been performed. In addition, a number of external authorities have inspected avinor, including the civil aviation authority norway, the norwegian labour inspection authority and efta’s surveillance authority, eSa.
there have been no aviation accidents with or without (0) personal injury in norwegian aviation in which avinor was a contributory party. there were 7 (4) incidents which under the definition set out in the regulation (BSl a 1-9) are categorised as serious aviation accidents in which avinor was a contributory party (directly or indirectly).
In the field of bird and wildlife control, avinor has introduced a new tool for conducting risk analyses at airports in 2012.
from 1 January 2014 new pan-european safety regulations for operating and designing airports will be introduced. the regulations are being prepared by the european aviation Safety agency (eaSa) under the direction of the european commission. a transition period of four years is provided for certifying the airports based on the new requirements. avinor has established an extensive project to ensure the certification work is completed.
avinor is implementing several major projects that are intended to optimise norwegian airspace for increased safety, greater capacity, more efficient service provision and reduced environmental impact.
gRete oveNRud
Born: 1966role: Member of the board,
employee-elected
occupation: air traffic controller
Member of the board since: 2011
HeIdI SØRuM
Born: 1967role: Member of the board,
employee-elected
occupation: traffic plannerMember of the board since:
2011
Helge lØBeRgSlI
Born: 1953role: Member of the board,
employee-elected
occupation: teamlederMember of the board since:
2002
CHRIStIAN BeRge
Born: 1978role: Member of the board,
employee-elected
occupation: air traffic controller
Member of the board since: 2009
avinor annual report 2012 13
one of the projects is Southern norway airspace project (Snap) which aims to optimise the airspace over Western norway, Møre & trøndelag. at oslo airport, Gardermoen the aim is to optimise the approach paths, efforts include a test project that has been set up using curved approach flight paths.
Work on establishing newer surveillance technology, adS-B (automatic dependent Surveillance – Broadcast) in the north Sea has been progressing well in 2012. the purpose of this project is to facilitate controlled airspace to and from the ekofisk area and eventually the Heimdal/Sleipner area.
there continues to be emphasis on the risk of terrorist actions against aviation. efforts to improve the efficiency of security inspections have continued in 2012.
exercise tyr is the police service’s national crisis response exercise, focusing on countering serious criminal activity and terrorism. Many parts of the exercise in 2012 were carried out at oslo airport. avinor actively participated in the exercise.
In connection with the 22 July commission’s learning points, avinor has identified its own measures and prepared an action plan intended to further improve crisis preparedness.
as the principal company avinor has the coordinating responsibility for HSe with respect to activities under the area of responsibility of avinor’s airports. through the Group’s investment programme, avinor is also the client, which means that safety, health and working environment considerations at the building or construction site are safeguarded. In 2012 a total of 42 (32) workplace accidents resulting in employee injuries were reported. 11 (11) of these resulted in absence. the Group’s ltI was 3.4. the t2 project (oslo airport Gardermoen) is being carried out at an airport that is in full operation, and the project entails extensive airside building activity. the work has been carried out without any serious accidents thus far. during 2012 there has been one injury with absence due to illness extending beyond the injury day. the ltI for the t2 project is 2.3.
In november oslo airport Gardermoen received the prize for “Årets seniorinitiativ” (Initiative of the year for seniors).
CoRPoRAte SoCIAl ReSPoNSIBIlItyavinor attaches considerable importance to its corporate social responsibility and actively follows up expectations for the company’s corporate social responsibility in the articles of association, national and international conventions, guidelines and standards. these are related in particular to the environment and environmental measures, human rights, workers’ rights and work against corruption. corporate social responsibility measures do not necessarily promote short-term profitability and one of the elements of corporate social responsibility is the Group’s support of local or national organisations, associations and events.
the external environmentone of avinor’s aims is to be a leader in the work of limiting local pollution and noise from aviation operations. the external environment is an integral part of avinor’s management system and follows the principles set out in ISo 14001. this involves continuous improvement in all phases from planning, execution and monitoring to corrective actions. oslo airport Gardermoen will certify its environmental management system in accordance with ISo 14001 during the course of 2013. Moreover, avinor began a review and revision of the environmental management system in 2012.
a permit is required for emissions linked to aircraft and runway de-icing, as well as fire drill activities, under the pollution control act. all of avinor’s airports have discharge permits. In 2011 avinor found that soil was contaminated with pfoS, a substance containing fluorine that is not decomposed in nature and that has been used as an additive in fire extinguishing foam. avinor phased out the use of pfoS in 2001, and the substances were banned in norway in 2007. extensive studies were carried out in 2011 and 2012 at all of the Group’s former and current fire exercise areas. this work is continuing in 2013. consideration will be given to whether to implement measures at Kirkenes airport, Høybuktmoen, Bergen airport, flesland, Kristiansand airport, Kjevik, oslo airport Gardermoen and Harstad/narvik airport, evenes, among others. there is little experience in norway and internationally with handling this type of pollution. In consultation with the climate and pollution agency (Klif), avinor will study alternative measures.
In order to ensure that the operations and condition of the technical installations at the airports satisfy the discharge permits from the county Governors and comply with the pollution control act and regulations pursuant thereto, a project has been initiated to study and carry out the necessary measures at avinor’s airports. this project will be carried out during the period from 2010 to 2015.
avinor’s climate accounts show combined annual greenhouse gas emissions from avinor’s own operations of around 16,200 tonnes of co2 (16,800 tonnes), including 4,860 tonnes (4,900 tonnes) from oslo airport Gardermoen, a reduction compared with 2011. comprehensive energy conservation projects have been initiated at many airports, and at the same time we are focusing on renewable sources of energy, heat exchange using seawater, for example, and more energy-efficient vehicles. this is producing results, but it should still be noted that the Group’s greenhouse gas emissions are very weather-dependent, and will vary somewhat from year to year.Several airports have made arrangements for the parking and charging of electric cars, and electric cars or other vehicles with reduced greenhouse gas emissions have been purchased. In addition to implementing special measures, avinor compensates on its own initiative for the remaining emissions by investing in emission rights through the un’s green development mechanism. the airports in oslo, trondheim and Kristiansand have also been accredited by the airport carbon accreditation programme, which now encompasses over 50 per cent of all air traffic in europe.
14 avinor annual report 2012
avinor has continued its cooperation with the airlines and the federation of norwegian aviation Industries to reduce greenhouse gas emissions from aviation. adding synthetic bio fuel to conventional jet fuel has been certified, and as part of the follow-up of “Sustainable and Socially Beneficial air travel - 2nd report” from 2011 a comprehensive study has been carried out on the potential for production of sustainable bio fuel for aviation in norway. the results of the project will be published in 2013.
through its work with the national transport plan, avinor has participated in the development of the interagency method for greenhouse gas budgeting. a comprehensive set of greenhouse gas accounts is being prepared in the t2 project at oslo airport Gardermoen. an equivalent set of greenhouse gas accounts is planned for the expansion of the terminal at Bergen airport, flesland.
In order to manage and conserve areas that are important with respect to biological diversity at airports, avinor is conducting a multi-year project that will provide a comprehensive survey of biological diversity. the airports will be surveyed in a prioritised order based on an assessment of the estimated natural assets and planned construction activities. a total of 25 of the Group’s airports has been surveyed now, and it is expected that the remaining airports will be surveyed by 2014. the norwegian armed forces has also carried out equivalent surveys at six of the airports operated by avinor.
all the airports where avinor has mapping responsibility have updated aircraft noise maps in accordance with the current guidelines (t-1442). updated surveying in accordance with the pollution control regulations shows that introduction of the helicopter type Sikorsky S92 for offshore transport has led in some cases to extensive obligations to introduce measures in order to comply with indoor noise limits in resincetial housing around Stavanger airport, Sola and Bergen airport, flesland. the survey in 2012 indicates that avinor does not have an obligation to introduce measures under the pollution control regulations at any other airports. the combined aircraft noise impact around oslo airport Gardermoen decreased by 0.4 dB from 2011 to 2012, while traffic increased by 2.8 per cent. the change in level is due to the most noisy aircraft continuing to be phased out.
environmental responsibility and corporate social responsibility are integrated into the Group’s procurement policy. the plan for operations in 2012 includes measures to safeguard sustainability in the procurement processes, including requirements for certification and environmental standards in line with dIfI’s recommendations and guidelines. furthermore, proprietary environmental requirements have been key elements in the procurement processes in connection with de-icing compounds and waste management.
the Board of directors approve avinors environmental report and refer to this for more information about the environmental work. the report is available at avinors internet pages.
Impartiality, corruption and safe notificationa special purchasing strategy has been developed in avinor to assure the quality of the Group’s purchasing routines. this will ensure competitiveness and appropriate contract coverage to achieve economies of scale and ensure local contract coverage. Key performance indicator reports have been prepared to illustrate loyalty to the purchasing system and loyalty to the framework agreements and these reports serve as a tool for following up compliance of the guidelines and ensuring impartiality in the purchasing process. external suppliers are subject to the Group’s ethical guidelines and are requested to comply with these guidelines.
avinor has established a compliance function that shall monitor the Group’s compliance with external and internal regulations relating to corruption/misconduct and ethical rules.
avinor has established routines for the notification of reprehensible actions or situations in all parts of the organisation. the Group’s preferred means of notification is open notification through the line and employee representatives/safety delegates or via avinor’s independent notification committee. Six (five) cases were notified through the notification committee in 2012. all the cases were resolved at the end of January 2013.
Research and developmentavinor actively focuses on research and development both nationally and internationally. the primary focus areas of the research and development work are improved safety, better environment, increased profitability and global harmonisation. • SES/SESAR JUavinor participates in the pan-european aviation collaboration Single european Sky (SeS). this research and development work is coordinated by the Single european Sky air traffic Management research Joint undertaking programme (SeSar Ju) where avinor participates both directly and through noracon, which is a joint group of airspace and airport operators from the northernmost countries in europe. the work and assignments are very broad in scope and will continue over several years. the collaboration’s work will culminate in new technical solutions, operational improvements and a new pan-european set of regulations from eaSa. norway and avinor will be required to comply with these new regulations.
the establishment of airspace blocks is a crucial element in achieving the goals of the eu’s Single european Sky programme. through nefaB (north european functional airspace Block), avinor is working closely with the companies eanS (estonia), finavia (finland) and lGS (latvia) to utilise the airspace as effectively as possible. nefaB was formally established in december 2012.
• Remotely operated towers through SeSar avinor has agreed, among other things, to participate in testing remotely operated towers for afIS duties. In autumn 2012

avinor annual report 2012 15
avinor started testing remotely operated towers at værøy heliport. Signals are transmitted from this location to a work station situated at Bodø airport, where the air traffic is being controlled during the test period. the test will subsequently be expanded to include one more airport.
• International participationavinor follows and also participates in other global r&d activities and has, for example, arranged to regularly participate each year at the transportation research Board (trB) in the u.S. which attracts the largest number of transport industry participants from across the world. aviation is global and it is therefore necessary for avinor
to participate and contribute to r&d activities in the international arena. active participation in international environments provides the opportunity to influence and safeguard avinor’s interests to ensure that new international regulations take into consideration that the requirements for airports with relatively low passenger volumes need to be adapted somewhat compared with larger airports. norway’s special climate challenges and geographic location are followed up through international cooperation with other players in the nordic regions.In 2012 avinor became a member of the Borealis alliance together with 8 other air navigation service suppliers in northern europe. the alliance collaboration is also included as part of the international development work.

16 avinor annual report 2012
• NationalIn norway avinor has strengthened its collaboration with research institutions and academia, where the focus is on r&d within topics relevant to the aviation industry. closer ties have been established with Innovation norway and the research council of norway. avinor has put forward its interest in having a separate aviation-themed area which will also give smaller norwegian firms better opportunities to apply for support for research and development projects that benefit all aspects of the aviation industry both nationally and internationally. • National Transport Planthrough the national transport plan (ntp) collaboration, an initial joint strategic plan for long-term r&d has been drawn up that will form the basis for further interagency collaboration in 2013 and the years ahead. • ATM Forum Norwayavinor is a member of the atM forum norway, which supports avinor’s policy for research and development by stimulating active supplier development and industrial cooperation, primarily with an aim to achieve better and more efficient services and products.
• Winter operationsavinor is a leader in winter operations among international airport operators. the Group’s focus on research and development in the area of winter operations has resulted in an improved training programme and increased effectiveness, and airport operators from across the world visit avinor to learn from its experience. avinor’s focus on research and development in the area of winter operations has resulted in an improved training programme. Several airports have installed support systems that have resulted in improved predictability and availability at the airports.
AvINoR’S RePutAtIoNIn the annual reputation survey conducted by Ipsos MMI (formerly Synovate), which includes 116 companies, avinor was ranked number 71 for overall impression in 2011 - and advanced to number 69 in 2012. avinor was among the ten companies in norway that strengthened their reputation the most in 2011, and this trend has continued: 40 per cent had a positive overall impression of avinor in 2012, 39 per cent in 2011. In northern norway 59 per cent said that they had a positive overall impression of avinor in 2012. the survey was conducted in May 2012, in other words prior to the challenges in connection with managing the summer traffic, which must be expected to have had a negative influence on the reputation.
PeRSoNNel ANd oRgANISAtIoNthere were 3,109 (3,077) permanent employees in the Group at the end of the year. permanent and temporary employees performed work corresponding to 3,218 (3,149) full-time equivalents. the average age of all employee groups in the Group was 45, the average age of managers was 50.
the percentage of women among permanent employees was 23.4
per cent, among managers it was 17.6 per cent. the percentage of women in the executive management was 30 per cent. It is important that both genders and all ethnicities have equal opprtunities in the Group.
absence due to illness was 4.7 per cent (4.6 per cent) in 2012. long-term absence due to illness (more than eight weeks) was 0.4 per cent (0.7 per cent ). the Group’s Inclusive Working life target for absence due to illness is 4.5 per cent or lower.
cooperation between the Group’s management and employee representatives was somewhat more challenging in connection with the main settlement in 2012 than it has been in recent years. Beyond this, the cooperation is considered good and constructive, and new principles have been prepared that will influence the cooperation in the future.avinor has implemented over 20 measures designed to improve the staffing situation among air traffic controllers. this includes an agreement to hire air traffic control personnel from the Swedish company lfv aviation consulting. In addition, a thorough review and reorganisation of resource management is also being conducted, with a new holiday policy, smoother distribution of overtime duties and optimisation of duty rosters and routines.
the Group has worked actively with preventive measures to reduce the number of employees who do not meet the physical and/or medical requirements of the job position. In addition, the Group continues to focus on substance abuse prevention work.
avinor’s strategy plan for the period from 2011 to 2015 entails restructuring and change processes for the entire Group, in which development towards a more change and business oriented culture are vital for success. two major projects have been carried out: an expanded culture analysis and a project connected to strategic competency. avinor has entered into a collaboration with Spekter on a management training concept called “Manager’s scope for action”, which focuses on specific and practical challenges that managers face. the pilot project for this system will be conducted in avinor in 2013.In 2012 avinor was awarded a research grant by nav through the farve programme, which through testing, research and analysis projects shall increase knowledge and contribute to the dissemination of knowledge about how the goals of labour and welfare policies can be achieved in a better way.
outlooK ANd fRAMewoRK CoNdItIoNSBased on the financial and demographic developments, we expect there to be continued growth in air traffic. therefore the high level of current activity and investments is assumed to continue. at the same time, aviation industry companies are facing significant profitability challenges. this reinforces the requirement that avinor organises and manages its activities as effectively as possible.
In order to ensure the companys corporate social responsibility, the Board of directors has requested and emission of noK 2.5 billion
avinor annual report 2012 17
from the owner. It is also proposed to organize the air navigation division in a corporation wholly owned by avinor. furthermore it is proposed that the system of customs regulations that brings this advantages for passengers travelling from abroad, going further inland is abolished.
the Board is concerned with ensuring that avinor contributes to national and regional development. this takes place through efficient and safe aviation services, but also through active collaboration with local stakeholders and close dialogue with other relevant parties.Major restructuring within the air navigation service, new international
regulatory requirements and the need for greater capacity at the largest airports, mean that avinor has entered a phase that is characterised by significant change and development. the Board closely monitors the Group’s earnings, operating developments, regulatory and financial framework.
the Board would like to thank all the employees and partners for their efforts in 2012.
enclosures: corporate governance
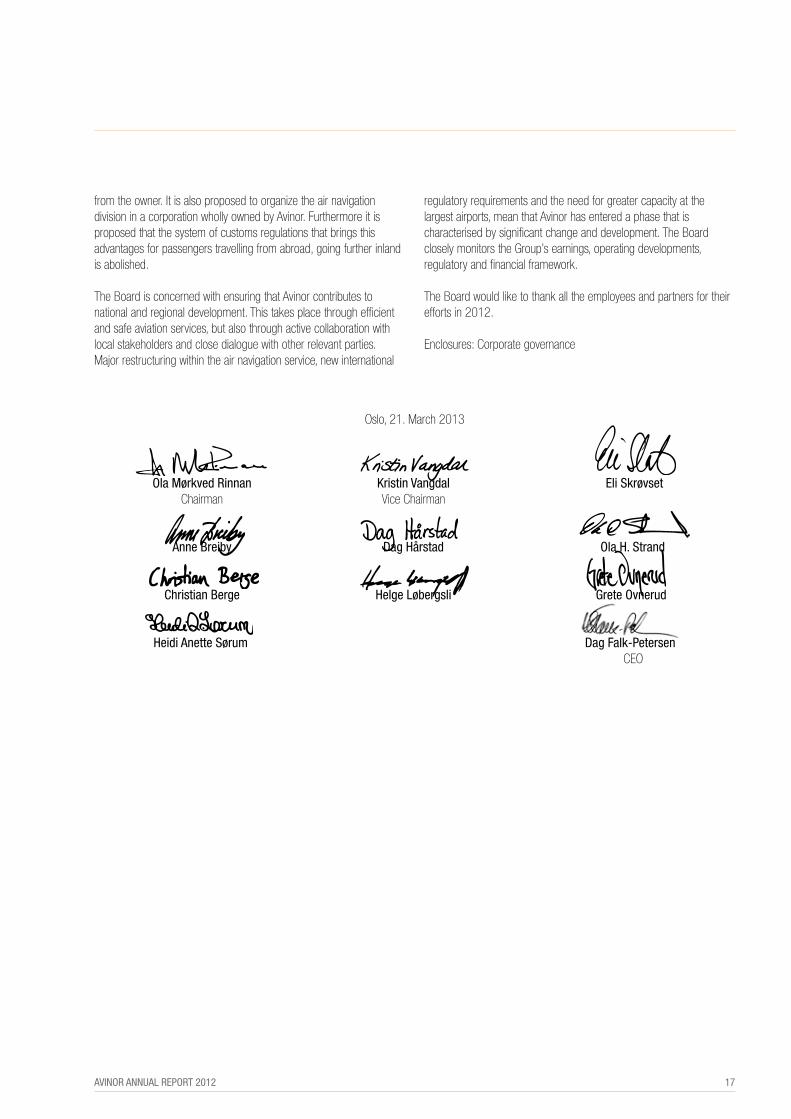
oslo, 21. March 2013
ola Mørkved Rinnan Kristin vangdal eli Skrøvset chairman vice chairman
Anne Breiby dag Hårstad ola H. Strand
Christian Berge Helge løbergsli grete ovnerud
Heidi Anette Sørum dag falk-Petersen ceo

18 avinor annual report 2012
corporate Governance In tHe avInor GroupIn tHe avInor Group
Good corporate governance in avinor aims to ensure that the maximum possible value is created and business risk is curtailed. the company’s core values and ethical guidelines are a basic premise for corporate governance in avinor.
avinor issued bonds in 2009 that are listed on oslo Børs. Section 3-3b of the norwegian accounting act stipulates that companies under a statutory accounting obligation which issue securities in accordance with Section 5-4 of the Securities trading act must provide a report on their policies and practices for corporate governance either in the annual report of the Board of directors or in a document referred to in the annual report of the Board of directors. point 3.10 in oslo Børs’ document entitled “Bond regulations – entry requirements and ongoing obligations” states that the borrower shall provide an account of their policies and practices relating to corporate governance in a similar manner. the norwegian accounting act may be found at www.lovdata.no. oslo Børs’ regulations are available at www.oslobors.no.
as the owner, the state focuses on ensuring that state-owned companies adhere to “the norwegian code of practice for corporate Governance”. the Board attaches importance to following this recommendation regarding the Group’s corporate governance whenever possible.
the norwegian code of practice for corporate Governance may be found at www.nues.no.
StAteMeNt oN CoRPoRAte goveRNANCethe aim of the norwegian code of practice for corporate Governance is to ensure that companies that are listed on regulated markets in norway practice corporate governance that clarifies the role of the shareholders, the board of directors and the day-to-day management beyond what follows from legislation.
this statement has been prepared in accordance with the structure of the norwegian code of practice for corporate Governance dated 23 october 2012, with the adjustments that are required due to the fact that avinor is a wholly state-owned limited company. In addition to the general provisions of the limited liability companies act, special provisions apply to state-owned limited companies.
the basic premise for avinor’s operations is that safety is paramount and is prioritised ahead of any other considerations. after which, the greatest emphasis is placed on rendering effective services to the customers and society.
the Group’s ethical guidelines were most recently revised in spring 2012. the ethical guidelines apply to Board members, employees, contracted personnel and others who work for the Group. the guidelines set out basic rules of personal conduct and rules for business practices, and express the Group’s attitudes in interactions with customers, suppliers, colleagues and the general community.the ethical guidelines may be found at www.avinor.no.
BuSINeSSavinor is a group with activities in the transport sector in norway. the parent company avinor aS is wholly owned by the norwegian state represented by the Ministry of transport and communications. the Group’s head office is in oslo. the company’s operations are described in the articles of association.
the company’s role in society is to own, operate and develop a national network of airports for the civilian sector and a joint air navigation service for the civilian and military sectors.the company’s operations shall be carried out in a safe, efficient and environmentally-friendly manner and ensure good availability for all groups of travellers.
the operations may be run by the company itself, by wholly-owned subsidiaries, or by other companies it has interests in or cooperates with.
the company shall be self-financed to the greatest possible extent through its own revenues from its principal activities and business activities in connection with the airports. financially profitable units shall finance financially unprofitable units internally within the company.the company shall carry out the duties imposed by society as stipulated by its owner.
the company’s articles of association may be found at www.avinor.no.
the owner has imposed demands that avinor shall facilitate safe, environmentally friendly and efficient aviation in all parts of the country. to meet the owner’s demands, strategic primary objectives have been established within economics and finance, society and the environment, aviation safety and HSe, customers and partners and personnel and organisation.
equIty ANd dIvIdeNdSthe company’s share capital is noK 5,400,100,000, divided into 540,010 shares, each with a par value of noK 10,000. the company’s equity at any given time shall correspond at least to 40 per cent of the sum total of the company’s recognised interest-bearing loans and equity at any given time.
avinor aS is a wholly state-owned limited company. the shareholders’ rights are safeguarded by the responsible cabinet minister or his deputy at the General Meeting. the General Meeting is not bound by the distribution of dividends proposed by the Board of directors. dividends are declared each year. the office of the auditor General monitors the management of the norwegian state’s interests and can carry out any inspections that it deems necessary.
the Board of directors does not have the authority to increase the share capital. equal treatment of shareholders and transactions with close associates

avinor annual report 2012 19
avinor aS has one class of shares. the shares are not listed on a stock exchange and there are no transactions involving the shares.
Intra-group agreements are entered into in accordance with the arm’s length principle on ordinary commercial terms. all such agreements are made in writing.
transactions with close associatesthe Board is not aware of any transactions during 2012 between the company and its shareholders, Board members, executive employees or close associates of these that may be characterised as being not immaterial transactions.
Board members and executive employees are required to submit an annual statement concerning close associates.
guidelines for Board members and executive employeesthe Group’s ethical guidelines contain a separate section on conflicts of interest. In which it is stated that an employee shall never participate in or attempt to influence a decision if he/she has a conflict of interest or questions may be raised about the employee’s impartiality. It also contains provisions on impartiality. If there is doubt whether the person concerned is impartial the issue must be discussed with the most immediate manager. the Board member is responsible him/her self for informing the Board as to the circumstances of a conflict of interest, and must refrain from participating in deliberations or decisions in matters where the member has a conflict of interest. the minutes of the Board meetings shall reflect when one of the Board members is disqualified due to a conflict of interest in a particular case.
the State as shareholderavinor is wholly-owned by the norwegian state. the Ministry of transport and communications convenes quarterly meetings with the company. during these meetings, the company updates the owners about operations, financial developments and other conditions considered to be relevant to the owner at that time. no decisions are reached at these meetings, and the company does not receive any guidelines for how it shall respond to individual issues.
a meeting on corporate social responsibility is convened once a year.
fReely NegotIABle SHAReSthere are no provisions in the articles of association that entail any limitations in the negotiability of the company’s shares.
geNeRAl MeetINgSthe transport and communications Minister constitutes the company’s General Meeting and is the company’s highest authority. In accordance with Section 20-5 of the limited liability companies act, the Ministry of transport and communications is responsible for calling the annual and extraordinary General Meetings. the Ministry of transport and communications also determines how the meetings will be called. notice of the meeting must be issued at least one week prior to the
date of the annual General Meeting, cf. the limited liability companies act Section 20-5 cf. Section 5-10.
the annual General Meeting shall be held each year by the end of the month of June. In accordance with the articles of association, the annual General Meeting shall approve the annual report and accounts, including the distribution of dividends. It also considers approval of the auditor’s remuneration, determines the remuneration of the Board for the current year and appoints shareholder-elected members of the Board and considers any other matters that, according to law or the articles of association, shall be dealt with by the General Meeting.
the members of the Board of directors, ceo and auditor who audited the previous year’s accounts shall be invited to the General Meeting. the Board chairman and ceo are obligated to attend the General Meeting. the other Board members as well as the auditor and the office of the auditor General are entitled to attend the meeting.
the agenda is set by the Ministry of transport and communications.
the minutes of the General Meeting are available to the public.
NoMINAtIoN CoMMItteethe General Meeting of avinor aS consists of the norwegian state represented by the Ministry of transport and communications. the General Meeting has not appointed a nomination committee.
corporate assembly and Board of directors: composition and independence
the company’s articles of association stipulate that the Board of directors shall consist of seven to ten members. five or six of the members, including the Board chairman and vice chairman, are elected by the General Meeting. two or three Board members and alternates shall be elected directly by and from among the employees pursuant to the provisions of the limited liability companies act concerning the employees’ right to representation on the company’s Board of directors. the company does not have a corporate assembly in accordance with an agreement with the employees, but in accordance with the articles of association it is entitled to elect an extra Board member and alternate.
In 2009 the corporate democracy committee approved the corporate scheme whereby employees of avinor aS and its subsidiaries may be elected to the Board of directors. the number of employee representatives was increased from three to four at the same time upon clarification with the owner. after this the Board consists of six shareholder-elected members and four representatives that are elected by and from among the employees. the percentage of women among the board members is 50 per cent.
the Board chairman is elected by the General Meeting. all Board members are elected for a term of two years.
20 avinor annual report 2012
the Ministry of transport and communications does not have its own Board members, but in accordance with the norwegian state’s principles of good corporate governance all Board members are expected to seek to safeguard the common interests of the company and shareholders. the composition of the Board of directors is such that, in aggregate, it can safeguard the owner’s interests and the company’s need for skills, capacity and diversity. executive employees are not members of the Group’s Board of directors, and they do not own shares in the company.
IN 2012 tHe BoARd of dIReCtoRS CoNSISted of: • Chairman since 2010 Ola Mørkved Rinnan, 63 years old, CEO of eidsiva energi aS • Vice Chairman since 2002 Kristin Vangdal, 48 years old, Manager for Business Support Services at SpareBank 1 nord-norge • Board member since 2007 Dag H. Hårstad, 50 years old, CEO of the treatment centre for Substance abuse at central norway regional Health authority• Board member since 2011 Eli Skrøvset, 47 years old, CFO eksportfinans norge • Board member since 2012 Ola H. Strand, 55 years old, CEO of coop norge aS • Board member since 2012 Anne Breiby, 56 years old, self- employed • Employee-elected Board member since 2002 Helge Løbergsli, 59 years old • Employee-elected Board member since 2009 Christian Berge, 34 years old • Employee-elected Board member since 2011 Grete Ovnerud, 46 years old • Employee-elected Board member since 2011 Heidi A. Sørum, 45 years old oddbjørg a. Starrfelt, 64 years old, was replaced by anne Breiby at the General Meeting in 2012. Starrfelt had then been a member of the Board since 2005.
Information on the individual Board members is available at www.avinor.no.
11 Board meetings were held in 2012. the meetings were fully attended, with only very few exceptions.
woRK of tHe BoARd of dIReCtoRSthe Board of directors follows the requirements stipulated for the management and supervision of the company pursuant to the limited liability companies act. In accordance with the articles of association, the Board of directors shall ensure that the company is socially responsible. the Board of directors’ tasks are stipulated in separate rules of procedure. these rules of procedure are reviewed annually and updated in the event of changes to the relevant regulations or otherwise as required. the Board of directors sets out an annual agenda for its work, with a special focus on goals, strategies and implementation. the Board of directors assesses its work and competence on an annual basis. the owner has a meeting with each Board member once a year.
the ceo’s responsibilities and duties are defined in instructions adopted by the Board of directors. these instructions are reviewed and updated as required.
the Board has established an audit committee as a preparatory and advisory body for the Board of directors with respect to its responsibility for financial reporting, auditing, internal control and overall risk management. the committee consists of three of the Board members, and the chairman has expertise in accounting.
the Board of directors has also established a compensation committee to act as a preparatory subcommittee in matters relating to remuneration of executive employees in the company. the committee shall prepare guidelines for and cases concerning remuneration of executive employees and carry out continuous assessment and monitoring of the Group’s policy in this area. the committee consists
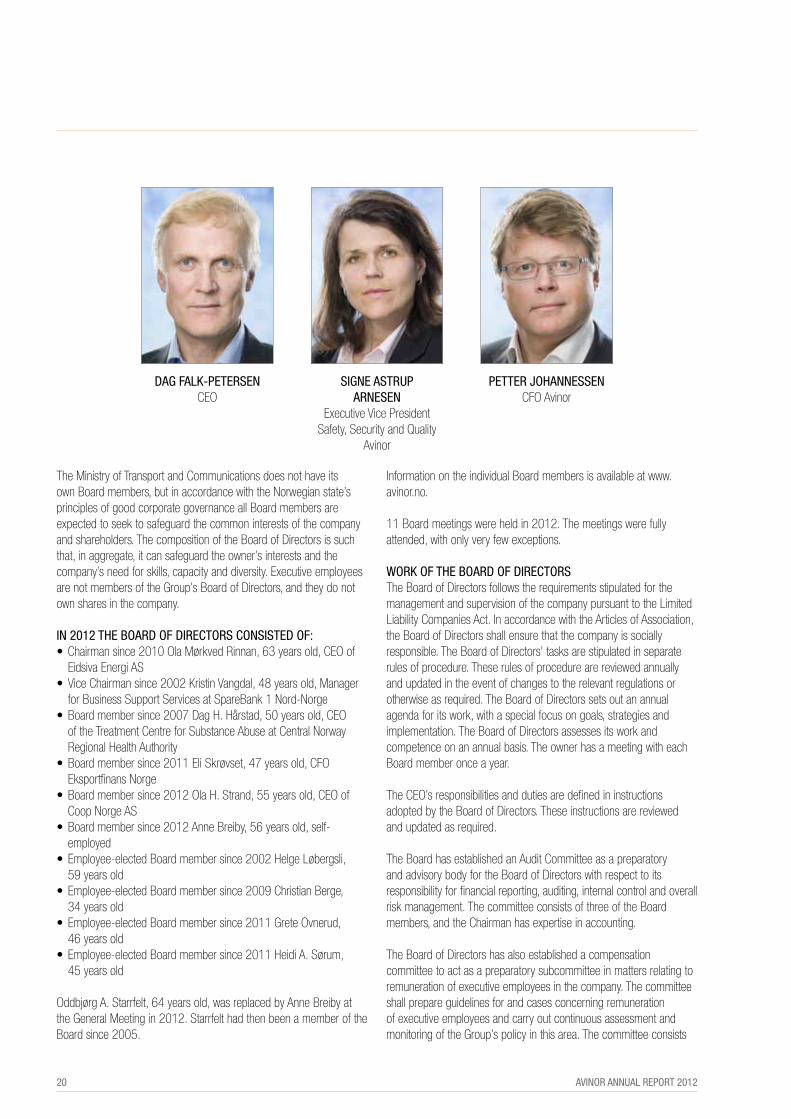
dAg fAlK-PeteRSeNceo
SIgNe AStRuP ARNeSeN
executive vice president Safety, Security and Quality
avinor
PetteR joHANNeSSeN cfo avinor

avinor annual report 2012 21
of three of the Board members, and is chaired by the chairman.
RISK MANAgeMeNt ANd INteRNAl CoNtRolIn order to ensure comprehensive management of the company, a separate management system has been prepared, which consists of management documents, contingency plans, safety procedures and processes for the management and control of the operations.
an annual risk assessment of the group’s activities is performed, and measures to manage the risk situation are evaluated and implemented. the Board of directors reviews the company’s risk management and internal control on an annual basis.
the company’s appointed auditor shall review management’s dispositions annually.
Systems for internal control and risk management related to the financial reporting process avinor’s ethical guidelines and core values establish the foundation for a good internal control environment with respect to financial reporting together with the company’s organisation, management fora and reporting lines.
Business and support processes that are essential to financial reporting have been identified. this includes processes related to investment projects, revenues, financial items, closing of accounts and It systems that support these processes. overall risk is managed and assessed centrally, while transaction management is subject to both centralised and decentralised controls. considerable importance is attached to thorough documentation and assessment of important valuation items.
control measures are carried out in the ongoing production of accounts and through continuous financial monitoring. Systems for the evaluation/monitoring of the internal control related to the financial reporting process is under development and assessed on a continuous basis.
ReMuNeRAtIoN of tHe BoARd of dIReCtoRSthe General Meeting determines the remuneration of the Board of directors. remuneration is not performance-based and no options are issued to board members. Shareholder-elected Board members generally do not perform any special tasks for the company beyond their position on the Board of directors. remuneration of the Board members is specified in a note to the annual financial statements.
remuneration of the Board members amounted to noK 2,096,500 in 2012. the remuneration is broken down as follows: the Board chairman received noK 373,500, the vice chairman received noK 226,000, other Board members received noK 186,000.
Members of the audit committee received remuneration totalling noK 124,500 in 2012, comprising noK 56,500 to the chairman and noK 34,000 to the other two members.
ReMuNeRAtIoN of exeCutIve eMPloyeeSthe Board of directors appoints the ceo and stipulates the ceo’s salary following preliminary consideration by the compensation committee. the Board of directors evaluates the ceo’s work and salary terms on an annual basis following preliminary consideration by the compensation committee. the ceo informs and recommends to the compensation committee the remuneration for executive employees who report to the ceo.
the Board of directors has prepared a statement on the determination of salaries and other remuneration of executive employees. the statement is discussed at the annual General Meeting.
the remuneration of executive employees is specified in note 24 to the annual financial statements.
INfoRMAtIoN ANd CoMMuNICAtIoNpublic information on the Group is provided by the Group’s management. each year the Group prepares a financial calendar
joN SjØlANdeR executive vice president
Strategy avinor
lASSe BARdAl executive vice president
International airports division avinor
MARgRetHe SNeKKeRBAKKeN
executive vice president national, regional and local
airports division avinor

22 avinor annual report 2012
indicating the dates for the publication of financial information. this financial calendar is available on the company’s website and the oslo Børs website. financial information is published in the form of a stock exchange notice before it is made available on www.avinor.no.
the Group presents a complete set of annual financial statements in conjunction with the annual report of the Board of directors and the annual report at the end of the month of March. accounting figures are reported quarterly.
In accordance with the articles of association, the Board of directors shall submit a plan for the operations, including subsidiaries, to the transport and communications Minister each year. the contents of the plan shall include the following:
description of the status of the market and the Group, including the development of the Group since the last plan was published.the highlights of the Group’s operations for the coming years, including any major restructuring, development and discontinuation of existing operations, or development of new operations.the Group’s investment level, important investments and financing plans.
assessments of the financial development during the plan period.report on measures and results of the company’s social role, duties imposed by society and corporate social responsibility.
the Board of directors shall submit any major changes to plans that have previously been submitted to the transport and communications Minister. tAKe-oveRSavinor aS is wholly owned by the norwegian state represented by the Ministry of transport and communications. accordingly this point in the code of practice is not regarded as relevant to the company.
AudItoRavinor has an independent external auditor appointed by the General Meeting based on a recommendation from the Board of directors. the auditor submits a plan for the auditing work to the Board of directors annually. each year the auditor prepares a letter to the Board of directors (Management letter), which summarises the audit of the company and the status of the company’s internal control.
the auditor has an annual meeting with the Board of directors without the management being present. the auditor also has an annual meeting with the audit committee without the management being present. the auditor attends the company’s General Meeting. the auditor’s remuneration is broken down into auditing and other consulting services, and it is specified in a note to the financial statements.
ANdeRS KIRSeBoM chief executive air navigation
Services avinor
MARI HeRMANSeN executive vice president Hr
and legal avinor
NIC. NIlSeN Managing director,
oslo airport
egIl tHoMPSoN director communications, Brand and public relations
avinor
avinor annual report 2012 23

fInancIal StateMentS
Main figures - Avinor group
Income Statement
Statement of Comprehensive Income
Balance Sheet
Statement of Changes in equity
Statement of Cash flows
Notes to the financial Statement
Responsibility Statement from the Board of directors and the Managing director
Auditor’s Report
24 AvINoR ANNuAl RePoRt 2012

avinor annual report 2012 25
avInor Group - MaIn fIGureSaMountS In MnoK 2012 2011 2010
traffic income 2,860.2 2,665.3 2,381.1 Security (cost based) 948.7 1,092.4 1,035.0 other income 4,245.5 3,803.3 3,381.7 Inter-group income 201.4 195.0 184.2total income airport operations 8,255.8 7,756.0 6,982.0 en route charges 947.0 954.4 903.0 Inter-group income approach and control tower services 745.9 733.8 713.2 other income 144.2 103.1 167.0 total income air navigation services 1,837.1 1,791.3 1,783.2 other group income (a) 474.1 459.6 225.6elimination of inter-group income -1,414.9 -1,385.1 -1,120.1 total group income 9,152.1 8,621.8 7,870.8 operating expenses airport operations (a) -5,200.0 -4,887.7 -4,386.6 operating expenses air navigation services -1,680.1 -1,608.1 -1,628.3other operating expenses group -668.7 -731.2 -177.3 elimination of inter-group expenses 1,414.9 1,385.1 1,120.1 total group expenses -6,133.9 -5,841.9 -5,072.1 eBItda airport operations 3,055.8 2,868.3 2,595.4 eBItda air navigation services 157.0 183.2 154.9 eBItda others -194.6 -271.6 48.3 eBItdA group 3,018.2 2,779.9 2,798.6 depreciation, amortisation and impairment charges -1,335.7 -1,258.7 -1,090.1 changes in value and other (losses)/gains, net -20.3 -35.8 36.2 operating profit/(loss) 1,662.2 1,485.4 1,744.8 net finance income/(costs) -355.9 -295.0 -325.6 Profit/(loss) before income tax 1,306.3 1,190.4 1,419.2 Income tax expense -379.6 -346.8 -411.1 Profit/(loss) after tax 926.7 843.6 1,008.1 eBItda-margin airport operations 37.0% 37.0% 37.2%eBItda-margin air navigation services 8.5% 10.2% 8.7%eBItda-margin others 33.0% 32.2% 35.6% Investments airport operations 3,883.1 2,441.5 1,877.7 Investments air navigation services 78.1 75.6 58.5 Investments others 123.4 93.3 75.2 total investments 4,084.6 2,610.4 2,011.4 distributed dividends -421.8 -504.0 - cash flow before borrowings -2,229.6 -563.1 -181.3 net interest-bearing debts 11,187.8 9,752.7 8,644.5 total assets 28,146.0 25,848.5 23,474.8 equity ratio 48.1% 51.6% 56.0%return on total capital after tax 5.8% 5.7% 7.1% number of passengers (in 1000) 46,357.0 44,278.0 40,112.0 number of aircraft departures (in 1000) 669.0 648.0 619.0 number of service units (in 1000) 1,845.0 1,713.0 1,583.0 punctuality 86% 88% 88%regularity 98% 99% 98%(a) exclusive of inter-group leases on land

26 avinor annual report 2012
IncoMe StateMent AvINoR AS AvINoR gRouPyeAR eNded 31 deCeMBeR yeAR eNded 31 deCeMBeR 2011 2012 All AMouNtS IN MNoK Note 2012 2011 operating income 3,005.5 3,041.9 traffic income 5.23 4,755.8 4,712.1 1,429.9 1,648.9 Sales and rental income 5.23 4,374.6 3,899.0 597.3 626.9 other operating income 21.7 10.7 5,032.7 5,317.7 total operating income 9,152.1 8,621.8 operating expenses 60.8 96.7 raw materials and consumables used 142.6 106.8 2,422.7 2,575.2 employee benefits expense 24.26 3,072.8 2,871.4 591.5 624.1 depreciation, amortisation and impairment charges 6,7,26 1,335.7 1,258.7 1,938.0 1,946.3 other operating expenses 25.26 2,918.5 2,863.7 total operating expenses before changes in 5,013.0 5,242.3 value and other losses/gains, net 7,469.6 7,100.6 operating profit/(loss) before changes in value 19.7 75.4 and other losses/gains, net 1,682.5 1,521.2 -23.6 -13.5 changes in value and other losses/(gains) - net 27 -20.3 -35.8 -3.9 61.9 operating profit/(loss) 1,662.2 1,485.4 1,224.4 617.2 finance income 28 61.1 55.2 110.8 179.2 finance costs 28 417.0 350.2 1,113.6 438.0 Net finance costs -355.9 -295.0 1,109.7 499.9 Profit before income tax 1,306.3 1,190.4
324.3 41.4 Income tax expense 18 379.6 346.8 785.4 458.5 Profit for the year 926.7 843.6 Attributable to: 785.4 458.5 owners of the parent 926.7 843.6
the notes (note 1 to 31) are an intergral part of these consolidated financial statements.
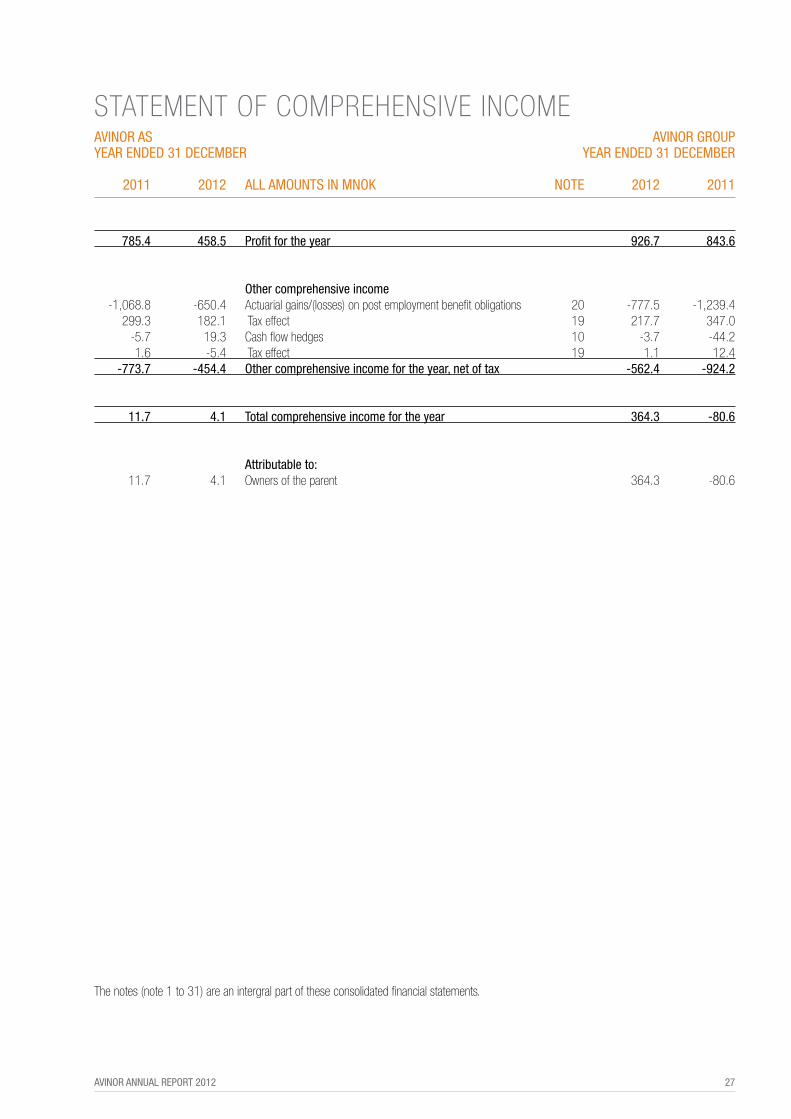
avinor annual report 2012 27
StateMent of coMpreHenSIve IncoMe AvINoR AS AvINoR gRouPyeAR eNded 31 deCeMBeR yeAR eNded 31 deCeMBeR 2011 2012 All AMouNtS IN MNoK Note 2012 2011
785.4 458.5 Profit for the year 926.7 843.6 other comprehensive income -1,068.8 -650.4 actuarial gains/(losses) on post employment benefit obligations 20 -777.5 -1,239.4 299.3 182.1 tax effect 19 217.7 347.0 -5.7 19.3 cash flow hedges 10 -3.7 -44.2 1.6 -5.4 tax effect 19 1.1 12.4 -773.7 -454.4 other comprehensive income for the year, net of tax -562.4 -924.2 11.7 4.1 total comprehensive income for the year 364.3 -80.6 Attributable to: 11.7 4.1 owners of the parent 364.3 -80.6
the notes (note 1 to 31) are an intergral part of these consolidated financial statements.

28 avinor annual report 2012
Balance SHeetASSetS AvINoR AS AvINoR gRouPyeAR eNded 31 deCeMBeR yeAR eNded 31 deCeMBeR 2011 2012 All AMouNtS IN MNoK Note 2012 2011 Non-current Assets Intangible assets 1,959.1 2,241.3 deferred tax assets 19 2,614.2 2,411.6 61.4 46.4 other intangible assets 7 46.4 61.4 2,020.5 2,287.7 total intangible assets 2,660.6 2,473.0 Property, plant and equipment 7,389.4 8,589.6 property, plant and equipment 6 18,255.5 16,889.7 1,814.5 2,261.7 assets under construction 4,552.3 3,170.8 9,203.9 10,851.3 total property, plant and equipment 22,807.8 20,060.5 financial assets 653.8 672.0 Investments in subsidiaries 8 0.0 0.0 1,946.3 3,196.4 loans to group companies 31 0.0 0.0 21.9 22.7 derivative financial instruments 10 22.9 21.9 other financial assets and investments in 1.5 8.6 associated companies 11 79.0 52.4 2,623.5 3,899.7 total financial assets 101.9 74.3 13,847.9 17,038.7 total non-current assets 25,570.3 22,607.8 Current Assets 13.7 15.7 Inventories 12 15.7 13.7 1,126.3 1,240.2 trade and other receivables 13 1,242.9 1,116.5 0.5 0.2 derivative financial instruments 10 1.4 0.8 2,064.1 1,289.3 cash and cash equivalents 14 1,315.7 2,109.7 3,204.6 2,545.4 total current assets 2,575.7 3,240.7 17,052.5 19,584.1 total assets 28,146.0 25,848.5
oslo, 21. March 2013
ola Mørkved Rinnan Kristin vangdal eli Skrøvset chairman vice chairman
Anne Breiby dag Hårstad ola H. Strand
Christian Berge Helge løbergsli grete ovnerud
Heidi Anette Sørum dag falk-Petersen ceo
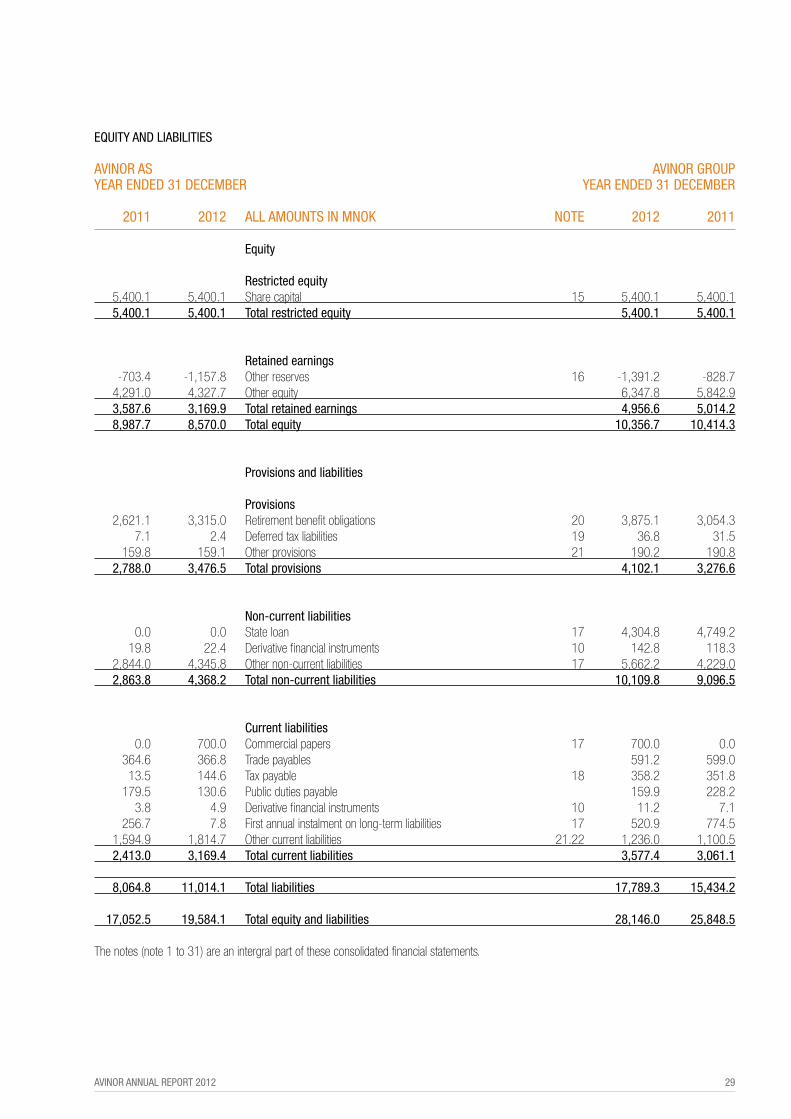
avinor annual report 2012 29
equIty ANd lIABIlItIeS AvINoR AS AvINoR gRouPyeAR eNded 31 deCeMBeR yeAR eNded 31 deCeMBeR 2011 2012 All AMouNtS IN MNoK Note 2012 2011 equity Restricted equity 5,400.1 5,400.1 Share capital 15 5,400.1 5,400.1 5,400.1 5,400.1 total restricted equity 5,400.1 5,400.1 Retained earnings -703.4 -1,157.8 other reserves 16 -1,391.2 -828.7 4,291.0 4,327.7 other equity 6,347.8 5,842.9 3,587.6 3,169.9 total retained earnings 4,956.6 5,014.2 8,987.7 8,570.0 total equity 10,356.7 10,414.3 Provisions and liabilities Provisions 2,621.1 3,315.0 retirement benefit obligations 20 3,875.1 3,054.3 7.1 2.4 deferred tax liabilities 19 36.8 31.5 159.8 159.1 other provisions 21 190.2 190.8 2,788.0 3,476.5 total provisions 4,102.1 3,276.6 Non-current liabilities 0.0 0.0 State loan 17 4,304.8 4,749.2 19.8 22.4 derivative financial instruments 10 142.8 118.3 2,844.0 4,345.8 other non-current liabilities 17 5,662.2 4,229.0 2,863.8 4,368.2 total non-current liabilities 10,109.8 9,096.5 Current liabilities 0.0 700.0 commercial papers 17 700.0 0.0 364.6 366.8 trade payables 591.2 599.0 13.5 144.6 tax payable 18 358.2 351.8 179.5 130.6 public duties payable 159.9 228.2 3.8 4.9 derivative financial instruments 10 11.2 7.1 256.7 7.8 first annual instalment on long-term liabilities 17 520.9 774.5 1,594.9 1,814.7 other current liabilities 21.22 1,236.0 1,100.5 2,413.0 3,169.4 total current liabilities 3,577.4 3,061.1 8,064.8 11,014.1 total liabilities 17,789.3 15,434.2 17,052.5 19,584.1 total equity and liabilities 28,146.0 25,848.5
the notes (note 1 to 31) are an intergral part of these consolidated financial statements.

30 avinor annual report 2012
StateMent of cHanGeS In eQuIty AvINoR AS otHeR AMouNt IN MNoK SHARe CAPItAl ReSeRveS otHeR equIty totAl eqIty
Balance at 1 january 2011 5,400.1 70.3 4,009.6 9,480.0 profit for the year 785.4 785.4actuarial loss on post employnent benefit obligation - net of tax -769.5 -769.5cash flow hedge -4.2 -4.2total comprehensive income for the year 0.0 -773.7 785.4 11.7 transactions with owners: dividends relating to 2010 -504.0 -504.0total transactions with owners 0.0 0.0 -504.0 -504.0 Balance at 1 january 2012 5,400.1 -703.4 4,291.0 8,987.7 profit for the year 458.5 458.5actuarial loss on post employnent benefit obligation - net of tax -468.3 -468.3cash flow hedge 13.9 13.9total comprehensive income for the year 0.0 -454.4 458.5 4.1 transactions with owners: dividends relating to 2011 -421.8 -421.8total transactions with owners 0.0 0.0 -421.8 -421.8 Balance at 31 december 2012 5,400.1 -1,157.8 4,327.7 8,570.0

avinor annual report 2012 31
AvINoR gRouP otHeR AMouNt IN MNoK SHARe CAPItAl ReSeRveS otHeR equIty totAl eqIty
Balance at 1 january 2011 5,400.1 95.5 5,503.4 10,999.0 profit for the year 843.6 843.6actuarial loss on post employnent benefit obligation - net of tax -892.4 -892.4cash flow hedge -31.8 -31.8total comprehensive income for the year 0.0 -924.2 843.6 -80.6 transactions with owners: dividends relating to 2010 -504.0 -504.0total transactions with owners 0.0 0.0 -504.0 -504.0 Balance at 1 january 2012 5,400.1 -828.7 5,843.0 10,414.3 profit for the year 926.7 926.7actuarial loss on post employnent benefit obligation - net of tax -559.8 -559.8cash flow hedge -2.6 -2.6total comprehensive income for the year 0.0 -562.4 926.7 364.3 transactions with owners: dividends relating to 2011 -421.8 -421.8total transactions with owners 0.0 0.0 -421.8 -421.8 Balance at 31 december 2012 5,400.1 -1,391.1 6,347.8 10,356.7
the notes (note 1 to 31) are an intergral part of these consolidated financial statements.
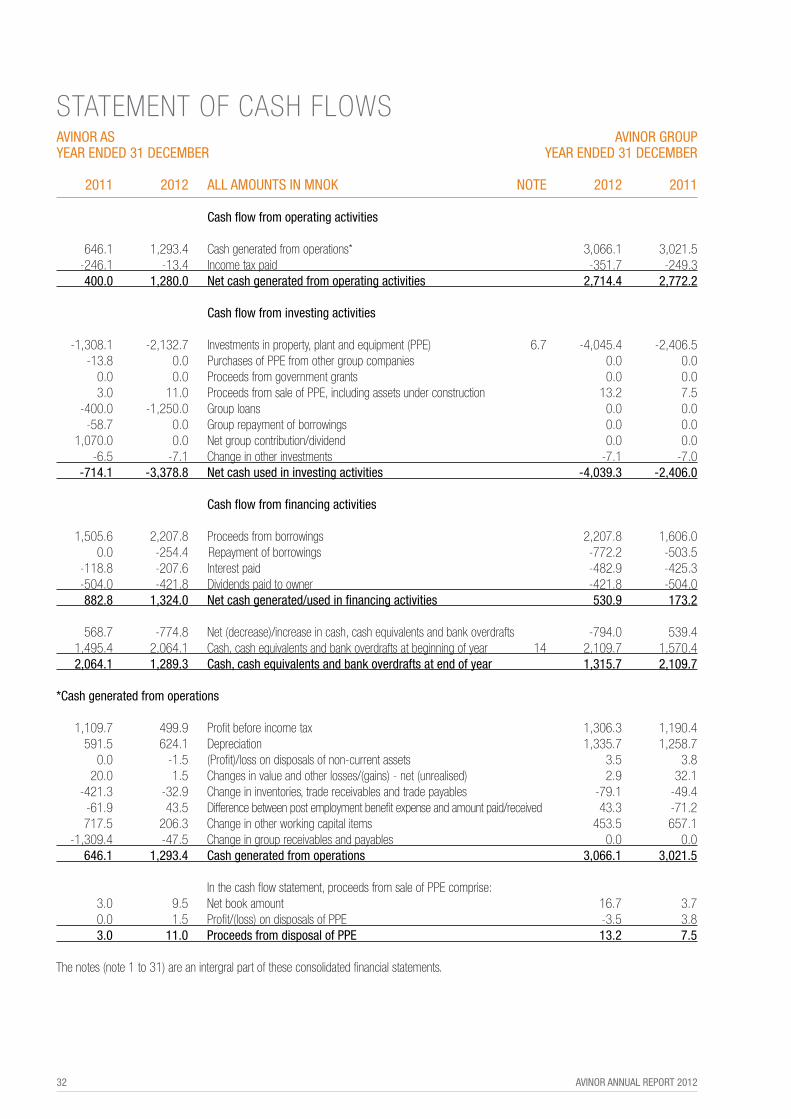
32 avinor annual report 2012
StateMent of caSH floWSAvINoR AS AvINoR gRouPyeAR eNded 31 deCeMBeR yeAR eNded 31 deCeMBeR 2011 2012 All AMouNtS IN MNoK Note 2012 2011 Cash flow from operating activities 646.1 1,293.4 cash generated from operations* 3,066.1 3,021.5 -246.1 -13.4 Income tax paid -351.7 -249.3 400.0 1,280.0 Net cash generated from operating activities 2,714.4 2,772.2 Cash flow from investing activities -1,308.1 -2,132.7 Investments in property, plant and equipment (ppe) 6.7 -4,045.4 -2,406.5 -13.8 0.0 purchases of ppe from other group companies 0.0 0.0 0.0 0.0 proceeds from government grants 0.0 0.0 3.0 11.0 proceeds from sale of ppe, including assets under construction 13.2 7.5 -400.0 -1,250.0 Group loans 0.0 0.0 -58.7 0.0 Group repayment of borrowings 0.0 0.0 1,070.0 0.0 net group contribution/dividend 0.0 0.0 -6.5 -7.1 change in other investments -7.1 -7.0 -714.1 -3,378.8 Net cash used in investing activities -4,039.3 -2,406.0 Cash flow from financing activities 1,505.6 2,207.8 proceeds from borrowings 2,207.8 1,606.0 0.0 -254.4 repayment of borrowings -772.2 -503.5 -118.8 -207.6 Interest paid -482.9 -425.3 -504.0 -421.8 dividends paid to owner -421.8 -504.0 882.8 1,324.0 Net cash generated/used in financing activities 530.9 173.2 568.7 -774.8 net (decrease)/increase in cash, cash equivalents and bank overdrafts -794.0 539.4 1,495.4 2,064.1 cash, cash equivalents and bank overdrafts at beginning of year 14 2,109.7 1,570.4 2,064.1 1,289.3 Cash, cash equivalents and bank overdrafts at end of year 1,315.7 2,109.7
*Cash generated from operations 1,109.7 499.9 profit before income tax 1,306.3 1,190.4 591.5 624.1 depreciation 1,335.7 1,258.7 0.0 -1.5 (profit)/loss on disposals of non-current assets 3.5 3.8 20.0 1.5 changes in value and other losses/(gains) - net (unrealised) 2.9 32.1 -421.3 -32.9 change in inventories, trade receivables and trade payables -79.1 -49.4 -61.9 43.5 difference between post employment benefit expense and amount paid/received 43.3 -71.2 717.5 206.3 change in other working capital items 453.5 657.1 -1,309.4 -47.5 change in group receivables and payables 0.0 0.0 646.1 1,293.4 Cash generated from operations 3,066.1 3,021.5 In the cash flow statement, proceeds from sale of ppe comprise: 3.0 9.5 net book amount 16.7 3.7 0.0 1.5 profit/(loss) on disposals of ppe -3.5 3.8 3.0 11.0 Proceeds from disposal of PPe 13.2 7.5 the notes (note 1 to 31) are an intergral part of these consolidated financial statements.

AvINoR ANNuAl RePoRt 2012 33
noteS to tHe fInancIal StateMentS
1 general information
2 Summary of significant accounting policies
3 financial risk factors
4 Critical accounting estimates and judgements
5 Segment information
6 Property, plant and equipment
7 Intangible assets
8 Subsidiaries
9 financial instruments by category
10 derivative financial instruments
11 other financial assets and investments in associated companies
12 Inventories
13 trade and other receivables
14 Cash and cash equivalents
15 Share capital, shareholder information, dividend and results
16 other reserves
17 Borrowings
18 Income tax expense
19 deferred income tax
20 Pension obligation
21 Provisions for other liabilities and charges
22 other short-term liability
23 operating income
24 Salaries and personnel costs, number of employees, remunerations
25 other operating expenses
26 Impact on earnings – terminal 2 project
27 Changes in value and other losses/gains - net
28 finance income and costs
29 Contingencies
30 Commitments
31 Related-party transactions

34 avinor annual report 2012
1. General InforMatIon avinor aS and its subsidiaries (together ‘the group’) own, manage and develop aviation infrastructure and systems by facilitating safe and efficient aviation. the group also renders services within the same areas together with other activities that add to the group’s main business, including commercial development.
the avinor group’s headquarters are located in oslo.
2.SuMMary of SIGnIfIcant accountInG polIcIeS the principal accounting policies applied in the preparation of these consolidated financial statements are set out below. these policies have been consistently applied to all the years presented, unless otherwise stated.the accounting policies set out below do also apply to the preparation of the financial statements of avinor aS.
2.1. Basis of preparationthe consolidated financial statements of avinor have been prepared in accordance with International financial reporting Standards as adopted by the eu.
the consolidated financial statements have been prepared under the historical cost convention, as modified by financial assets and financial liabilities (including derivative instruments) recognised partly at fair value through profit or loss and partly (cash flow hedges) in other comprehensive income.
the whole of avinor group’s operations have been defined as one cash-generating unit (cGu). the group’s economic model is based on the assumption that there is full cross-subsidisation between profitable and unprofitable airports as well as all areas of operations (overall system). the group has a distinct expressed objective to develop, within the overall system, commercial activities in order to provide capital for unprofitable activities (social considerations/responsibilities) and reduce the level of traffic charges. due to this the group assess that a solution where the group’s operations are evaluated as a whole, presents a true and fair view of the operations.
the preparation of financial statements in conformity with IfrS requires the use of certain critical accounting estimates. It also requires management to exercise its judgement in the process of applying the group’s accounting policies. areas involving a higher degree of judgement or complexity, or areas where assumptions and estimates are significant to the consolidated financial statements are disclosed in particular.
2.1.1 Changes in accounting policy and disclosure(a) New and amended standards adopted by the group there are no IfrSs or IfrIc interpretations that are effective for the first time for the financial year beginning on or after 1 January 2012 that would be expected to have a material impact on the group.
(b) New standards, amendments and interpretations not yet adoptedthere are no IfrSs or IfrIc interpretations early adopted by the group.
amendment to IaS 1 ‘financial statement presentation’ regarding other comprehensive income. the main change resulting from these amendments is a requirement for entities to group items presented in ‘other comprehensive income’ ocI on the basis of whether they are potentially reclassifiable to profit or loss subsequently (reclassification adjustments). the amendments do not address which items are presented in ocI.IaS 19, ‘employee benefits’ was amended in June 2011. the impact on the group will be as follows: to eliminate the corridor approach and recognise all actuarial gains and losses in ocI as they occur; to immediately recognise all past service costs; and to replace interest cost and expected return on plan assets with a net interest amount that is calculated by applying the discount rate to the net defined benefit liability. the group already use the option in the present IaS 19 and recognise actuarial gains or losses in ocI as well as immediately recognition of past service cost. the adoption of the rest of the amendments in 2012 would have resulted in an increased pension cost of approximately 100 MnoK for the group (90 MnoK for the parent company).
IfrS 9, ‘financial instruments’ addresses the classification, measurement and recognition of financial assets and financial liabilities. IfrS 9 was issued in november 2009 and october 2010. It replaces the parts of IaS 39 that relate to the classification and measurement of financial instruments. IfrS 9 require financial assets to be classified into two measurement categories: those measured as at fair value and those measured at amortised cost. the determination is made at initial recognition. the classification depends on the entity’s business model for managing its financial instruments and the contractual cash flow characteristics of the instrument. for financial liabilities, the standard retains most of the IaS 39 requirements. the main change is that, in cases where the fair value option is taken for financial liabilities, the part of fair value change due to an entity’s own credit risk is recorded in other comprehensive income rather than the income statement, unless this creates an accounting mismatch. the group is yet to assess IfrS 9’s full impact and intends to adopt IfrS 9 no later than the accounting period beginning on or after 1 January 2015. the group will also consider the impact of the remaining phases of IfrS 9 when completed by the Board.

avinor annual report 2012 35
IfrS 13 ‘fair value measurement’ aims to improve consistency and reduce complexity by providing a precise definition of fair value and a single source of fair value measurement and disclosure requirements for use across IfrSs. the requirements, which are largely aligned between IfrSs and uS Gaap, do not extend the use of fair value accounting but provide guidance on how it should be applied where its use is already required or permitted by other standards within IfrSs or uS Gaap. the group already uses fair value measurement for some of its assets and obligations. the group is yet to assess IfrS13’s full impact and intends to adopt IfrS 13 no later than the accounting period beginning on or after 1 January 2013.
there are no other IfrSs or IfrIc interpretation that are not yet effective that would be expected to have a material impact on the group.
2.2. ConsolidationSubsidiariesthe consolidated financial statements encompasses avinor aS and all entities over which avinor aS has the power to govern the financial and operating policies generally accompanying a shareholding of more than one half of the voting rights.as at 31 december 2012 all subsidiaries are wholly owned.
Inter-company transactions, balances and unrealised gains on transactions between group companies are eliminated.accounting policies of subsidiaries have been changed where necessary to ensure consistency with the policies adopted by the group.
Associatesthe consolidated financial statements encompasses all entities over which the group has significant influence but not control, generally accompanying a shareholding of between 20% and 50% of the voting rights. the group’s share of its associates’ post-acquisition profits or losses is recognised in the income statement, and its share of post-acquisition movements in other comprehensive income is recognised in other comprehensive income with a corresponding adjustment to the carrying amount of the investment. unrealised gains on transactions between the group and its associates are eliminated to the extent of the group’s interest in the associates. unrealised losses are also eliminated.
2.3. Segment reportingoperating segments are reported in a manner consistent with the internal reporting provided to the chief operating decision-maker.the chief operating decision-maker, who is responsible for allocating resources and assessing performance of the operating segments, has been identified as the group management.
2.4. foreign currency translationforeign currency transactions are translated into the functional currency using the exchange rates prevailing at the date of the transaction, except transactions from en route income which are translated using a fixed exchange rate.
Monetary assets and liabilities denominated in foreign currencies are translated using the exchange rate at the balance sheet date. non-monetary assets and liabilities measured at historical cost denominated in foreign currencies are translated using the exchange rate at the date of transaction. non-monetary assets and liabilities measured at fair value denominated in foreign currencies are translated using the exchange rate at the balance sheet date. foreign exchange gains and losses are recognised in the income statement. the functional currency of the group companies is noK.
foreign exchange gains and losses that relate to receivables, liabilities, cash and cash equivalents were previously presented as finance income or cost have been reclassified and presented in changes in value and other losses/(gains) - net.
2.5. Property, plant and equipmentproperty, plant and equipment is stated at historical cost less depreciation. Historical cost includes expenditure that is directly attributable to the acquisition of the items. cost may also include transfers from equity of any gains/losses on qualifying cash flow hedges of foreign currency purchases of property, plant and equipment.
Subsequent costs are included in the asset’s carrying amount or recognised as a separate asset, as appropriate, only when it is probable that future economic benefits associated with the item will flow to the group and the cost of the item can be measured reliably. all other repairs and maintenance are charged to the income statement during the financial period in which they are incurred.
Borrowing costs incurred for the construction of any qualifying asset are capitalised during the period of time that is required to complete and prepare the asset for its intended use. land and housing are not depreciated. depreciation on other assets is calculated using the straight-line method to allocate their cost to their residual values over their estimated useful lives, as follows: Buildings 10 - 50 yearsInfrastructure 5 - 50 yearsrunways and other related assets 15 - 50 yearsvehicles 3 - 10 yearsother non-current assets 5 - 15 years
36 avinor annual report 2012
the assets’ residual values and useful lives are reviewed, and adjusted if appropriate, at the end of each reporting period. Gains and losses on disposals are determined by comparing the proceeds with the carrying amount.
assets that are subject to amortisation are reviewed for impairment whenever events or changes in circumstances indicate that the carrying amount may not be recoverable. an impairment loss is recognised for the amount by which the asset’s carrying amount exceeds its recoverable amount. the recoverable amount is the higher of an asset’s fair value less costs to sell and value in use. non-financial assets other than goodwill that suffered an impairment are reviewed for possible reversal of the impairment at each reporting date. 2.6. Intangible assets Separately acquired intangible assets are shown at historical cost. Intangible assets acquired in a business combination are recognised at fair value at the acquisition date. Intangible assets are carried at cost less accumulated depreciation and amortisation.
Internally generated intangible assets, with the exception of development costs that are recognised as intangible assets, are recogised as an expense as incurred.
the useful life of an intangible asset is either finite or indefinite. Intangible assets with finite useful life are amortised using the straight-line method to allocate the cost over their estimated useful lives. assets that are subject to amortisation are reviewed for impairment whenever events or changes in circumstances indicate that the carrying amount may not be recoverable. Method of amortisation and estimated useful life is reviewed at least at the end of each reporting period. changes in method and/or estimated useful life is accounted for as changes in estimates.
Computer softwarecosts associated with purchasing new computer software are recognised as an intangible asset, unless it is a part of the acquisition of hardware. amortisation is calculated using the straight-line method to allocate the cost over their estimated useful life, normally 5 years. costs associated with maintaining computer software programs or maintaining future usage of computer software programs are expensed unless the changes enhance the future usage of the program. 2.7. leases (i) the group as a lesseefinance leasesleases where the group has substantially all the risks and rewards of ownership are classified as finance leases. leases with contingent rents are expensed.
operating leasesleases in which a significant portion of the risks and rewards of ownership are retained by the lessor are classified as operating leases. payments made under operating leases are charged to the income statement on a straight-line basis over the period of the lease.
(ii) the group as a lessoroperating leasesthe group presents rental assets as non-current assets in the balance sheet. rental income is recognised in income on a straight-line basis over the period of the lease. 2.8. government grants a government grant is recognised at fair value when there is reasonable assurance that the group will comply with the conditions attached to it, and that the grant will be received. Government grants are recognised as income over the periods necessary to match them with the related costs which they are intended to compensate, on a systematic basis. Government grants related to assets are presented in the statement of financial position by deducting the grant to arrive at the carrying amount of the asset. 2.9. Impairment of non-financial assets assets are reviewed for impairment whenever events or changes in circumstances indicate that the carrying amount may not be recoverable. for the purpose of assessing impairment the whole group is defined as one cash generating unit (cGu). the difference between the carrying amount and recoverable amount is recognised as an impairment loss in the income statement. 2.10. Shares in subsidiaries Shares in subsidiaries are recognised at cost at the acquisition date and are classified as a long-term investment. the shares are assessed whether there is any indication that their carrying amount exceeds the amount to be recovered through use or sale. 2.11. financial assets 2.11.1 Classification the group classifies its financial assets in the following categories: at fair value through profit or loss and loans and receivables. the classification depends on the purpose for which the financial assets were acquired. Management determines the classification of its financial assets at initial recognition.

avinor annual report 2012 37
(a) financial assets at fair value through profit or loss financial assets at fair value through profit or loss are derivatives with a positive fair value. assets in this category are classified as current if expected realisation is within 12 months after the end of the reporting period. (b) loans and receivables loans and receivables are non-derivative financial assets with fixed or determinable payments that are not quoted in an active market. they are included in current assets, excepts for maturities greater than 12 months after the end of the reporting period. these are classified as non-current assets. the group’s loans and receivables comprise ‘trade and other receivables’ in the balance sheet.
2.11.2 Recognition and measurement regular purchases and sales of financial assets are recognised on the trade-date - the date on which the group commits to purchase or sell the asset. Investments are initially recognised at fair value plus transaction costs for all financial assets not carried at fair value through profit or loss. financial assets carried at fair value through profit or loss are initially recognised at fair value, and transaction costs are expensed in the income statement. financial assets are derecognised when the rights to receive cash flows from the investments have expired or have been transferred and the group has transferred substantially all risks and rewards of ownership. 2.11.3 Impairment of financial assets the group assesses at the end of each reporting period whether there is objective evidence that a financial asset or a group of financial assets is impaired. an impairment loss is recognised when the loss is material and assumed to last for a longer period of time.
2.12. derivative financial instruments and hedging activities derivatives are initially recognised at fair value on the date a derivative contract is entered into and are subsequently re-measured at their fair value. the method of recognising the resulting gain or loss depends on whether the derivative is designated as a hedging instrument, and if so, the nature of the item being hedged. the group designates certain derivatives as either: (a) Hedges of the fair value of recognised assets, liabilities or a firm commitment (fair value hedge) (b) Hedges of a particular risk associated with a recognised asset or liability or a highly probable forecast transaction (cash flow hedge) the group documents at the inception of the transaction the relationship between hedging instruments and hedged items, as well as its risk management objectives and strategy for undertaking various hedging transactions. the group also documents its assessment, both at hedge inception and on an ongoing basis, of whether the derivatives that are used in hedging transactions are highly effective in offsetting changes in fair values or cash flows of hedged items. the full fair value of hedging derivatives is classified as a non-current asset or liability when the remaining maturity of the hedged item is more than 12 months, and as a current asset or liability when the remaining maturity of the hedged item is less than 12 months. trading derivatives are classified as a current asset or liability. the group normally defines derivatives related to borrowings as hedging derivatives and as designated and qualified for hedge accounting. the group uses derivative financial instruments related to the purchase of energy and foreign currency. for energy, forward energy contracts are purchased at nordpool. none of these derivatives qualify for hedge accounting. changes in the fair value of derivatives that do not qualify for hedge accounting are, depending on whether the derivative is related to operating or financing activities, recognised in the income statement within ‘changes in value and other losses/gains - net’ or within ‘finance cost’. Both derivatives are recognised at fair value through profit or loss. (a) fair value hedge changes in the fair value of derivatives that are designated and qualify as fair value hedges are recorded in the income statement, together with any changes in the fair value of the hedged asset or liability that are attributable to the hedged risk. the group only applies fair value hedge accounting for hedging fixed interest risk on borrowings. the gain or loss relating to the effective portion of interest rate swaps hedging fixed rate borrowings is recognised in the income statement within ‘finance costs’. the gain or loss relating to the ineffective portion is recognised in the income statement within ‘changes in value and other losses/(gains) - net’. changes in the fair value of the hedge fixed rate borrowings attributable to interest rate risk are recognised in the income statement within ‘finance costs’. (b) Cash flow hedge the effective portion of changes in the fair value of derivatives that are designated and qualify as cash flow hedges is recognised in other comprehensive income. the gain or loss relating to the ineffective portion is recognised in the income statement within ‘net finance costs’.

38 avinor annual report 2012
amounts accumulated in equity are reclassified to profit or loss in the periods when the hedged item affects profit or loss (for example, when the forecast sale that is hedged takes place). the gain or loss relating to the effective portion of interest rate swaps hedging variable rate borrowings is recognised in the income statement within ‘finance costs’. When a hedging instrument expires or is sold, or when a hedge no longer meets the criteria for hedge accounting, any cumulative gain or loss existing in equity at that time remains in equity and is recognised when the forecast transaction is ultimately recognised in the income statement. When a forecast transaction is no longer expected to occur, the cumulative gain or loss that was reported in equity is immediately transferred to the income statement. 2.13. financial liabilities the group classifies its financial liabilities in the following categories: at fair value through profit or loss and other financial liabilities. the classification depends on the purpose for which the financial liabilities were incurred. Management determines the classification of its financial liabilities at initial recognition. (a) financial liabilities at fair value through profit or loss financial liabilities at fair value through profit or loss are derivatives with a negative fair value. derivatives are initially recognised at fair value. Subsequent changes in fair value are recorded in the income statement. assets in this category are classified as current if expected realisation is within 12 months after the end of the reporting period. (b) other financial liabilities other financial liabilities are non-derivative financial liabilities with fixed or determinable payments that are not quoted in an active market. other financial liabilities are recognised intially at fair value and subsequently measured at amortised cost using the effective interest method. they are included in current liabilities, except for maturities greater than 12 months after the end of the reporting period. these are classified as non-current liabilities. 2.14. Inventories Inventories are stated at the lower of cost and net realisable value. cost is determined using the first-in, first-out (fIfo) method. 2.15. trade receivables trade receivables are amounts due from customers for merchandise sold or services performed in the ordinary course of business. If collection is expected in one year or less, they are classified as current assets. If not, they are presented as non-current assets. trade receivables are recognised initially at fair value and subsequently measured at amortised cost using the effective interest method, less provision for impairment. 2.16. Cash and cash equivalents cash and cash equivalents includes cash in hand, deposits held at call with banks, and bank overdrafts. Bank overdrafts are shown within borrowings in current liabilities on the balance sheet. 2.17. Share capital and share premium reserve ordinary shares are classified as equity. 2.18. trade payables trade payables are recognised initially at fair value and subsequently measured at amortised cost using the effective interest method. 2.19. Borrowings Borrowings are recognised initially at fair value. Borrowings are subsequently carried at amortised cost using the effective interest method, except for borrowings hedged with a derivative fair value hedge, which is also carried at fair value in subsequent periods. Borrowings are classified as current liabilities unless the group has an unconditional right to defer settlement of the liability for at least 12 months after the balance sheet date. 2.20. Current and deferred income tax the tax expense for the period comprises current and deferred tax. tax is recognised in the income statement, except to the extent that it relates to items recognised in other comprehensive income or directly in equity. In this case the tax is also recognised in other comprehensive income or directly in equity, respectively. deferred income tax is provided in full, using the liability method, on temporary differences arising between the tax bases of assets and liabilities and their carrying amounts in the financial statements. deferred income tax is determined using tax rates and laws that have been enacted or substantially enacted by the balance sheet date and are expected to apply when the related deferred income tax asset is realised or the deferred income tax liability is settled. deferred income tax assets are recognised only to the extent that it is probable that future taxable profit will be available against which temporary differences can be utilised. deferred income tax assets are assessed against future taxable income and are evaluated separately.

avinor annual report 2012 39
2.21. employee benefits Pension obligations the pension schemes are generally funded through payments to Statens pensjonskasse (the norwegian public Service pension fund, SpK), determined by periodic actuarial calculations. the group has a defined benefit plan. a defined benefit plan is a pension plan that defines an amount of pension benefit that an employee will receive on retirement, dependent on one or more factors such as years of service and compensation. the liability recognised in the balance sheet in respect of defined benefit pension plans is the present value of the defined benefit obligation at the end of the reporting period less the fair value of plan assets. the defined benefit obligation is calculated annually by independent actuaries using the projected unit credit method.
the present value of the defined benefit obligation is determined by discounting the estimated future cash outflow using interest rates of high-quality corporate bonds (or long-term treasury bonds) that are denominated in the currency in which the benefits will be paid, and that have terms to maturity approximating to the terms of the related pension liability. actuarial gains and losses arising from experience adjustments and changes in actuarial assumptions are charged or credited to equity in other comprehensive income in the period in which they arise. changes in assumptions, basic data and the benefits of the pension plan which have as an effect an accounting loss or gain will be set off against equity through other comprehensive income in the period they occur. a change in the benefits which refers to previous periods of earning implies a change in the pension plan which is a cost related to previous periods of earning. a negative cost occurs when the benefits are changed in such a way that the present value of the projected benefits are reduced. the pension scheme is not directly funded. the pension payments are guaranteed by the norwegian government (Section 1 of the pensions act). administration of the allocated fund (fictitious fund) is simulated as if the funds were placed in long-term government bonds. the pension scheme is not movable in the same way as private pensions schemes and it is assumed that the pension scheme will be continued in SpK. In the simulation it is assumed that the bonds are held to maturity. the pension fund is therefore estimated at nominal value plus the return on the fund. Severance pay until 31 december 2005 all employees given notice were entitled to severance pay. the obligation is recognised in the financial statement at present value of the defined benefits at the balance sheet date. 2.22. Provisions provisions are recognised when: the group has a present legal or constructive obligation as a result of past events; it is probable that an outflow of resources will be required to settle the obligation; and the amount has been reliably estimated. When the effect is material, provisions are determined by discounting expected future cash flows at a pre-tax rate that reflects current market assessments of the time value of money and, where appropriate, the risks specific to the liability. provisions for contract losses are recognised when the group’s expected income from the contract is lower than the expenses necessary to settle the contractual obligation. 2.23. Revenue recognition revenue comprises the fair value of the consideration received or receivables for the sale of goods and services in the ordinary course of the group’s activities. revenue is shown net of value-added tax, returns, rebates and discounts and after eliminating sales within the group. revenue is recognised as follows (most of the group’s revenues consist of civil aviation fees and rent from property leases (note 23)): (a) Sale of traffic and real estate services revenue from services is recognised in the period the services are provided. for spesification, see note 23. revenue from property leases with fixed lease payment is recognised in the period the services are provided, using a straight line basis over the term of the contract.
revenue from property leases with revenue-based lease payments is recognised when it is earned. revenue from sale of real estate property is recognised when the risk and control of the object is transferred to the buyer, normally at the time of disposal. (b) dividend income dividend income is recognised when the right to receive payment is established.

40 avinor annual report 2012
2.24. dividend distribution dividend distribution to the company’s shareholders is recognised as a liability in the group’s financial statements in the period in which the dividends are approved by the company’s shareholders. 2.25. events after the reporting period new information after the reporting period about conditions that existed at the end of the reporting period is recognised in the financial statement. events after the reporting period affecting the group’s future financial position are disclosed if material.
3. fInancIal rISK factorS the group’s activities expose it to a variety of financial risks: market risk (including currency risk, fair value interest rate risk, cash flow interest rate risk and price risk), credit risk and liquidity risk. the group’s overall risk management programme seeks to minimise the volatility of the group’s financial performance. the group uses derivative financial instruments to hedge certain risk exposures. risk management is carried out by a central treasury department under policies approved by the board of directors. Group treasury identifies, evaluates and hedges financial risks in close co-operation with the group’s operating units. the board provides written principles for overall risk management, as well as written policies covering specific areas, such as foreign exchange risk, interest rate risk, credit risk, use of derivative financial instruments and non-derivative financial instruments, and investment of excess liquidity. Market risk (i) foreign exchange risk the group and avinor aS are exposed to foreign exchange risk with respect to the value of noK against other currencies caused by income and expenses in foreign currency. the group uses forward contracts to reduce the foreign exchange risk in cash flows nominated in foreign currency. the group and avinor aS are primarily exposed to foreign exchange risk with respect to eur. the group’s income from en route charges is exposed to foreign exchange risk. for avinor the risk is connected to the transfer of the revenue to norway.the period from the determination of the exchange rate to the actual payment is about three months. revenue in foreign currency is sold forward to the extent that it is not hedged by cash outflow in the same currency. the group also has foreign exchange risk connected to contractual payments in foreign currency. as a fundamental principle, hedging of transaction risk for contracts in foreign exchange is carried through for contracts exceeding the value of MnoK 2. normally, forward contracts entered into do not have terms exceeding three years.foreign exchange rate derivatives do not normally qualify for hedge accounting. oslo lufthavn aS has, as part of the hedging of larger aquisitions, entered into forward foreign exchange contracts in connection with the development of Gardermoen (terminal 2 project). the forward foreign axchange contracts are in eur for payment of baggage system, navigation equipment, vehicles etc. parts of these forward foreign exchange contracts qualify for hedge accounting.for the notional principal amount of the outstanding forward foreign exchange contracts, see note 10. (ii) Interest rate risk the group are exposed to interest rate risk through its financial activities (see note 17). parts of the borrowings are issued at variable rates, which means that the group is influenced by changes in the interest rates. the objective of the group’s interest rate management is to keep the volatility of future interest costs within acceptable limits. Group policy is to interest rate hedge all new long-term loans till 70% of expected debt in 2017 is hedged. the group manages its effective interest exposure risk by using various interest rate swaps. at 31 december 2012 all interest rate swaps are adapted to the terms of specific loans and other conditions. When the interest rate swaps are taken into consideration, the group has 87% of its long-term borrowings at a fixed rate of interest. at 31 december 2012 the group had interest rate swaps instruments at a face value of MnoK 1,153 (2011: MnoK 1,186), where the group receives a variable nIBor rate and pays a fixed rate of 5.09% of face value and MnoK 425 (2011: MnoK 425) where the group receives a fixed rate of 5.77% and pays a variable 6-month interest rate based on nIBor + 1.95%. the interest rate swaps are used to hedge against volatility in the p&l reporting as a result of changes in the interest levels. the hedged loans and the interest rate swaps agreements have similar conditions. all interest swaps are made as a hedge against financial risks caused by fair value interest rate risk or cash flow interest rate risk. all interest swaps are carried at their fair value in the balance sheet. the following table presents the group’s sensitivity to a defined interest rate shift as at 31 december. the simulation takes into consideration all interest rate derivatives.

avinor annual report 2012 41
Avinor group: Changes in interest levels in basis points Impact on pre-tax profit (MNoK) Impact on equity (MNoK)2012 +50 -0.4 22.4 -50 0.3 -23.82011 +50 -4.8 29.3 -50 4.9 -31.5 Avinor AS: Changes in interest levels in basis points Impact on pre-tax profit (MNoK) Impact on equity (MNoK)2011 +50 -3.8 0.0 -50 3.7 0.02011 +50 -0.2 4.4 -50 0.3 -4.7Based on the financial instruments at 31 december 2012, the simulation shows that if the interest rate had been 0.5% higher, pre-tax profit for the year would have been MnoK 0.4 lower (2011: MnoK 4.8). the average yield on financial instruments were as follows: 2012 (%) 2011 (%)overdraft na naState loan 3.99 4.11debenture loan 5.74 5.79Bank loan 5.44 5.11
the figures include interest hedging derivatives. at 31 december 2012, avinor aS had total borrowings amounting to MnoK 4,975.3 (2011: MnoK 3,000.0) in addition to a overdraft of MnoK 0.0 (2011: MnoK 0.0).
(iii) Power price risk avinor is a consumer of electrical power. avinor has entered into financial power contracts via nord pool to hedge parts of its power consumption. at 31 december 2012 the majority of 2013’s estimated consumption is covered by such contracts. the group does not apply hedge accounting to these contracts.
power purchases are made in eur. the fair value of power contracts is estimated at MnoK -7.4 (2011: MnoK -6.4) based on the exchange rate at year-end. Sensitivity analysis at 31 december 2012: Market value 31.12.12 Impact on pre-tax profit (MNoK) as a consequence of Avinor group: a 20% increase in power price -7,4 16.6 Market value 31.12.12 Impact on pre-tax profit (MNoK) as a consequence of Avinor AS: a 20% increase in power price -4,3 9.6 Credit riskthe group’s credit risks are mainly connected to airlines and air traffic-related industries. the group has credit risks attached to three main customers. there have not been any difficulties concerning settlements from these customers (se below).the group assesses the risk that customers cannot fulfil their obligations as moderate. the group has guidelines to limit exposure to possible losses. the group has not made any third-party guarantees. Maximum risk exposure is illustrated by the carried amounts of the financial assets, including derivatives in the balance sheet. Since the opposite party in derivative trading is normally banks and the power trade exchange, the credit risk connected to derivatives is assessed as small.the group’s assessment is that the group’s maximum credit exposure is illustrated by the carried amounts of trade receivables and other short-term assets (see note 13). the group does not have any material overdue trade receivables. (See note 13) the groups main bank connexion has external credit rating a-1 (short term) and a+ (long term) (Standard & poors). Creditworthiness in trade receivables and intra-group accounts in detailcredit risk in non-due financial instruments which have not been written down, may be evaluated by external sources (if available) or based on a previous negative
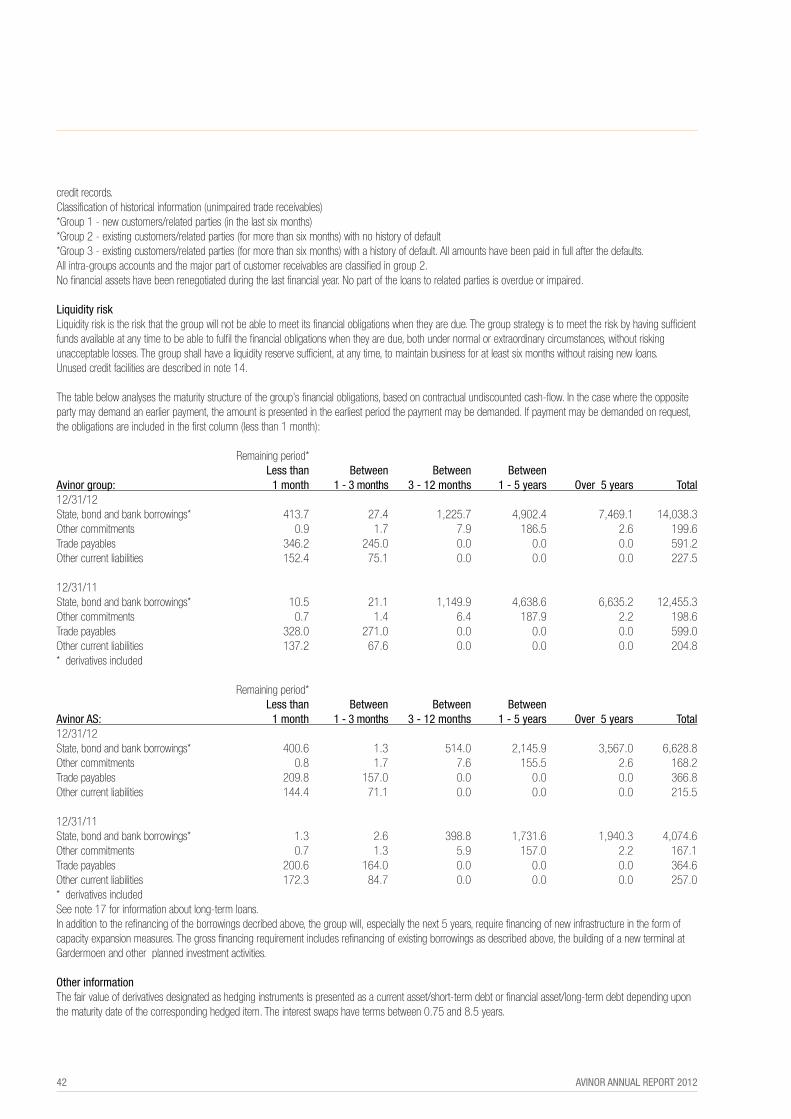
42 avinor annual report 2012
credit records. classification of historical information (unimpaired trade receivables) *Group 1 - new customers/related parties (in the last six months) *Group 2 - existing customers/related parties (for more than six months) with no history of default *Group 3 - existing customers/related parties (for more than six months) with a history of default. all amounts have been paid in full after the defaults. all intra-groups accounts and the major part of customer receivables are classified in group 2. no financial assets have been renegotiated during the last financial year. no part of the loans to related parties is overdue or impaired.
liquidity risk liquidity risk is the risk that the group will not be able to meet its financial obligations when they are due. the group strategy is to meet the risk by having sufficient funds available at any time to be able to fulfil the financial obligations when they are due, both under normal or extraordinary circumstances, without risking unacceptable losses. the group shall have a liquidity reserve sufficient, at any time, to maintain business for at least six months without raising new loans. unused credit facilities are described in note 14. the table below analyses the maturity structure of the group’s financial obligations, based on contractual undiscounted cash-flow. In the case where the opposite party may demand an earlier payment, the amount is presented in the earliest period the payment may be demanded. If payment may be demanded on request, the obligations are included in the first column (less than 1 month): remaining period* less than Between Between Between Avinor group: 1 month 1 - 3 months 3 - 12 months 1 - 5 years over 5 years total12/31/12 State, bond and bank borrowings* 413.7 27.4 1,225.7 4,902.4 7,469.1 14,038.3other commitments 0.9 1.7 7.9 186.5 2.6 199.6trade payables 346.2 245.0 0.0 0.0 0.0 591.2other current liabilities 152.4 75.1 0.0 0.0 0.0 227.5
12/31/11 State, bond and bank borrowings* 10.5 21.1 1,149.9 4,638.6 6,635.2 12,455.3other commitments 0.7 1.4 6.4 187.9 2.2 198.6trade payables 328.0 271.0 0.0 0.0 0.0 599.0other current liabilities 137.2 67.6 0.0 0.0 0.0 204.8* derivatives included remaining period* less than Between Between Between Avinor AS: 1 month 1 - 3 months 3 - 12 months 1 - 5 years over 5 years total12/31/12 State, bond and bank borrowings* 400.6 1.3 514.0 2,145.9 3,567.0 6,628.8other commitments 0.8 1.7 7.6 155.5 2.6 168.2trade payables 209.8 157.0 0.0 0.0 0.0 366.8other current liabilities 144.4 71.1 0.0 0.0 0.0 215.5 12/31/11 State, bond and bank borrowings* 1.3 2.6 398.8 1,731.6 1,940.3 4,074.6other commitments 0.7 1.3 5.9 157.0 2.2 167.1trade payables 200.6 164.0 0.0 0.0 0.0 364.6other current liabilities 172.3 84.7 0.0 0.0 0.0 257.0* derivatives included See note 17 for information about long-term loans. In addition to the refinancing of the borrowings decribed above, the group will, especially the next 5 years, require financing of new infrastructure in the form of capacity expansion measures. the gross financing requirement includes refinancing of existing borrowings as described above, the building of a new terminal at Gardermoen and other planned investment activities. other informationthe fair value of derivatives designated as hedging instruments is presented as a current asset/short-term debt or financial asset/long-term debt depending upon the maturity date of the corresponding hedged item. the interest swaps have terms between 0.75 and 8.5 years.
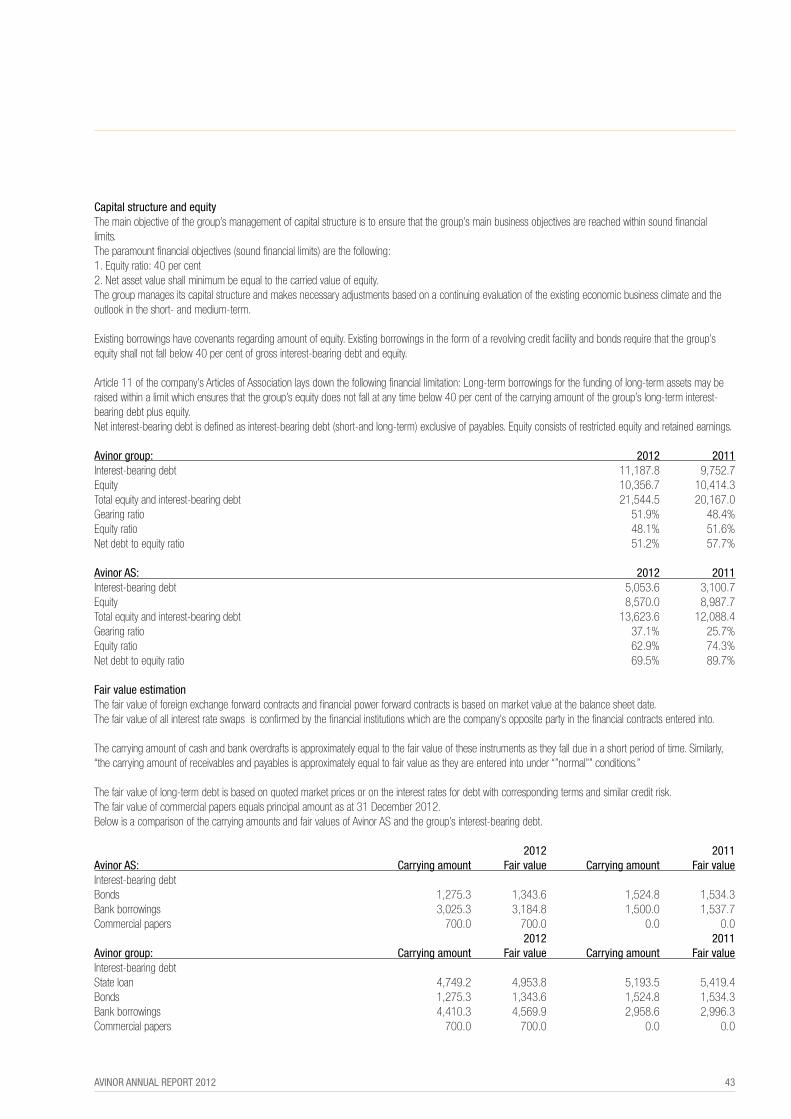
avinor annual report 2012 43
Capital structure and equitythe main objective of the group’s management of capital structure is to ensure that the group’s main business objectives are reached within sound financial limits. the paramount financial objectives (sound financial limits) are the following: 1. equity ratio: 40 per cent 2. net asset value shall minimum be equal to the carried value of equity. the group manages its capital structure and makes necessary adjustments based on a continuing evaluation of the existing economic business climate and the outlook in the short- and medium-term. existing borrowings have covenants regarding amount of equity. existing borrowings in the form of a revolving credit facility and bonds require that the group’s equity shall not fall below 40 per cent of gross interest-bearing debt and equity. article 11 of the company’s articles of association lays down the following financial limitation: long-term borrowings for the funding of long-term assets may be raised within a limit which ensures that the group’s equity does not fall at any time below 40 per cent of the carrying amount of the group’s long-term interest-bearing debt plus equity. net interest-bearing debt is defined as interest-bearing debt (short-and long-term) exclusive of payables. equity consists of restricted equity and retained earnings. Avinor group: 2012 2011Interest-bearing debt 11,187.8 9,752.7equity 10,356.7 10,414.3total equity and interest-bearing debt 21,544.5 20,167.0Gearing ratio 51.9% 48.4%equity ratio 48.1% 51.6%net debt to equity ratio 51.2% 57.7%
Avinor AS: 2012 2011Interest-bearing debt 5,053.6 3,100.7equity 8,570.0 8,987.7total equity and interest-bearing debt 13,623.6 12,088.4Gearing ratio 37.1% 25.7%equity ratio 62.9% 74.3%net debt to equity ratio 69.5% 89.7%
fair value estimationthe fair value of foreign exchange forward contracts and financial power forward contracts is based on market value at the balance sheet date. the fair value of all interest rate swaps is confirmed by the financial institutions which are the company’s opposite party in the financial contracts entered into. the carrying amount of cash and bank overdrafts is approximately equal to the fair value of these instruments as they fall due in a short period of time. Similarly, “the carrying amount of receivables and payables is approximately equal to fair value as they are entered into under “”normal”” conditions.” the fair value of long-term debt is based on quoted market prices or on the interest rates for debt with corresponding terms and similar credit risk.the fair value of commercial papers equals principal amount as at 31 december 2012. Below is a comparison of the carrying amounts and fair values of avinor aS and the group’s interest-bearing debt. 2012 2011Avinor AS: Carrying amount fair value Carrying amount fair valueInterest-bearing debt Bonds 1,275.3 1,343.6 1,524.8 1,534.3Bank borrowings 3,025.3 3,184.8 1,500.0 1,537.7commercial papers 700.0 700.0 0.0 0.0 2012 2011Avinor group: Carrying amount fair value Carrying amount fair valueInterest-bearing debt State loan 4,749.2 4,953.8 5,193.5 5,419.4Bonds 1,275.3 1,343.6 1,524.8 1,534.3Bank borrowings 4,410.3 4,569.9 2,958.6 2,996.3commercial papers 700.0 700.0 0.0 0.0
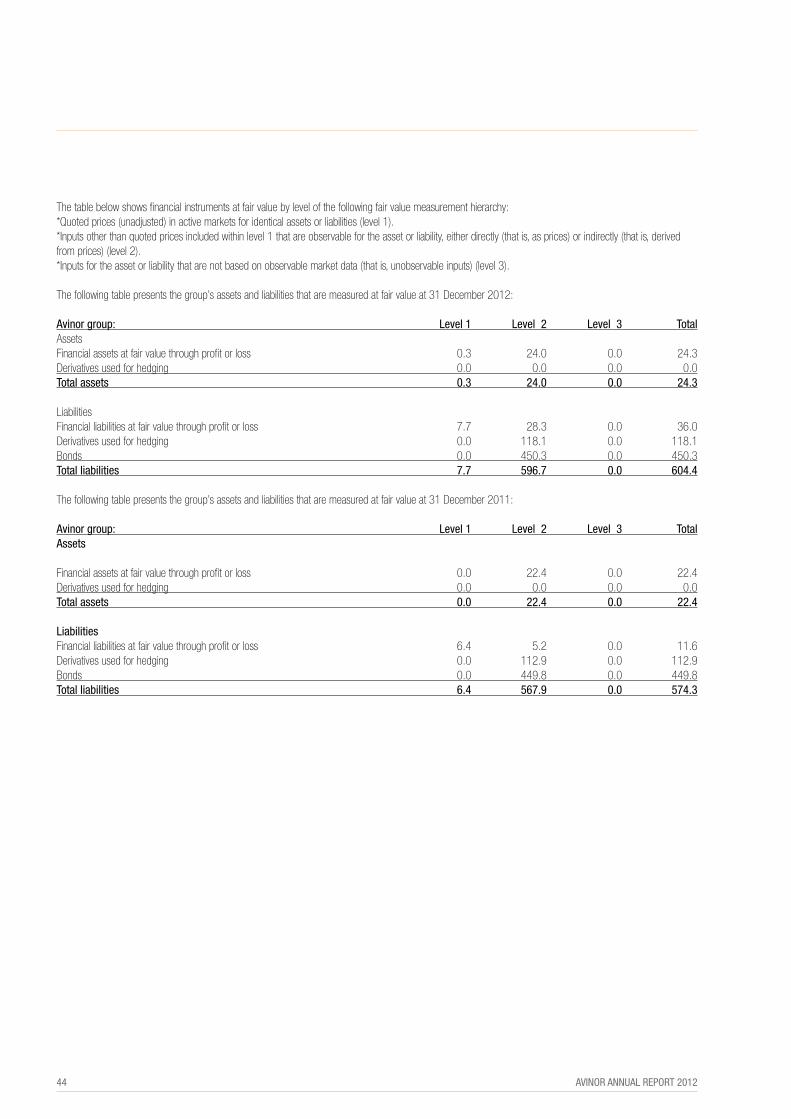
44 avinor annual report 2012
the table below shows financial instruments at fair value by level of the following fair value measurement hierarchy:*Quoted prices (unadjusted) in active markets for identical assets or liabilities (level 1). *Inputs other than quoted prices included within level 1 that are observable for the asset or liability, either directly (that is, as prices) or indirectly (that is, derived from prices) (level 2). *Inputs for the asset or liability that are not based on observable market data (that is, unobservable inputs) (level 3). the following table presents the group’s assets and liabilities that are measured at fair value at 31 december 2012:
Avinor group: level 1 level 2 level 3 totalassets financial assets at fair value through profit or loss 0.3 24.0 0.0 24.3derivatives used for hedging 0.0 0.0 0.0 0.0total assets 0.3 24.0 0.0 24.3 liabilities financial liabilities at fair value through profit or loss 7.7 28.3 0.0 36.0derivatives used for hedging 0.0 118.1 0.0 118.1Bonds 0.0 450.3 0.0 450.3total liabilities 7.7 596.7 0.0 604.4 the following table presents the group’s assets and liabilities that are measured at fair value at 31 december 2011: Avinor group: level 1 level 2 level 3 totalAssets financial assets at fair value through profit or loss 0.0 22.4 0.0 22.4derivatives used for hedging 0.0 0.0 0.0 0.0total assets 0.0 22.4 0.0 22.4 liabilities financial liabilities at fair value through profit or loss 6.4 5.2 0.0 11.6derivatives used for hedging 0.0 112.9 0.0 112.9Bonds 0.0 449.8 0.0 449.8total liabilities 6.4 567.9 0.0 574.3
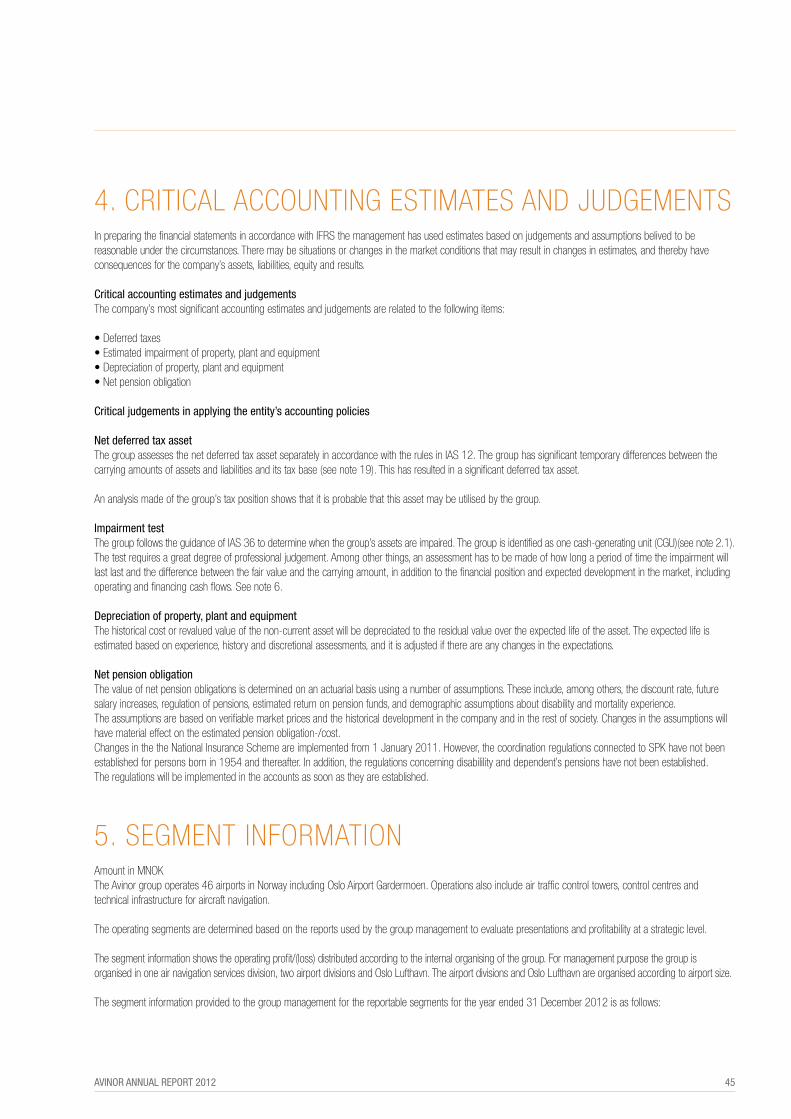
avinor annual report 2012 45
4. crItIcal accountInG eStIMateS and JudGeMentS In preparing the financial statements in accordance with IfrS the management has used estimates based on judgements and assumptions belived to be reasonable under the circumstances. there may be situations or changes in the market conditions that may result in changes in estimates, and thereby have consequences for the company’s assets, liabilities, equity and results. Critical accounting estimates and judgementsthe company’s most significant accounting estimates and judgements are related to the following items: • Deferred taxes • Estimated impairment of property, plant and equipment • Depreciation of property, plant and equipment • Net pension obligation Critical judgements in applying the entity’s accounting policies Net deferred tax assetthe group assesses the net deferred tax asset separately in accordance with the rules in IaS 12. the group has significant temporary differences between the carrying amounts of assets and liabilities and its tax base (see note 19). this has resulted in a significant deferred tax asset.
an analysis made of the group’s tax position shows that it is probable that this asset may be utilised by the group. Impairment testthe group follows the guidance of IaS 36 to determine when the group’s assets are impaired. the group is identified as one cash-generating unit (cGu)(see note 2.1).the test requires a great degree of professional judgement. among other things, an assessment has to be made of how long a period of time the impairment will last last and the difference between the fair value and the carrying amount, in addition to the financial position and expected development in the market, including operating and financing cash flows. See note 6. depreciation of property, plant and equipment the historical cost or revalued value of the non-current asset will be depreciated to the residual value over the expected life of the asset. the expected life is estimated based on experience, history and discretional assessments, and it is adjusted if there are any changes in the expectations. Net pension obligation the value of net pension obligations is determined on an actuarial basis using a number of assumptions. these include, among others, the discount rate, future salary increases, regulation of pensions, estimated return on pension funds, and demographic assumptions about disability and mortality experience.the assumptions are based on verifiable market prices and the historical development in the company and in the rest of society. changes in the assumptions will have material effect on the estimated pension obligation-/cost. changes in the the national Insurance Scheme are implemented from 1 January 2011. However, the coordination regulations connected to SpK have not been established for persons born in 1954 and thereafter. In addition, the regulations concerning disabilility and dependent’s pensions have not been established. the regulations will be implemented in the accounts as soon as they are established.
5. SeGMent InforMatIonamount in MnoK the avinor group operates 46 airports in norway including oslo airport Gardermoen. operations also include air traffic control towers, control centres and technical infrastructure for aircraft navigation. the operating segments are determined based on the reports used by the group management to evaluate presentations and profitability at a strategic level. the segment information shows the operating profit/(loss) distributed according to the internal organising of the group. for management purpose the group is organised in one air navigation services division, two airport divisions and oslo lufthavn. the airport divisions and oslo lufthavn are organised according to airport size. the segment information provided to the group management for the reportable segments for the year ended 31 december 2012 is as follows:

46 avinor annual report 2012
Medium AirAvinor group as at other large and small Navigation 31 december 2012: oslo Airport Airports Airports Services others elimination totaltraffic income 1,713.9 1,265.5 829.5 947.0 0.0 4,755.8other income 2,657.9 1,079.0 508.6 144.2 6.5 4,396.3Inter-segment income 75.8 89.3 36.4 745.9 856.0 -1,803.3 0.0total income 4,447.6 2,433.7 1,374.5 1,837.1 862.5 -1,803.3 9,152.1 employee benefits expense 497.6 309.6 752.4 1,229.1 284.1 3,072.8depreciation and amortisation 665.0 213.7 320.1 95.1 41.1 1,335.0other operating expenses 1,108.1 505.9 831.0 342.1 294.3 3,081.5Inter-segment expenses 642.9 359.3 588.4 108.9 103.8 -1,803.3 -0.0total expenses 2,913.6 1,388.4 2,492.0 1,775.1 723.4 -1,803.3 7,489.2 Net income/(expense) 1,534.0 1,045.3 -1,117.5 61.9 139.1 0.0 1,662.9 Group adjustments depreciation (a) 181.7 -65.8 -115.5 0.0 -1.1 -0.7Group adjustments lease (b) 388.4 -388.4 0.0 operating profit/(loss) 2,104.2 979.5 -1,233.0 61.9 -250.4 0.0 1,662.2 Assets 7,437.0 4,457.5 5,603.7 653.1 150.7 18,302.0 the segment information provided to the group management for the reportable segments for the year ended 31 december 2011 is as follows:
Medium AirAvinor group as at other large and small Navigation 31 december 2011: oslo Airport Airports Airports Services others elimination totaltraffic income 1,706.6 1,234.1 817.0 954.4 0.0 4,712.1other income 2,409.8 951.9 441.6 103.1 3.3 3,909.7Inter-segment income 72.0 87.4 35.6 733.8 838.5 -1,767.3 0.0total income 4,188.3 2,273.4 1,294.2 1,791.3 841.8 -1,767.3 8,621.8 employee benefits expense 449.2 279.6 727.5 1,189.2 225.8 2,871.4depreciation and amortisation 605.6 197.8 298.4 89.4 49.9 1,241.0other operating expenses 1,060.3 437.1 768.2 295.0 445.7 3,006.3Inter-segment expenses 629.2 346.1 585.2 123.9 82.8 -1,767.3 0.0total expenses 2,744.2 1,260.6 2,379.3 1,697.6 804.3 -1,767.3 7,118.7 Net income/(expense) 1,444.1 1,012.8 -1,085.1 93.7 37.6 0.0 1,503.1 Group adjustments depreciation (a) 164.7 -65.8 -115.5 0.0 -1.1 -17.7Group adjustments lease (b) 382.2 -382.2 0.0 operating profit/(loss) 1,990.9 947.0 -1,200.6 93.7 -345.7 0.0 1,485.4 Assets 7,050.3 3,809.0 5,280.5 653.5 157.8 16,951.1
(a) Group adjustments due to assessment of the opening balance as at 1 January 2003.(b) the lease on the land at Gardermoen is attributed to oslo lufthavn aS in the segment reporting.
non-current liabilities comprise the oslo lufthavn aS state loan, avinor aS bond and bank borrowings and separate financing of hotels and car parks.
debt is not used by the group management as a control parameter at the segment level. the financing of the group is carried out by a central treasury department (group treasury) in accordance with guidelines approved by the board of directors.Sales between segments are carried out at arm’s length. the revenue from external parties reported to group management is measured in a manner consistent with that in the income statement. risk management is carried out by group treasury under policies approved by the board of directors.
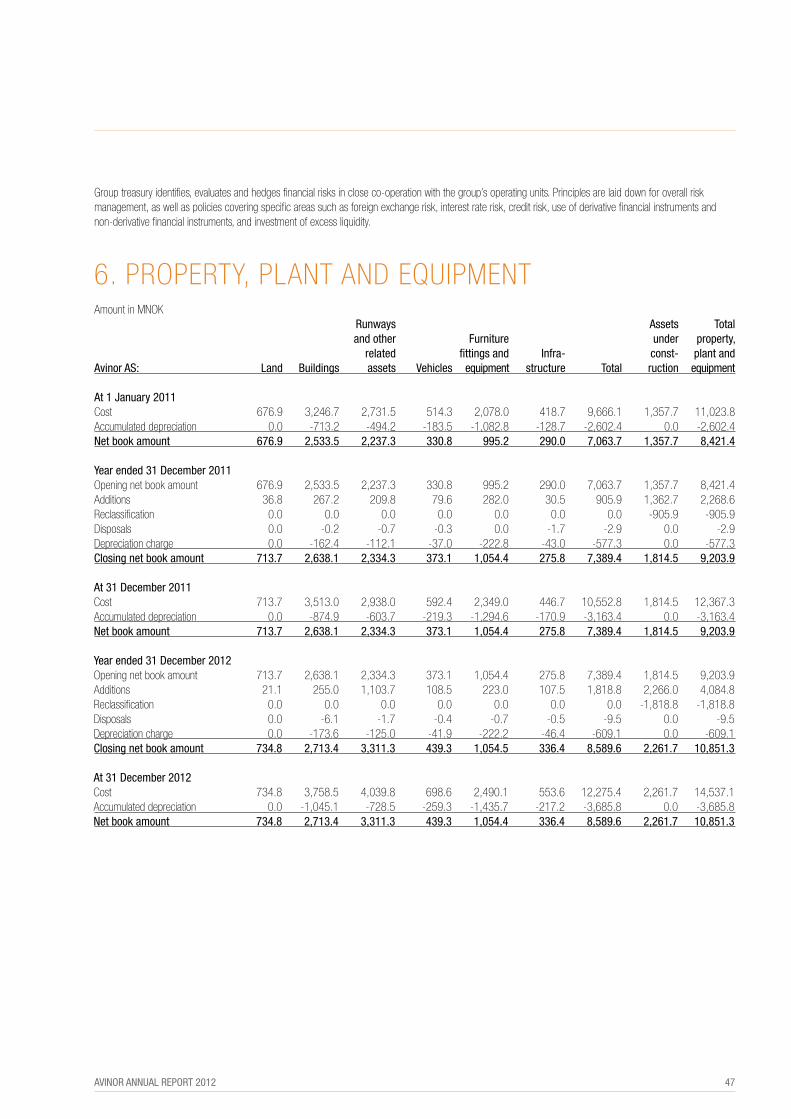
avinor annual report 2012 47
Group treasury identifies, evaluates and hedges financial risks in close co-operation with the group’s operating units. principles are laid down for overall risk management, as well as policies covering specific areas such as foreign exchange risk, interest rate risk, credit risk, use of derivative financial instruments and non-derivative financial instruments, and investment of excess liquidity. 6. property, plant and eQuIpMent amount in MnoK Runways Assets total and other furniture under property, related fittings and Infra- const- plant andAvinor AS: land Buildings assets vehicles equipment structure total ruction equipment
At 1 january 2011 cost 676.9 3,246.7 2,731.5 514.3 2,078.0 418.7 9,666.1 1,357.7 11,023.8accumulated depreciation 0.0 -713.2 -494.2 -183.5 -1,082.8 -128.7 -2,602.4 0.0 -2,602.4Net book amount 676.9 2,533.5 2,237.3 330.8 995.2 290.0 7,063.7 1,357.7 8,421.4 year ended 31 december 2011 opening net book amount 676.9 2,533.5 2,237.3 330.8 995.2 290.0 7,063.7 1,357.7 8,421.4additions 36.8 267.2 209.8 79.6 282.0 30.5 905.9 1,362.7 2,268.6reclassification 0.0 0.0 0.0 0.0 0.0 0.0 0.0 -905.9 -905.9disposals 0.0 -0.2 -0.7 -0.3 0.0 -1.7 -2.9 0.0 -2.9depreciation charge 0.0 -162.4 -112.1 -37.0 -222.8 -43.0 -577.3 0.0 -577.3Closing net book amount 713.7 2,638.1 2,334.3 373.1 1,054.4 275.8 7,389.4 1,814.5 9,203.9 At 31 december 2011 cost 713.7 3,513.0 2,938.0 592.4 2,349.0 446.7 10,552.8 1,814.5 12,367.3accumulated depreciation 0.0 -874.9 -603.7 -219.3 -1,294.6 -170.9 -3,163.4 0.0 -3,163.4Net book amount 713.7 2,638.1 2,334.3 373.1 1,054.4 275.8 7,389.4 1,814.5 9,203.9 year ended 31 december 2012 opening net book amount 713.7 2,638.1 2,334.3 373.1 1,054.4 275.8 7,389.4 1,814.5 9,203.9additions 21.1 255.0 1,103.7 108.5 223.0 107.5 1,818.8 2,266.0 4,084.8reclassification 0.0 0.0 0.0 0.0 0.0 0.0 0.0 -1,818.8 -1,818.8disposals 0.0 -6.1 -1.7 -0.4 -0.7 -0.5 -9.5 0.0 -9.5depreciation charge 0.0 -173.6 -125.0 -41.9 -222.2 -46.4 -609.1 0.0 -609.1Closing net book amount 734.8 2,713.4 3,311.3 439.3 1,054.5 336.4 8,589.6 2,261.7 10,851.3 At 31 december 2012 cost 734.8 3,758.5 4,039.8 698.6 2,490.1 553.6 12,275.4 2,261.7 14,537.1accumulated depreciation 0.0 -1,045.1 -728.5 -259.3 -1,435.7 -217.2 -3,685.8 0.0 -3,685.8Net book amount 734.8 2,713.4 3,311.3 439.3 1,054.4 336.4 8,589.6 2,261.7 10,851.3
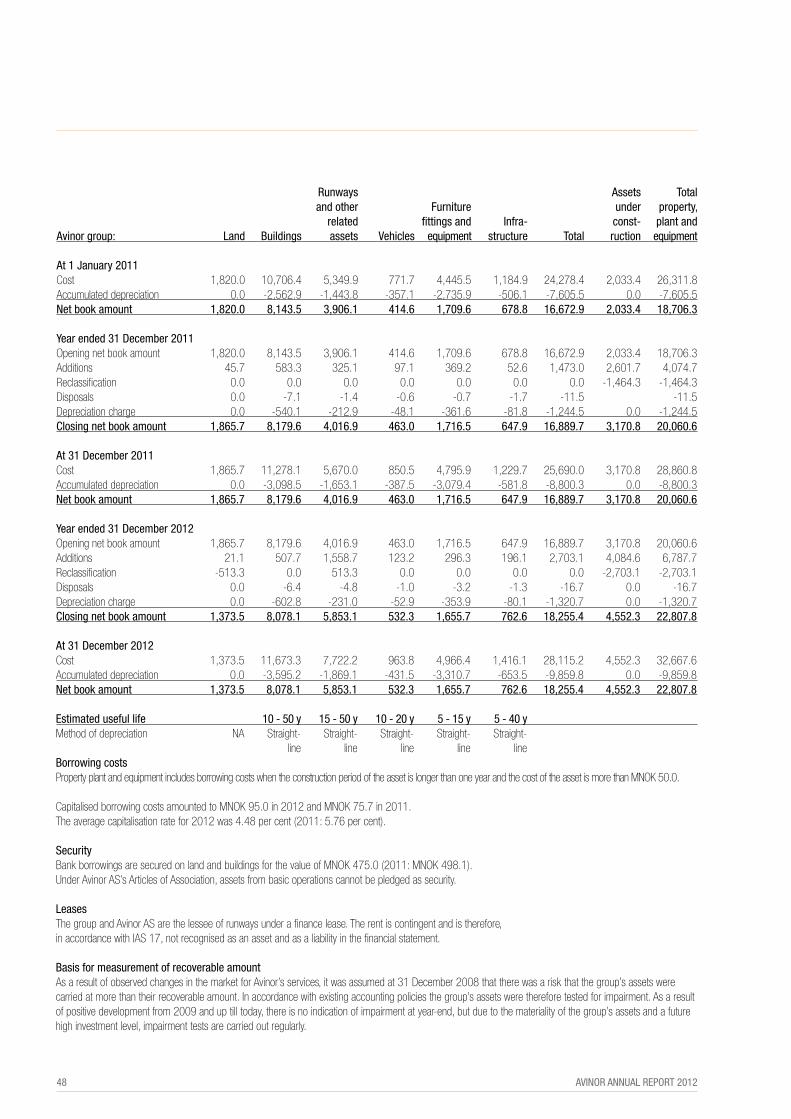
48 avinor annual report 2012
Runways Assets total and other furniture under property, related fittings and Infra- const- plant andAvinor group: land Buildings assets vehicles equipment structure total ruction equipment
At 1 january 2011 cost 1,820.0 10,706.4 5,349.9 771.7 4,445.5 1,184.9 24,278.4 2,033.4 26,311.8accumulated depreciation 0.0 -2,562.9 -1,443.8 -357.1 -2,735.9 -506.1 -7,605.5 0.0 -7,605.5Net book amount 1,820.0 8,143.5 3,906.1 414.6 1,709.6 678.8 16,672.9 2,033.4 18,706.3 year ended 31 december 2011 opening net book amount 1,820.0 8,143.5 3,906.1 414.6 1,709.6 678.8 16,672.9 2,033.4 18,706.3additions 45.7 583.3 325.1 97.1 369.2 52.6 1,473.0 2,601.7 4,074.7reclassification 0.0 0.0 0.0 0.0 0.0 0.0 0.0 -1,464.3 -1,464.3disposals 0.0 -7.1 -1.4 -0.6 -0.7 -1.7 -11.5 -11.5depreciation charge 0.0 -540.1 -212.9 -48.1 -361.6 -81.8 -1,244.5 0.0 -1,244.5Closing net book amount 1,865.7 8,179.6 4,016.9 463.0 1,716.5 647.9 16,889.7 3,170.8 20,060.6 At 31 december 2011 cost 1,865.7 11,278.1 5,670.0 850.5 4,795.9 1,229.7 25,690.0 3,170.8 28,860.8accumulated depreciation 0.0 -3,098.5 -1,653.1 -387.5 -3,079.4 -581.8 -8,800.3 0.0 -8,800.3Net book amount 1,865.7 8,179.6 4,016.9 463.0 1,716.5 647.9 16,889.7 3,170.8 20,060.6 year ended 31 december 2012 opening net book amount 1,865.7 8,179.6 4,016.9 463.0 1,716.5 647.9 16,889.7 3,170.8 20,060.6additions 21.1 507.7 1,558.7 123.2 296.3 196.1 2,703.1 4,084.6 6,787.7reclassification -513.3 0.0 513.3 0.0 0.0 0.0 0.0 -2,703.1 -2,703.1disposals 0.0 -6.4 -4.8 -1.0 -3.2 -1.3 -16.7 0.0 -16.7depreciation charge 0.0 -602.8 -231.0 -52.9 -353.9 -80.1 -1,320.7 0.0 -1,320.7Closing net book amount 1,373.5 8,078.1 5,853.1 532.3 1,655.7 762.6 18,255.4 4,552.3 22,807.8 At 31 december 2012 cost 1,373.5 11,673.3 7,722.2 963.8 4,966.4 1,416.1 28,115.2 4,552.3 32,667.6accumulated depreciation 0.0 -3,595.2 -1,869.1 -431.5 -3,310.7 -653.5 -9,859.8 0.0 -9,859.8Net book amount 1,373.5 8,078.1 5,853.1 532.3 1,655.7 762.6 18,255.4 4,552.3 22,807.8 estimated useful life 10 - 50 y 15 - 50 y 10 - 20 y 5 - 15 y 5 - 40 y Method of depreciation na Straight- Straight- Straight- Straight- Straight- line line line line line Borrowing costsproperty plant and equipment includes borrowing costs when the construction period of the asset is longer than one year and the cost of the asset is more than MnoK 50.0.
capitalised borrowing costs amounted to MnoK 95.0 in 2012 and MnoK 75.7 in 2011.the average capitalisation rate for 2012 was 4.48 per cent (2011: 5.76 per cent).
Security Bank borrowings are secured on land and buildings for the value of MnoK 475.0 (2011: MnoK 498.1).under avinor aS’s articles of association, assets from basic operations cannot be pledged as security.
leasesthe group and avinor aS are the lessee of runways under a finance lease. the rent is contingent and is therefore, in accordance with IaS 17, not recognised as an asset and as a liability in the financial statement.
Basis for measurement of recoverable amount as a result of observed changes in the market for avinor’s services, it was assumed at 31 december 2008 that there was a risk that the group’s assets were carried at more than their recoverable amount. In accordance with existing accounting policies the group’s assets were therefore tested for impairment. as a result of positive development from 2009 and up till today, there is no indication of impairment at year-end, but due to the materiality of the group’s assets and a future high investment level, impairment tests are carried out regularly.
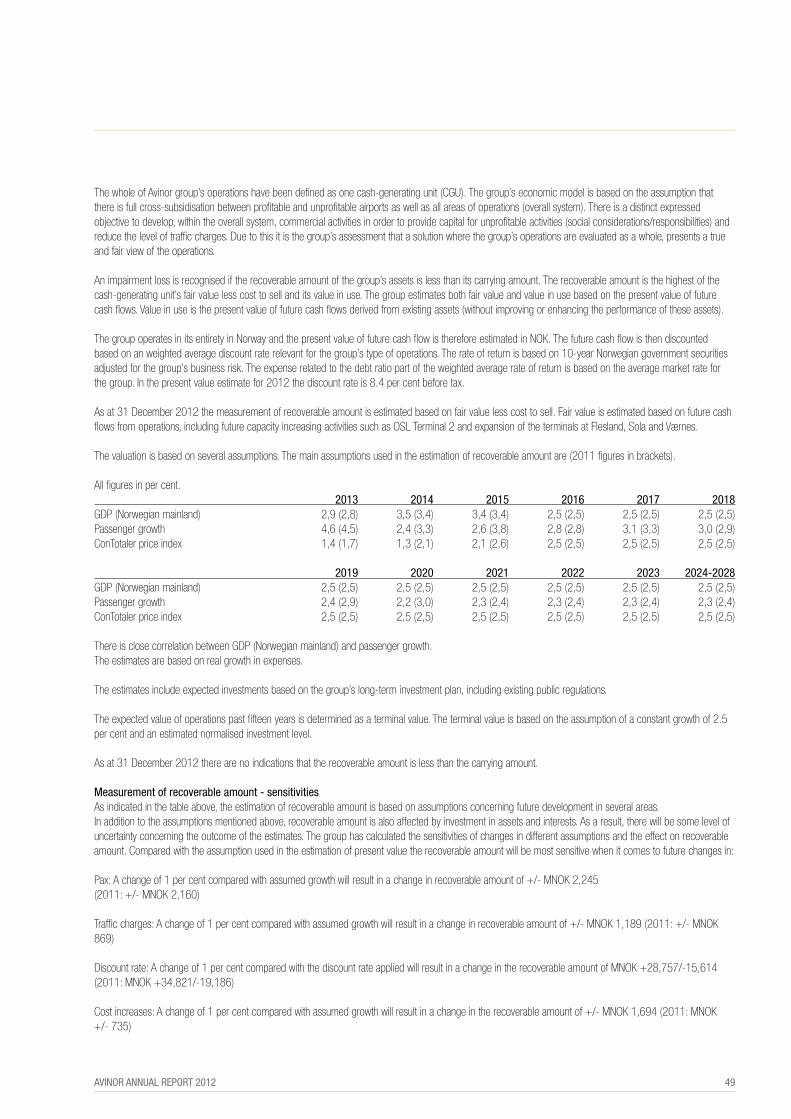
avinor annual report 2012 49
the whole of avinor group’s operations have been defined as one cash-generating unit (cGu). the group’s economic model is based on the assumption that there is full cross-subsidisation between profitable and unprofitable airports as well as all areas of operations (overall system). there is a distinct expressed objective to develop, within the overall system, commercial activities in order to provide capital for unprofitable activities (social considerations/responsibilities) and reduce the level of traffic charges. due to this it is the group’s assessment that a solution where the group’s operations are evaluated as a whole, presents a true and fair view of the operations.
an impairment loss is recognised if the recoverable amount of the group’s assets is less than its carrying amount. the recoverable amount is the highest of the cash-generating unit’s fair value less cost to sell and its value in use. the group estimates both fair value and value in use based on the present value of future cash flows. value in use is the present value of future cash flows derived from existing assets (without improving or enhancing the performance of these assets).
the group operates in its entirety in norway and the present value of future cash flow is therefore estimated in noK. the future cash flow is then discounted based on an weighted average discount rate relevant for the group’s type of operations. the rate of return is based on 10-year norwegian government securities adjusted for the group’s business risk. the expense related to the debt ratio part of the weighted average rate of return is based on the average market rate for the group. In the present value estimate for 2012 the discount rate is 8.4 per cent before tax.
as at 31 december 2012 the measurement of recoverable amount is estimated based on fair value less cost to sell. fair value is estimated based on future cash flows from operations, including future capacity increasing activities such as oSl terminal 2 and expansion of the terminals at flesland, Sola and værnes.
the valuation is based on several assumptions. the main assumptions used in the estimation of recoverable amount are (2011 figures in brackets). all figures in per cent. 2013 2014 2015 2016 2017 2018Gdp (norwegian mainland) 2,9 (2,8) 3,5 (3,4) 3,4 (3,4) 2,5 (2,5) 2,5 (2,5) 2,5 (2,5)passenger growth 4,6 (4,5) 2,4 (3,3) 2,6 (3,8) 2,8 (2,8) 3,1 (3,3) 3,0 (2,9)contotaler price index 1,4 (1,7) 1,3 (2,1) 2,1 (2,6) 2,5 (2,5) 2,5 (2,5) 2,5 (2,5) 2019 2020 2021 2022 2023 2024-2028Gdp (norwegian mainland) 2,5 (2,5) 2,5 (2,5) 2,5 (2,5) 2,5 (2,5) 2,5 (2,5) 2,5 (2,5)passenger growth 2,4 (2,9) 2,2 (3,0) 2,3 (2,4) 2,3 (2,4) 2,3 (2,4) 2,3 (2,4)contotaler price index 2,5 (2,5) 2,5 (2,5) 2,5 (2,5) 2,5 (2,5) 2,5 (2,5) 2,5 (2,5) there is close correlation between Gdp (norwegian mainland) and passenger growth.the estimates are based on real growth in expenses.
the estimates include expected investments based on the group’s long-term investment plan, including existing public regulations.
the expected value of operations past fifteen years is determined as a terminal value. the terminal value is based on the assumption of a constant growth of 2.5 per cent and an estimated normalised investment level.
as at 31 december 2012 there are no indications that the recoverable amount is less than the carrying amount.
Measurement of recoverable amount - sensitivitiesas indicated in the table above, the estimation of recoverable amount is based on assumptions concerning future development in several areas. In addition to the assumptions mentioned above, recoverable amount is also affected by investment in assets and interests. as a result, there will be some level of uncertainty concerning the outcome of the estimates. the group has calculated the sensitivities of changes in different assumptions and the effect on recoverable amount. compared with the assumption used in the estimation of present value the recoverable amount will be most sensitive when it comes to future changes in:
pax: a change of 1 per cent compared with assumed growth will result in a change in recoverable amount of +/- MnoK 2,245(2011: +/- MnoK 2,160)
traffic charges: a change of 1 per cent compared with assumed growth will result in a change in recoverable amount of +/- MnoK 1,189 (2011: +/- MnoK 869)
discount rate: a change of 1 per cent compared with the discount rate applied will result in a change in the recoverable amount of MnoK +28,757/-15,614 (2011: MnoK +34,821/-19,186)
cost increases: a change of 1 per cent compared with assumed growth will result in a change in the recoverable amount of +/- MnoK 1,694 (2011: MnoK +/- 735)
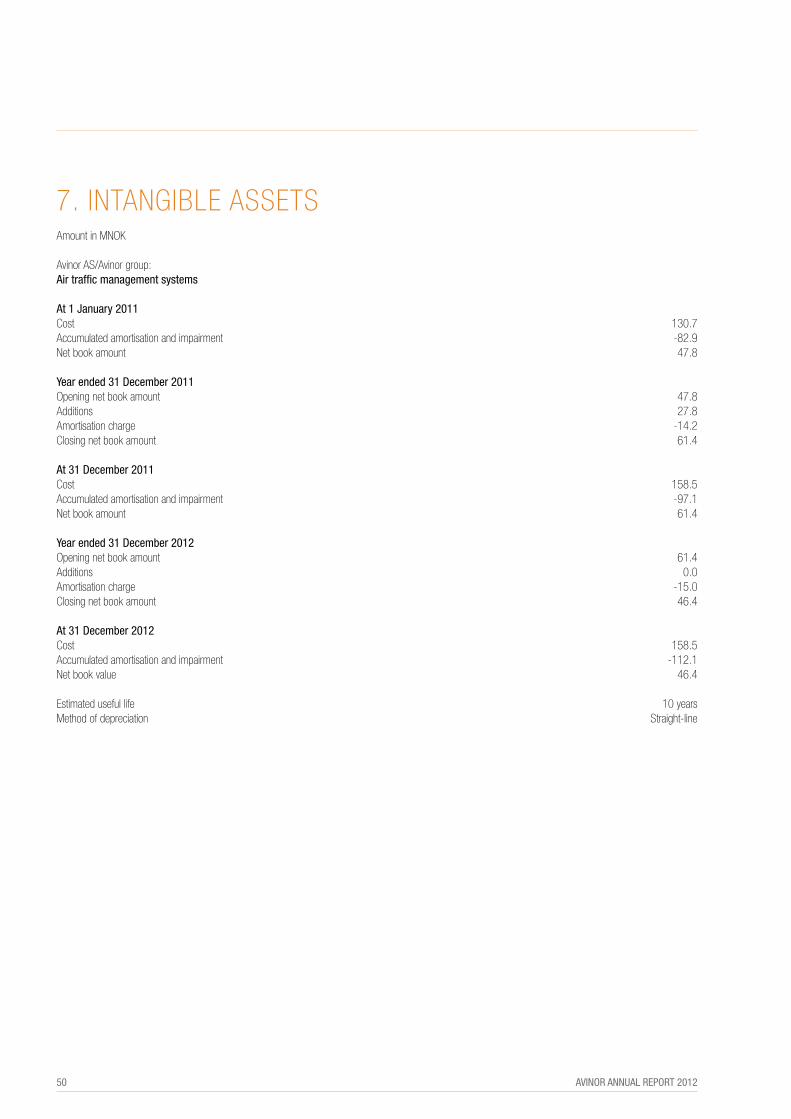
50 avinor annual report 2012
7. IntanGIBle aSSetS amount in MnoK avinor aS/avinor group: Air traffic management systems At 1 january 2011 cost 130.7accumulated amortisation and impairment -82.9net book amount 47.8
year ended 31 december 2011opening net book amount 47.8additions 27.8amortisation charge -14.2closing net book amount 61.4 At 31 december 2011 cost 158.5accumulated amortisation and impairment -97.1net book amount 61.4 year ended 31 december 2012 opening net book amount 61.4additions 0.0amortisation charge -15.0closing net book amount 46.4 At 31 december 2012 cost 158.5accumulated amortisation and impairment -112.1net book value 46.4 estimated useful life 10 yearsMethod of depreciation Straight-line

avinor annual report 2012 51
8.SuBSIdIarIeS amount in MnoK the consolidated financial statement of the group includes the following subsidiaries: total equitydirectly ownership/ as at 31 Profitowned Home Business Main voting Book december for thesubsidiaries: country office business shares value 2012 year 2012 oslo lufthavn aS norway ullensaker airport opr. 100% 467.9 1,875.8 862.3avinors parkeringsanlegg aS norway oslo parking 100% 109.6 113.3 4.6flesland eiendom aS norway oslo real estate 100% 16.8 25.2 7.9værnes eiendom aS norway oslo real estate 100% 43.8 15.5 -3.0Sola Hotel eiendom aS norway oslo real estate 100% 9.9 13.8 6.9Hell eiendom aS norway oslo real estate 100% 24.1 17.4 0.1total 672.0 2,061.0 878.8
total equityIndirectly ownership/ as at 31 Profitowned Home Business Main voting Book december for thesubsidiaries: country office business shares value 2012 year 2012 oslo lufthavn eiendom aS norway ullensaker real estate 100% 89.8 169.6 54.9total 89.8 169.6 54.9
9. fInancIal InStruMentS By cateGoryamount in MnoK Assets at fair value through the derivatives loans and profit and used for Avinor AS: 31 december 2012 receivables loss hedging total
Assets as per balance sheet loans and receivables to group companies 3,711.9 3,711.9derivative financial instruments 22.9 22.9other financial assets 8.6 8.6trade receivables 635.7 635.7other receivables 49.7 49.7cash and cash equivalents 1,289.3 1,289.3total 5,695.2 22.9 0.0 5,718.1 liabilities at fair value through derivatives other the profit used for financial and loss hedging liabilities total liabilities as per balance sheet State loan 0.0loans and payables to group companies 862.2 862.2derivative financial instruments 27.3 27.3other long-term liabilities 4,345.8 4,345.8trade payables and other liabilities 1,290.1 1,290.1total 27.3 0.0 6,498.1 6,525.4

52 avinor annual report 2012
Assets at fair value through the derivatives loans and profit and used for Avinor AS: 31 december 2011 receivables loss hedging total
Assets as per balance sheet loans and receivables to group companies 2,396.4 2,396.4derivative financial instruments 22.4 22.4other financial assets 1.5 1.5trade receivables 600.6 600.6other receivables 14.0 14.0cash and cash equivalents 2,064.1 2,064.1total 5,076.6 22.4 0.0 5,099.0
liabilities at fair value through derivatives other the profit used for financial and loss hedging liabilities total liabilities as per balance sheet State loan 0.0loans and payables to group companies 818.4 818.4derivative financial instruments 3.8 19.8 23.6other long-term liabilities 2,844.0 2,844.0trade payables and other liabilities 878.3 878.3total 3.8 19.8 4,540.7 4,564.3
Assets at fair value through the derivatives loans and profit and used for Avinor group: 31 december 2012 receivables loss hedging total
Assets as per balance sheet derivative financial instruments 24.3 24.3other financial assets 79.0 79.0trade receivables 1,069.7 1,069.7other receivables 126.8 126.8cash and cash equivalents 1,315.7 1,315.7total 2,591.2 24.3 0.0 2,615.5
liabilities at fair value through derivatives other the profit used for financial and loss hedging liabilities total liabilities as per balance sheet State loan 4,304.8 4,304.8derivative financial instruments 35.9 118.2 154.1other long-term liabilities 5,662.2 5,662.2trade payables and other liabilities 2,039.6 2,039.6total 35.9 118.2 12,006.6 12,160.7
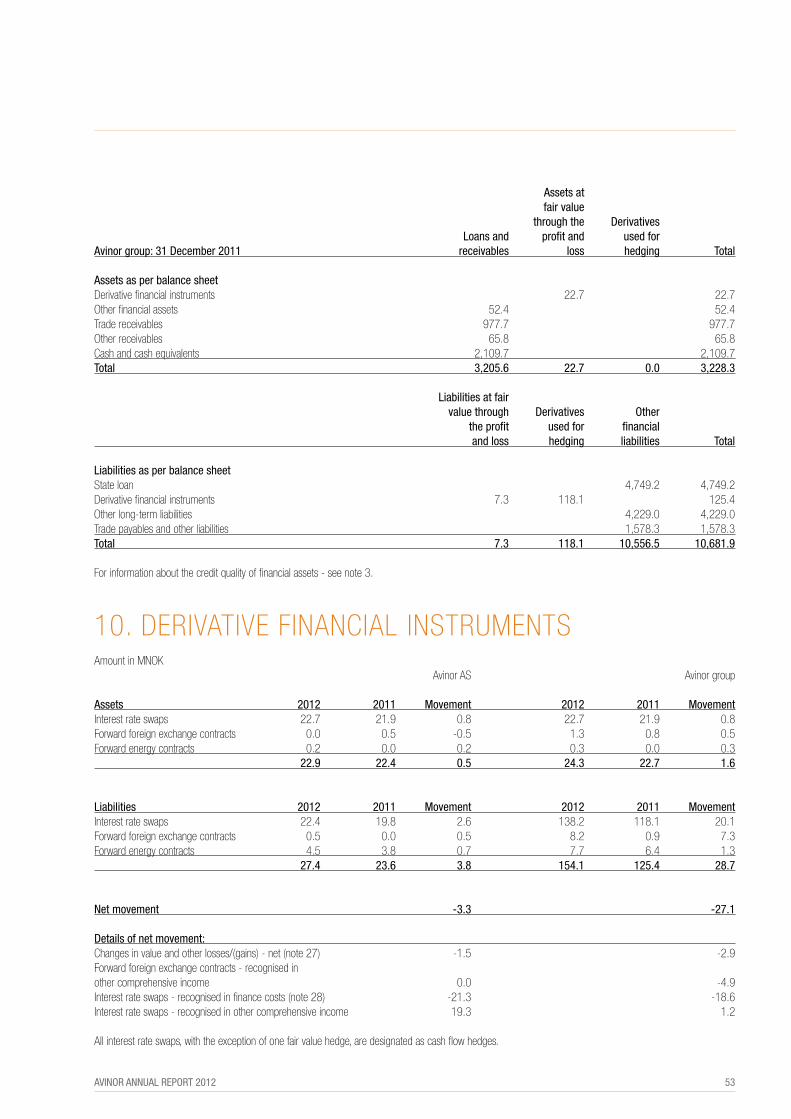
avinor annual report 2012 53
Assets at fair value through the derivatives loans and profit and used for Avinor group: 31 december 2011 receivables loss hedging total
Assets as per balance sheet derivative financial instruments 22.7 22.7other financial assets 52.4 52.4trade receivables 977.7 977.7other receivables 65.8 65.8cash and cash equivalents 2,109.7 2,109.7total 3,205.6 22.7 0.0 3,228.3
liabilities at fair value through derivatives other the profit used for financial and loss hedging liabilities total liabilities as per balance sheet State loan 4,749.2 4,749.2derivative financial instruments 7.3 118.1 125.4other long-term liabilities 4,229.0 4,229.0trade payables and other liabilities 1,578.3 1,578.3total 7.3 118.1 10,556.5 10,681.9 for information about the credit quality of financial assets - see note 3.
10. derIvatIve fInancIal InStruMentSamount in MnoK avinor aS avinor group Assets 2012 2011 Movement 2012 2011 MovementInterest rate swaps 22.7 21.9 0.8 22.7 21.9 0.8forward foreign exchange contracts 0.0 0.5 -0.5 1.3 0.8 0.5 forward energy contracts 0.2 0.0 0.2 0.3 0.0 0.3 22.9 22.4 0.5 24.3 22.7 1.6 liabilities 2012 2011 Movement 2012 2011 Movement Interest rate swaps 22.4 19.8 2.6 138.2 118.1 20.1forward foreign exchange contracts 0.5 0.0 0.5 8.2 0.9 7.3 forward energy contracts 4.5 3.8 0.7 7.7 6.4 1.3 27.4 23.6 3.8 154.1 125.4 28.7
Net movement -3.3 -27.1
details of net movement: changes in value and other losses/(gains) - net (note 27) -1.5 -2.9forward foreign exchange contracts - recognised in other comprehensive income 0.0 -4.9 Interest rate swaps - recognised in finance costs (note 28) -21.3 -18.6 Interest rate swaps - recognised in other comprehensive income 19.3 1.2
all interest rate swaps, with the exception of one fair value hedge, are designated as cash flow hedges.
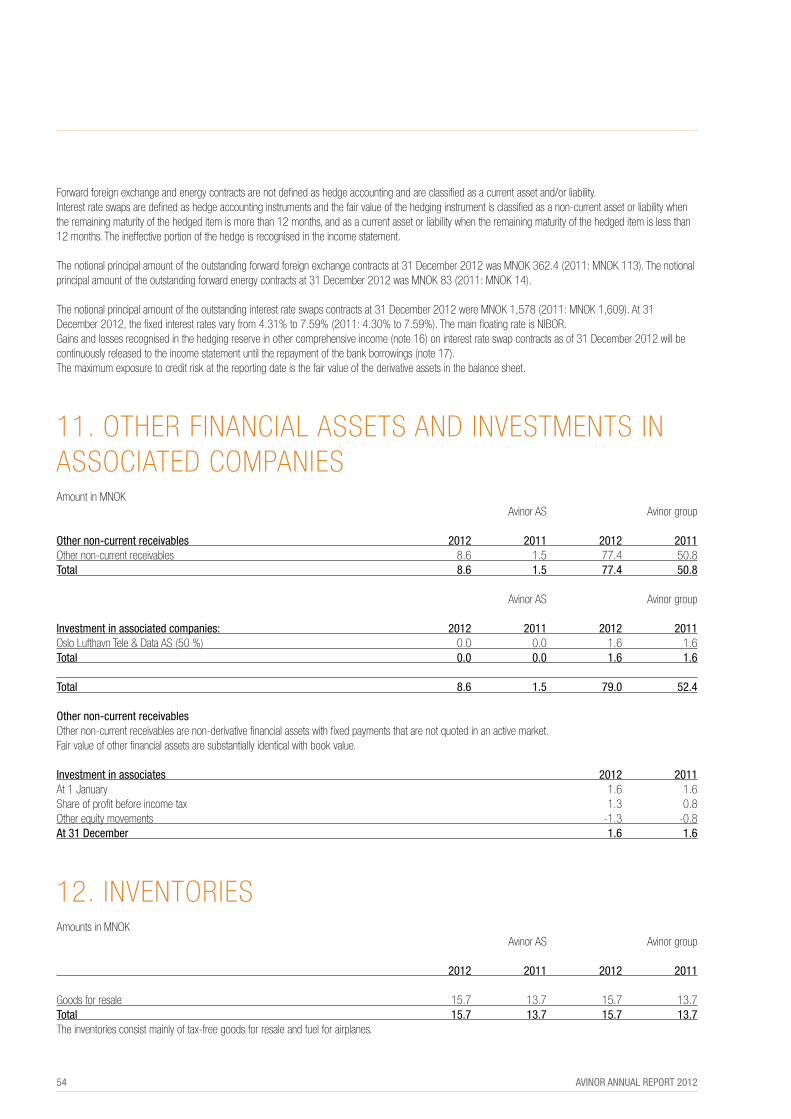
54 avinor annual report 2012
forward foreign exchange and energy contracts are not defined as hedge accounting and are classified as a current asset and/or liability.Interest rate swaps are defined as hedge accounting instruments and the fair value of the hedging instrument is classified as a non-current asset or liability when the remaining maturity of the hedged item is more than 12 months, and as a current asset or liability when the remaining maturity of the hedged item is less than 12 months. the ineffective portion of the hedge is recognised in the income statement.
the notional principal amount of the outstanding forward foreign exchange contracts at 31 december 2012 was MnoK 362.4 (2011: MnoK 113). the notional principal amount of the outstanding forward energy contracts at 31 december 2012 was MnoK 83 (2011: MnoK 14).
the notional principal amount of the outstanding interest rate swaps contracts at 31 december 2012 were MnoK 1,578 (2011: MnoK 1,609). at 31 december 2012, the fixed interest rates vary from 4.31% to 7.59% (2011: 4.30% to 7.59%). the main floating rate is nIBor.Gains and losses recognised in the hedging reserve in other comprehensive income (note 16) on interest rate swap contracts as of 31 december 2012 will be continuously released to the income statement until the repayment of the bank borrowings (note 17). the maximum exposure to credit risk at the reporting date is the fair value of the derivative assets in the balance sheet.
11. otHer fInancIal aSSetS and InveStMentS In aSSocIated coMpanIeSamount in MnoK avinor aS avinor group other non-current receivables 2012 2011 2012 2011 other non-current receivables 8.6 1.5 77.4 50.8total 8.6 1.5 77.4 50.8 avinor aS avinor group
Investment in associated companies: 2012 2011 2012 2011 oslo lufthavn tele & data aS (50 %) 0.0 0.0 1.6 1.6 total 0.0 0.0 1.6 1.6 total 8.6 1.5 79.0 52.4 other non-current receivables other non-current receivables are non-derivative financial assets with fixed payments that are not quoted in an active market. fair value of other financial assets are substantially identical with book value. Investment in associates 2012 2011 at 1 January 1.6 1.6Share of profit before income tax 1.3 0.8other equity movements -1.3 -0.8 At 31 december 1.6 1.6
12. InventorIeSamounts in MnoK avinor aS avinor group 2012 2011 2012 2011 Goods for resale 15.7 13.7 15.7 13.7 total 15.7 13.7 15.7 13.7 the inventories consist mainly of tax-free goods for resale and fuel for airplanes.

avinor annual report 2012 55
13. trade and otHer receIvaBleSamounts in MnoK avinor aS avinor group 2012 2011 2012 2011 trade receivables 640.2 603.0 1,075.1 980.6less: provision for impairment of trade receivables -4.5 -2.4 -5.4 -2.9 trade receivables - net 635.7 600.6 1,069.7 977.7 Receivables written off during the year 3.7 2.3 5.3 3.4 the fair value of trade receivables is approximately equal to the carrying amount. loss on trade receivables is classified as other operating expense in the income statement. avinor aS avinor group Movement in the provision for impairment of of trade receivables is as follows: 2012 2011 2012 2011 at 1 January 2.4 5.1 2.9 5.5 provision for receivables impairment 8.2 4.7 10.7 6.2 receivables written off during the year as uncollectible -3.7 -2.3 -5.3 -3.4 unused amounts reversed -2.4 -5.1 -2.9 -5.4 At 31 december 4.5 2.4 5.4 2.9 credit risk and foreign exchange risk are described in note 3. At 31 december the aging of the company’s receivables was as follows: total Not due <30 d 30-60d 60-90d >90d2012 640.2 572.1 65.7 1.1 0.3 1.02011 603.0 539.3 30.4 3.1 2.3 27.9 At 31 december the aging of the group´s receivables was as follows: total Not due <30 d 30-60d 60-90d >90d2012 1,075.1 969.5 101.6 2.2 0.6 1.2 2011 980.6 911.6 32.8 6.6 1.1 28.5 avinor aS avinor group Specification of trade and other receivables 2012 2011 2012 2011 trade receivables 635.7 600.6 1,069.7 977.7 Intra-group accounts 515.5 450.1 0.0 0.0 associated companies 0.0 0.0 0.0 0.0 accrued income 38.3 4.0 99.2 47.3 prepaid expenses 39.3 61.5 46.4 73.0other short-term assets 11.4 10.1 27.6 18.5 total 1,240.2 1,126.3 1,242.9 1,116.5 fair value of trade and other receivables is approximately equal to the carrying amount. avinor aS avinor group the carrying amount of trade and other receivables in foreign currency is: 2012 2011 2012 2011 euro 88.3 86.3 88.3 86.3 88.3 86.3 88.3 86.3
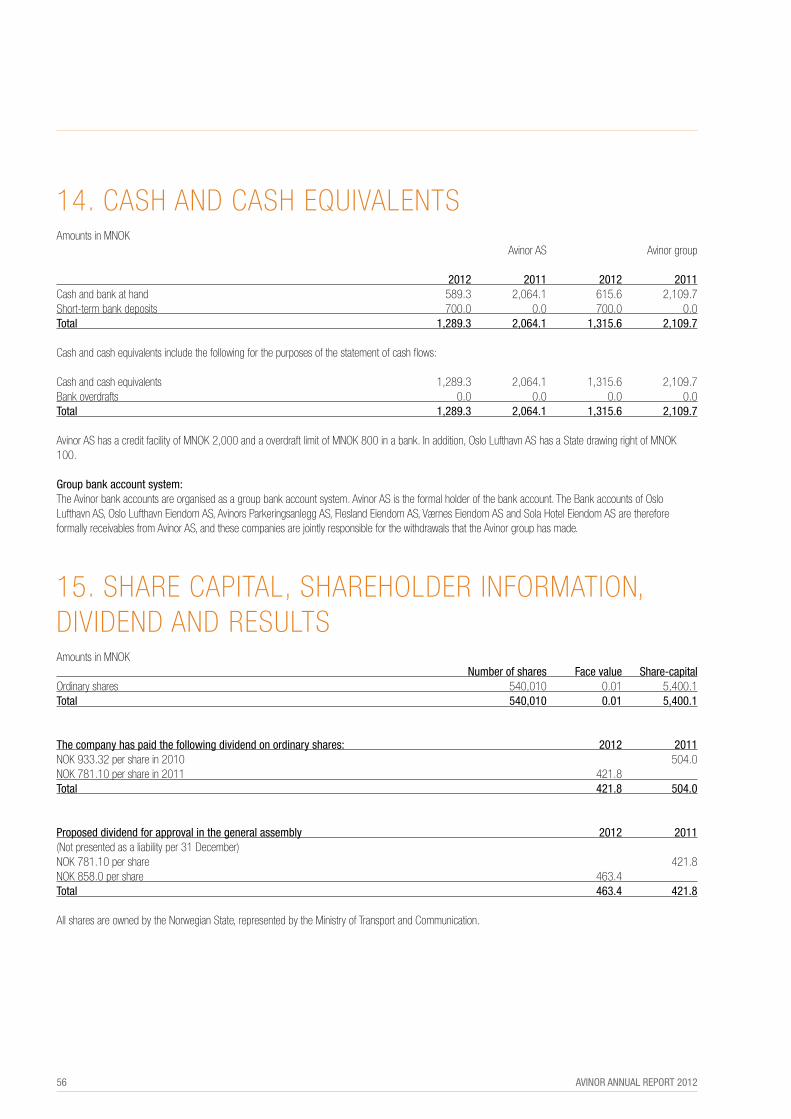
56 avinor annual report 2012
14. caSH and caSH eQuIvalentS amounts in MnoK avinor aS avinor group 2012 2011 2012 2011 cash and bank at hand 589.3 2,064.1 615.6 2,109.7 Short-term bank deposits 700.0 0.0 700.0 0.0 total 1,289.3 2,064.1 1,315.6 2,109.7 cash and cash equivalents include the following for the purposes of the statement of cash flows: cash and cash equivalents 1,289.3 2,064.1 1,315.6 2,109.7 Bank overdrafts 0.0 0.0 0.0 0.0 total 1,289.3 2,064.1 1,315.6 2,109.7 avinor aS has a credit facility of MnoK 2,000 and a overdraft limit of MnoK 800 in a bank. In addition, oslo lufthavn aS has a State drawing right of MnoK 100. group bank account system:the avinor bank accounts are organised as a group bank account system. avinor aS is the formal holder of the bank account. the Bank accounts of oslo lufthavn aS, oslo lufthavn eiendom aS, avinors parkeringsanlegg aS, flesland eiendom aS, værnes eiendom aS and Sola Hotel eiendom aS are therefore formally receivables from avinor aS, and these companies are jointly responsible for the withdrawals that the avinor group has made.
15. SHare capItal, SHareHolder InforMatIon, dIvIdend and reSultSamounts in MnoK Number of shares face value Share-capital ordinary shares 540,010 0.01 5,400.1 total 540,010 0.01 5,400.1
the company has paid the following dividend on ordinary shares: 2012 2011 noK 933.32 per share in 2010 504.0 noK 781.10 per share in 2011 421.8 total 421.8 504.0 Proposed dividend for approval in the general assembly 2012 2011 (not presented as a liability per 31 december) noK 781.10 per share 421.8 noK 858.0 per share 463.4 total 463.4 421.8 all shares are owned by the norwegian State, represented by the Ministry of transport and communication.

avinor annual report 2012 57
16. otHer reServeSamounts in MnoK Avinor AS: Pensions Hedges total At 1 january 2011 80.0 -9.8 70.3actuarial gains/(losses) on pensions -1,068.8 -1,068.8 tax effect 299.3 299.3fair value change cash flow hedge -5.7 -5.7 tax effect 1.6 1.6 At 31 december 2011 -689.5 -14.0 -703.4actuarial gains/(losses) on pensions -650.4 -650.4 tax effect 182.1 182.1fair value change cash flow hedge 19.3 19.3 tax effect -5.4 -5.4At 31 december 2012 -1,157.8 -0.1 -1,157.8
Avinor group: Pensions Hedges total At 1 january 2011 142.3 -46.7 95.6actuarial gains/(losses) on pensions -1,239.4 -1,239.4 tax effect 347.0 347.0fair value change cash flow hedge -44.2 -44.2 tax effect 12.4 12.4At 31 december 2011 -750.1 -78.5 -828.7 actuarial gains/(losses) on pensions -777.5 -777.5 tax effect 217.7 217.7fair value change cash flow hedge -3.7 -3.7 tax effect 1.1 1.1At 31 december 2012 -1,309.9 -81.1 -1,391.2
17. BorroWInGSamounts in MnoK avinor aS avinor group 2012 2011 2012 2011 Non-current State loan 0.0 0.0 4,304.8 4,749.2 Bonds 1,275.3 1,274.8 1,275.3 1,274.8 Bank borrowings 3,025.2 1,500.0 4,341.6 2,885.0lufthavnutbygging aS 45.3 69.2 45.3 69.2 total long-term 4,345.8 2,844.0 9,967.0 8,978.2 Current commercial papers 700.0 0.0 700.0 0.0 first year instalment on long-term debt 7.8 256.7 520.9 774.5total current 707.8 256.7 1,220.9 774.5 all borrowings in noK.
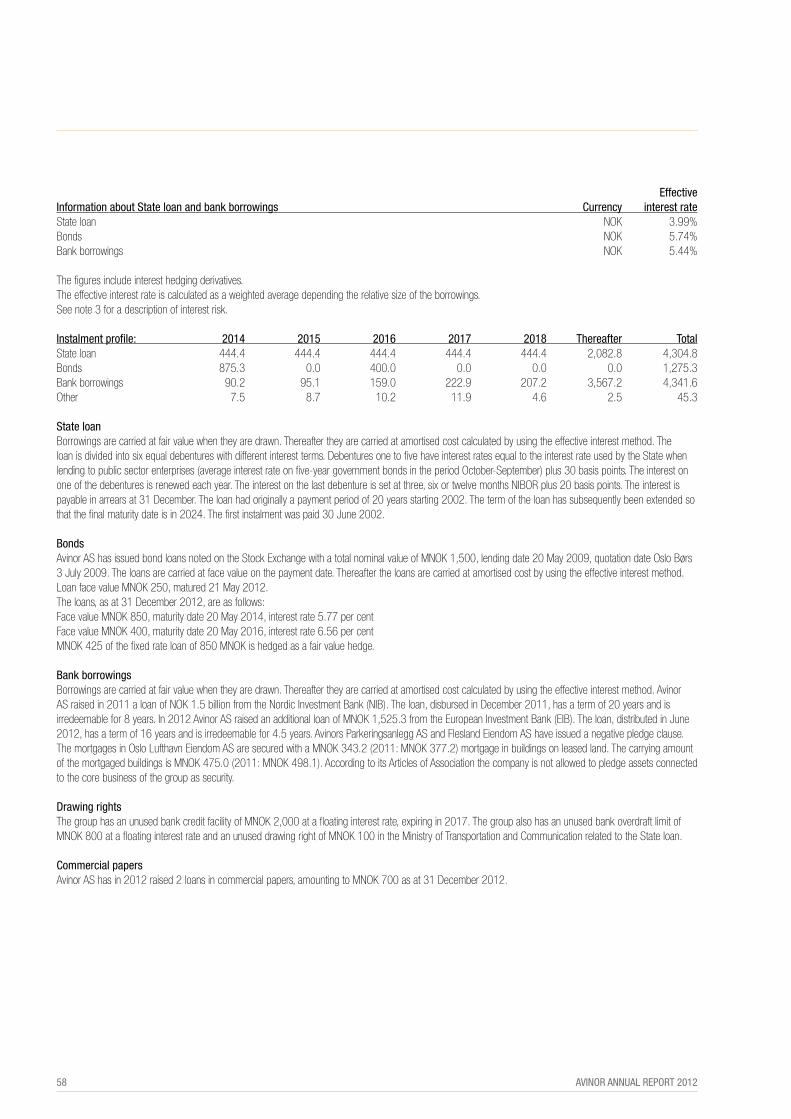
58 avinor annual report 2012
effectiveInformation about State loan and bank borrowings Currency interest rate State loan noK 3.99%Bonds noK 5.74% Bank borrowings noK 5.44% the figures include interest hedging derivatives.the effective interest rate is calculated as a weighted average depending the relative size of the borrowings.See note 3 for a description of interest risk. Instalment profile: 2014 2015 2016 2017 2018 thereafter total State loan 444.4 444.4 444.4 444.4 444.4 2,082.8 4,304.8 Bonds 875.3 0.0 400.0 0.0 0.0 0.0 1,275.3 Bank borrowings 90.2 95.1 159.0 222.9 207.2 3,567.2 4,341.6other 7.5 8.7 10.2 11.9 4.6 2.5 45.3 State loan Borrowings are carried at fair value when they are drawn. thereafter they are carried at amortised cost calculated by using the effective interest method. the loan is divided into six equal debentures with different interest terms. debentures one to five have interest rates equal to the interest rate used by the State when lending to public sector enterprises (average interest rate on five-year government bonds in the period october-September) plus 30 basis points. the interest on one of the debentures is renewed each year. the interest on the last debenture is set at three, six or twelve months nIBor plus 20 basis points. the interest is payable in arrears at 31 december. the loan had originally a payment period of 20 years starting 2002. the term of the loan has subsequently been extended so that the final maturity date is in 2024. the first instalment was paid 30 June 2002. Bonds avinor aS has issued bond loans noted on the Stock exchange with a total nominal value of MnoK 1,500, lending date 20 May 2009, quotation date oslo Børs 3 July 2009. the loans are carried at face value on the payment date. thereafter the loans are carried at amortised cost by using the effective interest method.loan face value MnoK 250, matured 21 May 2012.the loans, as at 31 december 2012, are as follows: face value MnoK 850, maturity date 20 May 2014, interest rate 5.77 per centface value MnoK 400, maturity date 20 May 2016, interest rate 6.56 per centMnoK 425 of the fixed rate loan of 850 MnoK is hedged as a fair value hedge. Bank borrowings Borrowings are carried at fair value when they are drawn. thereafter they are carried at amortised cost calculated by using the effective interest method. avinor aS raised in 2011 a loan of noK 1.5 billion from the nordic Investment Bank (nIB). the loan, disbursed in december 2011, has a term of 20 years and is irredeemable for 8 years. In 2012 avinor aS raised an additional loan of MnoK 1,525.3 from the european Investment Bank (eIB). the loan, distributed in June 2012, has a term of 16 years and is irredeemable for 4.5 years. avinors parkeringsanlegg aS and flesland eiendom aS have issued a negative pledge clause.the mortgages in oslo lufthavn eiendom aS are secured with a MnoK 343.2 (2011: MnoK 377.2) mortgage in buildings on leased land. the carrying amount of the mortgaged buildings is MnoK 475.0 (2011: MnoK 498.1). according to its articles of association the company is not allowed to pledge assets connected to the core business of the group as security. drawing rights the group has an unused bank credit facility of MnoK 2,000 at a floating interest rate, expiring in 2017. the group also has an unused bank overdraft limit of MnoK 800 at a floating interest rate and an unused drawing right of MnoK 100 in the Ministry of transportation and communication related to the State loan.
Commercial papersavinor aS has in 2012 raised 2 loans in commercial papers, amounting to MnoK 700 as at 31 december 2012.

avinor annual report 2012 59
18. IncoMe tax expenSeamounts in MnoK avinor aS avinor group Income tax expense 2012 2011 2012 2011 current tax on profit for the year 146.9 20.6 358.2 351.8 deferred tax on origination and reversal of temporary differences -105.5 303.7 21.4 -5.0 total 41.4 324.3 379.6 346.8 effective tax rate reconciliation 28% of profit before tax 140.0 310.7 365.8 333.3 dividends received -112.0 0.0 -0.3 -0.2 permanent differences (28%) 0.5 0.8 1.2 0.9 permanent differences (28%) Spitzbergen 12.9 12.8 12.9 12.8 Income tax expense 41.4 324.3 379.6 346.8 effective tax rate 8.3 29.2 29.1 29.1 a decision by oslo city court dated 9 december 2010 affirmed that the deficit from operations on Spitzbergen is non-deductible in net taxable income from operations on the mainland. the operations on Spitzbergen will never be profitable and the deficits are therefore treated as permanent differences.
19. deferred IncoMe taxamounts in MnoK Charged/ Charged/ credited todeferred tax assets and liabilities credited to other comp- At 31 At 1 january the income rehensive decemberAvinor AS: 2012 statement income 2012 receivables -0.1 -0.4 0.0 -0.5 Group contributions (receivables) -14.3 -144.1 0.0 -158.4non-current assets -1,106.8 61.0 0.0 -1,045.7provisions -87.8 -5.7 0.0 -93.4 pension benefits -734.0 -12.2 -182.1 -928.3 Group contributions (payables) 7.1 0.0 -4.7 2.4 profit and loss account -9.0 2.3 0.0 -6.7 derivative financial instruments -7.2 -6.5 5.4 -8.3 deferred tax asset(-)/liability (net) -1,952.0 -105.5 -181.4 -2,238.9 deferred tax asset -1,959.1 -2,241.3 deferred tax liability 7.1 2.4 Charged/ Charged/ credited to credited to other comp- At 31 At 1 january the income rehensive decemberAvinor AS: 2011 statement income 2011 receivables -1.1 -1.0 0.0 -0.1 Group contributions (receivables) -307.0 292.7 0.0 -14.3non-current assets -1,160.9 54.1 0.0 -1,106.8provisions -30.0 -57.8 0.0 -87.8pension benefits -452.0 17.3 -299.3 -734.0Group contributions (payables) 7.4 0.0 -0.3 7.1profit and loss account -11.2 2.2 0.0 -9.0derivative financial instruments 0.2 -5.8 -1.6 -7.2 deferred tax asset(-)/liability (net) -1,954.6 303.7 -301.2 -1,952.0 deferred tax asset -1,961.9 -1,959.1 deferred tax liability 7.4 7.1

60 avinor annual report 2012
2012 2011 deferred tax assets deferred tax asset to be recovered after more than 12 months -1,989.0 -1,856.9 deferred tax asset to be recovered within 12 months -252.3 -102.2 -2,241.3 -1,959.1
deferred tax liabilities deferred tax liability to be recovered after more than 12 months 0.0 0.0 deferred tax liability to be recovered within 12 months 2.4 7.1 2.4 7.1 deferred tax asset(-)/liability (net) -2,238.9 -1,952.0
Charged/ Charged/ credited todeferred tax assets and liabilities credited to other comp- At 31 At 1 january the income rehensive decemberAvinor group: 2012 statement income 2012 receivables -0.3 -0.5 0.0 -0.8 Group contributions (receivables) 0.0 -0.0 0.0 -0.0non-current assets -1,382.5 43.9 0.0 -1,338.5provisions -94.2 -7.9 0.0 -102.1pension benefits -855.3 -12.1 -217.7 -1,085.1Group contributions (payables) 0.0 0.0 0.0 0.0profit and loss account -11.2 2.1 0.0 -9.1derivative financial instruments -36.6 -4.1 -1.1 -41.8deferred tax asset(-)/liability (net) -2,380.1 21.4 -218.8 -2,577.4 deferred tax asset -2,411.6 -2,614.2 deferred tax liability 31.5 36.8 Charged/ Charged/ credited todeferred tax assets and liabilities credited to other comp- At 31 At 1 january the income rehensive decemberAvinor group: 2011 Acquisition statement income 2011 receivables -1.3 0.0 1.0 0.0 -0.3Group contributions (receivables) 0.0 0.0 0.0 0.0 0.0non-current assets -1,425.8 0.0 43.4 0.0 -1,382.5provisions -24.8 0.0 -69.4 0.0 -94.2pension benefits -528.1 0.0 19.9 -347.0 -855.3Group contributions (payables) 0.0 0.0 0.0 0.0 0.0profit and loss account -12.0 -0.8 1.6 0.0 -11.2derivative financial instruments -18.8 0.0 -5.3 -12.4 -36.6tax losses carry forward 0.0 -3.8 3.8 0.0 0.0 deferred tax asset(-)/liability (net) -2,010.8 -4.6 -5.0 -359.4 -2,380.1 deferred tax asset -2,042.5 -2,411.6 deferred tax liability 31.7 31.5

avinor annual report 2012 61
2012 2011 deferred tax assets deferred tax asset to be recovered after more than 12 months -2,520.0 -2,323.4 deferred tax asset to be recovered within 12 months -94.2 -88.2 -2,614.2 -2,411.6 deferred tax liabilities deferred tax liability to be recovered after more than 12 months 36.8 31.5 deferred tax liability to be recovered within 12 months 0.0 0.0 36.8 31.5 deferred tax asset(-)/liability (net) -2,577.4 -2,380.1 20. penSIon oBlIGatIonamounts in MnoK defINed BeNefIt PlAN the group is required by law to have a pension plan. the pension plan of the group satisfies these requirements. the pension plan encompasses pension benefits in accordance with the act relating to SpK. the benefits are retirement pension, disability pension and dependent pension. In addition, the calculations do include a contractual pension right, which is a tariff-regulated early retirement scheme from 62 years of age. the benefits are coordinated with the national Insurance Scheme and any previous membership periods with service pensions fund within the public sector. the pensions have a guaranteed level of gross payment independent of the national Insurance Scheme. about 54 per cent of the employees have an ordinary retirement age of 62 or 65 years. actuarial losses in 2012 (MnoK 777.5 for the group and MnoK 650.4 for the parent) were mainly caused by changes in financial assumptions. life expectancy Mortality expectancy disability expectancy Age Male female Male female Male female 20 79 84 0.0151% 0.0153% 0.1148% 0.1724% 40 80 84 0.0877% 0.0480% 0.2638% 0.5236% 60 82 85 0.7540% 0.4090% 1.4064% 2.4044% 80 87 89 6.6932% 4.3052% Ia Ia
avinor aS avinor group
the amounts recognised in the income statement are as follows: 2012 2011 2012 2011 current service cost 325.2 241.1 383.8 282.1Interest cost 151.9 182.3 175.6 211.0expected return on plan assets -176.8 -163.1 -200.2 -186.2contribution from the employees -32.8 -31.1 -39.4 -37.0administration fee 5.8 5.4 7.0 6.4 payroll tax, employers contribution 32.0 28.0 40.4 34.6 total pension cost (Note 24) 305.3 262.6 367.2 310.9 avinor aS the movement in pension 2012 2011obligations and plan assets: funded unfunded total funded unfunded total Change in gross pension obligation:obligation at 1 January 5,896.4 5.4 5,901.8 4,598.6 8.0 4,606.6current service cost 329.9 1.1 331.0 243.7 -2.6 241.1Interest cost 151.9 151.9 182.3 182.3actuarial losses/(gains) 557.0 557.0 954.6 954.6 Benefits paid -106.5 -106.5 -82.8 -82.8 gross pension obligation at 31 december 6,828.7 6.5 6,835.2 5,896.4 5.4 5,901.8

62 avinor annual report 2012
2012 2011 funded unfunded total funded unfunded total Change in pension funds: fair value at 1 January 3,529.9 3,529.9 3,146.0 3,146.0expected return on plan assets 176.8 176.8 163.1 163.1employer contributions 266.8 266.8 316.2 316.2actuarial (losses)/gains -31.6 -31.6 -12.6 -12.6 Benefits paid -106.5 -106.5 -82.8 -82.8fair value of plan assets at 31 december 3835.4 0.0 3,835.4 3,529.9 0.0 3,529.9 Net pension obligation 2,993.3 6.5 2,999.8 2,366.5 5.4 2,371.9payroll tax, employers contribution 314.3 0.9 315.2 248.4 0.8 249.2Net pension obligation recognised in the balance sheet at 31 december 3,307.6 7.4 3,315.0 2,614.9 6.2 2,621.1 actual return on plan assets last year 159.1 159.1 147.7 147.7expected employer/employee contribution next year 320.1 320.1 264.1 264.1 expected payment of benefits next year -109.1 -109.1 -84.8 -84.8 avinor group the movement in pension 2012 2011obligations and plan assets: funded unfunded total funded unfunded total change in gross pension obligation: obligation at 1 January 6,816.3 15.1 6,831.4 5,321.6 17.5 5,339.1current service cost 389.7 1.1 390.8 284.5 -2.4 282.1Interest cost 175.6 175.6 211.0 211.0actuarial losses/(gains) 664.3 -1.4 662.9 1,096.8 1,096.8 Benefits paid -123.9 -123.9 -97.6 -97.6 gross pension obligation at 31 december 7,922.0 14.8 7,936.8 6,816.3 15.1 6,831.4 Change in pension funds: fair value at 1 January 4,079.5 4,079.5 3,640.1 3,640.1expected return on plan assets 200.2 200.2 186.2 186.2employer contributions 327.0 327.0 370.9 370.9actuarial (losses)/gains -37.2 -37.2 -20.1 -20.1 Benefits paid -123.9 -123.9 -97.6 -97.6fair value of plan assets at 31 december 4,445.6 0.0 4,445.6 4,079.5 0.0 4,079.5
2012 2011 funded unfunded total funded unfunded total net pension obligation 3,476.4 14.8 3,491.2 2,736.8 15.1 2,751.9payroll tax, employers contribution 381.9 2.0 383.9 300.3 2.1 302.4 Net pension obligation recognised in the balance sheet at 31 december 3,858.3 16.8 3,875.1 3,037.1 17.2 3,054.3 actual return on plan assets last year 180.7 180.7 168.5 168.5 expected employer/employee contribution next year 382.6 382.6 311.4 311.4 expected employee payment of benefits next year -126.2 -126.2 -100.0 -100.0

avinor annual report 2012 63
avinor aS avinor groupMovement in the defined benefit obligation over the year: 2012 2011 2012 2011 obligation at 1 January 2,371.9 1,460.6 2,751.9 1,699.0 pension cost charged to the income statement 306.1 260.3 366.2 306.9 employer/employee contribution -272.6 -321.6 -334.0 -377.3administration fee 5.8 5.4 7.0 6.4actuarial (gains)/losses recognised in other comprehensive income 588.6 967.2 700.1 1,116.9 liability in the balance sheet at 31 december 2,999.8 2,371.9 3,491.2 2,751.8 Actuarial (gains)/losses on post-employment benefit obligations: actuarial (gains)/losses 588.6 967.2 700.1 1,116.9payroll tax on actuarial (gains)/losses 61.8 101.7 77.4 122.5 total actuarial (gains)/losses on post-employment benefit obligations 650.4 1,068.9 777.5 1,239.4 the calculation of pension cost and net pension obligation are made on the basis of a set of assumptions. the determination of the discount rate to be used is made on the basis of norwegian government bond interest rates with an addition for long maturity. the pension obligation’s weighted average duration is 25 years. assumptions regarding future salary and pension increases in addition to official pension benefit adjustments are made on the basis of historical observations for the group . 2012 2011 discount rate 2.40% 2.60%expected return on plan assets 4,6/4,0% 4,9/4,1% future salary increases 3.50% 3.50% future pension increases 2.50% 2.50%early retirement scheme 15.00% 10.00% average turnover rate (under 50 years of age) 3.00% 3.00% average turnover rate (over 50 years of age) 0.20% 0.20% PlAN ASSetS the determination of premium levels and the calculation of provisions for pension obligations are based on ordinary actuarial principles the pension agreement is not directly funded. the payment of pensions are guaranteed by the norwegian State (Section 1 of the pensions act). “the plan assets are a simulation of the allocation of funds as if these funds were invested in long-term government bonds (“”Simulated funds””)” the pension fund may not be transferred in the same way as an ordinary private pension agreement. this calculation is made on the presumption that the pension agreement continues in SpK. the simulation is made on the presumption that the bonds are held to maturity. the plan assets are therefore valued at the nominal value plus the return on the assets. avinor aS At 31 december 2012 2011 2010 2009 2008 present value of defined benefit obligation 6,835.2 5,901.8 4,606.6 4,322.1 4,190.5fair value of plan assets 3,835.4 3,529.9 3,146.0 2,837.9 2,477.8 deficit in the plan 2,999.8 2,371.9 1,460.6 1,484.2 1,712.7 experience adjustments on plan liabilities 557.0 954.6 169.0 -217.1 228.2 experience adjustments on plan assets -37.2 -12.6 -9.9 -68.9 -40.6 avinor group At 31 december 2012 2011 2010 2009 2008present value of defined benefit obligation 7,936.8 6,831.4 5,339.1 5,035.7 4,851.9fair value of plan assets 4,445.6 4,079.5 3,640.1 3,247.4 2,885.3 deficit in the plan 3,491.2 2,751.9 1,699.0 1,788.3 1,966.6 experience adjustments on plan liabilities 662.9 1,096.8 168.6 -234.9 189.6 experience adjustments on plan assets -37.2 -20.1 -49.2 -31.9 -66.0
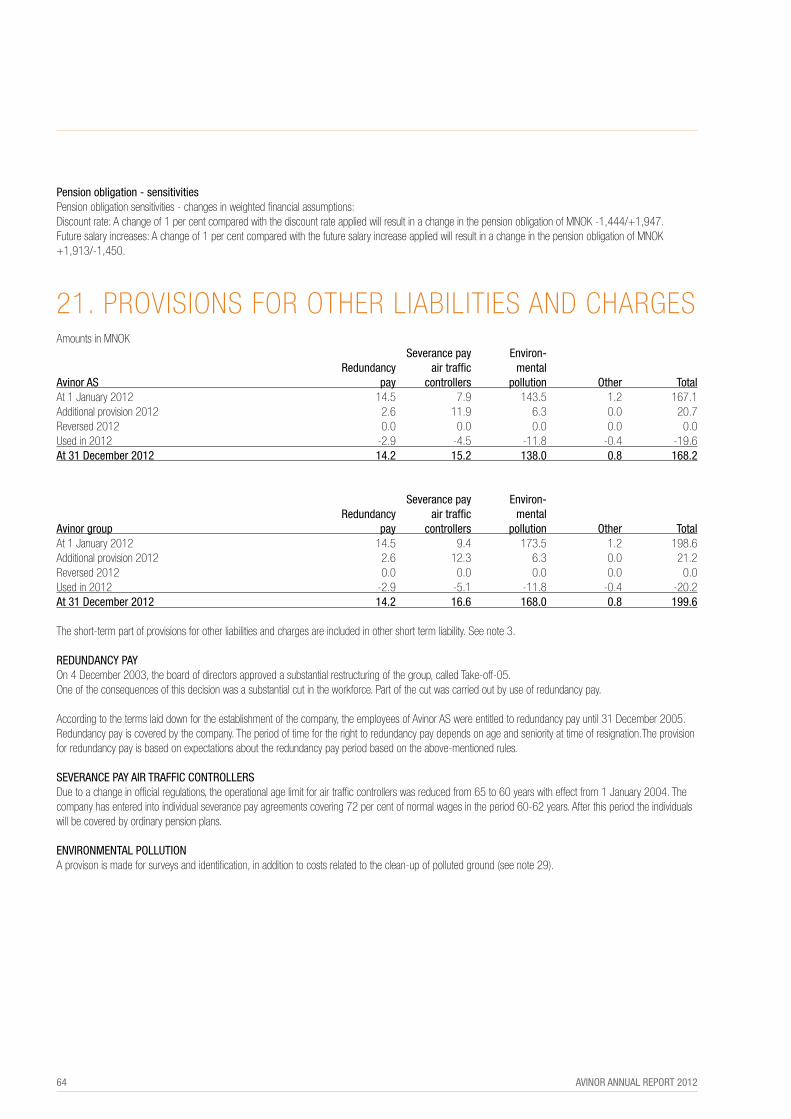
64 avinor annual report 2012
Pension obligation - sensitivitiespension obligation sensitivities - changes in weighted financial assumptions: discount rate: a change of 1 per cent compared with the discount rate applied will result in a change in the pension obligation of MnoK -1,444/+1,947.future salary increases: a change of 1 per cent compared with the future salary increase applied will result in a change in the pension obligation of MnoK +1,913/-1,450. 21. provISIonS for otHer lIaBIlItIeS and cHarGeSamounts in MnoK Severance pay environ- Redundancy air traffic mentalAvinor AS pay controllers pollution other total at 1 January 2012 14.5 7.9 143.5 1.2 167.1additional provision 2012 2.6 11.9 6.3 0.0 20.7reversed 2012 0.0 0.0 0.0 0.0 0.0used in 2012 -2.9 -4.5 -11.8 -0.4 -19.6 At 31 december 2012 14.2 15.2 138.0 0.8 168.2 Severance pay environ- Redundancy air traffic mentalAvinor group pay controllers pollution other total at 1 January 2012 14.5 9.4 173.5 1.2 198.6additional provision 2012 2.6 12.3 6.3 0.0 21.2reversed 2012 0.0 0.0 0.0 0.0 0.0used in 2012 -2.9 -5.1 -11.8 -0.4 -20.2 At 31 december 2012 14.2 16.6 168.0 0.8 199.6 the short-term part of provisions for other liabilities and charges are included in other short term liability. See note 3. ReduNdANCy PAy on 4 december 2003, the board of directors approved a substantial restructuring of the group, called take-off-05.one of the consequences of this decision was a substantial cut in the workforce. part of the cut was carried out by use of redundancy pay. according to the terms laid down for the establishment of the company, the employees of avinor aS were entitled to redundancy pay until 31 december 2005. redundancy pay is covered by the company. the period of time for the right to redundancy pay depends on age and seniority at time of resignation.the provision for redundancy pay is based on expectations about the redundancy pay period based on the above-mentioned rules. SeveRANCe PAy AIR tRAffIC CoNtRolleRS due to a change in official regulations, the operational age limit for air traffic controllers was reduced from 65 to 60 years with effect from 1 January 2004. the company has entered into individual severance pay agreements covering 72 per cent of normal wages in the period 60-62 years. after this period the individuals will be covered by ordinary pension plans.
eNvIRoNMeNtAl PollutIoN a provison is made for surveys and identification, in addition to costs related to the clean-up of polluted ground (see note 29).

avinor annual report 2012 65
22. otHer SHort-terM lIaBIlItyamounts in MnoK Avinor AS Avinor group 2012 2011 2012 2011 Holiday allowance 223.0 214.8 263.7 251.4advance from customers 50.5 44.4 131.5 131.5Wages and social security 71.8 77.3 85.5 88.8accruals 391.7 247.8 526.2 423.9Intra-group liability 862.2 818.4 0.0 0.0 other short-term liability 215.5 192.2 229.1 204.9 total 1,814.7 1,594.9 1,236.0 1,100.5
23. operatInG IncoMe amounts in MnoK Avinor AS Avinor group 2012 2011 2012 2011traffic income takeoff charges 647.2 598.4 1,104.5 1,029.0terminal charges 576.3 518.5 1,148.3 1,044.7en route charges 947.0 954.4 947.0 954.4Security charges 531.7 605.1 948.7 1,092.4terminal navigation charges 339.7 329.1 607.3 591.6 total 3,041.9 3,005.5 4,755.8 4,712.1 Sales and rental income rental income 1,179.6 1,046.8 3,783.2 3,403.6 Sales revenues 469.3 383.1 591.4 495.4 total 1,648.9 1,429.9 4,374.6 3,899.0 other income Intercompany services 607.2 591.6 0.0 0.0other 19.7 5.7 21.7 10.7 total 626.9 597.3 21.7 10.7 total operating income 5,317.7 5,032.7 9,152.1 8,621.8

66 avinor annual report 2012
24. SalarIeS and perSonnel coStS, nuMBer of eMployeeS, reMuneratIonS amounts in MnoK Avinor AS Avinor groupSalaries and personnel costs: 2012 2011 2012 2011 Salaries 1,925.1 1,857.3 2,278.4 2,188.7payroll tax 245.2 207.3 306.6 256.2pension costs 305.3 262.6 367.2 310.9other personnel costs 99.6 95.5 120.6 115.6 total 2,575.2 2,422.7 3,072.8 2,871.4 average number of man-years employed 2,632 2,598 3,218 3,149 group management:for management purposes the group is organised in one air navigation services division, three airport divisions and one subsidiary. the airport divisions and the subsidiary are organised according to airport size. the group management consists of the group ceo and the managing director of each division and the subsidiary in addition to the managing directors of each corporate staff.
Pension 2012 other cost, Amount in NoK Board fee Salary benefits estimated total group management: dag falk-petersen 0 2,390,371 10,799 272,235 2,673,405nic nilsen 0 1,647,043 132,000 213,119 1,992,162Signe astrup arnesen 0 1,396,301 14,779 291,241 1,702,321lasse Bardal (from 09.30.2012 ) 85,000 371,170 2,732 43,058 501,960Mari Hermansen (from 06.01.2012) 0 688,519 8,314 176,321 873,154petter Johannessen, økonomi og finansdirektør 0 1,550,988 10,799 337,083 1,898,870anders Kirsebom 0 1,501,071 14,679 244,809 1,760,559Jon Sjølander 0 1,569,456 14,706 164,901 1,749,063Knut Skaar (until 09.28.2012) 0 1,301,211 8,067 133,271 1,442,549Margrethe Snekkerbakken 0 1,657,394 10,799 340,178 2,008,371egil thompson (from 10.22.2012) 0 293,377 1,155 130,608 425,139 Board: ola Mørkved rinnan, styrets leder 373,500 0 0 0 373,500Kristin vangdal, nestleder 226,000 0 0 0 226,000Dag Hårstad, Member of the board 220,000 0 0 0 220,000eli Skrøvset, Member of the board 242,500 0 0 0 242,500oddbjørg a. Starrfelt (until 06.26.2012) 93,000 0 0 0 93,000ola H. Strand (from 01.03.2012) 186,000 0 0 0 186,000anne Breiby (from 06.26.2012) 93,000 0 0 0 93,000christian Berge 186,000 186,000Helge løbergsli 220,000 220,000Grete ovnerud 186,000 186,000Heidi anette Sørum 210,000 210,000 total 2,321,000 14,366,900 228,828 2,346,824 19,263,553

avinor annual report 2012 67
Pension 2011 other cost, Amount in NoK Board fee Salary benefits estimated total group management: dag falk-petersen (from 02.28.2011) 0 1,802,444 8,463 210,070 2,020,977nic nilsen 0 1,666,377 114,888 196,269 1,977,534Signe astrup arnesen 0 1,342,965 11,872 251,488 1,606,325petter Johannessen 0 1,501,127 10,058 291,539 1,802,724anders Kirsebom 0 1,385,780 11,912 212,880 1,610,572Jon Sjølander 0 1,504,185 10,058 184,099 1,698,342Knut Skaar 0 1,678,291 10,058 179,811 1,868,160Margrethe Snekkerbakken 0 1,588,426 10,058 296,266 1,894,750 Board: ola Mørkved rinnan 359,000 0 0 0 359,000Kristin vangdal 217,500 0 0 0 217,500Dag Hårstad 227,750 0 0 0 227,750petter Jansen (until 11.01.2011) 179,000 0 0 0 179,000Marianne Njåstein (until 06.22.2011) 144,000 0 0 0 144,000eli Skrøvset (from 06.22.2011) 116,750 0 0 0 116,750oddbjørg a. Starrfelt 179,000 0 0 0 179,000christian Berge 179,000 179,000Ingrid Synnøve Brendryen (until 05.27.2011) 89,500 89,500Helge løbergsli 227,750 227,750Grete ovnerud (from 05.27.2011) 89,500 89,500torunn Sneltvedt (until 05.27.2011) 89,500 89,500Heidi anette Sørum (from 05.27.2011) 89,500 89,500total 2,187,750 12,469,595 187,367 1,822,422 16,667,134 on termination or changes in conditions of employment or board appointment no obligations exist to give the group management or the board any distinct compensation, beyond what is stated below. nor are there any arrangements concerning bonuses, profit sharing or share-based payments. no loans or guarantees have been given to the members of the group management or the board. none of the members of the group management have received any remunerations or economic benefits from other companies in the group, other than shown in the table above. there is no additional remuneration to executives for special services other than normal operations, see below.
the Board of directors’ declaration on the determination of salaries and other remuneration for the ceo and other executive employees of the avinor Group.according to article 8 of the company’s articles of association, the Board of directors shall prepare a declaration concerning the determination of salaries and other remuneration for the senior management. this declaration shall be included as a note in the annual accounts. the declaration shall contain the contents specified in section 6-16a of the public limited companies act, and shall be handled in a corresponding manner at the company’s ordinary general meeting. reference is made to section 5-6 third paragraph of the public limited companies act.
the Board of avinor aS has established a remuneration committee tasked with preparing guidelines for, and agenda items concerning, the remuneration of executive employees, as well as continuously assessing and monitoring the Group’s policy in this area. the committee prepared the following declaration on the determination of salaries and other remuneration for the ceo and other executive employees of the avinor Group in accordance with article 8 of the articles of association, ref. section 6-16a of the public limited liability companies act. the declaration was considered and approved by the Board on 21 March 2013. the declaration will be presented for consideration at the company’s annual general meeting on 12 June 2013. 1. employees covered by the declaration at year-end 2012, the Group’s executive management team comprised the following employees, who are covered by this declaration: • Dag Falk-Petersen, CEO Avinor • Nic. Nilsen, Managing Director, Oslo Airport • Signe Astrup Arnesen, Executive Vice President Safety, Security and Quality Avinor • Petter Johannessen, CFO Avinor • Mari Hermansen, Executive Vice President HR and Legal Avinor • Egil Thompson, Director Communications, Brand and Public Relations Avinor • Anders Kirsebom, Chief Executive Air Navigation Services Avinor • Jon Sjølander, Executive Vice President Strategy Avinor

68 avinor annual report 2012
• Lasse Bardal, Executive Vice President International Airports Division Avinor • Margrethe Snekkerbakken, Executive Vice President National, Regional and Local Airports Division Avinor
2. declaration’s validitythe declaration applies for the coming financial year, ref. article 8 of the articles of association and section 6-16a (2) of the public limited liability companies act. the declaration will be used as the basis for the Board’s work following its consideration at the annual general meeting on 12 June 2013.
3. Main principles of the company’s executive remuneration policyavinor’s executive remuneration policy has to comply with the Government’s policy for the remuneration of leading personnel in state-owned enterprises and com-panies (adopted by the norwegian Government on 31 March 2011). executive remuneration in the Group should be competitive but not leading when compared to similar companies.the ceo’s remuneration is determined by the full Board based on the recommendations of the remuneration committee. the remuneration of other executive employees who report directly to the ceo is determined by the ceo setting and informing the remuneration committee of their remuneration package. remu-neration packages must comply with the policy for the remuneration of leading personnel.
3.1 Salarythe main element of the Group’s remuneration packages must be a fixed basic salary.
3.2 directors’ remunerationno remuneration is paid for board appointments in other companies in the avinor Group.
3.3 Benefits in kindexecutive employees shall receive the benefits in kind that are common for comparable positions. these may include a car allowance, parking, commuting allow-ance, free newspapers, free phone, laptop pc and free broadband service.
3.4 Performance paya performance pay scheme may be established for executive employees based on individual targets. there must be a clear correlation between performance pay targets and the Group’s targets. Scorecards must be established that state specific targets, deadlines for achieving these targets, and the consequences of achiev-ing these targets. Scorecards must be reviewed in annual performance assessment interviews.
performance pay must be viewed in the context of the salary level of the individual covered by the scheme before being introduced.
a 10 per cent performance pay ceiling shall apply for each executive employee.
4. options and share programmesno options or similar schemes will be established in the company. no share programme involving share-based remuneration will be established in the company.
5. Pension plansexecutive employees shall participate in the Group’s general pension plan. the terms shall be similar to the terms that apply for other company employees. the age limit is 70, but the retirement age is generally 67. the basis for calculating pension entitlements shall not exceed 12G (where G = the national Insurance Scheme’s basic amount).
an additional pension scheme may be established for executive employees in the form of a defined contribution pension with an entitlement ceiling of 30 per cent of fixed salary in excess of 12G. provisions shall be made in the financial statements, while an adjusted model for the practical implementation of this is designed by the ministry of trade and Industry.the total cost of each individual pension plan must be calculated before it is entered into.
6. Severance packagesthe ordinary period of notice is 3 months. a severance package of up to 12 months’ pay may be agreed in the event of termination. In the event of appointment to a new position or if an income is received from an enterprise of which the employee concerned is an active owner, the severance package can be reduced by a proportional amount calculated on the basis of the new annual income. reductions may only be made after the normal period of notice for the position has expired.
7. executive remuneration policy and implementation of the guidelines in the preceding yearthe Board’s declaration concerning the determination of salaries and other remuneration was published for the first time in the 2011 financial year. the material contents of the declaration published in the 2011 financial year have been continued. two new executive employees covered by the declaration were appointed in the 2012 financial year. established remuneration policy was followed when the remuneration of the new executive employees was determined.
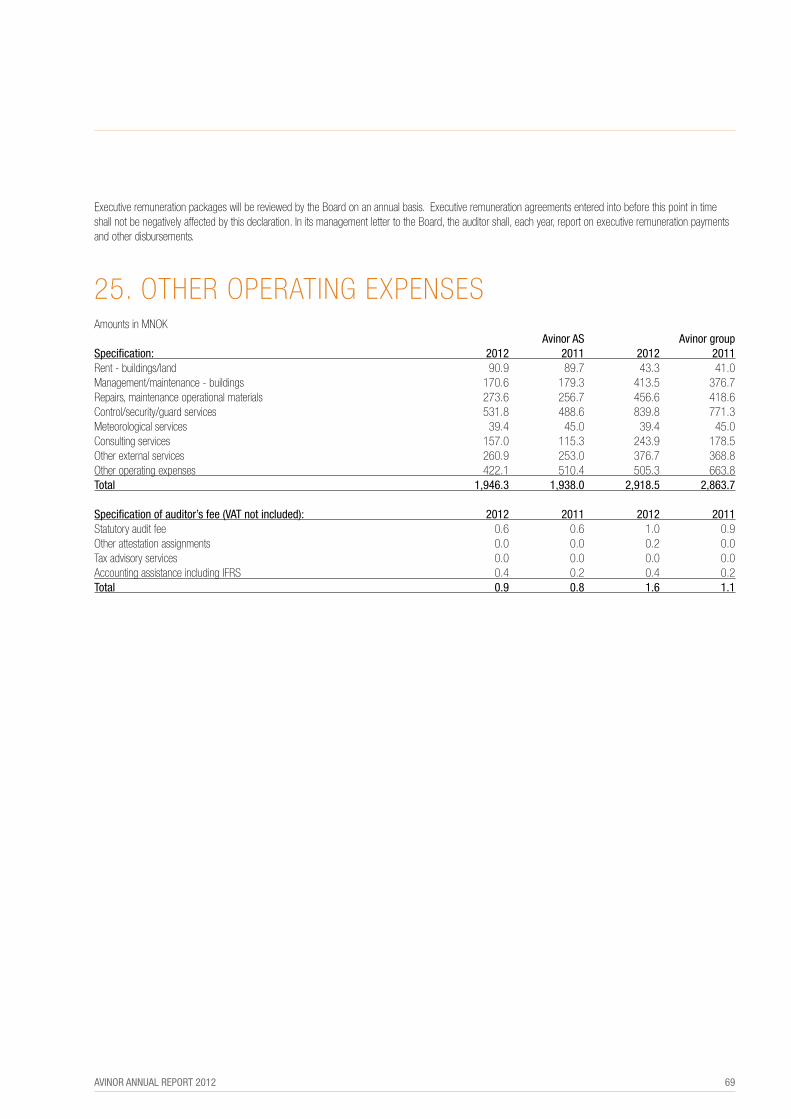
avinor annual report 2012 69
executive remuneration packages will be reviewed by the Board on an annual basis. executive remuneration agreements entered into before this point in time shall not be negatively affected by this declaration. In its management letter to the Board, the auditor shall, each year, report on executive remuneration payments and other disbursements.
25. otHer operatInG expenSeS amounts in MnoK Avinor AS Avinor groupSpecification: 2012 2011 2012 2011 rent - buildings/land 90.9 89.7 43.3 41.0Management/maintenance - buildings 170.6 179.3 413.5 376.7repairs, maintenance operational materials 273.6 256.7 456.6 418.6control/security/guard services 531.8 488.6 839.8 771.3Meteorological services 39.4 45.0 39.4 45.0consulting services 157.0 115.3 243.9 178.5other external services 260.9 253.0 376.7 368.8 other operating expenses 422.1 510.4 505.3 663.8 total 1,946.3 1,938.0 2,918.5 2,863.7 Specification of auditor’s fee (vAt not included): 2012 2011 2012 2011 Statutory audit fee 0.6 0.6 1.0 0.9other attestation assignments 0.0 0.0 0.2 0.0tax advisory services 0.0 0.0 0.0 0.0accounting assistance including IfrS 0.4 0.2 0.4 0.2total 0.9 0.8 1.6 1.1

70 avinor annual report 2012
26. IMpact on earnInGS – terMInal 2 proJect amounts in MnoK as a result of the development of Gardermoen (terminal 2 project) the income statement includes charges for extra costs related to the maintenance of normal operations during the construction period, as well as costs related to the scrapping of assets, including higher depreciation as a result of a re-assessed economic life. Specification: 2012 2011employee benefits expense payroll and other personnel expenses for operating personnel 35.5 24.1 total 35.5 24.1 depreciation, amortisation and impairment charges Higher depreciation as the result of scrapping portions of the terminal in 2013 132.0 91.8total 132.0 91.8 other operating expenses operational coordination 42.1 28.7Security 11.2 7.5More bussing 6.9 5.5consulting services 18.2 14.6losses from the scrapping of existing plant 4.1 7.8demolishing expenses existing plant 45.7 0.0other 12.2 2.6 total 140.5 66.8 total 308.0 182.7
27. cHanGeS In value and otHer loSSeS/GaInS - net amounts in MnoK Avinor AS Avinor group Specification: 2012 2011 2012 2011 changes in value - unrealised (note 10) -1.5 -20.0 -2.9 -32.1 changes in value - realised energy contracts -8.6 -4.5 -14.6 -6.7foreign currency translation gains/losses -3.4 0.9 -2.8 3.0total -13.5 -23.6 -20.3 -35.8

avinor annual report 2012 71
28. fInance IncoMe and coStSamounts in MnoK Avinor AS Avinor group 2012 2011 2012 2011 finance income Interest income on short-term bank deposits 57.5 52.6 59.8 54.4Interest income on loans to group companies 108.5 75.4 0.0 0.0Income from investments in associated companies (note 11) 0.0 0.0 1.3 0.8Group contributions and dividends received 451.2 1,096.4 0.0 0.0total 617.2 1,224.4 61.1 55.2 finance costs Interest expense on bank borrowings 195.9 86.1 478.6 391.4Interest expense on loans from group companies 8.4 20.9 0.0 0.0Interest expense on others 16.1 36.1 14.3 35.6Borrowing costs capitalised (note 6) -63.0 -33.0 -95.0 -75.7fair value gains/losses on bank borrowings 0.5 5.8 0.5 5.8fair value loss on financial instruments (note 10) - interest rate swaps: cash flow hedges, transfer from equity 21.3 0.0 18.6 -1.8- interest rate swaps: fair value hedges 0.0 -5.1 0.0 -5.1total 179.2 110.8 417.0 350.2 finance income/(costs) - net 438.0 1,113.6 -355.9 -295.0 29. contInGencIeS NoRwegIAN defeNCe: a cooperation agreement exists between norwegian defence and avinor with corresponding local agreements concerning sharing responsibilities and expenses for airports where both parties have activities. for fy 2008-2009 the final settlements of accounts is still pending. accounts payment have been made on the basis of figures from 2004. In 2007, norwegian defence initiated a renegotiation of the agreement. Based on a mandate from the Ministry of transportation and the Ministry of defence a new agreement has been entered into. the agreement was approved by the government in february 2011, with effect from 1 January 2010. the agreement establishes principles for the basis of allocation of investment- and operational expenses between the parties. the practical implementation of the agreement, including calculation of the cash-flow between the parties, has not been completed. there is therefore uncertainty attached to the economic consequences. In a letter dated 11 March 2009, the attorney General concluded that avinor shall pay norwegian defence compensation for the right to use land at værnes (trondheim airport) and flesland (Bergen airport). a legal assessment shall be carried out to determine the value of the land at these airports. there is uncertainty attached to the outcome. tHe exteRNAl eNvIRoNMeNt:a survey of contaminated soils at all of avinor’s airports has been carried out. at all the fire exercise areas, both disused and operative, contamination from the environmental toxin pfoS was detected. In addition to the survey, risk assessments have been carried out into the potential damage to the local natural environment and harm to people from the contamination.the results from these assessments indicate that there is an unacceptable risk at four airports, additional surveys must be carried out at fifteen airports and twenty four airports are not at risk. three airports are under the norwegian armed forces. the reports from the survey and risk analyses have been submitted to the climate and pollution agency (Klif) for review.there is a risk that Klif may base its review on stricter guidelines for these contaminants than has been the case for other types of contamination.that may entail a broader scope of measures than are being currently considered. See note 21.

72 avinor annual report 2012
fIgHteR PlANe BASe:the Storting has resolved that Bodø’s main air station shall be closed down, while evenes will be the advanced base for fighter planes in the north.avinor currently operates evenes and the norwegian armed forces manage Bodø’s main air station where avinor is responsible for civil operations.at both locations the costs are divided between the norwegian armed forces and avinor.the changes at these airports will have financial consequences for avinor, both with regard to future investments in property, plant and equipment and running operating expenses. IRRegulARItIeS IN AIR tRAffIC duRINg tHe SuMMeR of 2012:In summer 2012 avinor had challenges with the provision of services from Gardermoen tower and oslo control centre. the consequences of this included disturbances to air traffic. through the federation of norwegian aviation Industries and in written letters, the airlines have stated that the disturbances to operations have resulted in significant financial losses to their businesses, and that avinor must accept the responsibility for these costs. avinor is reviewing these claims. 30. coMMItMentSamounts in MnoK the parent company and the group have contracted for capital expenditure not yet incurred at the end of the reporting period as follows: avinor aS avinor group 2012 2011 2012 2011 property, plant and equipment 1,235.9 976.5 4,094.2 2,834.0 total 1,235.9 976.5 4,094.2 2,834.0 31. related-party tranSactIonSamounts in MnoK tHe MINIStRy of tRANSPoRt ANd CoMMuNICAtIoN as the sole owner of avinor aS the norwegian State represented by the Ministry of transport and communication (Sd) is a related party.Sd has the principal authority regarding the structure of the airport network and the traffic charges. any closing down of an airport or other material changes in the airport structure shall be presented to Sd. the final decision is made by the Storting. the charges regulation which decides the setting of air traffic charges shall be sanctioned by Sd. gRouP CoMPANIeS: outstanding accounts between companies in the group:
oslo oslo Avinors SolaAvinor AS at lufthavn lufthavn parkerings- flesland værnes Hotel Hell31 december 2012 AS eiendom AS selskap AS eiendom AS eiendom AS eiendom AS eiendom AS totalloans to group companies 3,021.4 0.0 0.0 55.0 60.0 60.0 0.0 3,196.4Intra-group receivables 435.3 52.7 19.7 2.4 2.6 2.5 0.3 515.5total 3,456.7 52.7 19.7 57.4 62.6 62.5 0.3 3,711.9 other short-term intra- group liability 426.4 135.7 92.9 78.0 52.5 62.3 14.4 862.2total 426.4 135.7 92.9 78.0 52.5 62.3 14.4 862.2

avinor annual report 2012 73
oslo oslo Avinors SolaAvinor AS at lufthavn lufthavn parkerings- flesland værnes Hotel Hell31 december 2011 AS eiendom AS selskap AS eiendom AS eiendom AS eiendom AS eiendom AS totalloans to group companies 1,771.3 0.0 0.0 55.0 60.0 60.0 0.0 1,946.3Intra-group receivables 431.1 1.5 13.5 1.3 1.2 1.2 0.2 450.1total 2,202.4 1.5 13.5 56.3 61.2 61.2 0.2 2,396.4 other short-term intra- group liability 522.4 52.9 78.3 74.7 41.6 48.3 0.3 818.4total 522.4 52.9 78.3 74.7 41.6 48.3 0.3 818.4
the subordinated loan capital of oslo lufthavn aS amounts to MnoK 1371.3 at 31 december 2012. there are ordinarily no instalments on the loan.the interest on the loan is determined as the average of 12 months nIBor at 15.02, 15.05, 15.08 and 15.11 each year. a margin of 1.5 percentage points is added.loan from avinor aS, financing the development of terminal 2 (t2) at oslo lufthavn aS, amounts to MnoK 1650.0 at 31 december 2012. the interest on the loan is based on the borrowing rate of avinor aS. there are no instalments on the loan. the subordinated loan capital of flesland eiendom aS, værnes eiendom aS and Sola Hotel eiendom aS amounts to MnoK 55, MnoK 60 and MnoK 60respectively at 31 december 2012. there are ordinarily no instalments on the loans. the interest on the loans is determined as the interest rate ofnorges Bank’s current account at 31 december the year before the year in question. avinor aS charges oslo lufthavn aS a ground rent of MnoK 388.4.

74 avinor annual report 2012
reSponSIBIlIty StateMent froM tHe Board of dIrectorS and tHe ManaGInG dIrector
We confirm, to the best of our knowledge that the financial statements for the period 1 January to 31 december 2012
have been prepared in accordance with current applicable accounting standards, and give a true and fair view of the
assets, liabilities, financial position and profit or loss of the entity and the group taken as a whole. We also confirm
that the Board of directors’ report includes a true and fair view of the development and performance of the business
and the position of the entity and the group, together with a description of the principal risks and uncertainties facing
the entity and the group.
oslo, 21. March 2013
ola Mørkved Rinnan Kristin vangdal eli Skrøvset chairman vice chairman
Anne Breiby dag Hårstad ola H. Strand
Christian Berge Helge løbergsli grete ovnerud
Heidi Anette Sørum dag falk-Petersen ceo
avinor annual report 2012 75

76 avinor annual report 2012


postal address: avinor, p.o.Box 150, n-2061 Gardermoenvisiting address: oslo atrium, dronning eufemias gate 6, 0191 oslo
telephone: +47 815 30 550, fax: +47 6481 2001, www.avinor.no