Annual Report 2012 - Servcorp · SERVCORP ANNUAL REPORT 2012. PAGE 3. 2012 ... Levels 20 & 22, Al...
116
PAGE 1 Annual Report 2012 2IFC Hong Kong Qatar Doha 6 Battery Road Singapore Hilton Plaza Osaka Mori Trust Marunouchi Tokyo Emirates Towers Dubai
Transcript of Annual Report 2012 - Servcorp · SERVCORP ANNUAL REPORT 2012. PAGE 3. 2012 ... Levels 20 & 22, Al...

PAGE 1
Annual Report 2012
2IFCHong Kong
QatarDoha6 Battery Road
SingaporeHilton PlazaOsaka
Mori TrustMarunouchi
Tokyo
Emirates TowersDubai

PAGE 4
Scan QR code to watch the global network video
Servcorp Limited ABN 97 089 222 506

Something sensational is happening
Do you know whodunit? Do you know where? Do you know how?
Follow the clues!
Follow me and be sure to keep up!
SERVCORP ANNUAL REPORT 2012 PAGE 1
Welcome 03
2012 - a snapshot 04
Global locations 06
Chairman’s message 08
CEO’s message 09
Global expansion 10
New scenes 15
Green initiative 16
Community service 17
Information & communication technology 18
Service, products and awards 19
The Servcorp team 22
Corporate governance 24
Directors’ report 34
Financial report 55
Auditor’s report 108
Shareholder information 110
Corporate information 112
What’s inside
PAGE 2
Welcome
Do you know whodunit?
Servcorp is committed to being the world’s finest Serviced Office and Virtual Office provider.
Our business was founded on one principle – to help our clients’ businesses succeed. By reducing your costs and sharing your overheads, you can focus on growing your business while we give you the support you need to achieve your goals.
Servcorp not only gives you the ability to run your business from the best locations in the best cities around the world, but we also give you the best facilities, the best technology and the best people crucial to making your business successful. Our team is proactive, efficient and on hand to support you. We believe in taking a genuine interest in the growth and success of your business.
We are proud to be an innovator of the Serviced and Virtual Office industry in our development of technology driven solutions which benefit your business.
Not the biggest just the best.
SERVCORP ANNUAL REPORT 2012 PAGE 3
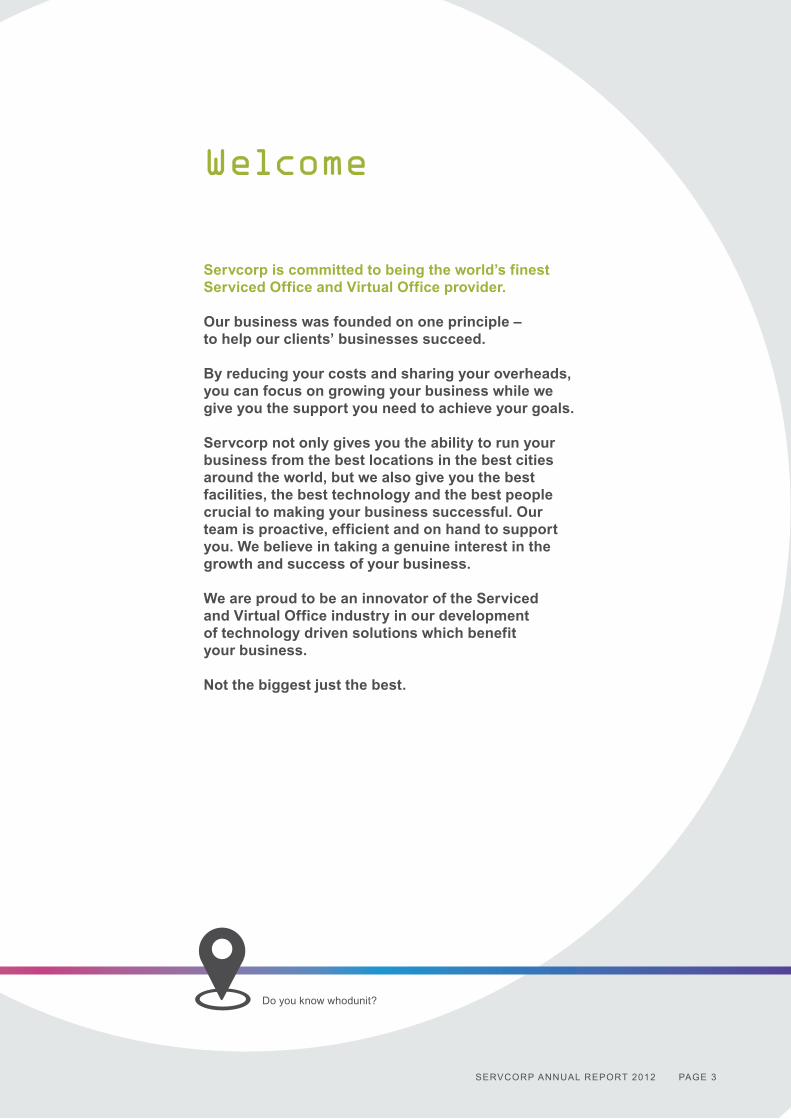
2012 - a snapshot
12 months ended 30 June
2008$’000
2009$’000
2010$’000
2011$’000
2012$’000
Revenue & other income 190,142 228,646 168,837 182,056 200,785
Net profit before tax 44,578 47,275 2,875 3,036 18,329
Net profit after tax 33,834 34,097 2,006 2,493 14,801
Net operating cash flows 51,192 43,024 8,798 18,788 32,003
Cash & cash equivalents 73,716 83,958 131,948 99,993 104,334
Net assets 127,651 145,291 212,610 192,612 198,709
Earnings per share $0.420 $0.427 $0.022 $0.025 $0.150
Dividends per share $0.200 $0.250 $0.100 $0.100 $0.150
Actual Forecast
Net profit before tax ($ millions)
50
40
30
20
10
008 09 10 11 12 13
$47.3
$44.6
$2.9 $3.0
$18.3
$27.0
Mature floors Immature floors
Revenue ($ millions)
$219.1
$185.8
$4.4 $9.5
$159.6$169.4
$180.6
250
200
150
100
50
008 09 10 11 12
$9.2 $12.7$20.2
PAGE 4
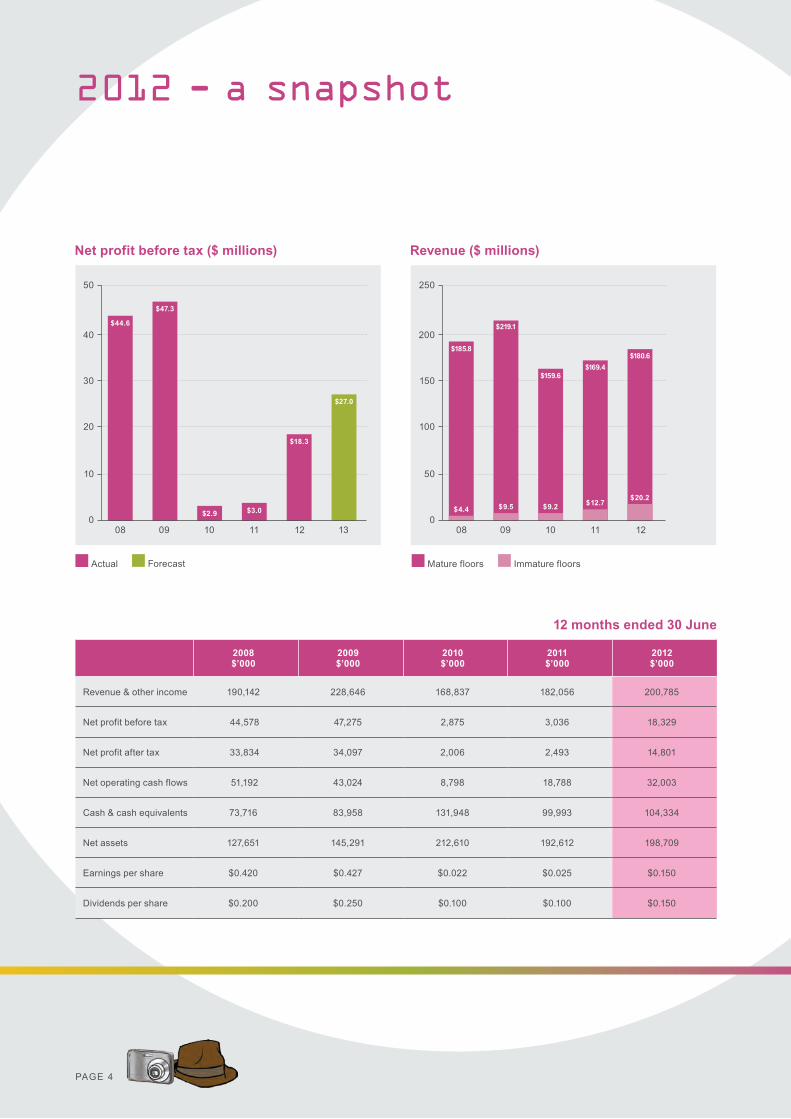
Locations Floors Locations forecast Floors forecast
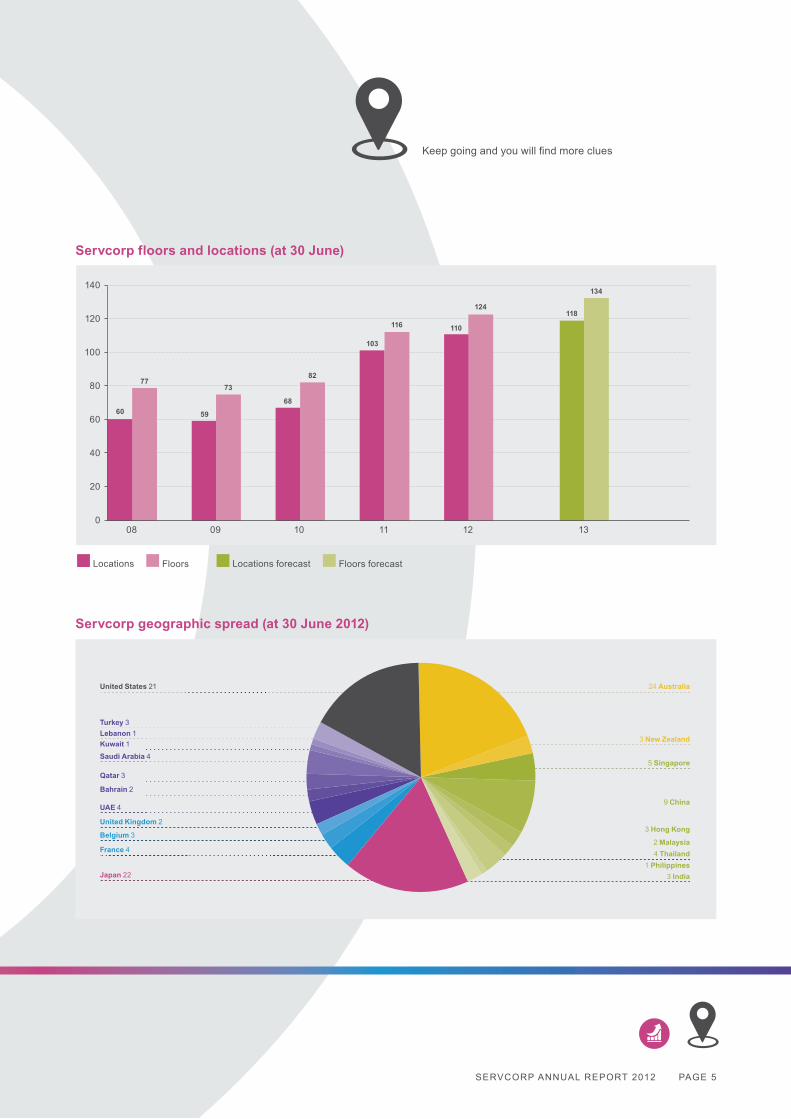
Servcorp floors and locations (at 30 June)
60 59
68
103
110
118
7773
82
116
124
134140
120
100
80
60
40
20
008 09 10 11 12 13
Servcorp geographic spread (at 30 June 2012)
United States 21 24 Australia
3 New Zealand
5 Singapore
9 China
3 Hong Kong
2 Malaysia4 Thailand
1 Philippines3 India
Turkey 3Lebanon 1Kuwait 1
Saudi Arabia 4
Qatar 3
Bahrain 2
UAE 4
United Kingdom 2
Belgium 3
France 4
Japan 22
Keep going and you will find more clues
SERVCORP ANNUAL REPORT 2012 PAGE 5

130 Global locations
AustraliaSydneyLevel 29, Chifley Tower
Levels 56 & 57, MLC Centre
Level 26, 44 Market Street
Level 32, 101 Miller Street North Sydney
Level 22, Tower Two Westfield Bondi Junction
Level 1, The OctagonParramatta
Level 15, Eclipse TowerParramatta Level 9, Avaya House North Ryde Level 5, Nexus Norwest Baulkham Hills
MelbourneLevels 18 & 27, 101 Collins Street
Level 40, 140 William Street
Level 2, 710 Collins StreetDocklands
Level 2, Riverside Quay Southbank
BrisbaneLevel 36, Riparian Plaza
Level 19, AMP Place
Level 27, Santos Place
PerthLevels 15 & 28, AMP Tower
Level 18, Central Park
Level 11, Brookfield Place City Square
HobartLevel 6, Reserve Bank Building
AdelaideLevels 24 & 30, Westpac House
CanberraLevel 11, St George Centre
Level 1, The Realm
New ZealandAucklandLevel 27, PWC Tower
Level 31, Vero Centre
WellingtonLevel 16, Vodafone on the Quay
United States of AmericaAtlantaLevel 20, Terminus 200
Level 36, 12th & Midtown
BostonLevel 14, One International Place
ChicagoLevel 42, 155 North Wacker Drive
Level 49, 300 North LaSalle Street
DallasLevel 6, JP Morgan International Plaza III
Level 10, Rosewood Court
Level 3, 5500 Preston Road
HoustonLevel 39, Bank of America Center
Level 41, Williams Tower
IrvineLevel 8, Irvine Towers
Los AngelesLevel 40, Figueroa at Wilshire
MiamiLevel 27, Southeast Financial Center
New York CityLevel 23, 1330 Avenue of the Americas
Level 26, The Seagram Building
PhiladelphiaLevel 37, BNY Mellon Center
San FranciscoLevel 27, 101 California Street
Level 49, 555 California Street
Tysons Corner Level 15, Corporate Office Center Tysons II
Washington D.C.Level 10, 1717 Pennsylvania Avenue
Level 10, 1155 F Street
JapanTokyoLevel 11, Aoyama Palacio Tower
Level 14, Hibiya Central Building
Level 20, Marunouchi Trust Tower – Main
Level 7, Wakamatsu Building
Level 8, Nittochi Nishi-Shinjuku Building
Level 9, Ariake Frontier Building Tower B
Level 28, Shinagawa Intercity Tower A
Level 32, Shinjuku Nomura Building
Level 21, Shiodome Shibarikyu Building
Level 27, Shiroyama Trust Tower
Level 45, Sunshine 60
Level 27, Tokyo Sankei Building Level 18, Yebisu Garden Place Tower
YokohamaLevel 10, TOC Minato Mirai
NagoyaLevel 40, Nagoya Lucent Tower
Level 4, Nagoya Nikko Shoken Building
OsakaLevel 9, Edobori Center Building
Level 19, Hilton Plaza West Office Tower
Level 4, Cartier Building Shinsaibashi Plaza
FukuokaLevel 15, Fukuoka Tenjin Fukoku Seimei Building
Level 2, NOF Hakata Ekimae Building
IndiaMumbaiLevels 7 & 8, Vibgyor Towers
HyderabadLevel 7, Maximus Towers
PAGE 6

SingaporePenthouse Level & Level 42, Suntec Tower Three
Levels 30 and 31, Six Battery Road
Level 39, Marina Bay Financial Centre
Level 26, PSA Building
MalaysiaKuala LumpurLevel 36, Menara Citibank
Level 20, Menara Standard Chartered
ThailandBangkokLevels 8 & 9, 1 Silom Road, Silom
Level 29, The Offices at Centralworld
Level 18, Park Ventures Ecoplex
PhilippinesManilaLevel 22, Tower One Ayala Triangle
ChinaShanghaiLevel 23, Citigroup Tower
Level 29, Shanghai Kerry Centre
5/F Somekh Building, Bund
ChengduLevel 18, Shangri-La Office Tower
Level 28, One Aerospace Center
BeijingLevel 24, China Central Place
Level 19, Oriental Plaza
HangzhouLevel 3, Jiahua International Business Center
GuangzhouLevel 54, Guangzhou IFC
Hong KongCentralLevel 19, Two International Finance Centre
Level 9, The Hong Kong Club Building
KowloonLevel 12, One Peking Road
United Arab EmiratesAbu DhabiLevel 4, Al Mamoura
DubaiLevels 41 & 42, Emirates Towers
Levels 21 & 28, Al Habtoor Business Tower
Kingdom of BahrainManamaLevels 22 & 41, West TowerBahrain Financial Harbour
QatarDohaLevels 14 & 15, Commercialbank Plaza
Level 22, Tornado Tower
Kingdom of Saudi ArabiaJeddahLevel 9, Jameel Square
Level 26, Kings Road Tower
RiyadhLevel 18, Al Faisaliah Tower
Al Khobar Levels 20 & 22, Al Hugayet Tower
KuwaitKuwait CityLevel 18, Sahab Tower
LebanonBeirutLevel 2, Beirut Souks Louis Vuitton Building
TurkeyIstanbulLevels 5 and 6, Louis Vuitton Orjin Building
Level 8, Tekfen Tower
FranceParisLevel 5, Louis Vuitton BuildingAvenue des Champs Elysées
Levels 2 & 3, Square Edouard VII, Opera
Actualis, Level 2, Boulevard Haussmann
BelgiumBrusselsLevels 20 & 21, Bastion Tower
Level 4, European Quarter - Schuman
United KingdomLondonLevel 17, Dashwood House
Level 18, 40 Bank Street
Do you know where this is happening?
PAGE 7SERVCORP ANNUAL REPORT 2012

Chairman’s message
Revenue and profit growth was achieved across most geographic segments. We are encouraged by profit growth of 20% in the mature business, and immature floor revenue continues to increase modestly each month.
The Directors have declared a final dividend of 7.50 cents per share, 85% franked, bringing total dividends for the year to 15.00 cents per share, resulting in a payout to shareholders of approximately $14.77 million. The average franking for the year was 67.5%.
When we released our 2012 results we forecast that net profit before tax for the 2013 financial year would increase by approximately 50% on 2012 to approximately $27 million. This forecast assumes currencies remain constant, global financial markets remain stable, and no unforeseen circumstances.
Directors anticipate the level of dividends for the 2013 financial year will be 15.00 cents per share, fully franked.
Servcorp continues to enjoy financial strength. During the 2012 financial year the business generated strong net operating cash flows of $32.00 million, up 70% on 2011. Cash balances at 30 June 2012 were $104.33 million; $95.77 million of the cash balance was unencumbered and the Company has negligible debt.
Global markets continue to be volatile and uncertain, however, we remain optimistic for the outlook for Servcorp. The Company has a strong balance sheet, global critical mass, little exposure to Europe and a presence in the growth markets of Southeast Asia, the Middle East, Australia and the USA. We have experienced management, an outstanding IT platform and propriety product offerings. It is a good story. We look forward to updating shareholders on how we are performing at our annual general meeting in November.
On behalf of the Board I thank our CEO, Alf Moufarrige, our leadership group and all the Servcorp team members for their dedication and commitment during the past year.
Thanks to management we have achieved an immense amount in the past couple of years. Due to their efforts we have an expanded global presence and continue to maintain our position as the world’s leading provider of serviced and virtual office solutions.
We thank you, our shareholders, for your continuing support.
Bruce Corlett
2012 was a year of consolidation for Servcorp’s operations in its new and existing markets. 2011 had been Servcorp’s biggest expansion year in its history and, given the challenging trading conditions in world markets, it was prudent to slow expansion and take the opportunity to assess our position, and focus on growing revenue. We are satisfied with the overall result.
Revenue for the year was $200.79 million, an increase of 10% on 2011, despite the strong Australian dollar. Our mature floors contributed $37.31 million profit before tax, an increase of 20%, and in line with guidance. Immature floor losses were $18.98 million, an improvement of 32% compared to 2011. As a result, net profit after tax increased to $14.80 million with an increase in earnings per share to 15.00 cents.
PAGE 8

CEO’s message
We have now almost doubled our size over the past 3 years, and whilst nothing in the commercial world, in this environment, is certain, we seem to have our immature floor losses under control and have maintained a $100 million cash balance with less than $10 million encumbered.
To hit immature and mature floor targets, in what was a challenging global environment was a combination of a great management team, dedicated people on the ground and a little bit of good luck!
My projections for this year will be only a projection for net profit before tax, and I anticipate this will increase by 50% from $18 million to $27 million.
I am so pleased to have a stable management team going forward, and this year have relied on, and appreciated, the advice and support of our Board.
The future challenges are not insurmountable and I look forward to real growth in the Middle East, stability in Australia, South East Asia and China and a challenge in both Japan and Europe.
Geographically we are well positioned to outperform most of our global competitors.
A G Moufarrige
Reflecting on a tough last year, I am pleased with the positive results achieved by the Servcorp team.
Last year we projected we would have a net profit before tax of $17 million and revenue increase from $182 million to $198 million, and that our mature floor profit would move from $31 million to $37 million.
This appeared to be a big ask but we achieved or exceeded every projection.
It’s quite elementary!
SERVCORP ANNUAL REPORT 2012 PAGE 9

Global expansionIn 2009 the global market conditions created an opportunity to secure leases on what was expected to be very favourable terms. This represented an attractive opportunity for aggressive expansion.
During October and November 2009 Servcorp successfully undertook an equity capital raising of $80 million to fund a global expansion program. Servcorp has a strong track record of global organic growth since its IPO in 1999. At the time of the IPO, Servcorp operated in 8 countries with 35 floors. In October 2009 it operated in 14 countries, with 73 floors.
In the 36 months to June 2012, 62 new floors have been opened, and Servcorp’s operations have expanded into 7 new countries. The 2011 financial year was Servcorp’s biggest expansion year in its history, with 40 floors opening in 29 cities across 12 countries.
This year we have opened floors in Shanghai, Guangzhou, Chengdu, Hangzhou, Doha, Jeddah, Bangkok, Brisbane and Perth.
We have undertaken a major expansion program which is now essentially behind us. We estimate we have executed the majority of leases at or near the bottom of the market which should ensure that Servcorp will be competitive if global business confidence recovers. We are well placed to move forward, with over 130 floors providing real critical mass.
In the 2013 financial year, we will continue with our current strategy of a steady pace of expansion. It is time to sell, stabilise and maximise profit. New openings will be limited to floors in established locations where expansion is expected to be expeditiously profitable.
We expect to open approximately 11 floors in the 2013 financial year. This will bring the total floor openings to 73 during the 48 months of expansion.
At 30 June 2012 Servcorp operated 124 floors in 52 cities across 21 countries.
PAGE 10
The plot is getting bigger all the time - keep following...

View from Park Avenue l New York
SERVCORP ANNUAL REPORT 2012 PAGE 11
PAGE 12
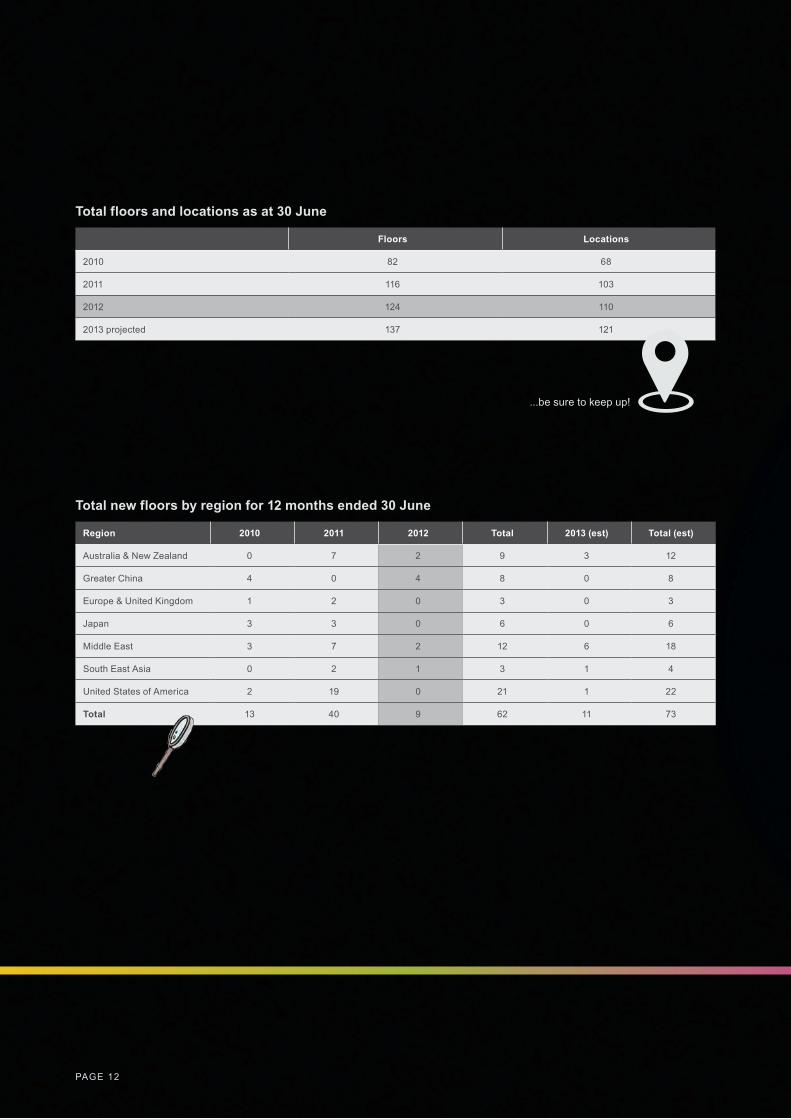
Total floors and locations as at 30 June
Floors Locations
2010 82 68
2011 116 103
2012 124 110
2013 projected 137 121
Total new floors by region for 12 months ended 30 June
Region 2010 2011 2012 Total 2013 (est) Total (est)
Australia & New Zealand 0 7 2 9 3 12
Greater China 4 0 4 8 0 8
Europe & United Kingdom 1 2 0 3 0 3
Japan 3 3 0 6 0 6
Middle East 3 7 2 12 6 18
South East Asia 0 2 1 3 1 4
United States of America 2 19 0 21 1 22
Total 13 40 9 62 11 73
...be sure to keep up!

SERVCORP ANNUAL REPORT 2012 PAGE 13

View from Shiodome l Tokyo
Do you know where it will happen next?
PAGE 14
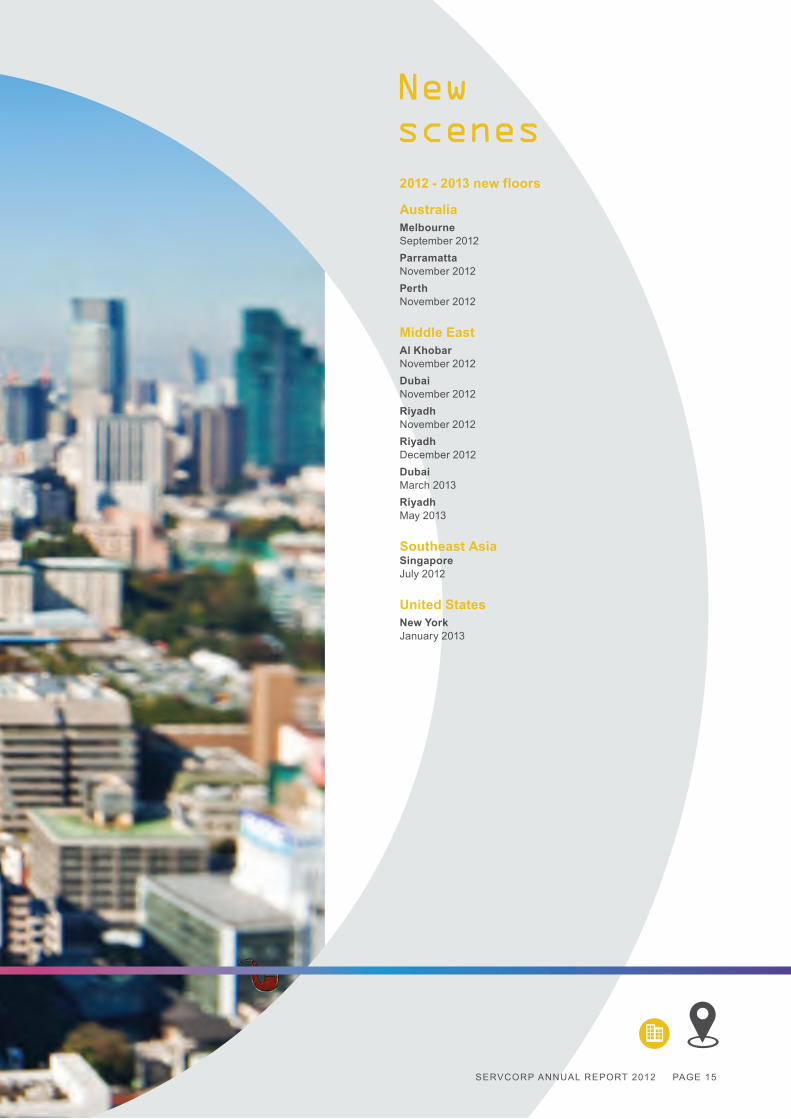
New scenes
AustraliaMelbourne September 2012Parramatta November 2012Perth November 2012
Middle EastAl Khobar November 2012Dubai November 2012Riyadh November 2012Riyadh December 2012DubaiMarch 2013RiyadhMay 2013
Southeast AsiaSingapore July 2012
United StatesNew York January 2013
2012 - 2013 new floors
SERVCORP ANNUAL REPORT 2012 PAGE 15

PAGE 16
Servcorp continues to acknowledge the seriousness of climate change and the impact high concentrations of greenhouse gases in the atmosphere are having on our planet. It is critical that we play a part in reducing our environmental impact through the development of green technologies and activities.
We recognize that there is a growing need for businesses to become sustainable to ensure the protection of the environment from further damage.
The Green Offices Project is our global platform for proactive initiatives that reduce our impact on the environment and highlights green issues within our teams and client base.
As part of The Green Offices Project, Servcorp plants a tree for every Virtual Office sold online through the Servcorp website. Virtual Offices, which are inherently environmentally friendly, continue to be a driving force behind the Green Offices Project.
The project aims to reduce our carbon emissions, offset our existing footprint and educate our teams and clients about improving their day-to-day impact on the environment. We have three distinct areas of focus; Reduce, Offset and Educate.
Servcorp has already planted more than 24,084 trees and the ‘Servcorp Forest’ now covers more than 100,000 square metres of regional land and is greater than the combined floor space occupied by our network of offices, globally.
The Servcorp Forest will already sequester more than 6,454.16 tonnes of carbon dioxide from the atmosphere during its lifespan. This is the equivalent to taking more than 1,200 cars off the road!
Servcorp believes that clients value the Green Office Project and its contribution to the future. We believe that they appreciate working with a business partner who is committed to supporting the community and the planet with responsible corporate measures.
Green initiative
Community serviceServcorp continues to support and assist continuing research into the prevention and cure of cancer and assisting young, seriously or terminally ill members of the community.
Servcorp holds charity functions and balls, runs raffles and undertakes donation drives all year round in all our locations. Every dollar that is raised by our teams on the ground is matched dollar for dollar by Servcorp.
In Australia, Youngcare continues to be the main focus of our fundraising, and Non-executive director, Taine Moufarrige continues to be heavily involved with this organisation.
The other organisations we strongly supported globally this year included: ▪ Cancer Council ▪ Carers Australia – Pollie Pedal ▪ Exodus Foundation ▪ Harry Windsor Trust Fund at St Vincent’s Hospital ▪ Lifestart – Kayak for Kids ▪ The Mater Hospital – Sydney ▪ MS Research Australia ▪ Rotary Club of Sydney ▪ Sony Foundation Australia ▪ St Vincents & Mater Health – Sydney ▪ Sydney Children’s Hospital Foundation ▪ Women’s Plans Foundations ▪ Assisi Hospice – Singapore ▪ Christchurch Earthquake Appeal – New Zealand ▪ Persatuan Rumah Sayangan – Kuala Lumpur Orphanage Home ▪ Tyler Foundation – Japan ▪ World Cancer Research Fund – Hong Kong
Servcorp also contributed to many other local charitable organisations around the world and sponsors and/or supports the Australian Chamber Orchestra, Opera Australia and Sydney Dance Company.
In 2011/2012 Servcorp raised and donated in excess of $750,000 to help the above organisations.
We are proud of the fact that as a global Company we work with our local communities to bring about real change for good. We’d like to thank our clients and those who contributed to the success of our fundraising for the year.
We will keep you updated.
Working for the collective good
PAGE 17SERVCORP ANNUAL REPORT 2012
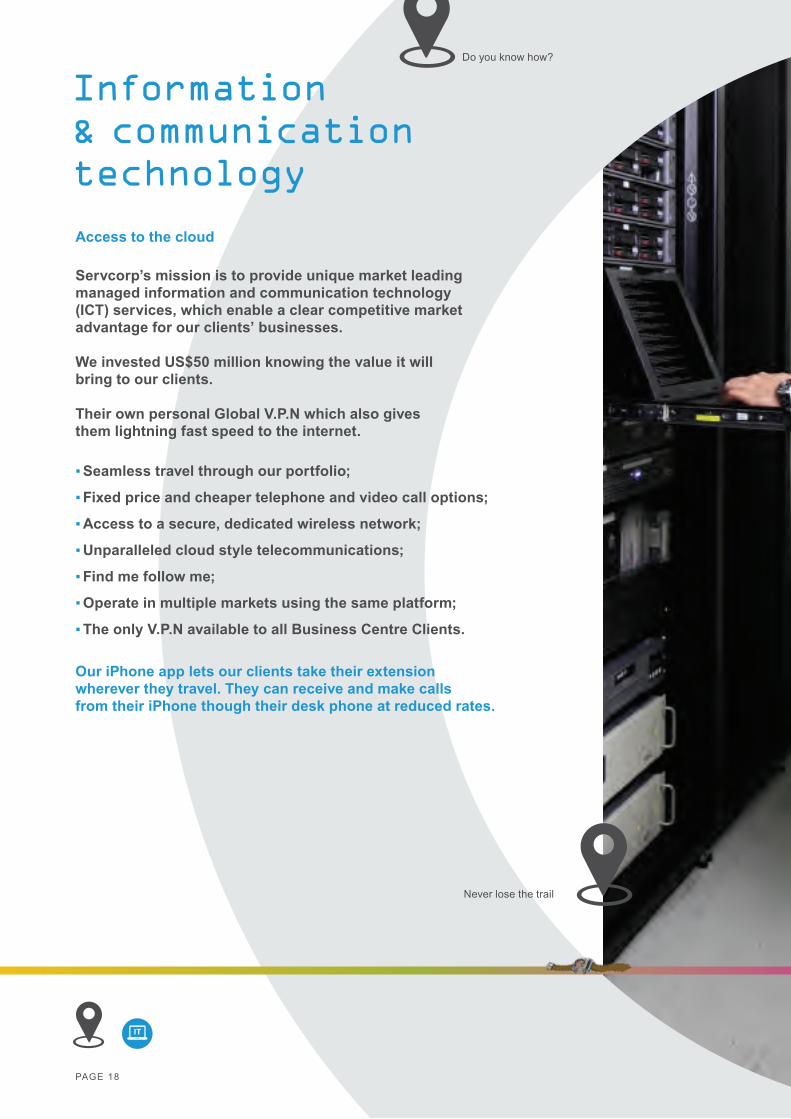
Information & communication technology
Access to the cloud
Servcorp’s mission is to provide unique market leading managed information and communication technology (ICT) services, which enable a clear competitive market advantage for our clients’ businesses.
We invested US$50 million knowing the value it will bring to our clients.
Their own personal Global V.P.N which also gives them lightning fast speed to the internet.
▪ Seamless travel through our portfolio;
▪ Fixed price and cheaper telephone and video call options;
▪ Access to a secure, dedicated wireless network;
▪ Unparalleled cloud style telecommunications;
▪ Find me follow me;
▪ Operate in multiple markets using the same platform;
▪ The only V.P.N available to all Business Centre Clients.
Our iPhone app lets our clients take their extension wherever they travel. They can receive and make calls from their iPhone though their desk phone at reduced rates.
Do you know how?
Never lose the trail
PAGE 18
IT

Service& products
Local number
Professional phone greetings
Automated attendant
Conference calling
Fax to email
Voicemail notification
Call diversion
Extension rings on iPhone
Awards
Premier’s NSW 2011 Innovation in Export Winner
Japan SocialMedia100 company
SERVCORP ANNUAL REPORT 2012 PAGE 19

SAN FRANCISCOLOS ANGELES
CHICAGO
IRVINE
TYSONS CORNER BOSTON
MIAMI
ATLANTAWASHINGTON D.C.
PHILADELPHIANEW YORK CITY
LONDONPARIS BRUSSELS
ISTANBUL
BEIRUTKU WAIT CITY
JEDDAHRIYADH
AL KHOBAR - DAMMAMMANAMA
PERTH
BRISBANE
AUCKLAND
SYDNEY
CANBERRA
WELLINGTONHOBART
MELBOURNE
ADELAIDE
HYDERABAD
SINGAPORE
MANILA
YOKOHAMATOKYO
HANGZHOUSHANGHAI
MUMBAI
BEIJING
CHENGDU
NAGOYAOSAKA
FUKUOKA
ABU DHABIDOHA
KUALA LUMPUR
BANGKOK
HONG KONG
DALLASHOUSTON
DUBAIGUANGZHOU
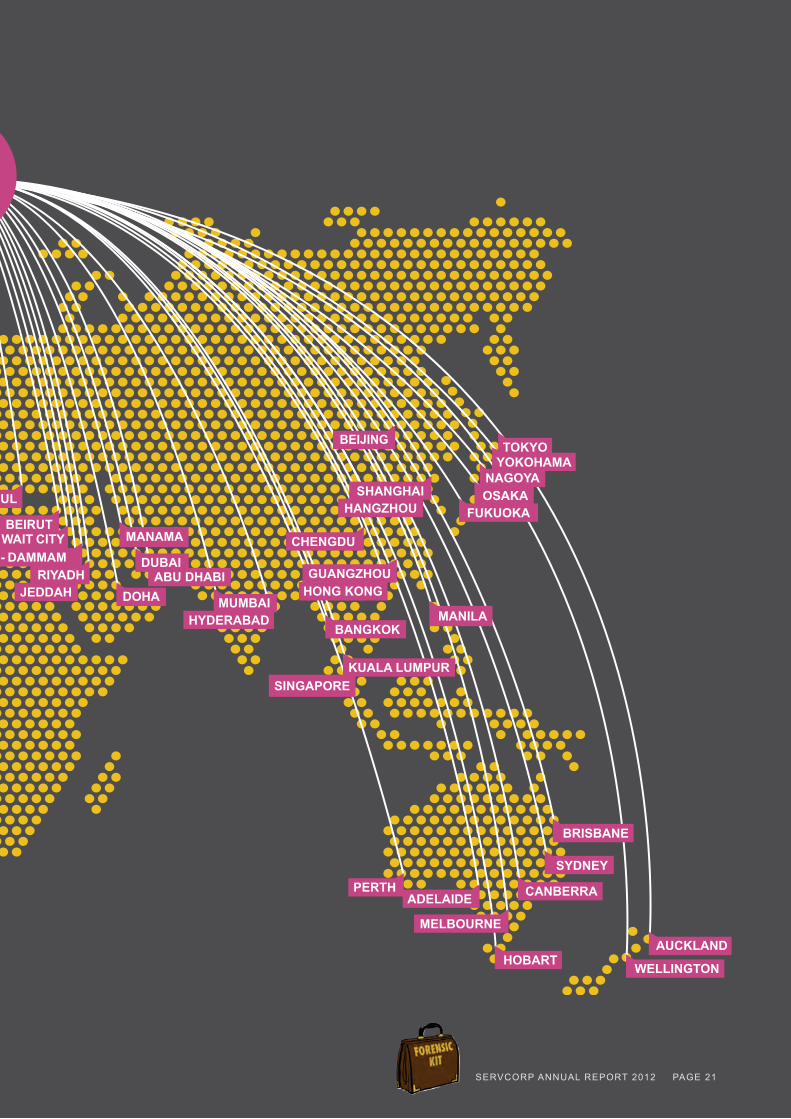
Servcorp IT global network
PAGE 20
...figure out how to use it to improve your bottom line
It’s your goldmine in the cloud...
SAN FRANCISCOLOS ANGELES
CHICAGO
IRVINE
TYSONS CORNER BOSTON
MIAMI
ATLANTAWASHINGTON D.C.
PHILADELPHIANEW YORK CITY
LONDONPARIS BRUSSELS
ISTANBUL
BEIRUTKU WAIT CITY
JEDDAHRIYADH
AL KHOBAR - DAMMAMMANAMA
PERTH
BRISBANE
AUCKLAND
SYDNEY
CANBERRA
WELLINGTONHOBART
MELBOURNE
ADELAIDE
HYDERABAD
SINGAPORE
MANILA
YOKOHAMATOKYO
HANGZHOUSHANGHAI
MUMBAI
BEIJING
CHENGDU
NAGOYAOSAKA
FUKUOKA
ABU DHABIDOHA
KUALA LUMPUR
BANGKOK
HONG KONG
DALLASHOUSTON
DUBAIGUANGZHOU
SERVCORP ANNUAL REPORT 2012 PAGE 21

Servcorp Board & chief investigators
The Board and ExecutiveBruce Corlett – ChairmanRick Holliday-Smith – Non-Executive DirectorMark Vaile – Non-Executive DirectorAlf Moufarrige – Executive Director, CEOTaine Moufarrige – Non-Executive DirectorMarcus Moufarrige (BCom) – Chief Operating OfficerThomas Wallace (BBS, FCA) – Chief Financial OfficerGreg Pearce (CA, ACSA, ACIS) – Company Secretary
Operational ExecutiveSusie Martin (BEc) – General Manager South East Asia & IndiaOlga Vlietstra (BA) – General Manager JapanJennifer Goodwyn (BA) – Vice President/General Manager USALaudy Lahdo (BCom) – General Manager Middle East & TurkeyLiane Gorman – General Manager Australia & New ZealandKureha Ogawa (BA) – Senior Manager JapanMichaela Julian (BA) – Senior Manager ChinaWilma Wu (BA Hons) – General Manager Hong KongAnne Guinebault (BBus, MMR) – Senior Manager ParisWarren James – Manager International Property PortfolioLachlan Buchanan (BCom) – International Property Project ManagerMatthew Baumgartner (BInfTech (SE), CCIE) – Chief Information OfficerDaniel Kukucka (BE, DipEngPrac) – Chief Technology Officer
PAGE 22
Park AvenueNew York
MLC CentreSydney
ChengduChina
Hilton PlazaOsaka

PAGE 23
Emirates TowersDubai
whodunit?Servcorp
where? In its prestigious locations globally
how?With the global network
PAGE 24
Corporate governance
Role of the BoardThe Board has adopted a formal statement of matters reserved for the Board. The central role of the Board is to set the Company’s strategic direction and to oversee the Company’s management and business activities.
Responsibility for management of the Company’s business activities is delegated to the CEO and management.
The Board’s primary responsibilities are: ▪ the protection and enhancement of long-term
shareholder value; ▪ ensuring Servcorp has appropriate corporate governance
structures in place; ▪ endorsing strategic direction; ▪ monitoring the Company’s performance within
that strategic direction; ▪ appointing the Chief Executive Officer and evaluating
his performance and remuneration; ▪ monitoring business performance and results; ▪ identifying areas of significant risk and seeking to put
in place appropriate and adequate control, monitoring and reporting mechanisms to manage those risks; ▪ establishing appropriate standards of ethical behaviour
and a culture of corporate and social responsibility; ▪ approving senior executive remuneration policies; ▪ ratifying the appointment of the Chief Financial Officer
and the Company Secretary; ▪ monitoring compliance with continuous disclosure policy
in accordance with the Corporations Act 2001 and the Listing Rules of the Australian Securities Exchange; ▪ monitoring that the Company acts lawfully and responsibly; ▪ reporting to shareholders; ▪ addressing all matters in relation to issued securities
of the Company including the declaration of dividends; ▪ ensuring the Board is, and remains, appropriately skilled
to meet the changing needs of the Company.
The Board Charter is available on the Company’s website; servcorp.com.au
Composition of the BoardThe size and composition of the Board is determined by the Board, subject to the limits set out in Servcorp’s Constitution which requires a minimum of three directors and a maximum of twelve directors.
The Board comprises five directors (one executive and four non-executive). Three non-executive directors are independent.
Changes to the Board since the last annual report are: ▪ Mrs Julia King retired as a director on 16 November 2011; ▪ Mr Taine Moufarrige resigned as an executive of the
Company effective 31 December 2011. He remains on the Board as a non-executive director.
The Chairman of the Board, Mr Bruce Corlett, is an independent non-executive director.
The non-executive directors bring to the Board an appropriate range of skills, experience and expertise to ensure that Servcorp is run in the best interest of all stakeholders. The skills, experience and expertise of each director in office at the date of this annual report are set out on pages 34 and 35 of this annual report. The Board will continue to be made up of a majority of independent non-executive directors. The performance of non-executive directors was reviewed during the year.
The names of the directors of the Company in office at the date of this annual report are set out in the table on the following page.
Directors’ independenceIt is important that the Board is able to operate independently of executive management.
The non-executive directors, with the exception of Mr T Moufarrige, are considered by the Board to be independent of management. Independence is assessed by determining whether the director is free of any business interest or other relationship which could materially interfere with the exercise of their unfettered and independent judgement and their ability to act in the best interests of Servcorp.
Mr T Moufarrige is the only non-executive director who has ever been employed by Servcorp. Mr T Moufarrige resigned as an executive of Servcorp on 31 December 2011 after 15 years of service.
The Board has responsibility for the long-term financial health and prosperity of Servcorp. The directors are responsible to the shareholders for the performance of the Company and the Consolidated Entity and to ensure that it is properly managed.
The Board is committed to the principles underpinning the ASX Corporate Governance Council Principles and Recommendations. The Board is continually working to improve the Company’s governance policies and practices, where such practices will bring benefits or efficiencies to the Company.
Details of Servcorp’s compliance are set out below, and in the ASX principles compliance statement on pages 28 to 33 of this annual report.
PAGE 25
Election of directorsThe Company’s Constitution specifies that an election of directors must take place each year. One-third of the Board (excluding the Managing Director and rounded down to the nearest whole number), and any other director who has held office for three or more years since they were last elected, must retire from office at each annual general meeting. The directors are eligible for re-election. Directors may be appointed by the Board during the year. Directors appointed by the Board must retire from office at the next annual general meeting.
Any changes to directorships will be dealt with by the full Board and accordingly a Nomination Committee has not been established.
Conflict of interestIn accordance with the Corporations Act 2001 and the Company’s Constitution, directors must keep the Board advised, on an ongoing basis, of any interest that would potentially conflict with those of Servcorp. Where the Board believes that an actual or potential significant conflict exists, the director concerned, if appropriate, will not take part in any discussions or decision making process on the matter and will abstain from voting on the item being considered. Details of director related entity transactions with the Company and the Consolidated Entity are set out in Note 26 to the Consolidated financial report.
Independent professional adviceEach director has the right to seek independent professional advice, at Servcorp’s expense, to help them carry out their responsibilities. Prior approval of the Chairman is required, which will not be unreasonably withheld. A copy of any written advice received by the director is made available to all other members of the Board.
Director and officer dealings in Company sharesServcorp policy prohibits directors, officers and senior executives from dealing in Company shares or exercising options: ▪ in the six weeks prior to the announcement to the
ASX of the Company’s half-year and full-year results; or ▪ whilst in possession of non-public price
sensitive information.
Directors must discuss proposed purchases or sales of shares in the Company with the Chairman before proceeding. The Chairman must receive approval from the next most senior director before proceeding. Directors must also notify the Company Secretary when they buy or sell shares in the Company. This is reported to the Board.
In accordance with the provisions of the Corporations Act 2001 and the Listing Rules of the ASX, each director has entered into an agreement with the Company that requires disclosure to the Company of all information needed for it to comply with the obligation to notify the ASX of directors’ holdings and interests in its securities.
The Company’s Securities Trading Policy is available on the Company’s website; servcorp.com.au
Ethical standardsAll directors, managers and employees are expected to act with the utmost integrity and objectivity, striving at all times to enhance the reputation and performance of Servcorp.
Codes of conduct, outlining the standards of personal and corporate behaviour to be observed, form part of Servcorp’s management and team manuals.
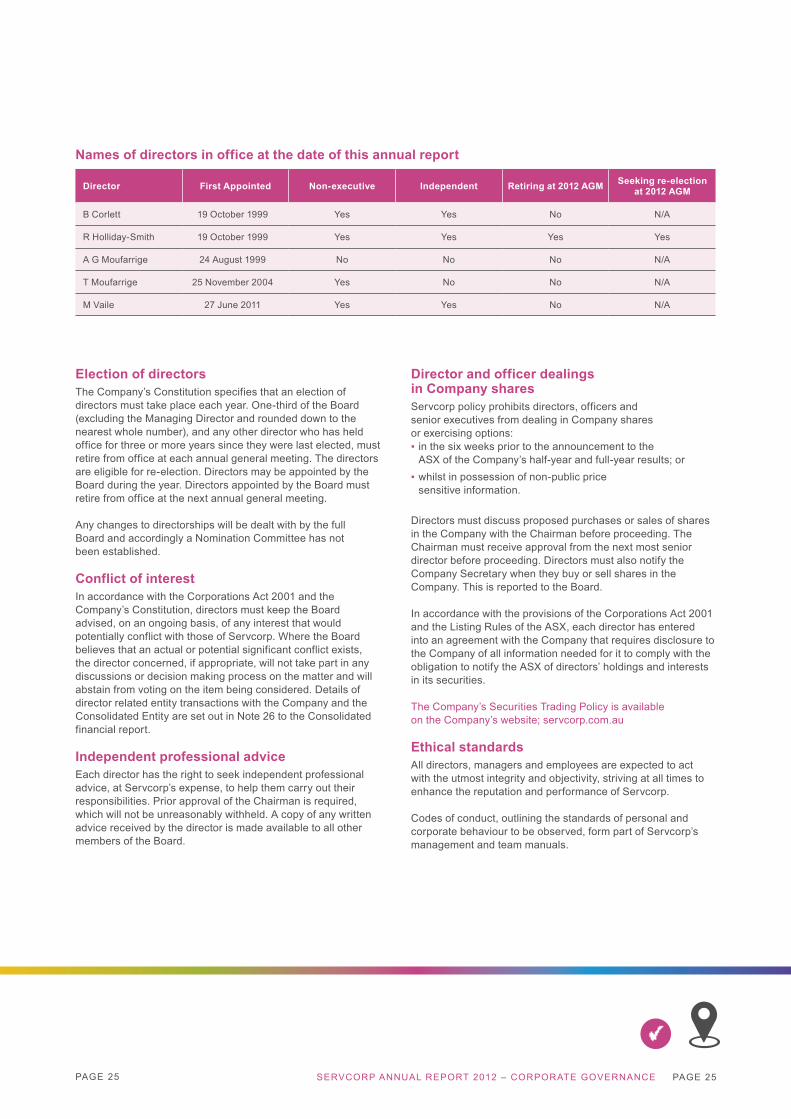
Names of directors in office at the date of this annual report
Director First Appointed Non-executive Independent Retiring at 2012 AGM Seeking re-election at 2012 AGM
B Corlett 19 October 1999 Yes Yes No N/A
R Holliday-Smith 19 October 1999 Yes Yes Yes Yes
A G Moufarrige 24 August 1999 No No No N/A
T Moufarrige 25 November 2004 Yes No No N/A
M Vaile 27 June 2011 Yes Yes No N/A
SERVCORP ANNUAL REPORT 2012 – CORPORATE GOVERNANCE PAGE 25
PAGE 26
Continuous disclosureServcorp is committed to ensuring that all shareholders and investors are provided with full and timely information and that all stakeholders have equal and timely access to material information concerning the Company. Procedures are in place to ensure that all price sensitive information is disclosed to the ASX in accordance with the continuous disclosure requirements of the Corporations Act 2001 and ASX Listing Rules.
The Company Secretary has been appointed as the person responsible for communications with the ASX.
Auditor independenceThe Company’s auditor Deloitte Touche Tohmatsu (Deloitte) was appointed at the annual general meeting of the Company on 6 November 2003.
The Lead Partner at the time of Deloitte’s appointment, Mr P Forrester, completed his five year tenure upon signing the financial report for the year ended 30 June 2008. In accordance with the mandatory requirements under the Corporations Law, Mr Forrester rotated off the Servcorp audit engagement and was replaced by Mr S Gustafson as Lead Partner. Mr S Gustafson will be due for rotation following the completion of the audit for the year ending 30 June 2013.
Deloitte have established policies and procedures designed to ensure their independence, and provide the Audit and Risk Committee with an annual confirmation as to their independence.
DiversityThe Company has a culture that both embraces and achieves diversity in its global operations.
The Company is culturally diverse in its employment practices and has a global culture of employing the best qualified available talent for any position regardless of gender, age or race. The Company benefits from the diversity of its team members and has training programs to assist with developing their skills and with career advancement. The Company travels team members to work in its global locations, giving them exposure to and understanding of various differing cultures and marketplaces.
CommitteesThe Board does not delegate major decisions to committees. Committees are responsible for considering detailed issues and making recommendations to the Board. The Board has established two committees to assist in the implementation of its corporate governance practices.
Audit and Risk CommitteeThe members of the Audit and Risk Committee during the year were: ▪ Mr R Holliday-Smith (Chair) ▪ Mr B Corlett ▪ Mrs J King - retired 16 November 2011 ▪ Mr T Moufarrige - appointed 22 December 2011
A majority of members are independent non-executive directors. The chairman of the Audit and Risk Committee is independent and is not the chairman of the Board.
The primary function of the Audit and Risk Committee is to assist the Board to meet its oversight responsibilities in relation to: ▪ ensuring the Company adopts, maintains and applies
appropriate accounting and financial reporting processes and procedures; ▪ reviewing and monitoring the integrity of the Company’s
financial reports and statements; ▪ ensuring the Company maintains an effective risk
management framework and internal control systems; ▪ monitoring the performance and independence of the
external audit process and addressing issues arising from the audit process.
It is the Committee’s responsibility to maintain free and open communication between the Committee and the external auditor and the management of Servcorp.
The external auditors attend all meetings of the Committee. The Chief Executive Officer, the Chief Financial Officer and other senior management may attend Committee meetings by invitation.
The Audit and Risk Committee met four times during the year. The Committee meets with the external auditors without management being present before signing off its reports each half year. The Committee Chairman also meets with the auditors at regular intervals during the year.
Corporate governance(continued)
The Company has a high participation of women across all employment levels
Full time employees Total No.
Women %
Men %
Consolidated entity 755 83% 17%
Senior executives 16 50% 50%
Board 5 0% 100%
PAGE 27
The responsibilities of the Audit and Risk Committee, as stated in its charter, include: ▪ reviewing the financial reports and other financial
information distributed externally; ▪ reviewing the Company’s policies and procedures for
compliance with Australian equivalents to International Financial Reporting Standards; ▪ monitoring the procedures in place to ensure compliance
with the Corporations Act 2001, ASX Listing Rules and all other regulatory requirements; ▪ assisting management in improving the quality of the
accounting function; ▪ monitoring the internal control framework and
compliance structures and considering enhancements; ▪ overseeing the risk management framework; ▪ reviewing external audit reports to ensure that, where
major deficiencies or breakdown in controls or procedures have been identified, appropriate and prompt remedial action is taken by management; ▪ reviewing reports on any major defalcations, frauds
and thefts from the Company; ▪ considering the appointment and fees of the
external auditor; ▪ reviewing and approving the terms of engagement
and fees of the external auditor at the start of each audit; ▪ considering and reviewing the scope of work, reports
and activities of the external auditor; ▪ establishing appropriate policies in regard to the
independence of the external auditor and assessing that independence; ▪ liaising with the external auditor to ensure that the
statutory annual audit and half-yearly review are conducted in an effective manner; ▪ addressing with management any matters outstanding
with the auditors, taxation authorities, corporate regulators, Australian Securities Exchange and financial institutions; ▪ monitoring the establishment of appropriate
ethical standards.
The Audit and Risk Committee Charter is available on the Company’s website; servcorp.com.au
Remuneration CommitteeThe Remuneration Committee members during the year were: ▪ The Hon. M Vaile (Chair) ▪ Mrs J King - retired 16 November 2011 ▪ Mr B Corlett - resigned 22 December 2011 ▪ Mr R Holliday-Smith ▪ Mr T Moufarrige - appointed 22 December 2011
The primary function of the Remuneration Committee is to assist the Board in adopting remuneration policy and practices that: ▪ supports the Board’s overall strategy and objectives; ▪ attracts and retains key employees; ▪ links total remuneration to financial performance
and the attainment of strategic objectives.
Specifically this will include: ▪ making recommendations to the Board on appropriate
remuneration, in relation to both the amount and its composition, for the Chief Executive Officer and senior executives who report to the Chief Executive Officer; ▪ developing and recommending to the Board short-term
and long-term incentive programs; ▪ monitoring superannuation arrangements for the Company; ▪ reviewing recruitment, retention and termination strategies
and procedures; ▪ ensuring the total remuneration policy and practices
are designed with proper consideration of accounting, legal and regulatory requirements for both local and foreign jurisdictions; ▪ reviewing the Remuneration Report for the Company
and ensuring that publicly disclosed information meets all legal requirements and is accurate.
The Remuneration Committee shall ensure the Company is committed to the principles of accountability and transparency and to ensuring that remuneration arrangements achieve a balance between shareholder and executive rewards.
The Remuneration Committee met twice during the year. The Chief Executive Officer may attend Committee meetings by invitation to assist the Committee in its deliberations.
The Remuneration Committee Charter is available on the Company’s website; servcorp.com.au
SERVCORP ANNUAL REPORT 2012 – CORPORATE GOVERNANCE PAGE 27

PAGE 28
Principle 1 Lay solid foundations for management and oversightEstablish and disclose the respective roles and responsibilities of board and management.
Recommendation 1.1 Establish the functions reserved to the board and those delegated to senior executives and disclose those functions.
Servcorp Board Response
The Board has adopted a charter that sets out the responsibilities reserved for the Board and those delegated to the Managing Director and senior executives. Primary responsibilities are set out on page 24.
The Board Charter is available on the Company’s website; servcorp.com.au
Recommendation 1.2 Disclose the process for evaluating the performance of senior executives.
Servcorp Board Response The process for evaluating the performance of senior executives is included in the remuneration report on pages 44 to 47 of this annual report.
Recommendation 1.3 Provide the information indicated in the Guide to reporting on Principle 1.
Servcorp Board Response All relevant information is included in the corporate governance section on pages 24 to 33 of this annual report.
Principle 2Structure the board to add valueHave a board of an effective composition, size and commitment to adequately discharge its responsibilities and duties.
Recommendation 2.1 A majority of the board should be independent directors.
Servcorp Board Response The Board has a majority of independent directors. Three of the four currently serving non-executive directors are independent.
Recommendation 2.2 The chair should be an independent director.
Servcorp Board Response The Chair is an independent director.
Recommendation 2.3 The roles of chair and chief executive officer should not be exercised by the same individual.
Servcorp Board Response The roles of Chair and Managing Director/CEO are not exercised by the same individual.
Recommendation 2.4 The board should establish a nomination committee.
Servcorp Board Response
The Board has not established a nomination committee. Given the size of the current Board, efficiencies are not forthcoming from a separate committee structure. Selection and appointment of new directors is undertaken by the full Board. Any director appointed by the Board must retire from office at the next annual general meeting and seek re-election by shareholders.
A specific skills matrix has not been developed, however the current non-executive directors each bring a mix of skills and experience to the Board. The Board has endeavoured to expand this skills mix when considering new appointments.
Corporate governance(continued)
ASX principles compliance statementThis table provides a description of the manner in which Servcorp complies with the ASX Corporate Governance Principles and Recommendations or where applicable, an explanation of any departures from the Principles. Compliance has been measured against the 2nd edition of the Principles and Recommendations with 2010 Amendments which apply to the first financial year commencing after 1 January 2011.
PAGE 29
Recommendation 2.5 Disclose the process for evaluating the performance of the board, its committees and individual directors.
Servcorp Board Response
The Board operates under a charter and a code of conduct which recognises that strong ethical values must be at the heart of director and Board performance. The non-executive directors evaluate individual director’s performance and also the Board’s performance. As a tool to evaluation, a questionnaire is completed annually by the non-executive directors with the responses assessed and discussed by the non-executive directors. There is good interaction between all directors and with senior executives and it is considered that the non-executive directors have a solid understanding of the culture and values of the Company.
Recommendation 2.6 Provide the information indicated in the Guide to reporting on Principle 2.
Servcorp Board Response All relevant information is included in the corporate governance section on pages 24 to 33 of this annual report.
Principle 3 Promote ethical and responsible decision-makingActively promote ethical and responsible decision-making.
Recommendation 3.1
Establish a code of conduct and disclose the code or a summary of the code as to: ▪ the practices necessary to maintain confidence in the company’s integrity; ▪ the practices necessary to take into account their legal obligations and the reasonable expectations
of their stakeholders; ▪ the responsibility and accountability of individuals for reporting and investigating reports of unethical practices.
Servcorp Board Response
The Company has established codes of conduct and ethical standards which all directors, executives and employees are expected to uphold and promote. They guide compliance with legal requirements and ethical responsibilities, and also set a standard for employees and directors dealing with Servcorp’s obligations to external stakeholders.
In regard to stakeholders, the Company: ▪ reports its financial performance twice a year to the Australian Securities Exchange; ▪ maintains a website; ▪ publishes external announcements to the website and maintains these announcements for at least two years; ▪ at general meetings, shareholders are given a reasonable opportunity to ask questions; ▪ briefings are held following the release of the half-year and full-year financial results.
Recommendation 3.2Establish a policy concerning diversity and disclose the policy or a summary of that policy. The policy should include requirements for the board to establish measurable objectives for achieving gender diversity for the board to assess annually both the objectives and progress in achieving them.
Servcorp Board Response
The Company has not established a written policy concerning diversity. The Company has a culture that both embraces and achieves diversity in its global operations. The establishment of a written policy with measurable objectives for achieving gender diversity would not bring any efficiency or greater benefit to the current diverse culture.
SERVCORP ANNUAL REPORT 2012 – CORPORATE GOVERNANCE PAGE 29

PAGE 30
Recommendation 3.3 Disclose in each annual report the measurable objectives for achieving gender diversity set by the board in accordance with the diversity policy and progress towards achieving them.
Servcorp Board Reponse
The Board has not set measurable objectives for gender diversity. The Company is culturally diverse in its employment practices and has a global culture of employing the best qualified available talent for any position regardless of gender, age or race. The Company benefits from the diversity of its team members and has training programs to assist with developing their skills and with career advancement. The Company travels team members to work in its global locations, giving them exposure to and understanding of various differing cultures and marketplaces.
Recommendation 3.4 Disclose in each annual report the proportion of women employees in the whole organisation, women in senior executive positions and women on the board.
Servcorp Board Reponse
The Company has a high participation of women across all employment levels, including in senior executive positions. The retirement of Mrs King has resulted in there being no women on the Board. The Board supports diversity in gender and is interested in having the best Board available, therefore appointment is based on merit, not gender.
The proportion of women employees in the Company is provided in the table on page 26 of this annual report.
Recommendation 3.5 Provide the information indicated in the Guide to reporting on Principle 3.
Servcorp Board Response
An explanation of departures from Recommendations 3.2 and 3.3 is included in the respective responses.
The relevant information is made publicly available by inclusion of the main provisions in the annual report. Complete versions are not available on the Company’s website as they form part of manuals which are proprietary and confidential.
Principle 4Safeguard integrity in financial reportingHave a structure to independently verify and safeguard the integrity of the company’s financial reporting.
Recommendation 4.1 The board should establish an audit committee.
Servcorp Board Response The Board has established an Audit and Risk Committee.
Recommendation 4.2
The audit committee should be structured so that it: ▪ consists only of non-executive directors; ▪ consists of a majority of independent directors; ▪ is chaired by an independent chair, who is not chair of the board; ▪ has at least three members.
Servcorp Board Response All three members of the Audit and Risk Committee are non-executive directors, and two members are independent directors. The Chair of the committee is not the Chair of the Board.
Recommendation 4.3 The audit committee should have a formal charter.
Servcorp Board Response
The Audit and Risk Committee has a formal charter which sets out its specific roles and responsibilities and composition requirements.
The Audit and Risk Committee charter is available on the Company’s website; servcorp.com.au
Corporate governance(continued)
ASX principles compliance statement (continued)
PAGE 31
Recommendation 4.4
Provide the information indicated in the Guide to reporting on Principle 4.
▪ the names and qualifications of those appointed to the audit committee, and their attendance at meetings of the committee; ▪ the number of meetings of the audit committee.
Servcorp Board Response This information is provided on pages 26, and 34 to 36 of this annual report.
Recommendation 4.4 (continued)
▪ procedures for the selection and appointment of the external auditor, and for the rotation of external audit engagement partners.
Servcorp Board Response
The external auditor, Deloitte Touche Tohmatsu (Deloitte), under the scrutiny of the Audit and Risk Committee, presently conducts the statutory audits in return for reasonable fees. Deloitte were appointed at the annual general meeting of the Company held on 6 November 2003. The committee also has specific responsibility for recommending the appointment or dismissal of external auditors and monitoring any non-audit work carried out by the external audit firm. No director has any association, past or present, with the external auditor.
Deloitte rotate their audit engagement partner every five years.
Principle 5 Make timely and balanced disclosure Promote timely and balanced disclosure of all material matters concerning the company.
Recommendation 5.1Establish written policies designed to ensure compliance with ASX Listing Rule disclosure requirements and to ensure accountability at a senior executive level for that compliance and disclose those policies or a summary of those policies.
Servcorp Board Response
The Company has established a continuous disclosure compliance plan. The Board and management continually monitor information and events and their obligation to report any matters. Responsibility for communications to the ASX on all material matters rests with the Company Secretary following consultation with the Chair and Managing Director.
Recommendation 5.2 Provide the information indicated in the Guide to reporting on Principle 5.
Servcorp Board Response There is no further information to be provided.
Principle 6 Respect the rights of shareholdersRespect the rights of shareholders and facilitate the effective exercise of those rights.
Recommendation 6.1 Design a communications policy for promoting effective communication with shareholders and encouraging their participation at general meetings and disclose the policy or a summary of that policy.
Servcorp Board Response
Servcorp aims to communicate clearly and transparently with shareholders and the community. Servcorp places company announcements on its website and also displays annual and half-year reports.
Shareholders are given a reasonable opportunity to ask questions at the annual general meeting.
Briefings are held following the release of annual and half-year results and the time and location of these briefings are notified to the market.
Recommendation 6.2 Provide the information indicated in the Guide to reporting on Principle 6.
Servcorp Board Response The information has been provided in the response to recommendation 6.1.
SERVCORP ANNUAL REPORT 2012 – CORPORATE GOVERNANCE PAGE 31

PAGE 32PAGE 32
Principle 7 Recognise and manage riskEstablish a sound system of risk oversight and management and internal control.
Recommendation 7.1 Companies should establish policies for the oversight and management of material business risks and disclose a summary of those policies.
Servcorp Board Response
Management has a sound and comprehensive understanding of the inherent risks of the business which have been identified and managed through the experience of the Chief Executive Officer and long serving executives.
Management have identified and documented the key risks of the business across the spectrum of strategic, information technology, human resources, operational, financial and legal/ compliance. The company does not have formal written policies for all aspects of its risk oversight and management.
The company is a globally run business where senior executives have oversight through the systems and reporting mechanisms of all activities in all global locations. The systems infrastructure is centrally managed through a small group of senior executives. Management’s objective is to create a culture in which all executives focus on risk as a natural part of their day to day activities. The senior executives responsible for the day to day management of key risks have been identified.
Many processes are documented through the Company’s manuals which are proprietary and confidential, and these are regularly being strengthened and improved with time.
Business processes are continually improved to reduce the potential for financial loss.
Recommendation 7.2
The board should require management to design and implement the risk management and internal control system to manage the company’s material business risks and report to it on whether those risks are being managed effectively. The board should disclose that management has reported to it as to the effectiveness of the company’s management of its material business risks.
Servcorp Board Response
The Board has established an Audit and Risk Committee that is comprised only of non-executive directors. The Committee reviews the Company’s risk management strategy, its adequacy and effectiveness and the communication of risks to the Board.
The Committee is satisfied that the Company and management have a culture of risk control and are gradually formalising the infrastructure of this culture. Although not all policies have been formally documented, the identified risks are tightly controlled and being managed effectively.
The Company is heavily reliant on financial controls and senior executive controls. Day to day responsibility is delegated to the Chief Executive Officer and senior management. The Chief Executive Officer and senior management are responsible for: ▪ identification of risk; ▪ monitoring risk; ▪ communication of risk events to the Board; and ▪ responding to risk events, with Board authority.
The Board defines risk to be any event that, if it occurs, will have a material impact on the ability of the Company to achieve its objectives. Risk is considered across the financial, operational and organisational aspects of the Company’s affairs.
The Audit and Risk Committee is working with management to ensure continuous improvement to the risk management and internal control systems.
Corporate governance(continued)
ASX principles compliance statement (continued)
PAGE 33 SERVCORP ANNUAL REPORT 2012 – CORPORATE GOVERNANCE PAGE 33
Recommendation 7.3
The board should disclose whether it has received assurance from the chief executive officer (or equivalent) and the chief financial officer (or equivalent) that the declaration provided in accordance with section 295A of the Corporations Act is founded on a sound system of risk management and internal control and that the system is operating effectively in all material respects in relation to financial reporting risks.
Servcorp Board Response The Chief Executive Officer and Chief Financial Officer provide such assurance.
Recommendation 7.4 Provide the information indicated in the Guide to reporting on Principle 7.
Servcorp Board Response This information is provided above.
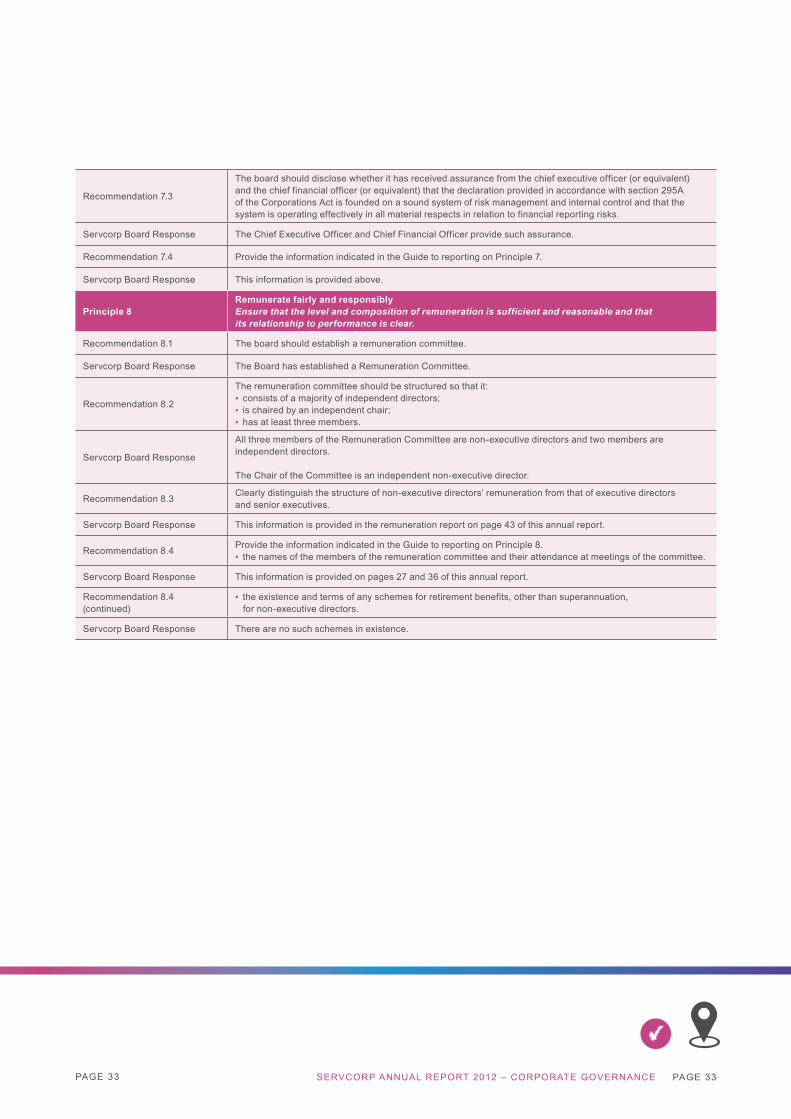
Principle 8Remunerate fairly and responsiblyEnsure that the level and composition of remuneration is sufficient and reasonable and that its relationship to performance is clear.
Recommendation 8.1 The board should establish a remuneration committee.
Servcorp Board Response The Board has established a Remuneration Committee.
Recommendation 8.2
The remuneration committee should be structured so that it: ▪ consists of a majority of independent directors; ▪ is chaired by an independent chair; ▪ has at least three members.
Servcorp Board Response
All three members of the Remuneration Committee are non-executive directors and two members are independent directors.
The Chair of the Committee is an independent non-executive director.
Recommendation 8.3 Clearly distinguish the structure of non-executive directors’ remuneration from that of executive directors and senior executives.
Servcorp Board Response This information is provided in the remuneration report on page 43 of this annual report.
Recommendation 8.4 Provide the information indicated in the Guide to reporting on Principle 8. ▪ the names of the members of the remuneration committee and their attendance at meetings of the committee.
Servcorp Board Response This information is provided on pages 27 and 36 of this annual report.
Recommendation 8.4 (continued)
▪ the existence and terms of any schemes for retirement benefits, other than superannuation, for non-executive directors.
Servcorp Board Response There are no such schemes in existence.

PAGE 34
The directors of Servcorp Limited (“the Company”) present their report together with the Consolidated financial report of the “Consolidated Entity”, being the Company and its controlled entities, for the financial year ended 30 June 2012.
DirectorsThe directors of the Company at any time during or since the end of the financial year are:
Directors’ report
Alf Moufarrige Managing director
Chief Executive OfficerAppointed August 1999
Alf is one of the global leaders in the serviced office industry, with 34 years of experience. Alf is primarily responsible for Servcorp’s expansion, profitability, cash generation and currency management.
Directorships of listed entities in the last three years: ▪ None.
Bruce Corlett AMChairIndependent non-executive directorBA, LLB
Member of Audit and Risk CommitteeAppointed October 1999
For more than 30 years Bruce has been a director of many publicly listed companies. He has an extensive business background involving a range of industries including banking, property and maritime. His other publicly listed directorship is Chair of The Trust Company Limited.
Bruce is also Chair of the Mark Tonga Perpetual Relief Trust, Chair of Lifestart Co-operative Limited and an Ambassador of The Australian Indigenous Education Foundation.
Directorships of listed entities in the last three years: ▪ The Trust Company Limited
since October 2000 (Chair); ▪ Tooth and Co. Limited since
September 1999 (Tooth & Co was removed from the official list of ASX on 12 February 2010).
Rick Holliday-SmithIndependent non-executive directorBA (Hons), CA, FAICD
Chair of Audit and Risk CommitteeMember of Remuneration CommitteeAppointed October 1999
Rick spent over 11 years in Chicago in the roles of Divisional President of global trading and sales for NationsBank, N.A. and, prior to that, Chief Executive Officer of Chicago Research and Trading Group Limited. Rick also spent over 4 years in London as Managing Director of Hong Kong Bank Limited, a wholly owned merchant banking subsidiary of HSBC Bank.
Rick is currently Chair of ASX Limited and Cochlear Limited. He became Chair of ASX in March 2012. Rick has a Bachelor of Arts (Hons) from Macquarie University, is a Chartered Accountant and is a Fellow of the Australian Institute of Company Directors.
Directorships of listed entities in the last three years: ▪ ASX Limited since July 2006
(Chair since March 2012); ▪ Cochlear Limited since February
2005 (Chair since July 2010).
PAGE 35 SERVCORP ANNUAL REPORT 2012 – DIRECTORS’ REPORT PAGE 35
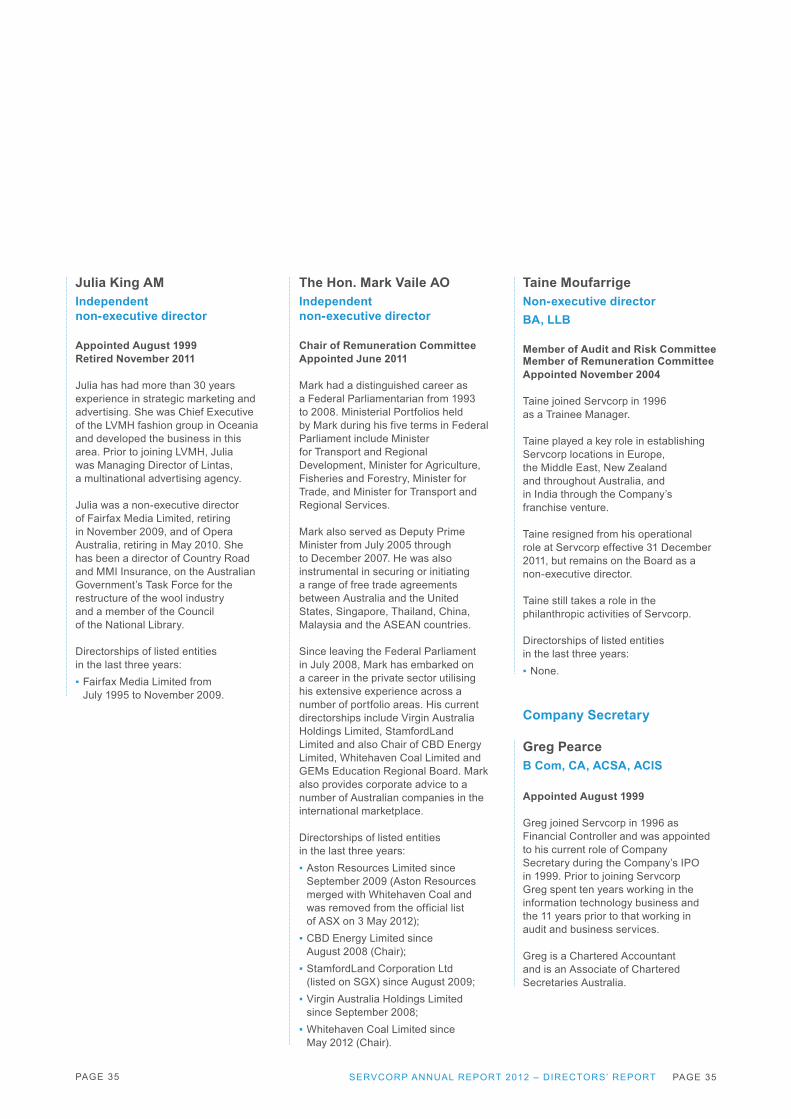
Julia King AMIndependent non-executive director
Appointed August 1999 Retired November 2011
Julia has had more than 30 years experience in strategic marketing and advertising. She was Chief Executive of the LVMH fashion group in Oceania and developed the business in this area. Prior to joining LVMH, Julia was Managing Director of Lintas, a multinational advertising agency.
Julia was a non-executive director of Fairfax Media Limited, retiring in November 2009, and of Opera Australia, retiring in May 2010. She has been a director of Country Road and MMI Insurance, on the Australian Government’s Task Force for the restructure of the wool industry and a member of the Council of the National Library.
Directorships of listed entities in the last three years: ▪ Fairfax Media Limited from
July 1995 to November 2009.
The Hon. Mark Vaile AOIndependent non-executive director
Chair of Remuneration Committee Appointed June 2011
Mark had a distinguished career as a Federal Parliamentarian from 1993 to 2008. Ministerial Portfolios held by Mark during his five terms in Federal Parliament include Minister for Transport and Regional Development, Minister for Agriculture, Fisheries and Forestry, Minister for Trade, and Minister for Transport and Regional Services.
Mark also served as Deputy Prime Minister from July 2005 through to December 2007. He was also instrumental in securing or initiating a range of free trade agreements between Australia and the United States, Singapore, Thailand, China, Malaysia and the ASEAN countries.
Since leaving the Federal Parliament in July 2008, Mark has embarked on a career in the private sector utilising his extensive experience across a number of portfolio areas. His current directorships include Virgin Australia Holdings Limited, StamfordLand Limited and also Chair of CBD Energy Limited, Whitehaven Coal Limited and GEMs Education Regional Board. Mark also provides corporate advice to a number of Australian companies in the international marketplace.
Directorships of listed entities in the last three years: ▪ Aston Resources Limited since
September 2009 (Aston Resources merged with Whitehaven Coal and was removed from the official list of ASX on 3 May 2012); ▪ CBD Energy Limited since
August 2008 (Chair); ▪ StamfordLand Corporation Ltd
(listed on SGX) since August 2009; ▪ Virgin Australia Holdings Limited
since September 2008; ▪ Whitehaven Coal Limited since
May 2012 (Chair).
Taine MoufarrigeNon-executive directorBA, LLB
Member of Audit and Risk CommitteeMember of Remuneration Committee Appointed November 2004
Taine joined Servcorp in 1996 as a Trainee Manager.
Taine played a key role in establishing Servcorp locations in Europe, the Middle East, New Zealand and throughout Australia, and in India through the Company’s franchise venture.
Taine resigned from his operational role at Servcorp effective 31 December 2011, but remains on the Board as a non-executive director.
Taine still takes a role in the philanthropic activities of Servcorp.
Directorships of listed entities in the last three years: ▪ None.
Company Secretary
Greg PearceB Com, CA, ACSA, ACIS
Appointed August 1999
Greg joined Servcorp in 1996 as Financial Controller and was appointed to his current role of Company Secretary during the Company’s IPO in 1999. Prior to joining Servcorp Greg spent ten years working in the information technology business and the 11 years prior to that working in audit and business services.
Greg is a Chartered Accountant and is an Associate of Chartered Secretaries Australia.
PAGE 36
Director Board Audit & Risk Committee
Remuneration Committee
Number of meetings held 9 4 2
Number of meetings attended
B Corlett (i) 9 4 1
R Holliday-Smith 9 4 2
J King (ii) 4 1 1
A G Moufarrige 9
T Moufarrige (iii) 7 2 1
M Vaile 8 2
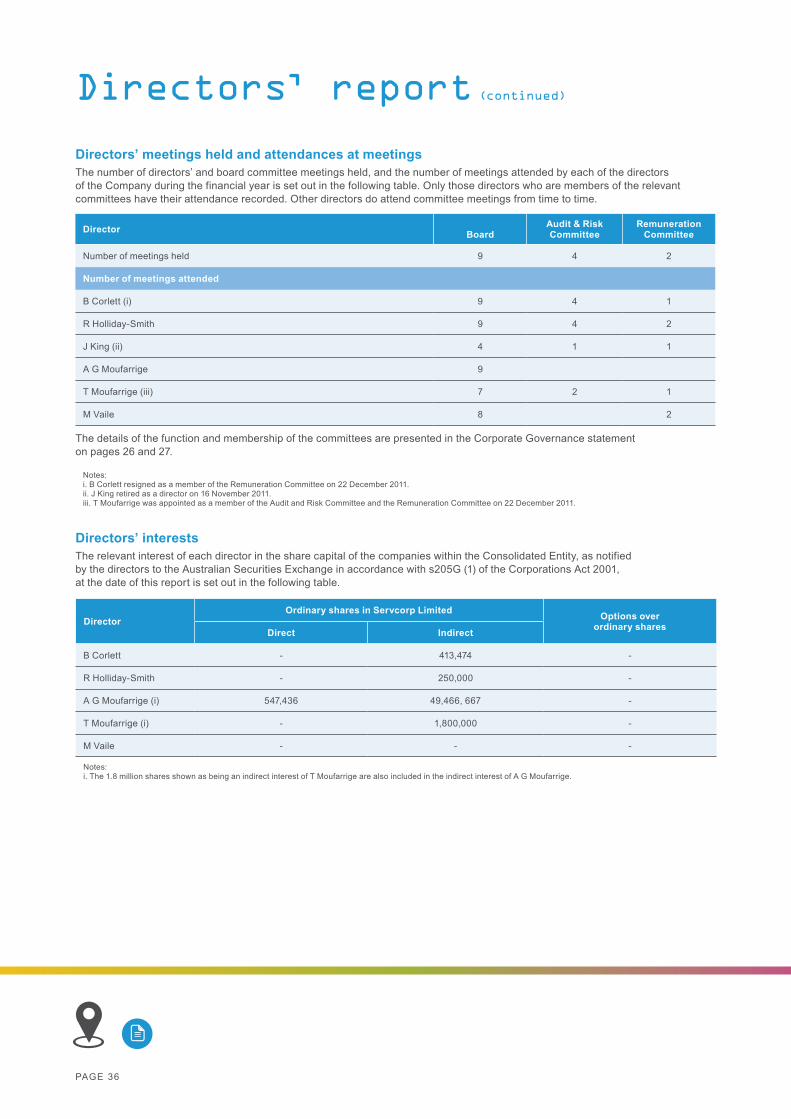
The details of the function and membership of the committees are presented in the Corporate Governance statement on pages 26 and 27.
Notes:i. B Corlett resigned as a member of the Remuneration Committee on 22 December 2011. ii. J King retired as a director on 16 November 2011. iii. T Moufarrige was appointed as a member of the Audit and Risk Committee and the Remuneration Committee on 22 December 2011.
Directors’ meetings held and attendances at meetingsThe number of directors’ and board committee meetings held, and the number of meetings attended by each of the directors of the Company during the financial year is set out in the following table. Only those directors who are members of the relevant committees have their attendance recorded. Other directors do attend committee meetings from time to time.
Directors’ interestsThe relevant interest of each director in the share capital of the companies within the Consolidated Entity, as notified by the directors to the Australian Securities Exchange in accordance with s205G (1) of the Corporations Act 2001, at the date of this report is set out in the following table.
Director Ordinary shares in Servcorp Limited Options over
ordinary sharesDirect Indirect
B Corlett - 413,474 -
R Holliday-Smith - 250,000 -
A G Moufarrige (i) 547,436 49,466, 667 -
T Moufarrige (i) - 1,800,000 -
M Vaile - - -
Notes:i. The 1.8 million shares shown as being an indirect interest of T Moufarrige are also included in the indirect interest of A G Moufarrige.
Directors’ report (continued)
PAGE 37 PAGE 37SERVCORP ANNUAL REPORT 2012 – DIRECTORS’ REPORT
Directors’ benefitsSince the end of the previous financial year, no director of the Consolidated Entity has received or become entitled to receive a benefit (other than a benefit included in the aggregate amount of emoluments received or due and receivable by directors shown in the Consolidated financial report, or the fixed salary of a full-time employee of the Consolidated Entity or of a related entity) by reason of a contract made by the Consolidated Entity or a related entity with the director or with a firm of which a director is a member, or with an entity in which a director has a substantial financial interest.
Options grantedDuring the year, or since the end of the financial year, the Company has not granted options over unissued ordinary shares of the Company.
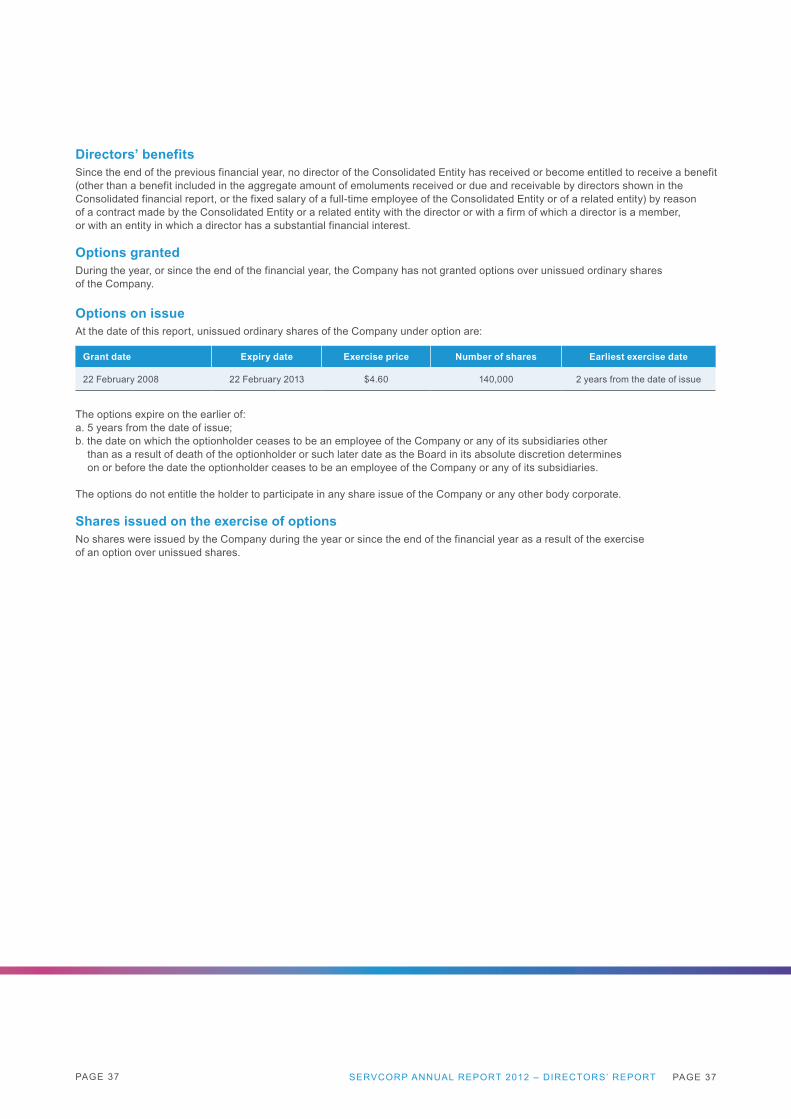
Options on issueAt the date of this report, unissued ordinary shares of the Company under option are:
Grant date Expiry date Exercise price Number of shares Earliest exercise date
22 February 2008 22 February 2013 $4.60 140,000 2 years from the date of issue
The options expire on the earlier of:a. 5 years from the date of issue;b. the date on which the optionholder ceases to be an employee of the Company or any of its subsidiaries other than as a result of death of the optionholder or such later date as the Board in its absolute discretion determines on or before the date the optionholder ceases to be an employee of the Company or any of its subsidiaries.
The options do not entitle the holder to participate in any share issue of the Company or any other body corporate.
Shares issued on the exercise of optionsNo shares were issued by the Company during the year or since the end of the financial year as a result of the exercise of an option over unissued shares.
PAGE 38
Dividends paid and declared
Type Cents
per share
Total amount
$’000
Date of payment
Franked %
Tax rate for
franking credit
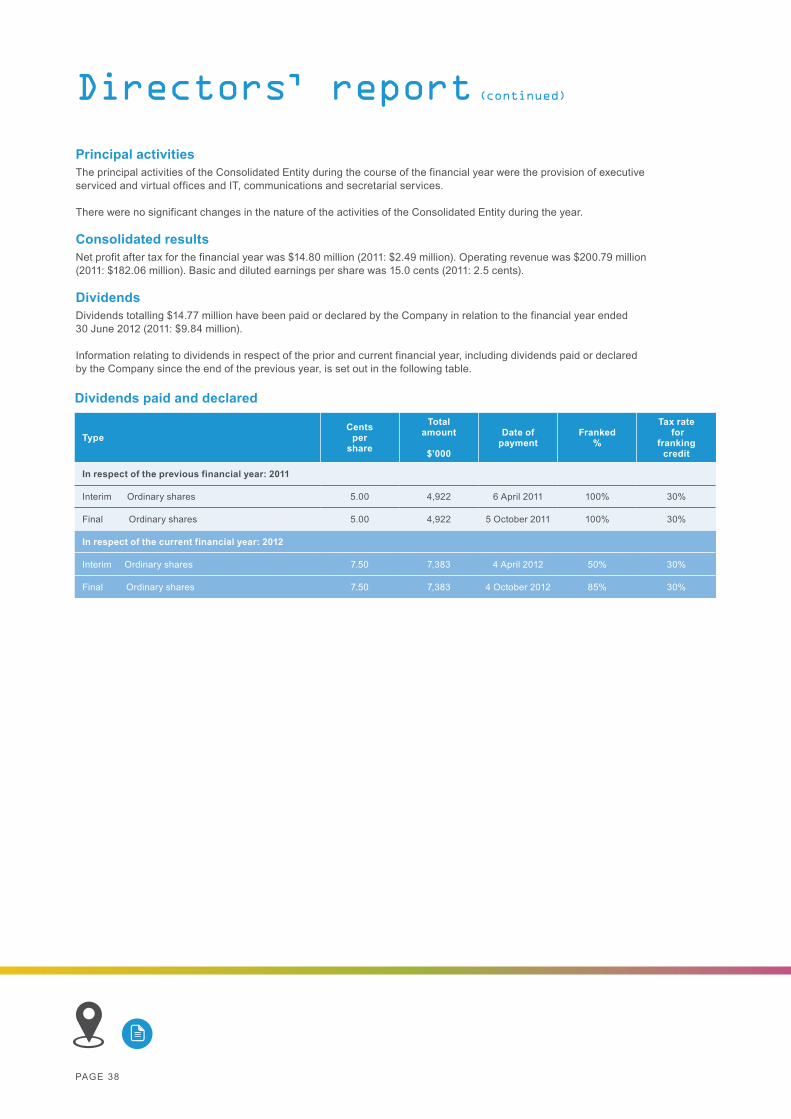
In respect of the previous financial year: 2011
Interim Ordinary shares 5.00 4,922 6 April 2011 100% 30%
Final Ordinary shares 5.00 4,922 5 October 2011 100% 30%
In respect of the current financial year: 2012
Interim Ordinary shares 7.50 7,383 4 April 2012 50% 30%
Final Ordinary shares 7.50 7,383 4 October 2012 85% 30%
Principal activitiesThe principal activities of the Consolidated Entity during the course of the financial year were the provision of executive serviced and virtual offices and IT, communications and secretarial services.
There were no significant changes in the nature of the activities of the Consolidated Entity during the year.
Consolidated results Net profit after tax for the financial year was $14.80 million (2011: $2.49 million). Operating revenue was $200.79 million(2011: $182.06 million). Basic and diluted earnings per share was 15.0 cents (2011: 2.5 cents).
DividendsDividends totalling $14.77 million have been paid or declared by the Company in relation to the financial year ended 30 June 2012 (2011: $9.84 million).
Information relating to dividends in respect of the prior and current financial year, including dividends paid or declared by the Company since the end of the previous year, is set out in the following table.
Directors’ report (continued)
PAGE 39 PAGE 39SERVCORP ANNUAL REPORT 2012 – DIRECTORS’ REPORT
Review of operationsRevenue from ordinary activities for the twelve months ended 30 June 2012 was $192.80 million, up 10% from the twelve months ended 30 June 2011. During the year the Australian dollar increased by an average of 5% against the US dollar and 7% against the Euro, but decreased by 1% against the Japanese yen. In constant currency terms revenue increased by 12% compared to the 2011 year.
Net profit before tax for the twelve months to 30 June 2012 was $18.33 million, up from $3.04 million in the prior year. When expressed in constant currency terms, net profit before tax was unchanged at $18.32 million for 2012.
Cash balances were $104.33 million at 30 June 2012 (30 June 2011: $99.99 million). Of this balance, $8.57 million has been pledged with banks as collateral for bank guarantees and facilities, leaving an unencumbered cash balance of $95.77 million in the business as at 30 June 2012 (30 June 2011: $91.27 million).
The business generated strong net operating cash flows during the 2012 financial year of $32.00 million, up 70% compared to the 2011 financial year (2011: $18.79 million).
Mature businessThe 2012 financial year was challenging from an economic, commercial and trading point of view. Competition in many markets continues to be aggressive, largely as a result of the prolonged downturn in the USA, Europe and Japan.
Notwithstanding these difficult trading conditions, we are encouraged by profit growth of 20% in the mature business. Revenue and profit growth was achieved across most geographic segments despite the strength of the Australian dollar throughout the period.
Average mature floor occupancy remained stable for the 2012 financial year at 78% (average for 2011: 79%).
Immature businessImmature floor revenue continues to increase modestly each month. We are satisfied with the overall progress of the immature floor portfolio, with the exception of the USA.
The challenges experienced in building and opening 21 floors in a brand new market in the USA in challenging economic times caused an initial lag in revenue growth. This lag has impacted the rate at which our USA floors have matured. Revenue growth for the 2012 financial year is on target, however overall revenue is approximately 12 months behind original projections. Consequently, the immature USA floors as a group will not become cash flow breakeven or mature until 1 July 2013.
ExpansionAs previously stated, it was our intention to slow the pace of expansion in the 2012 financial year and consolidate operations in new and existing markets.
Our original intention was to open no more than 15 floors in the 2012 financial year. Given the continued volatility in global markets and the continuing uncertainty in the USA and Europe, we slowed the pace of growth in the 2012 financial year and opened 9 floors. This brings total new floor openings to 62 in the 36 months to 30 June 2012 as part of this expansion phase.
We anticipate opening approximately 11 floors in the 2013 financial year.
As at 30 June 2012, Servcorp operated 124 floors in 52 cities across 21 countries.
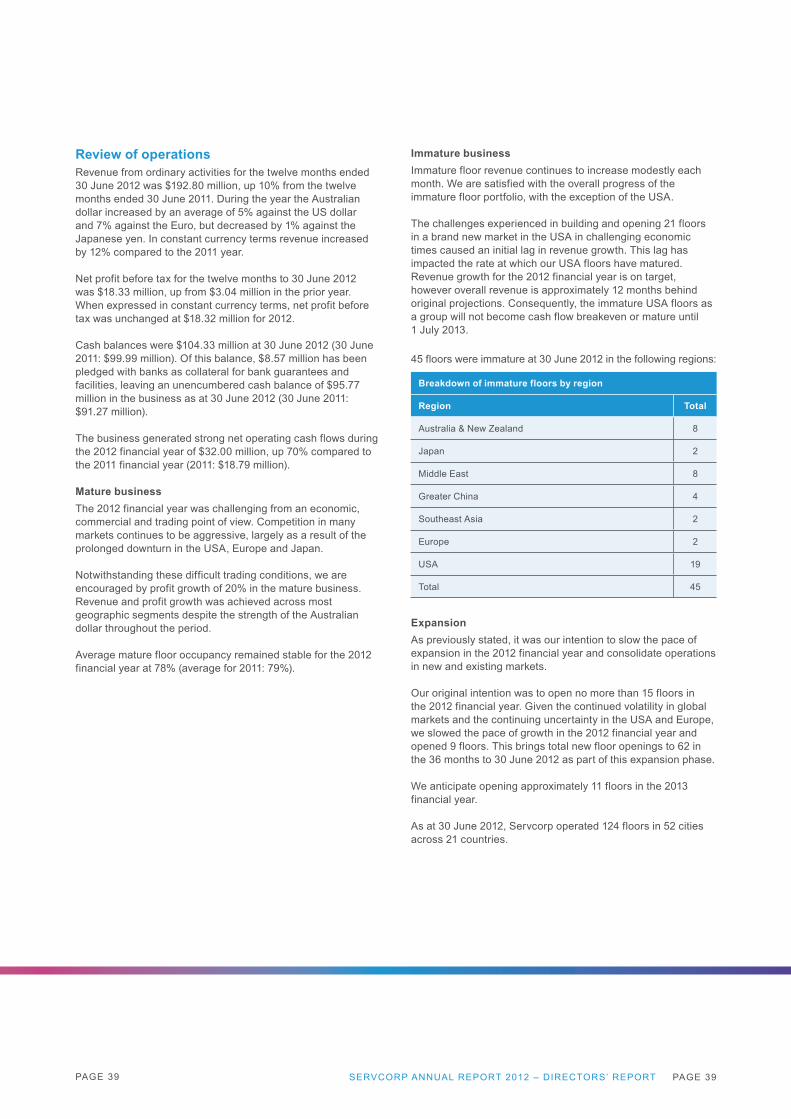
45 floors were immature at 30 June 2012 in the following regions:
Breakdown of immature floors by region
Region Total
Australia & New Zealand 8
Japan 2
Middle East 8
Greater China 4
Southeast Asia 2
Europe 2
USA 19
Total 45

PAGE 40
Directors’ report (continued)
Review of operations (continued)Australia and New ZealandMature floorsThe performance of Australia and New Zealand in the 2012 financial year was consistent with the 2011 financial year. The Sydney and Melbourne markets continue to be impacted by soft demand, however, the mining markets of Perth and Brisbane continue to perform strongly. Margins improved across New Zealand in the 2012 financial year.
During the 2012 financial year mature floor revenue was $49.09 million, consistent with the 2011 financial year. Mature floor net profit before tax decreased by 6% to $14.75 million for the 2012 financial year. No floors were closed in the 2012 financial year (closure costs 2011: $0.53 million).
Immature floorsTwo new floors opened in Brisbane and Perth during the 2012 financial year, bringing the total number of immature floors to eight in Australia and New Zealand. Immature floor losses were $1.91 million for the 2012 financial year (2011: loss of $1.87 million).
JapanMature floorsBusiness confidence in Japan in the 2012 financial year was significantly impacted by the earthquake in Fukushima in the latter part of the 2011 financial year. Levels of competition in the Serviced Office business have increased, directly impacting pricing and margins. Notwithstanding these issues, management is satisfied with the operating results in this market.
During the 2012 financial year, revenue from mature locations remained stable at $49.45 million, whereas mature floor net profit before tax increased by 10% to $6.06 million (2011: $5.51 million). The result in Japan includes a cost of $0.87 million for the closure of one floor in Tokyo (closure costs 2011: $0.59 million).
Immature floorsNo new floors were opened in Japan during the 2012 financial year. Immature floor losses were $0.67 million for the 2012 financial year (2011: loss of $2.08 million).
Middle EastMature floorsThe results in the Middle East continue to improve in line with management expectations. The mature markets in UAE and Qatar continue to produce solid results. A floor in Jeddah became mature during the 2012 financial year and is now contributing to mature profits, whereas Bahrain continues to be difficult, but Servcorp is breakeven in this city.
Mature floor revenue increased by 18% to $17.30 million for the 2012 financial year (2011: $14.65 million). Mature floor net profit before tax increased by 7% to $4.55 million during the 2012 financial year (2011: $4.24 million).
Immature floorsTwo new floors opened in Jeddah and Doha during the 2012 financial year, bringing the total number of immature floors to eight in this region. Immature floor losses were $2.18 million in the 2012 financial year (2011: loss of $4.14 million).
Greater ChinaMature floorsThe growth momentum experienced in China in the 2011 financial year has continued into the 2012 financial year. Increased pricing by Servcorp in this market has led to an increase in margins.
During the 2012 financial year, revenue increased by 10% to $20.55 million (2011: $18.70 million). Mature floor net profit before tax increased by 25% to $4.07 million for the 2012 financial year (2011: $3.25 million).
Immature floorsFour floors were opened in Shanghai, Guangzhou, Hangzhou and Chengdu during the 2012 financial year. These four floors were immature with losses of $1.12 million during the 2012 financial year (2011: loss of $0.56 million).
PAGE 41 PAGE 41SERVCORP ANNUAL REPORT 2012 – DIRECTORS’ REPORT
Southeast AsiaMature floorsAll markets in Southeast Asia performed strongly in the 2012 financial year with revenue and margins increasing across the entire region.
Revenue from ordinary activities increased by 23% to $19.14 million in the 2012 financial year (2011: $15.61 million) and mature floor net profit before tax increased by 76% to $5.95 million for the 2012 financial year (2011: $3.38 million).
Immature floorsOne floor opened in Bangkok in the 2012 financial year. Two floors were immature with a loss of $0.45 million in the 2012 financial year (2011: loss of $0.39 million).
Europe Mature floorsMargins in both London and Brussels improved in the 2012 financial year, however the Serviced Office market in Paris continues to be soft. One traditional floor in London became mature during the 2012 financial year and is now contributing to mature floor profits.
Mature floor revenue increased by 13% to $14.39 million for the 2012 financial year. The net profit before tax on mature floors was $0.13 million for the 2012 financial year (2011: loss of $0.33 million).
Immature floorsNo new floors opened in Europe in the 2012 financial year. Two floors in this region were immature at 30 June 2012 with a net loss before tax of $0.81 million for the 2012 financial year (2011: loss of $1.57 million).
USAMature floorsTwo floors became mature in this region during the 2012 financial year. Mature floor revenue was $0.96 million for the 2012 financial year (2011: Nil). The net loss before tax on mature floors was $0.31 million (2011: Nil).
Immature floorsThe lag in revenue growth initially experienced has impacted the maturity profile of floors in this region. Consequently, the immature floors as a group will not mature until 1 July 2013. Revenue in the USA, however, continues to increase each month and management is comfortable that growth is now on the right trajectory.
Nineteen floors were immature in the USA at 30 June 2012. Immature floor losses were $10.64 million for the 2012 financial year (2011: loss of $11.67 million).
Events subsequent to balance dateDividendOn 28 August 2012 the directors declared a partly franked final dividend of 7.50 cents per share, payable on 4 October 2012.
The financial effects of the above transactions have not been brought to account in the financial statements for the year ended 30 June 2012.
The directors are not aware of any matter or circumstance, other than that referred to above or in the financial statements or notes thereto, that has arisen since the end of the year that has significantly affected, or may significantly affect, the operations of the Consolidated Entity, the results of those operations, or the state of affairs of the Consolidated Entity, in future financial years.
Likely developmentsThe Consolidated Entity will continue to pursue its policy of seeking to increase the profitability and market share of its major business sectors during the next financial year.
Further information about likely developments in the operations of the Consolidated Entity and the expected results of those operations in future financial years has not been included in this report because disclosure of the information would be likely to result in unreasonable prejudice to the Consolidated Entity.
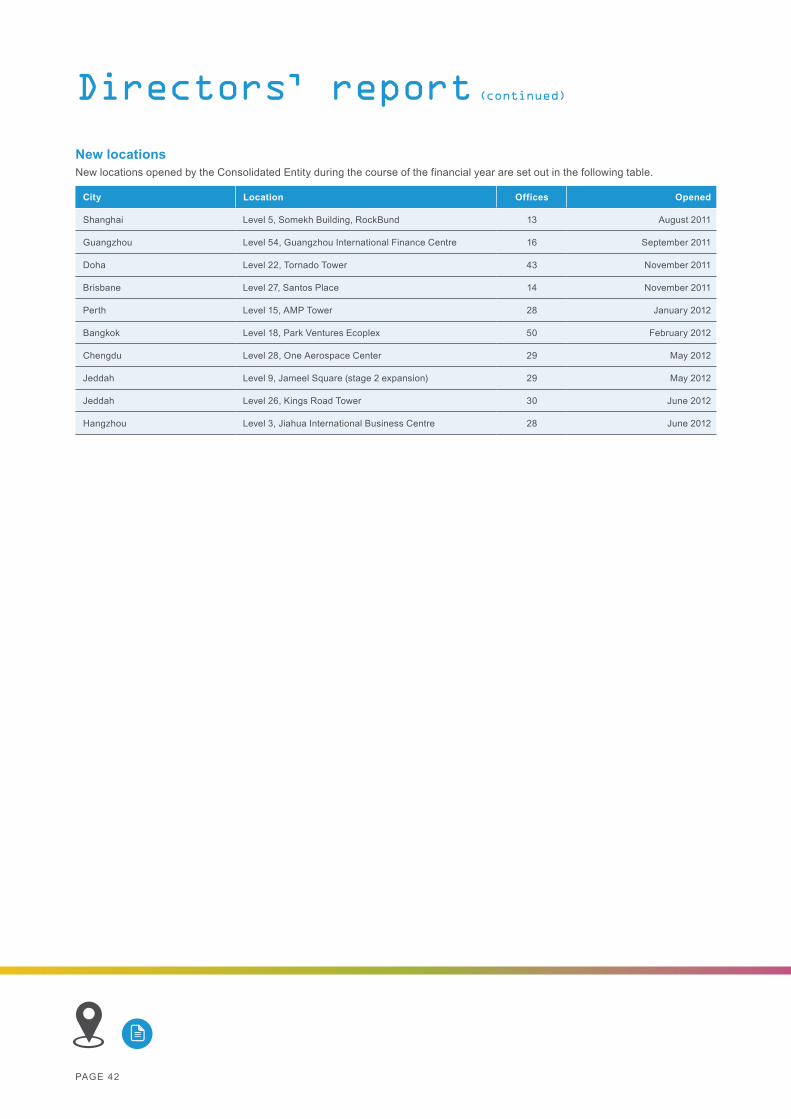
PAGE 42
New locationsNew locations opened by the Consolidated Entity during the course of the financial year are set out in the following table.
City Location Offices Opened
Shanghai Level 5, Somekh Building, RockBund 13 August 2011
Guangzhou Level 54, Guangzhou International Finance Centre 16 September 2011
Doha Level 22, Tornado Tower 43 November 2011
Brisbane Level 27, Santos Place 14 November 2011
Perth Level 15, AMP Tower 28 January 2012
Bangkok Level 18, Park Ventures Ecoplex 50 February 2012
Chengdu Level 28, One Aerospace Center 29 May 2012
Jeddah Level 9, Jameel Square (stage 2 expansion) 29 May 2012
Jeddah Level 26, Kings Road Tower 30 June 2012
Hangzhou Level 3, Jiahua International Business Centre 28 June 2012
Directors’ report (continued)
PAGE 43 PAGE 43SERVCORP ANNUAL REPORT 2012 – DIRECTORS’ REPORT
Remuneration reportRemuneration principles The Board recognises that the Consolidated Entity’s performance is dependent on the quality and contribution of its people. To achieve its financial and operating objectives, Servcorp must be able to attract, retain and motivate highly skilled executives.
The objective of the Consolidated Entity’s executive reward framework is to ensure reward for performance is competitive and appropriate for the results delivered. The framework aligns executive reward with achievement of strategic objectives and the creation of value for shareholders.
Executive remuneration packages involve a balance between fixed and incentive pay. In determining the appropriate balance, regular reviews are undertaken that involve cross referencing position descriptions to reliable accessible remuneration surveys and comparing current remuneration packages with the latest survey information.
Servcorp’s executive remuneration policy and principles are designed to ensure that the Consolidated Entity: ▪ provides competitive rewards that attract, retain
and motivate the highest calibre executives; ▪ encourages a strong and long term commitment
to Servcorp; ▪ builds a structure for long term growth
and succession planning; ▪ structures remuneration at a level that reflects the
executive’s duties and accountabilities and is competitive within Australia and, for certain roles, internationally; ▪ aligns executive incentive rewards with the creation
of value for shareholders; ▪ complies with applicable legal requirements
and appropriate standards of governance.
The framework may provide a mix of fixed and variable pay, and a blend of short and long term incentives.
The Board’s current policy regarding remuneration for key management personnel is summarised on pages 44 to 47. Non-executive directors are remunerated on a different basis to senior executives as set out below.
Non-executive directorsFees and payments to non-executive directors reflect the demands which are made on, and the responsibilities of, the directors. Non-executive directors’ fees and payments are reviewed by the Board. The Board ensures non-executive directors’ fees and payments are appropriate and in line with the market. Non-executive directors are not employed under a contract and do not receive share options or other equity based remuneration.
Directors’ feesNon-executive directors’ fees are determined by the Board within an aggregate directors’ fees limit approved by shareholders.
The fees limit currently stands at $500,000 per annum inclusive of payments for superannuation. This limit was approved at the 2011 Annual General Meeting.
The most recent review of directors’ fees was effective 1 January 2010 when non-executive directors’ fees were set as: ▪ Chair - $150,000 per annum including superannuation; ▪ Non-executive - $80,000 per annum including
superannuation; ▪ Chair of the Audit and Risk Committee - an additional
$10,000 per annum including superannuation.
Additional fees are not paid for membership of Board committees other than as referred to in the previous paragraph.
There was no increase in individual non-executive directors’ fees during the 2012 financial year. The overall increase in fees reflects the impact of the appointment of one additional non-executive director since July 2011.
Retirement allowances for directorsNon-executive directors are not entitled to retirement allowances.
Details of remunerationDetails of the nature and amount of each element of the remuneration of each director of Servcorp Limited for the year ended 30 June 2012 are set out on pages 48 and 49.
PAGE 44
Directors’ report (continued)
Remuneration report (continued)Key management personnel (other than non-executive directors)Remuneration structure
The key management personnel remuneration and reward framework has three components: ▪ Fixed remuneration; ▪ Short term incentives; ▪ Long term incentives.
The combination of these comprises the key management personnel’s total remuneration. No key management personnel are employed under a contract.
The Remuneration Committee frequently reviews the Consolidated Entity’s remuneration practices to ensure they provide key management personnel with a structured scheme for long term and short term incentives, based on earnings, earnings growth and individual performance criteria. The criteria for each year have been detailed in the remuneration report included in the respective year’s annual reports.
The Remuneration Committee has continued to develop the incentive schemes to take into consideration the cyclical nature of the Consolidated Entity’s results caused by the ratio of mature to immature floors and also external economic factors. A new scheme has been developed which the Committee believes will more closely link key management personnel remuneration to the Consolidated Entity’s performance and shareholder reward. Remuneration under this scheme commenced in the 2012 financial year.
Details of incentive schemes are included on pages 46 and 47.
Consolidated Entity performance Determination of the nature and amount of remuneration of key management personnel, and the relationship between such policy and the Consolidated Entity’s performance in this financial year and in the previous four financial years, has taken into account the foreseen negative impact of the Consolidated Entity’s expansion program during those years.
In October 2009 the Consolidated Entity began an aggressive expansion program to substantially expand the Servcorp footprint globally. Sixty new floors have opened between October 2009 and June 2012, almost doubling the number of floors that were operating at 30 June 2009. The large number of immature floors as a consequence of the expansion program has had a material negative impact on profitability in 2010, 2011 and this year.
The 2008 and 2009 financial years witnessed record results for the Consolidated Entity prior to the global financial crisis. The Consolidated Entity’s net profit after tax increased to $33.83 million in 2008 and to $34.10 million in 2009. Largely due to the expansion program, net profit after tax decreased to $2.01 million in 2010. As the immature floors come to maturity, it is anticipated that net profit after tax will steadily increase. In 2011, net profit after tax increased marginally to $2.49 million and this trend continued in 2012 with net profit after tax rising to $14.80 million.
Mature floor net profit before tax increased from $25.13 million in 2010 to $31.19 million in 2011 and to $37.31 million in 2012, an increase of 48% over the 2 years. The Consolidated Entity achieved its forecast net profit before tax on mature floors of $37 million, and immature floor losses were less than forecast and continue to decrease.
Shareholder wealth also increased over the 2008 and 2009 financial years. Dividends paid were 20.0 cents per share and 25.0 cents per share in 2008 and 2009 respectively. The Consolidated Entity’s strong performance and healthy cash flow and balance sheet were reflected in its ability to pay ‘special’ dividends in the 2008 and 2009 financial years. Earnings per share increased to 42.0 cents per share in 2008 and 42.7 cents per share in 2009. Due to the decreased profits in 2010 and 2011, dividends per share also decreased, however management’s ability to closely manage cash flows and maintain a strong balance sheet in the high profit years meant that shareholders were still rewarded with dividends of 10.0 cents per share in each of the 2010 and 2011 financial years, despite earnings per share decreasing to 2.2 cents and 2.5 cents respectively. Dividends increased to 15.0 cents per share in 2012 and it is anticipated they will continue to increase should higher profits be generated.
Over the same five year period, the average total remuneration paid to key management personnel, including executive directors, showed similar trends. The average increased by 5% over 2008 and 2009, increased by 2% in 2010 and decreased by 4% in the 2011 financial year. If the effects of termination benefits paid to T Moufarrige are removed, the increase in 2012 is 22%.
In response to the expected negative impact of the expansion program on profitability, and the resultant decrease in financial rewards for shareholders, the directors and management agreed that short term and long term incentives should not be paid to key management personnel for the 2010 and 2011 years, except for exceptional circumstances.
Most of the Consolidated Entity’s key management personnel are long-serving employees, with an average of 14 years of service (excluding the CEO). They are committed to the long term performance of the Consolidated Entity and the associated reward for its shareholders.
Given the impact of the global financial crisis and the substantial expansion in the Consolidated Entity’s global footprint, the directors are satisfied with the results achieved and remain confident that shareholder wealth will increase in the future.
PAGE 45 PAGE 45SERVCORP ANNUAL REPORT 2012 – DIRECTORS’ REPORT
Remuneration report (continued)Key management personnel (continued)Fixed remunerationThis is targeted to be reasonable and fair, taking into account the Consolidated Entity’s legal and industrial obligations, labour market conditions and the scale of the Consolidated Entity. This fixed remuneration component reflects core performance requirements and expectations.
Fixed remuneration is reviewed annually to ensure the key management personnel’s remuneration is competitive with the market. Remuneration is also reviewed on promotion. There are no guaranteed fixed remuneration increases for any key management personnel.
Short term incentivesThe short term incentive component of key management personnel remuneration may comprise an annual cash incentive which is linked to the performance of both the Consolidated Entity and the individual key management personnel.
For the 2012 financial year, short term incentives were governed by the objectives and criteria set out in the Servcorp Key Executive Bonus Pool Scheme which became effective on 1 July 2010. Specific details of this Scheme are set out on pages 46 and 47.
Key management personnel do not have a fixed proportion of their total remuneration that is performance related. The short term incentive target is reviewed annually. Performance targets are agreed with KMP at the start of each year to ensure they meet specific business objectives to which the individual can contribute.
Cash incentives (bonuses) are payable following finalisation of full-year results. Using a profit target ensures variable reward is only available when value has been created for shareholders and when profit is consistent with the business plan.
Long term incentivesThe long term incentive component of key management personnel remuneration may comprise a cash incentive which is linked to the performance of the Consolidated Entity and to future service requirements of the individual key management personnel. In prior years, share options have also been utilised.
For the 2012 financial year, long term incentives were governed by the objectives and criteria set out in the Servcorp Key Executive Bonus Pool Scheme which became effective on 1 July 2010. Specific details of this Scheme are set out on pages 46 and 47.
Long term incentives for any year are payable on the 5th anniversary of that year subject to employment criteria.
Retirement benefitsRetirement payments for key management personnel are provided to the extent required by the law of the country in which they reside. Key management personnel are not contractually entitled to any other retirement allowances.
The Board may, in its discretion, determine to make a termination payment to key management personnel taking into consideration matters such as length of service and their overall contribution to the Consolidated Entity.
Details of remunerationDetails of the nature and amount of each element of theremuneration of each member of the key management personnel of the Company and the Consolidated Entity for the financial year ended 30 June 2012 are set out in the table on pages 50 and 51.
PAGE 46
Directors’ report (continued)
Remuneration report (continued)Key executive bonus pool schemeFrom the 2011 financial year, the Remuneration Committee has adopted a new key executive bonus pool scheme.
The Remuneration Committee, on written recommendation from the CEO, will from time to time invite key executives to join the scheme. The maximum number of participants in any given year will be 14 key executives.
ObjectivesThe scheme objectives are: ▪ to motivate key executives to maximise the profits of
the Consolidated Entity and to enhance shareholder return; ▪ to retain the key executives of the Consolidated Entity; ▪ to formalise a visible and transparent incentive structure
for the key executives of the Consolidated Entity.
The scheme acts as both a short term and long term incentive scheme.
Accumulation of fundsA bonus pool has been established that accumulates funds based on a percentage of both mature floor net profit before tax performance and net profit before tax performance of the Consolidated Entity for each financial year.
Accumulation of funds in the bonus pool started in the 2011 financial year based on the percentages of profit outlined below. There is no minimum net profit before tax threshold for accumulation.
▪ for the initial 2011 and 2012 financial years, funds accumulated in the bonus pool based on: - 2.0% of achieved mature floor net profit before tax; plus - 3.0% of achieved net profit before tax. ▪ should mature floor net profit before tax in any given
year exceed $75 million, the following bonus pool accumulation percentages will apply: - 2.5% of achieved mature floor net profit before tax; plus - 3.5% of achieved net profit before tax. ▪ should mature floor net profit before tax in any given year
exceed $100 million, the following bonus pool accumulation percentages will apply: - 3.0% of achieved mature floor net profit before tax; plus - 4.0% of achieved net profit before tax.
Short term incentive shemeThe short term incentive scheme criteria are: ▪ the first short term incentive distribution year was based
on the results for the 2012 financial year; ▪ the minimum mature net profit before tax thresholds before
any distributions (other than discretionary distributions) can be made from the bonus pool each financial year are as follows: - 2012 financial year - $40 million; - 2013 financial year - $40 million; - 2014 financial year - $44 million; - 2015 and subsequent financial years - the previous year’s threshold increased by 10%. ▪ if the minimum threshold of mature floor net profit before tax
is not reached in any performance year, then accumulated bonus pool funds will be rolled forward to the next financial year; ▪ a minimum of 85% and a maximum of 90% of the bonus pool
accumulated funds will be distributed as short term incentive to qualifying key executives in relation to each financial year; ▪ short term incentive payments will be inclusive of any
superannuation guarantee or equivalent local payments; ▪ if a general manager receives a bonus locally, this bonus will
be deducted from their entitlement under this scheme such that the maximum bonus they will receive will be the amount under this scheme; ▪ discretionary cash bonuses may also be paid; ▪ the discretionary bonus component of the scheme
is defined as the difference between the total base bonus percentage component payable to key executives and 85%; ▪ the discretionary component of the bonus scheme can only
be distributed to participating key executives for each particular year; ▪ any discretionary bonus payable to a key executive is directly
linked to the key executive’s individual performance and is at the discretion of the Remuneration Committee, based on a written recommendation from the Chief Executive Officer; ▪ all or a portion of the discretionary bonus component may
be distributed each performance year notwithstanding that minimum thresholds for base short term incentive distributions are not met.
Scheme participation The following base distribution participation levels apply to the scheme for key management personnel:
Title Scheme base distribution level
Executive directors (excluding CEO) 7%
Chief Operating Officer 7%
General managers 6%
Chief Financial Officer 5%
PAGE 47 PAGE 47SERVCORP ANNUAL REPORT 2012 – DIRECTORS’ REPORT
Remuneration report (continued)Key executive bonus pool scheme (continued)Long term incentive schemeThe long term incentive scheme criteria are: ▪ the long term incentive will be paid in cash; ▪ long term incentive funds will vest in the qualifying
key executives in direct proportion to the executive’s short term incentive component for that year; ▪ the long term incentive cash component will be paid
to qualifying key executives on the 5th anniversary of the base short term incentive payment date in relation to each financial year.
Vesting criteriaThe vesting criteria for the scheme are: ▪ base short term incentive bonuses will vest in participating
key executives and, if the profit targets for the year are achieved, will be paid no later than 5 business days after the Consolidated Entity releases its full-year financial results to the ASX; ▪ if the profit targets for the year are not achieved, the
vested short term incentive bonuses will roll forward to each subsequent financial year until the profit targets are achieved; ▪ vested long term incentive bonuses will be paid on the
5th anniversary of the performance year, but only if the short term incentive component is paid to the key executive in relation to the performance year; ▪ if by the 5th anniversary the short term incentive has not
been paid, the long term incentive payment date will coincide with the payment date for the short term incentive; ▪ unvested discretionary short term incentive amounts
(and associated long term incentive amounts) will carry forward to the following performance year and will add to the general pool for the following performance year; ▪ scheme participants must be employed by the Consolidated
Entity on the last day of the financial year to receive a short term incentive for that year; ▪ to qualify for the scheme each year, general managers will
need to make a profit of greater than zero in their respective area; ▪ scheme participants must be employed by the
Consolidated Entity on the 5th anniversary of the performance year to receive a long term incentive payment for that year; ▪ notwithstanding the above, the Remuneration Committee,
on written recommendation from the Chief Executive Officer, has the discretion to pay departing key executives their vested base short term incentive amounts in relation to previous performance years, a pro-rated base short term incentive in relation to the current performance year and vested long term incentive amounts in relation to previous performance years.The stewardship of the scheme will be the responsibility of the Remuneration Committee.
Executive share option schemeThe Consolidated Entity also has in place an Executive Share Option Scheme. The Board may grant options to eligible key management personnel in accordance with the Executive Share Option Scheme.
The Executive Share Option Scheme was first approved by shareholders on 19 October 1999 and was subject to various amendments until November 2008.
Pursuant to the Scheme, options will only vest (and hence be capable of being exercised) if the Consolidated Entity meets specified earnings per share hurdles. The options will vest in increasing proportions, depending on the level of growth in the Consolidated Entity’s earnings per share. No options will vest unless the Consolidated Entity achieves earnings per share growth of at least 10% in the specified financial year. The exercise period for vested options commences 3 years after issue date and expires 5 years after issue date.
Pursuant to the terms and conditions of the Scheme, any person who is employed on a full or part time basis by the Company and any of its controlled entities in a management role and whom the Board determines is eligible to participate in the Scheme is entitled to participate in the Scheme. For the avoidance of doubt, non-executive directors are therefore ineligible to participate in the Scheme but executive directors are eligible to participate.
Options do not form a fixed percentage of any key management personnel’s remuneration.
In the current financial year, the directors did not grant any options under the Scheme. Options were last granted under the Scheme on 22 September 2008, but these lapsed as the vesting criteria was not met.
The only options currently on issue under the Scheme were issued on 22 Feburary 2008 at an exercise price of $4.60. These options expire on 22 February 2013.
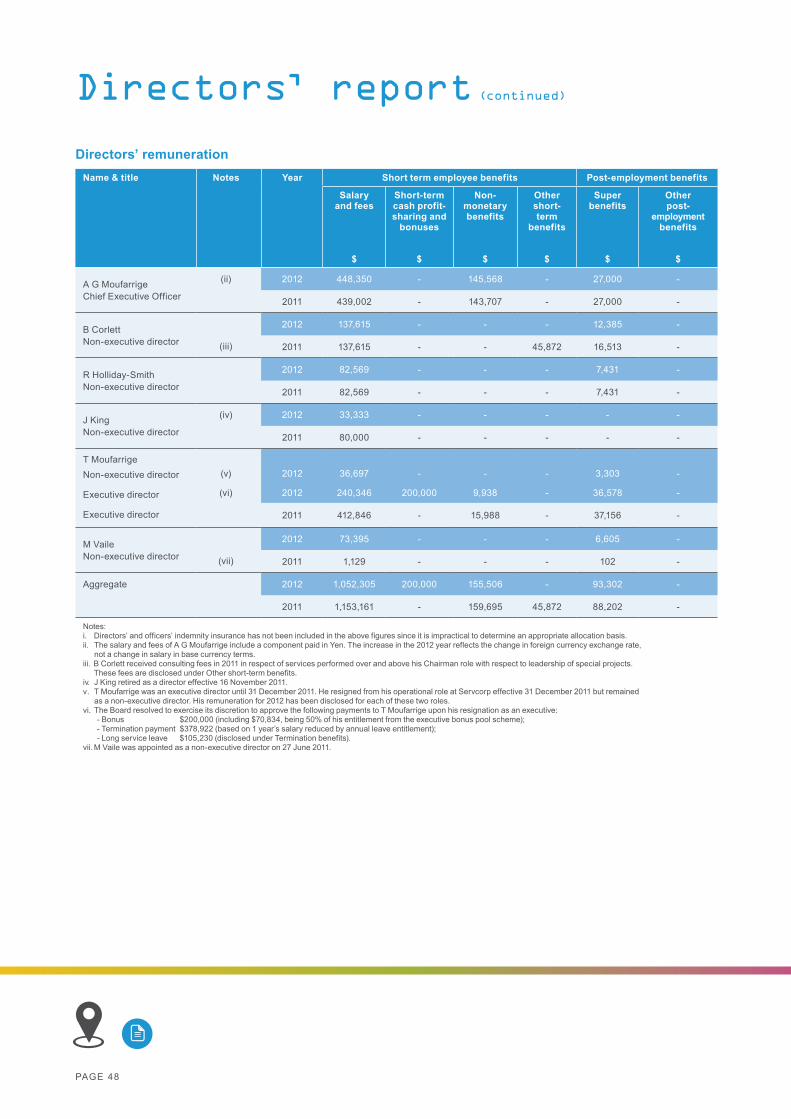
PAGE 48
Directors’ remuneration
Directors’ report (continued)
Name & title Notes Year Short term employee benefits Post-employment benefits
Salary and fees
$
Short-term cash profit-sharing and
bonuses
$
Non-monetary benefits
$
Other short-term
benefits
$
Super benefits
$
Other post-
employment benefits
$
A G MoufarrigeChief Executive Officer
(ii) 2012 448,350 - 145,568 - 27,000 -
2011 439,002 - 143,707 - 27,000 -
B Corlett Non-executive director (iii)
2012 137,615 - - - 12,385 -
2011 137,615 - - 45,872 16,513 -
R Holliday-SmithNon-executive director
2012 82,569 - - - 7,431 -
2011 82,569 - - - 7,431 -
J King Non-executive director
(iv) 2012 33,333 - - - - -
2011 80,000 - - - - -
T MoufarrigeNon-executive director
Executive director
Executive director
(v) 2012 36,697 - - - 3,303 -
(vi) 2012 240,346 200,000 9,938 - 36,578 -
2011 412,846 - 15,988 - 37,156 -
M Vaile Non-executive director (vii)
2012 73,395 - - - 6,605 -
2011 1,129 - - - 102 -
Aggregate 2012 1,052,305 200,000 155,506 - 93,302 -
2011 1,153,161 - 159,695 45,872 88,202 -
Notes: i. Directors’ and officers’ indemnity insurance has not been included in the above figures since it is impractical to determine an appropriate allocation basis.ii. The salary and fees of A G Moufarrige include a component paid in Yen. The increase in the 2012 year reflects the change in foreign currency exchange rate, not a change in salary in base currency terms.iii. B Corlett received consulting fees in 2011 in respect of services performed over and above his Chairman role with respect to leadership of special projects. These fees are disclosed under Other short-term benefits.iv. J King retired as a director effective 16 November 2011.v. T Moufarrige was an executive director until 31 December 2011. He resigned from his operational role at Servcorp effective 31 December 2011 but remained as a non-executive director. His remuneration for 2012 has been disclosed for each of these two roles. vi. The Board resolved to exercise its discretion to approve the following payments to T Moufarrige upon his resignation as an executive: - Bonus $200,000 (including $70,834, being 50% of his entitlement from the executive bonus pool scheme); - Termination payment $378,922 (based on 1 year’s salary reduced by annual leave entitlement); - Long service leave $105,230 (disclosed under Termination benefits). vii. M Vaile was appointed as a non-executive director on 27 June 2011.
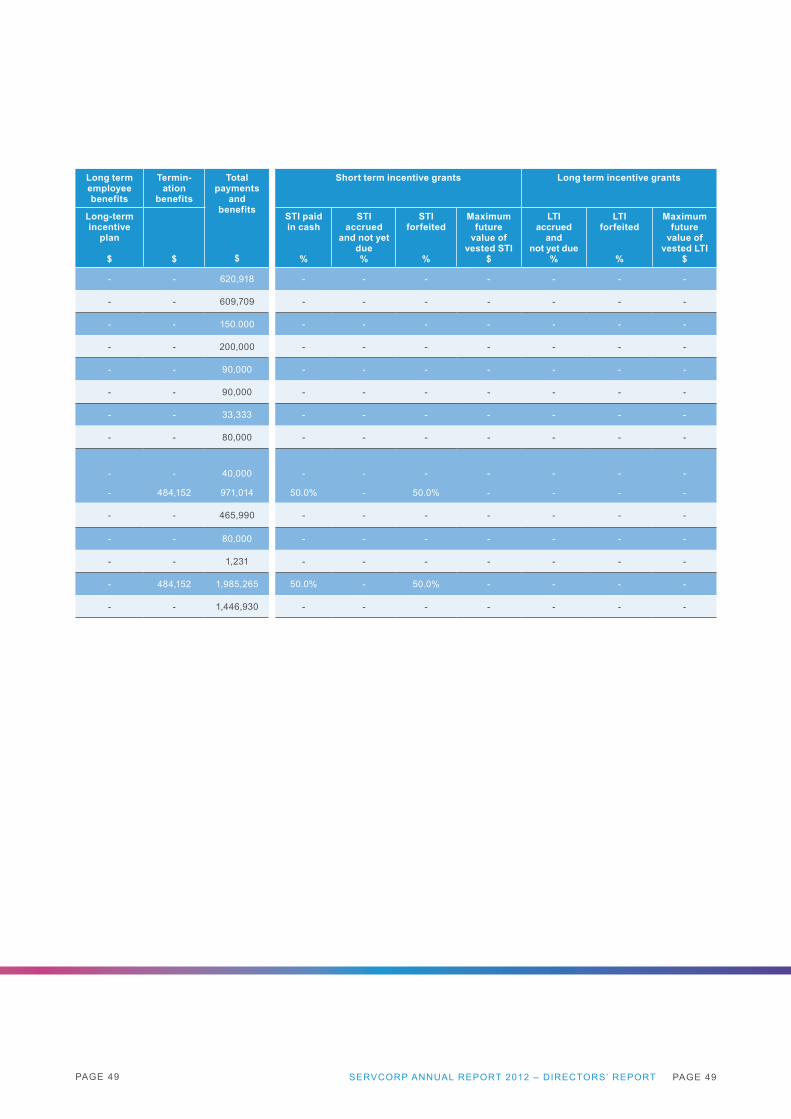
PAGE 49 PAGE 49SERVCORP ANNUAL REPORT 2012 – DIRECTORS’ REPORT
Long term employee benefits
Termin-ation
benefits
Total payments
and benefits
$
Short term incentive grants Long term incentive grants
Long-term incentive
plan
$ $
STI paid in cash
%
STI accrued
and not yet due%
STI forfeited
%
Maximum future
value of vested STI
$
LTI accrued
and not yet due
%
LTI forfeited
%
Maximum future
value of vested LTI
$
- - 620,918 - - - - - - -
- - 609,709 - - - - - - -
- - 150.000 - - - - - - -
- - 200,000 - - - - - - -
- - 90,000 - - - - - - -
- - 90,000 - - - - - - -
- - 33,333 - - - - - - -
- - 80,000 - - - - - - -
- - 40,000 - - - - - - -
- 484,152 971,014 50.0% - 50.0% - - - -
- - 465,990 - - - - - - -
- - 80,000 - - - - - - -
- - 1,231 - - - - - - -
- 484,152 1,985,265 50.0% - 50.0% - - - -
- - 1,446,930 - - - - - - -
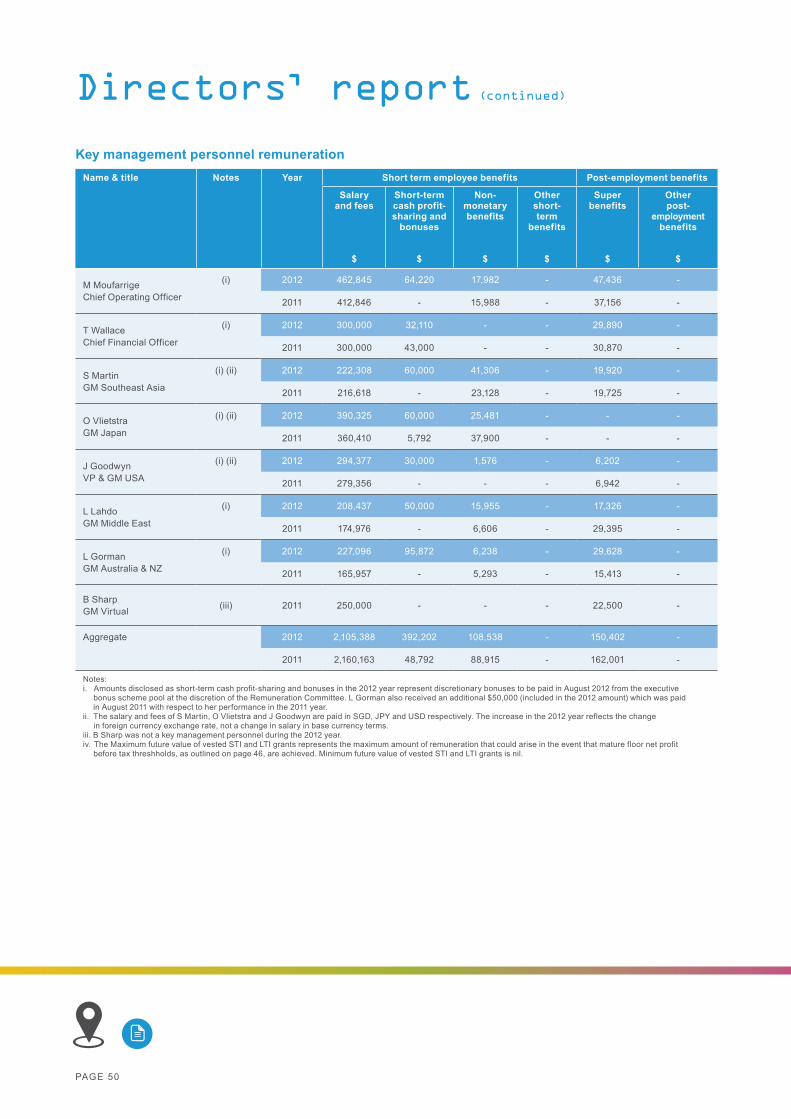
PAGE 50
Directors’ report (continued)
Name & title Notes Year Short term employee benefits Post-employment benefits
Salary and fees
$
Short-term cash profit-sharing and
bonuses
$
Non-monetary benefits
$
Other short-term
benefits
$
Super benefits
$
Other post-
employment benefits
$
M Moufarrige Chief Operating Officer
(i) 2012 462,845 64,220 17,982 - 47,436 -
2011 412,846 - 15,988 - 37,156 -
T WallaceChief Financial Officer
(i) 2012 300,000 32,110 - - 29,890 -
2011 300,000 43,000 - - 30,870 -
S MartinGM Southeast Asia
(i) (ii) 2012 222,308 60,000 41,306 - 19,920 -
2011 216,618 - 23,128 - 19,725 -
O VlietstraGM Japan
(i) (ii) 2012 390,325 60,000 25,481 - - -
2011 360,410 5,792 37,900 - - -
J GoodwynVP & GM USA
(i) (ii) 2012 294,377 30,000 1,576 - 6,202 -
2011 279,356 - - - 6,942 -
L LahdoGM Middle East
(i) 2012 208,437 50,000 15,955 - 17,326 -
2011 174,976 - 6,606 - 29,395 -
L GormanGM Australia & NZ
(i) 2012 227,096 95,872 6,238 - 29,628 -
2011 165,957 - 5,293 - 15,413 -
B SharpGM Virtual (iii) 2011 250,000 - - - 22,500 -
Aggregate 2012 2,105,388 392,202 108,538 - 150,402 -
2011 2,160,163 48,792 88,915 - 162,001 -
Notes: i. Amounts disclosed as short-term cash profit-sharing and bonuses in the 2012 year represent discretionary bonuses to be paid in August 2012 from the executive bonus scheme pool at the discretion of the Remuneration Committee. L Gorman also received an additional $50,000 (included in the 2012 amount) which was paid in August 2011 with respect to her performance in the 2011 year. ii. The salary and fees of S Martin, O Vlietstra and J Goodwyn are paid in SGD, JPY and USD respectively. The increase in the 2012 year reflects the change in foreign currency exchange rate, not a change in salary in base currency terms. iii. B Sharp was not a key management personnel during the 2012 year. iv. The Maximum future value of vested STI and LTI grants represents the maximum amount of remuneration that could arise in the event that mature floor net profit before tax threshholds, as outlined on page 46, are achieved. Minimum future value of vested STI and LTI grants is nil.
Key management personnel remuneration
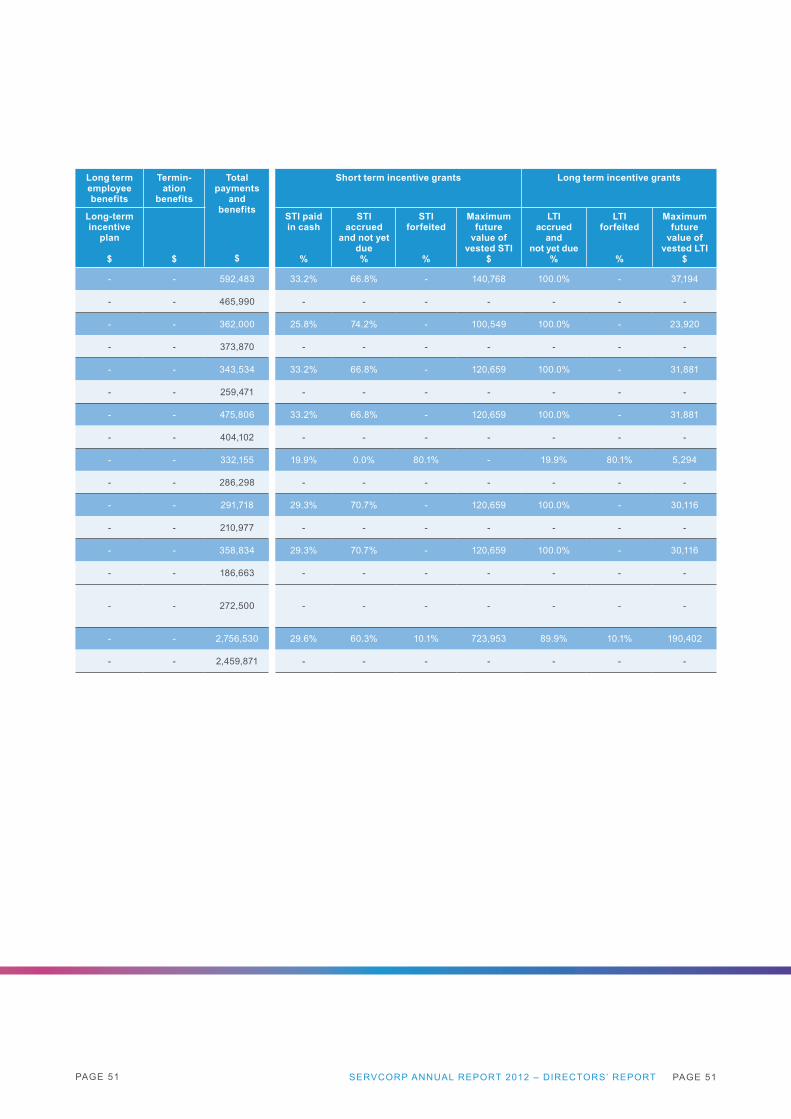
PAGE 51 PAGE 51SERVCORP ANNUAL REPORT 2012 – DIRECTORS’ REPORT
Long term employee benefits
Termin-ation
benefits
Total payments
and benefits
$
Short term incentive grants Long term incentive grants
Long-term incentive
plan
$ $
STI paid in cash
%
STI accrued
and not yet due%
STI forfeited
%
Maximum future
value of vested STI
$
LTI accrued
and not yet due
%
LTI forfeited
%
Maximum future
value of vested LTI
$
- - 592,483 33.2% 66.8% - 140,768 100.0% - 37,194
- - 465,990 - - - - - - -
- - 362,000 25.8% 74.2% - 100,549 100.0% - 23,920
- - 373,870 - - - - - - -
- - 343,534 33.2% 66.8% - 120,659 100.0% - 31,881
- - 259,471 - - - - - - -
- - 475,806 33.2% 66.8% - 120,659 100.0% - 31,881
- - 404,102 - - - - - - -
- - 332,155 19.9% 0.0% 80.1% - 19.9% 80.1% 5,294
- - 286,298 - - - - - - -
- - 291,718 29.3% 70.7% - 120,659 100.0% - 30,116
- - 210,977 - - - - - - -
- - 358,834 29.3% 70.7% - 120,659 100.0% - 30,116
- - 186,663 - - - - - - -
- - 272,500 - - - - - - -
- - 2,756,530 29.6% 60.3% 10.1% 723,953 89.9% 10.1% 190,402
- - 2,459,871 - - - - - - -
PAGE 52
Signed in accordance with a resolution of the directors pursuant to section 298(2) of the Corporations Act 2001.
A G MoufarrigeCEODated at Sydney this 28th day of August 2012.
Directors’ report (continued)
Indemnification and insurance of directors and officers The constitution of the Company provides that the Company must indemnify, on a full indemnity basis and to the full extent permitted by law, each current and former director, alternate director or executive officer against all losses or liabilities incurred in that capacity in defending any proceedings, whether civil or criminal, in which judgement is given in their favour or in which they are acquitted or in connection with any application in relation to any such proceedings in which relief is granted under the Corporations Act 2001.
The Company has agreed to indemnify the following current and former directors of the Company, Mr A G Moufarrige, Mr B Corlett, Mr R Holliday-Smith, Mrs J King, The Hon. Mark Vaile, Mr T Moufarrige and Mr B Pashby against any loss or liability that may arise from their position as directors of the Company and its controlled entities, except where the liability arises out of conduct involving a wilful breach of duty. The agreement stipulates that the Company will meet the full amount of any such liabilities to the extent permitted by law, including reasonable costs and expenses.
The Company has not, during or since the financial year, indemnified or agreed to indemnify an auditor of the Company.
During the financial year the Company has paid insurance premiums in respect of directors’ and officers’ liability and legal expenses insurance contracts, for current and former directors, secretaries and officers of the Company and its controlled entities. The insurance policies prohibit disclosure of the nature of the liability insured against and the amount of the premiums.
State of affairsThere were no significant changes in the state of affairs of the Consolidated Entity during the financial year.
Corporate governanceA statement of the Board’s governance practices is set out on pages 24 to 33 of this annual report.
Environmental managementThe Consolidated Entity’s operations are not subject to any particular and significant environmental regulations under either Commonwealth or State legislation.
Rounding offThe Company is of a kind referred to in ASIC Class Order 98/0100 dated 10 July 1998 and, in accordance with that Class Order, amounts in the financial report and the directors’ report have been rounded off to the nearest thousand dollars, unless otherwise stated.
Non-audit servicesDuring the year Deloitte Touche Tohmatsu, the Company’s auditor, has performed certain “non-audit services” in addition to their statutory duties.
The Board of directors has considered the non-audit services provided during the year by the auditor and in accordance with written advice provided by resolution of the Audit and Risk Committee, is satisfied that the provision of those non-audit services during the year by the auditor is compatible with the general standard of independence for auditors, and did not compromise the auditor independence requirements of, the Corporations Act 2001 for the following reasons: ▪ Non-audit services were subject to the corporate
governance procedures adopted by the Company and have been reviewed by the Audit and Risk Committee; and ▪ The non-audit services provided do not undermine the
general principles relating to auditor independence as set out in APES 110 Code of Ethics for Professional Accountants as they did not involve reviewing or auditing the auditor’s own work, acting in a management or decision making capacity for the Company or jointly sharing risks and rewards.
A copy of the auditor’s independence declaration as required under Section 307C of the Corporations Act 2001 is set out on page 53 and forms part of this report.
Details of the amounts paid or payable to the auditor of the Company, Deloitte Touche Tohmatsu and its related practices for audit and non-audit services provided during the year are set out in Note 4 to the Consolidated financial report.

PAGE 53 PAGE 53

PAGE 54PAGE 54
View from Miller Street l North Sydney
PAGE 55
2012 Financial report
Contents
Statement of comprehensive income 56
Statement of financial position 57
Statement of changes in equity 58
Statement of cash flows 59
Notes to the Consolidated financial report 60
Directors’ declaration 107
Auditor’s report 108 - 109
SERVCORP ANNUAL REPORT 2012 – FINANCIAL REPORT PAGE 55
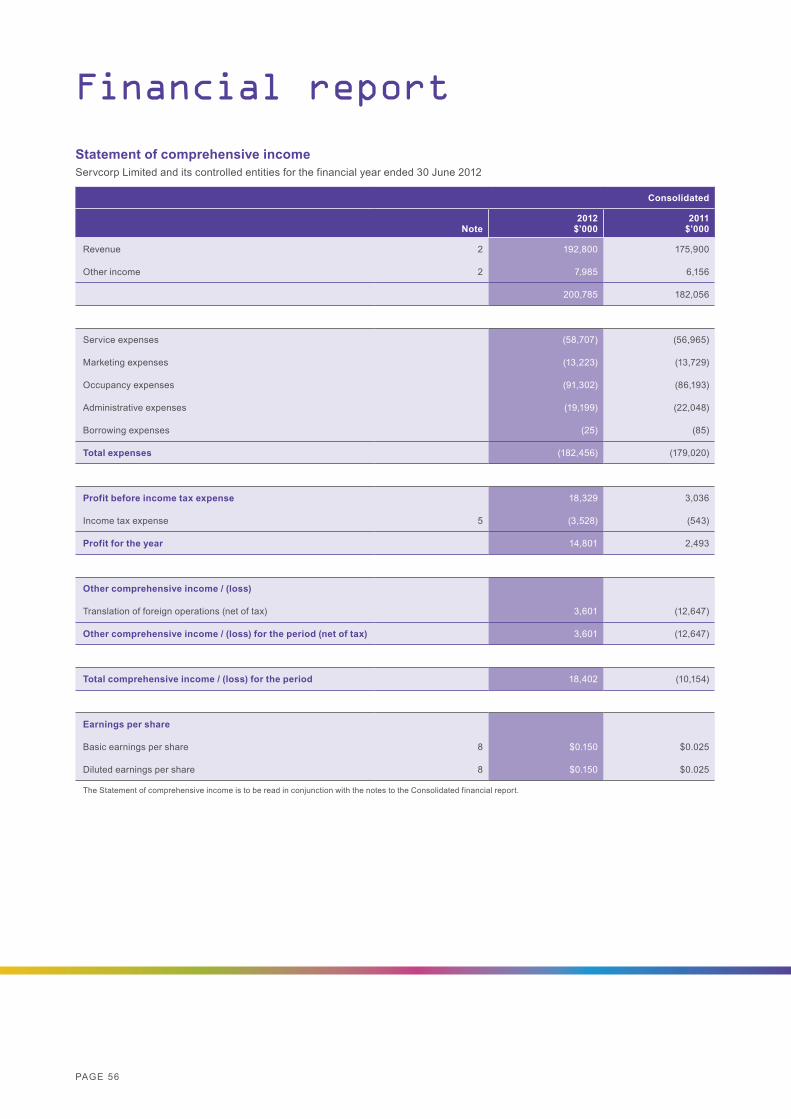
PAGE 56
Consolidated
Note2012
$’0002011
$’000
Revenue 2 192,800 175,900
Other income 2 7,985 6,156
200,785 182,056
Service expenses (58,707) (56,965)
Marketing expenses (13,223) (13,729)
Occupancy expenses (91,302) (86,193)
Administrative expenses (19,199) (22,048)
Borrowing expenses (25) (85)
Total expenses (182,456) (179,020)
Profit before income tax expense 18,329 3,036
Income tax expense 5 (3,528) (543)
Profit for the year 14,801 2,493
Other comprehensive income / (loss)
Translation of foreign operations (net of tax) 3,601 (12,647)
Other comprehensive income / (loss) for the period (net of tax) 3,601 (12,647)
Total comprehensive income / (loss) for the period 18,402 (10,154)
Earnings per share
Basic earnings per share 8 $0.150 $0.025
Diluted earnings per share 8 $0.150 $0.025
The Statement of comprehensive income is to be read in conjunction with the notes to the Consolidated financial report.
Statement of comprehensive incomeServcorp Limited and its controlled entities for the financial year ended 30 June 2012
Financial report
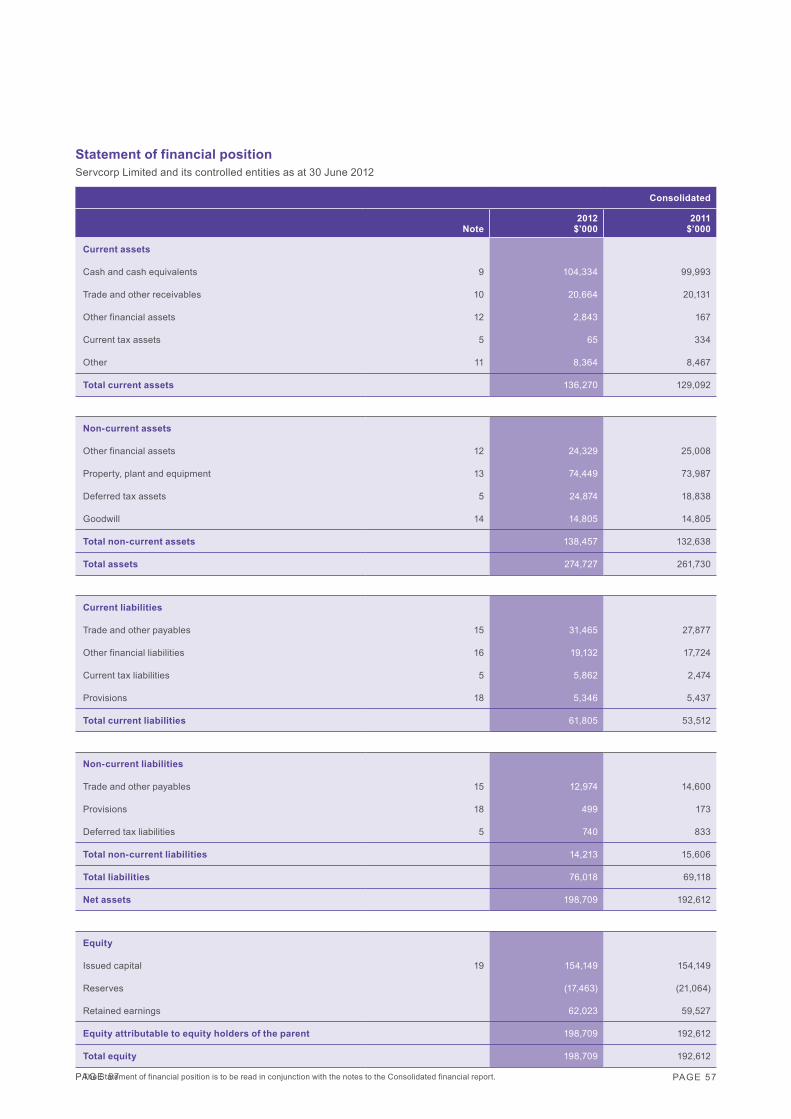
PAGE 57
Statement of financial positionServcorp Limited and its controlled entities as at 30 June 2012
Consolidated
Note2012
$’0002011
$’000
Current assets
Cash and cash equivalents 9 104,334 99,993
Trade and other receivables 10 20,664 20,131
Other financial assets 12 2,843 167
Current tax assets 5 65 334
Other 11 8,364 8,467
Total current assets 136,270 129,092
Non-current assets
Other financial assets 12 24,329 25,008
Property, plant and equipment 13 74,449 73,987
Deferred tax assets 5 24,874 18,838
Goodwill 14 14,805 14,805
Total non-current assets 138,457 132,638
Total assets 274,727 261,730
Current liabilities
Trade and other payables 15 31,465 27,877
Other financial liabilities 16 19,132 17,724
Current tax liabilities 5 5,862 2,474
Provisions 18 5,346 5,437
Total current liabilities 61,805 53,512
Non-current liabilities
Trade and other payables 15 12,974 14,600
Provisions 18 499 173
Deferred tax liabilities 5 740 833
Total non-current liabilities 14,213 15,606
Total liabilities 76,018 69,118
Net assets 198,709 192,612
Equity
Issued capital 19 154,149 154,149
Reserves (17,463) (21,064)
Retained earnings 62,023 59,527
Equity attributable to equity holders of the parent 198,709 192,612
Total equity 198,709 192,612
The Statement of financial position is to be read in conjunction with the notes to the Consolidated financial report. PAGE 57
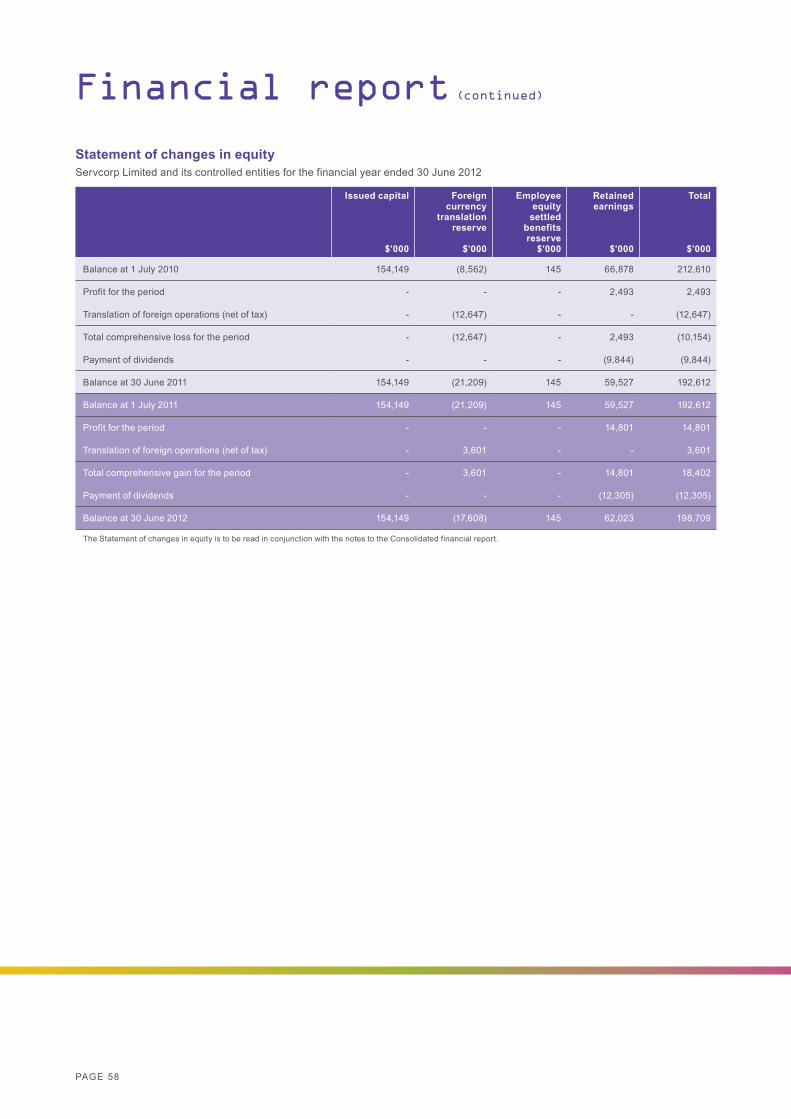
PAGE 58
Issued capital
$’000
Foreign currency
translation reserve
$’000
Employee equity
settled benefits reserve
$’000
Retained earnings
$’000
Total
$’000
Balance at 1 July 2010 154,149 (8,562) 145 66,878 212,610
Profit for the period - - - 2,493 2,493
Translation of foreign operations (net of tax) - (12,647) - - (12,647)
Total comprehensive loss for the period - (12,647) - 2,493 (10,154)
Payment of dividends - - - (9,844) (9,844)
Balance at 30 June 2011 154,149 (21,209) 145 59,527 192,612
Balance at 1 July 2011 154,149 (21,209) 145 59,527 192,612
Profit for the period - - - 14,801 14,801
Translation of foreign operations (net of tax) - 3,601 - - 3,601
Total comprehensive gain for the period - 3,601 - 14,801 18,402
Payment of dividends - - - (12,305) (12,305)
Balance at 30 June 2012 154,149 (17,608) 145 62,023 198,709
The Statement of changes in equity is to be read in conjunction with the notes to the Consolidated financial report.
Statement of changes in equityServcorp Limited and its controlled entities for the financial year ended 30 June 2012
Financial report (continued)

PAGE 59
Consolidated
Note2012
$’0002011
$’000
Cash flows from operating activities
Receipts from customers 205,759 190,161
Payments to suppliers and employees (173,893) (174,124)
Franchise fees received 621 616
Income tax paid (5,394) (2,497)
Interest and other items of similar nature received 4,935 4,722
Interest and other costs of finance paid (25) (90)
Net operating cash flows 25(b) 32,003 18,788
Cash flows from investing activities
Payments for property, plant and equipment (16,340) (40,710)
Payments for lease deposits (909) (1,468)
Proceeds from sale of property, plant and equipment - 47
Proceeds from refund of lease deposits 438 3,251
Net investing cash flows (16,811) (38,880)
Cash flows from financing activities
Proceeds from borrowings - 2,504
Repayment of borrowings - (3,437)
Dividends paid (12,305) (9,844)
Landlord capital incentives received 936 5,021
Net financing cash flows (11,369) (5,756)
Net increase/(decrease) in cash and cash equivalents 3,823 (25,848)
Cash and cash equivalents at the beginning of the financial year 99,849 131,331
Effects of exchange rate changes on cash transactions in foreign currencies 662 (5,634)
Cash and cash equivalents at the end of the financial year 25(a) 104,334 99,849
The Statement of cash flows is to be read in conjunction with the notes to the Consolidated financial report.
Statement of cash flowsServcorp Limited and its controlled entities for the financial year ended 30 June 2012
SERVCORP ANNUAL REPORT 2012 – FINANCIAL REPORT PAGE 59
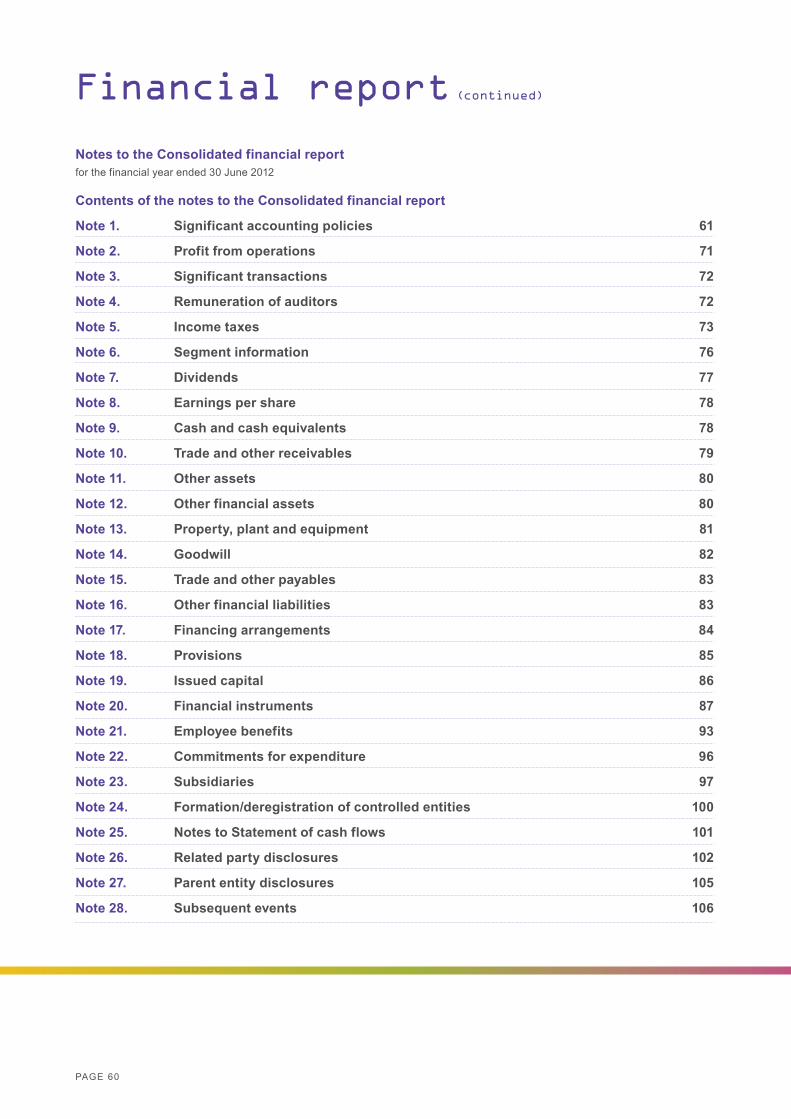
PAGE 60
Financial report (continued)
Notes to the Consolidated financial reportfor the financial year ended 30 June 2012
Contents of the notes to the Consolidated financial report
Note 1. Significant accounting policies 61
Note 2. Profit from operations 71
Note 3. Significant transactions 72
Note 4. Remuneration of auditors 72
Note 5. Income taxes 73
Note 6. Segment information 76
Note 7. Dividends 77
Note 8. Earnings per share 78
Note 9. Cash and cash equivalents 78
Note 10. Trade and other receivables 79
Note 11. Other assets 80
Note 12. Other financial assets 80
Note 13. Property, plant and equipment 81
Note 14. Goodwill 82
Note 15. Trade and other payables 83
Note 16. Other financial liabilities 83
Note 17. Financing arrangements 84
Note 18. Provisions 85
Note 19. Issued capital 86
Note 20. Financial instruments 87
Note 21. Employee benefits 93
Note 22. Commitments for expenditure 96
Note 23. Subsidiaries 97
Note 24. Formation/deregistration of controlled entities 100
Note 25. Notes to Statement of cash flows 101
Note 26. Related party disclosures 102
Note 27. Parent entity disclosures 105
Note 28. Subsequent events 106
PAGE 61
1. Significant accounting policiesStatement of compliance The financial report is a general purpose financial report which has been prepared in accordance with the Corporations Act 2001, Accounting Standards and Interpretations, and complies with other requirements of the law.
The financial report comprises the consolidated financial statements of Servcorp Limited and its controlled entities (‘Group’ or ‘Consolidated Entity’).
Accounting Standards include Australian equivalents to International Financial Reporting Standards (‘A-IFRS’). Compliance with A-IFRS ensures that the financial statements and notes of the Group comply with International Financial Reporting Standards (‘IFRS’).
The financial statements were authorised for issue by the directors on 28 August 2012.
Basis of preparationThe financial report has been prepared on the basis of historical cost, except for financial instruments that are measured at their fair value as explained below. Cost is based on the fair value of the consideration given in exchange for assets. All amounts are presented in Australian dollars, unless otherwise noted.
The Company is a company of the kind referred to in ASIC Class Order 98/0100, dated 10 July 1998, and in accordance with that Class Order, amounts in the financial report are rounded off to the nearest thousand dollars, unless otherwise indicated.
Adoption of new and revised Accounting StandardsIn the current year, the Group has adopted all of the new and revised Standards and Interpretations issued by the Australian Accounting Standards Board (AASB) that are relevant to its operations and effective for the current annual reporting period. The adoption of these new accounting standards did not have any material impact.
At the date of authorisation of the financial report, the following Standards and Interpretations relevant to the Group were on issue but not yet effective: ▪ AASB9 ‘Financial Instruments’ AASB2009-11 Amendments to Australian Accounting Standards arising from AASB9.
Effective for annual reporting periods beginning 1 January 2013. ▪ AASB13 ‘Fair Value Measurement’ and AASB2011-8 ‘Amendments to Australian Accounting Standards arising from AASB13’. ▪ AASB10 ‘Consolidated Financial Statements’. Effective for annual reporting periods beginning 1 January 2013. ▪ AASB119 ‘Employee Benefits’ (2011) and AASB2011-10 ‘Amendments to Australian Accounting Standards arising from AASB119
(2011)’. Effective for annual reporting periods beginning 1 January 2013. ▪ AASB12 ‘Disclosure of Interests in Other Entities’. Effective for annual reporting periods beginning 1 January 2013.
The directors anticipate that the adoption of these Standards and Interpretations on issue but not yet effective in future periods will have no material financial impact on the financial statements of the Consolidated Entity.
Notes to the Consolidated financial reportfor the financial year ended 30 June 2012
SERVCORP ANNUAL REPORT 2012 – FINANCIAL REPORT PAGE 61

PAGE 62
1. Significant accounting policies (continued)The following significant accounting policies have been adopted in the preparation and presentation of the financial report:
a. Basis of consolidationThe consolidated financial statements incorporate the financial statements of the Company and entities controlled by the Company (its subsidiaries). Control is achieved when the Company has the power to govern the financial and operating policies of an entity so as to obtain benefits from its activities. A list of subsidiaries appears in Note 23 to the financial statements. Consistent accounting policies are employed in the preparation and presentation of the consolidated financial statements.
On acquisition, the assets, liabilities and contingent liabilities of a subsidiary are measured at their fair values at the date of acquisition. Any excess in the cost of acquisition over the fair value of the identifiable net assets acquired is recognised as goodwill. If after reassessment, the fair value of the identifiable net assets acquired exceeds the cost of acquisition the difference is credited to the Statement of comprehensive income in the period of acquisition.
The consolidated financial statements include the information and results of each subsidiary from the date on which the Company obtains control, and until such time as the Company ceases to control an entity.
In preparing the consolidated financial statements, all intercompany balances and transactions, and unrealised profits arising within the Consolidated Entity are eliminated in full.
b. GoodwillGoodwill arising on acquisition is recognised as an asset and initially recognised at cost, representing the excess of the cost of acquisition over the net fair value of the identifiable assets, liabilities and contingent liabilities acquired. Goodwill is not amortised, but is tested for impairment at each reporting date and whenever there is an indication that goodwill may be impaired. Any impairment of goodwill is recognised immediately in the Statement of comprehensive income and is not subsequently reversed.
For the purpose of impairment testing, goodwill is allocated to each of the Group’s cash-generating units (CGUs), or groups of CGUs, expected to benefit from the synergies of the business combination. CGUs (or groups of CGUs) to which goodwill has been allocated are tested for impairment annually, or more frequently if events or changes in circumstances indicate that goodwill might be impaired.
If the recoverable amount of the CGU (or group of CGUs) is less than the carrying amount of the CGU, the impairment loss is allocated to reduce the carrying amount of any goodwill allocated to the CGU (or group of CGUs) and then to the other assets of the CGUs pro-rata on the basis of the carrying amount of each asset in the CGU (or group of CGUs). An impairment loss for goodwill is immediately recognised in profit or loss and is not reversed in a subsequent period. On disposal of an operation within a CGU, the attributable amount of goodwill is included in the determination of the profit or loss on disposal of the operation.
Financial report (continued)
Notes to the Consolidated financial reportfor the financial year ended 30 June 2012
PAGE 63
1. Significant accounting policies (continued)c. Impairment of tangible and intangible assets excluding goodwillAt each reporting date, the Consolidated Entity reviews the carrying values of its tangible and intangible assets, to determine whether there is any indication that those assets have suffered an impairment loss. If any such indication exists the recoverable amount of the asset is estimated in order to determine the extent of the impairment loss (if any). Where the asset does not generate cash flows that are independent from other assets, the Consolidated Entity estimates the recoverable amount of the cash-generating unit to which the asset belongs.
Intangible assets with indefinite useful lives and intangible assets not yet available for use are tested for impairment at each reporting date and whenever there is an indication that the asset may be impaired.
The recoverable amount is the higher of fair value less costs to sell and value in use. In assessing the value in use, the estimated future cash flows are discounted to their present value by using a pre-tax discount rate that reflects the time value of money and the risks specific to the asset for which the estimates of future cash flows have not been adjusted.
If the recoverable amount of an asset (or CGU) is estimated to be less than its carrying amount, the carrying amount of the asset (or CGU) is reduced to its recoverable amount.
Where an impairment loss subsequently reverses, the carrying amount of the asset (or CGU) is increased to the revised estimate of its recoverable amount, but only to the extent that the increased carrying amount does not exceed the carrying amount that would have been determined had no impairment loss been recognised for the asset (or CGU) in prior years. A reversal of the impairment loss is recognised in the Statement of comprehensive income immediately.
d. Revenue recognitionServices revenueServices revenue comprises revenue earned net of the amount of goods and services tax from the provision of services to entities outside the Consolidated Entity. Rental, telephone and services revenue are typically invoiced in advance and are recognised in the period in which the services are provided.
e. Other income / expenseInterest incomeInterest income is accrued on a time basis, by reference to the principal outstanding and at the effective interest rate applicable.
Disposal of assetsThe profit and loss on disposal of assets is brought to account when the significant risks and rewards of ownership are passed to a party external to the Consolidated Entity.
f. Foreign currencyTransactionsForeign currency transactions are translated to Australian currency at the rates of exchange ruling at the dates of the transactions. Amounts receivable and payable in foreign currencies at balance date are translated at the rates of exchange ruling on that date.
Foreign currency monetary items at reporting date are translated at the exchange rates existing at reporting date. Non-monetary assets and liabilities carried at fair value that are denominated in foreign currencies are translated at the rates prevailing at the date when the fair value was determined. Non-monetary items that are measured in terms of historical cost in a foreign currency are not re-translated.
Exchange differences are recognised in profit and loss in the period in which they arise except exchange differences on monetary items receivable from or payable to a foreign operation for which settlement is neither planned or likely to occur, which form part of the net investment in a foreign operation. Such exchange differences are recognised in the foreign currency translation reserve and in the profit and loss on disposal of the net investment.
Notes to the Consolidated financial reportfor the financial year ended 30 June 2012
SERVCORP ANNUAL REPORT 2012 – FINANCIAL REPORT PAGE 63

PAGE 64
1. Significant accounting policies (continued)f. Foreign currency (continued) Translation of controlled foreign entitiesThe individual financial statements of each group entity are presented in its functional currency being the currency of the primary economic environment in which the entity operates. For the purpose of the consolidated financial statements, the results and financial position of each entity are expressed in Australian dollars, which is the functional currency of Servcorp Limited and the presentation currency for the consolidated financial statements.
The assets and liabilities of overseas operations are translated at the rates of exchange ruling at the balance sheet date.
Income and expense items are translated at the average exchange rate for the period. Exchange differences arising on translation are taken directly to the foreign currency translation reserve.
The balance of the foreign currency translation reserve relating to an overseas operation that is disposed of is recognised in the profit and loss in the period of disposal.
Goodwill and fair value adjustments arising on the acquisition of a foreign entity on or after the date of transition to A-IFRS are treated as assets and liabilities of the foreign entity and translated at exchange rates prevailing at the reporting date. Goodwill arising on acquisitions before the date of transition to A-IFRS is treated as an Australian dollar denominated asset.
g. Borrowing costsBorrowing costs include interest, amortisation of discounts or premiums relating to borrowings, and amortisation of ancillary costs using the effective interest rate method in connection with the arrangement of borrowings. Borrowing costs are expensed to the Statement of comprehensive income as incurred.
h. Taxation Current taxCurrent tax is calculated by reference to the amount of income tax payable or recoverable in respect of the taxable profit or loss for the period. Income tax is calculated using tax rates and tax laws that have been enacted or substantively enacted by the reporting date. Current tax for current and prior periods is recognised as a liability or asset to the extent that it is unpaid or refundable.
Deferred taxDeferred tax is accounted for using the comprehensive balance sheet liability method in respect of temporary differences arising from differences between the carrying amount of assets and liabilities in the financial statements and the corresponding tax base of those items.
In principle, deferred tax liabilities are recognised for all taxable temporary differences. Deferred tax assets are recognised to the extent that it is probable that sufficient taxable amounts will be available against which deductible temporary differences or unused tax losses and tax offsets can be utilised. However, deferred tax assets and liabilities are not recognised if the temporary differences giving rise to them arises from the initial recognition of assets and liabilities, other than as a result of a business combination, which affects neither taxable income nor accounting profit. Furthermore, a deferred tax liability is not recognised in relation to taxable temporary differences arising from goodwill.
Deferred tax liabilities are recognised for taxable temporary differences arising on investments in subsidiaries, branches and associates except where the Consolidated Entity is able to control the reversal of the temporary differences and it is probable that the temporary differences will not reverse in the foreseeable future. Deferred tax assets arising from deductible temporary differences associated with these investments are only recognised to the extent that it is probable that there will be sufficient taxable profits against which to utilise benefits of the temporary differences and they are expected to reverse in the foreseeable future.
Deferred tax assets and liabilities are measured at the tax rates that are expected to apply in the period when the assets and liabilities giving rise to them are realised or settled, based on tax rates and tax laws that have been enacted or substantially enacted by the reporting date.
Financial report (continued)
Notes to the Consolidated financial reportfor the financial year ended 30 June 2012
PAGE 65
1. Significant accounting policies (continued)h. Taxation (continued)Deferred tax (continued)The measurement of deferred tax liabilities and assets reflects the tax consequences that would follow from the manner in which the Consolidated Entity expects, at the reporting date, to recover or settle the carrying amount of its assets and liabilities.
Deferred tax assets and liabilities are offset when they relate to income taxes levied by the same taxation authority and the Consolidated Entity intends to settle its current tax assets and liabilities on a net basis.
Current and deferred tax for the periodCurrent and deferred tax is recognised as an expense or income in the Statement of comprehensive income, except when it relates to items credited or debited directly to equity, in which case the deferred tax is also recognised in equity.
Tax consolidationThe Company and all its wholly-owned Australian resident entities are part of a tax consolidated group under Australian taxation law. Servcorp Limited is the head entity in the tax consolidated group. Tax expense income, deferred tax liabilities and deferred tax assets arising from temporary differences of the members of the tax consolidated group are recognised in the separate financial statements of the members of the tax consolidated group using the ‘separate tax payer within group’ approach. Current tax liabilities and assets and deferred tax assets arising from unused tax losses and tax credits of the members of the tax consolidated group are recognised by the Company. Under this method, each entity is subject to tax as part of the tax consolidated group.
Due to the existence of a tax funding arrangement between entities in the tax consolidated group, amounts are recognised as payable to or receivable by the Company, and each member of the tax consolidated group in relation to the tax contribution amounts paid or payable between the parent entity, and the other members of the tax consolidated group in accordance with the arrangement. Where the tax contribution amount recognised by each member of the tax consolidated group for a particular period is different to the aggregate of the current tax liability or asset and any deferred tax asset arising from unused tax losses and tax credits in respect of that period, the difference is recognised as a contribution from (or distribution to) equity participants.
Goods and services taxRevenues, expenses and assets are recognised net of the amount of goods and services tax (GST), except where the amount of GST incurred is not recoverable from the Australian Tax Office (ATO). In these circumstances the GST is recognised as part of the cost of acquisition of the asset or as part of an item of expense.
Receivables and payables are stated inclusive of GST.
The net amount of GST recoverable from or payable to the ATO is included as a current asset or liability in the Statement of financial position.
Cash flows are included in the Statement of cash flows on a gross basis. The GST components of cash flows arising from investing and financing activities which are recoverable from or payable to the ATO are classified as operating cash flows.
i. ReceivablesTrade debtors to be settled within 30 days are carried at amounts due. The collectability of debts is assessed at balance sheet date and a specific allowance is made for any doubtful amounts.
j. Derivative financial instrumentsThe Consolidated Entity enters into derivative financial instruments to manage its exposure to fluctuations in foreign exchange rates. Further details of derivative financial instruments are disclosed in Note 20 to the Consolidated financial report.
Derivatives are initially recognised at fair value on the date a derivative contract is entered into and are subsequently remeasured to their fair value at each reporting date. The resulting gain or loss is recognised immediately in the profit or loss.
Notes to the Consolidated financial reportfor the financial year ended 30 June 2012
SERVCORP ANNUAL REPORT 2012 – FINANCIAL REPORT PAGE 65
PAGE 66
1. Significant accounting policies (continued)k. Share based paymentsThe Board may grant options to eligible executives in accordance with the Servcorp Executive Share Option Scheme. These equity-settled-share-based payments are non-market based and have earnings per share performance hurdles for the vesting of options.
Equity-settled share-based payments with employees are measured at the fair value of the equity instrument at the grant date. Fair value is measured by use of a Binomial Tree model. The expected life used in the model has been adjusted, based on management’s best estimate for the effects of non-transferability, exercise restrictions, and behavioural considerations. Further details on how the fair value of equity-settled share-based transactions has been determined can be found in Note 21.
The fair value determined at the grant date of the equity-settled share-based payments is expensed on a straight line basis over the vesting period, based on the Group’s estimate of equity instruments that will eventually vest.
At each reporting date, the Group revises its estimate of the number of equity instruments that are expected to vest. The impact of the revision of the original estimates, if any, is recognised in profit or loss, with a corresponding adjustment to the equity-settled employee benefits reserve.
l. Financial assetsSubsequent to initial recognition, Servcorp Limited’s investments in subsidiaries are measured at cost.
The classification of financial assets depends on the nature and purpose of the financial assets and is determined at the time of initial recognition. Other financial assets are classified into the following specified categories:
Loans and receivablesTrade receivables, loans and other receivables that have fixed or determinable payments that are not quoted in an active market are classified as ‘Loans and receivables‘. Loans and receivables are measured at amortised costs using the effective interest method less impairment.
Impairment of financial assetsFinancial assets are assessed for indicators of impairment at each balance sheet date. Financial assets are impaired where there is objective evidence that, as a result of one or more events that occurred after the initial recognition of the financial asset, the estimated future cash flow of the investment have been impacted.
Effective interest methodThe effective interest method is a method of calculating the amortised cost of a financial asset and of allocating interest income over the relevant period. The effective interest rate is the rate that will exactly discount estimated future cash receipts (including all fees paid or received that form an integral part of the effective interest rate, transaction costs and other premiums or discounts) through the expected life of the financial asset or, where appropriate, a shorter period.
Financial report (continued)
Notes to the Consolidated financial reportfor the financial year ended 30 June 2012
PAGE 67
1. Significant accounting policies (continued)m. Property, plant and equipmentAcquisitionItems of property, plant and equipment acquired are capitalised when it is probable that the future economic benefits associated with the item will flow to the entity and the cost can be measured reliably. Where these costs represent separate components of a complex asset, they are accounted for as separate assets and are separately depreciated over their useful lives. Rent incurred in bringing floors to a state of operational readiness is capitalised to leasehold improvements and depreciated over the useful life of the asset.
Costs incurred on property, plant and equipment, which does not meet the criteria for capitalisation are expensed as incurred.
Property, plant and equipment, leasehold improvements and equipment under finance lease are stated at cost less accumulated depreciation, less impairment losses. Cost includes expenditure that is directly attributable to the acquisition of the item.
DepreciationItems of property, plant and equipment, including buildings and leasehold property but excluding freehold land, are depreciated using the straight line method over their estimated useful lives. Leasehold improvements are depreciated over the useful life of the asset using the straight line method.
The estimated useful lives used for each class of asset are as follows:Buildings 40 yearsLeasehold improvements Useful life of the assetOffice furniture and fittings 7.7 yearsOffice equipment 3-4 yearsSoftware 3.7 yearsMotor vehicles 6.7 years
Depreciation rates and methods are reviewed annually and, where changed, are accounted for as a change in accounting estimate. Where depreciation rates or methods are changed, the net written down value of the asset is depreciated from the date of the change in accordance with the new depreciation rate or method.
Assets are depreciated from the date of acquisition from the time an asset is completed and ready for use.
n. Leased assetsFinance leasesLeased plant and equipmentLeases of plant and equipment under which the Company or its controlled entities assume substantially all the risks and benefits of ownership are classified as finance leases. Other leases are classified as operating leases.
Lease payments are apportioned between finance charges and reduction of the lease obligation so as to achieve a constant rate of interest on the remaining balance of the liability.
Lease liabilities are reduced by repayments of principal. The interest components of the lease payments are charged to the Statement of comprehensive income.
Operating leasesOperating lease payments are recognised as an expense on a straight line basis over the lease term, except where another systematic basis is more representative of the time pattern in which economic benefits from the leased asset are consumed.
Lease incentivesFloor rental is expensed on a straight line basis over the period of the lease term in accordance with lease agreements entered into with landlords. Where a rent free period or other lease incentives exist under the terms of a lease agreement, the aggregate rent payable over the lease term is calculated and a charge is made to the profit and loss on a straight line basis over the term of the lease. In the event that lease incentives are received to enter into operating leases, such incentives are recognised as a liability.
Notes to the Consolidated financial reportfor the financial year ended 30 June 2012
SERVCORP ANNUAL REPORT 2012 – FINANCIAL REPORT PAGE 67

PAGE 68
1. Significant accounting policies (continued)o. PayablesLiabilities are recognised for amounts payable in the future for goods or services received, whether or not billed to the Consolidated Entity. Trade accounts payable are normally settled within 60 days.
p. Borrowing costsBorrowings are recorded initially at fair value, net of transaction costs. Any difference between the initial recognised amount and the redemption value is recognised in the Statement of comprehensive income over the life of the borrowings using the effective interest rate method.
q. ProvisionsProvisions are recognised when the Consolidated Entity has a present obligation (legal or constructive) as a result of a past event, the future sacrifice of economic benefits is probable, and the amount of the provision can be measured reliably.
When some or all of the economic benefits required to settle a provision are expected to be recovered from a third party, the receivable is recognised as an asset if it is virtually certain that recovery will be received and the amount of the receivable can be measured reliably.
The amount recognised as a provision is the best estimate of the consideration required to settle the present obligation at the reporting date, taking into account the risks and uncertainties surrounding the obligation. Where a provision is measured using the cash flows estimated to settle the present obligation, its carrying amount is the present value of those cash flows.
Make good costsA provision is made for make good costs on leases that are expected to terminate where those make good costs can be reliably measured, and can be reasonably expected to occur.
Onerous contractsAn onerous contract is considered to exist where the Consolidated Entity has a contract under which the unavoidable costs of meeting the contractual obligations exceed the economic benefits estimated to be received. Present obligations arising under onerous contracts are recognised as a provision to the extent that the present obligation exceeds the economic benefits estimated to be received.
Financial report (continued)
Notes to the Consolidated financial reportfor the financial year ended 30 June 2012
PAGE 69
1. Significant accounting policies (continued)r. Employee benefitsWages, salaries and annual leaveThe provisions for employee benefits in respect of wages, salaries and annual leave represents the amount which the Consolidated Entity has a present obligation to pay resulting from employees’ services provided up to the reporting date. Provisions made in respect of employee benefits expected to be settled within twelve months, are measured at their nominal values using the remuneration rate expected to apply at the time of settlement.
Long service leaveThe provision for employee benefits in respect of long service leave represents the present value of the estimated future cash outflows to be made by the Consolidated Entity resulting from employees’ services provided up to the reporting date.
Provisions for employee benefits which are not expected to be settled within twelve months are discounted using the rates attaching to national government securities at the reporting date which most closely match the terms of maturity of the related liabilities.
In determining the provision for employee benefits, consideration has been given to future increases in wage and salary rates, and the Consolidated Entity’s experience with staff departures. Related on-costs have also been included in the liability.
Contributions to Australian superannuation fundsThe Company and other Australian controlled entities contribute to defined contribution superannuation plans. Contributions are charged to the Statement of comprehensive income as they are incurred. Further information is set out in Note 21. Contributions to defined contribution superannuation plans are expensed as incurred.
s. Earnings per share (EPS)Basic earnings per shareBasic EPS is calculated by dividing the net profit attributable to members of the Consolidated Entity for the reporting period by the weighted average number of ordinary shares of the Company.
Diluted earnings per shareDiluted EPS is calculated by adjusting the basic EPS earnings by the effect of conversion to ordinary shares of the associated dilutive potential ordinary shares. The notional earnings on the funds that would have been received by the entity had the potential ordinary shares been converted are not included.
The diluted EPS weighted average number of shares includes the number of shares assumed to be issued for no consideration in relation to dilutive potential ordinary shares.
The identification of dilutive potential ordinary shares is based on net profit or loss from continuing ordinary operations and is applied on a cumulative basis, taking into account the incremental earnings and incremental number of shares for each series of potential ordinary share.
t. Debt and equity instrumentsDebt and equity instruments are classified as either liabilities or as equity in accordance with the substance of the contractual arrangement.
Notes to the Consolidated financial reportfor the financial year ended 30 June 2012
SERVCORP ANNUAL REPORT 2012 – FINANCIAL REPORT PAGE 69
PAGE 70
1. Significant accounting policies (continued)u. Cash and cash equivalentsCash comprises cash on hand and demand deposits. Cash equivalents are short-term, highly liquid investments that are readily convertible to known amounts of cash, which are subject to an insignificant risk of changes in value and have a maturity of six months or less.
v. Critical accounting issuesIn the application of the Group’s accounting policies, management is required to make judgments, estimates and assumptions about carrying values of assets and liabilities that are not readily apparent from other sources. The estimates and associated assumptions are based on historical experience and various other factors that are believed to be reasonable under the circumstances, the results of which form the basis of making the judgments. Actual results may differ from these estimates.
These estimates and underlying assumptions are reviewed on an ongoing basis. Revisions to accounting estimates are recognised in the period in which the estimate is revised if the revision affects only that period, or in the period of the revision and future periods if the revision affects both current and future periods.
The following are the critical judgments that management has made in the process of applying the Group’s accounting policies and that have the most significant effect on the amounts recognised in the financial statements:
Impairment of goodwillDetermining whether goodwill is impaired requires an estimation of the value in use of the cash-generating units to which goodwill has been allocated. The value in use calculation requires the entity to estimate the future cash flows expected to arise from the cash-generating unit and a suitable discount rate in order to calculate present value. Further information on goodwill impairment is set out in Note 14.
Useful lives of property, plant and equipmentAs described in Note 1(m), the Group reviews the estimated useful lives of property, plant and equipment at each reporting period.
Make good provisionsAt each reporting date, management reviews leases that are expected to terminate to determine the present obligation in relation to floor closure costs including make good, which is set out in Note 3.
Share optionsAs described in Note 21, management uses their judgment in selecting an appropriate valuation technique for share options. Valuation techniques commonly used by market practitioners are applied. For share options, the Binomial Tree option valuation technique was applied.
Tax lossesDeferred tax assets for the carry forward of unused tax losses are recognised to the extent that it is probable that future taxable profits will be available against which the unused tax losses and unused tax credits can be utilised. This is assessed at each reporting date. Further information is set out in Note 5.
Financial report (continued)
Notes to the Consolidated financial reportfor the financial year ended 30 June 2012
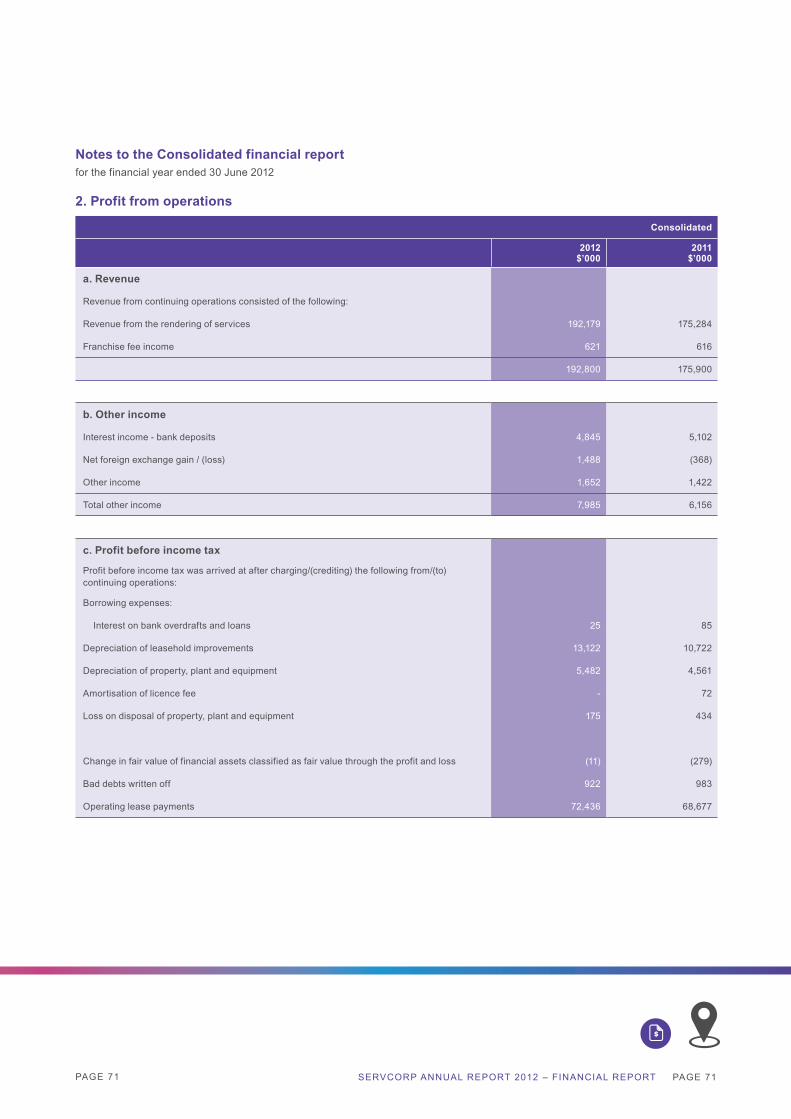
PAGE 71
2. Profit from operations
Consolidated
2012$’000
2011$’000
a. Revenue
Revenue from continuing operations consisted of the following:
Revenue from the rendering of services 192,179 175,284
Franchise fee income 621 616
192,800 175,900
b. Other income
Interest income - bank deposits 4,845 5,102
Net foreign exchange gain / (loss) 1,488 (368)
Other income 1,652 1,422
Total other income 7,985 6,156
c. Profit before income tax
Profit before income tax was arrived at after charging/(crediting) the following from/(to) continuing operations:
Borrowing expenses:
Interest on bank overdrafts and loans 25 85
Depreciation of leasehold improvements 13,122 10,722
Depreciation of property, plant and equipment 5,482 4,561
Amortisation of licence fee - 72
Loss on disposal of property, plant and equipment 175 434
Change in fair value of financial assets classified as fair value through the profit and loss (11) (279)
Bad debts written off 922 983
Operating lease payments 72,436 68,677
Notes to the Consolidated financial reportfor the financial year ended 30 June 2012
SERVCORP ANNUAL REPORT 2012 – FINANCIAL REPORT PAGE 71
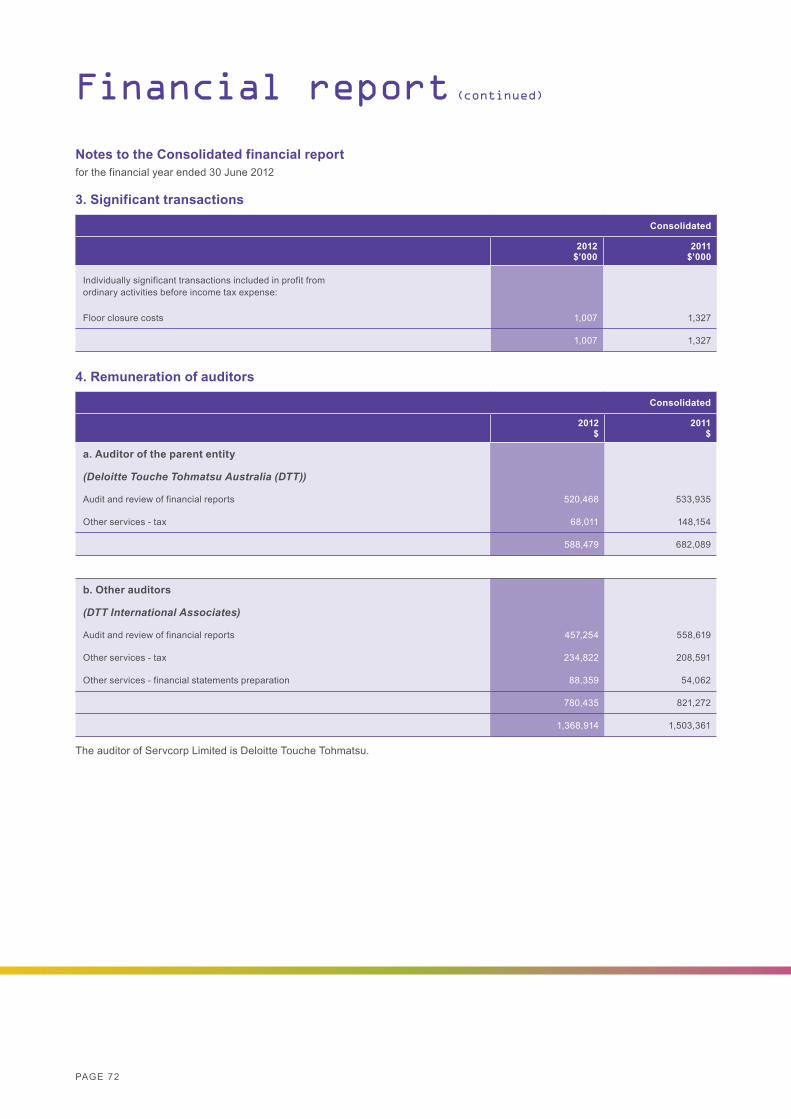
PAGE 72
4. Remuneration of auditors
Consolidated
2012$
2011$
a. Auditor of the parent entity
(Deloitte Touche Tohmatsu Australia (DTT))
Audit and review of financial reports 520,468 533,935
Other services - tax 68,011 148,154
588,479 682,089
b. Other auditors
(DTT International Associates)
Audit and review of financial reports 457,254 558,619
Other services - tax 234,822 208,591
Other services - financial statements preparation 88,359 54,062
780,435 821,272
1,368,914 1,503,361
The auditor of Servcorp Limited is Deloitte Touche Tohmatsu.
3. Significant transactions
Consolidated
2012$’000
2011$’000
Individually significant transactions included in profit fromordinary activities before income tax expense:
Floor closure costs 1,007 1,327
1,007 1,327
Financial report (continued)
Notes to the Consolidated financial reportfor the financial year ended 30 June 2012
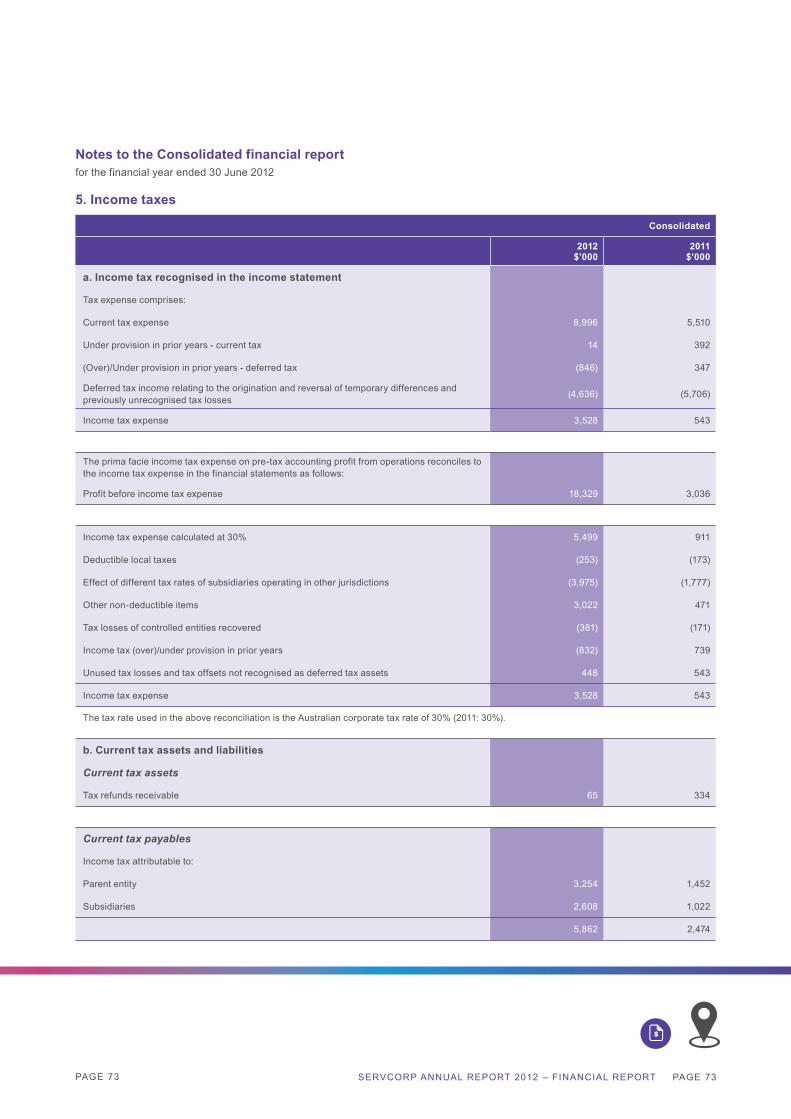
PAGE 73
5. Income taxes
Consolidated
2012$’000
2011$’000
a. Income tax recognised in the income statement
Tax expense comprises:
Current tax expense 8,996 5,510
Under provision in prior years - current tax 14 392
(Over)/Under provision in prior years - deferred tax (846) 347
Deferred tax income relating to the origination and reversal of temporary differences and previously unrecognised tax losses (4,636) (5,706)
Income tax expense 3,528 543
The prima facie income tax expense on pre-tax accounting profit from operations reconciles to the income tax expense in the financial statements as follows:
Profit before income tax expense 18,329 3,036
Income tax expense calculated at 30% 5,499 911
Deductible local taxes (253) (173)
Effect of different tax rates of subsidiaries operating in other jurisdictions (3,975) (1,777)
Other non-deductible items 3,022 471
Tax losses of controlled entities recovered (381) (171)
Income tax (over)/under provision in prior years (832) 739
Unused tax losses and tax offsets not recognised as deferred tax assets 448 543
Income tax expense 3,528 543
The tax rate used in the above reconciliation is the Australian corporate tax rate of 30% (2011: 30%).
b. Current tax assets and liabilities
Current tax assets
Tax refunds receivable 65 334
Current tax payables
Income tax attributable to:
Parent entity 3,254 1,452
Subsidiaries 2,608 1,022
5,862 2,474
Notes to the Consolidated financial reportfor the financial year ended 30 June 2012
SERVCORP ANNUAL REPORT 2012 – FINANCIAL REPORT PAGE 73
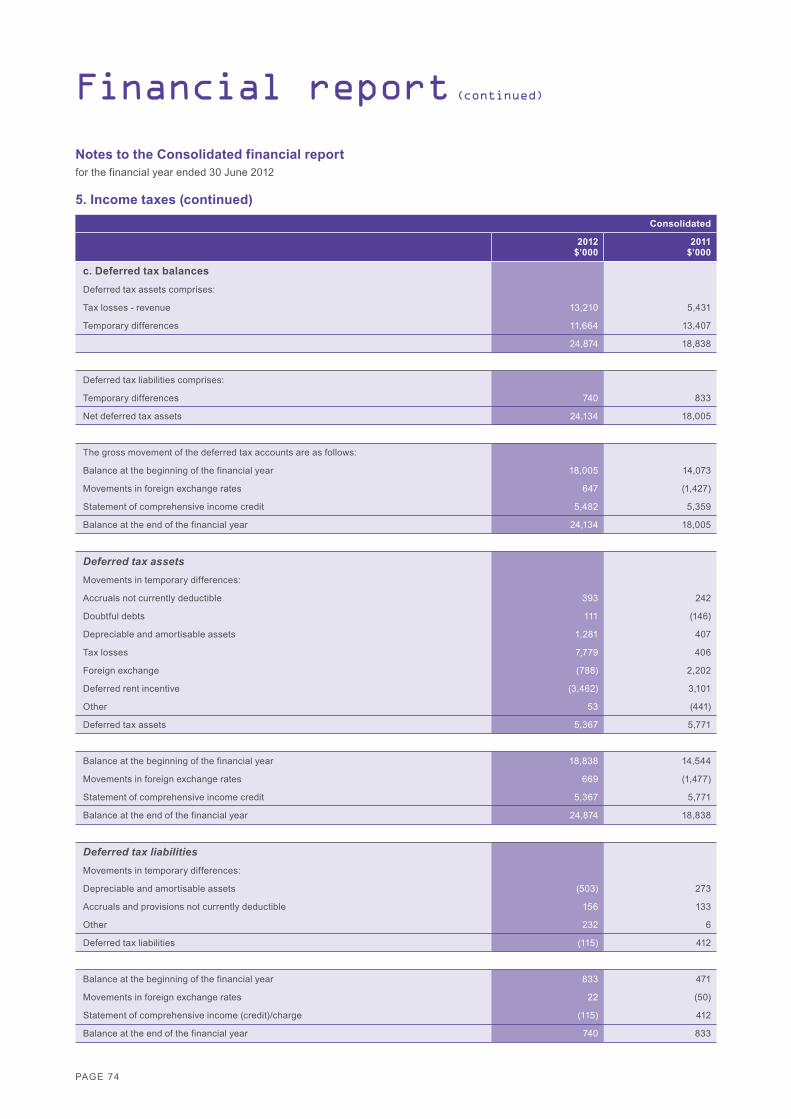
PAGE 74
5. Income taxes (continued)Consolidated
2012$’000
2011$’000
c. Deferred tax balances
Deferred tax assets comprises:
Tax losses - revenue 13,210 5,431
Temporary differences 11,664 13,407
24,874 18,838
Deferred tax liabilities comprises:
Temporary differences 740 833
Net deferred tax assets 24,134 18,005
The gross movement of the deferred tax accounts are as follows:
Balance at the beginning of the financial year 18,005 14,073
Movements in foreign exchange rates 647 (1,427)
Statement of comprehensive income credit 5,482 5,359
Balance at the end of the financial year 24,134 18,005
Deferred tax assetsMovements in temporary differences:
Accruals not currently deductible 393 242
Doubtful debts 111 (146)
Depreciable and amortisable assets 1,281 407
Tax losses 7,779 406
Foreign exchange (788) 2,202
Deferred rent incentive (3,462) 3,101
Other 53 (441)
Deferred tax assets 5,367 5,771
Balance at the beginning of the financial year 18,838 14,544
Movements in foreign exchange rates 669 (1,477)
Statement of comprehensive income credit 5,367 5,771
Balance at the end of the financial year 24,874 18,838
Deferred tax liabilitiesMovements in temporary differences:
Depreciable and amortisable assets (503) 273
Accruals and provisions not currently deductible 156 133
Other 232 6
Deferred tax liabilities (115) 412
Balance at the beginning of the financial year 833 471
Movements in foreign exchange rates 22 (50)
Statement of comprehensive income (credit)/charge (115) 412
Balance at the end of the financial year 740 833
Financial report (continued)
Notes to the Consolidated financial reportfor the financial year ended 30 June 2012
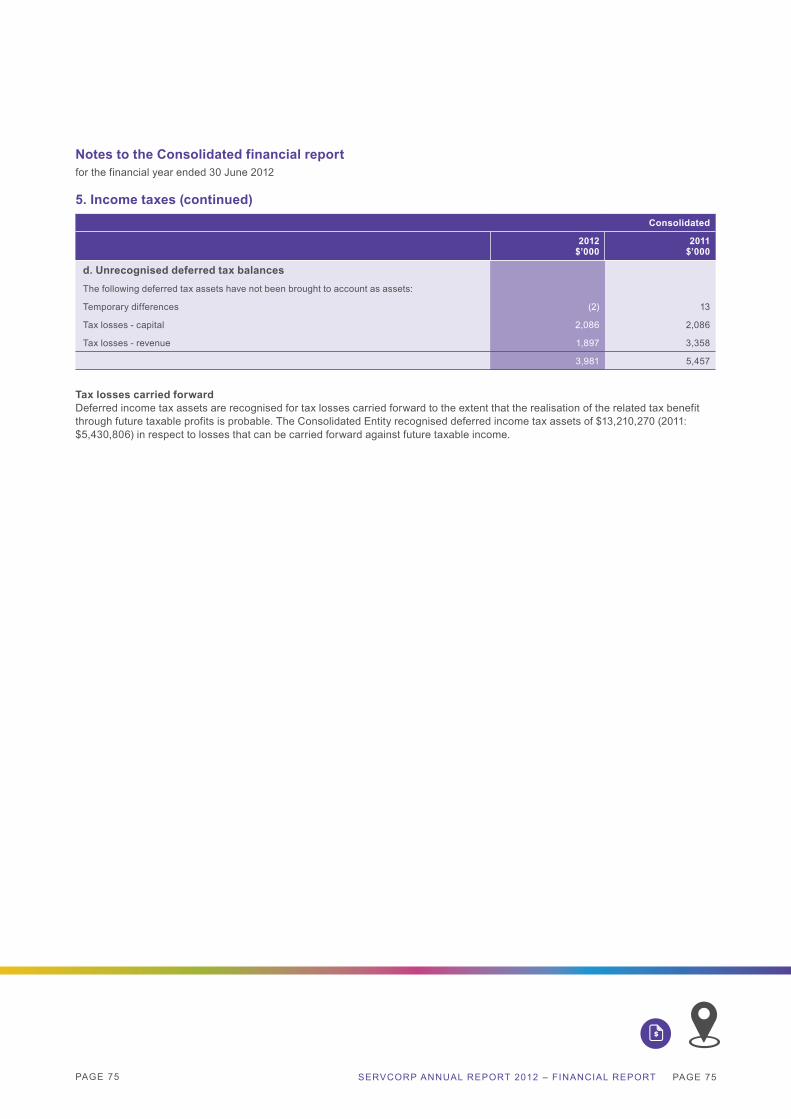
PAGE 75
5. Income taxes (continued)Consolidated
2012$’000
2011$’000
d. Unrecognised deferred tax balances The following deferred tax assets have not been brought to account as assets:
Temporary differences (2) 13
Tax losses - capital 2,086 2,086
Tax losses - revenue 1,897 3,358
3,981 5,457
Tax losses carried forwardDeferred income tax assets are recognised for tax losses carried forward to the extent that the realisation of the related tax benefit through future taxable profits is probable. The Consolidated Entity recognised deferred income tax assets of $13,210,270 (2011: $5,430,806) in respect to losses that can be carried forward against future taxable income.
Notes to the Consolidated financial reportfor the financial year ended 30 June 2012
SERVCORP ANNUAL REPORT 2012 – FINANCIAL REPORT PAGE 75
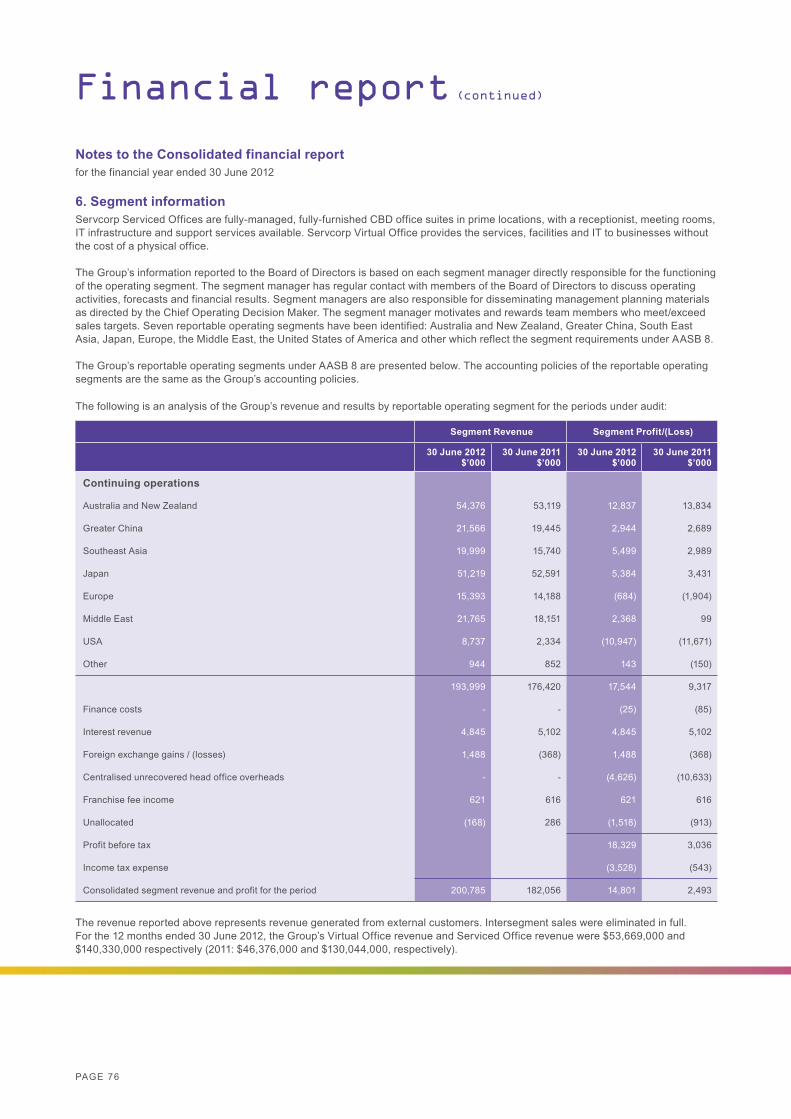
PAGE 76
6. Segment informationServcorp Serviced Offices are fully-managed, fully-furnished CBD office suites in prime locations, with a receptionist, meeting rooms, IT infrastructure and support services available. Servcorp Virtual Office provides the services, facilities and IT to businesses without the cost of a physical office.
The Group’s information reported to the Board of Directors is based on each segment manager directly responsible for the functioning of the operating segment. The segment manager has regular contact with members of the Board of Directors to discuss operating activities, forecasts and financial results. Segment managers are also responsible for disseminating management planning materials as directed by the Chief Operating Decision Maker. The segment manager motivates and rewards team members who meet/exceed sales targets. Seven reportable operating segments have been identified: Australia and New Zealand, Greater China, South East Asia, Japan, Europe, the Middle East, the United States of America and other which reflect the segment requirements under AASB 8.
The Group’s reportable operating segments under AASB 8 are presented below. The accounting policies of the reportable operating segments are the same as the Group’s accounting policies.
Financial report (continued)
Notes to the Consolidated financial reportfor the financial year ended 30 June 2012
The following is an analysis of the Group’s revenue and results by reportable operating segment for the periods under audit:
Segment Revenue Segment Profit/(Loss)
30 June 2012$’000
30 June 2011$’000
30 June 2012$’000
30 June 2011$’000
Continuing operations
Australia and New Zealand 54,376 53,119 12,837 13,834
Greater China 21,566 19,445 2,944 2,689
Southeast Asia 19,999 15,740 5,499 2,989
Japan 51,219 52,591 5,384 3,431
Europe 15,393 14,188 (684) (1,904)
Middle East 21,765 18,151 2,368 99
USA 8,737 2,334 (10,947) (11,671)
Other 944 852 143 (150)
193,999 176,420 17,544 9,317
Finance costs - - (25) (85)
Interest revenue 4,845 5,102 4,845 5,102
Foreign exchange gains / (losses) 1,488 (368) 1,488 (368)
Centralised unrecovered head office overheads - - (4,626) (10,633)
Franchise fee income 621 616 621 616
Unallocated (168) 286 (1,518) (913)
Profit before tax 18,329 3,036
Income tax expense (3,528) (543)
Consolidated segment revenue and profit for the period 200,785 182,056 14,801 2,493
The revenue reported above represents revenue generated from external customers. Intersegment sales were eliminated in full. For the 12 months ended 30 June 2012, the Group’s Virtual Office revenue and Serviced Office revenue were $53,669,000 and $140,330,000 respectively (2011: $46,376,000 and $130,044,000, respectively).

PAGE 77
Notes to the Consolidated financial reportfor the financial year ended 30 June 2012
2012$’000
2011$’000
Dividend franking account
30% franking credit available 4,115 2,865
Impact on franking account balance of dividends not recognised 2,689 2,109
The balance of the franking account has been adjusted for franking credits that will arise from the payment of income tax provided for in the financial statements, and for franking debits that will arise from the payment of dividends recognised as a liability at reporting date.
7. DividendsDividends proposed (unrecognised) or paid (recognised) by the Company are:
Centsper share
Totalamount
$’000Date of
paymentTax rate
for frankingcredit
Percentagefranked
Recognised amounts
2011
Final Fully paid ordinary shares 5.00 4,922 6 Oct 2010 30% 100%
Interim Fully paid ordinary shares 5.00 4,922 6 Apr 2011 30% 100%
2012
Final Fully paid ordinary shares 5.00 4,922 5 Oct 2011 30% 100%
Interim Fully paid ordinary shares 7.50 7,383 4 Apr 2012 30% 50%
Unrecognised amounts Since the end of the financial year, the directors have declared the following dividend:
Final Fully paid ordinary shares 7.50 7,383 4 Oct 2012 30% 85%
In determining the level of future dividends, the directors will seek to balance growth objectives and rewarding shareholders with income. This policy is subject to the cash flow requirements of the Company and its investment in new opportunities aimed at growing earnings. The directors cannot give any assurances concerning the extent of future dividends, or the franking of such dividends, as they are dependent on future profits, the financial and taxation position of the Company and the impact of taxation legislation.
SERVCORP ANNUAL REPORT 2012 – FINANCIAL REPORT PAGE 77
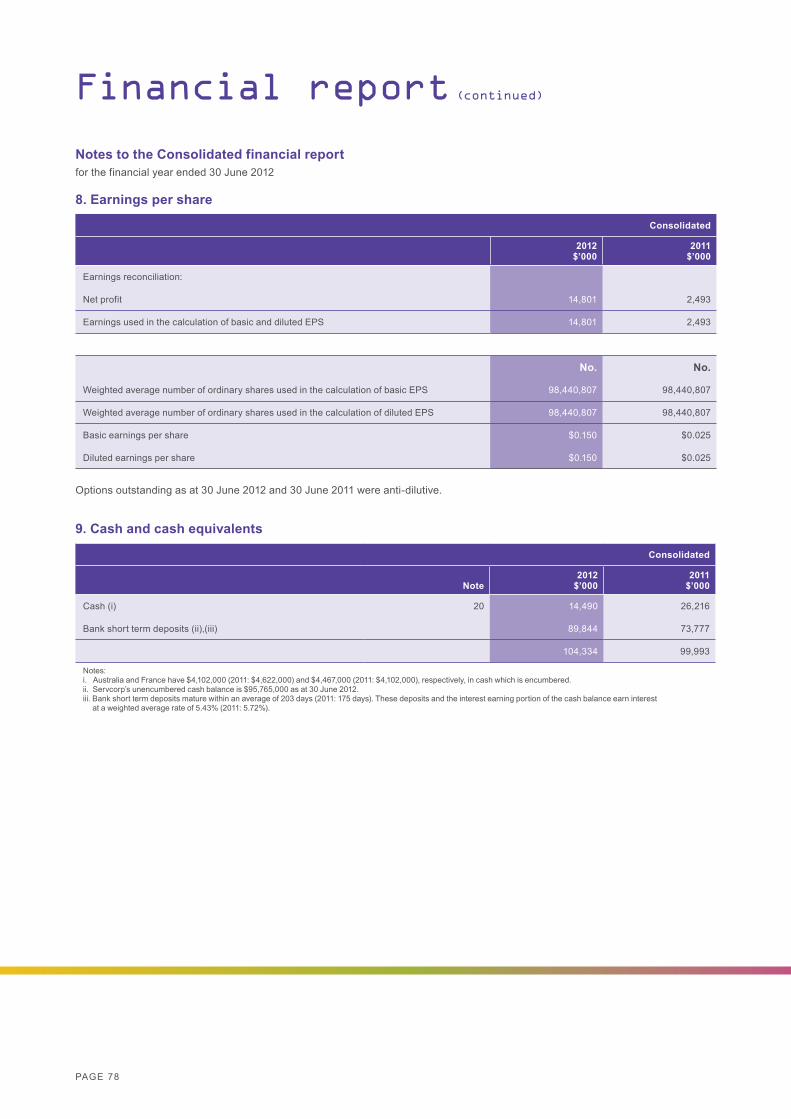
PAGE 78
9. Cash and cash equivalents
Consolidated
Note2012
$’0002011
$’000
Cash (i) 20 14,490 26,216
Bank short term deposits (ii),(iii) 89,844 73,777
104,334 99,993
Notes: i. Australia and France have $4,102,000 (2011: $4,622,000) and $4,467,000 (2011: $4,102,000), respectively, in cash which is encumbered.ii. Servcorp’s unencumbered cash balance is $95,765,000 as at 30 June 2012.iii. Bank short term deposits mature within an average of 203 days (2011: 175 days). These deposits and the interest earning portion of the cash balance earn interest at a weighted average rate of 5.43% (2011: 5.72%).
8. Earnings per share
Consolidated
2012$’000
2011$’000
Earnings reconciliation:
Net profit 14,801 2,493
Earnings used in the calculation of basic and diluted EPS 14,801 2,493
No. No.
Weighted average number of ordinary shares used in the calculation of basic EPS 98,440,807 98,440,807
Weighted average number of ordinary shares used in the calculation of diluted EPS 98,440,807 98,440,807
Basic earnings per share $0.150 $0.025
Diluted earnings per share $0.150 $0.025
Options outstanding as at 30 June 2012 and 30 June 2011 were anti-dilutive.
Financial report (continued)
Notes to the Consolidated financial reportfor the financial year ended 30 June 2012
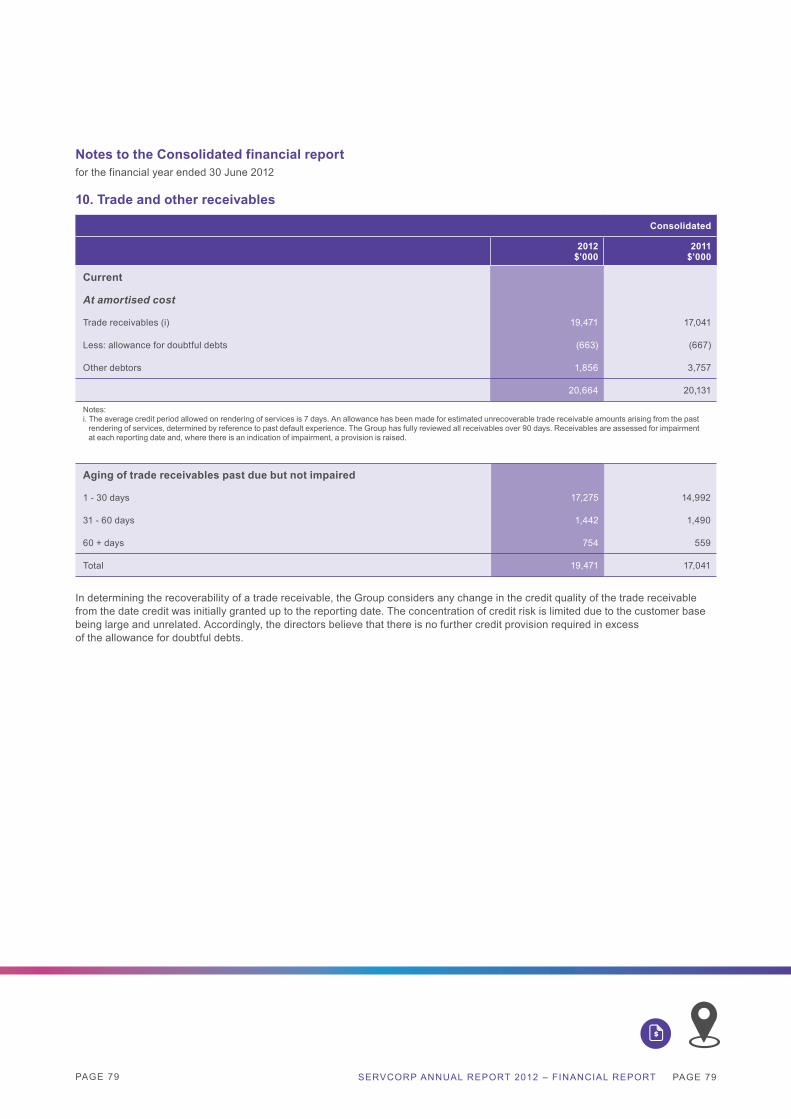
PAGE 79
Aging of trade receivables past due but not impaired
1 - 30 days 17,275 14,992
31 - 60 days 1,442 1,490
60 + days 754 559
Total 19,471 17,041
In determining the recoverability of a trade receivable, the Group considers any change in the credit quality of the trade receivable from the date credit was initially granted up to the reporting date. The concentration of credit risk is limited due to the customer base being large and unrelated. Accordingly, the directors believe that there is no further credit provision required in excess of the allowance for doubtful debts.
10. Trade and other receivables
Consolidated
2012$’000
2011$’000
Current
At amortised cost
Trade receivables (i) 19,471 17,041
Less: allowance for doubtful debts (663) (667)
Other debtors 1,856 3,757
20,664 20,131
Notes: i. The average credit period allowed on rendering of services is 7 days. An allowance has been made for estimated unrecoverable trade receivable amounts arising from the past rendering of services, determined by reference to past default experience. The Group has fully reviewed all receivables over 90 days. Receivables are assessed for impairment at each reporting date and, where there is an indication of impairment, a provision is raised.
Notes to the Consolidated financial reportfor the financial year ended 30 June 2012
SERVCORP ANNUAL REPORT 2012 – FINANCIAL REPORT PAGE 79

PAGE 80
12. Other financial assets
Current
At fair value through profit or loss
Forward foreign currency exchange contracts 130 167
At amortised cost
Lease deposits 2,713 -
2,843 167
Non-current
At amortised cost
Lease deposits 24,261 24,943
Other 68 65
24,329 25,008
Financial report (continued)
Notes to the Consolidated financial reportfor the financial year ended 30 June 2012
11. Other assets
Consolidated
2012$’000
2011$’000
Current
Prepayments 6,582 7,096
Other 1,782 1,371
8,364 8,467
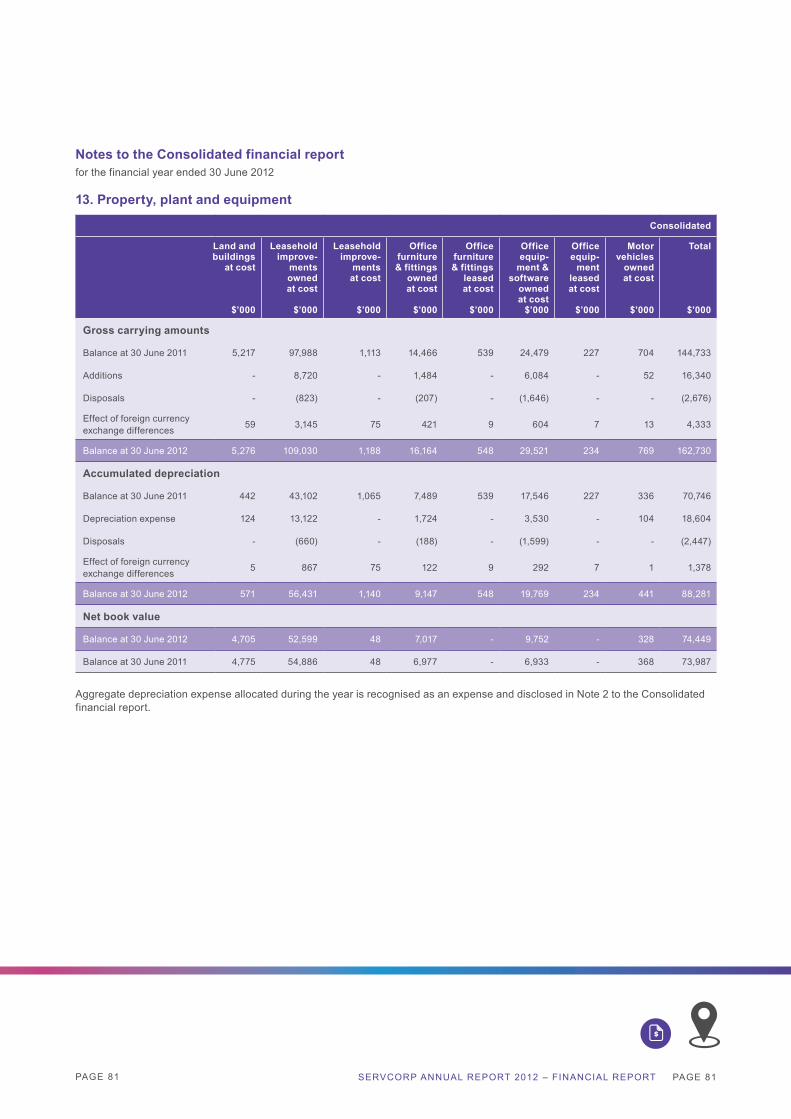
PAGE 81
13. Property, plant and equipment
Consolidated
Land andbuildings
at cost
$’000
Leaseholdimprove-
mentsownedat cost
$’000
Leaseholdimprove-
mentsat cost
$’000
Officefurniture& fittings
ownedat cost
$’000
Officefurniture& fittings
leasedat cost
$’000
Officeequip-
ment & software
ownedat cost
$’000
Officeequip-
ment leasedat cost
$’000
Motorvehicles
ownedat cost
$’000
Total
$’000
Gross carrying amounts
Balance at 30 June 2011 5,217 97,988 1,113 14,466 539 24,479 227 704 144,733
Additions - 8,720 - 1,484 - 6,084 - 52 16,340
Disposals - (823) - (207) - (1,646) - - (2,676)
Effect of foreign currency exchange differences 59 3,145 75 421 9 604 7 13 4,333
Balance at 30 June 2012 5,276 109,030 1,188 16,164 548 29,521 234 769 162,730
Accumulated depreciation
Balance at 30 June 2011 442 43,102 1,065 7,489 539 17,546 227 336 70,746
Depreciation expense 124 13,122 - 1,724 - 3,530 - 104 18,604
Disposals - (660) - (188) - (1,599) - - (2,447)
Effect of foreign currency exchange differences 5 867 75 122 9 292 7 1 1,378
Balance at 30 June 2012 571 56,431 1,140 9,147 548 19,769 234 441 88,281
Net book value
Balance at 30 June 2012 4,705 52,599 48 7,017 - 9,752 - 328 74,449
Balance at 30 June 2011 4,775 54,886 48 6,977 - 6,933 - 368 73,987
Aggregate depreciation expense allocated during the year is recognised as an expense and disclosed in Note 2 to the Consolidated financial report.
Notes to the Consolidated financial reportfor the financial year ended 30 June 2012
SERVCORP ANNUAL REPORT 2012 – FINANCIAL REPORT PAGE 81

PAGE 82
14. Goodwill
Consolidated
2012$’000
2011$’000
Gross carrying amount and net book value
Balance at the beginning of the financial year 14,805 14,805
Balance at the end of the financial year 14,805 14,805
Allocation of goodwill to cash-generating unitsThe following twenty countries are cash-generating units: Japan, Australia, New Zealand, China, Hong Kong, Malaysia, Singapore, Thailand, Belgium, United Arab Emirates,Bahrain, Qatar, Saudi Arabia, Philippines, Lebanon, Turkey, France, United States of America, Kuwait and United Kingdom.
Goodwill was allocated to the countries in which goodwill arose.
Financial report (continued)
Notes to the Consolidated financial reportfor the financial year ended 30 June 2012
The carrying amounts of goodwill relating to each cash-generating unit as at 30 June 2012 was as follows:
Consolidated
2012$’000
2011$’000
Japan 9,161 9,161
France 1,030 1,030
Australia 2,636 2,636
New Zealand 785 785
Singapore 706 706
Thailand 326 326
China 161 161
14,805 14,805
The recoverable amount of goodwill relating to each cash-generating unit was determined based on value in use calculations, which use cash flow projections, covering a five year period and terminal value. No growth factors were applied beyond year five of the forecast period. For the year ended 30 June 2012, the discount rate applied to the above countries, inclusive of country risk premium, was as follows: Japan 16.5%, France 15.5%, Australia 15.5%, New Zealand 15.5%, Singapore 15.5%, Thailand 17.7% and China 16.5% (2011: Japan 16.1%, France 15.4%, Australia 15.4%, New Zealand 15.4%, Singapore 15.4%, Thailand 17.6% and China 16.4%).
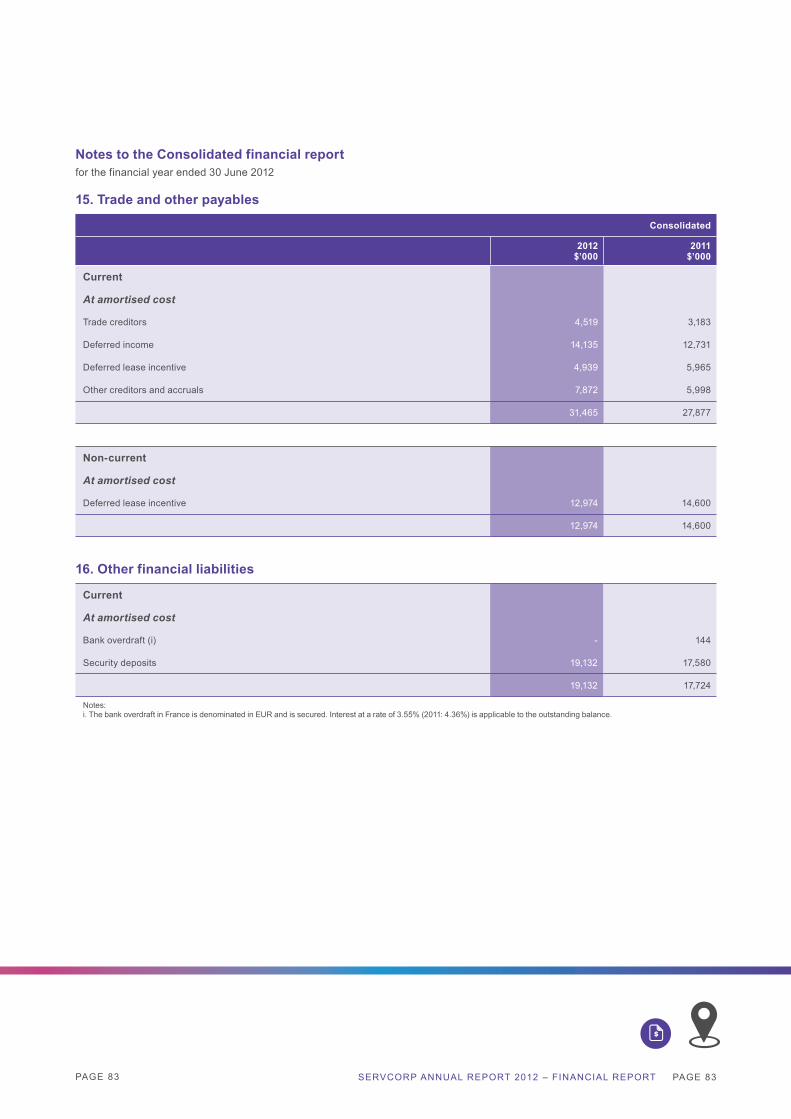
PAGE 83
15. Trade and other payables
Consolidated
2012$’000
2011$’000
Current
At amortised cost
Trade creditors 4,519 3,183
Deferred income 14,135 12,731
Deferred lease incentive 4,939 5,965
Other creditors and accruals 7,872 5,998
31,465 27,877
Non-current
At amortised cost
Deferred lease incentive 12,974 14,600
12,974 14,600
16. Other financial liabilities
Current
At amortised cost
Bank overdraft (i) - 144
Security deposits 19,132 17,580
19,132 17,724
Notes:i. The bank overdraft in France is denominated in EUR and is secured. Interest at a rate of 3.55% (2011: 4.36%) is applicable to the outstanding balance.
Notes to the Consolidated financial reportfor the financial year ended 30 June 2012
SERVCORP ANNUAL REPORT 2012 – FINANCIAL REPORT PAGE 83
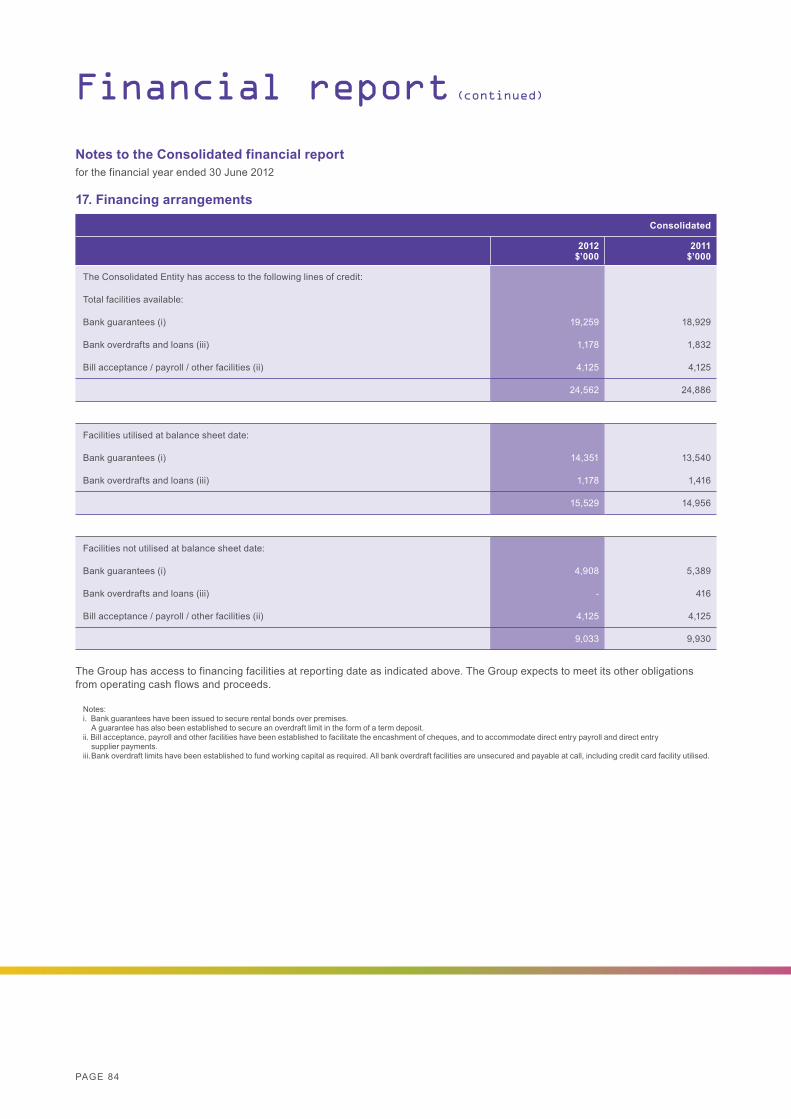
PAGE 84
17. Financing arrangements
Consolidated
2012$’000
2011$’000
The Consolidated Entity has access to the following lines of credit:
Total facilities available:
Bank guarantees (i) 19,259 18,929
Bank overdrafts and loans (iii) 1,178 1,832
Bill acceptance / payroll / other facilities (ii) 4,125 4,125
24,562 24,886
Facilities utilised at balance sheet date:
Bank guarantees (i) 14,351 13,540
Bank overdrafts and loans (iii) 1,178 1,416
15,529 14,956
Facilities not utilised at balance sheet date:
Bank guarantees (i) 4,908 5,389
Bank overdrafts and loans (iii) - 416
Bill acceptance / payroll / other facilities (ii) 4,125 4,125
9,033 9,930
The Group has access to financing facilities at reporting date as indicated above. The Group expects to meet its other obligations from operating cash flows and proceeds.
Notes:i. Bank guarantees have been issued to secure rental bonds over premises. A guarantee has also been established to secure an overdraft limit in the form of a term deposit.ii. Bill acceptance, payroll and other facilities have been established to facilitate the encashment of cheques, and to accommodate direct entry payroll and direct entry supplier payments.iii. Bank overdraft limits have been established to fund working capital as required. All bank overdraft facilities are unsecured and payable at call, including credit card facility utilised.
Financial report (continued)
Notes to the Consolidated financial reportfor the financial year ended 30 June 2012
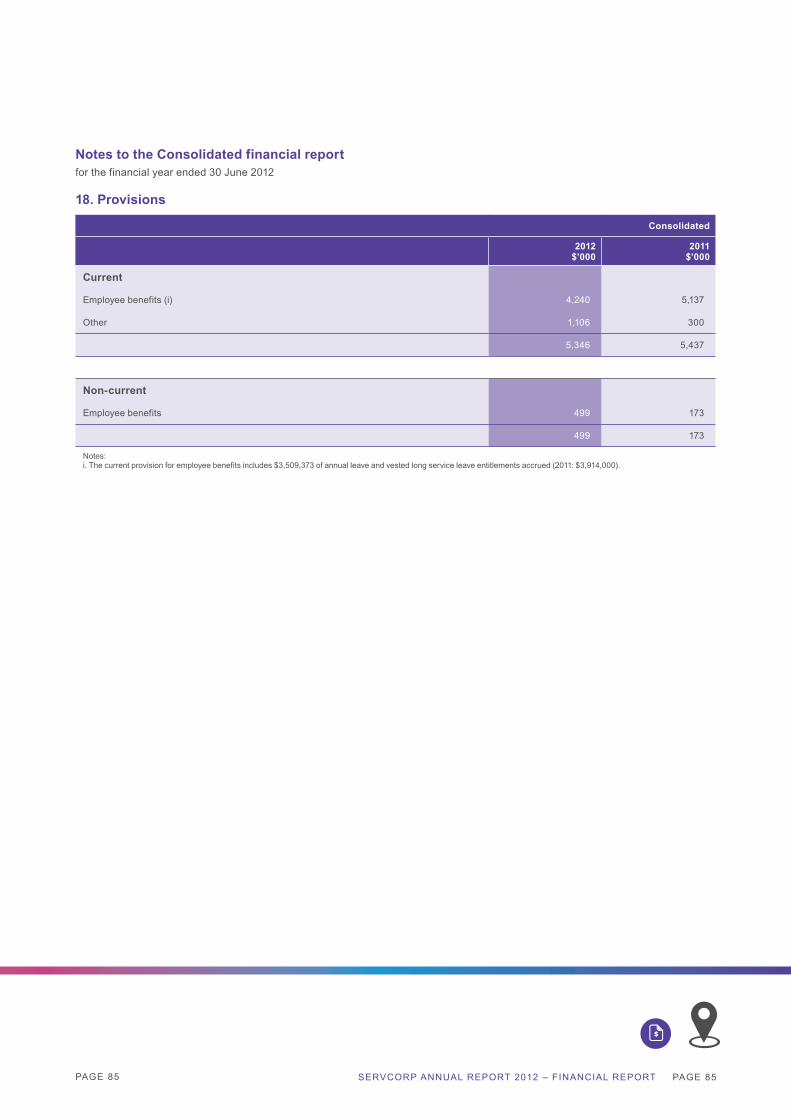
PAGE 85
18. Provisions
Consolidated
2012$’000
2011$’000
Current
Employee benefits (i) 4,240 5,137
Other 1,106 300
5,346 5,437
Non-current
Employee benefits 499 173
499 173
Notes:i. The current provision for employee benefits includes $3,509,373 of annual leave and vested long service leave entitlements accrued (2011: $3,914,000).
Notes to the Consolidated financial reportfor the financial year ended 30 June 2012
SERVCORP ANNUAL REPORT 2012 – FINANCIAL REPORT PAGE 85
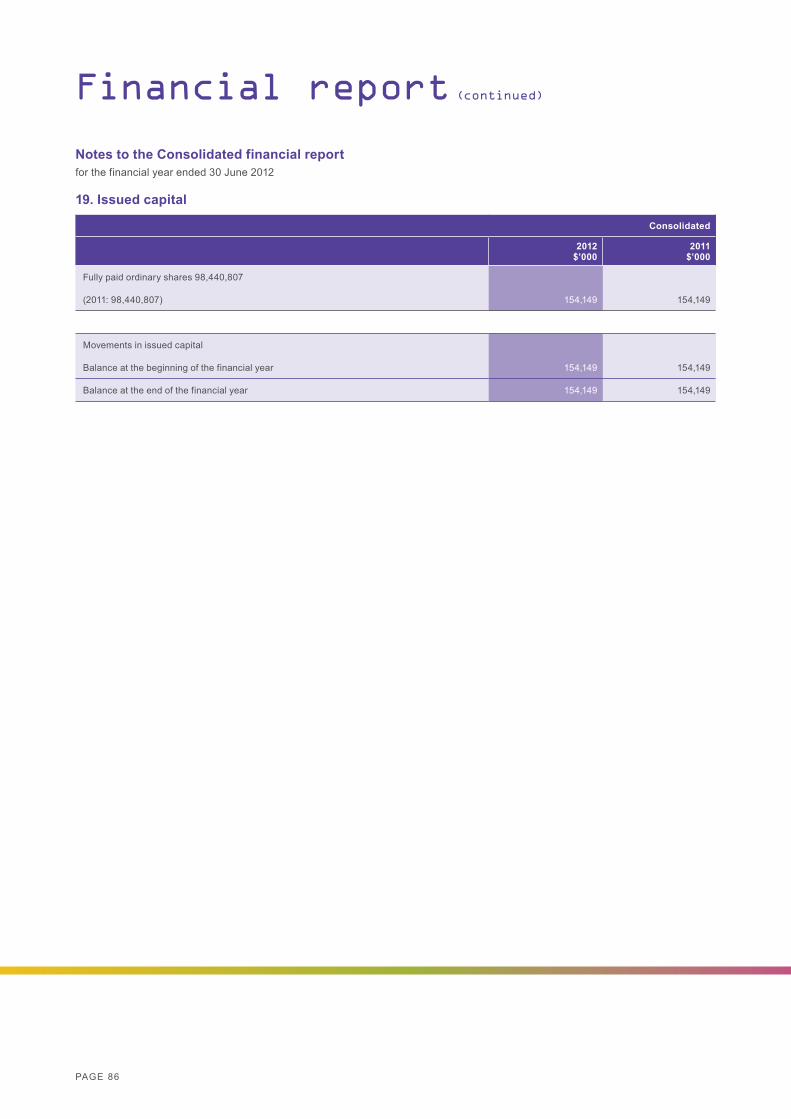
PAGE 86
19. Issued capital
Consolidated
2012$’000
2011$’000
Fully paid ordinary shares 98,440,807
(2011: 98,440,807) 154,149 154,149
Movements in issued capital
Balance at the beginning of the financial year 154,149 154,149
Balance at the end of the financial year 154,149 154,149
Financial report (continued)
Notes to the Consolidated financial reportfor the financial year ended 30 June 2012
PAGE 87
20. Financial instrumentsThe Group’s Audit and Risk Committee oversees the establishment of the capital and financial risk management system which identifies, evaluates, classifies, monitors, qualifies and reports significant risks to the Board of Directors. All controlled entities in the Servcorp Group apply this risk management system to manage their own risks.
a. Financial risk management objectivesThe financial risks that result from Servcorp’s activities are credit risk and market risk (interest rate risk and foreign exchange risk). The Consolidated Entity’s corporate treasury function provides services to the business, co-ordinates access to domestic and international financial markets, and manages the financial risks relating to the operations of the Consolidated Entity.
The Consolidated Entity does not enter into or trade financial instruments for speculative purposes. The Consolidated Entity does not apply hedge accounting. The use of financial derivatives is governed by the Consolidated Entity’s policies approved by the Board of Directors.
The Consolidated Entity’s corporate treasury function reports to the Group’s Audit and Risk Committee, an independent body that monitors risks and policies implemented to mitigate risk exposures.
b. Capital managementServcorp’s objective when managing capital is to ensure that entities within the Group will be able to continue as a going concern while maximising the return to stakeholders.
The Group’s overall strategy remains unchanged from 2011. The capital structure of Servcorp consists of equity attributable to equity holders of the parent, company issued capital, reserves and retained earnings.
Servcorp operates globally, primarily through subsidiary companies established in the markets in which Servcorp operates. Operating cash flows are used to maintain and expand Servcorp, as well as to make routine outflows of tax and dividend payments.
c. Market riskServcorp’s activities expose it primarily to the financial risks of changes in foreign currency exchange rates. The Group enters into forward foreign currency exchange contracts to economically hedge anticipated transactions.
i. Foreign exchange riskServcorp operates internationally and is exposed to foreign exchange risk arising from various currency exposures.
Servcorp’s foreign exchange risk arises primarily from: ▪ risk of fluctuations in foreign exchange rates to the Australian dollar (the reporting currency); ▪ firm commitments of receipts and payments settled in foreign currencies or with prices dependent on foreign currencies; ▪ investments in foreign operations; and ▪ loans and trading accounts to foreign operations.
Foreign currency assets and liabilitiesFor accounting purposes, net foreign operations are revalued at the end of each reporting period with the movement reflected as a movement in the foreign currency translation reserve. Borrowings and forward exchange contracts not forming part of the net investment in foreign operations are revalued at the end of each reporting period with the fair value movementreflected in the Statement of comprehensive income as exchange gains or losses.
Notes to the Consolidated financial reportfor the financial year ended 30 June 2012
SERVCORP ANNUAL REPORT 2012 – FINANCIAL REPORT PAGE 87
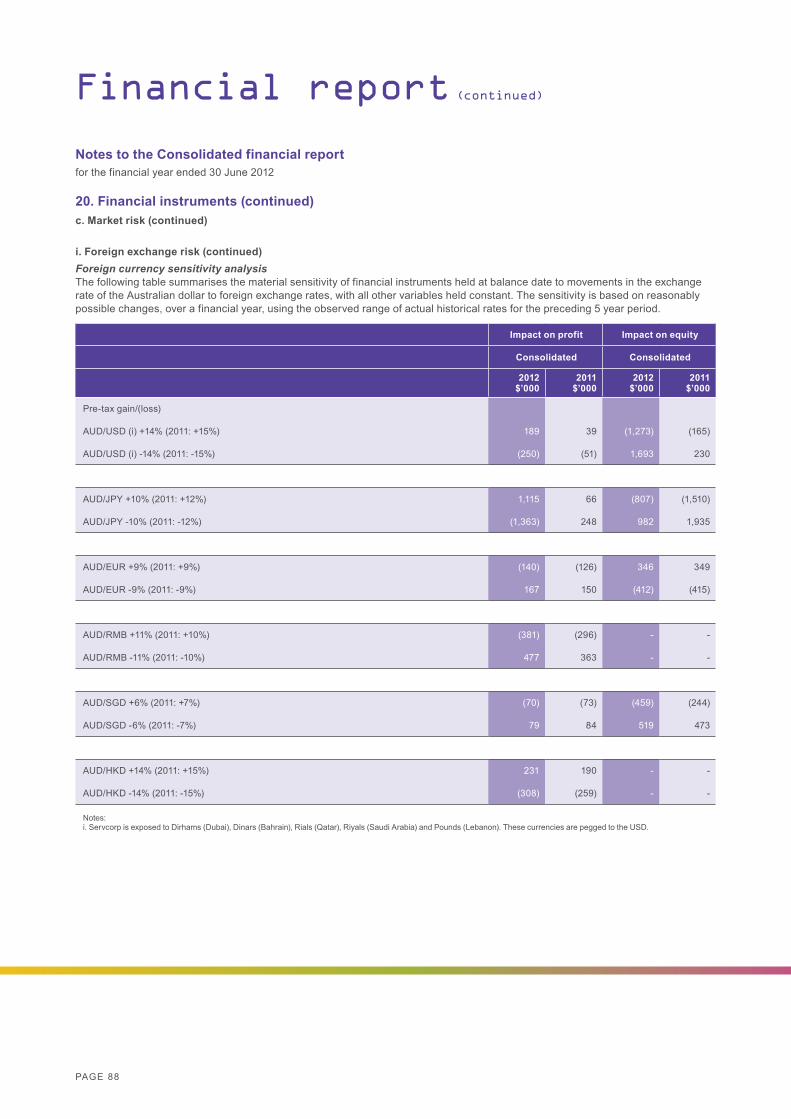
PAGE 88
20. Financial instruments (continued)c. Market risk (continued)
i. Foreign exchange risk (continued)Foreign currency sensitivity analysisThe following table summarises the material sensitivity of financial instruments held at balance date to movements in the exchange rate of the Australian dollar to foreign exchange rates, with all other variables held constant. The sensitivity is based on reasonably possible changes, over a financial year, using the observed range of actual historical rates for the preceding 5 year period.
Financial report (continued)
Notes to the Consolidated financial reportfor the financial year ended 30 June 2012
Impact on profit Impact on equity
Consolidated Consolidated
2012$’000
2011$’000
2012$’000
2011$’000
Pre-tax gain/(loss)
AUD/USD (i) +14% (2011: +15%) 189 39 (1,273) (165)
AUD/USD (i) -14% (2011: -15%) (250) (51) 1,693 230
AUD/JPY +10% (2011: +12%) 1,115 66 (807) (1,510)
AUD/JPY -10% (2011: -12%) (1,363) 248 982 1,935
AUD/EUR +9% (2011: +9%) (140) (126) 346 349
AUD/EUR -9% (2011: -9%) 167 150 (412) (415)
AUD/RMB +11% (2011: +10%) (381) (296) - -
AUD/RMB -11% (2011: -10%) 477 363 - -
AUD/SGD +6% (2011: +7%) (70) (73) (459) (244)
AUD/SGD -6% (2011: -7%) 79 84 519 473
AUD/HKD +14% (2011: +15%) 231 190 - -
AUD/HKD -14% (2011: -15%) (308) (259) - -
Notes:i. Servcorp is exposed to Dirhams (Dubai), Dinars (Bahrain), Rials (Qatar), Riyals (Saudi Arabia) and Pounds (Lebanon). These currencies are pegged to the USD.

PAGE 89
20. Financial instruments (continued)c. Market risk (continued)
i. Foreign exchange risk (continued)Forward foreign currency exchange contractsThe following table sets out the details of forward foreign currency exchange contracts in place as at 30 June 2012. These are level 2 fair value measurements derived from inputs as defined in Note 20(e).
ii. Interest rate riskInterest rate risk on cash or short term deposits is not considered to be a material risk due to the short term nature of these financial instruments.
The following table summarises the sensitivity of the financial instruments held at balance date, following a movement to interest rates, with all other variables held constant. The sensitivity is based on reasonably possible changes over a financial year, using the observed range of actual historical rates.
Notes to the Consolidated financial reportfor the financial year ended 30 June 2012
Average exchange rate Foreign currency Fair value
2012 2011 2012million
2011million
2012$’000
2011$’000
Outstanding contracts
Consolidated
Sell JPY Not later than one year 75.75 81.58 320 400 (103) (42)
Later than one year and not later than five years 72.97 73.38 650 150 (47) (123)
Sell USDNot later than one year 0.96 - 1 - 27 -
Impact on profit
Consolidated
2012$’000
2011$’000
Pre tax gain/(loss)
AUD balances
125 basis point increase 1,128 914
125 basis point decrease (1,114) (957)
Other balances
250 basis point increase 165 191
250 basis point decrease (132) (145)
SERVCORP ANNUAL REPORT 2012 – FINANCIAL REPORT PAGE 89
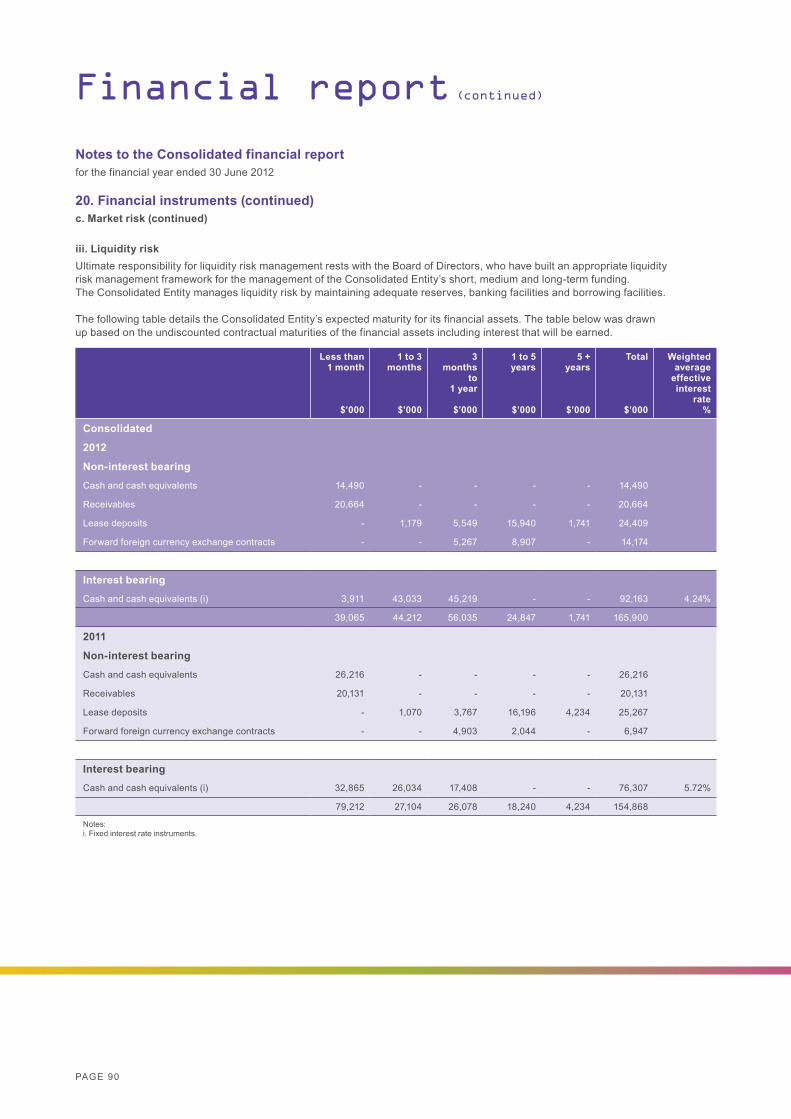
PAGE 90
Financial report (continued)
Notes to the Consolidated financial reportfor the financial year ended 30 June 2012
20. Financial instruments (continued)c. Market risk (continued)
iii. Liquidity riskUltimate responsibility for liquidity risk management rests with the Board of Directors, who have built an appropriate liquidity risk management framework for the management of the Consolidated Entity’s short, medium and long-term funding. The Consolidated Entity manages liquidity risk by maintaining adequate reserves, banking facilities and borrowing facilities.
The following table details the Consolidated Entity’s expected maturity for its financial assets. The table below was drawn up based on the undiscounted contractual maturities of the financial assets including interest that will be earned.
Less than 1 month
$’000
1 to 3 months
$’000
3 months
to 1 year
$’000
1 to 5 years
$’000
5 + years
$’000
Total
$’000
Weighted average
effective interest
rate%
Consolidated
2012
Non-interest bearing
Cash and cash equivalents 14,490 - - - - 14,490
Receivables 20,664 - - - - 20,664
Lease deposits - 1,179 5,549 15,940 1,741 24,409
Forward foreign currency exchange contracts - - 5,267 8,907 - 14,174
Interest bearing
Cash and cash equivalents (i) 3,911 43,033 45,219 - - 92,163 4.24%
39,065 44,212 56,035 24,847 1,741 165,900
2011
Non-interest bearing
Cash and cash equivalents 26,216 - - - - 26,216
Receivables 20,131 - - - - 20,131
Lease deposits - 1,070 3,767 16,196 4,234 25,267
Forward foreign currency exchange contracts - - 4,903 2,044 - 6,947
Interest bearing
Cash and cash equivalents (i) 32,865 26,034 17,408 - - 76,307 5.72%
79,212 27,104 26,078 18,240 4,234 154,868
Notes:i. Fixed interest rate instruments.
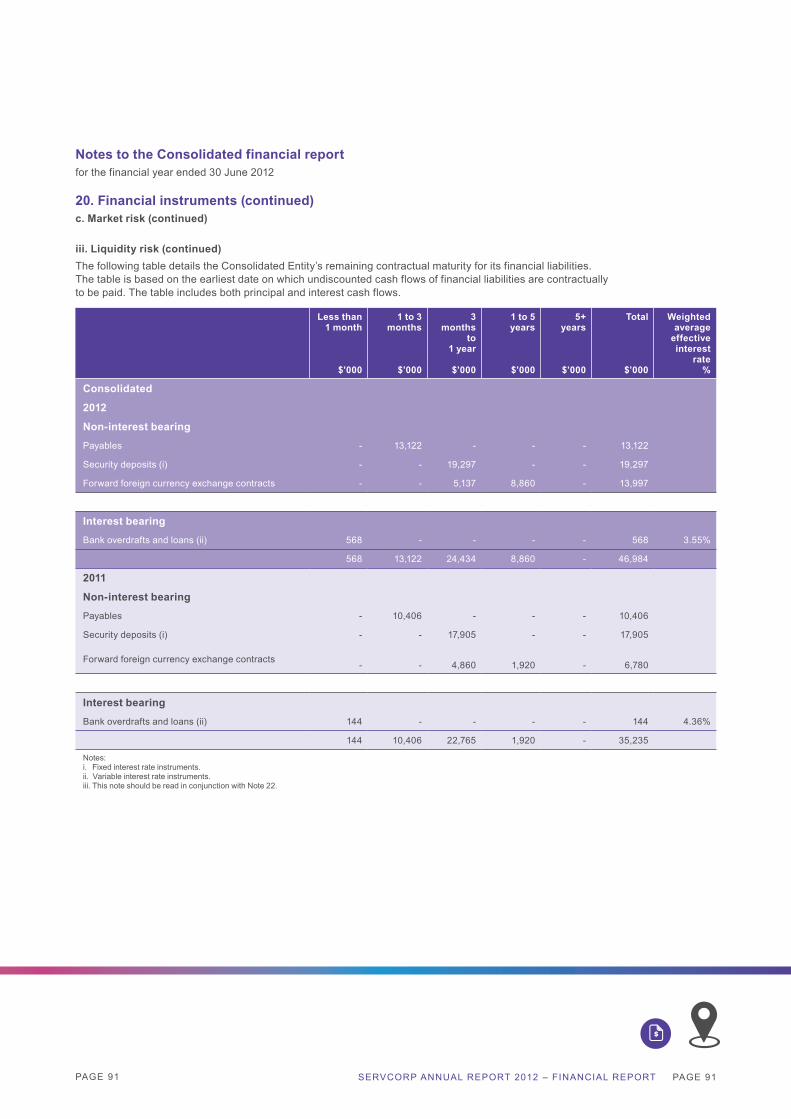
PAGE 91
Notes to the Consolidated financial reportfor the financial year ended 30 June 2012
20. Financial instruments (continued)c. Market risk (continued)
iii. Liquidity risk (continued)The following table details the Consolidated Entity’s remaining contractual maturity for its financial liabilities. The table is based on the earliest date on which undiscounted cash flows of financial liabilities are contractually to be paid. The table includes both principal and interest cash flows.
Less than 1 month
$’000
1 to 3 months
$’000
3 months
to 1 year
$’000
1 to 5 years
$’000
5+ years
$’000
Total
$’000
Weighted average
effectiveinterest
rate%
Consolidated
2012
Non-interest bearing
Payables - 13,122 - - - 13,122
Security deposits (i) - - 19,297 - - 19,297
Forward foreign currency exchange contracts - - 5,137 8,860 - 13,997
Interest bearing
Bank overdrafts and loans (ii) 568 - - - - 568 3.55%
568 13,122 24,434 8,860 - 46,984
2011
Non-interest bearing
Payables - 10,406 - - - 10,406
Security deposits (i) - - 17,905 - - 17,905
Forward foreign currency exchange contracts - - 4,860 1,920 - 6,780
Interest bearing
Bank overdrafts and loans (ii) 144 - - - - 144 4.36%
144 10,406 22,765 1,920 - 35,235
Notes:i. Fixed interest rate instruments.ii. Variable interest rate instruments.iii. This note should be read in conjunction with Note 22.
SERVCORP ANNUAL REPORT 2012 – FINANCIAL REPORT PAGE 91
PAGE 92
20. Financial instruments (continued)d. Credit riskCredit risk refers to the risk that the counterparty will default on its contractual obligations resulting in financial loss to the Consolidated Entity. The Group has adopted a policy of only dealing with creditworthy counterparties and obtaining sufficient collateral where appropriate, as a means of mitigating the risk of financial loss from defaults.
Trade receivables consist of a large number of customers, spread across diverse industries and geographical areas. Ongoing credit evaluation is performed on the financial condition of accounts receivable. The Group does not have any significant credit risk exposure to any single counterparty or any group of any counterparties having similar characteristics. Details of credit enhancements in the form of serviced office security deposits retained from customers are further disclosed in Note 16.
Credit risk on cash and short term fixed deposits is limited because counterparties are banks with high credit ratings assigned by international credit rating agencies. These liquid funds are managed centrally by Servcorp’s senior management on a daily basis.
e. Fair value of financial instrumentsThe directors consider that the carrying amount of financial assets and financial liabilities approximate their fair value other than in respect of Servcorp Limited’s investment in subsidiaries.
Financial instruments are measured subsequent to initial recognition at fair value, grouped into levels 1 to 3 based on the degree to which fair value is observable: ▪ Level 1 fair value measurements are those derived from quoted prices (unadjusted) in active markets for identical assets
or liabilities. ▪ Level 2 fair value measurements are those derived from inputs other than quoted prices included within Level 1 that are observable
for the asset or liability, either directly (i.e as prices) or indirectly (i.e derived from prices). ▪ Level 3 fair value measurements are those derived from valuation techniques that include inputs for the asset or liability that
are not based on observable market data (unobservable inputs).
Financial report (continued)
Notes to the Consolidated financial reportfor the financial year ended 30 June 2012
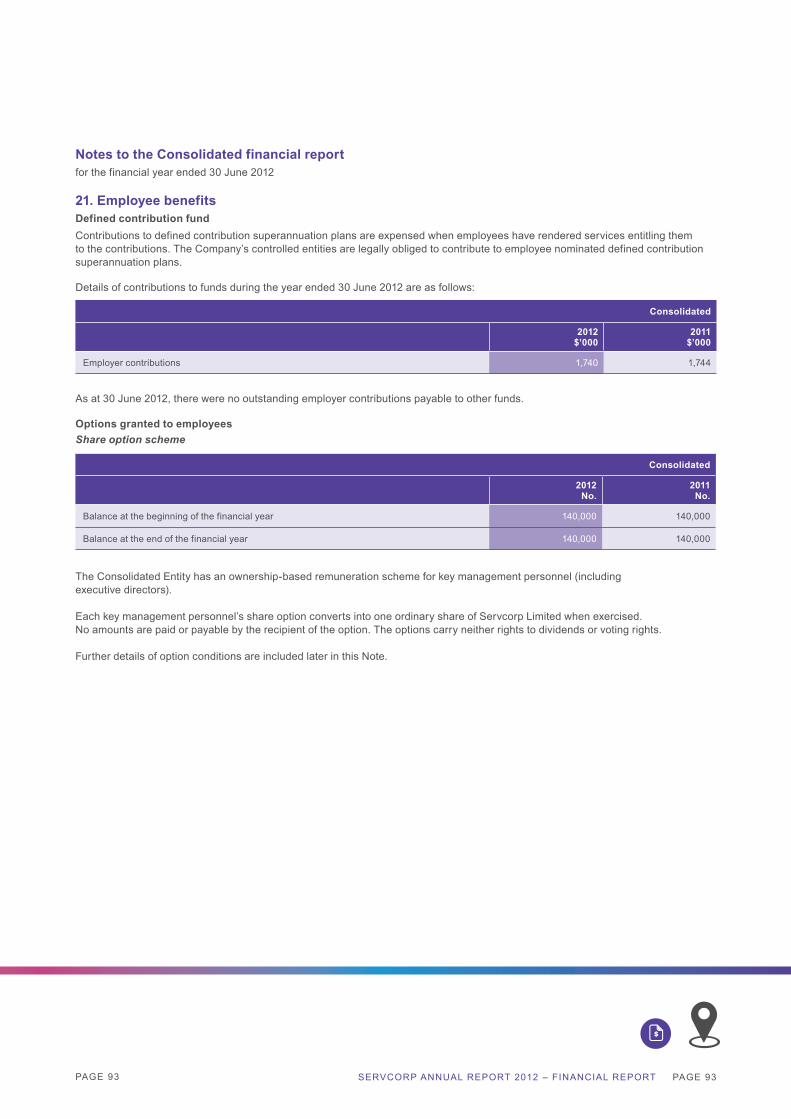
PAGE 93
21. Employee benefitsDefined contribution fundContributions to defined contribution superannuation plans are expensed when employees have rendered services entitling them to the contributions. The Company’s controlled entities are legally obliged to contribute to employee nominated defined contribution superannuation plans.
The Consolidated Entity has an ownership-based remuneration scheme for key management personnel (including executive directors).
Each key management personnel’s share option converts into one ordinary share of Servcorp Limited when exercised. No amounts are paid or payable by the recipient of the option. The options carry neither rights to dividends or voting rights.
Further details of option conditions are included later in this Note.
Notes to the Consolidated financial reportfor the financial year ended 30 June 2012
Details of contributions to funds during the year ended 30 June 2012 are as follows:
Consolidated
2012$’000
2011$’000
Employer contributions 1,740 1,744
As at 30 June 2012, there were no outstanding employer contributions payable to other funds.
Options granted to employeesShare option scheme
Consolidated
2012No.
2011No.
Balance at the beginning of the financial year 140,000 140,000
Balance at the end of the financial year 140,000 140,000
SERVCORP ANNUAL REPORT 2012 – FINANCIAL REPORT PAGE 93

PAGE 94
Options granted during the financial yearNil (2011:Nil) options were issued during the financial year ended 30 June 2012.
Options issued under the Executive Share Option Scheme carry no rights to dividends and have no voting rights.
Options exercised during the financial yearNil (2011: Nil) options were exercised into ordinary shares in Servcorp Limited during the financial year ended 30 June 2012.
Options lapsed during the financial yearNil (2011: Nil) options were forfeited under the Executive Share Option Scheme during the financial year ended 30 June 2012.
21. Employee benefits (continued)Options granted to employees (continued)Executive share options issued by Servcorp Limited
Financial report (continued)
Notes to the Consolidated financial reportfor the financial year ended 30 June 2012
Balance at 1/07/11
No.
Granted
No.
Forfeited
No.
Exercised
No.
Balance at 30/06/12
No.
Vested and exercisable
No.
Net vested
No.
T Wallace 30,000 - - - 30,000 30,000 30,000
O Vlietstra 40,000 - - - 40,000 40,000 40,000
S Martin 40,000 - - - 40,000 40,000 40,000
W Wu 30,000 - - - 30,000 30,000 30,000
140,000 - - - 140,000 140,000 140,000
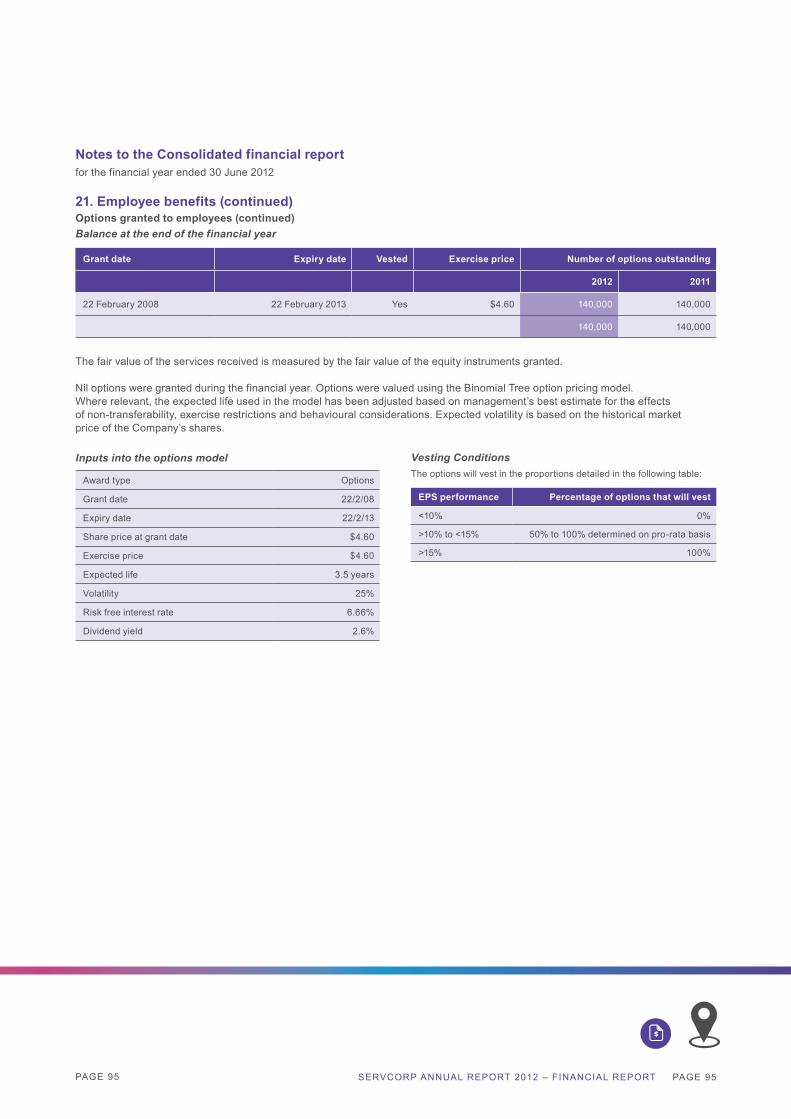
PAGE 95
21. Employee benefits (continued)Options granted to employees (continued)Balance at the end of the financial year
Notes to the Consolidated financial reportfor the financial year ended 30 June 2012
Grant date Expiry date Vested Exercise price Number of options outstanding
2012 2011
22 February 2008 22 February 2013 Yes $4.60 140,000 140,000
140,000 140,000
The fair value of the services received is measured by the fair value of the equity instruments granted.
Nil options were granted during the financial year. Options were valued using the Binomial Tree option pricing model. Where relevant, the expected life used in the model has been adjusted based on management’s best estimate for the effects of non-transferability, exercise restrictions and behavioural considerations. Expected volatility is based on the historical market price of the Company’s shares.
Inputs into the options model
Award type Options
Grant date 22/2/08
Expiry date 22/2/13
Share price at grant date $4.60
Exercise price $4.60
Expected life 3.5 years
Volatility 25%
Risk free interest rate 6.66%
Dividend yield 2.6%
Vesting ConditionsThe options will vest in the proportions detailed in the following table:
EPS performance Percentage of options that will vest
<10% 0%
>10% to <15% 50% to 100% determined on pro-rata basis
>15% 100%
SERVCORP ANNUAL REPORT 2012 – FINANCIAL REPORT PAGE 95
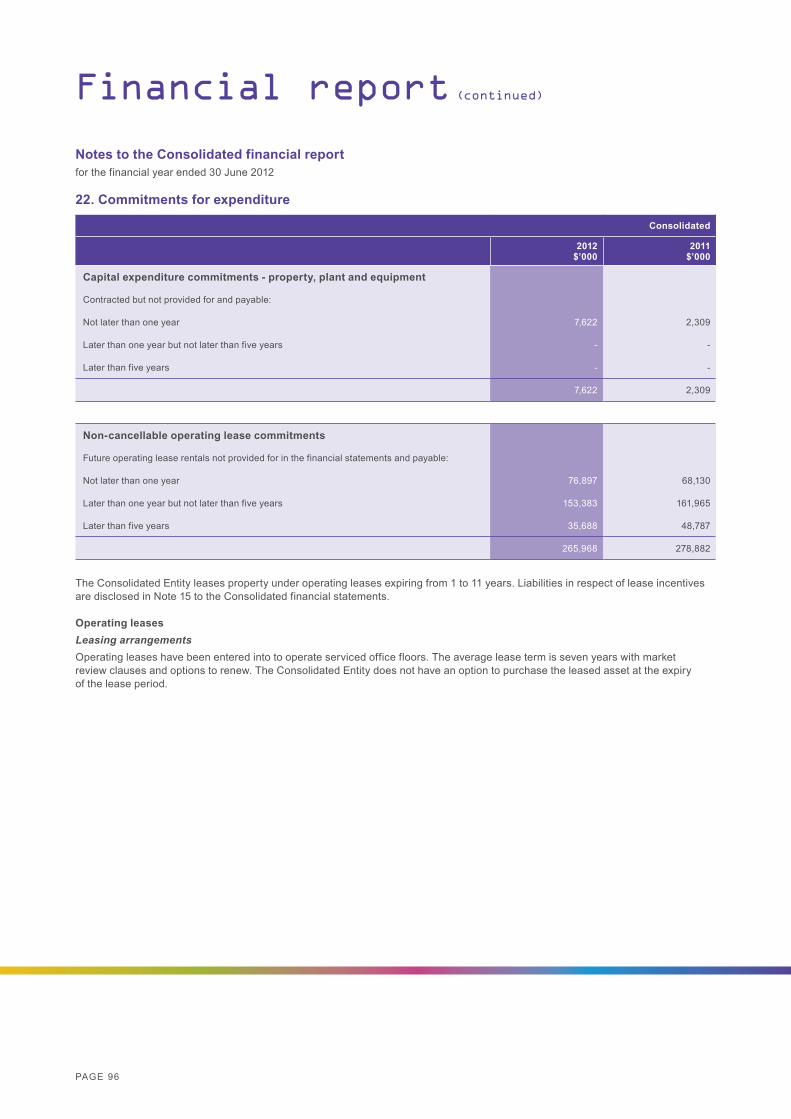
PAGE 96
The Consolidated Entity leases property under operating leases expiring from 1 to 11 years. Liabilities in respect of lease incentives are disclosed in Note 15 to the Consolidated financial statements.
Operating leasesLeasing arrangementsOperating leases have been entered into to operate serviced office floors. The average lease term is seven years with market review clauses and options to renew. The Consolidated Entity does not have an option to purchase the leased asset at the expiry of the lease period.
Financial report (continued)
Notes to the Consolidated financial reportfor the financial year ended 30 June 2012
22. Commitments for expenditure
Consolidated
2012$’000
2011$’000
Capital expenditure commitments - property, plant and equipment
Contracted but not provided for and payable:
Not later than one year 7,622 2,309
Later than one year but not later than five years - -
Later than five years - -
7,622 2,309
Non-cancellable operating lease commitments
Future operating lease rentals not provided for in the financial statements and payable:
Not later than one year 76,897 68,130
Later than one year but not later than five years 153,383 161,965
Later than five years 35,688 48,787
265,968 278,882

PAGE 97 SERVCORP ANNUAL REPORT 2012 – FINANCIAL REPORT PAGE 97
Notes to the Consolidated financial reportfor the financial year ended 30 June 2012
23. SubsidiariesOwnership interest
Name of entity Country of incorporation 2012%
2011%
Parent entityServcorp Limited (i) Australia
Controlled entitiesServcorp Australian Holdings Pty Ltd Australia 100 100
Servcorp Offshore Holdings Pty Ltd Australia 100 100
Servcorp Exchange Square Pty Ltd Australia 100 100
Servcorp (Miller Street) Pty Ltd Australia 100 100
Servcorp (North Ryde) Pty Ltd Australia 100 100
Servcorp Smart Office Pty Ltd Australia 100 100
Servcorp Smart Homes Pty Ltd Australia 100 100
Servcorp Business Service (Beijing) Pty Ltd Australia 100 100
Servcorp Virtual Pty Ltd Australia 100 100
Servcorp Holdings Pty Ltd Australia 100 100
Servcorp Administration Pty Ltd Australia 100 100
Servcorp Adelaide Pty Ltd Australia 100 100
Servcorp Bridge Street Pty Ltd Australia 100 100
Servcorp Brisbane Pty Ltd Australia 100 100
Servcorp Castlereagh Street Pty Ltd Australia 100 100
Servcorp Chifley 25 Pty Ltd Australia 100 100
Servcorp Chifley 29 Pty Ltd Australia 100 100
Servcorp Communications Pty Ltd Australia 100 100
Servcorp IT Pty Ltd Australia 100 100
Servcorp Melbourne Virtual Pty Ltd Australia 100 100
Servcorp MLC Centre Pty Ltd Australia 100 100
Servcorp Melbourne 27 Pty Ltd Australia 100 100
Servcorp Sydney Virtual Pty Ltd Australia 100 100
Servcorp William Street Pty Ltd Australia 100 100
Servcorp Melbourne 18 Pty Ltd (iii) Australia 100 100
Servcorp Perth Pty Ltd Australia 100 100
Servcorp Brisbane Riverside Pty Ltd Australia 100 100
Servcorp Market Street Pty Ltd Australia 100 100
Office Squared Pty Ltd Australia 100 100
Servcorp WA Pty Ltd Australia 100 100
Servcorp Parramatta Pty Ltd Australia 100 100
Servcorp Sydney 56 Pty Ltd Australia 100 100
Servcorp Norwest Pty Ltd Australia 100 100
Servcorp Level 12 Pty Ltd Australia 100 100
Servcorp Western Australia Pty Ltd Australia 100 100
Office Squared (Nexus) Pty Ltd Australia 100 100
Servcorp SA 30 Pty Ltd Australia 100 100
Servcorp Gold Coast Pty Ltd Australia 100 100
Servcorp North Sydney 32 Pty Ltd Australia 100 100
Servcorp Docklands Pty Ltd Australia 100 100
Servcorp Sydney 22 Pty Ltd Australia 100 100
Servcorp Hobart Pty Ltd Australia 100 100
Servcorp Brisbane 400 Pty Ltd Australia 100 100
Servcorp Southbank Pty Ltd Australia 100 100
Office Squared (Atlas) Pty Ltd Australia 100 100
Gnee Pty Ltd Australia 100 -
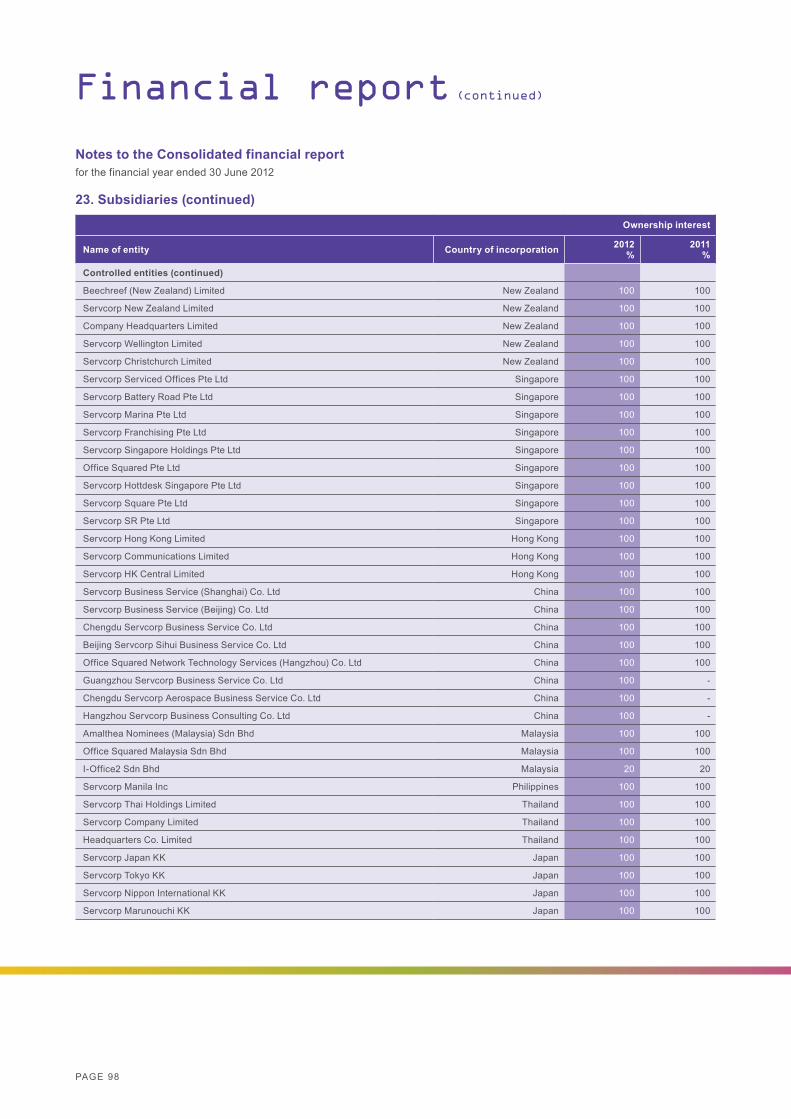
PAGE 98
Financial report (continued)
Notes to the Consolidated financial reportfor the financial year ended 30 June 2012
23. Subsidiaries (continued)
Ownership interest
Name of entity Country of incorporation 2012%
2011%
Controlled entities (continued)
Beechreef (New Zealand) Limited New Zealand 100 100
Servcorp New Zealand Limited New Zealand 100 100
Company Headquarters Limited New Zealand 100 100
Servcorp Wellington Limited New Zealand 100 100
Servcorp Christchurch Limited New Zealand 100 100
Servcorp Serviced Offices Pte Ltd Singapore 100 100
Servcorp Battery Road Pte Ltd Singapore 100 100
Servcorp Marina Pte Ltd Singapore 100 100
Servcorp Franchising Pte Ltd Singapore 100 100
Servcorp Singapore Holdings Pte Ltd Singapore 100 100
Office Squared Pte Ltd Singapore 100 100
Servcorp Hottdesk Singapore Pte Ltd Singapore 100 100
Servcorp Square Pte Ltd Singapore 100 100
Servcorp SR Pte Ltd Singapore 100 100
Servcorp Hong Kong Limited Hong Kong 100 100
Servcorp Communications Limited Hong Kong 100 100
Servcorp HK Central Limited Hong Kong 100 100
Servcorp Business Service (Shanghai) Co. Ltd China 100 100
Servcorp Business Service (Beijing) Co. Ltd China 100 100
Chengdu Servcorp Business Service Co. Ltd China 100 100
Beijing Servcorp Sihui Business Service Co. Ltd China 100 100
Office Squared Network Technology Services (Hangzhou) Co. Ltd China 100 100
Guangzhou Servcorp Business Service Co. Ltd China 100 -
Chengdu Servcorp Aerospace Business Service Co. Ltd China 100 -
Hangzhou Servcorp Business Consulting Co. Ltd China 100 -
Amalthea Nominees (Malaysia) Sdn Bhd Malaysia 100 100
Office Squared Malaysia Sdn Bhd Malaysia 100 100
I-Office2 Sdn Bhd Malaysia 20 20
Servcorp Manila Inc Philippines 100 100
Servcorp Thai Holdings Limited Thailand 100 100
Servcorp Company Limited Thailand 100 100
Headquarters Co. Limited Thailand 100 100
Servcorp Japan KK Japan 100 100
Servcorp Tokyo KK Japan 100 100
Servcorp Nippon International KK Japan 100 100
Servcorp Marunouchi KK Japan 100 100
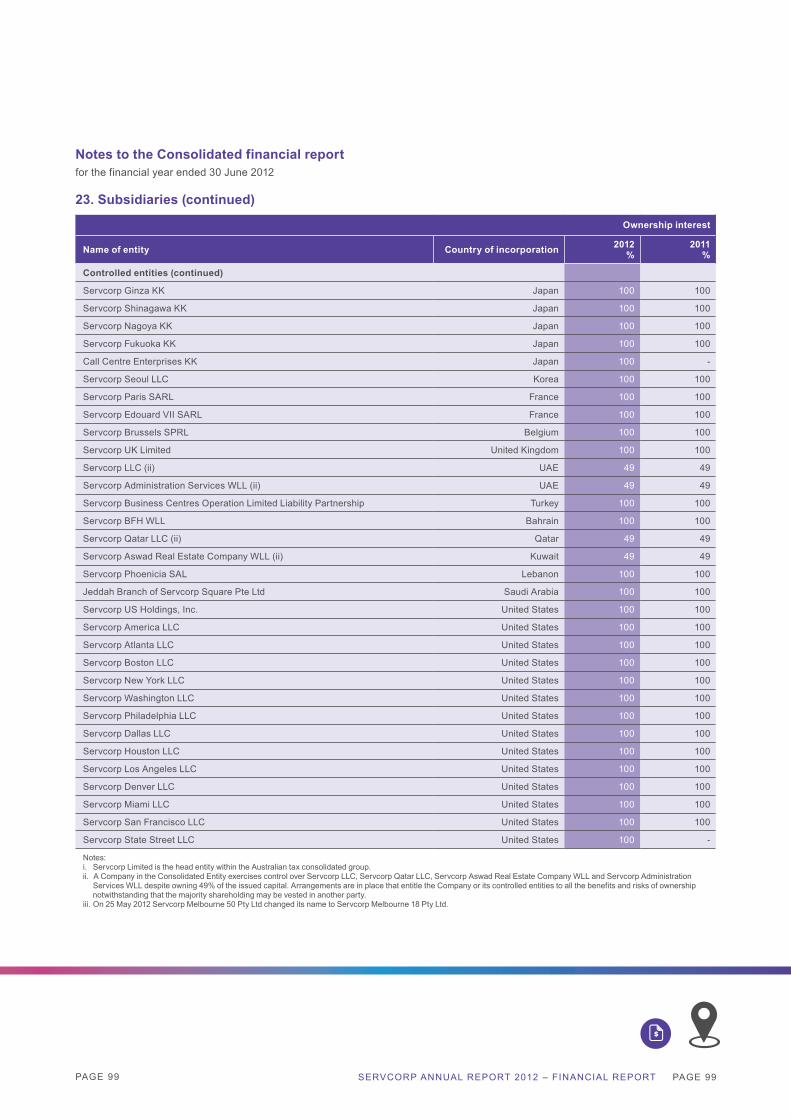
PAGE 99
Notes to the Consolidated financial reportfor the financial year ended 30 June 2012
23. Subsidiaries (continued)
Ownership interest
Name of entity Country of incorporation 2012%
2011%
Controlled entities (continued)
Servcorp Ginza KK Japan 100 100
Servcorp Shinagawa KK Japan 100 100
Servcorp Nagoya KK Japan 100 100
Servcorp Fukuoka KK Japan 100 100
Call Centre Enterprises KK Japan 100 -
Servcorp Seoul LLC Korea 100 100
Servcorp Paris SARL France 100 100
Servcorp Edouard VII SARL France 100 100
Servcorp Brussels SPRL Belgium 100 100
Servcorp UK Limited United Kingdom 100 100
Servcorp LLC (ii) UAE 49 49
Servcorp Administration Services WLL (ii) UAE 49 49
Servcorp Business Centres Operation Limited Liability Partnership Turkey 100 100
Servcorp BFH WLL Bahrain 100 100
Servcorp Qatar LLC (ii) Qatar 49 49
Servcorp Aswad Real Estate Company WLL (ii) Kuwait 49 49
Servcorp Phoenicia SAL Lebanon 100 100
Jeddah Branch of Servcorp Square Pte Ltd Saudi Arabia 100 100
Servcorp US Holdings, Inc. United States 100 100
Servcorp America LLC United States 100 100
Servcorp Atlanta LLC United States 100 100
Servcorp Boston LLC United States 100 100
Servcorp New York LLC United States 100 100
Servcorp Washington LLC United States 100 100
Servcorp Philadelphia LLC United States 100 100
Servcorp Dallas LLC United States 100 100
Servcorp Houston LLC United States 100 100
Servcorp Los Angeles LLC United States 100 100
Servcorp Denver LLC United States 100 100
Servcorp Miami LLC United States 100 100
Servcorp San Francisco LLC United States 100 100
Servcorp State Street LLC United States 100 -
Notes:i. Servcorp Limited is the head entity within the Australian tax consolidated group.ii. A Company in the Consolidated Entity exercises control over Servcorp LLC, Servcorp Qatar LLC, Servcorp Aswad Real Estate Company WLL and Servcorp Administration Services WLL despite owning 49% of the issued capital. Arrangements are in place that entitle the Company or its controlled entities to all the benefits and risks of ownership notwithstanding that the majority shareholding may be vested in another party.iii. On 25 May 2012 Servcorp Melbourne 50 Pty Ltd changed its name to Servcorp Melbourne 18 Pty Ltd.
SERVCORP ANNUAL REPORT 2012 – FINANCIAL REPORT PAGE 99
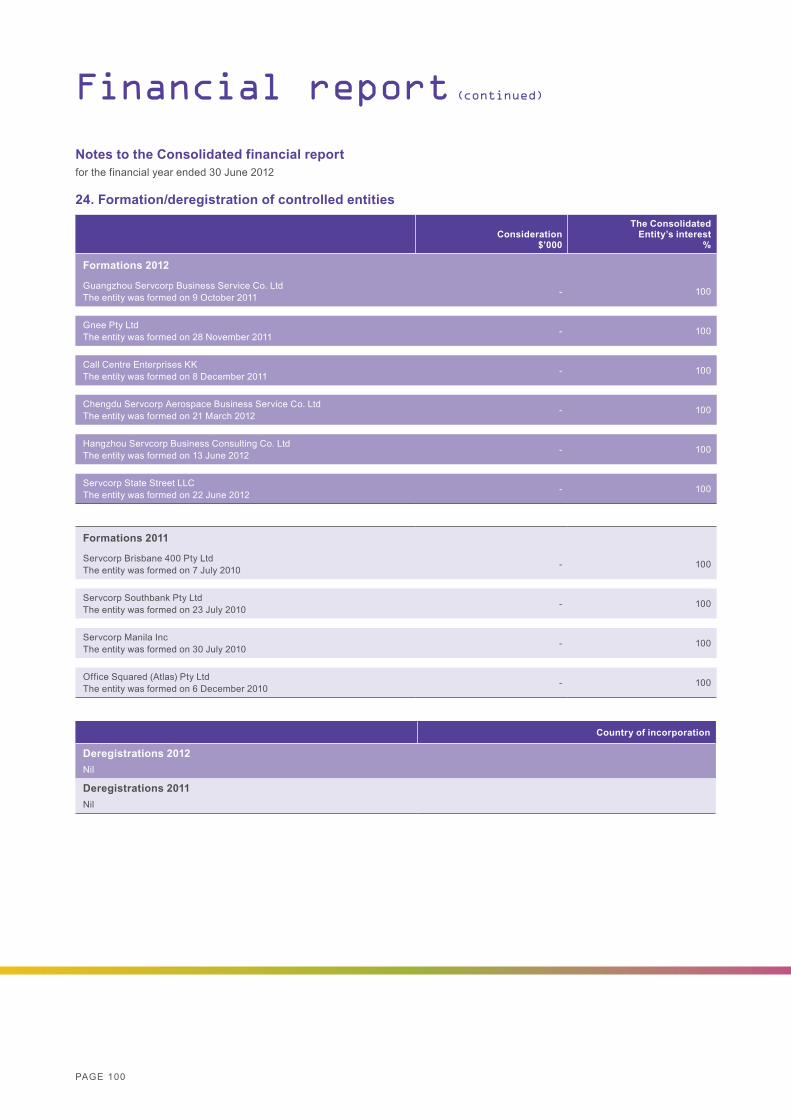
PAGE 100
Financial report (continued)
Notes to the Consolidated financial reportfor the financial year ended 30 June 2012
24. Formation/deregistration of controlled entities
Consideration$’000
The ConsolidatedEntity’s interest
%
Formations 2012
Guangzhou Servcorp Business Service Co. LtdThe entity was formed on 9 October 2011 - 100
Gnee Pty LtdThe entity was formed on 28 November 2011 - 100
Call Centre Enterprises KKThe entity was formed on 8 December 2011 - 100
Chengdu Servcorp Aerospace Business Service Co. LtdThe entity was formed on 21 March 2012 - 100
Hangzhou Servcorp Business Consulting Co. LtdThe entity was formed on 13 June 2012 - 100
Servcorp State Street LLCThe entity was formed on 22 June 2012 - 100
Formations 2011
Servcorp Brisbane 400 Pty LtdThe entity was formed on 7 July 2010 - 100
Servcorp Southbank Pty LtdThe entity was formed on 23 July 2010 - 100
Servcorp Manila IncThe entity was formed on 30 July 2010 - 100
Office Squared (Atlas) Pty LtdThe entity was formed on 6 December 2010 - 100
Country of incorporation
Deregistrations 2012Nil
Deregistrations 2011Nil
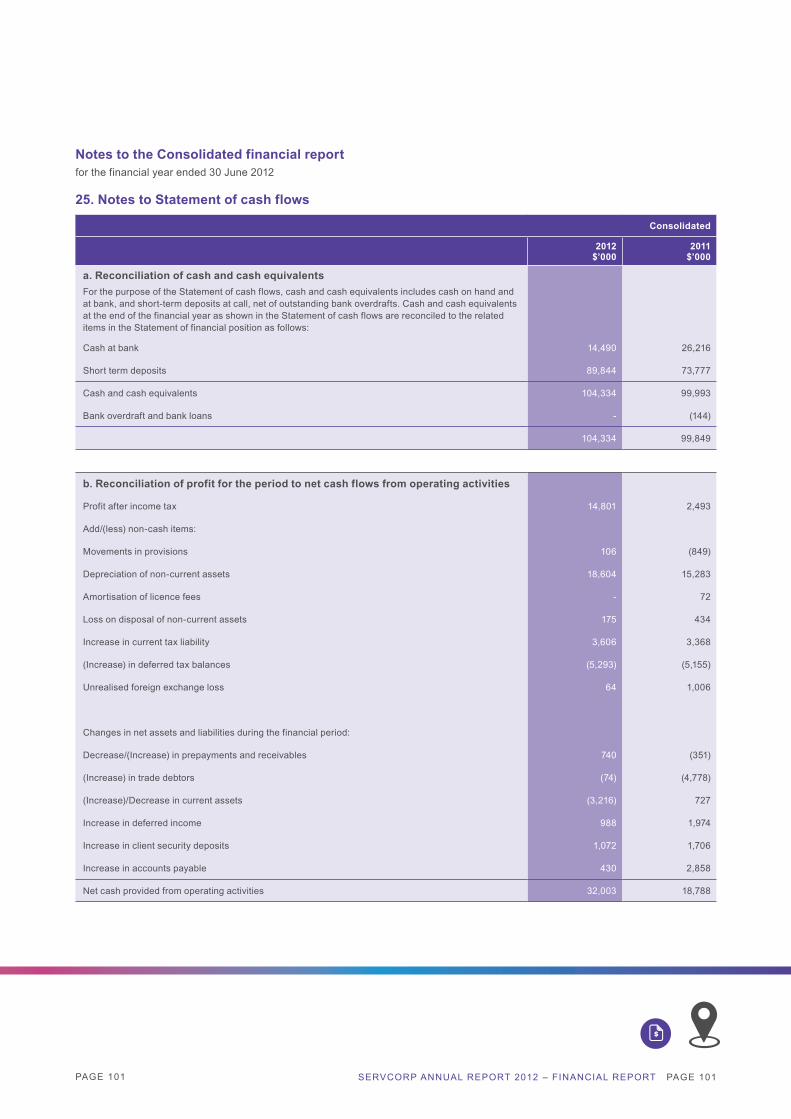
PAGE 101
25. Notes to Statement of cash flows
Consolidated
2012$’000
2011$’000
a. Reconciliation of cash and cash equivalentsFor the purpose of the Statement of cash flows, cash and cash equivalents includes cash on hand and at bank, and short-term deposits at call, net of outstanding bank overdrafts. Cash and cash equivalents at the end of the financial year as shown in the Statement of cash flows are reconciled to the related items in the Statement of financial position as follows:
Cash at bank 14,490 26,216
Short term deposits 89,844 73,777
Cash and cash equivalents 104,334 99,993
Bank overdraft and bank loans - (144)
104,334 99,849
b. Reconciliation of profit for the period to net cash flows from operating activities
Profit after income tax 14,801 2,493
Add/(less) non-cash items:
Movements in provisions 106 (849)
Depreciation of non-current assets 18,604 15,283
Amortisation of licence fees - 72
Loss on disposal of non-current assets 175 434
Increase in current tax liability 3,606 3,368
(Increase) in deferred tax balances (5,293) (5,155)
Unrealised foreign exchange loss 64 1,006
Changes in net assets and liabilities during the financial period:
Decrease/(Increase) in prepayments and receivables 740 (351)
(Increase) in trade debtors (74) (4,778)
(Increase)/Decrease in current assets (3,216) 727
Increase in deferred income 988 1,974
Increase in client security deposits 1,072 1,706
Increase in accounts payable 430 2,858
Net cash provided from operating activities 32,003 18,788
Notes to the Consolidated financial reportfor the financial year ended 30 June 2012
SERVCORP ANNUAL REPORT 2012 – FINANCIAL REPORT PAGE 101
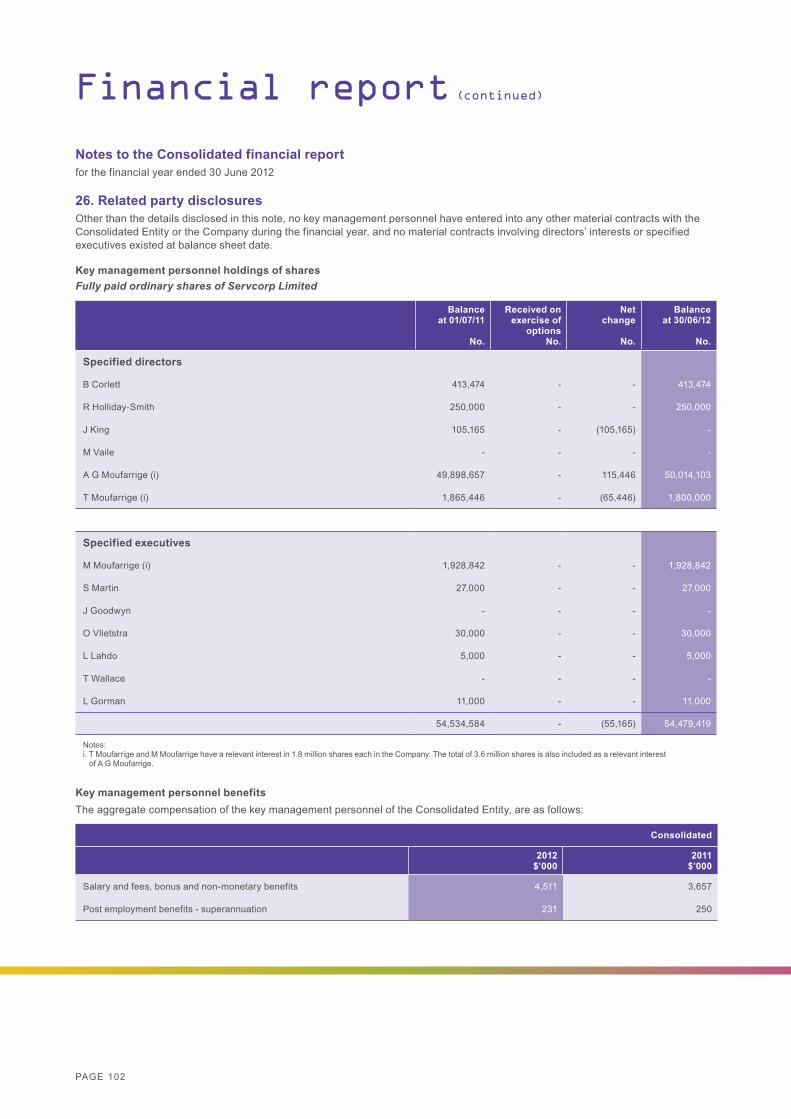
PAGE 102
Financial report (continued)
Notes to the Consolidated financial reportfor the financial year ended 30 June 2012
26. Related party disclosuresOther than the details disclosed in this note, no key management personnel have entered into any other material contracts with the Consolidated Entity or the Company during the financial year, and no material contracts involving directors’ interests or specified executives existed at balance sheet date.
Key management personnel holdings of sharesFully paid ordinary shares of Servcorp Limited
Balance at 01/07/11
No.
Received on exercise of
optionsNo.
Net change
No.
Balance at 30/06/12
No.
Specified directors
B Corlett 413,474 - - 413,474
R Holliday-Smith 250,000 - - 250,000
J King 105,165 - (105,165) -
M Vaile - - - -
A G Moufarrige (i) 49,898,657 - 115,446 50,014,103
T Moufarrige (i) 1,865,446 - (65,446) 1,800,000
Specified executives
M Moufarrige (i) 1,928,842 - - 1,928,842
S Martin 27,000 - - 27,000
J Goodwyn - - - -
O Vlietstra 30,000 - - 30,000
L Lahdo 5,000 - - 5,000
T Wallace - - - -
L Gorman 11,000 - - 11,000
54,534,584 - (55,165) 54,479,419
Notes:i. T Moufarrige and M Moufarrige have a relevant interest in 1.8 million shares each in the Company. The total of 3.6 million shares is also included as a relevant interest of A G Moufarrige.
Key management personnel benefitsThe aggregate compensation of the key management personnel of the Consolidated Entity, are as follows:
Consolidated
2012$’000
2011$’000
Salary and fees, bonus and non-monetary benefits 4,511 3,657
Post employment benefits - superannuation 231 250
PAGE 103
26. Related party disclosures (continued)Equity interests in subsidiariesDetails of the percentage of ordinary shares held in subsidiaries are disclosed in Note 23 to the financial statements.
Other transactions with the Company and its controlled entitiesFrom time to time directors of the Company and its controlled entities, or their director-related entities, may purchase goods from or provide services to the Consolidated Entity. These purchases or sales are on the same terms and conditions as those entered into by other employees, suppliers or customers of the Consolidated Entity and are trivial or domestic in nature.
The Consolidated Entity has a lease with Tekfon Pty Ltd for the use of Tekfon’s premises for storage. A director of the Company, Mr A G Moufarrige, has an interest in and is a director of Tekfon Pty Ltd. Enideb Pty Ltd operates the Servcorp franchise in Canberra on arm’s length terms. A relative of a director of the Company, Mr A G Moufarrige, has an interest in Enideb Pty Ltd. Mr A G Moufarrige has no interest in the affairs of Enideb Pty Ltd.
Rumble Australia Pty Ltd provided consulting services for the development of proprietary software to a company in the Consolidated Entity on arm’s length terms. A director of the Company, Mr A G Moufarrige, has an interest in and is a director of Rumble Australia Pty Ltd.
A director of the Company, Mr A G Moufarrige, has an interest in and is a director of Sovori Pty Ltd. Mr T Moufarrige, a director of the Company, is also a director of Sovori Pty Ltd.
A director of the Company, Mr A G Moufarrige, has an interest in and is a director of MRC Biotech Pty Ltd.
A relative of a director of the Company, Mr B Corlett, has an interest in TDM Asset Management Pty Ltd. TDM Asset Management Pty Ltd is a client of Servcorp in Sydney and in New York. Mr Corlett has no interest in the affairs of TDM Asset Management Pty Ltd nor any involvement in the negotiation of the terms of the arrangement with TDM Asset Management Pty Ltd.
A director of the Company, Mr B Corlett, has an interest in and is the Chairman of Australian Maritime Systems Limited. Australian Maritime Systems Limited is a client of Servcorp in Perth. Mr Corlett did not have any involvement in the negotiation of the terms of the arrangement with Australian Maritime Systems Limited.
A director of the Company, Mr B Corlett, has an interest in and is the Chairman of The Trust Company Limited. The Trust Company Limited is a client of Servcorp in Perth. Mr Corlett did not have any involvement in the negotiation of the terms of the arrangement with The Trust Company Limited.
A director of the Company, Mr R Holliday-Smith, has an interest in and is a director of Aegis Partners Pty Ltd. Aegis Partners Pty Ltd is a client of Servcorp in Sydney.
The terms and conditions of the transactions with directors and their director-related entities were no more favourable than those available, or which might reasonably be expected to be available, on similar transactions to non-director-related entities on an arm’s length basis.
Notes to the Consolidated financial reportfor the financial year ended 30 June 2012
SERVCORP ANNUAL REPORT 2012 – FINANCIAL REPORT PAGE 103
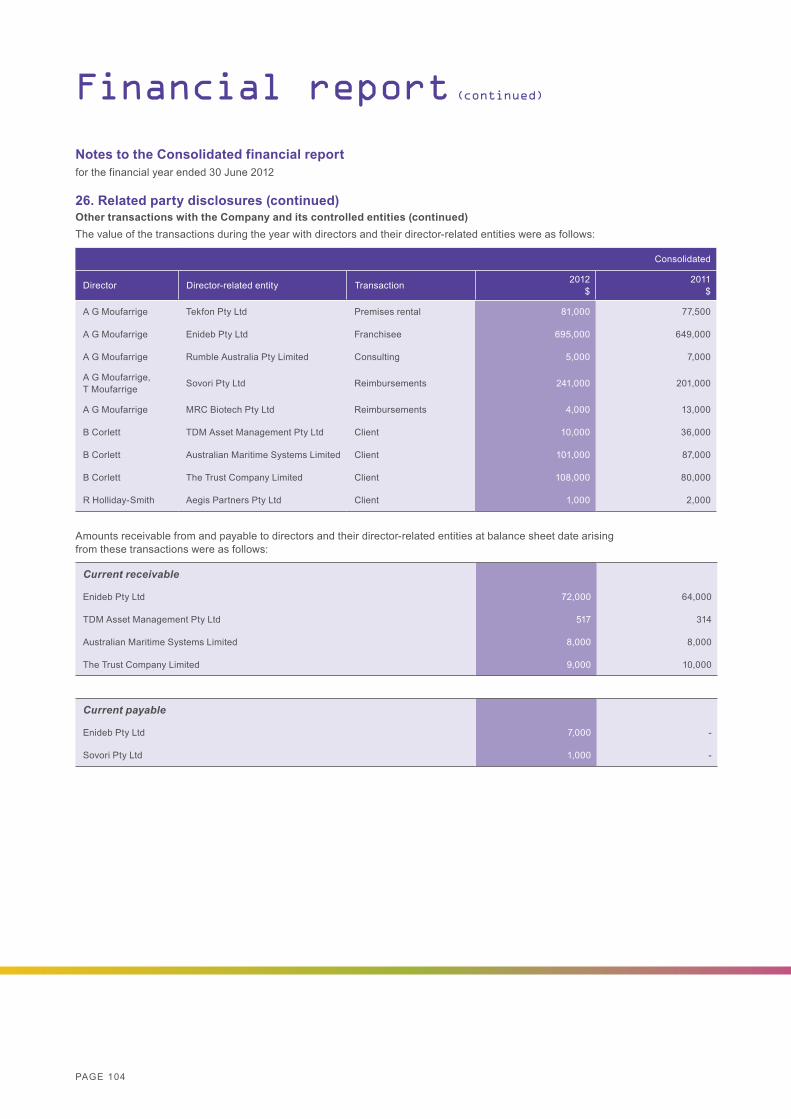
PAGE 104
26. Related party disclosures (continued)Other transactions with the Company and its controlled entities (continued)The value of the transactions during the year with directors and their director-related entities were as follows:
Financial report (continued)
Notes to the Consolidated financial reportfor the financial year ended 30 June 2012
Consolidated
Director Director-related entity Transaction 2012$
2011$
A G Moufarrige Tekfon Pty Ltd Premises rental 81,000 77,500
A G Moufarrige Enideb Pty Ltd Franchisee 695,000 649,000
A G Moufarrige Rumble Australia Pty Limited Consulting 5,000 7,000
A G Moufarrige, T Moufarrige Sovori Pty Ltd Reimbursements 241,000 201,000
A G Moufarrige MRC Biotech Pty Ltd Reimbursements 4,000 13,000
B Corlett TDM Asset Management Pty Ltd Client 10,000 36,000
B Corlett Australian Maritime Systems Limited Client 101,000 87,000
B Corlett The Trust Company Limited Client 108,000 80,000
R Holliday-Smith Aegis Partners Pty Ltd Client 1,000 2,000
Amounts receivable from and payable to directors and their director-related entities at balance sheet date arising from these transactions were as follows:
Current receivable
Enideb Pty Ltd 72,000 64,000
TDM Asset Management Pty Ltd 517 314
Australian Maritime Systems Limited 8,000 8,000
The Trust Company Limited 9,000 10,000
Current payable
Enideb Pty Ltd 7,000 -
Sovori Pty Ltd 1,000 -
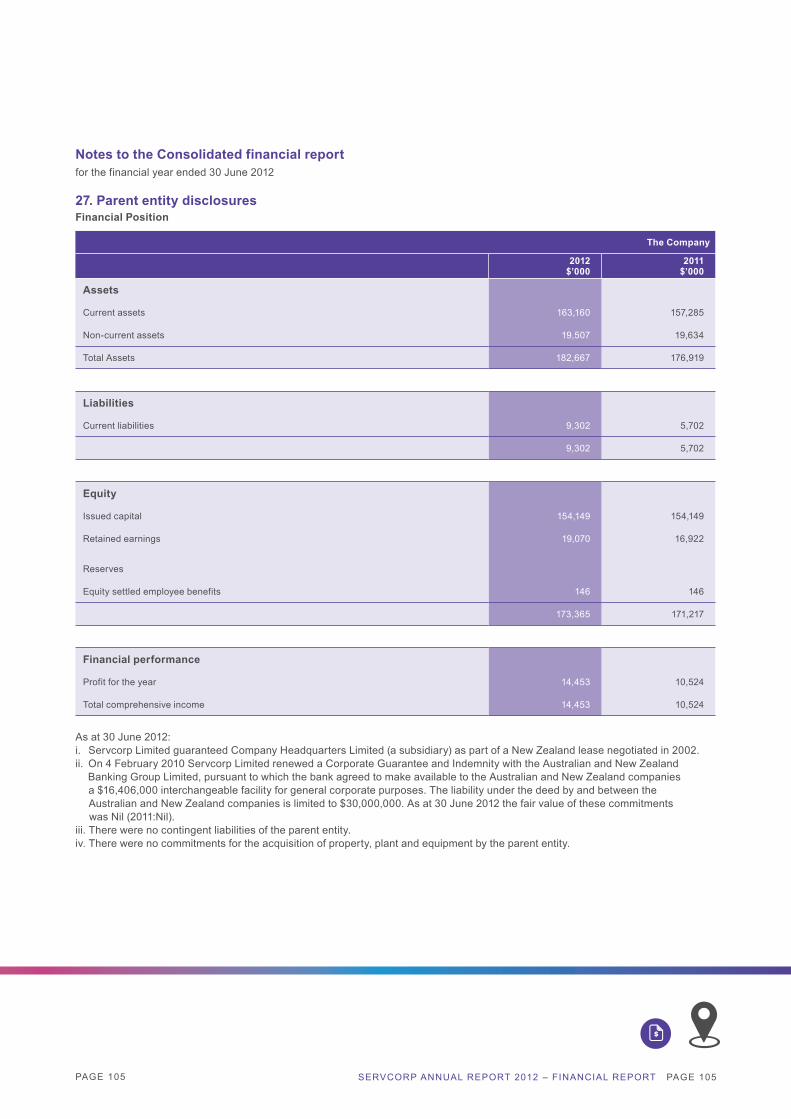
PAGE 105
27. Parent entity disclosuresFinancial Position
Notes to the Consolidated financial reportfor the financial year ended 30 June 2012
The Company
2012$’000
2011$’000
Assets
Current assets 163,160 157,285
Non-current assets 19,507 19,634
Total Assets 182,667 176,919
Liabilities
Current liabilities 9,302 5,702
9,302 5,702
Equity
Issued capital 154,149 154,149
Retained earnings 19,070 16,922
Reserves
Equity settled employee benefits 146 146
173,365 171,217
Financial performance
Profit for the year 14,453 10,524
Total comprehensive income 14,453 10,524
As at 30 June 2012:i. Servcorp Limited guaranteed Company Headquarters Limited (a subsidiary) as part of a New Zealand lease negotiated in 2002.ii. On 4 February 2010 Servcorp Limited renewed a Corporate Guarantee and Indemnity with the Australian and New Zealand Banking Group Limited, pursuant to which the bank agreed to make available to the Australian and New Zealand companies a $16,406,000 interchangeable facility for general corporate purposes. The liability under the deed by and between the Australian and New Zealand companies is limited to $30,000,000. As at 30 June 2012 the fair value of these commitments was Nil (2011:Nil).iii. There were no contingent liabilities of the parent entity.iv. There were no commitments for the acquisition of property, plant and equipment by the parent entity.
SERVCORP ANNUAL REPORT 2012 – FINANCIAL REPORT PAGE 105
PAGE 106
28. Subsequent eventsOther than the matters noted below, there has not arisen in the interval between reporting date and the date of this Financial Report, any item, transaction or event of a material and unusual nature likely, in the opinion of the directors of the Company, to affect significantly the operations of the Consolidated Entity, the results of those operations, or the state of affairs of the Consolidated Entity in future financial years:
DividendOn 28 August 2012 the directors declared a final dividend of 7.50 cents per share, franked to 85%, payable on 4 October 2012.
The financial effect of the above transaction has not been brought to account in the financial statements for the year ended 30 June 2012.
Financial report (continued)
Notes to the Consolidated financial reportfor the financial year ended 30 June 2012
PAGE 107
Directors’ declarationThe directors declare that:
a. in the directors’ opinion, there are reasonable grounds to believe that the company will be able to pay its debts as and when they become due and payable;
b. the attached financial statements are in compliance with International Financial Reporting Standards, as stated in Note 1 to the Consolidated financial report;
c. in the directors’ opinion, the attached financial statements and notes thereto are in accordance with the Corporations Act 2001, including compliance with accounting standards and giving a true and fair view of the financial position and performance of the consolidated entity; and
d. the directors have been given the declarations required by section 295A of the Corporations Act 2001.
Signed in accordance with a resolution of directors made pursuant to section 295(5) of the Corporations Act 2001.
On behalf of the directors
A G MoufarrigeCEODated at Sydney this 28th day of August 2012.
SERVCORP ANNUAL REPORT 2012 – FINANCIAL REPORT PAGE 107
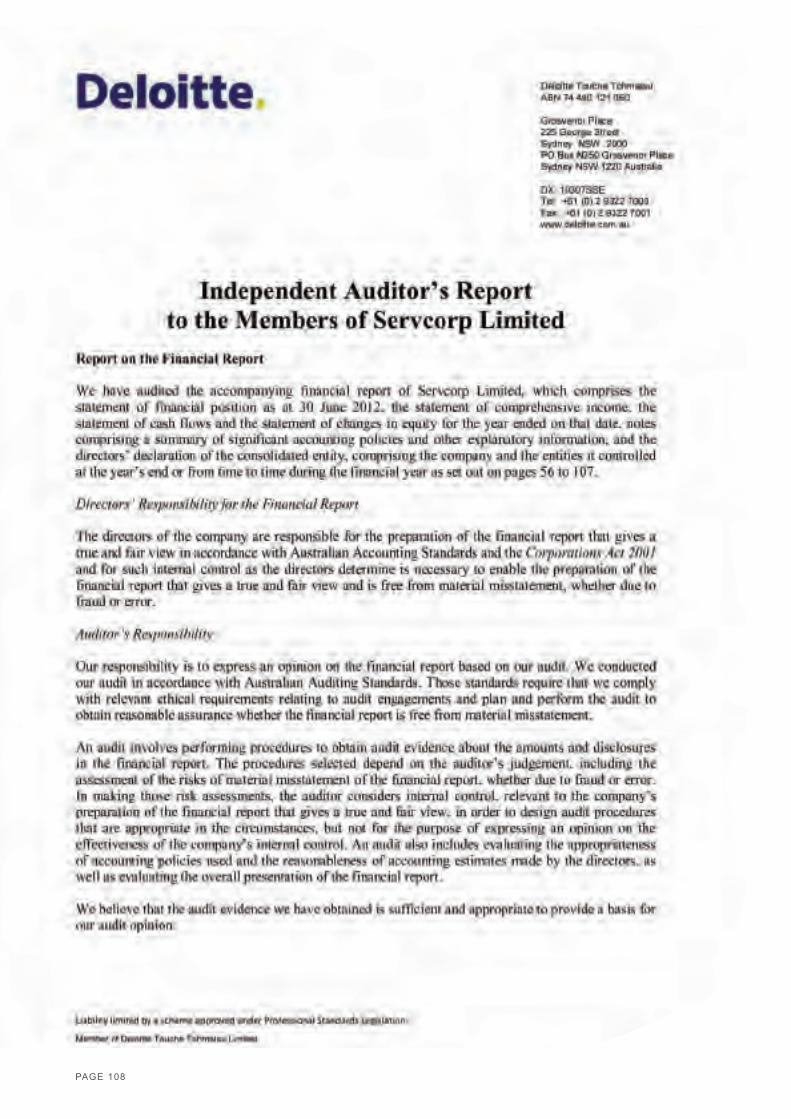
PAGE 108

PAGE 109 PAGE 109
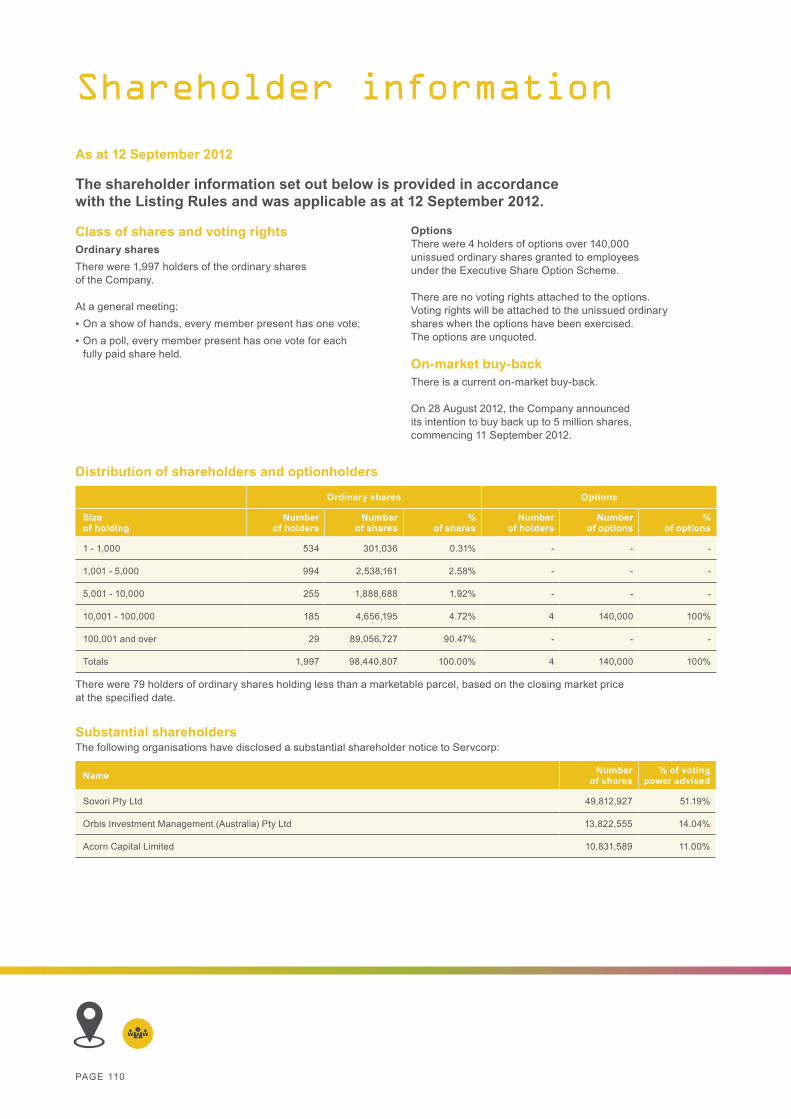
PAGE 110
Shareholder information
Class of shares and voting rightsOrdinary sharesThere were 1,997 holders of the ordinary shares of the Company.
At a general meeting: ▪ On a show of hands, every member present has one vote; ▪ On a poll, every member present has one vote for each
fully paid share held.
OptionsThere were 4 holders of options over 140,000 unissued ordinary shares granted to employees under the Executive Share Option Scheme.
There are no voting rights attached to the options. Voting rights will be attached to the unissued ordinary shares when the options have been exercised. The options are unquoted.
On-market buy-backThere is a current on-market buy-back.
On 28 August 2012, the Company announced its intention to buy back up to 5 million shares, commencing 11 September 2012.
As at 12 September 2012
The shareholder information set out below is provided in accordance with the Listing Rules and was applicable as at 12 September 2012.
Distribution of shareholders and optionholders
Ordinary shares Options
Size of holding
Number of holders
Number of shares
% of shares
Number of holders
Number of options
% of options
1 - 1,000 534 301,036 0.31% - - -
1,001 - 5,000 994 2,538,161 2.58% - - -
5,001 - 10,000 255 1,888,688 1.92% - - -
10,001 - 100,000 185 4,656,195 4.72% 4 140,000 100%
100,001 and over 29 89,056,727 90.47% - - -
Totals 1,997 98,440,807 100.00% 4 140,000 100%
There were 79 holders of ordinary shares holding less than a marketable parcel, based on the closing market price at the specified date.
Substantial shareholdersThe following organisations have disclosed a substantial shareholder notice to Servcorp:
Name Number of shares
% of voting power advised
Sovori Pty Ltd 49,812,927 51.19%
Orbis Investment Management (Australia) Pty Ltd 13,822,555 14.04%
Acorn Capital Limited 10,831,589 11.00%
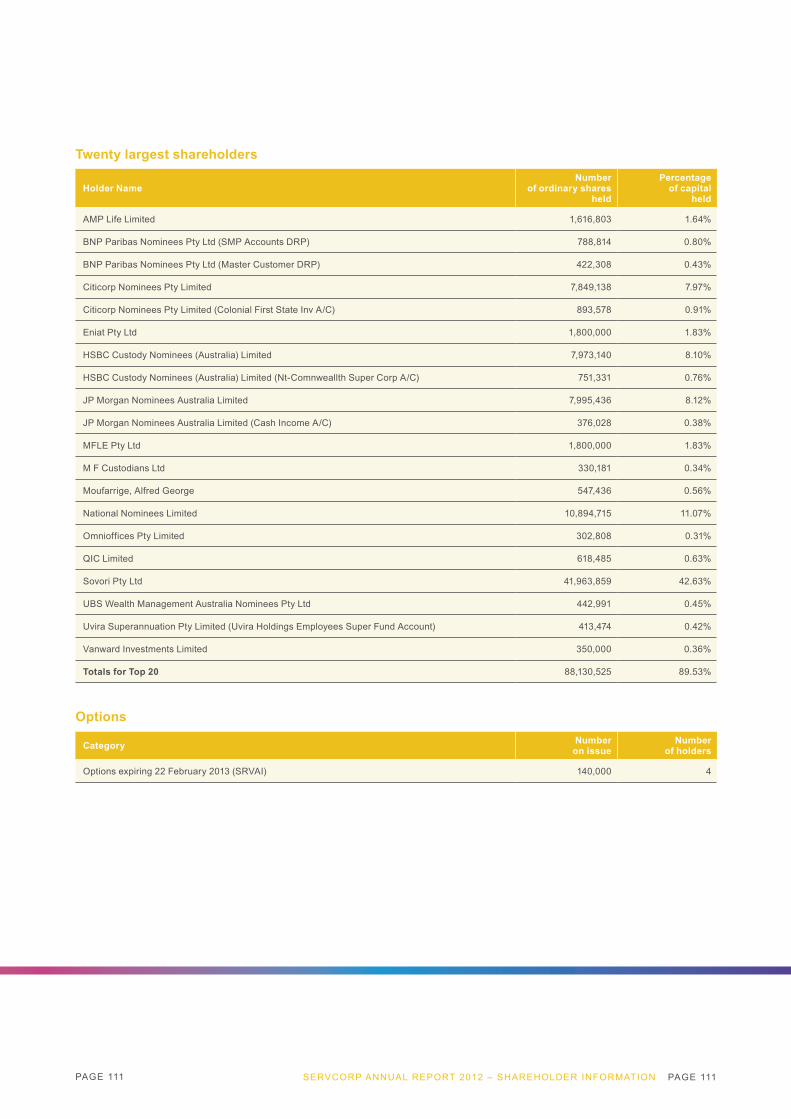
PAGE 111
Twenty largest shareholders
Holder NameNumber
of ordinary shares held
Percentage of capital
held
AMP Life Limited 1,616,803 1.64%
BNP Paribas Nominees Pty Ltd (SMP Accounts DRP) 788,814 0.80%
BNP Paribas Nominees Pty Ltd (Master Customer DRP) 422,308 0.43%
Citicorp Nominees Pty Limited 7,849,138 7.97%
Citicorp Nominees Pty Limited (Colonial First State Inv A/C) 893,578 0.91%
Eniat Pty Ltd 1,800,000 1.83%
HSBC Custody Nominees (Australia) Limited 7,973,140 8.10%
HSBC Custody Nominees (Australia) Limited (Nt-Comnweallth Super Corp A/C) 751,331 0.76%
JP Morgan Nominees Australia Limited 7,995,436 8.12%
JP Morgan Nominees Australia Limited (Cash Income A/C) 376,028 0.38%
MFLE Pty Ltd 1,800,000 1.83%
M F Custodians Ltd 330,181 0.34%
Moufarrige, Alfred George 547,436 0.56%
National Nominees Limited 10,894,715 11.07%
Omnioffices Pty Limited 302,808 0.31%
QIC Limited 618,485 0.63%
Sovori Pty Ltd 41,963,859 42.63%
UBS Wealth Management Australia Nominees Pty Ltd 442,991 0.45%
Uvira Superannuation Pty Limited (Uvira Holdings Employees Super Fund Account) 413,474 0.42%
Vanward Investments Limited 350,000 0.36%
Totals for Top 20 88,130,525 89.53%
Options
Category Number on issue
Number of holders
Options expiring 22 February 2013 (SRVAI) 140,000 4
SERVCORP ANNUAL REPORT 2012 – SHAREHOLDER INFORMATION PAGE 111
PAGE 112
Corporate information
DirectorsBruce Corlett Chairman & non-executive directorRick Holliday-Smith Non-executive directorAlf Moufarrige CEO & Managing directorTaine Moufarrige Non-executive directorMark Vaile Non-executive director
Company secretaryGreg Pearce
Registered office and principal officeLevel 12, MLC Centre19 Martin PlaceSydney NSW 2000
Telephone: + 61 (2) 9231 7500Facsimile: + 61 (2) 9231 7665
AuditorDeloitte Touche TohmatsuGrosvenor Place225 George StreetSydney NSW 2000
Share registryBoardroom Pty LimitedLevel 7207 Kent StreetSydney NSW 2000
GPO Box 3993Sydney NSW 2001
Telephone: 1300 737 760 + 61 (2) 9290 9600Facsimile: 1300 653 459 + 61 (2) 9279 0664Email: [email protected]
Stock exchangeServcorp Limited shares are quoted on the Australian Securities Exchange under the code SRV. The Home Exchange is Sydney.
Annual general meetingThe annual general meeting of Servcorp Limited will be held at The Grace Hotel, 77 York Street, Sydney at 5:00pm on Wednesday 21 November 2012.

PAGE 113

Park AvenueNew York
MLC CentreSydney
ChengduChina
Old Broad StreetCity of London Champs-Elysées
Paris