Annual Report 2011 Wageningen UR
172
Annual report Wageningen UR 2011
-
Upload
wageningen-ur -
Category
Documents
-
view
256 -
download
0
description
This is the 2011 annual report for Wageningen UR’s three organisational entities: Wageningen University, Van Hall Larenstein University of Applied Sciences and the DLO Research Foundation with its nine applied and demand-driven research institutes.
Transcript of Annual Report 2011 Wageningen UR
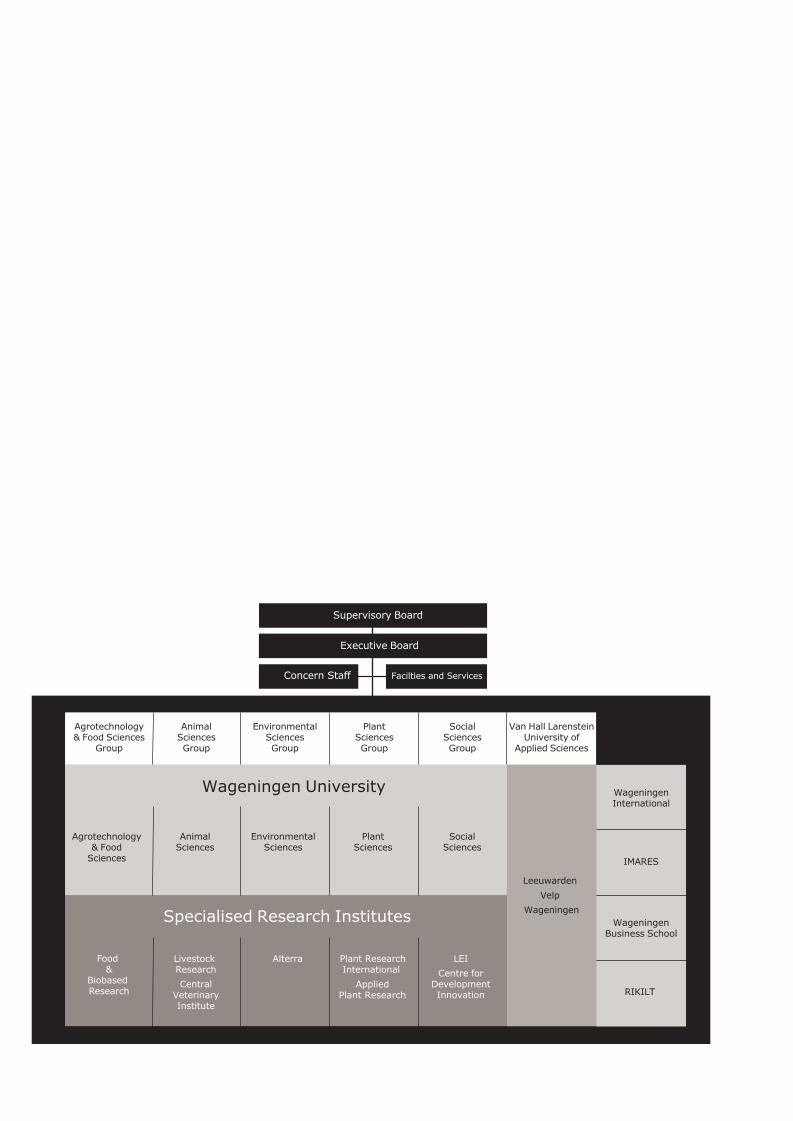
The mission of Wageningen UR (University & Research centre) is ‘To explore the potential of nature to improve the quality of life’. Within Wageningen UR, nine research institutes – both specialised and applied – have joined forces with Wageningen University and Van Hall Larenstein University of Applied Sciences to help answer the most important questions in the domain of healthy food and living environment. With approximately 40 locations (in the Netherlands, Brazil and China), 6,500 members of staff and 10,000 students, Wageningen UR is one of the leading organisations in its domain worldwide. The integral approach to problems and the cooperation between the exact sciences and the technological and social disciplines are at the heart of the Wageningen Approach .
Annual report 2011 W
ageningen UR
Annual report Wageningen UR
2011
12283_BC_omslag_jaarverslag EN V 29-05-2012.indd 1,3 31/05/2012 10:51:51
AnimalSciences
EnvironmentalSciences
Wageningen University
Alterra Plant ResearchInternational
LEICentre for
DevelopmentInnovation
Specialised Research Institutes
Food &
Biobased Research
Livestock ResearchCentral
VeterinaryInstitute
Concern Staff Facilties and Services
Agrotechnology& Food Sciences
Group
AnimalSciencesGroup
EnvironmentalSciencesGroup
PlantSciencesGroup
SocialSciencesGroup
Van Hall LarensteinUniversity of
Applied Sciences
IMARES
WageningenBusiness School
RIKILT
WageningenInternational
Agrotechnology& Food
Sciences
PlantSciences
SocialSciences
AppliedPlant Research
Supervisory Board
Executive Board
Leeuwarden Velp
Wageningen
Colophon publisherWageningen UR, June 2012www.wur.nl
editorsWorking Group Annual Report Wageningen UR
final editingWageningen UR, Communication Services
design and lay-outWageningen UR, Communication Services
photographyGuy Ackermans
printMediaCenter, Rotterdam
12283_BC_omslag_jaarverslag EN V 29-05-2012.indd 4,6 31/05/2012 10:51:52
Wageningen UR Annual Report 2011 | 1
Table of contents
Letter from the Chairman 3
Executive Board and Supervisory Board 5
1 Wageningen UR Annual Report 6
1.1 Introduction 6 1.2 Report of the Supervisory Board 6 1.3 Wageningen UR Statistics 9
1.3.1 Wageningen University Statistics 9 1.3.2 Hogeschool Van Hall Larenstein Statistics 9 1.3.3 DLO Research Foundation Statistics 10
1.4 Wageningen UR Overview 10 1.4.1 Mission and Objectives 11 1.4.2 Core Areas 11 1.4.3 Progress of Wageningen UR Strategic Plan 2011-2014 11 1.4.4 Knowledge Circulation and Valorisation 12 1.4.5 Student Recruitment 13 1.4.6 Internationalization 14 1.4.7 Governance 17 1.4.8 Participation Structure 19 1.4.9 Grievance Regulations, and Appeals and Objections (DLO, VHL, WU) 19 1.4.10 Sustainability 21
1.5 Wageningen University 23 1.5.1 Students and Education 24 1.5.2 Alumni and Fundraising 28 1.5.3 Research 29
1.6 VHL University of Applied Sciences 31 1.6.1 Students and Education 33 1.6.2 Alumni and Fundraising 37 1.6.3 Research 38
1.7 DLO Research Foundation 40 1.7.1 Research 40
1.8 Facilities 41 1.8.1 Housing 41 1.8.2 Information and Communication Technology in Education 42 1.8.3 Facilities Services 42 1.8.4 Safety and the Environment 43
2 Personnel 44
2.1 HR in Strategic Plans 44 2.1.1 Academic Staff Career Development 44 2.1.2 Internationalization 44 2.1.3 Development of Talent, Competence and Skills 44 2.1.4 Covenant Action Plan 45 2.1.5 Implementation of Workflow Management System 45
2.2 Developments in Collective Labour Agreements 45 2.3 Health and Welfare 45
2.3.1 Healthy Lifestyles and Absenteeism Due to Ill Health 45 2.3.2 Sickness Absentee Monitoring 46 2.3.3 Corporate Social Work 46 2.3.4 Wageningen UR Confidential Counsellor 46 2.3.5 Preventive Medical Research and Risk Inventory and Evaluation 46
2 | Wageningen UR Annual Report 2011
3 Annual Financial Report 48
3.1 Wageningen University Financial Report 48 3.1.1 Financial Statement 48 3.1.2 Supplementary Information 70 3.1.3 Appendices 72
3.2 Van Hall Larenstein University of Applied Sciences Financial Report 76 3.2.1 Financial Statement 76 3.2.2 Supplementary Information 93 3.2.3 Appendices 103
3.3 DLO Research Foundation Financial Report 107 3.3.1 Financial Statement 107 3.3.2 Supplementary Information 138 3.3.3 Appendices 140
3.4 Remuneration 143
Appendix 1A Education at Wageningen University 145
Appendix 1B Education at Van Hall Larenstein University of Applied Sciences 151
Appendix 2 Social year report 157
Appendix 3 GRI index 163
Wageningen UR Annual Report 2011 | 3
Letter from the Chairman
This is the 2011 annual report for Wageningen UR’s three organisational entities: Wageningen University, Van Hall Larenstein University of Applied Sciences and the DLO Research Foundation with its nine applied and demand-driven research institutes. This report aims to fulfil the statutory obligations in regards to reporting results and activities in 2011. A description of our ambition and strategic initiatives can be found in the Strategic Plan 2011-2014 and on our website: www.wur.nl We have closed the books on fiscal year 2011. And what a trying — but exciting — year it was. Measures were implemented to respond to the challenges posed by the economic and financial crises in Europe and the Netherlands and as a result, we are happy to report that Wageningen UR (University and Research Centre) managed to hold its own. The organization grew in strength, efficiency and responsiveness and, despite the economic circumstances, we are confident that our organization's position will remain strong. We occupy a stronger position in the (jobs) market. Our 'Golden Triangle' model of cooperation, which calls for close cooperation between the private sector, research institutions and government, has been widely embraced; we are in good shape with respect to the Agri-food and Horticulture industries, but also, e.g., to the Water industry, and a solid foundation was laid in 2011 for our continued role in the development and strengthening of the Dutch economy's innovative strengths. This innovation engine is fuelled by knowledge and (young) people who are able to exploit and apply that knowledge in the search for new solutions. All three of our organizational entities actively contribute to this effort, each with its own specific role. Our new four-year Strategic Plan was launched in 2011. Core themes or ‘pillars’ are the strengthening of the institutes’ market orientation, the continued implementation of quality policies at both Wageningen and the Van Hall Larenstein University of Applied Sciences and the creation of sustainable business operational excellence to promote optimum results in both education and research. Also high on the agenda are the continued internationalization of the institutes and the strengthening of same on a regional basis. In this respect, developments that took place in 2011 led to a significant strengthening of our position. Wageningen UR became the European coordinator of The Sustainability Consortium, a prestigious and independent organization of diverse industries and research institutions that work collaboratively to improve consumer product sustainability. We are now an integral part of a fascinating network, allowing us to operate at the international forefront of developments in the field of sustainability. The Mayor of Beijing's visit to Bleiswijk is yet more evidence that our vision, know-how and approach have a strong international appeal. In fact, Wageningen UR will play a major role in supplying the Chinese capital's 20 million inhabitants with food products and entered a partnership agreement thereto that includes other businesses (both local and international) for the security of food production. The DLO Research Foundation was hardest hit by measures taken following the economic crisis, but we managed to successfully absorb the cuts in research funds made by the Ministry of Economic Affairs, Agriculture and Innovation. Looking ahead, there is a crucial need for additional resources to maintain and expand our capacity. The THE World University Rankings ranked Wageningen UR second in the Netherlands and 75th overall. While this demonstrates that our quality policy was successfully implemented, there remains room for improvement. The National Student Benchmark Survey helped Wageningen University consolidate its lead position and we are back in first place. Wageningen University also had an relatively good financial year. Wageningen’s educational facilities were further enhanced by the opening of Orion in 2011. The campus will continue to grow with the construction of FrieslandCampina’s new Research and Development

4 | Wageningen UR Annual Report 2011
facility. Wageningen UR has therefore become the physical manifestation of Food Valley’s “cooperate to innovate” motto. Wageningen University’s expansion unfortunately meant there was a concomitant lack of available student housing in both the city of Wageningen and its surroundings. To give the market time to adjust, students are being housed in more than 800 temporary units in both Wageningen and Ede. These units are intended primarily for international students, so that the university can guarantee them housing upon arrival. As for VHL, 2011 was also an eventful year. The impact of several events that took place at the beginning of the academic year put a significant strain on the cooperative foundation of Wageningen UR. We are attempting to identify the causes and determine whether and how cooperation can continue. The ‘Inviting Prospect’ that directors and management presented at the end of the year suggests how the partnership between the two organizations may be strengthened and points to the financial gains that may be realized as a result of continued cooperation. The partnership between the two must be reinforced as the quality, effectiveness and power to attract are stronger as a whole. The opening of the Dairy Campus and Centre for Marine Policy, both under the auspices of VHL in Leeuwarden, illustrates the added value of continued cooperation. In short, despite the difficult economic circumstances and uncertain environment surrounding Wageningen UR, 2011 was a good year. A sincere thank you to both students and faculty for their contribution to this success, and to our shareholders and donors who made it all possible. Sincerely, Dr. Aalt Dijkhuizen Chairman of the Executive Board
Wageningen UR Annual Report 2011 | 5
Executive Board and Supervisory Board
The Wageningen University and Research Centre (Wageningen UR) is made up of the Wageningen University (WU), the Dienst Landbouwkundig Onderzoek (DLO Research Foundation) and the Van Hall Larenstein University of Applied Sciences (VHL). At the end of 2011, the Executive Board and Supervisory Board were as follows: Executive Board Dr A. A. Dijkhuizen (Chair) Prof. M. J. Kropff, Ph.D (Vice Chair, Vice Chancellor, WU) Dr IJ. J. H. Breukink (Board Member) The Executive Board of each institution (WU, VHL and DLO) is made up of the same members. Supervisory Board Ms M. de Boer (Chair) Dr J. J. van Duijn (Vice Chair) Dr L. B. A. M. G. Van Depoele Ms J. R. H. Maij-Weggen Dr B. J. Marttin MBA The Supervisory Board of each institution (WU, VHL and DLO) is made up of the same members. Please visit www.wur.nl/NL/over/bestuur for Executive Board position descriptions. Please visit www.wur.nl/NL/over/governance for Supervisory Board Rules, position, roster and profile descriptions.
6 | Wageningen UR Annual Report 2011
1 Wageningen UR Annual Report
1.1 Introduction Wageningen UR publishes an integrated Annual Report which consists of the following: • Wageningen UR Annual Report (including information about the organization, sustainability, staff,
the primary process and the facilities, broken down by legal entity where relevant); • The financial reports of Wageningen University, the DLO Research Foundation and the Van Hall
Larenstein University of Applied Sciences. The Annual Report was prepared in accordance with the following rules, regulations and agreements: • Civil Code Book 2, Title 9; • Annual Reporting Guidelines; • The Netherlands Corporate Governance Code, the HBO Governance Code and the 2007 Code of
Practice for Universities as well as the Wageningen UR Corporate Governance Code, derived therefrom;
• The Works Councils Act; • Agreements with unions and employee associations. Wageningen UR complies with information obligations stipulated in the Environmental Health and Safety Act and Working Conditions Act and provides information to the executive bodies that are authorized under these Acts to certify or issue licences.
1.2 Report of the Supervisory Board The Supervisory Board convened five general meetings and two special meetings in 2011. The Chairs of both the Supervisory and Executive Boards held regular informal talks. The Supervisory Board twice requested to hold consultations with the participation of VHL. No regular consultations were had with WU or DLO. The Supervisory Board convened on several occasions without the participation of the Executive Board. A major topic of discussion in 2011 was the situation and conditions surrounding VHL. Both the regular and special meetings centred around the lack of confidence, the laborious decision-making process and the nature of the collaborative relationship of the Supervisory and Executive Boards. The Supervisory Board convened two meetings with the participation of a VHL delegation. Consultations centred on whether VHL would continue to collaborate with Wageningen UR and to what extent the participational structure had been damaged. The Board considered whether settlements were possible in disputes between respective Boards that posed serious risk to the participational structure and determined that a positive conclusion could be reached with respect to these issues. However, the Board also concluded that the extent of the focus being paid to the internal processes of this strained relationship meant insufficient attention was being given to the organization’s primary goals. The Supervisory and Executive Boards discussed how to confront and tackle this situation, deciding that an external consulting firm would conduct a study. This firm indicated that VHL could function within Wageningen UR and suggested what needed to be changed for the partnership to be successful. The results of the study were shared with VHL employees, a majority of whom voted to continue the partnership with Wageningen UR under certain conditions. Once the conditions are ironed out, a final decision will be taken in the summer of 2012. Following a positive recommendation by the Audit Committee, the Supervisory Board approved the 2010 Annual Report, which included the financial reports of DLO, VHL and WU. The Supervisory Board asked the Executive Board to undertake the Auditor’s recommendations.
Wageningen UR Annual Report 2011 | 7
The Supervisory Board received periodical reports from management as to the financial condition of the organization. The Board approved several decisions concerning inter-university cooperation and the award of joint degrees. The Board also discussed the completion in 2010 of the previous four-year Strategic Plan (2007-2010) and determined that a variety of objectives had been achieved. Both the number of students and the quality of research grew, the latter of which is evidenced by the prestigious awards that were awarded to researchers and the significant portfolio of applied research assignments. In addition, our financial condition improved, as did our position on the international playing field. Despite this, there is yet more work that needs to be done; the Board noted that there are many more challenges ahead before the organization can fully achieve its objectives. In conjunction with an education monitor, the Board monitored developments in education. Also discussed as one of the objectives outlined in the Strategic Plan was academic success. The quality assurance plan was both discussed and approved, and distance-learning plans were explained to the Board. The Chairman of the Supervisory Board received a whistleblower report, which was examined by two independent external agencies upon request of the Board. The findings concluded that there was no question of irregularities within the meaning of the Whistleblower Regulations, and based on these findings, the Board concluded the same. The independent Municipal Government Whistleblowers Committee subsequently concluded the report to be unfounded. The results of the 2010 Staff Monitoring Report were evaluated in 2011 and the Board made clear that the results were discussed between directors of the respective institutions and the Board itself. The Supervisory Board requested the Executive Board to incorporate the results of the employee satisfaction survey in its assessment of managers. The Board also reflected on the reorganization of the risk management system within Wageningen UR. The Internal Audit and Compliance Function was deemed both independently positioned and well-executed. Also discussed were various real estate projects. Approval was granted to invest in temporary student housing for incoming international students. A Risk Committee was established to assess risks and submit periodic reports to the Audit Committee. Based on a positive recommendation of the Audit Committee, the Supervisory Board approved the 2012 budgets of WU, DLO and VHL. The Board also evaluated the functioning of the Executive Board in its entirety and that of its individual members. In addition, based on the positive recommendation of the Appointments and Remuneration Committee, the Board nominated Mr Marttin, Member of Rabobank Netherlands’ Executive Board to the Minister of Economic Affairs, Agriculture and Innovation for appointment to the Supervisory Board. The Board wishes to thank the Ministry for accepting the nomination, allowing Mr Marttin to be appointed on 1 July 2011. His (financial) expertise and significant (international) network have proven to be valuable assets for the proper functioning of the Board. Discussions also centred around future Board openings and how best to prepare to fill them. Audit Committee The Audit Committee convened three regular meetings in 2011 to discuss the 2010 Annual Report and the findings of the audit. The Audit Committee agreed with a number of the Auditor’s specific recommendations to improve both the assessment process and the integrity and reliability of the budget and forecasts. The Audit Committee also discussed management reports, which included financial reports, and advised the Supervisory Board to approve Wageningen UR’s Annual Report 2010, which included the Annual Accounts of the DLO Research Foundation, the VHL University of Applied Sciences and Wageningen University, and to implement the Auditor’s recommendations. The Audit Committee also discussed property risks and advised the Board as to various concerns in the valuation techniques and underlying models. The Committee recommended to the Board to approve the 2012 budgets of DLO, VHL and Wageningen University.
8 | Wageningen UR Annual Report 2011
Appointments and Remuneration Committee The Appointments and Remuneration Committee discussed the vacant position on the Supervisory Board caused by the death of Mr Heemskerk. The Committee recommended to the Supervisory Board to nominate Mr Marttin to the Ministry of Economic Affairs, Agriculture and Innovation for appointment to the Board. The Committee also advised the Supervisory Board on remuneration policies in response to the Salary Standardization Act. The Supervisory Board has discussed this with the Executive Board. Board member salary information (both Executive and Supervisory) is contained in Chapter 3 of this Annual Report. Independence The Supervisory Board ensures that Board members are independent. In the Board’s opinion, the Supervisory Board is independent in both composition and performance in accordance with the requirements of Wageningen UR’s Corporate Governance Code. Composition of the Supervisory Board In 2011, the Board’s composition was as follows: Ms M. de Boer (Chair) (1939) Member of the Board since September 2005; Member of the Appointments and Remuneration Committee. Ms de Boer’s term of office will expire on 1 September 2013, at which point she will not be eligible for reappointment due to the provisions of the Board’s rotation scheme. Ms de Boer has held various public posts. Dr J. J. van Duijn (Vice Chair) (1943) Member of the Board since September 2004; Member of the Audit Committee. Dr van Duijn’s term of office will expire on 1 September 2012, at which point he will not be eligible for reappointment due to the provisions of the Board’s rotation scheme. Dr van Duijn is a former member of the Executive Board of the Robeco Groep. Dr L. B. A. M. G. van Depoele (1939) Member of the Board since 1 May September 2008; Member of the Appointments and Remuneration Committee. Dr van Depoele’s term of office will expire on 1 September 2012. Although he will be eligible for an extension of his membership, he chooses not to make use of this option. Dr van Depoele is the former head of Rural Development at the European Commission’s Directorate-General for Agriculture and Rural Development. Dr H. Heemskerk (1943) Dr Heemskerk, a member of the Board since 1 September 2009 and Chairman of the Audit Committee, died on 22 March 2011. Dr B. J. Marttin MBA (1965) Member of the Board since 1 July 2011; Chairman of the Audit Committee. Dr Marttin’s term of office will expire on 1 July 2015, at which point he will be eligible for reappointment. Dr Marttin is a member of the Executive Board of Rabobank Netherlands. Ms J. R. H. Maij-Weggen (1943) Member of the Board since September 2004; Chairwoman of the Appointments and Remuneration Committee. Ms Maij-Weggen’s term of office will expire on 1 September 2012, at which point she will not be eligible for reappointment. Ms Maij-Weggen has held various public posts. On behalf of the Supervisory Board Ms Margreeth de Boer (Chair)
Wageningen UR Annual Report 2011 | 9
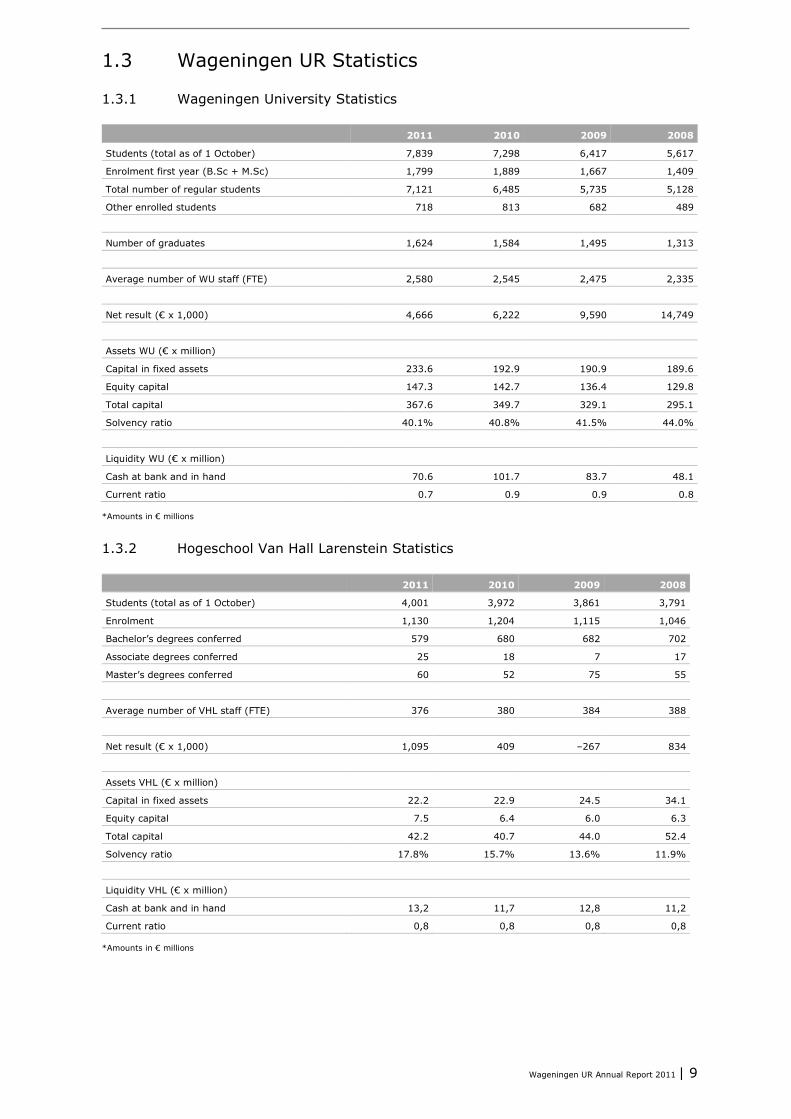
1.3 Wageningen UR Statistics
1.3.1 Wageningen University Statistics
2011 2010 2009 2008
Students (total as of 1 October) 7,839 7,298 6,417 5,617
Enrolment first year (B.Sc + M.Sc) 1,799 1,889 1,667 1,409
Total number of regular students 7,121 6,485 5,735 5,128
Other enrolled students 718 813 682 489
Number of graduates 1,624 1,584 1,495 1,313
Average number of WU staff (FTE) 2,580 2,545 2,475 2,335
Net result (€ x 1,000) 4,666 6,222 9,590 14,749
Assets WU (€ x million)
Capital in fixed assets 233.6 192.9 190.9 189.6
Equity capital 147.3 142.7 136.4 129.8
Total capital 367.6 349.7 329.1 295.1
Solvency ratio 40.1% 40.8% 41.5% 44.0%
Liquidity WU (€ x million)
Cash at bank and in hand 70.6 101.7 83.7 48.1
Current ratio 0.7 0.9 0.9 0.8
*Amounts in € millions
1.3.2 Hogeschool Van Hall Larenstein Statistics
2011 2010 2009 2008
Students (total as of 1 October) 4,001 3,972 3,861 3,791
Enrolment 1,130 1,204 1,115 1,046
Bachelor’s degrees conferred 579 680 682 702
Associate degrees conferred 25 18 7 17
Master’s degrees conferred 60 52 75 55
Average number of VHL staff (FTE) 376 380 384 388
Net result (€ x 1,000) 1,095 409 –267 834
Assets VHL (€ x million)
Capital in fixed assets 22.2 22.9 24.5 34.1
Equity capital 7.5 6.4 6.0 6.3
Total capital 42.2 40.7 44.0 52.4
Solvency ratio 17.8% 15.7% 13.6% 11.9%
Liquidity VHL (€ x million)
Cash at bank and in hand 13,2 11,7 12,8 11,2
Current ratio 0,8 0,8 0,8 0,8
*Amounts in € millions
10 | Wageningen UR Annual Report 2011
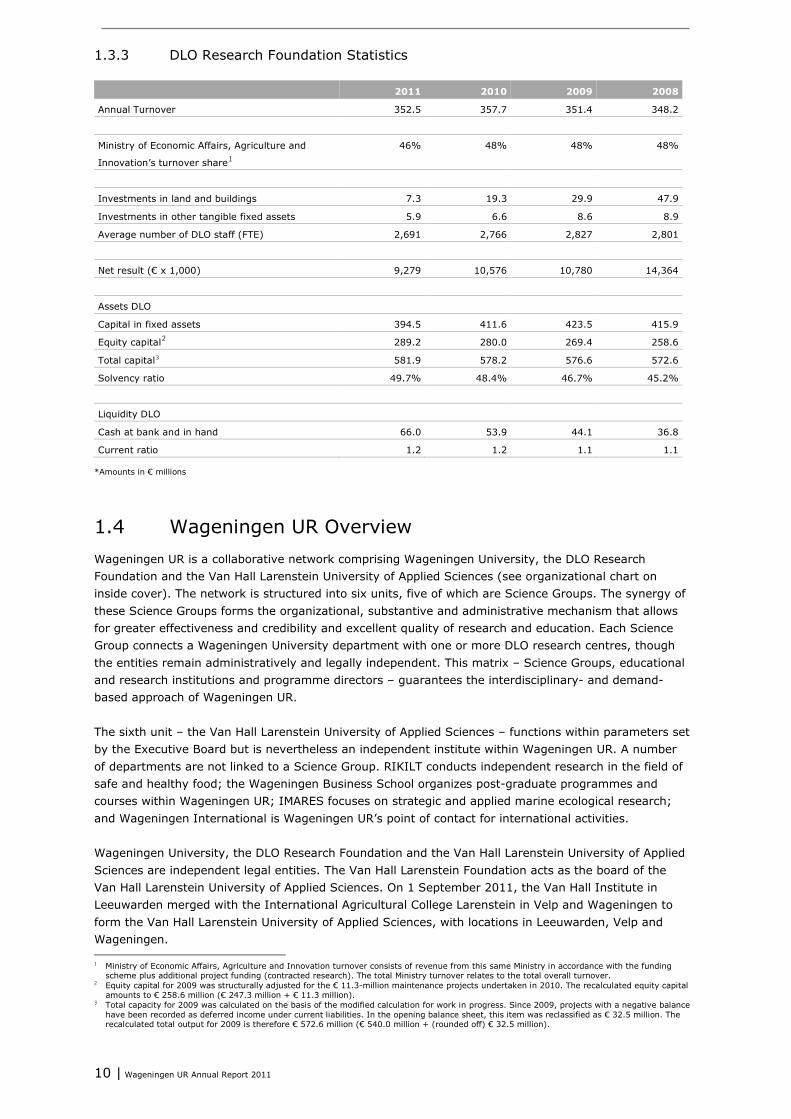
1.3.3 DLO Research Foundation Statistics
2011 2010 2009 2008
Annual Turnover 352.5 357.7 351.4 348.2
Ministry of Economic Affairs, Agriculture and
Innovation’s turnover share1
46% 48% 48% 48%
Investments in land and buildings 7.3 19.3 29.9 47.9
Investments in other tangible fixed assets 5.9 6.6 8.6 8.9
Average number of DLO staff (FTE) 2,691 2,766 2,827 2,801
Net result (€ x 1,000) 9,279 10,576 10,780 14,364
Assets DLO
Capital in fixed assets 394.5 411.6 423.5 415.9
Equity capital2 289.2 280.0 269.4 258.6
Total capital3 581.9 578.2 576.6 572.6
Solvency ratio 49.7% 48.4% 46.7% 45.2%
Liquidity DLO
Cash at bank and in hand 66.0 53.9 44.1 36.8
Current ratio 1.2 1.2 1.1 1.1
*Amounts in € millions
1.4 Wageningen UR Overview Wageningen UR is a collaborative network comprising Wageningen University, the DLO Research Foundation and the Van Hall Larenstein University of Applied Sciences (see organizational chart on inside cover). The network is structured into six units, five of which are Science Groups. The synergy of these Science Groups forms the organizational, substantive and administrative mechanism that allows for greater effectiveness and credibility and excellent quality of research and education. Each Science Group connects a Wageningen University department with one or more DLO research centres, though the entities remain administratively and legally independent. This matrix – Science Groups, educational and research institutions and programme directors – guarantees the interdisciplinary- and demand-based approach of Wageningen UR. The sixth unit – the Van Hall Larenstein University of Applied Sciences – functions within parameters set by the Executive Board but is nevertheless an independent institute within Wageningen UR. A number of departments are not linked to a Science Group. RIKILT conducts independent research in the field of safe and healthy food; the Wageningen Business School organizes post-graduate programmes and courses within Wageningen UR; IMARES focuses on strategic and applied marine ecological research; and Wageningen International is Wageningen UR’s point of contact for international activities. Wageningen University, the DLO Research Foundation and the Van Hall Larenstein University of Applied Sciences are independent legal entities. The Van Hall Larenstein Foundation acts as the board of the Van Hall Larenstein University of Applied Sciences. On 1 September 2011, the Van Hall Institute in Leeuwarden merged with the International Agricultural College Larenstein in Velp and Wageningen to form the Van Hall Larenstein University of Applied Sciences, with locations in Leeuwarden, Velp and Wageningen. 1 Ministry of Economic Affairs, Agriculture and Innovation turnover consists of revenue from this same Ministry in accordance with the funding
scheme plus additional project funding (contracted research). The total Ministry turnover relates to the total overall turnover. 2 Equity capital for 2009 was structurally adjusted for the € 11.3-million maintenance projects undertaken in 2010. The recalculated equity capital
amounts to € 258.6 million (€ 247.3 million + € 11.3 million). 3 Total capacity for 2009 was calculated on the basis of the modified calculation for work in progress. Since 2009, projects with a negative balance
have been recorded as deferred income under current liabilities. In the opening balance sheet, this item was reclassified as € 32.5 million. The recalculated total output for 2009 is therefore € 572.6 million (€ 540.0 million + (rounded off) € 32.5 million).
Wageningen UR Annual Report 2011 | 11
The objectives and activities of Wageningen UR’s separate legal entities are substantively coordinated at the strategic and tactical levels. Cooperation occurs at the operational level. There is, however, no policy governing the relationship between them. Individual organizational funds may not be diverted and are to be used for the realization of objectives and/or primary tasks only. The independent legal entities therefore publish consolidated annual accounts. Wageningen UR does not publish a consolidated annual account.
1.4.1 Mission and Objectives
Wageningen UR is an international research and knowledge centre whose mission is to explore the potential of nature and improve the quality of life. Its goal is to become, by 2020, the foremost research institute in Europe and leading worldwide partner in the field of Healthy Food and Living. Wageningen University must therefore maintain both its ranking as one of the world’s foremost research centres as well as its leading position in the National Student Benchmark Survey. The Van Hall Larenstein University of Applied Sciences will strive to retain a position among the top 10 national universities and continue to promote and serve regional clusters. The application-oriented research institutes of the DLO Research Foundation will, by 2020, establish themselves as the preferred partner in the development of ‘green knowledge’ and sustainable innovations. Their significant background in science, user-oriented approach and strong position in the ‘Golden Triangle’ will enable the DLO Research Foundation to accomplish this goal.
1.4.2 Core Areas
Wageningen UR implements its mission by focusing on three core areas: • Food and Food Production
The production and supply side of the food chain: sustainable agriculture and horticulture (including floriculture); fisheries and aquaculture; food safety; nutrition and health; international food chains and networks; health and welfare; and the use of biomass in the context of a biobased economy.
• Living Environments Nature, landscape, biodiversity, land use, climate change, ocean and water management and the various competing claims on space.
• Health, lifestyle and living conditions Impact of human choice on health, food and living conditions. Behaviour as consumer, citizen or recreational participant, attitudes towards risk-taking and uncertainty, the perception of quality and safety, working and living conditions in the agri-food sector and the importance of food security, especially in least-developed countries.
1.4.3 Progress of Wageningen UR Strategic Plan 2011-2014
The Strategic Plan 2011-2014 identifies five key areas that merit further consideration and development: the market position of the application-oriented research institutes (currently being reinforced); the research themes identified in the previous four-year Strategic Plan (currently being further developed); greater emphasis on excellence in both research and education; Wageningen UR’s commitment to a strengthened position both regionally and nationally and expansion of alliances with leading international universities and research institutes; and finally, improving its own sustainable organization and management. Wageningen UR has a clear profile that yields results and is recognized and acknowledged by both students and target groups. The number of enrolments has grown significantly in recent years; the quality and scope of research has improved; buildings and facilities were rapidly renovated; and the organization is in a healthy financial position. The field of Healthy Food and Living and the core areas of food, water, a healthy environment, climate change and renewable energy resources have become ever more important issues globally. We are therefore choosing to proceed with vigour, both nationally and internationally.

12 | Wageningen UR Annual Report 2011
In order to achieve the objectives set out in Wageningen UR’s Strategic Plan 2011-2014, a determined step forward must be taken during this planning period. Our goals are therefore far-reaching and careful planning must be carried out. Progress, including which of the Plan’s objectives were implemented, is evaluated on an annual basis. When it comes to priorities, our motto – that not everything can be done at once, but what we do, we do well – ensures quality in execution. Wageningen UR continues to carefully monitor the environment and, where necessary, change its activities and structure to fit demands. 2011 performance indicators in qualitative terms: • Strengthening of market position of the DLO Research Foundation: turnover increased in 2011 by +
€ 2.6 million; 2014 target goal of + € 50 million presents challenge; • Distance learning: the Executive Board launched two pilot programmes in training (food, plants);
each may become long-term should demand require; • Cash management: high on the agenda as an organization-wide issue; agreed ground rules for
directorial auditing of operations; savings through reduction of working capital and more efficient annual investments of € 0.5 million;
• Finalization of pilot shared-use facility for chemical analysis: the first steps have been taken; the various labs have been interconnected; and collaboration is carried out where possible;
• Internationalization: Development of continent-wide vision: focus on a limited number of countries that are divided
into three groups, viz., strategic, interesting/promising or fruitful; Student recruitment: activities focused on priority and partner countries; targeted use of fee
waivers in cases of study delays; fees are updated annually; • Innovation in co-decision making: this priority will continue to be a focus in 2012; the major
decision-making bodies launched a partnership in the Wageningen UR Council; • Adjustment to two-year Social Sciences Master’s: Wageningen University decided to provisionally
proceed with a two-year course with a quality impetus.
1.4.4 Knowledge Circulation and Valorisation
In 2011, Wageningen UR actively pressed for the circulation and valorisation of knowledge in the following ways: • Making research results available via the library, Kennis Online, METIS and other online databases
and via a large number of (targeted) Websites. Thematic papers began to be available online in 2011;
• Presenting research results at theme-based events, business cafés, professional networks and lectures;
• Implementing joint projects with potential users such as public-private co-innovation projects with SMEs and participation in so-called ‘top technological institutes’ (TTIs) (such as the Food and Nutrition Delta, Green Genetics TTI and the Wetsus centre, in which industry also participates);
• Participating in the Development Agenda of major industries, or, at the very least, in the Development Agenda of the Agri-food, Horticulture and Raw Materials industries, as well as Water, Energy, Life Sciences and Biobased Chemicals, and, to a lesser degree, Logistics, High Tech and the Creative Industry. As part of the agenda-setting process, current public-private partnerships have been highlighted, leading to a factsheet (inventory) of about 100 such partnerships, available at www.wur.nl/NL/onderzoek/samenwerking_bedrijfsleven/;
• Involvement in Food Valley, with focus on developing a cluster of research, education and innovative business expertise in areas surrounding Wageningen UR (regional perspective) but also to link Wageningen UR with industries on a national level (national and network perspectives). An example is our participation in the Food Valley Knowledge Portal, for which students execute real-life projects for SMEs as part of the educational curriculum;
• Protecting intellectual property rights of research results so as to ensure commercial value; • Encouraging and supporting researchers who wish to start their own business, which Wageningen
UR would like to participate in (spin-offs). Wageningen UR’s entrepreneurial initiative, called ‘Start Life’, offers, inter alia, facilities and services for such entrepreneurs;
• Campus development: In 2010, Wageningen UR aimed to enhance its campus’ profile, taking steps to attract knowledge-intensive businesses to set up shop on campus, with such efforts culminating
Wageningen UR Annual Report 2011 | 13
in the establishment of the FrieslandCampina R & D lab in 2011. In addition, work continued on the development of Wageningen UR’s meeting place ‘Impulse’;
• Education, training and courses (etc) within the cooperative network of the Green Knowledge Cooperation (GKC) institutions. The joint programmes of the GKC bring professors and researchers together to exchange knowledge and jointly develop new teaching aids and materials. Connections to the labour market are being actively sought through these programmes.
The Wageningen Business School (WBS) imparts knowledge, skill and expertise related to Wageningen subjects within the framework of the institution’s “Lifelong Learning”. In 2011, WBS organized over 40 training courses, workshops and projects for government, businesses and institutions in which approximately 800 professionals participated. Issues included management and entrepreneurship, professional competence, green space, water environment, and plant and animal sciences. The Wageningen Business School experienced a growth spurt in 2011 thanks to the ‘in-company’ activities of, inter alia, engineering firms, provinces, banks and Wageningen UR and increasingly turned its efforts to lead the ‘from idea to development’ movement. The demand for knowledge from WBC remains strong and there is a growing need for intensive thematic Master’s courses. The 2011 economic crisis resulted in fewer participants, particularly from the public sector. The portfolio of actions was subsequently modified. WBS is working on strengthening cooperation efforts with other parties within the realm of Wageningen UR’s Lifelong Learning so as to reduce costs and improve access to Wageningen’s knowledge and expertise. At the Van Hall Larenstein University of Applied Sciences, the transition to Training and Consultancy in education is currently under way. The selection of projects and regions is now fully connected to the strategic decisions made in the training courses. International projects also have a greater connection to the structural grouping of the training courses offered by partner institutions abroad. Both collaborative and individual projects require relevant field experience. Thus, to make better use of its expertise, lying mainly in the development of curricula and teaching skills, the college is now more prepared to teach the skills demanded by the post graduate employment marketplace. These students form quicker field connections. Cooperation with industry, in both the partner states and in the Netherlands, has also been sought. This enables us to develop our own training courses, allowing students to realize the maximum benefit from their contacts in the field and in finding internships.
1.4.5 Student Recruitment
National Recruitment "Are you 100% sure of the courses you want to take?” is the central question behind the new student recruitment campaign. The reason for this question is that experience has taught us that students find it difficult deciding what programme is suitable and whether or not they will be able to find a good job afterwards. Training courses continue to be offered in, inter alia, economics, geography, animals, water, technology, nutrition, biology, which are enhanced by the corresponding training courses at both Wageningen University and the Van Hall Larenstein University of Applied Sciences. In addition to recruitment campaign issues, emphasis will also be placed on one-on-one student counselling. Current students have an important role to play in this endeavour; social media and university Websites will be used for peer-to-peer messaging. A key objective in 2011 was to improve the findability of the websites. The number of attendees at the University of Applied Sciences’ information seminars in 2011 was reasonably comparable to the number of 2010 attendees. The total number of Welcome Day attendees increased significantly in 2011. There was a marked increase (10%) in the number of visitors who attended the University’s Open House as well as an increased interest in individual information activities such as shadowing and student counselling.

14 | Wageningen UR Annual Report 2011
International Recruitment International recruitment was strengthened in 2011. Traditional recruitment methods were complemented by the use of social media. Online activities and communication targeted focus countries. Training, visits, seminars and ‘meet and greet’ sessions formed part of our ‘representative’ network to raise our profile in different countries. Results of this network initiative have been very positive (student intake having increased). The new joint recruitment campaign “Get the most out of...” will be launched in 2012. Intra-Europe Wageningen UR was active in Bulgaria, Romania and Germany with respect to both VHL and WU and promoted VHL in Poland and Hungary, and WU in Greece and Spain. Student intake from Romania and Bulgaria rose, meaning our cooperation efforts in those countries were successful. Poland is proving to be an interesting market for VHL, with the former’s interest in our ‘Book-a-meeting’ growing substantially. The University completed its initial reconnaissance expedition in Spain with a series of road shows and presentations at various universities and over the next year, we will be determining to what extent Spain may structurally become a target country. Germany has remained an important target country for both VHL and WU, forming a significant part of student intake in Bachelor’s programmes. Next year, we will examine the possibility of expanding our focus to increase German graduate student intake. VHL student recruitment in Bulgaria, Poland and Hungary was accompanied by KIGO projects (knowledge dissemination and innovations in ‘green’ education) and EU Tempus projects (Trans-European Mobility Scheme for University Studies). Dutch industries active in the region were wholeheartedly involved. Finally, reconnaissance expeditions were carried out in Turkey. Extra-Europe Geographic targets of the current Internationalization Policy Plan are, for Bachelor’s students, Asia and Eastern Europe and, for Master’s students, Asia and Africa. After expanding our efforts in Thailand and Vietnam (2010), research in 2011 was conducted into opportunities in India, Indonesia and South Korea. Collaborative projects between Dutch and local businesses were carried out in these regions. Focus shifted to international high schools and counsellors. In 2011, cooperation was furthered between VHL and WU with respect to international recruitment. Dutch Placement Days (informational meetings for prospective students at a central location in the region) were organized in Thailand and will, in 2012, take place in other countries. The stark decline of scholarships awarded to non-affluent students will be looked into as it has a negative impact on the number of applications, especially from African countries. However, a favourable occurrence is the increase in the number of self-paying students, meaning our efforts in targeting this group bore fruit, especially with respect to the number of students from China, which rose sharply.
1.4.6 Internationalization
We began evaluating our chosen priority countries in 2011. Priority countries are those that present scientific and/or commercial opportunities for Wageningen UR, but also those wherein Wageningen UR wishes to make a substantial contribution to sustainable development. In this regard, Wageningen UR’s policies are in line with those of the Ministries of Economic Affairs, Agriculture and Innovation and of Foreign Affairs. Wageningen UR’s strategy for cooperation with renowned international partners – both within and without the European Union – was further developed in 2011. This resulted in, inter alia, stronger ties in the United States (Cornell University and University of California, Davis) and New Zealand (Massey University). At UC Davis, this lead to the signing of a momentous cooperative agreement. The relationship with Massey University in New Zealand was extended. Massey and UC Davis are also partners in the Global Alliance for Food Security Research, a Wageningen UR initiative, which includes as partners Embrapa in Brazil, the Chinese Academy of Agricultural Sciences (CAAS) and INRA in
Wageningen UR Annual Report 2011 | 15
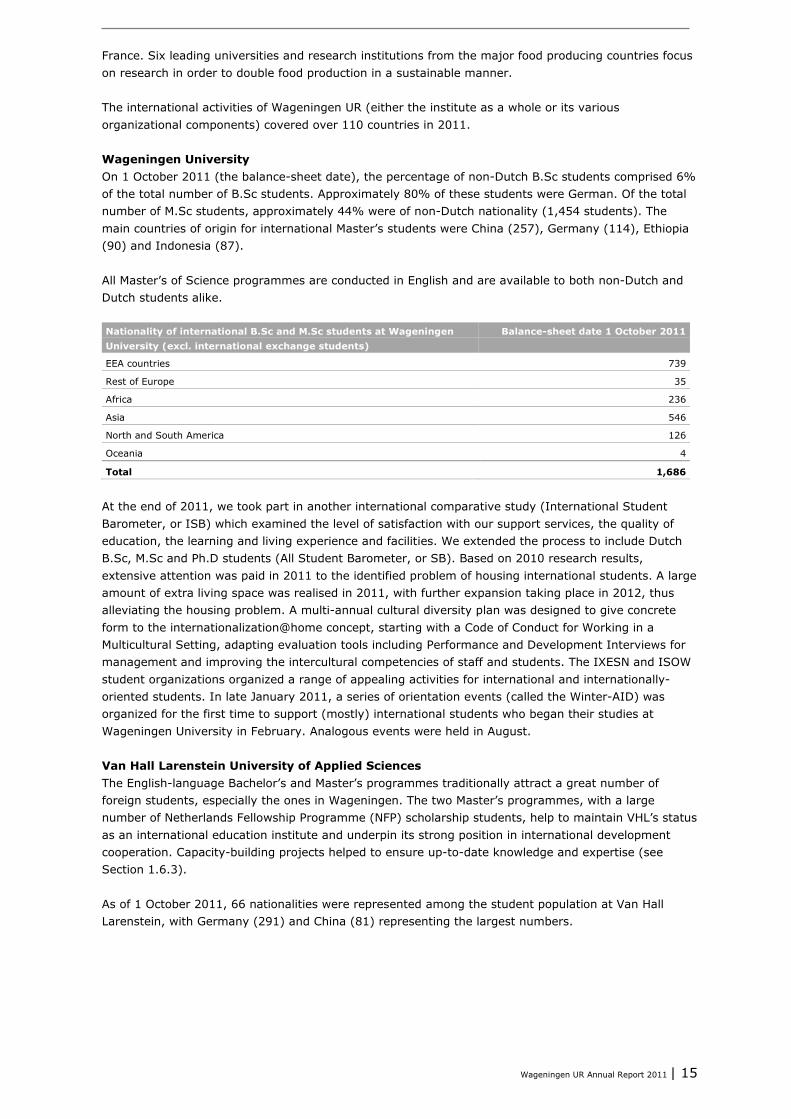
France. Six leading universities and research institutions from the major food producing countries focus on research in order to double food production in a sustainable manner. The international activities of Wageningen UR (either the institute as a whole or its various organizational components) covered over 110 countries in 2011. Wageningen University On 1 October 2011 (the balance-sheet date), the percentage of non-Dutch B.Sc students comprised 6% of the total number of B.Sc students. Approximately 80% of these students were German. Of the total number of M.Sc students, approximately 44% were of non-Dutch nationality (1,454 students). The main countries of origin for international Master’s students were China (257), Germany (114), Ethiopia (90) and Indonesia (87). All Master’s of Science programmes are conducted in English and are available to both non-Dutch and Dutch students alike. Nationality of international B.Sc and M.Sc students at Wageningen University (excl. international exchange students)
Balance-sheet date 1 October 2011
EEA countries 739
Rest of Europe 35
Africa 236
Asia 546
North and South America 126
Oceania 4
Total 1,686
At the end of 2011, we took part in another international comparative study (International Student Barometer, or ISB) which examined the level of satisfaction with our support services, the quality of education, the learning and living experience and facilities. We extended the process to include Dutch B.Sc, M.Sc and Ph.D students (All Student Barometer, or SB). Based on 2010 research results, extensive attention was paid in 2011 to the identified problem of housing international students. A large amount of extra living space was realised in 2011, with further expansion taking place in 2012, thus alleviating the housing problem. A multi-annual cultural diversity plan was designed to give concrete form to the internationalization@home concept, starting with a Code of Conduct for Working in a Multicultural Setting, adapting evaluation tools including Performance and Development Interviews for management and improving the intercultural competencies of staff and students. The IXESN and ISOW student organizations organized a range of appealing activities for international and internationally-oriented students. In late January 2011, a series of orientation events (called the Winter-AID) was organized for the first time to support (mostly) international students who began their studies at Wageningen University in February. Analogous events were held in August. Van Hall Larenstein University of Applied Sciences The English-language Bachelor’s and Master’s programmes traditionally attract a great number of foreign students, especially the ones in Wageningen. The two Master’s programmes, with a large number of Netherlands Fellowship Programme (NFP) scholarship students, help to maintain VHL’s status as an international education institute and underpin its strong position in international development cooperation. Capacity-building projects helped to ensure up-to-date knowledge and expertise (see Section 1.6.3). As of 1 October 2011, 66 nationalities were represented among the student population at Van Hall Larenstein, with Germany (291) and China (81) representing the largest numbers.

16 | Wageningen UR Annual Report 2011
Nationality of international students at VHL Univ. of Applied Sciences
Leeuwarden Campus
Velp/Wageningen Campus
VHL Total
Bachelor’s Bachelor’s Master’s
Europe 179 167 2 348
Africa 1 6 50 57
Asia 12 89 13 114
North and South America 3 6 2 11
Total 195 268 67 530
% relative to total number of students 13.0%
NB: Master’s student numbers have been included in this year’s table. In Appendix 1B and Section 1.3.2, Master’s student numbers were not taken into account as figures were similar to previous years’. Wageningen International Wageningen International provides coordinated support to the Science Groups and VHL in their international education and research activities so as to expand, and thus internationalize, Wageningen UR’s portfolio. Support was provided to international partners to connect them to appropriate research and education groups and to Wageningen researchers to unite them with the right international partners. At the end of 2011, there were three regional Wageningen UR offices in Brazil, China and Ethiopia. Centre for Development and Innovation (CDI) The CDI ties Wageningen UR’s capacity-building know-how, innovation and change processes for sustainable development. Promoting cooperation among citizens, governments, businesses, NGOs and the scientific community is crucial, as is developing new forms of learning. International activities Wageningen UR Wageningen UR is active in many regions in the world. In Africa, the focus was on Benin, Kenya, Mali, South Africa and, in particular, Ethiopia and Ghana. 2011 activities included, inter alia: • Strategic cooperation with the AGRA Foundation (Alliance for a Green Revolution in Africa),
AGRINATURA and RUFORUM (Regional Universities Forum for capacity-building in Eastern and Southern Africa);
• The Ethiopia-Wageningen UR Collaboration Programme with Science Groups PSG, SSG, ESG and ASG, Van Hall Larenstein, Wageningen UR Centre for Development and Innovation and Wageningen International (Wageningen UR) and the Ethiopian Institute of Agricultural Research (EIAR) and the universities of Addis Ababa, Haremaya, Hawassa, Jimma and Mekelle (Ethiopia);
• The AGRINATURA Risk Management in Smallholder Farming (ESG and LEI) project. In Asia, 2011 activities concentrated on China, India, Thailand and South Korea, with emphasis on joint research projects, including Ph.Ds and M.Sc programmes, financed mainly by Asian governments. Activities in 2011 included: • Opening of Sino-Europe Agricultural Development Centre (SEADC) in Zhangzhou (Fujian); • Start of collaboration with Beijing Municipal Agricultural Bureau; • Establishment of the NL Platform for the Development of Saemangeum lead by Wageningen UR,
Arcadis, Deltares and the Ministry of Economic Affairs, Agriculture and Innovation. In 2011, Wageningen UR consolidated its position in Europe with the help of European networks such as the Joint Programming Initiative (JPI) and the establishment of a Food Knowledge and Innovation Community (KIC). By the end of 2011, Wageningen UR was involved in 370 FP7 projects, 60 of those as coordinator. Other activities in Europe in 2011: • Established a FoodKIC lobby (FoodBEST) and became affiliate member of the Benelux FoodBest team; • National and EU consultations on HORIZON 2020 and the Strategic Innovation Agenda ; • Governing Board of JPI Food, Agriculture and Climate Change (FACCE), Work Package leader.
Wageningen UR Annual Report 2011 | 17
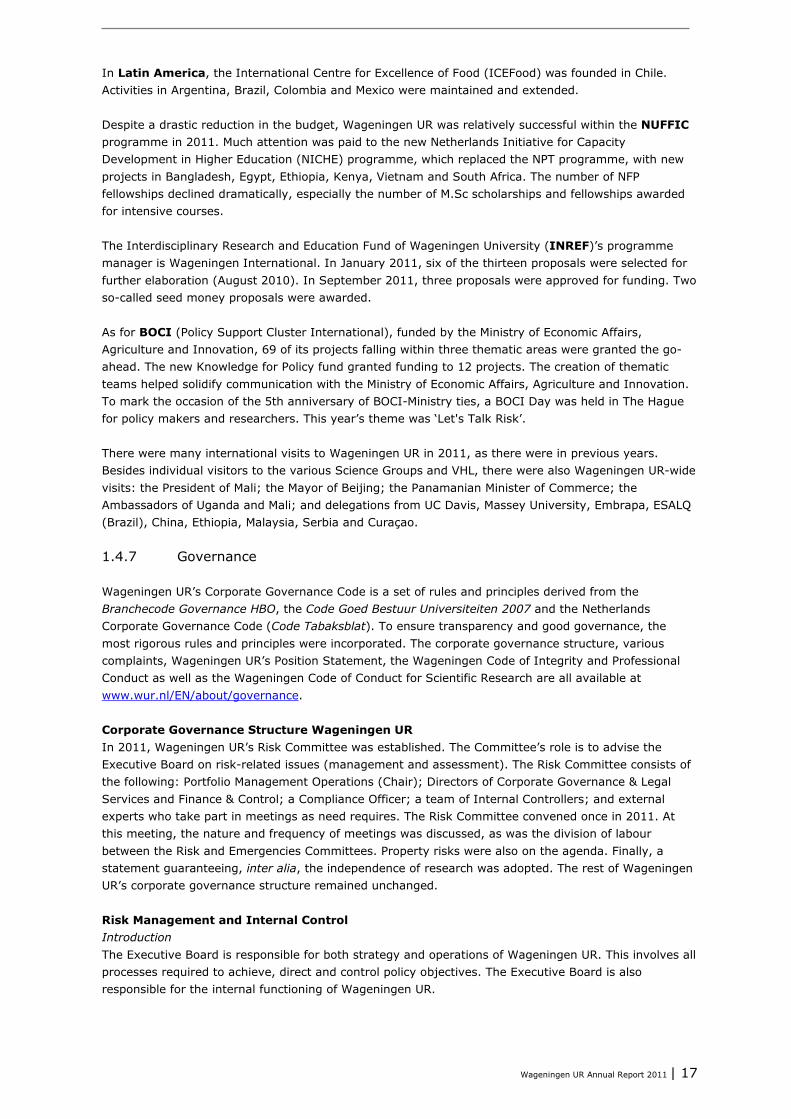
In Latin America, the International Centre for Excellence of Food (ICEFood) was founded in Chile. Activities in Argentina, Brazil, Colombia and Mexico were maintained and extended. Despite a drastic reduction in the budget, Wageningen UR was relatively successful within the NUFFIC programme in 2011. Much attention was paid to the new Netherlands Initiative for Capacity Development in Higher Education (NICHE) programme, which replaced the NPT programme, with new projects in Bangladesh, Egypt, Ethiopia, Kenya, Vietnam and South Africa. The number of NFP fellowships declined dramatically, especially the number of M.Sc scholarships and fellowships awarded for intensive courses. The Interdisciplinary Research and Education Fund of Wageningen University (INREF)’s programme manager is Wageningen International. In January 2011, six of the thirteen proposals were selected for further elaboration (August 2010). In September 2011, three proposals were approved for funding. Two so-called seed money proposals were awarded. As for BOCI (Policy Support Cluster International), funded by the Ministry of Economic Affairs, Agriculture and Innovation, 69 of its projects falling within three thematic areas were granted the go-ahead. The new Knowledge for Policy fund granted funding to 12 projects. The creation of thematic teams helped solidify communication with the Ministry of Economic Affairs, Agriculture and Innovation. To mark the occasion of the 5th anniversary of BOCI-Ministry ties, a BOCI Day was held in The Hague for policy makers and researchers. This year’s theme was ‘Let's Talk Risk’. There were many international visits to Wageningen UR in 2011, as there were in previous years. Besides individual visitors to the various Science Groups and VHL, there were also Wageningen UR-wide visits: the President of Mali; the Mayor of Beijing; the Panamanian Minister of Commerce; the Ambassadors of Uganda and Mali; and delegations from UC Davis, Massey University, Embrapa, ESALQ (Brazil), China, Ethiopia, Malaysia, Serbia and Curaçao.
1.4.7 Governance
Wageningen UR’s Corporate Governance Code is a set of rules and principles derived from the Branchecode Governance HBO, the Code Goed Bestuur Universiteiten 2007 and the Netherlands Corporate Governance Code (Code Tabaksblat). To ensure transparency and good governance, the most rigorous rules and principles were incorporated. The corporate governance structure, various complaints, Wageningen UR’s Position Statement, the Wageningen Code of Integrity and Professional Conduct as well as the Wageningen Code of Conduct for Scientific Research are all available at www.wur.nl/EN/about/governance. Corporate Governance Structure Wageningen UR In 2011, Wageningen UR’s Risk Committee was established. The Committee’s role is to advise the Executive Board on risk-related issues (management and assessment). The Risk Committee consists of the following: Portfolio Management Operations (Chair); Directors of Corporate Governance & Legal Services and Finance & Control; a Compliance Officer; a team of Internal Controllers; and external experts who take part in meetings as need requires. The Risk Committee convened once in 2011. At this meeting, the nature and frequency of meetings was discussed, as was the division of labour between the Risk and Emergencies Committees. Property risks were also on the agenda. Finally, a statement guaranteeing, inter alia, the independence of research was adopted. The rest of Wageningen UR’s corporate governance structure remained unchanged. Risk Management and Internal Control Introduction The Executive Board is responsible for both strategy and operations of Wageningen UR. This involves all processes required to achieve, direct and control policy objectives. The Executive Board is also responsible for the internal functioning of Wageningen UR.
18 | Wageningen UR Annual Report 2011
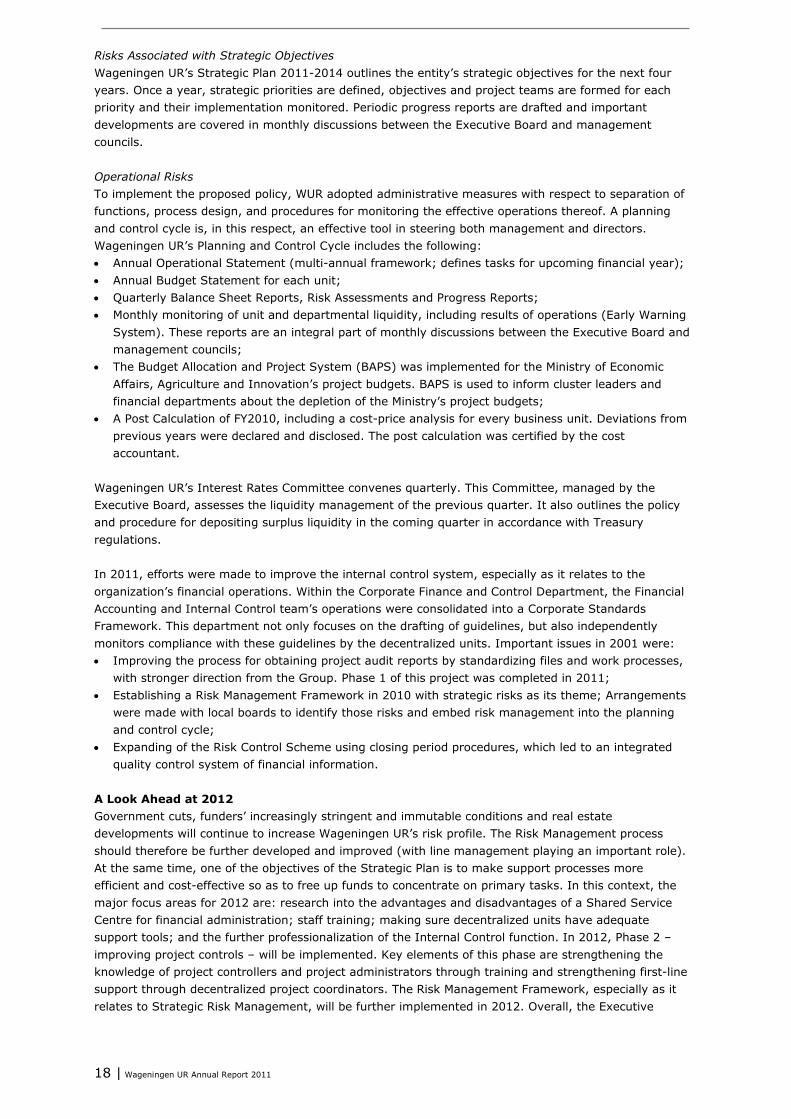
Risks Associated with Strategic Objectives Wageningen UR’s Strategic Plan 2011-2014 outlines the entity’s strategic objectives for the next four years. Once a year, strategic priorities are defined, objectives and project teams are formed for each priority and their implementation monitored. Periodic progress reports are drafted and important developments are covered in monthly discussions between the Executive Board and management councils. Operational Risks To implement the proposed policy, WUR adopted administrative measures with respect to separation of functions, process design, and procedures for monitoring the effective operations thereof. A planning and control cycle is, in this respect, an effective tool in steering both management and directors. Wageningen UR’s Planning and Control Cycle includes the following: • Annual Operational Statement (multi-annual framework; defines tasks for upcoming financial year); • Annual Budget Statement for each unit; • Quarterly Balance Sheet Reports, Risk Assessments and Progress Reports; • Monthly monitoring of unit and departmental liquidity, including results of operations (Early Warning
System). These reports are an integral part of monthly discussions between the Executive Board and management councils;
• The Budget Allocation and Project System (BAPS) was implemented for the Ministry of Economic Affairs, Agriculture and Innovation’s project budgets. BAPS is used to inform cluster leaders and financial departments about the depletion of the Ministry’s project budgets;
• A Post Calculation of FY2010, including a cost-price analysis for every business unit. Deviations from previous years were declared and disclosed. The post calculation was certified by the cost accountant.
Wageningen UR’s Interest Rates Committee convenes quarterly. This Committee, managed by the Executive Board, assesses the liquidity management of the previous quarter. It also outlines the policy and procedure for depositing surplus liquidity in the coming quarter in accordance with Treasury regulations. In 2011, efforts were made to improve the internal control system, especially as it relates to the organization’s financial operations. Within the Corporate Finance and Control Department, the Financial Accounting and Internal Control team’s operations were consolidated into a Corporate Standards Framework. This department not only focuses on the drafting of guidelines, but also independently monitors compliance with these guidelines by the decentralized units. Important issues in 2001 were: • Improving the process for obtaining project audit reports by standardizing files and work processes,
with stronger direction from the Group. Phase 1 of this project was completed in 2011; • Establishing a Risk Management Framework in 2010 with strategic risks as its theme; Arrangements
were made with local boards to identify those risks and embed risk management into the planning and control cycle;
• Expanding of the Risk Control Scheme using closing period procedures, which led to an integrated quality control system of financial information.
A Look Ahead at 2012 Government cuts, funders’ increasingly stringent and immutable conditions and real estate developments will continue to increase Wageningen UR’s risk profile. The Risk Management process should therefore be further developed and improved (with line management playing an important role). At the same time, one of the objectives of the Strategic Plan is to make support processes more efficient and cost-effective so as to free up funds to concentrate on primary tasks. In this context, the major focus areas for 2012 are: research into the advantages and disadvantages of a Shared Service Centre for financial administration; staff training; making sure decentralized units have adequate support tools; and the further professionalization of the Internal Control function. In 2012, Phase 2 – improving project controls – will be implemented. Key elements of this phase are strengthening the knowledge of project controllers and project administrators through training and strengthening first-line support through decentralized project coordinators. The Risk Management Framework, especially as it relates to Strategic Risk Management, will be further implemented in 2012. Overall, the Executive
Wageningen UR Annual Report 2011 | 19
Board is of the view that the internal control procedure of Wageningen UR’s internal risk management and control system is effective and efficient.
1.4.8 Participation Structure
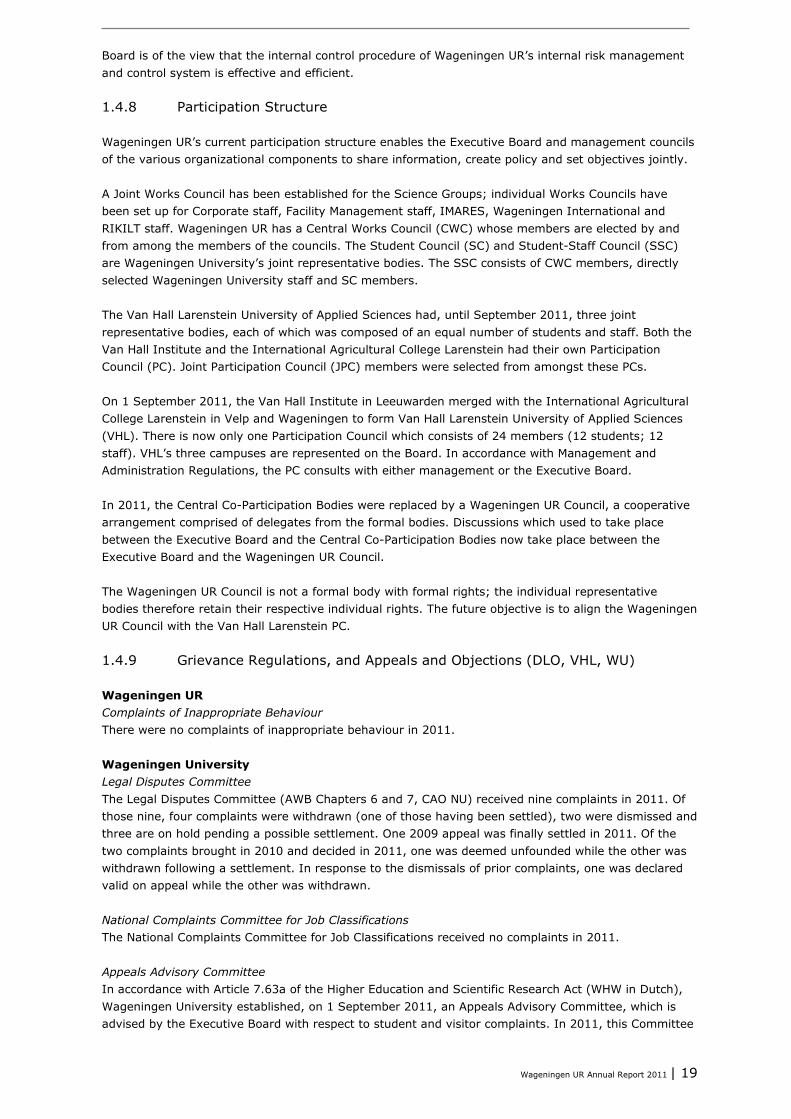
Wageningen UR’s current participation structure enables the Executive Board and management councils of the various organizational components to share information, create policy and set objectives jointly. A Joint Works Council has been established for the Science Groups; individual Works Councils have been set up for Corporate staff, Facility Management staff, IMARES, Wageningen International and RIKILT staff. Wageningen UR has a Central Works Council (CWC) whose members are elected by and from among the members of the councils. The Student Council (SC) and Student-Staff Council (SSC) are Wageningen University’s joint representative bodies. The SSC consists of CWC members, directly selected Wageningen University staff and SC members. The Van Hall Larenstein University of Applied Sciences had, until September 2011, three joint representative bodies, each of which was composed of an equal number of students and staff. Both the Van Hall Institute and the International Agricultural College Larenstein had their own Participation Council (PC). Joint Participation Council (JPC) members were selected from amongst these PCs. On 1 September 2011, the Van Hall Institute in Leeuwarden merged with the International Agricultural College Larenstein in Velp and Wageningen to form Van Hall Larenstein University of Applied Sciences (VHL). There is now only one Participation Council which consists of 24 members (12 students; 12 staff). VHL’s three campuses are represented on the Board. In accordance with Management and Administration Regulations, the PC consults with either management or the Executive Board. In 2011, the Central Co-Participation Bodies were replaced by a Wageningen UR Council, a cooperative arrangement comprised of delegates from the formal bodies. Discussions which used to take place between the Executive Board and the Central Co-Participation Bodies now take place between the Executive Board and the Wageningen UR Council. The Wageningen UR Council is not a formal body with formal rights; the individual representative bodies therefore retain their respective individual rights. The future objective is to align the Wageningen UR Council with the Van Hall Larenstein PC.
1.4.9 Grievance Regulations, and Appeals and Objections (DLO, VHL, WU)
Wageningen UR Complaints of Inappropriate Behaviour There were no complaints of inappropriate behaviour in 2011. Wageningen University Legal Disputes Committee The Legal Disputes Committee (AWB Chapters 6 and 7, CAO NU) received nine complaints in 2011. Of those nine, four complaints were withdrawn (one of those having been settled), two were dismissed and three are on hold pending a possible settlement. One 2009 appeal was finally settled in 2011. Of the two complaints brought in 2010 and decided in 2011, one was deemed unfounded while the other was withdrawn following a settlement. In response to the dismissals of prior complaints, one was declared valid on appeal while the other was withdrawn. National Complaints Committee for Job Classifications The National Complaints Committee for Job Classifications received no complaints in 2011. Appeals Advisory Committee In accordance with Article 7.63a of the Higher Education and Scientific Research Act (WHW in Dutch), Wageningen University established, on 1 September 2011, an Appeals Advisory Committee, which is advised by the Executive Board with respect to student and visitor complaints. In 2011, this Committee
20 | Wageningen UR Annual Report 2011
received six appeals and two comments that were not appeals within the meaning of the General Statute on Administrative Law. Both comments were forwarded to the Student Service Centre, one as a petition, the other for purposes of informing. Of the six appeals, three related to provisions of the Student Financial Support Regulations, two to Wageningen University Student Finance Regulations and one to restitution of fees. Four of the complaints were accepted by the Executive Board and the Appeals Advisory Committee issued no opinion. The Committee advised the Board to dismiss the two other complaints as unfounded. Examinations Appeals Board Six appeals were filed with the Examinations Appeals Board (EAB) in 2011. One appeal, having to do with a particular assessment, was dismissed as it was not brought within the appeals period. The five other appeals had to do with decisions not to allow the student into a M.Sc programme. In two cases, the appellants, after reviewing the EAB’s findings upholding the Admissions Committee’s rejections, accepted the Board’s decisions. One appeal was amicably settled so the EAB did not consider the substantive details of the appeal. Two appeals were dismissed by the EAB after arguments were heard. DLO Research Foundation Grievance Committee for Individual Grievances The Grievance Committee for Individual Grievances handled nine grievances in 2011: one was declared founded; two unfounded; four were withdrawn (one of which due to settlement); and two are still pending. DLO Complaints Committee for Job Classifications The DLO Complaints Committee for Job Classifications did not handle any complaints in 2011. Van Hall Larenstein University of Applied Sciences Van Hall Larenstein University of Applied Sciences has various regulations concerning objections, appeals and complaints from staff and students. Office of the Ombudsman Staff or students (individually or in groups) who feel disadvantaged by an act or omission of an officer or the institution may contact the Office of the Ombudsman. The Ombudsman may refer, advise, mediate or conduct a formal investigation. The Ombudsman drafts its own annual report containing information on the number of complaints received from students or staff, which, in 2011, was 27. Of these 27, 19 were brought by students, eight by staff. All complaints were solved through counselling, mediation or arbitration. Some complaints involved a long process while others were dealt with in one or two meetings. No official complaints report was released in 2011. Examinations Appeals Board Students may appeal a decision of the Examinations Board. In 2011, the Examinations Appeals Board received a total of 41 appeals, 38 of which were based on binding negative recommendations. All appeals were first submitted to the examination boards to determine whether an amicable settlement could be reached. Twenty cases were declared founded and therefore withdrawn. Two cases were withdrawn by the students themselves. The remaining 19 decisions were heard on appeal, 10 of those were upheld and nine declared unfounded. Appeals Board for VHL Students/Advisory Review Board The Appeals Board for VHL students received one petition in 2011. This appeal involved a decision to reject financial aid. The Board recommended the decision be upheld. Appeals Board HBO The Appeals Board HBO is an external body that adjudicates on matters brought by a student or staff member that first go through the administrative process. No cases were filed.
Wageningen UR Annual Report 2011 | 21
Reconsideration Committee An employee can request Administration, which acts on behalf of the Executive Board, to reconsider certain decisions. Before reconsidering its decision, the Board must first seek and obtain advice from the Reconsideration Committee. One reconsideration was requested in 2011, which the Board, on the advice of the Committee, upheld in part and declared unfounded in part. Objection Review Committee Any staff member dissatisfied with an assessment or lack thereof may file an objection with the Objection Review Committee. Two such objections were filed in 2011, one of which was upheld, the other declared unfounded. Objection Committee FUWA-HBO Any staff member objecting to a Board’s work evaluation may file an objection with the Objection Committee FUWA-HBO. No such objections were filed in 2011. Other No labour-related actions were filed in 2011.
1.4.10 Sustainability
Wageningen UR is an important pillar of sustainability in the primary process of research and education. This is reflected in the University’s Mission Statement: “To explore the potential of nature and improve the quality of life”. In addition to the primary process, sustainability has also been given a clear place in the manner in which Wageningen UR’s business is conducted. For a few years, ideas, innovations and input surrounding Corporate Social Responsibility (CSR) have been coordinated on a staff-, student- and organizational unit-level. Sustainability has therefore been incorporated into the Wageningen UR Strategic Plan 2011-2014. With respect to sustainability, Wageningen UR is very much in line with the needs of its stakeholders. The stakeholders jointly considered the level of Wageningen UR’s sustainability ambition. The idea was to strike a balance in the complex link between the current social, environmental and economic needs without jeopardizing future needs. Wageningen UR’s level of ambition has been described in terms of trend-setting (‘Voorlopen’ in Dutch). This means that Wageningen UR both embraces and promotes sustainability, including in decision-making. The level of our ambition requires the practice and implementation of ‘proven technologies’. Our sustainability ambition has been translated into targets and objectives, which have themselves been enshrined in our ‘Express Lane to a Sustainable Business’ plan. This plan outlines what is required to realize and maintain our sustainability ambition level, both in the short- and long-term. In the short-term, our aim is to achieve over 50 concrete actions in the following areas: Energy and Buildings; Acquisitions; Mobility; Catering; Waste; Education and Research; and Sustainable Employment. In the long-term, emphasis will be placed on securing these actions by transforming the organization and the attitude of both students and staff, as well as the process required to do so. This plan has been included in our multi-year environmental plan (see www.wur.nl). Anyone who works or studies at Wageningen UR is responsible for implementing sustainability across Wageningen UR. Overall responsibility lies with the Executive Board member who is Head of Portfolio Management. The various actions are performed by different groups within Wageningen UR. The Task Force, comprised of a sustainable policy-making staff member, one student and a small group of actors who reflect the organization’s ideals, has a support function and reports to the Steering Committee. The Steering Committee, comprised of Wageningen UR Directors, is then responsible to the Executive Board and Board of Directors. In 2011, Wageningen UR’s sustainability policy was characterized by action. The following concrete actions relating to sustainability were implemented: • A Wageningen campus Sustainability Vision Plan lasting until 2020;
22 | Wageningen UR Annual Report 2011
• A feasibility study of the use and handling (composting) of biodegradable cups on Wageningen campus;
• The Support Services Department worked according to the principle ‘Het nieuwe werken’ (new works) in the Actio building;
• The systematic adaptation of the Energy Management Control System to meet the tailored needs of the different organizational units. Each organizational unit is therefore aware of its energy consumption. This resulted in a reduction in costs and a reduction of waste in energy;
• A CO2 offsetting/compensation funds programme for Wageningen UR was explored; • Wageningen UR now has a Sustainability Advisory Board/Staff Panel; • Initial steps were taken to promote education and research in and operations of a Wageningen
Green Learning Centre/Green Office, in collaboration with researchers and students; • The incorporation of environmental results that were achieved into the Annual Environmental Report
2011 (see www.wur.nl). This Annual Environmental Report includes details on figures/statistics/KPIs for (the processing of) waste, energy consumption and generation, water consumption and hazardous substances.
The following sustainable supply chain results were achieved: • Reliable chain management that meets the sustainability requirements and needs of upstream
suppliers and the monitoring of sustainability and CSR KPIs of various contracts; • KPMG was commissioned by the Ministry of Infrastructure and the Environment to conduct an
evaluation of sustainable acquisitions for 2010; in early 2012, a sustainability scan was carried out for 2011. Both the evaluation and sustainability scan were conducted in accordance with sustainability criteria and product quality criteria as prepared by Agentschap NL and adopted by the Ministry of Infrastructure and the Environment. The percentage of sustainable acquisitions was calculated to be 71%. The sustainability scan results of the procurement project was 100% at the end of 2011. Both results are well above the 2012 national level of ambition;
• Total electrical energy consumption of 70 million KWh was fully sustainable. Not only does Wageningen UR generate its own energy with its wind farm in Lelystad, it also buys nothing but wind power (100%);
• Wageningen UR worked on its paperless tendering processes and putting internal and external orders through this system;
• The implementation of supply chain efficiency and renewable energy measures such as the solar meadow, the centre for sustainable business (ACCRESS in Lelystad) and natural cool-heating power (CHP) (inter alia, the Nij Bosma Zathe test farm in Goutum);
• Drafting a Thermal Storage Plan to gradually implement thermal storage mechanisms across the Wageningen campus;
• Establishing a model to measure our carbon footprint; • Engineering firm DHV calculated Wageningen UR’s carbon footprint in accordance with the guidelines
of the Greenhouse Gas Protocol (GHG Protocol). The carbon footprint approach includes cooling agent leakages, dangerous gas emissions (both direct and indirect) and livestock and land use. The carbon footprint allowed Wageningen UR to become aware of its CO2 emissions and what it can do to reduce them;
• Establishing a carbon offset programme; • In addition to reducing its own CO2 emissions, Wageningen UR also contributes to the overall
reduction of carbon emissions through the wind farm in Lelystad, waste separation and the use of natural CHP to deliver green gas to residential areas. These carbon compensation measures have allowed Wageningen UR to become aware of how and to what extent it can compensate for its carbon emissions.
The Task Force aimed to communicate openly on sustainability issues. This was achieved by: • Publishing policy documents, objectives which Wageningen UR must fulfill pursuant to various
covenants (e.g., environmental energy term agreements), figures/statistics, supplier information, KPIs, and any progress made on the intranet;
• Promoting sustainability through messaging and polling on the intranet with respect to developments both within and without Wageningen UR. Staff and students are thus triggered to think about sustainability and principles that define sustainability and “act” upon them;
Wageningen UR Annual Report 2011 | 23
• Raising awareness of National Sustainability Day by organizing a week of sustainability events consisting of ‘green’ catering, a lower house debate, lectures, theatre, news reports and films across the various Wageningen UR campuses.
The Task Force achieved responsibility and commitment throughout the organization by: • Regularly aligning expectations, developments within the sector and supply chain, the strategy,
policy, implementation and results with the Board of Directors, business executives, facility managers, and participation and quality assurance and safety and environment personnel;
• Providing all staff and students the opportunity to contribute to the harmonization of sustainability criteria and processes with the Sustainable Policy Officer (central point of contact), members of the Task Force, members of the Steering Committee, and through the sustainability e-mail list;
• Publishing results in the Task Force Sustainability Evaluation of September 2010-2011. These results have been included in the Annual Environmental Plan 2011 and are accessible both on the intra- and internet (www.wur.nl);
• Completing the advice route (Task Force-Steering Committee- Facility Management consultants- Business Consulting Directors-Executive Board-Board of Directors-Participation) in the 2010-2011 Task Force Evaluation. This Evaluation was made transparent through publication on the intranet;
• Bi-annual communication between the Steering Committee and the Task Force so the former can monitor the latter’s progress and align this progress with developments both within and without Wageningen UR. The Chair of the Steering Committee then communicates and coordinates with the Chairman of the Executive Board.
Despite the progress, Wageningen UR still has a way to go. Achieving a sustainable business requires continuous improvement of processes, balancing the needs of staff, students and the organization and the consideration and making of more sustainable choices by and for staff, students and the organization. In cooperation with its partners, Wageningen UR’s objective is to continuously act on its pioneering ambition so as to ensure its contribution to sustainability.
1.5 Wageningen University Wageningen University offers Bachelor’s and Master’s degrees as well as Ph.D programmes and conducts fundamental research in Life Sciences and Natural Resources. The research is carried out at graduate schools. Lecturers participate in both research and education at the university and work extensively with partner institutes both within and without the Netherlands. Following years of growth, Wageningen University experienced a slight decrease in interest in 2011, as compared with 2010 results. Enrolment in B.Sc courses declined by 4% while Master’s intake decreased by 1%. While international Master’s student intake decreased by 5% and HBO students by 2%, local student intake increased by 3% and intake of students with Bachelor’s degrees from other Dutch universities rose 22% (100 in 2011). Wageningen University was voted best university in the Netherlands in 2011, for the seventh time in a row. In 2010, it tied Open University for first place. According to the Higher Education Information Centre, publisher of the 2012 Complete Guide to Full-time Universities, “Wageningen stands above and beyond all competitors”. In 2011, Professor Ton Bisseling received an Advanced Grant of € 2.5 million from the European Research Council (ERC) for his research entitled ‘Parasponia to Crack Evolution of Rhizobium Symbiosis’. Doctor Dolf Weijers received an ERC Starting Grant of € 1.5 million to study plant stem cells. Professor Erwin Bulte received a € 1.5 million Vici Grant from NWO for research into effective methods of agricultural development in Africa, particularly in conflict-affected countries. In 2011, the Wageningen University Foundation (WUF) Teacher of the Year Award was awarded to Gert Peek, lecturer in Soil Sciences.
24 | Wageningen UR Annual Report 2011
The 2011 Diës Natalis (Foundation Day), entitled ‘Food for Health’, had as speakers Dr Willem de Vos, Professor of Microbiology at Wageningen University, Dr Louise Gunning-Schepers, President of the Health Council of The Netherlands and Dr Martin Kropff, Rector of Wageningen University. The opening of academic year 2011-2012 was given the slogan ‘The Golden Triangle’. Speakers included Dr Aalt Dijkhuizen, Chairman of the Wageningen UR Executive Board, Dr Maxime Verhagen, Minister of Economic Affairs, Agriculture and Innovation, Mr Bernard Wientjes, Chairman of the VNO-NCW, Prof Ruud Huirne, General Director of the Social Sciences Group at Wageningen UR.
1.5.1 Students and Education
1.5.1.1 Education and Training In 2010-2011, more than 6,500 students were enrolled in 19 Dutch Bachelor’s programmes and 29 English-language Master’s in Life Sciences, Social Sciences and Environmental Sciences (see Appendix 1A, Table 1). Wageningen University incorporates a multi-disciplinary approach to teaching and is highly international in character, as evidenced by its curriculum and the composition of the student body. Approximately 45% of M.Sc students come from abroad. Academic year 2010-2011 was the first year Wageningen University offered majors and minors in its Bachelor’s programmes. Among other things, this means students are now able to reserve their electives and take a semester abroad or at another university in the Netherlands. Students may also opt to minor in one of the university’s 50 minors programmes, or co-enrol at another institution. Despite government measures aimed at reducing the number of ‘langstudeerders’ (students who take too long to complete their studies), 2011 had a strong beginning. Professors marched through The Hague in quiet protest of these measures, whilst students demonstrated on Malieveld. The increased tuition fees were introduced in academic year 2011-2012; however, the base rate and premium rate remained the same. Political discourse continues. A working group examined the length of Master’s programmes in Social Sciences. Though the programmes last two years, the government only provides funding for one year of study. The working group recommended that the length should remain at two years, which is in line with university policy as these programmes are an important part of the university. Nevertheless, the so-called ‘Halbe Tax’, changes in student financing and the potential of further government measures may lead the university to proceed differently. The redesign of the Earth and Environment Master’s programme was completed in 2011. It is, in a sense, a formal continuation of the Soil Sciences Master’s but with a more integrated approach and encompassing both atmosphere and water components. The change responds to the professional needs of students with outstanding scientific knowledge in a particular field who wish to complement this knowledge with a broader-ranging view and more practical skills in earth sciences. Attempts to develop a new Health and Society Master’s programme failed due to government unwillingness to assess it as ‘sufficiently useful’. 1.5.1.2 Internal and External Quality Assurance Internal Quality Assurance Results of the annual first-year B.Sc student evaluation were very positive: Education scored an average of 3.9 on a scale of 1 to 5; 97% of first-years would recommend Wageningen University to secondary school students. Evaluations by Bachelor’s and Master’s graduates were also very positive: 79% of B.Sc graduates would choose the same course of study if given the choice again; 80% of M.Sc graduates would recommend potential students to follow a Master’s in Wageningen. Electronic survey results were, in general, “fair to good”. The results seemed to decrease slightly with respect to compatibility issues with new browsers. Preparations were made to improve the performance of evaluation software. The evaluations produced adequate, timely feedback for programme directors, professors and chair holders.
Wageningen UR Annual Report 2011 | 25
External Quality Assurance In 2011, the Health and Society Bachelor’s programme, the Biology Bachelor’s programme and the Biology Master’s programme received accreditation from the Dutch-Flemish Accreditation Organization (NVAO). In addition, in the context of accreditation (2012), key quality assurance criteria and reduced education assessments of 13 Bachelor's and 22 Master’s programmes were prepared. The preparation consisted of 36 critical reflections and 18 site visits by review panels in the first few months of 2012. 1.5.1.3 Internal and External Quality Assurance Student Services Centre The Student Services Centre (SSC) is a convenient point of contact to help students access services, information and advice. The SSC comprises the following: • Student Administration (admissions, enrolment, registration, graduation); • International Office (international student reception and administrative assistance); • Student Counselling (student counselling and welfare services). For the eleventh year in a row, the popular Info-Point was set up in the summer of 2011. Graduating international students help incoming international students learn about and understand Wageningen. Staff are also on hand to support international exchange students (including Erasmus students). The number of Master’s programme applicants increased to approximately 7,500 in 2011. In 2011, significant attention was paid to a number of IT projects, which are essential to the efficient and effective carrying out of student services: • Improving the content and accessibility of the Question and Answer application; • Converting current students to Studielink; • Processing (re-)registrations through the newest version of Dashboard; • Preparing a joint new Student Information System (SIS) for both WU and VHL; • Contributing to Internet and MyPortal projects; • Project ‘Guarantee International Students a Room’: 465 additional rooms, realized under the
direction of the SSC but administered on a day-to-day basis by iNFacilites, an external facility service company that was contracted to provide international student housing.
1.5.1.4 Student Progress and Success (Graduation Efficiency) Master’s student success and progress details for 2007-2009 and Bachelor’s student success and progress details for 2005-2007 are outlined in Tables 6 and 7 (Appendix 1A). While Master’s graduation efficiencies remained high (60% after two years; 90% after three years), Bachelor’s graduation efficiencies fell short of targets. Bachelor’s graduation efficiencies in the four years time-to-degree category improved significantly in recent years: from 50% for cohort 2005 to 62% for cohort 2007. The target agreed to by the Vereniging van Nederlandse Universiteiten (VSNU) or the Association of Dutch Universities and the Ministry of Education, Culture and Science is the target being used by Wageningen University in its Strategic Plan. The objective is to achieve a graduation efficiency of 70% in the four years time-to-degree category for Bachelor’s students re-enrolling in a second year of study at the same institution. Bachelor’s graduation efficiencies are expected to increase further in the coming years, in part due to the ‘hard cut-off’ (hard knip) requirement that students may begin a Master’s programme only once they have completed the stipulated Bachelor’s. 1.5.1.5 Student Facilities (Support, Services and Amenities) Studying at Wageningen University consists of the actual teaching, with finals and mid-terms, and students have access to the university’s facilities and collections. Student counselling services and academic tutoring are also provided. There is a wide range of student and other organizations that enrich the university experience by getting students involved with their campus and community. These include, but are not limited to, social clubs, sports clubs, theatre groups, a choir and orchestra, a politics club and student unions. Wageningen University is committed to building a thriving learning environment and therefore actively supports these organizations.
26 | Wageningen UR Annual Report 2011
Academic Tutoring The increased number of students once again resulted in an expansion of academic tutoring services in 2011, although the approach was somewhat altered, with greater emphasis now being laid on plans of action. In part, this was due to internal reasons: the introduction of the major-minor structure, as a result of which students now need to make choices earlier in their course of study. However, external reasons also played a role: the introduction of the ‘hard cut-off’ requirement that students may begin a Master’s only once they have completed the stipulated Bachelor’s. The ‘long-term student’ legislation will mean that we will have to once again visit our approach to academic tutoring and further tailor it to meet student needs. Although pressure to graduate within a stipulated amount of time is rapidly increasing, both the university and its students stress the importance of remaining active during the latter’s studies. With the introduction of the major-minor system, a correlated interest in studying abroad has increased for Wageningen undergraduate students. Academic tutors have played a significant role in helping students plan their ‘study abroad’ time and Erasmus coordinators provided specific support in the organizing of study trips abroad. Student Counselling In 2011, Student Counselling Services consisted of four student deans (3.3 FTE), three student psychologists (1.7 FTE) and one student doctor (1.0 FTE, until 1 April 1 2011). A VHL counsellor as well as an external psychologist were contracted to assist with various tasks. Student Deans In 2011, a total of 1,500 discussions with 1,120 students took place, a slight increase compared to 2010 numbers, corresponding to the increase in student numbers. Student dean teams are now no longer divided between Dutch and international students; all students are now free to speak with any student dean. Appointments were made with respect to, inter alia, students with disabilities, WHW policy issues, NUFFIC/IND issues and a variety of other topics. In 2011, four study-skills courses were organized and administered by the student deans. In addition, pilot training-skills courses in professionalism were prepared in collaboration with the Circle of Student Counsellors. The first course offered international students returning home skills in coping with ‘reverse culture shock’. Student Psychologists In 2011, 496 students sought the services of a student psychologist. While this represents a slight increase compared to 2010 numbers, the total number of actual visits/meetings dropped slightly. Slightly less than half the cases were study-related while the others had to do with personal problems. Two courses on how to deal with anxiety and four courses on the pace of study and/or impending graduation were offered in 2011. Student Doctor In 2011, the privatization of the student doctor service and vaccination centre was completed. On 1 January, the Wageningen University vaccination centre passed into commercial hands and on 1 May 2011, the student doctor services were handled by General Practitioners Van der Duin & Van Dinther in Wageningen. This practice is specifically designed for students and provides the university a one-day a week student service. Other Facilities Students seeking accommodation may rent a room or apartment through the private market, the Wageningen Student Organization room rental service or the Idealis housing organization. Idealis rents out approximately 4,500 rooms in fourteen complexes at various locations in Wageningen. In 2011, Wageningen UR was able to accommodate international students in nearly 1,200 Idealis rooms and over 250 private units built in late 2009. Also in 2011, 465 additional temporary rooms for international students became available. Despite the growth in the number of rooms, ‘overflow relief’ issues had yet
Wageningen UR Annual Report 2011 | 27
to be resolved, so housing was provided in three holiday resorts in Veluwe and in temporary accommodations across Wageningen. This ‘overflow relief’ came to an end at the beginning of November. The De Bongerd Sports Centre (SCB) is a multi-functional sports centre with extensive indoor and outdoor facilities. In 2011, the sports centre was expanded to include more fitness facilities, a dance studio, a studio for ‘spinning’ and 56 different classes – from Athletics to Zumba. In addition, more than 25 successful sporting events were organized by the Wageningen University Thymos Sports Foundation (SWU Thymos), which promotes sports and physical activity, interest in sports in general and in the 20 student sports clubs in particular. In 2011, the student sport associations grew, with rowing club Argo representing the largest at 380 members. 1.5.1.6 Financial Support (Art. 7.51 of the WHW) Wageningen University provides financial support to students through a variety of schemes: 1. FOS scheme (Financial Support for Students that provides funding in cases where studies are
delayed as a result of circumstances beyond the student’s control, such as force majeure, athletics or approved administrative activities);
2. WU funding for students following a two-year Master’s course in Applied Communications Science, International Development, Management, Economics and Consumer Studies or Development and Rural Innovation. This funding is for students entitled to Dutch student funding;
3. Wageningen University Fellowship Programme, scholarships/grants/tuition waivers for non-EEA students;
4. Emergency Student Funding. Fifteen non-EEA students took advantage of FOS funding, half of which were funded for approved administrative activities (such as Student Council membership, study groups or student associations such as fraternities), the other half of which were funded due to force majeure. No non-EEA student used WU funding. This, of course, is due to the requirement that the student receiving funding must be entitled to Dutch funding. Only under very special circumstances is a non-EEA student entitled to receive WU funding (e.g., refugees). As for the Wageningen University Fellowship Programme, only non-EEA students are eligible. In 2011, 28 full tuition scholarships were awarded to students demonstrating outstanding academic abilities, and 150 to 175 tuition fee waivers due to institutional cooperative programmes or agreements with donors. Seven non-EEA students availed themselves of Emergency Funding and received a one-time grant due to unforeseen circumstances and costs not attributable to the student him- or herself. 1.5.1.7 International Academic Exchanges and Mobility Erasmus Mundus is an important programme that contributed to Wageningen University’s international cooperation capacity and provided scholarships for students following joint M.Sc or Ph.D programmes. In 2011, an Advisory Board was established to review and evaluate the quality of submitted proposals. In 2011, two proposals for joint Master’s programmes were submitted. Of the two, the Joint Master’s in Sustainable Animal Nutrition and Feed (SANF) was approved. The application to renew the Animal Husbandry and Genetics programme was not approved, despite its ‘excellent’ rating. Due to the limited number of available grants and the significant total number of applications, not a single one of Wageningen University’s seven joint doctoral programmes was approved. The university currently participates in five joint Master’s programmes and two joint Ph.Ds. An institutional partnership programme proposal to work with universities in a number of Central Asian Republics was approved. Wageningen University currently participates in three Erasmus Mundus partnership programmes. In 2011, the balance between the number of incoming and outgoing students proved once more to be a cause for concern. Only bilateral university exchange agreements seem to be of any interest to
28 | Wageningen UR Annual Report 2011
outgoing students. Aside from the United States and Canada, opportunities outside the European Union now include Massey University in New Zealand, Stellenbosch University in South Africa and Universidad de Chile in Chile. During the annual ‘study abroad’ fair, international exchange students promoted their ‘home’ university as a ‘study abroad’ option and Erasmus Coordinators participated in ‘minor markets’, the orientation (AID) information market and one-on-one consultation sessions. The number of outgoing students increased from 189 in academic year 2010-2011 to 226 in academic year 2011-2012 (balance sheet date: 1 March 2012). The number of incoming students increased slightly from 321 in academic year 2010-2011 to 364 in academic year 2011-2012. There was also an increase in the intake of SKILL students for which VU cooperates. The number of incoming students remained relatively stable. The student support network was further developed with the help of the International Exchange Erasmus Student Network (IxESN). The buddy system changed from one-to-one consultations to group support. Student arrival proceeded smoothly; students were very pleased with the personal guidance they received from Erasmus Coordinators and very satisfied with the form and content of the range of courses offered and increasingly transferred to regular Wageningen University study programmes. Housing shortages, however, continued to cause problems, thereby threatening student choice to study at Wageningen. This mainly concerns American exchange students, rendering the number of available spots in the U.S. for outgoing WU students limited. Wageningen UR’s international character is reflected in part by its diverse student and staff population. The percentage of non-Dutch nationals employed at Wageningen UR was, in 2011, 11.7%. Eighty-seven different countries were represented, the top five being (in order): Germany; China; France; Italy; and Poland. Academic staff, especially from the sciences, also participate in international exchanges. These academic staff exchange programmes occur on either a short- or long-term basis and are completed either within or without the EU. Academic staff apply for sabbaticals and subsidies and/or grants. In addition, marketing and policy makers are active internationally to recruit students from abroad and/or help promote associations and partnerships between the universities/organizations. In 2011, three Wageningen UR staff members were permanently stationed in China, Brazil and Ethiopia. The Centre for Development Innovation (CDI), part of the Social Sciences Group (SSG), annually works on approximately 200 projects in 60 countries. CDI staff (around 40 employees) regularly work abroad for short periods. Figures from 2011 show that approximately 2% of Wageningen UR staff worked abroad in 2011, primarily in countries outside Europe for periods ranging from one to three months. CDI staff have the highest rate of international mobility. A number of Agro-technology and Food Sciences Group (AFSG) staff worked as visiting professors for periods ranging from four to six months at universities across Europe. An SSG project manager spent time working in Saudi Arabia developing an Agricultural Information Centre for the government. Two staff members from the Animal Sciences Group (ASG) worked in Indonesia on the Indonesian-Dutch Highly Pathogenic Avian Influenza Partnership (IDP-HPAI). A researcher from the Environmental Sciences Group (ESG) spent ten months working on Alterra in Bangladesh. A greenhouse researcher from the Plant Sciences Group (PSG) spent regular short periods working in the United Arab Emirates in 2011.
1.5.2 Alumni and Fundraising
Wageningen University has a network of over 35,000 graduates and doctorates in about 100 countries. The Alumni and Funds Department maintains relationships with alumni by providing information, creating meeting platforms and organizing events both at home and abroad. It works in close cooperation with the KLV Alumni Network. Alumni meetings were organized in the Netherlands in

Wageningen UR Annual Report 2011 | 29
association with existing regional alumni groups in northern, eastern, southern and central regions of the Netherlands. Alumni meetings were also organized in Brazil and China in partnership with KLV, as part of their 125-year jubilee. Reunions organized in 2011 for 25th and 50th year anniversary alumni were very well attended (as they were in 2010). The Wageningen Ambassadors alumni network remained at 40 members in 2011. In association with the Wageningen University Fund and Wageningen Ambassadors, a new fundraising campaign was launched in October 2010 entitled ‘Food for Thought, Thought for Food’. The campaign consisted of nine groundbreaking projects and focused on Wageningen’s role in developing solutions for the world’s food problem. The goal is to raise € 15 million in five years to fund pioneering research on the global food problem. The campaign got off to a flying start and by the end of 2011, the amount of donations received and pledged totalled more than € 7 million.
1.5.3 Research
1.5.3.1 Research Policy During the 2011-2014 plan period additional investments will be made in the following social areas: • Sustainable and smart food; • Customized nutrition; • Coasts and seas; • Biorefining. And in the following scientific areas: • Systems biology; • Information, behaviour and control; • Adaptability of complex systems. The research at Wageningen University is carried out by research groups. Each department has its own Department Head and field of study. All 93 research groups share one common feature: they carry out research into Healthy Food and Living. 1.5.3.2 Graduate Research Schools Wageningen University is the lead agency for six graduate schools. Wageningen University’s graduate schools are clustered under an umbrella body, Wageningen Graduate Schools. Graduate schools with Wageningen University as the lead agency are as follows: • Experimental Plant Sciences (EPS); • Wageningen School of Social Sciences (WASS); • The C.T. de Wit Graduate School of Production Ecology & Resource Conservation (PE&RC); • The VLAG Graduate School (Nutrition, Food Technology, Agro-biotechnology and Health Science); • Wageningen Institute of Animal Science (WIAS); • Wageningen Institute for Environment and Climate Research (WIMEK) as part of the national SENSE
graduate school. Participation in graduate schools with another university as the lead agency is as follows: • Research School for Resource Studies for Development (CERES); • Graduate School on Process Technology (OSPT); • Research Institute and Research School for Economic and Social History (N.W. Posthumous
Institute); • Graduate School of Polymer Science and Technology (PTN); • Research School for Biodiversity; • Graduate Research School of Science, Technology and Modern Culture (WTMC); • Graduate Research School of Biotechnological Science Delft Leiden (BSDL); • Dutch Institute of Systems and Control (DISC); • Interuniversity Centre for Educational Research (ICO).
The graduate schools have three primary duties:
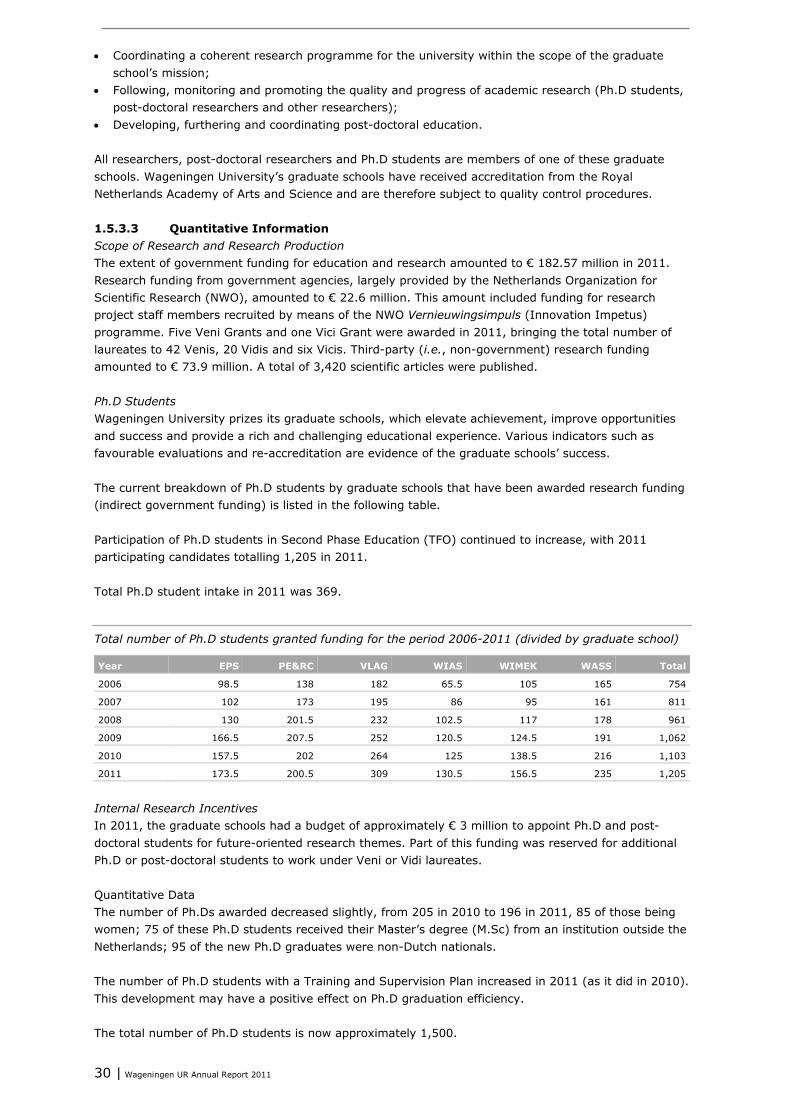
30 | Wageningen UR Annual Report 2011
• Coordinating a coherent research programme for the university within the scope of the graduate school’s mission;
• Following, monitoring and promoting the quality and progress of academic research (Ph.D students, post-doctoral researchers and other researchers);
• Developing, furthering and coordinating post-doctoral education. All researchers, post-doctoral researchers and Ph.D students are members of one of these graduate schools. Wageningen University’s graduate schools have received accreditation from the Royal Netherlands Academy of Arts and Science and are therefore subject to quality control procedures. 1.5.3.3 Quantitative Information Scope of Research and Research Production The extent of government funding for education and research amounted to € 182.57 million in 2011. Research funding from government agencies, largely provided by the Netherlands Organization for Scientific Research (NWO), amounted to € 22.6 million. This amount included funding for research project staff members recruited by means of the NWO Vernieuwingsimpuls (Innovation Impetus) programme. Five Veni Grants and one Vici Grant were awarded in 2011, bringing the total number of laureates to 42 Venis, 20 Vidis and six Vicis. Third-party (i.e., non-government) research funding amounted to € 73.9 million. A total of 3,420 scientific articles were published. Ph.D Students Wageningen University prizes its graduate schools, which elevate achievement, improve opportunities and success and provide a rich and challenging educational experience. Various indicators such as favourable evaluations and re-accreditation are evidence of the graduate schools’ success. The current breakdown of Ph.D students by graduate schools that have been awarded research funding (indirect government funding) is listed in the following table. Participation of Ph.D students in Second Phase Education (TFO) continued to increase, with 2011 participating candidates totalling 1,205 in 2011. Total Ph.D student intake in 2011 was 369. Total number of Ph.D students granted funding for the period 2006-2011 (divided by graduate school)
Year EPS PE&RC VLAG WIAS WIMEK WASS Total
2006 98.5 138 182 65.5 105 165 754
2007 102 173 195 86 95 161 811
2008 130 201.5 232 102.5 117 178 961
2009 166.5 207.5 252 120.5 124.5 191 1,062
2010 157.5 202 264 125 138.5 216 1,103
2011 173.5 200.5 309 130.5 156.5 235 1,205
Internal Research Incentives In 2011, the graduate schools had a budget of approximately € 3 million to appoint Ph.D and post-doctoral students for future-oriented research themes. Part of this funding was reserved for additional Ph.D or post-doctoral students to work under Veni or Vidi laureates. Quantitative Data The number of Ph.Ds awarded decreased slightly, from 205 in 2010 to 196 in 2011, 85 of those being women; 75 of these Ph.D students received their Master’s degree (M.Sc) from an institution outside the Netherlands; 95 of the new Ph.D graduates were non-Dutch nationals. The number of Ph.D students with a Training and Supervision Plan increased in 2011 (as it did in 2010). This development may have a positive effect on Ph.D graduation efficiency. The total number of Ph.D students is now approximately 1,500.
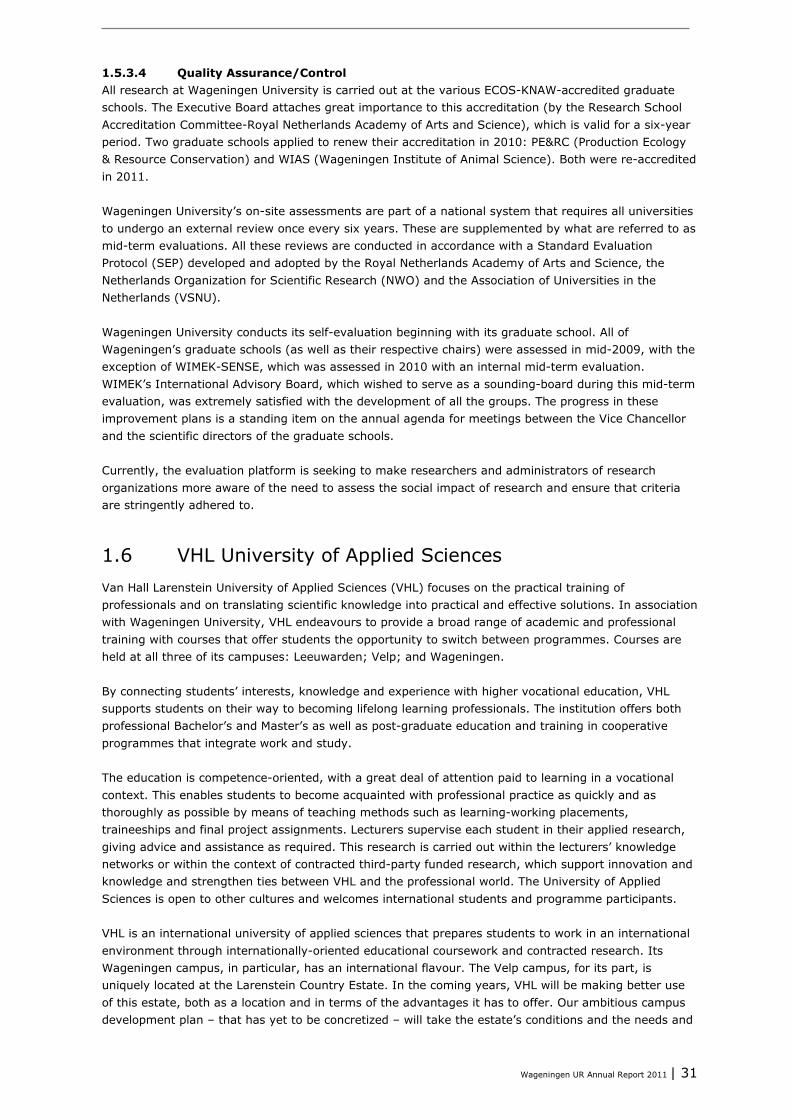
Wageningen UR Annual Report 2011 | 31
1.5.3.4 Quality Assurance/Control All research at Wageningen University is carried out at the various ECOS-KNAW-accredited graduate schools. The Executive Board attaches great importance to this accreditation (by the Research School Accreditation Committee-Royal Netherlands Academy of Arts and Science), which is valid for a six-year period. Two graduate schools applied to renew their accreditation in 2010: PE&RC (Production Ecology & Resource Conservation) and WIAS (Wageningen Institute of Animal Science). Both were re-accredited in 2011. Wageningen University’s on-site assessments are part of a national system that requires all universities to undergo an external review once every six years. These are supplemented by what are referred to as mid-term evaluations. All these reviews are conducted in accordance with a Standard Evaluation Protocol (SEP) developed and adopted by the Royal Netherlands Academy of Arts and Science, the Netherlands Organization for Scientific Research (NWO) and the Association of Universities in the Netherlands (VSNU). Wageningen University conducts its self-evaluation beginning with its graduate school. All of Wageningen’s graduate schools (as well as their respective chairs) were assessed in mid-2009, with the exception of WIMEK-SENSE, which was assessed in 2010 with an internal mid-term evaluation. WIMEK’s International Advisory Board, which wished to serve as a sounding-board during this mid-term evaluation, was extremely satisfied with the development of all the groups. The progress in these improvement plans is a standing item on the annual agenda for meetings between the Vice Chancellor and the scientific directors of the graduate schools. Currently, the evaluation platform is seeking to make researchers and administrators of research organizations more aware of the need to assess the social impact of research and ensure that criteria are stringently adhered to.
1.6 VHL University of Applied Sciences Van Hall Larenstein University of Applied Sciences (VHL) focuses on the practical training of professionals and on translating scientific knowledge into practical and effective solutions. In association with Wageningen University, VHL endeavours to provide a broad range of academic and professional training with courses that offer students the opportunity to switch between programmes. Courses are held at all three of its campuses: Leeuwarden; Velp; and Wageningen. By connecting students’ interests, knowledge and experience with higher vocational education, VHL supports students on their way to becoming lifelong learning professionals. The institution offers both professional Bachelor’s and Master’s as well as post-graduate education and training in cooperative programmes that integrate work and study. The education is competence-oriented, with a great deal of attention paid to learning in a vocational context. This enables students to become acquainted with professional practice as quickly and as thoroughly as possible by means of teaching methods such as learning-working placements, traineeships and final project assignments. Lecturers supervise each student in their applied research, giving advice and assistance as required. This research is carried out within the lecturers’ knowledge networks or within the context of contracted third-party funded research, which support innovation and knowledge and strengthen ties between VHL and the professional world. The University of Applied Sciences is open to other cultures and welcomes international students and programme participants. VHL is an international university of applied sciences that prepares students to work in an international environment through internationally-oriented educational coursework and contracted research. Its Wageningen campus, in particular, has an international flavour. The Velp campus, for its part, is uniquely located at the Larenstein Country Estate. In the coming years, VHL will be making better use of this estate, both as a location and in terms of the advantages it has to offer. Our ambitious campus development plan – that has yet to be concretized – will take the estate’s conditions and the needs and

32 | Wageningen UR Annual Report 2011
requirements of our educational concept into consideration. The development plan will also take economic principles into account, as well as the educational ambitions of VHL. In Autumn 2008, the Board began work on a strategic plan to set the course for the next four years. This resulted in the Draft Strategy Vision Plan 2010-2015. Sections of this Draft Strategy Vision Plan were incorporated into the Wageningen UR Strategic Plan 2011-2014 and the VHL Institutional Plan 2011-2014. Other sections were fleshed out and improved upon during the planning period. In 2011, VHL worked on its Operational Excellence project, further defining how to effectively and efficiently improve its educational support processes and systems within its three main pillars: people; processes; and systems. The premise: the student is central. The systems and processes are designed so that staff and students are delivered good services, cooperation and collaboration between different campuses and programmes is promoted and achieved, community learning is facilitated and it all occurs in an economically responsible manner. Internal discussions in 2011 demonstrated that there is considerable work to be done in terms of VHL’s potential within Wageningen UR. In December 2011, a Board and MT memorandum concluded that further steps would need to be taken to exploit and realize the potential. The memorandum also outlined our management of VHL and the objectives that would need to be achieved in order to realize our goals. These steps and objectives were fleshed out in 2012 and, where possible, implemented. On 1 September 2011, the Van Hall Institute in Leeuwarden merged with the International Agricultural College Larenstein in Velp and Wageningen to form the Van Hall Larenstein University of Applied Sciences in accordance with the Administration Enforcement Act. Agreements made during the merger were further concretized in 2011. In Autumn 2010, the new Higher Education and Scientific Research Act (WHW) came into force. Wageningen UR had already appointed a number of working groups in 2008 to assess the specific consequences of the new Act as compared to existing legislation. The University of Applied Sciences addressed this in more depth from mid-2010 onwards. One important project is the professionalization and positioning of the new design of examination committees. In Spring 2011, the agricultural educational institutes drafted a sector plan for higher agricultural education and presented it to the Ministry of Economic Affairs, Agriculture and Innovation. The plan outlines the relevant developments within agricultural education and how these institutes have responded to these developments. The Northern Sector’s Scholen voor ambities (Ambition Schools) Plan was drafted in 2010. The four northern universities of applied sciences (Van Hall Larenstein University of Applied Sciences; Hanze University of Applied Sciences at Groningen; NHL University; and Stenden University) reached an agreement on intensive cooperation within six areas as they relate to both education and research intended to strengthen the economy of northern Netherlands. The Van Hall Larenstein University of Applied Sciences is the project manager of Water Technology. A number of successful initiatives were launched in 2011: • Further shaping of the Advanced Water Technology Centre (launched beginning 2012); • Further shaping of the Centre for a Biobased Economy (begun 1 January 2012);
the Van Hall Larenstein University of Applied Sciences, Wageningen University, HAS Den Bosch, CAH Dronten and InHolland Delft are joint sponsors. The Centre aims to develop knowledge through ‘green’ education and transferring this knowledge to industry and other knowledge institutions;
• Food Circle was launched in autumn. Food Circle is a regional multidisciplinary cooperation and knowledge exchange platform between knowledge institutions, northern Dutch food companies, related industries and experts;
• In mid-2011, the University Campus Friesland (UCF) was established. Cooperation between northern educational institutions, the Province of Fryslân (Friesland) and the municipality of Leeuwarden was aimed at strengthening the educational activities, knowledge infrastructure and knowledge chain surrounding Fryske Hotspots;
• The Dairy Campus is a national and international centre for research, innovation, education and training in the field of dairy farming. The Dairy Campus works in association with VHL, the Province
Wageningen UR Annual Report 2011 | 33
of Fryslân (Friesland) the municipality of Leeuwarden and the Wageningen UR Livestock Research programme.
1.6.1 Students and Education
1.6.1.1 Programmes As of 1 September 2011, the Van Hall University of Applied Sciences (see Appendix 1B, Table 1) offered 14 professional Bachelor's programmes, three professional Master's programmes and six Associate Degree programmes. Of the 14 Bachelor’s programmes, four (Business Management and Agribusiness; Animal Husbandry and Livestock Farming; Rural Regeneration; and Food Technology) are offered on two different campuses. The study programmes both deepen and broaden the students’ knowledge in preparation for their transfer to the job market. All Master’s and Bachelor’s programmes offered in Wageningen are provided entirely in English. The Dutch-language Bachelor’s programmes endeavour to provide at least one English-language major. The Van Hall Larenstein University of Applied Sciences cooperates with other universities of applied sciences and institutes within various study programmes. The University of Applied Sciences’ Leeuwarden campus and NHL University jointly offer a number of technology programmes in Life Sciences. The laboratory courses provided by the Friesland College (upper secondary vocational education) are also included in this joint programme. The University of Applied Sciences is endeavouring to improve the transition from secondary and upper secondary vocational education to shortened and full-length higher vocational education. This has been realized at the Leeuwarden campus through the Life Sciences programme and the new Associate Degree programmes. In addition, VHL participated in a variety of discussions with other institutions, including LICA (a national information centre linking secondary and higher education), the Netherlands Association of Universities of Applied Sciences (HBO-Raad), GKC (Green Knowledge Cooperation), the Platformoverleg Voortgezet/Hoger Onderwijs (VOHO) (platform for discussions on secondary and higher education) in Velp and Leeuwarden, the AOC talks in Leeuwarden and AOC Oost. 1.6.1.2 Internal and External Quality Assurance Internal Quality Assurance Educational internal quality assurance consists mainly of student evaluations (satisfaction surveys) for each module and course. In 2011, module evaluations were standardized throughout the institution. Also in 2011, the foundation was laid to standardize and implement programme evaluations. Module evaluation results are then reported and summated into actions that may be implemented to reflect results. This implementation is secured and supervised by programme committees. Student satisfaction at the institutional level is measured externally through the National Student Survey (NSE), which, in 2011, was conducted online. The response rate was almost 40%. The average score for the entire institution (calculated to include all measurable items) was 3.63 (on a scale of 1-5), 0.06 higher than it was in 2010. The annual alumni survey was given concrete form at institutional and cluster levels and is available to large training courses. The survey did not yield any surprising findings. Graduates were slightly more satisfied with staff as compared to the previous year but the number of graduates who would choose the institution again if given the opportunity fell dramatically. Nevertheless, the response rate was fairly low, making concrete conclusions difficult to draw. Satisfaction surveys (especially module self-evaluations, the NSE and the annual alumni survey, or HBO-Monitor) are available for all courses and, in 2012, will be incorporated into management reviews. These surveys provide important input for the annual quality cycle of each course and will be included in management improvement plans, which are themselves incorporated into the Annual Plan and Annual Report. A checklist was introduced in 2011 for the annual plans. This checklist is monitored at quarterly management meetings. In 2012, Planning & Control was further developed.
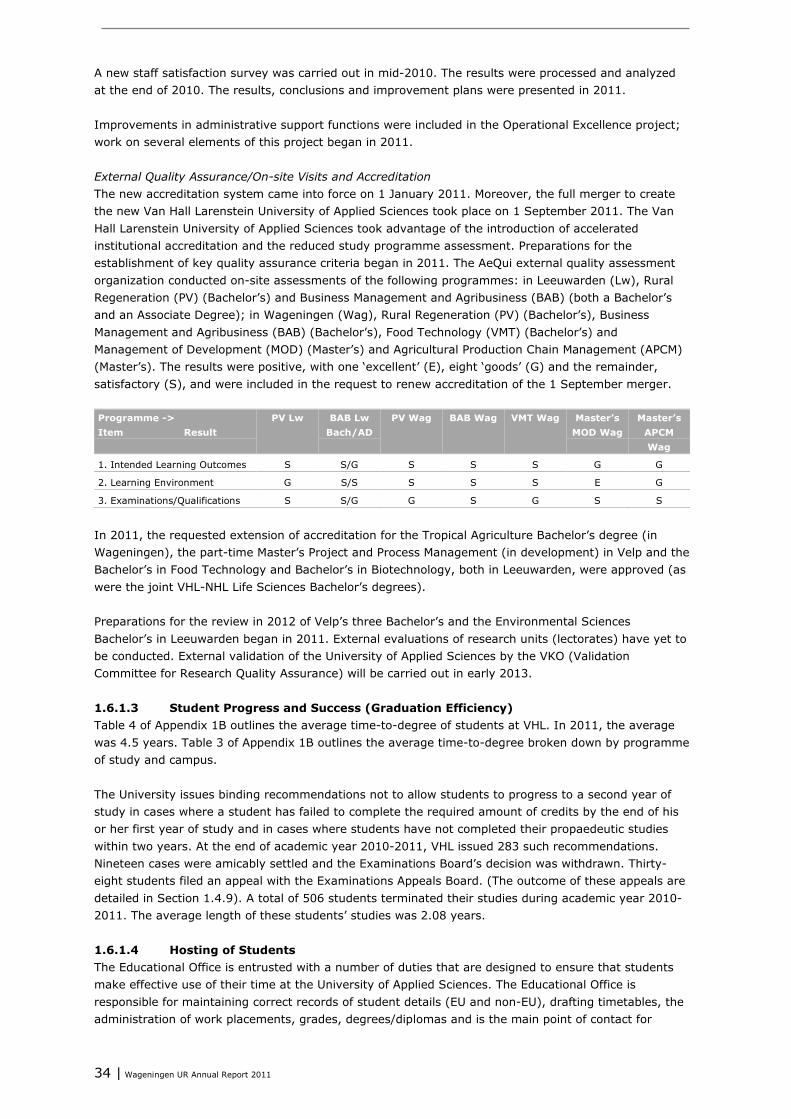
34 | Wageningen UR Annual Report 2011
A new staff satisfaction survey was carried out in mid-2010. The results were processed and analyzed at the end of 2010. The results, conclusions and improvement plans were presented in 2011. Improvements in administrative support functions were included in the Operational Excellence project; work on several elements of this project began in 2011. External Quality Assurance/On-site Visits and Accreditation The new accreditation system came into force on 1 January 2011. Moreover, the full merger to create the new Van Hall Larenstein University of Applied Sciences took place on 1 September 2011. The Van Hall Larenstein University of Applied Sciences took advantage of the introduction of accelerated institutional accreditation and the reduced study programme assessment. Preparations for the establishment of key quality assurance criteria began in 2011. The AeQui external quality assessment organization conducted on-site assessments of the following programmes: in Leeuwarden (Lw), Rural Regeneration (PV) (Bachelor’s) and Business Management and Agribusiness (BAB) (both a Bachelor’s and an Associate Degree); in Wageningen (Wag), Rural Regeneration (PV) (Bachelor’s), Business Management and Agribusiness (BAB) (Bachelor’s), Food Technology (VMT) (Bachelor’s) and Management of Development (MOD) (Master’s) and Agricultural Production Chain Management (APCM) (Master’s). The results were positive, with one ‘excellent’ (E), eight ‘goods’ (G) and the remainder, satisfactory (S), and were included in the request to renew accreditation of the 1 September merger. Programme -> Item Result
PV Lw BAB Lw Bach/AD
PV Wag BAB Wag VMT Wag Master’s MOD Wag
Master’s APCM Wag
1. Intended Learning Outcomes S S/G S S S G G
2. Learning Environment G S/S S S S E G
3. Examinations/Qualifications S S/G G S G S S
In 2011, the requested extension of accreditation for the Tropical Agriculture Bachelor’s degree (in Wageningen), the part-time Master’s Project and Process Management (in development) in Velp and the Bachelor’s in Food Technology and Bachelor’s in Biotechnology, both in Leeuwarden, were approved (as were the joint VHL-NHL Life Sciences Bachelor’s degrees). Preparations for the review in 2012 of Velp’s three Bachelor’s and the Environmental Sciences Bachelor’s in Leeuwarden began in 2011. External evaluations of research units (lectorates) have yet to be conducted. External validation of the University of Applied Sciences by the VKO (Validation Committee for Research Quality Assurance) will be carried out in early 2013. 1.6.1.3 Student Progress and Success (Graduation Efficiency) Table 4 of Appendix 1B outlines the average time-to-degree of students at VHL. In 2011, the average was 4.5 years. Table 3 of Appendix 1B outlines the average time-to-degree broken down by programme of study and campus. The University issues binding recommendations not to allow students to progress to a second year of study in cases where a student has failed to complete the required amount of credits by the end of his or her first year of study and in cases where students have not completed their propaedeutic studies within two years. At the end of academic year 2010-2011, VHL issued 283 such recommendations. Nineteen cases were amicably settled and the Examinations Board’s decision was withdrawn. Thirty-eight students filed an appeal with the Examinations Appeals Board. (The outcome of these appeals are detailed in Section 1.4.9). A total of 506 students terminated their studies during academic year 2010-2011. The average length of these students’ studies was 2.08 years. 1.6.1.4 Hosting of Students The Educational Office is entrusted with a number of duties that are designed to ensure that students make effective use of their time at the University of Applied Sciences. The Educational Office is responsible for maintaining correct records of student details (EU and non-EU), drafting timetables, the administration of work placements, grades, degrees/diplomas and is the main point of contact for
Wageningen UR Annual Report 2011 | 35
students in all three campus Registrar’s offices. The Educational Office devotes specific attention to international students, helping them, inter alia, obtain housing and apply for residence permits. The Educational Office is also tasked with providing administrative information to the various departments and Management Staff. A number of projects have been initiated to further harmonize the work processes of VHL’s three campuses. Much of the work can now be handled electronically. Cooperation between the Customer Contact Centre and the Education Office in Wageningen has been intensified, as a result of which all international students get the same answers and get them more quickly. Tight timetabling is a permanent concern for the Educational Office, meaning the continuous investing in tightening procedures, staff training and intensive communication with all stakeholders are matters of course. Work has begun on the replacement of the obsolescent Student Information System. The purchase of a ‘modern’ SIS with a digital archive will lead to more efficient and qualitatively better support of the university’s administrative processes. The Educational Office’s duties also include the provision of management information. The new SIS will also improve the delivery of information to the student (and take into account his or her personal wishes). In the coming years, the Educational Office will adopt working procedures in accordance with the principle of operational excellence, which focuses on the student. This will require close cooperation between the educational staff and the Educational Office. 1.6.1.5 Academic and Career Counselling Academic and career development counselling as well as a digital student portfolio are essential elements of VHL’s competence-based approach to education. As the study progresses, the emphasis shifts from supervising the student to promoting self-management. The students can use their digital portfolio to record and demonstrate their personal competence development. 1.6.1.6 Student Counselling VHL’s Office of the Student Dean is staffed by five part-time deans. Approximately 20% of students visit the Office of the Student Dean on one or more occasions. In addition, many questions are asked and answered by telephone or e-mail. 925 students contacted the Office of the Student Dean throughout academic year 2010-2011. In total, 2,176 consultations were held with these students, a decrease of about 10% as compared to the previous academic year. In academic year 2010-2011, the deans focused on the following topics: Consultations Consultations related to study problems, personal and psychological problems, questions about academic and career choices, study disabilities (particularly dyslexia and autism-related disorders). Most requests for help from students related to problems with their academic progress and personal circumstances. Study Disabilities The number of students with a complex functional disability (such as autism spectrum disorders (ASD) or attention deficit hyperactivity disorder (ADHD)) continues to increase. The dean’s office submitted an ASD memo to the management board. This resulted in a Practical Autism Manual (Velp), enhanced cooperation with educational staff and a standard to allocate cases to testing facilities. Leeuwarden organized a conference during Autism Week; deans visited a few classes to explain autism; low-stimulus rooms are available at the various campuses; and for students with dyslexia, VHL purchased and made available special software (Kurzweil).

36 | Wageningen UR Annual Report 2011
Organization/Policy The Outstanding Athletics financial funding scheme no longer exists; students must now submit an application to the FOS for funding (see Section 1.5.1.6). The deans recently submitted Course and Examination Regulations (OER) amendments and additions. Training Leeuwarden is running an accelerated study programme, which is a cooperative venture between VHL, NHL and Stenden and the local mental healthcare services (GGZ). Development Team As of 2008, the team has employed the use of a structured peer review process. Three deans completed training to become coaches. The team works pursuant to a code of conduct. In 2011, a colleague who fell ill took a prolonged leave and was replaced over the spring and summer months. Operational Bottlenecks There is a shortage of student housing in Wageningen. The increase of supervision time and guidance and the demands of students with complex disabilities were main problem areas for student counsellors. 1.6.1.7 Financial Support (including the VHL Fellowship Programme) In accordance with the WHW, VHL offers the following funding: 1. Financial support for students who are entitled to funding and for students whose studies are
delayed as a result of circumstances beyond the student’s control. Funding covers students who join student government associations or Participation Councils (administrative grants). The administrative grants have their own application process: students do not have to go through the dean and they are allocated a fixed number of months, meaning the ‘delay’ will not show up as one. The students receive their compensation afterwards;
2. Talent Scholarships for non-EEA students (in the form of tuition waivers). In 2011, financial support was awarded to: • 52 students under ‘special circumstances’.
In 2011, € 70,347.51 was paid out (compared with € 107,128.17 in 2010). Of these 52 students, 28 received an administrative scholarship; € 37,003 was paid out in 2011 (versus € 74,386 in 2010).
• 5 students from a so-called NFP (Netherlands Fellowship Programme) country, were granted tuition waivers in the amount of € 3,500 each. As of 2011, these tuition waivers only applied to nominal study duration (students completing their study within the required amount of time). € 17,500 was paid out in 2011 (versus € 14,000 in 2010).
Students in a so-called 2+2 programme with one of the two partner universities in China (CAU in Beijing or YAU in Kunming) are entitled to an annual tuition rebate on cost recovery tuition fees, as agreed. The total amount paid out from the fund in 2011 was € 196,375 to 75 students (compared to € 194,000 to 80 students in 2010). 1.6.1.8 Student Facilities (Support, Services and Amenities) The Van Hall Larenstein University of Applied Sciences attaches a great deal of importance to a wide range of thriving facilities at each campus and provides all necessary and required support in the form of student associations, work and/or study groups for individual study programmes, housing support groups, access to sports facilities at attractive prices. Two student associations, Quercus and Arboricultura, are active on the Velp campus. These student associations organize substantive and social activities and offer students an opportunity to acquire experience in administrative and committee work. Student associations provide a wide range of activities, such as assisting in the organization of orientation events. The Osiris student association is active in Leeuwarden. This student organization organizes numerous cultural, study-enriching, festive and sports-related activities from its headquarters in Leeuwarden.
Wageningen UR Annual Report 2011 | 37
Five student associations are active in Wageningen: WSV Ceres; KSV St. Franciscus Xaverius; Landbouwersvereniging Nji-Sri; SSR-W; and JV Unitas. These are supplemented by smaller Christian and regional student associations. The best way to be introduced to student and community life in Wageningen is to attend orientation (AID). Orientation events are organized by the AID committee, which began representing VHL students two year ago. Student Sport Arnhem offers sports facilities to students who study in Velp. The Larenstein Student Housing Foundation helps students find housing in Velp. Students based in Leeuwarden can contact Leeuwarden Student City for accommodation and sports services. Leeuwarden Student City also organizes the annual Leeuwarden Student Football Tournament and annual orientation events in Leeuwarden. Students studying in Wageningen have access to the De Bongerd Sports Centre. Idealis arranges student accommodation in Wageningen, although housing shortages continue to cause problems. The newly outfitted multi-media libraries at the Leeuwarden and Velp campuses continued to contribute to an inspiring learning environment for students in 2011. To make it easier for students and staff from all campuses, as well as outside visitors, information about the media library’s various services is now available online: www.vanhall-larenstein.nl/mediatheek. This site helps users search and find information and, more importantly, what may or may not be done with such information. In association with Wageningen UR and other ‘green’ educational institutions, students were guided through these multi-media libraries in a straightforward way, using the Green-i Portal. Information on the various structured disciplines was delivered, for which resources were selected based on relevance and quality. The library also provided information on and answered questions related to copyrights to both staff and students through its Information Point, which is a result of cooperative work between universities, other educational institutions and SURF. 1.6.1.9 International Academic Exchanges and Mobility In early 2011, the new internationalization policy plan was adopted. In preparation for this implementation, an inventory of all courses and ambitions in internationalization was carried out using the NUFFIC MINT (Mapping INTernationalization) tool. Implementation of the plan occurred in 2011. VHL utilizes Erasmus scholarship programmes for European mobility. In academic year 2010-2011, this resulted in 74 (European) outbound students to 13 partner institutes and 37 companies in 13 European countries and an intake of 28 scholarship students from 14 partner institutes in nine European countries. Study or a traineeship abroad is compulsory for a number of majors focused on work in the tropics, usually outside Europe, and scholarships are therefore unavailable. For this reason, actual mobility is much greater than the number of Erasmus scholarships would indicate. In addition, a number of short study-work visits took place across Europe and overseas, including Suriname. Nearly all staff mobility is tied to contracted research work within the European Tempus and NPT programmes. Three staff members utilized Erasmus Mobility Funding for Staff Training in academic year 2010-2011.
1.6.2 Alumni and Fundraising
The Van Hall Larenstein University of Applied Sciences aims to foster good relations with its alumni. As ambassadors of the institution, they serve as outposts in the identification of new developments in relevant fields of interest to our programmes of study, become members of field work advisory committees, are involved in applied research, or recruit or supervise students. The university, in turn, can provide alumni the opportunity to network within the Lifelong Learning context. At the end of 2011, management approved the VHL Alumni Policy Action Plan 2012-2015, which was drafted in cooperation with alumni associations.
38 | Wageningen UR Annual Report 2011
1.6.3 Research
The Van Hall Larenstein University of Applied Sciences’ applied research is carried out within the lectorates, KIGO projects (Expertise Dissemination and Innovation in Green Education) and in contracted research. The majority of this research is carried out within specific projects. The research addresses real problems from professional practice, which are deployed wherever possible in a sustainable network. VHL’s applied research is subjected to the Netherlands Association of Universities of Applied Sciences’ sector protocol for quality assurance in research. This quality assurance system became operational on 1 January 2009 and consists of two components: 1) a substantive assessment of the research; and 2) a qualitative assessment of the research. The substantive review of each research unit or research group takes place once every six years. Implementation of this system is currently under way. In September 2011, two professors began preparations for the substantive peer review assessment of their research (mid-2012). Validation by the Validation Committee for Research Quality Assurance is scheduled for March-April 2013. In 2011, preparations for VHL’s research policy began with three lecturer meetings. The research policy will be concretized and implemented in mid-2012 in close cooperation with Wageningen UR. Lectorates Lectors contribute to VHL’s aim to become a leading research institute. They emphasize, in a socially relevant manner, the connections between education, professional practice and society by promoting applied research, the formation of external and internal expertise networks and innovation in education. VHL had fifteen lecturers lecturing in a number of areas (water; living environment; nutrition; animal studies; and regional transition). Three lectorates are financed externally while five – what are referred to as ‘SKO lectorates’ – are funded from the earmarking of additional government funds. In addition to what are referred to as the ‘Green Plus’ lectureships that were awarded by the Ministry of Economic Affairs, Agriculture and Innovation in 2009 in Dairy Farming and in Integrated Natural Resources and Landscape Management, the Ministry once again awarded two Green Plus lectureships to the University of Applied Sciences in 2011 in Biobased Economy and in Sustainable Fisheries and Aquaculture. In 2011, Paddy Walker, John Janssen, Derk Stobbelaar and Martijn van der Heide pronounced their inaugural address as lectors. KIGO Applied Research Van Hall Larenstein University of Applied Sciences utilizes stimulus funding provided by the Knowledge Dissemination and Innovation in Green Education Scheme (KIGO). The benefits to the university are twofold: 1) lectors and students gain experience through project-based work and build professional networks and networks at fellow educational institutes; and 2) projects provide substantial practical input as they focus on finding specific solutions for everyday problems encountered in practice. The projects are often part of the lectorates’ applied research programmes. The Green Knowledge Cooperative monitors the coherence of the KIGO funds via a large number of programmes. VHL plays a leading role in five programmes: Regional Transition; Animal Welfare; Nature and Landscape; Equine Studies; and Water. In 2011, five new KIGO project applications were approved. The approved projects from 2010 will continue in 2011, in addition to nine projects from 2009. Four projects were completed in 2009. VHL staff participated in some 25 projects of other agricultural institutions. Each cycle involves an amount of more than €1 million in grants for work carried out by VHL staff. The final RAAK (Regional Focus and Action on Knowledge Circulation, Ministry of Education, Science and Cultural Affairs) project was completed. For the implementation of the Higher Education in Agriculture (HAO) sector plan (called box4 subsidy), five VHL project applications on the development of centres for excellence (such as corporate
Wageningen UR Annual Report 2011 | 39
sustainability) and broadening training offerings (such as the Bachelor's degree in Marine Biology) were approved. VHL as Centre for Excellence: Impulse The additional Green Impulse contribution from the Ministry of Economic Affairs, Agriculture and Innovation is intended for the implementation of innovations in the field of knowledge, the professionalization of staff and internationalization. The G-list outlines the projects. The subsidy granted in 2009 has been fully used. Subsidies granted in 2010 and 2011 were almost entirely allocated to the projects and have been partly used. The linking of these projects to fields and programmes and the detail of the linking, development and model function is reported separately via the Green Knowledge Cooperative. Projects result in an event, such as Career Day, The Solar Boat or The Posbank Hike, a publication (such as Delta), a new international contract for a 2+2 programme; complementary courses (such as Equine Talent Squad or Meet My Street) or fieldwork connected to an education in development (such as Metropolitan Agriculture or an education programme in Suriname). A major part of the professionalization budget was allocated to specific schooling programmes for lecturers in project management. The work carried out on internationalization included a number of activities with international partners (such as a joint education component in France) and improvements were made to internationalization@home for both outgoing and incoming students (such as study abroad activities and improving the Erasmus Guide). Higher Education in Agriculture Quality Impetus At the end of 2010, the Ministry of Economic Affairs, Agriculture and Innovation granted a number of specific higher education in agriculture quality impetus grants to the University of Applied Sciences. The objectives of the higher education in agriculture quality impetus are to: • Make higher education in agriculture more appealing and establish new target groups and stronger
connections within green education pillars (upper secondary vocational education, higher vocational education; and university education). This will increase intake, transfers and ‘outbounds’ thereby strengthening the critical mass;
• Improve educational success by reducing the percentage of dropouts and increasing graduation efficiency, thereby contributing to the achievement of one of the targets specified in the higher education strategic agenda and the higher vocational education covenant;
• Provide an up-to-date, flexible and accessible range of study programmes that is essential to the proper dissemination of knowledge and lifelong learning through green education as outlined in the multi-year plan for green education for the 2011-2015 period.
Of the projects already approved, the following began in 2011: 1) study choices with social media; 2) Operational Excellence, including the standardization of work processes; and 3) Education in Learning Communities, by developing the competence-oriented education of VHL. International Projects The institution’s international project focus is undergoing changes: • In Asia, projects were tied, as much as possible, to existing partnerships. Student recruitment is
often a subsidiary objective – the primary objective being substantive initiatives in fieldwork; • In Africa, interesting projects were undertaken, and attention is being paid to the network so that
we can become better acquainted with potential VHL Master’s students; • In Europe, a significant amount of attention is being paid to partnerships and education projects.
Geographical proximity means students and staff find it easier to undertake international internships and/or research.
In addition to consortium partnerships, three major international projects were undertaken in 2011 for which VHL was a leading partner: • Niche project in Ethiopia; • Niche project in Egypt; • EU Tempus project in the Balkans. Of note: VHL was the only Dutch educational institute in 2011 to
be awarded this project.

40 | Wageningen UR Annual Report 2011
1.7 DLO Research Foundation
1.7.1 Research
1.7.1.1 Research Policy The research carried out by the DLO Research Foundation consists partly of programmes funded by the Ministry of Economic Affairs, Agriculture and Innovation, namely Knowledge-based Research, Policy Support Research and Statutory Research Tasks. The Knowledge-based Research focuses on the medium-term knowledge needs of the Ministry of Economic Affairs, Agriculture and Innovation, the business community, non-governmental organizations, other government agencies and Wageningen UR. The budget for Knowledge-based Research is also allocated to extra investments as listed in Section 1.5.3.1. Policy Support Research and Statutory Research Tasks focus on current policy questions and/or support the Ministry of Economic Affairs, Agriculture and Innovation in the area of legislation and regulations. Work carried out within Knowledge-based Research, Policy Support Research and Statutory Research Tasks is based on thematic clusters/themes. A specific programming and accountability cycle for programmes of this nature has been agreed upon with the Ministry of Economic Affairs, Agriculture and Innovation. The results are communicated by, inter alia, Kennis Online (Knowledge Online) newsletters, e-News and a Website (www.kennisonline.wur.nl). Knowledge-based Research is divided into seven categories: • Global Food Security; • Sustainable Agricultural Chains; • Sustainable Development of Habitable Green Areas and Oceans in a Changing World; • Food Safety; • Transition, Innovation and Behaviour; • Technology Development Policy Support Research is divided into four categories: • Nature, Landscape and Rural Areas; • Agricultural Chains and Fisheries; • Food and Animal Safety and Consumer Protection; • International Cooperation. Research is also carried out in a programme which transects these domains. This research examines knowledge processes and the impact of knowledge and the Common Agricultural Policy. The statutory research tasks are carried out by two institutes and four programme units: Institutes for Statutory Research Tasks: • The RIKILT Institute for Food Safety; • Central Veterinary Institute (CVI). Four programme units for Statutory Research Tasks: • WOT Nature and the Environment (NMP); • Centre for Genetic Sources, the Netherlands (GCN); • Centre for Economic Information (CEI); • Centre for Fisheries Research (CVO). A review of the administration of Knowledge-based Research was begun in 2010 and completed in 2011. Not only has this resulted in a new control method, it has also resulted in a revised structure and a renewal of the research. In 2011, the development and implementation of the central government policy on key economic sectors affected DLO research funded by the Ministry of Economic Affairs, Agriculture and Innovation. In Autumn 2011, the Ministry established its 2012 budget for DLO (policy and knowledge-based) research. This budget amounts to € 51 million. These funds were allocated among the following sectors: Agro & Food; Horticulture & Raw Materials. Both the allocation of resources and the substantive agendas of these key sectors – information that was submitted to the Ministry in June 2011 – have had an impact on the programming for 2012.
Wageningen UR Annual Report 2011 | 41
In 2012, further adjustments to the DLO programming will take place based on the needs and requirements of key sectors. The management structure is expected to be adapted to 2012’s key sector policy. An increasing portion of DLO research is funded by other parties, such as the private market, the European Union, product boards and other government agencies. The content of this research also falls within the three related core areas (Nutrition & Food Production; Living Environment; and Health, Lifestyle & Living Conditions). 1.7.1.2 Quality Assurance The evaluations of the DLO Research Foundation’s various research centres are a mandatory component of the agreements between the Ministry of Economic Affairs, Agriculture and Innovation and the DLO Research Foundation. These evaluations have been incorporated into the DLO Research Foundation Funding Regulations. The evaluations are conducted on the basis of an evaluation protocol which is derived from the Standard Evaluation Protocol for universities (SEP). The institutes/business units are evaluated in terms of their scientific impact, socio-economic impact, research management and viability. The Statutory Research Task institutes are also assessed in terms of the performance of their statutory tasks. Along with an action plan based on the recommendations of peer committees, the evaluations are submitted to the Ministry. In 2011, an international committee of peers visited the Institute of Food & Biobased Research. Both the assessment report and FBR Action Plan were sent to the Ministry.
1.8 Facilities
1.8.1 Housing
The first phase of the Wageningen Campus Strategic Construction Plan was nearly entirely completed in 2011. The second phase of the Strategic Construction Plan is currently underway. In 2011, the following Phase 1 projects were carried out: • Implementation of the plan for the renovation of the Animal Sciences Group’s offices/laboratories,
completed end 2011; • Implementation of the plan for the construction of the Animal Sciences Group’s new research
accommodation. The rapid growth in the number of students and the wish to concentrate the education and research facilities on the Wageningen campus resulted in the decision to develop one complex for the educational facilities and Agrotechnology and Food Sciences Group. The completion of the planned educational facilities and the associated efficiency measures will enable Wageningen University to increase the number of students to 10,000. The following Phase 2 projects were addressed: • Preparations, procurement and execution of 2nd Orion education building; • Preparations for renovations and new construction projects AFSG: Atrium (renovate); Connecting
Building; Helix (new construction); • Implementation of the second phase of the Wageningen Campus Infrastructure Plan; On the completion of the Strategic Construction Plan, the following buildings and sites became surplus to requirements and were sold: • Kortenoord complex (sold, 2007; final pricing, 2011); • Dreijen Botanical Centre, including the pre-university education campus (the former library). Plans
for the redevelopment of Born-Oost, Dreijen, Duivendaal, the Animal Sciences Group practical centres and the Van Larenstein complex in Velp were under way.
42 | Wageningen UR Annual Report 2011
A new zoning plan was adopted in 2011 for the southern strip of the Wageningen campus, to prepare for FrieslandCampina. Plans for this southern strip, near the Bornsesteeg, also include student residences and convenience facilities, such as a compact supermarket, coffee bar and nursery. In addition to the Strategic Construction Plan projects, the following construction projects were also developed and carried out in 2011: • Construction of student housing on Haarweg, Stadsbrink and Kazerne Ede; • Algae PARC construction plan, completed in 2011; • Implementation of Service Centre (Actio) plan, completed in 2011; • Implementation of Administrative Centre Accommodation Plan (in the Atlas building), completed in
2011; • Preparation and implementation of Impulse on Wageningen campus; • Preparations for the re-accommodation of ISRIC with a new shared entrance to Gaia and Lumen; • Preparations for the construction and renovation projects for the Animal Sciences Group in Lelystad; • Plan Preparations for two wind turbines in Lelystad; • Preparations for IMARES housing in Den Helder and Yerseke. In 2011, the following housing-related actions were undertaken: • A number of studies and measures relating to sustainable construction and energy efficiency. These
measures and the generation of wind energy contributed to Wageningen UR becoming one of the Netherlands’ most sustainable centres for excellence;
• Various fire safety measures within the context of the occupancy permit; • Condition-dependent systematic maintenance, i.e., maintenance on the basis of the status of and
future plans for the buildings (retention, sale or demolition).
1.8.2 Information and Communication Technology in Education
In addition to increasing administrative and support activities for almost all EDUdiensten (partly due to the significant increase in the total number of students), the following are highlights from the 2012 CIO work plan: • In September 2011, a new version of Blackboard was rolled out. In addition to technical aspects, a
great deal of attention was paid to concomitant changes for staff and students. Along with the Education and Research Department, end users were both educated and trained on how to smoothly begin the new academic year;
• The introduction of the new Higher Education and Scientific Research Act (WHW) required modifications to the Student Information System (SIS). In 2011, in collaboration with the Education & Research Department, these modifications were made concrete by ‘Dagelijks Afstuderen’ (the timely graduate) and the ‘Hard Knip’ (hard cut-off date). The accompanying modifications in SIS were also determined;
• The approval process of study kits by examinations boards went from a practically full ‘paper process’ to a digital workflow facilitated by SPA (Study Programme Approval), a software tool specifically developed for the E & R Department. The development of a communal SIS for both VHL and Wageningen University was prepared and put in motion by the E & R Department and FB-IT provided input where necessary;
• An increase in students meant an increase in digital exams. There is a growing demand for functional support from FB-IT. It was thus determined that digital assessments ideally benefit from optimal cooperation in the whole professor-timetable maker-exam writer-PC-hall operator/aministrator-supervisors-and student chain. There are still areas that need improvement; this will occur in 2012;
• In 2011, recording of lectures through Lecture TV was frequent. Lecture TV can record between 5 and 6 lectures in all periods.
1.8.3 Facilities Services
Facilities Services once again contributed to cost reductions and efficiency improvements in 2011. Where relevant, the savings have already been passed on to 2012 rates or will be passed on to 2013 rates.
Wageningen UR Annual Report 2011 | 43
In 2011, the Dutch Student Survey (NSE) rated all of Wageningen University’s facilities (with the exception of restaurant facilities) significantly higher than the national average. For catering, which was re-procured in 2012, an evaluation was conducted based on the desires of users. The new Actio was completed as an example of New Work in an office environment. For the FB, it is a (cooperative) work methodology, which is more suited to the growing use of computers, phones and social media. Actio provides an attractive, open and well-equipped working environment that invites collaboration and knowledge sharing in a space that is efficiently utilized.
1.8.4 Safety and the Environment
Environment The policy, objectives and results achieved for the environment with respect to, e.g., water, energy, wildlife and soil as well as in areas such as suppliers, permits and incidents, are reflected in the Environmental Annual Report 2011 and the Environmental Annual Plan 2012-2014. Wageningen UR’s ‘Permit Counter’ was further optimized. All of Wageningen UR’s permit applications or reports go through the Permit Counter. This Permit Counter ensures clear communication, internal coordination and the keeping of an updated list of current licences. Safety The Quality, Safety, Health and Environment (KAM) and Corporate Safety & Environment sections ensured that risks within the Wageningen UR workplace were minimized or continuous risks were controlled. In the past year, four themed afternoons were held for the entire KAM ‘column’. In some cases, external speakers were invited from other universities. This led to useful coordination between Wageningen UR’s KAM column, the partnership, facilitative staff and the KAM columns of other universities. In 2011, the various organizational divisions were tested and evaluated for completeness and reliability using risk inventory analyses. Emergency response lessons and exercises were conducted throughout Wageningen UR, which put the administration of such exercises out to tender. New policy principles related to the service provision and content of the lessons and exercises were drafted to form the basis of this tender. The decision was also taken in 2011. In September, the tender was awarded and as of December, the lessons and exercises are being administered by PRECARE. In 2011, translations began on the Dutch-language Health and Safety Catalogue for Dutch Universities. First, a project plan was drafted, which outlined the procedure for coordinating and decision-making as well as related responsibilities and authorities. The project plan will serve as a guide for the translation of the individual sub-catalogues. In preparation for renovations and new construction, V & M formulated recommendations for fire safety, working conditions and the environment. Counselling took place in close cooperation with consultants from V & H.
44 | Wageningen UR Annual Report 2011
2 Personnel
2.1 HR in Strategic Plans Wageningen UR’s HR policy is an integral element of the organization’s goal to make a major contribution to the quality of life within the field of Healthy Food and Living and become a European centre for excellence. The optimization of the quality of both staff and management remains an important issue. HR policy in 2011 spearheaded further internationalization (including labour market communication), career and talent development and the implementation of the Covenant Action Plan and new workflow management system.
2.1.1 Academic Staff Career Development
The Tenure Track was introduced to attract new talent and develop and retain that talent. Since September 2009, 91 Tenure Tracks were started: 48 new appointments and 43 sitting professors. Towards the end of 2011, evaluations demonstrated that there was broad support for the Tenure Track system and it seemed that the university was able to attract new talent. However, according to the evaluation results, the assessment process needs to be more transparent and more uniformly organized. In addition, the delivery of information needs to be improved. The Board approved and adopted the recommendations of the evaluation committee, which were implemented in 2012.
2.1.2 Internationalization
Pursuant to one element of the Recruiting Power project, a job-applicant tracking system was implemented in 2010 and continued to be tailored in 2011 to increase Wageningen UR’s profile on the international labour market. With respect to international candidates, a special English-language werkenbij.wur Website was developed. In addition, methods were developed and implemented for the recruitment of (international) scientists. Meanwhile, the results of these actions were assessed by conducting surveys among new staff members of Wageningen UR. The proposal to merge the International Expert Group, currently working in different locations, into a central International Advice & Support office is the next step in the professionalization of Wageningen UR’s international objectives.
2.1.3 Development of Talent, Competence and Skills
Talent development within Wageningen UR has two focal points: the Young Leaders Group and the Talent Development Group. The Executive Board and Board of Directors outlined a vision for leadership. HR used this vision to develop leadership programmes, which resulted in a Leadership Expedition 2011-2012. Direction and guidance were provided as to how cohesion between Young Leaders and Wageningen UR could be further developed. The Leadership Expedition consists of several exciting meetings and interim assignments centred on self-reflection, feedback and the practical translation thereof. Each meeting has its own theme: Business; Business Development; Organizational Development; and Team Development. Insights Discovery was used for personal and team effectiveness. Twelve participants took part in the first group. In 2009, Wageningen UR developed the Talent Development programme in collaboration with Twente School of Management (TSM). In Autumn 2011, the 3rd Talent Development Group was launched and had 15 participants. The evaluations of the first two groups led to improvements in the programme. With a new programme manager/course leader, individual coaching of the participants was emphasized. Insights Discovery Personal Profiles was again utilized during coaching. Called “Leading Change”, the programme took the participants through three main components, namely: Leadership and Change Management in conjunction with a specific mandate from the Executive Board focused on organizational
Wageningen UR Annual Report 2011 | 45
development. The 2011-2012 group was commissioned to make concrete proposals to improve access for potential clients.
2.1.4 Covenant Action Plan
The Covenant Action Plan is intended to increase the appeal of teaching as a profession by enhancing the position of lecturers/professors, increasing their salary and optimizing their employability. Teacher bursaries were also established – a plan that, for the most part, compensates Master’s tuition costs. Dialogue over the professional space of the lecturer began in 2011, and will be furthered in 2012. Agreements were reached in local consultations with the trade unions on the further allocation of the non-recurrent funds that were available. It was agreed that within the space of four years, the University of Applied Sciences would upgrade positions equivalent to 23.8 FTE from job grade 11 to job grade 12. Positions equivalent to 11.1 FTE have now been upgraded. Positions equivalent to 7.4 FTE have also been upgraded from job scale 12 to job scale 13. This was realized for 2.0 FTE positions.
2.1.5 Implementation of Workflow Management System
In 2011, HR launched the implementation of the Employee Self Service and Management Self Service Systems (ESS/MSS). Through the current ‘Staff Button’, current staff, managers, HR and/or financial department (depending on jurisdiction) staff can submit data for HR processing. This allows for efficient organization of HR processes and reduces the administrative workload across the line. Having started in 2011 with a variety of HR processes (‘NAW’-data [name, address and city], omissions and declarations), other processes (including leave and R&D) will be rolled out in the coming years.
2.2 Developments in Collective Labour Agreements The Collective Labour Agreement (CAO) NU, which was closed from 1 March 2010 to 1 January 2011, was extended by one year until 1 January 2012. The DLO Research Foundation CAO was in force from 1 April 2010 to 1 April 2011. Negotiations for a new collective labour agreement had yet to be concluded by late 2011. Based on the CAO HBO, a salary increase of 0.4% was introduced on 1 January 2011. The CAO HBO expired on 1 February 2012; discussions are under way.
2.3 Health and Welfare
2.3.1 Healthy Lifestyles and Absenteeism Due to Ill Health
Wageningen UR’s approach to health and welfare is comprehensive. Its approach incorporates Industrial Medicine, Industrial Work, Labour and Organizational Theory, and Human Resources. In so doing, Wageningen UR is actively engaged in promoting a healthy lifestyle for its employees. Emphasis has therefore been placed on health promotion courses that seek to prevent arm, neck, back or shoulder pain. This emphasis is supported by the De Bongerd Sports Centre (SCB). In 2011, there was considerable interest in MyBalance, a pilot programme begun in 2010 at one of the Science Groups that, following positive evaluation results, was maintained as an actual programme across the organization. MyBalance offers employees full check-ups that examine physical and mental well-being. Questionnaire and test results are discussed with an independent counsellor, and, upon request, a tailored action plan may be provided. The entire process is managed by the individual him- or herself and privacy of information is guaranteed. In addition, appropriate absentee counselling (both preventive and curative) continues to be necessary. The employer must maintain contact with staff while on sick leave and the employer and staff member concerned must jointly make concerted efforts to ensure that the staff member can return to work as quickly as possible. In 2011, counselling was initiated in nine instances of sick leave (or the threat of sick leave). All cases resulted in favourable outcomes.
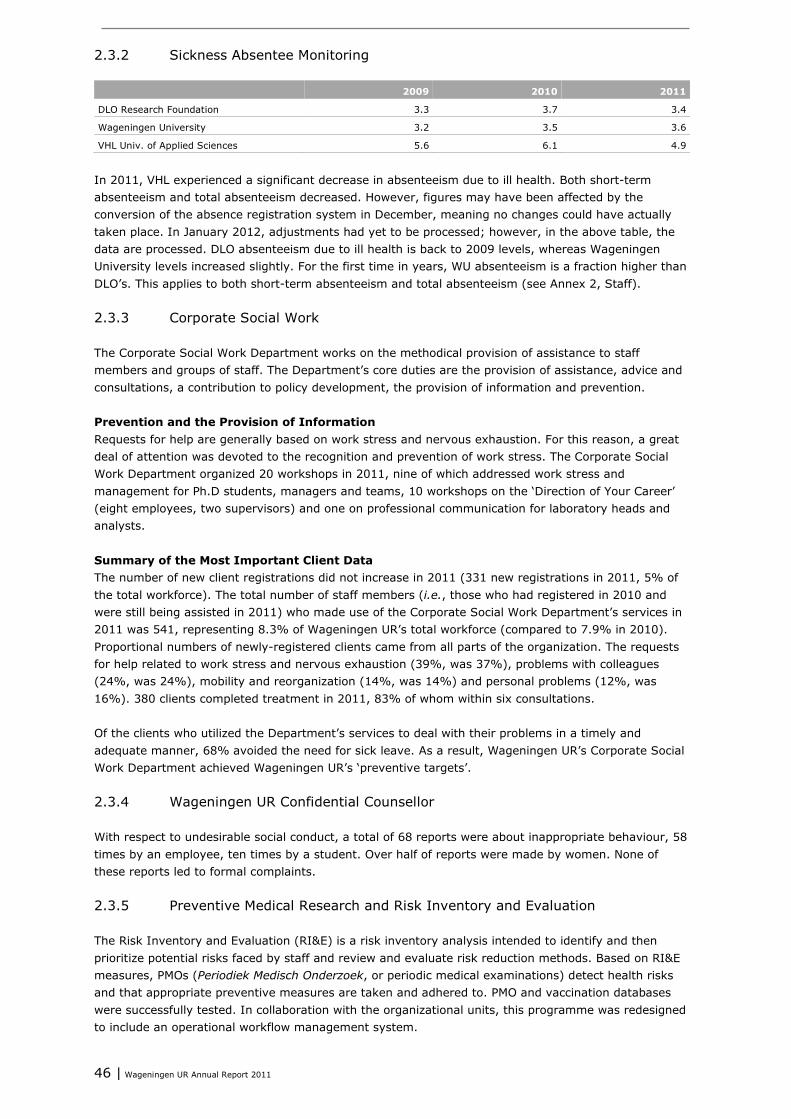
46 | Wageningen UR Annual Report 2011
2.3.2 Sickness Absentee Monitoring
2009 2010 2011
DLO Research Foundation 3.3 3.7 3.4
Wageningen University 3.2 3.5 3.6
VHL Univ. of Applied Sciences 5.6 6.1 4.9
In 2011, VHL experienced a significant decrease in absenteeism due to ill health. Both short-term absenteeism and total absenteeism decreased. However, figures may have been affected by the conversion of the absence registration system in December, meaning no changes could have actually taken place. In January 2012, adjustments had yet to be processed; however, in the above table, the data are processed. DLO absenteeism due to ill health is back to 2009 levels, whereas Wageningen University levels increased slightly. For the first time in years, WU absenteeism is a fraction higher than DLO’s. This applies to both short-term absenteeism and total absenteeism (see Annex 2, Staff).
2.3.3 Corporate Social Work
The Corporate Social Work Department works on the methodical provision of assistance to staff members and groups of staff. The Department’s core duties are the provision of assistance, advice and consultations, a contribution to policy development, the provision of information and prevention. Prevention and the Provision of Information Requests for help are generally based on work stress and nervous exhaustion. For this reason, a great deal of attention was devoted to the recognition and prevention of work stress. The Corporate Social Work Department organized 20 workshops in 2011, nine of which addressed work stress and management for Ph.D students, managers and teams, 10 workshops on the ‘Direction of Your Career’ (eight employees, two supervisors) and one on professional communication for laboratory heads and analysts. Summary of the Most Important Client Data The number of new client registrations did not increase in 2011 (331 new registrations in 2011, 5% of the total workforce). The total number of staff members (i.e., those who had registered in 2010 and were still being assisted in 2011) who made use of the Corporate Social Work Department’s services in 2011 was 541, representing 8.3% of Wageningen UR’s total workforce (compared to 7.9% in 2010). Proportional numbers of newly-registered clients came from all parts of the organization. The requests for help related to work stress and nervous exhaustion (39%, was 37%), problems with colleagues (24%, was 24%), mobility and reorganization (14%, was 14%) and personal problems (12%, was 16%). 380 clients completed treatment in 2011, 83% of whom within six consultations. Of the clients who utilized the Department’s services to deal with their problems in a timely and adequate manner, 68% avoided the need for sick leave. As a result, Wageningen UR’s Corporate Social Work Department achieved Wageningen UR’s ‘preventive targets’.
2.3.4 Wageningen UR Confidential Counsellor
With respect to undesirable social conduct, a total of 68 reports were about inappropriate behaviour, 58 times by an employee, ten times by a student. Over half of reports were made by women. None of these reports led to formal complaints.
2.3.5 Preventive Medical Research and Risk Inventory and Evaluation
The Risk Inventory and Evaluation (RI&E) is a risk inventory analysis intended to identify and then prioritize potential risks faced by staff and review and evaluate risk reduction methods. Based on RI&E measures, PMOs (Periodiek Medisch Onderzoek, or periodic medical examinations) detect health risks and that appropriate preventive measures are taken and adhered to. PMO and vaccination databases were successfully tested. In collaboration with the organizational units, this programme was redesigned to include an operational workflow management system.
Wageningen UR Annual Report 2011 | 47
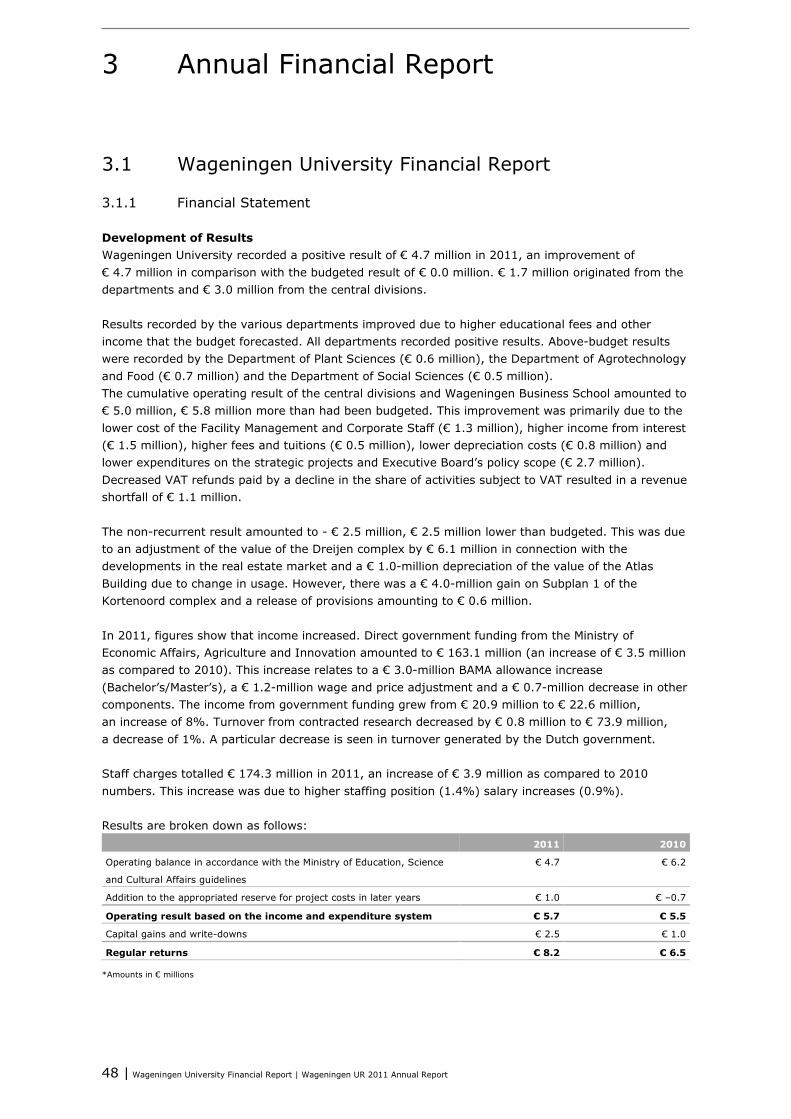
48 | Wageningen University Financial Report | Wageningen UR 2011 Annual Report
3 Annual Financial Report
3.1 Wageningen University Financial Report
3.1.1 Financial Statement
Development of Results Wageningen University recorded a positive result of € 4.7 million in 2011, an improvement of € 4.7 million in comparison with the budgeted result of € 0.0 million. € 1.7 million originated from the departments and € 3.0 million from the central divisions. Results recorded by the various departments improved due to higher educational fees and other income that the budget forecasted. All departments recorded positive results. Above-budget results were recorded by the Department of Plant Sciences (€ 0.6 million), the Department of Agrotechnology and Food (€ 0.7 million) and the Department of Social Sciences (€ 0.5 million). The cumulative operating result of the central divisions and Wageningen Business School amounted to € 5.0 million, € 5.8 million more than had been budgeted. This improvement was primarily due to the lower cost of the Facility Management and Corporate Staff (€ 1.3 million), higher income from interest (€ 1.5 million), higher fees and tuitions (€ 0.5 million), lower depreciation costs (€ 0.8 million) and lower expenditures on the strategic projects and Executive Board’s policy scope (€ 2.7 million). Decreased VAT refunds paid by a decline in the share of activities subject to VAT resulted in a revenue shortfall of € 1.1 million. The non-recurrent result amounted to - € 2.5 million, € 2.5 million lower than budgeted. This was due to an adjustment of the value of the Dreijen complex by € 6.1 million in connection with the developments in the real estate market and a € 1.0-million depreciation of the value of the Atlas Building due to change in usage. However, there was a € 4.0-million gain on Subplan 1 of the Kortenoord complex and a release of provisions amounting to € 0.6 million. In 2011, figures show that income increased. Direct government funding from the Ministry of Economic Affairs, Agriculture and Innovation amounted to € 163.1 million (an increase of € 3.5 million as compared to 2010). This increase relates to a € 3.0-million BAMA allowance increase (Bachelor’s/Master’s), a € 1.2-million wage and price adjustment and a € 0.7-million decrease in other components. The income from government funding grew from € 20.9 million to € 22.6 million, an increase of 8%. Turnover from contracted research decreased by € 0.8 million to € 73.9 million, a decrease of 1%. A particular decrease is seen in turnover generated by the Dutch government. Staff charges totalled € 174.3 million in 2011, an increase of € 3.9 million as compared to 2010 numbers. This increase was due to higher staffing position (1.4%) salary increases (0.9%). Results are broken down as follows: 2011 2010
Operating balance in accordance with the Ministry of Education, Science
and Cultural Affairs guidelines
€ 4.7 € 6.2
Addition to the appropriated reserve for project costs in later years € 1.0 € –0.7
Operating result based on the income and expenditure system € 5.7 € 5.5
Capital gains and write-downs € 2.5 € 1.0
Regular returns € 8.2 € 6.5
*Amounts in € millions
Wageningen UR 2011 Annual Report | Wageningen University Financial Report | 49
Note: Pursuant to regulations, direct government funding is calculated as income. Income related to project costs that will be incurred in later years is calculated as income in the review year and a write-down in later years. The distortion this causes is neutralized via the appropriated reserve. In accordance with this approach, € 1.0 million of the result was extracted from this appropriated reserve in 2011, which was offset by additions in previous years. Balance Developments In 2011, Wageningen University’s liquidity decreased from € 101.7 million to € 70.6 million, an improvement of € 56.9 million as compared to the budget. Factors that explain this improvement are as follows: Improved opening balance sheet position on 1-1-2011 € 27.2 million
Result recorded in excess of budget € 4.7 million
Increased depreciation and amortization (including write-downs) € 6.8 million
Improvement in short-term debt and receivables € 11.0 million
Lower investments € 7.2 million
Total € 56.9 million
Total liquidity (€ 70.6 million) includes prepayments of € 110 million, of which € 20.3 million are funds to be passed on to partners. These funds to be passed on to partners were received because Wageningen University is the lead party in a number of consortia. These funds will be passed on to the partners in 2012. Wageningen University’s solvency ratio was 40.1% on 31 December 2011, as compared to 40.8% in 2009. This deterioration was due to increased short-term debt resulting from prepaid subsidies, advance project payments and a higher debt to the DLO Research Foundation. 2012 Prospects Development of Results Wageningen University budgeted a result of € 1.3 million for 2012. In 2012’s operating result, the effects of cuts in research (€ -3.7 million) and the fine for students exceeding the set study term (€ -0.9 million) rendered the result significantly lower than in 2011. 2012 will be a transitional year for Wageningen University; in 2013, research turnover will be under pressure due to the phasing out of the Economic Structure Enhancing Fund (FES) sales and the initial effects of the fine for students exceeding the set study term will also be felt. In addition, 2013 costs will increase as a result of the commissioning of the Orion building. Wageningen University does not expect capital gains or losses from the overvaluation of fixed assets in 2012. Strategic Construction Plan In 2009, approximately € 100 million was earmarked for investment in the Wageningen campus (teaching rooms and a single complex for the Agrotechnology & Food Sciences Group), such plan to be completed by 2013. The 2012 budget specifies investments of € 57.0 million, of which € 28.1 million falls within the scope of the Strategic Construction Plan.
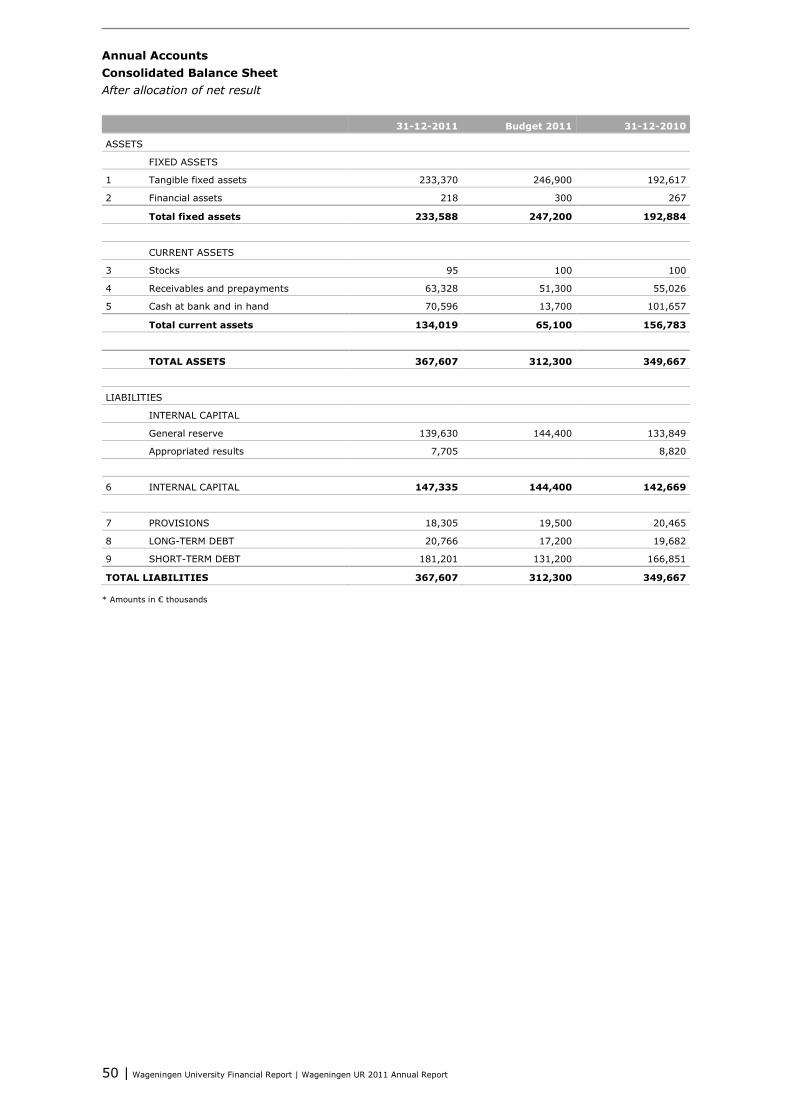
50 | Wageningen University Financial Report | Wageningen UR 2011 Annual Report
Annual Accounts Consolidated Balance Sheet After allocation of net result 31-12-2011 Budget 2011 31-12-2010
ASSETS
FIXED ASSETS
1 Tangible fixed assets 233,370 246,900 192,617
2 Financial assets 218 300 267
Total fixed assets 233,588 247,200 192,884
CURRENT ASSETS
3 Stocks 95 100 100
4 Receivables and prepayments 63,328 51,300 55,026
5 Cash at bank and in hand 70,596 13,700 101,657
Total current assets 134,019 65,100 156,783
TOTAL ASSETS 367,607 312,300 349,667
LIABILITIES
INTERNAL CAPITAL
General reserve 139,630 144,400 133,849
Appropriated results 7,705 8,820
6 INTERNAL CAPITAL 147,335 144,400 142,669
7 PROVISIONS 18,305 19,500 20,465
8 LONG-TERM DEBT 20,766 17,200 19,682
9 SHORT-TERM DEBT 181,201 131,200 166,851
TOTAL LIABILITIES 367,607 312,300 349,667
* Amounts in € thousands
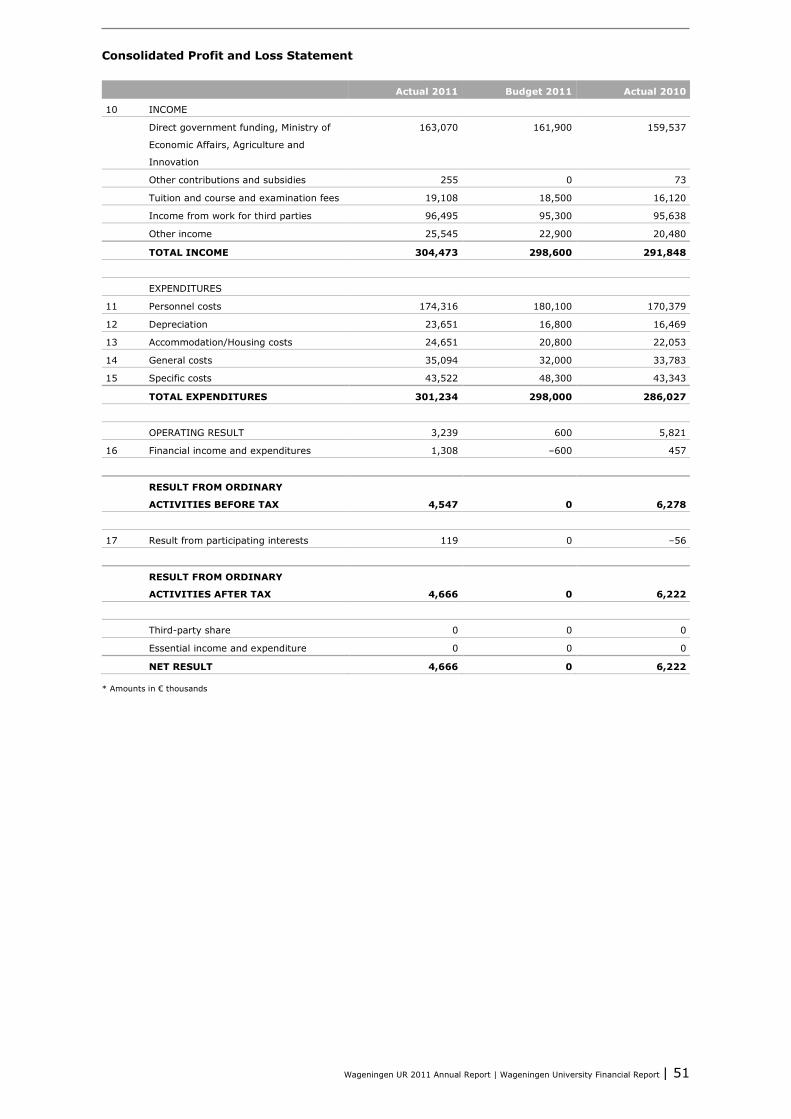
Wageningen UR 2011 Annual Report | Wageningen University Financial Report | 51
Consolidated Profit and Loss Statement Actual 2011 Budget 2011 Actual 2010
10 INCOME
Direct government funding, Ministry of
Economic Affairs, Agriculture and
Innovation
163,070 161,900 159,537
Other contributions and subsidies 255 0 73
Tuition and course and examination fees 19,108 18,500 16,120
Income from work for third parties 96,495 95,300 95,638
Other income 25,545 22,900 20,480
TOTAL INCOME 304,473 298,600 291,848
EXPENDITURES
11 Personnel costs 174,316 180,100 170,379
12 Depreciation 23,651 16,800 16,469
13 Accommodation/Housing costs 24,651 20,800 22,053
14 General costs 35,094 32,000 33,783
15 Specific costs 43,522 48,300 43,343
TOTAL EXPENDITURES 301,234 298,000 286,027
OPERATING RESULT 3,239 600 5,821
16 Financial income and expenditures 1,308 –600 457
RESULT FROM ORDINARY
ACTIVITIES BEFORE TAX
4,547
0
6,278
17 Result from participating interests 119 0 –56
RESULT FROM ORDINARY
ACTIVITIES AFTER TAX
4,666
0
6,222
Third-party share 0 0 0
Essential income and expenditure 0 0 0
NET RESULT 4,666 0 6,222
* Amounts in € thousands
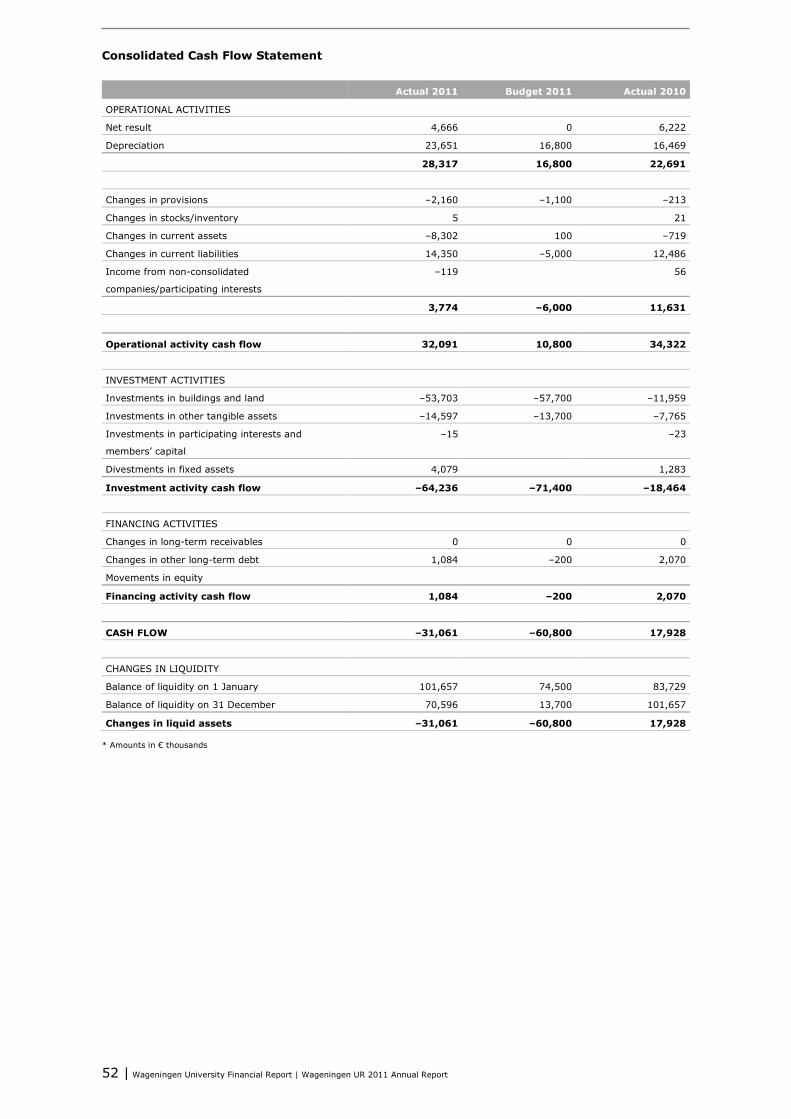
52 | Wageningen University Financial Report | Wageningen UR 2011 Annual Report
Consolidated Cash Flow Statement Actual 2011 Budget 2011 Actual 2010
OPERATIONAL ACTIVITIES
Net result 4,666 0 6,222
Depreciation 23,651 16,800 16,469
28,317 16,800 22,691
Changes in provisions –2,160 –1,100 –213
Changes in stocks/inventory 5 21
Changes in current assets –8,302 100 –719
Changes in current liabilities 14,350 –5,000 12,486
Income from non-consolidated
companies/participating interests
–119 56
3,774 –6,000 11,631
Operational activity cash flow 32,091 10,800 34,322
INVESTMENT ACTIVITIES
Investments in buildings and land –53,703 –57,700 –11,959
Investments in other tangible assets –14,597 –13,700 –7,765
Investments in participating interests and
members’ capital
–15 –23
Divestments in fixed assets 4,079 1,283
Investment activity cash flow –64,236 –71,400 –18,464
FINANCING ACTIVITIES
Changes in long-term receivables 0 0 0
Changes in other long-term debt 1,084 –200 2,070
Movements in equity
Financing activity cash flow 1,084 –200 2,070
CASH FLOW –31,061 –60,800 17,928
CHANGES IN LIQUIDITY
Balance of liquidity on 1 January 101,657 74,500 83,729
Balance of liquidity on 31 December 70,596 13,700 101,657
Changes in liquid assets –31,061 –60,800 17,928
* Amounts in € thousands
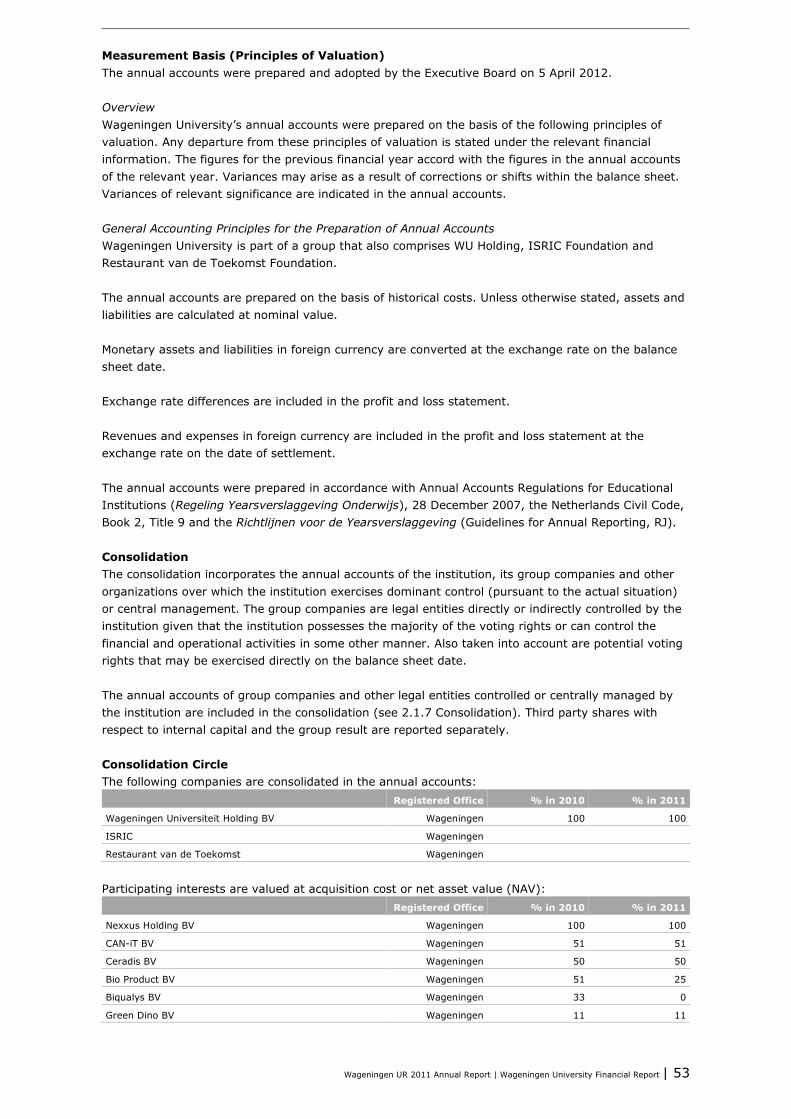
Wageningen UR 2011 Annual Report | Wageningen University Financial Report | 53
Measurement Basis (Principles of Valuation) The annual accounts were prepared and adopted by the Executive Board on 5 April 2012. Overview Wageningen University’s annual accounts were prepared on the basis of the following principles of valuation. Any departure from these principles of valuation is stated under the relevant financial information. The figures for the previous financial year accord with the figures in the annual accounts of the relevant year. Variances may arise as a result of corrections or shifts within the balance sheet. Variances of relevant significance are indicated in the annual accounts. General Accounting Principles for the Preparation of Annual Accounts Wageningen University is part of a group that also comprises WU Holding, ISRIC Foundation and Restaurant van de Toekomst Foundation. The annual accounts are prepared on the basis of historical costs. Unless otherwise stated, assets and liabilities are calculated at nominal value. Monetary assets and liabilities in foreign currency are converted at the exchange rate on the balance sheet date. Exchange rate differences are included in the profit and loss statement. Revenues and expenses in foreign currency are included in the profit and loss statement at the exchange rate on the date of settlement. The annual accounts were prepared in accordance with Annual Accounts Regulations for Educational Institutions (Regeling Yearsverslaggeving Onderwijs), 28 December 2007, the Netherlands Civil Code, Book 2, Title 9 and the Richtlijnen voor de Yearsverslaggeving (Guidelines for Annual Reporting, RJ). Consolidation The consolidation incorporates the annual accounts of the institution, its group companies and other organizations over which the institution exercises dominant control (pursuant to the actual situation) or central management. The group companies are legal entities directly or indirectly controlled by the institution given that the institution possesses the majority of the voting rights or can control the financial and operational activities in some other manner. Also taken into account are potential voting rights that may be exercised directly on the balance sheet date. The annual accounts of group companies and other legal entities controlled or centrally managed by the institution are included in the consolidation (see 2.1.7 Consolidation). Third party shares with respect to internal capital and the group result are reported separately. Consolidation Circle The following companies are consolidated in the annual accounts: Registered Office % in 2010 % in 2011
Wageningen Universiteit Holding BV Wageningen 100 100
ISRIC Wageningen
Restaurant van de Toekomst Wageningen
Participating interests are valued at acquisition cost or net asset value (NAV): Registered Office % in 2010 % in 2011
Nexxus Holding BV Wageningen 100 100
CAN-iT BV Wageningen 51 51
Ceradis BV Wageningen 50 50
Bio Product BV Wageningen 51 25
Biqualys BV Wageningen 33 0
Green Dino BV Wageningen 11 11
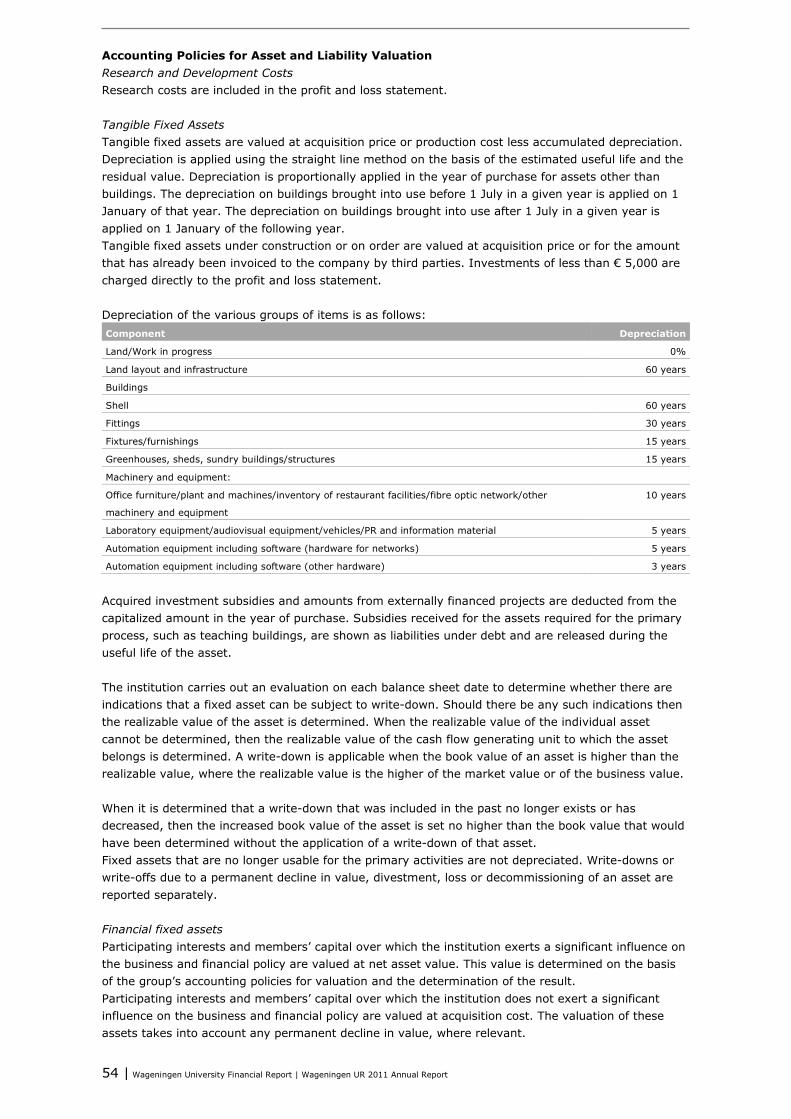
54 | Wageningen University Financial Report | Wageningen UR 2011 Annual Report
Accounting Policies for Asset and Liability Valuation Research and Development Costs Research costs are included in the profit and loss statement. Tangible Fixed Assets Tangible fixed assets are valued at acquisition price or production cost less accumulated depreciation. Depreciation is applied using the straight line method on the basis of the estimated useful life and the residual value. Depreciation is proportionally applied in the year of purchase for assets other than buildings. The depreciation on buildings brought into use before 1 July in a given year is applied on 1 January of that year. The depreciation on buildings brought into use after 1 July in a given year is applied on 1 January of the following year. Tangible fixed assets under construction or on order are valued at acquisition price or for the amount that has already been invoiced to the company by third parties. Investments of less than € 5,000 are charged directly to the profit and loss statement. Depreciation of the various groups of items is as follows: Component Depreciation
Land/Work in progress 0%
Land layout and infrastructure 60 years
Buildings
Shell 60 years
Fittings 30 years
Fixtures/furnishings 15 years
Greenhouses, sheds, sundry buildings/structures 15 years
Machinery and equipment:
Office furniture/plant and machines/inventory of restaurant facilities/fibre optic network/other
machinery and equipment
10 years
Laboratory equipment/audiovisual equipment/vehicles/PR and information material 5 years
Automation equipment including software (hardware for networks) 5 years
Automation equipment including software (other hardware) 3 years
Acquired investment subsidies and amounts from externally financed projects are deducted from the capitalized amount in the year of purchase. Subsidies received for the assets required for the primary process, such as teaching buildings, are shown as liabilities under debt and are released during the useful life of the asset. The institution carries out an evaluation on each balance sheet date to determine whether there are indications that a fixed asset can be subject to write-down. Should there be any such indications then the realizable value of the asset is determined. When the realizable value of the individual asset cannot be determined, then the realizable value of the cash flow generating unit to which the asset belongs is determined. A write-down is applicable when the book value of an asset is higher than the realizable value, where the realizable value is the higher of the market value or of the business value. When it is determined that a write-down that was included in the past no longer exists or has decreased, then the increased book value of the asset is set no higher than the book value that would have been determined without the application of a write-down of that asset. Fixed assets that are no longer usable for the primary activities are not depreciated. Write-downs or write-offs due to a permanent decline in value, divestment, loss or decommissioning of an asset are reported separately. Financial fixed assets Participating interests and members’ capital over which the institution exerts a significant influence on the business and financial policy are valued at net asset value. This value is determined on the basis of the group’s accounting policies for valuation and the determination of the result. Participating interests and members’ capital over which the institution does not exert a significant influence on the business and financial policy are valued at acquisition cost. The valuation of these assets takes into account any permanent decline in value, where relevant.
Wageningen UR 2011 Annual Report | Wageningen University Financial Report | 55
Stocks/Inventory This item is comprised of the trading stock, finished product, livestock and stock of harvested agricultural produce. The trading stock and finished product are valued according to the FIFO method at the acquisition cost or production cost increased by a margin for the indirect costs. The stock of harvested agricultural produce is not valued. The value of unmarketable stock or stock with a lower market value is decreased accordingly. Receivables and Prepayments Receivables are valued at nominal value less, where relevant, a provision for uncollectible debts. Work in Progress Work in progress for third parties is valued at the cost of direct material use and labour, increased by a margin for indirect costs. Invoiced instalments and forecast losses on projects are deducted from this balance. The allocation of the result is determined in proportion to the progress in (the proportion of the realized costs for) that project. The work in progress item is included under short-term receivables and prepayments. Securities Securities are valued at acquisition cost (FIFO method) or lower market value. Internal capital Wageningen University does not distinguish between private and public capital. • General Reserve
This reserve is credited with the operating result in any year in which the result is not allocated to a specific use.
• Appropriated Reserve Two appropriated reserves are formed within the equity capital at corporate level: The innovation fund Reserve for projects to be carried out in future.
Provisions The provisions are valued at nominal value, with the exception of the personnel provisions formed on the basis of RJ 271. The determination of the amount of the obligations takes account of future indexation and price increases. The amount of the provision included in the annual accounts is the best estimate of the amount that will be required to settle the relevant obligations and losses at balance sheet date. Provisions are formed for: • legally enforceable or actual obligations that exist at balance sheet date; • the settlement of obligations that will probably require an outflow of funds; and • obligations when a reliable estimate can be made of those obligations. Provision for Unemployment Insurance Obligations The provision for unemployment insurance obligations covers existing unemployment insurance obligations at balance sheet date and anticipated future expenditures relating to staff who have already left employment and staff employed under a temporary employment contract. Provision for Disability Insurance Act/Resumption of Work (Partially Disabled Persons) Act Obligations The provision for Disability Insurance Act/Resumption of Work (Partially Disabled Persons) Act obligations covers the anticipated Invalidity Insurance Act/Resumption of Work (Partially Disabled Persons) Act obligations at balance sheet date arising from the ‘own risk’ borne by the organization.
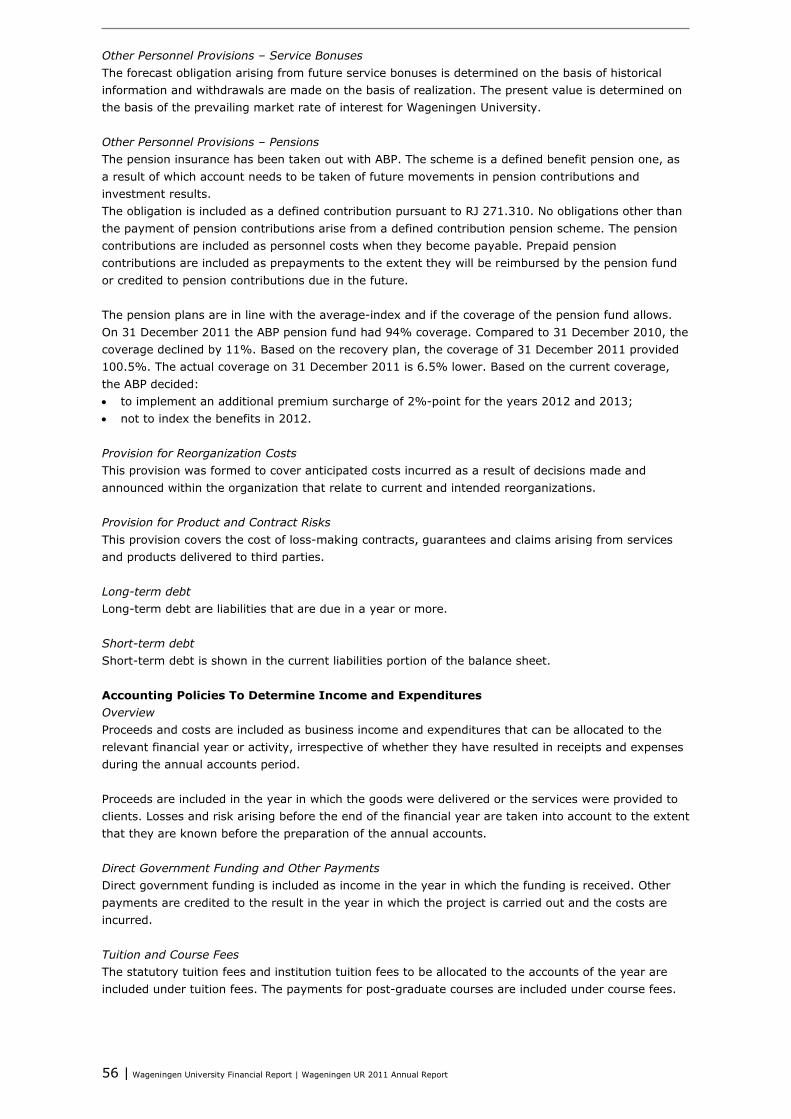
56 | Wageningen University Financial Report | Wageningen UR 2011 Annual Report
Other Personnel Provisions – Service Bonuses The forecast obligation arising from future service bonuses is determined on the basis of historical information and withdrawals are made on the basis of realization. The present value is determined on the basis of the prevailing market rate of interest for Wageningen University. Other Personnel Provisions – Pensions The pension insurance has been taken out with ABP. The scheme is a defined benefit pension one, as a result of which account needs to be taken of future movements in pension contributions and investment results. The obligation is included as a defined contribution pursuant to RJ 271.310. No obligations other than the payment of pension contributions arise from a defined contribution pension scheme. The pension contributions are included as personnel costs when they become payable. Prepaid pension contributions are included as prepayments to the extent they will be reimbursed by the pension fund or credited to pension contributions due in the future. The pension plans are in line with the average-index and if the coverage of the pension fund allows. On 31 December 2011 the ABP pension fund had 94% coverage. Compared to 31 December 2010, the coverage declined by 11%. Based on the recovery plan, the coverage of 31 December 2011 provided 100.5%. The actual coverage on 31 December 2011 is 6.5% lower. Based on the current coverage, the ABP decided: • to implement an additional premium surcharge of 2%-point for the years 2012 and 2013; • not to index the benefits in 2012.
Provision for Reorganization Costs This provision was formed to cover anticipated costs incurred as a result of decisions made and announced within the organization that relate to current and intended reorganizations. Provision for Product and Contract Risks This provision covers the cost of loss-making contracts, guarantees and claims arising from services and products delivered to third parties. Long-term debt Long-term debt are liabilities that are due in a year or more. Short-term debt Short-term debt is shown in the current liabilities portion of the balance sheet. Accounting Policies To Determine Income and Expenditures Overview Proceeds and costs are included as business income and expenditures that can be allocated to the relevant financial year or activity, irrespective of whether they have resulted in receipts and expenses during the annual accounts period. Proceeds are included in the year in which the goods were delivered or the services were provided to clients. Losses and risk arising before the end of the financial year are taken into account to the extent that they are known before the preparation of the annual accounts. Direct Government Funding and Other Payments Direct government funding is included as income in the year in which the funding is received. Other payments are credited to the result in the year in which the project is carried out and the costs are incurred. Tuition and Course Fees The statutory tuition fees and institution tuition fees to be allocated to the accounts of the year are included under tuition fees. The payments for post-graduate courses are included under course fees.
Wageningen UR 2011 Annual Report | Wageningen University Financial Report | 57
Income from Third Party Contracted Research/Work The proceeds from contract activities are included under income from third party contracted research/work item. The income is determined on the basis of the direct costs increased by a margin for indirect costs to a maximum of the rate to be paid by the provider of finance. Results are taken in proportion to the progress in the project. Accounting Principles for Liquidity (Cash Flow) Statement Preparation The cash flow statement was prepared using the indirect method.

58 | Wageningen University Financial Report | Wageningen UR 2011 Annual Report
Notes on the Balance Sheet 1 TANGIBLE FIXED ASSETS Land Buildings Equipment
and Inventory
Work in Progress
Assets Not Used for
the Primary Process
Total
Book value on 31-12-2010 10,986 130,116 21,399 20,888 9,228 192,617
Investments 3,750 6,620 14,597 43,333 0 68,300
Decommisioning –803 –3,655 4,458 0
Divestments* 470 1,582 498 0 1,346 3,896
Depreciation 75 8,191 8,295 0 0 16,561
Write-downs 0 7,090 0 0 0 7,090
Book value on 31-12-2011 13,388 116,218 27,203 64,221 12,340 233,370
Acquisition value on 31-12-2010 15,911 241,017 95,823 20,888 35,285 408,924
Acquisitions 2011 3,750 6,620 14,597 43,333 0 68,299
Decommissioning –1,250 –10,173 11,423 0
Acquisition value of divestments
2011
630 4,063 4,146 0 4,068 12,907
Acquisition value 31-12-2011 17,781 233,401 106,274 64,221 42,639 464,316
Accumulated depreciation 4,393 103,799 79,071 0 28,871 216,134
Accumulated write-downs 0 13,384 0 0 1,428 14,812
Book value 31-12-2011 13,388 116,218 27,203 64,221 12,340 233,370
* Divestments of which:
- Acquisition price 630 4,063 4,146 0 4,068 12,907
- Depreciation 160 2,481 3,648 0 2,722 9,011
Total divestments 470 1,582 498 0 1,346 3,896
* Amounts in € thousands
Wageningen University is carrying out an extensive new construction programme. In 2011, investment took place in new accommodation for the Department of Animal Sciences and in the new education building Orion. The Department of Animal Sciences moved in Autumn 2011. The test facilities will be brought into use in Spring 2012. In 2011, Wageningen University invested € 3.8 million in the Berinchem complex in Bennekom to house students. The value of this complex is determined by the value of the ground. Therefore, this complex is registered under Land. Of the depreciation of € 16.6 million, € 8.3 million relates to regular depreciation of buildings and infrastructure and € 8.3 million on equipment and inventory. Wageningen UR concluded an agreement for the sale of the Kortenoord complex with Bouwfonds MAB Ontwikkeling BV. The relevant assets have been delivered. The definitive selling price of the first subplan was established in 2011. Assets with a book value of € 3.4 million have been fully settled. The definitive selling price of the other subplans will be determined on the basis of the development planning for the land. Because Wageningen University is the economic owner of the assets, the assets are included in the balance sheet at a book value of € 16.9 million. The Animal Sciences and Zodiac testing facilities were still in use on 31 December 2011. It is expected that the use of these buildings will be terminated in 2012. Deposit received for subplans 2 to 4 totalling € 3.4 million (including interest) is included under short-term debt. The Administration Centre, LA13 and the ISRIC building on the Duivendaal complex were decommissioned in 2011.
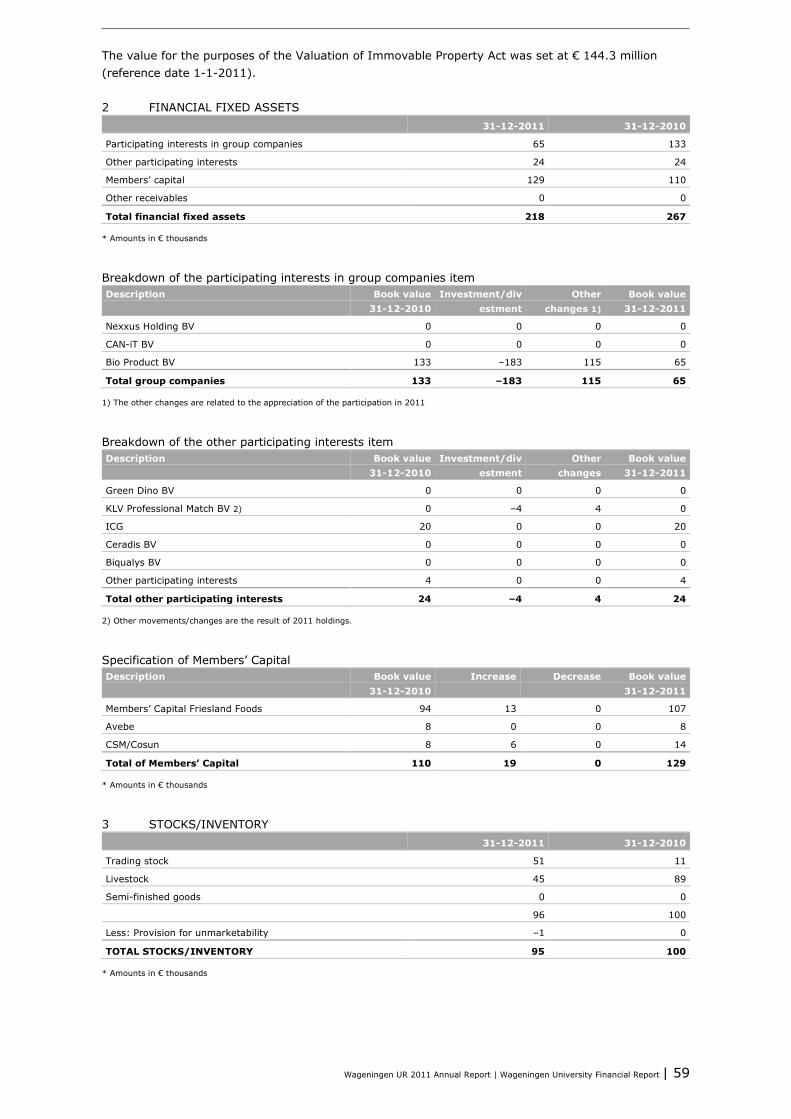
Wageningen UR 2011 Annual Report | Wageningen University Financial Report | 59
The value for the purposes of the Valuation of Immovable Property Act was set at € 144.3 million (reference date 1-1-2011). 2 FINANCIAL FIXED ASSETS 31-12-2011 31-12-2010
Participating interests in group companies 65 133
Other participating interests 24 24
Members’ capital 129 110
Other receivables 0 0
Total financial fixed assets 218 267
* Amounts in € thousands
Breakdown of the participating interests in group companies item Description Book value
31-12-2010 Investment/div
estment Other
changes 1) Book value
31-12-2011
Nexxus Holding BV 0 0 0 0
CAN-iT BV 0 0 0 0
Bio Product BV 133 –183 115 65
Total group companies 133 –183 115 65
1) The other changes are related to the appreciation of the participation in 2011
Breakdown of the other participating interests item Description Book value
31-12-2010 Investment/div
estment Other
changes Book value
31-12-2011
Green Dino BV 0 0 0 0
KLV Professional Match BV 2) 0 –4 4 0
ICG 20 0 0 20
Ceradis BV 0 0 0 0
Biqualys BV 0 0 0 0
Other participating interests 4 0 0 4
Total other participating interests 24 –4 4 24
2) Other movements/changes are the result of 2011 holdings.
Specification of Members’ Capital Description Book value
31-12-2010 Increase Decrease Book value
31-12-2011
Members’ Capital Friesland Foods 94 13 0 107
Avebe 8 0 0 8
CSM/Cosun 8 6 0 14
Total of Members’ Capital 110 19 0 129
* Amounts in € thousands
3 STOCKS/INVENTORY 31-12-2011 31-12-2010
Trading stock 51 11
Livestock 45 89
Semi-finished goods 0 0
96 100
Less: Provision for unmarketability –1 0
TOTAL STOCKS/INVENTORY 95 100
* Amounts in € thousands
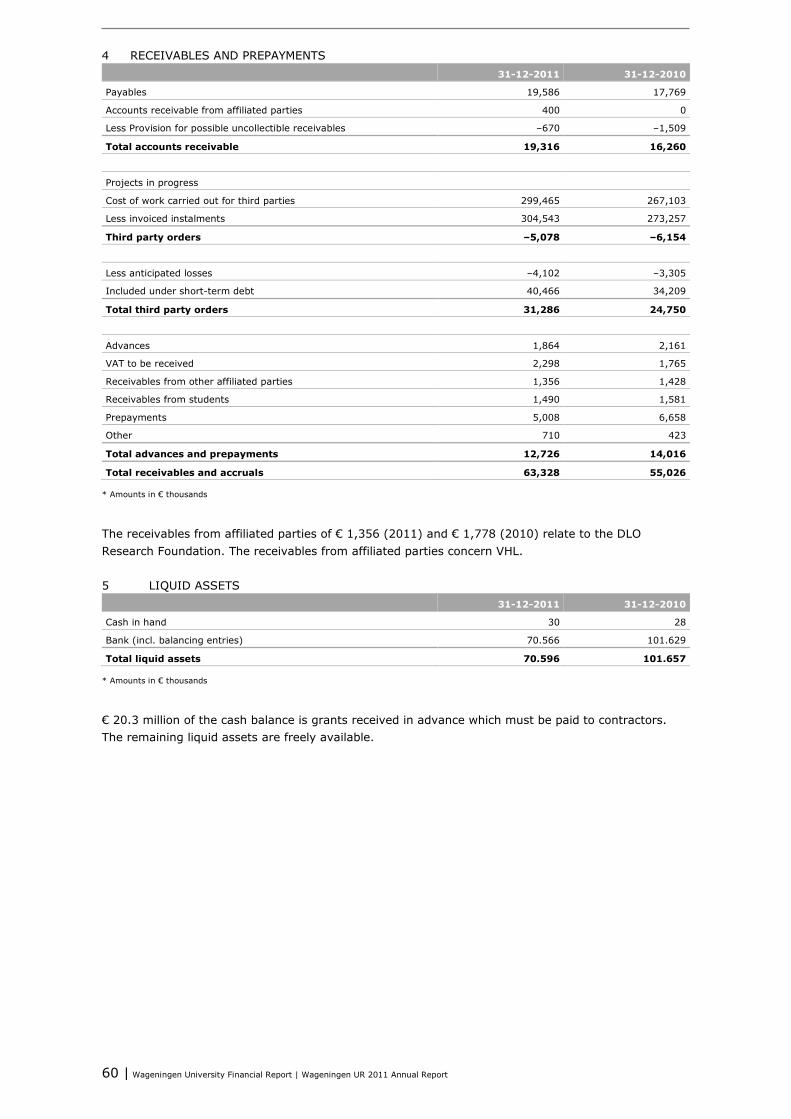
60 | Wageningen University Financial Report | Wageningen UR 2011 Annual Report
4 RECEIVABLES AND PREPAYMENTS 31-12-2011 31-12-2010
Payables 19,586 17,769
Accounts receivable from affiliated parties 400 0
Less Provision for possible uncollectible receivables –670 –1,509
Total accounts receivable 19,316 16,260
Projects in progress
Cost of work carried out for third parties 299,465 267,103
Less invoiced instalments 304,543 273,257
Third party orders –5,078 –6,154
Less anticipated losses –4,102 –3,305
Included under short-term debt 40,466 34,209
Total third party orders 31,286 24,750
Advances 1,864 2,161
VAT to be received 2,298 1,765
Receivables from other affiliated parties 1,356 1,428
Receivables from students 1,490 1,581
Prepayments 5,008 6,658
Other 710 423
Total advances and prepayments 12,726 14,016
Total receivables and accruals 63,328 55,026
* Amounts in € thousands
The receivables from affiliated parties of € 1,356 (2011) and € 1,778 (2010) relate to the DLO Research Foundation. The receivables from affiliated parties concern VHL. 5 LIQUID ASSETS 31-12-2011 31-12-2010
Cash in hand 30 28
Bank (incl. balancing entries) 70.566 101.629
Total liquid assets 70.596 101.657
* Amounts in € thousands
€ 20.3 million of the cash balance is grants received in advance which must be paid to contractors. The remaining liquid assets are freely available.
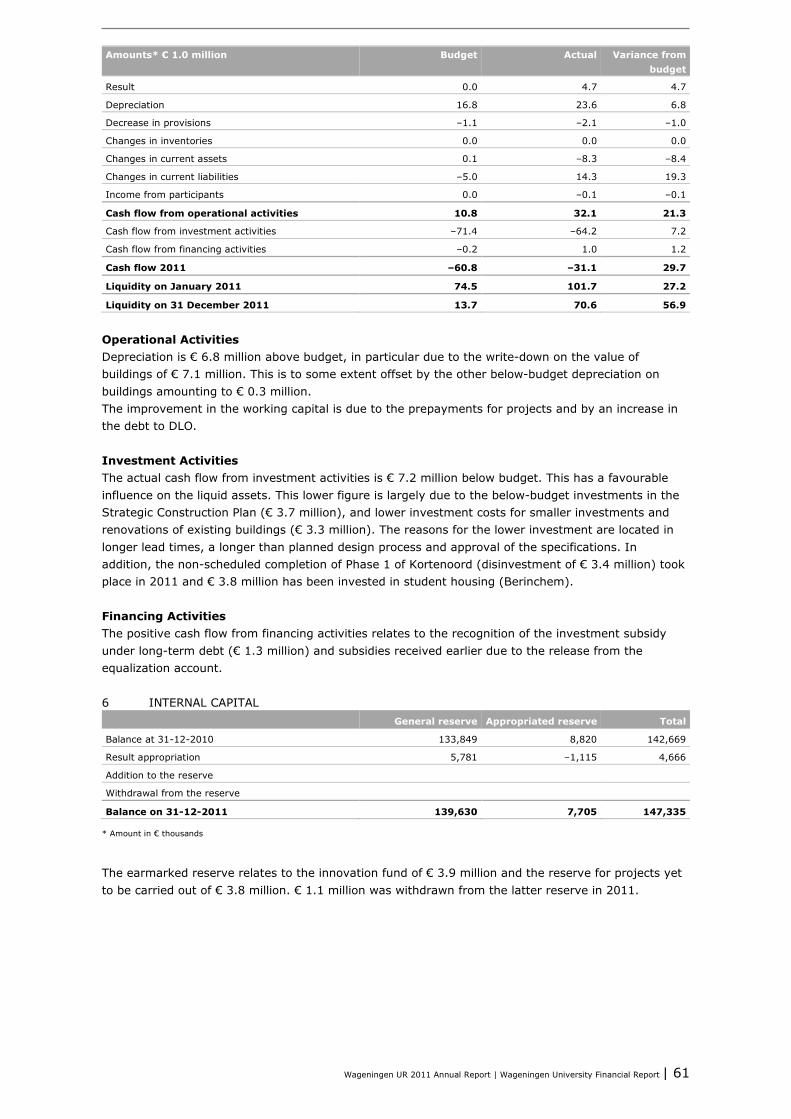
Wageningen UR 2011 Annual Report | Wageningen University Financial Report | 61
Amounts* € 1.0 million Budget Actual Variance from budget
Result 0.0 4.7 4.7
Depreciation 16.8 23.6 6.8
Decrease in provisions –1.1 –2.1 –1.0
Changes in inventories 0.0 0.0 0.0
Changes in current assets 0.1 –8.3 –8.4
Changes in current liabilities –5.0 14.3 19.3
Income from participants 0.0 –0.1 –0.1
Cash flow from operational activities 10.8 32.1 21.3
Cash flow from investment activities –71.4 –64.2 7.2
Cash flow from financing activities –0.2 1.0 1.2
Cash flow 2011 –60.8 –31.1 29.7
Liquidity on January 2011 74.5 101.7 27.2
Liquidity on 31 December 2011 13.7 70.6 56.9
Operational Activities Depreciation is € 6.8 million above budget, in particular due to the write-down on the value of buildings of € 7.1 million. This is to some extent offset by the other below-budget depreciation on buildings amounting to € 0.3 million. The improvement in the working capital is due to the prepayments for projects and by an increase in the debt to DLO. Investment Activities The actual cash flow from investment activities is € 7.2 million below budget. This has a favourable influence on the liquid assets. This lower figure is largely due to the below-budget investments in the Strategic Construction Plan (€ 3.7 million), and lower investment costs for smaller investments and renovations of existing buildings (€ 3.3 million). The reasons for the lower investment are located in longer lead times, a longer than planned design process and approval of the specifications. In addition, the non-scheduled completion of Phase 1 of Kortenoord (disinvestment of € 3.4 million) took place in 2011 and € 3.8 million has been invested in student housing (Berinchem). Financing Activities The positive cash flow from financing activities relates to the recognition of the investment subsidy under long-term debt (€ 1.3 million) and subsidies received earlier due to the release from the equalization account. 6 INTERNAL CAPITAL General reserve Appropriated reserve Total
Balance at 31-12-2010 133,849 8,820 142,669
Result appropriation 5,781 –1,115 4,666
Addition to the reserve
Withdrawal from the reserve
Balance on 31-12-2011 139,630 7,705 147,335
* Amount in € thousands
The earmarked reserve relates to the innovation fund of € 3.9 million and the reserve for projects yet to be carried out of € 3.8 million. € 1.1 million was withdrawn from the latter reserve in 2011.
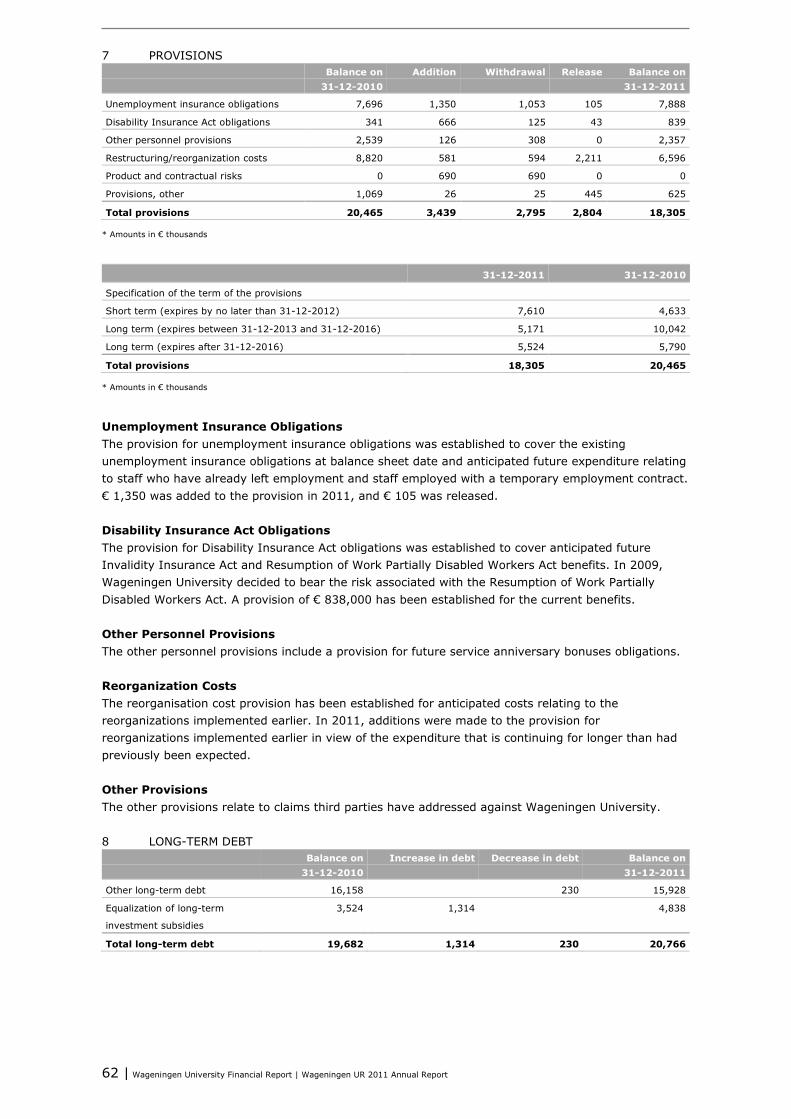
62 | Wageningen University Financial Report | Wageningen UR 2011 Annual Report
7 PROVISIONS Balance on
31-12-2010 Addition Withdrawal Release Balance on
31-12-2011
Unemployment insurance obligations 7,696 1,350 1,053 105 7,888
Disability Insurance Act obligations 341 666 125 43 839
Other personnel provisions 2,539 126 308 0 2,357
Restructuring/reorganization costs 8,820 581 594 2,211 6,596
Product and contractual risks 0 690 690 0 0
Provisions, other 1,069 26 25 445 625
Total provisions 20,465 3,439 2,795 2,804 18,305
* Amounts in € thousands
31-12-2011 31-12-2010
Specification of the term of the provisions
Short term (expires by no later than 31-12-2012) 7,610 4,633
Long term (expires between 31-12-2013 and 31-12-2016) 5,171 10,042
Long term (expires after 31-12-2016) 5,524 5,790
Total provisions 18,305 20,465
* Amounts in € thousands
Unemployment Insurance Obligations The provision for unemployment insurance obligations was established to cover the existing unemployment insurance obligations at balance sheet date and anticipated future expenditure relating to staff who have already left employment and staff employed with a temporary employment contract. € 1,350 was added to the provision in 2011, and € 105 was released. Disability Insurance Act Obligations The provision for Disability Insurance Act obligations was established to cover anticipated future Invalidity Insurance Act and Resumption of Work Partially Disabled Workers Act benefits. In 2009, Wageningen University decided to bear the risk associated with the Resumption of Work Partially Disabled Workers Act. A provision of € 838,000 has been established for the current benefits. Other Personnel Provisions The other personnel provisions include a provision for future service anniversary bonuses obligations. Reorganization Costs The reorganisation cost provision has been established for anticipated costs relating to the reorganizations implemented earlier. In 2011, additions were made to the provision for reorganizations implemented earlier in view of the expenditure that is continuing for longer than had previously been expected. Other Provisions The other provisions relate to claims third parties have addressed against Wageningen University. 8 LONG-TERM DEBT Balance on
31-12-2010 Increase in debt Decrease in debt Balance on
31-12-2011
Other long-term debt 16,158 230 15,928
Equalization of long-term
investment subsidies
3,524 1,314 4,838
Total long-term debt 19,682 1,314 230 20,766
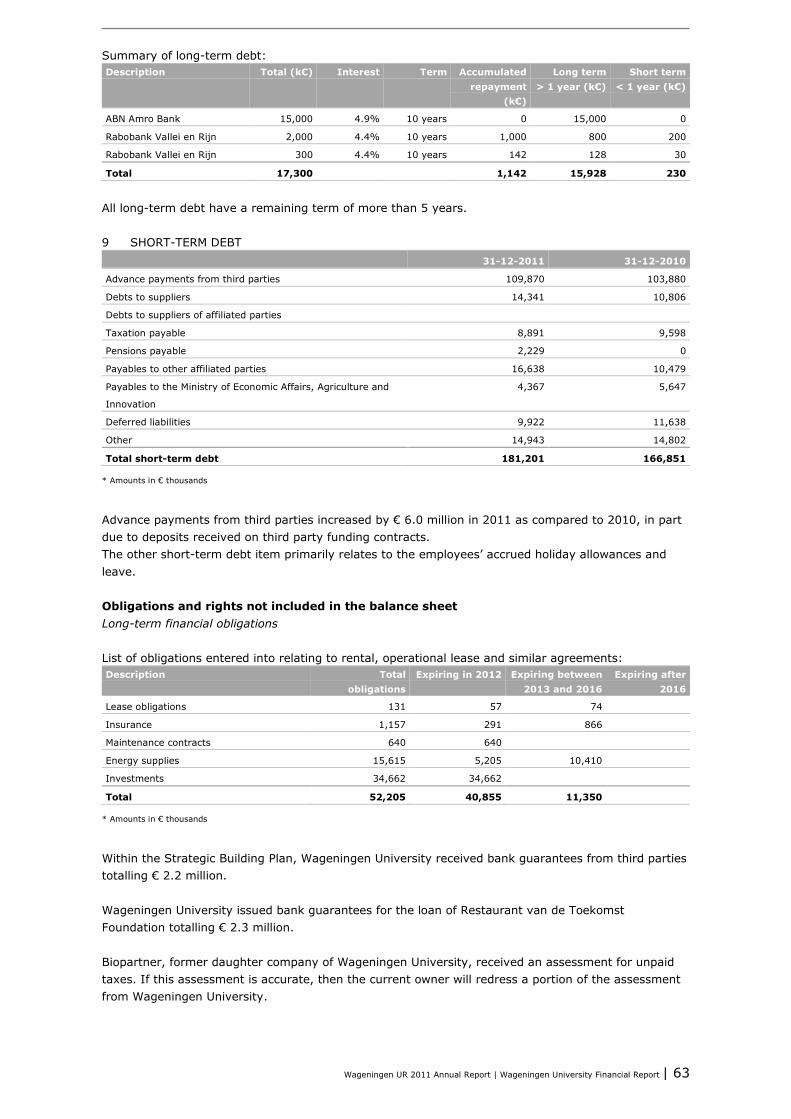
Wageningen UR 2011 Annual Report | Wageningen University Financial Report | 63
Summary of long-term debt: Description Total (k€) Interest Term Accumulated
repayment (k€)
Long term > 1 year (k€)
Short term < 1 year (k€)
ABN Amro Bank 15,000 4.9% 10 years 0 15,000 0
Rabobank Vallei en Rijn 2,000 4.4% 10 years 1,000 800 200
Rabobank Vallei en Rijn 300 4.4% 10 years 142 128 30
Total 17,300 1,142 15,928 230
All long-term debt have a remaining term of more than 5 years. 9 SHORT-TERM DEBT 31-12-2011 31-12-2010
Advance payments from third parties 109,870 103,880
Debts to suppliers 14,341 10,806
Debts to suppliers of affiliated parties
Taxation payable 8,891 9,598
Pensions payable 2,229 0
Payables to other affiliated parties 16,638 10,479
Payables to the Ministry of Economic Affairs, Agriculture and
Innovation
4,367 5,647
Deferred liabilities 9,922 11,638
Other 14,943 14,802
Total short-term debt 181,201 166,851
* Amounts in € thousands
Advance payments from third parties increased by € 6.0 million in 2011 as compared to 2010, in part due to deposits received on third party funding contracts. The other short-term debt item primarily relates to the employees’ accrued holiday allowances and leave. Obligations and rights not included in the balance sheet Long-term financial obligations List of obligations entered into relating to rental, operational lease and similar agreements: Description Total
obligations Expiring in 2012 Expiring between
2013 and 2016 Expiring after
2016
Lease obligations 131 57 74
Insurance 1,157 291 866
Maintenance contracts 640 640
Energy supplies 15,615 5,205 10,410
Investments 34,662 34,662
Total 52,205 40,855 11,350
* Amounts in € thousands
Within the Strategic Building Plan, Wageningen University received bank guarantees from third parties totalling € 2.2 million. Wageningen University issued bank guarantees for the loan of Restaurant van de Toekomst Foundation totalling € 2.3 million. Biopartner, former daughter company of Wageningen University, received an assessment for unpaid taxes. If this assessment is accurate, then the current owner will redress a portion of the assessment from Wageningen University.
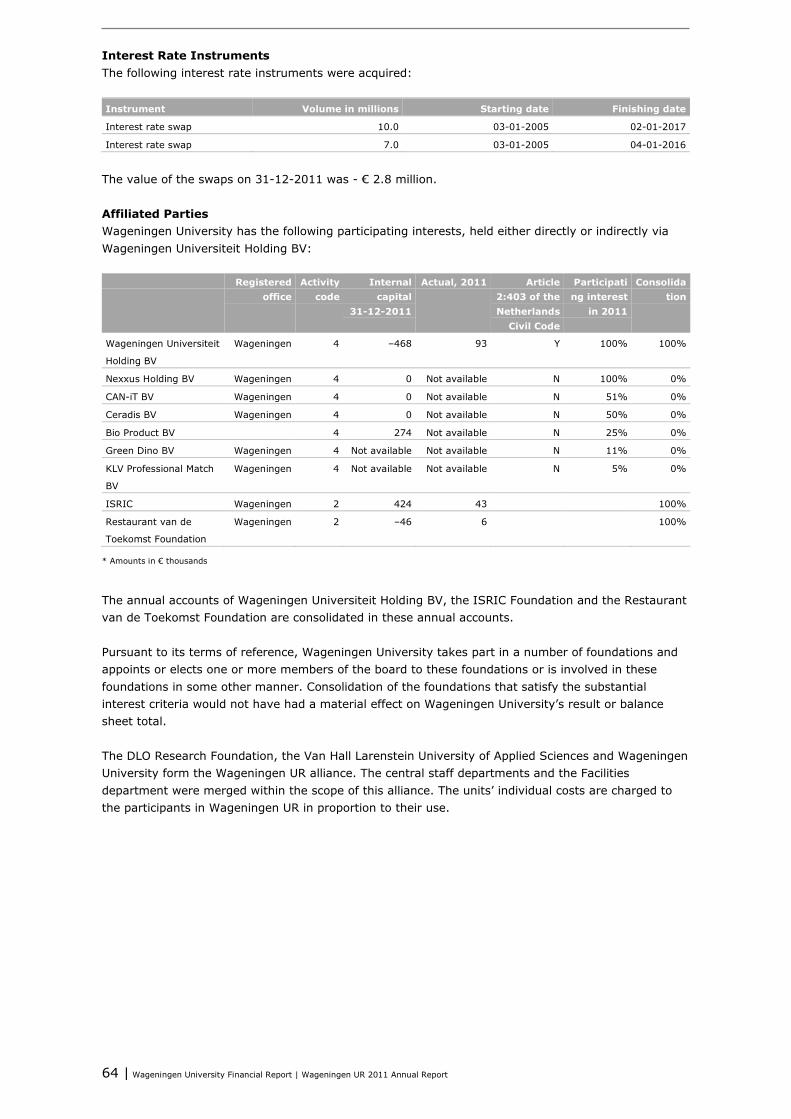
64 | Wageningen University Financial Report | Wageningen UR 2011 Annual Report
Interest Rate Instruments The following interest rate instruments were acquired: Instrument Volume in millions Starting date Finishing date
Interest rate swap 10.0 03-01-2005 02-01-2017
Interest rate swap 7.0 03-01-2005 04-01-2016
The value of the swaps on 31-12-2011 was - € 2.8 million. Affiliated Parties Wageningen University has the following participating interests, held either directly or indirectly via Wageningen Universiteit Holding BV: Registered
office Activity
code Internal
capital 31-12-2011
Actual, 2011 Article 2:403 of the Netherlands
Civil Code
Participating interest
in 2011
Consolidation
Wageningen Universiteit
Holding BV
Wageningen 4 –468 93 Y 100% 100%
Nexxus Holding BV Wageningen 4 0 Not available N 100% 0%
CAN-iT BV Wageningen 4 0 Not available N 51% 0%
Ceradis BV Wageningen 4 0 Not available N 50% 0%
Bio Product BV 4 274 Not available N 25% 0%
Green Dino BV Wageningen 4 Not available Not available N 11% 0%
KLV Professional Match
BV
Wageningen 4 Not available Not available N 5% 0%
ISRIC Wageningen 2 424 43 100%
Restaurant van de
Toekomst Foundation
Wageningen 2 –46 6 100%
* Amounts in € thousands
The annual accounts of Wageningen Universiteit Holding BV, the ISRIC Foundation and the Restaurant van de Toekomst Foundation are consolidated in these annual accounts. Pursuant to its terms of reference, Wageningen University takes part in a number of foundations and appoints or elects one or more members of the board to these foundations or is involved in these foundations in some other manner. Consolidation of the foundations that satisfy the substantial interest criteria would not have had a material effect on Wageningen University’s result or balance sheet total. The DLO Research Foundation, the Van Hall Larenstein University of Applied Sciences and Wageningen University form the Wageningen UR alliance. The central staff departments and the Facilities department were merged within the scope of this alliance. The units’ individual costs are charged to the participants in Wageningen UR in proportion to their use.
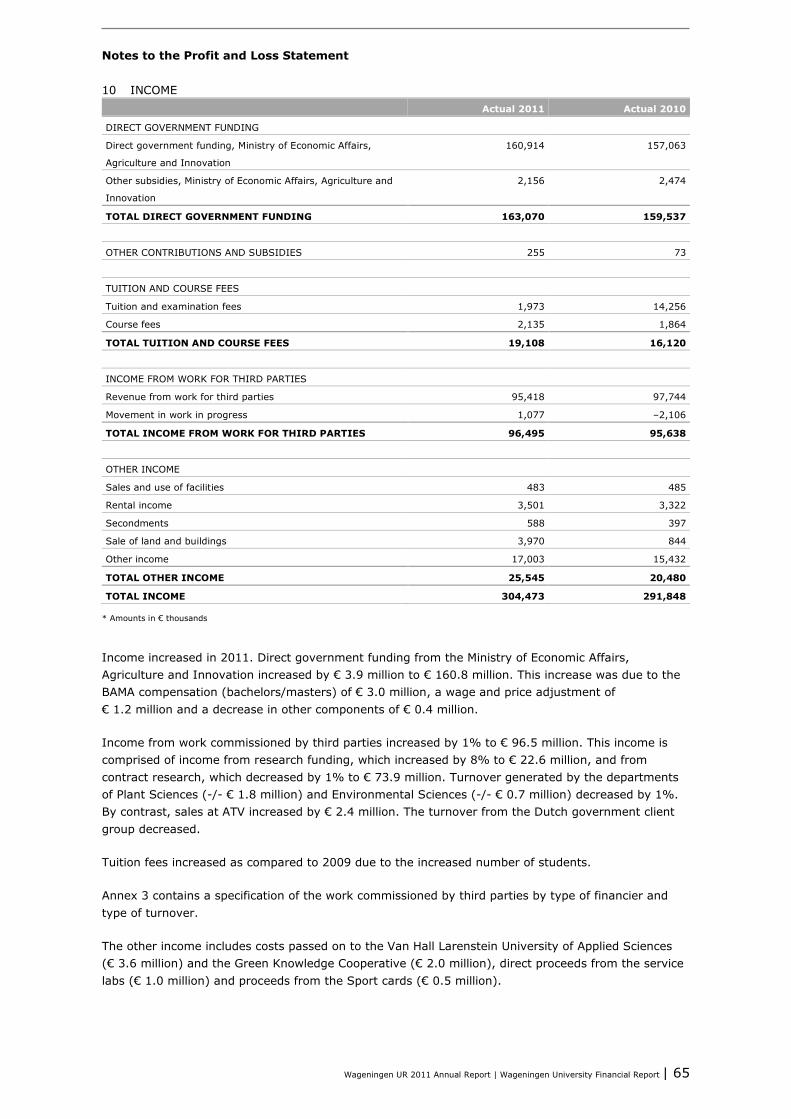
Wageningen UR 2011 Annual Report | Wageningen University Financial Report | 65
Notes to the Profit and Loss Statement 10 INCOME Actual 2011 Actual 2010
DIRECT GOVERNMENT FUNDING
Direct government funding, Ministry of Economic Affairs,
Agriculture and Innovation
160,914 157,063
Other subsidies, Ministry of Economic Affairs, Agriculture and
Innovation
2,156 2,474
TOTAL DIRECT GOVERNMENT FUNDING 163,070 159,537
OTHER CONTRIBUTIONS AND SUBSIDIES 255 73
TUITION AND COURSE FEES
Tuition and examination fees 1,973 14,256
Course fees 2,135 1,864
TOTAL TUITION AND COURSE FEES 19,108 16,120
INCOME FROM WORK FOR THIRD PARTIES
Revenue from work for third parties 95,418 97,744
Movement in work in progress 1,077 –2,106
TOTAL INCOME FROM WORK FOR THIRD PARTIES 96,495 95,638
OTHER INCOME
Sales and use of facilities 483 485
Rental income 3,501 3,322
Secondments 588 397
Sale of land and buildings 3,970 844
Other income 17,003 15,432
TOTAL OTHER INCOME 25,545 20,480
TOTAL INCOME 304,473 291,848
* Amounts in € thousands
Income increased in 2011. Direct government funding from the Ministry of Economic Affairs, Agriculture and Innovation increased by € 3.9 million to € 160.8 million. This increase was due to the BAMA compensation (bachelors/masters) of € 3.0 million, a wage and price adjustment of € 1.2 million and a decrease in other components of € 0.4 million.
Income from work commissioned by third parties increased by 1% to € 96.5 million. This income is comprised of income from research funding, which increased by 8% to € 22.6 million, and from contract research, which decreased by 1% to € 73.9 million. Turnover generated by the departments of Plant Sciences (-/- € 1.8 million) and Environmental Sciences (-/- € 0.7 million) decreased by 1%. By contrast, sales at ATV increased by € 2.4 million. The turnover from the Dutch government client group decreased.
Tuition fees increased as compared to 2009 due to the increased number of students.
Annex 3 contains a specification of the work commissioned by third parties by type of financier and type of turnover.
The other income includes costs passed on to the Van Hall Larenstein University of Applied Sciences (€ 3.6 million) and the Green Knowledge Cooperative (€ 2.0 million), direct proceeds from the service labs (€ 1.0 million) and proceeds from the Sport cards (€ 0.5 million).
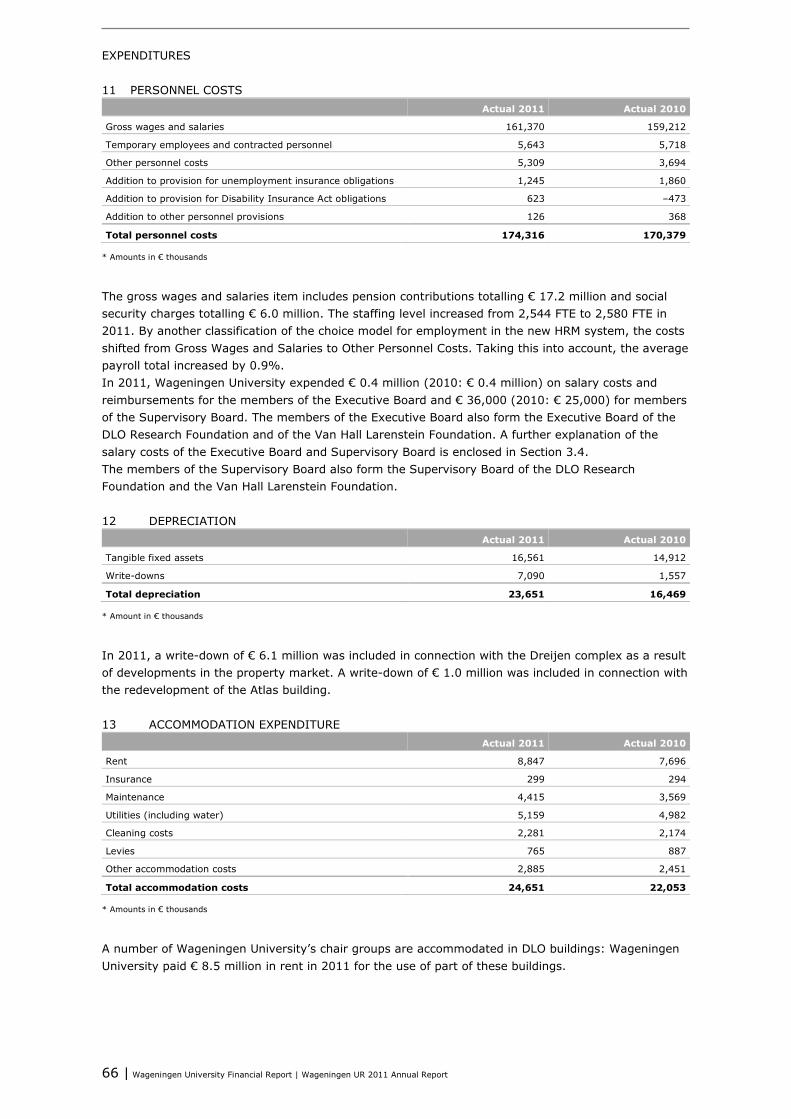
66 | Wageningen University Financial Report | Wageningen UR 2011 Annual Report
EXPENDITURES 11 PERSONNEL COSTS Actual 2011 Actual 2010
Gross wages and salaries 161,370 159,212
Temporary employees and contracted personnel 5,643 5,718
Other personnel costs 5,309 3,694
Addition to provision for unemployment insurance obligations 1,245 1,860
Addition to provision for Disability Insurance Act obligations 623 –473
Addition to other personnel provisions 126 368
Total personnel costs 174,316 170,379
* Amounts in € thousands
The gross wages and salaries item includes pension contributions totalling € 17.2 million and social security charges totalling € 6.0 million. The staffing level increased from 2,544 FTE to 2,580 FTE in 2011. By another classification of the choice model for employment in the new HRM system, the costs shifted from Gross Wages and Salaries to Other Personnel Costs. Taking this into account, the average payroll total increased by 0.9%. In 2011, Wageningen University expended € 0.4 million (2010: € 0.4 million) on salary costs and reimbursements for the members of the Executive Board and € 36,000 (2010: € 25,000) for members of the Supervisory Board. The members of the Executive Board also form the Executive Board of the DLO Research Foundation and of the Van Hall Larenstein Foundation. A further explanation of the salary costs of the Executive Board and Supervisory Board is enclosed in Section 3.4. The members of the Supervisory Board also form the Supervisory Board of the DLO Research Foundation and the Van Hall Larenstein Foundation. 12 DEPRECIATION Actual 2011 Actual 2010
Tangible fixed assets 16,561 14,912
Write-downs 7,090 1,557
Total depreciation 23,651 16,469
* Amount in € thousands
In 2011, a write-down of € 6.1 million was included in connection with the Dreijen complex as a result of developments in the property market. A write-down of € 1.0 million was included in connection with the redevelopment of the Atlas building. 13 ACCOMMODATION EXPENDITURE Actual 2011 Actual 2010
Rent 8,847 7,696
Insurance 299 294
Maintenance 4,415 3,569
Utilities (including water) 5,159 4,982
Cleaning costs 2,281 2,174
Levies 765 887
Other accommodation costs 2,885 2,451
Total accommodation costs 24,651 22,053
* Amounts in € thousands
A number of Wageningen University’s chair groups are accommodated in DLO buildings: Wageningen University paid € 8.5 million in rent in 2011 for the use of part of these buildings.
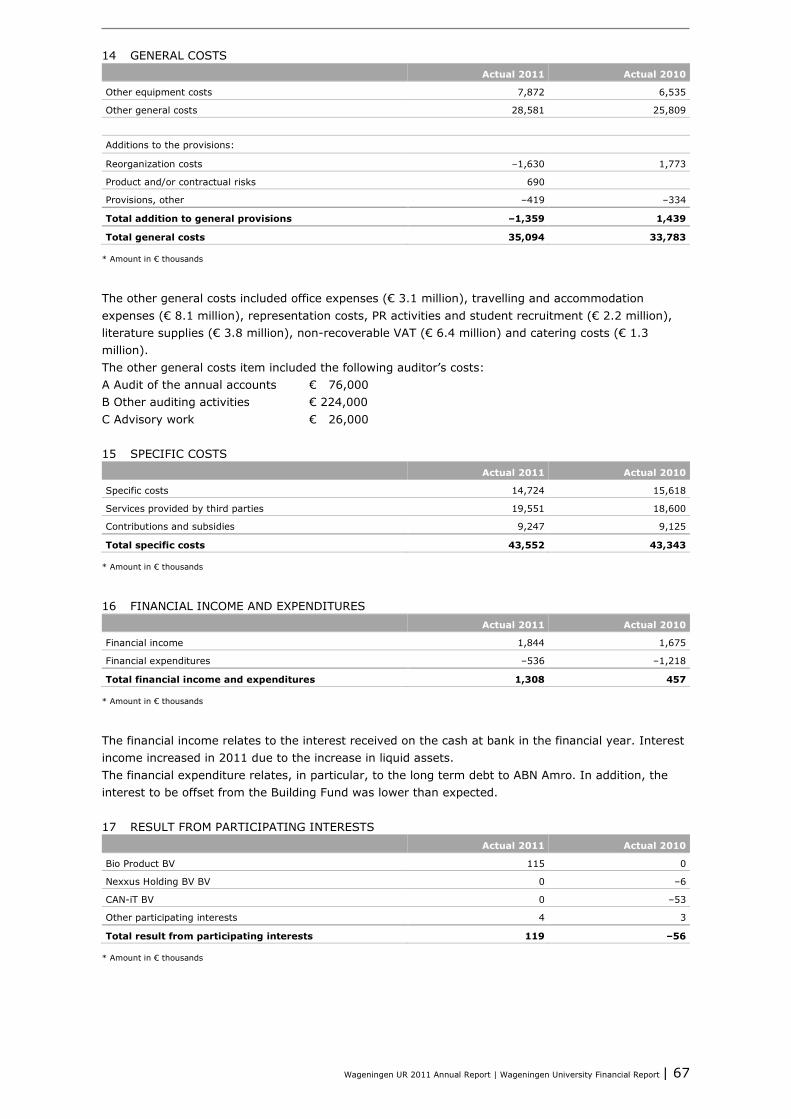
Wageningen UR 2011 Annual Report | Wageningen University Financial Report | 67
14 GENERAL COSTS Actual 2011 Actual 2010
Other equipment costs 7,872 6,535
Other general costs 28,581 25,809
Additions to the provisions:
Reorganization costs –1,630 1,773
Product and/or contractual risks 690
Provisions, other –419 –334
Total addition to general provisions –1,359 1,439
Total general costs 35,094 33,783
* Amount in € thousands
The other general costs included office expenses (€ 3.1 million), travelling and accommodation expenses (€ 8.1 million), representation costs, PR activities and student recruitment (€ 2.2 million), literature supplies (€ 3.8 million), non-recoverable VAT (€ 6.4 million) and catering costs (€ 1.3 million). The other general costs item included the following auditor’s costs: A Audit of the annual accounts € 76,000 B Other auditing activities € 224,000 C Advisory work € 26,000 15 SPECIFIC COSTS Actual 2011 Actual 2010
Specific costs 14,724 15,618
Services provided by third parties 19,551 18,600
Contributions and subsidies 9,247 9,125
Total specific costs 43,552 43,343
* Amount in € thousands
16 FINANCIAL INCOME AND EXPENDITURES Actual 2011 Actual 2010
Financial income 1,844 1,675
Financial expenditures –536 –1,218
Total financial income and expenditures 1,308 457
* Amount in € thousands
The financial income relates to the interest received on the cash at bank in the financial year. Interest income increased in 2011 due to the increase in liquid assets. The financial expenditure relates, in particular, to the long term debt to ABN Amro. In addition, the interest to be offset from the Building Fund was lower than expected. 17 RESULT FROM PARTICIPATING INTERESTS Actual 2011 Actual 2010
Bio Product BV 115 0
Nexxus Holding BV BV 0 –6
CAN-iT BV 0 –53
Other participating interests 4 3
Total result from participating interests 119 –56
* Amount in € thousands

68 | Wageningen University Financial Report | Wageningen UR 2011 Annual Report
Separate Financial Statements SEPARATE BALANCE SHEET 31-12-2011 31-12-2010
ASSETS
FIXED ASSETS
Tangible fixed assets 240,830 192,613
Financial fixed assets –336 –447
Total fixed assets 240,494 192,166
CURRENT ASSETS
Stocks 95 100
Receivables and prepayments 54,392 53,675
Cash at bank and in hand 69,415 100,135
Total current assets 123,902 153,910
TOTAL ASSETS 364,396 346,076
LIABILITIES
INTERNAL CAPITAL 146,958 142,331
PROVISIONS 18,015 20,134
LONG-TERM DEBT 19,836 18,523
SHORT-TERM DEBT 179,587 165,088
TOTAL LIABILITIES 364,396 346,076
* Amount in € thousands
The separate balance sheet does not incorporate ISRIC information, Restaurant van de Toekomst information or WU Holding BV information. This balance sheet incorporates Wageningen University’s receivables from ISRIC and WU Holding BV. The internal capital varies from the internal capital included in the consolidated balance sheet by an amount totalling € 378,000. This variance relates to ISRIC (€ 424,000) and Restaurant van de Toekomst (€- 46,000). Obligations not included in the balance sheet are equal to those in the consolidated account.
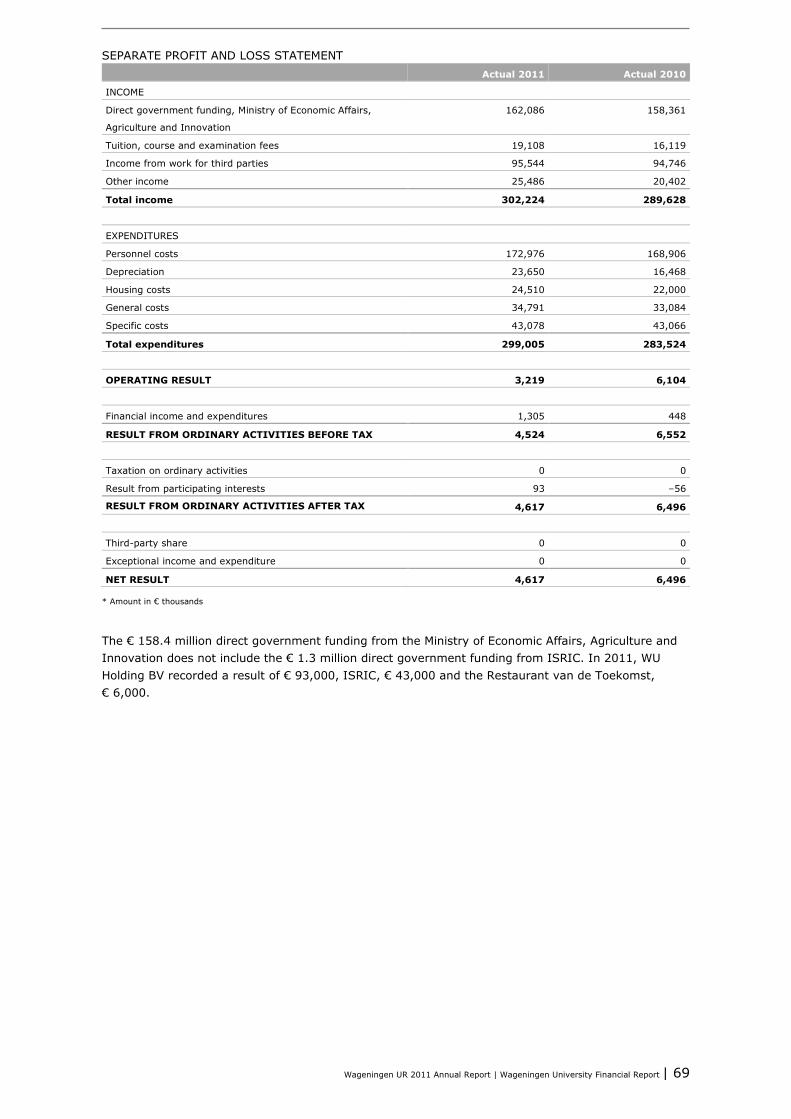
Wageningen UR 2011 Annual Report | Wageningen University Financial Report | 69
SEPARATE PROFIT AND LOSS STATEMENT Actual 2011 Actual 2010
INCOME
Direct government funding, Ministry of Economic Affairs,
Agriculture and Innovation
162,086 158,361
Tuition, course and examination fees 19,108 16,119
Income from work for third parties 95,544 94,746
Other income 25,486 20,402
Total income 302,224 289,628
EXPENDITURES
Personnel costs 172,976 168,906
Depreciation 23,650 16,468
Housing costs 24,510 22,000
General costs 34,791 33,084
Specific costs 43,078 43,066
Total expenditures 299,005 283,524
OPERATING RESULT 3,219 6,104
Financial income and expenditures 1,305 448
RESULT FROM ORDINARY ACTIVITIES BEFORE TAX 4,524 6,552
Taxation on ordinary activities 0 0
Result from participating interests 93 –56
RESULT FROM ORDINARY ACTIVITIES AFTER TAX 4,617 6,496
Third-party share 0 0
Exceptional income and expenditure 0 0
NET RESULT 4,617 6,496
* Amount in € thousands
The € 158.4 million direct government funding from the Ministry of Economic Affairs, Agriculture and Innovation does not include the € 1.3 million direct government funding from ISRIC. In 2011, WU Holding BV recorded a result of € 93,000, ISRIC, € 43,000 and the Restaurant van de Toekomst, € 6,000.
70 | Wageningen University Financial Report | Wageningen UR 2011 Annual Report
3.1.2 Supplementary Information
Post Balance Sheet Events There were no post balance sheet events that gave rise to the adjustment of or notification in the annual accounts. Independent auditor's report Report on the financial statements We have audited the accompanying financial statements 2011 of Wageningen University, Wageningen, which comprise the consolidated and company balance sheet as at December 31, 2011, the consolidated and company profit and loss account for the year then ended and the notes, comprising a summary of the accounting policies and other explanatory information. Management's responsibility Management is responsible for the preparation and fair presentation of these financial statements and for the preparation of the management board report, bath in accordance with 'Regeling jaarverslaggeving onderwijs'. Management is also responsible for financial rightfulness of the revenues, casts and changes in balance sheet items. This means that these amounts should be in accordance with appropriate rules and regulations. Furthermore management is responsible for such internal control as it determines is necessary to enable the preparation of the financial statements that are free from material misstatement, whether due to fraud or error. Auditor's responsibility Our responsibility is to express an opinion on these financial statements based on our audit as meant in section 2.9, paragraph 3 of 'Wet op het hoger onderwijs en wetenschappelijk onderzoek'. We conducted our audit in accordance with Dutch law, including the Dutch Standards on Auditing and 'Onderwijscontroleprotocol OCW/EL&I 2011'. This requires that we comply with ethical requirements and plan and perform the audit to obtain reasonable assurance about whether the financial statements are free from material misstatement. An audit involves performing procedures to obtain audit evidence about the amounts and disclosures in the financial statements. The procedures selected depend on the auditor's judgment, including the assessment of the risks of material misstatement of the financial statements, whether due to fraud or error. In making those risk assessments, the auditor considers internal control relevant to the entity's preparation and fair presentation of the financial statements in order to design audit procedures that are appropriate in the circumstances, but not for the purpose of expressing an opinion on the effectiveness of the entity's internal control. An audit also includes evaluating the appropriateness of accounting policies used and the reasonableness of accounting estimates made by management, as well as evaluating the overall presentation of the financial statements. We believe that the audit evidence we have obtained is sufficient and appropriate to provide a basis for our audit opinion. Opinion with respect to the financial statements In our opinion, the financial statements give a true and fair view of the financial position of Wageningen University as at December 31, 2011 and of its result for the year then ended in accordance with 'Regeling jaarverslaggeving onderwijs'. Furthermore, we are of the opinion that the revenues, costs and movements in balance sheet items meet the requirements of financial rightfulness. This means that these amounts are in accordance with appropriate rules and regulations, as mentioned in section 2.3.1 of 'Referentiekader van het onderwijscontroleprotocol OCW/EL&I 2011'.
Wageningen UR 2011 Annual Report | Wageningen University Financial Report | 71
Report on other legal and regulatory requirements Pursuant to the legal requirement under Section 2:393 sub 5 at e and f of the Dutch Civil Code, we have no deficiencies to report as a result of our examination whether the management board report, to the extent we can assess, has been prepared in accordance with Part 9 of Book 2 of this Code, and whether the information as required under Section 2:392 sub 1 at b-h has been annexed. Further we report that the management board report, to the extent we can assess, is consistent with the financial statements as required by Section 2:391 sub 4 of the Dutch Civil Code. Arnhem, 21 May 2012 Ernst & Young Accountants LLP w.g. F. de Bruijn RA
72 | Wageningen University Financial Report | Wageningen UR 2011 Annual Report
3.1.3 Appendices
Appendix 1 Clarifications Outsourcing of one or more Components of CROHO Registered Study Programmes to a Private Organization (+ costs) Wageningen University does not outsource activities in the sense referred to above. Any outside expertise contracted for teaching (for example, as a consequence of the earlier ‘division of duties & concentration’ operations) is contracted from sister higher education institutions and not from private institutions. Customised Programmes for Companies/Organizations Wageningen University does not provide any customized programmes for companies and/or organizations in the form of CROHO registered courses leading to a certificate. Customization in the form of post-initial courses are provide under the Wageningen UR umbrella by the Centre for Development and Innovation (CDI) and Wageningen Business School (WBS). Personnel Registered for Initial Study Programmes Once again, in 2011 Wageningen University had a large number of students who were simultaneously appointed members of staff of the university or members of staff who were also enrolled as students. The names of these persons are known. These persons include student assistants and students with a part-time job for a limited number of hours. None of these ‘staff students’ are following one of the university’s initial study programmes within the scope of the education and training of WU personnel. Consequently, the university has not paid the tuition fees for any member of staff. Allocation of Direct Government Funding to Private Activities Wageningen University allocates funds to the following private activities: • Post-initial education relating to establishing new study programmes and transferring knowledge to
society; • Student facilities such as sports facilities and training activities; • Student accommodation for international M.Sc students. Although the provision of student
accommodation is not one of the university’s primary duties, the acute accommodation needs nevertheless resulted in the Executive Board’s 2009 decision to invest in temporary accommodation for international students. The Supervisory Board agreed, in light of the state of Wageningen’s housing market, particularly as it relates to students. Housing is rented at fair market value prices. The objective is to achieve break-even operations with these investments. Wageningen University consulted with the housing corporations on the realization of these units.
Wageningen University did not make any investments in spin-outs in 2011.
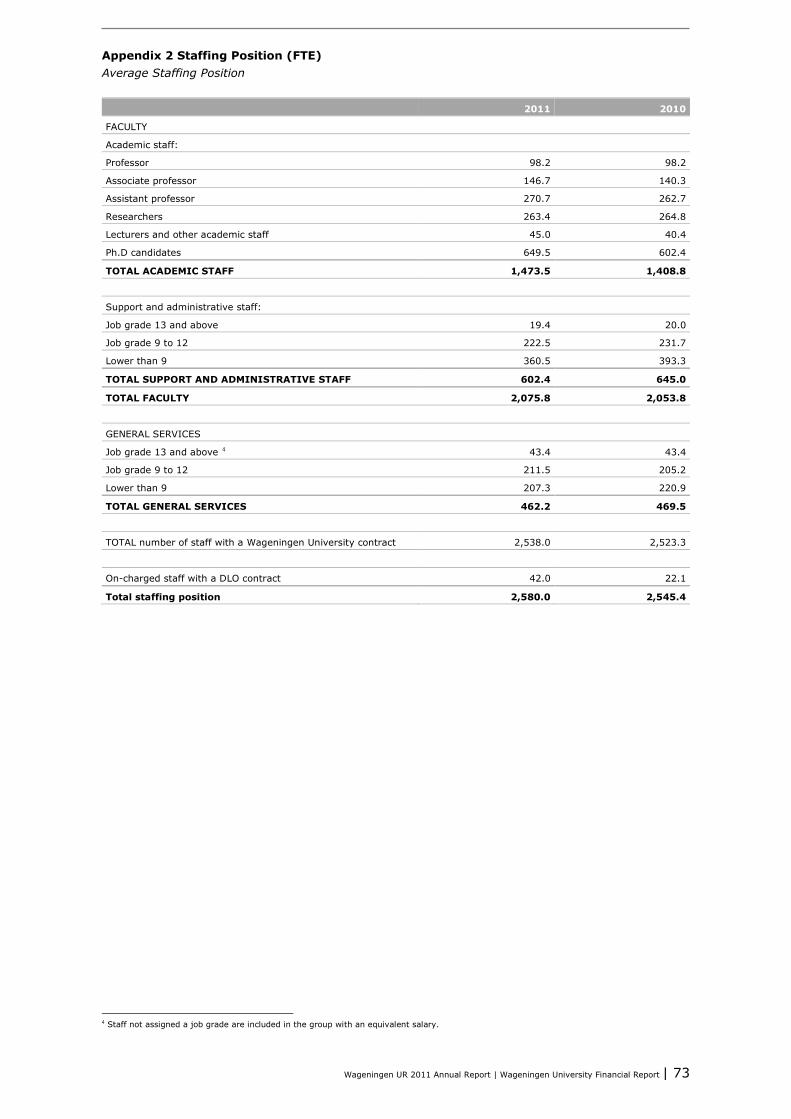
Wageningen UR 2011 Annual Report | Wageningen University Financial Report | 73
Appendix 2 Staffing Position (FTE) Average Staffing Position 2011 2010
FACULTY
Academic staff:
Professor 98.2 98.2
Associate professor 146.7 140.3
Assistant professor 270.7 262.7
Researchers 263.4 264.8
Lecturers and other academic staff 45.0 40.4
Ph.D candidates 649.5 602.4
TOTAL ACADEMIC STAFF 1,473.5 1,408.8
Support and administrative staff:
Job grade 13 and above 19.4 20.0
Job grade 9 to 12 222.5 231.7
Lower than 9 360.5 393.3
TOTAL SUPPORT AND ADMINISTRATIVE STAFF 602.4 645.0
TOTAL FACULTY 2,075.8 2,053.8
GENERAL SERVICES
Job grade 13 and above 4 43.4 43.4
Job grade 9 to 12 211.5 205.2
Lower than 9 207.3 220.9
TOTAL GENERAL SERVICES 462.2 469.5
TOTAL number of staff with a Wageningen University contract 2,538.0 2,523.3
On-charged staff with a DLO contract 42.0 22.1
Total staffing position 2,580.0 2,545.4
4 Staff not assigned a job grade are included in the group with an equivalent salary.
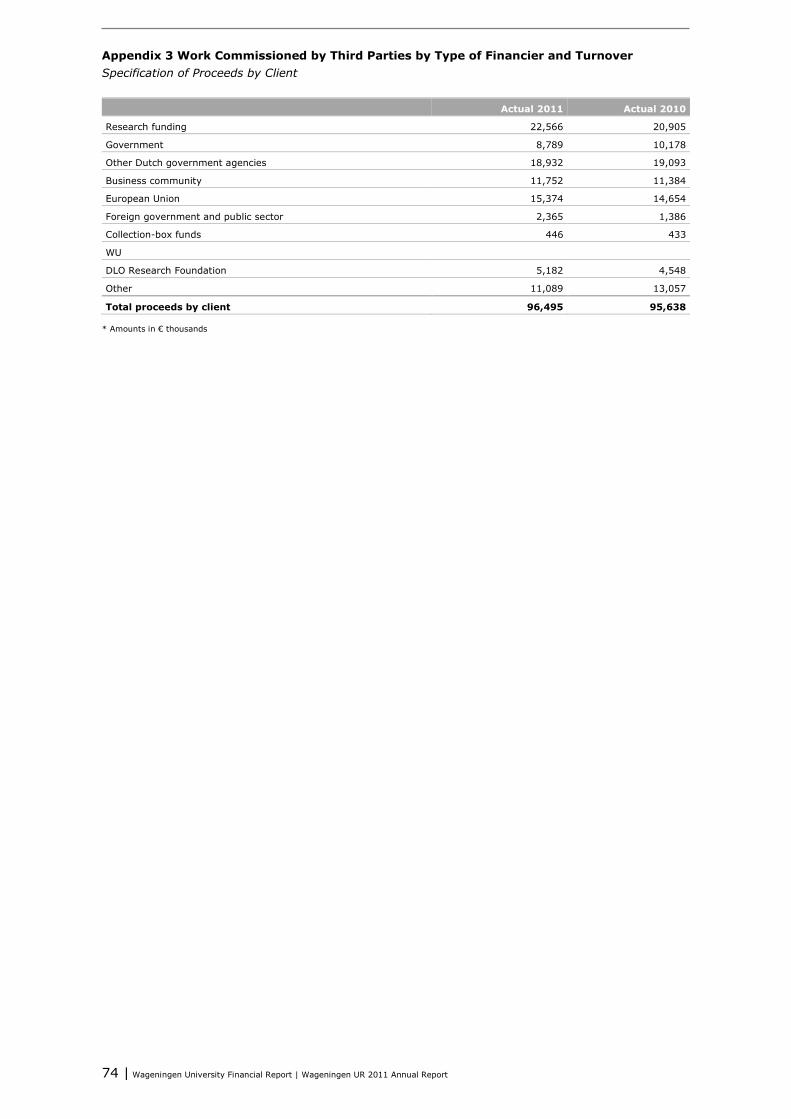
74 | Wageningen University Financial Report | Wageningen UR 2011 Annual Report
Appendix 3 Work Commissioned by Third Parties by Type of Financier and Turnover Specification of Proceeds by Client Actual 2011 Actual 2010
Research funding 22,566 20,905
Government 8,789 10,178
Other Dutch government agencies 18,932 19,093
Business community 11,752 11,384
European Union 15,374 14,654
Foreign government and public sector 2,365 1,386
Collection-box funds 446 433
WU
DLO Research Foundation 5,182 4,548
Other 11,089 13,057
Total proceeds by client 96,495 95,638
* Amounts in € thousands

Wageningen UR 2011 Annual Report | Wageningen University Financial Report | 75
Appendix 4 Target Funding, Deferred Liabilities and Payments To Be Reimbursed to the Ministry of Economic Affairs, Agriculture and Innovation
Project Description Decision Awarded amount Balance
31-12-2010
Received
incl. 2011
Expenditure 2011 Expenditure
Incl. 2011
Balance
31-12-2011
G2-A Target funding expiring on 31-12-2011
Completion of projects before 1-1-2011
BAMA DWK 2002/4101 d.d. 9-12-2002 499,158 58,232 440,926 440,926 0
Building momentum TRCDKI/2009/2247 d.d. 26-11-2009 3,715,534 –743,107 3,715,534 3,715,534 0
Completed projects in 2011
Learning in practice TRCDK/09/0676 d.d. 24-3-2009 166,600 16,048 166,600 16,048 166,600 0
Total target funding expiring by 31-12-2011 4,381,292 –668,827 4,323,060 16,048 4,323,060 0
G2-B Ongoing until the next year
WURKS 2009-2010 TRCDK 2009/2029 d.d. 24-11-2009 1,864,332 1,645,879 1,864,332 1,022,907 1,241,360 622.972
Introducing educational minors 804A0-27081 (CFI 11-11-2009) 136,906 93,552 136,906 39,062 82,416 54.490
Professionalization and Teachers 2009-2012 TRCDK 2009/2239 920,000 547,555 736,000 338,424 526,869 209.131
Quality impulse 2009-2012 TRCDKI/09/2064 d.d. 13-11-2009 1,925,000 83,474 1,275,000 200,606 742,132 532.868
Teaching academics TRCDKI 2010/2195 d.d. 13-12-2010 625,000 325,000 520,000 140,626 140,626 379.374
Centre for Biobased Economy TRCDKI 2010/2190 d.d. 15-12-2010 5,000,000 1,000,000 1,521,036 301,790 301,790 1.219.246
Total ongoing until the next year 10,471,238 3,695,460 6,053,274 2,043,415 3,035,193 3.018.081
Deferred liabilities direct government funding letter
Learning in practice 2010 and 2011 571,200 238,000 571,200 151,800 151,800 419.400
Incentive fund, Joint Degrees TRCDKI 2009/1402 95,000 95,000 95,000 95,000 95,000 0
Sector Physics and Chemistry 195,000 0 195,000 0 0 195.000
WURKS 2011 735,000 0 735,000 0 0 735.000
Total deferred liabilities 1,596,200 333,000 1,596,200 246,800 246,800 1.349.400
Total included under Ministry of Economic Affairs, Agriculture and Innovation subsidies 16.448.730 3,359,633 11,972,534 2,306,263 7,605,053 4,367,481
The Other Subsidies item under income is comprised of the following: Expenditure of Ministry of Economic Affairs, Agriculture and Innovation and Ministry of Education, Science and Cultural Affairs subsidies in accordance with Annex 4 € 2,306,263 Less: transfer payment from Centre for Biobased Economy to partners € 150,000 Included subsidies € 2,156,263 The following items are no longer included in the G-overview: Deleted items from G-overview Balance
31-12-2010 Notes
Green Knowledge Cooperative 1,398,171 Balance transferred to GKC (independent)
In search of excellence in the European PhD 80,000 No target grant. Is accounted for by statement of approval
Recovery soil samples ISRIC 66,000 Transferred to ISRIC, will be justified by ISRIC
Total deleted from G-overview 1,544,171
76 | Van Hall Larenstein University of Applied Sciences Financial Report | Wageningen UR Annual Report 2011
3.2 Van Hall Larenstein University of Applied Sciences Financial Report
3.2.1 Financial Statement
Development of Result The consolidated 2011 annual account concluded with a net return of €1.1 million, which is € 1.1 million greater than budgeted. The total income increased by € 2.2 million to € 53.0 million in 2011. This increase, as compared to the budget, is due largely to the increase in contracted research of € 1.6 million, the increase in tuition fees of € 0.8 million and the decrease in overall income of € 0.2 million. The increase in tuition fees was caused by an increase of the number of students and the annual tuition price increase. Other income decreased due to a reduction in rental income. The increase in revenues from contracted research and project financing is largely caused by the higher calculated specific costs and higher sales momentum due to convergence from previous years. On balance, costs increased by € 1.5 million, primarily due to a sharp increase in specific costs of € 1.8 million and an increase in overall costs of € 0.2 million. The increase in specific costs is mainly related to project costs, which are passed on to the grant providers. The decrease in depreciation expense is caused by the transfer of the IT equipment budget to overall costs starting in 2011; this amounts to approx. € 0.4 million. This contributed to the overall costs increase in 2011 compared to 2010. Movement in the balance sheet Tangible fixed assets decreased by € 0.7 million. There were investments of € 0.8 million over 2011 and the depreciation charges were € 1.5 million in 2011. Receivables and prepayments increased by € 0.7 million which was largely caused by the yet to be received construction funding boost of € 0.7 million. Liquid assets increased by € 1.5 million. This is caused by the € 1.1 million received tranche from the BNG loan as well as a positive result for 2011. On balance, facilities decreased by € 0.8 million, largely due to the declining expense for unemployment obligations (€ 0.6 million) and by a decrease in other personnel expenses of € 0.2 million. Short-term debt increased by € 2.0 million due to the repayment obligations of BNG loans by € 1.8 million. The solvency ratio was 17.8% on 31 December 2011 as compared to 15.7% in 2010. This increase was due to a positive result of € 1.1 million in 2011. In contrast, total assets increased by € 1.5 million. Prospects for 2011 Movement in the result The 2012 budget specifies an operating profit of €1.0 million.
Wageningen UR Annual Report 2011 | Van Hall Larenstein University of Applied Sciences Financial Report | 77
Financial macro framework • A limited productivity deduction has been applied to the government grant of 2012. This
productivity deduction will increase by approximately 1% per year over the following years. This official reduction is a possible harbinger of further cuts by the central government.
• It is expected that, similar to 2011, no wage price compensation will be paid in 2012. Any increases in the collective employment agreement should be absorbed within the budget.
• The overall funding system for the Higher Vocational Education has changed. The settlement through the Understanding on Commitments in Financial Services will disappear. There is a guarantee that this change may not exceed a 1% difference. Adjustments have been made to student funding. Students who have completed a certain degree are no longer funded from 2011.
• The fine for students exceeding the set study term set by September 1, 2011 was introduced at 0%. From 1 September 2012 this will cost approx. € 3,000 per student. In the budget, this creates lower state funding and higher tuition fees, this leads to a higher collection risk for VHL.
The main issues for attention are: 1. Van Hall Larenstein’s liquidity position will need to be improved during the coming years. The
Higher Vocational Education guarantee fund will be abolished, as a result of which the solvency will be subjected to an even more critical review within the context of financing or refinancing.
2. The central government has stated that it will implement major spending cuts in the coming years. In view of the magnitude of these spending cuts, it is necessary to assume that Higher Vocational Education institutes will also be confronted with cuts.
3. In 2012, the Wenkend Perspectief will be further developed, this is the vision of what VHL will have to achieve by 2016. Additional investment will be involved.
4. Finish reorganizations: Finish the T&C reorganization and the reorganization of the evaluation and redesign of staff services should receive attention in order for the intended cuts to be carried out.
5. Institution Accreditation: In 2012, obtaining the institution accreditation is important. This requires substantial effort in streamlining and improving a number of processes, as well as in the procedures related to the merging of institutions and preparing the necessary documentation for accreditation.
Operational Excellence Operational excellence is an important element of Van Hall Larenstein University of Applied Sciences’ new strategy. This relates primarily to the provision of support to education, as well as the services and information provided to students. Both the increasing requirements imposed on the annual reports with respect to student dossiers and funding, as well as the requirements governing the accreditation of institutes, give cause to the need of the standardization of the support and processes.
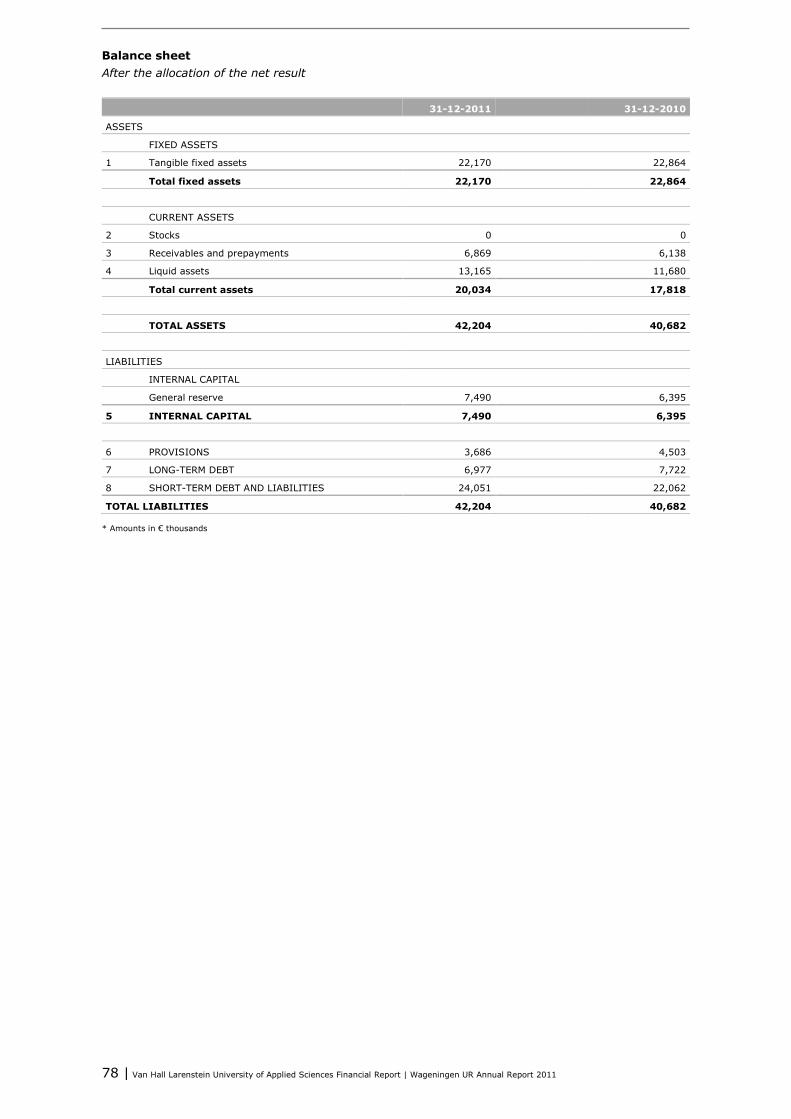
78 | Van Hall Larenstein University of Applied Sciences Financial Report | Wageningen UR Annual Report 2011
Balance sheet After the allocation of the net result 31-12-2011 31-12-2010
ASSETS
FIXED ASSETS
1 Tangible fixed assets 22,170 22,864
Total fixed assets 22,170 22,864
CURRENT ASSETS
2 Stocks 0 0
3 Receivables and prepayments 6,869 6,138
4 Liquid assets 13,165 11,680
Total current assets 20,034 17,818
TOTAL ASSETS 42,204 40,682
LIABILITIES
INTERNAL CAPITAL
General reserve 7,490 6,395
5 INTERNAL CAPITAL 7,490 6,395
6 PROVISIONS 3,686 4,503
7 LONG-TERM DEBT 6,977 7,722
8 SHORT-TERM DEBT AND LIABILITIES 24,051 22,062
TOTAL LIABILITIES 42,204 40,682
* Amounts in € thousands
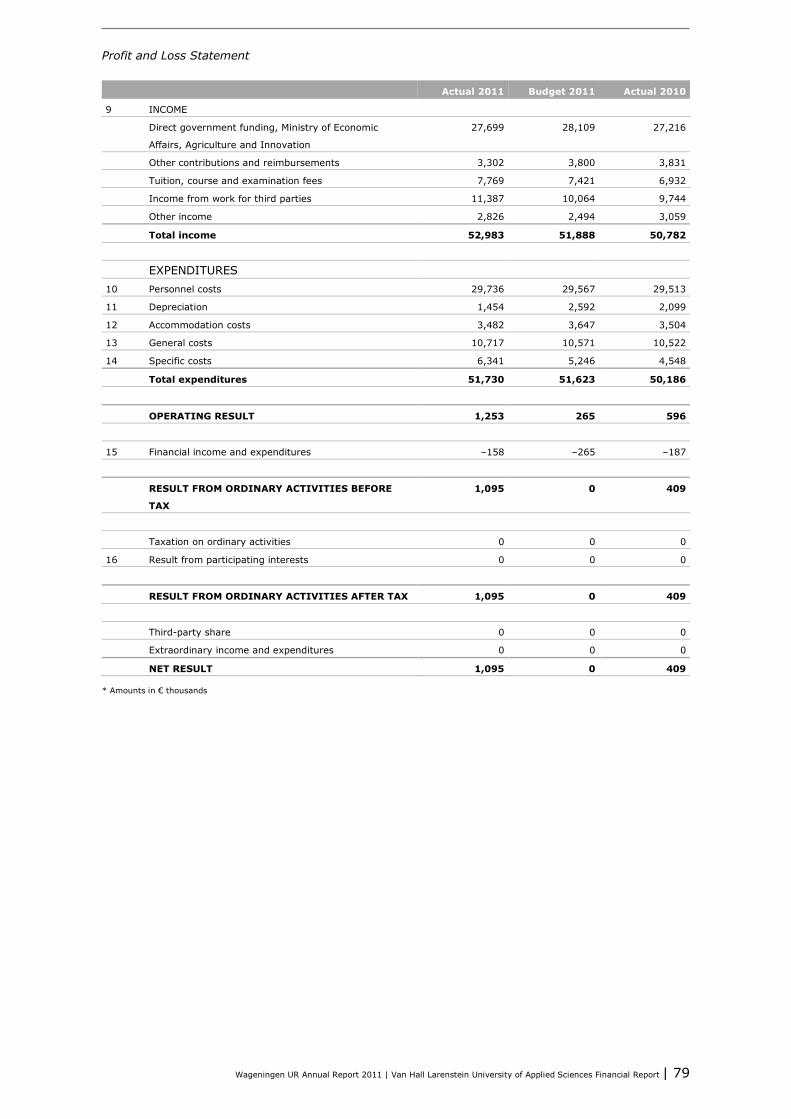
Wageningen UR Annual Report 2011 | Van Hall Larenstein University of Applied Sciences Financial Report | 79
Profit and Loss Statement Actual 2011 Budget 2011 Actual 2010
9 INCOME
Direct government funding, Ministry of Economic
Affairs, Agriculture and Innovation
27,699 28,109 27,216
Other contributions and reimbursements 3,302 3,800 3,831
Tuition, course and examination fees 7,769 7,421 6,932
Income from work for third parties 11,387 10,064 9,744
Other income 2,826 2,494 3,059
Total income 52,983 51,888 50,782
EXPENDITURES
10 Personnel costs 29,736 29,567 29,513
11 Depreciation 1,454 2,592 2,099
12 Accommodation costs 3,482 3,647 3,504
13 General costs 10,717 10,571 10,522
14 Specific costs 6,341 5,246 4,548
Total expenditures 51,730 51,623 50,186
OPERATING RESULT 1,253 265 596
15 Financial income and expenditures –158 –265 –187
RESULT FROM ORDINARY ACTIVITIES BEFORE
TAX
1,095 0 409
Taxation on ordinary activities 0 0 0
16 Result from participating interests 0 0 0
RESULT FROM ORDINARY ACTIVITIES AFTER TAX 1,095 0 409
Third-party share 0 0 0
Extraordinary income and expenditures 0 0 0
NET RESULT 1,095 0 409
* Amounts in € thousands
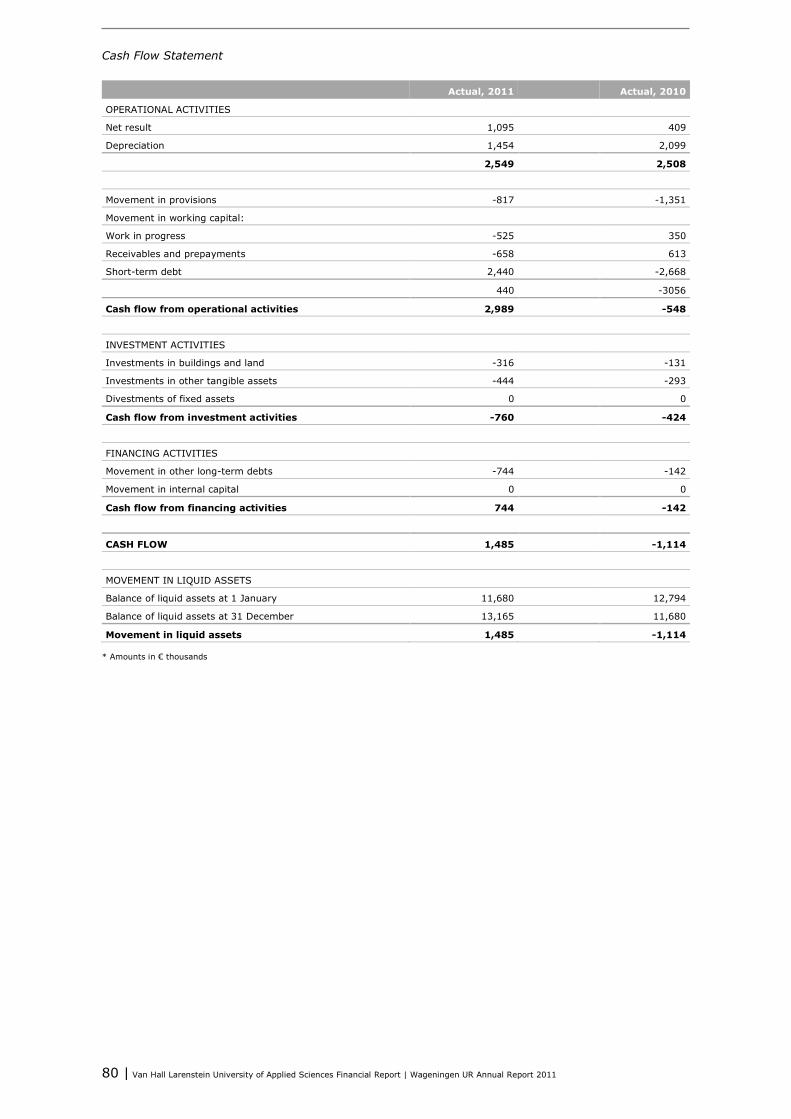
80 | Van Hall Larenstein University of Applied Sciences Financial Report | Wageningen UR Annual Report 2011
Cash Flow Statement Actual, 2011 Actual, 2010
OPERATIONAL ACTIVITIES
Net result 1,095 409
Depreciation 1,454 2,099
2,549 2,508
Movement in provisions -817 -1,351
Movement in working capital:
Work in progress -525 350
Receivables and prepayments -658 613
Short-term debt 2,440 -2,668
440 -3056
Cash flow from operational activities 2,989 -548
INVESTMENT ACTIVITIES
Investments in buildings and land -316 -131
Investments in other tangible assets -444 -293
Divestments of fixed assets 0 0
Cash flow from investment activities -760 -424
FINANCING ACTIVITIES
Movement in other long-term debts -744 -142
Movement in internal capital 0 0
Cash flow from financing activities 744 -142
CASH FLOW 1,485 -1,114
MOVEMENT IN LIQUID ASSETS
Balance of liquid assets at 1 January 11,680 12,794
Balance of liquid assets at 31 December 13,165 11,680
Movement in liquid assets 1,485 -1,114
* Amounts in € thousands
Wageningen UR Annual Report 2011 | Van Hall Larenstein University of Applied Sciences Financial Report | 81
Principles of Valuation (Amounts in thousands) Principles of Valuation The annual accounts were prepared and adopted by the Executive Directors on 5 April 2012. General These are the annual accounts of the Van Hall Larenstein Foundation. The annual accounts were prepared on the basis of the following principles of valuation. The figures for the previous financial year are in accordance with the figures in the annual accounts of the relevant year. General accounting principles for the preparation of the annual accounts The Van Hall Larenstein Foundation forms a group with the Business Center Van Hall Foundation, the Onroerend Goed Larenstein Foundation and the Larenstein Transfer Foundation. The annual accounts are prepared based on historic costs. Unless otherwise stated, assets and liabilities are recognized at nominal value. Monetary assets and liabilities in foreign currency are translated at the exchange rate on balance sheet date. Exchange rate differences are recognized in the profit and loss statement. Revenues and expenses in foreign currency are recognized in the profit and loss statement at the exchange rate on the date of settlement. The annual accounts have been prepared in accordance with the requirements imposed by the Regeling Jaarverslaggeving Onderwijs (‘Annual Accounts Regulations)’and the Ministry of Education, Culture and Science’s notes to those regulations. Consolidation The consolidation incorporates the annual accounts of the institution, its group companies and other organizations in which the institution exercises dominant control (pursuant to the actual situation) or conducts the central management. The group companies are legal entities over which the institution can exercise either direct or indirect dominant control since the institution possesses a majority of the voting rights or can control the financial and operational activities in some other manner. Account is then also taken of potential voting rights that can be exercised directly on the balance sheet date. The annual accounts of group companies and other legal entities over which the institution can exercise dominant control or conduct the central management are fully included in the consolidation. The share of third parties in the group internal capital and the group result is reported separately. Consolidation Circle These annual accounts incorporate the separate annual accounts of the Van Hall Larenstein Foundation. Settlement of costs between the Van Hall Larenstein Foundation, Business Center van Hall Foundation, Onroerend Goed Larenstein Foundation and Larenstein Transfer Foundation is based on actual direct costs with a surcharge for indirect costs. Accounting Policies for the Valuation of Assets and Liabilities Tangible Fixed Assets Tangible fixed assets are valued at the acquisition price or the production cost, less accumulated depreciation. Depreciation is applied using the straight line method on the basis of the estimated useful life and the residual value. Depreciation is applied in proportion in the year of purchase.
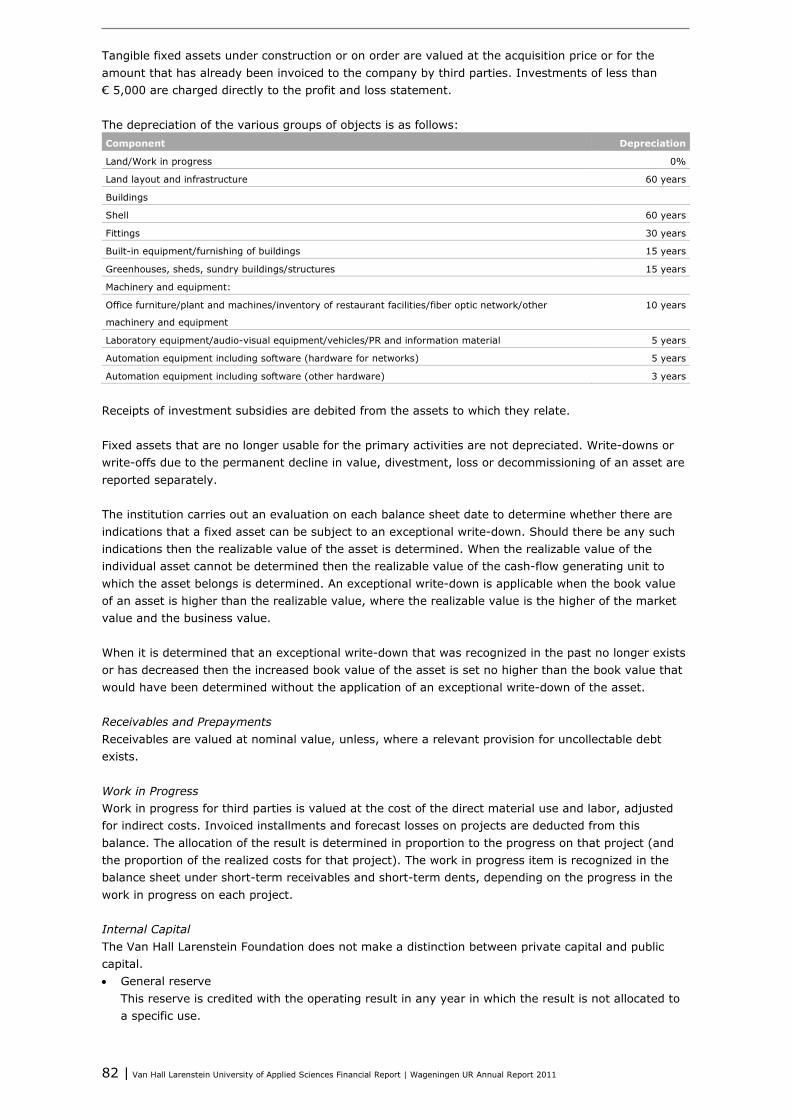
82 | Van Hall Larenstein University of Applied Sciences Financial Report | Wageningen UR Annual Report 2011
Tangible fixed assets under construction or on order are valued at the acquisition price or for the amount that has already been invoiced to the company by third parties. Investments of less than € 5,000 are charged directly to the profit and loss statement. The depreciation of the various groups of objects is as follows: Component Depreciation
Land/Work in progress 0%
Land layout and infrastructure 60 years
Buildings
Shell 60 years
Fittings 30 years
Built-in equipment/furnishing of buildings 15 years
Greenhouses, sheds, sundry buildings/structures 15 years
Machinery and equipment:
Office furniture/plant and machines/inventory of restaurant facilities/fiber optic network/other
machinery and equipment
10 years
Laboratory equipment/audio-visual equipment/vehicles/PR and information material 5 years
Automation equipment including software (hardware for networks) 5 years
Automation equipment including software (other hardware) 3 years
Receipts of investment subsidies are debited from the assets to which they relate. Fixed assets that are no longer usable for the primary activities are not depreciated. Write-downs or write-offs due to the permanent decline in value, divestment, loss or decommissioning of an asset are reported separately. The institution carries out an evaluation on each balance sheet date to determine whether there are indications that a fixed asset can be subject to an exceptional write-down. Should there be any such indications then the realizable value of the asset is determined. When the realizable value of the individual asset cannot be determined then the realizable value of the cash-flow generating unit to which the asset belongs is determined. An exceptional write-down is applicable when the book value of an asset is higher than the realizable value, where the realizable value is the higher of the market value and the business value. When it is determined that an exceptional write-down that was recognized in the past no longer exists or has decreased then the increased book value of the asset is set no higher than the book value that would have been determined without the application of an exceptional write-down of the asset. Receivables and Prepayments Receivables are valued at nominal value, unless, where a relevant provision for uncollectable debt exists. Work in Progress Work in progress for third parties is valued at the cost of the direct material use and labor, adjusted for indirect costs. Invoiced installments and forecast losses on projects are deducted from this balance. The allocation of the result is determined in proportion to the progress on that project (and the proportion of the realized costs for that project). The work in progress item is recognized in the balance sheet under short-term receivables and short-term dents, depending on the progress in the work in progress on each project. Internal Capital The Van Hall Larenstein Foundation does not make a distinction between private capital and public capital. • General reserve
This reserve is credited with the operating result in any year in which the result is not allocated to a specific use.
Wageningen UR Annual Report 2011 | Van Hall Larenstein University of Applied Sciences Financial Report | 83
• Appropriated reserve The appropriated reserve was created for the benefit of Stichting Waarborgfonds HBO.
Provisions Provisions are valued at nominal value. The size of the obligations is determined by taking in to account future indexation and price increases. The provision seen in the annual accounts is the best estimate of the amount which will be needed in order to settle the relevant obligations and losses at balance sheet date. Provisions are formed for: • legally enforceable or actual obligations existing on the balance sheet date; • the settlement of obligations likely to require an outflow of funds; and • obligations, if a reliable estimate can be made. Provision for Unemployment Insurance Obligations The provision for unemployment insurance obligations was formed to cover the unemployment insurance obligations existing on balance sheet date and anticipated future expenditure related to departed staff who and staff employed with a temporary employment contract. Provision for Reorganization Costs This provision was created to address the expected costs to be incurred from announced decisions within the organization related to current and future reorganizations. The pension plans are in line with the average-index, if allowed by the pension fund coverage. On 31 December 2011 the ABP pension fund had coverage of 94%. Compared to 31 December 2010, the coverage declined by 11%-point. Based on the recovery plan, the coverage on 31 December 2011 was expected to be 100.5%. The actual coverage on 31 December 2011 was 6.5% lower. Based on the current coverage, the ABP decided: • to implement an additional premium surcharge of two percentage points for the years 2012 and
2013; • to not index the benefits in 2012. Long-term Debt Long-term debt is debt which exists for more than one year after the date of the end of the accounts of the year. Short-term Debt Short-term debt is debt which exists for less than one year after the date of the end of the accounts of the year. Accounting policies for the determination of income and expenditure General Revenues and costs are recognized as business income and expenditure which can be allocated to the relevant financial year or activity, irrespective of whether they have resulted in receipts and expenses during the period of the accounts of the year. Proceeds are recognized in the year in which the goods were delivered or the services were provided to clients. Losses and risk arising before the end of the financial year are taken into account to the extent that they are known before the preparation of the annual accounts. Direct Government Funding and Other Payments Direct government funding is recognized as income in the year in which the funding was obtained. Other payments are credited to the result in the year in which the activity is carried out and the costs are incurred.
84 | Van Hall Larenstein University of Applied Sciences Financial Report | Wageningen UR Annual Report 2011
Tuition and Course Fees The statutory tuition fees and payments for post-initial courses are allocated to the accounts of the year and are recognized under tuition and course fees. Income from Work for Third Parties The proceeds from contract activities are recognized under the Income from work for third parties item. The income is determined on the basis of the direct costs and increased by a margin for indirect costs to a maximum rate, to be paid by the financial provider. Results are taken proportionally to the progress in the project. Accounting principles for the preparation of the cash flow statement The indirect method is used for the preparation of the cash flow statement.
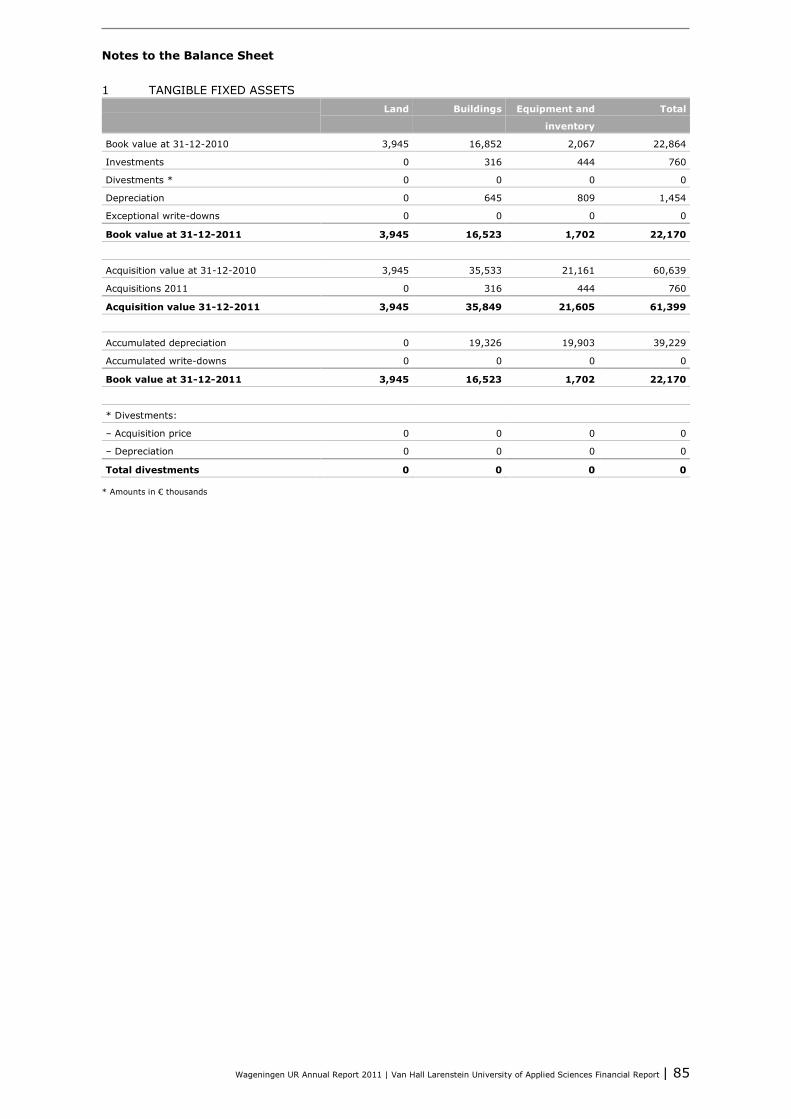
Wageningen UR Annual Report 2011 | Van Hall Larenstein University of Applied Sciences Financial Report | 85
Notes to the Balance Sheet 1 TANGIBLE FIXED ASSETS Land Buildings Equipment and
inventory
Total
Book value at 31-12-2010 3,945 16,852 2,067 22,864
Investments 0 316 444 760
Divestments * 0 0 0 0
Depreciation 0 645 809 1,454
Exceptional write-downs 0 0 0 0
Book value at 31-12-2011 3,945 16,523 1,702 22,170
Acquisition value at 31-12-2010 3,945 35,533 21,161 60,639
Acquisitions 2011 0 316 444 760
Acquisition value 31-12-2011 3,945 35,849 21,605 61,399
Accumulated depreciation 0 19,326 19,903 39,229
Accumulated write-downs 0 0 0 0
Book value at 31-12-2011 3,945 16,523 1,702 22,170
* Divestments:
– Acquisition price 0 0 0 0
– Depreciation 0 0 0 0
Total divestments 0 0 0 0
* Amounts in € thousands

86 | Van Hall Larenstein University of Applied Sciences Financial Report | Wageningen UR Annual Report 2011
2 STOCKS 31-12-2011 31-12-2010
STOCKS
Trading stock 0 0
0 0
Minus: provision for unmarketability 0 0
Total stocks 0 0
* Amounts in € thousands
3 RECEIVABLES AND PREPAYMENTS 31-12-2011 31-12-2010
Receivables 2,725 1,924
Accounts receivable from affiliated parties 193 425
Minus: provision for possible uncollectible receivables –1,274 –913
Total accounts receivable 1,644 1,436
Cost of work carried out for third parties 1,922 1,849
Minus: Invoiced installments 0 0
Work for third parties other than the Ministry of
Economic Affairs, Agriculture and Innovation
1,922 1,849
Total work in progress 1,922 1,849
Prepayments 646 261
Other 2,657 2,592
Total advances and prepayments 3,303 2,853
Total receivables and accruals 6,869 6,138
* Amounts in € thousands
The accounts receivable from affiliated parties relate to DLO and Wageningen University.
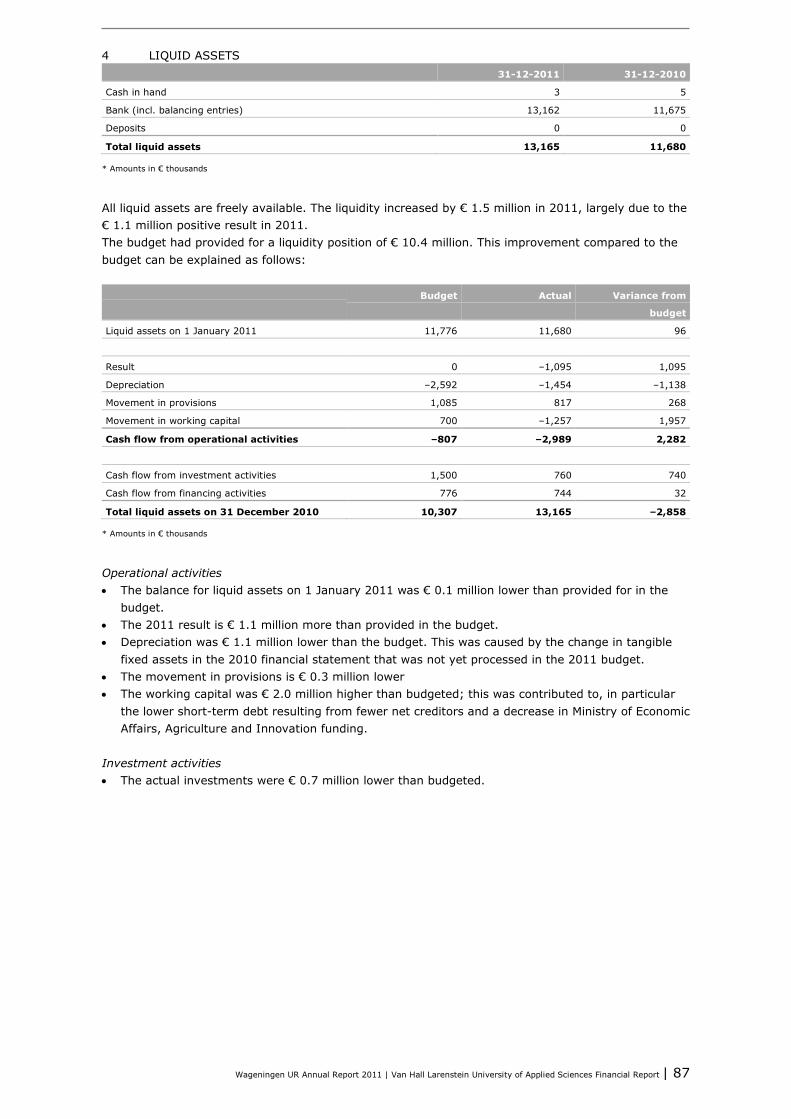
Wageningen UR Annual Report 2011 | Van Hall Larenstein University of Applied Sciences Financial Report | 87
4 LIQUID ASSETS 31-12-2011 31-12-2010
Cash in hand 3 5
Bank (incl. balancing entries) 13,162 11,675
Deposits 0 0
Total liquid assets 13,165 11,680
* Amounts in € thousands
All liquid assets are freely available. The liquidity increased by € 1.5 million in 2011, largely due to the € 1.1 million positive result in 2011. The budget had provided for a liquidity position of € 10.4 million. This improvement compared to the budget can be explained as follows: Budget Actual Variance from
budget
Liquid assets on 1 January 2011 11,776 11,680 96
Result 0 –1,095 1,095
Depreciation –2,592 –1,454 –1,138
Movement in provisions 1,085 817 268
Movement in working capital 700 –1,257 1,957
Cash flow from operational activities –807 –2,989 2,282
Cash flow from investment activities 1,500 760 740
Cash flow from financing activities 776 744 32
Total liquid assets on 31 December 2010 10,307 13,165 –2,858
* Amounts in € thousands
Operational activities • The balance for liquid assets on 1 January 2011 was € 0.1 million lower than provided for in the
budget. • The 2011 result is € 1.1 million more than provided in the budget. • Depreciation was € 1.1 million lower than the budget. This was caused by the change in tangible
fixed assets in the 2010 financial statement that was not yet processed in the 2011 budget. • The movement in provisions is € 0.3 million lower • The working capital was € 2.0 million higher than budgeted; this was contributed to, in particular
the lower short-term debt resulting from fewer net creditors and a decrease in Ministry of Economic Affairs, Agriculture and Innovation funding.
Investment activities • The actual investments were € 0.7 million lower than budgeted.
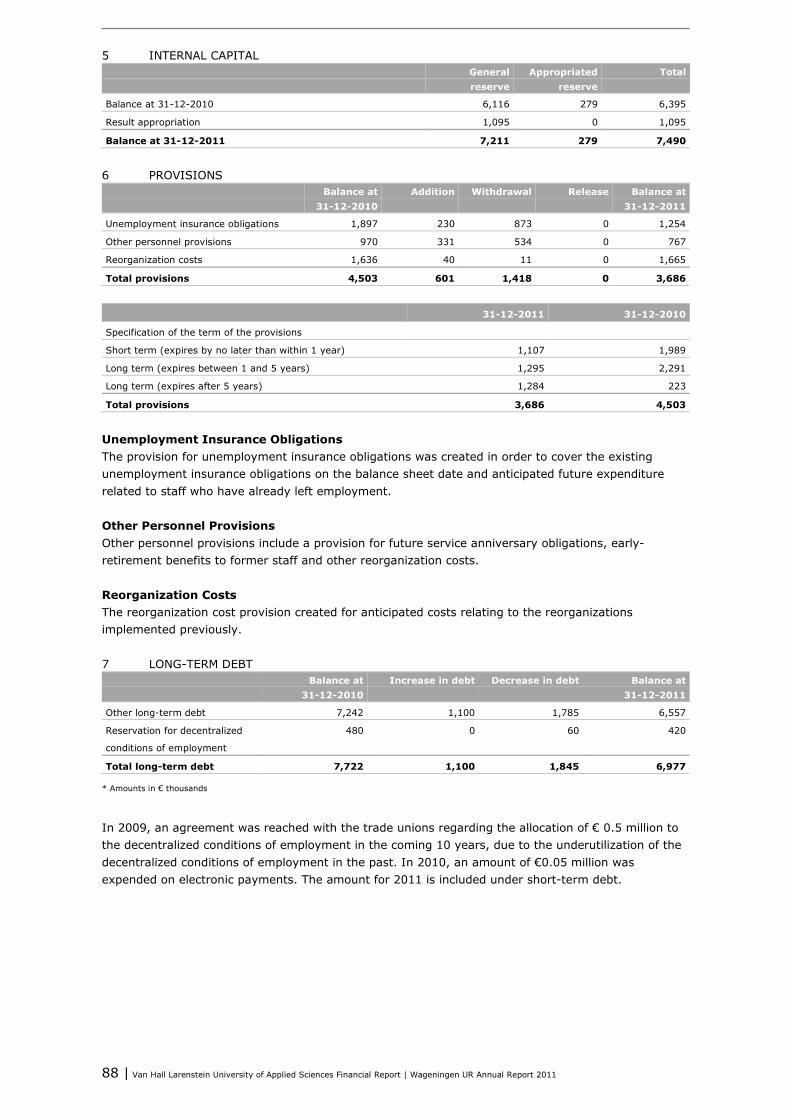
88 | Van Hall Larenstein University of Applied Sciences Financial Report | Wageningen UR Annual Report 2011
5 INTERNAL CAPITAL General
reserve Appropriated
reserve Total
Balance at 31-12-2010 6,116 279 6,395
Result appropriation 1,095 0 1,095
Balance at 31-12-2011 7,211 279 7,490
6 PROVISIONS Balance at
31-12-2010 Addition Withdrawal Release Balance at
31-12-2011
Unemployment insurance obligations 1,897 230 873 0 1,254
Other personnel provisions 970 331 534 0 767
Reorganization costs 1,636 40 11 0 1,665
Total provisions 4,503 601 1,418 0 3,686
31-12-2011 31-12-2010
Specification of the term of the provisions
Short term (expires by no later than within 1 year) 1,107 1,989
Long term (expires between 1 and 5 years) 1,295 2,291
Long term (expires after 5 years) 1,284 223
Total provisions 3,686 4,503
Unemployment Insurance Obligations The provision for unemployment insurance obligations was created in order to cover the existing unemployment insurance obligations on the balance sheet date and anticipated future expenditure related to staff who have already left employment. Other Personnel Provisions Other personnel provisions include a provision for future service anniversary obligations, early-retirement benefits to former staff and other reorganization costs. Reorganization Costs The reorganization cost provision created for anticipated costs relating to the reorganizations implemented previously. 7 LONG-TERM DEBT Balance at
31-12-2010 Increase in debt Decrease in debt Balance at
31-12-2011
Other long-term debt 7,242 1,100 1,785 6,557
Reservation for decentralized
conditions of employment
480 0 60 420
Total long-term debt 7,722 1,100 1,845 6,977
* Amounts in € thousands
In 2009, an agreement was reached with the trade unions regarding the allocation of € 0.5 million to the decentralized conditions of employment in the coming 10 years, due to the underutilization of the decentralized conditions of employment in the past. In 2010, an amount of €0.05 million was expended on electronic payments. The amount for 2011 is included under short-term debt.

Wageningen UR Annual Report 2011 | Van Hall Larenstein University of Applied Sciences Financial Report | 89
List of other long-term debts Description Remaining
debt (k€) Principal
(k€) Interest Term Accumulated
repayment (k€)
Long term Description
BNG (1) *) 7,100 8,500 4.71% 15 years 0 6,557 543
BNG (2) 1,242 2,269 6.28% 27 years 1,242 0 1,242
Total 8,242 10,769 1,242 5,787 1,785
* Amounts in € thousands
*) The total BNG loan (1) is € 8.5 million, of which € 7.1 million had been withdrawn on 31-12-2011. The fifth tranche of € 1.4 million will be released in February 2012. The loan term expires on 31 December 2023. Repayments will begin on 30 June 2012. The BNG loan (2), with a remaining debt of € 1.3 million, will be repaid on 30 January 2012. 8 SHORT-TERM DEBT AND LIABILITIES 31-12-2011 31-12-2010
Advance payments from third parties 7,235 6,195
Debt to suppliers 2,405 2,242
Debt to suppliers of affiliated parties 702 1,645
Payable taxation and contributions 1,613 1,586
Ministry of Economic Affairs, Agriculture and Innovation
research still to be carried out
2,443 2,794
Deferred liabilities 5,987 5,145
Other 3,676 2,455
Total short-term debt 24,051 22,062
Short-term debt increased by € 2.0 million compared to 2010. This is caused by the short-term loan repayment obligation from the BNG of € 1.8 million (included in Other). The payables to suppliers from affiliated parties relate to Wageningen University and DLO. Obligations and rights not included in the balance sheet Long-term Financial Obligations List of obligations entered into relating to rental, operational lease and similar agreements: Description Total obligations Falling due in 2012 Falling due between Description
Rental obligations 991 991 0 0
Operational lease car 59 15 30 14
Other obligations 512 512 0 0
Total 1,562 1,518 30 14
* Amounts in € thousands
A pledge has been given for the rights and receivables relating to the direct government funding for the accommodation of the Van Hall Instituut until 2024 has been included in the loan, with suretyship has been issued by the Stichting Waarborgfonds HBO in The Hague. The Stichting Waarborgfonds HBO in The Hague has issued a suretyship: a positive mortgage covenant with negative pledge clause has been issued related to the loans from the Netherlands Municipalities Bank (BNG). The bankers have issued guarantees to the Stichting Waarborgfonds HBO in The Hague for a total amount of the € 0.3 million balance.

90 | Van Hall Larenstein University of Applied Sciences Financial Report | Wageningen UR Annual Report 2011
Notes on the Profit and Loss Statement 9 INCOME Actual 2011 Actual 2010
DIRECT GOVERNMENT FUNDING
Direct government funding, Ministry of Economic Affairs,
Agriculture and Innovation
27,699 27,216
Other reimbursements 3,302 3,831
TOTAL DIRECT GOVERNMENT FUNDING 31,001 31,047
TUITION AND COURSE FEES
Tuition and examination fees 7,769 6,932
INCOME FROM WORK FOR THIRD PARTIES
Proceeds from work for third parties 12,119 10,775
Movement in work in progress –732 –1,031
TOTAL INCOME FROM WORK FOR THIRD PARTIES 11,387 9,744
OTHER INCOME
Rental income 1,258 1,417
Secondments 994 738
Other income 574 904
TOTAL OTHER INCOME 2,826 3,059
TOTAL INCOME 52,983 50,782
* Amounts in € thousands
Income increased by €2.2 million compared to 2010. Direct government funding from the Ministry of Economic Affairs, Agriculture and Innovation was € 31 million, the same as in 2010. Income from tuition fees increased by € 0.8 million as compared to 2010, due to an increase in number of students and the annual price increase. Other income decreased by € 0.2 million as compared to 2010, due to lower rental income and lowers other income. Annex 3 contains a specification of the work commissioned by third parties by type of financial provider and type of turnover. EXPENDITURES 10 PERSONNEL COSTS Actual 2011 Actual 2010
Gross wages and salaries 26,540 25,883
Temporary employees and contracted personnel 2,588 2,611
Other personnel costs 378 798
Addition to other personnel provisions 230 221
Total personnel costs 29,736 29,513
* Amounts in € thousands
The gross wages and salaries increased by € 0.6 million as compared to 2010 to € 26.5 million, due to Collective Labour Agreement measures. The staffing level is the same in 2011 as it was in 2010. The large increase in the number of temporary employees and contracted personnel is due to the interim fulfillment of a number of positions in the staff departments. The other personnel costs are € 0.4 million lower in 2011, due to an extra € 0.6 million reservation for the decentralized employment conditions in 2010. The personnel costs include social security and pensions amounting to € 5.0 million.
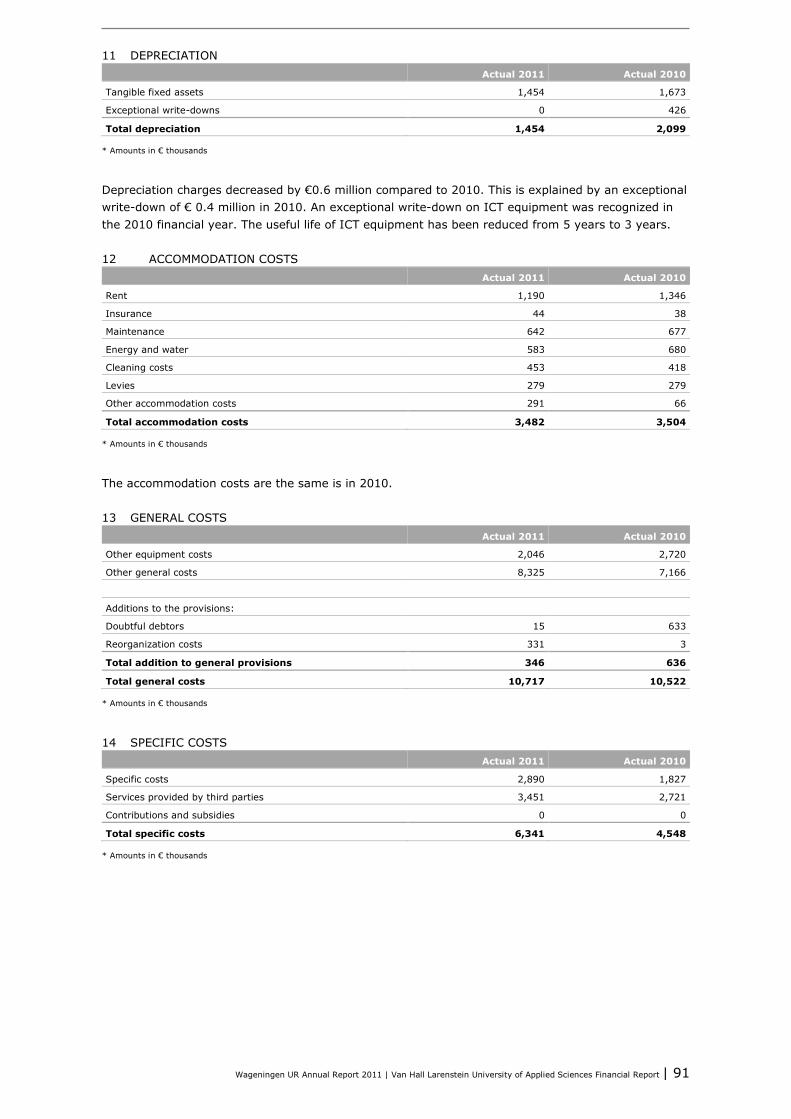
Wageningen UR Annual Report 2011 | Van Hall Larenstein University of Applied Sciences Financial Report | 91
11 DEPRECIATION Actual 2011 Actual 2010
Tangible fixed assets 1,454 1,673
Exceptional write-downs 0 426
Total depreciation 1,454 2,099
* Amounts in € thousands
Depreciation charges decreased by €0.6 million compared to 2010. This is explained by an exceptional write-down of € 0.4 million in 2010. An exceptional write-down on ICT equipment was recognized in the 2010 financial year. The useful life of ICT equipment has been reduced from 5 years to 3 years. 12 ACCOMMODATION COSTS Actual 2011 Actual 2010
Rent 1,190 1,346
Insurance 44 38
Maintenance 642 677
Energy and water 583 680
Cleaning costs 453 418
Levies 279 279
Other accommodation costs 291 66
Total accommodation costs 3,482 3,504
* Amounts in € thousands
The accommodation costs are the same is in 2010. 13 GENERAL COSTS Actual 2011 Actual 2010
Other equipment costs 2,046 2,720
Other general costs 8,325 7,166
Additions to the provisions:
Doubtful debtors 15 633
Reorganization costs 331 3
Total addition to general provisions 346 636
Total general costs 10,717 10,522
* Amounts in € thousands
14 SPECIFIC COSTS Actual 2011 Actual 2010
Specific costs 2,890 1,827
Services provided by third parties 3,451 2,721
Contributions and subsidies 0 0
Total specific costs 6,341 4,548
* Amounts in € thousands
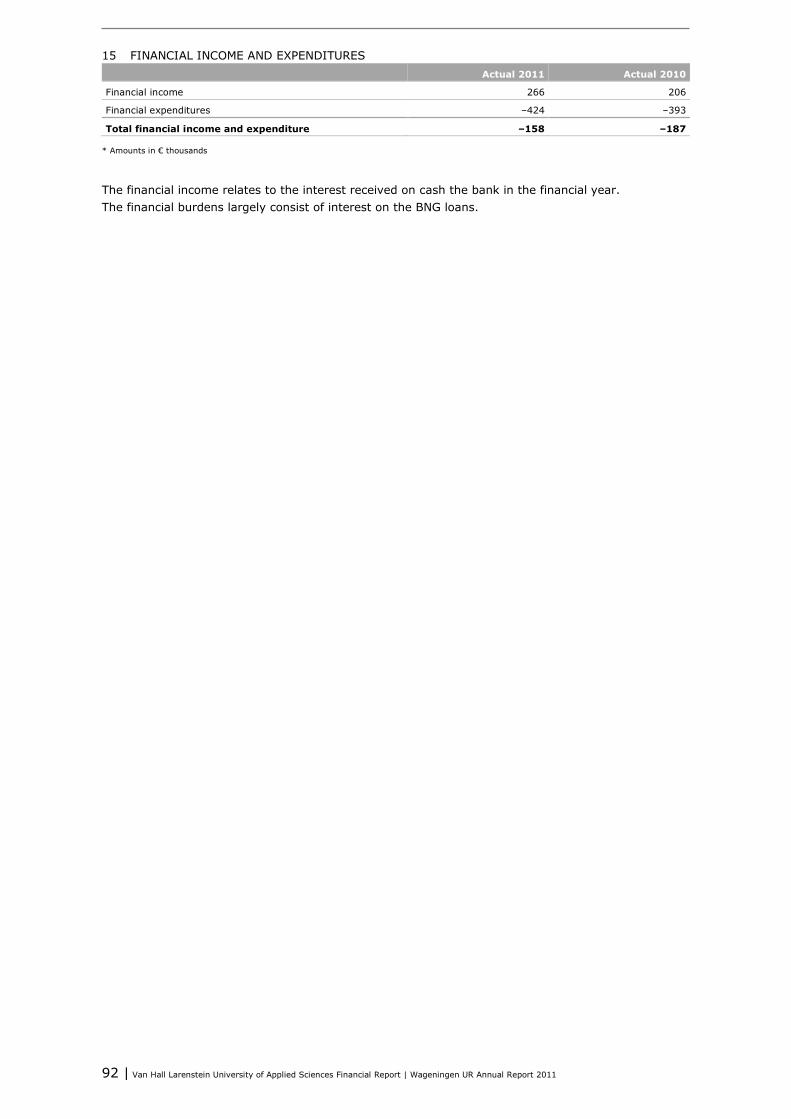
92 | Van Hall Larenstein University of Applied Sciences Financial Report | Wageningen UR Annual Report 2011
15 FINANCIAL INCOME AND EXPENDITURES Actual 2011 Actual 2010
Financial income 266 206
Financial expenditures –424 –393
Total financial income and expenditure –158 –187
* Amounts in € thousands
The financial income relates to the interest received on cash the bank in the financial year. The financial burdens largely consist of interest on the BNG loans.
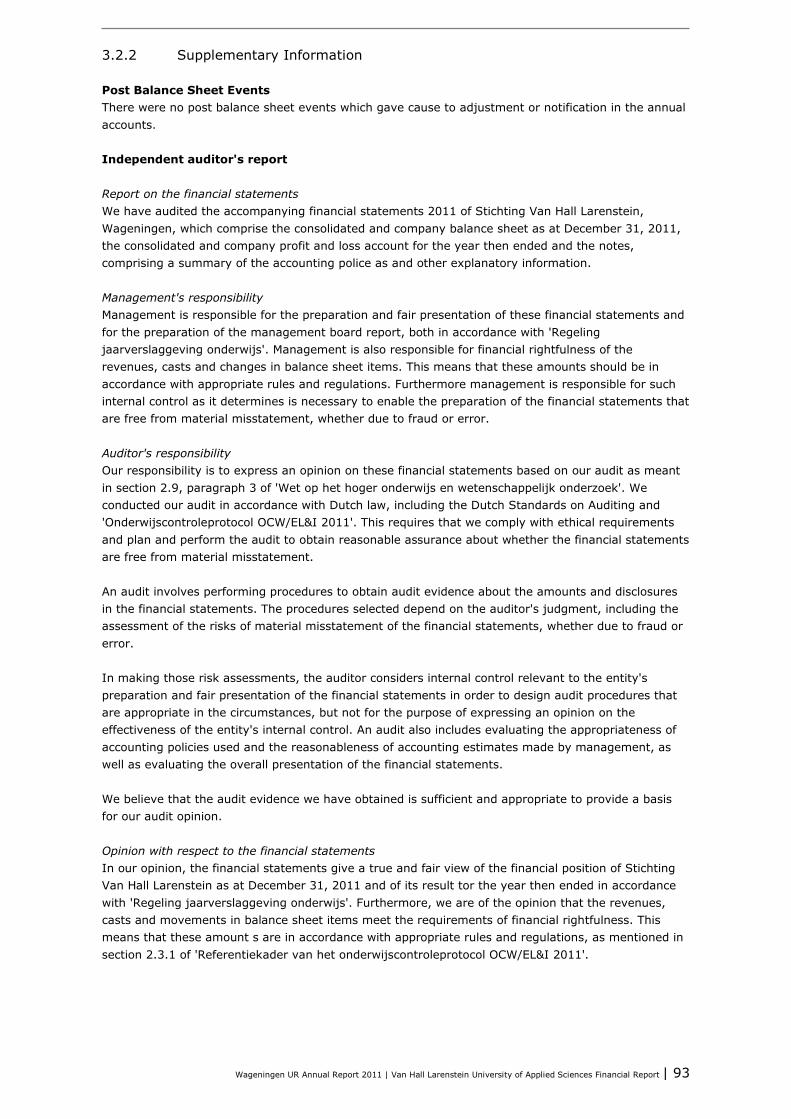
Wageningen UR Annual Report 2011 | Van Hall Larenstein University of Applied Sciences Financial Report | 93
3.2.2 Supplementary Information
Post Balance Sheet Events There were no post balance sheet events which gave cause to adjustment or notification in the annual accounts. Independent auditor's report Report on the financial statements We have audited the accompanying financial statements 2011 of Stichting Van Hall Larenstein, Wageningen, which comprise the consolidated and company balance sheet as at December 31, 2011, the consolidated and company profit and loss account for the year then ended and the notes, comprising a summary of the accounting police as and other explanatory information. Management's responsibility Management is responsible for the preparation and fair presentation of these financial statements and for the preparation of the management board report, both in accordance with 'Regeling jaarverslaggeving onderwijs'. Management is also responsible for financial rightfulness of the revenues, casts and changes in balance sheet items. This means that these amounts should be in accordance with appropriate rules and regulations. Furthermore management is responsible for such internal control as it determines is necessary to enable the preparation of the financial statements that are free from material misstatement, whether due to fraud or error. Auditor's responsibility Our responsibility is to express an opinion on these financial statements based on our audit as meant in section 2.9, paragraph 3 of 'Wet op het hoger onderwijs en wetenschappelijk onderzoek'. We conducted our audit in accordance with Dutch law, including the Dutch Standards on Auditing and 'Onderwijscontroleprotocol OCW/EL&I 2011'. This requires that we comply with ethical requirements and plan and perform the audit to obtain reasonable assurance about whether the financial statements are free from material misstatement. An audit involves performing procedures to obtain audit evidence about the amounts and disclosures in the financial statements. The procedures selected depend on the auditor's judgment, including the assessment of the risks of material misstatement of the financial statements, whether due to fraud or error. In making those risk assessments, the auditor considers internal control relevant to the entity's preparation and fair presentation of the financial statements in order to design audit procedures that are appropriate in the circumstances, but not for the purpose of expressing an opinion on the effectiveness of the entity's internal control. An audit also includes evaluating the appropriateness of accounting policies used and the reasonableness of accounting estimates made by management, as well as evaluating the overall presentation of the financial statements. We believe that the audit evidence we have obtained is sufficient and appropriate to provide a basis for our audit opinion. Opinion with respect to the financial statements In our opinion, the financial statements give a true and fair view of the financial position of Stichting Van Hall Larenstein as at December 31, 2011 and of its result tor the year then ended in accordance with 'Regeling jaarverslaggeving onderwijs'. Furthermore, we are of the opinion that the revenues, casts and movements in balance sheet items meet the requirements of financial rightfulness. This means that these amount s are in accordance with appropriate rules and regulations, as mentioned in section 2.3.1 of 'Referentiekader van het onderwijscontroleprotocol OCW/EL&I 2011'.
94 | Van Hall Larenstein University of Applied Sciences Financial Report | Wageningen UR Annual Report 2011
Report on other legal and regulatory requirements Pursuant to the legal requirement under Section 2:393 sub 5 at e and f of the Dutch Civil Code, we have no deficiencies to report as a result of our examination whether the management board report, to the extent we can assess, has been prepared in accordance with Part 9 of Book 2 of this Code, and whether the information as required under Section 2:392 sub 1at b-h has been annexed. Further we report that the management board report, to the extent we can assess, is consistent with the financial statements as required by Section 2:391sub 4 of the Dutch Civil Code. Arnhem, 21 May 2012 Ernst & Young Accountants LLP w.g. F. de Bruijn RA
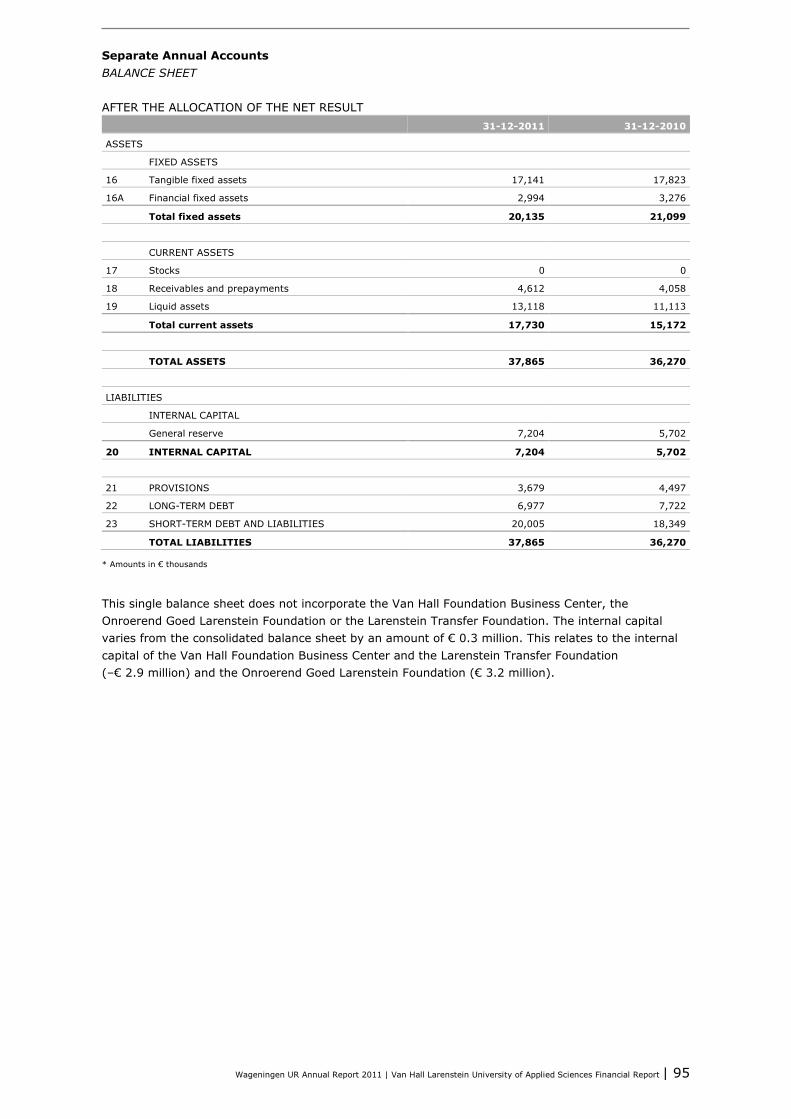
Wageningen UR Annual Report 2011 | Van Hall Larenstein University of Applied Sciences Financial Report | 95
Separate Annual Accounts BALANCE SHEET AFTER THE ALLOCATION OF THE NET RESULT 31-12-2011 31-12-2010
ASSETS
FIXED ASSETS
16 Tangible fixed assets 17,141 17,823
16A Financial fixed assets 2,994 3,276
Total fixed assets 20,135 21,099
CURRENT ASSETS
17 Stocks 0 0
18 Receivables and prepayments 4,612 4,058
19 Liquid assets 13,118 11,113
Total current assets 17,730 15,172
TOTAL ASSETS 37,865 36,270
LIABILITIES
INTERNAL CAPITAL
General reserve 7,204 5,702
20 INTERNAL CAPITAL 7,204 5,702
21 PROVISIONS 3,679 4,497
22 LONG-TERM DEBT 6,977 7,722
23 SHORT-TERM DEBT AND LIABILITIES 20,005 18,349
TOTAL LIABILITIES 37,865 36,270
* Amounts in € thousands
This single balance sheet does not incorporate the Van Hall Foundation Business Center, the Onroerend Goed Larenstein Foundation or the Larenstein Transfer Foundation. The internal capital varies from the consolidated balance sheet by an amount of € 0.3 million. This relates to the internal capital of the Van Hall Foundation Business Center and the Larenstein Transfer Foundation (–€ 2.9 million) and the Onroerend Goed Larenstein Foundation (€ 3.2 million).
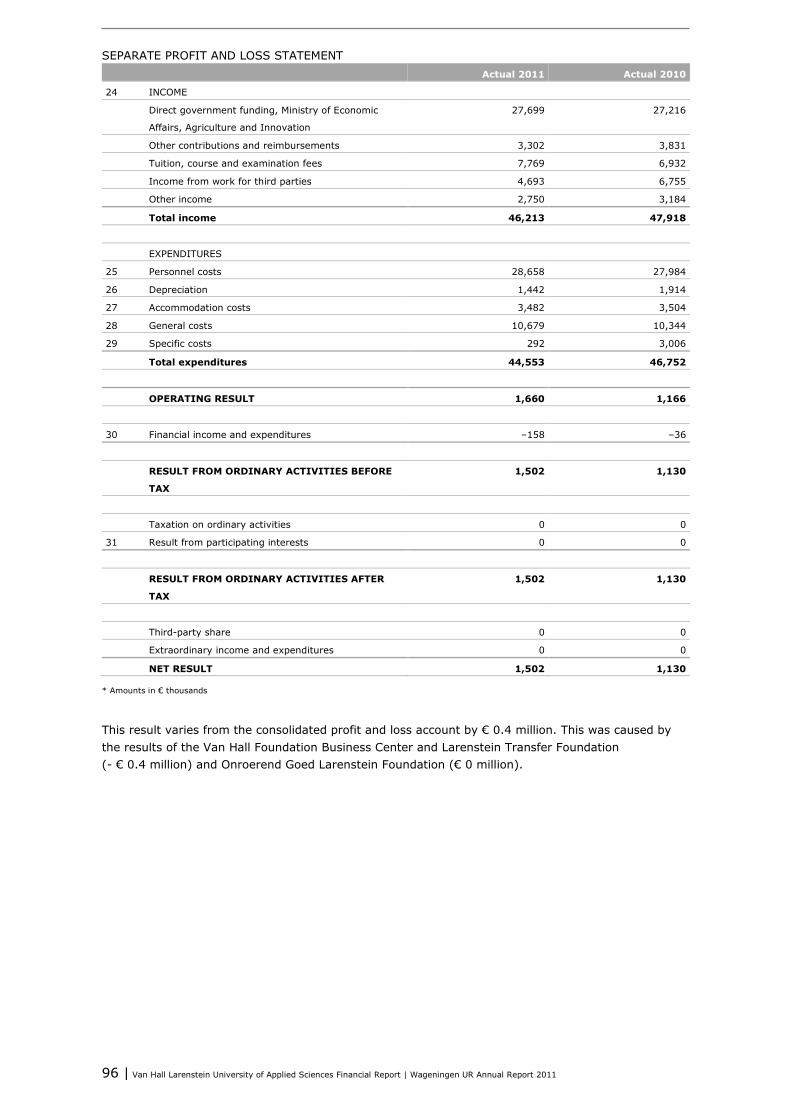
96 | Van Hall Larenstein University of Applied Sciences Financial Report | Wageningen UR Annual Report 2011
SEPARATE PROFIT AND LOSS STATEMENT Actual 2011 Actual 2010
24 INCOME
Direct government funding, Ministry of Economic
Affairs, Agriculture and Innovation
27,699 27,216
Other contributions and reimbursements 3,302 3,831
Tuition, course and examination fees 7,769 6,932
Income from work for third parties 4,693 6,755
Other income 2,750 3,184
Total income 46,213 47,918
EXPENDITURES
25 Personnel costs 28,658 27,984
26 Depreciation 1,442 1,914
27 Accommodation costs 3,482 3,504
28 General costs 10,679 10,344
29 Specific costs 292 3,006
Total expenditures 44,553 46,752
OPERATING RESULT 1,660 1,166
30 Financial income and expenditures –158 –36
RESULT FROM ORDINARY ACTIVITIES BEFORE
TAX
1,502 1,130
Taxation on ordinary activities 0 0
31 Result from participating interests 0 0
RESULT FROM ORDINARY ACTIVITIES AFTER
TAX
1,502 1,130
Third-party share 0 0
Extraordinary income and expenditures 0 0
NET RESULT 1,502 1,130
* Amounts in € thousands
This result varies from the consolidated profit and loss account by € 0.4 million. This was caused by the results of the Van Hall Foundation Business Center and Larenstein Transfer Foundation (- € 0.4 million) and Onroerend Goed Larenstein Foundation (€ 0 million).
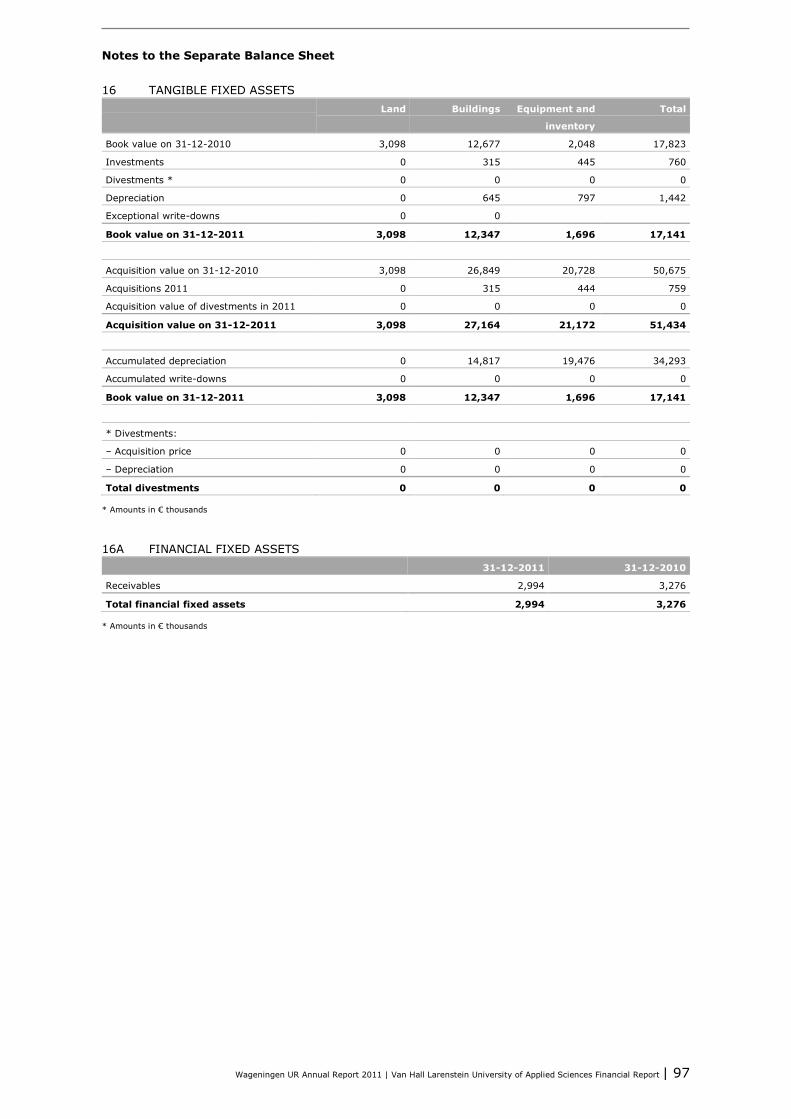
Wageningen UR Annual Report 2011 | Van Hall Larenstein University of Applied Sciences Financial Report | 97
Notes to the Separate Balance Sheet 16 TANGIBLE FIXED ASSETS Land Buildings Equipment and
inventory
Total
Book value on 31-12-2010 3,098 12,677 2,048 17,823
Investments 0 315 445 760
Divestments * 0 0 0 0
Depreciation 0 645 797 1,442
Exceptional write-downs 0 0
Book value on 31-12-2011 3,098 12,347 1,696 17,141
Acquisition value on 31-12-2010 3,098 26,849 20,728 50,675
Acquisitions 2011 0 315 444 759
Acquisition value of divestments in 2011 0 0 0 0
Acquisition value on 31-12-2011 3,098 27,164 21,172 51,434
Accumulated depreciation 0 14,817 19,476 34,293
Accumulated write-downs 0 0 0 0
Book value on 31-12-2011 3,098 12,347 1,696 17,141
* Divestments:
– Acquisition price 0 0 0 0
– Depreciation 0 0 0 0
Total divestments 0 0 0 0
* Amounts in € thousands
16A FINANCIAL FIXED ASSETS 31-12-2011 31-12-2010
Receivables 2,994 3,276
Total financial fixed assets 2,994 3,276
* Amounts in € thousands
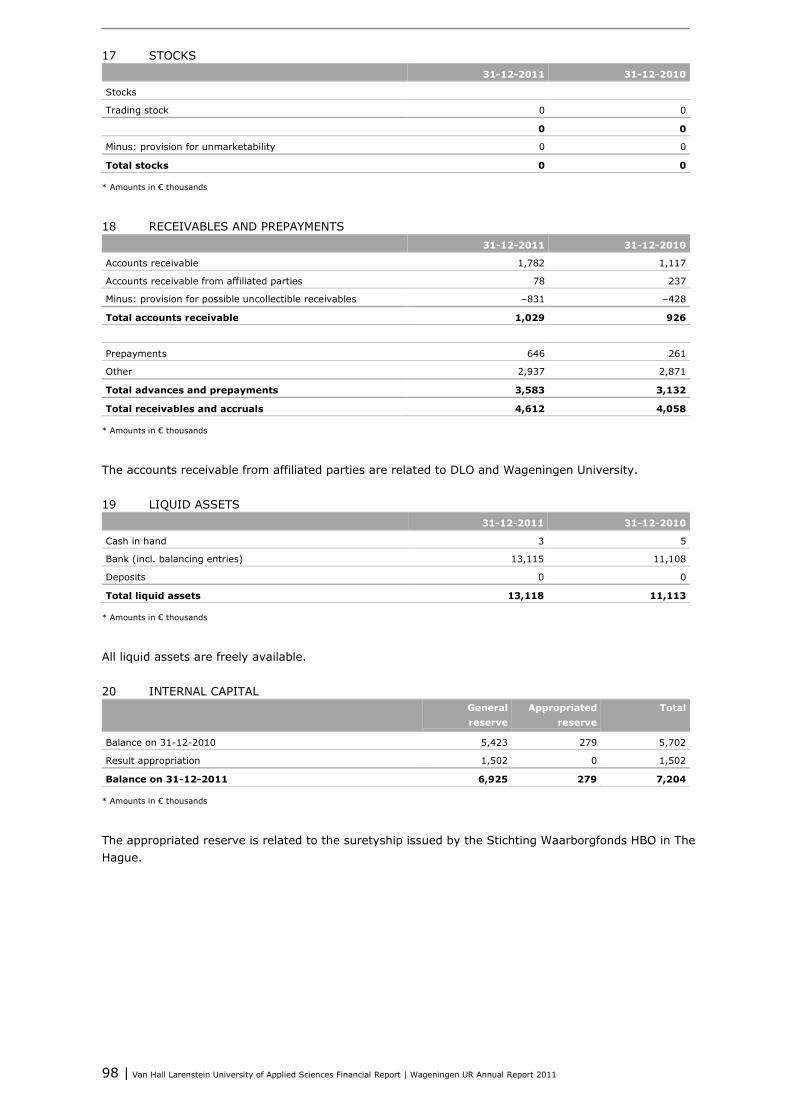
98 | Van Hall Larenstein University of Applied Sciences Financial Report | Wageningen UR Annual Report 2011
17 STOCKS 31-12-2011 31-12-2010
Stocks
Trading stock 0 0
0 0
Minus: provision for unmarketability 0 0
Total stocks 0 0
* Amounts in € thousands
18 RECEIVABLES AND PREPAYMENTS 31-12-2011 31-12-2010
Accounts receivable 1,782 1,117
Accounts receivable from affiliated parties 78 237
Minus: provision for possible uncollectible receivables –831 –428
Total accounts receivable 1,029 926
Prepayments 646 261
Other 2,937 2,871
Total advances and prepayments 3,583 3,132
Total receivables and accruals 4,612 4,058
* Amounts in € thousands
The accounts receivable from affiliated parties are related to DLO and Wageningen University. 19 LIQUID ASSETS 31-12-2011 31-12-2010
Cash in hand 3 5
Bank (incl. balancing entries) 13,115 11,108
Deposits 0 0
Total liquid assets 13,118 11,113
* Amounts in € thousands
All liquid assets are freely available. 20 INTERNAL CAPITAL General
reserve Appropriated
reserve Total
Balance on 31-12-2010 5,423 279 5,702
Result appropriation 1,502 0 1,502
Balance on 31-12-2011 6,925 279 7,204
* Amounts in € thousands
The appropriated reserve is related to the suretyship issued by the Stichting Waarborgfonds HBO in The Hague.

Wageningen UR Annual Report 2011 | Van Hall Larenstein University of Applied Sciences Financial Report | 99
21 PROVISIONS Balance on
31-12-2010 Addition Withdrawal Release Balance on
31-12-2011
Unemployment insurance obligations 1,897 230 873 0 1,254
Other personnel provisions 964 331 535 0 760
Reorganization costs 1,636 40 11 0 1,665
Total provisions 4,497 601 1,419 0 3,679
* Amounts in € thousands
31-12-2011 31-12-2010
Specification of the term of the provisions
Short term (expires by no later than within 1 year) 1,107 1,989
Long term (expires between 1 and 5 years) 1,288 2,285
Long term (expires after 5 years) 1,284 223
Total provisions 3,679 4,497
* Amounts in € thousands
Unemployment Insurance Obligations The provision for unemployment insurance obligations was created to cover the existing unemployment insurance obligations on the balance sheet date and anticipated future expenditures related to departed staff. Other Personnel Provisions Other personnel provisions include a provision for future service anniversary obligations, early-retirement benefits to former staff and other reorganization costs. Reorganization Costs The reorganization cost provision was created for anticipated costs related to the reorganizations implemented previously. 22 LONG-TERM DEBT Balance on
31-12-2010 Increase in
debt Decrease in
debt Balance on
31-12-2011
Other long-term debt 7,242 1,100 1,785 6,557
Reservation for decentralized conditions of
employment
480 0 60 420
Total long-term debt 7,722 1,100 1,845 6,977
* Amounts in € thousands
List of other long-term debt Description Remaining
debt (k€)
Principal
(k€)
Interest Term Accumulated
repayment
(k€)
Long term Description
BNG (1) *) 7,100 8,500 4.71% 15 years 0 6,557 543
BNG (2) 1,242 2,269 6.28% 27 years 1,242 0 1,242
Total 8,342 10,769 1,242 6,557 1,785
* Amounts in € thousands
*) The total BNG loan (1) is € 8.5 million, of which € 7.1 million had been withdrawn on 31-12-2011. The fifth tranche of € 1.4 million will be released in February 2012. The loan term expires on 31 December 2023. Repayment will begin on 30 June 2012. The BNG loan (2), with a remaining debt of € 1.3 million, will be repaid on 30 January 2012.
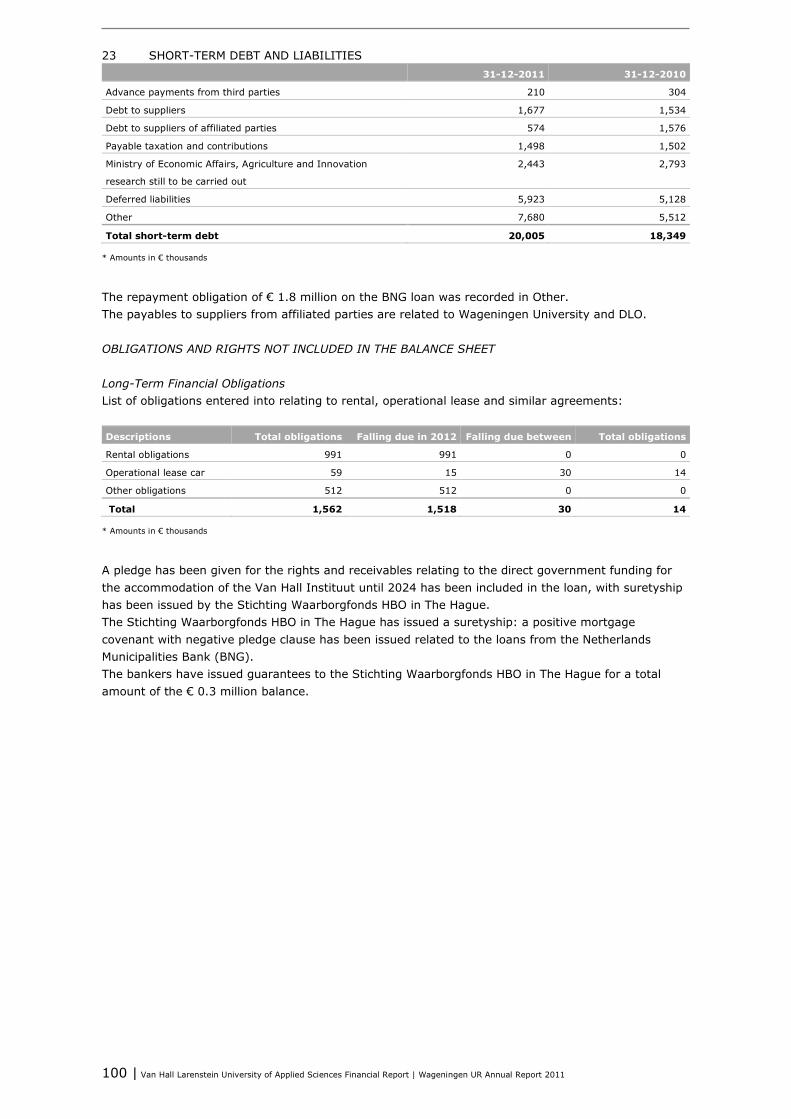
100 | Van Hall Larenstein University of Applied Sciences Financial Report | Wageningen UR Annual Report 2011
23 SHORT-TERM DEBT AND LIABILITIES 31-12-2011 31-12-2010
Advance payments from third parties 210 304
Debt to suppliers 1,677 1,534
Debt to suppliers of affiliated parties 574 1,576
Payable taxation and contributions 1,498 1,502
Ministry of Economic Affairs, Agriculture and Innovation
research still to be carried out
2,443 2,793
Deferred liabilities 5,923 5,128
Other 7,680 5,512
Total short-term debt 20,005 18,349
* Amounts in € thousands
The repayment obligation of € 1.8 million on the BNG loan was recorded in Other. The payables to suppliers from affiliated parties are related to Wageningen University and DLO. OBLIGATIONS AND RIGHTS NOT INCLUDED IN THE BALANCE SHEET Long-Term Financial Obligations List of obligations entered into relating to rental, operational lease and similar agreements: Descriptions Total obligations Falling due in 2012 Falling due between Total obligations
Rental obligations 991 991 0 0
Operational lease car 59 15 30 14
Other obligations 512 512 0 0
Total 1,562 1,518 30 14
* Amounts in € thousands
A pledge has been given for the rights and receivables relating to the direct government funding for the accommodation of the Van Hall Instituut until 2024 has been included in the loan, with suretyship has been issued by the Stichting Waarborgfonds HBO in The Hague. The Stichting Waarborgfonds HBO in The Hague has issued a suretyship: a positive mortgage covenant with negative pledge clause has been issued related to the loans from the Netherlands Municipalities Bank (BNG). The bankers have issued guarantees to the Stichting Waarborgfonds HBO in The Hague for a total amount of the € 0.3 million balance.
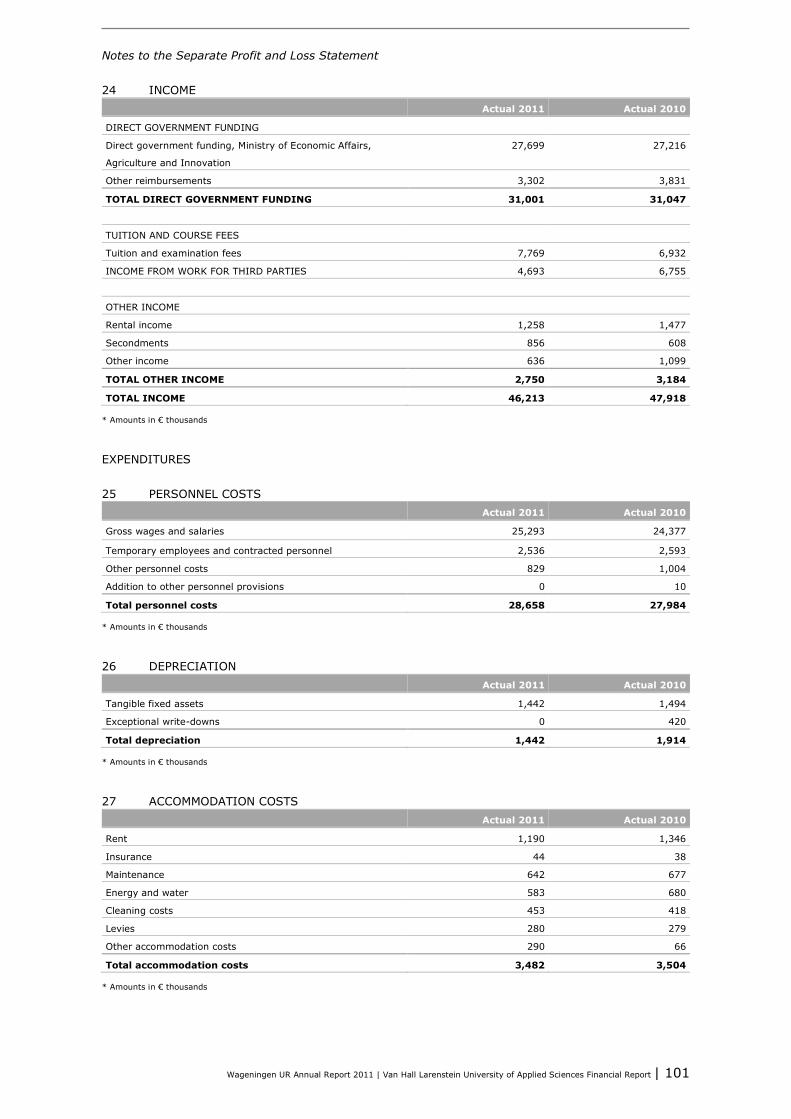
Wageningen UR Annual Report 2011 | Van Hall Larenstein University of Applied Sciences Financial Report | 101
Notes to the Separate Profit and Loss Statement 24 INCOME Actual 2011 Actual 2010
DIRECT GOVERNMENT FUNDING
Direct government funding, Ministry of Economic Affairs,
Agriculture and Innovation
27,699 27,216
Other reimbursements 3,302 3,831
TOTAL DIRECT GOVERNMENT FUNDING 31,001 31,047
TUITION AND COURSE FEES
Tuition and examination fees 7,769 6,932
INCOME FROM WORK FOR THIRD PARTIES 4,693 6,755
OTHER INCOME
Rental income 1,258 1,477
Secondments 856 608
Other income 636 1,099
TOTAL OTHER INCOME 2,750 3,184
TOTAL INCOME 46,213 47,918
* Amounts in € thousands
EXPENDITURES 25 PERSONNEL COSTS Actual 2011 Actual 2010
Gross wages and salaries 25,293 24,377
Temporary employees and contracted personnel 2,536 2,593
Other personnel costs 829 1,004
Addition to other personnel provisions 0 10
Total personnel costs 28,658 27,984
* Amounts in € thousands
26 DEPRECIATION Actual 2011 Actual 2010
Tangible fixed assets 1,442 1,494
Exceptional write-downs 0 420
Total depreciation 1,442 1,914
* Amounts in € thousands
27 ACCOMMODATION COSTS Actual 2011 Actual 2010
Rent 1,190 1,346
Insurance 44 38
Maintenance 642 677
Energy and water 583 680
Cleaning costs 453 418
Levies 280 279
Other accommodation costs 290 66
Total accommodation costs 3,482 3,504
* Amounts in € thousands
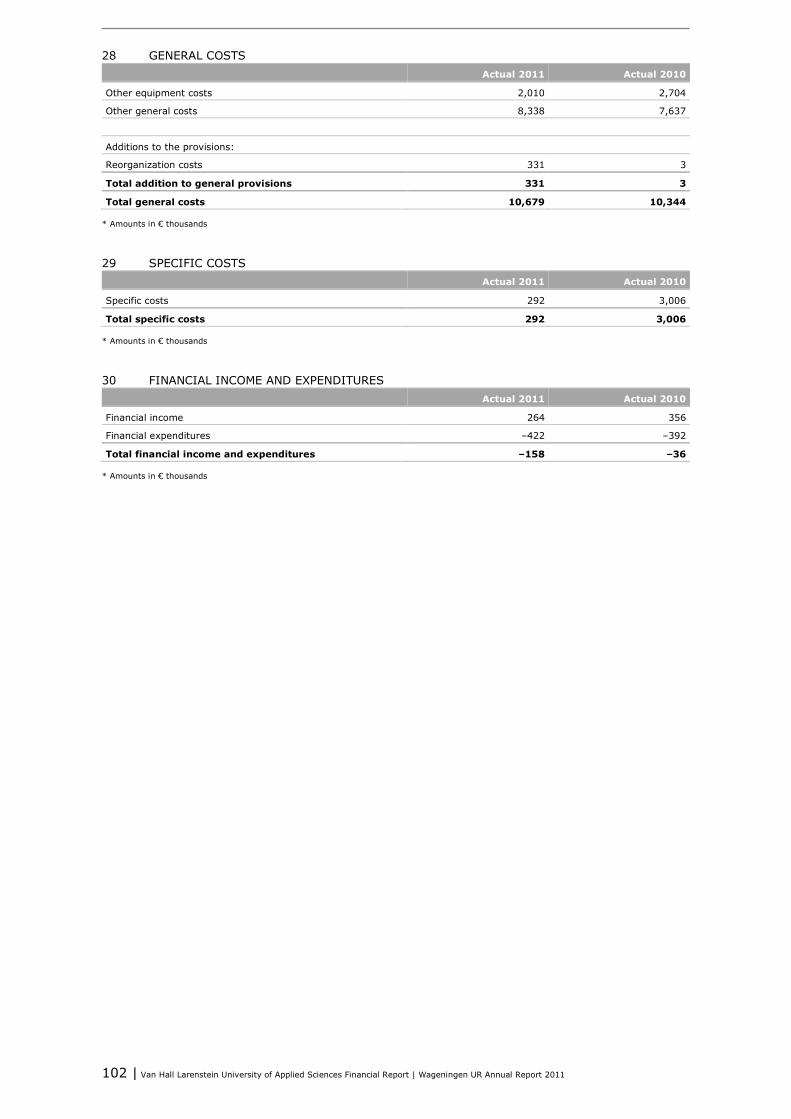
102 | Van Hall Larenstein University of Applied Sciences Financial Report | Wageningen UR Annual Report 2011
28 GENERAL COSTS Actual 2011 Actual 2010
Other equipment costs 2,010 2,704
Other general costs 8,338 7,637
Additions to the provisions:
Reorganization costs 331 3
Total addition to general provisions 331 3
Total general costs 10,679 10,344
* Amounts in € thousands
29 SPECIFIC COSTS Actual 2011 Actual 2010
Specific costs 292 3,006
Total specific costs 292 3,006
* Amounts in € thousands
30 FINANCIAL INCOME AND EXPENDITURES Actual 2011 Actual 2010
Financial income 264 356
Financial expenditures –422 –392
Total financial income and expenditures –158 –36
* Amounts in € thousands
Wageningen UR Annual Report 2011 | Van Hall Larenstein University of Applied Sciences Financial Report | 103
3.2.3 Appendices
Appendix 1 Clarifications The outsourcing of one or more of the components of CROHO registered study programs to a private organization (+ costs) Van Hall Larenstein University of Applied Sciences does not outsource activities in the sense referred to above. Any occasional outside expertise contracted for teaching is contracted from sister higher education institutions or by contracting individual guest lecturers. Customized programs for companies/organizations Van Hall Larenstein University of Applied Sciences does not provide any customized programs for companies and/or organizations in the form of CROHO registered courses leading to a certificate. However, Van Hall Larenstein does provide a variety of courses and training programs to the business community and authorities, within the scope of 'lifelong learning'. Personnel registered for initial study programs Once again, in 2010 Van Hall Larenstein University of Applied Sciences had a number of students who were simultaneously appointed members of staff of the University of Applied Sciences or, in other words, members of staff who were also enrolled as students. The names of these persons are known. These persons include student assistants and students with part time positions. None of these ‘staff students’ are following one of the University of Applied Science’s study programs within the scope of the education and training of VHL personnel. Consequently, the University of Applied Science has not paid the tuition fees for any member of staff. Allocation of direct government funding to private activities Van Hall Larenstein University of Applied Sciences allocates funds to the following private activities: • Student facilities such as sports facilities and training activities. • Van Hall Larenstein contributed approximately € 125,000 to student accommodation for foreign
students in 2011. Although student accommodation is not one of the University of Applied Sciences’ primary duties, in practice, the short period most international students attend the University of Applied Sciences makes it impossible to find adequate accommodation for them. This situation has given cause to Van Hall Larenstein University of Applied Sciences' decision to contribute towards part of the vacancy costs incurred by foreign students for temporary accommodation. The accommodation is available to the students for rents in line with the market rate.
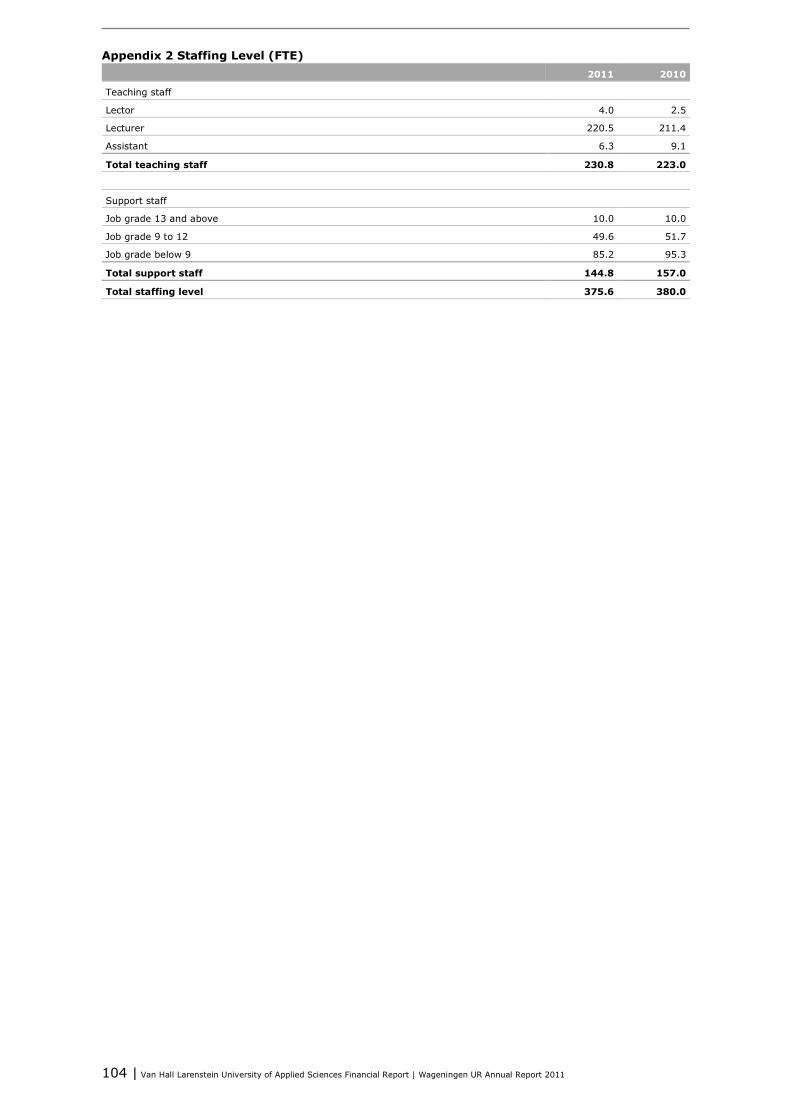
104 | Van Hall Larenstein University of Applied Sciences Financial Report | Wageningen UR Annual Report 2011
Appendix 2 Staffing Level (FTE) 2011 2010
Teaching staff
Lector 4.0 2.5
Lecturer 220.5 211.4
Assistant 6.3 9.1
Total teaching staff 230.8 223.0
Support staff
Job grade 13 and above 10.0 10.0
Job grade 9 to 12 49.6 51.7
Job grade below 9 85.2 95.3
Total support staff 144.8 157.0
Total staffing level 375.6 380.0
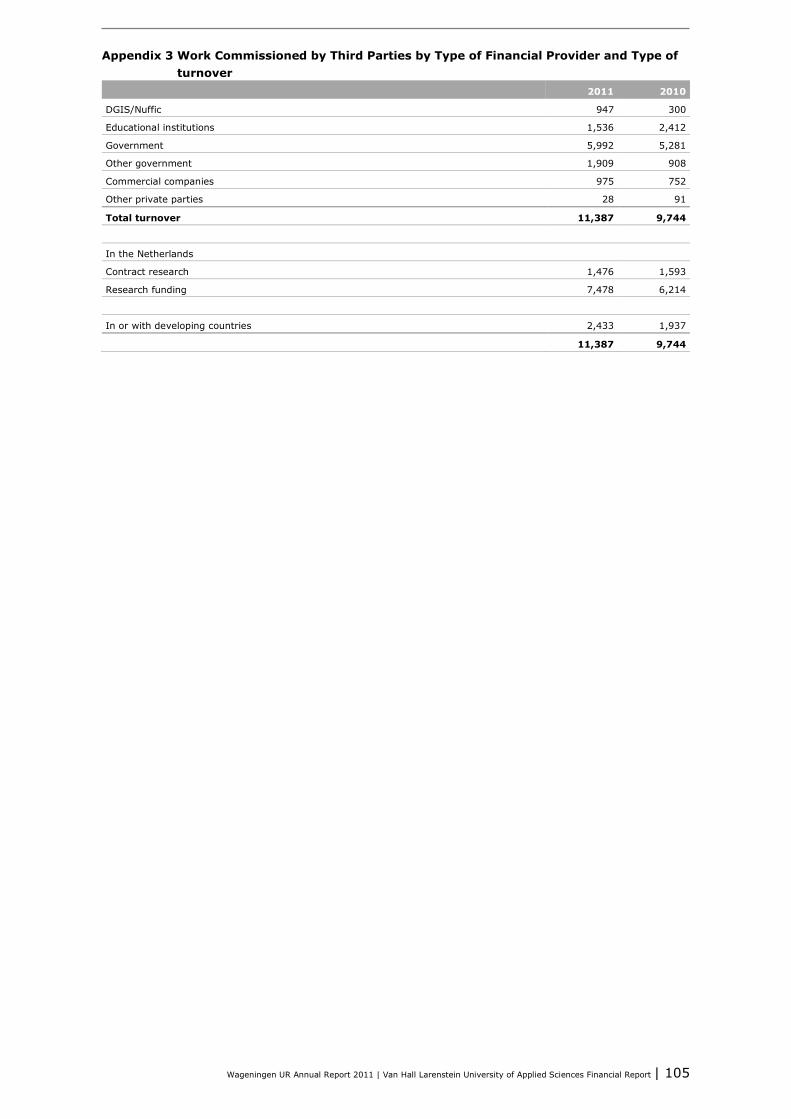
Wageningen UR Annual Report 2011 | Van Hall Larenstein University of Applied Sciences Financial Report | 105
Appendix 3 Work Commissioned by Third Parties by Type of Financial Provider and Type of turnover
2011 2010
DGIS/Nuffic 947 300
Educational institutions 1,536 2,412
Government 5,992 5,281
Other government 1,909 908
Commercial companies 975 752
Other private parties 28 91
Total turnover 11,387 9,744
In the Netherlands
Contract research 1,476 1,593
Research funding 7,478 6,214
In or with developing countries 2,433 1,937
11,387 9,744
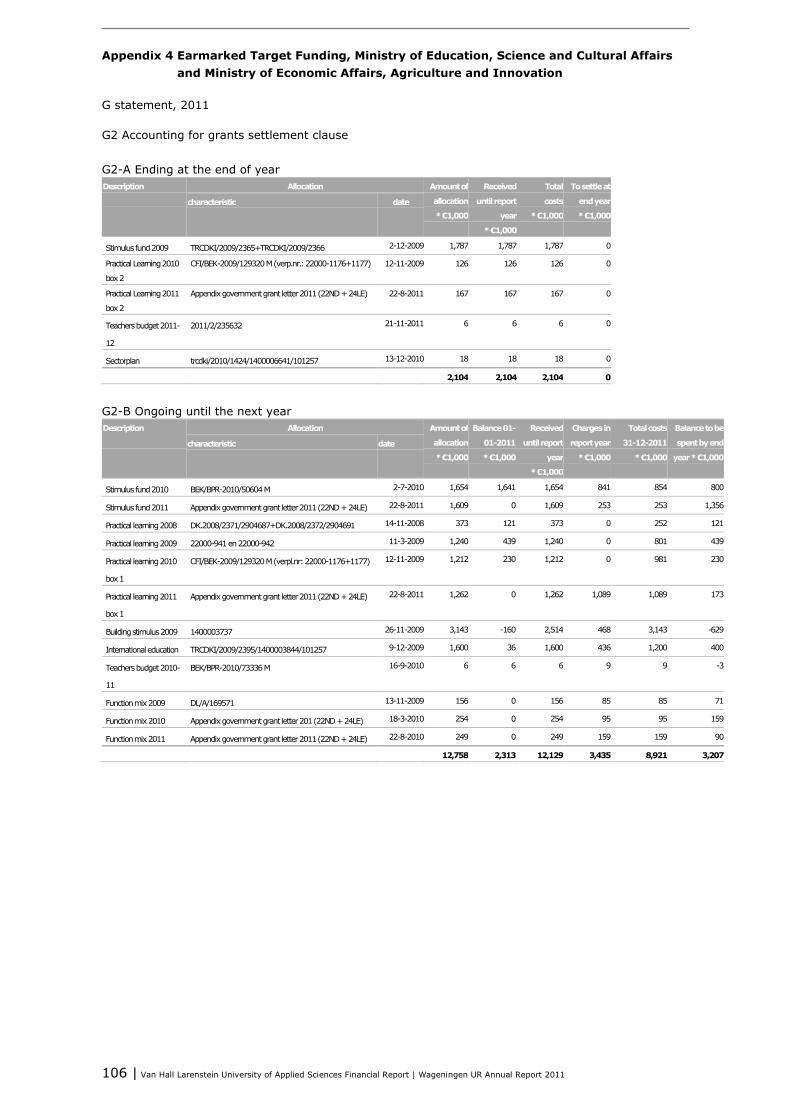
106 | Van Hall Larenstein University of Applied Sciences Financial Report | Wageningen UR Annual Report 2011
Appendix 4 Earmarked Target Funding, Ministry of Education, Science and Cultural Affairs and Ministry of Economic Affairs, Agriculture and Innovation
G statement, 2011 G2 Accounting for grants settlement clause G2-A Ending at the end of year Description
Allocation Amount of
allocation
* €1,000
Received
until report
year
* €1,000
Total
costs
* €1,000
To settle at
end year
* €1,000 characteristic date
Stimulus fund 2009 TRCDKI/2009/2365+TRCDKI/2009/2366 2-12-2009 1,787 1,787 1,787 0
Practical Learning 2010
box 2
CFI/BEK-2009/129320 M (verp.nr.: 22000-1176+1177) 12-11-2009 126 126 126 0
Practical Learning 2011
box 2
Appendix government grant letter 2011 (22ND + 24LE) 22-8-2011 167 167 167 0
Teachers budget 2011-
12
2011/2/235632 21-11-2011 6 6 6 0
Sectorplan trcdki/2010/1424/1400006641/101257 13-12-2010 18 18 18 0
2,104 2,104 2,104 0
G2-B Ongoing until the next year Description
Allocation Amount of
allocation
* €1,000
Balance 01-
01-2011
* €1,000
Received
until report
year
* €1,000
Charges in
report year
* €1,000
Total costs
31-12-2011
* €1,000
Balance to be
spent by end
year * €1,000
characteristic date
Stimulus fund 2010 BEK/BPR-2010/50604 M 2-7-2010 1,654 1,641 1,654 841 854 800
Stimulus fund 2011 Appendix government grant letter 2011 (22ND + 24LE) 22-8-2011 1,609 0 1,609 253 253 1,356
Practical learning 2008 DK.2008/2371/2904687+DK.2008/2372/2904691 14-11-2008 373 121 373 0 252 121
Practical learning 2009 22000-941 en 22000-942 11-3-2009 1,240 439 1,240 0 801 439
Practical learning 2010
box 1
CFI/BEK-2009/129320 M (verpl.nr: 22000-1176+1177) 12-11-2009 1,212 230 1,212 0 981 230
Practical learning 2011
box 1
Appendix government grant letter 2011 (22ND + 24LE) 22-8-2011 1,262 0 1,262 1,089 1,089 173
Building stimulus 2009 1400003737 26-11-2009 3,143 -160 2,514 468 3,143 -629
International education TRCDKI/2009/2395/1400003844/101257 9-12-2009 1,600 36 1,600 436 1,200 400
Teachers budget 2010-
11
BEK/BPR-2010/73336 M 16-9-2010 6 6 6 9 9 -3
Function mix 2009 DL/A/169571 13-11-2009 156 0 156 85 85 71
Function mix 2010 Appendix government grant letter 201 (22ND + 24LE) 18-3-2010 254 0 254 95 95 159
Function mix 2011 Appendix government grant letter 2011 (22ND + 24LE) 22-8-2010 249 0 249 159 159 90
12,758 2,313 12,129 3,435 8,921 3,207
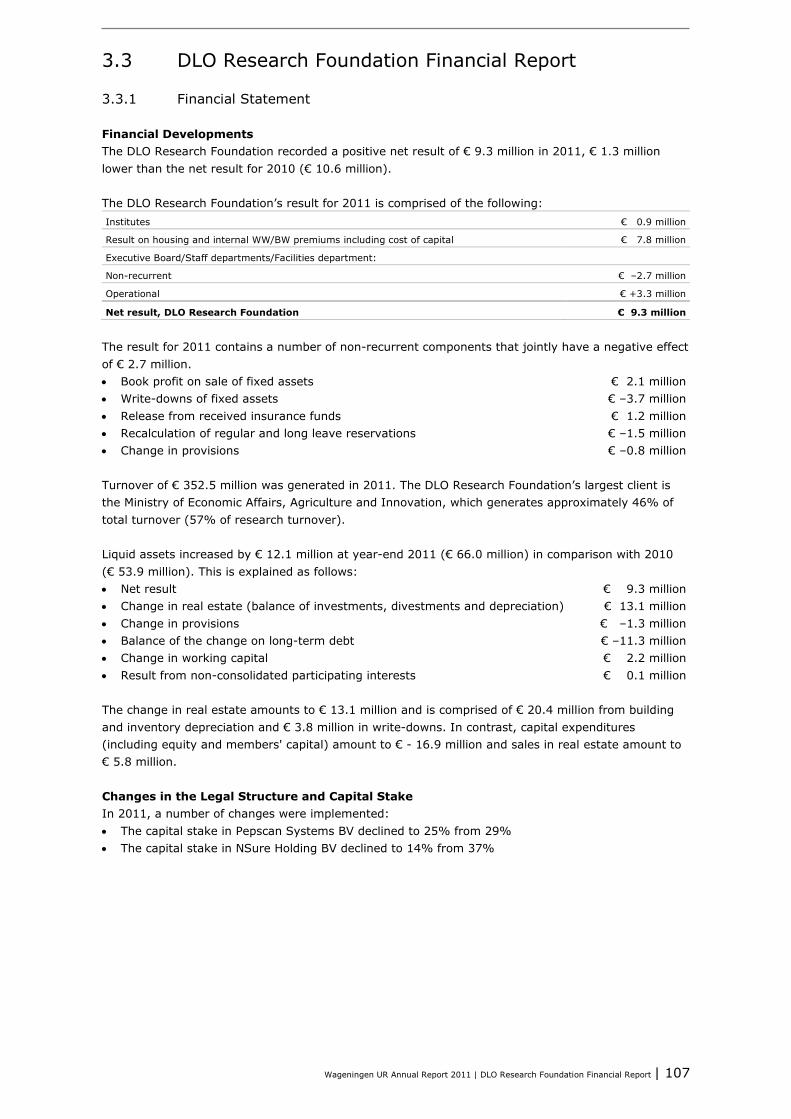
Wageningen UR Annual Report 2011 | DLO Research Foundation Financial Report | 107
3.3 DLO Research Foundation Financial Report
3.3.1 Financial Statement
Financial Developments The DLO Research Foundation recorded a positive net result of € 9.3 million in 2011, € 1.3 million lower than the net result for 2010 (€ 10.6 million). The DLO Research Foundation’s result for 2011 is comprised of the following: Institutes € 0.9 million
Result on housing and internal WW/BW premiums including cost of capital € 7.8 million
Executive Board/Staff departments/Facilities department:
Non-recurrent € –2.7 million
Operational € +3.3 million
Net result, DLO Research Foundation € 9.3 million
The result for 2011 contains a number of non-recurrent components that jointly have a negative effect of € 2.7 million. • Book profit on sale of fixed assets € 2.1 million • Write-downs of fixed assets € –3.7 million • Release from received insurance funds € 1.2 million • Recalculation of regular and long leave reservations € –1.5 million • Change in provisions € –0.8 million Turnover of € 352.5 million was generated in 2011. The DLO Research Foundation’s largest client is the Ministry of Economic Affairs, Agriculture and Innovation, which generates approximately 46% of total turnover (57% of research turnover). Liquid assets increased by € 12.1 million at year-end 2011 (€ 66.0 million) in comparison with 2010 (€ 53.9 million). This is explained as follows: • Net result € 9.3 million • Change in real estate (balance of investments, divestments and depreciation) € 13.1 million • Change in provisions € –1.3 million • Balance of the change on long-term debt € –11.3 million • Change in working capital € 2.2 million • Result from non-consolidated participating interests € 0.1 million The change in real estate amounts to € 13.1 million and is comprised of € 20.4 million from building and inventory depreciation and € 3.8 million in write-downs. In contrast, capital expenditures (including equity and members' capital) amount to € - 16.9 million and sales in real estate amount to € 5.8 million. Changes in the Legal Structure and Capital Stake In 2011, a number of changes were implemented: • The capital stake in Pepscan Systems BV declined to 25% from 29% • The capital stake in NSure Holding BV declined to 14% from 37%
108 | DLO Research Foundation Financial Report | Wageningen UR Annual Report 2011
Prospects for 2012 A net result of € 6.5 million was budgeted for the DLO Research Foundation. The result from ordinary activities (= net result less Executive Board’s non-recurrent result) amounted to € 10.3 million. In view of the current conditions resulting from the credit crisis and the government’s spending cuts it is possible to state that the DLO Research Foundation, with a normalized result of € 10.3 million in 2011, remains on course. The positive result increased the solvency ratio to 49.7%. In 2011, the solvency ratio was 48.4%. The budget takes account of a further increase in the solvency ratio to 51.7% in 2012. € 28.3 million will be invested in buildings and land in 2012. The majority of the investments within the scope of the Strategic Construction Plan (€ 11.8 million) will be made in the renovation of the Atrium and Turbotron and Infrastructure Phase 2. The regular investments amount to € 10.1 million, including a Research Hall and the renovation of the IMARES main building, construction of ISRIC and major maintenance. The knowledge units are also investing € 6.4 million in equipment and building fittings.
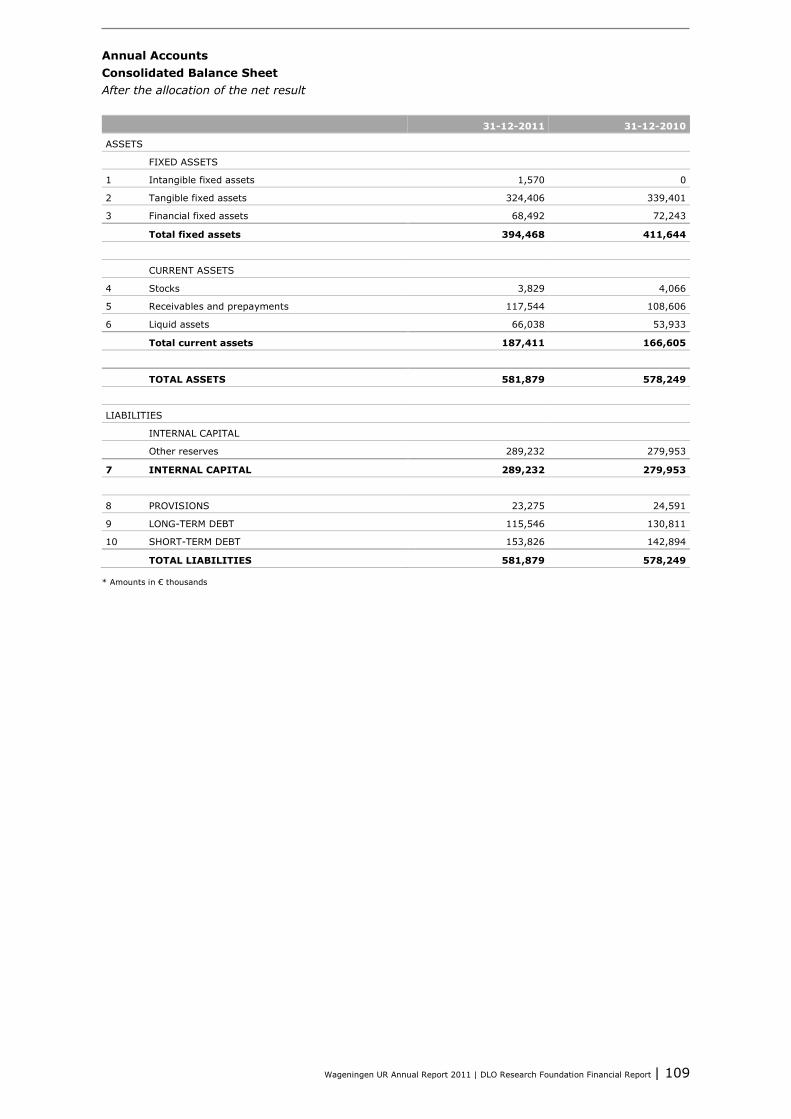
Wageningen UR Annual Report 2011 | DLO Research Foundation Financial Report | 109
Annual Accounts Consolidated Balance Sheet After the allocation of the net result 31-12-2011 31-12-2010
ASSETS
FIXED ASSETS
1 Intangible fixed assets 1,570 0
2 Tangible fixed assets 324,406 339,401
3 Financial fixed assets 68,492 72,243
Total fixed assets 394,468 411,644
CURRENT ASSETS
4 Stocks 3,829 4,066
5 Receivables and prepayments 117,544 108,606
6 Liquid assets 66,038 53,933
Total current assets 187,411 166,605
TOTAL ASSETS 581,879 578,249
LIABILITIES
INTERNAL CAPITAL
Other reserves 289,232 279,953
7 INTERNAL CAPITAL 289,232 279,953
8 PROVISIONS 23,275 24,591
9 LONG-TERM DEBT 115,546 130,811
10 SHORT-TERM DEBT 153,826 142,894
TOTAL LIABILITIES 581,879 578,249
* Amounts in € thousands

110 | DLO Research Foundation Financial Report | Wageningen UR Annual Report 2011
Consolidated Profit and Loss Statement Result 2011 Result 2010
11 INCOME 352,537 357,702
TOTAL INCOME 352,537 357,702
EXPENDITURE
12 Personnel costs 193,619 191,554
13 General costs 76,581 76,075
14 Specific costs 68,647 73,770
Total expenditure 338,847 341,399
OPERATING RESULT 13,690 16,303
15 Financial income and expenditure –4,313 –4,820
RESULT FROM ORDINARY ACTIVITIES BEFORE
TAX
9,377 11,483
16 Result from participating interests –98 –907
RESULT FROM ORDINARY ACTIVITIES AFTER
TAX
9,279 10,576
17 Third-party share 0 0
Extraordinary income and expenditure 0 0
NET RESULT 9,279 10,576
* Amounts in € thousands

Wageningen UR Annual Report 2011 | DLO Research Foundation Financial Report | 111
Consolidated Cash Flow Statement Result 2011 Result 2010
OPERATIONAL ACTIVITIES
Net result 9,279 10,576
Depreciation and write-downs 24,248 26,735
33,527 37,311
Change in provisions –1,316 –4,986
Change in stock 237 –960
Change in receivables –8,938 –2,707
Change in short-term debt 10,932 1,127
Result from non-consolidated participating interests 98 907
Cash flow from operational activities 34,540 30,692
INVESTMENT ACTIVITIES
Investments in intangible assets –3,401 0
Investments in buildings and sites (inc. WIU) –7,119 –19,254
Investments in other tangible assets –6,086 –6,575
Investments in participating interests and members’ capital –292 525
Divestments of fixed assets 5,783 5,587
Cash flow from investment activities –11,115 –19,717
FINANCING ACTIVITIES
Change in long-term receivables, Ministry of Economic Affairs,
Agriculture and Innovation
3,945 3,944
Change in long-term debt, Ministry of Economic Affairs,
Agriculture and Innovation
–6,583 –3,944
Change in other long-term debt –8,369 –792
Decrease in lease obligations –313 –310
Change in internal capital 0 0
Cash flow from financing activities –11,320 –1,102
CASH FLOW 12,105 9,873
CHANGE IN LIQUID ASSETS
Balance of liquid assets on 1 January 53,933 44,060
Balance of liquid assets on 31 December 66,038 53,933
Change in liquid assets 12,105 9,873
* Amounts in € thousands
112 | DLO Research Foundation Financial Report | Wageningen UR Annual Report 2011
Principles of Valuation The annual accounts were prepared and adopted by the Executive Board on 5 April 2012. General The settlements and debt ratios between the various members of the group (what are referred to as intergroup payments) have been eliminated. The figures for the previous financial year are in accordance with the figures in the annual accounts of the relevant year. Variances may arise as a result of corrections, shifts between items or changes in the rounding-off method. Variances of relevant significance are indicated in the annual accounts. General accounting principles for the preparation of the annual accounts The DLO Research Foundation, the DLO Holding BV and a number of (smaller) subsidiaries are grouped together. The staff are employed by the DLO Research Foundation and are allocated, on the basis of the on-charged actual wage costs, to the various operating companies. The DLO Research Foundation owns the real estate used by the operating companies pursuant to contracts for use. The annual accounts are prepared according to the historical cost model. Unless otherwise stated, assets and liabilities are included at nominal value. Monetary assets and liabilities in foreign currencies are converted at the exchange rate on balance sheet date. Exchange rate differences are included in the profit and loss statement. Revenues and expenses in foreign currencies are included in the profit loss statement at the exchange rate on the date of settlement. The annual accounts are prepared pursuant to the Netherlands Civil Code, Book 2, Title 9, and the accounting standards issued by the Dutch Accounting Standards Board. Consolidation circle The consolidation incorporates the annual accounts of the institution, its group companies and other organizations over which the institution exercises dominant control (pursuant to the actual situation) or central management. The group companies are legal entities directly or indirectly controlled by the institution given that the institution possesses the majority of the voting rights or can control the financial and operational activities in some other manner. Also taken into account are potential voting rights that can be exercised directly on the balance sheet date. The annual accounts of group companies and other legal entities controlled or centrally managed by the institution are fully included in the consolidation. Third party shares with respect to internal capital and the group result are reported separately. The annual accounts of the following companies are consolidated in full in the consolidated accounts. Registered office % year-end 2010 Change % year-end 2011
Agri New ventures BV Wageningen 100% – 100%
Calendula Oil BV Wageningen 56% – 56%
DLO Holding BV Wageningen 100% – 100%
Exploitatiemaatschappij Windmolenparken
Lelystad BV
Wageningen 100% – 100%
ID-Lelystad BV Wageningen 100% – 100%
Lelystad Biologicals BV Wageningen 100% – 100%
Wageningen Business Generator BV Wageningen 100% – 100%
Windmolenpark Neushoorntocht BV Wageningen 100% – 100%
Windmolenpark Mammoethtocht BV Wageningen 100% – 100%
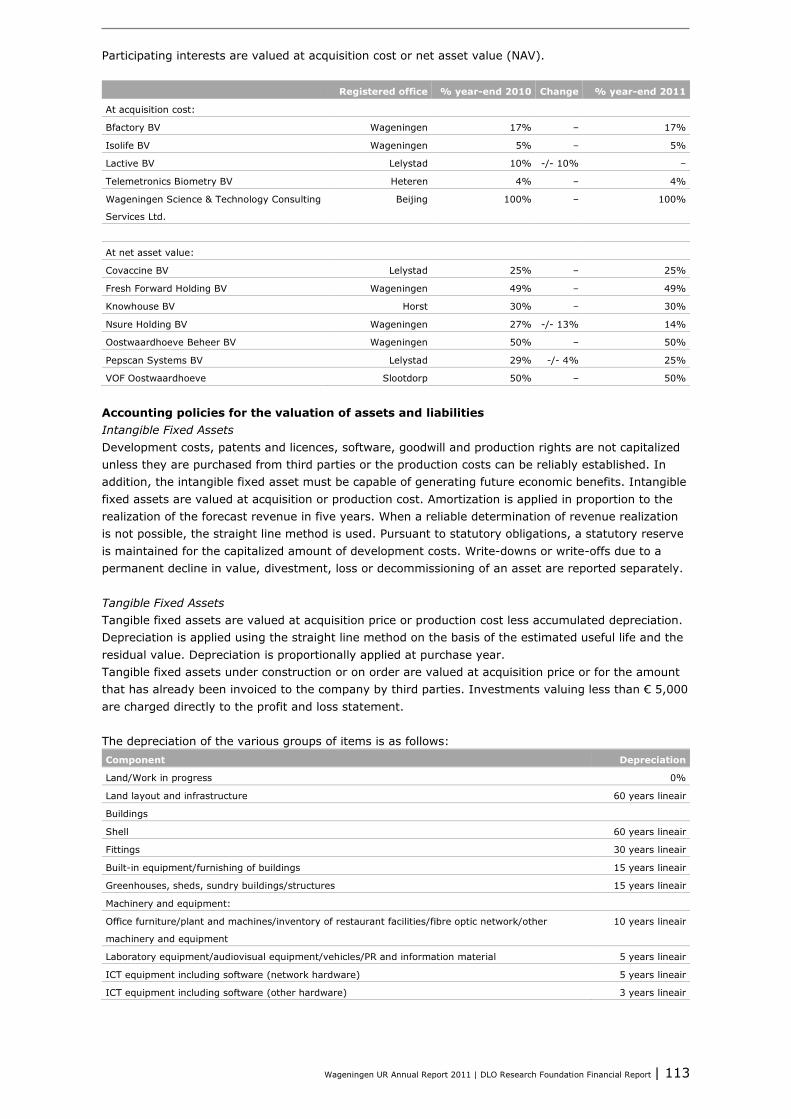
Wageningen UR Annual Report 2011 | DLO Research Foundation Financial Report | 113
Participating interests are valued at acquisition cost or net asset value (NAV). Registered office % year-end 2010 Change % year-end 2011
At acquisition cost:
Bfactory BV Wageningen 17% – 17%
Isolife BV Wageningen 5% – 5%
Lactive BV Lelystad 10% -/- 10% –
Telemetronics Biometry BV Heteren 4% – 4%
Wageningen Science & Technology Consulting
Services Ltd.
Beijing 100% – 100%
At net asset value:
Covaccine BV Lelystad 25% – 25%
Fresh Forward Holding BV Wageningen 49% – 49%
Knowhouse BV Horst 30% – 30%
Nsure Holding BV Wageningen 27% -/- 13% 14%
Oostwaardhoeve Beheer BV Wageningen 50% – 50%
Pepscan Systems BV Lelystad 29% -/- 4% 25%
VOF Oostwaardhoeve Slootdorp 50% – 50%
Accounting policies for the valuation of assets and liabilities Intangible Fixed Assets Development costs, patents and licences, software, goodwill and production rights are not capitalized unless they are purchased from third parties or the production costs can be reliably established. In addition, the intangible fixed asset must be capable of generating future economic benefits. Intangible fixed assets are valued at acquisition or production cost. Amortization is applied in proportion to the realization of the forecast revenue in five years. When a reliable determination of revenue realization is not possible, the straight line method is used. Pursuant to statutory obligations, a statutory reserve is maintained for the capitalized amount of development costs. Write-downs or write-offs due to a permanent decline in value, divestment, loss or decommissioning of an asset are reported separately. Tangible Fixed Assets Tangible fixed assets are valued at acquisition price or production cost less accumulated depreciation. Depreciation is applied using the straight line method on the basis of the estimated useful life and the residual value. Depreciation is proportionally applied at purchase year. Tangible fixed assets under construction or on order are valued at acquisition price or for the amount that has already been invoiced to the company by third parties. Investments valuing less than € 5,000 are charged directly to the profit and loss statement. The depreciation of the various groups of items is as follows: Component Depreciation
Land/Work in progress 0%
Land layout and infrastructure 60 years lineair
Buildings
Shell 60 years lineair
Fittings 30 years lineair
Built-in equipment/furnishing of buildings 15 years lineair
Greenhouses, sheds, sundry buildings/structures 15 years lineair
Machinery and equipment:
Office furniture/plant and machines/inventory of restaurant facilities/fibre optic network/other
machinery and equipment
10 years lineair
Laboratory equipment/audiovisual equipment/vehicles/PR and information material 5 years lineair
ICT equipment including software (network hardware) 5 years lineair
ICT equipment including software (other hardware) 3 years lineair
114 | DLO Research Foundation Financial Report | Wageningen UR Annual Report 2011
However, an exception is made for buildings and equipment that, pursuant to financial provider requirements, are immediately charged in full. The full cost of these fixed assets is included in the year of purchase. Write-downs or write-offs due to a permanent decline in value, divestment, loss or decommissioning of an asset are reported separately. An assessment is made on balance sheet date to review whether there are indications that a fixed asset can be subject to an impairment. Should there be any such indications then the realizable value of the asset is determined. When the realizable value of the individual asset cannot be determined, then the realizable value of the cash flow generating unit to which the asset belongs is determined. An impairment is applicable when the book value of an asset is higher than the realizable value, where the realizable value is the higher of the market value and of the business value. When it is determined that an impairment that was included in the past no longer exists or has decreased, then the increased book value of the asset is set no higher than the book value that would have been determined without the application of an impairment of the asset. Financial Fixed Assets Participating interests and members’ capital over which the institution exerts a significant influence on the business and financial policy are valued at net asset value. This value is determined on the basis of the group’s accounting policies for valuation and the determination of the result. Participating interests and members’ capital over which the institution does not exert a significant influence on the business and financial policy are valued at acquisition cost. The valuation of these assets takes into account any permanent decline in value, where relevant. Stocks This item is comprised of the trading stock, finished product, livestock and stock of harvested agricultural produce. The trading stock and finished product are valued in accordance with the FIFO method at the acquisition cost or production cost increased by a margin for indirect costs. The valuation of livestock and stock of harvested agricultural produce is based on market prices. The value of unmarketable stock or stock with a lower market value is decreased accordingly. The write-down on the stock of antisera is applied on the basis of five times the average sales in the past ten years. The stock of finished product is valued in accordance with the FIFO method at the acquisition cost or production cost increased by a margin for the indirect costs. Receivables and Prepayments Receivables are valued at nominal value less a provision for uncollectible debts, where relevant. Work in Progress Work in progress for third parties is valued at the cost of the direct material use and labour, increased by a margin for indirect costs. Invoiced instalments and forecast losses on projects are deducted from this balance. The allocation of the result is determined in proportion to the progress in the project or the proportion of the realized costs for that project. After setting off the prepayments that have been received, projects with a negative balance are then included under short-term receivables. Projects with a negative balance are included under the prepayments item of short-term debt. Securities Securities are valued at acquisition cost (FIFO method) or lower market value.

Wageningen UR Annual Report 2011 | DLO Research Foundation Financial Report | 115
Internal Capital • Subscribed capital
The nominal value of issued and paid-up share capital is included under this item. • Statutory reserve
The maintenance of a statutory reserve for research and development costs capitalized in the balance sheet is mandatory.
• General reserve This reserve is credited with the operating result in any year in which the result is not allocated to a specific use.
Third-party Share The share of third parties in a participating interest consolidated in full by the group is included in the Third-party Share item in the annual accounts. Provisions Unless otherwise stated, provisions are valued at nominal value. The amount of the provision included in the annual accounts is the best estimate of the amount that will be required to settle the relevant obligations and losses at balance sheet date. Provisions are formed for: • legally enforceable or actual obligations that exist at balance sheet date; • the settlement of obligations that will probably require an outflow of funds; and • obligations when a reliable estimate can be made of those obligations. Provision for Unemployment Insurance Obligations The provision for unemployment insurance obligations covers existing unemployment insurance obligations at balance sheet date and anticipated future expenditures relating to staff who have already left employment and staff employed with a temporary employment contract. Provision for the Resumption of Work (Partially Disabled Persons) Act The provision for Resumption of Work (Partially Disabled Persons) Act obligations covers the obligations pursuant to the Act as anticipated on the balance sheet date. The DLO Research Foundation bears deductibles for 2012. Other Personnel Provisions – Service Bonuses The anticipated obligation arising from future service (anniversary) bonuses is determined on the basis of historical information and withdrawals are made on the basis of realization. The present value is determined on the basis of the prevailing market rate of interest for the DLO Research Foundation. Other Personnel Provisions - Pensions DLO’s pension insurance provider is ABP. The scheme is a defined benefit pension scheme, as a result of which account needs to be taken of future changes in pension contributions and investment results. The obligation is included as a defined contribution pursuant to RJ 271.310. No obligations other than the payment of pension contributions arise from a defined contribution pension scheme. The pension contributions are included as personnel costs when they become payable. Prepaid pension contributions are included as prepayments to the extent that they will be reimbursed by the pension fund or credited to pension contributions due in future. The pension plans accord with the average and will be indexed if the coverage rate of the pension fund allows. The ABP pension fund had a coverage rate of 94% on 31 December 2011. Compared to 31 December 2010, the coverage rate decreased by 11%. Based on the recovery plan, a coverage rate of 100.5% was predicted for 31 December 2011. The actual coverage rate on 31 December 2011 was 6.5% lower. Based on the current coverage rate, the ABP decided: • to implement an additional premium surcharge of 2% for 2012 and 2013; • not to index benefits in 2012.
116 | DLO Research Foundation Financial Report | Wageningen UR Annual Report 2011
Provision for Reorganization Costs This provision covers anticipated costs incurred as a result of decisions made and announced within the organization that relate to current and intended reorganizations. Provision for Product and Contract Risks This provision covers the expected cost of loss-making contracts, guarantees and claims arising from services and products delivered to third parties. Long-term Debt Long-term debt is that which lasts longer than one year after the date of the end of the annual account. Short-term Debt Short-term debt is that which is paid less than one year after the date of the end of the annual account. Accounting policies for the determination of income and expenditure Overview Proceeds and costs are included as business income and expenditures that can be allocated to the relevant financial year or activity, irrespective of whether they have resulted in receipts and expenses during the annual account period. Proceeds are included in the year in which the goods were delivered or the services were provided to clients. Losses and risks arising before the end of the financial year are taken into account when they are known before preparation of the annual account. Contract revenue is included under the Contract Research item. The income is determined on the basis of the direct costs increased by a margin for indirect costs to a maximum of the rate to be paid by the provider of finance. Results are taken in proportion to the progress in the project. Revenue from the Ministry of Economic Affairs, Agriculture and Innovation falling under the subsidy regulation is included under the Ministry of Economic Affairs, Agriculture and Innovation Programme Research item. The income is determined on the basis of the direct costs increased by a margin for indirect costs. The margin for indirect costs is determined once a year in accordance with the prevailing system for the margin. Results are taken in proportion to the progress in the project. Taxation on the result is calculated from the profit before tax item in the income and expenditure statement, taking into account any available losses that are off-settable against tax (to the extent that these have not been included in the deferred tax credits) and tax-exempt profit constituents after the inclusion of non-deductible costs. Account is also taken of any changes in deferred tax credits and deferred tax liabilities arising from changes in the applicable tax rate. Changes in system Not applicable.

Wageningen UR Annual Report 2011 | DLO Research Foundation Financial Report | 117
Notes to the Balance Sheet 1 INTANGIBLE FIXED ASSETS Development costs Total
Book value at 31-12-2010 0 0
Investments 3,401 3,401
Disinvestments 0 0
Depreciation 374 374
Write-downs 1,457 1,457
Book value at 31-12-2010 1,570 1,570
Acquisition value at 31-12-2010 1,866 1,866
Acquisitions 2011 3,401 3,401
Accumulated depreciation 2,240 2,240
Accumulated write-downs 1,457 1,457
Book value at 31-12-2010 1,570 1,570
* Amounts in € thousands
The investment in development costs concerns Kameleon. In addition, the software package ARTIS is included under the year-end 2010. This package is written off over a five-year period. 2 TANGIBLE FIXED ASSETS Land Buildings Fixtures Machinery
and
equipment
Work in
progress
Total
Book value at 31-12-2010 108,251 203,715 159 19,152 8,124 339,401
Investments –440 1,354 176 5,910 6,205 13,205
Disinvestments 5,309 275 0 199 0 5,783
Depreciation 5 14,433 180 5,491 0 20,109
Write-downs 0 2,308 0 0 0 2,308
Book value at 31-12-2011 102,497 188,053 155 19,372 14,329 324,406
Acquisition value at 31-12-2010 108,271 328,571 695 88,085 8,124 533,747
Acquisitions 2011 –440 1,354 176 5,910 6,205 13,205
Acquisition value of divestments in 2011 5,309 320 163 2,789 0 8,581
Acquisition value 31-12-2011 102,522 329,605 708 91,206 14,329 538,371
Accumulated depreciation 25 111,275 553 71,691 0 183,544
Accumulated write-downs 0 30,277 0 143 0 30,420
Book value at 31-12-2011 102,497 188,053 155 19,372 14,329 324,406
Divestments, of which:
- Acquisition price 5,309 320 163 2,789 0 8,581
- Depreciation 0 45 163 2,590 0 2,798
Total divestments 5,309 275 0 199 0 5,783
* Amounts in € thousands
€ 11.1 million was added to the work in progress item for investments in buildings in 2011 and € 4.6 million was withdrawn. The other changes in the work in progress item relate to equipment investments and withdrawals. Alongside a number of smaller construction projects, the addition to the work in progress item includes the Strategic Construction Plan (Technotron teaching facilities € 0.2 million; AFSG Atrium
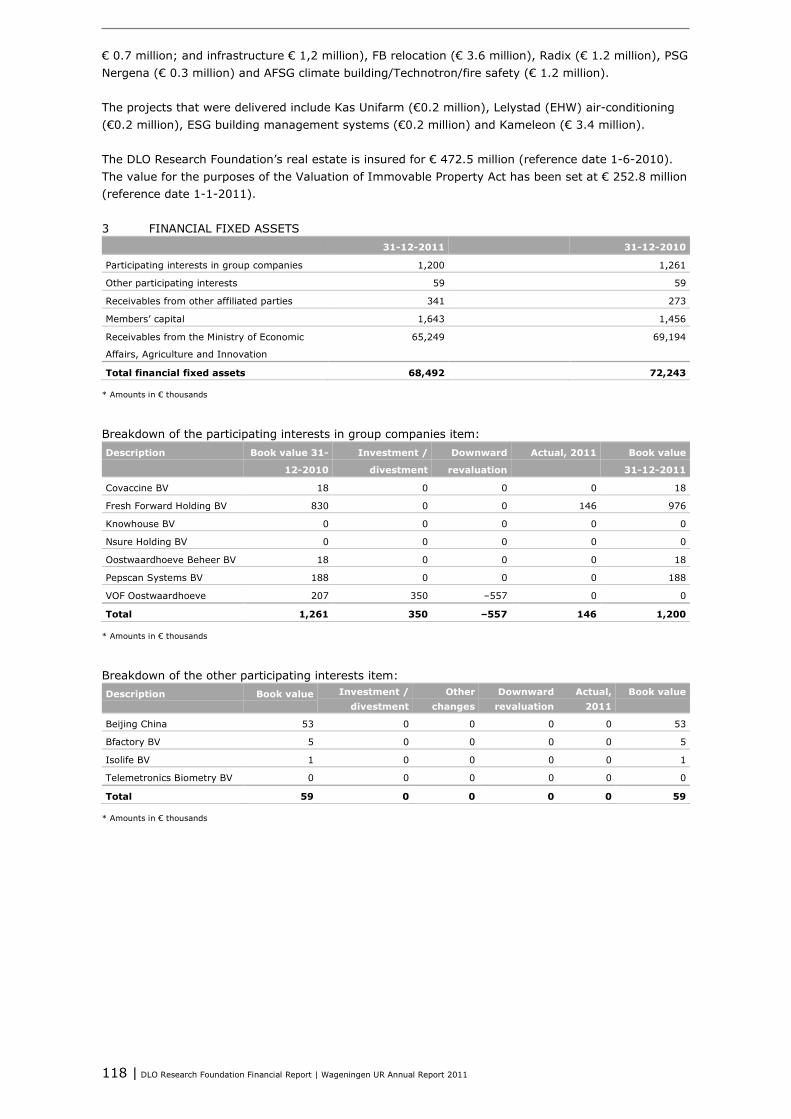
118 | DLO Research Foundation Financial Report | Wageningen UR Annual Report 2011
€ 0.7 million; and infrastructure € 1,2 million), FB relocation (€ 3.6 million), Radix (€ 1.2 million), PSG Nergena (€ 0.3 million) and AFSG climate building/Technotron/fire safety (€ 1.2 million). The projects that were delivered include Kas Unifarm (€0.2 million), Lelystad (EHW) air-conditioning (€0.2 million), ESG building management systems (€0.2 million) and Kameleon (€ 3.4 million). The DLO Research Foundation’s real estate is insured for € 472.5 million (reference date 1-6-2010). The value for the purposes of the Valuation of Immovable Property Act has been set at € 252.8 million (reference date 1-1-2011). 3 FINANCIAL FIXED ASSETS 31-12-2011 31-12-2010
Participating interests in group companies 1,200 1,261
Other participating interests 59 59
Receivables from other affiliated parties 341 273
Members’ capital 1,643 1,456
Receivables from the Ministry of Economic
Affairs, Agriculture and Innovation
65,249 69,194
Total financial fixed assets 68,492 72,243
* Amounts in € thousands
Breakdown of the participating interests in group companies item: Description Book value 31-
12-2010
Investment /
divestment
Downward
revaluation
Actual, 2011 Book value
31-12-2011
Covaccine BV 18 0 0 0 18
Fresh Forward Holding BV 830 0 0 146 976
Knowhouse BV 0 0 0 0 0
Nsure Holding BV 0 0 0 0 0
Oostwaardhoeve Beheer BV 18 0 0 0 18
Pepscan Systems BV 188 0 0 0 188
VOF Oostwaardhoeve 207 350 –557 0 0
Total 1,261 350 –557 146 1,200
* Amounts in € thousands
Breakdown of the other participating interests item: Description Book value Investment /
divestment Other
changes Downward
revaluation Actual,
2011 Book value
Beijing China 53 0 0 0 0 53
Bfactory BV 5 0 0 0 0 5
Isolife BV 1 0 0 0 0 1
Telemetronics Biometry BV 0 0 0 0 0 0
Total 59 0 0 0 0 59
* Amounts in € thousands
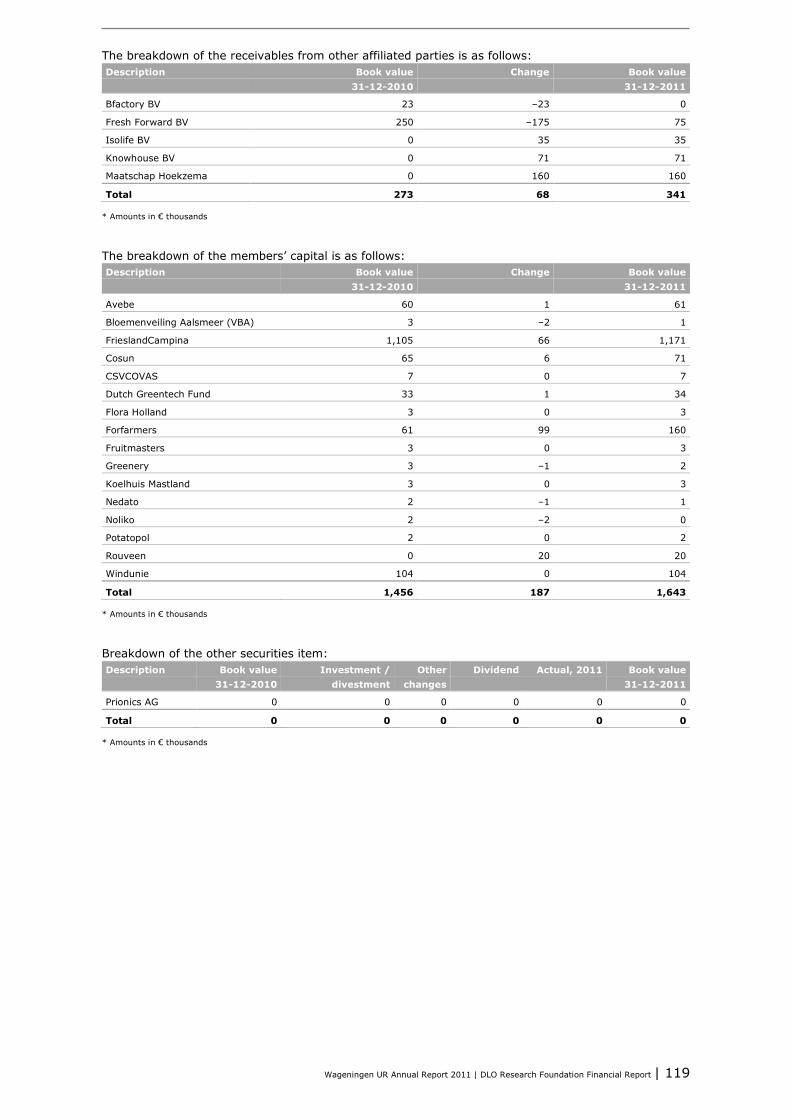
Wageningen UR Annual Report 2011 | DLO Research Foundation Financial Report | 119
The breakdown of the receivables from other affiliated parties is as follows: Description Book value
31-12-2010 Change Book value
31-12-2011
Bfactory BV 23 –23 0
Fresh Forward BV 250 –175 75
Isolife BV 0 35 35
Knowhouse BV 0 71 71
Maatschap Hoekzema 0 160 160
Total 273 68 341
* Amounts in € thousands
The breakdown of the members’ capital is as follows: Description Book value
31-12-2010 Change Book value
31-12-2011
Avebe 60 1 61
Bloemenveiling Aalsmeer (VBA) 3 –2 1
FrieslandCampina 1,105 66 1,171
Cosun 65 6 71
CSVCOVAS 7 0 7
Dutch Greentech Fund 33 1 34
Flora Holland 3 0 3
Forfarmers 61 99 160
Fruitmasters 3 0 3
Greenery 3 –1 2
Koelhuis Mastland 3 0 3
Nedato 2 –1 1
Noliko 2 –2 0
Potatopol 2 0 2
Rouveen 0 20 20
Windunie 104 0 104
Total 1,456 187 1,643
* Amounts in € thousands
Breakdown of the other securities item: Description Book value
31-12-2010 Investment /
divestment Other
changes Dividend Actual, 2011 Book value
31-12-2011
Prionics AG 0 0 0 0 0 0
Total 0 0 0 0 0 0
* Amounts in € thousands
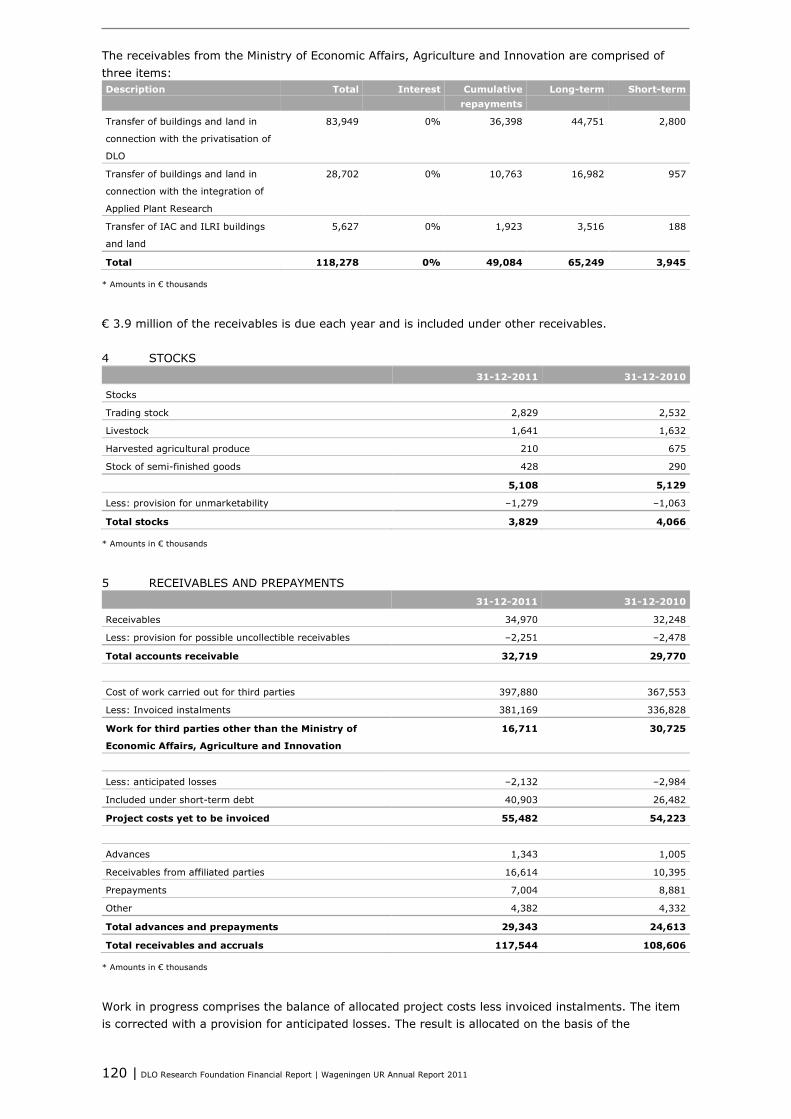
120 | DLO Research Foundation Financial Report | Wageningen UR Annual Report 2011
The receivables from the Ministry of Economic Affairs, Agriculture and Innovation are comprised of three items: Description Total Interest Cumulative
repayments Long-term Short-term
Transfer of buildings and land in
connection with the privatisation of
DLO
83,949 0% 36,398 44,751 2,800
Transfer of buildings and land in
connection with the integration of
Applied Plant Research
28,702 0% 10,763 16,982 957
Transfer of IAC and ILRI buildings
and land
5,627 0% 1,923 3,516 188
Total 118,278 0% 49,084 65,249 3,945
* Amounts in € thousands
€ 3.9 million of the receivables is due each year and is included under other receivables. 4 STOCKS 31-12-2011 31-12-2010
Stocks
Trading stock 2,829 2,532
Livestock 1,641 1,632
Harvested agricultural produce 210 675
Stock of semi-finished goods 428 290
5,108 5,129
Less: provision for unmarketability –1,279 –1,063
Total stocks 3,829 4,066
* Amounts in € thousands
5 RECEIVABLES AND PREPAYMENTS 31-12-2011 31-12-2010
Receivables 34,970 32,248
Less: provision for possible uncollectible receivables –2,251 –2,478
Total accounts receivable 32,719 29,770
Cost of work carried out for third parties 397,880 367,553
Less: Invoiced instalments 381,169 336,828
Work for third parties other than the Ministry of
Economic Affairs, Agriculture and Innovation
16,711 30,725
Less: anticipated losses –2,132 –2,984
Included under short-term debt 40,903 26,482
Project costs yet to be invoiced 55,482 54,223
Advances 1,343 1,005
Receivables from affiliated parties 16,614 10,395
Prepayments 7,004 8,881
Other 4,382 4,332
Total advances and prepayments 29,343 24,613
Total receivables and accruals 117,544 108,606
* Amounts in € thousands
Work in progress comprises the balance of allocated project costs less invoiced instalments. The item is corrected with a provision for anticipated losses. The result is allocated on the basis of the

Wageningen UR Annual Report 2011 | DLO Research Foundation Financial Report | 121
percentage of completion method determined in accordance with the degree of the realization of the forecast costs. Project losses are included immediately. The balance of orders from third parties comprises projects with a positive balance (the value of the work carried out is in excess of the invoiced instalments) and projects with a negative balance (the value of the invoiced instalments is in excess of the value of the work carried out). Projects with a negative balance are included under short-term debts. The receivables from affiliated parties relates to receivables from Wageningen University. These relate to short-term positions that are regularly offset against each other. The € 3.9 million portion of the receivables from the Ministry of Economic Affairs, Agriculture and Innovation that becomes due each year is included under other receivables. 6 LIQUID ASSETS 31-12-2011 31-12-2010
Cash in hand 46 59
Bank (incl. balancing entries) 65,992 53,874
Total liquid assets 66,038 53,933
* Amounts in € thousands
Liquidity increased by € 9.9 million. The breakdown of this increase is as follows: • Net result € 9.3 million • Change in real estate (balance of investments, divestments and depreciation) € 13.1 million • Change in provisions € - 1.3 million • Balance of the change in long-term debt € - 11.3 million • Change in working capital € 2.2 million • Result from non-consolidated participating interests € 0.1 million The change in real estate amounts to € 13.1 million and is comprised of € 20.4 million from building and inventory depreciation and € 3.8 million in write-downs. In contrast, capital expenditures amount to €- 16.9 million and sales in real estate amount to € 5.8 million. € 48.35 million of the cash balance is freely available. An amount of € 2.5 million has been pledged as security for bank guarantees issued. The credit amount of DLO is € 1.0 million. DLO has received € 15.2 million still to be paid to contractors. These liquid assets are not freely available to DLO. 7 EIGEN VERMOGEN General reserve Total
Balance at 31-12-2010 279,953 279,953
Result appropriation 9,279 9,279
Balance at 31-12-2011 289,232 289,232
* Amounts in € thousands
The entire positive net result of € 9.3 million recorded for the financial year has been transferred to the general reserve.
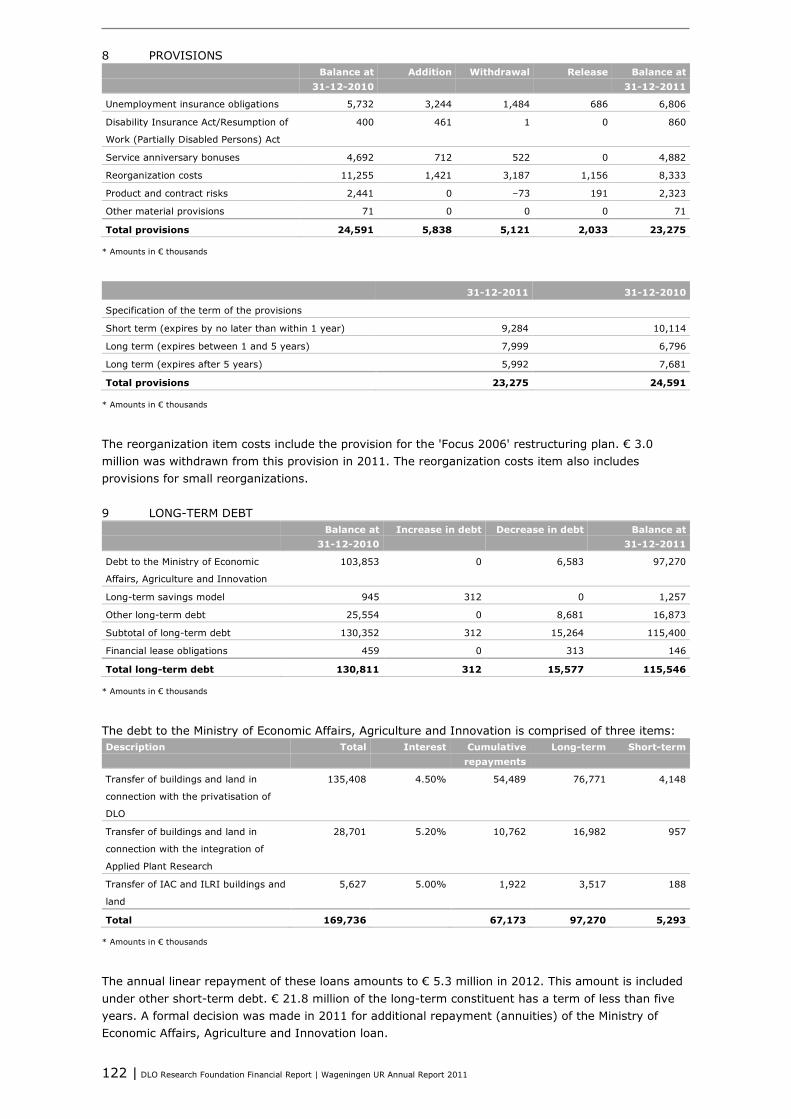
122 | DLO Research Foundation Financial Report | Wageningen UR Annual Report 2011
8 PROVISIONS Balance at
31-12-2010 Addition Withdrawal Release Balance at
31-12-2011
Unemployment insurance obligations 5,732 3,244 1,484 686 6,806
Disability Insurance Act/Resumption of
Work (Partially Disabled Persons) Act
400 461 1 0 860
Service anniversary bonuses 4,692 712 522 0 4,882
Reorganization costs 11,255 1,421 3,187 1,156 8,333
Product and contract risks 2,441 0 –73 191 2,323
Other material provisions 71 0 0 0 71
Total provisions 24,591 5,838 5,121 2,033 23,275
* Amounts in € thousands
31-12-2011 31-12-2010
Specification of the term of the provisions
Short term (expires by no later than within 1 year) 9,284 10,114
Long term (expires between 1 and 5 years) 7,999 6,796
Long term (expires after 5 years) 5,992 7,681
Total provisions 23,275 24,591
* Amounts in € thousands
The reorganization item costs include the provision for the 'Focus 2006' restructuring plan. € 3.0 million was withdrawn from this provision in 2011. The reorganization costs item also includes provisions for small reorganizations. 9 LONG-TERM DEBT Balance at
31-12-2010 Increase in debt Decrease in debt Balance at
31-12-2011
Debt to the Ministry of Economic
Affairs, Agriculture and Innovation
103,853 0 6,583 97,270
Long-term savings model 945 312 0 1,257
Other long-term debt 25,554 0 8,681 16,873
Subtotal of long-term debt 130,352 312 15,264 115,400
Financial lease obligations 459 0 313 146
Total long-term debt 130,811 312 15,577 115,546
* Amounts in € thousands
The debt to the Ministry of Economic Affairs, Agriculture and Innovation is comprised of three items: Description Total Interest Cumulative
repayments Long-term Short-term
Transfer of buildings and land in
connection with the privatisation of
DLO
135,408 4.50% 54,489 76,771 4,148
Transfer of buildings and land in
connection with the integration of
Applied Plant Research
28,701 5.20% 10,762 16,982 957
Transfer of IAC and ILRI buildings and
land
5,627 5.00% 1,922 3,517 188
Total 169,736 67,173 97,270 5,293
* Amounts in € thousands
The annual linear repayment of these loans amounts to € 5.3 million in 2012. This amount is included under other short-term debt. € 21.8 million of the long-term constituent has a term of less than five years. A formal decision was made in 2011 for additional repayment (annuities) of the Ministry of Economic Affairs, Agriculture and Innovation loan.
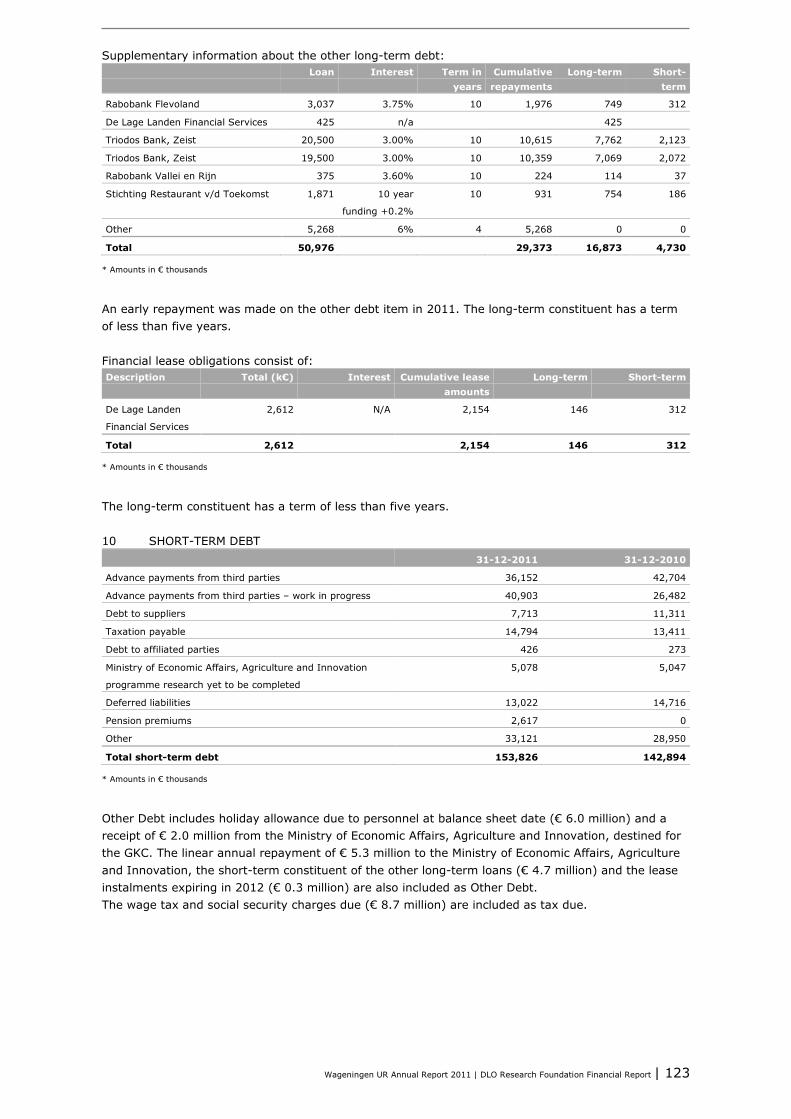
Wageningen UR Annual Report 2011 | DLO Research Foundation Financial Report | 123
Supplementary information about the other long-term debt: Loan Interest Term in
years Cumulative
repayments Long-term Short-
term
Rabobank Flevoland 3,037 3.75% 10 1,976 749 312
De Lage Landen Financial Services 425 n/a 425
Triodos Bank, Zeist 20,500 3.00% 10 10,615 7,762 2,123
Triodos Bank, Zeist 19,500 3.00% 10 10,359 7,069 2,072
Rabobank Vallei en Rijn 375 3.60% 10 224 114 37
Stichting Restaurant v/d Toekomst 1,871 10 year
funding +0.2%
10 931 754 186
Other 5,268 6% 4 5,268 0 0
Total 50,976 29,373 16,873 4,730
* Amounts in € thousands
An early repayment was made on the other debt item in 2011. The long-term constituent has a term of less than five years. Financial lease obligations consist of: Description Total (k€) Interest Cumulative lease
amounts Long-term Short-term
De Lage Landen
Financial Services
2,612 N/A 2,154 146 312
Total 2,612 2,154 146 312
* Amounts in € thousands
The long-term constituent has a term of less than five years. 10 SHORT-TERM DEBT 31-12-2011 31-12-2010
Advance payments from third parties 36,152 42,704
Advance payments from third parties – work in progress 40,903 26,482
Debt to suppliers 7,713 11,311
Taxation payable 14,794 13,411
Debt to affiliated parties 426 273
Ministry of Economic Affairs, Agriculture and Innovation
programme research yet to be completed
5,078 5,047
Deferred liabilities 13,022 14,716
Pension premiums 2,617 0
Other 33,121 28,950
Total short-term debt 153,826 142,894
* Amounts in € thousands
Other Debt includes holiday allowance due to personnel at balance sheet date (€ 6.0 million) and a receipt of € 2.0 million from the Ministry of Economic Affairs, Agriculture and Innovation, destined for the GKC. The linear annual repayment of € 5.3 million to the Ministry of Economic Affairs, Agriculture and Innovation, the short-term constituent of the other long-term loans (€ 4.7 million) and the lease instalments expiring in 2012 (€ 0.3 million) are also included as Other Debt. The wage tax and social security charges due (€ 8.7 million) are included as tax due.
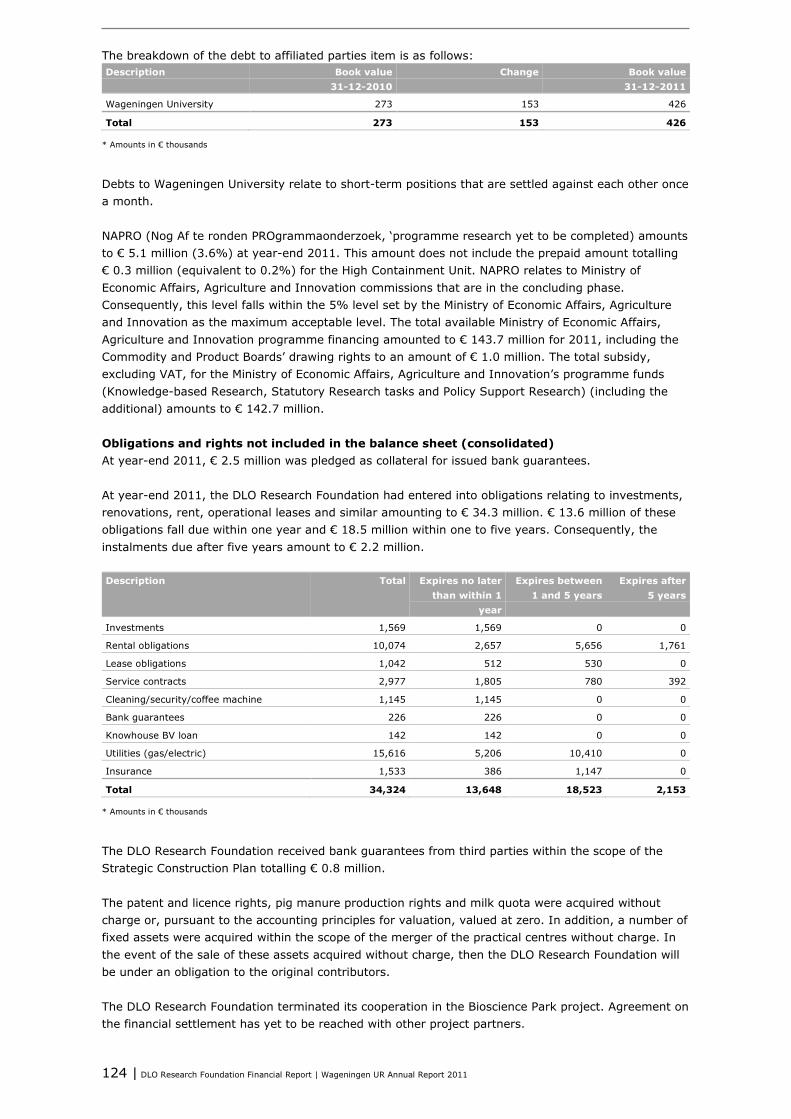
124 | DLO Research Foundation Financial Report | Wageningen UR Annual Report 2011
The breakdown of the debt to affiliated parties item is as follows: Description Book value
31-12-2010 Change Book value
31-12-2011
Wageningen University 273 153 426
Total 273 153 426
* Amounts in € thousands
Debts to Wageningen University relate to short-term positions that are settled against each other once a month. NAPRO (Nog Af te ronden PROgrammaonderzoek, ‘programme research yet to be completed) amounts to € 5.1 million (3.6%) at year-end 2011. This amount does not include the prepaid amount totalling € 0.3 million (equivalent to 0.2%) for the High Containment Unit. NAPRO relates to Ministry of Economic Affairs, Agriculture and Innovation commissions that are in the concluding phase. Consequently, this level falls within the 5% level set by the Ministry of Economic Affairs, Agriculture and Innovation as the maximum acceptable level. The total available Ministry of Economic Affairs, Agriculture and Innovation programme financing amounted to € 143.7 million for 2011, including the Commodity and Product Boards’ drawing rights to an amount of € 1.0 million. The total subsidy, excluding VAT, for the Ministry of Economic Affairs, Agriculture and Innovation’s programme funds (Knowledge-based Research, Statutory Research tasks and Policy Support Research) (including the additional) amounts to € 142.7 million. Obligations and rights not included in the balance sheet (consolidated) At year-end 2011, € 2.5 million was pledged as collateral for issued bank guarantees. At year-end 2011, the DLO Research Foundation had entered into obligations relating to investments, renovations, rent, operational leases and similar amounting to € 34.3 million. € 13.6 million of these obligations fall due within one year and € 18.5 million within one to five years. Consequently, the instalments due after five years amount to € 2.2 million. Description Total Expires no later
than within 1 year
Expires between 1 and 5 years
Expires after 5 years
Investments 1,569 1,569 0 0
Rental obligations 10,074 2,657 5,656 1,761
Lease obligations 1,042 512 530 0
Service contracts 2,977 1,805 780 392
Cleaning/security/coffee machine 1,145 1,145 0 0
Bank guarantees 226 226 0 0
Knowhouse BV loan 142 142 0 0
Utilities (gas/electric) 15,616 5,206 10,410 0
Insurance 1,533 386 1,147 0
Total 34,324 13,648 18,523 2,153
* Amounts in € thousands
The DLO Research Foundation received bank guarantees from third parties within the scope of the Strategic Construction Plan totalling € 0.8 million. The patent and licence rights, pig manure production rights and milk quota were acquired without charge or, pursuant to the accounting principles for valuation, valued at zero. In addition, a number of fixed assets were acquired within the scope of the merger of the practical centres without charge. In the event of the sale of these assets acquired without charge, then the DLO Research Foundation will be under an obligation to the original contributors. The DLO Research Foundation terminated its cooperation in the Bioscience Park project. Agreement on the financial settlement has yet to be reached with other project partners.
Wageningen UR Annual Report 2011 | DLO Research Foundation Financial Report | 125
The DLO Research Foundation had a credit facility of € 1.0 million on balance sheet date. The DLO Research Foundation collaborates with third parties in research projects. In some cases, partnerships have been founded for this purpose. The DLO Research Foundation is liable for any damage claims addressed to these partnerships. DLO Research Foundation’s wind park group companies The DLO Research Foundation granted a right of superficies to both the Windmolenpark Mammoethtocht BV and Windmolenpark Neushoorntocht BV wind park companies for the construction of wind turbines. A mortgage was established on the right of superficies as security for the loans to both Windmolenpark Neushoorntocht BV and Windmolenpark Mammoethtocht BV. In addition, the wind turbines, supply and guarantee agreement, maintenance agreement, power supply agreement and balance of the bank accounts were pledged to the financial provider. Pursuant to an agreement reached with financial providers, both companies shall maintain a deposit of € 1.2 million to serve as security for interest and repayment instalments. A € 3.3-million bank guarantee was issued for Exploitatiemaatschappij Windmolenparken Lelystad BV. The receivables from the power companies were also pledged to the financial provider. Bank guarantees (totalling € 0.8 million) were received from the party that bought Cedi Diagnostics from the DLO Research Foundation in 2009 within the scope of earn-out subsequent payments that could be received during the 2011-2013 period.
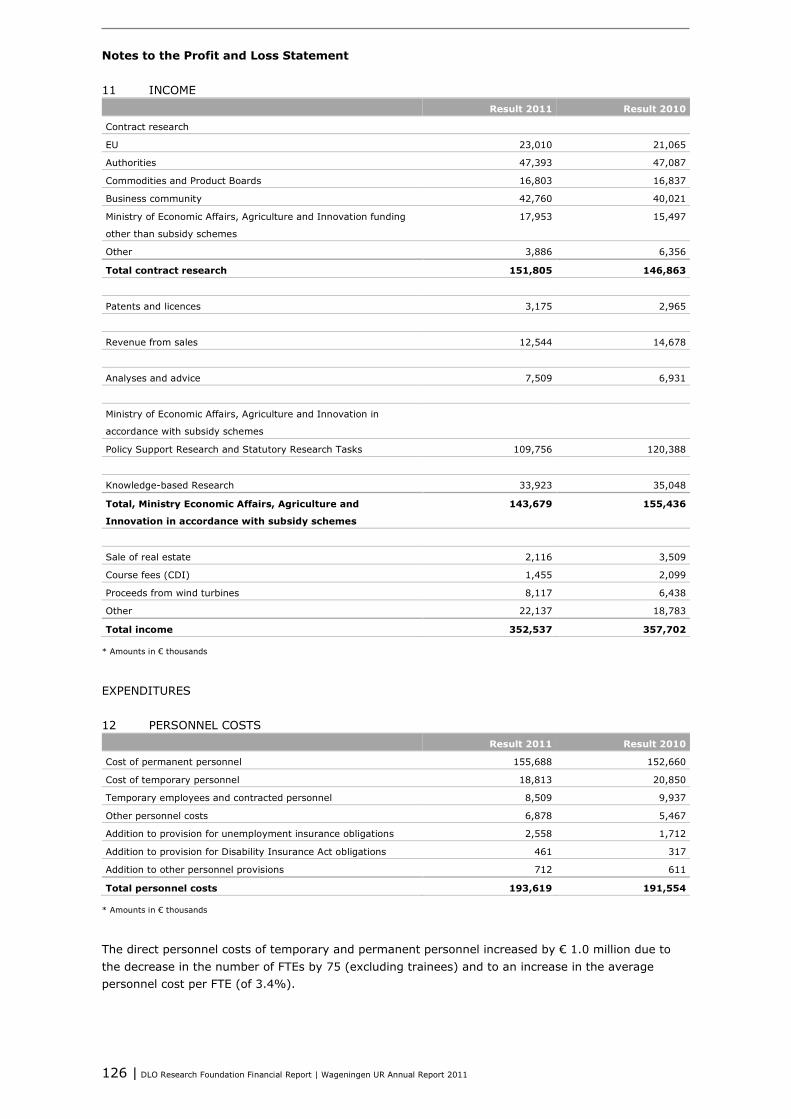
126 | DLO Research Foundation Financial Report | Wageningen UR Annual Report 2011
Notes to the Profit and Loss Statement 11 INCOME Result 2011 Result 2010
Contract research
EU 23,010 21,065
Authorities 47,393 47,087
Commodities and Product Boards 16,803 16,837
Business community 42,760 40,021
Ministry of Economic Affairs, Agriculture and Innovation funding
other than subsidy schemes
17,953 15,497
Other 3,886 6,356
Total contract research 151,805 146,863
Patents and licences 3,175 2,965
Revenue from sales 12,544 14,678
Analyses and advice 7,509 6,931
Ministry of Economic Affairs, Agriculture and Innovation in
accordance with subsidy schemes
Policy Support Research and Statutory Research Tasks 109,756 120,388
Knowledge-based Research 33,923 35,048
Total, Ministry Economic Affairs, Agriculture and
Innovation in accordance with subsidy schemes
143,679 155,436
Sale of real estate 2,116 3,509
Course fees (CDI) 1,455 2,099
Proceeds from wind turbines 8,117 6,438
Other 22,137 18,783
Total income 352,537 357,702
* Amounts in € thousands
EXPENDITURES 12 PERSONNEL COSTS Result 2011 Result 2010
Cost of permanent personnel 155,688 152,660
Cost of temporary personnel 18,813 20,850
Temporary employees and contracted personnel 8,509 9,937
Other personnel costs 6,878 5,467
Addition to provision for unemployment insurance obligations 2,558 1,712
Addition to provision for Disability Insurance Act obligations 461 317
Addition to other personnel provisions 712 611
Total personnel costs 193,619 191,554
* Amounts in € thousands
The direct personnel costs of temporary and permanent personnel increased by € 1.0 million due to the decrease in the number of FTEs by 75 (excluding trainees) and to an increase in the average personnel cost per FTE (of 3.4%).
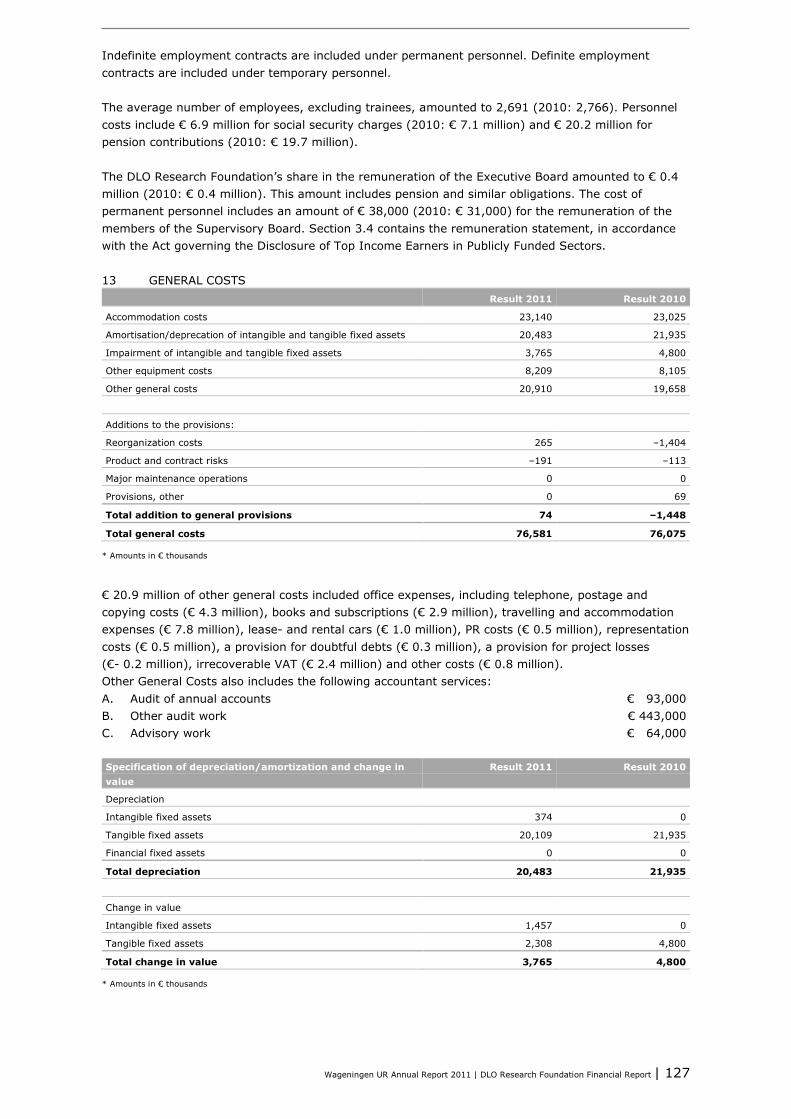
Wageningen UR Annual Report 2011 | DLO Research Foundation Financial Report | 127
Indefinite employment contracts are included under permanent personnel. Definite employment contracts are included under temporary personnel. The average number of employees, excluding trainees, amounted to 2,691 (2010: 2,766). Personnel costs include € 6.9 million for social security charges (2010: € 7.1 million) and € 20.2 million for pension contributions (2010: € 19.7 million). The DLO Research Foundation’s share in the remuneration of the Executive Board amounted to € 0.4 million (2010: € 0.4 million). This amount includes pension and similar obligations. The cost of permanent personnel includes an amount of € 38,000 (2010: € 31,000) for the remuneration of the members of the Supervisory Board. Section 3.4 contains the remuneration statement, in accordance with the Act governing the Disclosure of Top Income Earners in Publicly Funded Sectors. 13 GENERAL COSTS Result 2011 Result 2010
Accommodation costs 23,140 23,025
Amortisation/deprecation of intangible and tangible fixed assets 20,483 21,935
Impairment of intangible and tangible fixed assets 3,765 4,800
Other equipment costs 8,209 8,105
Other general costs 20,910 19,658
Additions to the provisions:
Reorganization costs 265 –1,404
Product and contract risks –191 –113
Major maintenance operations 0 0
Provisions, other 0 69
Total addition to general provisions 74 –1,448
Total general costs 76,581 76,075
* Amounts in € thousands
€ 20.9 million of other general costs included office expenses, including telephone, postage and copying costs (€ 4.3 million), books and subscriptions (€ 2.9 million), travelling and accommodation expenses (€ 7.8 million), lease- and rental cars (€ 1.0 million), PR costs (€ 0.5 million), representation costs (€ 0.5 million), a provision for doubtful debts (€ 0.3 million), a provision for project losses (€- 0.2 million), irrecoverable VAT (€ 2.4 million) and other costs (€ 0.8 million). Other General Costs also includes the following accountant services: A. Audit of annual accounts € 93,000 B. Other audit work € 443,000 C. Advisory work € 64,000 Specification of depreciation/amortization and change in value
Result 2011 Result 2010
Depreciation
Intangible fixed assets 374 0
Tangible fixed assets 20,109 21,935
Financial fixed assets 0 0
Total depreciation 20,483 21,935
Change in value
Intangible fixed assets 1,457 0
Tangible fixed assets 2,308 4,800
Total change in value 3,765 4,800
* Amounts in € thousands
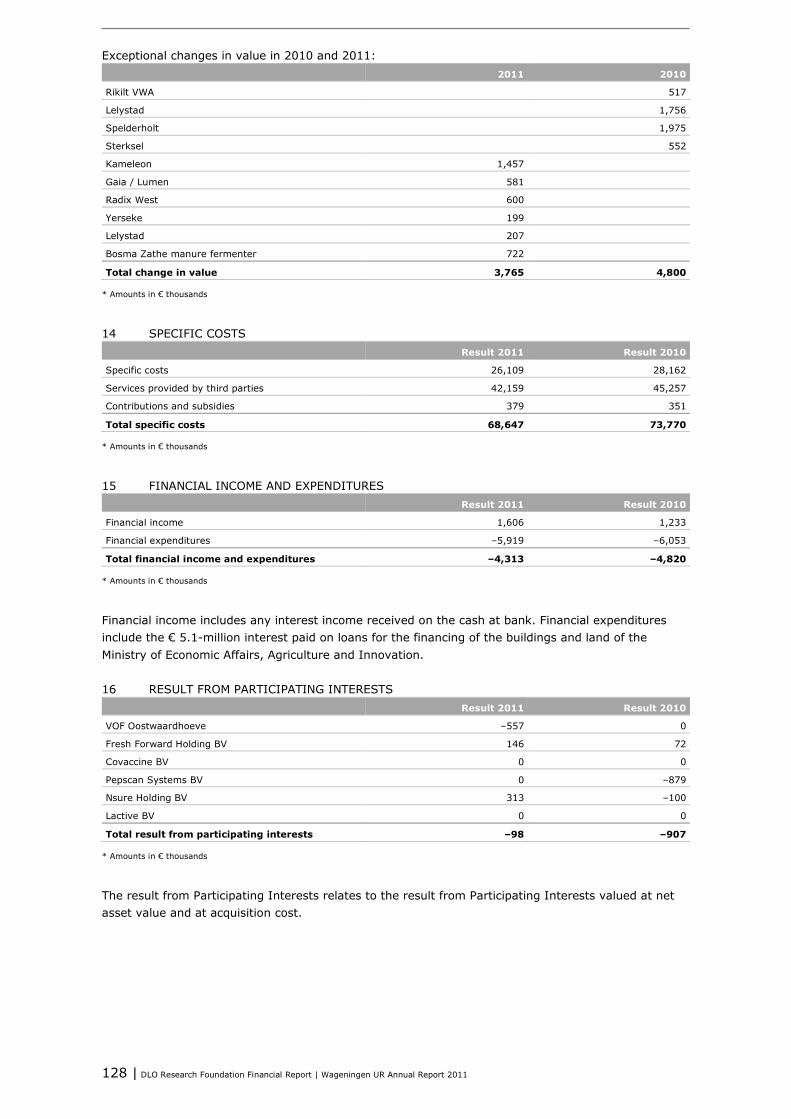
128 | DLO Research Foundation Financial Report | Wageningen UR Annual Report 2011
Exceptional changes in value in 2010 and 2011: 2011 2010
Rikilt VWA 517
Lelystad 1,756
Spelderholt 1,975
Sterksel 552
Kameleon 1,457
Gaia / Lumen 581
Radix West 600
Yerseke 199
Lelystad 207
Bosma Zathe manure fermenter 722
Total change in value 3,765 4,800
* Amounts in € thousands
14 SPECIFIC COSTS Result 2011 Result 2010
Specific costs 26,109 28,162
Services provided by third parties 42,159 45,257
Contributions and subsidies 379 351
Total specific costs 68,647 73,770
* Amounts in € thousands
15 FINANCIAL INCOME AND EXPENDITURES Result 2011 Result 2010
Financial income 1,606 1,233
Financial expenditures –5,919 –6,053
Total financial income and expenditures –4,313 –4,820
* Amounts in € thousands
Financial income includes any interest income received on the cash at bank. Financial expenditures include the € 5.1-million interest paid on loans for the financing of the buildings and land of the Ministry of Economic Affairs, Agriculture and Innovation. 16 RESULT FROM PARTICIPATING INTERESTS Result 2011 Result 2010
VOF Oostwaardhoeve –557 0
Fresh Forward Holding BV 146 72
Covaccine BV 0 0
Pepscan Systems BV 0 –879
Nsure Holding BV 313 –100
Lactive BV 0 0
Total result from participating interests –98 –907
* Amounts in € thousands
The result from Participating Interests relates to the result from Participating Interests valued at net asset value and at acquisition cost.
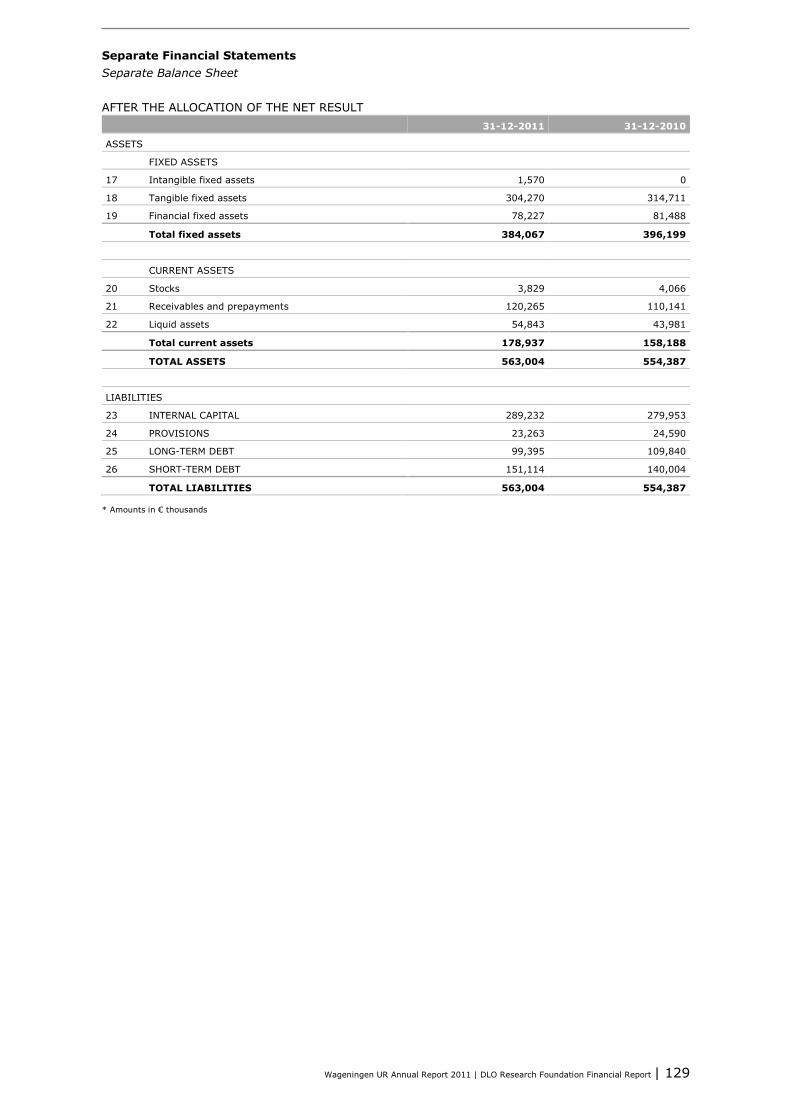
Wageningen UR Annual Report 2011 | DLO Research Foundation Financial Report | 129
Separate Financial Statements Separate Balance Sheet AFTER THE ALLOCATION OF THE NET RESULT 31-12-2011 31-12-2010
ASSETS
FIXED ASSETS
17 Intangible fixed assets 1,570 0
18 Tangible fixed assets 304,270 314,711
19 Financial fixed assets 78,227 81,488
Total fixed assets 384,067 396,199
CURRENT ASSETS
20 Stocks 3,829 4,066
21 Receivables and prepayments 120,265 110,141
22 Liquid assets 54,843 43,981
Total current assets 178,937 158,188
TOTAL ASSETS 563,004 554,387
LIABILITIES
23 INTERNAL CAPITAL 289,232 279,953
24 PROVISIONS 23,263 24,590
25 LONG-TERM DEBT 99,395 109,840
26 SHORT-TERM DEBT 151,114 140,004
TOTAL LIABILITIES 563,004 554,387
* Amounts in € thousands
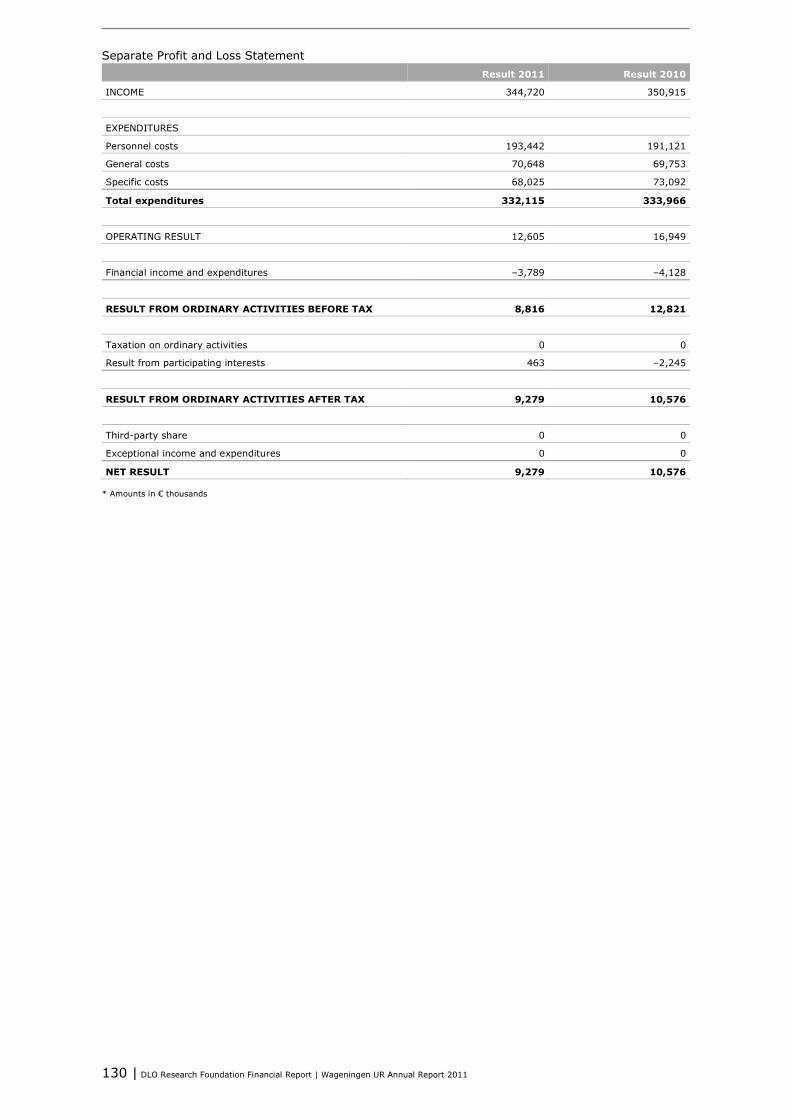
130 | DLO Research Foundation Financial Report | Wageningen UR Annual Report 2011
Separate Profit and Loss Statement Result 2011 Result 2010
INCOME 344,720 350,915
EXPENDITURES
Personnel costs 193,442 191,121
General costs 70,648 69,753
Specific costs 68,025 73,092
Total expenditures 332,115 333,966
OPERATING RESULT 12,605 16,949
Financial income and expenditures –3,789 –4,128
RESULT FROM ORDINARY ACTIVITIES BEFORE TAX 8,816 12,821
Taxation on ordinary activities 0 0
Result from participating interests 463 –2,245
RESULT FROM ORDINARY ACTIVITIES AFTER TAX 9,279 10,576
Third-party share 0 0
Exceptional income and expenditures 0 0
NET RESULT 9,279 10,576
* Amounts in € thousands
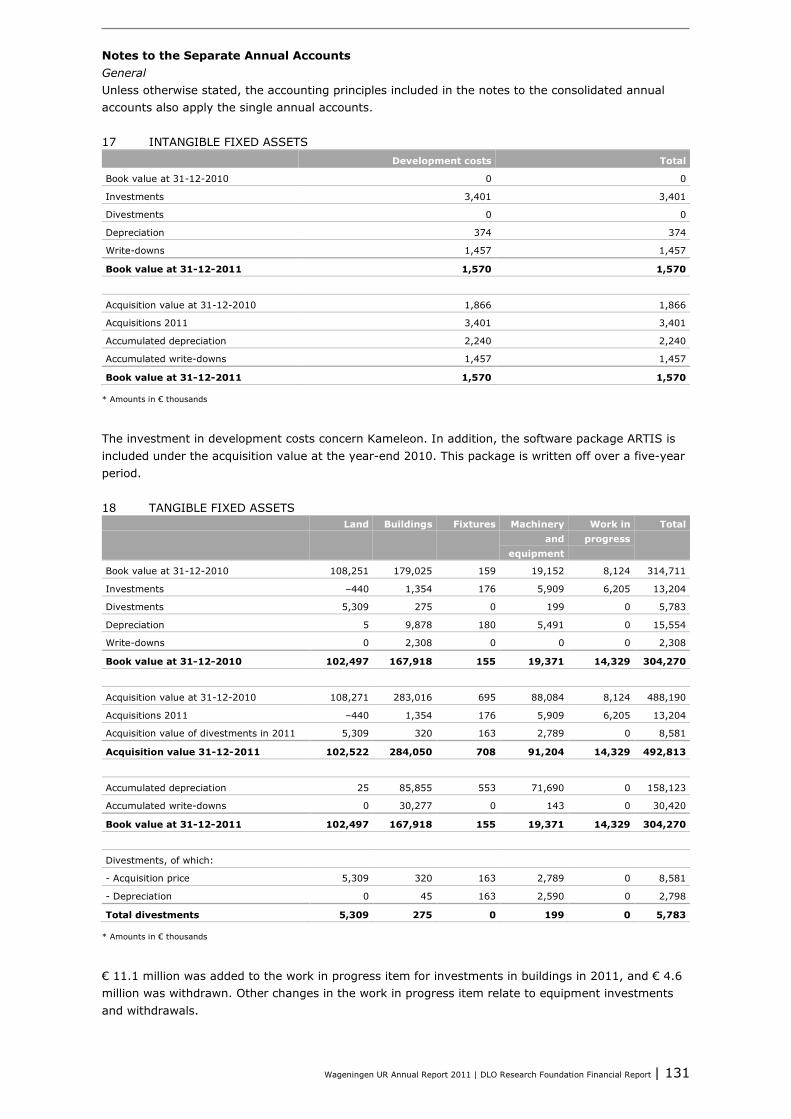
Wageningen UR Annual Report 2011 | DLO Research Foundation Financial Report | 131
Notes to the Separate Annual Accounts General Unless otherwise stated, the accounting principles included in the notes to the consolidated annual accounts also apply the single annual accounts. 17 INTANGIBLE FIXED ASSETS Development costs Total
Book value at 31-12-2010 0 0
Investments 3,401 3,401
Divestments 0 0
Depreciation 374 374
Write-downs 1,457 1,457
Book value at 31-12-2011 1,570 1,570
Acquisition value at 31-12-2010 1,866 1,866
Acquisitions 2011 3,401 3,401
Accumulated depreciation 2,240 2,240
Accumulated write-downs 1,457 1,457
Book value at 31-12-2011 1,570 1,570
* Amounts in € thousands
The investment in development costs concern Kameleon. In addition, the software package ARTIS is included under the acquisition value at the year-end 2010. This package is written off over a five-year period. 18 TANGIBLE FIXED ASSETS Land Buildings Fixtures Machinery
and equipment
Work in progress
Total
Book value at 31-12-2010 108,251 179,025 159 19,152 8,124 314,711
Investments –440 1,354 176 5,909 6,205 13,204
Divestments 5,309 275 0 199 0 5,783
Depreciation 5 9,878 180 5,491 0 15,554
Write-downs 0 2,308 0 0 0 2,308
Book value at 31-12-2010 102,497 167,918 155 19,371 14,329 304,270
Acquisition value at 31-12-2010 108,271 283,016 695 88,084 8,124 488,190
Acquisitions 2011 –440 1,354 176 5,909 6,205 13,204
Acquisition value of divestments in 2011 5,309 320 163 2,789 0 8,581
Acquisition value 31-12-2011 102,522 284,050 708 91,204 14,329 492,813
Accumulated depreciation 25 85,855 553 71,690 0 158,123
Accumulated write-downs 0 30,277 0 143 0 30,420
Book value at 31-12-2011 102,497 167,918 155 19,371 14,329 304,270
Divestments, of which:
- Acquisition price 5,309 320 163 2,789 0 8,581
- Depreciation 0 45 163 2,590 0 2,798
Total divestments 5,309 275 0 199 0 5,783
* Amounts in € thousands
€ 11.1 million was added to the work in progress item for investments in buildings in 2011, and € 4.6 million was withdrawn. Other changes in the work in progress item relate to equipment investments and withdrawals.
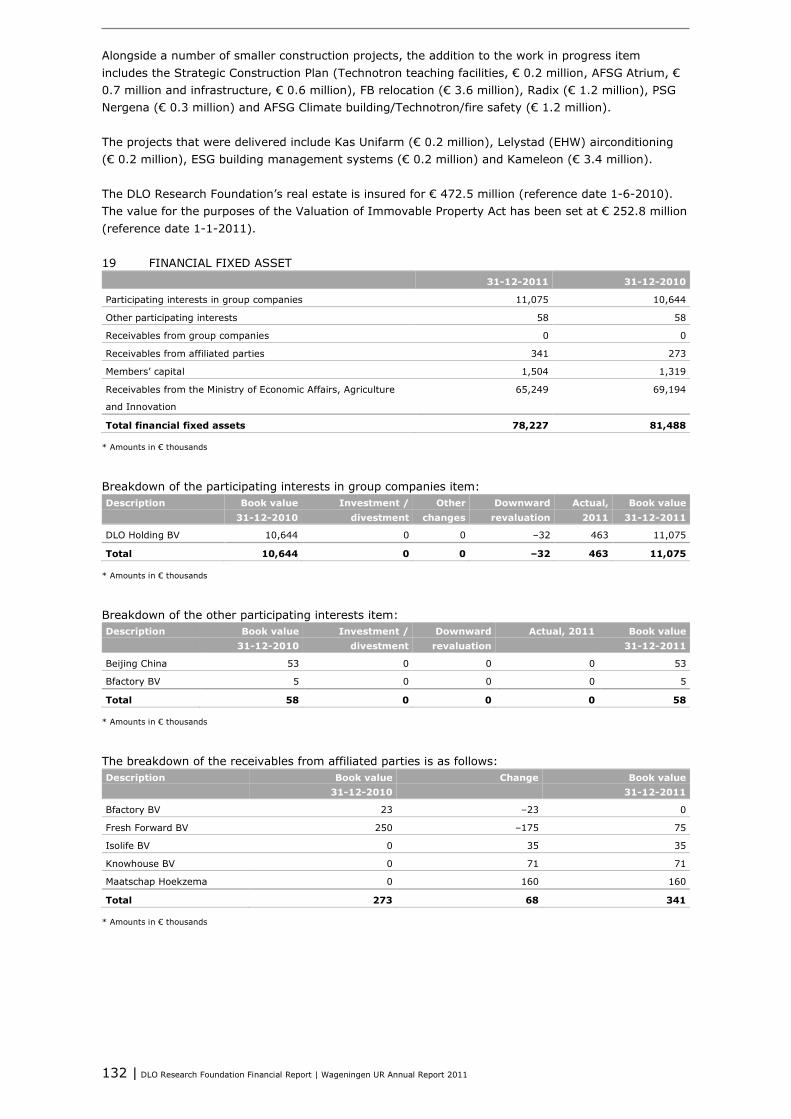
132 | DLO Research Foundation Financial Report | Wageningen UR Annual Report 2011
Alongside a number of smaller construction projects, the addition to the work in progress item includes the Strategic Construction Plan (Technotron teaching facilities, € 0.2 million, AFSG Atrium, € 0.7 million and infrastructure, € 0.6 million), FB relocation (€ 3.6 million), Radix (€ 1.2 million), PSG Nergena (€ 0.3 million) and AFSG Climate building/Technotron/fire safety (€ 1.2 million). The projects that were delivered include Kas Unifarm (€ 0.2 million), Lelystad (EHW) airconditioning (€ 0.2 million), ESG building management systems (€ 0.2 million) and Kameleon (€ 3.4 million). The DLO Research Foundation’s real estate is insured for € 472.5 million (reference date 1-6-2010). The value for the purposes of the Valuation of Immovable Property Act has been set at € 252.8 million (reference date 1-1-2011). 19 FINANCIAL FIXED ASSET 31-12-2011 31-12-2010
Participating interests in group companies 11,075 10,644
Other participating interests 58 58
Receivables from group companies 0 0
Receivables from affiliated parties 341 273
Members’ capital 1,504 1,319
Receivables from the Ministry of Economic Affairs, Agriculture
and Innovation
65,249 69,194
Total financial fixed assets 78,227 81,488
* Amounts in € thousands
Breakdown of the participating interests in group companies item: Description Book value
31-12-2010 Investment /
divestment Other
changes Downward
revaluation Actual,
2011 Book value
31-12-2011
DLO Holding BV 10,644 0 0 –32 463 11,075
Total 10,644 0 0 –32 463 11,075
* Amounts in € thousands
Breakdown of the other participating interests item: Description Book value
31-12-2010 Investment /
divestment Downward
revaluation Actual, 2011 Book value
31-12-2011
Beijing China 53 0 0 0 53
Bfactory BV 5 0 0 0 5
Total 58 0 0 0 58
* Amounts in € thousands
The breakdown of the receivables from affiliated parties is as follows: Description Book value
31-12-2010 Change Book value
31-12-2011
Bfactory BV 23 –23 0
Fresh Forward BV 250 –175 75
Isolife BV 0 35 35
Knowhouse BV 0 71 71
Maatschap Hoekzema 0 160 160
Total 273 68 341
* Amounts in € thousands
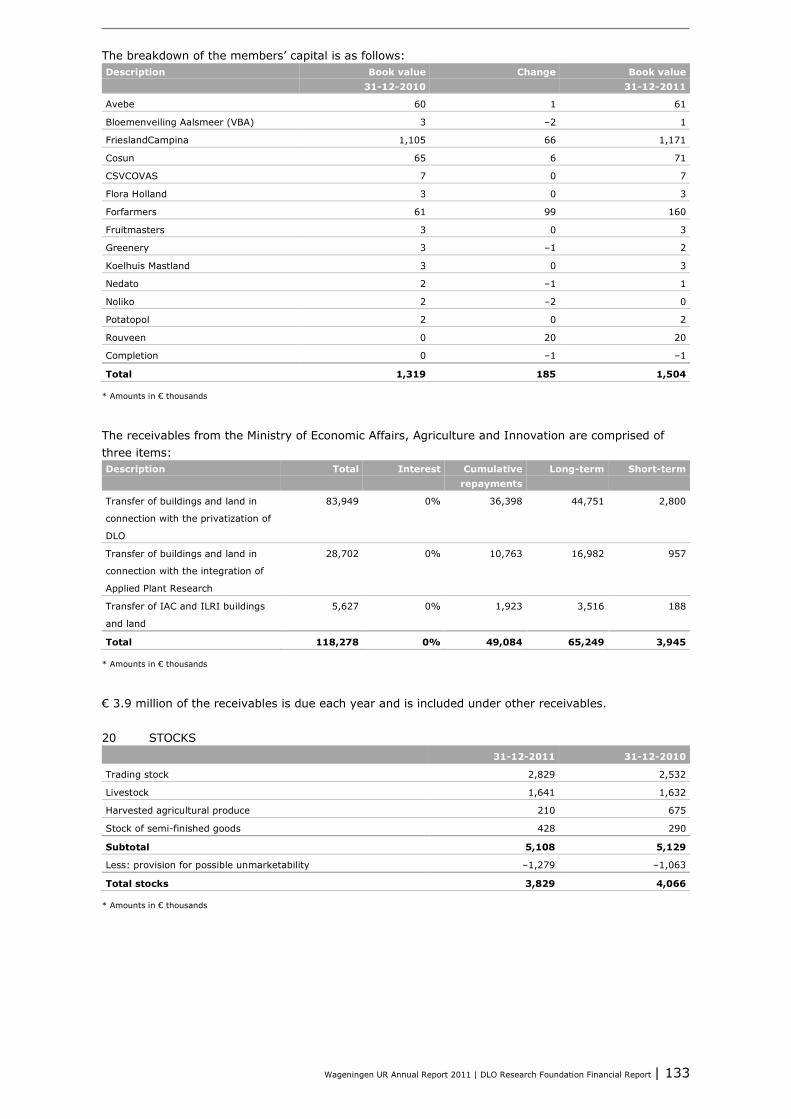
Wageningen UR Annual Report 2011 | DLO Research Foundation Financial Report | 133
The breakdown of the members’ capital is as follows: Description Book value
31-12-2010 Change Book value
31-12-2011
Avebe 60 1 61
Bloemenveiling Aalsmeer (VBA) 3 –2 1
FrieslandCampina 1,105 66 1,171
Cosun 65 6 71
CSVCOVAS 7 0 7
Flora Holland 3 0 3
Forfarmers 61 99 160
Fruitmasters 3 0 3
Greenery 3 –1 2
Koelhuis Mastland 3 0 3
Nedato 2 –1 1
Noliko 2 –2 0
Potatopol 2 0 2
Rouveen 0 20 20
Completion 0 –1 –1
Total 1,319 185 1,504
* Amounts in € thousands
The receivables from the Ministry of Economic Affairs, Agriculture and Innovation are comprised of three items: Description Total Interest Cumulative
repayments Long-term Short-term
Transfer of buildings and land in
connection with the privatization of
DLO
83,949 0% 36,398 44,751 2,800
Transfer of buildings and land in
connection with the integration of
Applied Plant Research
28,702 0% 10,763 16,982 957
Transfer of IAC and ILRI buildings
and land
5,627 0% 1,923 3,516 188
Total 118,278 0% 49,084 65,249 3,945
* Amounts in € thousands
€ 3.9 million of the receivables is due each year and is included under other receivables. 20 STOCKS 31-12-2011 31-12-2010
Trading stock 2,829 2,532
Livestock 1,641 1,632
Harvested agricultural produce 210 675
Stock of semi-finished goods 428 290
Subtotal 5,108 5,129
Less: provision for possible unmarketability –1,279 –1,063
Total stocks 3,829 4,066
* Amounts in € thousands
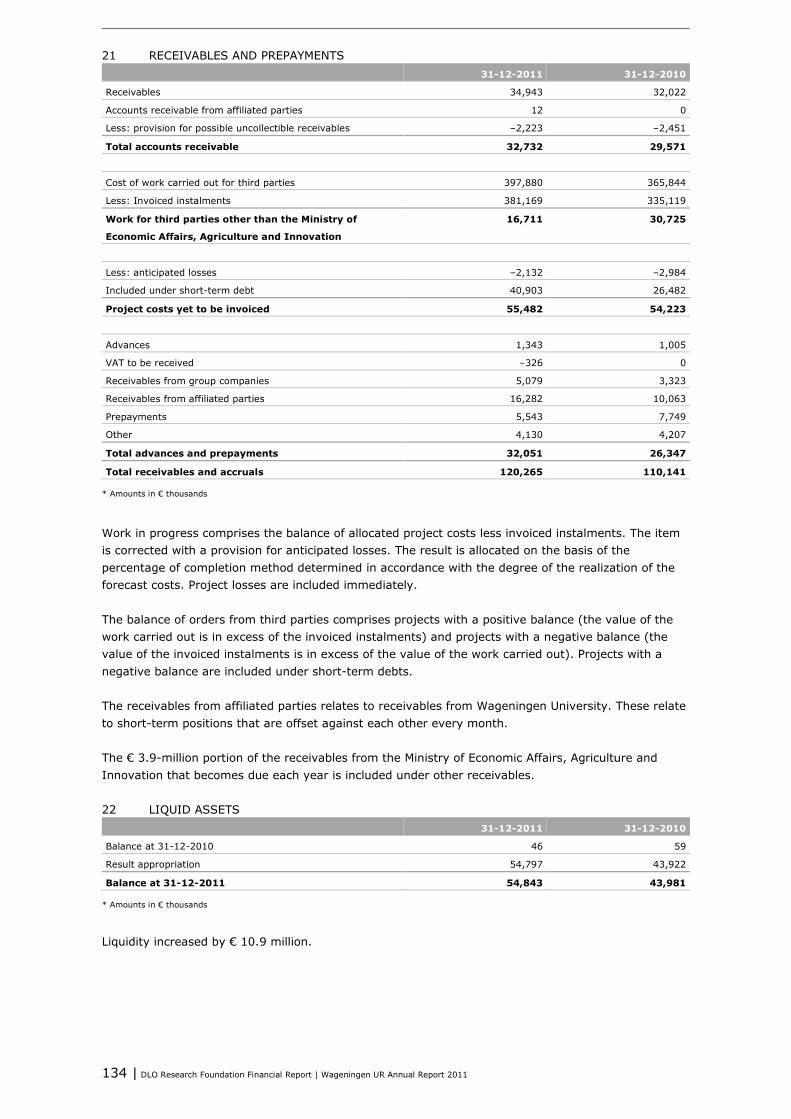
134 | DLO Research Foundation Financial Report | Wageningen UR Annual Report 2011
21 RECEIVABLES AND PREPAYMENTS 31-12-2011 31-12-2010
Receivables 34,943 32,022
Accounts receivable from affiliated parties 12 0
Less: provision for possible uncollectible receivables –2,223 –2,451
Total accounts receivable 32,732 29,571
Cost of work carried out for third parties 397,880 365,844
Less: Invoiced instalments 381,169 335,119
Work for third parties other than the Ministry of
Economic Affairs, Agriculture and Innovation
16,711 30,725
Less: anticipated losses –2,132 –2,984
Included under short-term debt 40,903 26,482
Project costs yet to be invoiced 55,482 54,223
Advances 1,343 1,005
VAT to be received –326 0
Receivables from group companies 5,079 3,323
Receivables from affiliated parties 16,282 10,063
Prepayments 5,543 7,749
Other 4,130 4,207
Total advances and prepayments 32,051 26,347
Total receivables and accruals 120,265 110,141
* Amounts in € thousands
Work in progress comprises the balance of allocated project costs less invoiced instalments. The item is corrected with a provision for anticipated losses. The result is allocated on the basis of the percentage of completion method determined in accordance with the degree of the realization of the forecast costs. Project losses are included immediately. The balance of orders from third parties comprises projects with a positive balance (the value of the work carried out is in excess of the invoiced instalments) and projects with a negative balance (the value of the invoiced instalments is in excess of the value of the work carried out). Projects with a negative balance are included under short-term debts. The receivables from affiliated parties relates to receivables from Wageningen University. These relate to short-term positions that are offset against each other every month. The € 3.9-million portion of the receivables from the Ministry of Economic Affairs, Agriculture and Innovation that becomes due each year is included under other receivables. 22 LIQUID ASSETS 31-12-2011 31-12-2010
Balance at 31-12-2010 46 59
Result appropriation 54,797 43,922
Balance at 31-12-2011 54,843 43,981
* Amounts in € thousands
Liquidity increased by € 10.9 million.
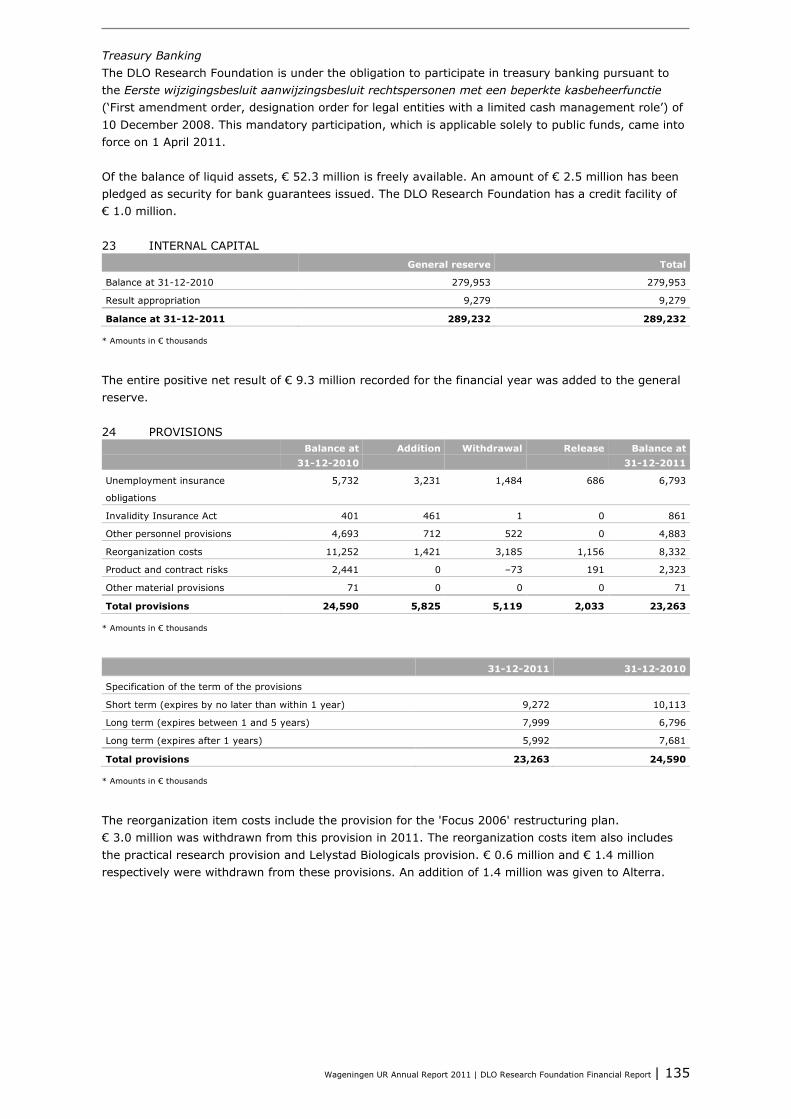
Wageningen UR Annual Report 2011 | DLO Research Foundation Financial Report | 135
Treasury Banking The DLO Research Foundation is under the obligation to participate in treasury banking pursuant to the Eerste wijzigingsbesluit aanwijzingsbesluit rechtspersonen met een beperkte kasbeheerfunctie (‘First amendment order, designation order for legal entities with a limited cash management role’) of 10 December 2008. This mandatory participation, which is applicable solely to public funds, came into force on 1 April 2011. Of the balance of liquid assets, € 52.3 million is freely available. An amount of € 2.5 million has been pledged as security for bank guarantees issued. The DLO Research Foundation has a credit facility of € 1.0 million. 23 INTERNAL CAPITAL General reserve Total
Balance at 31-12-2010 279,953 279,953
Result appropriation 9,279 9,279
Balance at 31-12-2011 289,232 289,232
* Amounts in € thousands
The entire positive net result of € 9.3 million recorded for the financial year was added to the general reserve. 24 PROVISIONS Balance at
31-12-2010 Addition Withdrawal Release Balance at
31-12-2011
Unemployment insurance
obligations
5,732 3,231 1,484 686 6,793
Invalidity Insurance Act 401 461 1 0 861
Other personnel provisions 4,693 712 522 0 4,883
Reorganization costs 11,252 1,421 3,185 1,156 8,332
Product and contract risks 2,441 0 –73 191 2,323
Other material provisions 71 0 0 0 71
Total provisions 24,590 5,825 5,119 2,033 23,263
* Amounts in € thousands
31-12-2011 31-12-2010
Specification of the term of the provisions
Short term (expires by no later than within 1 year) 9,272 10,113
Long term (expires between 1 and 5 years) 7,999 6,796
Long term (expires after 1 years) 5,992 7,681
Total provisions 23,263 24,590
* Amounts in € thousands
The reorganization item costs include the provision for the 'Focus 2006' restructuring plan. € 3.0 million was withdrawn from this provision in 2011. The reorganization costs item also includes the practical research provision and Lelystad Biologicals provision. € 0.6 million and € 1.4 million respectively were withdrawn from these provisions. An addition of 1.4 million was given to Alterra.
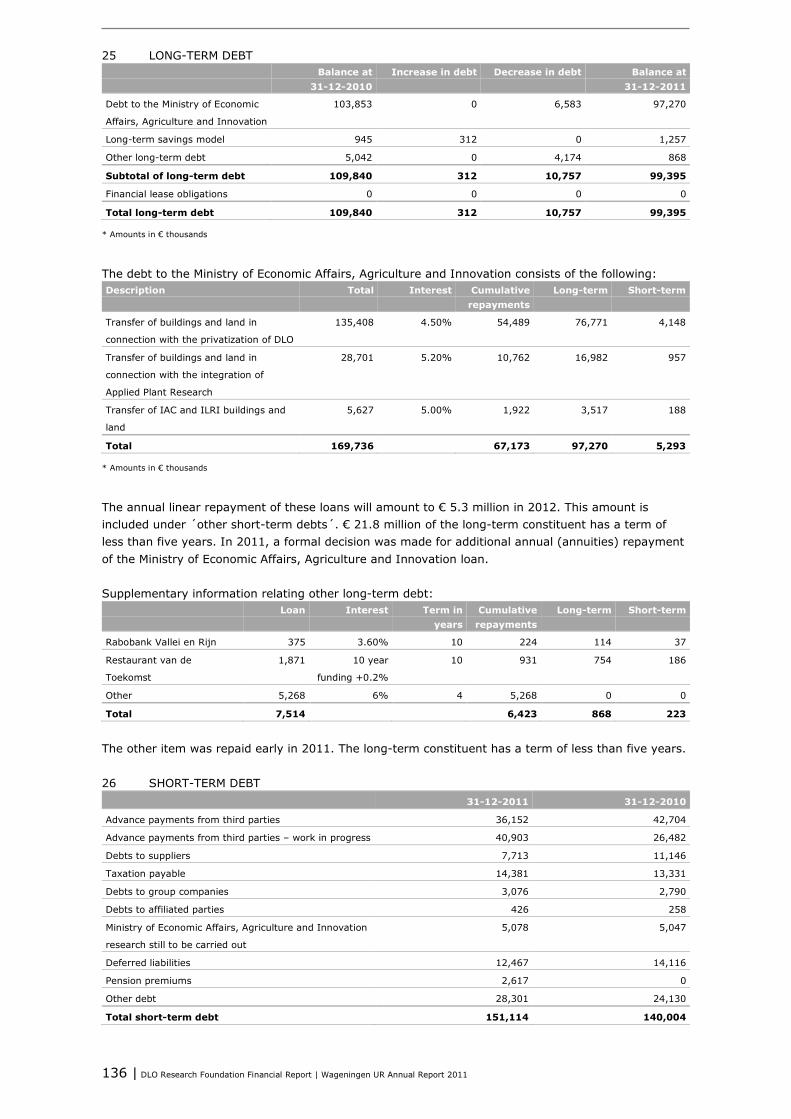
136 | DLO Research Foundation Financial Report | Wageningen UR Annual Report 2011
25 LONG-TERM DEBT Balance at
31-12-2010 Increase in debt Decrease in debt Balance at
31-12-2011
Debt to the Ministry of Economic
Affairs, Agriculture and Innovation
103,853 0 6,583 97,270
Long-term savings model 945 312 0 1,257
Other long-term debt 5,042 0 4,174 868
Subtotal of long-term debt 109,840 312 10,757 99,395
Financial lease obligations 0 0 0 0
Total long-term debt 109,840 312 10,757 99,395
* Amounts in € thousands
The debt to the Ministry of Economic Affairs, Agriculture and Innovation consists of the following: Description Total Interest Cumulative
repayments Long-term Short-term
Transfer of buildings and land in
connection with the privatization of DLO
135,408 4.50% 54,489 76,771 4,148
Transfer of buildings and land in
connection with the integration of
Applied Plant Research
28,701 5.20% 10,762 16,982 957
Transfer of IAC and ILRI buildings and
land
5,627 5.00% 1,922 3,517 188
Total 169,736 67,173 97,270 5,293
* Amounts in € thousands
The annual linear repayment of these loans will amount to € 5.3 million in 2012. This amount is included under ´other short-term debts´. € 21.8 million of the long-term constituent has a term of less than five years. In 2011, a formal decision was made for additional annual (annuities) repayment of the Ministry of Economic Affairs, Agriculture and Innovation loan. Supplementary information relating other long-term debt: Loan Interest Term in
years Cumulative
repayments Long-term Short-term
Rabobank Vallei en Rijn 375 3.60% 10 224 114 37
Restaurant van de
Toekomst
1,871 10 year
funding +0.2%
10 931 754 186
Other 5,268 6% 4 5,268 0 0
Total 7,514 6,423 868 223
The other item was repaid early in 2011. The long-term constituent has a term of less than five years. 26 SHORT-TERM DEBT 31-12-2011 31-12-2010
Advance payments from third parties 36,152 42,704
Advance payments from third parties – work in progress 40,903 26,482
Debts to suppliers 7,713 11,146
Taxation payable 14,381 13,331
Debts to group companies 3,076 2,790
Debts to affiliated parties 426 258
Ministry of Economic Affairs, Agriculture and Innovation
research still to be carried out
5,078 5,047
Deferred liabilities 12,467 14,116
Pension premiums 2,617 0
Other debt 28,301 24,130
Total short-term debt 151,114 140,004
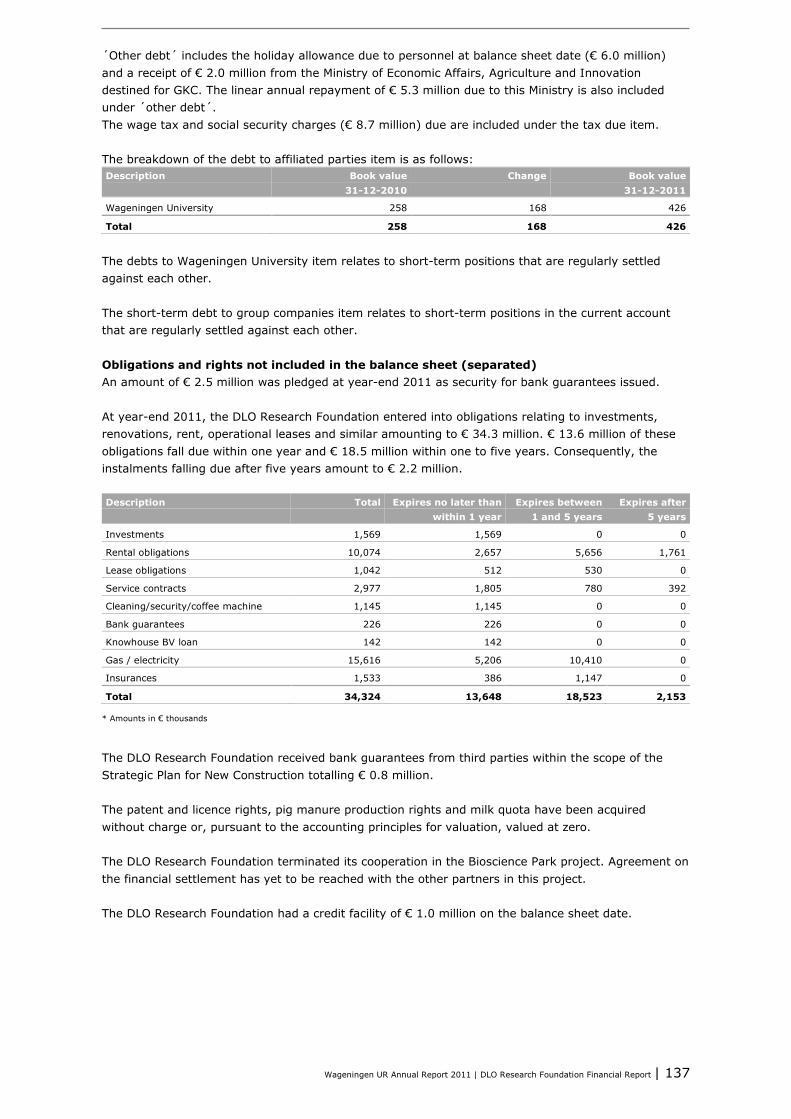
Wageningen UR Annual Report 2011 | DLO Research Foundation Financial Report | 137
´Other debt´ includes the holiday allowance due to personnel at balance sheet date (€ 6.0 million) and a receipt of € 2.0 million from the Ministry of Economic Affairs, Agriculture and Innovation destined for GKC. The linear annual repayment of € 5.3 million due to this Ministry is also included under ´other debt´. The wage tax and social security charges (€ 8.7 million) due are included under the tax due item. The breakdown of the debt to affiliated parties item is as follows: Description Book value
31-12-2010 Change Book value
31-12-2011
Wageningen University 258 168 426
Total 258 168 426
The debts to Wageningen University item relates to short-term positions that are regularly settled against each other. The short-term debt to group companies item relates to short-term positions in the current account that are regularly settled against each other. Obligations and rights not included in the balance sheet (separated) An amount of € 2.5 million was pledged at year-end 2011 as security for bank guarantees issued. At year-end 2011, the DLO Research Foundation entered into obligations relating to investments, renovations, rent, operational leases and similar amounting to € 34.3 million. € 13.6 million of these obligations fall due within one year and € 18.5 million within one to five years. Consequently, the instalments falling due after five years amount to € 2.2 million. Description Total Expires no later than
within 1 year Expires between
1 and 5 years Expires after
5 years
Investments 1,569 1,569 0 0
Rental obligations 10,074 2,657 5,656 1,761
Lease obligations 1,042 512 530 0
Service contracts 2,977 1,805 780 392
Cleaning/security/coffee machine 1,145 1,145 0 0
Bank guarantees 226 226 0 0
Knowhouse BV loan 142 142 0 0
Gas / electricity 15,616 5,206 10,410 0
Insurances 1,533 386 1,147 0
Total 34,324 13,648 18,523 2,153
* Amounts in € thousands
The DLO Research Foundation received bank guarantees from third parties within the scope of the Strategic Plan for New Construction totalling € 0.8 million. The patent and licence rights, pig manure production rights and milk quota have been acquired without charge or, pursuant to the accounting principles for valuation, valued at zero. The DLO Research Foundation terminated its cooperation in the Bioscience Park project. Agreement on the financial settlement has yet to be reached with the other partners in this project. The DLO Research Foundation had a credit facility of € 1.0 million on the balance sheet date.
138 | DLO Research Foundation Financial Report | Wageningen UR Annual Report 2011
3.3.2 Supplementary Information
Allocation of the Result The Articles of the DLO Research Foundation do not include any provisions relating to the allocation of the result. The Executive Board of the DLO Research Foundation proposed that the positive net result of € 9.3 million be allocated to the general reserve. Post Balance Sheet Events There were no post balance sheet events that gave cause to the adjustment of or notification in the annual accounts. Independent auditor’s report Report on the financial statements We have audited the accompanying financial statements 2011 of Stichting Dienst Landbouwkundig Onderzoek, Wageningen, which comprise the consolidated and company balance sheet as at December 31, 2011, the consolidated and company profit and loss account for the year then ended and the notes, comprising a summary of the accounting policies and other explanatory information. Management’s responsibility Management is responsible for the preparation and fair presentation of these financial statements and for the preparation of the management board report, bath in accordance with Dutch law, including the Dutch Standards on Auditing. Furthermore management is responsible for such internal control as it determines is necessary to enable the preparation of the financial statements that are tree from material misstatement, whether due to fraud or error. Auditor’s responsibility Our responsibility is to express an opinion on these financial statements based on our audit. We conducted our audit in accordance with Dutch law, including the Dutch Standards on Auditing and 'Controleprotocol DLO 2009'. This requires that we comply with ethical! requirements and plan and perform the audit to obtain reasonable assurance about whether the financial statements are free from material misstatement. An audit involves performing procedures to obtain audit evidence about the amounts and disclosures in the financial statements. The procedures selected depend on the auditor's judgment, including !he assessment of the risks of material misstatement of the financial statements, whether due to fraud or error. In making those risk assessments, the auditor considers internal control relevant to the entity's preparation and fair presentation of the financial statements in order to design audit procedures that are appropriate in the circumstances, but not for the purpose of expressing an opinion on the effectiveness of the entity's internal control. An audit also includes evaluating the appropriateness of accounting policies used and the reasonableness of accounting estimates made by management, as well as evaluating the overall presentation of the financial statements. We believe that the audit evidence we have obtained is sufficient and appropriate to provide a basis for our audit opinion. Opinion with respect to the financial statements In our opinion, the financial statements give a true and fair view of the financial position of Stichting Dienst Landbouwkundig Onderzoek as at December 31, 2011 and of its result for the year then ended in accordance with Part 9 of Book 2 of the Dutch Civil Code. Furthermore, we are of the opinion that the revenues, casts and movements in balance sheet items meet the requirements of financial rightfulness. This means that these amounts are in accordance with appropriate rules and regulations, as mentioned in 'Controleprotocol DLO 2009'.
Wageningen UR Annual Report 2011 | DLO Research Foundation Financial Report | 139
Report on other legal and regulatory requirements Pursuant to the legal requirement under Section 2:393 sub 5 at e and f of the Dutch Civil Code, v no deficiencies to report as a result of our examination whether the management board report, t extent we can assess, has been prepared in accordance with Part 9 of Book 2 of this Code, and VI the information as required under Section 2:392 sub 1at b-h has been annexed. Further we report the management board report, to the extent we can assess, is consistent with the financial statements as required by Section 2:391 sub 4 of the Dutch Civil Code. Arnhem, 21 May 2012 Ernst & Young Accountants LLP w.g. F. de Bruijn RA
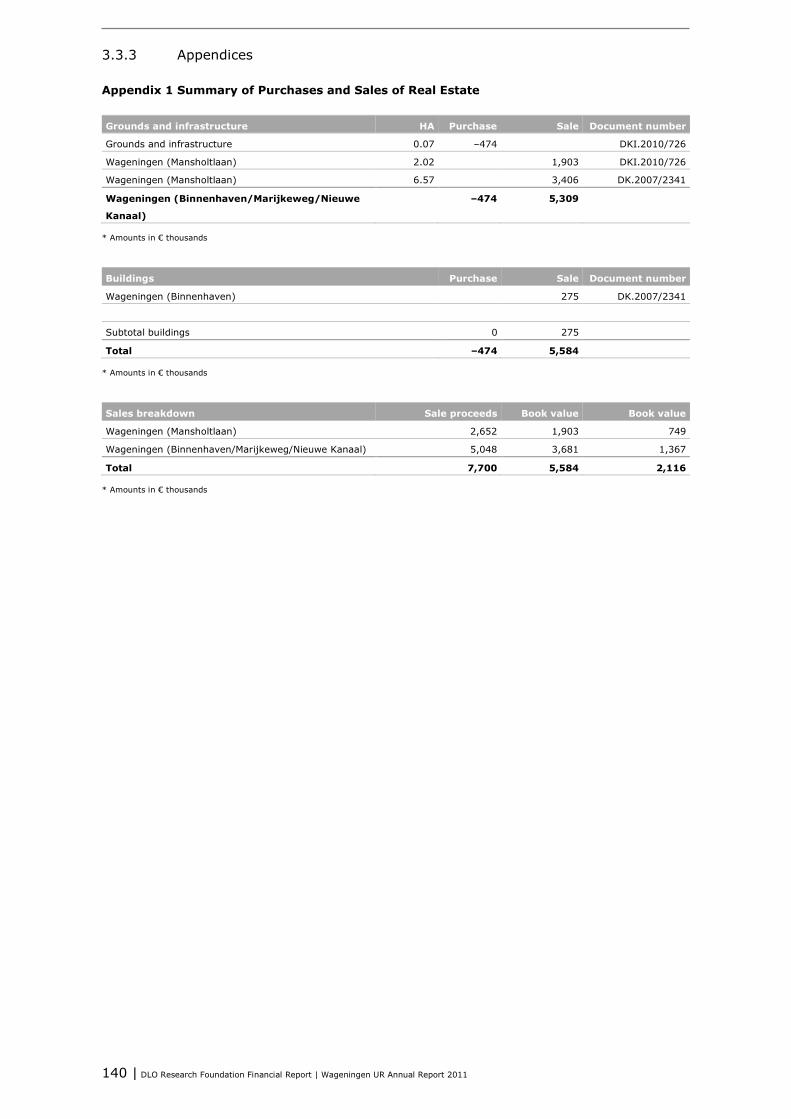
140 | DLO Research Foundation Financial Report | Wageningen UR Annual Report 2011
3.3.3 Appendices
Appendix 1 Summary of Purchases and Sales of Real Estate Grounds and infrastructure HA Purchase Sale Document number
Grounds and infrastructure 0.07 –474 DKI.2010/726
Wageningen (Mansholtlaan) 2.02 1,903 DKI.2010/726
Wageningen (Mansholtlaan) 6.57 3,406 DK.2007/2341
Wageningen (Binnenhaven/Marijkeweg/Nieuwe
Kanaal)
–474 5,309
* Amounts in € thousands
Buildings Purchase Sale Document number
Wageningen (Binnenhaven) 275 DK.2007/2341
Subtotal buildings 0 275
Total –474 5,584
* Amounts in € thousands
Sales breakdown Sale proceeds Book value Book value
Wageningen (Mansholtlaan) 2,652 1,903 749
Wageningen (Binnenhaven/Marijkeweg/Nieuwe Kanaal) 5,048 3,681 1,367
Total 7,700 5,584 2,116
* Amounts in € thousands
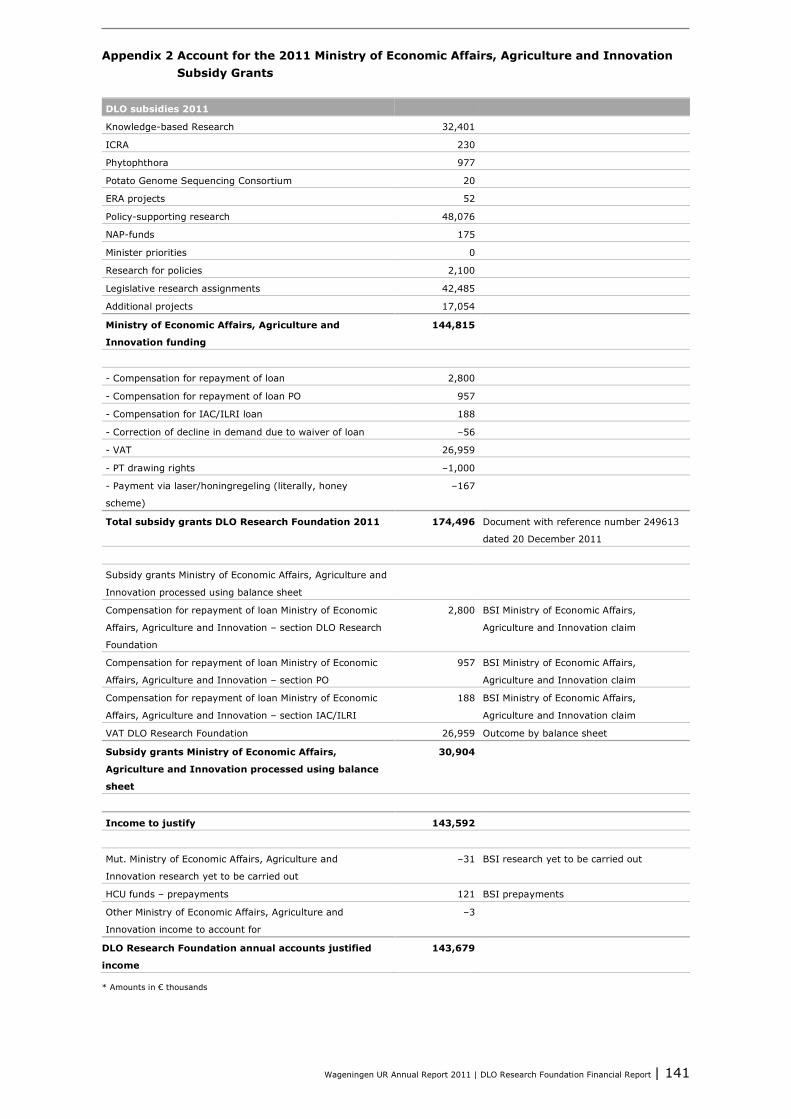
Wageningen UR Annual Report 2011 | DLO Research Foundation Financial Report | 141
Appendix 2 Account for the 2011 Ministry of Economic Affairs, Agriculture and Innovation Subsidy Grants
DLO subsidies 2011
Knowledge-based Research 32,401
ICRA 230
Phytophthora 977
Potato Genome Sequencing Consortium 20
ERA projects 52
Policy-supporting research 48,076
NAP-funds 175
Minister priorities 0
Research for policies 2,100
Legislative research assignments 42,485
Additional projects 17,054
Ministry of Economic Affairs, Agriculture and
Innovation funding
144,815
- Compensation for repayment of loan 2,800
- Compensation for repayment of loan PO 957
- Compensation for IAC/ILRI loan 188
- Correction of decline in demand due to waiver of loan –56
- VAT 26,959
- PT drawing rights –1,000
- Payment via laser/honingregeling (literally, honey
scheme)
–167
Total subsidy grants DLO Research Foundation 2011 174,496 Document with reference number 249613
dated 20 December 2011
Subsidy grants Ministry of Economic Affairs, Agriculture and
Innovation processed using balance sheet
Compensation for repayment of loan Ministry of Economic
Affairs, Agriculture and Innovation – section DLO Research
Foundation
2,800 BSI Ministry of Economic Affairs,
Agriculture and Innovation claim
Compensation for repayment of loan Ministry of Economic
Affairs, Agriculture and Innovation – section PO
957 BSI Ministry of Economic Affairs,
Agriculture and Innovation claim
Compensation for repayment of loan Ministry of Economic
Affairs, Agriculture and Innovation – section IAC/ILRI
188 BSI Ministry of Economic Affairs,
Agriculture and Innovation claim
VAT DLO Research Foundation 26,959 Outcome by balance sheet
Subsidy grants Ministry of Economic Affairs,
Agriculture and Innovation processed using balance
sheet
30,904
Income to justify 143,592
Mut. Ministry of Economic Affairs, Agriculture and
Innovation research yet to be carried out
–31 BSI research yet to be carried out
HCU funds – prepayments 121 BSI prepayments
Other Ministry of Economic Affairs, Agriculture and
Innovation income to account for
–3
DLO Research Foundation annual accounts justified
income
143,679
* Amounts in € thousands
142 | DLO Research Foundation Financial Report | Wageningen UR Annual Report 2011
To supplement the above justification: In 2011 an amount of € 42.500 was spent on the Agriculture ATVET Afghanistan – main phase, which began 1 November 2011 and will last until 31 October 2014.
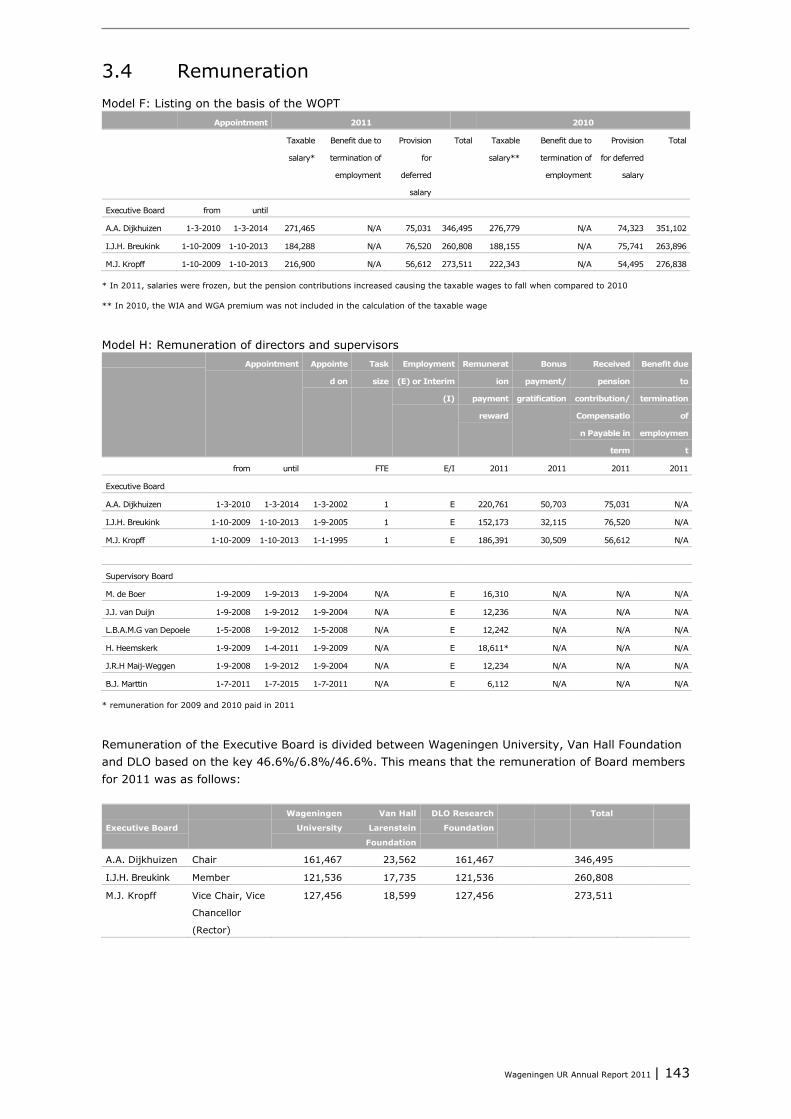
Wageningen UR Annual Report 2011 | 143
3.4 Remuneration Model F: Listing on the basis of the WOPT Appointment 2011 2010
Taxable
salary*
Benefit due to
termination of
employment
Provision
for
deferred
salary
Total Taxable
salary**
Benefit due to
termination of
employment
Provision
for deferred
salary
Total
Executive Board from until
A.A. Dijkhuizen 1-3-2010 1-3-2014 271,465 N/A 75,031 346,495 276,779 N/A 74,323 351,102
I.J.H. Breukink 1-10-2009 1-10-2013 184,288 N/A 76,520 260,808 188,155 N/A 75,741 263,896
M.J. Kropff 1-10-2009 1-10-2013 216,900 N/A 56,612 273,511 222,343 N/A 54,495 276,838
* In 2011, salaries were frozen, but the pension contributions increased causing the taxable wages to fall when compared to 2010
** In 2010, the WIA and WGA premium was not included in the calculation of the taxable wage
Model H: Remuneration of directors and supervisors Appointment Appointe
d on
Task
size
Employment
(E) or Interim
(I)
Remunerat
ion
payment
reward
Bonus
payment/
gratification
Received
pension
contribution/
Compensatio
n Payable in
term
Benefit due
to
termination
of
employmen
t
from until FTE E/I 2011 2011 2011 2011
Executive Board
A.A. Dijkhuizen 1-3-2010 1-3-2014 1-3-2002 1 E 220,761 50,703 75,031 N/A
I.J.H. Breukink 1-10-2009 1-10-2013 1-9-2005 1 E 152,173 32,115 76,520 N/A
M.J. Kropff 1-10-2009 1-10-2013 1-1-1995 1 E 186,391 30,509 56,612 N/A
Supervisory Board
M. de Boer 1-9-2009 1-9-2013 1-9-2004 N/A E 16,310 N/A N/A N/A
J.J. van Duijn 1-9-2008 1-9-2012 1-9-2004 N/A E 12,236 N/A N/A N/A
L.B.A.M.G van Depoele 1-5-2008 1-9-2012 1-5-2008 N/A E 12,242 N/A N/A N/A
H. Heemskerk 1-9-2009 1-4-2011 1-9-2009 N/A E 18,611* N/A N/A N/A
J.R.H Maij-Weggen 1-9-2008 1-9-2012 1-9-2004 N/A E 12,234 N/A N/A N/A
B.J. Marttin 1-7-2011 1-7-2015 1-7-2011 N/A E 6,112 N/A N/A N/A
* remuneration for 2009 and 2010 paid in 2011
Remuneration of the Executive Board is divided between Wageningen University, Van Hall Foundation and DLO based on the key 46.6%/6.8%/46.6%. This means that the remuneration of Board members for 2011 was as follows:
Executive Board
Wageningen
University
Van Hall
Larenstein
Foundation
DLO Research
Foundation
Total
A.A. Dijkhuizen Chair 161,467 23,562 161,467 346,495
I.J.H. Breukink Member 121,536 17,735 121,536 260,808
M.J. Kropff Vice Chair, Vice
Chancellor
(Rector)
127,456 18,599 127,456 273,511
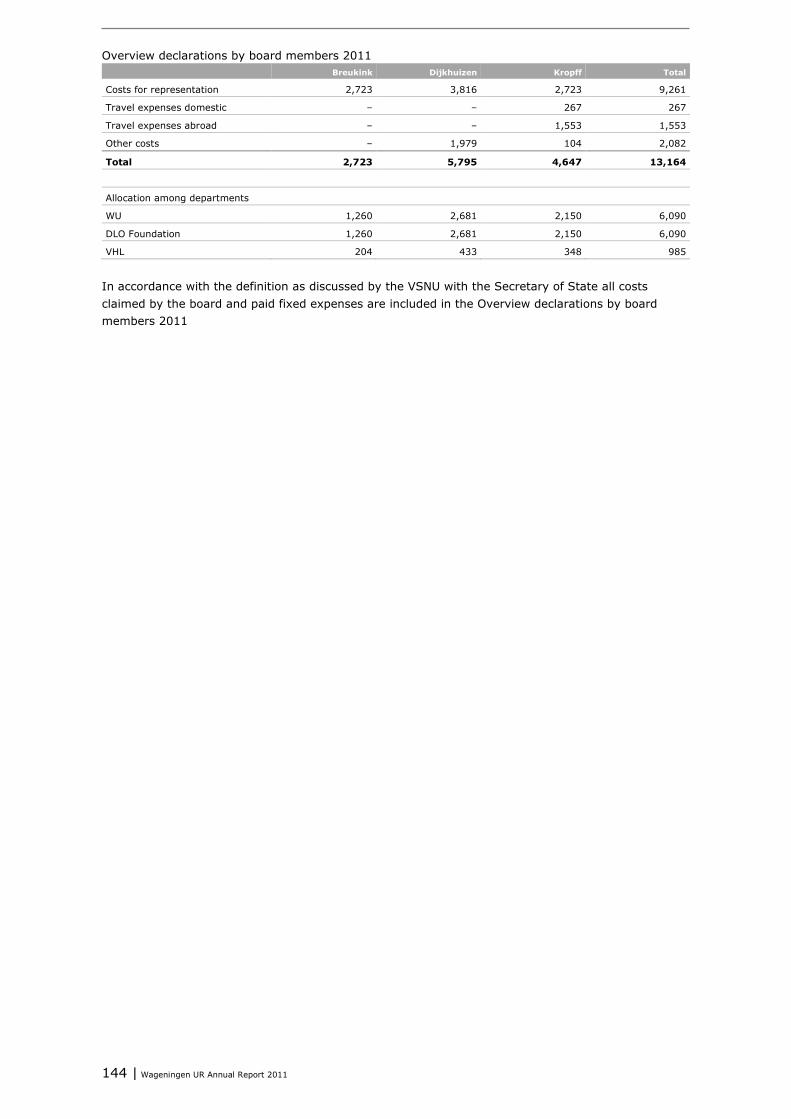
144 | Wageningen UR Annual Report 2011
Overview declarations by board members 2011 Breukink Dijkhuizen Kropff Total
Costs for representation 2,723 3,816 2,723 9,261
Travel expenses domestic – – 267 267
Travel expenses abroad – – 1,553 1,553
Other costs – 1,979 104 2,082
Total 2,723 5,795 4,647 13,164
Allocation among departments
WU 1,260 2,681 2,150 6,090
DLO Foundation 1,260 2,681 2,150 6,090
VHL 204 433 348 985
In accordance with the definition as discussed by the VSNU with the Secretary of State all costs claimed by the board and paid fixed expenses are included in the Overview declarations by board members 2011
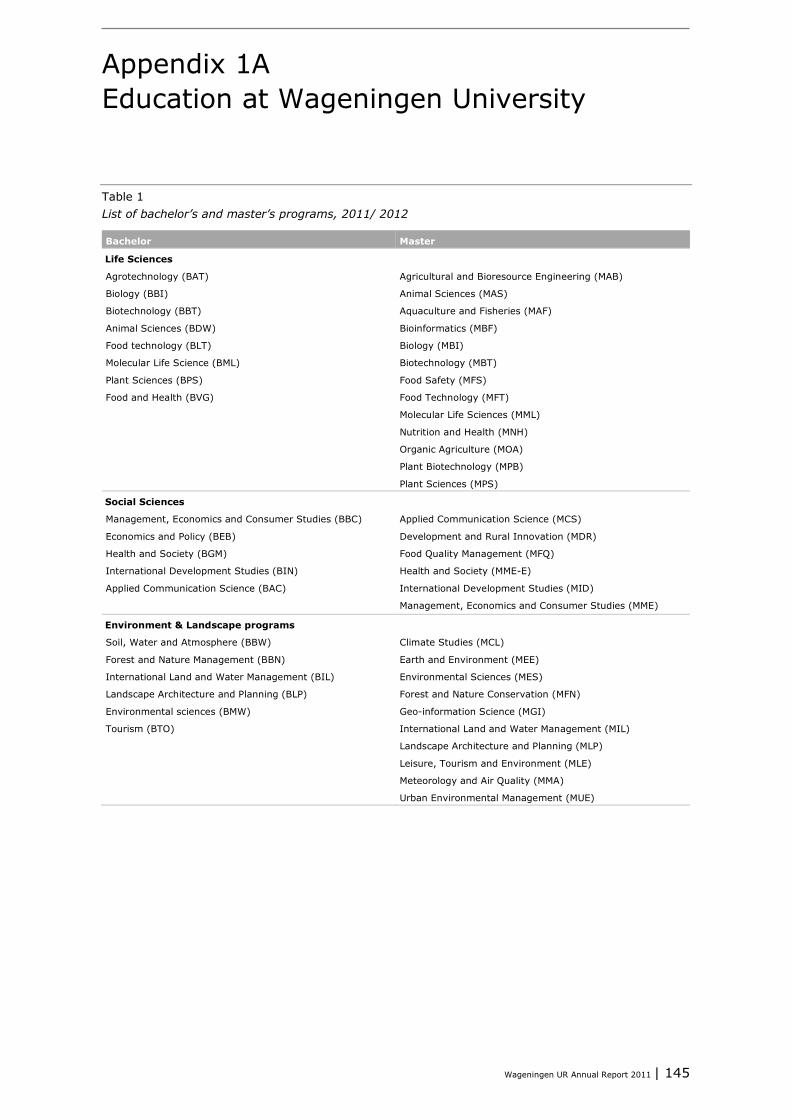
Wageningen UR Annual Report 2011 | 145
Appendix 1A Education at Wageningen University
Table 1 List of bachelor’s and master’s programs, 2011/ 2012
Bachelor Master
Life Sciences
Agrotechnology (BAT)
Biology (BBI)
Biotechnology (BBT)
Animal Sciences (BDW)
Food technology (BLT)
Molecular Life Science (BML)
Plant Sciences (BPS)
Food and Health (BVG)
Agricultural and Bioresource Engineering (MAB)
Animal Sciences (MAS)
Aquaculture and Fisheries (MAF)
Bioinformatics (MBF)
Biology (MBI)
Biotechnology (MBT)
Food Safety (MFS)
Food Technology (MFT)
Molecular Life Sciences (MML)
Nutrition and Health (MNH)
Organic Agriculture (MOA)
Plant Biotechnology (MPB)
Plant Sciences (MPS)
Social Sciences
Management, Economics and Consumer Studies (BBC)
Economics and Policy (BEB)
Health and Society (BGM)
International Development Studies (BIN)
Applied Communication Science (BAC)
Applied Communication Science (MCS)
Development and Rural Innovation (MDR)
Food Quality Management (MFQ)
Health and Society (MME-E)
International Development Studies (MID)
Management, Economics and Consumer Studies (MME)
Environment & Landscape programs
Soil, Water and Atmosphere (BBW)
Forest and Nature Management (BBN)
International Land and Water Management (BIL)
Landscape Architecture and Planning (BLP)
Environmental sciences (BMW)
Tourism (BTO)
Climate Studies (MCL)
Earth and Environment (MEE)
Environmental Sciences (MES)
Forest and Nature Conservation (MFN)
Geo-information Science (MGI)
International Land and Water Management (MIL)
Landscape Architecture and Planning (MLP)
Leisure, Tourism and Environment (MLE)
Meteorology and Air Quality (MMA)
Urban Environmental Management (MUE)
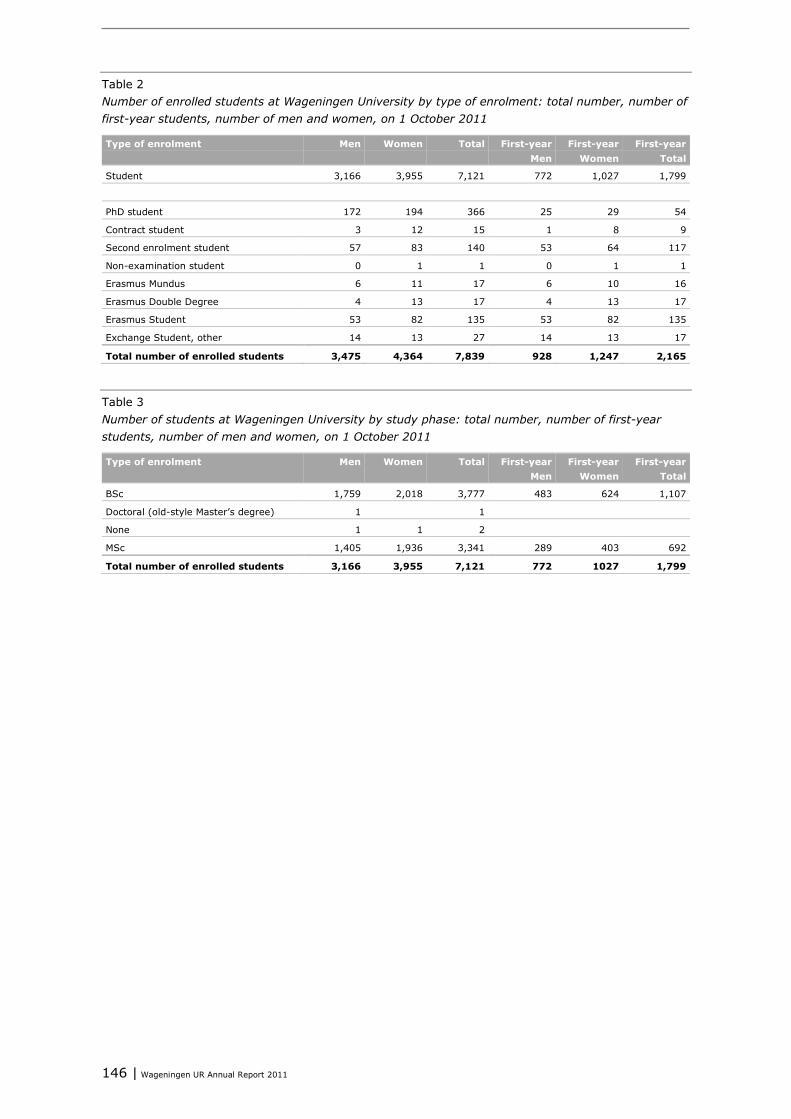
146 | Wageningen UR Annual Report 2011
Table 2 Number of enrolled students at Wageningen University by type of enrolment: total number, number of first-year students, number of men and women, on 1 October 2011
Type of enrolment Men Women Total First-year Men
First-year Women
First-year Total
Student 3,166 3,955 7,121 772 1,027 1,799
PhD student 172 194 366 25 29 54
Contract student 3 12 15 1 8 9
Second enrolment student 57 83 140 53 64 117
Non-examination student 0 1 1 0 1 1
Erasmus Mundus 6 11 17 6 10 16
Erasmus Double Degree 4 13 17 4 13 17
Erasmus Student 53 82 135 53 82 135
Exchange Student, other 14 13 27 14 13 17
Total number of enrolled students 3,475 4,364 7,839 928 1,247 2,165
Table 3 Number of students at Wageningen University by study phase: total number, number of first-year students, number of men and women, on 1 October 2011
Type of enrolment Men Women Total First-year Men
First-year Women
First-year Total
BSc 1,759 2,018 3,777 483 624 1,107
Doctoral (old-style Master’s degree) 1 1
None 1 1 2
MSc 1,405 1,936 3,341 289 403 692
Total number of enrolled students 3,166 3,955 7,121 772 1027 1,799
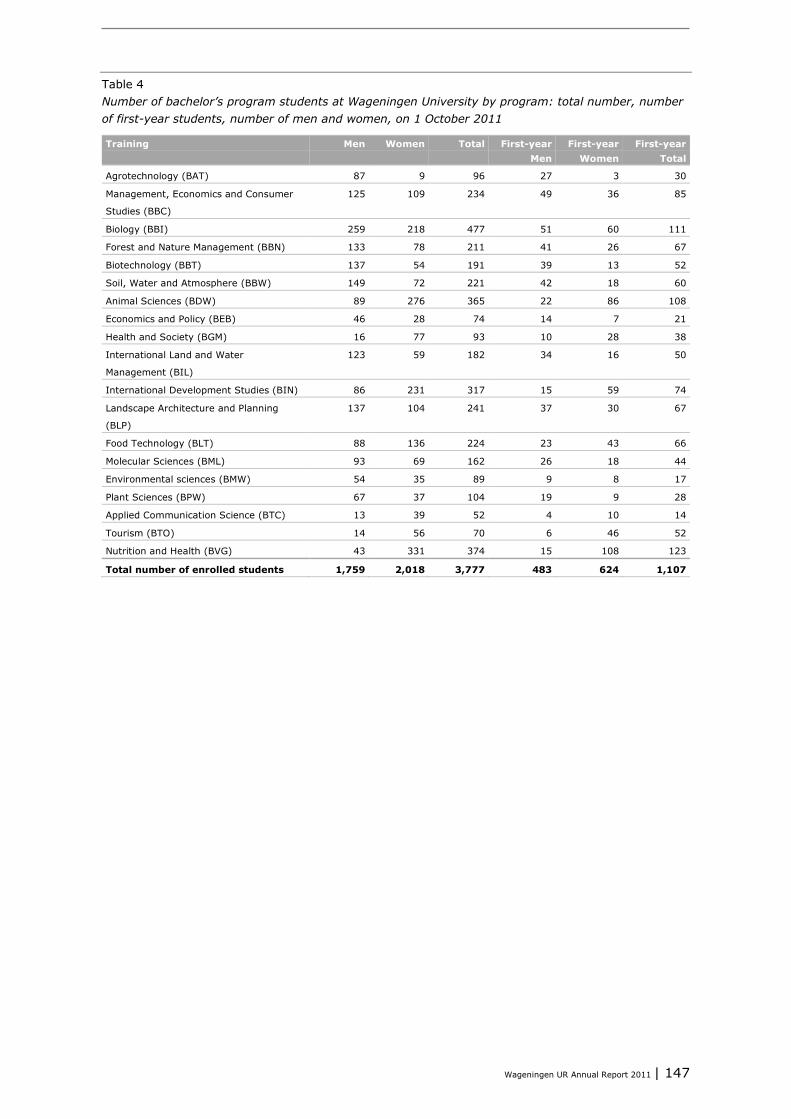
Wageningen UR Annual Report 2011 | 147
Table 4 Number of bachelor’s program students at Wageningen University by program: total number, number of first-year students, number of men and women, on 1 October 2011
Training Men Women Total First-year Men
First-year Women
First-year Total
Agrotechnology (BAT) 87 9 96 27 3 30
Management, Economics and Consumer
Studies (BBC)
125 109 234 49 36 85
Biology (BBI) 259 218 477 51 60 111
Forest and Nature Management (BBN) 133 78 211 41 26 67
Biotechnology (BBT) 137 54 191 39 13 52
Soil, Water and Atmosphere (BBW) 149 72 221 42 18 60
Animal Sciences (BDW) 89 276 365 22 86 108
Economics and Policy (BEB) 46 28 74 14 7 21
Health and Society (BGM) 16 77 93 10 28 38
International Land and Water
Management (BIL)
123 59 182 34 16 50
International Development Studies (BIN) 86 231 317 15 59 74
Landscape Architecture and Planning
(BLP)
137 104 241 37 30 67
Food Technology (BLT) 88 136 224 23 43 66
Molecular Sciences (BML) 93 69 162 26 18 44
Environmental sciences (BMW) 54 35 89 9 8 17
Plant Sciences (BPW) 67 37 104 19 9 28
Applied Communication Science (BTC) 13 39 52 4 10 14
Tourism (BTO) 14 56 70 6 46 52
Nutrition and Health (BVG) 43 331 374 15 108 123
Total number of enrolled students 1,759 2,018 3,777 483 624 1,107
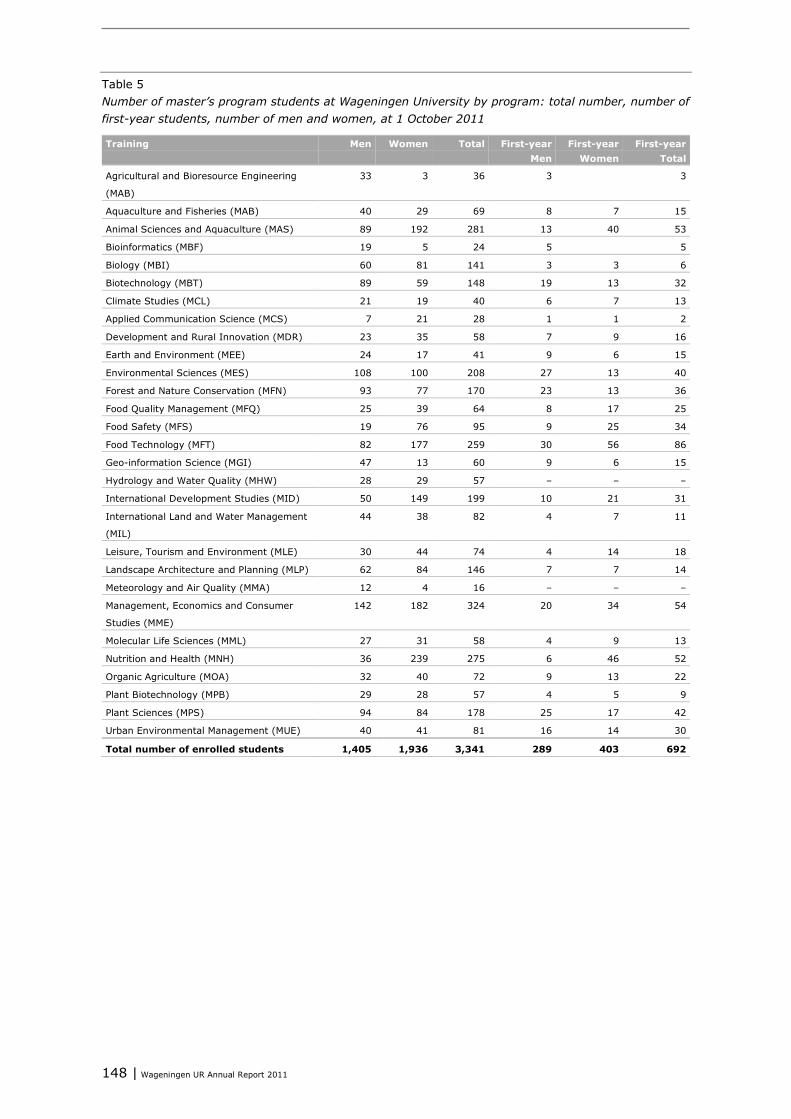
148 | Wageningen UR Annual Report 2011
Table 5 Number of master’s program students at Wageningen University by program: total number, number of first-year students, number of men and women, at 1 October 2011
Training Men Women Total First-year Men
First-year Women
First-year Total
Agricultural and Bioresource Engineering
(MAB)
33 3 36 3 3
Aquaculture and Fisheries (MAB) 40 29 69 8 7 15
Animal Sciences and Aquaculture (MAS) 89 192 281 13 40 53
Bioinformatics (MBF) 19 5 24 5 5
Biology (MBI) 60 81 141 3 3 6
Biotechnology (MBT) 89 59 148 19 13 32
Climate Studies (MCL) 21 19 40 6 7 13
Applied Communication Science (MCS) 7 21 28 1 1 2
Development and Rural Innovation (MDR) 23 35 58 7 9 16
Earth and Environment (MEE) 24 17 41 9 6 15
Environmental Sciences (MES) 108 100 208 27 13 40
Forest and Nature Conservation (MFN) 93 77 170 23 13 36
Food Quality Management (MFQ) 25 39 64 8 17 25
Food Safety (MFS) 19 76 95 9 25 34
Food Technology (MFT) 82 177 259 30 56 86
Geo-information Science (MGI) 47 13 60 9 6 15
Hydrology and Water Quality (MHW) 28 29 57 – – –
International Development Studies (MID) 50 149 199 10 21 31
International Land and Water Management
(MIL)
44 38 82 4 7 11
Leisure, Tourism and Environment (MLE) 30 44 74 4 14 18
Landscape Architecture and Planning (MLP) 62 84 146 7 7 14
Meteorology and Air Quality (MMA) 12 4 16 – – –
Management, Economics and Consumer
Studies (MME)
142 182 324 20 34 54
Molecular Life Sciences (MML) 27 31 58 4 9 13
Nutrition and Health (MNH) 36 239 275 6 46 52
Organic Agriculture (MOA) 32 40 72 9 13 22
Plant Biotechnology (MPB) 29 28 57 4 5 9
Plant Sciences (MPS) 94 84 178 25 17 42
Urban Environmental Management (MUE) 40 41 81 16 14 30
Total number of enrolled students 1,405 1,936 3,341 289 403 692
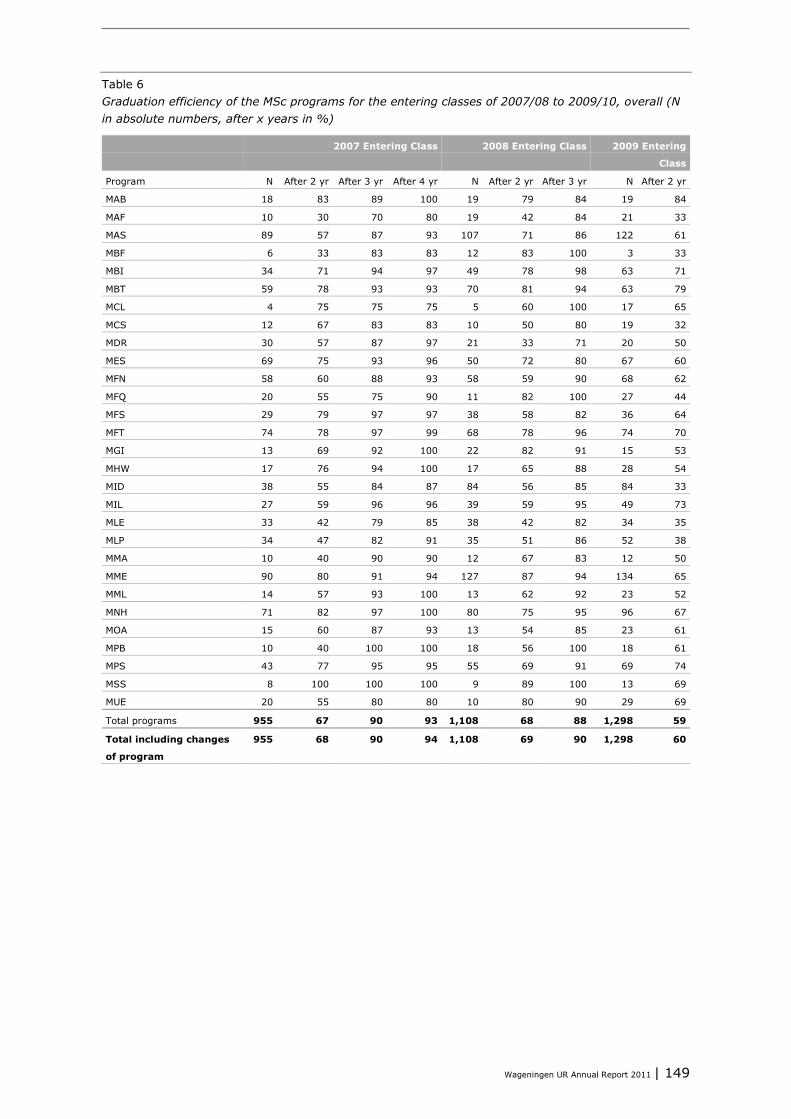
Wageningen UR Annual Report 2011 | 149
Table 6 Graduation efficiency of the MSc programs for the entering classes of 2007/08 to 2009/10, overall (N in absolute numbers, after x years in %)
2007 Entering Class 2008 Entering Class 2009 Entering
Class
Program N After 2 yr After 3 yr After 4 yr N After 2 yr After 3 yr N After 2 yr
MAB 18 83 89 100 19 79 84 19 84
MAF 10 30 70 80 19 42 84 21 33
MAS 89 57 87 93 107 71 86 122 61
MBF 6 33 83 83 12 83 100 3 33
MBI 34 71 94 97 49 78 98 63 71
MBT 59 78 93 93 70 81 94 63 79
MCL 4 75 75 75 5 60 100 17 65
MCS 12 67 83 83 10 50 80 19 32
MDR 30 57 87 97 21 33 71 20 50
MES 69 75 93 96 50 72 80 67 60
MFN 58 60 88 93 58 59 90 68 62
MFQ 20 55 75 90 11 82 100 27 44
MFS 29 79 97 97 38 58 82 36 64
MFT 74 78 97 99 68 78 96 74 70
MGI 13 69 92 100 22 82 91 15 53
MHW 17 76 94 100 17 65 88 28 54
MID 38 55 84 87 84 56 85 84 33
MIL 27 59 96 96 39 59 95 49 73
MLE 33 42 79 85 38 42 82 34 35
MLP 34 47 82 91 35 51 86 52 38
MMA 10 40 90 90 12 67 83 12 50
MME 90 80 91 94 127 87 94 134 65
MML 14 57 93 100 13 62 92 23 52
MNH 71 82 97 100 80 75 95 96 67
MOA 15 60 87 93 13 54 85 23 61
MPB 10 40 100 100 18 56 100 18 61
MPS 43 77 95 95 55 69 91 69 74
MSS 8 100 100 100 9 89 100 13 69
MUE 20 55 80 80 10 80 90 29 69
Total programs 955 67 90 93 1,108 68 88 1,298 59
Total including changes
of program
955 68 90 94 1,108 69 90 1,298 60
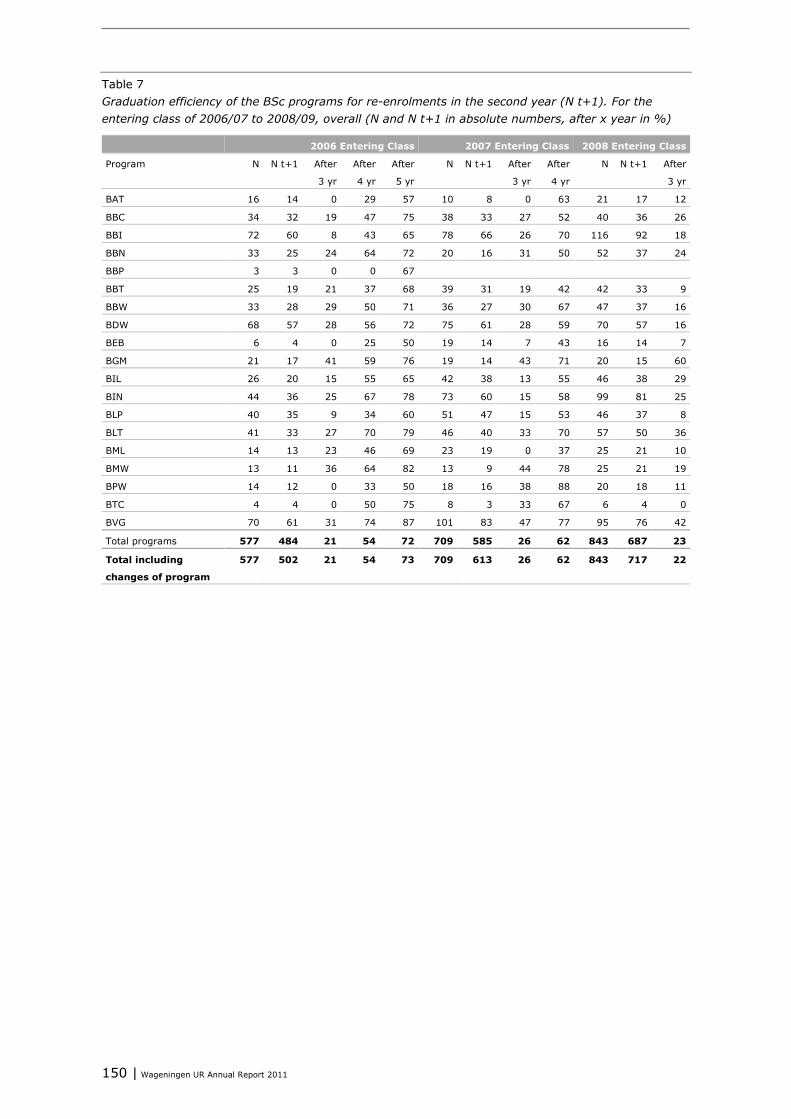
150 | Wageningen UR Annual Report 2011
Table 7 Graduation efficiency of the BSc programs for re-enrolments in the second year (N t+1). For the entering class of 2006/07 to 2008/09, overall (N and N t+1 in absolute numbers, after x year in %)
2006 Entering Class 2007 Entering Class 2008 Entering Class
Program N N t+1 After
3 yr
After
4 yr
After
5 yr
N N t+1 After
3 yr
After
4 yr
N N t+1 After
3 yr
BAT 16 14 0 29 57 10 8 0 63 21 17 12
BBC 34 32 19 47 75 38 33 27 52 40 36 26
BBI 72 60 8 43 65 78 66 26 70 116 92 18
BBN 33 25 24 64 72 20 16 31 50 52 37 24
BBP 3 3 0 0 67
BBT 25 19 21 37 68 39 31 19 42 42 33 9
BBW 33 28 29 50 71 36 27 30 67 47 37 16
BDW 68 57 28 56 72 75 61 28 59 70 57 16
BEB 6 4 0 25 50 19 14 7 43 16 14 7
BGM 21 17 41 59 76 19 14 43 71 20 15 60
BIL 26 20 15 55 65 42 38 13 55 46 38 29
BIN 44 36 25 67 78 73 60 15 58 99 81 25
BLP 40 35 9 34 60 51 47 15 53 46 37 8
BLT 41 33 27 70 79 46 40 33 70 57 50 36
BML 14 13 23 46 69 23 19 0 37 25 21 10
BMW 13 11 36 64 82 13 9 44 78 25 21 19
BPW 14 12 0 33 50 18 16 38 88 20 18 11
BTC 4 4 0 50 75 8 3 33 67 6 4 0
BVG 70 61 31 74 87 101 83 47 77 95 76 42
Total programs 577 484 21 54 72 709 585 26 62 843 687 23
Total including
changes of program
577 502 21 54 73 709 613 26 62 843 717 22
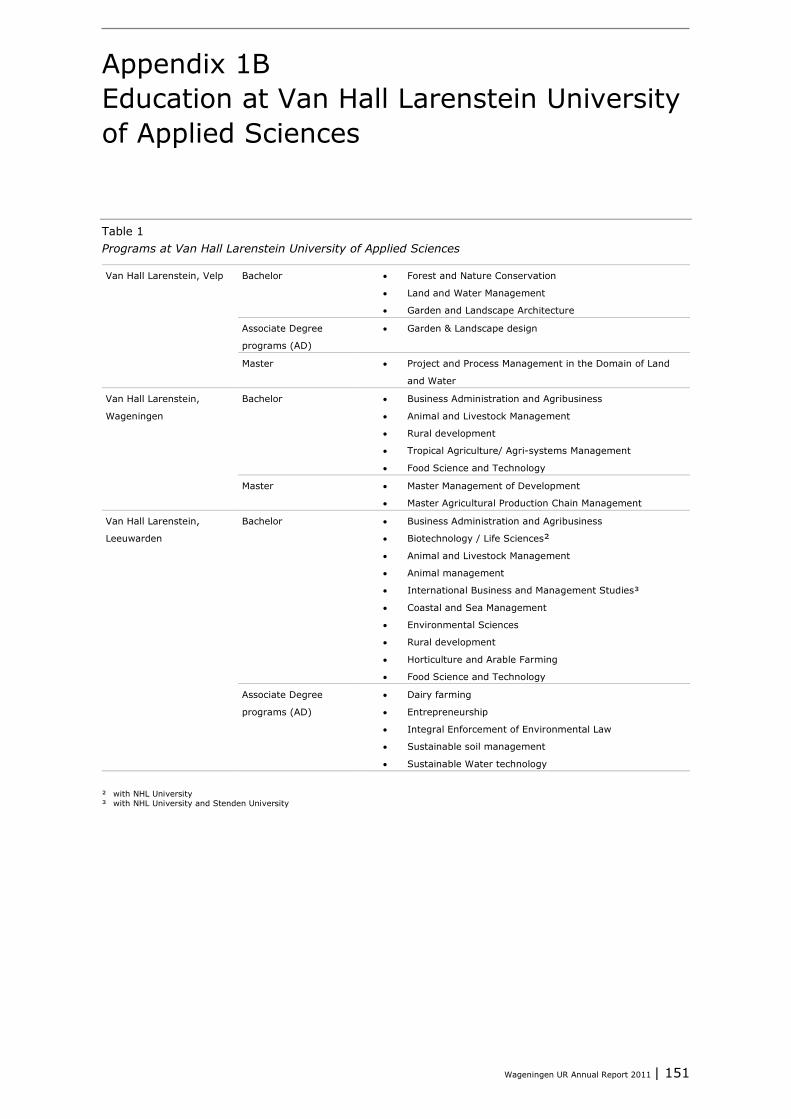
Wageningen UR Annual Report 2011 | 151
Appendix 1B Education at Van Hall Larenstein University of Applied Sciences
Table 1 Programs at Van Hall Larenstein University of Applied Sciences
Van Hall Larenstein, Velp Bachelor • Forest and Nature Conservation
• Land and Water Management
• Garden and Landscape Architecture
Associate Degree
programs (AD)
• Garden & Landscape design
Master • Project and Process Management in the Domain of Land
and Water
Van Hall Larenstein,
Wageningen
Bachelor • Business Administration and Agribusiness
• Animal and Livestock Management
• Rural development
• Tropical Agriculture/ Agri-systems Management
• Food Science and Technology
Master • Master Management of Development
• Master Agricultural Production Chain Management
Van Hall Larenstein,
Leeuwarden
Bachelor • Business Administration and Agribusiness
• Biotechnology / Life Sciences²
• Animal and Livestock Management
• Animal management
• International Business and Management Studies³
• Coastal and Sea Management
• Environmental Sciences
• Rural development
• Horticulture and Arable Farming
• Food Science and Technology
Associate Degree
programs (AD)
• Dairy farming
• Entrepreneurship
• Integral Enforcement of Environmental Law
• Sustainable soil management
• Sustainable Water technology
² with NHL University ³ with NHL University and Stenden University
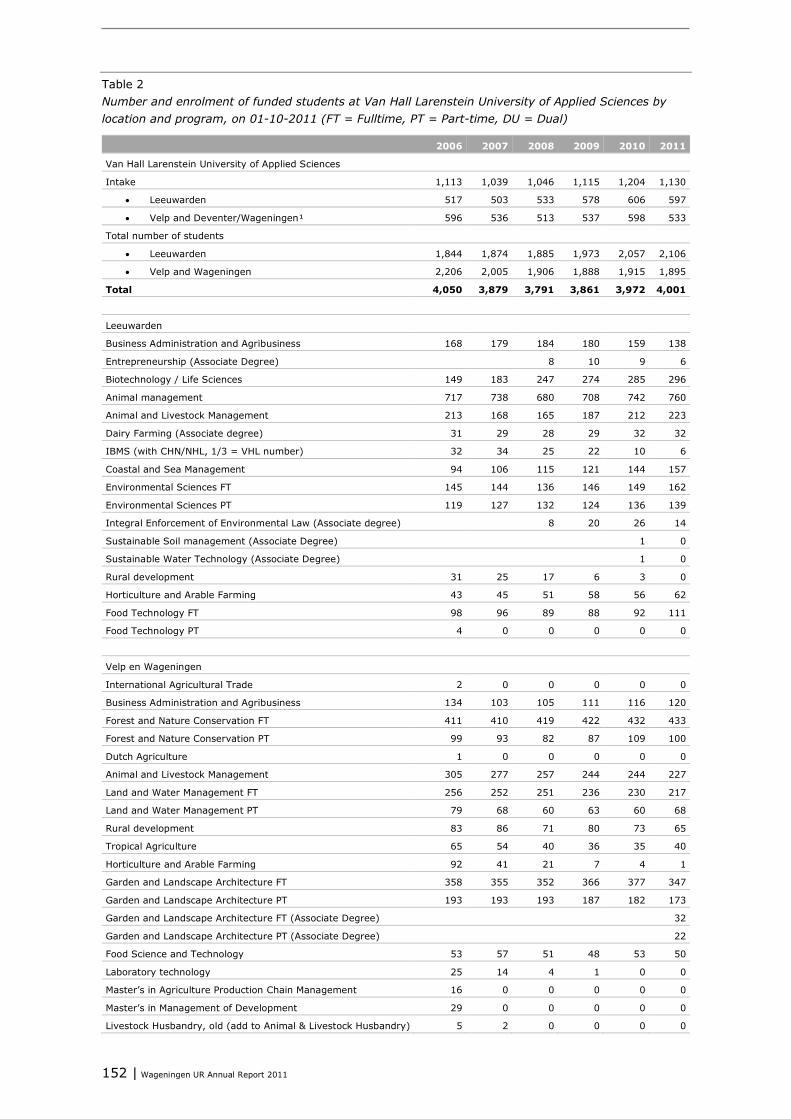
152 | Wageningen UR Annual Report 2011
Table 2 Number and enrolment of funded students at Van Hall Larenstein University of Applied Sciences by location and program, on 01-10-2011 (FT = Fulltime, PT = Part-time, DU = Dual)
2006 2007 2008 2009 2010 2011
Van Hall Larenstein University of Applied Sciences
Intake 1,113 1,039 1,046 1,115 1,204 1,130
• Leeuwarden 517 503 533 578 606 597
• Velp and Deventer/Wageningen¹ 596 536 513 537 598 533
Total number of students
• Leeuwarden 1,844 1,874 1,885 1,973 2,057 2,106
• Velp and Wageningen 2,206 2,005 1,906 1,888 1,915 1,895
Total 4,050 3,879 3,791 3,861 3,972 4,001
Leeuwarden
Business Administration and Agribusiness 168 179 184 180 159 138
Entrepreneurship (Associate Degree) 8 10 9 6
Biotechnology / Life Sciences 149 183 247 274 285 296
Animal management 717 738 680 708 742 760
Animal and Livestock Management 213 168 165 187 212 223
Dairy Farming (Associate degree) 31 29 28 29 32 32
IBMS (with CHN/NHL, 1/3 = VHL number) 32 34 25 22 10 6
Coastal and Sea Management 94 106 115 121 144 157
Environmental Sciences FT 145 144 136 146 149 162
Environmental Sciences PT 119 127 132 124 136 139
Integral Enforcement of Environmental Law (Associate degree) 8 20 26 14
Sustainable Soil management (Associate Degree) 1 0
Sustainable Water Technology (Associate Degree) 1 0
Rural development 31 25 17 6 3 0
Horticulture and Arable Farming 43 45 51 58 56 62
Food Technology FT 98 96 89 88 92 111
Food Technology PT 4 0 0 0 0 0
Velp en Wageningen
International Agricultural Trade 2 0 0 0 0 0
Business Administration and Agribusiness 134 103 105 111 116 120
Forest and Nature Conservation FT 411 410 419 422 432 433
Forest and Nature Conservation PT 99 93 82 87 109 100
Dutch Agriculture 1 0 0 0 0 0
Animal and Livestock Management 305 277 257 244 244 227
Land and Water Management FT 256 252 251 236 230 217
Land and Water Management PT 79 68 60 63 60 68
Rural development 83 86 71 80 73 65
Tropical Agriculture 65 54 40 36 35 40
Horticulture and Arable Farming 92 41 21 7 4 1
Garden and Landscape Architecture FT 358 355 352 366 377 347
Garden and Landscape Architecture PT 193 193 193 187 182 173
Garden and Landscape Architecture FT (Associate Degree) 32
Garden and Landscape Architecture PT (Associate Degree) 22
Food Science and Technology 53 57 51 48 53 50
Laboratory technology 25 14 4 1 0 0
Master’s in Agriculture Production Chain Management 16 0 0 0 0 0
Master’s in Management of Development 29 0 0 0 0 0
Livestock Husbandry, old (add to Animal & Livestock Husbandry) 5 2 0 0 0 0
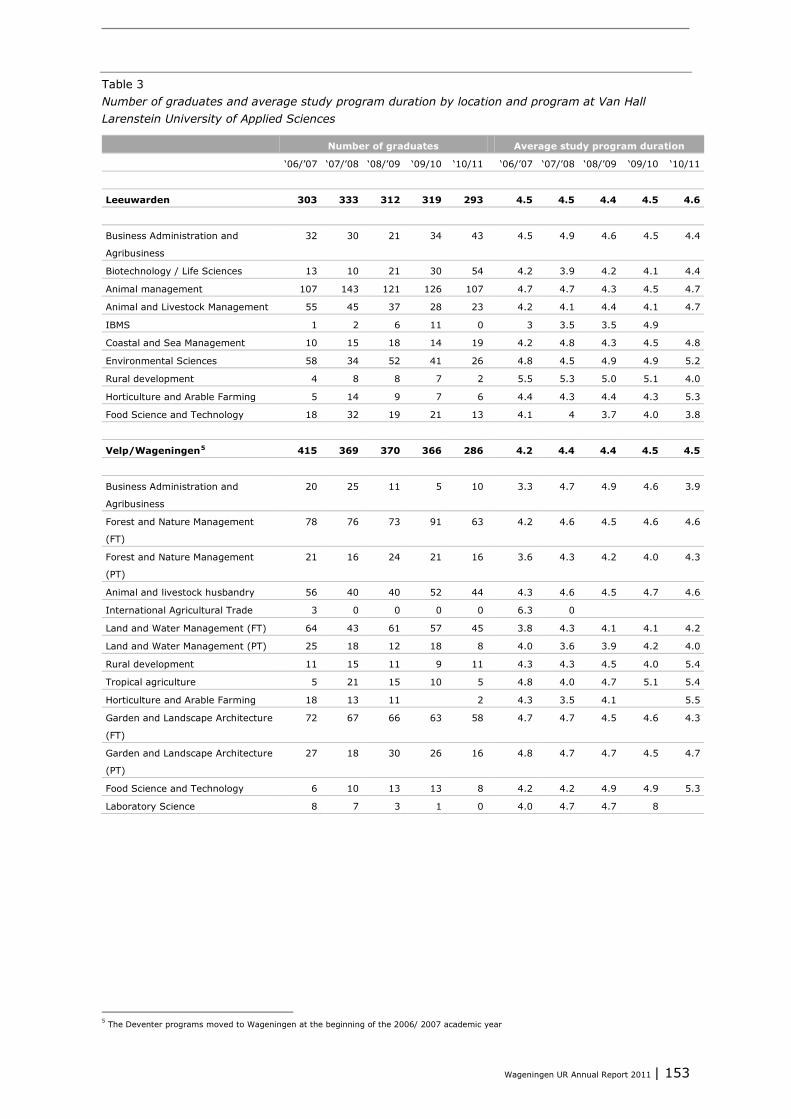
Wageningen UR Annual Report 2011 | 153
Table 3 Number of graduates and average study program duration by location and program at Van Hall Larenstein University of Applied Sciences
Number of graduates Average study program duration
‘06/’07 ‘07/’08 ‘08/’09 ‘09/10 ‘10/11 ‘06/’07 ‘07/’08 ‘08/’09 ‘09/10 ‘10/11
Leeuwarden 303 333 312 319 293 4.5 4.5 4.4 4.5 4.6
Business Administration and
Agribusiness
32 30 21 34 43 4.5 4.9 4.6 4.5 4.4
Biotechnology / Life Sciences 13 10 21 30 54 4.2 3.9 4.2 4.1 4.4
Animal management 107 143 121 126 107 4.7 4.7 4.3 4.5 4.7
Animal and Livestock Management 55 45 37 28 23 4.2 4.1 4.4 4.1 4.7
IBMS 1 2 6 11 0 3 3.5 3.5 4.9
Coastal and Sea Management 10 15 18 14 19 4.2 4.8 4.3 4.5 4.8
Environmental Sciences 58 34 52 41 26 4.8 4.5 4.9 4.9 5.2
Rural development 4 8 8 7 2 5.5 5.3 5.0 5.1 4.0
Horticulture and Arable Farming 5 14 9 7 6 4.4 4.3 4.4 4.3 5.3
Food Science and Technology 18 32 19 21 13 4.1 4 3.7 4.0 3.8
Velp/Wageningen5 415 369 370 366 286 4.2 4.4 4.4 4.5 4.5
Business Administration and
Agribusiness
20 25 11 5 10 3.3 4.7 4.9 4.6 3.9
Forest and Nature Management
(FT)
78 76 73 91 63 4.2 4.6 4.5 4.6 4.6
Forest and Nature Management
(PT)
21 16 24 21 16 3.6 4.3 4.2 4.0 4.3
Animal and livestock husbandry 56 40 40 52 44 4.3 4.6 4.5 4.7 4.6
International Agricultural Trade 3 0 0 0 0 6.3 0
Land and Water Management (FT) 64 43 61 57 45 3.8 4.3 4.1 4.1 4.2
Land and Water Management (PT) 25 18 12 18 8 4.0 3.6 3.9 4.2 4.0
Rural development 11 15 11 9 11 4.3 4.3 4.5 4.0 5.4
Tropical agriculture 5 21 15 10 5 4.8 4.0 4.7 5.1 5.4
Horticulture and Arable Farming 18 13 11 2 4.3 3.5 4.1 5.5
Garden and Landscape Architecture
(FT)
72 67 66 63 58 4.7 4.7 4.5 4.6 4.3
Garden and Landscape Architecture
(PT)
27 18 30 26 16 4.8 4.7 4.7 4.5 4.7
Food Science and Technology 6 10 13 13 8 4.2 4.2 4.9 4.9 5.3
Laboratory Science 8 7 3 1 0 4.0 4.7 4.7 8
5 The Deventer programs moved to Wageningen at the beginning of the 2006/ 2007 academic year
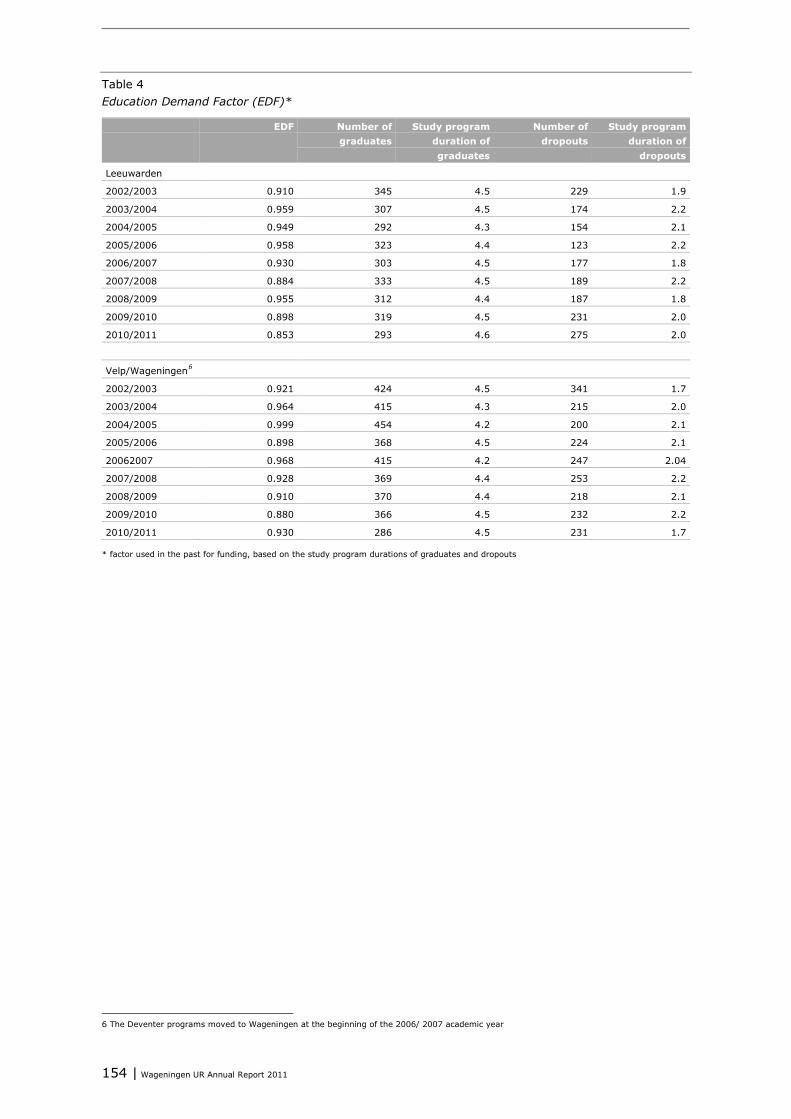
154 | Wageningen UR Annual Report 2011
Table 4 Education Demand Factor (EDF)*
EDF Number of graduates
Study program duration of graduates
Number of dropouts
Study program duration of
dropouts
Leeuwarden
2002/2003 0.910 345 4.5 229 1.9
2003/2004 0.959 307 4.5 174 2.2
2004/2005 0.949 292 4.3 154 2.1
2005/2006 0.958 323 4.4 123 2.2
2006/2007 0.930 303 4.5 177 1.8
2007/2008 0.884 333 4.5 189 2.2
2008/2009 0.955 312 4.4 187 1.8
2009/2010 0.898 319 4.5 231 2.0
2010/2011 0.853 293 4.6 275 2.0
Velp/Wageningen6
2002/2003 0.921 424 4.5 341 1.7
2003/2004 0.964 415 4.3 215 2.0
2004/2005 0.999 454 4.2 200 2.1
2005/2006 0.898 368 4.5 224 2.1
20062007 0.968 415 4.2 247 2.04
2007/2008 0.928 369 4.4 253 2.2
2008/2009 0.910 370 4.4 218 2.1
2009/2010 0.880 366 4.5 232 2.2
2010/2011 0.930 286 4.5 231 1.7
* factor used in the past for funding, based on the study program durations of graduates and dropouts
6 The Deventer programs moved to Wageningen at the beginning of the 2006/ 2007 academic year
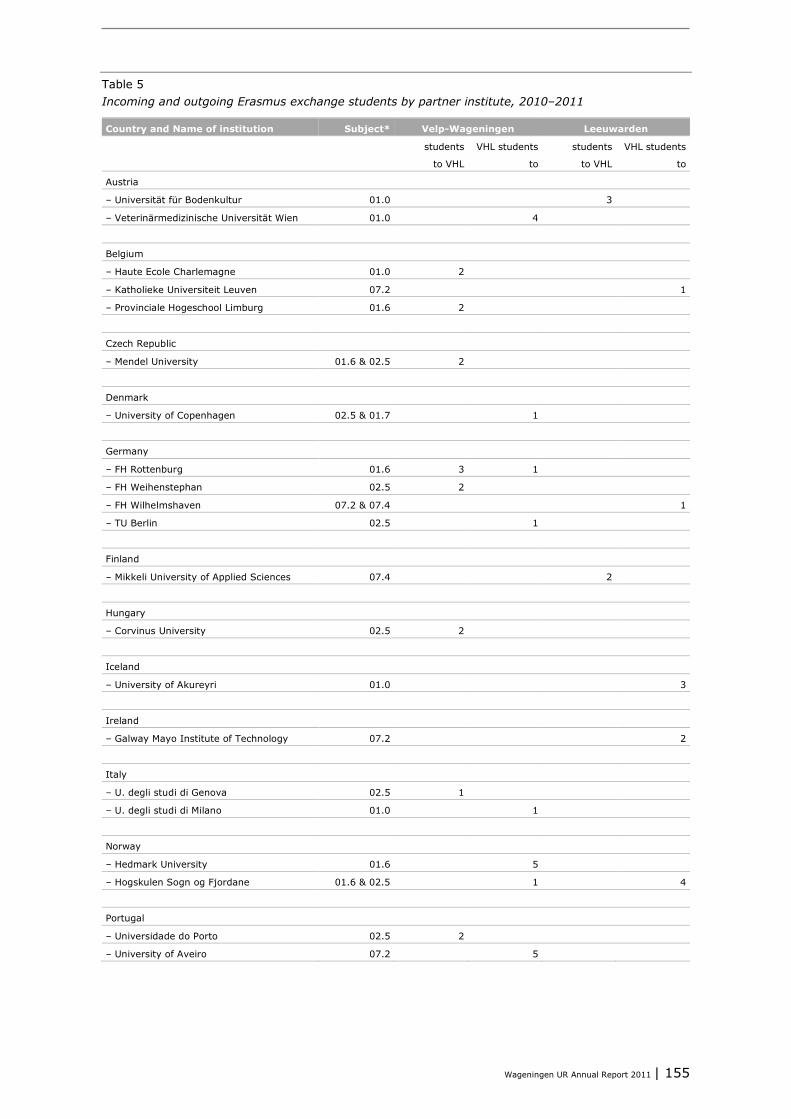
Wageningen UR Annual Report 2011 | 155
Table 5 Incoming and outgoing Erasmus exchange students by partner institute, 2010–2011
Country and Name of institution Subject* Velp-Wageningen Leeuwarden
students
to VHL
VHL students
to
students
to VHL
VHL students
to
Austria
– Universität für Bodenkultur 01.0 3
– Veterinärmedizinische Universität Wien 01.0 4
Belgium
– Haute Ecole Charlemagne 01.0 2
– Katholieke Universiteit Leuven 07.2 1
– Provinciale Hogeschool Limburg 01.6 2
Czech Republic
– Mendel University 01.6 & 02.5 2
Denmark
– University of Copenhagen 02.5 & 01.7 1
Germany
– FH Rottenburg 01.6 3 1
– FH Weihenstephan 02.5 2
– FH Wilhelmshaven 07.2 & 07.4 1
– TU Berlin 02.5 1
Finland
– Mikkeli University of Applied Sciences 07.4 2
Hungary
– Corvinus University 02.5 2
Iceland
– University of Akureyri 01.0 3
Ireland
– Galway Mayo Institute of Technology 07.2 2
Italy
– U. degli studi di Genova 02.5 1
– U. degli studi di Milano 01.0 1
Norway
– Hedmark University 01.6 5
– Hogskulen Sogn og Fjordane 01.6 & 02.5 1 4
Portugal
– Universidade do Porto 02.5 2
– University of Aveiro 07.2 5
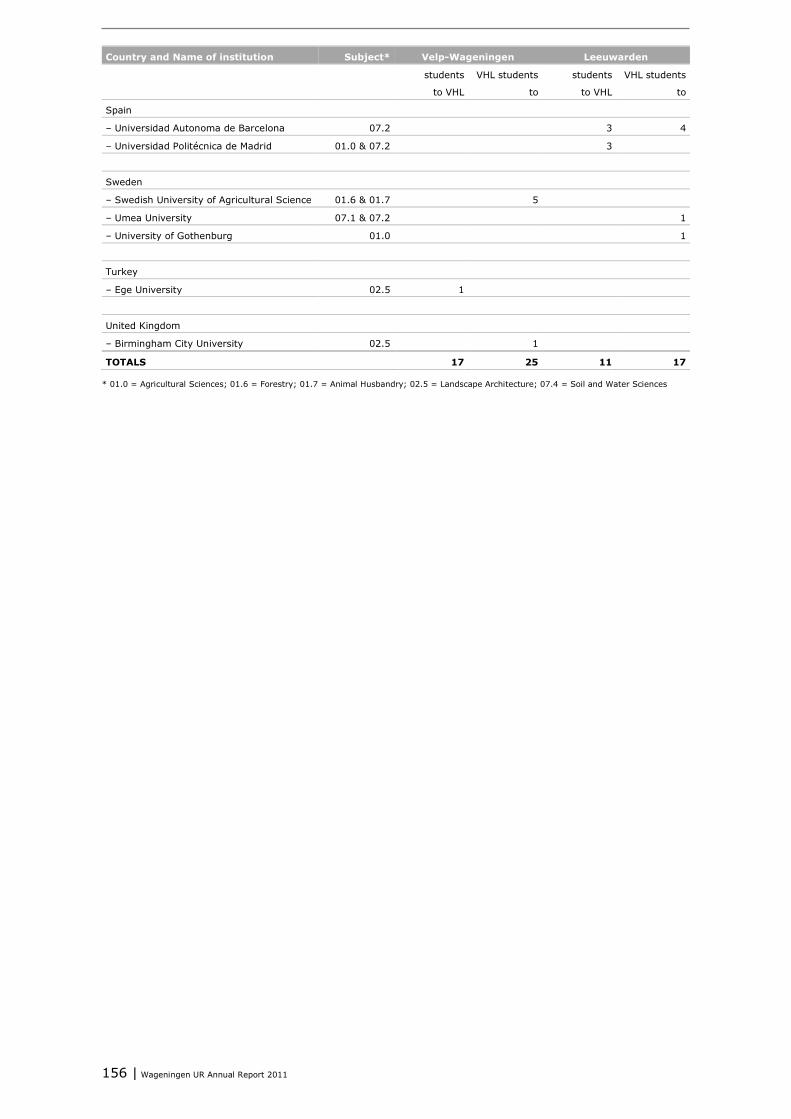
156 | Wageningen UR Annual Report 2011
Country and Name of institution Subject* Velp-Wageningen Leeuwarden
students
to VHL
VHL students
to
students
to VHL
VHL students
to
Spain
– Universidad Autonoma de Barcelona 07.2 3 4
– Universidad Politécnica de Madrid 01.0 & 07.2 3
Sweden
– Swedish University of Agricultural Science 01.6 & 01.7 5
– Umea University 07.1 & 07.2 1
– University of Gothenburg 01.0 1
Turkey
– Ege University 02.5 1
United Kingdom
– Birmingham City University 02.5 1
TOTALS 17 25 11 17
* 01.0 = Agricultural Sciences; 01.6 = Forestry; 01.7 = Animal Husbandry; 02.5 = Landscape Architecture; 07.4 = Soil and Water Sciences
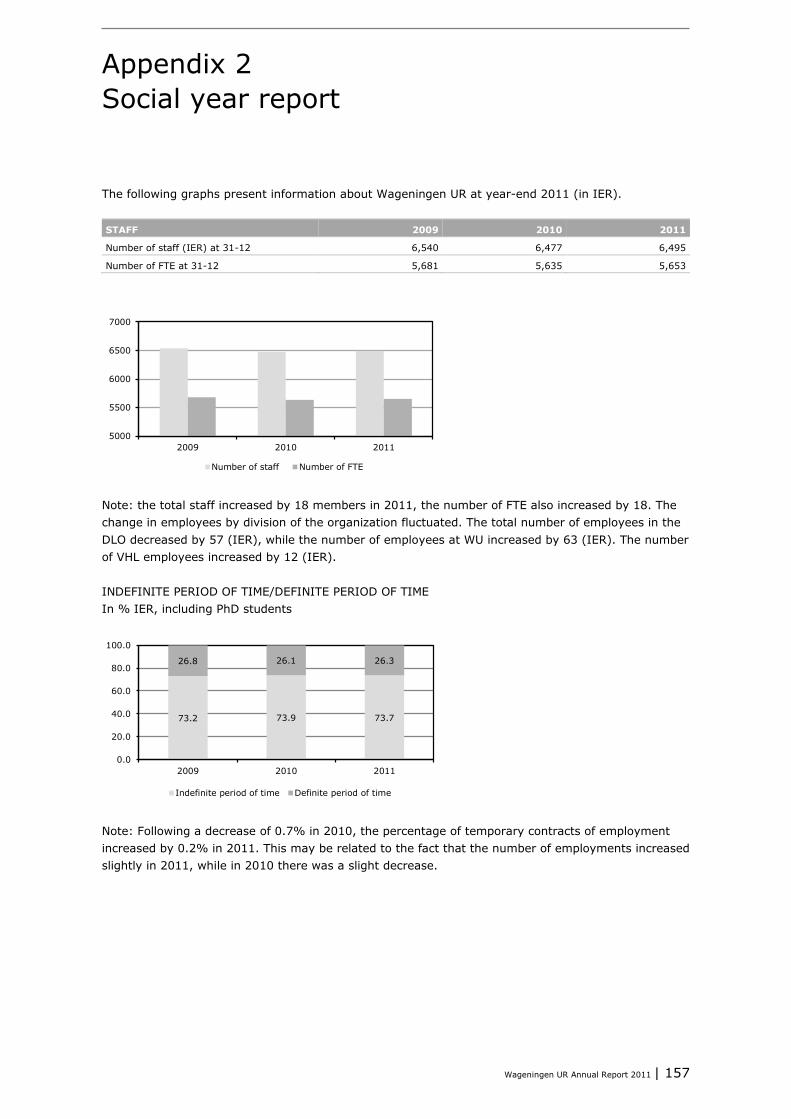
Wageningen UR Annual Report 2011 | 157
Appendix 2 Social year report
The following graphs present information about Wageningen UR at year-end 2011 (in IER). STAFF 2009 2010 2011
Number of staff (IER) at 31-12 6,540 6,477 6,495
Number of FTE at 31-12 5,681 5,635 5,653
Note: the total staff increased by 18 members in 2011, the number of FTE also increased by 18. The change in employees by division of the organization fluctuated. The total number of employees in the DLO decreased by 57 (IER), while the number of employees at WU increased by 63 (IER). The number of VHL employees increased by 12 (IER). INDEFINITE PERIOD OF TIME/DEFINITE PERIOD OF TIME In % IER, including PhD students
Note: Following a decrease of 0.7% in 2010, the percentage of temporary contracts of employment increased by 0.2% in 2011. This may be related to the fact that the number of employments increased slightly in 2011, while in 2010 there was a slight decrease.
5000
5500
6000
6500
7000
2009 2010 2011
Number of staff Number of FTE
73.2 73.9 73.7
26.8 26.1 26.3
0.0
20.0
40.0
60.0
80.0
100.0
2009 2010 2011
Indefinite period of time Definite period of time

158 | Wageningen UR Annual Report 2011
ABSENCE DUE TO ILLNESS 2009 2010 2011
Including absence > 1 year 3.4 3.8 3.6
Excluding absence > 1 year 2.8 2.9 2.8
Note: the rate of absenteeism decreased by 0.2% to 3.6%. This rate of absenteeism for the entire Wageningen UR organization is below the target of a maximum of 4%. The decrease mainly occurs at VHL, where both the total absence (by 1.2% to 4.9%) as the absence for less than one year (by 1.4% to 3.2%) significantly decreased. For an explanation of these percentages refer to Chapter 2 Section 2.3.2. Also, at DLO the absence decreased by 0.3% with respect to the total absences (in 2011 it amounted to 3.4% absenteeism) and by 0.2% for an absence of less than one year (2.7% in 2011). At Wageningen University both short- and total absence increased by 0.1% to point to respectively 2.8% and 3.6%. This raises the absenteeism at WU fractionally higher than the DLO, for the first time in years. However, it is still well below the prescribed limit. ABSENCE DUE TO ILLNESS, excluding maternity leave 2009 2010 2011
Average duration of absence (calendar days) 13.03 13.98 15.52
Absence frequency (number of reports sick divided by the average number of
staff)
1.10 1.01 1.02
Percentage of staff without absenteeism due to illness 45.38 49.42 47.92
Number of individual instances of sick leave 6.941 6.407 6.406
Rate of absenteeism rate by age category
< 25 years 1.3 1.4 1.2
25 - 34 years 2.23 2.75 2.64
35 - 44 years 3.31 3.49 3.31
45 - 54 years 3.48 3.78 3.92
55 years and older 4.61 5.01 4.47
Rate of absenteeism by job grade
job grade 1 - 6 6.38 6.91 6.62
job grade 7 - 9 4.06 4.16 4.17
job grade 10 - 11 2.66 3.37 3.19
job grade 12 3.05 3.71 3.55
job grade 13 - 14 2.21 1.66 2.14
job grade 15 and above 2.08 1.91 1.72
PhD 2.05 2.76 2.36
0.0
1.0
2.0
3.0
4.0
5.0
2009 2010 2011
Absence due to illness per year, excluding maternity leave
Including absence > 1 year Excluding absence > 1 year
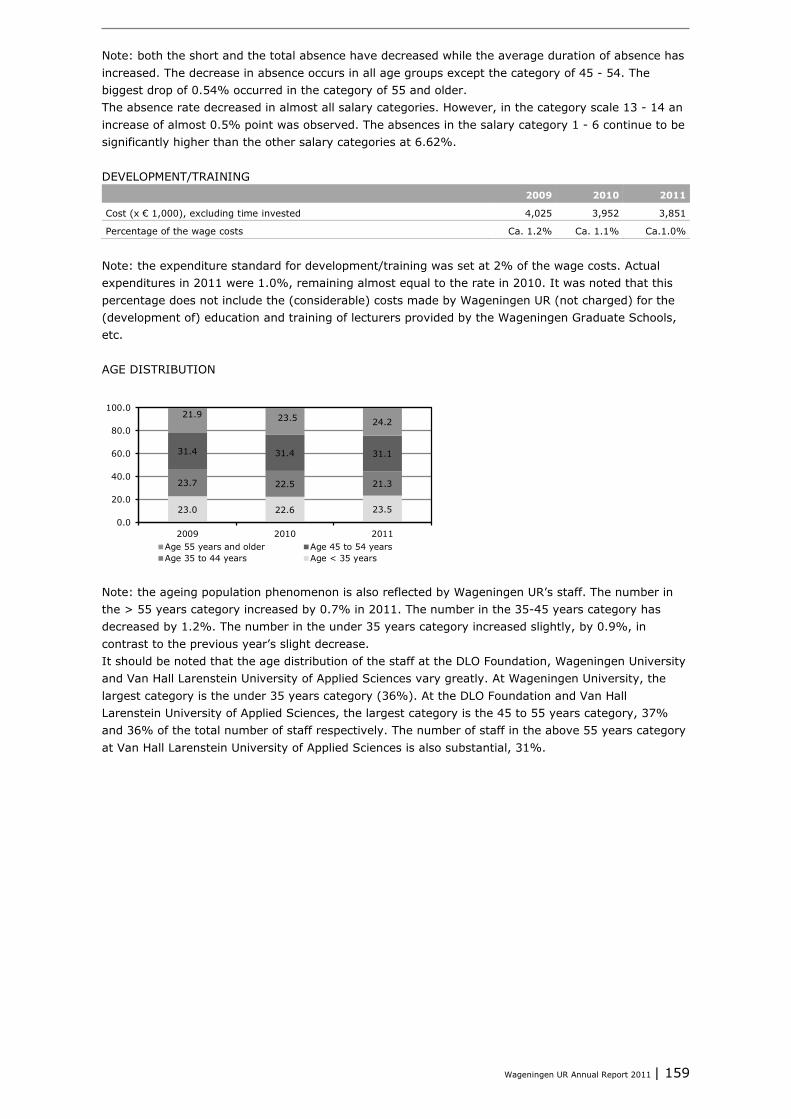
Wageningen UR Annual Report 2011 | 159
Note: both the short and the total absence have decreased while the average duration of absence has increased. The decrease in absence occurs in all age groups except the category of 45 - 54. The biggest drop of 0.54% occurred in the category of 55 and older. The absence rate decreased in almost all salary categories. However, in the category scale 13 - 14 an increase of almost 0.5% point was observed. The absences in the salary category 1 - 6 continue to be significantly higher than the other salary categories at 6.62%. DEVELOPMENT/TRAINING 2009 2010 2011
Cost (x € 1,000), excluding time invested 4,025 3,952 3,851
Percentage of the wage costs Ca. 1.2% Ca. 1.1% Ca.1.0%
Note: the expenditure standard for development/training was set at 2% of the wage costs. Actual expenditures in 2011 were 1.0%, remaining almost equal to the rate in 2010. It was noted that this percentage does not include the (considerable) costs made by Wageningen UR (not charged) for the (development of) education and training of lecturers provided by the Wageningen Graduate Schools, etc. AGE DISTRIBUTION
Note: the ageing population phenomenon is also reflected by Wageningen UR’s staff. The number in the > 55 years category increased by 0.7% in 2011. The number in the 35-45 years category has decreased by 1.2%. The number in the under 35 years category increased slightly, by 0.9%, in contrast to the previous year’s slight decrease. It should be noted that the age distribution of the staff at the DLO Foundation, Wageningen University and Van Hall Larenstein University of Applied Sciences vary greatly. At Wageningen University, the largest category is the under 35 years category (36%). At the DLO Foundation and Van Hall Larenstein University of Applied Sciences, the largest category is the 45 to 55 years category, 37% and 36% of the total number of staff respectively. The number of staff in the above 55 years category at Van Hall Larenstein University of Applied Sciences is also substantial, 31%.
23.0 22.6 23.5
23.7 22.5 21.3
31.4 31.4 31.1
21.9 23.5 24.2
0.0
20.0
40.0
60.0
80.0
100.0
2009 2010 2011Age 55 years and older Age 45 to 54 yearsAge 35 to 44 years Age < 35 years
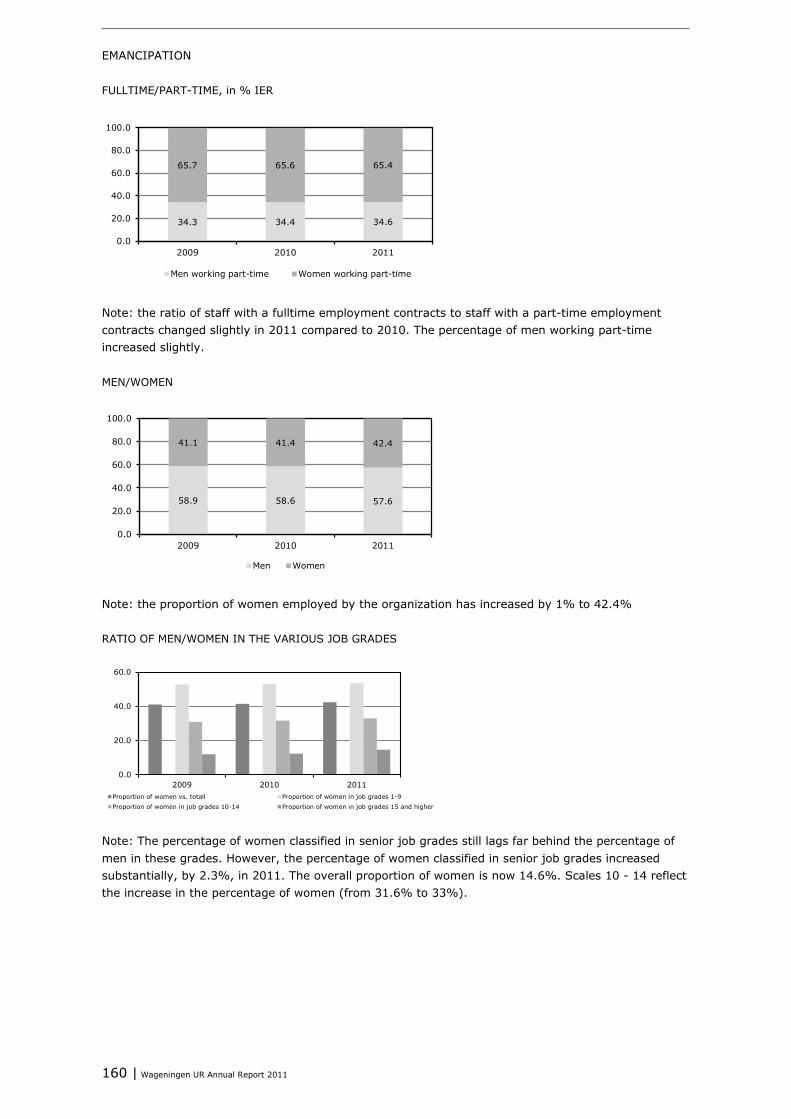
160 | Wageningen UR Annual Report 2011
EMANCIPATION FULLTIME/PART-TIME, in % IER
Note: the ratio of staff with a fulltime employment contracts to staff with a part-time employment contracts changed slightly in 2011 compared to 2010. The percentage of men working part-time increased slightly. MEN/WOMEN
Note: the proportion of women employed by the organization has increased by 1% to 42.4% RATIO OF MEN/WOMEN IN THE VARIOUS JOB GRADES
Note: The percentage of women classified in senior job grades still lags far behind the percentage of men in these grades. However, the percentage of women classified in senior job grades increased substantially, by 2.3%, in 2011. The overall proportion of women is now 14.6%. Scales 10 - 14 reflect the increase in the percentage of women (from 31.6% to 33%).
34.3 34.4 34.6
65.7 65.6 65.4
0.0
20.0
40.0
60.0
80.0
100.0
2009 2010 2011
Men working part-time Women working part-time
58.9 58.6 57.6
41.1 41.4 42.4
0.0
20.0
40.0
60.0
80.0
100.0
2009 2010 2011
Men Women
0.0
20.0
40.0
60.0
2009 2010 2011Proportion of women vs. totall Proportion of women in job grades 1-9Proportion of women in job grades 10-14 Proportion of women in job grades 15 and higher
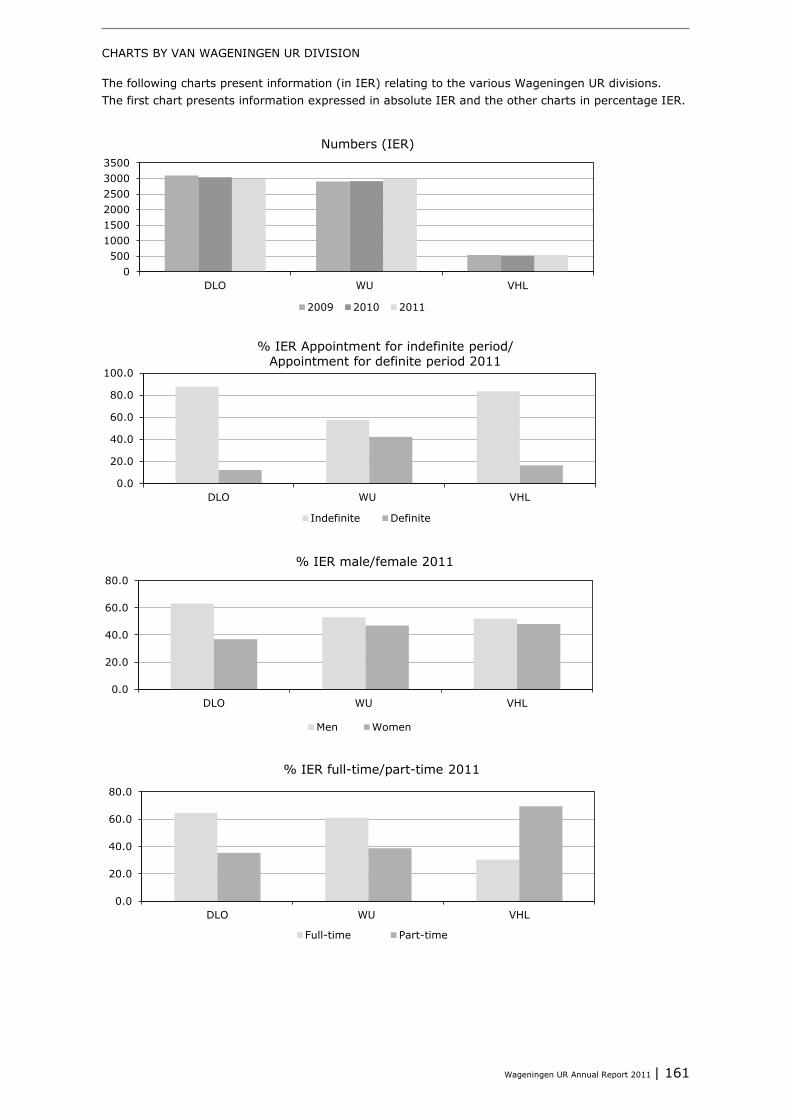
Wageningen UR Annual Report 2011 | 161
CHARTS BY VAN WAGENINGEN UR DIVISION The following charts present information (in IER) relating to the various Wageningen UR divisions. The first chart presents information expressed in absolute IER and the other charts in percentage IER.
0500
100015002000250030003500
DLO WU VHL
Numbers (IER)
2009 2010 2011
0.0
20.0
40.0
60.0
80.0
100.0
DLO WU VHL
% IER Appointment for indefinite period/Appointment for definite period 2011
Indefinite Definite
0.0
20.0
40.0
60.0
80.0
DLO WU VHL
% IER male/female 2011
Men Women
0.0
20.0
40.0
60.0
80.0
DLO WU VHL
% IER full-time/part-time 2011
Full-time Part-time
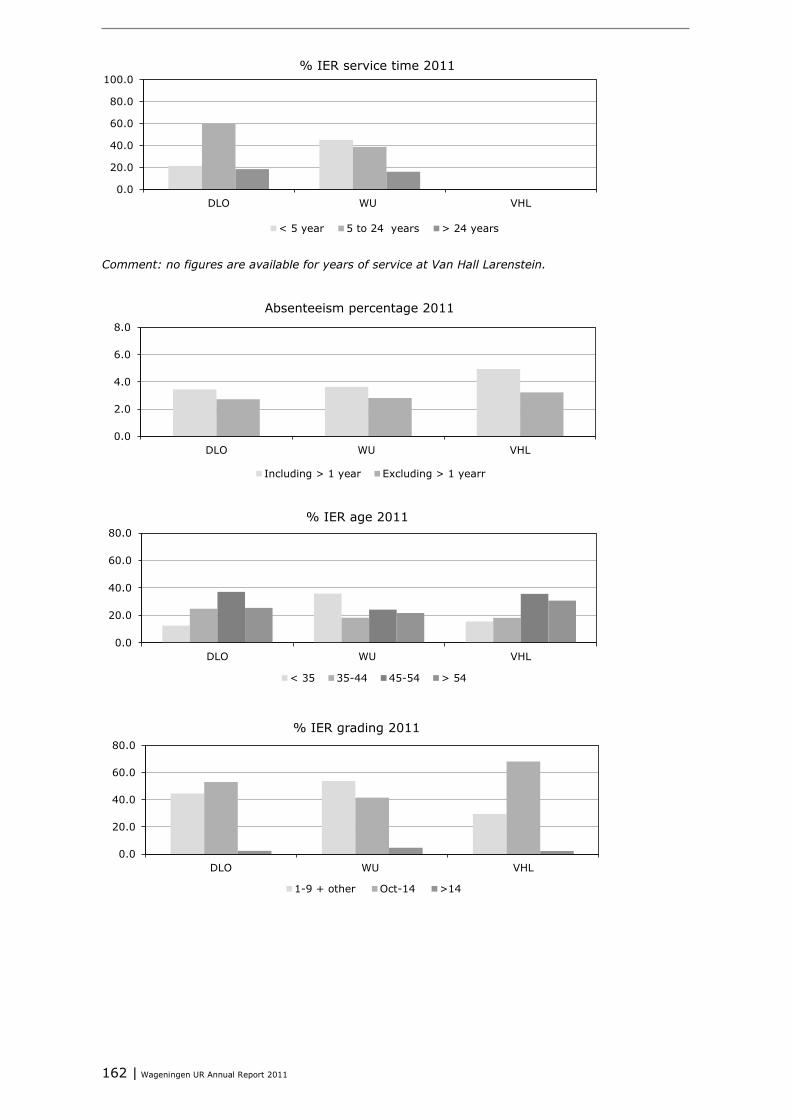
162 | Wageningen UR Annual Report 2011
Comment: no figures are available for years of service at Van Hall Larenstein.
0.0
20.0
40.0
60.0
80.0
100.0
DLO WU VHL
% IER service time 2011
< 5 year 5 to 24 years > 24 years
0.0
2.0
4.0
6.0
8.0
DLO WU VHL
Absenteeism percentage 2011
Including > 1 year Excluding > 1 yearr
0.0
20.0
40.0
60.0
80.0
DLO WU VHL
% IER age 2011
< 35 35-44 45-54 > 54
0.0
20.0
40.0
60.0
80.0
DLO WU VHL
% IER grading 2011
1-9 + other Oct-14 >14
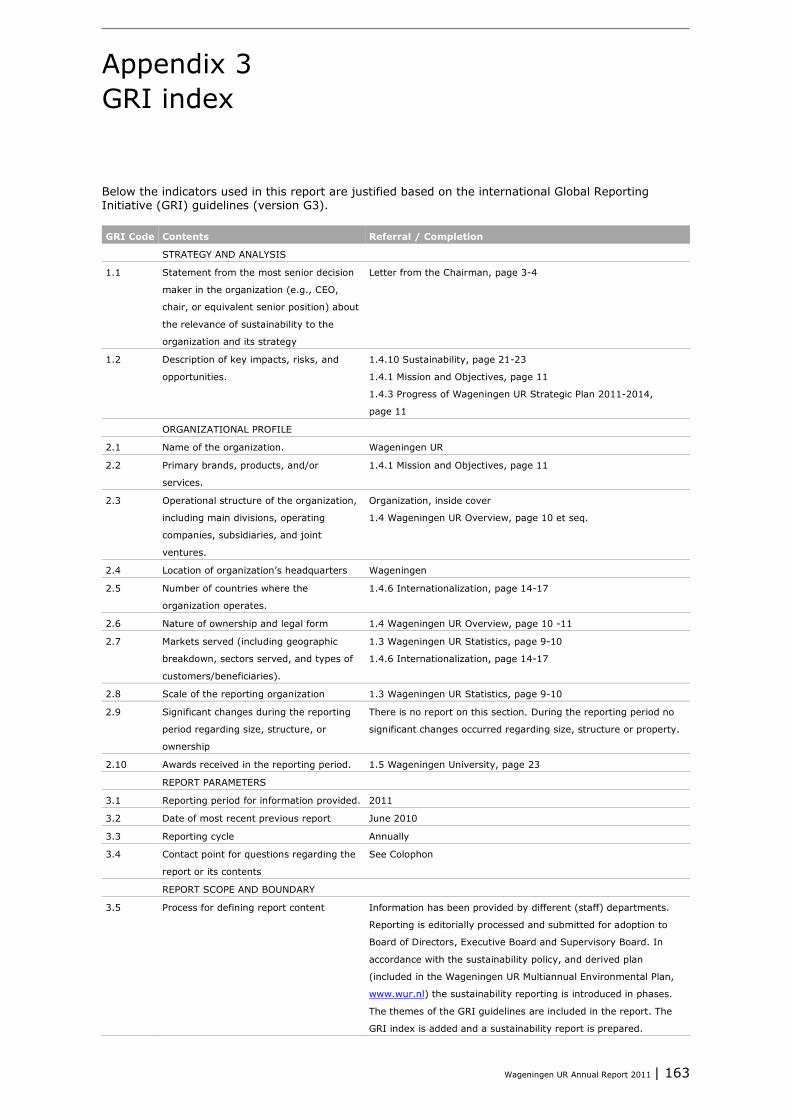
Wageningen UR Annual Report 2011 | 163
Appendix 3 GRI index
Below the indicators used in this report are justified based on the international Global Reporting Initiative (GRI) guidelines (version G3). GRI Code Contents Referral / Completion
STRATEGY AND ANALYSIS
1.1 Statement from the most senior decision
maker in the organization (e.g., CEO,
chair, or equivalent senior position) about
the relevance of sustainability to the
organization and its strategy
Letter from the Chairman, page 3-4
1.2 Description of key impacts, risks, and
opportunities.
1.4.10 Sustainability, page 21-23
1.4.1 Mission and Objectives, page 11
1.4.3 Progress of Wageningen UR Strategic Plan 2011-2014,
page 11
ORGANIZATIONAL PROFILE
2.1 Name of the organization. Wageningen UR
2.2 Primary brands, products, and/or
services.
1.4.1 Mission and Objectives, page 11
2.3 Operational structure of the organization,
including main divisions, operating
companies, subsidiaries, and joint
ventures.
Organization, inside cover
1.4 Wageningen UR Overview, page 10 et seq.
2.4 Location of organization’s headquarters Wageningen
2.5 Number of countries where the
organization operates.
1.4.6 Internationalization, page 14-17
2.6 Nature of ownership and legal form 1.4 Wageningen UR Overview, page 10 -11
2.7 Markets served (including geographic
breakdown, sectors served, and types of
customers/beneficiaries).
1.3 Wageningen UR Statistics, page 9-10
1.4.6 Internationalization, page 14-17
2.8 Scale of the reporting organization 1.3 Wageningen UR Statistics, page 9-10
2.9 Significant changes during the reporting
period regarding size, structure, or
ownership
There is no report on this section. During the reporting period no
significant changes occurred regarding size, structure or property.
2.10 Awards received in the reporting period. 1.5 Wageningen University, page 23
REPORT PARAMETERS
3.1 Reporting period for information provided. 2011
3.2 Date of most recent previous report June 2010
3.3 Reporting cycle Annually
3.4 Contact point for questions regarding the
report or its contents
See Colophon
REPORT SCOPE AND BOUNDARY
3.5 Process for defining report content Information has been provided by different (staff) departments.
Reporting is editorially processed and submitted for adoption to
Board of Directors, Executive Board and Supervisory Board. In
accordance with the sustainability policy, and derived plan
(included in the Wageningen UR Multiannual Environmental Plan,
www.wur.nl) the sustainability reporting is introduced in phases.
The themes of the GRI guidelines are included in the report. The
GRI index is added and a sustainability report is prepared.
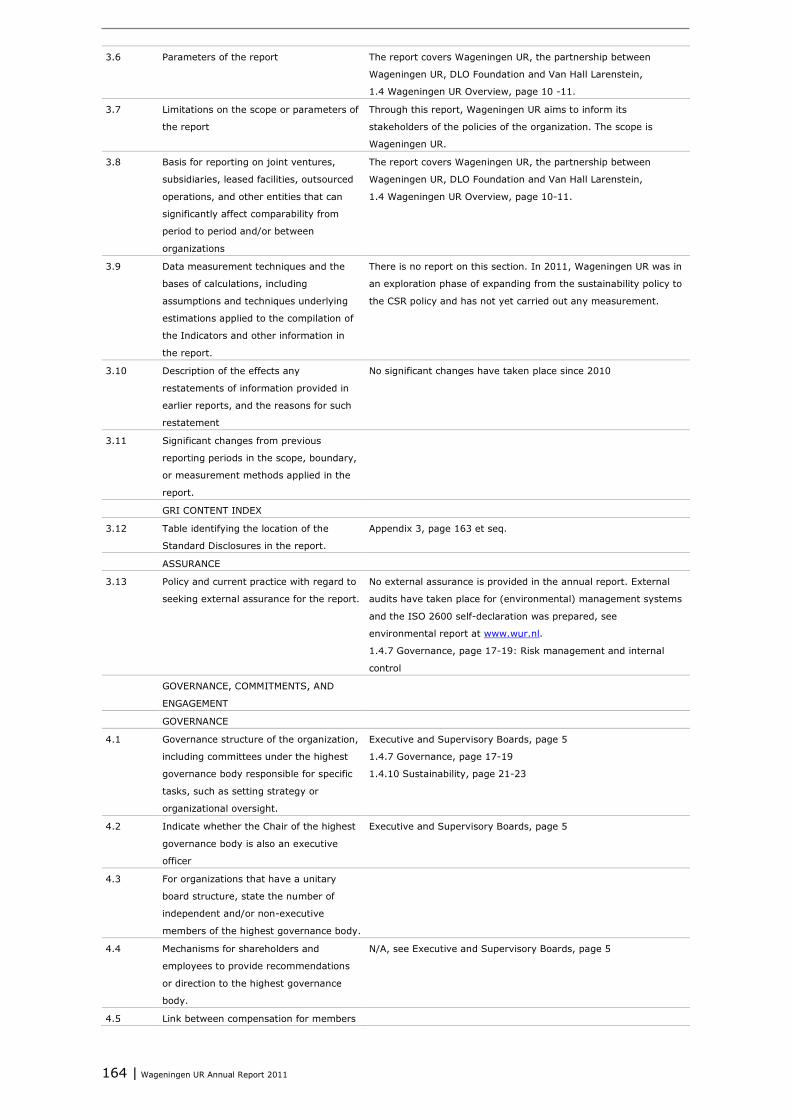
164 | Wageningen UR Annual Report 2011
3.6 Parameters of the report The report covers Wageningen UR, the partnership between
Wageningen UR, DLO Foundation and Van Hall Larenstein,
1.4 Wageningen UR Overview, page 10 -11.
3.7 Limitations on the scope or parameters of
the report
Through this report, Wageningen UR aims to inform its
stakeholders of the policies of the organization. The scope is
Wageningen UR.
3.8 Basis for reporting on joint ventures,
subsidiaries, leased facilities, outsourced
operations, and other entities that can
significantly affect comparability from
period to period and/or between
organizations
The report covers Wageningen UR, the partnership between
Wageningen UR, DLO Foundation and Van Hall Larenstein,
1.4 Wageningen UR Overview, page 10-11.
3.9
Data measurement techniques and the
bases of calculations, including
assumptions and techniques underlying
estimations applied to the compilation of
the Indicators and other information in
the report.
There is no report on this section. In 2011, Wageningen UR was in
an exploration phase of expanding from the sustainability policy to
the CSR policy and has not yet carried out any measurement.
3.10 Description of the effects any
restatements of information provided in
earlier reports, and the reasons for such
restatement
No significant changes have taken place since 2010
3.11 Significant changes from previous
reporting periods in the scope, boundary,
or measurement methods applied in the
report.
GRI CONTENT INDEX
3.12 Table identifying the location of the
Standard Disclosures in the report.
Appendix 3, page 163 et seq.
ASSURANCE
3.13 Policy and current practice with regard to
seeking external assurance for the report.
No external assurance is provided in the annual report. External
audits have taken place for (environmental) management systems
and the ISO 2600 self-declaration was prepared, see
environmental report at www.wur.nl.
1.4.7 Governance, page 17-19: Risk management and internal
control
GOVERNANCE, COMMITMENTS, AND
ENGAGEMENT
GOVERNANCE
4.1 Governance structure of the organization,
including committees under the highest
governance body responsible for specific
tasks, such as setting strategy or
organizational oversight.
Executive and Supervisory Boards, page 5
1.4.7 Governance, page 17-19
1.4.10 Sustainability, page 21-23
4.2 Indicate whether the Chair of the highest
governance body is also an executive
officer
Executive and Supervisory Boards, page 5
4.3 For organizations that have a unitary
board structure, state the number of
independent and/or non-executive
members of the highest governance body.
4.4 Mechanisms for shareholders and
employees to provide recommendations
or direction to the highest governance
body.
N/A, see Executive and Supervisory Boards, page 5
4.5 Link between compensation for members
Wageningen UR Annual Report 2011 | 165
of the highest governance body, senior
managers, and executives, and the
organization’s performance.
4.6 Processes in place to ensure conflicts of
interest are avoided for the highest
governance body.
1.4.7 Governance, p. 17-19, www.wur.nl/NL/over/governance
4.8 1.4.9 Grievance Regulations, and Appeals
and Objections (DLO, VHL, WU), page 21-
23
4.9 Procedures of the highest governance
body for overseeing the organization’s
identification and management of
economic, environmental, and social
performance, including relevant risks and
opportunities, and adherence or
compliance with internationally agreed
standards, codes of conduct, and
principles.
For Wageningen UR, the Dutch Corporate Governance
Code (adopted on 09/12/2003) is relevant. For the principles of
this code together with those of the HBO Sector Code of
Governance (02/02/2006) and the Code of Good University
Directors 2007 (2/12/2007) included in the Corporate governance
structure of Wageningen UR, see www.wur.nl.
The following policies and procedures are observed in relation to
human rights:
- Corporate Governance
- Wageningen Academic Integrity
- Wageningen UR Integrity Code.
- There are protocols to deal with complaints regarding undesirable
behavior as well as a whistleblower regulation.
Regarding 'fair dealing', the following policy or.
procedures are observed:
- Collective Labour Agreement (Universities/DLO): Art. 1.14/3.5
(Ancillary Activities) and 1.15/3.6 (Personal Benefit).
-Implementation of Ancillary Activities.
-Section 3 in the Collective Labour Agreement regarding patent
and copyright collective.
- Regulations regarding patents and findings
- Sustainable procurement, Wageningen UR
4.10 Processes for evaluating the highest
governance body’s own performance,
particularly with respect to economic,
environmental, and social performance.
4.7 Process for determining the qualifications
and expertise of the members of the
highest governance body for guiding the
organization’s strategy on economic,
environmental, and social topics.
Executive and Supervisory Boards, page 5
COMMITMENTS TO EXTERNAL
INITIATIVES
4.11
Explanation of whether and how the
precautionary principle is addressed by
the organization.
1.4.7 Governance, page 17-19, also see 4.6-4.10
4.12 Externally developed economic,
environmental, and social charters,
principles, or other initiatives to which the
organization subscribes or endorses.
4.13 Memberships in associations and/or
national/international advocacy
organizations.
1.4.4 Knowledge Circulation and Valorisation, page 12-13
1.4.6 Internationalization, page 14-17
STAKEHOLDER ENGAGEMENT
4.14
4.15
List of stakeholder groups engaged by the
organization.
Basis for identification and selection of
stakeholders to engage.
1.4 Wageningen UR Overview, page 11 et seq., including
1.4.10 Sustainability, page 21-23
ECONOMIC PERFORMANCE INDICATORS
EC1 Direct economic value generated and
distributed, including revenues, operating
costs, employee compensation, donations
1.3 Wageningen UR Statistics, page 9-10
3.1 Wageningen University Financial Report, page 48 et seq.
3.2 Van Hall Larenstein University of Applied Sciences Financial
166 | Wageningen UR Annual Report 2011
and other community investments,
retained earnings, and payments to
capital providers and governments.
Report, page 76 et seq.
3.3 DLO Research Foundation Financial Report, page 107 et seq.
EC2 Financial implications and other risks and
opportunities for the organization’s
activities due to climate change.
3.1.1 Financial Statement, Strategic Building Plan, page 48 and
page 57-58
1.8.1 Housing, page 41-42
Ambition translated into action, GreenCalc index for new
construction and reconstruction, see EC6.
3.3 DLO Research Foundation Financial Report, page 124-125: Off-
balance sheet commitments and rights to wind farms.
1.4.10 Sustainability, page 21-23, including the Wageningen
Campus’ purchase of 100% renewable, 100% self generated
electricity, purchase of Guarantees of Origin, CO2 compensation,
work in environmental assessment and sustainability Taskforce
2011, see www.wur.nl.
EC3 Coverage of the organization’s defined
benefit plan obligations.
3.1 Wageningen University Financial Report, page 48 et seq.
(specifically page 55-58)
3.2 Van Hall Larenstein University of Applied Sciences Financial
Report, page 76 et seq. (specifically page 88)
3.3 DLO Research Foundation Financial Report, page 107 et seq.
(specifically page 115).
EC4 Significant financial assistance received
from government.
1.3 Wageningen UR Statistics, page 9-10
3 Annual Financial Report, page 48 et seq.
EC6
EC8
Policy, practices, and proportion of
spending on locally-based suppliers at
significant operation locations.
Development and impact of infrastructure
investments and services provided
primarily for public benefit through
commercial, in-kind, or pro bono
engagements.
1.4.10 Sustainability, page 21-23, including responsible supply
chain management and 100% sustainable procurement. The
sustainability policy is expressed as ambition 'to stay ahead’. This
policy is implemented according to the 'Express to a more
sustainable business' plan, see Environmental Long-Range Plan.
Sustainability Actions including the GreenCalc index and (local)
suppliers are described in the plan.
Results are expressed in the 2011 Evaluation Sustainability Task
Force, included in the environmental report, see www.wur.nl.
EC7 Procedures for local hiring and proportion
of senior management hired from the
local community at significant operation
locations.
2.1 HR in Strategic Planning, page 44-45
ENVIRONMENTAL PERFORMANCE
INDICATORS
EN1-EN30 1.4.10 Sustainability, page 21-23
1.8.4 Safety and the Environment, page 43-44
All environmental results achieved in 2011, sorted by the various
environmental performance indicators, are outlined in the
Environmental Report 2011. The 2011 Sustainability Task Force is
included in the environmental assessment, see www.wur.nl.
Included are the realization of multiyear agreement objectives for
(processing) waste, energy use and generation, energy (2%
energy (program), energy efficiency, renewable energy, chain
reduction, energy management system), water consumption, the
use hazardous substances, and the exported CO2 footprint
(including the understanding of spills, biodiversity, soils, the direct
and indirect emission of hazardous gases) and CO2 footprint
offsets (validation initiatives to offset CO2 emissions)
LABOR PRACTICES AND GOOD WORK
PERFORMANCE INDICATORS
LA1 Total workforce by employment type,
employment contract, and region.
1.3 Wageningen UR Statistics, page 9-10
Appendix 1A/B, page 145 et seq.
Wageningen UR Annual Report 2011 | 167
Appendix 2 Annual Social Report, page 157 et seq.
LA2 Total number and rate of employee
turnover by age group, gender, and
region.
Appendix 2 Annual Social Report, page 157 et seq.
LA4
LA5
Percentage of employees covered by
collective bargaining agreements.
Minimum notice period(s) regarding
operational changes, including whether it
is specified in collective agreements.
2.2 Developments in Collective Labour Agreements, page 45
LA7 Rates of injury, occupational diseases,
lost days, and absenteeism, and number
of work related fatalities by region.
2.3.2 Sickness Absence Monitoring, page 46
Appendix 2 Annual Social Report, page 157 (specific pages 158-
159, 162)
LA8 Education, training, counseling,
prevention, and risk-control programs in
place to assist workforce members, their
families, or community members
regarding serious diseases.
1.8.4 Safety and the Environment, page 43-44
2.3.1 Healthy Lifestyles and Absenteeism Due to Ill Health,
pages 45
2.3.3 Corporate Social Work, page 46
2.3.5 Preventive Medical Research and Risk Assessment and
Evaluation, page 46
LA11 Programs for skills management and
lifelong learning that support the
continued employability of employees and
assist them in end of career
management.
1.4.4 Knowledge Circulation and Valorisation, page 12-13
Appendix 2 Annual Social Report, page 157 (specific page 159)
LA14 Ratio of basic salary of men to women by
employee category.
Appendix 2 Annual Social Report, page 157 et seq.
HUMAN RIGHTS PERFORMANCE
INDICATORS
HR1-7 For Wageningen UR, the Dutch Corporate Governance
Code (adopted on 09/12/2003) is relevant. For the principles of
this code together with those of the HBO Sector Code of
Governance (02/02/2006) and the Code of Good University
Directors 2007 (2/12/2007) included in the Corporate governance
structure of Wageningen UR, see www.wur.nl.
The following policies and procedures are observed in relation to
human rights:
- Corporate Governance
- Wageningen Academic Integrity
- Wageningen UR Integrity Code.
- There are protocols for dealing with complaints regarding
undesirable behavior as well as a whistleblower regulation.
Regarding 'fair dealing', the following policies or procedures are
observed:
- Collective Labour Agreement (Universities/DLO): Art. 1.14/3.5
(Ancillary Activities) and 1.15/3.6 (Personal Benefit).
-Implementation of Ancillary Activities.
-Section 3 in the Collective Labour Agreement regarding patent
and copyright collective.
- Regulations regarding patents and findings
- Sustainable Procurement, Wageningen UR
HR4 Total number of incidents of
discrimination and actions taken.
2.3.4 Wageningen UR Confidential Counsellors
SOCIETY PERFORMANCE INDICATORS For Wageningen UR, the Dutch Corporate Governance
Code (adopted on 09/12/2003) is relevant. For the principles of
this code together with those of the HBO Sector Code of
Governance (02/02/2006) and the Code of Good University
Directors 2007 (2/12/2007) included in the Corporate governance
structure of Wageningen UR, see www.wur.nl.
168 | Wageningen UR Annual Report 2011
The following policies and procedures are observed in relation to
human rights:
- Corporate Governance
- Wageningen Academic Integrity
- Wageningen UR Integrity Code.
- There are protocols for dealing with complaints regarding
undesirable behavior as well as a whistleblower regulation.
Regarding 'fair dealing', the following policies or procedures are
observed:
- Collective Labour Agreement (Universities/DLO): Art. 1.14/3.5
(Ancillary Activities) and 1.15/3.6 (Personal Benefit).
-Implementation of Ancillary Activities.
-Section 3 in the Collective Labour Agreement regarding patent
and copyright collective.
- Regulations regarding patents and findings
- Sustainable Procurement, Wageningen UR
SO1 Nature, scope, and effectiveness of any
programs and practices that assess and
manage the impact of operations on
communities, including entrance,
operation, and exit.
1.4.10 Sustainability, page 21-23
SO4 Actions taken in response to incidents of
corruption.
- Corporate Governance, www.wur.nl/NL/over/governance
- Wageningen Academic Integrity
- Wageningen UR Integrity Code.
- Collective Labour Agreement (universities / DLO): Art. 1.14 / 3.5
(Ancillary Activities) and 1.15/3.6 (Personal Benefit).
-Implementation Ancillary Activities.
SO5 Public policy positions and participation in
public policy development and lobbying.
Letter from the Chairman, page 3-4
1.4.1 Mission and Objectives, page 11
1.4.4 Knowledge Circulation and Valorization, page 12-13
1.4.7 Governance, page 17-19
PRODUCT RESPONSIBILITY
PERFORMANCE INDICATORS
PR5
Practices related to customer satisfaction,
including results of surveys measuring
customer satisfaction.
1.5.1.2 Internal and External Quality Control (WU), page 24-25
1.6.1.2 Internal and External Quality Control (VHL), page 33-34
1.7.1.2 Internal and External Quality Control (DLO), page 41
In addition to the 2011 Wageningen UR Annual Report, a sustainability report has been prepared.
AnimalSciences
EnvironmentalSciences
Wageningen University
Alterra Plant ResearchInternational
LEICentre for
DevelopmentInnovation
Specialised Research Institutes
Food &
Biobased Research
Livestock ResearchCentral
VeterinaryInstitute
Concern Staff Facilties and Services
Agrotechnology& Food Sciences
Group
AnimalSciencesGroup
EnvironmentalSciencesGroup
PlantSciencesGroup
SocialSciencesGroup
Van Hall LarensteinUniversity of
Applied Sciences
IMARES
WageningenBusiness School
RIKILT
WageningenInternational
Agrotechnology& Food
Sciences
PlantSciences
SocialSciences
AppliedPlant Research
Supervisory Board
Executive Board
Leeuwarden Velp
Wageningen
Colophon publisherWageningen UR, June 2012www.wur.nl
editorsWorking Group Annual Report Wageningen UR
final editingWageningen UR, Communication Services
design and lay-outWageningen UR, Communication Services
photographyGuy Ackermans
printMediaCenter, Rotterdam
12283_BC_omslag_jaarverslag EN V 29-05-2012.indd 4,6 31/05/2012 10:51:52
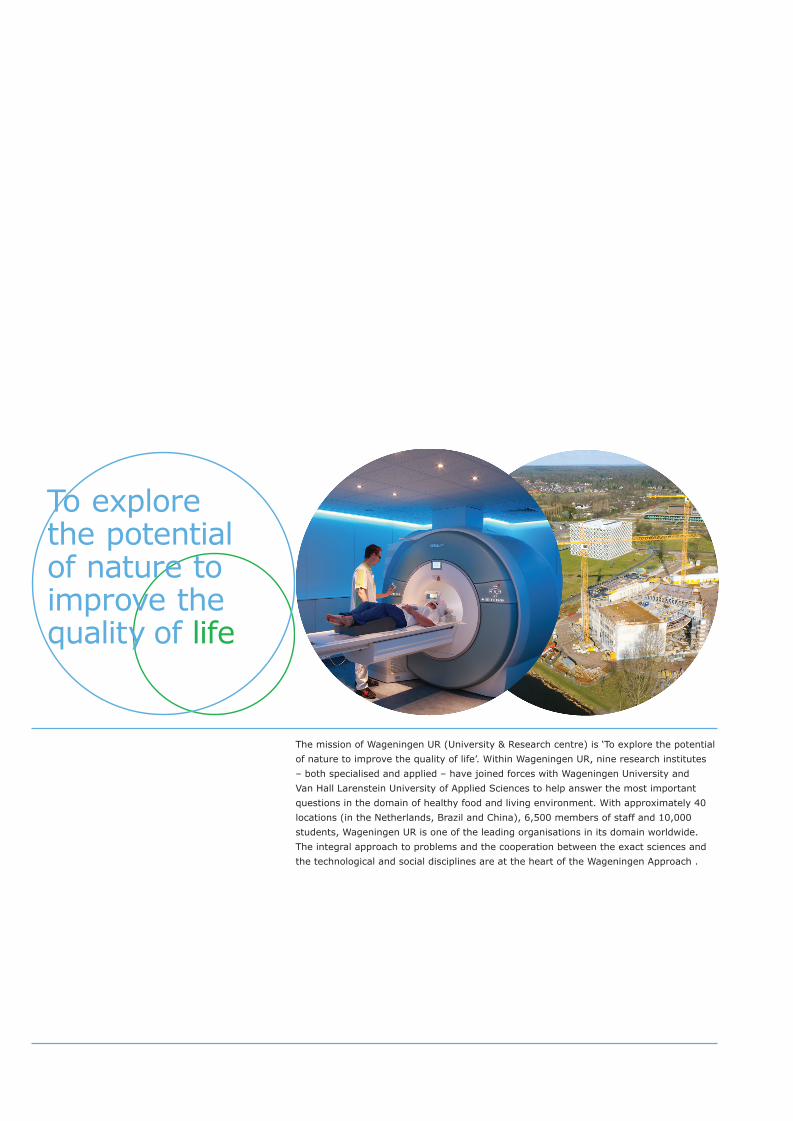
The mission of Wageningen UR (University & Research centre) is ‘To explore the potential of nature to improve the quality of life’. Within Wageningen UR, nine research institutes – both specialised and applied – have joined forces with Wageningen University and Van Hall Larenstein University of Applied Sciences to help answer the most important questions in the domain of healthy food and living environment. With approximately 40 locations (in the Netherlands, Brazil and China), 6,500 members of staff and 10,000 students, Wageningen UR is one of the leading organisations in its domain worldwide. The integral approach to problems and the cooperation between the exact sciences and the technological and social disciplines are at the heart of the Wageningen Approach .
Annual report 2011 W
ageningen UR
Annual report Wageningen UR
2011
12283_BC_omslag_jaarverslag EN V 29-05-2012.indd 1,3 31/05/2012 10:51:51