AnnuAl RepoRt 2011 - GBL annuel GBL 2011_EN.pdf · Ce rapport finacier annuel est aussi disponible...
180
ANNUAL REPORT 2011 Groupe Bruxelles Lambert
Transcript of AnnuAl RepoRt 2011 - GBL annuel GBL 2011_EN.pdf · Ce rapport finacier annuel est aussi disponible...
AnnuAl RepoRt 2011 Groupe Bruxelles Lambert


GBL’s primary objective is to create value for its shareholders. GBL strives to develop a portfolio of investments focusing on a small number of industrial companies that are leader on their markets, in which it can play its role as a long-term professional shareholder.This portfolio is meant to evolve over time depending on the companies’ development and market opportunities. GBL invests and disinvests according to its objectives of value creation and of maintaining a solid financial structure.
GBL’s dividend policy seeks to achieve a sound balance between providing an attractive cash yield to shareholders and achieving sustained growth in its share price.
Groupe Bruxelles Lambert
2 AnnuAl RepoRt 2011
1 Responsibility for the document
2 Declaration of the persons responsible for the financial statements and for the management report
3 Statutory Auditor
Responsible persons
Baron Frère CEO and Managing Director
Ian Gallienne, Managing Director
Gérard Lamarche, Managing Director
Baron Frère, Ian Gallienne and Gérard Lamarche, the Executive Management, and Olivier Pirotte, Chief Financial Officer, certify in the name and on behalf of GBL, that to the best of their knowledge:
• the financial statements as of 31 December 2011 contained in this annual report were drawn up in accordance with applicable accounting standards (IFRS or Belgian accounting legislation) and give a fair and true view of the assets as defined by IAS/IFRS, the financial position and results of GBL and of its consolidated companies (1);
• the management report presented in the annual report presents a true picture of the evolution of the activities, results and position of GBL and of its consolidated companies (1), and contains a description of the main risks and uncertainties with which they are confronted.
Deloitte Bedrijfsrevisoren/ Reviseurs d’Entreprises BV o.v.v.e. CVBA / SC s.f.d. SCRLRepresented by Michel DenayerBerkenlaan 8bB – 1831 Diegem
(1) “Consolidated companies” are GBL’s subsidiaries within the meaning of Article 6 of the Company Code. See list of subsidiaries on page 80 of the annual report
AnnuAl RepoRt 2011 3
Annual Report 2011
Message to shareholders ................................................................................................................................................... 4
Stock Exchange data ............................................................................................................................................................. 6GBL’s share on the Stock Exchange ................................................................................................................................. 6Stock market listings ................................................................................................................................................................ 6Shareholder information ......................................................................................................................................................... 8
Portfolio and adjusted net assets ............................................................................................................................... 9
Consolidated figures IFRS .............................................................................................................................................. 14
Overview of the activities ................................................................................................................................................ 21Total ............................................................................................................................................................................................... 22GDF SUEZ ................................................................................................................................................................................... 28Pernod Ricard ........................................................................................................................................................................... 34Lafarge ......................................................................................................................................................................................... 40Imerys ........................................................................................................................................................................................... 46Suez Environnement .............................................................................................................................................................. 52Arkema ........................................................................................................................................................................................ 58Other investments .................................................................................................................................................................. 64
Accounts at 31 December 2011 ................................................................................................................................. 67Consolidated financial statements .................................................................................................................................. 68Non-consolidated summary balance sheet and income statement ............................................................. 118Dividend policy ...................................................................................................................................................................... 120Historical data ........................................................................................................................................................................ 121
Corporate governance statement ......................................................................................................................... 124Board of Directors ................................................................................................................................................................ 125Board Committees ............................................................................................................................................................... 135Remuneration report .......................................................................................................................................................... 137Auditing of accounts ........................................................................................................................................................... 141Staff and organisation ........................................................................................................................................................ 141Risk management and internal control ...................................................................................................................... 143Policy on conflicts of interest .......................................................................................................................................... 147Policy relating to transactions in GBL shares .......................................................................................................... 149Shareholders .......................................................................................................................................................................... 150Corporate Social and Environmental Responsibility ............................................................................................ 153Other information relating to the Company ............................................................................................................. 154
Resolutions proposed to shareholders ............................................................................................................. 157
Appendix – Offices of Directors between 2007 and 2011 ................................................................ 158
Glossary ....................................................................................................................................................................................... 174
For further information ............................................................................................................... Inside back cover
This English version is a full translation of the French version
Ce rapport finacier annuel est aussi disponible en françaisDit jaarlijks financieel verslag is ook verkrijgbaar in het Nederlands
To obtain information on GBL, please contact:Carine DumasyTel.: +32-2-289.17.17 Fax: +32-2-289.17.37 e-mail: [email protected] www.gbl.be
4 AnnuAl RepoRt 2011
Ladies and Gentlemen,
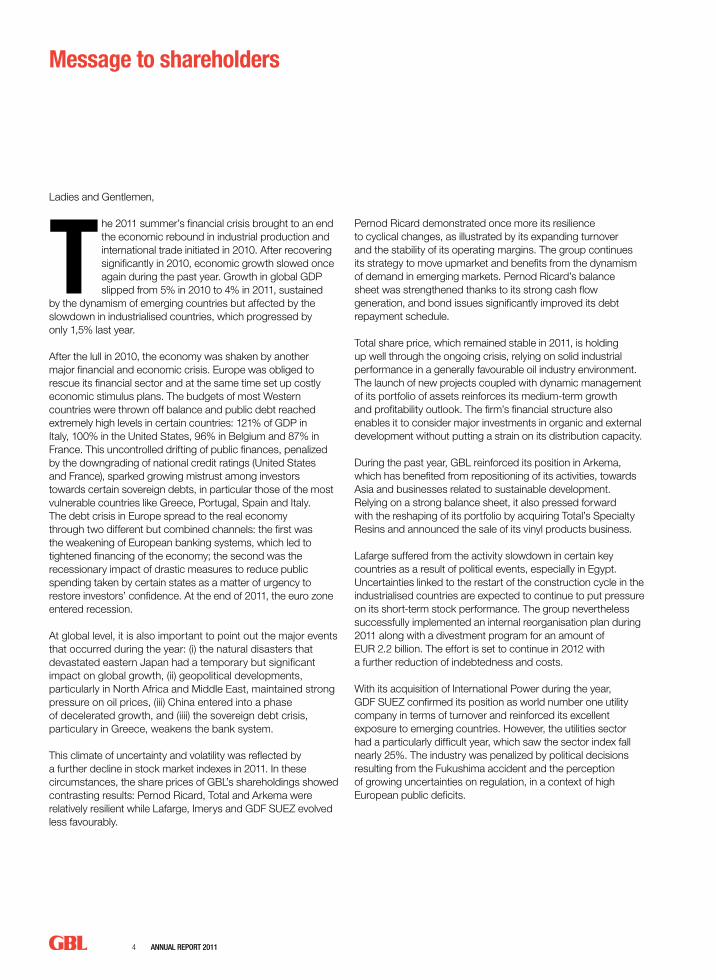
The 2011 summer’s financial crisis brought to an end the economic rebound in industrial production and international trade initiated in 2010. After recovering significantly in 2010, economic growth slowed once again during the past year. Growth in global GDP slipped from 5% in 2010 to 4% in 2011, sustained
by the dynamism of emerging countries but affected by the slowdown in industrialised countries, which progressed by only 1,5% last year.
After the lull in 2010, the economy was shaken by another major financial and economic crisis. Europe was obliged to rescue its financial sector and at the same time set up costly economic stimulus plans. The budgets of most Western countries were thrown off balance and public debt reached extremely high levels in certain countries: 121% of GDP in Italy, 100% in the United States, 96% in Belgium and 87% in France. This uncontrolled drifting of public finances, penalized by the downgrading of national credit ratings (United States and France), sparked growing mistrust among investors towards certain sovereign debts, in particular those of the most vulnerable countries like Greece, Portugal, Spain and Italy. The debt crisis in Europe spread to the real economy through two different but combined channels: the first was the weakening of European banking systems, which led to tightened financing of the economy; the second was the recessionary impact of drastic measures to reduce public spending taken by certain states as a matter of urgency to restore investors’ confidence. At the end of 2011, the euro zone entered recession.
At global level, it is also important to point out the major events that occurred during the year: (i) the natural disasters that devastated eastern Japan had a temporary but significant impact on global growth, (ii) geopolitical developments, particularly in North Africa and Middle East, maintained strong pressure on oil prices, (iii) China entered into a phase of decelerated growth, and (iiii) the sovereign debt crisis, particulary in Greece, weakens the bank system.
This climate of uncertainty and volatility was reflected by a further decline in stock market indexes in 2011. In these circumstances, the share prices of GBL’s shareholdings showed contrasting results: Pernod Ricard, Total and Arkema were relatively resilient while Lafarge, Imerys and GDF SUEZ evolved less favourably.
Pernod Ricard demonstrated once more its resilience to cyclical changes, as illustrated by its expanding turnover and the stability of its operating margins. The group continues its strategy to move upmarket and benefits from the dynamism of demand in emerging markets. Pernod Ricard’s balance sheet was strengthened thanks to its strong cash flow generation, and bond issues significantly improved its debt repayment schedule.
Total share price, which remained stable in 2011, is holding up well through the ongoing crisis, relying on solid industrial performance in a generally favourable oil industry environment. The launch of new projects coupled with dynamic management of its portfolio of assets reinforces its medium-term growth and profitability outlook. The firm’s financial structure also enables it to consider major investments in organic and external development without putting a strain on its distribution capacity.
During the past year, GBL reinforced its position in Arkema, which has benefited from repositioning of its activities, towards Asia and businesses related to sustainable development. Relying on a strong balance sheet, it also pressed forward with the reshaping of its portfolio by acquiring Total’s Specialty Resins and announced the sale of its vinyl products business.
Lafarge suffered from the activity slowdown in certain key countries as a result of political events, especially in Egypt. Uncertainties linked to the restart of the construction cycle in the industrialised countries are expected to continue to put pressure on its short-term stock performance. The group nevertheless successfully implemented an internal reorganisation plan during 2011 along with a divestment program for an amount of EUR 2.2 billion. The effort is set to continue in 2012 with a further reduction of indebtedness and costs.
With its acquisition of International Power during the year, GDF SUEZ confirmed its position as world number one utility company in terms of turnover and reinforced its excellent exposure to emerging countries. However, the utilities sector had a particularly difficult year, which saw the sector index fall nearly 25%. The industry was penalized by political decisions resulting from the Fukushima accident and the perception of growing uncertainties on regulation, in a context of high European public deficits.
Message to shareholders
AnnuAl RepoRt 2011 5
In the spring of 2011, GBL acquired an additional 25,6% stake in Imerys, achieving it majority control over this asset. Penalized on the stock market by the negative economic and market environment, Imerys nevertheless managed to play its hand well during the year by developing advantageously its portfolio of minerals – with the acquisition of Luzenac Talc group business – while seeing its performance indicators register a strong growth of more than 20%. With its resourcefulness and the quality of its positioning, this company is well placed to benefit from future growth under the lead of its new CEO.
GBL’s investment in Suez Environnement was sligthly increased to 7.2% following the payment of the dividend in shares for 2010. Notwithstanding overall robust operating performance in 2011, the company’s share price evolved unfavourably, penalized by the announcement of difficulties on a site in Melbourne, its exit from the CAC 40 index and the disappointing results of its leading competitors.
GBL is also taking forward its development in private equity by financing the new investments of its funds, and in particular of Ergon Capital Partners III in De Boeck (in Belgium) and Benito (in Spain). The group continues to base its strategy on providing support to companies with significant growth potential on their markets, backed by talented managers, while maintaining over the longer term a logic of asset rotation, thus creating value for its shareholders and providing sufficient manoeuvrability to seize new opportunities.
GBL, with its solid financial structure, a debt ratio limited to 5,7% of the stock market value of its portfolio and significant liquidity after investing more than EUR 1.2 billion (net of disposals) in 2011, is in a strong position today to benefit from potential recovery, particularly in the construction and energy industries, while maintaining its exposure to leading companies that offer high and attractive yields.
In light of GBL’s solidity and the predictability of its cash earnings (EUR 522 million in 2011), the Board of Directors will submit to the Ordinary General Meeting a proposal to increase the gross dividend per share by 2.4% to EUR 2.60.
To conclude, I would like to highlight the changes in the group’s governance, in particular the new team put in place at the start of this year.
At the end of 2011, Gérald Frère and Thierry de Rudder stepped down from their executive offices and were replaced as Managing Directors, by Gérard Lamarche and Ian Gallienne, from 1 January 2012. This transition from the old to the new team is an important stage in the life of the company, aimed at ensuring its timelessness. I trust both to continue taking forward GBL’s development, respecting the investment strategy that has been its strength, guided by the demanding criteria of profitability and growth. For my part, as you know, I will remain as CEO.
Baron Frère6 March 2012
6 AnnuAl RepoRt 2011
Stock Exchange data
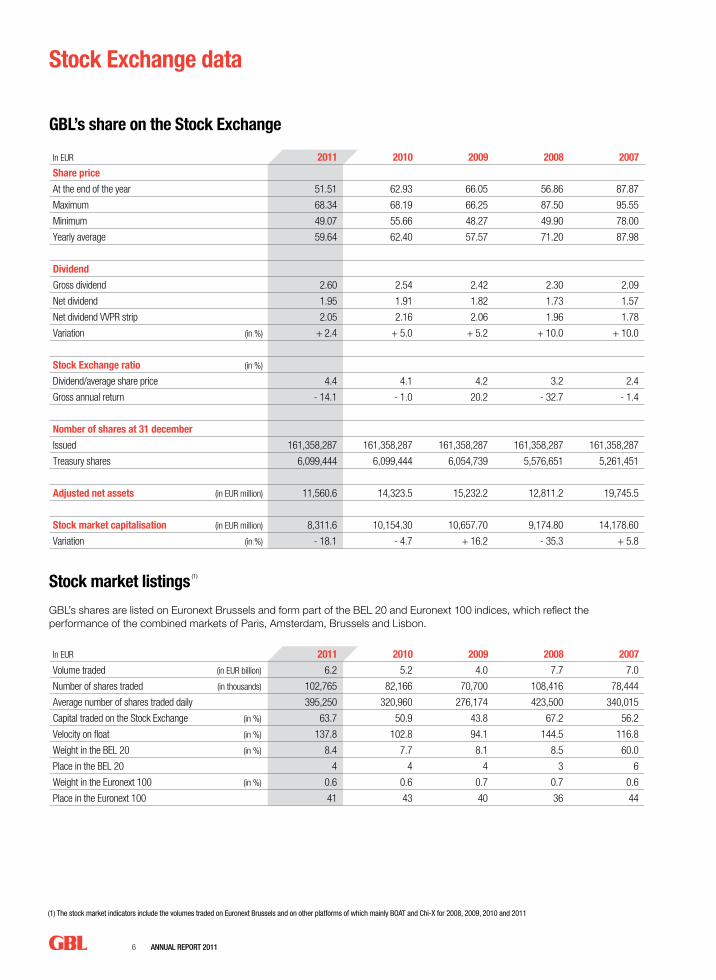
(1) The stock market indicators include the volumes traded on Euronext Brussels and on other platforms of which mainly BOAT and Chi-X for 2008, 2009, 2010 and 2011
GBL’s share on the Stock Exchange
In EUR 2011 2010 2009 2008 2007
Share price
At the end of the year 51.51 62.93 66.05 56.86 87.87
Maximum 68.34 68.19 66.25 87.50 95.55
Minimum 49.07 55.66 48.27 49.90 78.00
Yearly average 59.64 62.40 57.57 71.20 87.98
Dividend
Gross dividend 2.60 2.54 2.42 2.30 2.09
Net dividend 1.95 1.91 1.82 1.73 1.57
Net dividend VVPR strip 2.05 2.16 2.06 1.96 1.78
Variation (in %) + 2.4 + 5.0 + 5.2 + 10.0 + 10.0
Stock Exchange ratio (in %)
Dividend/average share price 4.4 4.1 4.2 3.2 2.4
Gross annual return - 14.1 - 1.0 20.2 - 32.7 - 1.4
Nomber of shares at 31 december
Issued 161,358,287 161,358,287 161,358,287 161,358,287 161,358,287
Treasury shares 6,099,444 6,099,444 6,054,739 5,576,651 5,261,451
Adjusted net assets (in EUR million) 11,560.6 14,323.5 15,232.2 12,811.2 19,745.5
Stock market capitalisation (in EUR million) 8,311.6 10,154.30 10,657.70 9,174.80 14,178.60
Variation (in %) - 18.1 - 4.7 + 16.2 - 35.3 + 5.8
Stock market listings (1)
GBL’s shares are listed on Euronext Brussels and form part of the BEL 20 and Euronext 100 indices, which reflect the performance of the combined markets of Paris, Amsterdam, Brussels and Lisbon.
In EUR 2011 2010 2009 2008 2007
Volume traded (in EUR billion) 6.2 5.2 4.0 7.7 7.0
Number of shares traded (in thousands) 102,765 82,166 70,700 108,416 78,444
Average number of shares traded daily 395,250 320,960 276,174 423,500 340,015
Capital traded on the Stock Exchange (in %) 63.7 50.9 43.8 67.2 56.2
Velocity on float (in %) 137.8 102.8 94.1 144.5 116.8
Weight in the BEL 20 (in %) 8.4 7.7 8.1 8.5 60.0
Place in the BEL 20 4 4 4 3 6
Weight in the Euronext 100 (in %) 0.6 0.6 0.7 0.7 0.6
Place in the Euronext 100 41 43 40 36 44

AnnuAl RepoRt 2011 7
Stock market capitalisation over 10 years (in EUR million)
GBL’s share price and value of the BEL 20 and the CAC 40 over 10 years (1/1/2002 = 100)
Adjusted net assets over 10 years (in EUR million)
0
40
20
100
80
60
140
120
200
180
160
Value of the BEL 20 Value of the CAC 40GBL’s share price
Valeur du BEL 20
Cours de bourse de GBL
2004
2003
2002
2009
2010
2011
02/20
1220
0820
0720
0620
05
0
40
80
120
160
200
+ 522
+ 509
- 410
- 1.31
1
+ 90 - 20
- 74
- 694
Inves
tisse
ments
Dividen
de ve
rsé
Tréso
rerie
nette
31/12
/2010
Ende
ttemen
t net
31/12
/2011
Cessio
ns
Priva
te eq
uity
Divers
Cash e
arning
s- 800
- 600
- 400
- 2000
200400
600
800
1.000
1.200
0
50
100
150
200
2004
2003
2002
2009
2010
2011
2008
2007
2006
2005
2004
2003
2002
2009
2010
02/20
1220
1120
0820
0720
0620
0520
0420
0320
0220
0920
10
02/20
1220
1120
0820
0720
0620
052,000
4,000
6,000
8,000
10,000
12,000
14,000
16,000
8,312
5,395
6,178
0
5,000
10,000
15,000
20,000
25,000
8,889
16,76
319
,746
15,23
2
14,32
4
Acqu
isition
s
Treas
ury
31/12
/2006
Treas
ury
31/12
/2011
Dispos
als
Capita
l incre
ases
Appro
priati
on of
profi
t
Cash e
arning
s and
othe
r
Inves
tmen
ts
Dividen
d paid
Net ca
sh
31/12
/2010
Net de
bt
31/12
/2011
Dispos
als
Priva
te eq
uity
Vario
us
Cash e
arning
s
Total
GDF SUEZ
Pernod Ricard
Lafarge
Imerys
Arkema
Suez Environnement
Iberdrola
2011 2010
34.4% Total
29.6% GDF SUEZLafarge 20.3%
Pernod Ricard 5.9%
Imerys 3.9%
Suez Environnement 3.8% 2.1% Other
36.4% Total
31.0% GDF SUEZLafarge 10.7%
Pernod Ricard 6.7%Imerys 9.0%
Arkema 0.7%Suez Environnement 4.0%
1.5% Other
1.9
(42.1)
(1.4)
(21.3)
1.5
(42.7)
GBL
Adjusted net asset GBL
BEL 20
CAC 40
Eurostoxx 50
DJ Eurostoxx Oil & Gas
DJ Eurostoxx Utilities
DJ Eurostoxx Construction
(30) (20) (10) 0 10(50) (40) (30) (20) (10) 0 10
(11.3)
1.4
(24.8)
(20.3)
(28.7)
(16.1)
(18.1)
(19.2)
(17.0)
(17.1)
(800)
(600)
(400)
(200)0
200400
600
800
1,000
1,200
8,284
10,65
8
10,15
4
13,40
0
11,45
8
14,17
9
9,175
8,934
11,11
012
,811
7,528
7,041
11,56
1
12,83
8
522
509
(410)
(1,31
1)
(694)
8,000
6,000
4,000
2,000
0
(2,000)
1,647
(694)
2,636
1,183
(7,00
9)
2,637
(1,78
8)
(20)
(74)
90
0
50
100
150
200
2004
2003
2002
2009
2010
2011
2008
2007
2006
2005
2004
2003
2002
2009
2010
02/20
1220
1120
0820
0720
0620
0520
0420
0320
0220
0920
10
02/20
1220
1120
0820
0720
0620
052,000
4,000
6,000
8,000
10,000
12,000
14,000
16,000
8,312
5,395
6,178
0
5,000
10,000
15,000
20,000
25,000
8,889
16,76
319
,746
15,23
2
14,32
4
Acqu
isition
s
Treas
ury
31/12
/2006
Treas
ury
31/12
/2011
Dispos
als
Capita
l incre
ases
Appro
priati
on of
profi
t
Cash e
arning
s and
othe
r
Inves
tmen
ts
Dividen
d paid
Net ca
sh
31/12
/2010
Net de
bt
31/12
/2011
Dispos
als
Priva
te eq
uity
Vario
us
Cash e
arning
s
Total
GDF SUEZ
Pernod Ricard
Lafarge
Imerys
Arkema
Suez Environnement
Iberdrola
2011 2010
34.4% Total
29.6% GDF SUEZLafarge 20.3%
Pernod Ricard 5.9%
Imerys 3.9%
Suez Environnement 3.8% 2.1% Other
36.4% Total
31.0% GDF SUEZLafarge 10.7%
Pernod Ricard 6.7%Imerys 9.0%
Arkema 0.7%Suez Environnement 4.0%
1.5% Other
1.9
(42.1)
(1.4)
(21.3)
1.5
(42.7)
GBL
Adjusted net asset GBL
BEL 20
CAC 40
Eurostoxx 50
DJ Eurostoxx Oil & Gas
DJ Eurostoxx Utilities
DJ Eurostoxx Construction
(30) (20) (10) 0 10(50) (40) (30) (20) (10) 0 10
(11.3)
1.4
(24.8)
(20.3)
(28.7)
(16.1)
(18.1)
(19.2)
(17.0)
(17.1)
(800)
(600)
(400)
(200)0
200400
600
800
1,000
1,200
8,284
10,65
8
10,15
4
13,40
0
11,45
8
14,17
9
9,175
8,934
11,11
012
,811
7,528
7,041
11,56
1
12,83
8
522
509
(410)
(1,31
1)
(694)
8,000
6,000
4,000
2,000
0
(2,000)
1,647
(694)
2,636
1,183
(7,00
9)
2,637
(1,78
8)
(20)
(74)
90
8 AnnuAl RepoRt 2011
Stock Exchange data
Shareholder information
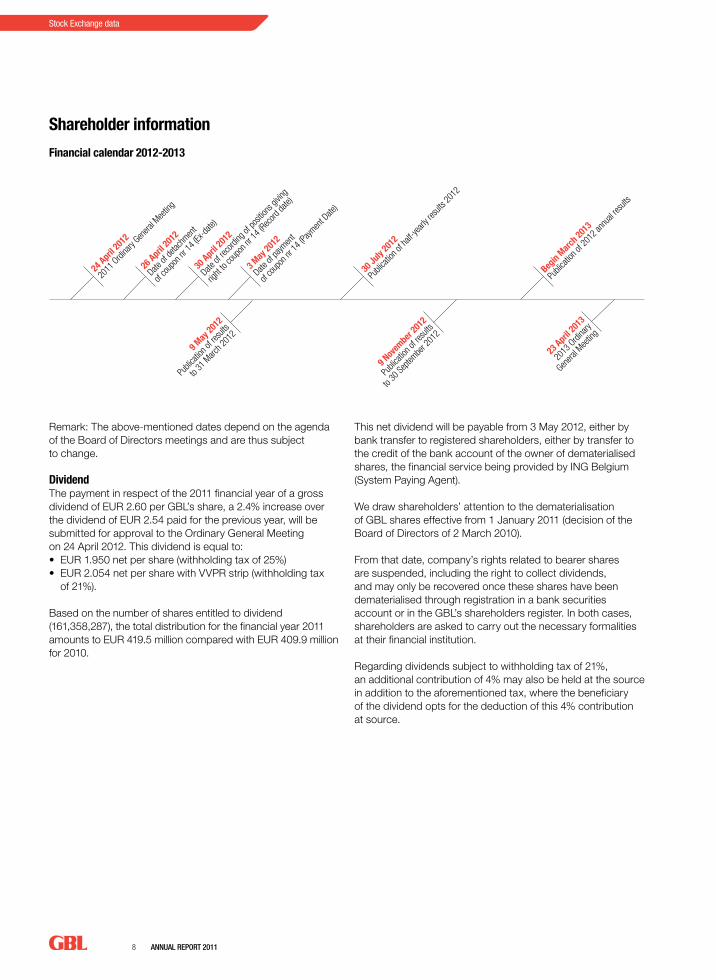
Financial calendar 2012-2013
Remark: The above-mentioned dates depend on the agenda of the Board of Directors meetings and are thus subject to change.
DividendThe payment in respect of the 2011 financial year of a gross dividend of EUR 2.60 per GBL’s share, a 2.4% increase over the dividend of EUR 2.54 paid for the previous year, will be submitted for approval to the Ordinary General Meeting on 24 April 2012. This dividend is equal to:• EUR 1.950 net per share (withholding tax of 25%)• EUR 2.054 net per share with VVPR strip (withholding tax
of 21%).
Based on the number of shares entitled to dividend (161,358,287), the total distribution for the financial year 2011 amounts to EUR 419.5 million compared with EUR 409.9 million for 2010.
This net dividend will be payable from 3 May 2012, either by bank transfer to registered shareholders, either by transfer to the credit of the bank account of the owner of dematerialised shares, the financial service being provided by ING Belgium (System Paying Agent).
We draw shareholders’ attention to the dematerialisation of GBL shares effective from 1 January 2011 (decision of the Board of Directors of 2 March 2010).
From that date, company’s rights related to bearer shares are suspended, including the right to collect dividends, and may only be recovered once these shares have been dematerialised through registration in a bank securities account or in the GBL’s shareholders register. In both cases, shareholders are asked to carry out the necessary formalities at their financial institution.
Regarding dividends subject to withholding tax of 21%, an additional contribution of 4% may also be held at the source in addition to the aforementioned tax, where the beneficiary of the dividend opts for the deduction of this 4% contribution at source.
24 Apri
l 201
2
2011
Ordina
ry Gen
eral M
eetin
g
26 Apri
l 201
2
Date of
detac
hmen
t
of co
upon
nr 14
(Ex-d
ate)
30 Apri
l 201
2
Date of
reco
rding
of po
sition
s givin
g
right
to co
upon
nr 14
(Rec
ord da
te)
3 May
2012
Date of
paym
ent
of co
upon
nr 14
(Paym
ent D
ate)
9 May
2012
Publi
catio
n of re
sults
to 31
Marc
h 201
2
30 Ju
ly 20
12
Publi
catio
n of h
alf-ye
arly r
esult
s 201
2
9 Nov
embe
r 201
2
Publi
catio
n of re
sults
to 30
Septe
mber 2
012
Begin
March 2
013
Publi
catio
n of 2
012 a
nnua
l resu
lts
23 Apri
l 201
3
2013
Ordina
ry
Genera
l Mee
ting
AnnuAl RepoRt 2011 9
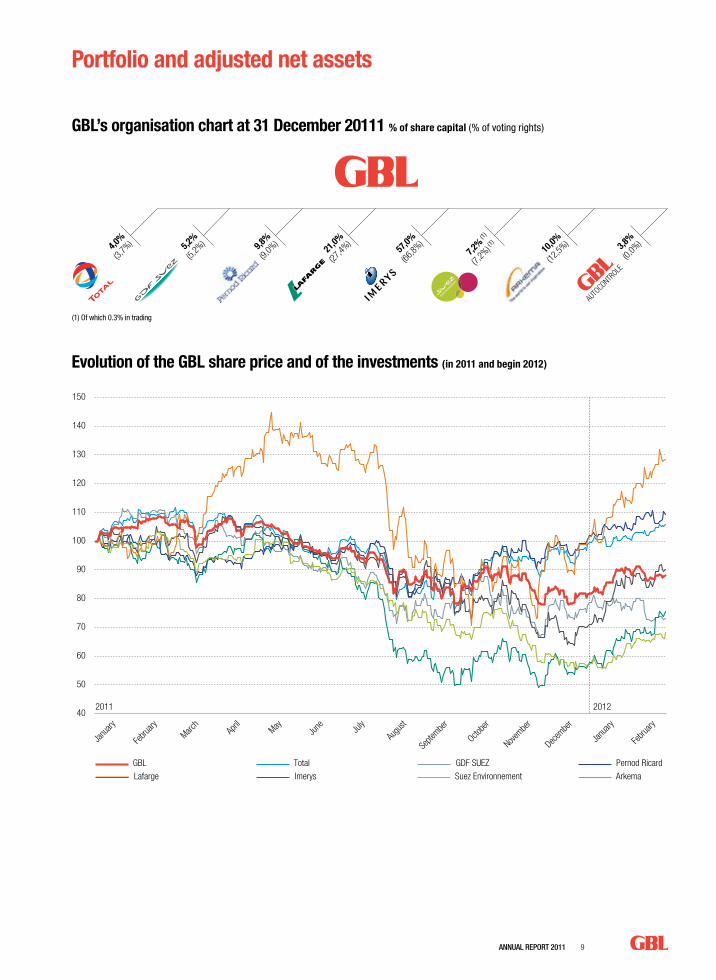
GBL’s organisation chart at 31 December 20111 % of share capital (% of voting rights)
TotalGBL GDF SUEZ Pernod Ricard
Lafarge Imerys Suez Environnement Arkema
Total
GBL
402011 2012
50
60
70
80
90
100
110
120
150
140
130
Janu
ary
Febru
ary
Janu
ary
Febru
aryMarc
hAp
rilMay
June Ju
ly
Augu
st
Septe
mber
Octobe
r
Novembe
r
Decem
ber
405060708090
100110120130140150
8090
100110120130140150
60
65
70
75
80
85
90
95
100
105
110
115
120
125
130
TotalGBL GDF SUEZ Lafarge
Pernod Ricard Imerys Suez Environnement Arkema
Janv
ier
4,0%
(3,7%
) 5,2%
(5,2%
)21
,0%
(27,4%
)9,8%
(9,0%
)57
,0%
(66,8%
)7,2
% (1
)
(7,2%
) (1)
10,0%
(12,5%
) 3,8%
(0,0%
)
AUTO
CONTROLE
Févri
erMars Av
ril MaiJu
inJu
illet
Août
Septe
mbre
Octobre
Novembre
Décem
bre
Portfolio and adjusted net assets
(1) Of which 0.3% in trading
Evolution of the GBL share price and of the investments (in 2011 and begin 2012)
10 AnnuAl RepoRt 2011
Portfolio and adjusted net assets
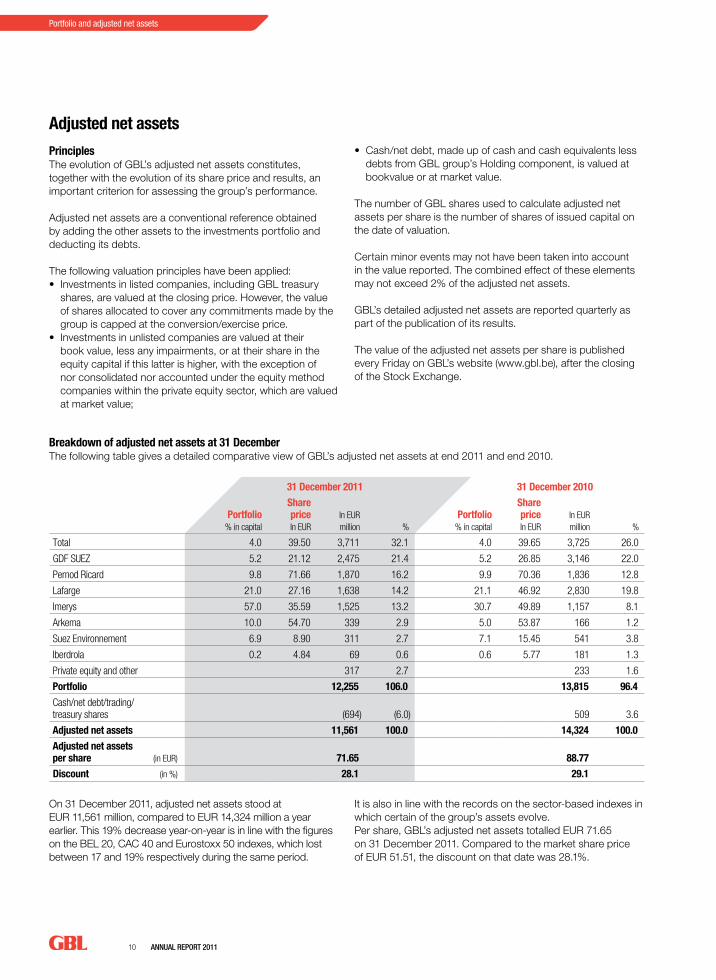
Breakdown of adjusted net assets at 31 DecemberThe following table gives a detailed comparative view of GBL’s adjusted net assets at end 2011 and end 2010.
31 December 2011 31 December 2010
Portfolio% in capital
Share priceIn EUR
In EUR million %
Portfolio% in capital
Share priceIn EUR
In EUR million %
Total 4.0 39.50 3,711 32.1 4.0 39.65 3,725 26.0
GDF SUEZ 5.2 21.12 2,475 21.4 5.2 26.85 3,146 22.0
Pernod Ricard 9.8 71.66 1,870 16.2 9.9 70.36 1,836 12.8
Lafarge 21.0 27.16 1,638 14.2 21.1 46.92 2,830 19.8
Imerys 57.0 35.59 1,525 13.2 30.7 49.89 1,157 8.1
Arkema 10.0 54.70 339 2.9 5.0 53.87 166 1.2
Suez Environnement 6.9 8.90 311 2.7 7.1 15.45 541 3.8
Iberdrola 0.2 4.84 69 0.6 0.6 5.77 181 1.3
Private equity and other 317 2.7 233 1.6
Portfolio 12,255 106.0 13,815 96.4
Cash/net debt/trading/ treasury shares (694) (6.0) 509 3.6
Adjusted net assets 11,561 100.0 14,324 100.0
Adjusted net assets per share (in EUR) 71.65 88.77
Discount (in %) 28.1 29.1
On 31 December 2011, adjusted net assets stood at EUR 11,561 million, compared to EUR 14,324 million a year earlier. This 19% decrease year-on-year is in line with the figures on the BEL 20, CAC 40 and Eurostoxx 50 indexes, which lost between 17 and 19% respectively during the same period.
It is also in line with the records on the sector-based indexes in which certain of the group’s assets evolve. Per share, GBL’s adjusted net assets totalled EUR 71.65 on 31 December 2011. Compared to the market share price of EUR 51.51, the discount on that date was 28.1%.
Adjusted net assets
PrinciplesThe evolution of GBL’s adjusted net assets constitutes, together with the evolution of its share price and results, an important criterion for assessing the group’s performance.
Adjusted net assets are a conventional reference obtained by adding the other assets to the investments portfolio and deducting its debts.
The following valuation principles have been applied:• Investments in listed companies, including GBL treasury
shares, are valued at the closing price. However, the value of shares allocated to cover any commitments made by the group is capped at the conversion/exercise price.
• Investments in unlisted companies are valued at their book value, less any impairments, or at their share in the equity capital if this latter is higher, with the exception of nor consolidated nor accounted under the equity method companies within the private equity sector, which are valued at market value;
• Cash/net debt, made up of cash and cash equivalents less debts from GBL group’s Holding component, is valued at bookvalue or at market value.
The number of GBL shares used to calculate adjusted net assets per share is the number of shares of issued capital on the date of valuation.
Certain minor events may not have been taken into account in the value reported. The combined effect of these elements may not exceed 2% of the adjusted net assets.
GBL’s detailed adjusted net assets are reported quarterly as part of the publication of its results.
The value of the adjusted net assets per share is published every Friday on GBL’s website (www.gbl.be), after the closing of the Stock Exchange.

AnnuAl RepoRt 2011 11
PortfolioThe Total share price, which was stable in 2011, stood up well in the face of declining stock market indexes. The market value of GBL’s 4.0% share in Total stood at EUR 3,711 million at end 2011, roughly equivalent to its value at end 2010 (EUR 3.725 million). Total’s share in GBL’s adjusted net assets thus amounted to 32% on 31 December 2011, compared to 26% a year earlier.
GDF SUEZ, like other players in its sector, experienced a year of ups and downs on the stock market in 2011: its share price fell by 21% year-on-year. However, this decline fares much better compared to the sector indexes, down by 25% for the same period. Its contribution to adjusted net assets (EUR 2,475 million) at end December 2011 was nevertheless stable at 21%, following 22% a year earlier.
The share price of Lafarge, which operates in a sector affected by the decline in activity in some countries and uncertainties over the restart of the construction cycle, eroded by 42% in 2011. Under this impact, Lafarge’s contribution to adjusted net assets fell by 20% to only 14%, with a market value of EUR 1,638 million on 31 December 2011.
The Pernod Ricard share confirmed once again its resilience in a difficult economic context, displaying a market value rising by 2% in 2011 over the previous year. GBL’s 9.8% interest in Pernod Ricard (EUR 1,870 million) accounted for 16% of adjusted net assets at end 2011, up from 13% a year earlier.
GBL increased its stake in Imerys, investing some EUR 1.1 billion in 2011 to secure sole control over this asset (57% of its capital). The Imerys share had a rough ride on Stock Exchanges due to the economic and market context, depreciating by 29%. GBL’s stake in Imerys registered a market value of EUR 1,525 million at end December 2011, representing 13% of its adjusted net assets on that date (8% at end 2010).
At the end of 2011, GBL’s share in Suez Environnement accounted for 3% of adjusted net assets (4% at end 2010). The Suez Environnement share did not perform well on markets (- 42%) notwithstanding the firm’s overall resilient operating performances in 2011.
In 2011, GBL raised its interest in Arkema to 10% of that firm’s capital, investing around EUR 170 million. The Arkema share price held up well, increasing by some 2% in 2011. The EUR 339 million stake made up 3% of GBL’s adjusted net assets at the end of the year, compared with EUR 166 million in 2010.
The residual stake in Iberdrola is valued at EUR 69 million, reflecting the partial sale of this position in 2011 coupled with the decline in the share price in the course of the year.
GBL’s interest in private equity/others amounts around EUR 317 million, reflecting among others the net investments realized in 2011.
Evolution of stock market parameters in 2011 (% change as of 31 December 2011/2010)
0
50
100
150
200
2004
2003
2002
2009
2010
2011
2008
2007
2006
2005
2004
2003
2002
2009
2010
02/20
1220
1120
0820
0720
0620
0520
0420
0320
0220
0920
10
02/20
1220
1120
0820
0720
0620
052,000
4,000
6,000
8,000
10,000
12,000
14,000
16,000
8,312
5,395
6,178
0
5,000
10,000
15,000
20,000
25,000
8,889
16,76
319
,746
15,23
2
14,32
4
Acqu
isition
s
Treas
ury
31/12
/2006
Treas
ury
31/12
/2011
Dispos
als
Capita
l incre
ases
Appro
priati
on of
profi
t
Cash e
arning
s and
othe
r
Inves
tmen
ts
Dividen
d paid
Net ca
sh
31/12
/2010
Net de
bt
31/12
/2011
Dispos
als
Priva
te eq
uity
Vario
us
Cash e
arning
s
Total
GDF SUEZ
Pernod Ricard
Lafarge
Imerys
Arkema
Suez Environnement
Iberdrola
2011 2010
34.4% Total
29.6% GDF SUEZLafarge 20.3%
Pernod Ricard 5.9%
Imerys 3.9%
Suez Environnement 3.8% 2.1% Other
36.4% Total
31.0% GDF SUEZLafarge 10.7%
Pernod Ricard 6.7%Imerys 9.0%
Arkema 0.7%Suez Environnement 4.0%
1.5% Other
1.9
(42.1)
(1.4)
(21.3)
1.5
(42.7)
GBL
Adjusted net asset GBL
BEL 20
CAC 40
Eurostoxx 50
DJ Eurostoxx Oil & Gas
DJ Eurostoxx Utilities
DJ Eurostoxx Construction
(30) (20) (10) 0 10(50) (40) (30) (20) (10) 0 10
(11.3)
1.4
(24.8)
(20.3)
(28.7)
(16.1)
(18.1)
(19.2)
(17.0)
(17.1)
(800)
(600)
(400)
(200)0
200400
600
800
1,000
1,200
8,284
10,65
8
10,15
4
13,40
0
11,45
8
14,17
9
9,175
8,934
11,11
012
,811
7,528
7,041
11,56
1
12,83
8
522
509
(410)
(1,31
1)
(694)
8,000
6,000
4,000
2,000
0
(2,000)
1,647
(694)
2,636
1,183
(7,00
9)
2,637
(1,78
8)
(20)
(74)
90
0
50
100
150
200
2004
2003
2002
2009
2010
2011
2008
2007
2006
2005
2004
2003
2002
2009
2010
02/20
1220
1120
0820
0720
0620
0520
0420
0320
0220
0920
10
02/20
1220
1120
0820
0720
0620
052,000
4,000
6,000
8,000
10,000
12,000
14,000
16,000
8,312
5,395
6,178
0
5,000
10,000
15,000
20,000
25,000
8,889
16,76
319
,746
15,23
2
14,32
4
Acqu
isition
s
Treas
ury
31/12
/2006
Treas
ury
31/12
/2011
Dispos
als
Capita
l incre
ases
Appro
priati
on of
profi
t
Cash e
arning
s and
othe
r
Inves
tmen
ts
Dividen
d paid
Net ca
sh
31/12
/2010
Net de
bt
31/12
/2011
Dispos
als
Priva
te eq
uity
Vario
us
Cash e
arning
s
Total
GDF SUEZ
Pernod Ricard
Lafarge
Imerys
Arkema
Suez Environnement
Iberdrola
2011 2010
34.4% Total
29.6% GDF SUEZLafarge 20.3%
Pernod Ricard 5.9%
Imerys 3.9%
Suez Environnement 3.8% 2.1% Other
36.4% Total
31.0% GDF SUEZLafarge 10.7%
Pernod Ricard 6.7%Imerys 9.0%
Arkema 0.7%Suez Environnement 4.0%
1.5% Other
1.9
(42.1)
(1.4)
(21.3)
1.5
(42.7)
GBL
Adjusted net asset GBL
BEL 20
CAC 40
Eurostoxx 50
DJ Eurostoxx Oil & Gas
DJ Eurostoxx Utilities
DJ Eurostoxx Construction
(30) (20) (10) 0 10(50) (40) (30) (20) (10) 0 10
(11.3)
1.4
(24.8)
(20.3)
(28.7)
(16.1)
(18.1)
(19.2)
(17.0)
(17.1)
(800)
(600)
(400)
(200)0
200400
600
800
1,000
1,200
8,284
10,65
8
10,15
4
13,40
0
11,45
8
14,17
9
9,175
8,934
11,11
012
,811
7,528
7,041
11,56
1
12,83
8
522
509
(410)
(1,31
1)
(694)
8,000
6,000
4,000
2,000
0
(2,000)
1,647
(694)
2,636
1,183
(7,00
9)
2,637
(1,78
8)
(20)
(74)
90

12 AnnuAl RepoRt 2011
Selected financial information
Financial situation GBL group’s net debt at the end of 2011 stood at EUR 694 million, which represents a small fraction, of 5.7 %, of the portfolio’s stock market value on that date.This amount includes:• on the one hand, cash of EUR 790 million held by the group,
including the valuation at market value of its 3.8% treasury shares;
• on the other, a gross debt of EUR 1,484 million made up of bonds totalling EUR 534 million, as well as outstanding bank credit lines of EUR 950 million.
The maturity of the gross debt was extended during the year and the weighted average maturity was 3.9 years at the end of 2011. No debt maturity occurs before 2014, apart from the reimbursement in April 2012 of the residual balance of the GBL convertible bonds, of EUR 184 million.
GBL has also undrawn confirmed credit lines for an amount of EUR 850 million, all of which have been extended until 2016/2017. This debt does not include the company’s private equity commitments for an amount of approximately EUR 340 million at the end of December.
Adjusted net assets over 5 years
In EUR million 2011 2010 2009 2008 2007
Adjusted net assets at the end of the year 11,560.6 14,323.5 15,232.2 12,811.2 19,745.5
Portfolio 12,254.9 13,814.5 14,663.8 11,965.1 17,942.7
Cash/net debt/trading/treasury shares (694.2) 509.0 568.4 846.1 1,802.8
of which treasury shares 313.7 380.2 391.9 317.1 460.0
Year-on-year change (in %) - 19.3 - 6.0 + 18.9 - 35.1 + 17.8
In EUR
Adjusted net assets per share 71.65 88.77 94.40 79.39 122.36
Share price 51.51 62.93 66.05 56.86 87.87
Discount (in %) 28.1 29.1 30 28.4 28.2
Portfolio and adjusted net assets
Treasury over 5 years (in EUR million)
0
50
100
150
200
2004
2003
2002
2009
2010
2011
2008
2007
2006
2005
2004
2003
2002
2009
2010
02/20
1220
1120
0820
0720
0620
0520
0420
0320
0220
0920
10
02/20
1220
1120
0820
0720
0620
052,000
4,000
6,000
8,000
10,000
12,000
14,000
16,000
8,312
5,395
6,178
0
5,000
10,000
15,000
20,000
25,000
8,889
16,76
319
,746
15,23
2
14,32
4
Acqu
isition
s
Treas
ury
31/12
/2006
Treas
ury
31/12
/2011
Dispos
als
Capita
l incre
ases
Appro
priati
on of
profi
t
Cash e
arning
s and
othe
r
Inves
tmen
ts
Dividen
d paid
Net ca
sh
31/12
/2010
Net de
bt
31/12
/2011
Dispos
als
Priva
te eq
uity
Vario
us
Cash e
arning
s
Total
GDF SUEZ
Pernod Ricard
Lafarge
Imerys
Arkema
Suez Environnement
Iberdrola
2011 2010
34.4% Total
29.6% GDF SUEZLafarge 20.3%
Pernod Ricard 5.9%
Imerys 3.9%
Suez Environnement 3.8% 2.1% Other
36.4% Total
31.0% GDF SUEZLafarge 10.7%
Pernod Ricard 6.7%Imerys 9.0%
Arkema 0.7%Suez Environnement 4.0%
1.5% Other
1.9
(42.1)
(1.4)
(21.3)
1.5
(42.7)
GBL
Adjusted net asset GBL
BEL 20
CAC 40
Eurostoxx 50
DJ Eurostoxx Oil & Gas
DJ Eurostoxx Utilities
DJ Eurostoxx Construction
(30) (20) (10) 0 10(50) (40) (30) (20) (10) 0 10
(11.3)
1.4
(24.8)
(20.3)
(28.7)
(16.1)
(18.1)
(19.2)
(17.0)
(17.1)
(800)
(600)
(400)
(200)0
200400
600
800
1,000
1,200
8,284
10,65
8
10,15
4
13,40
0
11,45
8
14,17
9
9,175
8,934
11,11
012
,811
7,528
7,041
11,56
1
12,83
8
522
509
(410)
(1,31
1)
(694)
8,000
6,000
4,000
2,000
0
(2,000)
1,647
(694)
2,636
1,183
(7,00
9)
2,637
(1,78
8)
(20)
(74)
90

AnnuAl RepoRt 2011 13
14 AnnuAl RepoRt 2011
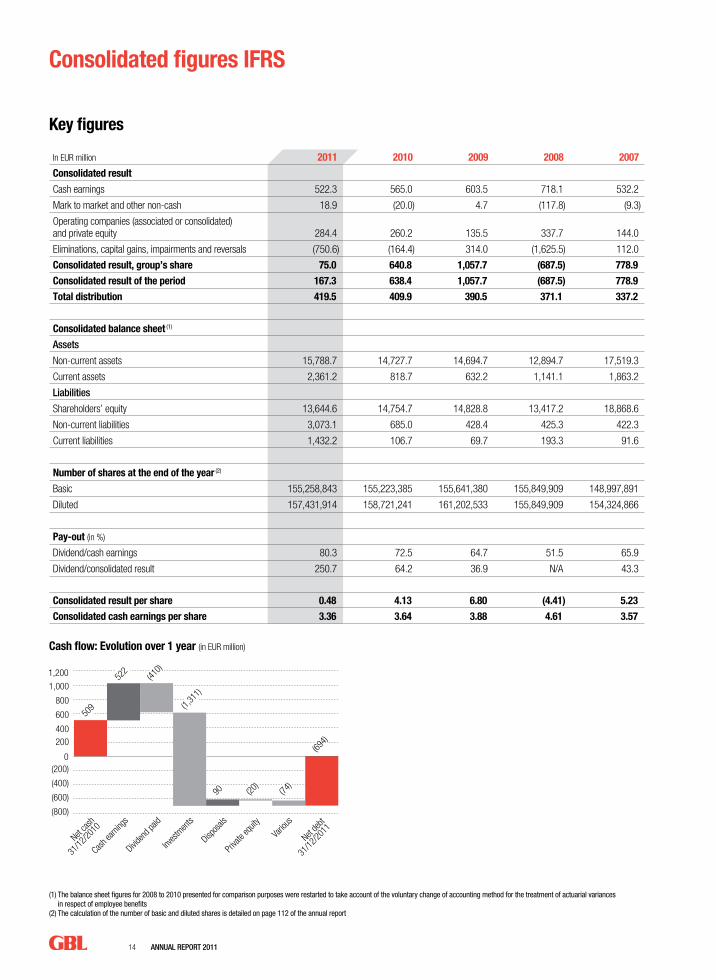
Key figures
In EUR million 2011 2010 2009 2008 2007
Consolidated result
Cash earnings 522.3 565.0 603.5 718.1 532.2
Mark to market and other non-cash 18.9 (20.0) 4.7 (117.8) (9.3)
Operating companies (associated or consolidated) and private equity 284.4 260.2 135.5 337.7 144.0
Eliminations, capital gains, impairments and reversals (750.6) (164.4) 314.0 (1,625.5) 112.0
Consolidated result, group’s share 75.0 640.8 1,057.7 (687.5) 778.9
Consolidated result of the period 167.3 638.4 1,057.7 (687.5) 778.9
Total distribution 419.5 409.9 390.5 371.1 337.2
Consolidated balance sheet (1)
Assets
Non-current assets 15,788.7 14,727.7 14,694.7 12,894.7 17,519.3
Current assets 2,361.2 818.7 632.2 1,141.1 1,863.2
liabilities
Shareholders’ equity 13,644.6 14,754.7 14,828.8 13,417.2 18,868.6
Non-current liabilities 3,073.1 685.0 428.4 425.3 422.3
Current liabilities 1,432.2 106.7 69.7 193.3 91.6
Number of shares at the end of the year (2)
Basic 155,258,843 155,223,385 155,641,380 155,849,909 148,997,891
Diluted 157,431,914 158,721,241 161,202,533 155,849,909 154,324,866
Pay-out (in %)
Dividend/cash earnings 80.3 72.5 64.7 51.5 65.9
Dividend/consolidated result 250.7 64.2 36.9 N/A 43.3
Consolidated result per share 0.48 4.13 6.80 (4.41) 5.23
Consolidated cash earnings per share 3.36 3.64 3.88 4.61 3.57
(1) The balance sheet figures for 2008 to 2010 presented for comparison purposes were restarted to take account of the voluntary change of accounting method for the treatment of actuarial variances in respect of employee benefits
(2) The calculation of the number of basic and diluted shares is detailed on page 112 of the annual report
Consolidated figures IFRS
Cash flow: Evolution over 1 year (in EUR million)
0
50
100
150
200
2004
2003
2002
2009
2010
2011
2008
2007
2006
2005
2004
2003
2002
2009
2010
02/20
1220
1120
0820
0720
0620
0520
0420
0320
0220
0920
10
02/20
1220
1120
0820
0720
0620
052,000
4,000
6,000
8,000
10,000
12,000
14,000
16,000
8,312
5,395
6,178
0
5,000
10,000
15,000
20,000
25,000
8,889
16,76
319
,746
15,23
2
14,32
4
Acqu
isition
s
Treas
ury
31/12
/2006
Treas
ury
31/12
/2011
Dispos
als
Capita
l incre
ases
Appro
priati
on of
profi
t
Cash e
arning
s and
othe
r
Inves
tmen
ts
Dividen
d paid
Net ca
sh
31/12
/2010
Net de
bt
31/12
/2011
Dispos
als
Priva
te eq
uity
Vario
us
Cash e
arning
s
Total
GDF SUEZ
Pernod Ricard
Lafarge
Imerys
Arkema
Suez Environnement
Iberdrola
2011 2010
34.4% Total
29.6% GDF SUEZLafarge 20.3%
Pernod Ricard 5.9%
Imerys 3.9%
Suez Environnement 3.8% 2.1% Other
36.4% Total
31.0% GDF SUEZLafarge 10.7%
Pernod Ricard 6.7%Imerys 9.0%
Arkema 0.7%Suez Environnement 4.0%
1.5% Other
1.9
(42.1)
(1.4)
(21.3)
1.5
(42.7)
GBL
Adjusted net asset GBL
BEL 20
CAC 40
Eurostoxx 50
DJ Eurostoxx Oil & Gas
DJ Eurostoxx Utilities
DJ Eurostoxx Construction
(30) (20) (10) 0 10(50) (40) (30) (20) (10) 0 10
(11.3)
1.4
(24.8)
(20.3)
(28.7)
(16.1)
(18.1)
(19.2)
(17.0)
(17.1)
(800)
(600)
(400)
(200)0
200400
600
800
1,000
1,200
8,284
10,65
8
10,15
4
13,40
0
11,45
8
14,17
9
9,175
8,934
11,11
012
,811
7,528
7,041
11,56
1
12,83
8
522
509
(410)
(1,31
1)
(694)
8,000
6,000
4,000
2,000
0
(2,000)
1,647
(694)
2,636
1,183
(7,00
9)
2,637
(1,78
8)
(20)
(74)
90
AnnuAl RepoRt 2011 15
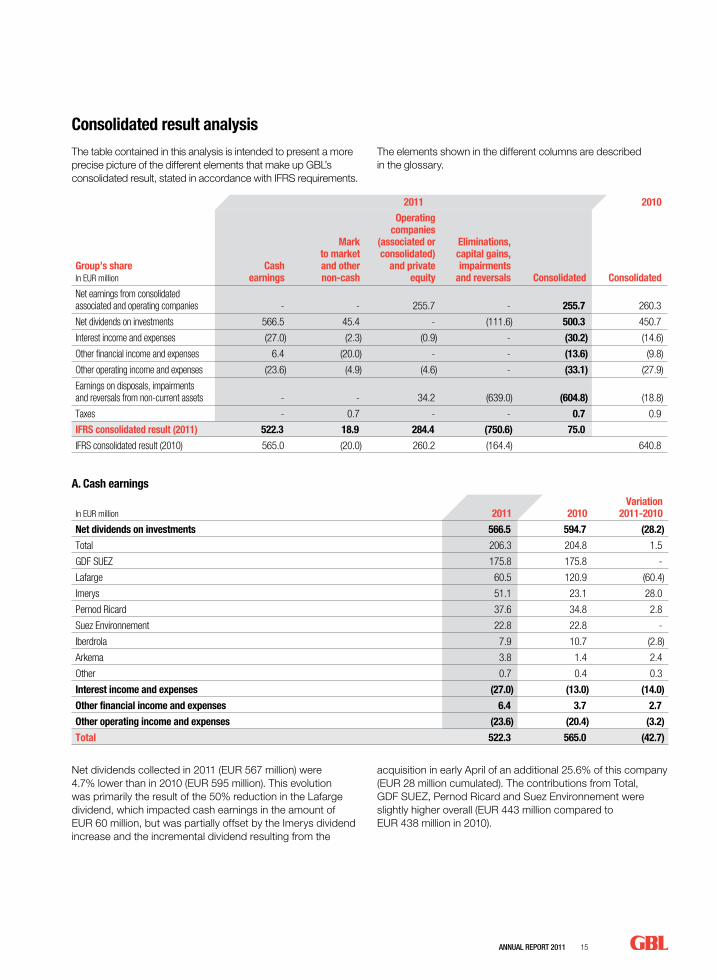
The table contained in this analysis is intended to present a more precise picture of the different elements that make up GBL’s consolidated result, stated in accordance with IFRS requirements.
The elements shown in the different columns are described in the glossary.
Consolidated result analysis
2011 2010
Group’s shareIn EUR million
Cash earnings
Mark to market and other non-cash
Operating companies
(associated or consolidated)
and private equity
Eliminations,capital gains, impairments
and reversals Consolidated Consolidated
Net earnings from consolidated associated and operating companies - - 255.7 - 255.7 260.3
Net dividends on investments 566.5 45.4 - (111.6) 500.3 450.7
Interest income and expenses (27.0) (2.3) (0.9) - (30.2) (14.6)
Other financial income and expenses 6.4 (20.0) - - (13.6) (9.8)
Other operating income and expenses (23.6) (4.9) (4.6) - (33.1) (27.9)
Earnings on disposals, impairments and reversals from non-current assets - - 34.2 (639.0) (604.8) (18.8)
Taxes - 0.7 - - 0.7 0.9
IFRS consolidated result (2011) 522.3 18.9 284.4 (750.6) 75.0
IFRS consolidated result (2010) 565.0 (20.0) 260.2 (164.4) 640.8
A. Cash earnings
In EUR million 2011 2010Variation
2011-2010
Net dividends on investments 566.5 594.7 (28.2)
Total 206.3 204.8 1.5
GDF SUEZ 175.8 175.8 -
Lafarge 60.5 120.9 (60.4)
Imerys 51.1 23.1 28.0
Pernod Ricard 37.6 34.8 2.8
Suez Environnement 22.8 22.8 -
Iberdrola 7.9 10.7 (2.8)
Arkema 3.8 1.4 2.4
Other 0.7 0.4 0.3
Interest income and expenses (27.0) (13.0) (14.0)
Other financial income and expenses 6.4 3.7 2.7
Other operating income and expenses (23.6) (20.4) (3.2)
Total 522.3 565.0 (42.7)
Net dividends collected in 2011 (EUR 567 million) were 4.7% lower than in 2010 (EUR 595 million). This evolution was primarily the result of the 50% reduction in the Lafarge dividend, which impacted cash earnings in the amount of EUR 60 million, but was partially offset by the Imerys dividend increase and the incremental dividend resulting from the
acquisition in early April of an additional 25.6% of this company (EUR 28 million cumulated). The contributions from Total, GDF SUEZ, Pernod Ricard and Suez Environnement were slightly higher overall (EUR 443 million compared to EUR 438 million in 2010).
16 AnnuAl RepoRt 2011
Consolidated figures IFRS
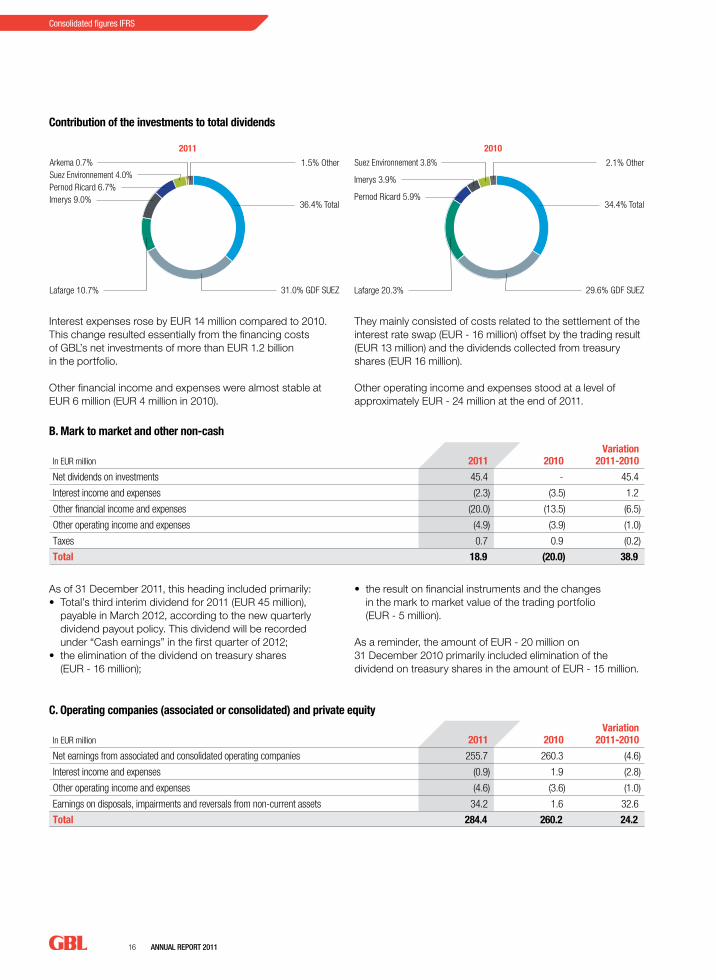
Interest expenses rose by EUR 14 million compared to 2010. This change resulted essentially from the financing costs of GBL’s net investments of more than EUR 1.2 billion in the portfolio.
Other financial income and expenses were almost stable at EUR 6 million (EUR 4 million in 2010).
They mainly consisted of costs related to the settlement of the interest rate swap (EUR - 16 million) offset by the trading result (EUR 13 million) and the dividends collected from treasury shares (EUR 16 million).
Other operating income and expenses stood at a level of approximately EUR - 24 million at the end of 2011.
As of 31 December 2011, this heading included primarily:• Total’s third interim dividend for 2011 (EUR 45 million),
payable in March 2012, according to the new quarterly dividend payout policy. This dividend will be recorded under “Cash earnings” in the first quarter of 2012;
• the elimination of the dividend on treasury shares (EUR - 16 million);
• the result on financial instruments and the changes in the mark to market value of the trading portfolio (EUR - 5 million).
As a reminder, the amount of EUR - 20 million on 31 December 2010 primarily included elimination of the dividend on treasury shares in the amount of EUR - 15 million.
B. Mark to market and other non-cash
In EUR million 2011 2010Variation
2011-2010
Net dividends on investments 45.4 - 45.4
Interest income and expenses (2.3) (3.5) 1.2
Other financial income and expenses (20.0) (13.5) (6.5)
Other operating income and expenses (4.9) (3.9) (1.0)
Taxes 0.7 0.9 (0.2)
Total 18.9 (20.0) 38.9
C. Operating companies (associated or consolidated) and private equity
In EUR million 2011 2010Variation
2011-2010
Net earnings from associated and consolidated operating companies 255.7 260.3 (4.6)
Interest income and expenses (0.9) 1.9 (2.8)
Other operating income and expenses (4.6) (3.6) (1.0)
Earnings on disposals, impairments and reversals from non-current assets 34.2 1.6 32.6
Total 284.4 260.2 24.2
Contribution of the investments to total dividends
0
50
100
150
200
2004
2003
2002
2009
2010
2011
2008
2007
2006
2005
2004
2003
2002
2009
2010
02/20
1220
1120
0820
0720
0620
0520
0420
0320
0220
0920
10
02/20
1220
1120
0820
0720
0620
052,000
4,000
6,000
8,000
10,000
12,000
14,000
16,000
8,312
5,395
6,178
0
5,000
10,000
15,000
20,000
25,000
8,889
16,76
319
,746
15,23
2
14,32
4
Acqu
isition
s
Treas
ury
31/12
/2006
Treas
ury
31/12
/2011
Dispos
als
Capita
l incre
ases
Appro
priati
on of
profi
t
Cash e
arning
s and
othe
r
Inves
tmen
ts
Dividen
d paid
Net ca
sh
31/12
/2010
Net de
bt
31/12
/2011
Dispos
als
Priva
te eq
uity
Vario
us
Cash e
arning
s
Total
GDF SUEZ
Pernod Ricard
Lafarge
Imerys
Arkema
Suez Environnement
Iberdrola
2011 2010
34.4% Total
29.6% GDF SUEZLafarge 20.3%
Pernod Ricard 5.9%
Imerys 3.9%
Suez Environnement 3.8% 2.1% Other
36.4% Total
31.0% GDF SUEZLafarge 10.7%
Pernod Ricard 6.7%Imerys 9.0%
Arkema 0.7%Suez Environnement 4.0%
1.5% Other
1.9
(42.1)
(1.4)
(21.3)
1.5
(42.7)
GBL
Adjusted net asset GBL
BEL 20
CAC 40
Eurostoxx 50
DJ Eurostoxx Oil & Gas
DJ Eurostoxx Utilities
DJ Eurostoxx Construction
(30) (20) (10) 0 10(50) (40) (30) (20) (10) 0 10
(11.3)
1.4
(24.8)
(20.3)
(28.7)
(16.1)
(18.1)
(19.2)
(17.0)
(17.1)
(800)
(600)
(400)
(200)0
200400
600
800
1,000
1,200
8,284
10,65
8
10,15
4
13,40
0
11,45
8
14,17
9
9,175
8,934
11,11
012
,811
7,528
7,041
11,56
1
12,83
8
522
509
(410)
(1,31
1)
(694)
8,000
6,000
4,000
2,000
0
(2,000)
1,647
(694)
2,636
1,183
(7,00
9)
2,637
(1,78
8)
(20)
(74)
90
0
50
100
150
200
2004
2003
2002
2009
2010
2011
2008
2007
2006
2005
2004
2003
2002
2009
2010
02/20
1220
1120
0820
0720
0620
0520
0420
0320
0220
0920
10
02/20
1220
1120
0820
0720
0620
052,000
4,000
6,000
8,000
10,000
12,000
14,000
16,000
8,312
5,395
6,178
0
5,000
10,000
15,000
20,000
25,000
8,889
16,76
319
,746
15,23
2
14,32
4
Acqu
isition
s
Treas
ury
31/12
/2006
Treas
ury
31/12
/2011
Dispos
als
Capita
l incre
ases
Appro
priati
on of
profi
t
Cash e
arning
s and
othe
r
Inves
tmen
ts
Dividen
d paid
Net ca
sh
31/12
/2010
Net de
bt
31/12
/2011
Dispos
als
Priva
te eq
uity
Vario
us
Cash e
arning
s
Total
GDF SUEZ
Pernod Ricard
Lafarge
Imerys
Arkema
Suez Environnement
Iberdrola
2011 2010
34.4% Total
29.6% GDF SUEZLafarge 20.3%
Pernod Ricard 5.9%
Imerys 3.9%
Suez Environnement 3.8% 2.1% Other
36.4% Total
31.0% GDF SUEZLafarge 10.7%
Pernod Ricard 6.7%Imerys 9.0%
Arkema 0.7%Suez Environnement 4.0%
1.5% Other
1.9
(42.1)
(1.4)
(21.3)
1.5
(42.7)
GBL
Adjusted net asset GBL
BEL 20
CAC 40
Eurostoxx 50
DJ Eurostoxx Oil & Gas
DJ Eurostoxx Utilities
DJ Eurostoxx Construction
(30) (20) (10) 0 10(50) (40) (30) (20) (10) 0 10
(11.3)
1.4
(24.8)
(20.3)
(28.7)
(16.1)
(18.1)
(19.2)
(17.0)
(17.1)
(800)
(600)
(400)
(200)0
200400
600
800
1,000
1,200
8,284
10,65
8
10,15
4
13,40
0
11,45
8
14,17
9
9,175
8,934
11,11
012
,811
7,528
7,041
11,56
1
12,83
8
522
509
(410)
(1,31
1)
(694)
8,000
6,000
4,000
2,000
0
(2,000)
1,647
(694)
2,636
1,183
(7,00
9)
2,637
(1,78
8)
(20)
(74)
90
AnnuAl RepoRt 2011 17
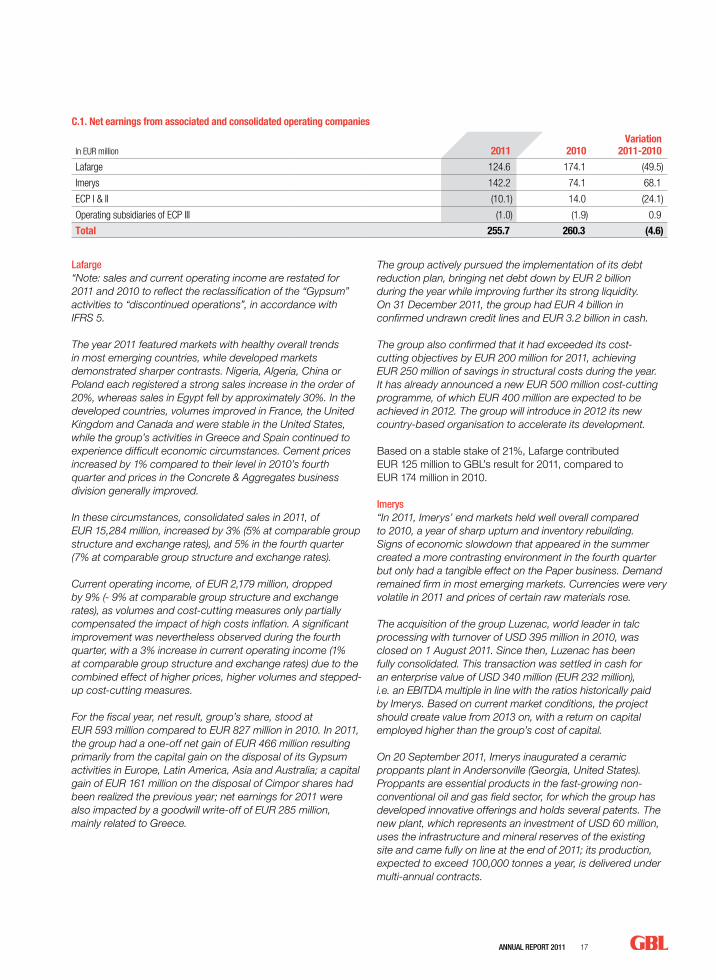
lafarge“Note: sales and current operating income are restated for 2011 and 2010 to reflect the reclassification of the “Gypsum” activities to “discontinued operations”, in accordance with IFRS 5.
The year 2011 featured markets with healthy overall trends in most emerging countries, while developed markets demonstrated sharper contrasts. Nigeria, Algeria, China or Poland each registered a strong sales increase in the order of 20%, whereas sales in Egypt fell by approximately 30%. In the developed countries, volumes improved in France, the United Kingdom and Canada and were stable in the United States, while the group’s activities in Greece and Spain continued to experience difficult economic circumstances. Cement prices increased by 1% compared to their level in 2010’s fourth quarter and prices in the Concrete & Aggregates business division generally improved.
In these circumstances, consolidated sales in 2011, of EUR 15,284 million, increased by 3% (5% at comparable group structure and exchange rates), and 5% in the fourth quarter (7% at comparable group structure and exchange rates).
Current operating income, of EUR 2,179 million, dropped by 9% (- 9% at comparable group structure and exchange rates), as volumes and cost-cutting measures only partially compensated the impact of high costs inflation. A significant improvement was nevertheless observed during the fourth quarter, with a 3% increase in current operating income (1% at comparable group structure and exchange rates) due to the combined effect of higher prices, higher volumes and stepped-up cost-cutting measures.
For the fiscal year, net result, group’s share, stood at EUR 593 million compared to EUR 827 million in 2010. In 2011, the group had a one-off net gain of EUR 466 million resulting primarily from the capital gain on the disposal of its Gypsum activities in Europe, Latin America, Asia and Australia; a capital gain of EUR 161 million on the disposal of Cimpor shares had been realized the previous year; net earnings for 2011 were also impacted by a goodwill write-off of EUR 285 million, mainly related to Greece.
The group actively pursued the implementation of its debt reduction plan, bringing net debt down by EUR 2 billion during the year while improving further its strong liquidity. On 31 December 2011, the group had EUR 4 billion in confirmed undrawn credit lines and EUR 3.2 billion in cash.
The group also confirmed that it had exceeded its cost- cutting objectives by EUR 200 million for 2011, achieving EUR 250 million of savings in structural costs during the year. It has already announced a new EUR 500 million cost-cutting programme, of which EUR 400 million are expected to be achieved in 2012. The group will introduce in 2012 its new country-based organisation to accelerate its development.
Based on a stable stake of 21%, Lafarge contributed EUR 125 million to GBL’s result for 2011, compared to EUR 174 million in 2010.
Imerys“In 2011, Imerys’ end markets held well overall compared to 2010, a year of sharp upturn and inventory rebuilding. Signs of economic slowdown that appeared in the summer created a more contrasting environment in the fourth quarter but only had a tangible effect on the Paper business. Demand remained firm in most emerging markets. Currencies were very volatile in 2011 and prices of certain raw materials rose.
The acquisition of the group Luzenac, world leader in talc processing with turnover of USD 395 million in 2010, was closed on 1 August 2011. Since then, Luzenac has been fully consolidated. This transaction was settled in cash for an enterprise value of USD 340 million (EUR 232 million), i.e. an EBITDA multiple in line with the ratios historically paid by Imerys. Based on current market conditions, the project should create value from 2013 on, with a return on capital employed higher than the group’s cost of capital.
On 20 September 2011, Imerys inaugurated a ceramic proppants plant in Andersonville (Georgia, United States). Proppants are essential products in the fast-growing non-conventional oil and gas field sector, for which the group has developed innovative offerings and holds several patents. The new plant, which represents an investment of USD 60 million, uses the infrastructure and mineral reserves of the existing site and came fully on line at the end of 2011; its production, expected to exceed 100,000 tonnes a year, is delivered under multi-annual contracts.
C.1. Net earnings from associated and consolidated operating companies
In EUR million 2011 2010Variation
2011-2010
Lafarge 124.6 174.1 (49.5)
Imerys 142.2 74.1 68.1
ECP I & II (10.1) 14.0 (24.1)
Operating subsidiaries of ECP III (1.0) (1.9) 0.9
Total 255.7 260.3 (4.6)
18 AnnuAl RepoRt 2011
Consolidated figures IFRS
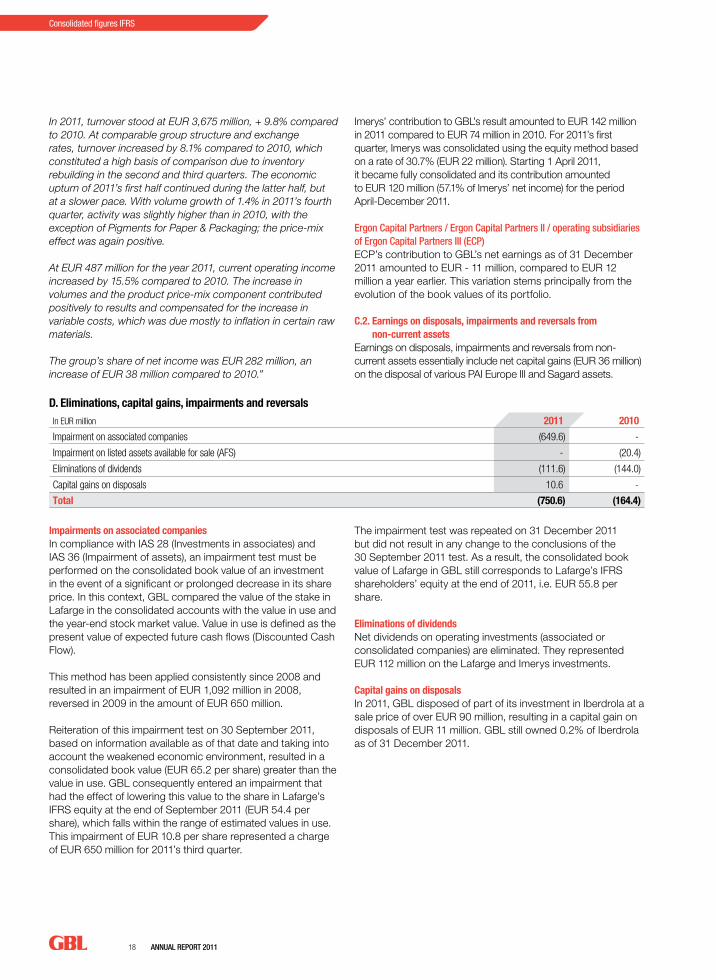
In 2011, turnover stood at EUR 3,675 million, + 9.8% compared to 2010. At comparable group structure and exchange rates, turnover increased by 8.1% compared to 2010, which constituted a high basis of comparison due to inventory rebuilding in the second and third quarters. The economic upturn of 2011’s first half continued during the latter half, but at a slower pace. With volume growth of 1.4% in 2011’s fourth quarter, activity was slightly higher than in 2010, with the exception of Pigments for Paper & Packaging; the price-mix effect was again positive.
At EUR 487 million for the year 2011, current operating income increased by 15.5% compared to 2010. The increase in volumes and the product price-mix component contributed positively to results and compensated for the increase in variable costs, which was due mostly to inflation in certain raw materials.
The group’s share of net income was EUR 282 million, an increase of EUR 38 million compared to 2010.”
Imerys’ contribution to GBL’s result amounted to EUR 142 million in 2011 compared to EUR 74 million in 2010. For 2011’s first quarter, Imerys was consolidated using the equity method based on a rate of 30.7% (EUR 22 million). Starting 1 April 2011, it became fully consolidated and its contribution amounted to EUR 120 million (57.1% of Imerys’ net income) for the period April-December 2011.
ergon Capital partners / ergon Capital partners II / operating subsidiaries of ergon Capital partners III (eCp)ECP’s contribution to GBL’s net earnings as of 31 December 2011 amounted to EUR - 11 million, compared to EUR 12 million a year earlier. This variation stems principally from the evolution of the book values of its portfolio.
C.2. Earnings on disposals, impairments and reversals from non-current assets
Earnings on disposals, impairments and reversals from non-current assets essentially include net capital gains (EUR 36 million) on the disposal of various PAI Europe III and Sagard assets.
D. Eliminations, capital gains, impairments and reversalsIn EUR million 2011 2010
Impairment on associated companies (649.6) -
Impairment on listed assets available for sale (AFS) - (20.4)
Eliminations of dividends (111.6) (144.0)
Capital gains on disposals 10.6 -
Total (750.6) (164.4)
Impairments on associated companiesIn compliance with IAS 28 (Investments in associates) and IAS 36 (Impairment of assets), an impairment test must be performed on the consolidated book value of an investment in the event of a significant or prolonged decrease in its share price. In this context, GBL compared the value of the stake in Lafarge in the consolidated accounts with the value in use and the year-end stock market value. Value in use is defined as the present value of expected future cash flows (Discounted Cash Flow).
This method has been applied consistently since 2008 and resulted in an impairment of EUR 1,092 million in 2008, reversed in 2009 in the amount of EUR 650 million.
Reiteration of this impairment test on 30 September 2011, based on information available as of that date and taking into account the weakened economic environment, resulted in a consolidated book value (EUR 65.2 per share) greater than the value in use. GBL consequently entered an impairment that had the effect of lowering this value to the share in Lafarge’s IFRS equity at the end of September 2011 (EUR 54.4 per share), which falls within the range of estimated values in use. This impairment of EUR 10.8 per share represented a charge of EUR 650 million for 2011’s third quarter.
The impairment test was repeated on 31 December 2011 but did not result in any change to the conclusions of the 30 September 2011 test. As a result, the consolidated book value of Lafarge in GBL still corresponds to Lafarge’s IFRS shareholders’ equity at the end of 2011, i.e. EUR 55.8 per share.
Eliminations of dividendsNet dividends on operating investments (associated or consolidated companies) are eliminated. They represented EUR 112 million on the Lafarge and Imerys investments.
Capital gains on disposalsIn 2011, GBL disposed of part of its investment in Iberdrola at a sale price of over EUR 90 million, resulting in a capital gain on disposals of EUR 11 million. GBL still owned 0.2% of Iberdrola as of 31 December 2011.
AnnuAl RepoRt 2011 19
Elements entered directly in shareholders’ equity
Comprehensive income
2010Group’s shareIn EUR million
Result of the
period 2011Mark
to market
Associated and consolidated
companies
Comprehensive income
2011
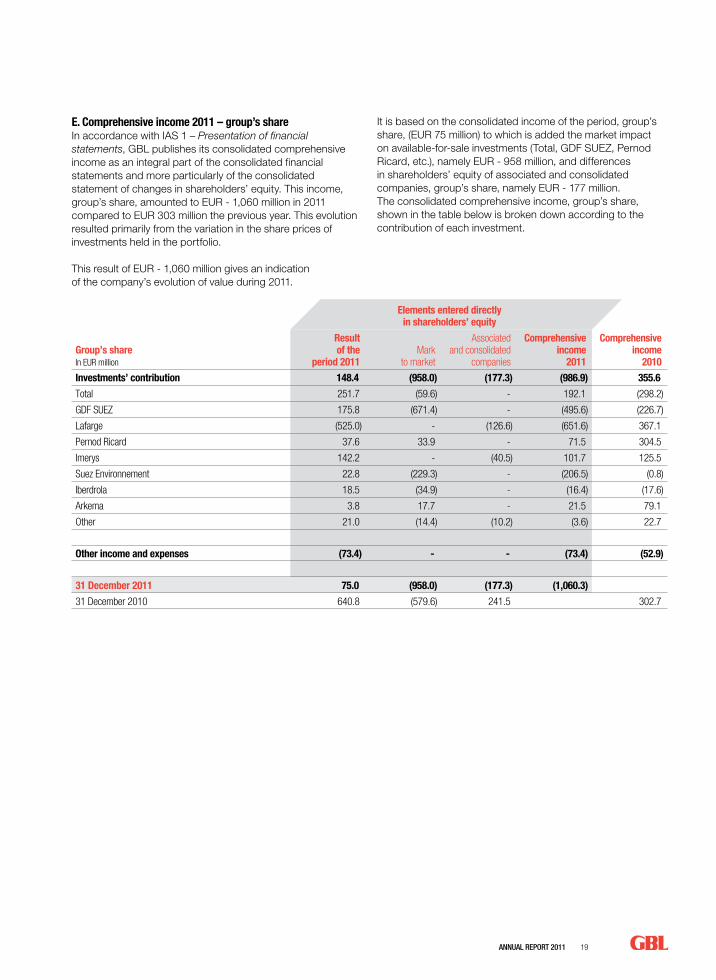
Investments’ contribution 148.4 (958.0) (177.3) (986.9) 355.6
Total 251.7 (59.6) - 192.1 (298.2)
GDF SUEZ 175.8 (671.4) - (495.6) (226.7)
Lafarge (525.0) - (126.6) (651.6) 367.1
Pernod Ricard 37.6 33.9 - 71.5 304.5
Imerys 142.2 - (40.5) 101.7 125.5
Suez Environnement 22.8 (229.3) - (206.5) (0.8)
Iberdrola 18.5 (34.9) - (16.4) (17.6)
Arkema 3.8 17.7 - 21.5 79.1
Other 21.0 (14.4) (10.2) (3.6) 22.7
Other income and expenses (73.4) - - (73.4) (52.9)
31 December 2011 75.0 (958.0) (177.3) (1,060.3)
31 December 2010 640.8 (579.6) 241.5 302.7
E. Comprehensive income 2011 – group’s shareIn accordance with IAS 1 – Presentation of financial statements, GBL publishes its consolidated comprehensive income as an integral part of the consolidated financial statements and more particularly of the consolidated statement of changes in shareholders’ equity. This income, group’s share, amounted to EUR - 1,060 million in 2011 compared to EUR 303 million the previous year. This evolution resulted primarily from the variation in the share prices of investments held in the portfolio.
This result of EUR - 1,060 million gives an indication of the company’s evolution of value during 2011.
It is based on the consolidated income of the period, group’s share, (EUR 75 million) to which is added the market impact on available-for-sale investments (Total, GDF SUEZ, Pernod Ricard, etc.), namely EUR - 958 million, and differences in shareholders’ equity of associated and consolidated companies, group’s share, namely EUR - 177 million. The consolidated comprehensive income, group’s share, shown in the table below is broken down according to the contribution of each investment.

20 AnnuAl RepoRt 2011
AnnuAl RepoRt 2011 21
Over
view
of t
he a
ctiv
ities
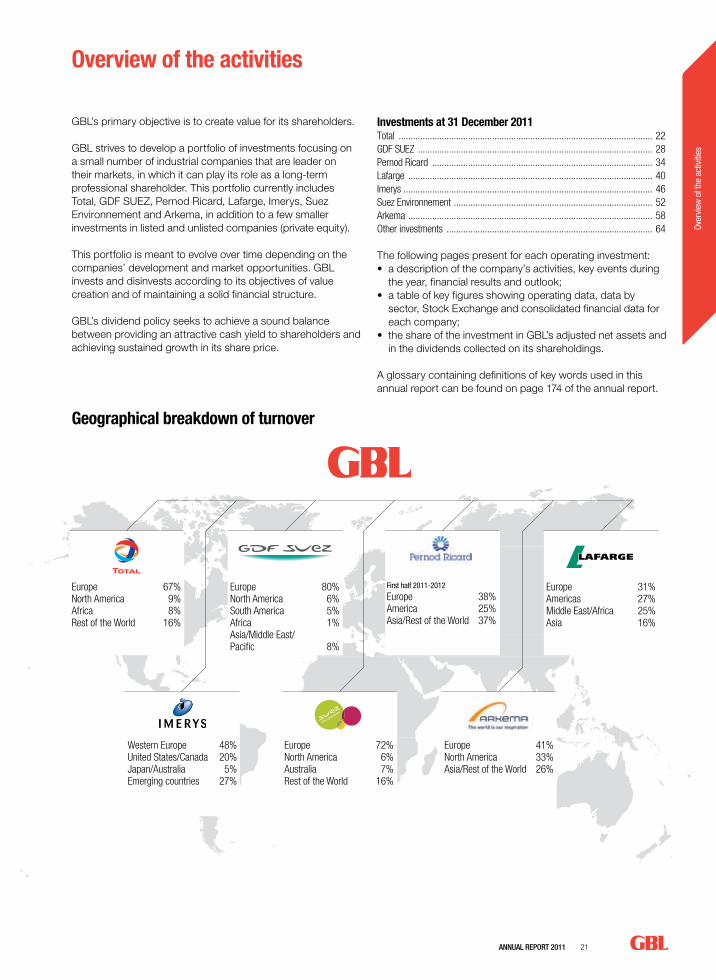
GBL’s primary objective is to create value for its shareholders.
GBL strives to develop a portfolio of investments focusing on a small number of industrial companies that are leader on their markets, in which it can play its role as a long-term professional shareholder. This portfolio currently includes Total, GDF SUEZ, Pernod Ricard, Lafarge, Imerys, Suez Environnement and Arkema, in addition to a few smaller investments in listed and unlisted companies (private equity).
This portfolio is meant to evolve over time depending on the companies’ development and market opportunities. GBL invests and disinvests according to its objectives of value creation and of maintaining a solid financial structure.
GBL’s dividend policy seeks to achieve a sound balance between providing an attractive cash yield to shareholders and achieving sustained growth in its share price.
Investments at 31 December 2011Total .......................................................................................................... 22GDF SUEZ .................................................................................................. 28Pernod Ricard ............................................................................................ 34Lafarge ...................................................................................................... 40Imerys ........................................................................................................ 46Suez Environnement ................................................................................... 52Arkema ...................................................................................................... 58Other investments ...................................................................................... 64
The following pages present for each operating investment:• a description of the company’s activities, key events during
the year, financial results and outlook;• a table of key figures showing operating data, data by
sector, Stock Exchange and consolidated financial data for each company;
• the share of the investment in GBL’s adjusted net assets and in the dividends collected on its shareholdings.
A glossary containing definitions of key words used in this annual report can be found on page 174 of the annual report.
Overview of the activities
Geographical breakdown of turnover
Europe 67%North America 9%Africa 8%Rest of the World 16%
Western Europe 48%United States/Canada 20%Japan/Australia 5%Emerging countries 27%
Europe 80%North America 6%South America 5%Africa 1%Asia/Middle East/ Pacific 8%
Europe 72%North America 6%Australia 7%Rest of the World 16%
Europe 31%Americas 27%Middle East/Africa 25%Asia 16%
Europe 41%North America 33%Asia/Rest of the World 26%
First half 2011-2012
Europe 38%America 25%Asia/Rest of the World 37%
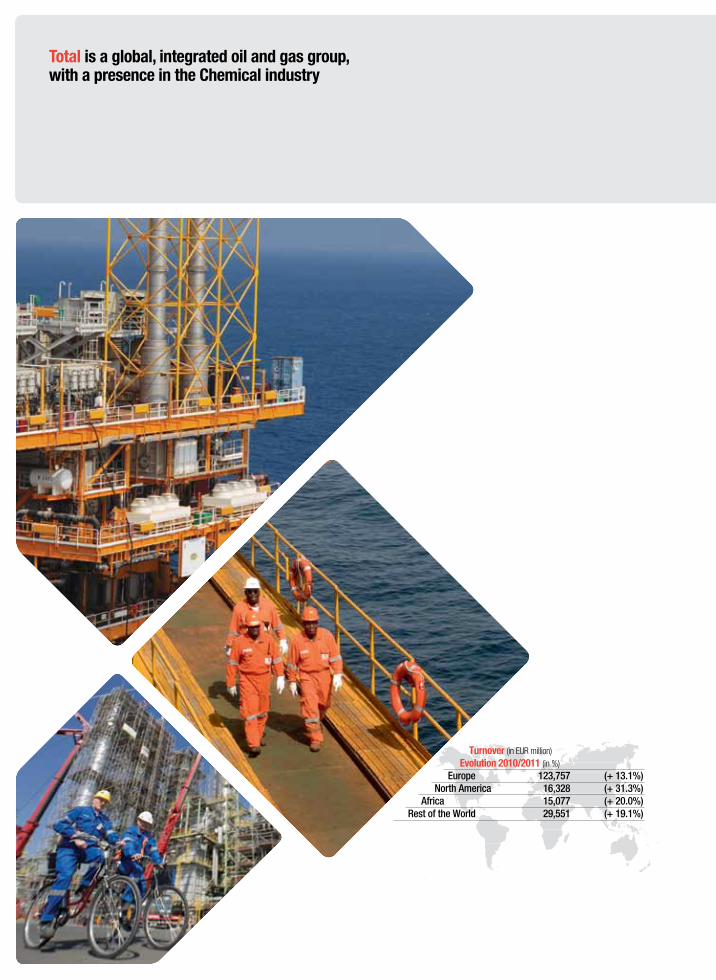
Total is a global, integrated oil and gas group, with a presence in the Chemical industry
Turnover (in EUR million) Evolution 2010/2011 (in %)
europe 123,757 (+ 13.1%)north America 16,328 (+ 31.3%)
Africa 15,077 (+ 20.0%)Rest of the World 29,551 (+ 19.1%)

AnnuAl RepoRt 2011 23
Over
view
of t
he a
ctiv
ities
Profile
Total is one of the leading international oil and gas groups. Its activities are based in more than 130 countries and cover the entire oil industry chain, upstream – exploration, development and production of oil, natural gas and LNG – and downstream – refining, distribution, transport and international trading of crude oil and refined products. Total is also a major player in Chemicals and is committed to the development of renewable energy.
Upstream, the group has exploration and production activities in more than 40 countries. It relies on a diversified portfolio of assets that offers some of the oil industry’s highest growth prospects as a result of Total’s investments in major projects with competitive technical costs and in highly promising areas. The group’s proven hydrocarbon reserves, calculated according to SEC rules, guarantee the company more than 13 years of production at the average 2011 production rate (2.3 million barrels of oil equivalent per day). A major player in the liquefied natural gas industry, Total is also extending its activities to related market segments such as gas distribution or electricity generation. The group is also preparing the future of energy and supports the development of new complementary sources of energy (solar, biomass, CO2 capture and storage).
Downstream, the group has positioned itself as a leader in Western Europe and Africa; it also operates throughout the Mediterranean basin and expands its footprint in growth markets, notably in Asia. It manages refining capacity of 2.1 million barrels a day and sells 3.6 million barrels of refined products a day. The group owns shares in 20 refineries and operates a network of around 15,000 service stations, primarily under the Total, Elf, Elan and AS24 banners, which have specific positionings.
Total’s Chemical activities rank among European and/or world leaders on most of their markets. Its Base Chemicals activities include petrochemicals and fertilisers while the Specialty Chemicals activities concern rubber processing, adhesives and electroplating, whose products primarily serve the industry sector. Total announced at the end of 2011 its intention to reorganise its Downstream and Chemical activities. In the new structure set up on 1 January 2012, two new divisions are created: a Refining-Chemicals division that forms a major industrial pole aimed at maximising the benefits of integrating the two activities; and a Supply-Marketing division focused on global supply and marketing of oil products, with the objective of increasing the flexibility and visibility of these operations.
Overview of 2011
The oil industry was impacted in 2011 by an economic slowdown that coincided with continuing pressure on supply. Crude oil prices increased by 40% to USD 111/b, compared with their 2010 average of USD 80/b. The average selling price of gas also increased overall by 27%, despite strong regional differences. In contrast, refining margins declined to an average (ERMI indicator) of USD 17/t in Europe (compared with USD 27/t in 2010), reflecting the sector’s chronic overcapacity. In Chemicals, the general environment remained favourable during the first half of the year before starting to deteriorate, especially in the fourth quarter. The dollar depreciated by 5% against the euro.
In this context, Total’s adjusted net income amounted to EUR 11.4 billion, an 11% increase over 2010; expressed in dollars, the increase was 17%. This result reflects both the improved environment and the solidity of the group’s performance, which supported cash flow generation and consequently reinforced the company’s balance sheet (debt ratio of 23% at the end of 2011 compared with 22% at the end of 2010) despite the significant increase in investments.
Percentage of share capital ................................................................... 4.0%Percentage of voting rights ............................................................. 3.7%Contribution to GBL’s adjusted net assets .................... 32.1%Dividends collected by GBL ....................... EUR 206 million
24 AnnuAl RepoRt 2011
Overview of the activities - Total
Generally speaking, Total confirmed in 2011 its more dynamic portfolio management strategy that gives precedence to Upstream assets with high growth potential, while continuing its bolder exploration policy. The group also restated its commitment to safety and the environment in the course of its operations and investments.
UpstreamUpstream, three major discoveries in Azerbaijan, Bolivia and French Guiana constituted the first results of the group’s bolder exploration strategy. Total registered a slight decline in its oil and gas production (- 1.3% to 2,346 million boe per day) in 2011, hit by security conditions, mainly in Libya, and by the unfavourable price impact resulting from the oil price levels, while simultaneously benefiting from the ramp-up of new fields, in particular the success of the start of Pazflor in the deepwater offshore Angola block. The group also took forward its ambitious investment programme, illustrated by the launch of several new projects (mainly in Australia, the North Sea, Russia and Nigeria) and investments in Novatek (Russia), the Fort Hills project in Canada and Tempa Rossa in Italy. Mining activities were also expanded by pursuing new promising exploration opportunities (pre-salt, unconventional gas and other neighboring areas). At the same time, Total disposed of mature production assets in Cameroon, interests in the Joslyn project in Canada, shares in pipelines in Colombia and assets in Nigeria.
In the field of renewable energy, Total acquired a 60% stake in the American firm SunPower (major solar energy player).
The level of proven hydrocarbon reserves, based on SEC rules (Brent at USD 110.96/b), was 11.4 billion boe at end 2011. Based on these same principles, the group’s proven reserves replacement rate was 185% in 2011. On this same date, the company’s level of proven and probable reserves represented more than 20 years of reserve life at the average 2011 rate of production; its portfolio of resources represents more than 40 years of reserve life.
DownstreamDownstream, the group continued its strategy of improving competitivity at its operations, reducing its exposure to mature markets, primarily Europe, and developing its presence in growth zones. It thus took forward its plan to reduce its refining capacity in Europe by disposing of its share in CEPSA, and to optimise its marketing strategy by selling its distribution activities in the United Kingdom. Also in 2011, Total undertook the upgrade of the refinery and petro-chemical platform in Normandy (France), the construction of the Jubail refinery in Saudi Arabia and the start of the deep-conversion unit in Port Arthur in the United States.
In 2011, the utilisation rate on processed crude stood at 78% (73% in 2010, a year impacted by social movements in France). The reduction of the group’s refining capacities led to a further decrease in refined volumes (- 7%) as well as a decline (- 4%) in products sales to 1.86 million and 3.6 million barrels per day respectively.
ChemicalsIn Petrochemicals, Total pursued the improvement and relocation of its sites so as to adapt its industrial profile to market structural trends. It thus benefited from the growth of its activities in Qatar and South Korea.
In Specialty Chemicals, the group sold part of its Resins business to Arkema, while other activities (Hutchinson, Atotech and Bostik) benefited from their leadership on different markets.
Outlook
In 2012, the group intends to reinforce its growth potential while complying with the commitment to safety, reliability and acceptability of its operations.
Upstream, Total will benefit from the ramp-up of Pazflor in Angola, whose production started at the end of August 2011, the start-up of Usan (Nigeria), Angola LNG and Bangkok South (Thailand), and the favourable effect of scope of consolidation changes related to its investment in Novatek. All these factors will contribute to expand its production in 2012 and achieve the target of an average of 2.5% growth per year between 2010 and 2015. The group will continue to build its post-2015 growth avenues by preparing the launch of its projects in West Africa, Russia and Canada in particular.
The group intends to benefit, starting this year, from the integration of the “Refining-Chemicals” activities and from the closer ties between its “Supply-Marketing” activities. Total is aiming at a 5% improvement in profitability between 2010 and 2015.
Overall, Total plans to budget USD 24 billion in organic investments in 2012, the bulk of which (80%) in Upstream activities. Net of disposals and acquisitions, the budget amounts to USD 20 billion. The group also intends to continue its acquisitions of targeted assets and its disposals of non-strategic assets. Its dynamic exploration strategy will continue in 2012 with a budget of USD 2.5 billion.
On this basis, Total maintains its goal of a debt ratio between 20 and 30% and a dividend policy targeting an average payout ratio of 50%.
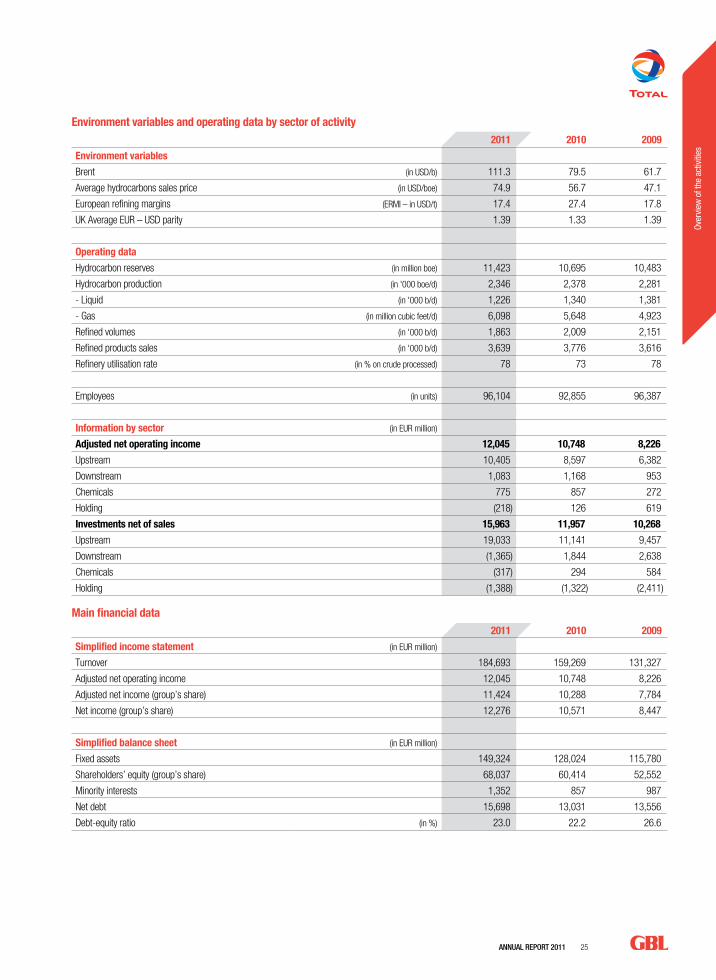
AnnuAl RepoRt 2011 25
Over
view
of t
he a
ctiv
ities
Environment variables and operating data by sector of activity2011 2010 2009
Environment variables
Brent (in USD/b) 111.3 79.5 61.7
Average hydrocarbons sales price (in USD/boe) 74.9 56.7 47.1
European refining margins (ERMI – in USD/t) 17.4 27.4 17.8
UK Average EUR – USD parity 1.39 1.33 1.39
Operating data
Hydrocarbon reserves (in million boe) 11,423 10,695 10,483
Hydrocarbon production (in '000 boe/d) 2,346 2,378 2,281
- Liquid (in '000 b/d) 1,226 1,340 1,381
- Gas (in million cubic feet/d) 6,098 5,648 4,923
Refined volumes (in '000 b/d) 1,863 2,009 2,151
Refined products sales (in '000 b/d) 3,639 3,776 3,616
Refinery utilisation rate (in % on crude processed) 78 73 78
Employees (in units) 96,104 92,855 96,387
Information by sector (in EUR million)
Adjusted net operating income 12,045 10,748 8,226
Upstream 10,405 8,597 6,382
Downstream 1,083 1,168 953
Chemicals 775 857 272
Holding (218) 126 619
Investments net of sales 15,963 11,957 10,268
Upstream 19,033 11,141 9,457
Downstream (1,365) 1,844 2,638
Chemicals (317) 294 584
Holding (1,388) (1,322) (2,411)
Main financial data2011 2010 2009
Simplified income statement (in EUR million)
Turnover 184,693 159,269 131,327
Adjusted net operating income 12,045 10,748 8,226
Adjusted net income (group’s share) 11,424 10,288 7,784
Net income (group’s share) 12,276 10,571 8,447
Simplified balance sheet (in EUR million)
Fixed assets 149,324 128,024 115,780
Shareholders’ equity (group’s share) 68,037 60,414 52,552
Minority interests 1,352 857 987
Net debt 15,698 13,031 13,556
Debt-equity ratio (in %) 23.0 22.2 26.6
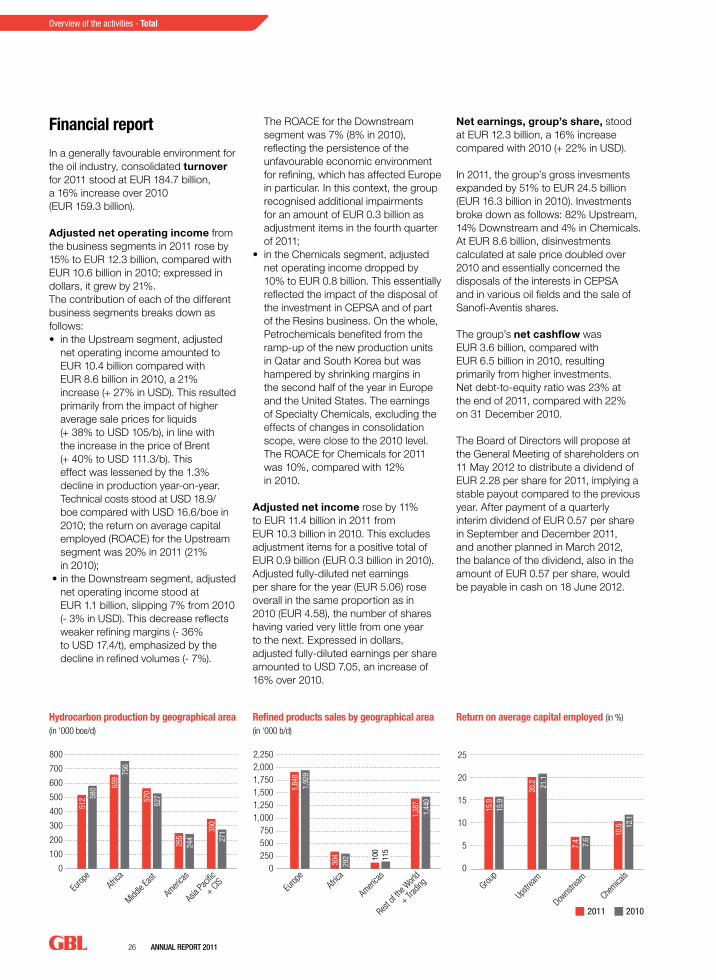
26 AnnuAl RepoRt 2011
Overview of the activities - Total
Financial report
In a generally favourable environment for the oil industry, consolidated turnover for 2011 stood at EUR 184.7 billion, a 16% increase over 2010 (EUR 159.3 billion).
Adjusted net operating income from the business segments in 2011 rose by 15% to EUR 12.3 billion, compared with EUR 10.6 billion in 2010; expressed in dollars, it grew by 21%.The contribution of each of the different business segments breaks down as follows:• in the Upstream segment, adjusted
net operating income amounted to EUR 10.4 billion compared with EUR 8.6 billion in 2010, a 21% increase (+ 27% in USD). This resulted primarily from the impact of higher average sale prices for liquids (+ 38% to USD 105/b), in line with the increase in the price of Brent (+ 40% to USD 111.3/b). This effect was lessened by the 1.3% decline in production year-on-year. Technical costs stood at USD 18.9/boe compared with USD 16.6/boe in 2010; the return on average capital employed (ROACE) for the Upstream segment was 20% in 2011 (21% in 2010);
• in the Downstream segment, adjusted net operating income stood at EUR 1.1 billion, slipping 7% from 2010 (- 3% in USD). This decrease reflects weaker refining margins (- 36% to USD 17.4/t), emphasized by the decline in refined volumes (- 7%).
The ROACE for the Downstream segment was 7% (8% in 2010), reflecting the persistence of the unfavourable economic environment for refining, which has affected Europe in particular. In this context, the group recognised additional impairments for an amount of EUR 0.3 billion as adjustment items in the fourth quarter of 2011;
• in the Chemicals segment, adjusted net operating income dropped by 10% to EUR 0.8 billion. This essentially reflected the impact of the disposal of the investment in CEPSA and of part of the Resins business. On the whole, Petrochemicals benefited from the ramp-up of the new production units in Qatar and South Korea but was hampered by shrinking margins in the second half of the year in Europe and the United States. The earnings of Specialty Chemicals, excluding the effects of changes in consolidation scope, were close to the 2010 level. The ROACE for Chemicals for 2011 was 10%, compared with 12% in 2010.
Adjusted net income rose by 11% to EUR 11.4 billion in 2011 from EUR 10.3 billion in 2010. This excludes adjustment items for a positive total of EUR 0.9 billion (EUR 0.3 billion in 2010). Adjusted fully-diluted net earnings per share for the year (EUR 5.06) rose overall in the same proportion as in 2010 (EUR 4.58), the number of shares having varied very little from one year to the next. Expressed in dollars, adjusted fully-diluted earnings per share amounted to USD 7.05, an increase of 16% over 2010.
Net earnings, group’s share, stood at EUR 12.3 billion, a 16% increase compared with 2010 (+ 22% in USD).
In 2011, the group’s gross invesments expanded by 51% to EUR 24.5 billion (EUR 16.3 billion in 2010). Investments broke down as follows: 82% Upstream, 14% Downstream and 4% in Chemicals. At EUR 8.6 billion, disinvestments calculated at sale price doubled over 2010 and essentially concerned the disposals of the interests in CEPSA and in various oil fields and the sale of Sanofi-Aventis shares.
The group’s net cashflow was EUR 3.6 billion, compared with EUR 6.5 billion in 2010, resulting primarily from higher investments. Net debt-to-equity ratio was 23% at the end of 2011, compared with 22% on 31 December 2010.
The Board of Directors will propose at the General Meeting of shareholders on 11 May 2012 to distribute a dividend of EUR 2.28 per share for 2011, implying a stable payout compared to the previous year. After payment of a quarterly interim dividend of EUR 0.57 per share in September and December 2011, and another planned in March 2012, the balance of the dividend, also in the amount of EUR 0.57 per share, would be payable in cash on 18 June 2012.
0
100
200
300
400
500
600
700
800
512 58
0
756
659
350
271
52757
0
255
244
Europ
eAfr
ica
Middle
East
Ameri
cas
Asia
Pacif
ic
+ CIS
1,84
81,
929
292
304
1,38
71,
440
Europ
eAfr
ica
Ameri
cas
Rest
of the
Worl
d
+ Trad
ing
0250500750
1,0001,2501,5001,7502,0002,250
15.9
15.9
21.1
20.2
10.5 12
.1
7.4 7.6
Group
Upstr
eam
Downs
tream
Chemica
ls0
5
10
15
20
25
100
115
36.4%32.1%
0
100
200
300
400
500
600
700
800
512 58
0
756
659
350
271
52757
0
255
244
Europ
eAfr
ica
Middle
East
Ameri
cas
Asia
Pacif
ic
+ CIS
1,84
81,
929
292
304
1,38
71,
440
Europ
eAfr
ica
Ameri
cas
Rest
of the
Worl
d
+ Trad
ing
0250500750
1,0001,2501,5001,7502,0002,250
15.9
15.9
21.1
20.2
10.5 12
.1
7.4 7.6
Group
Upstr
eam
Downs
tream
Chemica
ls0
5
10
15
20
25
100
115
36.4%32.1%
Hydrocarbon production by geographical area (in ‘000 boe/d)
Refined products sales by geographical area (in ‘000 b/d)
Return on average capital employed (in %)
2011 2010
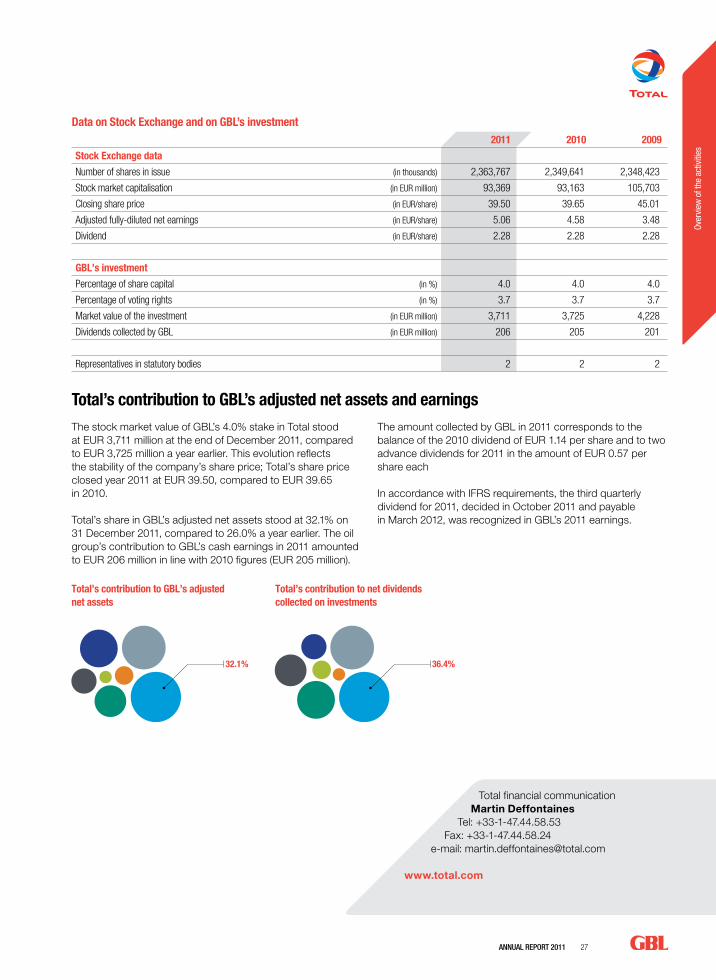
AnnuAl RepoRt 2011 27
Over
view
of t
he a
ctiv
ities
Data on Stock Exchange and on GBL’s investment2011 2010 2009
Stock Exchange data
Number of shares in issue (in thousands) 2,363,767 2,349,641 2,348,423
Stock market capitalisation (in EUR million) 93,369 93,163 105,703
Closing share price (in EUR/share) 39.50 39.65 45.01
Adjusted fully-diluted net earnings (in EUR/share) 5.06 4.58 3.48
Dividend (in EUR/share) 2.28 2.28 2.28
GBL’s investment
Percentage of share capital (in %) 4.0 4.0 4.0
Percentage of voting rights (in %) 3.7 3.7 3.7
Market value of the investment (in EUR million) 3,711 3,725 4,228
Dividends collected by GBL (in EUR million) 206 205 201
Representatives in statutory bodies 2 2 2
Total’s contribution to GBL’s adjusted net assets and earnings
0
100
200
300
400
500
600
700
800
512 58
0
756
659
350
271
52757
0
255
244
Europ
eAfr
ica
Middle
East
Ameri
cas
Asia
Pacif
ic
+ CIS
1,84
81,
929
292
304
1,38
71,
440
Europ
eAfr
ica
Ameri
cas
Rest
of the
Worl
d
+ Trad
ing
0250500750
1,0001,2501,5001,7502,0002,250
15.9
15.9
21.1
20.2
10.5 12
.1
7.4 7.6
Group
Upstr
eam
Downs
tream
Chemica
ls0
5
10
15
20
25
100
115
36.4%32.1%
0
100
200
300
400
500
600
700
800
512 58
0
756
659
350
271
52757
0
255
244
Europ
eAfr
ica
Middle
East
Ameri
cas
Asia
Pacif
ic
+ CIS
1,84
81,
929
292
304
1,38
71,
440
Europ
eAfr
ica
Ameri
cas
Rest
of the
Worl
d
+ Trad
ing
0250500750
1,0001,2501,5001,7502,0002,250
15.9
15.9
21.1
20.2
10.5 12
.1
7.4 7.6
Group
Upstr
eam
Downs
tream
Chemica
ls0
5
10
15
20
2510
011
5
36.4%32.1%
Total’s contribution to GBL’s adjusted net assets
Total’s contribution to net dividends collected on investments
Total financial communication Martin Deffontaines
Tel: +33-1-47.44.58.53Fax: +33-1-47.44.58.24
e-mail: [email protected]
www.total.com
The stock market value of GBL’s 4.0% stake in Total stood at EUR 3,711 million at the end of December 2011, compared to EUR 3,725 million a year earlier. This evolution reflects the stability of the company’s share price; Total’s share price closed year 2011 at EUR 39.50, compared to EUR 39.65 in 2010.
Total’s share in GBL’s adjusted net assets stood at 32.1% on 31 December 2011, compared to 26.0% a year earlier. The oil group’s contribution to GBL’s cash earnings in 2011 amounted to EUR 206 million in line with 2010 figures (EUR 205 million).
The amount collected by GBL in 2011 corresponds to the balance of the 2010 dividend of EUR 1.14 per share and to two advance dividends for 2011 in the amount of EUR 0.57 per share each
In accordance with IFRS requirements, the third quarterly dividend for 2011, decided in October 2011 and payable in March 2012, was recognized in GBL’s 2011 earnings.
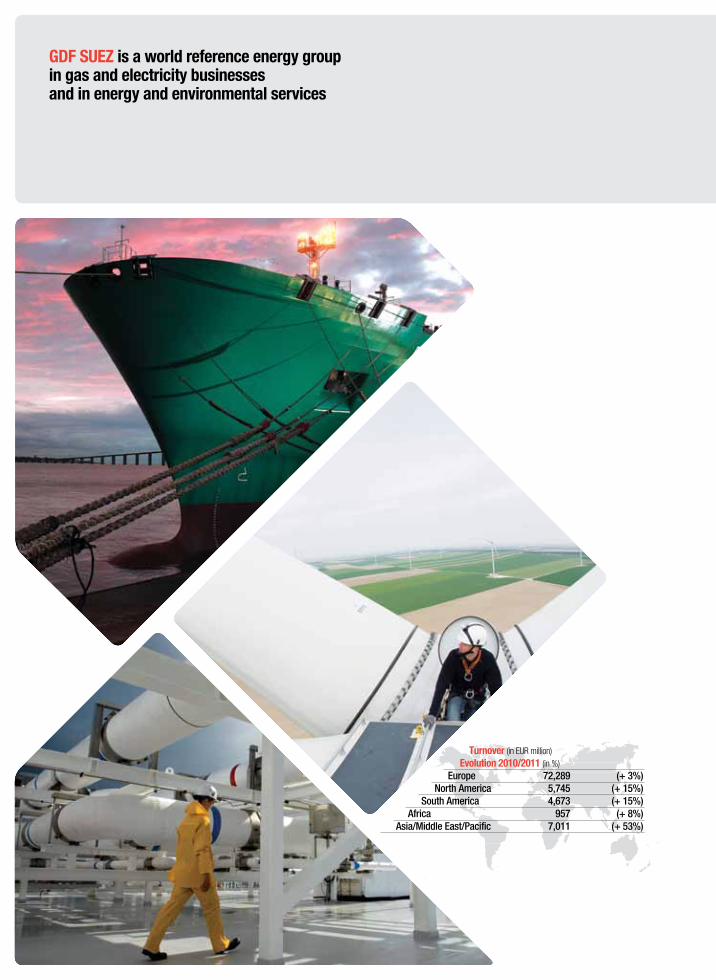
GDF SUEZ is a world reference energy group in gas and electricity businesses and in energy and environmental services
Turnover (in EUR million) Evolution 2010/2011 (in %)
europe 72,289 (+ 3%)north America 5,745 (+ 15%)
South America 4,673 (+ 15%)Africa 957 (+ 8%)
Asia/Middle east/pacific 7,011 (+ 53%)

AnnuAl RepoRt 2011 29
Over
view
of t
he a
ctiv
ities
Profile
Created by the merger of Suez and Gaz de France in July 2008, GDF SUEZ holds a leading position in the European and global energy scene, with a leading position in France and Belgium. The group also has an international presence with more than 40% of its capacities based outside of Europe. It is continuing its international development, as reflected in a pivotal transaction concluded in February 2011 that merged the activities of GDF SUEZ Energy International with those of International Power, creating the world leader in independent energy generation.
These major industrial transactions give the group a presence in the entire energy value chain, in electricity and natural gas, from upstream to downstream. Its activities cover the purchase, generation and sale of natural gas and electricity as well as the transport, storage, distribution, development and operation of major natural gas infrastructures. They also concern the provision of energy efficiency and environmental (water and waste) services.
The group relies on a portfolio of diversified supply sources as well as flexible production facilities offering a high degree of convergence between gas and electricity. It holds international positions of leadership in liquefied natural gas (LNG), independent electricity generation and energy services.
GDF SUEZ is organised into six operating branches, five in Energy and one in Environment, each of which may be subdivided by geographical areas: the Energy Europe and International business line, the Energy France branch, the Global Gas & LNG activities, the Infrastructures branch, the Energy Services business line and Suez Environnement. The group created the Energy Europe business line on 1 January 2012.
The strategy of GDF SUEZ is structured around several major priorities: the industrial development of its gas and electricity activities on strong growth markets, the integration and optimization of positions on mature markets and the strengthening of industrial positions in the upstream gas segment, liquefied natural gas and electricity generation (nuclear, renewable energy). The group also intends to strengthen its leadership in energy efficiency and the environment.
Overview of 2011
In 2011, in a context of a gas tariff freeze in France, very unfavourable weather conditions and the persistent phenomenon of de-correlation of oil and gas prices, GDF SUEZ recorded a new turnover increase taking advantage of its key positions in domestic markets and acceleration of its international development.
The group’s performance was also sustained by organic growth combined with a significant investment programme. 2011 achievements concern all the group’s businesses and include in particular the acquisition of International Power, the acquisition of a controlling stake in certain entities previously co-controlled with Acea, the commissioning of new capacity (5 GW) especially in South America and the Middle East, the commissioning of the Medgaz and Nord Stream gas pipelines, as well as the acquisition of five gas storage sites in Germany. In parallel, the group implemented its asset disposal programme with the divestment of G6 Rete Gas and the strategic partnerships put in place in GRTgaz and E&P International.
Percentage of share capital ................................................................... 5.2%Percentage of voting rights ............................................................. 5.2%Contribution to GBL’s adjusted net assets .................... 21.4%Dividends collected by GBL ....................... EUR 176 million
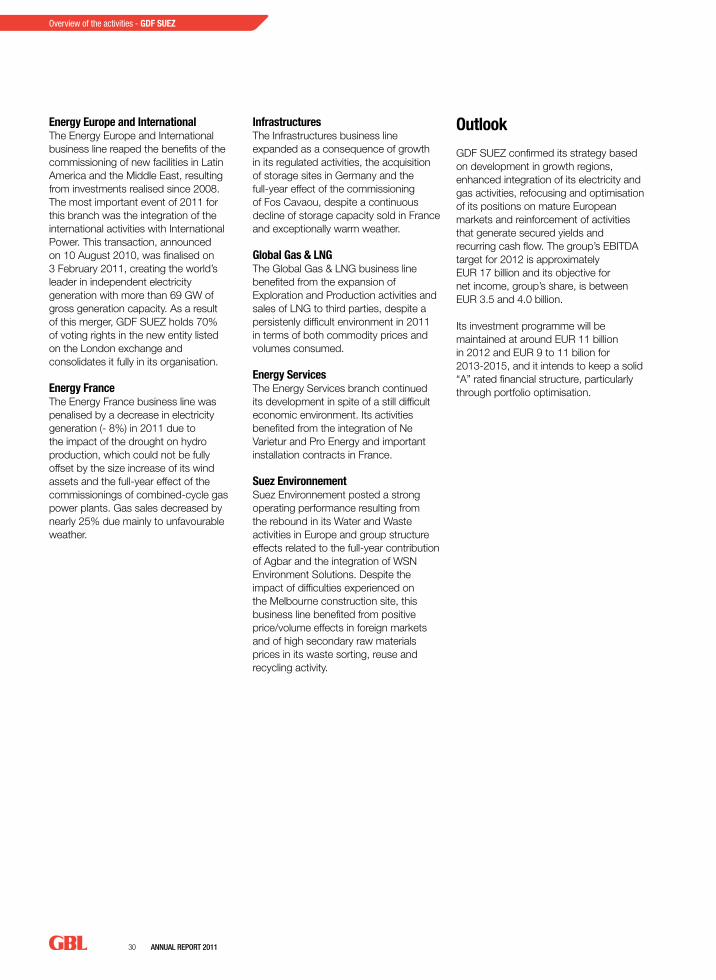
30 AnnuAl RepoRt 2011
Overview of the activities - GDF SUEZ
Energy Europe and InternationalThe Energy Europe and International business line reaped the benefits of the commissioning of new facilities in Latin America and the Middle East, resulting from investments realised since 2008. The most important event of 2011 for this branch was the integration of the international activities with International Power. This transaction, announced on 10 August 2010, was finalised on 3 February 2011, creating the world’s leader in independent electricity generation with more than 69 GW of gross generation capacity. As a result of this merger, GDF SUEZ holds 70% of voting rights in the new entity listed on the London exchange and consolidates it fully in its organisation.
Energy FranceThe Energy France business line was penalised by a decrease in electricity generation (- 8%) in 2011 due to the impact of the drought on hydro production, which could not be fully offset by the size increase of its wind assets and the full-year effect of the commissionings of combined-cycle gas power plants. Gas sales decreased by nearly 25% due mainly to unfavourable weather.
InfrastructuresThe Infrastructures business line expanded as a consequence of growth in its regulated activities, the acquisition of storage sites in Germany and the full-year effect of the commissioning of Fos Cavaou, despite a continuous decline of storage capacity sold in France and exceptionally warm weather.
Global Gas & LNGThe Global Gas & LNG business line benefited from the expansion of Exploration and Production activities and sales of LNG to third parties, despite a persistenly difficult environment in 2011 in terms of both commodity prices and volumes consumed.
Energy ServicesThe Energy Services branch continued its development in spite of a still difficult economic environment. Its activities benefited from the integration of Ne Varietur and Pro Energy and important installation contracts in France.
Suez EnvironnementSuez Environnement posted a strong operating performance resulting from the rebound in its Water and Waste activities in Europe and group structure effects related to the full-year contribution of Agbar and the integration of WSN Environment Solutions. Despite the impact of difficulties experienced on the Melbourne construction site, this business line benefited from positive price/volume effects in foreign markets and of high secondary raw materials prices in its waste sorting, reuse and recycling activity.
Outlook
GDF SUEZ confirmed its strategy based on development in growth regions, enhanced integration of its electricity and gas activities, refocusing and optimisation of its positions on mature European markets and reinforcement of activities that generate secured yields and recurring cash flow. The group’s EBITDA target for 2012 is approximately EUR 17 billion and its objective for net income, group’s share, is between EUR 3.5 and 4.0 billion.
Its investment programme will be maintained at around EUR 11 billion in 2012 and EUR 9 to 11 bilion for 2013-2015, and it intends to keep a solid “A” rated financial structure, particularly through portfolio optimisation.
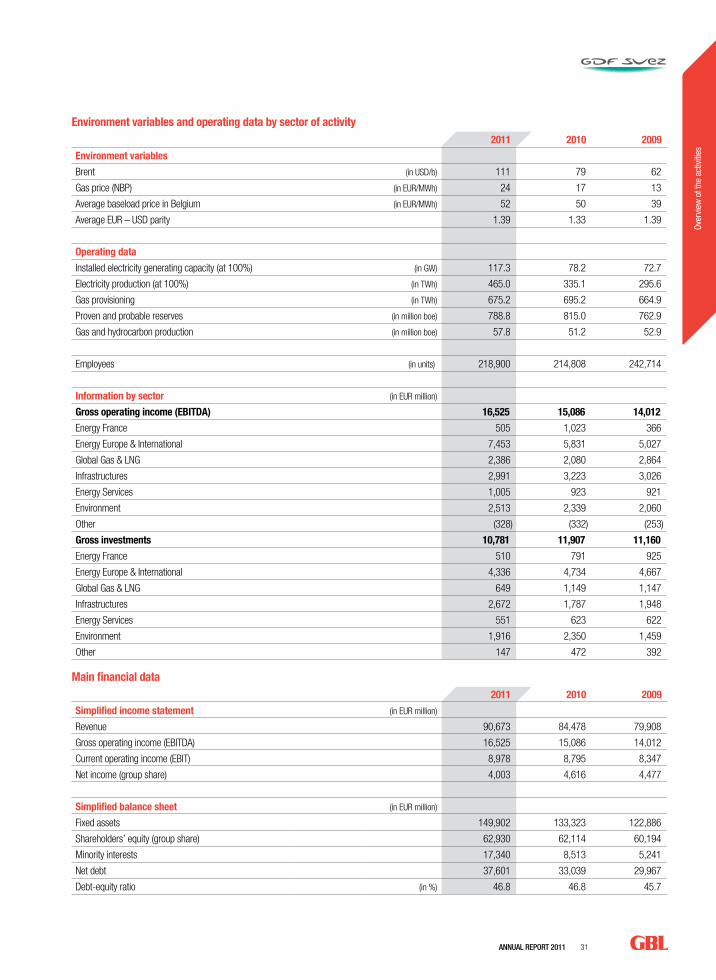
AnnuAl RepoRt 2011 31
Over
view
of t
he a
ctiv
ities
Environment variables and operating data by sector of activity2011 2010 2009
Environment variables
Brent (in USD/b) 111 79 62
Gas price (NBP) (in EUR/MWh) 24 17 13
Average baseload price in Belgium (in EUR/MWh) 52 50 39
Average EUR – USD parity 1.39 1.33 1.39
Operating data
Installed electricity generating capacity (at 100%) (in GW) 117.3 78.2 72.7
Electricity production (at 100%) (in TWh) 465.0 335.1 295.6
Gas provisioning (in TWh) 675.2 695.2 664.9
Proven and probable reserves (in million boe) 788.8 815.0 762.9
Gas and hydrocarbon production (in million boe) 57.8 51.2 52.9
Employees (in units) 218,900 214,808 242,714
Information by sector (in EUR million)
Gross operating income (EBITDA) 16,525 15,086 14,012
Energy France 505 1,023 366
Energy Europe & International 7,453 5,831 5,027
Global Gas & LNG 2,386 2,080 2,864
Infrastructures 2,991 3,223 3,026
Energy Services 1,005 923 921
Environment 2,513 2,339 2,060
Other (328) (332) (253)
Gross investments 10,781 11,907 11,160
Energy France 510 791 925
Energy Europe & International 4,336 4,734 4,667
Global Gas & LNG 649 1,149 1,147
Infrastructures 2,672 1,787 1,948
Energy Services 551 623 622
Environment 1,916 2,350 1,459
Other 147 472 392
Main financial data2011 2010 2009
Simplified income statement (in EUR million)
Revenue 90,673 84,478 79,908
Gross operating income (EBITDA) 16,525 15,086 14,012
Current operating income (EBIT) 8,978 8,795 8,347
Net income (group share) 4,003 4,616 4,477
Simplified balance sheet (in EUR million)
Fixed assets 149,902 133,323 122,886
Shareholders’ equity (group share) 62,930 62,114 60,194
Minority interests 17,340 8,513 5,241
Net debt 37,601 33,039 29,967
Debt-equity ratio (in %) 46.8 46.8 45.7
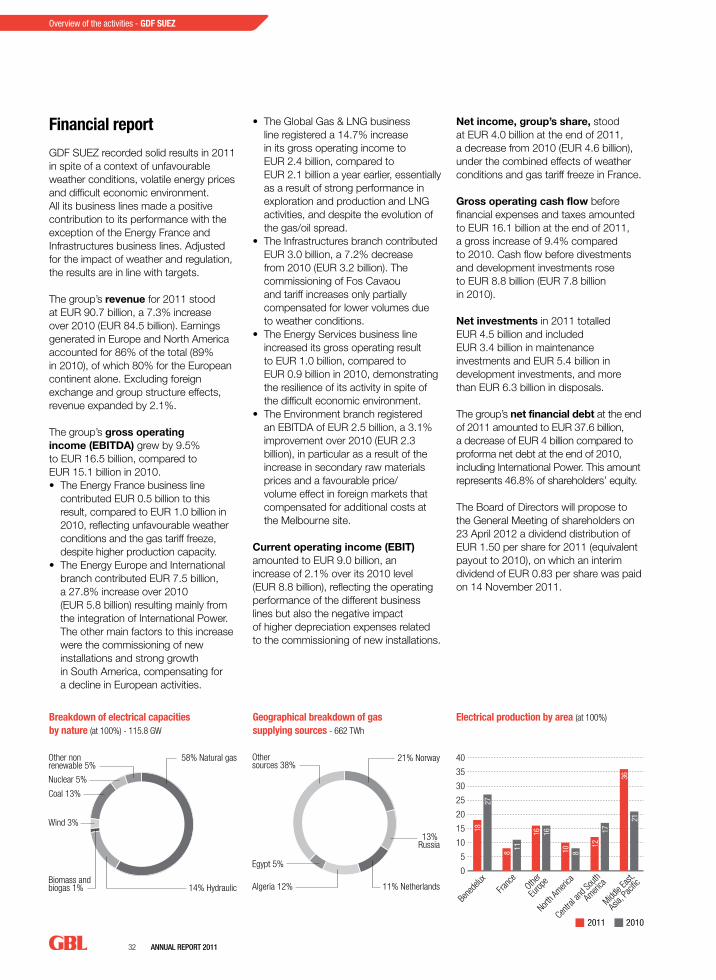
32 AnnuAl RepoRt 2011
Overview of the activities - GDF SUEZ
Bene
delux
Franc
eOthe
r
Europ
e
North A
merica
Centra
l and
South
Ameri
ca
Middle
East,
Asia,
Pacif
ic
58% Natural gas
14% HydraulicBiomass andbiogas 1%
Wind 3%
Nuclear 5%
Other non renewable 5%
Coal 13%
21% Norway
11% Netherlands
13% Russia
Algeria 12%
Egypt 5%
Othersources 38%
0
5
10
15
20
25
30
35
40
1827
811
16 16
10 8
1217
3621
31.0%21.4%
Geographical breakdown of gas supplying sources - 662 TWh
Breakdown of electrical capacities by nature (at 100%) - 115.8 GW
Electrical production by area (at 100%)
2011 2010
Financial report
GDF SUEZ recorded solid results in 2011 in spite of a context of unfavourable weather conditions, volatile energy prices and difficult economic environment. All its business lines made a positive contribution to its performance with the exception of the Energy France and Infrastructures business lines. Adjusted for the impact of weather and regulation, the results are in line with targets.
The group’s revenue for 2011 stood at EUR 90.7 billion, a 7.3% increase over 2010 (EUR 84.5 billion). Earnings generated in Europe and North America accounted for 86% of the total (89% in 2010), of which 80% for the European continent alone. Excluding foreign exchange and group structure effects, revenue expanded by 2.1%.
The group’s gross operating income (EBITDA) grew by 9.5% to EUR 16.5 billion, compared to EUR 15.1 billion in 2010.• The Energy France business line
contributed EUR 0.5 billion to this result, compared to EUR 1.0 billion in 2010, reflecting unfavourable weather conditions and the gas tariff freeze, despite higher production capacity.
• The Energy Europe and International branch contributed EUR 7.5 billion, a 27.8% increase over 2010 (EUR 5.8 billion) resulting mainly from the integration of International Power. The other main factors to this increase were the commissioning of new installations and strong growth in South America, compensating for a decline in European activities.
• The Global Gas & LNG business line registered a 14.7% increase in its gross operating income to EUR 2.4 billion, compared to EUR 2.1 billion a year earlier, essentially as a result of strong performance in exploration and production and LNG activities, and despite the evolution of the gas/oil spread.
• The Infrastructures branch contributed EUR 3.0 billion, a 7.2% decrease from 2010 (EUR 3.2 billion). The commissioning of Fos Cavaou and tariff increases only partially compensated for lower volumes due to weather conditions.
• The Energy Services business line increased its gross operating result to EUR 1.0 billion, compared to EUR 0.9 billion in 2010, demonstrating the resilience of its activity in spite of the difficult economic environment.
• The Environment branch registered an EBITDA of EUR 2.5 billion, a 3.1% improvement over 2010 (EUR 2.3 billion), in particular as a result of the increase in secondary raw materials prices and a favourable price/volume effect in foreign markets that compensated for additional costs at the Melbourne site.
Current operating income (EBIT) amounted to EUR 9.0 billion, an increase of 2.1% over its 2010 level (EUR 8.8 billion), reflecting the operating performance of the different business lines but also the negative impact of higher depreciation expenses related to the commissioning of new installations.
Net income, group’s share, stood at EUR 4.0 billion at the end of 2011, a decrease from 2010 (EUR 4.6 billion), under the combined effects of weather conditions and gas tariff freeze in France.
Gross operating cash flow before financial expenses and taxes amounted to EUR 16.1 billion at the end of 2011, a gross increase of 9.4% compared to 2010. Cash flow before divestments and development investments rose to EUR 8.8 billion (EUR 7.8 billion in 2010).
Net investments in 2011 totalled EUR 4.5 billion and included EUR 3.4 billion in maintenance investments and EUR 5.4 billion in development investments, and more than EUR 6.3 billion in disposals.
The group’s net financial debt at the end of 2011 amounted to EUR 37.6 billion, a decrease of EUR 4 billion compared to proforma net debt at the end of 2010, including International Power. This amount represents 46.8% of shareholders’ equity.
The Board of Directors will propose to the General Meeting of shareholders on 23 April 2012 a dividend distribution of EUR 1.50 per share for 2011 (equivalent payout to 2010), on which an interim dividend of EUR 0.83 per share was paid on 14 November 2011.

AnnuAl RepoRt 2011 33
Over
view
of t
he a
ctiv
ities
Data on Stock Exchange and on GBL’s investment2011 2010 2009
Stock Exchange data
Number of shares in issue (in thousands) 2,252,636 2,250,296 2,260,976
Stock market capitalisation (in EUR million) 47,576 60,420 68,485
Closing share price (in EUR/share) 21.12 26.85 30.29
Net income (in EUR/share) 1.80 2.11 2.05
Dividend (in EUR/share) 1.50 1.50 1.47
GBL’s investment
Percentage of share capital (in %) 5.2 5.2 5.2
Percentage of voting rights (in %) 5.2 5.2 5.2
Market value of the investment (in EUR million) 2,475 3,146 3,549
Dividends collected by GBL (in EUR million) 176 176 258
Representatives in statutory bodies 3 3 3
GDF SUEZ financial communication Anne Ravignon
Tel.: +33-1-44.22.67.59e-mail: [email protected]
Toll-free number in France: 0800.30.00.30Toll-free number in Belgium: 0800.25.125
www.gdfsuez.com
GDF SUEZ’s contribution to GBL’s adjusted net assets and earningsThe stock market value of GBL’s 5.2% stake in GDF SUEZ amounted to EUR 2,475 million at the end of December 2011, compared to EUR 3,146 million a year earlier. This decrease of EUR 671 million was the result of a 21% decline in the company’s share price year-on-year; the GDF SUEZ share price closed 2011 at EUR 21.12, compared to EUR 26.85 at the end of 2010.
GDF SUEZ’s contribution to GBL’s adjusted net assets amounted to 21% on 31 December 2011, compared to 22% a year earlier.
In 2011, GDF SUEZ contributed EUR 176 million to GBL’s earnings, unchanged from the previous year. The amount collected by GBL in 2011 corresponds to the 2010 balance and the advance for 2011 on GDF SUEZ dividends, i.e. EUR 0.67 and EUR 0.83 per share respectively, equivalent to the 2010 distributions.
Bene
delux
Franc
eOthe
r
Europ
e
North A
merica
Centra
l and
South
Ameri
ca
Middle
East,
Asia,
Pacif
ic
58% Natural gas
14% HydraulicBiomass andbiogas 1%
Wind 3%
Nuclear 5%
Other non renewable 5%
Coal 13%
21% Norway
11% Netherlands
13% Russia
Algeria 12%
Egypt 5%
Othersources 38%
0
5
10
15
20
25
30
35
40
1827
811
16 16
10 8
1217
3621
31.0%21.4%
GDF SUEZ’s contribution to GBL’s adjusted net assets
GDF SUEZ’s contribution to net dividends collected on investments
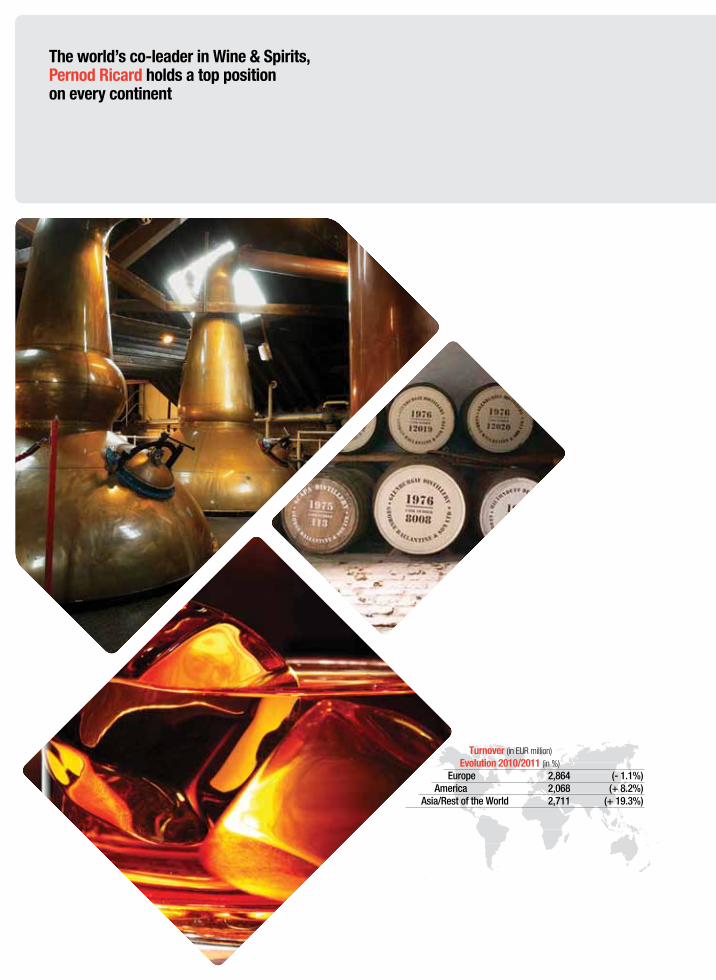
The world’s co-leader in Wine & Spirits, Pernod Ricard holds a top position on every continent
Turnover (in EUR million) Evolution 2010/2011 (in %)
europe 2,864 (- 1.1%)America 2,068 (+ 8.2%)
Asia/Rest of the World 2,711 (+ 19.3%)
AnnuAl RepoRt 2011 35
Over
view
of t
he a
ctiv
ities
Percentage of share capital ................................................................... 9.8%Percentage of voting rights ............................................................. 9.0%Contribution to GBL’s adjusted net assets .................... 16.2%Dividends collected by GBL .......................... EUR 38 million
Profile
Since its founding in 1975, Pernod Ricard has achieved significant internal growth and made numerous acquisitions, in particular Seagram in 2001, Allied Domecq in 2005 and Vin&Sprit in 2008, thus becoming the world’s co-leader in the Wine & Spirits market.
The group has a strong presence on every continent and a sound position in the emerging Asian, Eastern European and South American markets. It produces and distributes a range of 14 key brands of spirits and champagne and 4 brands of “Priority Premium Wines” as well as 18 local brands that are leaders on their markets, and a large number of regional brands. The group’s leading brands are:• Top 14: spirits: Absolut, Ballantine’s, Beefeater, Chivas Regal, Havana Club,
Jameson, Kahlúa, Malibu, Martell, Ricard, Royal Salute and The Glenlivet; champagnes: Mumm and Perrier-Jouët;
• Priority Premium Wines: Brancott Estate, Campo Viejo, Graffigna and Jacob’s Creek.
Pernod Ricard is number one in Premium spirits (retail price > USD 17) with leading positions in top-of-the-range scotches and in Premium vodka with Absolut. The group’s “premiumisation” strategy consists of giving priority to upmarket products offering a large margin and meeting consumers’ growing demands while reducing the group’s exposure to economic cycles. Pernod Ricard’s strategy is based on four key areas: • investing first and foremost in world-class strategic brands;• adding premium brands to position the company at the top end of the market and
thus accelerate growth and boost profitability;• expanding in emerging markets that offer the strongest growth prospects;• continuing to grow through acquisitions after reducing debt in order to remain a
dynamic player in the consolidation of the Wines & Spirits sector.
The group’s general organisation is structured around Pernod Ricard, the “Holding Company” that owns the companies referred to as “Brand Companies” and either directly or indirectly through holding companies called “Regions”, the so-called “Market Companies”. The Holding Company is in charge of certain reserved functions such as defining the group strategy, managing investments and financial structure. The Brand Companies are responsible for brands strategy and development as well as production. The Regions provide operational and financial control of the subsidiaries in a given geographical region (Asia, America and Europe). The Market Companies handle distribution and development of brands on local markets. Some companies combine the activities of the Brand Companies and Market Companies.
Overview of 2010-2011
Pernod Ricard demonstrated a remarkable performance for the financial year ended on 30 June 2011, with:• an acceleration of turnover organic
growth driven by a historic high in volumes for the Top 14 as a whole as well as for 7 of its brands;
• increased earnings, higher than targets set at the start of the financial year, coupled with stronger investments in advertising and on its strategic brands;
• a significant debt reduction and further refinancing.
The economic environment was characterised by an upturn in consumption on most markets, but also by strong currency volatility (in particular the EUR/USD rate) and historically low interest rates on the euro and the US dollar.
The year saw the introduction of organisational changes related to the conclusion of the Agility project:• creation of a new Brand Company
called Premium Wine Brands, which encompasses all the group’s priority wine brands;
• expansion of the remit of “The Absolut Company” to cover all international vodkas in the portfolio;
• creation of a new region, Pernod Ricard Sub-Saharan Africa, operating as a subsegment of Pernod Ricard Europe.
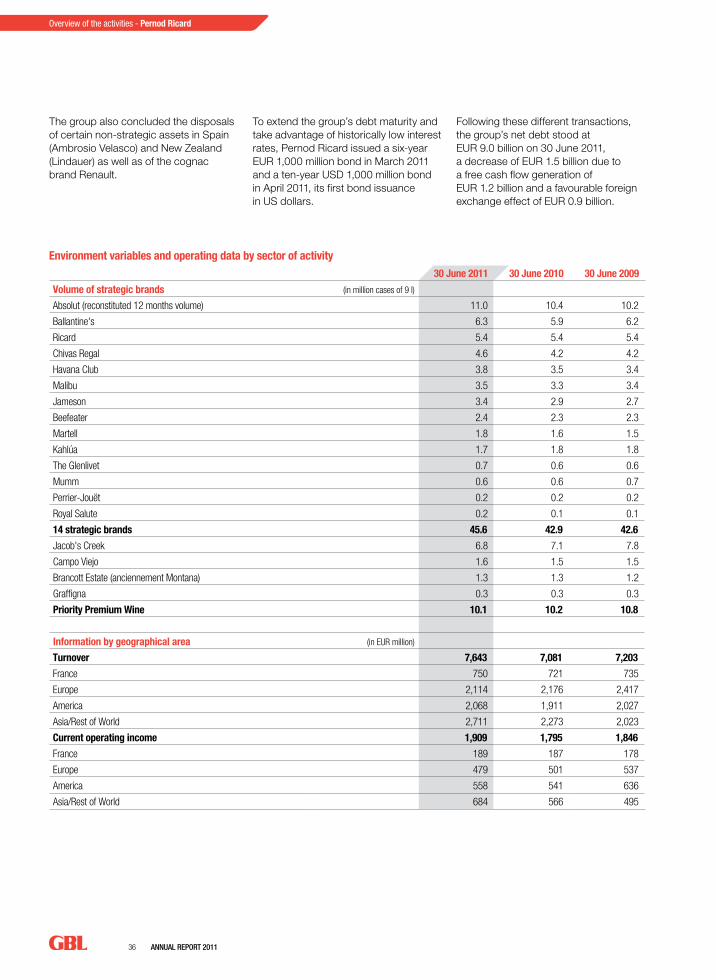
36 AnnuAl RepoRt 2011
Overview of the activities - Pernod Ricard
Environment variables and operating data by sector of activity30 June 2011 30 June 2010 30 June 2009
Volume of strategic brands (in million cases of 9 l)
Absolut (reconstituted 12 months volume) 11.0 10.4 10.2
Ballantine's 6.3 5.9 6.2
Ricard 5.4 5.4 5.4
Chivas Regal 4.6 4.2 4.2
Havana Club 3.8 3.5 3.4
Malibu 3.5 3.3 3.4
Jameson 3.4 2.9 2.7
Beefeater 2.4 2.3 2.3
Martell 1.8 1.6 1.5
Kahlúa 1.7 1.8 1.8
The Glenlivet 0.7 0.6 0.6
Mumm 0.6 0.6 0.7
Perrier-Jouët 0.2 0.2 0.2
Royal Salute 0.2 0.1 0.1
14 strategic brands 45.6 42.9 42.6
Jacob's Creek 6.8 7.1 7.8
Campo Viejo 1.6 1.5 1.5
Brancott Estate (anciennement Montana) 1.3 1.3 1.2
Graffigna 0.3 0.3 0.3
Priority Premium Wine 10.1 10.2 10.8
Information by geographical area (in EUR million)
Turnover 7,643 7,081 7,203
France 750 721 735
Europe 2,114 2,176 2,417
America 2,068 1,911 2,027
Asia/Rest of World 2,711 2,273 2,023
Current operating income 1,909 1,795 1,846
France 189 187 178
Europe 479 501 537
America 558 541 636
Asia/Rest of World 684 566 495
The group also concluded the disposals of certain non-strategic assets in Spain (Ambrosio Velasco) and New Zealand (Lindauer) as well as of the cognac brand Renault.
To extend the group’s debt maturity and take advantage of historically low interest rates, Pernod Ricard issued a six-year EUR 1,000 million bond in March 2011 and a ten-year USD 1,000 million bond in April 2011, its first bond issuance in US dollars.
Following these different transactions, the group’s net debt stood at EUR 9.0 billion on 30 June 2011, a decrease of EUR 1.5 billion due to a free cash flow generation of EUR 1.2 billion and a favourable foreign exchange effect of EUR 0.9 billion.
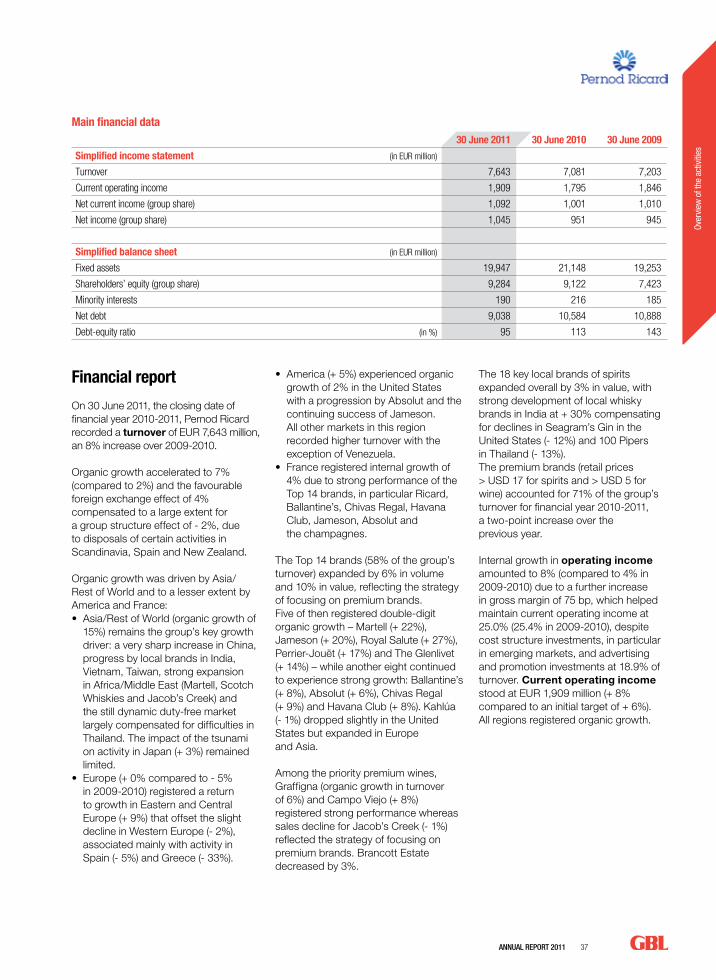
AnnuAl RepoRt 2011 37
Over
view
of t
he a
ctiv
ities
Main financial data30 June 2011 30 June 2010 30 June 2009
Simplified income statement (in EUR million)
Turnover 7,643 7,081 7,203
Current operating income 1,909 1,795 1,846
Net current income (group share) 1,092 1,001 1,010
Net income (group share) 1,045 951 945
Simplified balance sheet (in EUR million)
Fixed assets 19,947 21,148 19,253
Shareholders’ equity (group share) 9,284 9,122 7,423
Minority interests 190 216 185
Net debt 9,038 10,584 10,888
Debt-equity ratio (in %) 95 113 143
Financial report
On 30 June 2011, the closing date of financial year 2010-2011, Pernod Ricard recorded a turnover of EUR 7,643 million, an 8% increase over 2009-2010.
Organic growth accelerated to 7% (compared to 2%) and the favourable foreign exchange effect of 4% compensated to a large extent for a group structure effect of - 2%, due to disposals of certain activities in Scandinavia, Spain and New Zealand.
Organic growth was driven by Asia/Rest of World and to a lesser extent by America and France:• Asia/Rest of World (organic growth of
15%) remains the group’s key growth driver: a very sharp increase in China, progress by local brands in India, Vietnam, Taiwan, strong expansion in Africa/Middle East (Martell, Scotch Whiskies and Jacob’s Creek) and the still dynamic duty-free market largely compensated for difficulties in Thailand. The impact of the tsunami on activity in Japan (+ 3%) remained limited.
• Europe (+ 0% compared to - 5% in 2009-2010) registered a return to growth in Eastern and Central Europe (+ 9%) that offset the slight decline in Western Europe (- 2%), associated mainly with activity in Spain (- 5%) and Greece (- 33%).
• America (+ 5%) experienced organic growth of 2% in the United States with a progression by Absolut and the continuing success of Jameson. All other markets in this region recorded higher turnover with the exception of Venezuela.
• France registered internal growth of 4% due to strong performance of the Top 14 brands, in particular Ricard, Ballantine’s, Chivas Regal, Havana Club, Jameson, Absolut and the champagnes.
The Top 14 brands (58% of the group’s turnover) expanded by 6% in volume and 10% in value, reflecting the strategy of focusing on premium brands. Five of then registered double-digit organic growth – Martell (+ 22%), Jameson (+ 20%), Royal Salute (+ 27%), Perrier-Jouët (+ 17%) and The Glenlivet (+ 14%) – while another eight continued to experience strong growth: Ballantine’s (+ 8%), Absolut (+ 6%), Chivas Regal (+ 9%) and Havana Club (+ 8%). Kahlúa (- 1%) dropped slightly in the United States but expanded in Europe and Asia.
Among the priority premium wines, Graffigna (organic growth in turnover of 6%) and Campo Viejo (+ 8%) registered strong performance whereas sales decline for Jacob’s Creek (- 1%) reflected the strategy of focusing on premium brands. Brancott Estate decreased by 3%.
The 18 key local brands of spirits expanded overall by 3% in value, with strong development of local whisky brands in India at + 30% compensating for declines in Seagram’s Gin in the United States (- 12%) and 100 Pipers in Thailand (- 13%). The premium brands (retail prices > USD 17 for spirits and > USD 5 for wine) accounted for 71% of the group’s turnover for financial year 2010-2011, a two-point increase over the previous year.
Internal growth in operating income amounted to 8% (compared to 4% in 2009-2010) due to a further increase in gross margin of 75 bp, which helped maintain current operating income at 25.0% (25.4% in 2009-2010), despite cost structure investments, in particular in emerging markets, and advertising and promotion investments at 18.9% of turnover. Current operating income stood at EUR 1,909 million (+ 8% compared to an initial target of + 6%). All regions registered organic growth.

38 AnnuAl RepoRt 2011
Overview of the activities - Pernod Ricard
11% France
27% EuropeAmericas 25%
Asia/Rest of the World 37%
13% France
25% EuropeAmericas 25%
Asia/Rest of the World 38%
39% Emergingmarkets
Maturemarkets 61%
6.7%16.2%
11% France
27% EuropeAmericas 25%
Asia/Rest of the World 37%
13% France
25% EuropeAmericas 25%
Asia/Rest of the World 38%
39% Emergingmarkets
Maturemarkets 61%
6.7%16.2%
11% France
27% EuropeAmericas 25%
Asia/Rest of the World 37%
13% France
25% EuropeAmericas 25%
Asia/Rest of the World 38%
39% Emergingmarkets
Maturemarkets 61%
6.7%16.2%
Geographical breakdown of turnover (in % - First half 2011-2012)
Geographical breakdown of current operating income (in % - First half 2011-2012)
Emerging countries contribution to current operating income (in % - First half 2011-2012)
Financial costs remained stable under the combined effect of an increase in average debt cost and debt reduction. Current financial income was impacted favourably by the decrease in other financial income and expenses, contributing to the 10% increase in net earnings, group’s share, to EUR 1,045 million for financial year 2010-2011.
The General Meeting on 15 November 2011 decided to distribute a dividend of EUR 1.44 per share: an interim dividend of EUR 0.67 paid on 6 July 2011 and the balance of EUR 0.77 paid on 22 November 2011. In 2010, the dividend was EUR 1.34 per share.
Results for first half of financial year 2011-2012On 31 December 2011 (first half of financial year 2011-2012), the turnover registered an 8% increase to EUR 4,614 million, reflecting organic growth of 11%, with a negative foreign exchange effect of 2% resulting primarily from weakness in the US dollar and related currencies and a negative group structure effect of 1% related to certain activities in New Zealand and Spain. The Top 14 brands registered internal growth of 14%, the priority premium wines 3% and local brands 12%.
These developments were favourably impacted by technical effects (increase in distributors’ inventory in France on anticipation of an increase in exercise taxes on 1 January 2012, sales tied to Chinese New Year from second quarter, etc.). Excluding the impact of distributors’ inventory in France, turnover organic growth would have been 8%.
Gross margin rose significantly to 62.1% compared to 60.8% for the first half of the previous year. After a slight decline (-0.2%) in advertising and promotional investments to 17.7% of turnover, current operating income for the first half of the financial year increased by 14% to EUR 1,379 million, an organic growth of 17%. Net current income, group’s share, stood at EUR 843 million, a 16% increase, while net income, group’s share, rose by 20% to EUR 800 million. Net debt on 31 December 2011 rose to EUR 9.4 billion compared to EUR 9.0 billion on 30 June 2011 due to an unfavourable foreign exchange effect of EUR 564 million; excluding the foreign exchange effect, the debt dropped by EUR 0.2 billion primarily due to current cash generation of EUR 719 million, compared to EUR 716 million last year.
Outlook
The first half of 2011-2012 featured accelerated growth in activity and current operating income, which continue to be driven by the Top 14 brands and emerging markets.
In these circumstances, Pernod Ricard raised its target for organic growth in current operating income for financial year 2011-2012 to close to 8% from its earlier target of approximately 6%. The stated objective of a debt/equity ratio of around 3.9 (compared to 4.0 previously) for the financial year ending on 30 June 2012 also confirms management’s confidence in the group’s strong performance.

AnnuAl RepoRt 2011 39
Over
view
of t
he a
ctiv
ities
Data on Stock Exchange and on GBL’s investment30 June 2011 30 June 2010 30 June 2009
Stock Exchange data
Number of shares in issue (in thousands) 264,722 264,232 258,641
Stock market capitalisation (in EUR million) 17,933 16,906 11,605
Closing share price (in EUR/share) 67.97 63.98 44.87
Fully-diluted net income (1) (in EUR/share) 3.94 3.59 3.88
Dividend (in EUR/share) 1.44 1.34 0.50
GBL’s investment at 31 December 2011 2010 2009
Percentage of share capital (in %) 9.8 9.9 9.1
Percentage of voting rights (in %) 9.0 9.0 8.4
Market value of the investment (in EUR million) 1,870 1,836 1,444
Dividends collected by GBL (in EUR million) 38 35 11
Representatives in statutory bodies 2 2 2
(1) On the basis of the average number of shares in issue, excluding treasury shares, diluted
Pernod Ricard financial communication Jean Touboul
Manager, Financial communication & Investor Relations
Tel.: +33-1-41.00.41.71
www.pernod-ricard.com
Pernod Ricard’s contribution to GBL’s adjusted net assets and earningsGBL’s 9.8% stake in Pernod Ricard had a stock market value of EUR 1,870 million at the end of December 2011, compared to EUR 1,836 million a year earlier. This EUR 34 million increase was the result of the roughly 2% increase in the company’s share price year-on-year. The Pernod Ricard share closed at EUR 71.66 in 2011, compared to EUR 70.36 at the end of 2010.
Pernod Ricard’s share in GBL’s adjusted net assets stood at 16.2% on 31 December 2011, an increase over its 12.8% level a year earlier.
In 2011, the group contributed EUR 38 million to GBL’s earnings, compared to EUR 35 million in 2010. The amount collected by GBL in 2011 corresponds to the interim dividend and balance for financial year 2010-2011, i.e. EUR 0.67 and EUR 0.77 per share respectively.
11% France
27% EuropeAmericas 25%
Asia/Rest of the World 37%
13% France
25% EuropeAmericas 25%
Asia/Rest of the World 38%
39% Emergingmarkets
Maturemarkets 61%
6.7%16.2%
11% France
27% EuropeAmericas 25%
Asia/Rest of the World 37%
13% France
25% EuropeAmericas 25%
Asia/Rest of the World 38%
39% Emergingmarkets
Maturemarkets 61%
6.7%16.2%
Pernod Ricard’s contribution to GBL’s adjusted net assets
Pernod Ricard’s contribution to net dividends collected on investments
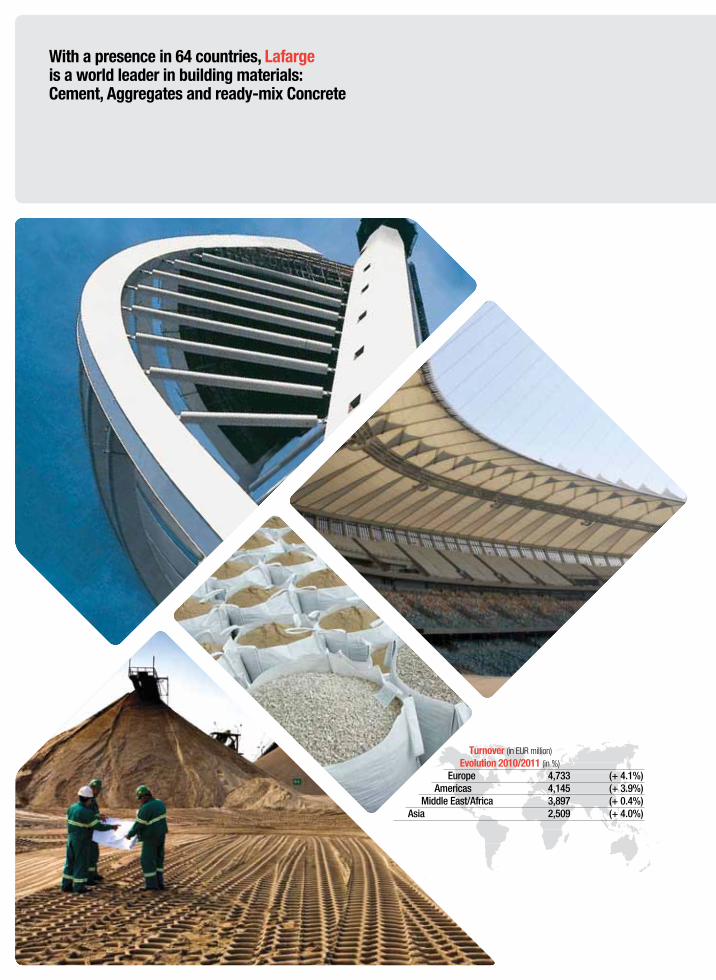
With a presence in 64 countries, Lafarge is a world leader in building materials: Cement, Aggregates and ready-mix Concrete
Turnover (in EUR million) Evolution 2010/2011 (in %)
europe 4,733 (+ 4.1%)Americas 4,145 (+ 3.9%)
Middle east/Africa 3,897 (+ 0.4%)Asia 2,509 (+ 4.0%)
AnnuAl RepoRt 2011 41
Over
view
of t
he a
ctiv
ities
Profile
Lafarge holds a leading position in each of its business divisions: it is the world’s largest producer of Cement, second largest producer of Aggregates and fourth largest producer of ready-mix Concrete.
Lafarge’s strategy aims to strengthen its position as world leader in building materials, in terms of market share, innovation, corporate image, geographical reach and profitability. The group has set two strategic priorities: Cement, primarily in growth markets, and innovation, particularly in innovative construction systems, notably with respect to the challenges of sustainable construction.
In Cement, consumption has grown significantly over the last twenty years, at an average growth rate of over 5% a year. Despite the economic crisis, global demand for Cement rose by nearly 8% in 2011, sustained by the dynamism of the activity in most of large emerging countries, in particular China, Brazil, India and sub-Saharan Africa. The outlook for the medium and long term remains favourable, particularly in the emerging countries where demographics, urbanisation, housing and infrastructure needs constitute significant levers. With more than 75% of its capacity located in emerging markets, the group is in a very strong position to benefit from this growth.
The second strategic priority is to develop sales of construction materials, innovative systems and services that meet customers’ needs in terms of sustainable construction, aesthetics and cost. To expand its range of products and services, the group relies on enhanced research and testing means and its many years of experience in the field of innovation in developed markets, to which the group’s development in emerging markets is now contributing. These products, systems and services with high value added are developed to respond to customers’ new rising expectations, whether in terms of performance, ease of use, faster implementation or recycling.
Overview of 2011
Growth in emerging countries continued in 2011. In the meantime, developed markets showed contrasting trends, with higher volumes in France and the United Kingdom, a deterioration of the economic cycle in southern Europe and a slight activity increase in North America.
In these circumstances, the group pursued and accelerated measures to adapt to the environment and strengthen its financial structure:• The group implemented cost-cutting
measures totalling EUR 250 million, exceeding its announced target of EUR 200 million. It targets at least EUR 400 million of incremental cost reductions in 2012.
• Debt was reduced by EUR 2 billion, in particular through the strategic disposal of Gypsum assets, which generated a net gain of EUR 466 million.
• A project for a new country-based organisation was announced for 2012, to increase productivity and stimulate internal growth and innovation.
Percentage of share capital ................................................................. 21.0%Percentage of voting rights .......................................................... 27.4%Contribution to GBL’s adjusted net assets .................... 14.2%Dividends collected by GBL .......................... EUR 61 million

42 AnnuAl RepoRt 2011
Overview of the activities - Lafarge
CementThe Cement business registered a turnover of EUR 10,622 million, representing an increase of 3.3% over 2010. Volumes increased in Canada, the United Kingdom and France, and remained stable in the United States, while Greece and Spain continued to face difficult economic conditions. Volumes grew by 7% (5% at comparable group structure) in all emerging markets. Foreign exchange variations had a negative impact of 3.3% while the group structure effect was positive at 2.4%. At constant group structure and exchange rates, turnover rose by 4.2%.
Aggregates & ConcreteTurnover in the Aggregates & Concrete business line increased by 3% to EUR 5,238 million. At constant group structure and exchange rates, it expanded by 5% due to higher volumes in France, the United Kingdom, Canada and Central and Eastern Europe, while other regions demonstrated contrasting trends. Aggregates volumes registered an expansion of 1% at constant group structure and exchange rates, while ready-mix concrete volumes remained stable compared to 2010.
Outlook
The group anticipates higher demand for cement of between 1% and 4% in 2012. Emerging markets are expected to remain the key driver of growth from which Lafarge plans to benefit through the broad geographical coverage of its high quality assets. Prices are expected to rise in 2012 and cost inflation to be more moderate than in 2011.
The group’s net debt is expected to continue to decline through the implementation of actions to maximise the group’s operating cash flow. These actions include a EUR 800 million cap on investments, additional strategic divestitures in the amount of more than EUR 1 billion and a cost-cutting programme of EUR 500 million, of which at least EUR 400 million will be achieved in 2012.
The new organisation scheme entails three key measures:• implementation of a country-based
organization common to the Cement, Aggregates & Concrete activities;
• the removal of one hierarchical layer, with the aim of cutting out the regional level;
• the resulting transformation of the Executive Committee, including the creation of a Performance function and an Innovation function.
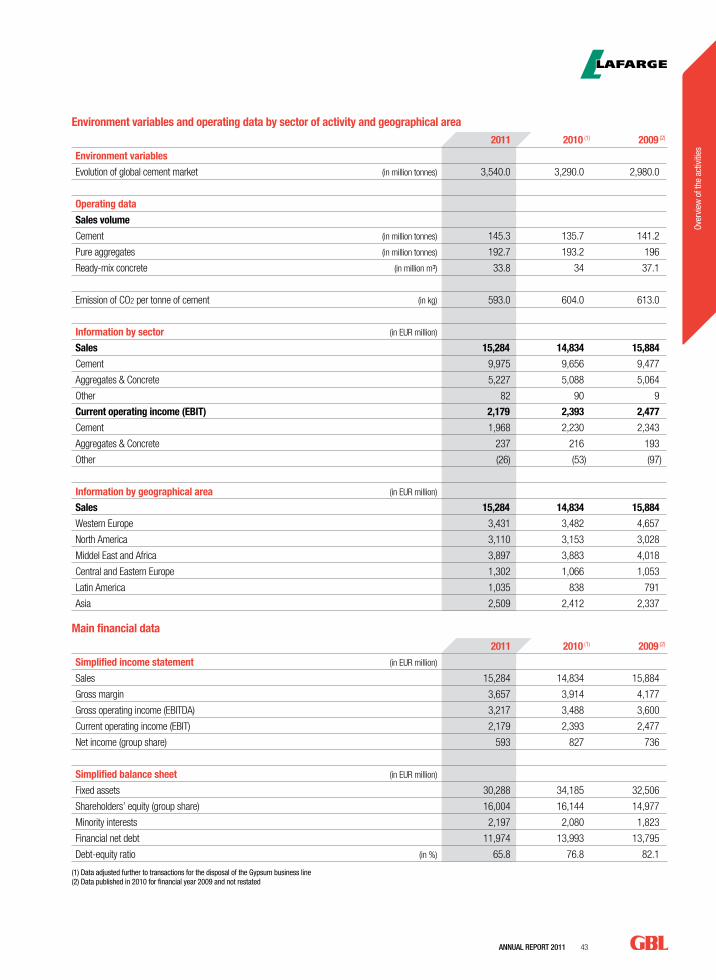
AnnuAl RepoRt 2011 43
Over
view
of t
he a
ctiv
ities
Environment variables and operating data by sector of activity and geographical area2011 2010 (1) 2009 (2)
Environment variables
Evolution of global cement market (in million tonnes) 3,540.0 3,290.0 2,980.0
Operating data
Sales volume
Cement (in million tonnes) 145.3 135.7 141.2
Pure aggregates (in million tonnes) 192.7 193.2 196
Ready-mix concrete (in million m³) 33.8 34 37.1
Emission of CO2 per tonne of cement (in kg) 593.0 604.0 613.0
Information by sector (in EUR million)
Sales 15,284 14,834 15,884
Cement 9,975 9,656 9,477
Aggregates & Concrete 5,227 5,088 5,064
Other 82 90 9
Current operating income (EBIT) 2,179 2,393 2,477
Cement 1,968 2,230 2,343
Aggregates & Concrete 237 216 193
Other (26) (53) (97)
Information by geographical area (in EUR million)
Sales 15,284 14,834 15,884
Western Europe 3,431 3,482 4,657
North America 3,110 3,153 3,028
Middel East and Africa 3,897 3,883 4,018
Central and Eastern Europe 1,302 1,066 1,053
Latin America 1,035 838 791
Asia 2,509 2,412 2,337
Main financial data2011 2010 (1) 2009 (2)
Simplified income statement (in EUR million)
Sales 15,284 14,834 15,884
Gross margin 3,657 3,914 4,177
Gross operating income (EBITDA) 3,217 3,488 3,600
Current operating income (EBIT) 2,179 2,393 2,477
Net income (group share) 593 827 736
Simplified balance sheet (in EUR million)
Fixed assets 30,288 34,185 32,506
Shareholders’ equity (group share) 16,004 16,144 14,977
Minority interests 2,197 2,080 1,823
Financial net debt 11,974 13,993 13,795
Debt-equity ratio (in %) 65.8 76.8 82.1
(1) Data adjusted further to transactions for the disposal of the Gypsum business line(2) Data published in 2010 for financial year 2009 and not restated
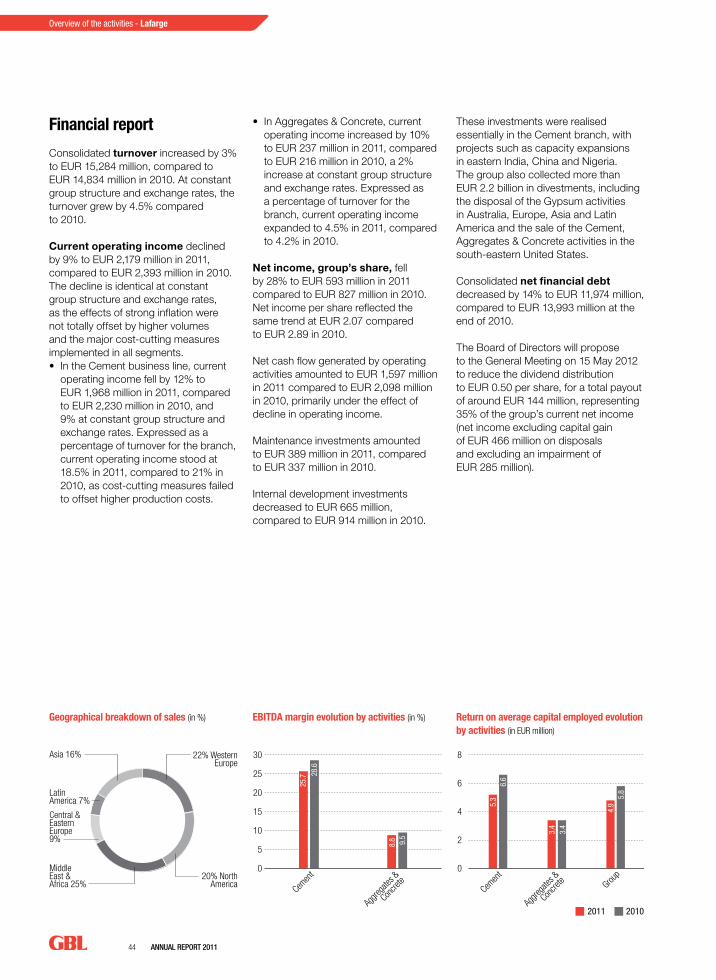
44 AnnuAl RepoRt 2011
Overview of the activities - Lafarge
22% WesternEurope
20% NorthAmerica
Middle East &Africa 25%
Central & Eastern Europe 9%
LatinAmerica 7%
Asia 16%
Cemen
t
Aggre
gates
&
Concre
te Group
0
2
4
6
8
5.3
3.4
4.9
6.6
3.4
5.8
Cemen
t
Aggre
gates
&
Concre
te0
5
10
15
20
25
30
25.7
8.8
28.6
9.5
10.7%14.2%
22% WesternEurope
20% NorthAmerica
Middle East &Africa 25%
Central & Eastern Europe 9%
LatinAmerica 7%
Asia 16%
Cemen
t
Aggre
gates
&
Concre
te Group
0
2
4
6
8
5.3
3.4
4.9
6.6
3.4
5.8
Cemen
t
Aggre
gates
&
Concre
te0
5
10
15
20
25
30
25.7
8.8
28.6
9.5
10.7%14.2%
22% WesternEurope
20% NorthAmerica
Middle East &Africa 25%
Central & Eastern Europe 9%
LatinAmerica 7%
Asia 16%
Cemen
t
Aggre
gates
&
Concre
te Group
0
2
4
6
8
5.3
3.4
4.9
6.6
3.4
5.8
Cemen
t
Aggre
gates
&
Concre
te0
5
10
15
20
25
30
25.7
8.8
28.6
9.5
10.7%14.2%
Geographical breakdown of sales (in %) EBITDA margin evolution by activities (in %) Return on average capital employed evolution by activities (in EUR million)
2011 2010
Financial report
Consolidated turnover increased by 3% to EUR 15,284 million, compared to EUR 14,834 million in 2010. At constant group structure and exchange rates, the turnover grew by 4.5% compared to 2010.
Current operating income declined by 9% to EUR 2,179 million in 2011, compared to EUR 2,393 million in 2010. The decline is identical at constant group structure and exchange rates, as the effects of strong inflation were not totally offset by higher volumes and the major cost-cutting measures implemented in all segments.• In the Cement business line, current
operating income fell by 12% to EUR 1,968 million in 2011, compared to EUR 2,230 million in 2010, and 9% at constant group structure and exchange rates. Expressed as a percentage of turnover for the branch, current operating income stood at 18.5% in 2011, compared to 21% in 2010, as cost-cutting measures failed to offset higher production costs.
• In Aggregates & Concrete, current operating income increased by 10% to EUR 237 million in 2011, compared to EUR 216 million in 2010, a 2% increase at constant group structure and exchange rates. Expressed as a percentage of turnover for the branch, current operating income expanded to 4.5% in 2011, compared to 4.2% in 2010.
Net income, group’s share, fell by 28% to EUR 593 million in 2011 compared to EUR 827 million in 2010. Net income per share reflected the same trend at EUR 2.07 compared to EUR 2.89 in 2010.
Net cash flow generated by operating activities amounted to EUR 1,597 million in 2011 compared to EUR 2,098 million in 2010, primarily under the effect of decline in operating income.
Maintenance investments amounted to EUR 389 million in 2011, compared to EUR 337 million in 2010.
Internal development investments decreased to EUR 665 million, compared to EUR 914 million in 2010.
These investments were realised essentially in the Cement branch, with projects such as capacity expansions in eastern India, China and Nigeria. The group also collected more than EUR 2.2 billion in divestments, including the disposal of the Gypsum activities in Australia, Europe, Asia and Latin America and the sale of the Cement, Aggregates & Concrete activities in the south-eastern United States.
Consolidated net financial debt decreased by 14% to EUR 11,974 million, compared to EUR 13,993 million at the end of 2010.
The Board of Directors will propose to the General Meeting on 15 May 2012 to reduce the dividend distribution to EUR 0.50 per share, for a total payout of around EUR 144 million, representing 35% of the group’s current net income (net income excluding capital gain of EUR 466 million on disposals and excluding an impairment of EUR 285 million).
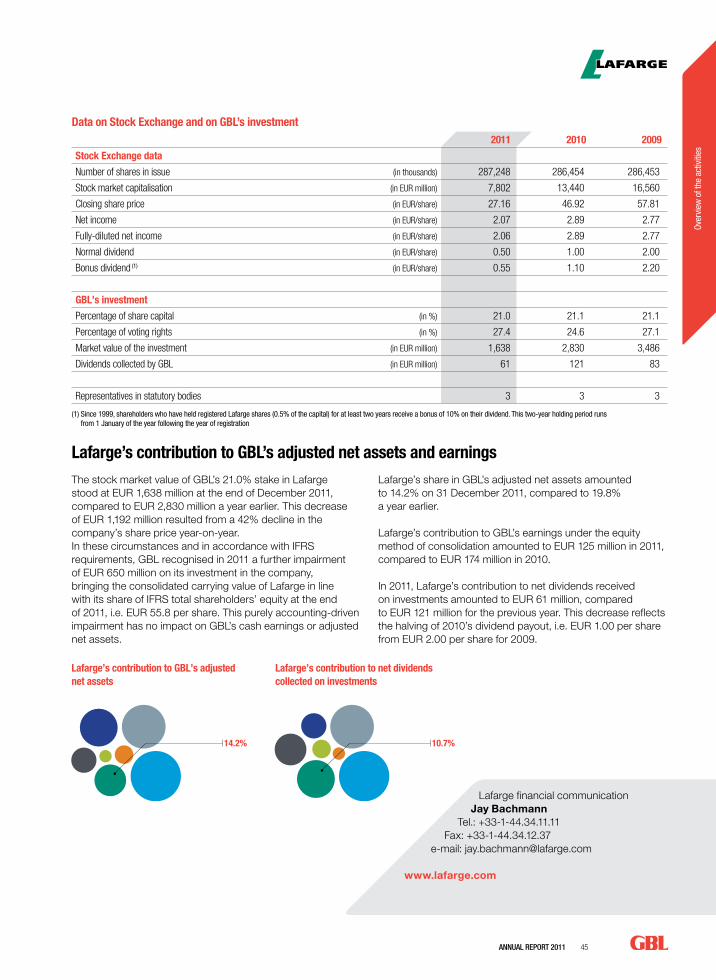
AnnuAl RepoRt 2011 45
Over
view
of t
he a
ctiv
ities
Data on Stock Exchange and on GBL’s investment2011 2010 2009
Stock Exchange data
Number of shares in issue (in thousands) 287,248 286,454 286,453
Stock market capitalisation (in EUR million) 7,802 13,440 16,560
Closing share price (in EUR/share) 27.16 46.92 57.81
Net income (in EUR/share) 2.07 2.89 2.77
Fully-diluted net income (in EUR/share) 2.06 2.89 2.77
Normal dividend (in EUR/share) 0.50 1.00 2.00
Bonus dividend (1) (in EUR/share) 0.55 1.10 2.20
GBL’s investment
Percentage of share capital (in %) 21.0 21.1 21.1
Percentage of voting rights (in %) 27.4 24.6 27.1
Market value of the investment (in EUR million) 1,638 2,830 3,486
Dividends collected by GBL (in EUR million) 61 121 83
Representatives in statutory bodies 3 3 3
(1) Since 1999, shareholders who have held registered Lafarge shares (0.5% of the capital) for at least two years receive a bonus of 10% on their dividend. This two-year holding period runs from 1 January of the year following the year of registration
Lafarge financial communication Jay Bachmann
Tel.: +33-1-44.34.11.11Fax: +33-1-44.34.12.37
e-mail: [email protected]
www.lafarge.com
Lafarge’s contribution to GBL’s adjusted net assets and earningsThe stock market value of GBL’s 21.0% stake in Lafarge stood at EUR 1,638 million at the end of December 2011, compared to EUR 2,830 million a year earlier. This decrease of EUR 1,192 million resulted from a 42% decline in the company’s share price year-on-year.In these circumstances and in accordance with IFRS requirements, GBL recognised in 2011 a further impairment of EUR 650 million on its investment in the company, bringing the consolidated carrying value of Lafarge in line with its share of IFRS total shareholders’ equity at the end of 2011, i.e. EUR 55.8 per share. This purely accounting-driven impairment has no impact on GBL’s cash earnings or adjusted net assets.
Lafarge’s share in GBL’s adjusted net assets amounted to 14.2% on 31 December 2011, compared to 19.8% a year earlier.
Lafarge’s contribution to GBL’s earnings under the equity method of consolidation amounted to EUR 125 million in 2011, compared to EUR 174 million in 2010.
In 2011, Lafarge’s contribution to net dividends received on investments amounted to EUR 61 million, compared to EUR 121 million for the previous year. This decrease reflects the halving of 2010’s dividend payout, i.e. EUR 1.00 per share from EUR 2.00 per share for 2009.
22% WesternEurope
20% NorthAmerica
Middle East &Africa 25%
Central & Eastern Europe 9%
LatinAmerica 7%
Asia 16%
Cemen
t
Aggre
gates
&
Concre
te Group
0
2
4
6
8
5.3
3.4
4.9
6.6
3.4
5.8
Cemen
t
Aggre
gates
&
Concre
te0
5
10
15
20
25
30
25.7
8.8
28.6
9.5
10.7%14.2%
22% WesternEurope
20% NorthAmerica
Middle East &Africa 25%
Central & Eastern Europe 9%
LatinAmerica 7%
Asia 16%
Cemen
t
Aggre
gates
&
Concre
te Group
0
2
4
6
8
5.3
3.4
4.9
6.6
3.4
5.8
Cemen
t
Aggre
gates
&
Concre
te0
5
10
15
20
25
30
25.7
8.8
28.6
9.5
10.7%14.2%
Lafarge’s contribution to GBL’s adjusted net assets
Lafarge’s contribution to net dividends collected on investments

Active in 47 countries with 240 industrial locations, Imerys is the world’s leader in minerals processing
Turnover (in EUR million) Evolution 2010/2011 (in %)
Western europe 1,754 (+ 9.6%)united States/Canada 724 (+ 5.6%)
Japan/Australia 198 (+ 17.0%)emerging countries 998 (+ 12.1%)
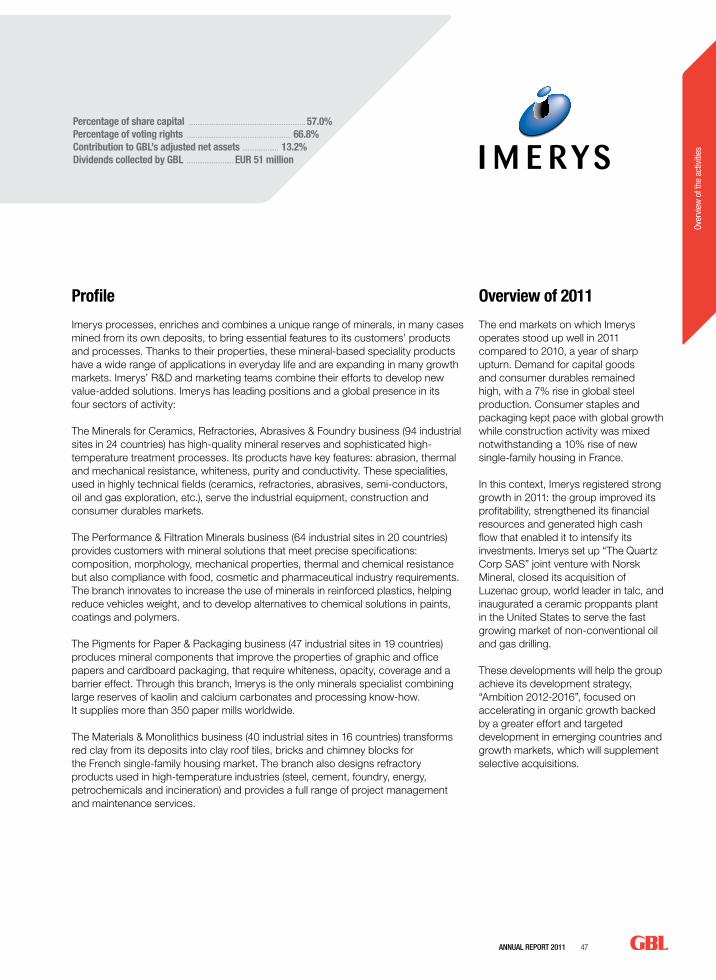
AnnuAl RepoRt 2011 47
Over
view
of t
he a
ctiv
ities
Profile
Imerys processes, enriches and combines a unique range of minerals, in many cases mined from its own deposits, to bring essential features to its customers’ products and processes. Thanks to their properties, these mineral-based speciality products have a wide range of applications in everyday life and are expanding in many growth markets. Imerys’ R&D and marketing teams combine their efforts to develop new value-added solutions. Imerys has leading positions and a global presence in its four sectors of activity:
The Minerals for Ceramics, Refractories, Abrasives & Foundry business (94 industrial sites in 24 countries) has high-quality mineral reserves and sophisticated high-temperature treatment processes. Its products have key features: abrasion, thermal and mechanical resistance, whiteness, purity and conductivity. These specialities, used in highly technical fields (ceramics, refractories, abrasives, semi-conductors, oil and gas exploration, etc.), serve the industrial equipment, construction and consumer durables markets.
The Performance & Filtration Minerals business (64 industrial sites in 20 countries) provides customers with mineral solutions that meet precise specifications: composition, morphology, mechanical properties, thermal and chemical resistance but also compliance with food, cosmetic and pharmaceutical industry requirements. The branch innovates to increase the use of minerals in reinforced plastics, helping reduce vehicles weight, and to develop alternatives to chemical solutions in paints, coatings and polymers.
The Pigments for Paper & Packaging business (47 industrial sites in 19 countries) produces mineral components that improve the properties of graphic and office papers and cardboard packaging, that require whiteness, opacity, coverage and a barrier effect. Through this branch, Imerys is the only minerals specialist combining large reserves of kaolin and calcium carbonates and processing know-how. It supplies more than 350 paper mills worldwide.
The Materials & Monolithics business (40 industrial sites in 16 countries) transforms red clay from its deposits into clay roof tiles, bricks and chimney blocks for the French single-family housing market. The branch also designs refractory products used in high-temperature industries (steel, cement, foundry, energy, petrochemicals and incineration) and provides a full range of project management and maintenance services.
Overview of 2011
The end markets on which Imerys operates stood up well in 2011 compared to 2010, a year of sharp upturn. Demand for capital goods and consumer durables remained high, with a 7% rise in global steel production. Consumer staples and packaging kept pace with global growth while construction activity was mixed notwithstanding a 10% rise of new single-family housing in France.
In this context, Imerys registered strong growth in 2011: the group improved its profitability, strengthened its financial resources and generated high cash flow that enabled it to intensify its investments. Imerys set up “The Quartz Corp SAS” joint venture with Norsk Mineral, closed its acquisition of Luzenac group, world leader in talc, and inaugurated a ceramic proppants plant in the United States to serve the fast growing market of non-conventional oil and gas drilling.
These developments will help the group achieve its development strategy, “Ambition 2012-2016”, focused on accelerating in organic growth backed by a greater effort and targeted development in emerging countries and growth markets, which will supplement selective acquisitions.
Percentage of share capital ................................................................. 57.0%Percentage of voting rights .......................................................... 66.8%Contribution to GBL’s adjusted net assets .................... 13.2%Dividends collected by GBL .......................... EUR 51 million
48 AnnuAl RepoRt 2011
Overview of the activities - Imerys
Minerals for Ceramics, Refractories, Abrasives & Foundries (32% of group turnover in 2011)Demand for Refractories, Abrasives & Foundries was sustained overall, in spite of a growth deceleration in steel production during the second half of the year in China and Europe, partially compensated by an improvement in North America.
Demand in Minerals for Ceramics remained strong, sustained by the dynamism of emerging countries.
Imerys increased capital spending with a USD 60 million investment in its new ceramic proppants plant (capacity of over 100,000 tonnes) based in Andersonville (Georgia, United States).
Performance & Filtration Minerals (19% of group turnover in 2011)Markets for consumer staples and intermediate industries were driven by dynamic growth in emerging countries. On the other hand, the construction market fared less well, improving only slightly in certain European countries and remaining stable at a low activity level in the United States. The markets served by the talc business stood up well overall.
Investments continued to inverse compared to the previous year, with a focus on the development of new products and geographical expansion.
Pigments for Paper & Packaging (21% of group turnover in 2011)In 2011, global paper production was comparable to its level of 2010, with growth in emerging countries (+ 6%) compensating for an erosion in mature markets (- 4%). The Packaging segment is still expanding and the branch allocates considerable means to increasing its product offering and sales in the sector.
Investments, up slightly over the previous year, mainly concerned the streamlining of Brazilian plants following PPSA’s acquisition and the reconstruction of the Miyagi Japanese plant damaged by the tsunami.
Materials & Monolithics (28% of group turnover in 2011)In France, new housing starts increased by 10% and the renovation activity remained solid. In this context, volumes of clay products increased by 9.4% and 19% for roof tiles and bricks, respectively.
Monolithic Refractories were driven by the dynamism of the global steel market and internal development of refractory solutions for new plants projects. Investments by this branch focused primarily on the maintenance of industrial assets and the improvement of its energy efficiency.
Outlook
The macro-economic environment has been more uncertain since the end of last summer; visibility is reduced in 2012 even though activity remained satisfactory in the early part of the year.
Therefore, the group remains wary: it will invest selectively, with a focus on growth projects and fast paybacks, strict management of working capital, expenditures, variable costs evolution and price/mix. In these circumstances, Imerys will continue its development strategy based on the acceleration of organic growth – through innovation and expansion of its portfolio in growth markets and geographics – and on a selective acquisition policy.
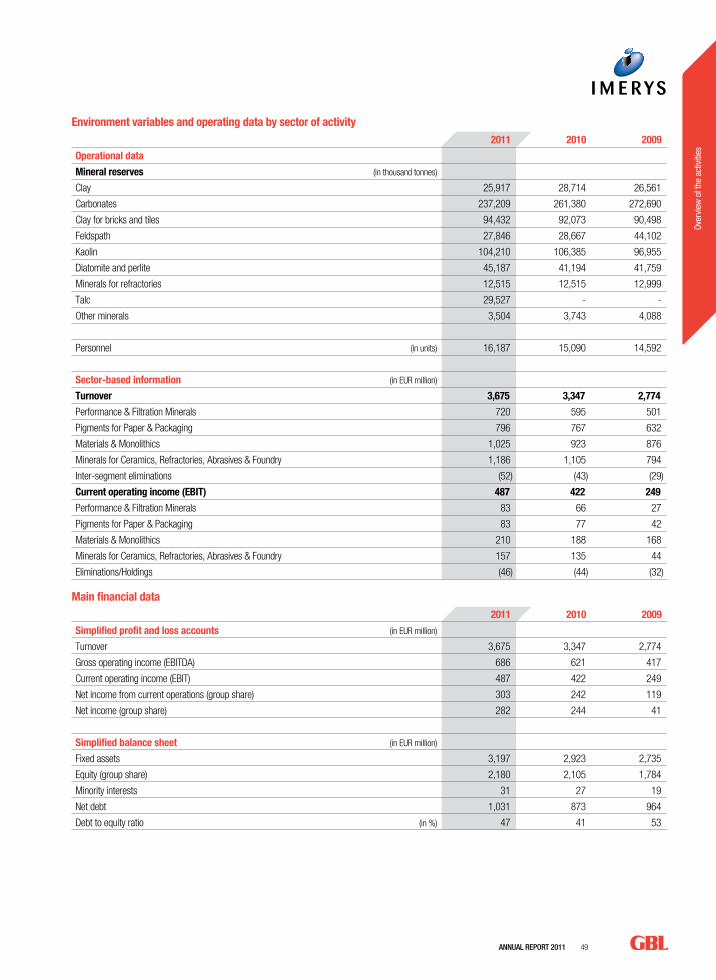
AnnuAl RepoRt 2011 49
Over
view
of t
he a
ctiv
ities
Environment variables and operating data by sector of activity2011 2010 2009
Operational data
Mineral reserves (in thousand tonnes)
Clay 25,917 28,714 26,561
Carbonates 237,209 261,380 272,690
Clay for bricks and tiles 94,432 92,073 90,498
Feldspath 27,846 28,667 44,102
Kaolin 104,210 106,385 96,955
Diatomite and perlite 45,187 41,194 41,759
Minerals for refractories 12,515 12,515 12,999
Talc 29,527 - -
Other minerals 3,504 3,743 4,088
Personnel (in units) 16,187 15,090 14,592
Sector-based information (in EUR million)
Turnover 3,675 3,347 2,774
Performance & Filtration Minerals 720 595 501
Pigments for Paper & Packaging 796 767 632
Materials & Monolithics 1,025 923 876
Minerals for Ceramics, Refractories, Abrasives & Foundry 1,186 1,105 794
Inter-segment eliminations (52) (43) (29)
Current operating income (EBIT) 487 422 249
Performance & Filtration Minerals 83 66 27
Pigments for Paper & Packaging 83 77 42
Materials & Monolithics 210 188 168
Minerals for Ceramics, Refractories, Abrasives & Foundry 157 135 44
Eliminations/Holdings (46) (44) (32)
Main financial data2011 2010 2009
Simplified profit and loss accounts (in EUR million)
Turnover 3,675 3,347 2,774
Gross operating income (EBITDA) 686 621 417
Current operating income (EBIT) 487 422 249
Net income from current operations (group share) 303 242 119
Net income (group share) 282 244 41
Simplified balance sheet (in EUR million)
Fixed assets 3,197 2,923 2,735
Equity (group share) 2,180 2,105 1,784
Minority interests 31 27 19
Net debt 1,031 873 964
Debt to equity ratio (in %) 47 41 53
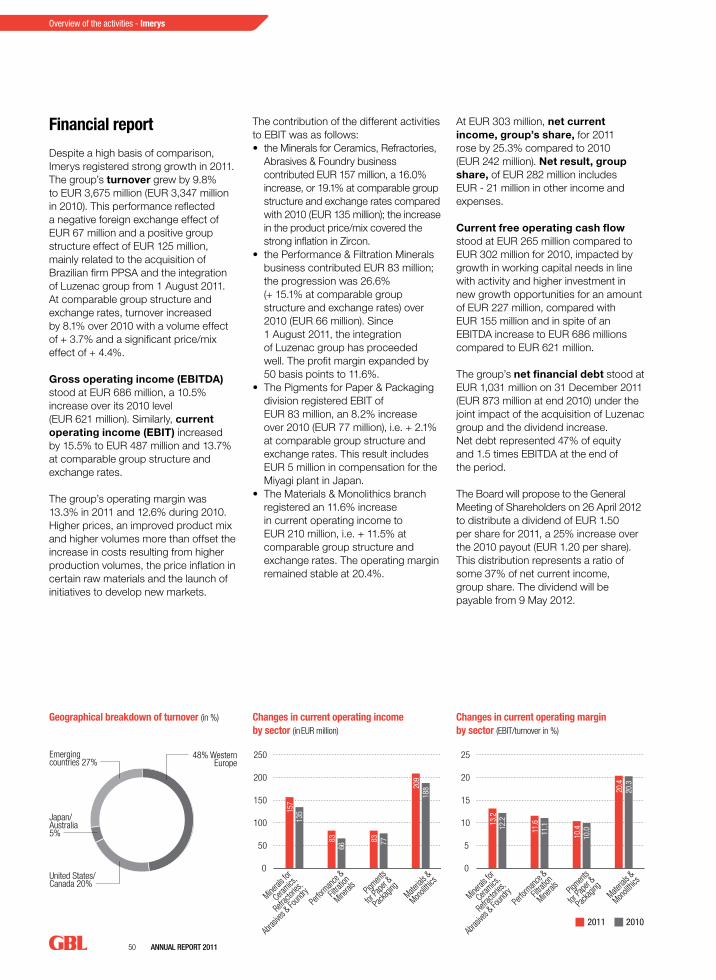
50 AnnuAl RepoRt 2011
Overview of the activities - Imerys
48% WesternEurope
United States/Canada 20%
Japan/Australia 5%
Emergingcountries 27%
32 % Minéraux pour Céramiques, Réfractaires,
Abrasifs & Fonderie
19 % Minéraux de Performance & Filtration
Pigments pour Papier & Emballage 21 %
Matériaux & Monolithiques 28 %
Minerals
for
Ceramics
,
Refra
ctories
,
Abras
ives &
Found
ry Material
s &
Mono
lithics
Perfo
rmanc
e &
Filtra
tion
Mine
rals Pigment
s
for P
aper &
Packa
ging
0
50
100
150
200
250
157
135
8366
83 77
209
188
Minerals
for
Ceramics
,
Refra
ctories
,
Abras
ives &
Found
ry Material
s &
Mono
lithics
Perfo
rmanc
e &
Filtra
tion
Mine
rals Pigment
s
for P
aper &
Packa
ging
0
5
10
15
20
25
13.2
12.2
11.6
11.1
10.4
10.0
20.4
20.3
9.0%13.2%
Geographical breakdown of turnover (in %) Changes in current operating income by sector (in EUR million)
Changes in current operating margin by sector (EBIT/turnover in %)
2011 2010
Financial report
Despite a high basis of comparison, Imerys registered strong growth in 2011. The group’s turnover grew by 9.8% to EUR 3,675 million (EUR 3,347 million in 2010). This performance reflected a negative foreign exchange effect of EUR 67 million and a positive group structure effect of EUR 125 million, mainly related to the acquisition of Brazilian firm PPSA and the integration of Luzenac group from 1 August 2011. At comparable group structure and exchange rates, turnover increased by 8.1% over 2010 with a volume effect of + 3.7% and a significant price/mix effect of + 4.4%.
Gross operating income (EBITDA) stood at EUR 686 million, a 10.5% increase over its 2010 level (EUR 621 million). Similarly, current operating income (EBIT) increased by 15.5% to EUR 487 million and 13.7% at comparable group structure and exchange rates.
The group’s operating margin was 13.3% in 2011 and 12.6% during 2010. Higher prices, an improved product mix and higher volumes more than offset the increase in costs resulting from higher production volumes, the price inflation in certain raw materials and the launch of initiatives to develop new markets.
The contribution of the different activities to EBIT was as follows:• the Minerals for Ceramics, Refractories,
Abrasives & Foundry business contributed EUR 157 million, a 16.0% increase, or 19.1% at comparable group structure and exchange rates compared with 2010 (EUR 135 million); the increase in the product price/mix covered the strong inflation in Zircon.
• the Performance & Filtration Minerals business contributed EUR 83 million; the progression was 26.6% (+ 15.1% at comparable group structure and exchange rates) over 2010 (EUR 66 million). Since 1 August 2011, the integration of Luzenac group has proceeded well. The profit margin expanded by 50 basis points to 11.6%.
• The Pigments for Paper & Packaging division registered EBIT of EUR 83 million, an 8.2% increase over 2010 (EUR 77 million), i.e. + 2.1% at comparable group structure and exchange rates. This result includes EUR 5 million in compensation for the Miyagi plant in Japan.
• The Materials & Monolithics branch registered an 11.6% increase in current operating income to EUR 210 million, i.e. + 11.5% at comparable group structure and exchange rates. The operating margin remained stable at 20.4%.
At EUR 303 million, net current income, group’s share, for 2011 rose by 25.3% compared to 2010 (EUR 242 million). Net result, group share, of EUR 282 million includes EUR - 21 million in other income and expenses.
Current free operating cash flow stood at EUR 265 million compared to EUR 302 million for 2010, impacted by growth in working capital needs in line with activity and higher investment in new growth opportunities for an amount of EUR 227 million, compared with EUR 155 million and in spite of an EBITDA increase to EUR 686 millions compared to EUR 621 million.
The group’s net financial debt stood at EUR 1,031 million on 31 December 2011 (EUR 873 million at end 2010) under the joint impact of the acquisition of Luzenac group and the dividend increase. Net debt represented 47% of equity and 1.5 times EBITDA at the end of the period.
The Board will propose to the General Meeting of Shareholders on 26 April 2012 to distribute a dividend of EUR 1.50 per share for 2011, a 25% increase over the 2010 payout (EUR 1.20 per share). This distribution represents a ratio of some 37% of net current income, group share. The dividend will be payable from 9 May 2012.
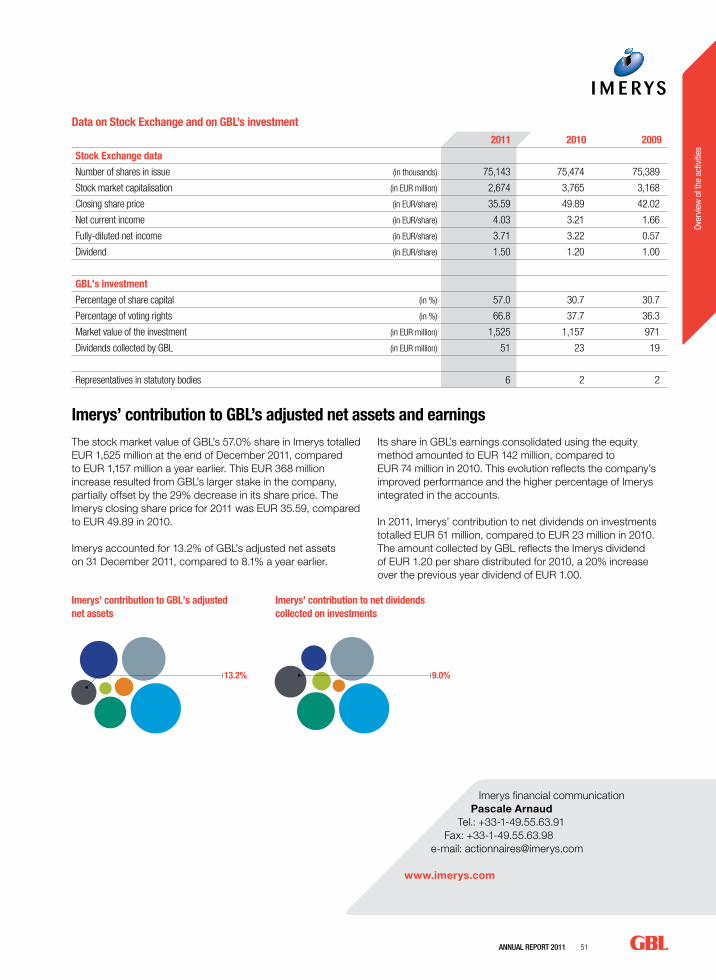
AnnuAl RepoRt 2011 51
Over
view
of t
he a
ctiv
ities
Data on Stock Exchange and on GBL’s investment2011 2010 2009
Stock Exchange data
Number of shares in issue (in thousands) 75,143 75,474 75,389
Stock market capitalisation (in EUR million) 2,674 3,765 3,168
Closing share price (in EUR/share) 35.59 49.89 42.02
Net current income (in EUR/share) 4.03 3.21 1.66
Fully-diluted net income (in EUR/share) 3.71 3.22 0.57
Dividend (in EUR/share) 1.50 1.20 1.00
GBL’s investment
Percentage of share capital (in %) 57.0 30.7 30.7
Percentage of voting rights (in %) 66.8 37.7 36.3
Market value of the investment (in EUR million) 1,525 1,157 971
Dividends collected by GBL (in EUR million) 51 23 19
Representatives in statutory bodies 6 2 2
Imerys financial communication Pascale Arnaud
Tel.: +33-1-49.55.63.91Fax: +33-1-49.55.63.98
e-mail: [email protected]
www.imerys.com
Imerys’ contribution to GBL’s adjusted net assets and earningsThe stock market value of GBL’s 57.0% share in Imerys totalled EUR 1,525 million at the end of December 2011, compared to EUR 1,157 million a year earlier. This EUR 368 million increase resulted from GBL’s larger stake in the company, partially offset by the 29% decrease in its share price. The Imerys closing share price for 2011 was EUR 35.59, compared to EUR 49.89 in 2010.
Imerys accounted for 13.2% of GBL’s adjusted net assets on 31 December 2011, compared to 8.1% a year earlier.
Its share in GBL’s earnings consolidated using the equity method amounted to EUR 142 million, compared to EUR 74 million in 2010. This evolution reflects the company’s improved performance and the higher percentage of Imerys integrated in the accounts.
In 2011, Imerys’ contribution to net dividends on investments totalled EUR 51 million, compared to EUR 23 million in 2010. The amount collected by GBL reflects the Imerys dividend of EUR 1.20 per share distributed for 2010, a 20% increase over the previous year dividend of EUR 1.00.
48% WesternEurope
United States/Canada 20%
Japan/Australia 5%
Emergingcountries 27%
32 % Minéraux pour Céramiques, Réfractaires,
Abrasifs & Fonderie
19 % Minéraux de Performance & Filtration
Pigments pour Papier & Emballage 21 %
Matériaux & Monolithiques 28 %
Minerals
for
Ceramics
,
Refra
ctories
,
Abras
ives &
Found
ry Material
s &
Mono
lithics
Perfo
rmanc
e &
Filtra
tion
Mine
rals Pigment
s
for P
aper &
Packa
ging
0
50
100
150
200
250
157
135
8366
83 77
209
188
Minerals
for
Ceramics
,
Refra
ctories
,
Abras
ives &
Found
ry Material
s &
Mono
lithics
Perfo
rmanc
e &
Filtra
tion
Mine
rals Pigment
s
for P
aper &
Packa
ging
0
5
10
15
20
25
13.2
12.2
11.6
11.1
10.4
10.0
20.4
20.3
9.0%13.2%
Imerys’ contribution to GBL’s adjusted net assets
Imerys’ contribution to net dividends collected on investments
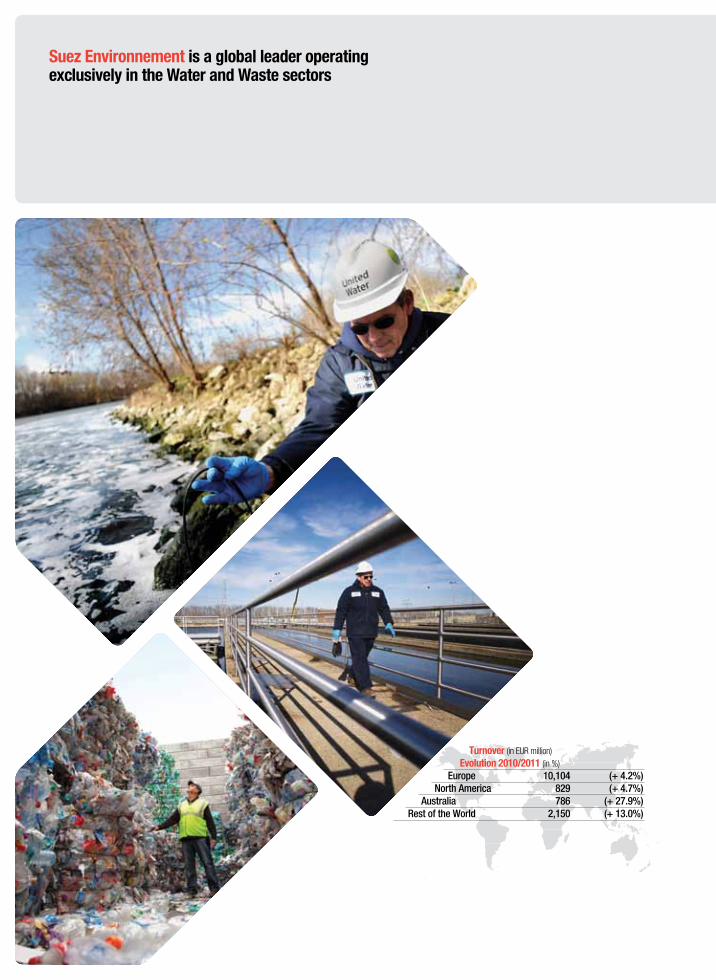
Suez Environnement is a global leader operating exclusively in the Water and Waste sectors
Turnover (in EUR million) Evolution 2010/2011 (in %)
europe 10,104 (+ 4.2%)north America 829 (+ 4.7%)
Australia 786 (+ 27.9%)Rest of the World 2,150 (+ 13.0%)
AnnuAl RepoRt 2011 53
Over
view
of t
he a
ctiv
ities
Profile
Suez Environnement is one of the world’s top two players in environment activities, with a strong presence in Europe, particularly in France and Spain (Agbar), and operating in more than 36 countries. The group is active in all water and waste cycles and operates under different banners such as SITA in the waste sector, and Lyonnaise des Eaux, Ondéo Industrial Solutions, Safège, Degrémont, United Water and Agbar in the water sector. It exercises its activities under different contractual forms, both for public bodies and for private sector operators, and has an extensive network of subsidiaries and agencies. The company is organised into three main business lines: Water Europe, Waste Europe and International, which are themselves divided up into nine business units.
In the Water sector, activities include the catchment, pumping, treatment and distribution of drinking water, network maintenance and the operation of plants, customer management, collection and purification of domestic and industrial waste water, the biological and energy development of sludge from the purification process, and consumption control services.
In the Waste sector, the group’s activities include among others the collection of all kinds of waste (apart from radioactive waste) and urban waste, selection and preliminary treatment of waste, recycling, material, biological and energy recovery of recoverable waste, the elimination of residual waste by incineration or landfill and integrated management of industrial sites, including in particular soil remediation, decontamination and rehabilitation as well as dismantling and decommissioning of end-of-life equipment.
The International division primarily comprises the activities of Degrémont, world leader in the design, construction and operation of drinking water production plants, sea water or brackish water desalination facilities, and waste water and sludge treatment and recycling sites. The group is also active in the United States through its subsidiary United Water, in China through water management and electricity concessions in Macao, and its subsidiary SITA Waste Services for waste activities in Hong Kong, and in Australia, Central Europe and the Middle East.
Globally, in the Water sector, Suez Environnement operated more than 1,200 drinking water production plants serving a population of 91 million people in 2011, and more than 2,300 water treatment facilities covering the needs of 63 million people. In the Waste sector, the group provided collection services to nearly 57 million people and treated nearly 42 million tonnes of waste. In the context of the merger between Suez and Gaz de France, Suez Environnement was floated on the Stock Exchange on 22 July 2008, a transaction implemented through the distribution by Suez of 65% of the company to its shareholders.
Overview of 2011
In an economic environment of subdued recovery, Suez Environnement recorded turnover growth above targets in all its businesses in 2011, reflecting dynamic commercial activity in Water and Waste in Europe and sustained growh in its International business. Regarding the results, performance was impacted by difficulties experienced on the construction of the desalination plant in Melbourne. The group never-theless benefited from the effective implementation of its cost-cutting plan (Compass) and financial discipline in investing and liquidity management.
In 2011, the group also reinforced strategic positions in its different businesses, including acceleration of its International expansion. The acquisition of the Waste activities of WSN Environmental Solutions consolidated the group’s presence in Australia. Similarly, the acquisition of PRSP in Poland reinforced Suez Environnement’s position in Eastern Europe.
The company also maintained resilient and innovation-oriented business activity through new service offerings, particularly in waste recovery, protection of water resources and reduction of environmental footprint.
Percentage of share capital ............................................................... 7.2% (1)
Percentage of voting rights .......................................................... 7.2% (1)
Contribution to GBL’s adjusted net assets ....................... 2.7% Dividends collected by GBL .......................... EUR 23 million
(1) Of which 0.3% in trading
54 AnnuAl RepoRt 2011
Overview of the activities - Suez Environnement
Water EuropeThe Water Europe segment registered growing results in 2011 in both Lyonnaise des Eaux and Agbar.
This performance was driven by growth in the sanitation activities of Lyonnaise des Eaux, positive price effects on concessions and the dynamism of the works and services activity, despite negative volume effects.
For Agbar, the favourable consequences of higher prices and volumes (Spain and Chile) outpaced the decline in the works activity in Spain.
This overall results improvement was moderated by an unfavourable group structure effect at Agbar, namely the disposal of 70% of the regulated activities of Bristol Water in the United Kingdom.
Waste EuropeThe Waste Europe business turned to good account in 2011 the expansion in all countries of Sorting/Recycling activities, which benefited from continuing high secondary raw materials prices (mainly metal and paper) coupled with an overall improvement in volumes. The volumes treated for energy recovery also increased significantly.
The waste treatment market is evolving towards increased energy recovery and less disposal, a trend reflected at the company’s level by an increase of more than 7.8% in volumes recovered in 2011. Conversely, volumes of waste disposed of through landfill decreased by 1.7%, with disparities amongst geographical regions though.
Overall, the tonnages treated by the group in Europe rose by 3.4% in 2011.
This market trend reinforces the group’s strategy based on maintaining activity throughout the waste treatment value chain and developing new material and energy recovery units.
InternationalGrowth in this segment was driven by an increased activity across all entities apart from Degrémont, which was impacted by difficulties with the construction of the Melbourne desalination plant. Progress on the Melbourne project was indeed slowed by unfavourable weather conditions and productivity.
The segment registered significant commercial profits, particularly in Australia, Czech Republic and Uruguay. North America also progressed, sustained by a positive trade balance on service contracts and positive tariff revisions, despite lower volumes. Growth was particularly strong in Asia-Pacific, notably in China and Australia due to higher prices and volumes. The group’s activities also expanded in Morocco and Algeria.
This improvement also resulted from favourable group structure effects, such as the acquisition of WSN Environmental Solutions in the waste market in Australia.
Outlook
In a sluggish economic environment, the group has set as priority for 2012 and 2013 to protect its profitability and maintain a solid balance sheet with satisfactory liquidity levels.
At constant foreign exchange rates, the group expects turnover, gross operating income (EBITDA) and free cash flow in 2012 to be greater or equal to 2011 levels, and plans to expand its Compass programme to EUR 360 million for the period 2010-2012.
For 2013, management expects to generate gross operating income (EBITDA), at constant foreign exchange rates, of EUR 2.7 billion or more, by capitalising on its long-term sustainable growth strategy based on exogenous factors such as regulation, urbanisation, growing scarcity of resources requiring optimal water management and waste recovery, and on the positioning of its businesses at the heart of the circular economy.
The net financial debt-to-EBITDA is expected to remain stable at around three to one for the entire period.
The company has also set a general framework for its future dividend policy, anticipating for 2012 a dividend per share of at least EUR 0.65 with a long-term payout objective of more than 60%.
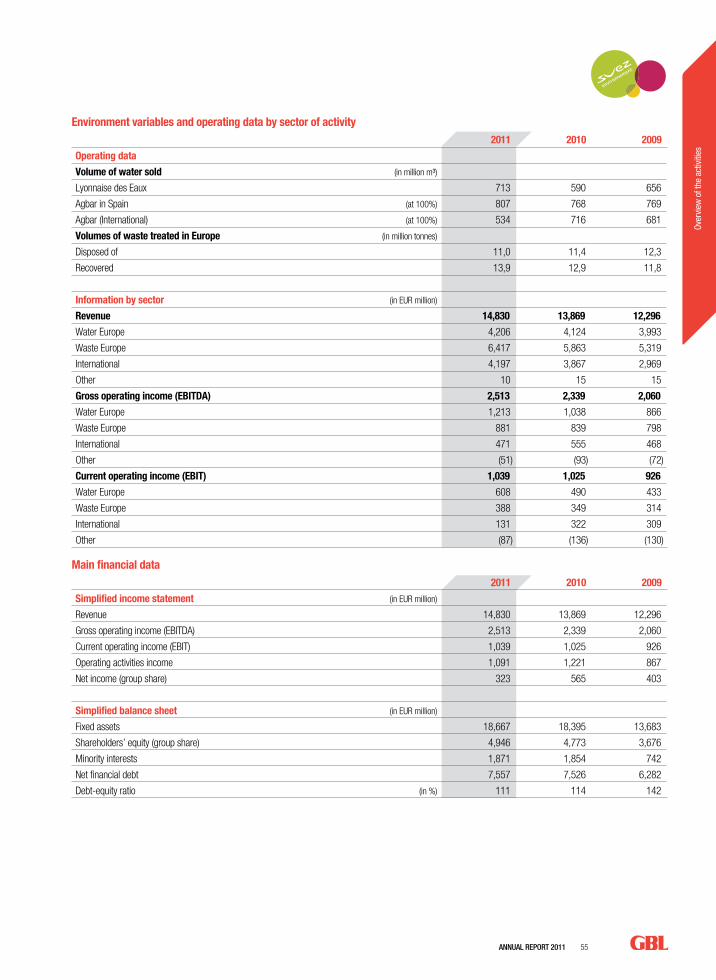
AnnuAl RepoRt 2011 55
Over
view
of t
he a
ctiv
ities
Environment variables and operating data by sector of activity2011 2010 2009
Operating data
Volume of water sold (in million m³)
Lyonnaise des Eaux 713 590 656
Agbar in Spain (at 100%) 807 768 769
Agbar (International) (at 100%) 534 716 681
Volumes of waste treated in Europe (in million tonnes)
Disposed of 11,0 11,4 12,3
Recovered 13,9 12,9 11,8
Information by sector (in EUR million)
Revenue 14,830 13,869 12,296
Water Europe 4,206 4,124 3,993
Waste Europe 6,417 5,863 5,319
International 4,197 3,867 2,969
Other 10 15 15
Gross operating income (EBITDA) 2,513 2,339 2,060
Water Europe 1,213 1,038 866
Waste Europe 881 839 798
International 471 555 468
Other (51) (93) (72)
Current operating income (EBIT) 1,039 1,025 926
Water Europe 608 490 433
Waste Europe 388 349 314
International 131 322 309
Other (87) (136) (130)
Main financial data2011 2010 2009
Simplified income statement (in EUR million)
Revenue 14,830 13,869 12,296
Gross operating income (EBITDA) 2,513 2,339 2,060
Current operating income (EBIT) 1,039 1,025 926
Operating activities income 1,091 1,221 867
Net income (group share) 323 565 403
Simplified balance sheet (in EUR million)
Fixed assets 18,667 18,395 13,683
Shareholders’ equity (group share) 4,946 4,773 3,676
Minority interests 1,871 1,854 742
Net financial debt 7,557 7,526 6,282
Debt-equity ratio (in %) 111 114 142
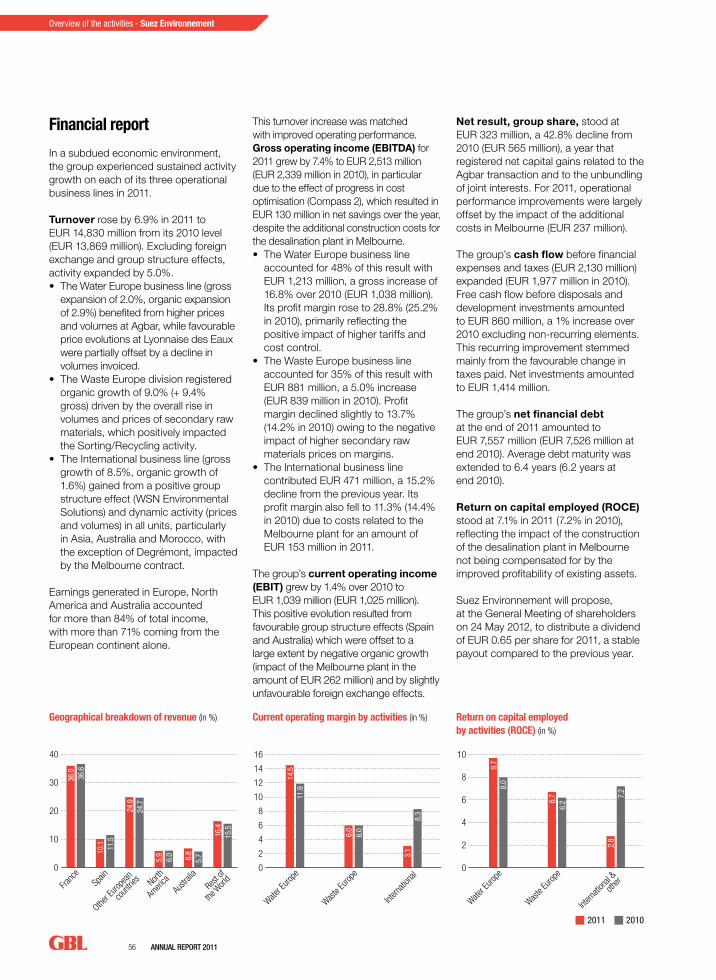
56 AnnuAl RepoRt 2011
Overview of the activities - Suez Environnement
Water E
urope
Waste
Europ
e
Water E
urope
Waste
Europ
e
Intern
ation
al
Intern
ation
al &
othe
r0
2
4
6
8
10
12
14
16
14.5
6.0
3.1
11.9
6.0
8.3
0
2
4
6
8
10
9.7
6.7
2.8
8.0
6.2
7.2
Franc
eSp
ain
Other E
urope
an
coun
tries Nort
h
Ameri
caAu
stralia
Rest
of
the W
orld
0
10
20
30
40
36.0
36.6
10.1 11.5
24.9
24.7
5.9
6.0 6.8
5.7
16.4
15.5
4.0%2.7%
Water E
urope
Waste
Europ
e
Water E
urope
Waste
Europ
e
Intern
ation
al
Intern
ation
al &
othe
r0
2
4
6
8
10
12
14
16
14.5
6.0
3.1
11.9
6.0
8.3
0
2
4
6
8
10
9.7
6.7
2.8
8.0
6.2
7.2
Franc
eSp
ain
Other E
urope
an
coun
tries Nort
h
Ameri
caAu
stralia
Rest
of
the W
orld
0
10
20
30
40
36.0
36.6
10.1 11.5
24.9
24.7
5.9
6.0 6.8
5.7
16.4
15.5
4.0%2.7%
Geographical breakdown of revenue (in %) Current operating margin by activities (in %) Return on capital employed by activities (ROCE) (in %)
2011 2010
Financial report
In a subdued economic environment, the group experienced sustained activity growth on each of its three operational business lines in 2011.
Turnover rose by 6.9% in 2011 to EUR 14,830 million from its 2010 level (EUR 13,869 million). Excluding foreign exchange and group structure effects, activity expanded by 5.0%.• The Water Europe business line (gross
expansion of 2.0%, organic expansion of 2.9%) benefited from higher prices and volumes at Agbar, while favourable price evolutions at Lyonnaise des Eaux were partially offset by a decline in volumes invoiced.
• The Waste Europe division registered organic growth of 9.0% (+ 9.4% gross) driven by the overall rise in volumes and prices of secondary raw materials, which positively impacted the Sorting/Recycling activity.
• The International business line (gross growth of 8.5%, organic growth of 1.6%) gained from a positive group structure effect (WSN Environmental Solutions) and dynamic activity (prices and volumes) in all units, particularly in Asia, Australia and Morocco, with the exception of Degrémont, impacted by the Melbourne contract.
Earnings generated in Europe, North America and Australia accounted for more than 84% of total income, with more than 71% coming from the European continent alone.
This turnover increase was matched with improved operating performance. Gross operating income (EBITDA) for 2011 grew by 7.4% to EUR 2,513 million (EUR 2,339 million in 2010), in particular due to the effect of progress in cost optimisation (Compass 2), which resulted in EUR 130 million in net savings over the year, despite the additional construction costs for the desalination plant in Melbourne.• The Water Europe business line
accounted for 48% of this result with EUR 1,213 million, a gross increase of 16.8% over 2010 (EUR 1,038 million). Its profit margin rose to 28.8% (25.2% in 2010), primarily reflecting the positive impact of higher tariffs and cost control.
• The Waste Europe business line accounted for 35% of this result with EUR 881 million, a 5.0% increase (EUR 839 million in 2010). Profit margin declined slightly to 13.7% (14.2% in 2010) owing to the negative impact of higher secondary raw materials prices on margins.
• The International business line contributed EUR 471 million, a 15.2% decline from the previous year. Its profit margin also fell to 11.3% (14.4% in 2010) due to costs related to the Melbourne plant for an amount of EUR 153 million in 2011.
The group’s current operating income (EBIT) grew by 1.4% over 2010 to EUR 1,039 million (EUR 1,025 million). This positive evolution resulted from favourable group structure effects (Spain and Australia) which were offset to a large extent by negative organic growth (impact of the Melbourne plant in the amount of EUR 262 million) and by slightly unfavourable foreign exchange effects.
Net result, group share, stood at EUR 323 million, a 42.8% decline from 2010 (EUR 565 million), a year that registered net capital gains related to the Agbar transaction and to the unbundling of joint interests. For 2011, operational performance improvements were largely offset by the impact of the additional costs in Melbourne (EUR 237 million).
The group’s cash flow before financial expenses and taxes (EUR 2,130 million) expanded (EUR 1,977 million in 2010). Free cash flow before disposals and development investments amounted to EUR 860 million, a 1% increase over 2010 excluding non-recurring elements. This recurring improvement stemmed mainly from the favourable change in taxes paid. Net investments amounted to EUR 1,414 million.
The group’s net financial debt at the end of 2011 amounted to EUR 7,557 million (EUR 7,526 million at end 2010). Average debt maturity was extended to 6.4 years (6.2 years at end 2010).
Return on capital employed (ROCE) stood at 7.1% in 2011 (7.2% in 2010), reflecting the impact of the construction of the desalination plant in Melbourne not being compensated for by the improved profitability of existing assets.
Suez Environnement will propose, at the General Meeting of shareholders on 24 May 2012, to distribute a dividend of EUR 0.65 per share for 2011, a stable payout compared to the previous year.

AnnuAl RepoRt 2011 57
Over
view
of t
he a
ctiv
ities
Data on Stock Exchange and on GBL’s investment2011 2010 2009
Stock Exchange data
Number of shares in issue (in thousands) 510,234 489,699 489,699
Stock market capitalisation (in EUR million) 4,541 7,566 7,896
Closing share price (in EUR/share) 8.90 15.45 16.13
Adjusted fully-diluted net income (in EUR/share) 0.60 1.15 0.82
Dividend (in EUR/share) 0.65 0.65 0.65
GBL’s investment
Percentage of share capital (in %) 7.2 (1) 7.1 7.1
Percentage of voting rights (in %) 7.2 (1) 7.1 7.1
Market value of the investment (in EUR million) 327 (1) 541 564
Dividends collected by GBL (in EUR million) 23 23 23
Representatives in statutory bodies 2 2 2
Suez Environnement financial communication
Sophie Lombard Tel.: +33-1-58.81.24.95
e-mail: [email protected]
www.suez-env.com
(1) Of which 0.3% in cash corresponding to the Suez Environnement shares granted as dividend payout for 2010 and valued at EUR 16 million
Suez Environnement’s contribution to GBL’s adjusted net assets and earningsGBL’s 7.2% (1) share in Suez Environnement had a stock market value of EUR 327 million (1) at the end of December 2011, compared to EUR 541 million a year earlier. This decrease resulted from the 42% year-on-year decline in the company’s share price; the Suez Environnement share closed at EUR 8.90 in 2011, compared to EUR 15.45 at end 2010.
Suez Environnement’s share in GBL’s adjusted net assets amounted to 2.8% on 31 December 2011, compared to 3.8% a year earlier.
In 2011, Suez Environnement’s contribution to GBL’s earnings was identical to its 2010 level of EUR 23 million. It reflects Suez Environnement’s dividend of EUR 0.65 per share (identical to the 2010 payout); GBL decide to collect Suez Environnement’s dividend in shares, which were held as cash at the end of 2011.
Water E
urope
Waste
Europ
e
Water E
urope
Waste
Europ
e
Intern
ation
al
Intern
ation
al &
othe
r0
2
4
6
8
10
12
14
16
14.5
6.0
3.1
11.9
6.0
8.3
0
2
4
6
8
10
9.7
6.7
2.8
8.0
6.2
7.2
Franc
eSp
ain
Other E
urope
an
coun
tries Nort
h
Ameri
caAu
stralia
Rest
of
the W
orld
0
10
20
30
40
36.0
36.6
10.1 11.5
24.9
24.7
5.9
6.0 6.8
5.7
16.4
15.5
4.0%2.7%
Water E
urope
Waste
Europ
e
Water E
urope
Waste
Europ
e
Intern
ation
al
Intern
ation
al &
othe
r0
2
4
6
8
10
12
14
16
14.5
6.0
3.1
11.9
6.0
8.3
0
2
4
6
8
10
9.7
6.7
2.8
8.0
6.2
7.2
Franc
eSp
ain
Other E
urope
an
coun
tries Nort
h
Ameri
caAu
stralia
Rest
of
the W
orld
0
10
20
30
40
36.0
36.6
10.1 11.5
24.9
24.7
5.9
6.0 6.8
5.7
16.4
15.5
4.0%2.7%
Suez Environnement’s contribution to GBL’s adjusted net assets
Suez Environnement’s contribution to net dividends collected on investments
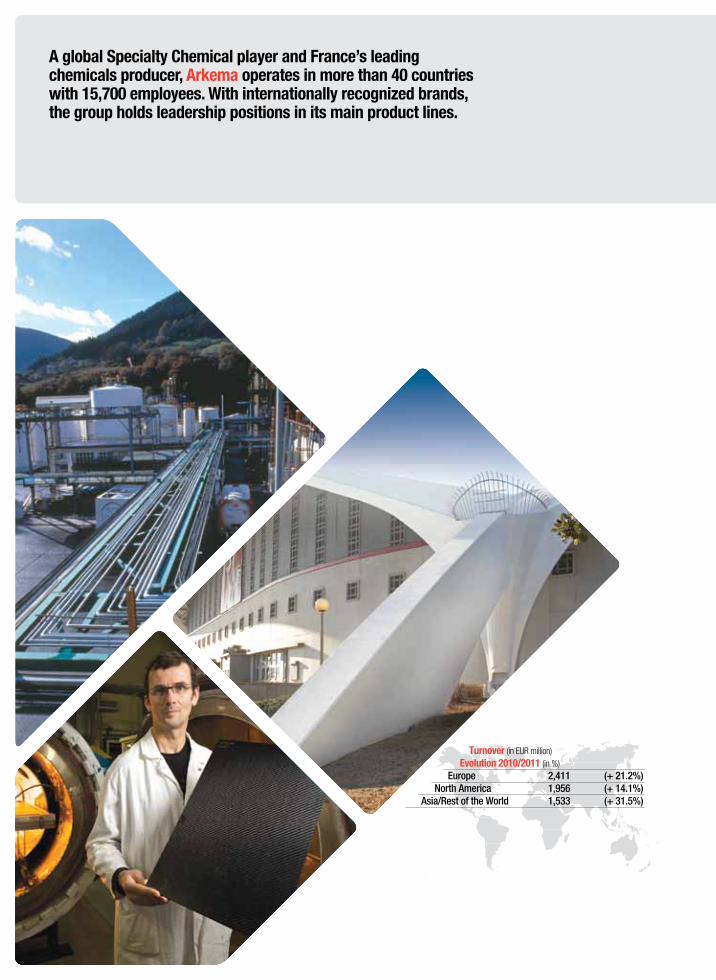
A global Specialty Chemical player and France’s leading chemicals producer, Arkema operates in more than 40 countries with 15,700 employees. With internationally recognized brands, the group holds leadership positions in its main product lines.
Turnover (in EUR million) Evolution 2010/2011 (in %)
europe 2,411 (+ 21.2%)north America 1,956 (+ 14.1%)
Asia/Rest of the World 1,533 (+ 31.5%)
AnnuAl RepoRt 2011 59
Over
view
of t
he a
ctiv
ities
Percentage of share capital ................................................................. 10.0%Percentage of voting rights .......................................................... 12.5%Contribution to GBL’s adjusted net assets ....................... 2.9%Dividends collected by GBL ............................ EUR 4 million
Profile
On 23 November 2011, Arkema announced a project to divest its Vinyl Products business segment which consists of its PVC business in Europe. Without Vinyls, Arkema has two business segments: Industrial Chemicals and Performance Products.
Industrial Chemicals group several lines of chemical intermediates such as acrylics, fluorogases and thiochemicals using complex manufacturing processes. The group ranks among the world’s leading companies on each of these mid-size markets with a limited number of major players. These markets offer strong growth prospects, particularly in Asia.
Performance Products provide technical solutions adapted to the needs expressed by the customers. The group has very strong positions in its main product lines, well-recognized brands, and manufacturing facilities on three continents. The priority of this segment is to consolidate and enhance its positioning in high added value niche markets, by boosting its presence in Asia and developing new innovative products particularly in the area of sustainable development.
Once the project to divest Vinyls would be finalized, the group would be refocused on its specialty businesses. With proforma sales of around EUR 6.5 billion (taking into account the full year contribution of the acquisitions finalized in 2011 and beginning 2012), the new Arkema would offer a well-balanced geographical presence (share of Europe would thus be reduced to 42% of total sales. North America would represent 32% of sales and the rest of the world 26%), a higher profitability and a greater resilience.
The business portfolio would be refocused on product lines well positioned to benefit from mega trends such as the growing worldwide population, the access to drinking water and to benefit from the fast development of emerging technologies such as new energies like photovoltaics, lithium-ion batteries, bio-plastics produced from renewable raw materials or very high performance polymers. These mega trends are one of the main growth drivers of Arkema and focus the efforts from the group Research and Development.
Overview of 2011
2011 was a new milestone in Arkema history both in terms of organic growth and M&A.
In M&A, the group finalized, in 2011 and beginning 2012, several significant acquisitions totalling close to EUR 1 billion additional sales, thus finalizing its acquisition plan initially announced for the 2011-2015 period.
The group has successfully integrated, on 1 July 2011, Total Specialty Resins representing around EUR 750 million additional sales. With this operation, the group reinforces its integration downstream of its acrylic value chain and positions itself as one of the leaders in coating materials (paints, adhesives, etc.).
Arkema has also finalized, end 2011, the acquisition of Seppic specialty chemicals, representing EUR 53 million sales. Arkema thus expands its specialty range for niche markets and supports the growth of a new range of dispersants and thickeners for paints, very high performance concrete offered by its subsidiary Coatex.
60 AnnuAl RepoRt 2011
Overview of the activities - Arkema
Finally, beginning of 2012, Arkema has strengthened its position in bio-sourced polyamides in China with the acquisition of the companies Hipro Polymers and Casda Biomaterials. This operation allows Arkema to enhance its specialty polyamide range, to reinforce its presence in Asia and to strengthen its position in green chemistry. These companies have achieved in 2011 combined sales of around USD 230 million.
Moreover, Arkema announced on 23 November 2011, a project to divest its Vinyls Products segment to the Klesch group. This project entails the sale of all the French and Spanish assets directly relating to the chlorine and its derivatives businesses as well as all the downstream businesses in the world (compounds, pipes and profiles).
The closing of the operation is expected mid-2012 subject to the legal information/ consultation process of the relevant workers councils currently ongoing and to the approval by the antitrust authorities. In 2011, these businesses achieved sales of EUR 1,090 million and net loss of EUR - 82 million.
In terms of organic growth, Arkema continued to expand in Asia with the start-up on its industrial platform in Changshu, China, of two new production plants: • One of fluoropolymer started to meet
the growing demand of the high performance industrial coatings, deep offshore and emerging applications such as lithium-ion batteries, photovoltaics and water treatment;
• One of rheological additives (dispersants, thickeners), started in August 2011, which enables Coatex to have a production capacity dedicated to Asian markets for paints and coatings, concrete, paper and mineral processing.
Several projects have also been announced such as the capacity increases of polymers and fluorogas on Changshu site and the construction, in Malaysia, of a thiochemicals platform and of a bio-methionine plant in partnership with the Korean company CJ Cheil Jedang, which start-up is expected late 2013. This last project is the largest industrial investment of the group (around USD 200 million).
Outlook
2012 should be another year of significant change for Arkema with the integration of the acquisitions recently finalized, the start-up of new units or capacity expansions in Asia and the beginning of the construction of the thiochemicals plant in Malaysia. The consultation process of workers councils on the project to divest Vinyls business to group Klesch will continue and the closing is expected mid 2012.
Growth in Asia should remain well oriented notably in China. Demand improvements are perceivable in the United States and Europe should remain challenging especially in construction. Raw materials are expected to remain volatile at high levels.
While remaining cautious about 2012 macro environment, Arkema is confident in its strengths and will continue to combine strict management of the company with targeted growth.
Taking into account the 2011 performance and the portfolio repositioning achieved since spin-off, Arkema upgrades its long-term targets and aims to achieve sales of EUR 8 billion and an EBITDA of EUR 1,250 million in five years time (2016) while maintaining its gearing at around 40%. This growth would come half from organic growth and half from bolt-on acquisitions. These targets have been defined in normalized environment.
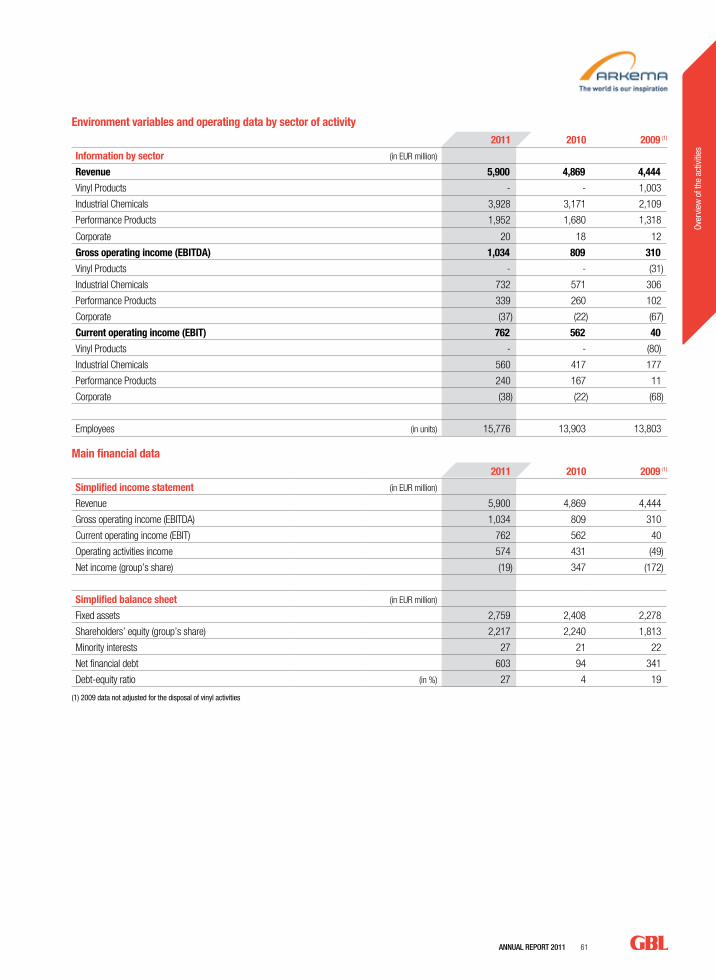
AnnuAl RepoRt 2011 61
Over
view
of t
he a
ctiv
ities
Environment variables and operating data by sector of activity2011 2010 2009 (1)
Information by sector (in EUR million)
Revenue 5,900 4,869 4,444
Vinyl Products - - 1,003
Industrial Chemicals 3,928 3,171 2,109
Performance Products 1,952 1,680 1,318
Corporate 20 18 12
Gross operating income (EBITDA) 1,034 809 310
Vinyl Products - - (31)
Industrial Chemicals 732 571 306
Performance Products 339 260 102
Corporate (37) (22) (67)
Current operating income (EBIT) 762 562 40
Vinyl Products - - (80)
Industrial Chemicals 560 417 177
Performance Products 240 167 11
Corporate (38) (22) (68)
Employees (in units) 15,776 13,903 13,803
Main financial data2011 2010 2009 (1)
Simplified income statement (in EUR million)
Revenue 5,900 4,869 4,444
Gross operating income (EBITDA) 1,034 809 310
Current operating income (EBIT) 762 562 40
Operating activities income 574 431 (49)
Net income (group’s share) (19) 347 (172)
Simplified balance sheet (in EUR million)
Fixed assets 2,759 2,408 2,278
Shareholders’ equity (group’s share) 2,217 2,240 1,813
Minority interests 27 21 22
Net financial debt 603 94 341
Debt-equity ratio (in %) 27 4 19
(1) 2009 data not adjusted for the disposal of vinyl activities
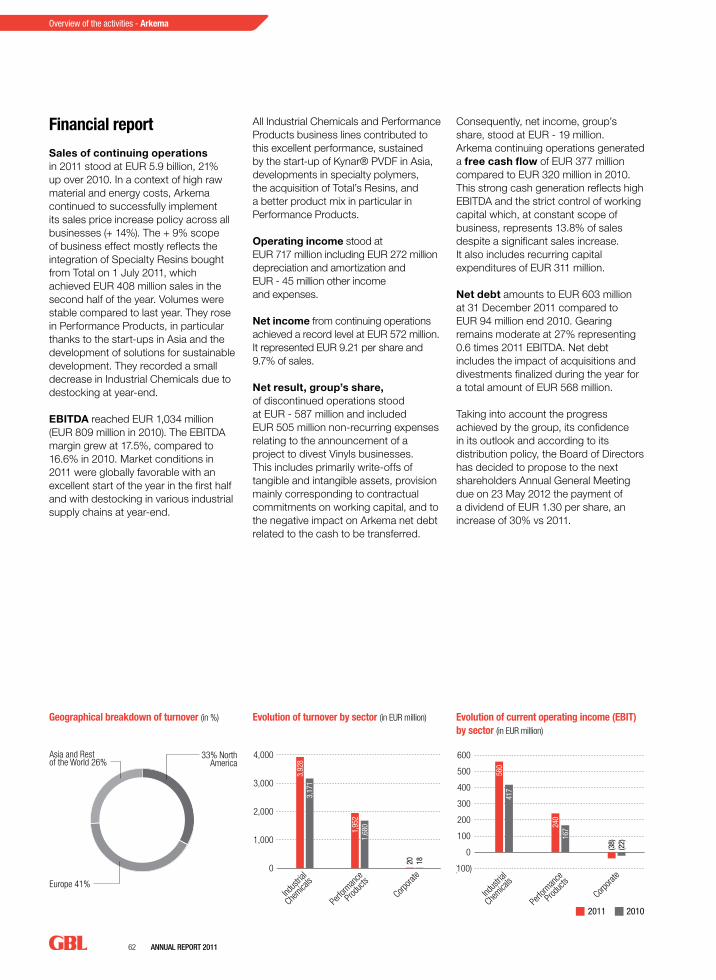
62 AnnuAl RepoRt 2011
Overview of the activities - Arkema
0.7%2.9%
33% NorthAmerica
Europe 41%
Asia and Rest of the World 26%
Perfo
rman
ce
Prod
ucts
Indus
trial
Chemica
ls
Corpora
te
Perfo
rman
ce
Prod
ucts
Indus
trial
Chemica
ls
Corpora
te(100)
0
100
200
300
400
500
600
560
240
417
167
(38)
(22)
0
1,000
2,000
3,000
4,000
3,92
8
1,95
2
3,17
1
1,68
0
20 18
Geographical breakdown of turnover (in %) Evolution of current operating income (EBIT) by sector (in EUR million)
Evolution of turnover by sector (in EUR million)
2011 2010
Financial report
Sales of continuing operations in 2011 stood at EUR 5.9 billion, 21% up over 2010. In a context of high raw material and energy costs, Arkema continued to successfully implement its sales price increase policy across all businesses (+ 14%). The + 9% scope of business effect mostly reflects the integration of Specialty Resins bought from Total on 1 July 2011, which achieved EUR 408 million sales in the second half of the year. Volumes were stable compared to last year. They rose in Performance Products, in particular thanks to the start-ups in Asia and the development of solutions for sustainable development. They recorded a small decrease in Industrial Chemicals due to destocking at year-end.
EBITDA reached EUR 1,034 million (EUR 809 million in 2010). The EBITDA margin grew at 17.5%, compared to 16.6% in 2010. Market conditions in 2011 were globally favorable with an excellent start of the year in the first half and with destocking in various industrial supply chains at year-end.
All Industrial Chemicals and Performance Products business lines contributed to this excellent performance, sustained by the start-up of Kynar® PVDF in Asia, developments in specialty polymers, the acquisition of Total’s Resins, and a better product mix in particular in Performance Products.
Operating income stood at EUR 717 million including EUR 272 million depreciation and amortization and EUR - 45 million other income and expenses.
Net income from continuing operations achieved a record level at EUR 572 million. It represented EUR 9.21 per share and 9.7% of sales.
Net result, group’s share, of discontinued operations stood at EUR - 587 million and included EUR 505 million non-recurring expenses relating to the announcement of a project to divest Vinyls businesses. This includes primarily write-offs of tangible and intangible assets, provision mainly corresponding to contractual commitments on working capital, and to the negative impact on Arkema net debt related to the cash to be transferred.
Consequently, net income, group’s share, stood at EUR - 19 million.Arkema continuing operations generated a free cash flow of EUR 377 million compared to EUR 320 million in 2010. This strong cash generation reflects high EBITDA and the strict control of working capital which, at constant scope of business, represents 13.8% of sales despite a significant sales increase. It also includes recurring capital expenditures of EUR 311 million.
Net debt amounts to EUR 603 million at 31 December 2011 compared to EUR 94 million end 2010. Gearing remains moderate at 27% representing 0.6 times 2011 EBITDA. Net debt includes the impact of acquisitions and divestments finalized during the year for a total amount of EUR 568 million.
Taking into account the progress achieved by the group, its confidence in its outlook and according to its distribution policy, the Board of Directors has decided to propose to the next shareholders Annual General Meeting due on 23 May 2012 the payment of a dividend of EUR 1.30 per share, an increase of 30% vs 2011.
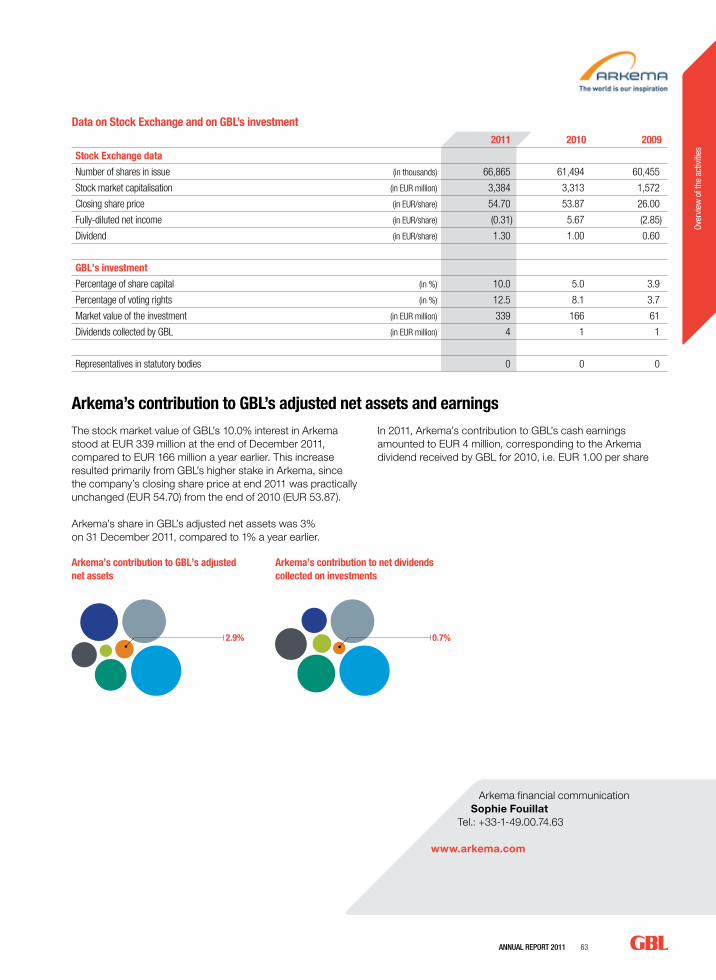
AnnuAl RepoRt 2011 63
Over
view
of t
he a
ctiv
ities
Data on Stock Exchange and on GBL’s investment2011 2010 2009
Stock Exchange data
Number of shares in issue (in thousands) 66,865 61,494 60,455
Stock market capitalisation (in EUR million) 3,384 3,313 1,572
Closing share price (in EUR/share) 54.70 53.87 26.00
Fully-diluted net income (in EUR/share) (0.31) 5.67 (2.85)
Dividend (in EUR/share) 1.30 1.00 0.60
GBL’s investment
Percentage of share capital (in %) 10.0 5.0 3.9
Percentage of voting rights (in %) 12.5 8.1 3.7
Market value of the investment (in EUR million) 339 166 61
Dividends collected by GBL (in EUR million) 4 1 1
Representatives in statutory bodies 0 0 0
0.7%2.9%
33% NorthAmerica
Europe 41%
Asia and Rest of the World 26%
Perfo
rman
ce
Prod
ucts
Indus
trial
Chemica
ls
Corpora
te
Perfo
rman
ce
Prod
ucts
Indus
trial
Chemica
ls
Corpora
te(100)
0
100
200
300
400
500
600
560
240
417
167
(38)
(22)
0
1,000
2,000
3,000
4,000
3,92
8
1,95
2
3,17
1
1,68
0
20 18
Arkema’s contribution to GBL’s adjusted net assets and earningsThe stock market value of GBL’s 10.0% interest in Arkema stood at EUR 339 million at the end of December 2011, compared to EUR 166 million a year earlier. This increase resulted primarily from GBL’s higher stake in Arkema, since the company’s closing share price at end 2011 was practically unchanged (EUR 54.70) from the end of 2010 (EUR 53.87).
Arkema’s share in GBL’s adjusted net assets was 3% on 31 December 2011, compared to 1% a year earlier.
In 2011, Arkema’s contribution to GBL’s cash earnings amounted to EUR 4 million, corresponding to the Arkema dividend received by GBL for 2010, i.e. EUR 1.00 per share
Arkema’s contribution to GBL’s adjusted net assets
Arkema’s contribution to net dividends collected on investments
Arkema financial communicationSophie Fouillat
Tel.: +33-1-49.00.74.63
www.arkema.com

64 AnnuAl RepoRt 2011
Iberdrola(http://www.iberdrola.es)
Iberdrola is a major international player in the generation, distribution and commercialization of electricity and natural gas and is emerging as a global leader in renewable energy through its subsidiary Iberdrola Renovables. The group holds leading positions in Spain and Latin America and recently extended its activities to the United Kingdom and the United States through the acquisitions of Scottish Power (2007) and Energy East (2008) respectively. In 2011, Iberdrola bought the minority shares of its subsidiary Iberdrola Renovables and acquired Elektro, a Brazilian company.
Iberdrola improved its gross margin in 2011, helped by a favourable group structure effect and strict year-on-year cost control of 1.6% for a total of EUR 7,650 million. EBIT declined by 6.7% to EUR 4,505 million and was affected by impairments of assets in the amount of EUR 332 million.
Net income, group’s share, slipped at end 2011 to EUR 2,805 million (EUR 2,871 million in 2010). The decline in financial expenses and taxes only partially offset the decrease in operating income.
Net financial debt at end 2011 amounted to EUR 31.7 billion (EUR 30.0 billion at end 2010), representing 95% of share-holders’ equity (same as in 2010).
The group will propose to the General Meeting of shareholders to distribute a dividend balance of at least EUR 0.18 per share, bringing the total dividend payout per share for 2011 to a level at least equivalent to its 2010 level (EUR 0.326 per share). The dividend contribution to GBL’s cash earnings in 2011 amounted to EUR 7.9 million (EUR 10.7 million in 2010), or the equivalent of 1.5% of total cash earnings.
As a reminder, during the first half of 2007, GBL acquired a 3% stake in Iberdrola at a cost of nearly EUR 1.4 billion. This investment was partially divested at end 2007 and early 2008 at a sale price of more than EUR 1.3 billion, resulting in a total capital gain of EUR 184 million over these two years.
GBL’s residual investment in Iberdrola stood at 0.2% of capital following its disposal of 0.4% in 2011 for a capital gain of EUR 10.6 million. At end December 2011, Iberdrola share price was EUR 4.84.
PAI Europe III (PAI)
GBL has paid up around 95% of its 2001 investment commitment of EUR 40 million in PAI (out of a total of EUR 1.8 billion). The sale of investments has allowed PAI to pay out to GBL cumulative distributions of EUR 105 million. During 2011, PAI concluded its disposal of Yoplait, Gruppo Coin and Compagnie Européenne de Prévoyance and sold on the Stock Exchange a part of its interest in Chr Hansen. On 31 December 2011, the portfolio included the investment in FTE and a residual position in Chr Hansen.
Sagard
In 2002, GBL initially agreed to invest in the primary Sagard fund (Sagard I) in the amount of EUR 50 million (slightly increased since then), out of a total commitment of EUR 536 million. During financial year 2006, GBL invested in that fund’s successor, Sagard II, for an initial amount of EUR 150 million, reduced in 2009 to EUR 120 million. Overall commitments to the Sagard II fund represent nearly EUR 810 million.
Situation of Sagard I fund The total amount paid out since the creation of the fund stands at EUR 53 million. On a cumulative basis, GBL has collected payouts of EUR 105 million from Sagard I. In 2011, Sagard I sold its stake in Souriau, Kiloutou, Olympia and increased its margin in Hermes Metal Yudigar. As of 31 December 2011, the Sagard I portfolio includes Hermes Metal Yudigar and Régie Linge Développement.
Situation of Sagard II fundOn 31 December 2011, GBL had invested a total of EUR 69 million in this fund. During 2011, Sagard II reinvested partially in Kiloutou, confident in the growth potential of this investment. The Sagard II portfolio includes five investments at end December 2011: Corialis, Vivarte, Fläkt Woods, Ceva and Kiloutou.
Other investments
AnnuAl RepoRt 2011 65
Over
view
of t
he a
ctiv
ities
Ergon Capital Partners (ECP)
ECP is a private equity investment company whose first fund, ECP I, was set up in February 2005 by GBL in partnership with Parcom Capital, an ING subsidiary. Both partners launched a second fund, Ergon Capital Partners II (ECP II) in December 2006. The latest fund, Ergon Capital Partners III (ECP III), which is fully backed by GBL, was launched in March 2010. In total, ECP has an investment capacity of EUR 775 million, of which GBL’s remaining undrawn commitment amounts to EUR 279 million.
During the financial year 2011, ECP analysed more than 160 potential investments. In April 2011, ECP III acquired a controlling share in group De Boeck, a leading Belgian player in the educational academic and professional publishing market. In July 2011, ECP III finalised its acquisition of Benito Artis, the market leader in design and distribution of street furniture in Spain. In October 2011, ECP II acquired a controlling share of PharmaZell, a German company that produces active ingredients used by the pharmaceutical industry. PharmaZell forms, together with Farmabios, another firm acquired by ECPII in 2007, and operating in areas complementary to PharmaZell’s activities, the ZellBios group.
In terms of divetsments, in July 2011, ECP I sold its stake in La Gardenia, one of the leading perfume/cosmetics retail chains in Italy, for an amount of EUR 39 million.
In a context of widespread economic slowdown, ECP actively monitored its investments and adopted a strategy aimed at striking a balance between growth in operational activities and cash generation.
The contribution of the two funds accounted for using the equity method, ECP I and ECP II, to GBL’s 2011 earnings amounted to EUR - 10 million, primarily as a result of the change in the bookvalue of their portfolios. ECP III and its operational subsidiaries, which are fully consolidated, contributed EUR - 4 million to GBL’s earnings.
At the end of December 2011, ECP’s portfolio comprised nine investments valued at EUR 378 million: Seves, Stroilli, Corialis, Joris Ide, ZellBios, Nicotra-Gebhardt, ELITech, De Boeck and Benito Artis.

66 AnnuAl RepoRt 2011
AnnuAl RepoRt 2011 67
Acco
unts
at 3
1 De
cem
ber 2
011
Accounts at 31 December 2011
Consolidated financial statements Consolidated balance sheet ............................................................................................................................................... 68Consolidated statement of comprehensive income ................................................................................................ 69Consolidated statement of changes in shareholders’ equity .............................................................................. 70Consolidated cash flow statement .................................................................................................................................. 71Accounting policies ................................................................................................................................................................ 72Consolidation scope, associated companies and changes in the group structure .................................. 80Notes ............................................................................................................................................................................................. 83Statutory Auditor’s report ................................................................................................................................................. 116
Condensed statutory balance sheet and income statement ......................................................... 118
Dividend policy ...................................................................................................................................................................... 120
Historical data ........................................................................................................................................................................ 121Summary of GBL’s investments since 2009 ........................................................................................................... 121Consolidated figures IFRS over 10 years .................................................................................................................. 122
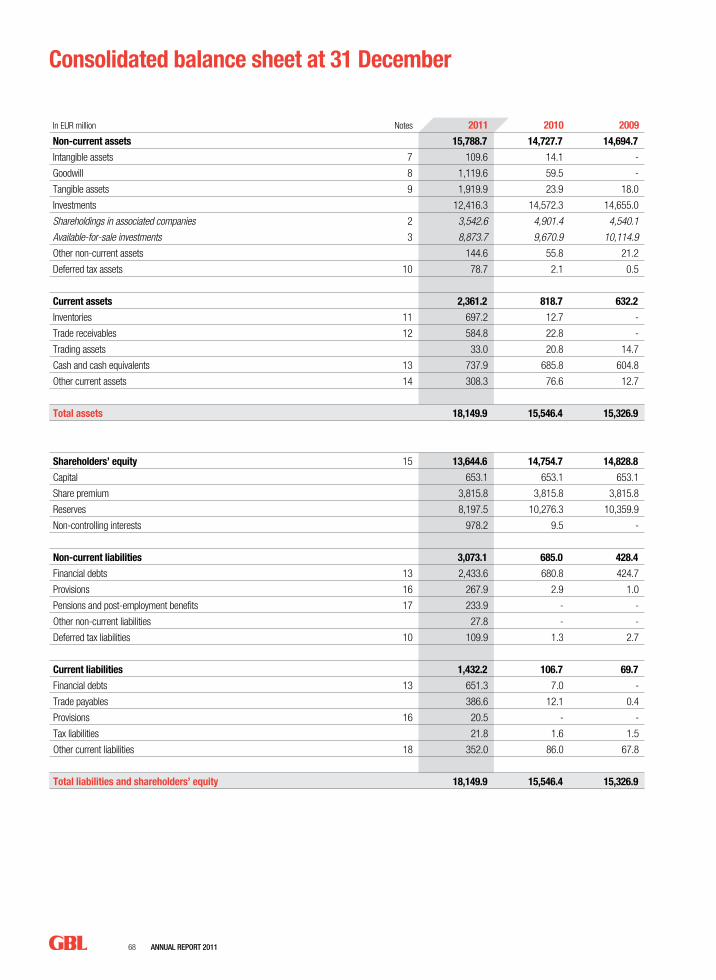
68 AnnuAl RepoRt 2011
Consolidated balance sheet at 31 December
In EUR million Notes 2011 2010 2009
Non-current assets 15,788.7 14,727.7 14,694.7
Intangible assets 7 109.6 14.1 -
Goodwill 8 1,119.6 59.5 -
Tangible assets 9 1,919.9 23.9 18.0
Investments 12,416.3 14,572.3 14,655.0
Shareholdings in associated companies 2 3,542.6 4,901.4 4,540.1
Available-for-sale investments 3 8,873.7 9,670.9 10,114.9
Other non-current assets 144.6 55.8 21.2
Deferred tax assets 10 78.7 2.1 0.5
Current assets 2,361.2 818.7 632.2
Inventories 11 697.2 12.7 -
Trade receivables 12 584.8 22.8 -
Trading assets 33.0 20.8 14.7
Cash and cash equivalents 13 737.9 685.8 604.8
Other current assets 14 308.3 76.6 12.7
Total assets 18,149.9 15,546.4 15,326.9
Shareholders’ equity 15 13,644.6 14,754.7 14,828.8
Capital 653.1 653.1 653.1
Share premium 3,815.8 3,815.8 3,815.8
Reserves 8,197.5 10,276.3 10,359.9
Non-controlling interests 978.2 9.5 -
Non-current liabilities 3,073.1 685.0 428.4
Financial debts 13 2,433.6 680.8 424.7
Provisions 16 267.9 2.9 1.0
Pensions and post-employment benefits 17 233.9 - -
Other non-current liabilities 27.8 - -
Deferred tax liabilities 10 109.9 1.3 2.7
Current liabilities 1,432.2 106.7 69.7
Financial debts 13 651.3 7.0 -
Trade payables 386.6 12.1 0.4
Provisions 16 20.5 - -
Tax liabilities 21.8 1.6 1.5
Other current liabilities 18 352.0 86.0 67.8
Total liabilities and shareholders’ equity 18,149.9 15,546.4 15,326.9
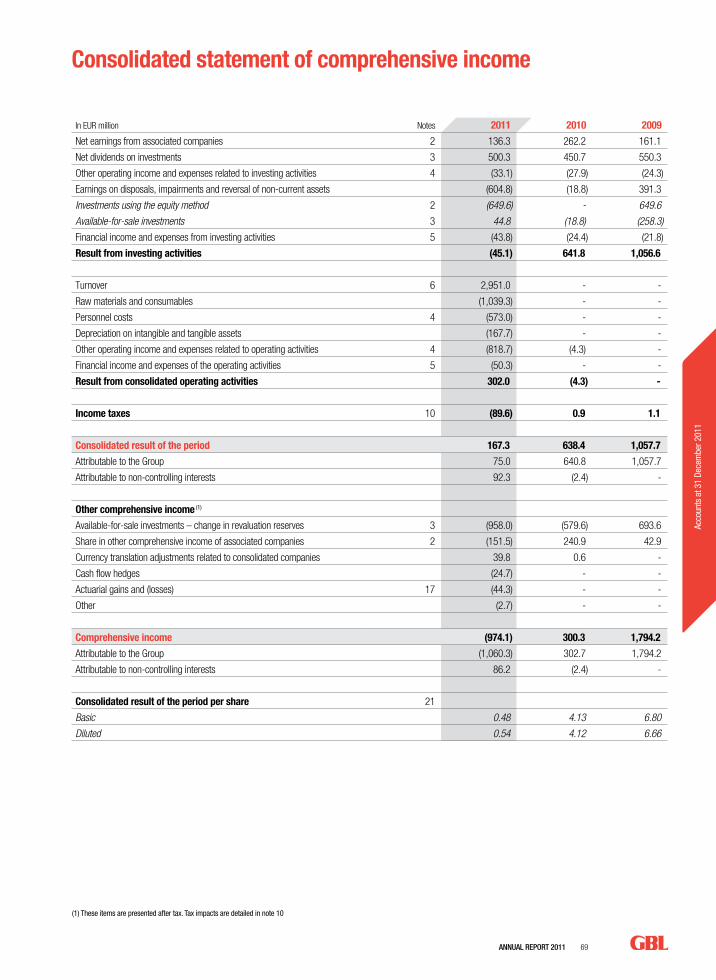
AnnuAl RepoRt 2011 69
Acco
unts
at 3
1 De
cem
ber 2
011
Consolidated statement of comprehensive income
In EUR million Notes 2011 2010 2009
Net earnings from associated companies 2 136.3 262.2 161.1
Net dividends on investments 3 500.3 450.7 550.3
Other operating income and expenses related to investing activities 4 (33.1) (27.9) (24.3)
Earnings on disposals, impairments and reversal of non-current assets (604.8) (18.8) 391.3
Investments using the equity method 2 (649.6) - 649.6
Available-for-sale investments 3 44.8 (18.8) (258.3)
Financial income and expenses from investing activities 5 (43.8) (24.4) (21.8)
Result from investing activities (45.1) 641.8 1,056.6
Turnover 6 2,951.0 - -
Raw materials and consumables (1,039.3) - -
Personnel costs 4 (573.0) - -
Depreciation on intangible and tangible assets (167.7) - -
Other operating income and expenses related to operating activities 4 (818.7) (4.3) -
Financial income and expenses of the operating activities 5 (50.3) - -
Result from consolidated operating activities 302.0 (4.3) -
Income taxes 10 (89.6) 0.9 1.1
Consolidated result of the period 167.3 638.4 1,057.7
Attributable to the Group 75.0 640.8 1,057.7
Attributable to non-controlling interests 92.3 (2.4) -
Other comprehensive income (1)
Available-for-sale investments – change in revaluation reserves 3 (958.0) (579.6) 693.6
Share in other comprehensive income of associated companies 2 (151.5) 240.9 42.9
Currency translation adjustments related to consolidated companies 39.8 0.6 -
Cash flow hedges (24.7) - -
Actuarial gains and (losses) 17 (44.3) - -
Other (2.7) - -
Comprehensive income (974.1) 300.3 1,794.2
Attributable to the Group (1,060.3) 302.7 1,794.2
Attributable to non-controlling interests 86.2 (2.4) -
Consolidated result of the period per share 21
Basic 0.48 4.13 6.80
Diluted 0.54 4.12 6.66
(1) These items are presented after tax. Tax impacts are detailed in note 10
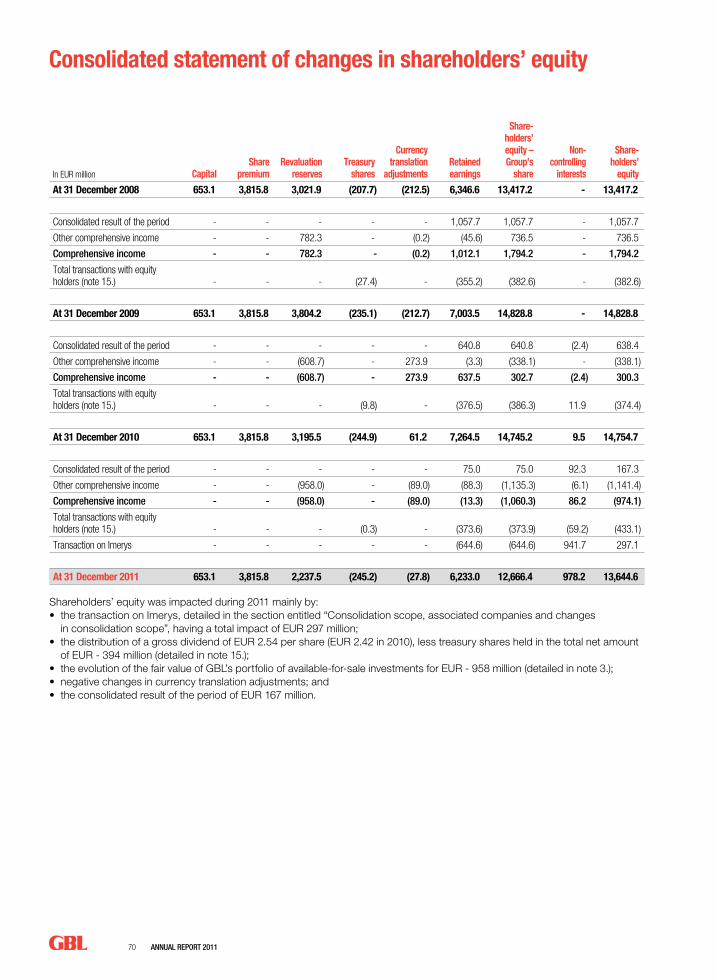
70 AnnuAl RepoRt 2011
Consolidated statement of changes in shareholders’ equity
In EUR million CapitalShare
premiumRevaluation
reservesTreasury
shares
Currency translation
adjustmentsRetained earnings
Share-holders’ equity – Group’s
share
Non-controlling
interests
Share-holders’
equity
At 31 December 2008 653.1 3,815.8 3,021.9 (207.7) (212.5) 6,346.6 13,417.2 - 13,417.2
Consolidated result of the period - - - - - 1,057.7 1,057.7 - 1,057.7
Other comprehensive income - - 782.3 - (0.2) (45.6) 736.5 - 736.5
Comprehensive income - - 782.3 - (0.2) 1,012.1 1,794.2 - 1,794.2
Total transactions with equity holders (note 15.) - - - (27.4) - (355.2) (382.6) - (382.6)
At 31 December 2009 653.1 3,815.8 3,804.2 (235.1) (212.7) 7,003.5 14,828.8 - 14,828.8
Consolidated result of the period - - - - - 640.8 640.8 (2.4) 638.4
Other comprehensive income - - (608.7) - 273.9 (3.3) (338.1) - (338.1)
Comprehensive income - - (608.7) - 273.9 637.5 302.7 (2.4) 300.3
Total transactions with equity holders (note 15.) - - - (9.8) - (376.5) (386.3) 11.9 (374.4)
At 31 December 2010 653.1 3,815.8 3,195.5 (244.9) 61.2 7,264.5 14,745.2 9.5 14,754.7
Consolidated result of the period - - - - - 75.0 75.0 92.3 167.3
Other comprehensive income - - (958.0) - (89.0) (88.3) (1,135.3) (6.1) (1,141.4)
Comprehensive income - - (958.0) - (89.0) (13.3) (1,060.3) 86.2 (974.1)
Total transactions with equity holders (note 15.) - - - (0.3) - (373.6) (373.9) (59.2) (433.1)
Transaction on Imerys - - - - - (644.6) (644.6) 941.7 297.1
At 31 December 2011 653.1 3,815.8 2,237.5 (245.2) (27.8) 6,233.0 12,666.4 978.2 13,644.6
Shareholders’ equity was impacted during 2011 mainly by: • the transaction on Imerys, detailed in the section entitled “Consolidation scope, associated companies and changes
in consolidation scope”, having a total impact of EUR 297 million;• the distribution of a gross dividend of EUR 2.54 per share (EUR 2.42 in 2010), less treasury shares held in the total net amount
of EUR - 394 million (detailed in note 15.);• the evolution of the fair value of GBL’s portfolio of available-for-sale investments for EUR - 958 million (detailed in note 3.); • negative changes in currency translation adjustments; and• the consolidated result of the period of EUR 167 million.
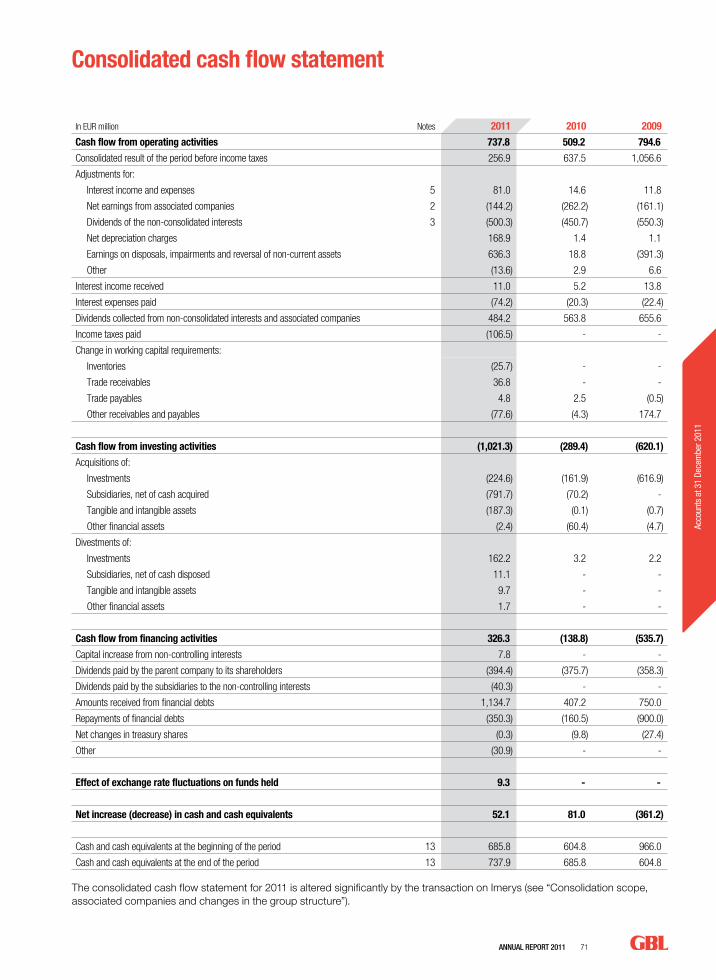
AnnuAl RepoRt 2011 71
Acco
unts
at 3
1 De
cem
ber 2
011
Consolidated cash flow statement
In EUR million Notes 2011 2010 2009
Cash flow from operating activities 737.8 509.2 794.6
Consolidated result of the period before income taxes 256.9 637.5 1,056.6
Adjustments for:
Interest income and expenses 5 81.0 14.6 11.8
Net earnings from associated companies 2 (144.2) (262.2) (161.1)
Dividends of the non-consolidated interests 3 (500.3) (450.7) (550.3)
Net depreciation charges 168.9 1.4 1.1
Earnings on disposals, impairments and reversal of non-current assets 636.3 18.8 (391.3)
Other (13.6) 2.9 6.6
Interest income received 11.0 5.2 13.8
Interest expenses paid (74.2) (20.3) (22.4)
Dividends collected from non-consolidated interests and associated companies 484.2 563.8 655.6
Income taxes paid (106.5) - -
Change in working capital requirements:
Inventories (25.7) - -
Trade receivables 36.8 - -
Trade payables 4.8 2.5 (0.5)
Other receivables and payables (77.6) (4.3) 174.7
Cash flow from investing activities (1,021.3) (289.4) (620.1)
Acquisitions of:
Investments (224.6) (161.9) (616.9)
Subsidiaries, net of cash acquired (791.7) (70.2) -
Tangible and intangible assets (187.3) (0.1) (0.7)
Other financial assets (2.4) (60.4) (4.7)
Divestments of:
Investments 162.2 3.2 2.2
Subsidiaries, net of cash disposed 11.1 - -
Tangible and intangible assets 9.7 - -
Other financial assets 1.7 - -
Cash flow from financing activities 326.3 (138.8) (535.7)
Capital increase from non-controlling interests 7.8 - -
Dividends paid by the parent company to its shareholders (394.4) (375.7) (358.3)
Dividends paid by the subsidiaries to the non-controlling interests (40.3) - -
Amounts received from financial debts 1,134.7 407.2 750.0
Repayments of financial debts (350.3) (160.5) (900.0)
Net changes in treasury shares (0.3) (9.8) (27.4)
Other (30.9) - -
Effect of exchange rate fluctuations on funds held 9.3 - -
Net increase (decrease) in cash and cash equivalents 52.1 81.0 (361.2)
Cash and cash equivalents at the beginning of the period 13 685.8 604.8 966.0
Cash and cash equivalents at the end of the period 13 737.9 685.8 604.8
The consolidated cash flow statement for 2011 is altered significantly by the transaction on Imerys (see “Consolidation scope, associated companies and changes in the group structure”).

72 AnnuAl RepoRt 2011
Groupe Bruxelles Lambert (“GBL”) is a Belgian holding company listed on Euronext Brussels. Its consolidated financial statements cover a period of 12 months ending 31 December 2011. They have been approved by the Board of Directors on 6 March 2012.
General accounting principles and applicable standardsThe consolidated financial statements have been prepared in accordance with the International Financial Reporting Standards (IFRS) as adopted by the European Union.
Mandatory changes in accounting methodsThe following new and amended standards and interpretations have been applied since 2011: • Improvements to IFRS (2009-2010) (normally applicable for
annual periods beginning on or after 1 January 2011).• Amendment to IFRS 1 – First Time Adoption of International
Financial Reporting Standards – IFRS 7 exemptions (applicable for annual periods beginning on or after 1 July 2010).
• Amendment to IAS 24 – Related Party Disclosures (applicable for annual periods beginning on or after 1 January 2011). This Standard supersedes IAS 24 Related Party Disclosures as issued in 2003.
• Amendments to IAS 32 – Financial Instruments: Presentation – Classification of Rights Issues (applicable for annual periods beginning on or after 1 February 2010).
• IFRIC 19 – Extinguishing Financial Liabilities with Equity Instruments (applicable for annual periods beginning on or after 1 July 2010).
• Amendment to IFRIC 14 IAS 19 – The Limit on a Defined Benefit Asset, Minimum Funding Requirements and their Interaction – Prepayments of a Minimum Funding Requirement (applicable for annual periods beginning on or after 1 January 2011).
These amendments and this new interpretation had no significant impact on GBL’s consolidated financial statements.
Voluntary changes in accounting methodsGBL and Imerys introduced in 2011 a change in accounting method for the treatment of actuarial differences on employee benefits. IAS 19 – Employee Benefits authorises the recording of actuarial differences on employee benefits either in profit and loss or in shareholders’ equity (other comprehensive income). The revised standard published by the IASB in June 2011 and applicable in 2013 abolishes the profit and loss option. GBL and Imerys, which had used this option and applied it in accordance with corridor method, therefore decided in the framework of the existing standard to use immediate recording of all actuarial differences in shareholders’ equity without subsequent reclassification in profit and loss (option “OCI”). By choosing this option, Imerys improves the readability of assets and liabilities related to employee benefits through a significant reduction inoff-balance sheet items and brings about a change in its accounting principles that is consistent with the choices of the IASB and of the majority of significant listed issuers.
This change of accounting principles was applied retrospectively from 31 December 2008. The impact on equity is limited and total amounts as of 31 December 2010, 2009 and 2008 were EUR - 20 million, EUR - 16 million and EUR - 1 million respectively.
Texts in force after the balance sheet dateGBL did not anticipate application of the new and amended standards and interpretations which entered into force after 31 December 2011, namely: • IFRS 9 – Financial Instruments (applicable for annual periods
beginning on or after 1 January 2015).• IFRS 10 – Consolidated Financial Statements (applicable for
annual periods beginning on or after 1 January 2013).• IFRS 11 – Joint Arrangements (applicable for annual periods
beginning on or after 1 January 2013).• IFRS 12 – Disclosures of Interests in Other Entities
(applicable for annual periods beginning on or after 1 January 2013).
• IFRS 13 – Fair Value Measurement (applicable for annual periods beginning on or after 1 January 2013).
• Amendment to IFRS 1 – First Time Adoption of International Financial Reporting Standards – Severe Hyperinflation and Removal of Fixed Dates for First-time Adopters (applicable for annual periods beginning on or after 1 July 2011).
• Amendment to IFRS 7 – Financial Instruments: Disclosures – Derecognition (applicable for annual periods beginning on or after 1 July 2011).
• Amendment to IAS 1 – Presentation of Financial Statements – Presentation of Items of Other Comprehensive Income (applicable for annual periods beginning on or after 1 July 2012).
• Amendment to IAS 12 – Income Taxes – Deferred Tax: Recovery of Underlying Assets (applicable for annual periods beginning on or after 1 January 2012).
• Amendments to IAS 19 – Employee Benefits (applicable for annual periods beginning on or after 1 January 2013).
• Amendments to IAS 27 – Separate Financial Statements (applicable for annual periods beginning on or after 1 January 2013).
• Amendments to IAS 28 – Investments in Associates and Joint Ventures (applicable for annual periods beginning on or after 1 January 2013).
• IFRIC 20 – Stripping Costs in the Production Phase of a Surface Mine (applicable for annual periods beginning on or after 1 January 2013).
Accounting policies

AnnuAl RepoRt 2011 73
Acco
unts
at 3
1 De
cem
ber 2
011
The future application of these new standards and interpretations is not expected to impact significantly the consolidated financial statements, apart from:• the new IFRS 9, which should influence the treatment of
non-consolidated interests that are not held for trading purposes. The Group should choose between the accounting of gains and losses on those assets in profit and loss or in shareholders’ equity. However, the potential impact of this new standard can only be ascertained once the proposal for replacement of IAS 39 has been finalised and adopted at European level; and
• IFRS 12 imposes the disclosure of additional information in the notes concerning investments consolidated and accounted for using the equity method. Application of this new standard is expected to impact the notes to the consolidated financial statements.
Methods and scope of consolidationThe consolidated financial statements, stated before appropriation of profit, include those of GBL and its subsidiaries (“the Group”) and the interests of the Group in joint ventures and associated companies consolidated using the equity method. The important subsidiaries, joint ventures and the associated companies close their accounts on 31 December.
Controlled companies Companies controlled by the Group are fully consolidated. Control is presumed to exist when the Group, directly or indirectly, holds more than 50% of the voting rights of an entity.
Intra-group balances and transactions as well as latent income have been eliminated. Newly acquired companies are consolidated as from the date of acquisition.
Jointly controlled companiesJointly controlled companies (joint ventures) are those whose financial and operating policies are subject to a unanimous vote by the Group and a third partner. These joint ventures are accounted for in the consolidated financial statements using the equity method.
Associated companies If the Group has a significant influence in a company, the investment it holds in that company is considered as an associated company. The exercise of significant influence is presumed to exist if the Group, directly or indirectly, through its subsidiaries holds more than 20% of the voting rights.
Associated companies are accounted for in the consolidated financial statements using the equity method.
Intangible assets Intangible assets are recorded at cost less any cumulative amortisation and depreciations.
Intangible assets with a finite useful life are amortised using the straight-line method in terms of their estimated useful life.
Intangible assets with an indefinite useful life are not amortised but are tested for impairment annually at the close of the financial year (or at an earlier date should there be an indication of impairment). When the recoverable amount of an asset is less than its carrying amount, this carrying amount is reduced to reflect this loss of value
Business combinations and goodwillWhen the Group acquires a business, the identifiable assets and liabilities of the acquired entity are recorded at fair value on the date of acquisition.
The counterparty transferred to a business combination corresponds to the fair value of the transferred assets (including cash holdings), the assumed liabilities and the shareholders’ equity instruments issued by the Group in exchange for the control of the acquired entity. The costs directly related to the acquisition are generally recorded in the income statement.
Goodwill is calculated as the positive difference between the following two elements: • sum of (i) the counterparty transferred and, where
appropriate, (ii) the amount of the non-controlling interests (minority interests) in the acquired entity, and (iii) the fair value of interests already held by the Group prior to acquisition of the controlling interest; and
• the net amount on the date of acquisition of the identifiable assets and liabilities acquired and assumed.
If, after confirmation of the values, this difference proves to be negative, this amount is immediately recorded in the income statement as profit on an advantageous acquisition.
Goodwill is accounted for as an asset in the balance sheet under the heading “Goodwill” and subjected to an annual impairment test, which consists in comparing the recoverable amount of the cash generating units (“UGT”) to which the goodwill has been allocated at their book value (including the goodwill). If the latter is higher, an impairment must be recorded in the income statement.
In addition, in valuing goodwill as outlined above, the amount of the non-controlling interests can be valued on a case by case basis and at GBL’s choice, either at fair value (the so-called “full goodwill” option) or at the share of the identifiable net asset in the acquired entity.
74 AnnuAl RepoRt 2011
Accounts at 31 December 2011 - Accounting policies
Tangible assetsTangible assets are recorded under assets if they are controlled as a result of a deed of ownerhsip or a finance lease contract that transfers the risks and rewards incident to ownership. Tangible assets are initially valued at acquisition or production cost.
The cost of tangible assets includes the cost of loans contracted to finance their construction or production when they necessitate a substantial period of time. The cost of fixed assets is reduced, where appropriate, by the amount of public subsidies used to finance their acquisition or construction. Maintenance and repair costs are immediately recorded under expenses in the heading “Other operating income and expenses related to operating activities”. The cost of tangible assets includes, in particular for satellite industrial installations built on clients’ land, the present value of the rehabilitation or dismantling obligation, where such an obligation exists. Tangible assets are subsequently valued at cost less amortisation and any accumulated impairments.
In the absence of a specific applicable text, Imerys has defined the following accounting and valuation policies for mineral assets. Exploration expenses, i.e. research of new knowledge on the mining potential, technical feasibility and commercial viability of a geographical area are recorded as expenses when incurred under the heading “Other operating income and expenses related to operating activities”. Extraction rights are recorded as intangible assets and are initially valued at acquisition cost. Mineral reserves constitute tangible assets and are initially valued at acquisition cost excluding subsoil and increased by expenditure incurred to determine the tonnage of ore present in the deposit. Overburden works, i.e. works to remove the topsoil to enable access to the deposit, are also recognised as intangible assets. Their initial valuation includes the production cost and present value of the rehabilitation obligation resulting from degradations caused by their construction. Mineral reserves and overburden works are recorded under “Tangible assets”. Mineral assets are subsequently valued at cost less depreciation and any cumulative impairments.
Depreciations are systematically distributed over the expected useful life of the different categories of tangible fixed assets under the straight-line method. The estimated useful lives of the most significant elements of tangible fixed assets fall in the following ranges:• building: 10 to 50 years;• industrical constructions: 10 to 30 years;• fixtures and fittings of buildings and constructions:
5 to 15 years;• machinery, equipment and installations: 5 to 20 years;• vehicles: 2 to 5 years;• other tangible fixed assets: 10 to 20 years.Land is not depreciated.
On the other hand, Imerys considers that straight-line depreciation is unsuited to the consumption of tangible fixed assets related to mining activity such as mining reserves and overburden assets, and to certain industrial assets not used on a continuing basis. Their depreciation is therefore estimated in production units on the basis of real extraction for mining assets or, for industrial assets, operational follow-up units such as production or hours of use. The subsoil, i.e. the land surface excluding the deposit, is not depreciated because it is not consumed by the extracting activity.
Available-for-sale investments Available-for-sale investments include investments in companies in which the Group does not exercise a significant influence. The absence of significant influence is presumed if the Group does not, directly or indirectly, hold more than 20% of the voting rights. These investments are recorded at fair value based on the share price for listed companies
Shares in the “Funds”, namely PAI Europe III, Sagard I and Sagard II, are revalued at fair value determined by the fund managers in terms of the investment portfolio.
Any changes between two closings in the fair value of those investments are recorded in shareholders’ equity.
When an investment is sold, the difference between the net proceeds of the sale and the book value (balance sheet value on the date of sale, adjusted by the amount of shareholders’ equity accumulated through periodic revaluation to fair value of the investment) is recorded as a credit or debit in the income statement.
AnnuAl RepoRt 2011 75
Acco
unts
at 3
1 De
cem
ber 2
011
Non-current assets held for sale and discontinued operationsWhen, at the end of the reporting period, it is highly likely that non-current assets or groups of directly related assets and liabilities will be disposed of, they are designated as non-current assets or groups of assets held for sale. Their sale is considered highly likely if, on the balance sheet date, a plan to put them up for sale at a reasonable price in relation to their fair value has been organised in order to find a buyer and finalise their transfer within one year at most. Non-current assets or groups of assets held for sale are presented as separate items in the financial statements. They are no longer depreciated and are valued at the lower of carrying value or fair value less costs to sell. Non-current assets or groups of assets that will be shut down and not sold constitute non-current assets that are to be abandoned. When non-current assets that are sold, held for sale or to be abandoned correspond to one or more CGUs (cash-generating units) and must be abandoned in the framework of a single and coordinated plan, they are considered discontinued operations and their related flows are placed in a separate presentation in the consolidated statement of comprehensive income and in the consolidated cash flow statement.
InventoriesInventories are recorded as assets at the date on which the risks, rewards and control are transferred to the Group. At the time of sale, their disposal is accounted for through an expense at the same date as the corresponding income. Inventories are valued at the lower of production cost or net realisable value. When production is less than normal capacity, fixed charges specifically exclude the share corresponding to the sub-activity. Inventories presenting similar characteristics are valued under the same method. The methods used in the Group are FIFO – First-In, First-Out – and the weighted average unit cost. When production cost cannot be recovered, it is lowered to net realisation value under the conditions existing at the balance sheet date.
Trade receivables and turnoverA trade receivable is recognised as a sale of goods upon transfer of the risks, rewards and control. In almost all cases, the incoterm of the transaction constitutes the main indicator of recognition of a sale of goods. A trade receivable is recognised as a provision of service in the amount of the percentage of completion of the service at the balance sheet date. As the greater part of the provision of services is made up of transport on sales, their recognition generally results from that of sale of the goods transported. For both sales of goods and provision of services, a receivable is recognised only if it is recoverable and if the amounts of the transaction and of the costs required for its completion can be valued reliably. Sales of goods and provision of services are valued at fair value of the transaction less trade and volume rebates, as well as discounts for early payment. Subsequent to their initial recognition, trade receivables are valued at amortised cost. Impairments are recorded during the financial year in which they are identified. A receivable transferred to a banking institution for financing purposes is derecognised only if the factoring service contract also transfers to the factor all risks and rewards inherent to the receivable.
Other financial assetsBonds considered as investments held to maturity (subject to the Group has the expressed intention and the ability to hold them to maturity) and the other loans and receivables issued by the Group are valued at their amortized cost, i.e. the amount at which they were initially recorded in the accounts plus or minus the accumulated amortization of any difference between this initial amount and the amount at maturity, and less any amounts recorded for impairment or non-recoverability. These bonds and other loans and receivables are recorded under the heading “Other current assets” or “Other non-current assets” in terms of their maturity.
Trading assets include other instruments held for transaction purposes and are valued at fair value at the balance sheet date. Changes in fair value between two balance sheet dates are recognised in profit or loss.
Cash and cash equivalentsCash and cash equivalents include bank deposits and fixed-term investments with a maturity date equal or of less than three months from the acquisition date.
Impairment of assetsAvailable-for-sale investmentsWhen there is an objective evidence of impairment of an available-for-sale investment, an impairment test must be carried out, in accordance with IAS 36 – Impairment of assets. The Group considers a significant or prolonged decline in fair value below cost as an objective indication of impairment. If the tested investment is considered as impaired, the impairment recorded in the revaluation reserves is reclassified to profit or loss. The amount of the impairment recorded is the difference between the acquisition cost of the investment and its fair value (share price) at closing.
Investments consolidated using the equity methodWhen there is an objective evidence of impairment of an investment consolidated using the equity method, an impairment test must be carried out, in accordance with IAS 36 – Impairment of assets and IAS 28 – Investments in associates. The recoverable amount of the asset is estimated in order to compare it to its book value and, if need be, to enter an impairment for the surplus. The recoverable amount is the highest of either the fair value less costs of sell or the value in use. The value in use corresponds to the future estimated discounted cash flow value. When an impairment accounted for in an earlier period ceases to exist, the book value is partially or totally restored. The reversal of an impairment is recorded immediately as profit.
76 AnnuAl RepoRt 2011
Accounts at 31 December 2011 - Accounting policies
Tangible and intangible assetsAt every reporting date, the Group reviews the carrying value of intangible and tangible assets with finite useful life in order to assess whether there is any evidence of impairment of these assets.
If there is any evidence of impairment, the asset’s recoverable amount is estimated to compare with its carrying value. The recoverable amount is the higher of the asset’s net sale price or its value in use. The value in use is the present value of estimated future cash flows from the continuous use of an asset. Where it is not possible to estimate the recoverable amount of an asset individually, the Group estimates the recoverable amount of the CGU to which the asset belongs. If the recoverable amount of the asset or of the CGU is estimated to be less than the carrying value, the carrying value of the asset or of the CGU is lowered to its recoverable amount. This impairment is immediately recognised to expenses.
When an impairment recorded during past financial years is no longer justified, the impairment on this asset or CGU is reversed in order to bring the asset or GGU back to a value corresponding to the new valuation of its recoverable amount. However, the carrying value of an asset or CGU may not exceed, following reversal of an impairment, the carrying value it would have had if no impairment had been recognised for the asset or CGU in previous years. The reversal of an impairment is recognised immediately as income.
Trade receivablesWhen the occurrence of a credit event makes the carrying amount of a trade receivable partially or fully irrecoverable, it is individually written down to its recoverable value by means of a write-down in accordance with the conditions existing at the reporting date.
Other financial assetsFor financial assets accounted for at amortised cost, the amount of the impairment is equal to the difference between the carrying value and the present value of the estimated future cash flows at the financial asset’s original effective interest rate.
TaxesIncome taxes of the financial year include both current and deferred taxes. They are recorded in the income statement unless they relate to items directly recorded in shareholders’ equity, in which case they also are recorded in the accounts in shareholders’ equity.
Current taxes are the taxes to be paid on the taxable profit for the financial year and are calculated in accordance with the tax rates in effect or that will be in effect on the last day of the financial year, plus any adjustments relating to prior years.
Deferred taxes are calculated in accordance with the variable carry-over method, which is applied to the temporary differences between the book values and tax basis of the assets and liabilities recorded in the balance sheet.
The following tax differences are disregarded: non-tax-deductible goodwill and initial valuations of assets and liabilities not affecting the book and taxable profit.
Deferred taxes are calculated according to the manner in which the related assets and liabilities are expected to be realised or settled, based on the tax rates in effect or that will be in effect on the last day of the financial year.
Additionally, deferred tax liabilities related to investments in subsidiaries are not recorded when the Group is able to control the date on which the temporary difference will reverse and when the Group does not expect the temporary difference to reverse within a foreseeable future.
Deferred tax assets are recorded if the taxable profits are likely to materialise in such a manner as to allow them to be offset against tax losses and tax credits.
Treasury sharesWhen treasury shares are bought (or sold), the amount paid (or received) is recorded as a decrease (or increase) in shareholders’ equity. Movements in these shares are shown in the consolidated statement of changes in shareholders’ equity. No profits or losses on these movements are recorded in the income statement.
Appropriation of profitDividends paid by GBL to its shareholders are included as a reduction of shareholders’ equity for their gross amount, i.e. before withholding tax. The financial statements are established before appropriation of profit.
Profit sharing plansGBL and Imerys stock optionsGBL and Imerys stock options granted prior to 7 November 2002 have not been recorded in the consolidated financial statements in accordance with the transitional provisions of IFRS 2 – Share-based payments.
Profit sharing plans granted as from 7 November 2002 are accounted for in accordance with IFRS 2. In accordance with this standard, the fair value of the options on the date of allocation is recorded in the income statement for the period of acquisition of the rights (“vesting period”). The options are valued by means of a valuation model generally authorised based on the market conditions prevailing at the time of their allocation.
Pargesa stock optionsThe Pargesa shares that cover the options issued are held by GBL and are accounted for under the heading “Trading assets”. The options are recorded on the liabilities in the balance sheet. Changes in the fair value of options and shares are recorded in the income statement.
AnnuAl RepoRt 2011 77
Acco
unts
at 3
1 De
cem
ber 2
011
Pension liabilities and similar obligationsDefined benefits schemesCommitments for defined benefit pension plans and similar obligations are valued using the Projected Unit Credit method in compliance with IAS 19. This valuation uses financial and demographic actuarial assumptions. These are used to value services rendered during the year on the basis of an estimate of the end-of-career salary.
Provisions (or assets) recognised correspond to the present value of the commitment less the fair value –possibly with an upper limit– of the scheme’s assets and past-service costs. Discount rates are adopted with reference to rates for bonds issued by AA (high quality) listed companies.
Net pension expenditure under these types of plans is recorded under “Personnel costs” or “Other operating income and expenditure relating to investing activities”, with the exception of undiscounting of the commitments and of the expected yield on assets, which are accounted for under financial income and expenses, and reductions caused by restructuring, which are recorded as other operating income and expenses.
Past-service costs not recognised are progressively incorporated into the value of provisions (or assets) through straight-line depreciation over the average vesting period of the rights. Actuarial differences and post-employment limits of scheme assets are wholly recognised as equity without subsequent reclassification to profit or loss (option “OCI”).
Defined contributions schemesThe Group contributes, in accordance with the laws and customs of each country, to the constitution of retirement reserves for its staff, paying contributions on a mandatory or voluntary basis to external bodies such as pension funds, insurance companies or financial establishments. These schemes are defined contributions plans, in other words they do not guarantee the level of benefits return. These contributions are recorded under “Personnel costs” or “Other operating income and expenses relating to investing activities”.
ProvisionsProvisions are recorded at the end of the financial year when a company of the Group has an actual legal or implicit obligation resulting from a past event, when it is probable that an amount will have to be paid out to settle this obligation, and if the amount of the obligation can be determined reliably.
The amount recorded as a provision should be the most accurate estimation of the expenditure required to meet the obligation existing on the last day of the financial year.
Provisions are recognised against profit or loss, apart from provisions for decommissioning and some provisions for rehabilitation, whose counterpart is included in the cost of assets whose construction has created the obligation. This treatment applies in particular to certain of Imerys’ industrial installations and overburden mineral assets.
Provisions whose settlement is expected within twelve months after the balance sheet date or whose settlement may occur at any time are not discounted. Provisions whose settlement is expected after twelve months after the balance sheet date are discounted. Changes in discounted provisions resulting from a revision of the amount of the obligation, its calendar or its discount rate are recognised against profit or loss, or for provisions recognised against assets, as an adjustment of the cost of the assets. The discounting is recognised as a debit in financial income and expenses.
Provisions for restructuring are not recorded unless the Group has approved a detailed and formal restructuring plan and if the restructuring has either begun or been publicly announced. Costs relating to the Group’s current operations are not taken into account.
Current and non-current debtsNon-current debts (bank loans and bonds) and current debts (bank deposits) are initially recorded in the accounts at their fair value less, in the case of a financial liability that has not been recorded at fair value through the income statement, the transaction costs that are directly imputed to the acquisition or release of the financial liability. After initial recording, they are valued at their amortized cost (initial amount less repayments of principal plus or minus the cumulative amortization of any difference between the initial amount and the value on maturity).
The exchangeable loans issued by the Group are considered as hybrid instruments. At the date of issue, the fair value of the liability component is estimated based on the prevailing market interest rate for similar non-exchangeable bonds. The difference between the proceeds of issuance of the exchangeable bond and the fair value assigned to the liability component, representing the embedded option to exchange the bonds into shares, is included in the shareholders’ equity. The interest cost of the liability component is calculated by applying the prevailing interest market rate.
Trade payables and other liabilities are measured at amortised cost.
Derivative financial instrumentsThe Group’s consolidated operating companies use derivative financial instruments to reduce their exposure to various risks, in particular foreign exchange, interest rate and energy price risks. The purpose of these instruments is to hedge the economic risks to which they are exposed. Financial instruments are recognised at the transaction date, i.e. the date the hedging contract is entered into. However, only those that fulfil the hedging criteria laid down in IAS 39 are given the accounting treatments described hereafter.
Changes in the fair value of financial instruments that do not qualify for hedge accounting are immediately recognised in profit or loss.

78 AnnuAl RepoRt 2011
Accounts at 31 December 2011 - Accounting policies
All transactions qualified as hedge accounting are documented by reference to the hedging strategy by identifying the hedged risk, the hedged item, the hedging instrument, the hedging relationship and the measurement method of the hedge relationship effectiveness. The measurement of the hedge relationship effectiveness is updated at every balance sheet date. Derivatives are measured at fair value on initial recognition. Fair value is subsequently remeasured at every balance sheet date by reference to market conditions.
Derivatives recorded as assets or liabilities are classified in the headings “Other non-current assets and liabilities” and “Other current assets and liabilities” depending on their maturity date and that of the underlying transactions. The recognition of derivatives classified as hedging varies depending on whether they are designated as fair value hedges, cash flow hedges or hedges of net investments in foreign entities.
Fair value hedgeWhen changes in fair value of a recognised asset or liability or an unrecognised firm commitment may affect income, these changes may be covered by a fair value hedge. The hedged item and the hedging instrument are remeasured symmetrically against profit or loss at every balance sheet date. The impact in profit or loss is limited to the ineffective portion of the hedge.
Cash flow hedge A cash flow hedge is used to cover unfavourable cash flow variations related to a recognised asset or liability or a highly likely future transaction when such variations are likely to affect income. At every balance sheet date, the effective portion of the hedge is recognised in equity and the ineffective portion in profit or loss. When the transaction is recognised, the effective portion in equity is reclassified to profit or loss simultaneously with recognition of the hedged item.
Hedge of net investments in foreign operationsExchange rate variations generated by net assets held in the Group’s consolidated operating companies in foreign currencies can be hedged. At every balance sheet date, the effective portion of the hedge is recognised in equity and the ineffective portion in profit or loss. Upon cessation of the activity, the effective portion in equity is reclassified in profit or loss.
GBL also uses derivatives. It can carry out transactions on listed shares in its portfolio using call or put options. These transactions are implemented with reference to thorough documentation and are monitored periodically and managed dynamically, as necessary.
Items denominated in foreign currenciesMonetary assets and liabilities denominated in foreign currencies in the accounts of Group’s companies are translated into euro using the exchange rates of the last day of the financial year. Unrealised differences on translation resulting from the application of this methodology are recorded as gains or losses of the financial year. Non-monetary assets and liabilities are recorded using the exchange rates applicable on the date of the transaction.
In the consolidated financial statements, the Group’s foreign assets and liabilities are converted at the closing rate. Headings of income and expenses in foreign currencies are converted into euro at the average exchange rate for the year. Differences on translation arising from the difference between average rate and closing rate are included in shareholders’ equity under the “Currency translation adjustments“ heading. These currency adjustments are recorded in profit or loss when the Group disposes of the entity concerned.
InterestInterest income and expenses include interest to be paid on loans and interest to be received on investments. Interest income received is recorded prorata temporis in the consolidated statement of comprehensive income, taking into account the effective interest rate on the investment.
DividendsDividends relating to available-for-sale investments or trading securities are booked on the date on which their distribution is decided upon. The amount of withholding tax is recorded as a deduction of gross dividends.
Accounting policies, changes in accounting estimates and errors/judgements A change in the accounting policies is only applied to meet the requirements of a standard or an interpretation, or if it gives a more reliable and more relevant information. Changes in accounting policies are recognized retrospectively, except in case of specific transitional provision stated in a standard or an interpretation. When an error is detected, it is also retrospectively adjusted.
Uncertainties inherent to the activities require estimates to be made when preparing the financial statements. These estimates result from judgements aiming at providing a true and fair view based upon available and reliable information. An estimate is revised to reflect changes in circumstances, new information available and effects linked to experience.
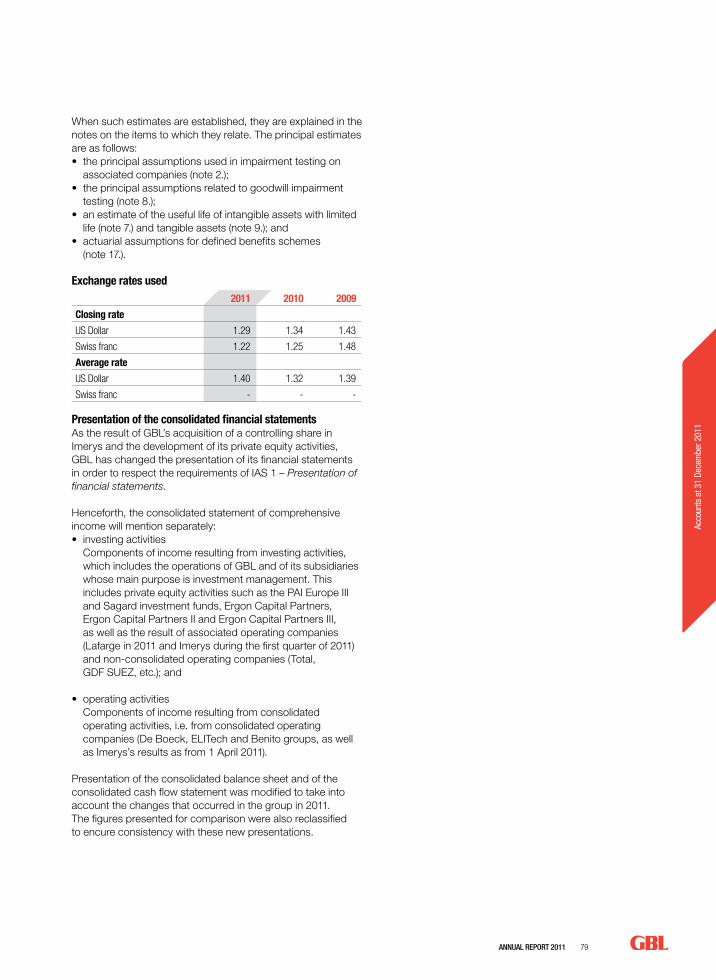
AnnuAl RepoRt 2011 79
Acco
unts
at 3
1 De
cem
ber 2
011
When such estimates are established, they are explained in the notes on the items to which they relate. The principal estimates are as follows:• the principal assumptions used in impairment testing on
associated companies (note 2.);• the principal assumptions related to goodwill impairment
testing (note 8.);• an estimate of the useful life of intangible assets with limited
life (note 7.) and tangible assets (note 9.); and• actuarial assumptions for defined benefits schemes
(note 17.).
Exchange rates used2011 2010 2009
Closing rate
US Dollar 1.29 1.34 1.43
Swiss franc 1.22 1.25 1.48
Average rate
US Dollar 1.40 1.32 1.39
Swiss franc - - -
Presentation of the consolidated financial statementsAs the result of GBL’s acquisition of a controlling share in Imerys and the development of its private equity activities, GBL has changed the presentation of its financial statements in order to respect the requirements of IAS 1 – Presentation of financial statements.
Henceforth, the consolidated statement of comprehensive income will mention separately:• investing activities Components of income resulting from investing activities,
which includes the operations of GBL and of its subsidiaries whose main purpose is investment management. This includes private equity activities such as the PAI Europe III and Sagard investment funds, Ergon Capital Partners, Ergon Capital Partners II and Ergon Capital Partners III, as well as the result of associated operating companies (Lafarge in 2011 and Imerys during the first quarter of 2011) and non-consolidated operating companies (Total, GDF SUEZ, etc.); and
• operating activities Components of income resulting from consolidated
operating activities, i.e. from consolidated operating companies (De Boeck, ELITech and Benito groups, as well as Imerys’s results as from 1 April 2011).
Presentation of the consolidated balance sheet and of the consolidated cash flow statement was modified to take into account the changes that occurred in the group in 2011. The figures presented for comparison were also reclassified to encure consistency with these new presentations.
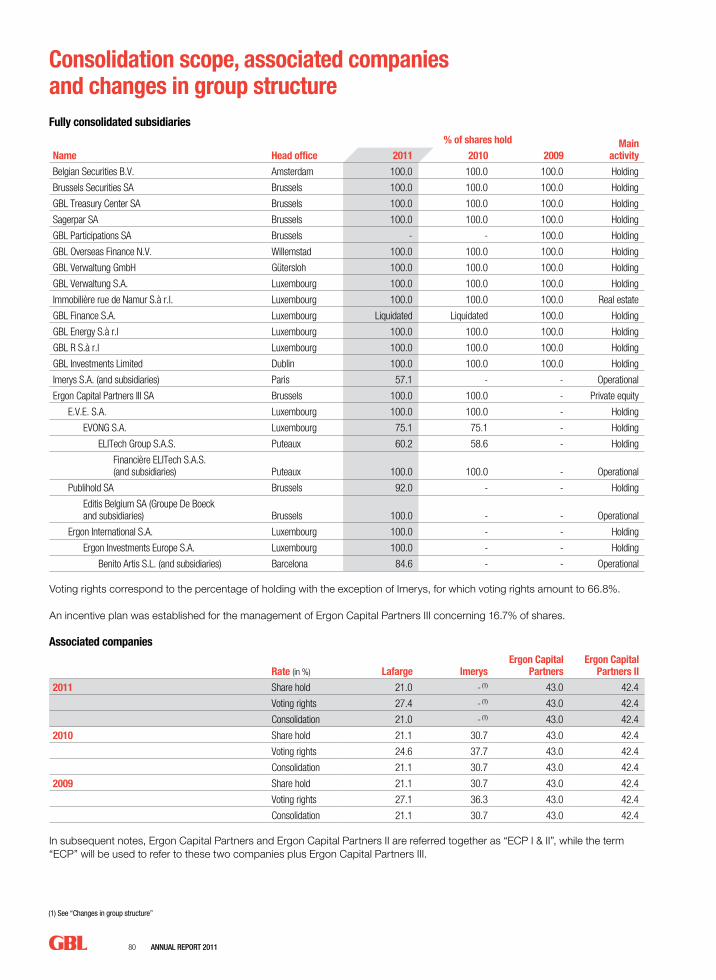
80 AnnuAl RepoRt 2011
Fully consolidated subsidiaries % of shares hold Main
activityName Head office 2011 2010 2009
Belgian Securities B.V. Amsterdam 100.0 100.0 100.0 Holding
Brussels Securities SA Brussels 100.0 100.0 100.0 Holding
GBL Treasury Center SA Brussels 100.0 100.0 100.0 Holding
Sagerpar SA Brussels 100.0 100.0 100.0 Holding
GBL Participations SA Brussels - - 100.0 Holding
GBL Overseas Finance N.V. Willemstad 100.0 100.0 100.0 Holding
GBL Verwaltung GmbH Gütersloh 100.0 100.0 100.0 Holding
GBL Verwaltung S.A. Luxembourg 100.0 100.0 100.0 Holding
Immobilière rue de Namur S.à r.l. Luxembourg 100.0 100.0 100.0 Real estate
GBL Finance S.A. Luxembourg Liquidated Liquidated 100.0 Holding
GBL Energy S.à r.l Luxembourg 100.0 100.0 100.0 Holding
GBL R S.à r.l Luxembourg 100.0 100.0 100.0 Holding
GBL Investments Limited Dublin 100.0 100.0 100.0 Holding
Imerys S.A. (and subsidiaries) Paris 57.1 - - Operational
Ergon Capital Partners III SA Brussels 100.0 100.0 - Private equity
E.V.E. S.A. Luxembourg 100.0 100.0 - Holding
EVONG S.A. Luxembourg 75.1 75.1 - Holding
ELITech Group S.A.S. Puteaux 60.2 58.6 - Holding
Financière ELITech S.A.S. (and subsidiaries) Puteaux 100.0 100.0 - Operational
Publihold SA Brussels 92.0 - - Holding
Editis Belgium SA (Groupe De Boeck and subsidiaries) Brussels 100.0 - - Operational
Ergon International S.A. Luxembourg 100.0 - - Holding
Ergon Investments Europe S.A. Luxembourg 100.0 - - Holding
Benito Artis S.L. (and subsidiaries) Barcelona 84.6 - - Operational
Voting rights correspond to the percentage of holding with the exception of Imerys, for which voting rights amount to 66.8%.
An incentive plan was established for the management of Ergon Capital Partners III concerning 16.7% of shares.
Associated companies
Rate (in %) Lafarge ImerysErgon Capital
PartnersErgon Capital
Partners II
2011 Share hold 21.0 - (1) 43.0 42.4
Voting rights 27.4 - (1) 43.0 42.4
Consolidation 21.0 - (1) 43.0 42.4
2010 Share hold 21.1 30.7 43.0 42.4
Voting rights 24.6 37.7 43.0 42.4
Consolidation 21.1 30.7 43.0 42.4
2009 Share hold 21.1 30.7 43.0 42.4
Voting rights 27.1 36.3 43.0 42.4
Consolidation 21.1 30.7 43.0 42.4
In subsequent notes, Ergon Capital Partners and Ergon Capital Partners II are referred together as “ECP I & II”, while the term “ECP” will be used to refer to these two companies plus Ergon Capital Partners III.
Consolidation scope, associated companies and changes in group structure
(1) See “Changes in group structure”
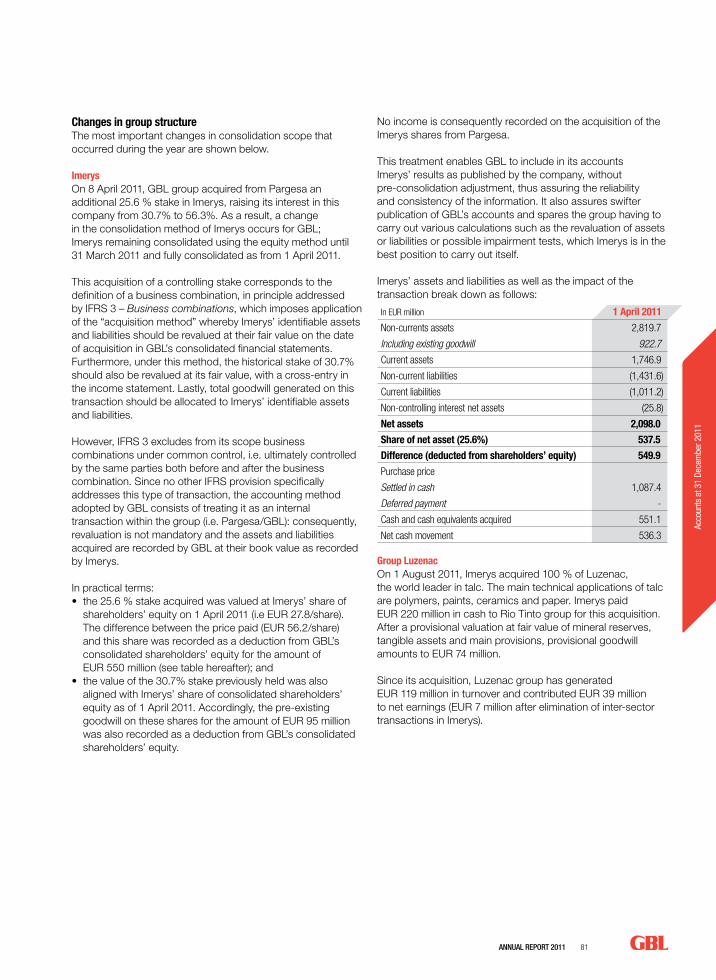
AnnuAl RepoRt 2011 81
Acco
unts
at 3
1 De
cem
ber 2
011
Changes in group structureThe most important changes in consolidation scope that occurred during the year are shown below.
ImerysOn 8 April 2011, GBL group acquired from Pargesa an additional 25.6 % stake in Imerys, raising its interest in this company from 30.7% to 56.3%. As a result, a change in the consolidation method of Imerys occurs for GBL; Imerys remaining consolidated using the equity method until 31 March 2011 and fully consolidated as from 1 April 2011.
This acquisition of a controlling stake corresponds to the definition of a business combination, in principle addressed by IFRS 3 – Business combinations, which imposes application of the “acquisition method” whereby Imerys’ identifiable assets and liabilities should be revalued at their fair value on the date of acquisition in GBL’s consolidated financial statements. Furthermore, under this method, the historical stake of 30.7% should also be revalued at its fair value, with a cross-entry in the income statement. Lastly, total goodwill generated on this transaction should be allocated to Imerys’ identifiable assets and liabilities.
However, IFRS 3 excludes from its scope business combinations under common control, i.e. ultimately controlled by the same parties both before and after the business combination. Since no other IFRS provision specifically addresses this type of transaction, the accounting method adopted by GBL consists of treating it as an internal transaction within the group (i.e. Pargesa/GBL): consequently, revaluation is not mandatory and the assets and liabilities acquired are recorded by GBL at their book value as recorded by Imerys.
In practical terms: • the 25.6 % stake acquired was valued at Imerys’ share of
shareholders’ equity on 1 April 2011 (i.e EUR 27.8/share). The difference between the price paid (EUR 56.2/share) and this share was recorded as a deduction from GBL’s consolidated shareholders’ equity for the amount of EUR 550 million (see table hereafter); and
• the value of the 30.7% stake previously held was also aligned with Imerys’ share of consolidated shareholders’ equity as of 1 April 2011. Accordingly, the pre-existing goodwill on these shares for the amount of EUR 95 million was also recorded as a deduction from GBL’s consolidated shareholders’ equity.
No income is consequently recorded on the acquisition of the Imerys shares from Pargesa.
This treatment enables GBL to include in its accounts Imerys’ results as published by the company, without pre-consolidation adjustment, thus assuring the reliability and consistency of the information. It also assures swifter publication of GBL’s accounts and spares the group having to carry out various calculations such as the revaluation of assets or liabilities or possible impairment tests, which Imerys is in the best position to carry out itself. Imerys’ assets and liabilities as well as the impact of the transaction break down as follows:
In EUR million 1 April 2011
Non-currents assets 2,819.7
Including existing goodwill 922.7
Current assets 1,746.9
Non-current liabilities (1,431.6)
Current liabilities (1,011.2)
Non-controlling interest net assets (25.8)
Net assets 2,098.0
Share of net asset (25.6%) 537.5
Difference (deducted from shareholders’ equity) 549.9
Purchase price
Settled in cash 1,087.4
Deferred payment -
Cash and cash equivalents acquired 551.1
Net cash movement 536.3
Group LuzenacOn 1 August 2011, Imerys acquired 100 % of Luzenac, the world leader in talc. The main technical applications of talc are polymers, paints, ceramics and paper. Imerys paid EUR 220 million in cash to Rio Tinto group for this acquisition. After a provisional valuation at fair value of mineral reserves, tangible assets and main provisions, provisional goodwill amounts to EUR 74 million.
Since its acquisition, Luzenac group has generated EUR 119 million in turnover and contributed EUR 39 million to net earnings (EUR 7 million after elimination of inter-sector transactions in Imerys).
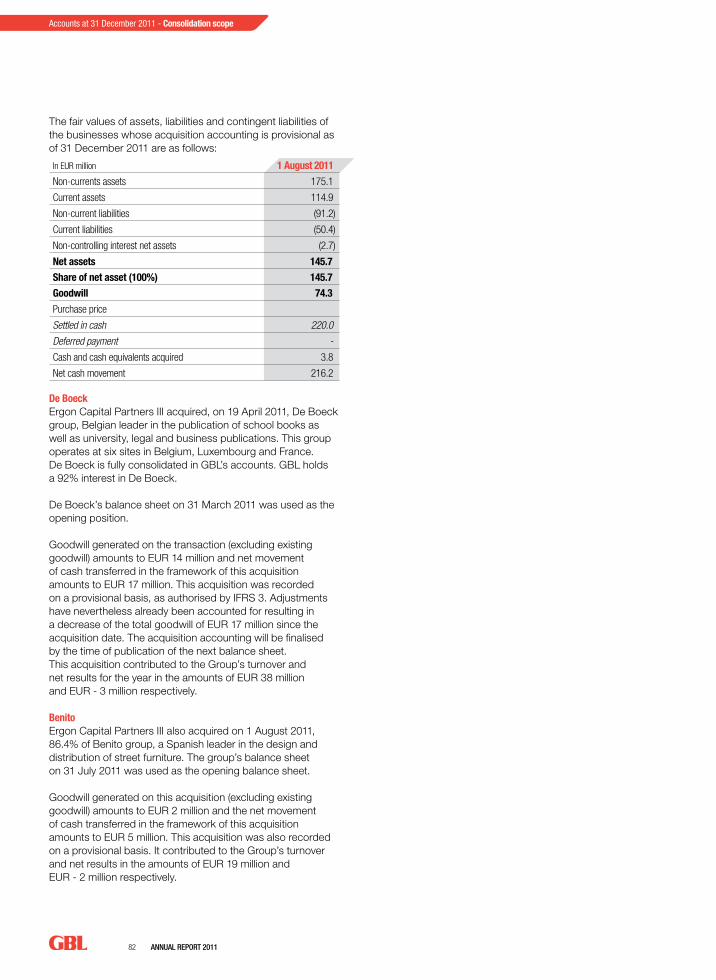
82 AnnuAl RepoRt 2011
Accounts at 31 December 2011 - Consolidation scope
The fair values of assets, liabilities and contingent liabilities of the businesses whose acquisition accounting is provisional as of 31 December 2011 are as follows:
In EUR million 1 August 2011
Non-currents assets 175.1
Current assets 114.9
Non-current liabilities (91.2)
Current liabilities (50.4)
Non-controlling interest net assets (2.7)
Net assets 145.7
Share of net asset (100%) 145.7
Goodwill 74.3
Purchase price
Settled in cash 220.0
Deferred payment -
Cash and cash equivalents acquired 3.8
Net cash movement 216.2
De BoeckErgon Capital Partners III acquired, on 19 April 2011, De Boeck group, Belgian leader in the publication of school books as well as university, legal and business publications. This group operates at six sites in Belgium, Luxembourg and France. De Boeck is fully consolidated in GBL’s accounts. GBL holds a 92% interest in De Boeck.
De Boeck’s balance sheet on 31 March 2011 was used as the opening position.
Goodwill generated on the transaction (excluding existing goodwill) amounts to EUR 14 million and net movement of cash transferred in the framework of this acquisition amounts to EUR 17 million. This acquisition was recorded on a provisional basis, as authorised by IFRS 3. Adjustments have nevertheless already been accounted for resulting in a decrease of the total goodwill of EUR 17 million since the acquisition date. The acquisition accounting will be finalised by the time of publication of the next balance sheet. This acquisition contributed to the Group’s turnover and net results for the year in the amounts of EUR 38 million and EUR - 3 million respectively.
BenitoErgon Capital Partners III also acquired on 1 August 2011, 86.4% of Benito group, a Spanish leader in the design and distribution of street furniture. The group’s balance sheet on 31 July 2011 was used as the opening balance sheet.
Goodwill generated on this acquisition (excluding existing goodwill) amounts to EUR 2 million and the net movement of cash transferred in the framework of this acquisition amounts to EUR 5 million. This acquisition was also recorded on a provisional basis. It contributed to the Group’s turnover and net results in the amounts of EUR 19 million and EUR - 2 million respectively.
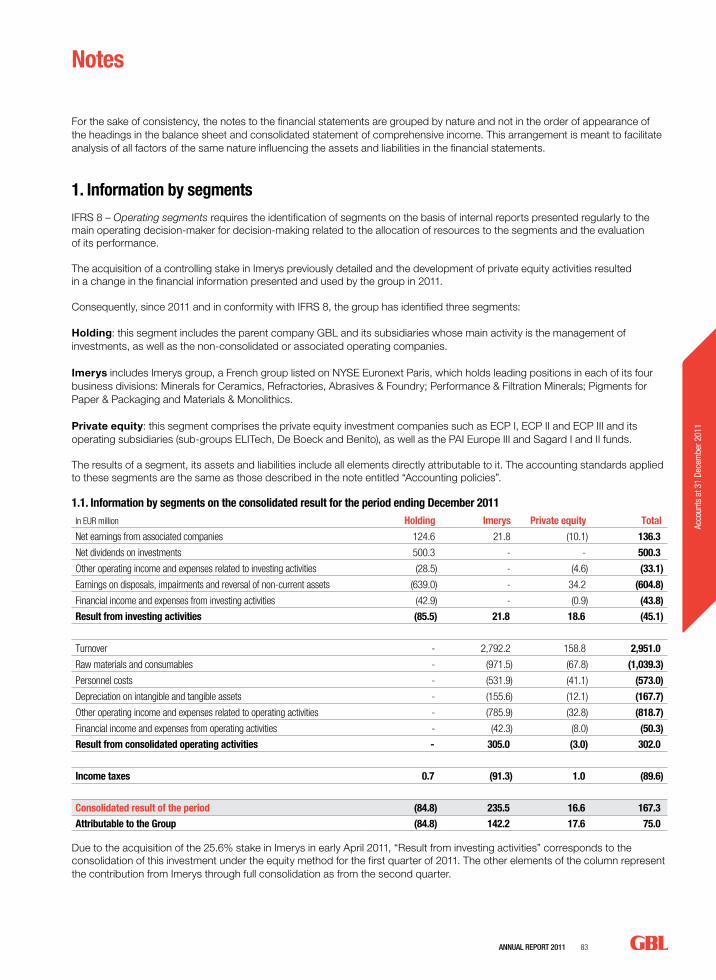
AnnuAl RepoRt 2011 83
Acco
unts
at 3
1 De
cem
ber 2
011
For the sake of consistency, the notes to the financial statements are grouped by nature and not in the order of appearance of the headings in the balance sheet and consolidated statement of comprehensive income. This arrangement is meant to facilitate analysis of all factors of the same nature influencing the assets and liabilities in the financial statements.
1. Information by segmentsIFRS 8 – Operating segments requires the identification of segments on the basis of internal reports presented regularly to the main operating decision-maker for decision-making related to the allocation of resources to the segments and the evaluation of its performance.
The acquisition of a controlling stake in Imerys previously detailed and the development of private equity activities resulted in a change in the financial information presented and used by the group in 2011.
Consequently, since 2011 and in conformity with IFRS 8, the group has identified three segments:
Holding: this segment includes the parent company GBL and its subsidiaries whose main activity is the management of investments, as well as the non-consolidated or associated operating companies.
Imerys includes Imerys group, a French group listed on NYSE Euronext Paris, which holds leading positions in each of its four business divisions: Minerals for Ceramics, Refractories, Abrasives & Foundry; Performance & Filtration Minerals; Pigments for Paper & Packaging and Materials & Monolithics.
Private equity: this segment comprises the private equity investment companies such as ECP I, ECP II and ECP III and its operating subsidiaries (sub-groups ELITech, De Boeck and Benito), as well as the PAI Europe III and Sagard I and II funds.
The results of a segment, its assets and liabilities include all elements directly attributable to it. The accounting standards applied to these segments are the same as those described in the note entitled “Accounting policies”.
1.1. Information by segments on the consolidated result for the period ending December 2011In EUR million Holding Imerys Private equity Total
Net earnings from associated companies 124.6 21.8 (10.1) 136.3
Net dividends on investments 500.3 - - 500.3
Other operating income and expenses related to investing activities (28.5) - (4.6) (33.1)
Earnings on disposals, impairments and reversal of non-current assets (639.0) - 34.2 (604.8)
Financial income and expenses from investing activities (42.9) - (0.9) (43.8)
Result from investing activities (85.5) 21.8 18.6 (45.1)
Turnover - 2,792.2 158.8 2,951.0
Raw materials and consumables - (971.5) (67.8) (1,039.3)
Personnel costs - (531.9) (41.1) (573.0)
Depreciation on intangible and tangible assets - (155.6) (12.1) (167.7)
Other operating income and expenses related to operating activities - (785.9) (32.8) (818.7)
Financial income and expenses from operating activities - (42.3) (8.0) (50.3)
Result from consolidated operating activities - 305.0 (3.0) 302.0
Income taxes 0.7 (91.3) 1.0 (89.6)
Consolidated result of the period (84.8) 235.5 16.6 167.3
Attributable to the Group (84.8) 142.2 17.6 75.0
Due to the acquisition of the 25.6% stake in Imerys in early April 2011, “Result from investing activities” corresponds to the consolidation of this investment under the equity method for the first quarter of 2011. The other elements of the column represent the contribution from Imerys through full consolidation as from the second quarter.
Notes
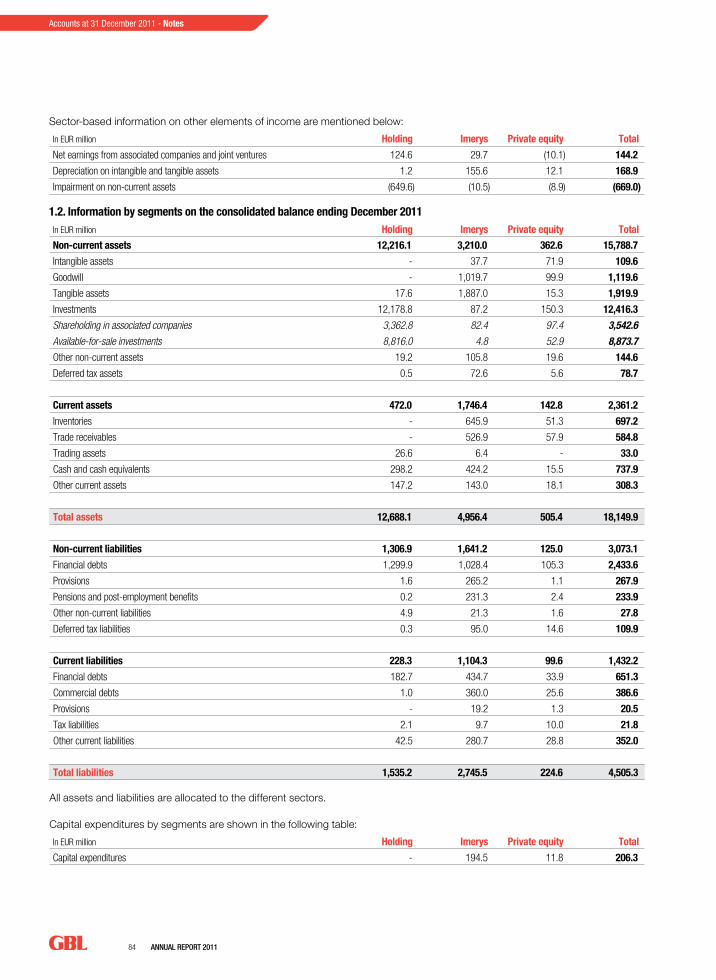
84 AnnuAl RepoRt 2011
Accounts at 31 December 2011 - Notes
Sector-based information on other elements of income are mentioned below:
In EUR million Holding Imerys Private equity Total
Net earnings from associated companies and joint ventures 124.6 29.7 (10.1) 144.2
Depreciation on intangible and tangible assets 1.2 155.6 12.1 168.9
Impairment on non-current assets (649.6) (10.5) (8.9) (669.0)
1.2. Information by segments on the consolidated balance ending December 2011In EUR million Holding Imerys Private equity Total
Non-current assets 12,216.1 3,210.0 362.6 15,788.7
Intangible assets - 37.7 71.9 109.6
Goodwill - 1,019.7 99.9 1,119.6
Tangible assets 17.6 1,887.0 15.3 1,919.9
Investments 12,178.8 87.2 150.3 12,416.3
Shareholding in associated companies 3,362.8 82.4 97.4 3,542.6
Available-for-sale investments 8,816.0 4.8 52.9 8,873.7
Other non-current assets 19.2 105.8 19.6 144.6
Deferred tax assets 0.5 72.6 5.6 78.7
Current assets 472.0 1,746.4 142.8 2,361.2
Inventories - 645.9 51.3 697.2
Trade receivables - 526.9 57.9 584.8
Trading assets 26.6 6.4 - 33.0
Cash and cash equivalents 298.2 424.2 15.5 737.9
Other current assets 147.2 143.0 18.1 308.3
Total assets 12,688.1 4,956.4 505.4 18,149.9
Non-current liabilities 1,306.9 1,641.2 125.0 3,073.1
Financial debts 1,299.9 1,028.4 105.3 2,433.6
Provisions 1.6 265.2 1.1 267.9
Pensions and post-employment benefits 0.2 231.3 2.4 233.9
Other non-current liabilities 4.9 21.3 1.6 27.8
Deferred tax liabilities 0.3 95.0 14.6 109.9
Current liabilities 228.3 1,104.3 99.6 1,432.2
Financial debts 182.7 434.7 33.9 651.3
Commercial debts 1.0 360.0 25.6 386.6
Provisions - 19.2 1.3 20.5
Tax liabilities 2.1 9.7 10.0 21.8
Other current liabilities 42.5 280.7 28.8 352.0
Total liabilities 1,535.2 2,745.5 224.6 4,505.3
All assets and liabilities are allocated to the different sectors.
Capital expenditures by segments are shown in the following table:
In EUR million Holding Imerys Private equity Total
Capital expenditures - 194.5 11.8 206.3
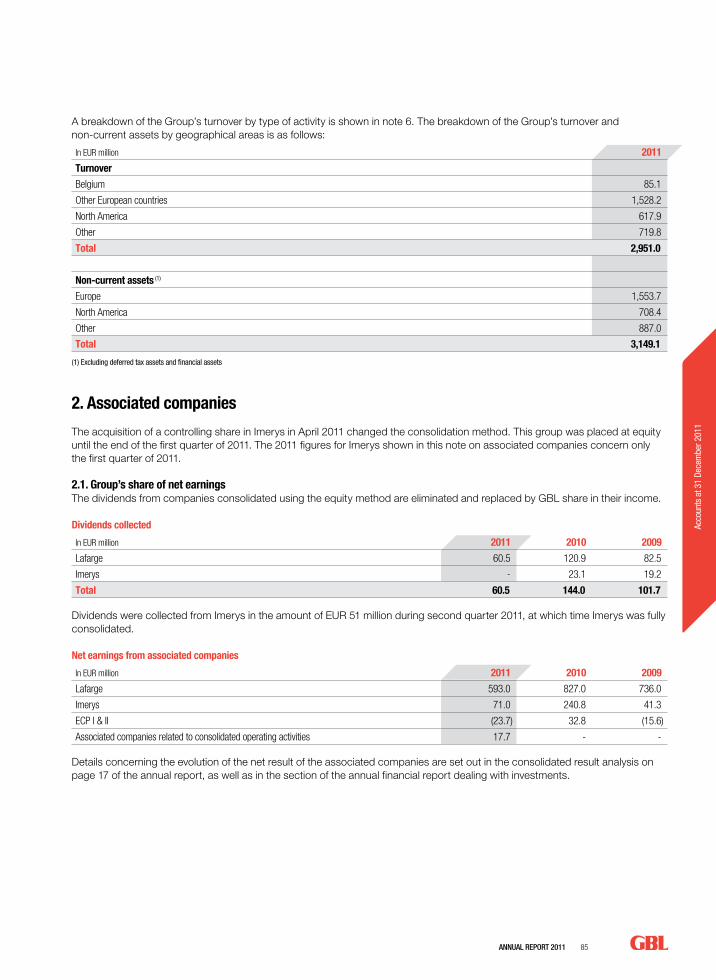
AnnuAl RepoRt 2011 85
Acco
unts
at 3
1 De
cem
ber 2
011
A breakdown of the Group’s turnover by type of activity is shown in note 6. The breakdown of the Group’s turnover and non-current assets by geographical areas is as follows:
In EUR million 2011
Turnover
Belgium 85.1
Other European countries 1,528.2
North America 617.9
Other 719.8
Total 2,951.0
Non-current assets (1)
Europe 1,553.7
North America 708.4
Other 887.0
Total 3,149.1
(1) Excluding deferred tax assets and financial assets
2. Associated companies
The acquisition of a controlling share in Imerys in April 2011 changed the consolidation method. This group was placed at equity until the end of the first quarter of 2011. The 2011 figures for Imerys shown in this note on associated companies concern only the first quarter of 2011.
2.1. Group’s share of net earnings The dividends from companies consolidated using the equity method are eliminated and replaced by GBL share in their income.
Dividends collected
In EUR million 2011 2010 2009
Lafarge 60.5 120.9 82.5
Imerys - 23.1 19.2
Total 60.5 144.0 101.7
Dividends were collected from Imerys in the amount of EUR 51 million during second quarter 2011, at which time Imerys was fully consolidated.
Net earnings from associated companies
In EUR million 2011 2010 2009
Lafarge 593.0 827.0 736.0
Imerys 71.0 240.8 41.3
ECP I & II (23.7) 32.8 (15.6)
Associated companies related to consolidated operating activities 17.7 - -
Details concerning the evolution of the net result of the associated companies are set out in the consolidated result analysis on page 17 of the annual report, as well as in the section of the annual financial report dealing with investments.
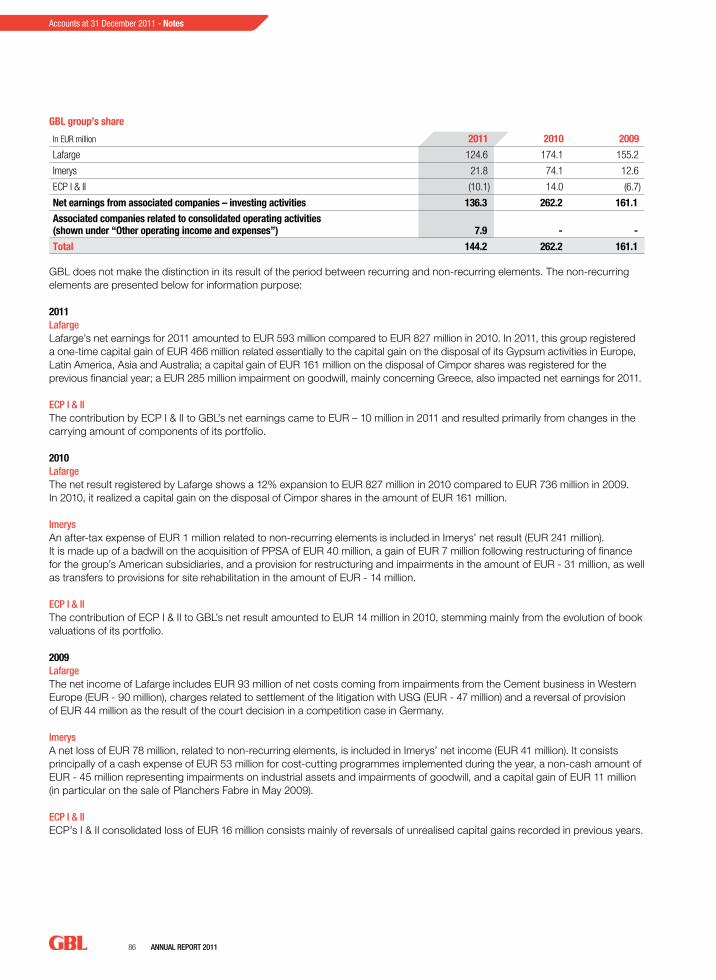
86 AnnuAl RepoRt 2011
Accounts at 31 December 2011 - Notes
GBL group’s share
In EUR million 2011 2010 2009
Lafarge 124.6 174.1 155.2
Imerys 21.8 74.1 12.6
ECP I & II (10.1) 14.0 (6.7)
Net earnings from associated companies – investing activities 136.3 262.2 161.1
Associated companies related to consolidated operating activities (shown under “Other operating income and expenses”) 7.9 - -
Total 144.2 262.2 161.1
GBL does not make the distinction in its result of the period between recurring and non-recurring elements. The non-recurring elements are presented below for information purpose:
2011lafargeLafarge’s net earnings for 2011 amounted to EUR 593 million compared to EUR 827 million in 2010. In 2011, this group registered a one-time capital gain of EUR 466 million related essentially to the capital gain on the disposal of its Gypsum activities in Europe, Latin America, Asia and Australia; a capital gain of EUR 161 million on the disposal of Cimpor shares was registered for the previous financial year; a EUR 285 million impairment on goodwill, mainly concerning Greece, also impacted net earnings for 2011.
eCp I & IIThe contribution by ECP I & II to GBL’s net earnings came to EUR – 10 million in 2011 and resulted primarily from changes in the carrying amount of components of its portfolio.
2010lafargeThe net result registered by Lafarge shows a 12% expansion to EUR 827 million in 2010 compared to EUR 736 million in 2009. In 2010, it realized a capital gain on the disposal of Cimpor shares in the amount of EUR 161 million.
ImerysAn after-tax expense of EUR 1 million related to non-recurring elements is included in Imerys’ net result (EUR 241 million). It is made up of a badwill on the acquisition of PPSA of EUR 40 million, a gain of EUR 7 million following restructuring of finance for the group’s American subsidiaries, and a provision for restructuring and impairments in the amount of EUR - 31 million, as well as transfers to provisions for site rehabilitation in the amount of EUR - 14 million.
eCp I & IIThe contribution of ECP I & II to GBL’s net result amounted to EUR 14 million in 2010, stemming mainly from the evolution of book valuations of its portfolio.
2009lafargeThe net income of Lafarge includes EUR 93 million of net costs coming from impairments from the Cement business in Western Europe (EUR - 90 million), charges related to settlement of the litigation with USG (EUR - 47 million) and a reversal of provision of EUR 44 million as the result of the court decision in a competition case in Germany.
ImerysA net loss of EUR 78 million, related to non-recurring elements, is included in Imerys’ net income (EUR 41 million). It consists principally of a cash expense of EUR 53 million for cost-cutting programmes implemented during the year, a non-cash amount of EUR - 45 million representing impairments on industrial assets and impairments of goodwill, and a capital gain of EUR 11 million (in particular on the sale of Planchers Fabre in May 2009).
eCp I & IIECP’s I & II consolidated loss of EUR 16 million consists mainly of reversals of unrealised capital gains recorded in previous years.
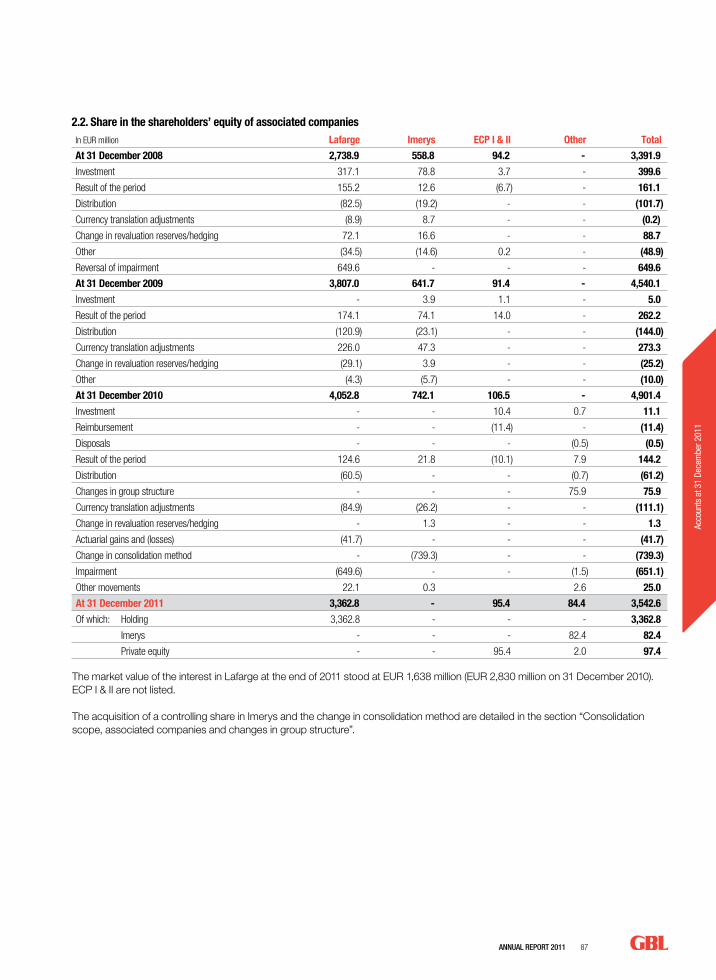
AnnuAl RepoRt 2011 87
Acco
unts
at 3
1 De
cem
ber 2
011
2.2. Share in the shareholders’ equity of associated companiesIn EUR million Lafarge Imerys ECP I & II Other Total
At 31 December 2008 2,738.9 558.8 94.2 - 3,391.9
Investment 317.1 78.8 3.7 - 399.6
Result of the period 155.2 12.6 (6.7) - 161.1
Distribution (82.5) (19.2) - - (101.7)
Currency translation adjustments (8.9) 8.7 - - (0.2)
Change in revaluation reserves/hedging 72.1 16.6 - - 88.7
Other (34.5) (14.6) 0.2 - (48.9)
Reversal of impairment 649.6 - - - 649.6
At 31 December 2009 3,807.0 641.7 91.4 - 4,540.1
Investment - 3.9 1.1 - 5.0
Result of the period 174.1 74.1 14.0 - 262.2
Distribution (120.9) (23.1) - - (144.0)
Currency translation adjustments 226.0 47.3 - - 273.3
Change in revaluation reserves/hedging (29.1) 3.9 - - (25.2)
Other (4.3) (5.7) - - (10.0)
At 31 December 2010 4,052.8 742.1 106.5 - 4,901.4
Investment - - 10.4 0.7 11.1
Reimbursement - - (11.4) - (11.4)
Disposals - - - (0.5) (0.5)
Result of the period 124.6 21.8 (10.1) 7.9 144.2
Distribution (60.5) - - (0.7) (61.2)
Changes in group structure - - - 75.9 75.9
Currency translation adjustments (84.9) (26.2) - - (111.1)
Change in revaluation reserves/hedging - 1.3 - - 1.3
Actuarial gains and (losses) (41.7) - - - (41.7)
Change in consolidation method - (739.3) - - (739.3)
Impairment (649.6) - - (1.5) (651.1)
Other movements 22.1 0.3 2.6 25.0
At 31 December 2011 3,362.8 - 95.4 84.4 3,542.6
Of which: Holding 3,362.8 - - - 3,362.8
Imerys - - - 82.4 82.4
Private equity - - 95.4 2.0 97.4
The market value of the interest in Lafarge at the end of 2011 stood at EUR 1,638 million (EUR 2,830 million on 31 December 2010). ECP I & II are not listed.
The acquisition of a controlling share in Imerys and the change in consolidation method are detailed in the section “Consolidation scope, associated companies and changes in group structure”.
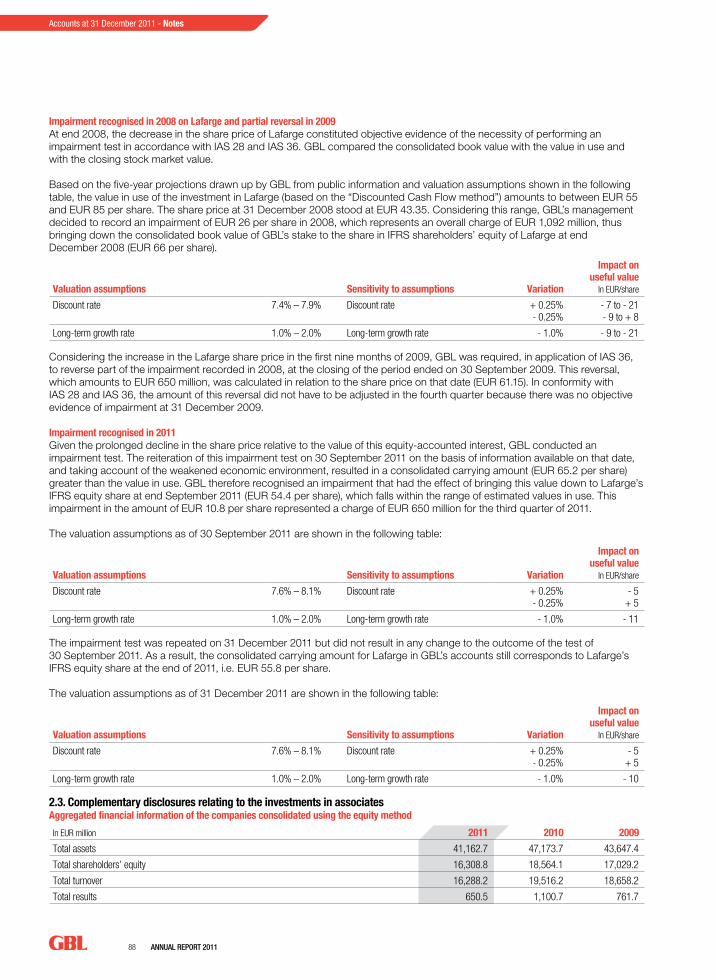
88 AnnuAl RepoRt 2011
Accounts at 31 December 2011 - Notes
Impairment recognised in 2008 on Lafarge and partial reversal in 2009At end 2008, the decrease in the share price of Lafarge constituted objective evidence of the necessity of performing an impairment test in accordance with IAS 28 and IAS 36. GBL compared the consolidated book value with the value in use and with the closing stock market value.
Based on the five-year projections drawn up by GBL from public information and valuation assumptions shown in the following table, the value in use of the investment in Lafarge (based on the “Discounted Cash Flow method”) amounts to between EUR 55 and EUR 85 per share. The share price at 31 December 2008 stood at EUR 43.35. Considering this range, GBL’s management decided to record an impairment of EUR 26 per share in 2008, which represents an overall charge of EUR 1,092 million, thus bringing down the consolidated book value of GBL’s stake to the share in IFRS shareholders’ equity of Lafarge at end December 2008 (EUR 66 per share).
Valuation assumptions Sensitivity to assumptions Variation
Impact on useful value
In EUR/share
Discount rate 7.4% – 7.9% Discount rate + 0.25%- 0.25%
- 7 to - 21- 9 to + 8
Long-term growth rate 1.0% – 2.0% Long-term growth rate - 1.0% - 9 to - 21 Considering the increase in the Lafarge share price in the first nine months of 2009, GBL was required, in application of IAS 36, to reverse part of the impairment recorded in 2008, at the closing of the period ended on 30 September 2009. This reversal, which amounts to EUR 650 million, was calculated in relation to the share price on that date (EUR 61.15). In conformity with IAS 28 and IAS 36, the amount of this reversal did not have to be adjusted in the fourth quarter because there was no objective evidence of impairment at 31 December 2009.
Impairment recognised in 2011Given the prolonged decline in the share price relative to the value of this equity-accounted interest, GBL conducted an impairment test. The reiteration of this impairment test on 30 September 2011 on the basis of information available on that date, and taking account of the weakened economic environment, resulted in a consolidated carrying amount (EUR 65.2 per share) greater than the value in use. GBL therefore recognised an impairment that had the effect of bringing this value down to Lafarge’s IFRS equity share at end September 2011 (EUR 54.4 per share), which falls within the range of estimated values in use. This impairment in the amount of EUR 10.8 per share represented a charge of EUR 650 million for the third quarter of 2011.
The valuation assumptions as of 30 September 2011 are shown in the following table:
Valuation assumptions Sensitivity to assumptions Variation
Impact on useful value
In EUR/share
Discount rate 7.6% – 8.1% Discount rate + 0.25%- 0.25%
- 5+ 5
Long-term growth rate 1.0% – 2.0% Long-term growth rate - 1.0% - 11
The impairment test was repeated on 31 December 2011 but did not result in any change to the outcome of the test of 30 September 2011. As a result, the consolidated carrying amount for Lafarge in GBL’s accounts still corresponds to Lafarge’s IFRS equity share at the end of 2011, i.e. EUR 55.8 per share.
The valuation assumptions as of 31 December 2011 are shown in the following table:
Valuation assumptions Sensitivity to assumptions Variation
Impact on useful value
In EUR/share
Discount rate 7.6% – 8.1% Discount rate + 0.25%- 0.25%
- 5+ 5
Long-term growth rate 1.0% – 2.0% Long-term growth rate - 1.0% - 10
2.3. Complementary disclosures relating to the investments in associates Aggregated financial information of the companies consolidated using the equity method
In EUR million 2011 2010 2009
Total assets 41,162.7 47,173.7 43,647.4
Total shareholders’ equity 16,308.8 18,564.1 17,029.2
Total turnover 16,288.2 19,516.2 18,658.2
Total results 650.5 1,100.7 761.7
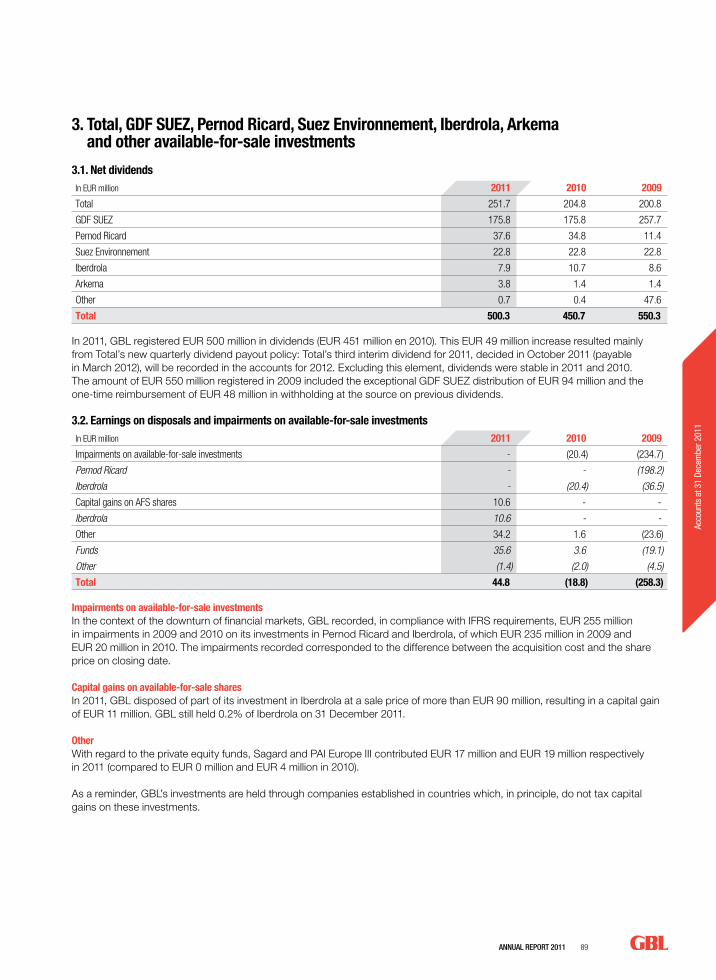
AnnuAl RepoRt 2011 89
Acco
unts
at 3
1 De
cem
ber 2
011
3. Total, GDF SUEZ, Pernod Ricard, Suez Environnement, Iberdrola, Arkema and other available-for-sale investments
3.1. Net dividendsIn EUR million 2011 2010 2009
Total 251.7 204.8 200.8
GDF SUEZ 175.8 175.8 257.7
Pernod Ricard 37.6 34.8 11.4
Suez Environnement 22.8 22.8 22.8
Iberdrola 7.9 10.7 8.6
Arkema 3.8 1.4 1.4
Other 0.7 0.4 47.6
Total 500.3 450.7 550.3
In 2011, GBL registered EUR 500 million in dividends (EUR 451 million en 2010). This EUR 49 million increase resulted mainly from Total’s new quarterly dividend payout policy: Total’s third interim dividend for 2011, decided in October 2011 (payable in March 2012), will be recorded in the accounts for 2012. Excluding this element, dividends were stable in 2011 and 2010. The amount of EUR 550 million registered in 2009 included the exceptional GDF SUEZ distribution of EUR 94 million and the one-time reimbursement of EUR 48 million in withholding at the source on previous dividends.
3.2. Earnings on disposals and impairments on available-for-sale investmentsIn EUR million 2011 2010 2009
Impairments on available-for-sale investments - (20.4) (234.7)
Pernod Ricard - - (198.2)
Iberdrola - (20.4) (36.5)
Capital gains on AFS shares 10.6 - -
Iberdrola 10.6 - -
Other 34.2 1.6 (23.6)
Funds 35.6 3.6 (19.1)
Other (1.4) (2.0) (4.5)
Total 44.8 (18.8) (258.3)
Impairments on available-for-sale investments In the context of the downturn of financial markets, GBL recorded, in compliance with IFRS requirements, EUR 255 million in impairments in 2009 and 2010 on its investments in Pernod Ricard and Iberdrola, of which EUR 235 million in 2009 and EUR 20 million in 2010. The impairments recorded corresponded to the difference between the acquisition cost and the share price on closing date.
Capital gains on available-for-sale sharesIn 2011, GBL disposed of part of its investment in Iberdrola at a sale price of more than EUR 90 million, resulting in a capital gain of EUR 11 million. GBL still held 0.2% of Iberdrola on 31 December 2011.
OtherWith regard to the private equity funds, Sagard and PAI Europe III contributed EUR 17 million and EUR 19 million respectively in 2011 (compared to EUR 0 million and EUR 4 million in 2010).
As a reminder, GBL’s investments are held through companies established in countries which, in principle, do not tax capital gains on these investments.
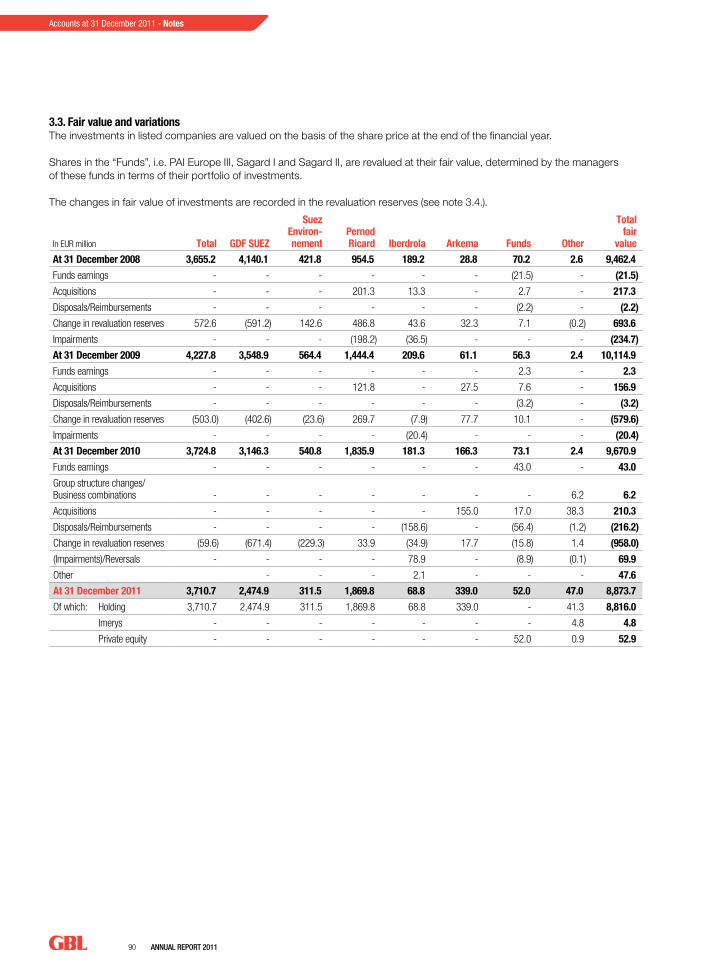
90 AnnuAl RepoRt 2011
Accounts at 31 December 2011 - Notes
3.3. Fair value and variationsThe investments in listed companies are valued on the basis of the share price at the end of the financial year.
Shares in the “Funds”, i.e. PAI Europe III, Sagard I and Sagard II, are revalued at their fair value, determined by the managers of these funds in terms of their portfolio of investments.
The changes in fair value of investments are recorded in the revaluation reserves (see note 3.4.).
In EUR million Total GDF SUEZ
Suez Environ-nement
Pernod Ricard Iberdrola Arkema Funds Other
Total fair
value
At 31 December 2008 3,655.2 4,140.1 421.8 954.5 189.2 28.8 70.2 2.6 9,462.4
Funds earnings - - - - - - (21.5) - (21.5)
Acquisitions - - - 201.3 13.3 - 2.7 - 217.3
Disposals/Reimbursements - - - - - - (2.2) - (2.2)
Change in revaluation reserves 572.6 (591.2) 142.6 486.8 43.6 32.3 7.1 (0.2) 693.6
Impairments - - - (198.2) (36.5) - - - (234.7)
At 31 December 2009 4,227.8 3,548.9 564.4 1,444.4 209.6 61.1 56.3 2.4 10,114.9
Funds earnings - - - - - - 2.3 - 2.3
Acquisitions - - - 121.8 - 27.5 7.6 - 156.9
Disposals/Reimbursements - - - - - - (3.2) - (3.2)
Change in revaluation reserves (503.0) (402.6) (23.6) 269.7 (7.9) 77.7 10.1 - (579.6)
Impairments - - - - (20.4) - - - (20.4)
At 31 December 2010 3,724.8 3,146.3 540.8 1,835.9 181.3 166.3 73.1 2.4 9,670.9
Funds earnings - - - - - - 43.0 - 43.0
Group structure changes/Business combinations - - - - - - - 6.2 6.2
Acquisitions - - - - - 155.0 17.0 38.3 210.3
Disposals/Reimbursements - - - - (158.6) - (56.4) (1.2) (216.2)
Change in revaluation reserves (59.6) (671.4) (229.3) 33.9 (34.9) 17.7 (15.8) 1.4 (958.0)
(Impairments)/Reversals - - - - 78.9 - (8.9) (0.1) 69.9
Other - - - 2.1 - - - 47.6
At 31 December 2011 3,710.7 2,474.9 311.5 1,869.8 68.8 339.0 52.0 47.0 8,873.7
Of which: Holding 3,710.7 2,474.9 311.5 1,869.8 68.8 339.0 - 41.3 8,816.0
Imerys - - - - - - - 4.8 4.8
Private equity - - - - - - 52.0 0.9 52.9

AnnuAl RepoRt 2011 91
Acco
unts
at 3
1 De
cem
ber 2
011
3.4. Revaluation reserves
In EUR million Total GDF SUEZ
Suez Environ-nement
Pernod Ricard Iberdrola Arkema Funds Other
Total fair
value
At 31 December 2008 1,530.0 1,556.7 76.1 - - 0.4 0.3 (141.6) 3,021.9
Change in fair value 572.6 (591.2) 142.6 288.6 7.1 32.3 7.1 88.5 547.6
Transfer to result (disposal/impairment) - - - 198.2 36.5 - - - 234.7
At 31 December 2009 2,102.6 965.5 218.7 486.8 43.6 32.7 7.4 (53.1) 3,804.2
Change in fair value (503.0) (402.6) (23.6) 269.7 (28.3) 77.7 10.1 (29.1) (629.1)
Transfer to result (disposal/impairment) - - - - 20.4 - - - 20.4
At 31 December 2010 1,599.6 562.9 195.1 756.5 35.7 110.4 17.5 (82.2) 3,195.5
Change in fair value (59.6) (671.4) (229.3) 33.9 (12.2) 17.7 (24.7) 1.4 (944.2)
Transfer to result (disposal/impairment) - - - - (22.7) - 8.9 - (13.8)
At 31 December 2011 1,540.0 (108.5) (34.2) 790.4 0.8 128.1 1.7 (80.8) 2,237.5
Changes in the fair value of available-for-sale investments (detailed in point 3.3.) are included in the above table. The “Other” heading covers the share of the variation of GBL in the revaluation reserves of associated companies (Lafarge and Imerys).
4. Other operating income and expenses and personnel costs
4.1. Details on other operating income and expenses
In EUR million 2011 2010 2009
Services and other goods (24.2) (19.2) (16.7)
Personnel costs (7.6) (8.0) (7.1)
Depreciation (1.2) (1.4) (1.1)
Other operating expenses (1.1) (0.1) (0.1)
Other operating income 1.0 0.8 0.7
Other operating expenses and income – investing activities (33.1) (27.9) (24.3)
Transport costs (426.4) - -
Sub-contracting costs (129.1) - -
Operating leases (44.9) - -
Fees (61.4) (4.3) -
Various taxes (34.5) - -
Other operating expenses (173.3) - -
Other operating income 43.0 - -
Net earnings from associated companies belonging to consolidated operating activities 7.9 - -
Other operating income and expenses – operating activities (818.7) (4.3) -
Other operating expenses related to operating activities includes EUR 7 million in transaction costs for the Imerys acquisitions.
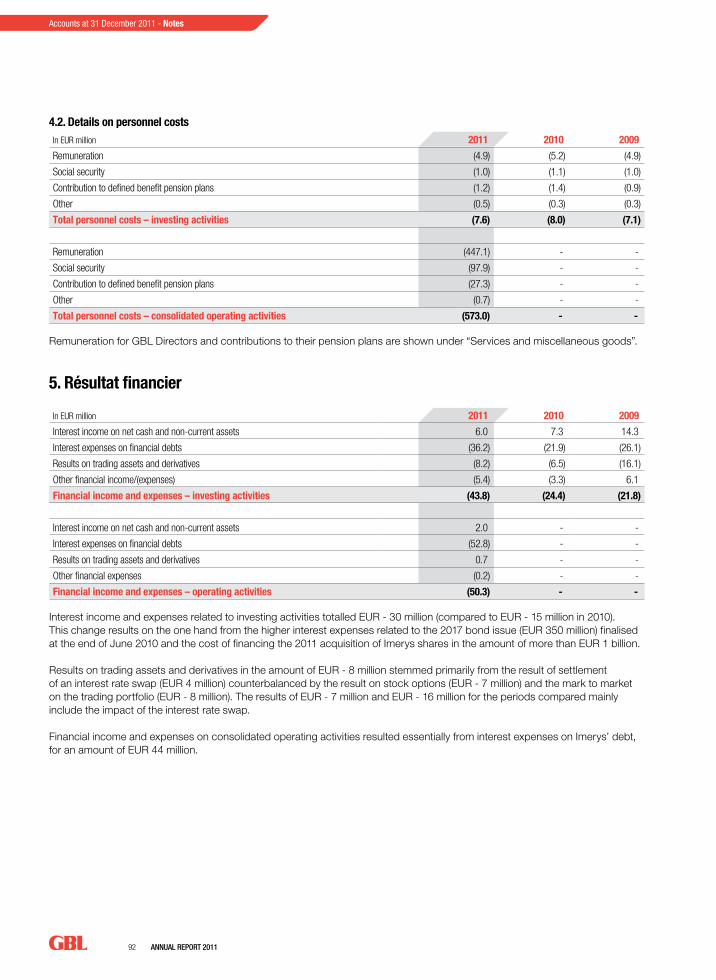
92 AnnuAl RepoRt 2011
Accounts at 31 December 2011 - Notes
4.2. Details on personnel costsIn EUR million 2011 2010 2009
Remuneration (4.9) (5.2) (4.9)
Social security (1.0) (1.1) (1.0)
Contribution to defined benefit pension plans (1.2) (1.4) (0.9)
Other (0.5) (0.3) (0.3)
Total personnel costs – investing activities (7.6) (8.0) (7.1)
Remuneration (447.1) - -
Social security (97.9) - -
Contribution to defined benefit pension plans (27.3) - -
Other (0.7) - -
Total personnel costs – consolidated operating activities (573.0) - -
Remuneration for GBL Directors and contributions to their pension plans are shown under “Services and miscellaneous goods”.
5. Résultat financier
In EUR million 2011 2010 2009
Interest income on net cash and non-current assets 6.0 7.3 14.3
Interest expenses on financial debts (36.2) (21.9) (26.1)
Results on trading assets and derivatives (8.2) (6.5) (16.1)
Other financial income/(expenses) (5.4) (3.3) 6.1
Financial income and expenses – investing activities (43.8) (24.4) (21.8)
Interest income on net cash and non-current assets 2.0 - -
Interest expenses on financial debts (52.8) - -
Results on trading assets and derivatives 0.7 - -
Other financial expenses (0.2) - -
Financial income and expenses – operating activities (50.3) - -
Interest income and expenses related to investing activities totalled EUR - 30 million (compared to EUR - 15 million in 2010). This change results on the one hand from the higher interest expenses related to the 2017 bond issue (EUR 350 million) finalised at the end of June 2010 and the cost of financing the 2011 acquisition of Imerys shares in the amount of more than EUR 1 billion.
Results on trading assets and derivatives in the amount of EUR - 8 million stemmed primarily from the result of settlement of an interest rate swap (EUR 4 million) counterbalanced by the result on stock options (EUR - 7 million) and the mark to market on the trading portfolio (EUR - 8 million). The results of EUR - 7 million and EUR - 16 million for the periods compared mainly include the impact of the interest rate swap.
Financial income and expenses on consolidated operating activities resulted essentially from interest expenses on Imerys’ debt, for an amount of EUR 44 million.
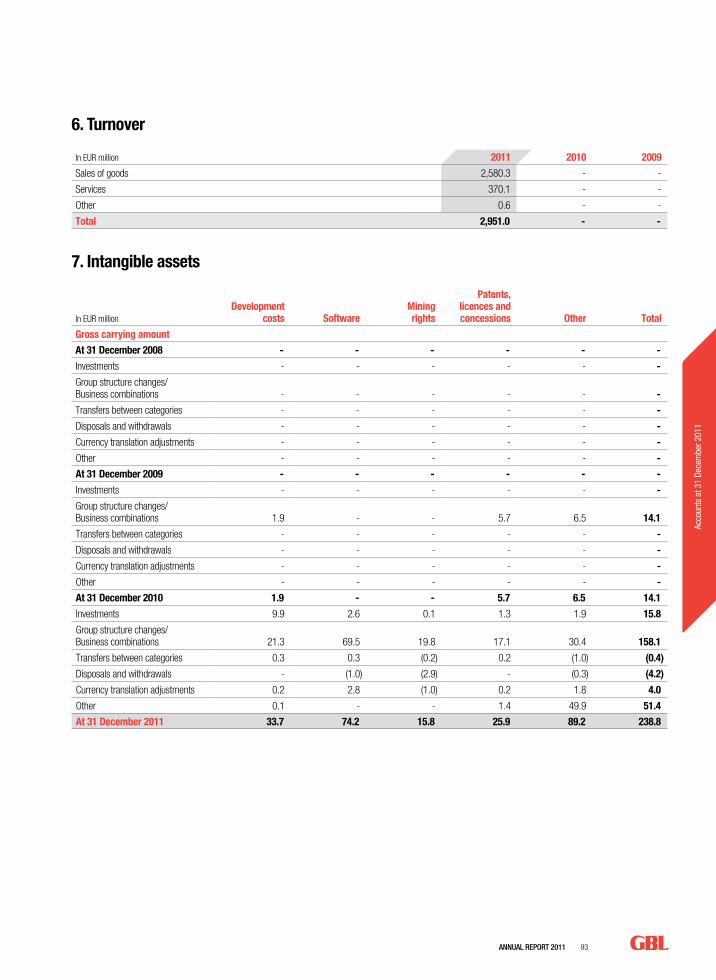
AnnuAl RepoRt 2011 93
Acco
unts
at 3
1 De
cem
ber 2
011
6. Turnover
In EUR million 2011 2010 2009
Sales of goods 2,580.3 - -
Services 370.1 - -
Other 0.6 - -
Total 2,951.0 - -
7. Intangible assets
In EUR millionDevelopment
costs SoftwareMining rights
Patents, licences and concessions Other Total
Gross carrying amount
At 31 December 2008 - - - - - -
Investments - - - - - -
Group structure changes/ Business combinations - - - - - -
Transfers between categories - - - - - -
Disposals and withdrawals - - - - - -
Currency translation adjustments - - - - - -
Other - - - - - -
At 31 December 2009 - - - - - -
Investments - - - - - -
Group structure changes/ Business combinations 1.9 - - 5.7 6.5 14.1
Transfers between categories - - - - - -
Disposals and withdrawals - - - - - -
Currency translation adjustments - - - - - -
Other - - - - - -
At 31 December 2010 1.9 - - 5.7 6.5 14.1
Investments 9.9 2.6 0.1 1.3 1.9 15.8
Group structure changes/ Business combinations 21.3 69.5 19.8 17.1 30.4 158.1
Transfers between categories 0.3 0.3 (0.2) 0.2 (1.0) (0.4)
Disposals and withdrawals - (1.0) (2.9) - (0.3) (4.2)
Currency translation adjustments 0.2 2.8 (1.0) 0.2 1.8 4.0
Other 0.1 - - 1.4 49.9 51.4
At 31 December 2011 33.7 74.2 15.8 25.9 89.2 238.8
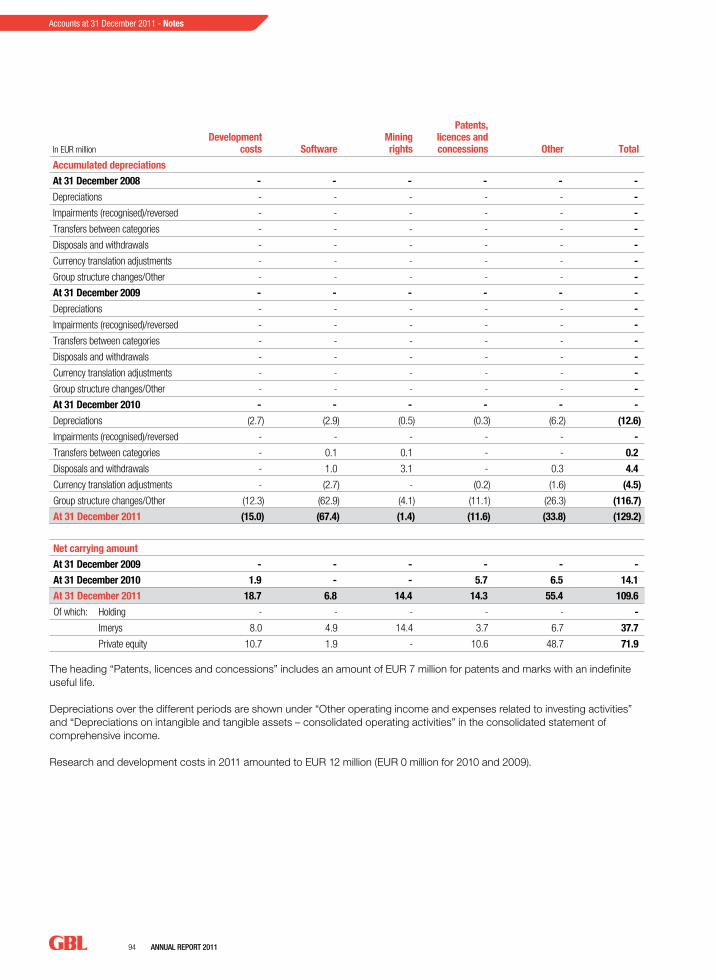
94 AnnuAl RepoRt 2011
Accounts at 31 December 2011 - Notes
In EUR millionDevelopment
costs SoftwareMining rights
Patents, licences and concessions Other Total
Accumulated depreciations
At 31 December 2008 - - - - - -
Depreciations - - - - - -
Impairments (recognised)/reversed - - - - - -
Transfers between categories - - - - - -
Disposals and withdrawals - - - - - -
Currency translation adjustments - - - - - -
Group structure changes/Other - - - - - -
At 31 December 2009 - - - - - -
Depreciations - - - - - -
Impairments (recognised)/reversed - - - - - -
Transfers between categories - - - - - -
Disposals and withdrawals - - - - - -
Currency translation adjustments - - - - - -
Group structure changes/Other - - - - - -
At 31 December 2010 - - - - - -
Depreciations (2.7) (2.9) (0.5) (0.3) (6.2) (12.6)
Impairments (recognised)/reversed - - - - - -
Transfers between categories - 0.1 0.1 - - 0.2
Disposals and withdrawals - 1.0 3.1 - 0.3 4.4
Currency translation adjustments - (2.7) - (0.2) (1.6) (4.5)
Group structure changes/Other (12.3) (62.9) (4.1) (11.1) (26.3) (116.7)
At 31 December 2011 (15.0) (67.4) (1.4) (11.6) (33.8) (129.2)
Net carrying amount
At 31 December 2009 - - - - - -
At 31 December 2010 1.9 - - 5.7 6.5 14.1
At 31 December 2011 18.7 6.8 14.4 14.3 55.4 109.6
Of which: Holding - - - - - -
Imerys 8.0 4.9 14.4 3.7 6.7 37.7
Private equity 10.7 1.9 - 10.6 48.7 71.9
The heading “Patents, licences and concessions” includes an amount of EUR 7 million for patents and marks with an indefinite useful life.
Depreciations over the different periods are shown under “Other operating income and expenses related to investing activities” and “Depreciations on intangible and tangible assets – consolidated operating activities” in the consolidated statement of comprehensive income.
Research and development costs in 2011 amounted to EUR 12 million (EUR 0 million for 2010 and 2009).
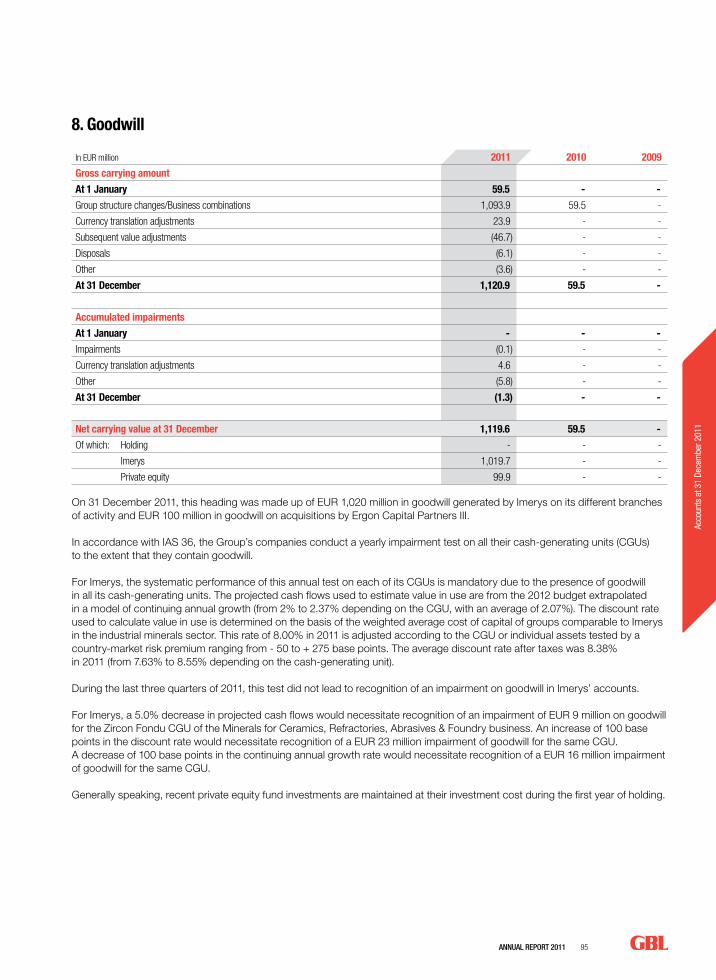
AnnuAl RepoRt 2011 95
Acco
unts
at 3
1 De
cem
ber 2
011
8. Goodwill
In EUR million 2011 2010 2009
Gross carrying amount
At 1 January 59.5 - -
Group structure changes/Business combinations 1,093.9 59.5 -
Currency translation adjustments 23.9 - -
Subsequent value adjustments (46.7) - -
Disposals (6.1) - -
Other (3.6) - -
At 31 December 1,120.9 59.5 -
Accumulated impairments
At 1 January - - -
Impairments (0.1) - -
Currency translation adjustments 4.6 - -
Other (5.8) - -
At 31 December (1.3) - -
Net carrying value at 31 December 1,119.6 59.5 -
Of which: Holding - - -
Imerys 1,019.7 - -
Private equity 99.9 - -
On 31 December 2011, this heading was made up of EUR 1,020 million in goodwill generated by Imerys on its different branches of activity and EUR 100 million in goodwill on acquisitions by Ergon Capital Partners III.
In accordance with IAS 36, the Group’s companies conduct a yearly impairment test on all their cash-generating units (CGUs) to the extent that they contain goodwill.
For Imerys, the systematic performance of this annual test on each of its CGUs is mandatory due to the presence of goodwill in all its cash-generating units. The projected cash flows used to estimate value in use are from the 2012 budget extrapolated in a model of continuing annual growth (from 2% to 2.37% depending on the CGU, with an average of 2.07%). The discount rate used to calculate value in use is determined on the basis of the weighted average cost of capital of groups comparable to Imerys in the industrial minerals sector. This rate of 8.00% in 2011 is adjusted according to the CGU or individual assets tested by a country-market risk premium ranging from - 50 to + 275 base points. The average discount rate after taxes was 8.38% in 2011 (from 7.63% to 8.55% depending on the cash-generating unit).
During the last three quarters of 2011, this test did not lead to recognition of an impairment on goodwill in Imerys’ accounts.
For Imerys, a 5.0% decrease in projected cash flows would necessitate recognition of an impairment of EUR 9 million on goodwill for the Zircon Fondu CGU of the Minerals for Ceramics, Refractories, Abrasives & Foundry business. An increase of 100 base points in the discount rate would necessitate recognition of a EUR 23 million impairment of goodwill for the same CGU. A decrease of 100 base points in the continuing annual growth rate would necessitate recognition of a EUR 16 million impairment of goodwill for the same CGU.
Generally speaking, recent private equity fund investments are maintained at their investment cost during the first year of holding.
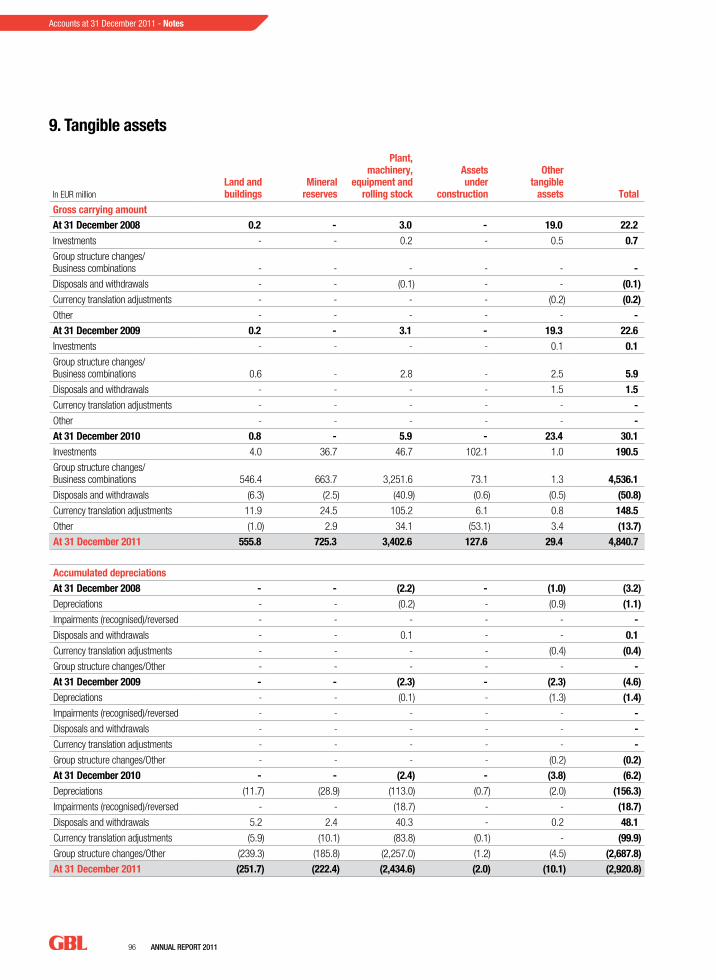
96 AnnuAl RepoRt 2011
Accounts at 31 December 2011 - Notes
9. Tangible assets
In EUR millionLand and buildings
Mineral reserves
Plant, machinery,
equipment and rolling stock
Assets under
construction
Other tangible
assets TotalGross carrying amountAt 31 December 2008 0.2 - 3.0 - 19.0 22.2Investments - - 0.2 - 0.5 0.7Group structure changes/ Business combinations - - - - - -Disposals and withdrawals - - (0.1) - - (0.1)Currency translation adjustments - - - - (0.2) (0.2)Other - - - - - -At 31 December 2009 0.2 - 3.1 - 19.3 22.6Investments - - - - 0.1 0.1Group structure changes/ Business combinations 0.6 - 2.8 - 2.5 5.9Disposals and withdrawals - - - - 1.5 1.5Currency translation adjustments - - - - - -Other - - - - - -At 31 December 2010 0.8 - 5.9 - 23.4 30.1Investments 4.0 36.7 46.7 102.1 1.0 190.5Group structure changes/ Business combinations 546.4 663.7 3,251.6 73.1 1.3 4,536.1Disposals and withdrawals (6.3) (2.5) (40.9) (0.6) (0.5) (50.8)Currency translation adjustments 11.9 24.5 105.2 6.1 0.8 148.5Other (1.0) 2.9 34.1 (53.1) 3.4 (13.7)At 31 December 2011 555.8 725.3 3,402.6 127.6 29.4 4,840.7
Accumulated depreciationsAt 31 December 2008 - - (2.2) - (1.0) (3.2)Depreciations - - (0.2) - (0.9) (1.1)Impairments (recognised)/reversed - - - - - -Disposals and withdrawals - - 0.1 - - 0.1Currency translation adjustments - - - - (0.4) (0.4)Group structure changes/Other - - - - - -At 31 December 2009 - - (2.3) - (2.3) (4.6)Depreciations - - (0.1) - (1.3) (1.4)Impairments (recognised)/reversed - - - - - -Disposals and withdrawals - - - - - -Currency translation adjustments - - - - - -Group structure changes/Other - - - - (0.2) (0.2)At 31 December 2010 - - (2.4) - (3.8) (6.2)Depreciations (11.7) (28.9) (113.0) (0.7) (2.0) (156.3)Impairments (recognised)/reversed - - (18.7) - - (18.7)Disposals and withdrawals 5.2 2.4 40.3 - 0.2 48.1Currency translation adjustments (5.9) (10.1) (83.8) (0.1) - (99.9)Group structure changes/Other (239.3) (185.8) (2,257.0) (1.2) (4.5) (2,687.8)At 31 December 2011 (251.7) (222.4) (2,434.6) (2.0) (10.1) (2,920.8)
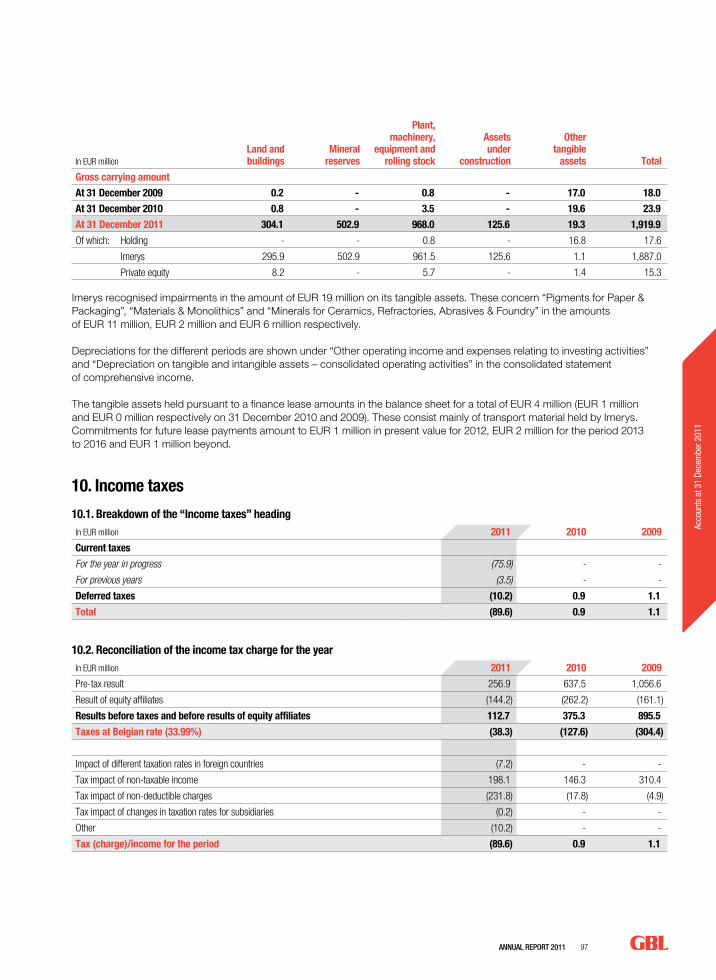
AnnuAl RepoRt 2011 97
Acco
unts
at 3
1 De
cem
ber 2
011
In EUR millionLand and buildings
Mineral reserves
Plant, machinery,
equipment and rolling stock
Assets under
construction
Other tangible
assets Total
Gross carrying amount
At 31 December 2009 0.2 - 0.8 - 17.0 18.0
At 31 December 2010 0.8 - 3.5 - 19.6 23.9
At 31 December 2011 304.1 502.9 968.0 125.6 19.3 1,919.9
Of which: Holding - - 0.8 - 16.8 17.6
Imerys 295.9 502.9 961.5 125.6 1.1 1,887.0
Private equity 8.2 - 5.7 - 1.4 15.3
Imerys recognised impairments in the amount of EUR 19 million on its tangible assets. These concern “Pigments for Paper & Packaging”, “Materials & Monolithics” and “Minerals for Ceramics, Refractories, Abrasives & Foundry” in the amounts of EUR 11 million, EUR 2 million and EUR 6 million respectively.
Depreciations for the different periods are shown under “Other operating income and expenses relating to investing activities” and “Depreciation on tangible and intangible assets – consolidated operating activities” in the consolidated statement of comprehensive income.
The tangible assets held pursuant to a finance lease amounts in the balance sheet for a total of EUR 4 million (EUR 1 million and EUR 0 million respectively on 31 December 2010 and 2009). These consist mainly of transport material held by Imerys. Commitments for future lease payments amount to EUR 1 million in present value for 2012, EUR 2 million for the period 2013 to 2016 and EUR 1 million beyond.
10. Income taxes
10.1. Breakdown of the “Income taxes” headingIn EUR million 2011 2010 2009
Current taxes
For the year in progress (75.9) - -
For previous years (3.5) - -
Deferred taxes (10.2) 0.9 1.1
Total (89.6) 0.9 1.1
10.2. Reconciliation of the income tax charge for the yearIn EUR million 2011 2010 2009
Pre-tax result 256.9 637.5 1,056.6
Result of equity affiliates (144.2) (262.2) (161.1)
Results before taxes and before results of equity affiliates 112.7 375.3 895.5
Taxes at Belgian rate (33.99%) (38.3) (127.6) (304.4)
Impact of different taxation rates in foreign countries (7.2) - -
Tax impact of non-taxable income 198.1 146.3 310.4
Tax impact of non-deductible charges (231.8) (17.8) (4.9)
Tax impact of changes in taxation rates for subsidiaries (0.2) - -
Other (10.2) - -
Tax (charge)/income for the period (89.6) 0.9 1.1
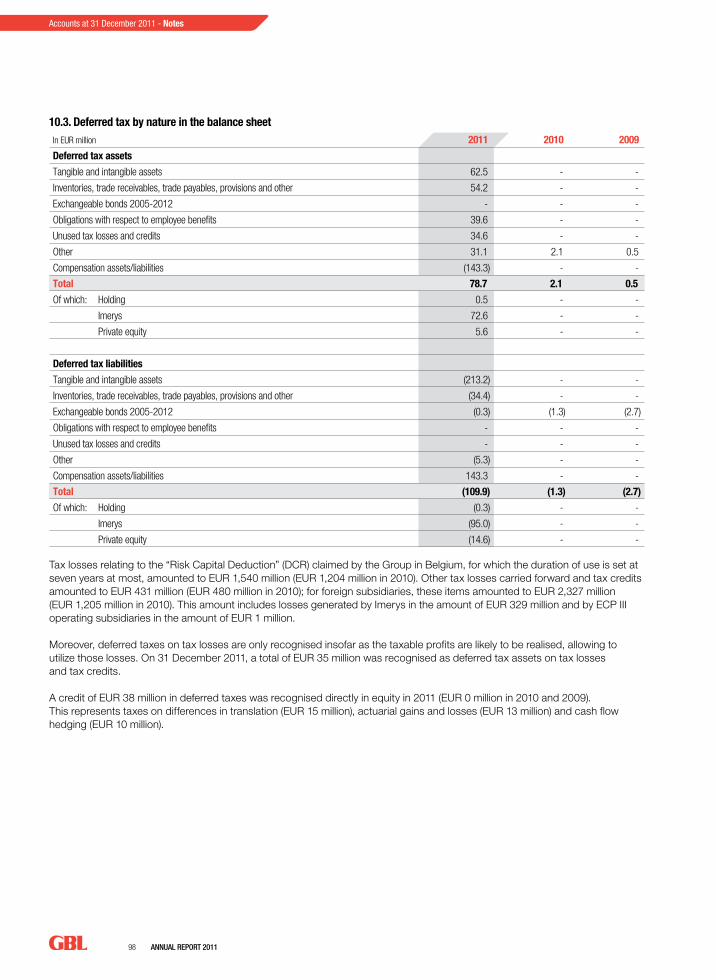
98 AnnuAl RepoRt 2011
Accounts at 31 December 2011 - Notes
10.3. Deferred tax by nature in the balance sheetIn EUR million 2011 2010 2009
Deferred tax assets
Tangible and intangible assets 62.5 - -
Inventories, trade receivables, trade payables, provisions and other 54.2 - -
Exchangeable bonds 2005-2012 - - -
Obligations with respect to employee benefits 39.6 - -
Unused tax losses and credits 34.6 - -
Other 31.1 2.1 0.5
Compensation assets/liabilities (143.3) - -
Total 78.7 2.1 0.5
Of which: Holding 0.5 - -
Imerys 72.6 - -
Private equity 5.6 - -
Deferred tax liabilities
Tangible and intangible assets (213.2) - -
Inventories, trade receivables, trade payables, provisions and other (34.4) - -
Exchangeable bonds 2005-2012 (0.3) (1.3) (2.7)
Obligations with respect to employee benefits - - -
Unused tax losses and credits - - -
Other (5.3) - -
Compensation assets/liabilities 143.3 - -
Total (109.9) (1.3) (2.7)
Of which: Holding (0.3) - -
Imerys (95.0) - -
Private equity (14.6) - -
Tax losses relating to the “Risk Capital Deduction” (DCR) claimed by the Group in Belgium, for which the duration of use is set at seven years at most, amounted to EUR 1,540 million (EUR 1,204 million in 2010). Other tax losses carried forward and tax credits amounted to EUR 431 million (EUR 480 million in 2010); for foreign subsidiaries, these items amounted to EUR 2,327 million (EUR 1,205 million in 2010). This amount includes losses generated by Imerys in the amount of EUR 329 million and by ECP III operating subsidiaries in the amount of EUR 1 million.
Moreover, deferred taxes on tax losses are only recognised insofar as the taxable profits are likely to be realised, allowing to utilize those losses. On 31 December 2011, a total of EUR 35 million was recognised as deferred tax assets on tax losses and tax credits.
A credit of EUR 38 million in deferred taxes was recognised directly in equity in 2011 (EUR 0 million in 2010 and 2009). This represents taxes on differences in translation (EUR 15 million), actuarial gains and losses (EUR 13 million) and cash flow hedging (EUR 10 million).
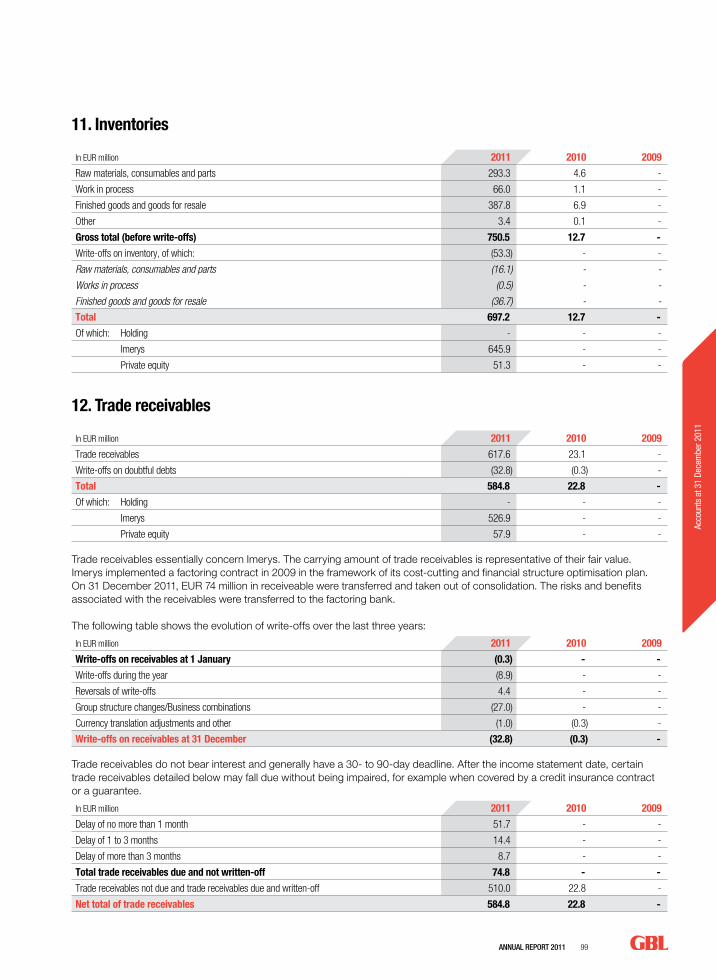
AnnuAl RepoRt 2011 99
Acco
unts
at 3
1 De
cem
ber 2
011
11. Inventories
In EUR million 2011 2010 2009
Raw materials, consumables and parts 293.3 4.6 -
Work in process 66.0 1.1 -
Finished goods and goods for resale 387.8 6.9 -
Other 3.4 0.1 -
Gross total (before write-offs) 750.5 12.7 -
Write-offs on inventory, of which: (53.3) - -
Raw materials, consumables and parts (16.1) - -
Works in process (0.5) - -
Finished goods and goods for resale (36.7) - -
Total 697.2 12.7 -
Of which: Holding - - -
Imerys 645.9 - -
Private equity 51.3 - -
12. Trade receivables
In EUR million 2011 2010 2009
Trade receivables 617.6 23.1 -
Write-offs on doubtful debts (32.8) (0.3) -
Total 584.8 22.8 -
Of which: Holding - - -
Imerys 526.9 - -
Private equity 57.9 - -
Trade receivables essentially concern Imerys. The carrying amount of trade receivables is representative of their fair value. Imerys implemented a factoring contract in 2009 in the framework of its cost-cutting and financial structure optimisation plan. On 31 December 2011, EUR 74 million in receiveable were transferred and taken out of consolidation. The risks and benefits associated with the receivables were transferred to the factoring bank.
The following table shows the evolution of write-offs over the last three years:
In EUR million 2011 2010 2009
Write-offs on receivables at 1 January (0.3) - -
Write-offs during the year (8.9) - -
Reversals of write-offs 4.4 - -
Group structure changes/Business combinations (27.0) - -
Currency translation adjustments and other (1.0) (0.3) -
Write-offs on receivables at 31 December (32.8) (0.3) -
Trade receivables do not bear interest and generally have a 30- to 90-day deadline. After the income statement date, certain trade receivables detailed below may fall due without being impaired, for example when covered by a credit insurance contract or a guarantee.
In EUR million 2011 2010 2009
Delay of no more than 1 month 51.7 - -
Delay of 1 to 3 months 14.4 - -
Delay of more than 3 months 8.7 - -
Total trade receivables due and not written-off 74.8 - -
Trade receivables not due and trade receivables due and written-off 510.0 22.8 -
Net total of trade receivables 584.8 22.8 -
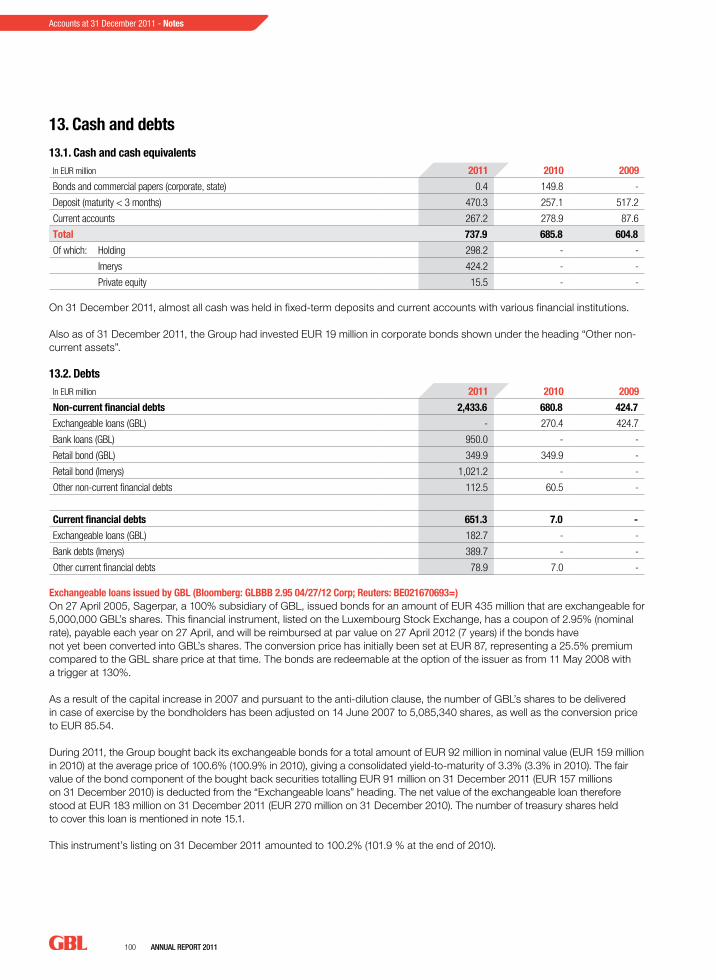
100 AnnuAl RepoRt 2011
Accounts at 31 December 2011 - Notes
13. Cash and debts
13.1. Cash and cash equivalentsIn EUR million 2011 2010 2009
Bonds and commercial papers (corporate, state) 0.4 149.8 -
Deposit (maturity < 3 months) 470.3 257.1 517.2
Current accounts 267.2 278.9 87.6
Total 737.9 685.8 604.8
Of which: Holding 298.2 - -
Imerys 424.2 - -
Private equity 15.5 - -
On 31 December 2011, almost all cash was held in fixed-term deposits and current accounts with various financial institutions.
Also as of 31 December 2011, the Group had invested EUR 19 million in corporate bonds shown under the heading “Other non-current assets”.
13.2. DebtsIn EUR million 2011 2010 2009
Non-current financial debts 2,433.6 680.8 424.7
Exchangeable loans (GBL) - 270.4 424.7
Bank loans (GBL) 950.0 - -
Retail bond (GBL) 349.9 349.9 -
Retail bond (Imerys) 1,021.2 - -
Other non-current financial debts 112.5 60.5 -
Current financial debts 651.3 7.0 -
Exchangeable loans (GBL) 182.7 - -
Bank debts (Imerys) 389.7 - -
Other current financial debts 78.9 7.0 -
Exchangeable loans issued by GBL (Bloomberg: GLBBB 2.95 04/27/12 Corp; Reuters: BE021670693=)On 27 April 2005, Sagerpar, a 100% subsidiary of GBL, issued bonds for an amount of EUR 435 million that are exchangeable for 5,000,000 GBL’s shares. This financial instrument, listed on the Luxembourg Stock Exchange, has a coupon of 2.95% (nominal rate), payable each year on 27 April, and will be reimbursed at par value on 27 April 2012 (7 years) if the bonds have not yet been converted into GBL’s shares. The conversion price has initially been set at EUR 87, representing a 25.5% premium compared to the GBL share price at that time. The bonds are redeemable at the option of the issuer as from 11 May 2008 with a trigger at 130%.
As a result of the capital increase in 2007 and pursuant to the anti-dilution clause, the number of GBL’s shares to be delivered in case of exercise by the bondholders has been adjusted on 14 June 2007 to 5,085,340 shares, as well as the conversion price to EUR 85.54.
During 2011, the Group bought back its exchangeable bonds for a total amount of EUR 92 million in nominal value (EUR 159 million in 2010) at the average price of 100.6% (100.9% in 2010), giving a consolidated yield-to-maturity of 3.3% (3.3% in 2010). The fair value of the bond component of the bought back securities totalling EUR 91 million on 31 December 2011 (EUR 157 millions on 31 December 2010) is deducted from the “Exchangeable loans” heading. The net value of the exchangeable loan therefore stood at EUR 183 million on 31 December 2011 (EUR 270 million on 31 December 2010). The number of treasury shares held to cover this loan is mentioned in note 15.1.
This instrument’s listing on 31 December 2011 amounted to 100.2% (101.9 % at the end of 2010).
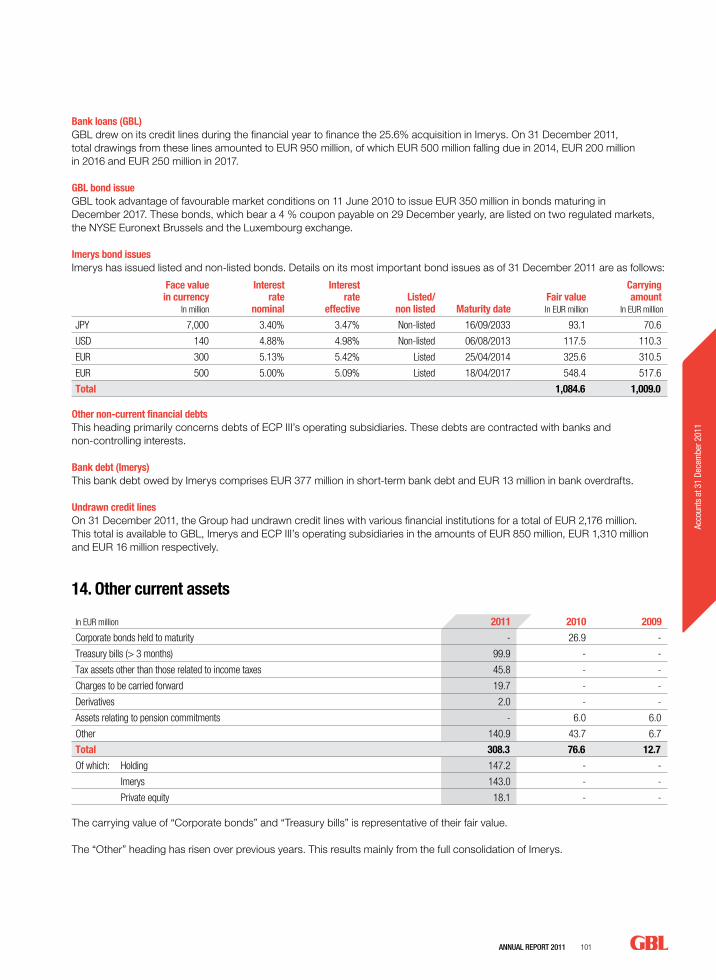
AnnuAl RepoRt 2011 101
Acco
unts
at 3
1 De
cem
ber 2
011
Bank loans (GBL)GBL drew on its credit lines during the financial year to finance the 25.6% acquisition in Imerys. On 31 December 2011, total drawings from these lines amounted to EUR 950 million, of which EUR 500 million falling due in 2014, EUR 200 million in 2016 and EUR 250 million in 2017.
GBL bond issueGBL took advantage of favourable market conditions on 11 June 2010 to issue EUR 350 million in bonds maturing in December 2017. These bonds, which bear a 4 % coupon payable on 29 December yearly, are listed on two regulated markets, the NYSE Euronext Brussels and the Luxembourg exchange.
Imerys bond issuesImerys has issued listed and non-listed bonds. Details on its most important bond issues as of 31 December 2011 are as follows:
Face value in currency
In million
Interest rate
nominal
Interest rate
effectiveListed/
non listed Maturity dateFair valueIn EUR million
Carrying amount
In EUR million
JPY 7,000 3.40% 3.47% Non-listed 16/09/2033 93.1 70.6
USD 140 4.88% 4.98% Non-listed 06/08/2013 117.5 110.3
EUR 300 5.13% 5.42% Listed 25/04/2014 325.6 310.5
EUR 500 5.00% 5.09% Listed 18/04/2017 548.4 517.6
Total 1,084.6 1,009.0
Other non-current financial debtsThis heading primarily concerns debts of ECP III’s operating subsidiaries. These debts are contracted with banks and non-controlling interests.
Bank debt (Imerys)This bank debt owed by Imerys comprises EUR 377 million in short-term bank debt and EUR 13 million in bank overdrafts.
Undrawn credit linesOn 31 December 2011, the Group had undrawn credit lines with various financial institutions for a total of EUR 2,176 million. This total is available to GBL, Imerys and ECP III’s operating subsidiaries in the amounts of EUR 850 million, EUR 1,310 million and EUR 16 million respectively.
14. Other current assets
In EUR million 2011 2010 2009
Corporate bonds held to maturity - 26.9 -
Treasury bills (> 3 months) 99.9 - -
Tax assets other than those related to income taxes 45.8 - -
Charges to be carried forward 19.7 - -
Derivatives 2.0 - -
Assets relating to pension commitments - 6.0 6.0
Other 140.9 43.7 6.7
Total 308.3 76.6 12.7
Of which: Holding 147.2 - -
Imerys 143.0 - -
Private equity 18.1 - -
The carrying value of “Corporate bonds” and “Treasury bills” is representative of their fair value.
The “Other” heading has risen over previous years. This results mainly from the full consolidation of Imerys.

102 AnnuAl RepoRt 2011
Accounts at 31 December 2011 - Notes
15. Capital and dividends
15.1. Number of shares representative of shareholders’ equity and treasury shares
In EUR millionNumber of
issued sharesof which
treasury shares
At 31 December 2008 161,358,287 (5,576,651)
Variation - (478,088)
At 31 December 2009 161,358,287 (6,054,739)
Variation - (44,705)
At 31 December 2010 161,358,287 (6,099,444)
Variation - -
At 31 December 2011 161,358,287 (6,099,444)
Treasury sharesOn 31 December 2011, the Group held 6,099,444 treasury shares, or 3.8% of the subscribed capital, of which the acquisition cost is deducted from shareholder’s equity. Of this total, 2,147,533 are intended to cover part of the exchangeable bonds issued in April 2005 not held by GBL (see note 13.) and 869,423 are intended to cover the stock option plans for 1999 and 2007 to 2011 (see note 20.).
During 2011 (2010), GBL acquired and sold respectively the same number of its treasury shares, i.e. 8,683 (compared to 343,699 and 298,994 respectively) for an overall net total of EUR 0 (10) million.Information on acquisitions of treasury shares by GBL or its subsidiaries has been published since 1 July 2009 on the GBL website (Legal aspects, share capital, purchase of treasury shares).
15.2. DividendsOn 19 April 2011, a dividend of EUR 2.54 per share (EUR 2.42 in 2010 and EUR 2.30 in 2009) had been paid to the shareholders.
The Board of Directors will propose a gross dividend of EUR 2.60 per share for the distribution relating to 2011, which will be payable on 3 May 2012. The General Meeting of 24 April 2012 will vote on the proposed distribution, which is expected to amount to EUR 420 million based on the above-mentioned assumptions and the number of shares entitled to dividends (161,358,287 shares).
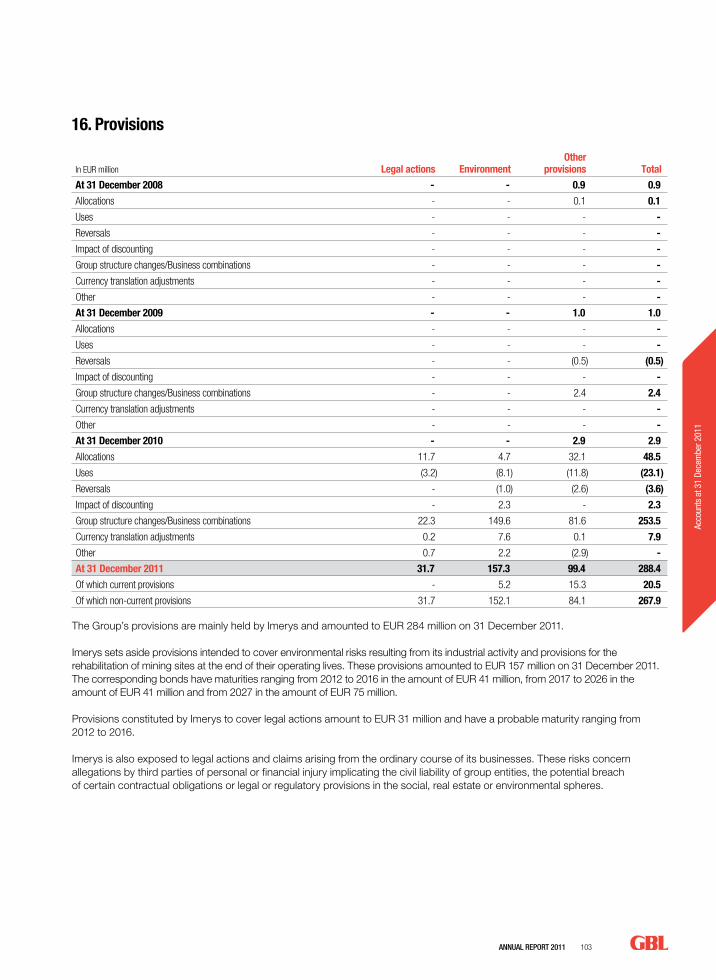
AnnuAl RepoRt 2011 103
Acco
unts
at 3
1 De
cem
ber 2
011
16. Provisions
In EUR million Legal actions EnvironmentOther
provisions Total
At 31 December 2008 - - 0.9 0.9
Allocations - - 0.1 0.1
Uses - - - -
Reversals - - - -
Impact of discounting - - - -
Group structure changes/Business combinations - - - -
Currency translation adjustments - - - -
Other - - - -
At 31 December 2009 - - 1.0 1.0
Allocations - - - -
Uses - - - -
Reversals - - (0.5) (0.5)
Impact of discounting - - - -
Group structure changes/Business combinations - - 2.4 2.4
Currency translation adjustments - - - -
Other - - - -
At 31 December 2010 - - 2.9 2.9
Allocations 11.7 4.7 32.1 48.5
Uses (3.2) (8.1) (11.8) (23.1)
Reversals - (1.0) (2.6) (3.6)
Impact of discounting - 2.3 - 2.3
Group structure changes/Business combinations 22.3 149.6 81.6 253.5
Currency translation adjustments 0.2 7.6 0.1 7.9
Other 0.7 2.2 (2.9) -
At 31 December 2011 31.7 157.3 99.4 288.4
Of which current provisions - 5.2 15.3 20.5
Of which non-current provisions 31.7 152.1 84.1 267.9
The Group’s provisions are mainly held by Imerys and amounted to EUR 284 million on 31 December 2011.
Imerys sets aside provisions intended to cover environmental risks resulting from its industrial activity and provisions for the rehabilitation of mining sites at the end of their operating lives. These provisions amounted to EUR 157 million on 31 December 2011. The corresponding bonds have maturities ranging from 2012 to 2016 in the amount of EUR 41 million, from 2017 to 2026 in the amount of EUR 41 million and from 2027 in the amount of EUR 75 million.
Provisions constituted by Imerys to cover legal actions amount to EUR 31 million and have a probable maturity ranging from 2012 to 2016.
Imerys is also exposed to legal actions and claims arising from the ordinary course of its businesses. These risks concern allegations by third parties of personal or financial injury implicating the civil liability of group entities, the potential breach of certain contractual obligations or legal or regulatory provisions in the social, real estate or environmental spheres.
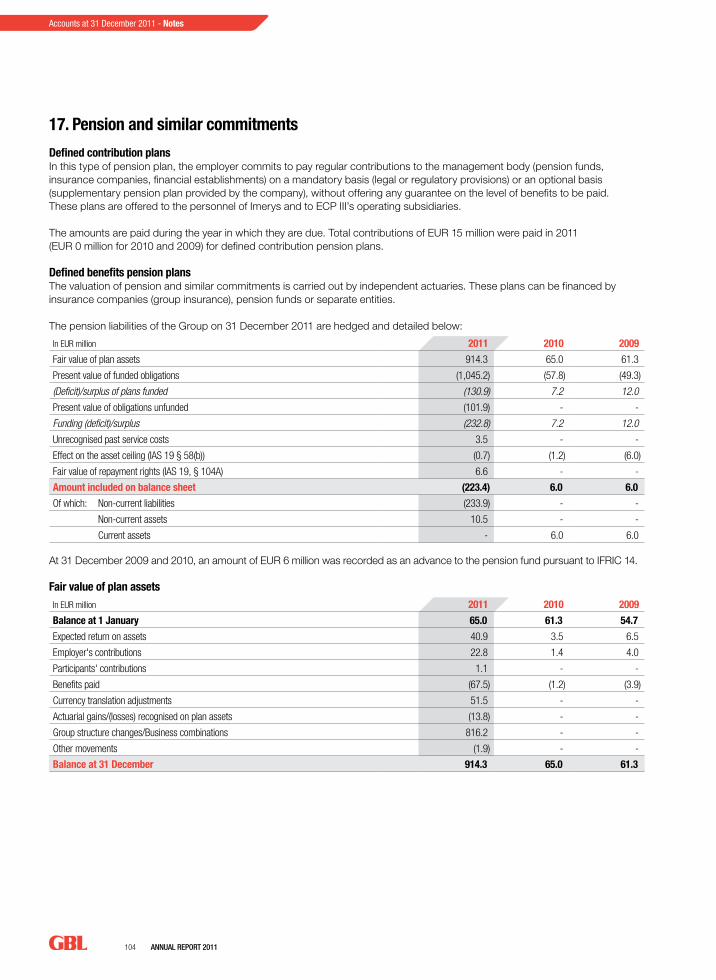
104 AnnuAl RepoRt 2011
Accounts at 31 December 2011 - Notes
17. Pension and similar commitments
Defined contribution plansIn this type of pension plan, the employer commits to pay regular contributions to the management body (pension funds, insurance companies, financial establishments) on a mandatory basis (legal or regulatory provisions) or an optional basis (supplementary pension plan provided by the company), without offering any guarantee on the level of benefits to be paid. These plans are offered to the personnel of Imerys and to ECP III’s operating subsidiaries.
The amounts are paid during the year in which they are due. Total contributions of EUR 15 million were paid in 2011 (EUR 0 million for 2010 and 2009) for defined contribution pension plans.
Defined benefits pension plansThe valuation of pension and similar commitments is carried out by independent actuaries. These plans can be financed by insurance companies (group insurance), pension funds or separate entities.
The pension liabilities of the Group on 31 December 2011 are hedged and detailed below:
In EUR million 2011 2010 2009
Fair value of plan assets 914.3 65.0 61.3
Present value of funded obligations (1,045.2) (57.8) (49.3)
(Deficit)/surplus of plans funded (130.9) 7.2 12.0
Present value of obligations unfunded (101.9) - -
Funding (deficit)/surplus (232.8) 7.2 12.0
Unrecognised past service costs 3.5 - -
Effect on the asset ceiling (IAS 19 § 58(b)) (0.7) (1.2) (6.0)
Fair value of repayment rights (IAS 19, § 104A) 6.6 - -
Amount included on balance sheet (223.4) 6.0 6.0
Of which: Non-current liabilities (233.9) - -
Non-current assets 10.5 - -
Current assets - 6.0 6.0
At 31 December 2009 and 2010, an amount of EUR 6 million was recorded as an advance to the pension fund pursuant to IFRIC 14.
Fair value of plan assetsIn EUR million 2011 2010 2009
Balance at 1 January 65.0 61.3 54.7
Expected return on assets 40.9 3.5 6.5
Employer's contributions 22.8 1.4 4.0
Participants' contributions 1.1 - -
Benefits paid (67.5) (1.2) (3.9)
Currency translation adjustments 51.5 - -
Actuarial gains/(losses) recognised on plan assets (13.8) - -
Group structure changes/Business combinations 816.2 - -
Other movements (1.9) - -
Balance at 31 December 914.3 65.0 61.3
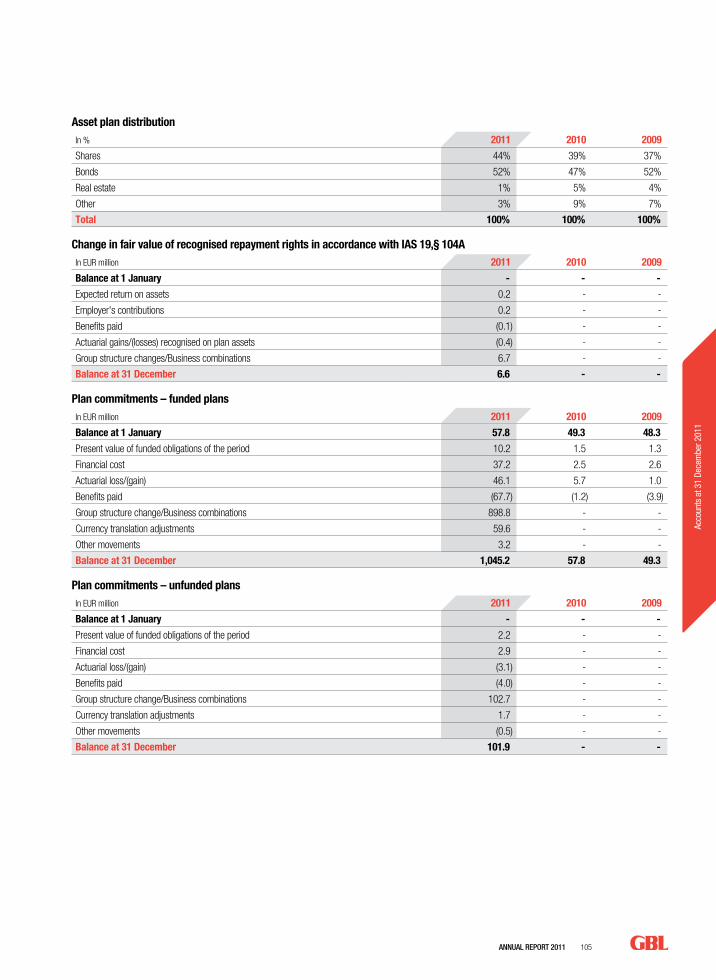
AnnuAl RepoRt 2011 105
Acco
unts
at 3
1 De
cem
ber 2
011
Asset plan distributionIn % 2011 2010 2009
Shares 44% 39% 37%
Bonds 52% 47% 52%
Real estate 1% 5% 4%
Other 3% 9% 7%
Total 100% 100% 100%
Change in fair value of recognised repayment rights in accordance with IAS 19,§ 104A In EUR million 2011 2010 2009
Balance at 1 January - - -
Expected return on assets 0.2 - -
Employer's contributions 0.2 - -
Benefits paid (0.1) - -
Actuarial gains/(losses) recognised on plan assets (0.4) - -
Group structure changes/Business combinations 6.7 - -
Balance at 31 December 6.6 - -
Plan commitments – funded plansIn EUR million 2011 2010 2009
Balance at 1 January 57.8 49.3 48.3
Present value of funded obligations of the period 10.2 1.5 1.3
Financial cost 37.2 2.5 2.6
Actuarial loss/(gain) 46.1 5.7 1.0
Benefits paid (67.7) (1.2) (3.9)
Group structure change/Business combinations 898.8 - -
Currency translation adjustments 59.6 - -
Other movements 3.2 - -
Balance at 31 December 1,045.2 57.8 49.3
Plan commitments – unfunded plansIn EUR million 2011 2010 2009
Balance at 1 January - - -
Present value of funded obligations of the period 2.2 - -
Financial cost 2.9 - -
Actuarial loss/(gain) (3.1) - -
Benefits paid (4.0) - -
Group structure change/Business combinations 102.7 - -
Currency translation adjustments 1.7 - -
Other movements (0.5) - -
Balance at 31 December 101.9 - -
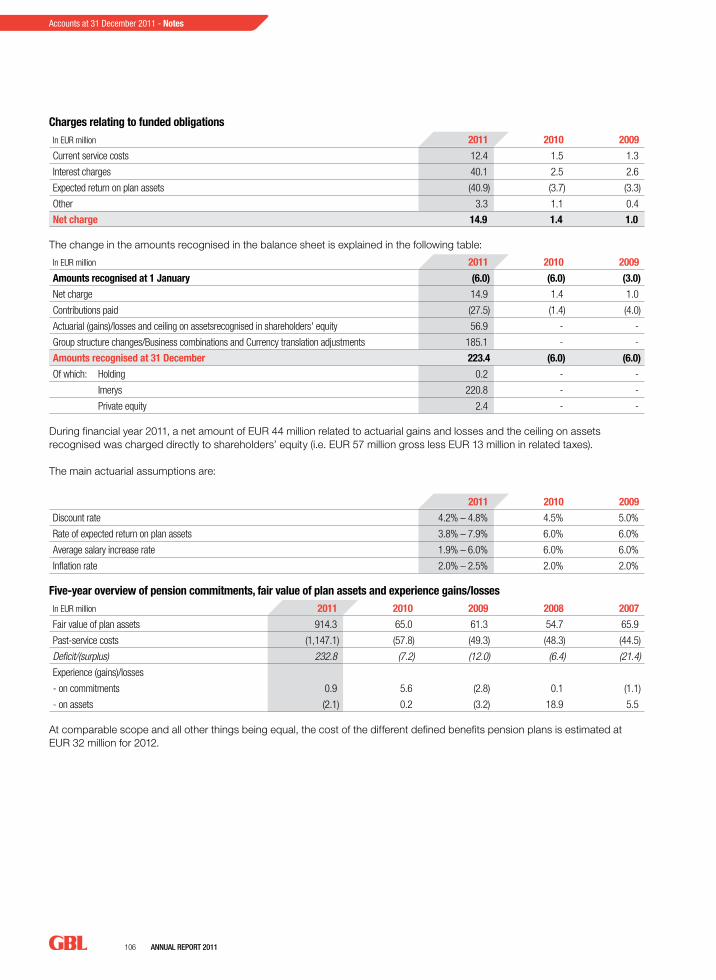
106 AnnuAl RepoRt 2011
Accounts at 31 December 2011 - Notes
Charges relating to funded obligationsIn EUR million 2011 2010 2009
Current service costs 12.4 1.5 1.3
Interest charges 40.1 2.5 2.6
Expected return on plan assets (40.9) (3.7) (3.3)
Other 3.3 1.1 0.4
Net charge 14.9 1.4 1.0
The change in the amounts recognised in the balance sheet is explained in the following table:
In EUR million 2011 2010 2009
Amounts recognised at 1 January (6.0) (6.0) (3.0)
Net charge 14.9 1.4 1.0
Contributions paid (27.5) (1.4) (4.0)
Actuarial (gains)/losses and ceiling on assetsrecognised in shareholders' equity 56.9 - -
Group structure changes/Business combinations and Currency translation adjustments 185.1 - -
Amounts recognised at 31 December 223.4 (6.0) (6.0)
Of which: Holding 0.2 - -
Imerys 220.8 - -
Private equity 2.4 - -
During financial year 2011, a net amount of EUR 44 million related to actuarial gains and losses and the ceiling on assets recognised was charged directly to shareholders’ equity (i.e. EUR 57 million gross less EUR 13 million in related taxes).
The main actuarial assumptions are:
2011 2010 2009
Discount rate 4.2% – 4.8% 4.5% 5.0%
Rate of expected return on plan assets 3.8% – 7.9% 6.0% 6.0%
Average salary increase rate 1.9% – 6.0% 6.0% 6.0%
Inflation rate 2.0% – 2.5% 2.0% 2.0%
Five-year overview of pension commitments, fair value of plan assets and experience gains/lossesIn EUR million 2011 2010 2009 2008 2007
Fair value of plan assets 914.3 65.0 61.3 54.7 65.9
Past-service costs (1,147.1) (57.8) (49.3) (48.3) (44.5)
Deficit/(surplus) 232.8 (7.2) (12.0) (6.4) (21.4)
Experience (gains)/losses
- on commitments 0.9 5.6 (2.8) 0.1 (1.1)
- on assets (2.1) 0.2 (3.2) 18.9 5.5
At comparable scope and all other things being equal, the cost of the different defined benefits pension plans is estimated at EUR 32 million for 2012.
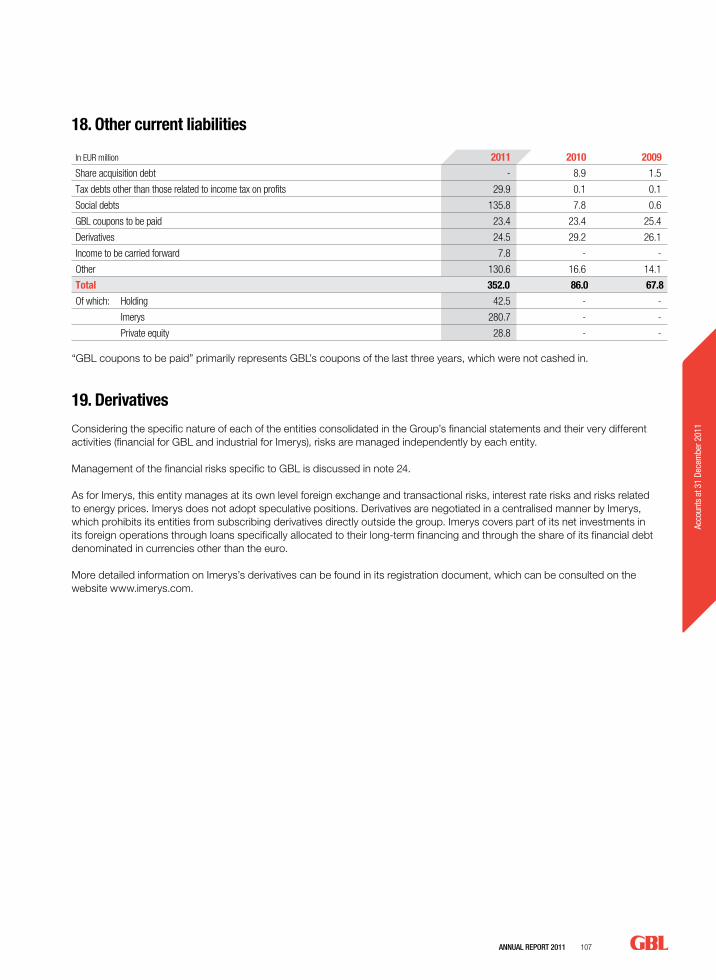
AnnuAl RepoRt 2011 107
Acco
unts
at 3
1 De
cem
ber 2
011
18. Other current liabilities
In EUR million 2011 2010 2009
Share acquisition debt - 8.9 1.5
Tax debts other than those related to income tax on profits 29.9 0.1 0.1
Social debts 135.8 7.8 0.6
GBL coupons to be paid 23.4 23.4 25.4
Derivatives 24.5 29.2 26.1
Income to be carried forward 7.8 - -
Other 130.6 16.6 14.1
Total 352.0 86.0 67.8
Of which: Holding 42.5 - -
Imerys 280.7 - -
Private equity 28.8 - -
“GBL coupons to be paid” primarily represents GBL’s coupons of the last three years, which were not cashed in.
19. Derivatives
Considering the specific nature of each of the entities consolidated in the Group’s financial statements and their very different activities (financial for GBL and industrial for Imerys), risks are managed independently by each entity.
Management of the financial risks specific to GBL is discussed in note 24.
As for Imerys, this entity manages at its own level foreign exchange and transactional risks, interest rate risks and risks related to energy prices. Imerys does not adopt speculative positions. Derivatives are negotiated in a centralised manner by Imerys, which prohibits its entities from subscribing derivatives directly outside the group. Imerys covers part of its net investments in its foreign operations through loans specifically allocated to their long-term financing and through the share of its financial debt denominated in currencies other than the euro.
More detailed information on Imerys’s derivatives can be found in its registration document, which can be consulted on the website www.imerys.com.

108 AnnuAl RepoRt 2011
Accounts at 31 December 2011 - Notes
19.1. Fair values of short-term and long-term derivatives The fair values of derivatives in place on 31 December 2011, 2010 and 2009 are shown in the following table:
In EUR million 2011 2010 2009
Assets 15.5 - -
Of which non-current assets 13.5 - -
Of which current assets 2.0 - -
Composed of:
Forwards, futures and currency swaps 1.7 - -
Interest rate swaps (IRS) 13.5 - -
Futures and commodities options 0.3 - -
Liabilities (38.5) (29.2) (26.1)
Of which current assets (14.0) - -
Of which non-current assets (24.5) (29.2) (26.1)
Composed of:
Forwards, futures and currency swaps (14.4) - -
Forwards, interest rate futures (3.3) - -
Interest rate swaps (IRS) (11.9) (19.9) (19.4)
Futures and commodities options (4.6) - -
Call and put options on shares (4.3) (9.3) (6.7)
Net position (23.0) (29.2) (26.1)
Forwards, futures and currency swaps (12.7) - -
Forwards, interest rate futures (3.3) - -
Interest rate swaps (IRS) 1.6 (19.9) (19.4)
Futures and commodities options (4.3) - -
Call and put options on shares (4.3) (9.3) (6.7)
The derivatives are used in their majority by Imerys.
The following table shows the maturity of cash flow hedge derivatives:
In EUR million TotalWithin
the year2 to
5 yearsOver
5 years
Forwards, futures and currency swaps (11.7) (11.7) - -
Interest rate swaps (IRS) (9.9) - 0.8 (10.7)
Futures and commodities options (4.2) (4.2) - -
Total At 31 December 2011 (25.8) (15.9) 0.8 (10.7)
No derivatives served as cash flow hedge in 2010 or 2009.
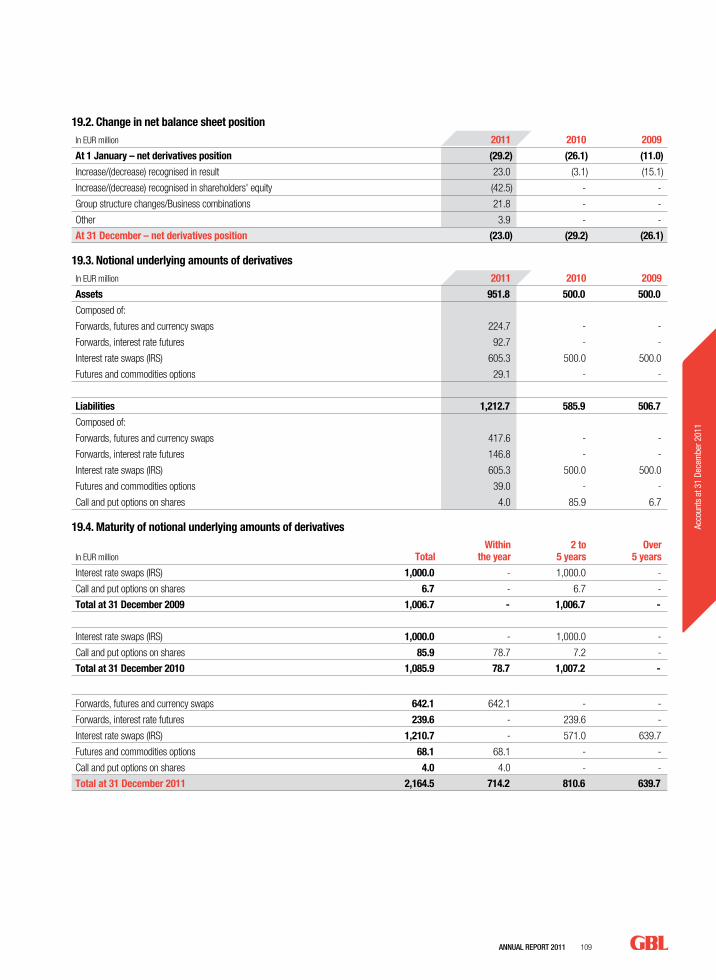
AnnuAl RepoRt 2011 109
Acco
unts
at 3
1 De
cem
ber 2
011
19.2. Change in net balance sheet positionIn EUR million 2011 2010 2009
At 1 January – net derivatives position (29.2) (26.1) (11.0)
Increase/(decrease) recognised in result 23.0 (3.1) (15.1)
Increase/(decrease) recognised in shareholders' equity (42.5) - -
Group structure changes/Business combinations 21.8 - -
Other 3.9 - -
At 31 December – net derivatives position (23.0) (29.2) (26.1)
19.3. Notional underlying amounts of derivativesIn EUR million 2011 2010 2009
Assets 951.8 500.0 500.0
Composed of:
Forwards, futures and currency swaps 224.7 - -
Forwards, interest rate futures 92.7 - -
Interest rate swaps (IRS) 605.3 500.0 500.0
Futures and commodities options 29.1 - -
Liabilities 1,212.7 585.9 506.7
Composed of:
Forwards, futures and currency swaps 417.6 - -
Forwards, interest rate futures 146.8 - -
Interest rate swaps (IRS) 605.3 500.0 500.0
Futures and commodities options 39.0 - -
Call and put options on shares 4.0 85.9 6.7
19.4. Maturity of notional underlying amounts of derivatives
In EUR million TotalWithin
the year2 to
5 yearsOver
5 years
Interest rate swaps (IRS) 1,000.0 - 1,000.0 -
Call and put options on shares 6.7 - 6.7 -
Total at 31 December 2009 1,006.7 - 1,006.7 -
Interest rate swaps (IRS) 1,000.0 - 1,000.0 -
Call and put options on shares 85.9 78.7 7.2 -
Total at 31 December 2010 1,085.9 78.7 1,007.2 -
Forwards, futures and currency swaps 642.1 642.1 - -
Forwards, interest rate futures 239.6 - 239.6 -
Interest rate swaps (IRS) 1,210.7 - 571.0 639.7
Futures and commodities options 68.1 68.1 - -
Call and put options on shares 4.0 4.0 - -
Total at 31 December 2011 2,164.5 714.2 810.6 639.7
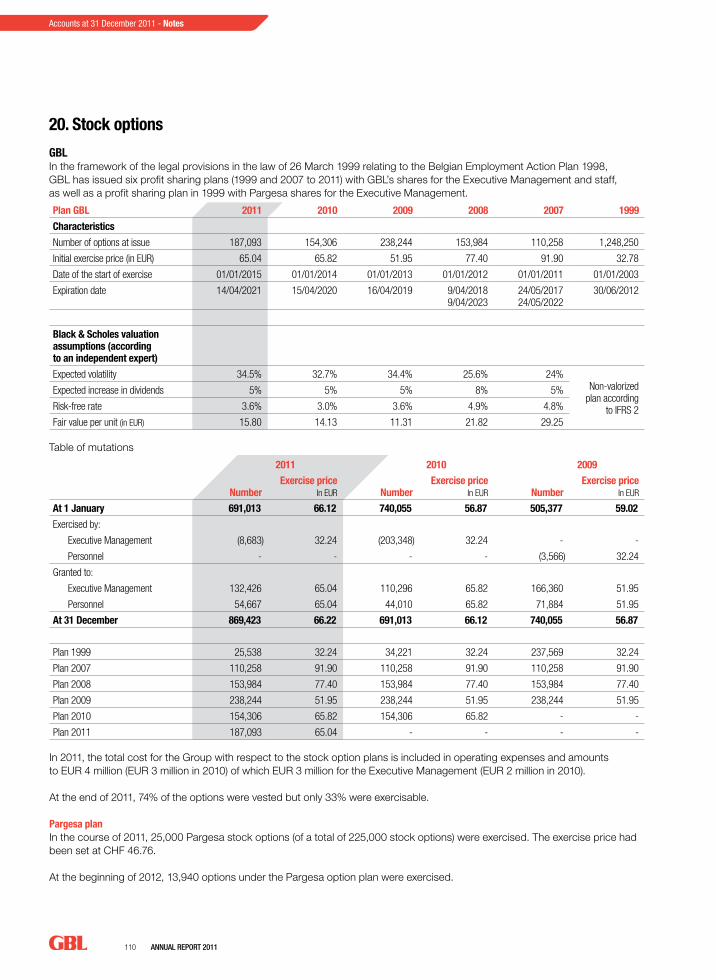
110 AnnuAl RepoRt 2011
Accounts at 31 December 2011 - Notes
20. Stock options
GBLIn the framework of the legal provisions in the law of 26 March 1999 relating to the Belgian Employment Action Plan 1998, GBL has issued six profit sharing plans (1999 and 2007 to 2011) with GBL’s shares for the Executive Management and staff, as well as a profit sharing plan in 1999 with Pargesa shares for the Executive Management.
Plan GBL 2011 2010 2009 2008 2007 1999
Characteristics
Number of options at issue 187,093 154,306 238,244 153,984 110,258 1,248,250
Initial exercise price (in EUR) 65.04 65.82 51.95 77.40 91.90 32.78
Date of the start of exercise 01/01/2015 01/01/2014 01/01/2013 01/01/2012 01/01/2011 01/01/2003
Expiration date 14/04/2021 15/04/2020 16/04/2019 9/04/2018 9/04/2023
24/05/2017 24/05/2022
30/06/2012
Black & Scholes valuation assumptions (according to an independent expert)
Expected volatility 34.5% 32.7% 34.4% 25.6% 24%Non-valorized
plan according to IFRS 2
Expected increase in dividends 5% 5% 5% 8% 5%
Risk-free rate 3.6% 3.0% 3.6% 4.9% 4.8%
Fair value per unit (in EUR) 15.80 14.13 11.31 21.82 29.25
Table of mutations
2011 2010 2009
Number Exercise price
In EUR Number Exercise price
In EUR Number Exercise price
In EUR
At 1 January 691,013 66.12 740,055 56.87 505,377 59.02
Exercised by:
Executive Management (8,683) 32.24 (203,348) 32.24 - -
Personnel - - - - (3,566) 32.24
Granted to:
Executive Management 132,426 65.04 110,296 65.82 166,360 51.95
Personnel 54,667 65.04 44,010 65.82 71,884 51.95
At 31 December 869,423 66.22 691,013 66.12 740,055 56.87
Plan 1999 25,538 32.24 34,221 32.24 237,569 32.24
Plan 2007 110,258 91.90 110,258 91.90 110,258 91.90
Plan 2008 153,984 77.40 153,984 77.40 153,984 77.40
Plan 2009 238,244 51.95 238,244 51.95 238,244 51.95
Plan 2010 154,306 65.82 154,306 65.82 - -
Plan 2011 187,093 65.04 - - - -
In 2011, the total cost for the Group with respect to the stock option plans is included in operating expenses and amounts to EUR 4 million (EUR 3 million in 2010) of which EUR 3 million for the Executive Management (EUR 2 million in 2010).
At the end of 2011, 74% of the options were vested but only 33% were exercisable.
Pargesa planIn the course of 2011, 25,000 Pargesa stock options (of a total of 225,000 stock options) were exercised. The exercise price had been set at CHF 46.76.
At the beginning of 2012, 13,940 options under the Pargesa option plan were exercised.
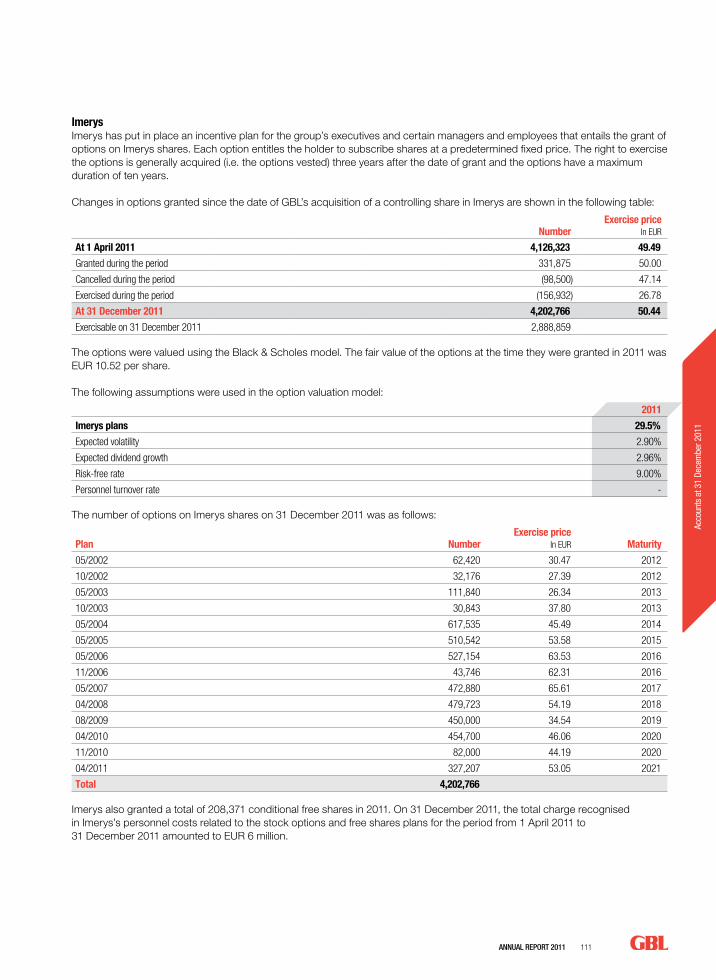
AnnuAl RepoRt 2011 111
Acco
unts
at 3
1 De
cem
ber 2
011
ImerysImerys has put in place an incentive plan for the group’s executives and certain managers and employees that entails the grant of options on Imerys shares. Each option entitles the holder to subscribe shares at a predetermined fixed price. The right to exercise the options is generally acquired (i.e. the options vested) three years after the date of grant and the options have a maximum duration of ten years.
Changes in options granted since the date of GBL’s acquisition of a controlling share in Imerys are shown in the following table:
Number Exercise price
In EUR
At 1 April 2011 4,126,323 49.49
Granted during the period 331,875 50.00
Cancelled during the period (98,500) 47.14
Exercised during the period (156,932) 26.78
At 31 December 2011 4,202,766 50.44
Exercisable on 31 December 2011 2,888,859
The options were valued using the Black & Scholes model. The fair value of the options at the time they were granted in 2011 was EUR 10.52 per share.
The following assumptions were used in the option valuation model:
2011
Imerys plans 29.5%
Expected volatility 2.90%
Expected dividend growth 2.96%
Risk-free rate 9.00%
Personnel turnover rate -
The number of options on Imerys shares on 31 December 2011 was as follows:
Plan Number Exercise price
In EUR Maturity
05/2002 62,420 30.47 2012
10/2002 32,176 27.39 2012
05/2003 111,840 26.34 2013
10/2003 30,843 37.80 2013
05/2004 617,535 45.49 2014
05/2005 510,542 53.58 2015
05/2006 527,154 63.53 2016
11/2006 43,746 62.31 2016
05/2007 472,880 65.61 2017
04/2008 479,723 54.19 2018
08/2009 450,000 34.54 2019
04/2010 454,700 46.06 2020
11/2010 82,000 44.19 2020
04/2011 327,207 53.05 2021
Total 4,202,766
Imerys also granted a total of 208,371 conditional free shares in 2011. On 31 December 2011, the total charge recognised in Imerys’s personnel costs related to the stock options and free shares plans for the period from 1 April 2011 to 31 December 2011 amounted to EUR 6 million.
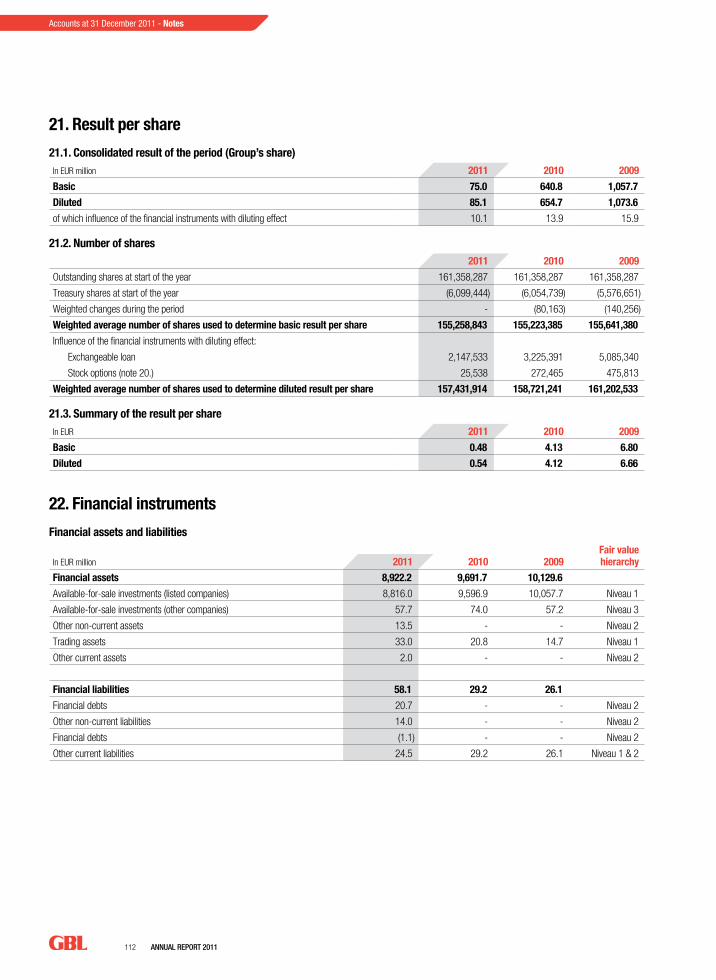
112 AnnuAl RepoRt 2011
Accounts at 31 December 2011 - Notes
21. Result per share
21.1. Consolidated result of the period (Group’s share)In EUR million 2011 2010 2009
Basic 75.0 640.8 1,057.7
Diluted 85.1 654.7 1,073.6
of which influence of the financial instruments with diluting effect 10.1 13.9 15.9
21.2. Number of shares2011 2010 2009
Outstanding shares at start of the year 161,358,287 161,358,287 161,358,287
Treasury shares at start of the year (6,099,444) (6,054,739) (5,576,651)
Weighted changes during the period - (80,163) (140,256)
Weighted average number of shares used to determine basic result per share 155,258,843 155,223,385 155,641,380
Influence of the financial instruments with diluting effect:
Exchangeable loan 2,147,533 3,225,391 5,085,340
Stock options (note 20.) 25,538 272,465 475,813
Weighted average number of shares used to determine diluted result per share 157,431,914 158,721,241 161,202,533
21.3. Summary of the result per shareIn EUR 2011 2010 2009
Basic 0.48 4.13 6.80
Diluted 0.54 4.12 6.66
22. Financial instruments
Financial assets and liabilities
In EUR million 2011 2010 2009Fair value hierarchy
Financial assets 8,922.2 9,691.7 10,129.6
Available-for-sale investments (listed companies) 8,816.0 9,596.9 10,057.7 Niveau 1
Available-for-sale investments (other companies) 57.7 74.0 57.2 Niveau 3
Other non-current assets 13.5 - - Niveau 2
Trading assets 33.0 20.8 14.7 Niveau 1
Other current assets 2.0 - - Niveau 2
Financial liabilities 58.1 29.2 26.1
Financial debts 20.7 - - Niveau 2
Other non-current liabilities 14.0 - - Niveau 2
Financial debts (1.1) - - Niveau 2
Other current liabilities 24.5 29.2 26.1 Niveau 1 & 2
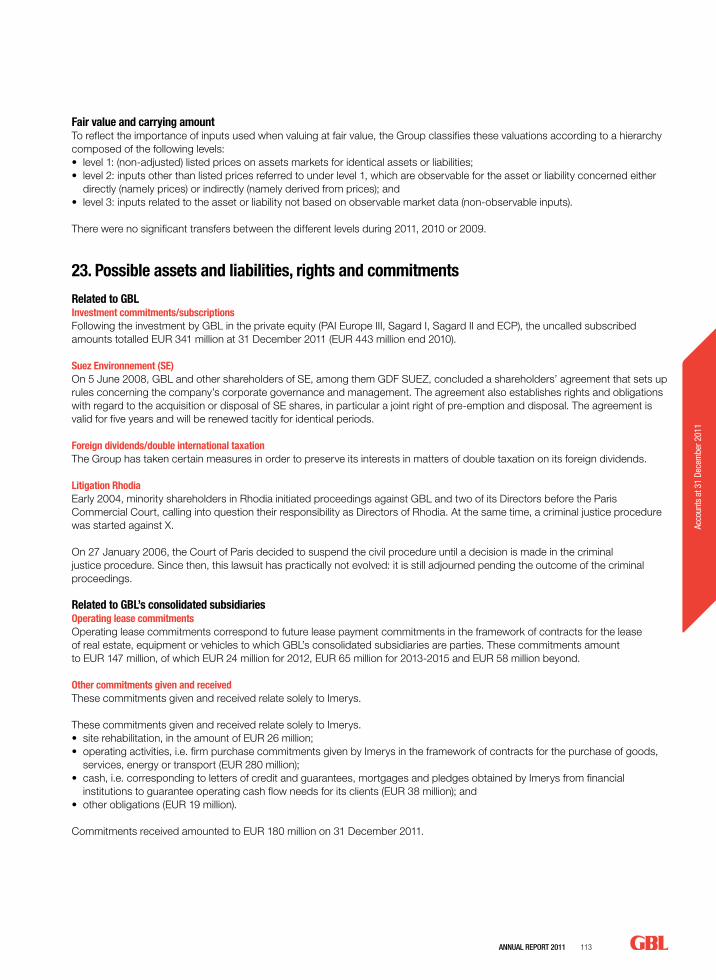
AnnuAl RepoRt 2011 113
Acco
unts
at 3
1 De
cem
ber 2
011
Fair value and carrying amountTo reflect the importance of inputs used when valuing at fair value, the Group classifies these valuations according to a hierarchy composed of the following levels:• level 1: (non-adjusted) listed prices on assets markets for identical assets or liabilities;• level 2: inputs other than listed prices referred to under level 1, which are observable for the asset or liability concerned either
directly (namely prices) or indirectly (namely derived from prices); and• level 3: inputs related to the asset or liability not based on observable market data (non-observable inputs).
There were no significant transfers between the different levels during 2011, 2010 or 2009.
23. Possible assets and liabilities, rights and commitments
Related to GBLInvestment commitments/subscriptionsFollowing the investment by GBL in the private equity (PAI Europe III, Sagard I, Sagard II and ECP), the uncalled subscribed amounts totalled EUR 341 million at 31 December 2011 (EUR 443 million end 2010).
Suez Environnement (SE)On 5 June 2008, GBL and other shareholders of SE, among them GDF SUEZ, concluded a shareholders’ agreement that sets up rules concerning the company’s corporate governance and management. The agreement also establishes rights and obligations with regard to the acquisition or disposal of SE shares, in particular a joint right of pre-emption and disposal. The agreement is valid for five years and will be renewed tacitly for identical periods.
Foreign dividends/double international taxationThe Group has taken certain measures in order to preserve its interests in matters of double taxation on its foreign dividends.
Litigation RhodiaEarly 2004, minority shareholders in Rhodia initiated proceedings against GBL and two of its Directors before the Paris Commercial Court, calling into question their responsibility as Directors of Rhodia. At the same time, a criminal justice procedure was started against X.
On 27 January 2006, the Court of Paris decided to suspend the civil procedure until a decision is made in the criminal justice procedure. Since then, this lawsuit has practically not evolved: it is still adjourned pending the outcome of the criminal proceedings.
Related to GBL’s consolidated subsidiariesOperating lease commitments Operating lease commitments correspond to future lease payment commitments in the framework of contracts for the lease of real estate, equipment or vehicles to which GBL’s consolidated subsidiaries are parties. These commitments amount to EUR 147 million, of which EUR 24 million for 2012, EUR 65 million for 2013-2015 and EUR 58 million beyond.
Other commitments given and receivedThese commitments given and received relate solely to Imerys.
These commitments given and received relate solely to Imerys.• site rehabilitation, in the amount of EUR 26 million;• operating activities, i.e. firm purchase commitments given by Imerys in the framework of contracts for the purchase of goods,
services, energy or transport (EUR 280 million);• cash, i.e. corresponding to letters of credit and guarantees, mortgages and pledges obtained by Imerys from financial
institutions to guarantee operating cash flow needs for its clients (EUR 38 million); and• other obligations (EUR 19 million).
Commitments received amounted to EUR 180 million on 31 December 2011.
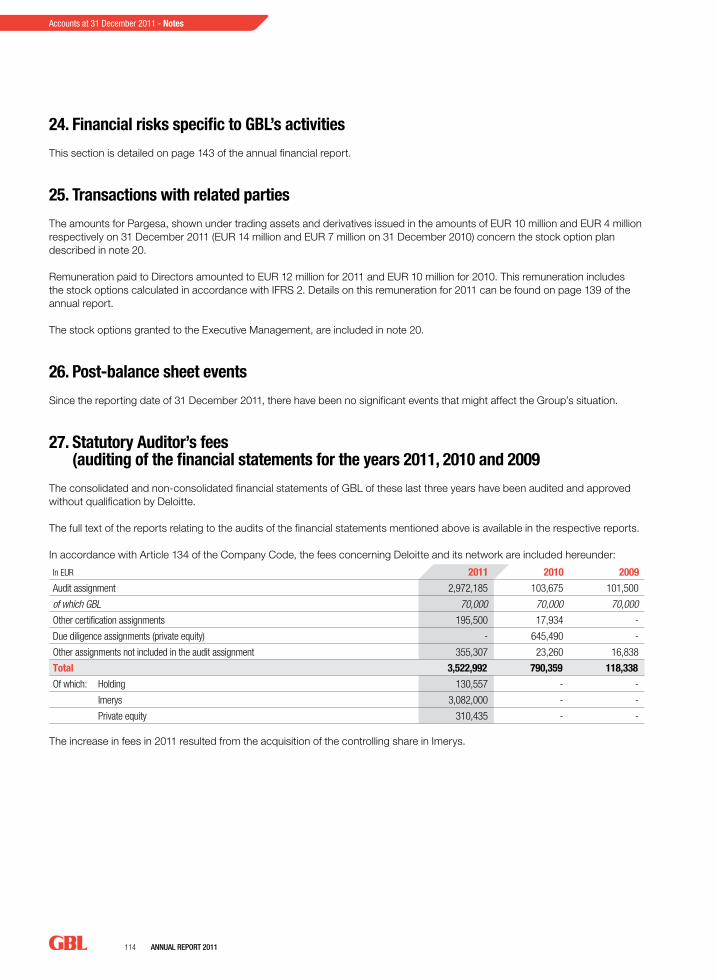
114 AnnuAl RepoRt 2011
Accounts at 31 December 2011 - Notes
24. Financial risks specific to GBL’s activities
This section is detailed on page 143 of the annual financial report.
25. Transactions with related parties
The amounts for Pargesa, shown under trading assets and derivatives issued in the amounts of EUR 10 million and EUR 4 million respectively on 31 December 2011 (EUR 14 million and EUR 7 million on 31 December 2010) concern the stock option plan described in note 20.
Remuneration paid to Directors amounted to EUR 12 million for 2011 and EUR 10 million for 2010. This remuneration includes the stock options calculated in accordance with IFRS 2. Details on this remuneration for 2011 can be found on page 139 of the annual report.
The stock options granted to the Executive Management, are included in note 20.
26. Post-balance sheet events
Since the reporting date of 31 December 2011, there have been no significant events that might affect the Group’s situation.
27. Statutory Auditor’s fees (auditing of the financial statements for the years 2011, 2010 and 2009
The consolidated and non-consolidated financial statements of GBL of these last three years have been audited and approved without qualification by Deloitte.
The full text of the reports relating to the audits of the financial statements mentioned above is available in the respective reports.
In accordance with Article 134 of the Company Code, the fees concerning Deloitte and its network are included hereunder:
In EUR 2011 2010 2009
Audit assignment 2,972,185 103,675 101,500
of which GBL 70,000 70,000 70,000
Other certification assignments 195,500 17,934 -
Due diligence assignments (private equity) - 645,490 -
Other assignments not included in the audit assignment 355,307 23,260 16,838
Total 3,522,992 790,359 118,338
Of which: Holding 130,557 - -
Imerys 3,082,000 - -
Private equity 310,435 - -
The increase in fees in 2011 resulted from the acquisition of the controlling share in Imerys.

AnnuAl RepoRt 2011 115
Acco
unts
at 3
1 De
cem
ber 2
011
116 AnnuAl RepoRt 2011
Statutory Auditor’s report
AnnuAl RepoRt 2011 117
Acco
unts
at 3
1 De
cem
ber 2
011
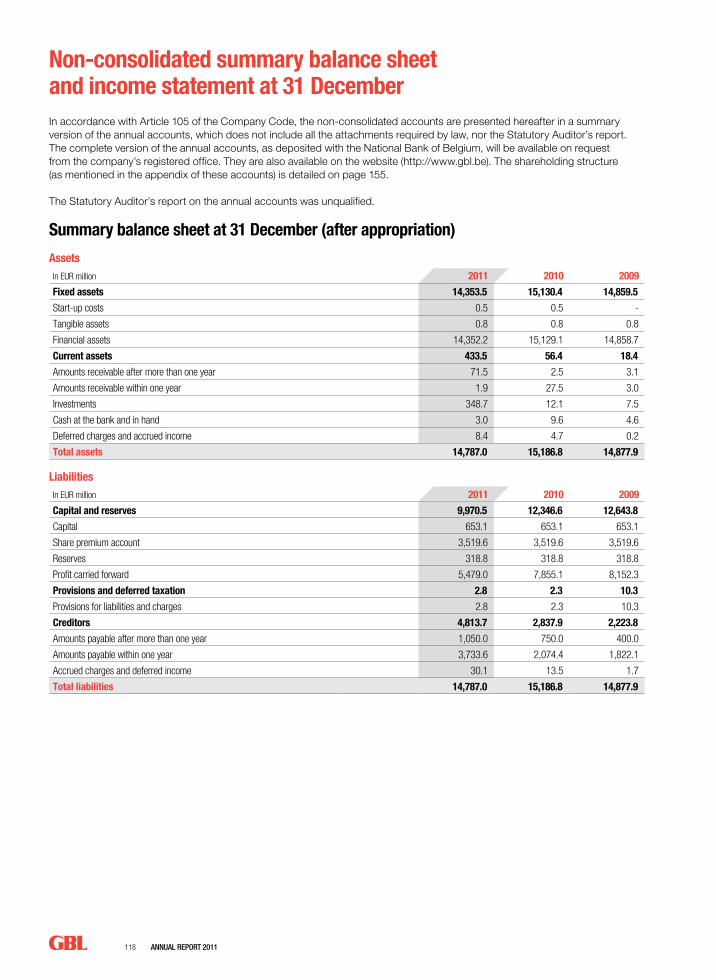
118 AnnuAl RepoRt 2011
In accordance with Article 105 of the Company Code, the non-consolidated accounts are presented hereafter in a summary version of the annual accounts, which does not include all the attachments required by law, nor the Statutory Auditor’s report. The complete version of the annual accounts, as deposited with the National Bank of Belgium, will be available on request from the company’s registered office. They are also available on the website (http://www.gbl.be). The shareholding structure (as mentioned in the appendix of these accounts) is detailed on page 155.
The Statutory Auditor’s report on the annual accounts was unqualified.
Summary balance sheet at 31 December (after appropriation)
AssetsIn EUR million 2011 2010 2009
Fixed assets 14,353.5 15,130.4 14,859.5
Start-up costs 0.5 0.5 -
Tangible assets 0.8 0.8 0.8
Financial assets 14,352.2 15,129.1 14,858.7
Current assets 433.5 56.4 18.4
Amounts receivable after more than one year 71.5 2.5 3.1
Amounts receivable within one year 1.9 27.5 3.0
Investments 348.7 12.1 7.5
Cash at the bank and in hand 3.0 9.6 4.6
Deferred charges and accrued income 8.4 4.7 0.2
Total assets 14,787.0 15,186.8 14,877.9
LiabilitiesIn EUR million 2011 2010 2009
Capital and reserves 9,970.5 12,346.6 12,643.8
Capital 653.1 653.1 653.1
Share premium account 3,519.6 3,519.6 3,519.6
Reserves 318.8 318.8 318.8
Profit carried forward 5,479.0 7,855.1 8,152.3
Provisions and deferred taxation 2.8 2.3 10.3
Provisions for liabilities and charges 2.8 2.3 10.3
Creditors 4,813.7 2,837.9 2,223.8
Amounts payable after more than one year 1,050.0 750.0 400.0
Amounts payable within one year 3,733.6 2,074.4 1,822.1
Accrued charges and deferred income 30.1 13.5 1.7
Total liabilities 14,787.0 15,186.8 14,877.9
Non-consolidated summary balance sheet and income statement at 31 December
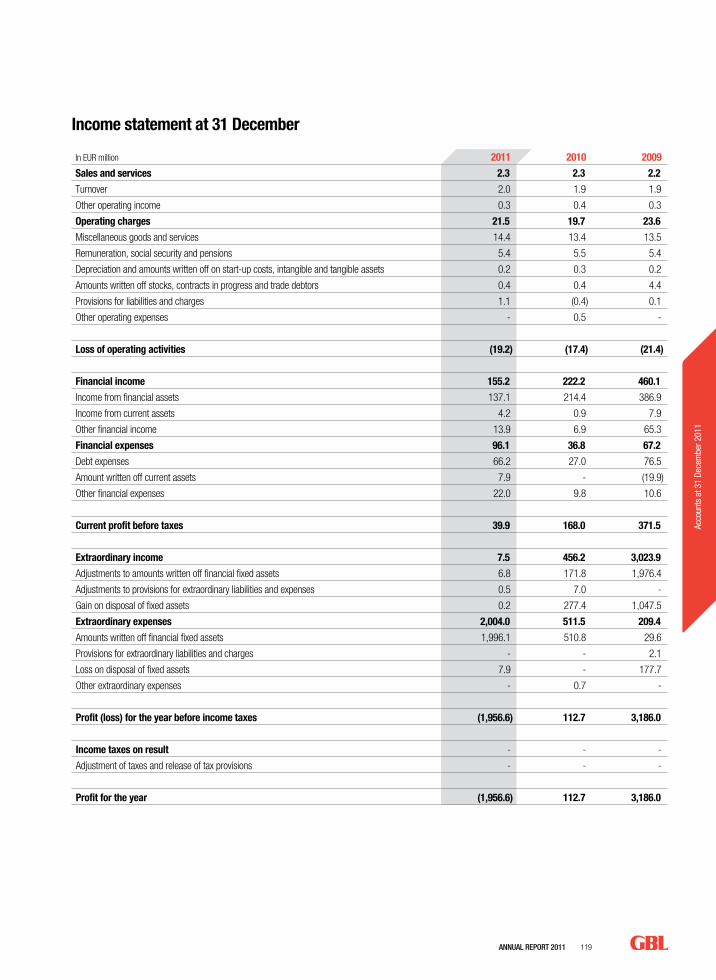
AnnuAl RepoRt 2011 119
Acco
unts
at 3
1 De
cem
ber 2
011
Income statement at 31 December
In EUR million 2011 2010 2009
Sales and services 2.3 2.3 2.2
Turnover 2.0 1.9 1.9
Other operating income 0.3 0.4 0.3
Operating charges 21.5 19.7 23.6
Miscellaneous goods and services 14.4 13.4 13.5
Remuneration, social security and pensions 5.4 5.5 5.4
Depreciation and amounts written off on start-up costs, intangible and tangible assets 0.2 0.3 0.2
Amounts written off stocks, contracts in progress and trade debtors 0.4 0.4 4.4
Provisions for liabilities and charges 1.1 (0.4) 0.1
Other operating expenses - 0.5 -
Loss of operating activities (19.2) (17.4) (21.4)
Financial income 155.2 222.2 460.1
Income from financial assets 137.1 214.4 386.9
Income from current assets 4.2 0.9 7.9
Other financial income 13.9 6.9 65.3
Financial expenses 96.1 36.8 67.2
Debt expenses 66.2 27.0 76.5
Amount written off current assets 7.9 - (19.9)
Other financial expenses 22.0 9.8 10.6
Current profit before taxes 39.9 168.0 371.5
Extraordinary income 7.5 456.2 3,023.9
Adjustments to amounts written off financial fixed assets 6.8 171.8 1,976.4
Adjustments to provisions for extraordinary liabilities and expenses 0.5 7.0 -
Gain on disposal of fixed assets 0.2 277.4 1,047.5
Extraordinary expenses 2,004.0 511.5 209.4
Amounts written off financial fixed assets 1,996.1 510.8 29.6
Provisions for extraordinary liabilities and charges - - 2.1
Loss on disposal of fixed assets 7.9 - 177.7
Other extraordinary expenses - 0.7 -
Profit (loss) for the year before income taxes (1,956.6) 112.7 3,186.0
Income taxes on result - - -
Adjustment of taxes and release of tax provisions - - -
Profit for the year (1,956.6) 112.7 3,186.0
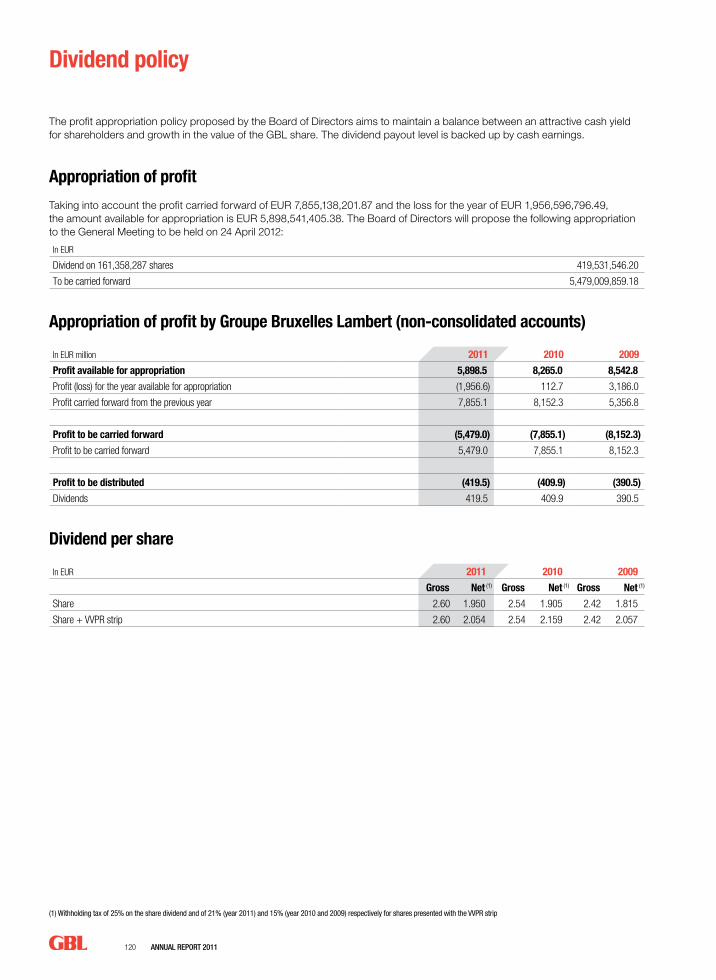
120 AnnuAl RepoRt 2011
The profit appropriation policy proposed by the Board of Directors aims to maintain a balance between an attractive cash yield for shareholders and growth in the value of the GBL share. The dividend payout level is backed up by cash earnings.
Appropriation of profit
Taking into account the profit carried forward of EUR 7,855,138,201.87 and the loss for the year of EUR 1,956,596,796.49, the amount available for appropriation is EUR 5,898,541,405.38. The Board of Directors will propose the following appropriation to the General Meeting to be held on 24 April 2012:
In EUR
Dividend on 161,358,287 shares 419,531,546.20
To be carried forward 5,479,009,859.18
Appropriation of profit by Groupe Bruxelles Lambert (non-consolidated accounts)
In EUR million 2011 2010 2009
Profit available for appropriation 5,898.5 8,265.0 8,542.8
Profit (loss) for the year available for appropriation (1,956.6) 112.7 3,186.0
Profit carried forward from the previous year 7,855.1 8,152.3 5,356.8
Profit to be carried forward (5,479.0) (7,855.1) (8,152.3)
Profit to be carried forward 5,479.0 7,855.1 8,152.3
Profit to be distributed (419.5) (409.9) (390.5)
Dividends 419.5 409.9 390.5
Dividend per share
In EUR 2011 2010 2009
Gross Net (1) Gross Net (1) Gross Net (1)
Share 2.60 1.950 2.54 1.905 2.42 1.815
Share + VVPR strip 2.60 2.054 2.54 2.159 2.42 2.057
Dividend policy
(1) Withholding tax of 25% on the share dividend and of 21% (year 2011) and 15% (year 2010 and 2009) respectively for shares presented with the VVPR strip
AnnuAl RepoRt 2011 121
Acco
unts
at 3
1 De
cem
ber 2
011
Historical data
Summary of GBL’s investments since 2009
2011Acquisition of exclusive control of ImerysIn April, GBL acquired the full 25.6% stake in Imerys held by Pargesa Holding S.A. for EUR 1,087 million, raising its stake to 56.4% of the firm’s capital and therefore securing sole control over this asset. GBL marginally increased its investment in the company during the year, bringing it to 57.0% in capital and thereby exceeding the threshold of two thirds of voting rights.
Increase to 10% in ArkemaGBL boosted its interest in Arkema to 10.0% in 2011, investing another EUR 170 million.
Extension of credit linesWith the aim of controlling its medium-term financing, the group took advantage of favourable market conditions to extend its confirmed credit lines and will consequently benefit from facilities in the amount of EUR 1.8 billion until 2016-2017.
Buyback of exchangeable bondsGBL continued in 2011 its policy of buying back its exchangeable bonds maturing in April 2012, for an additional EUR 92 million, bringing its accumulated buybacks to EUR 251 million of a total of EUR 435 million.
Distributions and additional investments in private equityIn 2011, GBL invested EUR 95 million in the Ergon Capital Partners, PAI Europe III and Sagard funds and collected distributions of EUR 75 million for the disposal of various interests. At the end of 2011, undrawn commitments on different private equity funds totalled EUR 341 million.
2010Stronger position in Pernod Ricard and ArkemaGBL spent EUR 120 million strengthening its investment in Pernod Ricard, raising it to 9.9% at the end of 2010. It also invested EUR 27 million in Arkema and passed the 5% threshold in its capital at the end of December.
Financing policy – Bond issueFor the sake of controlling its medium-term financing, GBL took advantage of favourable market conditions to raise EUR 350 million in June 2010 falling due in December 2017. These bonds are listed on the Stock Exchange and offer a coupon with a nominal rate of 4% gross.
Buyback of exchangeable bonds Taking advantage of attractive yields, the group earmarked some EUR 160 million of its cash holdings for the buyback on the market of part of the bonds exchangeable for GBL shares. This loan stock of EUR 435 million was issued by Sagerpar in 2005 and comes to maturity in April 2012. In consequence of these transactions part of the treasury shares initially allocated to cover the loan stock are free.
Private equityPrivate equity activity showed a modest recovery in 2010. Apart from a few pay-outs or marginal payments in full in the ECP I & II, PAI Europe III, Sagard and Sagard II funds, GBL invested some EUR 40 million in Ergon Capital Partners III, a vehicle created in the first half of 2010 in which GBL, the sole shareholder, has agreed to invest EUR 350 million. At the end of 2010, the uncalled subscribed commitments on these different funds totalled around EUR 443 million.
2009Stronger position in Pernod Ricard and distribution of shares free of charges GBL increased its shareholding by nearly 1% in 2009, bringing it to 9.1% at the end of the year. It spent EUR 113 million to this increase, which was made through acquisitions on the Stock Exchange.During fourth quarter 2009, Pernod Ricard allocated shares free of charges in the proportion of 1 new share for 50 existing shares. This transaction, which had no impact on the ownership rate, increased the number of shares held by GBL by 500,000.
Participation in the capital increases of Lafarge, Pernod Ricard and ImerysDuring the first half of 2009, GBL invested nearly EUR 485 million in the capital increases launched by Lafarge (EUR 1,500 million; EUR 16.65 per share), Pernod Ricard (EUR 1,036 million; EUR 26.70 per share) and Imerys (EUR 251 million; EUR 20.00 per share) in accordance with its role of long-term shareholder.
Distributions and additional investments in the funds Ergon Capital Partners, PAI Europe III and Sagard In 2009, GBL invested EUR 7 million in the different private equity vehicles that make up its portfolio and collected dividend payouts totalling EUR 2 million. The commitments not called up totalled EUR 138 million on 31 December 2009.
Acquisition of treasury sharesDuring 2009, GBL acquired 478,088 treasury shares for a total amount of EUR 27 million.
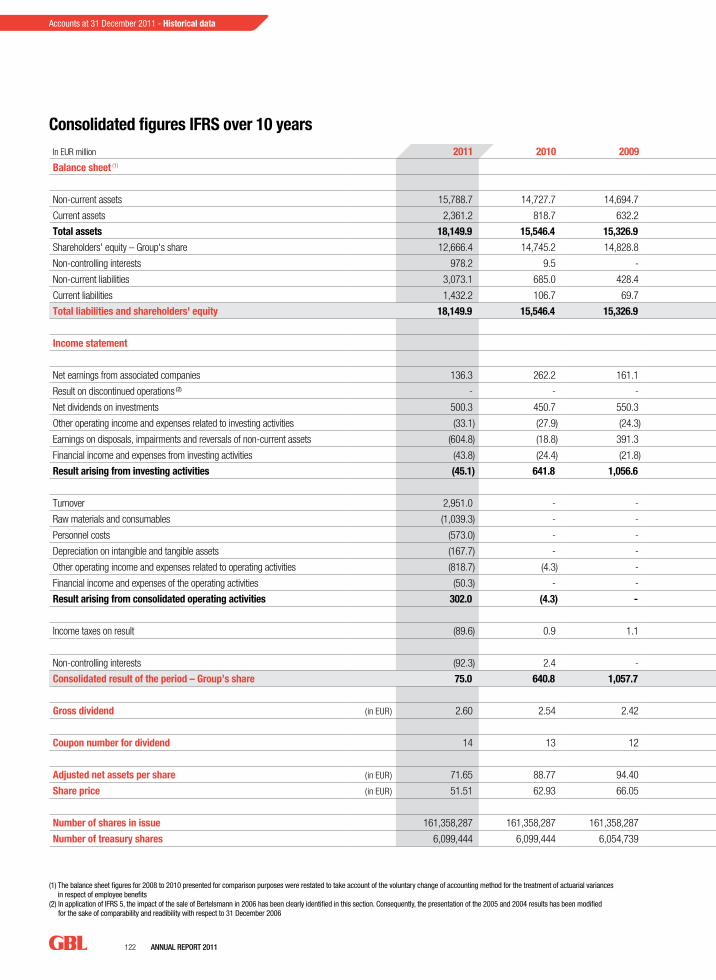
122 AnnuAl RepoRt 2011
Accounts at 31 December 2011 - Historical data
Consolidated figures IFRS over 10 yearsIn EUR million 2011 2010 2009 2008 2007 2006 2005 2004 2003 2002
Balance sheet (1)
Non-current assets 15,788.7 14,727.7 14,694.7 12,894.7 17,519.3 13,496.0 10,533.6 7,543.1 6,777.6 6,646.5
Current assets 2,361.2 818.7 632.2 1,141.1 1,863.2 2,737.2 123.6 411.4 594.2 964.6
Total assets 18,149.9 15,546.4 15,326.9 14,035.8 19,382.5 16,233.2 10,657.2 7,954.5 7,371.8 7,611.1
Shareholders' equity – Group's share 12,666.4 14,745.2 14,828.8 13,417.2 18,868.6 15,682.0 10,159.7 7,911.6 6,966.4 6,772.3
Non-controlling interests 978.2 9.5 - - - - - - - -
Non-current liabilities 3,073.1 685.0 428.4 425.3 422.3 434.6 437.6 22.5 24.4 359.9
Current liabilities 1,432.2 106.7 69.7 193.3 91.6 116.6 59.9 20.4 381.0 478.9
Total liabilities and shareholders' equity 18,149.9 15,546.4 15,326.9 14,035.8 19,382.5 16,233.2 10,657.2 7,954.5 7,371.8 7,611.1
Income statement
Net earnings from associated companies 136.3 262.2 161.1 324.9 90.3 70.7 83.2 62.5 71.5 (425.5)
Result on discontinued operations (2) - - - - - 2,487.0 259.6 323.8 - -
Net dividends on investments 500.3 450.7 550.3 479.8 446.0 257.2 169.3 186.0 206.9 203.1
Other operating income and expenses related to investing activities (33.1) (27.9) (24.3) (20.3) (23.9) (28.6) (19.0) (18.6) (18.7) (16.0)
Earnings on disposals, impairments and reversals of non-current assets (604.8) (18.8) 391.3 (1,436.4) 214.7 11.7 6.5 37.5 (39.1) (12.5)
Financial income and expenses from investing activities (43.8) (24.4) (21.8) (36.5) 38.0 66.7 22.7 5.5 (10.3) 24.4
Result arising from investing activities (45.1) 641.8 1,056.6 (688.5) 765.1 2,864.7 522.3 596.7 210.3 (226.5)
Turnover 2,951.0 - - - - - - - - -
Raw materials and consumables (1,039.3) - - - - - - - - -
Personnel costs (573.0) - - - - - - - - -
Depreciation on intangible and tangible assets (167.7) - - - - - - - - -
Other operating income and expenses related to operating activities (818.7) (4.3) - - - - - - - -
Financial income and expenses of the operating activities (50.3) - - - - - - - - -
Result arising from consolidated operating activities 302.0 (4.3) - - - - - - - -
Income taxes on result (89.6) 0.9 1.1 1.0 13.8 18.6 0.7 (2.7) 0.1 (11.3)
Non-controlling interests (92.3) 2.4 - - - - - - - -
Consolidated result of the period – Group’s share 75.0 640.8 1,057.7 (687.5) 778.9 2,883.3 523.0 594.0 210.4 (237.8)
Gross dividend (in EUR) 2.60 2.54 2.42 2.30 2.09 1.90 1.72 1.60 1.49 1.42
Coupon number for dividend 14 13 12 11 10 8 7 5 4 3
Adjusted net assets per share (in EUR) 71.65 88.77 94.40 79.39 122.37 113.91 80.33 64.27 54.43 50.91
Share price (in EUR) 51.51 62.93 66.05 56.86 87.87 91.05 82.85 59.90 44.67 39.01
Number of shares in issue 161,358,287 161,358,287 161,358,287 161,358,287 161,358,287 147,167,666 138,300,053 138,300,053 138,300,053 138,300,053
Number of treasury shares 6,099,444 6,099,444 6,054,739 5,576,651 5,261,451 5,272,701 5,382,726 6,134,556 6,313,032 5,647,376
(1) The balance sheet figures for 2008 to 2010 presented for comparison purposes were restated to take account of the voluntary change of accounting method for the treatment of actuarial variances in respect of employee benefits
(2) In application of IFRS 5, the impact of the sale of Bertelsmann in 2006 has been clearly identified in this section. Consequently, the presentation of the 2005 and 2004 results has been modified for the sake of comparability and readibility with respect to 31 December 2006
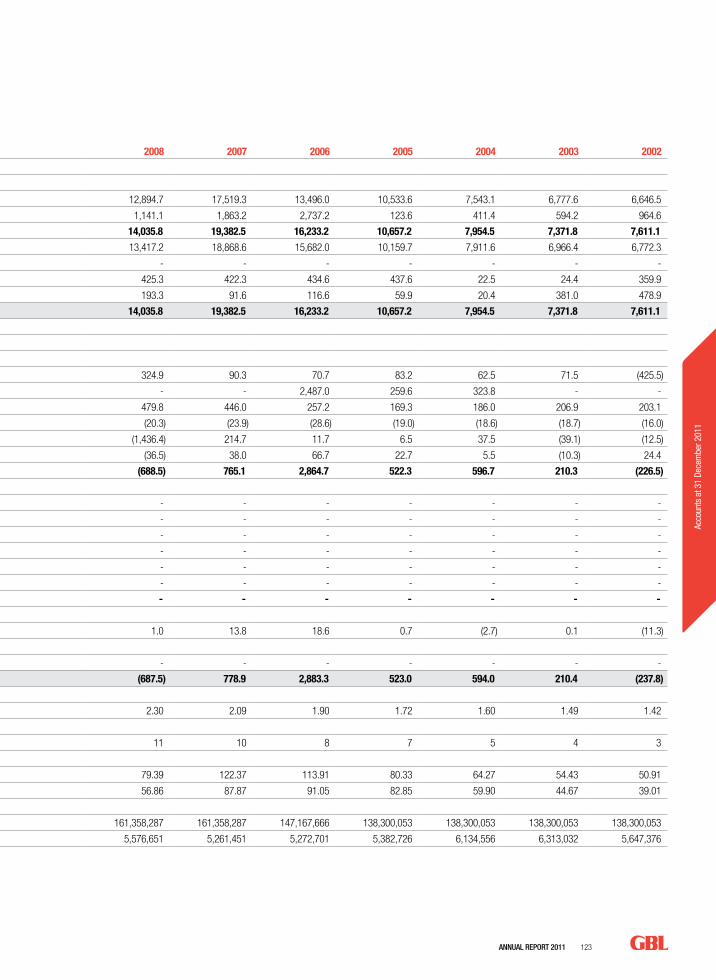
AnnuAl RepoRt 2011 123
Acco
unts
at 3
1 De
cem
ber 2
011
In EUR million 2011 2010 2009 2008 2007 2006 2005 2004 2003 2002
Balance sheet (1)
Non-current assets 15,788.7 14,727.7 14,694.7 12,894.7 17,519.3 13,496.0 10,533.6 7,543.1 6,777.6 6,646.5
Current assets 2,361.2 818.7 632.2 1,141.1 1,863.2 2,737.2 123.6 411.4 594.2 964.6
Total assets 18,149.9 15,546.4 15,326.9 14,035.8 19,382.5 16,233.2 10,657.2 7,954.5 7,371.8 7,611.1
Shareholders' equity – Group's share 12,666.4 14,745.2 14,828.8 13,417.2 18,868.6 15,682.0 10,159.7 7,911.6 6,966.4 6,772.3
Non-controlling interests 978.2 9.5 - - - - - - - -
Non-current liabilities 3,073.1 685.0 428.4 425.3 422.3 434.6 437.6 22.5 24.4 359.9
Current liabilities 1,432.2 106.7 69.7 193.3 91.6 116.6 59.9 20.4 381.0 478.9
Total liabilities and shareholders' equity 18,149.9 15,546.4 15,326.9 14,035.8 19,382.5 16,233.2 10,657.2 7,954.5 7,371.8 7,611.1
Income statement
Net earnings from associated companies 136.3 262.2 161.1 324.9 90.3 70.7 83.2 62.5 71.5 (425.5)
Result on discontinued operations (2) - - - - - 2,487.0 259.6 323.8 - -
Net dividends on investments 500.3 450.7 550.3 479.8 446.0 257.2 169.3 186.0 206.9 203.1
Other operating income and expenses related to investing activities (33.1) (27.9) (24.3) (20.3) (23.9) (28.6) (19.0) (18.6) (18.7) (16.0)
Earnings on disposals, impairments and reversals of non-current assets (604.8) (18.8) 391.3 (1,436.4) 214.7 11.7 6.5 37.5 (39.1) (12.5)
Financial income and expenses from investing activities (43.8) (24.4) (21.8) (36.5) 38.0 66.7 22.7 5.5 (10.3) 24.4
Result arising from investing activities (45.1) 641.8 1,056.6 (688.5) 765.1 2,864.7 522.3 596.7 210.3 (226.5)
Turnover 2,951.0 - - - - - - - - -
Raw materials and consumables (1,039.3) - - - - - - - - -
Personnel costs (573.0) - - - - - - - - -
Depreciation on intangible and tangible assets (167.7) - - - - - - - - -
Other operating income and expenses related to operating activities (818.7) (4.3) - - - - - - - -
Financial income and expenses of the operating activities (50.3) - - - - - - - - -
Result arising from consolidated operating activities 302.0 (4.3) - - - - - - - -
Income taxes on result (89.6) 0.9 1.1 1.0 13.8 18.6 0.7 (2.7) 0.1 (11.3)
Non-controlling interests (92.3) 2.4 - - - - - - - -
Consolidated result of the period – Group’s share 75.0 640.8 1,057.7 (687.5) 778.9 2,883.3 523.0 594.0 210.4 (237.8)
Gross dividend (in EUR) 2.60 2.54 2.42 2.30 2.09 1.90 1.72 1.60 1.49 1.42
Coupon number for dividend 14 13 12 11 10 8 7 5 4 3
Adjusted net assets per share (in EUR) 71.65 88.77 94.40 79.39 122.37 113.91 80.33 64.27 54.43 50.91
Share price (in EUR) 51.51 62.93 66.05 56.86 87.87 91.05 82.85 59.90 44.67 39.01
Number of shares in issue 161,358,287 161,358,287 161,358,287 161,358,287 161,358,287 147,167,666 138,300,053 138,300,053 138,300,053 138,300,053
Number of treasury shares 6,099,444 6,099,444 6,054,739 5,576,651 5,261,451 5,272,701 5,382,726 6,134,556 6,313,032 5,647,376
124 AnnuAl RepoRt 2011
Groupe Bruxelles Lambert (“GBL” or the “Company”) complies with the provisions of the 2009 Belgian Code on Corporate Governance (the “2009 Code”) that may be consulted on http://www.corporategovernancecommittee.be/en/2009_code/latest_edition/.
The Company also ensures its compliance with various good governance legal requirements.
The rules of conduct for members of GBL’s Board of Directors and of its specialised Committees as well as the rules governing the functioning of these bodies are set out in the Company’s Corporate Governance Charter (the “Charter”). The Company published its first Charter at the end of 2005. Since then, the Board of Directors has ensured that this document remains in line with the 2009 Code and the various legal developments in the field of corporate governance. The amended document is available on the Company’s website (http://www.gbl.be).
Legislation related to corporate governance has evolved significantly in recent years. The law of 6 April 2010 strengthened corporate governance for listed companies by transforming a number of 2009 Code provisions into legal obligations, for which the “comply or explain” principle will no longer apply. This is the case, for instance, for the creation of a remuneration committee and for the publication of a corporate governance statement which, as from financial year 2011, must also include a remuneration report. For matters not regulated by the law of 6 April 2010, this legislation obliges listed companies to specify which Corporate Governance Code they apply and consequently, in case of derogation, to explain the reasons (the “comply or explain” principle). On 6 June 2010, a royal decree designated the 2009 Code as the reference code on corporate governance.
The law of 20 December 2010 introduced new rules for listed companies that must be complied with as from 1 January 2012. These rules aim to increase shareholders’ active participation in general meetings and to foster effective dialogue between shareholders and management. The Company adopted the measures required to comply with this law of 20 December 2010 by amending its Articles of Association on 12 April 2011.
The diversity of the Board of Directors’ composition was strengthened by the law of 28 July 2011, which aims to ensure presence of women on the Board of Directors of listed companies. Accordingly, from 1 January 2017, GBL’s Board of Directors will have to include at least one third of women.
Lastly, the law of 7 November 2011 amending the Company Code regarding the variable remuneration for non-executive directors of listed companies has no impact on GBL’s corporate governance. The Company’s remuneration policy does not provide for variable remuneration for non-executive members of the Board of Directors.
This chapter describes the composition and functioning of the administrative bodies and of their committees. It comments on the practical application of GBL group’s governance rules during the financial year ended on 31 December 2011 and the period following its closing up to the Ordinary General Meeting on 24 April 2012. It also lists the Company’s derogations from certain provisions of the 2009 Code and explains the reasons behind them. It includes a remuneration report and describes the principal characteristics of the Company’s internal control and risk management systems.
Corporate governance statement
Ian Gallienne, Baron Frère and Gérard Lamarche
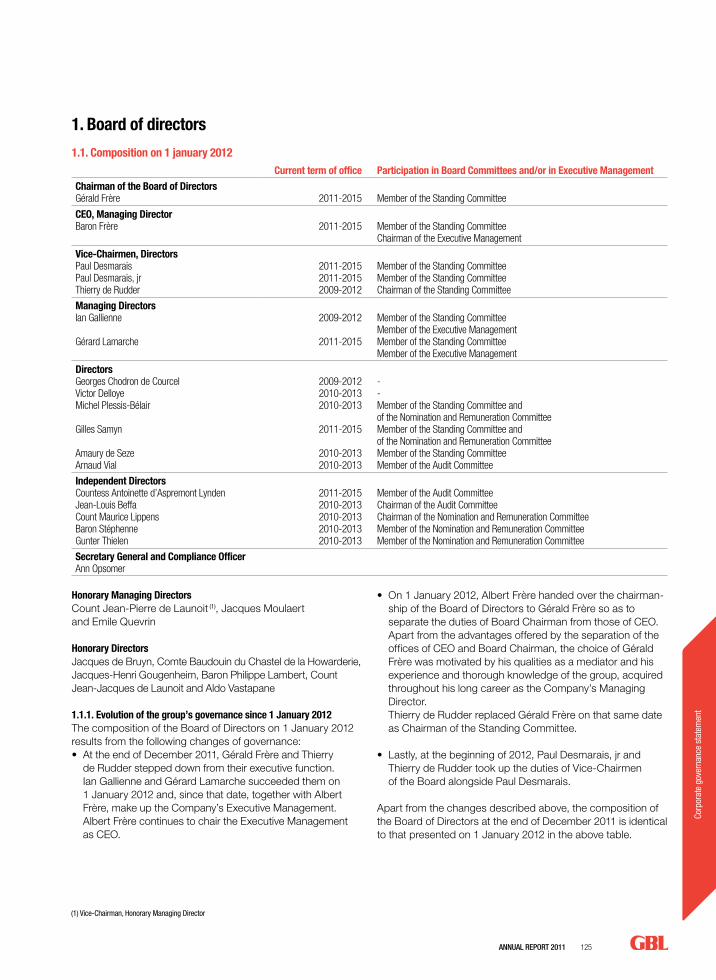
AnnuAl RepoRt 2011 125
Corp
orat
e go
vern
ance
sta
tem
ent
Honorary Managing DirectorsCount Jean-Pierre de Launoit (1), Jacques Moulaert and Emile Quevrin
Honorary Directors Jacques de Bruyn, Comte Baudouin du Chastel de la Howarderie, Jacques-Henri Gougenheim, Baron Philippe Lambert, Count Jean-Jacques de Launoit and Aldo Vastapane
1.1.1. Evolution of the group’s governance since 1 January 2012The composition of the Board of Directors on 1 January 2012 results from the following changes of governance:• At the end of December 2011, Gérald Frère and Thierry
de Rudder stepped down from their executive function. Ian Gallienne and Gérard Lamarche succeeded them on 1 January 2012 and, since that date, together with Albert Frère, make up the Company’s Executive Management. Albert Frère continues to chair the Executive Management as CEO.
• On 1 January 2012, Albert Frère handed over the chairman-ship of the Board of Directors to Gérald Frère so as to separate the duties of Board Chairman from those of CEO. Apart from the advantages offered by the separation of the offices of CEO and Board Chairman, the choice of Gérald Frère was motivated by his qualities as a mediator and his experience and thorough knowledge of the group, acquired throughout his long career as the Company’s Managing Director.
Thierry de Rudder replaced Gérald Frère on that same date as Chairman of the Standing Committee.
• Lastly, at the beginning of 2012, Paul Desmarais, jr and Thierry de Rudder took up the duties of Vice-Chairmen of the Board alongside Paul Desmarais.
Apart from the changes described above, the composition of the Board of Directors at the end of December 2011 is identical to that presented on 1 January 2012 in the above table.
1. Board of directors
1.1. Composition on 1 january 2012Current term of office Participation in Board Committees and/or in Executive Management
Chairman of the Board of DirectorsGérald Frère 2011-2015 Member of the Standing Committee
CEO, Managing DirectorBaron Frère 2011-2015 Member of the Standing Committee
Chairman of the Executive Management
Vice-Chairmen, DirectorsPaul DesmaraisPaul Desmarais, jrThierry de Rudder
2011-20152011-20152009-2012
Member of the Standing CommitteeMember of the Standing CommitteeChairman of the Standing Committee
Managing DirectorsIan Gallienne
Gérard Lamarche
2009-2012
2011-2015
Member of the Standing Committee Member of the Executive ManagementMember of the Standing CommitteeMember of the Executive Management
DirectorsGeorges Chodron de CourcelVictor DelloyeMichel Plessis-Bélair
Gilles Samyn
Amaury de SezeArnaud Vial
2009-20122010-20132010-2013
2011-2015
2010-20132010-2013
--Member of the Standing Committee and of the Nomination and Remuneration CommitteeMember of the Standing Committee and of the Nomination and Remuneration CommitteeMember of the Standing Committee Member of the Audit Committee
Independent DirectorsCountess Antoinette d’Aspremont LyndenJean-Louis BeffaCount Maurice LippensBaron StéphenneGunter Thielen
2011-20152010-20132010-20132010-20132010-2013
Member of the Audit CommitteeChairman of the Audit CommitteeChairman of the Nomination and Remuneration CommitteeMember of the Nomination and Remuneration CommitteeMember of the Nomination and Remuneration Committee
Secretary General and Compliance OfficerAnn Opsomer
(1) Vice-Chairman, Honorary Managing Director
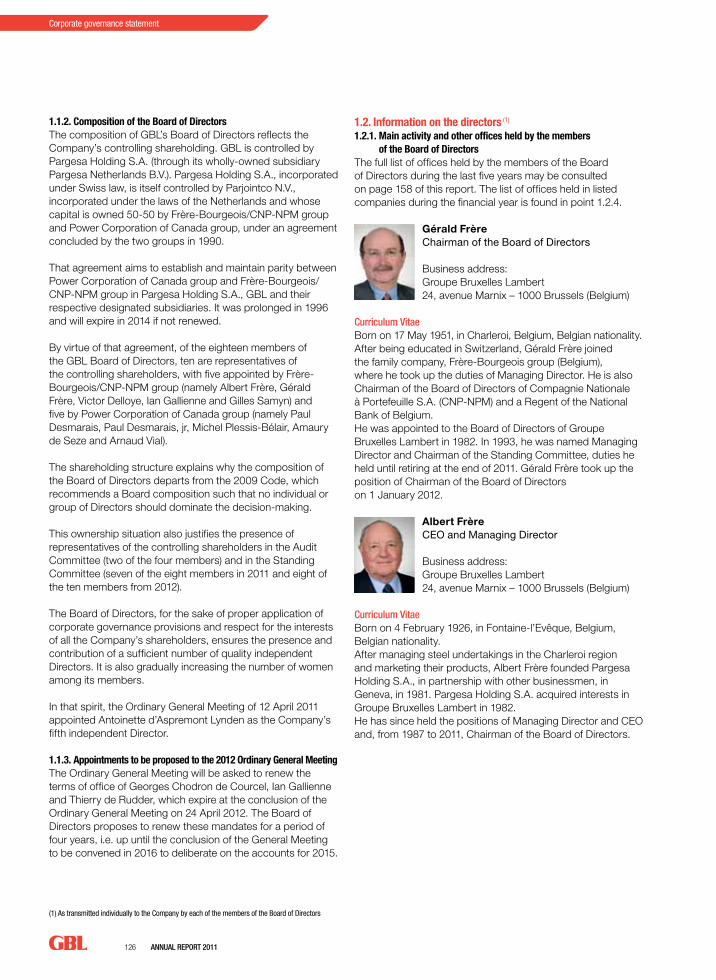
126 AnnuAl RepoRt 2011
Corporate governance statement
1.1.2. Composition of the Board of DirectorsThe composition of GBL’s Board of Directors reflects the Company’s controlling shareholding. GBL is controlled by Pargesa Holding S.A. (through its wholly-owned subsidiary Pargesa Netherlands B.V.). Pargesa Holding S.A., incorporated under Swiss law, is itself controlled by Parjointco N.V., incorporated under the laws of the Netherlands and whose capital is owned 50-50 by Frère-Bourgeois/CNP-NPM group and Power Corporation of Canada group, under an agreement concluded by the two groups in 1990.
That agreement aims to establish and maintain parity between Power Corporation of Canada group and Frère-Bourgeois/CNP-NPM group in Pargesa Holding S.A., GBL and their respective designated subsidiaries. It was prolonged in 1996 and will expire in 2014 if not renewed.
By virtue of that agreement, of the eighteen members of the GBL Board of Directors, ten are representatives of the controlling shareholders, with five appointed by Frère-Bourgeois/CNP-NPM group (namely Albert Frère, Gérald Frère, Victor Delloye, Ian Gallienne and Gilles Samyn) and five by Power Corporation of Canada group (namely Paul Desmarais, Paul Desmarais, jr, Michel Plessis-Bélair, Amaury de Seze and Arnaud Vial).
The shareholding structure explains why the composition of the Board of Directors departs from the 2009 Code, which recommends a Board composition such that no individual or group of Directors should dominate the decision-making.
This ownership situation also justifies the presence of representatives of the controlling shareholders in the Audit Committee (two of the four members) and in the Standing Committee (seven of the eight members in 2011 and eight of the ten members from 2012).
The Board of Directors, for the sake of proper application of corporate governance provisions and respect for the interests of all the Company’s shareholders, ensures the presence and contribution of a sufficient number of quality independent Directors. It is also gradually increasing the number of women among its members.
In that spirit, the Ordinary General Meeting of 12 April 2011 appointed Antoinette d’Aspremont Lynden as the Company’s fifth independent Director.
1.1.3. Appointments to be proposed to the 2012 Ordinary General Meeting The Ordinary General Meeting will be asked to renew the terms of office of Georges Chodron de Courcel, Ian Gallienne and Thierry de Rudder, which expire at the conclusion of the Ordinary General Meeting on 24 April 2012. The Board of Directors proposes to renew these mandates for a period of four years, i.e. up until the conclusion of the General Meeting to be convened in 2016 to deliberate on the accounts for 2015.
1.2. Information on the directors (1) 1.2.1. Main activity and other offices held by the members
of the Board of DirectorsThe full list of offices held by the members of the Board of Directors during the last five years may be consulted on page 158 of this report. The list of offices held in listed companies during the financial year is found in point 1.2.4.
Gérald FrèreChairman of the Board of Directors
Business address:Groupe Bruxelles Lambert24, avenue Marnix – 1000 Brussels (Belgium)
Curriculum VitaeBorn on 17 May 1951, in Charleroi, Belgium, Belgian nationality.After being educated in Switzerland, Gérald Frère joined the family company, Frère-Bourgeois group (Belgium), where he took up the duties of Managing Director. He is also Chairman of the Board of Directors of Compagnie Nationale à Portefeuille S.A. (CNP-NPM) and a Regent of the National Bank of Belgium. He was appointed to the Board of Directors of Groupe Bruxelles Lambert in 1982. In 1993, he was named Managing Director and Chairman of the Standing Committee, duties he held until retiring at the end of 2011. Gérald Frère took up the position of Chairman of the Board of Directors on 1 January 2012.
Albert Frère CEO and Managing Director
Business address:Groupe Bruxelles Lambert24, avenue Marnix – 1000 Brussels (Belgium)
Curriculum VitaeBorn on 4 February 1926, in Fontaine-l’Evêque, Belgium, Belgian nationality.After managing steel undertakings in the Charleroi region and marketing their products, Albert Frère founded Pargesa Holding S.A., in partnership with other businessmen, in Geneva, in 1981. Pargesa Holding S.A. acquired interests in Groupe Bruxelles Lambert in 1982. He has since held the positions of Managing Director and CEO and, from 1987 to 2011, Chairman of the Board of Directors.
(1) As transmitted individually to the Company by each of the members of the Board of Directors
AnnuAl RepoRt 2011 127
Corp
orat
e go
vern
ance
sta
tem
ent
Paul DesmaraisVice-Chairman of the Board of Directors
Business address:Power Corporation of Canada751, Victoria Square – Montreal, Quebec H2Y 2J3 (Canada)
Curriculum VitaeBorn on 4 January 1927 in Sudbury, Ontario, Canada, Canadian nationality.After earning a degree in business administration from the University of Ottawa (Canada), Paul Desmarais took over a bus company in Sudbury (Ontario) in 1951. In 1959, he founded Transportation Management Corporation Limited and then went on to acquire Provincial Transport Limited in 1960. He acquired effective control over Entreprises Gelco Limitée in 1962. In 1968, he acquired a controlling stake in Power Corporation of Canada, an international management and holding company. He served as its Chairman and Chief Management Officer from 1968 to 1996. Today, he chairs the firm’s Executive Committee. He has been a Director of Groupe Bruxelles Lambert since 1982 and currently is Vice-Chairman of the Board of Directors.
Paul Desmarais, jrVice-Chairman of the Board of Directors
Business address:Power Corporation of Canada751, Victoria Square – Montreal, Quebec H2Y 2J3 (Canada)
Curriculum VitaeBorn on 3 July 1954 in Sudbury, Ontario, Canada, Canadian nationality.Paul Desmarais, jr has a degree in business studies from McGill University in Montreal and an MBA from INSEAD in Fontainebleau.He began his career in England with S.G. Warburg & Co. Ltd., moving on to Standard Brands Incorporated in New York. In 1981, he joined Power Corporation of Canada, where he is now Chairman of the Board and co-Chief Management Officer. He has been a Director of Groupe Bruxelles Lambert since 1990.
Thierry de RudderVice-Chairman of the Board of Directors
Business address:Groupe Bruxelles Lambert24, avenue Marnix - 1000 Brussels (Belgium)
Curriculum VitaeBorn on 3 September 1949, in Paris, France, French and Belgian nationality.Thierry de Rudder has degrees in mathematics from the University of Geneva and Free University of Brussels (ULB) and an MBA from Wharton School in Philadelphia.He began his career in the United States and joined Citibank in 1975, where he held various positions in New York and then in Europe. He is currently Vice-Chairman of the Board of Directors and Chairman of the Standing Committee of Groupe Bruxelles Lambert, which he joined in 1986 and where he held the position of Managing Director until December 2011.
Ian Gallienne Managing Director
Business address:Groupe Bruxelles Lambert24, avenue Marnix - 1000 Brussels (Belgium)
Curriculum VitaeBorn on 23 January 1971, in Boulogne-Billancourt, France, French nationality.Ian Gallienne has a degree in Management and Administration, with a specialisation in Finance, from the E.S.D.E. in Paris and an MBA from INSEAD in Fontaineble u. He began his career in Spain, in 1992, as co-founder of a commercial company. From 1995 to 1997, he was a member of management of a consulting firm specialised in the reorganisation of ailing companies in France. From 1998 to 2005, he was Manager of the private equity funds Rhône Capital LLC in New York and London. Since 2005, he has been a co-founder and Managing Director of the private equity funds Ergon Capital Partners in Brussels.He has been a Director of Groupe Bruxelles Lambert since 2009 and Managing Director since 1 January 2012.
128 AnnuAl RepoRt 2011
Corporate governance statement
Gérard LamarcheManaging Director
Business address:Groupe Bruxelles Lambert24, avenue Marnix – 1000 Brussels (Belgium)
Curriculum VitaeBorn on 15 July 1961, in Huy, Belgium, Belgian nationality.Gérard Lamarche has a degree in Economics from the University of Louvain-La-Neuve and went through management training at the INSEAD Business School (Advanced Management Program for Suez Group Executives). He also received training at the Wharton International Forum in 1998-99 (Global Leadership Series).He began his professional career in 1983 at Deloitte Haskins & Sells in Belgium. From 1988 to 1995, he held various positions at Société Générale de Belgique. In 1995, he joined Compagnie Financière de Suez. In 2000, he continued his career in the United States as Director, Senior Executive Vice-President of NALCO. In 2004, he joined the General Management of Suez Group, where he was promoted in 2008 to the position of Senior Executive Vice-President - Finance, and member of the Management Committee and of the Executive Committee of GDF SUEZ Group, offices he held until 31 October 2011 and 31 December 2011 respectively.Gérard Lamarche has been a Director of Groupe Bruxelles Lambert since 12 April 2011 and Managing Director since 1 January 2012.
Antoinette d’Aspremont LyndenDirector
Business address:23, avenue du Général de Gaulle – 1050 Brussels (Belgium)
Curriculum VitaeBorn on 24 October 1949, in London, United Kingdom, Belgian nationality.Antoinette d’Aspremont Lynden holds a Master of Science degree from the School of Engineering of Stanford University in California and a Doctorate in Applied Economics from the Catholic University of Louvain (UCL). She began her career in quantitative methods consulting in Palo Alto, in California and held various positions at Banque Bruxelles Lambert in Brussels between 1973 and 1990. Then she was during twenty years management professor at University Charles-de-Gaulle Lille 3. She is also guest professor of accounting and financial analysis at the Political Science Institute in Lille. She is also active in the non-profit sector as Vice-President of the Royal Philanthropic Society in Brussels, Treasurer of the Cathedral St Michael and St Gudula in Brussels, President of the French-speaking jury for the Queen Paola Prize for education and Member of the Organizing Authority of Maredsous Private School (Belgium).She has been a Director of Groupe Bruxelles Lambert since 2011.
Jean-Louis BeffaDirector
Business address:Saint-Gobain“Les Miroirs”, 18, avenue d’Alsace – 92096 La Défense Cedex (France)
Curriculum VitaeBorn on 11 August 1941, in Nice, France, French nationality.After earning a degree in mining Engineering from the “Ecole polytechnique”, Jean-Louis Beffa went on to take degrees from the National College of Petroleum Engineering and the Political Science Institute in Paris. He began his career as an Engineer at the Fuel Directorate of the Ministry for Industry, where he was subsequently named Head of the Refining Service and then Deputy Director. In 1974, he joined Compagnie de Saint-Gobain, where he served as Chairman-Chief Executive Officer from 1986 to 2007. He served as Chairman from June 2007 to June 2010. Today he is Honorary Chairman and Director of Compagnie de Saint-Gobain, Senior Advisor at Lazard Frères and Chairman of Lazard Asia Financial Advisory.He has been a Director of Groupe Bruxelles Lambert since 1999.
Georges Chodron de CourcelDirector
Business address:BNP Paribas3, rue d’Antin – 75002 Paris (France)
Curriculum VitaeBorn on 20 May 1950, in Amiens, France, French nationalityAfter earning a degree from Ecole Centrale Paris in 1971, and a second degree in economics in 1972, Georges Chodron de Courcel began his career at Banque Nationale de Paris, where he held various positions of responsibility. After six years at Banque Commerciale, he was appointed Manager of Financial Studies and subsequently of the Stocks and Securities Management Department. In 1989, he was named Director of Financial Affairs and Industrial Shareholdings and Chairman of Banexi. In January 1991, he was appointed head of the Financial Division and then Banking and International Finance Division in 1996. Following the merger with Paribas in August 1999, he was named a Member of the Executive Committee and placed in charge of BNP Paribas’ Banque de Financement et d’Investissement. Since June 2003, he has served as Chief Operating Officer of BNP Paribas. He has been a Director of Groupe Bruxelles Lambert since 2009.
AnnuAl RepoRt 2011 129
Corp
orat
e go
vern
ance
sta
tem
ent
Victor DelloyeDirector
Business address:Compagnie Nationale à Portefeuille S.A.12, rue de la Blanche Borne – 6280 Loverval (Belgium)
Curriculum VitaeBorn on 27 September 1953, Belgian nationality.Victor Delloye has a law degree from Catholic University of Louvain (UCL) and a master’s degree in taxation studies from the School of Business Studies (ICHEC - Brussels). Since the start of the 1989-1990 academic year, he has been a lecturer at ULB’s Solvay Business School in the master’s programme in tax planning.He joined Frère-Bourgeois group in 1987 and is now Director-General Secretary of CNP-NPM. He has been a Director of Groupe Bruxelles Lambert since 1999.
Maurice LippensDirector
Business address:161, Avenue Winston Churchill box 12 – 1180 Brussels (Belgium)
Curriculum VitaeBorn on 9 May 1943, Belgian nationality.Maurice Lippens has a doctorate in law from Free University of Brussels (ULB) and an MBA from Harvard Business School.He began his career in corporate turnarounds and venture capital. He served successively as Director, Managing Director and Chairman-Managing Director of AG group, which became Fortis in 1990. He served as Executive Chairman of Fortis until 2000 and non-executive Chairman from 2000 to 1 October 2008.He has been a Director of Groupe Bruxelles Lambert since 2001.
Michel Plessis-BélairDirector
Business address:Power Corporation of Canada751, Victoria Square – Montreal, Quebec H2Y 2J3 (Canada)
Curriculum VitaeBorn on 26 March 1942, in Montreal, Canada, Canadian nationality.Michel Plessis-Bélair holds a master’s degree in business from the Montreal Business School and an MBA from Columbia University in New York. He is also a Fellow of the Order of Chartered Accountants of Quebec.He began his career with Samson Bélair, moving on in 1975 to Société Générale de Financement du Québec, where he held various management positions and also served as Director. In 1986, he joined Power Corporation of Canada and Power Financial Corporation, where he served until his retirement on 31 January 2008 as Vice-Chairman of the Board and Chief Financial Officer and Executive Vice-President and Chief Financial Officer respectively. He continues to serve as Vice-Chairman of the Board of Power Corporation of Canada and is also a member of the Board of Power Corporation of Canada and of Power Financial Corporation. He has been a Director of Groupe Bruxelles Lambert since 1990.
Gilles SamynDirector
Business address:Compagnie Nationale à Portefeuille S.A.12, rue de la Blanche Borne – 6280 Loverval (Belgium)
Curriculum VitaeBorn on 2 January 1950, in Cannes, France, French and Belgian nationalityGilles Samyn is a market development engineer, a graduate of the Solvay Business School (ULB), where he has held research and teaching positions since 1970.His career began in the Mouvement Coopératif Belge in 1972, after which Gilles Samyn moved on to Groupe Bruxelles Lambert in late 1974. After a year of self-employment, in 1983, he joined the Frère-Bourgeois group, where he is now Managing Director, and Managing Director of CNP-NPM.He has been a Director of Groupe Bruxelles Lambert since 1987.

130 AnnuAl RepoRt 2011
Corporate governance statement
Amaury de SezeDirector
Business address:PGB1, rond-point des Champs Elysées – 75008 Paris (France)
Curriculum VitaeBorn on 7 May 1946, French nationality.Amaury de Seze has a degree from the Higher School of Business Administration (“Centre de Perfectionnement dans l’Administration des Affaires”) and Stanford Graduate School of Business.His career began at Bull General Electric. From 1978 to 1993, he worked for Volvo group as Chairman of Volvo Europe and Member of the group’s Executive Committee. In 1993, he joined Paribas group as a Member of the Executive Board in charge of industrial affairs. He was Chairman of PAI Partners and is currently a lead Director of Carrefour S.A. and Vice-Chairman of Power Financial Corporation.He is a Director of Pargesa Holding S.A. and has been a Director of Groupe Bruxelles Lambert since 1994.
Jean StéphenneDirector
Business address:GlaxoSmithKline Biologicals20, avenue Fleming (Building W23) – 1300 Wavre (Belgium)
Curriculum VitaeBorn on 1 September 1949, in Furfooz, near Dinant, Belgium, Belgian nationality.Jean Stéphenne holds a degree in chemical engineering and agronomy from the Agronomy College of Gembloux, and a degree in management from Catholic University of Louvain (UCL).He began his career at SmithKline-Rit, where he moved up the ranks to become Chairman-Chief Executive Officer. He chaired the UWE (Union Wallonne des Entreprises) from 1997 to 2000.He has been a Director of Groupe Bruxelles Lambert since 2003.
Gunter ThielenDirector
Business address:Bertelsmann Stiftung256, Carl-Bertelsmannstraße – P.O. Box 103 – 33311 Gütersloh (Germany)
Curriculum VitaeBorn on 4 August 1942 in Saarland, Germany, German nationality. Gunter Thielen has a doctorate in mechanical (construction) engineering and economics from the Technical University of Aachen.His career began in 1970 at BASF group, where he held various management positions. In 1976, he took up the duties of Technical Director of the Wintershall refinery in Kassel. In 1980, he was appointed Head of Management of Maul-Belser in Nuremberg (a printing of Bertelsmann group). He moved to Bertelsmann AG in 1985 as a member of the management body. In 2002, he was named Chairman of the Board and CEO.Since January 2008, he has served as Chairman of the Supervisory Board of Bertelsmann AG.He has been a Director of Groupe Bruxelles Lambert since 2007.
Arnaud VialDirector
Business address:Power Corporation of Canada751, Victoria Square – Montreal, Quebec H2Y 2J3 (Canada)
Curriculum VitaeBorn on 3 January 1953, in Paris, France, French and Canadian nationality.After completing a degree programme at the “Ecole supérieure d’Electricité”, Arnaud Vial began his career in 1977 at Banque Paribas (Paris). In 1988, he joined Pargesa group. Since 1997, he has been Senior Vice-President of Power Corporation of Canada and of Power Financial Corporation. He has been a Director of Groupe Bruxelles Lambert since 2004.
AnnuAl RepoRt 2011 131
Corp
orat
e go
vern
ance
sta
tem
ent
1.2.2. Designation and appointment of DirectorsDirectors are designated and appointed on the basis of procedures and selection criteria that are described in the Charter in Chapter III, point A. 2., in conformity with the 2009 Code, apart from one exception. The 2009 Code states that the Chairman of the Board of Directors or another non-executive Director shall conduct the appointment process. In 2011, this task was performed by the Chairman of the Board, who was also the CEO. On 1 January 2012, GBL came fully into compliance with this provision: Gérald Frère, as non-executive Director, succeeded Albert Frère as Chairman of the Board of Directors and from that date has taken on the procedure for the appointment of Directors.
1.2.3. Professional developmentNew Directors receive appropriate information enabling them to contribute rapidly to the work of the Board of Directors. If the Director sits in a Board Committee as well, the information transmitted also includes a description of the Committee’s remit, and all other information related to its tasks. Directors are also given the opportunity to discuss any questions about the performance of their mandate with the Company’s Executive Management. The selection of new Directors is primarily determined by the level of professional experience and competence with respect to the activities of a holding company, no other formal training being required.
Throughout their term of office, Directors continue to develop their competence and knowledge of the Company in order to carry out their responsibilities in the Board of Directors and in its Committees.
1.2.4. Offices held by Directors in listed companiesThe following table shows the offices held in listed companies by each of the Directors as of 31 December 2011, both in Belgium and in other countries.
Two figures are indicated for the number of offices. The first figure represents the total number of offices held; the second smaller figure is obtained by consolidating all the offices held within a same group as its representative to the different companies in which it owns a shareholding.
The specific nature of a holding company is to own shares whose performance must be monitored by the company’s managers. In these circumstances, Directors may legitimately hold more than five offices as their main professional activity, which explains why the Charter establishes a derogation from the provisions of the 2009 Code in this respect.
Number of offices Name of the listed company
Albert Frère 5 / 3 Pargesa Holding S.A. (CH) Groupe Bruxelles Lambert (B) GDF SUEZ (F)LVMH (F)Métropole Télévision (M6) (F)
Paul Desmarais 4 / 1 Power Corporation of Canada (CDN) Power Financial Corporation (CDN) Pargesa Holding S.A. (CH) Groupe Bruxelles Lambert (B)
Gérald Frère 6 / 3 National Bank of Belgium (B)Power Financial Corporation (CDN)Pargesa Holding S.A. (CH) Groupe Bruxelles Lambert (B) Lafarge (F) Pernod Ricard (F)
Thierry de Rudder 4 / 1 Groupe Bruxelles Lambert (B) GDF SUEZ (F) Lafarge (F) Total S.A. (F)
Antoinette d’Aspremont Lynden 1 / 1 Groupe Bruxelles Lambert (B)
Jean-Louis Beffa 4 / 4 Compagnie de Saint-Gobain (F)GDF SUEZ (F)Siemens AG (D)Groupe Bruxelles Lambert (B)
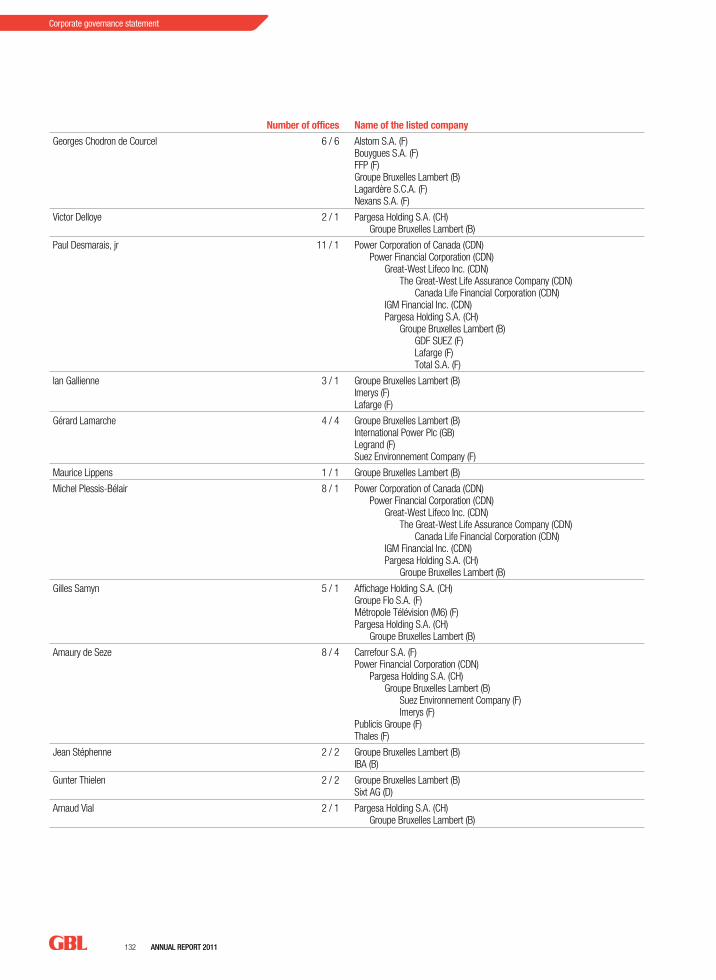
132 AnnuAl RepoRt 2011
Corporate governance statement
Number of offices Name of the listed company
Georges Chodron de Courcel 6 / 6 Alstom S.A. (F)Bouygues S.A. (F)FFP (F) Groupe Bruxelles Lambert (B)Lagardère S.C.A. (F)Nexans S.A. (F)
Victor Delloye 2 / 1 Pargesa Holding S.A. (CH) Groupe Bruxelles Lambert (B)
Paul Desmarais, jr 11 / 1 Power Corporation of Canada (CDN) Power Financial Corporation (CDN) Great-West Lifeco Inc. (CDN) The Great-West Life Assurance Company (CDN) Canada Life Financial Corporation (CDN) IGM Financial Inc. (CDN) Pargesa Holding S.A. (CH) Groupe Bruxelles Lambert (B) GDF SUEZ (F) Lafarge (F) Total S.A. (F)
Ian Gallienne 3 / 1 Groupe Bruxelles Lambert (B)Imerys (F)Lafarge (F)
Gérard Lamarche 4 / 4 Groupe Bruxelles Lambert (B)International Power Plc (GB)Legrand (F)Suez Environnement Company (F)
Maurice Lippens 1 / 1 Groupe Bruxelles Lambert (B)
Michel Plessis-Bélair 8 / 1 Power Corporation of Canada (CDN) Power Financial Corporation (CDN) Great-West Lifeco Inc. (CDN) The Great-West Life Assurance Company (CDN) Canada Life Financial Corporation (CDN) IGM Financial Inc. (CDN) Pargesa Holding S.A. (CH) Groupe Bruxelles Lambert (B)
Gilles Samyn 5 / 1 Affichage Holding S.A. (CH)Groupe Flo S.A. (F)Métropole Télévision (M6) (F)Pargesa Holding S.A. (CH) Groupe Bruxelles Lambert (B)
Amaury de Seze 8 / 4 Carrefour S.A. (F)Power Financial Corporation (CDN) Pargesa Holding S.A. (CH) Groupe Bruxelles Lambert (B) Suez Environnement Company (F) Imerys (F)Publicis Groupe (F)Thales (F)
Jean Stéphenne 2 / 2 Groupe Bruxelles Lambert (B)IBA (B)
Gunter Thielen 2 / 2 Groupe Bruxelles Lambert (B)Sixt AG (D)
Arnaud Vial 2 / 1 Pargesa Holding S.A. (CH) Groupe Bruxelles Lambert (B)
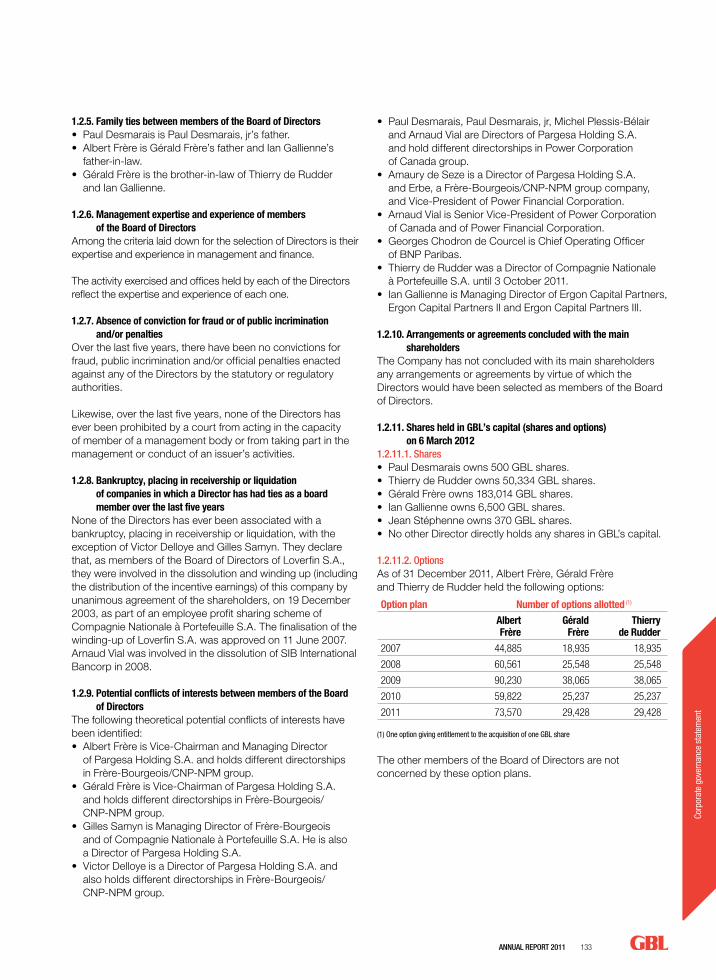
AnnuAl RepoRt 2011 133
Corp
orat
e go
vern
ance
sta
tem
ent
1.2.5. Family ties between members of the Board of Directors• Paul Desmarais is Paul Desmarais, jr’s father.• Albert Frère is Gérald Frère’s father and Ian Gallienne’s
father-in-law.• Gérald Frère is the brother-in-law of Thierry de Rudder
and Ian Gallienne.
1.2.6. Management expertise and experience of members of the Board of Directors
Among the criteria laid down for the selection of Directors is their expertise and experience in management and finance.
The activity exercised and offices held by each of the Directors reflect the expertise and experience of each one.
1.2.7. Absence of conviction for fraud or of public incrimination and/or penalties
Over the last five years, there have been no convictions for fraud, public incrimination and/or official penalties enacted against any of the Directors by the statutory or regulatory authorities.
Likewise, over the last five years, none of the Directors has ever been prohibited by a court from acting in the capacity of member of a management body or from taking part in the management or conduct of an issuer’s activities.
1.2.8. Bankruptcy, placing in receivership or liquidation of companies in which a Director has had ties as a board member over the last five years
None of the Directors has ever been associated with a bankruptcy, placing in receivership or liquidation, with the exception of Victor Delloye and Gilles Samyn. They declare that, as members of the Board of Directors of Loverfin S.A., they were involved in the dissolution and winding up (including the distribution of the incentive earnings) of this company by unanimous agreement of the shareholders, on 19 December 2003, as part of an employee profit sharing scheme of Compagnie Nationale à Portefeuille S.A. The finalisation of the winding-up of Loverfin S.A. was approved on 11 June 2007.Arnaud Vial was involved in the dissolution of SIB International Bancorp in 2008.
1.2.9. Potential conflicts of interests between members of the Board of Directors
The following theoretical potential conflicts of interests have been identified:• Albert Frère is Vice-Chairman and Managing Director
of Pargesa Holding S.A. and holds different directorships in Frère-Bourgeois/CNP-NPM group.
• Gérald Frère is Vice-Chairman of Pargesa Holding S.A. and holds different directorships in Frère-Bourgeois/ CNP-NPM group.
• Gilles Samyn is Managing Director of Frère-Bourgeois and of Compagnie Nationale à Portefeuille S.A. He is also a Director of Pargesa Holding S.A.
• Victor Delloye is a Director of Pargesa Holding S.A. and also holds different directorships in Frère-Bourgeois/ CNP-NPM group.
• Paul Desmarais, Paul Desmarais, jr, Michel Plessis-Bélair and Arnaud Vial are Directors of Pargesa Holding S.A. and hold different directorships in Power Corporation of Canada group.
• Amaury de Seze is a Director of Pargesa Holding S.A. and Erbe, a Frère-Bourgeois/CNP-NPM group company, and Vice-President of Power Financial Corporation.
• Arnaud Vial is Senior Vice-President of Power Corporation of Canada and of Power Financial Corporation.
• Georges Chodron de Courcel is Chief Operating Officer of BNP Paribas.
• Thierry de Rudder was a Director of Compagnie Nationale à Portefeuille S.A. until 3 October 2011.
• Ian Gallienne is Managing Director of Ergon Capital Partners, Ergon Capital Partners II and Ergon Capital Partners III.
1.2.10. Arrangements or agreements concluded with the main shareholders
The Company has not concluded with its main shareholders any arrangements or agreements by virtue of which the Directors would have been selected as members of the Board of Directors.
1.2.11. Shares held in GBL’s capital (shares and options) on 6 March 2012
1.2.11.1. Shares• Paul Desmarais owns 500 GBL shares.• Thierry de Rudder owns 50,334 GBL shares.• Gérald Frère owns 183,014 GBL shares.• Ian Gallienne owns 6,500 GBL shares.• Jean Stéphenne owns 370 GBL shares.• No other Director directly holds any shares in GBL’s capital.
1.2.11.2. optionsAs of 31 December 2011, Albert Frère, Gérald Frère and Thierry de Rudder held the following options:
Option plan Number of options allotted (1)
Albert Frère
Gérald Frère
Thierry de Rudder
2007 44,885 18,935 18,935
2008 60,561 25,548 25,548
2009 90,230 38,065 38,065
2010 59,822 25,237 25,237
2011 73,570 29,428 29,428
(1) One option giving entitlement to the acquisition of one GBL share
The other members of the Board of Directors are not concerned by these option plans.
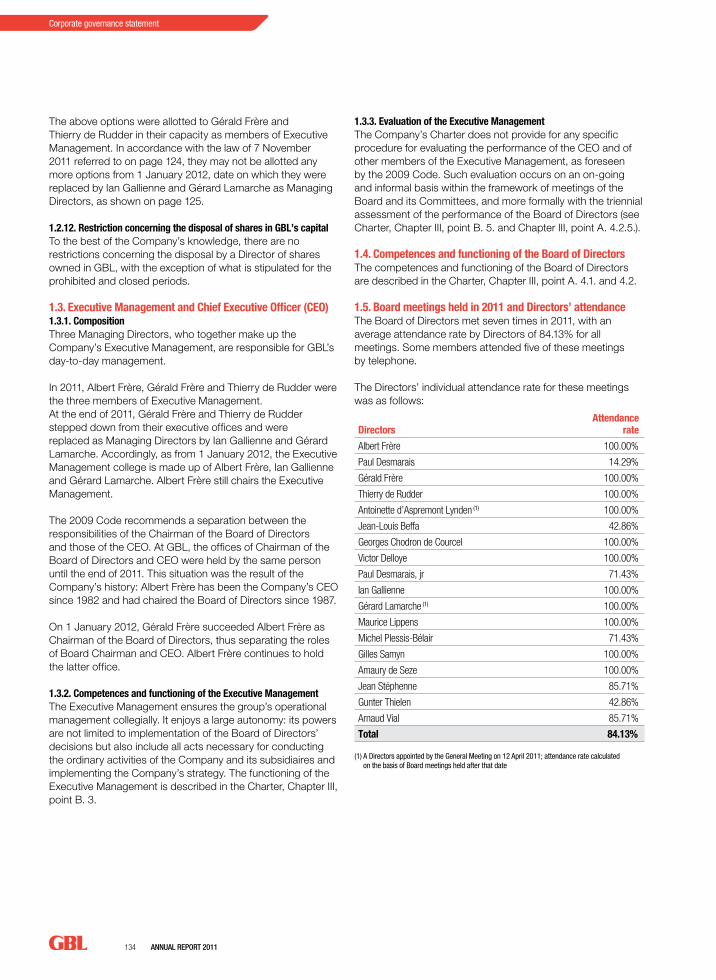
134 AnnuAl RepoRt 2011
Corporate governance statement
The above options were allotted to Gérald Frère and Thierry de Rudder in their capacity as members of Executive Management. In accordance with the law of 7 November 2011 referred to on page 124, they may not be allotted any more options from 1 January 2012, date on which they were replaced by Ian Gallienne and Gérard Lamarche as Managing Directors, as shown on page 125.
1.2.12. Restriction concerning the disposal of shares in GBL’s capital To the best of the Company’s knowledge, there are no restrictions concerning the disposal by a Director of shares owned in GBL, with the exception of what is stipulated for the prohibited and closed periods.
1.3. Executive Management and Chief Executive Officer (CEO)1.3.1. CompositionThree Managing Directors, who together make up the Company’s Executive Management, are responsible for GBL’s day-to-day management.
In 2011, Albert Frère, Gérald Frère and Thierry de Rudder were the three members of Executive Management.At the end of 2011, Gérald Frère and Thierry de Rudder stepped down from their executive offices and were replaced as Managing Directors by Ian Gallienne and Gérard Lamarche. Accordingly, as from 1 January 2012, the Executive Management college is made up of Albert Frère, Ian Gallienne and Gérard Lamarche. Albert Frère still chairs the Executive Management.
The 2009 Code recommends a separation between the responsibilities of the Chairman of the Board of Directors and those of the CEO. At GBL, the offices of Chairman of the Board of Directors and CEO were held by the same person until the end of 2011. This situation was the result of the Company’s history: Albert Frère has been the Company’s CEO since 1982 and had chaired the Board of Directors since 1987.
On 1 January 2012, Gérald Frère succeeded Albert Frère as Chairman of the Board of Directors, thus separating the roles of Board Chairman and CEO. Albert Frère continues to hold the latter office.
1.3.2. Competences and functioning of the Executive ManagementThe Executive Management ensures the group’s operational management collegially. It enjoys a large autonomy: its powers are not limited to implementation of the Board of Directors’ decisions but also include all acts necessary for conducting the ordinary activities of the Company and its subsidiaires and implementing the Company’s strategy. The functioning of the Executive Management is described in the Charter, Chapter III, point B. 3.
1.3.3. Evaluation of the Executive ManagementThe Company’s Charter does not provide for any specific procedure for evaluating the performance of the CEO and of other members of the Executive Management, as foreseen by the 2009 Code. Such evaluation occurs on an on-going and informal basis within the framework of meetings of the Board and its Committees, and more formally with the triennial assessment of the performance of the Board of Directors (see Charter, Chapter III, point B. 5. and Chapter III, point A. 4.2.5.).
1.4. Competences and functioning of the Board of Directors The competences and functioning of the Board of Directors are described in the Charter, Chapter III, point A. 4.1. and 4.2.
1.5. Board meetings held in 2011 and Directors’ attendance The Board of Directors met seven times in 2011, with an average attendance rate by Directors of 84.13% for all meetings. Some members attended five of these meetings by telephone.
The Directors’ individual attendance rate for these meetings was as follows:
DirectorsAttendance
rate
Albert Frère 100.00%
Paul Desmarais 14.29%
Gérald Frère 100.00%
Thierry de Rudder 100.00%
Antoinette d’Aspremont Lynden (1) 100.00%
Jean-Louis Beffa 42.86%
Georges Chodron de Courcel 100.00%
Victor Delloye 100.00%
Paul Desmarais, jr 71.43%
Ian Gallienne 100.00%
Gérard Lamarche (1) 100.00%
Maurice Lippens 100.00%
Michel Plessis-Bélair 71.43%
Gilles Samyn 100.00%
Amaury de Seze 100.00%
Jean Stéphenne 85.71%
Gunter Thielen 42.86%
Arnaud Vial 85.71%
Total 84.13%
(1) A Directors appointed by the General Meeting on 12 April 2011; attendance rate calculated on the basis of Board meetings held after that date
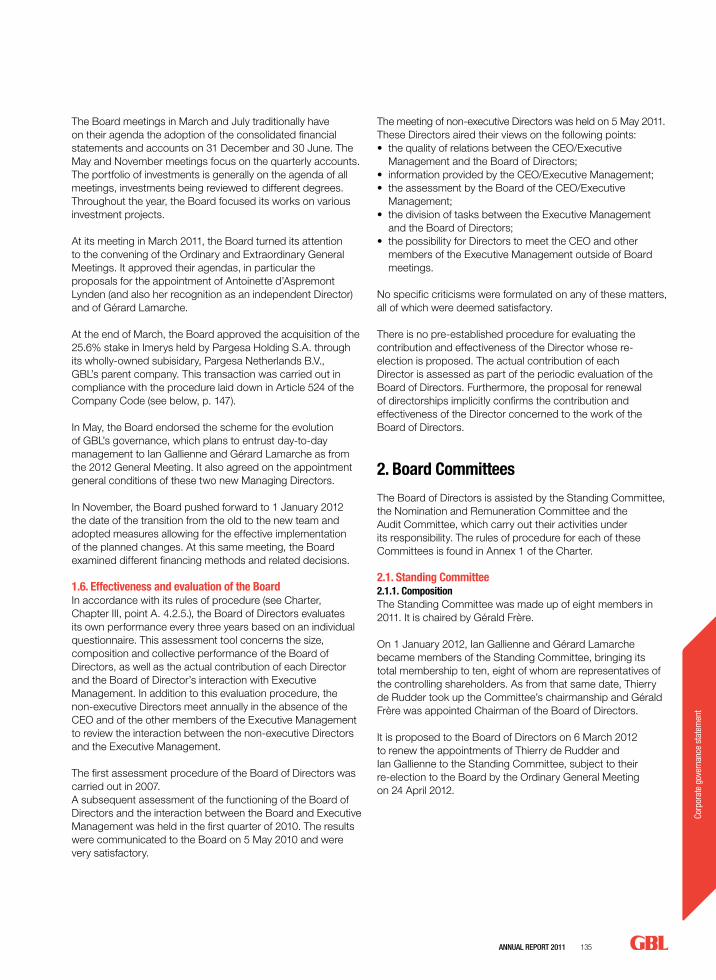
AnnuAl RepoRt 2011 135
Corp
orat
e go
vern
ance
sta
tem
ent
The Board meetings in March and July traditionally have on their agenda the adoption of the consolidated financial statements and accounts on 31 December and 30 June. The May and November meetings focus on the quarterly accounts. The portfolio of investments is generally on the agenda of all meetings, investments being reviewed to different degrees. Throughout the year, the Board focused its works on various investment projects.
At its meeting in March 2011, the Board turned its attention to the convening of the Ordinary and Extraordinary General Meetings. It approved their agendas, in particular the proposals for the appointment of Antoinette d’Aspremont Lynden (and also her recognition as an independent Director) and of Gérard Lamarche.
At the end of March, the Board approved the acquisition of the 25.6% stake in Imerys held by Pargesa Holding S.A. through its wholly-owned subisidary, Pargesa Netherlands B.V., GBL’s parent company. This transaction was carried out in compliance with the procedure laid down in Article 524 of the Company Code (see below, p. 147).
In May, the Board endorsed the scheme for the evolution of GBL’s governance, which plans to entrust day-to-day management to Ian Gallienne and Gérard Lamarche as from the 2012 General Meeting. It also agreed on the appointment general conditions of these two new Managing Directors.
In November, the Board pushed forward to 1 January 2012 the date of the transition from the old to the new team and adopted measures allowing for the effective implementation of the planned changes. At this same meeting, the Board examined different financing methods and related decisions.
1.6. Effectiveness and evaluation of the Board In accordance with its rules of procedure (see Charter, Chapter III, point A. 4.2.5.), the Board of Directors evaluates its own performance every three years based on an individual questionnaire. This assessment tool concerns the size, composition and collective performance of the Board of Directors, as well as the actual contribution of each Director and the Board of Director’s interaction with Executive Management. In addition to this evaluation procedure, the non-executive Directors meet annually in the absence of the CEO and of the other members of the Executive Management to review the interaction between the non-executive Directors and the Executive Management.
The first assessment procedure of the Board of Directors was carried out in 2007.A subsequent assessment of the functioning of the Board of Directors and the interaction between the Board and Executive Management was held in the first quarter of 2010. The results were communicated to the Board on 5 May 2010 and were very satisfactory.
The meeting of non-executive Directors was held on 5 May 2011. These Directors aired their views on the following points:• the quality of relations between the CEO/Executive
Management and the Board of Directors;• information provided by the CEO/Executive Management;• the assessment by the Board of the CEO/Executive
Management;• the division of tasks between the Executive Management
and the Board of Directors;• the possibility for Directors to meet the CEO and other
members of the Executive Management outside of Board meetings.
No specific criticisms were formulated on any of these matters, all of which were deemed satisfactory.
There is no pre-established procedure for evaluating the contribution and effectiveness of the Director whose re-election is proposed. The actual contribution of each Director is assessed as part of the periodic evaluation of the Board of Directors. Furthermore, the proposal for renewal of directorships implicitly confirms the contribution and effectiveness of the Director concerned to the work of the Board of Directors.
2. Board Committees
The Board of Directors is assisted by the Standing Committee, the Nomination and Remuneration Committee and the Audit Committee, which carry out their activities under its responsibility. The rules of procedure for each of these Committees is found in Annex 1 of the Charter.
2.1. Standing Committee2.1.1. CompositionThe Standing Committee was made up of eight members in 2011. It is chaired by Gérald Frère.
On 1 January 2012, Ian Gallienne and Gérard Lamarche became members of the Standing Committee, bringing its total membership to ten, eight of whom are representatives of the controlling shareholders. As from that same date, Thierry de Rudder took up the Committee’s chairmanship and Gérald Frère was appointed Chairman of the Board of Directors.
It is proposed to the Board of Directors on 6 March 2012 to renew the appointments of Thierry de Rudder and Ian Gallienne to the Standing Committee, subject to their re-election to the Board by the Ordinary General Meeting on 24 April 2012.
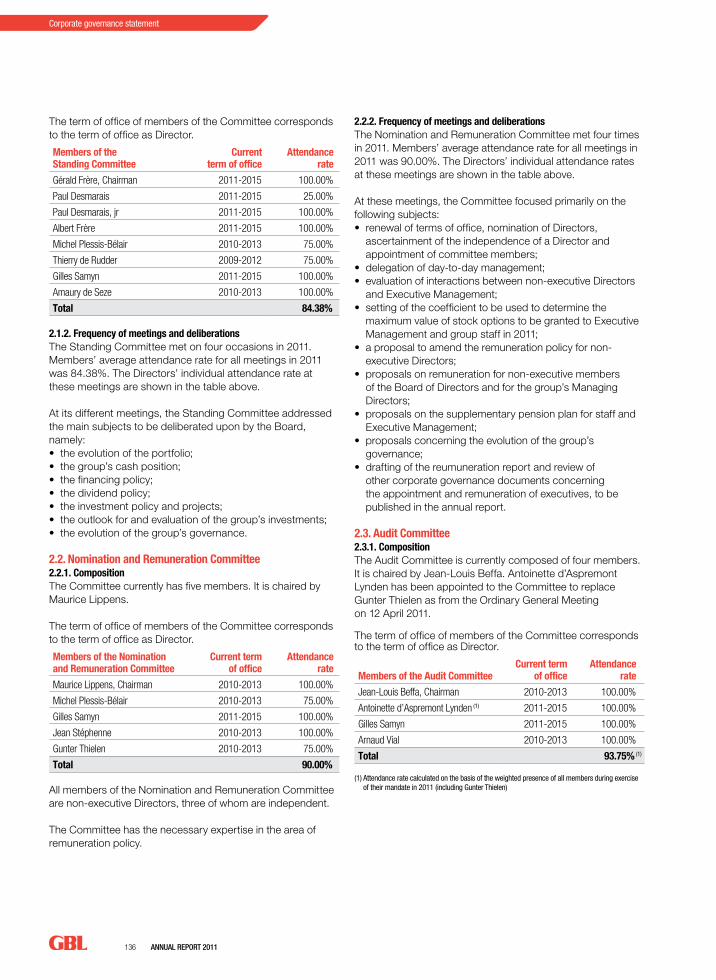
136 AnnuAl RepoRt 2011
Corporate governance statement
The term of office of members of the Committee corresponds to the term of office as Director.
Members of the Standing Committee
Current term of office
Attendance rate
Gérald Frère, Chairman 2011-2015 100.00%
Paul Desmarais 2011-2015 25.00%
Paul Desmarais, jr 2011-2015 100.00%
Albert Frère 2011-2015 100.00%
Michel Plessis-Bélair 2010-2013 75.00%
Thierry de Rudder 2009-2012 75.00%
Gilles Samyn 2011-2015 100.00%
Amaury de Seze 2010-2013 100.00%
Total 84.38%
2.1.2. Frequency of meetings and deliberationsThe Standing Committee met on four occasions in 2011. Members’ average attendance rate for all meetings in 2011 was 84.38%. The Directors’ individual attendance rate at these meetings are shown in the table above.
At its different meetings, the Standing Committee addressed the main subjects to be deliberated upon by the Board, namely:• the evolution of the portfolio;• the group’s cash position;• the financing policy;• the dividend policy;• the investment policy and projects;• the outlook for and evaluation of the group’s investments;• the evolution of the group’s governance.
2.2. Nomination and Remuneration Committee2.2.1. CompositionThe Committee currently has five members. It is chaired by Maurice Lippens.
The term of office of members of the Committee corresponds to the term of office as Director.
Members of the Nomination and Remuneration Committee
Current term of office
Attendance rate
Maurice Lippens, Chairman 2010-2013 100.00%
Michel Plessis-Bélair 2010-2013 75.00%
Gilles Samyn 2011-2015 100.00%
Jean Stéphenne 2010-2013 100.00%
Gunter Thielen 2010-2013 75.00%
Total 90.00%
All members of the Nomination and Remuneration Committee are non-executive Directors, three of whom are independent.
The Committee has the necessary expertise in the area of remuneration policy.
2.2.2. Frequency of meetings and deliberationsThe Nomination and Remuneration Committee met four times in 2011. Members’ average attendance rate for all meetings in 2011 was 90.00%. The Directors’ individual attendance rates at these meetings are shown in the table above.
At these meetings, the Committee focused primarily on the following subjects:• renewal of terms of office, nomination of Directors,
ascertainment of the independence of a Director and appointment of committee members;
• delegation of day-to-day management;• evaluation of interactions between non-executive Directors
and Executive Management;• setting of the coefficient to be used to determine the
maximum value of stock options to be granted to Executive Management and group staff in 2011;
• a proposal to amend the remuneration policy for non-executive Directors;
• proposals on remuneration for non-executive members of the Board of Directors and for the group’s Managing Directors;
• proposals on the supplementary pension plan for staff and Executive Management;
• proposals concerning the evolution of the group’s governance;
• drafting of the reumuneration report and review of other corporate governance documents concerning the appointment and remuneration of executives, to be published in the annual report.
2.3. Audit Committee 2.3.1. CompositionThe Audit Committee is currently composed of four members. It is chaired by Jean-Louis Beffa. Antoinette d’Aspremont Lynden has been appointed to the Committee to replace Gunter Thielen as from the Ordinary General Meeting on 12 April 2011.
The term of office of members of the Committee corresponds to the term of office as Director.
Members of the Audit CommitteeCurrent term
of officeAttendance
rate
Jean-Louis Beffa, Chairman 2010-2013 100.00%
Antoinette d’Aspremont Lynden (1) 2011-2015 100.00%
Gilles Samyn 2011-2015 100.00%
Arnaud Vial 2010-2013 100.00%
Total 93.75% (1)
(1) Attendance rate calculated on the basis of the weighted presence of all members during exercise of their mandate in 2011 (including Gunter Thielen)
AnnuAl RepoRt 2011 137
Corp
orat
e go
vern
ance
sta
tem
ent
All members of the Committee are non-executive Directors. Two members, including its chairman, are independent within the meaning of Article 526(b) of the Company Code. The two are Jean-Louis Beffa and Antoinette d’Aspremont Lynden, who represent 50% of the Committee’s members. The 2009 Code provides that the majority of members of the Audit Committee must be independent Directors. However, owing to GBL’s shareholding structure, the Charter allows a derogation from this provision and limit the number of independent Directors to half the Committee’s membership.
As stated in the biographies of members of the Board of Directors presented from page 126 to page 130 of this report, all members of the Committee have financial and/or accounting expertise as a result of their education or experience.
2.3.2. Frequency of meetings and deliberationsThe Audit Committee met on four occasions in 2011 with an average attendance rate of 93.75%, calculated on the basis of the weighted attendance of all members during exercise of their mandate. Committee members were either physically present for meetings or participated by telephone. The Directors’ individual attendance rate at these meetings are shown in the table above.
One member of the Executive Management, the Company’s Chief Financial Officer, as well as its Statutory Auditor, attended all the meetings.
The Audit Committee assists the Board of Directors with its task of ensuring the true and fair presentation of GBL’s accounts and consolidated financial statements and with its auditing responsibilities in the broad sense of the term, in particular the quality of internal audits and of information provided to shareholders and markets.
In 2011, the main subjects addressed by the Committee were as follows: • review of the Company’s annual and half-yearly consolidated
financial statements and consolidated quarterly results;• review of projections for the short and medium terms;• analysis of the financing situation and indebtness;• review of the book values of shareholdings, including the
recording of an impairment on Lafarge;• review of risks and assessment of the effectiveness of
internal control and risk management systems;• review of press releases, notably concerning the group’s
financial statements and results;• review of texts to be published in the annual report
concerning:- financial information;- comments on internal control and risk management;
• review and follow-up of the independence of and services provided by the Statutory Auditor, other than the tasks assigned by law (in particular the statutory auditing of the accounts).
• examination of the full consolidation of Imerys and of the ensuing consequences on the presentation of the financial statements;
• follow-up of the main legal actions under way.
2.4. Assessment of the functioning and performance of the Board of Directors’ Committees
In terms of the evolution and effectiveness of their work, the different Committees may, at any time, propose changes to their respective rules of procedure. The Charter therefore does not establish a regular procedure for review of the Committees’ rules of procedure. The functioning and performance of each Committee is measured and analysed as part of the triennial assessment of the performance of the Board of Directors. Part of the individual assessment questionnaire is reserved for this purpose to members of the respective Committees.
3. Remuneration Report
3.1. Procedure for establishing remuneration policy and setting remuneration for members of the Board of Directors
The procedure for establishing remuneration policy and setting remuneration for members of the Board is determined by the Board of Directors on the basis of proposals from the Nomination and Remuneration Committee.
The fees paid to non-executive Directors are set by the Board of Directors on a proposal from the Nomination and Remuneration Committee, within a ceiling submitted to the General Meeting for approval. These fees, which had not been reviewed since 2001, were benchmarked and revised in 2011.
The nature and the amount of the remunerations, as well as possible severance payments, for members of Executive Management are decided by the Board of Directors on a proposal from the Nomination and Remuneration Committee, which is assisted in its work by an outside consultant.
Performance-based stock option plans are determined by the Board of Directors on a proposal from the Nomination and Remuneration Committee.
These plans must first be approved by the shareholders. Such approval covers the plan itself as well as its overall maximum value, but not the individual grant of stock options under the plan.
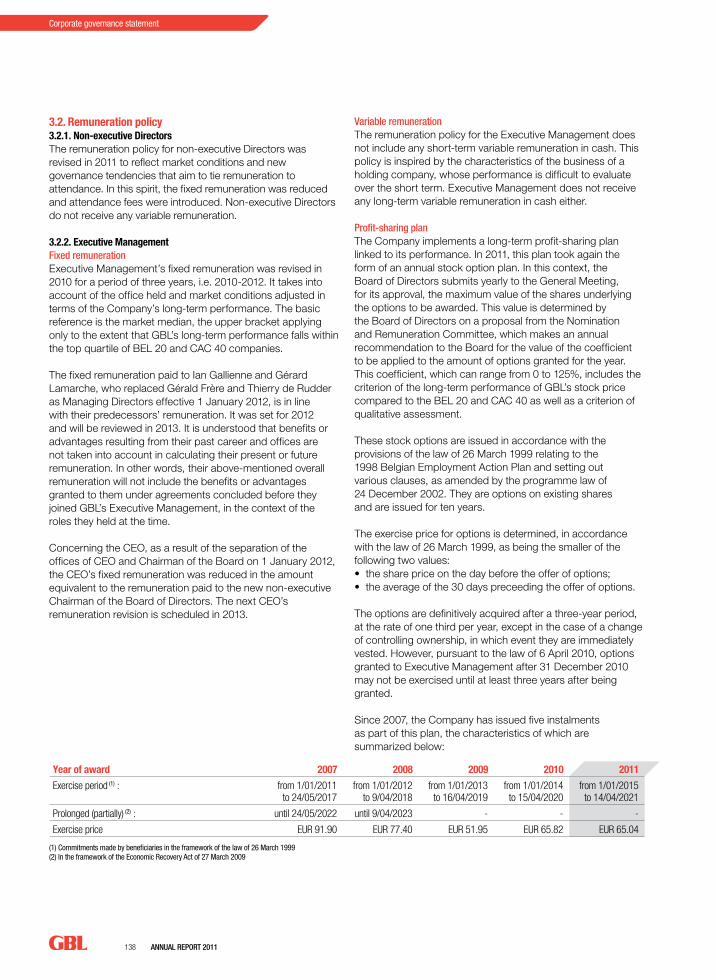
138 AnnuAl RepoRt 2011
Corporate governance statement
3.2. Remuneration policy3.2.1. Non-executive DirectorsThe remuneration policy for non-executive Directors was revised in 2011 to reflect market conditions and new governance tendencies that aim to tie remuneration to attendance. In this spirit, the fixed remuneration was reduced and attendance fees were introduced. Non-executive Directors do not receive any variable remuneration.
3.2.2. Executive ManagementFixed remunerationExecutive Management’s fixed remuneration was revised in 2010 for a period of three years, i.e. 2010-2012. It takes into account of the office held and market conditions adjusted in terms of the Company’s long-term performance. The basic reference is the market median, the upper bracket applying only to the extent that GBL’s long-term performance falls within the top quartile of BEL 20 and CAC 40 companies.
The fixed remuneration paid to Ian Gallienne and Gérard Lamarche, who replaced Gérald Frère and Thierry de Rudder as Managing Directors effective 1 January 2012, is in line with their predecessors’ remuneration. It was set for 2012 and will be reviewed in 2013. It is understood that benefits or advantages resulting from their past career and offices are not taken into account in calculating their present or future remuneration. In other words, their above-mentioned overall remuneration will not include the benefits or advantages granted to them under agreements concluded before they joined GBL’s Executive Management, in the context of the roles they held at the time.
Concerning the CEO, as a result of the separation of the offices of CEO and Chairman of the Board on 1 January 2012, the CEO’s fixed remuneration was reduced in the amount equivalent to the remuneration paid to the new non-executive Chairman of the Board of Directors. The next CEO’s remuneration revision is scheduled in 2013.
Variable remunerationThe remuneration policy for the Executive Management does not include any short-term variable remuneration in cash. This policy is inspired by the characteristics of the business of a holding company, whose performance is difficult to evaluate over the short term. Executive Management does not receive any long-term variable remuneration in cash either.
profit-sharing planThe Company implements a long-term profit-sharing plan linked to its performance. In 2011, this plan took again the form of an annual stock option plan. In this context, the Board of Directors submits yearly to the General Meeting, for its approval, the maximum value of the shares underlying the options to be awarded. This value is determined by the Board of Directors on a proposal from the Nomination and Remuneration Committee, which makes an annual recommendation to the Board for the value of the coefficient to be applied to the amount of options granted for the year. This coefficient, which can range from 0 to 125%, includes the criterion of the long-term performance of GBL’s stock price compared to the BEL 20 and CAC 40 as well as a criterion of qualitative assessment.
These stock options are issued in accordance with the provisions of the law of 26 March 1999 relating to the 1998 Belgian Employment Action Plan and setting out various clauses, as amended by the programme law of 24 December 2002. They are options on existing shares and are issued for ten years.
The exercise price for options is determined, in accordance with the law of 26 March 1999, as being the smaller of the following two values:• the share price on the day before the offer of options;• the average of the 30 days preceeding the offer of options.
The options are definitively acquired after a three-year period, at the rate of one third per year, except in the case of a change of controlling ownership, in which event they are immediately vested. However, pursuant to the law of 6 April 2010, options granted to Executive Management after 31 December 2010 may not be exercised until at least three years after being granted.
Since 2007, the Company has issued five instalments as part of this plan, the characteristics of which are summarized below:
Year of award 2007 2008 2009 2010 2011
Exercise period (1) : from 1/01/2011 to 24/05/2017
from 1/01/2012 to 9/04/2018
from 1/01/2013 to 16/04/2019
from 1/01/2014 to 15/04/2020
from 1/01/2015to 14/04/2021
Prolonged (partially) (2) : until 24/05/2022 until 9/04/2023 - - -
Exercise price EUR 91.90 EUR 77.40 EUR 51.95 EUR 65.82 EUR 65.04
(1) Commitments made by beneficiaries in the framework of the law of 26 March 1999(2) In the framework of the Economic Recovery Act of 27 March 2009

AnnuAl RepoRt 2011 139
Corp
orat
e go
vern
ance
sta
tem
ent
The non-executive Directors received no variable remuneration.
The General Meeting of 12 April 2011 decided to set at EUR 1,200,000 the ceiling for fees paid to non-executive Directors for their offices in the Board of Directors and Committees. A proposal will be put to the Ordinary General Meeting on 24 April 2012 to raise this ceiling to EUR 1,400,000. The proposed increase is the result of the accession to Vice-Chairmanship of two new members and the allocation of remuneration for the offices of Chairman of the Board and Chairman of the Standing Committee.
As a result of the separation of the offices of Chairman of the Board and CEO, the Board decided to offset the direct remuneration of the Board Chairman through an equivalent decrease in the CEO’s remuneration. This decrease has no direct impact on the ceiling submitted to the General Meeting for approval, since it does not cover executive remuneration. Economically, however, it represents a transfer from the “Executive” to the “non-executive” category, which has the effect of bringing about a face value increase in the ceiling submitted to the General Meeting for approval.
Subject to approval by the General Meeting, this amount of EUR 1,400,000 would be allocated from 1 January 2012, based on the following schedule:• an unchanged annual fixed amount of EUR 25,000 for
members of the Board of Directors (1);
• an annual fixed amount of EUR 200,000 for the Chairmanship of the Board of Directors;
• an unchanged annual fixed amount of EUR 15,000 for members of the Standing Committee (2);
• an unchanged annual fixed amount of EUR 12,500 for members of the other Committees (3);
• unchanged Director’s fees of EUR 3,000 per Board or Committee meeting.
There is no service contract between non-executive members of the Board of Directors and the Company or any of its subsidiaries providing for the grant of advantages upon conclusion of their mandate.
The members of the Executive Management receive no remuneration for their Directorship as such.
3.4. Remuneration of the Executive ManagementFixed remuneration for the Executive Management, which had not been revised since 2006, was adjusted in 2010 to reflect market conditions. Given the difficult economic and financial climate, the benchmarking exercise was limited to a general review of the evolution of the remuneration of executives of BEL 20 and CAC 40 companies over the four years preceding 2010.
The amount of remuneration collected directly and indirectly by members of the Executive Management includes remuneration for offices held in companies in which they represent GBL.
3.3. Fees and other gross remuneration collected by non-executive Directors for financial year 2011
In EURBoard
Member
Board Committee
Member Sub-total Other (1) Total
Antoinette d’Aspremont Lynden (2) 28,667 17,333 46,000 - 46,000
Jean-Louis Beffa 34,000 37,000 71,000 - 71,000
Georges Chodron de Courcel 46,000 - 46,000 - 46,000
Victor Delloye 46,000 - 46,000 - 46,000
Paul Desmarais (3) 53,000 18,000 71,000 - 71,000
Paul Desmarais, jr 40,000 24,000 64,000 158,597 222,597
Ian Gallienne 46,000 - 46,000 720,024 (4) 766,024
Gérard Lamarche (2) 28,667 - 28,667 - 28,667
Maurice Lippens 46,000 37,000 83,000 - 83,000
Michel Plessis-Bélair 40,000 42,500 82,500 - 82,500
Gilles Samyn 46,000 76,000 122,000 - 122,000
Amaury de Seze 46,000 27,000 73,000 70,583 143,583
Jean Stéphenne 43,000 24,500 67,500 - 67,500
Gunter Thielen 34,000 25,667 59,667 - 59,667
Arnaud Vial 43,000 24,500 67,500 - 67,500
Total 620,334 353,500 973,834 949,204 1,923,038
(1) Remuneration for offices held in companies in which the group has shareholdings(2) Since 12 April 2011(3) Of which EUR 25,000 as Board Vice-Chairman(4) Amount excluding long-term profit-sharing on the Ergon Capital Partners I, II and III private equity funds
(1) This amount is doubled for the Vice-Chairmen of the Board of Directors (three since 1 January 2012)(2) This amount is doubled for the Committee Chairman from 1 January 2012(3) This amount is doubled for the other Committees’ Chairman
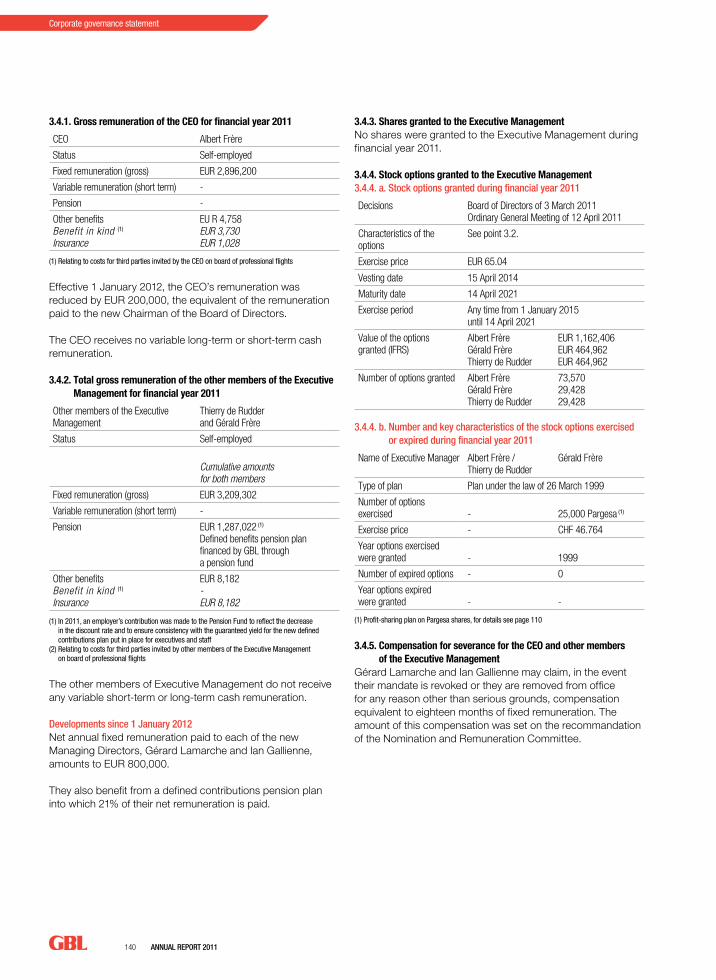
140 AnnuAl RepoRt 2011
Corporate governance statement
3.4.1. Gross remuneration of the CEO for financial year 2011
CEO Albert Frère
Status Self-employed
Fixed remuneration (gross) EUR 2,896,200
Variable remuneration (short term) -
Pension -
Other benefitsBenefit in kind (1)
Insurance
EU R 4,758EUR 3,730EUR 1,028
(1) Relating to costs for third parties invited by the CEO on board of professional flights
Effective 1 January 2012, the CEO’s remuneration was reduced by EUR 200,000, the equivalent of the remuneration paid to the new Chairman of the Board of Directors.
The CEO receives no variable long-term or short-term cash remuneration.
3.4.2. Total gross remuneration of the other members of the Executive Management for financial year 2011
Other members of the Executive Management
Thierry de Rudder and Gérald Frère
Status Self-employed
Cumulative amounts for both members
Fixed remuneration (gross) EUR 3,209,302
Variable remuneration (short term) -
Pension EUR 1,287,022 (1)
Defined benefits pension plan financed by GBL through a pension fund
Other benefitsBenefit in kind (1)
Insurance
EUR 8,182-EUR 8,182
(1) In 2011, an employer’s contribution was made to the Pension Fund to reflect the decrease in the discount rate and to ensure consistency with the guaranteed yield for the new defined contributions plan put in place for executives and staff
(2) Relating to costs for third parties invited by other members of the Executive Management on board of professional flights
The other members of Executive Management do not receive any variable short-term or long-term cash remuneration.
Developments since 1 January 2012Net annual fixed remuneration paid to each of the new Managing Directors, Gérard Lamarche and Ian Gallienne, amounts to EUR 800,000.
They also benefit from a defined contributions pension plan into which 21% of their net remuneration is paid.
3.4.3. Shares granted to the Executive ManagementNo shares were granted to the Executive Management during financial year 2011.
3.4.4. Stock options granted to the Executive Management3.4.4. a. Stock options granted during financial year 2011
Decisions Board of Directors of 3 March 2011Ordinary General Meeting of 12 April 2011
Characteristics of the options
See point 3.2.
Exercise price EUR 65.04
Vesting date 15 April 2014
Maturity date 14 April 2021
Exercise period Any time from 1 January 2015 until 14 April 2021
Value of the options granted (IFRS)
Albert FrèreGérald FrèreThierry de Rudder
EUR 1,162,406EUR 464,962EUR 464,962
Number of options granted Albert FrèreGérald FrèreThierry de Rudder
73,57029,42829,428
3.4.4. b. number and key characteristics of the stock options exercised or expired during financial year 2011
Name of Executive Manager Albert Frère / Thierry de Rudder
Gérald Frère
Type of plan Plan under the law of 26 March 1999
Number of options exercised - 25,000 Pargesa (1)
Exercise price - CHF 46.764
Year options exercised were granted - 1999
Number of expired options - 0
Year options expired were granted - -
(1) Profit-sharing plan on Pargesa shares, for details see page 110
3.4.5. Compensation for severance for the CEO and other members of the Executive Management
Gérard Lamarche and Ian Gallienne may claim, in the event their mandate is revoked or they are removed from office for any reason other than serious grounds, compensation equivalent to eighteen months of fixed remuneration. The amount of this compensation was set on the recommandation of the Nomination and Remuneration Committee.
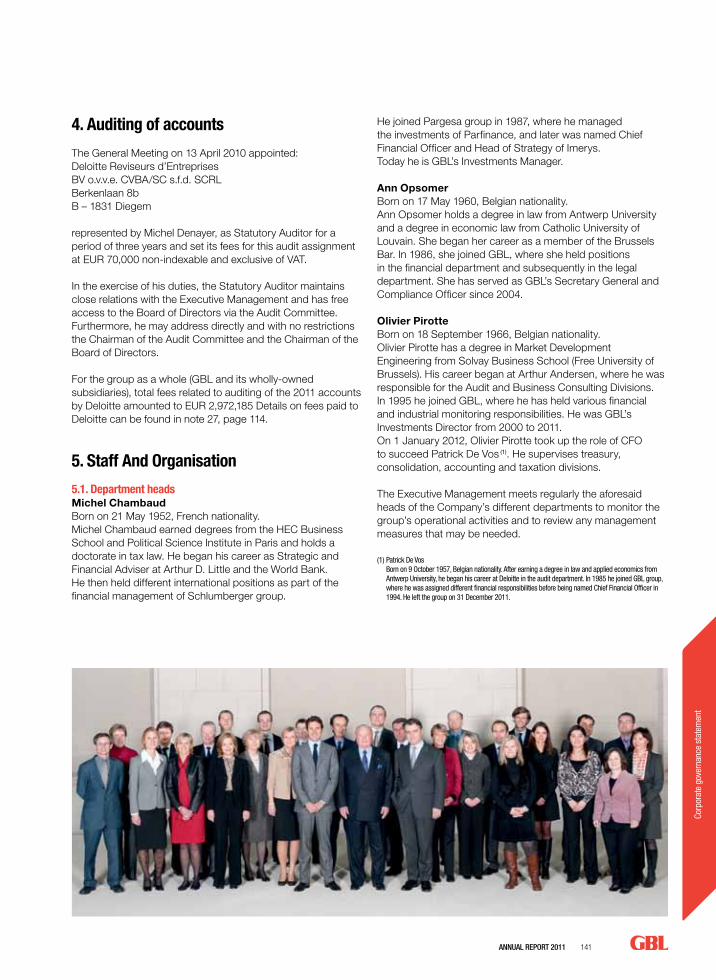
AnnuAl RepoRt 2011 141
Corp
orat
e go
vern
ance
sta
tem
ent
4. Auditing of accounts
The General Meeting on 13 April 2010 appointed: Deloitte Reviseurs d’Entreprises BV o.v.v.e. CVBA/SC s.f.d. SCRLBerkenlaan 8b B – 1831 Diegem
represented by Michel Denayer, as Statutory Auditor for a period of three years and set its fees for this audit assignment at EUR 70,000 non-indexable and exclusive of VAT.
In the exercise of his duties, the Statutory Auditor maintains close relations with the Executive Management and has free access to the Board of Directors via the Audit Committee. Furthermore, he may address directly and with no restrictions the Chairman of the Audit Committee and the Chairman of the Board of Directors.
For the group as a whole (GBL and its wholly-owned subsidiaries), total fees related to auditing of the 2011 accounts by Deloitte amounted to EUR 2,972,185 Details on fees paid to Deloitte can be found in note 27, page 114.
5. Staff And Organisation
5.1. Department headsMichel ChambaudBorn on 21 May 1952, French nationality.Michel Chambaud earned degrees from the HEC Business School and Political Science Institute in Paris and holds a doctorate in tax law. He began his career as Strategic and Financial Adviser at Arthur D. Little and the World Bank. He then held different international positions as part of the financial management of Schlumberger group.
He joined Pargesa group in 1987, where he managed the investments of Parfinance, and later was named Chief Financial Officer and Head of Strategy of Imerys. Today he is GBL’s Investments Manager.
Ann OpsomerBorn on 17 May 1960, Belgian nationality. Ann Opsomer holds a degree in law from Antwerp University and a degree in economic law from Catholic University of Louvain. She began her career as a member of the Brussels Bar. In 1986, she joined GBL, where she held positions in the financial department and subsequently in the legal department. She has served as GBL’s Secretary General and Compliance Officer since 2004.
Olivier PirotteBorn on 18 September 1966, Belgian nationality.Olivier Pirotte has a degree in Market Development Engineering from Solvay Business School (Free University of Brussels). His career began at Arthur Andersen, where he was responsible for the Audit and Business Consulting Divisions. In 1995 he joined GBL, where he has held various financial and industrial monitoring responsibilities. He was GBL’s Investments Director from 2000 to 2011. On 1 January 2012, Olivier Pirotte took up the role of CFO to succeed Patrick De Vos (1). He supervises treasury, consolidation, accounting and taxation divisions.
The Executive Management meets regularly the aforesaid heads of the Company’s different departments to monitor the group’s operational activities and to review any management measures that may be needed.
(1) Patrick De VosBorn on 9 October 1957, Belgian nationality. After earning a degree in law and applied economics from Antwerp University, he began his career at Deloitte in the audit department. In 1985 he joined GBL group, where he was assigned different financial responsibilities before being named Chief Financial Officer in 1994. He left the group on 31 December 2011.
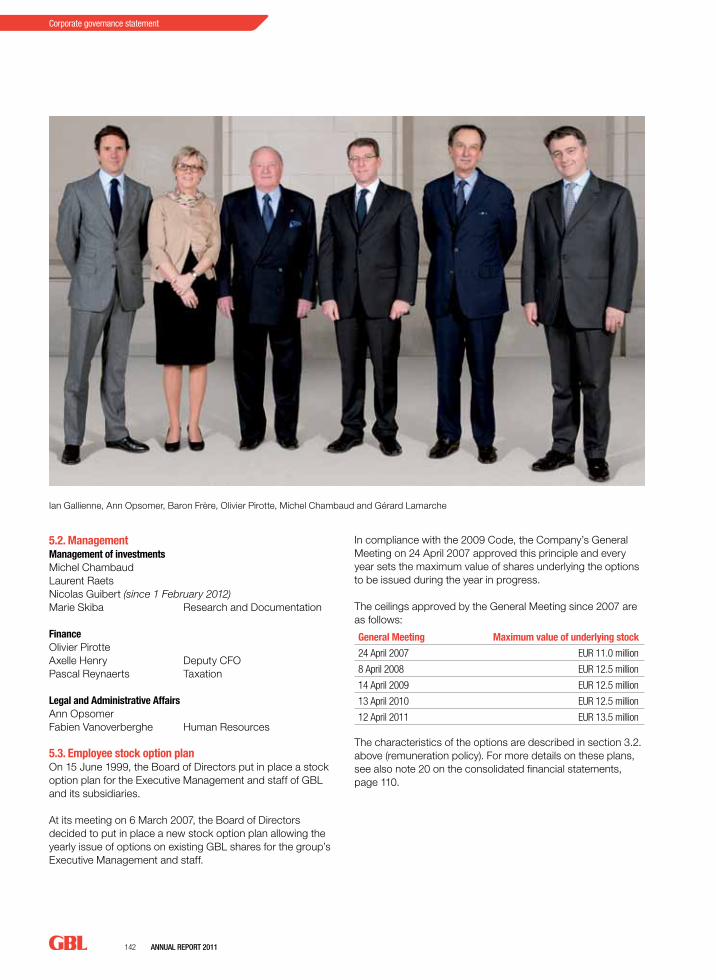
142 AnnuAl RepoRt 2011
Corporate governance statement
5.2. ManagementManagement of investmentsMichel ChambaudLaurent Raets Nicolas Guibert (since 1 February 2012)Marie Skiba Research and Documentation
FinanceOlivier Pirotte Axelle Henry Deputy CFOPascal Reynaerts Taxation
Legal and Administrative AffairsAnn Opsomer Fabien Vanoverberghe Human Resources
5.3. Employee stock option planOn 15 June 1999, the Board of Directors put in place a stock option plan for the Executive Management and staff of GBL and its subsidiaries.
At its meeting on 6 March 2007, the Board of Directors decided to put in place a new stock option plan allowing the yearly issue of options on existing GBL shares for the group’s Executive Management and staff.
In compliance with the 2009 Code, the Company’s General Meeting on 24 April 2007 approved this principle and every year sets the maximum value of shares underlying the options to be issued during the year in progress.
The ceilings approved by the General Meeting since 2007 are as follows:
General Meeting Maximum value of underlying stock
24 April 2007 EUR 11.0 million
8 April 2008 EUR 12.5 million
14 April 2009 EUR 12.5 million
13 April 2010 EUR 12.5 million
12 April 2011 EUR 13.5 million
The characteristics of the options are described in section 3.2. above (remuneration policy). For more details on these plans, see also note 20 on the consolidated financial statements, page 110.
Ian Gallienne, Ann Opsomer, Baron Frère, Olivier Pirotte, Michel Chambaud and Gérard Lamarche
AnnuAl RepoRt 2011 143
Corp
orat
e go
vern
ance
sta
tem
ent
6. Risk management and internal control
The Board of Directors of GBL is responsible for assessing risks inherent to GBL group and the effectiveness of internal control.
On risk management and internal control, the Belgian legislative framework consists of the law of 17 December 2008 (application of European Directive 2006/43 on statutory audits of corporate annual accounts) and the law of 6 April 2010 (the so-called Corporate Governance Act). The 2009 Code also lays down provisions on corporate governance.
The IFRS 7 likewise defines additional constraints with regards to management of risks related to financial instruments.
Since 2006, GBL formalized its internal control and risk management systems based on the COSO (1) model. The COSO methodology is based on five areas: the control environment, risk analysis, control activities, information and communication, and supervision and monitoring.
6.1. Control environment6.1.1. The Company’s objectiveGBL’s primary objective is to create value for its shareholders. GBL strives to develop a portfolio of investments focusing on a small number of industrial companies that are leader on their markets, in which it can play its role as a long-term professional shareholder. This portfolio is meant to evolve over time depending on the companies’ development and market opportunities. GBL invests and disinvests according to its objectives of value creation and maintaining a solid financial structure.
Internal control at GBL aims to provide reasonable assurance about achievement of the objectives of compliance with laws and regulations and the reliability of accounting information and financial reporting.
Generally speaking, it helps ensure the safeguarding of assets and control and optimisation of transactions. Like any control system, it can provide only a reasonable assurance that the risks of errors or fraud are totally controlled or eliminated.
6.1.2. Role of the management bodiesGBL has a Board of Directors, a Standing Committee, a Nomination and Remuneration Committee and an Audit Committee. Their respective modes of functioning are described from page 134 to page 137.
The Audit Committee is in charge in particular of checking the effectiveness of the Company’s internal control and risk management systems. In this context, the Audit Committee also monitors proper application of a whistle blowing procedure. Half its members, all of whom are designated by the Board, are independent Directors. The Chairman of the Audit Committee may not be the Chairman of the Board of Directors.
6.1.3. Risk culture GBL aims to invest in companies that offer potential of long-term value creation. New opportunities and portfolio management are monitored continuously at the highest level (see “Strategic Risk”, page 145). The disinvestment policy aims to divest investments deemed to have reached maturity while respecting the group’s financial balance.
6.1.4. Professional ethics GBL has adopted a Charter and Code of Professional Ethics with a view to ensuring honest, ethical and law-abiding conduct as well as respect for good governance principles on the part of the group’s Directors and staff in the exercise of their duties.
6.1.5. Adapted measures to ensure appropriate competenceThe Nomination and Remuneration Committee reviews candidacies and seeks to ensure that the Board of Directors maintains a satisfactory balance in terms of its members’ competences, knowledge and experience, particularly in finance, accounting and investment.
The Board of Directors conducts regular evaluations – at intervals of no more than three years – of its size, composition and performance, as well as the performance of its Committees. It also examines regularly in this context the interaction between non-executive Directors and the Executive Management.
A recruitment process suited to the profiles sought, appropriate training and a remuneration and evaluation policy based on the achievement of targets combine to ensure the competence of GBL’s staff.
6.2. Risk analysisGBL set up a formal risk analysis and evaluation process in 2006. In 2011, the Audit Committee reviewed and updated the main risks with which GBL is confronted. They are outlined below.The current level of control of these risks (see “Control activities” below) appears sufficient and no additional measures are required. Based on developments in the economic sphere, the portfolio or the control environment, the Audit Committee will re-assess the risks involved and their level of control, and if need be will ensure that management puts in place a remediation plan.
(1) COSO (Committee of Sponsoring Organisations) is a private non-governmental international body recognised on matters of governance, internal control, risk managment and financial reporting

144 AnnuAl RepoRt 2011
Corporate governance statement
Risk related to investments1. Indirect risk on investmentsEvery significant investment in a listed company held by GBL is exposed to specific risks that may have an impact on GBL. These are described and analysed in their respective activity reports and registration documents in accordance with legislation in force. The possible materialisation of these risks in one or more investments may lead to a change in the overall value of the GBL portfolio. GBL is also exposed to risks concerning its private equity investments, which nevertheless account for less than 3% of its adjusted net assets at present.
Risks specific to GBL2. Strategic risk The composition of the portfolio, determined by the investment decisions, implies a particular exposure to certain industrial sectors, certain geographical areas or certain regulations.
3. Reputation riskGBL’s historic performance, its investment policy, its conduct as a shareholder, and its approach to ethics and governance contribute to the group’s renown. Safeguarding this sound reputation is essential.
4. Market riskGBL is exposed, given the nature of its activities, to stock market fluctuations on its portfolio.
5. Interest rate riskGBL is exposed, given its financial situation, to interest rate developments. Evolving interest rates also have macro-economic implications on both its debt and its cash.
6. exchange riskThe transactions carried out by GBL are primarily denominated in euros. The group’s value can nevertheless be impacted by exchange rates through investments making up its portfolio.
7. Counterparty default riskCounterparty default risk occurs within the framework of deposit, hedge, stock market purchase/sale transactions or other transactions with banks or financial intermediaries.
8. Credit risk Since GBL has no commercial activity, this risk primarily concerns the financial intermediaries with which GBL has made short-term cash investments.
9. liquidity riskGBL must at all times have sufficient financial capacity to meet its obligations, whether to finance investments or to honour maturing debts.
10. Risk on derivativesDerivatives can result in both a counterparty default risk and an economic effect related to call and put options whose value will evolve with market conditions.
11. Collateral riskCollateral implies a counterparty default risk, a contractual risk and a potential economic loss related to the release of the collateral.
12. Risk on delegation of powersNon-respect for powers of signature could engage GBL in transactions it has not authorised.
13. Risk of fraudCollective or individual fraud by GBL staff could lead to a financial loss or an unauthorised leak of information, which would undermine the group’s image.
14. legal riskContractual discipline is essential for protecting the group’s assets and ensuring the success of its policies. It is general in scope and particularly important in the case of agreements concerning financing, acquisition or sale transactions, etc.
GBL must also keep control over litigation with which it may be confronted in the context of its own activities, in order to limit the financial loss that could result.
15. planning/budgeting riskBudgets and projections are important instruments for decision-making and management control. Their reliability and relevance can influence the Company’s performance.
16. Risk related to financial statements (management information, registration of transactions in the accounts, consolidation)
The production of complete, reliable and relevant information is an essential element of management and governance.
17. Risk on cash transactions Any loss of control on cash input, output and trading securities can have negative financial consequences for the Company.
18. Risk related to human resourcesThis concerns the Company’s capacity to find and retain the human capital required to ensure that it operates effectively and achieves its objectives.
19. Information technology risk This risk occurs at the level of the general information technology environment, the data backup system and the use of and access to software.
20. tax riskThis risk is related to an unexpected evolution of taxation.
These risks have been ranked on the basis of impact and occurrence criteria and in terms of the obligations resulting from IFRS 7.
AnnuAl RepoRt 2011 145
Corp
orat
e go
vern
ance
sta
tem
ent
Six specific risks have been identified and will be the focus of particular attention. The six are: • Risk related to investments;• Strategic risk;• Reputation risk;• Risk on cash transactions; • Risk related to financial statements (management
information, registration of transactions in the accounts and consolidation);
• Risk related to financial instruments (in application of IFRS 7) (counterparty, interest rates, cash, derivatives).
6.3. Control activitiesControl activities include all the measures taken by GBL to ensure that the principal risks it has identified are appropriately controlled.
6.3.1. Risk related to investmentsThe specific risks related to investments are identified and addressed by the companies themselves within the framework of their own internal control.
The following table presents links to the measures taken by these companies to identify risks and implement internal control.
Investments Pages Reference (link)
Total 65-83 http://www.total.com/MEDIAS/MEDIAS_INFOS/4386/EN/Total-2010-document-reference-va-V1.pdf
GDF SUEZ 135-154 http://www.gdfsuez.com/en/group/publications/publications/ (reference document)
Lafarge 11-22 http://www.lafarge.fr/03222011-press_publication-2010_annual_report-uk.pdf
Pernod Ricard 92-101 http://www.pernod-ricard.com/en/pages/321/pernod/Finance/annual-Reports.html
Imerys 111-124 http://www.imerys.com/uniflip/uniflip_publication_RA2010vo/index.html
Suez Environnement 11-30 http://www.suez-environnement.com/ (reference document)
Arkema 31-43 http://www.arkema.com/pdf/EN/finance/ddr10_va.pdf
6.3.2. Strategic riskThe composition of the portfolio is an essential performance element for GBL. The choice of portfolio investments is made in the context of creating value for its shareholders. GBL seeks to attenuate this risk by diversifying its portfolio and analysing and monitoring its different investments. Every investment or disinvestment is analysed in depth and these analyses are reviewed by the Executive Management and the Standing Committee, then approved by the Board of Directors. Investments are monitored through a systematic review of the portfolio by the different levels of competent hierarchy at GBL and at every meeting of the Board of Directors. Members of management of companies in which GBL has investments are regularly invited to the GBL Board meetings to present their development strategy. GBL’s management also regularly meets the management teams of its strategic investments and sits usually in their Committees and Boards.
6.3.3. Reputation riskGBL bases its strategy on maintaining a top-rate long-term performance in strict keeping with the ethical principles contained in the Code of Professional Ethics and in the Charter, which apply to the group’s Directors and staff.
GBL organises its communication so as to ensure that it is thorough, reliable and transparent.
6.3.4. Risk on cash transactions Cash transactions are subject to formal delegations of power, separation of tasks at payment level and reconciliation of cash data with the accounts. Appropriate information technology tools are used, particularly to monitor cash positions, develop cash flow projections and assess return on investments and counterparty quality.
6.3.5. Risk related to financial statementsGBL publishes consolidated financial statements four times a year. These are reviewed by internal financial committees and the Audit Committee before being submitted to the Board. Complex accounting subjects, in particular the application of IFRS requirements, are identified and discussed by the Board. The analysis also concerns significant transactions and key events during the period under review. A budget and revisions of projections are presented at these four meetings. Financing, cash management and access to liquidities are also generally at the heart of these discussions.
In addition, the consolidation process is based on a centralised information technology system in place in the group’s subsidiaries that ensures consistency and the comparability of accounting plans. The process of registering transactions in the accounts is based on an appropriate separation of tasks, a review of non-recurring transactions by financial management, appropriate documentation of cash transactions and transactions on investments and documentation of the process of reconciliation of the accounts.

146 AnnuAl RepoRt 2011
Corporate governance statement
More specifically with regard to the principle of double approval, the Articles of Association provide that the Company is validly bound by the acts of two Directors. In the framework of day-to-day management, which is not limited to implementation of decisions of the Board of Directors, but extends to all acts necessary to ensure the ongoing activities of GBL, the Managing Directors have a large measure of autonomy and act jointly.
The Board has also assigned special mandates with respect to representing GBL in relation to third parties: in particular for bank transfers, cash operations including derivative contracts and delivery of securities, a Director and a member of management may sign together.
Lastly, the Statutory Auditor (Deloitte Reviseurs d’Entreprises) carries out its audits, comments on the way its assignment is proceeding and presents its conclusions to the Audit Committee.
6.3.6. Risk related to financial instruments (IFRS 7) GBL has put in place strict rules on appropriate separation of tasks and internal approval processes. Every financial transaction requires two signatures and is reviewed regularly by the financial department. In addition, major debt transactions require the approval of the Board of Directors, which may mandate execution to GBL’s Executive Management.
6.3.6.1. Counterparty default risk GBL tries to limit this risk by diversifying its types of investments and counterparties, and by reviewing their financial situation. In this respect, on 31 December 2011, almost all cash was held in the form of time deposits/current accounts with a limited number of banks. All financial contracts (EASDA, GMSLA, GMRA, etc.) are reviewed internally by the legal officer.
6.3.6.2. liquidity risk On 31 December 2011, gross financial debt stood at nearly EUR 1.5 billion and was composed of amounts drawn on its credit lines with banks and bonds traded on the market. It is partially offset by available cash holdings of approximately EUR 300 million. GBL holds confirmed credit lines with various financial institutions (EUR 1,800 million), of which EUR 950 million were drawn at the end of December 2011. The validity of these credit lines has been extended until 2016/2017. As a rule, GBL uses external debt to a limited extent and on a selective basis. GBL issued bonds for individual buyers in 2010 and its bonds exchangeable for GBL shares, subscribed by institutional buyers in 2005, will mature in April 2012.
6.3.6.3. Interest rate risk GBL’s financial debt is made up of exchangeable bonds maturing in 2012, issued at a fixed nominal interest rate of 2.95%, and 7.5-year bonds issued at a fixed rate of 4%. Amounts drawn on bank credit lines were concluded on the basis of fixed rates in terms of the maturity sought. GBL is therefore not exposed to an interest rate risk on this debt. GBL remains attentive to rate developments and their significance in the overall economic context.
6.3.6.4. Risk on derivatives activities GBL occasionally uses derivatives. GBL can also carry out transactions on listed shares in the portfolio using call or put options. Such transactions are based on thorough documentation, are monitored periodically and managed dynamically as needed. The related risk at the end of December 2011 was low in relation to the notional amounts at stake and the Company’s size.
6.4. Information and communicationIn order to transmit reliable financial information to shareholders without delay, GBL has developed a standardised information flow process. It has also applied IFRS requirements since 2000. Its valuation rules are published yearly in its financial report. Uniform reporting of accounts is used both upstream and downstream in GBL group in order to ensure the consistency of data and to detect potential anomalies. A financial calendar for this reporting is established every year in consultation with the parent company and the associated companies in terms of publications.
Computerised data backup operations are organised on a daily basis and a monthly storage process prevents any total loss of financial data. Restricted access to software (accounts, consolidation, payment and remuneration) is also applied.
6.5. Supervision and monitoringSupervision is exercised by the Board through the Audit Committee’s activities. Given the structure and nature of GBL’s activities, there is no internal auditor’s function. This situation is assessed yearly and is deemed appropriate.
The Statutory Auditor (Deloitte Reviseurs d’Entreprises) also reviews the internal control procedure on an annual basis for risks related to GBL’s financial statements. This review of internal control forms part of the assignment of certifying GBL’s statutory and consolidated accounts in conformity with audit standards applicable in Belgium.
More specifically, the Statutory Auditor tests on the basis of a triennial rotation plan the operational effectiveness of internal control of risks that are deemed critical in relation to the financial statements. Its work consists of discussions with members of the organisation and tests on a limited number of transactions.
The conclusions of this work, presented in a report submitted to GBL, do not reveal any major weaknesses in internal control. The report is transmitted to members of the Audit Committee.

AnnuAl RepoRt 2011 147
Corp
orat
e go
vern
ance
sta
tem
ent
7. Policy on conflicts of interest
Chapter III, point A. 2.2., of GBL’s Charter describes the Company’s policy on transactions or other contractual relations between the Company, including affiliated companies, and Directors when such transactions or other contractual relations are not covered by legal provisions on conflicts of interests. It also provides for the application of specific procedures laid down in Articles 523 and 524 of the Company Code.
Conflicts of interests within the meaning of Article 523 of the Company Code were brought to the attention of the Board of Directors at its meetings on 3 March 2011, 21 March 2011 and 4 November 2011 and were addressed in accordance with the procedure dictated by that article. At the meetings of the Board of Directors of 3 and 21 March 2011, other Directors who were not concerned by this legal procedure also abstained in accordance with the policy set out in the Charter.
The Statutory Auditor was informed of these situations and the texts of the related resolutions are reproduced in full below:
The Company also applied the procedure laid down in Article 524 of the Company Code at the Board of Directors’ meetings on 14 and 21 March 2011, in the framework of the proposed acquisition of the 25.6% stake in Imerys held by Pargesa Netherlands B.V., the wholly-owned subsidiary of Pargesa Holding S.A., GBL’s parent company. This investment was decided at the Board of Directors’ meeting on 21 March 2011 based on a report drawn up by a Committee of three independent Directors designated for this purpose on 14 March 2011. The conclusion of the report of the Committee of independent Directors is contained in the minutes of the Board of 21 March 2011, the full text of which is reproduced below.
The Statutory Auditor’s report on the annual accounts contains the same descriptions and conclusions found in the report of the independent Directors and makes no additional comments.
Extract from the minutes of the meeting of the Board of Directors of 3 March 2011“ … Stock option plan 2011The decision on the stock option plan may give rise to a conflict of interest for members of the Executive Management and must be put through the procedure established in Article 523 of the Company Code. Albert Frère, Gérald Frère and Thierry de Rudder consequently left the meeting.
Victor Delloye and Gilles Samyn announced that they intended to abstain from the vote on this item considering the similarity between the CNP and the GBL stock option plan.
In accordance with the stock option plan put in place in 2007, the Committee shall propose annually to the Board the coefficent to be applied to the grant of options for the year. This coefficient, which can range from 0 to 125%, includes the criterion of the long-term performance of the GBL’s stock price compared to the BEL 20 and CAC 40 as well as a criterion of qualitative assessment.
The base amount to which the coefficient is applied is eighteen months of gross remuneration for the CEO and twelve months for the other members of the Executive Management.
The Committee proposed to set the coefficient for 2011 at 110%.
The Board recorded its agreement on this coefficient.
The Ordinary General Meeting will therefore be asked to set the underlying ceiling for 2011 at EUR 13.5 million.
Based on a share price of EUR 65.82, this ceiling allows for the grant of around 205,105 shares, which in the event of exercise of the options will result in a dilution of less than 0.13% of GBL’s capital.
Since the application of Article 520(b)(2) of the Company Code on the grant of stock options gives rise to varying interpretations, the General Meeting will also be asked to approve a proposal to state specifically in the Articles of Association that the procedure described in this paragraph does not apply to the issue of stock options initiated by GBL.
The Board approved these proposals.
Thierry de Rudder was asked to return to the meeting room.
Compensation in the event of revocation of Gérald Frère’s mandateGérald Frère is entitled, in the event that his mandate is revoked or his position terminated before he reaches the age of 62 for any reason other than serious grounds, to a compensation equivalent to three years of fixed remuneration.
Gérald Frère, in the context of renewal of his mandate and of the new law of 6 April 2010 concerning enhanced corporate governance in listed companies, agreed to the reduction of this compensation to eighteen months of fixed remuneration.
The Board approved this proposal.
Albert Frère and Gérald Frère were asked to return to the meeting room. … “
148 AnnuAl RepoRt 2011
Corporate governance statement
Extract from the minutes of the meeting of the Board of Directors of 21 March 2011“ … Investment proposalAt the request of the Chairman, Thierry de Rudder explained that this meeting of the Board of Directors followed on from the meeting of 14 March, during which the Directors examined whether it was advisable for GBL to acquire the 25.6% stake in Imerys held by its parent company Pargesa, for the purpose of increasing its stake in the company from 30.7% to 56.4%.
He also pointed out that, as this is a transaction with an associated company and pursuant to the procedure laid down in Article 524 of the Company Code, a Committee of independent Directors chaired by Maurice Lippens and made up of Jean-Louis Beffa and Jean Stéphenne had been set up to carry out the following tasks:- describe the nature of the transaction;- assess the gain or prejudice to the company and its
shareholders;- estimate the financial consequences of the transaction;- determine whether or not the transaction may cause to
the company an abusive damage in the light of the policy implemented by the company.
The purpose of this meeting was therefore to hear said Committee’s report on its assignment, for which it was assisted by Deutsche Bank as an independent expert.
Reports by the Committee of independent Directors and the financial expertAt the request of the Chairman, Maurice Lippens reported on the work of the Committee, which met on 18 and 20 March 2011 to examine the conclusions of the financial expert’s report and adopt its opinion. These documents and their annexes were transmitted to the Directors in advance of today’s meeting and conclude respectively as follows:
• Conclusion of the Fairness Opinion drafted by Deutsche Bank “Based upon and subject to the foregoing, it is Deutsche Bank’s
opinion as investment bankers that as of the date hereof, the Consideration is fair, from a financial point of view, to GBL.”
• Conclusion of the opinion of the independent Directors “Based on our work and that of the independent expert
Deutsche Bank, we consider that the proposed acquisition of 25.6% of the capital of Imerys from Pargesa at the price of EUR 56.2 per share:- is not likely to cause to the company an abusive damage in
the light of the policy implemented by GBL;- strengthens GBL’s investment portfolio through the addition
of a majority stake in a significant listed group with a promising outlook;
- is accretive in cash earnings for the current year and contributes to consolidated results. It will give rise to a revaluation appreciation and goodwill (1).
Consequently, on the date of this opinion, the Committee recommends that the Board of Directors approves the proposed acquisition.”
On the conclusion of this presentation, the Board of Directors placed on record the opinion of the independent Directors, which did not necessitate any particular comments and the quality of which was highlighted by several Directors.
DecisionPrior to approval of the investment proposal, Thierry de Rudder informed the Board that the decision to be taken may create a conflict of interest for Gérald Frère, Victor Delloye and Gilles Samyn within the meaning of Article 523 of the Company Code, of which the Statutory Auditor has been informed. Victor Delloye and Gilles Samyn therefore left the meeting for the duration of the vote, while Gérald Frère left the telephone conference, adding that he approved, as need be, the draft press release contained in the file.
Albert Frère, Georges Chodron de Courcel, Paul Desmarais, jr, Ian Gallienne, Michel Plessis-Bélair, Amaury de Seze and Arnaud Vial declared that they did not wish to vote on this proposal for reasons of good corporate governance.
In the light of the usefulness of this transaction for GBL and the positive conclusions of the report by the Committee of independent Directors and of the Fairness Opinion drawn up by Deutsche Bank, the Board approved the transaction by an unanimous vote of the members entitled to vote. It authorised GBL to acquire, through its subsidiary Belgian Securities B.V., the 25.6% stake in Imerys held by Pargesa at the total price of EUR 1,087,380,754, equivalent to a share price of EUR 56.20, with a coupon of EUR 1.20 attached.
This transaction is subject to ratification by the Board of Directors of Pargesa, which will meet today at 17.30, and grant of the derogation requested from the Financial Market Authority (AMF) in France by virtue of a transfer between companies belonging to the same group. It must also be validated by the governing bodies of Dutch subsidiaries having a stake in the transaction.
The Board of Directors also validated the Share Transfer Agreement, the draft of which is attached hereto, it being specified that ownership of the Imerys shares would be transferred on the date of payment, planned for 8 April 2011 at the latest.
The Board of Directors approved, subject to certain changes, the draft press release transmitted to the Directors. The final version attached will be published this evening, after the markets close, provided Pargesa’s Board of Directors has ratified the transaction. It was specifed that a second press release confirming the AMF grant of the derogation would be published once the Market Authority had handed down its decision. …“
(1) As mentioned in the half-yearly press release of 29 July 2011, no income is recorded on the acquisition of the Imerys shares from Pargesa, contrary to what was stated in the press release of 21 March 2011
AnnuAl RepoRt 2011 149
Corp
orat
e go
vern
ance
sta
tem
ent
Extract of the minutes of the meeting of the Board of Directors on 4 November 2011“ … Contracts with Ian Gallienne and Gérard LamarcheFor the deliberations on the following items concerning their remuneration, Ian Gallienne and Gérard Lamarche left the meeting, given the conflict of interest within the meaning of Article 523 of the Company Code.
The Committee Chairman pointed out that, as he had outlined at the previous Board meeting, the economic conditions laid down in the contracts with Ian Gallienne and Gérard Lamarche are based in large measure on the scheme applied to the team currently in place, namely:- fixed net remuneration of EUR 800,000, excluding any
variable cash remuneration;- long-term incentive compensation based on the company’s
results type stock option plan defined periodically by the Board;
- participation in a defined-contributions pension plan, to which the employer contributes annually 21% of net remuneration. This marks a change from the defined benefits scheme existing earlier;
- various insurance policies;- use of a company car;- severance payment clause of eighteen months.
Advantages or interests for the two applicants as a result of their past career and responsibilities were not taken into account in establishing their present and future remuneration. In other words, their above-mentioned overall remuneration will not include the benefits or advantages granted to them under agreements concluded before they joined GBL’s Executive Management, in the context of the roles they held at the time.
It was also pointed out that members of the Executive Management receive no remuneration for their directorship per se.
This having been specified, the Board was asked to record its agreement with all of GBL’s contractual commitments towards Ian Gallienne and Gérard Lamarche.
The Board recorded its agreement.
Ian Gallienne and Gérard Lamarche were asked to return to the meeting room.
[…]
Pension supplement for Gérald Frère and Thierry de RudderSince this item concerned the pension scheme for Gérald Frère and Thierry de Rudder, they left the meeting in line with the procedure for conflicts of interest within the meaning of Article 523 of the Company Code.
It was proposed to make an employer’s contribution to the pension fund in the amount of EUR 879,469.43 and EUR 772,834.12 for Gérald Frère and Thierry de Rudder respectively, in order to reflect the decrease in the discount rate and to ensure consistency with the guaranteed yield under the new “defined contributions” plan put in place for executives and staff.
The Board of Directors approved this proposal.
Gérald Frère and Thierry de Rudder returned to the meeting room. ...”
Outside the scope of Article 523 of the Company Code and apart from the above cases, the Company was confronted with a situation for which a Director declares that he did not want to attend the deliberations of the Board for professional ethics reasons.
8. Policy relating to transactions in GBL shares
The rules of procedure relating to transactions in GBL’s shares, set out in Appendix 2 to the Company’s Charter, lay down the Company’s internal policy on the prevention of unfair trading. Under these rules, the Directors and other potential insiders whose names are included on a list kept by the Company, must inform the Compliance Officer before carrying out any transaction in GBL’s shares and confirm the transaction once it has been performed. GBL’s Directors and persons having close ties with them also have the legal obligation to notify to the Financial Services and Markets Authority (FSMA) all transactions in GBL’s shares enacted on their behalf.
Notice is also sent to the persons in possession of privileged information or presumably in possession of such information to announce the start and end of the closed period or the period of prohibition on such transactions.
A calendar showing the closed periods as defined in the Charter is also transmitted to the Executive Management and staff.
Lastly, the Compliance Officer ensures the application of all legal measures relating to unfair trading and the measures laid down by the Charter. The Compliance Officer is available to provide useful information on this subject to members of the Board of Directors and staff.
150 AnnuAl RepoRt 2011
Corporate governance statement
9. Shareholders
9.1. Compliance with provisions of the 2009 Code with respect to shareholders
The Company complies with all provisions of the 2009 Code concerning shareholders.
Prior to 2012, an exception to these provisions existed with regard to shareholders’ right to submit proposals to the General Meeting. The level of shareholding required for exercise of this right was set at 20% of the capital. This measure was in conformity with the Company Code but represented a derogation from the 2009 Code.
Effective 1 January 2012, further to amendment of the Company Code on this point, one or more shareholders owning at least 3% of the Company’s share capital may request the addition of an item to the agenda of the General Meeting and may also present proposals of decisions concerning the items to be discussed or to be placed on the agenda. On the other hand, the threshold from which one or more shareholders may request the convocation of a General Meeting remains set at 20% of the capital.
The Company publishes the results of votes and the minutes of the General Meeting on its website as soon as possible and no later than fifteen days following the Meeting.
9.2. Relations with controlling shareholdersThe Company’s shareholding is characterised by the presence of a controlling shareholder, Pargesa Holding S.A. (via its wholly-owned subsidiary, Pargesa Netherlands B.V.). Pargesa Holding S.A., incorporated under Swiss law, is itself controlled by Parjointco N.V., which is incorporated under the laws of the Netherlands and whose capital is owned 50-50 by Frère-Bourgeois/CNP-NPM group and Power Corporation of Canada group, under an agreement concluded by the two groups in 1990.
That agreement aims to establish and maintain parity between Power Corporation of Canada group and Frère-Bourgeois/CNP-NPM group in Pargesa Holding S.A., GBL and their respective designated subsidiaries.Each group has agreed not to acquire, hold or sell interests in these companies, either directly or indirectly, except with the agreement of the other party, and has granted the other group a right of pre-emption, subject to certain restrictions, on shares in Pargesa Holding S.A. and GBL in the event of the disposal of such shares during a five-year period following expiry of the agreement.
This agreement was prolonged in 1996 and will expire in 2014 if not renewed.
9.3. Information on shareholding structure9.3.1. Notification in accordance with legislation on takeover bidsThe Company received, on 21 February 2008, a notification from its controlling shareholders concerning their interest in GBL as of 1 September 2007.
This notification was transmitted in accordance with Article 74(7) of the law of 1 April 2007 on takeover bids. Under that law, shareholders owning more than 30% of the capital of a listed company are exempted from the obligation of launching a public takeover bid on the company provided they have notified their shareholding at the date of entry into force of the law (i.e. 1 September 2007) to the FSMA and to the company concerned, by 21 February 2008 at the latest.
Also pursuant to that law, these shareholders are obliged to report annually any change in their controlling interest to the FSMA and to the company concerned. In this context, they transmitted to GBL an update of the structure of the controlling shareholding as of 1 September 2011, which is reproduced below:
number and percentage of shares with voting rights held by the declarants
ShareholdersNumber of shares with voting rights %
Pargesa Netherlands B.V. 80,680,729 50.00
Sagerpar (1) 6,099,444 3.78
Compagnie Nationale à Portefeuille S.A. 38,500 0.02
Paul G. Desmarais 500 p.m.
Total 86,819,173 53.81
(1) Voting rights suspended
natural and/or legal persons holding final ownership of the declarants who are legal persons Paul G. Desmarais and Albert Frère, bound by a concerted action agreement.

AnnuAl RepoRt 2011 151
Corp
orat
e go
vern
ance
sta
tem
ent
Chain of ownership
N.B. In the ownership chain concerning Albert Frère, the companies whose nationality is not mentioned are Belgian and have their registered office located at 6280 Loverval (Gerpinnes), 12 rue de la Blanche Borne.
(1) In accordance with the Articles of Association of the Stichting Administratiekantoor Frère-Bourgeois – Rotterdam – Nederland(2) Joint control organised under a shareholders’ agreement between the CNP-NPM and Frère-Bourgeois groups(3) 0.26% shareholding in CNP-NPM(4) 0.63% shareholding in CNP-NPM(5) Joint control
10.5% ord. patr.51.0% voting rights
89.5% ord. patr.31.2% voting rights
100% pref. patr.
17.8% voting rights
56.5% of the share
capital76.0%
of the voting rights
68%
6.98%100%
93.02%
78.96%100%
50.00%
0.0003%3.78%
86.59%
100%
11.13% 100%
88.87%
57.49%
0.03%
94.9%
32%
5.1%
2.1%
21.65%
10.30%
100%21.35%
78.65%
0.17%
100%
66.08%
100%
99.99%
0.35% 53.62%
4.52%
0.36%
100%
21.04%
100% 0.02%
100%
100%
50.0% 50.0%
100%100%
77.19%
100%
3.11%
3876357 Canada Inc.
3439496 Canada Inc.
Power Corporation of Canada
171263 Canada Inc.
Power Financial
Corporation
Power Financial Europe
B.V. (NL)
Brussels Securities (B)
Nordex Inc.
Gelco Entreprises
Ltd.
Parjointco N.V. (NL) (5)
Pargesa Holding S.A. (CH)
Pargesa Netherlands
B.V. (NL)
GBL (B)
Albert Frère (1)
Chairman of Raad van
Bestuur
Filux S.A. (L)
Frère-Bourgeois S.A.
Helio Charleroi Finance S.A.
Financière de la
Sambre S.A.
Agesca Nederland N.V. (NL) (2)
Carpar S.A.
Erbe S.A.
Fingen S.A.
Compagnie Immobilière de Roumont S.A. (4)
Paul G. Desmarais
Pansolo Holding Inc.
Kermadec S.A. (L)
Investor S.A.
Fibelpar S.A. (3)
Pargesa Asset Management (Netherlands)
N.V. (NL)Sagerpar (B)
Capucines Corporation
Compagnie Nationale à
Portefeuille S.A.
Stichting A.K.Frère-Bourgeois
(NL)
152 AnnuAl RepoRt 2011
Corporate governance statement
9.3.2. Notification of major shareholdingsOn 1 September 2008, the new Belgian regulation on transparency entered into force. In accordance with the transitional scheme, all GBL shareholders whose interest as of 1 September 2008 reached or exceeded a legal threshold were obliged to submit notification thereof no later than 31 October 2008.
Accordingly, on 30 October 2008, GBL received notification from its controlling shareholders concerning their interest in GBL as of 1 September 2008. The content of this notification is summarized below.
Subsequently, the shareholders will be obliged to submit a declaration whenever their voting rights either exceed or drop below 5%, 10%, 15% (and other multiples of 5%) of total voting rights.
GBL’s Articles of Association do not lay down a declaration threshold higher than 5% or 10%.
Paul G. Desmarais, Albert Frère and Pargesa Netherlands B.V. declare that they act in concert pursuant to an agreement on the exercise of their voting rights,
with a view to implementing a sustainable common policy and aimed at obtaining control, frustrating a bid or maintaining control.
notification of 30 october 2008 relative to the situation as of 1 September 2008Denominator taken into account: 161,358,287
A) Voting rights
Holders of voting rightsNumber of voting rights
(attaching to shares)% of voting rights
(attaching to shares)
Paul G. Desmarais 500 0.00
Albert Frère 0 0.00
Compagnie Nationale à Portefeuille S.A. 38,500 0.02
Pargesa Netherlands B.V. 80,680,729 50.00
Sagerpar 5,576,651 3.46
Total 86,296,380 53.48
B) Equivalent financial instruments
Holders of equivalent financial instruments
Type of financial instruments Maturity date Exercise period or date
% of voting rights
Albert Frère (1) 44,885 stock options 25/05/2017 Any time after vesting, from 01/01/2011 to 24/05/2017 inclusive
0.00
Albert Frère (1) 60,561 stock options 10/04/2018 Any time after vesting, from 1/01/2012 to 9/04/2018 inclusive
0.00
Total 0.00
(1) For the sake of clarity, the 44,885 and 60,561 stock options were not included in the numerator to avoid double counting of the voting rights, as they are covered by treasury shares held by GBL through Sagerpar
C) Total (voting rights and equivalent financial instruments)
Number of voting rights % of voting rights
86,296,380 53.48
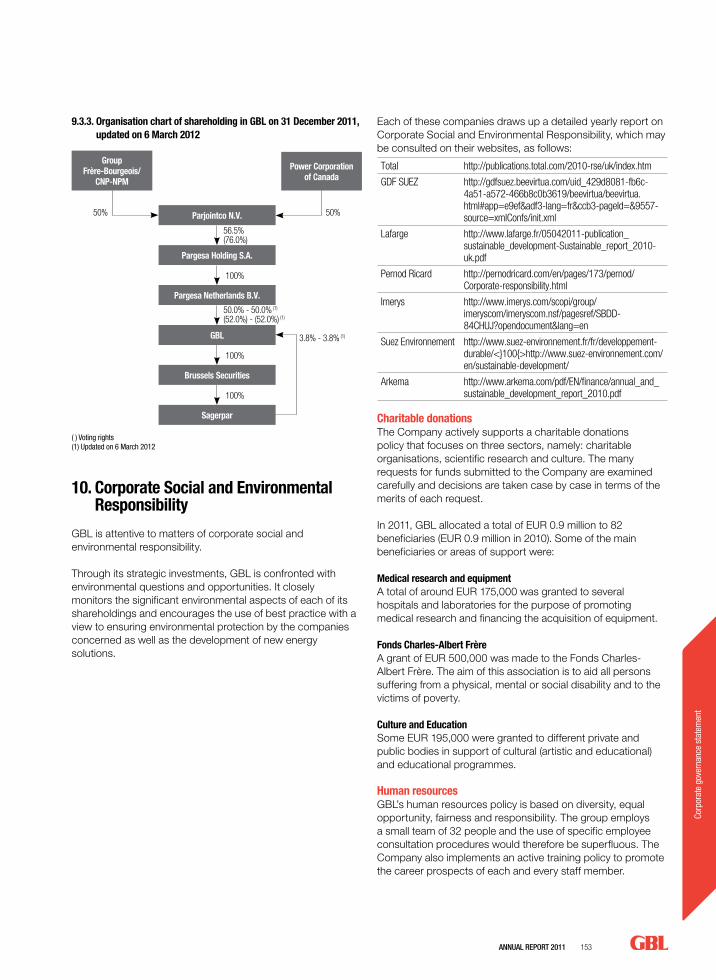
AnnuAl RepoRt 2011 153
Corp
orat
e go
vern
ance
sta
tem
ent
9.3.3. Organisation chart of shareholding in GBL on 31 December 2011, updated on 6 March 2012
( ) Voting rights(1) Updated on 6 March 2012
10. Corporate Social and Environmental Responsibility
GBL is attentive to matters of corporate social and environmental responsibility.
Through its strategic investments, GBL is confronted with environmental questions and opportunities. It closely monitors the significant environmental aspects of each of its shareholdings and encourages the use of best practice with a view to ensuring environmental protection by the companies concerned as well as the development of new energy solutions.
Each of these companies draws up a detailed yearly report on Corporate Social and Environmental Responsibility, which may be consulted on their websites, as follows:
Total http://publications.total.com/2010-rse/uk/index.htm
GDF SUEZ http://gdfsuez.beevirtua.com/uid_429d8081-fb6c-4a51-a572-466b8c0b3619/beevirtua/beevirtua.html#app=e9ef&adf3-lang=fr&ccb3-pageId=&9557-source=xmlConfs/init.xml
Lafarge http://www.lafarge.fr/05042011-publication_sustainable_development-Sustainable_report_2010-uk.pdf
Pernod Ricard http://pernodricard.com/en/pages/173/pernod/Corporate-responsibility.html
Imerys http://www.imerys.com/scopi/group/imeryscom/imeryscom.nsf/pagesref/SBDD-84CHUJ?opendocument&lang=en
Suez Environnement http://www.suez-environnement.fr/fr/developpement-durable/<}100{>http://www.suez-environnement.com/en/sustainable-development/
Arkema http://www.arkema.com/pdf/EN/finance/annual_and_sustainable_development_report_2010.pdf
Charitable donationsThe Company actively supports a charitable donations policy that focuses on three sectors, namely: charitable organisations, scientific research and culture. The many requests for funds submitted to the Company are examined carefully and decisions are taken case by case in terms of the merits of each request.
In 2011, GBL allocated a total of EUR 0.9 million to 82 beneficiaries (EUR 0.9 million in 2010). Some of the main beneficiaries or areas of support were:
Medical research and equipmentA total of around EUR 175,000 was granted to several hospitals and laboratories for the purpose of promoting medical research and financing the acquisition of equipment.
Fonds Charles-Albert FrèreA grant of EUR 500,000 was made to the Fonds Charles-Albert Frère. The aim of this association is to aid all persons suffering from a physical, mental or social disability and to the victims of poverty.
Culture and EducationSome EUR 195,000 were granted to different private and public bodies in support of cultural (artistic and educational) and educational programmes.
Human resourcesGBL’s human resources policy is based on diversity, equal opportunity, fairness and responsibility. The group employs a small team of 32 people and the use of specific employee consultation procedures would therefore be superfluous. The Company also implements an active training policy to promote the career prospects of each and every staff member.
Parjointco N.V.
Group Frère-Bourgeois/
CNP-NPM
Power Corporation of Canada
56.5% (76.0%)
Pargesa Holding S.A.
100%
50.0% - 50.0% (1)
(52.0%) - (52.0%) (1)
Pargesa Netherlands B.V.
3.8% - 3.8% (1)
100%
Brussels Securities
100%
Sagerpar
50%50%
GBL
154 AnnuAl RepoRt 2011
Corporate governance statement
11. Other information relating to the company
11.1. History and developmentThe Company was founded as the result of the merger in April 2001 between GBL S.A. and Electrafina, in which GBL S.A. held more than an 80% stake.
Over the years, Electrafina had become the “energy branch” of the group, holding the interests in the oil and electricity industries. Later, it also invested in media. GBL S.A. on the other hand held direct interests in fields such as financial services, real estate and trade. As the differences between the assets of the parent company and the subsidiary became less pronounced over the years, they were brought together into a single entity.
This merger also fit in with the group’s strategy of keeping its assets internationally positioned in a context of concentration and increasing competition, which resulted in the divestment of the financial services and the sale of interests that had become marginal.
Since then, the group’s portfolio has been focused on a limited number of industrial companies that are leader on their markets in which GBL gradually consolidated its interest and in which it plays the role of long-term professional shareholder. Details on the evolution of the portfolio over the last three financial years can be found on page 121 of this annual report.
11.2. NameGroupe Bruxelles Lambert Groep Brussel Lambertin abbreviated form “GBL”
The French and Dutch registered names may be used together or separately.
11.3. Registered office 24, avenue Marnix – 1000 Brussels
The registered office may be transferred to any other address in Belgium on a decision by the Board of Directors.
11.4. Legal form, incorporation and statutory publicationsThe Company was incorporated on 4 January 1902 as a limited liability company under Belgian law, by deed executed by Edouard Van Halteren, Notary in Brussels, published in the Appendices to the Moniteur Belge of 10 January 1902, reference number 176. The Articles of Association have been amended on a number of occasions, most recently by a deed enacted on 12 April 2011 published in the Appendices to the Moniteur Belge of 25 May 2011, reference numbers 2011-05-25/0078414 and 2011-05-25/0078415, 14 June 2011 (amending extract), reference numbers 2011-06-14/0087618 and 2011-06-14/0087619 and 19 October 2011 (transitional provisions), reference numbers 2011-10-19/0157685 and 2011-10-19/0157686.
11.5. Legislation governing its activitiesThe Company is governed by existing and future laws and regulations applicable to limited liability companies and by its Articles of Association.
11.6. Register of legal entitiesThe Company is listed in the Register of Legal Entities (RPM) under business number 0407.040.209. This number replaces the Trade Register Number (3.902), the VAT number and the social security number.
11.7. TermThe Company is incorporated for an unlimited period .
11.8. Corporate objectThe Company’s object is to:• conduct on its own behalf or on behalf of third parties any
and all real estate, financial and portfolio management transactions; to this end, it may set up companies or bodies, acquire shares therein, and conduct any financing, payment, lending, security or deposit transactions;
• carry out studies of all kinds and provide technical, legal, accounting, financial, commercial, administrative or management assistance, on behalf of companies or bodies in which it directly or indirectly owns shares, or on behalf of third parties;
• provide on its own behalf or on behalf of third parties any transport or transit operations.
The Company may take an interest, through capital contributions or mergers, in any existing or future companies or bodies whose object might be similar or related to its own or that might be of such a nature as to confer an advantage in the pursuit of its corporate object.
AnnuAl RepoRt 2011 155
Corp
orat
e go
vern
ance
sta
tem
ent
11.9. Capital 11.9.1. Issued capitalOn 31 December 2011, the fully paid-up share capital amounted to EUR 653,136,356.46. It is represented by 161,358,287 shares without nominal value.
All shares making up the share capital have the same rights.
In accordance with Article 28 of the Articles of Association, each share entitles its holder to one vote. GBL has not issued any other class of shares, such as non-voting or preferential shares.
On 1 January 2008, bearer shares placed in a securities account were converted by law into dematerialised shares. From that date, the Company’s shares exist in either a registered or dematerialised form or as bearer shares.
Holders of bearer shares must have converted their shares into registered or dematerialised shares by 31 December 2013 at the latest.
However, the Extraordinary General Meeting of 24 April 2007 authorised the Board of Directors to set a date, before 31 December 2013, after which exercise of the rights attaching to the bearer shares shall be suspended until the said shares have been converted into registered or dematerialised shares. The Board of Directors of 2 March 2010 has set 1 January 2011 as this date.
As from 1 January 2008, the Company’s shares may only be issued in registered or dematerialised form.
11.9.2. Authorised capital The Extraordinary General Meeting held on 12 April 2011 renewed for a five-year period the authorisation granted to the Board of Directors to:• increase the share capital, on one or more occasions, up to
a total of EUR 125 million;• decide one or more issues of convertible bonds or bonds
reimbursable in shares, subscription rights or other financial instruments, whether or not attaching to bonds or other securities that can in time give rise to capital increases in a maximum amount such that the amount of capital increases that may result from exercise of these conversion or subscription rights, whether or not attaching to such securities, shall not exceed the limits of the remaining capital in the above mentioned limits.
In both cases, the Board of Directors may, in the interest of the Company, limit or cancel shareholders’ preferential subscription rights in conformity with the terms and conditions laid down by law.
This authorisation, initially granted in 1987, was renewed on 25 May 1993, 28 May 1996, 25 May 1999, 27 April 2004, 24 April 2007 and for the last time on 12 April 2011. It is valid for a five-year period from 25 May 2011, i.e. until May 2016. On 31 December 2011, the authorised capital amounted to EUR 125 million. On the basis of this amount, a maximum of 30,881,431 new shares may be issued.
11.9.3. Treasury sharesThe Extraordinary General Meeting of 12 April 2011 renewed the authorisation given to the Company’s Board of Directors, for a period of five years, to buy a maximum of 32,271,657 GBL shares, in compliance with all legal provisions. The value of these acquisitions may not be more than 10% below the lowest share price over the twelve months preceding the transaction, nor may they be more than 10% above the highest share price of the previous twenty market quotations.
This authorisation also covers acquisitions by GBL’s direct subsidiaries.
The same Extraordinary General Meeting also renewed the Board of Directors’ authorisation to acquire and dispose of its treasury shares when such acquisition or disposal is necessary to prevent serious and imminent harm to the Company. This authorisation is valid for three years as from 25 May 2011, i.e. until May 2014.
Under the Company’s Articles of Association, the Board of Directors may also sell GBL shares on or off the Stock Exchange without the prior intervention of the General Meeting and with unlimited effect.
Acquisitions and disposals of treasury shares in 2009, 2010 and 2011 are detailed on page 102 of this annual report.
11.9.4. Exchangeable loansIn 2005, GBL issued bonds exchangeable for GBL shares. The details of this issue are found on page 100 of this annual report.
11.10. Voting rightsThere are no statutory restrictions on the exercise of voting rights, without prejudice to general rules on admission to the General Meeting.
156 AnnuAl RepoRt 2011
Corporate governance statement
11.11. Documents available to the public11.11.1. Shareholders’ access to information and websiteWith the aim of facilitating shareholders’ access to information, GBL has set up a website (http://www.gbl.be).
This site, which is updated regularly, contains the information required under the Royal Decree of 14 November 2007 concerning the obligations of issuers of financial instruments accepted for trading on a regulated market.
It presents the GBL accounts, annual reports and all press releases put out by the Company, as well as all useful and necessary information on General Meetings and on shareholders’ participation in such meetings, in particular the conditions laid down by the Articles of Association concerning the convening of General Meetings (Ordinary and Extraordinary) of shareholders.
The results of votes as well as the minutes of General Meetings are also published on the site.
11.11.2. Availability of company documents for public consultationThe Company’s Articles of Association may be consulted at the Registry of the Brussels Commercial Court, at the Company’s registered office and on its website (http://www.gbl.be).
The annual accounts are deposited with the National Bank of Belgium and may be consulted on the website. Resolutions relating to the appointment and removal of members of the Company’s executive bodies are published in the Appendices to the Moniteur Belge.Financial announcements relating to the Company are published in the financial press and daily newspapers. Other documents available for public inspection may be consulted at the Company’s registered office.
The Company’s annual report is sent each year to registered shareholders and to any person requesting a copy; it is available free of charge at the registered office.
The annual reports for the last three financial years and all the documents referred to in this section may be consulted on the website.

AnnuAl RepoRt 2011 157
Resolutions proposed to shareholders
1. 1. Management report of the Board of Directors and reports of the Statutory Auditor on the financial year 2011
2. Financial statements for the year ended 31 december 20112.1. Presentation of the consolidated financial statements for
the year ended 31 December 2011.
2.2. Approval of annual accounts for the year ended 31 December 2011.
3. Discharge of the Directors Proposal for the discharge to be granted to the
Directors for duties performed during the year ended 31 December 2011.
4. Discharge of the Statutory Auditor Proposal for the discharge to be granted to the Statutory
Auditor for duties performed during the year ended 31 December 2011.
5. Resignations and appointments5.1. Take note of the resignation of Gérald Frère and
Thierry de Rudder as Managing Directors at the end of 2011 (without prejudice of their capacity as Directors)
5.2. Renewal of Directors’ terms of office Proposal to re-elect for a four-year term, in their capacity
as Directors, Georges Chodron de Courcel, Ian Gallienne and Thierry de Rudder, whose current term of office expires at the end of this General Meeting.
6. Remuneration report Proposal to approve the Board of Directors’ remuneration
report for the year 2011.
7. Setting of fees for non-executive Directors Proposal to set fees for non-executive Directors for the
performance of their duties in the Board of Directors and in Committees set up from amongst its members, at a maximum total of EUR 1,400,000 per year, to be allocated on a decision of the Board of Directors.
8. Stock option plan In accordance with the decisions on the establishment
of a stock option plan by the General Meeting of 24 April 2007, proposal to set up at EUR 13,500,000 the maximum value of shares in relation to the options to be granted in 2012.
9. Miscellaneous
Agenda of the Ordinary General Meeting on 24 April 2012
158 AnnuAl RepoRt 2011
Gérald FrèreChairman of the Board of Directors
List of activities and other mandates exercised in Belgian and foreign companies in 2011• Chairman of the Board of Directors of Compagnie Nationale
à Portefeuille S.A. (B) (until 3 October 2011), Compagnie Nationale à Portefeuille S.A. (formerly Fingen S.A.) (since 3 October 2011), Filux S.A. (L) (until 22 November 2011), Segelux S.A. (formerly Gesecalux S.A.) (L) (until 22 November 2011), Stichting Administratiekantoor Bierlaire (NL) and RTL Belgium (B).
• Vice-Chairman of the Board of Directors of Pargesa Holding S.A. (CH).
• Chairman of the Board of Directors and Managing Director of Haras de la Bierlaire S.A. (B).
• Chairman of the Nomination and Remuneration Committee of Compagnie Nationale à Portefeuille S.A. (B) (until 3 October 2011).
• Managing Director of Financière de la Sambre S.A. (B) and Frère-Bourgeois S.A. (B).
• Director of Power Financial Corporation (CDN), Electrabel (B), Erbe S.A. (B), Fonds Charles-Albert Frère A.S.B.L. (B), Stichting Administratiekantoor Frère-Bourgeois (NL), Lafarge (F) (until 3 November 2011) and Pernod Ricard (F).
• Auditor of Agesca Nederland N.V. (NL) and Parjointco N.V. (NL).• Regent and Member of the Budget Committee of
the National Bank of Belgium S.A. (B).• Member of the Remuneration Committee of Power Financial
Corporation (CDN).• Member of the Remuneration Committee of Pernod
Ricard (F).• Member of the Related Party and Conduct Review
Committee of Power Financial Corporation (CDN).• Member of the Corporate Governance and Nominations
Committee of Lafarge (F) (until 3 November 2011). • Honorary Consul of France in Charleroi.• Manager of Agriger S.P.R.L. (B), GBL Energy S.à r.l. (L)
(until 29 December 2011) and GBL Verwaltung S.à r.l. (L) (until 29 December 2011).
List of activities and other mandates exercised in Belgian and foreign companies between 2007 and 2010Financial year 2010• Chairman of the Board of Directors of Compagnie Nationale
à Portefeuille S.A. (B), Filux S.A. (L), Gesecalux S.A. (L), Stichting Administratiekantoor Bierlaire (NL) and RTL Belgium (B).
• Vice-Chairman of the Board of Directors of Pargesa Holding S.A. (CH).
• Chairman of the Board of Directors and Managing Director of Haras de la Bierlaire S.A. (B).
• Chairman of the Nomination and Remuneration Committee of Compagnie Nationale à Portefeuille S.A. (B).
• Chairman of the Remuneration Committee of the National Bank of Belgium S.A. (B) (until 31 December 2010).
• Managing Director of Financière de la Sambre S.A. (B) and Frère-Bourgeois S.A. (B).
• Director of Power Financial Corporation (CDN), Electrabel (B) (since 27 April 2010), Erbe S.A. (B), Fonds Charles-Albert Frère A.S.B.L. (B), Stichting Administratiekantoor Frère-Bourgeois (NL), Suez-Tractebel S.A. (B) (until 27 April 2010), Lafarge (F) and Pernod Ricard (F).
• Auditor of Agesca Nederland N.V. (NL) and Parjointco N.V. (NL).• Regent and Member of the Budget Committee of the
National Bank of Belgium S.A. (B).• Member of the Remuneration Committee of Power Financial
Corporation (CDN).• Member of the Remuneration Committee of Pernod
Ricard (F).• Member of the Related Party and Conduct Review
Committee of Power Financial Corporation (CDN).• Member of the Board of Supervisors of the Financial Services
Authority (B) (until 26 October 2010).• Member of the Corporate Governance and Nominations
Committee of Lafarge (F). • Honorary Consul of France in Charleroi.• Manager of Agriger S.P.R.L. (B), GBL Energy S.à r.l. (L)
and GBL Verwaltung S.à r.l. (L).
Financial year 2009• Chairman of the Board of Directors of Compagnie Nationale
à Portefeuille S.A. (B), Filux S.A. (L), Gesecalux S.A. (L), Stichting Administratiekantoor Bierlaire (NL) and RTL Belgium (B) (ex-TVI S.A.).
• Vice-Chairman of the Board of Directors of Pargesa Holding S.A. (CH).
• Chairman of the Board of Directors and Managing Director of Haras de la Bierlaire S.A. (B).
• Chairman of the Nomination and Remuneration Committee of Compagnie Nationale à Portefeuille S.A. (B).
• Chairman of the Remuneration Committee of the National Bank of Belgium S.A. (B).
• Managing Director of Financière de la Sambre S.A. (B) and Frère-Bourgeois S.A. (B).
• Director of Power Financial Corporation (CDN), Erbe S.A. (B), Fingen S.A. (B) (until 8 April 2009), Fonds Charles-Albert Frère A.S.B.L. (B), GBL Finance S.A. (L) (until 24 April 2009), Stichting Administratiekantoor Frère-Bourgeois (NL), Suez-Tractebel S.A. (B), Lafarge (F) and Pernod Ricard (F) (since 2 November 2009).
• Auditor of Agesca Nederland N.V. (NL), Frère-Bourgeois Holding B.V. (NL) (until 5 June 2009) and Parjointco N.V. (NL).
List of the other offices held by the members of the Board of Directors between 2007 and 2011
APPENDIx – Offices of Directors
AnnuAl RepoRt 2011 159
• Regent and Member of the Budget Committee of the National Bank of Belgium S.A. (B).
• Member of the Remuneration Committee of Power Financial Corporation (CDN).
• Member of the Remuneration Committee of Pernod Ricard (F) (since 2 November 2009).
• Member of the Related Party and Conduct Review Committee of Power Financial Corporation (CDN).
• Member of the Board of Supervisors of the Financial Services Authority (B).
• Member of the Board of Trustees of Guberna (B) (until 16 March 2009).
• Member of the Corporate Governance and Nominations Committee of Lafarge (F).
• Honorary Consul of France.• Manager of Agriger S.P.R.L. (B), GBL Energy S.à r.l. (L) and
GBL Verwaltung S.à r.l. (L) (since 24 March 2009).
Financial year 2008• Chairman of the Board of Directors of Compagnie Nationale
à Portefeuille S.A. (B), Diane S.A. (CH) (until 5 May 2008), Filux S.A. (L), Gesecalux S.A. (L), Stichting Administratie-kantoor Bierlaire (NL) and TVI S.A. (B).
• Vice-Chairman of the Board of Directors of Pargesa Holding S.A. (CH).
• Chairman of the Board of Directors and Managing Director of Haras de la Bierlaire S.A. (B).
• Chairman of the Nomination and Remuneration Committee of Compagnie Nationale à Portefeuille S.A. (B).
• Chairman of the Remuneration Committee of the National Bank of Belgium S.A. (B).
• Managing Director of Financière de la Sambre S.A. (B) and Frère-Bourgeois S.A. (B).
• Director of Power Financial Corporation (CDN), Erbe S.A. (B), Fingen S.A. (B), Fonds Charles-Albert Frère A.S.B.L. (B), GBL Finance S.A. (L), Stichting Administratiekantoor Frère-Bourgeois (NL), Suez-Tractebel S.A. (B) and Lafarge (F) (since 7 May 2008).
• Auditor of Agesca Nederland N.V. (NL), Frère-Bourgeois Holding B.V. (NL) and Parjointco N.V. (NL).
• Regent and Member of the Budget Committee of the National Bank of Belgium S.A. (B).
• Member of the Remuneration Committee of Power Financial Corporation (CDN).
• Member of the Related Party and Conduct Review Committee of Power Financial Corporation (CDN).
• Member of the Board of Supervisors of the Financial Services Authority (B).
• Member of the Board of Trustees of Guberna (B).• Member of the Corporate Governance and Nominations
Committee of Lafarge (F) (since 7 May 2008).• Honorary Consul of France.• Manager of Agriger S.P.R.L. (B) and GBL Energy S.à r.l. (L)
(since 10 November 2008).
Financial year 2007• Chairman of the Board of Directors of Compagnie Nationale
à Portefeuille S.A. (B), Diane S.A. (CH), Filux S.A. (L), Gesecalux S.A. (L), Stichting Administratiekantoor Bierlaire (NL) and TVI S.A. (B).
• Vice-Chairman of the Board of Directors of Pargesa Holding S.A. (CH).
• Chairman of the Board of Directors and Managing Director of Haras de la Bierlaire S.A. (B).
• Chairman of the Nomination and Remuneration Committee of Compagnie Nationale à Portefeuille S.A. (B).
• Chairman of the Remuneration Committee of the National Bank of Belgium S.A. (B) (since 14 February 2007).
• Managing Director of Financière de la Sambre S.A. (B) and Frère-Bourgeois S.A. (B).
• Director of Power Financial Corporation (CDN), Erbe S.A. (B), Fingen S.A. (B), Fonds Charles-Albert Frère A.S.B.L. (B), GBL Finance S.A. (L), Stichting Administratiekantoor Frère-Bourgeois (NL) and Suez-Tractebel S.A. (B).
• Auditor of Agesca Nederland N.V. (NL), Frère-Bourgeois Holding B.V. (NL) and Parjointco N.V. (NL).
• Regent and Member of the Budget Committee (change of name on 14 February 2007) of the National Bank of Belgium S.A. (B).
• Member of the Remuneration Committee of Power Financial Corporation (CDN).
• Member of the Related Party and Conduct Review Committee of Power Financial Corporation (CDN).
• Member of the Board of Supervisors of the Financial Services Authority (B).
• Member of the Board of Trustees of Guberna (formerly Belgian Governance Institute) (B).
• Honorary Consul of France.• Manager of Agriger S.P.R.L. (B).
Albert FrèreCEO and Managing Director
List of activities and other mandates exercised in Belgian and foreign companies in 2011• Chairman of the Board of Directors of Frère-Bourgeois S.A. (B),
Financière de la Sambre S.A. (B), Erbe S.A. (B) and Stichting Administratiekantoor Frère-Bourgeois (NL).
• Chairman of the Supervisory Board of Métropole Télévision (M6) (F).
• Vice-Chairman and Managing Director of Pargesa Holding S.A. (CH).
• Vice-Chairman of the Board of Directors of GDF SUEZ (F).• Honorary Chairman of Chambre de Commerce et d’Industrie
de Charleroi (B).• Honorary Regent of the National Bank of Belgium S.A. (B).• Director of LVMH S.A. (F), Société Civile du Château
Cheval Blanc (F), Les Amis des Aveugles (B) and Groupe Arnault S.A. (F) as permanent representative of Belholding Belgium S.A.
• Manager of GBL Verwaltung S.à r.l. (L) and GBL Energy S.à r.l. (L) as permanent representative of Frère-Bourgeois S.A.
• Member of the Board of Directors of Université du Travail Paul Pastur (B).
• Member of the Strategy Planning Board of Université Libre de Bruxelles (B).
160 AnnuAl RepoRt 2011
Appendix – Offices of Directors
List of activities and other mandates exercised in Belgian and foreign companies between 2007 and 2010Financial year 2010• Chairman of the Board of Directors of Frère-Bourgeois S.A.
(B), Financière de la Sambre S.A. (B), Erbe S.A. (B) and Stichting Administratiekantoor Frère-Bourgeois (NL).
• Chairman of the Supervisory Board of Métropole Télévision (M6) (F).
• Vice-Chairman and Managing Director of Pargesa Holding S.A. (CH).
• Vice-Chairman of the Board of Directors of GDF SUEZ (F).• Honorary Chairman of Chambre de Commerce et d’Industrie
de Charleroi (B).• Honorary Regent of the National Bank of Belgium S.A. (B).• Director of LVMH S.A. (F), Société Civile du Château Cheval
Blanc (F), Les Amis des Aveugles (B) and Groupe Arnault S.A. (F) as permanent representative of Belholding Belgium S.A.
• Manager of GBL Verwaltung S.à r.l. (L) and GBL Energy S.à r.l. (L) as permanent representative of Frère-Bourgeois S.A.
• Member of the International Committee of Assicurazioni Generali SpA (I) (until May 2010).
• Member of the Board of Directors of Université du Travail Paul Pastur (B).
• Member of the Strategy Planning Board of Université Libre de Bruxelles (B).
Financial year 2009• Chairman of the Board of Directors of Frère-Bourgeois S.A. (B),
Financière de la Sambre S.A. (B), Erbe S.A. (B), Fingen S.A. (B) (until April 2009) and Stichting Administratie-kantoor Frère-Bourgeois (NL).
• Chairman of the Supervisory Board of Métropole Télévision (M6) (F).
• Vice-Chairman and Managing Director of Pargesa Holding S.A. (CH).
• Vice-Chairman of the Board of Directors of GDF SUEZ (F).• Honorary Chairman of Chambre de Commerce et d’Industrie
de Charleroi (B).• Honorary Regent of the National Bank of Belgium S.A. (B).• Director of LVMH S.A. (F), Société Civile du Château Cheval
Blanc (F), Raspail Investissements (F), Gruppo Banca Leonardo (I) (until April 2009), Les Amis des Aveugles (B), Fondation FRESERTH (B), Centre TSIRA A.S.B.L. (B) and Groupe Arnault S.A. (F) as permanent representative of Belholding Belgium S.A.
• Manager of GBL Verwaltung S.à r.l. (L) and GBL Energy S.à r.l. (L) as permanent representative of Frère-Bourgeois S.A.
• Member of the International Committee of Assicurazioni Generali SpA (I).
• Member of the Board of Directors of Université du Travail Paul Pastur (B).
• Member of the Strategy Planning Board of Université Libre de Bruxelles (B).
Financial year 2008• Chairman of the Board of Directors of Frère-Bourgeois S.A. (B),
Financière de la Sambre S.A. (B), Erbe S.A. (B), Fingen S.A. (B) and Stichting Administratiekantoor Frère-Bourgeois (NL).
• Chairman of the Supervisory Board of Métropole Télévision (M6) (F).
• Vice-Chairman and Managing Director of Pargesa Holding S.A. (CH).
• Director (since 16 July 2008) and Vice-Chairman (since 17 December 2008) of the Board of Directors of GDF SUEZ (F).
• Honorary Chairman of Chambre de Commerce et d’Industrie de Charleroi (B).
• Honorary Regent of the National Bank of Belgium S.A. (B).• Director of LVMH S.A. (F), Société Civile du Château
Cheval Blanc (F), Raspail Investissements (F), Gruppo Banca Leonardo (I), Les Amis des Aveugles (B), Fondation FRESERTH (B), Centre TSIRA A.S.B.L. (B) and Groupe Arnault S.A. (F) as permanent representative of Belholding Belgium S.A.
• Manager of GBL Verwaltung S.à r.l. (L) as permanent representative of Frère-Bourgeois S.A.
• Member of the International Committee of Assicurazioni Generali SpA (I).
• Member of the Board of Directors of Université du Travail Paul Pastur (B).
• Member of the Strategy Planning Board of Université Libre de Bruxelles (B).
Financial year 2007• Chairman of the Board of Directors of Frère-Bourgeois S.A. (B),
Financière de la Sambre S.A. (B), Erbe S.A. (B), Fingen S.A. (B) and Stichting Administratiekantoor Frère-Bourgeois (NL).
• Chairman of the Supervisory Board of Métropole Télévision (M6) (F).
• Vice-Chairman and Managing Director of Pargesa Holding S.A. (CH).
• Vice-Chairman of the Board of Directors of Suez (F).• Honorary Chairman of Chambre de Commerce et d’Industrie
de Charleroi (B).• Honorary Regent of the National Bank of Belgium S.A. (B).• Director of LVMH S.A. (F), Société Civile du Château
Cheval Blanc (F), Raspail Investissements (F), Gruppo Banca Leonardo (I), Les Amis des Aveugles (B), Fondation FRESERTH (B), Centre TSIRA A.S.B.L. (B) and Groupe Arnault S.A. (F) as permanent representative of Belholding Belgium S.A.
• Manager of GBL Verwaltung S.à r.l. (L) as permanent representative of Frère-Bourgeois S.A.
• Member of the International Committee of Assicurazioni Generali SpA (I).
• Member of the Board of Directors of Université du Travail Paul Pastur (B).
• Member of the Strategy Planning Board of Université Libre de Bruxelles (B).
AnnuAl RepoRt 2011 161
Paul DesmaraisVice-Chairman of the Board of Directors
List of activities and other mandates exercised in Belgian and foreign companies in 2011• Director and Chairman of the Executive Committee of Power
Corporation of Canada (CDN).• Managing Director and Chairman of the Board of Directors
of Pargesa Holding S.A. (CH).• Director and Chairman of the Board of Power Corporation
International (CDN).• Director and Member of the Executive Committee of Power
Financial Corporation (CDN).• Director of La Presse Ltd. (CDN), Gesca Ltd. (CDN) and Square
Victoria Communications Group Inc. (CDN).
List of activities and other mandates exercised in Belgian and foreign companies between 2007 and 2010Financial year 2010• Director and Chairman of the Executive Committee of Power
Corporation of Canada (CDN).• Managing Director and Chairman of the Board of Directors
of Pargesa Holding S.A. (CH).• Director and Chairman of the Board of Power Corporation
International (CDN).• Director and Member of the Executive Committee of Power
Financial Corporation (CDN).• Director of La Presse Ltd. (CDN), Gesca Ltd. (CDN), Barrick
Power Gold Corporation of China Ltd. (HK) (until 10 February 2010), 3819787 Canada Inc. (CDN) (until 30 March 2010) and Square Victoria Communications Group Inc. (CDN) (since 23 February 2010).
Financial year 2009• Director and Chairman of the Executive Committee of Power
Corporation of Canada (CDN).• Managing Director and Chairman of the Board of Directors
of Pargesa Holding S.A. (CH).• Director and Chairman of the Board of Power Corporation
International (CDN).• Director and Member of the Executive Committee of Power
Financial Corporation (CDN).• Director of La Presse Ltd. (CDN), Gesca Ltd. (CDN),
Corporation d’Investissements en Technologies Power (CDN) (until 13 July 2009), Barrick Power Gold Corporation of China Ltd. (HK) and 3819787 Canada Inc. (CDN).
Financial year 2008• Director and Chairman of the Executive Committee of Power
Corporation of Canada (CDN).• Managing Director and Chairman of the Board of Directors
of Pargesa Holding S.A. (CH).• Director and Chairman of the Board of Power Corporation
International (CDN). • Director and Member of the Executive Committee of Power
Financial Corporation (CDN).
• Director of La Presse Ltd. (CDN), Gesca Ltd. (CDN), Corporation d’Investissements en Technologies Power (CDN), Canada Life Capital Corporation Inc. (CDN) (until 25 July 2008), Barrick Power Gold Corporation of China Ltd. (HK) and 3819787 Canada Inc. (CDN).
Financial year 2007• Director and Chairman of the Executive Committee of Power
Corporation of Canada (CDN).• Managing Director and Chairman of the Board of Directors
of Pargesa Holding S.A. (CH).• Director and Chairman of the Board of Power Corporation
International (CDN). • Director and Member of the Executive Committee of Power
Financial Corporation (CDN).• Director of Les Journaux Trans-Canada (1996) Inc. (CDN),
Gesca Ltd. (CDN), Corporation d’Investissements en Technologies Power (CDN), Canada Life Capital Corporation Inc. (CDN), Barrick Power Gold Corporation of China Ltd. (HK), 3819787 Canada Inc. (CDN) and La Presse Ltd. (CDN).
• Member of the International Advisory Board of Barrick Gold Corporation (CDN) (until 25 May 2007).
Paul Desmarais, jrVice-Chairman of the Board of Directors
List of activities and other mandates exercised in Belgian and foreign companies in 2011• Chairman of the Board and co-Chief Management Officer
of Power Corporation of Canada (CDN).• Co-Chairman of the Board of Power Financial
Corporation (CDN).• Director and Chairman of the Board of 171263
Canada Inc. (CDN) • Vice-Chairman of the Board and Managing Director
of Pargesa Holding S.A. (CH).• Director of 152245 Canada Inc. (CDN), The Canada Life
Assurance Company (CDN), Canada Life Financial Corporation (CDN), Canada Life Capital Corporation Inc. (CDN), The Canada Life Insurance Company of Canada (CDN), Canada Life Insurance Company of America (USA), Crown Life Insurance Company (CDN), Gesca Ltd. (CDN), Great-West Life & Annuity Insurance Company (USA), Great-West Lifeco Inc. (CDN), The Great-West Life Assurance Company (CDN), GWL&A Financial Inc. (USA), Great-West Financial (Canada) Inc. (CDN), Great-West Financial (Nova Scotia) Co. (CDN), First Great-West Life & Annuity Insurance Company (USA), IGM Financial Inc. (CDN), Investors Group Inc. (CDN), Lafarge (F), La Presse Ltd. (CDN), London Insurance Group Inc. (CDN), Parjointco N.V. (NL), Power Communications Inc. (CDN), Power Corporation International (CDN), Power Financial Europe B.V. (NL), Putnam Investment, LLC (USA) and Total S.A. (F).
• Director and Member of the Nominations Committee and of the Compensation Committee of GDF SUEZ (F).
• Director and Member of the Executive Committee of London Life Insurance Company (CDN) and Mackenzie Inc. (CDN).
• Chairman of the Advisory Committee of Sagard Private Equity Partners (F).

162 AnnuAl RepoRt 2011
Appendix – Offices of Directors
List of activities and other mandates exercised in Belgian and foreign companies between 2007 and 2010Financial year 2010• Chairman of the Board and co-Chief Management Officer
of Power Corporation of Canada (CDN).• Co-Chairman of the Board of Power Financial
Corporation (CDN).• Director and Chairman of the Board of 171263
Canada Inc. (CDN) • Vice-Chairman of the Board and Managing Director
of Pargesa Holding S.A. (CH).• Director of 152245 Canada Inc. (CDN), The Canada Life
Assurance Company (CDN), Canada Life Financial Corporation (CDN), Canada Life Capital Corporation Inc. (CDN), The Canada Life Insurance Company of Canada (CDN), Canada Life Insurance Company of America (USA), Crown Life Insurance Company (CDN), Gesca Ltd. (CDN), Great-West Life & Annuity Insurance Company (USA), Great-West Lifeco Inc. (CDN), The Great-West Life Assurance Company (CDN), GWL&A Financial Inc. (USA), Great-West Financial (Canada) Inc. (CDN), Great-West Financial (Nova Scotia) Co. (CDN), First Great-West Life & Annuity Insurance Company (USA), IGM Financial Inc. (CDN), Investors Group Inc. (CDN), Lafarge (F), La Presse Ltd. (CDN), London Insurance Group Inc. (CDN), Parjointco N.V. (NL), Power Communications Inc. (CDN), Power Corporation International (CDN), Power Financial Europe B.V. (NL), Putnam Investment, LLC (USA) and Total S.A. (F).
• Director and Member of the Nominations Committee and of the Compensation Committee of GDF SUEZ (F).
• Director and Member of the Executive Committee of London Life Insurance Company (CDN) and Mackenzie Inc. (CDN).
• Chairman of the Advisory Committee of Sagard Private Equity Partners (F).
Financial year 2009• Chairman of the Board and co-Chief Management Officer
of Power Corporation of Canada (CDN).• Co-Chairman of the Board of Power Financial
Corporation (CDN).• Director and Chairman of the Board of 171263
Canada Inc. (CDN) • Director and Vice-Chairman of the Board of 3819787
Canada Inc. (CDN).• Vice-Chairman of the Board and Managing Director
of Pargesa Holding S.A. (CH).• Director of 152245 Canada Inc. (CDN), The Canada Life
Assurance Company (CDN), Canada Life Financial Corporation (CDN), Canada Life Capital Corporation Inc. (CDN), The Canada Life Insurance Company of Canada (CDN), Canada Life Insurance Company of America (USA), Crown Life Insurance Company (CDN), Gesca Ltd. (CDN), Great-West Life & Annuity Insurance Company (USA), Great-West Lifeco Inc. (CDN), The Great-West Life Assurance Company (CDN), GWL&A Financial Inc. (USA), Great-West Financial (Canada) Inc. (CDN), Great-West Financial (Nova Scotia) Co. (CDN), First Great-West Life & Annuity Insurance Company (USA), IGM Financial Inc. (CDN), Investors Group Inc. (CDN), Lafarge (F), La Presse Ltd. (CDN), London Insurance Group Inc. (CDN), Parjointco N.V. (NL), Power
Communications Inc. (CDN), Power Corporation International (CDN), Power Financial Europe B.V. (NL), Putnam Investment, LLC (USA) and Total S.A. (F).
• Director and Member of the Nominations Committee and of the Compensation Committee of GDF SUEZ (F).
• Director and Member of the Executive Committee of London Life Insurance Company (CDN) and Mackenzie Inc. (CDN).
• Chairman of the Advisory Committee of Sagard Private Equity Partners (F).
Financial year 2008• Chairman of the Board and co-Chief Management Officer
of Power Corporation of Canada (CDN).• Co-Chairman of the Board of Power Financial Corporation
(CDN) (since May 2008).• Director and Chairman of the Board of 171263
Canada Inc. (CDN) and 2795957 Canada Inc. (CDN) (until December 2008).
• Director and Vice-Chairman of the Board of 3819787 Canada Inc. (CDN).
• Vice-Chairman of the Board and Managing Director of Pargesa Holding S.A. (CH).
• Director of 152245 Canada Inc. (CDN), The Canada Life Assurance Company (CDN), Canada Life Financial Corporation (CDN), Canada Life Capital Corporation Inc. (CDN), The Canada Life Insurance Company of Canada (CDN), Canada Life Insurance Company of America (USA), Crown Life Insurance Company (CDN), Gesca Ltd. (CDN), Great-West Life & Annuity Insurance Company (USA), Great-West Lifeco Inc. (CDN), The Great-West Life Assurance Company (CDN), GWL&A Financial Inc. (USA), Great-West Financial (Canada) Inc. (CDN), Great-West Financial (Nova Scotia) Co. (CDN), First Great-West Life & Annuity Insurance Company (USA), IGM Financial Inc. (CDN), Investors Group Inc. (CDN), Lafarge (F), La Presse Ltd. (CDN), London Insurance Group Inc. (CDN), Parjointco N.V. (NL), Power Communications Inc. (CDN), Power Corporation International (CDN), Power Financial Europe B.V. (NL), Putnam Investment, LLC (USA) and Total S.A. (F).
• Director and Member of the Nominations Committee and of the Compensation Committee of GDF SUEZ (F).
• Director and Member of the Executive Committee of London Life Insurance Company (CDN) and Mackenzie Inc. (CDN).
• Chairman of the Advisory Committee of Sagard Private Equity Partners (F).
Financial year 2007• Chairman of the Board and co-Chief Management Officer
of Power Corporation of Canada (CDN).• Chairman of the Executive Committee of Power Financial
Corporation (CDN).• Vice-Chairman of the Board of Directors and Member
of the Strategic Committee of Imerys (F).• Director and Chairman of the Board of 171263
Canada Inc. (CDN) and 2795957 Canada Inc. (CDN). • Director and Vice-Chairman of the Board of 3819787
Canada Inc. (CDN).• Vice-Chairman of the Board and Managing Director
of Pargesa Holding S.A. (CH).

AnnuAl RepoRt 2011 163
• Director of 152245 Canada Inc. (CDN), The Canada Life Assurance Company (CDN), Canada Life Financial Corporation (CDN), Canada Life Capital Corporation Inc. (CDN), The Canada Life Insurance Company of Canada (CDN) (since May 2007), Canada Life Insurance Company of America (USA), Crown Life Insurance Company (CDN) (since November 2007), Gesca Ltd. (CDN), Great-West Life & Annuity Insurance Company (USA), Great-West Lifeco Inc. (CDN), The Great-West Life Assurance Company (CDN), GWL&A Financial Inc. (USA), Great-West Financial (Canada) Inc. (CDN), Great-West Financial (Nova Scotia) Co. (CDN), First Great-West Life & Annuity Insurance Company (USA), Groupe La Poste (F) (until September 2007), IGM Financial Inc. (CDN), Investors Group Inc. (CDN), La Presse Ltd. (CDN), Les Journaux Trans-Canada (1996) Inc. (CDN), London Insurance Group Inc. (CDN), Parjointco N.V. (NL), Power Communications Inc. (CDN), Power Corporation International (CDN), Power Financial Europe B.V. (NL), Putnam Investment, LLC (USA) (since November 2007) and Total S.A. (F).
• Director and Member of the Remuneration Committee of Suez (F).
• Director and Member of the Executive Committee of London Life Insurance Company (CDN) and Mackenzie Inc. (CDN).
• Chairman of the Advisory Committee of Sagard Private Equity Partners (F).
Thierry de RudderVice-Chairman of the Board of Directors
List of activities and other mandates exercised in Belgian and foreign companies in 2011• Director of Compagnie Nationale à Portefeuille S.A. (B)
(until October 2011), GDF SUEZ (F), Electrabel (B) (since November 2011), Lafarge (F) and Total S.A. (F).
• Member of the Audit Committee of GDF SUEZ (F), Lafarge (F), Electrabel (B) (since November 2011) and Total S.A. (F).
• Chairman of the Strategy and Investment Committee of GDF SUEZ (F).
• Member of the Remuneration Committee of Lafarge (F).
List of activities and other mandates exercised in Belgian and foreign companies between 2007 and 2010Financial year 2010• Director of Compagnie Nationale à Portefeuille S.A. (B),
GDF SUEZ (F), Imerys (F) (until 29 April 2010), Lafarge (F), Suez-Tractebel S.A. (B) (until 27 April 2010) and Total S.A. (F).
• Member of the Audit Committee of GDF SUEZ (F), Lafarge (F), Suez-Tractebel S.A. (B) (until 27 April 2010) and Total S.A. (F).
• Member of the Strategic Committee of Imerys (F) (until 29 April 2010).
• Chairman of the Strategy and Investment Committee of GDF SUEZ (F).
• Member of the Remuneration Committee of Lafarge (F).
Financial year 2009• Director of Compagnie Nationale à Portefeuille S.A. (B),
GDF SUEZ (F), Imerys (F), Lafarge (F), Suez-Tractebel S.A. (B) and Total S.A. (F).
• Member of the Audit Committee of GDF SUEZ (F), Lafarge (F), Suez-Tractebel S.A. (B) and Total S.A. (F).
• Member of the Strategic Committee of Imerys (F).• Member of the Strategy and Investment Committee
of GDF SUEZ (F).• Member of the Remuneration Committee of Lafarge (F).
Financial year 2008• Director of Compagnie Nationale à Portefeuille S.A. (B),
GDF SUEZ (F) (since July 2008), Imerys (F), Lafarge (F) (since January 2008), Suez-Tractebel S.A. (B) and Total S.A. (F).
• Member of the Audit Committee of Suez-Tractebel S.A. (B), Total S.A. (F) and GDF SUEZ (F) (since July 2008).
• Member of the Audit Committee of Lafarge (F).• Member of the Strategic Committee of Imerys (F).• Member of the Strategy and Investment Committee
of GDF SUEZ (F) (since July 2008).• Member of the Remuneration Committee of Lafarge (F).
Financial year 2007• Director of Compagnie Nationale à Portefeuille S.A. (B),
Imerys (F), Suez (F), Suez-Tractebel S.A. (B) and Total S.A. (F).• Member of the Audit Committee of Suez-Tractebel S.A. (B)
and Total S.A. (F).• Member of the Strategic Committee of Imerys (F).
Ian GallienneManaging Director
List of activities and other mandates exercised in Belgian and foreign companies in 2011• Managing Director of Ergon Capital Partners S.A. (B),
Ergon Capital Partners II S.A. (B) and Ergon Capital Partners III S.A. (B).
• Director of Ergon Capital S.A. (B), Seves SpA (I), Steel Partners N.V. (B), PLU Holding S.A.S. (F), ELITech Group S.A.S. (F), Publihold S.A. (B) (since April 2011), Gruppo Banca Leonardo SpA (I), Imerys (F), Lafarge (F) (since November 2011), Central Parc Villepinte S.A. (F) (until 31 July 2011) and Fonds de dotation du Palais (F).
• Manager of Egerton S.à r.l. (L) and Ergon Capital II S.à r.l. (L).
List of activities and other mandates exercised in Belgian and foreign companies between 2007 and 2010Financial year 2010• Managing Director of Ergon Capital Partners S.A. (B),
Ergon Capital Partners II S.A. (B) and Ergon Capital Partners III S.A. (B).
• Director of Ergon Capital S.A. (B), Seves SpA (I), Arno Glass S.A. (L), Steel Partners N.V. (B), PLU Holding S.A.S. (F), ELITech Group S.A.S. (F), Gruppo Banca Leonardo SpA (I), Imerys (F), Central Parc Villepinte S.A. (F) and Fonds de dotation du Palais (F).
• Manager of Egerton S.à r.l. (L) and Ergon Capital II S.à r.l. (L).

164 AnnuAl RepoRt 2011
Appendix – Offices of Directors
Financial year 2009• Managing Director of Ergon Capital Partners S.A. (B)
and Ergon Capital Partners II S.A. (B).• Director of Ergon Capital S.A. (B), Seves SpA (I), Arno
Glass S.A. (L), Central Parc Villepinte S.A. (F), Steel Partners N.V. (B), PLU Holding S.A.S. (F), Fapakt S.A. (B) (until 30 June 2009), Gruppo Banca Leonardo SpA (I) and Fonds de dotation du Palais (F).
• Manager of Egerton S.à r.l. (L) and Ergon Capital II S.à r.l. (L).
Financial year 2008• Managing Director of Ergon Capital Partners S.A. (B) and
Ergon Capital Partners II S.A. (B).• Director of Ergon Capital S.A. (B), Seves SpA (I), Arno
Glass S.A. (L), Central Parc Villepinte S.A. (F), Steel Partners N.V. (B), PLU Holding S.A.S. (F), Fapakt S.A. (B) and Nicotra Gebhardt SpA (I) (until May 2008).
• Manager of Egerton S.à r.l. (L) and Ergon Capital II S.à r.l. (L).
Financial year 2007• Managing Director of Ergon Capital Partners S.A. (B) and
Ergon Capital Partners II S.A. (B).• Director of Ergon Capital S.A. (B), Seves SpA (I), Arno
Glass S.A. (L), Central Parc Villepinte S.A. (F), King Benelux Holding B.V. (B) (until 29 August 2007), King Belgium (B) (until August 2007), King Nederland (NL) (until August 2007) and Stroili Oro SpA (I).
• Manager of Egerton S.à r.l. (L) and Ergon Capital II S.à r.l. (L).
Gérard LamarcheManaging Director
List of activities and other mandates exercised in Belgian and foreign companies in 2011• Director of Legrand (F), Electrabel (B) (until 31 December 2011),
Suez Environnement Company (F) (from 19 May 2011 to 31 December 2011), International Power plc. (GB) (from 3 February 2011 to 8 December 2011), Europalia (B) (until 12 October 2011), GDF SUEZ Belgium (B) (until 1 October 2011), Aguas de Barcelona (ES) (until 28 June 2011), GDF SUEZ Energie Services (F) (until 16 June 2011) and Suez-Tractebel S.A. (B) (until 25 January 2011).
List of activities and other mandates exercised in Belgian and foreign companies between 2007 and 2010Financial year 2010• Director of Legrand (F), Electrabel (B), Europalia (B),
Suez-Tractebel S.A. (B), GDF SUEZ Belgium (B) (since 2 December 2010), Aguas de Barcelona (ES), GDF SUEZ Energie Services (F) and Fortis Banque S.A. (B) (until 2 July 2010).
Financial year 2009• Director of Legrand (F), Electrabel (B), Europalia (B) (since
21 October 2009), Aguas de Barcelona (ES), GDF SUEZ Energie Services (F), Suez-Tractebel S.A. (B), Fortis Banque S.A. (B) (since 14 May 2009), Leo Holding Company (USA) (until 15 May 2009) and Suez Environnement North America (USA) (until 31 December 2009).
Financial year 2008• Director and Chairman of Genfina (B) (until 18 December 2008),
GDF SUEZ CC (B) (until 28 November 2008). • Director of Legrand (F), Electrabel (B), Aguas de
Barcelona (ES), GDF SUEZ Energie Services (F), Suez-Tractebel S.A. (B), Leo Holding Company (USA), Suez Environnement North America (USA), Suez Environnement Company (F) (until 15 July 2008), Suez Environnement (F) (until 28 October 2008) and Distrigaz (B) (until 30 October 2008).
Financial year 2007• Director and Chairman of Genfina (B), GDF SUEZ CC (B). • Director of Legrand (F), Electrabel (B), Aguas de
Barcelona (ES), GDF SUEZ Energie Services (F), Suez-Tractebel S.A. (B), Leo Holding Company (USA), Suez Environnement North America (USA), Suez Environnement Company (F) (since 5 December 2007), Suez Environnement (F) and Distrigaz (B).
Antoinette d’Aspremont LyndenDirector
List of activities and other mandates exercised in Belgian and foreign companies in 2011None
List of activities and other mandates exercised in Belgian and foreign companies between 2007 and 2010Financial year 2010None
Financial year 2009None
Financial year 2008None
Financial year 2007None
Jean-Louis BeffaDirector
List of activities and other mandates exercised in Belgian and foreign companies in 2011• Director of Compagnie de Saint-Gobain (F), GDF SUEZ (F)
and Saint-Gobain Corporation (USA).• Member of the Board of Supervisors of Le Monde S.A. (F),
Le Monde & Partenaires Associés S.A.S. (F), Société Editrice du Monde S.A. (F) and Siemens AG (D).
• Chairman of Claude Bernard Participations S.A.S. (F).• Vice-Chairman of the Supervisory Board of Fonds de Réserve
des Retraites (F).• Chairman of JL2B Conseils (F).
AnnuAl RepoRt 2011 165
List of activities and other mandates exercised in Belgian and foreign companies between 2007 and 2010Financial year 2010• Chairman of the Board of Directors of Compagnie de
Saint-Gobain (F).• Vice-Chairman of the Board of Directors of BNP Paribas (F)
(until 1 July 2010).• Director of GDF SUEZ (F) and Saint-Gobain Corporation (USA).• Member of the Board of Supervisors of Le Monde S.A. (F),
Le Monde & Partenaires Associés S.A.S. (F), Société Editrice du Monde S.A. (F) and Siemens AG (D).
• Chairman of Claude Bernard Participations S.A.S. (F).• Vice-Chairman of the Supervisory Board of Fonds de Réserve
des Retraites (F).• Chairman of JL2B Conseils (F).
Financial year 2009• Chairman of the Board of Directors of Compagnie
de Saint-Gobain (F). • Vice-Chairman of the Board of Directors of BNP Paribas (F).• Director of GDF SUEZ (F) and Saint-Gobain Corporation (USA).• Member of the Board of Supervisors of Le Monde S.A. (F),
Le Monde & Partenaires Associés S.A.S. (F), Société Editrice du Monde S.A. (F) and Siemens AG (D).
• Chairman of Claude Bernard Participations S.A.S. (F).• Vice-Chairman of the Supervisory Board of Fonds de Réserve
des Retraites (F).
Financial year 2008• Chairman of the Board of Directors of Compagnie
de Saint-Gobain (F).• Vice-Chairman of the Board of Directors of BNP Paribas (F).• Director of GDF SUEZ (F) and Saint-Gobain Corporation (USA).• Member of the Board of Supervisors of Le Monde S.A. (F),
Le Monde & Partenaires Associés S.A.S. (F), Société Editrice du Monde S.A. (F) and Siemens AG (D).
• Chairman of Claude Bernard Participations S.A.S. (F).• Vice-Chairman of the Supervisory Board of Fonds de Réserve
des Retraites (F).
Financial year 2007• Chairman-Chief Executive Officer of Compagnie
de Saint-Gobain (F).• Vice-Chairman of the Board of Directors of BNP Paribas (F).• Director of Gaz de France (F), Saint-Gobain Cristaleria (ES)
and Saint-Gobain Corporation (USA).• Chairman of the Supervisory Board of Agence de l’Innovation
Industrielle (F).• Member of the Board of Supervisors of Le Monde S.A. (F),
Le Monde & Partenaires Associés S.A.S. (F) and Société Editrice du Monde S.A. (F).
• Chairman of the Managing Committee of Claude Bernard Participations S.A.S. (F).
• Vice-Chairman of the Supervisory Board of Fonds de Réserve des Retraites (F).
• Permanent representative of Saint-Gobain PAM (F).
Georges Chodron de CourcelDirector
List of activities and other mandates exercised in Belgian and foreign companies in 2011• Chief Operating Officer of BNP Paribas (F).• Director and Member of the Audit Committee
of Alstom S.A. (F).• Director and Member of the Accounts Committee
of Bouygues S.A. (F) and Nexans S.A. (F).• Director, Member of the Nomination and Remuneration
Committee and Member of the Audit Committee of FFP (F). • Member of the Supervisory Board and Member
of the Nomination and Remuneration Committee of Lagardère S.C.A. (F).
• Censor and Member of the Nomination and Remuneration Committee of SCOR SE (F).
• Censor of Safran S.A. (F) (until 21 April 2011) and Exane S.A. (F).
• Chairman of BNP Paribas Suisse S.A. (CH), Compagnie d’Investissement de Paris S.A.S. (F) and Financière BNP Paribas S.A.S. (F).
• Vice-Chairman of Fortis Banque S.A./N.V. (B).• Director of Compagnie Nationale à Portefeuille S.A. (B)
(since 3 October 2011), Erbe S.A. (B), SCOR Holding (Switzerland) Ltd. (CH), SCOR Global Life Rückversicherung Schweiz AG (CH), SCOR Switzerland Ltd. (CH) and Verner Investissements S.A.S. (F).
List of activities and other mandates exercised in Belgian and foreign companies between 2007 and 2010Financial year 2010• Chief Operating Officer of BNP Paribas (F).• Director and Member of the Audit Committee
of Alstom S.A. (F).• Director and Member of the Accounts Committee
of Bouygues S.A. (F) and Nexans S.A. (F).• Director, Member of the Nomination and Remuneration
Committee and Member of the Audit Committee (since 26 August 2010) of FFP (F).
• Member of the Supervisory Board and Member of the Nomination and Remuneration Committee (since 2010) of Lagardère S.C.A. (F).
• Censor and Member of the Nomination and Remuneration Committee of SCOR SE (F).
• Censor of Safran S.A. (F) and Exane S.A. (F).• Chairman of BNP Paribas Suisse S.A. (CH), Compagnie
d’Investissement de Paris S.A.S. (F) and Financière BNP Paribas S.A.S. (F).
• Vice-Chairman of Fortis Banque S.A./N.V. (B).• Director of Erbe S.A. (B), SCOR Holding (Switzerland) Ltd. (CH),
SCOR Global Life Rückversicherung Schweiz AG (CH), SCOR Switzerland Ltd. (CH) and Verner Investissements S.A.S. (F).

166 AnnuAl RepoRt 2011
Appendix – Offices of Directors
Financial year 2009• Chief Operating Officer of BNP Paribas (F).• Director and Member of the Audit Committee of Alstom S.A. (F).• Director and Member of the Accounts Committee
of Bouygues S.A. (F) and Nexans S.A. (F).• Director and Member of the Nomination and Remuneration
Committee of FFP (F). • Member of the Board of Supervisors of Lagardère S.C.A. (F).• Censor and Member of the Nomination and Remuneration
Committee of SCOR SE (F).• Censor of Safran S.A. (F) and Exane S.A. (F).• Chairman of BNP Paribas Suisse S.A. (CH), Compagnie
d’Investissement de Paris S.A.S. (F) and Financière BNP Paribas S.A.S. (F).
• Vice-Chairman of Fortis Banque S.A./N.V. (B) (since 14 May 2009).
• Director of Erbe S.A. (B), SCOR Holding (Switzerland) Ltd. (CH), SCOR Global Life Rückversicherung Schweiz AG (CH), SCOR Switzerland Ltd. (CH), Verner Investissements S.A.S. (F) and BNP Paribas ZAO (Russia) (until 30 July 2009).
Financial year 2008• Chief Operating Officer of BNP Paribas (F).• Director and Member of the Audit Committee of Alstom S.A. (F).• Director and Member of the Accounts Committee
of Bouygues S.A. (F) and Nexans S.A. (F).• Director of Erbe S.A. (B), FFP (F), SCOR Holding
(Switzerland) Ltd. (CH), Verner Investissements S.A.S. (F), BNP Paribas ZAO (Russia) and Banca Nazionale del Lavoro (I) (until 1 September 2008).
• Member of the Supervisory Board of Lagardère S.C.A. (F).• Censor and Member of the Nomination and Remuneration
Committee of SCOR SE (F).• Censor of Safran S.A. (F) and Exane S.A. (F).• Chairman of BNP Paribas Suisse S.A. (CH), Compagnie
d’Investissement de Paris S.A.S. (F) and Financière BNP Paribas S.A.S. (F).
Financial year 2007• Chief Operating Officer of BNP Paribas (F).• Director and Member of the Nomination and Remuneration
Committee (until May 2007) then of the Audit Committee of Alstom S.A. (F).
• Director and Member of the Accounts Committee of Bouygues S.A. (F) and Nexans S.A. (F).
• Director of Erbe S.A. (B), FFP (F), SCOR Holding (Switzerland) Ltd. (CH), Verner Investissements S.A.S. (F), BNP Paribas ZAO (Russia) and Banca Nazionale del Lavoro (I).
• Member of the Board of Supervisors of Lagardère S.C.A. (F).• Censor and Member of the Nomination and Remuneration
Committee of SCOR SE (F).• Censor of Safran S.A. (F) and Exane S.A. (F).• Chairman of BNP Paribas Suisse S.A. (CH), Compagnie
d’Investissement de Paris S.A.S. (F), Financière BNP Paribas S.A.S. (F) and BNP Paribas UK Holdings Ltd. (UK) (until September 2007).
Victor DelloyeDirector
List of activities and other mandates exercised in Belgian and foreign companies in 2011• Director – General Secretary of Compagnie Nationale
à Portefeuille S.A. (formerly Fingen S.A.) (B) (since 3 October 2011), Compagnie Nationale à Portefeuille S.A. (B) (until 3 October 2011), Compagnie Immobilière de Roumont S.A. (B), Carpar S.A. (B), Investor S.A. (B), Europart S.A. (B) and Fibelpar S.A. (B).
• Director of Pargesa Holding S.A. (CH), Frère-Bourgeois S.A. (B), Financière de la Sambre S.A. (B), Safimar S.A. (B), Delcortil S.A. (B), Newcor S.A. (B), Société des Quatre Chemins S.A. (B) (until 10 November 2011), Stichting Administratie-kantoor Bierlaire (NL), Stichting Administratiekantoor Peupleraie (NL), Finer S.A. (L) (formerly Erbe Finance S.A.), Filux S.A. (L), Kermadec S.A. (L), Segelux S.A. (L) (formerly Gesecalux S.A.), Cargefin S.A. (L), GB-INNO-BM S.A. (B), GIB Group International S.A. (L) and Safe Lux S.A. (ex-Safe Re (Immo)) (L).
• Director of GIB Corporate Services S.A. (B) as permanent representative of Compagnie Nationale à Portefeuille S.A.
• Auditor of Agesca Nederland N.V. (NL) and Parjointco N.V. (NL).• Vice-Chairman of Association Belge des Sociétés
Cotées A.S.B.L. (B).
List of activities and other mandates exercised in Belgian and foreign companies between 2007 and 2010Financial year 2010• Director – General Secretary of Compagnie Nationale
à Portefeuille S.A. (B), Compagnie Immobilière de Roumont S.A. (B), Carpar S.A. (B), Investor S.A. (B), Europart S.A. (B) and Fibelpar S.A. (B).
• Director of Pargesa Holding S.A. (CH), Frère-Bourgeois S.A. (B), Financière de la Sambre S.A. (B), Fingen S.A. (B), Société des Quatre Chemins S.A. (B), Centre de Coordination de Charleroi S.A. (B) (until 10 December 2010), Stichting Administratie kantoor Bierlaire (NL), Stichting Administratie-kantoor Peupleraie (NL), Erbe Finance S.A. (L), Filux S.A. (L), Kermadec S.A. (L), Gesecalux S.A. (L), Cargefin S.A. (L), GB-INNO-BM S.A. (B), GIB Group International S.A. (L) and Safe Lux S.A. (ex-Safe Re (Immo)) (L).
• Director of GIB Corporate Services S.A. (B) as permanent representative of Compagnie Nationale à Portefeuille S.A.
• Auditor of Agesca Nederland N.V. (NL) and Parjointco N.V. (NL).• Vice-Chairman of Association Belge des Sociétés
Cotées A.S.B.L. (B).
Financial year 2009• Director – General Secretary of Compagnie Nationale
à Portefeuille S.A. (B), Compagnie Immobilière de Roumont S.A. (B), Carpar S.A. (B), Investor S.A. (B), Europart S.A. (B) and Fibelpar S.A. (B).

AnnuAl RepoRt 2011 167
• Director of Pargesa Holding S.A. (CH), Frère-Bourgeois S.A. (B), Financière de la Sambre S.A. (B), Fingen S.A. (B), Société des Quatre Chemins S.A. (B), Centre de Coordination de Charleroi S.A. (B), Manoir de Roumont S.A. (B) (until 15 May 2009), Stichting Administratiekantoor Bierlaire (NL), Stichting Administratiekantoor Peupleraie (NL), Erbe Finance S.A. (L), Filux S.A. (L), Kermadec S.A. (L), Gesecalux S.A. (L), Cargefin S.A. (L), GB-INNO-BM S.A. (B), GIB Group International S.A. (L) and Safe Lux S.A. (ex-Safe Re (Immo)) (L).
• Director of GIB Corporate Services S.A. (B) as permanent representative of Compagnie Nationale à Portefeuille S.A.
• Auditor of Agesca Nederland N.V. (NL), Frère-Bourgeois Holding B.V. (NL) (until 5 June 2009) and Parjointco N.V. (NL).
• Vice-Chairman of Association Belge des Sociétés Cotées A.S.B.L. (B).
Financial year 2008• Director – General Secretary of Compagnie Nationale
à Portefeuille S.A. (B), Compagnie Immobilière de Roumont S.A. (B), Carpar S.A. (B), Investor S.A. (B), Europart S.A. (B) and Fibelpar S.A. (B).
• Director of Pargesa Holding S.A. (CH), Frère-Bourgeois S.A. (B), Financière de la Sambre S.A. (B), Fingen S.A. (B), Société des Quatre Chemins S.A. (B), Centre de Coordination de Charleroi S.A. (B), Manoir de Roumont S.A. (B), Stichting Administratiekantoor Bierlaire (NL), Stichting Administratie-kantoor Peupleraie (NL), Erbe Finance S.A. (L), Filux S.A. (L), Kermadec S.A. (L), Gesecalux S.A. (L), Swifin S.A. (L) (until 23 December 2008), Cargefin S.A. (L), GB-INNO-BM S.A. (B), GIB Group International S.A. (L) and Safe Lux S.A. (ex-Safe Re (Immo)) (L).
• Director of GIB Corporate Services S.A. (B) as permanent representative of Compagnie Nationale à Portefeuille S.A.
• Auditor of Agesca Nederland N.V. (NL), Frère-Bourgeois Holding B.V. (NL) and Parjointco N.V. (NL).
• Vice-Chairman of Association Belge des Sociétés Cotées A.S.B.L. (B).
Financial year 2007• Director – General Secretary of Compagnie Nationale
à Portefeuille S.A. (B), Compagnie Immobilière de Roumont S.A. (B), Carpar S.A. (B), Investor S.A. (B), Europart S.A. (B) and Fibelpar S.A. (B).
• Director of Pargesa Holding S.A. (CH), Frère-Bourgeois S.A. (B), Financière de la Sambre S.A. (B), Fingen S.A. (B), Société des Quatre Chemins S.A. (B), Centre de Coordination de Charleroi S.A. (B), Manoir de Roumont S.A. (B), Stichting Administratiekantoor Bierlaire (NL), Stichting Administratie-kantoor Peupleraie (NL), Erbe Finance S.A. (L), Filux S.A. (L), Kermadec S.A. (L), Gesecalux S.A. (L), Swifin S.A. (L), Cargefin S.A. (L), GB-INNO-BM S.A. (B), GIB Group International S.A. (L) and Safe Lux S.A. (ex-Safe Re (Immo)) (L).
• Director of GIB Corporate Services S.A. (B) as permanent representative of Compagnie Nationale à Portefeuille S.A.
• Liquidator of Loverfin S.A. (B) (until 11 June 2007).• Auditor of Agesca Nederland N.V. (NL), Frère-Bourgeois
Holding B.V. (NL) and Parjointco N.V. (NL).
Maurice LippensDirector
List of activities and other mandates exercised in Belgian and foreign companies in 2011• Chairman of Compagnie Het Zoute (B), Compagnie
Het Zoute Real Estate (B), Compagnie Het Zoute Réserve (B) and Zoute Promotions (B).
• Director of Compagnie Immobilière d’Hardelot (F).• Director and Treasurer of Le Musée des Enfants A.S.B.L. (B).
List of activities and other mandates exercised in Belgian and foreign companies between 2007 and 2010Financial year 2010• Chairman of Compagnie Het Zoute (B), Compagnie
Het Zoute Real Estate (B), Compagnie Het Zoute Réserve (B) and Zoute Promotions (B).
• Director of Finasucre (B) (until July 2010) and Compagnie Immobilière d’Hardelot (F).
• Director and Treasurer of Le Musée des Enfants A.S.B.L. (B).
Financial year 2009• Chairman of Compagnie Het Zoute (B) and Compagnie
Het Zoute Real Estate (B).• Director of Finasucre (B), Groupe Sucrier (B) (until June 2009)
and Iscal Sugar (B) (until June 2009).• Director and Treasurer of Le Musée des Enfants A.S.B.L. (B).
Financial year 2008• Chairman of Fortis S.A./N.V. (B) (until September 2008),
Fortis N.V. (NL) (until September 2008), Fortis Foundation Belgium (B) (until September 2008), Compagnie Het Zoute (B), Compagnie Het Zoute Real Estate (B), Guberna (B) (until October 2008) and Commission Corporate Governance (B) (until October 2008).
• Director of Belgacom (B) (until October 2008), Finasucre (B), Groupe Sucrier (B) and Iscal Sugar (B).
• Director and Treasurer of Le Musée des Enfants A.S.B.L. (B).
Financial year 2007• Chairman of Fortis S.A./N.V. (B), Fortis N.V. (NL), Fortis
Foundation Belgium (B), Compagnie Het Zoute (B), Belgian Governance Institute (B) and Commission Corporate Governance (B).
• Director of Belgacom (B), Total S.A. (F) (until May 2007), Finasucre (B), Groupe Sucrier (B) and Iscal Sugar (B).
• Member of Trilateral Commission and Insead Belgium Council (B).
• Director and Treasurer of Le Musée des Enfants A.S.B.L. (B).
168 AnnuAl RepoRt 2011
Appendix – Offices of Directors
Michel Plessis-BélairDirector
List of activities and other mandates exercised in Belgian and foreign companies in 2011• Director and Executive of Power Corporation of Canada (CDN).• Director of Power Financial Corporation (CDN), Great-West
Lifeco Inc. (CDN), La Great-West, compagnie d’assurance-vie (CDN), Great-West Financial (Canada) Inc. (CDN), Great-West Financial (Nova Scotia) Co. (CDN), GWL&A Financial Inc. (USA), Great-West Life & Annuity Insurance Company (USA), Groupe d’assurances London Inc. (CDN), London Life Compagnie d’assurance-vie (CDN), La Compagnie d’assurance du Canada sur la vie (CDN), Corporation financière Canada-vie (CDN), The Canada Life Assurance Company of Canada (CDN), Crown Life Insurance Company (CDN), IGM Financial Inc. (CDN), Investors Group Inc. (CDN), Mackenzie Inc. (CDN), Victoria Square Ventures Inc. (CDN), Square Victoria Communications Group Inc. (CDN), Gesca Ltd. (CDN), La Presse Ltd. (CDN), 3819787 Canada Inc. (CDN), Power Financial Europe B.V. (NL), Parjointco N.V. (NL), Pargesa Holding S.A. (CH), Lallemand Inc. (CDN), Université de Montréal (CDN) and Hydro-Québec (CDN).
List of activities and other mandates exercised in Belgian and foreign companies between 2007 and 2010Financial year 2010• Director and Executive of Power Corporation of Canada (CDN).• Director of Power Financial Corporation (CDN), Great-West
Lifeco Inc. (CDN), La Great-West, compagnie d’assurance-vie (CDN), Great-West Financial (Canada) Inc. (CDN), Great-West Financial (Nova Scotia) Co. (CDN), GWL&A Financial Inc. (USA), Great-West Life & Annuity Insurance Company (USA), Groupe d’assurances London Inc. (CDN), London Life Compagnie d’assurance-vie (CDN), La Compagnie d’assurance du Canada sur la vie (CDN), Corporation financière Canada-vie (CDN), The Canada Life Assurance Company of Canada (CDN), Crown Life Insurance Company (CDN), IGM Financial Inc. (CDN), Investors Group Inc. (CDN), Mackenzie Inc. (CDN), Victoria Square Ventures Inc. (CDN), Square Victoria Communications Group Inc. (CDN), Gesca Ltd. (CDN), La Presse Ltd. (CDN), 3819787 Canada Inc. (CDN), Power Financial Europe B.V. (NL), Parjointco N.V. (NL), Pargesa Holding S.A. (CH), Lallemand Inc. (CDN), Université de Montréal (CDN) and Hydro-Québec (CDN).
Financial year 2009• Director and Executive of Power Corporation
of Canada (CDN) and Sagard Capital Partners GP Inc. (CDN) (until 4 December 2009).
• Director of Power Financial Corporation (CDN), Great-West Lifeco Inc. (CDN), La Great-West, compagnie d’assurance-vie (CDN), Great-West Financial (Canada) Inc. (CDN), Great-West Financial (Nova Scotia) Co. (CDN), GWL&A Financial Inc. (USA), Great-West Life & Annuity Insurance Company (USA), Groupe d’assurances London Inc. (CDN), London Life Compagnie d’assurance-vie (CDN), La Compagnie d’assurance du Canada sur la vie (CDN), Corporation financière Canada-vie (CDN), The Canada Life Assurance Company of Canada (CDN), Canada Life Insurance Company of America (USA), Crown Life Insurance Company (CDN), IGM Financial Inc. (CDN), Investors Group Inc. (CDN), Mackenzie Inc. (CDN), Victoria Square Ventures Inc. (CDN), Gesca Ltd. (CDN), La Presse Ltd. (CDN), 3819787 Canada Inc. (CDN), Power Financial Europe B.V. (NL), Parjointco N.V. (NL), Pargesa Holding S.A. (CH), Sagard Capital Partners Management Corp. (CDN) (until 4 December 2009), Lallemand Inc. (CDN), Université de Montréal (CDN) and Hydro-Québec (CDN).
Financial year 2008• Director and Executive of Power Corporation
of Canada (CDN) and Sagard Capital Partners GP Inc. (CDN).• Director of Power Financial Corporation (CDN), Great-West
Lifeco Inc. (CDN), La Great-West, compagnie d’assurance-vie (CDN), Great-West Financial (Canada) Inc. (CDN), Great-West Financial (Nova Scotia) Co. (CDN), GWL&A Financial Inc. (USA), Great-West Life & Annuity Insurance Company (USA), Groupe d’assurances London Inc. (CDN), London Life Compagnie d’assurance-vie (CDN), La Compagnie d’assurance du Canada sur la vie (CDN), Corporation financière Canada-vie (CDN), The Canada Life Assurance Company of Canada (CDN), Canada Life Insurance Company of America (USA), Crown Life Insurance Company (CDN), IGM Financial Inc. (CDN), Investors Group Inc. (CDN), Mackenzie Inc. (CDN), Victoria Square Ventures Inc. (CDN), Gesca Ltd. (CDN), La Presse Ltd. (CDN), 3819787 Canada Inc. (CDN), Power Financial Europe B.V. (NL), Parjointco N.V. (NL), Pargesa Holding S.A. (CH), Sagard Capital Partners Management Corp. (CDN), Lallemand Inc. (CDN), Université de Montréal (CDN) and Hydro-Québec (CDN).
Financial year 2007• Director and Executive of Power Corporation
of Canada (CDN), Power Financial Corporation (CDN), Gelprim Inc. (CDN), Jolliet Energy Resources Inc. (CDN), Power Financial Capital Corporation (CDN), Sagard Capital Partners GP Inc. (CDN), Corporation Internationale Power (CDN), 152245 Canada Inc. (CDN), 2795957 Canada Inc. (CDN), 171263 Canada Inc. (CDN), 3540529 Canada Inc. (CDN), 3411893 Canada Inc. (CDN), 3249531 Canada Inc. (CDN), 3439453 Canada Inc. (CDN), 4190297 Canada Inc. (CDN), 4400003 Canada Inc. (CDN), 4400038 Canada Inc. (CDN), 4400046 Canada Inc. (CDN), 4400020 Canada Inc. (CDN) and Power Communications Inc. (CDN).
AnnuAl RepoRt 2011 169
• Director of Great-West Lifeco Inc. (CDN), La Great-West, compagnie d’assurance-vie (CDN), Great-West Financial (Canada) Inc. (CDN), Great-West Financial (Nova Scotia) Co. (CDN), GWL&A Financial Inc. (USA), Great-West Life & Annuity Insurance Company (USA), Groupe des assurances London Life Inc. (CDN), London Life Compagnie d’assurance (CDN), La Compagnie d’assurance du Canada sur la vie (CDN), Corporation financière Canada-vie (CDN), The Canada Life Assurance Company Corporation (CDN), Canada Life Insurance Company of America (USA), Crown Life Insurance Company (CDN), IGM Financial Inc. (CDN), Investors Group Inc. (CDN), Mackenzie Inc. (CDN), Corporation d’Investissements en Technologies Power (CDN), Gesca Ltd. (CDN), La Presse Ltd. (CDN), Les Journaux Trans-Canada (1996) Inc. (CDN), Power Financial Europe B.V. (NL), Parjointco N.V. (NL), Pargesa Holding S.A. (CH), Sagard Capital Partners Management Corp. (CDN), Lallemand Inc. (CDN), Université de Montréal (CDN) and Hydro-Québec (CDN).
Gilles SamynDirector
List of activities and other mandates exercised in Belgian and foreign companies in 2011• Chairman of the Board of Directors of Finer S.A. (L)
(formerly Erbe Finance S.A.), Financière Flo S.A. (F), Groupe Flo S.A. (F), Groupe Jean Dupuis S.A. (B), Helio Charleroi Finance S.A. (B), Kermadec S.A. (L), Solvay Alumni A.S.B.L. (B), Swilux S.A. (L), Transcor Astra Group S.A. (B) and Unifem S.A.S. (F) (until January 2011).
• Chairman and Director of Distripar S.A. (B).• Chairman and Managing Director of Newcor S.A. (B)
(since October 2011).• Vice-Chairman and Managing Director of Compagnie
Nationale à Portefeuille S.A. (B) (until 3 October 2011).• Managing Director of Belholding Belgium S.A. (B),
Carpar S.A. (B), Compagnie Immobilière de Roumont S.A. (B), Erbe S.A. (B), Europart S.A. (B), Fibelpar S.A. (B), Financière de la Sambre S.A. (B), Compagnie Nationale à Portefeuille S.A. (B) (formerly Fingen S.A.) (since 3 October 2011), Frère-Bourgeois S.A. (B), Investor S.A. (B), Safimar S.A. (B) (since August 2011), SCP S.A. (L) and Société des Quatre Chemins S.A. (B).
• Director of Acide Carbonique Pur S.A. (B) as representative of Société des Quatre Chemins S.A., Affichage Holding S.A. (CH), AOT Holding S.A. (CH), Banca Leonardo SpA (I), Belgian Sky Shops S.A. (B), Cheval des Andes S.A. (Argentina), Entremont Alliance S.A.S. (F) (until January 2011), Filux S.A. (L), Segelux S.A. (L) (formerly Gesecalux S.A.), Grand Hôpital de Charleroi A.S.B.L. (B), Newcor S.A. (B) (until October 2011), Société Civile du Château Cheval Blanc (F), Stichting Administratiekantoor Frère-Bourgeois (NL), Transcor East Ltd. (CH), Société Générale d’Affichage S.A. (CH) (until April 2011) and TTR Energy S.A. (B).
• Director and Member of the Audit Committee and of the Compensation Committee of Pargesa Holding S.A. (CH).
• Member of the Supervisory Board of Métropole Télévision (M6) (F).
• Manager of Gosa S.D.C. (B) (since November 2011).• Auditor of Agesca Nederland N.V. (NL) and Parjointco N.V. (NL).• Member of the Investment Committee of Tikehau Capital
Partners S.A.S. (F)
List of activities and other mandates exercised in Belgian and foreign companies between 2007 and 2010Financial year 2010• Chairman of the Board of Directors of Centre de Coordination
de Charleroi S.A. (B) (until December 2010), Erbe Finance S.A. (L), Financière Flo S.A. (F), Groupe Flo S.A. (F), Groupe Jean Dupuis S.A. (B), Helio Charleroi Finance S.A. (B), Kermadec S.A. (L), Solvay Alumni A.S.B.L. (B), Swilux S.A. (L), Transcor Astra Group S.A. (B) and Unifem S.A.S. (F).
• Chairman and Director of Distripar S.A. (B).• Vice-Chairman and Managing Director of Compagnie
Nationale à Portefeuille S.A. (B).• Managing Director of Belholding Belgium S.A. (B),
Carpar S.A. (B), Compagnie Immobilière de Roumont S.A. (B), Erbe S.A. (B), Europart S.A. (B), Fibelpar S.A. (B), Financière de la Sambre S.A. (B), Fingen S.A. (B), Frère-Bourgeois S.A. (B), Investor S.A. (B), SCP S.A. (L) (since April 2010) and Société des Quatre Chemins S.A. (B).
• Director of Acide Carbonique Pur S.A. (B) as representative of Société des Quatre Chemins S.A. (since May 2010), Affichage Holding S.A. (CH), AOT Holding S.A. (CH), Banca Leonardo SpA (I), Belgian Sky Shops S.A. (B), Cheval des Andes S.A. (Argentina), Entremont Alliance S.A.S. (F), Filux S.A. (L), Gesecalux S.A. (L), Grand Hôpital de Charleroi A.S.B.L. (B), Lyparis S.A. (F) (until July 2010), Newcor S.A. (B), Société Civile du Château Cheval Blanc (F), Stichting Administratiekantoor Frère-Bourgeois (NL), Tikehau Capital Advisors S.A.S. (F) (until September 2010), Transcor East Ltd. (CH), Société Générale d’Affichage S.A. (CH) (since May 2010) and TTR Energy S.A. (B).
• Director and Member of the Audit Committee and of the Compensation Committee of Pargesa Holding S.A. (CH).
• Member of the Supervisory Board of Métropole Télévision (M6) (F).
• Auditor of Agesca Nederland N.V. (NL) and Parjointco N.V. (NL).• Member of the Investment Committee of Tikehau Capital
Partners S.A.S. (F)
Financial year 2009• Chairman of the Board of Directors of Centre de Coordination
de Charleroi S.A. (B), Erbe Finance S.A. (L), Financière Flo S.A. (F), Finimpress S.A. (B) as representative of Société des Quatre Chemins S.A. (until June 2009), Groupe Flo S.A. (F), Groupe Jean Dupuis S.A. (B), Helio Charleroi Finance S.A. (B), Kermadec S.A. (L), Solvay Alumni A.S.B.L. (B), Swilux S.A. (L), Transcor Astra Group S.A. (B) and Unifem S.A.S. (F).
• Chairman, Managing Director of Manoir de Roumont S.A. (B) (until May 2009).
• Chairman and Director of Distripar S.A. (B).
170 AnnuAl RepoRt 2011
Appendix – Offices of Directors
• Vice-Chairman and Managing Director of Compagnie Nationale à Portefeuille S.A. (B).
• Managing Director of Belholding Belgium S.A. (B), Carpar S.A. (B), Compagnie Immobilière de Roumont S.A. (B), Erbe S.A. (B), Europart S.A. (B), Fibelpar S.A. (B), Financière de la Sambre S.A. (B), Fingen S.A. (B), Frère-Bourgeois S.A. (B), Investor S.A. (B) and Société des Quatre Chemins S.A. (B).
• Director of Acide Carbonique Pur S.A. (B), Affichage Holding S.A. (CH), AOT Holding S.A. (CH), Banca Leonardo SpA (I), Belgian Sky Shops S.A. (B), Cheval des Andes S.A. (Argentina), Entremont Alliance S.A.S. (F), Filux S.A. (L), Gesecalux S.A. (L), Grand Hôpital de Charleroi A.S.B.L. (B), Lyparis S.A. (F), Newcor S.A. (B), Société Civile du Château Cheval Blanc (F), Stichting Administratiekantoor Frère-Bourgeois (NL), Tikehau Capital Advisors S.A.S. (F), Transcor East Ltd. (CH) and TTR Energy S.A. (B).
• Director and Member of the Audit Committee and of the Compensation Committee of Pargesa Holding S.A. (CH).
• Member of the Supervisory Board of Métropole Télévision (M6) (F).
• Censor and Member of the Investment Committee of Marco Polo Capital S.A. (F) (until June 2009).
• Auditor of Agesca Nederland N.V. (NL), Frère-Bourgeois Holding B.V. (NL) (until September 2009) and Parjointco N.V. (NL).
• Member of the Investment Committee of Tikehau Capital Partners S.A.S. (F)
Financial year 2008• Chairman of the Board of Directors of Centre de Coordination
de Charleroi S.A. (B), Erbe Finance S.A. (L), Financière Flo S.A. (F), Finimpress S.A. (B) as representative of Société des Quatre Chemins S.A., Groupe Flo S.A. (F), Groupe Jean Dupuis S.A. (B), Helio Charleroi Finance S.A. (B), Kermadec S.A. (L), Solvay Alumni A.S.B.L. (B), Swilux S.A. (L), Transcor Astra Group S.A. (B) and Unifem S.A.S. (F).
• Chairman, Managing Director of Manoir de Roumont S.A. (B) • Chairman and Director of Distripar S.A. (B).• Vice-Chairman and Managing Director of Compagnie
Nationale à Portefeuille S.A. (B).• Managing Director of Belholding Belgium S.A. (B),
Carpar S.A. (B), Compagnie Immobilière de Roumont S.A. (B), Erbe S.A. (B), Europart S.A. (B), Fibelpar S.A. (B), Financière de la Sambre S.A. (B), Fingen S.A. (B), Frère-Bourgeois S.A. (B), Investor S.A. (B) and Société des Quatre Chemins S.A. (B).
• Director of Acide Carbonique Pur S.A. (B), Affichage Holding S.A. (CH) (since May 2008), AOT Holding S.A. (CH), Banca Leonardo SpA (I), Belgian Sky Shops S.A. (B), Cheval des Andes S.A. (Argentina), Entremont Alliance S.A.S. (F), Filux S.A. (L), Gesecalux S.A. (L), Mesa S.A. (B) (until 19 December 2008), Grand Hôpital de Charleroi A.S.B.L. (B) (since January 2008), Lyparis S.A. (F), Newcor S.A. (B) (since June 2008), Société Civile du Château Cheval Blanc (F), Stichting Administratiekantoor Frère-Bourgeois (NL), Swifin S.A. (L) (until December 2008), Tikehau Capital Advisors S.A.S. (F), Transcor East Ltd. (CH) (since May 2008) and TTR Energy S.A. (B) (since May 2008).
• Director and Member of the Audit Committee and of the Compensation Committee of Pargesa Holding S.A. (CH).
• Member of the Supervisory Board of Métropole Télévision (M6) (F).
• Censor and Member of the Investment Committee of Marco Polo Capital S.A. (F)
• Auditor of Agesca Nederland N.V. (NL), Frère-Bourgeois Holding B.V. (NL) and Parjointco N.V. (NL).
• Member of the Investment Committee of Tikehau Capital Partners S.A.S. (F)
Financial year 2007• Chairman of the Board of Directors of Centre de Coordination
de Charleroi S.A. (B), Erbe Finance S.A. (L), Financière Flo S.A. (F), Finimpress S.A. (B) as representative of Société des Quatre Chemins S.A., Groupe Flo S.A. (F), Groupe Jean Dupuis S.A. (B), Helio Charleroi Finance S.A. (B), Kermadec S.A. (L), Solvay Alumni A.S.B.L. (B), Swilux S.A. (L), Transcor Astra Group S.A. (B) and Unifem S.A.S. (F).
• Chairman, Managing Director of Manoir de Roumont S.A. (B).• Chairman and Director of Distripar S.A. (B).• Vice-Chairman and Managing Director of Compagnie
Nationale à Portefeuille S.A. (B).• Managing Director of Belholding Belgium S.A. (B),
Carpar S.A. (B), Compagnie Immobilière de Roumont S.A. (B), Erbe S.A. (B), Europart S.A. (B), Fibelpar S.A. (B), Financière de la Sambre S.A. (B), Fingen S.A. (B), Frère-Bourgeois S.A. (B), Investor S.A. (B) and Société des Quatre Chemins S.A. (B).
• Director of Acide Carbonique Pur S.A. (B), AOT Holding S.A. (CH), Banca Leonardo SpA (I), Belgian Sky Shops S.A. (B), Cheval des Andes S.A. (Argentina), Eiffage (F) (until February 2007), Entremont Alliance S.A.S. (F), Filux S.A. (L), Gesecalux S.A. (L), Lyparis S.A. (F) (since September 2007), Mesa S.A. (B), Société Civile du Château Cheval Blanc (F), Stichting Administratiekantoor Frère-Bourgeois (NL), Swifin S.A. (L) and Tikehau Capital Advisors S.A.S. (F).
• Director and Member of the Audit Committee and of the Compensation Committee of Pargesa Holding S.A. (CH).
• Member of the Supervisory Board of Métropole Télévision (M6) (F) (since May 2007).
• Censor and Member of the Investment Committee of Marco Polo Capital S.A. (F).
• Auditor of Agesca Nederland N.V. (NL), Frère-Bourgeois Holding B.V. (NL) and Parjointco N.V. (NL).
• Member of the Investment Committee of Tikehau Capital Partners S.A.S. (F)
• Liquidator of Loverfin S.A. being liquidated (B) (until June 2007).
AnnuAl RepoRt 2011 171
Amaury de SezeDirector
List of activities and other mandates exercised in Belgian and foreign companies in 2011• Chairman of the Supervisory Board of PAI Partners S.A.S. (F).• Vice-Chairman of Power Financial Corporation (CDN).• Lead Board Director of Carrefour S.A. (F).• Director of BW Group (BM), Erbe S.A. (B), Imerys (F), Pargesa
Holding S.A. (CH), Suez Environnement Company (F) and Thales (F).
• Member of the Supervisory Board of Publicis Groupe (F).• Member of the Board of Directors of Power Financial
Corporation (CDN).
List of activities and other mandates exercised in Belgian and foreign companies between 2007 and 2010Financial year 2010• Chairman of the Board of Directors of Carrefour S.A. (F).• Vice-Chairman of Power Financial Corporation (CDN).• Director of BW Group (BM), Erbe S.A. (B), Groupe
Industriel Marcel Dassault S.A.S. (F), Imerys (F), Pargesa Holding S.A. (CH), Suez Environnement Company (F) and Thales (F).
• Chairman of the Supervisory Board of PAI Partners S.A.S. (F).• Member of the Supervisory Board of Gras Savoye S.C.A. (F)
and Publicis Groupe (F).• Member of the Board of Directors of Power Financial
Corporation (CDN).
Financial year 2009• Chairman of the Board of Directors of Carrefour S.A. (F).• Vice-Chairman of Power Corporation of Canada (CDN).• Director of BW Group (BM), Erbe S.A. (B), Groupe
Industriel Marcel Dassault S.A.S. (F), Imerys (F), Pargesa Holding S.A. (CH), Suez Environnement Company (F) and Thales (F).
• Member of the Supervisory Board of Gras Savoye S.C.A. (F) and Publicis Groupe (F).
Financial year 2008• Chairman of the Board of Directors of Carrefour S.A. (F).• Vice-Chairman of Power Corporation of Canada (CDN).• Director of BW Group (BM), Erbe S.A. (B), Groupe Industriel
Marcel Dassault S.A.S. (F), Imerys (F), Pargesa Holding S.A. (CH) and Suez Environnement Company (F).
• Member of the Supervisory Board of Gras Savoye S.C.A. (F) and Publicis Groupe (F).
Financial year 2007• Chairman of the Supervisory Board of PAI Partners S.A.S. (F).• Chairman of PAI Partners UK Ltd. (GB).• Vice-Chairman of the Supervisory Board of Carrefour S.A. (F).• Director of Eiffage (F), Erbe S.A. (B), Groupe Industriel Marcel
Dassault S.A.S. (F), PAI Europe III General Partner N.C. (GG), PAI Europe IV General Partner N.C. (GG), PAI Europe IV UK General Partner Ltd. (GB), PAI Europe V General Partner N.C. (GG), PAI Partners Srl (I), Saeco SpA (I), Pargesa Holding S.A. (CH) and Power Corporation of Canada (CDN).
• Member of the Supervisory Board of Gras Savoye S.C.A. (F) and Publicis Groupe (F).
Jean StéphenneDirector
List of activities and other mandates exercised in Belgian and foreign companies in 2011• Chairman of the Board of Directors of Besix S.A. (B),
GlaxoSmithKline Biologicals (B), IBA (B) and Vesalius Biocapital (L).
• Director of BNP Paribas Fortis (B), Auguria Residential Real Estate Fund S.A. (B) and Nanocyl S.A. (B).
List of activities and other mandates exercised in Belgian and foreign companies between 2007 and 2010Financial year 2010• Chairman of the Board of Directors of Aseptic
Technologies (B), Besix S.A. (B), GlaxoSmithKline Biologicals (B), IBA (B) and Vesalius Biocapital (L).
• Director of Fortis Banque S.A. (B) and Nanocyl S.A. (B).
Financial year 2009• Chairman of the Board of Directors of Aseptic
Technologies (B), Besix S.A. (B), GlaxoSmithKline Biologicals (B) and Vesalius Biocapital (L).
• Director of Fortis Banque S.A. (B), IBA (B) and Nanocyl S.A. (B).
Financial year 2008• Chairman of the Board of Directors of Aseptic
Technologies (B), Besix S.A. (B), GlaxoSmithKline Biologicals (B), Henogen S.A. (B) and Vesalius Biocapital (L).
• Director of Fortis Banque S.A. (B), IBA (B) and Nanocyl S.A. (B).
Financial year 2007• Chairman of the Board of Directors of Aseptic
Technologies (B), Besix S.A. (B), GlaxoSmithKline Biologicals (B), Henogen S.A. (B) and Vesalius Biocapital (L) (since November 2007).
• Director of Fortis Banque S.A. (B), IBA (B) and Nanocyl S.A. (B).
172 AnnuAl RepoRt 2011
Appendix – Offices of Directors
Gunter ThielenDirector
List of activities and other mandates exercised in Belgian and foreign companies in 2011• Chairman of the Supervisory Board of Bertelsmann AG (D).• Chairman of the Board of Directors of Sixt AG (D) and Sixt
Allgemeine Leasing GmbH (D).• Director of Leipziger Messe GmbH (D).
List of activities and other mandates exercised in Belgian and foreign companies between 2007 and 2010Financial year 2010• Chairman of the Supervisory Board of Bertelsmann AG (D).• Chairman of the Board of Directors of Sixt AG (D) and Sixt
Allgemeine Leasing GmbH (D).• Director of Leipziger Messe GmbH (D).
Financial year 2009• Chairman of the Supervisory Board of Bertelsmann AG (D).• Chairman of the Board of Directors of Sixt AG (D) and Sixt
Allgemeine Leasing GmbH (D).• Director of Sanofi-Aventis (F) (until 24 November 2009) and
Leipziger Messe GmbH (D).• Member of the Remuneration Committee of Sanofi-Aventis (F)
(until 24 November 2009).
Financial year 2008• Chairman of the Supervisory Board of Bertelsmann AG (D).• Chairman of the Board of Directors of Sixt AG (D) and Sixt
Allgemeine Leasing GmbH (D). • Director of Sanofi-Aventis (F) and Leipziger Messe GmbH (D).• Member of the Remuneration Committee of Sanofi-Aventis (F).
Financial year 2007• Chairman and CEO of Bertelsmann AG (D).• Chairman of the Supervisory Board of Arvato AG (D) and
Gruner + Jahr AG (D).• Chairman of the Board of Bertelsmann Inc. (USA).• Director of Leipziger Messe GmbH (D), RTL Group S.A. (L)
and Sony BMG (USA).
Arnaud VialDirector
List of activities and other mandates exercised in Belgian and foreign companies in 2011• Executive (Senior Vice-President) of Power Corporation
of Canada (CDN) and Power Financial Corporation (CDN).• Executive (Vice-Chairman) of 152245 Canada Inc. (CDN) (until
June 2011), 171263 Canada Inc. (CDN) (until June 2011), Victoria Square Ventures Inc. (4400038 Canada Inc.) (CDN), Gelprim Inc. (CDN) (until June 2011), Power Communications Inc. (CDN) (until June 2011), Power Corporation International (CDN) (until June 2011) and Power Financial Capital Corporation (CDN) (until June 2011).
• Director Executive (Chairman) of 3121011 Canada Inc. (CDN) (until June 2011).
• Director Executive (Vice-Chairman) of 3249531 Canada Inc. (CDN), 3411893 Canada Inc. (CDN) (until June 2011), 3439453 Canada Inc. (CDN) (until June 2011), 4190297 Canada Inc. (CDN), 4400003 Canada Inc. (CDN) (until June 2011), 4400020 Canada Inc. (CDN) (until June 2011), Power Pacific Equities Limited (CDN), 4507037 Canada Inc. (CDN) (until June 2011), 4524781 Canada Inc. (CDN) (until June 2011), 4524799 Canada Inc. (CDN) (until June 2011), 4524802 Canada Inc. (CDN) (until June 2011), 4507045 Canada Inc. (CDN) (until June 2011), 4507088 Canada Inc. (CDN) (until June 2011), 4400046 Canada Inc. (CDN) and 7575343 Canada Inc. (CDN).
• Director Executive (Treasurer) of Sagard Capital Partners GP, Inc. (CDN).
• Director of DP Immobilier Québec (CDN) (since October 2011), CF Real Estate Maritimes Inc. (CDN) (since October 2011), CF Real Estate Max Inc. (CDN) (since October 2011), CF Real Estate First Inc. (CDN) (since October 2011), Power Financial Europe B.V. (NL), Sagard Capital Partners Management Corp. (CDN), Square Victoria Digital Properties Inc. (4507061 Canada Inc.) (CDN), 9059-2114 Québec Inc. (CDN), Du Proprio Inc. (CDN), Private Real Estate Corporation (CDN) (company dissolved in 2011), VR Estates Inc. (CDN), 1083411 Alberta Ltd. (CDN) (company dissolved in 2011), ComFree-Commission Free Realty Inc. (CDN), 0757075 B.C. Ltd. (CDN) and Pargesa Holding S.A. (CH).
List of activities and other mandates exercised in Belgian and foreign companies between 2007 and 2010Financial year 2010• Executive (Senior Vice-President) of Power Corporation
of Canada (CDN) and Power Financial Corporation (CDN).• Executive (Vice-Chairman) of 152245 Canada Inc. (CDN),
171263 Canada Inc. (CDN), Victoria Square Ventures Inc. (4400038 Canada Inc.) (CDN), Gelprim Inc. (CDN), Power Communications Inc. (CDN), Power Corporation International (CDN) and Power Financial Capital Corporation (CDN).
• Director Executive (Chairman) of 3121011 Canada Inc. (CDN).• Director Executive (Vice-Chairman) of 3249531
Canada Inc. (CDN), 3411893 Canada Inc. (CDN), 3439453 Canada Inc. (CDN), 4190297 Canada Inc. (CDN), 4400003 Canada Inc. (CDN), 4400020 Canada Inc. (CDN), Power Pacific Equities Limited (CDN), 4507037 Canada Inc. (CDN), 4524781 Canada Inc. (CDN), 4524799 Canada Inc. (CDN), 4524802 Canada Inc. (CDN), 4507045 Canada Inc. (CDN), 4507088 Canada Inc. (CDN) and 7575343 Canada Inc. (CDN) (since June 2010).
• Director Executive (Treasurer) of Sagard Capital Partners GP, Inc. (CDN).

AnnuAl RepoRt 2011 173
• Director of 4400046 Canada Inc. (CDN), Power Financial Europe B.V. (NL), Sagard Capital Partners Management Corp. (CDN), Square Victoria Digital Properties Inc. (4507061 Canada Inc.) (CDN), 9059-2114 Québec Inc. (CDN), Du Proprio Inc. (CDN), Private Real Estate Corporation (CDN), VR Estates Inc. (CDN), 1083411 Alberta Ltd. (CDN), ComFree-Commission Free Realty Inc. (CDN), 0757075 B.C. Ltd. (CDN) and Pargesa Holding S.A. (CH) (since May 2010).
Financial year 2009• Executive (Senior Vice-President) of Power Corporation
of Canada (CDN) and Power Financial Corporation (CDN).• Executive (Vice-Chairman) of 152245 Canada Inc. (CDN),
171263 Canada Inc. (CDN), Victoria Square Ventures Inc. (4400038 Canada Inc.) (CDN), Gelprim Inc. (CDN), Power Communications Inc. (CDN), Power Corporation International (CDN), Power Financial Capital Corporation (CDN) and Power Technology Investment Corporation (CDN) (until July 2009).
• Director Executive (Chairman) of 3121011 Canada Inc. (CDN).• Director Executive (Vice-Chairman) of 3249531
Canada Inc. (CDN), 3411893 Canada Inc. (CDN), 3439453 Canada Inc. (CDN), 4190297 Canada Inc. (CDN), 4400003 Canada Inc. (CDN), 4400020 Canada Inc. (CDN), 4400046 Canada Inc. (CDN), Power Pacific Equities Limited (CDN), 4507037 Canada Inc. (CDN) (since February 2009), 4524781 Canada Inc. (CDN) (since July 2009), 4524799 Canada Inc. (CDN) (since July 2009), 4524802 Canada Inc. (CDN) (since July 2009), 4507045 Canada Inc. (CDN) (since February 2009) and 4507088 Canada Inc. (CDN) (since February 2009).
• Director Executive (Treasurer) of Sagard Capital Partners GP, Inc. (CDN).
• Director of Power Financial Europe B.V. (NL), Sagard Capital Partners Management Corp. (CDN), 6939511 Canada Inc. (CDN) (until November 2009), 4507061 Canada Inc. (CDN) (since February 2009), 9059-2114 Québec Inc. (CDN) (since September 2009), Du Proprio Inc. (CDN) (since September 2009), Private Real Estate Corporation (CDN) (since September 2009), VR Estates Inc. (CDN) (since September 2009), 1083411 Alberta Ltd. (CDN) (since September 2009), ComFree-Commission Free Realty Inc. (CDN) (since September 2009) and 0757075 B.C. Ltd. (CDN) (since September 2009).
Financial year 2008• Executive (Senior Vice-President) of Power Corporation
of Canada (CDN) and Power Financial Corporation (CDN).• Executive (Vice-Chairman) of 152245 Canada Inc. (CDN),
171263 Canada Inc. (CDN), 2795957 Canada Inc. (CDN), Victoria Square Ventures Inc. (4400038 Canada Inc.) (CDN), Gelprim Inc. (CDN), Power Communications Inc. (CDN), Power Corporation International (CDN), Power Financial Capital Corporation (CDN) and Power Technology Investment Corporation (CDN).
• Director Executive (Chairman) of 3121011 Canada Inc. (CDN).
• Director Executive (Vice-Chairman) of 3249531 Canada Inc. (CDN), 3411893 Canada Inc. (CDN), 3439453 Canada Inc. (CDN), 4190297 Canada Inc. (CDN), 4400003 Canada Inc. (CDN), 4400020 Canada Inc. (CDN), 4400046 Canada Inc. (CDN) and Power Pacific Equities Limited (CDN).
• Director Executive (Treasurer) of Sagard Capital Partners GP, Inc. (CDN).
• Director of Power Financial Europe B.V. (NL), Sagard Capital Partners Management Corp. (CDN) and 6939511 Canada Inc. (CDN) (since March 2008).
• Executive (Chairman) of SIB International Bancorp., Inc. (until 1 October 2008).
Financial year 2007• Executive (Senior Vice-President, Finance) of Power
Corporation of Canada (CDN) and Power Financial Corporation (CDN).
• Executive (Vice-Chairman) of 152245 Canada Inc. (CDN), 171263 Canada Inc. (CDN), 2795957 Canada Inc. (CDN), Gelprim Inc. (CDN), Jolliet Energy Resources Inc. (CDN), Power Communications Inc. (CDN), Power Corporation International (CDN), Power Financial Capital Corporation (CDN) and Power Technology Investment Corporation (CDN) (since March 2007).
• Director Executive (Chairman) of 3121011 Canada Inc. (CDN).• Director Executive (Vice-Chairman) of 3249531
Canada Inc. (CDN), 3411893 Canada Inc. (CDN), 3439453 Canada Inc. (CDN), 4190297 Canada Inc. (CDN), 4400003 Canada Inc. (CDN) (since May 2007), 4400020 Canada Inc. (CDN) (since April 2007), Victoria Square Ventures Inc. (4400038 Canada Inc.) (CDN) (since April 2007), 4400046 Canada Inc. (CDN) (since April 2007) and Power Pacific Equities Limited (CDN).
• Director Executive (Treasurer) of Sagard Capital Partners GP, Inc. (CDN) (since August 2007).
• Director of Power Financial Europe B.V. (NL) and Sagard Capital Partners Management Corp. (CDN) (since August 2007).
• Executive (Chairman) of SIB International Bancorp., Inc.
174 AnnuAl RepoRt 2011
For terms found in the section presenting financial data on the investments, from page 21 to page 65, please refer to the definitions provided by each company in their financial communication.
The specific terminology used in the section on “Accounts on 31 December 2011” refers to the IFRS (International Financial Reporting Standards) rules as adopted by the European Union. The terms used in the “Corporate governance statement” refer directly to the 2009 Belgian Code on Corporate Governance and other specific legislation.
Adjusted net assetsAdjusted net assets are a conventional reference obtained by adding the other assets to the investments portfolio and deducting its debts.
The following valuation principles have been applied:• Investments in listed companies, including GBL treasury
shares, are valued at the closing price. However, the value of shares allocated to cover any commitments made by the group is capped at the conversion/exercise price.
• Investments in unlisted companies are valued at their book value, less any impairments, or at their share in the equity capital if this latter is higher, with the exception of nor consolidated nor accounted under the equity method companies within the Private equity sector, which are valued at market value.
• Cash/net debt, made up of cash and cash equivalents less debts from GBL group’s Holding component, is valued at book value or at market value.
Earnings analysis Cash earnings• Cash earnings primarily include dividends on investments,
income from management of net cash and tax refunds, less general overheads and taxes. Cash earnings also constitute a factor for determining the company’s dividend payout level.
Mark to market and other non-cash• The concept of mark to market is one of the foundations
of the fair value method of valuation as defined in IFRS international accounting standards, the principle of which is to value assets at their market value on the last day of the financial year.
• Mark to market and other non-cash items in GBL’s accounts reflect the changes in fair value of the financial instruments bought or issued (trading assets, options), the actuarial costs of financial liabilities valued at their amortized cost, as well as the elimination of certain cash earnings in accordance with IFRS rules (dividends approved but not paid out during the financial year, costs of capital increase/share buybacks, dividends on treasury shares, etc.). These changes do not influence the group’s cash position.
Operational companies (associated or consolidated) and private equity• This column shows earnings from associated operational
companies, namely operational companies in which the group has significant influence. Significant influence is presumed to exist if the group has more than 20% voting rights, directly or indirectly through its subsidiaries. Associated operational companies are recorded in the consolidated financial statements using the equity method.
• Also included is income, group’s share, from consolidated operational companies, i.e. controlled by the group. Control is presumed to exist when GBL has more than 50% voting rights in an entity, either directly or indirectly.
• This column also includes the contribution of income from private equity (Ergon Capital Partners I, II and III, PAI Europe III, Sagard and Sagard II).
Eliminations, capital gains, impairments and reversals• The eliminations, capital gains, impairments and reversals
include the elimination of dividends received from associated or operational consolidated companies as well as earnings on disposals, impairments and reversals of non-current assets and on discontinued activities.
Weighted average number of ordinary shares (basic calculation) This corresponds to the number of outstanding ordinary shares at the start of the financial period, less treasury shares, adjusted by the number of ordinary shares reimbursed (capital reduction) or issued (capital increase), or sold or bought back during the period, multiplied by a time-based weighting factor.
Weighted average number of ordinary shares (diluted calculation) It is obtained by adding potential dilutive shares to the weighted average number of ordinary shares (basic calculation). In this case, potential dilutive shares correspond to call options issued by the group.
Group’s shareholding • In capital it is the percentage interest held directly and
indirectly through consolidated intermediate companies, calculated on the basis of the number of shares in issue on 31 December.
• In voting rights it is the percentage held directly or indirectly through consolidated intermediate companies, calculated on the basis of the number of voting rights existing on 31 December, including suspended voting rights.
Glossary

AnnuAl RepoRt 2011 175
Gross annual returnThe gross annual return is calculated on the share price and the gross dividend received.
It equals to Gross dividend received
+ change in share price from 1 January to 31 December
Share price on 1 January
VVPR stripThe VVPR strip (Verlaagde Voorheffing Précompte Réduit) is a coupon presented with the corresponding share dividend coupon that entitles the holder to the 15% reduced rate of withholding tax on dividends paid by the company. This VVPR strip is listed separately from ordinary GBL shares and is freely negotiable.
Velocity on float (%) The velocity on float, expressed as a percentage, is an indicator of the stock market activity of a listed company, which corresponds to the ratio between the number of shares traded on the Stock Exchange and the float on 1 January of the financial year.
A listed company’s float, or floating capital, corresponds to the part of the shares actually liable to be traded on the Stock Exchange. It can be expressed in value, but is more often expressed as a percentage of capitalisation.
Payment of dividend and ESES systemESES, for Euroclear Settlement for Euronext-zone Securities, is a single settlement-delivery system that in time aims to include all Euronext zone markets. ESES aims, among other things, to harmonise the operating rules applying to Euronext on the European market and to phase in by 2013 a Single Platform for the processing of stock market transactions.
ESES has repercussions on the distribution calendar and in particular on the payment of dividends, due to its introduction of the additional concept of “Record Date”.• Ex-Date: date (at the opening of the Stock Exchange)
from which the underlying share is traded without its dividend or ex-dividend;
• Record Date: date on which positions are recorded by the central depository (at market closing, after clearing) in order to determine which shareholders are entitled to dividends;
• Payment Date: date of payment of the dividend in cash.
Given the time needed for settlement-delivery and ownership transfer relative to J+3 (J being the transaction date), the last day on which the share is traded with entitlement to dividend distribution is three trading days before the Record Date and shares are consequently traded ex-dividend from the beginning of the following day (Ex-Date), i.e. two trading days before the Record Date.
The Payment Date may not be earlier than the day after the Record Date.
System Paying AgentIn ESES, the entity that proceeds with distribution will always be a single party, known as the System Paying Agent. This is the party responsible within the CSD (Central Securities Depositary, i.e. Euroclear Belgium) for distribution to other CSD participants of the resources related to a specific distribution. The system paying agent may be either an external paying agent (a CSD participant) or the CSD itself.

For further information
Groupe Bruxelles LambertAvenue Marnix 24 – B-1000 BrusselsRPM: BrusselsVAT: BE 407 040 209ING: 310-0065552-66IBAN: BE 07 3100 0655 5266BIC: BBRU BEBBWebsite : http://www.gbl.be
For more information about GBL, please contact:Carine Dumasy – Tel.: +32-2-289.17.17 – Fax: +32-2-289.17.37e-mail: [email protected]
Dit jaarverslag is ook verkrijgbaar in het NederlandsCe rapport annuel est également disponible en français
Design and production: Landmarks, Brussels
Photography: Total: Total Document © Gilles Gauret / Marco Dufour / Thielker Karsten GDF SUEZ: © GDF SUEZ - Abaca Press, Ramon Guillaume / Daniel Julien, L’Oeil Public / Gilles Crampes Pernod Ricard: © Strathisla Distillery, Keith / Distillerie Ballantine’s, Glenburgie / Shutterstock Lafarge: © Médiathèque Lafarge - Ignus Gerber / Mikolaj Katus / Garth Dale, Scott Wilson Advanced
Technology Group (Architect) / DR Médiathèque Lafarge Imerys: © Achim Forstner / Tom Grow Suez Environnement: © Suez Environnement - Abaca Press, Olivier Douliery / Pierre-Emmanuel Rastoin Arkema: © Arkema Portraits and group shots: ©Tanguy Stichelmans and © Hermonce Triay (photography of J.L. Beffa)
Printed in Belgium by Van der Poorten
www.gbl.be
Groupe Bruxelles Lambert