Annual Report 2009 Year Ended March 31, 2009Santen Pharmaceutical Co., Ltd. Annual Report 2009...
66
Annual Report 2009 Year Ended March 31, 2009
Transcript of Annual Report 2009 Year Ended March 31, 2009Santen Pharmaceutical Co., Ltd. Annual Report 2009...

Annual Report 2009 Year Ended March 31, 2009

1 Consolidated Financial Highlights
2 Overview of Santen
4 Toward a Global Company
5 A Message from the Chairman
6 A Message from the President and CEO
7 An Interview with the President and CEO
10 Status of Medium-term Management Plan
11 Special Feature: Leveraging a Growth Driver — Aiming for further growth by maximizing Tapros product value
16 Research and Development
19 Review of Operations
20 Prescription Pharmaceuticals, Ophthalmic Pharmaceuticals
24 Prescription Pharmaceuticals, Anti-Rheumatic Pharmaceuticals
25 Over-the-Counter Pharmaceuticals
25 Medical Devices
26 Society and the Environment
28 Corporate Governance
30 Board of Directors, Corporate Auditors and Corporate Officers
31 Financial Section
61 Major Subsidiaries and Facilities
62 Corporate Information / Stock Information
63 History
Santen Pharmaceutical Co., Ltd. specializes in the research, development,
manufacturing and marketing of ophthalmic and anti-rheumatic
pharmaceuticals to protect and improve people’s eyesight and health.
Deeply aware of the sanctity of human life, we apply our unique capabilities
and technologies in our areas of expertise to contribute to the health and
quality of life of patients and their loved ones, and society as a whole.
Contents
NOTE CONCERNING GRAPHSGraphs in this annual report are based on fiscal years ended March 31, if no note is specified.
NOTE CONCERNING DATASome information in this annual report is based on IMS data (JPM, MIDAS).Period: March 2004 to March 2009
CAUTION CONCERNING FORWARD-LOOKING STATEMENTSThis annual report contains forward-looking statements regarding the Company’s plans, outlook, strategies and results for the future. All forward-looking statements are based on judgments derived from the information available to the Company at the time of publication. Certain risks and uncertainties could cause the Company’s actual results to differ materially from any projections presented in this report. These risks and uncertainties include, but are not limited to, the economic circumstances surrounding the Company’s businesses, competitive pressures, changes in related laws and regulations, status of product develop-ment programs and changes in exchange rates.

�Santen Pharmaceutical Co., Ltd. Annual Report 2009
Thousands of Millions of yen Change U.S. dollars
2009 2008 2009/2008 2009
For the year:
Net sales ¥101,619 ¥103,394 (1.7)% $1,034,498
Operating income 15,494 20,371 (23.9) 157,734
Net income 10,123 12,651 (20.0) 103,056
R&D expenditures 18,458 12,942 42.6 187,905
Capital expenditures 2,953 3,151 (6.3) 30,064
Depreciation and amortization 4,210 4,593 (8.3) 42,855
At year-end:
Total assets ¥151,012 ¥156,547 (3.5)% $1,537,332
Long-term debt 154 5,278 (97.1) 1,565
Equity 125,181 126,998 (1.4) 1,274,359
Per share data (yen and U.S. dollars):
Net income – basic ¥ 119.08 ¥ 146.15 (18.5)% $ 1.21
Net income – diluted 118.97 145.94 (18.5) 1.21
Equity 1,472.32 1,494.48 (1.5) 14.99
Cash dividends, applicable to period 80.00 80.00 — 0.81
Other financial data:
Operating income margin (%) 15.2 19.7
Overseas sales to net sales (%) 12.8 14.3
R&D expenditures to net sales (%) 18.2 12.5
Return on equity (ROE) (%) 8.0 9.9
Dividend on equity (DOE) (%) 5.4 5.4
Number of employees 2,690 2,483
Notes: 1. U.S. dollar amounts have been translated from yen, solely for the convenience of the reader, at the rate of ¥98.23 to U.S.$1 prevailing on March 31, 2009. 2. See Notes 2. 13) and 11 of Notes to Consolidated Financial Statements in respect of per share data. 3. Figures in parentheses indicate a decrease. 4. Equity comprises shareholders’ equity and total accumulated (losses) gains on evaluation and translation.
101,619
103,394
100,486
98,398
92,696
Net sales Overseas sales to net sales
2005
2006
2007
2008
2009 12.8
14.3
13.3
11.8
10.0
Net sales and Overseas sales to net sales Millions of yen / %
10,123
12,651
13,148
13,023
11,0232005
2006
2007
2008
2009 8.0
9.9
10.6
11.5
10.4
Net income and ROE Millions of yen / %
Net income ROE
15,494
20,371
20,412
20,995
18,9822005
2006
2007
2008
2009 15.2
19.7
20.3
21.3
20.5
Operating income Operating income margin
Operating income and Operating income margin Millions of yen / %
18,458
12,942
13,663
13,971
12,6202005
2006
2007
2008
2009 18.2
12.5
13.6
14.2
13.6
R&D expenditures and R&D expenditures to net sales Millions of yen / %
R&D expenditures R&D expenditures to net sales
Consolidated Financial HighlightsSanten Pharmaceutical Co., Ltd. and Subsidiaries Years ended March 31, 2009 and 2008

Santen Pharmaceutical Co., Ltd. Annual Report 2009�
Overview of Santen
Santen has been involved in pharmaceutical research, development, manufacturing
and sales since its founding in 1890. Initially, cold medicines were the Company’s
mainstay products; however, we have continued to market high-quality pharmaceuticals
in the ophthalmic segment since launching Daigaku Eye Drops in 1899. Today we are
conducting business operations in Japan, Europe, the U.S. and China as a unique
pharmaceutical company specializing in the areas of ophthalmology and rheumatoid
arthritis (RA). Prescription ophthalmic pharmaceuticals are the Company’s core business,
accounting for more than 80% of Santen’s sales.
A leading company in ophthalmology and RA, Santen has carved out the largest shares
of the markets in these areas. Santen provides information answering the practical
needs of the medical community through approximately 400 medical representatives
(MRs) and has an unrivaled lineup of outstanding ophthalmic pharmaceutical products
for the treatment of a broad range of ocular diseases. Santen holds 38.0% of Japan’s
prescription ophthalmic market; further, it boasts a dominant 45.0% share of Japan’s
market for disease-modifying anti-rheumatic drugs (DMARDs).
Specialty Company
Market Leader
Specializing in Ophthalmic and Anti-rheumatic Pharmaceuticals
Maintaining a Strong Presence in Target Markets

�Santen Pharmaceutical Co., Ltd. Annual Report 2009
Japan’s prescription ophthalmic market is expected to grow approximately 2% annually
until 2010. Moreover, growth of the glaucoma and corneal disorders areas that Santen
concentrates its efforts on will likely outpace the growth of the prescription ophthalmic
market as a whole. In addition, overseas prescription ophthalmic markets are growing faster
than Japan’s market. Especially in China, where the market is growing at an annualized rate
of more than 10%, buoyed by the country’s remarkable economic development. Aiming to
grow in such promising markets, we are focusing our efforts on expanding overseas opera-
tions while strengthening operations in Japan as well.
As an R&D-oriented pharmaceutical company, Santen is focusing its R&D efforts on growth
areas where its strengths can be fully utilized and where there is significant growth potential.
We are building a clinical development system which includes overseas subsidiaries and
encompasses Japan, the U.S. and Europe. Furthermore, having begun clinical development
in Asia, our efforts to the further globalization of clinical trials are progressing steadily. Also,
we actively foster products by working to ensure their competitive superiority and maximizing
their value through R&D focused on the generation of useful data that leads to EBM*.
* Evidence based medicine: This refers to medical treatment based on scientific evidence. It is a series of guidelines that require medical treatment to be based on an understanding of the most reliable evidence reasonably available as well as consideration of the unique clinical situation for each patient and the patient’s values.
Promising Markets
R&D Capabilities
Aiming for Growth in Promising Markets
Providing Products Rooted in R&D Capabilities

Santen Pharmaceutical Co., Ltd. Annual Report 2009�
TowardaGlobalCompanySanten has had a significant presence in Japan’s ophthalmic
pharmaceutical market for many years. We aim to be a company that
contributes to the health and quality of life of patients and their loved
ones not only in Japan but also in countries throughout the world.
2006
Becoming a Global Company
2010
2015
First Step
�006–�0�0 Medium-term Management Plan
Creating new drug candidates and generating growth in promising regions by leveraging strengths
1. Enhance the global strategic product pipeline through internal discovery and development, joint development projects and in-licensing efforts
2. Generate growth mainly in Japan, Northern/Eastern Europe, Russia and China. Focus U.S. activities on clinical and business development
3. Strengthen manufacturing bases
4. Strengthen human resources and organizational capabilities on a global basis
Second Step
The R&D investment will generate products that will allow Santen to accelerate global growth.
Long-term Vision
• Become a global company
• Leader in ophthalmic and anti-rheumatic fields
• R&D oriented pharmaceutical company special-izing in ophthalmology and other areas where we can leverage our strengths

�Santen Pharmaceutical Co., Ltd. Annual Report 2009
Aiming to Become a Global Company Becoming a global company is the centerpiece of our long-term
vision. Santen aims to be a company internationally recognized
for supplying the world with highly original and effective
products developed using its outstanding R&D capabilities.
Our first step on the road to becoming a global company
by fiscal 2015 is to achieve the initiatives of the 2006–2010
Medium-term Management Plan. Under this plan, we aim to
achieve solid growth in the medium-term by continuing to
invest actively in R&D and expanding our business in regions
where we can utilize our strengths.
As a second step, from fiscal 2011 to fiscal 2015, we will
realize the benefits of our R&D investments and achieve faster
global expansion and further growth.
Contributing to Society through Our Business Activities
Santen expresses its core value as follows, “We are focused
on specific areas of expertise, such as eye care, developing our
unique capabilities and technologies, and contributing to the
health and quality of life of patients and their loved ones, and
society as a whole.” Based on this core value, Santen employees
strive to develop innovative pharmaceutical products and ensure
that patients have complete confidence in its products. By
extending Santen’s efforts worldwide, Santen will contribute to
the health and quality of life of patients and their loved ones
not only in Japan but in countries worldwide.
Moreover, Santen is actively involved in social contribution
initiatives. As well as supporting the development of new
medical treatments and providing donations and aid to
ophthalmology and rheumatoid arthritis-related causes, we
contribute to large-scale natural disaster relief projects and
promote in-house environmental conservation activities.
Providing Stable Returns to ShareholdersSanten regards the continuous and steady return of profits to
shareholders as an important management task. The current
Medium-term Management Plan reflects our emphasis on
returns to shareholders through dividends and improvement
of capital efficiency by using the dividend on equity (DOE) ratio
as an indicator for dividends. The DOE ratio combines the
payout ratio with return on equity (ROE). The Medium-term
Management Plan sets out a target of 5.0% for DOE in its final
year, fiscal 2010.
Although fiscal 2008 saw a year-on-year decline in earnings
due to a temporary increase in R&D expenditures related to the
in-licensing of a new drug candidate, Santen paid a full-year
dividend of ¥80 per share and achieved a DOE of 5.4%. We aim
to continue achieving DOE of 5.0% or higher from the current
fiscal year onward.
In closing, I would like to ask our shareholders for their
continued understanding and support.
August 2009
Takakazu Morita
Chairman
We are steadily moving forward to
becoming a global company.
A Message from the Chairman

Santen Pharmaceutical Co., Ltd. Annual Report 20096
A Message from the President and CEO
Foundation for Future Earnings Strengthened in Fiscal 2008
In fiscal 2008, ended March 31, 2009, net sales decreased 1.7%
year on year, to ¥101.6 billion. Also, we recorded year-on-year
decreases of 23.9% in operating income, to ¥15.5 billion,
and 20.0% in net income, to ¥10.1 billion. These decreases
in earnings were attributable to a temporary increase in R&D
expenditures related to the in-licensing of a new drug candi-
date, the retinal disorder treatment DE-109 (sirolimus), with
a view to long-term growth.
In Japan, NHI drug price revisions resulted in an average
reduction of around 3.0% in the prices of Santen’s products,
compared with an average 5.2% reduction in the prescription
ophthalmic pharmaceuticals industry. Despite such circum-
stances, domestic sales of prescription ophthalmic pharmaceuti-
cals increased 0.1% year on year thanks to Santen’s promotional
campaigns, including the provision of medical information
accurately catering to the potential needs of individual medical
facilities. In particular, strong sales of the glaucoma and ocular
hypertension treatment Tapros, launched in December 2008,
and higher sales of the corneal and conjunctival epithelial
disorder treatment Hyalein contributed significantly to overall
earnings. Meanwhile, rapid appreciation of the yen resulted in
a 7.4% year-on-year decrease in total overseas sales of prescrip-
tion ophthalmic pharmaceuticals.
Furthermore, with a view to maximizing product values in
overseas markets, we concluded licensing agreements in fiscal
2008 with Merck & Co., Inc. (of the U.S.) for tafluprost (sold as
Tapros in Japan) as well as with Bausch & Lomb Inc. (of the U.S.)
for MD-14, an intraocular lens (IOL) (sold as Eternity in Japan).
Targeting a Record Performance in Fiscal 2009For fiscal 2009, ending March 31, 2010, we hope to achieve
record net sales, operating income and net income. We project
net sales of ¥111.0 billion, operating income of ¥25.5 billion
and net income of ¥16.0 billion. We plan to rapidly maximize
the value of Tapros in Japan and further increase the market
penetration of Hyalein. In addition, we expect to benefit from
favorable trends in Asia’s prescription ophthalmic pharmaceuti-
cal market.
While concentrating efforts on maximizing the value of
Tapros, we will strive to control selling, general and administra-
tive expenses (excluding R&D expenditures). On the other hand,
we anticipate R&D expenditures of ¥15.3 billion as we steadily
advance development of global strategic products*.
As a company specializing in ophthalmic and anti-rheumatic
treatments, Santen will continue to provide pharmaceuticals
that contribute to the health and quality of life of patients and
their loved ones.
With our sights set on medium-to-long term growth,
we will spare no effort to reach our targets. As we take on
these challenges, I would like to ask our stakeholders for their
continued support.
* New drug candidates with a new mechanism of action that have potential to generate higher sales than existing products in Japan, the U.S. and Europe.
August 2009
Akira Kurokawa
President and Chief Executive Officer
We will shift to a more proactive
business strategy and accelerate
toward growth.

�Santen Pharmaceutical Co., Ltd. Annual Report 2009
An Interview with the President and CEO
In fiscal 2008, we implemented policies and strategies in line with the Medium-term Management
Plan and achieved significant targets. In my view, it was a year in which we successfully laid the
foundations for medium-to-long term growth.
First and foremost, we began marketing the glaucoma and ocular hypertension treatment Tapros
in Japan and Europe. I think this is extremely important in the context of our efforts to achieve
medium-to-long term growth. Tapros is a prostaglandin analogue, which are first-line treatments for
glaucoma and ocular hypertension worldwide. The new product is selling well in Japan, while
in Europe we have received approval in around 20 countries, and launched in five countries.
In China, the Suzhou Plant, completed in 2007, started up operations, and Santen Pharmaceuti-
cal (China) Co., Ltd., began direct marketing operations. Among China’s urban hospitals, Santen
has claimed the largest share of the market for six consecutive years. We aim to further increase
revenues by providing high-quality medical information through our medical representatives (MRs)
to earn the trust of ophthalmologists. Given that China’s prescription ophthalmic pharmaceutical
market will likely continue double-digit growth, we expect to achieve further growth in this market.
As for R&D, in Japan we have filed for approval of DE-089 (diquafosol sodium), a treatment
for corneal conjunctival epithelial disorders. DE-089 has a different mechanism of action from the
corneal and conjunctival epithelial disorder treatment Hyalein, a mainstay product that accounts
for a substantial share of the corneal disorders market segment. Also, we successfully in-licensed
DE-109 (sirolimus) to strengthen our pipeline in the retinal disorders segment, which has significant
unmet medical needs. In another initiative, we launched an IOL, MD-14 (sold as Eternity in Japan),
featuring a unique hydrophobic acrylic material, the most popular type of IOL material used in
cataract surgery worldwide.
Japan’s prescription ophthalmic pharmaceutical market is expected to continue growing despite
government efforts to promote the use of generic products. However, the market’s growth is soften-
ing, and competition in our business environment is intensifying as more competitors enter the
market. In response to these conditions, we will concentrate management resources on segments
that promise continuous growth, such as the glaucoma segment and the corneal disorders segment.
What were Santen’s achievements in fiscal �008 under the �006–�0�0 Medium-term Management Plan?
In my view, it was a year in which we successfully laid the foundations for medium-to-long term growth.
Could you please explain your priorities for fiscal �009, especially regarding prescription ophthalmic pharmaceutical operations in Japan?
We will further strengthen our position as the holder of the largest share of Japan’s prescription ophthalmic pharmaceutical market.

An Interview with the President and CEO
Santen Pharmaceutical Co., Ltd. Annual Report 20098
In fiscal 2009, we will focus efforts on maximizing the product value of Tapros. The glaucoma
segment is very large and success in this segment will cement the foundations of our operations in
Japan. The Tapros launch expanded and enriched our product lineup in the glaucoma segment and
the product roll-out will enable us to offer prescribing information suited to patients’ symptoms.
We will conduct promotional campaigns providing high-quality data that leads to EBM (evidence
based medicine) and will leverage our enhanced product lineup to increase Santen’s presence in
the glaucoma segment.
In the corneal disorders segment, we will continue to conduct campaigns to increase awareness
of dry eye and the importance of regular checkups to ensure that patients receive appropriate
diagnosis and treatment. Through such campaigns, we hope to continue to grow sales of Hyalein.
Based on such initiatives, we will further strengthen our position as the holder of the largest
share of Japan’s prescription ophthalmic pharmaceutical market. Further, we will invest the earnings
from pharmaceutical operations in Japan to expand our R&D and overseas operations and thereby
pave the way to future growth.
Santen’s basic R&D strategy is to focus its research themes in the glaucoma, corneal disorders and
retinal disorders segments, which promise growth and where Santen can utilize its strengths. By
concentrating R&D resources on these segments, we aim to shorten lead times from development
through to product creation and marketing. In the context of this basic strategy, we view the period
of the Medium-term Management Plan as a phase for preparing new drug candidates for global
launches. Accordingly, we are focusing efforts on the clinical development of the global strategic
products DE-104 in the glaucoma segment and DE-101 (rivoglitazone) in the corneal disorders
segment. Further, as I mentioned, we have filed for approval of DE-089 (diquafosol sodium) in
Japan. Also in Japan, we are progressing steadily with the development of DE-108 (levofloxacin
1.5%) in the ophthalmic infections segment and DE-109 in the retinal disorders segment.
Santen will use all of its resources to confirm the proof of concept of these global strategic
products, develop the optimum product profile, increase their likelihood of approval and advance
them to the next stage of clinical development. Santen will work to improve the efficiency of its
development process in order to bring products quickly to market and win out in markets.
Also, further enriching our R&D pipeline is critical if we are to achieve long-term growth. With
this in mind, we consolidated our pharmaceutical development by expanding and upgrading the
facilities of the Nara Research and Development Center in fiscal 2008. In addition, we intend to
continue developing operations in mainstay areas and areas where we can fully utilize our strengths.
Regarding R&D, how are Santen’s efforts to “enhance the global strategic pipeline” progressing?
We will bring products quickly to market and win out in markets.

9Santen Pharmaceutical Co., Ltd. Annual Report 2009
We will expand our businesses in markets where we can capitalize on our strengths, focusing on
China, Russia, Northern Europe and Eastern Europe. We expect to grow in such markets as we
already have operational platforms in these regions, which are likely to see high growth rates.
Looking at China first, we began direct marketing efforts and started up operations at our new
plant in Suzhou in October 2008. In fiscal 2009, we will strengthen systems for direct marketing.
Even in a worldwide recession, China’s market is continuing to grow at a high rate. Although
there are moves to curb China’s medical treatment costs, the percentage of patients covered by
health insurance systems will likely increase as these systems evolve and so we expect China’s
prescription ophthalmic pharmaceutical market will maintain strong growth. Santen will increase
sales of such mainstay offerings as the anti-infective ophthalmic solution Cravit and the corneal
and conjunctival epithelial disorder treatment Hyalein through promotional campaigns providing
high-quality scientific information to ophthalmologists. Furthermore, Phase III trials are currently
underway in China for DE-085 (tafluprost). Santen will advance R&D rapidly and efficiently to
strengthen its product lineup in China’s market.
In Europe, tafluprost has received approval in about 20 countries. We concluded a licensing
agreement with Merck & Co., Inc. (of the U.S.) in April 2009 to help maximize the value of this
product. As a result of this agreement, we look forward to seeing an expansion of the marketing
of tafluprost beyond the regions such as Northern Europe and Germany where we have established
sales platforms. In addition, we will continue efforts to maximize the product value of Oftaquix
(sold as Cravit in Japan), a first-choice anti-infective ophthalmic solution, which is marketed in
27 countries, including Russia.
For the MD-14 IOL (sold as Eternity in Japan), we concluded an agreement with Bausch & Lomb
Inc. (of the U.S.) in March 2009, granting it worldwide rights, excluding Japan, for the development,
manufacturing and marketing of the MD-14 IOL and lens material.
Based on active consideration of a broad range of strategic options, including such licensing
agreements, we are eager to take on diverse challenges to maximize the market value of
our products.
Lastly, how do you intend to develop overseas operations?
We are eager to take on diverse challenges to maximize the market value of our products.
Santen Pharmaceutical Co., Ltd. Annual Report 2009�0
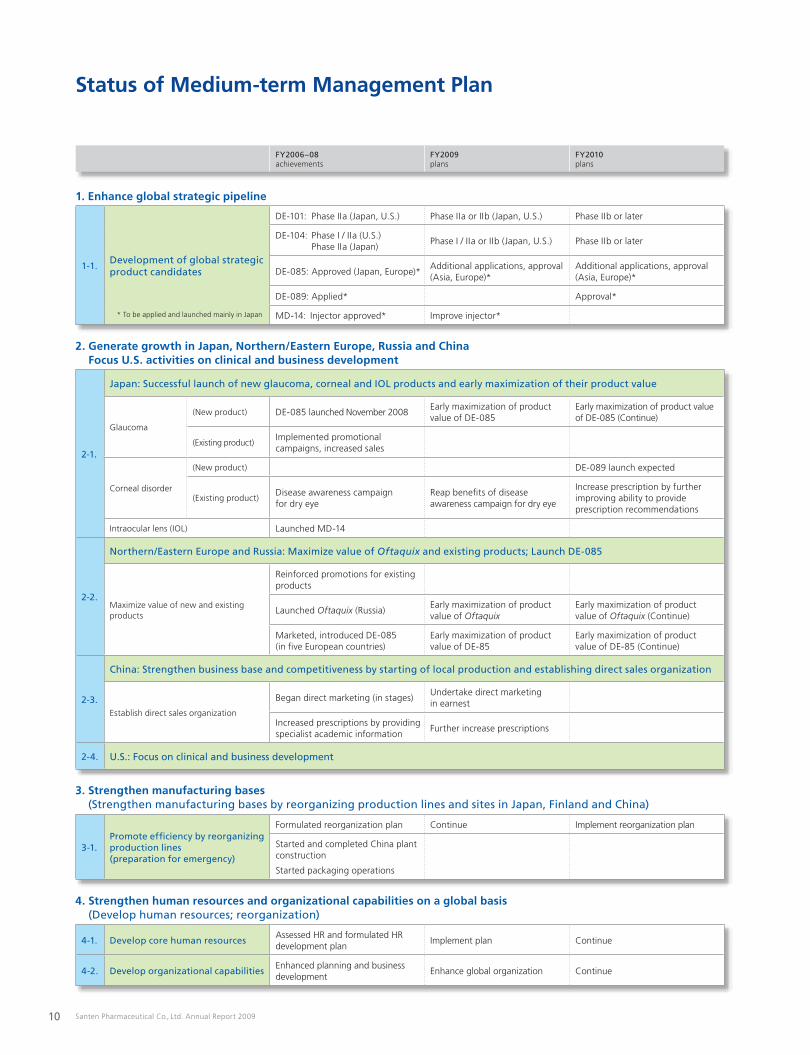
Status of Medium-term Management Plan
FY�006–08achievements
FY�009plans
FY�0�0plans
�-�. Development of global strategic product candidates
DE-101: Phase IIa (Japan, U.S.) Phase IIa or IIb (Japan, U.S.) Phase IIb or later
DE-104: Phase I / IIa (U.S.) Phase IIa (Japan)
Phase I / IIa or IIb (Japan, U.S.) Phase IIb or later
DE-085: Approved (Japan, Europe)*Additional applications, approval (Asia, Europe)*
Additional applications, approval (Asia, Europe)*
DE-089: Applied* Approval*
MD-14: Injector approved* Improve injector*
�-�.
Japan: Successful launch of new glaucoma, corneal and IOL products and early maximization of their product value
Glaucoma
(New product) DE-085 launched November 2008Early maximization of product value of DE-085
Early maximization of product value of DE-085 (Continue)
(Existing product)Implemented promotional campaigns, increased sales
Corneal disorder
(New product) DE-089 launch expected
(Existing product)Disease awareness campaign for dry eye
Reap benefits of disease awareness campaign for dry eye
Increase prescription by further improving ability to provide prescription recommendations
Intraocular lens (IOL) Launched MD-14
�-�.
Northern/Eastern Europe and Russia: Maximize value of Oftaquix and existing products; Launch DE-08�
Maximize value of new and existing products
Reinforced promotions for existing products
Launched Oftaquix (Russia)Early maximization of product value of Oftaquix
Early maximization of product value of Oftaquix (Continue)
Marketed, introduced DE-085 (in five European countries)
Early maximization of product value of DE-85
Early maximization of product value of DE-85 (Continue)
�-�.
China: Strengthen business base and competitiveness by starting of local production and establishing direct sales organization
Establish direct sales organization
Began direct marketing (in stages)Undertake direct marketing in earnest
Increased prescriptions by providing specialist academic information
Further increase prescriptions
�-�. U.S.: Focus on clinical and business development
�-�.Promote efficiency by reorganizing production lines (preparation for emergency)
Formulated reorganization plan Continue Implement reorganization plan
Started and completed China plant construction
Started packaging operations
�-�. Develop core human resourcesAssessed HR and formulated HR development plan
Implement plan Continue
�-�. Develop organizational capabilitiesEnhanced planning and business development
Enhance global organization Continue
3. Strengthen manufacturing bases (Strengthen manufacturing bases by reorganizing production lines and sites in Japan, Finland and China)
2. Generate growth in Japan, Northern/Eastern Europe, Russia and China Focus U.S. activities on clinical and business development
1. Enhance global strategic pipeline
4. Strengthen human resources and organizational capabilities on a global basis (Develop human resources; reorganization)
* To be applied and launched mainly in Japan

LargerPresence
��Santen Pharmaceutical Co., Ltd. Annual Report 2009
—Aiming for Further Growth by
Maximizing Tapros Product Value—
Santen launched the glaucoma and ocular hypertension treatment Tapros ophthalmic solution (tafluprost) in Japan on December �6, �008. As the glaucoma market holds high potential for growth, introduction of Tapros to the market is very important for Santen. Consequently, we expect Tapros to be a major driving force for Santen’s medium- to-long term growth.
Santen’s 2006–2010 Medium-term Management Plan sets out the Company’s basic policy: “Santen’s
Global Development: Creating New Drug Candidates, and Generating Growth in Promising Regions
by Leveraging Strengths.” Reflecting this policy, we have worked toward the launch of the glaucoma
and ocular hypertension treatment drug Tapros and rapid maximization of its product value for
further growth in Japan, where we have a strong operational platform.
The glaucoma segment is a particularly promising market and it continues to expand primarily
due to the growth of the geriatric population. In fiscal 2008, the glaucoma segment generated
revenues of ¥460 billion, maintaining its position as the largest segment of the world’s prescription
ophthalmic pharmaceutical market, with a share of 36%. Meanwhile, the Japanese glaucoma market
showed 2.2% growth in fiscal 2008 and is expected to grow by approximately 2% in fiscal 2009.
Although Santen continues to hold the largest share of Japan’s prescription ophthalmic pharma-
ceutical market, its share of the glaucoma segment has remained around 20%, partly because it has
lacked blockbuster drugs in this segment for several years. Aiming to strengthen and increase our
presence in the glaucoma segment in Japan as well as overseas, we have concentrated efforts on
developing Tapros.
Aiming For an Enhanced Presence in the Glaucoma SegmentAiming For an Enhanced Presence in the Glaucoma Segment
Leve a naG owth D veLeve a naG owth D veLeve a naG owth D ve
Special Feature:

NewDrugs
Santen Pharmaceutical Co., Ltd. Annual Report 2009��
The Dimple Bottle Wins Good Design Award
In fiscal 2008, the Dimple Bottle—Santen’s independently developed container for pre-scription ophthalmics—won a Good Design Award* from the Japan Industrial Design Promotion Organization. We developed the Dimple Bottle from scratch, starting by reas-sessment of existing containers for prescription ophthalmics. We aimed for a container that patients and medical professionals would find easy to use. The Dimple Bottle is the container used for Tapros. Because glaucoma requires long-term treatment, we hope that the functionality and patient-friendliness of the Dimple Bottle will contribute significantly to glaucoma treatment.
* Organized by Japan Industrial Design Promotion Organization with the support of METI, it is Japan’s only system for presenting general design evaluations and commendations for products with outstanding designs.
In Japan, Santen obtained regulatory approval for Tapros on October 16, 2008. Tapros is a prosta-
glandin analogue, which is the most commonly used first-line treatment for glaucoma and ocular
hypertension.
Glaucoma is a disease characterized by optic nerve damage, caused by factors such as increased
intraocular pressure. The basic treatment for glaucoma is to lower intraocular pressure and to keep
it under control over a long period of time. Tapros shows a potent and stable intraocular pressure-
lowering effect by promoting uveoscleral outflow of the aqueous humor, which was demonstrated
in Japanese clinical trials.
However, some glaucoma patients develop visual field defects even if they have normal or even
low intraocular pressure. Tapros is the first drug to have undergone clinical trials for normal tension
glaucoma, a disease commonly seen among Japanese people. These clinical trials produced clinical
data that will facilitate EBM (evidence based medicine)* for the product as an intraocular pressure-
lowering agent for normal tension glaucoma. The clinical trials showed its efficacy for increasing
retinal arterial blood flow around the optic disk, as well as increasing blood flow in the retinal tissue.
Also, Tapros has excellent stability, retaining consistent quality for three years when stored at room
temperature. Although Tapros is the fourth prostaglandin analogue on the market, it has the added
value of patient-friendly innovations such as the Dimple Bottle ophthalmic solution container.
As results of these strengths, medical professionals have expressed considerable expectations
for this product.
Developing Promising New Drugs Developing Promising New Drugs
Cap sizes
65 or older
Less than 65
Ease of opening and closing caps
Ease of carrying containers
Containerhardness
Frequency ofsolution drops
Dimple Bottle survey resultsInterviews were conducted with 208 patients (95 men and 113 women; average age 64.9 ± 13.3 years) using ophthalmic solutions for glaucoma about the usability of ophthalmic solution containers.
Source: Ryoko Hyodo, Shiro Mizoue, Shiro Kawasaki and Yasuhito Hayashi, “Investigation of Glaucoma Eyedrop Bottle Usability by Elderly Patients” Atarashii Ganka, Vol. 24, 371, 2007
Special Feature: Leveraging a Growth Driver —Aiming for further growth by maximizing Tapros product value—
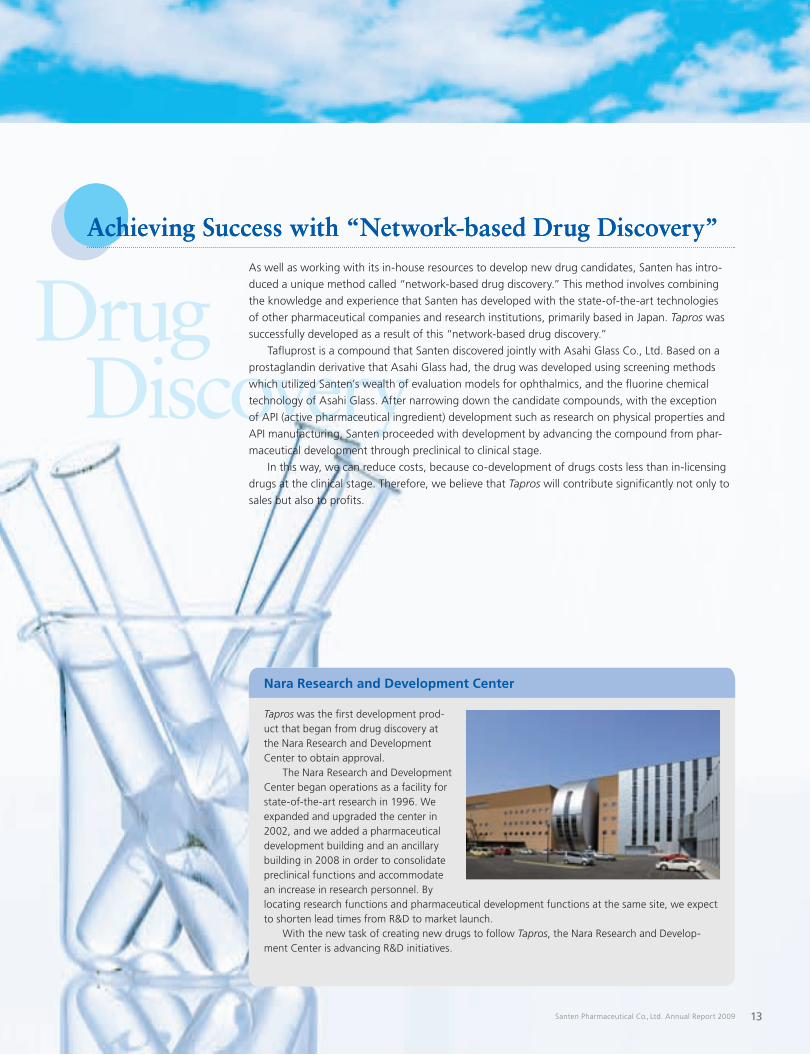
DrugDiscovery
��Santen Pharmaceutical Co., Ltd. Annual Report 2009
As well as working with its in-house resources to develop new drug candidates, Santen has intro-
duced a unique method called “network-based drug discovery.” This method involves combining
the knowledge and experience that Santen has developed with the state-of-the-art technologies
of other pharmaceutical companies and research institutions, primarily based in Japan. Tapros was
successfully developed as a result of this “network-based drug discovery.”
Tafluprost is a compound that Santen discovered jointly with Asahi Glass Co., Ltd. Based on a
prostaglandin derivative that Asahi Glass had, the drug was developed using screening methods
which utilized Santen’s wealth of evaluation models for ophthalmics, and the fluorine chemical
technology of Asahi Glass. After narrowing down the candidate compounds, with the exception
of API (active pharmaceutical ingredient) development such as research on physical properties and
API manufacturing, Santen proceeded with development by advancing the compound from phar-
maceutical development through preclinical to clinical stage.
In this way, we can reduce costs, because co-development of drugs costs less than in-licensing
drugs at the clinical stage. Therefore, we believe that Tapros will contribute significantly not only to
sales but also to profits.
Achieving Success with “Network-based Drug Discovery” Achieving Success with “Network-based Drug Discovery”
Nara Research and Development Center
Tapros was the first development prod-uct that began from drug discovery at the Nara Research and Development Center to obtain approval. The Nara Research and Development Center began operations as a facility for state-of-the-art research in 1996. We expanded and upgraded the center in 2002, and we added a pharmaceutical development building and an ancillary building in 2008 in order to consolidate preclinical functions and accommodate an increase in research personnel. By locating research functions and pharmaceutical development functions at the same site, we expect to shorten lead times from R&D to market launch. With the new task of creating new drugs to follow Tapros, the Nara Research and Develop-ment Center is advancing R&D initiatives.

OverseasGrowth
TopShare
Santen Pharmaceutical Co., Ltd. Annual Report 2009��
Tapros has produced concrete results, generating sales of more than ¥1.0 billion within three
months of its launch. While this achievement is, of course, attributable to the drug’s potent efficacy,
it is also supported by market penetration, which is powered by the high-quality medical information
provided by Santen’s medical representatives (MRs).
In the ophthalmology field, Santen has a team of approximately 400 MRs, who call on roughly
10,500 hospitals and 13,000 ophthalmologists. Santen’s strength is its ability to provide very
detailed information and services for all ocular diseases, rather than being restricted to a particular
ophthalmic disease field. Taking advantage of this strength, Santen has been promoting a doctor
marketing (DM) strategy since 2005.
Our DM strategy involves gathering information in order to understand the needs of each
physician along with the needs of the patients. Santen aims to develop closer relationships with
physicians and to establish a competitive edge by responding promptly and precisely to these needs
as well as providing appropriate recommendations for prescriptions and treatments. Other companies
may not able to replicate Santen’s DM strategy, as they mainly focus on product-based strategies.
Consequently, DM strategy based on detailed analysis of individual physicians has become one of
Santen’s unique assets.
The introduction of Tapros has strengthened our DM strategy in the glaucoma segment by
providing a wider range of prescription and treatment options. Following this strategy, we will
analyze the needs of individual physicians in relation to glaucoma treatment, with the goal of
increasing Tapros sales.
For fiscal 2009, we are targeting Tapros sales of ¥4.8 billion in Japan. With our goals set on
achieving the largest share of the glaucoma market, we will continue to promote initiatives to
maximize the product value of Tapros.
The overseas glaucoma market is large, and its growth potential is also as large as that of Japan’s
market if not greater. Therefore, we look forward to increasing tafluprost sales in overseas markets.
Prior to the launch of Tapros in Japan, Santen launched it in Europe as Taflotan. In Europe, we
have already received approval for this product in approximately 20 countries and begun sales in
five countries. In particular, Taflotan is penetrating Germany’s market faster than planned. In April
2009, Santen concluded a licensing agreement for tafluprost with Merck & Co., Inc. (of the U.S.).
Based on this agreement, Santen granted sales rights in areas of the world where Santen does not
have strong sales platforms, such regions as Western Europe (excluding Germany), North America,
South America and Africa.
Furthermore, Santen will continue promotional campaigns to support direct marketing efforts in
regions where it has developed powerful marketing platforms (Germany, Eastern Europe, Northern
Europe and Asia Pacific, including Japan). In conjunction with these initiatives, we will actively
increase product value through efforts that include realizing the benefits of the collaboration with
Merck & Co.
Targeting the Top Share of the Glaucoma Segment Targeting the Top Share of the Glaucoma Segment
Preparing for Overseas Growth Preparing for Overseas Growth
Special Feature: Leveraging a Growth Driver —Aiming for further growth by maximizing Tapros product value—

FurtherGrowth
��Santen Pharmaceutical Co., Ltd. Annual Report 2009
Akira KurokawaPresident and Chief Executive Officer
Our Mission is to Provide Outstanding Pharmaceuticals
Santen’s core value calls on the Company to contribute to society with a particular focus on patients and their loved ones. Glaucoma is a serious disease that in the worst cases leads to blindness and requires long-term treatment. By contributing to the treatment of glaucoma patients through Tapros, we are putting into practice our core value, based on which “we apply our unique capabilities and technologies in our areas of expertise to contribute to the health and quality of life of patients and their loved ones, and society as a whole.” Including glaucoma, there are still many diseases with regard to which patients are not fully satisfied with existing treatments. Santen is conducting R&D rapidly and efficiently in order to bring pharmaceuticals to market for such diseases as quickly as possible. We will further upgrade the medical information we provide through MRs to ensure that medical professionals and patients use newly developed pharmaceuticals appropriately and safely. We are convinced that this is our social mission.
In this way, Tapros is expected to become a significant promoter of Santen’s medium-to-long
term growth. Further, the successful development of Tapros has important ramifications for R&D.
Tapros was developed based on Santen’s basic R&D strategy, which is to narrow down research
themes in order to focus resources on growth areas where Santen can fully utilize its strengths and
where there is significant growth potential. Santen has been taking steps to develop new drugs
focusing especially on such areas as glaucoma, corneal disorders and retinal disorders—its highest-
priority disease fields. This strategic approach to R&D resulted in the development of Tapros, and
successful development of this product has given us a great deal of confidence to proceed further
with R&D efforts.
Tapros is Santen’s first global development product. First obtaining regulatory approval in
Denmark in April 2008, we now have obtained approval for the product in about 20 European
countries. Obtaining approval not only in Japan but also in Europe, despite the differences in
regulations concerning clinical trial systems and medical environments has been a valuable experi-
ence. As we look toward the globalization of clinical trials, not limiting ourselves to Europe, we
are also promoting clinical development of Tapros in Asia.
For Santen’s future growth, acceleration of global development is essential. With that in mind,
we will apply the R&D capabilities cultivated through Tapros development to clinical and pharma-
ceutical development in a range of products, including the global strategic product DE-101 (rivogli-
tazone), a drug for corneal and conjunctival epithelial disorders, and DE-104, a drug for glaucoma
and ocular hypertension. Also, we will extend our clinical development efforts by adding Asia to
existing initiatives in Japan, the U.S. and Europe, and we will make our R&D even more rapid and
efficient. Santen will achieve medium-to-long-term growth by achieving results from R&D invest-
ments, growing in areas where it can exploit strengths and realizing globalization.
Looking to Achieve Further Growth Looking to Achieve Further Growth

Santen Pharmaceutical Co., Ltd. Annual Report 2009�6
Basic R&D StrategyThe fundamental R&D strategy of Santen
is to focus its resources on growth areas
where its strengths can be fully utilized
and where there is significant growth
potential. As part of this strategy, we
have strengthened our R&D capabilities
by consolidating existing preclinical
divisions into the Nara Research and
Development Center, specializing in the
fields of ophthalmology and rheumatol-
ogy. Within ophthalmology, we narrowed
our focus even further to target the core
therapeutic fields of glaucoma, corneal
disorders and retinal disorders to enable
us to pursue more effective and faster
new drug development.
The markets for glaucoma and corneal
disorder treatments are expanding as the
global population ages, and the number
of patients in these segments grows. The
number of patients with retinal disorders
is also rising. However, there are few
treatments available in this area, resulting
in a considerable need to develop effec-
tive new drugs. Therefore, Santen will
develop new drugs in these important
fields to fulfill unmet medical needs and
help enhance patients’ quality of life.
Building a Rich Development Pipeline
While working to discover new drug
candidates using our own research
capabilities, we are proceeding in parallel
with a unique method called “network-
based drug discovery,” which utilizes
external resources. This method of drug
design takes simultaneous advantage
of Santen’s considerable accumulated
knowledge and technologies as well as
leading-edge technologies from other
pharmaceutical companies and research
institutions, primarily based in Japan.
For example, by accessing the chemical
library of a collaborating pharmaceutical
company and applying our own abun-
dant resources in an ophthalmic disease-
model, we can select and strategically
introduce highly effective compounds
in our target market segments. We also
engage in joint research efforts to develop
strong candidate compounds based on
in-house ideas, including the glaucoma
and ocular hypertension treatment Tapros
(tafluprost) and DE-104, which is currently
under development.
By applying these drug discovery
methods, we aim to create a rich devel-
opment pipeline that will generate
a steady flow of marketable new prod-
ucts. Further, we actively introduce new
drug candidates, and have successfully
acquired DE-109 (sirolimus). Santen also
secures backup compounds for each
development candidate to reduce the
inherent risk of additional R&D activities
and expenses.
Strengthening R&D CapabilitiesCompetition among pharmaceutical
companies is becoming fiercer on the
global stage. To stay ahead of competi-
tors, it is essential to quickly develop and
launch globally innovative and competi-
tive new drugs. To achieve this, we place
a strong emphasis on “accelerating” and
“globalizing” our R&D efforts.
On the “accelerating” front, Santen
has worked steadily to achieve the specific
time-reduction targets set out in its
2003–2005 Medium-term Management
Plan to shorten preclinical testing to one
and a half years (from a previous time-
frame of approximately three years) and
clinical testing to five years (from approxi-
mately seven to eight years). The 2006–
2010 Medium-term Management Plan
also highlights acceleration through
ongoing reviews of in-house R&D
processes. In 2008, aiming to build an
even more efficient R&D system, we built
a pharmaceutical development building
and an ancillary building within the Nara
Research and Development Center in
order to consolidate preclinical functions
and accommodate a future increase in
research staff.
In “globalizing” efforts, we now have
a clinical development network spanning
three centers—Japan, the U.S. and
Europe—and we are currently carrying
out clinical trials for several products in
Europe and the U.S. As well as Japan,
Research and Development

��Santen Pharmaceutical Co., Ltd. Annual Report 2009
the U.S. and Europe, we are developing
a system for simultaneous international
joint development including China and
other major Asian countries. As a result
of this initiative, we hope to realize joint
international trials with an even greater
global scope. We further aim to continue
reducing clinical development lead times
and costs by standardizing clinical trial
protocols and sharing data among regions.
We classify new drug candidates
slated for marketing overseas as either
global strategic products or global prod-
ucts. Global strategic products are drug
candidates based on new mechanisms
and that promise to surpass the sales of
existing products. We look to market
such products globally. Global products
are drug candidates that are based on
upgraded existing mechanisms and that
will likely generate sales of a magnitude
comparable with those of existing
products. Generally, global products are
marketed in Japan and in certain overseas
regions. Santen gives priority to develop-
ing global strategic products.
Moreover, in order to develop
marketed products we generate clinical
evidence to enable us to recommend
prescriptions and treatments that take
advantage of product characteristics.
Development AdvancesSanten focuses R&D on core therapeutic
fields: glaucoma, corneal disorders and
retinal disorders. The progress of our
development efforts as of July 31, 2009,
is as follows.
Glaucoma Segment
In December 2008, we began sales of
the prostaglandin derivative DE-085
(tafluprost, sold as Taflotan in Europe)
in Japan. In Europe, we launched sales in
Germany in June 2008, and at present
we are directly marketing Taflotan in five
countries. In South Korea, we obtained
marketing approval in June 2009, and in
China Phase III clinical trials are underway.
We cancelled development of the angio-
tensin II receptor antagonist DE-092
(olmesartan) because the results of
a pilot study in Europe using a modified
formulation revealed that it would be
difficult for DE-092 to meet the criteria
we expected of it as a new treatment.
Based on the results of early Phase II
clinical trials in Japan and the U.S. for
the ROCK inhibitor DE-104, for glaucoma
and ocular hypertension, we are currently
conducting additional clinical trials in
the U.S.—Phase I / early Phase II clinical
trials—based on higher dosages, aiming
to increase efficacy for alleviation of
ocular hypertension.
Corneal and Conjunctival Epithelial
Disorder Segment
In May 2008, we filed an NDA in Japan
for DE-089 (diquafosol sodium), a treat-
ment for corneal and conjunctival epithe-
lial disorders associated with dry eye. This
application is currently under evaluation.
Regarding DE-101 (rivoglitazone), based
on the results of early Phase II clinical
trials in the U.S. we are currently imple-
menting early Phase II clinical trials in
Japan to establish dosages. Phase I
clinical trials for DE-105, a development
candidate for a treatment for intractable
persistent corneal epithelial defects, have
been completed in the U.S., and prepara-
tions are currently underway for early
Phase II clinical trials. We cancelled
development of the phosphodiesterase
type 4 inhibitor for allergic conjunctivitis,
DE-103, because it became clear that it
would be difficult for it to meet the
criteria expected of a new treatment.
Retinal Disorder Segment
A treatment for diabetic macular edema
(DME), DE-102, is in Phase I / early Phase
II clinical trials in Japan to determine
safety and efficacy in patients. Santen
acquired rights from MacuSight, Inc. (of
the U.S.) in May 2008 to develop and sell
DE-109. Accordingly, we began Phase I /
early Phase II clinical trials in April 2009
in Japan to determine safety and efficacy
for patients with wet age-related macular
degeneration (wet AMD) and with DME.
Other Areas
For the bacterial conjunctivitis treatment
DE-108 (levofloxacin 1.5%), Phase III
clinical trials are underway in Japan.
Further, DE-098, an anti-APO-1 antibody
rheumatoid arthritis treatment licensed to
Argenes, Inc. for development in Japan,
is in Phase I / II clinical trials in Europe and
Japan to determine safety and efficacy.
Phase I Phase II Phase III
LaunchDiscoveryresearch
Preclinicaltrials Clinical trials Application
for approval
Estimate initial safety and tolerability of drug on a small number of healthy volunteers
Investigate and determine the appropriate dose and regimen for a specific treatment purpose on a small number of patients
Confirm safety and efficacy relative to existing drugs and placebos on a large number of patients
About Research and Development
After passing preclinical tests for safety and efficacy, new drug candidates are put through the clinical trial phases outlined below. Once Phase III is completed, an NDA is filed with the appropriate regulatory agency in each of our global regions. If it passes evaluation, the drug receives approval for manufacturing and marketing.

Research and Development
Santen Pharmaceutical Co., Ltd. Annual Report 2009�8
Dev. Code/Generic Name (Original/Licensor)
Indication RegionPhase NDA
FiledApproved Characteristics
I II III
DE-085/Tafluprost (Co-development with Asahi Glass)
Glaucoma Ocular hypertension
Japan Prostaglandin derivative treatment for glaucoma and ocular hypertension. Launched in Japan in December 2008. In Europe, launched in June 2008 in Germany and currently marketed directly in five countries. Granted U.S. development rights to Merck & Co. in April 2009. Marketing approval was granted in South Korea in June 2009, and Phase III trials are underway in China.
(* excluding Japan)
Europe
U.S.
Asia*
DE-090/Lomerizine HCl(Schering-Plough)
Glaucoma Japan
A new type of glaucoma treatment studied for inhibiting the progression of visual field defects. The only calcium antagonist in development as an oral glaucoma treatment. Compared with NMDA receptor antagonists, fewer systemic side effects are expected, thus having excellent safety. Marketed by Schering-Plough as a migraine treatment.
DE-104/Undetermined (Co-development with Ube Industries)
Glaucoma Ocular hypertension
U.S. ROCK inhibitor co-developed with Ube Industries for treatment of glaucoma and ocular hypertension has a different action mechanism from other existing drugs. It is expected to show a strong intraocular pressure reduction by promoting aqueous humor outflow by acting directly on trabecular meshwork cells.Japan
DE-089/Diquafosol sodium(Inspire Pharm.)
Corneal and conjunctival epithelial disorder associated with dry eye
Japan
A treatment for corneal and conjunctival epithelial disorder mostly associated with dry eye that stimulates the ocular surface to secrete tear fluid and components. It is expected to be used in combination with existing treatments. A comparative Phase III study met the primary objective and we filed for manufacturing and marketing approval.
DE-101/Rivoglitazone(Daiichi Sankyo)
Corneal and conjunctival epithelial disorder associated with dry eye
U.S. Expected to show a potent effect on corneal and conjunctival epithelial disorder mostly associated with dry eye by directly acting on the corneal and conjunctival epithelial cells. Unique mechanism of action which differs from existing treatments.Japan
DE-105/Undetermined(Original)
Persistent corneal epithelial defects
U.S.Expected to accelerate corneal epithelial migration and demonstrate high safety for intractable persistent corneal epithelial defects compared with existing therapy.
DE-102/Undetermined(Co-development with Oakwood)
Diabetic macular edema (DME)
JapanSteroid microsphere product for a sustained release injection. Animal studies demonstrated sustained efficacy by local injection. In order to produce sterile microsphere in commercial scale, we collaborate with Oakwood Laboratories.
DE-109/Sirolimus(MacuSight)
Wet age-related macular degeneration (wet AMD) Diabetic macular edema (DME)
Japan
Subconjunctival or intravitreal injection having immunosuppressive effect, and anti-angiogenic effect, etc. Phase I clinical trials in patients with wet AMD and DME have shown patients who participated in these studies exhibited improve-ments in visual acuity that were consistent with morphological changes following a single administration of sirolimus. In May 2008, Santen made an R&D collaboration and license agreement with MacuSight (of the U.S.), for the Japanese and Asian development and commercialization of sirolimus.
DE-108/Levofloxacin 1.5%(Daiichi Sankyo)
Bacterial conjunctivitis
Japan
Fluoroquinolone antibacterial agent. A higher-concentration product for control of drug resistance. Levofloxacin 0.5% was launched as a treatment for bacterial conjunctivitis in Japan in April 2004 (sold as Cravit), in the U.S. in November 2000 (sold as Quixin) and in Europe in May 2002 (sold as Oftaquix).
DE-098/Undetermined(license out)
Rheumatoid arthritis
JapanJoint injection that induces apoptosis in diseased joints of rheumatoid arthritis patients. Bulk pharmaceutical manufacturing process for actual production scale has been established. Santen granted the domestic development rights to Argenes. The compound had been in-licensed from Centocor (of the U.S.). Clinical trials are underway in Japan and Europe. Santen continues to hold the marketing rights in Japan and the overseas marketing and development rights.
Europe
Rheumatoid arthritis
Retinal disorders
Corneal and conjunctival epithelial disorders
Glaucoma
PIPElINE OF PRESCRIPTION PHARMACEUTICAlS (Clinical Development)As of July 31, 2009
Launched, December 2008
Launched, June 2008
Phase I/II
Phase I/II
May 2008
Phase I/II
Category
Global strategic product
Global product
Domestic (Japan) product
(License out)
Phase I/II
Ophthalmic infections
Phase I/II
June 2009

�9Santen Pharmaceutical Co., Ltd. Annual Report 2009
Review of OperationsYear ended March 31, 2009
Consolidated Net Sales
¥101,619million
–1.7%
Others
1.6%
Medical Devices
0.6% Over-the-Counter
Pharmaceuticals
5.1% Prescription Anti-Rheumatic Pharmaceuticals
9.6%
Business Area Description of Business Market Share; Market Position
Ophthalmic Pharmaceuticals
In Japan, Santen markets a broad range of ophthalmic pharmaceutical products, such as treatments for corneal and conjunctival epithelial disorders, anti-infective ophthalmics, treatments for glaucoma and anti-allergy ophthalmics.
Overseas, Santen markets Cravit and Tapros (brand names differ according to region) and other products through sales networks in the U.S., Europe and Asia.
38.0%; Number One1
Santen enjoys its position as the leader of the Japanese prescription ophthalmics market. We deploy approximately 400 medical representatives (MRs) and our product lineup covers a broad array of ophthalmic disorders.
Anti-Rheumatic Pharmaceuticals
In Japan, we offer Rimatil and Azulfidine EN, the physicians’ disease modifying anti-rheumatic drugs (DMARDs)2 of choice for treating rheumatoid arthritis.
45.0%; Number One1
Over-the-Counter (OTC) Pharmaceuticals
Our OTC pharmaceuticals business consists of market-leading eye drop brands in Japan, such as Sante FX Neo, the Sante 40 series and the Sante de U series.
Approx. 20%; Number Two3
Medical Devices In Japan, Santen handles medical devices used in cataract surgery, including intraocular lenses.
—
Prescription Ophthalmic Pharmaceuticals
83.1%
Notes: 1. Market share and market position in Japan for the year ended March 31, 2009. The share and position for anti-rheumatic pharmaceuticals represent those in the DMARDs segment. Source: Santen analysis based on IMS data. 2. A class of medicines that are used not only to alleviate symptoms but also to treat the causes of disease. The anti-rheumatic effect works by calming inflammation through the correction of
immune abnormalities, which are considered a cause of rheumatoid arthritis. 3. Market share and market position in the Japanese OTC eye drop market for the year ended March 31, 2009. Source: Santen Pharmaceutical Co., Ltd.
All comparisons are with the previous fiscal year unless otherwise stated.

JAPANThe Japanese prescription ophthalmic pharmaceutical market grew �.6%
overall, to ¥��6,900 million, in fiscal �008, which benefited from the growth in
sales of products for glaucoma and corneal disorders and anti-allergy ophthal-
mics due to the prevalence of cedar hay fever. This combined growth offset
an average �.�% reduction in product prices in the prescription ophthalmic
pharmaceuticals industry due to NHI drug price revisions that took effect April
�008. Amid these market conditions, Santen’s domestic prescription ophthalmic
pharmaceutical sales edged up 0.�%, to ¥��,��� million. This increase was
achieved despite an average reduction of around �.0% in the prices of Santen’s products due to NHI drug price
revisions and other factors, which counteracted promotional activities in which Santen’s medical representatives
(MRs) provide individual medical facilities with scientific information tailored to their changing needs.
Net Sales of PrescriptionOphthalmic Pharmaceuticals
2005
2006
2007
2008
2009 12,131
13,106
10,880
9,706
7,241
72,357
72,320
71,272
71,215
68,383
Domestic sales Overseas sales
Millions of yen
Review of Operations
2005
2006
2007
2008
2009
0 80,000 160,000 240,000
Prescription Ophthalmic Pharmaceuticals Market Millions of yen
Prescription Pharmaceuticals Ophthalmic Pharmaceuticals
For fiscal 2008, ended March 31, 2009, net sales of
prescription ophthalmic pharmaceuticals decreased
1.1%, to ¥84,488 million. Santen’s domestic sales of
prescription ophthalmic pharmaceuticals rose 0.1%,
to ¥72,357 million, and overseas sales decreased 7.4%,
to ¥12,131 million.
Hyalein
Santen Pharmaceutical Co., Ltd. Annual Report 2009�0
Santen products hold an 80% share of
the market for treatment for corneal and
conjunctival epithelial disorders associ-
ated with dry eye. This market expanded
5.7%, to ¥30,500 million, in fiscal 2008.
Since dry eye—caused by inadequate tear
fluid volume or a change in tear fluid
composition—is a condition that can
result in corneal damage, it is important
that dry eye is correctly diagnosed and
treated through regular consultations
with an ophthalmologist. As this is not
widely recognized, many patients with
obvious symptoms do not consult
a doctor. In addition, the number of
people suffering from dry eye is trending
upward with increased use of personal
computers and contact lenses and the
aging of Japan’s population. As a result,
the market for effective treatments for
corneal and conjunctival epithelial disor-
ders is expected to continue growing.
Santen’s mainstay product, Hyalein,
a treatment for corneal and conjunctival
epithelial disorders, has earned unequivo-
cal endorsement as the first choice in
treatment for dry eye. It is a highly
water-retentive ophthalmic solution that
increases tear film stability and demon-
strates superior efficacy in alleviating
corneal and conjunctival epithelial disor-
ders associated with dry eye. In fiscal
2008, sales of Hyalein grew steadily,
increasing 3.8%, to ¥18,541 million,
thanks to these product characteristics
and Santen’s dry eye awareness cam-
paign targeting patients and medical
professionals.
Treatments for Corneal and Conjunctival Epithelial Disorders
¥84,488million –1.1%
Net Sales
2005
2006
2007
2008
2009
Sales include overseas sales
0 7,000 14,000 21,000
Sales of Hyalein Millions of yen

��Santen Pharmaceutical Co., Ltd. Annual Report 2009
Glaucoma treatments represent the
largest sector of the domestic prescrip-
tion ophthalmic pharmaceutical market,
accounting for approximately 37% of
the total. Rising intraocular pressure
is a significant risk factor for damage
caused to the optic nerve, leading to
visual field loss and in some cases blind-
ness. Glaucoma is one of the most
common causes of blindness in people
with ophthalmic disease. According to
recent epidemiological studies, there are
a high number of potential glaucoma
patients who have not been diagnosed
by doctors. Early detection and treatment
of the disorder has become a major issue.
Combined with increasing patient num-
bers from Japan’s aging population, the
glaucoma market has expanded steadily,
growing 2.2% in fiscal 2008.
In December 2008, Santen intro-
duced a new ophthalmic solution, Tapros,
to this market, which meets the treat-
ment needs of patients with glaucoma
and ocular hypertension. Reflecting
advancing market penetration, Tapros
accounted for sales of ¥1,058 million in
fiscal 2008. Meanwhile, despite contin-
ued efforts to increase the market
penetration and presence of Rescula and
other glaucoma products, there was
a 6.1% decrease in the combined sales
of our four leading products—Rescula,
Detantol, Timoptol XE and Timoptol—to
¥13,359 million.
Santen aims to rapidly maximize the
value of its new product Tapros. Further,
Santen will continue to highlight the
particular benefits of Rescula and Detan-
tol. We will heighten our presence in the
glaucoma treatment sector by providing
the latest glaucoma-related information
and advice on prescribing pharmaceuticals
to meet the needs of medical professionals.
The anti-infective ophthalmic pharmaceu-
tical market is trending slightly downward
due to the shortening of the treatment
duration for anti-infective ophthalmic
products after cataract and other surgeries.
Santen dominates the anti-infective
ophthalmic pharmaceutical market with
a share of approximately 70%, supported
by its two key products, Cravit and Tarivid,
which both display strong antibacterial
properties, broad-spectrum coverage
(effective against a wide range of infec-
tions) and excellent intraocular penetra-
tion and safety. Both are widely used for
conjunctivitis, keratitis and preventing
post-operative eye infection. As a result
of market contraction and increased
competition, combined sales of Cravit
and Tarivid declined 5.5%, to ¥13,838
million, in fiscal 2008.
We will continue to promote Cravit,
highlighting the scientific data supporting
its superior clinical efficacy and safety. In
addition, providing the latest information
on ophthalmic disease will help reinforce
the position of Cravit as the gold stan-
dard among treatments for ophthalmic
infections, and allow it to maintain its
leading position in the market for anti-
infective ophthalmic products.
Anti-Infective Ophthalmics
Treatments for Glaucoma
Santen plans to continue promoting
greater understanding of the diagnosis
and treatment of dry eye to further raise
awareness and expect that new patients
will consult their physicians and existing
patients will maintain appropriate courses
of treatment. We believe this will contrib-
ute to growth in the market for dry eye
medications as well as strengthen our
presence in that market. Furthermore,
we are continuing efforts to expand and
improve our development pipeline to
enhance our product lineup for corneal
and conjunctival epithelial disorders.
Tapros Detantol
Cravit Tarivid
2005
2006
2007
2008
2009
0 6,000 12,000 18,000
Sales include overseas sales
Sales of Cravit and Tarivid Millions of yen
Cravit Tarivid
2005
2006
2007
2008
2009
Sales include overseas sales
0 5,000 10,000 15,000
Sales of Timoptol, Timoptol XE, Detantol, Rescula and Tapros Millions of yen
Timoptol Timoptol XE DetantolRescula Tapros
Livostin Alegysal
Review of Operations
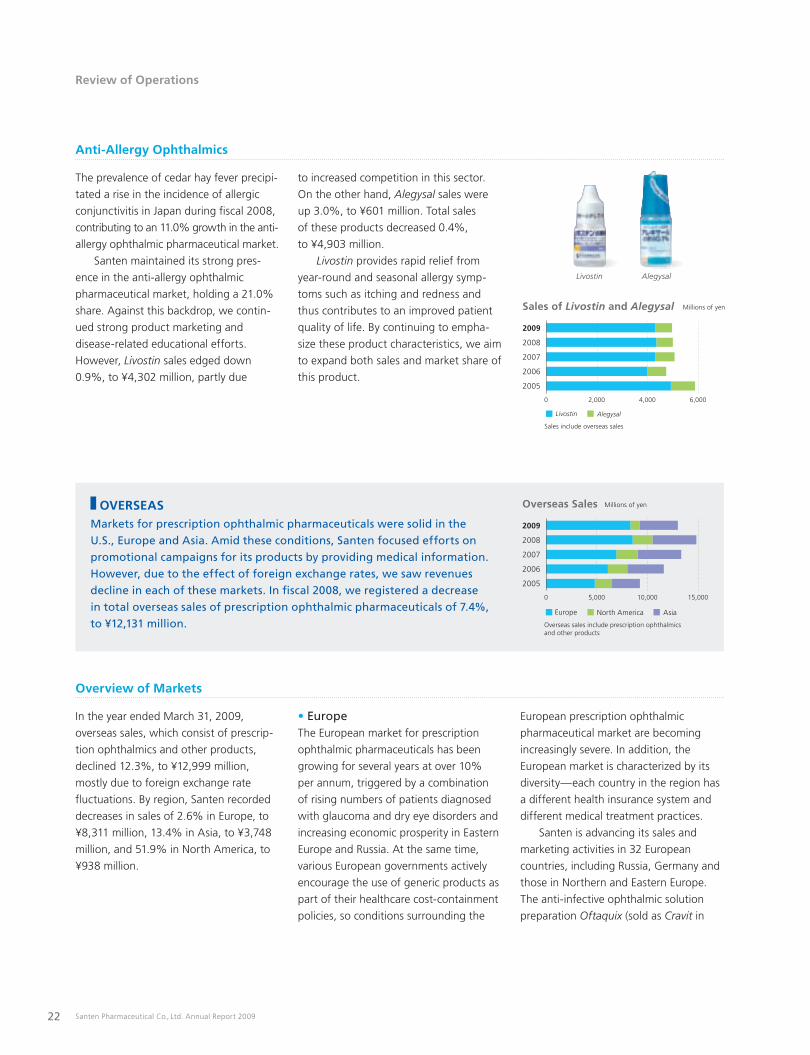
Anti-Allergy Ophthalmics
Overview of Markets
Santen Pharmaceutical Co., Ltd. Annual Report 2009��
OVERSEASMarkets for prescription ophthalmic pharmaceuticals were solid in the
U.S., Europe and Asia. Amid these conditions, Santen focused efforts on
promotional campaigns for its products by providing medical information.
However, due to the effect of foreign exchange rates, we saw revenues
decline in each of these markets. In fiscal �008, we registered a decrease
in total overseas sales of prescription ophthalmic pharmaceuticals of �.�%,
to ¥��,��� million.
2005
2006
2007
2008
2009
Europe North America Asia
Overseas sales include prescription ophthalmics and other products
0 5,000 10,000 15,000
Overseas Sales Millions of yen
In the year ended March 31, 2009,
overseas sales, which consist of prescrip-
tion ophthalmics and other products,
declined 12.3%, to ¥12,999 million,
mostly due to foreign exchange rate
fluctuations. By region, Santen recorded
decreases in sales of 2.6% in Europe, to
¥8,311 million, 13.4% in Asia, to ¥3,748
million, and 51.9% in North America, to
¥938 million.
• EuropeThe European market for prescription
ophthalmic pharmaceuticals has been
growing for several years at over 10%
per annum, triggered by a combination
of rising numbers of patients diagnosed
with glaucoma and dry eye disorders and
increasing economic prosperity in Eastern
Europe and Russia. At the same time,
various European governments actively
encourage the use of generic products as
part of their healthcare cost-containment
policies, so conditions surrounding the
European prescription ophthalmic
pharmaceutical market are becoming
increasingly severe. In addition, the
European market is characterized by its
diversity—each country in the region has
a different health insurance system and
different medical treatment practices.
Santen is advancing its sales and
marketing activities in 32 European
countries, including Russia, Germany and
those in Northern and Eastern Europe.
The anti-infective ophthalmic solution
preparation Oftaquix (sold as Cravit in
The prevalence of cedar hay fever precipi-
tated a rise in the incidence of allergic
conjunctivitis in Japan during fiscal 2008,
contributing to an 11.0% growth in the anti-
allergy ophthalmic pharmaceutical market.
Santen maintained its strong pres-
ence in the anti-allergy ophthalmic
pharmaceutical market, holding a 21.0%
share. Against this backdrop, we contin-
ued strong product marketing and
disease-related educational efforts.
However, Livostin sales edged down
0.9%, to ¥4,302 million, partly due
to increased competition in this sector.
On the other hand, Alegysal sales were
up 3.0%, to ¥601 million. Total sales
of these products decreased 0.4%,
to ¥4,903 million.
Livostin provides rapid relief from
year-round and seasonal allergy symp-
toms such as itching and redness and
thus contributes to an improved patient
quality of life. By continuing to empha-
size these product characteristics, we aim
to expand both sales and market share of
this product.
Livostin Alegysal
2005
2006
2007
2008
2009
Sales include overseas sales
0 2,000 4,000 6,000
Sales of Livostin and Alegysal Millions of yen

��Santen Pharmaceutical Co., Ltd. Annual Report 2009
Japan) has gained an excellent reputation
among ophthalmic surgeons for its supe-
rior reliability in preventing pre-operative
and post-operative eye infections and is
now available in 27 countries. Additionally,
Santen has obtained approval for Taflotan
(tafluprost, sold as Tapros in Japan) in
about 20 countries. In June 2008, we
introduced this new product in Germany,
and currently market this product directly
in five countries. Furthermore, our subsid-
iary in Finland, Santen Oy, manufactures
pharmaceuticals for the European and the
U.S. markets, and it also conducts R&D
and clinical development as our European
R&D center.
Santen will continue promotional
campaigns for its existing products as well
as work to increase sales of Taflotan in its
existing markets. At the same time, we will
advance preparations to launch the prod-
uct in new markets. In another effort to
maximize the value of Taflotan, we seek to
enable sales of the product more globally.
To this end, we concluded a licensing
agreement with Merck & Co., Inc.,
granting it sales rights in Western Europe
(except Germany), North America, South
America and Africa, areas in which Santen
does not have strong sales platforms.
• AsiaIn Asia, Santen operates in China, South
Korea and the ASEAN nations. Our vision
for the Asian market is to become the top
ophthalmic drug manufacturer. Accord-
ingly, we are striving to enhance trust-
based relationships with patients and
medical professionals, thereby contribut-
ing to the improvement of ophthalmic
treatment in the region. In fiscal 2008,
we stepped up marketing activities and
provided academic information on ophthal-
mology. Also, in China, our main market
in the region, Santen Pharmaceutical
(China) Co., Ltd., started up operations
at our plant in Suzhou and began direct
marketing in October 2008.
The Chinese market is expected to see
strong sales growth in the medium-to-
long term as the country continues its
upward economic trend and the numbers
of physicians and patients increase in step
with the development of medical infra-
structure. Santen Pharmaceutical (China)
has a sales headquarters in Beijing and 29
sales offices throughout China. We are
concentrating our development of
business on these urban centers. Until
recently, we used indirect marketing
through local sales agents for prescription
ophthalmic pharmaceutical products, such
as Cravit anti-infective eye drops, and
Hyalein, a corneal and conjunctival epithe-
lial disorder treatment. In October 2008,
Santen switched to direct marketing.
To coincide with this change, we began
providing specialists with high-quality
academic information on ophthalmic
disease. We are also working to increase
the penetration of the Santen brand in
the South Korean and ASEAN markets
through Santen Pharmaceutical Korea,
Co., Ltd. and local agencies.
• North AmericaIn the U.S., Santen is advancing the
clinical development of DE-101 (rivogli-
tazone), DE-104 and DE-105, which are
key areas of focus for Santen’s new
product development. In conjunction
with these initiatives, we are increasing
business development activities to
expand and improve our development
pipeline. Further, we market the follow-
ing products under a licensing agreement
with VISTAKON Pharmaceuticals, LLC (of
the U.S.): the anti-infective Quixin (sold as
Cravit in Japan), the glaucoma treatment
Betimol, the anti-allergy ophthalmic
solution Alamast (sold as Alegysal in
Japan) and the high-concentration
levofloxacin ophthalmic solution Iquix.
The 17th Congress of the European Society of Ophthalmology held in Amsterdam in the Netherlands in June 2009
The Suzhou Plant, started up by Santen Pharmaceutical (China) Co., Ltd. in October 2008

Santen Pharmaceutical Co., Ltd. Annual Report 2009��
Although the causes of rheumatoid
arthritis (RA) are not yet well understood,
RA is thought to be a chronic inflamma-
tory disorder that affects the whole body.
Inflammation occurs particularly in the
joints, causing pain and swelling, and can
often lead to bone and cartilage damage
and subsequent joint deformity. It is
estimated that there are approximately
700,000 people with RA in Japan today.
The Japanese market for DMARDs*
expanded 2.8%, to ¥24,800 million, in
fiscal 2008, as the number of patients
grew in line with population aging and
prescriptions of higher-priced medica-
tions increased.
Santen has built its leading position in
the prescription anti-rheumatic pharma-
ceuticals market through active promotion
of Rimatil, Azulfidine EN and Metolate in
hospitals and clinics. Among sales results
of core products in the period under
review, Rimatil fell 4.8%; Azulfidine EN,
which displays early-onset effect charac-
teristics, grew a solid 1.6%; and Metolate,
launched in July 2004, made good inroads
in the market. As a result, net sales of
prescription anti-rheumatic pharmaceuti-
cals increased 1.2%, to ¥9,742 million,
and Santen maintained its dominant
position as leader of the DMARDs market
with a 45.0% share.
The Manual on the Medical Treatment
of Rheumatoid Arthritis and Medical
Treatment Guidelines Based on EBM,
compiled by a study group of the Ministry
of Health, Labour and Welfare and
published by the Japan Rheumatism
Foundation, recommends treating RA
with DMARDs from the early stages to
improve patients’ quality of life by retard-
ing the progress of joint destruction and
so avoiding the development of joint
deformity. Santen’s Rimatil, Azulfidine EN
and Metolate are each rated “Grade A –
Highly Recommended” under the guide-
lines, which gives them a high profile
as strongly recommended treatment
options. To broaden the market share of
these three products even further, we will
continue to emphasize this solid indepen-
dent support for their superior efficacy in
our promotional activities.
* A class of medicines that are used not only to alleviate symptoms but also to treat the causes of disease. The anti-rheumatic effect works by calming inflammation through the correction of immune abnormalities, which are considered a cause of RA.
2005
2006
2007
2008
2009
0 4,000 8,000 12,000
Rimatil Azulfidine EN Metolate
Sales of Rimatil, Azulfidine EN and Metolate Millions of yen
Review of Operations
Prescription Pharmaceuticals Anti-Rheumatic Pharmaceuticals
NHI drug price revisions and competing products
affected Rimatil, Azulfidine EN and Metolate. However,
Santen’s net sales of prescription anti-rheumatic phar-
maceuticals grew 1.2%, to ¥9,742 million, in fiscal 2008
because these products are each highly recommended
under the Guidelines for the Management of Rheuma-
toid Arthritis.
Sales of Prescription Anti-Rheumatic Pharmaceuticals
2005
2006
2007
2008
2009 9,742
9,627
9,379
9,041
8,353
Millions of yen
¥9,742 million +1.2%
Net Sales

��Santen Pharmaceutical Co., Ltd. Annual Report 2009
Santen’s OTC pharmaceuticals sales are
mostly generated in the Japanese OTC
ophthalmic market. In fiscal 2008, this
market grew as demand rose for prod-
ucts for eye fatigue, contact lens wearers
and allergies.
Our OTC business specializes in
a range of ophthalmic products, including
Sante FX Neo, Japan’s top-selling oph-
thalmic solution brand, and the Sante 40
series, highly effective in improving
blurred vision. Fiscal 2008 saw the
launches of an ophthalmic solution that
improves blurred vision, Sante 40i, in
October 2008 and an ophthalmic solution
that refreshes the eyes, Sante FX V Plus,
in March 2009. However, such efforts did
not fully compensate for tough competi-
tive conditions, and OTC pharmaceuticals
net sales were down 4.1%, to ¥5,225
million. With fierce competition set to
continue in this market, we will continue
promoting sales of new products while
maintaining the market share of our
existing product range, concentrating on
ophthalmic products for tired eyes,
blurred vision and eye refreshment.
Santen’s medical devices business
specializes in the cataract surgery field,
focusing primarily on IOLs. In recent
years, IOL demand has shifted primarily
to foldable lenses that can be inserted
through a small incision. Targeting this
trend, Santen sells the Eternity foldable
IOL, which is made of a new highly
refractive acrylic optical material and
manufactured by Advanced Vision
Science, Inc., a U.S. subsidiary of Santen.
In fiscal 2008, we focused efforts on
promotional campaigns for Eternity,
which resulted in a 50.1% increase in net
sales of medical devices, to ¥623 million.
Moreover, in March 2009 we granted
worldwide rights, excluding Japan, for
the development, manufacturing and
marketing rights for Eternity and its
materials to Bausch & Lomb Inc. (of
the U.S.). Santen will continue efforts
to increase sales of medical devices.
Net Sales of OTC Pharmaceuticals
2005
2006
2007
2008
2009 5,225
5,451
5,307
5,247
5,277
Rimatil
Millions of yen
2005
2006
2007
2008
2009 623
415
537
638
754
Net Sales of Medical Devices Millions of yen
Sante FX V Plus Sante 40i
¥623 million +50.1%
Net Sales
¥5,225 million –4.1%
Net SalesOver-the-Counter Pharmaceuticals
Santen continued promotional activities focusing on
products for tired eyes, blurred vision and eye
refreshment. Amid tough competitive conditions,
Santen’s OTC pharmaceuticals net sales declined 4.1%,
to ¥5,225 million.
Medical Devices
Santen’s concentration on promotional campaigns for
its foldable intraocular lens (IOL) Eternity led to an
increase of 50.1% in net sales of medical devices,
to ¥623 million.

Santen Pharmaceutical Co., Ltd. Annual Report 2009�6
Earning the Trust of SocietyAs a company involved in medicine,
Santen is committed to becoming
a company trusted by all stakeholders,
including healthcare professionals,
members of the community, patients and
their loved ones. Aiming to deepen the
relationship of trust we have fostered
with society at large and fulfill our
corporate duties and responsibilities
through robust business practices, we
formulated the Santen Corporate Ethics
Mission in 1999.
This mission expresses our fundamen-
tal approach to society, customers,
shareholders, business partners and
employees, and we revise it in accordance
with changes in society. Santen aims to
be a good, socially responsible corporate
citizen based on the high ethical prin-
ciples outlined in the Santen Corporate
Ethics Mission.
Relationship with Society
Santen makes a variety of social contribu-
tions, which include supporting advances
in medical treatment and benefiting local
communities.
To achieve advances in medical
treatment, developing personnel is
important. Santen has formed a joint
lecture program with the Nara Institute of
Science and Technology, in which Santen’s
research personnel instruct students at
the Company’s training facilities. Also,
Santen continuously donates to a number
of charities, including the Japan Eye Bank
Association, the Japan National Society
for the Prevention of Blindness and the
non-profit organization Helen Keller
International, which is devoted to fighting
and treating preventable blindness in
developing countries. In those Asian
nations where standards of medical
treatment have not yet reached globally
accepted levels, we aim to raise the
standard of medical treatment by
supporting the education of ophthal-
mologists. We also support the Chinese
Ophthalmology Scholarship Program in
China and the Ophthalmology Training
Fund in South Korea. Further, we donated
IOLs to Sri Lanka to support cataract
surgery in September 2008.
Santen contributes to the local
community by making concerted efforts
to beautify and promote the greening of
the areas surrounding its research facili-
ties, manufacturing plants and offices.
In recognition of these efforts, our Noto
Plant received the Furusato Kigyo Taisho
Minister for Internal Affairs and
Communications Award in 2008.
We make donations and provide free
supplies of such pharmaceuticals as Cravit
ophthalmic solution in response to relief
efforts for large-scale natural disasters,
including the earthquake that occurred on
the Noto Peninsula, Japan, and the major
earthquake in Sichuan, China.
Relationship with Customers and
Business Partners
Santen strives to discover innovative
new drugs that improve quality of life
of patients and their loved ones and can
be used by patients in a safe and appro-
priate manner.
Japan’s Medicine Act strictly details
the standards required for pharmaceutical
quality control and post-marketing safety
supervision. In addition to adhering to
these requirements, Santen has estab-
lished its own world-class quality assur-
ance system based on an in-house product
quality policy. It is necessary to provide
information about indications, side effects
and method of use in order to ensure
correct usage of products. Santen has
a sales force of approximately 400
medical representatives (MRs) in Japan.
Through our MRs, we provide quick,
accurate and pertinent information to
healthcare professionals, and by continu-
ously updating MR professional training
we are able to keep our standards high.
Further, we established a Customer
Service Center to deal comprehensively
with customer requests and suggestions.
Society and the Environment
Santen donates IOLs in Sri Lanka in September 2008
��Santen Pharmaceutical Co., Ltd. Annual Report 2009
By responding to this feedback, we are
able to improve our products and enhance
our information services. Winning a Good
Design Award in October 2008 under-
scored the high acclaim our ergonomically
designed Dimple Bottle has earned for its
patient-friendliness. In addition, viewing
our suppliers as important business
partners, we aim to evolve with them by
working together to realize and bring to
market even higher quality products.
Relationship with Employees
Santen promotes the creation of pleasant
working environments.
Santen works to maintain safe, clean
and comfortable workplace environments
and provides support systems for employ-
ees’ physical and emotional well-being.
To ensure no discrimination or harassment
occurs in the workplace, we continually
promote human rights awareness
activities and encourage understanding
and consideration.
To create a culture that encourages
our employees’ individual abilities to
shine, we set up a range of training
systems and instituted an employee
performance evaluation system that
better recognizes individual achievement.
To assist employees in balancing work
and raising children, we actively support
employees’ family responsibilities. In
October 2007, we were approved Indus-
try Participant status in Supporting the
Development of the Next Generation.
Further, in October 2008 we received
an award from the Minister of Health,
Labour and Welfare, in the Family-Friendly
Company category, in recognition of our
initiatives to support employees combin-
ing work and child rearing or nursing care
of family members.
Conserving the Global Environment
Protecting the Earth’s resources and
preserving the natural environment for
future generations is a major concern
for everyone. Santen has placed environ-
mental conservation high on its list of
management goals. In order to clarify our
basic approach to the environment and
environmental conservation activities, we
formulated a Basic Environmental Policy
in 1998 and set up our corporate Environ-
mental Guidelines in 2000. Based on
these, we have been pushing forward
with environmental conservation activities.
To increase the effectiveness of these
activities, all of our plants in Japan have
now been certified to ISO 14001 stan-
dards. Throughout the Company, Santen
has established environmental manage-
ment systems which now operate
continually. Overseas, Santen Oy built
a system integrating environmental
management and health and safety
management and acquired ISO 14001
certification in September 2008.
Aiming for green procurement,
Santen chooses environment-friendly
goods when sourcing product raw
materials and manufacturing materials.
Having drawn up Green Procurement
Guidelines, we are advancing green
procurement by seeking the understand-
ing and cooperation of our suppliers.
Moreover, we follow a policy of Green
Purchasing by purchasing environment-
friendly office supplies.
To make our environmental conserva-
tion activities even more effective, we try
to inspire all our employees to be more
environmentally aware. In addition, we
conduct environmental education and
environmental awareness campaigns as
well as participate in regional environ-
mental conservation activities.
Inspection for ISO 14001 certification (Santen Oy)
CO2 Emission Volumes (10,000 t-CO2)
2005
2006
2007
2008
2009 3.26
3.39
3.41
3.54
3.63
Initiatives to Prevent Global Warming
To help prevent global warming, we are taking ongoing measures to reduce our CO2 emission volumes. Our emission volumes have decreased every year since peaking at 36,489 t-CO2 in the year ended March 31, 2003. In the year ended March 31, 2009, Santen achieved a 3.7% year-on-year reduction in CO2 emission volume, to 32,624 t-CO2.
Training for new MRs

Santen Pharmaceutical Co., Ltd. Annual Report 2009�8
Corporate Governance
Santen recognizes that it is vital to upgrade and strengthen corporate governance in order to achieve and enhance corporate value, and thus returns to shareholders. Accord-ingly, Santen is working to raise business performance while main-taining transparent and sound management practices through the development of effective corporate governance systems.
Governance SystemsBoard of Directors
In addition to various statutory functions,
the Board of Directors formulates man-
agement policies, strategies and business
plans for the Santen Group. The Board of
Directors makes decisions relating to the
acquisition or disposal of major financial
assets and important organizational or
personnel-related moves, and oversees
the execution of business at Santen and
its subsidiaries. The Board convenes once
a month in principle. As of July 31, 2009,
the Board comprised seven members
including three outside directors. The
Board of Directors convened 14 times
during fiscal 2008.
Board of Corporate Auditors
Santen has adopted a governance system
using corporate auditors. The Board
of Corporate Auditors consists of four
members, including outside auditors.
Corporate auditors formulate auditing
policies and plans and attend Board of
Directors’ and other important business
meetings as well as oversee the execution
of duties by directors through auditing
the operational and financial status of
Santen’s head office, major operating
sites and subsidiaries. The Board of
Corporate Auditors convened eight times
during fiscal 2008
Voluntary Committees
Santen has established the following
three committees composed of inside
and outside directors as deliberative
bodies to further strengthen corporate
governance and to improve management
transparency and objectivity.
• The Corporate Strategy Committee deliber-
ates on key strategic issues such as business
strategies.
• The Nominating Committee deliberates
on the selection of directors and submits
recommendations to the Board of Directors
as well as deliberating on the selection of
corporate officers and corporate auditors
and submitting recommendations to the
Board of Directors.
• The Executive Compensation Committee
deliberates on the compensation of directors
and corporate officers and submits recom-
mendations to the Board of Directors.
Note that these committees are not
part of any statutory “Company with
Committees” under Japan Corporate Law.
Corporate Officer System
Santen has introduced a corporate officer
system to strengthen management while
improving the quality and speed of
strategic decision-making processes.
There were eight corporate officers at
the end of July 2009, excluding some
serving concurrently as directors.
Internal Governance SystemSanten benefits society with a particular
focus on contributing to the health and
quality of life of patients and their loved
ones, which includes Santen’s core value,
as a company active in the pharmaceuti-
cals industry. At the same time, aiming
to heighten society’s recognition of our
value and achieve sustainable growth,
we are developing the following internal
control systems.
Our compliance system, the Santen
Corporate Ethics Mission, which was
formulated in December 1999 and
revised in line with changing social
conditions, consists of a corporate action
declaration and a corporate code of
conduct that defines strict ethical stan-
dards governing corporate activities. The
Santen Corporate Ethics Mission stipu-
lates that the Company will not respond
to any demands whatsoever made by
* These committees are voluntary and not part of any statutory “Company with Committees” under Japan Corporate Law.
General Meeting of Shareholders
Board of Directors Corporate Auditors Board of Corporate Auditors
Chairman
President & CEO
Corporate Officers
Corporate Strategy Committee*
Nominating Committee*
Executive Compensation Committee*
Santen Internal Governance System (as of July 2009)

�9Santen Pharmaceutical Co., Ltd. Annual Report 2009
antisocial forces that threaten the order
and stability of civilian society.
In addition, we have established
a CSR Committee as a Companywide
lateral organization tasked with ensuring
rigorous compliance. Further, we maintain
an internal system for compliance-related
enquiries and an external helpline to an
attorney, which enable employees to
report directly any suspected compliance
violations or to receive advice.
Santen has built a system for respond-
ing appropriately to major risks related to
its business activities, which is based on
a risk management manual that sets out
basic policies and a code of conduct for
crisis management. Operating divisions
and headquarters avoid or minimize risk
by routinely gathering information and
preparing risk management policies and
countermeasures for their operations.
Further, the Risk Evaluation Committee
discusses risk management policies and
countermeasures for significant risks that
transcend several divisions.
An emergency situation affecting
Santen beyond a certain level triggers the
operation of a Crisis Response Committee
headed by a representative director.
Based on Santen’s Risk Management
Manual, this committee coordinates
efforts to minimize any losses or damages
and institutes measures to prevent recur-
rence. The Administration division checks
the status of such risk management
efforts from a Companywide viewpoint,
while the Internal Audit Group examines
them from an independent standpoint.
Regarding information control
systems, Santen appropriately stores
and controls information relating to the
execution of duties by directors based
on in-house rules for basic information
security, decision-making authority and
document control.
Santen aims to increase the appropri-
ateness of the Santen Group’s operations,
which comprise the operations of the
Company and its subsidiaries, by building
a control system in which the Company
provides recommendations and guidance
on increasing appropriateness, develop-
ing regulations for the control of Group
companies to clarify their roles and
responsibilities and strengthening audit
functions at major Group companies.
As a department independent from
operating divisions, the Internal Audit
Group—comprised of three people
including the chief officer—verifies that
the above internal control systems work
efficiently.
Regarding internal control related to
the reliability of financial reports, Santen
has established a system whereby divi-
sions and principal subsidiaries check the
appropriateness of their systems, and the
Internal Audit Group checks the suitabil-
ity of these self-checks. In fiscal 2008,
Santen did not discover any significant
deficiencies or omissions that could
undermine the reliability of its financial
reports. Santen will continue to develop
and maintain systems that consistently
meet the requirements of the internal
control reporting system, which is based
on Japan’s Financial Instruments and
Exchange Law.
Internal Audits and Corporate Auditors’ Audits
Cooperation between Corporate
Auditors and Independent Auditors
The corporate auditors hold a meeting with
the independent auditors at the beginning
of each fiscal year to receive presentations
on the financial auditing plans for the year
and any key audit-related issues, and to
exchange opinions including corporate
auditors’ requests. The independent
auditors present audit findings to the
corporate auditors at meetings twice
a year to exchange opinions.
In addition, the corporate auditors
attend an audit review meeting with the
independent auditors after the conclusion
of the quarterly and year-end audit
review to share comments on audit
results and procedures.
Cooperation between Corporate
Auditors and the Internal Audit Group
The corporate auditors inform the Internal
Audit Group of any specific audit-related
issues or future risk-related items that may
be identified in the course of auditing
Santen’s head office or operating sites.
The Internal Audit Group also reports
to the corporate auditors any important
information gained from internal audits
and related measures. The corporate
auditors may provide support to the
Internal Audit Group in implementing
countermeasures as deemed necessary.
Compensation for Directors and Corporate Auditors
Total remuneration for directors and
corporate auditors for fiscal 2008 equaled
¥314 million. The breakdown is as follows:
�. Compensation paid to directors:
¥268 million
(of which ¥31 million was paid to outside directors)
�. Compensation paid to corporate auditors:
¥46 million
(of which ¥22 million was paid to outside auditors)
Relationships between the Company and its Outside Directors and Outside Auditors
There are no special interest relationships
between the Company and its outside
directors and outside auditors.
Outline of Agreements to limit Responsibilities
To invite and appoint competent experts
to work for the Company as outside
directors or outside auditors to ensure
further management transparency and
objectivity and further reinforce the audit
system, the Company stipulates in its
Articles of Incorporation that it can enter
into an agreement with outside directors
and outside auditors to limit their liabilities
for compensation of damage they might
incur within a certain range.

Santen Pharmaceutical Co., Ltd. Annual Report 2009�0
Board of Directors, Corporate Auditors and Corporate OfficersAs of July 2009
Takakazu Morita Chairman
Akira Kurokawa President and Chief Executive Officer
Masahiro Mita, M.D., Ph.D. Managing Director Corporate and Regulatory Affairs
Toshiaki Nishihata, Ph.D. Member of the Board Senior Corporate Officer Head of Research and Development Division
Isao Muramatsu �
Member of the Board
Noboru Kotani �
Member of the Board
Tatsuhiko Hamamoto �
Member of the Board
Yukinori Mizumoto Standing Corporate Auditor
Tadao Kagono �
Corporate Auditor
Yasuo Sato �
Corporate Auditor
Eiju Miyauchi �
Corporate Auditor
1. Outside Director 2. Outside Corporate Auditor
Board of Directors Corporate Auditors
Sadatoshi Furukado Senior Corporate Officer Sales and Marketing Division, Prescription
Pharmaceuticals
Kenji Iwamoto Corporate Officer Head of Asia Division
Masamichi Sato Corporate Officer Head of Corporate Development Division
Adrienne Graves, Ph.D. Corporate Officer President of Santen Inc.
Jyrki Liljeroos Corporate Officer President of Santen Oy
Kenji Morishima Corporate Officer Head of Product Supply Division
Yoshihiro Noutsuka Corporate Officer Community and Environment Relations
Satoshi Harada Corporate Officer Head of Administration Division
Corporate Officers

Financial Section
32 Report and Analysis of Operating Results and Financial Condition
36 Risks Related to Our Business
38 Eleven-year Summary of Selected Financial Data
40 Consolidated Balance Sheets
42 Consolidated Statements of Income
43 Consolidated Statements of Changes in Net Assets
44 Consolidated Statements of Cash Flows
45 Notes to Consolidated Financial Statements
59 Internal Control Report
60 Independent Auditors’ Report
Contents
31Santen Pharmaceutical Co., Ltd. Annual Report 2009

Net SalesSales of the Santen Group are comprised of four segments: pre-
scription pharmaceuticals, over-the-counter (OTC) pharmaceuti-
cals, medical devices and others. Consolidated net sales for the
year ended March 31, 2009 declined 1.7%, to ¥101,619 million,
primarily due to a decrease in revenues from mainstay prescrip-
tion pharmaceuticals and OTC pharmaceuticals, which reflected
the effect of foreign exchange rates.
PrescriPtion Pharmaceuticals
Santen’s prescription pharmaceuticals are divided into three cat-
egories: ophthalmics, anti-rheumatics and other pharmaceuti-
cals. In the year under review, a slight decrease in ophthalmic
sales resulted in a 0.8% decline in prescription pharmaceutical
net sales, to ¥94,538 million, which represented 93.0% of con-
solidated net sales.
• ophthalmics
Santen mounted successful promotional campaigns in Japan to
provide individual medical facilities with scientific information
tailored to their specific and changing needs, which counteract-
ed an average reduction of around 3.0% in the prices of Santen’s
products due to NHI drug price revisions, and as a result do-
mestic sales of prescription ophthalmic pharmaceuticals edged
up 0.1%, to ¥72,357 million.
Overseas, prescription ophthalmic pharmaceutical revenues
were down 7.4% after conversion to yen, to ¥12,131 million. In
Europe, we concentrated on promotional campaigns centered
on providing medical information to ophthalmic professionals.
However, revenues decreased primarily due to foreign exchange
rates. In Asia, foreign exchange rates also lowered revenues
from China and South Korea.
As a result, prescription ophthalmic pharmaceuticals net
sales decreased 1.1%, to ¥84,488 million.
• anti-rheumatics
Rimatil, Azulfidine EN and Metolate 2mg were highly recom-
mended under the Manual on the Medical Treatment of Rheu-
matoid Arthritis and Medical Treatment Guidelines Based on EBM,
compiled by a study group of the Ministry of Health, Labour and
Welfare and published by the Japan Rheumatism Foundation.
Net sales of anti-rheumatics rose 1.2%, to ¥9,742 million, amid
the effects of NHI drug price revisions and competition.
otc Pharmaceuticals
Despite effective promotional campaigns for our range of oph-
thalmic products for tired eyes, blurred vision and eye refresh-
ment, challenging competitive conditions resulted in a 4.1%
decrease in net sales of OTC pharmaceuticals, to ¥5,225 million.
medical devices
As a result of focusing initiatives on promotional campaigns for
a new foldable IOL made of a new highly refractive acrylic opti-
cal material, Eternity, net sales of medical devices were up
50.1%, to ¥623 million.
others
Due to the ending of the contract manufacturing of an anti-
infective otic pharmaceutical product, net sales decreased
44.1%, to ¥1,233 million.
Cost of SalesIn line with a decrease in net sales, cost of sales declined 1.6%,
to ¥35,947 million. The ratio of cost of sales to net sales was
roughly level with the previous period, at 35.4%.
Net Sales Millions of yen
2005
2006
2007
2008
2009 101,619
103,394
100,486
98,398
92,696
Net Sales Millions of yen
2005
2006
2007
2008
2009 101,619
103,394
100,486
98,398
92,696
35,947
36,513
35,484
34,535
33,7102005
2006
2007
2008
2009 35.4
35.3
35.3
35.1
36.4
Cost of sales As percentage of net sales
Cost of Sales and as Percentage of Net Sales Millions of yen / %
35,947
36,513
35,484
34,535
33,7102005
2006
2007
2008
2009 35.4
35.3
35.3
35.1
36.4
Cost of sales As percentage of net sales
Cost of Sales and as Percentage of Net Sales Millions of yen / %
Report and Analysis of Operating Results and Financial Condition
OPERATING RESULTS
net sales by Business segment Millions of yen %
2009 2008 ChangePrescription pharmaceuticals ¥ 94,538 ¥ 95,322 (0.8)
Ophthalmics 84,488 85,426 (1.1)
Anti-rheumatics 9,742 9,627 1.2
Other pharmaceuticals 308 269 14.5
OTC pharmaceuticals 5,225 5,451 (4.1)
Medical devices 623 415 50.1
Others 1,233 2,206 (44.1)
Total ¥101,619 ¥103,394 (1.7)
Santen Pharmaceutical Co., Ltd. Annual Report 200932

Selling, General and Administrative ExpensesWe implemented several activities during the year to encourage
future sales growth, including promotional campaigns accom-
panying the marketing of Tapros ophthalmic solution, a dry eye
awareness campaign and defensive strategies to combat com-
petition in the Japanese market as well as promotional cam-
paigns in Europe and Asia implemented in accordance with our
business plans. As a result of these activities, selling, general
and administrative expenses increased 7.9%, to ¥50,178 million.
Further, R&D expenditures were up 42.6%, to ¥18,458 mil-
lion, which was due to the recognition of a one-time payment
of US$50 million for the in-licensing of development and mar-
keting for all ophthalmic indications of the retinal disorder
treatment DE-109 (sirolimus) in Japan and Asia from MacuSight,
Inc. (of the U.S.) in May 2008.
Operating IncomeOperating income declined 23.9%, to ¥15,494 million, due
to the recognition of a one-time payment accompanying the
conclusion of a license agreement for a new compound. As a
result, the ratio of operating income to net sales dropped to
15.2%, down 4.5 percentage points from 19.7% in the
previous year.
Other Income and ExpensesNet other income for the year ended March 31, 2009 was
¥330 million.
Other income decreased ¥145 million, to ¥1,449 million,
due to a ¥237 million gain on sale of investment securities rec-
ognized for the previous fiscal year, which offset the recogni-
tion of net exchange gains of ¥185 million.
Other expenses declined ¥363 million, to ¥1,119 million,
resulting from a ¥317 million loss on impairment of fixed assets
and net exchange losses of ¥746 million recognized in the pre-
vious fiscal year, which counteracted the recognition of equity
in losses of affiliates of ¥679 million.
Income TaxesIncome taxes totaled ¥5,701 million. The effective tax rate
declined to 36.0%, compared with 38.2% for the previous year.
Net IncomeNet income was down 20.0%, to ¥10,123 million, in the year
ended March 31, 2009. The ratio of net income to net sales
was 10.0%, compared with 12.2% in the previous year. Basic
net income per share was ¥119.08, compared with ¥146.15 in
the previous fiscal year, and diluted net income per share was
¥118.97, down from ¥145.94.2005
2006
2007
2008
2009 50,178
46,510
44,590
42,868
40,004
Selling, General and Administrative Expenses Millions of yen
2005
2006
2007
2008
2009 50,178
46,510
44,590
42,868
40,004
Selling, General and Administrative Expenses Millions of yen
15.2
19.7
20.3
21.3
20.5
15,494
20,371
20,412
20,995
18,9822005
2006
2007
2008
2009
Operating Income and Operating Income Margin Millions of yen / %
Operating income Operating income margin
15.2
19.7
20.3
21.3
20.5
15,494
20,371
20,412
20,995
18,9822005
2006
2007
2008
2009
Operating Income and Operating Income Margin Millions of yen / %
Operating income Operating income margin
119.08 10,123
12,651
13,148
13,023
11,023
146.15
151.58
150.26
125.852005
2006
2007
2008
2009
Net Income and Net Income per Share–Basic Millions of yen / Yen
Net income Net income per share–basic
119.08 10,123
12,651
13,148
13,023
11,023
146.15
151.58
150.26
125.852005
2006
2007
2008
2009
Net Income and Net Income per Share–Basic Millions of yen / Yen
Net income Net income per share–basic
33Santen Pharmaceutical Co., Ltd. Annual Report 2009

AssetsAs of March 31, 2009, total assets were ¥151,012 million,
down ¥5,535 million, or 3.5%, from the previous year-end.
Return on total assets (ROA) was 6.6%, down 1.4 percentage
points from 8.0% in the previous year. Total current assets
were ¥101,053 million, and the ratio of total current assets to
total assets rose 1.3 percentage points, to 66.9%, from 65.6%
in the previous year.
Within fixed assets, net property, plant and equipment to-
taled ¥28,665 million, other total investments and other assets
amounted to ¥21,294 million.
LiabilitiesTotal liabilities at March 31, 2009 were ¥25,643 million, down
¥3,786 million, or 12.9%, from the previous year-end. Interest-
bearing debt was ¥700 million, a decline of ¥4,578 million, or
86.7%, from the previous fiscal year-end. Total current liabilities
were ¥22,440 million, and total noncurrent liabilities were
¥3,203 million.
Net AssetsNet assets amounted to ¥125,369 million, down ¥1,749 million,
or 1.4%, from the previous fiscal year-end. This decrease was
attributable to a decline in unrealized gains on securities, net of
taxes, due to a decrease in valuation of investment securities,
and lower foreign currency translation adjustments stemming
from foreign exchange fluctuations, which outweighed a rise in
retained earnings. The equity ratio increased to 82.9%, up 1.8
percentage points from 81.1% at the previous year-end. Return
on equity (ROE) declined to 8.0%, down 1.9 percentage points
from 9.9% at the previous year-end. Equity per share was
¥1,472.32, a decrease of ¥22.16, or 1.5%, from the previous
year-end.
Capital and LiquiditySanten strives to maintain a healthy balance sheet and to en-
sure an appropriate level of liquidity and sufficient resources to
fund its business activities. Cash and cash equivalents at end
of year amounted to ¥45,957 million, down ¥5,713 million, or
11.1%. Net cash provided by operating activities was ¥11,849
million, of which ¥5,619 million was used in investment activi-
ties and ¥11,373 million in financing activities.
6.6 151,012
156,547
159,099
150,458
139,980
8.0
8.5
9.0
7.62005
2006
2007
2008
2009
Total Assets and ROA Millions of yen / %
Total assets ROA
6.6 151,012
156,547
159,099
150,458
139,980
8.0
8.5
9.0
7.62005
2006
2007
2008
2009
Total Assets and ROA Millions of yen / %
Total assets ROA
8.0 125,181
126,998
128,587
118,637
108,240
9.9
10.6
11.5
10.42005
2006
2007
2008
2009
Equity and ROE Millions of yen / %
Equity ROE
8.0 125,181
126,998
128,587
118,637
108,240
9.9
10.6
11.5
10.42005
2006
2007
2008
2009
Equity and ROE Millions of yen / %
Equity ROE
FINANCIAL CONDITION
Report and Analysis of Operating Results and Financial Condition
Santen Pharmaceutical Co., Ltd. Annual Report 200934

Cash FlowsNet cash provided by operating activities was ¥11,849 million,
which mainly resulted from income before income taxes of
¥15,824 million, depreciation and amortization of ¥4,210 mil-
lion, increase in inventories of ¥1,334 million, increase in trade
receivables of ¥916 million and income taxes paid of ¥8,431
million.
Net cash used in investment activities was ¥5,619 million.
Increase in fixed deposits of ¥4,421 million, payments for
acquisition of fixed assets of ¥2,953 million and purchase
of investment securities of ¥2,081 million offset decrease in
fixed deposits of ¥3,359 million.
Net cash used in financing activities was ¥11,373 million,
which resulted primarily from repayment of long-term debt of
¥5,168 million and dividends paid of ¥6,799 million.
As a result, cash and cash equivalents at end of year was
¥45,957 million, a decrease of ¥5,713 million.
Distribution of ProfitsSanten views returns to shareholders as one of its most impor-
tant management goals and has instituted the following funda-
mental policies for the distribution of profits:
• To enhance corporate value, we will focus on increasing capi-
tal efficiency and on securing internal reserves to fund R&D
and the implementation of growth strategies.
• We will strive to increase the level of dividends in line with
such factors as the Company’s demand for funds and finan-
cial position.
• We will consider the repurchase and retirement of treasury
stock as a flexible method of providing a return to shareholders.
To maintain a stable level of dividends, we target the divi-
dend on equity (DOE) ratio, which combines the dividend pay-
out ratio and ROE. For fiscal 2010, the final year of the current
Medium-term Management Plan, our DOE goal is 5.0%.
For fiscal 2008, the annual dividend per share was ¥80. As
a result, the DOE ratio was 5.4%. In the future, we will main-
tain our DOE target at more than 5.0% and consider the possi-
bility of further treasury stock repurchase and retirement.
5.4 80
80
65
60
50
5.4
4.6
4.6
4.12005
2006
2007
2008
2009
Dividend per Share and DOE Ratio Yen / %
Dividend per share DOE ratio
5.4 80
80
65
60
50
5.4
4.6
4.6
4.12005
2006
2007
2008
2009
Dividend per Share and DOE Ratio Yen / %
Dividend per share DOE ratio
cash Flows summary Millions of yen
2009 2008 ChangeCash flows from operating activities ¥ 11,849 ¥ 15,468 ¥(3,619)
Cash flows from investing activities (5,619) (2,083) (3,536)
Cash flows from financing activities (11,373) (11,415) 42
Cash and cash equivalents at end of year ¥ 45,957 ¥ 51,670 ¥(5,713)
Note: Figures in parentheses indicate a decrease.
35Santen Pharmaceutical Co., Ltd. Annual Report 2009

Forward-looking Information and Factors that Might Affect Future Results
Any statements that we make, other than historical facts,
contain forward-looking information based on our business
plans and assumptions at the time of disclosure. Such forward-
looking information includes, but is not limited to, our expected
growth strategies, projected operating results, market forecasts
and anticipated timing for developing, obtaining approval and
bringing products to market. Our business, as well as each
product we develop and market, is subject to various risks and
uncertainties beyond our control. Therefore, these forward-
looking statements might differ substantially from actual
results. Risks and uncertainties that could affect the Company’s
future results and financial conditions include, but are not
limited to, the factors described below.
External Factorsregulatory controls
Our prescription pharmaceuticals business is subject to govern-
ment regulatory controls regarding healthcare programs and
drug prices in Japan and other countries. Although our current
operating and / or financial projections were made fully in con-
sideration of drug price revisions in Japan to the extent possi-
ble, those revisions that may take place beyond the scope of
our anticipated projections or other revisions in healthcare pro-
grams might also affect our operating and / or financial results.
In April 2008, NHI drug price revisions went into effect, resulting
in an average 3.8% reduction for the prescription ophthalmic
pharmaceuticals industry. In other countries and markets where
we manufacture and sell our products, we continue to face a
variety of regulatory controls over prices of prescription phar-
maceuticals and government pressures for drug price reduction.
social and economic conditions and
changes in the law
Santen’s future results might be affected by political and eco-
nomic changes in key markets worldwide in which we operate.
Our anticipated performance and financial conditions might
also be affected by changes in applicable accounting principles,
and laws and regulations concerning taxes, the Product Liability
Law, the Antitrust Law, environmental laws and regulations and
other factors.
Foreign exchange
Overseas sales and expenses, as well as assets of overseas
subsidiaries, affect our sales, profits and financial conditions
depending on foreign exchange rate fluctuations. Overseas
sales for the year ended March 31, 2009 accounted for 12.8%
of our consolidated net sales.
Dependency on Specific Products and Business Partners
dePendency on mainstay Products
Total sales of Hyalein and Cravit accounted for 30% of Santen’s
consolidated net sales for the year ended March 31, 2009.
Should any sales suspension or a decline in sales occur due to
any unanticipated negative influences, such as potential prod-
uct defects or newly discovered side effects, our business
results and financial performance might be negatively affected.
dePendency on in-licensed Products
Many products that the Santen Group sells are licensed by oth-
er companies. We hold exclusive rights to manufacture and sell
ophthalmic formulations such as Cravit and Detantol. We also
have sales rights in Japan for Timoptol, Timoptol XE and Livos-
tin, and exclusive sales rights in Japan for Azulfidine EN and
Rescula. Should changes be made in the terms and conditions
after the expiration of such contracts or should the agreements
not be renewed, our business performance might be affected.
Risks Related to Our Business
Santen Pharmaceutical Co., Ltd. Annual Report 200936

dePendency on sPeciFic Business Partners
In the U.S., we have a distribution agreement with VISTAKON
Pharmaceuticals, LLC for certain prescription ophthalmics. In
the event that VISTAKON cannot achieve sufficient sales of such
products we consigned, our financial results might be affected.
We depend on specific business partners for the supply of
certain raw materials such as the active pharmaceutical ingredi-
ent for Cravit and containers for our OTC pharmaceuticals. If
supply of these materials is interrupted or discontinued for any
reason, our pharmaceutical production might be adversely
affected. Should it subsequently affect the supply of our
products and cause any interruption or discontinuance, it
would adversely affect our business performance.
The percentage of our business conducted with the top 10
wholesalers in Japan has reached 70% of our consolidated net
sales. If our wholesale partners experience bankruptcy leading
to a lending loss, our business performance might be adversely
affected.
R&D Activitiesuncertainties in new Product develoPment
Years are required to bring new drugs from initial R&D to final
approval and marketing. Various uncertainties exist at every
stage in the development process that could sidetrack a new
product, such as discontinuance of development or disapproval
after the application is filed. It is difficult for us to accurately
predict when new products, new indications or formulations
under development will reach the approval stage and be ready
for launching manufacturing and sales. Forecasting a precise
timeline for project development and completion depends on
a number of variable factors, including, but not limited to,
delayed government reviews, conflicting or unusable clinical
data that do not indicate significance in relation to competitor
products, safety and efficacy concerns and unexpected side
effects—which might lead to discontinued development or
delayed product release and thereby negatively affect projected
sales of new drugs.
Potentially insuFFicient returns on
r&d investment
The creation of new pharmaceuticals, as well as the develop-
ment of new indications and formulations, is critical for the
future growth of Santen. Every year we invest significantly
in R&D, and there is a possibility that future investments will
not result in sales of new products sufficient to provide an
adequate return.
issues oF alliances
Forecasts for new pharmaceuticals include various assumptions
of alliances in development and / or sales. Actual results of these
alliances might affect our overall sales and financial conditions.
Other FactorsProduction interruPtions or delays
The interruption or delay of production activities due to natural
disasters or other catastrophes such as fire might affect our
financial performance and conditions. Certain products are only
manufactured at one location. If a specific plant is forced to
halt production, supply of some products might be interrupted
or delayed.
cancellation oF sales and
Product withdrawals
If sales of products are cancelled, or if we withdraw products
due to a batch defect, unexpected side effects, tampering or
other causes, our overall financial results might be negatively
affected.
litigation
Our main business involves the production and sales of pre-
scription pharmaceuticals. The nature of our business makes us
vulnerable to litigation related to patents, the Product Liability
Law, violation of the Antitrust Law and consumer-related and
environmental lawsuits. If such legal actions take place, the pro-
ceedings might affect our overall performance and financial
conditions. Currently, we are involved in no litigation that
substantially impacts the management of the Company.
37Santen Pharmaceutical Co., Ltd. Annual Report 2009

Thousandsof Millionsofyen U.Sdollars
1999 2000 2001 2002 2003 2004 2005 2006 2007 2008 2009 2009
For the year:
Netsales ¥79,639 ¥83,577 ¥88,449 ¥88,966 ¥90,253 ¥89,858 ¥92,696 ¥98,398 ¥100,486 ¥103,394 ¥ 101,619 $1,034,498
Costofsales 32,746 32,195 33,385 32,701 32,272 31,859 33,710 34,535 35,484 36,513 35,947 365,948
Selling,generalandadministrativeexpenses 30,294 33,894 38,546 44,475 45,284 43,475 40,004 42,868 44,590 46,510 50,178 510,816
Operatingincome 16,599 17,488 16,518 11,790 12,697 14,524 18,982 20,995 20,412 20,371 15,494 157,734
Interestexpense 588 462 430 465 480 366 182 94 91 97 65 666
Incomebeforeincometaxes 15,969 14,422 15,521 12,679 9,947 13,775 18,436 20,342 21,039 20,483 15,824 161,090
Incometaxes 7,864 6,481 7,807 7,373 1,444 7,454 7,413 7,319 7,891 7,832 5,701 58,034
Netincome 8,105 7,941 7,714 5,306 8,503 6,321 11,023 13,023 13,148 12,651 10,123 103,056
Capitalexpenditures 3,443 2,510 4,943 6,586 7,046 3,226 4,907 2,106 3,556 3,151 2,953 30,064
Depreciationandamortization 6,314 5,725 5,683 5,334 4,311 4,521 4,750 4,824 4,761 4,593 4,210 42,855
R&Dexpenditures 7,335 9,221 10,511 12,187 12,719 11,853 12,620 13,971 13,663 12,942 18,458 187,905
Per share data (yenandU.S.dollars):
Netincome– basic ¥85.27 ¥83.54 ¥81.32 ¥57.34 ¥93.67 ¥71.65 ¥125.85 ¥150.26 ¥151.58 ¥146.15 ¥ 119.08 $ 1.21
Netincome– diluted 78.63 77.04 75.01 53.07 85.97 71.64 125.71 150.01 151.31 145.94 118.97 1.21
Equity 935.71 1,006.48 1,022.99 1,048.51 1,104.21 1,176.83 1,249.32 1,368.27 1,481.83 1,494.48 1,472.32 14.99
Cashdividends,applicabletoperiod 12.00 12.00 20.00 20.00 20.00 40.00 50.00 60.00 65.00 80.00 80.00 0.81
Cash flows:
Netcashprovidedbyoperatingactivities ¥16,339 ¥9,372 ¥6,832 ¥6,941 ¥15,808 ¥23,196 ¥6,619 ¥20,879 ¥14,959 ¥15,468 ¥ 11,849 $ 120,628
Netcash(usedin)providedbyinvestingactivities (8,305) 837 (3,172) (6,374) (9,951) 5,246 (2,907) (1,330) (5,846) (2,083) (5,619) (57,204)
Netcashusedinfinancingactivities (3,857) (3,817) (7,193) (5,684) (6,507) (12,122) (12,712) (5,900) (5,691) (11,415) (11,373) (115,782)
Interestcoverageratio(times) 27.8 20.3 16.8 14.9 34.5 70.6 36.1 218.7 164.3 163.6 165.5
Debttocashflowratio(%) 173.8 274.7 367.3 352.5 145.8 54.7 104.0 26.9 36.4 34.1 5.5
At year-end:
Totalcurrentassets ¥78,018 ¥82,218 ¥88,025 ¥86,064 ¥83,431 ¥91,231 ¥82,735 ¥93,893 ¥100,820 ¥102,754 ¥ 101,053 $1,028,740
Netproperty,plantandequipment 39,638 37,416 36,684 42,159 40,850 37,237 32,676 30,395 30,485 29,849 28,665 291,814
Totalassets 144,913 149,968 153,243 152,103 147,148 150,238 139,980 150,458 159,099 156,547 151,012 1,537,332
Long-termdebt 27,496 26,491 25,482 24,467 23,047 12,686 6,882 5,614 5,446 5,278 154 1,565
Equity 88,950 95,669 94,834 95,101 97,126 103,500 108,240 118,637 128,587 126,998 125,181 1,274,359
Returnonequity(ROE)(%) 9.5 8.6 8.1 5.6 8.8 6.3 10.4 11.5 10.6 9.9 8.0
Returnontotalassets(ROA)(%) 5.7 5.4 5.1 3.5 5.7 4.3 7.6 9.0 8.5 8.0 6.6
Equityratio(%) 61.4 63.8 61.9 62.5 66.0 68.9 77.3 78.9 80.8 81.1 82.9
Equityratioonstockpricebasis(%) 145.0 139.4 134.3 86.6 68.7 101.8 142.3 163.0 165.3 126.2 154.3
Priceearningsratio(PER)(times) 25.9 26.3 27.3 25.3 12.3 24.3 18.3 18.8 20.0 15.9 23.0
Dividendonequity(DOE)(%) 1.3 1.2 2.0 1.9 1.9 3.5 4.1 4.6 4.6 5.4 5.4
Issuedshares(thousands) 95,075 95,075 92,721 90,704 90,704 87,963 86,659 86,751 86,825 86,867 86,916
Numberofemployees 2,037 2,093 2,167 2,463 2,500 2,335 2,308 2,312 2,409 2,483 2,690
Notes:1.U.S.dollaramountshavebeentranslatedfromyen,solelyfortheconvenienceofthereader,attherateof¥98.23toU.S.$1prevailingonMarch31,2009. 2.SeeNotes2.13)and11ofNotestoConsolidatedFinancialStatementsinrespectofpersharedata. 3. NetsalesinthenineyearsendedMarch31,2009includeroyaltyincomewhichwaspresentedas“Other,net”in“Otherincome(expenses)”through
theyearendedMarch31,2000. 4.Equitycomprisesshareholders’equityandtotalaccumulated(losses)gainsonevaluationandtranslation.
Eleven-year Summary of Selected Financial DataYearsendedMarch31
SantenPharmaceuticalCo.,Ltd.AnnualReport200938

Thousandsof Millionsofyen U.Sdollars
1999 2000 2001 2002 2003 2004 2005 2006 2007 2008 2009 2009
For the year:
Netsales ¥79,639 ¥83,577 ¥88,449 ¥88,966 ¥90,253 ¥89,858 ¥92,696 ¥98,398 ¥100,486 ¥103,394 ¥ 101,619 $1,034,498
Costofsales 32,746 32,195 33,385 32,701 32,272 31,859 33,710 34,535 35,484 36,513 35,947 365,948
Selling,generalandadministrativeexpenses 30,294 33,894 38,546 44,475 45,284 43,475 40,004 42,868 44,590 46,510 50,178 510,816
Operatingincome 16,599 17,488 16,518 11,790 12,697 14,524 18,982 20,995 20,412 20,371 15,494 157,734
Interestexpense 588 462 430 465 480 366 182 94 91 97 65 666
Incomebeforeincometaxes 15,969 14,422 15,521 12,679 9,947 13,775 18,436 20,342 21,039 20,483 15,824 161,090
Incometaxes 7,864 6,481 7,807 7,373 1,444 7,454 7,413 7,319 7,891 7,832 5,701 58,034
Netincome 8,105 7,941 7,714 5,306 8,503 6,321 11,023 13,023 13,148 12,651 10,123 103,056
Capitalexpenditures 3,443 2,510 4,943 6,586 7,046 3,226 4,907 2,106 3,556 3,151 2,953 30,064
Depreciationandamortization 6,314 5,725 5,683 5,334 4,311 4,521 4,750 4,824 4,761 4,593 4,210 42,855
R&Dexpenditures 7,335 9,221 10,511 12,187 12,719 11,853 12,620 13,971 13,663 12,942 18,458 187,905
Per share data (yenandU.S.dollars):
Netincome– basic ¥85.27 ¥83.54 ¥81.32 ¥57.34 ¥93.67 ¥71.65 ¥125.85 ¥150.26 ¥151.58 ¥146.15 ¥ 119.08 $ 1.21
Netincome– diluted 78.63 77.04 75.01 53.07 85.97 71.64 125.71 150.01 151.31 145.94 118.97 1.21
Equity 935.71 1,006.48 1,022.99 1,048.51 1,104.21 1,176.83 1,249.32 1,368.27 1,481.83 1,494.48 1,472.32 14.99
Cashdividends,applicabletoperiod 12.00 12.00 20.00 20.00 20.00 40.00 50.00 60.00 65.00 80.00 80.00 0.81
Cash flows:
Netcashprovidedbyoperatingactivities ¥16,339 ¥9,372 ¥6,832 ¥6,941 ¥15,808 ¥23,196 ¥6,619 ¥20,879 ¥14,959 ¥15,468 ¥ 11,849 $ 120,628
Netcash(usedin)providedbyinvestingactivities (8,305) 837 (3,172) (6,374) (9,951) 5,246 (2,907) (1,330) (5,846) (2,083) (5,619) (57,204)
Netcashusedinfinancingactivities (3,857) (3,817) (7,193) (5,684) (6,507) (12,122) (12,712) (5,900) (5,691) (11,415) (11,373) (115,782)
Interestcoverageratio(times) 27.8 20.3 16.8 14.9 34.5 70.6 36.1 218.7 164.3 163.6 165.5
Debttocashflowratio(%) 173.8 274.7 367.3 352.5 145.8 54.7 104.0 26.9 36.4 34.1 5.5
At year-end:
Totalcurrentassets ¥78,018 ¥82,218 ¥88,025 ¥86,064 ¥83,431 ¥91,231 ¥82,735 ¥93,893 ¥100,820 ¥102,754 ¥ 101,053 $1,028,740
Netproperty,plantandequipment 39,638 37,416 36,684 42,159 40,850 37,237 32,676 30,395 30,485 29,849 28,665 291,814
Totalassets 144,913 149,968 153,243 152,103 147,148 150,238 139,980 150,458 159,099 156,547 151,012 1,537,332
Long-termdebt 27,496 26,491 25,482 24,467 23,047 12,686 6,882 5,614 5,446 5,278 154 1,565
Equity 88,950 95,669 94,834 95,101 97,126 103,500 108,240 118,637 128,587 126,998 125,181 1,274,359
Returnonequity(ROE)(%) 9.5 8.6 8.1 5.6 8.8 6.3 10.4 11.5 10.6 9.9 8.0
Returnontotalassets(ROA)(%) 5.7 5.4 5.1 3.5 5.7 4.3 7.6 9.0 8.5 8.0 6.6
Equityratio(%) 61.4 63.8 61.9 62.5 66.0 68.9 77.3 78.9 80.8 81.1 82.9
Equityratioonstockpricebasis(%) 145.0 139.4 134.3 86.6 68.7 101.8 142.3 163.0 165.3 126.2 154.3
Priceearningsratio(PER)(times) 25.9 26.3 27.3 25.3 12.3 24.3 18.3 18.8 20.0 15.9 23.0
Dividendonequity(DOE)(%) 1.3 1.2 2.0 1.9 1.9 3.5 4.1 4.6 4.6 5.4 5.4
Issuedshares(thousands) 95,075 95,075 92,721 90,704 90,704 87,963 86,659 86,751 86,825 86,867 86,916
Numberofemployees 2,037 2,093 2,167 2,463 2,500 2,335 2,308 2,312 2,409 2,483 2,690
Notes:1.U.S.dollaramountshavebeentranslatedfromyen,solelyfortheconvenienceofthereader,attherateof¥98.23toU.S.$1prevailingonMarch31,2009. 2.SeeNotes2.13)and11ofNotestoConsolidatedFinancialStatementsinrespectofpersharedata. 3. NetsalesinthenineyearsendedMarch31,2009includeroyaltyincomewhichwaspresentedas“Other,net”in“Otherincome(expenses)”through
theyearendedMarch31,2000. 4.Equitycomprisesshareholders’equityandtotalaccumulated(losses)gainsonevaluationandtranslation.
39SantenPharmaceuticalCo.,Ltd.AnnualReport2009

Thousandsof U.S.dollars Millionsofyen (Note3)
ASSETS 2009 2008 2009
Current assets:
Cashandcashequivalents ¥ 45,957 ¥51,670 $ 467,847
Short-terminvestments(Note4) 2,557 182 26,033
Tradereceivables:
Notes 473 221 4,812
Accounts 35,538 35,393 361,790
Allowancefordoubtfulreceivables (1) (1) (12)
Nettradereceivables 36,010 35,613 366,590
Inventories(Note6) 12,236 11,333 124,563
Deferredtaxassets(Note14) 1,941 1,699 19,763
Othercurrentassets 2,352 2,257 23,944
Totalcurrentassets 101,053 102,754 1,028,740
Property, plant and equipment(Notes7and8):
Land 8,679 8,558 88,349
Buildingsandstructures 41,476 39,860 422,231
Machineryandequipment 10,967 10,988 111,647
Tools,furnitureandvehicles 10,684 10,628 108,770
Leaseassets 53 — 540
Constructioninprogress 99 1,879 1,009
Total 71,958 71,913 732,546
Accumulateddepreciationandimpairmentloss (43,293) (42,064) (440,732)
Netproperty,plantandequipment 28,665 29,849 291,814
Investments and other assets:
Investmentsinunconsolidatedsubsidiariesandaffiliates 580 480 5,905
Investmentsecurities(Note4) 11,239 16,470 114,413
Goodwill — 301 —
Otherintangibles 1,549 1,933 15,772
Deferredtaxassets(Note14) 6,410 1,822 65,254
Otherassets 1,516 2,938 15,434
Totalinvestmentsandotherassets 21,294 23,944 216,778
Totalassets ¥151,012 ¥156,547 $1,537,332
Seeaccompanyingnotestoconsolidatedfinancialstatements.
Consolidated Balance SheetsSantenPharmaceuticalCo.,Ltd.andSubsidiariesAsofMarch31,2009and2008
SantenPharmaceuticalCo.,Ltd.AnnualReport200940

Thousandsof U.S.dollars Millionsofyen (Note3)
LIABILITIES AND NET ASSETS 2009 2008 2009
Current liabilities:
Short-termborrowings(Note9) ¥ 546 ¥ — $ 5,555
Currentportionoflong-termdebt(Note9) 110 5,168 1,120
Tradeaccountspayable 6,018 5,634 61,266
Otherpayables 7,414 7,690 75,477
Accruedexpenses 3,475 3,249 35,377
Incometaxespayable(Note14) 4,164 4,324 42,388
Othercurrentliabilities 713 496 7,260
Totalcurrentliabilities 22,440 26,561 228,443
Noncurrent liabilities:
Long-termdebt(Note9) 44 110 445
Retirementandseverancebenefits(Note10) 2,899 2,302 29,509
Deferredtaxliabilities(Note14) 20 18 207
Otherliabilities 240 438 2,451
Totalnoncurrentliabilities 3,203 2,868 32,612
Contingent liabilities(Note15)
Totalliabilities 25,643 29,429 261,055
Net assets(Note11):
Commonstock(Note12):
Authorized– 220,000,000shares
(220,000,000sharesin2008)
Issued– 86,916,203shares
(86,866,703sharesin2008) 6,457 6,419 65,734
Capitalsurplus(Note12) 7,152 7,114 72,811
Retainedearnings 121,134 117,787 1,233,163
Treasurystock,atcost:
1,893,769sharesin2009and1,888,743sharesin2008 (4,934) (4,921) (50,234)
Totalshareholders’equity 129,809 126,399 1,321,474
Unrealized(losses)gainsonsecurities,netoftaxes(Note4) (247) 2,273 (2,511)
Foreigncurrencytranslationadjustments (4,381) (1,674) (44,604)
Totalaccumulated(losses)gainsonevaluationandtranslation (4,628) 599 (47,115)
Stocksubscriptionrights(Note12) 188 120 1,918
Totalnetassets 125,369 127,118 1,276,277
Totalliabilitiesandnetassets ¥151,012 ¥156,547 $1,537,332
41SantenPharmaceuticalCo.,Ltd.AnnualReport2009

Thousandsof U.S.dollars Millionsofyen (Note3)
2009 2008 2007 2009
Netsales ¥101,619 ¥103,394 ¥100,486 $1,034,498
Costofsales 35,947 36,513 35,484 365,948
Grossprofit 65,672 66,881 65,002 668,550
Selling,generalandadministrativeexpenses 50,178 46,510 44,590 510,816
Operatingincome 15,494 20,371 20,412 157,734
Otherincome(expenses):
Interestanddividendincome 549 607 460 5,587
Exchangegains(losses),net 185 (746) (182) 1,881
Dividendsreceivedfrominvestmentlimitedpartnership — — 72 —
Interestexpense (65) (97) (91) (666)
Equityinlossesofaffiliates (679) — — (6,917)
Gainonsaleofinvestmentsecurities — 237 — —
Gainonsaleoffixedassets — 0 251 —
Lossonimpairmentoffixedassets(Note8) — (317) — —
Other,net 340 428 117 3,471
Incomebeforeincometaxes 15,824 20,483 21,039 161,090
Incometaxes(Note14):
Current 8,269 8,146 7,902 84,185
Deferred (2,568) (314) (11) (26,151)
5,701 7,832 7,891 58,034
Netincome ¥ 10,123 ¥12,651 ¥13,148 $ 103,056
U.S.dollars Yen (Note3)
Per share data: 2009 2008 2007 2009
Netincome–basic ¥ 119.08 ¥146.15 ¥151.58 $ 1.21
Netincome–diluted 118.97 145.94 151.31 1.21
Cashdividends,applicabletotheperiod 80.00 80.00 65.00 0.81
Seeaccompanyingnotestoconsolidatedfinancialstatements.
Consolidated Statements of IncomeSantenPharmaceuticalCo.,Ltd.andSubsidiariesFortheyearsendedMarch31,2009,2008and2007
SantenPharmaceuticalCo.,Ltd.AnnualReport200942

Millionsofyen Unrealized Unrealized (losses) gainson Foreign Treasury gainson hedging currency Stock Common Capital Retained stock, securities, derivatives, translation subscription stock surplus earnings atcost netoftaxes netoftaxes adjustments rights
BalanceatMarch31,2006 ¥6,319 ¥7,014 ¥104,134 ¥ (90) ¥3,996 ¥— ¥ (2,736) ¥ —
Exerciseofstockoptions 63 63
Cashdividends (5,637)
Netincome 13,148
Repurchaseoftreasurystock,net (17)
Retirementoftreasurystock 0 1
Other 1,207 3 1,119 59
BalanceatMarch31,2007 ¥6,382 ¥7,077 ¥111,645 ¥ (106) ¥5,203 ¥ 3 ¥ (1,617) ¥59
Exerciseofstockoptions 37 37
Cashdividends (6,509)
Netincome 12,651
Repurchaseoftreasurystock,net (4,816)
Retirementoftreasurystock 0 1
Other (2,930) (3) (57) 61
BalanceatMarch31,2008 ¥6,419 ¥7,114 ¥117,787 ¥(4,921) ¥2,273 ¥— ¥ (1,674) ¥120
Effectofchangesin accountingpolicies appliedtoforeignsubsidiaries 210Changesduringthefiscalyear:
Exerciseofstockoptions 38 38 Cashdividends (6,800) Netincome 10,123 Repurchaseoftreasurystock,net (15) Retirementoftreasurystock 0 2 Effectofapplying theequitymethodofaccounts (186) Other (2,520) (2,707) 68
Balance at March 31, 2009 ¥ 6,457 ¥ 7,152 ¥121,134 ¥ (4,934) ¥ (247) ¥ — ¥ (4,381) ¥ 188
ThousandsofU.S.dollars(Note3) Unrealized Unrealized (losses) gainson Foreign Treasury gainson hedging currency Stock Common Capital Retained stock, securities, derivatives, translation subscription stock surplus earnings atcost netoftaxes netoftaxes adjustments rights
BalanceatMarch31,2008 $65,342 $72,419 $1,199,091 $(50,096) $23,149 $— $(17,039) $1,221
Effectofchangesin accountingpolicies appliedtoforeignsubsidiaries 2,133 Changesduringthefiscalyear:
Exerciseofstockoptions 392 392 Cashdividends (69,223) Netincome 103,056 Repurchaseoftreasurystock,net (158) Retirementoftreasurystock 0 20 Effectofapplying theequitymethodofaccounts (1,894) Other (25,660) (27,565) 697 Balance at March 31, 2009 $65,734 $72,811 $1,233,163 $(50,234) $ (2,511) $ — $(44,604) $1,918
Seeaccompanyingnotestoconsolidatedfinancialstatements.
Consolidated Statements of Changes in Net AssetsSantenPharmaceuticalCo.,Ltd.andSubsidiariesFortheyearsendedMarch31,2009,2008and2007
43SantenPharmaceuticalCo.,Ltd.AnnualReport2009

Thousandsof U.S.dollars Millionsofyen (Note3)
2009 2008 2007 2009
Cash flows from operating activities:
Incomebeforeincometaxes ¥ 15,824 ¥20,483 ¥21,039 $ 161,090
Depreciationandamortization 4,210 4,593 4,761 42,855
Lossonimpairmentoffixedassets(Note8) — 317 — —
Increaseinretirementandseverancebenefits 554 412 160 5,636
Interestanddividendincome (549) (607) (460) (5,587)
Interestexpense 65 97 91 666
Equityinlossesofaffiliates 679 — — 6,917
Increaseintradereceivables (916) (587) (414) (9,327)
Increaseininventories (1,334) (1,006) (357) (13,582)
Increase(decrease)intradeaccountspayable 509 (430) 401 5,186
Other,net 759 (562) (1,717) 7,727
Subtotal 19,801 22,710 23,504 201,581
Interestanddividendincomereceived 551 611 460 5,607
Interestexpensepaid (72) (95) (91) (729)
Incometaxespaid (8,431) (7,758) (8,914) (85,831)
Netcashprovidedbyoperatingactivities 11,849 15,468 14,959 120,628
Cash flows from investing activities:
Capitalexpenditures (2,953) (3,151) (3,556) (30,064)
Proceedsfromsaleofproperty,plantandequipment 3 5 601 26
Purchaseofinvestmentsecurities (2,081) (3,266) (2,209) (21,183)
Proceedsfromsaleofinvestmentsecurities 463 2,660 — 4,712
Purchaseofshort-terminvestments (4,421) (1,518) (1,223) (45,003)
Proceedsfromsaleofshort-terminvestments 3,359 3,160 554 34,195
Increaseinloansreceivable (300) — — (3,054)
Proceedsfromcollectionofloansreceivable 311 — — 3,166
Other,net 0 27 (13) 1
Netcashusedininvestingactivities (5,619) (2,083) (5,846) (57,204)
Cash flows from financing activities:
Increaseinshort-termborrowings 546 — — 5,555
Repaymentoflong-termdebt (5,168) (168) (168) (52,611)
Repurchaseoftreasurystock,net (15) (4,815) (17) (158)
Dividendspaid (6,799) (6,506) (5,632) (69,211)
Other,net 63 74 126 643
Netcashusedinfinancingactivities (11,373) (11,415) (5,691) (115,782)
Effect of exchange rate changes on cash and cash equivalents (570) (141) 314 (5,802)
Net (decrease) increase in cash and cash equivalents (5,713) 1,829 3,736 (58,160)
Cash and cash equivalents at beginning of year 51,670 49,841 46,105 526,007
Cash and cash equivalents at end of year ¥ 45,957 ¥51,670 ¥49,841 $ 467,847
Seeaccompanyingnotestoconsolidatedfinancialstatements.
Consolidated Statements of Cash FlowsSantenPharmaceuticalCo.,Ltd.andSubsidiariesFortheyearsendedMarch31,2009,2008and2007
SantenPharmaceuticalCo.,Ltd.AnnualReport200944

1. Basis of Presentation of Consolidated Financial Statements
Notes to Consolidated Financial StatementsSantenPharmaceuticalCo.,Ltd.andSubsidiaries
TheconsolidatedfinancialstatementsofSantenPharmaceuticalCo.,Ltd.(the“Company“)havebeenpreparedinaccordancewiththeprovisionssetforthintheJapaneseFinancialInstru-mentsandExchangeActanditsrelatedaccountingregulations,andinconformitywithaccountingprinciplesgenerallyacceptedinJapan(“JapaneseGAAP”),whicharedifferentincertainrespectsastoapplicationanddisclosurerequirementsofInternationalFinancialReportingStandards. PriortotheyearendedMarch31,2009,theaccountsofconsolidatedoverseassubsidiariesarebasedontheiraccountingrecordsmaintainedinconformitywithgenerallyacceptedaccountingprinciplesprevailingintherespectivecountriesofdomicile.
AsdiscussedinNote2,16),(i),theaccountsofconsolidatedoverseassubsidiariesfortheyearendedMarch31,2009arepre-paredinaccordancewitheitherInternationalFinancialReportingStandardsorU.S.generallyacceptedaccountingprinciples. TheconsolidatedfinancialstatementshavebeenrestructuredandtranslatedintoEnglish(withcertainexpandeddisclosures)fromtheconsolidatedfinancialstatementsoftheCompanypre-paredinaccordancewithJapaneseGAAPandfiledwiththeappropriateLocalFinanceBureauoftheMinistryofFinanceasrequiredbytheFinancialInstrumentsandExchangeAct.CertainsupplementaryinformationincludedinthestatutoryJapaneselanguageconsolidatedfinancialstatementsisnotpresentedintheconsolidatedfinancialstatements.
2. Summary of Significant Accounting Policies
1)PrinciplesofconsolidationTheconsolidatedfinancialstatementsincludetheaccountsoftheCompanyanditssubsidiaries(the“Companies”).Allsignificantintercompanybalancesandtransactionsareeliminatedonconsolidation. Investmentinanunconsolidatedsubsidiaryisaccountedforusingtheequitymethod. Investmentinanaffiliatedcompanyisstatedatcostduetoimmateriality.
2)UseofestimatesThepreparationoftheconsolidatedfinancialstatementsinconformitywithJapaneseGAAPrequiresmanagementtomakeestimatesandassumptionsthataffectthereportedamountsofassetsandliabilitiesanddisclosureofcontingentassetsandliabilities.Actualresultscoulddifferfromthoseestimates.
3)Short-terminvestments,investmentsecuritiesandgolfmembershiprights(seeNote4)
TheCompanyanditsdomesticsubsidiarieshaveadopted“AccountingStandardforFinancialInstruments”whichwasissuedbytheBusinessAccountingCouncilinJapan.Inaccor-dancewiththisstandard,securitiesareclassifiedintothreecategories;trading,held-to-maturity,orothersecurities. Basedonthisclassification,alltradingsecuritiesand,anyheld-to-maturityandothersecuritieswithamaturityoflessthanoneyear,areincludedincurrentassets.Allothersecuritiesareincludedininvestmentsecuritiesasnoncurrentassets. Thoseclassifiedasothersecuritieswithanavailablemarketvaluearereportedatfairvaluewithunrealizedholdinggains(losses),netofrelatedtaxesreportedasaseparatecomponentofnetassets. Realizedgainsandlossesonsalesofsuchsecuritiesaredeter-minedbythemovingaveragecostmethod.Othersecuritieswithnoavailablemarketvaluearecarriedatcost,whichisdeterminedbythemovingaveragecostmethod.
Inaddition,thisstandardalsorequirestherecognitionofanimpairmentlossongolfmembershiprights,includedinotherassets,ontheconsolidatedbalancesheets,whenthemarketvalueshowsasubstantialdeclineandisnotanticipatedtorecover.
4)Derivativeinstruments(seeNote5)Derivativeinstrumentsarestatedatfairvalue,andaccountedforusingdeferredhedgeaccounting.Recognitionofgainsorlossesresultingfromchangesinfairvaluesofderivativefinancialinstrumentsaredeferreduntiltherelatedlossesorgainsonthehedgeditemsarerecognizedifderivativefinancialinstrumentsareusedashedgesandmeetcertainhedgingcriteria.Foreignexchangecontractsthatmeetthecriteriaareaccountedforundertheallocationmethod.Theallocationmethodrequiresrecognizedforeigncurrencyreceivablesorpayablestobetrans-latedusingthecorrespondingforeignexchangecontractrates.Interestrateswapsthatmeetthecriteriaareaccountedforunderthespecialmethod,asregulatedintheaccountingstan-dard,asiftheinterestratesunderinterestrateswapswereoriginallyappliedtounderlyingborrowings. TheCompanyhasalsodevelopedahedgingpolicytocontrolvariousaspectsofderivativeinstrumentsincludingauthorizationlevelsandtransactionvolumes.Basedonthispolicy,theCompanyhedgestheexposureriskarisingfromfluctuationsinforeigncurrencyexchangerates,interestrates,andpricesofsecurities.TheCompanyevaluateshedgeeffectivenessbycom-paringthecumulativechangesincashflowsfromhedgeditemsandcorrespondingchangesinhedgingderivativeinstruments.Withrespecttointerestrateswapsunderthespecialmethod,theevaluationofhedgeeffectivenessisomitted.
5)AllowancefordoubtfulreceivablesAllowancefordoubtfulreceivablesisprovidedprincipallyatanamountdeterminedbasedonthehistoricalexperienceofbaddebtsandtheestimateduncollectibleamountsbasedonthespecificanalysisofreceivableswithdefaultpossibility.
45SantenPharmaceuticalCo.,Ltd.AnnualReport2009

6)Inventories(seeNote6)PriortoApril1,2008,inventoriesoftheCompanyanditsdomesticsubsidiariesarestatedatcostdeterminedprincipallybytheaveragemethod.AsdiscussedinNote2,16),(ii),effec-tiveApril1,2008,theCompanyanditsdomesticsubsidiariesadoptedanewaccountingstandardformeasurementofinven-toriesandstatedtheinventoriesatthelowerofaveragecostornetrealizablevalueatMarch31,2009. Inventoriesofconsolidatedforeignsubsidiariesarestatedatthelowerofaveragecostormarket.
7)Property,plantandequipment(excludingleaseassets)Property,plantandequipmentisstatedatcost.Depreciationofbuildings,acquiredpriortoApril1,1998,andotherproperty,plantandequipmentiscomputedovertheestimatedusefullivesoftheassetsusingthedeclining-balancemethodfortheCompanyanditsdomesticsubsidiaries.Buildings(otherthanleaseholdimprovements),whichwereacquiredonorafterApril1,1998,aredepreciatedusingthestraight-linemethodfortheCompanyanditsdomesticsubsidiaries.Depreciationiscom-putedovertheestimatedusefullivesoftheassetsusingthestraight-linemethodforalloverseassubsidiaries. Theprincipalestimatedusefullivesareasfollows:
Buildingsandstructures 31to50years Machineryandequipment 7to8years Tools,furnitureandvehicles 4to10years
8)Leases(seeNote7)Financeleases,exceptforcertainimmaterialleases,arecapital-izedanddepreciatedovertheestimatedusefullivesorleaseterms,asapplicable.However,aspermittedanddiscussedinNote2,16),(iii),theCompanyanditsdomesticsubsidiariesaccountforfinanceleasescommencingpriortoApril1,2008whichdonottransferownershipoftheleasedpropertytothelesseeasoperatingleaseswithdisclosureofcertain“asifcapi-talized”information.
9)Impairmentoffixedassets(seeNote8)Inaccordancewith“AccountingStandardsforImpairmentofFixedAssets”whichwasissuedbytheBusinessAccountingCouncilinJapan,fixedassets,suchasproperty,plantandequipmentandintangibleassetsarereviewedforimpairmentwhenevereventsorchangesincircumstancesindicatethatthecarryingamountofanassetmaynotberecoverable. Recoverabilityofassetstobeheldandusedismeasuredbyacomparisonofthecarryingamountofanasset,orgroupofassets,toestimatedundiscountedfuturecashflowsexpectedtobegenerated.Ifthecarryingamountofanasset,orgroupofassets,exceedsitsestimatedfuturecashflows,animpairmentchargeisrecognizedfortheamountbywhichthecarryingamountoftheassetexceedsthegreaterofitsnetrealizablevalueorvalueinuse.
10)Retirementandseverancebenefits(seeNote10)EmployeesoftheCompanyanditsdomesticsubsidiariesaregenerallyentitledtolump-sumseveranceand,incertaincases,annuitypaymentsonretirement,basedoncurrentratesofpay,lengthofserviceandcertainotherfactors. TheCompanyanditsdomesticsubsidiarieshaveadopted“AccountingStandardforRetirementBenefits”whichwasissuedbytheBusinessAccountingCouncil.Inaccordancewiththisstandard,theallowanceforretirementbenefitsforemploy-eesisprovidedbasedontheestimatedretirementbenefitobligationandthepensionassets.Actuarialgainsandlossesareamortized,fromtheyearinwhichtheactuarialgainsandlossesareincurred,usingthestraight-linemethod,overtheestimatedaverageremainingserviceyearsofemployees. TheCompanyhasaretirementbenefitscheme,whichisacombinationoflump-sumseveranceplan,cashbalanceanddefinedcontributionpensionplan.TheCompanyalsohasaretirementbenefitstrust. Inaddition,theCompanyhasanunfundedretirementbenefitplanfordirectorsandcorporateauditors.Theamountsrequiredundertheplanhavebeenfullyaccrued.Accruedseveranceindemnitiesforthemembersoftheboardandcorporateaudi-torsoftheCompanyareprovidedbasedoninternalregulations.Theaccruedprovisionforseveranceindemnitiesformembersoftheboardandcorporateauditorsisnotfunded. Certainoverseassubsidiarieshavedefinedcontributionplanscoveringsubstantiallyalloftheiremployees.Theamountscon-tributedundertheplansarechargedtoincome.
11)ForeigncurrencytranslationAllmonetaryassetsandliabilitiesdenominatedinforeigncur-renciesaretranslatedattherateofexchangeprevailingonthebalancesheetdate,exceptforthoseitemscoveredbyforwardexchangecontracts. TheCompanyanditsdomesticsubsidiarieshaveadopted“AccountingStandardforForeignCurrencyTransactions”whichwasissuedbytheBusinessAccountingCouncilinJapan. FinancialstatementsofoverseassubsidiariesaretranslatedintoJapaneseyenatyear-endratesforallassetsandliabilitiesandatweightedaverageratesforincomeandexpenseaccounts.Adjustmentsresultingfromthetranslationoffinancialstatementsarereflectedunderthecaption,“Foreigncurrencytranslationadjustments”,innetassets.
12)Researchanddevelopmentandcomputersoftware(seeNote13)
Researchanddevelopmentexpendituresarechargedtoincomewhenincurred. Expendituresrelatingtocomputersoftwaredevelopedforinternalusearechargedtoincomewhenincurredexceptiftheycontributetothegenerationofincomeortofuturecostsavings.Suchexpendituresarecapitalizedasanassetandareamortizedusingthestraight-linemethodovertheirestimatedusefullife,fiveyears.
Notes to Consolidated Financial Statements
SantenPharmaceuticalCo.,Ltd.AnnualReport200946

13)Netincomeanddividendspershare(seeNote11)Thecomputationofbasicnetincomepershareisbasedontheweightedaveragenumberofsharesofcommonstockoutstandingduringeachperiod.Theaveragenumberofsharesusedinthecomputationis85,011thousand,86,561thousandand86,735thousandfortheyearsendedMarch31,2009,2008and2007,respectively. Thedilutednetincomepershareassumesthedilutionthatcouldoccurifsecuritiesorothercontractstoissuecommonstockwereexercisedorconvertedintocommonstockorresultedintheissuanceofcommonstock.Theaveragenumberofsharesusedinthecomputationis85,089thousand,86,683thousandand86,891thousandfortheyearsendedMarch31,2009,2008and2007,respectively. Cashdividendspershareshownintheaccompanyingconsoli-datedstatementsofincomearetheamountsapplicabletotherespectiveyears.
14)Incometaxes(seeNote14)Incometaxesareaccountedforundertheassetandliabilitymethod.Deferredtaxassetsandliabilitiesarerecognizedfortheestimatedfuturetaxconsequencesattributabletodifferencesbetweenthefinancialstatementcarryingamountsofexistingassetsandliabilitiesandtheirrespectivetaxbases,operatinglosscarryforwardsandforeigntaxcreditcarryforwards.Deferredtaxassetsandliabilitiesaremeasuredusingenactedtaxratesexpectedtoapplytotaxableincomeintheyearsinwhichthosetemporarydifferencesareexpectedtoberecoveredorsettled.Theeffectondeferredtaxassetsandliabilitiesofachangeintaxratesisrecognizedinincomeintheperiodthatincludestheenactmentdate.
15)CashandcashequivalentsCashandcashequivalentsmainlyincludecashonhand,readilyavailabledepositsandallhighlyliquiddebtinvestments,gener-allywithamaturityofthreemonthsorless,thatarereadilyconvertibletoknownamountsofcashandaresonearmaturitythattheypresentinsignificantriskofchangesinvalue.
16)ChangesinAccountingPolicies(i)UnificationofAccountingPoliciesAppliedtoForeign
SubsidiariesforConsolidatedFinancialStatementsOnMay17,2006,theAccountingStandardsBoardofJapanissuedPracticalIssuesTaskForceNo.18“PracticalSolutiononUnificationofAccountingPoliciesAppliedtoForeignSubsidiariesforConsolidatedFinancialStatements”(“PITFNo.18”).PITFNo.18requiresthataccountingpoliciesandproce-duresappliedbyaparentcompanyanditssubsidiariestosimilartransactionsandeventsundersimilarcircumstancesshould,inprinciple,beunifiedforthepreparationoftheconsolidatedfinancialstatements.PITFNo.18,however,asatentativemea-sure,allowsaparentcompanytoprepareconsolidatedfinancialstatementsusingforeignsubsidiaries’financialstatementspre-paredinaccordancewitheitherInternationalFinancialReportingStandardsorU.S.generallyacceptedaccountingprinciples.Inthiscase,adjustmentsforthefollowingsixitemsarerequiredin
theconsolidationprocesssothattheirimpactonnetincomeareaccountedforinaccordancewithJapaneseGAAPunlesstheimpactisnotmaterial.
(a)Goodwillnotsubjecttoamortization(b)Actuarialgainsandlossesofdefined-benefitretirementplans
recognizedoutsideprofitorloss(c)Capitalizedexpendituresforresearchanddevelopmentactivities(d)Fairvaluemeasurementofinvestmentproperties,andrevalu-
ationofproperty,plantandequipmentandintangibleassets(e)Retrospectivetreatmentofachangeinaccountingpolicies(f)Accountingfornetincomeattributabletominorityinterests
AsaresultofadoptingPITFNo.18,effectiveApril1,2008,retainedearningsatApril1,2008wasincreasedby¥210million($2,133thousand),andoperatingincome,incomebeforeincometaxesandnetincomewereincreasedby¥240million($2,445thousand),¥223million($2,271thousand)and¥581million($5,915thousand),respectively.
(ii)Newaccountingstandardformeasurementforinventories
OnJuly5,2006,theAccountingStandardsBoardofJapanissuedASBJStatementNo.9,“AccountingStandardforMeasurementofInventories”.Aspermittedunderthesuper-sededaccountingstandard,theCompanyanditsdomesticsub-sidiariespreviouslystatedinventoriesatcost.Thenewaccountingstandardrequiresthatinventoriesheldforsaleintheordinarycourseofbusinessbemeasuredatthelowerofcostornetreal-izablevalue.Replacementcostmaybeusedinlieuofthenetrealizablevalue,ifappropriate. TherearenomaterialeffectsontheCompany’sconsolidatedfinancialstatements.
(iii)Newaccountingstandardsforleasetransactionsaslessee
OnMarch30,2007,theAccountingStandardsBoardofJapanissuedStatementNo.13,“AccountingStandardforLeaseTransactions”andGuidanceNo.16,“GuidanceonAccountingStandardforLeaseTransactions”.Thenewaccountingstandardsrequirethatallfinanceleasetransactionsbetreatedascapitalleases. EffectiveApril1,2008,theCompanyanditsdomesticsubsid-iariesadoptedthenewaccountingstandardsforfinanceleasescommencingafterMarch31,2008andcapitalizedassetsusedundersuchleases,exceptforcertainimmaterialorshort-termfinanceleases,whichareaccountedforasoperatingleases.Aspermitted,financeleaseswhichcommencedpriortoApril1,2008andhavebeenaccountedforasoperatingleases,con-tinuetobeaccountedforasoperatingleaseswithdisclosureofcertain“asifcapitalized”information.
17)ReclassificationsCertainreclassificationshavebeenmadetoprioryears’consoli-datedfinancialstatementstoconformwiththepresentationusedfortheyearendedMarch31,2009.
47SantenPharmaceuticalCo.,Ltd.AnnualReport2009

TheCompanyprincipallyutilizesderivativeinstrumentssuchasforeignexchangecontractsandinterestrateswapstohedgetheexposureriskarisingfromfluctuationsinforeigncurrencyexchangerates,interestratesandmarketpriceofsecurities. TheCompanyisexposedtotheriskthatthecounterparties
willnotbeabletofullysatisfytheirobligationsundercontracts,buttheCompanybelievesthatsuchriskismitigatedbythehighcreditratingsofthecounterparties. ThereisnooutstandingderivativetransactionforwhichhedgeaccountingwasnotappliedatMarch31,2009and2008.
5. Derivative Instruments
ThefollowingisasummaryofothersecuritieswithamarketvalueatMarch31,2009and2008:
Millionsofyen
2009 2008 Acquisitioncost Bookvalue Difference Acquisitioncost Bookvalue Difference
Securitieswithbookvalues exceedingacquisitioncosts:
Equitysecurities ¥ 4,121 ¥ 4,982 ¥ 861 ¥ 7,136 ¥11,351 ¥4,215
Securitieswithbookvalues notexceedingacquisitioncosts:
Equitysecurities 6,693 5,461 (1,232) 3,693 3,308 (385)
¥10,814 ¥10,443 ¥ (371) ¥10,829 ¥14,659 ¥3,830
ThousandsofU.S.dollars
2009 Acquisitioncost Bookvalue Difference
Securitieswithbookvalues exceedingacquisitioncosts:
Equitysecurities $ 41,952 $ 50,718 $ 8,766
Securitieswithbookvalues notexceedingacquisitioncosts:
Equitysecurities 68,133 55,590 (12,543)
$110,085 $106,308 $ (3,777)
Themarketpriceinthetableabovedoesnotincludethenegativevalueofsharesamountingto¥43million($438thousand)ofsecuritiesheldbyinvestmentlimitedpartnerships.
MaturitiesofinvestmentsatMarch31,2009and2008areasfollows:
Thousandsof Millionsofyen U.S.dollars
2009 2008 2009
Duewithinoneyear ¥2,557 ¥ 182 $26,033
Dueafteroneyearthroughfiveyears — 1,500 —
¥2,557 ¥1,682 $26,033
4. Short-term Investments and Investment Securities
3. Translation into United States Dollars
TheaccompanyingconsolidatedfinancialstatementsareexpressedinJapaneseyenand,solelyfortheconvenienceofthereader,havebeentranslatedintoUnitedStatesdollarsattherateof¥98.23=US$1,theapproximateexchangerateprevailingonMarch31,2009.ThetranslationshouldnotbeconstruedasarepresentationthattheJapaneseyenhavebeen,couldhavebeen,orcouldinthefuturebeconvertedintoUnitedStatesdollarsatthatrateoranyotherrate.
Notes to Consolidated Financial Statements
SantenPharmaceuticalCo.,Ltd.AnnualReport200948

InventoriesatMarch31,2009and2008consistofthefollowing:
Thousandsof Millionsofyen U.S.dollars
2009 2008 2009
Merchandiseandfinishedgoods ¥10,236 ¥ 9,387 $104,202
Workinprocess 76 260 771
Rawmaterialsandsupplies 1,924 1,686 19,590
¥12,236 ¥11,333 $124,563
6. Inventories
7. Leases
Financeleases,commencedpriortoApril1,2008,whichdonottransferownershipofleaseassetstolessees,areaccountedforasoperatingleasesandequivalentpurchaseamount,accumulateddepreciationandfutureminimumleasepaymentsonan“asifcapital-ized”basisatMarch31,2009and2008areasfollows*:
Thousandsof Millionsofyen U.S.dollars
2009 2008 2009
Machineryandequipment:
Equivalentpurchaseamount ¥3,147 ¥12,577 $32,036
Equivalentaccumulateddepreciationamount 2,727 11,453 27,766
Equivalentbalanceatyear-end 420 1,124 4,270
Tools:
Equivalentpurchaseamount 356 558 3,620
Equivalentaccumulateddepreciationamount 221 346 2,243
Equivalentbalanceatyear-end 135 212 1,377
Total:
Equivalentpurchaseamount 3,503 13,135 35,656
Equivalentaccumulateddepreciationamount 2,948 11,799 30,009
Equivalentbalanceatyear-end ¥ 555 ¥1,336 $ 5,647
Futureminimumleasepayments:
Duewithinoneyear ¥ 425 ¥872 $ 4,331
Dueafteroneyear 154 581 1,563
¥ 579 ¥1,453 $ 5,894
*TheamountforrenewedleasecontractswereexcludedsincetheyearendedMarch31,2009.
49SantenPharmaceuticalCo.,Ltd.AnnualReport2009

TheCompanyanditsdomesticsubsidiariesaccountforimpairmentoffixedassetsinaccordancewith“AccountingStandardsforImpairmentofFixedAssets.” TheCompanyanditsdomesticsubsidiariesreviewtherecordedvalueoftheirproperty,plantandequipmentandintangibleassetstodetermineifthefuturecashflowstobederivedfromthesepropertieswillbesufficienttorecovertheremainingrecordedassetvalues.
TheimpairmentlossesrecognizedforthethreeyearsendedMarch31,2009areasfollows:
Thousandsof Millionsofyen U.S.dollars
2009 2008 2007 2009
Land ¥ — ¥253 ¥— $ —
Buildingsandstructures — 64 — —
¥ — ¥317 ¥— $ —
TheCompanyrecordedimpairmentlossesrelatedtolandandbuildingsfordormitoryduetotheCompany’sdecisiontoclosedownduringtheyearendedMarch31,2008.Thefairvalueoftheland,buildingsandstructureswasbasedonlocaltaxauthority’svaluation.
8. Impairment of Fixed Assets
Leasepayments,equivalentdepreciationandequivalentinterestexpenseforthethreeyearsendedMarch31,2009areasfollows*:
Thousandsof Millionsofyen U.S.dollars
2009 2008 2007 2009
Leasepayments ¥865 ¥1,013 ¥1,032 $8,802
Equivalentdepreciation ¥821 ¥942 ¥970 $8,362
Equivalentinterestexpense ¥ 18 ¥33 ¥47 $ 188
*TheamountforrenewedleasecontractswereexcludedsincetheyearendedMarch31,2009.
Operatingleases:Futureminimumrentsundernon-cancellableoperatingleasesatMarch31,2009and2008consistofthefollowing:
Thousandsof Millionsofyen U.S.dollars
2009 2008 2009
Duewithinoneyear ¥198 ¥112 $2,019
Dueafteroneyear 111 124 1,125
¥309 ¥236 $3,144
Notes to Consolidated Financial Statements
SantenPharmaceuticalCo.,Ltd.AnnualReport200950

Short-termborrowingsatMarch31,2009consistofbankloans. Theweightedaverageinterestratesofshort-termborrowingsasofMarch31,2009were5.3%.
Long-termdebtatMarch31,2009and2008consistsofthefollowing:
Thousandsof Millionsofyen U.S.dollars
2009 2008 2009
Unsecuredyensyndicatedloansfromdomesticbanks,duein2008,interest1.4% ¥ — ¥ 5,000 $ —
Unsecuredyenloansfromdomesticbanks, dueininstallmentsthrough2009,interest4.8% 110 278 1,120
Leaseobligation 44 — 445
Total 154 5,278 1,565
Currentportionshownincurrentliabilities (110) (5,168) (1,120)
¥ 44 ¥ 110 $ 445
Theaggregateannualmaturitiesoflong-termdebtatMarch31,2009areasfollows:
ThousandsofYearsendingMarch31 Millionsofyen U.S.dollars
2010 ¥110 $1,120
2011 39 387
2012 4 46
2013 1 12
¥154 $1,565
9. Short-tem Borrowings and Long-term Debt
AsiscustomaryinJapan,short-termborrowingsandlong-termbankloansaremadeundergeneralagreementswhichpro-videthatundercertaincircumstances,additionalsecurityandguaranteesforpresentandfutureindebtednesswillbegivenuponthebankrequestsandthatthebankshallhavetheright,astheobligationsbecomedue,orintheeventofdefault,tooffsetcashdepositsagainsttheobligationsduetothebank.
Todate,theCompanyhasnotreceivedsucharequestfromitsbanks. InMarch2009,theCompanyenteredintoacommitmentlinecontractwithfivedomesticbanks.ThemaximumaggregatecreditfacilityavailabletotheCompanyis¥16,000million($162,883thousand).ThecreditfacilityhasnotbeenusedasofMarch31,2009.
51SantenPharmaceuticalCo.,Ltd.AnnualReport2009

AsdiscussedinNote2,10),theCompanyhasaretirementbenefitscheme,whichisacombinationoflump-sumseveranceplan,cashbalanceanddefinedcontributionpensionplan.TheCompanyalsohasaretirementbenefittrust.
Thefollowingtablesetsforththedetailsofbenefitobligation,planassetsandfundedstatusoftheCompaniesatMarch31,2009and2008.
Thousandsof Millionsofyen U.S.dollars
2009 2008 2009
Foremployees:
Benefitobligationatendofyear ¥(13,234) ¥(12,613) $(134,729)
Fairvalueofplanassetsatendofyear 8,766 9,427 89,237
Fundedstatus(benefitobligationinexcessofplanassets) (4,468) (3,186) (45,492)
Unrecognizedactuarialloss 2,075 1,371 21,125
Fordirectorsandcorporateauditors:
Accruedretirementbenefit (506) (487) (5,142)
Retirementandseverancebenefitsrecognizedin theconsolidatedbalancesheets ¥ (2,899) ¥(2,302) $ (29,509)
RetirementandseverancecostsoftheCompaniesincludethefollowingcomponentsforthethreeyearsendedMarch31,2009.
Thousandsof Millionsofyen U.S.dollars
2009 2008 2007 2009
Foremployees:
Servicecost ¥ 805 ¥802 ¥701 $ 8,191
Interestcost 246 226 218 2,501
Expectedreturnonplanassets (189) (187) (179) (1,919)
Recognizedactuarialloss 209 143 79 2,124
Contributiontodefinedcontributionpensionplan 830 901 807 8,452
Netperiodicbenefitcost ¥1,901 ¥1,885 ¥1,626 $19,349
Fordirectorsandcorporateauditors:
Accrualforretirementbenefit ¥ 18 ¥17 ¥79 $ 179
AssumptionsusedintheaccountingforretirementandseverancebenefitsforthethreeyearsendedMarch31,2009areasfollows:
2009 2008 2007
Methodofattributingbenefittoperiodofservice Straight-line basis Straight-linebasis Straight-linebasis
Discountrate 2.00% 2.00% 2.00%
Expectedreturnonplanassets 2.00% 2.00% 2.00%
Amortizationperiodforactuariallosses* 14 years 14years 14years
*Amortizedonastraight-linebasisovertheaverageremainingserviceperiodforemployeesinservicestartingfromtheyearinwhichthelossesoccur.
10. Retirement and Severance Benefits
Domesticsubsidiarieshasadoptedthepermittedalternativetreatment,accruingfor100%oftheamountrequiredifallemployeesweretovoluntarilyterminatetheiremploymentasofthebalancesheetdate,inaccordancewiththeaccounting
standardforretirementbenefitsforsmallbusinessentities. Domesticsubsidiaryand2overseassubsidiarieshavelump-sumseveranceplans.
Notes to Consolidated Financial Statements
SantenPharmaceuticalCo.,Ltd.AnnualReport200952

UndertheJapaneselawsandregulations,theentireamountpaidfornewsharesisrequiredtobedesignatedascommonstock.However,acompanymay,byaresolutionoftheBoardofDirectors,designateanamountnotexceedingone-halfofthepriceofthenewsharesasadditionalpaid-incapital,whichisincludedincapitalsurplus. UndertheJapaneseCorporateLaw(“TheLaw”),incaseswheredividenddistributionofsurplusismade,thesmallerofanamountequalto10%ofthedividendandtheexcess,ifany,of25%ofcommonstockoverthetotalofadditionalpaid-incapitalandlegalearningsreservemustbesetasideasadditionalpaid-incapitalorlegalearningsreserve.Legalearningsreserveisincluded
inretainedearningsintheaccompanyingconsolidatedbalancesheetsandamountedto¥1,551million($15,794thousand)and¥1,551millionasofMarch31,2009and2008,respectively. CashdividendschargedtoretainedearningsduringthethreeyearsendedMarch31,2009representdividendspaidoutdur-ingtheperiods.Theaccompanyingconsolidatedfinancialstate-mentsdonotincludeanyprovisionfortheyearenddividendof¥40($0.41)pershare,aggregating¥3,401million($34,622thousand)whichwasapprovedattheCompany’sshareholders’meetingonJune24,2009inrespectoftheyearendedMarch31,2009.
11. Net Assets
12. Stock Options
TheCompanyhasstock-basedcompensationplansunderwhichstockoptionsaregrantedannuallytodirectorsandcorporateofficersatthemarketpriceonthedateofthegrant.Thestockoptionsarefullyexercisableaftertwoyearsandexpirestenyearsfromthedateofgrant.
StockoptionsexistingfortheyearendedMarch31,2009areasfollows:
Stockoptionsgranted 2008 2007 2006 2005
Personsgranted Directorsandcorporate Directorsandcorporate Directorsandcorporate Directorsandcorporate officers:12 officers:12 officers:15 officers:15
Numberofshares CommonStock161,700 CommonStock99,300 CommonStock102,700 CommonStock129,200
Dateofgrant July2,2008 July3,2007 July4,2006 July4,2005
Vestingconditions Noprovisions Noprovisions Noprovisions Noprovisions
Serviceperiod Noprovisions Noprovisions Noprovisions Noprovisions
Exerciseperiod FromJune28,2010 FromJune27,2009 FromJune28,2008 FromJune25,2007 toJune25,2018 toJune26,2017 toJune24,2016 toJune23,2015
Stockoptionsgranted 2004 2003 2002 2001
Personsgranted Directorsandcorporate Directorsandcorporate Directorsandcorporate Directorsandcorporate officers:11 officers:12 officers:14 officers:14
Numberofshares CommonStock78,200 CommonStock137,600 CommonStock92,000 CommonStock55,000
Dateofgrant July5,2004 July4,2003 July5,2002 July9,2001
Vestingconditions Noprovisions Noprovisions Noprovisions Noprovisions
Serviceperiod Noprovisions Noprovisions Noprovisions Noprovisions
Exerciseperiod FromJune26,2006 FromJune27,2005 FromJune27,2004 FromJune29,2003 toJune24,2014 toJune25,2013 toJune25,2012 toJune27,2011
Stockoptionsgranted 2000 1999 1998
Personsgranted Directorsandcorporate Directors:10 Directors:12 officers:16 Management:6
Numberofshares CommonStock60,000 CommonStock66,000 CommonStock106,000
Dateofgrant July10,2000 July8,1999 July1,1998
Vestingconditions Noprovisions Noprovisions Noprovisions
Serviceperiod Noprovisions Noprovisions Noprovisions
Exerciseperiod FromJune30,2002 FromJune30,2001 FromJune27,2000 toJune28,2010 toJune28,2009 toJune25,2008
53SantenPharmaceuticalCo.,Ltd.AnnualReport2009

Number,movementandpriceofstockoptionsfortheyearendedMarch31,2009areasfollows:
Before vesting options (Number of shares):Stockoptionsgranted 2008 2007 2006 2005 2004 2003
BalanceatApril1,2008 — — — — — —
Granted 161,700 — — — — —
Vested 161,700 — — — — —
Balance at March 31, 2009 — — — — — —Stockoptionsgranted 2002 2001 2000 1999 1998
BalanceatApril1,2008 — — — — —
Granted — — — — —
Vested — — — — —
Balance at March 31, 2009 — — — — —
After vesting options (Number of shares):Stockoptionsgranted 2008 2007 2006 2005 2004 2003
BalanceatApril1,2008 — 99,300 102,700 127,500 66,100 55,200
Vested 161,700 — — — — —
Exercised — — — — 4,800 10,400
Balance at March 31, 2009 161,700 99,300 102,700 127,500 61,300 44,800
Stockoptionsgranted 2002 2001 2000 1999 1998
BalanceatApril1,2008 30,900 38,600 46,200 37,000 24,000
Vested — — — — —
Exercised 4,700 4,600 1,000 — 24,000
Balance at March 31, 2009 26,200 34,000 45,200 37,000 —
Price information (yen):Stockoptionsgranted 2008 2007 2006 2005 2004 2003
Optionprice 2,734 3,050 2,715 2,480 1,743 1,176
Weighted-averagestockprice — — — — 2,789 2,725
Fairvalueatgrantdate* 423.16 609.45 579.05 — — —
Stockoptionsgranted 2002 2001 2000 1999 1998
Optionprice 1,326 2,299 2,705 2,480 1,540
Weighted-averagestockprice 2,737 2,870 2,870 — 2,614
Fairvalueatgrantdate* — — — — —
*OmittedduetostockoptionswhichhadbeengrantedbeforetheLawbecameeffectiveonMay1,2006.
OnJune24,2009,theCompany’sshareholders’meetingapprovedthattheCompany’sstocksubscriptionrightsforallotmentasstockoptionstodirectorsandcorporateofficersoftheCompany.ThesestocksubscriptionrightsareexercisablefromJune27,2011toJune24,2019.Themaximumnumberofstocksubscriptionrightsthatcanbeexercisedis168,400commonshares.
Notes to Consolidated Financial Statements
SantenPharmaceuticalCo.,Ltd.AnnualReport200954

ResearchanddevelopmentexpenditureschargedtoincomefortheyearsendedMarch31,2009,2008and2007are¥18,458million($187,905thousand),¥12,942and¥13,663million,respectively.
14. Income Taxes
TheCompanyanditsdomesticsubsidiariesaresubjecttoanumberoftaxesbasedonearningswhich,intheaggregate,resultedinanaveragenormaltaxrateofapproximately40.4%forthethreeyearsendedMarch31,2009.Overseassubsidiariesaresubjecttoincometaxesofthecountriesinwhichtheyoperate. TheeffectiveratesforthethreeyearsendedMarch31,2009differfromthenormaltaxratesforthefollowingreasons:
2009 2008 2007
Normaltaxrate 40.4 % 40.4% 40.4%
Equityinlossesofaffiliates 1.7 — —
Expensesnotdeductiblefortaxpurposes 1.5 1.6 1.4
Lowertaxratesofsubsidiaries 1.3 (0.2) (0.4)
Changeinvaluationallowanceallocatedtoincometaxexpenses (1.5) 1.6 1.5
Taxcreditforresearchanddevelopmentexpenses (8.0) (5.5) (5.8)
Others 0.6 0.3 0.4
Effectivetaxrate 36.0 % 38.2% 37.5%
ThetaxeffectsoftemporarydifferencesandtaxlosscarryforwardsthatgiverisetosignificantportionsofthedeferredtaxassetsanddeferredtaxliabilitiesatMarch31,2009and2008arepresentedbelow:
Thousandsof Millionsofyen U.S.dollars
2009 2008 2009
Deferredtaxassets:
Taxlosscarryforwards ¥ 5,986 ¥6,074 $60,935
Retirementandseverancebenefits 2,708 2,487 27,565
Deferredassetsfortaxpurposes 2,222 458 22,620
Accruedexpenses 1,139 1,072 11,598
Depreciationandamortization 828 892 8,433
Accruedenterprisetaxes 369 363 3,759
Lossonimpairmentoffixedassets 271 272 2,758
Lossonimpairmentofgolfmembershiprights 209 208 2,129
Lossonvaluationofinventories 193 84 1,969
Netunrealizedholdinglossesonsecurities 167 — 1,705
Lossonvaluationofsecurities 43 43 441
Other 860 925 8,736
Subtotal 14,995 12,878 152,648
Valuationallowance (6,508) (7,674) (66,254)
Totalgrossdeferredtaxassets 8,487 5,204 86,394
Deferredtaxliabilities:
Reserveforspecialdepreciation (133) (131) (1,357)
Netunrealizedholdinggainsonsecurities (1) (1,551) (8)
Other (22) (19) (219)
Totalgrossdeferredtaxliabilities (156) (1,701) (1,584)
Netdeferredtaxassets ¥ 8,331 ¥3,503 $84,810
13. Research and Development Expenditures
55SantenPharmaceuticalCo.,Ltd.AnnualReport2009

NetdeferredtaxassetsatMarch31,2009and2008arereflectedintheaccompanyingconsolidatedbalancesheetsunderthefollowingcaptions:
Thousandsof Millionsofyen U.S.dollars
2009 2008 2009
Currentassets–deferredtaxassets ¥1,941 ¥1,699 $19,763
Investmentsandotherassets–deferredtaxassets 6,410 1,822 65,254
Noncurrentliabilities–deferredtaxliabilities (20) (18) (207)
Netdeferredtaxassets ¥8,331 ¥3,503 $84,810
TheCompaniesoperatepredominantlyinasingleindustrysegment:theproduction,saleandmarketingofpharmaceuticals. Intercompanysalesbetweengeographicareasarerecordedatcostplusamarkupandintercompanysalesandprofitsareeliminatedonconsolidation.Corporateassetsarecomposedmainlyofcashandcashequivalents,short-terminvestmentsandinvestmentsecurities.
16. Segment Information
Informationbygeographicareaandoverseassalesareasfollows:
Thousandsof Millionsofyen U.S.dollars
2009 2008 2007 2009
Geographic areas:
Netsales:
Japan:
Externalcustomers ¥ 91,405 ¥92,098 ¥90,695 $ 930,522
Intersegment 2,422 1,978 1,167 24,659
Total 93,827 94,076 91,862 955,181
Europe:
Externalcustomers 9,453 10,617 9,186 96,226
Intersegment 1,838 2,041 2,028 18,714
Total 11,291 12,658 11,214 114,940
Other:
Externalcustomers 761 679 605 7,750
Intersegment 2,879 2,761 2,611 29,304
Total 3,640 3,440 3,216 37,054
Corporateandeliminations (7,139) (6,780) (5,806) (72,677)
Consolidated ¥101,619 ¥103,394 ¥100,486 $1,034,498
15. Contingent Liabilities
AtMarch31,2009,theCompanyhasprovidedguaranteestofinancialinstitutionscoveringemployeeloanstotaling¥446million($4,539thousand).
Notes to Consolidated Financial Statements
SantenPharmaceuticalCo.,Ltd.AnnualReport200956

Thousandsof Millionsofyen U.S.dollars
2009 2008 2007 2009
Operatingincome(loss):
Japan ¥ 18,284 ¥22,633 ¥21,768 $ 186,139
Europe 178 555 980 1,817
Other (662) (819) (755) (6,738)
Corporateandeliminations (2,306) (1,998) (1,581) (23,484)
Consolidated ¥ 15,494 ¥20,371 ¥20,412 $ 157,734
Assets:
Japan ¥138,095 ¥129,610 ¥125,822 $1,405,832
Europe 10,017 10,908 10,635 101,974
Other 5,387 5,745 4,880 54,845
Corporateandeliminations (2,487) 10,284 17,762 (25,319)
Consolidated ¥151,012 ¥156,547 ¥159,099 $1,537,332
ThemaincountriesincludedinEuropeandOtherareasfollows:Europe:Finland,GermanyandSwedenOther: UnitedStatesofAmerica,China,KoreaandTaiwan
AsdiscussedinNote2,16),(i),theCompaniesappliedthenewPITF,“PracticalSolutiononUnificationofAccountingPoliciesAppliedtoForeignSubsidiariesforConsolidatedFinancialStatements(ASBJPITFNo.18,May17,2006)”fortheyearendedMarch31,2009.TheeffectofthisadoptionwastoincreaseoperatingincomeofEuropesegmentby¥1million($15thousand)andothersegmentby¥239million($2,430thousand).
Thousandsof Millionsofyen U.S.dollars
2009 2008 2007 2009
Overseas sales:
Europe ¥ 8,311 ¥8,533 ¥6,917 $ 84,604
NorthAmerica 938 1,951 2,129 9,549
Asia 3,748 4,326 4,247 38,153
Other 2 17 41 23
Total ¥ 12,999 ¥14,827 ¥13,334 $ 132,329
Consolidatednetsales ¥101,619 ¥103,394 ¥100,486 $1,034,498
Percentageofoverseassalestoconsolidatednetsales 12.8% 14.3% 13.3%
ThemaincountriesincludedinEurope,NorthAmerica,AsiaandOtherareasfollows:Europe: Finland,Russia,Germany,SwedenandNorwayNorthAmerica: UnitedStatesofAmericaAsia: Korea,China,VietnamandTaiwanOther: Australia
OverseassalesrepresentthetotalamountofexportsalesoftheCompanyanditsdomesticsubsidiariesandsalesofoverseassubsidiaries(intercompanysalesbetweenconsoli-datedsubsidiariesareeliminateduponconsolidation).
57SantenPharmaceuticalCo.,Ltd.AnnualReport2009

LicenseagreementwithMerck&Co.,IncOnApril15,2009,theCompanyandMerck&Co.,Inc(“Merck”)signedaworldwidelicensingagreementforTafluprost,atreatmentforglaucomaandocularhypertension.
Thesummaryoftheagreementisasfollows: (i)TheCompanygrantsMerckexclusivecommercialrightsto
TafluprostinWesternEurope,(excludingGermany),NorthAmerica,SouthAmericaandAfrica.
(ii)TheCompanyretainscommercialrightstoTafluprostinGermany,EasternEurope,NorthernEuropeandAsiaPacific,includingJapan.
(iii)Underthetermsofthisagreement,MerckwillpayafeeasmilestonesareachievedandasroyaltybasedonfuturesalesofTafluprostaccordingtothelicenseagreement.
(iv)MerckwillprovidepromotionalsupporttotheCompaniesinGermanyandPoland.IfTafluprostisapprovedintheUnitedStatesofAmerica,theCompanywillhavetheoptiontoco-promotetheproductintheUnitedStatesofAmerica.
17. Subsequent Event
Notes to Consolidated Financial Statements
SantenPharmaceuticalCo.,Ltd.AnnualReport200958

1 FRAMewORkOFINTeRNALCONTROLOveRFINANCIALRePORTINgI,asPresidentandCEOofSantenpharmaceuticalCo.,Ltd.(theCompany),amresponsibleforthedesignandoperationofinternalcontrolsoverfinan-cialreporting(“ICOFR”)andestablishingandmaintaininganICOFRbasedontheframeworkofICOFRinJapaninaccordancewith“OntheSettingoftheStandardsandPracticeStandardsforManagementAssessmentandAuditconcerningInternalControlOverFinancialReport(BusinessAccountingCouncil(CouncilOpinions),February15,2007)”. Internalcontrolaimsatachievingtheobjectivestoareasonableextentwiththeorganizedandintegratedfunctionofindividualcomponentasawhole.ThereforeICOFRdoesnotprovideanabsoluteassuranceforpreventinganddetectingallerrorstoconsolidatedfinancialstatements.
2 ASSeSSMeNTSCOPe,TIMINgANDPROCeDUReSBasisofPresentingInternalControlReportThereportonICOFRoftheconsolidatedfinancialstatementsoftheCompany(“InternalControlReport”)ispreparedonthebasisofgenerallyacceptedassessmentstandardsofinternalcontroloverfinancialreportinginJapan(“AssessmentStandards”)andiscompiledfromtheInternalControlReportpreparedbytheCompanyasrequiredbytheFinancialInstrumentsandExchangeLawofJapan(“Law”). TheAssessmentStandardsrequiremanagementtoassessICOFR,whichconsistsoftheinternalcontrolsovertheconsolidatedfinancialstatementsincludedintheAnnualSecuritiesReportfiledundertheLawandtheinternalcontroloverdisclosureinformationandothersincludedintheAnnualSecuritiesReportthatmateriallyaffectsthereliabilityofthefinancialstatements. Thescopeofmanagement’sassessmentofICOFRinthisannualreportisdifferentfromthescoperequiredbytheAssessmentStandards.ManagementassessmentofICOFRinthisannualreportcoverstheICOFRwithrespecttotheaccompanyingconsolidatedfinancialstatementsonly.Inaddition,asexplainedinNote1onthebasisofpresentationofconsolidatedfinancialstatements,theaccompanyingconsolidatedfinancialstatementsarereclassifiedandmodifiedfromtheconsolidatedfinancialstatementspreparedforthepurposeoftheLaw.Supplementaryinformationisalsoaddedtotheconsolidatedfinancialstatements.TheprocessofmakingreclassificationsandmodificationsandtheadditionofcertaininformationisfortheconvenienceofreadersoutsideJapan.ManagementvoluntarilyincludestheprocessinitsassessmentofICOFR,eventhoughitisoutsidethescopeoftheAssessmentStandards.
ScopeofAssessmentManagement’sassessmentofICOFRwasconductedasofMarch31,2009inaccordancewiththeAssessmentStandards. Inevaluatinginternalcontrols,managementfirstassessedinternalcontrolsthathaveamaterialimpactonoverallconsolidatedfinancialreporting(“company-levelcontrols”)and,basedontheresults,selectedbusinessprocesstobeassessed.Forassessmentofprocesslevelcontrolsmanagementanalyzedtheselectedbusinessprocesses,identifyakeycontrolthatwouldhaveamaterialimpactonthereliabilityoffinancialreporting,andassessedeffectivenessofinternalcontrolsthroughassessingdesignandoperationofthekeycontrols. ManagementassessedtheeffectivenessoftheICOFRapplicablefortheCompany,itssubsidiariesanditsaffiliates,toextentnecessaryinlightoftheirdegreeofimpactonthereliabilityoffinancialreporting.Managementdeterminedmaterialityforreliabilityoffinancialreportinginlightoftheirdegreeofquantitativeandqualitativeimpactonfinancialreporting.Fromtheresultsofthecompany-levelcontrolsassessmentoftheCompanyandasubsid-iary,managementdeterminedareasonablescopeforprocesslevelcontrolstobeassessed. ManagementselectedthePharmaceuticalsbusinessunitoftheCompanyasthesignificantbusinessunitforassessingprocesslevelcontrols,asitssaleswasmorethan80%ofthepreviousfiscalyear’sconsolidatednetsales.Theprocessrelatedtonetsales,accountreceivablesandinventoriesfromthePharmaceuticalsbusinessunitoftheCompanywasselectedforprocesslevelcontrolassessmentastheyhavesignificantrelationtothebusinessobjectivesoftheCompany.Apartfromselectedsignificantbusinessunits,includingotherbusinessunits,processeswhoseaccountsweredeterminedtohaveahighriskofmisstatementandinvolvessignificantuseofmanagementestimateandprojection,andprocesseswhosebusinessesoroperationsincludedhighrisktransactionswereadditionallyselectedforcontrolsassessment.
3 ReSULTSOFASSeSSMeNTBasedonourassessmentproceduresnotedabove,IconcludedtheCompany’sinternalcontroloverfinancialreportingwaseffectiveasofMarch31,2009.
4 SUPPLeMeNTARyINFORMATIONNosubsequenteventshavearisenthathascausedtomateriallyeffectourevaluationoftheeffectivenessontheinternalcontroloverfinancialreportingasofMarch31,2009.
5 OTheRNone.
AkiraKurokawaPresident&CEO
June24,2009
Internal Control Report
59SantenPharmaceuticalCo.,Ltd.AnnualReport2009

TotheBoardofDirectorsofSantenPharmaceuticalCo.,Ltd.:
FinancialstatementauditWehaveauditedtheaccompanyingconsolidatedbalancesheetsofSantenPharmaceuticalCo.,Ltd.andconsolidatedsubsidiariesasofMarch31,2009and2008,andtherelatedconsolidatedstatementsofincome,changesinnetassetsandcashflowsforeachofthethree-yearintheperiodendedMarch31,2009,expressedinJapaneseyen.TheseconsolidatedfinancialstatementsaretheresponsibilityoftheCompany’smanagement.Ourresponsi-bilityistoindependentlyexpressanopinionontheseconsolidatedfinancialstatementsbasedonouraudits.
WeconductedourauditsinaccordancewithauditingstandardsgenerallyacceptedinJapan.Thosestandardsrequirethatweplanandperformtheaudittoobtainreasonableassuranceaboutwhetherthefinancialstatementsarefreeofmaterialmisstatement.Anauditincludesexamining,onatestbasis,evidencesupportingtheamountsanddisclosuresinthefinancialstatements.Anauditalsoincludesassessingtheaccountingprinciplesusedandsignificantestimatesmadebymanagement,aswellasevaluatingtheoverallfinancialstatementpresentation.Webelievethatourauditsprovidearea-sonablebasisforouropinion.
Inouropinion,theconsolidatedfinancialstatementsreferredtoabovepresentfairly,inallmaterialrespects,thefinancialpositionofSantenPharmaceuticalCo.,Ltd.andsubsidiariesasofMarch31,2009and2008,andtheresultsoftheiroperationsandtheircashflowsfortheeachofthethree-yearintheperiodendedMarch31,2009,inconformitywithaccountingprinciplesgenerallyacceptedinJapan.
TheU.S.dollaramountsintheaccompanyingconsolidatedfinancialstatementswithrespecttotheyearendedMarch31,2009arepresentedsolelyforcon-venienceofthereader.OurauditalsoincludedthetranslationofyenamountsintoU.S.dollaramountsand,inouropinion,suchtranslationhasbeenmadeonthebasisdescribedinNote3,totheconsolidatedfinancialstatements.
InternalcontrolauditWealsohaveauditedtheaccompanyingreportoninternalcontroloverfinancialreportingoftheconsolidatedfinancialstatementsofSantenPharmaceuticalCo.,Ltd.asofMarch31,2009(“InternalControlReport”).ThedesignandoperationofinternalcontroloverfinancialreportingandthepreparationoftheInternalControlReportaretheresponsibilityoftheCompany’smanagement.OurresponsibilityistoindependentlyexpressanopinionontheInternalControlReportbasedonouraudit.Internalcontroloverfinancialreportingmaynotcompletelypreventordetectfinancialstatementmisstatements.
WeconductedourinternalcontrolauditinaccordancewithauditingstandardsforinternalcontroloverfinancialreportinggenerallyacceptedinJapan.ThosestandardsrequirethatweplanandperformtheaudittoobtainreasonableassuranceaboutwhethertheInternalControlReportisfreeofmate-rialmisstatement.Aninternalcontrolauditisperformedonatestbasisandincludesevaluatingtheappropriatenessofthescope,proceduresandresultoftheassessmentdeterminedandpresentedbymanagementandtheoverallInternalControlReportpresentation.Webelievethatourinternalcontrolauditprovidesareasonablebasisforouropinion.
Inouropinion,theInternalControlReportreferredtoabove,inwhichSantenPharmaceuticalCo.,Ltd.statesthatinternalcontroloverfinancialreportingoftheconsolidatedfinancialstatementswaseffectiveasofMarch31,2009,presentsfairly,inallmaterialrespects,theassessmentofinter-nalcontroloverfinancialreportinginconformitywithassessmentstandardsforinternalcontroloverfinancialreportinggenerallyacceptedinJapan.
Osaka,JapanJune24,2009
Independent Auditors’ Report
SantenPharmaceuticalCo.,Ltd.AnnualReport200960

61Santen Pharmaceutical Co., Ltd. Annual Report 2009
Subsidiaries1 Claire Co., Ltd.348-3, Aza-suwa, Oaza-shide, Taga-cho, Inukami-gun,
Shiga 522-0314, Japan
TEL: +81-749-48-2234 FAX: +81-749-48-2239
Business: Cleaning of antidust and sterilized clothing
Equity Ownership: 100%
2 Santen Holdings U.S. Inc.555 Gateway Drive, Napa, California 94558, U.S.A.
Business: Holding company for North American
businesses and business development
Equity Ownership: 100%
3 Santen Inc.555 Gateway Drive, Napa, California 94558, U.S.A.
TEL: +1-707-254-1750 FAX: +1-707-254-1755
Business: Clinical development of pharmaceuticals
Equity Ownership: 100%*
4 Advanced Vision Science, Inc.5743 Thornwood Drive, Goleta, California 93117, U.S.A.
TEL: +1-805-683-3851 FAX: +1-805-964-3065
Business: Research and development of medical devices
Equity Ownership: 100%*
* Indirect investment through Santen Holdings U.S. Inc.
5 Santen OyNiittyhaankatu 20, P.O. Box 33, FIN-33721
Tampere, Finland
TEL: +358-3-284-8111 FAX: +358-3-318-1900
Business: Development, production, marketing of
pharmaceuticals and contract manufacturing
Equity Ownership: 100%
6 SantenPharma ABSolna torg 3, SE-17145 Solna, Sweden
TEL: +46-8-83-4140 FAX: +46-8-83-4145
Business: Marketing support of pharmaceuticals
Equity Ownership: 100%
7 Santen GmbHIndustriestrasse 1, Germering D-82110, Germany
TEL: +49-89-848078-0 FAX: +49-89-848078-60
Business: Marketing of pharmaceuticals,
regulatory affairs, scientific marketing and
business development
Equity Ownership: 100%
8 Taiwan Santen Pharmaceutical Co., Ltd.16F, No. 57, Sec. 2, Tun-Hwa South Rd., Taipei, R.O.C.
TEL: +886-2-2700-1553 FAX: +886-2-2700-1730
Business: Import and marketing of pharmaceuticals
Equity Ownership: 100%
9 Santen Pharmaceutical Korea, Co., Ltd.Room 805, Center Building, 91-1, Sogongdong,
Chung-ku, Seoul, 10070, R.O.K.
TEL: +82-2-754-1434 FAX: +82-2-754-2929
Business: Import and marketing of pharmaceuticals
Equity Ownership: 100%
J Santen Pharmaceutical (China) Co., Ltd.No. 169 Tinglan Road, Suzhou Industrial Park,
Jiangsu Province, 215026, P.R.C.
TEL: +86-512-6295-7500 FAX: +86-512-6295-7800
Business: Production and marketing of pharmaceuticals
Equity Ownership: 100%
Offices, Laboratory and Plants Corporate Headquarters9-19, Shimoshinjo 3-chome, Higashiyodogawa-ku,
Osaka 533-8651, Japan
TEL: +81-6-6321-7000 FAX: +81-6-6328-5082
Nara Research and Development Center8916-16, Takayama-cho, Ikoma-shi,
Nara 630-0101, Japan
TEL: +81-743-79-4501 FAX: +81-743-79-4521
Noto Plant2-14, Shikinami, Houdatsushimizu-cho, Hakui-gun,
Ishikawa 929-1494, Japan
TEL: +81-767-29-2666 FAX: +81-767-29-4233
Shiga Plant348-3, Aza-suwa, Oaza-shide, Taga-cho, Inukami-gun,
Shiga 522-0314, Japan
TEL: +81-749-48-2900 FAX: +81-749-48-2901
Osaka Plant9-19, Shimoshinjo 3-chome, Higashiyodogawa-ku,
Osaka 533-8651, Japan
TEL: +81-6-6321-9976 FAX: +81-6-6321-7149
Beijing Representative OfficeSuit 1204 to 1206, TOWER W3, Oriental Plaza, No. 1
East Chang An Ave., Dong Cheng District,
Beijing, 100738, P.R.C.
TEL: +86-10-8515-1515 FAX: +86-10-8515-1020
J
Major Subsidiaries and FacilitiesAs of July 2009
Santen Pharmaceutical Co., Ltd. Annual Report 200962
Corporate Information / Stock InformationAs of March 31, 2009
Corporate Headquarters Santen Pharmaceutical Co., Ltd.
9-19, Shimoshinjo 3-chome,
Higashiyodogawa-ku, Osaka 533-8651, Japan
URL: http://www.santen.com
Investor relations contact:
TEL: +81-6-6321-7007
FAX: +81-6-6321-8400
E-MAIL: [email protected]
Established 1890
Paid-in Capital ¥6,457 million
Number of Shareholders 11,180
Stock Exchange Listings Tokyo and Osaka
Ticker Code 4536
Transfer Agent Mitsubishi UFJ Trust and Banking Corporation
1-5, Dojimahama 1-chome, Kita-ku,
Osaka 530-0004, Japan
Major Offices Sendai, Tokyo, Saitama, Nagoya,
Osaka, Hiroshima and Fukuoka
Manufacturing Plants Noto, Shiga and Osaka
Research Laboratory Nara Research and Development Center
Number of Employees 2,690 (nonconsolidated: 1,908)
Number of Shares Issued 86,916,203
Breakdown of Shareholding
Major Shareholders Name
Number of shares held
Percentage of investment
Japan Trustee Service Bank, Ltd. 12,388 14.3%
The Master Trust Bank of Japan, Ltd. 6,308 7.3
Mita Sangyo Co., Ltd. 4,756 5.5
The Bank of Tokyo-Mitsubishi UFJ, Ltd. 4,241 4.9
Nippon Life Insurance Company 3,017 3.5
Tokio Marine and Nichido Fire Insurance Co., Ltd. 2,668 3.1
Trust and Custody Services Bank, Ltd. 2,057 2.4
RBC Dexia Investor Services, London-lending account 1,905 2.2
DAIICHI SANKYO COMPANY, LIMITED 1,642 1.9
ONO PHARMACEUTICAL CO., LTD. 1,630 1.9
Note: Santen Pharmaceutical Co., Ltd. holds treasury stock (1,893 thousand shares), but is excluded from the major shareholders.
1,000
0
2,000
3,000
4,000
* TOPIX: Tokyo stock price index
TOPIX*
04/4 05/4 07/4 08/4 09/406/4
Stock Price RangeOsaka Securities Exchange (monthly basis)
Yen
Yearly High and Low Prices
3,000
0
6,000
9,000
12,000
04/4 05/4 07/4 08/4 09/406/4
Trading VolumeOsaka Securities Exchange (monthly basis)
Thousands of shares
2005 2006 2007 2008 2009
High (yen) 3,290 3,370 3,450 3,050 3,040
Low (yen) 2,050 2,440 2,480 2,125 2,460
Breakdown of shareholding Breakdown of shareholding by number of shares
Securities firms0.6%
Other institutions15.0%
Treasury stock2.2%
Financialinstitutions41.6%
Foreigninvestors27.3%
Individualinvestors13.3%
Securities firms0.3%
Other institutions1.2%
Foreign investors3.2%
Treasury stock0.0%
Financialinstitutions0.7%
Individualinvestors94.6%
Note: Calendar years. Stock prices for 2009 are for the period to the end of June.
Thousands of shares

63Santen Pharmaceutical Co., Ltd. Annual Report 2009
1890s Main product is Heburin-gan, a cold medicine
1899 Launch of Daigaku Eye Drops
1952 Launch of Daigaku Penicillin Eye Drops1953 Launch of Daigaku Mycillin Eye Drops1954 Launch of Daigaku Super Eye Drops1956 Launch of Sante de U
1962 Launch of Mydrin-P, a mydriatic drug (for pupil dilation) Launch of Super Sante marks first use of plastic eye drop containers in Japan
1963 Launch of Thiola, an original liver detoxification agent
1970 Launch of antibiotic ophthalmic Ecolicin1975 Launch of anti-inflammatory ophthalmic Flumetholon
1978 Santen commences sales of medical devices
1981 Launch of Timoptol, a treatment for glaucoma
1985 Launch of Sante 40 NE1986 Santen commences sales of intraocular lenses
1987 Launch of anti-infective ophthalmic Tarivid Launch of anti-rheumatic Rimatil
1991 Launch of Sante FX1992 Launch of BSS PLUS, an ophthalmic perfusion and bathing solution
Launch of Kary Uni, a treatment for early-stage senile cataracts
1995 Launch of Hyalein a drug for treating corneal and conjunctival epithelial disordersLaunch of anti-allergy ophthalmic AlegysalLaunch of anti-rheumatic Azulfidine ENLaunch of OPEGAN Hi, an adjuvant for ophthalmic operations
1999 Launch of Timoptol XE, a treatment for glaucoma Launch of Sante FX Neo
2000 Launch of anti-infective ophthalmic Cravit
2001 Launch of Detantol, a treatment for glaucoma Launch of anti-allergy ophthalmic Livostin
2002 Launch of Sante de U Plus E AlphaLaunch of Sante 40
2003 Launch of ClariFlex foldable intraocular lenses
2004 Launch of Rescula, a treatment for glaucomaLaunch of anti-rheumatic Metolate
2006 Launch of PAPILOCK Mini ophthalmic solution 0.1%, a treatment for vernal keratoconjunctivitisLaunch of Sante Medical 10Launch of Sante AL Cool II
2007 Launch of Sante Uruoi Contact a
2008 Launch of nutritional supplement Sante LutaxLaunch of Sante 40iLaunch of Eternity foldable intraocular lensLaunch of Tapros, a treatment for glaucoma and ocular hypertension
2009 Launch of Sante FX V Plus
History
Company History Product History
Note: Based on the years when sales were launched by Santen Pharmaceutical.
1890 Founder Kenkichi Taguchi opens Taguchi Santendo in Kitahama, Osaka
1925 Operations incorporated as Santendo Co., Ltd.
1936 Yodogawa Plant established in Higashiyodogawa-ku, Osaka
1945 Head Office transferred to Yodogawa Plant (current site) Company name changed to Santendo Pharmaceutical Co., Ltd.
1958 Company name changed to current form of Santen Pharmaceutical Co., Ltd.Santen enters prescription pharmaceuticals business
1977 Stock listed on First Section of Tokyo Stock Exchange and Osaka Securities Exchange Production system introduced to allow filling of solution into molded containers to make bottle-packed eye drops
1982 Central Research Laboratories established
1985 Noto Plant established
1990 Long-term business vision formulated to mark centenary
1993 Subsidiary Santen Inc. established in the U.S.
1994 Subsidiary Santen GmbH established in Germany
1996 Representative office established in Beijing, China Nara Research and Development Center and Shiga Plant established
1997 Finnish ophthalmics pharmaceutical company acquired and Santen Oy establishedSubsidiary Taiwan Santen Pharmaceutical Co., Ltd. established
1998 Medium-term Plan “Hitomi 21” formulated
2000 Subsidiary Santen Pharmaceutical Korea, Co., Ltd. establishedRepresentative office established in Guangzhou, China
2001 U.S.-based Advanced Vision Science, Inc. acquired
2002 Introduced Dimple Bottle, an innovative patient-oriented container for ophthalmic solutions
2003 2003–2005 Medium-term Management Plan Formulated ISO 14001 certification acquired by Noto Plant Santen Activity Improved Navigator (SAIN) medical information support system developed
2004 U.S. sales partnership with Johnson & Johnson Vision Care, Inc. (currently: VISTAKON Pharmaceuticals, LLC) started
2005 Representative office established in Shanghai, China Subsidiary Santen Pharmaceutical (China) Co., Ltd. established
2006 2006–2010 Medium-term Management Plan formulated
2007 Representative office established in Shenyang, ChinaSanten Pharmaceutical (China) Co., Ltd. established Suzhou Plant
2008 Operations start up at Suzhou Plant, commencement of direct marketing Completion of pharmaceutical development building and ancillary building at Nara Research and Development Center

The following are registered trademarks of Santen’s alliance partners:Cravit, Tarivid, Iquix, Oftaquix and Quixin (Daiichi Sankyo Company, Limited); Azulfidine (Pfizer Inc.);Alegysal (Mitsubishi Tanabe Pharma Corporation); ClariFlex (Advanced Medical Optics Inc.); Detantol (Eisai Co., Ltd.);Timoptol (Merck & Co., Inc.); Livostin (Johnson & Johnson); and Rescula (R-Tech Ueno).
This report is printed with soybean ink certified as being environment-friendly by the American Soybean Association. Printed in Japan.
www.santen.com