Annual report 2006
195
CONSOLIDATED FINANCIAL STATEMENTS, STATUTORY FINANCIAL STATEMENTS AND ANNUAL REPORT
-
Upload
archivio-documenti -
Category
Documents
-
view
219 -
download
4
description
2006 CONSOLIDATED FINANCIAL STATEMENTS, STATUTORY FINANCIAL STATEMENTS AND ANNUAL REPORT
Transcript of Annual report 2006

CONSOLIDATED FINANCIAL STATEMENTS,
STATUTORY FINANCIAL STATEMENTS
AND ANNUAL REPORT
CIR S.p.A
. • CO
NSO
LIDATED
FINA
NC
IAL STATEM
ENTS, STATU
TORY FIN
AN
CIA
L STATEMEN
TS AN
D A
NN
UA
L REPOR T • FIN
AN
CIA
L YEAR 2006
C O N T E N T S
ADMINISTRATIVE BODIES 4
LETTER TO THE SHAREHOLDERS 7
MANAGEMENT REPORT 91. PERFOMANCE OF THE GROUP 142. PERFORMANCE OF THE PARENT COMPANY 183. CHART RECONCILING THE FIGURES OF THE PARENT COMPANY WITH THOSE OF THE
CONSOLIDATED FINANCIAL STATEMENTS 194. PERFORMANCE OF THE VARIOUS BUSINESS SECTORS 215. OTHER ACTIVITIES 276. SIGNIFICANT EVENTS WHICH OCCURRED AFTER THE CLOSE OF THE YEAR 297. OTHER INFORMATION 308. PROPOSED ALLOCATION OF NET INCOME FOR THE YEAR 33
CONSOLIDATED FINANCIAL STATEMENTS AS OF DECEMBER 31 20061. BALANCE SHEET 362. INCOME STATEMENT 373. CASH FLOW STATEMENT 384. STATEMENT OF CHANGES IN SHAREHOLDERS’ EQUITY 395. EXPLANATORY NOTES TO THE CONSOLIDATED FINANCIAL STATEMENTS 41
CONSOLIDATED FINANCIAL STATEMENTS OF DIRECTLY CONTROLLED SUBSIDIARIES 93
STATUTORY FINANCIAL STATEMENTS OF THE PARENT COMPANY AS OF DECEMBER 31 20061. BALANCE SHEET 1042. INCOME STATEMENT 1053. CASH FLOW STATEMENT 1064. STATEMENT OF CHANGES IN SHAREHOLDERS’ EQUITY 1075. EXPLANATORY NOTES TO THE FINANCIAL STATEMENTS 109
FINANCIAL STATEMENTS OF DIRECTLY CONTROLLED SUBSIDIARIES 145
LIST OF INVESTMENTS AT DECEMBER 31 2006 171
REPORT OF THE BOARD OF STATUTORY AUDITORS 179
REPORT OF THE INDEPENDENT AUDITORS 187
0860_CIR_2006 COVER+INDICE.qxd 19-06-2007 9:30 Pagina 1


COMPAGNIE INDUSTRIALI RIUNITE
Limited-liability corporation - Share capital € 391,688,733.50 - Registered Office: Strada Volpiano, 53 - 10040 Leinì (Turin) - www.cirgroup.itR.E.A. n. 3933 - Turin Company Register / Fiscale Code / VAT no. 00519120018Company subject to the management and coordination action of COFIDE S.p.A.
Head Office: Via Ciovassino, 1 - 20121 Milan - Tel. +39 02 72270.1Office in Rome: Via del Tritone, 169 - 00187 Rome - Tel. +39 06 692055.1

4
BOARD OF DIRECTORS
Chairman CARLO DE BENEDETTI (1) (5)
Chief Executive Officer RODOLFO DE BENEDETTI (2) and General Manager
Directors GIAMPIO BRACCHI FRANCO DEBENEDETTI PIERLUIGI FERRERO (3) GIOVANNI GERMANO (5) FRANCO GIRARD (3) PAOLO MANCINELLI (6) (7) LUCA PARAVICINI CRESPI (6) CLAUDIO RECCHI (6) (7) MASSIMO SEGRE (4)
GUIDO TABELLINI (8) UMBERTO ZANNI (5)
Secretary to the Board FRANCA SEGRE
BOARD OF STATUTORY AUDITORS
Chairman PIETRO MANZONETTO
Statutory Auditors LUIGI NANI RICCARDO ZINGALES
Reserve Auditors MARCO REBOA GIANLUCA PONZELLINI LUIGI MACCHIORLATTI VIGNAT
INDEPENDENT AUDITORS
PRICEWATERHOUSECOOPERS S.p.A.
Notice pursuant to the recommendation contained in Consob Circular no. DAC/RM/97001574 of February 20 1997:
(1) Power to sign all documents relating to ordinary and extraordinary administration with single signature except for those reserved by law to the Board of Directors (2) Power to sign all documents relating to ordinary administration with single signature (3) Power to sign all documents specified in mandate with joint signature (4) Power to sign all documents specified in mandate with single signature (5) Member of the Compensation Committee (6) Member of the Internal Control Committee (7) Member of the Surveillance Body (8) Lead Independent Director

5
CIR S.p.A. 101st Year of Business
ANNUAL GENERAL MEETING OF SHAREHOLDERS Turin, April 26 2007, 1st call Turin, April 27 2007, 2nd call
NOTICE OF THE ORDINARY AND EXTRAORDINARY ANNUAL GENERAL MEETING OF SHAREHOLDERS
All Shareholders are invited to attend the Ordinary and Extraordinary Meeting of the Shareholders of the Company to be held in the Centro Congressi dell’Unione Industriale di Torino, in Turin - Via Fanti 17, on April 26 2007 at 10.30 a.m., at the first call, and on April 27 2007 at the same time and place, if a second call is necessary, in order to discuss and pass resolution on the following:
AGENDA
Ordinary Session
1. Annual Report and Financial Statements as of December 31 2006 Report of the Board of Statutory Auditors.
Resolutions pertaining to the above
2. Proposal to revoke the resolution adopted on April 27 2006 authorizing the buy-back of the Company’s own shares and the disposal of the same. Proposal for a new authorization.
3. Proposal regarding the approval of the incentive program for the year 2007.
4. Proposal to amend the regulations of Stock Option Plans March 7 2000, September 13 2000 and January 30 2001.
Extraordinary Session
5. Proposal to amend the Company Bylaws partly to bring them into line with Law 262/2005 and subsequent amendments: specifically, the amendment of articles 4, 8, 9, 10, 12, 15, 16, 19 and 20 of the Bylaws. Resolutions pertaining to and resulting from the above.
Shareholders have a right to take part in the Shareholders’ Meeting provided that their intermediaries have notified their attendance, in accordance with the terms of Art. 34-bis of Consob Resolution no. 11768 and subsequent amendments and additions. at least two working prior to the meeting. Any holders of shares that have not yet been dematerialized should present their share certificates to an authorized intermediary for input into the centralized clearing system in electronic form, in accordance with the provisions of Article 51 of Consob Resolution no. 11768 and subsequent amendments and additions, and should request that notification as above be sent within the required time limit. As from April 11 2007 Shareholders may obtain a copy of the documentation relating to the items on the Agenda from the Company offices or from Borsa Italiana S.p.A.. The Financial Statements of the Company as of December 31 2006 and the Consolidated Financial Statements of the Group as of the same date will be available as from March 30 2007 from the Company offices or from Borsa Italiana S.p.A..
THE BOARD OF DIRECTORS
Notice of this meeting was published in the newspapers: "Il Sole-24 Ore" and "la Repubblica"of March 24 2007


7
LETTER TO OUR SHAREHOLDERS
Dear Shareholders,
In November 2006 we celebrated the first thirty years of CIR. Thirty years of building and promoting in CIR and its subsidiaries that which today is recognized as “our” Business Culture, which considers human capital as the most important factor to guarantee lasting success in any business activity. The spirit and values that underpinned the company when it was established are still valid today and are a firm point of reference for all those who have worked with us and those who work with us today.
Thirty years in which we have continued to project ourselves into the future and anticipate some of the great evolutionary trends of industry and the economy, always selecting new investment opportunities with the aim of helping to create fresh value for our shareholders.
The ever faster evolution of the environment surrounding us compels us to adapt our organization and our positioning continually but we never distort their nature. The main objective of our role in allocating investment capital has always been to continue to create value and this we do by defining strategies and checking that business plans are being implemented, in conjunction with the managers of the operating companies. Today we can say that we have completed our transformation from a traditional holding company into a modern Group able to create and sustain new businesses in high-growth sectors following an investment logic of creating deep value in the medium-long term.
Towards our shareholders we take full responsibility for the decisions we make, some big and some small, and we are entirely answerable for the credibility of our business plans and the objectives that we set ourselves. We are committed to achieving successful results so that over time we can build up and strengthen the relationship of trust between CIR and its Stakeholders.
Today CIR holds a portfolio of assets balanced between companies operating in mature business sectors with consolidated positions in the market and good profitability, and businesses that have started up more recently, are interesting opportunities for allocation of capital, have promising growth prospects but with profitability that has not yet reached satisfactory levels due to the relative immaturity of the business.
Every company in our Group has a business plan agreed on with those who are directly responsible for its management and the prerogatives of top management of the investee companies are respected in every way. It is an essential condition if we too are to fulfil the expectations of our shareholders that these business plans contribute to the creation of value in the medium-long term in a realistic and credible way.
We operate in three broad business sectors: Energy (Sorgenia), Media (Espresso), and Automotive components (Sogefi), plus the Healthcare sector, which has been developed more recently, and a new area of investment which is Innovative Finance (Jupiter and Oakwood).

During 2006 the performance of our subsidiaries was very satisfactory and in some cases was better than we had expected.
In particular Sorgenia, which has become our principal investment, has been continuing its expansion in the power generating business: the new Termoli plant has started operating to capacity and work has begun on the construction of the Modugno plant. Recently the new business plan for 2007-2010 was approved, involving further expansion with the construction of new plants with particular attention devoted to those with a low impact on the environment and those using renewable sources. The Espresso Group has confirmed its position both as top newspaper and top private radio broadcaster with good levels of profitability. Sogefi, despite operating in an unfavourable market environment, has again confirmed its leadership in the filter and suspension components sectors and has improved its net profitability for the fifth year running. The acquisition of Anni Azzurri by HSS has enabled us to become the number one private operator in the field of care for the elderly.
Our recent acquisition of 47% of the capital of Oakwood Financial Investments has further strengthened our commitment in the innovative financial service business where our new company Jupiter Finance is already operating in the field of non-performing loans.
Investors who have given us their trust by becoming our shareholders share our medium-long term time horizon for achieving a return on their investment. Calculated in terms of average annual return, our stock has given a return of 22.1% over the last 3 years and of 20.2% over the last 10 years.
Our goal for 2007 is to pursue and give concrete support to the development of our new businesses and at the same time to strengthen our commitment to the successful rollout of the individual business plans of investee companies.
The Chairman Chief Executive Officer Carlo De Benedetti Rodolfo De Benedetti

9
MANAGEMENT REPORT ON THE PERFORMANCE OF OPERATIONS IN FINANCIAL YEAR 2006
Dear Shareholders,
In 2006 the CIR Group reported consolidated net income of € 101.1 million, up by 15.3% from € 87.7 million in 2005. Consolidated revenues came in at € 4,136.8 million, showing an increase of 22.3% from € 3,382.7 million in the previous year.
The year saw further consolidation of the growth strategies of the Group which strengthened con-siderably its presence in the utilities sector and at the end of the year made a new investment in the financial sector.
This confirms the strategy of CIR which is pursuing the objective of creating value for its share-holders in the medium-long term with the launch of new business initiatives in sectors considered to be of potential interest and through the management of its investments in businesses where it already has a presence. This strategy is carried out by constantly developing the business and con-tinually seeking to optimize profitability. In putting this strategy into practice CIR has maintained a prudent approach, following a financial policy that guarantees a balanced ratio of its own resources to those of third parties, thus maintain-ing a solid financial structure.
CIR considers that the most important factor to guarantee lasting success in the business activities in which it has invested and is continuing to invest is having human capital of a very high profes-sional level which with its capabilities, intuition and strategic vision can make a very positive con-tribution to reaching the common objective of the creation of value for the whole Group.
The current configuration of the Group includes four main business sectors: utilities (electricity and gas), media (publishing, radio and television), automotive components (filters and suspension systems) and healthcare (residences for the elderly, hospitals and rehabilitation centres).
The Group has also identified an investment opportunity in a sector considered of potential inter-est, that of non-performing loans. 2006 was the first full year of operation of Jupiter Finance, the company created at the end of 2005, with the aim of acquiring from financial institutions and managing portfolios of non-performing loans. In 2006 the company acquired over 50 portfolios
Management Report

10
for a total amount of approximately € 40 million and a nominal value of approximately € 340 mil-lion.
In January 2007, continuing to implement its strategy of expansion in businesses with a high growth potential and of value creation, the Group made an important investment - the acquisition with a prime financial institution of the standing of Merrill Lynch of joint control of the company Oakwood Financial Investments, specializing in innovative retail financial services aimed at non-conforming or non-prime clients, meaning those who do not fulfil the traditional criteria for being given loans. Oakwood currently operates through five companies: three in Britain, one in Austra-lia and one in Italy. On completion of the deal CIR invested approximately € 100 million, with a commitment to support the development of new initiatives for a further investment estimated at around € 50 million.
All the businesses described above are aimed at achieving the objective of continuing growth in the value of the investments over the medium-long term. The economic results for each period do not always reflect this growth in a linear way and a comparison over a short time frame may not be very representative, considering all the events of an extraordinary nature that can affect the re-sults from time to time.
*****
To make it easier to evaluate the profitability of the Group, the performance of 2006 is presented below through a breakdown of the economic contribution and the balance sheet structures of the operating groups and of the holding company, which contains the figures for CIR and CIR Inter-national.
As has already been mentioned, consolidated net income for 2006 came in at € 101.1 million up from € 87.7 million in 2005. The contribution of the operating groups to this result rose by € 6.9 million (+ 6.6%) from € 104.7 million in 2005 to € 111.6 million in 2006 while the contribution of the financial subsidiaries de-clined from € 16.2 million in 2005 to € 15 million in 2006.
The result of the holding company in 2006 was a negative € 25.5 million and compares with a net loss of € 33.2 million in 2005, which included non-recurring charges of € 16.1 million. Apart from overheads, this result was determined by: - Net financial charges of € 21.1 million due to the higher average cost of the gross debt com-
pared with the average return on financial investments; - Dividends, gains and losses from trading securities for € 4.3 million consisting mainly of
gains on investments in private equity funds for € 20.5 million offset by write-downs of finan-cial assets for € 16.4 million.
The results of the operating groups for financial year 2006 are illustrated below for each of the main business sectors.
In the utilities sector the Energia group adopted the new name of Sorgenia in July 2006 with the aim of giving maximum value to its positioning and to the role that it intends to take in the Italian free market for electricity and gas, defining itself as a provider sensitive to environmental issues. In 2006 the Sorgenia group was engaged in the roll-out of its industrial program which involves investment in the period up to 2010 of over € 1.8 billion in addition to the € 0.9 billion invested up to 2006. This investment will finance a significant expansion in the sector of power generation
Management Report

11
with particular attention being devoted to low environmental impact and renewable sources. In 2006 the consolidated revenues of the group rose by 56.4% reaching € 1,916.1 million thanks to the good performance of sales of both electricity and natural gas and consolidated net income reached € 56.3 million, up from € 29.1 million in the previous year (+93,5%).
In the media sector in 2006 the Espresso group reported consolidated revenues of € 1,102.6 mil-lion (+2.1% from 2005) and posted consolidated net income of € 103.6 million compared with € 116.3 million in the previous year. The rise in advertising and the good performance of circula-tion offset the decline in the sale of add-ons. Again in 2006 the daily news title la Repubblica con-firmed its ranking as number one newspaper in Italy for number of readers and the Espresso group’s radio stations confirmed their leadership in terms of audience.
The Sogefi Group, top Italian producer of automotive components, confirmed its leadership in Europe in the two sectors in which it operates: filters and suspension components. In an unfavour-able market environment due to the decline in business of several important clients, in 2006 the group confirmed sales revenues of over one billion euro (€ 1,018.6 million), while at the same time improving its net profitability for the fifth year running, posting consolidated net income of € 50.8 million, up by 13.7% from € 44.7 million in 2005. In the next few years the group plans to expand its business both in Asian markets (China, Korea and India) and in the North American market, continuing to maintain among its strategic objectives possible acquisitions in the automo-tive components sector.
During 2006 HSS – Holding Sanità e Servizi continued to develop its operations with a view to consolidating its presence in the healthcare sector. In 2006 the Group reported consolidated revenues of € 99.2 million up from € 53.8 million in 2005 (+ 84.4%). The net result was a negative € 4.4 million (due to higher financial expense and non-recurring costs for acquisitions) which compares with a net loss of € 1.4 million in 2005. In June 2006 the company HSS acquired 100% of Anni Azzurri, the company specializing in the construction and management of residences for the elderly and present in four regions with eleven residences and 1,600 beds. This deal together with other smaller acquisitions made during 2006 was an important step for-ward in the roll-out of the strategy of the HSS group which intends to develop further in the Ital-ian healthcare market through fresh acquisitions.
Apart from a breakdown by business sector of the economic and financial results of the Group, the charts on the following pages also show a breakdown of the contribution of the main subsidi-aries to the aggregate results of the holding (CIR and CIR International).
Management Report

12
BREAKDOWN OF INCOME STATEMENT BY BUSINESS SECTOR AND CONTRIBUTIONS TO THE RESULTS OF THE GROUP
(in milllions of euro)2005
CONSOLIDATED Revenues Costs of Other operating Adjustments to Amortization, Net financial Dividends, Income Income (Loss) Net income Net incomeNet income
(loss)productionncome & expense to value of depreciation and income and gains and taxes from assets (loss) Minority (loss) for the for the Group
investments write-downs expenses losses from held for interests Groupvalued at trading and disposal
equity valuationAGGREGATE of securitiesSorgenia group 1,916.1 (1,861.6) 32.6 33.0 (7.7) (8.4) 0.5 (34.8) -- (36.6) 33.1 16.8
Espresso group 1,102.6 (899.8) 0.3 1.4 (41.2) (19.0) (0.6) (39.8) -- (49.8) 54.1 59.1
Sogefi group 1,018.6 (869.8) (15.1) (0.3) (49.3) (11.0) 1.9 (21.6) -- (23.7) 29.7 26.3
HSS group 99.2 (88.4) (4.4) -- (4.1) (3.3) -- (2.9) (0.9) 1.0 (3.8) (1.1)
Other subsidiaries 0.3 (3.5) 0.7 -- (0.1) 0.7 -- 0.5 -- (0.1) (1.5) 3.6
Total operating subsidiaries 4,136.8 (3,723.1) 14.1 34.1 (102.4) (41.0) 1.8 (98.6) (0.9) (109.2) 111.6 104.7
Financial subsidiaries -- (2.2) -- -- -- (0.5) 20.9 -- -- (3.2) 15.0 16.2
Total subsidiaries 4,136.8 (3,725.3) 14.1 34.1 (102.4) (41.5) 22.7 (98.6) (0.9) (112.4) 126.6 120.9
Holding companies (CIR and CIR International)
Revenues -- -- --
Costs of production (22.1) (22.1) (20.7)
Other operating income and expense 4.8 4.8 2.8
Adjustments to the value ofinvestments valued at equity -- -- -- Amortization, depreciation and write-downs (0.5) (0.5) (0.2)
Net financial income and expense (21.1) (21.1) (13.0)
Dividends, gains and losses from trading and valuation of securities 4.3 4.3 8.7
Income taxes 9.1 9.1 5.3
Total holding companies (CIR and CIR International)before non-recurring items -- (22.1) 4.8 -- (0.5) (21.1) 4.3 9.1 (25.5) (17.1)
Non-recurring items -- -- -- -- -- -- -- -- -- (16.1)
Consolidated total for the Group 4,136.8 (3,747.4) 18.9 34.1 (102.9) (62.6) 27.0 (89.5) (0.9) (112.4) 101.1 87.7
2006
Managem
ent Report

CONSOLIDATED BALANCE SHEET FIGURES BY BUSINESS SECTOR
(in millions of euro)31.12.2005
CONSOLIDATED Fixed assets Other net Net working Net financial Total Minority Shareholders' Shareholders'non-current assets capital position shareholders' of which: shareholders' equity - Group equity - Group
AGGREGATE and liabilities equity equitySorgenia group 734.1 222.3 186.1 (596.9) (*) 545.6 293.8 251.8 220.9
Espresso group 907.0 (158.8) 87.8 (262.7) 573.3 279.6 293.7 279.5
Sogefi group 367.2 (58.2) 113.0 (126.3) 295.7 132.4 163.3 145.6
HSS group 170.7 5.0 (0.9) (110.7) 64.1 9.9 54.2 21.2
Other subsidiaries 0.3 11.7 47.6 (12.2) 47.4 4.0 43.4 27.6
Total subsidiaries 2,179.3 22.0 433.6 (1,108.8) 1,526.1 719.7 806.4 694.8
Fixed assets 103.0 103.0 103.0 81.4
Other net non-current assets and liabilities 107.3 107.3 107.3 58.3
Net working capital (14.7) (14.7) (14.7) (9.3)
Net financial position 258.2 258.2 258.2 359.8
Consolidated total - Group 2,282.3 129.3 418.9 (850.6) 1,979.9 719.7 1,260.2 1,185.0
( *) The financial position includes the free cash flow of Energia Holding S.p.A.
31.12.2006
Holding companies (CIR and CIR International)
13M
anagement Report

14 M t R t
1. PERFORMANCE OF THE GROUP
Consolidated revenues for 2006 totalled € 4,136.8 million, up from € 3,382.7 million in 2005, with a rise of € 754.1 million (+22.3%).
Consolidated revenues can be broken down by business sector as follows:
(in millions of euro) Change 2006 % 2005 % absolute %
Utilities Sorgenia Group 1,916.1 46.3 1,225.2 36.2 690.9 56.4
Media Espresso Group 1,102.6 26.7 1,079.9 31.9 22.7 2.1
Automotive components Sogefi Group 1,018.6 24.6 1,023.4 30.3 (4.8) (0.5)
Healthcare HSS Group 99.2 2.4 53.8 1.6 45.4 84.4
Other sectors 0.3 -- 0.4 -- (0.1) (25.0)
Total consolidated revenues 4,136.8 100.0 3,382.7 100.0 754.1 22.3
of which: ITALY 3,213.9 77.7 2,471.2 73.1 742.7 30.1
ABROAD 922.9 22.3 911.5 26.9 11.4 1.3
The highlights of the consolidated income statement are as follows:
(in millions of euro) 2006 % 2005 %
Revenues 4,136.8 100.0 3,382.7 100.0
Consolidated gross operating margin (EBITDA) 442.4 10.7 370.0 10.9
Consolidated operating result (EBIT) 339.5 8.2 275.1 8.1
Financial management result (35.6) (0.9) (20.5) (0.6)
Income taxes (89.5) (2.2) (64.7) (1.9)
Income (loss) from assets held for disposal (0.9) -- -- --
Net income including minority interests 213.5 5.2 189.9 5.6
Minority interests (112.4) (2.7) (102.2) (3.0)
Net result of the Group 101.1 2.4 87.7 2.6
The consolidated gross operating margin (EBITDA) in 2006 was € 442.4 million (10.7% of revenues) compared to € 370 million in 2005 (10.9% of revenues), with a rise of € 72.4 million (+ 19.6%). This result was determined mainly by the following factors:
A significant improvement of approximately € 65 million reported by the Sorgenia group, due to the development of the generating business; The continuing profitability of the Sogefi group; A reduction in the profitability of the Espresso group of around € 18 million, mainly due to the absence of paper subsidies, which were not renewed for financial year 2006.
14 Management Report

15
The consolidated operating margin (EBIT) in 2006 was a positive € 339.5 million (8.2% of revenues) up from € 275.1 million (8.1% of revenues) in 2005, with a rise of 23.4%.
The financial management result was determined by net financial expense that rose from € 48.2 million in 2005 to € 62.6 million mainly due to the rise in debt, and to dividends and net gains from trading securities for € 27 million (€ 27.7 million in 2005).
The consolidated balance sheet highlights of the CIR Group at December 31 2006, prepared according to a “managerial” format with a comparison with the same situation at December 31 2005 is as follows:
(in millions of euro) 31.12.2006 31.12.2005
Fixed assets 2,282.3 1,997.9
Other net non-current assets and liabilities 129.3 74.9
Net working capital 418.9 248.8
Net invested capital 2,830.5 2,321.6
Net financial debt (850.6) (465.2)
Total shareholders’ equity 1,979.9 1,856.4
Shareholders’ equity of the Group 1,260.2 1,185.0
Minority interests 719.7 671.4
Net invested capital at December 31 2006 amounted to € 2,830.5 million compared to € 2,321.6 million at December 31 2005, with a rise of € 508.9 million mainly due to the considerable in-vestment made during the year by the Sorgenia and HSS groups in particular.
The net financial debt position at December 31 2006 showed a balance of € 850.6 million (com-pared to € 465.2 million at December 31 2005), which was the result of the following: - a financial surplus for CIR and CIR International of € 258.2 million which compares with
€ 359.8 million at December 31 2005. The reduction of € 101.6 million which took place dur-ing the year was mainly due to disbursements for the buyback of own shares and for invest-ment in private equity funds and in shareholdings for approximately € 119 million, only par-tially offset by the positive balance of € 14 million between dividends received and those paid out;
- total debt of the operating groups of € 1,108.8 million, up from € 825 million at December 31 2005. The increase of € 283.8 million was mainly due to the investments made by the Sorgenia group for the construction of new power stations and to the acquisition of Anni Azzurri by the HSS group.
Total shareholders’ equity at December 31 2006 stood at € 1,979.9 million compared with € 1,856.4 million at December 31 2005, with a rise of € 123.5 million after the distribution of € 37.5 million of dividends by CIR and a total of € 53.3 million by the subsidiaries to their minor-ity shareholders.
The shareholders’ equity of the Group rose from € 1,185 million at December 31 2005 to € 1,260.2 million at December 31 2006, with a net rise of € 75.2 million.
Minority interests rose from € 671.4 million at December 31 2005 to € 719.7 million at Decem-ber 31 2006, with a rise of € 48.3 million.
Management Report

16
The net financial debt and shareholders’ equity figures at December 31 2006 include € 127.1 mil-lion resulting from the fair value adjustment of available-for-sale securities, which are held mainly by the company Medinvest. In fact the accounting treatment of Medinvest involves recognizing any changes in the fair value of the funds directly to shareholders’ equity. The total net increase during 2006, excluding foreign exchange differences, was € 20.7 million compared to € 13.6 mil-lion in 2005. Since inception (April 1994) performance has been particularly satisfactory up to and including 2006, giving the portfolio a weighted average annual return in dollar terms of 9.7%. In 2006 too, performance gave a positive return, net of commissions, of 11.3%.
The evolution of consolidated shareholders’ equity is given in the Explanatory Notes to the Fi-nancial Statements.
The consolidated cash flow statement for 2006, prepared according to a “managerial” format which, unlike the format used in the statements attached, shows the changes in net financial posi-tion instead of the changes in cash and cash equivalents, and can be broken down as follows:
(in millions of euro) 2006 2005
SOURCES OF FUNDS
Net income for the period including minority interests 213.5 189.9
Amortization, depreciation and write-downs and other non-monetary changes 109.3 79.4
Self-financing 322.8 269.3
Change in working capital (174.0) (89.9)
CASH FLOW GENERATED BY CURRENT OPERATIONS 148.8 179.4
Capital increases 10.4 26.0
TOTAL SOURCES 159.2 205.4
APPLICATIONS
Net investments in fixed assets (434.5) (443.9)
Buy-back of own shares (15.6) (35.9)
Payment of dividends (90.8) (75.9)
Other changes (3.7) (39.4)
TOTAL APPLICATIONS OF FUNDS (544.6) (595.1)
FINANCIAL SURPLUS (DEFICIT) (385.4) (389.7)
NET FINANCIAL POSITION AT THE BEGINNING OF THE PERIOD (465.2) (75.5)
NET FINANCIAL POSITION AT THE END OF THE PERIOD (850.6) (465.2)
The composition of the net financial debt figure, given in the Explanatory Notes to the Financial Statements, includes the following items: the cash and cash equivalents, securities, financial re-ceivables and available-for-sale financial assets (including the hedge funds held by Medinvest) classified as current assets, net of bank liabilities, borrowings and bonds.
Management Report

17
Net financial debt rose from € 465.2 million at the start of the year to € 850.6 million at December 31 2006. The change is mainly attributable to the investment flows to the Sorgenia group and the HSS group in particular.
Self-financing rose by over 20% compared with last year and was partly absorbed by the change in working capital which rose mainly because of the higher turnover of the Sorgenia group.
Also during the year dividends were paid out for € 90.8 million, shares were bought back for € 15.6 million and other “applications” were made for € 3.7 millions.
At December 31 2006 the Group had 11,102 employees.
Management Report

18
2. PERFORMANCE OF THE PARENT COMPANY
The parent company CIR S.p.A. closed financial year 2006 with net income of € 36.7 million (compared with € 4.8 million in 2005 which was penalized for € 16.1 million by tax charges relat-ing to prior periods). Shareholders’ equity at December 31 2006 stood at € 940.7 million compared with € 953.2 mil-lion at December 31 2005.
The key income statement figures of CIR S.p.A. for 2006, with a comparison with those of 2005, are as follows:
(in millions of euro) 2006 2005
Net operating costs (12.5) (12.3)
Other operating costs and amortization (2.3) (1.8)
Financial management result 42.4 29.7
Result before taxes and non-recurring items 27.6 15.6
Taxes from prior periods -- (16.1)
Income taxes 9.1 5.3
Net income 36.7 4.8
Net operating costs for 2006, which amounted to € 12.5 million (€ 12.3 million in 2005), include charges resulting from the IAS/IFRS treatment of stock option plans for € 2.2 million. This com-pares with € 5.7 million in 2005 (of which € 3.8 million referred to extraordinary stock option plans).Other operating costs amounted to € 2.3 million and compare with € 1.8 million in 2005.
The financial management result includes the dividends of subsidiaries, which totalled € 61.1 mil-lion in 2006 compared to € 42.8 million in 2005.
Lastly, 2006 benefited from a positive net tax position of € 9.1 million, compared with € 5.3 mil-lion in 2005, as a result taking part in the group fiscal consolidation as from 2004.
Management Report

19
The key balance sheet figures of CIR S.p.A. at December 31 2006, compared with the situation at December 31 2005, is as follows:
(in millions of euro) 31.12.2006 31.12.2005
Fixed assets 966.7 917.6
Other net non-current assets and liabilities (0.1) 0.0
Net working capital 42.3 15.6
Net invested capital 1,008.9 933.2
Net financial position (68.2) 20.0
Shareholders’ equity 940.7 953.2
The net financial position at December 31 2006 was a position of net debt of € 68.2 million which compares with a net financial surplus of € 20 million at December 31 2005. The change of € 88.2 million was mainly due to an investment in own shares for approximately € 16 million, sharehold-ings for € 47 million, loans made to subsidiaries for approximately € 29 million, net dividends re-ceived for € 23 million and operating costs for € 8 million.
The decrease in shareholders ‘equity from € 953.2 million at December 31 2005 to € 940.7 mil-lion at December 31 2006 was mainly caused by the distribution of dividends for € 37.5 million and the effects of the IAS/IFRS treatment of own share buybacks which were only partially offset by the net income for the period. At December 31 2006 there were 34,094,000 own shares held in the portfolio, equal to 4.37% of capital, for a total value of € 76.9 million, compared with 27,216,642 at December 31 2005.
3. CHART RECONCILING THE ACCOUNTING FIGURES OF THE PARENT COM-PANY AND THOSE OF THE CONSOLIDATED ACCOUNTS
The following chart shows the reconciliation of the results for the year and the shareholders’ eq-uity of the Group with the figures of the parent company.
(in thousands of euro) Shareholders’ equity 31.12.2006
Net result2006
Figures of the parent company CIR S.p.A. 940,738 36,697
- Dividends from companies included in consolidation (61,046) (61,046)
- Reversal of valuations and cover of losses on investments in companies included in the consolidation 1,193 1,193
- Net contribution of consolidated companies 325,534 126,334
- Difference between carrying value of subsidiaries and portion of consolidated shareholders’ equity, net of contributions 55,794 --
- Other consolidation adjustments (2,058) (2,058)
Consolidated figures, Group’s share 1,260,155 101,120
Management Report

(*) Percentage of indirect control through Energia Holding
20
MAIN EQUITY INVESTMENTS OF THE GROUPAS OF DECEMBER 31 2006
Healthcare
Automotive ComponentsSOGEFI58.4%
Media
HSS85.3%
UtilitiesSORGENIA58.2% (*)
ESPRESSO52.2%
Management Report
21
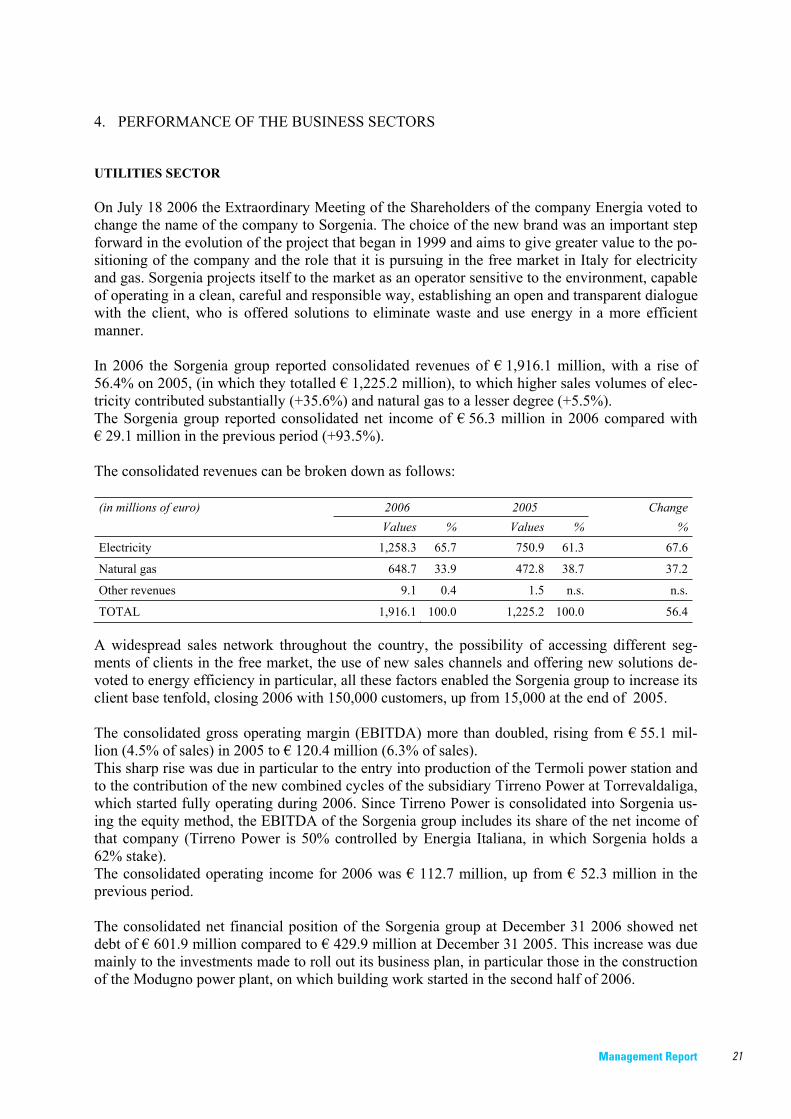
4. PERFORMANCE OF THE BUSINESS SECTORS
UTILITIES SECTOR
On July 18 2006 the Extraordinary Meeting of the Shareholders of the company Energia voted to change the name of the company to Sorgenia. The choice of the new brand was an important step forward in the evolution of the project that began in 1999 and aims to give greater value to the po-sitioning of the company and the role that it is pursuing in the free market in Italy for electricity and gas. Sorgenia projects itself to the market as an operator sensitive to the environment, capable of operating in a clean, careful and responsible way, establishing an open and transparent dialogue with the client, who is offered solutions to eliminate waste and use energy in a more efficient manner.
In 2006 the Sorgenia group reported consolidated revenues of € 1,916.1 million, with a rise of 56.4% on 2005, (in which they totalled € 1,225.2 million), to which higher sales volumes of elec-tricity contributed substantially (+35.6%) and natural gas to a lesser degree (+5.5%). The Sorgenia group reported consolidated net income of € 56.3 million in 2006 compared with € 29.1 million in the previous period (+93.5%).
The consolidated revenues can be broken down as follows:
(in millions of euro) 2006 2005 ChangeValues % Values % %
Electricity 1,258.3 65.7 750.9 61.3 67.6
Natural gas 648.7 33.9 472.8 38.7 37.2
Other revenues 9.1 0.4 1.5 n.s. n.s.
TOTAL 1,916.1 100.0 1,225.2 100.0 56.4
A widespread sales network throughout the country, the possibility of accessing different seg-ments of clients in the free market, the use of new sales channels and offering new solutions de-voted to energy efficiency in particular, all these factors enabled the Sorgenia group to increase its client base tenfold, closing 2006 with 150,000 customers, up from 15,000 at the end of 2005.
The consolidated gross operating margin (EBITDA) more than doubled, rising from € 55.1 mil-lion (4.5% of sales) in 2005 to € 120.4 million (6.3% of sales). This sharp rise was due in particular to the entry into production of the Termoli power station and to the contribution of the new combined cycles of the subsidiary Tirreno Power at Torrevaldaliga, which started fully operating during 2006. Since Tirreno Power is consolidated into Sorgenia us-ing the equity method, the EBITDA of the Sorgenia group includes its share of the net income of that company (Tirreno Power is 50% controlled by Energia Italiana, in which Sorgenia holds a 62% stake). The consolidated operating income for 2006 was € 112.7 million, up from € 52.3 million in the previous period.
The consolidated net financial position of the Sorgenia group at December 31 2006 showed net debt of € 601.9 million compared to € 429.9 million at December 31 2005. This increase was due mainly to the investments made to roll out its business plan, in particular those in the construction of the Modugno power plant, on which building work started in the second half of 2006.
Management Report

22
At December 31 2006 the group had 208 employees compared with 148 at December 31 2005.
The Board of Directors of Sorgenia S.p.A., which met on February 26 2007, proposed distributing dividends for a total of € 9.3 million, against € 8 million the previous year, corresponding to a dividend of € 0.0115 per share up from € 0.010 in 2005.
The Sorgenia group is engaged in the roll-out of its industrial plan which involves significant ex-pansion in the electricity generating sector, with particular attention being devoted to sources with a low environmental impact and to renewables. The industrial objectives of the program include the construction of four combined cycle power plants fired by natural gas, each with an output of 770 MW; the completion of the repowering of the power plants of the subsidiary Tirreno Power; the construction of 450 MW of wind plant and investment in the photovoltaic solar sector. These projects will require investment going forward to 2010 for over € 1.8 billion. The second half of 2006 saw the Termoli (Cb) power plant enter full operation. This is the first of the four power plants planned and work continued on the construction of the Modugno plant in Puglia. In September the authorization process was completed for the Aprilia plant (Lazio), with the favourable opinion expressed by the Service Conference and the issue of the final authoriza-tion decree on October 2 2006 by the Ministry of Economic Development. This authorization joins the one already obtained for the Bertonico-Turano Lodigiano plant (Lombardy).
As far as the Tirreno Power repowering is concerned, the conversion to a 760 MW combined cy-cle of a section of the Vado Ligure plant is going ahead according to schedule and is expected to start operating during 2007. A new 380 MW combined cycle module is also being constructed at Napoli Levante and this one should start operating in 2008.In 2006 Tirreno Power reported revenues of € 988.4 million, up by 27.9% from € 772.7 in 2005, with a net production volume of approximately 11.6 TWh (10.9 TWh in 2005). The gross operat-ing margin rose by 38.9%, coming in at € 229 million compared to € 164.9 million in 2005. Net income more than quadrupled, rising from € 15.4 million in 2005 to € 57.4 million in 2006.
As already indicated, Sorgenia is also developing generating projects from renewable sources, with particular attention being devoted to the construction of wind and photovoltaic solar plants. Soluxia, its wholly owned subsidiary set up to design and build photovoltaic plants, has already obtained from the GSE (Electricity Services Management), admission to incentive feed-in tariffs for 15 new photovoltaic plants each with an output of 1 MW, located in various regions of the South of Italy, with a total installed capacity of approximately 15 MW. On the subject of wind en-ergy, Sorgenia has obtained authorization for projects with a total output of 62 MW – Minervino Murge (Bari) for 18 MW, Castelnuovo di Conza (Salerno) for 10 MW and San Gregorio Magno (Salerno) for 34 MW.
MEDIA SECTOR
The Espresso group closed 2006 with consolidated revenues of € 1,102.6 million up from € 1,079.9 million in 2005 (+2.1%).
Consolidated net income came in at € 103.6 million compared to € 116.3 million in the previous year and benefited this year again (for the last time) from the recognition of deferred tax assets re-lating to the previous losses of the subsidiary Elemedia.
Management Report

23
The revenues of the group can be broken down as follows:
(in millions of euro) 2006 2005 ChangeValues % Values % %
Circulation 458.9 41.6 466.6 43.2 (1.6)
Advertising 615.8 55.9 585.7 54.2 5.1
Other revenues 27.9 2.5 27.6 2.6 1.1
TOTAL 1,102.6 100.0 1,079.9 100.0 2.1
Consolidated advertising revenues, which rose by 5.1%, benefited also from the competitive ad-vantage that the Espresso group derives from being the only company in Italy in the media sector to be able to offer advertisers multimedia advertising, with a portfolio of published titles that are all leaders in their respective markets.
Circulation revenues declined by 1.6% compared with 2005 on account of lower sales of optional products (22 million printed and multimedia add-ons in 2006 compared with almost 26 million in 2005).The negative impact of strikes on revenues was however offset by the good performance of the circulation of la Repubblica, (628 thousand average copies per day) and L’espresso (395 thousand copies per week), and by the rise in price of certain local papers to one euro. This change did not produce any further negative effects on the performance of circulation which reached a total of 452 thousand average copies per issue.
All the media of the group performed well even in terms of readers and traffic. For the fifth time running La Repubblica confirmed its ranking as the most widely read newspaper in Italy with over 3 million readers and the trend is a rising one. The readers of L’espresso are more than 2.3 million and the local papers clocked up 3.2 million readers. In December the group’s internet website network reached 9.5 million unique users and 339 mil-lion page views. The number of visitors to Repubblica.it rose during the year by 45% reaching 6.7 million, more than one third of all Italian users of the web.
The listening figures of the radio stations were also positive, with an overall rise of 4% on 2005: Radio Deejay confirmed its position as the number one private broadcaster in Italy on an average day with 5.8 million listeners which rise to 13.7 million over the whole week; the audience of Ra-dio Capital is now over 2 million people on an average day and 6.6 million over a seven day pe-riod, while m2o now clocks up 1.1 million listeners per day and 2.9 million per week (Audiradio). These listening figures also rewarded the music television channel All Music which in October, according to research carried out by IPSOS, had over 2.8 million viewers in the 15-34 age group, claiming the position as the young people’s broadcaster with the highest audience increase over the last few months.
Consolidated operating income declined from € 177.5 million in 2005 to € 163.3 million in 2006. If the effect of subsidized paper purchases is netted out of the 2005 figures, the operating result for that year would be € 156.9 million giving a rise of 0.8% in 2006 with a ratio to sales stable at over 14%, despite the decline in optional products, the margins of which were still significant but reduced by the declining trend of the market.
Management Report

24
The consolidated net financial position at December 31 2006 showed net debt of € 262.7 million, up from € 252.6 million at December 31 2005 thanks to the good performance of operating cash flow (€ 121.9 million).
Consolidated shareholders’ equity rose from € 550 million at December 31 2005 to € 562.8 mil-lion at December 31 2006.
At December 31 2006 there were 3,384 employees on the group payrolls, down by 13 from 3,397 at December 31 2005.
The Board of Directors of the parent company Gruppo Editoriale L’Espresso, which met on Feb-ruary 21 2007, proposed the distribution of a dividend of € 0.16 per share (€ 0.145 in 2005).
National newspapers Revenues of the national daily sector totalled € 539.8 million, up from € 524 million in 2005 (+3%).The operating result of this area was € 64.9 million and compares with a result for 2005 (net of subsidies for the purchase of paper which were no longer given in 2006) of € 69.7 million with a decline of € 4.8 million due to the cost of designing and launching new titles and to the 4.5% rise in the price of paper.
Local newspapers Consolidated revenues of this sector totalled € 260.5 million, which was in line with the figure for the previous year (+0.2%). The operating result of the area declined from € 49.5 million (19% of revenues) in 2005 to € 46.7 million (17.9% of revenues) in 2006, penalized by the absence of € 2.6 million in the form of sub-sidies. Excluding these subsidies, profitability was unchanged at 18%.
PeriodicalsThe periodicals area reported revenues of € 118.1 million, down by 5.7% from € 125.2 million in 2005.The operating result was € 12.2 million, up from € 6.9 million in 2005. The ratio of operating in-come to sales rose from 9.2% last year to 10.3% in 2006, thanks mainly to the rise in advertising and to the positive contribution of optional products.
RadioIn 2006 the group radio stations increased their revenues by 3.8% from € 75.4 million in 2005 to € 78.3 million. Operating income rose from € 34.1 million in 2005 to € 34.6 million, with a ratio to sales of 44.2%.In 2006 the three broadcasters of the group invested a lot in the circulation of published content on different platforms, confirming their collaboration with the TV group All Music and strength-ening the internet business.
In the early months of this current year advertising revenues have continued to grow for all the media of the group, circulation is performing well, while optional add-ons have declined com-pared with previous years because the market is saturated and competition is becoming more and more aggressive. From the above scenario, management expects advertising revenues to grow while revenues and margins on optional products decline. Consolidated net income for the year 2007 should in any
Management Report

25
case be lower than that of 2006 since there is of no longer the benefit of any deferred tax assets relating to losses of subsidiaries in prior periods.
AUTOMOTIVE COMPONENTS SECTOR
The consolidated revenues of the Sogefi group in 2006 came in at € 1,018.6 million, substantially in line with the previous year’s figure of € 1,023.4 million, in a market environment that was not particularly favourable due to a decline in the business of several important clients. The further growth of sales volumes in South American countries largely offset the decline in revenues in the European and US markets.
Consolidated net income was € 50.8 million, up by 13.7% from € 44.7 million in 2005.
The breakdown of consolidated sales of the Sogefi group by business sector is as follows:
(in millions of euro) 2006 2005 ChangeValues % Values % %
Filters 527.2 51.7 518.5 50.7 1.7
Suspension components and precision springs 491.6 48.3 504.9 49.3 (2.6)
Intercompany elimination (0.2) -- 0.0 -- --
TOTAL 1,018.6 100.0 1,023.4 100.0 (0.5)
The profitability of industrial management actually rose in both divisions (Filters and Suspension components) despite being burdened by rises in energy prices and in the prices of components in aluminium and other alloys used in the special steels for the suspension business.
Consolidated EBITDA was € 128.5 million in 2006 (12.6% of sales), with an improvement of 1.3% from € 126.9 million (12.4% of sales) last year. The latter result was negatively impacted by industrial restructuring charges (€ 5.2 million), write-downs of fixed assets (€ 4.3 million) and non-recurring expense for paying management bonuses for results achieved in recent years (€ 2.3 million). By contrast the year 2006 benefited from capital gains of € 4 million, mainly due to the sale of a factory in Spain.
Consolidated EBIT was € 83.5 million (8.2% of sales), up by 3.1% from € 81 million (7.9% of sales) in 2005.
In 2006 the result before taxes and minority interests was € 74.9 million, up by 11.6% from € 67.1 million in 2005, thanks to lower financial expenses, higher gains from recovering withholding tax on foreign dividends in prior periods and a capital gain from the sale of a shareholding invest-ment.
At December 31 2006 the consolidated net financial position showed net debt of € 126.3 million, with an improvement of € 41 million compared with the figure of € 167.3 million at December 31 2005.
The group had 6,168 employees on its payroll at December 31 2006 compared to 6,171 at De-cember 31 2005.
Management Report

26
The Board of Directors of Sogefi, which met on February 27 2007, proposed distributing a divi-dend of € 0.20 per share (€ 0.175 in 2005).
Sales revenues of the filter division in 2006 came in at € 527.2 million, up from 518.5 million in 2005 (+1.7%). The division improved its economic results both in Europe and in South America, thanks to the good performance of sales in the aftermarket sector during the latter months of the year. EBITDA came to € 70.2 million (13.3% of sales) up from € 68.5 million (13.2% of sales) in 2005, while EBIT rose to € 51.9 million (9.8% of sales) from € 50 million (9.6% of sales) in 2005.
The suspension components division reported sales revenues of € 491.6 million in 2006, down from € 504.9 million in 2005 (-2.6%), following the decline in production volumes of French ve-hicle manufacturers. Despite this, profitability improved: EBITDA rose by 3.6% to € 63.4 million (12.9% of sales) from € 61.2 million in 2005 (12.1% of sales). EBIT reached € 37.4 million (7.6% of sales) with a rise of 8.4% from € 34.5 million (6.8% of sales) in 2005.
No change is expected this year in the main markets in which the group operates: the European market is stable, and the South American market is still growing. In the markets where there is less presence (US and China) the evolution of demand should be positive with orders from new clients. Since, however, there is likely to be more tension on the steel and energy fronts, manage-ment strategy will continue to be based on increasing efficiency and defending profit margins.
HEALTHCARE SECTOR
In 2006 the HSS group continued to develop and manage the new initiatives it has undertaken in this sector. In June a 100% acquisition was made of Anni Azzurri, the company specializing in the construction and management of residences for the elderly, which in 2005 reported consolidated sales revenues of approximately € 50 million and is present in four regions with 11 residences and a total of 1,600 beds. In the second half of 2006 there were two acquisitions – of the companies Meia (which manages four residences for the elderly in Piedmont) and Medipass, which purchases and manages ad-vanced technology in public and private hospitals. At the close of the year the company Physio-clinic, which operates in the development of competitive and amateur sports rehabilitation, was sold to minority shareholders.
In 2006 the HSS group reported revenues of € 99.2 million, up from € 53.8 million in the previous year (+84.4%). Confirming the trend already evident in the final months of 2005, in 2006 the group achieved a positive EBIT figure of € 2.3 million compared with a negative figure of € 0.7 million in 2005.
The net result was a negative € 4.4 million (compared with a net loss of € 1.4 million in 2005) and was affected by higher net financial expense (from € 0.3 million in 2005 to € 3.3 million in 2006) due to the rise in debt and to non-recurring costs for acquisitions made.
At December 31 2006 the HSS group showed net financial debt of € 110.7 million compared with a net financial surplus of € 4.2 million at December 31 2005. The change was mainly due to the acquisition of Anni Azzurri, which involved a disbursement of approximately € 60 million for the shares plus the debt taken on for some € 90 million, to other acquisitions for approximately € 25 million and to a capital increase of € 40 million.
Management Report
27
In line with the strategy followed so far, for part of the properties belonging to Anni Azzurri a preliminary contract of sale was signed in February 2007 for an amount of € 50 million and they were posted to assets held for disposal.
At December 31 2006 consolidated shareholders’ equity amounted to € 63.5 million.
The business of the HSS group is currently directed at managing four kinds of services: 1) Residences and nursing homes (RSAs), through the companies Villa Margherita, which
manages three residences, Casaverde (eight residences), Meia (five residences) and Anni Azzurri (eleven residences);
2) Psychiatric services, with the company Redancia which manages seven psychiatric care communities;
3) Rehabilitation, with the company Rehab specializing in functional recovery and rehabilita-tion;
4) Hospital management, with the company Ospedale di Suzzara (controlled by HSS) which in 2004 was awarded management of the Presidio Ospedaliero F.lli Montecchi di Suzzara (Mantua) and with the company Medipass, which manages diagnostic imaging units in pub-lic and private hospitals.
Currently the HSS group manages a total of 3,400 beds.
The employees of the group totalled 1,302 at December 31 2006.
5. OTHER ACTIVITIES
JUPITER FINANCE – This company was set up on September 2 2005 with the aim of acquiring portfolios of non-performing loans from financial institutions and managing them.The current phase of regulatory discontinuity, following the Basel2 agreements and the introduc-tion of the new international accounting standards, offers an interesting opportunity to enter a business sector with the potential for high growth, as examples of the development of this busi-ness in advanced markets demonstrate (US, Japan, UK and Germany). The company aims to become an independent industrial partner of Italian banks and businesses in the management of non-performing loans, both for bloc sales on a non-recourse basis and for pro-grams of optimization of a credit portfolio over a period of time, acting as services in the broadest sense of the term. Target segments include: distressed bank loans (loan agreements), problem securitized loans, con-sumer credit in arrears (credit cards and personal loans), irrecoverable receivables of industrial companies and public administrations, overdue leasing (with purchase of asset) and mortgage re-ceivables.In line with the scheduled growth plan, in 2006 more than 50 portfolios of non-performing loans were acquired from banks and consumer credit companies for an overall sum of approximately € 40 million and a gross book value of around € 340 million. During 2006 the company started collecting the receivables it had acquired using servicing com-panies. At December 31 2006 the total amount recovered was according to plan.
CIR VENTURES – At the end of 2006 the portfolio of CIR Ventures, the venture capital fund of the Group, contained investments in seven companies of which six in the United States and one in Is-rael. These companies all operate in the sector of information and communications technology. The fair value of these investments at December 31 2006 totalled 14.8 million dollars.
Management Report

28
During 2006 the stake in the Italian company Iriscube was sold to the company Reply and two new investments were made in the Californian companies Active Optical Mems, which operates in the sector of advanced components for fibre optics communication networks, and Home Ro-bots, which develops robotized devices that aid home cleaning. In December 2006 the sale was announced of the stake in Bitfone to Hewlett-Packard and the deal was successfully completed in February 2007. The management activity of the fund is still mainly directed towards supporting the companies in the portfolio and identifying opportunities for taking profit. The prospects for the evolution of the business of these companies remain cautiously optimistic within a scenario of a general improve-ment in the technology sector.
DRY PRODUCTS – The early part of 2006 saw the completion of the sale of the investment in Ric-ciarelli, the only company of the Dry Products group still operating in the sector of machinery for the food industry at a price of € 3.6 million, which was in line with its carrying value. With this transaction the CIR group has now terminated its program of gradual disinvestment from this sec-tor, which was no longer considered strategic.
INVESTMENTS IN PRIVATE EQUITY FUNDS - Through its subsidiary CIR International the CIR group holds a diversified portfolio of funds and minority private equity holdings, of which the fair value determined on the basis of the NAV provided by the various funds was approximately € 87 million at December 31 2006. Remaining commitments outstanding as of the same date amounted to € 20 million. During 2006 approximately € 17.6 million of realized gains were recognized to the accounts.Investors in this kind of fund undertake to provide asset managers with a predetermined amount. The fund managers have a limited time (approximately 5 years) to identify and make the investments following their strategy, requiring from investors the amounts they had paid in. The duration of these investment vehicles is generally limited to about 10 years and proceeds from the sale of investments are immediately distributed to the investors. The investment strategies of these funds follow various procedures, the main one being the acqui-sition of controlling shareholdings often using significant leverage. Risk on private equity investments is reduced by a process of diversification based on criteria that include, among other things, establishing a maximum amount for each individual commitment. At December 31 2006 CIR had invested in some 25 funds mainly denominated in euro and in dol-lars. The exchange rate risk on dollar investments has been hedged.
Management Report

29
6. SIGNIFICANT EVENTS WHICH OCCURRED AFTER THE CLOSE OF THE YEAR
With regard to the principal events which have taken place since December 31 2006 and the out-look for business in this current year, detailed information has already been given in the section of the report on the performance of the business sectors.
In January 2007, through its subsidiary CIR International, CIR finalized the acquisition of a 47.4% shareholding, in joint control with Merrill Lynch, in Oakwood Financial Investments, with a disbursement of approximately € 100 million and a further commitment of € 50 million. The Oakwood Group specializes in the creation, acquisition and management of retail finance companies and concentrates on the non-conforming or non-prime client sector, i.e. those clients that do not meet the traditional criteria for obtaining mortgages, consumer credit, vehicle loans and leasing solutions.Oakwood currently operates in the Australian, British and Italian markets through five companies: three of these were set up between 2001 and 2006 by management (Pepper Homeloans in Austra-lia, One World Leasing and Edeus in Britain), while controlling stakes were acquired in the other two (Ktesios in Italy and Blue Motor Finance in Britain). Details of these are as follows:
1. Pepper Homeloans, founded in 2001, based in Sydney is currently the third largest lender of residential non-conforming mortgages in Australia and to date has issued 5 securitizations;
2. One World Leasing, set up in 2003, based in Manchester UK, specializes in originating small ticket leases;
3. Ktesios, control of which was acquired during 2006, is based in Rome and is one of the lead-ing Italian distributors of salary-secured personal loans;
4. Blue Motor Finance, based in Warrington (UK), originates non-conforming auto loans. The ma-jority stake in this company was also acquired in 2006;
5. Edeus, launched in September 2006, is based in Essington (UK) and specializes in offering non-conforming residential mortgages. Edeus uses highly advanced technology that enables brokers to complete mortgages much faster than they could with traditional methods.
As far as own share deals are concerned, it should be pointed out that between January 1 2007 and today (March 13 2007) CIR bought back 2,950,000 of its own shares for a total of € 8.5 million. As of today, therefore, treasury stock held amounts to 37,044,000 equal to 4.7% of share capital.
It should also be noted that between January 1 2007 and today 2,312,800 shares have been issued in exercise of options by the beneficiaries of existing stock option plans. After this operation the share capital consisted of 782,791,867 shares with a nominal value of € 0.50 each, for a total value of € 391,395,933.50.
Management Report

30
7. OTHER INFORMATION
Information on shares held by Directors, General Managers and Statutory Auditors
The chart below gives the information required by Art. 79 of Consob Resolution no. 11971 of May 14 1999 and subsequent amendments and additions.
SHARES HELD BY DIRECTORS, STATUTORY AUDITORS AND GENERAL MANAGERS
Last name and first name Company in which shares are held Number of shares
Number of shares
Number of shares
Number of shares owned at end
Notes
owned at end bought sold of this year of previous year
DE BENEDETTI CARLO CIR S.p.A. 358,708,621 -- -- 358,708,621 (1)
DE BENEDETTI CARLO GRUPPO EDITORIALE L’ESPRESSO S.p.A. 218,826,235 1,950,000 -- 220,776,235 (2)
DE BENEDETTI CARLO SOGEFI S.p.A. 65,194,962 -- -- 65,194,962 (3)
DE BENEDETTI RODOLFO CIR S.p.A. 6,710,000 337,500 -- 7,047,500
PIASER ALBERTO CIR S.p.A. 94,000 180,000 274,000 --
DEBENEDETTI FRANCO CIR S.p.A. 375,000 -- -- 375,000
FERRERO PIERLUIGI CIR S.p.A. 315,000 100,000 65,000 350,000
FERRERO PIERLUIGI GRUPPO EDITORIALE L’ESPRESSO S.p.A. 30,000 -- -- 30,000
FERRERO PIERLUIGI SOGEFI S.p.A. 10,000 10,000 10,000 10,000
GERMANO GIOVANNI SOGEFI S.p.A. 2,012,000 -- -- 2,012,000
GERMANO GIOVANNI SOGEFI S.p.A. 1,004,312 -- -- 1,004,312 (4)
GIRARD FRANCO CIR S.p.A. 128,000 -- -- 128,000
GIRARD FRANCO SOGEFI S.p.A. -- 10,000 -- 10,000
GIRARD FRANCO GRUPPO EDITORIALE L’ESPRESSO S.p.A. -- 10,000 -- 10,000
PARAVICINI CRESPI LUCA CIR S.p.A. 333,333 -- -- 333,333
SEGRE MASSIMO GRUPPO EDITORIALE L’ESPRESSO S.p.A. 3,000 -- -- 3,000
(1) Indirectly owned through COFIDE S.p.A. (2) At December 31 2006 the shares are owned through the following subsidiaries:
CIR S.p.A. 218,825,235 ROMED S.p.A. 1,000
(3) Indirectly owned through CIR S.p.A. (4) Indirectly owned through Siria S.r.l.
Transactions with companies of the Group and related parties
During the period CIR S.p.A. provided management and strategic support services to its subsidiaries and affiliates which involved, among other things, supplying administrative and financial services, making loans, and issuing guarantees. Transactions with the controlling parent company consisted of providing services of an administrative and financial nature and being supplied with management support and communication services. The main concern of CIR and its counterparties in relation to these services is to ensure quality and a high level of efficiency of the services rendered, which derive from CIR’s specific knowledge of the businesses of the Group. Transactions between companies of the Group are settled at normal market conditions on the basis of the quality and the specific nature of the services rendered.
Management Report

31
The most significant financial transactions between CIR and its subsidiaries are analysed in detail in the Explanatory Notes particularly under the item Miscellaneous receivables, Other payables and Financial receivables with subsidiaries in the Balance Sheet and under the items Miscellaneous revenues and income, Financial expenses and Dividends in the In-come Statement.
Regarding the main equity transactions reference is made to the appropriate sections of the explanatory notes.
It should be pointed out that the CIR Group did not enter into any transactions with related parties, according to Consob’s definition, of a non-typical or unusual nature beyond nor-mal business administration or such as to have any significant impact on the economic, fi-nancial or equity situation of the Group.
The code of conduct governing transactions with related parties was defined by the Board of Directors of the Company in September 2002.
National tax consolidation
As is known, the new Income Tax Consolidation Act (TUIR) introduced the possibility for companies belonging to the same group to determine a single total income figure corre-sponding more or less to the sum of the taxable income of the various companies (parent company and subsidiaries controlled directly and/or indirectly for at least 50% according to certain requisites) and thus to calculate a single income tax figure for the income of the companies of the group. In the last few months of 2004 the Boards of Directors of 28 com-panies belonging to the Espresso, Sorgenia, Sogefi and HSS subgroups voted to take part in the “CIR Tax Consolidation”, signing a general agreement (“General Rules of the CIR Tax Consolidation”), which sets out the rights and obligations of CIR and its subsidiaries, re-sulting from their taking part in the tax consolidation. At December 31 2006 there were 26 companies taking part in the CIR tax consolidation.
Report on Corporate Governance
It should be noted that the full text of the “Annual Report on Corporate Governance” for the year 2006 was approved – in its entirety – by the Board of Directors convened to ap-prove the Financial Statements for the year ended December 31 2006.
This Report will be available to anybody who requests it, according to the conditions stipu-lated by Borsa Italiana for publishing the same. The Report will also be available on the website of the Company.
In relation to D.Lgs. 231/01, issued with the aim of bringing regulations on the subject of the administrative liability of entities into line with international agreements signed by It-aly, on March 7 2003 the Board of Directors of the Company approved the adoption of a Code of Ethics of the CIR Group, published as an attachment to the “Annual Report on Corporate Governance”, which defines the values which the Group follows in the achieve-ment of its objectives and establishes binding principles of conduct for its Directors, em-ployees and those who have a relationship with the Group. Moreover, on September 5 2003, the Board of Directors of the company approved the “Organization Model – the Or-
Management Report
32
ganizational and Management Model as defined by D.Lgs. no. 231/01”, in line with the in-structions laid down in the decree which aimed to ensure correctness and transparency in the conduct of business and corporate activities.
On April 27 2006 the Board of Directors approved an update to the Organizational and Management Model as defined by D.Lgs. no. 231/01 which was needed after law no. 62 of April 18 2005 took effect. This law amended decree 231/2001 inserting art. 25-sexties which establishes fines for offences involving the abuse of privileged information and ma-nipulation of the market.
Lastly it should be noted that the companies of the Group have complied with the provi-sions of Art. 2497-bis of the Civil Code.
Preparation of “Security Policy Document (DPS)”
D.Lgs. no. 196/03, giving instructions on the protection of personal information, stipulates that by March 31 of each year the organization responsible for the treatment of personal in-formation draw up a formal security policy document containing, among other things, ap-propriate information regarding the following: - the list of the types of treatment of personal information carried out by the organiza-
tion;- the distribution of responsibilities and tasks within the sphere of the treatment of such
information; - a description of the measures to be taken to guarantee the integrity and the availability
of the information and the protection of the areas set aside for storing it and making it accessible;
- the description of the criteria and the procedures for restoring access to the said infor-mation in the event of it being destroyed or damaged;
- the description of the criteria to be adopted in order to guarantee that the minimum measures of security are followed when the treatment of personal information is en-trusted, in conformity with the Civil Code, to someone outside the structure of the Of-ficer Responsible.
Article 26 of the Technical Rules states that the preparation or amendment of the Security Policy Document must be mentioned in the Annual Report accompanying the Financial Statements if required. The Security Policy Document was updated with the support of specialist consultants in this field who have been certified as BS7799 lead auditors by the British Standard Institute.
Other
The company CIR S.p.A. – Compagnie Industriali Riunite has its registered office in Strada Volpiano 53, Leinì (To), Italy and its operating headquarters in Via Ciovassino 1, Milan, Italy.
CIR shares, which have been quoted on the Milan Stock Exchange since 1973, since 2004 have been traded on the Blue-chip segment (Reuter code: CIRX.MI, Bloomberg code CIR IM).
This Annual Report for the period January 1 – December 31 2006 was approved by the Board of Directors on March 13 2007.
Management Report

33
PROPOSED ALLOCATION OF NET INCOME FOR THE YEAR
Dear Shareholders,
The Financial Statements for the year ended December 31 2006 that we are submitting to your ap-proval closed with net income of € 36,697,002.36.
We propose:
. making 2.5% of distributable net income, amounting to € 917,425.06, available to the Board of Directors in accordance with Art. 23 of the Company Bylaws.
. distributing a dividend of € 0.050 to each of the shares in circulation with dividend rights as of January 1 2006 (with the exclusion of own shares held as treasury stock), using the distributable part of the net income for the year of € 35,779,577.30, which is equal to € 36,697,002.36 minus the amount of € 917,425.06 made available to the Board of Directors and making up the differ-ence from the item “Retained earnings”.
The proposed allocation of the net income for the year:
¨ takes into account the provisions of Art. 2357 ter, 2nd paragraph, of the Civil Code which stipu-lates that the dividend rights on own shares be allocated pro rata to the other shares;
¨ will take into account the dividend entitlement of the 4,941 shares servicing 810 former Sasib privileged shares, the conversion of which has not yet been requested.
It should be pointed out that the actual amounts allocated to dividends and the withdrawal from the “Retained earnings” reserve will be based on the number of own shares held as treasury stock and the ordinary shares in circulation as of the date of the Shareholders’ Meeting, in case any further shares are bought back in the meantime or any new shares are issued in execution of the exercise of options by beneficiaries of the various stock option plans outstanding.
THE BOARD OF DIRECTORS
Milan, March 13 2007
Management Report


35
CIR Group
Consolidated Financial Statements as of December 31 2006
BALANCE SHEET
INCOME STATEMENT
CASH FLOW STATEMENT
STATEMENT OF CHANGES IN SHAREHOLDERS’ EQUITY
Consolidated Financial Statements

36
1. CONDOLIDATED BALANCE SHEET
(in thousands of euro)
ASSETS Notes 31.12.2006 31.12.2005
NON-CURRENT ASSETS 2,742,536 2,401,558 INTANGIBLE ASSETS (9.a) 951,009 864,436
TANGIBLE ASSETS (9.b) 1,091,030 897,972
REAL-ESTATE INVESTMENTS (9.c) 17,604 6,944
INVESTMENTS IN COMPANIES VALUED AT EQUITY (9.d) 214,163 221,042
OTHER EQUITY INVESTMENTS (9.e) 8,530 7,529
OTHER RECEIVABLES (9.f) 250,991 261,403
SECURITIES (9.g) 98,583 59,841
DEFERRED TAX ASSETS (9.h) 110,626 82,391
CURRENT ASSETS 2,984,189 2,775,594 INVENTORIES (10.a) 217,082 162,864
WORK IN PROGRESS 1,685 933
TRADE RECEIVABLES (10.b) 996,477 790,744
OTHER RECEIVABLES (10.c) 273,992 201,362
FINANCIAL RECEIVABLES (10.d) 21,354 26,513
SECURITIES (10.e) 654,248 467,959
AVAILABLE-FOR-SALE FINANCIAL ASSETS (10.f) 372,867 362,930
CASH AND CASH EQUIVALENTS (10.g) 446,484 762,289
ASSETS HELD FOR SALE (2.c) 47,589 17,143
TOTAL ASSETS 5,774,314 5,194,295
LIABILITIES AND SHAREHOLDERS' EQUITY 31.12.2006 31.12.2005
SHAREHOLDERS' EQUITY 1,979,912 1,856,383 SHARE CAPITAL (11.a) 390,240 389,621
RESERVES (11.b) 367,779 401,794
RETAINED EARNINGS (LOSSES) (11.c) 401,016 305,945
NET INCOME FOR THE YEAR 101,120 87,675
SHAREHOLDERS' EQUITY - GROUP 1,260,155 1,185,035 MINORITY INTERESTS 719,757 671,348
NON-CURRENT LIABILITIES 2,288,420 2,186,453 BONDS (12.a) 1,187,750 1,199,251
OTHER BORROWINGS (12.b) 758,514 654,785
OTHER PAYABLES 1,178 21
DEFERRED TAX LIABILITIES (9.h.) 137,743 126,260
PERSONNEL OBLIGATIONS (12.c) 166,554 163,671
PROVISIONS FOR RISKS AND LOSSES (12.d) 36,681 42,465
CURRENT LIABILITIES 1,469,640 1,137,983 BANK OVERDRAFT FACILITIES 265,180 54,962
OTHER BORROWINGS (13.a) 134,134 175,881
TRADE PAYABLES (13.b) 748,901 649,766
OTHER PAYABLES (13.c) 273,962 213,768
PROVISIONS FOR RISKS AND LOSSES (12.d) 47,463 43,606
LIABILITIES HELD FOR SALE (2.c.) 36,342 13,476
TOTAL LIABILITIES AND SHAREHOLDERS' EQUITY 5,774,314 5,194,295
Consolidated Financial Statements

37Consolidated Financial Statements
2. CONSOLIDATED INCOME STATEMENT
(in thousands of euro)
Notes 2006 2005
REVENUES FROM SALES AND SERVICES (14) 4,136,769 3,382,661
CHANGE IN INVENTORIES 2,206 (1,691)
COSTS FOR PURCHASE OF GOODS (15.a) (2,457,185) (1,818,934)
COSTS FOR SERVICES (15.b) (711,792) (674,847)
PERSONNEL COSTS (15.c) (575,342) (545,777)
OTHER OPERATING INCOME (15.d) 80,263 92,443
OTHER OPERATING EXPENSE (15.e) (66,651) (82,448)
ADJUSTMENTS TO THE VALUE OF INVESTMENTS VALUED AT EQUITY (9.d.) 34,154 18,596
AMORTIZATION, DEPRECIATION AND WRITE-DOWNS (102,938) (94,894)
INCOME BEFORE INTEREST AND TAXES ( E B I T ) 339,484 275,109
FINANCIAL INCOME (16.a) 67,176 83,512
FINANCIAL EXPENSES (16.b) (129,763) (131,657)
DIVIDENDS 1,470 396
GAINS FROM TRADING SECURITIES (16.c) 96,539 93,094
LOSSES FROM TRADING SECURITIES (16.d) (54,030) (65,527)
ADJUSTMENTS TO THE VALUE OF FINANCIAL ASSETS (16,958) (297)
INCOME BEFORE TAXES 303,918 254,630
INCOME TAXES (17) (89,478) (64,753)
INCOME AFTER TAX FROM OPERATING ACTIVITY 214,440 189,877
NET INCOME/(LOSS) FROM BUSINESSES HELD FOR DISPOSAL (932) --
NET INCOME FOR THE YEAR INCLUDING MINORITY INTERESTS 213,508 189,877
- NET INCOME - MINORITY INTERESTS (112,388) (102,202)
- NET INCOME - GROUP 101,120 87,675
BASIC EARNINGS PER SHARE (in euro) 0.1351 0.1156
DILUTED EARNINGS PER SHARE (in euro) 0.1343 0.1149

38
3. CONSOLIDATED CASH FLOW STATEMENT
(in thousands of euro)
2006 2005
OPERATING ACTIVITY
NET INCOME FOR THE PERIOD INCLUDING MINORITY INTERESTS 213,508 189,877
ADJUSTMENTS:
AMORTIZATION, DEPRECIATION AND WRITE-DOWNS 102,938 94,894
SHARE OF THE RESULT OF COMPANIES VALUED AT EQUITY (34,154) (18,596)
ACTUARIAL VALUATION OF STOCK OPTION PLANS 9,726 11,000
CHANGE IN PERSONNEL PROVISIONS AND PROVISIONS FOR RISKS AND LOSSES 956 (8,179)
ADJUSTMENTS TO THE VALUE OF FINANCIAL ASSETS 16,958 297
INCREASE/(REDUCTION) IN NON-CURRENT RECEIVABLES AND PAYABLES (12,763) (29,673)
(INCREASE)/REDUCTION IN NET WORKING CAPITAL (174,004) (89,935)
OTHER NON-MONETARY CHANGES 39,960 (8,219)
CASH FLOW FROM OPERATING ACTIVITY 163,125 141,466
of which:
- interest received (paid) (70,679) (38,024)
- payment of income taxes (50,909) (92,700)
INVESTMENT ACTIVITY
(PURCHASE) SALE OF SECURITIES (210,573) (266,468)
NET DISBURSEMENT FOR ACQUISITIONS OF COMPANIES (73,752) (119,213)
NET PROCEEDS FROM DISPOSALS 637 7,426
PURCHASE OF FIXED ASSETS (361,395) (322,610)
CASH FLOW FROM INVESTMENT ACTIVITY (645,083) (700,865)
FINANCING ACTIVITY
PROCEEDS FROM CAPITAL INCREASES 10,372 26,000
OTHER CHANGES IN SHAREHOLDERS' EQUITY (3,666) (20,608)
BONDS -- (294,966)
PROCEEDS/(REPAYMENT) OF OTHER BANK BORROWINGS 55,640 268,967
FINANCIAL RECEIVABLES - JOINT VENTURES -- (21,924)
BUY-BACK OF OWN SHARES (15,564) (35,878)
DIVIDENDS PAID OUT (90,847) (75,930)
CASH FLOW FROM FINANCING ACTIVITY (44,065) (154,339)
INCREASE (DECREASE) IN NET CASH AND CASH EQUIVALENTS (526,023) (713,738)
NET CASH AND CASH EQUIVALENTS AT BEGINNING OF PERIOD 707,327 1,421,065
NET CASH AND CASH EQUIVALENTS AT END OF PERIOD 181,304 707,327
Consolidated Financial Statements

39
4. STATEMENT OF CHANGES IN CONSOLIDATED SHAREHOLDERS' EQUITY
(in thousands of euro) Minority Total
Share Reserves Retained Net income Total interestscapital earnings (losses) for the year
BALANCE AT JANUARY 1 2005 388.279 374.528 201.274 155.247 1.119.328 583.332 1.702.660
Capital increases 1.342 2.273 -- -- 3.615 22.385 26.000
Dividends to Shareholders -- -- -- (38.009) (38.009) (37.921) (75.930)
Portion of income available to Board of Directors -- -- -- (708) (708) -- (708)
Retained earnings -- -- 116.530 (116.530) -- -- --
AGM Resolution to buy back own shares -- 11.859 (11.859) -- -- -- --
Fair value of hedging instruments -- 1.424 -- -- 1.424 1.291 2.715
Fair value of securities -- 47.373 -- -- 47.373 -- 47.373
Securities fair value reserve recognized toincome statement -- (7.608) -- -- (7.608) -- (7.608)
Buy-back of own shares -- (35.879) -- -- (35.879) -- (35.879)
Notional value of stock option plans -- 5.737 -- -- 5.737 -- 5.737
Effects of equity changes in subsidiaries -- (7.087) -- -- (7.087) (4.523) (11.610)
Currency translation adjustments -- 9.174 -- 9.174 4.582 13.756
Net income for the year -- -- -- 87.675 87.675 102.202 189.877
BALANCE AT DECEMBER 31 2005 389.621 401.794 305.945 87.675 1.185.035 671.348 1.856.383
Capital increases 619 1.076 -- -- 1.695 8.677 10.372
Dividends to Shareholders -- -- -- (*) (37.520) (37.520) (53.327) (90.847)
Retained earnings -- -- 50.155 (50.155) -- -- --
Cancellations of AGM resolution of April 272005 to buy-back own shares -- (54.816) 54.816 -- -- -- --
Fair value of hedging instruments -- 478 -- -- 478 357 835
Fair value of securities -- 33.075 -- -- 33.075 -- 33.075
Securities fair value reserve recognized toincome statement -- (16.893) -- -- (16.893) -- (16.893)
Buy-back of own shares -- (**) (5.664) (9.900) -- (15.564) -- (15.564)
Notional value of stock option plans -- 2.213 -- -- 2.213 -- 2.213
Effects of equity changes in subsidiaries -- 20.751 -- -- 20.751 (18.953) 1.798
Currency translation adjustments -- (14.235) -- (14.235) (733) (14.968)
Net income for the year -- -- -- 101.120 101.120 112.388 213.508
BALANCE AT DECEMBER 31 2006 390.240 367.779 401.016 101.120 1.260.155 719.757 1.979.912
(*) Annual General Meeting of April 27 2006: dividend per share € 0.05
(**) Reduction of the reserve for "Buy-back of own shares" (note 11.b. consolidated financial statements and note 7.b. statutory financial statements of CIR S.p.A.)
Attributable to Shareholders of the Parent Company
Consolidated Financial Statements


41
EXPLANATORY NOTES TO THE CONSOLIDATED FINANCIAL STATEMENTS
1. STRUCTURE AND CONTENT OF THE FINANCIAL STATEMENTS
These consolidated financial statements have been prepared in accordance with IAS/IFRS interna-tional accounting standards supplemented by the interpretations of the Standing Interpretation Committee issued by the International Accounting Standards Boards (IASB).
The consolidated financial statements for the year ended December 31 2006 include the Parent company CIR S.p.A. (hereinafter “CIR”) and the companies that the latter controls.
The consolidated Financial Statements for the year ended December 31 2006 were prepared using the statements of the individual companies included in the consolidation, i.e. their statutory finan-cial statements (known as “individual” or “separate” in IAS/IFRS terminology), or else consoli-dated into subgroups, examined and approved by their respective boards and amended and re-stated where necessary in order to bring them into line with the accounting principles listed below and with Italian regulations.
These financial statements were prepared in thousands of euro, which is the “functional” and “presentation” currency of the Group according to the terms of IAS 21, except where expressly indicated otherwise.
2. CONSOLIDATION PRINCIPLES
2.a. Consolidation methods
Controlled companies (subsidiaries): All the companies in which the Group exercises control according to the terms of IAS 27, SIC 12 and IFRIC Interpretation 2 are considered controlled companies. In particular, companies and in-vestment funds are considered as controlled companies when the Group has the power to make decisions regarding financial and operating policy. The existence of this power is presumed to ex-ist where the Group possesses the majority of the voting rights of a company, including potential voting rights that are exercisable without any restrictions. The controlled companies are fully consolidated as from the date on which the Group took control and they are de-consolidated when such control ceases to exist. Consolidation is carried out using the full line-by-line consolidation method. The main criteria adopted for the application of this method are the following: - the book value of the holding is eliminated against the appropriate portion of shareholders’ eq-uity and the difference between acquisition cost and the shareholders’ equity of the subsidiaries is posted, where the conditions exist, to the items of assets and liabilities included in the consolida-tion. Any remaining part is recognized to the statement of income when it is negative or to the “Goodwill” item of the assets when it is positive. Goodwill is then subjected to an impairment test to determine its recoverable value; - significant transactions between consolidated companies are eliminated as are payables, receiv-ables and unrealized income resulting from transactions between companies of the Group, net of any tax effects; - minority equity and their portion of net income for the period are shown in special items of the consolidated balance sheet and income statement.
Consolidated Financial Statements

42
Affiliated companiesAll those companies in which the Group has a significant influence, without having control, in ac-cordance with the terms of IAS 28, are considered as affiliated companies or affiliates. Significant influence is presumed to exist when the Group holds a percentage of the voting rights of between 20% and 50% (excluding cases where there is joint control).The consolidated financial statements include the part attributable to the Group of the results of the affiliates, accounted for using the equity method starting from the date on which the Group acquires substantial influence over the affiliate and they are de-consolidated when such influence ceases to exist. Whenever the part attributable to the Group of the losses of the affiliate exceeds the carrying value of the investment in the accounts, the value of the investment is written off and the share of any further losses is not recognized except to the extent to which the Group has the obligation to answer for them. The accounting principles of the affiliate are amended, where necessary, in order to make them compatible with the accounting principles adopted by the Group.
Joint venturesAll companies in which the Group exercises control jointly with another company according to the terms of IAS 31 are considered as joint ventures. It is presumed that joint control exists when the Group owns half of the voting rights of a company. The most significant joint venture belonging to the Group is Tirreno Power. International account-ing standards give two methods for consolidating joint ventures: . the reference method, which involves pro-rata consolidation: . the alternative method with allows them to be consolidated using the equity method. The Group has adopted the equity method.
2.b. Translation of foreign companies’ financial statements into euros
The translation into euros of the financial statements of foreign subsidiaries not belonging to the single currency, none of which has an economy subject to hyperinflation according to the defini-tion given in IAS 29, is carried out at the year-end exchange rate for the balance sheet and at the period average exchange rate for the income statement. Any exchange rate differences resulting from the translation of shareholders’ equity at the year-end exchange rate and from the translation of the income statement at the average rate for the period are recorded in a separate component of the shareholders’ equity entitled “Other reserves”.
The main exchange rates used are the following:
31.12.2006 31.12.2005
Average rate 31.12.2006 Average rate 31.12.2005
US Dollar 1.2556 1.317 1.2441 1.1797
UK Sterling 0.6729 0.6715 0.6838 0.6853
Swedish Krona 9.2524 9.0408 9.2773 9.3888
Brazilian Real 2.7292 2.8133 3.0062 2.7432
Argentine Peso 3.8565 4.0450 3.6323 3.5727
Chinese Renminbi 10.004 10.2796 10.1792 9.5202
Slovene Tolar 239.8082 239.8082 239.8082 239.2345
Consolidated Financial Statements

43
2.c. Consolidation area
The consolidated financial statements as of December 31 2006 and the consolidated financial statements for the previous year of the Group are the result of the consolidation at those dates of the Parent Company CIR and of all the companies directly or indirectly controlled, jointly con-trolled or affiliated, with the exception of any companies being wound up. The assets and liabili-ties of companies scheduled for disposal are reclassified in the items of assets and liabilities that show such an eventuality. Specifically, in 2006 the assets as above refer mainly to the properties belonging to the HSS group and which are scheduled for disposal while the liabilities are mainly the borrowings associated with these properties.
The HSS group has extended its consolidation through the acquisitions of the Anni Azzurri Group(Residenze Anni Azzurri S.r.l., Residenze Anni Azzurri Monza S.p.A, La Nuova Palma S.r.l., So-demare S.A.) and of the companies Medipass S.p.A. and Meia S.r.l.. In addition the group has in-creased its percentage of ownership of a company which it had already controlled since 2005 (Cima S.r.l. subsequently incorporated into Redancia S.r.l.). The following chart gives the main figures as of December 31 2006 of the acquired companies.
(in thousands of euro) Residenze Anni Azzurri Group Medipass S.p.A. Meia S.r.l.
Fixed assets 150,724 14,923 3,484
Working capital 10,769 4,063 (588)
Net financial debt (124,047) (16,443) (566)
Non-current liabilities (19,102) (1,311) (701)
Shareholders’ equity 18,344 1,232 1,629
As far as the Dry Products group is concerned, in the first half of 2006 the sale of the stake in Ric-ciarelli was finalized for a price of € 3.6 million, which was in line with its carrying value. With this deal the CIR group completed its program of gradual disinvestment from this sector which in the consolidated financial statements for 2005 was classified under assets and liabilities held for disposal.
The list of equity investments included in the consolidation, with an indication of the method u-sed, and of those excluded is given in the appropriate section of this document.
3. ACCOUNTING PRINCIPLES APPLIED
3.a. Intangible assets (IAS 38)
Intangible assets are recognized only if they can be separately identified, if it is probable that they will generate future economic benefits and if the cost can be measured reliably. Intangible assets with a finite useful life are valued at purchase or production cost net of deprecia-tion and impairment.
Intangible assets are initially recognized at purchase or production cost. Purchase cost is repre-sented by the fair value of payments and any additional cost directly incurred for preparing the as-set for use. The purchase cost is the equivalent price in cash as of the date of the acquisition and,
Consolidated Financial Statements

44
where payment is deferred beyond normal terms of credit, the difference compared with the cash price is recognized as interest for the whole period of deferment. Amortization is calculated on a straight-line basis following the expected useful life of the asset and starts when the asset is ready for use.
The carrying value of intangible assets is maintained as long as there is evidence that this value can be recovered through use; to this end at least once a year an impairment test is carried out to check that the intangible asset is able to generate future cash flows.Intangible assets with an indefinite useful life are not amortized but are constantly monitored for any permanent loss of value. It is mainly the newspaper and magazine titles and frequencies of the Espresso Group that are considered as intangible assets with an indefinite useful life.
Development costs are recognized as intangible assets when their cost can be measured reliably, when there is a reasonable assumption that the asset can be made available for use or for sale and that it is able to generate future benefits. Once a year or any time there are reasons which justify it, capitalized costs are subjected to an impairment test. Research costs are charged to the income statement as and when they are incurred. Trademarks and licenses, which are initially recognized at cost, are subsequently accounted for net of amortization and any impairment. The period of amortization is defined as the lower of the contractual duration for use of the license and the useful life of the asset. Software licenses, including associated costs, are recognized at cost and are recorded net of amor-tization and of any impairment.
Goodwill represents the excess of the cost of an acquisition over the fair value of the subsidiaries and affiliates at the date of their acquisition, with reference to the net values of their assets and li-abilities identifiable as of the date of the acquisition. After initial recognition, goodwill is valued at cost less any impairment. Goodwill resulting from acquisitions made after March 31 2004 is no longer amortized whereas goodwill already recorded prior to that date is no longer amortized as from January 1 2004. Goodwill always refers to identified income-producing assets, the ability of which to generate in-come and cash flows is constantly monitored for any impairment.
3.b. Tangible assets (IAS 16)
Tangible assets are recognized at purchase price or at production cost net of accrued depreciation. Cost includes associated expenses and any direct and indirect costs incurred at the moment of ac-quisition and necessary to make the asset ready for use. Financial expense relating to loans for long-term investments are capitalized until the date when the assets start operating. Where there are contractual or compulsory obligations for decommissioning, removing or clearing sites where fixed assets are installed, the value recognized includes an estimate of costs that will be incurred on disposal of the same, discounted to present value. Fixed assets are depreciated on a straight-line basis for each year in relation to their remaining useful life.
Land, assets in process and payments on account are not subject to depreciation.
Extraordinary maintenance costs which determine an increase in the value, the functionality or the useful life of the assets, such as costs for improvements, renovations and conversions which in-
Consolidated Financial Statements

45
crease value, are allocated directly to the assets to which they refer and are depreciated over the residual useful of the assets. Ordinary maintenance costs are charged to the income statement.
Real estate and land that are not used for instrumental or operating purposes are classified under a special item of assets and are accounted for on the basis of the terms of IAS 40 “Investment prop-erties” (see paragraph 3.e. below).
Should there be any events which one can assume will cause a lasting reduction in the value of an asset, its carrying value is checked against its recoverable value, which is the higher of fair value and its value in use. Fair value is defined on the basis of values expressed by the active market, by recent transactions or from the best information available to determine the potential amount ob-tainable from the sale of the asset. Value in use is determined from the net present value of cash flows resulting from the use expected of the same asset, applying the best estimates of its residual useful life and a rate that also takes into account the implicit risk of the specific business sectors in which the Group operates. This valuation is carried out for each individual asset or for the small-est identifiable cash generating unit (CGU). Where there is a negative difference between the values stated above and the carrying value, the asset’s carrying value is written down, while as soon as the reasons for such loss in value cease to exist the asset then undergoes an upward revaluation. Write-downs and revaluations are posted to the income statement.
3.c. Public entity grants
Any grants from a public entity are recognized when there is a reasonable degree of certainty that the receiving company will comply with all the conditions stipulated for such a grant, independ-ently of whether or not there is a formal resolution awarding the said grant, and the certainty that the grant will actually be received. Capital contributions are recognized in the balance sheet either as deferred income, which is po-sted to the income statement on the basis of the useful life of the asset for which it has been granted so that the depreciation can be reduced, or else they are deducted directly from the asset to which they refer. Any State grants obtained in the form of reimbursement of expenses and costs already incurred or with the purpose of providing immediate support for the beneficiary company without there being any future related costs, are recognized as income in the period in which they can be claimed.
3.d. Leasing contracts (IAS 17)
Leasing contracts for assets where the lessee substantially assumes all the risks and rewards of ownership are classified as finance leases. Where there are such finance lease contracts out-standing the asset is recognized at the lower of its fair value and the present value of the minimum lease payments stipulated in the relevant contracts. The total lease payments are allocated between the liability and finance charges so as to achieve a constant rate on the finance balance out-standing. The residual lease payments, net of financial expenses, are classified as borrowings. The interest expense is charged to the income statement over the lease period. Assets acquired with fi-nancial leasing contracts are depreciated to an extent consistent with the nature of the asset.
Consolidated Financial Statements

46
The leasing contracts in which the lessor substantially retains the risks and rewards of ownership are, on the other hand, classified as operating leases and payments made under such leases are charged to the income statement on a straight-line basis over the period of the lease. In the event of a sale and lease-back agreement, any difference between the price of sale and the carrying value of the asset is not recognized to the income statement unless there is a loss repre-senting an impairment of the asset itself.
3.e. Investment property/real estate investments - (IAS 40)
An investment property is a property, either land or building – or part of a building – or both, o-wned by the owner or by the lessee, through a financial leasing agreement, for the purpose of re-ceiving lease payments or for obtaining a gain on the capital invested or for both of these reasons, rather than for the purpose of directly using it for the production or supply of goods or services or for administration of the company or for sales, in ordinary business activities. The cost of an investment property is represented by its purchase price, any improvements made, and any replacement and extraordinary maintenance. For self-constructed investment property an estimation is made of all costs incurred as of the date on which the construction or the development was finished. Until that date the conditions set forth in IAS 16 apply. In the event of an asset held through a finance lease contract, the initial cost is determined accord-ing to IAS 17 from the lower of the fair value of the property and the present value of the mini-mum lease payments due. The Group has opted for the cost method to be applied to all investment property held. According to the cost method, estimation is made net of depreciation and of any impairments.
At the moment of disposal or in the event of permanent non-use of the assets, all related income and expenses will be charged to the income statement.
3.f. Impairment of assets (IAS 36)
Periodically and whenever events or changes in circumstance make it appropriate, tangible and intangible assets are subjected to an impairment test to see whether they have undergone any loss in value.The impairment test consists of an estimate of the recoverable value of the asset and a subsequent comparison with its net carrying amount. If the recoverable value is lower than the carrying amount, the latter is written down and the impairment loss is charged to the income statement. If at a later date the reasons for the write-down cease to exist, the original carrying amount is re-stored with the relative entry to the income statement.
3.g. Other equity investments
Investments in companies where the Parent Company does not exercise a significant influence are accounted under IAS 39 and are therefore classified as available-for-sale investments and are measured at fair value or at cost if the estimation of fair value or market price is not reliable.
Consolidated Financial Statements

47
3.h. Receivables and payables (IAS 32, 39 and 21)
Receivables are recognized at amortized cost and measured at their presumed realization value, while payables are recognized at amortized cost. Receivables and payables in foreign currencies, which are originally recognized at the spot rates of the transaction date, are adjusted to the year-end spot exchange rates and any exchange gains and losses are recognized to the income statement: if the net of such adjustments is a gain the amount is recorded in a specific equity reserve and cannot be distributed until it is realized.
3.i. Securities (IAS 32 and 39)
In accordance with IAS 32 and IAS 39 investments in companies other than subsidiaries and af-filiates are classified as available-for-sale financial assets and are measured at fair value. Gains and losses resulting from fair value adjustments are recorded in a separate component of equity. When there are impairment losses or when the assets are sold, the gains and losses recog-nized previously to shareholders’ equity are then posted to the income statement.
This category also includes financial assets either bought or issued for trading purposes or classified at fair value through profit and loss in application of the fair value option.For a more complete description of the treatment of financial instruments we would refer readers to the note specially prepared on the subject.
3.l. Income taxes (IAS 12)
Current taxes are recorded and determined on the basis of a realistic estimate of taxable income following current tax regulations of the country in which the company is based and taking into ac-count any exemptions that apply and any tax credits that can be claimed.
Deferred taxes are calculated on the basis of time differences, which are taxable or deductible, be-tween the carrying values of assets and liabilities and their tax bases and are classified under non-current assets and liabilities. A deferred tax asset is recognized to the extent that it is probable that future taxable profit will be available against which the temporary differences can be utilized. The carrying value of deferred tax assets is subject to periodic analysis and is reduced to the ex-tent to which it is no longer probable that there will be sufficient taxable income to allow the benefit of this deferred asset to be utilized.
3.m. Inventories (IAS 2)
Inventories are stated at the lower of purchase or production cost, calculated using the weighted average cost method, and the net realizable value.
3.n. Work in progress (IAS 11)
Contracted work in progress refers to specific projects in progress that have been requested by ex-ternal clients.
Consolidated Financial Statements

48
Contractual revenues and their related costs are recognized according to their percentage of com-pletion. Revenues include any price revision included in the contract. When it is likely that total costs will exceed contractual revenues, the expected loss is immediately recognized to the income statement.
If the outcome of a construction contract cannot be reliably estimated, the contractual income is recognized in relation to the costs incurred, provided that it is likely that such costs can be recov-ered.
3.o. Cash and cash equivalents (IAS 32 and IAS 39)
Cash and cash equivalents include cash in hand, call deposits and short-term and high-liquidity financial assets, which are easily convertible into cash and which have a risk of change in value that is irrelevant.
3.p. Shareholders’ equity
Ordinary shares are recorded at nominal value. Costs directly attributable to the issuance of new shares are deducted from the shareholders’ equity reserves, net of any related tax benefit.
Own shares are classified in a special item which is deducted from reserves; any subsequent transaction of sale, re-issuance or cancellation will have no impact on the income statement but will affect only shareholders’ equity.
Unrealized gains and losses, net of tax, on financial assets classified as available for sale are re-corded under shareholders’ equity in the fair value reserve. The reserve is reversed to the income statement when the asset is realized or when a permanent loss of value is recognized.
The hedging reserve is formed from the fair value movements of derivatives which, under IAS 39, have been designated as “cash flow hedging instruments” or as instruments hedging net invest-ments in foreign operations”. The portion of the profit and loss considered as “effective” is recognized to shareholders’ equity and is reversed to the income statement as and when the elements hedged are in turn recognized to the income statement, i.e. when the subsidiary is sold.
When a subsidiary prepares its financial statements in a currency different from the Group’s func-tional currency, the subsidiary’s financial statements are translated accounting any differences re-sulting from such translation in a special reserve. When the subsidiary is sold the reserve is re-versed to the income statement with a detail of any gains or losses resulting from the subsidiary’s disposal.The item “Retained earnings (losses)” includes accrued income and losses and the transfer of bal-ances from other equity reserves when these become free of any “limitations” to which they have been subject. This item also shows the cumulative effect of the changes in accounting principles and/or the cor-rection of errors which are accounted for in accordance with IAS 8.
Consolidated Financial Statements

49
3.q. Financial liabilities (IAS 32 and IAS 39)
Loans are initially recognized at cost, represented by their fair value net of ancillary costs in-curred. Subsequently loans are measured at amortized cost calculated by applying the effective interest rate, taking into consideration any issuance costs incurred and any premium or discount applied at the time in which the instrument is settled.
3.r. Provisions for risks and losses (IAS 37)
Provisions for risks and losses refer to liabilities which are extremely likely but where the amount and/or maturity is uncertain. These are the result of past events which will cause a future cash out-flow. Provisions are recognized exclusively in the presence of a current obligation, either legal or constructive, towards third parties which implies an outflow and when a reliable estimate of the amount involved can be made. The amount recognized as a provision is the best estimate of the outflow required to fulfil the obligation as of the date of the financial statements. The provisions recognized are re-examined at the closing date of each accounting period and are adjusted to rep-resent the best current estimate. Changes in the estimate are recognized to the income statement.
When the estimated outflow relating to the obligation is expected in a time horizon longer than normal payment terms and the discount factor is significant, the provision represents the present value, discounted at a risk-free interest rate, of the expected future outflows to discharge the obli-gation.
Contingent assets and liabilities (possible assets and liabilities, or those not recognized because no reliable estimate can be made) are not recognized. However specific disclosure on such items is given.
3.s. Revenue recognition (IAS 18)
Revenues from the sale of goods are recognized at the moment when the goods change hands and the risks and benefits are transferred. Revenues are recognized net of returns, discounts and re-bates. Revenues for the rendering of services are recognized at the moment when the service is rendered, with reference to the state of completion of the activity as of the date of the financial statements.
Income from dividends, interest and royalties are recognized as follows: - Dividends, when the shareholder’s right to receive payment is established (with an offset in re-
ceivables at the resolution date); - Interest, using the effective interest rate method (IAS 39); - Royalties, on an accruals basis, in accordance with the substance of the relevant contractual
agreement.
3.t. Employee benefits (IAS 19)
Benefits to be paid to employees after the termination of their employment and other long term benefits are subject to actuarial valuation.
Consolidated Financial Statements
50
Following this methodology, liabilities recognized represent the present value of the obligation adjusted for any actuarial gains or losses which have not been accounted for. The instruments underlying the above mentioned benefits can be distinguished between “defined contribution plans” and “defined benefit plans”, where in the first case the obligation of the com-pany is limited to paying the contributions (to Government, to funds or to other separate legal en-tities) and is determined on the basis of the contributions owed, while in the second case liabilities are determined on the basis of actuarial calculations. Actuarial gains and losses for the defined benefit pension plans are recognized in the income statement, pro rata on the basis of the remaining working life of the employees covered by the plan, for the part in excess of 10% of the greater of the fair value of any assets servicing the plan and the present value of the associated liability, in accordance with the so called corridor method. For other long-term benefits, actuarial gains and losses are recognised to income statement.
IFRS 2 “Share-based payments” issued in February 2005 but applicable as from January 1 2005 stated in its transition instructions that application would be retrospective for all transactions where the assignation of stock option took place after November 7 2002 and for which, as of the date of its taking effect, the vesting conditions contained in the various plans had not yet been sat-isfied.In compliance with this principle the CIR Group measures the notional cost of stock options and recognizes it to the income statement under personnel costs during the vesting period of the bene-fit, with a corresponding posting to the appropriate reserve in shareholders’ equity. The cost of the option is determined at the grant date of the plan applying special models and mul-tiplying by the number of options exercisable over the respective period, which is evaluated with the aid of appropriate actuarial variables.
3.u. Derivative financial instruments (IAS 32 and 39)
Derivative financial instruments are measured at fair value. The Group uses derivatives mainly to hedge risks, in particular interest rate, foreign exchange and commodity price risks. The hedging purpose of the derivative is formally documented and the de-gree of “effectiveness” of the hedge is specified. For accounting purposes hedging transactions can be classified as: - fair value hedges – where the effects of the hedge are recognized to the income statement. - cash flow hedges – where the effective portion of the hedge is recognized directly to share-
holders’ equity while the non-effective part is recognized to income statement. - hedge of a net investment in a foreign operation – where the effective portion of the hedge is
recognized directly to shareholders’ equity while the non-effective part is recognized to the in-come statement.
3.v. Foreign currency translation (IAS 21)
The Group’s functional currency is the euro, which is the currency in which its financial state-ments are prepared and published. The companies of the Group prepare their financial statements in the currencies that are used in their respective countries.
Transactions carried out in foreign currencies are initially recognized at the spot exchange rate on the date of the transaction.
Consolidated Financial Statements

51
At the date of the close of the reporting period monetary assets and liabilities denominated in for-eign currency are translated at the spot exchange rate prevailing on that date. Non-monetary items measured at historical cost in a foreign currency are translated using the his-torical exchange rate prevailing on the date of the transaction. Non-monetary items measured at fair value are translated using the spot exchange rate at the date on which the measurements are determined for the financial statements. The assets and liabilities of the companies within the Group whose functional currency is not the euro are valued using the following procedures:- assets and liabilities are translated using the spot exchange rate prevailing at the date of the
close of the reporting period;- costs and revenues are translated using the average exchange rate for the period; Exchange rate differences are recognized directly to a special reserve under shareholders’ equity in a special reserve.Should an investment in a foreign operation be sold, the accumulated exchange rate differences recognized in the equity reserve are reversed to the income statement.
3.w. Adoption of new accounting standards
In financial year 2006 the Group adopted the following Principles, Interpretations and Updates to the standards already published: - IAS 39 – Financial instruments Recognition and Measurement. This principle was amended by Regulation no. 1864 of November 15 2005 effective January 1 2006 (fair value option), which partially revised the classification of financial assets and liabilities; in particular the revision limited the use of the initial designation option for financial assets and liabilities other than de-rivatives and those held for trading, as items measured at fair value directly to the income state-ment to those instruments that meet the following requirements:
a) The fair value option designation eliminates or significantly reduces an accounting mis-match, or
b) A group of financial assets, financial liabilities, or both are managed and their performance is evaluated on a fair value basis, in accordance with a documented investment risk man-agement strategy, and
c) An instrument contains an implicit derivative which meets particular conditions. - IAS39 – Financial instruments. Recognition and measurement. This principle was amended by Regulation no. 2106 of December 21 2005 which partly revised the basic assumptions regarding intercompany transactions, - IFRS6 – Exploration for and Evaluation of Mineral Resources. This principle is not relevant for the business of the Group; - IFRIC4 – Checking the requisites for a contract to be considered as a leasing contract; - IFRIC5 – Rights to interest arising from decommissioning, restoration and environmental reha-bilitation funds. This interpretation is not relevant for the Group; - IFRIC6 – Liabilities arising from Participating in a Specific market: Waste electrical and Elec-tronic Equipment. This interpretation is not relevant for the Group.
Moreover the Group did not opt for the early adoption of the following Principles, Interpretation and Updates to principles already published, which will become obligatory in the next few years: - IFRIC7 – Applying the Restatement Approach under IAS 29. This interpretation will take effect for financial years following March 1 2006. This interpretation is not relevant for the Group; -IFRIC8 – Scope of IFRS2. This interpretation will take effect for financial years following May 1 2006. This interpretation is not relevant for the Group;
Consolidated Financial Statements

52
- IFRIC9 – Reassessment of Embedded Derivatives. This interpretation will take effect for finan-cial years following June 1 2006. The interpretation is not relevant for the Group. - IFRIC10 – Interim Financial Reporting and Impairment. This interpretation will take effect for financial years following November 1 2006; - IFRS7 – Financial instruments: Disclosures. This principle introduces new information to be provided for financial instruments and will take effect as from January 1 2007.
3.z. Earnings per share (IAS 33)
Basic earnings per share are determined by dividing the net income attributable to the ordinary shareholders of the Parent Company by the weighted average number of ordinary shares in circu-lation during the period.
Diluted earnings per share are calculated by adjusting the weighted average number of ordinary shares in circulation to take into account the effect of all potential ordinary shares, resulting for example from the possibility of the exercise of stock options assigned, which can have a dilutive effect.
4. FINANCIAL INSTRUMENTS
Financial instruments take on a particular significance in the economic and financial structure of the CIR Group; for this reason, in order to give a better and clearer understanding of financial is-sues, it was considered useful to devote a special section to the accounting treatment of IAS 32 and IAS 39.
According to IAS 32 financial instruments are classified in four categories: a) Financial instruments that are valued at fair value through profit and loss (FVTPL) in ap-
plication of the fair value option, which are held for trading purposes; b) Investments held to maturity (HTM); c) Loans and receivables (L&R); d) Available-for-sale financial assets (AFS).
Classification depends on Financial Management’s intended use of the financial instrument in the business context and each involves a different measurement for accounting purposes; financial transactions are recognized on the basis of their value date.
Financial instruments at fair value through profit and lossInstruments are classified as such if they satisfy one of the following conditions: - they are held for trading purposes; - they are a financial asset designated on adoption of the fair value option, the fair value of
which can be reliably determined. Trading generally means frequent buying and selling with the aim of generating profit on price movements in the short term. Derivatives are included in this category unless they are designated as hedge instruments. The initial designation of financial instruments, other than derivatives and those held for trading, as instruments at fair value through profit and loss in adoption of the fair value option is limited to those instruments that meet the following conditions:
Consolidated Financial Statements

53
a) The fair value option designation eliminates or significantly reduces an accounting mis-match, or;
b) A group of financial assets, financial liabilities, or both are managed and their performance is evaluated on a fair value basis, in accordance with a documented investment risk man-agement strategy, and
c) An instrument contains an implicit derivative which meets particular conditions.
The designation of an individual instrument to this category is definitive, is made at the moment of initial recognition and cannot be modified.
Investments held to maturityThis category includes non-derivative instruments with fixed payments or payments that can be determined and that have a fixed maturity, and which it is intended and possible to hold until ma-turity. These instruments are measured at amortized cost and constitute an exception to the general measurement principle of fair value. Amortized cost is determined by applying the effective interest rate of the financial instrument, taking into account any discounts or premiums received or paid at the moment of purchase, and recognizing them throughout the whole life of the instrument until its final maturity. Amortized cost represents the initial recognition value of a financial instrument, net of any capital repayments and of any impairment, plus or minus the cumulated amount of the differences be-tween its initial net value and the nominal amount at maturity calculated using the effective inter-est rate method. The effective interest rate method is a calculation criterion used to assign financial expenses to their appropriate time period. The effective interest rate is the rate that gives a correct present value to expected future cash flows until maturity, so as to obtain the net present carrying value of the financial instrument. If even one single instrument belonging to this category is sold before maturity, for a significant amount and where there is no special justification for this, the tainting rule is applicable and re-quires that the whole portfolio of securities classified as Held To Maturity be reclassified and measured at fair value, and this category cannot be used in the two following years.
Loans and receivablesThis refers to financial instruments which are not derivatives, have payments that are either fixed or can be determined, which are not quoted on an active market and which are not intended to be traded.This category includes trade receivables (and payables), which are classified as current assets or liabilities with the exception of the part due in over 12 months from the date of the financial state-ments. The measurement of these instruments is made by applying the method of amortized cost, using the effective interest rate and taking into account any discounts or premiums obtained or paid at the moment of acquisition and recognizing them throughout the whole life of the instrument until its final maturity.
Available-for-sale financial assetsThis is a “residual” category which includes non-derivative financial instruments that are desig-nated as available for sale and are not included in any of the previous categories.
Consolidated Financial Statements

54
Financial instruments held for trading are recognized at their fair value plus any transaction costs. Gains and losses are recognized to a special equity reserve until the financial instruments are sold or have been impaired. In such cases the profit or loss accrued under shareholders’ equity is re-leased to the income statement.
Fair value is the amount for which an asset can be exchanged or a liability can be settled, between knowledgeable, willing parties in a transaction at arm’s length. In the case of securities listed on regulated liquid markets, the fair value is the bid price at the close of trading on the last day of the accounting period. Where no market prices are available, fair value is determined either on the basis of the fair value of another financial instrument that is substantially similar or by using appropriate financial tech-niques (for example the discounted cash flow method). Investments in financial assets can be eliminated from the balance sheet, or derecognized, only when the contractual rights to receive their respective financial cash flows have expired or when the financial asset is transferred to third parties together with all its associated risks and rewards.
5. FINANCIAL RISK MANAGEMENT
The CIR Group operates in different sectors of industry and services both at the domestic and the international level and as a result its businesses are exposed to different kinds of financial risk, in-cluding market risk (exchange rate and price risk), credit risk, liquidity risk and interest rate risk. In order to minimize these risks the Group uses derivative instruments for hedging purposes.
Risk management is carried out by the central finance and treasury function on the basis of poli-cies approved by the Management of CIR and passed on to the subsidiaries on July 25 2003.
Market riskForeign currency risk
Some companies of the Group (Sogefi in particular) are exposed to foreign exchange risk result-ing from their use of difference currencies. Exchange rate movements in the foreign currencies can affect the fair value of their assets and liabilities.This risk is however limited by the fact that the companies operate in the local currency, they are active both in their home markets and abroad and in the event of such a need arising financial re-sources are raised locally.
Regarding the net investment in Medinvest Plc, expressed in USD, a specific hedging strategy is followed with purpose of hedging the net investment from the volatility of the spot EUR/USD ex-change rate used to translate the subsidiary’s net investment into the functional currency of the Group, i.e. the euro.
Price risk The Group is exposed to price risk on its commodities, such as paper, cellulose products, steel, plastic products, aluminium, oil and gas. These risks are managed centrally by the individual sub-holdings through the diversification of their sourcing and, where deemed necessary, through suitable derivative hedging products.
Consolidated Financial Statements

55
Credit riskCredit risk can be evaluated both in commercial terms in relation to client type, contractual condi-tions and concentration of sales, and also in financial terms in relation to the type of counterparty of financial transactions. Within the Group there are no significant concentrations of credit risk. Adequate policies were put in place several years ago to ensure that sales are made to clients with an appropriate credit rating. Counterparties for derivatives instruments and cash transactions are exclusively financial institutions with a high credit rating. The Group also has policies which limit credit exposure to single financial institutions.
Liquidity riskPrudent management of liquidity risk implies maintaining sufficient liquidity and tradable securi-ties as well as having the availability of financial resources obtainable through an adequate supply of credit lines.The Group respects the maturity dates of its commitments systematically, which allows it to oper-ate in the market with flexibility and the availability of funds in order to maintain a correct bal-ance between funding and the application of its financial resources.
Interest rate risk (fair value risk and cash flow risk)Interest rate risk is caused by movements in interest rates in the market which can change the fair value of the cash flows of financial assets or liabilities.Interest rates on leasing contracts are determined at the commencement of the contract and there is no exposure to a change in the fair value of the interest rate. Interest rate risk mainly affects long-term bond issues, which having been issued at a fixed rate, expose the Group to the risk of a change in the fair value of the bonds due to interest rates move-ments.
Following risk management policies, the Parent Company and the subsidiaries have entered into various IRS contracts throughout the years in order to hedge fair value interest rate risk on their bond issues and loan agreements.
Derivative instruments are recognized at their fair value.
The accounting models for hedging transactions are as follows: - fair value hedges if they are subject to price changes in the market value of the underlying as-
set or liability; - cash flow hedges if they are entered into to protect from the risk of changes in cash flows re-
sulting from an existing asset and liability, or from a future transaction. - hedges of a net investment in a foreign operation if they are entered into to hedge the net in-
vestments from the exchange rate risk arising from the translation of equity denominated in currencies other than the functional currency of the Group.
For derivative financial instruments classified as fair value hedges, gains and losses resulting from both the determination of their own market value and the fair value adjustment of the element un-derlying the hedge are recognized to the income statement. For derivative instruments classified as cash flow hedges (for example interest rate swaps), the ef-fective portion of gains and losses due to changes in their fair value are recognized directly to shareholders’ equity while any non-effective portion is recognized to the income statement.
Consolidated Financial Statements

56
For derivative financial instruments classified as hedges of a net investment in a foreign operationthe effective portion of gains and losses due to changes in their fair value are recognized directly to shareholders’ equity while any non-effective portion is recognized to the income statement. Hedge accounting specifies that derivatives for hedging purposes be accompanied by a hedging relationship which documents the individual instrument being hedged, and gives the degree of ef-fectiveness of the hedging strategy in relation to the instrument being hedged. The effectiveness of the hedges is assessed regularly and the effective part is posted to sharehold-ers’ equity while any non-effective part is recognized to the income statement. More specifically, the hedge is considered effective when the change in fair value or in the cash flows of the item be-ing hedged is “almost entirely” offset by the change in the fair value or the cash flows of the hedging instrument and the actual results are in a range of between 80% and 125%.
At December 31 2006 the Group had the following derivatives contracts outstanding, which were recognized under hedge accounting and are shown at their notional value: (a) Interest rate swaps hedging bonds: Fixed/floating IRS contracts with a notional value of € 400 million maturing in March 2009
entered into by CIR International, (b) Forward sales of foreign currency on the investment in Medinvest Plc.: 10 forward contracts selling USD and buying EURO for a total of USD 415 million entered
into by CIR International. (c) Interest rate swaps on bank loans for the value of € 20 million relating to the Sorgenia group,
maturing on October 15 2010; (d) 3 forward sales of GBP 4.3 million maturing March 2007 and 2 forward sales of USD 20.8
million maturing in March 2007, entered into by the Sogefi group; (e) Interest rate swaps on bank loans for the value of € 15 million maturing in September 2007
and € 20 million maturing in December 2008 relating to the Sogefi group.
Consolidated Financial Statements
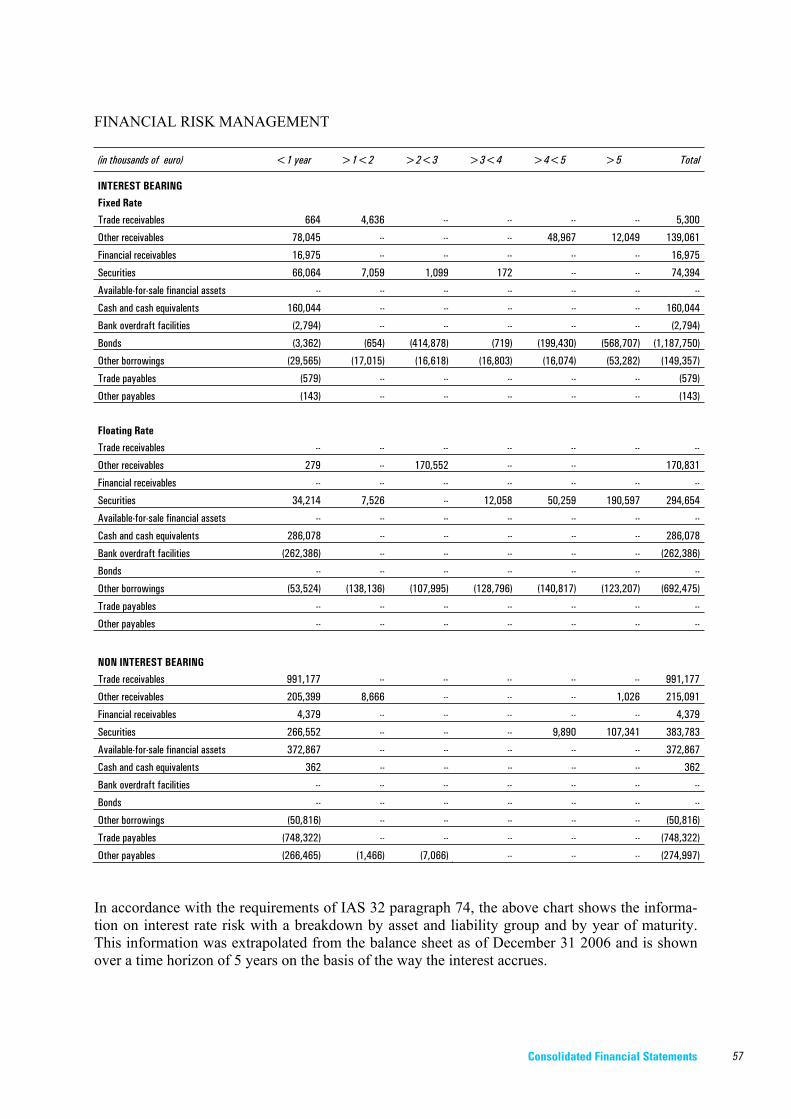
57
FINANCIAL RISK MANAGEMENT
(in thousands of euro) <1 year >1<2 >2<3 >3<4 >4<5 >5 Total
INTEREST BEARING
Fixed Rate
Trade receivables 664 4,636 -- -- -- -- 5,300
Other receivables 78,045 -- -- -- 48,967 12,049 139,061
Financial receivables 16,975 -- -- -- -- -- 16,975
Securities 66,064 7,059 1,099 172 -- -- 74,394
Available-for-sale financial assets -- -- -- -- -- -- --
Cash and cash equivalents 160,044 -- -- -- -- -- 160,044
Bank overdraft facilities (2,794) -- -- -- -- -- (2,794)
Bonds (3,362) (654) (414,878) (719) (199,430) (568,707) (1,187,750)
Other borrowings (29,565) (17,015) (16,618) (16,803) (16,074) (53,282) (149,357)
Trade payables (579) -- -- -- -- -- (579)
Other payables (143) -- -- -- -- -- (143)
Floating Rate
Trade receivables -- -- -- -- -- -- --
Other receivables 279 -- 170,552 -- -- 170,831
Financial receivables -- -- -- -- -- -- --
Securities 34,214 7,526 -- 12,058 50,259 190,597 294,654
Available-for-sale financial assets -- -- -- -- -- -- --
Cash and cash equivalents 286,078 -- -- -- -- -- 286,078
Bank overdraft facilities (262,386) -- -- -- -- -- (262,386)
Bonds -- -- -- -- -- -- --
Other borrowings (53,524) (138,136) (107,995) (128,796) (140,817) (123,207) (692,475)
Trade payables -- -- -- -- -- -- --
Other payables -- -- -- -- -- -- --
NON INTEREST BEARING
Trade receivables 991,177 -- -- -- -- -- 991,177
Other receivables 205,399 8,666 -- -- -- 1,026 215,091
Financial receivables 4,379 -- -- -- -- -- 4,379
Securities 266,552 -- -- -- 9,890 107,341 383,783
Available-for-sale financial assets 372,867 -- -- -- -- -- 372,867
Cash and cash equivalents 362 -- -- -- -- -- 362
Bank overdraft facilities -- -- -- -- -- -- --
Bonds -- -- -- -- -- -- --
Other borrowings (50,816) -- -- -- -- -- (50,816)
Trade payables (748,322) -- -- -- -- -- (748,322)
Other payables (266,465) (1,466) (7,066) -- -- -- (274,997)
In accordance with the requirements of IAS 32 paragraph 74, the above chart shows the informa-tion on interest rate risk with a breakdown by asset and liability group and by year of maturity. This information was extrapolated from the balance sheet as of December 31 2006 and is shown over a time horizon of 5 years on the basis of the way the interest accrues.
Consolidated Financial Statements

58
6. ACCOUNTING PRINCIPLES, CHANGES IN ACCOUNTING ESTIMATES AND ERRORS
The criteria for making estimates and measurements are re-examined on a regular basis and are based on historical experience and on other factors such as expectations of possible future events that are reasonably likely to take place.
If the initial application of a principle affects the current year or the previous one, its effect is rec-ognized by indicating the change resulting from any transitional rules, the nature of the change, the description of the transitional rules, which may also affect future years, and the amount of any adjustments relating to years preceding those being presented. If a voluntary change of a principle affects the current or previous year this effect is shown by in-dicating the nature of the change, the reasons for the adoption of the new principle, the amount of any adjustments made for years preceding those being presented. In the event of a new principle/interpretation issued but not yet endorsed, an indication is given of the fact, of its potential impact, the reason for the principle/interpretation, the date on which it will take effect and the date on which it will first be applied.
A change in accounting estimates involves an indication of the nature and the impact of the change. Estimates are used mainly to show impairment of assets recorded, provisions made for risks, employees benefits, taxes and other provisions and reserves. Estimates and assumptions are reviewed regularly and the effects of any such changes are reflected in the income statement.
Lastly, the treatment of accounting errors involves an indication of the nature of the error, the a-mount of the adjustments to be made at the beginning of the first accounting period after it was discovered.
7. NON-CURRENT ASSETS HELD FOR SALE (IFRS 5)
A non-current asset is held for sale if its carrying value will be recovered principally through a sale rather than through use. For this condition to be satisfied the asset must be immediately sella-ble in its present condition and the sale must be considered as highly likely. The assets or groups of assets for disposal that are classified as held for sale are valued at the lo-wer of their carrying value and fair value less costs to sell. Individual assets or assets belonging to a group classified as held for sale are not amortized. The above assets are shown in the financial statements in a single item of the income statement giving the profits and losses net of taxes resulting from the sale. Similarly the assets and liabilities must be shown on a separate line of the Balance Sheet.
Consolidated Financial Statements

59
8. INFORMATION ON THE BUSINESS SECTORS
The business sectors coincide with the Groups of companies in which CIR S.p.A. holds a control-ling stake. These are: - the Sorgenia group: utilities; - the Espresso group: media; - the Sogefi group: automotive components; - the HSS group: healthcare.
Geographically speaking, with the exception of the Sogefi group, all the business activities are carried out in Italy. An analysis of the income contribution and the balance sheet and equity figures for the primary sector is given in the Management Report, while the breakdown of revenues by geographical segment (secondary sector) is given in the Explanatory Notes to the Financial Statements in the section regarding revenues (note 14). The breakdown by geographical area of the businesses, investments, amortization and write-downs, as required by IAS 14, is given in the following chart.
(in thousands of euro) Businesses Investments Amortization /Write-downs
Italy 4,489,149 391,957 62,249
Other European countries 1,701,199 31,642 40,639
North America 42,148 5,659 5,042
South America 70,360 6,249 4,012
Asia 7,474 185 836
Other countries -- -- --
Consolidation adjustments (536,016) (1,144) (9,840)
Total assets 5,774,314 434,548 102,938
Consolidated Financial Statements
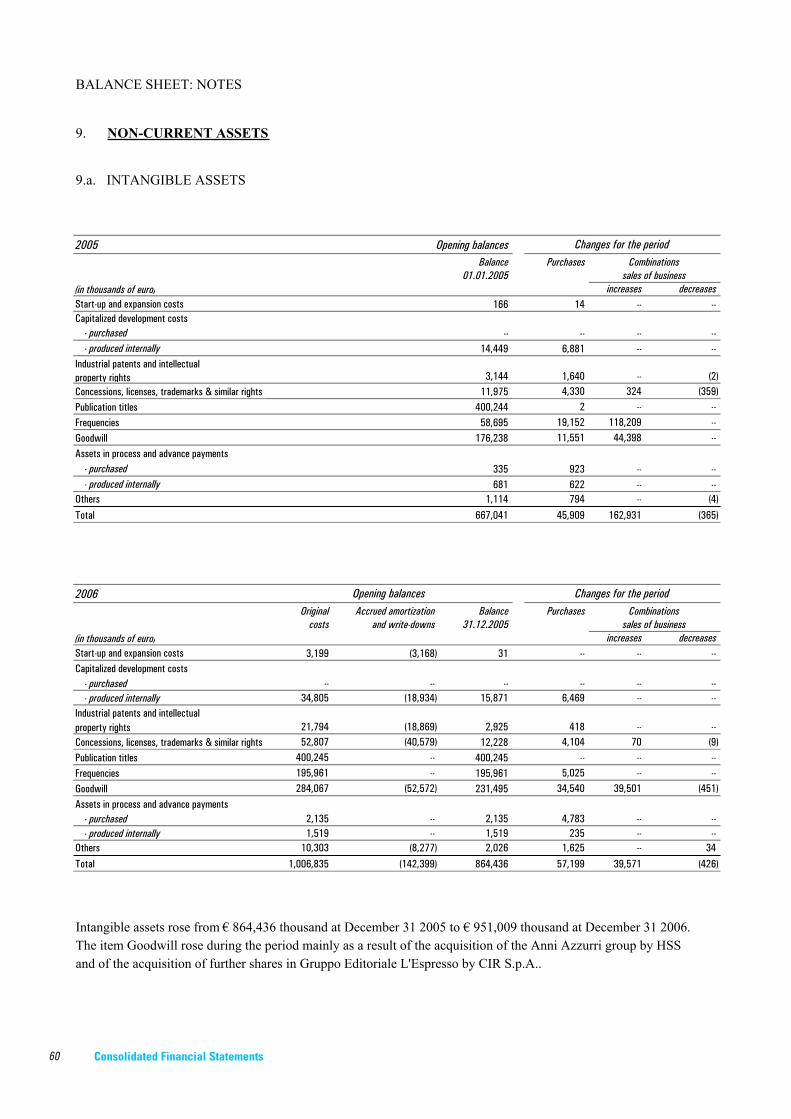
60
BALANCE SHEET: NOTES
9. NON-CURRENT ASSETS
9.a. INTANGIBLE ASSETS
2005 Opening balancesBalance Purchases
01.01.2005(in thousands of euro) increases decreasesStart-up and expansion costs 166 14 -- -- Capitalized development costs
- purchased -- -- -- -- - produced internally 14,449 6,881 -- --
Industrial patents and intellectualproperty rights 3,144 1,640 -- (2)Concessions, licenses, trademarks & similar rights 11,975 4,330 324 (359)Publication titles 400,244 2 -- -- Frequencies 58,695 19,152 118,209 -- Goodwill 176,238 11,551 44,398 -- Assets in process and advance payments
- purchased 335 923 -- -- - produced internally 681 622 -- --
Others 1,114 794 -- (4)Total 667,041 45,909 162,931 (365)
2006Original Accrued amortization Balance Purchases
costs and write-downs 31.12.2005(in thousands of euro) increases decreasesStart-up and expansion costs 3,199 (3,168) 31 -- -- -- Capitalized development costs
- purchased -- -- -- -- -- -- - produced internally 34,805 (18,934) 15,871 6,469 -- --
Industrial patents and intellectualproperty rights 21,794 (18,869) 2,925 418 -- -- Concessions, licenses, trademarks & similar rights 52,807 (40,579) 12,228 4,104 70 (9)Publication titles 400,245 -- 400,245 -- -- -- Frequencies 195,961 -- 195,961 5,025 -- -- Goodwill 284,067 (52,572) 231,495 34,540 39,501 (451)Assets in process and advance payments
- purchased 2,135 -- 2,135 4,783 -- -- - produced internally 1,519 -- 1,519 235 -- --
Others 10,303 (8,277) 2,026 1,625 -- 34 Total 1,006,835 (142,399) 864,436 57,199 39,571 (426)
Intangible assets rose from € 864,436 thousand at December 31 2005 to € 951,009 thousand at December 31 2006.The item Goodwill rose during the period mainly as a result of the acquisition of the Anni Azzurri group by HSSand of the acquisition of further shares in Gruppo Editoriale L'Espresso by CIR S.p.A..
Combinationssales of business
sales of business
Opening balances Changes for the period
Combinations
Changes for the period
Consolidated Financial Statements

61
Exchange rate Other Net Amortization and Original Accrued amortization Balancedifferences changes disposals write-downs costs and write-downs 31.12.2005
costs7 (146) -- (10) 3,199 (3,168) 31
-- -- -- -- -- -- -- 755 (1,233) -- (4,981) 34,805 (18,934) 15,871
29 -- -- (1,886) 21,794 (18,869) 2,925 110 100 -- (4,252) 52,807 (40,579) 12,228
-- -- (1) -- 400,245 -- 400,245-- -- (95) -- 195,961 -- 195,961-- (692) -- -- 284,067 (52,572) 231,495
---- 877 -- -- 2,135 -- 2,135
31 185 -- -- 1,519 -- 1,519 111 195 (1) (183) 10,303 (8,277) 2,026
1,043 (714) (97) (11,312) 1,006,835 (142,399) 864,436
Exchange rate Other Net Amortization and Original Accrued amortization Balancedifferences changes disposals write-downs costs and write-downs 31.12.2006
costs-- (16) -- (4) 38 (27) 11
-- -- -- -- -- -- -- (144) 1,145 (22) (5,508) 44,743 (26,932) 17,811
(2) 85 (1) (1,580) 19,916 (18,071) 1,845 (49) 1,097 (337) (5,484) 57,110 (45,490) 11,620
-- -- -- -- 400,245 -- 400,245-- -- (414) -- 200,572 -- 200,5721 57 -- -- 359,739 (54,596) 305,143
(70) (1,976) -- -- 4,872 -- 4,872 (19) -- (33) -- 1,702 -- 1,702 (44) 3,970 -- (423) 15,129 (7,941) 7,188
(327) 4,362 (807) (12,999) 1,104,066 (153,057) 951,009
Changes in the period
Closing BalancesChanges in the period
Closing Balances
Consolidated Financial Statements

62
AMORTIZATION RATES
Description %
Capitalized development costs 20-33%
Industrial patents and intellectual property rights 4-20%
Concessions, licences, trademarks and similar rights 16-30%
Other intangible assets 16-30%
A more detailed analysis of the main items of intangible assets is given in the following charts.
Publication titles: (in thousands of euro) 31.12.2006 31.12.2005
la Repubblica 229,952 229,952
Il Piccolo / Messaggero Veneto 104,527 104,527
Other local newspapers 61,222 61,222
Other titles 4,544 4,544
Total 400,245 400,245
Frequencies: (in thousands of euro) 31.12.2006 31.12.2005
Radio frequencies 63,491 58,937
Television frequencies 137,081 137,024
Total 200,572 195,961
Goodwill:(in thousands of euro) 31.12.2006 31.12.2005
Gruppo Editoriale L’Espresso S.p.A. 116,307 98,447
Sogefi S.p.A. 91,293 91,292
Energia Holding S.p.A. 23,602 22,463
Holding Sanità e Servizi S.p.A. 73,941 19,293
Total 305,143 231,495
Consolidated Financial Statements

63
For the purposes of carrying out the impairment test on goodwill, the estimate of the value recov-erable for each cash generating unit, as defined by IAS 38, was carried out on the basis of the value in use calculated by discounting to net present value, at an appropriate discount rate, the fu-ture cash flows generated by the unit in its productive phase and at the moment of its disposal (discounted cash flow method). The cash flows of the single operating units were extrapolated from the budgets and forecasts made by management. These plans were then processed on the basis of economic trends recorded in previous years and using the forecasts made by top analysts on the outlook for the respective markets and more in general on the evolution of each business sector. In order to determine the discount rate to use, an estimate was made of the weighted average cost of capital invested (WACC) net of inflation, gross of taxes and independently of the financial structure of the individual company/subgroup. The impairment tests carried out using the cash flow method and other methods of valuation showed that there had been no losses of value.
Consolidated Financial Statements

64
9.b. TANGIBLE ASSETS
2005 Opening balancesNet balance Purchases01.01.2005
(in thousands of euro) increases decreasesLand 26,217 268 -- (1,213)Buildings used for business 122,622 1,747 4,246 (12,506)Property, plant and equipment 311,250 22,164 6,217 (7,325)Power stations 5,232 26 -- -- Industrial and commercial equipment 13,060 5,609 284 (101)Other assets 36,658 16,316 1,245 (1,299)Assets in process and advance payments 243,264 185,380 -- -- Total 758,303 231,510 11,992 (22,444)
2006Original Accrued depreciation Net balance Purchases
cost and write-downs 31.12.2005(in thousands of euro) increases decreasesLand 26,533 (152) 26,381 1,206 2,775 -- Buildings used for business 202,408 (89,028) 113,380 2,240 43,785 -- Property, plant and equipment 917,526 (613,797) 303,729 24,290 14,098 (82)Power stations 5,928 (949) 4,979 255 501 -- Industrial and commercial equipment 100,800 (84,094) 16,706 5,723 2,309 (249)Other assets 153,349 (111,494) 41,855 15,189 16,422 (195)Assets in process and advance payments 390,942 -- 390,942 149,369 2,517 -- Total 1,797,486 (899,514) 897,972 198,272 82,407 (526)
DEPRECIATION RATES
Description %
Buildings used for business 3.00%Plant and machinery 10.00-25.00%
Other assets:
- Electronic office equipment 20.00%- Furniture and fittings 12.00%- Motor vehicles 25.00%
Opening balances Changes during the period
Combinationssales of businesses
Changes during the period
Combinationssales of businesses
Consolidated Financial Statements
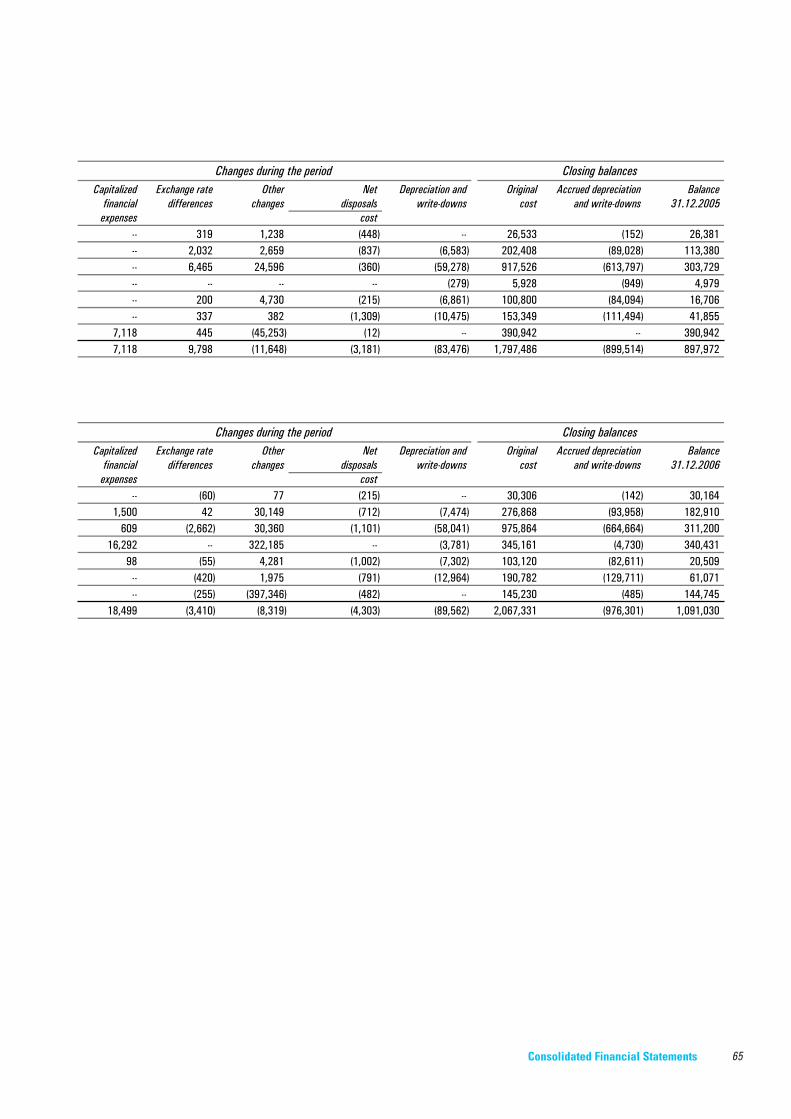
65
Capitalized Exchange rate Other Net Depreciation and Original Accrued depreciation Balancefinancial differences changes disposals write-downs cost and write-downs 31.12.2005
expenses cost-- 319 1,238 (448) -- 26,533 (152) 26,381 -- 2,032 2,659 (837) (6,583) 202,408 (89,028) 113,380 -- 6,465 24,596 (360) (59,278) 917,526 (613,797) 303,729 -- -- -- -- (279) 5,928 (949) 4,979 -- 200 4,730 (215) (6,861) 100,800 (84,094) 16,706 -- 337 382 (1,309) (10,475) 153,349 (111,494) 41,855
7,118 445 (45,253) (12) -- 390,942 -- 390,942 7,118 9,798 (11,648) (3,181) (83,476) 1,797,486 (899,514) 897,972
Capitalized Exchange rate Other Net Depreciation and Original Accrued depreciation Balancefinancial differences changes disposals write-downs cost and write-downs 31.12.2006
expenses cost-- (60) 77 (215) -- 30,306 (142) 30,164
1,500 42 30,149 (712) (7,474) 276,868 (93,958) 182,910 609 (2,662) 30,360 (1,101) (58,041) 975,864 (664,664) 311,200
16,292 -- 322,185 -- (3,781) 345,161 (4,730) 340,431 98 (55) 4,281 (1,002) (7,302) 103,120 (82,611) 20,509
-- (420) 1,975 (791) (12,964) 190,782 (129,711) 61,071 -- (255) (397,346) (482) -- 145,230 (485) 144,745
18,499 (3,410) (8,319) (4,303) (89,562) 2,067,331 (976,301) 1,091,030
Changes during the period Closing balances
Closing balancesChanges during the period
Consolidated Financial Statements
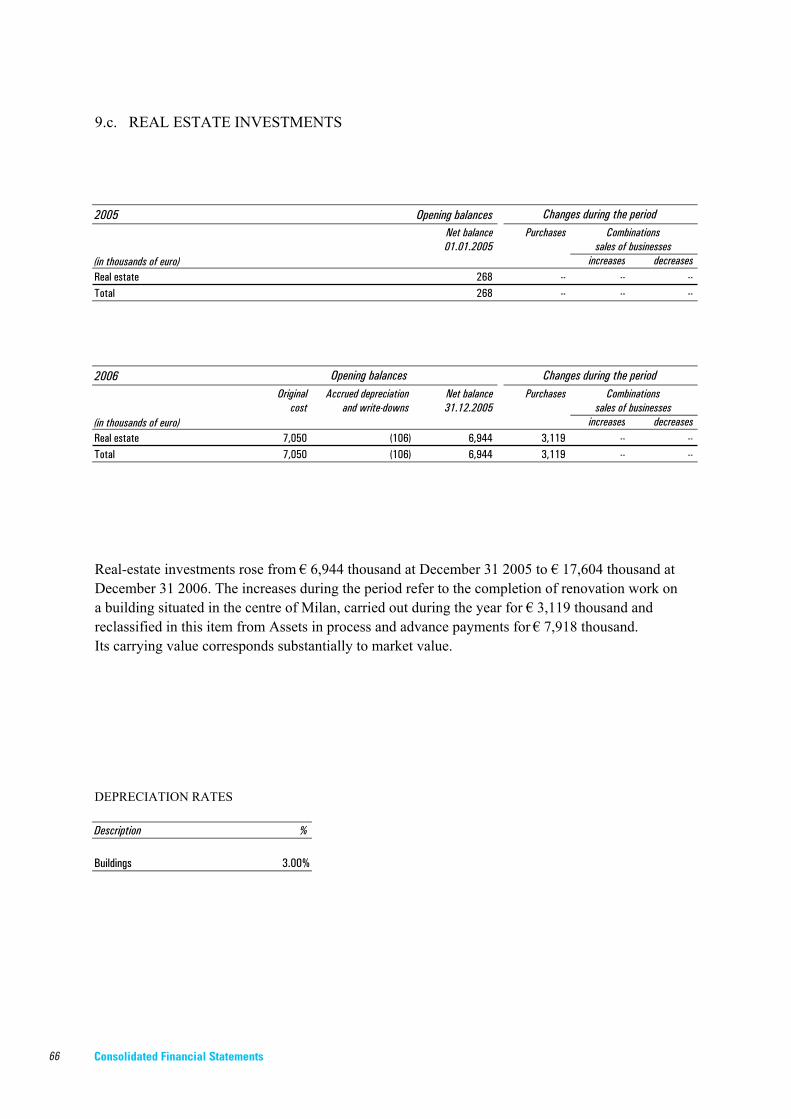
66
9.c. REAL ESTATE INVESTMENTS
2005 Opening balancesNet balance Purchases01.01.2005
(in thousands of euro) increases decreasesReal estate 268 -- -- -- Total 268 -- -- --
2006Original Accrued depreciation Net balance Purchases
cost and write-downs 31.12.2005(in thousands of euro) increases decreasesReal estate 7,050 (106) 6,944 3,119 -- -- Total 7,050 (106) 6,944 3,119 -- --
Real-estate investments rose from € 6,944 thousand at December 31 2005 to € 17,604 thousand atDecember 31 2006. The increases during the period refer to the completion of renovation work ona building situated in the centre of Milan, carried out during the year for € 3,119 thousand and reclassified in this item from Assets in process and advance payments for € 7,918 thousand.Its carrying value corresponds substantially to market value.
DEPRECIATION RATES
Description %
Buildings 3.00%
Combinationssales of businesses
Opening balances Changes during the period
sales of businesses
Changes during the periodCombinations
Consolidated Financial Statements

67
Capitalized Exchange rate Other Net Depreciation and Original Accrued depreciation Balancefinancial differences changes disposals write-downs cost and write-downs 31.12.2005
expenses cost-- -- 6,782 -- (106) 7,050 (106) 6,944 -- -- 6,782 -- (106) 7,050 (106) 6,944
Capitalized Exchange rate Other Net Depreciation and Original Accrued depreciation Balancefinancial differences changes disposals write-downs cost and write-downs 31.12.2006
expenses cost-- -- 7,918 -- (377) 18,087 (483) 17,604 -- -- 7,918 -- (377) 18,087 (483) 17,604
Changes during the period Closing balances
Changes during the period Closing balances
Consolidated Financial Statements

68
LEASING
The position of assets under leasing as of December 31 2006 and of restrictions applied to tangi-ble assets on account of guarantees and commitments is as follows:
(in thousands of euro) Gross leasing amount Accrued depreciation Restrictions for guarantees and commitments
2006 2005 2006 2005 2006 2005Land 3,556 827 -- -- 1,851 2,678
Buildings 54,403 14,844 4,340 2,914 36,573 6,939
Property, plant and equipment 32,382 24,104 12,999 11,408 569,392 251,558
Other assets 2,937 1,498 804 477 4,910 341,069
9.d. INVESTMENTS IN COMPANIES VALUED AT EQUITY
(in thousands of euro)
2005 % Balance Increases Decreases Dividends Contributions Other Balance 01.01.2005 Loss Income changes 31.12.2005
Aire/Tirreno Power (*) 50.00 170,688 -- -- -- -- 19,762 3,295 193,745
Le Scienze S.p.A. 50.00 185 -- -- (121) -- 284 -- 348
Saire S.r.l. 50.00 348 -- -- -- -- 15 -- 363
Editoriale La Libertà S.p.A. 35.00 22,691 -- -- (875) -- 917 (190) 22,543
Altrimedia S.p.A. 35.00 683 -- -- (140) -- 128 -- 671
Allevard Ressorts Composites S.A. 50.00 392 -- -- -- (20) -- -- 372
KS Automotive Suspensions Asia Private Ltd 50.00 5,562 -- -- -- (2,490) -- (72) 3,000
Total 200,549 -- -- (1,136) (2,510) 21,106 3,033 221,042
(*) On June 30 2005 the merger by incorporation of Aire into Tirreno Power became effective. Following the merger by incorporation of the controlling com-pany (a reverse merger), Tirreno Power is now controlled equally by Energia Italiana and Eblacea
(in thousands of euro)
2006 % Balance Increases Decreases Dividends Contributions Other Balance 31.12.2005 Loss Income changes 31.12.2006
Aire/Tirreno Power 50.00 193,745 -- -- (39,960) -- 33,018 252 187,055
Le Scienze S.p.A. 50.00 348 -- (285) -- -- 129 -- 192
Saire S.r.l. 50.00 363 -- -- -- -- 16 -- 379
Editoriale La Libertà S.p.A. 35.00 22,543 -- (875) -- -- 1,072 -- 22,740
Editoriale Corriere di Romagna S.r.l. 49.00 -- 2,940 -- -- -- 41 -- 2,981
Altrimedia S.p.A. 35.00 671 -- (105) -- -- 149 -- 715
Allevard Ressorts Composites S.A. 50.00 372 -- -- -- (271) -- -- 101
KS Automotive Suspensions Asia Private Ltd -- 3,000 -- (3,000) -- -- -- -- --
Total 221,042 2,940 (4,265) (39,960) (271) 34,425 252 214,163
Consolidated Financial Statements
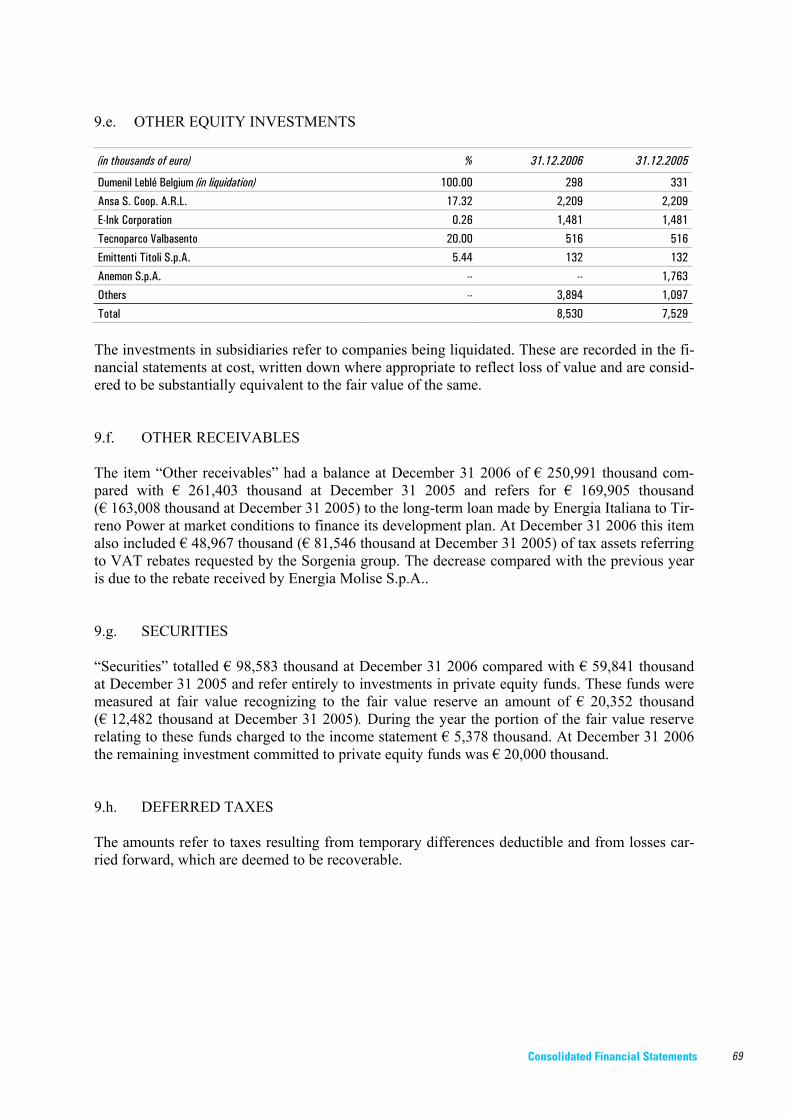
69
9.e. OTHER EQUITY INVESTMENTS
(in thousands of euro) % 31.12.2006 31.12.2005
Dumenil Leblé Belgium (in liquidation) 100.00 298 331
Ansa S. Coop. A.R.L. 17.32 2,209 2,209
E-Ink Corporation 0.26 1,481 1,481
Tecnoparco Valbasento 20.00 516 516
Emittenti Titoli S.p.A. 5.44 132 132
Anemon S.p.A. -- -- 1,763
Others -- 3,894 1,097
Total 8,530 7,529
The investments in subsidiaries refer to companies being liquidated. These are recorded in the fi-nancial statements at cost, written down where appropriate to reflect loss of value and are consid-ered to be substantially equivalent to the fair value of the same.
9.f. OTHER RECEIVABLES
The item “Other receivables” had a balance at December 31 2006 of € 250,991 thousand com-pared with € 261,403 thousand at December 31 2005 and refers for € 169,905 thousand (€ 163,008 thousand at December 31 2005) to the long-term loan made by Energia Italiana to Tir-reno Power at market conditions to finance its development plan. At December 31 2006 this item also included € 48,967 thousand (€ 81,546 thousand at December 31 2005) of tax assets referring to VAT rebates requested by the Sorgenia group. The decrease compared with the previous year is due to the rebate received by Energia Molise S.p.A..
9.g. SECURITIES
“Securities” totalled € 98,583 thousand at December 31 2006 compared with € 59,841 thousand at December 31 2005 and refer entirely to investments in private equity funds. These funds were measured at fair value recognizing to the fair value reserve an amount of € 20,352 thousand (€ 12,482 thousand at December 31 2005). During the year the portion of the fair value reserve relating to these funds charged to the income statement € 5,378 thousand. At December 31 2006 the remaining investment committed to private equity funds was € 20,000 thousand.
9.h. DEFERRED TAXES
The amounts refer to taxes resulting from temporary differences deductible and from losses car-ried forward, which are deemed to be recoverable.
Consolidated Financial Statements

70
The breakdown of “Deferred tax assets and liabilities” by type of temporary difference, is as fol-lows:
(in thousands of euro) 2006 2005 Amount
of temporarydifferences
Taxeffect
Amountof temporary
differencesTax
effect
Temporary difference liabilities from: - write-down of current assets 46,286 16,257 37,362 13,208 - write-down of fixed assets 40,816 14,096 29,419 15,104
- revaluation of current liabilities 8,545 2,734 24,845 7,669
- revaluation of personnel provisions 38,484 12,676 9,332 3,069
- revaluation of provisions for risks and losses 41,041 13,366 63,232 18,179
- write-down of financial instruments 10,810 3,644 12,029 4,094
- tax losses of prior periods 143,379 47,853 64,100 21,068
Total deferred tax assets 329,361 110,626 240,319 82,391
Temporary difference assets from: - revaluation of current assets 4,626 1,499 3,300 1,117 - revaluation of fixed assets 356,276 128,871 325,895 117,159
- write-down of current liabilities 4,704 1,513 6,995 1,850
- valuation of personnel provisions 7,558 2,504 6,871 2,282
- write-down of provisions for risks and losses 2,391 806 191 633
- revaluation of financial instruments 6,905 2,550 8,755 3,219
Total deferred tax liabilities 382,460 137,743 352,007 126,260
Net deferred taxes (27,117) (43,869)
The deferred taxes credited directly to shareholders’ equity during the period amounted to € 528 thousand.
Earlier losses not utilized for the calculation of deferred taxes refer to the Espresso group for € 18 million, the company CIR International for € 541.5 million that can be carried forward indefi-nitely and the Sogefi group for € 10 million. It should be pointed out that no deferred tax assets were calculated for these losses because at present conditions are such that there is no certainty that they can be recovered.
Consolidated Financial Statements

71
10. CURRENT ASSETS
10.a. INVENTORIES
Inventories can be broken down as follows:
(in thousands of euro) 31.12.2006 31.12.2005
Raw materials, secondary materials and consumables 76,973 72,304
Work in progress and semi-finished goods 13,033 13,579
Finished goods and merchandise 127,043 76,948
Advance payments 33 33
Total 217,082 162,864
Inventories of finished goods and merchandise rose mainly as a result of the higher volumes of gas stored for marketing and sale by Sorgenia S.p.A.. The value of stocks is shown net of any write-down made either in past periods or in this current one and take into account the degree of obsolescence of finished goods, merchandise and secon-dary materials.
10.b. TRADE RECEIVABLES
(in thousands of euro) 31.12.2006 31.12.2005
Receivables - clients 988,534 784,505
Receivables – subsidiaries 6,914 5,665
Receivables – affiliated companies 1,029 574
Total 996,477 790,744
“Receivables - clients” are non-interest bearing and have an average maturity in line with market conditions. The net increase is mainly due to the increase in revenues. Trade receivables are shown net of any write-downs accounting for credit risk. During 2006 pro-visions were made to the reserve for the write-down of receivables for the sum of € 10,515 thou-sand compared with € 7,228 thousand in 2005.
“Receivables - subsidiaries” represent intercompany receivables not eliminated because they refer to companies not fully consolidated line-by-line. The balance at December 31 2006 refers mainly to receivables from CIGA Luxembourg.
10.c. OTHER RECEIVABLES
(in thousands of euro) 31.12.2006 31.12.2005
Financial receivables from affiliated companies -- 256
Tax receivables 163,862 146,327
Receivables – others 110,130 54,779
Total 273,992 201,362
Consolidated Financial Statements

72
“Tax receivables” amounted to € 163,862 thousand up from € 146,327 thousand at December 31 2005. The rise in the balance of this item is mainly due to the higher VAT receivable of Energia Molise S.p.A. linked to the investment in the Termoli power plant and to higher duties due to in-creased volumes in the Sorgenia group.
10.d. FINANCIAL RECEIVABLES
“Financial receivables” declined from € 26,513 thousand at December 31 2005 to € 21,354 thou-sand at December 31 2006 and refer essentially to the fair value of outstanding interest rate swap contracts on Bonds.
10.e. SECURITIES
This item consists of the following categories of securities:
(in thousands of euro) 31.12.2006 13.12.2005
Italian Government securities or equivalent securities 25,208 41,093
Investments funds or similar funds 248,578 53,939
Bonds 49,947 97,203
Certificates of deposit and miscellaneous securities 330,515 275,724
Total 654,248 467,959
(in thousands of euro) 31.12.2006 31.12.2005
Of which held for trading 607,568 438,429Of which in application of the fair value option due to the presence of an implied de-rivative
46,680 29,530
Total 654,248 467,959
The fair value of the item “Securities” involved a negative adjustment to the statement of income of € 13.7 million, of which € 10.9 million referred to securities held for trading.
10.f. AVAILABLE-FOR-SALE FINANCIAL ASSETS
This item refers in its entirety to shares in hedge funds and redeemable shares in asset manage-ment companies held by Medinvest which collects excess liquidity that the Group has available on a regular basis. The degree of liquidity of the investment is a function of the time required for the redemption of the funds in which Medinvest invests, which normally varies from one to three months. Diversification between categories of funds give the performance of Medinvest a low level of volatility. Assigning a fair value to the funds held by Medinvest meant making an adjustment to the value of these funds which at December 31 2006 amounted to € 146,075 thousand (€ 136,524 thou-sands at December 31 2005). The effects of this valuation on CIR’s shareholders’ equity for the amount pertaining to the Group total € 127,115 thousand (€ 118,803 thousand at December 31
Consolidated Financial Statements
73
2005). The amount of fair value recognized to the income statement after the sale of some of the funds came to € 11,508 thousand. To cover the exchange rate risk resulting from the translation of the part of the equity of Medin-vest denominated in $USD into the functional currency of the Group, hedging contracts were en-tered into, the effects of which are indicated under item 11.b. “Reserves” in the breakdown of the ”Translation reserve”.
10.g. CASH AND CASH EQUIVALENTS
Cash and cash equivalents decreased from € 762,289 thousand at December 31 2005 to € 446,484 thousand at December 31 2006. A breakdown of the change during the period is given in the cash flow statement.
11. SHAREHOLDERS’ EQUITY
11.a. SHARE CAPITAL
Share capital rose from € 389,620,833.50 at December 31 2005 (comprising 779,241,667 shares each with a nominal value € 0.50) to € 390,239,533.50 (780,479,067 shares) at December 31 2006 as a result of the issuance of 1,237,400 shares in execution of the exercise of option rights by beneficiaries of stock option plans. At December 31 2006 the Company was holding 34,094,000 of it own shares (4.37% of share capital) for a total value of € 76,884 thousand, up from 27,216,642 shares for a total value of € 61,320 thousand at December 31 2005. In application of IAS 32, as from January 1 2005 the treasury stock held by the Parent Company is being deducted from shareholders’ equity.
The share capital is fully subscribed and paid in. No shares carry any rights, privileges or restric-tions on the distribution of dividends, except for the own shares held a treasury stock.
It should be pointed out that Board of Directors has been given the power for a period of five years starting from April 27 2005 to increase the share capital either in one or several tranches up to a maximum of € 500 million (nominal value) and for a further maximum of € 20 million (nominal value) in favour of employees of the Company and of its subsidiaries and parent com-panies.
Regarding stock option plans, at December 31 2006 there were 41,710,600 options in circulation, corresponding to the same number of shares. The total notional cost of the stock options assigned to employees, which was posted to a special equity reserve, totalled € 2,213 thousand at December 31 2006.
Consolidated Financial Statements

74
11.b. RESERVES
The evolution and breakdown of the item “Reserves” is given below:
(in thousands of euro) Additional Legal Fair value Translation Stock option Other Total paid-in reserve reserve reserve reserve reserves reserves capital
Balance at January 1 2005 7,699 115,969 89,761 (1,389) 1,915 160,573 374,528
Capital increases 2,273 -- -- -- -- -- 2,273
Shareholder resolution to buy back own shares (3,553) -- -- -- -- 15,412 11,859
Fair value recognition of hedging instruments -- -- 1,424 -- -- -- 1,424
Fair value recognition of securities -- -- 47,373 -- -- -- 47,373
Fair value reserve recognized to income statement -- -- (7,608) -- -- -- (7,608)
Buy-back of own shares -- -- -- -- -- (35,879) (35,879)
Recognition of notional cost of stock options -- -- -- -- 5,737 -- 5,737
Effects of equity changes in subsidiaries -- -- -- -- -- (7,087) (7,087)
Currency translation adjustments -- -- -- 9,174 -- -- 9,174
Balance at December 31 2005 6,419 115,969 130,950 7,785 7,652 133,019 401,794
Capital increases 1,076 -- -- -- -- -- 1,076
Cancellation of AGM resolution of April 27 2005 to buy back own shares 16,422 -- -- -- -- (71,238) (54,816)
Fair value recognition of hedging instruments -- -- 478 -- -- -- 478
Fair value recognition of securities -- -- 33,075 -- -- -- 33,075
Fair value reserve recognized to income statement -- -- (16,893) -- -- -- (16,893)
Buy-back of own shares -- -- -- -- -- (5,664) (5,664)
Recognition of notional cost of stock options -- -- -- -- 2,213 -- 2,213
Effects of equity changes in subsidiaries -- -- -- -- -- 20,751 20,751
Currency translation adjustments -- -- -- (14,235) -- -- (14,235)
Balance at December 31 2006 23,917 115,969 147,610 (6,450) 9,865 76,868 367,779
The “Additional paid-in capital” reserve totalled € 23,917 thousand at December 31 2006 com-pared to € 6,419 thousand at December 31 2005. The change is due to the subscription of stock option plans for € 1,076 thousand and for € 16,422 thousand is due to the resolution adopted on April 27 2006 by the Ordinary Shareholders’ Meeting which cancelled the previous resolution of April 27 2005 to buy back own shares, giving a new authorization for eighteen months from the aforesaid date to buy back a maximum of 25,000,000 shares at a minimum price per share of € 0.50 and a maximum of € 4.00.
The “Fair value reserve” totalled € 147,610 thousand at December 31 2006 and referred for € 20,352 thousand to the valuation of “Securities” in item 9.g., for € 127,115 thousand to the valuation of “Available-for-sale financial assets” in item 10.f. and for € 143 thousand to the valuation of hedging instruments.
Consolidated Financial Statements

75
The “Translation reserve” totalled € 6,450 thousand at December 31 2006 and consisted of the following breakdown:
(in thousands of euro)
(in thousands of euro) 31.12.2005 Increases Decreases 31.12.2006
Sogefi group 5,952 -- (976) 4,976
CIR Ventures 1,032 -- (3,246) (2,214)
Medinvest 36,435 -- (33,658) 2,777
Medinvest hedging effect (35,726) 23,645 -- (12,081)
Others 92 -- -- 92
Total 7,785 23,645 (37,880) (6,450)
The item “Other reserves” at December 31 2006 comprised the following:
(in thousands of euro)
Reserve for capital increases 3
Extraordinary reserve 21
Consolidation reserve 76,844
Total 76,868
The movement of treasury stock during the period was as follows:
(in thousands of euro) Number of shares Value
Balance at December 31 2005 27,216,642 61,320
Increases 6,877,358 15,564
Balance at December 31 2006 34,094,000 76,884
11.c. RETAINED EARNING (LOSSES)
The changes in Retained earnings (losses) are shown in the “Chart showing changes in Sharehol- ders’ equity”.
Consolidated Financial Statements

76
12. NON-CURRENT LIABILITIES
12.a. BONDS
The detail of the item “Bonds”, net of intercompany elimination, is as follows:
(in thousands of euro) Effective rate 31.12.2006 Fair value
at 31.12.200631.12.2005 Fair value
at 31.12.2005CIR S.p.A. Bond issue 5.75% 2004/2024 5.90% 266,382 252,445 266,225 262,502
CIR International S.A. Bond issue 6.375% 2003/2011 6.03% 198,677 194,620 199,162 203,870
CIR International S.A. Bond issue 5.25% 1999/2009 5.41% 414,192 414,192 424,769 424,769Gruppo Editoriale L’Espresso S.p.A. Bond issue 5.125% 2004/2014 4.82% 308,499 295,452 309,095 315,558Total 1,187,750 1,156,709 1,199,251 1,206,699
In application of IAS 32 and 39, at January 1 2005 the original values of bonds issued were writ-ten down to account for expenses incurred and bond issuance discounts. Liabilities relating to fi-xed/floating interest rate swaps entered into for hedging purposes were also recognized for an amount of € 5.3 million.
At December 31 2006 CIR International was holding a nominal € 30,000 thousand (unchanged from December 31 2005) of the CIR 5.75% Bond issue 2004/2024.
12.b. OTHER BORROWINGS
(in thousands of euro) 31.12.2006 31.12.2005
Loans from banks secured by collateral 170,304 134,812
Other loans from banks 558,140 496,319
Leasing 16,305 19,799
Other borrowings 13,765 3,855
Total 758,514 654,785
The item “Other loans from banks” consists mainly of the following items:- € 59,000 thousand granted in 2003 to Energia Italiana by Banca Monte dei Paschi di Siena for the acquisition of Tirreno Power, with a maturity of January 2010 and a floating rate of Euribor plus 150 basis points; - € 24,500 thousand made during 2004 to Sorgenia, with a maturity of June 2009 - a syndicated loan organized by Banca Popolare di Vicenza with a floating rate of Euribor plus 140 basis points;- € 30,000 thousand made on December 23 2005 to Sorgenia by Centrobanca with a maturity of December 2009 at a floating rate; - € 254,776 thousand, € 141,673 thousand of which were paid out during the year to Energia Mo-lise by Banca Monte dei Paschi di Siena in relation to the construction of the Termoli thermoelec-tric power plant, maturing 2014 with a floating rate, and a non-recourse basis; - € 10,000 thousand, which refers to the share of a loan made to Sorgenia by Banca Monte dei Paschi di Siena at a floating rate and a maturity of 2011; - € 50,000 thousand, made to Sorgenia by Intesa BCI at a floating rate with a maturity of 2011;
Consolidated Financial Statements

77
- € 40,000 thousand, made during 2003 to Sogefi, as partial drawdown of a syndicated loan facil-ity of € 100,000 thousand, with a maturity of December 2008 and a floating rate of Euribor plus 60 basis points; - € 29,900 thousand, as partial drawdown of a loan agreement of € 50,000 thousand, entered into by Sogefi S.p.A. during the year with a maturity of September 2011 and a floating rate of Euribor plus 22.5 basis points; - € 29,800 thousand, as partial drawdown of a loan agreement of € 100,000 thousand, entered into by Sogefi S.p.A. during the year with a maturity of September 2011 and a floating rate of Euribor plus 22.5 basis points.
12.c. PERSONNEL OBLIGATIONS
The detail of this item is the following:
(in thousands of euro) 31.12.2006 31.12.2005
Employee severance and leaving indemnity fund (TFR) 126,794 120,431
Retirement fund and similar obligations 39,805 43,240
Total 166,554 163,671
(in thousands of euro) 31.12.2006 31.12.2005
Starting balance 163,671 157,759
Provisions made for work done during the period 18,924 16,522
Increases for interest 5,416 5,804
Actuarial income or expense (781) 1,763
Benefits paid out (25,734) (17,153)
Increases or decreases due to changes in consolidation area 5,018 (1,809)
Other changes 40 785
Closing balance 166,554 163,671
In compliance with IAS 19, personnel funds were valued using special actuarial methods based on demographic, economic and financial factors. The application of the corridor method generated an actuarial cost not recognized to the Income Statement of € 5,008 thousand. The data used for calculating the TFR fund, Pensions funds and the Defined Benefit Plan in-cluded in the item “Retirement funds and similar obligations” are summarized in the following chart:
TFR and Defined Benefit Provisions
Annual discount rate for calculating present value 4.0% - 4.25%
Annual inflation rate 2%
Annual rate of pay increases 2% - 3%
Annual rate of TFR increase 3%
Annual payout probability rate 4%
Voluntary resignation rate 2% - 5% of staff
Consolidated Financial Statements

78
Pension Funds
Annual discount rate for calculating present value 4.8%
Annual inflation rate 2.8%
Annual rate of pay increases 3.25% - 4%
Return on assets servicing the plan 3.25% - 6%
Retirement age 63
STOCK OPTION PLANS OUTSTANDING AT DECEMBER 31 2006
The following chart shows the stock option plans of the Parent Company CIR S.p.A..
Options in circulation at the beginning of the year
Options awarded during the year
Options exercised during the year
Options in circulation at the end of the year
Options exercisable at the end of the year
No. of options
Weighted average
strike price
No. of options
Weighted average
strike price
No. of options
Weighted average
strike price
No. of options
Weighted average
strike price
Average duration (years)
No. of options
Weighted average
strike price
Stock Option Plan March 7 2000 3,110,000 3.70 -- -- -- -- 3,110,000 3.70 3.75 3,110,000 3.70
Stock Option Plan September 13 2000 70,000 4.06 -- -- -- -- 70,000 4.06 4.25 70,000 4.06
Stock Option Plan January 30 2001 1,743,000 2.62 -- -- -- -- 1,743,000 2.62 4.75 1,743,000 2.62
Stock Option Plan September 7 2001 2,359,600 1.28 -- -- 100,800 1.28 2,258,800 1.28 5.00 2,258,800 1.28
Stock Option Plan March 14 2002 578,600 1.20 -- -- 70,300 1.20 508,300 1.20 5.75 508,300 1.20
Stock Option Plan September 13 2002 769,400 1.02 -- -- 82,300 1.02 687,100 1.02 6.17 687,100 1.02
Stock Option Plan March 7 2003 1,141,800 0.84 -- -- 436,500 0.84 705,300 0.84 6.75 468,550 0.84
Stock Option Plan September 5 2003 1,353,800 1.13 -- -- 99,000 1.13 1,254,800 1.13 7.17 747,700 1.13
Stock Option Plan March 12 2004 2,031,900 1.60 -- -- 91,500 1.60 1,940,400 1.60 7.75 1,075,100 1.60
Stock Option Plan June 8 2004 3,500,000 1.60 -- -- -- -- 3,500,000 1.60 2.46 3,500,000 1.60
Stock Option Plan September 6 2004 2,212,100 1.56 -- -- 96,600 1.56 2,115,500 1.56 8.17 921,800 1.56
Stock Option Plan March 11 2005 4,407,800 2.34 -- -- 175,400 2.34 4,232,400 2.34 8.75 1,663,000 2.34
Stock Option Plan September 6 2005 2,790,000 2.49 -- -- 85,000 2.49 2,705,000 2.49 9.17 752,000 2.49
Stock Option Plan 2006 1st tranche 2,765,000 2.50 -- -- 2,765,000 2.50 10.01 331,800 2.50
Stock Option Plan 2006 2nd tranche 2,765,000 2.47 -- -- 2,765,000 2.47 10.50 -- --
Total 26,068,000 2.03 5,530,000 2.49 1,237,400 1.37 30,360,600 2.14 6.98 17,837,150 2.08
TREASURY STOCK HELD
Stock Option Plan January 11 2005 11,550,000 2.15 -- -- 200,000 2.15 11,350,000 2.15 3.33 11,350,000 2.15
Total 11,550,000 2.15 -- -- 200,000 2.15 11,350,000 2.15 3.33 11,350,000 2.15
Grand total 37,618,000 2.07 5,530,000 2.49 1,437,400 1.48 41,710,600 2.14 5.99 29,187,150 2.11
Consolidated Financial Statements

79
12.d. PROVISIONS FOR RISKS AND LOSSES
The breakdown and changes in the non-current part of these provisions is as follows:
(in thousands of euro) Provision for
disputes in progressProvision for
restructuring chargesProvisions for
miscellaneous risks Total
Balance at December 31 2005 19,925 15,597 6,943 42,465
Sums set aside during the period 2,938 5,488 2,680 11,106
Withdrawals (1,696) (14,941) (1,520) (18,157)
Exchange rate differences (140) 14 (11) (137)
Other changes (3,952) (253) 5,609 1,404
Balance at December 31 2006 17,075 5,905 13,701 36,681
The breakdown and changes in the current part of these provisions is as follows:
(in thousands of euro) Provision for
disputes in progressProvision for
restructuring chargesProvisions for
miscellaneous risks Total
Balance at December 31 2005 5,326 2,829 35,451 43,606
Sums set aside during the period 1,961 2,301 11,671 15,933
Withdrawals (3,341) (1,327) (6,957) (11,625)
Other changes 2,867 253 (3,571) (451)
Balance at December 31 2006 6,813 4,056 36,594 47,463
Apart from the libel disputes regarding the Espresso group, which are typical of all publishing businesses, the Provision for disputes in progress includes risks for disputes of a commercial na-ture and labour disputes. The Provision for restructuring charges includes sums set aside for restructuring action that has been announced to the parties concerned and in particular refers to the production reorganization programs of the Sogefi group. The Provisions for miscellaneous risks is mainly to cover tax disputes outstanding with local tax authorities.
13. CURRENT LIABILITIES
13.a. OTHER BORROWINGS
(in thousands of euro) 31.12.2006 31.12.2005
Loans from banks secured by collateral 43,339 12,023
Other loans from banks 30,211 109,811
Leasing 2,602 2,910
Other borrowings 57,752 50,887
Loans from subsidiaries 230 250
Total 134,134 175,881
Consolidated Financial Statements

80
The item “Other loans from banks” at December 31 2005 included a loan of € 80,000 thousand made in 2001 to Sogefi and repaid in December 2006.
13.b. TRADE PAYABLES
(in thousands of euro) 31.12.2006 31.12.2005
Payables - subsidiaries 16,928 16,560
Payables - affiliated companies 639 694
Payables - suppliers 730,658 629,809
Advance payments 627 2,052
Payables in the form of notes 49 651
Total 748,901 649,766
The item “Payables - subsidiaries” refers mainly to the trade payable due by Sorgenia S.p.A. to Tirreno Power S.p.A..
Trade payables are settled on average between 60 and 90 days and are not subject to interest.
13.c. OTHER PAYABLES
(in thousands of euro) 31.12.2006 31.12.2005
Due to employees 65,913 58,617
Tax payables 111,267 60,555
Social security payables 34,385 32,635
Other payables 62,397 61,961
Total 273,962 213,768
Consolidated Financial Statements

81
INCOME STATEMENT: NOTES
14. REVENUES
BREAKDOWN BY BUSINESS SECTOR
(in millions of euro) 2006 2005 Changeamount % amount % %
Utilities 1,916.1 46.3 1,225.2 36.2 56.4
Media 1,102.6 26.7 1,079.9 31.9 2.1
Automotive components 1,018.6 24.6 1,023.4 30.3 (0.5)
Healthcare 99.2 2.4 53.8 1.6 84.4
Others 0.3 -- 0.4 -- n.s.
Total consolidated revenues 4,136.8 100.0 3,382.7 100.0 22.3
BREAKDOWN BY GEOGRAPHICAL AREA
(in millions of euro) 2006 Total Italy Other European North South Asia Other revenues countries America America Countries
Utilities 1,916.1 1,913.3 2.8 -- -- -- --
Media 1,102.6 1,102.6 -- -- -- -- --
Automotive components 1,018.6 98.5 757.5 25.1 123.4 9.6 4.5
Healthcare 99.2 99.2 -- -- -- -- --
Others 0.3 0.3 -- -- -- -- --
Total consolidated revenues 4,136.8 3,213.9 760.3 25.1 123.4 9.6 4.5
Percentage 100.0% 77.7% 18.4% 0.6% 3.0% 0.2% 0.1%
(in millions of euro)
2005 Total Italy Other European North South Asia Other revenues countries America America Countries
Utilities 1,225.2 1,225.2 -- -- -- -- --
Media 1,079.9 1,079.9 -- -- -- -- --
Automotive components 1,023.4 111.9 756.2 29.9 112.2 9.7 3.5
Healthcare 53.8 53.8 -- -- -- -- --
Others 0.4 0.4 -- -- -- -- --
Total consolidated revenues 3,382.7 2,471.2 756.2 29.9 112.2 9.7 3.5
Percentage 100.0% 73.1% 22.3% 0.9% 3.3% 0.3% 0.1%
The types of products marketed by the Group and the nature of the business sectors in which it operates mean that revenues flows are reasonably linear throughout the year and are not subject to any particular cyclical phenomena provided that the basis of consolidation remains unchanged.
Consolidated Financial Statements

82
15. OPERATING COSTS AND REVENUES
15.a. COSTS FOR THE PURCHASE OF GOODS
This item rose from € 1,818,934 thousand in 2005 to € 2,457,185 thousand in 2006. The increase recorded (+35.1%) is mainly attributable on the one hand to the Sorgenia group, be-ing closely connected to the rate of revenue growth in the utilities sector (+56.4%), and on the other hand to the Sogefi group as a result of the rise in the cost of steel and in production volumes.
15.b. COSTS FOR SERVICES
This item rose from € 674,847 thousand in 2005 to € 711,792 thousand in 2006, as can be seen from the following breakdown:
(in thousands of euro) 2006 2005
Technical and professional consulting 95,407 83,977
Distribution and transportation costs 45,727 47,508
Outsourcing 110,514 127,524
Other expenses 460,144 415,838
Total 711,792 674,847
The rise in costs for services (+5.5%) was however in part due to the increased turnover of the Group which in turn led to a greater need for external services.
15.C. PERSONNEL EXPENSES
Personnel expenses totalled € 575,342 thousand in 2006 (€ 545,777 thousand in 2005).
The Group had an average of 10,654 employees in 2006.
(in thousands of euro) 2006 2005
Salaries and wages 396,869 375,378
Social security contributions 121,902 117,329
Severance and leaving indemnity 14,099 14,800
Retirement and similar benefits 4,007 5,238
Valuation of stock option plans 9,726 11,000
Other costs 28,739 22,032
Total 575,342 545,777
Consolidated Financial Statements

83
15.d. OTHER OPERATING REVENUES
This item can be broken down as follows:
(in thousands of euro) 2006 2005
State grants and contributions 6,608 21,916
Capital gains on disposals 5,008 1,201
Non-recurring gains and other income 68,647 69,326
Total 80,263 92,443
The item “Non-recurring gains and other income” was positively affected by the penalties billed by the Sorgenia group to the EPC Contractor as “liquidated damage cost”.
15.e. OTHER OPERATING COSTS
This item can be broken down as follows:
(in thousands of euro) 2006 2005
Write-downs and losses on receivables 12,070 10,289
Provisions made for risks and losses 9,430 13,018
Indirect taxes 17,589 15,727
Taxes relating to prior periods 24 16,371
Restructuring charges 5,234 12,513
Capital losses on disposal of assets 209 1,172
Non-recurring losses and other charges 22,095 13,358
Total 66,651 82,448
The balance of the item “Taxes relating to prior periods” for 2005 included € 16,059 thousand of taxes for the year 1989, relating to charges and tax credits concerning voting rights on shares. These tax liabilities were the result of an unfavourable ruling by the Tax Commission against which an appeal has been lodged.
The item “Restructuring charges” went down by € 7,279 thousand from the previous year because less restructuring was carried out than in the previous year mainly in the Sogefi group.
Consolidated Financial Statements
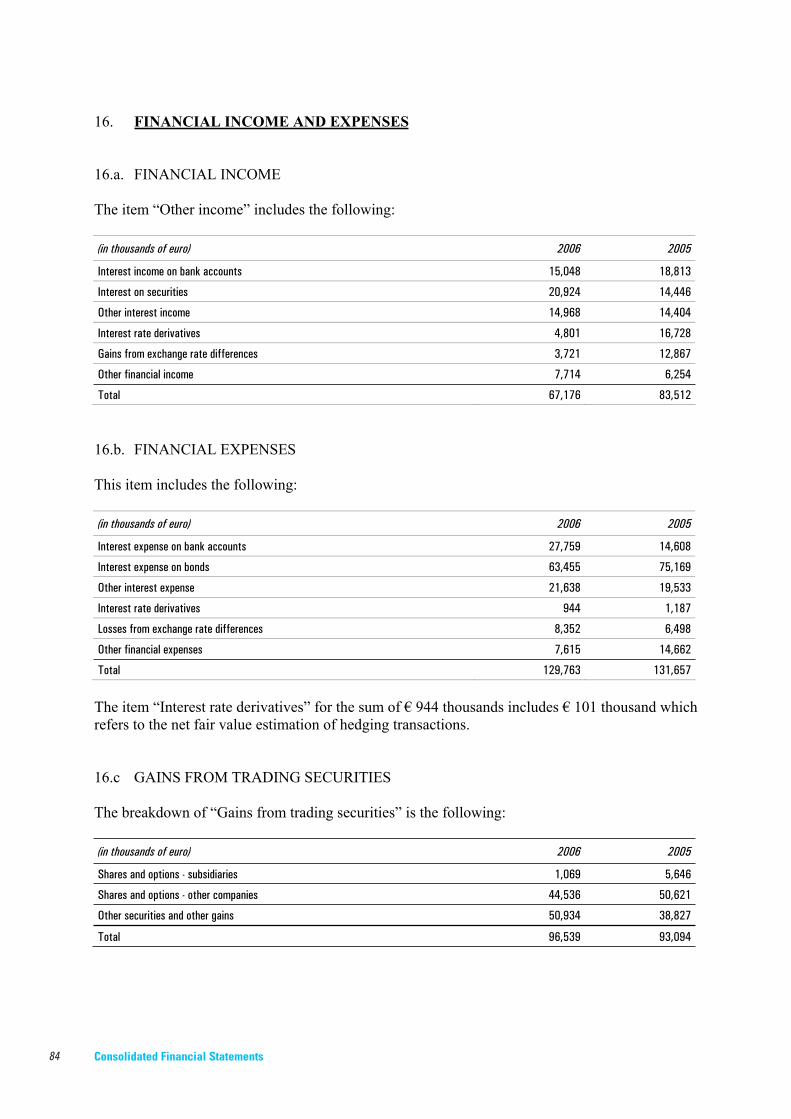
84
16. FINANCIAL INCOME AND EXPENSES
16.a. FINANCIAL INCOME
The item “Other income” includes the following:
(in thousands of euro) 2006 2005
Interest income on bank accounts 15,048 18,813
Interest on securities 20,924 14,446
Other interest income 14,968 14,404
Interest rate derivatives 4,801 16,728
Gains from exchange rate differences 3,721 12,867
Other financial income 7,714 6,254
Total 67,176 83,512
16.b. FINANCIAL EXPENSES
This item includes the following:
(in thousands of euro) 2006 2005
Interest expense on bank accounts 27,759 14,608
Interest expense on bonds 63,455 75,169
Other interest expense 21,638 19,533
Interest rate derivatives 944 1,187
Losses from exchange rate differences 8,352 6,498
Other financial expenses 7,615 14,662
Total 129,763 131,657
The item “Interest rate derivatives” for the sum of € 944 thousands includes € 101 thousand which refers to the net fair value estimation of hedging transactions.
16.c GAINS FROM TRADING SECURITIES
The breakdown of “Gains from trading securities” is the following:
(in thousands of euro) 2006 2005
Shares and options - subsidiaries 1,069 5,646
Shares and options - other companies 44,536 50,621
Other securities and other gains 50,934 38,827
Total 96,539 93,094
Consolidated Financial Statements

85
16.d. LOSSES FROM TRADING SECURITIES
The breakdown of “Losses from trading securities” is the following:
(in thousands of euro) 2006 2005
Shares and options - subsidiaries 2,384 4,175
Shares and options - other companies 40,061 49,957
Other securities and other losses 11,585 11,395
Total 54,030 65,527
17. INCOME TAXES
Income taxes can be broken down as follows:
(in thousands of euro) 2006 2005
Current taxes 104,447 77,483
Deferred taxes (14,969) (12,730)
Total 89,478 64,753
The following chart shows the reconciliation of the ordinary tax rate and the effective tax rate for financial year 2006:
(in thousands of euro) 2006
Pre-tax income resulting from financial statements 303,918
Theoretical income taxes 100,294
Tax effect of non-deductible costs 13,508
Tax effect of losses of prior periods that generate deferred tax assets in the period (39,491)
Tax effect of losses of prior periods that did not generate deferred tax assets 2,763
Tax effect on interest rate differentials of foreign companies (6,065)
Non-taxable grants (998)
Other (8,629)
Income taxes 61,382
Average effective tax rate 20.20%
Theoretical tax rate 33.00%
IRAP and other taxes 28,096
Total taxes from financial statements 89,478
18. EARNINGS PER SHARE
The basic earnings per share is calculated by dividing the net income for the period attributable to ordinary Shareholders by the weighted average number of shares in circulation. The diluted earn-ings per share is calculated by dividing the net income for the period attributable to ordinary
Consolidated Financial Statements

86
Shareholders by the weighted average number of ordinary shares in circulation during the period, adjusted for the capital dilution effects of any options outstanding. The calculation of the shares in circulation does not include own shares held as treasury stock. The company has only one category of potential ordinary shares, which are those shares resulting from the stock options assigned to employees. To determine the average number of options, the average fair value of the shares for the period under examination (financial year 2006) was used. The average fair value of CIR ordinary shares in 2006 was € 2.391 compared to an average fair value of € 2.311 in 2005.
The following chart shows the information on the shares used to calculate the basic and diluted earnings per share.
2006 2005
Net income attributable to the Shareholders (in thousands of euro) 101,120 87,675
Weighted average number of ordinary shares in circulation 748,300,414 758,420,760
Earnings per share (euro) 0.1351 0.1156
2006 2005
Net income attributable to the Shareholders (in thousands of euro) 101,120 87,675
Weighted average number of ordinary shares in circulation 748,300,414 758,420,760
Weighted average number of options 38,608,367 35,125,550
Fair value of weighted average number of options 4,575,961 4,891,852
Adjusted weighted average number of shares circulation 752,876,375 763,312,612
Diluted earnings per share (euro) 0.1343 0.1149
OTHER INFORMATION
19. GUARANTEES AND COMMITMENTS
At December 31 2006 the guarantee and commitment position was as follows:
CIR S.p.A.
- Guarantees issued in favour of the ENI group following the agreements for the supply of Nor-wegian and Libyan gas starting from October 2001. Supply contracts generally include take or pay clauses with purchase price revision based on the trend of certain oil products. These clauses are substantially in line with normal market conditions;
- Guarantees in favour of Inland Revenue for VAT credits totalling € 6,781 thousand; - Government securities pledged as collateral for financial option transactions for a total of
€ 19,500 thousand; - Commitments for investment in private equity funds made by CIR International for € 20,000
thousand.
Consolidated Financial Statements

87
Sorgenia Group
Guarantees issued
As collateral for loans obtained by the companies Energia Molise S.p.A. and Energia Modugno S.p.A. (a loan currently being finalized), the shares of the two companies have been pledged in favour of the lenders for € 78,000 thousand (equal to 100% of the capital) and € 24,458 thousand (equal to 90% of the capital) respectively.
Guarantees
These refer to guarantees issued by banks in favour of suppliers of electricity and gas to protect supply contracts.
Commitments
Sorgenia S.p.A. has also issued a guarantee in favour of the banks lending to Energia Molise S.p.A., following the administrative appeals pending with the Molise Administrative Court (TAR). This commitment for the amount of € 305,986,273 corresponds to the principal amount of the loan obtained by Energia Molise S.p.A. at December 31 2006.
Espresso group
Guarantees issued totalled € 8,507 thousand and referred to guarantees made by the parent com-pany of the Group and the subsidiaries Elemedia, Editoriale La Nuova Sardegna and A. Manzoni & C. for the lease of their respective premises and by the subsidiary Ksolutions in favour of Pub-lic Administration clients with whom they have service contracts. Commitments outstanding, for a total of € 3,351 thousand, referred to: - contracts for the purchase of plant and equipment (€ 2,213 thousand) mainly for Repubblica
and Editoriale La Nuova Sardegna as part of the full-colour project; - risks linked to a ruling in the court case in which Editoriale FVG is involved (€ 1,138 thou-
sand).
Sogefi group
Operating Leases
For accounting purposes, leasing and hire contracts are classified as operating leases when the fol-lowing conditions apply: - a significant part of the risks and benefits of ownership are maintained by the lessor; - there are no options giving the right to buy the leased property at a price that does not represent
the presumed market value of the same at the close of the period ; - the duration of the contract does not extend over most of the useful life of the property rented
or hired. The rental payments for operating leases are recognized to the income statement in line with the underlying contracts.
The main operating lease recorded refers to a contract signed by the American subsidiary Allevard Spring U.S.A. Inc. for the lease of the production site situated in Prichard (West Virginia). The contract terminates on October 27 2018 and the remaining instalments total USD 4,792 thousand, of which USD 386 thousand by the end of the year.
Consolidated Financial Statements

88
Against this contract Sogefi S.p.A. has issued a guarantee for approximately 50% of the remain-ing lease instalments which is renewed at the end of each year on the basis of the remaining amount. There are no restrictions of any kind connected with this kind of leasing and at the end of the contract the US company will have the right to buy the property at a market price.
Future lease payments in relation to the operating lease contracts of the Sogefi group at December 31 2006 are as follows:
(in thousands of euro) 2006 2005
Up to 1 year 4,265 3,831 Over 1 year but up to 5 11,594 8,589 Over 5 years 3,148 3,487 Total 19,007 15,907
Commitments for investments
At December 31 2006 there were commitments for investments for a total of € 1,014 thousand.
Guarantees issued
The detail of these guarantees is as follows:
(in thousands of euro) 2006 2005
Guarantees in favour of third parties 3,008 2,601
Other guarantees in favour of third parties 9,714 9,714
Collateral security provided for debt shown on the balance sheet 5,681 5,905
Guarantees issued refer to borrowings and are recognized at the value of the commitment out-standing as of the date of these accounts. The item Other guarantees in favour of third parties refers to the commitment of LPDN GmbH towards the employee pension fund of the two business divisions at the time of the acquisition made in 1996. This commitment is covered by contractual obligations on the part of the vendor, a prime German economic operator. Collateral security refers to bonds or privileges granted to lenders against loans obtained for the purchase of assets.
Other risks
At December 31 2006 the Sogefi group had assets belonging to third parties on the premises of its companies for € 4,700 thousand.
20. JOINT VENTURES
The only company of the Group consisting of a joint venture is Tirreno Power. International ac-counting standards give two methods for consolidating holdings in joint ventures: . the reference method, which involves consolidation pro-rata; . the alternative method allowed, which is the equity method. The Group has adopted valuation according to the equity method for the sake of consistency with the way the accounts have been presented until now.
Consolidated Financial Statements

89
The chart below shows the key financial figures according to Italian accounting principles for the company Tirreno Power:
(in millions of euro) Financial year Financial year Change in Change 2006 2005 absolute terms %
Income Statement Electricity sold (TWh) 12.4 11.7 0.7 6.0 Revenues from sales and services 988.4 772.7 215.7 27.9 Gross operating margin (EBIT) 229.0 164.9 64.1 38.9 Net income 57.4 15.4 42.0 272.7
31.12.2006 31.12.2005 Change in
absolute terms Balance Sheet Net capital invested 1,260.9 1,286.4 25.5 Net financial debt 978.2 981.2 (3.0)Shareholders’ equity 282.7 305.2 (22.5)No. of employees 626 651 25.0
The pertinent part of the earnings of Tirreno Power, consolidated using the equity method on the basis of values determined by the application of IAS/IFRS accounting standards, totalled € 33 million in 2006, up from € 19.8 million in 2005.
In accordance with the terms of the revised IAS 38, the goodwill of Tirreno Power was subjected to an impairment test at December 31 2006.
21. BUSINESS COMBINATIONS
Regarding business combinations, it should be remembered that on June 7 2006 the HSS group acquired the Anni Azzurri group.
The following chart shows the balance sheet of the Anni Azzurri group at June 30 2006:
(in thousands of euro)
Asset items Equity and liability items
Intangible assets 103,750 TFR Fund 5,014
Tangible assets 882 Payables 148,389
Financial assets 117,308 Total payables 153,403
Total fixed assets 221,940 Shareholders’ equity 91,370
Current assets 22,833
Total assets 244,773 Total equity and liabilities 244,773
The excess amount paid for acquiring the identifiable assets and liabilities as well as any potential liabilities as of the date of the acquisition represents goodwill which in the case of the Anni Azzurri group was recognized to the extent of € 50,615 thousand.
Consolidated Financial Statements

90
During July 2006 the HSS group also acquired the companies Meia S.r.l. and Medipass S.p.A.. The financial highlights at December 31 2006 of these companies are shown in the following chart:
(in thousands of euro) Medipass S.p.A. Meia S.r.l.
Fixed assets 14,923 3,484
Working capital 4,063 (588)
Net financial debt (16,443) (566)
Non-current liabilities (1,311) (701)
Shareholders’ equity 1,232 1,629
From the acquisition of the above companies goodwill was recognized for € 2,840 thousand and € 5,050 thousand respectively, which adequately represents the capacity of the companies to gener-ate future income and which were subjected to an impairment test at the end of the year.
22. NET FINANCIAL POSITION
The net financial position can be broken down as follows:
(in thousands of euro) 31.12.2006 31.12.2005
A. Cash and bank deposits 446,484 762,289
B. Other free cash flow 372,867 362,930
C. Securities held for trading 654,248 467,959
D. Cash and cash equivalents (A) + (B) + (C) 1,473,599 1,593,178
E. Current financial receivables 21,354 26,513
F. Current bank borrowings (*) (338,730) (176,796)
G. Current part of non-current debt (60,353) (53,797)
H. Other current borrowings (231) (250)
I. Current financial debt (F) + (G) + (H) (399,314) (230,843)
J. Net current financial position (I) + (E) + (D) 1,095,639 1,388,848
K. Non-current bank borrowings (**) (728,444) (631,131)
L. Bonds issued (1,187,750) (1,199,251)
M. Other non-current borrowings (**) (30,070) (23,654)
N. Non-current financial debt (K) + (L) + (M) (1,946,264) (1,854,036)
O. Net financial position (J) + (N) (850,625) (465,188)
(*) The amount of € 73,350 thousand (€ 338,730 - € 265,180) is included in the Balance Sheet under the item “Other borrowings”..(**) Classified under the item “Other borrowings” – Non-current liabilities
23. LEGAL DISPUTES
Some companies of the Group have legal proceedings outstanding against which their respective Boards have set aside risk provisions for amounts considered to be appropriate, taking into ac-count the opinion of their consultants, based on the degree of likelihood that significant liabilities will actually occur.
Consolidated Financial Statements

91
24. CHART SHOWING THE KEY FIGURES OF THE FINANCIAL STATEMENTS OF THE PARENT COMPANY COFIDE S.p.A. (Art. 2497-bis paragraph 4 Civil Code)
BALANCE SHEET (in euro)
ASSETS 31.12.2005
NON-CURRENT ASSETS 571,317,323
CURRENT ASSETS 116,11,365
TOTAL ASSETS 687,28,688
LIABILITIES AND SHAREHOLDERS’ EQUITY 31.12.2005
SHAREHOLDERS’ EQUITY 569,283,982
NON-CURRENT LIABILITIES 10,096,075
CURRENT LIABILITIES 108,548,631
TOTAL LIABILITIES AND SHAREHOLDERS’ EQUITY 687,928,688
INCOME STATEMENT (in euro)
2005
MISCELLANEOUS REVENUES AND INCOME 1,816,056
COSTS FOR PURCHASE OF GOODS (63,256)
COSTS FOR SERVICES (2,545,774)
PERSONNEL COSTS (1,185,374)
OTHER OPERATING COSTS (363,560)
AMORTIZATION, DEPRECIATION AND WRITE-DOWNS (45,925)
OPERATING RESULT (2,387,833)
FINANCIAL INCOME 1,834,854
FINANCIAL EXPENSES (4,029,905)
DIVIDENDS 20,315,131
GAINS FROM TRADING SECURITIES 31,800
LOSSES FROM TRADING SECURITIES (296,860)
ADJUSTMENTS TO THE VALUE OF FINANCIAL ASSETS (59,352)
INCOME / (LOSS) BEFORE TAXES 15,407,835
INCOME TAXES 15,817
NET INCOME (LOSS) FOR THE YEAR 15,423,652
The financial highlights of the parent company COFIDE S.p.A. are shown in the chart above, which is required by article 2497-bis of the Civil Code, and are extrapolated from the financial statements of that company for the year ended December 31 2005. For a correct and full under-standing of the equity and financial situation of COFIDE S.p.A. at December 31 2005, and of the results the company obtained in the year ended as of that date, we would refer readers to the fi-nancial statements in question which of course include the Report of the Statutory Auditors and that of the Independent Auditors and are available at the Company offices or with Borsa Italiana.
Consolidated Financial Statements


93
CIR GROUP
Consolidated Financial Statements of directly controlled subsidiaries as of December 31 2006
SORGENIA GROUP
ESPRESSO GROUP
SOGEFI GROUP
HSS GROUP

94
SORGENIA GROUP
CONSOLIDATED BALANCE SHEET(in thousands of euro)
ASSETS 31.12.2006 31.12.2005
NON-CURRENT ASSETSIntangible assets 13,011 8,554 Tangible assets 507,524 365,042 Investments in companies valued at equity 187,055 193,745 Other equity investments 2,899 2,284 Other non-current receivables 219,710 246,063 Advance taxes 11,004 6,051
TOTAL NON-CURRENT ASSETS 941,203 821,739
CURRENT ASSETSInventories 65,956 18,995 Trade current receivables 444,818 275,891 Other current receivables 117,142 46,844 Cash and cash equivalents 59,756 17,968 Shareholder receivables for capital to be called up 420 495
TOTAL CURRENT ASSETS 688,092 360,193
TOTAL ASSETS 1,629,295 1,181,932
LIABILITIES AND SHAREHOLDERS' EQUITY 31.12.2006 31.12.2005
SHAREHOLDERS'EQUITYShare capital 8,077 8,009 Other accrued reserves 371,613 358,002 Payments on account dividends minority shareholders (8,513) -- Net income (loss) for the year 69,217 36,802 Retained earnings (losses) - group 76,709 55,180
TOTAL SHAREHOLDERS'EQUITY 517,103 457,993 of which:SHAREHOLDERS' EQUITY - GROUP 396,906 345,188 MINORITY INTERESTS 120,196 112,805
NON-CURRENT LIABILITIESDeferred tax liabilities 1,337 739 Personnel provisions 1,730 1,535 Provisions for risks and losses 5,358 -- Non-current bank borrowings 428,276 412,703
TOTAL NON-CURRENT LIABILITIES 436,701 414,977
CURRENT LIABILITIESCurrent bank borrowings 233,347 35,137 Other current borrowings 9 1,081 Current trade payables 379,110 256,528 Other current liabilities 52,927 12,703 Provisions for current risks and losses 10,098 3,513
TOTAL CURRENT LIABILITIES 675,491 308,962
TOTAL LIABILITIES AND SHAREHOLDERS' EQUITY 1,629,295 1,181,932

95
SORGENIA GROUP
CONSOLIDATED INCOME STATEMENT(in thousands of euro)
2006 2005
SALES REVENUES 1,916,085 1,225,178
Change in inventories 46,812 11,817
Costs for purchase of goods (1,847,333) (1,211,854)
Costs for services (42,624) (15,116)
Personnel costs (18,715) (12,544)
Other operating income 49,249 49,468
Other operating costs (16,098) (11,509)
Adjustments to the value of investments valued at equity 33,018 19,762
Amortization, depreciation and write-downs (7,731) (2,883)
OPERATING INCOME (LOSS) 112,663 52,319
Financial income 12,509 12,034
Financial expenses (21,322) (14,283)
Dividends 24 25
INCOME (LOSS) BEFORE TAXES FROMOPERATING ACTIVITY 103,874 50,095
Income taxes (34,657) (13,293)
INCOME (LOSS) AFTER TAXES FROMOPERATING ACTIVITY 69,217 36,802
Income (Loss) from businesses sold -- --
NET INCOME (LOSS) FOR THE YEAR 69,217 36,802
of which:
- NET INCOME (LOSS) - MINORITY INTERESTS 56,264 29,061
- NET INCOME (LOSS) - THE GROUP 12,953 7,741

96
ESPRESSO GROUP
CONSOLIDATED BALANCE SHEET(in thousands of euro)
ASSETS 31.12.2006 31.12.2005
Intangible assets with indefinite useful life 638,163 633,552 Other intangible assets 4,432 4,476 Intangible assets 642,595 638,028
Tangible assets 233,337 249,975 Investments valued at equity 27,007 23,925 Other equity investments 4,043 4,072 Non-current receivables 3,075 2,610 Deferred tax asset receivables 68,667 47,494
NON-CURRENT ASSETS 978,724 966,104
Inventories 35,631 32,186 Trade receivables 285,804 266,391 Securities 50 52 Financial receivables 37,205 59,921 Other receivables 25,437 22,631 Cash and cash equivalents 172,643 204,942
CURRENT ASSETS 556,770 586,123
TOTAL ASSETS 1,535,494 1,552,227
LIABILITIES 31.12.2006 31.12.2005
Share capital 65,150 65,072 Reserves 344,215 342,462 Retained earnings (losses) 49,828 26,138 Net income (loss) for the year 103,561 116,336
Total equity - Group 562,754 550,008
Minority interests 10,526 10,775
SHAREHOLDERS' EQUITY 573,280 560,783
Borrowings 413,898 432,606 Provisions for risks and losses 12,018 13,369 TFR and other personnel provisions 107,704 104,954 Deferred tax liability payables 110,818 102,556
NON-CURRENT LIABILITIES 644,438 653,485
Borrowings 21,517 25,015 Provisions for risks and losses 12,500 10,029 Trade payables 175,989 196,707 Taxes payable 22,769 16,145 Other payables 85,001 90,063
CURRENT LIABILITIES 317,776 337,959
TOTAL LIABILITIES 962,214 991,444
TOTAL LIABILITIES AND SHAREHOLDERS'EQUITY 1,535,494 1,552,227

97
ESPRESSO GROUP
CONSOLIDATED INCOME STATEMENT(in thousands of euro)
2006 2005
Revenues 1,102,565 1,079,919
Change in product inventories (327) 2,094
Other operating income 17,284 34,454
Purchasing costs (171,407) (158,921)
Service costs (439,622) (433,297)
Other operating expenses (17,021) (19,463)
Valuation of investments at equity 1,407 1,344
Personnel costs (288,464) (283,890)
Amortization, depreciation and write-downs (41,165) (44,772)
Operating income (loss) 163,250 177,468
Net financial income (expenses) (19,601) (25,560)
Income before taxes 143,649 151,908
Taxes (39,750) (35,116)
NET INCOME 103,899 116,792
Net income - minority interests (338) (456)Net income - the group 103,561 116,336
Basic earnings per share 0.243 0.271
Diluted earning per share 0.234 0.262

98
SOGEFI GROUP
CONSOLIDATED BALANCE SHEET(in thousands of euro)
ASSETS 31.12.2006 31.12.2005
CURRENT ASSETSCash and cash equivalents 51,519 55,390 Securities and financial assets held for trading 160 2,116 Working capitalInventories 111,709 107,793 Trade receivables 226,992 232,803 Other receivables 6,010 4,250 Tax receivables 10,952 13,824 Other assets 2,391 2,438 TOTAL WORKING CAPITAL 358,054 361,108
TOTAL CURRENT ASSETS 409,733 418,614 NON-CURRENT ASSETSFIXED ASSETS
Land 15,623 15,972 Property, plant and machinery 229,176 239,249 Other tangible assets 4,450 4,684 Of which in leasing 18,259 19,605 Intangible assets 117,403 113,878
TOTAL FIXED ASSETS 366,652 373,783 OTHER NON-CURRENT ASSETS
Equity investments in affiliated companies 101 3,372 Other financial assets available for sale 450 443 Financial receivables 301 -- Other receivables 5,305 3,540 Advance taxes 26,819 26,779
TOTAL OTHER NON-CURRENT ASSETS 32,976 34,134 TOTAL NON-CURRENT ASSETS 399,628 407,917 NON-CURRENT ASSETS HELD FOR SALE 2,646 -- TOTAL ASSETS 812,007 826,531
LIABILITIES AND SHAREHOLDERS' EQUITY 31.12.2006 31.12.2005
CURRENT LIABILITIESCurrent bank borrowings 13,278 26,353 Current portion of long-term borrowings and other loans 18,578 93,876 of which leasing 1,186 1,213 TOTAL SHORT-TERM FINANCIAL DEBT 31,856 120,229 Other short term borrowings for cash flow hedges -- 132 TOTAL SHORT-TERM FINANCIAL DEBT AND CASH FLOW HEDGES 31,856 120,361 Trade and other payables 234,514 224,050 Taxes payable 8,210 7,897 Other current liabilities 2,359 2,558
TOTAL CURRENT LIABILITIES 276,939 354,866 NON-CURRENT LIABILITIESTOTAL MEDIUM/LONG-TERM DEBT AND CASH FLOW HEDGES
Bank borrowings 128,402 83,549 Other medium/long-term borrowings 18,000 20,755 of which leasing 15,306 17,199 TOTAL MEDIUM/ LONG-TERM DEBT 146,402 104,304 Other medium/long-term debt for cash flow hedges -- 139
TOTAL MEDIUM/LONG-TERM DEBT AND CASH FLOW HEDGES 146,402 104,443 OTHER LONG-TERM LIABILITIES
Long term provisions 68,465 83,969 Other payables -- 21 Deferred tax liabilities 24,478 21,946
TOTAL OTHER LONG-TERM LIABILITIES 92,943 105,936 TOTAL NON-CURRENT LIABILITIES 239,345 210,379 SHAREHOLDERS' EQUITY
Share capital 58,826 58,338 Reserves and retained earnings (losses) 170,013 143,930 Net Income (loss) for the year - group 50,767 44,660
TOTAL SHAREHOLDERS' EQUITY ATTRIBUTABLE TO THE PARENT COMPANY 279,606 246,928 Minority interests 16,117 14,358
TOTAL SHAREHOLDERS' EQUITY 295,723 261,286 TOTAL LIABILITIES AND SHAREHOLDERS' EQUITY 812,007 826,531

99
SOGEFI GROUP
CONSOLIDATED INCOME STATEMENT(in thousands of euro)
2006 2005
Sales revenues 1,018,579 1,023,421
Variable sales costs 653,215 657,636
CONTRIBUTION MARGIN 365,364 365,785
Manufacturing and R&D overheads 114,264 115,641
Amortization and depreciation 45,036 45,911
Distribution, marketing and sales fixed costs 37,719 39,362
Administrative costs and overheads 61,761 59,237
OPERATING INCOME 106,584 105,634
Restructuring costs 5,234 12,637
Capital losses (gains) on disposals (3,969) (75)
Exchange rate (gains) losses 843 (58)
Other non-operating costs (revenues) 21,010 12,150
- of which non-recurring 6,547 --
EBIT 83,466 80,980
Net financial expenses (income) 10,182 11,547
Losses (gains) from equity investments (1,594) 2,349
INCOME BEFORE TAXES AND MINORITY INTERESTS 74,878 67,084
Income taxes 21,543 21,179
NET INCOME BEFORE MINORITY INTERESTS 53,335 45,905
Loss (income) attributable to Minority Interests (2,568) (1,245)
NET INCOME OF THE GROUP 50,767 44,660
Earning per share (euro):
Basic 0.457 0.406
Diluted 0.454 0.404

100
HSS GROUP
CONSOLIDATED BALANCE SHEET *(in thousands of euro)
ASSETS 31.12.2006 31.12.2005
NON-CURRENT ASSETS 175.576 31.541 INTANGIBLE ASSETS 74.589 19.707 TANGIBLE ASSETS 96.168 11.130 OTHER EQUITY INVESTMENTS 10 9 OTHER RECEIVABLES 1.332 240 SECURITIES 1.252 -- DEFERRED TAX ASSETS 2.225 455
CURRENT ASSETS 52.852 32.609 INVENTORIES 1.044 585 TRADE RECEIVABLES 39.252 13.495 OTHER RECEIVABLES 3.898 1.404 CASH AND CASH EQUIVALENTS 8.658 17.125
NON-CURRENT ASSETS HELD FOR SALE 44.943 --
TOTAL ASSETS 273.371 64.150
LIABILITIES AND SHAREHOLDERS'EQUITY 31.12.2006 31.12.2005
SHAREHOLDERS' EQUITY 64.060 27.774 SHARE CAPITAL 4.286 2.428 RESERVES 69.635 30.716 RETAINED EARNINGS (LOSSES) (10.435) (5.933)
TOTAL EQUITY - GROUP 63.486 27.211
MINORITY INTERESTS 574 563
NON-CURRENT LIABILITIES 83.271 11.802 OTHER BORROWINGS 74.825 10.304 OTHER PAYABLES 1.178 -- DEFERRED TAX LIABILITIES 917 676 PERSONNEL PROVISIONS 6.351 822
CURRENT LIABILITIES 89.698 24.574 BANK OVERDRAFT FACILITIES 9.776 694 BONDS -- -- OTHER BORROWINGS 34.763 1.942 TRADE PAYABLES 31.266 17.377 OTHER PAYABLES 12.571 4.287 PROVISIONS FOR RISKS AND LOSSES 1.322 274
LIABILITIES DIRECTLY ASSOCIATED WITH NON-CURRENT ASSETS HELD FOR DISPOSAL 36.342 --
TOTAL LIABILITIES AND SHAREHOLDERS' EQUITY 273.371 64.150
* This consolidated balance sheet was prepared solely for the purpose of drawing up the CIR Consolidated Financial Statements, since the parent company HSS S.p.A. is exempt from the obligation to prepare consolidated accounts according to Art. 27 of D.L. no. 127/91

101
HSS GROUP
CONSOLIDATED INCOME STATEMENT *(in thousands of euro)
2006 2005
REVENUES FROM SALES AND SERVICES 99.189 53.798
CHANGE IN INVENTORIES 161 --
COSTS FOR PURCHASE OF GOODS (8.308) (4.884)
COSTS FOR SERVICES (57.071) (39.474)
PERSONNEL COSTS (23.162) (7.108)
OTHER OPERATING INCOME 1.752 1.915
OTHER OPERATING EXPENSE (6.111) (3.796)
ADJUSTMENTS TO THE VALUE OF INVESTMENTS VALUED AT EQUITY -- --
AMORTIZATION DEPRECIATION AND WRITE-DOWNS (4.110) (1.143)
OPERATING RESULT - (EBIT) 2.340 (692)
FINANCIAL INCOME 372 263
FINANCIAL EXPENSES (3.656) (550)
DIVIDENDS -- --
GAINS FROM TRADING SECURITIES -- --
LOSSES FROM TRADING SECURITIES -- --
ADJUSTMENTS TO THE VALUE OF FINANCIAL ASSETS -- --
INCOME/(LOSS) BEFORE TAXES (944) (979)
INCOME TAXES (2.934) (397)
INCOME/(LOSS) FROM DISCONTINUED OPERATIONSAND BUSINESSES HELD FOR DISPOSAL (933) --
NET INCOME/(LOSS) FOR THE PERIOD INCLUDING MINORITY INTERESTS (4.811) (1.376)
- NET INCOME/LOSS - MINORITY INTERESTS (379) (14)
- NET INCOME/LOSS - THE GROUP (4.432) (1.362)
* The consolidated income statement was prepared solely for the purpose of drawing up the CIR Consolidated Financial Statements since the parent company HSS S.p.A. is exempt from the obligation to prepare consolidated accounts according to Art. 27 of D.L. no. 127/91


103CIR S.p.A.
CIR S.p.A.
Statutory Financial Statements as of December 31 2006
BALANCE SHEET
INCOME STATEMENT
CASH FLOW STATEMENT
STATEMENT OF CHANGES IN SHAREHOLDERS’ EQUITY

104 CIR S.p.A.
1. BALANCE SHEET
(in euro)
ASSETS Notes 31.12.2006 31.12.2005
NON-CURRENT ASSETS 968,361,309 919,464,511
INTANGIBLE ASSETS (5.a) 80,583 55,667
TANGIBLE ASSETS (5.b) 4,575,792 11,911,546
REAL-ESTATE INVESTMENTS (5.c) 17,604,580 6,944,487
EQUITY INVESTMENTS (5.d) 944,482,717 898,728,609
MISCELLANEOUS RECEIVABLES (5.e) 188,832 211,859
DEFERRED TAX ASSETS (5.f) 1,428,805 1,612,343
CURRENT ASSETS 357,257,579 409,885,235
MISCELLANEOUS RECEIVABLES (6.a) 86,031,991 52,328,165
of which with related parties (6.a) 34,450,292 6,522,269
BONDS (6.b) 206,493,818 180,962,954
CASH AND CASH EQUIVALENTS (6.c) 64,731,770 176,594,116
TOTAL ASSETS 1,325,618,888 1,329,349,746
LIABILITIES AND SHAREHOLDERS' EQUITY 31.12.2006 31.12.2005
SHAREHOLDERS' EQUITY 940,738,402 953,217,713
SHARE CAPITAL (7.a) 390,239,534 389,620,834
RESERVES (7.b) 311,985,099 369,175,921
RETAINED EARNINGS (LOSSES) (7.c) 201,816,767 189,622,482
NET INCOME FOR THE YEAR 36,697,002 4,798,476
NON-CURRENT LIABILITIES 297,378,012 297,286,488
BONDS (8.a) 295,640,119 295,483,269
DEFERRED TAX LIABILITIES (5.f) 179,863 340,908
PERSONNEL OBLIGATIONS (8.b) 1,558,030 1,462,311
CURRENT LIABILITIES 87,502,474 78,845,545
BANK OVERDRAFT FACILITIES 1,903 --
BORROWINGS FROM RELATED PARTIES (9.a) 43,756,650 42,102,350
OTHER PAYABLES (9.b) 40,709,217 33,708,491
PROVISIONS FOR RISKS AND LOSSES (9.c) 3,034,704 3,034,704
TOTAL LIABILITIES AND SHAREHOLDERS' EQUITY 1,325,618,888 1,329,349,746

105CIR S.p.A.
2. INCOME STATEMENT
(in euro)
Notes
MISCELLANEOUS REVENUES AND INCOME (10) 6,276,030 7,149,870
of which from related parties (10) 5,560,164 5,296,000
COSTS FOR SERVICES (11) (9,719,835) (8,874,996)
of which with related parties (11) (1,955,000) (1,777,000)
PERSONNEL COSTS (12) (9,090,746) (10,567,262)
OTHER OPERATING COSTS (13) (1,771,695) (1,552,276)
AMORTIZATION, DEPRECIATION AND WRITE-DOWNS (547,683) (211,994)
OPERATING INCOME (LOSS) (14,853,929) (14,056,658)
FINANCIAL INCOME (14) 12,728,507 12,213,754
FINANCIAL EXPENSES (15) (20,958,308) (19,092,713)
of which with related parties 1,953,683 1,335,446
DIVIDENDS (16) 61,079,051 42,791,314
of which from related parties (16) 61,045,596 42,747,274
GAINS FROM TRADING SECURITIES (17) 1,520,047 688,750
LOSSES FROM TRADING SECURITIES (18) (4,913,463) (282,188)
ADJUSTMENTS TO THE VALUE OF FINANCIAL ASSETS (19) (6,972,689) (6,710,323)
INCOME / (LOSS) BEFORE TAXES AND NON-RECURRING CHARGES 27,629,216 15,551,936
TAX EXPENSES FROM PRIOR PERIODS (20) -- (16,058,875)
INCOME / (LOSS) BEFORE TAXES 27,629,216 (506,939)
INCOME TAXES (21) 9,067,786 5,305,415
NET INCOME FOR THE YEAR 36,697,002 4,798,476
BASIC EARNINGS PER SHARES (in euro) 0.0490 0.0063 EARNINGS PER SHARE (in euro) 0.0487 0.0063
2006 2005

106
3. CASH FLOW STATEMENT
(in euro)
2006 2005
OPERATING ACTIVITY
NEET INCOME FOR THE YEAR 36,697,002 4,798,476
ADJUSTMENTS:AMORTIZATION, DEPRECIATION AND WRITE-DOWNS 547,683 211,994 LOSSES/(GAINS) FROM THE SALE OF EQUITY INVESTMENTSAND CURRENT SECURITIES 4,135,940 4,179,031 ACTUARIAL VALUATION OF STOCK OPTION PLANS 2,212,607 5,736,787 PROVISIONS TO SEVERANCE AND LEAVING INDEMNITY FUND (TFR) 239,739 232,368 ADJUSTMENTS TO THE VALUE OF FINANCIAL ASSETS 6,972,689 6,710,323 (INCREASE) REDUCTION IN NET WORKING CAPITAL (24,846,430) 7,908,220
of which with related parties (27,928,023) 10,291,090 OTHER NON-MONETARY CHANGES -- (9,328,415)
CASH FLOW FROM OPERATING ACTIVITY 25,959,230 20,448,784
of which:- interest received (paid out) (6,182,035) (8,765,173)- dividends received 61,079,051 42,791,314 - inflows (disbursements) for income taxes * 9,527,755 3,602,464
INVESTING ACTIVITY
PURCHASE OF CURRENT SECURITIES (35,440,285) (63,581,537)PURCHASE OF FIXED ASSETS (50,850,254) (26,292,766)
CASH FLOW FROM INVESTING ACTIVITY (86,290,539) (89,874,303)
FINANCING ACTIVITY
PROCEEDS FROM CAPITAL INCREASES 1,695,042 3,614,613
PAYMENT OF SEVERANCE AND LEAVING INDEMNITY (144,020) (132,280)
BUY-BACK OF OWN SHARES (15,563,782) (35,878,184)
DIVIDENDS PAID TO SHAREHOLDERS (37,520,180) (38,008,840)
OTHER CHANGES -- 507,757
CASH FLOW FROM FINANCING ACTIVITY (51,532,940) (69,896,934)
INCREASE (DECREASE) IN NET CASH AND CASH EQUIVALENTS (111,864,249) (139,322,453)
NET CASH AND CASH EQUIVALENTS AT BEGINNING OF PERIOD 176,594,116 315,916,569
NET CASH AND CASH EQUIVALENTS AT END OF PERIOD 64,729,867 176,594,116
* The amounts refer to current tax receivables received from the tax consolidation
CIR S.p.A.

107
4. STATEMENT OF CHANGES IN SHAREHOLDERS' EQUITY
(in euro) Share Reserves Retained Net income Totalcapital earnings (losses) for the year
BALANCE AT JANUARY 1 2005 388,278,784 385,186,096 213,553,049 26,644,945 1,013,662,874
Capital increases 1,342,050 2,272,563 -- -- 3,614,613
Dividends to Shareholders -- -- (12,071,908) (25,936,932) (38,008,840)
Portion of net income available to Board of Directors -- -- -- (708,013) (708,013)
AGM resolution to buy back own shares -- 11,858,659 (11,858,659) -- --
Buy-back of own shares -- (35,878,184) -- -- (35,878,184)
Notional recognition of stock options -- 5,736,787 -- -- 5,736,787
Net income for the year -- -- -- 4,798,476 4,798,476
BALANCE AT DECEMBER 31 2005 389,620,834 369,175,921 189,622,482 4,798,476 953,217,713
Capital increases 618,700 1,076,342 -- -- 1,695,042
Dividends to Shareholders -- -- (32,721,704) (4,798,476) (37,520,180)
Cancellations of AGM resolution of April 272005 to buy-back own shares -- (54,815,390) 54,815,390 -- --
Buy-back of own shares -- (*) (5.664.381) (9,899,401) -- (15,563,782)
Notional recognition of stock options -- 2,212,607 -- -- 2,212,607
Net income for the year -- -- -- 36,697,002 36,697,002
BALANCE AT DECEMBER 31 2006 390,239,534 311,985,099 201,816,767 36,697,002 940,738,402
(*) Reduction of the reserve for "Buy-back of own shares" (note 11.b. consolidated financial statements and note 7.b. statutory financial statements of CIR S.p.A.)
CIR S.p.A.


109
EXPLANATORY NOTES TO THE FINANCIAL STATEMENTS OF THE PARENT COMPANY
1. ACCOUNTING PRINCIPLES APPLIED
These financial statements have been prepared in accordance with international accounting stan-dards (IAS/IFRS) and their respective interpretations (Standing Interpretation Committee) pub-lished by the International Accounting Standards Boards (IASB) and are expressed in euro.
1.a. Intangible assets (IAS 38)
Intangible assets are recognized only if they can be separately identified, if it is probable that they will generate future economic benefits and if the cost can be measured reliably. Intangible assets with a finite useful life are valued at purchase or production cost net of deprecia-tion and impairment.
Intangible assets are initially recognized at purchase or production cost. Purchase cost is repre-sented by the fair value of payments and any additional cost directly incurred for preparing the as-set for use. The purchase cost is the equivalent price in cash as of the date of the acquisition and, where payment is deferred beyond normal terms of credit, the difference compared with the cash price is recognized as interest for the whole period of deferment.
Amortization is calculated on a straight-line basis following the expected useful life of the asset and starts when the asset is ready for use.
The carrying value of intangible assets is maintained as long as there is evidence that this value can be recovered through use; to this end at least once a year an impairment test is carried out to check that the intangible asset is able to generate future cash flows.Intangible assets with an indefinite useful life are not amortized but are constantly monitored for any permanent loss of value. It is mainly the newspaper and magazine titles and frequencies of the Espresso Group that are considered as intangible assets with an indefinite useful life.
Development costs are recognized as intangible assets when their cost can be measured reliably, when there is a reasonable assumption that the asset can be made available for use or for sale and that it is able to generate future benefits. Once a year or any time there are reasons which justify it, capitalized costs are subjected to an impairment test. Research costs are charged to the income statement as and when they are incurred. Trademarks and licenses, which are initially recognized at cost, are subsequently accounted for net of amortization and any impairment. The period of amortization is defined as the lower of the contractual duration for use of the license and the useful life of the asset. Software licenses, including associated costs, are recognized at cost and are recorded net of amor-tization and of any impairment.
CIR S.p.A.
110
1.b. Tangible assets (IAS 16)
Tangible assets are measured at purchase price or at production cost and are recognized net of any accrued depreciation.
Cost includes associated expenses and any direct and indirect costs incurred at the moment of ac-quisition and necessary to make the asset ready for use.
Fixed assets are depreciated on a straight-line basis for each year in relation to their remaining useful life.
For some categories the values determined in this way can be doubled in the first three years of use. This is a technical and economic kind of depreciation which has no tax effect. The total net values are considered to be representative of the remaining useful life of the various assets.
Extraordinary maintenance costs which determine an increase in the value or the functionality or the useful life of the assets, such as costs for improvements, renovations and conversions which increase value, are allocated directly to the assets to which they refer and are depreciated over the residual useful of the assets. Ordinary maintenance costs are charged to the income statement.
Real estate (investment properties) not held for instrumental or operating purposes is classified under a special item of assets and is accounted for on the basis of the terms of IAS 40 “Investment properties”.
Should there be any events which one can assume will cause a lasting reduction in the value of an asset, its carrying value is checked against its recoverable value, which is the higher of fair value and value in use.
Fair value is defined on the basis of values expressed by the active market, by recent transactions or from the best information available to determine the potential amount obtainable from the sale of the asset.
Value in use is determined from the net present value of cash flows resulting from the use ex-pected of the same asset, applying the best estimates of its residual useful life and a rate that also takes into account the implicit risk of the specific business sectors in which the Group operates. This valuation is carried out for each individual asset or for the smallest identifiable cash generat-ing unit (CGU).
Where there is a negative difference between the values stated above and the carrying value then the asset’s carrying value is written down, while as soon as the reasons for such loss in value cease to exist then the asset is revaluated. Write-downs and revaluations are posted to the income statement.
1.c. Real estate investments/investment property (IAS 40)
An investment property is a property, either land or building – or part of a building – or both, o-wned by the owner or by the lessee, with a financial leasing agreement, for the purpose of receiv-ing lease payments or for obtaining a gain on the capital invested or for both of these reasons, ra-
CIR S.p.A.

111
ther than for the purpose of directly using it for the production or supply of goods or services or for administration of the company or for sales, in ordinary business activities. The cost of an investment property is represented by its purchase price, any improvements made, and any replacement and extraordinary maintenance. According to the cost method, estimation is made net of depreciation and of any impairment.
At the moment of disposal or in the event of permanent non-use of the assets, all related income and expenses will be charged to the income statement.
1.d. Impairment of tangible assets (IAS 36)
Periodically and whenever events or changes in circumstance make it appropriate, tangible assets are subjected to an impairment test to see whether they have undergone any loss in value.
The impairment test consists of an estimate of the recoverable value of the asset which is then compared with its net carrying amount. If the recoverable value is lower than the carrying amount, the latter is written down and the impairment loss is charged to the statement of income. If at a later date the reasons for the write-down cease to exist, the original carrying amount is re-stored and with the relative gain posted to the income statement.
1.e. Investments in subsidiaries (IAS 27)
In accounting for investments in subsidiaries the cost method was adopted rather than fair value measurement.
1.f. Other equity investments
Investments in companies where the Company does not exercise a significant influence are ac-counted under IAS 39 and are therefore classified as available-for-sale investments and are meas-ured at fair value or at cost if it is not possible to determine a fair value or a market price.
1.g. Receivables and payables (IAS 32 and 39)
Receivables are recognized at amortized cost and measured at their presumed realization value, while payables are recognized at amortized cost. Receivables and payables in foreign currencies, which are originally recognized at the spot rates of the transaction date, are adjusted to the year-end spot exchange rates and any exchange gains and losses are recognized to the income statement. Any net gain is recorded in a specific equity reserve and cannot be distributed until it is realized.
1.h. Securities (IAS 32 and 39)
In accordance with IAS 32 and IAS 39 investments in companies other than subsidiaries and af-filiates are classified as available-for-sale financial assets and are measured at fair value.
CIR S.p.A.

112
Gains and losses resulting from fair value adjustments are recorded in a special equity reserve. In the event of permanent losses of value or of disposal, the gains and losses recognized previously to shareholders’ equity are then posted to the income statement.
This category also includes financial assets either bought or issued and then held for trading purposes or classified at fair value through profit and loss in application of the so-called fair value option.For a more complete description of the treatment of financial instruments we would refer readers to the note specially prepared on the subject.
1.i. Income taxes (IAS 12)
Current taxes are recorded and determined on the basis of a realistic estimate of taxable income according to current tax regulations and taking into account any exemptions that apply.
Deferred taxes are calculated on the basis of time differences, which are taxable or deductible, be-tween the carrying values of assets and liabilities and their tax bases and are classified under non-current assets and liabilities. A deferred tax asset is recognized to the extent that it is probable that future taxable profit will be available against which the temporary differences can be utilized. The carrying value of deferred tax assets is subject to periodic analysis and is reduced to the ex-tent to which it is no longer probable that there will be sufficient taxable income to allow the benefit of this deferred asset to be utilized.
1.l. Cash and cash equivalents (IAS 32 and 39)
Cash and cash equivalents include cash in hand, call deposits and short-term and high-liquidity financial assets, which are easily convertible into cash and which have a risk of change in value that is irrelevant.
1.m. Shareholders’ equity
Ordinary shares are recorded at nominal value. Costs directly attributable to the issuance of new shares are deducted from the shareholders’ equity reserves, net of any related tax benefit.
Own shares are classified in a special item and are deducted from reserves; any subsequent trans-action of sale, re-issuance or cancellation will have no impact on the income statement but will affect only shareholders’ equity.
Unrealized gains and losses, net of tax, on financial assets classified as “available for sale” are re-corded in shareholders’ equity in the fair value reserve. The reserve is reversed to the income statement when the asset is realized or when a permanent impairment loss to the said asset is recognized.
The item “Retained earnings (losses)” includes accrued income and losses and the transfer of bal-ances from other equity reserves when these become free of any limitations to which they have
CIR S.p.A.

113
been subject. This item also shows the cumulative effect of the changes in accounting principles and/or the correction of errors which are accounted for in accordance with IAS 8.
1.n. Borrowings (IAS 32 and 39)
Loans are initially recognized at cost, represented by their fair value net of ancillary costs in-curred. Subsequently loans are measured at amortized cost calculated by applying the effective interest rate, taking into consideration any issuance costs incurred and any premium or discount applied at the time in which the instrument is settled.
1.o. Provisions for risks and losses (IAS 37)
Provisions for risks and losses refer to liabilities which are extremely likely but where the amount and/or maturity is uncertain. These are the result of past events which will cause a future dis-bursement. Provisions are recognized exclusively in the presence of a current obligation, either legal or constructive, towards third parties which implies an outflow and when a reliable estimate of the amount involved can be made. The amount recognized as a provision is the best estimate of the outflow required to fulfil the obligation as of the date of the financial statements. The provi-sions recognized are re-examined at the closing date of each accounting period and are adjusted to represent the best current estimate. Changes in the estimate are recognized to the income state-ment. When the estimated disbursement relating to the obligation is expected in a time horizon longer than normal payment terms and the discount factor is significant, the provision represents the pre-sent value, discounted at a risk-free interest rate, of the expected future payments necessary to dis-charge the obligation.
Contingent assets and liabilities (possible assets and liabilities, or those not recognized because no reliable estimate can be made) are not recognized. However specific disclosure on such items is given.
1.p. Revenue recognition (IAS 18)
Revenues for the rendering of services are recognized at the moment when the service is rendered, with reference to the state of completion of the activity as of the date of the financial statements.
Dividend and interest income are recognized as follows: - Dividends, when the shareholder’s right to receive payment is established (with an offset in re-
ceivables at the resolution date); - Interest, using the effective interest rate method (IAS 39).
1.q. Employee benefits (IAS 19)
Benefits to be paid to employees after the termination of their employment and other long term benefits are subject to actuarial valuation. Following this methodology, liabilities recognized represent the present value of the obligation adjusted for any actuarial gains or losses which have not been accounted for.
CIR S.p.A.

114
The instruments underlying the above mentioned benefits can be distinguished between “defined contribution plans” and “defined benefit plans”, where in the first case the obligation of the com-pany is limited to paying the contributions (to Government, to funds or to other separate legal en-tities) and is determined on the basis of the contributions owed, while in the second case liabilities are determined on the basis of actuarial calculations.
1.r. Derivative instruments (IAS 32 and 39)
Derivative financial instruments are measured at fair value. Derivatives not for hedging purposes are classified as financial instruments at fair value through profit and loss (FVTPL).
The classification of a derivative as a hedge must be formally documented and the degree of “ef-fectiveness” of the hedge must be specified. For accounting purposes hedging transactions can be classified as:
- Fair value hedges – where the effects of the hedge are recognized to the income statement;
- Cash flow hedges – where the effective portion of the hedge is recognized directly to share-holders’ equity while the non-effective part is recognized to income statement;
- Hedges of a net investment in a foreign operation – where the effective portion of the hedge is recognized directly to shareholders’ equity while the non-effective part is recognized to the in-come statement.
As of December 31 2006 there were no hedging derivatives on the books.
1.s. Foreign currency translation (IAS 21)
The Company’s functional currency is the euro, which is the currency in which its financial state-ments are prepared and published.
Transactions carried out in foreign currencies are initially recognized at the spot exchange rate on the date of the transaction.
At the date of the close of the reporting period monetary assets and liabilities denominated in for-eign currency are translated at the spot exchange rate prevailing on that date.
Non-monetary items measured at historical cost in a foreign currency are translated using the his-torical exchange rate prevailing on the date of the transaction. Non-monetary items measured at fair value are translated using the spot exchange rate at the date on which the measurements are determined for the financial statements.
There were no assets or liabilities in foreign currencies recorded in the financial statements as of December 31 2006.
CIR S.p.A.

115
1.t. Adoption of new accounting standards
It should be stated that in financial year 2006 the Group adopted the following Principles, Inter-pretations and Updates to the standards already published: - IAS 39 – Financial instruments Recognition and Measurement. This principle was amended by Regulation no. 1864 of November 15 2005 effective January 1 2006 (fair value option), which partly revised the classification of financial assets and liabilities; in particular the revision lim-ited the use of the initial designation option for financial assets and liabilities other than deriva-tives and those held for trading, as items measured at fair value directly to the income statement to those instruments that meet the following requirements:
a) The fair value option designation eliminates or significantly reduces an accounting mis-match, or
b) A group of financial assets, financial liabilities, or both is managed and its performance is evaluated on a fair value basis, in accordance with a documented investment risk man-agement strategy, and
c) An instrument contains an implicit derivative that fulfils particular conditions. - IAS39 – Financial instruments. Recognition and measurement. This principle was amended by Regulation no. 2106 of December 21 2005 which partly revised the basic assumptions regarding intercompany transactions; - IFRS6 – Exploration for and Evaluation of Mineral Resources. This principle is not relevant for the business of the Group; - IFRIC4 – Checking the requisites for a contract to be considered as a leasing contract; - IFRIC5 – Rights to interest arising from decommissioning, restoration and environmental reha-bilitation funds. This interpretation is not relevant for the Group; - IFRIC6 – Liabilities arising from Participating in a Specific market: Waste Electrical and Elec-tronic Equipment. This interpretation is not relevant for the Group.
Moreover the Group did not opt for the early adoption of the following Principles, Interpretations and Updates to principles already published, which will become obligatory in the next few years: - IFRIC7 – Applying the Restatement Approach under IAS 29. This interpretation will take effect for financial years following March 1 2006. This interpretation is not relevant for the Group; IFRIC8 – Scope of IFRS2. This interpretation will take effect for financial years following May 1 2006. This interpretation is not relevant for the Group; - IFRIC9 – Reassessment of Embedded Derivatives. This interpretation will take effect for finan-cial years following June 1 2006. The interpretation is not relevant for the Group. - IFRIC10 – Interim Financial Reporting and Impairment. This interpretation will take effect for financial years following November 1 2006; - IFRS7 – Financial instruments: Disclosures. This principle introduces new information to be provided for financial instruments and will take effect as from January 1 2007.
1.u. Earnings per share (IAS 33)
Basic earnings per share are determined by dividing the net income attributable to the ordinary shareholders of the Parent Company by the weighted average number of ordinary shares in circu-lation during the period.
Diluted earnings per share are calculated by adjusting the weighted average number of ordinary shares in circulation to take into account the effect of all potential ordinary shares.
CIR S.p.A.
116
2. FINANCIAL INSTRUMENTS
Financial instruments take on a particular significance in the economic and financial structure of the CIR Group; for this reason, in order to give a better and clearer understanding of financial is-sues, it was considered useful to devote a special section to the accounting treatment of IAS 32 and IAS 39.
According to IAS 32 financial instruments are classified in four categories: a) Financial instruments that are valued at fair value through profit and loss (FVTPL) in ap-
plication of the fair value option, which are held for trading purposes; b) Investments held to maturity (HTM); c) Loans and receivables (L&R); d) Available-for-sale financial assets (AFS).
Classification depends on Financial Management’s intended use of the financial instrument in the business context and each involves a different measurement for accounting purposes; financial transactions are recognized on the basis of their value date.
Financial instruments at fair value through profit and lossInstruments are classified as such if they satisfy one of the following conditions: - They are held for trading purposes; - They are a financial asset designated on adoption of the fair value option, the fair value of
which can be reliably determined. Trading generally means frequent buying and selling with the aim of generating profit on price movements in the short term. Derivatives are included in this category unless they are designated as hedge instruments. The initial designation of financial instruments, other than derivatives and those held for trading, as instruments at fair value through profit and loss in adoption of the fair value option is limited to those instruments that meet the following conditions:
a) Designation according to the fair value option eliminates or significantly reduces account-ing mismatches;
b) A group of financial assets, financial liabilities or both are managed and their performance is measured on the basis of their fair value following a documented investment risk strat-egy, and
c) An instrument contains an implicit derivative which meets particular conditions.
The designation of an individual instrument to this category is definitive, is made at the moment of initial recognition and cannot be modified.
Investments held to maturityThis category includes non-derivative instruments with fixed payments or payments that can be determined and that have a fixed maturity, and which it is intended and possible to hold until ma-turity. These instruments are measured at amortized cost and constitute an exception to the general measurement principle of fair value. Amortized cost is determined by applying the effective interest rate of the financial instrument, taking into account any discounts or premiums received or paid at the moment of purchase, and recognizing them throughout the whole life of the instrument until its final maturity. Amortized cost represents the initial recognition value of a financial instrument, net of any capital repayments and of any impairment, plus or minus the cumulated amount of the differences be-
CIR S.p.A.

117
tween its initial net value and the nominal amount at maturity calculated using the effective inter-est rate method. The effective interest rate method is a calculation criterion used to assign financial expenses to their appropriate time period. The effective interest rate is the rate that gives a correct present value to expected future cash flows until maturity, so as to obtain the net present carrying value of the financial instrument. If even one single instrument belonging to this category is sold before maturity, for a significant amount and where there is no special justification for this, the tainting rule is applicable and re-quires that the whole portfolio of securities classified as Held To Maturity be reclassified and measured at fair value, and this category cannot be used in the two following years.
Loans and receivablesThis refers to financial instruments which are not derivatives, have payments that are either fixed or can be determined, which are not quoted on an active market and which are not intended to be traded.This category includes trade receivables (and payables), which are classified as current assets with the exception of the part due in over 12 months from the date of the financial statements. The measurement of these instruments is made by applying the method of amortized cost, using the effective interest rate and taking into account any discounts or premiums obtained or paid at the moment of acquisition and recognizing them throughout the whole life of the instrument until its final maturity.
Available-for-sale financial assetsThis is a “residual” category which includes non-derivative financial instruments that are desig-nated as available for sale and are not included in any of the previous categories. Financial instruments held for trading are recognized at their fair value plus any transaction costs. Gains and losses are recognized to a separate item of equity until the financial instruments are sold or have been impaired. In such cases the profit or loss accrued under shareholders’ equity is released to the income statement.
Fair value is the amount for which an asset can be exchanged or a liability can be settled, between knowledgeable, willing parties in a transaction at arm’s length. In the case of securities listed on regulated markets, the fair value is the bid price at the close of trading on the last day of the accounting period. Where no market prices are available, fair value is determined either on the basis of the fair value of another financial instrument that is substantially similar or by using appropriate financial tech-niques (for example the discounted cash flow method). Investments in financial assets can be eliminated from the balance sheet, or derecognized, only when the contractual rights to receive their respective financial cash flows have expired or when the financial asset is transferred to third parties together with all its associated risks and rewards.
4. FINANCIAL RISK MANAGEMENT
Financial risk management is carried out by the central finance and treasury function of the group headed by the Company, on the basis of policies approved by Management. Reference should therefore be made to the appropriate section of the Explanatory Notes to the Consolidated Finan-cial Statements for a full description of this area.
CIR S.p.A.

118
FINANCIAL RISK MANAGEMENT
(in thousands of euro) <1 year >1<2 >2<3 >3<4 >4<5 >5 Total
INTEREST BEARING
Fixed Rate
Trade receivables -- -- -- -- -- -- --
Other receivables 5,550 -- -- -- -- -- 5,550
Financial receivables -- -- -- -- -- -- --
Securities 45,065 -- 1,099 -- -- 46,164
Available-for-sale financial assets -- -- -- -- -- -- --
Cash & cash equivalents -- -- -- -- -- -- --
Bank overdraft facilities -- -- -- -- -- -- --
Bonds -- -- -- -- -- (295,640) (295,640)
Other borrowings (43,757) -- -- -- -- -- (43,757)
Trade payables -- -- -- -- -- -- --
Other payables -- -- -- -- -- -- --
Floating Rate
Trade receivables -- -- -- -- -- -- --
Other receivables -- -- -- -- -- -- --
Financial receivables -- -- -- -- -- -- --
Securities -- 7,526 -- 12,058 19,980 61,334 100,898
Available-for-sale financial assets -- -- -- -- -- -- --
Cash and cash equivalents 64,732 -- -- -- -- -- 64,732
Bank overdraft facilities (2) -- -- -- -- -- (2)
Bonds -- -- -- -- -- -- --
Other borrowings -- -- -- -- -- -- --
Trade payables -- -- -- -- -- -- --
Other payables -- -- -- -- -- -- --
NON INTEREST BEARING Trade receivables 29,383 -- -- -- -- -- 29,383
Other receivables 51,098 -- -- -- -- 188 51,286
Financial receivables -- -- -- -- -- -- --
Securities 39,532 -- -- -- 9,890 10,010 59,432
Available-for-sale financial assets -- -- -- -- -- -- --
Cash and cash equivalents -- -- -- -- -- -- --
Bank overdraft facilities -- -- -- -- -- -- --
Bonds -- -- -- -- -- -- --
Other borrowings -- -- -- -- -- -- --
Trade payables (4,474) -- -- -- -- -- (4,474)
Other payables (36,234) -- -- -- -- (36,234)
In accordance with the requirements of IAS 32 paragraph 74, the above chart shows the informa-tion on interest rate risk with a breakdown by asset and liability group and by year of maturity. This information is shown over a time horizon of 5 years on the basis of the way the interest ac-crues.
CIR S.p.A.

119
5. ACCOUNTING PRINCIPLES, CHANGES IN ACCOUNTING ESTIMATES AND ERRORS
The criteria for making estimates and measurements are re-examined on a regular basis and are based on historical experience and on other factors such as expectations of possible future events that are reasonably likely to take place.
If the initial application of a principle affects the current year or the previous one, its effect is rec-ognized by indicating the change resulting from any transitional rules, the nature of the change, the description of the transitional rules, which may also affect future years, and the amount of any adjustments relating to years preceding those being presented.
If a voluntary change of a principle affects the current or previous year this effect is shown by in-dicating the nature of the change, the reasons for the adoption of the new principle, and the amount of any adjustments made for years preceding those being presented.
In the event of a new principle/interpretation issued but not yet endorsed, an indication is given of the fact, of its potential impact, the reason for the principle/interpretation, the date on which it will take effect and the date on which it will first be applied.
A change in accounting estimates involves an indication of the nature and the impact of the change. Estimates are used mainly to show impairment of assets recorded, provisions made for risks, employees benefits, taxes and other provisions and reserves. Estimates and assumptions are reviewed regularly and the effects of any such changes are reflected in the income statement.
Lastly, the treatment of accounting errors involves an indication of the nature of the error, the a-mount of the adjustments to be made at the beginning of the first accounting period after it was discovered.
CIR S.p.A.

120
5. NON-CURRENT ASSETS
5.a INTANGIBLE ASSETS
2005Original Accrued amortization Balance
(in thousands of euro) cost and write-downs 01.01.2005
Concessions, licenses, trademarks and similar rights 406 (347) 59
2006Original Accrued amortization Balance
(in thousands of euro) cost and write-downs 31.12.2005
Concessions, licenses, trademarks and similar rights 421 (365) 56
Description %
Concessions, licenses, trademarks and similar rights 5-30%Other intangible assets 16-30%
AMORTIZATION RATES
BALANCE SHEET
Opening balances
Opening balances
CIR S.p.A.

121
Purchases Amortization and Original Accrued amortization Balancecost acc.amort. write-downs cost and write-downs 31.12.2005
15 -- -- (18) 421 (365) 56
Purchases Amortization and Original Accrued amortization Balancecost acc.amort. write-downs cost and write-downs 31.12.2006
53 -- -- (28) 474 (393) 81
Closing balancesDisposals
Changes for the period
Changes for the period Closing BalancesDisposals
CIR S.p.A.

122
5.b. TANGIBLE ASSETS
2005 Changes for the periodOriginal Accrued depreciation Balance Purchases
(in thousands of euro) cost and write-downs 01.01.2005Land 723 -- 723 -- Buildings 4,132 (4,095) 37 9 Plant and machinery 747 (735) 12 35 Other assets 3,276 (1,947) 1,329 336 Assets in process and advance payments 13,313 -- 13,313 3,255 Total 22,191 (6,777) 15,414 3,635
2006 Changes for the periodOriginal Accrued depreciation Balance Purchases
(in thousands of euro) cost and write-downs 31.12.2005Land 1,961 -- 1,961 -- Buildings 4,179 (4,100) 79 66 Plant and machinery 782 (743) 39 208 Other assets 3,623 (2,022) 1,601 452 Assets in process and advance payments 8,231 -- 8,231 -- Total 18,776 (6,865) 11,911 726
Tangible assets rose from € 11,911 thousand at December 31 2005 to € 4,576 thousand atDecember 31 2006.The reduction is essentially due to classification under "Real estate investments" following completion of work on a building located in Milan
Description %
Buildings and real-estate investments 3.00%Equipment and machinery
Other assets:
- Electronic office equipment 20.00%- Furniture and fittings 12.00%- Motor vehicles 25.00%
10.00-25.00%
DEPRECIATION RATES
Opening balances
Opening balances
CIR S.p.A.
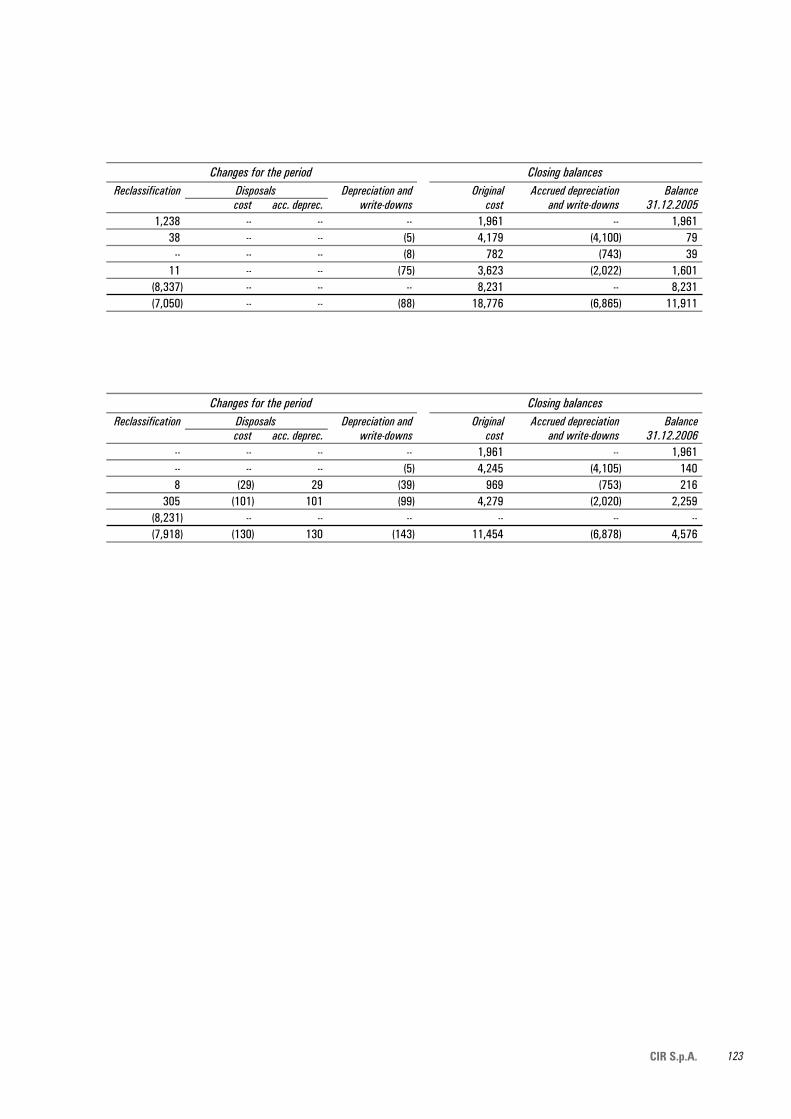
123
Reclassification Depreciation and Original Accrued depreciation Balancecost acc. deprec. write-downs cost and write-downs 31.12.2005
1,238 -- -- -- 1,961 -- 1,961 38 -- -- (5) 4,179 (4,100) 79
-- -- -- (8) 782 (743) 39 11 -- -- (75) 3,623 (2,022) 1,601
(8,337) -- -- -- 8,231 -- 8,231 (7,050) -- -- (88) 18,776 (6,865) 11,911
Reclassification Depreciation and Original Accrued depreciation Balancecost acc. deprec. write-downs cost and write-downs 31.12.2006
-- -- -- -- 1,961 -- 1,961 -- -- -- (5) 4,245 (4,105) 140 8 (29) 29 (39) 969 (753) 216
305 (101) 101 (99) 4,279 (2,020) 2,259 (8,231) -- -- -- -- -- -- (7,918) (130) 130 (143) 11,454 (6,878) 4,576
Disposals
Closing balancesDisposals
Changes for the period Closing balances
Changes for the period
CIR S.p.A.

124
5.c. REAL-ESTATE INVESTMENTS
2005 Changes for the periodOriginal Accrued depreciation Balance Purchases
(in thousands of euro) cost and write-downs 01.01.2005-- -- --
2006 Changes for the periodOriginal Accrued depreciation Balance Purchases
(in thousands of euro) cost and write-downs 31.12.20057.050 (106) 6.944 3.119
Real-estate investments rose from € 6,944 thousand at December 31 2005 to € 17,604 thousandat December 31 2006. The increases during the period refer to the completion of renovation work ona building situated in the centre of Milan, carried out during the year for € 3,119 thousand and re-classifield from the item Assets in process and advance payments to this item for € 7,918 thousand.The carrying value of this property is very close to market value.
Opening balances
Opening balances
CIR S.p.A.
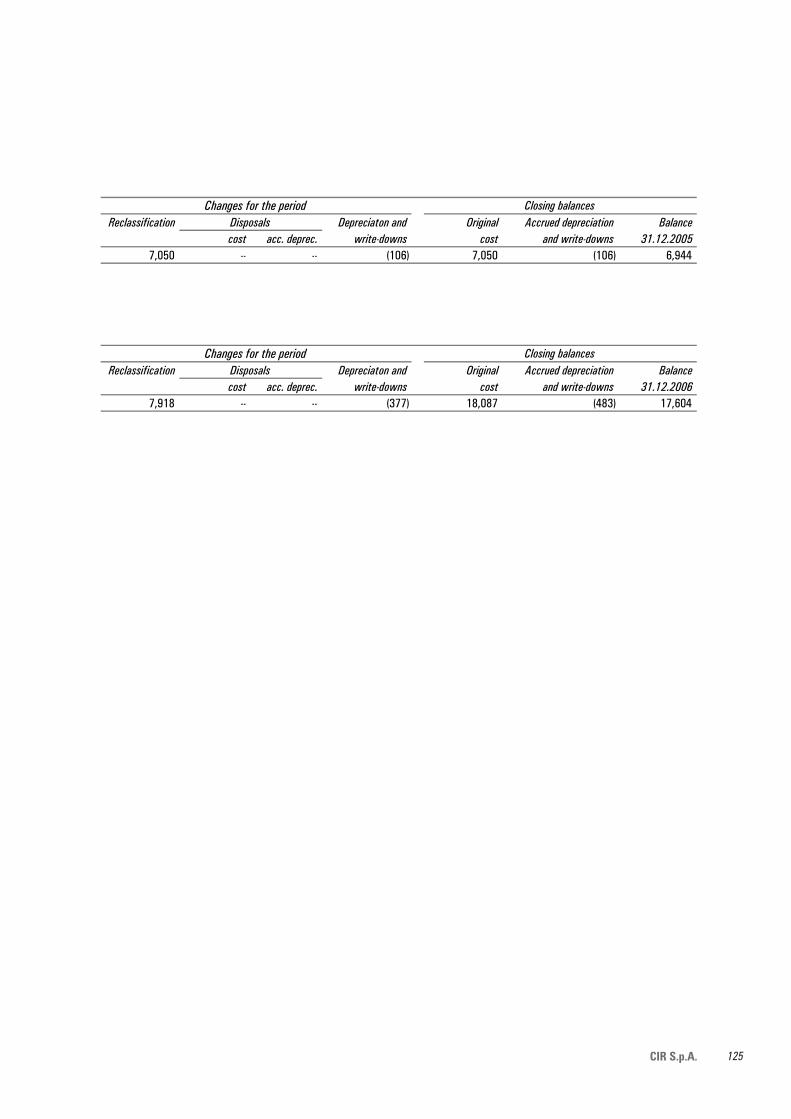
125
Reclassification Depreciaton and Original Accrued depreciation Balancecost acc. deprec. write-downs cost and write-downs 31.12.2005
7,050 -- -- (106) 7,050 (106) 6,944
Reclassification Depreciaton and Original Accrued depreciation Balancecost acc. deprec. write-downs cost and write-downs 31.12.2006
7,918 -- -- (377) 18,087 (483) 17,604
Changes for the period Closing balancesDisposals
Changes for the period Closing balancesDisposals
CIR S.p.A.

126
5.d. EQUITY INVESTMENTS 2005
(in thousands of euro) Opening balances Changes for the year Closing balances
Write-downs/
Revaluation
01.01.2005 Reclassification Increases Decreases Val.restored 31.12.2005
no. of shares amount no. of shares amount no. of shares amount no. of shares amount amount no. of shares amount
Subsidiaries
GRUPPO EDITORIALEL’ESPRESSO S.p.A. 218,825,235 333,862 -- -- -- -- -- -- -- 218,825,235 333,862
ENERGIA HOLDING S.p.A. 86,424,197 173,376 -- -- 1,913,612 11,482 -- -- -- 88,337,809 184,858
SOGEFI S.p.A. 65,194,962 105,193 -- -- -- -- -- -- -- 65,194,962 105,193
HOLDING SANITÀ E SERVIZI S.p.A. -- -- -- -- 1,889,382 32,790 -- -- -- 1,889,382 32,790
DRY PRODUCTS S.p.A. 55,000 -- -- -- -- -- -- -- -- 55,000 --
CIR INTERNATIONAL S.A. 25,000,000 238,686 -- -- -- -- -- -- -- 25,000,000 238,686
CIRINVEST B.V. (in liquidation)(formerly Sasib International B.V.) 18,152 -- -- -- -- 30 -- -- (6) 18,152 24
COFIDEFIN SERVICOS LDA 93,000 180 -- -- -- -- -- -- -- 93,000 180
INTERGEFI S.r.l. 500,000 512 -- -- -- -- -- -- -- 500,000 512
CIR VENTURE S.r.l. 10,000 2 -- -- -- 4,183 -- -- (4,175) 10,000 10
SCALA CAPITAL S.p.A.(formerly Mantegna SGR S.p.A.) -- -- -- -- 1,000,000 1,000 -- -- -- 1,000,000 1,000
JUPITER FINANCE S.p.A. -- -- -- -- 592,800 1,482 -- -- -- 592,800 1,482
Total subsidiaries 851,811 -- 50,967 -- (4,181) 898,597
Other companies
C IDC S.p.A.
(in liquidation and arrangementbefore bankruptcy) 1,231,319 -- -- -- -- -- -- -- -- 1,231,319 --
EMITTENTI TITOLI S.p.A. 232,000 132 -- -- -- -- -- -- -- 232,000 132
CAAF DELL’INDUSTRIADELL'EMILIA CENTRALE S.p.A. 5,000 2 -- -- -- -- (5,000) (2) -- -- --
FILIPPO FOCHI S.p.A.(in receivership) 409,520 -- -- -- -- -- -- -- -- 409,520 --
IST. EDIL. ECONOM.POPOLARE S.r.l. 1,350 1 -- -- -- -- -- -- -- 1,350 1
Total other companies 135 -- -- (2) -- 133
TOTAL EQUITY INVESTMENTS 851,946 -- 50,967 (2) (4,181) 898,730
CIR S.p.A.

127
5.d. EQUITY INVESTMENTS 2006
(in thousands of euro) Opening balances Changes for the year Closing balances
Write-downs/
Revaluation
31.12.2005 Reclassification Increases Decreases Val.restored 31.12.2006
no. of shares amount no. of shares amount no. of shares amount no. of shares amount amount no. of shares amount
Subsidiaries
GRUPPO EDITORIALE
L’ESPRESSO S.p.A. 218.825.235 333.862 -- -- 1.950.000 7.818 -- -- -- 220.775.235 341.680
ENERGIA HOLDING S.p.A. 88.337.809 184.858 -- -- -- -- -- -- -- 88.337.809 184.858
SOGEFI S.p.A. 65.194.962 105.193 -- -- -- -- -- -- -- 65.194.962 105.193
HOLDING SANITÀ E SERVIZI S.p.A. 1.889.382 32.790 -- -- 1.765.363 38.838 -- -- -- 3.654.745 71.628
DRY PRODUCTS S.p.A. 55.000 -- -- -- -- -- -- -- -- 55.000 --
CIR INTERNATIONAL S.A. 25.000.000 238.686 -- -- -- -- -- -- -- 25.000.000 238.686
CIRINVEST B.V. (in liquidation) 18.152 24 -- -- -- -- (18.152) (5) (19) -- --
COFIDEFIN SERVICOS LDA 93.000 180 -- -- -- -- -- -- -- 93.000 180
INTERGEFI S.r.l. 500.000 512 -- -- -- -- -- -- -- 500.000 512
CIR VENTURE S.r.l. 10.000 10 -- -- -- 6 -- -- (6) 10.000 10
CIRINVEST S.p.A.(formerly Scala Capital S.p.A.) 1.000.000 1.000 -- -- -- -- (878.250)* -- (878) 121.750 122
JUPITER FINANCE S.p.A. 592.800 1.482 -- -- -- 296 -- -- (296) 592.800 1.482
Total subsidiaries 898.597 -- 46.958 (5) (1.199) 944.351
Other companies
C IDC S.p.A.
(in liquidation and arrangement
before bankruptcy) 1.231.319 -- -- -- -- -- -- -- -- 1.231.319 --
EMITTENTI TITOLI S.p.A. 232.000 132 -- -- -- -- -- -- -- 232.000 132
FILIPPO FOCHI S.p.A.(in receivership) 409.520 -- -- -- -- -- -- -- -- 409.520 --
IST. EDIL. ECONOM.
POPOLARE S.r.l. 1.350 1 -- -- -- -- -- -- -- 1.350 1
Total other companies 133 -- -- -- -- 133
TOTAL EQUITY INVESTMENTS 898.730 -- 46.958 (5) (1.199) 944.484
The changes during the period were mainly to do with the purchase of shares in Gruppo Editoriale L'Espresso S.p.A. following favourable conditions in themarket and to the subscription of a capital increase in HSS to finance its development, particularly for the acquisition of the company Anni Azzurri.The decrease during the period was mainly due to the write-off of the capital of the company Scala Capital S.p.A. renamed Cirinvest S.p.A..
CIR S.p.A.

128
LIST OF INVESTMENTS IN SUBSIDIARIES AS OF DECEMBER 31 2006 (ART. 2427 no. 5, Civil Code)
(in thousands of euro) Head Share Total Result Percentage Carrying Office Capital equity for the of valueName year ownership
GRUPPO EDITORIALE L’ESPRESSO S.p.A. Rome 65,150 332,802 85,928 50.83 (*) 341,680
ENERGIA HOLDING S.p.A. Turin 120,351 259,519 6,362 73.40 184,858
SOGEFI S.p.A. Mantua 58,826 250,108 22,284 57.53 (**) 105,193
DRY PRODUCTS S.p.A. (***) Milan 100 1,552 1,032 55.00 --
CIR INTERNATIONAL S.A. Luxembourg 250,000 270,385 1,112 100.00 238,686
COFIDEFIN SERVICOS DE CONSULTORIA LDA Madeira 125 6,264 6,038 74.40 180
INTERGEFI S.r.l. Milan 500 790 146 100.00 512
CIR VENTURE S.r.l. Milan 10 1 (9) 100.00 10
HSS - HOLDING SANITÀ E SERVIZI S.p.A. Milan 4,286 68,532 (2,837) 85.28 71,628
JUPITER FINANCE S.p.A. Milan 600 748 (779) 98.80 1,482
CIRINVEST S.p.A. (formerly Scala Capital S.p.A.) Milan 122 (134) (1,094) 100.00 122
(*) 52.20% of voting rights (**) 58.41% of voting rights (***) For financial year ended March 31 2006
5.e. MISCELLANEOUS RECEIVABLES
The balance at December 31 2006 includes security deposits with a nominal value of € 166 thou-sand (€ 179 thousand at December 31 2005) and tax advances on severance and leaving indemnity (TFR), revalued in accordance with the law, for € 23 thousand (€ 33 thousand at December 31 2005).
5.f. DEFERRED TAXES
The breakdown of “Deferred tax assets and liabilities” by type of temporary difference is as fol-lows:
(in thousands of euro) 31.12.2006 31.12.2005
Amount Tax Amount Tax of temporary effect of temporary effect differences differences
Deferred tax assets: Write-down of fixed assets 1,751 578 7,836 2,586
Risk provision and other 2,579 851 (2,987) (974)
Total deferred tax assets 1,429 1,612
Deferred tax liabilities: Valuation of financial instruments (54) (19) (54) (19)
Capital gain on sale of property (3,068) (161) (6,135) (322)
Total deferred tax liabilities (180) (341)
Total net deferred taxes 1,249 1,271
During the year no deferred taxes were recognized directly to shareholders’ equity neither were there any prior losses for which the company has not set aside deferred taxes.
CIR S.p.A.

129
6. CURRENT ASSETS
6.a. MISCELLANEOUS RECEIVABLES
(in thousands of euro) 31.12.2006 31.12.2005
Tax receivables 18,977 39,719
Financial receivables with related parties 34,450 6,522
Other receivables with related parties 29,357 2,929
Receivables others 3,248 3,158
Total 86,032 52,328
The item “Financial receivables with related parties” can be broken down as follows:
(in thousands of euro) 31.12.2006 31.12.2005
Jupiter Finance S.p.A. 31,122 --
Intergefi S.r.l. 3,328 2,992
Dry Products S.p.A. -- 3,530
Total 34,450 6,522
The item “Other receivables with related parties” refers to receivables from companies that took part in the tax consolidation and specifically € 23,767 from companies of the Sorgenia group and € 5,590 thousand from the Espresso group. The financial receivables due from the company Jupi-ter Finance S.p.A. were for providing operational support in its start-up phase.
6.b. SECURITIES
The item “Securities” includes the following categories of securities:
(in thousands of euro) 31.12.2006 31.12.2005
Italian Government securities and similar securities 21,204 37,085
Investment funds and similar funds 35,556 --
Bonds 21,079 51,627
Miscellaneous securities 124,679 89,070
Interest on securities 3,976 3,181
Total 206,494 180,963
(in thousands of euro) 31.12.2006 31.12.2005
Of which are held for trading 188,882 161,343
Of which were in application of the fair value option because of the presence of an implied derivative 17,612 19,620Total 206,494 180,963
The fair value measurement of the item “securities” involved making a negative adjustment to the income statement of € 5,774 thousand of which € 3,766 thousand were from securities held for trading.
CIR S.p.A.

130
“Miscellaneous securities” contains investments of liquidity in the short term which have a rating of “double A” or higher.
6.c. CASH AND CASH EQUIVALENTS
Cash and cash equivalents declined by € 111,862 thousand from € 176,594 thousand to € 64,732 thousand. A breakdown of this change is shown in the cash flow statement.
7. SHAREHOLDERS’ EQUITY
7.a. SHARE CAPITAL
Share capital rose from € 389,620,833.50 at December 31 2005 (779,241,667 shares each with nominal value of € 0.50) to € 390,239,533.50 (780,479,067 shares) at December 31 2006 as a re-sult of the issuance of 1,237,400 shares following the exercise of stock option plans.
At December 31 2006 the Company owned 34,094,000 of its own shares (4.37% of capital) for a total value of € 76,884 thousand compared to 27,216,642 shares owned at December 31 2005. In application of IAS 32, since January 1 2005 treasury stock held by the Parent Company is be-ing deducted from shareholders’ equity.
The share capital is fully subscribed and paid up. No shares have any rights, privileges or limita-tions on the distribution of dividends with the exception of the own shares held as treasury stock.
It should be noted that the Board of Directors was authorized for a period of five years starting from April 27 2005 to increase once or more the share capital up to a maximum € 500 million (nominal value) and by a further maximum of € 20 million (nominal value) in favour of employ-ees of the Company, its subsidiaries and parent companies.
CIR S.p.A.

131
7.b. RESERVES
The breakdown of the item “Reserves” is as follows:
(in thousands of euro) Additional paid-in Legal Statutory Reserve Reserve for Own shares “First Stock Reserve for Totalcapital reserve reserves for own buy-back of held as adoption of option future capital reserves reserve shares held own shares stock IFRS” reserve increases
reserve
Balance at January 1 2005 7,699 115,969 21 25,442 97,369 (25,442) 162,210 1,915 3 385,186
Capital increases 2,273 -- -- -- -- -- -- -- -- 2,273
Buy-back of own shares -- -- -- 35,879 (35,879) (35,879) -- -- -- (35,879)
AGM resolution to buy back own shares (3,553) -- -- -- 15,412 -- -- -- -- 11,859
Notional cost of stock options credited -- -- -- -- -- -- 5,737 -- 5,737
Balance at December 31 2005 6,419 115,969 21 61,321 76,902 (61,321) 162,210 7,652 3 369,176
Capital increases 1,076 -- -- -- -- -- -- -- -- 1,076
Buy-back of own shares -- -- -- 15,563 (5,664) (15,563) -- -- -- (5,664)
Cancellation of AGM resolution of April 27 2005 to buy back own shares 16,422 -- -- -- (71,238) -- -- -- -- (54,816)
Notional cost of stock options credited -- -- -- -- -- -- -- 2,213 -- 2,213
Balance at December 31 2006 23,917 115,969 21 76,884 -- (76,884) 162,210 9,865 3 311,985
CIRS.p.A
.
132
It should be remembered that on April 27 2006 the General Ordinary Meeting of the Shareholders voted to cancel the previous resolution of April 27 2005 to buy back own shares and to give a new authorization for eighteen months from that date to buy back a maximum of 25,000,000 own shares at a minimum unit price of € 0.50 and a maximum of € 4.00.
The “Stock option reserve” refers to the value of the notional cost of the stock options assigned to employees, which were approved after November 7 2002.
7.c. RETAINED EARNINGS (LOSSES)
The changes in Retained earnings (losses) are shown in the “Statement of Changes in Sharehold-ers’ Equity”.
INFORMATION AS PER ART. 2427 – 7BIS – CIVIL CODE
The following chart gives a breakdown of the items of shareholders’ equity and shows how they can be utilized:
(in thousands of euro) Balance at Possibility of Part Summary of uses made
December 31 2006 use available in the last three periods (*) For covering For distributing Other losses as dividends
CAPITAL 390,239 -- -- -- -- --
Capital reserves: Additional paid in capital reserve 23,917 ABC -- -- -- --
Legal reserve 12,678 B -- -- -- --
Capital reserve 3 A -- -- -- --
Earnings reserves: Legal reserve 103,291 B -- -- -- --
Statutory reserve 21 ABC -- -- -- --
“First adoption of IFRS” reserve 162,210 ABC -- -- -- --
Stock option reserve 9,865 ABC -- -- --
Retained earnings 201,817 ABC -- -- 12,072 --
TOTAL 904,041 -- -- 12,072 --
Key = A: for capital increases; B: for covering losses; C: for distribution to shareholders
(*) The uses shown are those that caused the reduction in total equity
CIR S.p.A.

133
8. NON CURRENT LIABILITIES
8.a. BONDS
At December 31 2006 the item “Bonds” totalled € 295,640 thousand, compared to € 295,483 thousand at December 31 2005 and referred to the Bond issued by the Company in December 2004 for a nominal € 300 million, with a maturity of 2024 and a fixed rate of interest of 5.75%. Using the amortized cost method this bond was accounted for including the interest accruing for the period and subtracting the issuance discount and expense. The effective interest rate is 5.90%. The bonds are quoted on the Luxembourg Bourse. The fair value of the Bond was € 280,494 thou-sand at December 31 2006 and € 291,668 thousand at December 31 2005.
8.b. PERSONNEL PROVISIONS
The changes in the provision “Employee severance and leaving indemnity” (TFR) are shown be-low:
(in thousands of euro) 31.12.2006 31.12.2005
Starting balance 1,462 1,362
Amount accrued 240 232
Sums paid out (144) (132)
Total 1,558 1,462
9. CURRENT LIABILITIES
9.a. FINANCIAL LIABILITIES WITH RELATED PARTIES
The balance at December 31 2006 of € 43,756 thousand (€ 42,102 at December 31 2005) refers to a loan from CIR International S.A., including € 1,654 thousand of interest at a rate of 4% accrued during the year.
9.b. OTHER PAYABLES
(in thousands of euro) 31.12.2006 31.12.2005
Tax payables 30,779 13,496
Payables related parties 2,570 15,172
Trade payables suppliers 1,904 1,509
Other payables 5,456 3,532
Total 40,709 33,709
CIR S.p.A.
134
The item “Tax payables”, totalling € 30,779 thousand, includes the Inland Revenue payable of € 17,733 thousand resulting from the tax consolidation.
The item “Payables related parties” refers mainly to amounts payable to the companies that took part in the tax consolidation and specifically € 70 thousand to companies of the Espresso group, € 1,472 thousand to companies of the Sogefi group, € 229 thousand to companies of the Sorgenia group and € 599 to companies of the HSS group.
9.c. PROVISIONS FOR RISKS AND LOSSES
“Provisions for risks and losses” totalled € 3,035 thousand at December 31 2006, unchanged from the previous year.
CIR S.p.A.

135
INCOME STATEMENT
10. MISCELLANEOUS REVENUES AND INCOME
This item consists of the following:
(in thousands of euro) 2006 2005
Services to subsidiaries 5,044 4,795
Services to parent company 516 501
Income from real estate 640 38
Other income and recovery of costs 76 168
Other non-recurring revenues -- 1,648
Total 6,276 7,150
Revenues from services provided to subsidiaries are the chargeback of fees for strategic and man-agement support and special administrative, financial and tax assistance supplied to them. The services provided to the parent company were mainly of an administrative and financial nature.
Income from services supplied to companies of the Group in 2006 can be broken down as fol-lows:
(in thousands of euro) 31.12.2006 31.12.2005
COFIDE S.p.A. 516 501
Gruppo Editoriale L'Espresso S.p.A. 2,440 2,370
Sorgenia S.p.A. 700 600
Sogefi S.p.A. 1,850 1,795
Holding Sanità e Servizi S.p.A. 50 30
Jupiter Finance S.p.A. 4 --
Total 5,560 5,296
The balance of the item “Other non-recurring income” the previous year referred mainly to the re-versal of provisions set up in previous periods for disputes in progress, which were settled in 2005.
CIR S.p.A.

136
11. COSTS FOR SERVICES
This item can be broken down as follows:
(in thousands of euro) 2006 2005
Administrative, fiscal, legal and corporate governance consulting fees 3,158 3,029
Services provided by the parent company COFIDE S.p.A. 1,955 1,777
Directors’ and Statutory Auditors’ fees 1,792 1,560
Other expenses 2,814 2,509
Total 9,720 8,875
12. PERSONNEL COSTS
Personnel costs declined by € 1,476 thousand from € 10,567 thousand in 2005 to € 9,091 thousand in 2006. This item includes the notional cost of € 2,213 thousand (€ 5,737 thousand in 2005) from the valuation of existing stock option plans, approved after November 7 2002.
The chart below shows the changes in the number of employees in the different categories during the year:
31.12.2005 Hires Departures 31.12.2006 Average for the year
Executives 10 -- 1 9 9
Managers and Office Staff 18 -- -- 18 18
Total 28 -- 1 27 27
13. OTHER OPERATING COSTS
(in thousands of euro) 2006 2005
Non-deductible VAT and other taxes 823 802
Other charges and non-operating expenses 935 650
Other non-recurring charges 13 100
Total 1,771 1,552
CIR S.p.A.

137
14. FINANCIAL INCOME
This item consists of the following:
(in thousands of euro) 2006 2005
Interest income from securities 9,822 5,947
Interest income from deposits 2,021 4,502
Interest income from subsidiaries 181 446
Other interest income 704 1,319
Total 12,728 12,214
The breakdown of the interest income from subsidiaries is the following:
(in thousands of euro) 2006 2005
Dry Products S.p.A. 20 277
Intergefi S.r.l. 118 112
Jupiter Finance S.p.A. 43 --
CIR Ventures S.r.l. -- 47
Sasib Packaging North America Inc. -- 10
Total 181 446
15. FINANCIAL EXPENSES
This item consists of the following:
(in thousands of euro) 2006 2005
Interest expense on bonds 17,354 17,348
Interest expense on borrowings from subsidiaries 1,953 1,335
Other interest expense and bank charges 1,651 409
Total 20,958 19,092
The item “Interest expense on borrowings from subsidiaries” for 2006 refers for € 1,654 thousand to interest accrued on the loan made by CIR International S.A. and for € 299 thousand to interest due to companies of the Group who took part in the tax consolidation process (€ 70 thousand due to the Espresso group and € 229 thousand to companies of the Sorgenia group).
CIR S.p.A.

138
16. DIVIDENDS
This item can be broken down as follows:
(in thousands of euro) 2006 2005
Dividends from related parties:
Gruppo Editoriale L’Espresso S.p.A. 31,730 28,447
Energia Holding S.p.A. 3,666 --
Sogefi S.p.A. 11,409 10,431
CIR International S.A. 10,000 --
Cofidefin Serviços de Consultoria 4,241 3,869
Total dividends from related parties 61,046 42,747
Dividends from other companies 33 44
Total dividends 61,079 42,791
17. GAINS FROM TRADING SECURITIES
These total € 1,520 thousand (€ 689 thousand in 2005) and refer for € 1,069 thousand to premium transactions on equities and for € 451 thousand to bond trading.
18. LOSSES FROM TRADING SECURITIES
These total € 4,913 thousand (€ 283 thousand in 2005) and refer for € 326 thousand to premium transactions on equities, for € 4,563 thousand to bond trading and for € 24 thousand to trading in-vestment funds and similar funds.
19. ADJUSTMENTS TO THE VALUE OF FINANCIAL ASSETS
This item includes the following:
(in thousands of euro) 2006 2005
Write-down of bonds (6,627) (4,955)
Write-down of investments in subsidiaries (1,199) (4,181)
(Increases to) / Withdrawals from provisions covering losses from equity investments -- 2,110
Revaluation of bonds 268 315
Revaluation of investment funds and similar funds 585 --
Total (6,973) (6,711)
CIR S.p.A.

139
20. TAX EXPENSE FROM PRIOR PERIODS
The amount of € 16,059 thousand in 2005 refers to IRPEG and ILOR tax claims for 1989 from Sasib, a company merged by incorporation into CIR in 1998. The amount includes taxes, fines and interest payments resulting from the unfavourable ruling (no. 312/2/04) of the Provincial Tax Commission of Bologna relating to charges recorded in the financial statements and tax credits relating to the purchase of dividend rights on shares carried out in past years. A first demand for tax was received in June 2005 for an amount of € 4.8 million and was duly paid, a second demand was notified at the beginning of 2006 for an amount of € 11.3 million. An appeal was made against both of these demands. For the second one in particular, an application was made for suspension of the payment.
21. INCOME TAXES
This item includes the following:
(in thousands of euro) 2006 2005
Current taxes 9,090 8,312
Deferred taxes (22) (3,006)
Total 9,068 5,306
RECONCILIATION OF THEORETICAL AND ACTUAL TAX LIABILITY
Taxable income Tax rate % Amount of tax
RESULT BEFORE TAXES 27,629 33 9,117
Effect of increases (decreases) compared to ordinary tax rate
- Dividends (58,025) 33 (19,148)
- Temporary differences deductible in subsequent years 3,051 33 1,007
- Deductible temporary differences from prior periods (3,410) 33 (1,125)
- Non-deductible costs 5,549 33 1,831
Other miscellaneous permanent differences -- 33 --
SUB-TOTAL (25,206) 33 (8,318)
Adjustments to taxable income for participation in national tax consolidation (2,340) 33 (772)
Taxable income / Income tax for the year (27,546) 33 (9,090)
Note: Because of its specific characteristics, IRAP was not considered for the purposes of this chart, which refers just to IRES
22. GUARANTEES AND COMMITMENTS
At December 31 2006 the guarantee and commitment position was as follows:
- Guarantees issued in favour of the ENI group following agreements for the supply of Norwe-gian and Libyan gas as from October 2001. Commercial contracts generally contain take or pay clauses and a price revision based on the trend of certain oil products. These clauses are substantially in line with normal market conditions;
CIR S.p.A.

140
- A guarantee for € 613 million issued to Banks on behalf of CIR International for bond issues; - Guarantees in favour of Inland Revenue for VAT credits totalling € 6,781 thousand; - Government securities pledged as collateral for financial option transactions for a total of
€ 19,500 thousand.
23. RELATED PARTY TRANSACTIONS
Information regarding the impact that related party transactions have on the financial and equity situation and on the result for the year are given in the comment on the individual items of the fi-nancial statements.
The paragraph “Other information” in the Management Report shows the different types of re-lated party transactions, the amounts of which are given in the Explanatory Notes.
24. NET FINANCIAL POSITION
The net financial position can be broken down as follows:
(in thousands of euro) 31.12.2006 31.12.2005
A. Cash and banks 64,732 176,594
B. Other free cash flow -- --
C. Securities held for trading 206,494 180,963
D. Cash and cash equivalents (A) + (B) + (C) 271,226 357,557
E. Current financial receivables -- --
F. Current bank borrowings (2) --
G. Current part of non-current borrowings -- --
H. Other current borrowings (43,757) (42,102)
I. Current financial debt (F) + (G) + (H) (43,759) (42,102)
J. Net current financial position (I) + (E) + (D) 227,467 315,455
K. Non-current bank borrowings -- --
L. Bonds issued (295,640) (295,483)
M. Other non-current borrowings -- --
N. Non-current financial debt (K) + (L) + (M) (295,640) (295,483)
O. Net financial position (J) + (N) (68,173) 19,972
CIR S.p.A.

141
25. OTHER INFORMATION
EMOLUMENTS PAID TO DIRECTORS, STATUTORY AUDITORS AND GENERAL MA-NAGERS
The chart below shows the information required by Article 78 of Consob Resolution no. 11971 of May 14 1999 and subsequent amendments and additions.
(in thousands of euro) Last name and first name Position held Dates position Expiry of Emoluments Non-monetary Bonuses Other Notes held mandate for the position benefits and other fees in the company incentives preparing the Financial statements
DE BENEDETTI CARLO Chairman of the Board 1.1.06-31.12.06 Appr. Fin. St. 2007 -- 130 -- -- (1)
DE BENEDETTI RODOLFO Chief Executive Officer and General Manager 1.1.06-31.12.06 Appr. Fin. St. 2007 720 -- -- 2.969 (2)
PIASER ALBERTO General Manager 1.1.06-31.12.06 -- -- -- -- 403 (2)
BRACCHI GIAMPIO Director 1.1.06-31.12.06 Appr. Fin. St. 2007 20 -- -- --
DEBENEDETTI FRANCO Director 1.1.06-31.12.06 Appr. Fin. St. 2007 20 -- -- --
FERRERO PIERLUIGI Director 1.1.06-31.12.06 Appr. Fin. St. 2007 70 -- 63 (3)
GERMANO GIOVANNI Director 1.1.06-31.12.06 Appr. Fin. St. 2007 20 -- -- 10 (3)
GIRARD FRANCO Director 1.1.06-31.12.06 Appr. Fin. St. 2007 20 -- -- 13 (3)
MANCINELLI PAOLO Director 1.1.06-31.12.06 Appr. Fin. St. 2007 33 -- -- 3 (3)
PARAVICINI CRESPI LUCA Director 1.1.06-31.12.06 Appr. Fin. St. 2007 33 -- -- 30 (3)
RECCHI CLAUDIO Director 1.1.06-31.12.06 Appr. Fin. St. 2007 33 -- -- --
SEGRE MASSIMO Director 1.1.06-31.12.06 Appr. Fin. St. 2007 20 -- -- 294 (4)
TABELLINI GUIDO Director 1.1.06-31.12.06 Appr. Fin. St. 2007 20 -- -- --
ZANNI UMBERTO Director 1.1.06-31.12.06 Appr. Fin. St. 2007 20 -- -- --
MANZONETTO PIETRO Chairman Board of Statu-tory Auditors 1.1.06-31.12.06 Appr. Fin. St. 2007 50 -- -- --
NANI LUIGI Statutory Auditor 1.1.06-31.12.06 Appr. Fin. St. 2007 33 -- -- --
ZINGALES RICCARDO Statutory Auditor 1.1.06-31.12.06 Appr. Fin. St. 2007 33 -- -- 157 (5)
(1) Fees of € 520 thousand as Chairman of CIR S.p.A. and € 10 thousand as Chairman of the subsidiary Sogefi S.p.A. and € 357 thousand as Director of the subsidiary Gruppo Editoriale L’Espresso S.p.A are paid to ROMED S.p.A..
(2) Other fees include emoluments for the position of Director in other companies of the Group and employee salary
(3) Other fees include emoluments for the position of Director in other companies of the Group
(4) Other fees refer to fees for professional services
(5) Other fees include emoluments for the position of Statutory Auditor in other companies of the Group
Stock Option Plans
As required by Consob Resolution no. 11971 of May 14 1999 and subsequent amendments and additions, it should be stated that CIR has set up stock option plans for employees of the Group. At December 31 2006 stock option plans issued as from the year 2000 were still valid for a total of 30,360,600 options, as can be seen from the chart on page 78 of the Explanatory Notes to the Consolidated Financial Statements.
With reference to the plans issued in the last three years, it should be said that:
CIR S.p.A.

142
- On March 12 2004 the Board of Directors voted to assign to executives of the Company and its parent company options for the subscription of shares according to the terms and condi-tions laid down in the Regulation of “Stock Option Plan March 12 2004”, which was ap-proved at the same meeting. This plan gives the beneficiaries the right to exercise an option to subscribe a total maximum of 2,545,000 newly issued shares at a given price and within a predefined period of time. The Regulation also requires that in order to be entitled to exercise the option the beneficiaries must be employed by the Company or its parent company at the moment in which the option is exercised except in cases of retirement, permanent invalidity or death. The subscription price was fixed at € 1.60. The options can be exercised by each bene-ficiary starting from September 30 2004, at three-monthly intervals until the final maturity of September 30 2014.
- On September 6 2004 the Board of Directors voted to assign options to subscribe a further 2,595,000 newly issued shares at the unit price of € 1.56 reserved for subscription by execu-tives of the Company and its parent company who are beneficiaries of the “Stock Option Plan September 6 2004”, approved at the same meeting. The Regulation of this plan stipulates terms and conditions identical to those of the previous plan except for the date on which the options become exercisable (February 28 2005) and the final expiration date of the same op-tions (February 28 2015).
- Furthermore on June 8 2004 the Board of Directors approved the award of further options for the subscription of 4,150,000 shares at the price of € 1.60 per share reserved for the executives of the Company and its parent company who are beneficiaries of “Stock Option Plan June 8 2004” approved during that same meeting. The Regulations of this plan stipulate that the op-tions can be exercised at any time from June 15 2004 to June 15 2009.
- On January 11 2005 the Board of Directors voted to award options for the purchase of 11,700,000 shares at the price of € 2.15 per share – shares which are currently in the portfolio of CIR – to executives of the Company and its parent company, in accordance with the terms and conditions set forth in the document “Regulation of Extraordinary Stock Option Plan January 11 2005”. The options can be exercised at any time from April 30 2005 to April 30 2010.
- On March 11 2005 the Board of Directors voted to assign to executives of the Company and its parent company options for the subscription of shares according to the terms and condi-tions laid down in the Regulation of “Stock Option Plan March 11 2005”, which was ap-proved at the same time. This plan gives the beneficiaries the right to exercise options to sub-scribe a total maximum of 2,670,000 newly issued shares at a given price and within a prede-fined period of time. The Regulation also requires that in order to be entitled to exercise the options the beneficiaries must be employed by the Company or its parent company at the moment when the option is exercised except in cases of retirement, permanent invalidity or death. The subscription price was fixed at € 2.34 per share. The options can be exercised by each beneficiary starting from September 30 2005, at three-monthly intervals, until the final maturity of September 30 2015. On the same date a resolution was also passed assigning 1,760,000 newly issued shares at the price of € 2.34 to employees of CIR S.p.A., of its sub-sidiary CIR International and of its parent company, who are beneficiaries of “Stock Option Plan 2005”, which was approved at the same time. The regulation of this plan gives terms, conditions and exercise periods identical to those of “Stock Option Plan 11.03.2005”.
CIR S.p.A.

143
- On September 6 2005 the Board of Directors voted to assign options to subscribe a further 2,790,000 newly issued shares at the price of € 2.49 per share reserved for subscription by ex-ecutives of the Company and its parent company and the subsidiary Dry Products S.p.A., who are beneficiaries of “Stock Option Plan September 6 2005”, approved during the same meet-ing. The Regulation of this plan stipulates terms and conditions identical to those of the previ-ous plan except for the date on which the options become exercisable (February 28 2006) and the final expiration date of the same options (February 29 2016). It should be remembered that the Board of Directors Meetings as above approved the relative share capital increases (for a total maximum amount of € 3,610,000.00 through the issuance of a maximum of 7,220,000 shares) on the basis of the authorization given by the Extraordinary Meetings of Shareholders held on May 12 2000 and April 27 2005.
- On April 27 2006 the Board of Directors voted to assign to executives of the Company, of its subsidiary Dry Products S.p.A. and of its parent company options to subscribe shares accord-ing to the terms and conditions defined in the Regulations of “Stock option plan 2006”, which was approved at the same time. This plan gives the beneficiaries the right to exercise options to subscribe a total of 5,530,000 newly issued shares at a given price and within a predefined pe-riod of time. The options will be divided into two tranches, each of 2,765,000 options. The Regulations also require that in order to be entitled to exercise the options the beneficiaries must be employed by the Company, its subsidiary or its parent company at the moment when the option is exercised except in cases of retirement, permanent invalidity or death. The sub-scription price was fixed at € 2.50 for the first tranche options and at € 2.47 for the second tra-nche options.
The following chart gives information on the stock options assigned to the Directors and General Managers.
CIR S.p.A.

144
STOCK OPTIONS ASSIGNED TO DIRECTORS AND GENERAL MANAGERS
Options held at beginning of the year
Options assigned during the year
Options exercised during the year
Options which expired
during year
Options held at end of the year
Last name and first name Position held
Number of options
Average strike price
Average expiry date
(years)
Number of options
Average strike price
Average expiry date
(years)
Number of options
Average strike price
Average expiry date
(years)
Number of options
Number of options
Average strike price
Average expiry date
(years)
DE BENEDETTI RODOLFO C.E.O. & G.M.
Stock Option Plan 7/3/2000 1,500,000 3.70
1,500,000 3.70
Stock Option Plan 30/1/2001 1,000,000 2.62
1,000,000 2.62
Stock Option Plan 7/9/2001 2,000,000 1.28
2,000,000 1.28
Stock Option Plan 14/3/2002 340,000 1.20 340,000 1.20
Stock Option Plan 13/9/2002 460,000 1.02 460,000 1.02
Stock Option Plan 7/3/2003 652,500 0.84 (337,500) 0.84 2.523 315,000 0.84
Stock Option Plan /9/2003 787,500 1.13 787,500 1.13
Stock Option Plan 12/3/2004 1,250,000 1.60
1,250,000 1.60
Stock Option Plan 8/6/2004 3,500,000 1.60
3,500,000 1.60
Stock Option Plan 6/9/2004 1,250,000 1.56
1,250,000 1.56
Stock Option Plan 11/1/2005 10,000,000 2.15
10,000,000 2.15
Stock Option Plan 11/3/2005 1,350,000 2.34
1,350,000 2.34
Stock Option Plan 6/9/2005 1,250,000 2.49
1,250,000 2.49
Stock Option Plan 2006 1st tranche 1,250,000 2.50 1,250,000 2.50
Stock Option Plan 2006 2nd tranche 1,250,000 2.47 1,250,000 2.47
TOTAL 25,340,000 1.99 7.13 2,500,000 2.49 10.01 (337,500) 0.84 2.523 27,502,500 2.05 6.6
PIASER ALBERTO G.M.
Stock Option Plan 14/3/2002 32,000 1.20 (24,000) 1.20 2.523 8,000 1.20
Stock Option Plan 13/9/2002 56,000 1.02 (24,000) 1.02 2.523 32,000 1.02
Stock Option Plan 7/3/2003 100,000 0.84 (30,000) 0.84 2.523 70,000 0.84
Stock Option Plan 5/9/2003 130,000 1.13 (30,000) 1.13 2.523 100,000 1.13
Stock Option Plan 12/3/2004 192,000 1.60 (36,000) 1.60 2.523 156,000 1.60
Stock Option Plan 9/2004 228,000 1.56 (36,000) 1.56 2.523 192,000 1.56
Stock Option Plan 11/3/2005 400,000 2.34 400,000 2.34
Stock Option Plan /9/2005 300,000 2.49 300,000 2.49 Stock Option Plan 2006 1sttranche 300,000 2.50 300,000 2.50
Stock Option Plan 2006 2nd tranche 300,000 2.47 300,000 2.47
TOTAL 1,438,000 1.86 8.47 600,000 2.49 10.01 (180,000) 1.26 2.523 1,858,000 2.12 7.97
FERRERO PIERLUIGI Dir.
Stock Option Plan 7/3/2000 220,000 3.70
220,000 3.70
Stock Option Plan 30/1/2001 125,000 2.62
125,000 2.62
Stock Option Plan 7/9/2001 100,000 1.28
(100,000) 1.28 2.53 -- --
TOTAL 445,000 2.85 5.50 (100,000) 1.28 2.53 345,000 3.31 4.25
CIR S.p.A.

145
Statutory Financial Statements of directly controlled subsidiaries as of December 31 2006
ENERGIA HOLDING S.p.A.
GRUPPO EDITORIALE L’ESPRESSO S.p.A.
SOGEFI S.p.A.
HSS – HOLDING SANITÀ E SERVIZI S.p.A.
DRY PRODUCTS S.p.A.
CIR INTERNATIONAL S.A.
MEDINVEST Plc
COFIDEFIN SERVIÇOS DE CONSULTORIA Lda
INTERGEFI S.r.l.
CIR VENTURE S.r.l.
JUPITER FINANCE S.p.A.
CIRINVEST S.p.A. (formerly SCALA CAPITAL S.p.A.)

146
ENERGIA HOLDING S.p.A.Headquarters: TURINShare capital at December 31 2006: € 120,351,238.00
BALANCE SHEET(in euro)
ASSETS 31.12.2006 31.12.2005
A - SHAREHOLDER RECEIVABLES FOR PAYMENTS STILL DUE -- --
B - FIXED ASSETSI Intangible assets
Start-up and expansion costs 4,064 6,264 Concessions, licenses and traademarks 1,513 1,730
Total intangible assets 5,577 7,994
II Tangible assets -- --
III Financial assetsInvestments in subsidiaries 254,582,461 252,870,557
Total financial assets 254,582,461 252,870,557
TOTAL FIXED ASSETS 254,588,038 252,878,551
C - CURRENT ASSETSI Inventories -- -- II Accounts receivable
Parent companies due in up to one year 34,711 56,420 Advanced taxes due in up to one year -- -- Others due in up to one year 3,370 5,707
Total receivables 38,081 62,127 III Financial assets not classified as fixed assets -- --
IV Cash and cash equivalentsBank and Post Office deposits 5,016,322 5,341,708
Total cash and cash equivalents 5,016,322 5,341,708
TOTAL CURRENT ASSETS 5,054,403 5,403,835
D - ACCRUED INCOME AND PREPAID EXPENSES -- --
TOTAL ASSETS 259,642,441 258,282,386
LIABILITIES AND SHAREHOLDERS' EQUITY 31.12.2006 31.12.2005
A - SHAREHOLDERS' EQUITYI Capital 120,351,238 120,351,238 II Additional paid-in capital 131,485,190 131,485,190 III Revaluation reserves -- --IV Legal reserve 1,084,709 813,101 V Statutory reserve -- --VI Reserve for treasury stock held -- --VII Other reserves 10,171 10,173 VIII Retained earnings (losses) 226,278 60,293 IX Net income (loss) for the year 6,361,741 5,432,169
TOTAL SHAREHOLDERS' EQUITY 259,519,327 258,152,164
B - PROVISIONS FOR RISKS AND LOSSES -- --
C - EMPLOYEE SEVERANCE AND LEAVING INDEMNITY FUND (TFR) -- --
D - ACCOUNTS PAYABLETrade payables due in up to one year 121,696 129,448 Tax payables 1,418 774
TOTAL PAYABLES 123,114 130,222
E - ACCRUED EXPENSES AND DEFERRED INCOME -- --
TOTAL LIABILITIES AND SHAREHOLDERS' EQUITY 259,642,441 258,282,386

147
ENERGIA HOLDING S.p.A.Headquarters: TURINShare capital at December 31 2006: € 120,351,238.00
INCOME STATEMENT(in euro)
2006 2005
A - VALUE OF PRODUCTIONOther revenues and income -- --
TOTAL VALUE OF PRODUCTION -- --
B - COSTS OF PRODUCTIONServices 92,479 130,064 Amortization, depreciation and write-downs
Amortization of intangible assets 2,416 3,380 Miscellaneous operating costs 25,325 134,687
TOTAL COSTS OF PRODUCTION 120,220 268,131 OPERATING INCOME (LOSS) (120,220) (268,131)
C - FINANCIAL INCOME AND EXPENSESIncome from equity investments
Subsidiaries 6,339,364 5,583,427 Other financial income
Income other than the aboveOther 148,992 88,126
Interest and other financial chargesOther -- 152
TOTAL FINANCIAL INCOME AND EXPENSES 6,488,356 5,671,401 D - ADJUSTMENTS TO THE VALUE OF FINANCIAL ASSETS -- --
E - EXTRAORDINARY GAINS AND LOSSESGains 104,600 92,126
Losses -- 1,605
EXTRAORDINARY ITEMS 104,600 90,521
INCOME (LOSS) BEFORE TAXES 6,472,736 5,493,791
Income taxes for the year (110,995) (61,622)NET INCOME (LOSS) FOR THE YEAR 6,361,741 5,432,169

148
GRUPPO EDITORIALE L’ESPRESSO S.p.A.Headquarters: ROMEShare capital at 31.12.2006: € 65,149,551.00
BALANCE SHEET(in euro)
ASSETS
Intangible assets with an indefinite useful life 220,660,859 220,660,858 Other intangible assets 2,811,161 3,369,339 Intangible assets 223,472,020 224,030,197
Tangible assets 68,035,523 74,132,977 Equity investments 391,694,134 379,552,649 Non-current receivables 348,290 727,242 Deferred tax assets 14,733,787 16,670,202
NON-CURRENT ASSETS 698,283,754 695,113,267
Inventories 30,398,197 27,790,838 Trade receivables 119,111,943 118,860,859
of which from associated companies 102,261,915 98,782,928 Tax receivables 25,115,809 38,765,743
of which receivable from associated companies 2,437,298 6,966,619 Other receivables 11,194,173 9,893,993 Cash and cash equivalents 219,313,119 230,093,697
of which with associated companies 59,859,659 39,215,349
CURRENT ASSETS 405,133,241 425,405,130
TOTAL ASSETS 1,103,416,995 1,120,518,397
LIABILITIES AND SHAREHOLDERS' EQUITY
Share capital 65,149,551 65,071,648 Reserves 131,897,461 163,351,911 Retained earnings (losses) 49,826,975 26,133,512 Net income (loss) for the year 85,927,510 83,128,474
SHAREHOLDERS' EQUITY 332,801,497 337,685,545
Borrowings 338,744,633 345,249,565 Provisions for risks and losses 6,969,941 7,582,603 TFR and other personnel funds 47,576,131 45,555,983 Deferred tax liabilities 40,676,591 35,117,100
NON-CURRENT LIABILITIES 433,967,296 433,505,251
Borrowings 168,319,724 168,377,992 of which from associated companies 159,078,867 159,283,247
Provisions for risks and losses 2,847,972 2,993,100 Trade payables 115,232,168 132,589,349
of which to associated companies 23,847,651 21,612,734 Tax payables 12,128,359 6,804,244
of which to associated companies 6,188,844 591,434 Other payables 38,119,979 38,562,916
CURRENT LIABILITIES 336,648,202 349,327,601
TOTAL LIABILITIES 770,615,498 782,832,852
TOTAL LIABILITIES AND SHAREHOLDERS' EQUITY 1,103,416,995 1,120,518,397
31.12.2006 31.12.2005
31.12.2006 31.12.2005

149
GRUPPO EDITORIALE L’ESPRESSO S.p.A.Headquarters: ROMEShare capital at 31.12.2006: € 65,149,551.00
INCOME STATEMENT(in euro)
Revenues 657,905,137 649,191,974 of which from associated companies 3,176,940 299,266,251
Change in product inventories (1,011,526) 2,042,701
Other operating income 7,222,198 22,852,133 of which from associated companies 97,926 23,494
Costs for the purchase of goods (122,957,111) (116,232,470)of which from associated companies 472,261 343,061
Costs for services (332,542,877) (334,793,421)of which from associated companies (97,828,025) (92,279,608)
Other operating expenses (6,242,749) (9,155,075)of which from associated companies (4,476) (856,984)
Personnel costs (112,035,293) (111,836,004)of which from associated companies 67,359 (70,962)
Amortization, depreciation and write-downs (13,251,245) (14,733,432)
Operating income 77,086,534 87,336,406
Net financial income (expenses) (14,958,372) (21,503,583)of which from associated companies (2,514,835) (418,421)
Dividends 56,319,888 47,175,878 of which from associated companies 56,319,888 47,175,878
Income before taxes 118,448,050 113,008,701
Taxes (32,520,540) (29,880,227)
NET INCOME (LOSS) 85,927,510 83,128,474
Basic earnings per share 0.201 0.193
Diluted earnings per share 0.195 0.187
2006 2005

150
SOGEFI S.p.A.Headquarters: MANTUAShare capital at 31.12.2006: € 58,926,707.84
BALANCE SHEET(in euro)
ASSETS 31.12.2006 31.12.2005CURRENT ASSETS
Cash and cash equivalents 6,201,827 19,599,084 Centralized treasury accounts with subsidiaries 21,460,909 10,027,842 Securities and available-for-sale financial assets 4,442 25,344 Loans and similar financial receivables with subsidiaries 26,123,308 20,163,332 WORKING CAPITALTrade receivables 2,304,693 2,275,442 of which with subsidiaries 1,773,649 2,009,224 of which with the parent company 529,804 266,219 Other receivables 130,437 179,352 Tax assets 275,643 314,860 Other assets 215,594 186,758 of which with subsidiaries 139,316 113,109
TOTAL WORKING CAPITAL 2,926,367 2,956,412 TOTAL CURRENT ASSETS 56,716,853 52,772,014 NON-CURRENT ASSETSFIXED ASSETS
Real estate investment: land 12,154,000 12,154,000 Real estate investment: other buildings 15,173,100 15,173,100 Other tangible assets 101,090 118,123 Intangible assets 47,049 40,742
TOTAL FIXED ASSETS 27,475,239 27,485,965 OTHER NON-CURRENT ASSETS
Investments in subsidiaries 256,420,932 256,996,593 Other available-for-sale financial assets 10,180 2,954 Loans and similaar financial receivables 91,759,986 91,800,000 of which with subsidiaries 91,459,301 91,800,000 of which other medium/long term assets for cash flow hedging 300,685 -- Other receivables 2,513 1,105 Advanced taxes 1,415,582 1,417,406
TOTAL OTHER NON-CURRENT ASSETS 349,609,193 350,218,058 TOTAL NON-CURRENT ASSETS 377,084,432 377,704,023 TOTAL ASSETS 433,801,285 430,476,037
LIABILITIES AND SHAREHOLDERS' EQUITY 31.12.2006 31.12.2005CURRENT LIABILITIES
Current bank borrowings 7,098,833 148,844 Centralized treasury accounts with subsidiaries 58,205,452 32,792,250 Current part of long-term loans and other borrowings 2,750,444 95,847,728 TOTAL SHORT-TERM FINANCIAL LIABILITIES 68,054,729 128,788,822 Other financial liabilities for cash flow hedging -- 131,870 TOTAL BORROWINGS AND SHORT-TERM CASH-FLOW HEDGING 68,054,729 128,920,692 Trade payables and other payables 5,840,632 3,188,975 of which with subsidiaries 763,866 221,533 Taxes payable 230,443 2,556,991 Other current liabilities 435,618 376,074
TOTAL CURRENT LIABILITIES 74,561,422 135,042,732 NON-CURRENT LIABILITIESMEDIUM-LONG TERM DEBT AND CASH FLOW HEDGING
Bank borrowings 102,634,967 43,928,994 Other medium-long term debt -- 1,824,350 TOTAL MEDIUM-LONG TERM DEBT AND CASH FLOW HEDGING 102,634,967 45,753,344 Other medium-long term financial liabilities for cash flow hedging -- 138,710
TOTAL MEDIUM-LONG TERM DEBT AND CASH FLOW HEDGING 102,634,967 45,892,054 OTHER LONG-TERM LIABILITIES
Long-term provisions 1,464,715 1,248,935 Deferred tax liabilities 5,032,080 5,056,578
TOTAL OTHER LONG-TERM LIABILITIES 6,496,795 6,305,513 TOTAL NON-CURRENT LIABILITIES 109,131,762 52,197,567 SHAREHOLDERS' EQUITY
Share capital 58,826,348 58,337,652 Reserves and retained earnings (losses) 168,997,307 105,336,180 Net income (loss) for the year 22,284,446 79,561,906
TOTAL SHAREHOLDERS' EQUITY 250,108,101 243,235,738 TOTAL LIABILITIES AND SHAREHOLDERS' EQUITY 433,801,285 430,476,037

151
SOGEFI S.p.A.Headquarters: MANTUAShare capital at 31.12.2006: € 58,926,707.84
INCOME STATEMENT(in euro)
2006 2005
FINANCIAL INCOME AND EXPENSES1) Income from equity investments - dividends and other income from subsidiaries 28,744,713 27,160,378 - dividends and other income from other companies 270 179 TOTAL 28,744,983 27,160,557 2) Other financial income - from securities held for trading included in current assets 36,534 110,936 - income other than the above interest income and commissions from subsidiaries 5,830,120 5,439,589 interest income and commissions from others and miscellaneous income 461,350 448,736 foreign exchange gains 503,193 529,644 TOTAL 6,831,197 6,528,905 3) Interest expense and other financial charges - subsidiaries 1,155,049 248,173 - others 5,489,882 7,568,203 - foreign exchange losses 945,270 1,698,007 TOTAL 7,590,201 9,514,383 ADJUSTMENTS TO THE VALUE OF FINANCIAL ASSETS4) Revaluations -- -- 5) Write-downs 1,346,557 6,976,463 TOTAL ADJUSTMENTS (1,346,557) (6,976,463)6) OTHER OPERATING INCOME 9,974,550 10,527,793
of which from subsidiaries 9,718,535 9,848,080 OTHER OPERATING COSTS7) Non-financial services 5,791,708 5,389,485
of which from subsidiaries 476,806 245,644 of which from parent company 1,850,000 1,795,000
8) Lease and rental 385,402 446,187 9) Personnel costs 4,277,725 4,676,375 10) Amortization, depreciation and write-downs 42,702 43,278 11) Risk provisions -- -- 12) Other provisions -- -- 13) Operating costs 1,142,168 1,145,514 TOTAL OTHER OPERATING COSTS 11,639,705 13,741,483 OPERATING INCOME 24,974,267 16,025,570 NON-OPERATING INCOME AND EXPENSES14) Income -- 62,175,468
of which non-recurring -- 62,175,468 15) Expenses 3,116,430 552,210
of which non-recurring 2,171,515 -- NON-OPERATING INCOME (LOSS) (3,116,430) 61,623,258 INCOME BEFORE TAXES 21,857,837 77,648,828 16) Income taxes for the year (426,609) (1,913,078)NET INCOME FOR THE YEAR 22,284,446 79,561,906

152
HSS - HOLDING SOCIETÀ E SERVIZI S.p.A.Headquarters: MILANShare capital at 31.12.2006: € 4,285,610.00
BALANCE SHEET(in euro)
ASSETS 31.12.2006 31.12.2005
A - SHAREHOLDER RECEIVABLES FOR PAYMENTS STILL DUE -- --B - FIXED ASSETS
I Intangible assetsStart-up and expansion costs -- 718 Concessions, licenses, trademarks and similar rights 317,606 61,563 Other assets 37,091 --
Total intangible assets 354,697 62,281 II Tangible assets
Land and buildings 1,524,553 1,524,553 Plant and machinery 13,339 3,326 Industrial and commercial equipment 4,196 -- Other assets 239,182 61,455 Assets in process and advance payments 7,180,053 2,141,779
Total tangible assets 8,961,323 3,731,113 III Financial assets
Investments in subsidiaries 46,753,095 13,098,779 Receivables
Subsidiaries - up to 12 months 8,729,141 1,125,240 Subsidiaries - over 12 months 26,718 26,718 Other companies - up to 12 months 310 310 Other companies - over 12 months 415,437 181,567
Total financial assets 55,924,701 14,432,614 TOTAL FIXED ASSETS 65,240,721 18,226,008 C - CURRENT ASSETS
I Inventories -- -- II Accounts receivable
Clients - up to 12 months 18,587 18,546 Subsidiaries - up to 12 months 3,529,742 1,424,381 Parent companies - up to 12 months 893,798 469,265 Tax assets 779,648 308,805 Advanced taxes -- -- Other - up to 12 months 561,815 109,400
Total receivables 5,783,590 2,330,397 III Financial assets not classified as fixed assets -- -- IV Cash and cash equivalents
Bank and Post office deposits 1,871,932 11,251,445 Cash and valuables on hand 694 778
Total cash and cash equivalents 1,872,626 11,252,223 TOTAL CURRENT ASSETS 7,656,216 13,582,620 D - ACCRUED INCOME AND PREPAID EXPENSES
Accrued income -- -- Prepaid expenses 53,562 25,920
TOTAL ACCRUED INCOME AND PREPAID EXPENSES 53,562 25,920 TOTAL ASSETS 72,950,499 31,834,548
LIABILITIES AND SHAREHOLDERS' EQUITY 31.12.2006 31.12.2005
A - Shareholders' equityI Capital 4,285,610 2,427,729 II Additional paid-in capital 69,402,258 30,510,282 III Revaluation reserve -- -- IV Legal reserve -- -- V Statutory reserves -- -- VI Reserve for treasury stock held -- -- VII Other reserves 1 -- VIII Retained earnings (losses) (2,318,130) (1,492,847)IX Net income (loss) for the year (2,837,300) (825,283)
TOTAL SHAREHOLDERS' EQUITY 68,532,439 30,619,881 B - PROVISIONS FOR RISKS AND LOSSES -- -- C - EMPLOYEE SEVERANCE AND LEAVING INDEMNITY FUND (TFR) 81,595 36,025 D - ACCOUNTS PAYABLE
Trade payables up to 12 months 2,125,058 919,336 Payables - subsidiaries up to 12 months 7,363 43,631 Taxes payable up to 12 months 82,474 68,846 Social security payables up to 12 months 94,454 62,511 Social security payables over 12 months 50,870 -- Other payables up to 12 months 1,227,692 80,130 Other payables over 12 months 662,960 --
TOTAL PAYABLES 4,250,871 1,174,454 E - ACCRUED EXPENSES AND DEFERRED INCOME
Other accrued expenses and deferred income 85,594 4,188 TOTAL ACCRUED EXPENSES AND DEFERRED INCOME 85,594 4,188 TOTAL LIABILITIES AND SHAREHOLDERS' EQUITY 72,950,499 31,834,548
MEMORANDUM ACCOUNTS 31.12.2006 31.12.2005(in euro)
Guarantees issuedGuarantees
Subsidiaries 54,207,508 9,693,728 Other 515,785 913,351
TOTAL MEMORANDUM ACCOUNTS 54,723,293 10,607,079

153
HSS - HOLDING SOCIETÀ E SERVIZI S.p.A.Headquarters: MILANShare capital at 31.12.2006: € 4,285,610.00
INCOME STATEMENT(in euro)
2006 2005
A - VALUE OF PRODUCTIONRevenues from sales and services -- -- Other revenues and income 1,443,685 279,371
TOTAL VALUE OF PRODUCTION 1,443,685 279,371
B - COSTS OF PRODUCTIONServices 2,493,526 516,032 Lease and rental 149,466 110,140 Personnel costs
Salaries and wages 1,178,789 631,931 Social contributions 366,763 202,025 Severance and leaving indemnity 71,571 40,928 Other costs -- --
Amortization, depreciation and write-downsAmortization of intangible assets 29,679 22,261 Depreciation of tangible assets 35,282 18,126
Miscellaneous operating costs 645,123 179,153 TOTAL COSTS OF PRODUCTION 4,970,199 1,720,596 OPERATING INCOME (LOSS) (3,526,514) (1,441,225)
C - FINANCIAL INCOME AND EXPENSESIncome from equity investments
Subsidiaries 174,141 24,640 Total revenues from equity investments 174,141 24,640 Other financial income
Financial income other than the aboveFrom other receivables 197,162 171,800
Total other financial income 197,162 171,800 Interest and other financial expenses
Other creditors (191,932) (3,499)Foreign exchange gains and losses -- --
TOTAL FINANCIAL INCOME AND EXPENSES 179,371 192,941 D - ADJUSTMENTS TO THE VALUE OF FINANCIAL ASSETS -- -- E - EXTRAORDINARY GAINS AND LOSSES
Gains -- -- Losses
Capital losses on disposals (328,600) --
TOTAL EXTRAORDINARY GAINS AND LOSSES (328,600) -- INCOME BEFORE TAXES (3,675,743) (1,248,284)
Income taxes for the yearCurrent taxes -- -- Deferred and advanced taxes 838,443 423,002
NET INCOME (LOSS) FOR THE YEAR (2,837,300) (825,282)

154
DRY PRODUCTS S.p.A.Headquarters in Milan: Via Ciovassino 1Share capital at March 31 2006: € 100,000.00
BALANCE SHEET(in euro)
ASSETS 31.03.2006 * 31.03.2005
A) SHAREHOLDER RECEIVABLES FOR PAYMENTS STILL DUE -- -- B) FIXED ASSETS
I Intangible assets -- -- II Tangible assets
Other assets 1,299 1,570 Total tangible assets 1,299 1,570 III Financial assets
Investments in subsidiaries 188,000 4,843,834 Total financial assets 188,000 4,843,834
TOTAL FIXED ASSETS 189,299 4,845,404
C) CURRENT ASSETSI Inventories -- -- II Receivables ** **
Subsidiaries -- -- -- 1,684,912 Parent companies -- 40,000 -- -- Others -- 138,089 -- 1,623,926
Total receivables -- 178,089 -- 3,308,838 III Financial assets not classified as fixed assets
Financial receivables - subsidiaries -- 519,151 Total financial assets -- 519,151 IV Cash and cash equivalents
Bank and Post Office deposits 3,198,268 349,450 Cash and valuables on hand 403 14
Total cash and cash equivalents 3,198,671 349,464 TOTAL CURRENT ASSETS 3,376,760 4,177,453 D) ACCRUED INCOME AND PREPAID EXPENSES 2,095 2,097 TOTAL ASSETS 3,568,154 9,024,954
LIABILITIES AND SHAREHOLDERS' EQUITY 31.03.2006 * 31.03.2005
A) SHAREHOLDERS' EQUITYI Capital 100,000 100,000 II Additional paid-in capital -- --III Revaluation reserves -- --IV Legal reserve 50,955 37,898 V Reserve for treasury stock held -- --VI Statutory reserves -- --VII Other reserves -- --VIII Retained earnings (losses) 368,957 120,867 IX Net income (loss) for the year 1,032,401 261,147
TOTAL SHAREHOLDERS' EQUITY 1,552,313 519,912 B) PROVISIONS FOR RISKS AND LOSSES
Other -- 1,488,073 TOTAL PROVISIONS FOR RISKS AND LOSSES -- 1,488,073 C) EMPLOYEE SEVERANCE AND LEAVING INDEMNITY FUND 25,284 21,499 D) ACCOUNTS PAYABLE ** **
Trade payables -- 51,202 -- 4,310 Payables - parent companies -- 1,897,427 -- 6,918,159 Tax payables -- 5,750 -- 13,124 Social security payables -- 7,340 -- 13,595 Other payables -- 28,838 -- 46,282
TOTAL PAYABLES -- 1,990,557 -- 6,995,470 E) ACCRUED EXPENSES AND DEFERRED INCOME -- -- TOTAL LIABILITIES AND SHAREHOLDERS' EQUITY 3,568,154 9,024,954
* Financial year ended March 31 2006* * of which due in over 12 months

155
DRY PRODUCTS S.p.A.Headquarters in Milan: Via Ciovassino 1Share capital at March 31 2006: € 100,000.00
INCOME STATEMENT(in euro)
2006 * 2005
A) VALUE OF PRODUCTIONOther revenues and income 1,572,701 1,292,852
TOTAL VALUE OF PRODUCTION 1,572,701 1,292,852 B) COSTS OF PRODUCTION
Services 32,035 278,618 Lease and rental 15,776 29,122 Personnel costs:
Salaries and wages 166,641 172,715 Social contributions 54,805 53,126 Severance and leaving indemnity 9,225 9,123
Amortization, depreciation and write-downs 559 176,042 Risk provisions -- 49,000 Miscellaneous operating costs 27,813 128,783
TOTAL COSTS OF PRODUCTION 306,854 896,529 OPERATING INCOME (LOSS) 1,265,847 396,323 C) FINANCIAL INCOME AND EXPENSES
Other financial income:Income other than the above
Interest and commissions from subsidiaries 10,464 24,430 Interest and commissions from others and miscellaneous income 3,430 1,813
Total other financial income 13,894 26,243 Interest expense and other financial charges
Parent companies 191,268 481,565
Others 269 2,262 Total interest expense and other financial sharges 191,537 483,827 Foreign exchange gains and losses 31 (4,619)
TOTAL FINANCIAL INCOME AND EXPENSES (177,612) (462,203)
D) ADJUSTMENTS TO THE VALUE OF FINANCIAL ASSETSRevaluation:
of equity investments -- 505,928 Write-downs:
of equity investments -- 279,000
TOTAL ADJUSTMENTS TO THE VALUE OF FINANCIAL ASSETS -- 226,928
E) EXTRAORDINARY GAINS AND LOSSES
Gains:Capital gains on disposals -- 414,161
Losses:Capital losses on disposals 5,834 -- Other charges 50,000 314,062
TOTAL EXTRAORDINARY GAINS AND LOSSES (55,834) 100,099
INCOME (LOSS) BEFORE TAXES 1,032,401 261,147
Income taxes for the year -- --
Net income (loss) for the year 1,032,401 261,147
* Financial year ended March 31 2006

156
CIR INTERNATIONAL S.A.Headquarters: LUXEMBOURGShare capital at 31.12.2006: € 250,000,000.00
BALANCE SHEET(in euro)
ASSETS 31.12.2006 31.12.2005
Fixed assets
- tangible assets 4,536 695 - investments 94,077,977 64,542,798
94,082,513 64,543,493 Current assets
- receivables 61,518,209 57,616,985 - marketable securities 660,136,205 525,619,868 - cash at banks and in hand 76,886,207 268,922,737
798,540,621 852,159,590 Prepaid expenses and accrued income 32,266,160 28,567,847
Total assets 924,889,294 945,270,930
LIABILITIES AND SHAREHOLDERS’ EQUITY 31.12.2006 31.12.2005
Share capital 250,000,000 250,000,000 Legal reserve 3,684,059 2,127,106 Profit (Loss) brought forward 15,588,730 (3,993,385)Profit for the year 693,651 31,139,068
Total shareholders’ equity 269,966,440 279,272,789
Provisions for risks and charges 31,865,154 38,260,549
Long term debt 585,000,000 585,000,000
CURRENT LIABILITIES- short term debt 230,022 249,841 - other liabilities 6,863,947 6,029,509
7,093,969 6,279,350
Accrued expenses and deferred income 30,963,731 36,458,242
Totale liabilities 654,922,854 665,998,141
Total liabilities and shareholders' equity 924,889,294 945,270,930
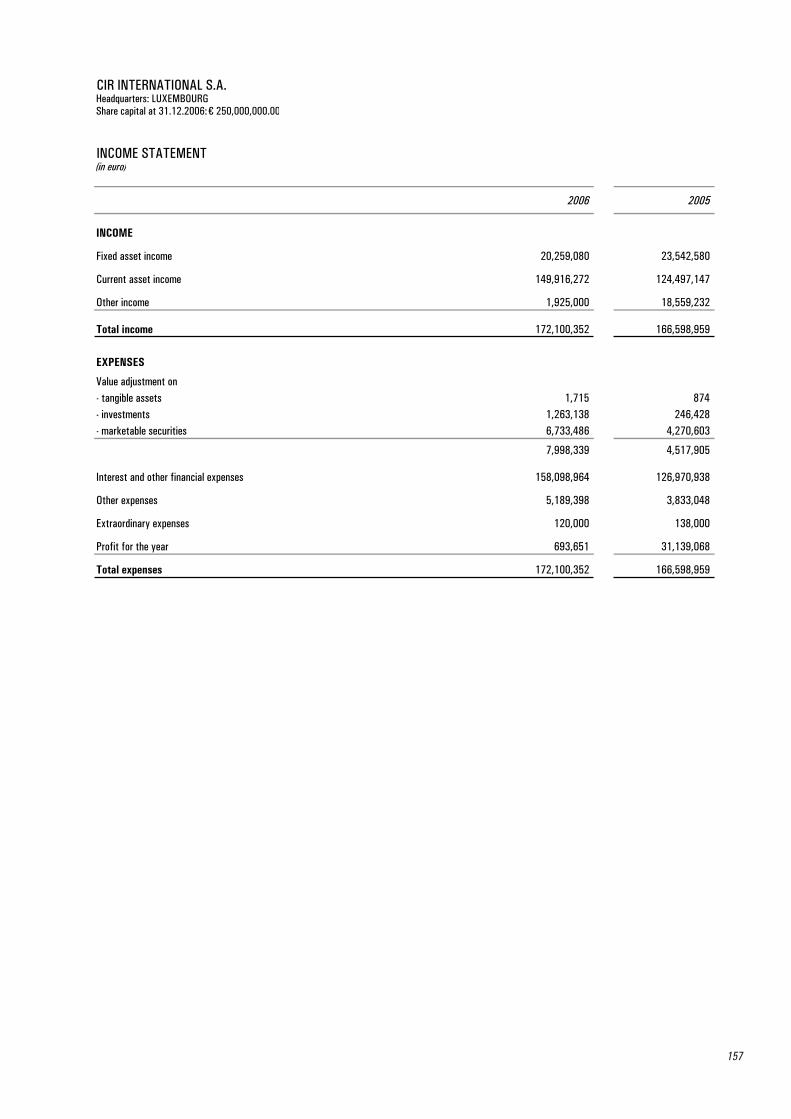
157
CIR INTERNATIONAL S.A.Headquarters: LUXEMBOURGShare capital at 31.12.2006: € 250,000,000.00
INCOME STATEMENT(in euro)
2006 2005
INCOME
Fixed asset income 20,259,080 23,542,580
Current asset income 149,916,272 124,497,147
Other income 1,925,000 18,559,232
Total income 172,100,352 166,598,959
EXPENSES
Value adjustment on- tangible assets 1,715 874 - investments 1,263,138 246,428 - marketable securities 6,733,486 4,270,603
7,998,339 4,517,905
Interest and other financial expenses 158,098,964 126,970,938
Other expenses 5,189,398 3,833,048
Extraordinary expenses 120,000 138,000
Profit for the year 693,651 31,139,068
Total expenses 172,100,352 166,598,959

158
MEDINVEST PlcHeadquarters: DUBLINShare capital at 31.12.2006: $US 361,498.87
BALANCE SHEET(in US dollars)
STATEMENT OF NET ASSETS 31.12.2006 31.12.2005
Current AssetsInvestments in securities 491,065,525 428,148,446 Other debtors 656,657 43,183 Cash 174,576 6,303,074 Receivable for investments sold -- --
491,896,758 434,494,703
Liabilities - Amounts falling due within one yearFinancial liabilities at fair value through profit or loss (3,834) -- Cash - overdrawn (7,578,612) -- Sundry payables and accrued expenses (4,818,901) (3,762,022)Total liabilities (12,401,347) (3,762,022)
Net assets attributable to holders of redeemable participating shares 479,495,411 430,732,681
Participating shares in issue 361,490 361,490
Net asset value per participating share 1,326 1,192
STATEMENT OF CHANGES IN NET ASSETS ATTRIBUTABLE TOHOLDERS OF REDEEMABLE PARTICIPATING SHARES
31.12.2006 31.12.2005
Net assets attributable to holders of redeemableparticipating shares at beginning of year 430,732,681 349,425,350
Share capital transaction -- 50,000,000
Increase/(decrease) in net assets attributable to holders of redeemable preference shares from operations 48,762,730 31,307,331
Net assets attributable to holders of redeemableparticipating shares at end of year 479,495,411 430,732,681

159
MEDINVEST PlcHeadquarters: DUBLINShare capital at 31.12.2006: $US 361,498.87
INCOME STATEMENT(in US dollars)
2006 2005
IncomeBank interest 176,569 160,487 Other income 21,386 33,097 Net gain/(loss) on financial assets and liabilities at fair value through profit or loss 58,739,765 39,329,895
58,937,720 39,523,479
ExpensesInvestment management fee (6,787,207) (5,744,667)Administration fee (100,000) (100,000)Performance fee (2,960,683) (2,098,852)Custodian fee (104,902) (104,439)Transaction fees (6,475) (10,898)Directors' fees (18,098) (25,192)
Audit fee (46,464) (35,985)
Other expenses (52,216) (50,539)
Total operating expenses (10,076,045) (8,170,572)
Total operating profit 48,861,675 31,352,907
Finance costs - Distribution (98,945) (45,576)
Increase/(decrease) in net assets attributable to holders of redeemablepreference shares from operations 48,762,730 31,307,331

160
COFIDEFIN SERVICOS de CONSULTORIA LdaHeadquarters: MADEIRAShare capital at 31.12.2006: € 125,000.00
BALANCE SHEET(in euro)
ASSETS 31.12.2006 31.12.2005
Debts
Other debtors -- --
Total current assets -- --
Bank deposits and cash
Time deposits 3,396,950 3,292,531 Current accounts 57,119 14,874 Total banks deposits and cash 3,454,069 3,307,405
Accruals and deferred itemsAccruals and income 3,571,112 3,117,952 Deferred costs -- 4 Total accruals and deferred items 3,571,112 3,117,956
TOTAL ASSETS 7,025,181 6,425,361
LIABILITIES AND SHAREHOLDERS’ EQUITY 31.12.2006 31.12.2005
SHAREHOLDERS’ EQUITY
Share capital 125,000 125,000 Legal reserve 25,000 25,000 Results carried forward 76,127 96,857 Results for the financial year 6,037,709 5,679,270
Total shareholders’ equity 6,263,836 5,926,127
Debts to third parties - Short-term
Debts to credit institutions -- --
Total current liabilities -- --
Accruals deferred itemsCost accruals 761,345 499,234
Total liabilities 761,345 499,234 TOTAL LIABILITIES AND SHAREHOLDERS’ EQUITY 7,025,181 6,425,361

161
COFIDEFIN SERVICOS de CONSULTORIA LdaHeadquarters: MADEIRAShare capital at 31.12.2006: € 125,000.00
INCOME STATEMENT(in euro)
2006 2005
INCOME
Services provided 7,596,422 6,593,359 Financial income 60,704 69,660
Total income 7,657,126 6,663,019
EXPENSESFinancial expenses 137,782 1,588 General and administrative expenses 1,481,634 982,161
Total expenses 1,619,416 983,749
PROFIT (LOSS) FOR THE YEAR 6,037,710 5,679,270
Total expenses 7,657,126 6,663,019

162
INTERGEFI S.r.l.Headquarters: MILANShare capital at 31.12.2006: € 500,000.00
BALANCE SHEET(in euro)
ASSETS 31.12.2006 31.12.2005
A - SHAREHOLDER RECEIVABLES FOR PAYMENTS STILL DUE -- --B - FIXED ASSETS
I Intangible assets -- --II Tangible assets -- --III Financial assets -- --
TOTAL FIXED ASSETS -- --C - CURRENT ASSETS
I InventoriesFinished buildings 4,239,358 4,239,358
Total inventories 4,239,358 4,239,358 II Accounts receivable
Clients up to 12 months 381,490 118,732 Tax assets up to 12 months 12,739 1,847 Tax assets over 12 months 364 365 Others 463 668
Total receivables 395,056 121,612 III Financial assets not classified as fixed assets -- --IV Cash and cash equivalents
Bank and post office deposits -- 10,777 Cash and valuables on hand 465 465
Total cash and cash equivalents 465 11,242 TOTAL CURRENT ASSETS 4,634,879 4,372,212 D - ACCRUED INCOME AND PREPAID EXPENSES
Other accrued income and prepaid expenses -- --TOTAL ACCRUED INCOME AND PREPAID EXPENSES -- --
TOTAL ASSETS 4,634,879 4,372,212
LIABILITIES AND SHAREHOLDERS' EQUITY 31.12.2006 31.12.2005
A - SHAREHOLDERS' EQUITYI Share capital 500,000 500,000 II Additional paid-in capital -- --III Revaluation reserve -- --IV Legal reserve 20,000 10,000 V Statutory reserves -- --VI Reserve for treasury stock held -- --VII Other reserves 123,732 2,158 VIII Retained earnings (losses) -- --IX Net income (loss) for the year 146,119 131,575
TOTAL SHAREHOLDERS' EQUITY 789,851 643,733 B - PROVISIONS FOR RISKS AND LOSSES -- --C - EMPLOYEE SEVERANCE AND LEAVING INDEMNITY FUND -- --D - ACCOUNTS PAYABLE
Bank borrowings up to 12 months 240,491 230,709 Bank borrowings over 12 months 249,089 486,453 Other borrowings 91 91 Trade payables 13,797 11,648 Payables - parent companies 3,328,090 2,992,400 Tax payables 12,638 6,002
TOTAL PAYABLES 3,844,196 3,727,303 E - ACCRUED EXPENSES AND DEFERRED INCOME 832 1,176
TOTAL LIABILITIES AND SHAREHOLDERS' EQUITY 4,634,879 4,372,212

163
INTERGEFI S.r.l.Headquarters: MILANShare capital at 31.12.2006: € 500,000.00
INCOME STATEMENT(in euro)
2005 2005
A - VALUE OF PRODUCTIONRevenues from sales and services 349,595 344,025 Other revenues and income 1,161 1,054
TOTAL VALUE OF PRODUCTION 350,756 345,079 B - COSTS OF PRODUCTION
Raw materials, secondary materials, consumables and goods -- 11 Services 23,605 244,430 Personnel costs
Salaries and wages -- --Social contributions -- --Severance and leaving indemnity -- --
Changes in inventories of raw materialssecondary materials, consumables and goods -- (215,014)Miscellaneous operating costs 32,306 29,955
TOTAL COSTS OF PRODUCTION 55,911 59,382 OPERATING INCOME (LOSS) 294,845 285,697 C - FINANCIAL INCOME AND EXPENSES
Income from equity investments -- --
Other financial incomeIncome other than the above
Other 9,641 3,305 Total financial income 9,641 3,305
Interest and other financial chargesParent companies 117,690 111,697 Others 28,040 33,406
Total interest and other financial charges 145,730 145,103 TOTAL FINANCIAL INCOME AND EXPENSES (136,089) (141,798)D - ADJUSTMENTS TO THE VALUE OF FINANCIAL ASSETS -- -- E - EXTRAORDINARY GAINS AND LOSSES
GainsMiscellaneous 1 1
LossesMiscellaneous -- --
TOTAL EXTRAORDINARY GAINS AND LOSSES 1 1 INCOME BEFORE TAXES 158,757 143,900
Income taxes for the year (12,638) (12,325)NET INCOME(LOSS) FOR THE YEAR 146,119 131,575

164
CIR VENTURE S.r.l.Headquarters: MILANShare capital at December 31 2006: € 10,000.00
BALANCE SHEET(in euro)
ASSETS 31.12.2006 31.12.2005
A - SHAREHOLDER RECEIVABLES FOR PAYMENTS STILL DUE -- --
B - FIXED ASSETSI Intangible assets -- --II Tangible assets -- --III Financial assets -- --
TOTAL FIXED ASSETS -- --
C - CURRENT ASSETSI Inventories -- --II Receivables -- --
Receivables up to 12 months 3,197 23 Total receivables 3,197 23
III Financial assets not classified as fixed assets -- --IV Cash and cash equivalents 2,886 8,801
TOTAL CURRENT ASSETS 6,083 8,824
D - ACCRUED INCOME AND PREPAID EXPENSES -- --
TOTAL ASSETS 6,083 8,824
LIABILITIES AND SHAREHOLDERS' EQUITY 31.12.2006 31.12.2005
A - SHAREHOLDERS' EQUITY
I Capital 10,000 10,000 II Additional paid-in capital -- -- III Revaluation reserves -- -- IV Legal reserve -- -- V Statutory reserves -- -- VI Reserve for treasury stock held -- -- VII Other reserves - Cover of losses -- 4,174,636 VIII Retained earnings (losses) -- -- IX Net income (loss) for the year (9,231) (4,180,212)
TOTAL SHAREHOLDERS' EQUITY 769 4,424
B - PROVISIONS FOR RISKS AND LOSSES -- --
C - EMPLOYEE SEVERANCE AND LEAVING INDEMNITY FUND -- --
D - ACCOUNTS PAYABLE
Payables up to 12 months 5,314 4,400
TOTAL PAYABLES 5,314 4,400
E - ACCRUED EXPENSES AND DEFERRED INCOME -- --
TOTAL LIABILITIES AND SHAREHOLDERS' EQUITY 6,083 8,824

165
CIR VENTURE S.r.l.Headquarters: MILANShare capital at December 31 2006: € 10,000.00
INCOME STATEMENT(in euro)
2006 2005
A - VALUE OF PRODUCTION -- --
B - COSTS OF PRODUCTIONServices 6,831 44,516 Miscellaneous operating costs 2,436 810
TOTAL COSTS OF PRODUCTION 9,267 45,326
OPERATING INCOME (LOSS) (9,267) (45,326)
C - FINANCIAL INCOME AND EXPENSESOther financial income
Financial income other than the above:from other receivables 79 87
Total other financial income 79 87 Interest and other financial charges
Other creditors (43) (47,595)Total interest and other financial charges (43) (47,595)
TOTAL FINANCIAL INCOME AND EXPENSES 36 (47,508)
D - ADJUSTMENTS TO THE VALUE OF FINANCIAL ASSETS -- --
E - EXTRAORDINARY GAINS AND LOSSESExtraordinary gains -- -- Extraordinary losses
capital losses on the sale of equity investments -- (4,087,378)TOTAL EXTRAORDINARY GAINS AND LOSSES -- (4,087,378)
INCOME BEFORE TAXES (9,231) (4,180,212)
Income taxes for the year -- -- NET INCOME (LOSS) FOR THE YEAR (9,231) (4,180,212)

166
JUPITER FINANCE S.p.A.Headquarters: MILANShare capital at 31.12.2006: € 600,000.00
BALANCE SHEET(in euro)
ASSETS 31.12.2006 31.12.2005
Cash and cash equivalents 40 10
Receivables 44,843,264 3,803,266
Equity investments 4,300,000 4,300,000
Tangible assets 202,481 57,096
Intangible assets 95,582 1,407
Tax assets 636,160 30,192 a) current 161,241 30,192 b) advanced 474,919 --
Other assets 4,125 2,759
TOTAL ASSETS 50,081,652 8,194,730
LIABILITIES AND SHAREHOLDERS' EQUITY 31.12.2006 31.12.2005
Payables 48,658,221 6,802,466
Tax liabilities 43,570 4,662 a) current 30,533 4,351 b) advanced 13,037 311
Other liabilities 620,721 169,621
Employee severance and leaving indemnity 18,389 1,886
Capital 600,000 600,000
Issuance premiums 900,000 900,000
Reserves 16,095 --
Net income (loss) for the year (775,344) (283,905)
TOTAL LIABILITIES AND SHAREHOLDERS' EQUITY 50,081,652 8,194,730

167
JUPITER FINANCE S.p.A.Headquarters: MILANShare capital at 31.12.2006: € 600,000.00
INCOME STATEMENT(in euro)
2006 2005
Interest income and similar income 366,146 10,973
Interest expense and similar charges (277,620) (2,466)
INTEREST MARGIN 88,526 8,507
Commissions received 100,331 --
Commissions paid -- --
NET COMMISSIONS 100,331 --
Administrative costs: (1,504,251) (290,768)a) personnel costs (670,503) (128,780)b) other administrative costs (833,748) (161,988)
Net adjustments to the value of tangible assets (18,929) (1,220)
Net adjustments to the value of intangible assets (29,157) (113)
Other operating expenses (584,796) --
Other operating income 567,354 --
OPERATING INCOME (LOSS) (1,569,779) (292,101)
Gain(Loss) on sale of investments 143,385 --
INCOME (LOSS) FROM CURRENT OPERATIONS GROSS OF TAXES (1,237,537) (283,594)
Taxes for the year on income from current operations 462,193 (311)
INCOME (LOSS) FROM CURRENT OPERATIONS NET OF TAXES (775,344) (283,905)
Income (loss) from groups of assets held for sale net of taxes -- --
NET INCOME (LOSS) FOR THE YEAR (775,344) (283,905)

CIRINVEST S.p.A. (formerly Scala Capital S.p.A.)Headquarters: MILANShare capital at December 31 2006: € 121,750.00
BALANCE SHEET(in euro)
ASSETS 31.12.2006 31.12.2005
A - SHAREHOLDER RECEIVABLES FOR PAYMENTS STILL DUE --
B - FIXED ASSETS 7,016 9,355
I INTANGIBLE ASSETS 7,016 9,355 Start-up and expansion costs 7,016 9,355 Historical cost 11,694 11,694
- Accrued amortization (4,678) (2,339)Concessions, licenses, trademarks and similar rights -- -- Historical cost 13,800 --
- Accrued amortization (13,800) --
II TANGIBLE ASSETS -- --
III FINANCIAL ASSETS -- --
C - CURRENT ASSETS 343,515 974,622
I INVENTORIES -- --
II RECEIVABLES 12,872 27 Tax receivables over 12 months 8,605 27 Other receivables over 12 months 4,267 --
III FINANCIAL ASSETS NOT CLASSIFIED AS FIXED ASSETS -- --
IV CASH AND CASH EQUIVALENTS 330,643 974,595
D - ACCRUED INCOME AND PREPAID EXPENSES 2,045 --
TOTAL ASSETS 352,576 983,977
LIABILITIES AND SHAREHOLDERS' EQUITY 31.12.2006 31.12.2005
A - SHAREHOLDERS' EQUITY (134,053) 959,414
I Capital 121,750 1,000,000 II Additional paid-in capital -- -- III Revaluation reserves -- -- IV Legal reserve -- -- V Statutory reserves -- -- VI Reserve for treasury stock held -- -- VII Other reserves 837,664 -- VIII Retained earnings (losses) -- -- IX Net income (loss) for the year (1,093,467) (40,586)
B - PROVISIONS FOR RISKS AND LOSSES -- --
C - EMPLOYEE SEVERANCE AND LEAVING INDEMNITY FUND 4,899 --
D - ACCOUNTS PAYABLE 481,833 24,563 Trade payables up to 12 months 30,387 16,829 Taxes payable up to 12 months 61,332 -- Social security payables up to 12 months 34,013 -- Other payables up to 12 months 356,101 7,734
E - ACCRUED EXPENSES AND DEFERRED INCOME -- --
TOTAL LIABILITIES AND SHAREHOLDERS' EQUITY 352,679 983,977 168

169
CIRINVEST S.p.A. (formerly Scala Capital S.p.A.)Headquarters: MILANShare capital at December 31 2006: € 121,750.00
INCOME STATEMENT(in euro)
30/6-31/122006 2005
A - VALUE OF PRODUCTION 2,189 -- Other revenues and income 2,189 --
B - COSTS OF PRODUCTION (1,097,777) (40,686)
Services (305,853) (37,456)- consulting (106,764) (29,596)- Directors' and Statutory Auditors' fees (162,963) (7,734)- other (36,126) (126)Lease and rental (27,562) --Personnel costs: (667,392) -- a) salaries and wages (211,620) -- b) social contributions (88,850) -- c) severance and leaving indemnity (14,922) -- e) other costs (352,000) -- Amortization, depreciation and write-downs (16,947) (2,339)a) Amortization of intangible assets (2,339) (2,339)b) Depreciation of tangible assets (808) -- c) Other write-downs of fixed assets (13,800) -- Miscellaneous operating costs (80,023) (891)
OPERATING INCOME (LOSS) (1,095,588) (40,686)
C - FINANCIAL INCOME AND EXPENSES (665) 100 Other financial income 149 100 Interest and financial expenses (814) --
D - ADJUSTMENTS TO THE VALUE OF FINANCIAL ASSETS -- --
E - EXTRAORDINARY GAINS AND LOSSES 2,786 -- Gains 2,786 --
INCOME (LOSS) BEFORE TAXES (1,093,467) (40,586)
Income taxes for the year -- --
NET INCOME (LOSS) FOR THE YEAR (1,093,467) (40,586)


171
LIST OF EQUITY INVESTMENTS AS OF DECEMBER 31 2006
in accordance with Art. 38.2 of D.L. no. 127/91

172
SUBSIDIARIES CONSOLIDATED WITH THE FULL LINE-BY-LINE METHOD
(in euro or foreign currency) Name of Company Registered
OfficesShare
capitalCurrency Parent
companies% of
ownership
CIR GROUP
CIR INTERNATIONAL S.A. Luxembourg 250,000,000.00 € CIR S.p.A. 100.00
INTERGEFI S.r.l. Italy 500,000.00 € CIR S.p.A. 100.00
COFIDEFIN SERVICOS DE CONSULTORIA Lda Portugal 125,000.00 € CIR S.p.A. 74.40
CIRINVEST S.p.A. (formerly Scala Capital S.p.A.) Italy 121,750.00 € CIR S.p.A. 100.00
JUPITER FINANCE S.p.A. Italy 600,000.00 € CIR S.p.A. 98.80
JUPITER MARKETPLACE S.p.A. Italy 5,000,000.00 € JUPITER FINANCE S.p.A. 100.00
SORGENIA GROUP
ENERGIA HOLDING S.p.A. Italy 120,351,238.00 € CIR S.p.A. 73.40
SORGENIA S.p.A. Italy 8,077,392.65 € ENERGIA HOLDING S.p.A. 79.25
ENERGIA ITALIANA S.p.A. Italy 26,050,000.00 € SORGENIA S.p.A. 62.00
ENERGIA PLASSIER S.r.l Italy 50,000.00 € SORGENIA S.p.A. 100.00
ENERGIA LUCANA S.p.A. Italy 2,500,000.00 € SORGENIA S.p.A. 80.00 TECNOPARCO VALBASENTO S.p.A. 20.00 100.00
ENERGIA PROGETTI S.r.l. Italy 500,000.00 € SORGENIA S.p.A. 80.00
ENERGIA MOLISE S.p.A. Italy 14,600,000.00 € SORGENIA S.p.A. 100.00
ENERGIA OPERATION S.p.A. Italy 100,000.00 € SORGENIA S.p.A. 100.00
ENERGIA APRILIA S.r.l. Italy 10,000.00 € SORGENIA S.p.A. 90.00
ENERGIA MINERVINO S.p.A. Italy 200,000.00 € SORGENIA S.p.A. 75.00
ENERGIA LOMBARDA S.p.A. Italy 120,000.00 € SORGENIA S.p.A. 100.00
ENERGIA MODUGNO S.p.A. Italy 1,620,000.00 € SORGENIA S.p.A. 90.00
SOLUXIA S.r.l. Italy 670,000.00 € SORGENIA S.p.A. 100.00
ANEMON S.p.A. Italy 1,343,156.00 € SORGENIA S.p.A. 100.00
ELIGENT S.r.l. Italy 136,050.00 € SORGENIA S.p.A. 70.00
ITALIA ENERGIA S.r.l. Italy 10,000.00 € SORGENIA S.p.A. 100.00
ENERGY STAR S.r.l. Italy 10,200.00 € SORGENIA S.p.A. 100.00
ESPRESSO GROUP
GRUPPO EDITORIALE L’ESPRESSO S.p.A. (*) Italy 65,149,550.70 € CIR S.p.A. 50.83
FIN.E.GI.L. EDITORIALE S.p.A. Italy 18,161,000.00 € GRUPPO EDITORIALE L’ESPRESSO S.p.A. 100.00
S.E.T.A. S.p.A. Italy 774,750.00 € GRUPPO EDITORIALE L’ESPRESSO S.p.A. 71.00
A. MANZONI & C. S.p.A. Italy 15,000,000.00 € GRUPPO EDITORIALE L’ESPRESSO S.p.A. 100.00
CENTRO PREPARAZIONE STAMPA – C.P.S. S.p.A. Italy 520,000.00 € GRUPPO EDITORIALE L’ESPRESSO S.p.A. 100.00
ROTOCOLOR S.p.A. Italy 23,000,000.00 € GRUPPO EDITORIALE L’ESPRESSO S.p.A. 100.00
SOMEDIA S.p.A. Italy 500,000.00 € GRUPPO EDITORIALE L’ESPRESSO S.p.A. 100.00
ROTOSUD S.p.A. Italy 2,860,000.00 € GRUPPO EDITORIALE L’ESPRESSO S.p.A. 100.00
(*) 52.20% of voting rights

173
Name of Company Registered Offices
Sharecapital
Currency Parent companies
% ofownership
ELEMEDIA S.p.A. Italy 25,000,000.00 € GRUPPO EDITORIALE L’ESPRESSO S.p.A. 100.00
EDITORIALE FVG S.p.A. Italy 87,959,976.00 € GRUPPO EDITORIALE L’ESPRESSO S.p.A. 92.12
EDITORIALE LA NUOVA SARDEGNA S.p.A. Italy 775,500.00 € FIN.E.GI.L. EDITORIALE S.p.A. 100.00
E.A.G. S.p.A. Italy 815,000.00 € FIN.E.GI.L. EDITORIALE S.p.A. 100.00
EDIZIONI NUOVA EUROPA S.p.A. Italy 104,000.00 € FIN.E.GI.L. EDITORIALE S.p.A. 100.00
EDITORIALE LA CITTÀ S.p.A. Italy 774,000.00 € FIN.E.GI.L. EDITORIALE S.p.A. 100.00
S.E.L.P.I. S.p.A. Italy 3,202,300.00 € GRUPPO EDITORIALE L’ESPRESSO S.p.A. 70.00 FIN.E.GI.L. EDITORIALE S.p.A. 30.00 100.00
EDIGRAF S.r.l. Italy 312,000.00 € EDITORIALE FVG S.p.A. 66.67
KATAWEB NEWS S.r.l. Italy 10,330.00 € ELEMEDIA S.p.A. 100.00
KSOLUTIONS S.p.A. Italy 1,000,000.00 € ELEMEDIA S.p.A. 100.00
EDITORIALE METROPOLI S.p.A. Italy 500,000.00 € ELEMEDIA S.p.A. 100.00
RETE A S.p.A. Italy 9,198,000.00 € GRUPPO EDITORIALE L’ESPRESSO S.p.A. 100.00
ALL MUSIC S.p.A. Italy 6,500,000.00 € RETE A S.p.A. 100.00
SOGEFI GROUP
SOGEFI S.p.A. (**) Italy 58,926,707.84 € CIR S.p.A. 57.53
REJNA S.p.A. Italy 5,200,000.00 € SOGEFI S.p.A. 99.84
FILTRAUTO S.A. France 5,750,000.00 € SOGEFI S.p.A. 99.99
SOGEFI FILTRATION Ltd Britain 5,126,737 £ SOGEFI S.p.A. 100.00
SOGEFI FILTRATION B.V. Netherlands 1,125,000.00 € SOGEFI S.p.A. 100.00
SOGEFI FILTRATION A.B. Sweden 100,000 Sw.Kr. SOGEFI S.p.A. 100.00
SOGEFI FILTRATION S.A. Spain 12,953,713.60 € SOGEFI S.p.A. 86.08 FILTRAUTO S.A. 13.92 100.00
SOGEFI FILTRATION d.o.o. Slovenia 2,466,326,560 Sit. SOGEFI S.p.A. 100.00
ALLEVARD REJNA AUTOSUSPENSIONS S.A. France 36,000,000.00 € SOGEFI S.p.A. 99.98
SOGEFI Inc. United States 1,000 $USA SOGEFI S.p.A. 100.00
SOGEFI FILTRATION S.p.A. Italy 21,951,000.00 € SOGEFI S.p.A. 100.00
FILTRAUTO GmbH (in liquidation) Germany 51,130.00 € SOGEFI FILTRATION B.V. 100.00
FILTRAUTO U.K. Ltd (in liquidation) Britain 6,810,000 £ SOGEFI FILTRATION Ltd 100.00
SOGEFI FILTRATION DO BRASIL Ltda Brazil 29,857,374 Real SOGEFI FILTRATION S.A. 99.99
SOGEFI FILTRATION ARGENTINA S.A. Argentina 10,691,607 Pesos SOGEFI FILTRATION DO BRASIL Ltda 91.90 FILTRAUTO S.A. 7.28 SOGEFI FILTRATION S.p.A. 0.81 99.99
SHANGHAI SOGEFI FILTRATION Co., Ltd China 3,600,000 $USA SOGEFI FILTRATION S.p.A. 70.00
ALLEVARD SPRINGS Co. Ltd Britain 4,000,002 £ ALLEVARD REJNA AUTOSUSPENSIONS S.A. 100.00
ALLEVARD FEDERN GmbH Germany 50,000.00 € ALLEVARD REJNA AUTOSUSPENSIONS S.A. 100.00
ALLEVARD REJNA ARGENTINA S.A. Argentina 600,000 Pesos ALLEVARD REJNA AUTOSUSPENSIONS S.A. 99.97
IBERICA DE SUSPENSIONES S.L. (ISSA) Spain 10,529,668.00 € ALLEVARD REJNA AUTOSUSPENSIONS S.A. 50.00
ALLEVARD MOLAS DO BRAZIL Ltda Brazil 37,161,683 Real ALLEVARD REJNA AUTOSUSPENSIONS S.A. 99.99 ALLEVARD SPRINGS Co. Ltd 0.01 100.00(**) 58.41% of voting rights

174
Name of Company Registered Offices
Sharecapital
Currency Parent companies
% ofownership
UNITED SPRINGS Ltd Britain 6,500,000 £ ALLEVARD REJNA AUTOSUSPENSIONS S.A. 100.00UNITED SPRINGS B.V. Netherlands 254,979.00 € ALLEVARD REJNA AUTOSUSPENSIONS S.A. 100.00SHANGHAI ALLEVARD SPRINGS Co. Ltd China 5,335,308.00 € ALLEVARD REJNA AUTOSUSPENSIONS S.A. 60.58UNITED SPRINGS S.A.S. France 10,218,000.00 € ALLEVARD REJNA AUTOSUSPENSIONS S.A. 99.99ALLEVARD SPRINGS U.S.A. Inc. United 20,055,000 $USA SOGEFI S.p.A. 31.41 States ALLEVARD REJNA AUTOSUSPENSIONS S.A. 58.12 89.53
COOPERS FILTERS Ltd Britain 3,000,000 £ SOGEFI FILTRATION Ltd 100.00
LUHN & PULVERMACHER – DITTMANN & NEUHAUS GmbH Germany 50,000.00 € ALLEVARD FEDERN GmbH 100.00
HOLDING SANITÀ E SERVIZI GROUP
HSS – HOLDING SANITÀ E SERVIZI S.p.A. Italy 4,285,610.00 € CIR S.p.A. 85.28
VILLA MARGHERITA S.r.l. Italy 751,000.00 € HOLDING SANITÀ E SERVIZI S.p.A. 100.00
CASAVERDE S.p.A Italy 910,000.00 € HOLDING SANITÀ E SERVIZI S.p.A. 100.00
REDANCIA S.r.l. Italy 100,000.00 € HOLDING SANITÀ E SERVIZI S.p.A. 100.00
REHAB S.r.l. Italy 120,000.00 € HOLDING SANITÀ E SERVIZI S.p.A. 100.00
OSPEDALE DI SUZZARA S.p.A. Italy 1,000,000.00 € HOLDING SANITÀ E SERVIZI S.p.A. 65.00
RESIDENZE ANNI AZZURRI S.r.l. Italy 15,567,034.00 € HOLDING SANITÀ E SERVIZI S.p.A. 100.00
SODEMARE S.A. Luxembourg 671,000.00 € RESIDENZE ANNI AZZURRI S.r.l. 100.00
LA NUOVA PALMA S.r.l. Italy 10,200.00 € RESIDENZE ANNI AZZURRI S.r.l. 100.00
RESIDENZE ANNI AZZURRI MONZA S.p.A. Italy 2,064,000.00 € RESIDENZE ANNI AZZURRI S.r.l. 100.00
MEDIPASS S.p.A. Italy 700,000.00 € HOLDING SANITÀ E SERVIZI S.p.A. 100.00
MEIA S.r.l. Italy 50,000.00 € CASAVERDE S.p.A. 60.00
DRY PRODUCTS GROUP
DRY PRODUCTS S.p.A. Italy 100,000.00 € CIR S.p.A. 55.00FOOD MACHINERY MEDIUM VOLUME S.p.A. (in liquidation) Italy 3,000,000.00 € DRY PRODUCTS S.p.A. 100.00
CIR INTERNATIONAL GROUP
CIR VENTURES L.P. United States 20,020,000 $USA CIR INTERNATIONAL S.A. 99.00
MEDINVEST Plc Ireland 361,489.87 $USA CIR INTERNATIONAL S.A. 87.02

175
SHAREHOLDINGS IN JOINT VENTURES AND AFFILITED COMPANIES VALUED USING THE EQUITY METHOD
(in euro or foreign currency)
Name of Company Registered Offices
Sharecapital
Currency Parent companies
% ofownership
SORGENIA GROUP
TIRRENO POWER S.p.A. Italy 91,130,000.00 € ENERGIA ITALIANA S.p.A. 50.00 ESPRESSO GROUP
LE SCIENZE S.p.A. Italy 103,400.00 € GRUPPO EDITORIALE L’ESPRESSO S.p.A. 50.00
SAIRE S.r.l. Italy 46,800.00 € GRUPPO EDITORIALE L’ESPRESSO S.p.A. 50.00
EDITORIALE CORRIERE ROMAGNA S.r.l. Italy 2,856,000.00 € FIN.E.GI.L. EDITORIALE S.p.A. 49.00
EDITORIALE LIBERTÀ S.p.A. Italy 1,000,000.00 € FIN.E.GI.L. EDITORIALE S.p.A. 35.00
ALTRIMEDIA S.p.A. Italy 517,000.00 € FIN.E.GI.L. EDITORIALE S.p.A. 35.00 SOGEFI GROUP
ALLEVARD RESSORTS COMPOSITES S.A.S. France 300,000.00 € ALLEVARD REJNA AUTOSUSPENSIONS S.A. 50.00

176
SHAREHOLDINGS IN SUBSIDIARIES AND AFFILIATED COMPANIES VALUED USING THE COST METHOD (*)
(in euro or foreign currency)
Name of Company Registered Offices
Sharecapital
Currency Parent companies
% ofownership
CIR GROUP
CIR VENTURE S.r.l. (non- operational) Italy 10,000.00 € CIR S.p.A. 100.00
SORGENIA GROUP
TECNOPARCO VALBASENTO S.p.A. Italy 945,000.00 € SORGENIA S.p.A. 20.00
E-ENERGY S.r.l. Italy 15,000.00 € SORGENIA S.p.A. 20.00
EOLICA BISACCIA S.r.l. Italy 10,000.00 € SORGENIA S.p.A. 20.00
NOVENTI SORGENIA VENTURES LP United States 3,030,303.00 $USA SORGENIA S.p.A. 99.00
SENECA S.c.a.r.l. Italy 10,000.00 € SORGENIA S.p.A. 86.25
ESPRESSO GROUP
SANDALYAWEB S.r.l. (in liquidation) Italy 75,000.00 € EDITORIALE LA NUOVA SARDEGNA S.p.A. 51.00 ELEMEDIA S.p.A. 49.00 100.00RADIO DEEJAY Kft (in liquidation) Hungary 50,000,000 HuF. ELEMEDIA S.p.A. 100.00
ENOTRYA S.r.l. (in liquidation) Italy 78,000.00 € ELEMEDIA S.p.A. 70.00
ZIVAGO S.p.A. (in liquidation) Italy 3,096,000.00 € ELEMEDIA S.p.A. 50.00CELLULARMANIA.COM S.r.l. (in liquidation) Italy 10,400.00 € ELEMEDIA S.p.A. 100.00UHURU MULTIMEDIA S.r.l. (non-operational) Italy 10,400.00 € KSOLUTIONS S.p.A. 100.00
BENEDETTINE S.r.l. (in liquidation) Italy 255,000.00 € FIN.E.GI.L. EDITORIALE S.p.A. 35.00
SOGEFI GROUP
MAKKAWI CARS & LORRIES Co. Sudan 900,000 Ls.Pt. REJNA S.p.A. 25.00
HOLDING SANITÀ E SERVIZI GROUP
CONSORZIO CORIMADE Italy 6,000.00 € CASAVERDE S.p.A. 50.00
CIR GROUP INTERNATIONAL
CIGA - Luxembourg S.a.r.l. Luxembourg 3,500,000.00 € CIR INTERNATIONAL S.A. 100.00
BANQUE DUMENIL LEBLE S.A.(in liquidation) France 16,007,146.81 € CIR INTERNATIONAL S.A. 100.00
DUMENIL LEBLE (BELGIUM) S.A.(in liquidation) Belgium 7,561,217.00 € CIR INTERNATIONAL S.A. 100.00
DUMENIL LEBLE (SUISSE) S.A. Switzerland 441,650 SFR CIR INTERNATIONAL S.A. 100.00
VELASQUEZ VIE S.A. (in liquidation) France 59,980.46 € CIR INTERNATIONAL S.A. 100.00
PHA – Participations Hotelières Astor France 12,150.00 € CIR INTERNATIONAL S.A. 99.99
CIR VENTURES MANAGEMENT CO. L.L.C. United States 7,100 $USA CIR INTERNATIONAL S.A. 20.00
(*) Holdings that are non-significant, non-operational or of recent acquisition, unless stated otherwise

177
SHAREHOLDINGS IN OTHER COMPANIES VALUED USING THE COST METHOD (*)
(in euro or foreign currency)
Name of Company Registered Offices
Sharecapital
Currency Parent companies
% ofownership
CIR GROUP
C IDC S.p.A. (in liquidation and settlement with creditors) Italy 4,000,000.00 € CIR S.p.A. 1.23
SORGENIA GROUP
8.2 ENERGIA S.r.l. Italy 100,000.00 € ANEMON S.p.A. 2.50
ESPRESSO GROUP
A.G.F. S.r.l. Italy 30,000.00 € GRUPPO EDITORIALE L’ESPRESSO S.p.A. 10.00
AGENZIA A.N.S.A. S. COOP. A.r.l. Italy 12,307,880.00 € GRUPPO EDITORIALE L’ESPRESSO S.p.A. 3.21 FIN.E.GI.L. EDITORIALE S.p.A. 3.21 EDITORIALE LA NUOVA SARDEGNA S.p.A. 3.21 EDITORIALE FVG S.p.A. 3.21 S.E.T.A. S.p.A. 2.56 E.A.G. S.p.A. 1.92 17.32
CONSULEDIT S. CONSORTILE a.r.l. Italy 20,000.00 € GRUPPO EDITORIALE L’ESPRESSO S.p.A. 6.62 FIN.E.GI.L. EDITORIALE S.p.A. 3.99 EDITORIALE LA NUOVA SARDEGNA S.p.A. 0.62 S.E.T.A. S.p.A. 0.49 EDITORIALE FVG S.p.A. 0.47 E.A.G. S.p.A. 0.39 12.58
E-INK CORPORATION United States 71,190,856 $USA GRUPPO EDITORIALE L’ESPRESSO S.p.A. 0.26
IMMOBILIARE EDITORI GIORNALI S.r.l. Italy 830,462.00 € S.E.T.A. S.p.A. 0.17 EDITORIALE LA NUOVA SARDEGNA S.p.A. 0.12 0.29
TRENTO PRESS SERVICE S.r.l. Italy 260,000.00 € S.E.T.A. S.p.A. 14.40
AGENZIA INFORMATIVA ADRIATICA d.o.o. Slovenia 2,120,000 Sit. EDITORIALE FVG S.p.A. 19.00
CLUB D.A.B. ITALIA – CONSORZIO Italy 18,075.96 € ELEMEDIA S.p.A. 14.29
AUDIRADIO S.r.l. Italy 258,000.00 € A. MANZONI & C. S.p.A. 3.63
PRESTO TECHNOLOGIES Inc. (non- operational) United States 7,663,998.4 $USA ELEMEDIA S.p.A. 7.83
CERT – CONSORZIO EMITTENTI RADIO TELEVISIVE Italy 178,563.57 € RETE A S.p.A. 6.67
CONSORZIO COLLE MADDALENA Italy 62,223.84 € RETE A S.p.A. 4.17
TELELIBERTÀ S.p.A. Italy 500,000.00 € FIN.E.GI.L. S.p.A. 19.00
SOGEFI GROUP
AFICO FILTERS S.A.E. Egypt 10,000,000 EGP SOGEFI FILTRATION S.p.A. 19.00
(*) Holdings lower than 20%

178
SHAREHOLDINGS IN SUBSIDIARIES AND AFFILITED COMPANIES AND IN OTHER COMPANIES NOT INCLUDED IN THE CONSOLIDATED FINANCIAL STATEMENTS
(in euro or foreign currency)
Name of Company Registered Offices
Sharecapital
Currency Parent companies
% ofownership
SOGEFI GROUP
FILTRAUTO DO BRASIL Ltda Brazil 354,600 Real SOGEFI FILTRATION DO BRASIL Ltda 99.00 FILTRAUTO S.A. 1.00 100.00INTEGRAL S.A. Argentina 2,515,600 Pesos FILTRAUTO S.A. 93.50 SOGEFI FILTRATION ARGENTINA S.A. 6.50 100.00
LES NOUVEAUX ATELIERS Belgium 2,880,000.00 € SOGEFI S.p.A. 74.90MECANIQUES S.A. (in liquidation) REJNA S.p.A. 25.10 100.00
CIR INTERNATIONAL GROUP
C.B.D.O. - COMPAGNIE BOURGUIGNONNE DES OENOPHILES EURL France 9,000.00 € CIGA LUXEMBOURG S.a.r.l. 100.00
SO.GE.LOC. S.a.r.l. France 7,622.45 € C.B.D.O. EURL 99.80
VICTOR HUGO CENTRE D’AFFAIRES S.a.r.l. France 7,622.45 € C.B.D.O. EURL 76.00
FINAL S.A. France 2,324,847.00 € C.B.D.O. EURL 47.73

179
Report of the Board of Statutory Auditors


181
C.I.R. S.p.A.
REPORT OF THE BOARD OF STATUTORY AUDITORS IN ACCORDANCE
WITH THE TERMS OF ARTICLE 153 D. LGS. NO. 58/1998 AND
ARTICLE 2429, PARAGRAPH 2 OF THE CIVIL CODE
(TRANSLATION FROM THE ORIGINAL ISSUED IN ITALIAN)
To the Meeting of the Shareholders of C.I.R. S.p.A.
During financial year ended December 31 2006 we performed the surveillance activities re-
quired of us by law, according to the Principles of Conduct for Statutory Auditors recom-
mended by the National Councils of Business Consultants and Accountants. In the prepara-
tion of this report we took into account both the aforesaid principles and the indications
given by Consob in its Communiqué no. 1025564 of April 6 2001.
Concerning the way in which the institutional duties included in our mandate were carried
out, we hereby attest that:
– We attended all the Shareholders’ Meetings and all the Meetings of the Board of Direc-
tors that were held during the year under examination and obtained regularly from the
Directors, sometimes on an informal basis, timely and suitable information on the activ-
ity that had been carried out by the Company and the Group of companies which it con-
trols, with particular regard to the most significant transactions from the economic, fi-
nancial and equity points of view;
– We obtained a degree of knowledge necessary to carry out the duties contained in our
mandate, verifying that the organizational structure of the Company was adequate and
that the principles of sound administration were being complied with. We did this by
means of direct investigation, gathering information from the heads of the appropriate
departments and by exchanging relevant data and information with the firm of inde-
pendent auditors;
– We monitored – both as a Board and through individual action – how well the system of
internal control and the administration and accounting systems functioned, in order to
evaluate how well they meet operational needs; we also assessed the reliability of the
accounting system to represent operational events, through direct investigation, gather-
ing information from the heads of the various functions and analysing the results of the
work carried out by the firm of independent auditors;

182
– We monitored the functional efficiency of the control system for the companies in
which CIR holds a stake and verified the adequacy of the instructions given to them,
even according to the terms of Article 114.2 of D.L. no. 58/98;
– We verified that the provisions of the law and of regulations were being complied with
in relation to the preparation, the organization and the layout of the Statutory Financial
Statements and the Consolidated Financial Statements and the documents accompany-
ing them and also in relation to the adoption by the Company of IAS/IFRS international
accounting standards;
– We checked that the Management Report for financial year 2006 conformed to current
laws and regulations and was consistent with the resolutions adopted by the Board of
Directors and also with the events represented in the Statutory Financial Statements for
the period and in the consolidated accounts. The Semi-Annual Interim Report required
no observations to be made by the Board of Statutory Auditors. The Semi-Annual and
Quarterly Interim Reports were made public as required by law and by regulations on
the subject.
In the course of our surveillance activity, carried out as above, no significant facts emerged
requiring notification to Surveillance Bodies. On the basis of what emerged from our own
direct action and from the information we collected, the choices made by the Directors ap-
peared to us to be in conformity with the law and with the Company Bylaws, with the prin-
ciples of sound administration and consistent and compatible with the size of the Company
and with its net worth.
* * *
The specific indications that this report must provide are listed below, in accordance with
the above-cited Consob Communiqué of April 6, 2001.
- We obtained sufficient information on the most significant transactions from the eco-
nomic, financial and equity viewpoint which were entered into by the Company and its
subsidiaries, ensuring that these transactions were in conformity with the law and with
the Company Bylaws; the Directors have given full details of these transactions in their
Management Report; we also obtained information in an informal way and we made
certain that the operations approved and/or put in place were not imprudent, rash or in
contrast with the resolutions adopted or in potential conflict of interest and that they
were based on the principles of sound company management;

183
- The regular checks and controls that we carried out on the Company did not reveal any
non-typical or unusual transactions entered into with third parties, related parties or in-
tercompany parties;
- Regarding routine transactions entered into with third parties, related parties and inter-
company parties, the Directors in their Management Report have given sufficient in-
formation on the principal transactions entered into and on the relations between C.I.R.
S.p.A., the companies of the Group to which it belongs and/or any related parties, stat-
ing that the transactions involved took place at normal market conditions and in the in-
terests of the Company and of the Group and we agree with this judgement; the trans-
actions in question were mainly intercompany loans, both as borrower and as lender,
the issue of guarantees and the provision of management services; financial details and
the economic effects of these transactions are given in the documents accompanying
the Statutory Financial Statements;
- On April 6 2007 the firm of auditors PriceWaterhouseCoopers S.p.A. issued their Au-
dit Reports for the Statutory Financial Statements for the year and the consolidated ac-
counts as of December 31 2006 which do not contain any objections or requests for in-
formation;
- We did not receive any complaints as per Article 2408 of the Civil Code or any peti-
tions, neither did we hear of any such complaints being made to others;
- During the year the firm of independent auditors and other companies connected with
this firm were not awarded any further contracts by CIR S.p.A. apart from the audit
mandate. Within the sphere of the Group, however, mandates were given by the
Sorgenia S.p.A. Group for a total of Euro 43,000 for due diligence activity and activity
relating to D.Lgs 231/2001, by the Holding Sanità e Servizi S.p.A. Group for Euro
314,000 and by Cir International S.A. for Euro 340,330, both for due diligence work.
These fees seem reasonable in consideration of the size and complexity of the work
carried out. Regarding subsidiaries whose shares are traded on regulated markets, for
the year under examination the firm of independent auditors and other companies asso-
ciated with this firm were awarded mandates by the subsidiary Sogefi S.p.A. (Group)
for a total of Euro 332,890, and by the subsidiary Gruppo Editoriale l’Espresso S.p.A.
for a total of 137,911, as can be seen from the information obtained from their respec-
tive controllers;
- During the year under examination we gave no opinions;

184
- During 2006 the Board of Directors met 6 times and the Board of Statutory Auditors
was present at all of these meetings; the Board of Statutory Auditors also met 5 times,
meeting the firm of independent auditors holding the mandate twice; there were nu-
merous meetings of individual Auditors with members of the Company management;
- We have no particular observations to make concerning compliance with the principles
of correct administration because these appear to have been constantly observed, nor
have we any observations to make on the adequacy of the organizational structure
which we found to be appropriate for satisfying the operational needs of the Company
and the Group;
- We carried out an evaluation of the adequacy of the system of internal control, of the
administrative and accounting system and of the reliability of the latter to represent op-
erational events correctly; in particular we monitored the functional capacity of the
control systems of the subsidiaries and verified that the latter had received adequate in-
structions, even in relation to the terms of Article 114.2 of D.L. no. 58/1998. These in-
structions were deemed to be adequate for the structure and size of the Group and no
necessary corrective action was identified;
- We took due note of the work carried out by the firm of independent auditors, directed
towards ascertaining that the Company accounts were being kept correctly and that op-
erational events were being recorded in such a way as to enable them to be used as a
basis for the preparation of Statutory Financial Statements in accordance with the pro-
visions of the law; in particular we requested and were given by the independent audi-
tors full information concerning the work carried out regarding the preparation of the
Financial Statements in question; no significant aspects emerged from this;
- The Company has substantially adhered to the recommendations of the March 2006
edition of the Code of Conduct of the Committee for the Corporate Governance of
Listed Companies, and has illustrated its corporate governance model in the report that
will be published in accordance with the Instructions to the Rules of Borsa Italiana
S.p.A. To the extent of our responsibility we have been monitoring the way in which
the rules of corporate governance set forth in the above-mentioned Code of Conduct
were actually being implemented, ensuring among other things that the Corporate Gov-
ernance Report of CIR S.p.A. contained the results of the regular check that the Board
of Statutory Auditors has the necessary requisites of independence, which are deter-
mined on the same basis as those for the Members of the Board of Directors;

185
- The Board of Statutory Auditors attended the meetings of the Internal Control Commit-
tee and examined the minutes of the meetings of the Compensation Committee. Lastly,
concerning the provisions of D.L. nos. 231/2001 and 61/2002, the Company has
adopted a Code of Ethics governing conduct, and has appointed the Surveillance Body
as required by regulations on this subject; it has also adopted and implemented an “Or-
ganizational Model” for the conduct and regulation of business.
- Our surveillance activity was carried out on a routine basis during 2006 and did not re-
veal any omissions, facts that could be censured or any irregularities worthy of note.
In giving a positive overall judgement on the results of our surveillance activity, as regards
the Statutory and Consolidated Financial Statements, after having verified that all the terms
of the law governing the preparation and the format of the same had been respected, we
consider the Statutory Financial Statements for the year to be worthy of your approval, to-
gether with the proposed allocation of the net income for the period, as formulated by the
Board of Directors in their Management Report, and in the absence of any further proposals
made by the Board of Statutory Auditors pursuant to the terms of Article 153.2 of D.L. no.
58/1998.
Milan, April 10 2007
THE BOARD OF STATUTORY AUDITORS
Prof. Pietro Manzonetto – Chairman of the Board of Statutory Auditors
Dott. Riccardo Zingales – Statutory Auditor
Dott. Luigi Nani – Statutory Auditor


187
Reports of the Independent Auditors


189


191


CONSOLIDATED FINANCIAL STATEMENTS,
STATUTORY FINANCIAL STATEMENTS
AND ANNUAL REPORT
CIR S.p.A
. • CO
NSO
LIDATED
FINA
NC
IAL STATEM
ENTS, STATU
TORY FIN
AN
CIA
L STATEMEN
TS AN
D A
NN
UA
L REPOR T • FIN
AN
CIA
L YEAR 2006
C O N T E N T S
ADMINISTRATIVE BODIES 4
LETTER TO THE SHAREHOLDERS 7
MANAGEMENT REPORT 91. PERFOMANCE OF THE GROUP 142. PERFORMANCE OF THE PARENT COMPANY 183. CHART RECONCILING THE FIGURES OF THE PARENT COMPANY WITH THOSE OF THE
CONSOLIDATED FINANCIAL STATEMENTS 194. PERFORMANCE OF THE VARIOUS BUSINESS SECTORS 215. OTHER ACTIVITIES 276. SIGNIFICANT EVENTS WHICH OCCURRED AFTER THE CLOSE OF THE YEAR 297. OTHER INFORMATION 308. PROPOSED ALLOCATION OF NET INCOME FOR THE YEAR 33
CONSOLIDATED FINANCIAL STATEMENTS AS OF DECEMBER 31 20061. BALANCE SHEET 362. INCOME STATEMENT 373. CASH FLOW STATEMENT 384. STATEMENT OF CHANGES IN SHAREHOLDERS’ EQUITY 395. EXPLANATORY NOTES TO THE CONSOLIDATED FINANCIAL STATEMENTS 41
CONSOLIDATED FINANCIAL STATEMENTS OF DIRECTLY CONTROLLED SUBSIDIARIES 93
STATUTORY FINANCIAL STATEMENTS OF THE PARENT COMPANY AS OF DECEMBER 31 20061. BALANCE SHEET 1042. INCOME STATEMENT 1053. CASH FLOW STATEMENT 1064. STATEMENT OF CHANGES IN SHAREHOLDERS’ EQUITY 1075. EXPLANATORY NOTES TO THE FINANCIAL STATEMENTS 109
FINANCIAL STATEMENTS OF DIRECTLY CONTROLLED SUBSIDIARIES 145
LIST OF INVESTMENTS AT DECEMBER 31 2006 171
REPORT OF THE BOARD OF STATUTORY AUDITORS 179
REPORT OF THE INDEPENDENT AUDITORS 187
0860_CIR_2006 COVER+INDICE.qxd 19-06-2007 9:30 Pagina 1