ANNUAL REPORT 2003...Year Ended March 31, 2003 ANNUAL REPORT 2003 Nippon Light Metal Company, Ltd....
34
Year Ended March 31, 2003 ANNUAL REPORT 2003
Transcript of ANNUAL REPORT 2003...Year Ended March 31, 2003 ANNUAL REPORT 2003 Nippon Light Metal Company, Ltd....

Year Ended March 31, 2003ANNUAL REPORT 2003
Nippon Light Metal Company, Ltd.
NYK Tennoz Building,
2-20, Higashi-Shinagawa 2-chome
Shinagawa-ku, Tokyo 140-8628, Japan
http://www.nikkeikin.co.jp
Printed in Japan

31
Profile Corporate Data
Since its foundation in 1939, Nippon Light Metal Company, Ltd. has been constantlyinvolved with aluminum. Today, Nippon Light Metal is Japan’s sole fully integrated alu-minum manufacturer with activities ranging from alumina smelting to fabrication ofvarious products.
Nippon Light Metal comprises four business segments: Aluminum Ingot andChemicals concerning the production of alumina and related chemicals and alu-minum ingot; Aluminum Sheet and Extrusions involving the production of sheets andshapes; Fabricated Products and Others including the production of transportation-related products, electronic materials, foil and powder; and Building Materials cover-ing the production of residential and office building materials. Through thesesegments, Nippon Light Metal is actively engaged in a wide range of fields such asautomobiles and railroads, electric machinery and electronics, industrial products,construction, and living necessities.
The NLM Group—the preeminent source of products and services combiningaluminum’s excellent characteristics with new functionality and added value that caterto pressing customer needs—delivers customer satisfaction and contributes to envi-ronmental protection.
Contents
Consolidated Six-Year Summary................................................. 1To Our Shareholders ................................................................. 2Special Feature (President’s Interview) ....................................... 4NLM Group Topics .................................................................... 7Review of Operations ................................................................ 8Financial Review ....................................................................... 10Consolidated Balance Sheets ..................................................... 12Consolidated Statements of Income ........................................... 14Consolidated Statements of Shareholders’ Equity ...................... 15Consolidated Statements of Cash Flows ..................................... 16Notes to the Consolidated Financial Statements ......................... 17Report of Independent Auditors ................................................ 28Overseas Network ..................................................................... 29Directors and Officers ............................................................... 30Corporate Data ......................................................................... 31
Cautionary StatementThis annual report contains various projections and estimates. Important factors that could alter these projections and esti-mates include changes in the balance of aluminum supply and demand, fluctuations in the price of aluminum ingot andforeign exchange rates, as well as shifts in Japanese government policies and regulations. The Company cautions, therefore,that the projections and estimates contained herein involve risk and uncertainty, and that actual results could differ materi-ally from those expressed or implied.
On the Cover:Top form left: “smelted aluminum” “crystal face of high-purity aluminum” “cleanroom” “etched circuit foil” “scene ofanalysis”, Middle: “slab”, Bottom: “melting furnace”
Head OfficeNYK Tennoz Building2-20, Higashi-Shinagawa 2-chomeShinagawa-ku, Tokyo 140-8628, Japanhttp://www.nikkeikin.co.jpPhone: 03-5461-9333Fax: 03-5461-9344E-mail: [email protected]
EstablishedMarch 30, 1939
Paid-In Capital¥39,085 million
Shares of Common StockAuthorized: 1,600,000,000Issued: 543,350,370
Number of Shareholders54,705
Stock Exchange ListingsTokyo, Osaka and three other domestic stock exchanges
Transfer Agent of Common StockThe Chuo Mitsui Trust & Banking Co., Ltd.
Last Shareholders’ MeetingJune 27, 2003
Major Shareholders(Percentage of Total Voting right)
Mizuho Corporate Bank, Ltd.(5.2%)
The Dai-ichi Mutual Life Insurance Co.(5.2%)
Alcan Nikkei Asia Holdings Ltd.(–%)
The Master Trust Bank of Japan, Ltd.(trust accounts)(3.7%)
Asahi Mutual Life Insurance Co.(2.9%)
The Light Metal Educational Foundation, Inc.(2.9%)
Namekawa Aluminum Co., Ltd.(2.8%)
Nikkei-Keiyu-Kai(2.4%)
UFJ Trust Bank, Ltd. (trust accounts)(2.3%)
Mizuho Bank, Ltd.(2.3%)
Major Domestic Affiliated CompaniesShin Nikkei Company, Ltd.Aluminum sashes, construction materials
Nippon Fruehauf Co., Ltd.Aluminum vans, trucks, trailers, containers(66%)
Toyo Aluminium K.KAluminum foil, powder and paste(100%)
Riken Light Metal Industrial Co., Ltd.Aluminum construction materials *2
Nippon Electrode Co., Ltd.Carbon for iron and steel blast furnacesand for aluminum smelting, and othertypes of carbon(100%)
Nikkei Sangyo Co., Ltd.Aluminum welding rods, various kindsof contract work(98.6%)
Nikkei Information System Co., Ltd.Development, maintenance and opera-tion of computer software(100%)
Nikkei Logistics Co., Ltd.Transport, warehousing *3
Nikkei Products Co., Ltd.Household utensils(100%)
Nikkei Extrusions Co., Ltd.Aluminum extruded products(100%)
Nikkei Aluminum Core TechnologyCo., Ltd.Aluminum extrusions and fabricatedproducts(100%)
Nikkei Panel System Co., Ltd.Panel for pre-fabricated freezer/refriger-ator and cleanroom(100%)
Nikkei ECAL Co., Ltd.Housing for cellular and mobiletelecommunications base stations(100%)
Aluminum Wire and Rod Co., Ltd.Aluminum rough drawing wire(58.3%)
Matsuo Industry Co., Ltd.Aluminum castings and forgings *4
*1 98%; Direct interest by NLM2%; Interest held by Nikkei Sangyo Co., Ltd.
*2 98.5%; Direct interest by NLM1.5%; Interest held by Nikkei Logistics Co., Ltd.
*3 46%; Direct interest by NLM44%; Interest held by Shin Nikkei Co., Ltd.10%; Interest held by Nippon Fruehauf Co., Ltd.
*4 99.1%; Direct interest by NLM0.1%; Interest held by Nikkei Sangyo Co., Ltd.
(As of March 31, 2003)
*1
1
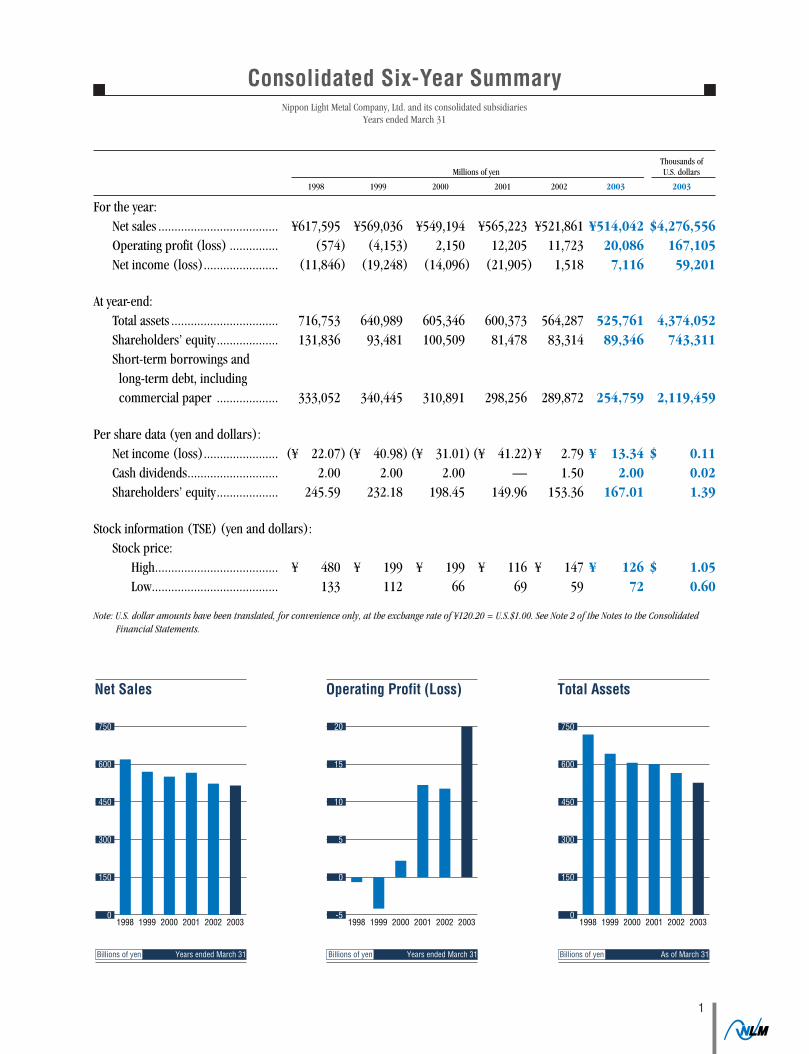
Consolidated Six-Year SummaryNippon Light Metal Company, Ltd. and its consolidated subsidiaries
Years ended March 31
Thousands ofMillions of yen U.S. dollars
1998 1999 2000 2001 2002 2003 2003
For the year:Net sales ..................................... ¥617,595 ¥569,036 ¥549,194 ¥565,223 ¥521,861 ¥514,042 $4,276,556Operating profit (loss) ............... (574) (4,153) 2,150 12,205 11,723 20,086 167,105Net income (loss)....................... (11,846) (19,248) (14,096) (21,905) 1,518 7,116 59,201
At year-end:Total assets ................................. 716,753 640,989 605,346 600,373 564,287 525,761 4,374,052Shareholders’ equity................... 131,836 93,481 100,509 81,478 83,314 89,346 743,311Short-term borrowings and long-term debt, including commercial paper ................... 333,052 340,445 310,891 298,256 289,872 254,759 2,119,459
Per share data (yen and dollars):Net income (loss)....................... (¥ 22.07) (¥ 40.98) (¥ 31.01) (¥ 41.22) ¥ 2.79 ¥ 13.34 $ 0.11Cash dividends............................ 2.00 2.00 2.00 — 1.50 2.00 0.02Shareholders’ equity................... 245.59 232.18 198.45 149.96 153.36 167.01 1.39
Stock information (TSE) (yen and dollars):Stock price:
High...................................... ¥ 480 ¥ 199 ¥ 199 ¥ 116 ¥ 147 ¥ 126 $ 1.05Low....................................... 133 112 66 69 59 72 0.60
Note: U.S. dollar amounts have been translated, for convenience only, at the exchange rate of ¥120.20 = U.S.$1.00. See Note 2 of the Notes to the ConsolidatedFinancial Statements.
200320022001200019991998
Billions of yen Years ended March 31
Net Sales
750
600
450
300
150
0200320022001200019991998
Billions of yen Years ended March 31
Operating Profit (Loss)
20
15
10
5
0
-5200320022001200019991998
Billions of yen As of March 31
Total Assets
750
600
450
300
150
0

2
To Our Shareholders
I am pleased to report on the operating results for Nippon Light Metal Company, Ltd. (NLM) and its consolidated group companies for fiscal 2002, the year from April 1, 2002,
to March 31, 2003, and explain the business issues facing the Group.
Operating ResultsDuring the year under review, the aluminum industry saw total demand return to the four million ton level for thefirst time in two years, fueled by recovery in IT-related demand and increased automobile production volumes inJapan that offset a continuing slump in demand for building materials. Although the Japanese economy continued toshow an underlying deflationary trend, and lackluster economic recovery in Japan and overseas brought an adversebusiness environment, initiatives to develop demand for products that take advantage of the characteristics of alu-minum bore fruit.
In these economic circumstances, the NLM Group delivered improved business performance. On a consolidatedbasis, despite a decrease in net sales of 1.5% year on year to ¥514 billion owing to intensified competition in thedeflationary environment and lower metal trading volumes, new product introductions and other sales expansioninitiatives coupled with the implementation of groupwide cost cutting measures led to a ¥7.5 billion increase inordinary profit to ¥12.3 billion. Despite reporting substantial special losses in connection with various streamliningmeasures, the Group posted a ¥5.6 billion increase in net income to ¥7.1 billion.
NLM declared a ¥0.5 per share increase in the dividend to ¥2.0. Management is aware that the dividend remainsat an insufficient level and will continue to work to improve the operating results and meet the expectations of ourshareholders.
Specifics of Improvements in Business PerformanceThe improved business performance during the year under review is proof that the Mid-Term Management Plan theGroup formulated and began implementing in November 2001 is steadily delivering results. The plan is aimed atfurther strengthening strong operations and boldly implementing structural improvements in poorly performingoperations to rapidly turn them into profitable businesses.
Shigesato Sato President and CEO

3
In fiscal 2002, earnings in the fabricated products category increased at the Group’s strong operations during atime of recovery in IT-related demand and increased automobile production volumes in Japan. In the materials cat-egory, we increased sales of both aluminum alloy ingots and sheet products in the growing markets such as theautomotive and electronics markets, contributing to the increase in earnings.
At the same time, we made great strides forward at problem operations. Rebuilding the Group’s building materi-als operation is an urgent task, and Shin Nikkei Company, Ltd. has moved into profit (on a non-consolidated basis)for the first time in six years on the strength of root-and-branch cost cutting, management streamlining, and profitimprovement efforts at its building materials operation.
Progress with Structural ReformA review of structural reforms being implemented in line with the Mid-Term Management Plan indicates that, asdescribed above, tremendous results are being achieved at Shin Nikkei. In the aluminum extrusion operation aswell, during the first half of the year under review we disposed of two extrusion presses and related facilities, elimi-nating excess extrusion capacity and optimizing capacity for the Group as a whole.
As part of business rationalization measures, the Company spun off several operations and set them up as separatecompanies. On October 1, 2002, the Company spun off its aluminum extrusion and fabricated products operation asNikkeikin Aluminum Core Technology Company, Ltd. and its panel systems operation as Nikkei Panel SystemCompany, Ltd. At the same time, we combined the Toyo Aluminum’s manufacturing and sales covering aluminum foil,powder, and paste operations in a single business unit by transferring the manufacturing unit from NLM to ToyoAluminum K.K. The purpose of these moves was to create a business structure that enables each operation to com-pete more effectively in the marketplace, and the results are already reflected in business performance in fiscal 2002.
A typical example of how we are nurturing strong operations is the introduction of FLEXCAST technology, a con-tinuous casting technology, which revolutionizes the aluminum sheet fabrication process.
A review of cash flows is useful in illustrating progress made with measures implemented to strengthen the Group’sfinancial structure. An increase in cash flows from operating activities and the generation of own funds through thedisposal of assets made possible a ¥36.5 billion reduction in interest-bearing debt, resulting in a balance of ¥258.8billion at fiscal year-end. This has put the Group ahead of schedule for achieving the target of reducing interest-bear-ing debt to under ¥200 billion at the end of fiscal 2006, the final year of the Mid-Term Management Plan.
Outlook for Fiscal 2003The current forecast for the coming year is for consolidated net sales of ¥510 billion and consolidated ordinaryprofit of ¥13 billion. Although management anticipates continuing uncertainty in the overall economic environmenton account of deflation and concerns about a global economic slowdown, we intend to increase profitability anddeliver higher profits by implementing various cost cutting measures and increasing sales of new products.
I look forward to the continuing support and understanding of our shareholders as we drive toward our goals.
June 2003
Shigesato SatoPresident and CEO
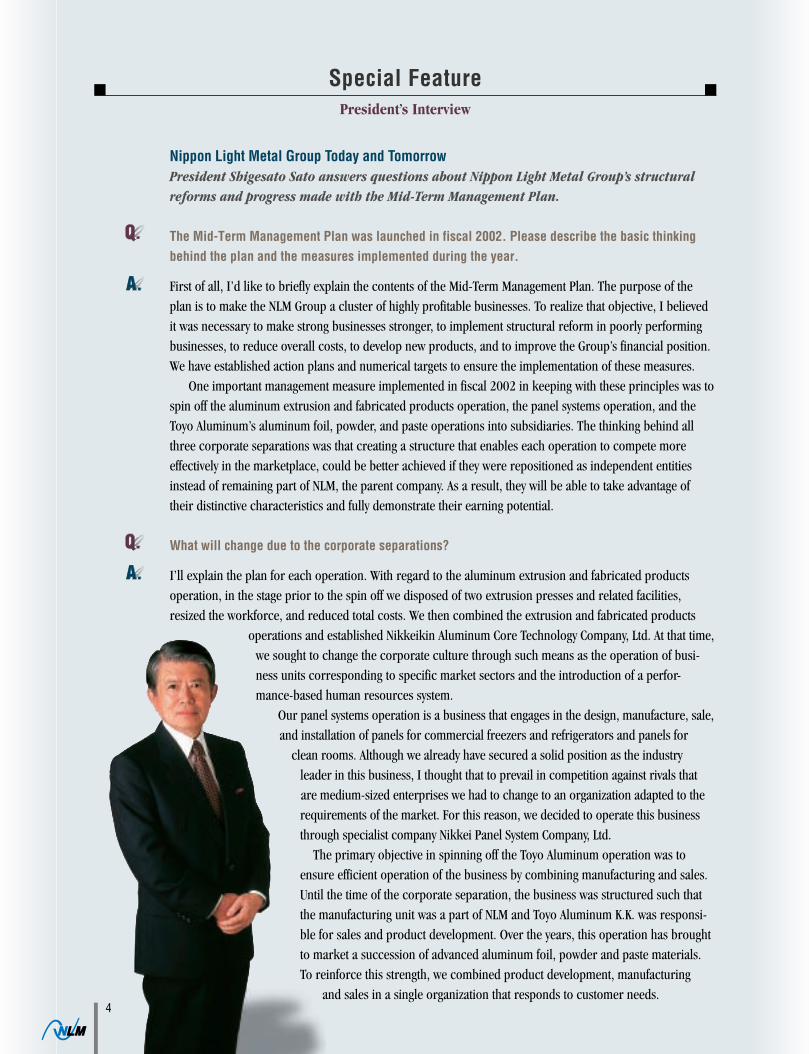
Special FeaturePresident’s Interview
Nippon Light Metal Group Today and TomorrowPresident Shigesato Sato answers questions about Nippon Light Metal Group’s structuralreforms and progress made with the Mid-Term Management Plan.
The Mid-Term Management Plan was launched in fiscal 2002. Please describe the basic thinkingbehind the plan and the measures implemented during the year.
First of all, I’d like to briefly explain the contents of the Mid-Term Management Plan. The purpose of theplan is to make the NLM Group a cluster of highly profitable businesses. To realize that objective, I believedit was necessary to make strong businesses stronger, to implement structural reform in poorly performingbusinesses, to reduce overall costs, to develop new products, and to improve the Group’s financial position.We have established action plans and numerical targets to ensure the implementation of these measures.
One important management measure implemented in fiscal 2002 in keeping with these principles was tospin off the aluminum extrusion and fabricated products operation, the panel systems operation, and theToyo Aluminum’s aluminum foil, powder, and paste operations into subsidiaries. The thinking behind allthree corporate separations was that creating a structure that enables each operation to compete moreeffectively in the marketplace, could be better achieved if they were repositioned as independent entitiesinstead of remaining part of NLM, the parent company. As a result, they will be able to take advantage oftheir distinctive characteristics and fully demonstrate their earning potential.
What will change due to the corporate separations?
I’ll explain the plan for each operation. With regard to the aluminum extrusion and fabricated productsoperation, in the stage prior to the spin off we disposed of two extrusion presses and related facilities,resized the workforce, and reduced total costs. We then combined the extrusion and fabricated products
operations and established Nikkeikin Aluminum Core Technology Company, Ltd. At that time,we sought to change the corporate culture through such means as the operation of busi-ness units corresponding to specific market sectors and the introduction of a perfor-mance-based human resources system.
Our panel systems operation is a business that engages in the design, manufacture, sale,and installation of panels for commercial freezers and refrigerators and panels for
clean rooms. Although we already have secured a solid position as the industryleader in this business, I thought that to prevail in competition against rivals thatare medium-sized enterprises we had to change to an organization adapted to therequirements of the market. For this reason, we decided to operate this businessthrough specialist company Nikkei Panel System Company, Ltd.
The primary objective in spinning off the Toyo Aluminum operation was toensure efficient operation of the business by combining manufacturing and sales.Until the time of the corporate separation, the business was structured such thatthe manufacturing unit was a part of NLM and Toyo Aluminum K.K. was responsi-ble for sales and product development. Over the years, this operation has broughtto market a succession of advanced aluminum foil, powder and paste materials.To reinforce this strength, we combined product development, manufacturing
and sales in a single organization that responds to customer needs.4

What progress has been made with the first of the fiveaction plans: improving Shin Nikkei Company, Ltd.?
The three key points concerning the improvements Shin Nikkeiis currently implementing are thoroughgoing cost cutting,increasing customer satisfaction, and enhancement of productcompetitiveness.
First, let’s look at cost reductions. Shin Nikkei’s annualsales are about ¥150 billion, and its purchases and outsourcing costs are the highest in the Group. In suchcircumstances, it is normal business practice to seek to implement sweeping cost cutting. That prompted usto launch the V Project consisting of various cost cutting programs. The results of those programs have with-out question propped up Shin Nikkei’s business performance.
Next, we changed the organization to combine manufacturing and sales into a single business unit. Wehad previously introduced the business unit operating structure, but the commercial building materials,housing materials, and exterior materials business units were responsible only for sales, and the manufac-turing unit was under separate management. While greater efficiency is one aim of the organizationalreform, the most important target is enhancement of customer satisfaction. In the market we are engaged inan all-out battle involving product function, quality, delivery time, and cost. I thought that it is precisely theoperational and organizational capabilities attained through alignment of development, production, andsales that make it possible to strengthen front-line selling power and enhance customer satisfaction.
I think the importance of product competitiveness goes without saying. In our building materials opera-tion we must compete against numerous rivals. In this business what is important is to introduce highlycompetitive new products in a timely manner and earn the satisfaction of more customers than the competi-tors. In product development, Shin Nikkei has advanced technological capabilities in the area of buildingmaterials, and we will also take advantage of the technical resources of the Group as a whole. We will utilizethese capabilities to create and introduce into the market products that will deliver customer satisfaction.
During the year under review Shin Nikkei moved into profit on a non-consolidated basis for the first timein six years. Although by no means at a satisfactory level, the profits are proof that steady improvement isbeing made at Shin Nikkei.
Are the action plans Making Strong Businesses Stronger and Developing Strong Businesses—Creating New Products and Businesses progressing satisfactorily?
Yes, they are. Let’s consider areas other than the previously discussed Toyo Aluminum and Nikkei PanelSystems initiatives. In the materials category, the Group is establishing solid positions in the industries inwhich we are active for the alumina and chemical products operation and the aluminum alloy operation. Inthe processed products category, we are building strong positions for the van and truck outfitting operationof Nippon Fruehauf Company, Ltd. and the operation of anodized aluminum foil for electrolytic capacitors.
With regard to investments for business expansion, the Group decided to introduce FLEXCASTER, a con-tinuous caster, to produce aluminum sheet product. FLEXCASTER is an innovative technology NLM jointlydeveloped with Alcan International of Canada for more than a decade. This strategic investment enablesNLM’s aluminum sheet business to enter new market segments, particularly that for automotive applications,which is expected to grow in coming years. This technology also makes it possible to make distinctive
5
products for markets other than the automotive sector. This caster is world-class, technologically superiorequipment, and I expect it to become a pillar to support future growth.
What is the situation with organizational initiatives and specific results in the areas of new productdevelopment and new business creation?
Since 1999 the NLM Group has engaged in lateral activities that enable business operation that cuts acrossdivisional or company boundaries and makes the market the central point of focus. To make these activitiesorganizational initiatives, in April 2001 we established the Strategic Committee for ProductCommercialization and Business Development. The purpose of this organization is to integrate the intellectu-al assets and information collected at various locations in the Group and to develop and commercialize“market-in products” (products to be developed through close and deep involvement in the market), anarea in which the Group had been deficient. The lateral activities are currently divided into several projectteams: the Automotive Group, the Rail & Road Group, the Architectural Structure Group, and the Electrical &Electronics Group.
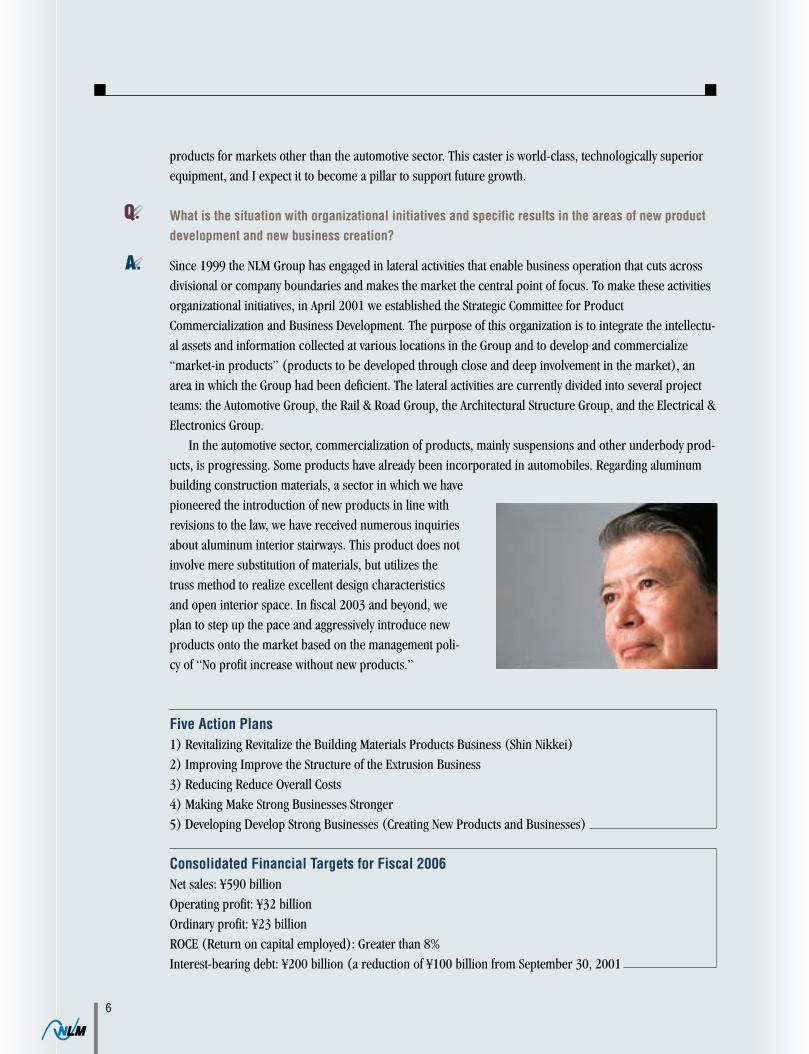
In the automotive sector, commercialization of products, mainly suspensions and other underbody prod-ucts, is progressing. Some products have already been incorporated in automobiles. Regarding aluminumbuilding construction materials, a sector in which we havepioneered the introduction of new products in line withrevisions to the law, we have received numerous inquiriesabout aluminum interior stairways. This product does notinvolve mere substitution of materials, but utilizes thetruss method to realize excellent design characteristicsand open interior space. In fiscal 2003 and beyond, weplan to step up the pace and aggressively introduce newproducts onto the market based on the management poli-cy of “No profit increase without new products.”
Five Action Plans1) Revitalizing Revitalize the Building Materials Products Business (Shin Nikkei)2) Improving Improve the Structure of the Extrusion Business3) Reducing Reduce Overall Costs4) Making Make Strong Businesses Stronger5) Developing Develop Strong Businesses (Creating New Products and Businesses)
Consolidated Financial Targets for Fiscal 2006Net sales: ¥590 billionOperating profit: ¥32 billionOrdinary profit: ¥23 billionROCE (Return on capital employed): Greater than 8%Interest-bearing debt: ¥200 billion (a reduction of ¥100 billion from September 30, 2001
6
NLM Group Topics
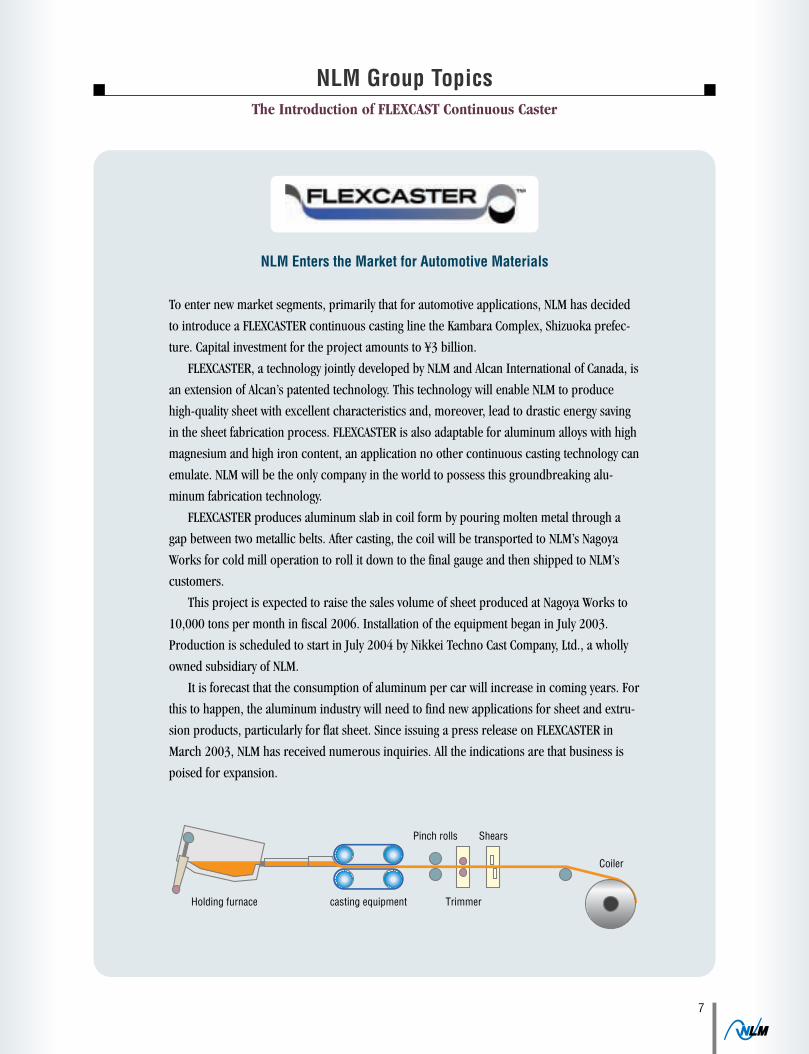
NLM Enters the Market for Automotive Materials
To enter new market segments, primarily that for automotive applications, NLM has decided
to introduce a FLEXCASTER continuous casting line the Kambara Complex, Shizuoka prefec-
ture. Capital investment for the project amounts to ¥3 billion.
FLEXCASTER, a technology jointly developed by NLM and Alcan International of Canada, is
an extension of Alcan’s patented technology. This technology will enable NLM to produce
high-quality sheet with excellent characteristics and, moreover, lead to drastic energy saving
in the sheet fabrication process. FLEXCASTER is also adaptable for aluminum alloys with high
magnesium and high iron content, an application no other continuous casting technology can
emulate. NLM will be the only company in the world to possess this groundbreaking alu-
minum fabrication technology.
FLEXCASTER produces aluminum slab in coil form by pouring molten metal through a
gap between two metallic belts. After casting, the coil will be transported to NLM’s Nagoya
Works for cold mill operation to roll it down to the final gauge and then shipped to NLM’s
customers.
This project is expected to raise the sales volume of sheet produced at Nagoya Works to
10,000 tons per month in fiscal 2006. Installation of the equipment began in July 2003.
Production is scheduled to start in July 2004 by Nikkei Techno Cast Company, Ltd., a wholly
owned subsidiary of NLM.
It is forecast that the consumption of aluminum per car will increase in coming years. For
this to happen, the aluminum industry will need to find new applications for sheet and extru-
sion products, particularly for flat sheet. Since issuing a press release on FLEXCASTER in
March 2003, NLM has received numerous inquiries. All the indications are that business is
poised for expansion.
The Introduction of FLEXCAST Continuous Caster
casting equipmentHolding furnace Trimmer
Coiler
Pinch rolls Shears
7
8
Review of Operations
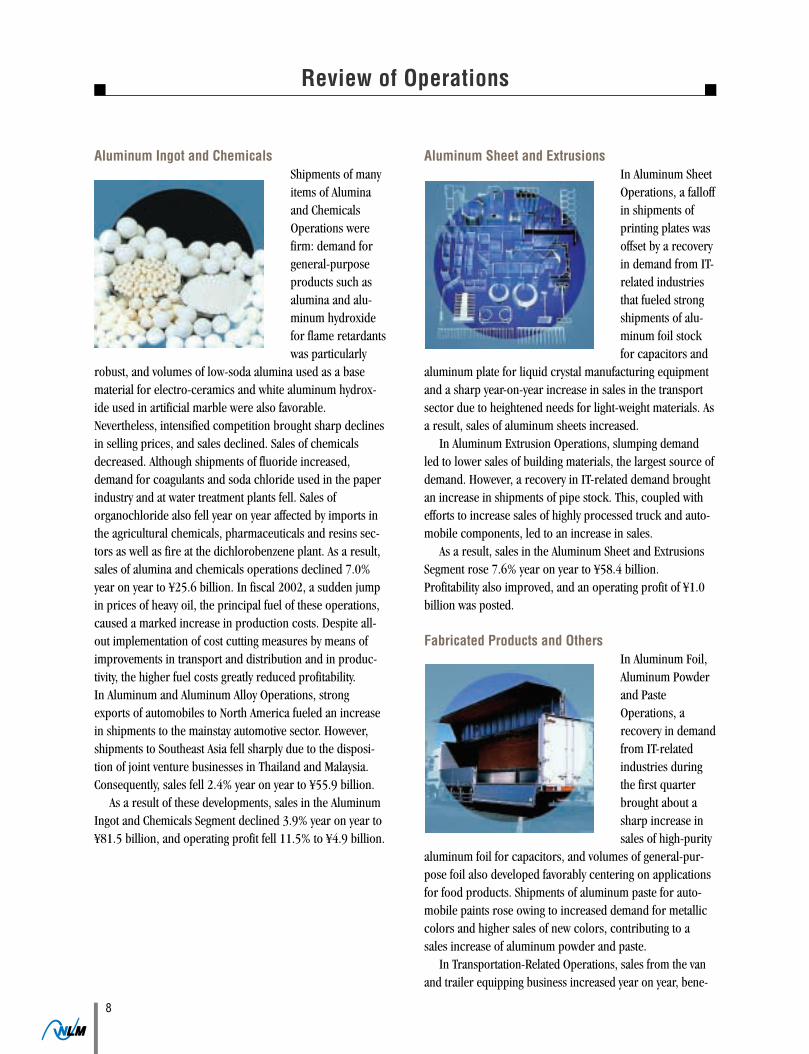
Aluminum Ingot and ChemicalsShipments of manyitems of Aluminaand ChemicalsOperations werefirm: demand forgeneral-purposeproducts such asalumina and alu-minum hydroxidefor flame retardantswas particularly
robust, and volumes of low-soda alumina used as a basematerial for electro-ceramics and white aluminum hydrox-ide used in artificial marble were also favorable.Nevertheless, intensified competition brought sharp declinesin selling prices, and sales declined. Sales of chemicalsdecreased. Although shipments of fluoride increased,demand for coagulants and soda chloride used in the paperindustry and at water treatment plants fell. Sales oforganochloride also fell year on year affected by imports inthe agricultural chemicals, pharmaceuticals and resins sec-tors as well as fire at the dichlorobenzene plant. As a result,sales of alumina and chemicals operations declined 7.0%year on year to ¥25.6 billion. In fiscal 2002, a sudden jumpin prices of heavy oil, the principal fuel of these operations,caused a marked increase in production costs. Despite all-out implementation of cost cutting measures by means ofimprovements in transport and distribution and in produc-tivity, the higher fuel costs greatly reduced profitability.In Aluminum and Aluminum Alloy Operations, strongexports of automobiles to North America fueled an increasein shipments to the mainstay automotive sector. However,shipments to Southeast Asia fell sharply due to the disposi-tion of joint venture businesses in Thailand and Malaysia.Consequently, sales fell 2.4% year on year to ¥55.9 billion.
As a result of these developments, sales in the AluminumIngot and Chemicals Segment declined 3.9% year on year to¥81.5 billion, and operating profit fell 11.5% to ¥4.9 billion.
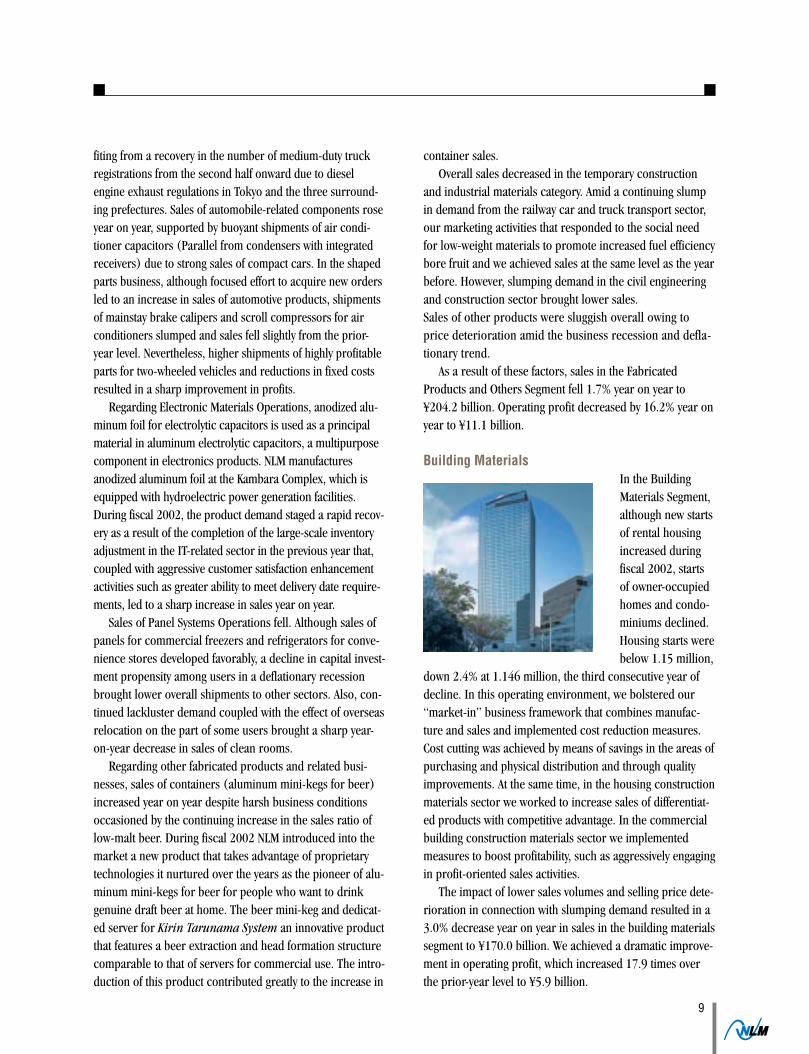
Aluminum Sheet and ExtrusionsIn Aluminum SheetOperations, a falloffin shipments ofprinting plates wasoffset by a recoveryin demand from IT-related industriesthat fueled strongshipments of alu-minum foil stockfor capacitors and
aluminum plate for liquid crystal manufacturing equipmentand a sharp year-on-year increase in sales in the transportsector due to heightened needs for light-weight materials. Asa result, sales of aluminum sheets increased.
In Aluminum Extrusion Operations, slumping demandled to lower sales of building materials, the largest source ofdemand. However, a recovery in IT-related demand broughtan increase in shipments of pipe stock. This, coupled withefforts to increase sales of highly processed truck and auto-mobile components, led to an increase in sales.
As a result, sales in the Aluminum Sheet and ExtrusionsSegment rose 7.6% year on year to ¥58.4 billion.Profitability also improved, and an operating profit of ¥1.0billion was posted.
Fabricated Products and OthersIn Aluminum Foil,Aluminum Powderand PasteOperations, arecovery in demandfrom IT-relatedindustries duringthe first quarterbrought about asharp increase insales of high-purity
aluminum foil for capacitors, and volumes of general-pur-pose foil also developed favorably centering on applicationsfor food products. Shipments of aluminum paste for auto-mobile paints rose owing to increased demand for metalliccolors and higher sales of new colors, contributing to asales increase of aluminum powder and paste.
In Transportation-Related Operations, sales from the vanand trailer equipping business increased year on year, bene-
9
fiting from a recovery in the number of medium-duty truckregistrations from the second half onward due to dieselengine exhaust regulations in Tokyo and the three surround-ing prefectures. Sales of automobile-related components roseyear on year, supported by buoyant shipments of air condi-tioner capacitors (Parallel from condensers with integratedreceivers) due to strong sales of compact cars. In the shapedparts business, although focused effort to acquire new ordersled to an increase in sales of automotive products, shipmentsof mainstay brake calipers and scroll compressors for airconditioners slumped and sales fell slightly from the prior-year level. Nevertheless, higher shipments of highly profitableparts for two-wheeled vehicles and reductions in fixed costsresulted in a sharp improvement in profits.
Regarding Electronic Materials Operations, anodized alu-minum foil for electrolytic capacitors is used as a principalmaterial in aluminum electrolytic capacitors, a multipurposecomponent in electronics products. NLM manufacturesanodized aluminum foil at the Kambara Complex, which isequipped with hydroelectric power generation facilities.During fiscal 2002, the product demand staged a rapid recov-ery as a result of the completion of the large-scale inventoryadjustment in the IT-related sector in the previous year that,coupled with aggressive customer satisfaction enhancementactivities such as greater ability to meet delivery date require-ments, led to a sharp increase in sales year on year.
Sales of Panel Systems Operations fell. Although sales ofpanels for commercial freezers and refrigerators for conve-nience stores developed favorably, a decline in capital invest-ment propensity among users in a deflationary recessionbrought lower overall shipments to other sectors. Also, con-tinued lackluster demand coupled with the effect of overseasrelocation on the part of some users brought a sharp year-on-year decrease in sales of clean rooms.
Regarding other fabricated products and related busi-nesses, sales of containers (aluminum mini-kegs for beer)increased year on year despite harsh business conditionsoccasioned by the continuing increase in the sales ratio oflow-malt beer. During fiscal 2002 NLM introduced into themarket a new product that takes advantage of proprietarytechnologies it nurtured over the years as the pioneer of alu-minum mini-kegs for beer for people who want to drinkgenuine draft beer at home. The beer mini-keg and dedicat-ed server for Kirin Tarunama System an innovative productthat features a beer extraction and head formation structurecomparable to that of servers for commercial use. The intro-duction of this product contributed greatly to the increase in
container sales.Overall sales decreased in the temporary construction
and industrial materials category. Amid a continuing slumpin demand from the railway car and truck transport sector,our marketing activities that responded to the social needfor low-weight materials to promote increased fuel efficiencybore fruit and we achieved sales at the same level as the yearbefore. However, slumping demand in the civil engineeringand construction sector brought lower sales.Sales of other products were sluggish overall owing toprice deterioration amid the business recession and defla-tionary trend.
As a result of these factors, sales in the FabricatedProducts and Others Segment fell 1.7% year on year to¥204.2 billion. Operating profit decreased by 16.2% year onyear to ¥11.1 billion.
Building MaterialsIn the BuildingMaterials Segment,although new startsof rental housingincreased duringfiscal 2002, startsof owner-occupiedhomes and condo-miniums declined.Housing starts werebelow 1.15 million,
down 2.4% at 1.146 million, the third consecutive year ofdecline. In this operating environment, we bolstered our“market-in” business framework that combines manufac-ture and sales and implemented cost reduction measures.Cost cutting was achieved by means of savings in the areas ofpurchasing and physical distribution and through qualityimprovements. At the same time, in the housing constructionmaterials sector we worked to increase sales of differentiat-ed products with competitive advantage. In the commercialbuilding construction materials sector we implementedmeasures to boost profitability, such as aggressively engagingin profit-oriented sales activities.
The impact of lower sales volumes and selling price dete-rioration in connection with slumping demand resulted in a3.0% decrease year on year in sales in the building materialssegment to ¥170.0 billion. We achieved a dramatic improve-ment in operating profit, which increased 17.9 times overthe prior-year level to ¥5.9 billion.

Financial Review
10
Net Sales By Segment
750
600
450
300
150
020032002200120001999
Billions of yen
Aluminum Ingot and Chemicals
*including intersegment transactionsYears ended March 31
20032002200120001999
Billions of yen As of March 31
Total Shareholders’ Equity
150
120
90
60
30
02002 2003200120001999
% As of March 31
Equity Ratio
20
16
12
8
4
0
Aluminum Sheet and ExtrusionsFabricated Products and OthersBuilding Materials
OverviewDuring the first half of fiscal 2002, the year ended March 31,
2003, the Japanese economy exhibited a modest recovery
led by foreign demand thanks to robust exports to the United
States and Asia. However, in the second half, the economic
outlook became increasingly uncertain due to weak stock
prices in Japan, concern about the slowing U.S. economy
and the rising tension over Iraq.
For the aluminum industry, although the business
environment remained challenging in the construction-
related and certain other fields, total demand surpassed the
level of the previous fiscal year, because greater use of
aluminum in automotive and other transport-related fields
together with a sharp recovery in IT-related demand pushed
shipments higher.
Earnings and ExpensesIn these circumstances, consolidated net sales of the NLM
Group were ¥514.0 billion ($4,277million), having
decreased 1.5% or ¥7.8 billion from the previous fiscal year,
reflecting a decline in selling prices due to deflationary
pressure and lower volumes. Please refer to the Review of
Operations (Pages 8 and 9) for an overview of the results of
operations.
The cost of sales decreased 2.1% or ¥8.7 billion from
the previous fiscal year to ¥410.4 billion ($3,415 million),
and the cost of sales ratio decreased 0.5 percentage points
to 79.8%. Cutting of overall costs, including logistics costs
and labor costs, led to a 8.2% or ¥7.4 billion decline in
selling, general and administrative expenses to ¥83.5 billion
($695 million). As a result, operating profit surged 71.3%
or ¥8.4 billion from the previous fiscal year to ¥20.1 billion
($167 million).
Non-operating income increased 7.1% or ¥591 million
to ¥8.9 billion ($74 million). Non-operating expenses rose
9.4% or ¥1.4 billion to ¥16.7 billion ($139 million) due to a
¥1.0 billion increase in the loss on disposal of inventories.
As a result, ordinary profit jumped 156.5% or ¥7.5
billion from the previous fiscal year to ¥12.3 billion ($103
million). The Company reported a gain on sale of fixed
assets amounting to ¥2.3 billion ($19 million), due to sale
of the former Osaka Plant site, as a special gain. On the
other hand, special losses amounted to ¥8.0 billion ($66
million), having increased by ¥7.5 billion from ¥463 million
recorded in the previous fiscal year. Special losses included
additional retirement allowance for early retirement
program amounting to ¥3.4 billion, as well as a ¥2.2 billion
loss on disposal of fixed assets, a ¥2.0 billion loss on

11
devaluation of investment securities, and a ¥0.5 billion prior
year severance costs for directors and statutory auditors.
The total amount of current and deferred income taxes
decreased by ¥4.9 billion from the previous fiscal year. This
decrease was the result of lower income tax payments in line
with adoption of the Japanese consolidated taxation system
and increased deferred tax assets as a result of calculation of
lump-sum taxes for all the companies subject to
consolidated taxation. Consequently, consolidated net
income soared 368.8% or ¥5.6 billion ($47 million) from
the previous fiscal year to ¥7.1 billion ($59 million). The
average number of shares outstanding during the fiscal year
decreased from 543,320,940 shares in fiscal 2001 to
530,380,188 shares in fiscal 2002. As a result, net income
per share of common stock was ¥13.34 ($0.11), having
increased 378.1% or ¥10.55 from the previous fiscal year.
Payment of cash dividends of ¥2.0 per share of common
stock, ¥0.5 higher than for the previous fiscal year, was
approved by resolution of the general meeting of
shareholders of the Company held on June 27, 2003.
Assets, Liabilities and Shareholders’ EquityTotal assets were ¥525.8 billion ($4,374 million), 6.8% or
¥38.5 billion less than at the end of the previous fiscal year.
The decline were mainly attributable to the fact that the last
day of the previous fiscal year fell on a holiday, which was
not so in the case of the fiscal year under review, and to
disposal of two extrusion presses and related facilities at
Kambara Complex.
Total liabilities were ¥433.3 billion ($3,604 million),
9.1% or ¥43.3 billion less than at the end of the previous
fiscal year. This decrease was also attributable to the fact
that the last day of the previous fiscal year fell on a holiday
as mentioned above, and to a decrease in corporate bonds
due to redemption. As a result, interest-bearing debt
decreased 12.1% or ¥35.1billion to ¥254.8 billion ($2,119
million).
Minority interest in consolidated subsidiaries was ¥3.2
billion ($26 million), 27.8% or ¥1.2 billion lower than at
the end of the previous fiscal year. Shareholders’ equity rose
7.2% or ¥6.0 billion ($50 million) to ¥89.3 billion ($743
million). This rise was due to an increase in retained
earnings because the Company recorded net income.
Shareholders’ equity per share of common stock amounted
to ¥167.01 ($1.39), up ¥13.65 from the end of the previous
fiscal year. The equity ratio was 17.0%, an improvement of
2.2 percentage points.
Cash FlowsCash and cash equivalents at the end of the fiscal year were
¥44.7 billion ($371 million), down 6.2% or ¥2.9 billion
from the end of the previous fiscal year.
Net cash provided by operating activities amounted to
¥33.5 billion ($279 million), having increased by 25.6% or
¥6.8 billion. Cash flows from investing activities experienced
a turnaround from the outflow in the previous fiscal year to
an inflow, and net cash provided by investing activities
totaled ¥224 million, compared with net cash used for
investing activities amounting to ¥12.3 billion in the previous
fiscal year. This upturn was attributable to reporting of
proceeds from sale of fixed assets and from liquidation of an
affiliated company. Net cash used for financing activities
amounted to ¥36.5 billion ($304 million). This figure is
287.7% or ¥27.1 billion greater than the figure for the
previous fiscal year. This was due to the fact that there was a
positive net balance of ¥16.2 billion between the proceeds
from long-term debt and payments of long-term debt as well
as redemption of corporate bonds amounting to ¥47.0
billion.
Prospects for Fiscal 2003Adhering to our management policy of “No profit increase
without new products,” we are accelerating the introduction
of new product and the development of new businesses
intended to become the driving force for sustainable growth.
We intend to pursue growth by bringing all our resources
into full play. For fiscal 2003, on a consolidated basis we
forecast net sales of ¥510.0 billion, ordinary profit of ¥13.0
billion and net income of ¥9.0 billion. Net income per share
of common stock is expected to be ¥16.83. We plan to pay
out year-end cash dividends of ¥2.5 per share of common
stock, ¥0.5 higher than for fiscal 2002.

Consolidated Balance SheetsNippon Light Metal Company, Ltd. and its consolidated subsidiaries
As of March 31, 2002 and 2003
Thousands ofU.S. dollars
Millions of yen (Note 2)
ASSETS 2002 2003 2003
Current assets:Cash and deposits (Notes 3 and 6) .............................................................. ¥ 48,755 ¥ 45,227 $ 376,265Notes and accounts receivable—trade (Notes 6 and 14) ............................ 172,598 157,189 1,307,729Inventories (Note 4) ................................................................................... 73,381 68,027 565,948Deferred income taxes (Note 8) .................................................................. 4,324 5,472 45,524Other current assets (Note 3) ..................................................................... 10,644 13,653 113,586Allowance for doubtful accounts ................................................................. (3,889) (2,485) (20,674)
Total current assets ..................................................................... 305,813 287,083 2,388,378
Fixed assets:Property, plant and equipment (Note 6)—
Buildings and structures ........................................................................ 136,737 134,158 1,116,123Machinery and equipment ..................................................................... 302,900 271,071 2,255,166Land ...................................................................................................... 64,784 66,101 549,925Construction-in-progress ....................................................................... 2,800 3,082 25,641Accumulated depreciation ..................................................................... (310,540) (289,906) (2,411,863)
196,681 184,506 1,534,992
Intangible fixed assets ................................................................................. 3,941 4,414 36,722
Investments and other assets:Investment securities (Notes 5 and 6) ................................................... 38,515 32,153 267,496Deferred income taxes (Note 8) ............................................................ 8,237 9,495 78,993Other assets ........................................................................................... 19,143 12,782 106,339Allowance for doubtful accounts ........................................................... (8,043) (4,672) (38,868)
57,852 49,758 413,960Total fixed assets ......................................................................... 258,474 238,678 1,985,674
Total assets ................................................................................... ¥ 564,287 ¥ 525,761 $4,374,052
The accompanying notes are an integral part of these statements.
12

13
Thousands ofU.S. dollars
LIABILITIES, MINORITY INTEREST IN CONSOLIDATED Millions of yen (Note 2)
SUBSIDIARIES AND SHAREHOLDERS’ EQUITY 2002 2003 2003
Current liabilities:Short-term borrowings (Note 6) ................................................................. ¥103,630 ¥ 99,403 $ 826,980Current portion of long-term debt (Note 6) ................................................ 75,677 48,714 405,274Notes and accounts payable—trade ............................................................ 112,569 97,953 814,917Other current liabilities (Note 8) ................................................................ 42,856 48,567 404,052
Total current liabilities .................................................................... 334,732 294,637 2,451,223
Long-term liabilities:Long-term debt (Note 6) ............................................................................. 110,565 106,642 887,205Accrued pension and severance costs—
for Employees (Note 7) ......................................................................... 20,042 23,897 198,810for Directors and statutory auditors ....................................................... — 1,444 12,013
Negative goodwill ........................................................................................ 5,240 1,314 10,932Other long-term liabilities (Note 8) ............................................................. 6,023 5,326 44,310
Total long-term liabilities ................................................................ 141,870 138,623 1,153,270
Minority interest in consolidated subsidiaries ........................................ 4,371 3,155 26,248
Shareholders’ equity:Common stock—
Authorized: 1,600,000,000 sharesIssued: 543,350,370 shares ..................................................... 39,085 39,085 325,166
Additional paid-in capital ............................................................................ 24,569 24,680 205,325Retained earnings (Note 9) ......................................................................... 19,428 25,697 213,785Revaluation surplus (Note 10) .................................................................... 493 510 4,243Net unrealized gains on securities ............................................................... 324 743 6,181Foreign currency translation adjustment ..................................................... (578) (505) (4,201)Treasury stock, at cost (82,000 shares in 2002 and 8,621,823 shares in 2003) .............................. (7) (864) (7,188)
Total shareholders’ equity ................................................................ 83,314 89,346 743,311
Contingent liabilities (Note 14)
Total liabilities, minority interest in consolidated subsidiaries and shareholders’ equity ................... ¥564,287 ¥525,761 $4,374,052

Consolidated Statements of IncomeNippon Light Metal Company, Ltd. and its consolidated subsidiaries
For the years ended March 31, 2002 and 2003
Thousands ofU.S. dollars
Millions of yen (Note 2)
2002 2003 2003
Net sales ......................................................................................................... ¥ 521,861 ¥514,042 $4,276,556Cost of sales (Note 13) ................................................................................. 419,189 410,449 3,414,717
Gross profit .............................................................................................. 102,672 103,593 861,839Selling, general and administrative expenses (Note 13) ........................ 90,949 83,507 694,734
Operating profit ....................................................................................... 11,723 20,086 167,105Non-operating income:
Interest income ........................................................................................... 156 122 1,015Amortization of negative goodwill ................................................................ 3,926 4,386 36,489Equity in earnings of affiliated companies ................................................... — 987 8,211Other .......................................................................................................... 4,243 3,421 28,461Total non-operating income 8,325 8,916 74,176
Non-operating expenses:Interest expense .......................................................................................... 6,257 6,157 51,223Equity in losses of affiliated companies ....................................................... 141 — —Amortization of transition obligation for employees retirement benefits (Note 7) .... 2,797 2,187 18,195Loss on disposal of inventories .................................................................... — 1,706 14,193Other .......................................................................................................... 6,048 6,627 55,133Total non-operating expenses ............................................................... 15,243 16,677 138,744Ordinary profit ........................................................................................ 4,805 12,325 102,537
Special gains:Gain on sale of fixed assets .......................................................................... 924 2,287 19,027Gain on sale of investment securities ........................................................... 810 — —Total special gains ...................................................................................... 1,734 2,287 19,027
Special losses:Additional retirement allowance for early retirement program (Note 7) ..... — 3,364 27,987Loss on disposal of fixed assets ................................................................... — 2,158 17,953Loss on devaluation of investment securities ............................................... 463 1,966 16,356Prior year severance costs for directors and statutory auditors .................... — 482 4,010Total special losses ................................................................................. 463 7,970 66,306Income before income taxes and minority interest ........................... 6,076 6,642 55,258
Income taxes (Note 8)—current ................................................................... 2,916 2,350 19,551—deferred .................................................................. 1,163 (3,140) (26,123)
4,079 (790) (6,572)Minority interest in income of consolidated subsidiaries ...................... 479 316 2,629
Net income ¥ 1,518 ¥ 7,116 $ 59,201
U.S. dollarsPer share of common stock: Yen (Note 2)
Net income .................................................................................................. ¥ 2.79 ¥ 13.34 $ 0.11Cash dividends ............................................................................................ ¥ 1.50 ¥ 2.00 $ 0.02
The accompanying notes are an integral part of these statements.
14
15
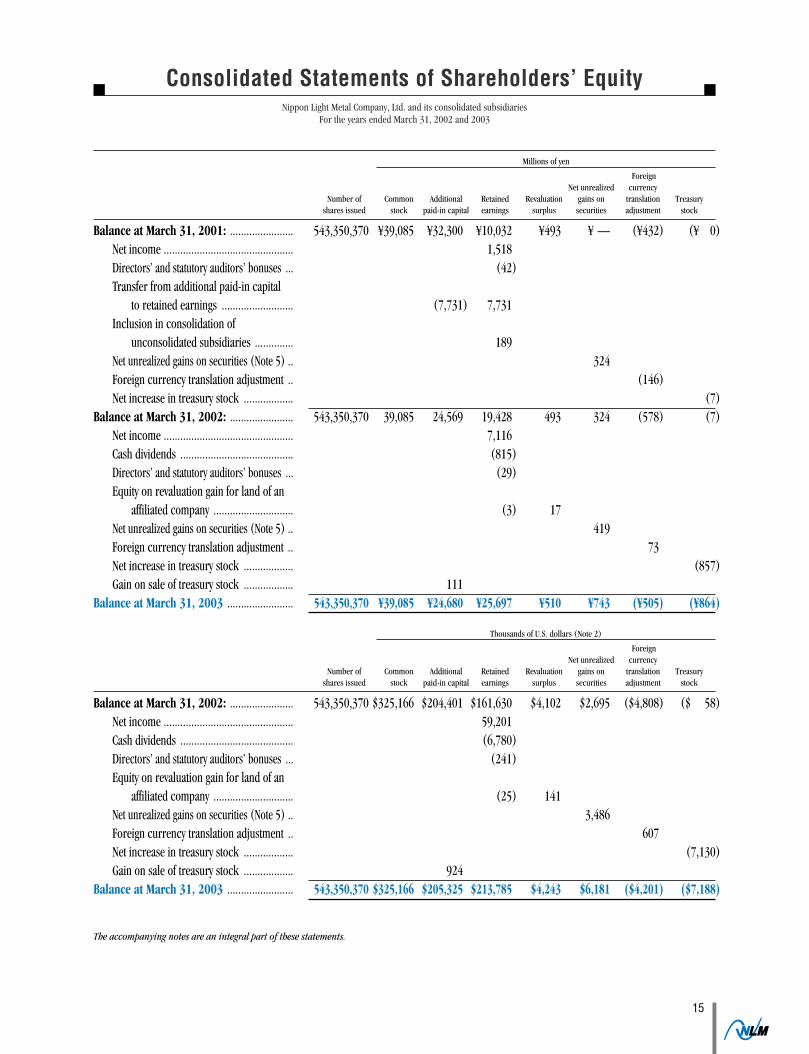
Consolidated Statements of Shareholders’ EquityNippon Light Metal Company, Ltd. and its consolidated subsidiaries
For the years ended March 31, 2002 and 2003
Millions of yen
ForeignNet unrealized currency
Number of Common Additional Retained Revaluation gains on translation Treasuryshares issued stock paid-in capital earnings surplus securities adjustment stock
Balance at March 31, 2001: ....................... 543,350,370 ¥39,085 ¥32,300 ¥10,032 ¥493 ¥ — (¥432) (¥ 0)Net income ............................................... 1,518Directors’ and statutory auditors’ bonuses ... (42)Transfer from additional paid-in capital
to retained earnings .......................... (7,731) 7,731Inclusion in consolidation of
unconsolidated subsidiaries .............. 189Net unrealized gains on securities (Note 5) .. 324Foreign currency translation adjustment .. (146)Net increase in treasury stock .................. (7)
Balance at March 31, 2002: ....................... 543,350,370 39,085 24,569 19,428 493 324 (578) (7)Net income ............................................... 7,116Cash dividends ......................................... (815)Directors’ and statutory auditors’ bonuses ... (29)Equity on revaluation gain for land of an
affiliated company ............................. (3) 17Net unrealized gains on securities (Note 5) .. 419Foreign currency translation adjustment .. 73Net increase in treasury stock .................. (857)Gain on sale of treasury stock .................. 111
Balance at March 31, 2003 ........................ 543,350,370 ¥39,085 ¥24,680 ¥25,697 ¥510 ¥743 (¥505) (¥864)
Thousands of U.S. dollars (Note 2)
ForeignNet unrealized currency
Number of Common Additional Retained Revaluation gains on translation Treasuryshares issued stock paid-in capital earnings surplus securities adjustment stock
Balance at March 31, 2002: ....................... 543,350,370 $325,166 $204,401 $161,630 $4,102 $2,695 ($4,808) ($ 58)Net income ............................................... 59,201Cash dividends ......................................... (6,780)Directors’ and statutory auditors’ bonuses ... (241)Equity on revaluation gain for land of an
affiliated company ............................. (25) 141Net unrealized gains on securities (Note 5) .. 3,486Foreign currency translation adjustment .. 607Net increase in treasury stock .................. (7,130)Gain on sale of treasury stock .................. 924
Balance at March 31, 2003 ........................ 543,350,370 $325,166 $205,325 $213,785 $4,243 $6,181 ($4,201) ($7,188)
The accompanying notes are an integral part of these statements.

Consolidated Statements of Cash FlowsNippon Light Metal Company, Ltd. and its consolidated subsidiaries
For the years ended March 31, 2002 and 2003
Thousands ofU.S. dollars
Millions of yen (Note 2)
2002 2003 2003
Cash flows from operating activities: Income before income taxes and minority interest ...................................... ¥ 6,076 ¥ 6,642 $ 55,258Depreciation and amortization .................................................................... 18,542 17,128 142,496Amortization of negative goodwill ................................................................ (3,926) (4,386) (36,489)Loss on disposal of fixed assets ................................................................... — 2,158 17,953Gain on sale of fixed assets, net ................................................................... (924) (2,287) (19,027)Gain on sale of investment securities ........................................................... (810) — —Loss on devaluation of investment securities ............................................... 463 1,966 16,356Increase in accrued pension and severance costs ....................................... 1,376 3,919 32,604Interest and dividend income ...................................................................... (462) (347) (2,887)Interest expense .......................................................................................... 6,257 6,157 51,223Equity in (earnings) losses of affiliated companies ...................................... 141 (987) (8,211)Decrease in notes and accounts receivable—trade ..................................... 24,811 21,517 179,010Decrease in inventories ............................................................................... 4,842 5,318 44,243Decrease in notes and accounts payable—trade ......................................... (22,479) (14,050) (116,889)Other .......................................................................................................... 1,454 (617) (5,133)
Sub total ........................................................................................ 35,361 42,131 350,507Interest and dividend income received ........................................................ 661 892 7,421Interest paid ................................................................................................ (6,389) (6,274) (52,196)Income taxes paid ....................................................................................... (2,948) (3,242) (26,972)
Net cash provided by operating activities ................................ 26,685 33,507 278,760Cash flows from investing activities:
Decrease in time deposits ........................................................................... 8 389 3,236Payments for purchase of investment securities ........................................... (611) (2,156) (17,937)Proceeds from redemption of investment securities ..................................... — 2,002 16,656Proceeds from sale of investment securities ................................................ 2,977 232 1,930Payments for purchase of fixed assets ......................................................... (15,235) (12,577) (104,634)Proceeds from sale of fixed assets ............................................................... 1,259 9,526 79,251(Increase) decrease in long-term loans receivable ..................................... (289) 201 1,672Payments for purchase of securities of consolidated subsidiaries ................ — (1,187) (9,875)Proceeds from liquidation of an affiliated company ..................................... — 2,887 24,019Proceeds from capital reduction of affiliated companies ............................. — 1,189 9,892Other .......................................................................................................... (359) (282) (2,346)
Net cash provided by (used for) investing activities .............. (12,250) 224 1,864Cash flows from financing activities:
Decrease in short-term borrowings ............................................................. (2,724) (4,214) (35,058)Proceeds from long-term debt .................................................................... 41,678 49,490 411,730Payments of long-term debt ......................................................................... (47,575) (80,310) (668,136)Proceeds from sale of treasury stock ........................................................... 15 — —Cash dividends paid by the Company ........................................................... (2) (813) (6,764)Cash dividends paid to minority interest ...................................................... (395) (471) (3,919)Other .......................................................................................................... (413) (186) (1,547)
Net cash used for financing activities ....................................... (9,416) (36,504) (303,694)Effect of exchange rate changes on cash and cash equivalents ..................... 156 (170) (1,414)Net increase (decrease) in cash and cash equivalents ................................. 5,175 (2,943) (24,484)Cash and cash equivalents at beginning of year ........................................... 41,683 47,594 395,957Cash and cash equivalents of newly consolidated subsidiaries ..................... 736 — —
Cash and cash equivalents at end of year (Note 3) .................. ¥47,594 ¥ 44,651 $ 371,473
The accompanying notes are an integral part of these statements.
16
17
Notes to the Consolidated Financial StatementsNippon Light Metal Company, Ltd. and its consolidated subsidiaries
1. SIGNIFICANT ACCOUNTING POLICIES:(a) Basis of presenting financial statements —The accompanying consolidated financial statements of Nippon Light Metal Company, Ltd. (“the Company”) and its consolidated subsidiaries(together “the Companies”) are prepared in accordance with accounting principles generally accepted in Japan, which are different in certainrespects from the application and disclosure requirements of International Accounting Standards. The notes to the consolidated financialstatements include financial information which is not required under accounting principles generally accepted in Japan, but is presented herein asadditional information. In addition, the consolidated statements of shareholders’ equity are not required in Japan, but are presented herein asadditional information. The accompanying consolidated financial statements include certain reclassifications and modifications for the purpose ofpresenting them in a form more familiar to readers outside Japan.
(b) Consolidation and investments in affiliated companies —The consolidated financial statements include the accounts of the Company and, with minor exceptions, companies substantially controlled by theCompany. All significant intercompany transactions and accounts are eliminated.
Investments in significant companies where the Company has significant influence over management are stated at cost plus the Company’sshare of undistributed earnings.
The difference between the cost and the underlying net equity of investments in consolidated subsidiaries or affiliates accounted for by theequity method has been allocated to identifiable assets based on fair market value at the date of acquisition. Any unassigned residual amount isrecognized as goodwill and deferred or amortized on a straight-line basis over the effective period, with the exception of minor amounts which arecharged to income in the year of acquisition.
Negative goodwill, recognized on the integration of a subsidiary company, Shin Nikkei Company, Ltd. for the year ended March 31, 2001, isbeing amortized on a straight-line basis over a 3-year period.
(c) Translation of foreign currencies —All monetary assets and liabilities denominated in foreign currencies, whether long-term or short-term, are translated into Japanese yen at theexchange rates prevailing at the balance sheet date. Resulting gains and losses are included in the net profit or loss for the period.
Assets and liabilities of foreign subsidiaries and affiliates are translated into Japanese yen at the exchange rates prevailing at the balance sheetdate. Profit and loss accounts for the year are translated into Japanese yen using the average exchange rate during the year. The resultingtranslation adjustments are accounted for as a component of “Shareholders’ equity”, except for the minority interest portion which is allocated to“Minority interest in consolidated subsidiaries”.
(d) Cash and cash equivalents —“Cash and cash equivalents” in the consolidated statements of cash flows comprise cash on hand, bank deposits available for withdrawal ondemand and short-term investments with an original maturity of three months or less and which represent a minor risk of fluctuation in value.
(e) Inventories —Inventories are principally stated at cost, determined by the moving-average method, except for costs related to construction-type-contracts whichare specifically identified.
(f) Financial Instruments —i) Derivatives:All derivatives are stated at fair value with changes in fair value being included in the net profit or loss of the year in which they arise, except forderivatives designated as hedging instruments (see iii) Hedge accounting).
ii) Securities:Securities held by the Companies are classified into ‘Held-to-maturity debt securities’, ‘Investments in equity securities issued by unconsolidatedsubsidiaries and affiliates’ and ‘Other securities’.
‘Held-to-maturity debt securities’, that the Companies intend to hold to maturity are stated at cost, after accounting for any premium ordiscount on acquisition which is amortized over the period to maturity.
‘Investments in equity securities issued by unconsolidated subsidiaries and affiliates’ are accounted for using the equity method. Exceptionally,investments in certain unconsolidated subsidiaries and affiliates are stated at cost because the effect of application of the equity method would beimmaterial.
‘Other securities’ for which market quotations are available are stated at fair value as of the end of the year with net unrealized gains or lossesbeing included as a separate component of shareholders’ equity, net of related taxes. Realized gains and losses on sales are determined using theaverage cost method and are included in the net profit or loss for the period.
‘Other securities’ for which market quotations are not available are stated at cost, except as stated in the paragraph below.In cases where the fair value of ‘Held-to-maturity debt securities’, ‘Investments in equity securities issued by unconsolidated subsidiaries and
affiliates’ or ‘Other securities’ has declined significantly and such impairment of value is not temporary, such securities are written-down to fairvalue and the resulting losses are included in the net profit or loss for the period.
iii) Hedge accounting:The Companies use derivatives to reduce the Companies’ exposure to the risk of fluctuations in foreign exchange rates, interest rates, and the priceof aluminum ingot in the market. Derivatives designated as hedging instruments by the Companies are principally forward exchange contracts,interest rate swap contracts and aluminum ingot forward contracts. The related hedged items are trade accounts receivable and payable, long-termbank loans, debt securities issued by the Companies, and sales or purchases of aluminum ingot. Thus, the Companies’ purchases of hedginginstruments are limited to, at maximum, the amounts of the hedged items.
Gains or losses arising from changes in the fair value of the derivatives designated as ‘hedging instruments’ are deferred as an asset or liabilityand included in net profit or loss in the same period in which the gains and losses on the hedged items or transactions are recognized. TheCompanies use interest rate swaps to hedge their interest rate risk exposure. The related interest differentials paid or received under the interest rateswap agreements are recognized over the terms of the agreements in interest expense.
The Companies evaluate the effectiveness of their hedging activities by reference to the accumulated gains or losses on the hedging instru-ments and the related hedged items from the commencement of the hedges.
(g) Allowance for doubtful accounts —The allowance for doubtful accounts is estimated by applying the average percentage of actual bad debts in the past to the balance of receivables.In addition, an amount deemed necessary to cover non-collectable receivables is provided on an individual account basis.
(h) Property, plant and equipment and depreciation —Property, plant and equipment are stated at cost. Depreciation is computed principally using the straight-line method at rates based on theestimated useful lives of the respective assets.
(i) Accrued pension and severance costs —“Accrued pension and severance costs for employees” represents the estimated present value of projected benefit obligations in excess of the fairvalue of the plan assets, except for the unrecognized transition amount and unrecognized actuarial differences. The unrecognized transitionamount is being amortized on a straight-line basis over 12 years and the unrecognized actuarial differences are being amortized on a declining-balance basis over 12 years from the year following that in which they arise, except for these unrecognized costs in respect of retired employees towhom the early retirement program applied, which were fully amortized at the time of their retirement.
Until the year ended March 31, 2002, ‘severance costs for directors and statutory auditors’ were accounted for on a cash basis with the approvalof a general meeting of shareholders. Effective from the year ended March 31, 2003, the Company and some consolidated subsidiaries changedtheir method of accounting for severance costs for directors and statutory auditors to an accrual basis, so that “Accrued pension and severance costsfor directors and statutory auditors” represents the estimated amount to be paid if all directors and statutory auditors retired at the balance sheetdate, based on the Company retirement rules, in order to more appropriately reflect their costs and liabilities. While the Company and someconsolidated subsidiaries have no legal obligation, it is a customary practice in Japan to make lump-sum payments to directors or statutoryauditors upon retirement with the approval of a general meeting of shareholders, and it is general in Japan to credit “Accrued pension andseverance costs for directors and statutory auditors”. The effects of this change for the year ended March 31, 2003, was to decrease “Ordinary profit”by ¥94 million ($782 thousand) and to decrease “Income before income taxes and minority interest” by ¥576 million($4,792 thousand),compared with the amounts which would have been reported if the previous method had been applied consistently.
(j) Lease transactions —Under Japanese accounting practices, finance leases are capitalized in principle. However, finance leases without an option to transfer ownership ofthe leased assets to the lessee may be accounted for as operating leases subject to appropriate footnote disclosure. Therefore, the Companies chargeor credit periodic lease payments and receipts to income as incurred.
(k) Income taxes —Income taxes of the Company and its domestic subsidiaries consist of corporate income taxes, local inhabitants taxes and enterprise taxes. Effectivefrom the year ended March 31, 2003, the Company and its wholly-owned domestic subsidiaries adopted the Japanese consolidated taxation system.The Company and its subsidiaries adopt the deferred tax accounting method. Income taxes are determined using the asset and liability approach,whereby deferred tax assets and liabilities are recognized in respect of temporary differences between the tax basis of assets and liabilities and thoseas reported in the financial statements.
18
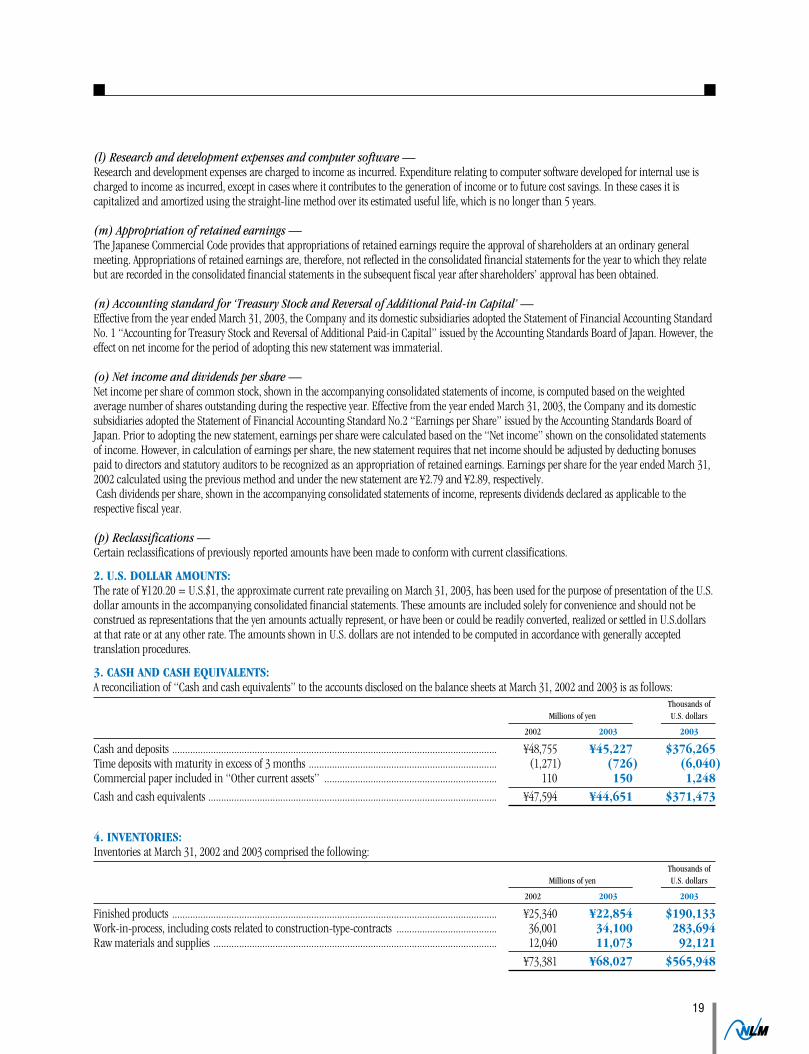
3. CASH AND CASH EQUIVALENTS:A reconciliation of “Cash and cash equivalents” to the accounts disclosed on the balance sheets at March 31, 2002 and 2003 is as follows:
Thousands ofMillions of yen U.S. dollars
2002 2003 2003
Cash and deposits .............................................................................................................................. ¥48,755 ¥45,227 $376,265Time deposits with maturity in excess of 3 months ......................................................................... (1,271) (726) (6,040)Commercial paper included in “Other current assets” ................................................................... 110 150 1,248Cash and cash equivalents ................................................................................................................ ¥47,594 ¥44,651 $371,473
4. INVENTORIES:Inventories at March 31, 2002 and 2003 comprised the following:
Thousands ofMillions of yen U.S. dollars
2002 2003 2003
Finished products .............................................................................................................................. ¥25,340 ¥22,854 $190,133Work-in-process, including costs related to construction-type-contracts ....................................... 36,001 34,100 283,694Raw materials and supplies .............................................................................................................. 12,040 11,073 92,121
............................................................................................................................................. ¥73,381 ¥68,027 $565,948
19
(l) Research and development expenses and computer software —Research and development expenses are charged to income as incurred. Expenditure relating to computer software developed for internal use ischarged to income as incurred, except in cases where it contributes to the generation of income or to future cost savings. In these cases it iscapitalized and amortized using the straight-line method over its estimated useful life, which is no longer than 5 years.
(m) Appropriation of retained earnings —The Japanese Commercial Code provides that appropriations of retained earnings require the approval of shareholders at an ordinary generalmeeting. Appropriations of retained earnings are, therefore, not reflected in the consolidated financial statements for the year to which they relatebut are recorded in the consolidated financial statements in the subsequent fiscal year after shareholders’ approval has been obtained.
(n) Accounting standard for ‘Treasury Stock and Reversal of Additional Paid-in Capital’ —Effective from the year ended March 31, 2003, the Company and its domestic subsidiaries adopted the Statement of Financial Accounting StandardNo. 1 “Accounting for Treasury Stock and Reversal of Additional Paid-in Capital” issued by the Accounting Standards Board of Japan. However, theeffect on net income for the period of adopting this new statement was immaterial.
(o) Net income and dividends per share —Net income per share of common stock, shown in the accompanying consolidated statements of income, is computed based on the weightedaverage number of shares outstanding during the respective year. Effective from the year ended March 31, 2003, the Company and its domesticsubsidiaries adopted the Statement of Financial Accounting Standard No.2 “Earnings per Share” issued by the Accounting Standards Board ofJapan. Prior to adopting the new statement, earnings per share were calculated based on the “Net income” shown on the consolidated statementsof income. However, in calculation of earnings per share, the new statement requires that net income should be adjusted by deducting bonusespaid to directors and statutory auditors to be recognized as an appropriation of retained earnings. Earnings per share for the year ended March 31,2002 calculated using the previous method and under the new statement are ¥2.79 and ¥2.89, respectively.Cash dividends per share, shown in the accompanying consolidated statements of income, represents dividends declared as applicable to the
respective fiscal year.
(p) Reclassifications —Certain reclassifications of previously reported amounts have been made to conform with current classifications.
2. U.S. DOLLAR AMOUNTS:The rate of ¥120.20 = U.S.$1, the approximate current rate prevailing on March 31, 2003, has been used for the purpose of presentation of the U.S.dollar amounts in the accompanying consolidated financial statements. These amounts are included solely for convenience and should not beconstrued as representations that the yen amounts actually represent, or have been or could be readily converted, realized or settled in U.S.dollarsat that rate or at any other rate. The amounts shown in U.S. dollars are not intended to be computed in accordance with generally acceptedtranslation procedures.

5. INVESTMENT SECURITIES:(a) ‘Held-to-maturity debt securities’ with available market value —The aggregate carrying amount, market value and gross unrealized gains and losses of ‘Held-to-maturity debt securities’ with available marketvalues at March 31, 2002 was as follows:
Millions of yen
2002
Carrying Unrealized Unrealized Market amount gains losses value
Corporate bonds ................................................................................................... ¥2,000 ¥ — ¥62 ¥1,938
At March 31, 2003, there were no ‘Held-to-maturity debt securities’ with available market values.
(b) ‘Other securities’ with available market value —The aggregate cost, carrying amount and gross unrealized gains and losses of ‘Other securities’ with available market values at March 31, 2002and 2003 were as follows:
Millions of yen
2002
Unrealized Unrealized CarryingCost gains losses amount
Equity securities .................................................................................... ¥6,848 ¥1,888 ¥1,011 ¥7,725Other ..................................................................................................... 209 — 75 134
............................................................................................................... ¥7,057 ¥1,888 ¥1,086 ¥7,859
Millions of yen
2003
Unrealized Unrealized CarryingCost gains losses amount
Equity securities .................................................................................... ¥4,950 ¥1,688 ¥383 ¥6,255Other ..................................................................................................... 100 0 — 100............................................................................................................... ¥5,050 ¥1,688 ¥383 ¥6,355
Thousands of U.S. dollars
2003
Unrealized Unrealized CarryingCost gains losses amount
Equity securities .................................................................................... $41,181 $14,043 $3,186 $52,038Other ..................................................................................................... 832 0 — 832............................................................................................................... $42,013 $14,043 $3,186 $52,870
20
21
(c) Sale of ‘Other securities’ —The realized gains and losses on sale of ‘Other securities’ during the years ended March 31, 2002 and 2003 were as follows:
Thousands ofMillions of yen U.S. dollars
2002 2003 2003
Selling amount ................................................................................................................ ¥614 ¥232 $1,930Realized gains on sale ..................................................................................................... 105 70 582Realized losses on sale .................................................................................................... 44 23 191
(d) ‘Held-to-maturity securities’ and ‘Other securities’ without available market values —The carrying amounts of ‘Held-to-maturity securities’ and ‘Other securities’ without available market values at March 31, 2002 and2003, were as follows:
Thousands ofMillions of yen U.S. dollars
2002 2003 2003
(1) ‘Held-to-maturity securities’
Domestic debt securities privately offered ....................................................................... ¥ 135 ¥ 133 $ 1,107(2) ‘Other securities’
Equity investments in non-public companies ................................................................. 11,454 13,217 109,958Other ......................................................................................................................... 59 57 474................................................................................................................... ¥11,648 ¥13,407 $111,539
(e) Maturity of debt securities —The redemption schedules for maturity of debt securities at March 31, 2002 and 2003 were as follows:
Millions of yen
2002
Due within Due after one year, but Due after five years, but Due after moreone year within five years within ten years than ten years
Debt securities:Government and municipal bonds .............................................................. ¥110 ¥ — ¥— ¥125Corporate debt securities .............................................................................. — 2,010 — —
Other ..................................................................................................................... — 235 2 —
....................................................................................................................... ¥110 ¥2,245 ¥ 2 ¥125
Millions of yen
2003
Due within Due after one year, but Due after five years, but Due after moreone year within five years within ten years than ten years
Debt securities:Government and municipal bonds .............................................................. ¥ 2 ¥ 7 ¥ 9 ¥105Corporate debt securities .............................................................................. — 10 — —
Other ..................................................................................................................... 1 127 — —............................................................................................ ¥ 3 ¥144 ¥ 9 ¥105
Thousands of U.S. dollars
2003
Due within Due after one year, but Due after five years, but Due after moreone year within five years within ten years than ten years
Debt securities:Government and municipal bonds .............................................................. $17 $ 58 $75 $874Corporate debt securities .............................................................................. — 83 — —
Other ..................................................................................................................... 8 1,057 — —............................................................................................ $25 $1,198 $75 $874

6. SHORT-TERM BORROWINGS AND LONG-TERM DEBT:“Short-term borrowings” at March 31, 2003 bore interest at annual rates ranging from 0.580% to 3.944% and generally represented bank loans orshort-term notes maturing at various dates within one year.
“Long-term debt” at March 31 comprised the following:Thousands of
Millions of yen U.S. dollars
2002 2003 2003
Loans, principally from banks and insurance companies due from 2002 to 2014 with interest rates ranging from 0.800% to 8.020%:
Secured ....................................................................................................................................... ¥ 40,648 ¥ — $ —Unsecured .................................................................................................................................. 59,594 — —
Loans, principally from banks and insurance companies due from 2003 to 2014 with interest rates ranging from 0.799% to 8.020%:
Secured ....................................................................................................................................... — 36,641 304,833Unsecured .................................................................................................................................. — 79,715 663,186
Unsecured 2.90% Bonds due November 7, 2002, redeemable before due date ............................... 10,000 — —Unsecured 2.75% Bonds due December 5, 2002, redeemable before due date ................................ 10,000 — —Unsecured 2.65% Bonds due February 10, 2004, redeemable before due date ............................... 10,000 10,000 83,195Unsecured 2.40% Bonds due February 10, 2003, redeemable before due date ............................... 10,000 — —Unsecured 2.45% Bonds due July 25, 2003, redeemable before due date ........................................ 10,000 10,000 83,195Unsecured 2.675% Bonds due August 20, 2004, redeemable before due date ................................. 10,000 10,000 83,195Unsecured 2.175% Bonds due September 11, 2002, redeemable before due date ........................... 10,000 — —Unsecured 2.40% Bonds due July 19, 2002, redeemable before due date ........................................ 7,000 — —Unsecured 1.25% Bonds due July 20, 2006, redeemable before due date ........................................ 9,000 9,000 74,875
............................................................................................................................................. 186,242 155,356 1,292,479Less: portion due within one year ..................................................................................................... (75,677) (48,714) (405,274)Total long-term debt ......................................................................................................................... ¥110,565 ¥106,642 $ 887,205
Differences between the issue price and the principal amount are credited or charged to income at the time of issue.
A summary of assets pledged as collateral for “Short-term borrowings” and “Long-term debt” at March 31, 2003 is as follows:Thousands of
Millions of yen U.S. dollars
Cash and deposits ........................................................................................................................................................... ¥ 82 $ 682Notes and accounts receivable—trade .......................................................................................................................... 48 399Property, plant and equipment ...................................................................................................................................... 75,697 629,759Investment securities ...................................................................................................................................................... 432 3,594
The aggregate annual maturities of “Long-term debt” beyond March 31, 2003 are as follows:Thousands of
Years ending March 31 Millions of yen U.S. dollars
2004 ................................................................................................................................................................................ ¥ 48,714 $ 405,2742005 ................................................................................................................................................................................ 40,875 340,0582006 ................................................................................................................................................................................ 23,911 198,9272007 ................................................................................................................................................................................ 26,290 218,7192008 ................................................................................................................................................................................ 12,978 107,970Thereafter ....................................................................................................................................................................... 2,588 21,531
......................................................................................................................................................................................... ¥155,356 $1,292,479
22

23
7. RETIREMENT BENEFIT PLANS:The Company and its domestic subsidiaries have defined benefit tax qualified pension plans and a non-contributory plan covering substantially allemployees. Additional benefits may be granted to employees according to the conditions under which termination occurs. Certain foreignsubsidiaries have defined contribution plans.
“Accrued pension and severance costs” as of March 31, 2002 and 2003 can be analyzed as follows:Thousands of
Millions of yen U.S. dollars
2002 2003 2003
Projected benefit obligations ............................................................................................................ (¥70,936) (¥67,810) ($564,143)Fair value of plan assets .................................................................................................................... 21,279 16,863 140,291............................................................................................................................................................ (49,657) (50,947) (423,852)Unrecognized transition amount ..................................................................................................... 22,308 18,813 156,514Unrecognized actuarial differences .................................................................................................. 7,343 8,237 68,528............................................................................................................................................................ (20,006) (23,897) (198,810)Prepaid pension expenses ................................................................................................................. 36 — —Accrued pension and severance costs ............................................................................................... (¥20,042) (¥23,897) ($198,810)
The net pension cost related to retirement benefits for the years ended March 31, 2002 and 2003 was as follows:Thousands of
Millions of yen U.S. dollars
2002 2003 2003
Service cost ........................................................................................................................................ ¥4,141 ¥3,801 $31,622Interest cost ....................................................................................................................................... 1,748 1,516 12,612Expected return on plan assets ......................................................................................................... (568) (468) (3,893)Amortization of transition amount .................................................................................................. *1 2,797 3,495 29,077Amortization of unrecognized actuarial differences ........................................................................ *2 455 1,581 13,153Net pension and severance cost ........................................................................................................ ¥8,573 ¥9,925 $82,571
*1 The above figures include an amount of ¥546 million and ¥1,308 million ($10,882 thousand) for the years ended March 31, 2002and 2003, respectively, in respect of employees who retired during the respective fiscal years under the early retirement program.These amounts were fully amortized at the time of employees’ retirement.
*2 The above figure includes an amount of ¥404 million ($3,361 thousand) for the years ended March 31, 2003 in respect ofemployees who retired during the fiscal year under the early retirement program.
This amount was fully amortized at the time of employees’ retirement.
*3 In addition to *1 and *2 above, additional benefits of ¥1,652 million ($13,744 thousand) under the early retirement programwere granted for the year ended March 31, 2003. The total amount of all these costs is disclosed within special losses as “Additionalretirement allowance for early retirement program” for the year ended March 31, 2003.
Assumptions used in calculation of the above information were as follows:2002 2003
Discount rate ..................................................................................................................................... 2.5% 2.5%Expected rate of return on plan assets .............................................................................................. 3.0% 2.5%Method of attributing the projected benefits to periods of employee service ................................... Straight-line basis Straight-line basisAmortization of unrecognized actuarial differences ........................................................................ Mainly 12 years Mainly 12 yearsAmortization of transition amount .................................................................................................. 12 years 12 years

8. INCOME TAXES:The Company and its domestic subsidiaries are subject to a number of different taxes based on income which, in aggregate, indicate a statutoryeffective tax rate of approximately 42% for the years ended March 31, 2002 and 2003.
Tax losses can be carried forward for a five-year period for offset against future taxable income.Effective from the year ended March 31, 2003, the Company and its wholly-owned domestic subsidiaries adopted the Japanese consolidated
taxation system.Significant components of deferred tax assets and liabilities at March 31, 2002 and 2003 were as follows:
Thousands ofMillions of yen U.S. dollars
2002 2003 2003
Deferred tax assets:Tax loss carry forwards .............................................................................................................. ¥26,890 ¥21,710 $180,616Accrued pension and severance costs ........................................................................................ 6,472 8,678 72,196Allowance for doubtful accounts ............................................................................................... 2,895 1,997 16,614Loss on disposal of fixed assets .................................................................................................. 1,731 1,851 15,399Accrued bonuses.......................................................................................................................... — 1,649 13,719Loss on devaluation of investment securities ............................................................................ 1,849 — —Others ......................................................................................................................................... 7,056 8,418 70,033
Total gross deferred tax assets ............................................................................................ 46,893 44,303 368,577Valuation allowance .................................................................................................................. (34,043) (28,068) (233,511)
Total deferred tax assets, net of valuation allowance ........................................................ 12,850 16,235 135,066Deferred tax liabilities:
Valuation gain on subsidiaries .................................................................................................. — (545) (4,534)Unrealized gains on securities ................................................................................................... — (524) (4,359)Depreciation ............................................................................................................................... (80) — —Others ......................................................................................................................................... (516) (296) (2,463)
Total gross deferred tax liabilities ...................................................................................... (596) (1,365) (11,356)Net deferred tax assets ....................................................................................................................... ¥12,254 ¥14,870 $123,710
A reconciliation of the difference between the statutory tax rate and the effective income tax rate for the year ended March 31, 2002 and 2003 isas follows:
2002 2003
Statutory tax rate ............................................................................................................................... 42.0% 42.0%Increase (decrease) in taxes resulting from:
Permanently non-deductible expenses ..................................................................................... 7.3 7.0Amortization of negative goodwill ............................................................................................ (27.1) (27.7)Equity in earnings of affiliated companies ............................................................................... — (6.3)Equalization inhabitants taxes ................................................................................................. 9.4 —Increase(decrease) in valuation allowance .............................................................................. 37.2 (30.0)Decrease in deferred income taxes with tax-rates change ........................................................ — 4.7Other .......................................................................................................................................... (1.7) (1.6)
Effective income tax rate .................................................................................................................. 67.1% (11.9%)
On March 31, 2003, Japanese National Diet approved various changes to the calculation of the statutory local enterprise tax for companieswith capital in excess of ¥100 million, effective April 1, 2004. Under the basic enterprise tax rate for the income based component has decreased. Asa result of this amendment, the tax rate to be applied to temporary differences between the carrying amount and tax basis of assets and liabilitiesthat are expected to reverse in the years beginning April 1, 2004 decreased as at March 31, 2003. This resulted in a reduction in deferred tax assetsat March 31, 2003 by ¥297 million ($2,471 thousand), compared with the assets that would have been recognized had the previous tax rate beenfully applied to all temporary differences. Net income for the year ended March 31, 2003 decreased by ¥309 million ($2,571 thousand) as a resultof these changes in local enterprise tax regulations.
24
25
9. APPROPRIATIONS OF RETAINED EARNINGS:The following appropriation was approved at the ordinary general meeting of shareholders of the Company held on June 27, 2003.
Thousands of Millions of yen U.S. dollars
Cash dividends ................................................................................................................................................................ ¥ 1,085 $ 9,027
10. REVALUATION SURPLUS:An equity affiliate of the Company revalued its land used for business purposes in accordance with the Land Revaluation Law. As a result of thisrevaluation, the Company recognized its portion of the affiliate’s revaluation surplus net of related taxes.
11. LEASE TRANSACTIONS:The Companies charge or credit to income periodic lease payments and receipts for finance leases that do not have options to transfer ownership ofthe leased assets to the lessee. Such periodic lease payments under finance lease contracts totaled ¥1,961 million and ¥1,830 million ($15,225thousand), and receipts under finance lease contracts totaled ¥101 million and ¥101 million ($840 thousand), for the years ended March 31, 2002and 2003, respectively. Future lease payments and receipts under the Companies’ finance leases and non-cancelable operating leases, includingamounts representing interest, at March 31, 2002 and 2003 were as follows:
Thousands ofMillions of yen U.S. dollars
2002 2003 2003
Lease payments:Due within one year ................................................................................................................... ¥1,757 ¥1,797 $14,950Due beyond one year ................................................................................................................. 2,134 4,917 40,907
¥3,891 ¥6,714 $55,857Lease receipts:
Due within one year ................................................................................................................... ¥ 236 ¥ 143 $ 1,190Due beyond one year ................................................................................................................. 163 60 499
¥ 399 ¥ 203 $ 1,689
Leased assets under the Companies’ finance leases, where lessors retain ownership of leased assets, are accounted for as operating leases by theCompanies. If such leases had been capitalized, then the cost of the assets and the related accumulated depreciation at March 31, 2002 and 2003would have been as follows:
Millions of yen
2002
Accumulated NetCost depreciation amount
Buildings and structures ...................................................................................... ¥ 26 ¥ 13 ¥ 13Machinery and equipment ................................................................................... 7,561 4,504 3,057Intangible fixed assets .......................................................................................... 155 86 69
¥7,742 ¥4,603 ¥3,139
Thousands ofMillions of yen U.S. dollars
2003 2003
Accumulated Net NetCost depreciation amount amount
Buildings and structures ...................................................................................... ¥ 41 ¥ 18 ¥ 23 $ 191Machinery and equipment ................................................................................... 9,785 3,523 6,262 52,097Intangible fixed assets .......................................................................................... 263 175 88 732
¥10,089 ¥3,716 ¥6,373 $53,020

The depreciation amount for these leased assets computed on the straight-line method over the period of the leases would have been ¥1,961million and ¥1,830 million ($15,225 thousand) for the years ended March 31, 2002 and 2003, respectively.
Fixed assets, excluding sub-leased assets, which are leased to other companies under finance leases without options to transfer ownership ofthe leased assets to the lessee at March 31, 2002 and 2003, were as follows:
Millions of yen
2002
Accumulated NetCost depreciation amount
Machinery and equipment ................................................................................... ¥147 ¥96 ¥51
Thousands ofMillions of yen U.S. dollars
2003 2003
Accumulated Net NetCost depreciation amount amount
Machinery and equipment ................................................................................... ¥140 ¥97 ¥43 $358
The depreciation amount for these leased assets computed on the straight-line method over the period of the leases would have been ¥90million and ¥64 million ($532 thousand) for the years ended March 31, 2002 and 2003, respectively.
12. DERIVATIVES:In the normal course of business, the Companies enter into various derivative financial instruments in order to manage the exposure resultingfrom fluctuations in foreign currency exchange rates, interest rates and the prices of aluminum ingot in the market. The Companies do not holdor issue derivative financial instruments for trading purposes.
The following are the interest rate swap contracts at March 31, 2002 that have been recognized as a suspension of hedges. Accordingly, the netunrealized gain was credited to income.
Millions of yen
2002
Contract Estimated Unrealizedamount fair value gain/(loss)
Interest rate swap agreements:Variable-rate into fixed-rate obligations ....................................................... ¥11,000*1 ¥298*2 ¥141Fixed-rate into variable-rate obligations....................................................... 11,000*1 (84)*2 (73)
Any derivatives to which hedge accounting is applied are excluded from the above table.At March 31, 2003, there were no derivative financial instruments, except those instruments to which hedge accounting is applied.
13. RESEARCH AND DEVELOPMENT EXPENSES:Research and development expenses charged to “Cost of sales” and “Selling, general and administrative expenses” for the years ended March 31,2002 and 2003 were ¥4,686 million and ¥4,427 million ($36,830 thousand), respectively.
14. CONTINGENT LIABILITIES:Contingent liabilities at March 31, 2003 for loans guaranteed and other guarantees given in the ordinary course of business amounted to ¥23,734million ($197,454 thousand), including ¥5,157 million ($42,903 thousand) shared by other joint guarantors, and ¥4,045 million ($33,652thousand) for notes discounted and ¥27 million ($225 thousand) for notes endorsed.
15. SUBSEQUENT EVENT:On May 23, 2003, the board of directors of the Company decided to sell the former site of Osaka Plant to Ito-Yokado Company, Ltd. The sale amountis ¥3,659 million ($30,441 thousand) and “Gain on sale of fixed assets” is approximately ¥2,600 million ($21,631 thousand), which will be creditedas a special gain for the year ended March 31, 2004.
16. SEGMENT INFORMATION:The Companies operate within four distinct industry segments, mainly in Japan: “Aluminum ingot and chemicals”, “Aluminum sheet andextrusions”, “Fabricated products and others” and “Building materials”.
The “Aluminum ingot and chemicals” segment supplies aluminum primary and remelted ingot used for various industrial materials, andproduces a wide spectrum of aluminas and alumina hydrates ranging from raw materials to basic materials for ceramic compounds.
The “Aluminum sheet and extrusions” segment produces sheet, coil, and extrusion products consisting primarily of shapes, tubes and rods.The “Fabricated products and others” segment produces a variety of products which include, among others, aluminum foil, aluminum powder,
wing bodies for transport vehicles, automobile components and electronic materials.26
*1 The “Contract amount” represents the nominal amount of the interest rate swap contracts.*2 The fair values of the interest rate swap contracts were estimated using quotes from brokers, and represent the discounted amounts of net future cash flows.

27
Millions of yen
2002
Aluminum Aluminum Fabricated Eliminationingot and sheet and products Building orchemicals extrusions and others materials corporate items Consolidated
Sales: Customers ........................................... ¥ 84,775 ¥54,239 ¥207,652 ¥175,195 ¥ — ¥521,861Intersegment ...................................... 44,795 24,849 18,713 3,179 (91,536) —
Total ............................................ 129,570 79,088 226,365 178,374 (91,536) 521,861
Operating expenses .................................... 123,981 79,708 216,841 178,046 (88,438)*1 510,138
Operating profit (loss) ............................... ¥ 5,589 (¥ 620) ¥ 9,524 ¥ 328 (¥ 3,098) ¥ 11,723
Identifiable assets ...................................... ¥ 95,847 ¥78,617 ¥201,230 ¥184,200 ¥ 4,393 *2 ¥564,287
Depreciation .............................................. ¥ 2,921 ¥ 3,007 ¥ 5,632 ¥ 6,901 ¥ 81 ¥ 18,542
Capital expenditures .................................. ¥ 2,984 ¥ 2,437 ¥ 5,610 ¥ 3,856 ¥ 60 ¥ 14,947
The “Building materials” segment produces a wide range of materials including sashes, curtain walls, and doors and fences for commercialand residential construction.
“Corporate items” includes general and administrative expenses and other expenses not specifically related to business segments.Export sales and operations outside Japan are insignificant.Information by industry segment for the years ended March 31, 2002 and 2003 is as follows:
*1 Netting of corporate items ...¥3,063 million *2 Netting of corporate items ...¥32,080 millionMillions of yen
2003
Aluminum Aluminum Fabricated Eliminationingot and sheet and products Building orchemicals extrusions and others materials corporate items Consolidated
Sales: Customers ........................................... ¥81,495 ¥58,374 ¥204,171 ¥170,002 ¥ — ¥514,042Intersegment ...................................... 47,749 21,922 19,008 6,781 (95,460) —
Total ............................................ 129,244 80,296 223,179 176,783 (95,460) 514,042Operating expenses .................................... 124,298 79,269 212,110 170,908 (92,629)*1 493,956Operating profit (loss) ............................... ¥ 4,946 ¥ 1,027 ¥ 11,069 ¥ 5,875 (¥ 2,831) ¥ 20,086Identifiable assets ...................................... ¥ 97,424 ¥68,997 ¥188,840 ¥174,199 (¥ 3,699)*2 ¥525,761Depreciation .............................................. ¥ 2,878 ¥ 2,232 ¥ 5,050 ¥ 6,881 ¥ 87 ¥ 17,128Capital expenditures .................................. ¥ 3,303 ¥ 1,714 ¥ 4,300 ¥ 4,101 ¥ 83 ¥ 13,501*1 Netting of corporate items ...¥2,825 million *2 Netting of corporate items ...¥29,139 million
Thousands of U.S. dollars
2003
Aluminum Aluminum Fabricated Eliminationingot and sheet and products Building orchemicals extrusions and others materials corporate items Consolidated
Sales: Customers ........................................... $ 677,995 $485,641 $1,698,594 $1,414,326 $ — $4,276,556Intersegment ...................................... 397,246 182,379 158,136 56,415 (794,176) —
Total ............................................ 1,075,241 668,020 1,856,730 1,470,741 (794,176) 4,276,556Operating expenses .................................... 1,034,093 659,476 1,764,642 1,421,864 (770,624)*1 4,109,451Operating profit (loss) ............................... $ 41,148 $ 8,544 $ 92,088 $ 48,877 ($ 23,552) $ 167,105Identifiable assets ...................................... $ 810,516 $574,019 $1,571,048 $1,449,243 ($ 30,774)*2 $4,374,052Depreciation .............................................. $ 23,944 $ 18,569 $ 42,013 $ 57,246 $ 724 $ 142,496Capital expenditures .................................. $ 27,479 $ 14,260 $ 35,774 $ 34,118 $ 690 $ 112,321
*1 Netting of corporate items ...$23,502 thousand *2 Netting of corporate items ...$242,421 thousand
As discussed in Note 1 (i), effective from the year ended March 31, 2003, the Company and some consolidated subsidiaries changed their method ofaccounting for severance costs for directors and statutory auditors.The effect of this change for the year ended March 31, 2003 was to decrease “Operating profit” by ¥37 million ($308 thousand) in the “Buildingmaterials” segment, and to increase “Operating loss” by ¥57 million ($474 thousand) in the “Elimination or corporate items” column.
Report of Independent Auditors
June 27, 2003
To the Board of Directors of
Nippon Light Metal Company, Ltd.
In our opinion, the accompanying consolidated balance sheets and the related consolidated statements of income, shareholders’ equity
and of cash flows, expressed in Japanese yen, present fairly in all material respects the financial position of Nippon Light Metal Company,
Ltd. and its consolidated subsidiaries at March 31, 2002 and 2003, and the results of their operations and their cash flows for the years
then ended, in conformity with accounting principles generally accepted in Japan. These consolidated financial statements are the
responsibility of the Company’s management; our responsibility is to express an opinion on these financial statements based on our
audits. We conducted our audits of these statements in accordance with auditing standards generally accepted in Japan, which require
that we plan and perform the audit to obtain reasonable assurance about whether the consolidated financial statements are free of
material misstatement. An audit includes examining, on a test basis, evidence supporting the amounts and disclosures in the
consolidated financial statements, assessing the accounting principles used and significant estimates made by management, and
evaluating the overall consolidated financial statement presentation. We believe that our audits provide a reasonable basis for the opinion
expressed above.
As described in Note 1(i) to the accompanying consolidated financial statements, effective from the year ended March 31, 2003, the
Company and some consolidated subsidiaries changed their method of accounting for severance costs for directors and statutory
auditors.
In addition, as described in Note 15 to the accompanying consolidated financial statements, on May 23, 2003, the board of directors of
the Company decided to sell the former site of Osaka Plant.
The U.S. dollar amounts shown in the accompanying consolidated financial statements have been translated solely for convenience. We
have reviewed this translation and, in our opinion, the consolidated financial statements expressed in Japanese yen have been translated
into U.S. dollars on the basis described in Note 2 to the consolidated financial statements.
Notice to ReadersThe accompanying consolidated financial statements are not intended to present the financial position and the results of operations and of cash flows inaccordance with accounting principles and practices generally accepted in countries and jurisdictions other than Japan. Accordingly the accompanying consolidatedbalance sheets and the related consolidated statements of income, shareholders’ equity and of cash flows and their utilization are not designed for those who are notinformed about Japanese accounting principles, procedures and practices.
The standards, procedures and practices utilized in Japan to audit such financial statements may differ from those generally accepted in countries andjurisdictions other than Japan.
28
29
Overseas Network
Overseas Subsidiaries and Affiliates
North AmericaNikkei North America Aluminum Inc.Ohio, U.S.A.Phone: 1-330-463-5565Trading and marketing(100%)
Toyal America Inc.Illinois, U.S.A.Phone: 1-815-740-3037Aluminum powder and paste(100%)
Alcan Nikkei Asia HoldingsLtd.BermudaPhone: 1-441-295-3550Holding company for investmentwith Alcan in Southeast Asia andChina(40%)
EuropeToyal Europe Société AnonymeAccous, FrancePhone: 33-5-59-983535Aluminum powder and paste(100%)
East AsiaNonfemet International (China-Canada-Japan) Aluminium Co., Ltd.Shenzhen, ChinaPhone: 86-755-661-1569Extrusion 1
Alcan Nikkei China LimitedHong Kong, SAR, ChinaPhone: 852-2522-3001Trading and marketing(51%)
Nippon Light Metal (HongKong) LimitedHong Kong, SAR, ChinaPhone: 852-2541-5563Building materials(100%)
Southeast AsiaAlcan Nikkei Asia CompanyLimitedMalaysiaPhone: 60-3-7954-5286Management of invested companiesin Southeast Asia(40%)
Alcan Nikkei Siam LimitedThailandPhone: 66-2-529-0136Aluminum sheet, foil 2
Aluminium Companyof Malaysia Bhd. MalaysiaPhone: 60-3-3341-2311Aluminum sheet, foil 3
Alcom Nikkei SpecialtyCoatings Sdn. Bhd.MalaysiaPhone: 60-3-3342-2234Pre-coated finstock 4
Amalgamated Aluminiumand Alloys Sdn. Bhd.MalaysiaPhone: 60-3-341-9500Aluminum alloys(35%)
Nikkei SingaporeAluminium Pte. Ltd.SingaporePhone: 65-222-8991Trading and marketing(100%)
Daiki Nikkei Thai Co., Ltd.ThailandPhone: 66-3821-4631Aluminum alloys(35%)
1 45%; Interest held by Alcan Nikkei
Asia Holdings Limited (ANAH)
2 100%; Interest held by ANAH
3 59.15%; Interest held by ANAH
4 51%; Interest held by Aluminium
Company of Malaysia Bhd.
49%; Interest held by ANAH
(As of March 31, 2003)
30
Directors and Officers
Directors
Shigesato Sato
PresidentRepresentative Director
Yoshisato Hiratsuka
Akihiko Hayashi
Takashi Ishiyama
Shigeru Kohmura
Takamichi Sakai
Kazuyuki Hasegawa
Masao Imasu
Yasuo Noda
Glen R. Lucas
Auditors
Hideaki Nagaoka
Hajime Hosokawa
Yasuyuki Wakahara
Seiichi Takeda
Officers
Shigesato Sato
PresidentChief Executive Officer
Yoshisato Hiratsuka
Executive Vice PresidentSenior Executive Officer
Shigeru Kohmura
Senior Executive Officer
Takashi Ishiyama
Senior Executive Officer
Motoi Kobayashi
Executive Officer
Yoshinobu Hiki
Executive Officer
Takamichi Sakai
Senior Executive Officer
Tsuyoshi Nakajima
Executive Officer
Teruo Miyashita
Koji Kawakami
Toshikazu Wasa
Mitsuru Ishihara
Yoshiaki Kurihara
Akira Kato
Tadakazu Miyauchi
Koji Ueno
(As of June 27, 2003)

31
Profile Corporate Data
Since its foundation in 1939, Nippon Light Metal Company, Ltd. has been constantlyinvolved with aluminum. Today, Nippon Light Metal is Japan’s sole fully integrated alu-minum manufacturer with activities ranging from alumina smelting to fabrication ofvarious products.
Nippon Light Metal comprises four business segments: Aluminum Ingot andChemicals concerning the production of alumina and related chemicals and alu-minum ingot; Aluminum Sheet and Extrusions involving the production of sheets andshapes; Fabricated Products and Others including the production of transportation-related products, electronic materials, foil and powder; and Building Materials cover-ing the production of residential and office building materials. Through thesesegments, Nippon Light Metal is actively engaged in a wide range of fields such asautomobiles and railroads, electric machinery and electronics, industrial products,construction, and living necessities.
The NLM Group—the preeminent source of products and services combiningaluminum’s excellent characteristics with new functionality and added value that caterto pressing customer needs—delivers customer satisfaction and contributes to envi-ronmental protection.
Contents
Consolidated Six-Year Summary................................................. 1To Our Shareholders ................................................................. 2Special Feature (President’s Interview) ....................................... 4NLM Group Topics .................................................................... 7Review of Operations ................................................................ 8Financial Review ....................................................................... 10Consolidated Balance Sheets ..................................................... 12Consolidated Statements of Income ........................................... 14Consolidated Statements of Shareholders’ Equity ...................... 15Consolidated Statements of Cash Flows ..................................... 16Notes to the Consolidated Financial Statements ......................... 17Report of Independent Auditors ................................................ 28Overseas Network ..................................................................... 29Directors and Officers ............................................................... 30Corporate Data ......................................................................... 31
Cautionary StatementThis annual report contains various projections and estimates. Important factors that could alter these projections and esti-mates include changes in the balance of aluminum supply and demand, fluctuations in the price of aluminum ingot andforeign exchange rates, as well as shifts in Japanese government policies and regulations. The Company cautions, therefore,that the projections and estimates contained herein involve risk and uncertainty, and that actual results could differ materi-ally from those expressed or implied.
On the Cover:Top form left: “smelted aluminum” “crystal face of high-purity aluminum” “cleanroom” “etched circuit foil” “scene ofanalysis”, Middle: “slab”, Bottom: “melting furnace”
Head OfficeNYK Tennoz Building2-20, Higashi-Shinagawa 2-chomeShinagawa-ku, Tokyo 140-8628, Japanhttp://www.nikkeikin.co.jpPhone: 03-5461-9333Fax: 03-5461-9344E-mail: [email protected]
EstablishedMarch 30, 1939
Paid-In Capital¥39,085 million
Shares of Common StockAuthorized: 1,600,000,000Issued: 543,350,370
Number of Shareholders54,705
Stock Exchange ListingsTokyo, Osaka and three other domestic stock exchanges
Transfer Agent of Common StockThe Chuo Mitsui Trust & Banking Co., Ltd.
Last Shareholders’ MeetingJune 27, 2003
Major Shareholders(Percentage of Total Voting right)
Mizuho Corporate Bank, Ltd.(5.2%)
The Dai-ichi Mutual Life Insurance Co.(5.2%)
Alcan Nikkei Asia Holdings Ltd.(–%)
The Master Trust Bank of Japan, Ltd.(trust accounts)(3.7%)
Asahi Mutual Life Insurance Co.(2.9%)
The Light Metal Educational Foundation, Inc.(2.9%)
Namekawa Aluminum Co., Ltd.(2.8%)
Nikkei-Keiyu-Kai(2.4%)
UFJ Trust Bank, Ltd. (trust accounts)(2.3%)
Mizuho Bank, Ltd.(2.3%)
Major Domestic Affiliated CompaniesShin Nikkei Company, Ltd.Aluminum sashes, construction materials
Nippon Fruehauf Co., Ltd.Aluminum vans, trucks, trailers, containers(66%)
Toyo Aluminium K.KAluminum foil, powder and paste(100%)
Riken Light Metal Industrial Co., Ltd.Aluminum construction materials *2
Nippon Electrode Co., Ltd.Carbon for iron and steel blast furnacesand for aluminum smelting, and othertypes of carbon(100%)
Nikkei Sangyo Co., Ltd.Aluminum welding rods, various kindsof contract work(98.6%)
Nikkei Information System Co., Ltd.Development, maintenance and opera-tion of computer software(100%)
Nikkei Logistics Co., Ltd.Transport, warehousing *3
Nikkei Products Co., Ltd.Household utensils(100%)
Nikkei Extrusions Co., Ltd.Aluminum extruded products(100%)
Nikkei Aluminum Core TechnologyCo., Ltd.Aluminum extrusions and fabricatedproducts(100%)
Nikkei Panel System Co., Ltd.Panel for pre-fabricated freezer/refriger-ator and cleanroom(100%)
Nikkei ECAL Co., Ltd.Housing for cellular and mobiletelecommunications base stations(100%)
Aluminum Wire and Rod Co., Ltd.Aluminum rough drawing wire(58.3%)
Matsuo Industry Co., Ltd.Aluminum castings and forgings *4
*1 98%; Direct interest by NLM2%; Interest held by Nikkei Sangyo Co., Ltd.
*2 98.5%; Direct interest by NLM1.5%; Interest held by Nikkei Logistics Co., Ltd.
*3 46%; Direct interest by NLM44%; Interest held by Shin Nikkei Co., Ltd.10%; Interest held by Nippon Fruehauf Co., Ltd.
*4 99.1%; Direct interest by NLM0.1%; Interest held by Nikkei Sangyo Co., Ltd.
(As of March 31, 2003)
*1
Year Ended March 31, 2003ANNUAL REPORT 2003
Nippon Light Metal Company, Ltd.
NYK Tennoz Building,
2-20, Higashi-Shinagawa 2-chome
Shinagawa-ku, Tokyo 140-8628, Japan
http://www.nikkeikin.co.jp
Printed in Japan