Annual Report 1999 - AnnualReports.com€¦ · Cognizant’s onsite/offshore model offers ......
36
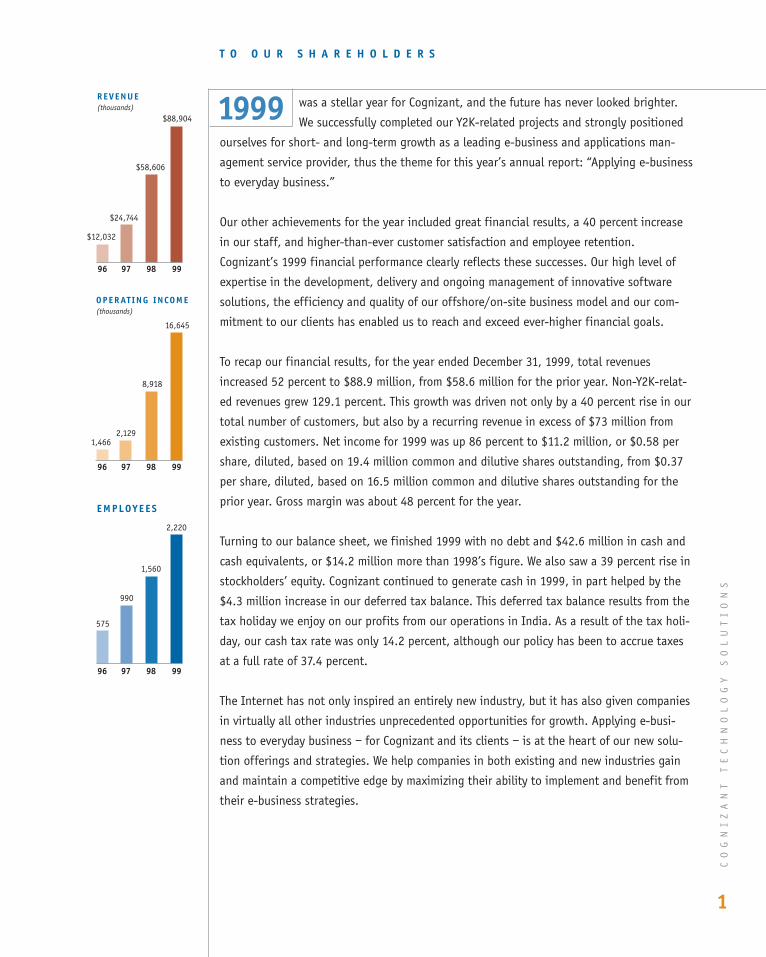
was a stellar year for Cognizant, and the future has never looked brighter. We successfully completed our Y2K-related projects and strongly positioned ourselves for short- and long-term growth as a leading e-business and applications man- agement service provider, thus the theme for this year’s annual report: “Applying e-business to everyday business.” Our other achievements for the year included great financial results, a 40 percent increase in our staff, and higher-than-ever customer satisfaction and employee retention. Cognizant’s 1999 financial performance clearly reflects these successes. Our high level of expertise in the development, delivery and ongoing management of innovative software solutions, the efficiency and quality of our offshore/on-site business model and our com- mitment to our clients has enabled us to reach and exceed ever-higher financial goals. To recap our financial results, for the year ended December 31, 1999, total revenues increased 52 percent to $88.9 million, from $58.6 million for the prior year. Non-Y2K-relat- ed revenues grew 129.1 percent. This growth was driven not only by a 40 percent rise in our total number of customers, but also by a recurring revenue in excess of $73 million from existing customers. Net income for 1999 was up 86 percent to $11.2 million, or $0.58 per share, diluted, based on 19.4 million common and dilutive shares outstanding, from $0.37 per share, diluted, based on 16.5 million common and dilutive shares outstanding for the prior year. Gross margin was about 48 percent for the year. Turning to our balance sheet, we finished 1999 with no debt and $42.6 million in cash and cash equivalents, or $14.2 million more than 1998’s figure. We also saw a 39 percent rise in stockholders’ equity. Cognizant continued to generate cash in 1999, in part helped by the $4.3 million increase in our deferred tax balance. This deferred tax balance results from the tax holiday we enjoy on our profits from our operations in India. As a result of the tax holi- day, our cash tax rate was only 14.2 percent, although our policy has been to accrue taxes at a full rate of 37.4 percent. The Internet has not only inspired an entirely new industry, but it has also given companies in virtually all other industries unprecedented opportunities for growth. Applying e-busi- ness to everyday business – for Cognizant and its clients – is at the heart of our new solu- tion offerings and strategies. We help companies in both existing and new industries gain and maintain a competitive edge by maximizing their ability to implement and benefit from their e-business strategies. TO OUR SHAREHOLDERS COGNIZANT TECHNOLOGY SOLUTIONS 1 REVENUE (thousands) OPERATING INCOME (thousands) EMPLOYEES 1999 $88,904 $58,606 $24,744 $12,032 96 97 98 99 96 97 98 99 96 97 98 99 16,645 8,918 2,129 1,466 2,220 1,560 990 575
-
Upload
truonghanh -
Category
Documents
-
view
212 -
download
0
Transcript of Annual Report 1999 - AnnualReports.com€¦ · Cognizant’s onsite/offshore model offers ......
was a stellar year for Cognizant, and the future has never looked brighter.
We successfully completed our Y2K-related projects and strongly positioned
ourselves for short- and long-term growth as a leading e-business and applications man-
agement service provider, thus the theme for this year’s annual report: “Applying e-business
to everyday business.”
Our other achievements for the year included great financial results, a 40 percent increase
in our staff, and higher-than-ever customer satisfaction and employee retention.
Cognizant’s 1999 financial performance clearly reflects these successes. Our high level of
expertise in the development, delivery and ongoing management of innovative software
solutions, the efficiency and quality of our offshore/on-site business model and our com-
mitment to our clients has enabled us to reach and exceed ever-higher financial goals.
To recap our financial results, for the year ended December 31, 1999, total revenues
increased 52 percent to $88.9 million, from $58.6 million for the prior year. Non-Y2K-relat-
ed revenues grew 129.1 percent. This growth was driven not only by a 40 percent rise in our
total number of customers, but also by a recurring revenue in excess of $73 million from
existing customers. Net income for 1999 was up 86 percent to $11.2 million, or $0.58 per
share, diluted, based on 19.4 million common and dilutive shares outstanding, from $0.37
per share, diluted, based on 16.5 million common and dilutive shares outstanding for the
prior year. Gross margin was about 48 percent for the year.
Turning to our balance sheet, we finished 1999 with no debt and $42.6 million in cash and
cash equivalents, or $14.2 million more than 1998’s figure. We also saw a 39 percent rise in
stockholders’ equity. Cognizant continued to generate cash in 1999, in part helped by the
$4.3 million increase in our deferred tax balance. This deferred tax balance results from the
tax holiday we enjoy on our profits from our operations in India. As a result of the tax holi-
day, our cash tax rate was only 14.2 percent, although our policy has been to accrue taxes
at a full rate of 37.4 percent.
The Internet has not only inspired an entirely new industry, but it has also given companies
in virtually all other industries unprecedented opportunities for growth. Applying e-busi-
ness to everyday business – for Cognizant and its clients – is at the heart of our new solu-
tion offerings and strategies. We help companies in both existing and new industries gain
and maintain a competitive edge by maximizing their ability to implement and benefit from
their e-business strategies.
T O O U R S H A R E H O L D E R S
CO
GN
IZ
AN
T
TE
CH
NO
LO
GY
S
OL
UT
IO
NS
1
R E V E N U E(thousands)
O P E R AT I N G I N C O M E(thousands)
E M P L O Y E E S
1999$88,904
$58,606
$24,744
$12,032
96 97 98 99
96 97 98 99
96 97 98 99
16,645
8,918
2,1291,466
2,220
1,560
990
575
23805p01t10 4/25/00 12:05 PM Page 1
Cognizant is now successfully positioned as an e-business service provider. And since e-business
needs map so well to our business model, we believe we will be able to make e-business 50 per-
cent of our business. Already, we have taken many steps toward that goal. Much of our R&D
outlays for 1999 went toward developing and defining e-business-related offerings, and we will
rrcontinue to enhance these R&D efforts throughout this year. Cognizant is
rrconcentrating first on delivering services to its strongest vertical
rrmarkets, including financial and information services and health-
rrcare, and then expanding the number of industries it is able to sup-
rrport. We will also continue to partner with other consulting companies
and software vendors and to collaborate with academic institutions to build our business and
deliver top solutions to our clients.
We’ve continued to improve our operations by training and hiring more than 400 programmers
in e-commerce technologies. In addition, Cognizant’s internal operations systems are now Web-
based. The Company opened two new software centers in India, bringing the total to eight,
which gives us space for our expanded staff and the dedicated technical support for our e-busi-
ness efforts. In 2000, we plan to further expand our infrastructure to support our ongoing
anticipated growth in e-business and applications management. We ended the year with a bill-
able headcount of 2,000, up from 1,390. We also installed a new high-performance telecommu-
nications network in 1999, linking our development center in India with our clients, and
doubled our bandwidth, which we will continue to upgrade in the coming years.
Cognizant invested significantly in sales and marketing in
1999, and it’s paying off. The Company opened a new office
in Frankfurt to ramp up sales in Germany and to develop its
presence in Continental Europe. We hired a vice president of
marketing and a vice president of large account sales, and
built a highly effective, industry-leading sales and marketing
organization, to support our growth and to build brand
recognition for Cognizant and its offerings. We also boosted
our investment in account management and significantly
increased our ability to forge stronger, long-lasting relation-
ships with our clients and to expand those relationships to
include multiple Cognizant services.
Customer satisfaction is extremely important to us, so we are compelled to provide the best
service and support. And our efforts in this area are paying off. Cognizant’s customer satisfac-
tion has never been higher according to our yearly surveys. A big driver of Cognizant's high
CO
GN
IZ
AN
T
TE
CH
NO
LO
GY
S
OL
UT
IO
NS
2
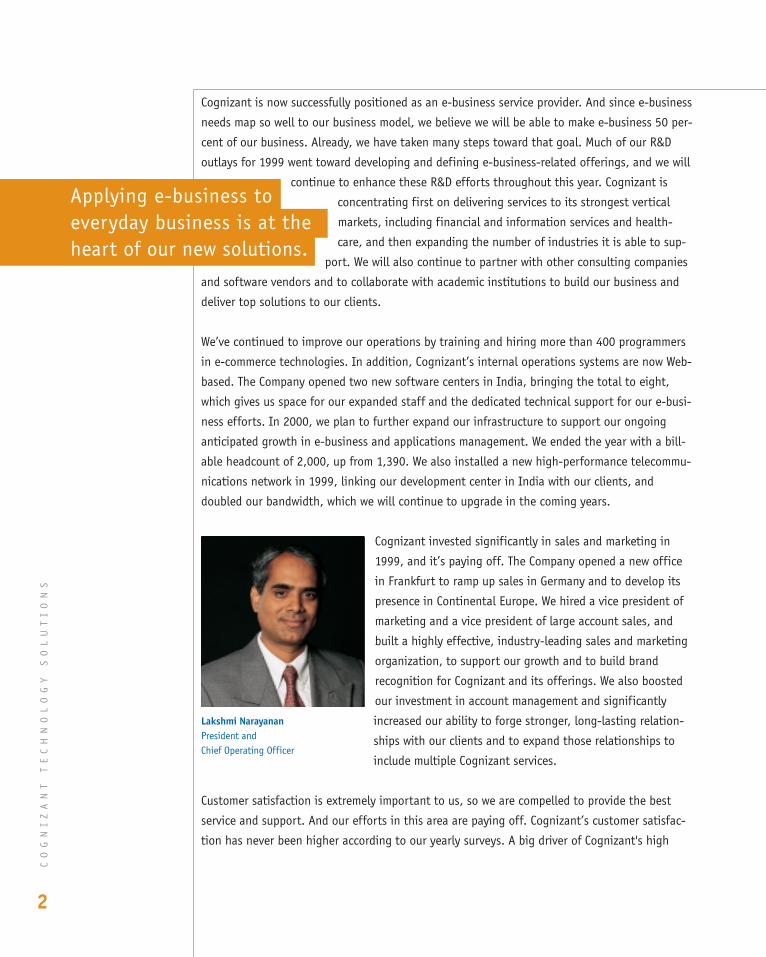
Lakshmi NarayananPresident andChief Operating Officer
Applying e-business toeveryday business is at theheart of our new solutions.
23805p01t10 4/25/00 12:05 PM Page 2
customer satisfaction is our achievement of Level 4 certification by the Software
Engineering Institute’s (SEI’s) Capability Maturity Model (CMM). This is a very rare and
meaningful achievement in our industry. Widely viewed as the standard for measuring
software development and maintenance processes, SEI-CMM Level 4 proficiency certifi-
cation has been achieved by only a small percentage of companies in the industry.
Cognizant provides the best service and support to its customers because we have
great people. We recruit the cream of the crop from the best universities in India and
provide extensive leadership and technical training. Each member of our staff is highly
valued and respected, and, as a result, our employee turnover rate is a meager 11 percent, or
roughly half the industry average. Our Company benefits greatly from its ability to retain talent-
ed employees, not only by reaping the long-term rewards of its training efforts, but also by
being able to provide continuity of quality service to its clients. Cognizant is able to make itself
an indispensable extension of our clients’ IT organizations because of the talent, expertise and
work ethic of its people.
We’ve also received terrific public recognition in the past year. In November 1999, Forbes maga-
zine named Cognizant the number one best small company in its list of the “200 Best Small
Companies” in America, and the New Jersey Technology Council selected us as “Public Company
of the Year.” We consider these and the other numerous honors we’ve received as added valida-
tion of our efforts to deliver maximum results to our shareholders.
We thank our employees for their innovative thinking and hard work, our shareholders and the
financial community for their continued support, and our clients for their business. We look for-
ward to bringing you more good news in 2000 as we build upon the successes of 1999.
Sincerely,
Wijeyaraj Mahadeva
Chairman and Chief Executive Officer
Lakshmi Narayanan
President and Chief Operating Officer
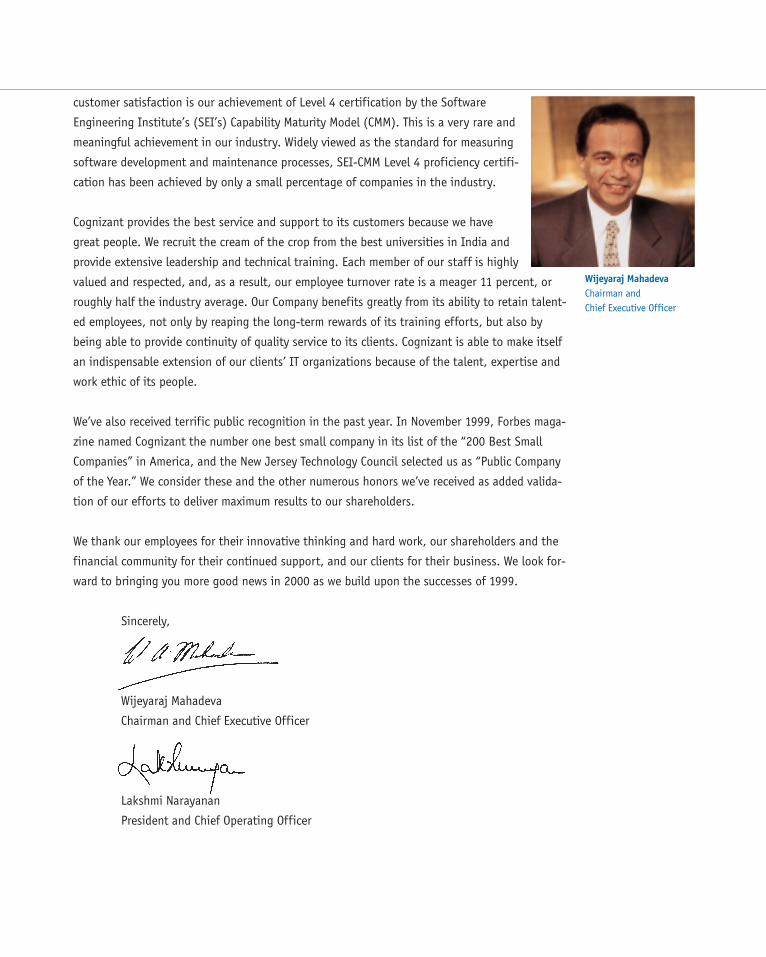
Wijeyaraj MahadevaChairman andChief Executive Officer
23805p01t10 4/25/00 12:05 PM Page 3
1 9 9 9 O P E R A T I O N S R E V I E W
The E-Business OpportunityThe Internet represents some of the most
exciting and challenging opportunities for
businesses since the advent of the informa-
tion age. E-business, which most consumers
simply think of as Web sites and online
shopping, has the potential to completely
transform the way companies manage their
business and the way they reach and interact
with their suppliers and customers. Indicative
of the tremendous opportunities in this area,
the market for e-business consulting services
is expected to grow from $8 billion this year
to $87 billion in 2008.*
Despite these opportunities, the road to e-
business success is littered with IT-related
obstacles for many companies, hindering
their ability to apply e-business to their
everyday business and win big in a high-
stakes, hyper-competitive environment.
Cognizant has the expertise to partner with
CIOs and help them remove the obstacles and
reach their goals.
Just as most companies are completing con-
struction of their initial Web presence, the
pressure is on for them to rapidly expand
their functionality, and to apply e-business
technology to seamlessly integrate internal
business processes, customers, suppliers and
partners in new business arrangements.
CO
GN
IZ
AN
T
TE
CH
NO
LO
GY
S
OL
UT
IO
NS
4
Cognizant applies e-business to everyday business
23805p01t10 4/25/00 12:05 PM Page 4
Cognizant’s onsite/offshore model offers
many unique benefits to e-businesses.
Our Company does not suffer from the same
resource shortages that are constraining the
growth of e-businesses in the US and Europe.
So far, we have barely tapped the
resource pool in India,
and as an employer of
choice in India, our ability
to attract and retain the
best people is very strong.
The savings we realize by operating off-
shore allow us to invest heavily in R&D, so
we are vendor neutral and have a vast selec-
tion of technologies from which to choose to
ensure that our clients get robust, scaleable
and extensible systems that will best support
Analysts estimate that companies will spend
$7 on this second-generation of e-business
applications for every $1 they spend on
developing their digital strategy and estab-
lishing their initial Web presence.**
Cognizant focuses on building these second
generation, industrial-strength, e-business
applications. We then integrate the new sys-
tems seamlessly with clients’ legacy applica-
tions. Our established competencies in
large-scale transaction processing systems,
large databases, sophisticated distributed
networks, and high availability requirements
provide us with the insight and experience to
apply e-business to everyday business.
Indicative of our own successful transition to
e-business solutions, we expanded the size
and training of our staff of consultants.
Cognizant now has 400 consultants able to
expertly deliver the latest Internet technolo-
gies, and many more with expertise in back-
end development and integration — vital
components of second-generation e-business
applications.
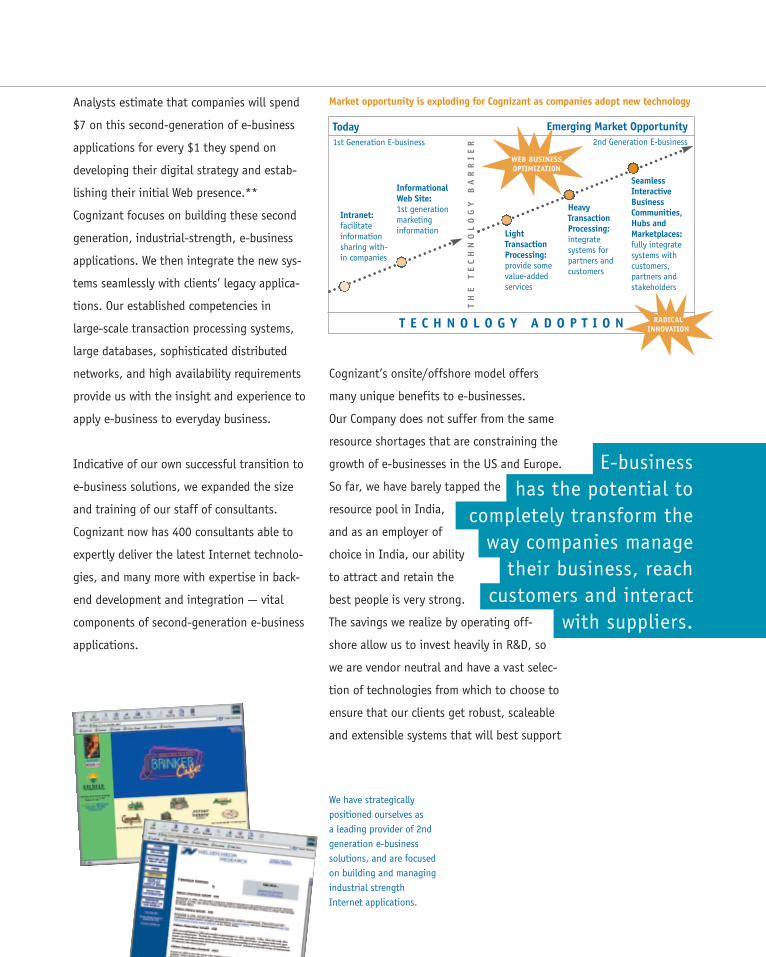
Intranet:facilitate informationsharing with-in companies
InformationalWeb Site:1st generationmarketinginformation Light
TransactionProcessing:provide somevalue-addedservices
HeavyTransactionProcessing:integratesystems forpartners andcustomers
T E C H N O L O G Y A D O P T I O N
Today1st Generation E-business
Emerging Market Opportunity2nd Generation E-business
SeamlessInteractiveBusinessCommunities,Hubs andMarketplaces:fully integratesystems withcustomers,partners andstakeholders
WEB BUSINESSOPTIMIZATION
TH
E
TE
CH
NO
LO
GY
B
AR
RI
ER
We have strategicallypositioned ourselves asa leading provider of 2ndgeneration e-businesssolutions, and are focusedon building and managingindustrial strengthInternet applications.
RADICALINNOVATION
E-businesshas the potential to
completely transform theway companies manage
their business, reachcustomers and interact
with suppliers.
Market opportunity is exploding for Cognizant as companies adopt new technology
23805p01t10 4/25/00 12:05 PM Page 5
their business growth. We also boost our
technological capabilities and offerings by
forming alliances with other consulting com-
panies and software vendors and collaborat-
ing with academic institutions. Moreover,
because the time difference between the US
and India allows us to “follow the sun” and
operate on a 24x7 cycle, we are able to sig-
rrnificantly increase the speed at
rrwhich we can execute
rrclient projects, there-
rrby reducing their time
rrto market. And we can
efficiently deliver an array of technology
solutions without compromising on quality.
We have been awarded SEI-CMM Level 4 certi-
fication, the industry standard for measuring
software development and maintenance
processes and an achievement only a very
small percentage of companies in our indus-
try can claim.
As we successfully build our business, we will
also be helping our clients build their busi-
nesses by providing end-to-end solutions.
A good example of this is our recently
announced partnership with Viant Corporation,
a leading digital business strategist. Viant
chose us specifically for our ability to deliver
high-quality technology solutions and for our
reputation for customer satisfaction. This
partnership enables Viant and Cognizant to
offer clients end-to-end solutions, from digi-
tal strategy, application development and
integration to on-going e-business applica-
tion management.
The process of supporting our customers’
digital transformation from traditional busi-
ness to e-business is a journey for which
Cognizant is well equipped. Companies are
increasingly recognizing the advantages of
choosing Cognizant to lead their way. We’ve
not only won e-business contracts from a
Nielsen Media ResearchThe leader in televisionaudience measurementand related services in theUS and Canada, NielsenMedia Research serves tele-vision networks and affili-ates, cable networks andsystems, advertisers andtheir agencies and othersin the media industry.Nielsen Media Researchderives enormous value
from being a leader in pro-viding strategic informa-tion-based services to itscustomers.
“Nielsen Media Researchfirst partnered withCognizant in 1995, andsince then, the relation-ship has blossomed. Mostrecently, Cognizant hasbeen working on a varietyof Internet applicationdevelopment projects,which will transform ourbusiness processes and
CO
GN
IZ
AN
T
TE
CH
NO
LO
GY
S
OL
UT
IO
NS
6
Cognizant has wone-business contracts fromour long-standing clientsand from new dot-coms.
interaction with our cus-tomers. Cognizant is alsoworking with us on Web-enabling existing applica-tions and on a new systemfor managing researchpanel recruitment andtracking for Nielsen//NetRatings, our newInternet-use and advertis-ing measurement service.”
Kim Ross
CIO
Nielsen Media Research
23805p01t10 4/25/00 12:05 PM Page 6
number of our long-standing application
management clients, but also from venture-
capital-funded dot-coms that recognize the
value of working with an industrial-strength
Internet solutions provider that can enhance
their growth prospects. We will foster these
relationships, so that as these companies
grow, we can expand with them over the long
term and cross-sell our full range of services,
including applications management.
Cognizant’s e-business offerings include
architecture and application
development, e-business
integration, and e-business
application management.
Offshore application management offers astrong value proposition
Application Management SolutionsCompanies worldwide currently have over
$1 trillion invested in legacy IT systems, and
since today’s new e-business technology is
destined to become tomorrow’s legacy, that
investment is growing. Cognizant has a
tremendous opportunity in this area for man-
aging these systems and adapting them to
e-business, freeing up companies’ resources
for efforts more central to the growth of their
core business.
23805p01t10 4/25/00 12:05 PM Page 7
Cognizant’s on-site/offshore business model
helps deliver optimal results in application
management by employing the IT talent to
provide round-the-clock service by combining
rran onsite team with a cost-effi-
rrcient offshore team
rrthat handles night-
rrtime support and
rrroutine maintenance. In fact, we
rrnot only maintain our clients’ systems,
but also improve them on an ongoing basis,
which reduces the potential for future prob-
lems, enhances stability and functionality,
and prepares them for e-business. And all
this is achieved with substantial cost savings
to the client.
Like e-business, application management is a
robust growth business. Cognizant's applica-
tion management revenues grew more than
200 percent in 1999 and accounted for more
than 46 percent of revenues by year end. We
expect to continue benefiting from the dy-
namic growth of this business for many years.
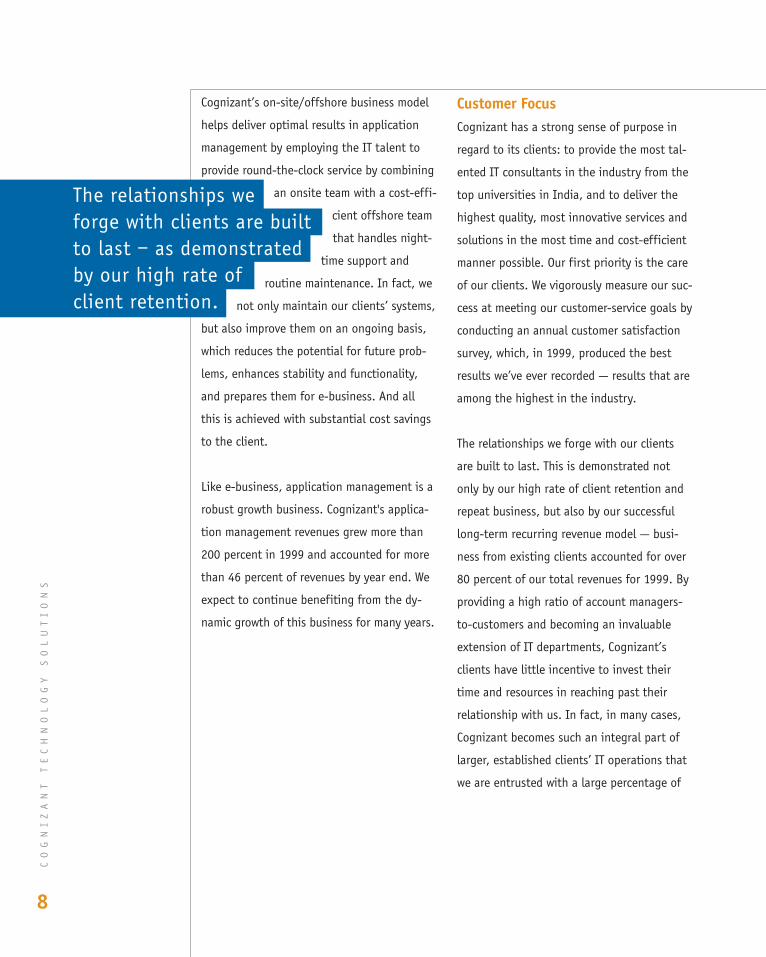
Customer Focus Cognizant has a strong sense of purpose in
regard to its clients: to provide the most tal-
ented IT consultants in the industry from the
top universities in India, and to deliver the
highest quality, most innovative services and
solutions in the most time and cost-efficient
manner possible. Our first priority is the care
of our clients. We vigorously measure our suc-
cess at meeting our customer-service goals by
conducting an annual customer satisfaction
survey, which, in 1999, produced the best
results we’ve ever recorded — results that are
among the highest in the industry.
The relationships we forge with our clients
are built to last. This is demonstrated not
only by our high rate of client retention and
repeat business, but also by our successful
long-term recurring revenue model — busi-
ness from existing clients accounted for over
80 percent of our total revenues for 1999. By
providing a high ratio of account managers-
to-customers and becoming an invaluable
extension of IT departments, Cognizant’s
clients have little incentive to invest their
time and resources in reaching past their
relationship with us. In fact, in many cases,
Cognizant becomes such an integral part of
larger, established clients’ IT operations that
we are entrusted with a large percentage of
CO
GN
IZ
AN
T
TE
CH
NO
LO
GY
S
OL
UT
IO
NS
8
The relationships weforge with clients are builtto last – as demonstratedby our high rate ofclient retention.
23805p01t10 4/25/00 12:05 PM Page 8
Brinker InternationalThe world’s premier multi-unit restaurant operator,Brinker International is theparent company of ninepopular restaurant con-cepts, including Chili’sGrill and Bar, Romano’sMacaroni Grill, and OnThe Border Mexican Café.
“Cognizant’s reputation forbuilding strong relation-ships with its partners andproviding innovative appli-cation management solu-
tions is well earned. Ourpartnership with Cognizantenables us to maintain theinformation systems weneed to accomplish ourprimary objective of pro-viding our customers witha great dining experience.”
Johnny Earl
Vice President of
Information Technology
Brinker International
their IT business. Our hard work and exper-
tise perfectly position us to expand client
relationships year-over-year to earn a higher
percentage of each client’s total IT spending.
As a result, our business is much more secure
than project-oriented companies that have to
rebuild their client books yearly, and our
foundation for growth is solid.
As we’ve grown and expanded, our Company
has been focusing on addressing the needs
of some of the most IT-intensive vertical
markets. We are still in the
very early stages of
growth in
Our unique on-site/offshore modelemploys proprietary software tools
23805p01t10 4/25/00 12:05 PM Page 9
CO
GN
IZ
AN
T
TE
CH
NO
LO
GY
S
OL
UT
IO
NS
10
application management and e-business, and
we believe that some of the greatest oppor-
tunities for growth lie ahead.
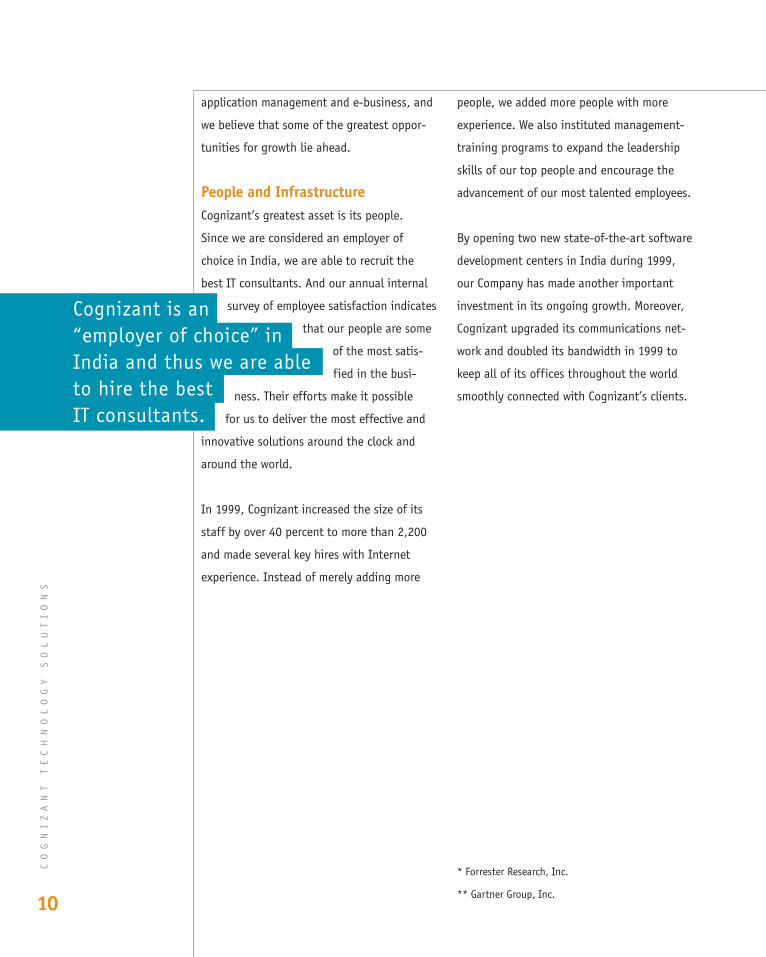
People and InfrastructureCognizant’s greatest asset is its people.
Since we are considered an employer of
choice in India, we are able to recruit the
best IT consultants. And our annual internal
rrsurvey of employee satisfaction indicates
rrthat our people are some
rrof the most satis-
rrfied in the busi-
rrness. Their efforts make it possible
rrfor us to deliver the most effective and
innovative solutions around the clock and
around the world.
In 1999, Cognizant increased the size of its
staff by over 40 percent to more than 2,200
and made several key hires with Internet
experience. Instead of merely adding more
Cognizant is an“employer of choice” inIndia and thus we are ableto hire the bestIT consultants.
people, we added more people with more
experience. We also instituted management-
training programs to expand the leadership
skills of our top people and encourage the
advancement of our most talented employees.
By opening two new state-of-the-art software
development centers in India during 1999,
our Company has made another important
investment in its ongoing growth. Moreover,
Cognizant upgraded its communications net-
work and doubled its bandwidth in 1999 to
keep all of its offices throughout the world
smoothly connected with Cognizant’s clients.
* Forrester Research, Inc.
** Gartner Group, Inc.
23805p01t10 4/25/00 12:05 PM Page 10
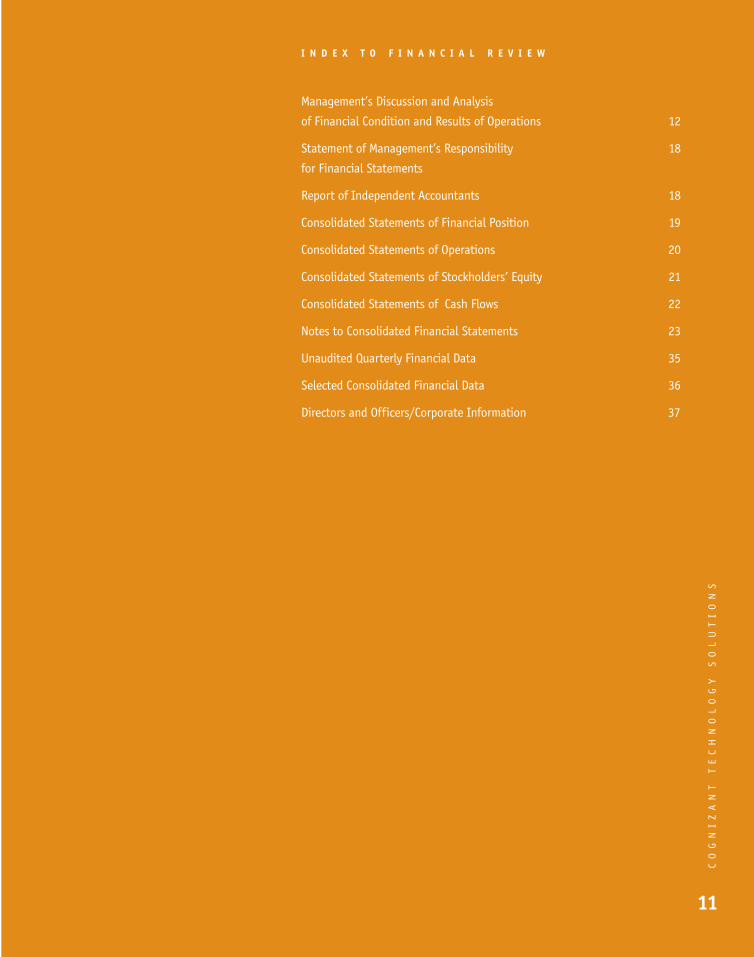
Management’s Discussion and Analysis
of Financial Condition and Results of Operations 12
Statement of Management’s Responsibility 18
for Financial Statements
Report of Independent Accountants 18
Consolidated Statements of Financial Position 19
Consolidated Statements of Operations 20
Consolidated Statements of Stockholders’ Equity 21
Consolidated Statements of Cash Flows 22
Notes to Consolidated Financial Statements 23
Unaudited Quarterly Financial Data 35
Selected Consolidated Financial Data 36
Directors and Officers/Corporate Information 37
CO
GN
IZ
AN
T
TE
CH
NO
LO
GY
S
OL
UT
IO
NS
11
I N D E X T O F I N A N C I A L R E V I E W
23805p11t36 4/25/00 12:06 PM Page 1
CO
GN
IZ
AN
T
TE
CH
NO
LO
GY
S
OL
UT
IO
NS
12
Management’s Discussion and Analysis ofFinancial Condition and Results of Operations
OverviewThe Company delivers high-quality, cost-effective, full life cycle solutions to complex software development and maintenance problemsthat companies face as they transition to e-business. These services are delivered through the use of a seamless on-site and offshore con-sulting project team. The Company’s primary service offerings include: application development and integration; application management;re-engineering; and mass change.
The Company began its software development and maintenance services business in early 1994, as an in-house technology developmentcenter for The Dun & Bradstreet Corporation and its operating units. In 1996, the Company, along with Erisco, IMS International, NielsenMedia Research, Pilot Software and Sales Technologies and certain other entities, plus a majority interest in Gartner Group were spun-offfrom The Dun & Bradstreet Corporation to form a new company, Cognizant Corporation. In 1997, the Company purchased the 24.0%minority interest in its Indian subsidiary from a third party for $3.4 million, making the Indian subsidiary wholly owned by the Company.
On February 11, 2000, the Board of Directors declared a 2-for-1 stock split effected by a 100% dividend payable on March 16, 2000 tostockholders of record on March 2, 2000. The stock split has been reflected in the accompanying financial statements, and all applicablereferences as to the number of outstanding common shares and per share information have been restated. Appropriate adjustments havebeen made in the exercise price and number of shares subject to stock options. Stockholders’ equity accounts have been restated toreflect the reclassification of an amount equal to the par value of the increase in issued common shares from the capital in excess of parvalue account to the common stock accounts.
In June 1998, the Company completed its initial public offering. On June 30, 1998, a majority interest in the Company, Erisco, IMSInternational and certain other entities were spun-off from Cognizant Corporation to form IMS Health. At December 31, 1999, IMS Healthowned approximately 61% of the outstanding stock of the Company and held approximately 94% of the combined voting power of theCompany’s common stock.
During 1996, the Company made a strategic decision to attract customers that were not affiliated with Cognizant Corporation or any ofthe former affiliates of The Dun & Bradstreet Corporation. As a result of the implementation of this strategy, the Company has successful-ly transitioned from a company primarily serving affiliated customers to a company whose customer base now consists primarily of unaf-filiated third parties. For example, revenues derived from customers not currently or previously affiliated with The Dun & BradstreetCorporation, Cognizant Corporation, IMS Health, and any of their respective subsidiaries grew from $6.5 million, or 26.4% of revenues, in1997 to $26.9 million, or 46.0% of revenues, in 1998 and $50.5 million, or 56.8% of revenues, in 1999. Approximately 73.6%, 54.0% and43.2% of the Company’s revenues in 1997, 1998 and 1999, respectively, were generated from current and former affiliates includingapproximately 23.7%, 18.0% and 16.7%, respectively, from IMS Health and its current subsidiaries.
The Company has derived and believes that it will continue to derive a significant portion of its revenues from a limited number of largethird-party customers. During 1997, 1998 and 1999, the Company’s five largest customers (other than IMS Health and its current sub-sidiaries) accounted for 50.8%, 43.7% and 44.9% of revenues, respectively. In 1997, Cognizant Corporation and ACNielsen accounted formore than 40.0% and 10.0% of revenues, respectively. In 1998, IMS Health, First Data Corporation and ACNielsen each accounted formore than 10.0% of revenue. In 1999, IMS Health and First Data Corporation accounted for more than 10.0% of revenue. The volume ofwork performed for IMS Health and its subsidiaries and other customers is likely to vary from year to year. Major customers, whether affil-iated or unaffiliated, in one year may not provide the same level of revenues in any subsequent year.
Historically, Year 2000 compliance services were an important element of the Company’s service offerings. Approximately 44.4%, 44.1%and 15.6% of the Company’s revenues were derived from Year 2000 compliance services in 1997, 1998 and 1999, respectively. Revenuesderived from providing Year 2000 compliance services have become an increasingly less significant component of the Company’s overallrevenue base. The Company believes that it has successfully utilized its Year 2000 compliance expertise to establish relationships with newcustomers and deepen its relationships with existing customers. The knowledge of customers’ systems gained while performing Year 2000compliance services gave the Company a competitive advantage in securing additional application development and application manage-ment projects and projects for such customers.
Application development and integration services represented approximately 19.4%, 25.8% and 32.3% of revenues in 1997, 1998 and1999, respectively. Application management services accounted for 28.4%, 21.1% and 44.0% of revenues in 1997, 1998 and 1999, respec-tively.
23805p11t36 4/25/00 12:06 PM Page 2
CO
GN
IZ
AN
T
TE
CH
NO
LO
GY
S
OL
UT
IO
NS
13
Management’s Discussion and Analysis ofFinancial Condition and Results of Operations
The Company’s services are performed on either a time-and-materials or fixed-price basis. The Company expects that an increasing num-ber of future projects will be fixed-price rather than time-and-materials (which has historically been the basis for its contracts). Revenuesrelated to time-and-materials contracts are recognized as the service is performed. Revenues related to fixed-price contracts are recog-nized using the percentage-of-completion method of accounting. Under such method, the sales value of performance, including earningsthereon, is recognized on the basis of the percentage that each contract’s cost to date bears to the total estimated contract cost.Estimates are subject to adjustment as a project progresses, to reflect changes in expected completion costs. The cumulative impact of anyrevision in estimates of the percentage of work completed is reflected in the financial reporting period in which the change in the esti-mate becomes known. Additionally, any anticipated losses are recognized immediately. Since the Company bears the risk of cost over-runsand inflation associated with fixed-price projects, the Company’s operating results may be adversely affected by changes in estimates ofcontract completion costs.
The majority of the Company’s revenues are earned within North America. Revenues outside of North America totaled $3.5 million, $10.7million and $17.7 million in 1997, 1998 and 1999, respectively. Revenues from customers located outside of North America have been-generated primarily in the United Kingdom and Germany. As a percentage of revenues, revenues outside of North America represented14.3%, 18.3% and 19.9% in 1997, 1998 and 1999, respectively. The primary denomination for invoices issued by the Company is U.S.dollars, with the exception of invoices issued in Canada, Germany and the United Kingdom. Invoices issued in Canada, Germany and theUnited Kingdom are issued in local currency. Gains and losses as a result of fluctuations in foreign currency exchange rates have not hada significant impact on historical results of operations.
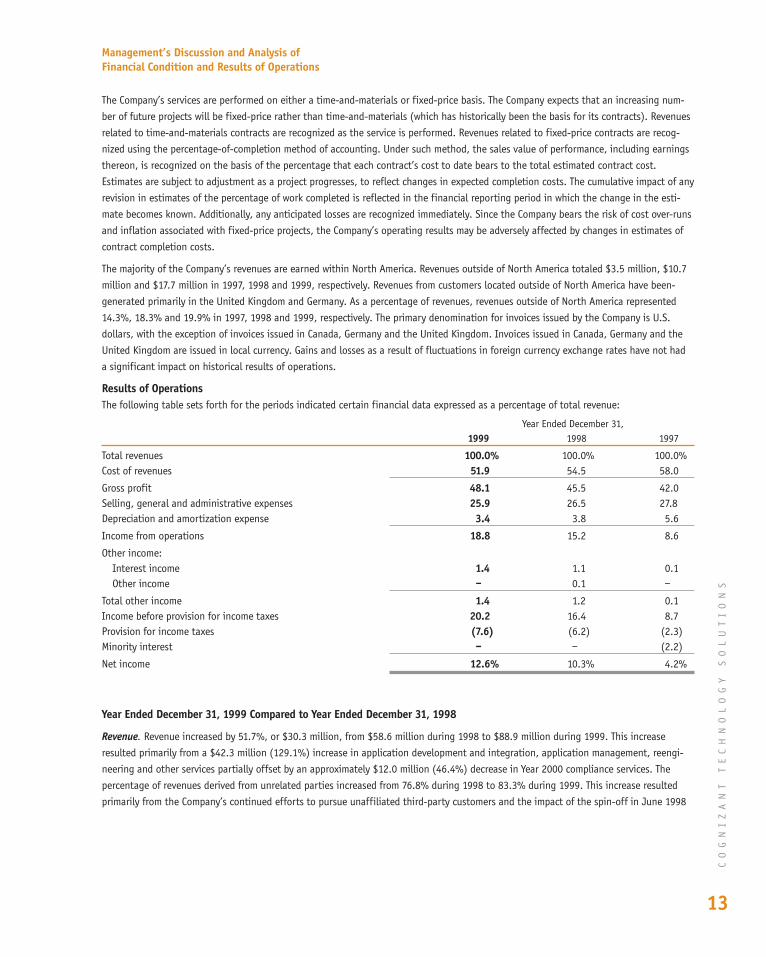
Results of OperationsThe following table sets forth for the periods indicated certain financial data expressed as a percentage of total revenue:
Year Ended December 31, 1999 Compared to Year Ended December 31, 1998
Revenue. Revenue increased by 51.7%, or $30.3 million, from $58.6 million during 1998 to $88.9 million during 1999. This increaseresulted primarily from a $42.3 million (129.1%) increase in application development and integration, application management, reengi-neering and other services partially offset by an approximately $12.0 million (46.4%) decrease in Year 2000 compliance services. Thepercentage of revenues derived from unrelated parties increased from 76.8% during 1998 to 83.3% during 1999. This increase resultedprimarily from the Company’s continued efforts to pursue unaffiliated third-party customers and the impact of the spin-off in June 1998
Total revenues 100.0% 100.0% 100.0%Cost of revenues 51.9 54.5 58.0
Gross profit 48.1 45.5 42.0Selling, general and administrative expenses 25.9 26.5 27.8Depreciation and amortization expense 3.4 3.8 5.6
Income from operations 18.8 15.2 8.6
Other income:Interest income 1.4 1.1 0.1Other income – 0.1 –
Total other income 1.4 1.2 0.1Income before provision for income taxes 20.2 16.4 8.7Provision for income taxes (7.6) (6.2) (2.3)Minority interest – – (2.2)
Net income 12.6% 10.3% 4.2%
Year Ended December 31,1999 1998 1997
23805p11t36 4/25/00 12:06 PM Page 3
CO
GN
IZ
AN
T
TE
CH
NO
LO
GY
S
OL
UT
IO
NS
14
of a majority interest in the Company, Erisco, IMS International and certain other entities to form IMS Health. For statement of opera-tions purposes, revenues from related parties only include revenues recognized during the period in which the related party was affiliatedwith the Company. During 1999, sales to one related party customer accounted for 16.7% of revenues and one third-party customeraccounted for 17.4% of revenues. During 1998, sales to one related party customer accounted for 23.2% of revenues and two third-partycustomers accounted for 12.5% and 11.3% of revenues, respectively.
Gross profit. The Company’s cost of revenues consists primarily of the cost of salaries, payroll taxes, benefits, immigration and travel fortechnical personnel, and the cost of sales commissions related to revenues. The Company’s cost of revenues increased by 44.6%, or $14.2million, from $31.9 million during 1998 to $46.2 million during 1999. The increase was due primarily to the increased cost resulting fromthe increase in the number of the Company’s technical professionals from approximately 1,400 employees at December 31, 1998 toapproximately 2,000 employees at December 31, 1999. The increased number of technical professionals is a direct result of greaterdemand for the Company’s services. The Company’s gross profit increased by 60.2%, or approximately $16.1 million, from approximately$26.7 million during 1998 to approximately $42.7 million during 1999. Gross profit margin increased from 45.5% of revenues during 1998to 48.1% of revenues during 1999. The increase in such gross profit margin was primarily attributable to the increased third-party rev-enue and the shift toward newer, higher margin customers.
Selling, general and administrative expenses. Selling, general and administrative expenses consist primarily of salaries, employee bene-fits, travel, promotion, communications, management, finance, administrative and occupancy costs. Selling, general and administrativeexpenses, including depreciation and amortization, increased by 46.9%, or $8.3 million, from $17.8 million during 1998 to $26.1 millionduring 1999, but decreased as a percentage of revenue from 30.3% to 29.4%, respectively. The dollar increase in such expenses was pri-marily due to expenses incurred to expand the Company’s sales and marketing activities and increased infrastructure expenses to supportthe Company’s revenue growth. The decrease in selling, general and administrative expenses as a percentage of revenue resulted from theCompany’s increased revenues.
Income from Operations. Income from operations increased 86.6%, or $7.7 million, from $8.9 million during 1998 to $16.6 million during1999, representing 15.2% and 18.7% of revenues, respectively. The increase in operating margin was primarily due to the increased third-party revenue and the shift toward newer, higher margin customers, discussed above.
Other Income. Other income consists primarily of interest income and foreign currency exchange gains. Interest income increased byapproximately $625,000, from $638,000 during 1998 to approximately $1.3 million during 1999. The increase in such interest income wasattributable primarily to the investment of the net proceeds generated from the Company’s initial public offering and generally higheroperating cash balances. The Company recognized a net foreign currency exchange loss of approximately $32,000 during 1999, as a resultof changes in exchange rates on its transactions.
Provision for Income Taxes. Historically, through the date of the IPO, the Company had been included in the consolidated federal incometax returns of The Dun & Bradstreet Corporation and Cognizant Corporation. The Company’s provision for income taxes in the consolidatedstatements of income reflects the federal and state income taxes calculated on the Company’s stand alone basis. The provision for incometaxes increased from $3.6 million in 1998 to $6.7 million in 1999, with an effective tax rate of 37.4% in both 1998 and 1999.
Net Income. Net income increased from approximately $6.0 million in 1998 to $11.2 million in 1999, representing 10.3% and 12.6% as apercentage of revenues, respectively.
Year Ended December 31, 1998 Compared to Year Ended December 31, 1997
Revenue. Revenue increased by 136.8%, or $33.9 million, from $24.7 million in 1997 to $58.6 million in 1998. This increase included$14.9 million of increased Year 2000 compliance services, and $19.0 million of increased sales of application development and integra-tion, application management, reengineering and other services. Revenue growth resulted, in part, from the successful implementation ofthe Company’s Year 2000 rollover strategy, pursuant to which Year 2000 clients have been converted to include non-Year 2000 assign-ments including software development and maintenance. The percentage of revenues from unrelated parties increased from 56.2% in1997 to 76.8% in 1998. This increase resulted primarily from the Company’s continued efforts to pursue unaffiliated third-party cus-
Management’s Discussion and Analysis ofFinancial Condition and Results of Operations
23805p11t36 4/25/00 12:06 PM Page 4
CO
GN
IZ
AN
T
TE
CH
NO
LO
GY
S
OL
UT
IO
NS
15
tomers and the impact of the spin-off in June 1998 of a majority interest in the Company’s company, Erisco, IMS International and certainother entities to form IMS Health, and the establishment of Nielsen Media Research as a separate publicly traded company. For statementof operations purposes, revenues from related parties only include revenues recognized during the period in which the related party wasaffiliated with the Company. Accordingly, as of July 1, 1998, Nielsen Media Research was no longer deemed to be a related party. During1998, sales to one related party customer accounted for 23.2% of revenues and two third-party customers accounted for 12.5% and11.3% of revenues, respectively. During 1997, sales to one related party customer accounted for 44.3% of revenues and one third-partycustomer accounted for 13.9% of revenues.
Gross profit. The Company’s cost of revenues increased by 122.3%, or $17.6 million, from $14.4 million in 1997 to $31.9 million in 1998.The increase was due primarily to the increased cost resulting from the increase in the number of the Company’s technical professionalsfrom approximately 900 employees at December 31, 1997 to approximately 1,400 employees at December 31, 1998. The Company’s grossprofit increased by 157.0%, or approximately $16.3 million, from approximately $10.4 million in 1997 to approximately $26.7 million in1998. Gross profit margin increased from 42.0% of revenues in 1997 to 45.5% of revenues in 1998. The increase in gross profit marginwas primarily attributable to the increased third party revenue which have higher margins and a higher utilization level of technical pro-fessionals during 1998 compared to 1997.
Selling, general and administrative expenses. Selling, general and administrative expenses, including depreciation and amortization,increased by 115.2%, or $9.5 million, from $8.3 million in 1997 to $17.8 million in 1998, but decreased as a percentage of revenue from33.4% to 30.3%, respectively. The increase in such expenses in absolute dollars was primarily due to expenses incurred to expand theCompany’s sales and marketing activities and increased infrastructure expenses to support the Company’s revenue growth. The decrease inselling, general and administrative expenses as a percentage of revenue resulted from the Company’s continued ability to leverage thesignificant investments it made in the beginning of 1997 to establish a sales and marketing organization and to create the infrastructurenecessary to operate as an independent company.
Income from Operations. Income from operations increased 318.9% or $6.8 million, from $2.1 million in 1997 to $8.9 million in 1998,representing 8.6% and 15.2% of revenues, respectively. The increase in operating margin was primarily due to the increased third-partyrevenue, which generally has higher margins and the higher utilization level of technical professionals mentioned above.
Other Income. Interest income increased by $613,000 from $25,000 in 1997 to $638,000 in 1998. The increase in such interest incomewas attributable primarily to increased interest income resulting from the investment of the net proceeds generated from the Company’sinitial public offering and generally higher cash balances. The Company recognized a net foreign currency exchange gain of $83,000 in1998, as a result of the effect of changing exchange rates on the Company’s transactions.
Provision for Income Taxes. The provision for income taxes increased from $581,000 in 1997 to $3.6 million in 1998 resulting in an effec-tive tax rate of 27.0% in 1997 and 37.4% in 1998. Without the effect of minority interest, the effective tax rate would have been approxi-mately 35.0% in 1997.
Minority Interest. In 1997, minority interest expense was $545,000. This expense was attributable to profitability of the Company’s Indiansubsidiary in which an unaffiliated third party held a 24.0% minority interest. The Company purchased the minority interest in October1997 for $3.4 million. The Company has not recognized any minority expense subsequent to such purchase. In 1997 and 1998 theCompany recorded $76,000 and $317,000 of amortization expense, respectively, in connection with the goodwill recorded on the acquisi-tion of the remaining portion of its Indian subsidiary.
Net Income. Net income increased from $1.0 million in 1997 to $6.0 million in 1998, representing 4.2% and 10.3% as a percentage ofrevenues, respectively.
BacklogThe Company generally enters into written contracts with its customers at the time it commences work on a project. These written con-tracts contain varying terms and conditions and the Company does not generally believe it is appropriate to characterize such writtencontracts as creating backlog. Additionally, because these written contracts often provide that the arrangement can be terminated withlimited advance notice and without penalty, the Company does not believe that projects in progress at any one time are a reliable indica-tor or measure of expected future revenue.
Management’s Discussion and Analysis ofFinancial Condition and Results of Operations
23805p11t36 4/25/00 12:06 PM Page 5
CO
GN
IZ
AN
T
TE
CH
NO
LO
GY
S
OL
UT
IO
NS
16
Liquidity and Capital ResourcesHistorically, through the date of the IPO, the Company’s primary sources of funding had been cash flow from operations and intercompanycash transfers with its majority owner and controlling parent company IMS Health. In June 1998, the Company consummated its initialpublic offering of 5,834,000 (2,917,000 pre-split) shares of its Class A Common Stock at a price to the public of $5.00 ($10.00 pre-split)per share, of which 5,000,000 (2,500,000 pre-split) shares were issued and sold by the Company and 834,000 (417,000 pre-split) shareswere sold, at that time, by Cognizant Corporation. The net proceeds to the Company from the offering were approximately $22.4 millionafter $845,000 of direct expenses. The funds received by the Company from the initial public offering were invested in short-term, invest-ment grade, interest bearing securities, after the Company used a portion of the net proceeds to repay approximately $6.6 million of non-trade related party balances to Cognizant Corporation. The Company expects to use the remainder of the net proceeds from the offeringfor (i) expansion of existing operations, including its offshore software development centers; (ii) continued development of new servicelines and possible acquisitions of related businesses; and (iii) general corporate purposes including working capital.
Net cash provided by operating activities was approximately $1.7 million, $13.3 million and $18.6 million for the years ended December31, 1997, 1998 and 1999, respectively. The increase for 1998 compared to 1997 results primarily from a higher level of accrued liabilities,increased net income, and an increase in deferred taxes, partially offset by increased other current assets. The increase for 1999 com-pared to 1998 results primarily from increased net income and a decrease in accounts receivable partially offset by a lower increase inaccrued liabilities versus the prior year. Accounts receivable increased from $7.4 million at December 31, 1997 to $11.1 million atDecember 31, 1998 and decreased to $10.0 million at December 31, 1999. The decrease in accounts receivable during 1999 was due pri-marily to improved collection efforts and earlier than expected year-end payments due to Year 2000 preparations by our customers. TheCompany monitors turnover, aging and the collection of accounts receivable through the use of management reports which are preparedon a customer basis and evaluated by the Company’s finance staff.
The Company’s investing activities used net cash of $6.4 million, $3.7 million and $5.9 million for the years ended December 31, 1997,1998 and 1999, respectively. The decrease in 1998 of net cash used in investing activities compared to 1997 primarily reflects the paymentin 1997 for the acquisition of the minority interest of the Company’s Indian subsidiary. The increase in 1999 of net cash used in investingactivities compared to 1998 primarily reflects increased purchases of equipment to expand the Company’s offshore development infra-structure.
The Company’s financing activities provided net cash of $5.7 million, $16.1 million and $1.6 million for the years ended December 31,1997, 1998 and 1999, respectively. The increase in 1998 compared to 1997 resulted primarily from the net proceeds generated from theinitial public offering of $22.4 million, offset by the repayment of non-trade related party balances of approximately $6.6 million. Thedecrease in 1999 compared to 1998 similarly resulted from the absence of the net IPO proceeds discussed above.
As of December 31, 1999, the Company had no significant third-party debt.
The Company had working capital of $43.5 million at December 31, 1999 and $29.4 million at December 31, 1998.
The Company believes that its available funds and the cash flows expected to be generated from operations, will be adequate to satisfyits current and planned operations and needs for at least the next 12 months. The Company’s ability to expand and grow its business inaccordance with current plans, to make acquisitions and form joint ventures and to meet its long-term capital requirements beyond this12-month period will depend on many factors, including the rate, if any, at which its cash flow increases, its ability and willingness toaccomplish acquisitions and joint ventures with capital stock and the availability to the Company of public and private debt and equityfinancing. The Company cannot be certain that additional financing, if required, will be available on terms favorable to it, if at all.
Foreign Currency TranslationThe assets and liabilities of the Company’s Canadian and European subsidiaries are translated into U.S. dollars at current exchange ratesand revenues and expenses are translated at average monthly exchange rates. The resulting translation adjustments are recorded in aseparate component of stockholders’ equity. For the Company’s Indian subsidiary, the functional currency is the U.S. dollar since its salesare made primarily in the United States, the sales price is predominantly in U.S. dollars; and there is a high volume of intercompanytransactions denominated in U.S. dollars between the Indian subsidiary and the Company’s U.S. affiliates. Non-monetary assets and lia-bilities are translated at historical exchange rates, while monetary assets and liabilities are translated at current exchange rates. A por-
Management’s Discussion and Analysis ofFinancial Condition and Results of Operations
23805p11t36 4/25/00 12:06 PM Page 6
CO
GN
IZ
AN
T
TE
CH
NO
LO
GY
S
OL
UT
IO
NS
17
tion of the Company’s costs in India are denominated in local currency and subject to exchange fluctuations, which has not had anymaterial effect on the Company’s results of operations.
Effects of InflationThe Company’s most significant costs are the salaries and related benefits for its programming staff and other professionals. Competitionin India and the United States for professionals with advanced technical skills necessary to perform the services offered by the Companyhave caused wages to increase at a rate greater than the general rate of inflation. As with other IT service providers, the Company mustadequately anticipate wage increases, particularly on its fixed-price contracts. There can be no assurance that the Company will be able torecover cost increases through increases in the prices that it charges for its services in the United States and elsewhere.
Risks Associated with the Year 2000Historically, certain computer programs have been written using two digits rather than four to define the applicable year, which couldresult in the computer recognizing a date using “00” as the year 1900 rather than 2000. This in turn, could result in major system failuresor miscalculations, and is generally referred to as the “Year 2000 Problem”. The Company did not experience any significant computer orsystems problems relating to the Year 2000 Problem. Upon review of the Company’s internal and external systems during 1999, theCompany determined that it did not have any material exposure to such computer problems and that the software and systems requiredto operate its business and provide its services were Year 2000 compliant. As a result, the Company did not incur, and does not expect toincur, any material expenditures relating to Year 2000 systems issues.
Recent Accounting PronouncementsDuring 1999, various new accounting pronouncements were issued which may impact the Company’s financial statements. (See Note 2. tothe Consolidated Financial Statements.)
Forward Looking StatementsThe statements contained in this Annual Report on Form 10-K that are not historical facts are forward-looking statements (within themeaning of Section 21E of the Securities Exchange Act of 1934, as amended) that involve risks and uncertainties. Such forward-lookingstatements may be identified by, among other things, the use of forward-looking terminology such as “believes,” “expects,” “may,” “will,”“should” or “anticipates” or the negative thereof or other variations thereon or comparable terminology, or by discussions of strategythat involve risks and uncertainties. From time to time, the Company or its representatives have made or may make forward-looking state-ments, orally or in writing. Such forward-looking statements may be included in various filings made by the Company with the Securitiesand Exchange Commission, or press releases or oral statements made by or with the approval of an authorized executive officer of theCompany. These forward-looking statements, such as statements regarding anticipated future revenues, contract percentage completions,capital expenditures, and other statements regarding matters that are not historical facts, involve predictions. The Company’s actualresults, performance or achievements could differ materially from the results expressed in, or implied by, these forward-looking state-ments. Potential risks and uncertainties that could affect the Company’s future operating results include, but are not limited to: (i) thesignificant fluctuations of the Company’s quarterly operating results caused by a variety of factors, many of which are not within theCompany’s control, including (a) the number, timing, scope and contractual terms of software development and maintenance projects,(b) delays in the performance of projects, (c) the accuracy of estimates of costs, resources and time to complete projects, (d) seasonalpatterns of the Company’s services required by customers, (e) levels of market acceptance for the Company’s services, and (f) the hiringof additional staff; (ii) changes in the Company’s billing and employee utilization rates; (iii) the Company’s ability to manage its growtheffectively, which will require the Company (a) to increase the number of its personnel, particularly skilled technical, marketing and man-agement personnel, and (b) to continue to develop and improve its operational, financial, communications and other internal systems,both in the United States and India; (iv) the Company’s limited operating history with unaffiliated customers; (v) the Company’s relianceon key customers and large projects; (vi) the highly competitive nature of the markets for the Company’s services; (vii) the Company’sability to successfully address the continuing changes in information technology, evolving industry standards and changing customerobjectives and preferences; (viii) the Company’s reliance on the continued services of its key executive officers and leading technical per-sonnel; (ix) the Company’s ability to attract and retain a sufficient number of highly skilled employees in the future; (x) the Company’sability to protect its intellectual property rights; (xi) general economic conditions; (xii) year 2000 compliance of vendors’ products andrelated issues, including impact of the year 2000 problem on customer buying patterns; and (xiii) the outcome of the impact of Year 2000on the Company. The Company’s actual results may differ materially from the results disclosed in such forward-looking statements.
Management’s Discussion and Analysis ofFinancial Condition and Results of Operations
23805p11t36 4/25/00 12:06 PM Page 7
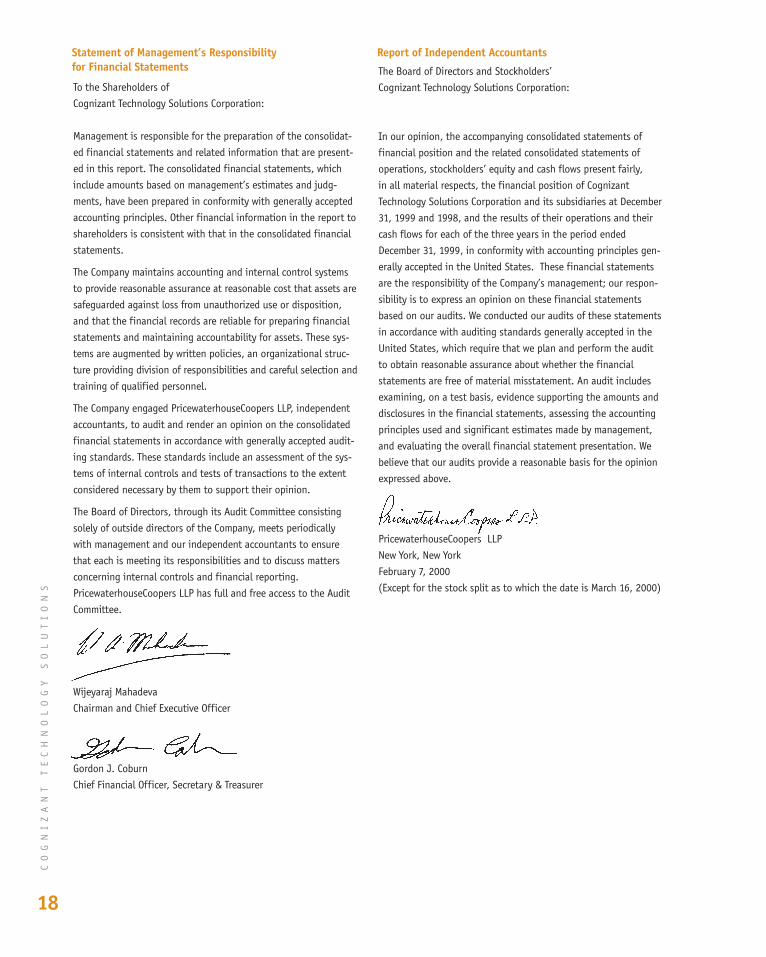
The Board of Directors and Stockholders’Cognizant Technology Solutions Corporation:
In our opinion, the accompanying consolidated statements offinancial position and the related consolidated statements ofoperations, stockholders’ equity and cash flows present fairly,in all material respects, the financial position of CognizantTechnology Solutions Corporation and its subsidiaries at December31, 1999 and 1998, and the results of their operations and theircash flows for each of the three years in the period endedDecember 31, 1999, in conformity with accounting principles gen-erally accepted in the United States. These financial statementsare the responsibility of the Company’s management; our respon-sibility is to express an opinion on these financial statementsbased on our audits. We conducted our audits of these statementsin accordance with auditing standards generally accepted in theUnited States, which require that we plan and perform the auditto obtain reasonable assurance about whether the financialstatements are free of material misstatement. An audit includesexamining, on a test basis, evidence supporting the amounts anddisclosures in the financial statements, assessing the accountingprinciples used and significant estimates made by management,and evaluating the overall financial statement presentation. Webelieve that our audits provide a reasonable basis for the opinionexpressed above.
PricewaterhouseCoopers LLPNew York, New YorkFebruary 7, 2000(Except for the stock split as to which the date is March 16, 2000)
CO
GN
IZ
AN
T
TE
CH
NO
LO
GY
S
OL
UT
IO
NS
18
Statement of Management’s Responsibility for Financial Statements
Report of Independent Accountants
To the Shareholders ofCognizant Technology Solutions Corporation:
Management is responsible for the preparation of the consolidat-ed financial statements and related information that are present-ed in this report. The consolidated financial statements, whichinclude amounts based on management’s estimates and judg-ments, have been prepared in conformity with generally acceptedaccounting principles. Other financial information in the report toshareholders is consistent with that in the consolidated financialstatements.
The Company maintains accounting and internal control systemsto provide reasonable assurance at reasonable cost that assets aresafeguarded against loss from unauthorized use or disposition,and that the financial records are reliable for preparing financialstatements and maintaining accountability for assets. These sys-tems are augmented by written policies, an organizational struc-ture providing division of responsibilities and careful selection andtraining of qualified personnel.
The Company engaged PricewaterhouseCoopers LLP, independentaccountants, to audit and render an opinion on the consolidatedfinancial statements in accordance with generally accepted audit-ing standards. These standards include an assessment of the sys-tems of internal controls and tests of transactions to the extentconsidered necessary by them to support their opinion.
The Board of Directors, through its Audit Committee consistingsolely of outside directors of the Company, meets periodicallywith management and our independent accountants to ensurethat each is meeting its responsibilities and to discuss mattersconcerning internal controls and financial reporting.PricewaterhouseCoopers LLP has full and free access to the AuditCommittee.
Wijeyaraj MahadevaChairman and Chief Executive Officer
Gordon J. CoburnChief Financial Officer, Secretary & Treasurer
23805p11t36 4/25/00 12:06 PM Page 8
CO
GN
IZ
AN
T
TE
CH
NO
LO
GY
S
OL
UT
IO
NS
19
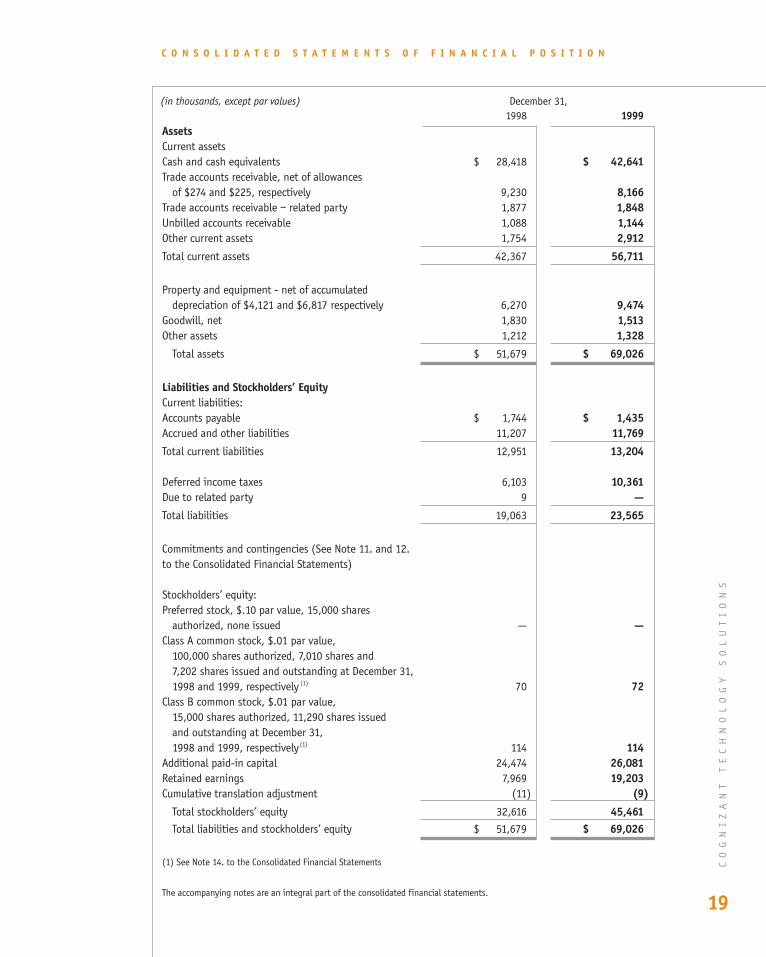
AssetsCurrent assetsCash and cash equivalents $ 28,418 $ 42,641Trade accounts receivable, net of allowances
of $274 and $225, respectively 9,230 8,166Trade accounts receivable – related party 1,877 1,848Unbilled accounts receivable 1,088 1,144Other current assets 1,754 2,912Total current assets 42,367 56,711
Property and equipment - net of accumulateddepreciation of $4,121 and $6,817 respectively 6,270 9,474
Goodwill, net 1,830 1,513Other assets 1,212 1,328
Total assets $ 51,679 $ 69,026
Liabilities and Stockholders’ EquityCurrent liabilities:Accounts payable $ 1,744 $ 1,435Accrued and other liabilities 11,207 11,769Total current liabilities 12,951 13,204
Deferred income taxes 6,103 10,361Due to related party 9 —Total liabilities 19,063 23,565
Commitments and contingencies (See Note 11. and 12.to the Consolidated Financial Statements)
Stockholders’ equity:Preferred stock, $.10 par value, 15,000 shares
authorized, none issued — —Class A common stock, $.01 par value,
100,000 shares authorized, 7,010 shares and7,202 shares issued and outstanding at December 31,1998 and 1999, respectively (1) 70 72
Class B common stock, $.01 par value,15,000 shares authorized, 11,290 shares issuedand outstanding at December 31,1998 and 1999, respectively(1) 114 114
Additional paid-in capital 24,474 26,081Retained earnings 7,969 19,203Cumulative translation adjustment (11) (9)
Total stockholders’ equity 32,616 45,461Total liabilities and stockholders’ equity $ 51,679 $ 69,026
(1) See Note 14. to the Consolidated Financial Statements
The accompanying notes are an integral part of the consolidated financial statements.
(in thousands, except par values)1998 1999
C O N S O L I D A T E D S T A T E M E N T S O F F I N A N C I A L P O S I T I O N
December 31,
23805p11t36 4/25/00 12:06 PM Page 9
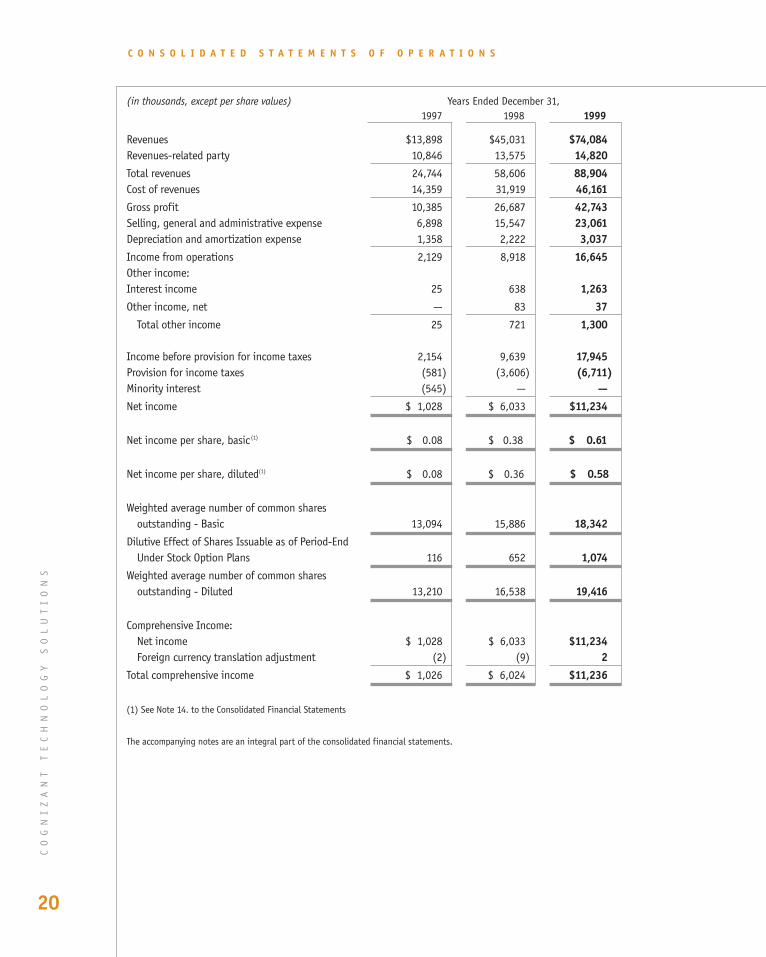
Revenues $13,898 $45,031 $74,084Revenues-related party 10,846 13,575 14,820Total revenues 24,744 58,606 88,904Cost of revenues 14,359 31,919 46,161Gross profit 10,385 26,687 42,743Selling, general and administrative expense 6,898 15,547 23,061Depreciation and amortization expense 1,358 2,222 3,037Income from operations 2,129 8,918 16,645Other income:Interest income 25 638 1,263Other income, net — 83 37
Total other income 25 721 1,300
Income before provision for income taxes 2,154 9,639 17,945Provision for income taxes (581) (3,606) (6,711)Minority interest (545) — —Net income $ 1,028 $ 6,033 $11,234
Net income per share, basic(1) $ 0.08 $ 0.38 $ 0.61
Net income per share, diluted(1) $ 0.08 $ 0.36 $ 0.58
Weighted average number of common sharesoutstanding - Basic 13,094 15,886 18,342
Dilutive Effect of Shares Issuable as of Period-EndUnder Stock Option Plans 116 652 1,074
Weighted average number of common sharesoutstanding - Diluted 13,210 16,538 19,416
Comprehensive Income:Net income $ 1,028 $ 6,033 $11,234Foreign currency translation adjustment (2) (9) 2
Total comprehensive income $ 1,026 $ 6,024 $11,236
(1) See Note 14. to the Consolidated Financial Statements
The accompanying notes are an integral part of the consolidated financial statements.
CO
GN
IZ
AN
T
TE
CH
NO
LO
GY
S
OL
UT
IO
NS
20
C O N S O L I D A T E D S T A T E M E N T S O F O P E R A T I O N S
(in thousands, except per share values) Years Ended December 31,1997 1998 1999
23805p11t36 4/25/00 12:06 PM Page 10
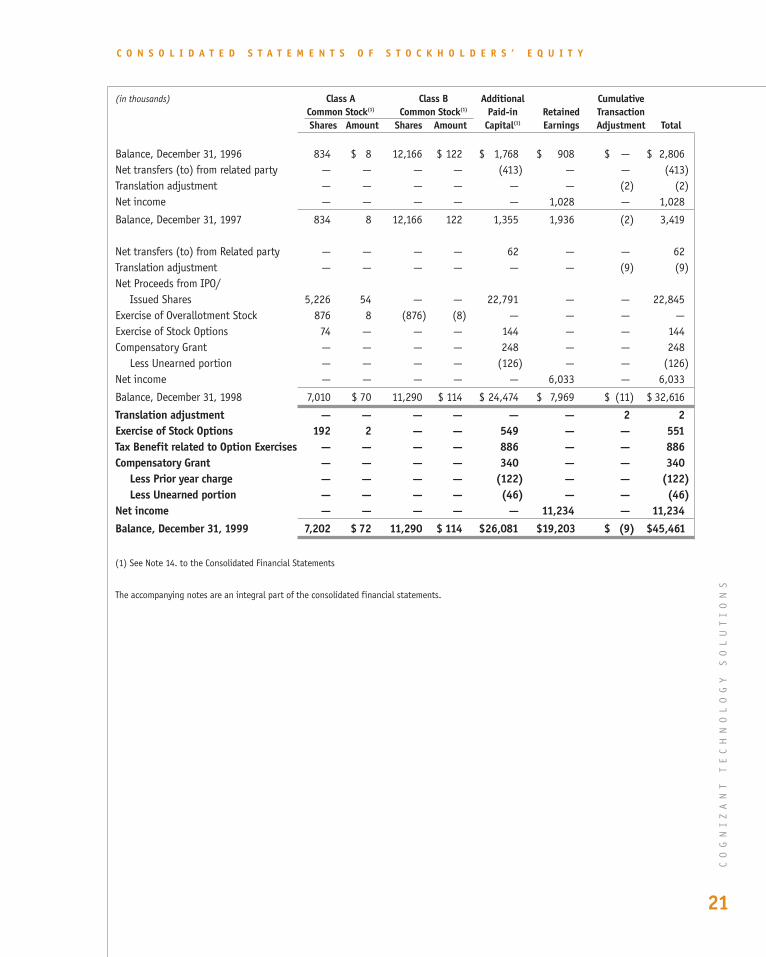
C O N S O L I D A T E D S T A T E M E N T S O F S T O C K H O L D E R S ’ E Q U I T Y
Balance, December 31, 1996 834 $ 8 12,166 $ 122 $ 1,768 $ 908 $ — $ 2,806Net transfers (to) from related party — — — — (413) — — (413)Translation adjustment — — — — — — (2) (2)Net income — — — — — 1,028 — 1,028
Balance, December 31, 1997 834 8 12,166 122 1,355 1,936 (2) 3,419
Net transfers (to) from Related party — — — — 62 — — 62Translation adjustment — — — — — — (9) (9)Net Proceeds from IPO/
Issued Shares 5,226 54 — — 22,791 — — 22,845Exercise of Overallotment Stock 876 8 (876) (8) — — — —Exercise of Stock Options 74 — — — 144 — — 144Compensatory Grant — — — — 248 — — 248
Less Unearned portion — — — — (126) — — (126)Net income — — — — — 6,033 — 6,033
Balance, December 31, 1998 7,010 $ 70 11,290 $ 114 $ 24,474 $ 7,969 $ (11) $ 32,616
Translation adjustment — — — — — — 2 2Exercise of Stock Options 192 2 — — 549 — — 551Tax Benefit related to Option Exercises — — — — 886 — — 886Compensatory Grant — — — — 340 — — 340
Less Prior year charge — — — — (122) — — (122)Less Unearned portion — — — — (46) — — (46)
Net income — — — — — 11,234 — 11,234Balance, December 31, 1999 7,202 $ 72 11,290 $ 114 $26,081 $19,203 $ (9) $45,461
(1) See Note 14. to the Consolidated Financial Statements
The accompanying notes are an integral part of the consolidated financial statements.
(in thousands) Additional CumulativePaid-in Retained Transaction
Shares Amount Shares Amount Capital(1) Earnings Adjustment Total
Class A Class BCommon Stock(1) Common Stock(1)
CO
GN
IZ
AN
T
TE
CH
NO
LO
GY
S
OL
UT
IO
NS
21
23805p11t36 4/25/00 12:06 PM Page 11
CO
GN
IZ
AN
T
TE
CH
NO
LO
GY
S
OL
UT
IO
NS
22
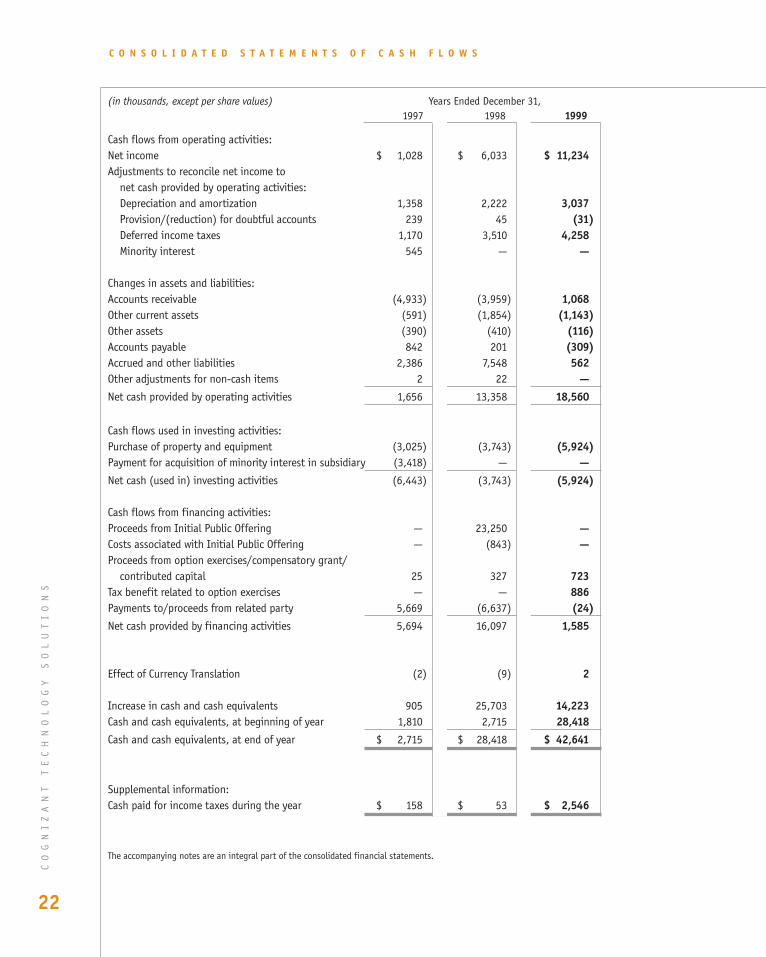
Cash flows from operating activities:Net income $ 1,028 $ 6,033 $ 11,234Adjustments to reconcile net income to
net cash provided by operating activities:Depreciation and amortization 1,358 2,222 3,037Provision/(reduction) for doubtful accounts 239 45 (31)Deferred income taxes 1,170 3,510 4,258Minority interest 545 — —
Changes in assets and liabilities:Accounts receivable (4,933) (3,959) 1,068Other current assets (591) (1,854) (1,143)Other assets (390) (410) (116)Accounts payable 842 201 (309)Accrued and other liabilities 2,386 7,548 562Other adjustments for non-cash items 2 22 —Net cash provided by operating activities 1,656 13,358 18,560
Cash flows used in investing activities:Purchase of property and equipment (3,025) (3,743) (5,924)Payment for acquisition of minority interest in subsidiary (3,418) — —Net cash (used in) investing activities (6,443) (3,743) (5,924)
Cash flows from financing activities:Proceeds from Initial Public Offering — 23,250 —Costs associated with Initial Public Offering — (843) —Proceeds from option exercises/compensatory grant/
contributed capital 25 327 723Tax benefit related to option exercises — — 886Payments to/proceeds from related party 5,669 (6,637) (24)Net cash provided by financing activities 5,694 16,097 1,585
Effect of Currency Translation (2) (9) 2
Increase in cash and cash equivalents 905 25,703 14,223Cash and cash equivalents, at beginning of year 1,810 2,715 28,418Cash and cash equivalents, at end of year $ 2,715 $ 28,418 $ 42,641
Supplemental information:Cash paid for income taxes during the year $ 158 $ 53 $ 2,546
The accompanying notes are an integral part of the consolidated financial statements.
(in thousands, except per share values) Years Ended December 31,1997 1998 1999
C O N S O L I D A T E D S T A T E M E N T S O F C A S H F L O W S
23805p11t36 4/25/00 12:06 PM Page 12
Notes to Consolidated Financial Statements(in thousands, except share and per share data)
1. Basis of Presentation
The Company is principally engaged in providing high-quality, cost-effective, full life cycle solutions to complex software development and
maintenance requirements that companies face as they transition to e-business. The Company has operations and subsidiaries in India,
the United Kingdom, Germany, Canada and the United States. These services are delivered through the use of a seamless on-site and off-
shore consulting project team. These solutions include application development and integration services, application management, re-
engineering and mass change implementation.
The Company is a Delaware corporation originally organized in 1988. The Company began its software development and maintenance ser-
vices business in early 1994, as an in-house technology development center for The Dun & Bradstreet Corporation and its operating units.
In 1996, the Company, Erisco, Inc. (“Erisco”), IMS International Inc. (“IMS International”), Nielsen Media Research, Inc., Pilot Software
Inc. and Sales Technologies, Inc. and certain other entities, plus a majority interest in Gartner Group, Inc. were spun-off from The Dun &
Bradstreet Corporation to form Cognizant Corporation (“Cognizant”). In 1997, the Company purchased the 24.0% minority interest in its
Indian subsidiary from a third party for $3.4 million, making the Indian subsidiary wholly owned by the Company. In June 1998, the
Company completed its IPO. On June 30, 1998, a majority interest in the Company, Erisco, IMS International and certain other entities
were spun-off from Cognizant to form IMS Health Incorporated (“IMS Health”), the “accounting successor” to Cognizant, the Company’s
majority owner and controlling parent company.
IMS Health currently provides the Company with certain administrative services, including payroll and payables processing, e-mail, tax
planning and compliance, and permitted the Company to participate in IMS Health’s insurance and employee benefit plans. Costs for
these services for all periods prior to the IPO were allocated to the Company based on utilization of certain specific services. All subse-
quent services were performed under the CTS IMS Health intercompany services agreement. (See also Note 10. to the Consolidated
Financial Statements.)
2. Summary of Significant Accounting Policies
Principles of Consolidation. The consolidated financial statements reflect the consolidated financial position, results of operations and
cash flows of the Company and its consolidated subsidiaries as if it were a separate entity for all periods presented.
Cash and Cash Equivalents. Cash and cash equivalents primarily include time and demand deposits in the Company’s operating bank
accounts. The Company considers all highly liquid instruments with an initial maturity of three months or less to be cash equivalents.
Property and Equipment. Property and equipment are stated at cost, net of accumulated depreciation. Depreciation is calculated on the
straight-line basis over the estimated useful lives of the assets. Leasehold improvements are amortized on a straight-line basis over the
shorter of the term of the lease or the estimated useful life of the improvement. Maintenance and repairs are expensed as incurred, while
renewals and betterments are capitalized.
Goodwill. Goodwill represents the excess of the purchase price of the former minority interest in the Company’s Indian subsidiary over the
fair values of amounts assigned to the incremental net assets acquired. Amortization expense is recorded using the straight-line method
over a period of seven years. Amortization expense was $317 for each of the years ended December 31, 1999 and 1998. Accumulated
amortization was $711 and $393 at December 31, 1999 and 1998, respectively. In accordance with SFAS No. 121, “Accounting for the
Impairment of Long-Lived Assets and for Long-Lived Assets to Be Disposed Of,” the Company reviews for impairment of long-lived assets
and certain identifiable intangibles whenever events or changes in circumstances indicate that the carrying amount of an asset may not
be recoverable. In general, the Company will recognize an impairment loss when the sum of undiscounted expected future cash flows is
less than the carrying amount of such assets. The measurement for such an impairment loss is then based on the fair value of the asset.
Revenue Recognition. The Company’s services are entered into on either a time-and-materials or fixed-price basis. Revenues related to
time-and-material contracts are recognized as the service is performed. Revenues related to fixed-price contracts are recognized as the
service is performed using the percentage-of-completion method of accounting, under which the sales value of performance, including
CO
GN
IZ
AN
T
TE
CH
NO
LO
GY
S
OL
UT
IO
NS
23
23805p11t36 4/25/00 12:06 PM Page 13
Notes to Consolidated Financial Statements(in thousands, except share and per share data)
estimated earnings thereon, is recognized on the basis of the percentage that each contract’s cost to date bears to the total estimated
cost. Fixed price contracts are cancellable subject to a specified notice period. All services provided by the Company through the date of
cancellation are due and payable under the contract terms. The Company issues invoices related to fixed price contracts based upon
achievement of milestones during a project. Estimates are subject to adjustment as a project progresses to reflect changes in expected
completion costs. The cumulative impact of any revision in estimates is reflected in the financial reporting period in which the change in
estimate becomes known and any anticipated losses on contracts are recognized immediately. A reserve for warranty provisions under
such contracts, which generally exist for ninety days past contract completion, is estimated and accrued during the contract period.
Unbilled Accounts Receivable. Unbilled accounts receivable represent revenues on contracts to be billed, in subsequent periods, as per
the terms of the contracts.
Foreign Currency Translation. The assets and liabilities of the Company’s Canadian and European subsidiaries are translated into U.S. dol-
lars from local currencies at current exchange rates and revenues and expenses are translated from local currencies at average monthly
exchange rates. The resulting translation adjustments are recorded in a separate component of stockholders’ equity. For the Company’s
Indian subsidiary (“CTS India”), the functional currency is the U.S. dollar, since its sales are made primarily in the United States, the sales
price is predominantly in U.S. dollars and there is a high volume of intercompany transactions denominated in U.S. dollars between CTS
India and its U.S. affiliates. Non-monetary assets and liabilities are translated at historical exchange rates, while monetary assets and lia-
bilities are translated at current exchange rates. The resulting gain (loss) is included in other income.
Risks and Uncertainties. The preparation of financial statements in accordance with generally accepted accounting principles requires
management to make estimates and assumptions that affect the reported amounts of assets and liabilities and disclosure of contingent
assets and liabilities as of the date of the financial statements, and the reported amounts of revenues and expenses during the reported
period. The most significant estimates relate to the allowance for doubtful accounts, reserve for warranties, depreciation of fixed assets
and long-lived assets and the recognition of revenue and profits based on the percentage of completion method of accounting for fixed
bid contracts. Actual results could vary from the estimates and assumptions used in the preparation of the accompanying financial state-
ments.
All of the Company’s software development centers, including a substantial majority of its employees and assets, are located in India. As a
result, the Company may be subject to certain risks associated with international operations, including risks associated with foreign cur-
rency exchange rate fluctuations and risks associated with the application and imposition of protective legislation and regulations relating
to import and export or otherwise resulting from foreign policy or the variability of foreign economic conditions. To date, the Company
has not engaged in any significant hedging transactions to mitigate its risks relating to exchange rate fluctuations. Additional risks asso-
ciated with international operations include difficulties in enforcing intellectual property rights, the burdens of complying with a wide
variety of foreign laws, potentially adverse tax consequences, tariffs, quotas and other barriers.
Net Income Per Share. In 1997, the Company adopted Statement of Financial Accounting Standards (“SFAS”) No. 128, “Earnings Per
Share,” which replaces the presentation of primary net income (loss) per share (“EPS”) and fully diluted EPS with a presentation of basic
EPS and diluted EPS, respectively. Basic EPS excludes dilution and is computed by dividing earnings available to common stockholders by
the weighted average number of common shares outstanding for the period. Similar to fully diluted EPS, diluted EPS includes all dilutive
potential common stock in the weighted average shares outstanding. (See Note 14. to the Consolidated Financial Statements)
Concentration of Credit Risk. Financial instruments that potentially subject the Company to significant concentrations of credit risk con-
sist primarily of cash and cash equivalents and trade accounts receivable. The Company maintains its cash and cash equivalents with high
credit quality financial institutions.
Income Taxes. Prior to the consummation of the Company’s IPO, the Company had been included in the federal and certain state income
tax returns of Cognizant and The Dun & Bradstreet Corporation. The provision for income taxes in the Company’s consolidated financial
statements has been calculated on a separate company basis. Income tax benefits realized by the Company and utilized by Cognizant or
CO
GN
IZ
AN
T
TE
CH
NO
LO
GY
S
OL
UT
IO
NS
24
23805p11t36 4/25/00 12:06 PM Page 14
The Dun & Bradstreet Corporation are included in stockholders’ equity. The Company is no longer included in the consolidated return of
its majority owner and controlling parent company, and is required to file separate income tax returns.
On a stand-alone basis, the Company provides for income taxes utilizing the asset and liability method of accounting for income taxes.
Under this method, deferred income taxes are recorded to reflect the tax consequences in future years of differences between the tax
basis of assets and liabilities and their financial reporting amounts at each year end based on enacted tax laws and statutory tax rates
applicable to the periods in which the differences are expected to affect taxable income. If it is determined that it is more likely than not
that future tax benefits associated with a deferred tax asset will not be realized, a valuation allowance will be provided. The effect on
deferred tax assets and liabilities of a change in the tax rates is recognized in income in the period that includes the enactment date.
CTS India is an export oriented company that is entitled to claim a tax holiday for a period of nine years from April 1995 through March
2004 in respect to its export profits. Under the Indian Income Tax Act of 1961, substantially all of the earnings of the Company’s Indian
subsidiary are currently exempt from Indian Income Tax as profits are attributable to export operations. However, since management cur-
rently intends to repatriate all accumulated earnings from India to the United States, the Company has provided deferred U.S. income
taxes on all undistributed earnings.
Stock-Based Compensation. With respect to stock options granted to employees, SFAS No. 123 “Accounting for Stock-Based
Compensation” permits companies to continue using the accounting method promulgated by the Accounting Principles Board Opinion No.
25 (“APB 25”), “Accounting for Stock Issued to Employees,” to measure compensation or to adopt the fair value based method prescribed
by SFAS No. 123. Management has determined not to adopt the SFAS No. 123’s accounting recognition provisions, but has included the
required pro forma disclosures.
Reclassifications. Certain prior-year amounts have been reclassified to conform with the 1998 presentation.
Recently Issued Accounting Standards. In July 1999, the FASB issued SFAS No. 137, ”Accounting for Derivative Instruments and Hedging
Activities - Deferral of the Effective Date of the FASB Statement No. 133, an Amendment of FASB Statement No. 133”. SFAS No. 137
defers the effective date of FASB No. 133, which establishes accounting and reporting standards for derivative instruments embedded in
other contracts, (collectively referred to as derivatives) and for hedging activities. FASB No. 133 requires that an entity recognize all
derivatives as either assets or liabilities in the statement of financial position and measure those instruments at fair value. If certain con-
ditions are met, a derivative may be specifically designated as (a) a hedge of the exposure to changes in the fair value of a recognized
asset or liability or an unrecognized firm commitment, (b) a hedge of the exposure to variability in cash flows attributable to a particular
risk, or (c) a hedge of the foreign currency exposure of a net investment in a foreign operation, an unrecognized firm commitment, an
available for sale security and a forecasted transaction. As a result of FASB No. 137, the Company will be required to implement SFAS No.
133 for all fiscal quarters of fiscal years beginning after June 15, 2000. The Company does not expect the adoption of this pronounce-
ment to have a material effect on the Company’s results of operations, financial position or cash flows.
3. Initial Public Offering
On June 24, 1998, the Company consummated its Initial Public Offering (“IPO”) of 5,834,000 (2,917,000 pre-split) shares of its Common
Stock at a price of $5.00 ($10.00 pre-split) per share, 5,000,000 (2,500,000 pre-split) of which were issued and sold by the Company and
834,000 (417,000 pre-split) of which were sold by Cognizant Corporation (“Cognizant”), the Company’s then majority owner and control-
ling parent company. The net proceeds to the Company from the IPO were approximately $22.4 million after $845 of direct expenses. In
July 1998, IMS Health (the accounting successor to Cognizant) sold 875,100 (437,550 pre-split) shares of Class B Common Stock, which
were converted to Class A Common Stock pursuant to an over allotment option granted to the underwriters of the IPO. Of the total net
proceeds received by the Company upon the consummation of its IPO, approximately $6.6 million was used to repay the related party bal-
ance then owed to Cognizant. The related party balance resulted from certain advances to the Company from Cognizant used to purchase
CO
GN
IZ
AN
T
TE
CH
NO
LO
GY
S
OL
UT
IO
NS
25
23805p11t36 4/25/00 12:06 PM Page 15
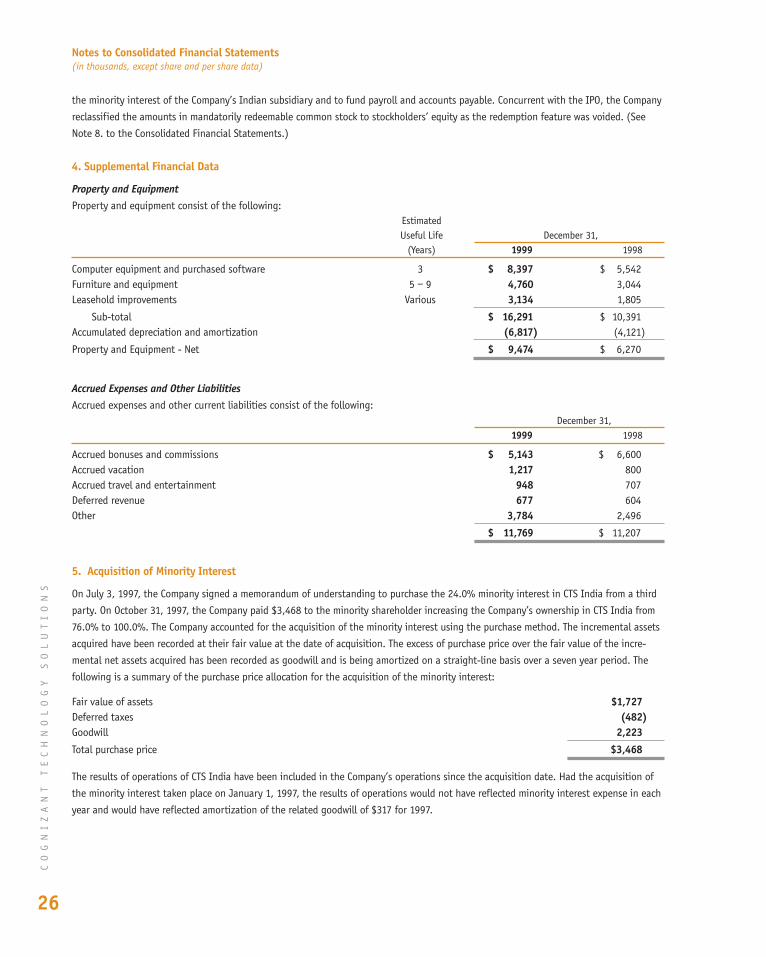
Notes to Consolidated Financial Statements(in thousands, except share and per share data)
CO
GN
IZ
AN
T
TE
CH
NO
LO
GY
S
OL
UT
IO
NS
26
the minority interest of the Company’s Indian subsidiary and to fund payroll and accounts payable. Concurrent with the IPO, the Company
reclassified the amounts in mandatorily redeemable common stock to stockholders’ equity as the redemption feature was voided. (See
Note 8. to the Consolidated Financial Statements.)
4. Supplemental Financial Data
Property and EquipmentProperty and equipment consist of the following:
Accrued Expenses and Other LiabilitiesAccrued expenses and other current liabilities consist of the following:
5. Acquisition of Minority Interest
On July 3, 1997, the Company signed a memorandum of understanding to purchase the 24.0% minority interest in CTS India from a third
party. On October 31, 1997, the Company paid $3,468 to the minority shareholder increasing the Company’s ownership in CTS India from
76.0% to 100.0%. The Company accounted for the acquisition of the minority interest using the purchase method. The incremental assets
acquired have been recorded at their fair value at the date of acquisition. The excess of purchase price over the fair value of the incre-
mental net assets acquired has been recorded as goodwill and is being amortized on a straight-line basis over a seven year period. The
following is a summary of the purchase price allocation for the acquisition of the minority interest:
The results of operations of CTS India have been included in the Company’s operations since the acquisition date. Had the acquisition of
the minority interest taken place on January 1, 1997, the results of operations would not have reflected minority interest expense in each
year and would have reflected amortization of the related goodwill of $317 for 1997.
Computer equipment and purchased software 3 $ 8,397 $ 5,542Furniture and equipment 5 – 9 4,760 3,044Leasehold improvements Various 3,134 1,805
Sub-total $ 16,291 $ 10,391Accumulated depreciation and amortization (6,817) (4,121)
Property and Equipment - Net $ 9,474 $ 6,270
EstimatedUseful Life December 31,
(Years) 1999 1998
Accrued bonuses and commissions $ 5,143 $ 6,600Accrued vacation 1,217 800Accrued travel and entertainment 948 707Deferred revenue 677 604Other 3,784 2,496
$ 11,769 $ 11,207
December 31,1999 1998
Fair value of assets $1,727Deferred taxes (482)Goodwill 2,223Total purchase price $3,468
23805p11t36 4/25/00 12:06 PM Page 16
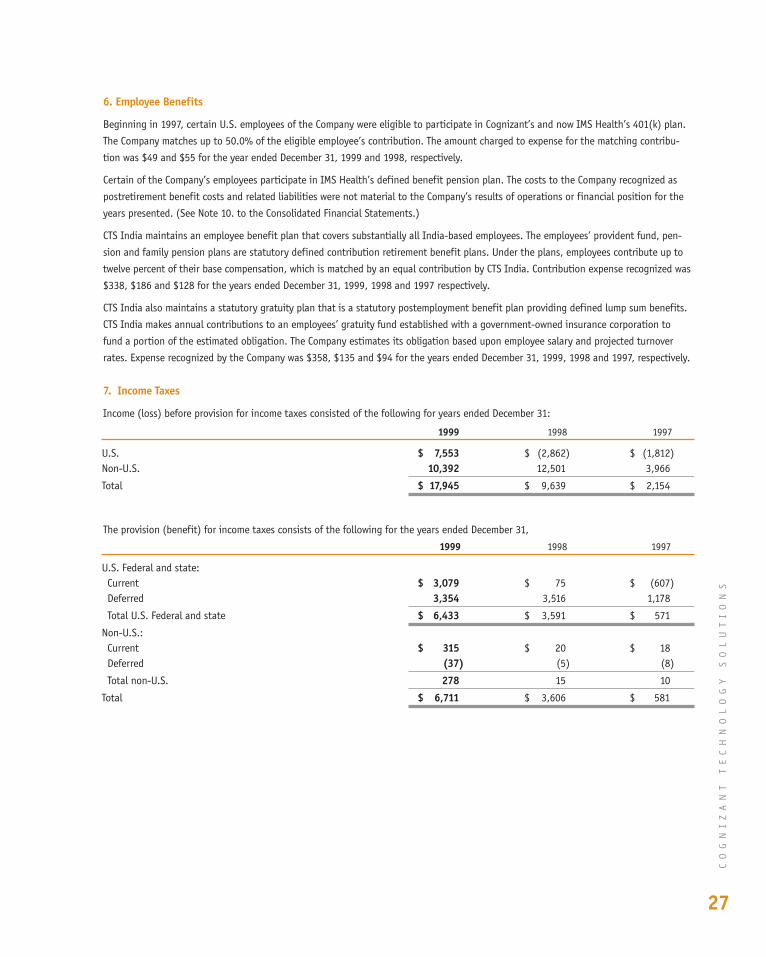
CO
GN
IZ
AN
T
TE
CH
NO
LO
GY
S
OL
UT
IO
NS
27
6. Employee Benefits
Beginning in 1997, certain U.S. employees of the Company were eligible to participate in Cognizant’s and now IMS Health’s 401(k) plan.
The Company matches up to 50.0% of the eligible employee’s contribution. The amount charged to expense for the matching contribu-
tion was $49 and $55 for the year ended December 31, 1999 and 1998, respectively.
Certain of the Company’s employees participate in IMS Health’s defined benefit pension plan. The costs to the Company recognized as
postretirement benefit costs and related liabilities were not material to the Company’s results of operations or financial position for the
years presented. (See Note 10. to the Consolidated Financial Statements.)
CTS India maintains an employee benefit plan that covers substantially all India-based employees. The employees’ provident fund, pen-
sion and family pension plans are statutory defined contribution retirement benefit plans. Under the plans, employees contribute up to
twelve percent of their base compensation, which is matched by an equal contribution by CTS India. Contribution expense recognized was
$338, $186 and $128 for the years ended December 31, 1999, 1998 and 1997 respectively.
CTS India also maintains a statutory gratuity plan that is a statutory postemployment benefit plan providing defined lump sum benefits.
CTS India makes annual contributions to an employees’ gratuity fund established with a government-owned insurance corporation to
fund a portion of the estimated obligation. The Company estimates its obligation based upon employee salary and projected turnover
rates. Expense recognized by the Company was $358, $135 and $94 for the years ended December 31, 1999, 1998 and 1997, respectively.
7. Income Taxes
Income (loss) before provision for income taxes consisted of the following for years ended December 31:
The provision (benefit) for income taxes consists of the following for the years ended December 31,
U.S. $ 7,553 $ (2,862) $ (1,812)Non-U.S. 10,392 12,501 3,966
Total $ 17,945 $ 9,639 $ 2,154
1999 1998 1997
U.S. Federal and state:Current $ 3,079 $ 75 $ (607)Deferred 3,354 3,516 1,178
Total U.S. Federal and state $ 6,433 $ 3,591 $ 571
Non-U.S.:Current $ 315 $ 20 $ 18Deferred (37) (5) (8)
Total non-U.S. 278 15 10
Total $ 6,711 $ 3,606 $ 581
1999 1998 1997
23805p11t36 4/25/00 12:06 PM Page 17
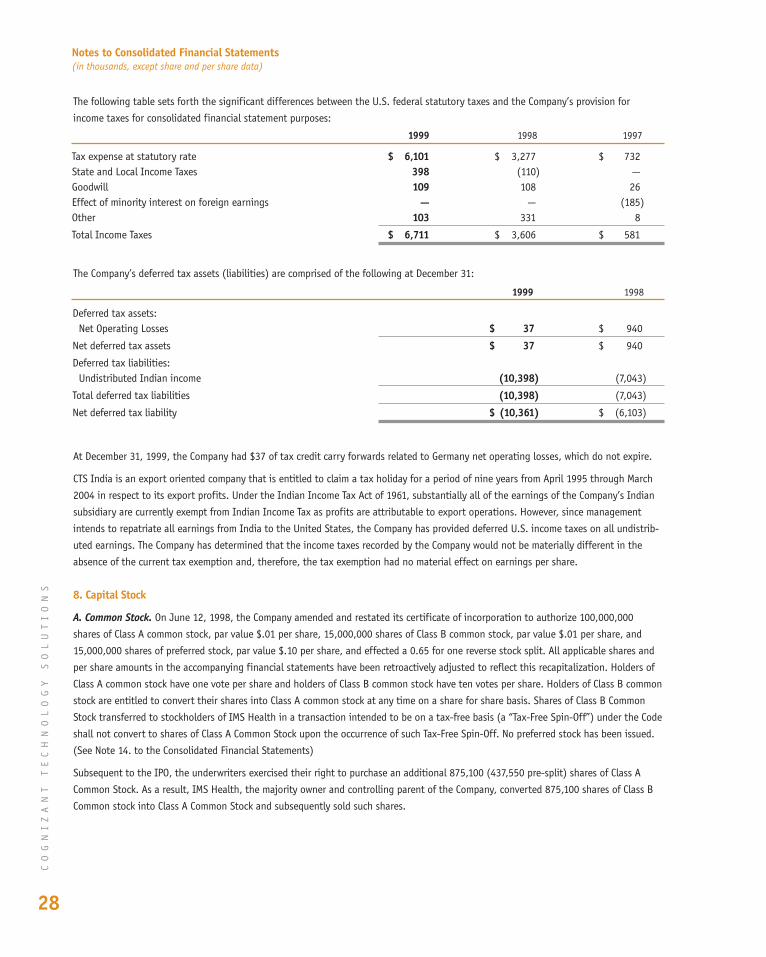
CO
GN
IZ
AN
T
TE
CH
NO
LO
GY
S
OL
UT
IO
NS
28
The following table sets forth the significant differences between the U.S. federal statutory taxes and the Company’s provision for
income taxes for consolidated financial statement purposes:
The Company’s deferred tax assets (liabilities) are comprised of the following at December 31:
At December 31, 1999, the Company had $37 of tax credit carry forwards related to Germany net operating losses, which do not expire.
CTS India is an export oriented company that is entitled to claim a tax holiday for a period of nine years from April 1995 through March
2004 in respect to its export profits. Under the Indian Income Tax Act of 1961, substantially all of the earnings of the Company’s Indian
subsidiary are currently exempt from Indian Income Tax as profits are attributable to export operations. However, since management
intends to repatriate all earnings from India to the United States, the Company has provided deferred U.S. income taxes on all undistrib-
uted earnings. The Company has determined that the income taxes recorded by the Company would not be materially different in the
absence of the current tax exemption and, therefore, the tax exemption had no material effect on earnings per share.
8. Capital Stock
A. Common Stock. On June 12, 1998, the Company amended and restated its certificate of incorporation to authorize 100,000,000
shares of Class A common stock, par value $.01 per share, 15,000,000 shares of Class B common stock, par value $.01 per share, and
15,000,000 shares of preferred stock, par value $.10 per share, and effected a 0.65 for one reverse stock split. All applicable shares and
per share amounts in the accompanying financial statements have been retroactively adjusted to reflect this recapitalization. Holders of
Class A common stock have one vote per share and holders of Class B common stock have ten votes per share. Holders of Class B common
stock are entitled to convert their shares into Class A common stock at any time on a share for share basis. Shares of Class B Common
Stock transferred to stockholders of IMS Health in a transaction intended to be on a tax-free basis (a “Tax-Free Spin-Off”) under the Code
shall not convert to shares of Class A Common Stock upon the occurrence of such Tax-Free Spin-Off. No preferred stock has been issued.
(See Note 14. to the Consolidated Financial Statements)
Subsequent to the IPO, the underwriters exercised their right to purchase an additional 875,100 (437,550 pre-split) shares of Class A
Common Stock. As a result, IMS Health, the majority owner and controlling parent of the Company, converted 875,100 shares of Class B
Common stock into Class A Common Stock and subsequently sold such shares.
Deferred tax assets:Net Operating Losses $ 37 $ 940
Net deferred tax assets $ 37 $ 940
Deferred tax liabilities:Undistributed Indian income (10,398) (7,043)
Total deferred tax liabilities (10,398) (7,043)
Net deferred tax liability $ (10,361) $ (6,103)
1999 1998
Tax expense at statutory rate $ 6,101 $ 3,277 $ 732State and Local Income Taxes 398 (110) —Goodwill 109 108 26Effect of minority interest on foreign earnings — — (185)Other 103 331 8
Total Income Taxes $ 6,711 $ 3,606 $ 581
1999 1998 1997
Notes to Consolidated Financial Statements(in thousands, except share and per share data)
23805p11t36 4/25/00 12:06 PM Page 18
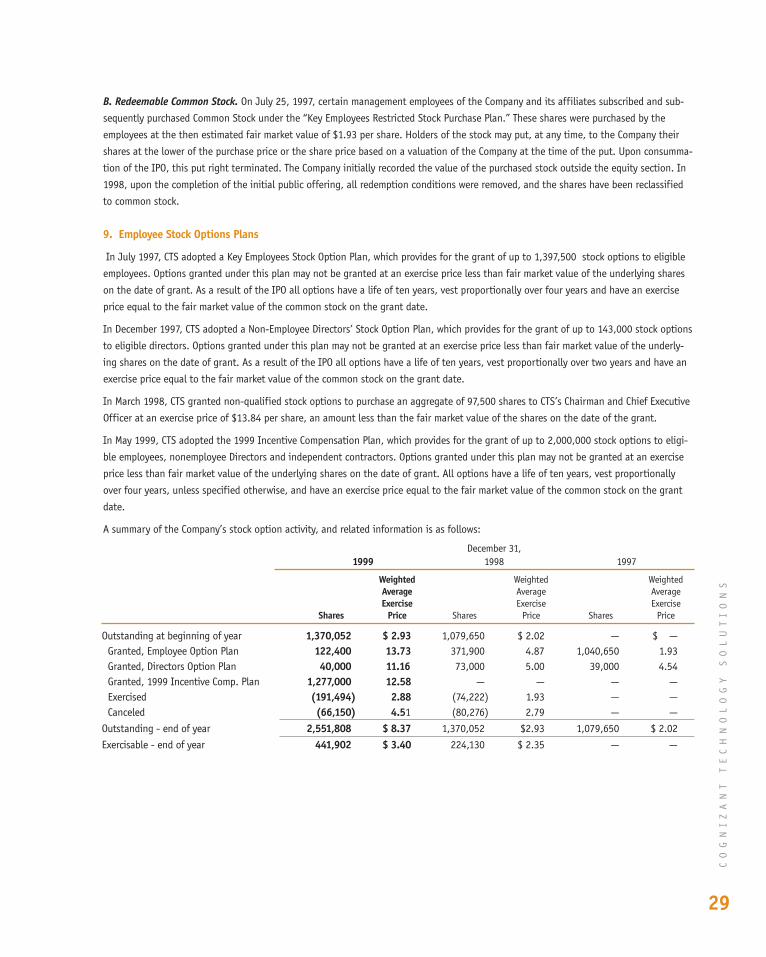
CO
GN
IZ
AN
T
TE
CH
NO
LO
GY
S
OL
UT
IO
NS
29
B. Redeemable Common Stock. On July 25, 1997, certain management employees of the Company and its affiliates subscribed and sub-
sequently purchased Common Stock under the “Key Employees Restricted Stock Purchase Plan.” These shares were purchased by the
employees at the then estimated fair market value of $1.93 per share. Holders of the stock may put, at any time, to the Company their
shares at the lower of the purchase price or the share price based on a valuation of the Company at the time of the put. Upon consumma-
tion of the IPO, this put right terminated. The Company initially recorded the value of the purchased stock outside the equity section. In
1998, upon the completion of the initial public offering, all redemption conditions were removed, and the shares have been reclassified
to common stock.
9. Employee Stock Options Plans
In July 1997, CTS adopted a Key Employees Stock Option Plan, which provides for the grant of up to 1,397,500 stock options to eligible
employees. Options granted under this plan may not be granted at an exercise price less than fair market value of the underlying shares
on the date of grant. As a result of the IPO all options have a life of ten years, vest proportionally over four years and have an exercise
price equal to the fair market value of the common stock on the grant date.
In December 1997, CTS adopted a Non-Employee Directors’ Stock Option Plan, which provides for the grant of up to 143,000 stock options
to eligible directors. Options granted under this plan may not be granted at an exercise price less than fair market value of the underly-
ing shares on the date of grant. As a result of the IPO all options have a life of ten years, vest proportionally over two years and have an
exercise price equal to the fair market value of the common stock on the grant date.
In March 1998, CTS granted non-qualified stock options to purchase an aggregate of 97,500 shares to CTS’s Chairman and Chief Executive
Officer at an exercise price of $13.84 per share, an amount less than the fair market value of the shares on the date of the grant.
In May 1999, CTS adopted the 1999 Incentive Compensation Plan, which provides for the grant of up to 2,000,000 stock options to eligi-
ble employees, nonemployee Directors and independent contractors. Options granted under this plan may not be granted at an exercise
price less than fair market value of the underlying shares on the date of grant. All options have a life of ten years, vest proportionally
over four years, unless specified otherwise, and have an exercise price equal to the fair market value of the common stock on the grant
date.
A summary of the Company’s stock option activity, and related information is as follows:
Outstanding at beginning of year 1,370,052 $ 2.93 1,079,650 $ 2.02 — $ —Granted, Employee Option Plan 122,400 13.73 371,900 4.87 1,040,650 1.93Granted, Directors Option Plan 40,000 11.16 73,000 5.00 39,000 4.54Granted, 1999 Incentive Comp. Plan 1,277,000 12.58 — — — —Exercised (191,494) 2.88 (74,222) 1.93 — —Canceled (66,150) 4.51 (80,276) 2.79 — —
Outstanding - end of year 2,551,808 $ 8.37 1,370,052 $2.93 1,079,650 $ 2.02Exercisable - end of year 441,902 $ 3.40 224,130 $ 2.35 — —
Weighted Weighted WeightedAverage Average AverageExercise Exercise Exercise
Shares Price Shares Price Shares Price
December 31,1999 1998 1997
23805p11t36 4/25/00 12:06 PM Page 19
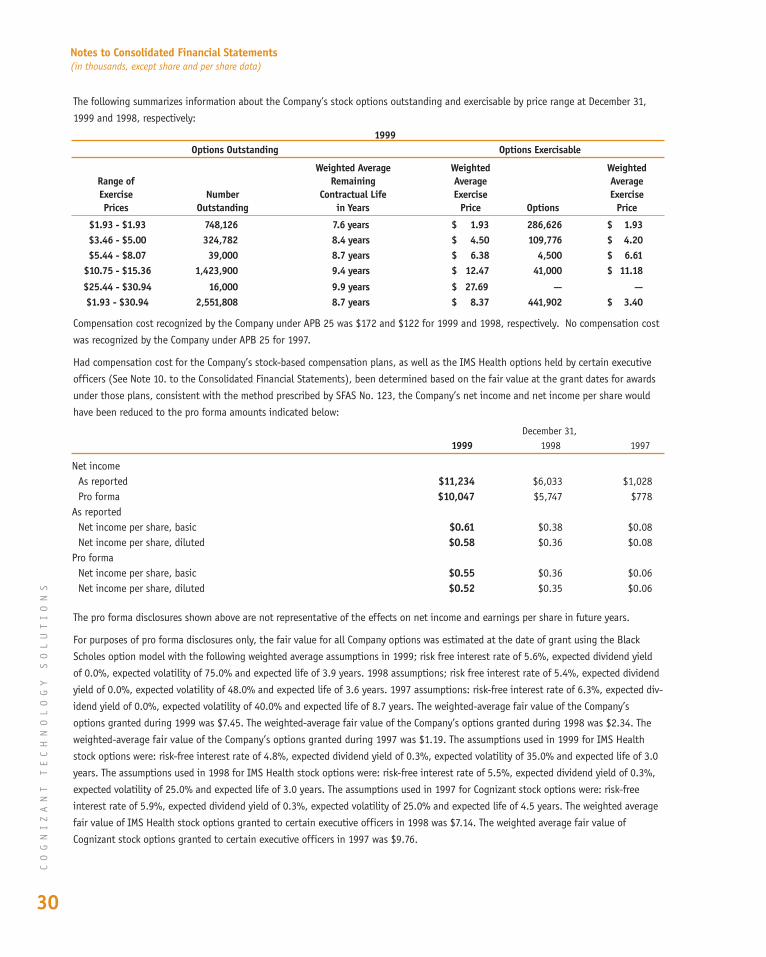
CO
GN
IZ
AN
T
TE
CH
NO
LO
GY
S
OL
UT
IO
NS
30
The following summarizes information about the Company’s stock options outstanding and exercisable by price range at December 31,
1999 and 1998, respectively:
Compensation cost recognized by the Company under APB 25 was $172 and $122 for 1999 and 1998, respectively. No compensation cost
was recognized by the Company under APB 25 for 1997.
Had compensation cost for the Company’s stock-based compensation plans, as well as the IMS Health options held by certain executive
officers (See Note 10. to the Consolidated Financial Statements), been determined based on the fair value at the grant dates for awards
under those plans, consistent with the method prescribed by SFAS No. 123, the Company’s net income and net income per share would
have been reduced to the pro forma amounts indicated below:
The pro forma disclosures shown above are not representative of the effects on net income and earnings per share in future years.
For purposes of pro forma disclosures only, the fair value for all Company options was estimated at the date of grant using the Black
Scholes option model with the following weighted average assumptions in 1999; risk free interest rate of 5.6%, expected dividend yield
of 0.0%, expected volatility of 75.0% and expected life of 3.9 years. 1998 assumptions; risk free interest rate of 5.4%, expected dividend
yield of 0.0%, expected volatility of 48.0% and expected life of 3.6 years. 1997 assumptions: risk-free interest rate of 6.3%, expected div-
idend yield of 0.0%, expected volatility of 40.0% and expected life of 8.7 years. The weighted-average fair value of the Company’s
options granted during 1999 was $7.45. The weighted-average fair value of the Company’s options granted during 1998 was $2.34. The
weighted-average fair value of the Company’s options granted during 1997 was $1.19. The assumptions used in 1999 for IMS Health
stock options were: risk-free interest rate of 4.8%, expected dividend yield of 0.3%, expected volatility of 35.0% and expected life of 3.0
years. The assumptions used in 1998 for IMS Health stock options were: risk-free interest rate of 5.5%, expected dividend yield of 0.3%,
expected volatility of 25.0% and expected life of 3.0 years. The assumptions used in 1997 for Cognizant stock options were: risk-free
interest rate of 5.9%, expected dividend yield of 0.3%, expected volatility of 25.0% and expected life of 4.5 years. The weighted average
fair value of IMS Health stock options granted to certain executive officers in 1998 was $7.14. The weighted average fair value of
Cognizant stock options granted to certain executive officers in 1997 was $9.76.
Net incomeAs reported $11,234 $6,033 $1,028Pro forma $10,047 $5,747 $778
As reportedNet income per share, basic $0.61 $0.38 $0.08Net income per share, diluted $0.58 $0.36 $0.08
Pro formaNet income per share, basic $0.55 $0.36 $0.06Net income per share, diluted $0.52 $0.35 $0.06
December 31,1999 1998 1997
Weighted Average Weighted WeightedRange of Remaining Average AverageExercise Number Contractual Life Exercise ExercisePrices Outstanding in Years Price Options Price
1999Options Outstanding Options Exercisable
$1.93 - $1.93 748,126 7.6 years $ 1.93 286,626 $ 1.93$3.46 - $5.00 324,782 8.4 years $ 4.50 109,776 $ 4.20$5.44 - $8.07 39,000 8.7 years $ 6.38 4,500 $ 6.61
$10.75 - $15.36 1,423,900 9.4 years $ 12.47 41,000 $ 11.18$25.44 - $30.94 16,000 9.9 years $ 27.69 — —$1.93 - $30.94 2,551,808 8.7 years $ 8.37 441,902 $ 3.40
Notes to Consolidated Financial Statements(in thousands, except share and per share data)
23805p11t36 4/25/00 12:06 PM Page 20
CO
GN
IZ
AN
T
TE
CH
NO
LO
GY
S
OL
UT
IO
NS
31
10. Other Transactions with Affiliates
Background. The Company began its software development and maintenance services business in early 1994 as an in-house technology
development center for The Dun & Bradstreet Corporation and its operating units. These operating units principally included A.C.Nielsen,
Dun & Bradstreet Information Services, Dun & Bradstreet Software, Erisco, Inc. (“Erisco”), IMS International, Inc. (“IMS International”),
NCH Promotional Services, Inc. (“NCH Promotional Services”), Nielsen Media Research, Inc. (“Nielsen Media Research”), The Reuben H.
Donnelley Corporation (“RHDonnelley”), Pilot Software, Inc. (“Pilot Software”) and Sales Technologies, Inc. (“Sales Technologies”), and a
majority interest in Gartner Group, Inc. (“Gartner Group”). In November 1996, the Company, Erisco, IMS International, Nielsen Media
Research, Pilot Software, Sales Technologies and certain other entities, plus a majority interest in Gartner Group, were spun-off from The
Dun & Bradstreet Corporation to form Cognizant, the then majority owner and controlling parent of the Company. At that time, ACNielsen
was separately spun-off from The Dun & Bradstreet Corporation and Dun & Bradstreet Software was sold to GEAC Software. In 1997,
Cognizant sold Pilot Software to a third party.
On January 15, 1998, Cognizant announced that it would, subject to certain conditions, reorganize itself (the “Reorganization”), by spin-
ning the Nielsen Media Research business from the rest of its businesses, creating two publicly traded companies, IMS Health Corporation
(“IMS Health”) and Nielsen Media Research. The reorganization became effective on July 1, 1998. The shares of the Company previously
held by Cognizant are now held by IMS Health and all services previously provided to the Company by Cognizant are now being provided
by IMS Health.
In July 1998, IMS Health sold 875,100 (437,550 pre-split) shares of Class B Common Stock pursuant to an over allotment option granted
to the underwriters of the IPO. As of December 31, 1999, IMS Health owned a majority and controlling interest in the outstanding
Common Stock of the Company and held approximately 94% of the combined voting power of the Company’s Common Stock. (See also
Note 3. to the Consolidated Financial Statements.)
IMS Health currently provides the Company with certain administrative services including payroll and payables processing, e-mail, tax
planning and compliance, and permits the Company to participate in IMS Health’s insurance and employee benefit plans. Costs for these
services for all periods prior to the IPO were allocated to the Company based on utilization of certain specific services. All subsequent
services were performed under the CTS IMS Health intercompany services agreement.
Affiliated Agreements. In 1997, the Company entered into various agreements with Cognizant which were assigned to IMS Health as part
of the 1998 spin-off. The agreements include an Intercompany Services Agreement for services provided by IMS Health such as payroll
and payables processing, tax, finance, personnel administration, real estate and risk management services, a License Agreement to use
the “Cognizant” trade name and an Intercompany Agreement. On July 1, 1998, IMS Health transferred all of its rights to the “Cognizant”
name and related trade and service marks to the Company.
Revenues. In 1997, the Company recognized related party revenues totaling $10,846 including revenues from Erisco, IMS International,
Nielsen Media Research, Strategic Technologies, Pilot Software and Gartner Group for the full year. In 1998, the Company recognized
related party revenues totaling $13,575 including revenues from IMS Health, Nielsen Media Research (through June 30, 1998), Strategic
Technologies and Gartner Group. In 1999, the Company recognized related party revenues totaling $14,820 including revenues from IMS
Health and Strategic Technologies.
Services. The Company, IMS Health and Nielsen Media Research have entered into Master Services Agreements pursuant to which the
Company provides IT services to such subsidiaries. IMS Health, Cognizant and The Dun & Bradstreet Corporation provided the Company
with certain administrative services, including financial planning and administration, legal, tax planning and compliance, treasury and
communications, and permitted the Company to participate in Cognizant’s insurance and employee benefit plans. Costs for these services
for all periods prior to the IPO were allocated to the Company based on utilization of certain specific services. All subsequent services
were performed under the CTS IMS Health intercompany services agreement. Management believes that these allocations are reasonable.
23805p11t36 4/25/00 12:06 PM Page 21
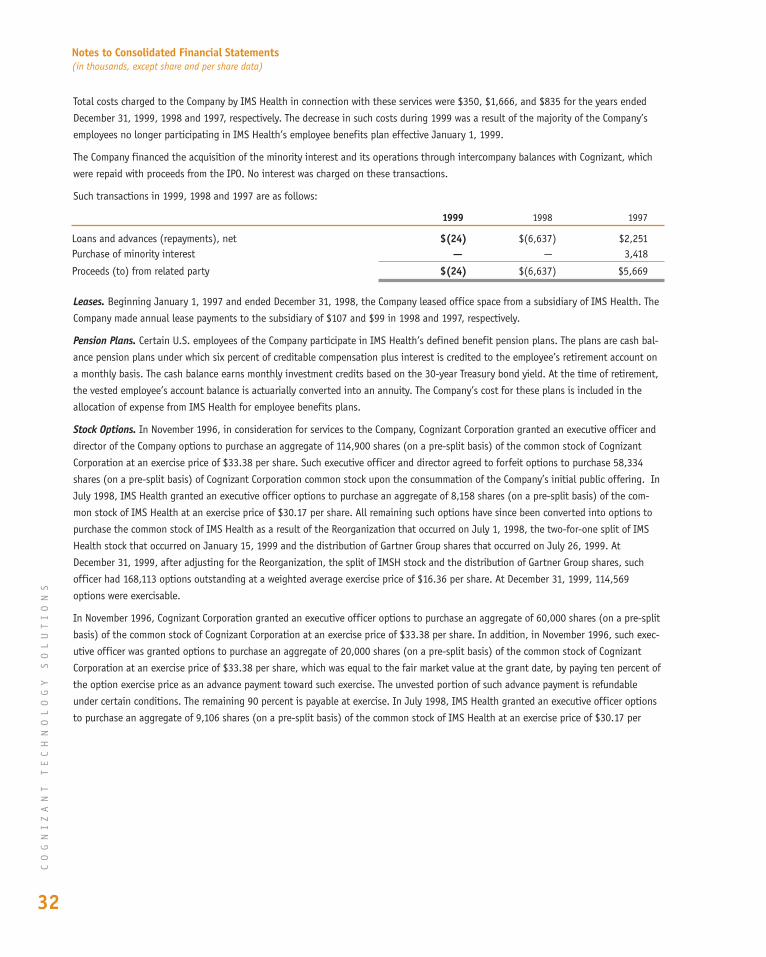
Total costs charged to the Company by IMS Health in connection with these services were $350, $1,666, and $835 for the years ended
December 31, 1999, 1998 and 1997, respectively. The decrease in such costs during 1999 was a result of the majority of the Company’s
employees no longer participating in IMS Health’s employee benefits plan effective January 1, 1999.
The Company financed the acquisition of the minority interest and its operations through intercompany balances with Cognizant, which
were repaid with proceeds from the IPO. No interest was charged on these transactions.
Such transactions in 1999, 1998 and 1997 are as follows:
Leases. Beginning January 1, 1997 and ended December 31, 1998, the Company leased office space from a subsidiary of IMS Health. The
Company made annual lease payments to the subsidiary of $107 and $99 in 1998 and 1997, respectively.
Pension Plans. Certain U.S. employees of the Company participate in IMS Health’s defined benefit pension plans. The plans are cash bal-
ance pension plans under which six percent of creditable compensation plus interest is credited to the employee’s retirement account on
a monthly basis. The cash balance earns monthly investment credits based on the 30-year Treasury bond yield. At the time of retirement,
the vested employee’s account balance is actuarially converted into an annuity. The Company’s cost for these plans is included in the
allocation of expense from IMS Health for employee benefits plans.
Stock Options. In November 1996, in consideration for services to the Company, Cognizant Corporation granted an executive officer and
director of the Company options to purchase an aggregate of 114,900 shares (on a pre-split basis) of the common stock of Cognizant
Corporation at an exercise price of $33.38 per share. Such executive officer and director agreed to forfeit options to purchase 58,334
shares (on a pre-split basis) of Cognizant Corporation common stock upon the consummation of the Company’s initial public offering. In
July 1998, IMS Health granted an executive officer options to purchase an aggregate of 8,158 shares (on a pre-split basis) of the com-
mon stock of IMS Health at an exercise price of $30.17 per share. All remaining such options have since been converted into options to
purchase the common stock of IMS Health as a result of the Reorganization that occurred on July 1, 1998, the two-for-one split of IMS
Health stock that occurred on January 15, 1999 and the distribution of Gartner Group shares that occurred on July 26, 1999. At
December 31, 1999, after adjusting for the Reorganization, the split of IMSH stock and the distribution of Gartner Group shares, such
officer had 168,113 options outstanding at a weighted average exercise price of $16.36 per share. At December 31, 1999, 114,569
options were exercisable.
In November 1996, Cognizant Corporation granted an executive officer options to purchase an aggregate of 60,000 shares (on a pre-split
basis) of the common stock of Cognizant Corporation at an exercise price of $33.38 per share. In addition, in November 1996, such exec-
utive officer was granted options to purchase an aggregate of 20,000 shares (on a pre-split basis) of the common stock of Cognizant
Corporation at an exercise price of $33.38 per share, which was equal to the fair market value at the grant date, by paying ten percent of
the option exercise price as an advance payment toward such exercise. The unvested portion of such advance payment is refundable
under certain conditions. The remaining 90 percent is payable at exercise. In July 1998, IMS Health granted an executive officer options
to purchase an aggregate of 9,106 shares (on a pre-split basis) of the common stock of IMS Health at an exercise price of $30.17 per
Loans and advances (repayments), net $(24) $(6,637) $2,251Purchase of minority interest — — 3,418
Proceeds (to) from related party $(24) $(6,637) $5,669
1999 1998 1997
CO
GN
IZ
AN
T
TE
CH
NO
LO
GY
S
OL
UT
IO
NS
32
Notes to Consolidated Financial Statements(in thousands, except share and per share data)
23805p11t36 4/25/00 12:06 PM Page 22
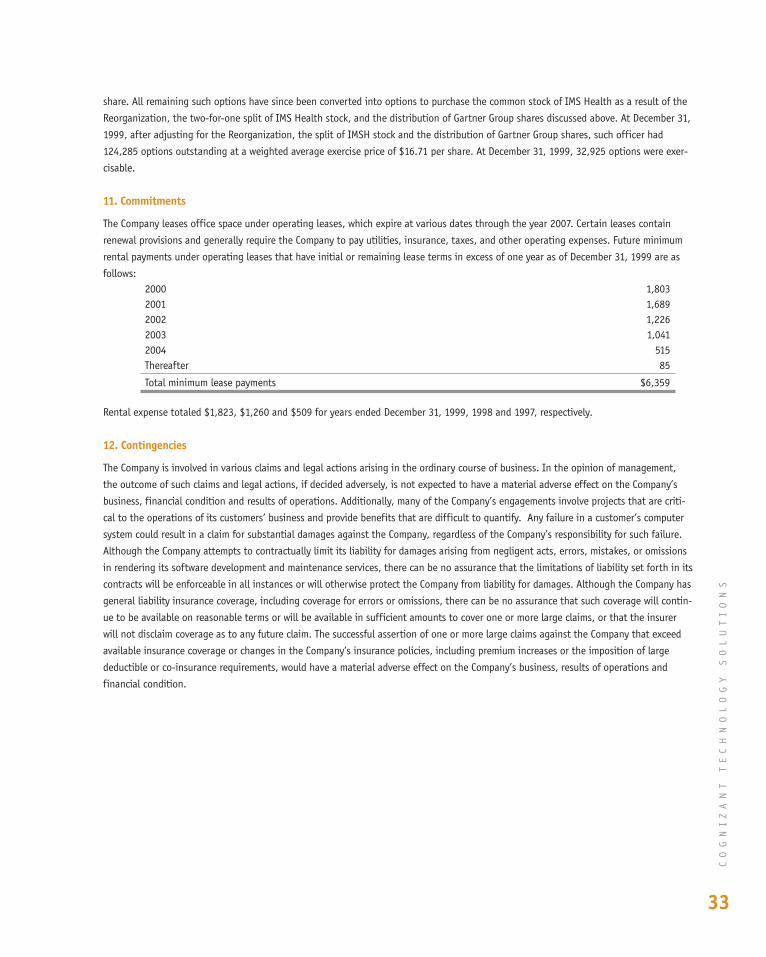
share. All remaining such options have since been converted into options to purchase the common stock of IMS Health as a result of the
Reorganization, the two-for-one split of IMS Health stock, and the distribution of Gartner Group shares discussed above. At December 31,
1999, after adjusting for the Reorganization, the split of IMSH stock and the distribution of Gartner Group shares, such officer had
124,285 options outstanding at a weighted average exercise price of $16.71 per share. At December 31, 1999, 32,925 options were exer-
cisable.
11. Commitments
The Company leases office space under operating leases, which expire at various dates through the year 2007. Certain leases contain
renewal provisions and generally require the Company to pay utilities, insurance, taxes, and other operating expenses. Future minimum
rental payments under operating leases that have initial or remaining lease terms in excess of one year as of December 31, 1999 are as
follows:
Rental expense totaled $1,823, $1,260 and $509 for years ended December 31, 1999, 1998 and 1997, respectively.
12. Contingencies
The Company is involved in various claims and legal actions arising in the ordinary course of business. In the opinion of management,
the outcome of such claims and legal actions, if decided adversely, is not expected to have a material adverse effect on the Company’s
business, financial condition and results of operations. Additionally, many of the Company’s engagements involve projects that are criti-
cal to the operations of its customers’ business and provide benefits that are difficult to quantify. Any failure in a customer’s computer
system could result in a claim for substantial damages against the Company, regardless of the Company’s responsibility for such failure.
Although the Company attempts to contractually limit its liability for damages arising from negligent acts, errors, mistakes, or omissions
in rendering its software development and maintenance services, there can be no assurance that the limitations of liability set forth in its
contracts will be enforceable in all instances or will otherwise protect the Company from liability for damages. Although the Company has
general liability insurance coverage, including coverage for errors or omissions, there can be no assurance that such coverage will contin-
ue to be available on reasonable terms or will be available in sufficient amounts to cover one or more large claims, or that the insurer
will not disclaim coverage as to any future claim. The successful assertion of one or more large claims against the Company that exceed
available insurance coverage or changes in the Company’s insurance policies, including premium increases or the imposition of large
deductible or co-insurance requirements, would have a material adverse effect on the Company’s business, results of operations and
financial condition.
2000 1,8032001 1,6892002 1,2262003 1,0412004 515Thereafter 85
Total minimum lease payments $6,359
CO
GN
IZ
AN
T
TE
CH
NO
LO
GY
S
OL
UT
IO
NS
33
23805p11t36 4/25/00 12:06 PM Page 23
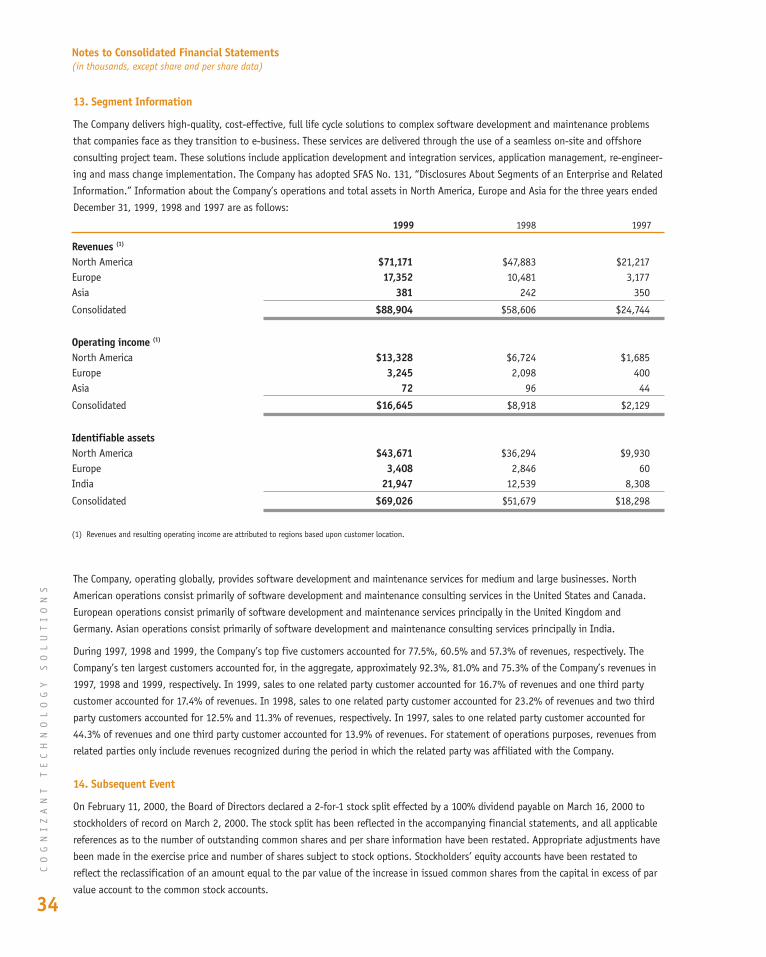
13. Segment Information
The Company delivers high-quality, cost-effective, full life cycle solutions to complex software development and maintenance problems
that companies face as they transition to e-business. These services are delivered through the use of a seamless on-site and offshore
consulting project team. These solutions include application development and integration services, application management, re-engineer-
ing and mass change implementation. The Company has adopted SFAS No. 131, “Disclosures About Segments of an Enterprise and Related
Information.” Information about the Company’s operations and total assets in North America, Europe and Asia for the three years ended
December 31, 1999, 1998 and 1997 are as follows:
The Company, operating globally, provides software development and maintenance services for medium and large businesses. North
American operations consist primarily of software development and maintenance consulting services in the United States and Canada.
European operations consist primarily of software development and maintenance services principally in the United Kingdom and
Germany. Asian operations consist primarily of software development and maintenance consulting services principally in India.
During 1997, 1998 and 1999, the Company’s top five customers accounted for 77.5%, 60.5% and 57.3% of revenues, respectively. The
Company’s ten largest customers accounted for, in the aggregate, approximately 92.3%, 81.0% and 75.3% of the Company’s revenues in
1997, 1998 and 1999, respectively. In 1999, sales to one related party customer accounted for 16.7% of revenues and one third party
customer accounted for 17.4% of revenues. In 1998, sales to one related party customer accounted for 23.2% of revenues and two third
party customers accounted for 12.5% and 11.3% of revenues, respectively. In 1997, sales to one related party customer accounted for
44.3% of revenues and one third party customer accounted for 13.9% of revenues. For statement of operations purposes, revenues from
related parties only include revenues recognized during the period in which the related party was affiliated with the Company.
14. Subsequent Event
On February 11, 2000, the Board of Directors declared a 2-for-1 stock split effected by a 100% dividend payable on March 16, 2000 to
stockholders of record on March 2, 2000. The stock split has been reflected in the accompanying financial statements, and all applicable
references as to the number of outstanding common shares and per share information have been restated. Appropriate adjustments have
been made in the exercise price and number of shares subject to stock options. Stockholders’ equity accounts have been restated to
reflect the reclassification of an amount equal to the par value of the increase in issued common shares from the capital in excess of par
value account to the common stock accounts.
Revenues (1)
North America $71,171 $47,883 $21,217Europe 17,352 10,481 3,177Asia 381 242 350
Consolidated $88,904 $58,606 $24,744
Operating income (1)
North America $13,328 $6,724 $1,685Europe 3,245 2,098 400Asia 72 96 44
Consolidated $16,645 $8,918 $2,129
Identifiable assetsNorth America $43,671 $36,294 $9,930Europe 3,408 2,846 60India 21,947 12,539 8,308
Consolidated $69,026 $51,679 $18,298
(1) Revenues and resulting operating income are attributed to regions based upon customer location.
1999 1998 1997
CO
GN
IZ
AN
T
TE
CH
NO
LO
GY
S
OL
UT
IO
NS
34
Notes to Consolidated Financial Statements(in thousands, except share and per share data)
23805p11t36 4/25/00 12:06 PM Page 24
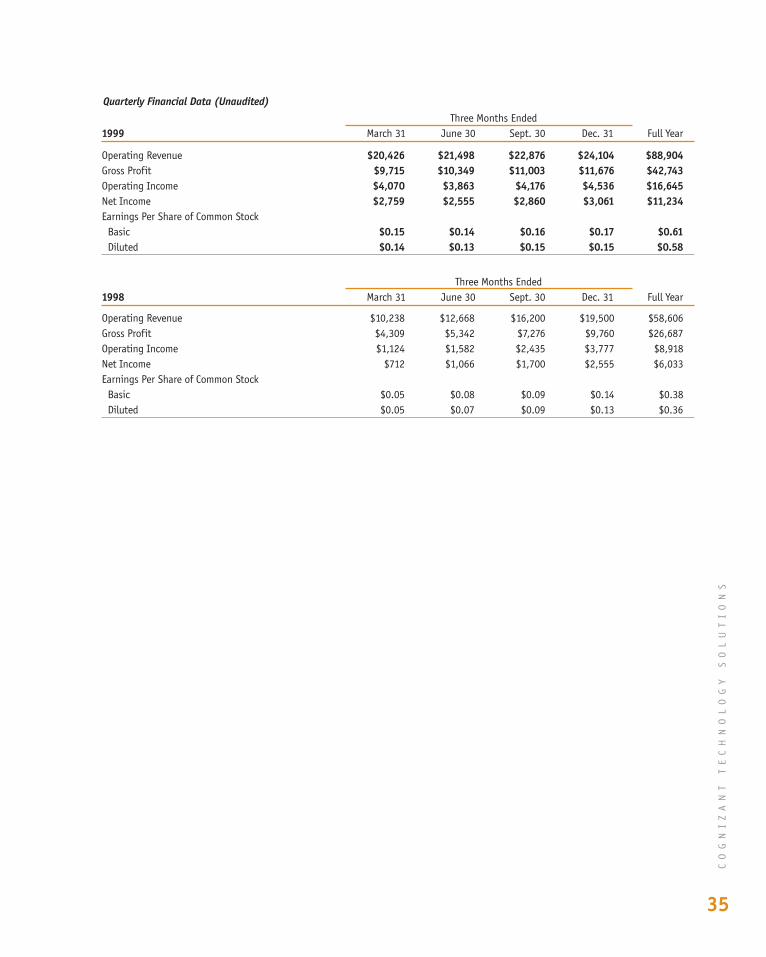
Quarterly Financial Data (Unaudited)
Operating Revenue $20,426 $21,498 $22,876 $24,104 $88,904Gross Profit $9,715 $10,349 $11,003 $11,676 $42,743Operating Income $4,070 $3,863 $4,176 $4,536 $16,645Net Income $2,759 $2,555 $2,860 $3,061 $11,234Earnings Per Share of Common Stock
Basic $0.15 $0.14 $0.16 $0.17 $0.61Diluted $0.14 $0.13 $0.15 $0.15 $0.58
Three Months Ended1999 March 31 June 30 Sept. 30 Dec. 31 Full Year
CO
GN
IZ
AN
T
TE
CH
NO
LO
GY
S
OL
UT
IO
NS
35
Operating Revenue $10,238 $12,668 $16,200 $19,500 $58,606Gross Profit $4,309 $5,342 $7,276 $9,760 $26,687Operating Income $1,124 $1,582 $2,435 $3,777 $8,918Net Income $712 $1,066 $1,700 $2,555 $6,033Earnings Per Share of Common Stock
Basic $0.05 $0.08 $0.09 $0.14 $0.38Diluted $0.05 $0.07 $0.09 $0.13 $0.36
Three Months Ended1998 March 31 June 30 Sept. 30 Dec. 31 Full Year
23805p11t36 4/25/00 12:06 PM Page 25
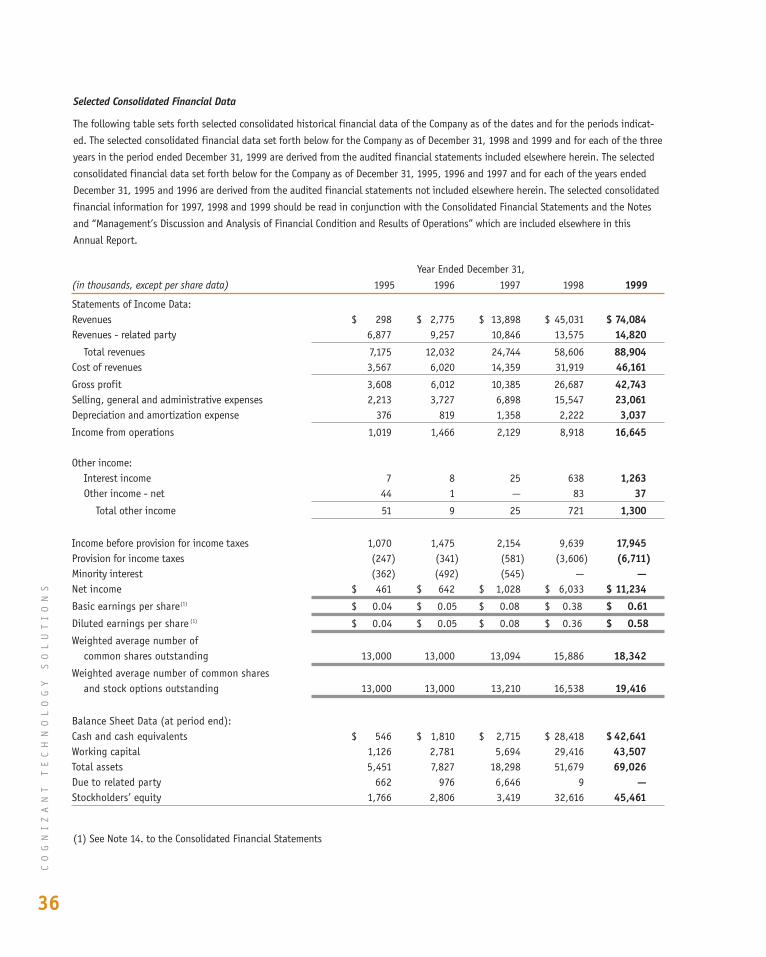
Selected Consolidated Financial Data
The following table sets forth selected consolidated historical financial data of the Company as of the dates and for the periods indicat-
ed. The selected consolidated financial data set forth below for the Company as of December 31, 1998 and 1999 and for each of the three
years in the period ended December 31, 1999 are derived from the audited financial statements included elsewhere herein. The selected
consolidated financial data set forth below for the Company as of December 31, 1995, 1996 and 1997 and for each of the years ended
December 31, 1995 and 1996 are derived from the audited financial statements not included elsewhere herein. The selected consolidated
financial information for 1997, 1998 and 1999 should be read in conjunction with the Consolidated Financial Statements and the Notes
and “Management’s Discussion and Analysis of Financial Condition and Results of Operations” which are included elsewhere in this
Annual Report.
(1) See Note 14. to the Consolidated Financial Statements
Statements of Income Data:Revenues $ 298 $ 2,775 $ 13,898 $ 45,031 $ 74,084Revenues - related party 6,877 9,257 10,846 13,575 14,820
Total revenues 7,175 12,032 24,744 58,606 88,904Cost of revenues 3,567 6,020 14,359 31,919 46,161Gross profit 3,608 6,012 10,385 26,687 42,743Selling, general and administrative expenses 2,213 3,727 6,898 15,547 23,061Depreciation and amortization expense 376 819 1,358 2,222 3,037Income from operations 1,019 1,466 2,129 8,918 16,645
Other income:Interest income 7 8 25 638 1,263Other income - net 44 1 — 83 37
Total other income 51 9 25 721 1,300
Income before provision for income taxes 1,070 1,475 2,154 9,639 17,945Provision for income taxes (247) (341) (581) (3,606) (6,711)Minority interest (362) (492) (545) — —Net income $ 461 $ 642 $ 1,028 $ 6,033 $ 11,234Basic earnings per share(1) $ 0.04 $ 0.05 $ 0.08 $ 0.38 $ 0.61Diluted earnings per share (1) $ 0.04 $ 0.05 $ 0.08 $ 0.36 $ 0.58Weighted average number of
common shares outstanding 13,000 13,000 13,094 15,886 18,342Weighted average number of common shares
and stock options outstanding 13,000 13,000 13,210 16,538 19,416
Balance Sheet Data (at period end):Cash and cash equivalents $ 546 $ 1,810 $ 2,715 $ 28,418 $ 42,641Working capital 1,126 2,781 5,694 29,416 43,507Total assets 5,451 7,827 18,298 51,679 69,026Due to related party 662 976 6,646 9 —Stockholders’ equity 1,766 2,806 3,419 32,616 45,461
Year Ended December 31,(in thousands, except per share data) 1995 1996 1997 1998 1999
CO
GN
IZ
AN
T
TE
CH
NO
LO
GY
S
OL
UT
IO
NS
36
23805p11t36 4/25/00 12:06 PM Page 26