
NetComm Limited 1 NetComm IPDSLAM NetComm NCT1020 Micro NCT1000 Mini IP DSLAM June 2007.

Annual Report 2010 | 1
NetComm Limited
2010ANNUAL REPORT

2 | Annual Report 2010
NetComm Limited
Annual Report 2010 | 3
NetComm Limited
ContentsChairman’s Letter 4-5
Managing Director’s Letter 6-7
Customers 8
Markets 9
Products 10-11
Expanding our reach 12-13
Our Integrated Approach 14
Innovation through understanding 15
Sustaining Growth 16-17
Corporate Governance 18-19
Financial Highlights
1H07 2H07 1H08 2H08 1H09
NetComm Revenue Performance2007 – 2010, $A Millions
2H09 1H10 2H10
Revenue $AUD – Revenue trend line
$4.444m
9.5 9.8
10.2 10
42
35
23
32.6
revenue, representing 2nd largest revenue year in last10 years of operation
$55.2m
Full year EBITDA
$1.625m
NPAT
1cents per share dividend
$1.56c
Earnings per share of 1.56 centsper share from operations
paid during the year
Additional major mobile operators signed and / or shipping4
AUD $000’s 1H 2010 2H 2010Revenue 22,928 32,336EBITDA 886 3,558NPAT (60) 1,685

4 | Annual Report 2010
NetComm Limited
Annual Report 2010 | 5
NetComm Limited
Dear Shareholders
As Chairman, I am in the fortunate position of providing a report on the solid result achieved by NetComm over the past year. Despite the current climate of uncertainty, we have continued to grow our business, maintain profitability, and retain positive earnings.
Terrific milestones have been achieved across the NetComm group as a result of the development, and successful implementation, of a global expansion strategy which has enabled us to acquire a growing share of the international market.
Our strong value proposition has enabled us to gain awareness amongst global blue chip mobile operators who now view our products to be the best of their category. As a result, our international carrier portfolio has grown through partnerships with major mobile operators including: Etisalat, Rogers Communications and Telus.
Closer to home, Telstra continues to be a key partner. Maintaining a strong domestic presence is the foundation of our international expansion strategy, and this year we continued to win market share with the securing of product supply agreements with Telecom New Zealand and FOXTEL.
It continued to be a year of firsts. In 2008, NetComm was the first to commercially launch a 850Mhz 7.2Mbps Mobile Broadband Gateway. In 2009, NetComm continued to lead the charge in market responsiveness as Telstra Bigpond launched its NetComm supplied 21Mbps Elite Gateway. Our MyZone Portable Mobile Broadband Gateway was critically acclaimed as the leader in its category for customer experience – reflecting the importance that we place on the end user experience. MyZone was initially sold exclusively through Apple Australia, and is now finding its way through NetComm’s international distribution network.
We have focused heavily on reducing risks to the business throughout this turbulent year for global economies, and we are well-positioned to take advantage of sustained demand growth. The first half of 2010 saw a number of new international carriers come on board. These contracts came to fruition in the second half of the year leading to the second largest revenue year in the past 10 years of operation. That momentum will be carried forward into 2011 and beyond.
It is our responsibility to ensure that we continue to meet the requirements of our global customers, and grow our market share through the steady expansion of NetComm’s international distribution network. Our focus, both now and into the future, is to provide our shareholders with long-term sustainable growth and profits.
Terry WintersChairman
Chairman’s Letter

6 | Annual Report 2010
NetComm Limited
Annual Report 2010 | 7
NetComm Limited
Managing Director’s LetterDear Shareholders
2010 was a year to prove that NetComm’s business model is robust.
We have demonstrated that our formula for success with Telstra in Australia can be transferred to the international arena – from the Middle East to North America. By employing a scalable model, we continue to achieve international growth; and with sufficient economies of scale and scope we are experiencing an overall increase in profitability.
The past year has been defined by the new and exciting customer partnerships formed by our experienced Australian and international business development teams who are well on their way to achieving our target of eight major carrier partnerships in 2011.
Continuing on from our recent first-to-market commercial launches, we are set to maintain our position at the forefront of technological innovation with the launch of what will be the world’s first 42Mbps Mobile Broadband Gateway.
Global demand for Mobile Broadband devices continues to grow; but more critically, the number of commercially deployed HSPA+ networks grew by 28% in 2010, and this growth is expected continue.
Closer to home, the formalisation of the Australia’s National Broadband Network (NBN) presents us with an exciting opportunity in our own backward. A number of NetComm products are ideally suited to use with the NBN and we are actively seeking out these opportunities.
Our commitment to forming solid long-term relationships with our current clients, whilst continuing to build our portfolio of carrier partners, will ensure that we remain on track for significant growth.
I would like to thank you for being a valued part of NetComm’s growth and am pleased to assure you that our board of directors, management team, and staff are dedicated to generating long-term value for you.
David StewartManaging Dirrector

8 | Annual Report 2010
NetComm Limited
Annual Report 2010 | 9
NetComm Limited
CustomersConnecting with our customers is critical as technology evolves
We continue to build strong and lasting relationships by meeting and surpassing the needs of both the carrier and the end user. Our deep understanding of the end user experience allows us to remain highly responsive to our customer’s needs.
An upsurge in the use of Internet-connectable devices is responsible for growing customer expectations—and global networks are growing as a result. The past year has seen NetComm stay ahead of the pack by maintaining awarness of changing trends in customer requirements and keeping pace with market demand and network advancements. With a global trend of moving from fixed line to 3G networks, and the creation of new networks in developing countries, we have been idealy positioned to leverage these opportunities by being among the fastest to market our range of 3G devices.
A rich and innovative feature set, and the fast release of quality products, has been the key to maintaining our ongoing relationships with our carrier partners.
Our first significant step onto the international arena was achieved with Etisalat and the rapid growth of international 3G networks along with a rise in the demand for quality broadband technology from a trusted supplier has allowed us to secure further agreements with Telus and Rogers.
Markets
Reaching new markets with technological innovation
New markets have opened with the global wave of broadband technological advancement.
Our experience with international carriers has offered valuable insights into the varied nature of regional markets, so we continue to define ourselves with our flexible innovative approach.
Extending connectivity
We believe that everyone should be able to enjoy Internet connectivity and our range of Consumer Premises Equipment (CPE) devices has been designed with offerings to service customers in metro areas, as well as specialised devices for those on the ‘edge’ of network availability. Individuals on the move, small or home offices, businesses, enterprise and government segments form the markets we connect.
This year has also seen a move into the lucrative remote machine to machine and industrial segments.
HELping oUR CUstoMERs gRow tHEiR bUsinEss
We have differentiated ourselves on the international stage by working closely with our carrier clients to provide:
• Innovative 3G / HSPA broadband products
• First to market technologies
• Flexible customisation capabilities
May09
Aug09
Dec09
Apr10
Sept10
HSPA+ Commercial Network LaunchesSeptember 22, 2010
Source: GSA surveys - Global HSPA+ Network Committments and Deployments
4 15 37 52 73
four
fift
een thirty
-sev
en fift
y-tw
o
seve
nty
-thre
e

10 | Annual Report 2010
NetComm Limited
Annual Report 2010 | 11
NetComm Limited
productssoMEtHing FoR EvERyonE
Through meticulous design and exhaustive testing before release, our customers can be assured of a product that will work flawlessly straight out of the box. Our understanding of the end user experience has allowed us to produce particularly user friendly products with tailored hardware and software to meet the carrier’s exact requirements.
Our carriers are given a superior product package which includes: Device installation; user interface; product manuals and custom device design.
Our carrier partners are given a superior product package that is completely customised to extend our partners brand values and equity into homes and businesses.bRoADbAnD gAtEwAys intEgRAtE two DistinCt
tECHnoLogy gRoUps
bRoADbAnD ConnECtion (bEARER nEtwoRk) tECHnoLogiEs:
• 3G• 4G/LTE• ADSL2+ / VDSL• Fibre• Wi-Max• HFC• Satellite
LoCAL nEtwoRk (LAn) sHARing tECHnoLogiEs:
• Ethernet• WiFi (b/g/n)• Bluetooth• Powerline
tELstRA tURbo™ gAtEwAy
Launched 14 July 2009
NetComm developed the Telstra Turbo™ Gateway for Telstra. The gateway represents Australia’s first fully integrated 3G router with voice capabilities over Next G’s network.
bigponD ELitE™ nEtwoRk gAtEwAy
Launched 24 November 2009
NetComm delivered Australia’s fastest wireless broadband gateway to Telstra and shortly after, delivered the same 21Mbps 3G gateway to Etisalat in the Middle East.
ADsL2+/3g wiRELEss n300 MoDEM RoUtER
Launched 24 November 2009
NetComm Limited released a dual ADSL and 3G modem-router, offering small businesses connectivity to the internet via ADSL or 3G. The device features automatic failover, ensuring businesses are connected.
nEtCoMM MyZonE
Launched 31 May 2010
NetComm launched its MyZone exclusively with Apple Australia in conjunction with the launch of Apple’s WiFi iPad.
tELUs sMARt HUb
Launched 28 June 2010
NetComm launched its first 3G/HSPA gateway in Canada for TELUS. The fully featured data and voice gateway operates over the TELUS 3G+ network.
RogERs RoCkEt HUb
Launched 7 July 2010
NetComm commenced delivery of the Rogers Rocket Hub, a 3G Gateway with Voice to Rogers Communications of Canada.

12 | Annual Report 2010
NetComm Limited
Annual Report 2010 | 13
NetComm Limited
Expanding our reachWe are making our mark on the global scene as the world confronts unprecedented demand for fast and reliable connectivity.
Successfully meeting the needs of international carriers through the implementation of our ongoing global expansion strategy has underpinned our continued growth and prosperity.
Our primary objective over the past year, and into the future, is to provide our international carrier partners with advanced 3G / HSPA+, VoIP, xDSL and wireless technologies to enable them to keep pace with the incredible growth and change experienced in overseas markets.
The international mobile broadband sector has proven extremely resilient to the global economic downturn, and has reached new heights over the past year. We are experiencing an exciting period in the development of 3G technologies and continue to expand with 106 dedicated specialist staff working from our headquarters in Sydney, Australia, and offices in New Zealand, Canada, Middle East and Europe.

14 | Annual Report 2010
NetComm Limited
Annual Report 2010 | 15
NetComm Limited
Our ability to customize production to suit customer requirements
associated with meeting the needs of our changing technological
world provides a solid foundation for our business.
We do not seek to make short-term profits from our key
partnerships, but work to ensure the continued enhancement of
the long-term partnerships on which our business is based. This
is achieved by meeting the growing demands of international
carriers with a focus on providing quality core technology
competencies to individual specifications along with: mobile
broadband intelligence, marketing and public relations support.
As we continue to expand into new frontiers, a vital element of
our growth strategy is to provide our carrier partners with a range
of tailored options so that we can release low-cost, high-quality
products and services to meet market demand in a timely fashion.
As economic growth trends return, the extraordinary global
demand for innovative mobile broadband technologies brings
great opportunities and challenges. A proactive approach is
essential and with products of the future already in our production
pipeline, we have ensured that we will never get caught in a
reactive cycle.
Our purpose is to create long-term shareholder value by staying
ahead of network developments and market requirements and
thanks to our in-depth understanding of end user needs, once
the 3G platform evolves to accept faster upload and download
speeds we will be ready to release 42Mbps, 84Mbps and LTE
devices, allowing us to give our carrier partners the edge.
For our carrier clients speed to market is crucial to remaining
competitive, so the year has been defined by our prompt
delivery of innovative products developed to reflect our in-depth
understanding of future trends.
innovation through understanding
our integrated Approach

16 | Annual Report 2010
NetComm Limited
Annual Report 2010 | 17
NetComm Limited
sustaining growth
As the only universally accessible source of information, the Internet has consolidated itself as an extremely
powerful platform which has changed the way the world communicates. Internet growth exceeds that of any
previous technology and the corresponding proliferation of Internet-connectable gadgets brings with it lucrative
long-term opportunities for our business.
Our business is transforming and evolving in response to growing global demands. Emerging countries account
for a significant proportion of technological growth, but are not equipped to produce devices capable of
functioning with the growing size, power and functionality of the Internet— thereby opening the door to further
export opportunities.
New international agreements and requirements are an extension of our existing operations so we have the
benefit of understanding the associated production, operations and marketing issues. This provides us with an
immediate, low-cost and low-risk means of increasing output.
Most of our growth over the next five years will come from expanding our international operations using innovative
technologies in regions experiencing rapid technological growth. We expect to be providing portable, fixed,
industrial and machine to machine 3G routers to 35 international carriers by 2015.
Growth will also be achieved through valuable partnerships with telecommunications operators, Internet service
providers and distributors.
Imag
e: D
avid
Iliff
18 | Annual Report 2010
NetComm Limited
Annual Report 2010 | 19
NetComm Limited
Corporate governa ncein the Directors’ Report. The independence of directors is reviewed annually prior to completion of the Annual Report. Independence is defined in accordance with the definitions contained within the ASX recommendations. Relevant disclosure is then made in the Annual Report. Directors are entitled to obtain independent external advice on matters relating to accounting law or other relevant professional matters.
The procedures for selecting and nominating new candidates for the Board are more fully described in the Corporate Governance Statement and are available on the Company’s website.
principle 3 – promote ethical and responsible decision-making The Board has approved a Code of Conduct a summary of which is available on the Company’s website. All directors, executives and employees are required to comply with that Code. Failure to comply will result in disciplinary action and may include reprimand, formal warning, demotion or, in extreme cases, termination of employment. The Code of Conduct addresses expectations for conduct in the following areas;
• Confidential information• Rights of Security Holders• Privacy• Security trading• Conflicts of interest• Responsibility to suppliers and customers• Employment policies and procedures
Copies of the main provisions of the Code of Conduct and Security Dealing Guidelines are available on the Company’s website.
The Company has not adopted the so called “whistle blower” recommendations as this is considered unnecessary at this stage of the Company’s operations.
The Company’s policy regarding directors and employees trading in its securities is set out in Dealing Rules. The policy restricts Directors and employees from acting on material information until it has been released to the market and adequate time has been given for this to be reflected in the securities prices.
principle 4 – safeguard integrity in financial reportingThe Board Charter provides for the formation of an Audit Committee the Charter of which is available on the Company’s website. The members, number of meetings and attendance at meetings of the audit committee are detailed in the Directors’ Report. The Committee reviews annually the Group’s relationship with its external auditors including receipt of the audit independence statement on behalf of the Board. The Chief Executive Officer / Managing Director and Company Secretary provide semi annually to the Board in writing a statement to the effect that the financial statements including the accompanying notes:
• Are in accordance with the Corporation Act 2001 and the relevant accounting standards; and
• Present a true and fair view, in all material respects, of the Group’s financial position and performance.
principle 5 – Make timely and balanced disclosureThe Company has adopted policies concerning shareholder communication and continuous disclosure. The policies are designed to promote investor confidence by providing full and timely information to all security holders and market participants about the Group’s activities, so as to comply with the requirements of the Corporations Act 2001 and the ASX Listing Rules. A summary of the continuous disclosure policy and the communications policy are available on the Company’s website.
principle 6 – Respect the rights of shareholdersThe Company has established a link to the ASX website listing all of the Company’s announcements to the market. Shareholders and market participants registering their email addresses with the Company are provided with a copy of each announcement.
principle 7 – Recognise and manage riskThe Board has adopted a detailed risk management policy a summary of which is available on the Company’s website. It is a policy of companies in the Group to adopt a common sense approach to the management of risk. This approach involves a clear strategy defining the risks that the Company is in a business to take and those that it is not.
The basis of this policy is the obligation and desire to protect:
a) the Company’s people and customers;
b) the environment in which the Group operates;
c) the Company’s position as a provider of the highest quality services and products.
The Company’s policy in respect of these foundations attributes that its physical, financial and human resources will be applied to ensure that the Company’s standards of products and services achieve and exceed expectations. To do this the entity must pursue opportunities that involve some degree of risk. Shareholders and stakeholders must expect that optimisation of such rewards are only gained from this degree of risk taking.
Management reported to the Board during the relevant reporting period as to the effectiveness of the Company’s management of its material business risk. The Board received assurance from the managing director and chief financial officer that the declaration provided in accordance with section 295A of the Corporations Act was founded on a sound system of risk management and internal control – and that the system is operating effectively in all material respects in relation to financial report risks.
principle 8 – Remunerate fairly and responsiblyThe Company has established a Nominations and Remuneration Committee the Charter of which is available on the Company’s website. The members, number of meetings and attendance at meetings of the committee are detailed in the Directors’ Report. The Committee’s Charter includes the following duties:
1. Reviewing the remuneration guidelines for senior management, including base salary, bonuses, share options, salary packaging and final contractual agreements.
2. Reviewing non-executive fees and costs by seeking external benchmarks.
3. Reviewing the Managing Director’s remuneration, allowances and incentives and final package in consultation with both independent and external reference.
During the relevant reporting period, remuneration for the Company’s managing director and key executives included a fixed salary component, superannuation and performance based participation in the employee share scheme. Non-executive directors’ remuneration has in the past consisted solely of fees. However, at the Annual General Meeting held on 30 October 2008, shareholders also decided to reward non-executive directors for improvements in the Company’s results by approving the issue of performance based options to them. Further information is contained in the Remuneration report tables within the Directors’ Report.
Equity components of remuneration, including the issue of options, are required to be approved by shareholders prior to award.
Adoption of AsX principles Recommendations
A summary of the main provisions of the Code of Conduct for directors and key executives and the main provisions of the Securities Dealing Policy are available in the corporate governance section of NetComm Limited’s website.
principle 1 – Lay solid foundations for management and oversight The Company has adopted Principle 1. A performance evaluation for senior executives has taken place during the reporting period in accordance with this principle. The Board Charter describes the matters that are the reserve of the Board. Responsibility for other matters is delegated to the CEO / Managing Director. A summary of the Board Charter is available on the Company’s website.
principle 2 – structure the board to add valueBoard policy is that the Board will constantly review and monitor its performance. As part of this process the Board may seek to appoint persons who, in the opinion of the Board, will provide specialist expertise required for the Board to adequately perform its role. Additionally, the Board will also review its composition and advise Board members where it is felt that a Director’s skills are different from those required by the Company.
The skills, experience and expertise of each director in office at the date of this report and their period of office are detailed in the Directors Report. This also identifies the independent directors. None of the independent directors have any relationship with the company (as defined in accordance with the ASX recommendations) which may affect their independent status. Directors are entitled to obtain independent external advice on matters relating to accounting, law and other relevant provisional matters at the expense of the company.
The Board has established a Nominations and Remuneration Committee. The members and attendance at meetings of the committee are detailed

20 | Annual Report 2010
NetComm Limited
Annual Report 2010 | 21
NetComm Limited
CONTENTSDirectors' Report 21
Auditors Independence Declaration 30
Consolidated Statement of Comprehensive Income 32
Consolidated Statement of Financial Position 33
Consolidated Statement of Changes in Equity 34
Consolidated Statement of Cash Flows 35
Notes to the Financial Statements 36
Directors' Declaration 77
Independent Auditor's Report 78
ASX Additional Information 80
Corporate Directory 81
Directors’ ReportFOR ThE YEaR ENDED 30 JuNE 2010
Your directors present their report on the company and its controlled entities for the financial year ended 30 June 2010.
1. General information
a. DirectorsThe names of the directors in office at any time during, or since the end of, the year are:
T R Winters Independent Non Executive Chairman
D P J Stewart Managing Director
J A Brennan Independent Non Executive Director
J M Burton Independent Non Executive Director
Directors have been in office since the start of the financial year to the date of this report unless otherwise stated.
b. Company SecretaryThe following person held the position of company secretary for the whole financial year:
Mr Peter Beveridge – appointed as company secretary on 13 June 2008. Peter has over 25 years experience in financial management, marketing and accounting. Peter’s broad business background includes managerial roles for companies such as IBM Australia and Xerox.
c. Principal ActivitiesThe principal activities during the financial year include the development of broadband communication devices, which include ADSL, VDSL and HSPA (3G) technologies. Distribution of these products is via a national and international network of leading resellers, ISPs and telecommunication carriers.
2. Business review
a. Operating ResultsThe consolidated profit of the Group after providing for income tax amounted to $1,624,988 (2009: $5,891,378)
Results and Dividends Consolidated
2010 $ 2009 $
Total Revenue from Continuing Operations 55,264,440 78,473,388
EBITDA from Continuing Business 4,444,677 6,199,161
Operating Profit/(Loss) from Continuing Business before Taxation 2,294,204 5,296,429
Income Tax (Expense)/Income (669,216) 594,949
Net Profit for the year after tax 1,624,988 5,891,378
Dividend (cents per share) 1.0cps -
b. Review of operationsNetComm has continued to drive its international expansion strategy and focus on Mobile Broadband Gateways. This success evidenced by supply agreements with major carriers including Telstra (Australia), Etisalat (UAE), Telus (Canada) and Rogers Communications (Canada).
During the period NetComm became the first Telecommunications Equipment provider to commercially launch a 21 Mbps Mobile Broadband Gateway. Continued investment in the development of HSPA+ Gateway technologies has resulted in a flexible and high quality product portfolio.
Our focus on first to market is consistent with our strategy to provide our carrier customers with a unique combination of differentiated products with a speed-to-market competitive advantage.
c. Significant Changes in State of AffairsNo significant changes in the state of affairs occurred during the financial year.
d. Subsequent EventsNo matters or circumstances have arisen since the end of the financial year which significantly affected or may significantly affect the operations of the Group, the results of those operations or the state of affairs of the Group in future financial years.

22 | Annual Report 2010
NetComm Limited
Annual Report 2010 | 23
NetComm Limited
Directors’ ReportFOR ThE YEaR ENDED 30 JuNE 2010
2. Business review (continued)
e. Environmental RegulationsThe Group is not subject to significant environmental regulation.
f. Future DevelopmentsDisclosure of information regarding likely developments in the operations of the Group in future financial years and the expected results of those operations is likely to result in unreasonable prejudice to the Group. Accordingly, this information has not been disclosed in this report.
3. directors’ information
a. Information on Directors
Mr Terry R Winters FAICD, Independent Non Executive ChairmanThe founder and former CEO of Link Telecommunications and visionary behind the formation of Optus Communications Pty Ltd, Mr Winters has more than 30 years experience in the telecommunications and technology industry. Mr. Winters is currently chairman of Australian Home Care Services Pty Limited and Converge International Limited.
Mr David P J Stewart, Managing DirectorMr Stewart founded Banksia Technology Pty Limited in 1988 and successfully managed the company as a fast growing and highly profitable business. In 1996, he instigated the successful takeovers of a number of his competitors including NetComm Limited, which was completed in November 1997. Mr Stewart assumed the role of Managing Director of the merged entity and remains the single largest shareholder of NetComm. He has a strong financial background, extensive experience in sales and marketing and has maintained an ongoing interest in new technologies. While being very active in the operational aspects of the business, Mr Stewart also focuses on the strategic direction of the company.
Mr John A Brennan, FAICD, FAIM, Independent Non Executive Director Mr Brennan is Managing Director of John David Cooper and Associates Pty Limited, a management consulting company focused on the development and deployment of e-business strategies for mid to large sized organisations. His previous roles include National General Manager, Corporate and Government Sales for Telstra, General Manager Corporate Services for Advance Bank and Regional Manager (Computers and Telecommunications) with the PA Consulting Group.
Mr John M Burton, Independent Non Executive DirectorWith more than 25 years experience in the telecommunications industry, both in Australia and overseas, Mr Burton has an in depth understanding of the factors that drive commercial success in the telecommunications arena. His professional background includes senior management roles with Telecom (now Telstra), KPMG Management Consulting, DSC Communications and Nextgen Networks. Mr Burton is also the Chairman of Spatial Vision Innovations Pty Ltd, a company that uses digital technology to address business and environmental problems. He is currently CEO of Manson Consulting, a company which provides consultancy services to a range of telecommunications organisations.
b. Meetings of DirectorsDuring the financial year, 11 meetings of directors (including committees of directors) were held. Attendances by each director during the year were as follows:
Directors’ Meetings Audit Committee Meetings Remuneration Committee Meetings
Eligible to attend Number attended Eligible to attend Number attended Eligible to attend Number attended
T R Winters 11 11 2 2 1 1
D P J Stewart 11 11 - - 1 1
J A Brennan 11 11 2 2 - -
J M Burton 11 11 2 2 1 1
Directors’ ReportFOR ThE YEaR ENDED 30 JuNE 2010
4. remuneration reportThis remuneration report, which forms part of the directors’ report, sets out the information about the remuneration of NetComm Limited’s directors and its senior management for the financial year ended 30 June 2010.
The following persons acted as directors and senior management of the company during or since the end of the financial year:
T R Winters Independent Non Executive Chairman
D P J Stewart Managing Director
J A Brennan Independent Non Executive Director
J M Burton Independent Non Executive Director
D Morrison General Manager
W Trattles Chief Financial Officer
P Beveridge Company Secretary
Remuneration Policy The board’s policy for determining the nature and amount of remuneration of key management personnel for the Group is as follows:
• The remuneration committee, consisting of two non executive directors and one executive director, advises the Board on remuneration policies and practices generally, and makes specific recommendations on remuneration packages and other terms of employment for executive directors, other senior executives and non executive directors.
• The remuneration committee reviews the remuneration packages of all directors and other key management personnel on an annual basis and makes recommendations to the Board. Remuneration packages are reviewed and determined with due regard to current market rates and are benchmarked against comparable industry salaries. The overall objective is to ensure maximum shareholder benefit from the retention of a quality Board and Executive Team. To assist in achieving this objective, the nature and amount of the Executives and Directors and other key management personnel’s emoluments is linked to the Group’s financial and operational performance, as determined by the Remuneration Committee.
Relationship between the remuneration policy and company performanceThe following tables set out summary information about the consolidated entity’s earnings and movements in shareholder wealth for the five years to June 2010:
30 June 2010 $ 30 June 2009 $ 30 June 2008 $ 30 June 2007 $ 30 June 2006 $
Revenue 55,264,440 78,473,388 19,368,090 21,340,932 22,352,875
Net Profit before tax 2,294,204 5,296,429 512,850 (1,339,640) (1,258,181)
Net Profit after tax 1,624,988 5,891,378 2,146,404 (1,337,485) (1,258,181)
30 June 2010 $ 30 June 2009 $ 30 June 2008 $ 30 June 2007 $ 30 June 2006 $
Share price at start of the year 0.17 0.18 0.06 0.09 0.13
Share price at end of the year 0.20 0.17 0.18 0.06 0.09
Interim dividend 1cps - - - -
Final dividend - - - - -
Basic earnings per share (cents) 1.58 6.01 2.39 (1.70) (1.59)
Diluted earnings per share (cents) 1.56 5.95 2.38 (1.70) (1.58)

24 | Annual Report 2010
NetComm Limited
Annual Report 2010 | 25
NetComm Limited
Directors’ ReportFOR ThE YEaR ENDED 30 JuNE 2010
4. remuneration report (continued)
Details of remuneration for year ended 30 June 2010. Details of each element of the remuneration of each director of NetComm Limited and executive officers of the company are set out in the following tables:
Year ended 30 June 2010:Short Term Employee Benefits Post Employment
BenefitsShare Based
PaymentsOther Benefits Total
Salary & Fees Bonus Other Benefits Superannuation Options Termination Benefits
Independent Non-Executive Directors
T R Winters 78,000 - - - 23,823 - 101,823
J A Brennan 48,000 - - - 15,645 - 63,645
J M Burton 48,000 - - - 15,645 - 63,645
TOTAL 174,000 - - - 55,113 - 229,113
Executive Directors
D P J Stewart 366,972 - 20,000 33,028 122,167 - 542,167
TOTAL 366,972 - 20,000 33,028 122,167 - 542,167
Executive Officers
D Morrison 149,336 62,265 15,000 13,439 3,767 - 243,807
W Trattles 180,000 22,000 - 16,200 72,816 - 291,016
P Beveridge 138,229 - - - 11,306 - 149,535
TOTAL 467,565 84,265 15,000 29,639 87,889 - 684,358
Year ended 30 June 2010:Short Term Employee Benefits Post Employment
BenefitsShare Based
PaymentsOther Benefits Total
Salary & Fees Bonus Other Benefits Superannuation Options Termination Benefits
Independent Non-Executive Directors
T R Winters 78,000 - - - 23,313 - 100,313
J A Brennan 48,000 - - - 18,358 - 66,358
J M Burton 48,000 - - - 18,358 - 66,358
TOTAL 174,000 - - - 59,029 - 233,029
Executive Directors
D P J Stewart 366,972 345,000 20,000 33,028 114,426 - 879,426
TOTAL 366,972 345,000 20,000 33,028 114,426 - 879,426
Executive Officers
D Morrison 145,000 37,000 15,000 13,050 7,499 - 217,549
W Trattles** 169,615 40,000 - 15,266 24,290 - 249,171
P Beveridge 107,704 - - - 5,884 113,588
TOTAL 422,319 77,000 15,000 28,316 37,673 - 580,308
** W Trattles commenced on 21 July 2008.
Directors’ ReportFOR ThE YEaR ENDED 30 JuNE 2010
4. remuneration report (continued)The following table provides employment details of persons who were, during the financial year, the directors and executive officers of the consolidated group receiving the highest remuneration. The table also illustrates the proportion of remuneration that was performance and non-performance based.
Position held as at 30 June 2010 Contract details (duration & termination)
Proportion of elements of remuneration related to
performance
Proportions of elements of remuneration not related to
performance
Non-salary cash-based
incentives %
Options % Fixed Salary %
Total %
T R Winters Independent Non Executive Director
No fixed term. - 23 77 100
J A Brennan Independent Non Executive Director
No fixed term. - 25 75 100
J M Burton Independent Non Executive Director
No fixed term. - 25 75 100
D P J Stewart Managing Director 12 month contract automatically renewed. 12 months notice required to terminate. Entitled to 12 months gross salary.
- 23 77 100
D Morrison General Manager Standard employment agreement. 2 months notice required to terminate. Entitled to 2 months gross salary.
25 2 73 100
W Trattles Chief Financial Officer Standard employment agreement. 2 months notice required to terminate. Entitled to 2 months gross salary.
8 25 67 100
P Beveridge Company Secretary No fixed term. 1 months notice required to terminate.
- 4 96 100

26 | Annual Report 2010
NetComm Limited
Annual Report 2010 | 27
NetComm Limited
Directors’ ReportFOR ThE YEaR ENDED 30 JuNE 2010
4. remuneration report (continued)
Share Options An employee share option plan is in place for all employees, including directors and key management personnel. The board of directors may at its discretion offer options to employees in such numbers and at such times as it thinks fit. Each option entitles the holder to subscribe for and be allotted one share in the capital of the company at a pre-determined exercise price per share. Shares issued on the exercise of options will rank pari passu with all existing shares in the capital of the company from the date of issue. The option holder must remain employed with the company in order to meet the performance conditions attached to the options.
Any option issued to an employee in a particular year will vest in the following time periods, and expire 5 years from the date of issue:
i. At the end of year 1 from the date of the relevant option issue, 30% of the option issued will vest ii. At the end of year 2 from the date of the relevant option issue, 20% of the option issued will vest iii. At the end of year 3 from the date of the relevant option issue, 30% of the option issued will vest iv. At the end of year 4 from the date of the relevant option issue, 20% of the option issued will vest
Any option issued to an employee in a particular year, except for the ones mentioned in the following paragraphs, will vest in the aforementioned time periods:
2,000,000 options issued in 2009 to W Trattles will vest in the following time periods:i. At the end of year 1 from the date of the relevant option issue, 25% of the option issued will vest ii. At the end of year 2 from the date of the relevant option issue, 25% of the option issued will vestiii. At the end of year 3 from the date of the relevant option issue, 25% of the option issued will vestiv. At the end of year 4 from the date of the relevant option issue, 25% of the option issued will vest
4,000,000 options issued in 2009 to D P J Stewart will vest in the following time periods:i. At the end of year 1 from the date of the relevant option issue, 25% of the option issued will vestii. At the end of year 2 from the date of the relevant option issue, 25% of the option issued will vestiii. At the end of year 3 from the date of the relevant option issue, 50% of the option issued will vest
480,000 options issued in 2009 to each Director J A Brennan and J M Burton will vest in the following time periods:i. At the end of year 1 from the date of the relevant option issue, 50% of the option issued will vestii. At the end of year 2 from the date of the relevant option issue, 50% of the option issued will vest
780,000 options in 2009 issued to Director T R Winters will vest in the following time periods:i. At the end of year 1 from the date of the relevant option issue, 25% of the option issued will vestii. At the end of year 2 from the date of the relevant option issue, 25% of the option issued will vestiii. At the end of year 3 from the date of the relevant option issue, 50% of the option issued will vest
Vesting of 4,000,000 options issued to D P J Stewart and 1,740,000 options issued to non-executive directors is subject to the following preconditions:i. At the end of year 1 market share price $0.205 and EBIT $704,593ii. At the end of year 2 market share price $0.240 and EBIT $845,512iii. At the end of year 3 market share price $0.280 and EBIT $1,014,614
Where preconditions are not met as the vesting date, the non-vested options will be aded to the next vesting date where the performance hurdle will be tested again.
Directors’ ReportFOR ThE YEaR ENDED 30 JuNE 2010
4. remuneration report (continued)During the financial year, the following share-based payment arrangements were in existence:
Grant date $ Expiry Date $ Exercise Price $ Value per Option at
Grant Date $
Issued 13 December 2004 13/12/2004 13/12/2009 0.200 0.066
Issued 24 June 2005 24/06/2005 24/06/2010 0.140 0.060
Issued 24 August 2006 24/08/2006 24/08/2011 0.090 0.045
Issued 26 April 2007 26/04/2007 26/04/2012 0.064 0.045
Issued 19 July 2007 19/07/2007 19/07/2012 0.060 0.030
Issued 17 December 2007 17/12/2007 17/12/2012 0.070 0.039
Issued 27 February 2008 27/02/2008 27/02/2013 0.075 0.023
Issued 3 March 2008 03/03/2008 03/03/2013 0.071 0.034
Issued 19 August 2008 19/08/2008 19/08/2013 0.164 0.076
Issued 31 July 2008 31/07/2008 31/07/2013 0.185 0.084
Issued 30 October 2008 30/10/2008 30/10/2014 0.162 0.075
Issued 30 October 2008 30/10/2008 30/10/2015 0.162 0.081
Issued 30 October 2008 30/10/2008 30/10/2016 0.162 0.086
Issued 27 November 2008 27/11/2008 27/11/2013 0.143 0.064
Issued 10 December 2008 10/12/2008 10/12/2013 0.162 0.042
Issued 12 February 2009 12/02/2009 12/02/2014 0.113 0.035
Issued 15 July 2009 15/07/2009 15/07/2014 0.150 0.061
At 30 June 2010, there are 9,831,880 options (2009: 9,882,500) issued to 25 employees and directors (2009: 22 employees) to acquire ordinary shares. These options progressively vest on an annual basis commencing 12 months from the date of issue, details as follows:
Number of Options Exercise Price $ Expiry Date
430,000 0.090 24-Aug-2011
643,750 0.064 26-Apr-2012
50,000 0.060 19-Jul-2012
290,000 0.070 17-Dec-2012
157,500 0.075 27-Feb-2013
100,000 0.071 3-Mar-2013
50,000 0.164 19-Aug-2013
200,000 0.185 31-Jul-2013
1,870,630 0.143 27-Nov-2013
100,000 0.162 10-Dec-2013
100,000 0.150 15-Jul-2014
100,000 0.113 12-Feb-2014
1,675,000 0.162 30-Oct-2014
1,675,000 0.162 30-Oct-2015
2,390,000 0.162 30-Oct-2016
9,831,880
165,000 (2009: 292,500) options issued to employees expired during the financial year in accordance with the rules of the Share Option Plan. There were 610,620 options (2009: 125,000) exercised during the year ended 30 June 2010.

28 | Annual Report 2010
NetComm Limited
Annual Report 2010 | 29
NetComm Limited
Directors’ ReportFOR ThE YEaR ENDED 30 JuNE 2010
4. remuneration report (continued)The following grants of share-based compensation to directors and senior management relate to the current financial year and prior financial years:
During the Financial Year % of compensation
for the year consisting of
options
Name Date granted No. granted No. vested % of grant vested
% of grant forfeited
2010
P Beveridge* 27/02/2008 225,000 112,500 50% 0% 3.50%
P Beveridge* 10/12/2008 100,000 30,000 30% 0% 2.20%
P Beveridge* 12/02/2009 100,000 30,000 30% 0% 1.86%
2009
D Morrison 31/07/2008 100,000 - 0% 0% 3.45%
W Trattles 27/11/2008 2,000,000 - 0% 0% 9.75%
D P J Stewart 30/10/2008 4,000,000 - 0% 0% 13.01%
J A Brennan 30/10/2008 480,000 - 0% 0% 27.67%
J M Burton 30/10/2008 480,000 - 0% 0% 27.67%
T R Winters 30/10/2008 780,000 - 0% 0% 22.53%
*These options were granted in 2010.
The names of all holders of options are entered in the Company’s Register of Option Holders, inspection of which may be made free of charge.
Directors’ Shareholdings At the date of this report, the interests of the Directors in the ordinary shares and options of the Company were:
Ordinary Shares Options
T R Winters 193,068 780,000
D P J Stewart 22,647,063 4,000,000
J M Burton 377,795 480,000
J A Brennan 122,795 480,000
Other than this, none of the Directors have any direct or indirect interest in any material contracts with the Group.
Directors’ ReportFOR ThE YEaR ENDED 30 JuNE 2010
5. other information
a. Indemnification and Insurance of DirectorsAll Directors of the Group, its secretaries and executive officers are entitled to be indemnified under Clause 23 of the Company’s Constitution to the maximum extent permitted by law unless the liability arises out of conduct involving a lack of good faith. Since the end of the previous financial year, the Group has paid insurance premiums in respect of a directors and officers liability insurance contract against certain liabilities (subject to exclusions), for all current and former officers of the Group, including all directors named in this report, the company secretaries and executive officers of the Group, and directors and officers who have retired or relinquished their positions.
The insurance policies prohibit disclosure of the premiums paid in respect of those policies and the nature of the liabilities insured by the policies.
b. Proceedings on behalf of the CompanyNo person has applied to the Court under section 237 of the Corporations Act 2001 for leave to bring proceedings on behalf of the company, or to intervene in any proceedings to which the company is a party, for the purpose of taking responsibility on behalf of the company for all or part of those proceedings.
No proceedings have been brought or intervened in on behalf of the company with leave of the Court under section 237 of the Corporations Act 2001.
c. Auditors Independence DeclarationThe lead auditor’s independence declaration for the year ended 30 June 2010 has been received and can be found on page 14 of the financial report.
d. Non Audit ServicesThe directors are satisfied that the provision of non audit services during the year is compatible with the general standard of independence for auditors imposed by the Corporations Act 2001, because the nature and scope of each type of non audit service provided means that auditor independence was not compromised.The following fees for non audit services were paid/payable to the external auditors during the year ended 30 June 2010:
Tax compliance services 2010 $ 2009 $
30,190 14,526
e. Corporate GovernanceThe Directors of NetComm Limited have always recognised the need for appropriate standards of corporate behaviour and accountability to ensure the quality of the company’s financial reporting. Recent commentary and directions from Australian regulatory authorities have further emphasised this issue in the minds of investors. The Directors of NetComm Limited reaffirm their support for the principles of corporate governance and transparency and have reviewed their policies with regard to current best practice.
f. DividendsAn interim unfranked dividend of $0.01 per share totalling $1,040,710 was paid during the year-ended 30 June 2010 (2009: $nil).
The directors’ report is signed in accordance with a resolution of directors made pursuant to s.298(2) of the Corporations Act 2001.
On behalf of the Directors
Director: Director:
T R Winters, Chairman, Sydney D P J Stewart, Managing Director, Sydney
30 September 2010 30 September 2010

30 | Annual Report 2010
NetComm Limited
Annual Report 2010 | 31
NetComm Limited
Index to the financial statements30 JuNE 2010
consolidated statement of comprehensive income 32consolidated statement of financial position 33consolidated statement of chanGes in equity 34consolidated statement of cash flows 35
notes to the financial statements1. Significant accounting policies 36
2. Revenue and other income 50
3. Expenses 50
4. Income tax expense(income) 51
5. Dividends 53
6. Cash and cash equivalents 53
7. Trade and other receivables 53
8. Inventory 54
9. Other assets 55
10. Property, plant and equipment 55
11. Goodwill 56
12. Other intangible assets 57
13. Trade and other payables 58
14. Borrowings 58
15. Provisions 58
16. Other liabilities 59
17. Issued capital 59
18. Reserves 60
19. Contingent liabilities 60
20. Expenditure commitments 60
21. Cash flow information 61
22. Key management personnel compensation 61
23. Related party transactions 62
24. Share based payments 64
25. Retirement benefit obligations 67
26. Earnings per share 67
27. Acquisition of business 67
28. Financial instruments 69
29. Events after the reporting date 73
30. Segment reporting 73
31. Parent entity disclosures 75
32. Company details 76
director’s declaration 77audit report 78asX additional information 80corporate directory 81

32 | Annual Report 2010
NetComm Limited
Annual Report 2010 | 33
NetComm Limited
Consolidated statement of comprehensive incomeFOR ThE YEaR ENDED 30 JuNE 2010
Note 2010 $ 2009 $
Continuing Operations
Revenue from the sale of goods 2 55,201,037 78,415,889
Other income 2 63,403 57,499
Change in inventories 2,250,046 (1,579,408)
Raw materials consumed (39,587,701) (57,797,235)
Employee benefits (7,484,280) (6,762,412)
Other expenses 3 (5,997,828) (6,135,172)
Earnings before interest, tax, depreciation and amortisation (EBITDA) 4,444,677 6,199,161
Depreciation and amortisation expense 3 (1,846,290) (772,221)
Finance costs 3 (304,183) (130,511)
Profit before income tax 2,294,204 5,296,429
Income tax (expense)/benefit 4 (669,216) 594,949
Profit for the year 1,624,988 5,891,378
Other comprehensive income
Exchange differences arising on translation of foreign operations 17,885 (31,905)
Income tax relating to components of other comprehensive income - -
Other comprehensive income for the year (net of tax) 17,885 (31,905)
Total comprehensive income for the year 1,642,873 5,859,473
Total profit attributable to equity holders of the parent 1,624,988 5,891,378
Total comprehensive income attributable to equity holders of the parent 1,642,873 5,859,473
Earnings per share:
From continuing operations
Basic earnings per share (cents per share) 26 1.58 6.01
Diluted earnings per share (cents per share) 26 1.56 5.95
Consolidated statement of financial position30 JuNE 2010
Note 2010 $ 2009 $
ASSETS
Current assets
Cash and cash equivalents 6 4,250,948 4,762,135
Trade and other receivables 7 8,258,968 4,181,370
Inventories 8 10,233,328 7,695,750
Other current assets 9 329,656 123,206
Total current assets 23,072,900 16,762,461
Non-current assets
Property, plant and equipment 10 1,373,486 950,919
Deferred tax assets 4 (c) 2,180,308 2,493,436
Goodwill 11 895,999 840,101
Other intangible assets 12 3,846,240 3,443,721
Other non-current inventories 8 2,924,072 3,211,604
Total non-current assets 11,220,105 10,939,781
TOTAL ASSETS 34,293,005 27,702,242
LIABILITIES
Current liabilities
Trade and other payables 13 9,917,401 6,925,265
Borrowings 14 5,666,744 1,514,725
Short term provisions 15 1,713,007 1,350,084
Income tax liability 103,285 159,377
Other current liabilities 16 212,573 1,403,313
Total current liabilities 17,613,010 11,352,764
Non-current liabilities
Long term borrowings 14 183,581 261,854
Long term provisions 15 99,525 76,608
Other non current liabilities 16 - 135,223
Total non-current liabilities 283,106 473,685
TOTAL LIABILITIES 17,896,116 11,826,449
NET ASSETS 16,396,889 15,875,793
EQUITY
Issued capital 17 9,649,395 9,656,257
Reserves 18 232,872 289,192
Retained earnings 6,514,622 5,930,344
TOTAL EQUITY 16,396,889 15,875,793
34 | Annual Report 2010
NetComm Limited
Annual Report 2010 | 35
NetComm Limited
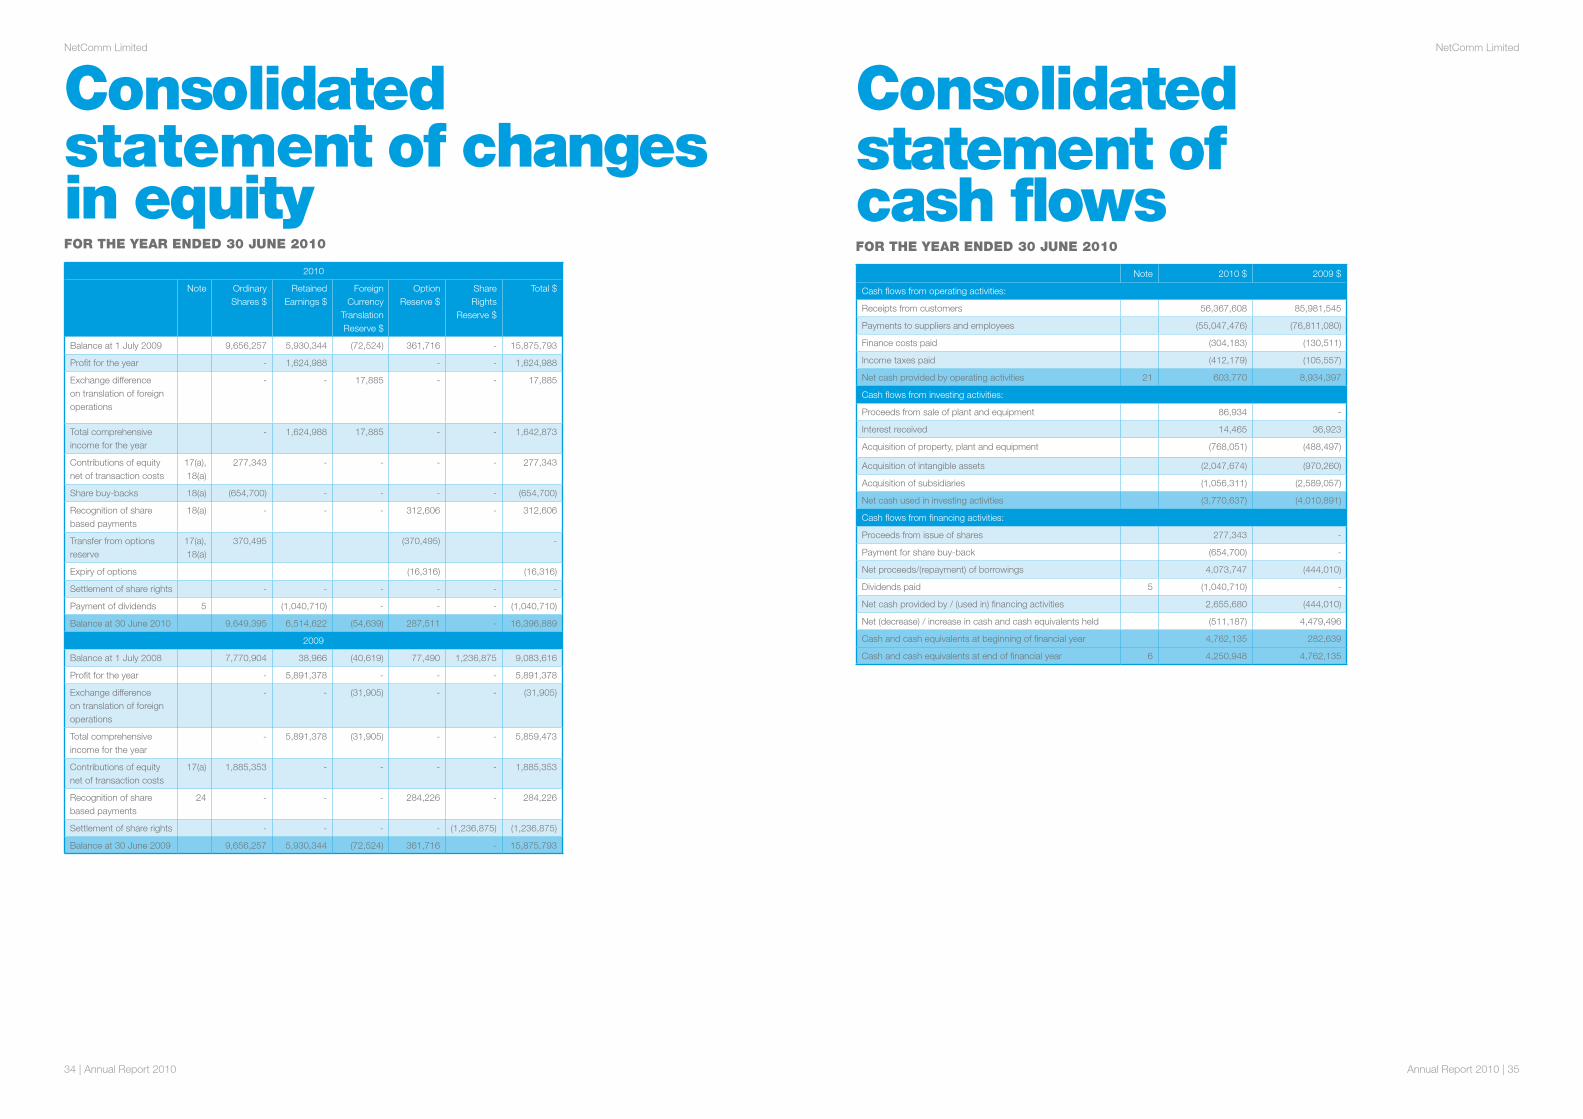
Consolidated statement of changes in equityFOR ThE YEaR ENDED 30 JuNE 2010
2010
Note Ordinary Shares $
Retained Earnings $
Foreign Currency
Translation Reserve $
Option Reserve $
Share Rights
Reserve $
Total $
Balance at 1 July 2009 9,656,257 5,930,344 (72,524) 361,716 - 15,875,793
Profit for the year - 1,624,988 - - 1,624,988
Exchange difference on translation of foreign operations
- - 17,885 - - 17,885
Total comprehensive income for the year
- 1,624,988 17,885 - - 1,642,873
Contributions of equity net of transaction costs
17(a), 18(a)
277,343 - - - - 277,343
Share buy-backs 18(a) (654,700) - - - - (654,700)
Recognition of share based payments
18(a) - - - 312,606 - 312,606
Transfer from options reserve
17(a), 18(a)
370,495 (370,495) -
Expiry of options (16,316) (16,316)
Settlement of share rights - - - - - -
Payment of dividends 5 (1,040,710) - - - (1,040,710)
Balance at 30 June 2010 9,649,395 6,514,622 (54,639) 287,511 - 16,396,889
2009
Balance at 1 July 2008 7,770,904 38,966 (40,619) 77,490 1,236,875 9,083,616
Profit for the year - 5,891,378 - - - 5,891,378
Exchange difference on translation of foreign operations
- - (31,905) - - (31,905)
Total comprehensive income for the year
- 5,891,378 (31,905) - - 5,859,473
Contributions of equity net of transaction costs
17(a) 1,885,353 - - - - 1,885,353
Recognition of share based payments
24 - - - 284,226 - 284,226
Settlement of share rights - - - - (1,236,875) (1,236,875)
Balance at 30 June 2009 9,656,257 5,930,344 (72,524) 361,716 - 15,875,793
Consolidated statement of cash flowsFOR ThE YEaR ENDED 30 JuNE 2010
Note 2010 $ 2009 $
Cash flows from operating activities:
Receipts from customers 56,367,608 85,981,545
Payments to suppliers and employees (55,047,476) (76,811,080)
Finance costs paid (304,183) (130,511)
Income taxes paid (412,179) (105,557)
Net cash provided by operating activities 21 603,770 8,934,397
Cash flows from investing activities:
Proceeds from sale of plant and equipment 86,934 -
Interest received 14,465 36,923
Acquisition of property, plant and equipment (768,051) (488,497)
Acquisition of intangible assets (2,047,674) (970,260)
Acquisition of subsidiaries (1,056,311) (2,589,057)
Net cash used in investing activities (3,770,637) (4,010,891)
Cash flows from financing activities:
Proceeds from issue of shares 277,343 -
Payment for share buy-back (654,700) -
Net proceeds/(repayment) of borrowings 4,073,747 (444,010)
Dividends paid 5 (1,040,710) -
Net cash provided by / (used in) financing activities 2,655,680 (444,010)
Net (decrease) / increase in cash and cash equivalents held (511,187) 4,479,496
Cash and cash equivalents at beginning of financial year 4,762,135 282,639
Cash and cash equivalents at end of financial year 6 4,250,948 4,762,135

36 | Annual Report 2010
NetComm Limited
Annual Report 2010 | 37
NetComm Limited
Notes to the financial statementsFOR ThE YEaR ENDED 30 JuNE 2010
1. statement of siGnificant accountinG policies
General informationThe financial statements are general purpose financial statements that have been prepared in accordance with Australian Accounting Standards, including Interpretations, other authoritative pronouncements of the Australian Accounting Standards Board and the Corporations Act 2001.
The financial statements cover the consolidated Group of NetComm Limited (the Group or the consolidated entity). NetComm Limited is a listed public company, incorporated and domiciled in Australia.
Accounting Standards include Australian equivalents to International Financial Reporting Standards (A-IFRS). Compliance with AIFRS ensures that the financial statements and notes of the Group comply with International Financial Reporting Standards (IFRS).
The financial statements were authorised for issue by the directors on 30 September 2010.
The following is a summary of the material accounting policies adopted by the Group in the preparation of the financial statements. The accounting policies have been consistently applied, unless otherwise stated.
Basis of PreparationThe financial statements have been prepared on an accruals basis and is based on historical costs modified by the revaluation of selected non current assets, financial assets and financial liabilities for which the fair value basis of accounting has been applied. Cost is based on the fair values of the consideration given in exchange for assets. All amounts are presented in Australian dollars, unless otherwise noted.
Critical accounting judgements and key sources of uncertaintyIn the application of the Group’s accounting policies, management is required to make judgements, estimates and assumptions about carrying values of assets and liabilities that are not readily apparent from other sources. The estimates and associated assumptions are based on historical experience and other factors that are considered to be relevant. Actual results may differ from these estimates. The estimates and underlying assumptions are reviewed on an ongoing basis. Revisions to accounting estimates are recognised in the period in which the estimate is revised if the revision affects only that period or in the period of the revision and future periods if the revision affects current and future periods. Refer to note 1(w) for a discussion of critical judgements in applying the entity’s accounting policies, and key sources of estimation uncertainty.
Adoption of new and revised Accounting StandardsIn the current year, the Group has adopted all of the new and revised Standards and Interpretations issued by the Australian Accounting Standards Board (the AASB) that are relevant to its operations and effective for the current annual reporting period. Details of the impact of the adoption of these new accounting standards are set out in the individual accounting policy notes set out below.
Notes to the financial statementsFOR ThE YEaR ENDED 30 JuNE 2010
1. statement of siGnificant accountinG policies (continued)
Adoption of new and revised Accounting Standards (continued)
Standards affecting presentation and disclosure
AASB 101 Presentation of Financial Statements (as revised in September 2007), AASB 2007-8 Amendments to Australian Accounting Standards arising from AASB 101 and AASB 2007-10 Further Amendments to Australian Accounting Standards arising from AASB 101
AASB 101 (September 2007) has introduced terminology changes (including revised titles for the financial statements) and changes in the format and content of the financial statements
AASB 8 Operating Segments AASB 8 is a disclosure Standard that has resulted in a redesignation of the Group’s reportable segments (see note 30)
AASB 2009-2 Amendments to Australian Accounting Standards – Improving Disclosures about Financial Instruments
The amendments to AASB 7 expand the disclosures required in respect of fair value measurements and liquidity risk. The Group has elected not to provide comparative information for these expanded disclosures in the current year in accordance with the transitional reliefs offered in these amendments.
Standards and Interpretations adopted with no effect on financial statementsThe following new and revised Standards and Interpretations have also been adopted in these financial statements. Their adoption has not had any significant impact on the amounts reported in these financial statements but may affect the accounting for future transactions or arrangements.
Standards affecting presentation and disclosure
AASB 2008-7 Amendments to Australian Accounting Standards – Cost of an Investment in a Subsidiary, Jointly Controlled Entity or Associate
The amendments deal with the measurement of the cost of investments in subsidiaries, jointly controlled entities and associates when adopting A-IFRS for the first time and with the recognition of dividend income from subsidiaries in a parent’s separate financial statements.
AASB 2008-1 Amendments to Australian Accounting Standard - Share-based Payments: Vesting Conditions and Cancellations
The amendments clarify the definition of vesting conditions for the purposes of AASB 2, introduce the concept of ‘non-vesting’ conditions, and clarify the accounting treatment for cancellations.
AASB 123 Borrowing Costs (as revised in 2007) and AASB 2007-6 Amendments to Australian Accounting Standards arising from AASB 123
The principal change to AASB 123 was to eliminate the option to expense all borrowing costs when incurred. This change has had no impact on these financial statements because it has always been the Group’s accounting policy to capitalise borrowing costs incurred on qualifying assets.
AASB 2008-2 Amendments to Australian Accounting Standards – Puttable Financial Instruments and Obligations Arising on Liquidation
The revisions to AASB 132 Financial Instruments: Presentation amend the criteria for debt/equity classification by permitting certain puttable financial instruments and instruments (or components of instruments) that impose on an entity an obligation to deliver to another party a pro-rata share of the net assets of the entity only on liquidation, to be classified as equity, subject to specified criteria being met.

38 | Annual Report 2010
NetComm Limited
Annual Report 2010 | 39
NetComm Limited
Notes to the financial statementsFOR ThE YEaR ENDED 30 JuNE 2010
1. statement of siGnificant accountinG policies (continued)
Adoption of new and revised Accounting Standards (continued)
Standards affecting presentation and disclosure
AASB 2008-8 Amendments to Australian Accounting Standards–Eligible Hedged Items
The amendments provide clarification on two aspects of hedge accounting: identifying inflation as a hedged risk or portion, and hedging with options.
Interpretation 16 Hedges of a Net Investment in a Foreign Operation The Interpretation provides guidance on the detailed requirements for net investment hedging for certain hedge accounting designations.
Interpretation 17 Distributions of Non-cash Assets to Owners and AASB 2008-13 Amendments to Australian Accounting Standards arising from AASB Interpretation 17 Distributions of Non-cash Assets to Owners
The Interpretation provides guidance on the appropriate accounting treatment when an entity distributes assets other than cash as dividends to its shareholders.
AASB 2008-5 Amendments to Australian Accounting Standards arising from the Annual Improvements Project and AASB 2008-6 Further Amendments to Australian Accounting Standards arising from the Annual Improvements Project
The amendments have led to a number of changes in the detail of the Group’s accounting policies – some of which are changes in terminology only, and some of which are substantive but have had no material effect on amounts reported.
AASB 2009-4 Amendments to Australian Accounting Standards arising from the Annual Improvements Project
The amendments have led to a number of changes in the detail of the Group’s accounting policies – some of which are changes in terminology only, and some of which are substantive but have had no material effect on amounts reported.
a. Principles of ConsolidationThe consolidated financial statements incorporate the assets and liabilities of all subsidiaries of NetComm Limited as at 30 June 2010 and the results of all subsidiaries for the year then ended.
A subsidiary is an entity over which NetComm Limited has the power to control the financial and operating policies of an entity so as to obtain benefits from its activities.
A list of subsidiaries is contained in Note 31 to the financial statements. All subsidiaries have a 30 June financial year end.
All intercompany balances and transactions between entities in the consolidated entity, including any unrealised profits or losses, have been eliminated on consolidation. Accounting policies of subsidiaries have been changed where necessary to ensure consistencies with those policies applied by the parent entity.
Subsidiaries are fully consolidated from the date which control is transferred to the Group. They are deconsolidated from the date control ceases.
Non-controlling interest in the net assets (excluding goodwill) of consolidated subsidiaries are identified separately from the Group’s equity therein. Non-controlling interests consist of the amount of those interests at the date of the original business combination and the non-controlling interest’s share of changes in equity since the date of the combination. Total comprehensive income is attributed to non-controlling interests even if this results in the non-controlling interests having a deficit balance.
Notes to the financial statementsFOR ThE YEaR ENDED 30 JuNE 2010
1. statement of siGnificant accountinG policies (continued)
b. Business CombinationsAcquisitions of subsidiaries and businesses are accounted for using the purchase method. The cost of the business combination is measured as the aggregate of the fair values (at the date of exchange) of assets given, liabilities incurred or assumed, and equity instruments issued by the Group in exchange for control of the acquiree. Acquisition related costs are recognised in the profit or loss as incurred. The acquiree’s identifiable assets, liabilities and contingent liabilities that meet the conditions for recognition under AASB 3 ‘Business Combinations’ are recognised at their fair values at the acquisition date, except for non-current assets (or disposal groups) that are classified as held for sale in accordance with AASB 5 ‘Non-current Assets Held for Sale and Discontinued Operations’, which are recognised and measured at fair value less costs to sell.
Goodwill arising on acquisition is recognised as an asset and initially measured at cost, being the excess of the cost of the business combination over the Group’s interest in the net fair value of the identifiable assets, liabilities and contingent liabilities recognised. If, after reassessment, the Group’s interest in the net fair value of the acquiree’s identifiable assets, liabilities and contingent liabilities exceeds the cost of the business combination the excess is recognised immediately in profit or loss.
The interest of minority shareholders in the acquiree is initially measured at the minority’s proportion of the net fair value of the assets, liabilities and contingent liabilities recognised.
Where settlement of any part of cash consideration is deferred, the amounts payable in the future are discounted to their present value as at the date of exchange. The discount rate used is the entity’s incremental borrowing rate, being the rate at which a similar borrowing could be obtained from an independent financier under comparable terms and conditions.
c. Foreign Currency Transactions and Balances
Functional and presentation currencyThe functional currency of each of the Group’s entities is measured using the currency of the primary economic environment in which that entity operates. The consolidated financial statements are presented in Australian dollars which is the parent entity’s functional and presentation currency.
Transaction and balancesForeign currency transactions are translated into functional currency using the exchange rates prevailing at the date of the transaction. Foreign currency monetary items are translated at the year end exchange rate. Non monetary items measured at historical cost continue to be carried at the exchange rate at the date of the transaction. Non monetary items measured at fair value are reported at the exchange rate at the date when fair values were determined.
Exchange differences arising on the translation of monetary items are recognised in profit or loss in the period in which they arise except for:• Exchange differences on transactions entered into in order to hedge certain foreign currency risks.

40 | Annual Report 2010
NetComm Limited
Annual Report 2010 | 41
NetComm Limited
Notes to the financial statementsFOR ThE YEaR ENDED 30 JuNE 2010
1. statement of siGnificant accountinG policies (continued)
c. Foreign currency transactions and balances (continued)
Group companiesThe financial results and position of foreign operations whose functional currency is different from the Group’s presentation currency are translated as follows:• assets and liabilities are translated at year end exchange rates prevailing at that reporting date;
• income and expenses are translated at average exchange rates for the period; and
• all resulting exchange differences shall be recognised in other comprehensive income and as a separate component of equity.
Exchange differences arising on translation of foreign operations are transferred directly to the Group’s foreign currency translation reserve in the statement of financial position. These differences are recognised in profit or loss in the period in which the operation is disposed. Goodwill and fair value adjustments arising on the acquisition of a foreign entity on or after the date of transition to A-IFRS are treated as assets and liabilities of the foreign entity and translated at exchange rates prevailing at the reporting date.
d. Goods and Services Tax (GST)Revenues, expenses and assets are recognised net of the amount of GST, except where the amount of GST incurred is not recoverable from the taxation authority or it is recognised as part of the cost of acquisition of an asset or part of an item of expenses.
Receivables and payables in the statement of financial position are shown inclusive of GST and the net amount of GST recoverable from, or payable to, the taxation authority is included as part of receivables or payables. Cash flows are presented in the statement of cash flows on a gross basis, except for the GST component of investing and financing activities, which are disclosed as operating cash flows.
e. Income TaxThe charge for current income tax expense is based on the profit for the year adjusted for any non assessable or disallowed items. It is calculated using the tax rates that have been enacted or are substantively enacted by the balance date.
Deferred tax is accounted for in respect of temporary differences arising between the tax bases of assets and liabilities and their carrying amounts in the financial statements. No deferred income tax will be recognised from the initial recognition of an asset or liability, excluding a business combination, where there is no effect on accounting or taxable profit or loss.
Notes to the financial statementsFOR ThE YEaR ENDED 30 JuNE 2010
1. statement of siGnificant accountinG policies (continued)
e. Income Tax (continued)Deferred tax is calculated at the tax rates that are expected to apply to the period when the asset is realised or liability is settled. Deferred tax is credited in profit or loss except where it relates to items that may be credited directly to equity, in which case the deferred tax is adjusted directly against equity.
Deferred tax assets are recognised to the extent that it is probable that future tax profits will be available against which deductible temporary differences can be utilised.
The amount of benefits brought to account or which may be realised in the future is based on the assumption that no adverse change will occur in income taxation legislation and the anticipation that the consolidated Group will derive sufficient future assessable income to enable the benefit to be realised and comply with the conditions of deductibility imposed by the law.
f. Revenue RecognitionRevenue is measured at the fair value of consideration received or receivable. Revenue is reduced for estimated customer returns, rebates and other similar allowances.
Revenue from the sale of goods, including communications and networking devices, are recognised at the time goods are dispatched to customers.
Revenue from a contract to provide services is recognised on a pro-rata basis over the term of the service agreement.
Interest revenue is accrued on a time basis, by reference to the principal outstanding and at the effective interest rate applicable, which is the rate that exactly discounts estimated future cash receipts through the expected life of the financial asset to that asset’s net carrying amount.
Other revenue is recognised when the right to receive the revenue has been established.
All revenue is stated net of the amount of goods and services tax (GST).
g. Share-based PaymentsEquity settled compensation benefits are provided to employees via the Employee Option Plan. Information relating to this scheme is set out in note 24.
The fair value of options granted is recognised as an employee benefit expense with a corresponding increase in equity. The fair value is measured at grant date and recognised over the period during which the employees become unconditionally entitled to the options.
The fair value at grant date is independently determined using a Binomial Approximation option pricing model that takes into account the exercise price, the term of the option, the share price at grant date, the expected volatility of the underlying share, the expected dividend yield and the risk free rate for the term of the option.

42 | Annual Report 2010
NetComm Limited
Annual Report 2010 | 43
NetComm Limited
Notes to the financial statementsFOR ThE YEaR ENDED 30 JuNE 2010
1. statement of siGnificant accountinG policies (continued)
g. Share-based Payments (continued)The fair value of the options granted excludes the impact of any non market vesting conditions. Non market vesting conditions are included in assumptions about the number of options that are expected to vest. At each balance date, the entity revises its estimate of the number of options that are expected to vest. The employee benefit expense recognised each period takes into account the most recent estimate. Upon the exercise of options, the balance of the share based payments reserve relating to those options is transferred to share capital and the proceeds received, net of any directly attributable transaction costs, are credited to share capital.
Equity-settled share based payment transactions with other parties are measured at the fair value of the goods and services received, except where the fair value cannot be estimated reliably, in which case they are measured at the fair value of the equity instruments granted, measured at the date the entity obtains the goods or the counterparty renders the service. For cash-settled share-based payments, a liability equal to the portion of the goods or services received is recognised at the current fair value determined at each reporting date.
h. Property, Plant and EquipmentEach class of property, plant and equipment is carried at cost less, where applicable, any accumulated depreciation and impairment losses. Cost includes all directly attributable expenditure incurred including costs to get the asset ready for its use as intended by management. Costs include an estimate of any expenditure expected to be incurred at the end of the asset’s useful life, including restoration, rehabilitation and decommissioning costs.
The carrying amount of property, plant and equipment is reviewed annually by directors for indications of impairment. If any such indications exist, an impairment test is carried out, and any impairment losses on the assets recognised.
DepreciationThe depreciable amount of all fixed assets is depreciated on a straight line basis over their useful lives to the Group commencing from the time the asset is held ready for use. Leasehold improvements are depreciated over the shorter of either the unexpired period of the lease or the estimated useful lives of the improvements. The depreciable amount is the carrying value of the asset less estimated residual amounts. The residual amount is based on what a similar asset of the expected condition of the asset at the end of its useful life could be sold for.
The depreciation rates used for each class of depreciable assets are:
Class of Asset Useful life
Plant and equipment 2-4 years
Leasehold improvements 6 years
The assets’ residual values and useful lives are reviewed, and adjusted if appropriate, at each balance date. Gains and losses on disposals are determined by comparing proceeds with the carrying amount. These gains and losses are recognised in profit or loss.
Notes to the financial statementsFOR ThE YEaR ENDED 30 JuNE 2010
1. statement of siGnificant accountinG policies (continued)
i. Impairment of AssetsAt each reporting date, the Group reviews the carrying values of its tangible and intangible assets to determine whether there is any indication that those assets have been impaired. If such an indication exists, the recoverable amount of the asset, being the higher of the asset’s fair value less costs to sell and value in use, is compared to the asset’s carrying value. Any excess of the asset’s carrying value over its recoverable amount is recognised in profit or loss. In assessing value in use, the estimated future cash flows are discounted to their present value using a pre tax discount rate that reflects current market assessments of the time value of money and the risks specific to the asset for which the estimates of future cash flows have not been adjusted.
Where it is not possible to estimate the recoverable amount of an individual asset, the Group estimates the recoverable amount of the cash generating unit to which the asset belongs.
Where an impairment loss subsequently reverses, the carrying amount of the asset or cash generating unit is increased to the revised recoverable amount, but so that the increased carrying amount does not exceed the carrying amount that would have been determined had no impairment loss been recognised in prior years. A reversal of an impairment loss is recognised immediately in profit or loss. Impairment of goodwill is not reversed.
j. LeasesLeases of fixed assets where substantially all the risks and benefits incidental to the ownership of the asset, but not the legal ownership that are transferred to entities in the Group are classified as finance leases.
Finance leases are capitalised by recording an asset and a liability at the lower of the amounts equal to the fair value of the leased property or the present value of the minimum lease payments, including any guaranteed residual values. Lease payments are allocated between the reduction of the lease liability and the lease interest expense for the period. The interest expense is recognised in the profit or loss so as to achieve a constant periodic rate of interest on the remaining balance of the liability outstanding.
Lease payments for operating leases, where substantially all of the risks and benefits remain with the lessor, are recognised in profit or loss on a straight line basis over the lease term. Contingent rentals are recognised as an expense in the period in which they are incurred.
Lease incentives under operating leases are recognised as a liability and amortised on a straight line basis over the life of the lease.

44 | Annual Report 2010
NetComm Limited
Annual Report 2010 | 45
NetComm Limited
Notes to the financial statementsFOR ThE YEaR ENDED 30 JuNE 2010
1. statement of siGnificant accountinG policies (continued)
k. Derivative Financial InstrumentsThe fair value of all derivative financial instruments outstanding at reporting date are recognised in the statement of financial position as either financial assets or financial liabilities. Changes in the fair value of derivative financial instruments that are designated and effective as hedges of future cash flows are recognised directly in equity, with any ineffective portion being recognised in profit or loss.
Changes in the fair value of derivative financial instruments are recognised in profit or loss as they arise.
Derivatives embedded in other financial instruments, or other non financial host contracts, are treated as separate derivatives when their risks and characteristics are not closely related to those of the host contract, and the host contract is not carried at fair value with unrealised gains or losses reported in profit or loss.
l. Financial AssetsFinancial assets are classified into the following specified category: ‘loans and receivables’. The classification depends on the nature and purpose of the financial assets and is determined at the time of initial recognition.
Loans and receivablesTrade receivables, loans and other receivables that have fixed or determinable payments that are not quoted in an active market are classified as ‘loans and receivables’. Loans and receivables are measured at amortised cost using the effective interest method less impairment. Interest income is recognised by applying the effective interest rate.
Appropriate allowances for estimated irrecoverable amounts are recognised in profit or loss when there is objective evidence that the asset is impaired. The allowance recognised is measured as the difference between the asset’s carrying amount and the present value of estimated future cash flows discounted at the effective interest rate computed at initial recognition.
Effective interest methodThe effective interest method is a method of calculating the amortised cost of a financial asset and of allocating interest income over the relevant period. The effective interest rate is the rate that exactly discounts estimated future cash receipts (including all fees on points paid or received that form an integral part of the effective interest rate, transaction costs and other premiums or discounts) through the expected life of the financial asset, or, where appropriate, a shorter period. Income is recognised on an effective interest basis for debt instruments.
m. Cash and Cash EquivalentsCash and cash equivalents include cash on hand and in banks, deposits held at call with banks and financial institutions, investments in money market instruments with maturities of three months or less from the date of acquisition, and bank overdrafts. Bank overdrafts are shown within short term borrowings in current liabilities on the statement of financial position.
Notes to the financial statementsFOR ThE YEaR ENDED 30 JuNE 2010
1. statement of siGnificant accountinG policies (continued)
n. InventoriesFinished goods and raw materials are valued at the lower of cost and net realisable value. Cost is the direct cost of purchase, plus freight and duty and any other costs directly attributable to acquisition. Net realisable value represents the estimated selling price for inventories less all estimated costs of completion and costs necessary to make the sale. Inventory is recognised on a weighted average cost basis.
o. Intangibles
Research and development costsExpenditure during the research phase of a project is recognised as an expense when incurred. Development costs (relating to the design and testing of new or improved products) are recognised as intangible assets when it is probable that the project will generate future benefits considering its commercial and technical feasibility and its cost can be measured reliably. The expenditure capitalised consists of all directly attributable costs. Capitalised development costs are amortised from the point at which the product is ready for use but no longer than 3 years.
Subsequent to initial recognition, intangible assets are reported at cost less accumulated amortisation and impairment costs.
Computer softwareComputer software is measured on the cost basis less amortisation and impairment losses. Computer software is amortised on a straight line basis over 3.3 years, commencing from the time the software is ready for use.
p. Borrowing CostsBorrowing costs are recognised in profit or loss in the period in which they are incurred.
q. Employee BenefitsProvision is made for the Group’s liability for employee benefits arising from services rendered by employees to balance date, including wages and salaries, annual leave and long service leave. Employee benefits that are expected to be settled within one year have been measured at the amounts expected to be paid when the liability is settled, plus related on costs. Employee benefits payable later than one year have been measured at present value of the estimated future cash outflows to be made for those benefits.
Contributions are made by the Group to employee superannuation funds which are of the defined contribution type. Contributions to these defined contribution superannuation schemes are recognised as an expense in the period they are payable.

46 | Annual Report 2010
NetComm Limited
Annual Report 2010 | 47
NetComm Limited
Notes to the financial statementsFOR ThE YEaR ENDED 30 JuNE 2010
1. statement of siGnificant accountinG policies (continued)
r. Financial instruments issued by the group
Debt and equity instrumentsDebt and equity instruments are classified as either liabilities or equity in accordance with the substance of the contractual arrangement. An equity instrument is any contract that evidences a residual interest in the assets of an entity after deducting all of its liabilities. Equity instruments issued by the Group are recorded at the proceeds received, net of direct issue costs.
Financial guarantee contract liabilitiesFinancial guarantee contract liabilities are measured initially at their fair values and subsequently at the higher of:
• The amount of the obligation under the contract, as determined under AASB 137 ‘Provisions, Contingent Liabilities and Contingent Assets’; and
• The amount initially recognised less, where appropriate, cumulative amortisation in accordance with the Group’s revenue recognition policies.
Other financial liabilitiesOther financial liabilities, including borrowings, are initially measured at fair value, net of transaction costs and are subsequently measured at amortised cost using the effective interest method, with the interest expense recognised in an effective yield basis. The effective interest method is a method of calculating the amortised cost of a financial liability and of allocating interest expense over the relevant period. The effective interest rate is the rate that exactly discounts estimated future cash payments through the expected life of the financial liability, or, where appropriate, a shorter period.
Trade payablesTrade payables are initially measured at fair value, and are subsequently measured at amortised cost.
s. ProvisionsProvisions are recognised when the Group has a legal or constructive obligation, as a result of past events, for which it is probable that an outflow of economic benefits will result and that outflow can be reliably measured.
t. Earnings per shareBasic earnings per share is determined by dividing net profit after income tax attributable to members of the company, by the weighted average number of ordinary shares outstanding during the financial year, adjusted for bonus elements in ordinary shares issued during the year.
Diluted earnings per share adjusts the figures in the determination of basic earnings per share by taking into account the after income tax effect of interest and other financing costs associated with dilutive potential ordinary shares and the weighted average number of shares assumed to have been issued for no consideration in relation to dilutive potential ordinary shares.
Notes to the financial statementsFOR ThE YEaR ENDED 30 JuNE 2010
1. statement of siGnificant accountinG policies (continued)
u. DividendsA liability is recorded for the amount of any dividend declared, determined or publicly recommended by the directors on or before the end of financial year but not distributed at balance date.
v. Standards and Interpretations issued not yet effectiveAt the date of authorisation of the financial report, the Standards and Interpretations listed below were in issue but not yet effective.
Initial application of the following Standards/Interpretations is not expected to have any material impact on the financial report of the company:
Standard/Interpretation Effective for annual reporting periods beginning
on or after
Expected to be initially applied in the financial year
ending
AASB 2009-8 Amendments to Australian Accounting Standards –Group Cash-Settled Share-based Payment Transactions
1 January 2010 30 June 2011
AASB 2009-10 Amendments to Australian Accounting Standards – Classification of Rights Issues
1 February 2010 30 June 2011
AASB 124 Related Party Disclosures (revised December 2009), AASB 2009-12 Amendments to Australian Accounting Standards
1 January 2011 30 June 2012
AASB 9 Financial Instruments, AASB 2009-11 Amendments to Australian Accounting Standards arising from AASB 9
1 January 2013 30 June 2014
AASB 2009-14 Amendments to Australian Interpretation – Prepayments of a Minimum Funding Requirement
1 January 2011 30 June 2012
Interpretation 19 Extinguishing Financial Liabilities with Equity Instruments 1 July 2010 30 June 2011
AASB 2009-5 Further Amendments to Australian Accounting Standards arising from the Annual Improvements Project
1 January 2010 30 June 2011
AASB 2010-3 Amendments to Australian Accounting Standards arising from the Annual Improvements Project
1 July 2010 30 June 2011
AASB 2010-4 Further Amendments to Australian Accounting Standards arising from the Annual Improvements Project
1 January 2011 30 June 2012

48 | Annual Report 2010
NetComm Limited
Annual Report 2010 | 49
NetComm Limited
Notes to the financial statementsFOR ThE YEaR ENDED 30 JuNE 2010
1. statement of siGnificant accountinG policies (continued)
w. Critical accounting estimates and judgementsThe directors evaluate estimates and judgments incorporated into the financial statements based on historical knowledge and best available current information. Estimates assume a reasonable expectation of future events and based on current trends and economic data, obtained both externally and within the Group.
The following are the critical judgements (apart from those involving estimations, which are dealt with below) that management has made in the process of applying the Group’s accounting policies and that have the most significant effect on the amounts recognised in the financial statements.
InventoriesNote 8 sets out the categories of inventories carried. The net realisable value of inventories is the estimated selling price in the ordinary course of business less estimated costs to sell which approximates fair value less costs to sell. The key assumptions require the use of management judgement and are reviewed annually. These key assumptions are the variables affecting the estimated costs to sell and expected selling price. Any reassessment of cost to sell or selling price in a particular year will affect the cost of goods sold.
The following are the key assumptions concerning the future, and other key sources of estimation uncertainty at the reporting date, that have a significant risk of causing a material adjustment to the carrying amounts of assets and liabilities within the next financial year:
Fair value of goods acquiredIn the prior year, the Group acquired goods in exchange for consideration paid in cash and in equity. Estimating the fair value of the goods acquired, and therefore the value of the component of consideration recognised in equity, required the use of management judgement.
Impairment of assetsThe Group assesses impairment at each reporting date by evaluating conditions specific to the Group that may lead to impairment of assets. Where an impairment trigger exists, the recoverable amount of the asset is determined. Value in use calculations performed in assessing recoverable amounts incorporate a number of key estimates.
Deferred Tax AssetIn the prior year, the Group recognised tax losses which had not previosuly been brought to account. Tax losses have been booked to the extent that the Group considers it probable of recoupment with reference to taxable income forecasts. Taxable income forecasts incorporate a number of key judgements and estimates.
Notes to the financial statementsFOR ThE YEaR ENDED 30 JuNE 2010
1. statement of siGnificant accountinG policies (continued)
w. Critical accounting estimates and judgements (continued)
Internally generated intangible assets – research and development expenditureExpenditure on research activities is recognised as an expense in the period in which it is incurred. An internally-generated intangible asset arising from development (or from the development phase of an internal project) is recognised if, and only if, all of the following have been demonstrated:• the technical feasibility of completing the intangible asset so that it will be available for use or sale;
• the intention to complete the intangible asset and use or sell it;
• the ability to use or sell the intangible asset;
• how the intangible asset will generate probable future economic benefits;
• the availability of adequate technical, financial and other resources to complete the development and to use or sell the intangible asset; and
• the ability to measure reliably the expenditure attributable to the intangible asset during its development.
The amount initially recognised for internally-generated intangible assets is the sum of the expenditure incurred from the date when the intangible asset first meets the recognition criteria listed above. Where no internally-generated intangible asset can be recognised, development expenditure is recognised in profit or loss in the period in which it is incurred. Subsequent to initial recognition, internally-generated intangible assets are reported at cost less accumulated amortisation and accumulated impairment losses, on the same basis as intangible assets that are acquired separately.
x. GoodwillGoodwill acquired in a business combination is initially measured at its cost, being the excess of the cost of the business combination over the Group’s interest in the net fair value of the identifiable assets, liabilities and contingent liabilities recognised at the date of the acquisition. Goodwill is subsequently measured at its cost less any accumulated impairment losses.
For the purpose of impairment testing, goodwill is allocated to each of the Group’s cash generating units, or groups of cash-generating units, expected to benefit from the synergies of the business combination. Cash-generating units or groups of cash-generating units to which goodwill has been allocated are tested for impairment annually or more frequently if events or changes in circumstances indicate that goodwill might be impaired.
If the recoverable amount of the cash-generating unit (or group of cash-generating units) is less than the carrying amount of the cash-generating unit (or groups of cash-generating units), the impairment loss is allocated first to reduce the carrying amount of any goodwill allocated to the cash-generating unit (or groups of cash-generating units) and then to the other assets of the cash generating units pro-rata on the basis of the carrying amount of each asset in the cash-generating unit (or groups of cash-generating units). An impairment loss recognised for goodwill is recognised immediately in profit or loss and is not reversed in a subsequent period. On disposal of an operation within a cash-generating unit, the attributable amount of goodwill is included in the determination of the profit or loss on disposal of the operation.

50 | Annual Report 2010
NetComm Limited
Annual Report 2010 | 51
NetComm Limited
Notes to the financial statementsFOR ThE YEaR ENDED 30 JuNE 2010
2. revenue and other income
Revenue 2010 $ 2009 $
Sales revenue 55,201,037 78,415,889
55,201,037 78,415,889
Other income 2010 $ 2009 $
Interest revenue 14,465 36,923
Other revenue 48,938 20,576
63,403 57,499
Total revenue and other income 55,264,440 78,473,388
3. eXpenses
Included in expenses are the following specific items
Other expenses comprising: 2010 $ 2009 $
Advertising and marketing 858,872 1,523,923
Property expenses 614,252 494,068
Distribution and selling costs 899,137 967,466
Insurance expenses 221,697 154,972
Legal & professional fees 580,865 697,691
Travel expenses 728,435 429,885
Contractor costs 628,340 454,751
Other expenses 1,466,230 1,412,416
5,997,828 6,135,172
Depreciation, amortisation and impairments:
Depreciation of property, plant and equipment (note 10(b))
332,213 196,113
Amortisation of intangible assets (note 12(b)) 1,514,077 576,108
1,846,290 772,221
Remuneration of parent company auditor: 2010 $ 2009 $
Auditing or reviewing the financial statements 127,943 104,074
Taxation services 30,190 14,526
158,133 118,600
The auditor of the Group is Deloitte Touche Tohmatsu.
Other auditors 2010 $ 2009 $
Auditing or reviewing the financial report - 2,522
Taxation services 5,400 -
Other assurance services 44,984 77,243
50,384 79,765
Notes to the financial statementsFOR ThE YEaR ENDED 30 JuNE 2010
3. eXpenses (continued)
Expenses (continued) 2010 $ 2009 $
Rental expenses on operating leases
Minimum lease payments 494,349 390,735
Finance Costs
Trade finance and deferred acquisitions 279,093 120,593
Finance leases 25,090 9,918
304,183 130,511
Cost of sales 37,337,655 59,376,643
(Reversal)/impairment of doubtful receivables (70,770) 150,283
Defined contribution superannuation expenses 521,513 494,716
Loss on sale of property, plant and equipment 1,785 1,674
Research & development costs 68,213 264,010
Share-based payments - equity settled benefit 296,290 284,226
4. income taX eXpense
a. Income tax recognised in profit or loss
Tax expense/(benefit) comprises 2010 $ 2009 $
Current tax expense 342,673 1,786,895
Deferred tax (benefit) relating to the origination and reversal of temporary differences
313,128 (109,474)
Under/(Over) provision for tax in prior year 13,415 (67,425)
Benefit arising from previously unrecognised tax losses, tax credits or temporary differences of a prior period that is used to reduce deferred tax expense
- (2,204,945)
Total tax expense/(benefit) 669,216 (594,949)
The nature of the evidence supporting the recognition of tax losses incurred in prior periods includes forecast taxable income that is expected to arise in the next 2 years as a result of new supply and distribution agreements entered into by the Group in prior years.
Tax losses arising from the reversal of timing differences recognised in the year are also expected to be recouped against forecast taxable income.
b. The prima facie income tax expense/(benefit) on pre-tax accounting profit from operations reconciles to the income tax expense/(benefit) in the financial statements as follows:
2010 $ 2009 $
Net profit before tax 2,294,204 5,296,429
Tax at the Australian tax rate of 30% (2009: 30%) 688,261 1,588,929
- Share based payments 88,887 85,283
- Entertainment 10,519 3,209
- Research and development (131,866) -
- Previously unrecognised and unused tax losses and tax offsets now recognised as deferred tax assets
- (2,204,945)
- Under/(over) provision for tax in prior year 13,415 (67,425)
Income tax expense/(benefit) 669,216 (594,949)

52 | Annual Report 2010
NetComm Limited
Annual Report 2010 | 53
NetComm Limited
Notes to the financial statementsFOR ThE YEaR ENDED 30 JuNE 2010
4. income taX Benefit (continued)
c. Deferred tax assets/(liabilities) arise from the following:
Opening balance Charged to income Closing balance
2010
Unused tax losses 2,114,207 (970,908) 1,143,299
Temporary differences
Accrued expenses 106,197 (45,382) 60,815
Provisions 217,205 213,406 430,611
Inventory 104,001 120,994 224,995
Other (48,174) 368,762 320,588
2,493,436 (313,128) 2,180,308
Opening balance Charged to income Closing balance
2009
Unused tax losses 1,363,799 750,408 2,114,207
Temporary differences
Accrued expenses 65,812 40,385 106,197
Provisions 134,058 83,147 217,205
Inventory 26,808 77,193 104,001
Other 43,077 (91,251) (48,174)
1,633,554 859,882 2,493,436
The directors believe the future income tax benefit should only be recognised if and when:i. Future assessable income is derived of a nature and of an amount sufficient to enable the benefit to be realised;
ii. The conditions for deductibility imposed by tax legislation are complied with; and
iii. No changes in tax legislation adversely affect the consolidated entity’s ability to realise the benefits.
d. Future income tax benefits arising from tax losses not brought to account at balance date as realisation of the benefit is not regarded as probable.
2010 $ 2009 $
Tax losses at 30% (2009: 30%) - 28,870
Capital losses at 30% (2009: 30%) 170,904 170,904
170,904 199,774
Notes to the financial statementsFOR ThE YEaR ENDED 30 JuNE 2010
5. dividendsAn interim unfranked dividend of $0.01 per share totalling $1,040,710 was paid during the year-ended 30 June 2010 (2009: $nil).
a. Balance of franking account
2010 $ 2009 $
Balance of franking account at period end adjusted for franking credits arising from dividends recognised as receivables, and franking debits arising from payment of proposed dividends, and franking credits that may be prevented from distribution in subsequent financial years
- -
6. cash and cash equivalents
a. Cash on hand
2010 $ 2009 $
Cash on hand 1,583 1,781
Cash at bank 4,249,365 4,760,354
4,250,948 4,762,135
b. Effective interest rateThese funds are bearing floating interest rates of between 0.3% and 1.0% (2009: 0.05% to 3.0%).
2010 $ 2009 $
Cash at the end of the financial year as shown in the statement of cash flows is reconciled to items in the statement of financial position as follows:
Cash and cash equivalents 4,250,948 4,762,135
4,250,948 4,762,135
7. trade and other receivaBles
2010 $ 2009 $
Trade receivables (i) 8,368,033 4,362,823
Allowance for doubtful debts (109,065) (181,453)
8,258,968 4,181,370
i. The average credit period on sales of goods and rendering of services is 30 days, although a few customers have 45 day terms. No interest is charged on overdue receivables. An allowance has been made for estimated unrecoverable trade receivable amounts arising from the past sale of goods and rendering of services, determined by reference to past default experience. The Group will also consider any change in the quality of the trade receivable from the date credit was initially granted up to the reporting date. Before accepting any new customers, the Group will obtain third party references to assess the potential customer’s credit quality and define the credit limits by customer. Included in the Group’s trade receivable balance are debtors with a carrying amount of $1,620,185 (2009: $1,702,729 ) which are past due at the reporting date for which the Group has not provided as there has not been a significant change in credit quality and the amounts are still considered recoverable. The Group does not hold any collateral over these balances. The average age of these receivables is 47 days (2009: 47 days).

54 | Annual Report 2010
NetComm Limited
Annual Report 2010 | 55
NetComm Limited
Notes to the financial statementsFOR ThE YEaR ENDED 30 JuNE 2010
7. trade and other receivaBles (continued)
Aging of past due but not impaired 2010 $ 2009 $
30 - 60 days 1,559,102 1,622,556
60 - 90 days 43,966 51,254
90+ days 17,117 28,919
1,620,185 1,702,729
Movement in the allowance for doubtful debts 2010 $ 2009 $
Balance at the beginning of the year 181,453 31,170
Increase/(decrease) in allowance for impairment (70,770) 154,565
Amounts written off as uncollectible (1,618) (4,283)
Balance at the end of the year 109,065 181,453
Aging of impaired receivables 2010 $ 2009 $
30 - 60 days - -
60 - 90 days - -
90+ days 109,065 181,453
109,065 181,453
8. inventories
2010 $ 2009 $
Current
Raw materials and stores 277,208 689,239
Finished goods 9,072,076 4,996,552
NetAssure inventories - components 371,168 120,960
Goods in transit 512,876 1,888,999
10,233,328 7,695,750
Non - Current
NetAssure inventories - components 2,924,072 3,211,604
9. other assets
2010 $ 2009 $
Prepayments 70,439 123,206
Deposits and bonds 259,217 -
329,656 123,206
Notes to the financial statementsFOR ThE YEaR ENDED 30 JuNE 2010
10. property, plant and equipment
a. Summary of Property, plant and equipment
2010 $ 2009 $
Plant and equipment
At cost 3,243,890 2,527,706
Less accumulated depreciation (2,171,531) (1,956,044)
Total plant and equipment 1,072,359 571,662
Leased plant and equipment
At cost 339,750 342,120
Less accumulated amortisation (98,789) (24,902)
Total leased plant and equipment 240,961 317,218
Leasehold improvements
At cost 193,420 176,062
Less accumulated amortisation (133,254) (114,023)
Total leasehold improvements 60,166 62,039
Total property,plant and equipment 1,373,486 950,919
b. Movements in carrying amounts
Plant and equipment $
Leased plant and equipment $
Leasehold improvements $
Total $
2010
Balance at the beginning of the year 571,662 317,218 62,039 950,919
Additions 749,429 - 18,622 768,051
Disposals (6,228) (7,252) - (13,480)
Net foreign currency translation differences 169 42 (2) 209
Depreciation/amortisation expenses (242,673) (69,047) (20,493) (332,213)
Carrying amount at the end of the year 1,072,359 240,961 60,166 1,373,486
2009
Balance at the beginning of the year 409,146 71,503 39,635 520,284
Additions 222,876 262,754 32,106 517,736
Acquisitions through business combinations 109,419 - - 109,419
Disposals (2,439) - - (2,439)
Net foreign currency translation differences 2,165 (87) (46) 2,032
Depreciation/amortisation expenses (169,505) (16,952) (9,656) (196,113)
Carrying amount at the end of the year 571,662 317,218 62,039 950,919

56 | Annual Report 2010
NetComm Limited
Annual Report 2010 | 57
NetComm Limited
Notes to the financial statementsFOR ThE YEaR ENDED 30 JuNE 2010
11. Goodwill
2010 $ 2009 $
Gross carrying amount
Balance at beginning of financial year 840,101 -
Reassessment of goodwill post acquisition 55,898
Additional amounts recognised from business combinations occurring during the period (note 27)
- 840,101
Balance at end of financial year 895,999 840,101
Net book value
At the beginning of the financial year 840,101 -
At the end of the financial year 895,999 840,101
All Goodwill has arisen from acquisitions made during the prior financial year.
During the financial year, the Group assessed the recoverable amount of goodwill by applying a value in use model for each identified cash generating unit. It was determined that goodwill associated with the Group’s activities was not impaired and there was no other circumstances in the performance of acquired entities indicating impairment. Both businesses have continued to operate and perform in accordance with the expectations of the Group. Goodwill has been allocated for impairment testing purposes to the following cash-generating units representing the goodwill that arose in the acquisition of each business: Call Direct Cellular Solutions 2003 Pty Limited; and C10 Communications Pty Limited.
Call Direct Cellular Solutions 2003 Pty LimitedThe primary assumptions underlying the cash flow projections include modest revenue growth of 4-6% for the next three years and a negative terminal growth rate of 3% thereafter.
C10 Communications Pty LimitedThe primary assumptions underlying the cash flow projections include negative revenue growth of 10-20% for the next three years and a negative terminal growth rate of 25% thereafter.
The forecasted future cash flows for both cash-generating units are discounted by the pre-tax weighted average cost of capital of Netcomm Limited of 12% (2009: 12%).
Notes to the financial statementsFOR ThE YEaR ENDED 30 JuNE 2010
12. other intanGiBle assets
a. Summary of intangible assets
2010 $ 2009 $
Development costs
Cost 3,111,010 1,244,845
Accumulated amortisation (830,453) (273,969)
Net carrying value 2,280,557 970,876
Computer software
Cost 771,077 701,977
Accumulated amortisation (547,727) (404,506)
Net carrying amount 223,350 297,471
Other intangibles
Cost 2,442,000 2,442,000
Accumulated amortisation (1,099,667) (266,626)
Net carrying amount 1,342,333 2,175,374
Total 3,846,240 3,443,721
b. Movements in carrying amounts
Development costs $
Computer software $
Other intangibles $
Total $
2010
Balance at the beginning of the year 970,876 297,471 2,175,374 3,443,721
Additions 1,866,166 125,720 - 1,991,886
Disposals (75,240) - (75,240)
Net foreign currency translation differences - (50) - (50)
Amortisation (556,485) (124,551) (833,041) (1,514,077)
Carrying amount at year end 2,280,557 223,350 1,342,333 3,846,240
2009
Balance at the beginning of the year 482,419 123,210 - 605,629
Additions 697,931 274,639 2,442,000 3,414,570
Net foreign currency translation differences - (370) - (370)
Amortisation (209,474) (100,008) (266,626) (576,108)
Carrying amount at year end 970,876 297,471 2,175,374 3,443,721

58 | Annual Report 2010
NetComm Limited
Annual Report 2010 | 59
NetComm Limited
Notes to the financial statementsFOR ThE YEaR ENDED 30 JuNE 2010
13. trade and other payaBles
2010 $ 2009 $
Current unsecured liabilities
Trade payables (i) 6,231,456 3,303,999
Sundry payables and accrued expenses 1,130,436 1,516,081
Letter of credit 2,555,509 2,105,185
Total current trade and other payables 9,917,401 6,925,265
i. The average credit period on purchases of certain goods from various Asian countries is 30 days, although some request payment in advance of shipment. No interest is charged on overdue payables. The Group has financial risk management policies in place to ensure that all payables are paid within the credit timeframe.
14. BorrowinGs
2010 $ 2009 $
Current - Secured
Finance lease 96,361 94,207
Trade receivable finance 539,843 486,852
Trade refinance 5,030,540 933,666
5,666,744 1,514,725
Non-Current - Secured
Finance lease 183,581 261,854
Total borrowings 5,850,325 1,776,579
The trade refinance facility is secured by a mortgage debenture with a fixed and floating charge over all assets and liabilities of NetComm Limited. The trade receivables finance facility is secured against the Group’s trade receivables. The finance lease is secured against the underlying finance lease asset. Refer to Note 20 for further details of this borrowing.
15. provisions
2010 $ 2009 $
Current
Employee entitlements 1,713,007 1,350,084
Non - current
Employee entitlements 99,525 76,608
Total provisions 1,812,532 1,426,692
Notes to the financial statementsFOR ThE YEaR ENDED 30 JuNE 2010
16. other liaBilities
2010 $ 2009 $
Current
Deferred income - current 37,573 428,900
Deferred acquisition consideration (i) 175,000 974,413
212,573 1,403,313
Non-current
Deferred acquisition consideration (i) - 135,223
Total other liabilities 212,573 1,538,536
Deferred acquisition consideration in 2009 represented future payments for the Call Direct Cellular Solutions 2003 Pty Ltd and C10 Communications Pty Ltd acquisitions. The balance of deferred acquisition consideration as at 30 June 2010 is in respect of the remaining future payments for the Call Direct Cellular Solutions 2003 Pty Limited.
17. issued capital
2010 $ 2009 $
102,968,233 (2009: 103,142,267) Ordinary shares
9,649,395 9,656,257
a. Movements in issued and paid up ordinary share capital of the company
2010 No. 2009 No. 2010 $ 2009 $
At the beginning of the reporting period 103,142,267 91,111,066 9,656,257 7,770,904
Shares issued during the year
3 Nov 2008 (i) - 8,074,534 - 1,300,000
20 Jan 2009 (ii) - 3,831,667 - 574,753
30 Oct 2009 (iii) 271,224 - 100,110 -
Shares purchased under share buy-back scheme (2,555,878) - (654,700) -
Exercise of Options 2,110,620 125,000 547,728 10,600
At reporting date 102,968,233 103,142,267 9,649,395 9,656,257
Changes to the then Corporations Law abolished the authorised capital and par value concept in relation to share capital from 1 July 1998. Therefore, the company does not have a limited amount of authorised capital and issued shares do not have a par value. Ordinary shares confer on their holders the right to participate in dividends and/or capital returns declared by the board and an entitlement to vote at any general meeting of the company.
i. This represented issue of shares to the shareholders of Call Direct Cellular Solutions 2003 Pty Ltd as part of the consideration of the purchase acquisition
ii. This represented share rights issued to YellowTuna Holdings Limited for the purchase of inventory. 3,831,667 shares with a value of $574,753 were issued on 20 January 2009. A cash consideration was provided for the balance of the share rights issued in the prior year.
iii. This represents shares issued under the dividend reinvestment plan.

60 | Annual Report 2010
NetComm Limited
Annual Report 2010 | 61
NetComm Limited
Notes to the financial statementsFOR ThE YEaR ENDED 30 JuNE 2010
18. reserves
Movements in share option reserve
2010 $ 2009 $
Balance at the beginning of the year 361,716 77,490
Recognition of share based payments 312,606 284,226
Exercise of options (370,495) -
Expiry of options (16,316) -
Balance at the end of the year 287,511 361,716
The option reserve is used to recognise the fair value of options issued but not exercised.
Movements in foreign exchange reserve
Balance at the beginning of the year (72,524) (40,619)
Exchange difference on translation of foreign operations 17,885 (31,905)
Balance at the end of the year (54,639) (72,524)
Exchange differences arising on translation of the foreign controlled entities are taken to the foreign currency translation reserve. The reserve is recognised in profit or loss when the net investment is disposed of.
19. continGent liaBilitiesThere were no contingent liabilities as at 30 June 2010 (2009 : Nil)
20. eXpenditure commitments
Non-cancellable operating lease commitments
2010 $ 2009 $
Not longer than 1 year 465,630 323,154
Longer than 1 year and not longer than 5 years 199,165 222,047
664,795 545,201
The Group leases its offices in Australia and New Zealand under operating leases. Leases generally provide the right of renewal at which time all terms are renegotiated. Lease payments comprise a base amount and, in some cases, an incremental contingent rental. Contingent rents are normally based on movements in the consumer price index, or market reviews. In the current year, the Parent renewed its lease on its Regents Park premises.
Finance lease liabilities
2010 $ 2009 $
Not longer than 1 year 96,744 101,208
Longer than 1 year and not longer than 5 years 198,968 295,702
Minimum future lease payments 295,712 396,910
Less future finance charges (15,770) (40,849)
Present value of minimum lease payments 279,942 356,061
Included in the financial statements:
Current borrowings (note 14) 96,361 94,207
Non - current borrowings (note 14) 183,581 261,854
279,942 356,061
Finance leases relate to plant and equipment. The Group has the option to purchase the plant and equipment at the conclusion of the lease arrangements. The Group’s obligation under finance leases are secured by the lessor’s title to the leased assets.
Commitments for the acquisition of property, plant and equipment by the parent entityThere are no commitments for the acquisition of property, plant and equipment outstanding at the year end.
Notes to the financial statementsFOR ThE YEaR ENDED 30 JuNE 2010
21. cash flow information
Reconciliation of cash flow from operations with profit after income tax
2010 $ 2009 $
Profit for the year 1,624,988 5,891,378
Non-cash flows in profit
Depreciation and amortisation 1,846,290 772,220
Loss on sale of property, plant and equipment 1,785 1,674
Share based payments 296,290 284,226
Interest received (14,465) (36,923)
Changes in operating assets and liabilities:
(Increase) in trade and other receivable (4,077,598) (156,740)
(Increase)/decrease in inventories (2,250,046) 2,981,434
(Increase)/decrease in other assets (206,450) 67,413
Decrease/(increase) in deferred tax assets 313,128 (700,506)
Increase/(decrease) in trade and other payables 2,992,136 (1,197,967)
(Decrease)/increase in deferred income & other liabilities (252,037) 314,500
Increase/(decrease) in provisions 329,749 713,688
Net cash from operating activities 603,770 8,934,397
NON-CASH FINANCING AND INVESTING ACTIVITIES
No property, plant and equipment was acquired by the group by way of finance lease $NIL (2009: $262,754).
Deferred payments arising from acquisitions recorded in other liabilities are investing related activities and thus have been excluded from this reconciliation.
22. Key manaGement personnel compensation
a. Directors and other key management personnelThe directors and other members of key management personnel of the Group during the year were:
T R Winters Independent Non Executive Chairman
D P J Stewart Managing Director
J A Brennan Independent Non Executive Director
J M Burton Independent Non Executive Director
D Morrison General Manager
W Trattles Chief Financial Officer
b. Remuneration of key management personnelThe aggregate compensation made to key management personnel of the Group is set out below:
2010 $ 2009 $
Short term benefits 989,573 1,312,587
Post employment benefits 62,667 61,344
Share based payments 253,863 205,244
Total 1,306,103 1,579,175
Further information on remuneration of key management personnel can be found in the remuneration report within the directors’ report.
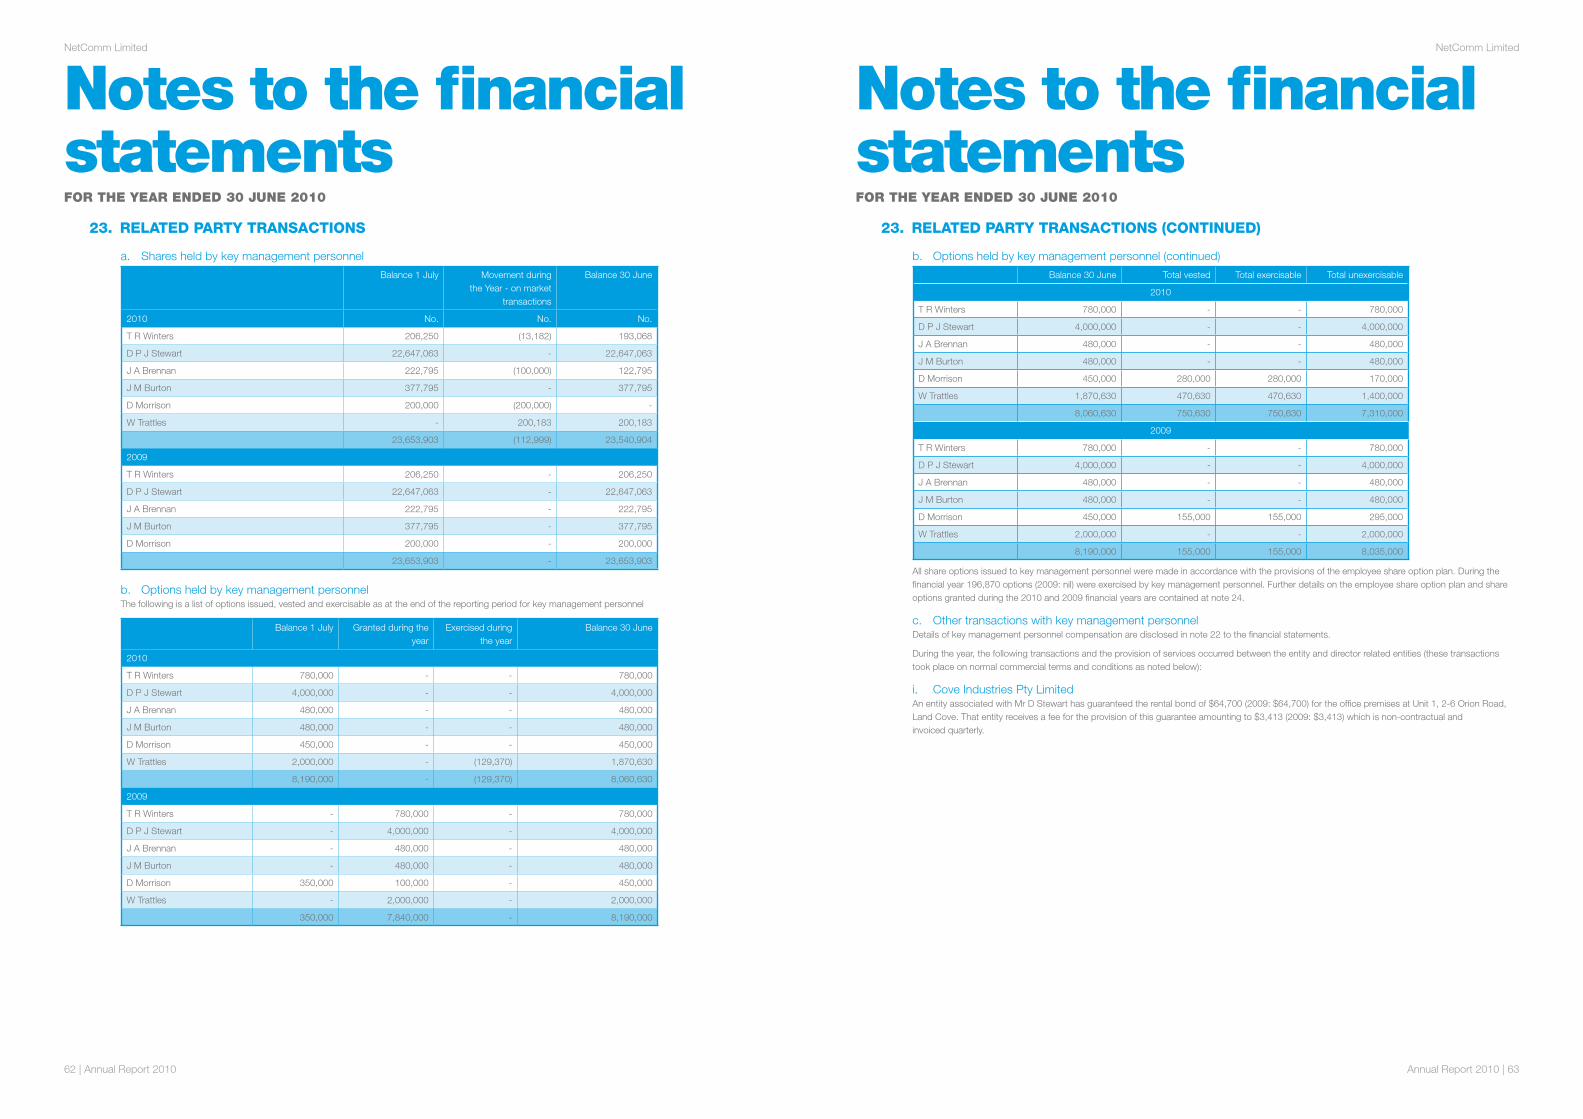
62 | Annual Report 2010
NetComm Limited
Annual Report 2010 | 63
NetComm Limited
Notes to the financial statementsFOR ThE YEaR ENDED 30 JuNE 2010
23. related party transactions
a. Shares held by key management personnel
Balance 1 July Movement during the Year - on market
transactions
Balance 30 June
2010 No. No. No.
T R Winters 206,250 (13,182) 193,068
D P J Stewart 22,647,063 - 22,647,063
J A Brennan 222,795 (100,000) 122,795
J M Burton 377,795 - 377,795
D Morrison 200,000 (200,000) -
W Trattles - 200,183 200,183
23,653,903 (112,999) 23,540,904
2009
T R Winters 206,250 - 206,250
D P J Stewart 22,647,063 - 22,647,063
J A Brennan 222,795 - 222,795
J M Burton 377,795 - 377,795
D Morrison 200,000 - 200,000
23,653,903 - 23,653,903
b. Options held by key management personnel The following is a list of options issued, vested and exercisable as at the end of the reporting period for key management personnel
Balance 1 July Granted during the year
Exercised during the year
Balance 30 June
2010
T R Winters 780,000 - - 780,000
D P J Stewart 4,000,000 - - 4,000,000
J A Brennan 480,000 - - 480,000
J M Burton 480,000 - - 480,000
D Morrison 450,000 - - 450,000
W Trattles 2,000,000 - (129,370) 1,870,630
8,190,000 - (129,370) 8,060,630
2009
T R Winters - 780,000 - 780,000
D P J Stewart - 4,000,000 - 4,000,000
J A Brennan - 480,000 - 480,000
J M Burton - 480,000 - 480,000
D Morrison 350,000 100,000 - 450,000
W Trattles - 2,000,000 - 2,000,000
350,000 7,840,000 - 8,190,000
Notes to the financial statementsFOR ThE YEaR ENDED 30 JuNE 2010
23. related party transactions (continued)
b. Options held by key management personnel (continued)
Balance 30 June Total vested Total exercisable Total unexercisable
2010
T R Winters 780,000 - - 780,000
D P J Stewart 4,000,000 - - 4,000,000
J A Brennan 480,000 - - 480,000
J M Burton 480,000 - - 480,000
D Morrison 450,000 280,000 280,000 170,000
W Trattles 1,870,630 470,630 470,630 1,400,000
8,060,630 750,630 750,630 7,310,000
2009
T R Winters 780,000 - - 780,000
D P J Stewart 4,000,000 - - 4,000,000
J A Brennan 480,000 - - 480,000
J M Burton 480,000 - - 480,000
D Morrison 450,000 155,000 155,000 295,000
W Trattles 2,000,000 - - 2,000,000
8,190,000 155,000 155,000 8,035,000
All share options issued to key management personnel were made in accordance with the provisions of the employee share option plan. During the financial year 196,870 options (2009: nil) were exercised by key management personnel. Further details on the employee share option plan and share options granted during the 2010 and 2009 financial years are contained at note 24.
c. Other transactions with key management personnelDetails of key management personnel compensation are disclosed in note 22 to the financial statements.
During the year, the following transactions and the provision of services occurred between the entity and director related entities (these transactions took place on normal commercial terms and conditions as noted below):
i. Cove Industries Pty LimitedAn entity associated with Mr D Stewart has guaranteed the rental bond of $64,700 (2009: $64,700) for the office premises at Unit 1, 2-6 Orion Road, Land Cove. That entity receives a fee for the provision of this guarantee amounting to $3,413 (2009: $3,413) which is non-contractual and invoiced quarterly.
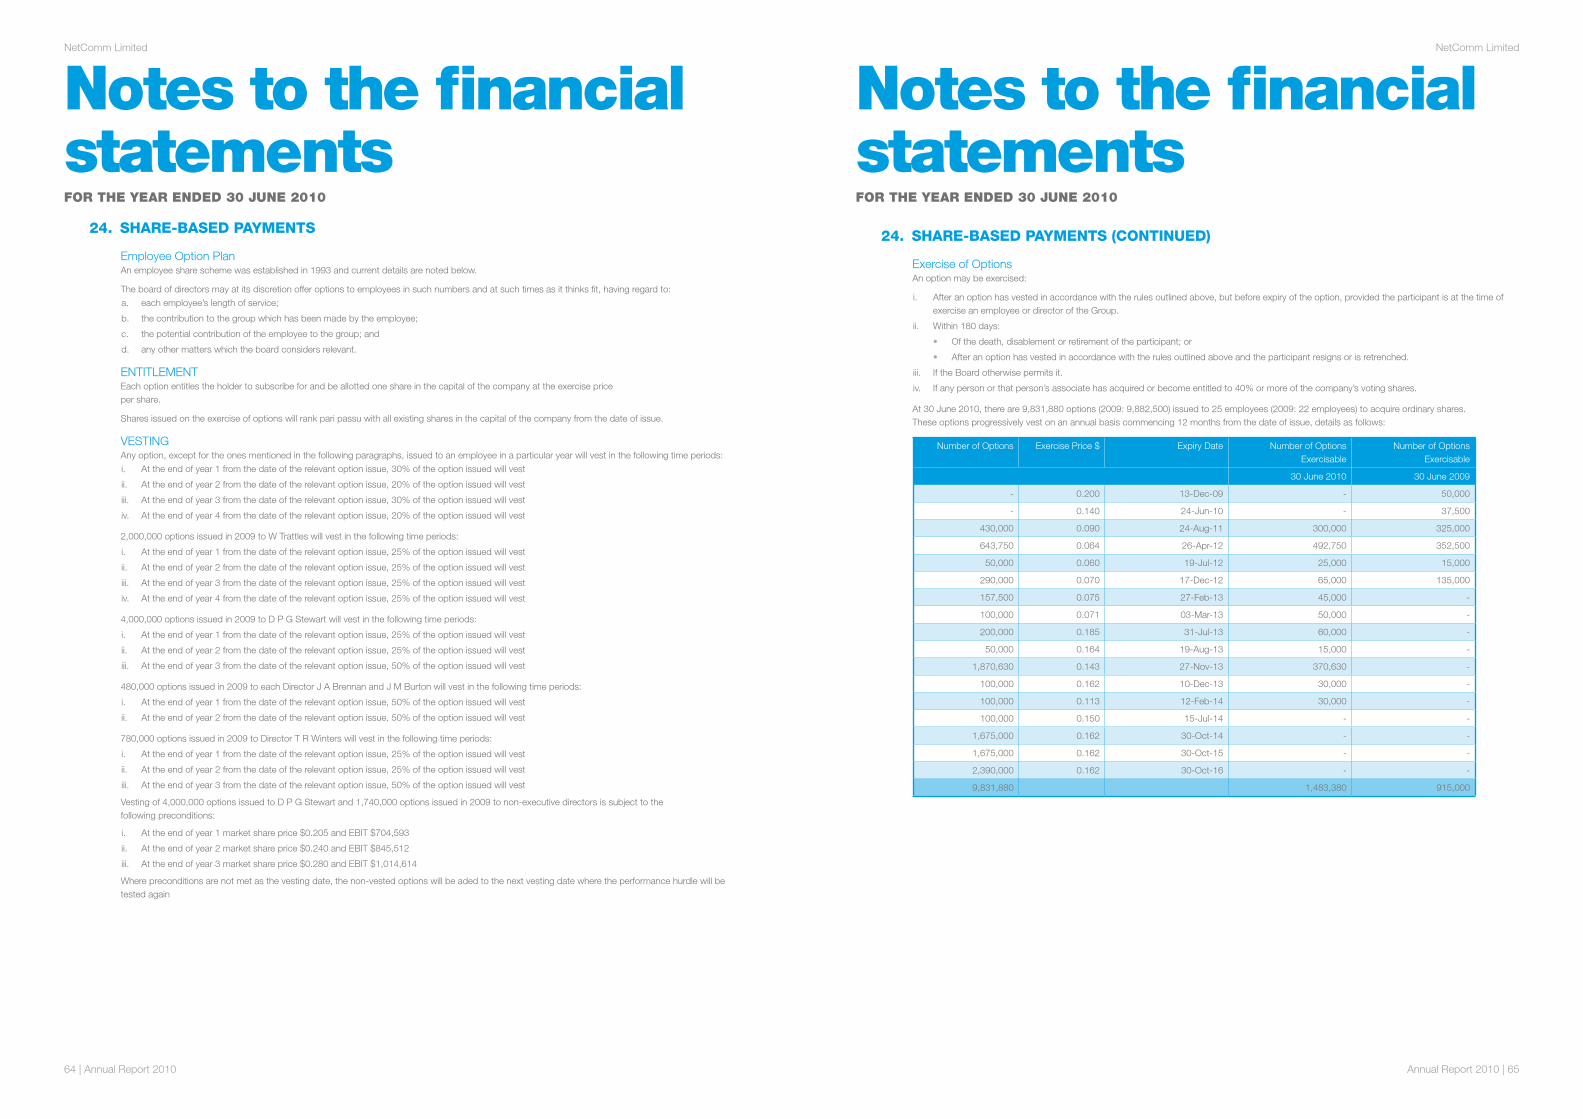
64 | Annual Report 2010
NetComm Limited
Annual Report 2010 | 65
NetComm Limited
Notes to the financial statementsFOR ThE YEaR ENDED 30 JuNE 2010
24. share-Based payments
Employee Option PlanAn employee share scheme was established in 1993 and current details are noted below.
The board of directors may at its discretion offer options to employees in such numbers and at such times as it thinks fit, having regard to:a. each employee’s length of service;
b. the contribution to the group which has been made by the employee;
c. the potential contribution of the employee to the group; and
d. any other matters which the board considers relevant.
ENTITLEMENTEach option entitles the holder to subscribe for and be allotted one share in the capital of the company at the exercise price per share.
Shares issued on the exercise of options will rank pari passu with all existing shares in the capital of the company from the date of issue.
VESTINGAny option, except for the ones mentioned in the following paragraphs, issued to an employee in a particular year will vest in the following time periods:i. At the end of year 1 from the date of the relevant option issue, 30% of the option issued will vest
ii. At the end of year 2 from the date of the relevant option issue, 20% of the option issued will vest
iii. At the end of year 3 from the date of the relevant option issue, 30% of the option issued will vest
iv. At the end of year 4 from the date of the relevant option issue, 20% of the option issued will vest
2,000,000 options issued in 2009 to W Trattles will vest in the following time periods:
i. At the end of year 1 from the date of the relevant option issue, 25% of the option issued will vest
ii. At the end of year 2 from the date of the relevant option issue, 25% of the option issued will vest
iii. At the end of year 3 from the date of the relevant option issue, 25% of the option issued will vest
iv. At the end of year 4 from the date of the relevant option issue, 25% of the option issued will vest
4,000,000 options issued in 2009 to D P G Stewart will vest in the following time periods:
i. At the end of year 1 from the date of the relevant option issue, 25% of the option issued will vest
ii. At the end of year 2 from the date of the relevant option issue, 25% of the option issued will vest
iii. At the end of year 3 from the date of the relevant option issue, 50% of the option issued will vest
480,000 options issued in 2009 to each Director J A Brennan and J M Burton will vest in the following time periods:
i. At the end of year 1 from the date of the relevant option issue, 50% of the option issued will vest
ii. At the end of year 2 from the date of the relevant option issue, 50% of the option issued will vest
780,000 options issued in 2009 to Director T R Winters will vest in the following time periods:
i. At the end of year 1 from the date of the relevant option issue, 25% of the option issued will vest
ii. At the end of year 2 from the date of the relevant option issue, 25% of the option issued will vest
iii. At the end of year 3 from the date of the relevant option issue, 50% of the option issued will vest
Vesting of 4,000,000 options issued to D P G Stewart and 1,740,000 options issued in 2009 to non-executive directors is subject to the following preconditions:
i. At the end of year 1 market share price $0.205 and EBIT $704,593
ii. At the end of year 2 market share price $0.240 and EBIT $845,512
iii. At the end of year 3 market share price $0.280 and EBIT $1,014,614
Where preconditions are not met as the vesting date, the non-vested options will be aded to the next vesting date where the performance hurdle will be tested again
Notes to the financial statementsFOR ThE YEaR ENDED 30 JuNE 2010
24. share-Based payments (continued)
Exercise of OptionsAn option may be exercised:
i. After an option has vested in accordance with the rules outlined above, but before expiry of the option, provided the participant is at the time of exercise an employee or director of the Group.
ii. Within 180 days:
• Of the death, disablement or retirement of the participant; or
• After an option has vested in accordance with the rules outlined above and the participant resigns or is retrenched.
iii. If the Board otherwise permits it.
iv. If any person or that person’s associate has acquired or become entitled to 40% or more of the company’s voting shares.
At 30 June 2010, there are 9,831,880 options (2009: 9,882,500) issued to 25 employees (2009: 22 employees) to acquire ordinary shares. These options progressively vest on an annual basis commencing 12 months from the date of issue, details as follows:
Number of Options Exercise Price $ Expiry Date Number of Options Exercisable
Number of Options Exercisable
30 June 2010 30 June 2009
- 0.200 13-Dec-09 - 50,000
- 0.140 24-Jun-10 - 37,500
430,000 0.090 24-Aug-11 300,000 325,000
643,750 0.064 26-Apr-12 492,750 352,500
50,000 0.060 19-Jul-12 25,000 15,000
290,000 0.070 17-Dec-12 65,000 135,000
157,500 0.075 27-Feb-13 45,000 -
100,000 0.071 03-Mar-13 50,000 -
200,000 0.185 31-Jul-13 60,000 -
50,000 0.164 19-Aug-13 15,000 -
1,870,630 0.143 27-Nov-13 370,630 -
100,000 0.162 10-Dec-13 30,000 -
100,000 0.113 12-Feb-14 30,000 -
100,000 0.150 15-Jul-14 - -
1,675,000 0.162 30-Oct-14 - -
1,675,000 0.162 30-Oct-15 - -
2,390,000 0.162 30-Oct-16 - -
9,831,880 1,483,380 915,000

66 | Annual Report 2010
NetComm Limited
Annual Report 2010 | 67
NetComm Limited
Notes to the financial statementsFOR ThE YEaR ENDED 30 JuNE 2010
24. share-Based payments (continued)
Exercise of Options (continued)165,000 (2009: 292,500) options issued to employees expired during the financial year in accordance with the rules of the Share Option Plan.
725,000 (2009: 7,940,000) new options were issued in accordance with the rules of the Share Option Plan during the year. The weighted average fair value of options granted during the year was $0.011 (2009: $0.077).
There were options of 610,620 (2009: 125,000) exercised during the year ended 30 June 2010.
The 9,831,880 (2009: 9,882,500) options outstanding at 30 June 2010 have a weighted average exercise price of $0.141 (2009: $0.142) and a weighted average remaining contractual life of 3.91 years (2009: 5.26 years). Exercise prices range from $0.06 to $0.19 in respect of options outstanding at 30 June 2010.
Subsequent to year end 77,500 options were exercised by employees.
At the date of this report, unissued shares under the above options totalled 9,831,880 ordinary shares. No person entitled to exercise these options had or has any right by virtue of the options, to participate in any share issue of any other body corporate.In December 2008 and February 2009 NetComm issued 1,000,000 share options on each date to the Logged On Group. The options vest in 12 months, expire in 5 years, have a pre-condition market share price of $0.36 and $0.48 respectively and an exercise price of $0.162 and $0.113 respectively. The options are part of a share based remuneration package, and Logged On Group has been engaged to assist NetComm in business development. None of these options have vested at 30 June 2010.
In May 2009 NetComm issued 425,000 share options to SME Business Growth Consulting Pty Limited. The options expire in 4 years and vest as follows: 30% at the end of year 1 from the date of issue; 20% at the end of year 2 from the date of issue; 30% at the end of year 3 from the date of issue and 20% at the end of year 4 from the date of issue. The exercise price for 225,000 of these share options is $0.075, $0.162 for 100,000 share options, and $0.113 for the remaining 100,000 share options. The options are part of a remuneration package, and SME has been engaged to assist NetComm in business development. 67,500 of the options have been exercised during the year ended 30 June 2010.
Valuations of OptionsThe fair value at grant date of all options is independently determined using the Binomial Approximation pricing model. The model inputs for options granted during the year included:
a. Options are granted in accordance with the terms of the Employee Option Plan (refer above for detail),
b. The expected price volatility is based on a daily closing share price for NetComm Limited over the 12 months immediately prior to date of grant: 43.67% (2009: 43.67%),
c. The risk free interest rate is based on the 5 year Commonwealth Bond rate on date of issue: 5.16% (2009: 3.37%-6.53%),
d. The expected dividend yield is based on the dividends received by shareholders of NetComm Limited during the 12 months prior to date of grant: 0% (2009: 0%) $296,290 (2009: $284,226) has been recognised as a share based payments expense for the year ended 30 June 2010.
Notes to the financial statementsFOR ThE YEaR ENDED 30 JuNE 2010
25. retirement Benefit oBliGations
Superannuation CommitmentsThe Group provides employees with access to external superannuation plans that provide benefits on retirement, resignation, disability or death. This is a defined contribution plan.
26. earninGs per share
2010 $ 2009 $
Earnings reconciliation
Net profit for the year 1,624,988 5,891,378
Basic and diluted earnings 1,624,988 5,891,378
Weighted average number of ordinary shares used as the denominator
No. No.
Number for basic earnings per share 102,968,233 98,107,537
Effect of share options issued under the employee option plan not yet vested
1,112,084 967,937
Number for diluted earnings per share 104,080,317 99,075,474
2010 2009
Earnings per share Cents Cents
Basic earnings per share 1.58 6.01
Diluted earnings per share 1.56 5.95
27. acquisition of Businesses
Names of business acquired Principal activity
Date of acquisition
Proportion of shares acquired
(%)
Cost of acquisition
$’000
2009
Call Direct Cellular Solutions 2003 Pty Ltd Distribution 3-Nov-08 100% 2,209
C10 Communications Pty Ltd Distribution 30-Apr-09 100% 3,000
Call Direct Cellular Solutions 2003 Pty LtdOn 3 November 2008, the Group acquired 100% of the issued share capital of Call Direct Cellular Solutions 2003 Pty Ltd for a cash consideration of $400,000, deferred cash consideration with a discounted value of $509,000 and issue of shares in the Group of $1,300,000. Call Direct Cellular Solutions 2003 Pty Ltd’s principal activity is the design and distribution of routers and modems specifically built for users of mobile 3G networks. This transaction has been accounted for using the acquisition method of accounting.

68 | Annual Report 2010
NetComm Limited
Annual Report 2010 | 69
NetComm Limited
Notes to the financial statementsFOR ThE YEaR ENDED 30 JuNE 2010
27. acquisition of Businesses (continued)
Call Direct Cellular Solutions 2003 Pty Ltd (continued)The net assets acquired in the business combination, and the goodwill arising, were as follows:
Book value Fair value adjustment Fair value acquisition Fair value
Net assets acquired $’000 $’000 $’000 $’000
Cash and cash equivalents 211 - 211
Trade and other receivables 282 - 282
Property, plant and equipment 66 - 66
Other assets 242 - 242
Trade and other payables (225) - (225)
Other liabilities (33) - (33)
Intangible assets arising on acquisition - 900 900
Goodwill 5 (5) -
548 895 1,443
Goodwill arising on acquisition 766
Total consideration, satisfied by cash and shares 2,209
Goodwill arose in the business combination because the cost of the combination included a control premium paid to acquire Call Direct Cellular Solutions 2003 Pty Limited. The consideration paid for the combination effectively included amounts in relation to the benefit of expected synergies, revenue growth, future market development and the assembled workforce of Call Direct Cellular Solutions 2003 Pty Limited. These expected benefits are reflected in the goodwill arising on acquisition. In addition consideration was paid for separately identifiable items including non-recurring engineering works (NREs) and Customer Lists, Relationships and Specifications which have been attributed at fair value.
C10 Communications Pty LtdOn 30 April 2009, the Group acquired 100% of the issued share capital of C10 Communications Pty Ltd for cash consideration of $1,500,000 and deferred cash consideration with a discounted value of $1,500,413. C10 Communications Pty Ltd’s principal activity is the design and distribution of ADSL2+ and ISDN filters for use by both residential and business users. This transaction has been accounted for using the acquisition method of accounting.
The net assets acquired in the business combination, and the goodwill arising, were as follows:
Net assets acquired Book value
$’000
Fair value adjustment
$’000
Fair value acquisition
$’000
Fair value
$’000
Cash and cash equivalents - - -
Trade and other receivables 1,218 - 1,218
Inventories 1,160 1,160
Property, plant and equipment 50 - 50
Other assets 93 - 93
Trade and other liabilities (887) - (887)
Other liabilities (250) - (250)
Goodwill - 1,542 1,542
1,384 1,542 2,926
Goodwill arising on acquisition 74
Total consideration, satisfied by cash 3,000
Goodwill assets arose in the business combination because the cost of the combination included a control premium paid to acquire C10 Communications Pty Limited. In addition consideration was paid for separately identifiable items including Customer Lists, Relationships and Specifications and Patented hardware technologies which have been attributed at fair value.
Included in net profit for 2009 was $465,174 and $234,559 attributable to the purchase of the distribution businesses of Call Direct Cellular Solutions 2003 Pty Ltd and C10 Communucatiions Ptd Ltd respectively
Had these business combinations been effected at 1 July 2008, the revenue for the group for 2009 would have been $87,542,521, and net profit $7,897,177. The directors of the Group consider these ‘pro-forma’ numbers to represent an approximate measure of the performance of the combined group on an annualised basis and to provide a reference point for comparision in future periods
In determining the ‘pro-forma’ revenue and profit of the Group had these distribution businesses been acquired at the beginning of the prior reporting period, the directors have applied the unadjusted revenue and profits in the these businesses at the date of acquisition. Any adjustments are not considered to be materially significant in impacting the estimated ‘pro-forma’ revenue and profit for the Group.
Notes to the financial statementsFOR ThE YEaR ENDED 30 JuNE 2010
27. acquisition of Businesses (continued)2010 2009
Net Cash flow on acquisitions $’000 $’000
Total purchase consideration - 5,209
Less: deferred cash consideration for C10 Communications Pty Ltd
- (814)
Less: deferred cash consideration for Call Direct Cellular Solutions 2003 Pty Ltd
- (295)
Less: non-cash consideration Call Direct Cellular Solutions 2003 Pty Ltd
- (1,300)
Consideration paid in cash - 2,800
Less: cash and cash equivalent balances acquired - (211)
Total - 2,589
The cost of the acquisitions comprises cash for all of the acquistions except for the acquisition of the Call Direct Cellular Solutions 2003 Pty Limited distribution business, which comprises cash of $909 thousand and shares in the Group of $1,300 thousand. In each acquisition, the Group has paid a premium for the acquiree as it believes the acquisitions will create synergistic benefits to its existing operations.
28. financial instruments
a. Capital Risk ManagementThe Group manages its capital to ensure that entities in the Group will be able to continue as a going concern while maximising the return to stakeholders through the optimisation of the debt and equity balance. The Group’s overall strategy remains unchanged from 2009.
The capital structure of the Group consists of debt, which includes the borrowings disclosed in note 14, cash and cash equivalents and equity attributable to equity holders of the parent, comprising issued capital, reserves and retained earnings. Operating cash flows are used to maintain and expand the Group’s assets as well as to pay for operating expenses, including tax liabilities.
b. Financial Risk Management ObjectivesThe Group’s activities expose it to a variety of financial risks: market risk (including foreign currency and interest rate risk), credit risk and liquidity risk. The Group’s overall risk management program focuses on the unpredictability of financial and exchange rate markets and seeks to minimise potential adverse effects on the Group’s performance. Risk management is carried out by the Board of Directors.
c. Market RiskThe Group’s activities expose it primarily to the financial risks of changes in foreign currency exchange rates and interest rates. In the last two financial years the Group has not used any derivative financial instruments to hedge its exposure to foreign exchange and interest rate risk. There has been no change to the Group’s exposure to market risks or the manner in which it manages and measures the risk from the previous period.
d. Foreign Currency Risk ManagementThe Group undertakes certain transactions denominated in foreign currencies that are different from the functional currency of the respective entities undertaking the transactions, hence exposures to exchange rate fluctuations arise. Exchange rate exposures are managed within approved policy parameters utilising natural hedging.
The carrying amount of the Group’s foreign currency denominated monetary assets and monetary liabilities at the reporting date that are denominated in a currency that is different to the functional currency of the respective entities holding the monetary assets and liabilities are as follows:
Liabilities Assets
2010 2009 2010 2009
US Dollars 5,279,522 2,112,579 2,650,817 2,567,802
Canadian Dollars - - 2,886,502 -
Total 5,279,522 2,112,579 5,537,319 2,567,802

70 | Annual Report 2010
NetComm Limited
Annual Report 2010 | 71
NetComm Limited
Notes to the financial statementsFOR ThE YEaR ENDED 30 JuNE 2010
28. financial instruments (continued)
d. Foreign Currency Risk Management (continued)
Foreign currency sensitivity analysisThe Group is mainly exposed to US dollars (USD) and Canadian dollars (CAD)
The following table details the Group’s sensitivity to a 10% increase and decrease in the Australian dollar against the relevant foreign currencies (arising from monetary assets and liabilities held at balance date in a currency different to the functional currency of the respective entities holding the assets or liabilities), which represents management’s assessment of the possible change in foreign exchange rates. The sensitivity analysis includes only outstanding foreign currency denominated monetary items (including liabilities for goods in transit) and adjusts their translation at a period end for a 10% change in foreign currency rates. A positive number indicates an increase in profit or loss and other equity where the Australian dollar strengthens against the respective currency. For a weakening of the Australian dollar against the respective currency there would be an equal and opposite impact on the profit and other equity, and the balances below would be negative.
Profit or loss
2010 2009
US Dollars (239,367) 50,580
Canadian Dollars 306,024 -
The foreign exchange impact in the table is mainly attributable to the exposure outstanding on USD receivables and payables and CAD receivables at year end in the Group.
In management’s opinion, the above sensitivity analysis is representative of the inherent foreign exchange risk during the course of the year.
The Group includes a New Zealand subsidiary whose functional currency is different to the Group’s presentation currency. As stated in the Group’s Accounting Policies per Note 1(c), on consolidation the assets and liabilities of this entity is translated into Australian dollars at exchange rates prevailing on the reporting date. The income and expenses of this entity is translated at the average exchange rates for the period. Exchange differences arising are classified as equity and are transferred to a foreign exchange translation reserve. The Group’s future reported profits could therefore be impacted by changes in rates of exchange between the Australian Dollar and the New Zealand Dollar.
The following table details the Group’s sensitivity to a 10% increase and decrease in the Australian dollar against the relevant foreign currencies arising from translation of foreign operations. A positive number indicates an increase in other comprehensive income where the Australian dollar strengthens against the respective currency. For a weakening of the Australian dollar against the respective currency there would be an equal and opposite impact on the profit and other equity, and the balances below would be negative.
Other comprehensive income
2010 2009
New Zealand Dollars 42,521 26,299
e. Interest rate risk management The Group is exposed to interest rate risk as the parent entity borrows funds at floating interest rates. The Group does not hedge this risk through derivatives such as interest rate swaps.
The Group’s exposures to interest rates on financial assets and financial liabilities are detailed in the liquidity risk management section of this note.
Notes to the financial statementsFOR ThE YEaR ENDED 30 JuNE 2010
28. financial instruments (continued)
Interest rate sensitivity analysisThe sensitivity analysis below has been determined based on a 50 basis point change in interest rates taking place at the beginning of the financial year and held constant throughout the reporting period, which represents management’s assessment of the possible change in interest rates. At reporting date, if interest rates had been 50 basis points higher or lower and all other variables were held constant, the Group’s net profit would increase/decrease by $3,858 (2009: increase/(decrease) by $135). This is mainly attributable to the Group’s exposure to interest rates on its variable rate borrowings.
f. Credit risk managementCredit risk refers to the risk that a counterparty will default on its contractual obligations resulting in financial loss to the Group. The Group has adopted a policy of only dealing with creditworthy counterparties. The Group uses publicly available financial information and its own trading record to rate its major customers. The Group’s exposure and the credit ratings of its counterparties are continuously monitored and controlled by counterparty limits that are reviewed and approved by the Chief Executive Officer. Trade receivables consist of a large number of customers, spread across diverse industries and geographical areas. Ongoing credit evaluation is performed on the financial condition of accounts receivable. The Group does not have any significant credit risk exposure to any single counterparty or any group of counterparties having similar characteristics. The credit risk on liquid funds is limited because the counterparties are banks with high credit-ratings assigned by international credit-rating agencies. The carrying amount of financial assets recorded in the financial statements, net of any allowances for losses, represents the Group’s maximum exposure to credit risk. Refer further detail in note 7.
g. Liquidity risk managementUltimate responsibility for liquidity risk management rests with the board of directors, who have built an appropriate liquidity risk management framework for the management of the Group’s short, medium and long term funding and liquidity management requirements. The Group manages liquidity risk by maintaining adequate reserves, banking facilities and reserve borrowing facilities by continuously monitoring forecast and actual cash flows and matching the maturity profiles of financial assets and liabilities. The Group also uses a trade receivables and trade payables finance facility to manage its liquidity risk.
The table below details the company’s and the Group’s drawn and undrawn facilities.
Consolidated
2010 $ 2009 $
Letter of Credit & Trade Refinance 15,000,000 17,000,000
Used at balance date (note 13) 2,555,509 2,105,185
Used at balance date (note 14) 5,030,540 933,666
Unused at balance date 7,413,951 13,961,149
Consolidated
2010 $ 2009 $
Trade Receivables Finance 2,000,000 2,000,000
Used at balance date (note 14) 539,843 486,852
Unused at balance date 1,460,157 1,513,148
Consolidated
2010 $ 2009 $
Floating Bill Facility 2,000,000 -
Used at balance date - -
Unused at balance date 2,000,000 -

72 | Annual Report 2010
NetComm Limited
Annual Report 2010 | 73
NetComm Limited
Notes to the financial statementsFOR ThE YEaR ENDED 30 JuNE 2010
28. financial instruments (continued)
g. Liquidity risk management (continued)
Liquidity and interest risk tablesThe following tables detail the Group’s remaining contractual maturity for its non-derivative financial liabilities. The tables have been drawn up based on the undiscounted cash flows of financial liabilities based on the earliest date on which the Group can be required to pay. The table includes both interest and principal cash flows.
Weighted avg
effective interest rate %
Less than 1 month $
1-3 months $
3 months-1
year $
1-5 years $ 5+ years $
2010
Non-interest bearing - 6,503,951 857,941 - - -
Finance lease liability 8.77% 8,439 16,425 71,880 198,968 -
Variable interest rate instruments 4.70% 2,555,509 5,556,815 - - -
9,067,899 6,431,181 71,880 198,968 -
2009
Non-interest bearing - 1,441,311 1,862,687 - - -
Finance lease liability 8.77% 8,434 16,868 75,906 295,702 -
Variable interest rate instruments 4.70% 3,042,631 498,820 - - -
4,492,376 2,378,375 75,906 295,702 -
The following tables detail the Group’s expected maturity for its non-derivative financial assets. The tables have been drawn up based on the undiscounted contractual maturities of the financial assets including interest that will be earned on those assets except where the Group anticipates that the cash flow will occur in a different period based on the earliest date on which the Group can expect to receive. The table includes both interest and principal cash flows.
Weighted avg
effective interest rate %
Less than 1 month $
1-3 months $
3 months-1
year $
1-5 years $ 5+ years $
2010
Non-interest bearing - 1,450,037 6,808,931 - - -
Variable interest rate instruments 0.39% 4,250,948 - - - -
5,700,985 6,808,931 - - -
2009
Non-interest bearing - 1,622,556 2,740,267 - - -
Variable interest rate instruments 1.09% 4,760,354 - - - -
6,382,910 2,740,267 - - -
Notes to the financial statementsFOR ThE YEaR ENDED 30 JuNE 2010
28. financial instruments (continued)
h. Fair Value of Financial Instruments• The fair value of financial assets and financial liabilities are determined as follows:
• The fair value of financial assets and financial liabilities with standard terms and conditions and trade on active liquid markets are determined with reference to quoted market prices;
The fair value of other financial assets and financial liabilities are determined in accordance with generally accepted pricing models based on discounted cash flow analysis using prices from observable current market transactions.
The directors consider that the carrying amounts of financial assets and financial liabilities recorded at amortised cost in the financial statements approximate their fair values.
29. events after the reportinG dateThere has not arisen during the interval between the end of the reporting period and the date of this report any item, transaction or event of a material and unusual nature that has, in the opinion of the Directors of the Company, significantly affected or may significantly affect the operations of the consolidated entity, the results of those operations or the state of affairs of the consolidated entity in subsequent financial years.
30. seGment reportinGThe Group has adopted AASB 8 Operating Segments and AASB 2007-3 Amendments to Australian Accounting Standards arising from AASB 8 with effect from 1 January 2009. AASB 8 requires operating segments to be identified on the basis of internal reports about components of the Group that are regularly reviewed by the chief operating decision maker in order to allocate resources to the segment and to assess its performance. In contrast, the predecessor Standard (AASB 114 Segment Reporting ) required an entity to identify two sets of segments (business and geographical), using a risks and rewards approach, with the entity’s system of internal financial reporting to key management personnel serving only as the starting point for the identification of such segments. As a result, following the adoption of AASB 8, the identification of the Group’s reportable segments has changed.
In prior years, segment information reported externally was analysed on the basis of business segment (computer hardware products) and geography (Australia and New Zealand). However, information reported to the Group’s Board of Directors for the purposes of resource allocation and assessment of performance is more specifically focused on the product grouping and category of customer. The Group’s reportable segments under AASB 8 are therefore as follows:• Product - Australia
• Product - International
• Services – Australia
The product reportable segment supplies communication devices, including but not limited to Mobile Internet Gateways, designed and manufactured for use primarily by consumer and small medium enterprises (SME). The services reportable segment provides communications related services, including but not limited to Gateway managed services, consumed primarily by consumer and small medium enterprises (SME).
Information regarding these segments is presented below. Amounts reported for the prior period have been restated to conform to the requirements of AASB 8. The accounting policies of the new reporting segments are the same as the Group’s accounting policies.
The following is an analysis of the Group’s revenue and results by reportable operating segment.

74 | Annual Report 2010
NetComm Limited
Annual Report 2010 | 75
NetComm Limited
Notes to the financial statementsFOR ThE YEaR ENDED 30 JuNE 2010
30. seGment reportinG (continued)
Revenue 30 June 2010 $
30 June 2009 $ Segment Profit 30 June 2010 $
30 June 2009 $
Continuing Operations
Revenue generated from external customers
Product - Australia 44,605,275 74,323,310 4,640,384 8,767,770
Product - International 10,517,177 4,060,271 831,419 (1,247,902)
Services - Australia 78,585 32,308 (1,090,529) (1,378,206)
Intersegment Revenue
Product - Australia 1,368,661 697,870 - -
Product - International 66,562 8,794 - -
Intersegment Eliminations (1,435,223) (706,664) - -
55,201,037 78,415,889 4,381,274 6,141,662
Other income 63,403 57,499
Depreciation and amortisation expense (1,846,290) (772,221)
Finance costs (304,183) (130,511)
Profit before tax 2,294,204 5,296,429
Income tax (expense)/benefit (669,216) 594,949
Consolidated segment revenue and profit for the period
55,201,037 78,415,889 1,624,988 5,891,378
The revenue reported above represents revenue generated from external customers. Intersegment revenues represent transfers between segments,which are eliminated on consolidation.Revenues from a single customer greater than 10% of total revenues reside in the Product-Australia segment. Segment profit represents the profit earned by each segment without allocation of other income, finance costs and depreciation and amortisation.
Notes to the financial statementsFOR ThE YEaR ENDED 30 JuNE 2010
31. parent entity disclosures
a. Financial position
2010 $ 2009 $
Assets
Current assets 18,226,037 12,234,419
Non-current assets 13,677,586 13,815,531
Total assets 31,903,623 26,049,950
Liabilities
Current liabilities 18,247,295 10,657,069
Non-current liabilities 237,437 424,907
Total liabilities 18,484,732 11,081,976
Equity
Issued capital 9,649,395 9,656,257
Retained earnings 3,481,985 4,950,001
Reserves
Other reserves 287,511 361,716
Total equity 13,418,891 14,967,974
b. Financial performance
2010 $ 2009 $
(Loss)/profit for the year (453,601) 5,307,516
Other comprehensive income - -
Total comprehensive income (453,601) 5,307,516
c. Commitments for the acquisition of property, plant and equipment by the parent entityThere are no commitments for the acquisition of property, plant and equipment outstanding at the year end.
d. Subsidiaries
Name of subsidiary Country of incorporation
Percentage owned 2010 %
Percentage owned 2009 %
Askey Australia Pty Ltd (i) Australia - 100
Dynalink Modems Ltd New Zealand 100 100
Banksia Technology Pty Ltd Australia 100 100
Mike Boorne Electronics Pty Ltd Australia 100 100
Spirit Technology (HK) Ltd Hong Kong 100 100
Call Direct Cellular Solutions 2003 Pty Ltd Australia 100 100
C10 Communications Pty Ltd Australia 100 100
i. Deregistered on 1 December, 2009

76 | Annual Report 2010
NetComm Limited
Annual Report 2010 | 77
NetComm Limited
Notes to the financial statementsFOR ThE YEaR ENDED 30 JuNE 2010
32. company detailsThe registered office and principal place of business of the company is:
NetComm Limited
Unit 1
2-6 Orion Road
Lane Cove NSW 2066
directors’ declarationthe directors declare that:
a. in the directors’ opinion, there are reasonable grounds to believe that the company will be able to pay its debts as and when they become due and payable;
b. the attached financial statements are in compliance with the International Financial Reporting Standards, as stated in note 1 to the financial statements;
c. in the directors’ opinion, the attached financial statements and notes thereto are in accordance with the Corporations Act 2001, including compliance with accounting standards and giving a true and fair view of the financial position and performance of the company and the consolidated entity; and
d. the directors have been given the declarations required by s.295A of the Corporations Act 2001.
Signed in accordance with a resolution of the directors made pursuant to s.295(5) of the Corporations Act 2001.
On behalf of the Directors
T R Winters D P J Stewart
Director Director
30 September 2010 30 September 2010

78 | Annual Report 2010
NetComm Limited
Annual Report 2010 | 79
NetComm Limited

80 | Annual Report 2010
NetComm Limited
Annual Report 2010 | 81
NetComm Limited
asX additional informationThE ShaREhOlDER INFORmaTION SET OuT bElOw waS applICablE aS aT 10 SEpTEmbER 2010.
1. distruBution of shareholdersAnalysis of number of shareholders by size of holding
Category of Holding Number Number of Shares
1 - 1,000 110 57,125
1,001 - 5,000 512 1,564,702
5,001 - 10,000 316 2,598,911
10,001 - 100,000 727 24,035,977
100,001 - share and over 148 74,789,018
Total 1,813 103,045,733
2. twenty larGest shareholdersThe names of the twenty largest holders of quoted shares are:
Shareholder Number of Shares Percentage of total shares
Brad Industries Pty Ltd 22,647,063 21.98%
Dr Colin Rose 5,011,407 4.86%
NBT Pty Limited 2,849,909 2.77%
Mr Michael John Cornelius 2,486,170 2.41%
Askey Computer Corp 2,053,528 1.99%
Mr Andrew Glackin 1,943,600 1.89%
Bond Street Custodians Limited 1,488,985 1.44%
Mr Robert Burnett Waldie & Mrs Mary Ellen Waldie 1,152,500 1.12%
Porttel Pty Ltd 1,000,000 0.97%
Catch 88 Pty Ltd 931,560 0.90%
Mr Gordon Coad & Miss Shirley Pratt 830,000 0.81%
Mrs Cher Suey Cheah 820,000 0.80%
Mr Darren Jacobus Jansen 750,000 0.73%
Ms Dawn Gabriella Leong & Mr Richard Antony Press 725,000 0.70%
Mr William Charles Wheelahan 720,000 0.70%
Yarradale Investments Pty Ltd 706,116 0.69%
Mr Thomas Chau Wa Zih 633,536 0.61%
Mr Mark Kenneth Davie 625,000 0.61%
Mr Christopher Edwin Howells 608,209 0.59%
G H & C Services Pty Limited 600,000 0.58%
Total 48,582,583 47.15%
3. votinG riGhtsAll ordinary shares (whether fully paid or not) carry one vote per share without restriction
4. suBstantial shareholdersAs at 10 September 2010 the substantial shareholders were as follows:
Shareholder Number of Shares
Brad Industries Pty Ltd 22,647,063
Dr Colin Rose 5,011,407
NBT Pty Limited 2,849,909
corporate directory30 JuNE 2010
DirectorsT R Winters (Non Executive Chairman)
D P J Stewart (Managing Director)
J A Brennan (Non Executive Director)
J M Burton (Non Executive Director)
Company Secretary
P Beveridge
Registered Office2 - 6 Orion Road
Lane Cove NSW 2066
Telephone: +61 (2) 9424-2000
Facsimile: +61 (2) 9427-9260
AuditorDeloitte Touche Tohmatsu
Chartered Accountants
Grosvenor Place
225 George Street, Sydney NSW 2000
SolicitorsDLA Phillips Fox
201 Elizabeth Street, Sydney NSW 2000
BankersNational Australia Bank
Share RegisterComputershare Investor Services Pty Limited Level 3
60 Carrington Street
Sydney NSW 2000
Telephone: 1300 855 080
Web Addresswww.netcomm.com.au

82 | Annual Report 2010
NetComm Limited
Annual Report 2010 | 83
NetComm Limited
Notes Notes

84 | Annual Report 2010
NetComm Limited
20NETCOMM LIMITED Head Office PO Box 1200, Lane Cove NSW 2066 AustraliaP: 02 9424 2070 F: 02 9424 2010 E: [email protected] W: www.netcomm.com.au


