AnnuAl repor t 2014 - Pakistan National Shipping ... · M.V. Multan’s voyage around the world ......
204
A N N U A L R E P O R T 2 0 1 4
Transcript of AnnuAl repor t 2014 - Pakistan National Shipping ... · M.V. Multan’s voyage around the world ......

A n n u A l r e p o r t 2 0 1 4

Future of Shipping
Global shipping is at a crossroads. Demand for commodities and manufactured goods is projected to rise over the next four decades. the maritime sector is responsible for transporting some 80 percent of goods traded around the world. obviously, this places a huge burden upon the industry and the environment. presently, sea-trade accounts for only 2%-3% of global greenhouse emissions*. However, pollution in ports remains a serious issue. With bigger ships carrying bigger loads, more powerful ship propulsion systems have also been introduced which contributes to greenhouse emissions. Heavy Fuel oil or HFo, is still the preferred fuel for sustained sailing in the industry. HFo is the dirtiest and the most polluting fuel.
emissions Control
the placement of particular of ports and their access ways in the ocean has led to certain shipping lanes which are particularly busy with dense shipping traffic. these regions are potential trouble spots for air pollution, hijacking and piracy, oil leaks from tankers among others. the scientific community has warned that any world-wide increase beyond 2°C would lead to catastrophic consequences. they have concluded with consensus that by 2050, global emissions of greenhouse gases need to be slashed by 60%. For this, the shipping sector needs to cut emissions of greenhouse gases by 80%*.
Biological ballast pollution is also gaining prominence as a troubling issue in the industry. the practice of dumping ballasts outside ports prior to taking on fuel by tankers leads to transportation of biological organisms around the world to unnatural habitats. Sea water, particularly near the shore, harbours various flora which feeds on the plankton on the continental shelf. When a ship takes ballast from this water, the biological organisms are taken along with the water and begin to dwell inside the ship’s tanks. now, when the ship reaches the port of destination for taking on fuel, it dumps the ballasts at the port, thereby discharging the water with the biological organisms. this has led to a worldwide ecological disaster, resulting in unprecedented levels of damage.
Advanced Ship Design
Modern ship designing has come a long way since man began sea-faring. Computer assisted design has helped designers perform real time simulations and scenarios before the ship is even built. this helps in designing ships with minimal drag, better efficiency and enhanced safety. Another exciting development has been modular construction. Modular construction is the process of building a ship in parts or modules. this is akin to putting together a huge jig-saw puzzle where everything fits perfectly. this has proved to save immensely on labour hours and safety. this process has resulted

in better division of labour, leading to efficient construction. Workers required to work on a certain section of the ship would not be required to attend other sections. this would ensure that their movement is restricted on the dock, leading to lesser fatalities and mishaps.
Modern ships have benefitted immensely from years of research in fluid dynamics, oceanography and metallurgy. lighter materials are being incorporated which results in weight-reduction and fuel-efficiency.
efficient Shipping
Shipping operators nowadays recognize the need to be efficient in their operations as this has direct influence on their financials bottom-lines. Increased demands and tighter lead times have culminated in various cooperative linkages amongst shippers and freight-forwarders. the entire supply-chain is now being assimilated into one contiguous plan. Different partners are required to deliver on their commitments individually to collectively satisfy the customer’s requirements. this has meant that shippers, overland freight forwarders and air-cargo operators come together to better coordinate on deliveries.
Safety
Safety is a paramount concern in shipping nowadays. High-profile hijacking and piracy episodes have caused a nervousness and lack of confidence in the public. the shipping operators are also struggling to deal with this issue while sustaining commercial operations. the political dimensions surrounding recent high-profile piracy incidents have rendered the Gulf of Aden a critical hot-spot for the shipping world. A global anti-piracy task force has been composed with naval ships from participating navies around the world. Most commercial shipping operators have standing noCs for such task forces to carry on kinetic operations onboard their vessels in the event of piracy. the task-forces have also establishes an international command and control system which tracks ships globally and provides immediate emergency response.
on-board fatalities are also a source of major public concern. the shipping industry’s fatality rate is ten times higher than that of onshore industries in oeCD countries. to reach parity, the shipping sector needs to reduce its fatality rate by 90 percent*.
*Source: DnV Gl, The Future Of Shipping, Høvik, 2014
Vision 4
Mission 5
Strategic objectives 6
Significant Highlights 7
Core Values 8
Corporate Information 13
Code of Conduct 14
Board of Directors’ profile 18
pnSC leadership team 25
regulatory Appointments 32
organogram 36
Fleet Strength 37
Contents
Directors’ report 38
Disclosure of It Governance policy 61
Sustainability 62
Commitment to Comply With latest International regulations 68
pnSC Workshop And Its Facilities 70
Counter piracy regime In pnSC 72
Value Added Statement 74
Financial ratios 75
Graphical Analysis 76
Horizontal Analysis (Group) 82
Vertical Analysis (Group) 84
Six Years At A Glance (pnSC) 86
Auditor’s review report on Compliance with the Code of Corporate Governance 88
Statement of Compliance with the Code of Corporate Governance 90
Auditor’s report on Consolidated accounts 97
Consolidated report and Accounts of pakistan national Shipping Corporation Group of Companies 98
Auditor’s report on Holding Company 148
report and Accounts of pakistan national Shipping Corporation (Holding Company) 150
pattern of Shareholding 197
Categories of Shareholders 198
notice of Annual General Meeting 199
proxy Form 201

Vision
to be a prominent player and key stakeholder in global shipping industry by maintaining diversified and efficient marine assets.

Mission
to provide reliable & efficient shipping services to overseas and pakistan’s sea borne trade, maintaining relationship of integrity and trust with our customers, partners, employees, safeguarding interests of our stakeholders and contributing towards betterment of national economy, society and the environment.

Strategic objectives
• Persistent growth by strategic investment and diversification in marine sectorsaccording to past performance and future outlook of industry.
• Tobeoptimallyprofitable,viable,commercialorganizationandcontributetothenationaleconomy by securing a reasonable return on capital and minimize outflow of national foreign reserves.
• ToensuresteadysuppliestoPakistandefenceforcesintimesofpeace&war.
• Todohighlyethical,environmentfriendlyandsociallyresponsiblebusinesspractices.
• ToensurethateveryemployeefeelsproudofbeingpartofPNSCteam.
• Toprovetoourclientelesafe,secure,reliableandefficientshippingservices.
• Topractice&believeinequalopportunityforeveryoneineveryaspectofbusiness.
Pakistan National Shipping Corporation6

Significant Highlights
new Vessel Acquisitionoil tanker M.t. Shalamar to be inductedin 2014-15
Share price highest since last 6 years
revenue from liquid Bulk Segment highest in years
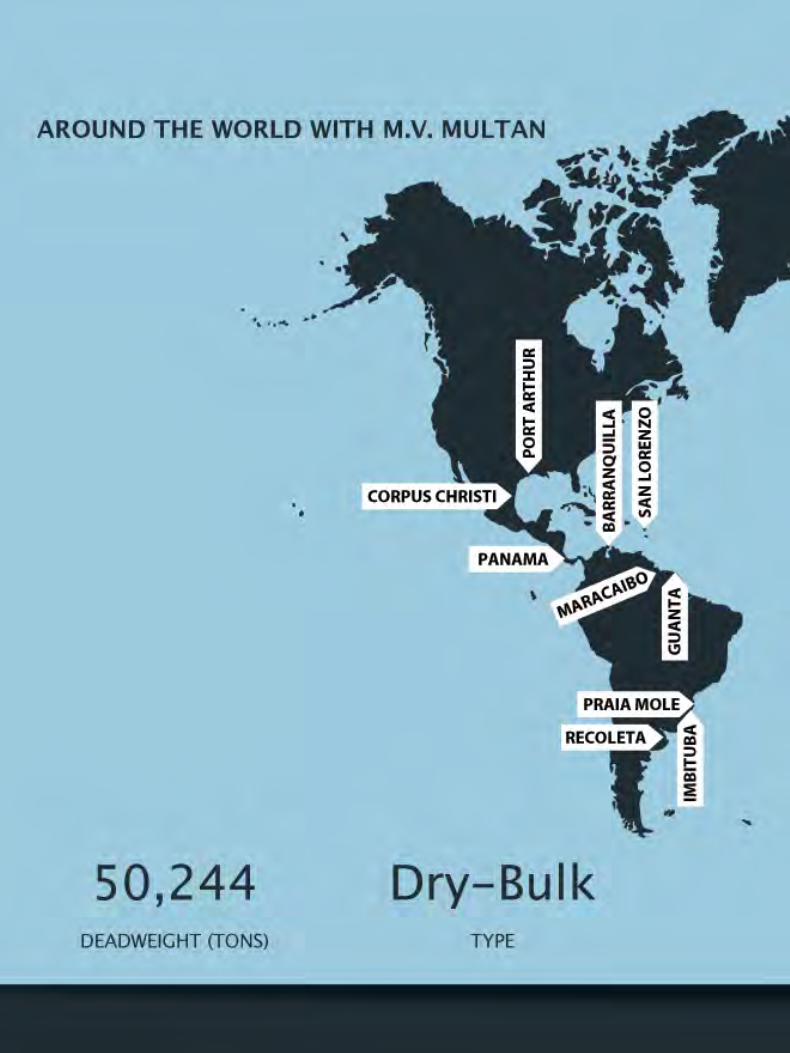
M.V. Multan’s voyage around the worldthe dry-bulk carrier completed a voyage around the world, showcasing maximum utilization
epS highest in recent years
17.51
7.33
12.36
5.70
15.08 16.27
8.00
5.39 4.52
-1.25
4.99 6.08
-5.00
0.00
5.00
10.00
15.00
20.00
Jun/09 Jun/10 Jun/11 Jun/12 Jun/13 Jun/14
EPS - Group & Standalone
Annual Report 2014 7

Safety
teamwork
Quality
Integrity
reliability
Competition
professionalism
Customer Focus
Core Values
Pakistan National Shipping Corporation8

SafetyAs a global sea-freight operator, pnSC believes in safety as the bedrock of its corporate philosophy. our commitment to the safety of our people compels us to invoke periodic safety training through fire and hijacking drills on board ships. pnSC never compromises on crew safety.
teamworkthe purpose of an organization is to amalgamate the talents and KSAs (Knowledge, Skills and Abilities) of its people and channel them to achieve its objectives which serve the interests of everyone. pnSC believes that business is not done in isolation. It is done through sharing of ideas and resources.
Qualitytoday’s business is highly competitive. the global shipping market has thousands of shipping lines operating globally. With a plethora of shipping companies to choose from, today’s shipper is well informed and tech-savvy. pnSC has re-oriented itself to suit the new market with a commitment to ensure quality at every stage of the value chain.
IntegrityIntegrity is not a collective virtue. It is a personal belief system which runs on conviction. pnSC believes in nurturing this virtue by encouraging it in the office environment. By combined effort, individual preference for integrity and fair business shape up pnSC’s belief in this virtue.
Customer FocuspnSC’s philosophy revolves around the customer. the customer is the best judge of our performance. Consequently, growth in revenue is a reliable barometer of performance.
professionalismpnSC prides itself on ensuring our workforce deal with our customers objectively without any interference of personal views. pnSC encourages an environment of open-communication and professionalism.
CompetitionCompetition allows for incentives for improvement. At pnSC, we believe competition is not only a way to win contracts from our global competitors, but also to improve ourselves.
reliabilityWhen we enter into a contract with our customers, we become an integral part of their supply chain. our delivery schedules have direct consequences on their business. Consequently, predictable schedules and lesser lead times give reliability to our business. our customers depend on us for getting their cargo on time and we take pride in acknowledging this responsibility. reliability is one of the most important tools for building our customer relationships.
Annual Report 2014 9
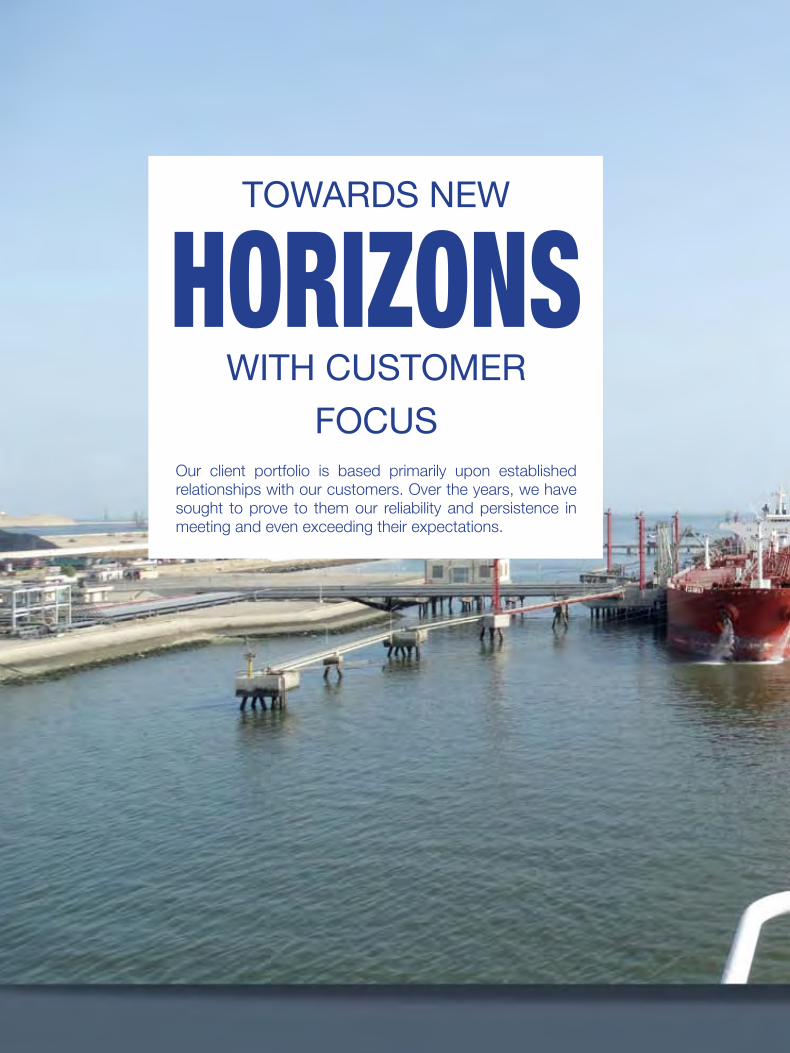
TOWARDS NEW
HORIZONSWITH CUSTOMER
FOCUSour client portfolio is based primarily upon established relationships with our customers. over the years, we have sought to prove to them our reliability and persistence in meeting and even exceeding their expectations.


Pakistan National Shipping Corporation12

Corporate Information
Board of Directors1. Mr. Muhammad Siddique Memon Chairman2. Mr. Shabbir Ahmed Member3. Mr. M. Anwar Malik Member4. Ms. Ava A. Cowasjee Member5. Mr. Akbar Adil Member6. Mr. Khowaja obaid Imran Ilyas Member7. Capt. Syed Anwar Shah Member
Audit Committee 1. Mr. Khowaja obaid Imran Ilyas Chairman2. Capt. Anwar Shah Member3. Mr. Akbar Adil Member
Human resource and remuneration Committee1. Capt. Anwar Shah Chairman2. Ms. Ava A. Cowasjee Member3. Mr. Akbar Adil Member
Commercial Committee1. Mr. Akbar Adil Chairman2. Ms. Ava A. Cowasjee Member3. Capt. Anwar Shah Member
Chief Financial officerMr. Imtiaz C. Agboatwala
Corporation & Board SecretaryMs. Zainab Suleman
Chief Internal AuditorMr. Babar Jamal Zubairi
Head officepnSC Building, Moulvi tamizuddin Khan road, Karachi - 74000
regional office Gulberg Heights, lower ground floor, near Sherpao Bridge Gulberg, lahore, pakistan.
Auditors1. A. F. Ferguson & Co., Chartered Accountants 2. ernst & Young Ford rhodes Sidat Hyder & Co., Chartered Accountants
Shares registrarM/s technology trade (pvt.) ltd. Dagia House 241-C, Block 2, p.e.C.H.S off Sharah-e-Quaideen, Karachi.
BankersBank Al-Falah limitedBank Al-Habib limitedBank Al-Habib BahrainBank Alfalah, BahrainBarclays Bank pakistan plCFaysal Bank limitedHabib Bank limitedMeezan Bank limitednIB Bank limitednational Bank of pakistannational Bank of pakistan, Hong Kongnational Bank of pakistan, tokyoSamba Bank limitedSilk Bank limitedSoneri Bank limitedStandard Chartered Bank limited pakistanunited Bank limited, london
Annual Report 2014 13

Code of Conduct
In pakistan national Shipping Corporation the Board, senior management and employees are committed to professionalism and understanding of themselves and others regarding accepted standards of the discipline.
the work related conduct requires a personal commitment to act in accordance with the accepted and especially professional standards of conduct and also to encourage such behaviour by employees and colleagues.
Corporation has always emphasized on the Business ethics as a matter of policy. the Business ethics include the principles of honesty, integrity, trustworthiness, loyalty, fairness and justice. the business ethics are rules for conduct which raise awareness of acceptable and unacceptable behaviour. Furthermore, the ethical minds of individual employees significantly contribute to ethical business practices of the Corporation.
It is the duty and responsibilities of directors, senior management and all employees to faithfully follow the Business ethics and comply with the policies and practices stated in this Code of Conduct. the Corporation’s ultimate goal is to achieve its business objectives for the benefit of all stakeholders including the shareholders and the community at large.
polICY StAteMent
It is the Corporation’s policy to conduct its business operations within the framework of the law and statutory rules and regulations, including the international law governing shipping operations.
the Corporation shall manage its affairs in accordance with concepts of good governance, with a high degree of integrity, transparency and accountability.
the Corporation shall constantly endeavour to formulate policies to ensure business growth, optimize operational efficiencies and profitability, anddevelop a corporate culture to reward merit and eliminate discrimination in all forms. It is the policy of the Corporation that professionalism is maintained in all recruiting, interviewing and hiring of individuals without regard to race, gender or religion.
there is no direct or indirect discrimination on grounds including, but not limited to race, gender, sex or marital status or religion or language and there is no harassment or victimization based on any of the aforesaid grounds.
DeVelopMent oF InternAl Control SYSteMS
It is the policy of the Corporation to maintain and update internal control systems, accounting/financial procedure, rules and regulations, in keeping with modern management practices, and ensure due compliance with regulatory requirements.
MAIntenAnCe oF proper BooKS oF ACCount AnD reCorDS
It is the policy of the Corporation to maintain proper books of account and supporting documents in accordance with law and regulatory requirements. no compromises as to the integrity of financial records orfinancial statements shall be permitted. the Corporation shall ensure that all statutory records are properly maintained and that statutory returns are filed strictly according to the regulatory requirements.All books of account, supporting documents, and statutory records shall be safeguarded and retained for such periods as may be prescribed by law or by the Corporation.
uSe AnD SAFeGuArDInG oF ConFIDentIAl InForMAtIon
All information about the policies and business affairs of the Corporation is confidential. Information received from third parties under obligation of confidentiality belongs to those third parties and is confidential. Such information must not be used or disclosed except as permissible under the relevant agreements.employees shall not intrusively remove any documents or tangible items which belong to the Corporation or which contain any confidential information, from the Corporation’s premises, including vessels. the responsibility to maintain the confidential nature of all non-public information in the Corporation’s possession continues after cessation ofemployment.
Pakistan National Shipping Corporation14

It is the policy of the Corporation to ensure confidentiality of all inside information and do not leak any inside information out of the Corporation and noemployee shall drive any personal benefit from such inside information not yet disclosed to the public and to maintain harmony among all co-workers and staff in the Corporation.
the Corporation has set up an important policy concerning the use of information of the Corporation in compliance with Good Corporate Governance and relevant regulations. the Corporation has advised its directors, senior management and employees to focus on confidential information especially internal information not yet disclosed to public or any data or information that may effect the business of the Corporation or its share price. they must not use information they receive from their directorships or employment for personal benefit or for conducting business or other activities in competition with the Corporation.
polICY toWArDS StAKeHolDerS
the Corporation recognizes the rights of all stakeholders and therefore encourages cooperation between the Corporation and all the stakeholders including employees, creditors, government agencies, community and society at large.
polICY on SAFetY, oCCupAtIonAl HeAltH AnD enVIronMent
the Corporation is committed to conducting business with the highest standards of safety, occupational health and environment conditions fully complying with all legislation and regulations relating to safety, occupational health and environmental requirements at all locations in which the Corporation operates. the Corporation shall follow practices that constantly ensure that its working environment is safe for the protection of property of the Corporation and life of itsemployees. the Corporation shall encourage health and safety awareness at all levels and promote procedures and practices that ensure environmental protection taking into account the current legislation and industry codes and practices. the Corporation
shall fully disclose all information regarding its operations and standards in relation to safety, occupational health and environment. It is the policy of the Corporation to take all necessary measures to protect the health and safety of its employees.
ConFlICt oF IntereSt
the Corporation has set up an important policy on conflict of interest. no directors, officer or employee shall have any financial interest in or be involved in the business activities of a competitor of the Corporation.
ACCeptAnCe or GIVInG oF BrIBeS
no employee of the Corporation shall accept or give bribe or any illegal gratification in the conduct of the Corporation’s business.
DISCIplIne AnD GenerAl ConDuCt
All employees shall conform to and abide by the rules and regulations of the Corporation, and shall observe, comply with and abide by all orders which may from time to time be given by any person under whose jurisdiction, superintendence or control an employee may for the time being be placed.
the Corporation expects that all directors, officers and employees will understand and adhere to this Code of Conduct. they shall be responsible for the consequences of any violation. If a violation of law is also implicated, civil or criminal liability may result.
It is expected of all to practice good / ethical behaviour and to pay attention to emerging questions, challenges and stress points positively in their respective capacities.
the purpose of this Code of Conduct is to maintain and promote dignity and reputation of the Corporation and achieve excellence. each employee is required to conduct himself/herself in a proper way, behave lawfully adhering to all laws, rules and regulations which are applicable. Failure to comply with this code or guidance may result in disciplinary action depending on the severity of the misconduct and the Corporation’s disciplinary record.
Annual Report 2014 15


our ambitious Vision 2025 sets out the strategic direction we have undertaken to better place pnSC for catering the freight demands of the future.
TOWARDS NEW
HORIZONSWITH vISION
2025

Mr. Muhammad Siddique Memon
Chairman / Ceo of pakistan national Shipping Corporation, BS-21 grade officer, started his career in Civil Services of pakistan on october 16, 1984. He has varied experience and has held various appointments in General Administration, planning Social Development, revenue, public Administration, Financial Management and Magistery.
During his service spanning over 30 years, he served as Secretary Sports, education, Finance, population Welfare, land utilization (Board of revenue), livestock & Fisheries, local Government etc. Moreover, he also served as Director Survey, District Coordination officer, Cane Commissioner, Deputy Commissioner, Assistant Commissioner, Managing Director Sindh Small Corporation, Secretary Sindh public Service Commission & Secretary Sindh text Book Board.
He assumed the charge of the Chairman / Ceo of pnSC on July 17, 2013.
Board of Directors’ profile
Pakistan National Shipping Corporation18

Ms. Ava A. Cowasjee
Ms. Ava Ardeshir Cowasjee is a prominent person in the shipping industry of pakistan. She did her schooling at Convent of Jesus and Mary, Karachi, and higher education at roedean School, england. thereafter she pursued Management training at Hyde park Hotel, london, Intercontinental Hotel, Karachi, and got her diploma in Hotel Management from the ecole Hotelier, Switzerland. She worked as Manager, Manpower Development at Intercontinental Hotel, Karachi, for four years.
She became partner of Cowasjee Group of Companies and has served for 29 years.
She has been the Chairperson of pakistan Ships Agents Association ‘pSAA’ having already served pSAA for 10 years as a Managing Committee Member. She has attended a number of conferences on shipping locally and abroad, and participated in advanced courses from pakistan Institute of Management Sciences.
She has been a Member on the Management Committee of pakistan International Freight Forwarders Association.
She is the Vice Chairman of SoS Children’s Village of Sindh for the last 10 years. She is a Member, Managing Committee Hermann Gmeiner School. She is the trustee of Cowasjee Foundation.
She was nominated as a director on the pnSC Board by the Federal Government on May 21, 2014.
Annual Report 2014 19

Mr. Anwar Malik
Mr. Anwar Malik is a Director General, privatization commission Ministry of Finance and Member of pnSC Board. He is a renowned and visionary professional, having served on various key positions in Federal & provincial setups. He holds Masters Degrees in Business Administration as well as political Science, besides being a law graduate from university of the punjab.He has versatile working experience at national & International fora, spread over more than 25 years.
He has vast exposure of Corporate Sector by virtue of which he possesses high business/commercial acumen. Mr. Malik is known for his integrity, dedication and hard work.
He was nominated as a director on the pnSC Board by the Federal Government on May 21, 2014.
Board of Directors’ profile
Pakistan National Shipping Corporation20

Mr. Akbar Adil’s profile
Mr. Akbar Adil has 38 years experience of working with IBM in pakistan and Middle east. He holds an engineering Degree in electronics and has received formal and informal training in Systems, Sales, Business Administration, and Marketing & Communications at different IBM centers in Middle east, Africa europe and uSA.
During his career he has held various leading management positions in Systems engineering, Marketing, Communications, Sales, Human resources and Services. Akbar’s experience include deep interaction with organizations in diversified sectors including Banking, telecommunication, Airline, Manufacturing, etc. In pakistan and Middle east and has participated in advising them in strategizing to deploy innovate technology solutions to improve controls, enhance customer experience and reduce costs. He has been credited for setting up a few new lines of Business for IBM pakistan.
Akbar has served on several committees of overseas Chamber of Commerce & Industry (oICCI) and American Business Council (ABC).
He has travelled extensively and is a keen photographer.
He was nominated as a director on the pnSC Board by the Federal Government on May 21, 2014.
Annual Report 2014 21

Captain Anwar Shah
Captain Anwar Shah is a reputed professional in the management and operation of port terminals, maritime transport and logistics industry with a vast experience of over 34 years that includes marketing, chartering, marine insurance hull and p&I Club, Cargo Claim Survey, Shipping and trading documentation, Salvage of Ship and Damaged Cargoes, Freight Forwarding, nVoCC operations, Stevedoring, Stowage plan.
Captain Shah is a Member Chartered Institute of Ship Brokers london and Fellow Chartered Institute of logistics & transport london and a law graduate. He also served as Director General ports and Shipping/Additional Secretary Ministry of ports and Shipping in 2003 – 2007.
He is an expert on World Bank panel, Governor World Maritime university Malmao (Sweden), Member IMo Secretary General’s panel of experts (london) and Maritime Advisor to KCCI.
Captain Shah is an elected member of pnSC’s Board of Directors.
Board of Directors’ profile
Pakistan National Shipping Corporation22

Khowaja obaid Imran Ilyas
Khowaja obaid Imran Ilyas is a graduate in economics from Cornell university new York uSA.
He is an ex-banker and served Standard Chartered Bank from year 2000 till year 2002 in Corporate and Industrial Banking.Currently he holds the position of Director Business Development in family owned business named IDSC (pvt) ltd in the business of indenting machinery and spares for the local industry.
Mr. Khowaja obaid Imran Ilyas is serving as an elected director on the board of directors of pnSC and also as Chairman of the Audit Committee.
Annual Report 2014 23

Mr. Shabbir Ahmed
Mr. Ahmed joined the Civil Services of pakistan in 1981 and has served in different positions in Audit Department of pakistan, Ministry of petroleum and national resources and Ministry of Finance. He holds a Master’s Degree in english literature from the university of punjab and post-graduate diploma in Managerial Control and Management Information Systems. He has also worked as member Finance – ptA and remained on the Board of Directors of pSo, SnGpl and CAA.
He has also served as Additional Secretary (Military Finance). While his assignment as executive Vice- president in the Industrial Development Bank of pakistan (IDBp), he helped in formulating bank-wide policies for the development of new businesses, products and instruments to be launched in underdeveloped areas in collaboration with national poverty reduction strategies.
He is currently serving as Additional Secretary Finance, Government of pakistan. He was nominated as a director on the pnSC Board by the Federal Government on September 09, 2013.
Board of Directors’ profile
Pakistan National Shipping Corporation24
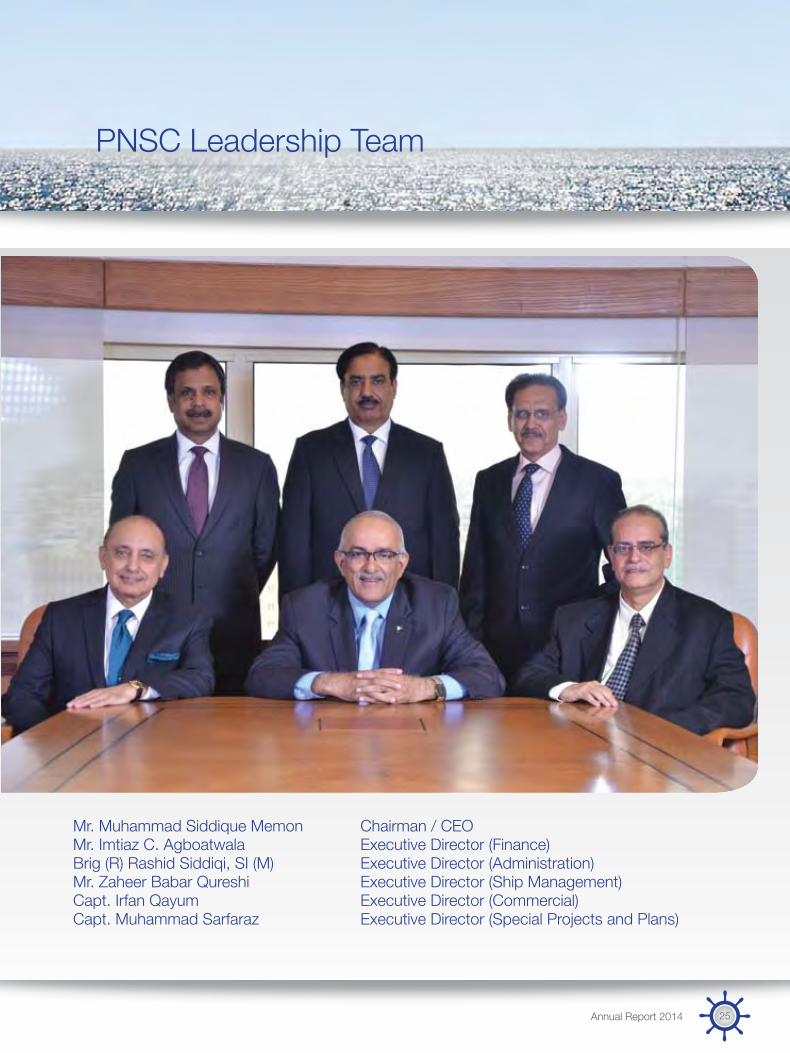
pnSC leadership team
Mr. Muhammad Siddique Memon Chairman / CeoMr. Imtiaz C. Agboatwala executive Director (Finance)Brig (r) rashid Siddiqi, SI (M) executive Director (Administration)Mr. Zaheer Babar Qureshi executive Director (Ship Management)Capt. Irfan Qayum executive Director (Commercial)Capt. Muhammad Sarfaraz executive Director (Special projects and plans)
Annual Report 2014 25
pnSC leadership team
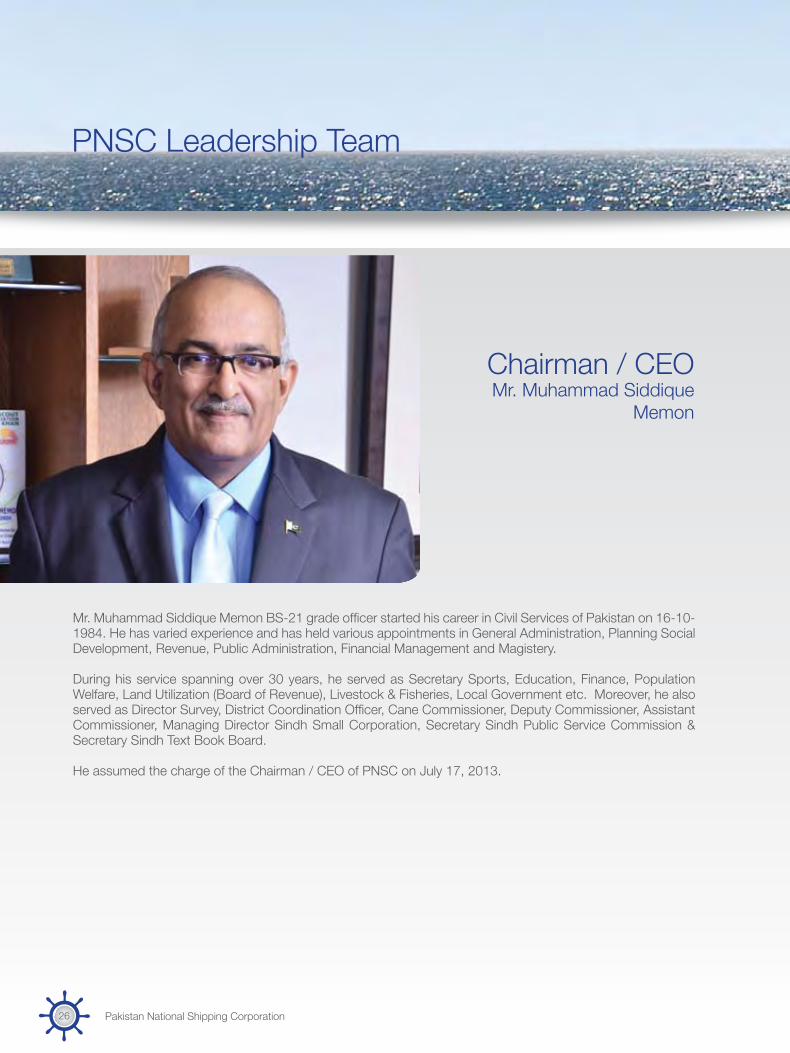
Chairman / CeoMr. Muhammad Siddique
Memon
Mr. Muhammad Siddique Memon BS-21 grade officer started his career in Civil Services of pakistan on 16-10-1984. He has varied experience and has held various appointments in General Administration, planning Social Development, revenue, public Administration, Financial Management and Magistery.
During his service spanning over 30 years, he served as Secretary Sports, education, Finance, population Welfare, land utilization (Board of revenue), livestock & Fisheries, local Government etc. Moreover, he also served as Director Survey, District Coordination officer, Cane Commissioner, Deputy Commissioner, Assistant Commissioner, Managing Director Sindh Small Corporation, Secretary Sindh public Service Commission & Secretary Sindh text Book Board.
He assumed the charge of the Chairman / Ceo of pnSC on July 17, 2013.
Pakistan National Shipping Corporation26

Imtiaz C. Agboatwala qualified as a Chartered Accountant in 1975 from Institute of Chartered Accountants of pakistan (ICAp). He started his post qualifying professional carrier with A. F. Ferguson & Co. in 1975. His 38 years professional experience includes working with national and multinational pharmaceutical companies/organizations as Chief Financial officer.
He has extensively travelled, having attended several Management Development programs and Seminars.
He joined pakistan national Shipping Corporation on 02 January 2006 as executive Director/Chief Financial officer. He is also a Director on the Boards of 19 subsidiary companies of pnSC Group.
executive Director(Finance)Mr. Imtiaz C. Agboatwala
Annual Report 2014 27

Brig. (retd) rashid Siddiqi, SI (M) joined pnSC in 2002 as executive Director (Administration). He is also the Chairman provident Fund and looks after its investment and Asset Management.
He was appointed Chairman / Ceo and Chairman Board of Directors of pakistan national Shipping Corporation in november 2009 till 21 March 2011. During this period, he developed five-year fleet development plan and arranged loan without Gop guarantee and added six modern vessels to the fleet.
He joined pakistan Army in September 1971 and remained so till 2002. He is a graduate of Command and Staff College and national Defence College. During his Army career he served as Member Faculty national Defence College Islamabad, Director Military Intelligence and Brigade Commander.
He has widely traveled and is a keen Golfer and an ardent jogger and loves sports.
executive Director(Administration)
Brig. (r) rashid Siddiqi, SI (M)
pnSC leadership team
Pakistan National Shipping Corporation28

Mr. Zaheer Babar Qureshi executive Director (Ship Management) has over 40 years of continuous service and professional experience with pakistan national Shipping Corporation in Ship operations and technical Management, both afloat and ashore.
He joined pnSC in August 1973 as an afloat officer. Mr. Babar holds 1st Class Certificate of Competency as Chief engineer of Merchant Ships and has also done Masters in technical Management of Shipping Companies 1991 from the World Maritime university, Malmo Sweden established by the International Maritime organization. Besides these qualifications, he is also a law graduate and member of the Middle east region technical Advisory Committee of American Bureau of Shipping, ClassnK and lloyd’s register.
executive Director(Ship Management)Mr. Zaheer Babar Qureshi
Annual Report 2014 29

Capt. Irfan Qayum is a Master Mariner; he also holds Certificate in Chartering form lloyd’s Maritime Academy london and is a member of the Chartered Institute of logistics and transport (MCIlt), uK. He has more than 38 years of Maritime experience, both afloat as well as ashore. He has had more than 8 years command experience on several types of ships before his induction in the shore-based operations of pnSC.
He has acquired tremendous hands-on expertise in various aspects of ship chartering, slot business and liner trade and extensive knowledge of charter-parties, contracts of affreightment, Marine Insurance and Arbitration. He has also attended several workshops/ conferences on the maritime trade and logistics, port development, freighting and commercial aspects of shipping and has represented the Corporation in several such conferences. He attended various courses and training sessions on the project and Managerial skills.
He assumed the charge of Director Commercial of the pakistan national Shipping Corporation on July 2nd, 2014.
executive Director(Commercial)
Capt. Irfan Qayum
pnSC leadership team
Pakistan National Shipping Corporation30

Capt. Muhammad Sarfaraz is a Master Mariner, a Fellow of Institute of Chartered Ship Brokers (FICS) uK, Member of Chartered Institute of logistics and transport (MCIlt) uK and lloyds accredited Auditor for Internal Safety Management System. He has more than 38 years of maritime experience, both afloat as well as ashore and more than 11 years of command experience on several types of ships before induction in the shore establishment of pnSC.While serving ashore he was actively involved in developing procedures for Sale & purchase of ships, revamping of Vision and Mission statement of pnSC, Annual and Five yearly Fleet Development plans, Business Development plans and Vision - 2025. He has participated in development of Ilo’s Maritime labor Convention (MlC-2006) and has hand on knowledge on IMo work. He has also attended training workshops organized by unCtAD, IMo and reputed organizations, which greatly enhanced his professional competence and managerial skills. He assumed the charge of Actg. executive Director (Special projects & planning) of the pakistan national Shipping Corporation on 3rd July 2014.
executive Director(Special projects and plans)Capt. Muhammad Sarfaraz
Annual Report 2014 31

regulatory Appointments
Mr. Syed Jarrar Haider Kazmi is Head of Finance Department and Chief Accountant since January 2007. He is associated with pnSC since october 2005. Mr. Jarar is a fellow member of the Institute of Chartered Accountants of pakistan and the fellow member of Institute of public Finance Accountants of pakistan with post qualification experience of more than 12 years on senior positions in other organizations including Automobile and pharmaceutical sector etc. Mr. Jarar is also a member of the public Sector Committee of the Institute of Chartered Accountants of pakistan.
He has attended various workshops and seminars, internationally and locally.
Chief AccountantMr. Syed Jarar Haider Kazmi
Pakistan National Shipping Corporation32
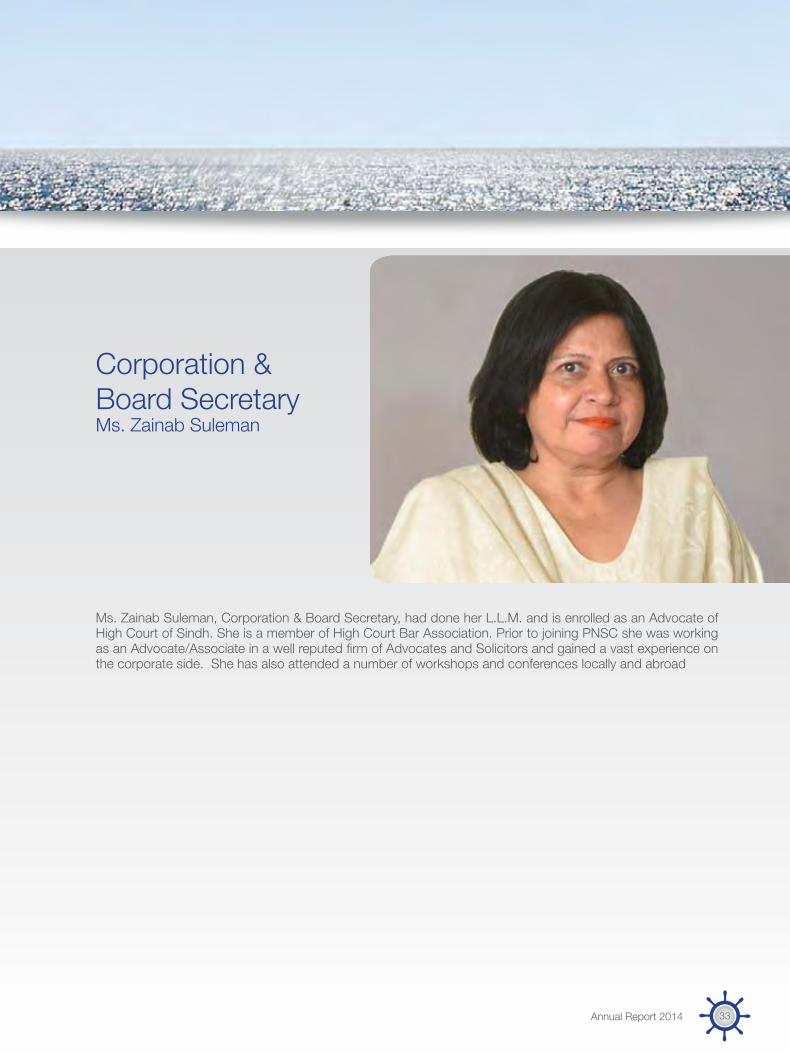
Ms. Zainab Suleman, Corporation & Board Secretary, had done her l.l.M. and is enrolled as an Advocate of High Court of Sindh. She is a member of High Court Bar Association. prior to joining pnSC she was working as an Advocate/Associate in a well reputed firm of Advocates and Solicitors and gained a vast experience on the corporate side. She has also attended a number of workshops and conferences locally and abroad
Corporation & Board SecretaryMs. Zainab Suleman
Annual Report 2014 33


organogram
exec
utive
Di
rect
orAd
min
istra
tion
Divis
ion
Gen
eral
Man
ager
pers
onne
l
Gen
eral
Man
ager
esta
te
Gen
eral
Man
ager
MIS
Gen
eral
Man
ager
lega
l
exec
utive
Di
rect
orSp
ecial
pro
jects
&
plan
ning
Di
visio
n
Man
ager
plan
ning
exec
utive
Di
rect
orFi
nanc
e Di
visio
n / C
Fo
Secr
etar
yBo
ard
/Co
rpor
atio
nSe
cret
arial
Gen
eral
Man
ager
Fina
nce
Gen
eral
Man
ager
Insu
ranc
e &
Claim
s
exec
utive
Di
rect
orCo
mm
ercia
l Di
visio
n
Gen
eral
Man
ager
Com
mer
cial
Gen
eral
Man
ager
Bills
/o
pera
tions
exec
utive
Di
rect
orSh
ip
Man
agem
ent
Divis
ion
Gen
eral
Man
ager
Mr
& S
/W
orks
hop
Chair
man
S. A
. to
Chair
man
Chief
Inte
rnal
Audi
tor
Pakistan National Shipping Corporation36

Fleet Strength
VeSSel nAMe BuIlt DeADWeIGHt lenGtH oVerAll
GroSS tonnAGe
Mt M Mt
tAnKerS
M.t QuettA JApAn 2003 107,215 246.80 58,118M.t lAHore JApAn 2003 107,018 246.80 58,157M.t KArACHI JApAn 2003 107,081 246.80 58,127
BulK CArrIerS
M.V KAGHAn JApAn 1986 65,716 225.78 36,098M.V CHItrAl JApAn 2003 46,710 185.73 26,395M.V MAlAKAnD JApAn 2004 76,830 225.00 40,040M.V HYDerABAD JApAn 2004 52,951 188.50 29,365M.V SIBI JApAn 2009 28,442 169.37 17,018M.V MultAn JApAn 2002 50,244 189.80 27,986
totAl 642,207 351,304
Annual Report 2014 37

the Board of Directors of pakistan national Shipping Corporation is pleased to present the thirty-sixth Annual report together with the audited financial statements for the year ended June 30, 2014.
InDuStrY outlooK
Shipping industry has been plagued by overcapacity and poor cash generation since 2009, and may only improve moderately as tonnage addition to the global fleet slows down. the Baltic Dry Index continues to be at historic lows indicating that it will take some time before the industry fully recovers. over 90% of global trade travels by ship, making the international freight market a key part of the global economy. Since 2009, the cost of shipping goods by sea has been highly volatile, and now rates look set to fall again, dealing another blow to this crucial industry.
Directors’ report
Pakistan National Shipping Corporation38

China, riding on the back of a decade-long golden age in investment-driven growth, now accounts for some 40% of dry bulk imports globally. the massive development of the country’s infrastructure in recent years, not to mention huge growth in autos production and consumer demand, has driven imports of iron ore, coal (both coking and thermal), copper, zinc and other metals, and grains, ever upwards. the growth in Chinese demand has been a boon for dry bulk shipping companies as the country has been one sure source of volume growth, a source even more important to the industry in the post-global crisis world. However, the reliance of the global dry bulk shipping sector on the Chinese market leaves it wide open to the impact of any slowdown in Chinese economic expansion or restructuring of its economy. With broader market fundamentals in the Dry Bulk trade expected to remain under stress due to demand supply mismatch, on back of tough financing environment, order cancellations and slippages in deliveries are also likely to remain high easing some pressure on the supply side. on the demand side, global sea-borne commodity movement is expected to advance as a result of amplified imports into Asia. But a slowdown in China or protracted recession in europe could possibly result in downward revision of demand, which can have a significant negative impact on freight rates.
the supply side (fleet growth) has now begun to decline, but weakening global economic growth is becoming a new threat. Despite decreasing bunker prices, dry bulk freight rates declined or stagnant across the most routes especially in larger vessel segments. Meanwhile new ordering activity continued despite pressure of unhealthy freight earnings.
the Aframax sector has seen strong levels of activity of late, re-affirming the high level of interest among buyers across the larger crude segments currently. In pakistan and Bangladesh, there would have been worry over the possibility of unfavourable policies being introduced in the national budgets.
Ship recyclers were razor-keen to stock their yards with pre-budget vessels, particularly after the market was abuzz with news that a number of VlCCs were being earmarked for the ship cemeteries. pakistani operators tried putting their hands into this segment, but with their counterparts from Chittagong with deeper pockets being vigilant in keeping their fingers on the market pulse, the Gadani breakers had to be content with a slew of Aframax tankers they have successfully negotiated. BuSIneSS AnAYlSIS
pakistan national Shipping Corporation’s achieved amicable targets in the year 2013-14 towards becoming a more focused company around the globe.
Important factors in the pnSC’s annual review includes the strength of world economies and currencies, general market conditions, fluctuations in charter hire rates and vessel values, changes in demand in the dry bulk market, changes in the Group’s operating expenses such as bunker prices, dry-docking and insurance costs, potential liability from pending or future litigation, general domestic and international political conditions, potential disruption of shipping routes due to accidents or political events, and other important factors described time to time in the reports filed by the Group.
the business is based on the intrinsic demand for transportation services & cargo handling infrastructure required by our refining industry. With focus on crude and dry bulk carriers. pnSC has made its remarkable success in its oil transportation segments through continuous efforts and maintain long term relationship with our customers, we broadly oversee our policies and make diversified strategies for market penetration and fleet optimization.
Annual Report 2014 39
With a diversified team of qualified and trained professional, pnSC stare up a better future prospect and continuously make efforts to engage and improve our standards in the global shipping industry’s. FInAnCIAl perForMAnCe
In the year 2013-14 pnSC has made significant contribution in country’s economy. the group maintains a strong balance sheet cash position that enables us to further strengthen our presence in global shipping cycle.the main influences on our results in this year were as follows:
pnSC Group achieved a turnover of rs. 15,585 million as against rs. 12,129 million last year with an increase in freight earnings by 28.49%. the increase was mainly attributable to improved liquid-cargo freight business despite plunging freight rates.
Direct fleet expenses also increased from rs. 8,863 million to rs. 12,257 million, an increase of 38.29%, mainly due to increased in charter hire and related expenses for employing foreign chartered vessels on our liquid-cargo business with refineries and oil marketing companies.
Gross profit of rs. 3,368 million was achieved as against rs. 3,291 million last year.
Administration expenses and other operating expenses decreased by 6.8% due to better cost control measures.Group profit after tax was rs. 2,149 million, slightly more than last year’s rs. 1,991 million.earnings per Share (epS) of the pakistan national Shipping Corporation Group of Companies were rs. 16.27 as against an epS of rs. 15.08 last year.
revenue from foreign chartered vessels witnessed a spike during the year, coming up to rs. 6,793 million as against rs. 3,456 million showing an increase of 96.56%.
the stand-alone accounts of pnSC show a profit after tax of rs. 803 million as compared to a profit after tax rs. 660 million in the last year. this was possible due to our increased liquid-cargo business with refineries. During the year, pnSC has not made any vessels disposal, overall, the fleet was fully engaged round the year without any break, in transportation of dry-bulk and liquid-cargo globally.
DrY CArGo BuSIneSS
pnSC Dry-Bulk Fleet comprises of six bulk carriers employed worldwide trading with trading houses & international charters on voyage & period charter transporting wheat, fertilizer, rock phosphate, iron ore coal & entered into log shipment CoA between (new Zealand to China).
A total of 2.4 million tonnes of cargo was carried by pnSC dry bulk fleet during the financial year 2013-14.
lIQuID CArGo BuSIneSS
pnSC has successfully carried crude oil on its owned tankers from 2003 onward under a 10-year CoA with three refineries. the CoAs have now been extended for further 5 years until 2018. pnSC is also transporting fuel oil and white oil for oil marketing company from Jan’13.
Directors’ report
Pakistan National Shipping Corporation40
pnSC provides nVoCC services through slot arrangements for imports of goods for government departments and autonomous bodies.
nAture oF our BuSIneSS, oBJeCtIVeS AnD StrAteGIeS
Being a national flag carrier, pakistan national Shipping Corporation has a rich history in global shipping. over the years, pnSC’s range of business operations has grown from basic shipping to include nVoCC business, maritime engineering works and real estate. Consequently, pnSC has evolved into an industrial provider of maritime freight services directly to producers, refineries and end-users of raw materials and commodities.
our pathway and market share in liquid-cargo business have earned us a strong reputation which, supported by our strong balance sheet:
a) Sets us apart as a ideal counterparty for liquid-cargo customers and tonnage providers, affording us access to long-term business opportunities; and
b) Allows us to connect closely with other excellent partners and stakeholders, including refineries, suppliers, foreign flag vessel owners, banks, investors and some of the best talent in our industry.
c) Maintain a assortment of competent and trained professionals for the smooth running of operations and business strategies
As far as maritime operations are concerned, the Group is mainly engaged in sea transportation trades of dry-bulk and liquid-bulk cargo as well as providing slot chartering services for dry-bulk cargo. Strategic cargo includes crude oil, petroleum products, raw materials and equipment of defence organizations being transported into pakistan. Majority of the crude oil and petroleum products are being brought from Arabian Gulf to Karachi through combination of pnSC’s own crude oil tankers and through foreign chartered tankers. our oBJeCtIVeS AnD StrAteGIeS For MeetInG tHoSe oBJeCtIVeS InCluDInG prIorItIeS For ACtIon AnD ADDreSSInG tHreAtS AnD opportunItIeS oF MArKet trenDS
the stable financial health of the Group despite slow economic activity and subdued freight rates is mainly attributable to its business strategy, fleet mix and capitalizing on opportunities.
the management has adhered to its policy of fleet modernization with the objective to lower operational costs. During fiscal year 2013-14 pnSC continued with its disposal plan by initiating sale of one bulk carrier vessel i.e. M.V. Kaghan, which had been incurring substantial expenditures in terms of maintenance and repairs without viable commercial employment in the low freight market conditions. Simultaneously, pnSC has been engaged actively in final stages of negotiation with sellers for acquisition of one modern Aframax Crude oil tanker to meet the shortfall of tankers for its captive business.
the forecast of dry market is continuing its subdued recovery and prospects remain fragile. So far, it is anticipated that the wet market will slowly and gradually firm up in coming years. However the performance of world shipping industry shall be dependent upon global economy trends.pnSC has taken steps to secure new business for maximum utilization of its cargo carrying capacity. pnSC is currently performing CoAs with three refineries and oil marketing company for transportation of crude, black
Annual Report 2014 41
and white oils into pakistan. In addition, efforts are being made to secure a long term CoA with a private oil refinery and trading Corporation of pakistan (tCp) for imports and exports of dry bulk cargoes.
StrAteGIC reVolutIon plAnS
pnSC has been positioning itself to cater for pakistan’s sea-borne trade requirements of both liquid and dry cargoes. the objectives of pnSC have been to diversify and modernize its fleet and enhance carrying capacity as well as expand business spectrum. As such, the goal defined by pnSC in VISIon 2025 is to enhance carrying capacity to over 1.5 million tones deadweight, maintain a modern and diversified fleet of 15 vessels under 15 years of age and achieve a lifting of minimum 40% of national sea-borne trade of about 64 million per annum by 2025.
the VISIon 2025 of pnSC subdivided into short term, medium term and long term is primarily based on business strategy of operating in international competitive markets while focusing dry and wet imports and exports of pakistan.
SHort terM plAn (2013-2015)
pakistan’s total annual imports of crude oil and petroleum products stand around 18 million tons. However amount of crude oil and petroleum products carried by pnSC have surpassed the agreed CoA quantity and reached over 15 million tons in FY 2013-14. the added demand for tonnage is being meet by chartering in tankers from open market.
the ultimate objective of pnSC is to enhance the scope of Contract of Affreightment (CoA) with oil refineries and oil marketing company to total 18 million tons of import of crude oil and oil products. to attain the objective set forth above, and reduce dependency of chartering in from open market, pnSC is increasing its capacity by purchasing second hand modern Aframax tankers through own resources and Commercial loans. the fleet development plan for FY 2014-15 caters acquisition of two (2) modern and relatively younger second hand Aframax tankers.
MeDIuM terM plAn (2013-2018)
trAnSportAtIon oF CoAl
the acute shortage of power to meet demand for industrial production and economic development of the country is being augmented by setting up of 10 coal fuelled power projects having a total capacity of 4,250 MW in different provinces of pakistan by the present government. this initiative would require import of around 20 million tons of coal annually by year 2017 when most of the coal fired power projects would become operational.
pnSC is a member of the working group established by the punjab power Development Board of Government of punjab for study and putting up a detailed report on coal logistics and transportation.
the objective of the Group is to achieve the status of carrier and shipping agent for all coal imports. the induction of second hand bulk carriers, primarily aimed to grow in dry bulk sector will be modified to cater expected demand for tonnage in with materialization of quantum of coal imports.
Directors’ report
Pakistan National Shipping Corporation42

trAnSportAtIon oF lnG
In order to meet the rising demand of natural gas as fuel in energy sector Government of pakistan has embarked upon developing lnG import project on fast track basis including setting up an FSru at port Qasim.
pnSC is currently in negotiations with other stakeholders in lnG project for shipping segment of lnG. the objective of pnSC is establishment of a consortium of all the stake holders including pnSC in the supply chain of lnG project.
pnSC is working closely for a long term agreement for shipping services basis this agreement is open to the options of hiring a lnG vessel on long term charter or a joint venture with lnG fleet owner/operator, a BBHp ( Bare Boat Hire purchase) as well as purchase of lnG carrier of its own by investing uS$ 200 million once a long term contract is finalized.
trAnSportAtIon oF eDIBle oIl
the annual import of edible oils of the country is around 2.5 million tons which is being imported through private sector on C&F basis. the growth of edible oil import is projected to be around 5%- 6% per annum. the project is being pursued with all stakeholders involved in the supply chain for utilization of shipping services of pnSC under a long term contract for transportation of edible oils. the progress is though slow but anticipated to materialize sooner than later. the tonnage requirement is catered for two (2) vegetable / edible oil carriers in the fleet development plan.
SHIppInG SerVICeS For puBlIC SeCtor orGAnIZAtIonS
negotiations are in progress with public Sector organization for a long term Contract of Affreightment (CoA) on a market based freight formula in compliance with the directive of Gop obligating pnSC to act as shipping agent and provide shipping service to public Sector organizations.
nVoCC AnD Slot SerVICeS
pnSC would be expanding nVoCC and Slot Charter services with the objective to become part of regional Container Service and establishing of a feeder service of its own.
An Mou has been signed with Karachi Chamber of Commerce and Industry (KCCI) in September 2013, while services being provided to other organizations are planned to be integrated in nVoCC/Slot service.
pnSC’S StAnDInG In reGIonAl trADe.
pnSC in past has provided satisfactory and competitive shipping services for import of oil by Sri lanka. pnSC has also carried oil for Bangladesh and India by participating and winning international tenders.A draft Mou has been exchanged between pnSC and counterparts in Sri lanka for a long term bilateral agreement providing shipping services for oil and dry bulk imports by Sri lanka. While the finalized Mou will be formally signed between the two Governments, pnSC, basis the Mou, will be providing shipping services in due course as per market practices.
Annual Report 2014 43

lonG terM plAn (2013-2025)
pnSC has been consistently monitoring its long term objectives which are set out as:
• ConsolidatecommercialandfinancialstandingofPNSC.
• Enhanceandmaintaindeadweightcarryingcapacityofover1.5milliontonsby2025,byaddingAframaxand product tankers, Supramax and other Bulk carrier.
• Achieveliftingofequivalenttoover40%byvolume/weightofPakistan’sannualseabornetradeby2025.
• Operateefficientandcompetitivecoastalaswellasregionalshipping.
• Maintainaninventoryof15shipsoflessthan15yearsofage.
our MArKet DYnAMICS
pnSC BuSIneSS relAtIonS
pnSC enjoys a very good reputation in the world shipping market. Its services are well recognized by all major trading houses. As a result, our dry-bulk fleet fully remained employed with first class charters world-wide. our main emphasis is to provide the best shipping services and competitive rates to public sector organizations. our modernized tanker fleet remains engaged in performing oil freight for various pakistani oil refineries. the utilization of national flag carrier for this purpose has resulted in substantial saving of foreign currency to the government in terms of freights. It has always been and will remain to be our utmost endeavour to provide most efficient and professional shipping services to our clients.
Further to enhance our global strategy our dry bulk fleet is presently employed with first class charters worldwide. Further, our tanker fleet is engaged in performing CoA for oil marketing company & various refineries. Currently the Group is set to sign contract with a private refinery for the transportation of oil cargo.
SIGnIFICAnt CHAnGeS In our oBJeCtIVeS AnD StrAteGIeS FroM tHe preVIouS perIoD or perIoDS
After Government decision obligating pnSC as shipping agent / carrier for all dry and wet imports / exports by public Sector, the Contract of Affreightment (CoA) with three refineries was signed for a further period of 5 years. In addition, CoAs were also executed for transportation of Fuel oil and White oils for oil marketing company which doubled the transportation volume of liquid cargo as a result the tanker acquisition program was updated and revived to include procurement of two (2) Aframax tankers in FY 2014-15 while acquisition process of one of the Aframax has progressed substantially and another procurement will eventually be finalized in FY 2014-15.
GeoGrApHICAl preSenCe
Being the national flag carrier of the country, pnSC enjoys a global presence in the shipping world.At present, pnSC operates its fleet on time charter / trips & voyage basis, beside tankers fulfilling CoA
Directors’ report
Pakistan National Shipping Corporation44

obligations. In term of trip and period charter, selection of routes is entire to time charterer commercial decision. to emphasize further pnSC fleet is operated on following routes:
tAnKerS
persian Gulf to Karachi / pQA, persian Gulf to India / Bangladesh (as & when cargo available)
BulK CArrIerS
MV Kaghan, MV Malakand, MV Chitral, MV Sibi, MV Multan and MV Hyderabad operate worldwide as they are either on time charter or voyage charter (mainly China – uSA, China – Australia – new Zealand and China to europe – West Africa including persian Gulf & Black Sea ports.
non VeSSel operAtInG CoMMon CArrIer - nVoCC (trADe AreA eASt AnD WeSt)
pnSC operates world wide nVoCC operation through slot charter arrangements with major container carriers. Any and all ports of the world are served. Major customers are mainly public sector organizations.
GloBAl SHIppInG MArKet ConDItIonS
Most shipping segments have continued to struggle in the first half of 2014. the long advertised slowdown in fleet growth has now begun but weakening economic growth in China is becoming a new threat to a much needed recovery in tonnage demand. Following three years of record high supply growth, new building deliveries will be much slower in the coming two years. Forecasters are expecting a net fleet growth below 5% and demand growth forecasted to outpace supply leading to higher utilization of the dry bulk fleet. pnSC is well positioned for a potential market recovery in Q4 2014- 2015 respectively.
Global Dry Bulk Market outlook
Annual Report 2014 45

Global Fleet trend and projection
BAltIC FFA ASSeSSMentS
4 BHSI tC7,408.007,538.007,638.008,431.00
4 BSI tC9,086.009,008.008,758.009,092.00
4 BpI tC7,229.007,721.007,544.008,268.00
perIoDQ3 13Q4 13
CAl 14CAl 15
Directors’ report
Pakistan National Shipping Corporation46

total67.77317.91426.40%
Wet24.50815.36962.70%
DrY43.2652.5455.8%
pakistan Seaborne tradepnSC SharepnSC Share %
Global Shipping Fleet Growth Forecast. Source: Arrow research.
MArKet SHAre
World sea-borne trade is worth about $18.78 trillion of which over 90% is carried by sea, pnSC having a total DWt capacity of 642,207 tones has lifted cargo about 17.875 million tones in 2014 which is equivalent to about 26.37% of country’s total sea-borne trade by volume which accounts for 67.773 million tones. Bifurcation excluding total container lifting 10.245 (Million tonnes) is as under:
(All in Million tones)
As there is no domestic competition – therefore the above Seaborne trade lifting comparison is based on pakistan Seaborne trade.
largely, the entire crude-oil requirement of the country is met by pnSC. Imports of petroleum products include various types of crude oil and some refined products which include HSFo, lSFo and MoGAS.
Source: oil Companies Advisory Committee
Annual Report 2014 47

Directors’ report
Year
FY 2010FY 2011FY 2012FY 2013FY 2014
pakistan’sSea-trade
(million tons)61.0062.0063.3064.2167.77
pnSC Contribution (million tons)
7.929.3310.3113.3917.914
pnSC Contribution (%)
12.9815.0516.2820.8526.40
CrItICAl perForMAnCe MeASureS
pnSC has implemented planning, monitoring, evaluation and analysis through an enterprise resource planning (erp) software including various others tools and KpIs specifically to closely monitor the overall performance. the Group has upgraded its erp software, “Ship management expert System (SeS)” and other modules which control vessel operations by providing online link between vessel and head office in real time. the management has revised its scoreboard by “pnSC Dashboard” which provides real time information about the Group and its subsidiaries performance along with the variance analysis.
Industry norms are religiously practiced in commercial planning and execution to achieve optimal performance in our market.
proJeCtIonS or ForeCAStS ABout KnoWn trenDS, unCertAIntIeS tHAt CoulD AFFeCt tHe entItY’S reSourCe, reVenue AnD operAtIonS.
With respect to dry market, demand for bulk cargoes such as coal is yet to firm up and the demand for iron ore, especially in China, also suffered the affect of increased inventories at ports. Also dry weather conditions have resulted in Australia with lower harvests which have affected the global grain trade to a large extent. However, according to the Korea Iron & Steel Association, the Korean steel market is expected to improve this year, as major industries in the country such as construction, automotive and shipbuilding are likely to expand, and steel output is expected to increase by 3.8% in 2014.
As for as wet market outlook is concerned, crude oil prices increased due to violence in Iraq may result in a civil war and inhibit crude supplies. the oil market is already suffering supply disruptions from the Middle east and Africa. However, weak refining margins in Asia-pacific, europe and the uS led to a decline in crude demand, offsetting any lost supply. As a result, supply remained plentiful despite the anxiety of the global oil market over Iraq. Moreover, increased crude production from north America and the Arabian Gulf made up for any a decline in supply.
perForMAnCe oF tHe entItY MeetS tHe ForWArD looKInG DISCloSureS MADe In tHe prIor perIoDS.
the risk and threats factors might affect earnings and operations of pnSC and leads towards the challenges years ahead.
the Group cash flows from fleet operations remained stronger over the years and pnSC is enjoying strong
Pakistan National Shipping Corporation48
coverage ratios in spite of taking long term finance for the acquisition of ship in earlier years. Further, pnSC is also looking a long term relationship with its strategic partners.
relAtIonSHIp BetWeen tHe entItY’S reSultS, MAnAGeMent oBJeCtIVeS AnD MAnAGeMent’S StrAteGIeS For ACHIeVInG tHoSe oBJeCtIVeS
our Management’s strategies and objectives have shown impressive results during past years in terms of maintaining profitability from 2002 as well as contribution to national economy.Currently the management is also pursuing a contract of affreightment with a private refinery for the transportation of oil cargo, efforts are being made to secure a long term CoA with trading Corporation of pakistan (tCp) for imports and exports of dry bulk cargoes.
CoMpArAtIVe perForMAnCe AGAInSt lASt YeAr AnD Future proSpeCtS
pnSC has a total DWt capacity of 642,207 tons and has lifted a total of 15.369 million tons of cargo, which is equivalent to approximately 26.40% of the total country’s sea-borne trade. pakistan’s sea-borne trade stood at million tons in 2013-14. pnSC is in the process of adding tonnage to its oil carrying capacity to cater to additional oil business.
HuMAn CApItAl BuIlDInG
pnSC seeks to be an attractive employer and maintains a human relations policy that is open and fair. pnSC is committed to providing equal employment opportunity to all employees and applicants for employment, regardless of race, ethnic background, gender, religion, or any other legally protected status. Diversity strengthens pnSC’s overall capacity and skills.
SuCCeSSIon plAnnInG
Succession planning is a process to identify necessary competencies, and then assess, develop, retain and engage a talent pool to ensure continuity of leadership for all critical positions.
It is pnSC’s policy to ensure that, for each key position, there is a documented succession plan as back up for the individual who currently holds that position.
this exercise is based on their performance evaluation reviews (per) and relevant job competencies as defined in the current and next level job descriptions. Such individuals will be especially monitored to assess any training and development needs or any other job-related assistance to prepare them for the next level job.line management and Hr work together to identify and support these individuals. Wherever possible, pnSC will strive to follow this internal succession planning to promote from within the existing pool. the HoDs and HrD are responsible for the overall implementation of this policy.
InDuStrIAl relAtIonS
Healthy industrial relations are key to progress and success at pnSC. this not only maintains uninterrupted service, high morale, complete mental focus of workers and employees but also reduces industrial disputes. Collective bargaining includes not only negotiations between the Management and union but also includes the
Annual Report 2014 49
Directors’ report
process of resolving labor-management conflicts. thus, collective bargaining is, essentially, a recognized way of creating a system of industrial jurisprudence.
pnSC is committed to follow Government of pakistan’s Industrial regulations Act 2012, in accordance with Ilo Convention.
eMploYMent oF SpeCIAl perSonS
As per government regulations, pnSC maintains 2% employment quota for disabled persons.
CreDIt rAtInG
pakistan Credit rating Agency (pACrA) has maintained pnSC’s credit rating as ‘A1+’ for short term and ‘AA-‘for long term. this rating denotes a very low expectation of credit risk. It indicates very strong capacity for timely payment of financial commitments. this capacity is not significantly vulnerable to foreseeable events.
CoMMerCIAl operAtIonS
During the year under review, pnSC and its vessel-owning subsidiary companies lifted 13.620 million freight tons of cargo as compared to 13.388 million freight tons of cargo in the previous year.
our MoSt SIGnIFICAnt rISKS InCluDInG StrAteGIC, CoMMerCIAl AnD operAtIonAl rISKS
pakistan national Shipping Corporation, as a global sea-freight operator, functions in a global market which experiences periodic swings between booms and depressions. these global shifts in the market have far-reaching consequences on all the shipping companies operating within. pnSC is well aware of these clear and present risks and has strategies in place to mitigate them.
no business is risk free and the shipping business is no exception. Intensified competition in both dry and wet markets with overcapacity particularly with subdued freight rates is a significant commercial risk. Shipping, as a global transportation industry in the world by playing a vital role in world economies caters for about 90% of world trade volume at lowest transportation costs. However, the industry is cyclical in nature and essentially operates in a volatile market. the earnings are dependent upon function of demand and supply dynamics of the global markets. the shipping sector benefited from global economic environment wherein GDp growth remained high however with global economy starting to melt down from beginning of 2008 the demand as a result continues to remain subdued and seriously/adversely impacted on all segments of world shipping i.e. freight, asset values, rise of bunker and demo prices.
Armed piracy in the Gulf of Aden and off the Somali coast with ever extending boundaries is a major operational
SeCtor
Dry-bulkliquid BulkSlot Charter
2013-2014FreIGHt tonS
(MIllIonS)2.48615.3690.059
2012-2013FreIGHt tonS
(MIllIonS)2.60610.6630.119
2011-2012FreIGHt tonS
(MIllIonS)2.537.7010.069
Pakistan National Shipping Corporation50

risk for the world shipping including pnSC.
Due to un sanctions on Iran, insurance clubs are forced not to cover vessels carrying Iranian cargo. In addition, insurance clubs have escalated insurance premiums for vessels operating close to Iranian waters, an operational risk for pnSC.
KeY SourCeS oF unCertAIntY
It is becoming more and more difficult to predict the manner in which markets will behave. At a time when caution could have been expected to be the watchword,. Basically threats being inherent factors of every business might give rise to uncertainty with no one in exception, pnSC might facade the factors which will be a key sources of uncertainty which would be:
• prolonged recession – anticipated too last till 2017.• oversupply in dry bulk and tanker segment.• Instability of oil & bunker prices.• Higher Cost of operations – ever increasing.• extensive competition in Dry Bulk sector internationally.• Changing operation norms in industry (Cost cutting) eCo ships.• Maintenance of non-profitable assets (Shipping & real estate). • High overhead and Admin costs.• resistance to Change and new Ideas – Status Quo.• lack of team Work.• lack of succession rotation strategy making individual indispensable.
MArKet rISK
the Group is exposed to the volatility inherent in the global dry-bulk and tanker market, where it has virtually all its assets and operations. the market is volatile and highly competitive. Demand for dry-bulk transportation is closely linked to global economic trends, with risks of demand setbacks in periods of economic downturns. Supply of tonnage serving the dry-bulk market is growing as an effect of large ordering in previous years. the market balance is difficult to predict, and it cannot be assurance that resulting rates will be sufficient to cover expenses and/or a return on the Group’s capital.
operAtIonAl rISKS
the Group’s operations may be subject to a number of risks. this includes risks of counter parties failing to honour its obligations, technical risks (including the service life of the Group’s vessels and unexpected repair costs), risks inherent in marine operations such as groundings and collisions, as well as environmental risks. In the course of its activities, the Group may become part to legal proceedings and disputes. Insurance protection may not be adequate in all instances. All of these factors could have a significant impact on the Group’s operations or financial position. For mitigation of commercial risk we are exercising pre and post fixture due diligence Sops.
plAnS AnD StrAteGIeS For MItIGAtInG tHeSe rISKS AnD potentIAl opportunItIeS Intensified competition in both dry and wet markets with overcapacity particularly with subdued freight rates is
Annual Report 2014 51
Directors’ report
a significant commercial risk. Shipping, as a global transportation industry in the world by playing a vital role in world economies caters for about 90% of world trade volume at lowest transportation costs. However, the industry is cyclical in nature and essentially operates in a volatile market. the earnings are dependent upon function of demand and supply dynamics of the global markets. the shipping sector benefited from global economic environment wherein GDp growth remained high however with global economy starting to melt down from beginning of 2008 the demand as a result continues to remain subdued and seriously/adversely impacted on all segments of world shipping i.e. freight, asset values, rise of bunker and demo prices.
pIrACY
Armed piracy in Gulf of Aden and off the Somali coast with ever extending boundaries is the major operational risk for the world shipping including pnSC. Due to un sanction on Iran, insurance clubs are forced not to cover vessels carrying Iranian cargo. In addition insurance club have escalated insurance premium for vessel operating close to Iranian water, an operational risk for pnSC.
More than 20,000 vessels transit through the Gulf of Aden each year. present piracy situation is a concern for the international shipping community, which is adding to ship owner’s daily operating costs and can affect the end-to-end supply chain. the Group being mindful of these risks takes necessary insurance cover against piracy. to protect group’s ships, when passing through high risk areas, Best Management practices (BMp-4) promulgated worldwide are being strictly adhered to. pnSC remains in close coordination with pakistan navy, nAto and CtF ISo Headquarters when ships are in high risk areas.
piracy conditions at Horn of Africa are very alarming for the shipping community. It has been estimated that on an average, an additional uSD 50,000-70,000 are incurred for each Gulf of Aden transit by every ship. this adds surplus cost to ship-owners’ daily operational expenses and can affect the end-to-end supply chain.
FInAnCIAl rISKS
Financial risks include risks of interest rate and currency fluctuations. In addition, its borrowings create leverage, which will amplify the effects of rate, cost, and value movements. In addition, changes in taxation could have a material impact on the Group. However, based on thorough reviews an appropriate strategy based on a consultative process is developed and deemed appropriate in the given circumstances to reduce the impact of risks arising out of any unfavourable situation.
CreDIt rISKS
In the present market, the risk of counter party default is very real. With a view to avoid such risks, we ensure stringent due diligence and try to restrict our dealings to parties who are reputable and financially sound.
CorporAte SoCIAl reSponSIBIlItY
Shipping is driven by the same pressures for low labour costs that push any company toward globalization of the supply chain and access to cheaper labour sources. Ships are manned increasingly by crews from all over the world, with varying degrees of training on safety and incident management.
ethics and corporate governance issues are exemplified in the lack of ownership transparency and flags of
Pakistan National Shipping Corporation52

convenience issues.
As a substantial business with an environmental footprint that comes from operating a large fleet of ships worldwide, we recognize our responsibilities to the environment generally and, in particular, we actively seek to minimize the impact our operations have on the atmosphere and our marine surroundings. We also have an obligation to our staff and the quality of their workplace, and to the communities in which we operate.
We integrate Corporate Social responsibility (“CSr”) efforts into our daily operating and business practices, because the actions we take not only have a bearing on the long-term sustainability of our business, but they also make us competitively stronger and enhance the value of our business in the future.
Corporate social responsibilities are rooted in our culture and, by integrating CSr information in our annual report, we create transparency about our operations so that all stakeholders have a clear sense of our non-financial business practices and the linkage across our actions, policies and performance.
the broad strategic objectives that guide our sustainability initiatives relate to the environment, workplace and operating practices and the communities where our ships trade and where our people live and work.
At sea
Sustainability initiatives are oriented towards reducing our impact on the atmosphere and marine environment. We seek to reduce waste by minimizing what we consume both at sea and ashore.
At workplace
We strive to create a culture whereby safety prevails across all activities and operating practices, and where our employees can thrive and make a difference.
At Country’s’ economy
We advocate and engage with organizations and refineries that are involved in importing oil we facilitate to accumulate national reserve by saving foreign currency.
enVIronMent
We recognise our role in reducing the impact of our operations on air, sea and land. one of the ways we do this is by renewing or expanding our fleet with next generation, modern ships designed and equipped to enhance efficiency. the information below is a summary of significant initiatives that reduce our environmental impact.
• optimal scheduling of our fleet, coupled with fuel-efficient voyage planning, minimizes ballast passages, resulting in fuel savings.
• By continually renewing our fleet, we introduce ships with fuel-efficient hull designs and machinery which reduces fuel consumption.
• Bringing the average age of our owned and finance-leased ships to 11 years• 0% environmental pollution incidents recorded during the year.
Annual Report 2014 53
Directors’ report
the health and safety of our employees underlies every aspect of how we operate, and is driven by policies, procedures, a culture of teamwork and efforts to continually improve how we conduct ourselves in our business at sea and onshore. providing healthy work conditions, a safe environment and opportunities to advance and develop within the Company are critical to the well-being and fulfilment of our staff and the Group success.
WorKplACe & operAtInG prACtICeS
the health and safety of our employees underlies every aspect of how we operate, and is driven by policies, procedures, a culture of teamwork and efforts to continually improve how we conduct ourselves in our business at sea and onshore. providing healthy work conditions, a safe environment and opportunities to advance and develop within the Group are critical to the well-being and fulfilment of our staff and the success of pakistan national Shipping Corporation.
Workplace safety, health and engagement metrics have been developed internally and follow best practices as defined by the industry and our peers. Shipping is a highly regulated industry and in all cases pnSC meets all minimum requirements and in some cases exceeds requirements determined by local, regional and industry mandates and customer expectations.
Investment in the development and training of our staff at sea and ashore is monumental to maximizing our crew and ship safety and productivity, and to motivating and retaining our people. this year we have introduced new metrics that capture training and staff retention for both seafarers and shore-based employees. pnSC directly and indirectly sponsors and promotes training and recruitment of the pakistani national in pakistan Maritime training Complex and other maritime training institutes to build a qualified maritime work force for employment on national and foreign flag ships. pnSC under its internship scheme provides training to fresh graduates from universities across the country.
We seek to improve our CSr performance not only because of the moral obligation we feel we have to do so, but also because we believe they make our business competitively stronger and positively impact long-term shareholder value.
CoMplIAnCe WItH CoDe oF CorporAte GoVernAnCe
the requirements of the Code of Corporate Governance set out by the Karachi Stock exchange in its listing regulations have been duly complied with. A statement to this effect is annexed with the report.
StAteMent oF etHICS AnD BuSIneSS prACtICeS
the Board has adopted the Statement of ethics and Business practices. All employees are informed of this Statement and are required to observe these rules of conduct in relation to business and its regulations. BoArD StruCture
Five Directors are appointed by the Federal Government and two are elected by shareholders for three years. the following committees have been established by the Board of Directors.
Pakistan National Shipping Corporation54

AuDIt CoMMIttee
the pnSC Board of Directors has determined the terms of reference of the Audit Committee as under:the Audit Committee is responsible for recommending to the Board of Directors the appointment of external auditors, any questions of resignation or removal of external auditors, audit fees and provisions by external auditors of any service to the Group. the Board is to consider the Audit Committee’s recommendations in this respect.
• to determine appropriate measures to safeguard the Group’s assets;
• to review preliminary announcement of results prior to publication;
• to review quarterly, half-yearly and annual financial statements of the Group, prior to their approval by the Board of Directors, focusing on:
• Major judgment areas;
• Significant adjustments resulting from the audit;
• the going-concern assumption;
• Any changes in accounting policies and practices;
• Compliance with applicable accounting standards; and Compliance with listing regulations and other statutory and regulatory requirements.
• to facilitate the external auditors in their work and discuss with them their major observations arising from the interim and the final audits of the Group and any other matter that the auditors may wish to highlight in the absence of management, where necessary;
• to review management letter issued by external auditors and management’s response thereto;
• to ensure coordination between the internal and external auditors of the Group;
S.no.123
CoMMItteeS oF tHe BoArDAudit CommitteeHuman resources & remuneration CommitteeCommercial Committee
nAMeS oF InDepenDent non-eXeCutIVe DIreCtorS on tHe HuMAn reSourCeS AnD reMunerAtIon CoMMIttee:
Current MembersCapt. Anwar ShahMs. Ava A. CowasjeeMr. Akbar Adil
2013-2014Capt. Anwar ShahVice Admiral (r) M. Asad QureshiCapt. S. Kamal A. Mahmoodi
Annual Report 2014 55
Directors’ report
• to review the scope and extent of internal audit and ensure the internal audit function has adequate resources to carry on with its work;
• to consider major findings of internal investigations and management’s response thereto;
• to ascertain that the internal control system including financial and operational controls, accounting system and reporting structure are adequate and effective;
• to review the Group’s statement on internal control systems prior to endorsement by the Board of Directors;
to institute special projects, value for money studies or other investigations on any matter specified by the Board of Directors, in consultation with the chief executive and to consider remittance of any matter to the external auditors or to any other external body;
• to determine compliance with relevant statutory requirements;
• to monitor compliance with the best practices of corporate governance and identification of significant violations thereof; and
• to consider any other issue or matter as may be assigned by the Board of Directors.
• CorporAte AnD FInAnCIAl reportInG FrAMeWorK
It is certified that:
• the financial statements prepared by the management present fairly its state of affairs, the result of its operations, cash flows and changes in equity.
• proper books of accounts of the Group have been maintained.
• Appropriate accounting policies have been consistently applied in the preparation of financial statements. Accounting estimates are based on reasonable and prudent judgment.
• International Accounting Standards, as applicable in pakistan, have been followed in the preparation of financial statements.
• the system of internal control system is sound in design and has been effectively implemented and monitored.
• there are no significant doubts about the Group’s ability to continue as a going concern.
• there has been no material departure from the best practices of corporate governance, as detailed in the Stock exchange listing regulations.
• Summary of key operating and financial data of last six financial years in summary form is annexed.
• outstanding duties and taxes, if any, have been duly disclosed in financial statements.
Pakistan National Shipping Corporation56

• the total of investments made by the pakistan national Shipping Corporation in employees Contributory provident Fund, based on the audited financial statements for the year ended June 30, 2014 stood at rs 841 million (2013: rs 850 million).
During the year ended June 30, 2014, a total of eight meetings of the Board of Directors were held. the position of attendance during respective tenure was as follows
FroM JulY 1, 2013 to June 30, 2014
S/n
1.
2.
3.
4.
5.
6.
7.
8.
9.
10.
Held
08
08
08
08
08
08
08
08
08
08
Attended
08
01
00
02
02
07
08
06
06
05
Directors
Mr. Muhammad Siddique Memon(From 24th September 2013)
Mr. Shabbir Ahmed(From 24th September 2013)
Mr. M. Anwar Malik(From 21st May 2014)
Ms. Ava A. Cowasjee(From 21st May 2014)
Mr. Akbar Adil(From 21st May 2014)
Mr. Khowaja obaid Imran Ilyas
Capt. Anwar Shah
Capt. S. Akhlaq Hussain Abidi(left 20th May 2014)
Capt. S. Kamal A. Mahmoodi(left 20th May 2014)
Vice Admiral (r) M. Asad Qureshi(left 20th May 2014)
Meeting
Annual Report 2014 57

Directors’ report
HuMAn reSourCe AnD reMunerAtIon CoMMIttee MeetInGS HelD FroM JulY 1, 2013 to June 30, 2014
S/n
1.
2.
3.
4.
5.
Held
05
-
-
05
05
Attended
05
-
-
05
05
Directors
Capt. Anwar Shah
Ms. Ava A. Cowasjee(From 21st May 2014)
Mr. Akbar Adil(From 21st May 2014)
Vice Admiral (r) M. Asad Qureshi(left 20th May 2014)
Capt. S. Kamal A. Mahmoodi(left 20th May 2014)
Meeting
AuDIt CoMMIttee MeetInGS HelD FroM JulY 1, 2013 to June 30, 2014
S/n
1.
2.
3.
4.
5.
Held
09
09
09
09
09
Attended
08
08
08
01
01
Directors
Mr. Khowaja obaid Imran Ilyas
Capt. S. Akhlaq Hussain Abidi(left 20th May 2014)
Vice Admiral (r) M. Asad Qureshi(left 20th May 2014)Capt. Anwar Shah
(From 21st May 2014)Mr. Akbar Adil
(From 21st May 2014)
Meeting
Pakistan National Shipping Corporation58

CoMMerCIAl CoMMIttee MeetInGS HelDFroM JulY 1, 2013 to June 30, 2014
S/n
1.
2.
3.
4.
5.
Held
04
04
-
-
-
Attended
04
04
-
-
-
Directors
Capt. S. Akhlaq Hussain Abidi(left 20th May 2014)
Capt. S. Kamal A. Mahmoodi(left 20th May, 2014)
Mr. Akbar Adil (From 21st May, 2014)
Ms. Ava A. Cowasjee(From 21st May, 2014)
Capt. Anwar ShahFrom 21st May, 2014
Meeting
S/n
1.
2.
3.
Date of Joining
May 21, 2014
May 21, 2014
May 21, 2014
Directors
Mr. M. Anwar Malik (Additional secretary privatization commission)
Ms. Ava A. Cowasjee
Mr. Akbar Adil
CertIFICAte oF relAteD pArtY trAnSACtIonS
It is confirmed that the transactions entered with related parties have been ratified by the Audit Committee and the Board and provide the information about the amounts due from related parties at the balance sheet date.
neW BoArD MeMBerS
Following are the new members on the pnSC Board:
Annual Report 2014 59
Directors’ report
AuDItorS
the joint auditors, A.F. Ferguson & Co., Chartered Accountants and ernst & Young Ford rhodes Sidat Hyder Chartered Accountants retire and have offered themselves for reappointment. the Board recommends that, as suggested by the Audit Committee, A.F. Ferguson & Co, Chartered Accountants and ernst & Young Ford rhodes Sidat Hyder chartered accountants may be appointed as joint auditors for the year ending June 30, 2015.
StrAteGIeS, oBJeCtIVeS AnD Future proSpeCtS
every shipping segment had continued to struggle during 2012, as expected. the supply side (fleet growth) has now begun to decline but weakening global economic growth is becoming a new threat. Despite decreasing bunker prices, dry-bulk freight rates declined or stagnant across the most routes especially in larger vessel segments. Meanwhile new ordering activity continued despite pressure of unhealthy freight earnings.
the Group’s cash flows from fleet operations remained stronger over the years and pnSC is enjoying strong coverage ratios. the above stated factors might affect earnings and operations of pnSC and leads towards the challenges years ahead.
the Group is also taking steps to secure new business for maximum utilization of its capacity both in the domestic and regional markets. nevertheless, the extent to recovery in the backdrop of overcapacity in the industry remains to be seen.
the Group has developed a Five Years Fleet Development plan (2013-18), which envisaged induction of 13 vessels. While pnSC is pursuing inductions, this development plan is kept under continuous review and is revised/updated on the basis of trade & freight market trends in global shipping industry.
DIVIDenD
the directors are pleased to recommend payment of cash dividend at 15% (rs. 1.50 per share) to the shareholders whose names appear on the Share register of the Corporation at the close of business on 22-10-2014.
ACKnoWleDGMent
the Board wishes to thank the officers and staff of the Group for their hard work and the dedication in the discharge of their duties.
the directors are also grateful to the refineries, shippers, agents, and other business associates for their continued patronage and support.
on behalf of the Board
MuHAMMAD SIDDIQue MeMonCHAIrMAn
Dated: September 16, 2014Pakistan National Shipping Corporation60

purpose
pakistan national Shipping Corporation sets a basic policy in respect of information disclosure to all our stakeholders, including investors, in order to disclose information concerning our Group appropriately.
Basic policy of Disclosure
the following is our basic policy when we disclose information.
1) Complying with relevant laws and regulations Comply with relevant laws such as Companies ordinance 1984 and regulations of Karachi stock exchange. 2) timeliness Disclose without delay any facts found, which should be disclosed. 3) transparency Always disclose factual information regardless of its content. 4) Accuracy Disclose necessary and sufficient information without creating misunderstanding. 5) Fairness Disclose information by a method which is equally accessible to our stakeholders. 6) Continuity Maintain continuity for information content for disclosure. 7) Confidentiality no information is to be leaked to a third party before an official disclosure is made.
Applicable Information for Disclosure
this basic policy applies to the following information disclosure. 1) Statutory disclosure in accordance with relevant local laws. 2) Disclosure of Group & holding company’s corporate information (quarterly, half-yearly & yearly reports, internal control and others reports). 3) Disclosure of tenders. 4) Disclosure of daily pnSC share rate quoted at Karachi stock exchange. 5) Disclosure of Safety Management policies and SMS Documentation pertaining to International Safety Management (ISM) code. 6) Disclosure of Fleet Information, Voyage Schedules, Vessel opening positions & Agents Information. 7) Disclosure of job opportunities. 8) Disclosure of real estate Information relating to vacant spaces availability.
Disclosure of It Governance policy
Annual Report 2014 61

‘Sustainable development meets the needs of the present without compromising the ability of future generations to meet their own needs.’
the World Commission on environment and Development 1987
In the context of sustainable development, three key areas emerge, which are identified by the pillars of sustainability and include the environment, economics and society (DeSA, 2011).
energy efficient operation of pnSC Vessels
there are roughly around 70,000 ships operating globally in the world trade and this unique industry transports about 90% of world trade. nearly all these vessels operate on Diesel engines which consume Intermediate Fuel oil & Diesel oil.
Burning these fuels, produce Green House Gases (GHG) which are detrimental to the global environment. the International Maritime organization (IMo), as the main regulatory body for shipping, has developed a number of technical and operational measures to control GHG emissions.
pnSC as per IMo requirement has developed Ship energy efficiency Measurement plan (SeeMp) for its fleet. A Ship energy efficiency Management plan provides a good approach for continuous monitoring of ships efficiency & performance. It also provides an opportunity to improve the performance on regular basis.
All pnSC vessels now have on board a certified manual of ship specific SeeMp plan which gives guidance to the officers what they have to do on board for reducing the fuel oil consumption including proceeding on economical speeds, following weather routing / tracking. We have our own software system SeS (Ship Management expert System) onboard for entering the data daily. this data upon receiving at the head office is viewed and analyzed. the relevant data for SeeMp such as fuel oil consumption, Cargo carried, Distance travelled, etc. is extracted and analyzed to see that our vessel are operating efficiently and within the allowable international regulatory parameters.
environmental protection measures
pnSC recognizes environmental protection and Management as one of its highest priorities and makes every effort to conserve and protect the environment from marine, atmospheric and other forms of pollutions.
the environment protection policy has been endorsed by the chairman pnSC and a signed copy of this is conspicuously displayed on board its each vessel. the policy includes a commitment to continual improvement and prevention of pollution, as well as a commitment to meet relevant environmental legislation, regulations and other requirements. the policy is reviewed periodically following change in environmental aspects and objectives and is communicated to the employees.
to eliminate the possibility of pollution at source a high standard of Safety and environmental awareness is maintained and all relevant legislation and conventions are followed in true spirit.
the following types and sources of potential environmental pollution have been recognized by us and every endeavour is made to mitigate their adverse impact upon the environment:
Sustainability
Pakistan National Shipping Corporation62

1. oil. this includes discharge into the sea of oil from accidents and also covers the operational discharge of oily waste from cargo and that, which is used as fuel and lubricating oil.
2. Chemicals, liquefied gases and other noxious liquid substances carried as cargo in bulk and chemical waste.
3. Dangerous Goods. this includes dangerous dry cargoes carried in bulk and in packaged from and also covers other packaged and containerized goods, liquid or otherwise that may constitute a hazard to the environmental if spilled or lost.
4. Garbage, including bio and non-biodegradable waste.
5. Sewage.
6. Ballast water. this includes the possibility of aquatic organisms or water-borne pathogens being transported in ships’ water ballast.
7. Anti-fouling paints and their effect on shellfish and other aquatic life.
8. Cargo vapour emissions and their effect on the natural environmental, human health and local and global climate change.
9. exhaust emissions, including gases and un-burnt hydrocarbon particles and their contribution to smog, acid rain and the greenhouse effect.
10. ozone depleting substances, particularly CFCs and Halon gases and their effect on global warming.
11. noise levels from machinery and its effect on marine mammals, ships’ crew and coastal populations.
environmental Management
All operations of pnSC vessels are closely monitored to ensure compliance with all the objectives of the ISM Code.
Annual Report 2014 63
Sustainability
oil pollution
All pnSC vessels carry dedicated oil spill removal equipment. this equipment complies with the International requirements and is listed in the vessel’s Sopep Manual.
regular oil Spill drills are conducted as per pnSC/SMS/040 (Drill Schedule) so that the crew is trained in correct operating procedures. Additionally regular onboard training is conducted in bunkering operations and the correct use of oil Discharge Monitoring equipment.
Ballast Water
the problem of harmful aquatic organism in ballast water had been at a very early stage recognized by pnSC and as such all its managed vessels stringently comply with the guidelines issued by IMo.All pnSC managed vessels carry ship specific ballast water management plan which lays down clear operating practices to be carried out for ballast operations as well as acting as a logbook for all ballast operations carried out on board.
these plans have been prepared for compliance with regulation B-1 of the International Convention for the Control and Management of Ships’ ballast Water and Sediments 2004 and the IMo guidelines for Ballast Water Management and Development of Ballast Water Management plans’ resolution MepC 127 (53).Ballast Water Management plans for all our dry cargo vessels calling Brazilian ports are Class approved.
Garbage Management.
pnSC recognizes its responsibility to fulfil all requirements under Annex V of MArpol as well as its responsibility to the world’s environment in general.
every pnSC managed ship has its own garbage management plan and record book.
All the operations for collection, storage and disposal of garbage are recorded in this garbage record Book. Chief officer is the eCo (environmental Control officer) and is responsible for recording all garbage management operations in the Garbage record book. the records are regularly monitored by the visiting Fleet Superintendents and reviewed during Internal SMS audits.
Comprehensive instructions and training on garbage management is given to all officers and crew joining pnSC managed vessels for the first time.
Anti-Fouling paint
pnSC at a much earlier stage realized the detrimental impacts of tBt based paints and as such discontinued the use tBt anti-fouling systems on the hulls of vessels managed by them. pnSC has practically been complying with the provision of AFS convention since 2003.
Pakistan National Shipping Corporation64

every pnSC managed vessel which undergoes docking, after grit blasting of its hull is applied with two coats of primer paint followed by one barrier coat or sealer coat so that there is no chance of any previous non-compliant anti-fouling system to leach into the environment. on top of this barrier coat, two coats of organotin free, biocide free paint are applied.
upon completion of docking, the Class issues a certificate which evidences the voluntary compliance with the requirements of the AFS Convention.
ozone Depleting Substances (oDS)
MArpol Annex VI prohibits any deliberate emission of oDS e.g.CFC (Chloro flouro carbons) refrigerants and Halon).
pnSC is aware that existing Halon system and equipment can be used until 2020.
only one pnSC managed vessel has an Halon fire extinguishing system fitted onboard however, the ship staff has been instructed to exercise due diligence and ensure that there is no deliberate venting of the Halon gas to atmosphere at anytime.
use of refrigerant gas r-12 has been discontinued and has been replaced by r-22 gas.
emissions to Atmosphere
pnSC support and endorse MArpol Annex VI which covers exhaust gas emissions (nox and Sox), ozone depleting substances, and volatile organic compounds (VoCs) etc.
Guidance to all pnSC managed vessels to prevent and control emissions have been set out in relevant SMS manual.
Masters and Chief engineers have been advised to strictly comply with regulation 14 and 18 of MArpol Annex VI.
pnSC managed tankers are fitted with video cameras on the funnel deck to continuously monitor the emission of the funnel.
Annual Report 2014 65

We have continued our policy of acquiring new vessels in order to expand our capacity for business. our acquisition of an oil tanker is in final phases. the oil tanker is capable of carrying crude oil, as well as refined petroleum products, and would enable us to engage in the oil-freight business much more effectively. the ship is scheduled to be inducted into the fleet as M.t. Shalamar in 2014-15.
TOWARDS NEW
HORIZONSWITH A MODERN
FLEET


Commitment to Comply With latest International regulations
1. the International labour organization (Ilo) adopted its Maritime labour Convention 2006 (MlC-2006) at its International Maritime Conference in February, 2006. this convention is being hailed as being the “Bills of rights” for the world seafarers. the convention has also been referred to as the “fourth pillar” of the maritime legislation after SolAS, StCW and MArpol.
2. the objectives of the MlC-2006 are aimed at working on a global level to address seafarers living conditions. this is achieved by a number of important key characteristics of the Convention.
3. the MlC, 2006 regulations and the Code are organized into general areas under five titles:
title 1: Minimum requirements for seafarers to work on a ship title 2: Conditions of employment title 3: Accommodation, recreational facilities, food and catering title 4: Health protection, medical care, welfare and social security protection title 5: Compliance and enforcement
3. In accordance with the code the working and living conditions of seafarers that must be inspected and approved by the flag State before certifying a ship to qualify for the MlC certificate.
4. the effective date for implementation of Maritime labour Convention is 20th August 2013 which is not very far off; however, pnSC has already drawn out its DMlC part-II clearly identifying the measure adopted to ensure ongoing compliance with the requirements on MlC-2006 and has submitted the same to the lloyd’s register of Shipping for review.
5. Following the successful inspection on board its ships against the requirements of the Convention, each pnSC ship will be issued with a Maritime labour Certificate.
Pakistan National Shipping Corporation68
Annual Report 2014 69

pnSC Workshop And Its Facilities
pnSC Workshop is the largest Marine Workshop in Karachi with more than forty years of experience in ship repairs.
established in 1970 to provide repair and maintenance facilities to our own fleet it has now grown up as a dynamically developed and financially stable industrial enterprise.
At pnSC Workshop, Safety is our number one priority and it is ensured that all jobs are conducted with zero accidents and within quoted cost and agreed timetables.
pnSC workshop over the years has earned reputation for its high quality work offered by its engineers, supervisory staff and workers.
the engineering services and expertise are not only provided to pnSC and foreign ships calling Karachi and port Qasim but also to pakistan navy, Karachi port trust, port Qasim Authority and the shore based industries.
Pakistan National Shipping Corporation70

Besides marine repairs, pnSC workshop undertakes shore based Industrial work which includes :-
i. Steel work. ii. electro hydraulic machineries and equipment. iii. electric power generation sets A/C, D/C and electrical panels. iv. All type of electric motors, accessories and components. v. Boilers and auxiliaries. vi. Internal combustion engines employed in power houses and industrial plants. vii. Heat exchangers and coolers. viii. refrigerating plants suitable for large cold storage. ix. Air compressors, centrifuges and all kinds of pumps. x. All kind of pipe lines. Workshop also provides training to Marine engineering and trade Apprentices for necessary up-gradation of their practical skills.
xi. pnSC workshop is providing training to 35 marine engineering cadets of pakistan Marine Academy every year. these cadets on completion of one year mandatory training become eligible to appear in examination and join ships as trainee engineers.
xii. Workshop also provides 03 years training to around 20 trade apprentices.
xiii. Apart from the above, workshop also provides internship to graduate engineers and diploma holders in mechanical and electrical fields.
xiv. Informatively, all trainings are provided free of cost and apprentices are also paid a monthly stipend.
Annual Report 2014 71

Counter piracy regime In pnSC
In response to the growing menace of piracy, pakistan national Shipping Corporation has enforced a comprehensive counter piracy regime as under :-
1. Standard operating procedures (Sops) to prevent piracy in Somalia as well as the Gulf of Guinea (West Africa) have been developed and are religiously implemented on board all pnSC vessels.
2. Communication plan when in High risk Area and when under attack is being followed.
3. High risk Area route planning and its implementation after being concurred by Director naval operations naval Headquarters Islamabad.
4. Mandatory compliance with requirements of Best Management practices (BMp-4):
a. Ship Security plan has been prepared by pnSC for each vessel and approved by Bureau Veritas. b. pnSC piracy Anti Attack plan. c. use of dummies. d. Ship Security Alert System installed. e. Automatic Identification System fitted. f. Barbed razor Wire all around Vessel’s perimeter. g. Fire Hoses rigged (pressurized). h. enhanced Vigilance. i. Manoeuvring practice. j. Citadels to retreat when pirates have boarded the ship has been established on board all pnSC vessels and have been provided with ISAt phones for the purpose of communication from there. k. port hole grills fitted and accommodation doors strengthened.
Pakistan National Shipping Corporation72

l. Ship alarms exercise. m. Anti-piracy drill/Citadel Drill (prior entering piracy high risk areas). n. Monitoring and supporting by pakistan navy Ships deployed at strategic points.
5. Standing noC to pakistan navy for carrying out kinetic operation onboard.
6. extensive briefing and training of ship staff with particular emphasis on adherence to BMp-4.
7. Citadel established on all vessels with dedicated independent satellite phone.
8. Ships directed to transit Gulf of Aden (GoA) only under escort (national Convoy) or International recommended transit Corridor IrtC group transit.
9. post piracy emergency response committee constituted to handle post piracy contingencies (including issues pertaining to rehabilitation and Welfare).
Annual Report 2014 73

Value Added Statement
2014 2013rs. in ‘000 % rs. in ‘000 %
Wealth Generated
Income from Shipping Business 15,585,416 94.94% 12,128,776 92.21%rental Income 141,130 0.86% 124,158 0.94%other operating income 688,901 4.20% 900,918 6.85%
16,415,447 100% 13,153,852 100%
Wealth Distributed
Fleet expenses 11,640,815 70.91% 8,332,255 63.34%Administrative and General expenses 709,408 4.32% 647,622 4.92%Salaries 1,114,149 6.79% 1,016,859 7.73%Finance Cost 548,845 3.34% 714,958 5.44%taxes 253,173 1.54% 450,819 3.43%Dividend 198,095 1.21% 132,063 1.00%retained for Business 1,950,962 11.88% 1,859,276 14.13%
16,415,447 100% 13,153,852 100%
2014 2013
Fleet ExpensesAdministrative and General Expenses
SalariesFinance Cost
TaxesDividend
Retained for Business
70.91%4.32%6.79%3.34%1.54%1.21%11.88%
63.34%4.92%7.73%5.44%3.43%1.00%14.13%
Pakistan National Shipping Corporation74

Financial ratios
uoM 2013-2014 2012-2013 2011-2012 2010-2011 2009-2010 2008-2009
profitability ratiosprofit before tax % 15.3% 19.9% 8.2% 21.8% 18.4% 26.1%Gp ratio % 21.50% 26.86% 23.61% 22.18% 18.48% 26.69%profit after tax % 13.7% 16.3% 8.5% 17.6% 12.3% 20.2%eBItDA margin to sales % 25.6% 34.3% 32.8% 35.5% 31.2% 42.2%operating leverage ratio % -23.0% 199.0% 479.1% 313.2% 165.7% -249.8%return on equity % 9.57% 9.74% 4.05% 9.04% 5.74% 14.56%return on capital employed % 7.56% 7.20% 2.91% 6.25% 5.43% 13.85%
liquidity ratiosCurrent ratio times 2.17 1.99 1.73 1.59 2.96 5.44Cash to Current liabilities times 0.47 0.54 0.63 0.78 1.02 1.33Cash flow from operations to Sales times 0.13 0.13 0.17 0.17 0.66 0.13
Activity/turnover ratiosDebtor turnover ratio times 8.70 15.22 16.34 16.64 12.52 16.86Asset turnover ratio times 0.50 0.41 0.31 0.39 0.42 0.56Fixed Assets turnover ratio times 0.66 0.50 0.37 0.38 0.52 1.24
Market ratiosearnings per share rs. 16.27 15.08 5.70 12.36 7.33 17.51p/e ratio times 4.37 3.05 2.70 1.94 5.44 2.64price to book ratio times 2.90 1.96 0.71 1.10 2.76 3.32Dividend Yield ratio % 2.11% 2.17% 3.24% 4.17% 3.76% 6.50%Dividend payout ratio times 0.09 0.07 0.09 0.08 0.20 0.17Dividend cover ratio times 10.85 15.08 11.41 12.36 4.89 5.84Cash dividend rs. 1.5 1.0 0.5 1.0 1.5 3.0Breakup value/share with surplus rs. 175.96 160.73 146.70 141.85 132.73 124.78Breakup value/share without surplus rs. 170.12 154.83 140.79 136.80 127.59 120.25Share price at year end rs. 73.12 46.00 15.41 24.00 39.89 46.16Share price- High rs. 94.57 52.00 25.89 41.74 75.54 52.31 low rs. 46.00 14.41 11.50 23.40 38.00 44.14
Capital Structure ratioFinancial leverage ratio times 0.26 0.35 0.37 0.44 0.02 0.01Debt Service Coverage ratio times 2.16 2.07 1.35 2.45 0.00 0.00Debt to equity ratio times 0.20 0.29 0.32 0.38 0.00 0.00Interest cover ratio times 5.38 4.42 1.68 8.66 0.00 0.00
Annual Report 2014 75
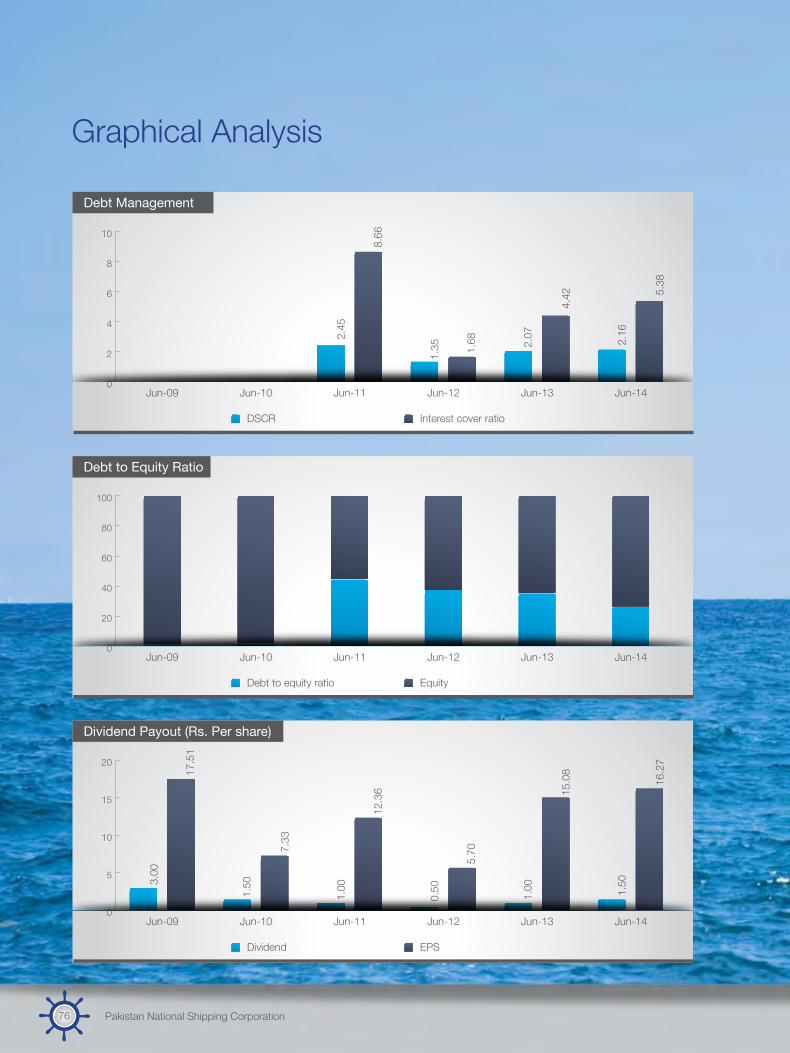
Graphical Analysis
Jun-09 Jun-10 Jun-11 Jun-12 Jun-13 Jun-14
Debt to Equity Ratio
0
20
40
60
80
100
Debt to equity ratio Equity
Jun-09 Jun-10 Jun-11 Jun-12 Jun-13 Jun-14
DSCR Interest cover ratio
Debt Management
0
2
4
6
8
10
2.45
1.35 2.
07
2.16
5.38
4.42
1.68
8.66
Jun-09 Jun-10 Jun-11 Jun-12 Jun-13 Jun-14
Dividend EPS
Dividend Payout (Rs. Per share)
0
5
10
15
20
3.0
0
1.5
0
1.0
0
0.5
0
1.0
0
1.5
0
16.
27
15.
08
5.7
0
12.
36
7.3
3
17.
51
Pakistan National Shipping Corporation76

Jun-09 Jun-10 Jun-11 Jun-12 Jun-13 Jun-14
Property plant & equipment Turnover
Fixed Assets & Turnover (Rs. '000)
0
5,000,000
10,000,000
15,000,000
20,000,000
25,000,000
8,264,524 7,889,942 9,293,169 8,875,322
12,252,934
15,726,546
22,567,568 23,210,977 22,614,412 23,476,232
14,266,718
11,474,349
Jun-09 Jun-10 Jun-11 Jun-12 Jun-13 Jun-14
Dividend Yield ratio
0
1
2
3
4
5
6
7 6.50%
4.17%
3.24%
2.17%
2.11%3.76%
Jun-09 Jun-10 Jun-11 Jun-12 Jun-13 Jun-14
GP Ratio NP Ratio
GP & NP Ratio
0
5
10
15
20
25
30 27%
18%
22% 24
% 27%
22%
14%16
%
8%
18%
12%
20%
Annual Report 2014 77

Graphical Analysis
Jun-09 Jun-10 Jun-11 Jun-12 Jun-13 Jun-14
Market value per share Break-up value per share
46.1
6
124.
78
39.8
9
132.
73
24.0
0
141.
85
15.5
1
146.
70
46.0
0
160.
73
73.1
2
175.
96
Market / Break-up value per share (Rs./ share)
0
50
100
150
200
Jun-09 Jun-10 Jun-11 Jun-12 Jun-13 Jun-14
Dividend Taxes
Payments to Federal Government
0
100,000,000
200,000,000
300,000,000
400,000,000
500,000,000
600,000,000
700,000,000
800,000,000
310
,745
,751
158
,395
,183
107
,128
,363
53,
564,
182
108
,554
,430
164
,878
,851
738
,950
,000
395
,362
,000
371
,478
,000
500
,322
,000
620
,309
,000
642
,066
,000
Jun-09 Jun-10 Jun-11 Jun-12 Jun-13 Jun-14
Shipping Revenue Gross profit Finance Costs PAT
Turnover & Profitability
0
5,000,000
10,000,000
15,000,000
20,000,000
11,
474,
349
3,0
62,5
68
54,
154
2,3
12,8
42 7,8
89,9
42
1,4
58,1
07
20,
912
967
,824
9,2
93,1
69
2,0
61,5
72
264
,435
1,6
32,9
42
8,8
75,3
22
2,0
95,6
46
1,0
71,4
05
753
,155
12,
252,
934
3,2
91,2
11
714
,958
1,9
91,3
39
15,
726,
546
3,3
81,4
86
548
,845
2,1
49,0
57
Pakistan National Shipping Corporation78

Jun-09 Jun-10 Jun-11 Jun-12 Jun-13 Jun-14
Revenue Operating Expenses
Revenue & Operating Expenses (Rs. '000)
2,000,000
6,500,000
11,000,000
15,500,000
20,000,000
8,411,780 6,431,835
7,231,597 6,779,676
8,961,723
12,345,060
15,726,546
12,252,934
8,875,322 9,293,169 7,889,942
11,474,349
Jun-09 Jun-10 Jun-11 Jun-12 Jun-13 Jun-14
PE Ratio
1
2
3
4
5
6
2.64
1.94
2.70
3.05 4.37
5.44
Jun-09 Jun-10 Jun-11 Jun-12 Jun-13 Jun-14
Sector-wise revenue
0
5,000,000
10,000,000
15,000,000
20,000,000
Liquid Bulk Dry Bulk Slot Charter
Annual Report 2014 79


We take safety as an integral part of our operational policy. pnSC is a signatory of the SolAS Convention; an international maritime treaty, formulated to enhance safety in global merchant shipping. our safety policy complies with international SAr guidelines. All pnSC vessels are equipped with modern GMDSS equipment, allowing them to report any safety event to a regional crisis reporting centre for immediate assistance.
TOWARDS NEW
HORIZONSWITH SAfETy

2014 2013‘000 % change ‘000 % change
profit & lossrevenues 15,726,546 28% 12,252,934 38%expenditure 12,345,060 38% 8,961,723 32%Gross profit 3,381,486 3% 3,291,211 57%Administrative and General expenses 816,516 -1% 823,137 35%other operating expenses 302,796 43% 211,876 -59%Finance costs 548,845 -23% 714,958 -33%other income 688,901 -24% 900,918 9%profit before taxation 2,402,230 -2% 2,442,158 237%taxation 253,173 -44% 450,819 -1699%profit after taxation 2,149,057 8% 1,991,339 164%
Balance Sheetproperty, plant and equipment 22,567,568 -3% 23,210,977 3%other non-Current Assets 1,225,190 2% 1,199,507 -3%trade debts 2,439,569 107% 1,177,691 173%Cash and bank balances 1,852,441 4% 1,788,301 3%other Current Assets 4,299,171 20% 3,576,655 39%total Assets 32,383,939 5% 30,953,131 8%
Shareholder’s equity 22,467,167 10% 20,447,185 10%Surplus on revaluation of Fixed Assets 771,073 -1% 778,889 -0%Deferred liabilities 617,483 9% 566,574 -3%long term Financing 4,568,861 -22% 5,873,286 -0%other non Current liabilities - - -Current portion of long term financing 1,316,882 0% 1,316,882 22%other Current liabilities 2,642,473 34% 1,970,315 18%total equity and liabilities 32,383,939 5% 30,953,131 8%
Cash Flow StatementCash Flows from operating Activities 2,001,668 22% 1,644,579 6%Cash Flows from Investing Activities (1,675,472) 30% (1,291,551) -442%Cash Flows from Financing Activities (1,460,066) -996% 162,942 -113%net (decrease) / increase in Cash and cash equivalents (1,133,870) -320% 515,970 -26%
othersprofit for the year 2,402,230 -2% 2,442,158 237%Finance Costs 548,845 -23% 714,958 -33%Depreciation 1,078,662 4% 1,040,093 -6%Amortisation - 0% - 0%eBItDA 4,029,737 -4% 4,197,209 44%
profit for the year 2,402,230 -2% 2,442,158 237%Finance Costs 548,845 -23% 714,958 -33%eBIt 2,951,075 -7% 3,157,116 76%
Horizontal Analysis (Group)
Pakistan National Shipping Corporation82

2012 2011 2010 2009‘000 % change ‘000 % change ‘000 % change ‘000 % change
8,875,322 -4% 9,293,169 18% 7,889,942 -31% 11,474,349 7% 6,779,676 -6% 7,231,597 12% 6,431,835 -24% 8,411,781 16% 2,095,646 2% 2,061,572 41% 1,458,107 -52% 3,062,568 -12%
608,494 -4% 631,646 1% 623,353 20% 519,807 17% 514,133 162% 196,303 -22% 253,206 -21% 319,113 73%
1,071,405 305% 264,435 1165% 20,912 -61% 54,154 -69% 823,344 -22% 1,055,964 19% 888,895 8% 825,417 1% 724,958 -64% 2,025,152 40% 1,449,531 -52% 2,994,911 -14% (28,197) -107% 392,210 -19% 481,707 -29% 682,069 -34% 753,155 -54% 1,632,942 69% 967,824 -58% 2,312,842 -6%
22,614,412 -4% 23,476,232 65% 14,266,718 73% 8,264,524 -39% 1,237,337 18% 1,051,143 1% 1,037,733 2% 1,013,768 -1%
432,070 -34% 654,580 42% 462,272 -42% 798,023 42% 1,742,306 -17% 2,100,797 60% 1,314,633 -41% 2,223,490 -35% 2,572,424 70% 1,513,423 -25% 2,023,878 -67% 6,071,744 56%
28,598,549 -1% 28,796,175 51% 19,105,234 4% 18,371,549 -18%
18,593,130 3% 18,066,178 7% 16,850,410 6% 15,880,463 23% 780,110 17% 667,582 -2% 678,837 13% 598,820 -92% 583,701 35% 433,440 49% 291,028 32% 219,894 5%
5,878,871 -15% 6,941,693 - - - - - 11,349 - - - - - - -
1,079,763 -0% 1,079,763 100% - - - -100% 1,671,626 4% 1,607,519 25% 1,284,959 -23% 1,672,372 8%
28,598,549 -1% 28,796,175 51% 19,105,234 4% 18,371,549 -18%
1,547,467 -1% 1,562,377 -70% 5,242,579 249% 1,503,728 -70% 377,914 -104% (9,278,524) 61% (5,762,074) 183% (2,034,478) -24%
(1,230,297) -116% 7,766,987 -2088% (390,752) -43% (686,251) 49% 695,084 1267% 50,840 -106% (910,247) -25% (1,217,001) -163%
724,958 -64% 2,025,152 40% 1,449,531 -52% 2,994,911 -14% 1,071,405 305% 264,435 1165% 20,912 -61% 54,154 -69% 1,111,501 10% 1,009,936 2% 994,772 -44% 1,790,586 134%
- 0% - 0% - 0% 1,649 -50% 2,907,864 -12% 3,299,523 34% 2,465,215 -49% 4,841,300 9%
724,958 -64% 2,025,152 40% 1,449,531 -52% 2,994,911 -14% 1,071,405 305% 264,435 1165% 20,912 -61% 54,154 -69% 1,796,363 -22% 2,289,587 56% 1,470,443 -52% 3,049,065 -17%
Annual Report 2014 83

Vertical Analysis (Group)
2014 2013‘000 % ‘000 %
profit & lossrevenues 15,726,546 100% 12,252,934 100%expenditure 12,345,060 78% 8,961,723 73%Gross profit 3,381,486 22% 3,291,211 27%Administrative and General expenses 816,516 5% 823,137 7%other operating expenses 302,796 2% 211,876 2%Finance costs 548,845 3% 714,958 6%other operating income 688,901 4% 900,918 7%profit before taxation 2,402,230 15% 2,442,158 20%taxation 253,173 2% 450,819 4%profit after taxation 2,149,057 14% 1,991,339 16%
Balance Sheetproperty, plant and equipment 22,567,568 70% 23,210,977 75%other non-Current Assets 1,225,190 4% 1,199,507 4%trade debts 2,439,569 8% 1,177,691 4%Cash and bank balances 1,852,441 6% 1,788,301 6%other Current Assets 4,299,171 13% 3,576,655 12%total Assets 32,383,939 100% 30,953,131 100%
Shareholder’s equity 22,467,167 69% 20,447,185 66%Surplus on revaluation of Fixed Assets 771,073 2% 778,889 3%Deferred liabilities 617,483 2% 566,574 2%long term Financing 4,568,861 14% 5,873,286 19%other non Current liabilities - - - -Current portion of long term financing 1,316,882 4% 1,316,882 4%other Current liabilities 2,642,473 8% 1,970,315 6%total equity and liabilities 32,383,939 100% 30,953,131 100%
Cash Flow StatementCash Flows from operating Activities 2,001,668 -177% 1,644,579 319%Cash Flows from Investing Activities (1,675,472) 148% (1,291,551) -250%Cash Flows from Financing Activities (1,460,066) 129% 162,942 32%net Increase/Decrease in Cash and cash equivalents (1,133,870) 100% 515,970 100%
othersprofit for the year 2,402,230 60% 2,442,158 58%Finance Costs 548,845 14% 714,958 17%Depreciation 1,078,662 27% 1,040,093 25%Amortisation - 0% - 0%eBItDA 4,029,737 100% 4,197,209 100%
profit for the year 2,402,230 81% 2,442,158 77%Finance Costs 548,845 19% 714,958 23%eBIt 2,951,075 100% 3,157,116 100%
Pakistan National Shipping Corporation84

2012 2011 2010 2009‘000 % ‘000 % ‘000 % ‘000 %
8,875,322 100% 9,293,169 100% 7,889,942 100% 11,474,349 100% 6,779,676 76% 7,231,597 78% 6,431,835 82% 8,411,781 73% 2,095,646 24% 2,061,572 22% 1,458,107 18% 3,062,568 27%
608,494 7% 631,646 7% 623,353 8% 519,807 5% 514,133 6% 196,303 2% 253,206 3% 319,113 3%
1,071,405 12% 264,435 3% 20,912 0% 54,154 0% 823,344 9% 1,055,964 11% 888,895 11% 825,417 7% 724,958 8% 2,025,152 22% 1,449,531 18% 2,994,911 26% (28,197) -0% 392,210 4% 481,707 6% 682,069 6% 753,155 8% 1,632,942 18% 967,824 12% 2,312,842 20%
22,614,412 79% 23,476,232 82% 14,266,718 75% 8,264,524 45% 1,237,337 4% 1,051,143 4% 1,037,733 5% 1,013,768 6%
432,070 2% 654,580 2% 462,272 2% 798,023 4% 1,742,306 6% 2,100,797 7% 1,314,633 7% 2,223,490 12% 2,572,424 9% 1,513,423 5% 2,023,878 11% 6,071,744 33%
28,598,549 100% 28,796,175 100% 19,105,234 100% 18,371,549 100%
18,593,130 65% 18,066,178 63% 16,850,410 88% 15,880,463 86% 780,110 3% 667,582 2% 678,837 4% 598,820 3% 583,701 2% 433,440 2% 291,028 2% 219,894 1%
5,878,871 21% 6,941,693 24% - 0% - 0% 11,349 - - - - - - -
1,079,763 4% 1,079,763 4% - 0% - 0% 1,671,626 6% 1,607,519 6% 1,284,959 7% 1,672,372 9%
28,598,549 100% 28,796,175 100% 19,105,234 100% 18,371,549 100%
1,547,467 223% 1,562,377 3073% 5,242,579 -576% 1,503,728 -124% 377,914 54% (9,278,524) -18251% (5,762,074) 633% (2,034,478) 167%
(1,230,297) -177% 7,766,987 15277% (390,752) 43% (686,251) 56% 695,084 100% 50,840 100% (910,247) 100% (1,217,001) 100%
724,958 25% 2,025,152 61% 1,449,531 59% 2,994,911 62% 1,071,405 37% 264,435 8% 20,912 1% 54,154 1% 1,111,501 38% 1,009,936 31% 994,772 40% 1,790,586 37%
- 0% - 0% - 0% 1,649 0% 2,907,864 100% 3,299,523 100% 2,465,215 100% 4,841,300 100%
724,958 40% 2,025,152 88% 1,449,531 99% 2,994,911 98% 1,071,405 60% 264,435 12% 20,912 1% 54,154 2% 1,796,363 100% 2,289,587 100% 1,470,443 100% 3,049,065 100%
Annual Report 2014 85
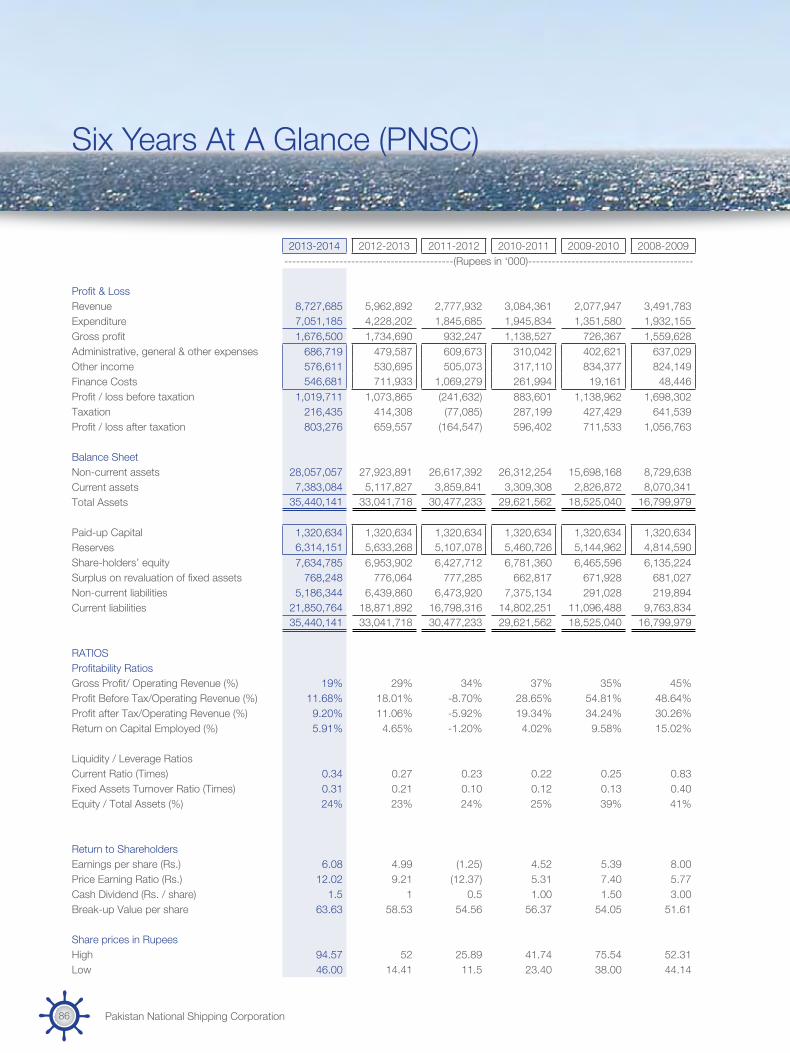
Six Years At A Glance (pnSC)
2013-2014 2012-2013 2011-2012 2010-2011 2009-2010 2008-2009-------------------------------------------(rupees in ‘000)------------------------------------------
profit & lossrevenue 8,727,685 5,962,892 2,777,932 3,084,361 2,077,947 3,491,783 expenditure 7,051,185 4,228,202 1,845,685 1,945,834 1,351,580 1,932,155 Gross profit 1,676,500 1,734,690 932,247 1,138,527 726,367 1,559,628 Administrative, general & other expenses 686,719 479,587 609,673 310,042 402,621 637,029 other income 576,611 530,695 505,073 317,110 834,377 824,149 Finance Costs 546,681 711,933 1,069,279 261,994 19,161 48,446 profit / loss before taxation 1,019,711 1,073,865 (241,632) 883,601 1,138,962 1,698,302 taxation 216,435 414,308 (77,085) 287,199 427,429 641,539 profit / loss after taxation 803,276 659,557 (164,547) 596,402 711,533 1,056,763
Balance Sheetnon-current assets 28,057,057 27,923,891 26,617,392 26,312,254 15,698,168 8,729,638 Current assets 7,383,084 5,117,827 3,859,841 3,309,308 2,826,872 8,070,341 total Assets 35,440,141 33,041,718 30,477,233 29,621,562 18,525,040 16,799,979
paid-up Capital 1,320,634 1,320,634 1,320,634 1,320,634 1,320,634 1,320,634 reserves 6,314,151 5,633,268 5,107,078 5,460,726 5,144,962 4,814,590 Share-holders’ equity 7,634,785 6,953,902 6,427,712 6,781,360 6,465,596 6,135,224 Surplus on revaluation of fixed assets 768,248 776,064 777,285 662,817 671,928 681,027 non-current liabilities 5,186,344 6,439,860 6,473,920 7,375,134 291,028 219,894 Current liabilities 21,850,764 18,871,892 16,798,316 14,802,251 11,096,488 9,763,834
35,440,141 33,041,718 30,477,233 29,621,562 18,525,040 16,799,979
rAtIoSprofitability ratiosGross profit/ operating revenue (%) 19% 29% 34% 37% 35% 45%profit Before tax/operating revenue (%) 11.68% 18.01% -8.70% 28.65% 54.81% 48.64%profit after tax/operating revenue (%) 9.20% 11.06% -5.92% 19.34% 34.24% 30.26%return on Capital employed (%) 5.91% 4.65% -1.20% 4.02% 9.58% 15.02%
liquidity / leverage ratiosCurrent ratio (times) 0.34 0.27 0.23 0.22 0.25 0.83 Fixed Assets turnover ratio (times) 0.31 0.21 0.10 0.12 0.13 0.40 equity / total Assets (%) 24% 23% 24% 25% 39% 41%
return to Shareholdersearnings per share (rs.) 6.08 4.99 (1.25) 4.52 5.39 8.00 price earning ratio (rs.) 12.02 9.21 (12.37) 5.31 7.40 5.77 Cash Dividend (rs. / share) 1.5 1 0.5 1.00 1.50 3.00 Break-up Value per share 63.63 58.53 54.56 56.37 54.05 51.61
Share prices in rupeesHigh 94.57 52 25.89 41.74 75.54 52.31low 46.00 14.41 11.5 23.40 38.00 44.14
Pakistan National Shipping Corporation86

Annual Report 2014 87

review report to the Members on the Statement of Compliance With the Code of Corporate Governance
We have reviewed the enclosed Statement of Compliance with the best practices contained in the Code of Corporate Governance (the Code) prepared by the Board of Directors of pakistan national Shipping Corporation (the Corporation) for the year ended June 30, 2014 to comply with the requirements of listing regulation no. 35 of the Karachi Stock exchange limited where the Corporation is listed.
the responsibility for compliance with the Code is that of the Board of Directors of the Corporation. our responsibility is to review, to the extent where such compliance can be objectively verified, whether the Statement of Compliance reflects the status of the Corporation’s compliance with the provisions of the Code and report if it does not and to highlight any non-compliance with the requirements of the Code. A review is limited primarily to inquiries of the Corporation’s personnel and review of various documents prepared by the Corporation to comply with the Code.
As a part of our audit of the financial statements, we are required to obtain an understanding of the accounting and internal control systems sufficient to plan the audit and develop an effective audit approach. We are not required to consider whether the Board of Directors’ statement on internal control covers all risks and controls or to form an opinion on the effectiveness of such internal controls, the Corporation’s corporate governance procedures and risks.
the Code requires the Corporation to place before the Audit Committee, and upon recommendation of the Audit Committee, place before the Board of Directors for their review and approval its related party transactions distinguishing between transactions carried out on terms equivalent to those that prevail in arm’s length transactions and transactions which are not executed at arm’s length price and recording proper justification for using such alternate pricing mechanism. We are only required and have ensured compliance of this requirement to the extent of the approval of the related party transactions by the Board of Directors upon recommendation of the Audit Committee. We have not carried out any procedures to determine whether the related party transactions were undertaken at arm’s length price or not.
Based on our review, nothing has come to our attention which causes us to believe that the Statement of Compliance does not appropriately reflect the Corporation’s compliance, in all material respects, with the best practices contained in the Code as applicable to the Corporation for the year ended June 30, 2014.
Further, we highlight below instances of non-compliance with the requirements of the Code as reflected in the paragraph reference where these are stated in the Statement of Compliance:
A. F. FerGuSon & Co.CHArtereD ACCountAntSa member firm of the pwC networkStAte lIFe BuIlDInG 1-CI. I. CHunDrIGAr roADKArACHI
ernSt & YounG ForD rHoDeS SIDAt HYDer CHArtereD ACCountAntSa member firm of ernst & Young Global limitedproGreSSIVe plAZABeAuMont roADKArACHI
Pakistan National Shipping Corporation88

A. F. FerGuSon & Co.CHArtereD ACCountAntSa member firm of the pwC networkStAte lIFe BuIlDInG 1-CI. I. CHunDrIGAr roADKArACHI
ernSt & YounG ForD rHoDeS SIDAt HYDer CHArtereD ACCountAntSa member firm of ernst & Young Global limitedproGreSSIVe plAZABeAuMont roADKArACHI
S. no paragraph reference DescriptionI. 11 the terms and conditions of employment and remuneration of the Head of
Internal Audit are to be ratified by the Board of Directors.II. 24 the mechanism for development of an annual evaluation plan to evaluate the
Board of Directors’ own performance is currently in process.III. 24 Materiality levels for placement of significant matters before the Board of
Directors is pending for Board’s approval.IV. 7 Formulation of whistle blowing policy.V. 10 Arrangement for director’s training program is currently in progress.
A. F. FerGuSon & Co.Chartered AccountantsKarachi: September 16, 2014Audit engagement partner : Khurshid Hasan
ernSt & YounG ForD rHoDeS SIDAt HYDerChartered AccountantsKarachi: September 16, 2014Audit engagement partner : Khurram Jameel
Annual Report 2014 89
pakistan national Shipping Corporation(established under the pakistan national Shipping Corporation ordinance, 1979)Year ended: 30th June, 2014
this statement is being presented to comply with the Code of Corporate Governance (the Code) contained in regulation 35 of listing regulations of Karachi Stock exchange for the purpose of establishing a framework of good governance, whereby a listed Company is managed in compliance with the best practices of corporate governance.
the Corporation has applied the principles contained in the Code in the following manner:
1. In accordance with the provisions of the pakistan national Shipping Corporation ordinance, 1979, ordinance no. xx of 1979, the Board of Directors (the Board) consists of five directors appointed by Federal Government, and two directors elected by the shareholders other than the Federal Government. All directors other than the Chairman are non-executive directors. At present the board includes:
2. the directors have confirmed that none of them is serving as a director on more than seven listed companies, including this Corporation.
3. All the resident directors of the Corporation are registered as taxpayers and none of them has defaulted in payment of any loan to a banking company, a DFI or an nBFI or, being a member of a stock exchange, has been declared as a defaulter by that stock exchange.
4. no casual vacancy has occurred during the year.
5. the Corporation has prepared a “Code of Conduct” and has ensured that appropriate steps have been taken to disseminate it throughout the Corporation along with its supporting policies and procedures.
6. All the powers of the Board have been duly exercised and decisions on material transactions have been taken by the Board. However the appointment and remuneration of the Chairman/Chief executive officer (Ceo) has been determined by the Federal Government.
7. the Board has developed a vision/mission statement, overall corporate strategy and significant policies of the Corporation. During the year the Board has approved governance, risk management and compliance issues, and human resource management policies. While the policies for write off of bad debts and capital expenditure have already been approved and defined in the financial statements. Further the Corporation follows the directions of the Federal Government for investment of funds and borrowing of monies. A complete record of particulars of significant policies along with the dates on which they were approved has been maintained.
CategoryChairman / Ceo of Board of Directorsnon – executive Directors (appointed by Federal Government) non – executive Directors (elected by Shareholders)
namesI. Mr. Muhammad Siddique MemonII. Mr. M. Anwar MalikIII. Mr. Shabbir Ahmed IV. Ms. Ava A. CowasjeeV. Mr. Akbar AdilI. Mr. Khowaja obaid Imran Ilyas II. Capt. Anwar Shah
Statement of Compliance With the Code of Corporate Governance
Pakistan National Shipping Corporation90

8. the Directors were apprised of their duties and responsibilities from time to time.
9. the meetings of the Board were presided over by the Chairman, and the Board met at least once in every quarter. Written notices of the Board meetings along with the agenda and working papers were circulated at least seven days before the meetings. the minutes of the meetings were appropriately recorded and circulated.
10. the Corporation has not arranged any training programs for its directors during the year as the government nominated directors were replaced with the new directors in the month of May, 2014 and accordingly training programs would be arranged soon.
11. there have been no fresh appointments of Chief Financial officer (CFo) and Company Secretary. During the year the Board has appointed acting Head of Internal Audit. However, the terms and conditions of employment and remuneration of the Head of Internal Audit are to be ratified by the Board.
12. the directors’ report for this year has been prepared in compliance with the requirements of the Code and fully describes the salient matters required to be disclosed.
13. the financial statements of the Corporation were duly endorsed by Ceo and CFo before approval of the Board.
14. the directors, Ceo and executives do not hold any interest in the shares of the Corporation other than that disclosed in the pattern of shareholding.
15. the Corporation has complied with all the corporate and financial reporting requirements of the Code.
16. the board has formed an Audit Committee. It comprises three members, of whom all are non-executive directors and the Chairman of the Committee is also a non-executive director.
17. the meetings of the Audit Committee (the Committee) were held at least once every quarter prior to approval of interim and final results of the Corporation and as required by the Code. the Committee was reconstituted as a sequel to the reconstitution of the Corporation’s Board by the Federal Government. the terms of reference of the Committee have been formed and advised to the Committee for compliance. All the requirements of the Code with respect to the Committee were complied.
18. the board has formed a Human resource and remuneration (Hr) Committee. the Hr Committee was also reconstituted as a sequel to the reconstitution of the pnSC Board by the Federal Government. It comprises of three members, of whom all are non-executive directors and the Chairman of the Hr Committee is a non-executive director.
19. the board has set up an internal audit function. the members of the internal audit function of the Corporation are suitably qualified and experienced for the purpose and are conversant with the policies and procedures of the Corporation.
20. the statutory auditors of the Corporation have confirmed that they have been given a satisfactory rating under the quality control review program of the Institute of Chartered Accountants of pakistan (ICAp), that they or any of the partners of the firm, their spouses and minor children do not hold any shares of
Annual Report 2014 91
the Corporation and that the firm and all its partners are in compliance with International Federation of Accountants (IFAC) guidelines on code of ethics as adopted by the ICAp.
21. the statutory auditors or the persons associated with them have not been appointed to provide other services except in accordance with the listing regulations and the auditors have confirmed that they have observed IFAC guidelines in this regard.
22. the closed period, prior to the announcement of interim/final results, and business decisions, which may materially affect the market price of the Corporation’s securities, was determined and intimated to directors, employees and stock exchange(s).
23. Material/price sensitive information has been disseminated among all market participants at once through the stock exchange(s).
24. We confirm that all other material principles enshrined in the Code have been complied with except for the following, towards which reasonable progress is being made by the Corporation to seek compliance by the end of next accounting year.
- Arrangement for training program of directors. - the materiality levels for approval of significant transactions have been determined and approved by the Audit Committee and are pending for the Board’s approval. - Formulations of mechanism to evaluate the Board’s own performance. - Formulation of whistle blowing policy by the Board.
__________________________
Muhammad Siddique Memon Chairman /Ceo Dated: September 16, 2014
Statement of Compliance With the Code of Corporate Governance
Pakistan National Shipping Corporation92
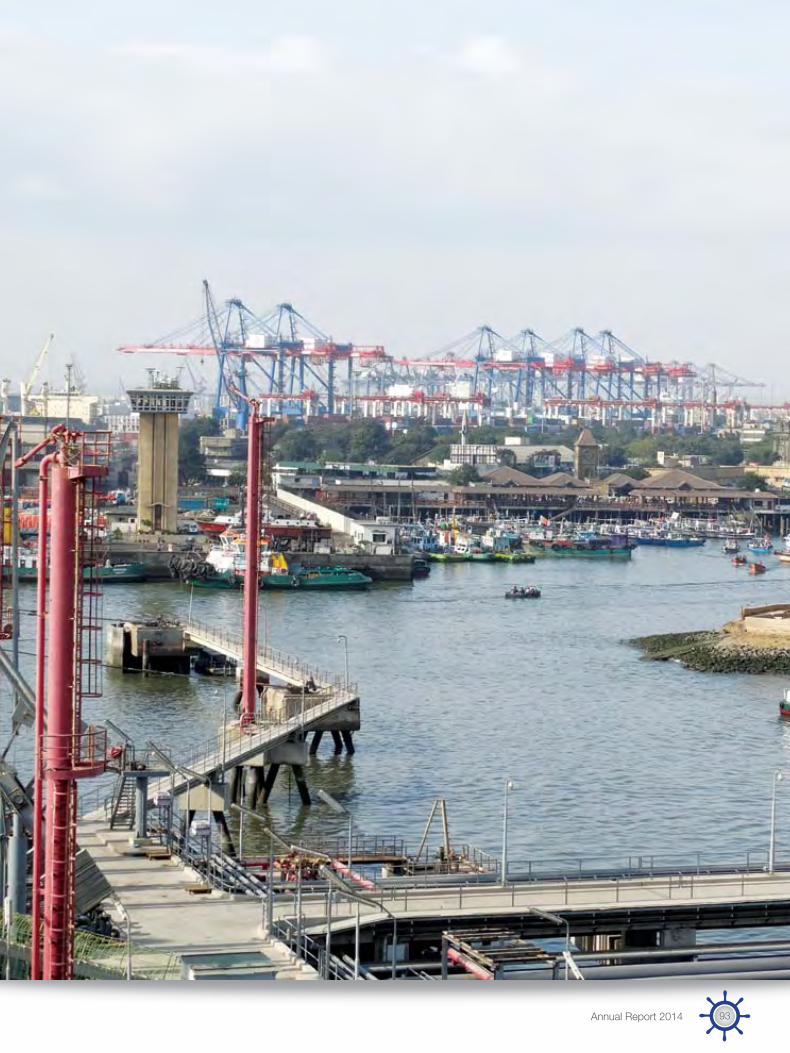
Annual Report 2014 93

Consolidated Report and Accounts
of
Pakistan National Shipping CorporationGroup of Companies
for the year ended June 30, 2014

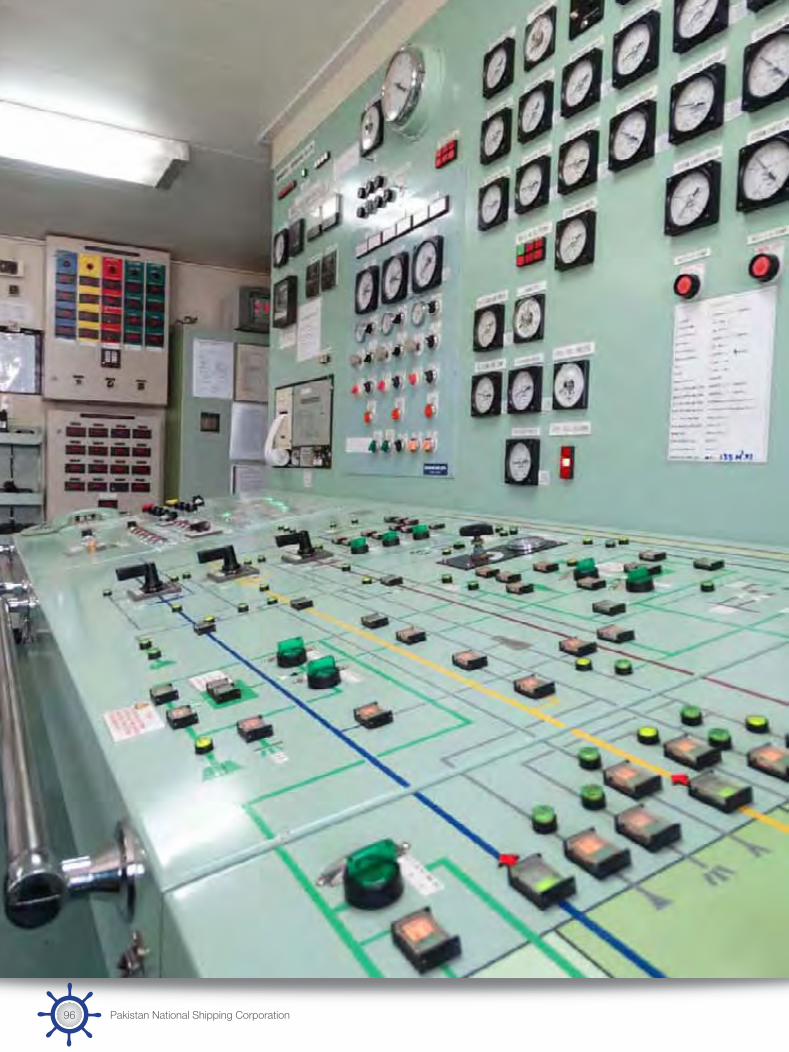
Pakistan National Shipping Corporation96
Auditors’ Report to the Members
We have audited the annexed consolidated financial statements comprising consolidated balance sheet of Pakistan National Shipping Corporation (the Holding Company), and its subsidiary companies as at June 30, 2014 and the related consolidated profit and loss account, consolidated statement of changes in equity and consolidated cash flow statement together with the notes forming part thereof, for the year then ended. We have also expressed separate opinions on the financial statements of the Holding Company and its subsidiary companies. These consolidated financial statements are the responsibility of the Holding Company’s management. Our responsibility is to express an opinion on the accompanying consolidated financial statements based on our audit.
Our audit was conducted in accordance with the auditing standards as applicable in Pakistan and accordingly included such tests of accounting records and such other auditing procedures as we considered necessary in the circumstances.
In our opinion, the consolidated financial statements present fairly the financial position of the Holding Company and its subsidiary companies as at June 30, 2014 and the results of its operations for the year then ended.
A. F. FERGUSON & CO.Chartered AccountantsKarachi: September 16, 2014Audit Engagement Partner : Khurshid Hasan
ERNST & YOUNG FORD RHODES SIDAT HYDERChartered AccountantsKarachi: September 16, 2014Audit Engagement Partner : Khurram Jameel
A. F. FERGUSON & CO.CHARTERED ACCOUNTANTSa member firm of the PwC networkSTATE LIFE BUILDING 1-CI. I. CHUNDRIGAR ROADKARACHI
ERNST & YOUNG FORD RHODES SIDAT HYDER CHARTERED ACCOUNTANTSa member firm of Ernst & Young Global LimitedPROGRESSIVE PLAZABEAUMONT ROADKARACHI
Annual Report 2014 97

Consolidated Balance Sheet As at June 30, 2014
Muhammad Siddique MemonChairman & Chief Executive
Akbar AdilDirector
Note 2014 2013-------------(Rupees in ‘000)------------
ASSETSNON-CURRENT ASSETS
Property, plant and equipment 4 22,567,568 23,210,977 Intangible asset 5 - - Investment properties 6 1,080,596 1,080,596 Long-term investments in:- Related party (associate) 7 - - - Listed companies and another entity 8 53,669 38,211 Long-term loans and advances 58 58 Long-term deposits 90 90 Deferred taxation 9 90,777 80,552
23,792,758 24,410,484 CURRENT ASSETSStores and spares 10 637,847 734,392 Trade debts 11 2,439,569 1,177,691 Agents’ and owners’ balances 12 124,824 8,991 Loans and advances 13 58,564 67,544 Trade deposits and short-term prepayments 14 47,664 37,575 Interest / mark-up accrued on bank deposits and investments 35,009 19,899 Other receivables 15 343,625 167,978 Incomplete voyages 27 - 99,180 Insurance claims 16 7,032 169,440 Taxation-net 749,726 276,206 Short-term investments 17 2,294,880 1,995,450 Cash and bank balances 18 1,852,441 1,788,301
8,591,181 6,542,647
TOTAL ASSETS 32,383,939 30,953,131
EQUITY AND LIABILITIES EQUITY ATTRIBUTABLE TO THE OWNERS OF THE HOLDING COMPANYShare capital 19 1,320,634 1,320,634 Reserves 20 21,144,018 19,124,419
22,464,652 20,445,053
NON-CONTROLLING INTEREST 21 2,515 2,132 EQUITY ATTRIBUTABLE TO EQUITY HOLDERS OF THE GROUP 22,467,167 20,447,185
SURPLUS ON REVALUATION OF PROPERTY, PLANT AND EQUIPMENT - NET OF TAX- Owners of the holding company 770,549 778,365 - Non-controlling interest 524 524
22 771,073 778,889 NON-CURRENT LIABILITIESLong-term financing 23 4,568,861 5,873,286 Deferred liabilities 24 617,483 566,574
5,186,344 6,439,860 CURRENT LIABILITIESTrade and other payables 25 2,520,301 1,854,311 Provision against damage claims 26 31,973 22,338 Current portion of long-term financing 23 1,316,882 1,316,882 Incomplete voyages 27 11,684 - Accrued mark-up on long term financing 78,515 91,087 Taxation - net - 2,579
3,959,355 3,287,197 TOTAL EQUITY AND LIABILITIES 32,383,939 30,953,131
CONTINGENCIES AND COMMITMENTS 28
The annexed notes 1 to 50 form an integral part of these consolidated financial statements.
Pakistan National Shipping Corporation98

Consolidated Profit and Loss Account For the year ended June 30, 2014
Muhammad Siddique MemonChairman & Chief Executive
Akbar AdilDirector
Note 2014 2013---------(Rupees in ‘000)--------
REVENUEIncome from shipping business 29 15,585,416 12,128,776 Rental income 141,130 124,158
15,726,546 12,252,934 EXPENDITUREFleet expenses - direct 30 (12,243,641) (8,862,616) - indirect 31 (33,878) (33,172)Real estate expenses 32 (67,541) (65,935) (12,345,060) (8,961,723)GROSS PROFIT 3,381,486 3,291,211
Administrative and general expenses 33 (816,516) (823,137)Other expenses 34 (302,796) (211,876)Other income 35 688,901 900,918
(430,411) (134,095)OPERATING PROFIT 2,951,075 3,157,116
Finance costs 36 (548,845) (714,958)
PROFIT BEFORE TAXATION 2,402,230 2,442,158
Taxation 37 (253,173) (450,819)
PROFIT FOR THE YEAR 2,149,057 1,991,339
Attributable to:Equity holders of the Holding Company 2,148,674 1,991,030 Non-controlling interest 383 309
2,149,057 1,991,339
OTHER COMPREHENSIVE INCOME FOR THE YEAR
Items that will not be reclassified to profit and loss accountRemeasurement of post-retirement benefits obligation 1,307 (87,643)Tax on remeasurement of post-retirement benefits obligation 914 13,333
2,221 (74,310)
TOTAL COMPREHENSIVE INCOME FOR THE YEAR 2,151,278 1,917,029
-----------(Rupees)-----------EARNINGS PER SHARE FOR PROFIT ATTRIBUTABLE
TO EQUITY HOLDERS OF THE HOLDING COMPANY 38 16.27 15.08
Note: The appropriations from profits are set out in the statement of changes in equity
The annexed notes 1 to 50 form an integral part of these consolidated financial statements.
Annual Report 2014 99
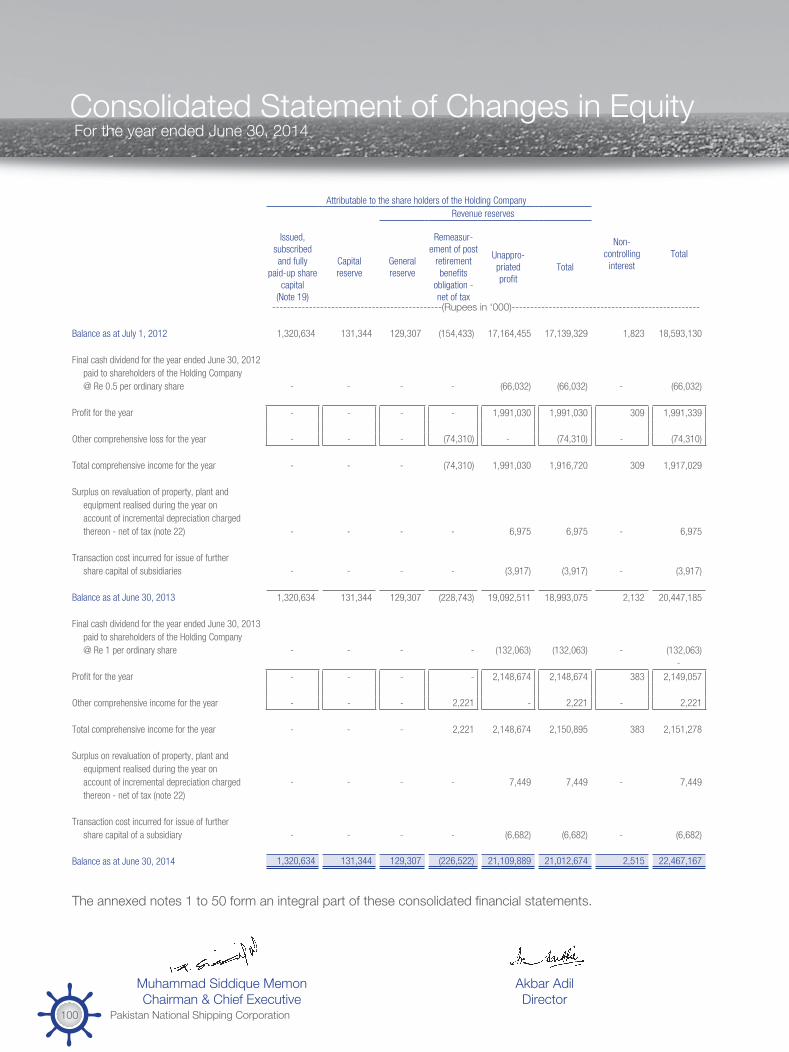
Consolidated Statement of Changes in Equity For the year ended June 30, 2014
Attributable to the share holders of the Holding Company Revenue reserves
Non-controlling
interestTotal
Issued, subscribed and fully
paid-up share capital
(Note 19)
Capital reserve
General reserve
Remeasur-ement of post
retirement benefits
obligation - net of tax
Unappro-priated profit
Total
----------------------------------------------(Rupees in ‘000)---------------------------------------------------
Balance as at July 1, 2012 1,320,634 131,344 129,307 (154,433) 17,164,455 17,139,329 1,823 18,593,130
Final cash dividend for the year ended June 30, 2012paid to shareholders of the Holding Company@ Re 0.5 per ordinary share - - - - (66,032) (66,032) - (66,032)
Profit for the year - - - - 1,991,030 1,991,030 309 1,991,339
Other comprehensive loss for the year - - - (74,310) - (74,310) - (74,310)
Total comprehensive income for the year - - - (74,310) 1,991,030 1,916,720 309 1,917,029
Surplus on revaluation of property, plant and equipment realised during the year on account of incremental depreciation chargedthereon - net of tax (note 22) - - - - 6,975 6,975 - 6,975
Transaction cost incurred for issue of further share capital of subsidiaries - - - - (3,917) (3,917) - (3,917)
Balance as at June 30, 2013 1,320,634 131,344 129,307 (228,743) 19,092,511 18,993,075 2,132 20,447,185
Final cash dividend for the year ended June 30, 2013paid to shareholders of the Holding Company@ Re 1 per ordinary share - - - - (132,063) (132,063) - (132,063)
- Profit for the year - - - - 2,148,674 2,148,674 383 2,149,057
Other comprehensive income for the year - - - 2,221 - 2,221 - 2,221
Total comprehensive income for the year - - - 2,221 2,148,674 2,150,895 383 2,151,278
Surplus on revaluation of property, plant and equipment realised during the year on account of incremental depreciation charged - - - - 7,449 7,449 - 7,449 thereon - net of tax (note 22)
Transaction cost incurred for issue of further share capital of a subsidiary - - - - (6,682) (6,682) - (6,682)
Balance as at June 30, 2014 1,320,634 131,344 129,307 (226,522) 21,109,889 21,012,674 2,515 22,467,167
The annexed notes 1 to 50 form an integral part of these consolidated financial statements.
Muhammad Siddique MemonChairman & Chief Executive
Akbar AdilDirector
Pakistan National Shipping Corporation100

Consolidated Cash Flow Statement For the year ended June 30, 2014
Muhammad Siddique MemonChairman & Chief Executive
Akbar AdilDirector
Note 2014 2013---------(Rupees in ‘000)-----------
Cash flows from operating activities
Cash generated from operations 39 3,419,104 3,223,807 Employees’ gratuity paid (7,474) (204,160)Employees’ compensated absences paid (60,241) (71,852)Post-retirement medical benefits paid (25,938) (25,342)Long-term loans and advances - 14 Finance costs paid (793,788) (984,178)Receipt under cross currency interest rate swap 208,955 102,104 Damage claims paid - (452)Taxes paid (738,950) (395,362)Net cash generated from operating activities 2,001,668 1,644,579
Cash flows from investing activities
Purchase of property, plant and equipment (435,253) (1,760,088)Proceeds from disposal of property, plant and equipment - 226,215 Short term investments made during the year (1,497,440) - Interest / mark-up received 256,400 241,089 Dividends received 821 1,233 Net cash used in investing activities (1,675,472) (1,291,551)
Cash flows from financing activities
Long-term financing (repaid) / obtained - net (1,323,158) 231,535 Transaction costs paid for issue of ordinary share capital (6,682) (3,917)Dividends paid (130,226) (64,676)Net cash (used in) / generated from financing activities (1,460,066) 162,942
Net (decrease) / increase in cash and cash equivalents (1,133,870) 515,970
Cash and cash equivalents at beginning of the year 3,783,751 3,267,781
Cash and cash equivalents at end of the year 40 2,649,881 3,783,751
The annexed notes 1 to 50 form an integral part of these consolidated financial statements.
Annual Report 2014 101

Notes to and Forming part of the Consolidated Financial StatementsFor The Year Ended June 30, 2014
1. GENERAL INFORMATION
Pakistan National Shipping Corporation (the Holding Company), its subsidiary companies and an associate (together ‘the Group’) were incorporated under the provisions of the Pakistan National Shipping Ordinance, 1979 and the Companies Ordinance, 1984, respectively. The Group is principally engaged in the business of shipping, including charter of vessels, transportation of cargo and other related services. The Group is also engaged in renting out its properties to tenants under lease agreements. The Group’s registered office is situated at PNSC Building, Moulvi Tamizuddin Khan Road, Karachi except for Pakistan Co-operative Ship Stores (Private) Limited which is situated at 70/4, Timber Pond, N.M Reclamation Kemari, Karachi.
The Group consists of:
Holding company- Pakistan National Shipping Corporation
Subsidiary companies- Bolan Shipping (Private) Limited- Chitral Shipping (Private) Limited- Hyderabad Shipping (Private) Limited- Islamabad Shipping (Private) Limited- Johar Shipping (Private) Limited- Kaghan Shipping (Private) Limited- Karachi Shipping (Private) Limited - Khairpur Shipping (Private) Limited- Lahore Shipping (Private) Limited - Lalazar Shipping (Private) Limited- Makran Shipping (Private) Limited- Malakand Shipping (Private) Limited- Multan Shipping (Private) Limited- Pakistan Co-operative Ship Stores (Private) Limited- Quetta Shipping (Private) Limited- Sargodha Shipping (Private) Limited- Shalamar Shipping (Private) Limited- Sibi Shipping (Private) Limited- Swat Shipping (Private) Limited
Associate - Muhammadi Engineering Works (Private) Limited
The Holding Company owns 73% (2013: 73%) of the share capital of Pakistan Co-operative Ship Stores (Private) Limited and 100% (2013: 100%) of the share capital of the remaining eighteen subsidiary companies. All the wholly owned subsidiaries operate one vessel / tanker each with the exception of Bolan Shipping (Private) Limited, Swat Shipping (Private) Limited, Lalazar Shipping (Private) Limited, Johar Shipping (Private) Limited, Shalamar Shipping (Private) Limited, Khairpur Shipping (Private) Limited, Islamabad Shipping (Private) Limited, Sargodha Shipping (Private) Limited and Makran Shipping (Private) Limited which currently do not own any vessel / tanker.
2. SIGNIFICANT ACCOUNTING INFORMATION AND POLICIES
The principal accounting policies applied in the preparation of these consolidated financial statements are set out below. These policies have been consistently applied to all the years presented, unless otherwise stated.
Pakistan National Shipping Corporation102
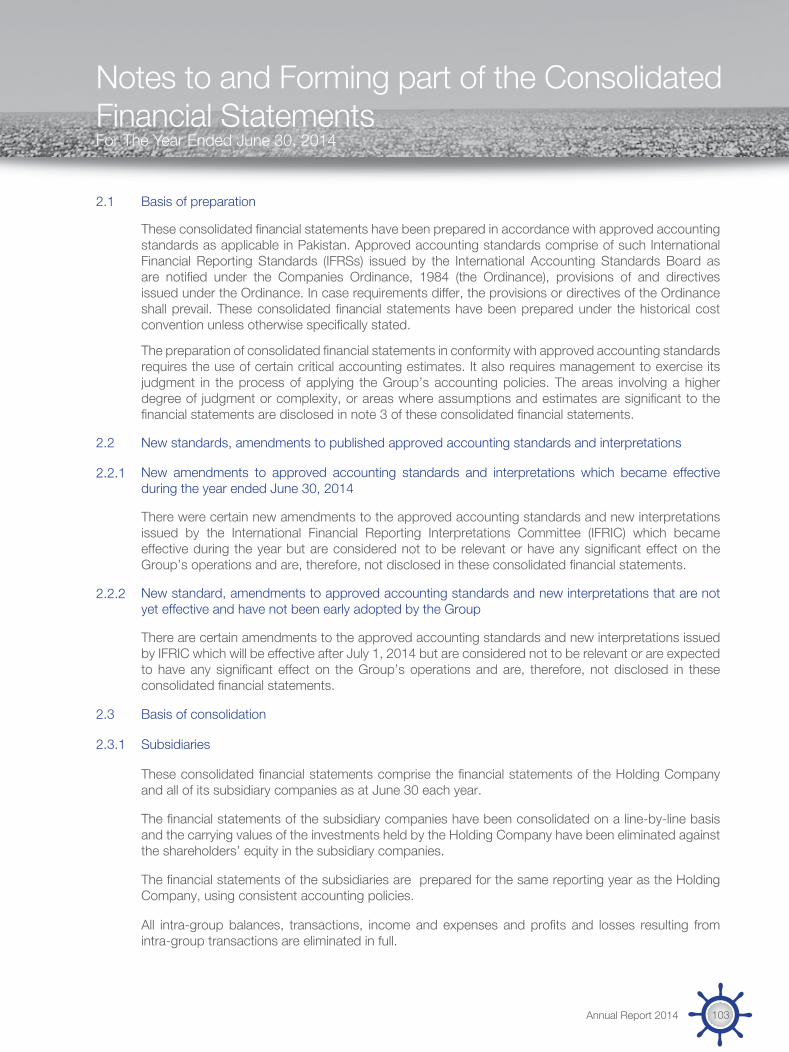
Notes to and Forming part of the Consolidated Financial StatementsFor The Year Ended June 30, 2014
2.1 Basis of preparation
These consolidated financial statements have been prepared in accordance with approved accounting standards as applicable in Pakistan. Approved accounting standards comprise of such International Financial Reporting Standards (IFRSs) issued by the International Accounting Standards Board as are notified under the Companies Ordinance, 1984 (the Ordinance), provisions of and directives issued under the Ordinance. In case requirements differ, the provisions or directives of the Ordinance shall prevail. These consolidated financial statements have been prepared under the historical cost convention unless otherwise specifically stated.
The preparation of consolidated financial statements in conformity with approved accounting standards requires the use of certain critical accounting estimates. It also requires management to exercise its judgment in the process of applying the Group’s accounting policies. The areas involving a higher degree of judgment or complexity, or areas where assumptions and estimates are significant to the financial statements are disclosed in note 3 of these consolidated financial statements.
2.2 New standards, amendments to published approved accounting standards and interpretations
2.2.1 New amendments to approved accounting standards and interpretations which became effective during the year ended June 30, 2014
There were certain new amendments to the approved accounting standards and new interpretations issued by the International Financial Reporting Interpretations Committee (IFRIC) which became effective during the year but are considered not to be relevant or have any significant effect on the Group’s operations and are, therefore, not disclosed in these consolidated financial statements.
2.2.2 New standard, amendments to approved accounting standards and new interpretations that are not yet effective and have not been early adopted by the Group
There are certain amendments to the approved accounting standards and new interpretations issued by IFRIC which will be effective after July 1, 2014 but are considered not to be relevant or are expected to have any significant effect on the Group’s operations and are, therefore, not disclosed in these consolidated financial statements.
2.3 Basis of consolidation
2.3.1 Subsidiaries
These consolidated financial statements comprise the financial statements of the Holding Company and all of its subsidiary companies as at June 30 each year.
The financial statements of the subsidiary companies have been consolidated on a line-by-line basis and the carrying values of the investments held by the Holding Company have been eliminated against the shareholders’ equity in the subsidiary companies.
The financial statements of the subsidiaries are prepared for the same reporting year as the Holding Company, using consistent accounting policies.
All intra-group balances, transactions, income and expenses and profits and losses resulting from intra-group transactions are eliminated in full.
Annual Report 2014 103

Notes to and Forming part of the Consolidated Financial StatementsFor The Year Ended June 30, 2014
Subsidiaries are fully consolidated from the date of acquisition, being the date on which the Group obtains control, and continue to be consolidated until the date that such control ceases.
The purchase method of accounting is used to account for the acquisition of subsidiaries by the Group. The cost of an acquisition is measured as the fair value of the assets given, equity instruments issued and liabilities incurred or assumed at the date of exchange, plus costs directly attributable to the acquisition. Identifiable assets acquired and liabilities and contingent liabilities assumed in a business combination are measured initially at their fair values at the acquisition date, irrespective of the extent of any non-controlling interest. The excess of the cost of acquisition over the fair value of the Group’s share of the identifiable net assets acquired is recorded as goodwill.
Transactions with non-controlling interests
The Group treats transactions with non controlling interest as transactions with equity owners of the Group. For purchase of interest from non controlling interests, the difference between any consideration paid and relevant share acquired of the carrying value of net assets of the subsidiary is recorded in equity. Gains or losses on disposals to non-controlling interests are also recorded in equity.
When the Group ceases to have control or significant influence, any retained interest in the equity is remeasured to its fair value, with the change in carrying amount recognised in the profit and loss account. The fair value is the initial carrying amount for the purposes of subsequent accounting for the retained interest as an associate, joint venture or financial assets. In addition, any amount previously recognised in other comprehensive income in respect to that entity are accounted for as if the Group had directly disposed off the related assets and liabilities.
2.3.2 Associates
Associates are all entities over which the Group has significant influence but no control. Investments in associate is accounted for using the equity method of accounting and are initially recognised at cost.
2.4 Property, plant and equipment
These are initially recognised at cost and subsequently carried at cost less accumulated depreciation and impairment losses, if any, except for leasehold land, buildings on leasehold land, beach huts and workshop machinery and equipment which are carried at revalued amounts less accumulated depreciation and any subsequent impairment losses, if any. The revaluation of related assets is carried out with sufficient regularity to ensure that the carrying amounts do not differ materially from those which would have been determined using fair values at the balance sheet date.
The value assigned to leasehold land is not depreciated as the leases are expected to be renewed for further periods on payment of relevant rentals. Annual lease rentals are charged to profit and loss account and premium paid at the time of renewal, if any, is amortised over the remaining period of the lease.
Depreciation is charged to income applying the straight line method whereby the depreciable amount of an asset is depreciated over its estimated useful life.
No depreciation is charged if the asset’s residual value exceeds its carrying amount.
Pakistan National Shipping Corporation104
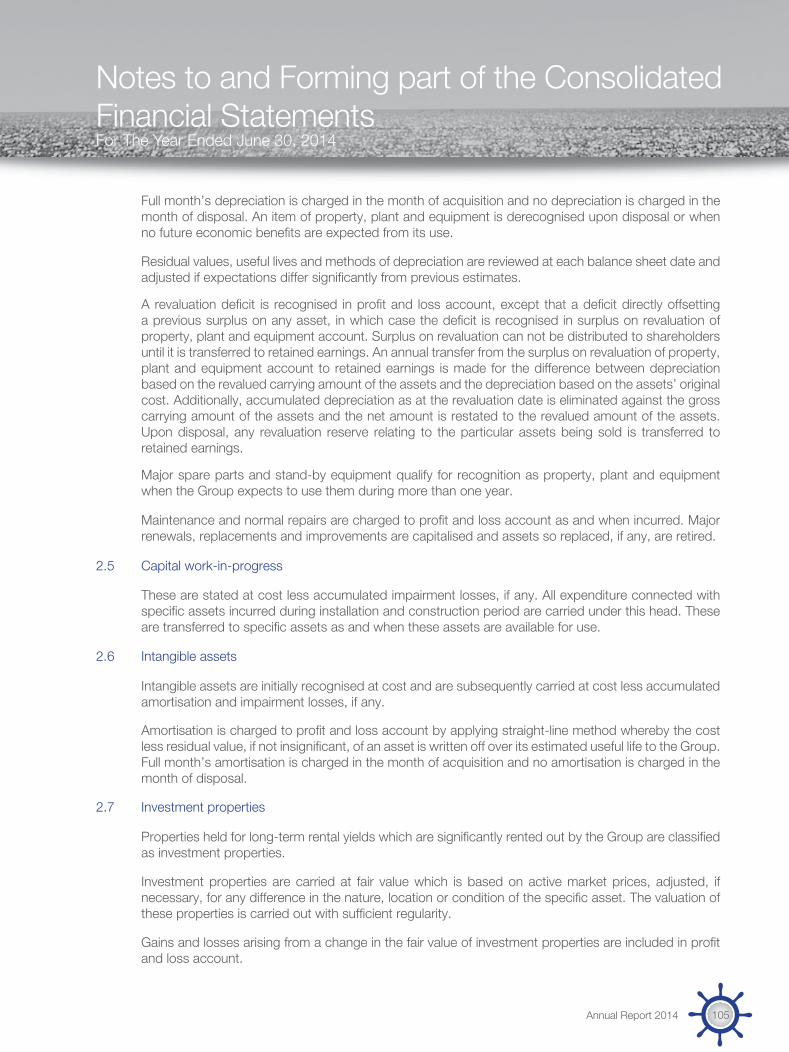
Notes to and Forming part of the Consolidated Financial StatementsFor The Year Ended June 30, 2014
Full month’s depreciation is charged in the month of acquisition and no depreciation is charged in the month of disposal. An item of property, plant and equipment is derecognised upon disposal or when no future economic benefits are expected from its use.
Residual values, useful lives and methods of depreciation are reviewed at each balance sheet date and adjusted if expectations differ significantly from previous estimates.
A revaluation deficit is recognised in profit and loss account, except that a deficit directly offsetting a previous surplus on any asset, in which case the deficit is recognised in surplus on revaluation of property, plant and equipment account. Surplus on revaluation can not be distributed to shareholders until it is transferred to retained earnings. An annual transfer from the surplus on revaluation of property, plant and equipment account to retained earnings is made for the difference between depreciation based on the revalued carrying amount of the assets and the depreciation based on the assets’ original cost. Additionally, accumulated depreciation as at the revaluation date is eliminated against the gross carrying amount of the assets and the net amount is restated to the revalued amount of the assets. Upon disposal, any revaluation reserve relating to the particular assets being sold is transferred to retained earnings.
Major spare parts and stand-by equipment qualify for recognition as property, plant and equipment when the Group expects to use them during more than one year.
Maintenance and normal repairs are charged to profit and loss account as and when incurred. Major renewals, replacements and improvements are capitalised and assets so replaced, if any, are retired.
2.5 Capital work-in-progress
These are stated at cost less accumulated impairment losses, if any. All expenditure connected with specific assets incurred during installation and construction period are carried under this head. These are transferred to specific assets as and when these assets are available for use.
2.6 Intangible assets
Intangible assets are initially recognised at cost and are subsequently carried at cost less accumulated amortisation and impairment losses, if any.
Amortisation is charged to profit and loss account by applying straight-line method whereby the cost less residual value, if not insignificant, of an asset is written off over its estimated useful life to the Group. Full month’s amortisation is charged in the month of acquisition and no amortisation is charged in the month of disposal.
2.7 Investment properties
Properties held for long-term rental yields which are significantly rented out by the Group are classified as investment properties.
Investment properties are carried at fair value which is based on active market prices, adjusted, if necessary, for any difference in the nature, location or condition of the specific asset. The valuation of these properties is carried out with sufficient regularity.
Gains and losses arising from a change in the fair value of investment properties are included in profit and loss account.
Annual Report 2014 105

Notes to and Forming part of the Consolidated Financial StatementsFor The Year Ended June 30, 2014
2.8 Impairment of non-financial assets
The Group assesses at each balance sheet date whether there is any indication that the assets may be impaired. If such indications exist, the carrying amounts of such assets are reviewed to assess whether they are recorded in excess of their recoverable amounts. Where carrying values exceed the respective recoverable amount, assets are written down to their recoverable amounts and the resulting impairment charge is recognised in income except for impairment loss on revalued assets, which is recognised directly against revaluation surplus of any other asset to the extent that the impairment loss does not exceed the amount held in the revaluation surplus.
2.9 Financial instruments
2.9.1 Financial assets
The Group classifies its financial assets in the following categories:
a) Financial assets at fair value through profit or loss
Financial assets at fair value through profit or loss are financial assets held for trading and financial assets designated upon initial recognition as at fair value through profit or loss.
b) Loans and receivables
Loans and receivables are non-derivative financial assets with fixed or determinable payments that are not quoted in an active market.
c) Available-for-sale financial assets
Available-for-sale financial assets are non-derivatives that are either designated in this category or not classified in any of the other categories.
All financial assets are recognised at the time when the Group becomes a party to the contractual provisions of the instrument. Regular purchases and sales of investments are recognised at trade-date i.e. the date on which the Group commits to purchase or sell the asset.
Financial assets are initially recognised at fair value plus transaction costs for all financial assets not carried at fair value through profit or loss. Financial assets carried at fair value through profit or loss are initially recognised at fair value and transactions costs are expensed in the profit and loss account.
Available-for-sale financial assets and financial assets at fair value through profit or loss are subsequently carried at fair value. Loans and receivables are carried at amortised cost using effective interest rate method.
Financial assets are derecognised when the rights to receive cash flows from the assets have expired or have been transferred and the Group has transferred substantially all the risks and rewards of ownership.
2.9.2 Impairment
The Group assesses at each balance sheet date whether there is objective evidence that a financial asset or group of financial assets is impaired.
Pakistan National Shipping Corporation106

Notes to and Forming part of the Consolidated Financial StatementsFor The Year Ended June 30, 2014
2.9.3 Financial liabilities
All financial liabilities are recognised at the time when the Group becomes a party to the contractual provisions of the instrument.
A financial liability is derecognised when the obligation under the liability is discharged or cancelled or expired.
2.9.4 Derivative financial instruments
The Group uses derivative financial instruments such as interest rate and cross currency swaps to manage its risks associated with interest and exchange rate fluctuations. Such derivative financial instruments are initially recognised at fair value on the date on which a derivative contract is entered into and are subsequently re-measured at fair value. Derivatives with positive market values (unrealised gains) are included in ‘other receivables’ and derivatives with negative market values (unrealised losses) are included in ‘trade and other payables’ in the balance sheet. Any gains or losses arising from changes in fair value of derivatives that do not qualify for hedge accounting are recognised directly to the profit and loss account.
2.10 Off-setting of financial assets and financial liabilities
A financial asset and a financial liability is offset and the net amount is reported in the consolidated financial statements if the Group has a legally enforceable right to set-off the transaction and also intends either to settle on a net basis or to realise the asset and settle the liability simultaneously.
2.11 Stores and spares
Stores are valued at weighted average cost while spares are valued at cost determined on first-in first-out basis. Stores and spares in transit are valued at cost incurred upto the balance sheet date.
Certain spares having low value and high consumption levels are charged to profit and loss account at the time of purchase.
The Group reviews the carrying amount of stores and spares on a regular basis and provision is made for obsolescence if there is any change in the usage pattern and physical form.
2.12 Trade debts and other receivables
Trade and other debts are recognised at the fair value of consideration to be received against goods and services and are carried at amortised cost. Provision is made in respect of doubtful debts, if any. Debts, considered irrecoverable, are written off, as and when identified.
2.13 Taxation
2.13.1 Current
Provision for current taxation is based on taxable income for the year at the current rates of taxation after taking into account tax credits and tax rebates available, if any, and tax paid on final tax basis or minimum tax on turnover, whichever is higher. For certain subsidiaries owning and operating vessels, the charge for current taxation is based on Final Tax Regime (FTR) under clause 21(a) of Part II of the Second Schedule to the Income Tax Ordinance, 2001.
Annual Report 2014 107

Notes to and Forming part of the Consolidated Financial StatementsFor The Year Ended June 30, 2014
2.13.2 Deferred Deferred tax is accounted for, using the liability method, on temporary differences arising between the tax base of assets and liabilities and their carrying amounts in the consolidated financial statements. However, deferred tax asset is recognised to the extent it is probable that future taxable profits will be available against which the temporary differences can be utilised.
2.14 Insurance claims
Hull claims and other claimable expenses relating to hull are charged to income currently and claims filed there-against are taken to income when such claims are accepted by the underwriters.Afloat medical expenses, cargo claims and other relevant amounts recoverable from underwriters are recognised to insurance claims receivable.
2.15 Trade and other payables
Liabilities for trade and other amounts payable are carried at cost which is the fair value of the consideration to be paid in future for goods and services whether billed or not.
2.16 Provisions
Provisions are recognised when the Group has a present legal or constructive obligation as a result of past events, it is probable that an outflow of resources embodying economic benefits will be required to settle the obligation and a reliable estimate of the obligation can be made. Provisions are reviewed at each balance sheet date and adjusted to reflect the current best estimate.
2.17 Dividend and appropriations
Dividends declared and transfers between reserves made subsequent to the balance sheet date are considered as non-adjusting events and are recognised in the consolidated financial statements in the period in which such dividends are declared / transfers are made.
2.18 Staff retirement benefits
2.18.1 The Group operates an approved provident fund scheme for all its permanent employees. Equal monthly contributions are made, both by the Group and its employees, to the fund at the rate of 10 percent of the basic salaries of employees.
2.18.2 Defined benefit gratuity scheme
The Group operates a funded retirement gratuity scheme for its permanent employees other than those who joined the Group on or after October 16, 1984. Further, the Group also operates an unfunded retirement gratuity scheme for contractual employees. Provisions are made in the consolidated financial statements to cover obligations on the basis of actuarial valuation carried out annually under the projected unit credit method. The remeasurement of defined benefit contribution is recognised directly to equity through other comprehensive income.
The benefit is payable on completion of prescribed qualifying period of service under these schemes.
Actuarial valuation is carried out annually and the latest valuation was carried out as at June 30, 2014 using the projected unit credit method.
The Group’s crew members are also entitled to gratuity in accordance with the Pakistan Maritime Board Regulations. However, these employee benefits are recognised upon payment as the amounts involved are not material.
Pakistan National Shipping Corporation108

Notes to and Forming part of the Consolidated Financial StatementsFor The Year Ended June 30, 2014
2.18.3 Post-retirement medical benefits
The Group provides lump sum medical allowance to its retired permanent employees in accordance with the service regulations. During the year ended June 30, 2014, the Group has introduced the policy of post-retirement medical benefits to its shore based contractual employees with effect from October 29, 2013.Provisions are made in the consolidated financial statements to cover obligations on the basis of actuarial valuation carried out annually using the projected unit credit method. The remeasurement of post-retirement benefit obligation is recognised directly to equity through other comprehensive income.The benefit is payable on completion of prescribed qualifying period of service under these schemes.
Actuarial valuation is carried out annually and the latest valuation was carried out as at June 30, 2014 using the projected unit credit method.
2.18.4 Employees’ compensated absences
The Group accounts for the liability in respect of employees’ compensated absences in the year in which these are earned. Annual provisions to cover the obligations under the scheme are based on actuarial estimates and are charged to profit and loss account currently. The remeasurement of defined benefit obligation arising at each valuation date is recognised immediately.Actuarial valuation is carried out annually and the latest valuation was carried out as at June 30, 2014 using the projected unit credit method.
2.19 Cash and cash equivalents
Cash and cash equivalents include cash in hand, cheques in hand, deposits held with banks and other short-term highly liquid investments with maturities of three months or less.
2.20 Foreign currency translation
These consolidated financial statements are presented in Pakistani Rupee, which is the Group’s functional and presentation currency. Transactions in foreign currencies are recorded in Pakistani Rupee at the exchange rates approximating those prevailing on the date of transaction. Monetary assets and liabilities in foreign currencies are reported in Pakistani Rupee at the exchange rates approximating those prevalent at the balance sheet date. Gains and losses on translation are recognised to profit and loss account.
2.21 Revenue recognition
- Earnings in respect of voyages other than time charter voyages are accounted for on the basis of completed voyages. Voyages are taken as complete when a vessel arrives at the last port of discharge on or before the balance sheet date. Freight revenue, direct and indirect operating expenses associated with the incomplete voyages are deferred until completion of voyage and are classified in the balance sheet as ‘Incomplete voyages’. With respect to time charter voyages, chartering revenue is accounted for on the basis of number of days to the balance sheet date.
- Rental income is recognised as revenue on a straight line basis over the term of the respective lease arrangements.
- Dividend income is recognised when the Group‘s right to receive the dividend is established.
- Profit from bank accounts and return on investments is recognised on a time proportion basis.
Annual Report 2014 109

Notes to and Forming part of the Consolidated Financial StatementsFor The Year Ended June 30, 2014
2.22 Benazir Employees’ Stock Option Scheme
On August 14, 2009, the Government of Pakistan (GoP) launched Benazir Employees’ Stock Option Scheme (the Scheme) for employees of certain State Owned Enterprises (SOEs) and non-State Owned Enterprises where GoP holds significant investments (non-SOEs). The Scheme is applicable to permanent and contractual employees who were in employment of these entities on the date of launch of the Scheme, subject to completion of five years vesting period by all contractual employees and by permanent employees in certain instances.
The Scheme provides for a cash payment to employees on retirement or termination based on the price of shares of respective entities. To administer this scheme, GoP shall transfer 12% of its investment in such SOEs and non-SOEs to a trust fund to be created for the purpose of such entities. The eligible employees would be allotted units by each Trust Fund in proportion to their respective length of service and on retirement or termination of such employees would be entitled to receive such amounts from Trust Funds in exchange for the surrendered units as would be determined based on market price of listed entities or breakup value of non-listed entities. The shares related to the surrendered units would be transferred back to GoP.
The Scheme also provides that 50% of dividend related to shares transferred to the respective Trust Fund would be distributed amongst the unit-holder employees. The balance 50% dividend would be transferred by the respective Trust Fund to the Central Revolving Fund managed by the Privatisation Commission of Pakistan for payment to employees against surrendered units. The deficits, if any, in Trust Funds to meet the re-purchase commitment would be met by GoP.
The Scheme, developed in compliance with the stated GoP policy of the empowerment of employees of SOEs need to be accounted for by the covered entities, including the Group, under the provisions of amended International Financial Reporting Standard-2 ‘Share Based Payments’ (IFRS 2). However, keeping in view the difficulties that may be faced by the entities covered under the Scheme, the Securities & Exchange Commission of Pakistan on receiving the representation from some of the entities covered under the Scheme and after having consulted the Institute of Chartered Accountants of Pakistan, has granted exemption vide SRO 587(I)/2011 dated June 7, 2011 to such entities from application of IFRS 2 to the Scheme.
Had the exemption not been granted, the impact based on the independent actuarial valuations conducted as on June 30, 2014, for the years ended June 30, 2014 and 2013 would have been as follows:
Year ended June 30, 2014
Year ended June 30, 2013
-----------(Rupees in ‘000)---------
Staff costs of the Group for the year would have been higher by 77,977 104,474
Profit for the year would have been lower by 77,977 104,474
Earnings per share would have been lower by 0.59 0.79
Pakistan National Shipping Corporation110

Notes to and Forming part of the Consolidated Financial StatementsFor The Year Ended June 30, 2014
Year ended June 30, 2014
Year ended June 30, 2013
-----------(Rupees in ‘000)---------
Retained earnings would have been lowered by 654,499 576,522
Reserves would have been higher by 654,499 576,522
3. CRITICAL ACCOUNTING ESTIMATES, JUDGEMENTS AND ASSUMPTIONS
The preparation of consolidated financial statements requires management to make judgments, estimates and assumptions that affect the reported amounts of revenues, expenses, assets and liabilities, and the disclosure of contingent liabilities, at the end of the reporting period. However, uncertainty about these assumptions and estimates could result in outcomes that require a material adjustment to the carrying amount of the asset or liability affected in future periods.
In the process of applying the accounting policies, management has made the following estimates and judgements which are significant to the consolidated financial statements.
(a) Valuation of certain property, plant and equipment and investment properties;
(b) Determination of the residual values and useful lives of property, plant and equipment;
(c) Recognition of taxation and deferred taxation;
(d) Accounting for provision for impairment against loans and advances, trade debts, agents and owners balances, deposits and other receivables;
(e) Accounting for provision against damage claims;
(f) Accounting for defined benefit plans;
(g) Measuring fair value of cross currency swap and interest rate swap;
(h) Recoverable amount of investment in related parties; and
(i) Determination of contingent assets and liabilities.
Estimates and judgements are continually evaluated and are based on historical experience and other factors, including expectation of future events that are believed to be reasonable under the circumstances.
Note 2014 2013-----------(Rupees in ‘000)---------
4. PROPERTY, PLANT AND EQUIPMENT
- Operating fixed assets 4.1 21,894,357 22,703,824 - Major spare parts and stand-by equipment 4.6 218,731 191,893 - Capital work-in-progress 4.8 454,480 315,260
22,567,568 23,210,977
Annual Report 2014 111
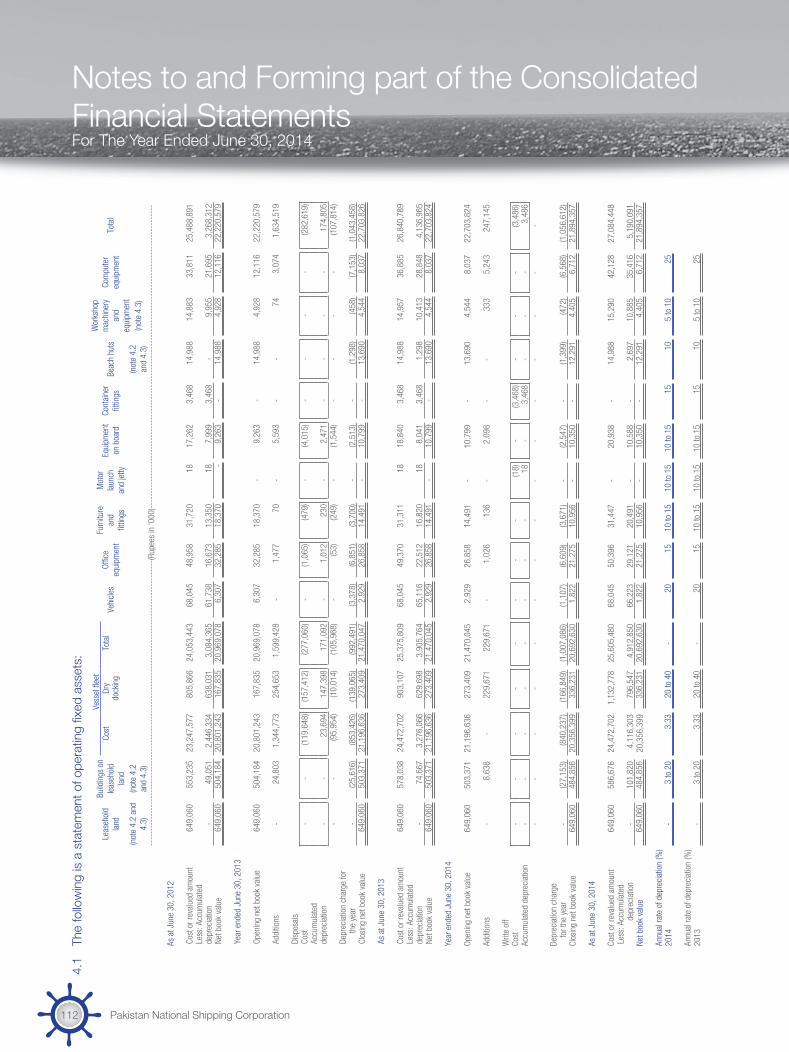
Notes to and Forming part of the Consolidated Financial StatementsFor The Year Ended June 30, 2014
4.1
The
follo
win
g is
a st
atem
ent o
f ope
ratin
g fix
ed a
sset
s:
Leas
ehol
d la
nd
Build
ings
on
leas
ehol
d la
nd
Vess
el fl
eet
Vehi
cles
Offic
e eq
uipm
ent
Furn
iture
an
d fit
tings
Mot
or
laun
ch
and
jetty
Equi
pmen
t on
boa
rdCo
ntai
ner
fittin
gsBe
ach
huts
Wor
ksho
p m
achi
nery
an
d eq
uipm
ent
Com
pute
r eq
uipm
ent
Tota
l Co
stDr
yTo
tal
dock
ing
(not
e 4.
2 an
d 4.
3)(n
ote
4.2
and
4.3)
(not
e 4.
2 an
d 4.
3)(n
ote
4.3)
----
----
----
----
----
----
----
----
----
----
----
----
----
----
----
----
----
----
----
----
----
----
----
----
-(Rup
ees
in ‘0
00)--
----
----
----
----
----
----
----
----
----
----
----
----
----
----
----
----
----
----
----
----
----
----
----
----
----
-
As a
t Jun
e 30
, 201
2
Cos
t or r
eval
ued
amou
nt
649
,060
5
53,2
35
23,
247,
577
805
,866
2
4,05
3,44
3 6
8,04
5 4
8,95
8 3
1,72
0 1
8 1
7,26
2 3
,468
1
4,98
8 1
4,88
3 3
3,81
1 2
5,48
8,89
1 L
ess:
Acc
umul
ated
dep
reci
atio
n
-
49,
051
2,4
46,3
34
638
,031
3
,084
,365
6
1,73
8 1
6,67
3 1
3,35
0 1
8 7
,999
3
,468
-
9
,955
2
1,69
5 3
,268
,312
N
et b
ook
valu
e
649
,060
5
04,1
84
20,
801,
243
167
,835
2
0,96
9,07
8 6
,307
3
2,28
5 1
8,37
0 -
9
,263
-
1
4,98
8 4
,928
1
2,11
6 2
2,22
0,57
9
Yea
r end
ed J
une
30, 2
013
Ope
ning
net
boo
k va
lue
6
49,0
60
504
,184
2
0,80
1,24
3 1
67,8
35
20,
969,
078
6,3
07
32,
285
18,
370
-
9,2
63
-
14,
988
4,9
28
12,
116
22,
220,
579
Add
ition
s -
2
4,80
3 1
,344
,773
2
54,6
53
1,5
99,4
28
-
1,4
77
70
-
5,5
93
-
-
74
3,0
74
1,6
34,5
19
Dis
posa
ls
Cos
t -
-
(1
19,6
48)
(157
,412
) (2
77,0
60)
-
(1,0
65)
(479
) -
(4
,015
) -
-
-
-
(2
82,6
19)
Acc
umul
ated
d
epre
ciat
ion
-
-
23,
694
147
,398
1
71,0
92
-
1,0
12
230
-
2
,471
-
-
-
-
1
74,8
05
-
-
(95,
954)
(10,
014)
(105
,968
) -
(5
3) (2
49)
-
(1,5
44)
-
-
-
-
(107
,814
) D
epre
ciat
ion
char
ge fo
r th
e ye
ar
-
(25,
616)
(853
,426
) (1
39,0
65)
(992
,491
) (3
,378
) (6
,851
) (3
,700
) -
(2
,513
) -
(1
,298
) (4
58)
(7,1
53)
(1,0
43,4
58)
Clo
sing
net
boo
k va
lue
6
49,0
60
503
,371
2
1,19
6,63
6 2
73,4
09
21,
470,
047
2,9
29
26,
858
14,
491
-
10,
799
-
13,
690
4,5
44
8,0
37
22,
703,
826
As
at J
une
30, 2
013
Cos
t or r
eval
ued
amou
nt
649
,060
5
78,0
38
24,
472,
702
903
,107
2
5,37
5,80
9 6
8,04
5 4
9,37
0 3
1,31
1 1
8 1
8,84
0 3
,468
1
4,98
8 1
4,95
7 3
6,88
5 2
6,84
0,78
9 L
ess:
Acc
umul
ated
d
epre
ciat
ion
-
7
4,66
7 3
,276
,066
6
29,6
98
3,9
05,7
64
65,
116
22,
512
16,
820
18
8,0
41
3,4
68
1,2
98
10,
413
28,
848
4,1
36,9
65
Net
boo
k va
lue
6
49,0
60
503
,371
2
1,19
6,63
6 2
73,4
09
21,
470,
045
2,9
29
26,
858
14,
491
-
10,
799
-
13,
690
4,5
44
8,0
37
22,
703,
824
Year
end
ed J
une
30, 2
014
Open
ing
net b
ook
valu
e 6
49,0
60
503
,371
2
1,19
6,63
6 2
73,4
09
21,
470,
045
2,9
29
26,
858
14,
491
-
10,
799
-
13,
690
4,5
44
8,0
37
22,
703,
824
Addi
tions
-
8,6
38
-
229
,671
2
29,6
71
-
1,0
26
136
-
2
,098
-
-
3
33
5,2
43
247
,145
Writ
e of
fCo
st -
-
-
-
-
-
-
-
(1
8) -
(3
,468
) -
-
-
(3
,486
)Ac
cum
ulat
ed d
epre
ciat
ion
-
-
-
-
-
-
-
-
18
-
3,4
68
-
-
-
3,4
86
-
-
-
-
-
-
-
-
-
-
-
-
-
-
-
Depr
ecia
tion
char
ge
fo
r the
yea
r -
(2
7,15
3) (8
40,2
37)
(166
,849
) (1
,007
,086
) (1
,107
) (6
,609
) (3
,671
) -
(2
,547
) -
(1
,399
) (4
72)
(6,5
68)
(1,0
56,6
12)
Clos
ing
net b
ook
valu
e 6
49,0
60
484
,856
2
0,35
6,39
9 3
36,2
31
20,
692,
630
1,8
22
21,
275
10,
956
-
10,
350
-
12,
291
4,4
05
6,7
12
21,
894,
357
As a
t Jun
e 30
, 201
4
Cost
or r
eval
ued
amou
nt 6
49,0
60
586
,676
2
4,47
2,70
2 1
,132
,778
2
5,60
5,48
0 6
8,04
5 5
0,39
6 3
1,44
7 -
2
0,93
8 -
1
4,98
8 1
5,29
0 4
2,12
8 2
7,08
4,44
8 L
ess:
Acc
umul
ated
de
prec
iatio
n
-
101
,820
4
,116
,303
7
96,5
47
4,9
12,8
50
66,
223
29,
121
20,
491
-
10,
588
-
2,6
97
10,
885
35,
416
5,1
90,0
91
Net b
ook
valu
e 6
49,0
60
484
,856
2
0,35
6,39
9 3
36,2
31
20,
692,
630
1,8
22
21,
275
10,
956
-
10,
350
-
12,
291
4,4
05
6,7
12
21,
894,
357
Annu
al ra
te o
f dep
reci
atio
n (%
)20
14 -
3
to 2
0 3
.33
20 to
40
-
2015
10 to
15
10 to
15
10 to
15
1510
5 to
10
25
Annu
al ra
te o
f dep
reci
atio
n (%
)20
13 -
3
to 2
0 3
.33
20 to
40
-
2015
10 to
15
10 to
15
10 to
15
1510
5 to
10
25
Pakistan National Shipping Corporation112

Notes to and Forming part of the Consolidated Financial StatementsFor The Year Ended June 30, 2014
4.2 The revaluation of the ‘leasehold land’, ‘buildings on leasehold land’ and ‘beach huts’ had been carried out as of June 30, 2012 by Pee Dee & Associates on the basis of their professional assessment of present market values. The revaluation resulted in a surplus of Rs 153.903 million on the written down values of Rs 1,010.686 million which was incorporated in the books of the Holding Company as at June 30, 2012. Out of the total revaluation surplus arisen, Rs 804.140 million (2013: Rs 813.778 million) remains undepreciated at June 30, 2014.
4.3 Had there been no revaluation, the carrying amount of revalued assets would have been as follows:
2014 2013---------(Rupees in ‘000)---------
Leasehold land, buildings on leasehold land and beach huts 285,874 313,933 Workshop machinery and equipment 4,290 4,487
290,164 318,420
4.4 Cost and accumulated depreciation of vessel amounting to Rs 1.440 million relates to M.V Ilyas Bux. This vessel was seized by the Indian authorities during the 1965 war and the Holding Company does not have physical possession or control over the vessel.
4.5 No operating fixed assets with a net book value exceeding Rs 50,000 were disposed of during the year.
Note 2014 2013---------(Rupees in ‘000)---------
4.6 Major spare parts and standby equipment
Net carrying value
Balance at beginning of the year 191,893 106,181 Additions during the year 48,888 97,963 Balance at end of the year 240,781 204,144 Depreciation (22,050) (12,251)Net book value 218,731 191,893
4.7 The depreciation charge for the year has been allocated as follows:
Fleet expenses - direct 30 1,026,798 982,016 Fleet expenses - indirect 31 474 458 Real estate expenses 32 21,816 20,282 Administrative and general expenses 33 24,860 27,885 Incomplete voyages 27 4,714 25,068
1,078,662 1,055,709
4.8 Capital work-in-progress - buildings on leasehold land
Balance at beginning of the year 315,260 287,652 Additions during the year 144,777 52,411 Transferred to operating fixed assets during the year (5,557) (24,803)Balance at end of the year 454,480 315,260
5. INTANGIBLE ASSETThis represents cost of Rs 16.503 million of software “Ship Management Expert System” (SES). SES was being amortised over the useful life of five years and was fully amortised during the year ended June 30, 2009, however, it is still in active use.
Annual Report 2014 113

Notes to and Forming part of the Consolidated Financial StatementsFor The Year Ended June 30, 2014
6. INVESTMENT PROPERTIES Note Leasehold
landBuildings on
leasehold land Total---------------(Rupees in ‘000)--------------------
Balance as at June 30, 2014 1,043,560 37,036 1,080,596
Balance as at June 30, 2013 6.1 1,043,560 37,036 1,080,596
6.1 The revaluation of the Group’s investment properties was carried out by Pee Dee & Associates as of June 30, 2012 on the basis of their professional assessment of present market value. As a result, a revaluation gain of Rs 91.060 million was determined in respect of leasehold land whereas a revaluation loss was determined on buildings on leasehold land amounting to Rs 8.092 million.
Note 2014 2013---------(Rupees in ‘000)--------
8. LONG-TERM INVESTMENTS IN LISTED COMPANIES AND ANOTHER ENTITY
Financial assets designated as ‘at fair value through profit or loss’
Listed companies
Siemens (Pakistan) Engineering Limited.6,930 (2013: 6,930) fully paid ordinary shares of Rs 10each. Market value per share as at June 30, 2014Rs 1,257 (2013: Rs 651.20). 8.1 8,711 4,513
Pakistan State Oil Company Limited.115,358 (2013: 104,871) fully paid ordinary shares of Rs 10 each. Market value per share as at June 30, 2014Rs 388.86 (2013: Rs 320.38). 8.2 44,858 33,598
53,569 38,111 Available-for-sale financial asset
Other entity - carried at cost
Pakistan Tourism Development Corporation Limited.10,000 (2013: 10,000) fully paid ordinary shares of Rs 10 each. 100 100
53,669 38,211
7. LONG-TERM INVESTMENT IN A RELATED PARTY (ASSOCIATE)
Equity methodNo. of shares -
ordinary Name of the
companyCountry of
incorporation Share of net assets Latest available audited financial
statements for the year ended
Percentage holding
Face value per share
2014 2013 2014 2013 2014 2013---(Rupees in ‘000)--- % (Rupees) -----(Rupees ‘000)------
Associate - unlisted
12,250 12,250
Muhammadi Engineering Works Limited Pakistan Pakistan 1,600 1,600
December 31, 1982
(unaudited) 49 100 1,600 1,600 Less: Accumulated impairment losses 1,600 1,600
- -
Pakistan National Shipping Corporation114

Notes to and Forming part of the Consolidated Financial StatementsFor The Year Ended June 30, 2014
Note 2014 2013---------(Rupees in ‘000)--------
8.1 The Group holds 0.00084% (2013: 0.00084%)of the investee’s share capital.
Opening balance 4,513 5,177 Change in fair value 4,198 (664)
8,711 4,513
8.2 The Group holds 0.04246% (2013: 0.04246%) of the investee’s share capital.
Opening balance 33,598 17,176 Change in fair value 11,260 16,422
44,858 33,598 9. DEFERRED TAXATION
Deductible temporary differences arising in respect of short-term provisions and deferred liabilities 136,660 129,710
Taxable temporary differences arising in respect of:- surplus on revaluation of property, plant and equipment 22 35,892 37,714 - accelerated depreciation 9,991 11,444
45,883 49,158
90,777 80,552
9.1 The management of the Group is confident that sufficient future taxable profits will be available against which deferred tax asset will be adjusted.
2014 2013---------(Rupees in ‘000)--------
10. STORES AND SPARES
Stores
- at depots 9,495 12,703 - at buildings 845 1,093 - on board 22,991 15,499
33,331 29,295 Spares
- at buildings 1,062 1,749 - in transit 169 169 - on board 193,449 151,733
194,680 153,651
Bunker on board 409,836 551,446 637,847 734,392
Annual Report 2014 115

Notes to and Forming part of the Consolidated Financial StatementsFor The Year Ended June 30, 2014
Note 2014 2013---------(Rupees in ‘000)--------
11. TRADE DEBTS - unsecured
Considered good 11.1 2,439,569 1,177,691 Considered doubtful 242,749 252,814
2,682,318 1,430,505 Less: Provision for impairment 11.2 242,749 252,814
2,439,569 1,177,691
11.1 The ageing analysis of these trade debts that are past due but not impaired is as follows:
Note 2014 2013---------(Rupees in ‘000)--------
Upto 1 month 1,031,717 762,813 1 to 6 months 933,226 266,028 More than 6 months 474,626 148,850
2,439,569 1,177,691 11.2 Provision for impairment
Balance at the beginning of the year 252,814 183,448 Provision made during the year 33 - 88,223 Provision reversed during the year (9,961) - Provision written off during the year (104) (18,857)Balance at the end of the year 11.3 242,749 252,814
11.3 As at June 30, 2014, trade debts of Rs 242.749 million (2013: Rs 252.814 million) were impaired and provided for.
Note 2014 2013---------(Rupees in ‘000)--------
12. AGENTS’ AND OWNERS’ BALANCES - unsecured
Considered good 12.1 124,824 8,991 Considered doubtful 4,453 4,453
129,277 13,444 Less: Provision for impairment 4,453 4,453
124,824 8,991
12.1 The ageing analysis of these agents’ and owners’ balances that are past due but not impaired is as follows:
2014 2013---------(Rupees in ‘000)--------
Upto 1 month 60,128 3,631 1 to 6 months 64,033 4,569 More than 6 months 663 791
124,824 8,991
Pakistan National Shipping Corporation116

Notes to and Forming part of the Consolidated Financial StatementsFor The Year Ended June 30, 2014
Note 2014 2013---------(Rupees in ‘000)--------
13. LOANS AND ADVANCES - considered good
To employees 1 1
Advances- employees 46,738 20,934 - contractors and suppliers 3,197 11,842 - others 8,628 34,767
58,564 67,544
14. TRADE DEPOSITS AND SHORT-TERM PREPAYMENTS
Deposits
- considered good 9,914 8,464 - considered doubtful 369 369
10,283 8,833 Less: Provision for impairment 369 369
9,914 8,464
Prepayments 37,750 29,111
47,664 37,575
15. OTHER RECEIVABLES
Rent receivable- considered good 15.1 10,335 13,837 - considered doubtful 3,801 4,211
14,136 18,048 Less: Provision for impairment 15.2 3,801 4,211
10,335 13,837
Amount held by lawyer in respect of a guarantee provided to the court 4,952 72,719
Derivative cross currency interest rate swap 15.4 & 15.5 147,209 -
Others
- considered good 181,129 81,422 - considered doubtful 12,659 12,659
15.6 193,788 94,081 Less: Provision for impairment 12,659 12,659
181,129 81,422 343,625 167,978
Annual Report 2014 117

Notes to and Forming part of the Consolidated Financial StatementsFor The Year Ended June 30, 2014
15.1 The ageing analysis of rent receivables past due but not impaired is as follows:
2014 2013---------(Rupees in ‘000)--------
Upto 1 month 890 2,614 1 to 6 months 1,952 5,848 More than 6 months 7,493 5,375
10,335 13,837
15.2 Provision for impairment
Balance at the beginning of the year 4,211 4,600 Provision written off during the year (410) (160)Provision reversed during the year - (229)Balance at the end of the year 3,801 4,211
15.3 As at June 30, 2014, rent receivables of Rs 3.801 million (2013: Rs 4.211 million) were impaired and provided for. These receivables have been outstanding for more than three years.
15.4 The Holding Company has entered into a cross currency interest rate swap of Rs 9,995.300 million in respect of its borrowing. Under the terms of the cross currency swap arrangement, the Holding Company is required to pay LIBOR plus 3.75% to the arranging bank on the borrowing denominated in USD (USD notional) for the purpose of cross currency swap, and receive KIBOR plus 2.20% from the arranging bank. Further, the Holding Company shall pay / receive any exchange loss / gain on the USD notional outstanding at each quarter end. Furthermore, the Holding Company had also entered into an interest rate swap. Under the terms of the interest rate swap, the Holding Company receives a fixed interest of 13% per annum, whereas the Holding Company has to pay 3 months KIBOR for each quarter. The net fair value of cross currency interest and interest rate swap as determined by the bank were Rs 86.851 million (favourable) (2013: Rs 140.098 million (unfavourable)) and Rs 14.015 million (fa-vourable) (2013: Rs 30.667 million) (favourable) respectively to the Holding Company as of the balance sheet date which has been increased by the net interest receivable and exchange loss aggregating Rs 46.343 million (2013: Rs 4.194 million) as at June 30, 2014.
15.5 On September 26, 2013, the Holding Company has early terminated one of its cross currency swap contract having a notional amount aggregating Rs 1,244.880 million. The early termination resulted in the payment by the Holding Company to the arranging bank aggregating Rs 87.624 million comprising of net effects of interest received aggregating Rs 7.982 million, exchange loss and swap spread paid amounting to Rs 60.565 million and Rs 35.041 million respectively.
2014 2013---------(Rupees in ‘000)--------
15.6 This includes the following:
Receivable from sundry debtors 128,226 71,953 Sales tax refund claims 26,017 14,396 Insurance claims receivable 29 - Others 39,516 7,732
193,788 94,081
Pakistan National Shipping Corporation118

Notes to and Forming part of the Consolidated Financial StatementsFor The Year Ended June 30, 2014
16. INSURANCE CLAIMS
In addition to Rs 7.032 million claims aggregating to Rs 6.5 million (2013: Rs 42.3 million) are receiv-able from cargo owners and charterers. These amounts are determined on the basis of adjustment received from independent adjuster. The Group has not recognised these claims as receivable pend-ing acceptance from the counter parties or underwriter.
Note 2014 2013---------(Rupees in ‘000)--------
17. SHORT-TERM INVESTMENTS
Term deposits with banks having maturity of - three to six months 17.1 1,497,440 - - three months or less 17.2 797,440 1,995,450
2,294,880 1,995,450
17.1 The mark-up on these term deposits denominated in local currency ranges from 10% to 10.50% (2013: Nil) per annum, whereas mark-up on term deposits denominated in foreign currency is 2% (2013: Nil) per annum.
17.2 The mark-up on these term deposits denominated in local currency ranges from 9.75% to 10.50% (2013: 8.9% to 12%) per annum, whereas mark-up on term deposits denominated in foreign currency ranges from 1.6% to 2% (2013: 1.5% to 2.95%) per annum.
Note 2014 2013---------(Rupees in ‘000)--------
18. CASH AND BANK BALANCES
Cash at bank- in current accounts- local currency 413,495 392,946 - foreign currency 145,426 114,197
558,921 507,143 - in saving accounts- local currency 18.1 & 18.2 1,290,962 1,278,218 - foreign currency 18.3 1,579 1,932
1,292,541 1,280,150
Cash in hand 979 1,008 1,852,441 1,788,301
18.1 This includes Rs 2.126 million (2013: Rs 2.126 million) and Rs 3 million (2013: Rs 3 million) held as security by Habib Bank Limited, P.N.S.C. Branch and Soneri Bank Limited, AKU Branch respectively against guarantees issued on behalf of the Holding Company.
18.2 The mark-up on savings accounts in local currency ranges from 4.8% to 9.4% (2013: 6% to 9.25%) per annum.
18.3 The mark-up on savings accounts in foreign currency ranges from 0.15% to 0.50% (2013: 0.15% to 0.50%) per annum.
Annual Report 2014 119

Notes to and Forming part of the Consolidated Financial StatementsFor The Year Ended June 30, 2014
19. SHARE CAPITAL
19.1 Issued, subscribed and fully paid-up capital
2014 2013 2014 2013---------(No. of Shares)--------- --------(Rupees in ‘000)--------
Ordinary shares of Rs 10 each issued as fully paid to shareholders of former National Shipping Corporation (NSC) and Pakistan Shipping Corporation (PSC) in consideration of their shareholdings in those companies 24,130,789 24,130,789 241,308 241,308
Ordinary shares of Rs 10 each issued as fully paid to the GoP for cash received in 1985 25,900,000 25,900,000 259,000 259,000
Ordinary shares of Rs 10 each issued as fully paid to the GoP on the financial restructuring of the Holding Company in the year 1989-90 64,309,800 64,309,800 643,098 643,098
Ordinary shares of Rs 10 each issued as fully paid bonus shares 17,722,791 17,722,791 177,228 177,228
132,063,380 132,063,380 1,320,634 1,320,634
19.2 As at June 30, 2014, the GoP held 109,919,234 (2013: 108,554,430) ordinary shares of the Holding Company.
Note 2014 2013--------(Rupees in ‘000)--------
20. RESERVES
Capital reserves 20.1 131,344 131,344 Revenue reserves- remeasurement of post-retirement benefits
obligation - net of tax (226,522) (228,743)- unappropriated profit (including general reserve) 21,239,196 19,221,818
21,144,018 19,124,419
20.1 This includes amount transferred from shareholders’ equity at the time of merger of former NSC and PSC.
2014 2013--------(Rupees in ‘000)--------
21. NON-CONTROLLING INTEREST
Share of non-controlling interest in:- share capital 59 59 - general reserve 10 10 - unappropriated profit 2,063 1,754 - profit for the year 383 309
2,515 2,132
Pakistan National Shipping Corporation120

Notes to and Forming part of the Consolidated Financial StatementsFor The Year Ended June 30, 2014
Note 2014 2013--------(Rupees in ‘000)--------
22. SURPLUS ON REVALUATION OF PROPERTY, PLANT AND EQUIPMENT - NET OF TAX
Balance at the beginning of the year 816,603 825,776
Less: Transferred to unappropriated profit:Surplus relating to incremental depreciation charged during the current year on related assets - net of tax 7,449 6,975 Related deferred tax liability 2,189 2,198
9,638 9,173 806,965 816,603
Less: Related deferred tax liability on:- Revaluation at the beginning of the year 37,714 45,666 - Incremental depreciation charged during the current year
on related assets transferred to profit and loss account (2,189) (2,198)- Effect of change in statutory tax rate for next year 1,109 (1,305)- Effect of allocation of revenue between presumptive
tax regime and normal tax regime (742) (4,449)9 35,892 37,714
Balance at the end of the year 771,073 778,889
Less: Surplus on revaluation of fixed assets attributable tonon-controlling interest 524 524
770,549 778,365
23. LONG-TERM FINANCING
Financing under syndicate term finance agreement 23.1 5,142,882 6,282,672 Less: Current portion 1,150,674 1,150,674
3,992,208 5,131,998 Financing under Term Finance Certificates agreement 23.1 742,861 907,496 Less: Current portion 166,208 166,208
576,653 741,288 4,568,861 5,873,286
23.1 During the year ended June 30, 2011, the Holding Company obtained a financing facility of Rs 10,300 million. The financing was obtained in the form of a syndicated term finance loan of Rs 9,000 million with the remaining amount of Rs 1,300 million in the form of Term Finance Certificates (TFCs) having a face value of Rs 5,000 each by way of private placement.
The financing carries mark-up of KIBOR+2.20%. The loan along with the mark-up is repayable on a quarterly basis with the last repayment date is November 23, 2018. The facility is secured by a first mortgage charge over certain vessels owned by subsidiary companies, all present and future receivables of the Holding Company from three major customers and its investment properties.
As at June 30, 2014, the Holding Company has drawn Rs 8,733.757 million (2013: Rs 8,733.757 million) and Rs 1,261.543 million (2013: Rs 1,261.543 million) from syndicated term finance and TFCs respectively. The Holding Company has also paid loan arrangement fee amounting to Rs 106.662 million out of which Rs Nil (2013: Rs 103.507 million) was included in the amortised cost of the long term financing whereas the remaining amount of Rs 3.155 million has been expensed out upon completion of the drawdowns and expiry of the facility on September 7, 2012.
Annual Report 2014 121

Notes to and Forming part of the Consolidated Financial StatementsFor The Year Ended June 30, 2014
Note 2014 2013--------(Rupees in ‘000)--------
24. DEFERRED LIABILITIES
Employees’ gratuity- funded 24.1.3 86,899 72,652 - unfunded 24.1.3 100,995 67,166
187,894 139,818 Post-retirement medical benefits 24.1.3 194,581 200,957 Employees’ compensated absences 24.2.3 235,008 225,799
617,483 566,574 24.1 Retirement benefit schemes
24.1.1 The disclosures made in note 24.1.2 to 24.1.12 are based on the information included in the actuarial valuation report as of June 30, 2014.
24.1.2 As stated in notes 2.18.2 and 2.18.3 of these consolidated financial statements, the Group operates a funded retirement gratuity scheme for those permanent employees who joined the Group before October 16, 1984, an unfunded retirement gratuity scheme for contractual employees and an unfunded post retirement medical benefit scheme for permanent and contractual employees. Liability is maintained against these schemes based on the actuarial recommendations. The following significant assumptions were used for the actuarial valuation of the defined benefit obligation schemes:
2014 2013Employees’ Post Employees’ Post
gratuity (funded and unfunded)
retirement gratuity (funded and unfunded)
retirementmedical medicalbenefits benefits
Discount rate 13.25% 13.25% 11.00% 11.00%
Future salary increases - for permanentemployeesFor the year 2013-14 N/A N/A 2.00% N/AFor the year 2014-15 40.00% N/A 40.00% N/AFor the year 2015-16 2.00% N/A 2.00% N/AFor the year 2016-17 40.00% N/A 40.00% N/AFor the year 2017-18 2.00% N/A 2.00% N/AFor the year 2018-19 40.00% N/A 40.00% N/AFor the year 2019-20 2.00% N/A 9.00% N/AFor the year 2020-21 and onwards 13.25% N/A 9.00% N/A
Future salary increases - for contractualemployeesFor the year 2013-14 N/A N/A 15.00% N/AFor the year 2014-15 till 2017-18 15.00% N/A 15.00% N/AFor the year 2018-19 15.00% N/A 9.00% N/AFor the year 2019-20 and onwards 13.25% N/A 9.00% N/A
Medical escalation rate N/A 13.25% N/A 11.00%Death rate based on SLIC (2001-05) Ultimate mortality tables.
Pakistan National Shipping Corporation122
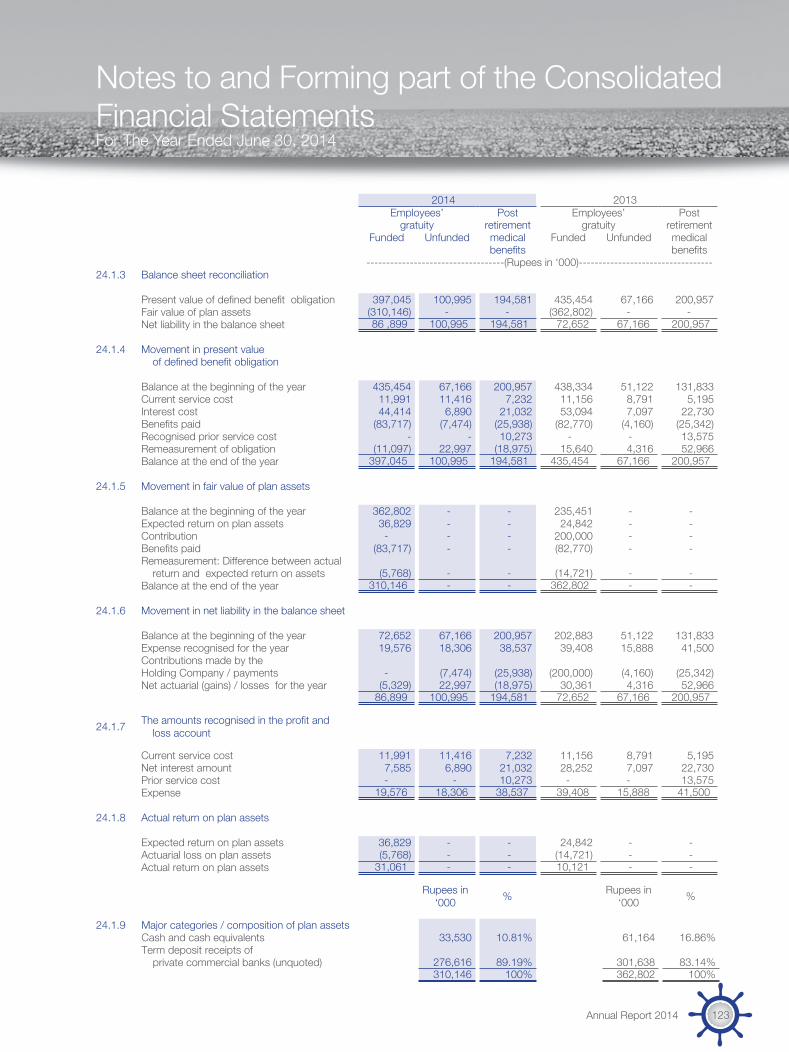
Rupees in ‘000 % Rupees in
‘000 %
24.1.9 Major categories / composition of plan assetsCash and cash equivalents 33,530 10.81% 61,164 16.86%Term deposit receipts of
private commercial banks (unquoted) 276,616 89.19% 301,638 83.14% 310,146 100% 362,802 100%
Notes to and Forming part of the Consolidated Financial StatementsFor The Year Ended June 30, 2014
2014 2013Employees’ Post Employees’ Post
gratuity retirement gratuity retirementFunded Unfunded medical Funded Unfunded medical
benefits benefits -----------------------------------(Rupees in ‘000)----------------------------------
24.1.3 Balance sheet reconciliation
Present value of defined benefit obligation 397,045 100,995 194,581 435,454 67,166 200,957 Fair value of plan assets (310,146) - - (362,802) - - Net liability in the balance sheet 86 ,899 100,995 194,581 72,652 67,166 200,957
24.1.4 Movement in present valueof defined benefit obligation
Balance at the beginning of the year 435,454 67,166 200,957 438,334 51,122 131,833 Current service cost 11,991 11,416 7,232 11,156 8,791 5,195 Interest cost 44,414 6,890 21,032 53,094 7,097 22,730 Benefits paid (83,717) (7,474) (25,938) (82,770) (4,160) (25,342)Recognised prior service cost - - 10,273 - - 13,575 Remeasurement of obligation (11,097) 22,997 (18,975) 15,640 4,316 52,966 Balance at the end of the year 397,045 100,995 194,581 435,454 67,166 200,957
24.1.5 Movement in fair value of plan assets
Balance at the beginning of the year 362,802 - - 235,451 - - Expected return on plan assets 36,829 - - 24,842 - - Contribution - - - 200,000 - - Benefits paid (83,717) - - (82,770) - - Remeasurement: Difference between actual
return and expected return on assets (5,768) - - (14,721) - - Balance at the end of the year 310,146 - - 362,802 - -
24.1.6 Movement in net liability in the balance sheet
Balance at the beginning of the year 72,652 67,166 200,957 202,883 51,122 131,833 Expense recognised for the year 19,576 18,306 38,537 39,408 15,888 41,500 Contributions made by theHolding Company / payments - (7,474) (25,938) (200,000) (4,160) (25,342)Net actuarial (gains) / losses for the year (5,329) 22,997 (18,975) 30,361 4,316 52,966
86,899 100,995 194,581 72,652 67,166 200,957
24.1.7 The amounts recognised in the profit and loss account
Current service cost 11,991 11,416 7,232 11,156 8,791 5,195 Net interest amount 7,585 6,890 21,032 28,252 7,097 22,730 Prior service cost - - 10,273 - - 13,575 Expense 19,576 18,306 38,537 39,408 15,888 41,500
24.1.8 Actual return on plan assets
Expected return on plan assets 36,829 - - 24,842 - - Actuarial loss on plan assets (5,768) - - (14,721) - - Actual return on plan assets 31,061 - - 10,121 - -
Annual Report 2014 123
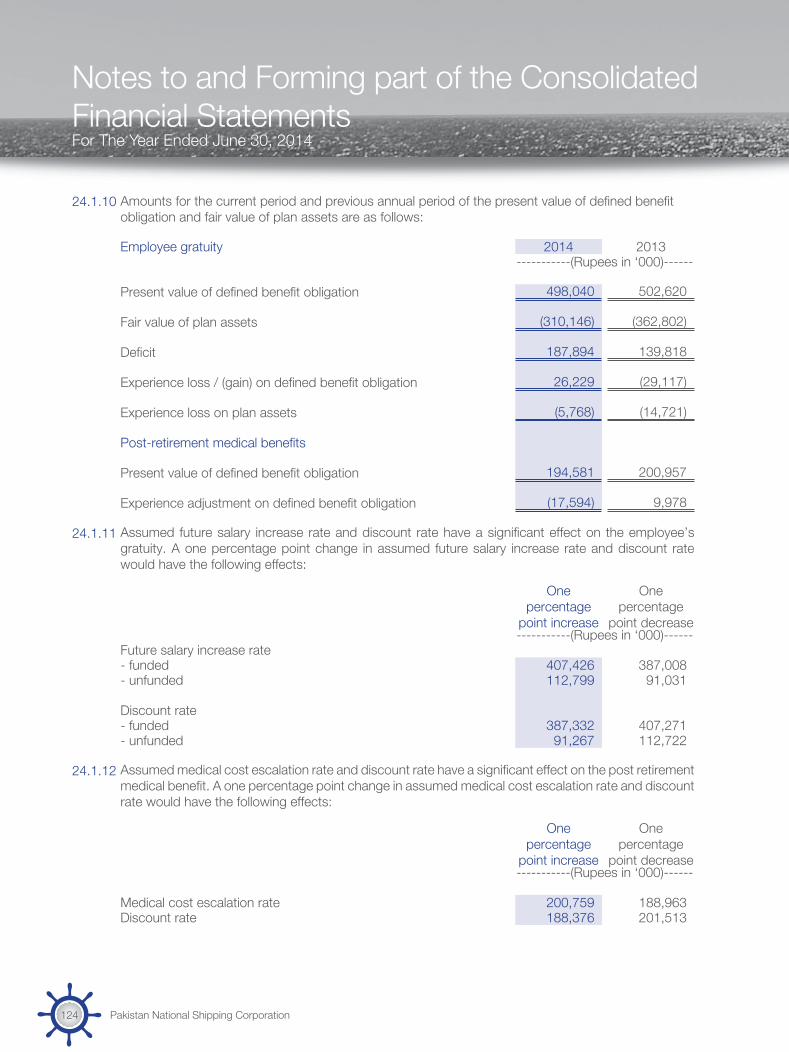
Notes to and Forming part of the Consolidated Financial StatementsFor The Year Ended June 30, 2014
24.1.10 Amounts for the current period and previous annual period of the present value of defined benefit obligation and fair value of plan assets are as follows:
Employee gratuity 2014 2013-----------(Rupees in ‘000)------
Present value of defined benefit obligation 498,040 502,620
Fair value of plan assets (310,146) (362,802)
Deficit 187,894 139,818
Experience loss / (gain) on defined benefit obligation 26,229 (29,117)
Experience loss on plan assets (5,768) (14,721)
Post-retirement medical benefits
Present value of defined benefit obligation 194,581 200,957
Experience adjustment on defined benefit obligation (17,594) 9,978
24.1.11 Assumed future salary increase rate and discount rate have a significant effect on the employee’s gratuity. A one percentage point change in assumed future salary increase rate and discount rate would have the following effects:
One percentage
point increase
One percentage
point decrease-----------(Rupees in ‘000)------
Future salary increase rate- funded 407,426 387,008 - unfunded 112,799 91,031
Discount rate- funded 387,332 407,271 - unfunded 91,267 112,722
24.1.12 Assumed medical cost escalation rate and discount rate have a significant effect on the post retirement medical benefit. A one percentage point change in assumed medical cost escalation rate and discount rate would have the following effects:
One percentage
point increase
One percentage
point decrease-----------(Rupees in ‘000)------
Medical cost escalation rate 200,759 188,963 Discount rate 188,376 201,513
Pakistan National Shipping Corporation124
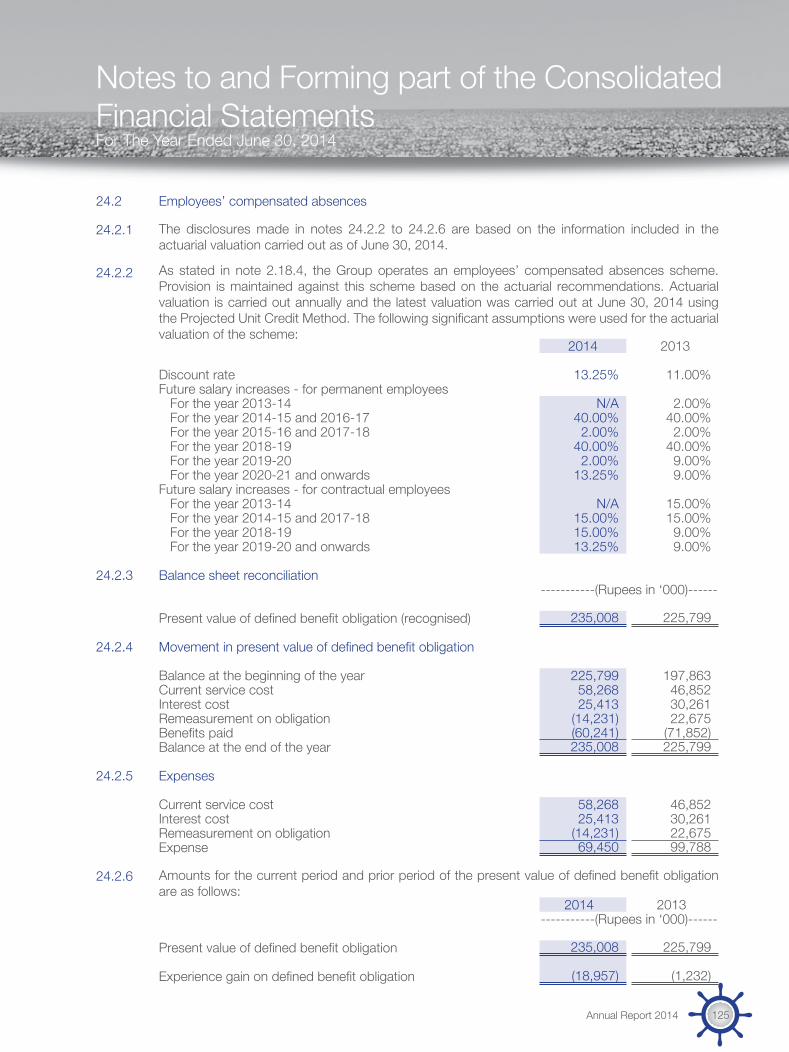
Notes to and Forming part of the Consolidated Financial StatementsFor The Year Ended June 30, 2014
24.2 Employees’ compensated absences
24.2.1 The disclosures made in notes 24.2.2 to 24.2.6 are based on the information included in the actuarial valuation carried out as of June 30, 2014.
24.2.2 As stated in note 2.18.4, the Group operates an employees’ compensated absences scheme. Provision is maintained against this scheme based on the actuarial recommendations. Actuarial valuation is carried out annually and the latest valuation was carried out at June 30, 2014 using the Projected Unit Credit Method. The following significant assumptions were used for the actuarial valuation of the scheme:
2014 2013
Discount rate 13.25% 11.00%Future salary increases - for permanent employees
For the year 2013-14 N/A 2.00%For the year 2014-15 and 2016-17 40.00% 40.00%For the year 2015-16 and 2017-18 2.00% 2.00%For the year 2018-19 40.00% 40.00%For the year 2019-20 2.00% 9.00%For the year 2020-21 and onwards 13.25% 9.00%
Future salary increases - for contractual employeesFor the year 2013-14 N/A 15.00%For the year 2014-15 and 2017-18 15.00% 15.00%For the year 2018-19 15.00% 9.00%For the year 2019-20 and onwards 13.25% 9.00%
24.2.3 Balance sheet reconciliation-----------(Rupees in ‘000)------
Present value of defined benefit obligation (recognised) 235,008 225,799
24.2.4 Movement in present value of defined benefit obligation
Balance at the beginning of the year 225,799 197,863 Current service cost 58,268 46,852 Interest cost 25,413 30,261 Remeasurement on obligation (14,231) 22,675 Benefits paid (60,241) (71,852)Balance at the end of the year 235,008 225,799
24.2.5 Expenses
Current service cost 58,268 46,852 Interest cost 25,413 30,261 Remeasurement on obligation (14,231) 22,675 Expense 69,450 99,788
24.2.6 Amounts for the current period and prior period of the present value of defined benefit obligation are as follows:
2014 2013-----------(Rupees in ‘000)------
Present value of defined benefit obligation 235,008 225,799
Experience gain on defined benefit obligation (18,957) (1,232)
Annual Report 2014 125

Notes to and Forming part of the Consolidated Financial StatementsFor The Year Ended June 30, 2014
24.3 Expected retirement benefits costs for the year ended June 30, 2015 are as follows: (Rupees in
‘000)
Gratuity 55,131 Post-retirement medical benefits 31,388 Compensated absences 89,504
24.4 During the year, the Group contributed Rs 10.589 million (2013: 11.876 million) to the provident fund.
Note 2014 2013----------(Rupees in ‘000)-------
25. TRADE AND OTHER PAYABLES
Creditors 102,188 286,024 Agents’ and owners’ balances 804,063 434,047 Accrued liabilities 1,262,344 665,087 Deposits 25.1 68,614 38,133 Derivative financial instruments 15.4 & 15.5 - 105,237 Unclaimed dividends 29,916 28,079 Sales tax payable 186 186 Bills payable 1,364 33,142 Advance from customers 128,305 136,678 Other liabilities- amounts retained from contractors 23,695 22,918 - others 99,626 104,780
123,321 127,698 2,520,301 1,854,311
25.1 These deposits are interest free and are repayable on demand or on completion of specific contracts.
Note 2014 2013----------(Rupees in ‘000)-------
26. PROVISION AGAINST DAMAGE CLAIMS
Balance at the beginning of the year 22,338 20,111 Charged during the year 34 15,847 7,663 Settled during the year - (452)Reversed during the year 35 (6,212) (4,984)Balance at the end of the year 31,973 22,338
27. INCOMPLETE VOYAGES Net freight 49,681 92,038
Salaries and allowances 2,708 11,524 Diesel, fuel and lubricants 18,530 88,767 Stores and spares consumed 4,744 23,973 Insurance 1,074 7,580 Charter hire and related expenses 5,992 32,793 Depreciation 4.7 4,714 25,068 Victualling 235 1,513
37,997 191,218
11,684 (99,180)
Pakistan National Shipping Corporation126
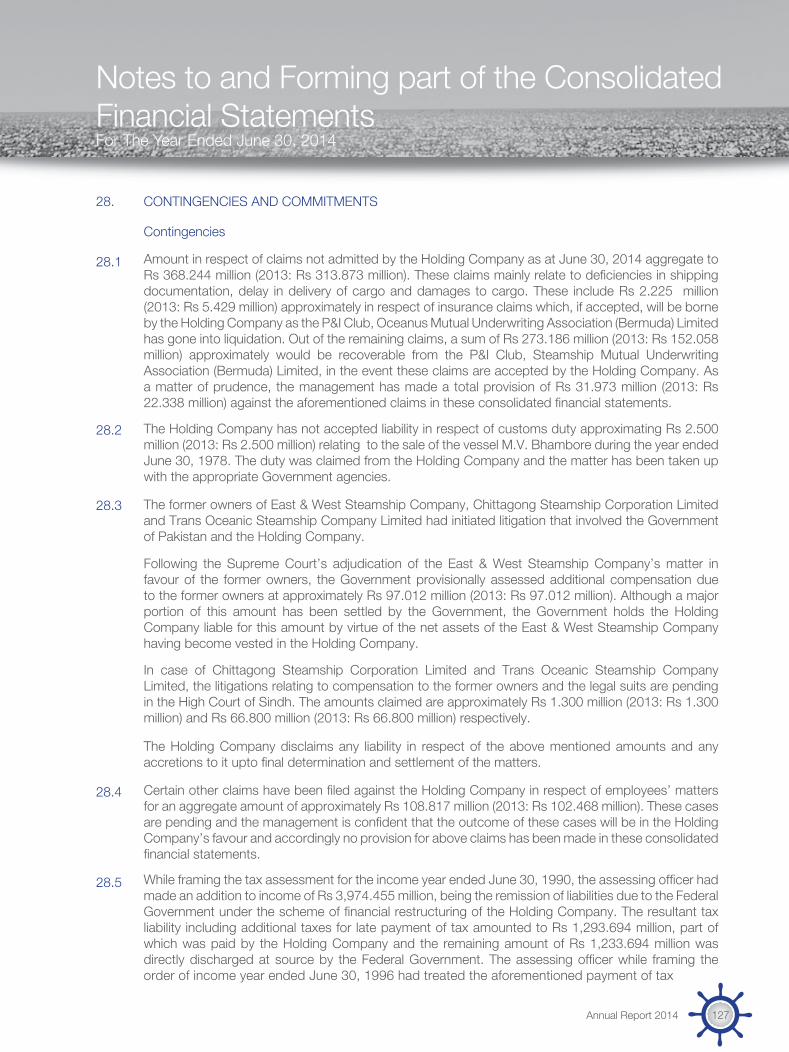
Notes to and Forming part of the Consolidated Financial StatementsFor The Year Ended June 30, 2014
28. CONTINGENCIES AND COMMITMENTS
Contingencies
28.1 Amount in respect of claims not admitted by the Holding Company as at June 30, 2014 aggregate to Rs 368.244 million (2013: Rs 313.873 million). These claims mainly relate to deficiencies in shipping documentation, delay in delivery of cargo and damages to cargo. These include Rs 2.225 million (2013: Rs 5.429 million) approximately in respect of insurance claims which, if accepted, will be borne by the Holding Company as the P&I Club, Oceanus Mutual Underwriting Association (Bermuda) Limited has gone into liquidation. Out of the remaining claims, a sum of Rs 273.186 million (2013: Rs 152.058 million) approximately would be recoverable from the P&I Club, Steamship Mutual Underwriting Association (Bermuda) Limited, in the event these claims are accepted by the Holding Company. As a matter of prudence, the management has made a total provision of Rs 31.973 million (2013: Rs 22.338 million) against the aforementioned claims in these consolidated financial statements.
28.2 The Holding Company has not accepted liability in respect of customs duty approximating Rs 2.500 million (2013: Rs 2.500 million) relating to the sale of the vessel M.V. Bhambore during the year ended June 30, 1978. The duty was claimed from the Holding Company and the matter has been taken up with the appropriate Government agencies.
28.3 The former owners of East & West Steamship Company, Chittagong Steamship Corporation Limited and Trans Oceanic Steamship Company Limited had initiated litigation that involved the Government of Pakistan and the Holding Company.
Following the Supreme Court’s adjudication of the East & West Steamship Company’s matter in favour of the former owners, the Government provisionally assessed additional compensation due to the former owners at approximately Rs 97.012 million (2013: Rs 97.012 million). Although a major portion of this amount has been settled by the Government, the Government holds the Holding Company liable for this amount by virtue of the net assets of the East & West Steamship Company having become vested in the Holding Company.
In case of Chittagong Steamship Corporation Limited and Trans Oceanic Steamship Company Limited, the litigations relating to compensation to the former owners and the legal suits are pending in the High Court of Sindh. The amounts claimed are approximately Rs 1.300 million (2013: Rs 1.300 million) and Rs 66.800 million (2013: Rs 66.800 million) respectively.
The Holding Company disclaims any liability in respect of the above mentioned amounts and any accretions to it upto final determination and settlement of the matters.
28.4 Certain other claims have been filed against the Holding Company in respect of employees’ matters for an aggregate amount of approximately Rs 108.817 million (2013: Rs 102.468 million). These cases are pending and the management is confident that the outcome of these cases will be in the Holding Company’s favour and accordingly no provision for above claims has been made in these consolidated financial statements.
28.5 While framing the tax assessment for the income year ended June 30, 1990, the assessing officer had made an addition to income of Rs 3,974.455 million, being the remission of liabilities due to the Federal Government under the scheme of financial restructuring of the Holding Company. The resultant tax liability including additional taxes for late payment of tax amounted to Rs 1,293.694 million, part of which was paid by the Holding Company and the remaining amount of Rs 1,233.694 million was directly discharged at source by the Federal Government. The assessing officer while framing the order of income year ended June 30, 1996 had treated the aforementioned payment of tax
Annual Report 2014 127
Notes to and Forming part of the Consolidated Financial StatementsFor The Year Ended June 30, 2014
liability by the Government as the income of the Holding Company. The Income Tax Appellate Tribunal (ITAT) has given the decision in favour of the Holding Company on the appeals filed against the above orders. However, the department has filed an appeal with the Honourable High Court against the aforementioned orders of ITAT. The Honourable High Court has decided the appeal against the Holding Company. The leave to appeal filed by the Holding Company has been accepted by the Honourable Supreme Court and the decision of the High Court has been suspended. Hearing of the appeal is pending in the Honourable Supreme Court.
28.6 During the year ended June 30, 2011, the Officer Inland Revenue (OIR) has issued assessment orders under section 122 (5A) of the Income Tax Ordinance, 2001 (ITO, 2001) in respect of tax years 2008, 2009 and 2010. According to the orders, the OIR had made certain additions and determined additional tax demand of Rs 363.421 million. OIR has disallowed a portion of administrative expenses by attributing the same to the subsidiary companies and further disallowed a portion of contribution made to approved gratuity fund (only in respect of tax year 2008) on the contention that the same is attributable to the subsidiary companies. The Holding Company has paid Rs 170 million under protest and filed an appeal with the Commissioner of Income Tax (Appeals) - CIT(A). During the year, CIT (A) in his order has upheld certain additions and has given decisions in favour of the Holding Company on certain matters resulting in refund of Rs 90.579 million. The management has provided for all the matters that have been decided against the Holding Company, with the exception of disallowance of allocation of common expenses to profit on debt for tax year 2008 and 2009 which may result in increase of tax liability by Rs 17.848 million. The Holding Company has filed an appeal with the ITAT in respect of aforementioned disallowances. The management of the Holding Company is confident that the matters in appeals shall be eventually decided in its favour.
28.7 During the year ended June 30, 2012, the OIR issued assessment orders under section 122 (5A) of the ITO, 2001 in respect of tax year 2011. According to the orders, the OIR has made certain additions and determined additional tax demand of Rs 251.092 million. OIR has disallowed a portion of administrative expenses by attributing the same to the subsidiary companies and further disallowed financial expenses incurred by the Holding Company on the contention that the same is equity specific and hence being capital in nature. The Holding Company had paid Rs 160.513 million (2013: Rs 160.513 million) and adjusted Rs 90.579 million against refunds relating to tax year 2008, 2009 and 2010 under protest. During the year, CIT (A) in his order has upheld certain additions and has given decisions in favour of the Holding Company on certain matters, and has worked out refund of Rs 15.068 million. The Holding Company and the tax department have filed appeals with the ITAT in respect of aforementioned disallowances. The management of the Holding Company is confident that the subject matter in respect of tax year 2011 will eventually be decided in favour of the Holding Company.
28.8 During the year ended June 30, 2013, the OIR issued assessment orders under section 122 (5A) of the ITO, 2001 in respect of tax year 2012. According to the orders, the OIR has made certain additions and determined additional tax demand of Rs 107.499 million. OIR disallowed a portion of administrative expenses by attributing the same to the subsidiary companies and further disallowed financial expenses incurred by the Holding Company on the contention that the same is equity specific and hence being capital in nature. The Holding Company has paid Rs 65 million under protest and has filed an appeal with the CIT (A) and at present the matter is pending for hearing. The management of the Holding Company is confident that the subject matter in respect of tax year 2012 will eventually be decided in favour of the Holding Company.
Pakistan National Shipping Corporation128

Notes to and Forming part of the Consolidated Financial StatementsFor The Year Ended June 30, 2014
28.9 During the year ended June 30, 2014, the OIR has issued assessment orders under section 122 (5A) of the ITO, 2001 in respect of tax year 2013. According to the orders, the OIR has made certain additions and determined additional tax demand of Rs 303.333 million. OIR has disallowed a portion of retirement benefit expenses by attributing the same to the subsidiary companies and further disallowed financial expenses incurred by the Holding Company on the contention that the same is equity specific and hence being capital in nature. Moreover, OIR disallowed the basis of apportionment of expenses. The Holding Company has paid Rs 288.265 million under protest and adjusted Rs 15.068 million against refunds available for the tax year 2011. Further the management has filed an appeal with the CIT (A) and at present the matter is pending for hearing. The management of the Holding Company is confident that the subject matter in respect of tax year 2013 will eventually be decided in favour of the Holding Company.
28.10 During the year ended June 30, 2014, the Deputy Commissioner Inland Revenue (DCIR) has issued assessment orders under section 161 of the ITO, 2001 in respect of tax years 2008 to 2013. According to the orders, the DCIR has held that the Holding Company was required to withhold tax under section 152 (2) of the ITO, 2001 while making payments to non-resident shipping Companies, and the failure to deduct tax at source renders it personally liable to pay tax along with default surcharge on the unpaid amount of tax, under section 205 of the ITO, 2001. By virtue of above orders a total tax demand of Rs 2,695.502 million was raised by the tax authorities. The Holding Company has filed an appeal with the CIT (A) and at present the matter is pending for hearing. The management of the Holding Company is confident that the subject matter in respect of tax year 2008 to 2013 will eventually be decided in favour of the Holding Company, and hence no provision has been recorded in the consolidated financial statements in respect of the said matter.
28.11 During the year ended June 30, 2014, the Assistant Commissioner Sindh Revenue Board (AC) has passed an order under Sindh Sales Tax on Services Act, 2011 for the tax period July 2011 to June 2012. The AC has held the Holding Company liable to pay sales tax on ‘Administrative and Financial Services’ provided to its subsidiaries and has also levied sales tax on the services that are provided by the Holding Company outside Sindh. By virtue of above order an additional tax demand of Rs 12.654 million, alongwith default surcharge of Rs 1.012 million was raised by the taxation authorities. The Holding Company paid the amount under protest and filed Appeal with Commissioner Appeals - SRB (CA) which was decided against the Holding Company. The Holding Company has filed another appeal against the decision of CA with the Appellate Tribunal, SRB which is pending for hearing.
28.12 Without prejudice to the Holding Company’s contention on the matters stated in notes 28.5 to 28.11, the management has, as a matter of prudence, provided an aggregate amount of Rs 250 million (2013: Rs 250 million) in respect of aforementioned matters.
28.13 The OIR issued an amended assessment order under section 122(5A) of the ITO, 2001 in respect of tax year 2003 against Karachi Shipping (Private) Limited (KSPL). According to the amended order, OIR made additions to taxable income of KSPL aggregating to Rs 163.523 million mainly on account of interest income and gain on sale of fixed assets, which have been taxed separately. KSPL made payment of Rs 70.315 million under protest, being the additional tax demand raised by the OIR in his order and filed an appeal against the subject order with CIT(A). Consequently, KSPL filed a petition to Alternate Dispute Resolution Committee (ADRC) with respect to the said matter. During the year ended June 30, 2009, the ADRC upheld the decision of OIR and decided the matter against KSPL. As KSPL was not satisfied with the order, KSPL continued to pursue its remedy against CIT(A) which is, at present, pending for hearing.
The management of KSPL is confident that the matter in the appeal shall eventually be decided in its favour. Without prejudice to the contentions of the management, the management has as a matter of prudence provided for amount aggregating Rs 70.315 million as payment under protest in these consolidated financial statements.
Annual Report 2014 129

Notes to and Forming part of the Consolidated Financial StatementsFor The Year Ended June 30, 2014
28.14 During the year ended June 30, 2011, the OIR has issued an order under section 122 (5A) of the ITO, 2001 in respect of tax year 2008 against KSPL. According to the order, OIR has made certain additions to the income of KSPL and determined tax demand aggregating Rs 11.225 million. KSPL has obtained stay order against the payment of aforesaid tax demand and filed an appeal with the CIT(A). During the year ended June 30, 2012, the CIT(A) has maintained certain disallowances and set aside the action of the OIR in invoking the provisions of section 108 of the ITO, 2001. As KSPL was not satisfied with the order, KSPL has filed an appeal with the ITAT. The management of KSPL is confident that the matter in the appeal shall eventually be decided in its favour. Accordingly, no provision has been made in these consolidated financial statements against the aforementioned tax demand.
28.15 The OIR issued an amended assessment order under section 122(5A) of the ITO, 2001 in respect of tax year 2004 against Swat Shipping (Private) Limited (SSPL). According to the amended order, OIR made additions to taxable income of SSPL aggregating to Rs 58.018 million mainly on account of other income and gain on sale of fixed assets, by taxing them separately. SSPL made payment of Rs 11.893 million under protest, against the additional tax demand of Rs 23.787 million raised by the OIR in his order and filed an appeal against the subject order with CIT(A). CIT(A), in his order, allowed partial relief to SSPL by reducing additional tax assessed to Rs 10.676 million resulting in refund claim of Rs 1.217 million. Being, aggrieved by the decision, SSPL and the tax authorities have filed appeals with the ITAT which are pending for hearing.
The management of SSPL is confident that the matter in the appeal shall eventually be decided in its favour. Accordingly, no provision has been made in these consolidated financial statements against the aforementioned tax demand.
28.16 While framing tax assessment for the income year ended June 30, 2005, the OIR issued order under section 122 (5A) of the ITO, 2001 whereby demand of Rs 139.118 million was raised by the tax department against Lalazar Shipping (Private) Limited (LSPL). According to the order, the OIR is of the view that the income appearing under the head ‘other income’ in the annual audited financial statements for the said year is taxable under normal tax regime with reference to section 39 of the ITO, 2001. LSPL had filed appeals with the CIT (A) and ITAT, however, the appeals were decided in favour of the tax department.
During the year ended June 30, 2011, the Honourable High Court had heard the appeal filed by LSPL and reduced the tax demand raised by OIR to Rs 68.284 million. LSPL had paid the reduced tax demand under protest and filed an appeal with the Honourable Supreme Court for which leave to appeal was granted to LSPL. Further, the tax department had also filed an appeal with the Honourable Supreme Court against the order and the matter is at present pending for hearing.
The management of LSPL is confident that the matter shall eventually be decided in favour of LSPL. However, the management, without prejudice to its contention in respect of the subject matter, as a matter of prudence, had provided an aggregate amount of Rs 68.284 million in this respect.
Commitments
28.17 Commitments in respect of capital expenditure amount to Rs 193.057 million (2013: Rs 285.589 million).
28.18 Outstanding letters of guarantee amount to Rs 5.126 million (2013: Rs 5.126 million).
Pakistan National Shipping Corporation130
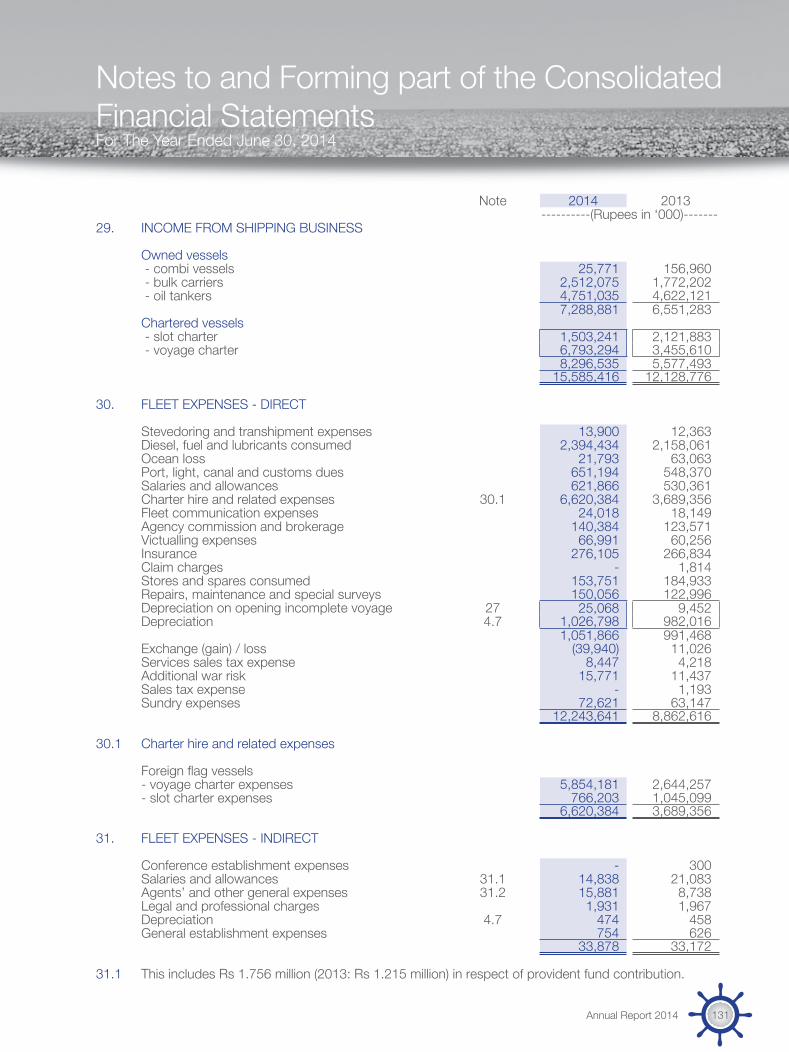
Notes to and Forming part of the Consolidated Financial StatementsFor The Year Ended June 30, 2014
Note 2014 2013 ----------(Rupees in ‘000)-------29. INCOME FROM SHIPPING BUSINESS
Owned vessels - combi vessels 25,771 156,960 - bulk carriers 2,512,075 1,772,202 - oil tankers 4,751,035 4,622,121
7,288,881 6,551,283 Chartered vessels - slot charter 1,503,241 2,121,883 - voyage charter 6,793,294 3,455,610
8,296,535 5,577,493 15,585,416 12,128,776
30. FLEET EXPENSES - DIRECT
Stevedoring and transhipment expenses 13,900 12,363 Diesel, fuel and lubricants consumed 2,394,434 2,158,061 Ocean loss 21,793 63,063 Port, light, canal and customs dues 651,194 548,370 Salaries and allowances 621,866 530,361 Charter hire and related expenses 30.1 6,620,384 3,689,356 Fleet communication expenses 24,018 18,149 Agency commission and brokerage 140,384 123,571 Victualling expenses 66,991 60,256 Insurance 276,105 266,834 Claim charges - 1,814 Stores and spares consumed 153,751 184,933 Repairs, maintenance and special surveys 150,056 122,996 Depreciation on opening incomplete voyage 27 25,068 9,452 Depreciation 4.7 1,026,798 982,016
1,051,866 991,468 Exchange (gain) / loss (39,940) 11,026 Services sales tax expense 8,447 4,218 Additional war risk 15,771 11,437 Sales tax expense - 1,193 Sundry expenses 72,621 63,147
12,243,641 8,862,616
30.1 Charter hire and related expenses
Foreign flag vessels- voyage charter expenses 5,854,181 2,644,257 - slot charter expenses 766,203 1,045,099
6,620,384 3,689,356
31. FLEET EXPENSES - INDIRECT
Conference establishment expenses - 300 Salaries and allowances 31.1 14,838 21,083 Agents’ and other general expenses 31.2 15,881 8,738 Legal and professional charges 1,931 1,967 Depreciation 4.7 474 458 General establishment expenses 754 626
33,878 33,172
31.1 This includes Rs 1.756 million (2013: Rs 1.215 million) in respect of provident fund contribution.
Annual Report 2014 131
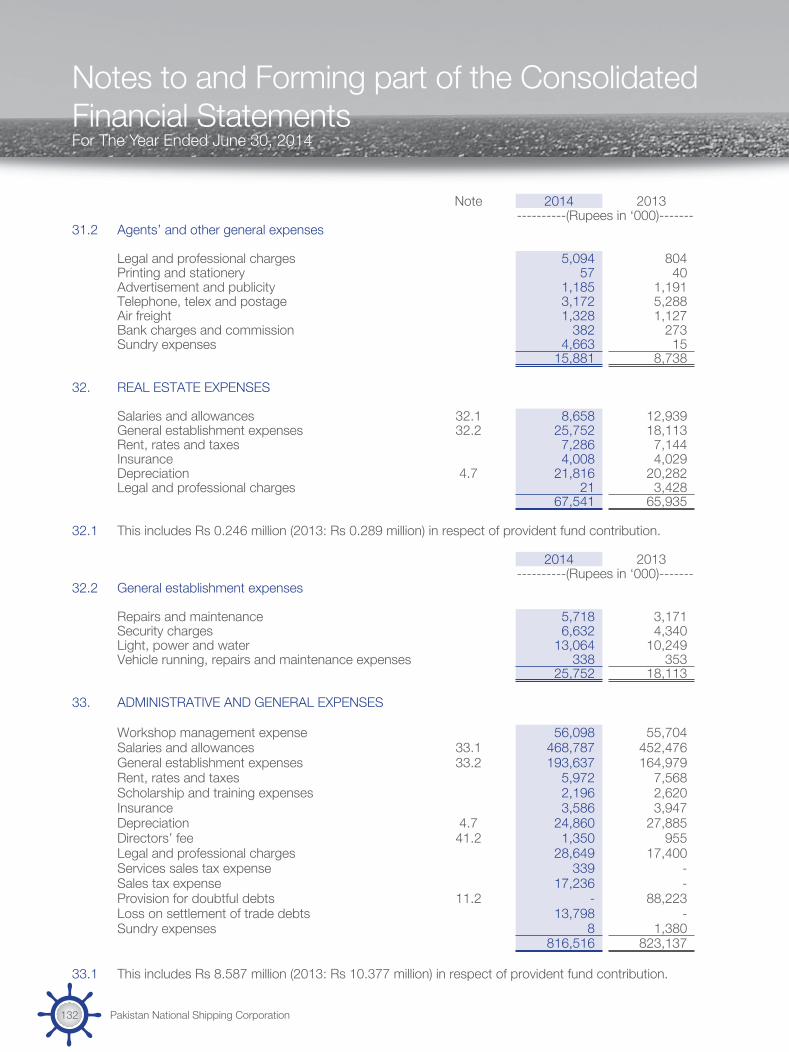
Notes to and Forming part of the Consolidated Financial StatementsFor The Year Ended June 30, 2014
Note 2014 2013----------(Rupees in ‘000)-------
31.2 Agents’ and other general expenses
Legal and professional charges 5,094 804 Printing and stationery 57 40 Advertisement and publicity 1,185 1,191 Telephone, telex and postage 3,172 5,288 Air freight 1,328 1,127 Bank charges and commission 382 273 Sundry expenses 4,663 15
15,881 8,738
32. REAL ESTATE EXPENSES
Salaries and allowances 32.1 8,658 12,939 General establishment expenses 32.2 25,752 18,113 Rent, rates and taxes 7,286 7,144 Insurance 4,008 4,029 Depreciation 4.7 21,816 20,282 Legal and professional charges 21 3,428
67,541 65,935
32.1 This includes Rs 0.246 million (2013: Rs 0.289 million) in respect of provident fund contribution.
2014 2013----------(Rupees in ‘000)-------
32.2 General establishment expenses
Repairs and maintenance 5,718 3,171 Security charges 6,632 4,340 Light, power and water 13,064 10,249 Vehicle running, repairs and maintenance expenses 338 353
25,752 18,113
33. ADMINISTRATIVE AND GENERAL EXPENSES
Workshop management expense 56,098 55,704 Salaries and allowances 33.1 468,787 452,476 General establishment expenses 33.2 193,637 164,979 Rent, rates and taxes 5,972 7,568 Scholarship and training expenses 2,196 2,620 Insurance 3,586 3,947 Depreciation 4.7 24,860 27,885 Directors’ fee 41.2 1,350 955 Legal and professional charges 28,649 17,400 Services sales tax expense 339 - Sales tax expense 17,236 - Provision for doubtful debts 11.2 - 88,223 Loss on settlement of trade debts 13,798 - Sundry expenses 8 1,380
816,516 823,137
33.1 This includes Rs 8.587 million (2013: Rs 10.377 million) in respect of provident fund contribution.
Pakistan National Shipping Corporation132

Notes to and Forming part of the Consolidated Financial StatementsFor The Year Ended June 30, 2014
Note 2014 2013----------(Rupees in ‘000)-------
33.2 General establishment expenses
Repairs and maintenance 9,973 10,578 Medical expenses 53,975 43,818 Contribution to employees welfare fund 9 11 Contribution to group term insurance 1,865 1,766 Security charges 2,524 1,839 Travelling and conveyance 47,702 31,118 Entertainment and canteen subsidy 2,884 2,763 Books, periodicals and subscription 5,506 5,673 Uniform and liveries 1,204 800 Hajj expenses 1,551 1,767 Printing and stationery 3,825 3,115 Telephone, telex and postage 6,954 7,323 Light, power and water 10,263 17,420 Computer expenses 7,851 7,468 Advertisement and publicity 5,083 3,909 Vehicle running, repairs and maintenance expenses 17,779 16,789 Ship inspection expenses 2,269 581 Sundry expenses 12,420 8,241
193,637 164,979
34. OTHER EXPENSES
Donations 34.1 1,000 100 Auditors’ remuneration 34.2 11,289 7,529 Demurrage expenses 128,791 - Employees’ gratuity
- funded 24.1.7 19,576 39,408 - unfunded 24.1.7 18,306 15,888
37,882 55,296 Post retirement medical benefits 24.1.7 38,537 41,500 Employees’ compensated absences 24.2.5 69,450 99,788 Provision in respect of damage claims 26 15,847 7,663
302,796 211,876
34.1 Donations were not made to any donee in which the Group or a director or his spouse had any interest.
Annual Report 2014 133

Notes to and Forming part of the Consolidated Financial StatementsFor The Year Ended June 30, 2014
34.2 Auditors’ remuneration2014 2013
A. F. Ernst & YoungTotal
A. F. Ernst & Young Total Ferguson Ford Rhodes Ferguson Ford Rhodes
& Co. Sidat Hyder & Co. Sidat Hyder--------------------------------- (Rupees in ‘000) ------------------------------------
Audit fee - the Holding Company 1,061 1,061 2,122 1,036 1,036 2,072 Audit fee - subsidiaries 1,461 1,461 2,922 1,461 1,461 2,922 Review of half yearly
financial statements 360 360 720 350 350 700 Review of compliance with
the best practices of the code of corporate governance 106 106 212 100 100 200
Fee for audit of the consolidated financial statements 130 130 260 125 125 250
Tax advisory services 4,286 - 4,286 692 - 692 Central Depository Company
certification fees 15 - 15 - 15 15 Out of pocket expenses 376 376 752 375 303 678
7,795 3,494 11,289 4,139 3,390 7,529
Note 2014 2013----------(Rupees in ‘000)-------
35. OTHER INCOME
Income from financial assets / liabilities
Income from saving account and term deposits 271,510 251,535 Dividend income 821 1,233 Agency fee 28,051 9,039 Gain on revaluation of long-term investments 15,458 15,758 Gain on revaluation of swap derivative - net 210,297 167,324 Exchange gain 10,051 33,086
Income from non-financial assets
Gain on disposal of fixed assets - 118,401 Sale of scrap 456 334 Provisions no longer required written back 16,173 24,200 Insurance claims 35.1 80,495 181,037 Demurrage income - 464 Ocean loss written back 1,050 - Sundry income 54,539 98,507
688,901 900,918
35.1 This represents recoveries from hull, cargo and other claims according to the insurance policies.
Pakistan National Shipping Corporation134

Notes to and Forming part of the Consolidated Financial StatementsFor The Year Ended June 30, 2014
Note 2014 2013----------(Rupees in ‘000)-------
36. FINANCE COSTS
Interest on long-term financing 796,913 964,854 Gain on cross currency interest rate swap derivative 36.1 (251,104) (254,344)Bank charges 3,036 4,448
548,845 714,958
36.1 This relates to the amount received during the year on account of quarterly exchanges and terminations under the swap arrangement as explained in note 15.4 amounting to Rs 251.104 million (2013: Rs 254.344 million).
2014 2013----------(Rupees in ‘000)-------
37. TAXATION
Tax charge for:- current year 305,430 301,785 - prior years (42,579) 76,372
262,851 378,157 Deferred (9,678) 72,662
253,173 450,819
37.1 Relationship between tax expense and accounting profit
Accounting profit before tax 2,402,230 2,442,158
Tax rate 34% 35%
Tax on accounting profit 816,758 854,755
Tax effect in respect of income / expenses not admissible for calculation of taxable profit 4,645 70,729
Tax effect of lower tax rates on certain incomes:- Tax saving due to lower income tax rates (433,744) (459,777)- Tax liability under final tax regime (101,082) (100,465)
(534,826) (560,242)
Effect of charging deferred tax on different rate than current tax 2,593 2,368
Others (including the impact arising as a consequence of change in allocation ratio of revenue chargeable underFTR and non-FTR tax regime) (4,589) 4,940
(532,177) (482,205) 284,581 372,550
Tax effects of adjustments in respect of taxes paid abroad 11,171 1,897 Tax effects of adjustments in respect of prior years (42,579) 76,372 Tax expense for the year 253,173 450,819
Annual Report 2014 135

Notes to and Forming part of the Consolidated Financial StatementsFor The Year Ended June 30, 2014
2014 2013----------(Rupees in ‘000)-------
38. EARNINGS PER SHARE FOR PROFIT ATTRIBUTABLE TO EQUITY HOLDERS OF THE HOLDING COMPANY
Profit for the year 2,148,674 1,991,030
---------(No. of Shares)---------
Weighted average ordinary shares in issue during the year 132,063,380 132,063,380
-------------(Rupees)------------
Earnings per share - basic and diluted 16.27 15.08
There were no dilutive potential ordinary shares outstanding as at June 30, 2014 and 2013.
Note 2014 2013----------(Rupees in ‘000)-------
39. CASH GENERATED FROM OPERATIONS
Profit before taxation 2,402,230 2,442,158
Adjustments for non-cash charges and other items:Depreciation 1,078,662 1,040,093 Provision in respect of damage claims 15,847 7,663 Provision for employees’ gratuity 37,882 55,296 Provision for employees’ compensated absences 69,450 99,788 Provision for post retirement medical benefits 38,537 41,500 Dividend income (821) (1,233)Provision for impairment on doubtful receivables - 88,223 Provision no longer required written back (6,212) (4,984)Interest / mark-up income (271,510) (251,535)Interest / mark-up expense 799,949 969,302 Gain on revaluation of long-term investments (15,458) (15,758)Gain on disposal of property, plant and equipment - (118,401)Gain on cross currency interest rate swap derivative (461,401) (421,668)Long term advance rent earned - (11,349)Working capital changes 39.1 (268,051) (695,288)
3,419,104 3,223,807
Pakistan National Shipping Corporation136
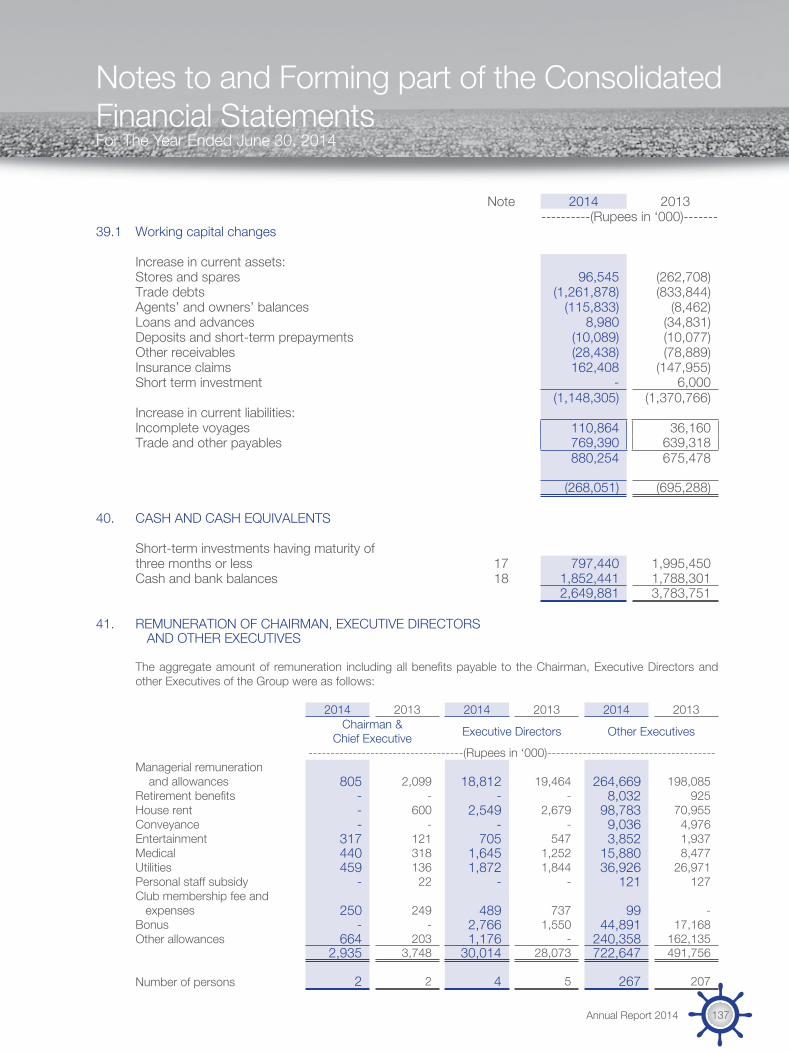
Notes to and Forming part of the Consolidated Financial StatementsFor The Year Ended June 30, 2014
Note 2014 2013----------(Rupees in ‘000)-------
39.1 Working capital changes Increase in current assets:Stores and spares 96,545 (262,708)Trade debts (1,261,878) (833,844)Agents’ and owners’ balances (115,833) (8,462)Loans and advances 8,980 (34,831)Deposits and short-term prepayments (10,089) (10,077)Other receivables (28,438) (78,889)Insurance claims 162,408 (147,955)Short term investment - 6,000
(1,148,305) (1,370,766)Increase in current liabilities:Incomplete voyages 110,864 36,160 Trade and other payables 769,390 639,318
880,254 675,478
(268,051) (695,288)
40. CASH AND CASH EQUIVALENTS
Short-term investments having maturity of three months or less 17 797,440 1,995,450 Cash and bank balances 18 1,852,441 1,788,301
2,649,881 3,783,751
41. REMUNERATION OF CHAIRMAN, EXECUTIVE DIRECTORSAND OTHER EXECUTIVES
The aggregate amount of remuneration including all benefits payable to the Chairman, Executive Directors and other Executives of the Group were as follows:
2014 2013 2014 2013 2014 2013Chairman & Executive Directors Other ExecutivesChief Executive
-----------------------------------(Rupees in ‘000)--------------------------------------Managerial remuneration and allowances 805 2,099 18,812 19,464 264,669 198,085 Retirement benefits - - - - 8,032 925 House rent - 600 2,549 2,679 98,783 70,955 Conveyance - - - - 9,036 4,976 Entertainment 317 121 705 547 3,852 1,937 Medical 440 318 1,645 1,252 15,880 8,477 Utilities 459 136 1,872 1,844 36,926 26,971 Personal staff subsidy - 22 - - 121 127 Club membership fee and expenses 250 249 489 737 99 - Bonus - - 2,766 1,550 44,891 17,168 Other allowances 664 203 1,176 - 240,358 162,135
2,935 3,748 30,014 28,073 722,647 491,756
Number of persons 2 2 4 5 267 207
Annual Report 2014 137

Notes to and Forming part of the Consolidated Financial StatementsFor The Year Ended June 30, 2014
41.1 Retirement benefits represent amount contributed towards various retirement benefit plans. The executives of the Group are entitled to retirement benefits as outlined in note 2.18 to these consolidated financial statements. The Chairman and Chief Executive, Executive Directors and certain Executives are provided with Group owned and maintained cars.
41.2 The aggregate amount charged in these consolidated financial statements for fee to 6 (2013: 5) non-executive directors was Rs 1.350 million (2013: Rs 0.955 million).
41.3 During the year ended June 30, 2014, a Chief Executive was replaced by another Chief Executive.
42. FINANCIAL INSTRUMENTS BY CATEGORY2014 2013
----------(Rupees in ‘000)-------FINANCIAL ASSETSFinancial assets at fair value through profit or loss
Long-term investments - listed companies 53,569 38,111 Derivative financial instruments 147,209 -
Loans and receivables
Loans - employees 59 59 Trade debts 2,439,569 1,177,691 Agents’ and owners’ balances 124,824 8,991 Deposits 9,914 5,324 Interest / mark-up accrued 35,009 19,899 Other receivables 196,416 167,978 Insurance claims 7,032 169,440 Short-term investments 2,294,880 1,995,450 Cash and bank balances 1,852,441 1,788,301
6,960,144 5,333,133 Available-for-sale financial assets
Long-term investments - other entity 100 100 7,161,022 5,371,344
FINANCIAL LIABILITIES
Fair value through profit or loss
Derivative financial instruments - 105,237
Amortised cost
Long-term financing 5,885,743 7,190,168 Trade and other payables 2,520,301 1,612,210 Accrued mark-up on long-term financing 78,515 91,087
8,484,559 8,998,702
Pakistan National Shipping Corporation138
Notes to and Forming part of the Consolidated Financial StatementsFor The Year Ended June 30, 2014
43. FINANCIAL RISK MANAGEMENT
43.1 Financial risk factors
The Group’s activities are exposed to a variety of financial risks namely credit risk, market risk (including currency risk, cash flow and fair value interest rate risk and price risk) and liquidity risk. The Group is not exposed to any significant price risk as it does not hold any major investments exposed to price risk. The Group has established adequate procedures to manage each of these risks as explained below.
43.1.1 Concentration of credit risk
Credit risk arises from cash and cash equivalents, derivative financial instruments and deposits with banks and financial institutions, as well as credit exposures to customers, including trade receivables and committed transactions. Credit risk represents the accounting loss that would be recognised at the reporting date if counter parties fail completely to perform as contracted.
As at June 30, 2014, out of the total financial assets of Rs 7,161.022 million (2013: Rs 5,371.343 million) , the financial assets which are subject to credit risk amounted to Rs 7,160.043 million (2013: Rs 5,370.335 million). The management continuously monitors the credit exposure towards the customers and makes provision against those balances considered doubtful of recovery.
Moreover, a significant component of the receivable balances of the Group relates to amounts due from the Public Sector organisations. Due to the Group’s long standing business relationships with these counterparties and after giving due consideration to their related credit standing, management does not expect non–performance by those counter parties on their obligations to the Group.
For banks and financial institutions, only independently rated parties with a minimum credit rating of A are accepted.
43.1.2 Market Risk
Foreign exchange risk
Foreign exchange risk is the risk that the fair value or future cash flows of a financial instrument will fluctuate because of changes in foreign exchange rates. The Group faces foreign currency risk on receivable, payable transactions at foreign ports and the derivative cross currency interest rate swap.
As at June 30, 2014, if the currency had weakened / strengthened by 5% against the US dollar with all other variables held constant, profit before taxation for the year would have been higher / lower by Rs 30.772 million (2013: Rs 81.913 million), mainly as a result of foreign exchange gains / losses on translation of US dollar denominated assets and liabilities.
As at June 30, 2014, the effect of fluctuations in other foreign currency denominated assets or liabilities balances would not be material, therefore, not disclosed.
Cash flow and fair value interest rate risk
Interest rate risk is the risk that the value of a financial instrument will fluctuate due to changes in the market interest rates. The Group has a high exposure to interest rate risk due to the long-term financing. In order to manage its exposure to such risks the management of the Group has entered into a derivative cross currency interest rate swap under which the Group receives three months KIBOR on the PKR notional in exchange for payment of three months LIBOR on the USD notional. During the year ended June 30, 2012, to further manage the exposure to such risk, management had obtained interest rate swap under which the Group receives a fixed interest rate of 13% in exchange for payment of KIBOR.
Annual Report 2014 139

Notes to and Forming part of the Consolidated Financial StatementsFor The Year Ended June 30, 2014
The Group has interest bearing liabilities that have floating interest rates. At June 30, 2014, if interest rates on borrowings had been 100 basis points higher / lower with all other variables held constant, profit after taxation for the year would have been lower / higher by Rs 10.480 million (2013: Rs 12.192 million).
Price risk
Price risk represents the risk that the fair value or future cash flows of a financial instrument will fluctuate because of changes in market prices (other than those arising from interest rate risk or foreign exchange risk), whether those changes are caused by factors specific to the individual financial instrument or its issuer, or factors affecting all similar financial instruments traded in the market.
The effects of changes in fair value of investments made by the Group, on the future profits are not considered to be material in the overall context of these consolidated financial statements.
43.1.3 Liquidity risk
Liquidity risk is the risk that the Group will encounter difficulties in raising funds to meet commitments associated with financial instruments. The Group believes that it is not exposed to any significant level of liquidity risk.
The management forecasts the liquidity of the Group on basis of expected cash flow considering the level of liquid assets necessary to meet such risk. This involves monitoring balance sheet liquidity ratios and maintaining debt financing plans.
Financial liabilities in accordance with their contractual maturities are presented below:
Contractual cash flows
Less than 1 year
Between 1 to 2 years
Between 2 to 5 years
More than 5 years
2014 -----------------------------(Rupees in ‘000)-------------------------------
Long term financing 7,712,144 1,932,063 1,864,640 3,915,441 - Trade and other payables 2,520,301 2,520,301 - - - Derivative financial instruments - - - - - Accrued mark-up on long-term financing 78,515 78,515 - - -
10,310,960 4,530,879 1,864,640 3,915,441 -
2013 -----------------------------(Rupees in ‘000)-------------------------------
Long term financing 9,694,388 2,109,536 1,956,723 4,940,387 687,742 Trade and other payables 1,612,210 1,612,210 - - - Derivative instrumentsliabilities 105,237 105,237 - - - Accrued mark-up on long-term financing 91,087 91,087 - - -
11,502,922 3,918,070 1,956,723 4,940,387 687,742
Pakistan National Shipping Corporation140

Notes to and Forming part of the Consolidated Financial StatementsFor The Year Ended June 30, 2014
43.1.4 Fair value of financial instruments
Fair value is an amount for which an asset could be exchanged, or a liability settled, between knowledgeable willing parties in an arm’s length transaction. Consequently, differences may arise between the carrying value and the fair value estimates.
The Group classifies financial instruments measured in the balance sheet at fair value in accordance with the following fair value measurement:
Level 1: Quoted prices in active markets for identical assets or liabilities;
Level 2: Those involving inputs other than quoted prices included in Level 1 that are observable for the asset or liability, either directly (as prices) or indirectly (derived from prices); and
Level 3: Those whose inputs for the asset or liability that are not based on observable market date (unobservable inputs).
The Group’s financial assets measured at fair value comprise of level 1 financial assets amounting to Rs 53.669 million (2013: Rs 38.111 million) and level 3 financial assets amounting to Rs 147.209 million (2013: Nil ) and financial liabilities amounting to Rs Nil (2013: Rs 105.237 million).
43.2 Capital risk management
The Group’s objectives when managing capital are to safeguard the Group’s ability to continue as a going concern in order to provide returns for shareholders and benefits for other stakeholders and to maintain an optimal capital structure to reduce the cost of capital.
The Group manages its capital structure by monitoring return on net assets and makes adjustment to it in the light of changes in economic conditions. In order to maintain or adjust the capital structure, the Group may adjust the amount of dividends paid to shareholders or issue new shares.
The Group is subject to externally imposed capital requirements, which are applicable at consolidated financial statements level.
During the year, the Group’s strategy was to maintain the debt equity ratio below 60:40. The debt equity ratios as at June 30, 2014 and 2013 were as follows:
2014 2013--------(Rupees in ‘000)--------
Long-term financing (note 23) 5,885,743 7,190,168 Total equity 22,467,167 20,447,185 Total 28,352,910 27,637,353
Debt-to-equity ratio 21:79 26:74
44. ENTITY WIDE INFORMATION
44.1 The Group constitutes a single reportable segment, the principal classes of services provided are transportation of dry cargo and liquid cargo through chartered and owned vessels, and rental of properties.
Annual Report 2014 141
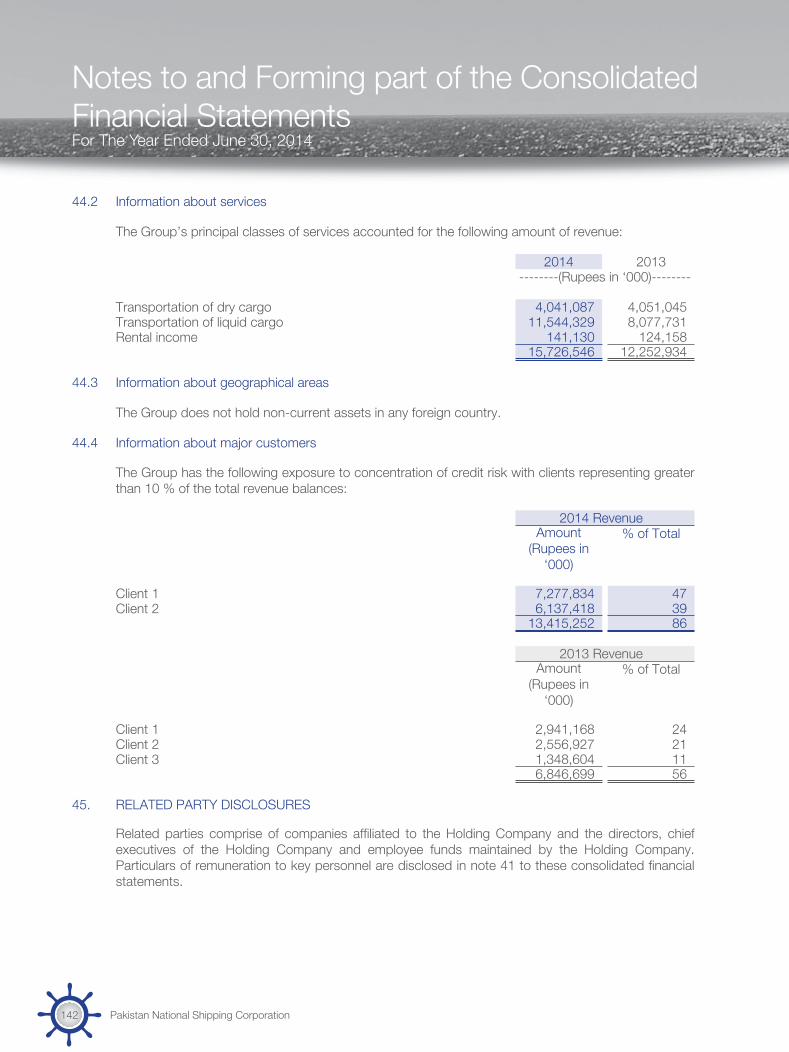
Notes to and Forming part of the Consolidated Financial StatementsFor The Year Ended June 30, 2014
44.2 Information about services
The Group’s principal classes of services accounted for the following amount of revenue:
2014 2013--------(Rupees in ‘000)--------
Transportation of dry cargo 4,041,087 4,051,045 Transportation of liquid cargo 11,544,329 8,077,731 Rental income 141,130 124,158
15,726,546 12,252,934
44.3 Information about geographical areas
The Group does not hold non-current assets in any foreign country.
44.4 Information about major customers
The Group has the following exposure to concentration of credit risk with clients representing greater than 10 % of the total revenue balances:
2014 RevenueAmount
(Rupees in ‘000)
% of Total
Client 1 7,277,834 47 Client 2 6,137,418 39
13,415,252 86
2013 RevenueAmount
(Rupees in ‘000)
% of Total
Client 1 2,941,168 24 Client 2 2,556,927 21 Client 3 1,348,604 11
6,846,699 56
45. RELATED PARTY DISCLOSURES
Related parties comprise of companies affiliated to the Holding Company and the directors, chief executives of the Holding Company and employee funds maintained by the Holding Company. Particulars of remuneration to key personnel are disclosed in note 41 to these consolidated financial statements.
Pakistan National Shipping Corporation142
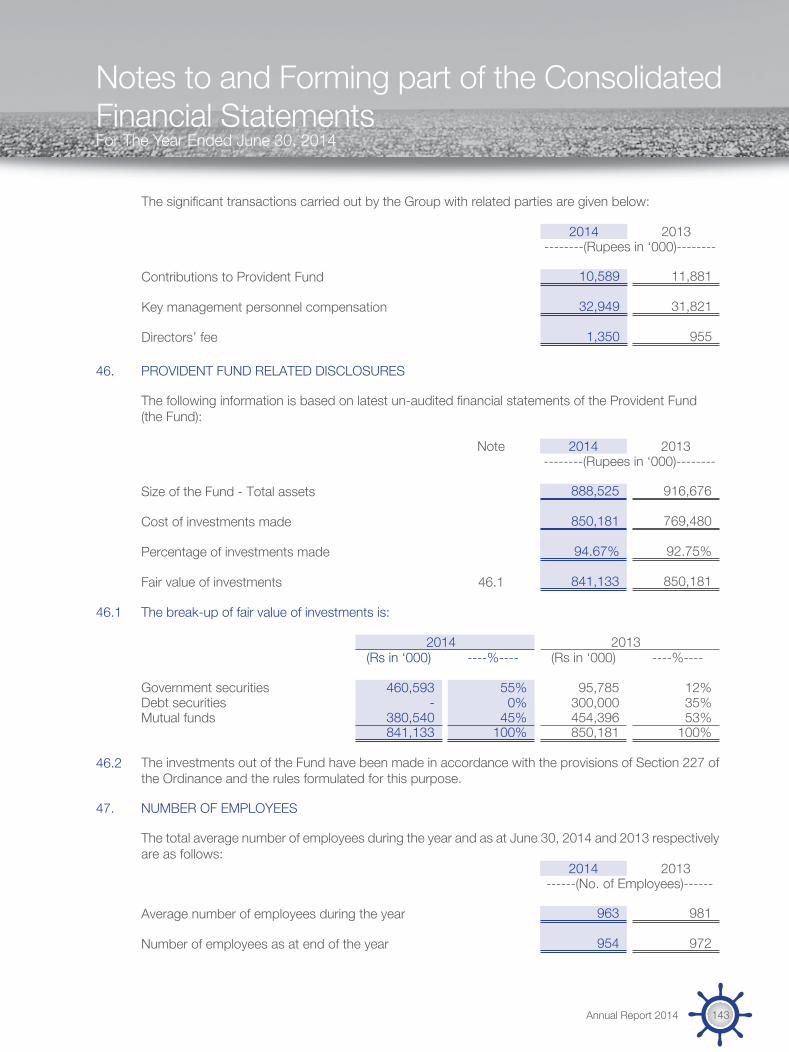
Notes to and Forming part of the Consolidated Financial StatementsFor The Year Ended June 30, 2014
The significant transactions carried out by the Group with related parties are given below:
2014 2013--------(Rupees in ‘000)--------
Contributions to Provident Fund 10,589 11,881
Key management personnel compensation 32,949 31,821
Directors’ fee 1,350 955
46. PROVIDENT FUND RELATED DISCLOSURES
The following information is based on latest un-audited financial statements of the Provident Fund (the Fund):
Note 2014 2013--------(Rupees in ‘000)--------
Size of the Fund - Total assets 888,525 916,676
Cost of investments made 850,181 769,480
Percentage of investments made 94.67% 92.75%
Fair value of investments 46.1 841,133 850,181
46.1 The break-up of fair value of investments is:
2014 2013(Rs in ‘000) ----%---- (Rs in ‘000) ----%----
Government securities 460,593 55% 95,785 12%Debt securities - 0% 300,000 35%Mutual funds 380,540 45% 454,396 53%
841,133 100% 850,181 100%
46.2 The investments out of the Fund have been made in accordance with the provisions of Section 227 of the Ordinance and the rules formulated for this purpose.
47. NUMBER OF EMPLOYEES
The total average number of employees during the year and as at June 30, 2014 and 2013 respectively are as follows:
2014 2013------(No. of Employees)------
Average number of employees during the year 963 981
Number of employees as at end of the year 954 972
Annual Report 2014 143

Muhammad Siddique MemonChairman & Chief Executive
Akbar AdilDirector
Notes to and Forming part of the Consolidated Financial StatementsFor The Year Ended June 30, 2014
48. NON-ADJUSTING EVENTS AFTER THE BALANCE SHEET DATE
48.1 The Board of Directors at the meeting held on September 16, 2014 have proposed for the year ended June 30, 2014, cash dividend of Rs 1.5 per share (2013: Re 1 per share) amounting to Rs 198.095 million (2013: Rs 132.063 million) subject to the approval of the members at the annual general meeting to be held on October 30, 2014. The consolidated financial statements for the year ended June 30, 2014 do not include the effect of this appropriation which will be accounted for subsequent to the year end.
49. GENERAL
Figures have been rounded off to the nearest thousand of rupees unless otherwise stated.
50. DATE OF AUTHORISATION
These consolidated financial statements were authorised for issue on September 16, 2014 by the Board of Directors of the Holding Company.
Pakistan National Shipping Corporation144

Annual Report 2014 145


Report and Accounts of
Pakistan National Shipping Corporation(Holding Company)
for the year ended June 30, 2014

We have audited the annexed balance sheet of Pakistan National Shipping Corporation (the Corporation) as at June 30, 2014 and the related profit and loss account, statement of changes in equity and cash flow statement together with the notes forming part thereof, for the year then ended and we state that we have obtained all the information and explanations which, to the best of our knowledge and belief, were necessary for the purposes of our audit.
It is the responsibility of the Corporation’s management to establish and maintain a system of internal control, and prepare and present the above said statements in conformity with the approved accounting standards as applicable in Pakistan and the requirements of the Companies Ordinance, 1984. Our responsibility is to express an opinion on these statements based on our audit.
We conducted our audit in accordance with the auditing standards as applicable in Pakistan. These standards require that we plan and perform the audit to obtain reasonable assurance about whether the above said statements are free of any material misstatement. An audit includes examining, on a test basis, evidence supporting the amounts and disclosures in the above said statements. An audit also includes assessing the accounting policies and significant estimates made by management, as well as, evaluating the overall presentation of the above said statements. We believe that our audit provides a reasonable basis for our opinion and, after due verification, we report that-
(a) in our opinion, proper books of account have been kept by the Corporation as required by the Companies Ordinance, 1984;
(b) in our opinion-
(i) the balance sheet and profit and loss account together with the notes thereon have been drawn up in conformity with the Companies Ordinance, 1984, and are in agreement with the books of account and are further in accordance with accounting policies consistently applied;
(ii) the expenditure incurred during the year was for the purpose of the Corporation’s business; and
(iii) the business conducted, investments made and the expenditure incurred during the year were in accordance with the objects of the Corporation;
Auditors’ Report to the Members
A. F. FERGUSON & CO.CHARTERED ACCOUNTANTSa member firm of the PwC networkSTATE LIFE BUILDING 1-CI. I. CHUNDRIGAR ROADKARACHI
ERNST & YOUNG FORD RHODES SIDAT HYDER CHARTERED ACCOUNTANTSa member firm of Ernst & Young Global LimitedPROGRESSIVE PLAZABEAUMONT ROADKARACHI
Pakistan National Shipping Corporation148
A. F. FERGUSON & CO.CHARTERED ACCOUNTANTSa member firm of the PwC networkSTATE LIFE BUILDING 1-CI. I. CHUNDRIGAR ROADKARACHI
ERNST & YOUNG FORD RHODES SIDAT HYDER CHARTERED ACCOUNTANTSa member firm of Ernst & Young Global LimitedPROGRESSIVE PLAZABEAUMONT ROADKARACHI
A. F. FERGUSON & CO.Chartered AccountantsKarachi: September 16, 2014Audit Engagement Partner : Khurshid Hasan
ERNST & YOUNG FORD RHODES SIDAT HYDERChartered AccountantsKarachi: September 16, 2014Audit Engagement Partner : Khurram Jameel
(c) in our opinion and to the best of our information and according to the explanations given to us, the balance sheet, profit and loss account, statement of changes in equity and cash flow statement together with the notes forming part thereof conform with approved accounting standards as applicable in Pakistan, and, give the information required by the Companies Ordinance, 1984, in the manner so required and respectively give a true and fair view of the state of the Corporation’s affairs as at June 30, 2014 and of the profit, its changes in equity and cash flows for the year then ended; and
(d) in our opinion zakat deductible at source under the Zakat and Ushr Ordinance, 1980 (XVIII of 1980) was deducted by the Corporation and deposited in the Central Zakat Fund established under section 7 of that Ordinance.
Annual Report 2014 149

Balance Sheet As at June 30, 2014
Note 2014 2013-----------(Rupees in ‘000)-----------
ASSETSNON-CURRENT ASSETSProperty, plant and equipment 4 1,642,894 1,535,411 Intangible asset 5 - - Investment properties 6 1,080,596 1,080,596 Long-term investments in:- Related parties (subsidiaries and an associate) 7 25,189,063 25,189,063 - Listed companies and another entity 8 53,669 38,211
25,242,732 25,227,274
Long-term loans and advances 58 58 Deferred taxation 9 90,777 80,552
28,057,057 27,923,891 CURRENT ASSETS
Stores and spares 10 11,402 100,381 Trade debts 11 1,987,993 771,219 Agents’ and owners’ balances 12 124,824 8,991 Loans and advances 13 58,564 67,544 Trade deposits and short-term prepayments 14 45,604 37,126 Interest / mark-up accrued on bank deposits and investments 34,539 19,836 Other receivables 15 239,755 35,450 Incomplete voyages 16 5,992 50,242 Taxation-net 737,000 252,591 Short-term investments 17 2,294,880 1,995,450 Cash and bank balances 18 1,842,531 1,778,997
7,383,084 5,117,827 TOTAL ASSETS 35,440,141 33,041,718
EQUITY AND LIABILITIES
SHARE CAPITAL AND RESERVES
Share capitalAuthorised (200,000,000 Ordinary shares of Rs 10 each) 2,000,000 2,000,000
Issued, subscribed and fully paid-up capital 19 1,320,634 1,320,634 Reserves 20 6,314,151 5,633,268
7,634,785 6,953,902
Surplus on revaluation of property, plant and equipment - net of tax 21 768,248 776,064
NON-CURRENT LIABILITIES
Long-term financing 22 4,568,861 5,873,286 Deferred liabilities 23 617,483 566,574
5,186,344 6,439,860 CURRENT LIABILITIES
Trade and other payables 24 20,423,394 17,441,585 Provision against damage claims 25 31,973 22,338 Current portion of long-term financing 22 1,316,882 1,316,882 Accrued markup on long-term financing 78,515 91,087
21,850,764 18,871,892 TOTAL EQUITY AND LIABILITIES 35,440,141 33,041,718
CONTINGENCIES AND COMMITMENTS 26
The annexed notes 1 to 50 form an integral part of these financial statements.
Muhammad Siddique MemonChairman & Chief Executive
Akbar AdilDirector
Pakistan National Shipping Corporation150

Profit and Loss Account For the year ended June 30, 2014
Note 2014 2013---------(Rupees in ‘000)----------
REVENUEChartering revenue 27 8,296,535 5,577,493 Service fees - net 28 290,625 262,051 Rental income 140,525 123,348
8,727,685 5,962,892 EXPENDITUREFleet expenses - direct 29 (6,591,784) (3,703,500) - indirect 30 (23,359) (28,777)Vessel management expenses 31 (368,501) (429,990)Real estate expenses 32 (67,541) (65,935)
(7,051,185) (4,228,202)GROSS PROFIT 1,676,500 1,734,690
Administrative and general expenses 33 (390,493) (278,430)Other expenses 34 (296,226) (201,157)Other income 35 576,611 530,695
(110,108) 51,108 OPERATING PROFIT 1,566,392 1,785,798
Finance costs 36 (546,681) (711,933)
PROFIT BEFORE TAXATION 1,019,711 1,073,865
Taxation 37 (216,435) (414,308)
PROFIT FOR THE YEAR 803,276 659,557
OTHER COMPREHENSIVE INCOME FOR THE YEAR
Items that will not be reclassified to profit and loss accountRemeasurement of post-retirement benefits obligation 1,307 (87,643)Tax on remeasurement of post-retirement benefits obligation 914 13,333
2,221 (74,310)
TOTAL COMPREHENSIVE INCOME FOR THE YEAR 805,497 585,247
--------------(Rupees)--------------
EARNINGS PER SHARE - basic and dilutive 38 6.08 4.99
Note: The appropriations from profits are set out in the statement of changes in equity.
The annexed notes 1 to 50 form an integral part of these financial statements.
Muhammad Siddique MemonChairman & Chief Executive
Akbar AdilDirector
Annual Report 2014 151

Statement of Changes in Equity For the year ended June 30, 2014
Issued, subscribed
and fully paid-up share capital
Capital reserve
Revenue reserves
TotalUnappro-priated profit
Remeasure-ment of post-
retirement benefits
obligation - net of tax
-------------------------------(Rupees in ‘000)------------------------------------
Balance as at July 1, 2012 1,320,634 126,843 5,134,668 (154,433) 6,427,712
Final cash dividend for the year ended June 30, 2012 @ Re 0.5 per ordinary share - - (66,032) - (66,032)
Profit for the year - - 659,557 - 659,557
Other comprehensive loss for the year - - - (74,310) (74,310)
Total comprehensive income for the year - - 659,557 (74,310) 585,247
Surplus on revaluation of property, plant and equipment realised during the year on account of incremental depreciation charged
- - 6,975 - 6,975
Balance as at June 30, 2013 1,320,634 126,843 5,735,168 (228,743) 6,953,902
Final cash dividend for the year ended June 30, 2013 @ Re 1 per ordinary share - - (132,063) - (132,063)
Profit for the year - - 803,276 - 803,276
Other comprehensive income for the year - - - 2,221 2,221
Total comprehensive income for the year - - 803,276 2,221 805,497
Surplus on revaluation of property, plant and equipment realised during the year on account of incremental depreciation chargedthereon - net of tax (note 21) - - 7,449 - 7,449
Balance as at June 30, 2014 1,320,634 126,843 6,413,830 (226,522) 7,634,785
The annexed notes 1 to 50 form an integral part of these financial statements.
Muhammad Siddique MemonChairman & Chief Executive
Akbar AdilDirector
Pakistan National Shipping Corporation152

Cash Flow Statement For the year ended June 30, 2014
Muhammad Siddique MemonChairman & Chief Executive
Akbar AdilDirector
Note 2014 2013---------(Rupees in ‘000)---------
Cash flows from operating activities
Cash generated from operations 39 3,100,569 3,024,271 Employees’ gratuity paid (7,474) (204,160)Employees’ compensated absences paid (60,241) (71,852)Post-retirement medical benefits paid (25,938) (25,342)Long-term loans and advances - 14 Finance costs paid (791,624) (974,015)Receipts under cross currency interest rate swap 208,955 102,104 Damage claims paid - (452)Taxes paid (710,522) (351,468)Net cash generated from operating activities 1,713,725 1,499,100
Cash flows from investing activities
Purchase of property, plant and equipment (154,596) (57,104)Proceeds from disposal of property, plant and equipment - 1,690 Long-term investments - related parties - (1,336,115)Short term investments made during the year (1,497,440) - Interest / mark-up received 256,398 240,420 Dividends received 821 1,233 Net cash used in investing activities (1,394,817) (1,149,876)
Cash flows from financing activities
Long-term financing (repaid) / obtained - net (1,323,158) 224,397 Dividends paid (130,226) (64,676)Net cash (used in) / generated from financing activities (1,453,384) 159,721
Net (decrease) / increase in cash and cash equivalents (1,134,476) 508,945
Cash and cash equivalents at beginning of year 3,774,447 3,265,502
Cash and cash equivalents at end of year 40 2,639,971 3,774,447
The annexed notes 1 to 50 form an integral part of these financial statements.
Annual Report 2014 153
Notes to and Forming Part of the Financial Statements For The Year Ended June 30, 2014
1. GENERAL INFORMATION
1.1 Pakistan National Shipping Corporation (the Corporation) was established under the provisions of the Pakistan National Shipping Corporation Ordinance, 1979 and is principally engaged in the business of shipping, including charter of vessels, transportation of cargo and other related services and providing commercial, technical, administrative, financial and other services to third parties in relation to the business of shipping. The Corporation is also engaged in renting out its properties to tenants under lease arrangements. The Corporation is listed on the Karachi and Lahore Stock Exchanges. The Corporation’s registered office is situated at PNSC Building, Moulvi Tamizuddin Khan Road, Karachi.
1.2 The Corporation had applied for delisting from the Lahore Stock Exchange (LSE) in the year 2002. However, at present the matter of delisting from LSE is pending subject to a final decision by the Honourable Supreme Court of Pakistan.
2. SIGNIFICANT ACCOUNTING INFORMATION AND POLICIES
The principal accounting policies applied in the preparation of these financial statements are set out below. These policies have been consistently applied to all the years presented, unless otherwise stated.
2.1 Basis of preparation
These financial statements are the separate financial statements of the Corporation and have been prepared in accordance with approved accounting standards as applicable in Pakistan. Approved accounting standards comprise of such International Financial Reporting Standards (IFRSs) issued by the International Accounting Standards Board as are notified under the Companies Ordinance, 1984 (the Ordinance), provisions of and directives issued under the Ordinance. In case requirements differ, the provisions or directives of the Ordinance shall prevail. These financial statements have been prepared under the historical cost convention unless otherwise specifically stated.
The preparation of financial statements in conformity with approved accounting standards requires the use of certain critical accounting estimates. It also requires management to exercise its judgment in the process of applying the Corporation’s accounting policies. The areas involving a higher degree of judgment or complexity, or areas where assumptions and estimates are significant to the financial statements are disclosed in note 3 of these financial statements.
2.2 New standards, amendments to published approved accounting standards and interpretations
2.2.1 New amendments to approved accounting standards and interpretations which became effective during the year ended June 30, 2014
There were certain new amendments to the approved accounting standards and new interpretations issued by the International Financial Reporting Interpretations Committee (IFRIC) which became effective during the year but are considered not to be relevant or have any significant effect on the Corporation’s operations and are, therefore, not disclosed in these financial statements.
2.2.2 New standard, amendments to approved accounting standards and new interpretations that are not yet effective and have not been early adopted by the Corporation:
There are certain amendments to the approved accounting standards and new interpretation issued by IFRIC which will be effective after July 1, 2014 but are considered not to be relevant or are expected to have any significant effect on the Corporation’s operations and are, therefore, not disclosed in these financial statements.
Pakistan National Shipping Corporation154

Notes to and Forming Part of the Financial Statements For The Year Ended June 30, 2014
2.3 Property, plant and equipment
These are initially recognised at cost and subsequently carried at cost less accumulated depreciation and impairment losses, if any, except for leasehold land, buildings on leasehold land, beach huts and workshop machinery and equipment which are carried at revalued amounts less accumulated depreciation and any subsequent impairment losses, if any. The revaluation of related assets is carried out with sufficient regularity to ensure that the carrying amounts do not differ materially from those which would have been determined using fair values at the balance sheet date.
The value assigned to leasehold land is not depreciated as the leases are expected to be renewed for further periods on payment of relevant rentals. Annual lease rentals are charged to profit and loss account and premium paid at the time of renewal, if any, is amortised over the remaining period of the lease.
Depreciation is charged to income applying the straight line method whereby the depreciable amount of an asset is depreciated over its estimated useful life.
No depreciation is charged if the asset’s residual value exceeds its carrying amount.
Full month’s depreciation is charged in the month of acquisition and no depreciation is charged in the month of disposal. An item of property, plant and equipment is derecognised upon disposal or when no future economic benefits are expected from its use.
Residual values, useful lives and methods of depreciation are reviewed at each balance sheet date and adjusted if expectations differ significantly from previous estimates.
A revaluation deficit is recognised in profit and loss account, except that a deficit directly offsetting a previous surplus on any asset, in which case the deficit is recognised in surplus on revaluation of property, plant and equipment account. Surplus on revaluation can not be distributed to shareholders until it is transferred to retained earnings. An annual transfer from the surplus on revaluation of property, plant and equipment account to retained earnings is made for the difference between depreciation based on the revalued carrying amount of the assets and the depreciation based on the assets’ original cost. Additionally, accumulated depreciation as at the revaluation date is eliminated against the gross carrying amount of the assets and the net amount is restated to the revalued amount of the assets. Upon disposal, any revaluation reserve relating to the particular assets being sold is transferred to retained earnings.
Major spare parts and stand-by equipment qualify for recognition as property, plant and equipment when the Corporation expects to use them during more than one year.
Maintenance and normal repairs are charged to profit and loss account as and when incurred. Major renewals, replacements and improvements are capitalised and assets so replaced, if any, are retired.
2.4 Capital work-in-progress
These are stated at cost less accumulated impairment losses, if any. All expenditure connected with specific assets incurred during installation and construction period are carried under this head. These are transferred to specific assets as and when these assets are available for use.
2.5 Intangible assets
Intangible assets are initially recognised at cost and are subsequently carried at cost less accumulated amortisation and impairment losses, if any.
Annual Report 2014 155

Amortisation is charged to profit and loss account by applying straight-line method whereby the cost less residual value, if not insignificant, of an asset is written off over its estimated useful life to the Corporation. Full month’s amortisation is charged in the month of acquisition and no amortisation is charged in the month of disposal.
2.6 Investment properties
Properties held for long-term rental yields which are significantly rented out by the Corporation are classified as investment properties.
Investment properties are carried at fair value which is based on active market prices, adjusted, if necessary, for any difference in the nature, location or condition of the specific asset. The valuation of these properties is carried out with sufficient regularity.
Gains and losses arising from a change in the fair value of investment properties are included in profit and loss account.
2.7 Investments in subsidiaries and associate
Investments in subsidiaries and associate are stated at cost less provision for impairment, if any.
2.8 Impairment of non-financial assets
The Corporation assesses at each balance sheet date whether there is any indication that the assets may be impaired. If such indications exist, the carrying amounts of such assets are reviewed to assess whether they are recorded in excess of their recoverable amounts. Where carrying values exceed the respective recoverable amount, assets are written down to their recoverable amounts and the resulting impairment charge is recognised in income except for impairment loss on revalued assets, which is recognised directly against revaluation surplus of any other asset to the extent that the impairment loss does not exceed the amount held in the revaluation surplus.
2.9 Financial instruments
2.9.1 Financial assets
The Corporation classifies its financial assets in the following categories:
a) Financial assets at fair value through profit or loss
Financial assets at fair value through profit or loss are financial assets held for trading and financial assets designated upon initial recognition as at fair value through profit or loss.
b) Loans and receivables
Loans and receivables are non-derivative financial assets with fixed or determinable payments that are not quoted in an active market.
c) Available-for-sale financial assets
Available-for-sale financial assets are non-derivatives that are either designated in this category or not classified in any of the other categories.
Notes to and Forming Part of the Financial Statements For The Year Ended June 30, 2014
Pakistan National Shipping Corporation156
All financial assets are recognised at the time when the Corporation becomes a party to the contractual provisions of the instrument. Regular purchases and sales of investments are recognised at trade-date i.e. the date on which the Corporation commits to purchase or sell the asset.
Financial assets are initially recognised at fair value plus transaction costs for all financial assets not carried at fair value through profit or loss. Financial assets carried at fair value through profit and loss are initially recognised at fair value and transactions costs are expensed in the profit and loss account.
Available-for-sale financial assets and financial assets at fair value through profit or loss are subsequently carried at fair value. Loans and receivables are carried at amortised cost using effective interest rate method.
Financial assets are derecognised when the rights to receive cash flows from the assets have expired or have been transferred and the Corporation has transferred substantially all the risks and rewards of ownership.
2.9.2 Impairment
The Corporation assesses at each balance sheet date whether there is objective evidence that a financial asset or group of financial assets is impaired.
2.9.3 Financial liabilities
All financial liabilities are recognised at the time when the Corporation becomes a party to the contractual provisions of the instrument.
A financial liability is derecognised when the obligation under the liability is discharged or cancelled or expired.
2.9.4 Derivative financial instruments
The Corporation uses derivative financial instruments such as interest rate and cross currency swaps to manage its risks associated with interest and exchange rate fluctuations. Such derivative financial instruments are initially recognised at fair value on the date on which a derivative contract is entered into and are subsequently re-measured at fair value. Derivatives with positive market values (unrealised gains) are included in ‘other receivable’ and derivatives with negative market values (unrealised losses) are included in ‘trade and other payables’ in the balance sheet. Any gains or losses arising from changes in fair value of derivatives are recognised directly to the profit and loss account.
2.9.5 Off-setting of financial assets and financial liabilities
A financial asset and a financial liability is offset and the net amount is reported in the financial statements if the Corporation has a legally enforceable right to set-off the transaction and also intends either to settle on a net basis or to realise the asset and settle the liability simultaneously.
2.10 Stores and spares
Stores are valued at weighted average cost while spares are valued at cost determined on first-in first-out basis. Stores and spares in transit are valued at cost incurred upto the balance sheet date.
Certain spares having low value and high consumption levels are charged to profit and loss account at the time of purchase.
The Corporation reviews the carrying amount of stores and spares on a regular basis and provision is made for obsolescence if there is any change in the usage pattern and physical form.
Notes to and Forming Part of the Financial Statements For The Year Ended June 30, 2014
Annual Report 2014 157
2.11 Trade debts and other receivables
Trade and other debts are recognised at the fair value of consideration to be received against goods and services and are carried at amortised cost. Provision is made in respect of doubtful debts, if any. Debts, considered irrecoverable, are written off, as and when identified.
2.12 Taxation
2.12.1 Current
Provision for current taxation is based on taxable income for the year at the current rates of taxation after taking into account tax credits and tax rebates available, if any, and tax paid on final tax basis or minimum tax on turnover, whichever is higher.
2.12.2 Deferred
Deferred tax is accounted for, using the liability method, on temporary differences arising between the tax base of assets and liabilities and their carrying amounts in the financial statements. However, deferred tax asset is recognised to the extent it is probable that future taxable profits will be available against which the temporary differences can be utilised.
2.13 Insurance claims
Hull claims and other claimable expenses relating to hull are charged to income currently and claims filed there-against are taken to income when such claims are accepted by the underwriters.
Afloat medical expenses, cargo claims and other relevant amounts recoverable from underwriters are recognised to insurance claims receivable.
2.14 Trade and other payables
Liabilities for trade and other amounts payable are carried at cost which is the fair value of the consideration to be paid in future for goods and services whether billed or not.
2.15 Provisions
Provisions are recognised when the Corporation has a present legal or constructive obligation as a result of past events, it is probable that an outflow of resources embodying economic benefits will be required to settle the obligation and a reliable estimate of the obligation can be made. Provisions are reviewed at each balance sheet date and adjusted to reflect the current best estimate.
2.16 Dividend and appropriations
Dividends declared and transfers between reserves made subsequent to the balance sheet date are considered as non-adjusting events and are recognised in the financial statements in the period in which such dividends are declared / transfers are made.
2.17 Staff retirement benefits
2.17.1 The Corporation operates an approved provident fund scheme for all its permanent employees. Equal monthly contributions are made, both by the Corporation and its employees, to the fund at the rate of 10 percent of the basic salaries of employees.
Notes to and Forming Part of the Financial Statements For The Year Ended June 30, 2014
Pakistan National Shipping Corporation158

2.17.2 Defined benefit gratuity scheme
The Corporation operates a funded retirement gratuity scheme for its permanent employees other than those who joined the Corporation on or after October 16, 1984. Further, the Corporation operates an unfunded retirement gratuity scheme for contractual employees. Provisions are made in the financial statements to cover obligations on the basis of actuarial valuation carried out annually under the projected unit credit method. The remeasurement of defined benefit contribution is recognised directly to equity through other comprehensive income.
The benefit is payable on completion of prescribed qualifying period of service under these schemes.
Actuarial valuation is carried out annually and the latest valuation was carried out as at June 30, 2014 using the projected unit credit method.
2.17.3 Post-retirement medical benefits
The Corporation provides lump sum medical allowance to its retired permanent employees in accordance with the service regulations.
During the year ended June 30, 2014, the Corporation has introduced the policy of post-retirement medical benefits for its shore based contractual employees with effect from October 29, 2013.
Provisions are made in the financial statements to cover obligations on the basis of actuarial valuation carried out annually using the projected unit credit method. The remeasurement of post-retirement benefit obligation is recognised directly to equity through other comprehensive income.
The benefit is payable on completion of prescribed qualifying period of service under these schemes.
Actuarial valuation is carried out annually and the latest valuation was carried out as at June 30, 2014 using the projected unit credit method.
2.18 Employees’ compensated absences
The Corporation accounts for the liability in respect of employees’ compensated absences in the year in which these are earned. Annual provisions to cover the obligations under the scheme are based on actuarial estimates and are charged to profit and loss account currently. The remeasurement of defined benefit obligation arising at each valuation date is recognised immediately.
Actuarial valuation is carried out annually and the latest valuation was carried out as at June 30, 2014 using the projected unit credit method.
2.19 Cash and cash equivalents
Cash and cash equivalents include cash in hand, cheques in hand, deposits held with banks and other short-term highly liquid investments with maturities of three months or less.
2.20 Foreign currency translation
These financial statements are presented in Pakistani Rupee, which is the Corporation’s functional and presentation currency.
Notes to and Forming Part of the Financial Statements For The Year Ended June 30, 2014
Annual Report 2014 159

Transactions in foreign currencies are recorded in Pakistani Rupee at the exchange rates approximating those prevailing on the date of transaction. Monetary assets and liabilities in foreign currencies are reported in Pakistani Rupee at the exchange rates approximating those prevalent at the balance sheet date. Gains and losses on translation are recognised to profit and loss account.
2.21 Revenue recognition
- Earnings in respect of voyages other than time charter voyages are accounted for on the basis of completed voyages. Voyages are taken as complete when a vessel arrives at the last port of discharge on or before the balance sheet date. Freight revenue, direct and indirect operating expenses associated with the incomplete voyages are deferred until completion of voyage and are classified in the balance sheet as ‘Incomplete voyages’. With respect to time charter voyages, chartering revenue is accounted for on the basis of number of days to the balance sheet date.
- Fee for technical, commercial, administrative and financial services are recognised as revenue when the services are rendered.
- Rental income is recognised as revenue on a straight line basis over the term of the respective lease arrangements.
- Dividend income is recognised when the Corporation’s right to receive the dividend is established.
- Profit from bank accounts and return on investments is recognised on a time proportion basis.
2.22 Benazir Employees’ Stock Option Scheme
On August 14, 2009, the Government of Pakistan (GoP) launched Benazir Employees’ Stock Option Scheme (the Scheme) for employees of certain State Owned Enterprises (SOEs) and non-State Owned Enterprises where GoP holds significant investments (non-SOEs). The scheme is applicable to permanent and contractual employees who were in employment of these entities on the date of launch of the Scheme, subject to completion of five years vesting period by all contractual employees and by permanent employees in certain instances.
The Scheme provides for a cash payment to employees on retirement or termination based on the price of shares of respective entities. To administer this scheme, GoP shall transfer 12% of its investment in such SOEs and non-SOEs to a trust fund to be created for the purpose of such entities. The eligible employees would be allotted units by each Trust Fund in proportion to their respective length of service and on retirement or termination of such employees would be entitled to receive such amounts from Trust Funds in exchange for the surrendered units as would be determined based on market price of listed entities or breakup value of non-listed entities. The shares related to the surrendered units would be transferred back to GoP.
The Scheme also provides that 50% of dividend related to shares transferred to the respective Trust Fund would be distributed amongst the unit-holder employees. The balance 50% dividend would be transferred by the respective Trust Fund to the Central Revolving Fund managed by the Privatisation Commission of Pakistan for payment to employees against surrendered units. The deficits, if any, in Trust Funds to meet the re-purchase commitment would be met by GoP.
Notes to and Forming Part of the Financial Statements For The Year Ended June 30, 2014
Pakistan National Shipping Corporation160

The Scheme, developed in compliance with the stated GoP policy of the empowerment of employees of State Owned Enterprises need to be accounted for by the covered entities, including the Corporation, under the provisions of amended International Financial Reporting Standard-2 ‘Share Based Payments’ (IFRS 2). However, keeping in view the difficulties that may be faced by the entities covered under the Scheme, the Securities & Exchange Commission of Pakistan on receiving the representation from some of the entities covered under the Scheme and after having consulted the Institute of Chartered Accountants of Pakistan, has granted exemption vide SRO 587(I)/2011 dated June 7, 2011 to such entities from application of IFRS 2 to the Scheme.
Had the exemption not been granted, the impact based on the independent actuarial valuations conducted as on June 30, 2014, for the years ended June 30, 2014 and 2013 would have been as follows:
Year ended June 30, 2014
Year ended June 30, 2013
---------------(Rupees in ‘000)---------------
Staff costs of the Corporation for the year would have been higher by 73,784 99,001
Profit for the year would have been lower by 73,784 99,001
--------------------(Rupees)--------------------
Earnings per share would have been lower by 0.56 0.75
Year endedJune 30, 2014
Year endedJune 30, 2013
---------------(Rupees in ‘000)---------------
Retained earnings would have been lower by 631,142 557,358
Reserves would have been higher by 631,142 557,358
3. CRITICAL ACCOUNTING ESTIMATES, JUDGEMENTS AND ASSUMPTIONS
The preparation of the Corporation’s financial statements requires management to make judgments, estimates and assumptions that affect the reported amounts of revenues, expenses, assets and liabilities, and the disclosure of contingent liabilities, at the end of the reporting period. However, uncertainty about these assumptions and estimates could result in outcomes that require a material adjustment to the carrying amount of the asset or liability affected in future periods.
In the process of applying the accounting policies, management has made the following estimates and judgements which are significant to the financial statements.
(a) Valuation of certain property, plant and equipment and investment properties;
(b) Determination of the residual values and useful lives of property, plant and equipment;
(c) Recognition of taxation and deferred taxation;
Notes to and Forming Part of the Financial Statements For The Year Ended June 30, 2014
Annual Report 2014 161
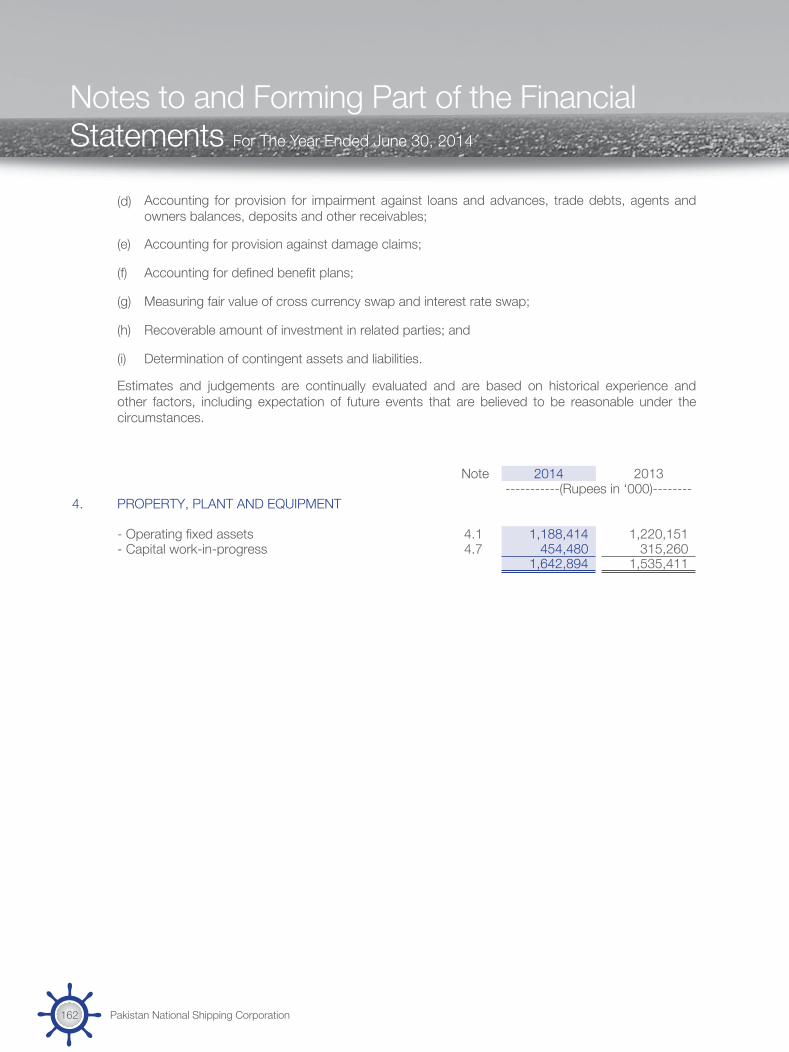
(d) Accounting for provision for impairment against loans and advances, trade debts, agents and owners balances, deposits and other receivables;
(e) Accounting for provision against damage claims;
(f) Accounting for defined benefit plans;
(g) Measuring fair value of cross currency swap and interest rate swap;
(h) Recoverable amount of investment in related parties; and
(i) Determination of contingent assets and liabilities.
Estimates and judgements are continually evaluated and are based on historical experience and other factors, including expectation of future events that are believed to be reasonable under the circumstances.
Note 2014 2013-----------(Rupees in ‘000)--------
4. PROPERTY, PLANT AND EQUIPMENT
- Operating fixed assets 4.1 1,188,414 1,220,151 - Capital work-in-progress 4.7 454,480 315,260
1,642,894 1,535,411
Notes to and Forming Part of the Financial Statements For The Year Ended June 30, 2014
Pakistan National Shipping Corporation162

4.1 The following is a statement of operating fixed assets:
Leasehold land(notes 4.2 & 4.3)
Buildings on
leasehold land (notes 4.2 & 4.3)
Vessel(note 4.4) Vehicles
Office equipment
Furniture and fittings
Motorlaunch and
jetty
Equipment on board
Container fittings
Beach huts (notes 4.2
& 4.3)
Workshop machinery
and equipment (note 4.3)
Computer equipment
Total
------------------------------------------------------------(Rupees in ‘000)----------------------------------------------------------------As at June 30, 2012
Cost or revalued amount 649,060 549,049 1,440 67,777 48,925 31,709 18 1,736 3,468 14,988 14,886 33,811 1,416,867
Less: Accumulated depreciation - 48,509 1,440 61,470 16,642 13,338 18 787 3,468 - 9,957 21,695 177,324
Net book value 649,060 500,540 - 6,307 32,283 18,371 - 949 - 14,988 4,929 12,116 1,239,543
Year ended June 30, 2013
Opening net book value 649,060 500,540 - 6,307 32,283 18,371 - 949 - 14,988 4,929 12,116 1,239,543
Additions - 24,803 - - 1,477 69 - - - - 73 3,074 29,496
Disposals
Cost - - - - (1,065) (479) - - - - - - (1,544)Accumulated depreciation - - - - 1,012 230 - - - - - - 1,242
- - - - (53) (249) - - - - - - (302)
Depreciation charge for the year - (25,577) - (3,378) (6,851) (3,700) - (171) - (1,298) (458) (7,153) (48,586)
Closing net book value 649,060 499,766 - 2,929 26,856 14,491 - 778 - 13,690 4,544 8,037 1,220,151
As at June 30, 2013
Cost or revalued amount 649,060 573,852 1,440 67,777 49,337 31,299 18 1,736 3,468 14,988 14,959 36,885 1,444,819
Less: Accumulated depreciation - 74,086 1,440 64,848 22,481 16,808 18 958 3,468 1,298 10,415 28,848 224,668
Net book value 649,060 499,766 - 2,929 26,856 14,491 - 778 - 13,690 4,544 8,037 1,220,151
Year ended June 30, 2014
Opening net book value 649,060 499,766 - 2,929 26,856 14,491 - 778 - 13,690 4,544 8,037 1,220,151
Additions - 8,638 - - 1,026 136 - - - - 333 5,243 15,376
Write off
Cost - - - - - - (18) - (3,468) - - - (3,486)Accumulated depreciation - - - - - - 18 - 3,468 - - - 3,486
- - - - - - - - - - - - -
Depreciation charge for the year - (27,116) - (1,107) (6,609) (3,671) - (171) - (1,399) (472) (6,568) (47,113)
Closing net book value 649,060 481,288 - 1,822 21,273 10,956 - 607 - 12,291 4,405 6,712 1,188,414
As at June 30, 2014
Cost or revalued amount 649,060 582,490 1,440 67,777 50,363 31,435 - 1,736 - 14,988 15,292 42,128 1,456,709
Less: Accumulated depreciation - 101,202 1,440 65,955 29,090 20,479 - 1,129 - 2,697 - 10,887 35,416 268,295
Net book value 649,060 481,288 - 1,822 21,273 10,956 - 607 - 12,291 4,405 6,712 1,188,414
Annual rate of depreciation (%) 2014 3 to 20 4 20 15 10 to 15 10 to 15 10 to 15 15 10 5 to 10 33
Annual rate of depreciation (%) 2013 3 to 20 4 20 15 10 to 15 10 to 15 10 to 15 15 10 5 to 10 33
4.2 The revaluation of the ‘leasehold land’, ‘buildings on leasehold land’ and ‘beach huts’ was carried out as of June 30, 2012 by Pee Dee & Associates on the basis of their professional assessment of present market values. The revaluation resulted in a surplus of Rs 153.903 million on the written down values of Rs 1,010.686 million which were incorporated in the books of the Corporation as at June 30, 2012. Out of the total revaluation surplus arisen, Rs 804.140 million (2013: Rs 813.778 million) remains undepreciated at June 30, 2014.
Notes to and Forming Part of the Financial Statements For The Year Ended June 30, 2014
Annual Report 2014 163

Notes to and Forming Part of the Financial Statements For The Year Ended June 30, 2014
4.3 Had there been no revaluation, the carrying amount of revalued assets would have been as follows:
2014 2013---------(Rupees in ‘000)--------
Leasehold land, buildings on leasehold land and beach huts 285,874 313,933 Workshop machinery and equipment 4,290 4,487
290,164 318,420
4.4 Cost and accumulated depreciation of vessel amounting to Rs 1.440 million relates to M.V Ilyas Bux. This vessel was seized by the Indian authorities during the 1965 war and the Corporation does not have physical possession or control over the vessel.
4.5 No operating fixed assets with a net book value exceeding Rs 50,000 were disposed off during the year.
4.6 The depreciation charge for the year has been allocated as follows:
Note 2014 2013----------(Rupees in ‘000)-------
Fleet expenses - indirect 30 474 458 Vessel management expenses 31 22,341 25,315 Real estate expenses 32 21,816 20,282 Administrative and general expenses 33 2,482 2,531
47,113 48,586
4.7 Capital work-in-progress - buildings on leasehold land
Balance at beginning of the year 315,260 287,652 Additions during the year 144,777 52,411 Transferred to operating fixed assets during the year (5,557) (24,803)Balance at end of the year 454,480 315,260
5. INTANGIBLE ASSET
5.1 This represents cost of Rs. 16.503 million of software “Ship Management Expert System” (SES). SES was being amortised over the useful life of five years and was fully amortised during the year ended June 30, 2009, however, it is still in active use.
6. INVESTMENT PROPERTIES Note Leasehold
landBuildings on
leasehold land Total-----------------(Rupees in ‘000)-----------------
Balance as at June 30, 2014 1,043,560 37,036 1,080,596
Balance as at June 30, 2013 6.1 1,043,560 37,036 1,080,596
6.1 The revaluation of the Corporation’s investment properties was carried out by Pee Dee & Associates as of June 30, 2012 on the basis of their professional assessment of present market value. As a result, a revaluation gain of Rs 91.060 million was determined in respect of leasehold land whereas a revaluation loss was determined on buildings on leasehold land amounting to Rs 8.092 million.
Pakistan National Shipping Corporation164
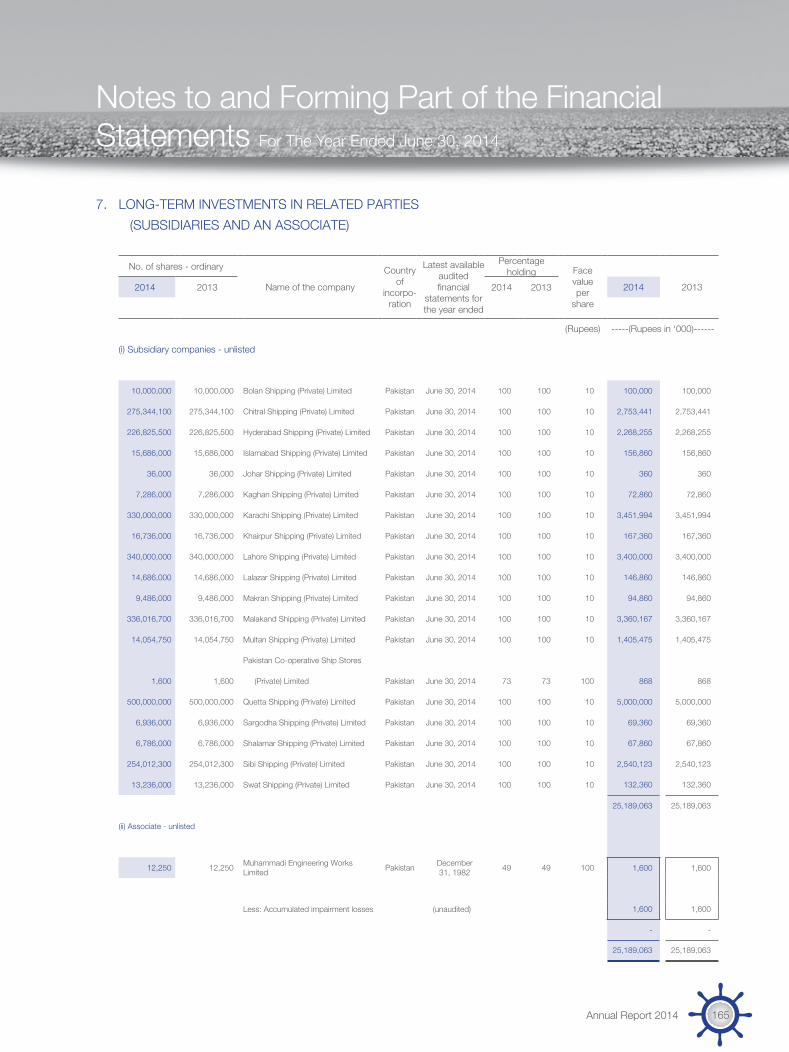
Notes to and Forming Part of the Financial Statements For The Year Ended June 30, 2014
7. LONG-TERM INVESTMENTS IN RELATED PARTIES(SUBSIDIARIES AND AN ASSOCIATE)
No. of shares - ordinary
Name of the company
Country of
incorpo-ration
Latest available audited financial
statements for the year ended
Percentage holding Face
value per
share
20132014 2013 2014 2013 2014
(Rupees) -----(Rupees in ‘000)------
(i) Subsidiary companies - unlisted
10,000,000 10,000,000 Bolan Shipping (Private) Limited Pakistan June 30, 2014 100 100 10 100,000 100,000
275,344,100 275,344,100 Chitral Shipping (Private) Limited Pakistan June 30, 2014 100 100 10 2,753,441 2,753,441
226,825,500 226,825,500 Hyderabad Shipping (Private) Limited Pakistan June 30, 2014 100 100 10 2,268,255 2,268,255
15,686,000 15,686,000 Islamabad Shipping (Private) Limited Pakistan June 30, 2014 100 100 10 156,860 156,860
36,000 36,000 Johar Shipping (Private) Limited Pakistan June 30, 2014 100 100 10 360 360
7,286,000 7,286,000 Kaghan Shipping (Private) Limited Pakistan June 30, 2014 100 100 10 72,860 72,860
330,000,000 330,000,000 Karachi Shipping (Private) Limited Pakistan June 30, 2014 100 100 10 3,451,994 3,451,994
16,736,000 16,736,000 Khairpur Shipping (Private) Limited Pakistan June 30, 2014 100 100 10 167,360 167,360
340,000,000 340,000,000 Lahore Shipping (Private) Limited Pakistan June 30, 2014 100 100 10 3,400,000 3,400,000
14,686,000 14,686,000 Lalazar Shipping (Private) Limited Pakistan June 30, 2014 100 100 10 146,860 146,860
9,486,000 9,486,000 Makran Shipping (Private) Limited Pakistan June 30, 2014 100 100 10 94,860 94,860
336,016,700 336,016,700 Malakand Shipping (Private) Limited Pakistan June 30, 2014 100 100 10 3,360,167 3,360,167
14,054,750 14,054,750 Multan Shipping (Private) Limited Pakistan June 30, 2014 100 100 10 1,405,475 1,405,475
Pakistan Co-operative Ship Stores
1,600 1,600 (Private) Limited Pakistan June 30, 2014 73 73 100 868 868
500,000,000 500,000,000 Quetta Shipping (Private) Limited Pakistan June 30, 2014 100 100 10 5,000,000 5,000,000
6,936,000 6,936,000 Sargodha Shipping (Private) Limited Pakistan June 30, 2014 100 100 10 69,360 69,360
6,786,000 6,786,000 Shalamar Shipping (Private) Limited Pakistan June 30, 2014 100 100 10 67,860 67,860
254,012,300 254,012,300 Sibi Shipping (Private) Limited Pakistan June 30, 2014 100 100 10 2,540,123 2,540,123
13,236,000 13,236,000 Swat Shipping (Private) Limited Pakistan June 30, 2014 100 100 10 132,360 132,360
25,189,063 25,189,063
(ii) Associate - unlisted
12,250 12,250 Muhammadi Engineering Works Limited Pakistan December
31, 1982 49 49 100 1,600 1,600
Less: Accumulated impairment losses (unaudited) 1,600 1,600
- -
25,189,063 25,189,063
Annual Report 2014 165

Notes to and Forming Part of the Financial Statements For The Year Ended June 30, 2014
8. LONG-TERM INVESTMENTS IN LISTED COMPANIES AND ANOTHER ENTITY
Note 2014 2013Financial assets designated as ‘at fair value through ---------(Rupees in ‘000)-------- profit or loss’
Listed companies
Siemens (Pakistan) Engineering Limited.6,930 (2013: 6,930) fully paid ordinary shares of Rs 10each. Market value per share as at June 30, 2014Rs 1,257 (2013: Rs 651.20). 8.1 8,711 4,513
Pakistan State Oil Company Limited.115,358 (2013: 104,871) fully paid ordinary shares of Rs 10 each. Market value per share as at June 30, 2014Rs 388.86 (2013: Rs 320.38). 8.2 44,858 33,598
53,569 38,111
Available-for-sale financial asset
Other entity - carried at cost
Pakistan Tourism Development Corporation Limited.10,000 (2013: 10,000) fully paid ordinary shares of Rs 10 each. 100 100
53,669 38,211
8.1 The Corporation holds 0.00084% (2013: 0.00084%)of the investee’s share capital.
Opening balance 4,513 5,177 Change in fair value 4,198 (664)
8,711 4,513
8.2 The Corporation holds 0.04246% (2013: 0.04246%) of the investee’s share capital.
Opening balance 33,598 17,176 Change in fair value 11,260 16,422
44,858 33,598
9. DEFERRED TAXATION
Deductible temporary differences arising in respect ofshort-term provisions and deferred liabilities 136,660 129,710
Taxable temporary differences arising in respect of:- surplus on revaluation of property, plant and equipment 21 35,892 37,714 - accelerated depreciation 9,991 11,444
45,883 49,158 90,777 80,552
Pakistan National Shipping Corporation166

Notes to and Forming Part of the Financial Statements For The Year Ended June 30, 2014
9.1 The management is confident that sufficient future taxable profits will be available against which deferred tax asset will be adjusted.
Note 2014 2013---------(Rupees in ‘000)--------
10. STORES AND SPARES
Stores- at depot 9,495 11,351 - at buildings 845 1,093
10,340 12,444 Spares- at buildings 1,062 1,749
Bunker on board - 86,188 11,402 100,381
11. TRADE DEBTS - unsecured
Considered good 11.1 1,987,993 771,219 Considered doubtful 17,280 18,265
2,005,273 789,484 Less: Provision for impairment 11.2 17,280 18,265
1,987,993 771,219
11.1 The ageing analysis of these trade debts that are past due but not impaired is as follows:
Note 2014 2013--------(Rupees in ‘000)---------
Upto 1 month 787,061 581,226 1 to 6 months 744,299 128,412 More than 6 months 456,633 61,581
1,987,993 771,219
11.2 Provision for impairment
Balance at the beginning of the year 18,265 17,625 Provision made during the year 33 - 3,165 Provision reversed during the year 35 (881) (2,525)Provision written off during the year (104) - Balance at the end of the year 17,280 18,265
As at June 30, 2014, trade debts of Rs 17.280 million (2013: Rs 18.265 million) were impaired and provided for. These balances have been outstanding for more than three years.
Note 2014 2013--------(Rupees in ‘000)---------
12. AGENTS’ AND OWNERS’ BALANCES - unsecured
Considered good 12.1 124,824 8,991 Considered doubtful 4,453 4,453
129,277 13,444 Less: Provision for impairment 4,453 4,453
124,824 8,991
Annual Report 2014 167
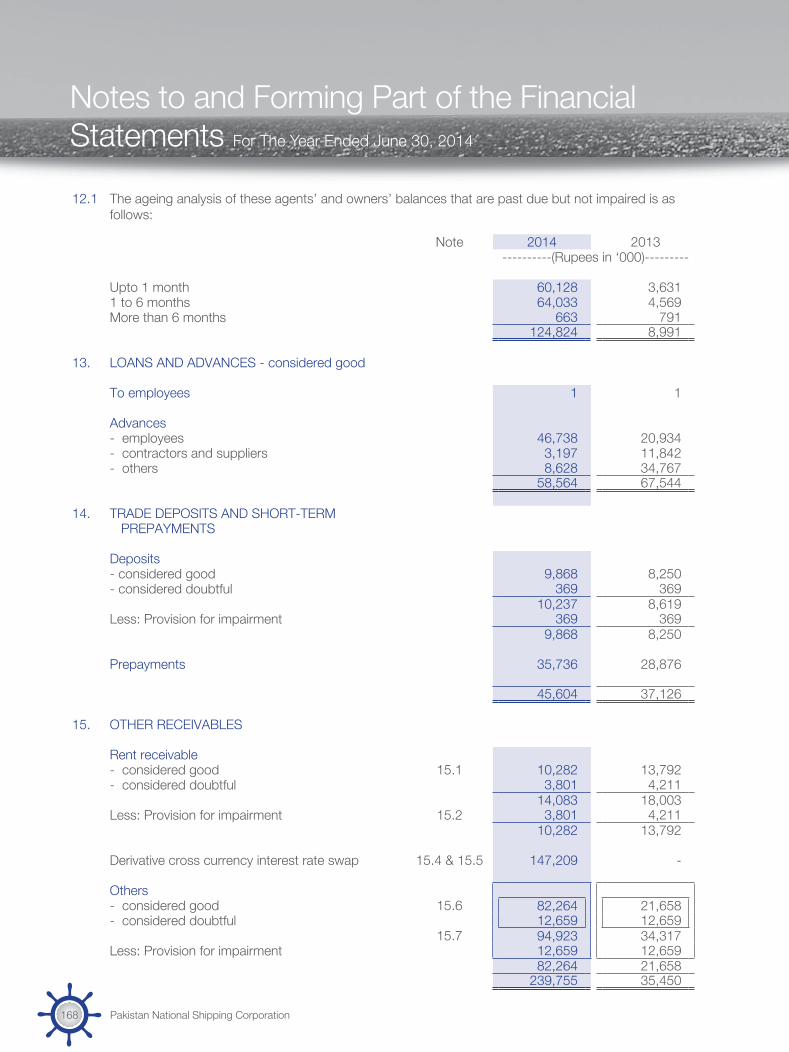
Notes to and Forming Part of the Financial Statements For The Year Ended June 30, 2014
12.1 The ageing analysis of these agents’ and owners’ balances that are past due but not impaired is as follows:
Note 2014 2013 ----------(Rupees in ‘000)---------
Upto 1 month 60,128 3,631 1 to 6 months 64,033 4,569 More than 6 months 663 791
124,824 8,991
13. LOANS AND ADVANCES - considered good
To employees 1 1
Advances- employees 46,738 20,934 - contractors and suppliers 3,197 11,842 - others 8,628 34,767
58,564 67,544
14. TRADE DEPOSITS AND SHORT-TERM PREPAYMENTS
Deposits- considered good 9,868 8,250 - considered doubtful 369 369
10,237 8,619 Less: Provision for impairment 369 369
9,868 8,250
Prepayments 35,736 28,876
45,604 37,126
15. OTHER RECEIVABLES
Rent receivable- considered good 15.1 10,282 13,792 - considered doubtful 3,801 4,211
14,083 18,003 Less: Provision for impairment 15.2 3,801 4,211
10,282 13,792
Derivative cross currency interest rate swap 15.4 & 15.5 147,209 -
Others- considered good 15.6 82,264 21,658 - considered doubtful 12,659 12,659
15.7 94,923 34,317 Less: Provision for impairment 12,659 12,659
82,264 21,658 239,755 35,450
Pakistan National Shipping Corporation168

Notes to and Forming Part of the Financial Statements For The Year Ended June 30, 2014
15.1 The ageing analysis of rent receivables that are past due but not impaired is as follows:
Note 2014 2013 --------(Rupees in ‘000)--------
Upto 1 month 837 2,385 1 to 6 months 1,952 5,643 More than 6 months 7,493 5,764
10,282 13,792
15.2 Provision for impairment
Balance at the beginning of the year 4,211 4,600 Provision written off during the year (410) (218)Provision reversed during the year 35 - (171)Balance at the end of the year 15.3 3,801 4,211
15.3 As at June 30, 2014, rent receivables of Rs 3.801 million (2013: Rs 4.211 million) were impaired and provided for. These receivables have been outstanding for more than three years.
15.4 The Corporation has entered into a cross currency interest rate swap of Rs 9,995.300 million in respect of its borrowing (note 22). Under the terms of the cross currency swap arrangement, the Corporation is required to pay LIBOR plus 3.75% to the arranging bank on the borrowing denominated in USD (USD notional) for the purpose of cross currency swap, and receive KIBOR plus 2.20% from the arranging bank. Further, the Corporation shall pay / receive any exchange loss / gain on the USD notional outstanding at each quarter end. Furthermore, the Corporation had also entered into an interest rate swap. Under the terms of the interest rate swap, the Corporation receives a fixed interest of 13% per annum, whereas the Corporation has to pay 3 months KIBOR for each quarter. The net fair value of cross currency interest and interest rate swap as determined by the bank were Rs 86.851 million (favourable) (2013: Rs 140.098 million (unfavourable)) and Rs 14.015 million (favourable) (2013: Rs 30.667 million (favourable)) respectively to the Corporation as of the balance sheet date which has been increased by the net interest receivable and exchange loss aggregating Rs 46.343 million (2013: Rs 4.194 million) as at June 30, 2014.
15.5 On September 26, 2013, the Corporation has early terminated one of its cross currency swap contract having a notional amount aggregating Rs 1,244.880 million. The early termination resulted in a payment by the Corporation to the arranging bank aggregating Rs 87.624 million comprising of net effects of interest received aggregating Rs 7.982 million, exchange loss and swap spread paid amounting to Rs 60.565 million and Rs 35.041 million respectively.
15.6 As at June 30, 2014, this includes an amount of Rs 82.264 million (2013: Rs 21.658 million) are past due but not impaired. These receivables have been outstanding for less than one year.
2014 2013--------(Rupees in ‘000)--------
15.7 This includes the following:
Receivable from sundry debtors 67,054 13,457 Sales tax refund claims 26,017 14,396 Insurance claims receivable 29 - Others 1,823 6,464
94,923 34,317
Annual Report 2014 169
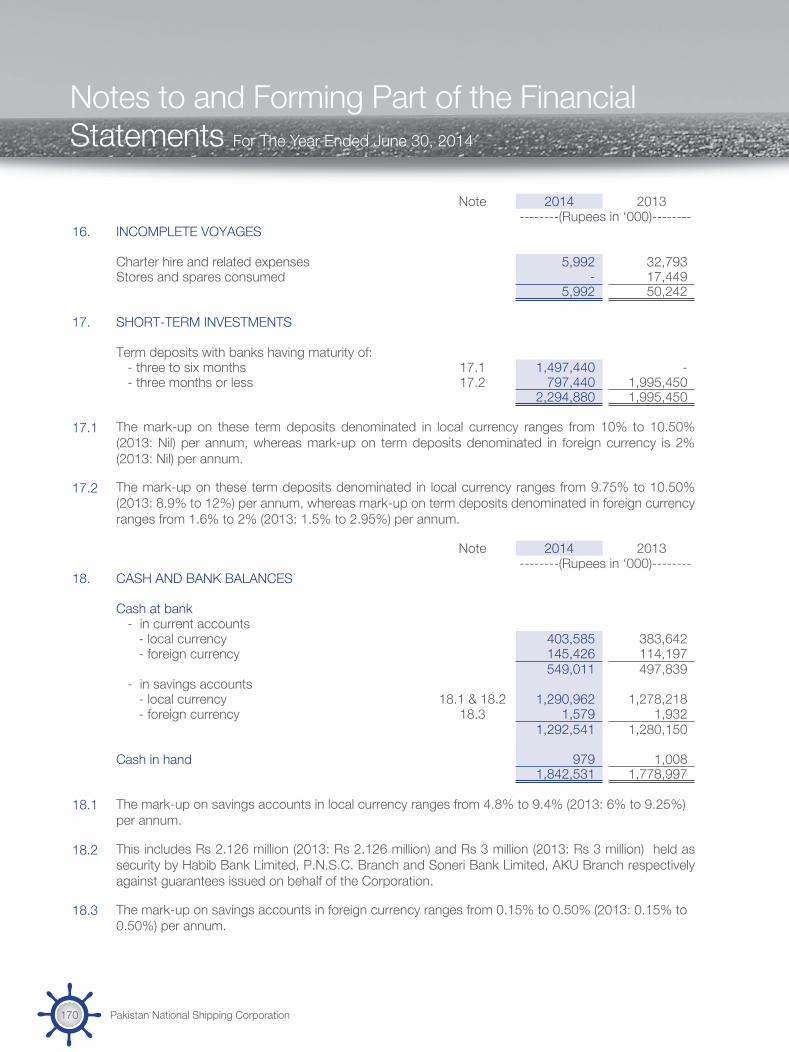
Notes to and Forming Part of the Financial Statements For The Year Ended June 30, 2014
Note 2014 2013--------(Rupees in ‘000)--------
16. INCOMPLETE VOYAGES
Charter hire and related expenses 5,992 32,793 Stores and spares consumed - 17,449
5,992 50,242
17. SHORT-TERM INVESTMENTS
Term deposits with banks having maturity of:- three to six months 17.1 1,497,440 - - three months or less 17.2 797,440 1,995,450
2,294,880 1,995,450
17.1 The mark-up on these term deposits denominated in local currency ranges from 10% to 10.50% (2013: Nil) per annum, whereas mark-up on term deposits denominated in foreign currency is 2% (2013: Nil) per annum.
17.2 The mark-up on these term deposits denominated in local currency ranges from 9.75% to 10.50% (2013: 8.9% to 12%) per annum, whereas mark-up on term deposits denominated in foreign currency ranges from 1.6% to 2% (2013: 1.5% to 2.95%) per annum.
Note 2014 2013--------(Rupees in ‘000)--------
18. CASH AND BANK BALANCES
Cash at bank- in current accounts
- local currency 403,585 383,642 - foreign currency 145,426 114,197
549,011 497,839 - in savings accounts
- local currency 18.1 & 18.2 1,290,962 1,278,218 - foreign currency 18.3 1,579 1,932
1,292,541 1,280,150
Cash in hand 979 1,008 1,842,531 1,778,997
18.1 The mark-up on savings accounts in local currency ranges from 4.8% to 9.4% (2013: 6% to 9.25%) per annum.
18.2 This includes Rs 2.126 million (2013: Rs 2.126 million) and Rs 3 million (2013: Rs 3 million) held as security by Habib Bank Limited, P.N.S.C. Branch and Soneri Bank Limited, AKU Branch respectively against guarantees issued on behalf of the Corporation.
18.3 The mark-up on savings accounts in foreign currency ranges from 0.15% to 0.50% (2013: 0.15% to 0.50%) per annum.
Pakistan National Shipping Corporation170
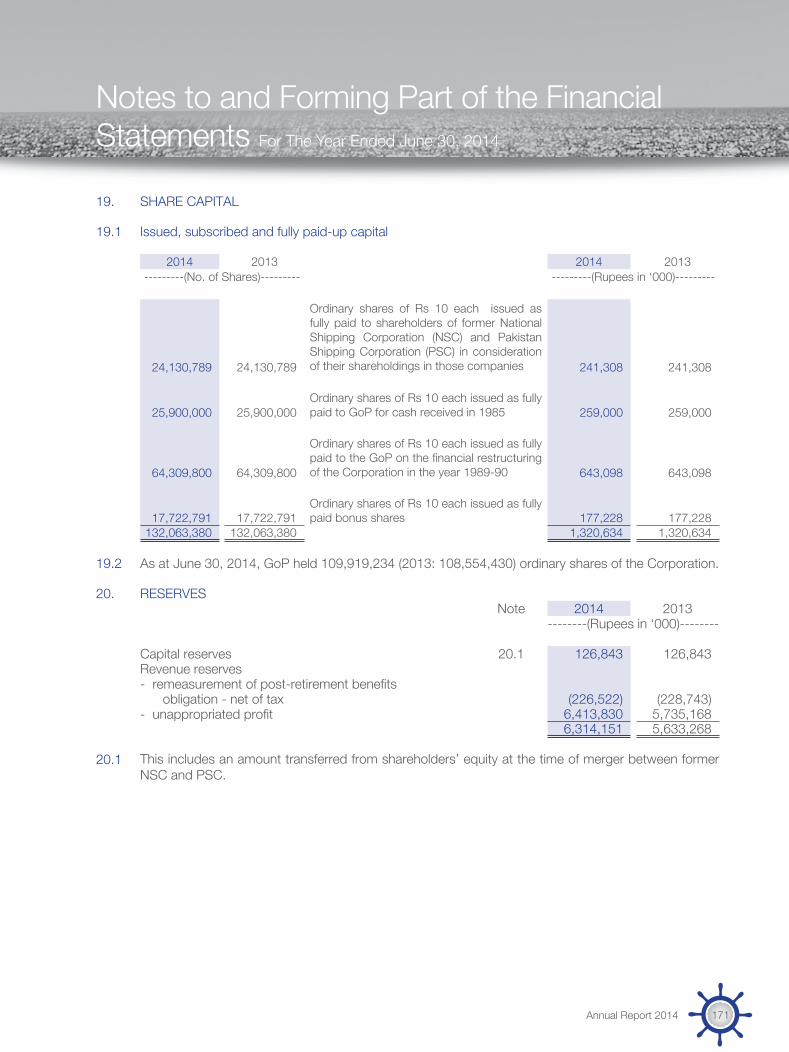
Notes to and Forming Part of the Financial Statements For The Year Ended June 30, 2014
19. SHARE CAPITAL
19.1 Issued, subscribed and fully paid-up capital
2014 2013 2014 2013---------(No. of Shares)--------- ---------(Rupees in ‘000)---------
Ordinary shares of Rs 10 each issued as fully paid to shareholders of former National Shipping Corporation (NSC) and Pakistan Shipping Corporation (PSC) in consideration of their shareholdings in those companies 24,130,789 24,130,789 241,308 241,308
Ordinary shares of Rs 10 each issued as fully paid to GoP for cash received in 1985 25,900,000 25,900,000 259,000 259,000
Ordinary shares of Rs 10 each issued as fully paid to the GoP on the financial restructuring of the Corporation in the year 1989-90 64,309,800 64,309,800 643,098 643,098
Ordinary shares of Rs 10 each issued as fully paid bonus shares 17,722,791 17,722,791 177,228 177,228
132,063,380 132,063,380 1,320,634 1,320,634
19.2 As at June 30, 2014, GoP held 109,919,234 (2013: 108,554,430) ordinary shares of the Corporation.
20. RESERVES Note 2014 2013
--------(Rupees in ‘000)--------
Capital reserves 20.1 126,843 126,843 Revenue reserves- remeasurement of post-retirement benefits
obligation - net of tax (226,522) (228,743)- unappropriated profit 6,413,830 5,735,168
6,314,151 5,633,268
20.1 This includes an amount transferred from shareholders’ equity at the time of merger between former NSC and PSC.
Annual Report 2014 171

Notes to and Forming Part of the Financial Statements For The Year Ended June 30, 2014
21. SURPLUS ON REVALUATION OF PROPERTY, PLANT AND EQUIPMENT - NET OF TAX
Note 2014 2013--------(Rupees in ‘000)--------
Balance at the beginning of the year 813,778 822,951
Less: Transferred to unappropriated profit: - Surplus relating to incremental depreciation charged during the current year on related assets - net of tax 7,449 6,975 - Related deferred tax liability 2,189 2,198
9,638 9,173 804,140 813,778
Less: Related deferred tax liability on: - Revaluation at the beginning of the year 37,714 45,666 - Incremental depreciation charged during the current year on related assets transferred to profit and loss account (2,189) (2,198)- Effect of change in statutory tax rate for next year 1,109 (1,305) - Effect of allocation of revenue between presumptive tax regime and normal tax regime (742) (4,449)
9 35,892 37,714 Balance at the end of the year 768,248 776,064
22. LONG-TERM FINANCING
Financing under syndicate term finance agreement 22.1 5,142,882 6,282,672 Less: Current portion 1,150,674 1,150,674
3,992,208 5,131,998
Financing under term finance certificates agreement 22.1 742,861 907,496 Less: Current portion 166,208 166,208
576,653 741,288 4,568,861 5,873,286
22.1 During the year ended June 30, 2011, the Corporation obtained a financing facility of Rs 10,300 million. The financing was obtained in the form of a syndicated term finance loan of Rs 9,000 million, with the remaining amount of Rs 1,300 million in the form of Term Finance Certificates (TFCs), having a face value of Rs 5,000 each by way of private placement.
The financing carries mark-up of KIBOR+2.20%. The loan along with the mark-up is repayable on a quarterly basis with the last repayment date on November 23, 2018. The facility is secured by a first mortgage charge over certain vessels owned by its subsidiary companies, all present and future receivables of the Corporation from three major customers and its investment properties.
As at June 30, 2014, the Corporation has drawn Rs 8,733.757 million (2013: Rs 8,733.757 million) and Rs 1,261.543 million (2013: Rs 1,261.543 million) from syndicated term finance and TFCs respectively. The Corporation has also paid loan arrangement fee amounting to Rs 106.662 million, out of which Rs Nil (2013: Rs 103.507 million) was included in the amortised cost of the long term financing whereas the remaining amount of Rs 3.155 million has been expensed out upon completion of the drawdowns and expiry of the facility on September 7, 2012.
Pakistan National Shipping Corporation172

Notes to and Forming Part of the Financial Statements For The Year Ended June 30, 2014
Note 2014 2013--------(Rupees in ‘000)--------
23. DEFERRED LIABILITIES
Employees’ gratuity- funded 23.1.3 86,899 72,652 - unfunded 23.1.3 100,995 67,166
187,894 139,818
Post-retirement medical benefits 23.1.3 194,581 200,957 Employees’ compensated absences 23.2.3 235,008 225,799
617,483 566,574
23.1 Retirement benefit schemes
23.1.1 The disclosures made in notes 23.1.2 to 23.1.13 are based on the information included in the actuarial valuation report as of June 30, 2014.
23.1.2 As stated in notes 2.17.2 and 2.17.3 of these financial statements, the Corporation operates a funded retirement gratuity scheme for those permanent employees who joined the Corporation before October 16, 1984, an unfunded retirement gratuity scheme for contractual employees and an unfunded post-retirement medical benefit scheme for permanent and contractual employees. Liability is maintained against these schemes based on the actuarial recommendations. The following significant assumptions were used for the actuarial valuation of the defined benefit obligation schemes:
2014 2013Employees’ Post Employees’ Post
gratuity retirement gratuity retirement(funded and medical (funded and medicalunfunded) benefits unfunded) benefits
Discount rate 13.25% 13.25% 11.00% 11.00%
Future salary increases - for permanentemployees
For the year 2013-14 N/A N/A 2.00% N/AFor the year 2014-15 40.00% N/A 40.00% N/AFor the year 2015-16 2.00% N/A 2.00% N/AFor the year 2016-17 40.00% N/A 40.00% N/AFor the year 2017-18 2.00% N/A 2.00% N/AFor the year 2018-19 40.00% N/A 40.00% N/AFor the year 2019-20 2.00% N/A 9.00% N/AFor the year 2020-21 and onwards 13.25% N/A 9.00% N/A
Future salary increases - for contractualemployees
For the year 2013-14 N/A N/A 15.00% N/AFor the year 2014-15 till 2017-18 15.00% N/A 15.00% N/AFor the year 2018-19 15.00% N/A 9.00% N/AFor the year 2019-20 and onwards 13.25% N/A 9.00% N/AMedical escalation rate N/A 13.25% N/A 11.00%Death rate based on SLIC (2001-05) Ultimate mortality tables.
Annual Report 2014 173

Notes to and Forming Part of the Financial Statements For The Year Ended June 30, 2014
2014 2013Employees’ Post- Employees’ Post-
gratuity retirement gratuity retirementFunded Unfunded medical Funded Unfunded medical
benefits benefits -----------------------------------(Rupees in ‘000)----------------------------------
23.1.3 Balance sheet reconciliation
Present value of defined benefit obligation 397,045 100,995 194,581 435,454 67,166 200,957 Fair value of plan assets (310,146) - - (362,802) - - Net liability in the balance sheet 86,899 100,995 194,581 72,652 67,166 200,957
23.1.4 Movement in present value of defined benefitobligation
Balance at the beginning of the year 435,454 67,166 200,957 438,334 51,122 131,833 Current service cost 11,991 11,416 7,232 11,156 8,791 5,195 Interest cost 44,414 6,890 21,032 53,094 7,097 22,730 Benefits paid (83,717) (7,474) (25,938) (82,770) (4,160) (25,342)Recognised prior service cost - - 10,273 - - 13,575 Remeasurement of obligation (11,097) 22,997 (18,975) 15,640 4,316 52,966 Balance at the end of the year 397,045 100,995 194,581 435,454 67,166 200,957
23.1.5 Movement in fair value of plan assets
Balance at the beginning of the year 362,802 - - 235,451 - - Expected return on plan assets 36,829 - - 24,842 - - Contribution - - - 200,000 - - Benefits paid (83,717) - - (82,770) - - Remeasurement: Difference between actual
return and expected return on assets (5,768) - - (14,721) - - Balance at the end of the year 310,146 - - 362,802 - -
23.1.6 Movement in net liability in the balance sheetBalance at the beginning of the year 72,652 67,166 200,957 202,883 51,122 131,833 Expense recognised for the year 19,576 18,306 38,537 39,408 15,888 41,500 Contributions made by the Corporation /
payments - (7,474) (25,938) (200,000) (4,160) (25,342)Net actuarial (gains) / losses for the year (5,329) 22,997 (18,975) 30,361 4,316 52,966
86,899 100,995 194,581 72,652 67,166 200,957
23.1.7 The amounts recognised in the income statement
Current service cost 11,991 11,416 7,232 11,156 8,791 5,195 Net interest amount 7,585 6,890 21,032 28,252 7,097 22,730 Prior service cost - - 10,273 - - 13,575
19,576 18,306 38,537 39,408 15,888 41,500 Less: Charged to subsidiaries 310 768 255 1,947 1,358 1,334 Expense 19,266 17,538 38,282 37,461 14,530 40,166
23.1.8 Actual return on plan assets
Expected return on plan assets 36,829 - - 24,842 - - Actuarial loss on plan assets (5,768) - - (14,721) - - Actual return on plan assets 31,061 - - 10,121 - -
Rupees in ‘000 % Rupees in
‘000 %
23.1.9 Major categories / composition of plan assetsCash and cash equivalents 33,530 10.81% 61,164 16.86%Term deposit receipts of
private commercial banks (unquoted) 276,616 89.19% 301,638 83.14% 310,146 100% 362,802 100%
Pakistan National Shipping Corporation174
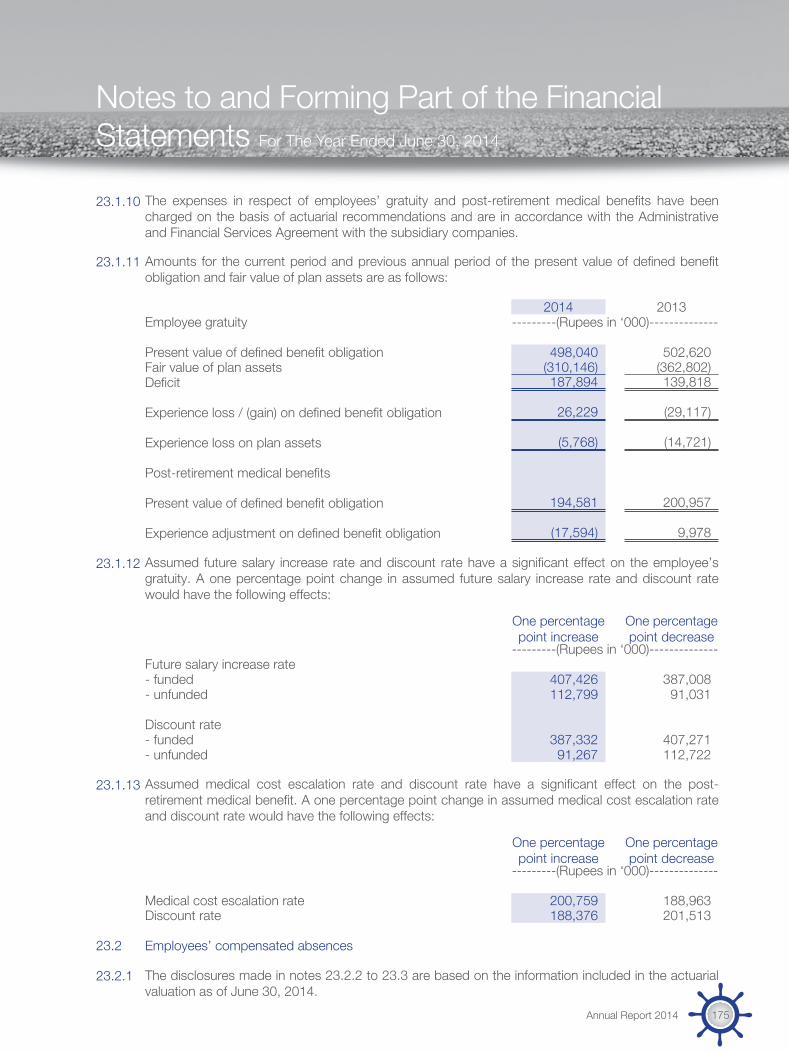
Notes to and Forming Part of the Financial Statements For The Year Ended June 30, 2014
23.1.10 The expenses in respect of employees’ gratuity and post-retirement medical benefits have been charged on the basis of actuarial recommendations and are in accordance with the Administrative and Financial Services Agreement with the subsidiary companies.
23.1.11 Amounts for the current period and previous annual period of the present value of defined benefit obligation and fair value of plan assets are as follows:
2014 2013Employee gratuity ---------(Rupees in ‘000)--------------
Present value of defined benefit obligation 498,040 502,620 Fair value of plan assets (310,146) (362,802)Deficit 187,894 139,818
Experience loss / (gain) on defined benefit obligation 26,229 (29,117)
Experience loss on plan assets (5,768) (14,721)
Post-retirement medical benefits
Present value of defined benefit obligation 194,581 200,957
Experience adjustment on defined benefit obligation (17,594) 9,978
23.1.12 Assumed future salary increase rate and discount rate have a significant effect on the employee’s gratuity. A one percentage point change in assumed future salary increase rate and discount rate would have the following effects:
One percentage point increase
One percentage point decrease
---------(Rupees in ‘000)--------------Future salary increase rate- funded 407,426 387,008 - unfunded 112,799 91,031
Discount rate- funded 387,332 407,271 - unfunded 91,267 112,722
23.1.13 Assumed medical cost escalation rate and discount rate have a significant effect on the post-retirement medical benefit. A one percentage point change in assumed medical cost escalation rate and discount rate would have the following effects:
One percentage point increase
One percentage point decrease
---------(Rupees in ‘000)--------------
Medical cost escalation rate 200,759 188,963 Discount rate 188,376 201,513
23.2 Employees’ compensated absences
23.2.1 The disclosures made in notes 23.2.2 to 23.3 are based on the information included in the actuarial valuation as of June 30, 2014.
Annual Report 2014 175

Notes to and Forming Part of the Financial Statements For The Year Ended June 30, 2014
23.2.2 As stated in note 2.18, the Corporation operates an employees’ compensated absences scheme. Provision is maintained against this scheme based on the actuarial recommendations. The following significant assumptions were used for the actuarial valuation of the scheme:
2014 2013
Discount rate 13.25% 11.00%Future salary increases - for permanent employeesFor the year 2013-14 N/A 2.00%For the year 2014-15 and 2016-17 40.00% 40.00%For the year 2015-16 and 2017-18 2.00% 2.00%For the year 2018-19 40.00% 40.00%For the year 2019-20 2.00% 9.00%For the year 2020-21 and onwards 13.25% 9.00%Future salary increases - for contractual employeesFor the year 2013-14 N/A 15.00%For the year 2014-15 till 2017-18 15.00% 15.00%For the year 2018-19 15.00% 9.00%For the year 2019-20 and onwards 13.25% 9.00%
2014 2013---------(Rupees in ‘000)--------
23.2.3 Balance sheet reconciliation
Present value of defined benefit obligation (recognised) 235,008 225,799
23.2.4 Movement in present value of defined benefit obligation
Balance at the beginning of the year 225,799 197,863 Current service cost 58,268 46,852 Interest cost 25,413 30,261 Remeasurement of obligation (14,231) 22,675 Benefits paid (60,241) (71,852)Balance at the end of the year 235,008 225,799
23.2.5 Expenses
Current service cost 58,268 46,852 Interest cost 25,413 30,261 Remeasurement of obligation (14,231) 22,675
69,450 99,788 Less: Charged to subsidiaries 291 2,288 Expense 69,159 97,500
23.2.6 Amounts for the current period and prior period of the present value of defined benefit obligation areas follows:
2014 2013-----------(Rupees in ‘000)------
Present value of defined benefit obligation 235,008 225,799
Experience gain on defined benefit obligation (18,957) (1,232)
Pakistan National Shipping Corporation176

Notes to and Forming Part of the Financial Statements For The Year Ended June 30, 2014
23.2.7 The expenses in respect of employees’ compensated absences have been charged on the basis of actuarial recommendations and are in accordance with the Administrative and Financial Services Agreement with the subsidiary companies.
23.3 Expected retirement benefits costs for the year ended June 30, 2015 are as follows:
(Rupees in ‘000)
Gratuity 55,131 Post-retirement medical benefits 31,388 Compensated absences 89,504
23.4 During the year, the Corporation contributed Rs 10.589 million (2013: Rs 11.876 million) to the provident fund.
Note 2014 201324. TRADE AND OTHER PAYABLES ---------(Rupees in ‘000)--------
Creditors 37,149 141,510 Current account balances with subsidiary companies 24.1 18,628,307 16,189,570 Agents’ and owners’ balances 804,063 434,047 Accrued liabilities 630,121 240,633 Deposits 24.2 42,212 38,133 Derivative financial instruments 15.4 & 15.5 - 105,237 Unclaimed dividends 29,916 28,079 Advances from customers 128,305 136,678 Other liabilities- amounts retained from contractors 23,695 22,918 - others 99,626 104,780
123,321 127,698 20,423,394 17,441,585
Annual Report 2014 177
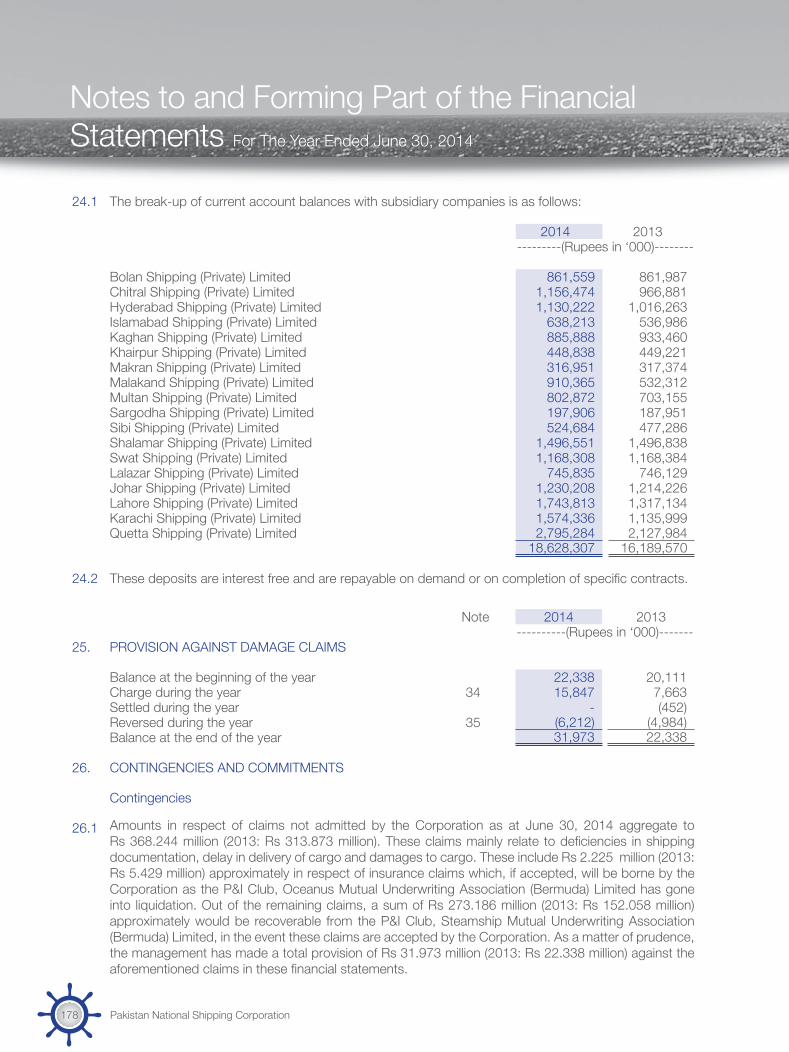
Notes to and Forming Part of the Financial Statements For The Year Ended June 30, 2014
Note 2014 2013----------(Rupees in ‘000)-------
25. PROVISION AGAINST DAMAGE CLAIMS
Balance at the beginning of the year 22,338 20,111 Charge during the year 34 15,847 7,663 Settled during the year - (452)Reversed during the year 35 (6,212) (4,984)Balance at the end of the year 31,973 22,338
26. CONTINGENCIES AND COMMITMENTS
Contingencies
26.1 Amounts in respect of claims not admitted by the Corporation as at June 30, 2014 aggregate to Rs 368.244 million (2013: Rs 313.873 million). These claims mainly relate to deficiencies in shipping documentation, delay in delivery of cargo and damages to cargo. These include Rs 2.225 million (2013: Rs 5.429 million) approximately in respect of insurance claims which, if accepted, will be borne by the Corporation as the P&I Club, Oceanus Mutual Underwriting Association (Bermuda) Limited has gone into liquidation. Out of the remaining claims, a sum of Rs 273.186 million (2013: Rs 152.058 million) approximately would be recoverable from the P&I Club, Steamship Mutual Underwriting Association (Bermuda) Limited, in the event these claims are accepted by the Corporation. As a matter of prudence, the management has made a total provision of Rs 31.973 million (2013: Rs 22.338 million) against the aforementioned claims in these financial statements.
24.1 The break-up of current account balances with subsidiary companies is as follows:
2014 2013---------(Rupees in ‘000)--------
Bolan Shipping (Private) Limited 861,559 861,987 Chitral Shipping (Private) Limited 1,156,474 966,881 Hyderabad Shipping (Private) Limited 1,130,222 1,016,263 Islamabad Shipping (Private) Limited 638,213 536,986 Kaghan Shipping (Private) Limited 885,888 933,460 Khairpur Shipping (Private) Limited 448,838 449,221 Makran Shipping (Private) Limited 316,951 317,374 Malakand Shipping (Private) Limited 910,365 532,312 Multan Shipping (Private) Limited 802,872 703,155 Sargodha Shipping (Private) Limited 197,906 187,951 Sibi Shipping (Private) Limited 524,684 477,286 Shalamar Shipping (Private) Limited 1,496,551 1,496,838 Swat Shipping (Private) Limited 1,168,308 1,168,384 Lalazar Shipping (Private) Limited 745,835 746,129 Johar Shipping (Private) Limited 1,230,208 1,214,226 Lahore Shipping (Private) Limited 1,743,813 1,317,134 Karachi Shipping (Private) Limited 1,574,336 1,135,999 Quetta Shipping (Private) Limited 2,795,284 2,127,984
18,628,307 16,189,570
24.2 These deposits are interest free and are repayable on demand or on completion of specific contracts.
Pakistan National Shipping Corporation178

Notes to and Forming Part of the Financial Statements For The Year Ended June 30, 2014
26.2 The Corporation has not accepted liability in respect of customs duty approximating Rs 2.500 million (2013: Rs 2.500 million) relating to the sale of the vessel M.V. Bhambore during the year ended June 30, 1978. The duty was claimed from the Corporation and the matter has been taken up with the appropriate Government agencies.
26.3 The former owners of East & West Steamship Company, Chittagong Steamship Corporation Limited and Trans Oceanic Steamship Company Limited had initiated litigation that involved the Government of Pakistan and the Corporation.
Following the Supreme Court’s adjudication of the East & West Steamship Company’s matter in favour of the former owners, the Government provisionally assessed additional compensation due to the former owners at approximately Rs 97.012 million (2013: Rs 97.012 million). Although a major portion of this amount has been settled by the Government, the Government holds the Corporation liable for this amount by virtue of the net assets of the East & West Steamship Company having become vested in the Corporation.
In case of Chittagong Steamship Corporation Limited and Trans Oceanic Steamship Company Limited, the litigations relating to compensation to the former owners and the legal suits are pending in the High Court of Sindh. The amounts claimed are approximately Rs 1.300 million (2013: Rs 1.300 million) and Rs 66.800 million (2013: Rs 66.800 million) respectively.
The Corporation disclaims any liability in respect of the above mentioned amounts and any accretions to it upto final determination and settlement of the matters.
26.4 Certain other claims have been filed against the Corporation in respect of employees’ matters for an aggregate amount of approximately Rs 108.817 million (2013: Rs 102.468 million). These cases are pending and the management is confident that the outcome of these cases will be in the Corporation’s favour and accordingly no provision for above claims has been made in these financial statements.
26.5 While framing the tax assessment for the income year ended June 30, 1990, the assessing officer had made an addition to income of Rs 3,974.455 million, being the remission of liabilities due to the Federal government under the scheme of financial restructuring of the Corporation. The resultant tax liability including additional taxes for late payment of tax amounted to Rs 1,293.694 million, part of which was paid by the Corporation and the remaining amount of Rs 1,233.694 million was directly discharged at source by the Federal Government. The assessing officer while framing the order of income year ended June 30, 1996 had treated the aforementioned payment of tax liability by the Government as the income of Corporation. The Income Tax Appellate Tribunal (ITAT) has given the decision in favour of the Corporation on the appeals filed against the above orders. However, the department has filed an appeal with the Honourable High Court against the aforementioned orders of ITAT. The Honourable High Court has decided the appeal against the Corporation. The leave to appeal filed by the Corporation has been accepted by the Honourable Supreme Court and the decision of the High Court has been suspended. Hearing of the appeal is pending in the Honourable Supreme Court.
Annual Report 2014 179

Notes to and Forming Part of the Financial Statements For The Year Ended June 30, 2014
26.6 During the year ended June 30, 2011, the Officer Inland Revenue (OIR) issued assessment orders under section 122 (5A) of the Income Tax Ordinance, 2001 (ITO, 2001) in respect of tax years 2008, 2009 and 2010. According to the orders, the OIR had made certain additions and determined additional tax demand of Rs 363.421 million. OIR has disallowed a portion of administrative expenses by attributing the same to the subsidiary companies and further disallowed a portion of contribution made to approved gratuity fund (only in respect of tax year 2008) on the contention that the same is attributable to the subsidiary companies. The Corporation has paid Rs 170 million under protest and filed an appeal with the Commissioner of Income Tax (Appeals). During the year, Commissioner of Income Tax (Appeals) in his order has upheld certain additions and has given decisions in favour of the Corporation on certain matters resulting in refund of Rs 90.579 million. The management has provided for all the matters that have been decided against the Corporation, with the exception of disallowance of allocation of common expenses to profit on debt for tax years 2008 and 2009 which may result in increase of tax liability by Rs 17.848 million. The Corporation has filed an appeal with the ITAT in respect of aforementioned disallowances. The management of the Corporation is confident that the matters in appeals shall be eventually decided in its favour.
26.7 During the year ended June 30, 2012, the OIR issued assessment orders under section 122 (5A) of the ITO, 2001 in respect of tax year 2011. According to the orders, the OIR has made certain additions and determined additional tax demand of Rs 251.092 million. OIR has disallowed a portion of administrative expenses by attributing the same to the subsidiary companies and further disallowed financial expenses incurred by the Corporation on the contention that the same is equity specific and hence being capital in nature. The Corporation had paid Rs 160.513 million (2013: Rs 160.513 million) and adjusted Rs 90.579 million against refunds relating to tax year 2008, 2009 and 2010 under protest. During the year, Commissioner of Income Tax (Appeals) in his order has upheld certain additions and has given decisions in favour of the Corporation on certain matters, and has worked out refund of Rs 15.068 million. The Corporation and the department have filed appeals with the ITAT in respect of aforementioned disallowances. The management of the Corporation is confident that the subject matter in respect of tax year 2011 will eventually be decided in favour of the Corporation.
26.8 During the year ended June 30, 2013, the OIR issued assessment orders under section 122 (5A) of the ITO, 2001 in respect of tax year 2012. According to the orders, the OIR has made certain additions and determined additional tax demand of Rs 107.499 million. OIR has disallowed a portion of administrative expenses by attributing the same to the subsidiary companies and further disallowed financial expenses incurred by the Corporation on the contention that the same is equity specific and hence being capital in nature. The Corporation has paid Rs 65 million under protest and has filed an appeal with the Commissioner of Income Tax (Appeals) and at present the matter is pending for hearing. The management of the Corporation is confident that the subject matters in respect of tax year 2012 will eventually be decided in favour of the Corporation.
26.9 During the year ended June 30, 2014, the OIR has issued assessment orders under section 122 (5A) of the ITO, 2001 in respect of tax year 2013. According to the orders, the OIR has made certain additions and determined additional tax demand of Rs 303.333 million. OIR has disallowed a portion of retirement benefit expenses by attributing the same to the subsidiary companies and further disallowed financial expenses incurred by the Corporation on the contention that the same is equity specific and hence being capital in nature. Moreover, OIR also disallowed the basis of apportionment of expenses. The Corporation has paid Rs 288.265 million under protest and adjusted Rs 15.068 million against refunds available for the tax year 2011. Further the management has filed an appeal with the Commissioner of Income Tax (Appeals) and at present the matter is pending for hearing. The management of the Corporation is confident that the subject matters in respect of tax year 2013 will eventually be decided in favour of the Corporation.
Pakistan National Shipping Corporation180

Notes to and Forming Part of the Financial Statements For The Year Ended June 30, 2014
26.10 During the year ended June 30, 2014, the Deputy Commissioner Inland Revenue (DCIR) has issued assessment orders under section 161 of the ITO, 2001 in respect of tax years 2008 to 2013. According to the orders, the DCIR has held that the Corporation was required to withhold tax under section 152 (2) of the Ordinance while making payments to non-resident shipping Companies, and the failure to deduct tax at source renders it personally liable to pay tax along with default surcharge on the unpaid amount of tax, under section 205 of the ITO, 2001. By virtue of above orders a total tax demand of Rs 2,695.502 million was raised by the tax authorities. The Corporation has filed an appeal with the Commissioner of Income Tax (Appeals) and at present the matter is pending for hearing. The management of the Corporation is confident that the subject matter in respect of tax years 2008 to 2013 will eventually be decided in favour of the Corporation, and hence no provision has been recorded in the financial statements in respect of the said matter.
26.11 During the year ended June 30, 2014, the Assistant Commissioner Sindh Revenue Board (AC) has passed an order under Sindh Sales Tax on Services Act, 2011 for the tax period July 2011 to June 2012. The AC has held the Corporation liable to pay sales tax on ‘Administrative and Financial Services’ provided to its subsidiaries and has also levied sales tax on the services that are provided by the Corporation outside Sindh. By virtue of above order an additional tax demand of Rs 12.654 million, alongwith default surcharge of Rs 1.012 million was raised by the taxation authorities. The Corporation paid the amount under protest and filed Appeal with Commissioner Appeals - SRB (CA) which was decided against the Corporation. The Corporation has filed another appeal against the decision of CA with the Appellate Tribunal, SRB which is pending for hearing.
26.12 Without prejudice to the Corporation’s contention on the matters stated in notes 26.5 to 26.11, the management has, as a matter of prudence, provided an aggregate amount of Rs 250 million (2013: Rs 250 million) in respect of aforementioned matters.
Commitments
26.13 Commitments in respect of capital expenditure amount to Rs 193.057 million (2013: Rs 285.589 million).
26.14 Outstanding letters of guarantee amount to Rs 5.126 million (2013: Rs 5.126 million).
Note 2014 201327. CHARTERING REVENUE ----------(Rupees in ‘000)-------
Foreign flag vessels- voyage charter revenue 6,793,294 3,455,610 - slot charter revenue 1,503,241 2,121,883
8,296,535 5,577,493
28. SERVICE FEES - NET
Technical and commercial services fee 225,280 201,955 Administrative and financial services fee 74,126 65,513 Sales tax (8,781) (5,417)
290,625 262,051
29. FLEET EXPENSES - DIRECT
Charter, hire and related expenses 29.1 6,620,384 3,689,356 Exchange (gain) / loss (28,600) 14,144
6,591,784 3,703,500
Annual Report 2014 181

Notes to and Forming Part of the Financial Statements For The Year Ended June 30, 2014
Note 2014 2013----------(Rupees in ‘000)-------
29.1 Charter, hire and related expenses
Foreign flag vessels- voyage charter expenses 5,854,181 2,644,257 - slot charter expenses 766,203 1,045,099
6,620,384 3,689,356 .30. FLEET EXPENSES - INDIRECT
Conference establishment expenses - 300 Salaries and allowances 30.1 14,838 21,083 Agents’ and other general expenses 30.2 7,293 6,310 Depreciation 4.6 474 458 General establishment expenses 754 626
23,359 28,777
30.1 This includes Rs 1.756 million (2013: Rs 1.215 million) in respect of provident fund contribution.
Note 2014 2013----------(Rupees in ‘000)-------
30.2 Agents’ and other general expenses
Printing and stationery 57 40 Advertisement and publicity 1,185 1,191 Telephone, telex and postage 3,172 2,860 Bank charges and commission 317 273 Legal and professional charges 1,234 804 Air freight 1,328 1,127 Sundry expenses - 15
7,293 6,310
31. VESSEL MANAGEMENT EXPENSES
Workshop management expenses 56,098 55,704 Salaries and allowances 31.1 220,690 267,484 General establishment expenses 31.2 60,433 70,954 Rent, rates and taxes 5,827 6,945 Insurance 3,112 3,588 Depreciation 4.6 22,341 25,315
368,501 429,990
31.1 This includes Rs 4.571 million (2013: Rs 6.138 million) in respect of provident fund contribution.
31.2 General establishment expenses
Repairs and maintenance 4,696 6,253 Medical expenses 25,409 25,904 Security charges 1,187 1,087 Travelling and conveyance 4,797 4,758 Entertainment and canteen subsidy 1,358 1,633 Uniform and liveries 1,084 727 Printing and stationery 1,801 1,841 Telephone, telex and postage 3,271 4,273 Light, power and water 4,830 10,298 Computer expenses 3,630 4,255 Vehicle running, repairs and maintenance expenses 8,370 9,925
60,433 70,954
Pakistan National Shipping Corporation182
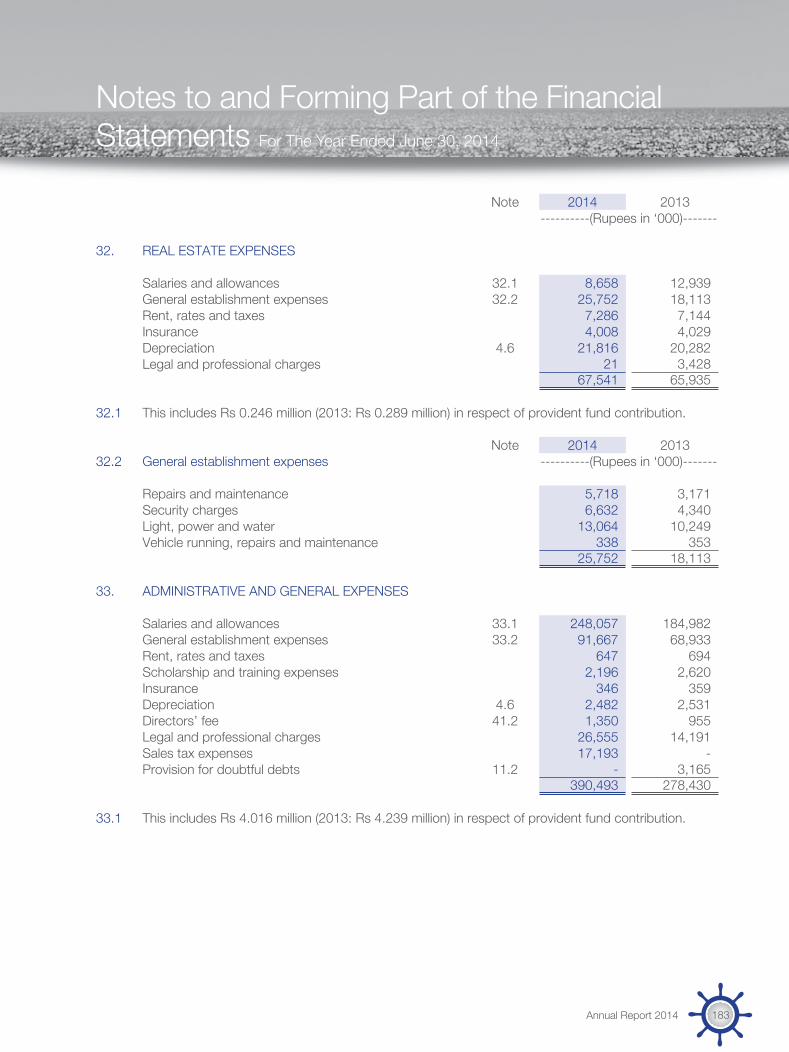
Notes to and Forming Part of the Financial Statements For The Year Ended June 30, 2014
Note 2014 2013----------(Rupees in ‘000)-------
32. REAL ESTATE EXPENSES
Salaries and allowances 32.1 8,658 12,939 General establishment expenses 32.2 25,752 18,113 Rent, rates and taxes 7,286 7,144 Insurance 4,008 4,029 Depreciation 4.6 21,816 20,282 Legal and professional charges 21 3,428
67,541 65,935
32.1 This includes Rs 0.246 million (2013: Rs 0.289 million) in respect of provident fund contribution.
Note 2014 201332.2 General establishment expenses ----------(Rupees in ‘000)-------
Repairs and maintenance 5,718 3,171 Security charges 6,632 4,340 Light, power and water 13,064 10,249 Vehicle running, repairs and maintenance 338 353
25,752 18,113
33. ADMINISTRATIVE AND GENERAL EXPENSES
Salaries and allowances 33.1 248,057 184,982 General establishment expenses 33.2 91,667 68,933 Rent, rates and taxes 647 694 Scholarship and training expenses 2,196 2,620 Insurance 346 359 Depreciation 4.6 2,482 2,531 Directors’ fee 41.2 1,350 955 Legal and professional charges 26,555 14,191 Sales tax expenses 17,193 - Provision for doubtful debts 11.2 - 3,165
390,493 278,430
33.1 This includes Rs 4.016 million (2013: Rs 4.239 million) in respect of provident fund contribution.
Annual Report 2014 183

Notes to and Forming Part of the Financial Statements For The Year Ended June 30, 2014
Note 2014 201333.2 General establishment expenses ----------(Rupees in ‘000)-------
Repairs and maintenance 5,277 4,325 Medical expenses 28,558 17,914 Contribution to employees welfare fund 9 11 Contribution to group term insurance 1,865 1,766 Hajj expenses 1,551 1,767 Security charges 1,337 752 Travelling and conveyance 5,393 3,290 Entertainment and canteen subsidy 1,526 1,130 Books, periodicals and subscription 4,787 5,550 Uniform and liveries 120 73 Printing and stationery 2,024 1,274 Telephone, telex and postage 3,675 2,955 Light, power and water 5,428 7,122 Computer expenses 4,080 2,942 Advertisement and publicity 4,708 3,536 Vehicle running, repairs and maintenance expenses 9,409 6,864 Ship inspection expenses 2,269 581 Sundry expenses 9,651 7,081
91,667 68,933
34. OTHER EXPENSES
Donations 34.1 1,000 100 Auditors’ remuneration 34.2 6,343 3,737 Demurrage expenses 128,791 - Employees’ gratuity
- funded 23.1.7 19,266 37,461 - unfunded 23.1.7 17,538 14,530
36,804 51,991 Post-retirement medical benefits 23.1.7 38,282 40,166 Employees’ compensated absences 23.2.5 69,159 97,500 Provision in respect of damage claims 25 15,847 7,663
296,226 201,157
34.1 Donations were not made to any donee in which the Corporation or a director or his spouse had any interest.
Pakistan National Shipping Corporation184

Notes to and Forming Part of the Financial Statements For The Year Ended June 30, 2014
34.2 Auditors’ remuneration2014 2013
A. F. Ernst & Young Total
A. F. Ernst & YoungTotalFerguson Ford Rhodes Ferguson Ford Rhodes
& Co. Sidat Hyder & Co. Sidat Hyder -----------------------------------(Rupees in ‘000)-----------------------------------
Audit fee 1,061 1,061 2,122 1,036 1,036 2,072 Fee for review of half yearly
financial statements 360 360 720 350 350 700 Fee for review of statement of
compliance with best practices of the code of corporategovernance 106 106 212 100 100 200
Fee for audit of consolidated financial statements 130 130 260 125 125 250
Tax advisory services fee 2,262 - 2,262 - - - Central Depository Company
certification fees 15 - 15 - 15 15 Out of pocket expenses 376 376 752 250 250 500
4,310 2,033 6,343 1,861 1,876 3,737
Note 2014 2013--------(Rupees in ‘000)---------
35. OTHER INCOME
Income from financial assets / liabilities
Income from saving accounts and term deposits 271,101 250,866 Agency fee 28,051 9,039 Dividend income 821 1,233 Exchange gain 35.1 9,543 33,086 Gain on revaluation of long-term investments 15,458 15,758 Gain on revaluation of swap derivative - net 210,297 167,324
Income from non-financial assets
Gain on disposal of fixed assets - 1,388 Sale of scrap 456 334 Provisions no longer required written back 11.2, 15.2 & 25 7,093 7,680 Sundry income 33,791 43,987
576,611 530,695
35.1 This represents exchange gain on foreign currency bank deposits maintained outside Pakistan.
Note 2014 2013--------(Rupees in ‘000)---------
36. FINANCE COSTS
Interest on long-term financing 796,913 964,854 Gain on cross currency interest rate swap derivative 36.1 (251,104) (254,344)Bank charges 872 1,423
546,681 711,933
36.1 This relates to the amount received during the year on account of quarterly exchanges and terminations under the swap arrangement as explained in note 15.4 amounting to Rs 251.104 million (2013: Rs 254.344 million).
Annual Report 2014 185

Notes to and Forming Part of the Financial Statements For The Year Ended June 30, 2014
2014 2013-----------(Rupees in ‘000)----------
37. TAXATION
Tax charge for:
- current year 269,045 265,562 - prior years (42,932) 76,084
226,113 341,646 Deferred (9,678) 72,662
216,435 414,308
37.1 Relationship between tax expense and accounting profit
Accounting profit before tax 1,019,711 1,073,865
Tax rate 34% 35%
Tax on accounting profit 346,702 375,853
Tax effect in respect of income / expenses not admissible for calculation of taxable profit 4,645 70,729
Effect of charging deferred tax on different rate than current tax 2,593 2,368
Tax effect of lower tax rates on certain incomes:
- Tax saving due to lower income tax rates - (15,201)- Tax liability under final tax regime (101,082) (100,465)
(101,082) (115,666)
Others (including the impact arising as a consequence of change in allocation ratio of revenue chargeable under FTR and non-FTR tax regime) (4,591) 4,940
(98,435) (37,629) 248,267 338,224
Tax effects of adjustments in respect of taxes paid abroad 11,100 - Tax effects of adjustments in respect of prior years (42,932) 76,084 Tax expense for the year 216,435 414,308
38. EARNINGS PER SHARE
Profit for the year attributable to ordinary shareholders 803,276 659,557
-----------(No. of Shares)-----------
Weighted average ordinary shares in issue during the year 132,063,380 132,063,380
--------------(Rupees)---------------
Earnings per share - basic and dilutive 6.08 4.99
There are no dilutive potential ordinary shares outstanding as at June 30, 2014 and 2013.
Pakistan National Shipping Corporation186

Notes to and Forming Part of the Financial Statements For The Year Ended June 30, 2014
Note 2014 2013---------(Rupees in ‘000)-------
39. CASH GENERATED FROM OPERATIONS
Profit before taxation 1,019,711 1,073,865
Adjustments for non-cash charges and other items:Depreciation 4.6 47,113 48,586 Gain on disposal of fixed assets - (1,388)Provision in respect of damage claims 25 15,847 7,663 Provision for employees’ gratuity 23.1.7 36,804 51,991 Provision for post-retirement medical benefits 23.1.7 38,282 40,166 Provision for employees’ compensated absences 23.2.5 69,159 97,500 Dividend income (821) (1,233)Provision for impairment on doubtful receivables 11.2 - 3,165 Provisions no longer required written back 35 (7,093) (7,680)Interest / mark-up income (271,101) (250,866)Interest / mark-up expense 797,785 966,277 Gain on revaluation of long-term investments (15,458) (15,758)Gain on cross currency interest rate swap derivative (461,401) (421,668)Long term advance rent earned - (11,349)Working capital changes 39.1 1,831,742 1,445,000
3,100,569 3,024,271
39.1 Working capital changes
Increase in current assetsStores and spares 66,321 (101,697)Trade debts (1,215,893) (582,127)Agents’ and owners’ balances (115,833) (8,462)Loans and advances 8,980 (34,897)Deposits and short-term prepayments (8,478) (10,477)Other receivables (57,096) (23,045)Incomplete voyages 44,250 13,294 Insurance claims - 47
(1,277,749) (747,364)Increase in current liabilitiesTrade and other payables 3,109,491 2,192,364
1,831,742 1,445,000
40. CASH AND CASH EQUIVALENTS
Short-term investments having maturity of three months or less 17 797,440 1,995,450
Cash and bank balances 18 1,842,531 1,778,997 2,639,971 3,774,447
Annual Report 2014 187

Notes to and Forming Part of the Financial Statements For The Year Ended June 30, 2014
41. REMUNERATION OF CHAIRMAN, EXECUTIVE DIRECTORSAND OTHER EXECUTIVES
The aggregate amount of remuneration including all benefits payable to the Chairman, Executive Directors / Directors and Executives of the Corporation were as follows:
2014 2013 2014 2013 2014 2013Chairman &
Chief Executive Executive Directors Other Executives----------------------------------- (Rupees in ‘000) -----------------------------------
Managerial remuneration and allowances 805 2,099 18,812 19,464 264,669 198,085 Retirement benefits - - - - 8,032 925 House rent 600 2,549 2,679 98,783 70,955 Conveyance - - - - 9,036 4,976 Entertainment 317 121 705 547 3,852 1,937 Medical 440 318 1,645 1,252 15,880 8,477 Utilities 459 136 1,872 1,844 36,926 26,971 Personal staff subsidy - 22 - - 121 127 Club membership fee and expenses 250 249 489 737 99 - Bonus - - 2,766 1,550 44,891 17,168 Other allowances 664 203 1,176 - 240,358 162,135
2,935 3,748 30,014 28,073 722,647 491,756
Number of persons 2 2 4 5 267 207
41.1 Retirement benefits represent amount contributed towards various retirement benefit plans. The executives of the Corporation are entitled to retirement benefits as outlined in note 2.17 and 2.18 to these financial statements. The Chairman, Chief Executive, Executive Directors and certain Executives are provided with the Corporation owned and maintained cars.
41.2 The aggregate amount charged in the financial statements for fee to 6 (2013: 5) non-executive directors was Rs 1.350 million (2013: Rs 0.955 million).
41.3 During the year ended June 30, 2014, a Chief Executive was replaced by another Chief Executive.
Pakistan National Shipping Corporation188

Notes to and Forming Part of the Financial Statements For The Year Ended June 30, 2014
42. FINANCIAL INSTRUMENTS BY CATEGORY2014 2013
--------(Rupees in ‘000)--------FINANCIAL ASSETSFair value through profit or lossLong term investments - listed companies 53,569 38,111 Derivative financial instruments 147,209 -
Loans and receivables
Loans - employees 59 59 Trade debts 1,987,993 771,219 Agents’ and owners’ balances 124,824 8,991 Deposits 9,868 8,250 Interest / mark-up accrued 34,539 19,836 Other receivables 92,546 35,450 Short-term investments 2,294,880 1,995,450 Cash and bank balances 1,842,531 1,778,997
6,387,240 4,618,252 Available-for-sale financial assetsLong-term investments - other entity 100 100
6,588,118 4,656,463 FINANCIAL LIABILITIESFair value through profit or lossDerivative financial instruments - 105,237
Amortised cost
Trade and other payables 20,295,089 17,199,670 Long-term financing 5,885,743 7,190,168 Accrued mark-up on long-term financing 78,515 91,087
26,259,347 24,586,162
43. FINANCIAL RISK MANAGEMENT
43.1 Financial risk factors
The Corporation’s activities are exposed to a variety of financial risks namely credit risk, market risk (including currency risk, cash flow and fair value interest rate risk and price risk) and liquidity risk. The Corporation is not exposed to any significant price risk as it does not hold any major investments exposed to price risk. The Corporation has established adequate procedures to manage each of these risks as explained below.
43.1.1 Concentration of credit risk
Credit risk arises from cash and cash equivalents, derivative financial instruments and deposits with banks and financial institutions, as well as credit exposures to customers, including trade receivables and committed transactions. Credit risk represents the accounting loss that would be recognised at the reporting date if counter parties fail completely to perform as contracted.
Annual Report 2014 189
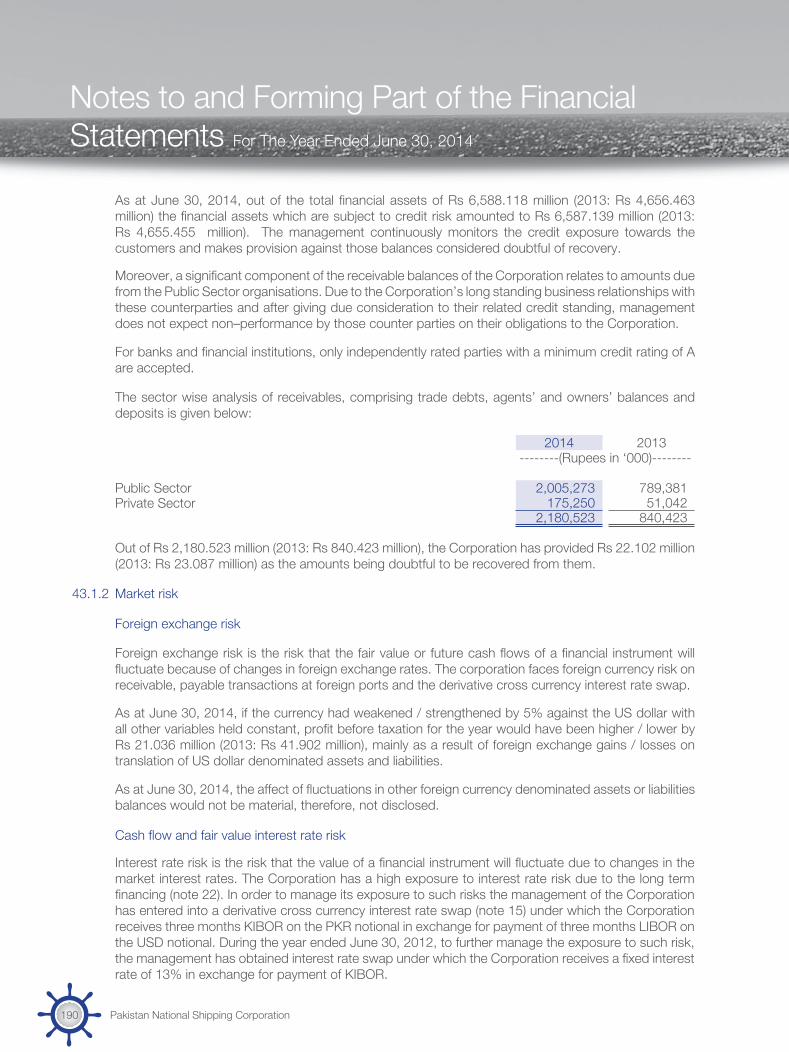
Notes to and Forming Part of the Financial Statements For The Year Ended June 30, 2014
As at June 30, 2014, out of the total financial assets of Rs 6,588.118 million (2013: Rs 4,656.463 million) the financial assets which are subject to credit risk amounted to Rs 6,587.139 million (2013: Rs 4,655.455 million). The management continuously monitors the credit exposure towards the customers and makes provision against those balances considered doubtful of recovery.
Moreover, a significant component of the receivable balances of the Corporation relates to amounts due from the Public Sector organisations. Due to the Corporation’s long standing business relationships with these counterparties and after giving due consideration to their related credit standing, management does not expect non–performance by those counter parties on their obligations to the Corporation.
For banks and financial institutions, only independently rated parties with a minimum credit rating of A are accepted.
The sector wise analysis of receivables, comprising trade debts, agents’ and owners’ balances and deposits is given below:
2014 2013--------(Rupees in ‘000)--------
Public Sector 2,005,273 789,381 Private Sector 175,250 51,042
2,180,523 840,423
Out of Rs 2,180.523 million (2013: Rs 840.423 million), the Corporation has provided Rs 22.102 million (2013: Rs 23.087 million) as the amounts being doubtful to be recovered from them.
43.1.2 Market risk
Foreign exchange risk
Foreign exchange risk is the risk that the fair value or future cash flows of a financial instrument will fluctuate because of changes in foreign exchange rates. The corporation faces foreign currency risk on receivable, payable transactions at foreign ports and the derivative cross currency interest rate swap.
As at June 30, 2014, if the currency had weakened / strengthened by 5% against the US dollar with all other variables held constant, profit before taxation for the year would have been higher / lower by Rs 21.036 million (2013: Rs 41.902 million), mainly as a result of foreign exchange gains / losses on translation of US dollar denominated assets and liabilities.
As at June 30, 2014, the affect of fluctuations in other foreign currency denominated assets or liabilities balances would not be material, therefore, not disclosed.
Cash flow and fair value interest rate risk
Interest rate risk is the risk that the value of a financial instrument will fluctuate due to changes in the market interest rates. The Corporation has a high exposure to interest rate risk due to the long term financing (note 22). In order to manage its exposure to such risks the management of the Corporation has entered into a derivative cross currency interest rate swap (note 15) under which the Corporation receives three months KIBOR on the PKR notional in exchange for payment of three months LIBOR on the USD notional. During the year ended June 30, 2012, to further manage the exposure to such risk, the management has obtained interest rate swap under which the Corporation receives a fixed interest rate of 13% in exchange for payment of KIBOR.
Pakistan National Shipping Corporation190

Notes to and Forming Part of the Financial Statements For The Year Ended June 30, 2014
The Corporation has interest bearing liabilities and have floating interest rates. At June 30, 2014, if interest rates on borrowings had been 100 basis points higher / lower with all other variables held constant, profit after taxation for the year would have been higher / lower by Rs 10.480 million (2013: Rs 12.192 million).
Price risk
Price risk represents the risk that the fair value or future cash flows of a financial instrument will fluctuate because of changes in market prices (other than those arising from interest rate risk or foreign exchange risk), whether those changes are caused by factors specific to the individual financial instrument or its issuer, or factors affecting all similar financial instruments traded in the market.
The effects of changes in fair value of investments made by the Corporation, on the future profits are not considered to be material in the overall context of these financial statements.
43.1.3 Liquidity risk
Liquidity risk is the risk that the Corporation will encounter difficulties in raising funds to meet commitments associated with financial instruments. The Corporation believes that it is not exposed to any significant level of liquidity risk.
The management forecasts the liquidity of the Corporation on basis of expected cash flow considering the level of liquid assets necessary to meet such risk. This involves monitoring balance sheet liquidity ratios and maintaining debt financing plans.
Financial liabilities in accordance with their contractual maturities are presented below:
Contractual cash flows
Less than 1 year
Between 1 to 2 years
Between 2 to 5 years
More than 5 years
2014 ---------------------------------------(Rupees in ‘000)---------------------------------------
Long term financing 7,712,144 1,932,063 1,864,640 3,915,441 - Trade and other payables 20,295,089 20,295,089 - - - Derivative financialinstruments - - - - - Accrued mark-up onlong-term financing 78,515 78,515 - - -
28,085,748 22,305,667 1,864,640 3,915,441 -
Contractual cash flows
Less than 1 year
Between 1 to 2 years
Between 2 to 5 years
More than 5 years
2013 ---------------------------------------(Rupees in ‘000)---------------------------------------
Long term financing 9,694,388 2,109,536 1,956,723 4,940,387 687,742 Trade and other payables 17,199,670 17,199,670 - - - Derivative financialinstruments 105,237 105,237 - - - Accrued mark-up onlong-term financing 91,087 91,087 - - -
27,090,382 19,505,530 1,956,723 4,940,387 687,742
Annual Report 2014 191

43.1.4 Fair value of financial instruments
Fair value is an amount for which an asset could be exchanged, or a liability settled, between knowledgeable willing parties in an arm’s length transaction. Consequently, differences may arise between the carrying value and the fair value estimates.
The corporation classifies financial instruments measured in the balance sheet at fair value in accordance with the following fair value measurement:
Level 1: Quoted prices in active markets for identical assets or liabilities;
Level 2: Those involving inputs other than quoted prices included in Level 1 that are observable for the asset or liability, either directly (as prices) or indirectly (derived from prices); and
Level 3: Those whose inputs for the asset or liability that are not based on observable market data (unobservable inputs).
The Corporation’s financial assets measured at fair value comprise only of level 1 financial assets amounting to Rs 53.569 million (2013: Rs 38.111 million) and level 3 financial assets amounting to Rs 147.209 million (2013: Nil) and financial liabilities amounting to Rs Nil (2013: Rs 105.237 million).
43.2 Capital risk management
The Corporation’s objectives when managing capital are to safeguard the Corporation’s ability to continue as a going concern in order to provide returns for shareholders and benefits for other stakeholders and to maintain an optimal capital structure to reduce the cost of capital.
The Corporation manages its capital structure by monitoring return on net assets and makes adjustment to it in the light of changes in economic conditions. In order to maintain or adjust the capital structure, the Corporation may adjust the amount of dividends paid to shareholders or issue new shares.
The Corporation is subject to externally imposed capital requirements, which are applicable at consolidated financial statements level.
During the year, the Corporation’s strategy was to maintain the debt equity ratio below 60:40. The debt equity ratios as at June 30, 2014 and 2013 were as follows:
2014 2013-------(Rupees in ‘000)---------
5,885,743 7,190,168 Total equity 7,634,785 6,953,902 Total 13,520,528 14,144,070
Debt-to-equity ratio 44:56 51:49
Notes to and Forming Part of the Financial Statements For The Year Ended June 30, 2014
Pakistan National Shipping Corporation192

44. ENTITY WIDE INFORMATION
44.1 The Corporation constitutes as a single reportable segment, the principal classes of services provided are transportation of dry cargo, liquid cargo, rental income and service fees through chartered vessels.
44.2 Information about services
The Corporation’s principal classes of services accounted for the following amount of revenue:
2014 2013-------(Rupees in ‘000)---------
Transportation of dry cargo 1,503,241 2,121,883 Transportation of liquid cargo 6,793,294 3,455,610 Rental income 140,525 123,348 Services fee 290,625 262,051
8,727,685 5,962,892
44.3 Information about geographical areas
The Corporation does not hold non-current assets in any foreign country.
44.4 Information about major customers
The corporation has the following exposure to concentration of credit risk with clients representing greater than 10 % of the total revenue balances:
2014 RevenueAmount
(Rupees in ‘000)
% of Total
Client 1 3,716,420 43%Client 2 1,638,296 19%Client 3 868,937 10%
6,223,653 72%
2013 RevenueAmount
(Rupees in ‘000)
% of Total
Client 1 1,388,572 23%Client 2 1,075,042 18%Client 3 1,052,957 18%Client 4 807,995 14%
4,324,566 73%
Notes to and Forming Part of the Financial Statements For The Year Ended June 30, 2014
Annual Report 2014 193
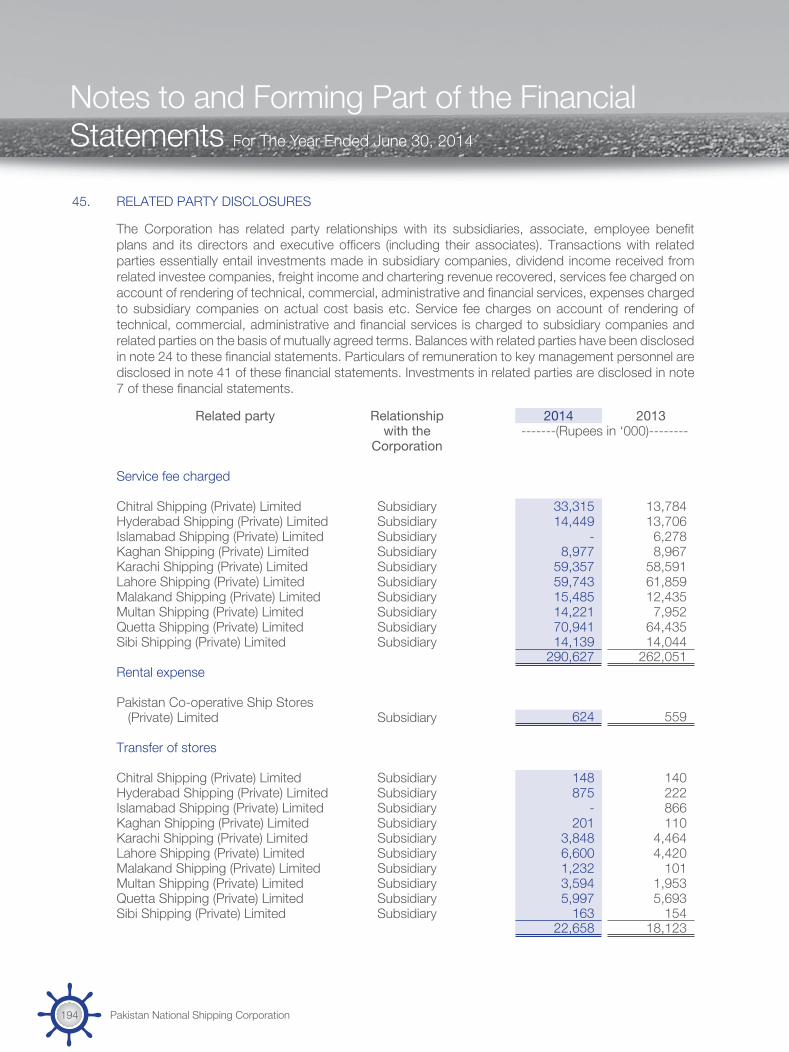
45. RELATED PARTY DISCLOSURES
The Corporation has related party relationships with its subsidiaries, associate, employee benefit plans and its directors and executive officers (including their associates). Transactions with related parties essentially entail investments made in subsidiary companies, dividend income received from related investee companies, freight income and chartering revenue recovered, services fee charged on account of rendering of technical, commercial, administrative and financial services, expenses charged to subsidiary companies on actual cost basis etc. Service fee charges on account of rendering of technical, commercial, administrative and financial services is charged to subsidiary companies and related parties on the basis of mutually agreed terms. Balances with related parties have been disclosed in note 24 to these financial statements. Particulars of remuneration to key management personnel are disclosed in note 41 of these financial statements. Investments in related parties are disclosed in note 7 of these financial statements.
Related party Relationship 2014 2013with the -------(Rupees in ‘000)--------
Corporation
Service fee charged
Chitral Shipping (Private) Limited Subsidiary 33,315 13,784 Hyderabad Shipping (Private) Limited Subsidiary 14,449 13,706 Islamabad Shipping (Private) Limited Subsidiary - 6,278 Kaghan Shipping (Private) Limited Subsidiary 8,977 8,967 Karachi Shipping (Private) Limited Subsidiary 59,357 58,591 Lahore Shipping (Private) Limited Subsidiary 59,743 61,859 Malakand Shipping (Private) Limited Subsidiary 15,485 12,435 Multan Shipping (Private) Limited Subsidiary 14,221 7,952 Quetta Shipping (Private) Limited Subsidiary 70,941 64,435 Sibi Shipping (Private) Limited Subsidiary 14,139 14,044
290,627 262,051 Rental expense
Pakistan Co-operative Ship Stores(Private) Limited Subsidiary 624 559
Transfer of stores
Chitral Shipping (Private) Limited Subsidiary 148 140 Hyderabad Shipping (Private) Limited Subsidiary 875 222 Islamabad Shipping (Private) Limited Subsidiary - 866 Kaghan Shipping (Private) Limited Subsidiary 201 110 Karachi Shipping (Private) Limited Subsidiary 3,848 4,464 Lahore Shipping (Private) Limited Subsidiary 6,600 4,420 Malakand Shipping (Private) Limited Subsidiary 1,232 101 Multan Shipping (Private) Limited Subsidiary 3,594 1,953 Quetta Shipping (Private) Limited Subsidiary 5,997 5,693 Sibi Shipping (Private) Limited Subsidiary 163 154
22,658 18,123
Notes to and Forming Part of the Financial Statements For The Year Ended June 30, 2014
Pakistan National Shipping Corporation194

Related party Relationship Note 2014 2013with the -------(Rupees in ‘000)--------
Corporation
Retirement benefit costs charged
Chitral Shipping (Private) Limited Subsidiary 328 788 Hyderabad Shipping (Private) Limited Subsidiary 349 1,455 Islamabad Shipping (Private) Limited Subsidiary 240 1,261 Kaghan Shipping (Private) Limited Subsidiary 128 287 Karachi Shipping (Private) Limited Subsidiary 73 157 Lahore Shipping (Private) Limited Subsidiary 80 66 Malakand Shipping (Private) Limited Subsidiary 346 1,212 Quetta Shipping (Private) Limited Subsidiary 48 88 Sibi Shipping (Private) Limited Subsidiary 32 1,613
1,624 6,927
Contribution to provident fund 10,589 11,881
Key management personnelcompensation 41 32,949 31,821
Investment in subsidiary companies - 1,336,115
45.1 Outstanding balances due from / due to related parties have been disclosed in the respective notes to these financial statements.
45.2 In addition, the Corporation is engaged in making certain payments / collections on behalf of the subsidiary companies in accordance with the ‘Technical and Commercial Services’ and ‘Administrative and Financial Services Agreement’ which are settled through a current account of the subsidiary.
46. PROVIDENT FUND RELATED DISCLOSURES
The following information is based on latest un-audited financial statements of the Provident Fund (the Fund):
Note 2014 2013-------(Rupees in ‘000)--------
Size of the Fund - Total assets 888,525 916,676
Cost of investments made 850,181 769,480
Percentage of investments made 94.67% 92.75%
Fair value of investments 46.1 841,133 850,181
Notes to and Forming Part of the Financial Statements For The Year Ended June 30, 2014
Annual Report 2014 195
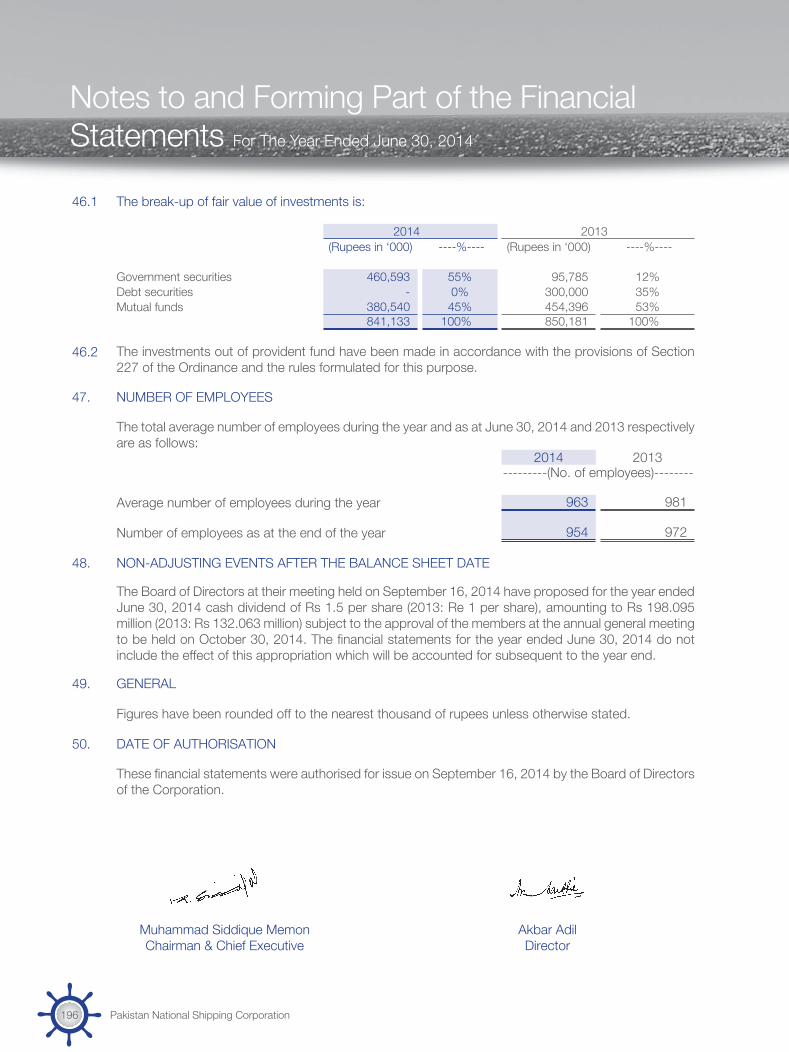
46.1 The break-up of fair value of investments is:
2014 2013(Rupees in ‘000) ----%---- (Rupees in ‘000) ----%----
Government securities 460,593 55% 95,785 12%Debt securities - 0% 300,000 35%Mutual funds 380,540 45% 454,396 53%
841,133 100% 850,181 100%
46.2 The investments out of provident fund have been made in accordance with the provisions of Section 227 of the Ordinance and the rules formulated for this purpose.
47. NUMBER OF EMPLOYEES
The total average number of employees during the year and as at June 30, 2014 and 2013 respectively are as follows:
2014 2013---------(No. of employees)--------
Average number of employees during the year 963 981
Number of employees as at the end of the year 954 972
48. NON-ADJUSTING EVENTS AFTER THE BALANCE SHEET DATE
The Board of Directors at their meeting held on September 16, 2014 have proposed for the year ended June 30, 2014 cash dividend of Rs 1.5 per share (2013: Re 1 per share), amounting to Rs 198.095 million (2013: Rs 132.063 million) subject to the approval of the members at the annual general meeting to be held on October 30, 2014. The financial statements for the year ended June 30, 2014 do not include the effect of this appropriation which will be accounted for subsequent to the year end.
49. GENERAL
Figures have been rounded off to the nearest thousand of rupees unless otherwise stated.
50. DATE OF AUTHORISATION
These financial statements were authorised for issue on September 16, 2014 by the Board of Directors of the Corporation.
Muhammad Siddique MemonChairman & Chief Executive
Akbar AdilDirector
Notes to and Forming Part of the Financial Statements For The Year Ended June 30, 2014
Pakistan National Shipping Corporation196
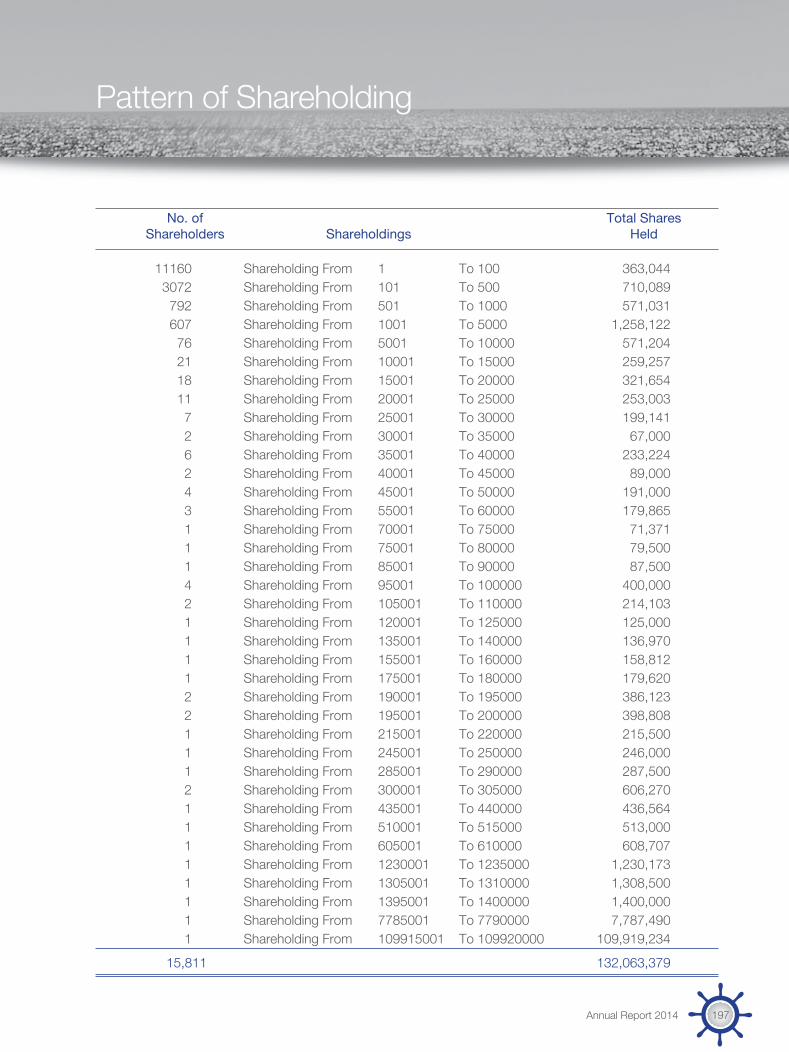
Pattern of Shareholding
No. of Total Shares Shareholders Shareholdings Held 11160 Shareholding From 1 To 100 363,044 3072 Shareholding From 101 To 500 710,089 792 Shareholding From 501 To 1000 571,031 607 Shareholding From 1001 To 5000 1,258,122 76 Shareholding From 5001 To 10000 571,204 21 Shareholding From 10001 To 15000 259,257 18 Shareholding From 15001 To 20000 321,654 11 Shareholding From 20001 To 25000 253,003 7 Shareholding From 25001 To 30000 199,141 2 Shareholding From 30001 To 35000 67,000 6 Shareholding From 35001 To 40000 233,224 2 Shareholding From 40001 To 45000 89,000 4 Shareholding From 45001 To 50000 191,000 3 Shareholding From 55001 To 60000 179,865 1 Shareholding From 70001 To 75000 71,371 1 Shareholding From 75001 To 80000 79,500 1 Shareholding From 85001 To 90000 87,500 4 Shareholding From 95001 To 100000 400,000 2 Shareholding From 105001 To 110000 214,103 1 Shareholding From 120001 To 125000 125,000 1 Shareholding From 135001 To 140000 136,970 1 Shareholding From 155001 To 160000 158,812 1 Shareholding From 175001 To 180000 179,620 2 Shareholding From 190001 To 195000 386,123 2 Shareholding From 195001 To 200000 398,808 1 Shareholding From 215001 To 220000 215,500 1 Shareholding From 245001 To 250000 246,000 1 Shareholding From 285001 To 290000 287,500 2 Shareholding From 300001 To 305000 606,270 1 Shareholding From 435001 To 440000 436,564 1 Shareholding From 510001 To 515000 513,000 1 Shareholding From 605001 To 610000 608,707 1 Shareholding From 1230001 To 1235000 1,230,173 1 Shareholding From 1305001 To 1310000 1,308,500 1 Shareholding From 1395001 To 1400000 1,400,000 1 Shareholding From 7785001 To 7790000 7,787,490 1 Shareholding From 109915001 To 109920000 109,919,234
15,811 132,063,379
Annual Report 2014 197

Categories of Shareholders No. Shares Held Percentage %
BANKS DEVELOPMENT FINANCIAL INSTITUTIONS, NON 72 720,980 0.55BANKING FINANCIAL INSTITUTIONS. INSURANCE COMPANIES 12 1,245,554 0.95 DIRECTORS, CHIEF EXECUTIVE OFFICER, AND THEIRSPOUSE AND MINOR CHILDREN KHOWAJA OBAID IMRAN ILYAS 1 2,299MR. ANWAR SHAH 1 100KHOWAJA OBAID IMRAN ILYAS 1 115 Sub-Totals : 2,514 0.00 ASSOCIATED COMPANIES, UNDERTAKING AND RELATEDPARTIES. M/S PNSC EMPLOYEES EMPOWERMENT TRUST 1 7,787,490MOHAMMADI ENGG. WORKS LTD 1 4,766 Sub-Totals : 7,792,256 5.90
MODARABAS AND MUTUAL FUNDS. 16 3,186,904 2.41 NIT AND ICP 13 78,087 0.06 FOREIGN INVESTORS 9 93,709 0.07 DIRECTOR GENERAL PORT & SHIPPING 1 109,919,234 83.23 OTHERS 85 1,413,809 1.07 Individuals* 15599 7,610,332 5.76 G-Totals : 15,811 132,063,379 100.00 *Including 3656 shareholders whose current domicile is not knownN.B.:- The above two statements include 1439 shareholders holding 11,523,299 Shares through Central Depository Company of Pakistan Limited.
Categories of ShareholdersFor The Year Ended June 30, 2014
Pakistan National Shipping Corporation198

Notice is hereby given that the 36th Annual General Meeting of the shareholders of Pakistan National Shipping Corporation will be held at the Navy Welfare Centre (Pakistan Navy Fleet Club), near Lucky Star Hotel, Saddar, Karachi, on 30th October, 2014 at 5:15 p.m. to transact the following business:
ORDINARY BUSINESS:
1. To confirm the Minutes of 35th Annual General Meeting of the shareholders held on 25th October, 2013.
2. To consider and adopt the Audited Accounts of the Corporation and the Consolidated Accounts of the PNSC Group together with the Reports of Auditors and Directors for the year ended 30th June 2014.
3. To consider and approve Board’s recommendation to pay 15% Cash Dividend (i.e. Rs. 1.50 per share) to the shareholders.
4. To consider Board’s recommendation to re-appoint the retiring auditors A.F. Ferguson & Co., Chartered Accountants, and Ford Rhodes Sidat Hyder & Co., Chartered Accountants, as joint auditors of the Corporation for the year 2014–2015 and to fix their remuneration.
5. To transact any other business that may be placed before the meeting with the permission of the chair.
By Order of the Board
ZAINAB SULEMAN COMPANY SECRETARY Dated: September 16, 2014
Note:
1. The Share Transfer Books of the Corporation will remain closed from 23rd October, 2014 to 30th October, 2014 (both days inclusive).
2. A shareholder entitled to attend and vote at this meeting is also entitled to appoint his/her proxy to attend the meeting. Proxies must be received at the Head Office of the Corporation not less than 48 hours before the time of holding the meeting.
3. CDC Account Holders are advised to bring their original National Identity Cards to authenticate their identity along with CDC account numbers at the meeting. However, if any proxies are granted by such shareholders, the same shall also have to be accompanied with attested copies of the National Identity Cards of the grantors, and the signature on the proxy form has to be the same as appearing on the National Identity Card.
4. The shareholders are requested to immediately notify change, if any, in their mailing addresses.
Notice of Annual General Meeting
Annual Report 2014 199


Form of Proxy
The Company Secretary,Pakistan National Shipping Corporation,Moulvi Tamizuddin Road,Karachi
Please quote your
Folio No./ CDC Account No.
I/We __________________________________________________________________________________________
of ____________________________________________________________________________________________
being shareholder of Pakistan National Shipping Corporation holding __________________________________
share (s) hereby appoint Mr./Miss/Mrs. ____________________________________________________________
S/o. D/o. W/o. _________________________________________________________________________________
of ____________________________________________________________________________________________
or failing him/her Mr./Miss./Mrs. __________________________________________________________________
S/o. D/o. W/o. _________________________________________________________________________________
of ____________________________________________________________________________________________
as my/ our proxy to vote for me/ us and on my/ our behalf at the meeting of the shareholders of the Corporation to be held at Karachi on the 30th day of October 2014 at 05:15 p.m. and at any adjournment thereof.
Dated this ___________________________ day of ___________________________ 2014.
Revenue Stamp
of
Rs 5
Signature of the Shareholder ____________________________
Address _____________________________________________
____________________________________________________
Folio No./CDC Account No. ____________________________
Transfer Receipt No. ___________________________________

p.n.S.C Building Moulvi tamizuddin Khan road, p.o.Box no.5350, Karachi-pakistan.
phone: (92-21) 99203980-99 (20 lines)Fax: (92-21) 99203974, 35636658
email: [email protected] www.pnSC.com.pk th
e Ti
mes
Pre
ss (p
rivat
e) l
imite
d