Annual Public Sector Debt Portfolio Report For the Year ...
75
i Annual Public Sector Debt Portfolio Report For the Year 2017/18 No.19 Average Loan Terms of External Public Sector Debt (2013/14 – 2017/18) DEBT MANAGEMENT DIRECTORATE MINISTRY OF FINANCE FEDERAL DEMOCRATIC REPUBLIC OF ETHIOPIA Annual Public Sector Debt Portfolio Report For the Year 2017/18 NO. 19
Transcript of Annual Public Sector Debt Portfolio Report For the Year ...

i Annual Public Sector Debt Portfolio Report For the Year 2017/18 No.19
Average Loan Terms of External Public Sector Debt (2013/14 – 2017/18)
DEBT MANAGEMENT DIRECTORATE MINISTRY OF FINANCE
FEDERAL DEMOCRATIC REPUBLIC OF ETHIOPIA
Annual Public Sector Debt
Portfolio Report
For the Year 2017/18 NO. 19

1 Annual Public Sector Debt Portfolio Report For the Year 2017/18 No.19
Forward
The principles of public debt management in Ethiopia are enshrined in the Financial
Administration Proclamation No. 648/2009 (as amended by Proclamation No. 970/2016)
and the Financial Administration Regulations. The legal framework is meant to promote
prudent and sound debt management practices for both Federal Government and State
Owned Enterprises with the aim of enhancing public finance effectiveness and
transparency in management of public resources. The 2018 Annual Public Sector Debt
Management Report is part of the reporting requirement under the legal framework of
the country.
Public debt management is the process of establishing and executing a strategy for
managing the public sector‟s debt to raise the required amount of funding, pursue its
cost/risk objectives, and meets any other public debt management goals the
government may have set, such as enhancing debt monitoring and management of the
country including developing and maintaining an efficient and liquid market for
government and corporate securities.
The Ministry of Finance is the primary agent of Government of Ethiopia responsible for
managing and conducting various cost-risk analyses of the country‟s public debt
portfolios. It prepares, manages and follows up the country‟s Medium Term Debt
Management Strategy. In addition, it is responsible for compilation and dissemination of
public debt statistics and Annual Public Sector Debt Portfolio Report. It also prepares
the country‟s Debt Sustainability Analysis every fiscal year and disseminates to the
policy makers for decision.
Hence, this Nineteenth Annual Public Sector Debt Portfolio Report (DPR) is an annual
report prepared by the Debt Management Directorate aiming to provide policy makers a
broader view of the public debt portfolio, dealing with the volume of the public debt and
its breakdown, variations in stocks as well as detail analysis of some key debt variables.
The current Nineteenth editions, comprehensively examines the five years‟ total public
debt situation and trends beginning from 2013/14 to 2017/18.
2 Annual Public Sector Debt Portfolio Report For the Year 2017/18 No.19
Preparation of comprehensive and timely DPR allows Government and other users to
monitor the evolution of the public sector‟s debt accumulation and its debt-service
obligations over time. This DPR is considered an essential inputs for Government
budget preparation, for approval by parliament, for execution, for forecasting, and for
compiling other macroeconomic statistics and serve as an indicator of the sustainability
of government and public corporations‟ policies.
The Government is considering this report in line with the Financial Administration Act,
as a tool for evaluating and managing the risk involved with different debt
compositions; facilitating coordination with fiscal and monetary management; and
enhancing transparency. In addition, the Government is expects through this action of
preparing annual debt report will support efforts that aim for the government‟s
financing needs and payment obligations are met at the lowest possible cost consistent
with a prudent degree of risk.
Similarly, the report will not only provide the senior management of the country with
details of the debt dynamics in 2018, but will also serve as a useful repository of
information for public, academicians, researchers, the media and all other relevant
stakeholders. An electronic version of this report is available on the website of Ministry
of Finance in PDF format and in Debt Management Directorate. All queries on the
contents of the report should be addressed to the Debt Management Directorate in the
Ministry of Finance through the address below.
Debt Management Directorate of Ministry of Finance
P.O. Box 1905/1037,
Addis Ababa
Telephone No.251111571524,
Fax No.251111567152.
Email: [email protected]

3 Annual Public Sector Debt Portfolio Report For the Year 2017/18 No.19
Mission Statement
Of
Debt Management Directorate
To ensure sound external and domestic debt
management by effectively and efficiently co-
negotiating and renegotiating external loans,
properly administering disbursements and
repayments of external and domestic debts, follow
up of on-lent debts, designing and updating
appropriate debt management strategy of the
country.

4 Annual Public Sector Debt Portfolio Report For the Year 2017/18 No.19
TTAABBLLEE OOFF CCOONNTTEENNTTSS
Forward .......................................................................................................................................1 EXECUTIVE SUMMARY ........................................................................................................6 1. Introduction .........................................................................................................................8 2. Macroeconomic Development in 2017/18 .......................................................................10 3. Implementation of Medium Term Debt Management Strategy (2016-2020) ..............13
4. Development of the Debt Portfolio in 2018 .....................................................................15
4.1 External Debt .............................................................................................................16
4.1.1 External Debt Outstanding by Major Creditors Groups .................................................... 17
4.1.2 External Debt Outstanding by Borrowers‟ Category ......................................................... 19
4.1.3 Public Sector External Debt Outstanding by Contracting Currency ................................ 20
4.1.4 External Debt Outstanding by Interest Rate Composition ............................................. 22
4.1.5 External Debt Outstanding by Concessionality................................................................ 23
4.1.6 New Commitments from External Sources ......................................................................... 24
4.1.6 External Debt Disbursements in the Period ........................................................................ 26
4.1.7 External Debt Disbursement by Major Creditors ............................................................... 27
4.1.8 Disbursement by Economic Sector ...................................................................................... 28
4.1.9 External Debt and Undisbursed Balances ........................................................................... 29
4.1.10 External Debt Service .......................................................................................................... 30
4.1.11 Net Resource Flows & Net Transfers ................................................................................ 32
4.2 DOMESTIC DEBT ............................................................................................................34
4.2.1 Total Domestic Debt Outstanding ........................................................................................ 35
4.2.2 Total Domestic Debt Outstanding by Instruments ............................................................ 36
4.2.3 Central Government Domestic Debt Portfolio .................................................................... 37
4.2.4 State Owned Enterprises Domestic Debt Portfolio ............................................................ 40
4.2.5 Domestic Debt By Holders .................................................................................................... 41
4.2.6 Government Domestic Debt Service .................................................................................... 42
5. On-Lending Loans, Guarantees and Contingent Liabilities ........................................44 6. Cost & Risk Analysis of Ethiopia’s Public and Publicly Guaranteed Debt ....................47
6.1 Refinancing Risk ..............................................................................................................47
6.2 Interest Rate Risk ...........................................................................................................53
6.3 Exchange Rate Risks ......................................................................................................55
7. Conclusion .............................................................................................................................58 8. GLOSSARY...........................................................................................................................61 9. Annex .......................................................................................................................................1

5 Annual Public Sector Debt Portfolio Report For the Year 2017/18 No.19
ACRONYMS
AfDB African Development Bank
AfDF African Development Fund
BADEA Arab Bank for Economic Development in Africa
CBE Commercial Bank of Ethiopia
DA Direct Advance
DBE Development Bank of Ethiopia
DS Debt Service
EAL Ethiopian Airlines
EEP Ethiopian Electric Power
EEU Ethiopian Electric Utility
EIB European Investment Bank
ESC Ethiopian Sugar Corporation
ETB Ethiopian Birr
EUR Official Currency for 19 member countries of European Union
ERC Ethiopian Railway Corporation
GDP Gross Domestic Product
HIPC Highly Indebted Poor Countries
ICBC Investment and Construction Bank of China
IDA International Development Association
IFAD International Fund for Agricultural Development
IMF International Monetary Fund
JPY Japanese Yen
MDRI Multilateral Debt Relief Initiatives
MoF Ministry of Finance
NBE National Bank of Ethiopia
NDF Nordic Development Fund
OFID OPEC Fund for International Development
POESSA Private Organization Employees Social Security Agency
PSSSA Public Servants Social Security Agency
SOEs State Owned Enterprises
SDR Special Drawing Rights
TBs Treasury Bills
6 Annual Public Sector Debt Portfolio Report For the Year 2017/18 No.19
EXECUTIVE SUMMARY Ethiopia‟s vision, committed leadership and diligence of its people, has now created the
necessary foundation for the country to reach lower middle income status. In the run
up to the current state of affairs of the Ethiopian economy, output grew continuously
for more than a decade and half, poverty was reduced by more than half, and the
economy remained resilient despite multiple shocks arising from drought, political
instability and global external sector performance slowdown. In this regard prudent
public debt management and ensuring sustainability of public debt over the medium
term will continue to be one of key functions of the Ministry of Finance.
Following the implementation of the HIPC initiative which culminated in successfully
reaching Completion Point in 2006, the country benefited from significant debt burden
reduction. Since then it is evident that a significant buildup of debt has materialized,
reaching the current level of 49.8% in NPV terms) of GDP in 2018.
By end June 2018, Ethiopia‟s total public external and domestic debt stock including
publicly guaranteed debt amounted to USD 49,361.60 million compared to USD
45,797.01 million reported at the end June 2017 representing an increase of 7.8%.
Domestic debt increased by 4.8% to USD 23,453.00 million while external debt
increased by 10.6% to USD 25,908.60 million at end June 2018 from June 2017.
Of Ethiopia‟s total external debt, multilateral agencies held 40.5% while bilateral
creditors have 33.2% share. Out of private creditors commercial banks and suppliers
held 13.3% and 9.1% respectively while bonds and note (Eurobond) held 3.9%.
As at June 2018, the stock of treasury bills, government bonds and direct advances
accounted for 17.4%, 5.8% and 23.8% of total domestic debt, respectively. As far the
SOEs domestic debt is concerned, corporate bond and long term loans accounted
37.8% and 15.1% respectively.

7 Annual Public Sector Debt Portfolio Report For the Year 2017/18 No.19
The currency composition of the Ethiopia‟s external debt stock comprised of the United
States Dollar (USD) at 60.6%, SDR at 31.5%, Euro at 4.4%, Chinese Yuan at 1.9%
while other currencies accounted for 1.6% of the portfolio.
The total public debt service payments in 2017/18 was USD 2.679.80 million with
external debt service standing at USD 1,575.21 million while domestic debt service was
at USD 1,104.59 million. As a percentage of the total public debt service, external and
domestic debt service were 58.8 % and 41.2% respectively.
Overall, Ethiopia‟s public debt remain sustainable over the medium term and well within
the limit of 56% in NPV terms as percent of GDP in line with the threshold set by the
World Bank and IMF. Public Debt to GDP ratio is expected to stabilize in the medium
term and come down gradually as the government implements prudent fiscal policy
commitments aimed at reducing the fiscal deficits as well as limiting contracting loans
from Non-Concessional sources to implement strategically important projects.
Ethiopia, cognizant of debt accumulation, has put in place a Public Private Partnership
(PPP) framework in order to fund infrastructure development as a catalyst to foster
economic growth. To minimize exposure and risks associated with debt accumulation
the government has embraced new innovations in financing infrastructure development
off balance sheet without impacting heavily the debt portfolio. Towards this end, the
country is working to increase private financing of public investments through the Public
Private Partnership (PPP) initiatives. This is one of the MoF key strategies to maintain
reduction of the fiscal deficits in order to ensure that debt accumulation remains at
prudent rates and that public debt remains within sustainable levels.
8 Annual Public Sector Debt Portfolio Report For the Year 2017/18 No.19
1. Introduction
Public Sector Debt Portfolio Reports provides information on the public debt including:
the central government external and domestic debt, government-guaranteed external
and domestic debt, the non-guaranteed external and domestic debt.
The central government external debt refers to all external loans contracted between
external creditors and Ministry of Finance while government-guaranteed external debt
comprises of loans and suppliers credits contracted by public enterprises, mainly the
Ethiopian Electric Power (EEP), Ethiopian Electric Utility (EEU), Sugar Corporation (SC),
Ethiopian Railways Corporation (ERC) and Ethiopian Shipping and Logistics Services
Enterprises (ESL) guaranteed by MoF.
The non-guaranteed external debt, on the other hand, includes loans contracted by
public enterprises, mainly the Ethiopian Airlines (EAL) and Ethio-Telecom without
government or government-owned bank guarantee. Domestic debt covers the debt of
the central government in forms of government bonds, treasury bills and direct advance
from National Bank of Ethiopia. In addition, the assessment covers SOEs borrowing
from both domestics as well as external sources including on-lent loans transferred to
SOEs
The primary governing law for debt management is the Financial Administration
Proclamation No. 648/2009 (as amended by Proclamation No. 970/2016) and the
Financial Administration Regulations. Accordingly, debt shall be managed in such a
manner as to prevent any negative impacts on the general economy, such as creating
instability in monetary policy or balance of payments.
This report is issued by the Ministry of Finance in pursuant to section 52 of the Financial
Administration law which requires the report to include inter alia:
Annual government borrowings and debt management operations,
9 Annual Public Sector Debt Portfolio Report For the Year 2017/18 No.19
Guarantee and lending activities of government,
Debt management strategy and the rationale for the strategy,
Debt accumulation trends,
Outstanding amounts and beneficiaries of the loans and an assessment of the risks
associated with the accumulation of debt.
This 2018 annual public sector debt report is structured as follows: part 1 introduces
the report contents, part 2 analyzes macroeconomic performance in 2017/18, part 3
looks at the Medium Term Debt Management Strategy and its implementation and
initiatives designed to ensure a well-structured portfolio and public debt sustainability,
part 4 presents Government borrowings in 2018 and debt accumulation trends in public
debt, part 5 presents contingent liabilities and on-lending loans, part 6 presents cost
and risk analysis of Ethiopia‟s public and publicly guaranteed debt, and part 7 concludes
the report with an outlook. A glossary part 8 is presented at the end of the report to
facilitate a greater understanding of this report by the general public.

10 Annual Public Sector Debt Portfolio Report For the Year 2017/18 No.19
2. Macroeconomic Development in 2017/18
Gross Domestic Product (GDP)
Ethiopia‟s Gross Domestic Product has been grown by 7.7% in 2018 from 10.1% in
2017. Although the medium-term outlook is strong, the growth recorded in fiscal year
17/18 was the lowest of the last several years. Trends of economic activity growth
continued in 2017/18, however, at a lower compared to the previous year. The
economy has remained resilient despite multiple shocks arising from prolonged drought,
lengthy political instability and global particularly external sector economic slowdown.
This poor performance of the Ethiopian economy was largely due to the low growth of
agriculture, external sector and industry.
GDP growth in 2018 was broad based, i.e. all sector recorded positive growth rates.
Industrial production continued its positive trends registering 12.2% growth, as a result
of the growth of the manufacturing industry and construction sector‟s significant
expansion of 15.7% in 2017/2018. Services sector experienced an 8.8% growth while
agriculture rose by 3.5%.
Fiscal Policy
The level and financing of the budget deficit is designed in view of promoting the
desired macroeconomic goals such as controlling inflation, boosting private investment
and growth and maintaining external credit worthiness. The main trust of fiscal policy in
Ethiopia is to strength domestic revenue generation, effective and efficient allocation
and utilization of the resources and maintaining fiscal deficit consistent with
macroeconomic objectives. As a result during the years 2008/09-2017/18 on average
about 80% of the government budgetary revenue was mobilized from domestic revenue
sources.
On the other hand, Government expenditure has been an important driver of Ethiopia‟s
economy. The expenditure pattern was mainly focusing on allocating more resource for
building economic and social infrastructure to provide basic services. To this end, in the

11 Annual Public Sector Debt Portfolio Report For the Year 2017/18 No.19
last many years the lion‟s share of the annual budget was devoted to capital
expenditures which are critical in bringing future benefits through building physical
assets and infrastructures, as well as promoting human resources development and
research and development.
The Government over the past years capped the overall budget deficit at 3% of GDP
through a general fiscal rule. In fiscal year 2017/18, the overall budget deficit including
grant turned out to be 3 % of GDP. This was against a deficit target of 3.4% of GDP.
Inflation
Average moving consumer price index inflation rate in 2018 is amounted to 13.1%.
Prices of food products had the most significant contribution to the increase of
consumer prices in 2018.
External Sector
During 2017/18, total merchandise export earnings reached USD 2.8 billion, showing
2.3% decrease compared to last year same period owing to fall in earnings from export
of goods. The net service export for 2017/18 stood at USD 309.7 million in deficit
compared to USD 546.9 million deficits a year ago. This narrow deficit was mainly
because of the development in net travel from deficit to surplus, the decline in deficit of
other services deficit, together with the increase in surplus of net transport services.
Net private transfers increased by 11.1% amounting to USD 6.1 billion as a result of
16.1 percent increase in transfers to private individuals‟ despite 9.9% decline in net
transfers to NGOs. Foreign exchange earnings from individual private transfers covered
41.4% of the trade deficit recorded during 2017/18 FY compared to 34.3% during last
year. Meanwhile, relative to last year same period, net official transfers decreased by
21% from USD 1.4 billion to USD 1.1 billion.
The 2017/18 current account deficit (including official transfers) amounted to USD 5.5
billion, lower than USD 6.5 billion same period a year earlier mainly owing to increase in
12 Annual Public Sector Debt Portfolio Report For the Year 2017/18 No.19
net private transfers, improvement in deficit of net services and merchandise trade
deficits despite decline in net official transfers.
The net capital inflow in 2017/18 was USD 6.2 billion, 8.8% lower than the USD 6.8
billion recorded a year ago. Foreign direct investment, relative to last year, decreased by
10.7% reaching USD 3.7 billion from USD 4.2 billion while inflows of private long term
capital decreased by 50.1%. On the other hand, net official long term capital and net
other public long term capital rose by 14.1% and 20.2% respectively. As a result, the
overall balance of payments deficit during the 2017/18 stood at USD 201.6 million
compared to the USD 658.6 million surpluses recorded last year.

13 Annual Public Sector Debt Portfolio Report For the Year 2017/18 No.19
3. Implementation of Medium Term Debt Management Strategy (2016-2020)
The ongoing GTP II needs huge resources. Accordingly, one of the sources to finance
GTP II is borrowing from both, external and domestic sources. These borrowing
activities need to be guided by internationally recognized framework for developing a
debt management strategy while ensuring that the public debt remains within
sustainable levels.
In Ethiopia there is a clear coordinating mechanism at the political and technical levels
as well as legislation and implementation circulars defining the parameters for debt
contraction, guarantees and servicing. The existence of a clear legal framework is an
important enabling element for formulating a debt management strategy.
To this effect, this (2016-2020) Medium Term Debt Management Strategy (MTDS),
designed by the Ministry of Finance with the technical support of the International
Monetary Fund (IMF) and a World Bank team provides a framework for developing an
effective public sector debt management strategy that aims to achieve a desired
composition of the public sector debt portfolio that reflects a cost-risk analysis and
captures the government‟s preferences with regard to the cost-risk trade-off.
The objectives of the strategy remains two-fold: to raise resources through borrowing
to meet central government budgetary requirements at minimum cost and prudent level
of risk; and to promote the development of domestic debt markets. Potential sources of
financing from abroad were identified by focusing from concessional sources, and
strategies were designed in order to ensure that funding plans are achieved while
minimizing the possible impact on the costs and risks of the debt portfolio.
This MTDS guided the past several years central government borrowing and providing
guarantee to state owned enterprises in the medium term while providing a path for
sustainable level of debt over the medium term. Accordingly, the Governments‟ fiscal
strategies were geared towards maintaining a sustainable level of debt.

14 Annual Public Sector Debt Portfolio Report For the Year 2017/18 No.19
Moreover, the governments has put in place a robust system for monitoring and closely
following up mechanism in order to maintain the transparency and accountability of
public borrowing so that it is possible to ensure the level of public debt is consistent
with the overall fiscal framework aimed at safeguarding macro-economic stability over
the medium term.
The implementation of this strategy in the past several years including 2018 has led to
some mixed results in the costs and risks factors associated with the debt portfolio.
Accordingly, the Average Time to Maturity (ATM) of the public debt portfolio declined,
the share of debt portfolio requiring refixing in one year increased, government
exposure to debt denominated in foreign currency also increased and the proportion of
debt maturing in a year increased.
The government has been taking appropriate measures to improve the debt situation of
the country including curtailing borrowing from non-concessional sources. The measure
underway with MoF leadership will lessen the burden of public debt both at the national
level so as not to undermine economic growth.

15 Annual Public Sector Debt Portfolio Report For the Year 2017/18 No.19
4. Development of the Debt Portfolio in 2018
The total public and publicly guaranteed debt for FY 2017/18 rose to 49.8% (in NP
terms) GDP of which 25.5% is external and 24.3% domestic. When we looked at the
past five years trends in detail total public debt outstanding (external and domestic),
which was USD 26,357.67 million in 2013/14 has significantly increased to USD
49,361.60 million (1.35 trillion ETB) in 2017/18.
In the last five years the volume of debt stock increased by 87.3%. The major reason
for this increment in the stock of public debt was an increase in disbursement from both
external and domestic sources.
The average increment of total public sector debt during the observation period was
17.2% per annum the highest increment being recorded in 2014/15 where the
Eurobond was issued and the highest disbursement recorded from non-concessional
external sources for SOEs to finance the mega infrastructure projects.
The exchange rate variation between 2013/14 and 2017/18 also have an impact on the
change of stock of total public debt among the periods. The table below sets out the
composition of the total debt for the period 2014/15-2017/2018.

16 Annual Public Sector Debt Portfolio Report For the Year 2017/18 No.19
4.1 External Debt
External Debt Outstanding:- Ethiopia‟s external debt stock which stood at US$
23,421.04 million as of June 30, 2017 rose to 25,908.80 million by end June 2018. The
increase of 10% in the external debt stock in 2017/18 is partly attributable to larger
than planned net resource flows resulting from external project loans disbursement.
The outstanding external debt in 2013/14 was USD 14,034.76 million and then the
stock during the last five years has increased to USD 25,908.60 million in 2017/18. The
increment in nominal terms within five years (2013/14 – 2017/18) was about USD
11,873.84 million which was about 85% of the stock in the 2013/14. The outstanding
debt as at June 30, 2018 was higher than that of the preceding year by 10.6%. This is
Table 1
TOTAL PUBLIC DEBT OUTSTANDING 2013/14 - 2017/18
In Million USD
2013/14 2014/15 2015/16 2016/17 2017/18
USD % USD % USD % USD % USD %
Total Public
Debt
26,357.68 100.00 34,055.96 100.00 39,310.62 100.00 45,797.01 100.00 49,361.60 100.00
External Debt
Total
14,034.76 53.25 18,636.23 54.72 21,342.44 54.29 23,421.04 51.14 25,908.60 52.49
Central
Government 8,388.30 31.82 9,983.94 29.32 11,580.45 29.46 12,980.32 28.34 14,742.12 29.87
State
Owned
Enterprises
5,646.46 21.42 8,652.29 25.41 9,761.99 24.83 10,440.72 22.80 11,166.48 22.62
Domestic Debt
Total 12,322.91 46.75 15,419.73 45.28 17,968.18 45.71 22,375.97 48.86 23,453.00 47.51
Central
Government 5,489.73 20.83 6,671.97 19.59 7,671.05 19.51 10,319.89 22.53 11,037.99 22.36
State
Owned
Enterprises
6,833.19 25.92 8,747.76 25.69 10,297.13 26.19 12,056.08 26.33 12,415.01 25.15

17 Annual Public Sector Debt Portfolio Report For the Year 2017/18 No.19
mainly attributed to new disbursements from IDA, Exim-Bank of China, as well as
borrowings by SOE‟s from commercial and suppliers creditors during the year indicated.
4.1.1 External Debt Outstanding by Major Creditors Groups
Out of the total external debt outstanding as at June 30, 2018 USD 19,099.71 million
(73.7%) was owed to official creditors, of which 55% was owed to multilateral and 45
% to bilateral creditors. The rest 26.3% was owed to private creditors, which constitute
commercial banks and suppliers.
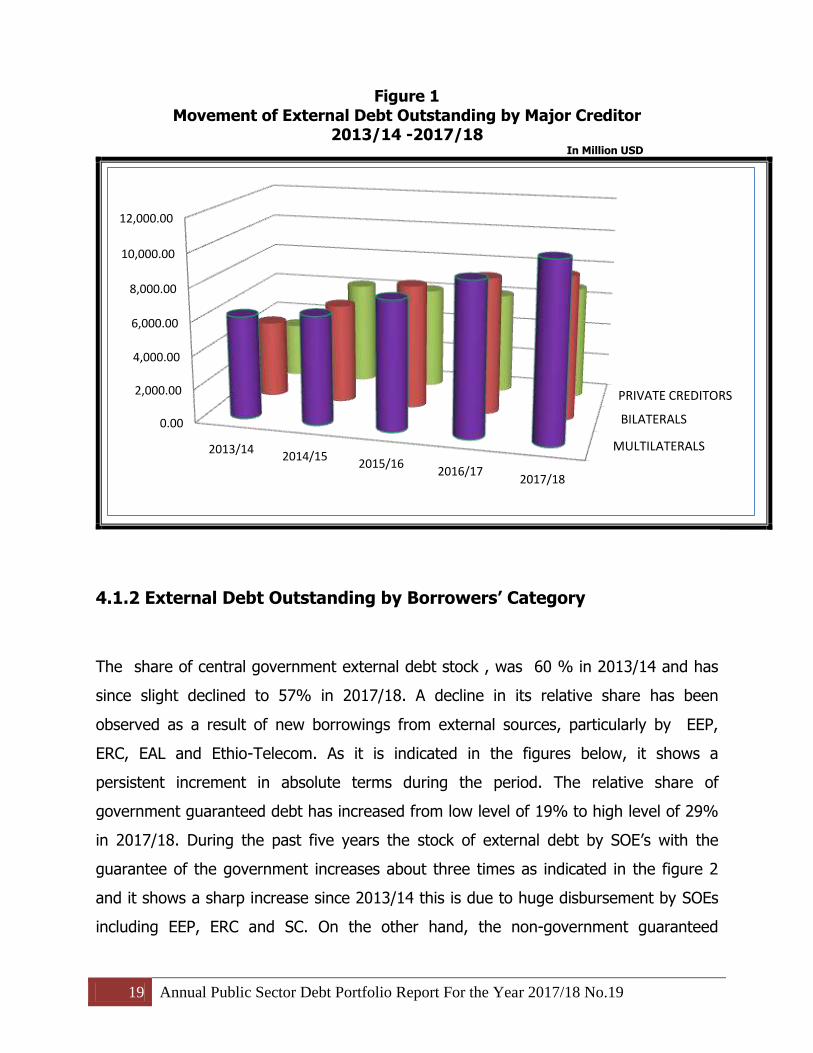
Between 2013/14 and 2017/18 the relative share of multilateral creditors has slightly
declined while the relative share of bilateral and private creditors increased as most of
the SOEs owed debt are sourced from Bilateral creditors primarily China and other
private creditors. Currently, out of the total external debt, creditors from China (Exim-
Bank of China , CDB ,ICBC,ZTE , Hawei etc.) take the top share followed by IDA as the
major creditors, with 34% and 30% of the total external debt outstanding owed to
those creditors respectively.
Multilateral Creditors:- The external debt stock owed to the multilateral financial
institutions, which was USD 6,155.01 million in 2013/14 has steadily increased
throughout the period and reached to USD 10,501.63 million in 2017/18 constituting
an average growth rate of 14%. This portion of debt, currently represents 40% of the
total external debt stock. Among the multilateral creditors, IDA is still the dominant
institution in terms of volume, making up almost 76% of the group and 30 % of the
total External debt stock, followed by AfDF contributing 18 % of the group and 7 %
the total debt stock.
Bilateral creditors:- The external debt stock owed to bilateral creditors has on
average increased by 17 % per annum throughout the observation period. It has
exhibited almost a two-fold increase compared to the year 2013/14 and in 2017/18 it
amounted to USD 8,598.08.This was mainly attributed to increment in disbursement
from the non-Paris club creditors specially from Exim-Bank of China.
18 Annual Public Sector Debt Portfolio Report For the Year 2017/18 No.19
Paris Club Creditors: - The debt owed to the Paris Club creditors as at June 30, 2018
amounted to USD 546 million. The share of the debt outstanding of this group is
relatively very small and it shows very minimal change during the observation period. In
recent years only Italy and France are the only official creditors from the group that
provide concessional loans.
Non-Paris Club Creditors: The debt owed to the non-Paris Club creditors has
steadily increased from its level of USD 4,110.52 million in 2013/14 to USD 8,052.09
million in 2017/18. The average increase over the period was about 18 % and this was
mainly due to an increase in new disbursements from different commercial creditors for
EEP and ERC.
Private Creditors:- Private creditor outstanding, which was USD 3,278.15 million as at
June 30, 2014, has steadily increased through the observation period and reached to
USD 6,808.90 million in 2017/18. The reason for this rise is mainly due to new
disbursements for Ethio-Telecom, suppliers‟ credits to EEP and ERC and new aircrafts
purchase by EAL.
19 Annual Public Sector Debt Portfolio Report For the Year 2017/18 No.19
Figure 1 Movement of External Debt Outstanding by Major Creditor
2013/14 -2017/18 In Million USD
MULTILATERALS
BILATERALS
PRIVATE CREDITORS
0.00
2,000.00
4,000.00
6,000.00
8,000.00
10,000.00
12,000.00
2013/142014/15
2015/162016/17
2017/18
4.1.2 External Debt Outstanding by Borrowers’ Category
The share of central government external debt stock , was 60 % in 2013/14 and has
since slight declined to 57% in 2017/18. A decline in its relative share has been
observed as a result of new borrowings from external sources, particularly by EEP,
ERC, EAL and Ethio-Telecom. As it is indicated in the figures below, it shows a
persistent increment in absolute terms during the period. The relative share of
government guaranteed debt has increased from low level of 19% to high level of 29%
in 2017/18. During the past five years the stock of external debt by SOE‟s with the
guarantee of the government increases about three times as indicated in the figure 2
and it shows a sharp increase since 2013/14 this is due to huge disbursement by SOEs
including EEP, ERC and SC. On the other hand, the non-government guaranteed

20 Annual Public Sector Debt Portfolio Report For the Year 2017/18 No.19
external debt stock contracted by, Ethio –telecom and EAL showing an increment of
about 20 % between 2013/14 and 2017/18 then after it remains flat.
Figure 2 Public Sector External Debt Outstanding by Borrower Category
2013/14 -2017/18
Million USD
-
2,000.00
4,000.00
6,000.00
8,000.00
10,000.00
12,000.00
14,000.00
16,000.00
2013/14 2014/15 2015/16 2016/17 2017/18
Central Government Gov.Guaranteed Non-Gov. Guaranteed
4.1.3 Public Sector External Debt Outstanding by Contracting Currency
Out of the total debt outstanding in 2017/18, 61%, 32 %, and 4% was denominated in
USD, SDR and EURO, respectively, while the remaining 3% was denominated in
various currencies including Japanese Yen, Kuwaiti Dinar and Chinese Yuan (CNY).
During the review period, the relative share of Euro denominated debt has declined
from 6% in 2013/14 to 4 % in 2017/18. While the relative share of all other currencies,
particularly of USD, has increased between 2013/14 and 2017/18. The share of USD
denominated debt has increased and reached more than 61 %, as most of the new
disbursement for the EEP, EAL, ERC, SC and Ethio Telecom are denominated in USD.

21 Annual Public Sector Debt Portfolio Report For the Year 2017/18 No.19
Figure 3 PUBLIC SECTOR EXTERNAL DEBT OUTSTANDING
BY CURRENCY COMPOSITION (2013/14 – 2017/18)
22 Annual Public Sector Debt Portfolio Report For the Year 2017/18 No.19
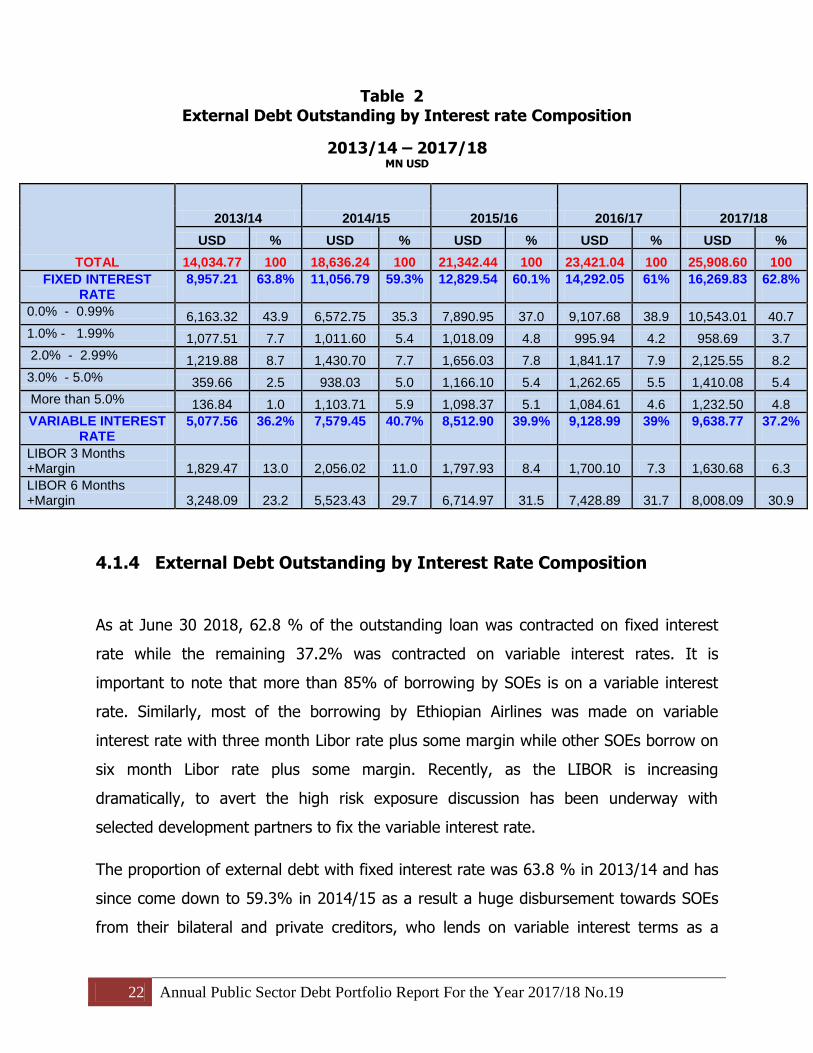
Table 2
External Debt Outstanding by Interest rate Composition
2013/14 – 2017/18
MN USD
TOTAL
2013/14 2014/15 2015/16 2016/17 2017/18
USD % USD % USD % USD % USD %
14,034.77 100 18,636.24 100 21,342.44 100 23,421.04 100 25,908.60 100
FIXED INTEREST RATE
8,957.21 63.8% 11,056.79 59.3% 12,829.54 60.1% 14,292.05 61% 16,269.83 62.8%
0.0% - 0.99% 6,163.32 43.9 6,572.75 35.3 7,890.95 37.0 9,107.68 38.9 10,543.01 40.7
1.0% - 1.99% 1,077.51 7.7 1,011.60 5.4 1,018.09 4.8 995.94 4.2 958.69 3.7
2.0% - 2.99% 1,219.88 8.7 1,430.70 7.7 1,656.03 7.8 1,841.17 7.9 2,125.55 8.2
3.0% - 5.0% 359.66 2.5 938.03 5.0 1,166.10 5.4 1,262.65 5.5 1,410.08 5.4
More than 5.0% 136.84 1.0 1,103.71 5.9 1,098.37 5.1 1,084.61 4.6 1,232.50 4.8
VARIABLE INTEREST RATE
5,077.56 36.2% 7,579.45 40.7% 8,512.90 39.9% 9,128.99 39% 9,638.77 37.2%
LIBOR 3 Months +Margin 1,829.47 13.0 2,056.02 11.0 1,797.93 8.4 1,700.10 7.3 1,630.68 6.3
LIBOR 6 Months +Margin 3,248.09 23.2 5,523.43 29.7 6,714.97 31.5 7,428.89 31.7 8,008.09 30.9
4.1.4 External Debt Outstanding by Interest Rate Composition
As at June 30 2018, 62.8 % of the outstanding loan was contracted on fixed interest
rate while the remaining 37.2% was contracted on variable interest rates. It is
important to note that more than 85% of borrowing by SOEs is on a variable interest
rate. Similarly, most of the borrowing by Ethiopian Airlines was made on variable
interest rate with three month Libor rate plus some margin while other SOEs borrow on
six month Libor rate plus some margin. Recently, as the LIBOR is increasing
dramatically, to avert the high risk exposure discussion has been underway with
selected development partners to fix the variable interest rate.
The proportion of external debt with fixed interest rate was 63.8 % in 2013/14 and has
since come down to 59.3% in 2014/15 as a result a huge disbursement towards SOEs
from their bilateral and private creditors, who lends on variable interest terms as a
23 Annual Public Sector Debt Portfolio Report For the Year 2017/18 No.19
result the outstanding debt with variable interest rate has increased but in late years
the percentage share of variable interest rate has declined continuously.
Out of the total debt outstanding in 2017/18, about 45 % carries interest rates below
2.0%.
Figure 3
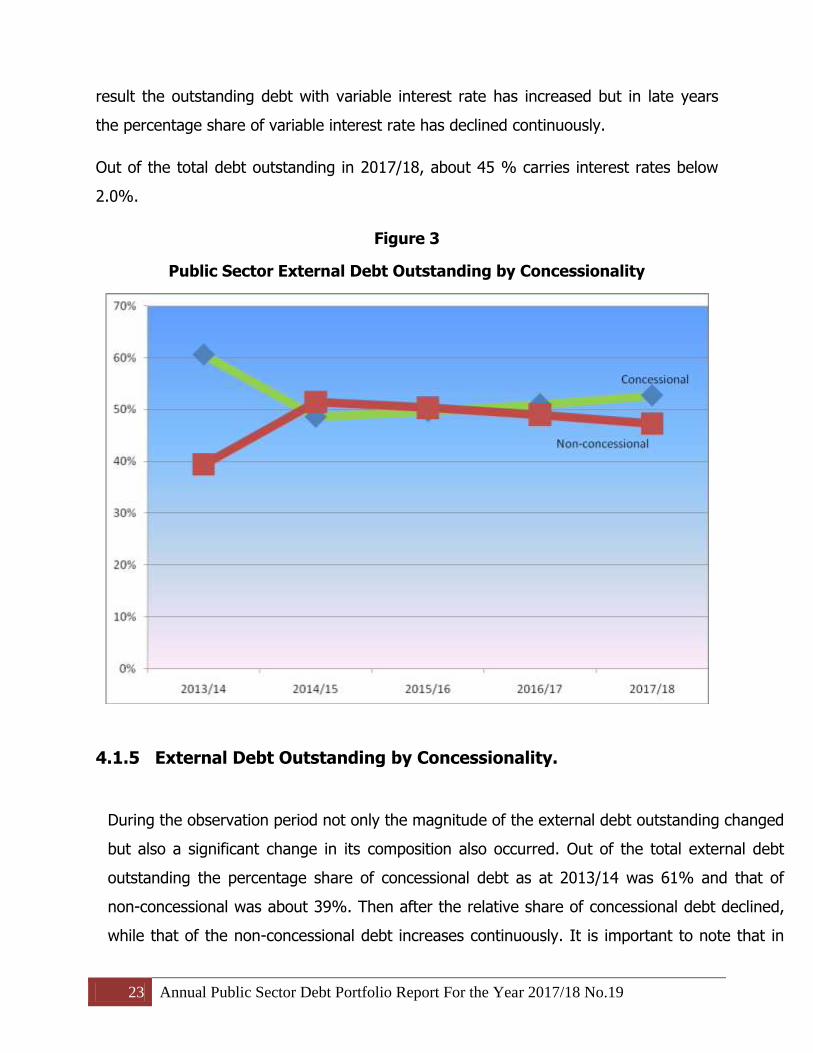
Public Sector External Debt Outstanding by Concessionality
4.1.5 External Debt Outstanding by Concessionality.
During the observation period not only the magnitude of the external debt outstanding changed
but also a significant change in its composition also occurred. Out of the total external debt
outstanding the percentage share of concessional debt as at 2013/14 was 61% and that of
non-concessional was about 39%. Then after the relative share of concessional debt declined,
while that of the non-concessional debt increases continuously. It is important to note that in
24 Annual Public Sector Debt Portfolio Report For the Year 2017/18 No.19
2014/15 the share of non-concessional debt increased markedly due to the issuance of
Eurobond and higher disbursement to SOEs from commercial creditors. The relative share of
concessional loan out of total external public debt is about 53 %, this could be explained partly
by the recent measure taken by the government towards decreasing borrowing from non-
concessional sources.
4.1.6 New Commitments from External Sources
During the past five year, which coincide with the last two years of GTP I and the first
three years of GTP II, the total amount of external loans contracted from multilateral,
bilateral and private creditors amounted to USD 18,419.87 million of which 67% for the
central government and the remaining 33% for SOEs to implement various mega
projects .
The commitments from multilateral source mostly contracted from IDA and ADF, with
highly concessional terms while the majority of bilateral were secured from the
concessional and non-concessional windows of Exim-Bank of China. On the other hand
the external debt commitments from the private creditors are mostly from suppliers of
China, and commercial creditors of EAL and the debut Eurobond issued in 2014.
External new loan commitment has displayed an increment, particularly during 2014/15
and started to decline since 2015/16 that is due to decline in new commitment by SOEs
from their non-concessional bilateral, commercial and supplier‟s creditors.
As depicted in the Table 3 below, about 47%, 26% and 27% of the committed amount
in the past five years was from multilaterals, bilateral and private creditors respectively.
IDA is the dominant development partner for the country in the past five years. The
total outstanding for this development partners is about USD 7,199.44 million of which
more 39% of the total external outstanding during the period. Of course, AfDF
contribution is about 8% and the remaining is from other bilateral ODA loans. This
shows that about half of the borrowings in the past five years are made from highly
concessional sources.

25 Annual Public Sector Debt Portfolio Report For the Year 2017/18 No.19
Table 3 New External Debt Commitment by Creditors MNUSD
CREDITOR 2013/14 2014/15 2015/16 2016/17 2017/18
CENTRAL GOVERNMENT 2,918.69 1,681.63 2,360.15 2,835.17 1,585.09
MULTILATERAL 1,877.90 1,544.20 2,161.42 1,410.25 1,501.53
ADF 129.02 131.51 254.83 37.92 86.77
ADB 76.11 104.61 EIB 42.40 77.79 IDA 1,630.55 1,374.69 1,773.27 1,006.17 1,414.76
IFAD 85.33
14.81 98.76 BADEA 10.00 13.00 0.00 35.00 OFID 23.00 25.00 0.00 50.00
BILATERAL 1,040.79 137.43 198.73 1,424.92 83.56
NON-PARIS CLUB 944.54 50.00 127.35 1,348.49 GOVERNMENT OF CHINA 23.96 0.00 0.00
GOVERNMENT OF JAPAN
0.00 0.00 48.60 SAUDI FUND 12.00 0.00 0.00
EXIM-BANK OF KOREA 100 0.00 127.35
EXIM-BANK OF CHINA 758.58 0.00 1,299.89 GOV. OF POLAND 50.00 50.00
PARIS CLUB 96.25 87.43
71.38 76.43 GOV. OF FRANCE (AFD) 96.25 62.83 22.06 49.16 83.56
GOV. OF ITALY
24.60 49.32 27.27 BOND HOLDERS
1,000.00
STATE OWEND ENTERPRISE 1,379.50 2,012.19 880.29 722.58 1,044.58
MULTILATERAL
152.83 0.00
ADB
152.83 0.00
BILATERAL 1,175.26 0.00 580.00 0.00 171.22
NON-PARIS CLUB 1,080.00 0.00
580.00 0.00 171.22
CHINA DEVELOPMENT .BANK 580.00 0.00
30.00 0.00 0.00
EXIM-BANK OF CHINA NON-CONCESSIONAL 500.00 0.00 0.00 171.22
IDUSTRIAL AND CONSTRUCTION BANK OF CHINA
550.00 0.00 0.00
PARIS CLUB 95.26 0.00 0.00 0.00 0.00
GOV. OF FRANCE (AFD) 95.26 0.00
0.00 0.00
PRIVATE CREDITORS 204.24 2,012.19 300.29 563.75 873.36
ZTE 28.49 0.00 0.00 ERICSSON 400 0.00 HUAWEI 34.04 0.00
JP MORGAN BANK 335.17
EXPORT CREDIT BANK OF TURKEY 300.00 CREDIT SUISSE AG 865 466.45
CHINA ELECTRIC POWER
74.81 74.49 UNICREDIT
402.76
KFW
37.21 0.00 TD SECURITIES (USA) 141.72
BANK HAPOALIN B.M. (ISRAEL)
225.8 STANDARD BANK OF SOUTH AFRICA
97.30
VARIOUS CREDITOR OF EAL
470.60
GRAND TOTAL 4,298.19 4,693.82 3,240.44 3,557.75 2,629.67

26 Annual Public Sector Debt Portfolio Report For the Year 2017/18 No.19
The chart below shows average loan terms and the average grant element of total
external debt contracted in the past five years shows about 31% grant element which is
lower than the IMF 35% benchmark. But the grant element for the central government
which constitutes 67% of the total new borrowing from external source in the past five
years was about 43% which is well above the IMFs concessionality bench mark.
Figure 4 Average Loan Terms of External Public Debt
(2013/14 – 2017/18)
4.1.6 External Debt Disbursements in the Period
The external debt accumulation increased by 19.2% in the period. When we look at the
trends the external debt accumulation in sum increased to the level of USD 19,152.40
million. It showed an average annual growth rate of about 11.6%. During 2014/15
there was the highest external debt disbursement (USD 5,945 million) that has been
recorded in the debt data of the country. This was mainly associated with significant

27 Annual Public Sector Debt Portfolio Report For the Year 2017/18 No.19
disbursements from bilateral and private creditors including issuance of USD 1 billion
Eurobond.
Out of the total amount USD 3,510.96 million disbursed in 2017/18, about 61% were
from official creditors while the remaining balance 39% was from the private creditors.
The beneficiary of the disbursement of external loans during 2017/18 was central
government with 52% and the remaining 48% was for SOE‟s.
4.1.7 External Debt Disbursement by Major Creditors
Out of the total disbursement during the fiscal year of 2017/18, USD 1,434.33 million
(41%) was from multilaterals sources while USD 702.03 million (20%) was from
bilateral creditors with the balance 39% coming from commercial banks and suppliers.
During 2017/18 the largest disbursement was obtained from IDA and creditors from
China making up 33 % and 17 % of total external debt disbursement respectively.
Figure 5 Gross Disbursement by Major Creditor
2013/14-2017/18

28 Annual Public Sector Debt Portfolio Report For the Year 2017/18 No.19
4.1.8 Disbursement by Economic Sector
In the last five-year period, the largest proportion of the disbursed resource was
allocated to highway and railway transport infrastructure (30.9%) followed by
electricity gas and steam (17.8%), air transport and telecommunication, disbursement
to Ethio-telecom and EAL (16.8%) sector, the major being sugar sector (12.41%),
agriculture 8.7% and basic services (5.1%). This shows that the external resource
inflow allocation mainly for the development of infrastructure so as to enhancing
expansion and ensuring quality of the infrastructural capital of the country as stipulated
in both GTP I and II.
Table 4 Disbursement by Major Economic Sector
2013/14 -2017/18
Economic Sector
2013/14 2014/15 2015/16 2016/17 2017/18 P
USD % USD % USD % USD % USD %
TOTAL 3,226.34 100 5,945.26 100 3,523.73 100 2,946.40 100 3,510.95 100
Agriculture 292.19 9.06 109.60 1.6 502.42 14.26 519.76 17.64 237.80 6.77
Financial Sector 6.95 0.22 0 0 30.0 0.85
-
Transport &
806.19 24.99 1,428.69 49.31 138.45 3.93
272.48
9.25 Communication 581.43 16.56
Highway & Railway Transport –
Infrastructure 980.04 30.38 1,784.83 5.54 1,597.77 45.34 823.51 27.95 731.72 20.84
Electricity, Gas & Steam 457.57 14.18 951.37 17.25 509.73 14.47 504.47 17.12 993.74 28.30
Industry & Tourism 159.26 4.94 1,142.41 17.93 387.53 11.00 422.99 14.36 255.82 7.29
Education &
Capacity Building 58.13 1.80 15.13 0.24 27.47 0.78 106.93 3.63 134.44 3.83
Health 6.87 0.21 26.72 0.42 5.40 0.15 6.55 0.22 74.58 2.12
Public and Social Admin 91.83 2.85 170.28 2.67 90.65 2.57 104.39 3.54 120.42 3.43
Water Works &
Supply 82.78 2.57 80.96 1.51 121.96 3.46 94.09 3.19 125.35 3.57
PBS 284.54 8.82 225.46 3.54 112.36 3.19 91.25 3.10 255.63 7.28

29 Annual Public Sector Debt Portfolio Report For the Year 2017/18 No.19
4.1.9 External Debt and Undisbursed Balances
As at the end of June 2018, the undisbursed balance from external loan commitments
was USD 9,939.29 million of which IDA and AfDB have very large undisbursed
balances, amounting to USD 4,275.88 million (43 %) and USD 663.51 million (7%),
respectively. Undisbursed amount from different Chinese Banks including Exim-Bank
China, CDB, ICBC and Government of China) is the second highest and was about USD
2,651.26 million (27.37%). The accumulation of undisbursed balance for creditors such
AfDB, Exim-Bank of China, Exim-Bank of India, Exim-Bank of Korea and AFD needs
strict follow up because the delay of projects financed by these creditors may entail
extra commitment fee payments.
Figure 6 Undisbursed Balance Total Public External Debt
As at 30/06/2018

30 Annual Public Sector Debt Portfolio Report For the Year 2017/18 No.19
4.1.10 External Debt Service
Total external debt service that have been effected in the last five years amounted to
USD 5,662.73 million . Out of the total external debt service payment only USD
1,278.36 million (23%) is central government‟s payments to its multilateral and bilateral
creditors while the remaining 77% payment was done by SOEs to their respective
creditors. The total public sector debt service during the past five years shows an
average annual growth rate of 24%, for this big overall annual growth in debt service
payments the share of SOEs debt service payments for the respective . Out of the total
Debt Service payment effected in the past five years 72% is made for principal and the
remaining 28 % for interest, commitment fees and other Payments.
Figure 7 External Debt Service Payment
2013/14 - 2017/18 (In Million USD)

31 Annual Public Sector Debt Portfolio Report For the Year 2017/18 No.19
Total external debt service payment in 2017/18 amounted to USD 1,575.21 Million (ETB
41,802.61 million) of which principal payment was USD 1,132.74 million (72%) while
the payment for interest and commission was USD 442.47 million (28%) during
2017/18. As a result of the ETB devaluation against USD in October 2017, the external
debt service in terms of ETB has risen significantly. As indicated in the Figure 8, the
general trend in debt service payment show significant increase throughout the
observation period.
Figure 8 External Debt Service Payment by Principal and Interest
2013/14 - 2017/18

32 Annual Public Sector Debt Portfolio Report For the Year 2017/18 No.19
4.1.11 Net Resource Flows & Net Transfers
Net Resource Flows
During the last five years net resource flows, gross disbursement less amortization
(Disbursement minus Principal Payments), was positive with relatively higher
magnitude. It implies that the disbursement from external creditors towards projects is
much higher than matured principal payments to the creditors throughout the period.
In particular the central government net resource flows is bigger than that of the other
public sectors except in 2014/15, where there was a huge disbursement for SOEs from
various creditors. The net resource flows on behalf of the SOEs shows a declining trend,
as most of the ongoing projects are in final stages, thus the level of new disbursement
is declining from time to time and some of the SOEs have also started to repay their
debt. On the other hand, the net resource flows towards government especially from
multilateral sources shows an increasing trend in the observation period. Over the
observation period, however, there was an average increase of 8.7% per annum in net
inflow as a result of an increase in drawings from multilaterals, non-Paris clubs creditors
commercial banks and suppliers. The net flow from private creditors in the past two
years was negative this is due to a relatively lower new disbursement compared to the
size of amortization to private creditors.
33 Annual Public Sector Debt Portfolio Report For the Year 2017/18 No.19
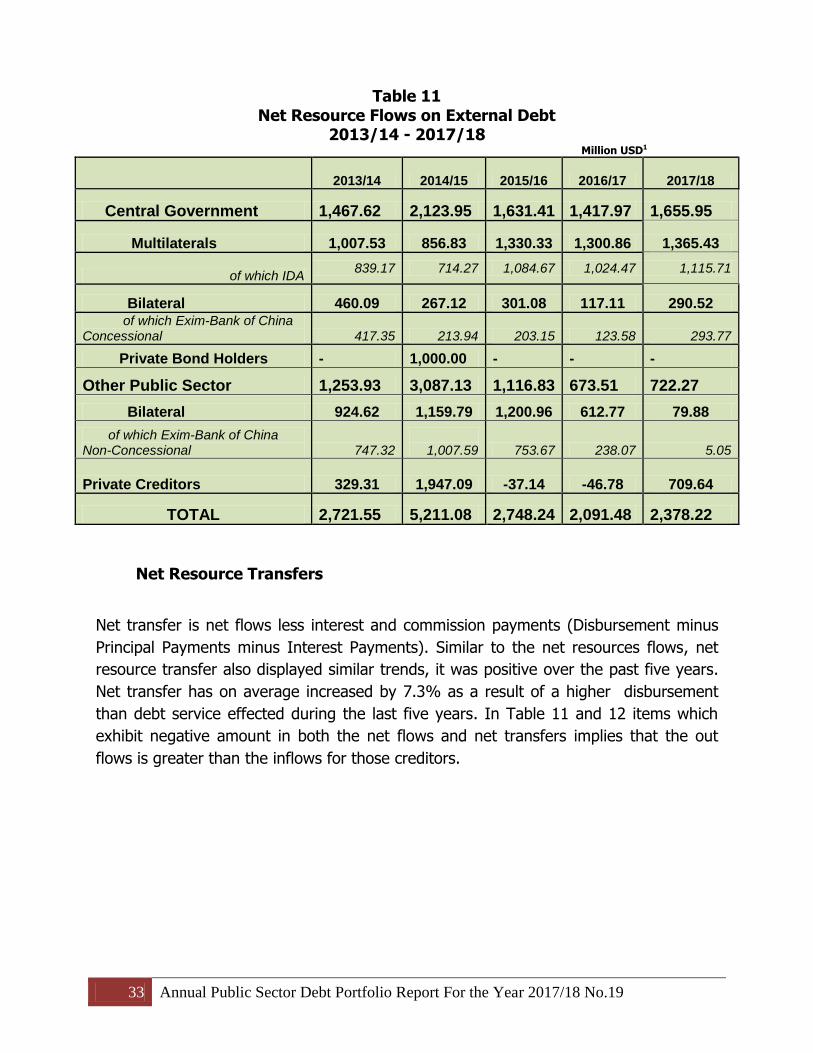
Table 11 Net Resource Flows on External Debt
2013/14 - 2017/18 Million USD1
2013/14 2014/15 2015/16 2016/17 2017/18
Central Government 1,467.62 2,123.95 1,631.41 1,417.97 1,655.95
Multilaterals 1,007.53 856.83 1,330.33 1,300.86 1,365.43
of which IDA 839.17 714.27 1,084.67 1,024.47 1,115.71
Bilateral 460.09 267.12 301.08 117.11 290.52 of which Exim-Bank of China Concessional 417.35 213.94 203.15 123.58 293.77
Private Bond Holders - 1,000.00 - - -
Other Public Sector 1,253.93 3,087.13 1,116.83 673.51 722.27
Bilateral 924.62 1,159.79 1,200.96 612.77 79.88
of which Exim-Bank of China Non-Concessional 747.32
1,007.59 753.67 238.07 5.05
Private Creditors 329.31 1,947.09 -37.14 -46.78 709.64
TOTAL 2,721.55 5,211.08 2,748.24 2,091.48 2,378.22
Net Resource Transfers
Net transfer is net flows less interest and commission payments (Disbursement minus
Principal Payments minus Interest Payments). Similar to the net resources flows, net
resource transfer also displayed similar trends, it was positive over the past five years.
Net transfer has on average increased by 7.3% as a result of a higher disbursement
than debt service effected during the last five years. In Table 11 and 12 items which
exhibit negative amount in both the net flows and net transfers implies that the out
flows is greater than the inflows for those creditors.

34 Annual Public Sector Debt Portfolio Report For the Year 2017/18 No.19
Table 12 Net Resource Transfers on External Debt
2013/14 - 2017/18 Million USD1
2013/14 2014/15 2015/16 2016/17 2017/18
Central Government 1,391.37 2,004.57 1,470.23 1,246.38 1,461.99
Multilaterals 964.06 811.19 1,277.43 1,239.97 1,292.52
Out of which IDA 813.12 684.60 1,049.89 983.54 1,064.26
Bilateral 427.30 226.50 259.05 72.66 235.72 Out of which Exim-Bank of China Concessional 398.97 191.38 174.58 90.07 254.66
Private Bond Holders - 1,000.00 - - -
Other Public Sector 1,170.55 2,987.57 1,013.45 514.25 580.62
Bilateral 908.87 1,104.93 1,110.88 640.69 -41.22 Out of which Exim-Bank of China Non-Concessional 733.64 969.02 680.06 143.13 -71.52
Private Creditors 261.67 1,862.90 -144.42 -177.76 568.41
TOTAL 2,561.91 4,952.65 2,389.70 1,658.00 1,935.74
4.2 DOMESTIC DEBT
The total domestic debt comprises of five instruments namely; direct advance, treasury
bills, government bonds for central government and corporate bonds, long term and
short term loans for SOEs. Government uses direct advance and Treasury Bills to fill the
budget gap. It is important to note that domestic debt market is not well developed and
as a result Direct Advance (DA) which is the National Bank of Ethiopia overdraft facility
that the government is used as a residual to fill the budget gap. The uses of direct
advance become reasonable when government is not able to sell enough Treasury Bill
because of low demand, to fill the budget financing gap. Treasury Bills are sold through
auctions, and do have four different maturities: 28 days, 91 days, 182 days and 364
days.

35 Annual Public Sector Debt Portfolio Report For the Year 2017/18 No.19
The government usually issues Government Bonds when there is a need to convert
short-term borrowings of Central Government and bad debts owed by public enterprises
into long-term instruments. Most of the Government Bonds are non-interest bearing.
SOEs issue corporate bonds mostly to CBE to finance mega projects and borrow also
long term and short term loans contracted from CBE and DBE.
4.2.1 Total Domestic Debt Outstanding
Total domestic debt, comprising of the above three instruments of Central government
and bonds and loans of SOE‟s, has shown an average increase of 27.7% per annum
and has rose from its level of ETB 241,246.94 million in 2013/14 to ETB 639,377.99
million in 2017/18.
The relative share of the stock of central government bonds, compared to other
instruments, has declined up to 2015/16 and shows tremendous increases in 2016/17.
This is mainly attributed to the issuance of new government bond to increase the
capital of Commercial Bank of Ethiopia and Development Bank of Ethiopia. On the other
hand, the relative share of the stocks of Treasury Bills, Direct Advance and SOEs bonds
& loans shows an average growth rate of 27 %, 24 %, and 26 % respectively. The total
stock of domestics debt increased more than 160% over the observation period.

36 Annual Public Sector Debt Portfolio Report For the Year 2017/18 No.19
Figure 11
Movement of Total Domestic Debt Outstanding (2013/14 - 2017/18) in MN ETB
4.2.2 Total Domestic Debt Outstanding by Instruments
Over the observation period there were some changes in the composition and structure
of the domestic debt. The total domestic debt is dominated by borrowings of SOEs
which currently constitute about 52.9 % of the total domestic debt. This tells that
currently SOEs are contracting huge loans to implement mega projects.
In the last fivel years due to increase in the sells of Treasury Bills, its relative share
increased and reached to 17.4% of the total stock of domestic debt. Accordingly,
although direct advance was suspended for one fiscal year (July 8, 2011-July 7 2012) to
arrest inflation, the percentage share of direct advance remains flat and declined to
23.8% in 2017/18. The stock of the corporate bonds of SOEs has the highest share of
the total domestic debt stock followed by direct advance and treasury bills of central
government.

37 Annual Public Sector Debt Portfolio Report For the Year 2017/18 No.19
Table 13 Domestic Debt Outstanding by Instrument Type
(2013/14 - 2017/18) Million ETB
4.2.3 Central Government Domestic Debt Portfolio
The Government to fill its budget deficit uses three instruments to mobilize resources in
the form of loans from domestic sources including Treasury Bills, Direct Advance and
Government Bonds. The first two are short term instrument which are used for deficit
financing while the government bond is usually issued for special purpose like that of
converting short term instrument of central government into long term and acquisition
of bad debt of SOEs during privatization of the enterprise..etc.
Direct Advance
Direct Advance is an overdraft facility from the National Bank of Ethiopia and is used to
cover temporary liquidity problems or financial shortages on daily basis arising when
2013/14 2014/15 2015/16R 2016/17
P 2017/18
P
ETB % ETB % ETB % ETB % ETB %
TOTAL Domestic
241,246.95 100.00 317,120.68 100.00 391,713.54 100.00 517,066.23 100.00 639,377.99 100.00
Total Central Gov. Domestic
107,472.93
44.38
137,215.09
42.58
167,231.89
41.86
238,473.04
45.97
300,918.85
46.67
Government Bonds
10,921.13 4.48 10,345.34 3.20 9,214.39 2.30 37,436.53 7.22 37,140.35 5.75
Treasury Bills 32,286.86 13.33 43,604.80 13.53 57,252.56 14.33 73,271.56 14.12 111,513.56 17.29
Direct Advance
64,264.95 26.16 83,264.95 25.57 100,764.95 25.03 127,764.95 24.50 152,264.95 23.50
Total SOEs Domestic
133,774.01 55.45 179,905.59 56.73 224,481.64 57.31 278,593.15 53.88 338,459.14 52.94
Corporate Bonds
92,400.00 37.61 128,100.00 39.34 160,100.00 39.77 195,000.00 37.39 241,628.11 37.29
Long term loans
41,374.01 17.15 51,805.59 16.34 64,381.64 16.44 83,593.15 16.17 96,831.03 15.14

38 Annual Public Sector Debt Portfolio Report For the Year 2017/18 No.19
government expenditures are greater than cash in the central government‟s treasury
account.
Direct Advance in nominal terms has significantly increased over the observation period.
It has risen from its level of ETB 64,264.95 million in 2013/14 to ETB 152,264.95 million
in 2017/18 and it has double in absolute terms in last five years.
Treasury Bills
Treasury bills are basically means for the government to raise money from the public
for a short period of time and are sold on the basis of weekly auctions. Currently there
are treasury bills of four different maturities of 28, 91, 182 and 364 days. Most of the
time the buyers of the bills are government banks, insurance companies, social Security
securities agencies and other non-financial public enterprises.
The outstanding balance for treasury bills, which was ETB 32,286.63 million in 2013/14
increased to 111,513.56 million in 2017/18. The share of 91 days treasury bills is the
highest in 2017/18; it accounted for 72 %; while the 182, 28 and 364 days bills
accounted for 1.0%, 0.1% and 27% respectively. Accordingly, the stock of Treasury
Bills accounted 17.2% of the total government domestic debt at the end of 2017/18.
The net issuance of treasury bills, as depicted Figure 12, at 2013/14 was ETB 6,352
million after a steady growth up to 2016/17 there was a sharp rise in 2017/18 to ETB
38,242.00 this specially a result of a higher net treasury bill issuance of 90 days and
364 days, to finance the budget gap during the period. The net borrowing from central
bank of Ethiopia in the form of direct advance in the last five years shows an
increasing trends until 2016/17 while for the current year the net borrowing in the form
of Direct Advance is a little lower than the preceding year.

39 Annual Public Sector Debt Portfolio Report For the Year 2017/18 No.19
Figure 12
Net Treasury Bills Issuance and Net Direct Advance Borrowing (2013/14-2017/18)
In Mn ETB
Government Bonds
Government Bonds, represent instruments which have long term maturity (10 years and
more), issued for special purposes rather than being used as a means for filling budget
deficit. The holders of long term bonds among others include the National Bank of
Ethiopia (NBE), the Commercial Bank of Ethiopia, the Development Bank of Ethiopia
(DBE), Public Servants Social Security Agency and Private Organization Social Security
Agency.
The outstanding balance of government bond was Birr 10,921.13 million in 2013/14 and
declined continuously since then reaching ETB 9,214.39 million in 2015/16. As a result
of the issuance of new government bond in 2016/17 for the purpose of increasing the
capital of Commercial Bank of Ethiopia and Development Bank of Ethiopia, the stock of
government bond increases to 37,436.53 million ETB. The average decline throughout

40 Annual Public Sector Debt Portfolio Report For the Year 2017/18 No.19
the past four years was about 8.32% per annum, while increases was three fold in the
last two years of the observation period compared to the preceding years.
4.2.4 State Owned Enterprises Domestic Debt Portfolio
State Owned Enterprises (SOE‟s) borrows from the domestic sources by issuing
corporate bonds as well as long term and short term loans from CBE and DBE. Most of
these borrowings are made with government guarantee. They issue corporate bonds
and loans mostly to CBE to implement mega projects. The domestic debt outstanding
balance of SOEs is ETB 133,774.01 million in 2013/14 and has continuously since then
to reach ETB 338,459.14 million in 2017/18.
Figure 13
Percentage Share of Domestic Debt by Instrument (2013/14 - 2017/18)
In Percent
41 Annual Public Sector Debt Portfolio Report For the Year 2017/18 No.19
4.2.5 Domestic Debt By Holders
The major holders of government domestic securities and lenders to SOEs in Ethiopia
are National Bank of Ethiopia, Social Security Agencies, Development Bank of Ethiopia,
Commercial Bank of Ethiopia and other non-financial public enterprises.
The National Bank of Ethiopia: has been the major holder of government securities
over the last 5 years. Its share from central government domestic debt was 68.2% in
2013/14 and 30.4 % the total domestic debt. However, during subsequent years its
share has continuously declined reaching 53.2% of the central government domestic
debt and 25 % of the total domestic debt in 2017/18. Its holdings are mainly in the
form of direct advance.
The Public Servants Social Security Agency (PSSSA) and Private
Organizations Employees Social Security Agency POSSA): are the second major
holder of government securities and their claims are long-term government bonds and
short term treasury bills. The claim by PSSSA & POSSA has increased from ETB
18,323.06 million in 2013/14 to ETB 78,261.58 million in 2017/18 displaying an
increment of 44% per annum on average. The share of the total government domestic
debt portfolio has increased over the years and reached 12.2 % in 2017/18.
The Development Bank of Ethiopia (DBE): is the third major holder of government
securities and its claims are predominantly treasury bills and long-term government
bonds. The claim by DBE has increased significantly from ETB 11,507.16 million in
2013/14 to ETB 32,796.90 million in 2017/18. This is mainly due to the surge in the
stock of 364 days treasury bills held by DBE.
The Commercial Bank of Ethiopia (CBE): holding of government securities was
insignificant until 2016/17 where the government issued a special bond to raise the
capital of the CBE.
42 Annual Public Sector Debt Portfolio Report For the Year 2017/18 No.19
Others: the other holders of government securities are government insurances
companies and other non- financial public enterprises. The holdings of insurances
companies and other public enterprise are declining over the observation period.
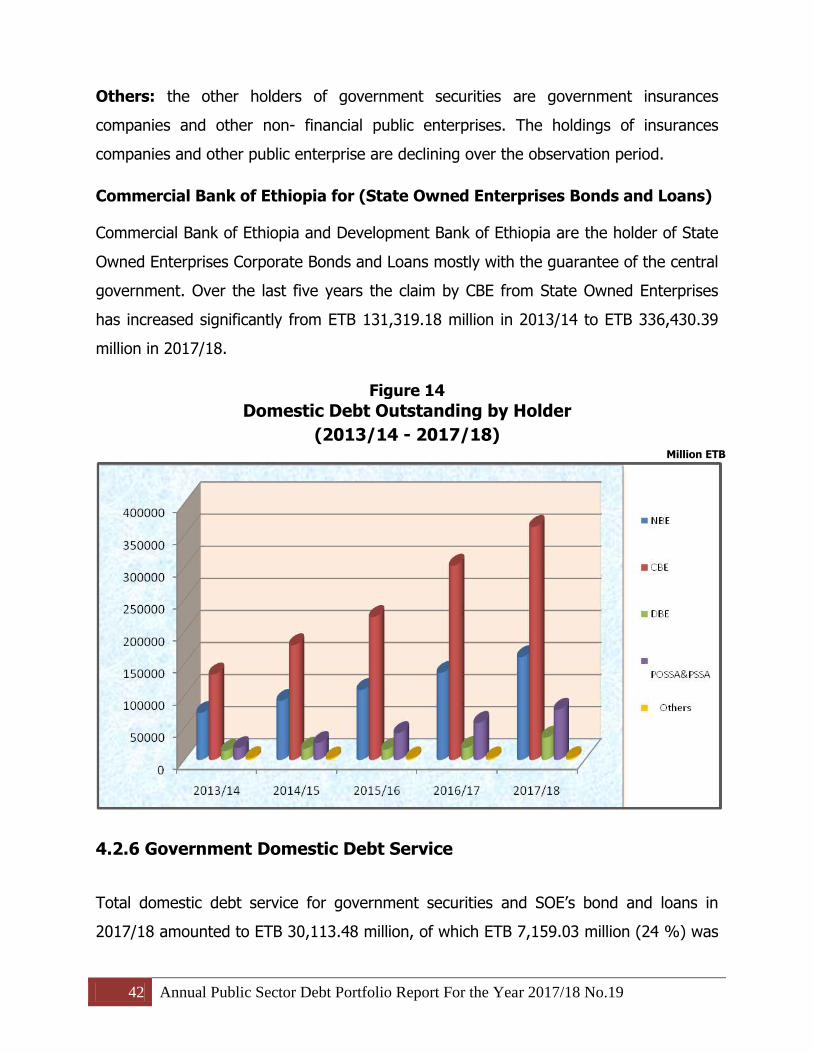
Commercial Bank of Ethiopia for (State Owned Enterprises Bonds and Loans)
Commercial Bank of Ethiopia and Development Bank of Ethiopia are the holder of State
Owned Enterprises Corporate Bonds and Loans mostly with the guarantee of the central
government. Over the last five years the claim by CBE from State Owned Enterprises
has increased significantly from ETB 131,319.18 million in 2013/14 to ETB 336,430.39
million in 2017/18.
Figure 14 Domestic Debt Outstanding by Holder
(2013/14 - 2017/18) Million ETB
4.2.6 Government Domestic Debt Service
Total domestic debt service for government securities and SOE‟s bond and loans in
2017/18 amounted to ETB 30,113.48 million, of which ETB 7,159.03 million (24 %) was
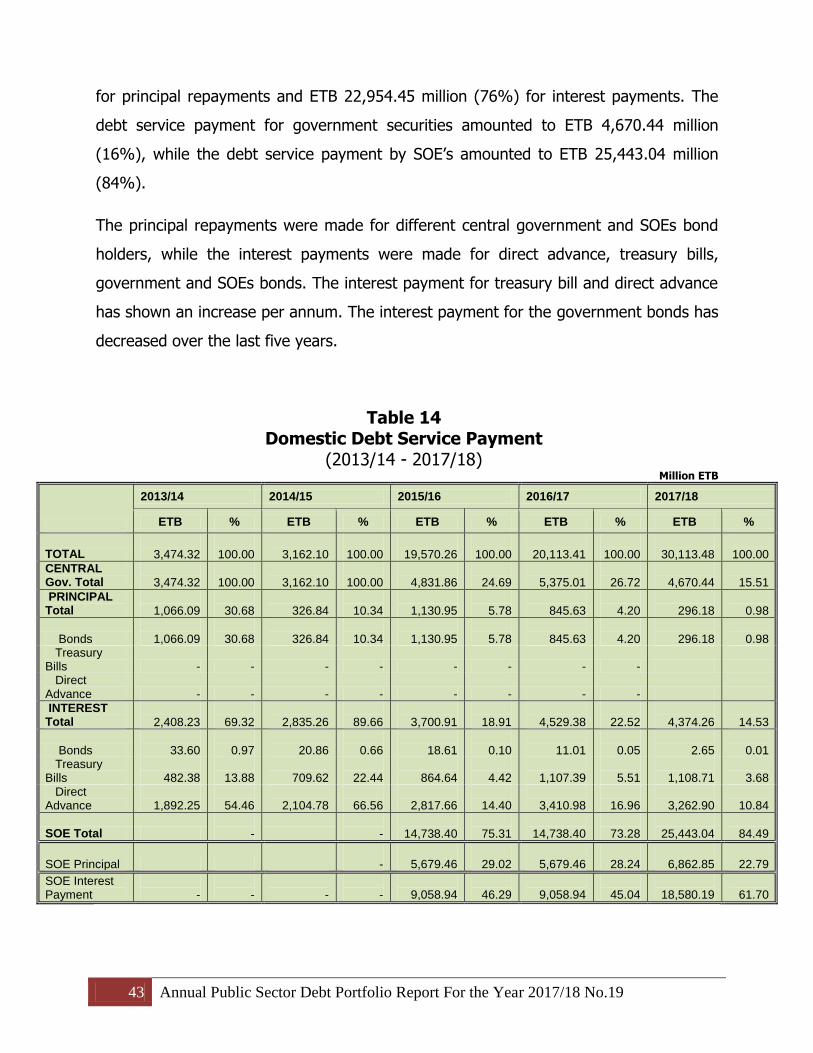
43 Annual Public Sector Debt Portfolio Report For the Year 2017/18 No.19
for principal repayments and ETB 22,954.45 million (76%) for interest payments. The
debt service payment for government securities amounted to ETB 4,670.44 million
(16%), while the debt service payment by SOE‟s amounted to ETB 25,443.04 million
(84%).
The principal repayments were made for different central government and SOEs bond
holders, while the interest payments were made for direct advance, treasury bills,
government and SOEs bonds. The interest payment for treasury bill and direct advance
has shown an increase per annum. The interest payment for the government bonds has
decreased over the last five years.
Table 14 Domestic Debt Service Payment
(2013/14 - 2017/18) Million ETB
2013/14 2014/15 2015/16 2016/17 2017/18
ETB % ETB % ETB % ETB % ETB %
TOTAL
3,474.32
100.00
3,162.10
100.00
19,570.26
100.00
20,113.41
100.00
30,113.48
100.00
CENTRAL Gov. Total
3,474.32
100.00
3,162.10
100.00
4,831.86
24.69
5,375.01
26.72
4,670.44
15.51
PRINCIPAL Total
1,066.09
30.68
326.84
10.34
1,130.95
5.78
845.63
4.20
296.18
0.98
Bonds
1,066.09
30.68
326.84
10.34
1,130.95
5.78
845.63
4.20
296.18
0.98 Treasury Bills - - - - - - - - Direct Advance - - - - - - - -
INTEREST Total
2,408.23
69.32
2,835.26
89.66
3,700.91
18.91
4,529.38
22.52
4,374.26
14.53
Bonds
33.60
0.97
20.86
0.66
18.61
0.10
11.01
0.05
2.65
0.01 Treasury Bills
482.38
13.88
709.62
22.44
864.64
4.42
1,107.39
5.51
1,108.71
3.68
Direct Advance
1,892.25
54.46
2,104.78
66.56
2,817.66
14.40
3,410.98
16.96
3,262.90
10.84
SOE Total
-
-
14,738.40
75.31
14,738.40
73.28
25,443.04
84.49
SOE Principal
-
5,679.46
29.02
5,679.46
28.24
6,862.85
22.79
SOE Interest Payment
-
-
-
-
9,058.94
46.29
9,058.94
45.04
18,580.19
61.70

44 Annual Public Sector Debt Portfolio Report For the Year 2017/18 No.19
5. On-Lending Loans, Guarantees and Contingent Liabilities
Contingent liabilities of the Government represent possible costs to Government arising
from the possible occurrence of events in the future that are not within government‟s
control. These include loan guarantees, warranties, indemnities, uncalled capital and
letters of comfort, together with those contingencies considered remote.
Government has also supported SOEs by providing explicit guarantees to facilitate the
process of securing credit on much softer terms. Government‟s policy on on-lending
and guarantees seeks to recover loans advanced to SOEs for commercially viable mega
projects in order to support economic development of the country.
On Lending Loans
In accordance with the implementation of the Financial Administration Proclamation
government sometimes initiated processes aimed at operationalizing all subsidiary on-
lending agreements entered into between MoF and SOEs to enhance project cash flows
towards debt service payment and reduce the debt burden on the taxpayer. In the past
many years Ministry of Finance has been contracting loans from either external or
domestic sources and in turn lent the proceeds to state-owned enterprises. On- lending
to a SOEs is only applicable and eligible under the following conditions:
The corporation plays a strategic role in economic development endeavor,
Implementing infrastructure mega projects focusing on country‟s potentials,
Has no access to multilateral credits and cannot attract competitive funding; and
Is performing a social project that would be more efficiently executed on behalf
of the government.
Accordingly, the government in the past several years has borrowed loans from both
concessional and non-concessional sources and transferred to selective SOEs to
implement infrastructure projects. As a result, the outstanding debt stock for all on-lent
loans to SOEs increased in the past years.

45 Annual Public Sector Debt Portfolio Report For the Year 2017/18 No.19
Providing Guarantees to SOEs
Some SOEs have been implementing various mega projects that enhance foreign
currency earning as well as supporting the economic development endeavor of the
country. In support of these objectives, the government has continued to supports the
SOEs to implement these projects among others by providing guarantee to secure
finance from domestic as well as external sources. Nowadays, the volume of SOEs
guaranteed debt outstanding has substantially increased thereby putting more risk on
the government in the form contingent liability.
Measures undertaken to avoid any unforeseen contingent liability
occurrences
Recently, to minimize exposure and risks associated with SOEs debt accumulation the
Government has embraced new innovations in financing infrastructure development off
balance sheet without impacting heavily on the debt portfolio. Towards this end
Ethiopia has introduced the framework for raising private financing for public
investments through the Public Private Partnership (PPP) initiatives.
Accordingly, the initiative will focus on two priority areas namely energy sector and
Road sector. All guarantees and other security instruments provided under the PPP,
together with all other contingent liabilities are integrated into the debt management
process. To mitigate the contingent liabilities risks, a close follow up mechanism was
established under the PPP Act to provide good governance framework to manage direct
liabilities and contingent liabilities in all phases of the project cycle.
To achieve h better outcomes in fiscal risk management, the Ministry of Finance is also
placing a lot of emphasis in project financial models, with the view to ensuring
manageable project debt repayment mechanism to avoid any unforeseen contingent
liabilities.
Similarly, the government has issued Public Debt Management and Guarantee Directive
in order to enhance monitoring system and putting in place an organized coordination
46 Annual Public Sector Debt Portfolio Report For the Year 2017/18 No.19
mechanism to avoid any risks associated with the borrowing by SOEs. In addition,
various reforms of SOEs towards finance and corporate governance are underway to
increase efficiency and effectiveness of the enterprises. All these concerted efforts by all
stakeholders will reduce the occurrence of contingent liability.
47 Annual Public Sector Debt Portfolio Report For the Year 2017/18 No.19
6. Cost & Risk Analysis of Ethiopia’s Public and Publicly Guaranteed Debt Risk refers to the potential for the cost of debt to deviate from its expected outcome.
This stems from unexpected variations of different economic variables such as interest
rate and exchange rate. Market risk, operational risk and liquidity risk are the types of
risks associated with public debt portfolio. In this regards it is important to assess the
risks associated with the debt portfolio because such information enables decision
makers to design forward looking strategies on the optimal debt structure in terms of
maturity, interest rate and exchange rate. In this analysis, exposure of the debt
portfolio risk is captured using the following risk indicators: refinancing risk, interest risk
and exchange risk.
6.1 Refinancing Risk
Refinancing risk (rollover risk) is the possibility of having the debt to be rolled over at a
higher interest rate. Three measures are used to assess the exposure of Ethiopia‟s
public debt to refinancing risk, namely: the redemption (maturity) profile of debt, the
Average Time to Maturity (ATM) and maturing in one year of the debt stock as
discussed below.
Refinancing Risk Analysis Using Redemption Profile and debt maturing
in one year
The redemption profile refers to the outstanding debt stock or the amount of debt that
is falling due in a given period of time. This indicator shows the specific time of a
country‟s vulnerability which is manifested by high debt service payments in the debt
repayment schedule. With new loans, it is feasible to choose repayment profile which
does not coincide with humps in the redemption profile. When choosing the maturity of
new borrowing, the redemption profile is useful in highlighting the specific points of a
country‟s vulnerability, which is manifested by high debt service payments in the debt
repayment schedule.

48 Annual Public Sector Debt Portfolio Report For the Year 2017/18 No.19
Figure 15
Public Debt Redemption Profile
Million USD
Out of the total public debt about 14% (USD 7,019.81 million) will fall in due in 2017/18
excluding direct advance and including the treasury bills that is going to be rolled over
during the year. The total amount of external debt payment accounts for 23% of the
total public debt service falling due during this year of which only 3% for central
government and 20 % for SOEs.
Out of the total public debt due in 2017/18 total domestic debt accounts for 77%
(central government domestic debt service accounts for 58% and SOEs debt accounts
for 19%). This shows to what extent external debt of central government is
characterized by very low exposure to rollover/refinancing risk while domestic debt is
characterized by high rollover risk as most of the domestic debt (excluding Direct
advance) is in the form of short term maturity or treasury bills.

49 Annual Public Sector Debt Portfolio Report For the Year 2017/18 No.19
The domestic debt falling due in 2017/18 is (about USD 5, 4032.07 million (4,097.52 for
central government and USD 1,334.65 for SOEs), representing 11 % of the total public
debt and 23 % of total domestic debt. This explain the short term nature of domestic
debt of central government which is mostly in the form of treasury bills which mature in
less than or equal to one year and is rolled over as it matures. Hence, the domestic
debt portfolio is highly exposed to refinancing risk.
From the redemption profile (Figure 16) it is possible to observe that high debt service
payment is manifested in 2018 and 2029. This accounts of the rollover of treasury bills
in 2018 and by 2025 the sovereign bond bullet payment which are due during this
period and most of the SOEs external borrowing will mature between this period.
Ethiopia is, given the debt strategy of the country, expected to contract concessional
loans for central government hence external debt obligations will be repaid over a long
period of time as shown in above graph.
The measure of concessionality of a loan, calculated as the difference between the face
value of the loan and the sum of the discounted future debt service payments
expressed as percentage of the face value of the loan. The higher the grant element
the higher the concessionality of the loan and the lower will be the cost. As most of the
central government external debt is from official creditors it has high concessionality.
The public debt redemption profile in the borrowing currency (Figure 12) indicates that,
most of the total debt repayment will be made in ETB, USD and SDR, as all domestic
debt are denominated in ETB and the majority of external debt is denominated in USD
and SDR. The largest payment in ETB will occur in 2018 and the majority of this
payment in ETB will be realized as a rollover of Treasury Bills and in 2025 there will be
big repayment in USD as a result of the redemption of the sovereign bond bullet
payment.
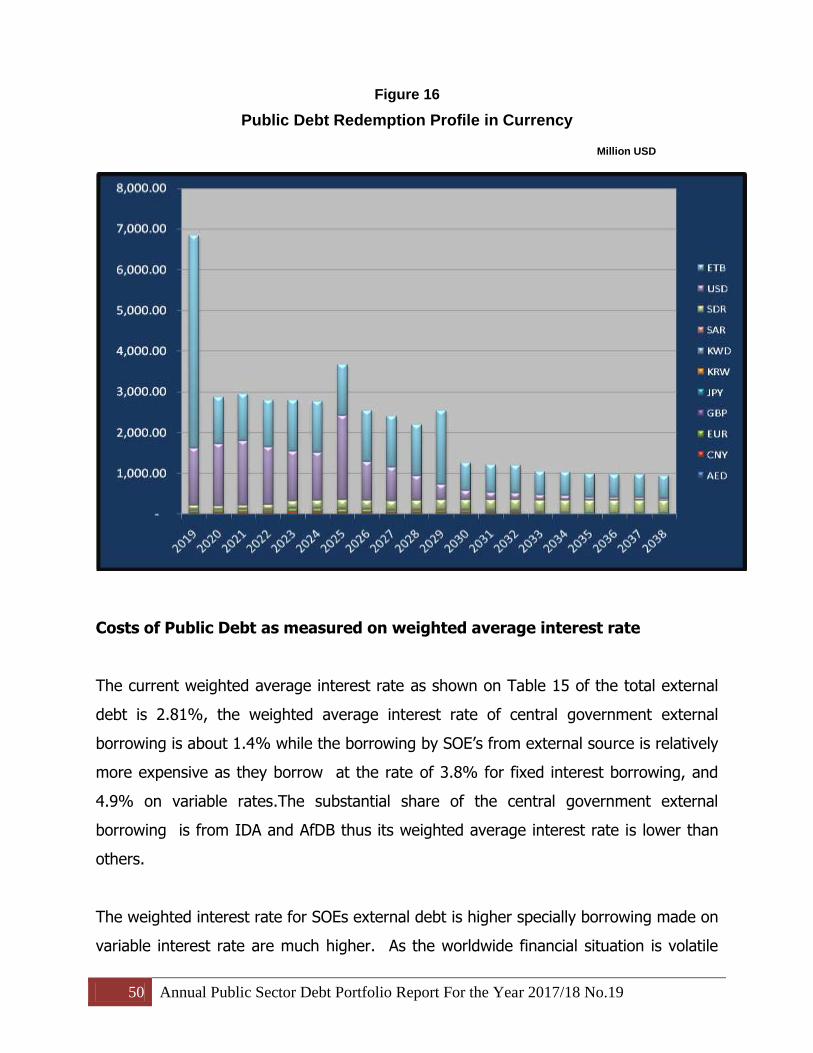
50 Annual Public Sector Debt Portfolio Report For the Year 2017/18 No.19
Figure 16
Public Debt Redemption Profile in Currency
Million USD
Costs of Public Debt as measured on weighted average interest rate
The current weighted average interest rate as shown on Table 15 of the total external
debt is 2.81%, the weighted average interest rate of central government external
borrowing is about 1.4% while the borrowing by SOE‟s from external source is relatively
more expensive as they borrow at the rate of 3.8% for fixed interest borrowing, and
4.9% on variable rates.The substantial share of the central government external
borrowing is from IDA and AfDB thus its weighted average interest rate is lower than
others.
The weighted interest rate for SOEs external debt is higher specially borrowing made on
variable interest rate are much higher. As the worldwide financial situation is volatile

51 Annual Public Sector Debt Portfolio Report For the Year 2017/18 No.19
the current situation may not hold for long time, specially the borrowing on variable
interest on the basis of LIBOR and EURIBOR, the rate is expected to rise and the cost
of borrowing by the SOE‟s will rise too.
Hence, to avoid refinancing risks and any unforeseen negative impacts on debt situation
of the country there is a need to closely monitor the cost and additional conditionality‟s
of borrowing by SOEs. The weighted average interest for total domestic debt is 5.6%
and 2.6% for Central government and it is 8.4% for SOEs domestic debt.
Refinancing Risk Analysis Using Average Time to Maturity
The Average Time to Maturity (ATM) of the debt portfolio also known as Average
Residual Life provides information on how long it takes on average to rollover or
refinances the debt portfolio. Long ATM in the external debt portfolio indicates that the
predominance of concessional loan is relatively higher and has less refinancing risk than
domestic debt.
Low value of ATM indicates that a high share of the debt will be due for payment or
roll-over in the near future, implying a substantial exposure to refinancing risk if
resources are not available to meet or roll-over the maturing debt. Higher value of ATM
indicates that a low proportion of the debt will be maturing in the near future, implying
a low exposure to refinancing risk. In this case, Ethiopia‟s public external debt portfolio
has a minimal exposure to refinancing risk.
Accordingly, the average time to maturity of the total public debt portfolio is about 9.2
years with the external and domestic debt portfolio displaying 11.0 years and 7.1 years
respectively. Central government external debt ATM has the highest which is 16.3 years
as most of the central government external borrowing is obtained from official
multilateral and bilateral sources, where the country secures credits with a long term
maturity and on highly concessional terms.

52 Annual Public Sector Debt Portfolio Report For the Year 2017/18 No.19
Table 15 Cost and Risk Indicators
June 30, 2018
EXTERNAL DEBT
TOTAL
EXTRNAL DEBT
CENTRAL GOV.
EXTRNAL DEBT SOEs
DOMESTIC DEBT
TOTAL
DOMESTIC DEBT
CENTRAL GOV.
DOMESTIC DEBT SOEs
TOTAL DEBT
Amount (in millions of
USD) 25,908.60 14,742.12 11,166.48
23,453.00 11,037.99 12,415.01 49,361.60
Nominal debt as % GDP
32.1 18.2 13.8 29 13.6 15.4 61.1
PV of debt as % of GDP 25.5
24.3 49.8
Interest Payment in % of GDP
0.5 0.2 0.3
1.0 0.2 0.8 1.5
Cost of debt
Weighted Av. IR (%) for Fixed 2.8 1.4 3.8
5.5 2.6 8.3 4.0
Weighted Av. IR (%) for Variable
4.9
Refinancing risk ATM (years) 11.0 16.3 4.5
7.1 8.9 5.5 9.2
Debt maturing in 1yr (% of total) 6.0 1.0 13.0
22.8 37.2 10.4 14.0
Interest rate risk ATR (years) 9.4 16.2 1.0
7.3 8.8 5.5 8.2
Debt refixing in 1yr (% of total) 39 1.5
90.0
23 37.2 10.5 31.2
Floating rate debt (% of total) 37.0 0.2 82.0
17.3 37.1
27.7
FX risk FX debt (% of total debt) 52.2
The ATM for bond, treasury bills and borrowing by SOE‟s from domestic and external
sources shows a bit somewhat shorter maturity period and may create risk to refinance
the debt portfolio.

53 Annual Public Sector Debt Portfolio Report For the Year 2017/18 No.19
Applying the above analysis the external debt will take a long period of time before the
debt due for repayment. Comparing the ATM for the total public debt at 9.2 years with
the external debt portfolio has a lower exposure of refinancing risk. This is explained by
the structure of the external debt profile which is comprised of concessional loans. All in
all, the average time to maturity for central government external debt is 16.3 years
while that of State Owned Enterprises (SOEs) is about 4.5 years.
In the case of the domestic debt, the Average Time to Maturity of total domestic debt is
7.1 years. For central government (assuming direct advance will be converted to 10
years bond with 10 years grace period) and 8.9 years for Central Government and 5.5
years for SOE‟s. This means that on average it takes 8.9 years for Central Government
Domestic debt and 5.5 years for SOEs domestic debt before the debt is due for
repayment or roll over. The domestic debt is associated with a substantial degree of
refinancing risk due to the short term nature of Treasury Bills.
6.2 Interest Rate Risk
Interest rate risk refers to the exposure of the portfolio to changes in the market
interest rates. Three measures are used to assess the exposure of the debt portfolio to
interest rate risks, as follows:
i. The ratio of debt that has fixed or floating interest rates in the total portfolio.
ii. Debt that is exposed to interest rate re-fixing within a specific time period. In other
words, this refers to maturing debt or variable debt whose interest rate is subject
to change within a given period. Maturing debt may be exposed to interest risk if
resources are not available to redeem it and thus it has to be rolled over.
iii. Average Time to Re-fixing (ATR), which indicates the average time required to
reset the interest rate for the debt portfolio. The Average Time to Re-fixing (ATR)
indicates the exposure of the debt portfolio to changes in interest rates. High ATR
will indicate low risk, because this will imply that a relatively low share of the debt
will have its interest rates re-set in a short period of time. Conversely, a low value

54 Annual Public Sector Debt Portfolio Report For the Year 2017/18 No.19
of ATR indicates that a high share of the debt will be re-fixed in the near future,
i.e. exposure to risk
Assessment of Interest Rate Risk of Ethiopia’s Public Debt
i. Analysis of Interest Rate Risk of Public Debt Based on Fixed and Floating Rates Mix
The central government external and domestic debt portfolio is made up of instruments
which were contracted on fixed and relatively on a low interest rate terms. This means
that the central government debt is less susceptible to interest rate risk except treasury
bills. Adverse interest rate movements on the world market would not significantly
affect the interest payment obligations of the central government.
On the other hand the majority of borrowing by SOEs‟ is on variable interest rate 86 %
and this implies that there will be an interest rate risk associated with the external
borrowing by SOE‟s. Overall, a significant proportion of the external loans are highly
concessional, with contractual interest rates for these loans set at significantly below
the market rates.
ii. Analysis of Interest Rate Risk of Public Debt Based on Exposure to Re-fixing
Interest rate risk of the public debt is well captured by proportion of debt that is subject
to interest rate re-fixing within a specified period. For both external and domestic debt,
changes in interest rates affect debt servicing costs. Hence, assessing the proportion of
debt to be re-fixed shows the extent to which the portfolio is vulnerable to higher
funding costs as a result of higher market interest rates.
Analysis of Ethiopia‟s external public debt shows that the portfolio is subject to high
interest rate risk because relatively a larger portion of the total public debt (38% total
external debt) is contracted in floating interest rate. On the other hand analysis of
domestic debt particularly treasury bills shows that the portfolio is subject to high
interest rate risk. This is as a result of the short-duration nature of the treasury bill. By
55 Annual Public Sector Debt Portfolio Report For the Year 2017/18 No.19
the end of June 2018 Treasury bill amounting to USD 4.1 billion is expected to be rolled
over. This implies that 17% of the central government domestic debt portfolio is subject
to changes in domestic interest rates. A higher proportion of debt that is subjected to
re-fixing within one year indicates high risk to adverse interest rate movements.
Excluding domestic debt, interest risk associated with Ethiopia‟s external debt is
relatively lower since 63% of the existing debt is not subject to interest rate changes
due to fixed interest rates.
iii. Analysis of Interest Rate Risk of Public Debt Based on Average Time to Re-
fixing
As of June 2018 the Average Time to Re-fixing (ATR) of Ethiopia‟s public debt was 8.2
years. Thus, it will take an average of 8.1 years to re-fix the interest rates of the
portfolio. The ATR of the external debt stands at 9.4 years which imply that it will take,
on average, 9.4 years to reset the interest rate of the external debt portfolio.
The ATR for central government is 16.3 years while that of SOEs external debt ATR is 1
year. This high value of central governments external debt ATR indicates lower interest
risk associated with the central government external debt portfolio whereas SOEs
external debt is with high exposure to interest risk as its ATR is the lowest.
The total domestic debt is also highly exposed to interest risk. This is confirmed by a
lower value of ATR which stands at 7.1 years. This ATR implies that it will take only 7.1
years to re-fix the interest on domestic debt hence domestic debt has a relatively high
exposure to interest rate risk. The reason for this lowest ATR for domestic debt is the
treasury bills which constitute more than one third of the total domestic debt.
6.3 Exchange Rate Risks
Exchange rate risk refers to the exposure of the debt portfolio to changes in exchange
rate or the mismatch between the repayment obligations and the sources of foreign
exchange rate risk. There are three methods of quantifying exchange rate risk of the
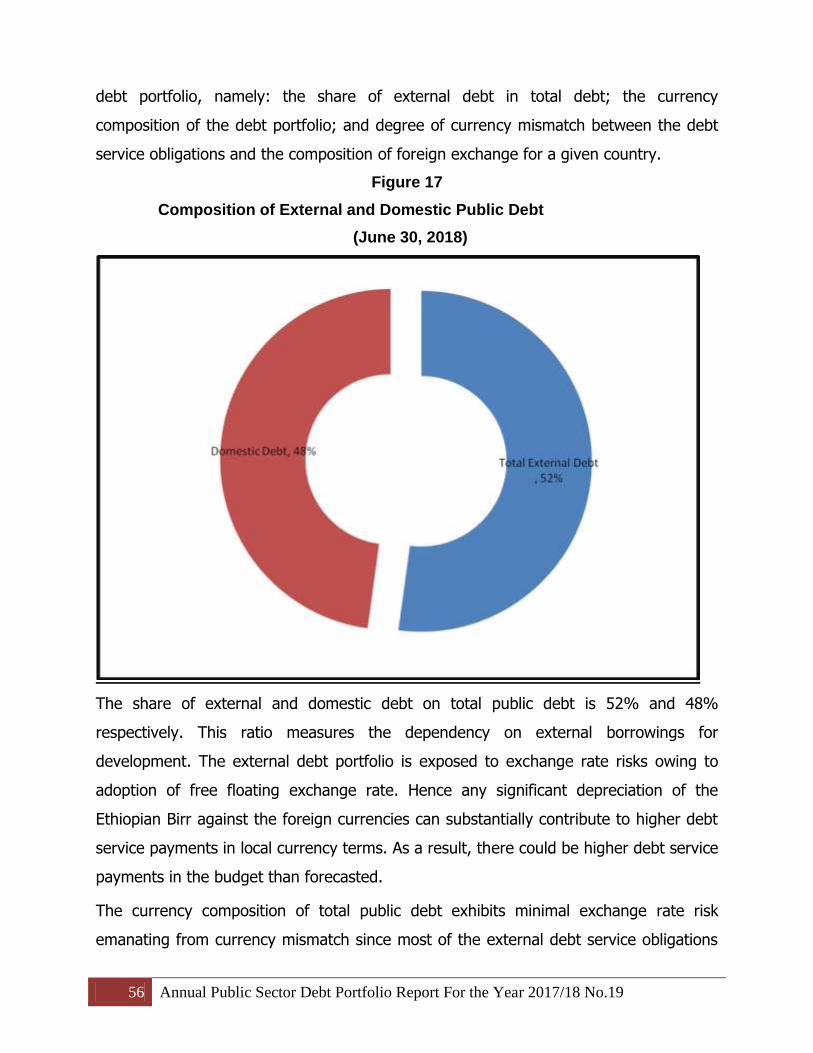
56 Annual Public Sector Debt Portfolio Report For the Year 2017/18 No.19
debt portfolio, namely: the share of external debt in total debt; the currency
composition of the debt portfolio; and degree of currency mismatch between the debt
service obligations and the composition of foreign exchange for a given country.
Figure 17
Composition of External and Domestic Public Debt
(June 30, 2018)
The share of external and domestic debt on total public debt is 52% and 48%
respectively. This ratio measures the dependency on external borrowings for
development. The external debt portfolio is exposed to exchange rate risks owing to
adoption of free floating exchange rate. Hence any significant depreciation of the
Ethiopian Birr against the foreign currencies can substantially contribute to higher debt
service payments in local currency terms. As a result, there could be higher debt service
payments in the budget than forecasted.
The currency composition of total public debt exhibits minimal exchange rate risk
emanating from currency mismatch since most of the external debt service obligations

57 Annual Public Sector Debt Portfolio Report For the Year 2017/18 No.19
are in United States Dollars whereas all domestic debt service obligations are in
Ethiopian Birr. The currency composition of Ethiopia‟s external debt does not constitute
a significant source of external vulnerability since the currency structure closely
matches with foreign reserves/ earnings.
Figure 18
Currency Composition of Total Public Debt
(June 30, 2018)

58 Annual Public Sector Debt Portfolio Report For the Year 2017/18 No.19
7. Conclusion
The current debt portfolio analysis exhibits that the stock of total public debt increases
at the rate of 17.2% per annum. Both public sector external debt and domestic debt
stock increased over the analysis time horizon, which can be partly explained by huge
disbursement towards the development and upgrading of infrastructures. Not only has
the magnitude of the public sector debt changed but also the beneficiaries and the
composition of the public debt shows a significant change. During the observation
period the relative share of central government debt is increasing at a declining rate
while that of the SOE‟s is increasing at an increasing rate.
Over the last years the main composition of the debt portfolio continued to be
concessional for loans denominated in foreign currency, and direct advances and
treasury bills for loans denominated in Ethiopian Birr.
Currently external debt is dominated by central government borrowing whereas
domestic debt is dominated by SOEs borrowings. It is evident that the share of
concessional loans as a total of external debt has decreased from 60% at end June
2015 to 53% as of end June 2018. This is due to higher borrowing of SOEs from
bilateral non-concessional sources in order to implement infrastructure mega projects.
The main areas where the resources were used are energy, sugar, transport, roads and
others projects that support the endeavor of economic development of the country.
The debt structure of the public debt has also changed towards non-concessional
sources, as all of the borrowing by SOEs from external non-concessional source is from
commercial banks and suppliers, and borrowing from domestic sources is from CBE on
a relatively higher interest rate. The accumulation of such non-concessional debt might
have a negative impact on the debt sustainability of the country.
As most of the SOEs borrowing is with the guarantee of the government, it is a
contingent liability for the government and if any of the SOEs are unable to repay their

59 Annual Public Sector Debt Portfolio Report For the Year 2017/18 No.19
debt service the guarantee might be called and may have a negative impact on the
government budget.
The share of external debt with variable interest rate is also increasing from time to
time and this will have an interest rate risk. Following the 2008 international financial
crisis the variable interest like LIBOR and EURIBOR was low and the interest payment
of the SOE‟s to their respective creditors was relatively low but currently the interest
rate is increasing, their future interest payment may show significant upward change as
a result of upward movement of LIBOR rate.
The borrowings of the government from domestic source is mainly in the form of
direct advance and treasury bills which has high rollover risk, that is the government
need to rollover the existing treasury bills whenever they mature. The borrowing of the
SOEs from CBE with the guarantee of the government has also significantly increased.
Debt is sustainable when a borrower is expected to be able to continue servicing its
debts without an unrealistically large correction to its income and expenditure balance.
Debt sustainability, thus, reflects a country‟s solvency, liquidity, and adjustment
capacity.
The public debt dynamics over the last few years appear to have worsened, due to
external sector poor performance indicating some risk on debt sustainability. As the
current debt volume is increasing at increasing rate, it is appropriate to evaluate and
manage the risk involved in different debt compositions, facilitating coordination with
fiscal and monetary management, and enhancing transparency. Accordingly, to improve
the existing situation, the government has taken subsequent measures including:
Issued Public Debt Management and Guarantee Directive No 46/2017 that
enhance its role to control and closely monitoring borrowing from non-
concessional sources,
Limited SOEs borrowing from non-concessional sources so that it is possible to
maintain the non-concessional borrowing limit recently given by the World Bank,
Focused central government borrowing exclusively from concessional sources,
60 Annual Public Sector Debt Portfolio Report For the Year 2017/18 No.19
Diversified sources of concessional borrowing focusing on non-traditional source,
Taken the necessary measures that enhance foreign currency earnings by
investing in the development of industrial zones, attract FDI inflow and boost
government revenue etc..,
Putt in place a framework for Public Private Partnership to implement strategic
infrastructure mega projects,
Started Developing domestic debt market and secondary market, with the
objective to introducing bonds with various maturities to replace part of the
treasury bills so that the rollover risk of the domestic debt will be minimized,
Started discussion with appropriate authority to convert the direct advance into a
25 years special bond to reduce the current government interest payment to
National Bank of Ethiopia,
Undertaken in a sustainable manner debt management capacity building so that it
is possible to sustain debt sustainability.
It is the expectation of the Ministry of Finance that this report will enhance
transparency and accountability of public debt management in Ethiopia.

61 Annual Public Sector Debt Portfolio Report For the Year 2017/18 No.19
8. GLOSSARY
DEFINITIONS
It is hoped that the following definitions could help the reader to understand the
concepts and correctly interpret the figures provided in the various tables. The
definitions are taken from:
„External Debt Management: An Introduction‟, by Thomas M. Klein, World Bank
Technical Paper No. 245
„External Debt Statistics: Guide for Compilers and Users, BIS, ComSec, Eurostat,
IMF, OECD, Paris Club Secretariat, UNCTAD, World Bank, 2003‟.
Debt and DMFAS Glossary, UNCTAD, 2008
A
Allocation of a Tranche: All or part of a loan/grant tranche assigned to finance
projects or programs.
Amortization: The repayment of principal of a loan spread out over a period of time.
Amortization Schedule: The schedule for the repayment of principal and payment of
interest on an ongoing basis.
Arrears: The total of scheduled debt service payments that have fallen due but remain
unpaid.
B
Bilateral Creditor: In DMFAS, it refers to a type of creditor in the context of external
debt. Official bilateral creditors include governments and their agencies (including
Central Bank), autonomous public bodies or official export credit agencies.
Bilateral Debt: Loans extended by a bilateral creditor.
Borrower (debtor): The organization or the entity defined as such in the loan
contract which usually is responsible for servicing the debt.
C
Cancellation: An agreed reduction in the undisbursed balance of a loan commitment.

62 Annual Public Sector Debt Portfolio Report For the Year 2017/18 No.19
Commercial Credit: In the context of the Paris Club, loans originally extended on
terms that do not qualify as official development assistance (ODA) credits.
Commercial Interest Reference Rates (CIRR): A set of currency-specific interest
rates for major OECD countries.
Commitment: An obligation to furnish resource of a given amount under specified
financial terms and conditions.
Commitment Charge (fee): Charge or fee made for holding available the
undisbursed balance of a loan commitment.
Commitment Date: The date on which the commitment occurs.
Concessional Loans: Loans that are extended on terms substantially more generous
than market loans.
Concessionality Level: See grant element.
Credit: An amount for which there is a specific obligation of repayment.
Creditor: The organization or entity that provides money or resources and to whom
payment is owed under the terms of a loan agreement.
Creditor Country: The country in which the creditor resides.
Currency of denomination or Currency of a Loan: The unit of account in which
amounts of indebtedness are expressed in the general/loan agreement.
Currency of Repayment: The unit of account in which a loan is to be repaid.
Currency of Reporting: The unit of account in which amounts are reported to the
compiling agency and/or to an international agency compiling debt statistics.
Currency of Transaction: The medium of exchange in which an individual transfer
occurs.
Current Maturities: Maturities falling due during the consolidation period of a
rescheduling.
D
Debt Relief: Any form of debt reorganization that relieves the overall
Debt Reorganization/Restructuring: Debt reorganization arises from bilateral
arrangements involving both the creditor and the debtor that alters the terms
established for the servicing of a debt.
63 Annual Public Sector Debt Portfolio Report For the Year 2017/18 No.19
Debt Rescheduling: Debt rescheduling refers to the formal deferment of debt service
payments and the application of new and extended maturities to the deferred amount.
Debt Service: Refers to payments in respect of both principal and interest.
Debt-Service to Export Ratio: The ratio of debt service (interest and principal
payments due) during a year, expressed as percentage of exports (typically of goods
and services) for that year.
Debt Sustainability Analysis: A study of a country‟s medium- to long term debt
situation.
Debtor Country: The country in which the debtor resides.
Direct Advance: Government over draft from the Central Bank.
Disbursed Loans: The amount that has been disbursed from a loan but has not yet
been repaid or forgiven.
Disbursed and Outstanding Debt (DOD): The amount that has been disbursed
from a loan commitment but has not yet been repaid or forgiven.
Disbursement: The transactions of providing financial resources.
Domestic Currency: It is a legal tender in the economy and issued by the monetary
authority for that economy, or for the common currency area to which the economy
belongs.
Domestic Debt: Gross domestic debt, at any given time, is the outstanding
contractual, and not contingent, liabilities that residents of a country owe to other
residents of the country that require payment(s) of interest and/or principal by the
debtor at some point(s) in the future.
E
External Debt: Gross external debt, at any given time, is the outstanding amount of
those actual current, and not contingent, liabilities that require payment(s) of interest
and/or principal by the debtor at some point(s) in the future and that are owed to
nonresidents by residents of an economy.

64 Annual Public Sector Debt Portfolio Report For the Year 2017/18 No.19
Euro Inter Bank Offered Rate (EURIBOR): is the rate at which euro inter bank
term deposits are being offered by one prime bank to another within the European
Monitory Union (EMU) zone. Such as Euribor 6 months
F
Face Value: The amount of principal to be repaid (for example, the redemption
amount of a bond).
Fixed Interest Rate: A rate of interest that is defined in absolute terms at the time
of the loan agreement.
Foreign Currency: A currency other than the domestic currency.
G
Government Bonds: Negotiable securities issued by the government. They are long
term obligations issued with maturity of more than 5 years.
Grace Period: The period between the commitment date of the loan and the date of
the first principal repayment.
Grant Element: The measure of concessionality of a loan, calculated as the difference
between the face value of the loan and the sum of the discounted future debt service
payments to be made by the borrower expressed as percentage of the face value of the
loan.
Guarantee of a loan: An undertaking usually by a bank or a government agency to
pay part or all of the amount due on a debt instrument extended by a lender in the
event of nonpayment by the borrower.
H
Heavily Indebted Poor Countries (HIPCs): Group of 41 developing countries
classified as being heavily indebted poor countries.
HIPC Initiative: Framework for action to resolve the external debt problems of the
heavily indebted poor countries that was developed jointly by the IMF and the World Bank
and was adopted in 1996.

65 Annual Public Sector Debt Portfolio Report For the Year 2017/18 No.19
I
Interest Payments: Payments made in accordance with the contractual terms of a
loan that specify the rate of interest that are to be applied, and the way in which the
interest is to be computed. The loan may have fixed or variable interest rates.
International Development Association (IDA): IDA, established in 1960, is the
concessional lending arm of the World Bank Group.
International Monetary Fund (IMF): Following the Bretton Woods Accords and
established in 1945, the IMF is a cooperative intergovernmental monetary and financial
institution with 184 member countries.
L
Late Interest Charges: This is the additional interest that may be levied on
obligations overdue beyond a specified time.
Line of Credit: An agreement that creates a facility under which one unit can borrow
credit from another up to a specified ceiling usually over a specified period of time.
Loan: An agreement in which a lender undertakes to make specified resources
available to a borrower. The amount of funds disbursed is to be repaid (with or without
interest and late fees) in accordance with the terms of a promissory note or repayment
schedule.
Loan Agreement: The legal evidence and terms of a loan.
Loan Guarantee: A legally binding agreement under which the guarantor agrees to
pay any or all of the amount due on a loan instrument in the event of nonpayment by
the borrower.
London Interbank Offered Rate (LIBOR): The London Interbank Offered Rate for
deposits, such as the six-month dollar LIBOR. LIBOR is a reference rate for the
international banking markets and is commonly the basis on which lending margins are
fixed.
Long-term External Debt: External debt that has a maturity of more than one year.
M
Maturity: The debt service amounts to be paid on a particular date.

66 Annual Public Sector Debt Portfolio Report For the Year 2017/18 No.19
Maturity Date (Final): The date on which a debt obligation is contracted to be
extinguished.
Maturity Structure: A time profile of the maturities of claims or liabilities.
Medium-Term Debt Management Strategy (MTDS): is a plan that the
Government intends to implement over the medium term in order to achieve a desired
composition of the Government debt portfolio, which captures the Government‟s
preferences with regard to the cost-risk trade off.
Multilateral Creditors: These creditors are multilateral institutions such as the IMF
and the World Bank, as well as other multilateral development banks.
Multilateral Development Banks (MDBs): Another term for international financial
institutions, such as the World Bank Group and the regional development banks.
N
Net Flows: From the view point of a loan, the net flow is gross disbursements less
principal repayments.
Net Present Value (NPV) of Debt: The nominal amount outstanding minus the sum
of all future debt service obligations (interest and principal) on existing debt discounted
at an interest rate different from the contracted rate.
Net Resource Transfers: Loan disbursements minus repayments of principal minus
service payments during some period.
Nominal Value: The nominal value of a loan instrument is the amount that at any
moment in time the debtor owes to the creditor at that moment.
O
Official Creditors: Official creditors are international organizations, governments and
government agencies including official monetary institutions.
Official Development Assistance (ODA): Flows of official financing administered
with the promotion of the economic development and welfare of developing countries
as the main objective, and which are concessional in character with a grant element of
at least 25 percent (using a fixed 10 percent rate of discount).
67 Annual Public Sector Debt Portfolio Report For the Year 2017/18 No.19
Official Development Assistance Loans: Loans with a maturity of over one year
meeting criteria set out in the definition of ODA, provided by governments or official
agencies and for which repayment is required in convertible currencies or in kind.
P
Paris Club: An informal group of creditor governments that has met regularly in Paris
since 1956 to reschedule bilateral debts; the French treasury provides the secretariat.
Present Value: The discounted sum of all future debt service at a given rate of
interest.
Present Value of Debt-to Exports Ratio (PV/X): Present value (PV) of debt as a
percentage of exports (usually of goods and services) (X).
Principal: The provision of economic value by the creditor, or the creation of debt
liabilities through other means, establishes a principal liability for the debtor, which,
until extinguished, may change in value over time.
Principal Outstanding: The amount of principal disbursed and not repaid.
Principal Repayment Schedule: The repayment schedule of principal by due date
and installment amount.
Principal Repayments: The payments which are made against the drawn and
outstanding amount of the loan.
Private Creditors: Creditors that are neither government nor public sector agencies.
These include private bondholders, private banks, other private financial institutions,
and manufacturers exporters, and other suppliers of goods that have a financial claim.
Program Allocation: A type of direct allocation for which there is a programme to
account for it.
Project: A specific set of activities aimed at the development of an economic sector.
Project Allocation: Allocation of a certain amount of a loan which is going to a
specific project.
Public Debt: The debt obligation of the public sector.
Public External Debt: The external debt obligation of the public sector.

68 Annual Public Sector Debt Portfolio Report For the Year 2017/18 No.19
Publicly Guaranteed Debt: The external obligation of a private debtor that is
guaranteed for repayment by a public entity.
Public Sector: The public sector includes the general government, monetary
authorities, and those entities in the banking and other sectors that are public
corporations.
R
Repayment Period: The period during which the debt obligation is to be repaid.
Rescheduling: See Debt Rescheduling
Rescheduling Agreement: An agreement between a creditor, or a group of
creditors, and a debtor to reschedule debt.
S
Service Charges: All charges that must be paid as a price for the loan, such as:
interest, commitment fees, management fees.
Service Payments: Amounts actually remitted by the borrower to repay a debt.
Short-term Debt: Debt that has maturity of one year or less.
Spread (Margin): A percentage to be added to some defined base interest rate, such
as LIBOR, to determine the rate of interest to be used for a loan.
Stock of Debt: The amount outstanding as of a moment of time.
Supplier Credit: A loan extended by an exporter to finance the purchase of that
exporter‟s goods or contractual services.
T
Tranche: A particular portion of a financial claim or liability with its own specific terms
as opposed to the general terms governing the whole claim or liability.
Treasury Bills: Negotiable securities issued by the government. In general these are
short term obligations issued with maturity of one year or less. They are traded on a
discount bases.
U
Undisbursed Balance: Funds committed by the creditor but not yet utilized by the
borrower.
69 Annual Public Sector Debt Portfolio Report For the Year 2017/18 No.19
W
Write-off: A financial claim that a creditor regards as unrecoverable and so no longer
carries on its books.

1 Annual Public Sector Debt Portfolio Report For the Year 2017/18 No.19
9. Annex
Action Plan to Improve DPR and Quarterly Statistical Bulletin
1. Annual Debt Portfolio Report
Action Description of desired outcome Completion date
Strengthen the analytical component
of the report.
Include a section describing the current
central government debt management
strategy (targets for domestic currency
vs. foreign currency debt, domestic
market development etc.).
Annual report for FY 2019
Include an analysis comparing central
government debt management
operations (domestic & external
borrowing) during the past year against
the central government debt
management strategy. Discuss whether
the targets laid out in the strategy were
met and explain if deviations happened
and why (both for domestic and
Annual report for FY 2019

2 Annual Public Sector Debt Portfolio Report For the Year 2017/18 No.19
external debt).
Include a forward-looking component
(may be part of the conclusion),
describing the central government debt
management strategy/targets for the
next year and outlining the central
government borrowing plan for
domestic and external public debt and
its expected effect on the cost and risk
characteristics of the central
government debt portfolio.
Annual report for FY 2019
Provide an analysis of the main risks
and costs of the central government
debt portfolio (in addition to the
currently provided cost and risk
indicators). The goal is to highlight the
main risk exposure of the central
government debt portfolio in a concise,
analytical way.
Annual report for FY 2019
Strengthen the section on on-lending
and guarantees and improve reporting
Improve the analysis of central
government on-lending and guarantees Annual report for FY 2019

3 Annual Public Sector Debt Portfolio Report For the Year 2017/18 No.19
on SOE debt. to SOEs by i) describing clearly the role
of the Ministry of Finance in providing
on-lending and guarantees to SOEs, and
ii) outlining the guarantees and on-
lending provided to SOEs (SOE by SOE)
during the past reporting year. Include
information on whether guarantees
were called.
Report in detail on (SOEs by SOEs) on
SOEs on-lent, guaranteed, and external
debt
Annual Report for 2021
Improve information on central
government domestic debt.
Provide detailed information on central
government domestic debt by holder
and by instrument, to better capture the
characteristics of the domestic market.
Annual report for FY 2019
Improve information on outstanding
debt in detail.
Provide detailed information on
central government external debt
by creditor, and domestic public
debt by holder and by
instrument.
Provide Information on SOEs
Annual report for FY 2019

4 Annual Public Sector Debt Portfolio Report For the Year 2017/18 No.19
external debt by Suppliers,
Commercial Banks and others
and domestic debt by holders
and instruments
Timeline of the publication of the
report.
Ensure publication within a maximum of
5 months after the end of the reporting
year.
Annual report FY 2019
2. Quarterly Statistical Bulletin
Action Description of desired outcome Completion date
Improve reporting on SOE debt. Report in detail (SOE by SOE) on SOEs
on-lent, guaranteed, and external debt. Annual Report for 2021
Cost and risk indicators for central
government debt.
Include a concise overview over (the
evolution of) the cost and risk
characteristics of the central
government public debt portfolio.
Bulletin Q1 FY2020
Quarterly data comparison.
Provide more quarterly data (past 3-4
quarters) on the main tables (especially
flow variables such as disbursements,
debt service payments etc.) to allow for
better comparison of quarterly debt
Bulletin Q1 FY 2020
5 Annual Public Sector Debt Portfolio Report For the Year 2017/18 No.19
management operations.
Information on fixed vs. variable rate
debt.
Provide information on the shares of
fixed vs. variable rate debt in the tables
on total, domestic and external central
government debt.
Bulletin Q1 FY 2020
Overview/introductory section. Include an overview section, describing
the key events of the past quarter. This
could be done as “highlights” in bullet
point form.
Bulletin Q1 FY2020
Timeline of publication. Publish the quarterly bulleting no more
than 3 months after the end of the
reporting quarter.
Bulletin Q1 FY2020
Required Capacity enhancement by
World Bank
Provide debt report prepared in a
full-fledged manner (as sample)
Provide Technical Training
focusing on risk and cost
assessment method
Finance Experience sharing and
other as required
Continuous