
Annual Progress Report (APR) - Midlothian
35
Midlothian Council LAQM Annual Progress Report 2019 Annual Progress Report (APR) 2019 Air Quality Annual Progress Report (APR) for Midlothian Council In fulfilment of Part IV of the Environment Act 1995 Local Air Quality Management August 2019
Transcript of Annual Progress Report (APR) - Midlothian
Midlothian Council
LAQM Annual Progress Report 2019
Annual Progress Report (APR)
2019 Air Quality Annual Progress Report (APR) for Midlothian Council In fulfilment of Part IV of the Environment Act 1995 Local Air Quality Management August 2019
Midlothian Council
LAQM Annual Progress Report 2019
Local Authority Officer
Lilianne Lauder, Principal Officer (Public Health)
Department Education, Communities and Economy
Address
Fairfield House
8 Lothian Road
Dalkeith
EH22 3ZN
Telephone 0131 271 3370
E-mail [email protected]
Report Reference number
APR. Midl.Aug.2019
Date 19 August 2019
Midlothian Council
LAQM Annual Progress Report 2019 i
Executive Summary: Air Quality in Our Area
Air Quality in Midlothian
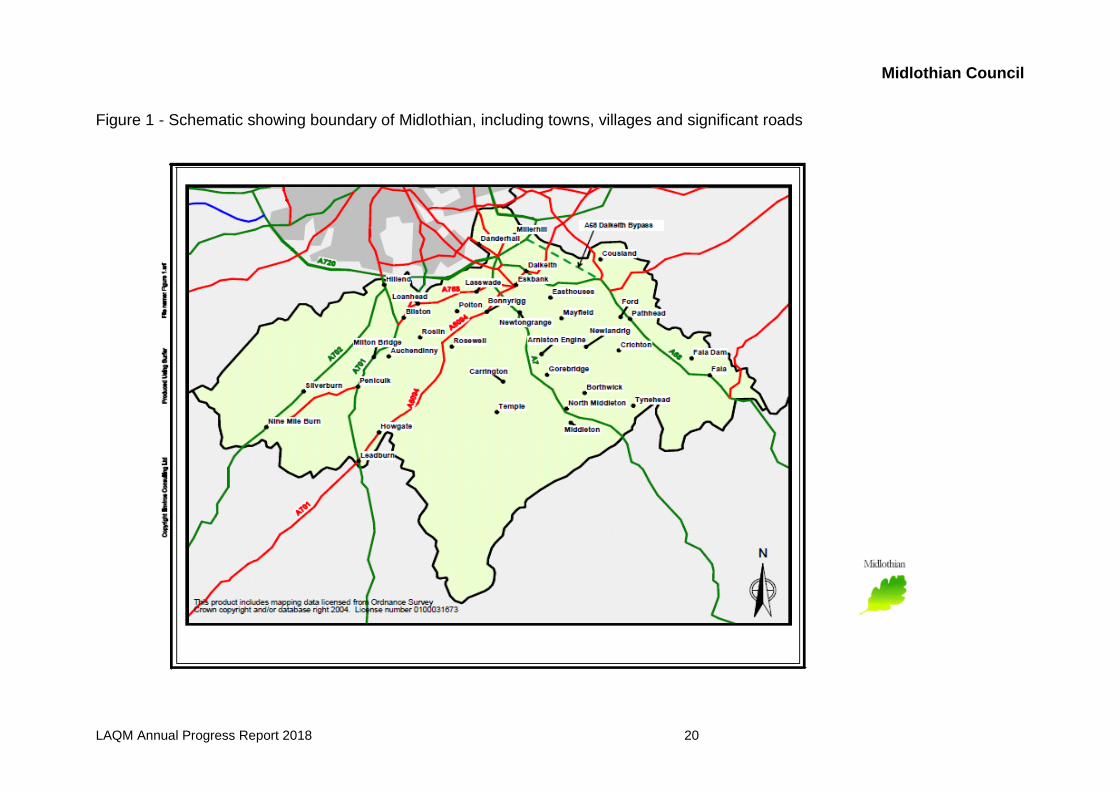
Midlothian has a population of just over 91, 000 and compromises a number of small
and medium sized towns, together with many small villages and Hamlets. Penicuik,
Bonnyrigg and Dalkeith are the largest towns; Loanhead, Gorebridge, Mayfield,
Newtongrange and Pathhead are smaller settlements. A schematic map of
Midlothian showing villages, towns and roads within the district is shown in Figure 1.
The new town of Shawfair at the south eastern “wedge” between Danderhall and the
City Bypass is currently under development and will include approximately 4,000 new
homes, commercial and retail use.
Midlothian is largely a countryside setting. The area stretches from the Pentland Hills
to the Moorfoots and Lammermuirs, and comprises a gently sloping plain, much of it
intensively farmed, rising to moorland with upland country beyond. Much of this
landscape is protected by policy designations such as the Green Belt.
There are currently no large industrial processes in very close proximity to housing in
Midlothian and the main issues with regards to air quality are due to road traffic
emissions, particularly in the town and village centres. Another issue is domestic
solid fuel combustion due to the rural setting of Midlothian and limited mains gas
supply to some villages. This has been addressed in the village of Pathhead with the
installation of a new gas main.
The report sets out the results of air quality monitoring carried out by Midlothian
Council since the last Annual Progress Report and considers the potential impacts
from a range of sources such as road traffic and other transport emissions, industrial
processes, commercial and domestic fuel use and fugitive emission sources.
A network of nitrogen dioxide diffusion tubes is maintained throughout the district.
The monitoring results indicate that concentrations measured at all locations are
within the annual mean air quality objective and that trends are fairly stable.
Midlothian Council
LAQM Annual Progress Report 2019 ii
No new issues were identified in 2018 as requiring further assessment and there are
currently no air quality issues in Midlothian.
The locations of the tubes were reviewed in December 2016, with changes
implemented during the 2017 monitoring period. This has included the introduction
of new monitoring sites in the village of Lasswade, the results of which are reported
in Appendix B.
Actions to Improve Air Quality
Midlothian Council has achieved significant improvements in air quality in Dalkeith
and village of Pathhead, two areas of previous concern.
The improvement in Pathhead in terms of PM10, allowed Midlothian Council to revoke
the Pathhead AQMA which was declared in 2008. There are no outstanding Air
Quality Managements Areas in Midlothian.
Midlothian Council forms part of East Central Scotland Vehicle Emissions
Partnership, together with West Lothian Council, East Lothian Council, Falkirk
Council, Stirling Council and Scottish Government. The remit of the Vehicle
Emisions Partnership is to help reduce vehicle emissions by encouraging drivers to
switch off their engine whenever possible, educating the general public by the
provision of free vehicle emissions testing and handling idling complaints. Further
information is available on the partnership website at http://switchoffandbreathe.org
Midlothian Council supports and encourages the development of a ‘green network’ in
Midlothian to promote active travel by walking and cycling and which will form part of
the Central Scotland Green Network. Further information is available in the
Midlothian Council Travel Plan, which is available on Midlothian Council website:
www.midlothian.gov.uk
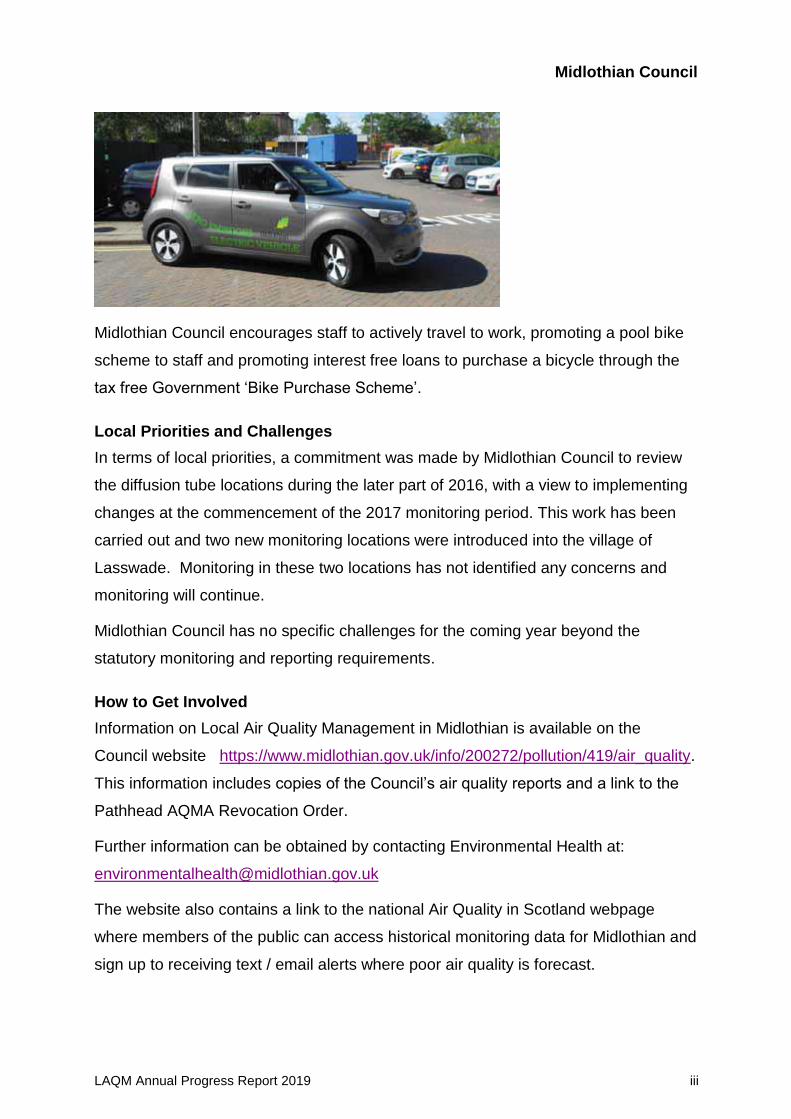
Initiatives to move towards a cleaner Council fleet have also been introduced.
Council staff have access to electric cars to use on local business trips, providing an
eco-friendly way of travelling.
Midlothian Council
LAQM Annual Progress Report 2019 iii
Midlothian Council encourages staff to actively travel to work, promoting a pool bike
scheme to staff and promoting interest free loans to purchase a bicycle through the
tax free Government ‘Bike Purchase Scheme’.
Local Priorities and Challenges
In terms of local priorities, a commitment was made by Midlothian Council to review
the diffusion tube locations during the later part of 2016, with a view to implementing
changes at the commencement of the 2017 monitoring period. This work has been
carried out and two new monitoring locations were introduced into the village of
Lasswade. Monitoring in these two locations has not identified any concerns and
monitoring will continue.
Midlothian Council has no specific challenges for the coming year beyond the
statutory monitoring and reporting requirements.
How to Get Involved
Information on Local Air Quality Management in Midlothian is available on the
Council website https://www.midlothian.gov.uk/info/200272/pollution/419/air_quality.
This information includes copies of the Council’s air quality reports and a link to the
Pathhead AQMA Revocation Order.
Further information can be obtained by contacting Environmental Health at:
The website also contains a link to the national Air Quality in Scotland webpage
where members of the public can access historical monitoring data for Midlothian and
sign up to receiving text / email alerts where poor air quality is forecast.
Midlothian Council
LAQM Annual Progress Report 2019 iv
Table of Contents Executive Summary: Air Quality in Our Area .......................................................... i
Air Quality in Midlothian Council ......................................................................................... i
Actions to Improve Air Quality ............................................................................................ ii
Local Priorities and Challenges ......................................................................................... iii
How to Get Involved.......................................................................................................... iii
1. Local Air Quality Management ........................................................................ 1
2. Actions to Improve Air Quality ........................................................................ 2
2.1 Air Quality Management Areas .............................................................................. 2
2.2 Progress and Impact of Measures to address Air Quality in Midlothian
Council ............................................................................................................................. 2
2.3 Cleaner Air for Scotland ........................................................................................ 6
2.3.1 Transport – Avoiding travel ........................................................................................... 6
2.3.2 Climate Change – Effective co-ordination of climate change and air quality
policies to deliver co-benefits ........................................................................................................ 6
3. Air Quality Monitoring Data and Comparison with Air Quality
Objectives ................................................................................................................. 7
3.1 Summary of Monitoring Undertaken ...................................................................... 7
3.1.1 Automatic Monitoring Sites ............................................................................................ 7
3.1.2 Non-Automatic Monitoring Sites..................................................................................... 7
3.2 Individual pollutants ............................................................................................... 7
3.2.1 Nitrogen Dioxide (NO2)................................................................................................... 8
3.2.2 Particulate Matter (PM10) ................................................................................................ 8
3.2.3 Particulate Matter (PM2.5) ............................................................................................... 8
3.2.4 Sulphur Dioxide (SO2) .................................................................................................... 8
3.2.5 Carbon Monoxide, Lead and 1,3-Butadiene .................................................................. 9
4. New Local Developments ................................................................................ 9
4.1 Road Traffic Sources ............................................................................................. 9
4.2 Other Transport Sources ....................................................................................... 9
4.3 Industrial Sources.................................................................................................. 9
4.4 Commercial and Domestic Sources .....................................................................10
4.5 New Developments with Fugitive or Uncontrolled Sources ...................................10
5. Planning Applications ................................................................................... 10
6. Conclusions and Proposed Actions ............................................................. 11
6.1 Conclusions from New Monitoring Data ................................................................11
6.2 Conclusions relating to New Local Developments ................................................11
6.3 Proposed Actions .................................................................................................11
Midlothian Council
LAQM Annual Progress Report 2019 v
Appendix A: Monitoring Results ........................................................................... 13
Appendix B: Full Monthly Diffusion Tube Results for 2018 ................................ 15
Appendix C: Supporting Technical Information / Air Quality Monitoring
Data QA/QC ............................................................................................................. 17
Glossary of Terms .................................................................................................. 18
References .............................................................................................................. 19
List of Tables
Table 1.1 – Summary of Air Quality Objectives in Scotland ........................................ 1 Table 2.1 – Declared Air Quality Management Areas .................................................. 2 Table 2.2 – Progress on Measures to Improve Air Quality .......................................... 3 List of Figures
Figure 1 – Schematic Showing Boundary of Midlothian………………………………20
Figure 2 – Extent of the now Revoked Pathhead AQMA……………………………...21
Figure 3 – Location of Passive Diffusion Tubes, Dalkeith……………………………..22
Figure 4 - Location of Passive Diffusion Tubes, Pathhhead…………………………..23
Figure 5 - Location of Passive Diffusion Tubes, Penicuik……………………………..24
Figure 6 - Location of Passive Diffusion Tubes, Bonnyrigg…………………………...25
Figure 7 - Location of Passive Diffusion Tubes, Loanhead…………………………...26
Figure 8 - Location of Passive Diffusion Tubes, Lasswade…………………………...27
Figure 9 – SO2 Concentration at Pathhead (Jan 2008 – Jan 2013)………………….28
Midlothian Council
LAQM Annual Progress Report 2019 1
1. Local Air Quality Management
This report provides an overview of air quality in Midlothian Council during 2018. It
fulfils the requirements of Local Air Quality Management (LAQM) as set out in Part IV
of the Environment Act (1995) and the relevant Policy and Technical Guidance
documents.
The LAQM process places an obligation on all local authorities to regularly review
and assess air quality in their areas, and to determine whether or not the air quality
objectives are likely to be achieved. Where an exceedance is considered likely the
local authority must declare an Air Quality Management Area (AQMA) and prepare
an Air Quality Action Plan (AQAP) setting out the measures it intends to put in place
in pursuit of the objectives. This Annual Progress Report (APR) is summarises the
work being undertaken by Midlothian Council to improve air quality and any progress
that has been made.
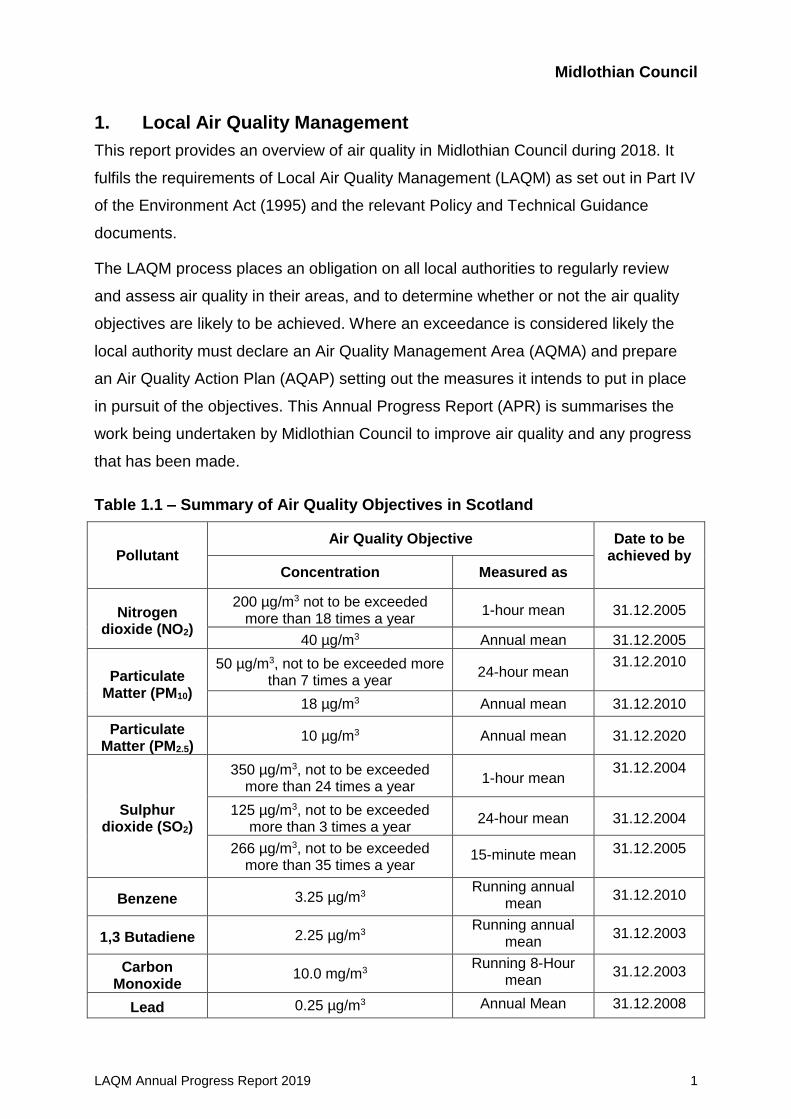
Table 1.1 – Summary of Air Quality Objectives in Scotland
Pollutant Air Quality Objective Date to be
achieved by Concentration Measured as
Nitrogen dioxide (NO2)
200 µg/m3 not to be exceeded more than 18 times a year
1-hour mean 31.12.2005
40 µg/m3 Annual mean 31.12.2005
Particulate Matter (PM10)
50 µg/m3, not to be exceeded more than 7 times a year
24-hour mean 31.12.2010
18 µg/m3 Annual mean 31.12.2010
Particulate Matter (PM2.5)
10 µg/m3 Annual mean 31.12.2020
Sulphur dioxide (SO2)
350 µg/m3, not to be exceeded more than 24 times a year
1-hour mean 31.12.2004
125 µg/m3, not to be exceeded more than 3 times a year
24-hour mean 31.12.2004
266 µg/m3, not to be exceeded more than 35 times a year
15-minute mean 31.12.2005
Benzene 3.25 µg/m3 Running annual
mean 31.12.2010
1,3 Butadiene 2.25 µg/m3 Running annual
mean 31.12.2003
Carbon Monoxide
10.0 mg/m3 Running 8-Hour
mean 31.12.2003
Lead 0.25 µg/m3 Annual Mean 31.12.2008
Midlothian Council
LAQM Annual Progress Report 2019 2
2. Actions to Improve Air Quality
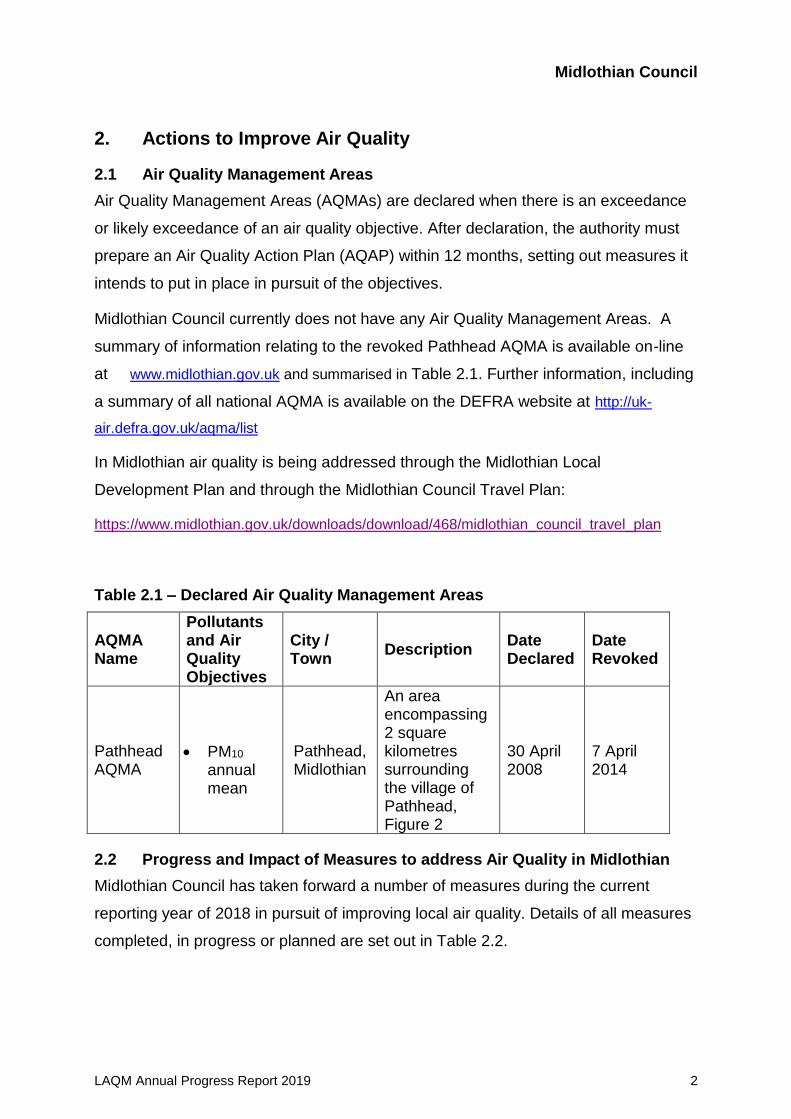
2.1 Air Quality Management Areas
Air Quality Management Areas (AQMAs) are declared when there is an exceedance
or likely exceedance of an air quality objective. After declaration, the authority must
prepare an Air Quality Action Plan (AQAP) within 12 months, setting out measures it
intends to put in place in pursuit of the objectives.
Midlothian Council currently does not have any Air Quality Management Areas. A
summary of information relating to the revoked Pathhead AQMA is available on-line
at www.midlothian.gov.uk and summarised in Table 2.1. Further information, including
a summary of all national AQMA is available on the DEFRA website at http://uk-
air.defra.gov.uk/aqma/list
In Midlothian air quality is being addressed through the Midlothian Local
Development Plan and through the Midlothian Council Travel Plan:
https://www.midlothian.gov.uk/downloads/download/468/midlothian_council_travel_plan
Table 2.1 – Declared Air Quality Management Areas
AQMA Name
Pollutants and Air Quality Objectives
City / Town
Description Date Declared
Date Revoked
Pathhead AQMA
PM10 annual mean
Pathhead, Midlothian
An area encompassing 2 square kilometres surrounding the village of Pathhead, Figure 2
30 April 2008
7 April 2014
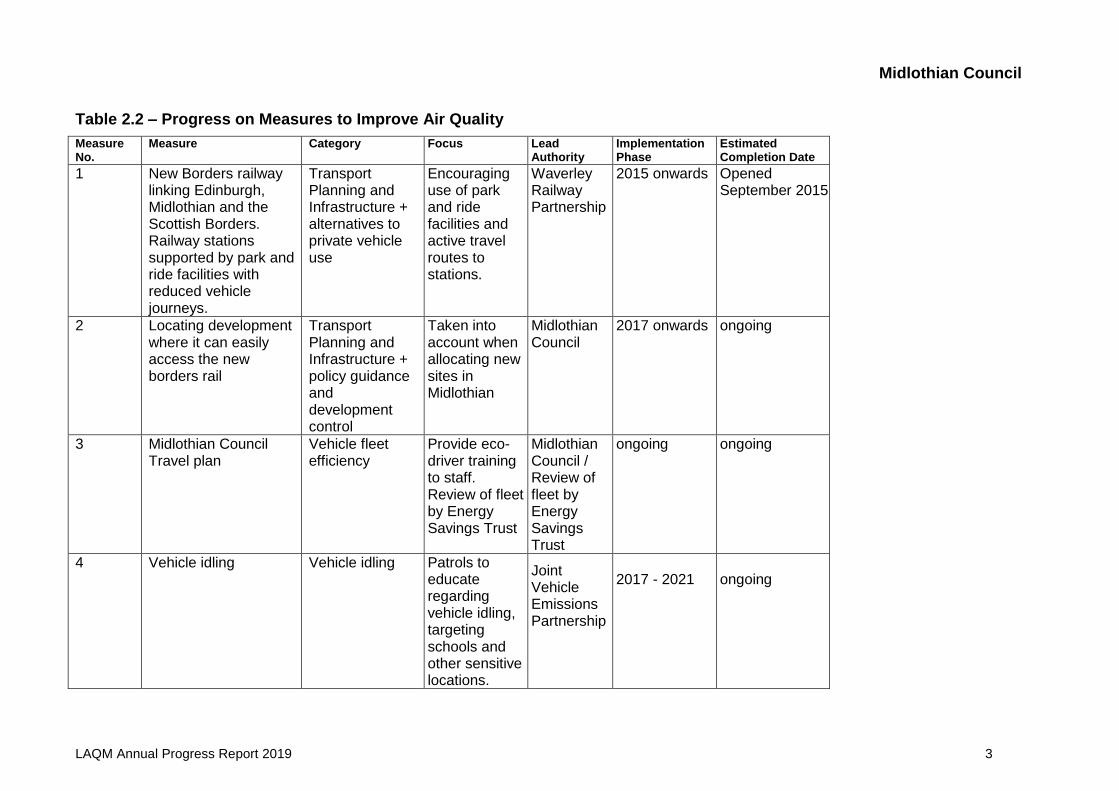
2.2 Progress and Impact of Measures to address Air Quality in Midlothian
Midlothian Council has taken forward a number of measures during the current
reporting year of 2018 in pursuit of improving local air quality. Details of all measures
completed, in progress or planned are set out in Table 2.2.
Midlothian Council
LAQM Annual Progress Report 2019 3
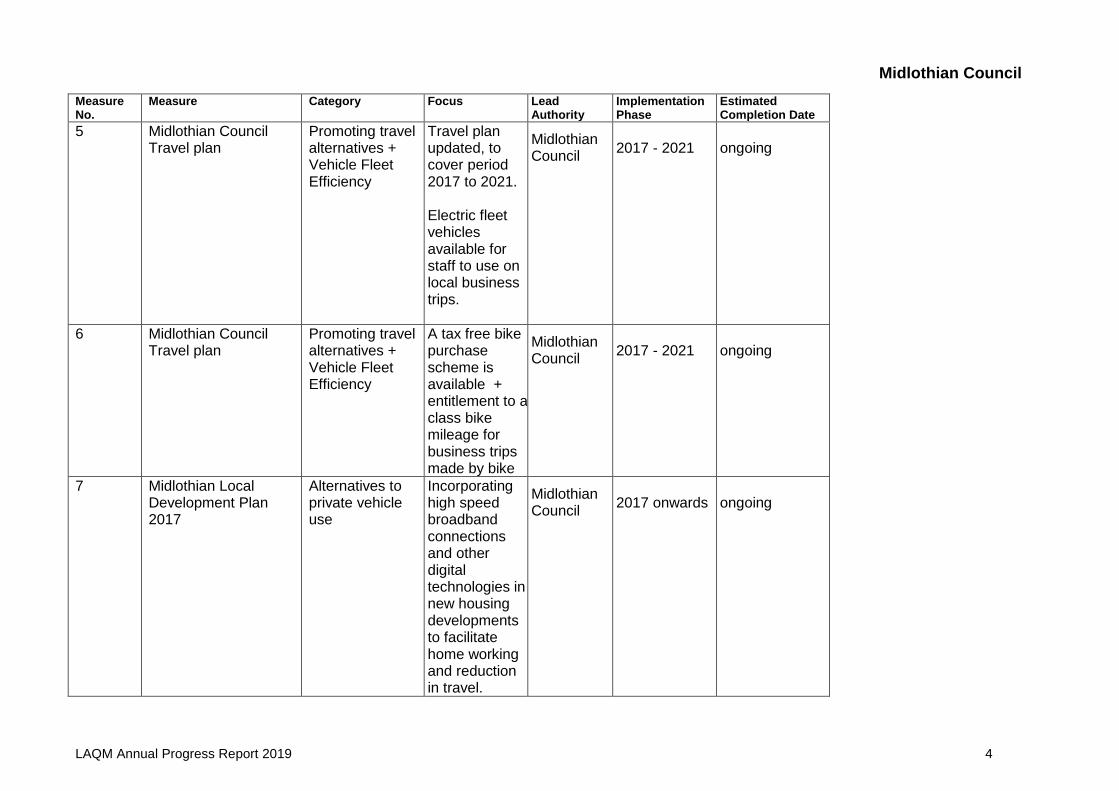
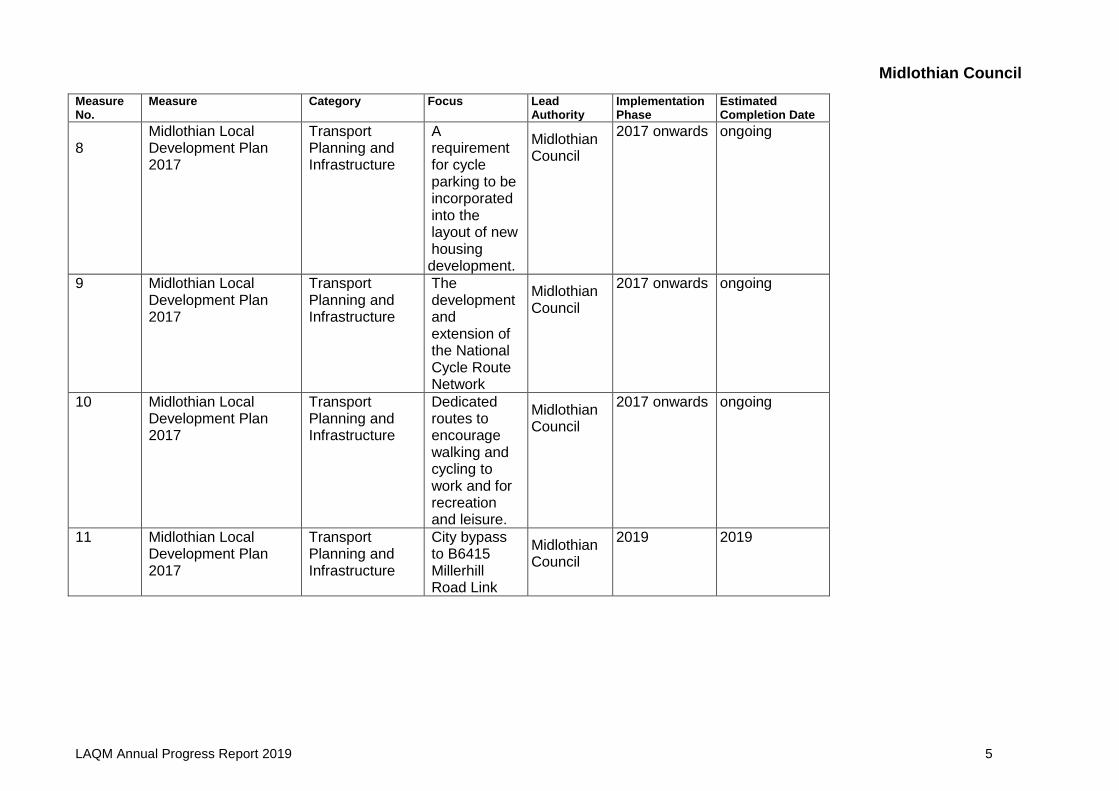
Table 2.2 – Progress on Measures to Improve Air Quality
Measure No.
Measure Category Focus Lead Authority
Implementation Phase
Estimated Completion Date
1 New Borders railway linking Edinburgh, Midlothian and the Scottish Borders. Railway stations supported by park and ride facilities with reduced vehicle journeys.
Transport Planning and Infrastructure + alternatives to private vehicle use
Encouraging use of park and ride facilities and active travel routes to stations.
Waverley Railway Partnership
2015 onwards Opened September 2015
2 Locating development where it can easily access the new borders rail
Transport Planning and Infrastructure + policy guidance and development control
Taken into account when allocating new sites in Midlothian
Midlothian Council
2017 onwards ongoing
3 Midlothian Council Travel plan
Vehicle fleet efficiency
Provide eco-driver training to staff. Review of fleet by Energy Savings Trust
Midlothian Council / Review of fleet by Energy Savings Trust
ongoing ongoing
4 Vehicle idling Vehicle idling Patrols to educate regarding vehicle idling, targeting schools and other sensitive locations.
Joint Vehicle Emissions Partnership
2017 - 2021
ongoing
Midlothian Council
LAQM Annual Progress Report 2019 4
Measure No.
Measure Category Focus Lead Authority
Implementation Phase
Estimated Completion Date
5 Midlothian Council Travel plan
Promoting travel alternatives + Vehicle Fleet Efficiency
Travel plan updated, to cover period 2017 to 2021. Electric fleet vehicles available for staff to use on local business trips.
Midlothian Council
2017 - 2021
ongoing
6 Midlothian Council Travel plan
Promoting travel alternatives + Vehicle Fleet Efficiency
A tax free bike purchase scheme is available + entitlement to a class bike mileage for business trips made by bike
Midlothian Council
2017 - 2021
ongoing
7
Midlothian Local Development Plan 2017
Alternatives to private vehicle use
Incorporating high speed broadband connections and other digital technologies in new housing developments to facilitate home working and reduction in travel.
Midlothian Council
2017 onwards
ongoing
Midlothian Council
LAQM Annual Progress Report 2019 5
Measure No.
Measure Category Focus Lead Authority
Implementation Phase
Estimated Completion Date
8
Midlothian Local Development Plan 2017
Transport Planning and Infrastructure
A requirement for cycle parking to be incorporated into the layout of new housing development.
Midlothian Council
2017 onwards ongoing
9 Midlothian Local Development Plan 2017
Transport Planning and Infrastructure
The development and extension of the National Cycle Route Network
Midlothian Council
2017 onwards ongoing
10 Midlothian Local Development Plan 2017
Transport Planning and Infrastructure
Dedicated routes to encourage walking and cycling to work and for recreation and leisure.
Midlothian Council
2017 onwards ongoing
11 Midlothian Local Development Plan 2017
Transport Planning and Infrastructure
City bypass to B6415 Millerhill Road Link
Midlothian Council
2019 2019
Midlothian Council
LAQM Annual Progress Report 2019 6
2.3 Cleaner Air for Scotland
Cleaner Air for Scotland – The Road to a Healthier Future (CAFS) is a national cross-
government strategy that sets out how the Scottish Government and its partner
organisations propose to reduce air pollution further to protect human health and fulfil
Scotland’s legal responsibilities as soon as possible. A series of actions across a
range of policy areas are outlined, a summary of which is available at
https://www.gov.scot/Publications/2015/11/5671/17. Progress by Midlothian Council
against relevant actions within this strategy is demonstrated below.
2.3.1 Transport – Avoiding travel
Local authorities are required to produce a corporate travel plan. Midlothian
Council’s travel plan is available on the Council’s website at:
https://www.midlothian.gov.uk/downloads/download/468/midlothian_council_travel_plan
The aim of the plan is to reduce the adverse impacts of travel, particularly car travel
associated with the activities undertaken by Midlothian Council in the provision of its
services. In particular the plan aims to reduce transport based pollutants and
greenhouse gases entering the environment and reduce traffic congestion.
Midlothian Council’s has obtained ‘Cycling Scotland’s ‘Cycle Friendly Employer’
Award.
2.3.2 Climate Change – Effective co-ordination of climate change and air quality policies to deliver co-benefits
Scottish Government expects any Scottish local authority which has or is currently
developing a Sustainable Energy Action Plan to ensure that air quality considerations
are covered. Midlothian Council has a corporate climate change strategy which can
be found here:
https://www.midlothian.gov.uk/info/1231/environment/445/sustainable_development_
and_climate_change/2
Midlothian Council
LAQM Annual Progress Report 2019 7
3. Air Quality Monitoring Data and Comparison with Air Quality Objectives
3.1 Summary of Monitoring Undertaken
Nitrogen dioxide (NO2) levels are currently monitored at 17 locations in Midlothian.
Measured NO2 levels at all sites are well within the Air Quality Objectives. No other
pollutant is currently measured by Midlothian Council.
3.1.1 Automatic Monitoring Sites
Automatic (continuous) monitors in Dakeith town centre and in Pathhead were
decommissioned in June 2011 and June 2013 respectively.
The automatic station in Dalkeith town centre was decommissioned following
improvement in air quality following the opening of the Dalkeith Bypass and the
Pathhead monitoring station was decommissioned in June 2013 following a reduction
in fossil fuel use and associated improvements in PM10. A significant improvement in
the level of SO2 in Pathhead was also recorded, figure 9.
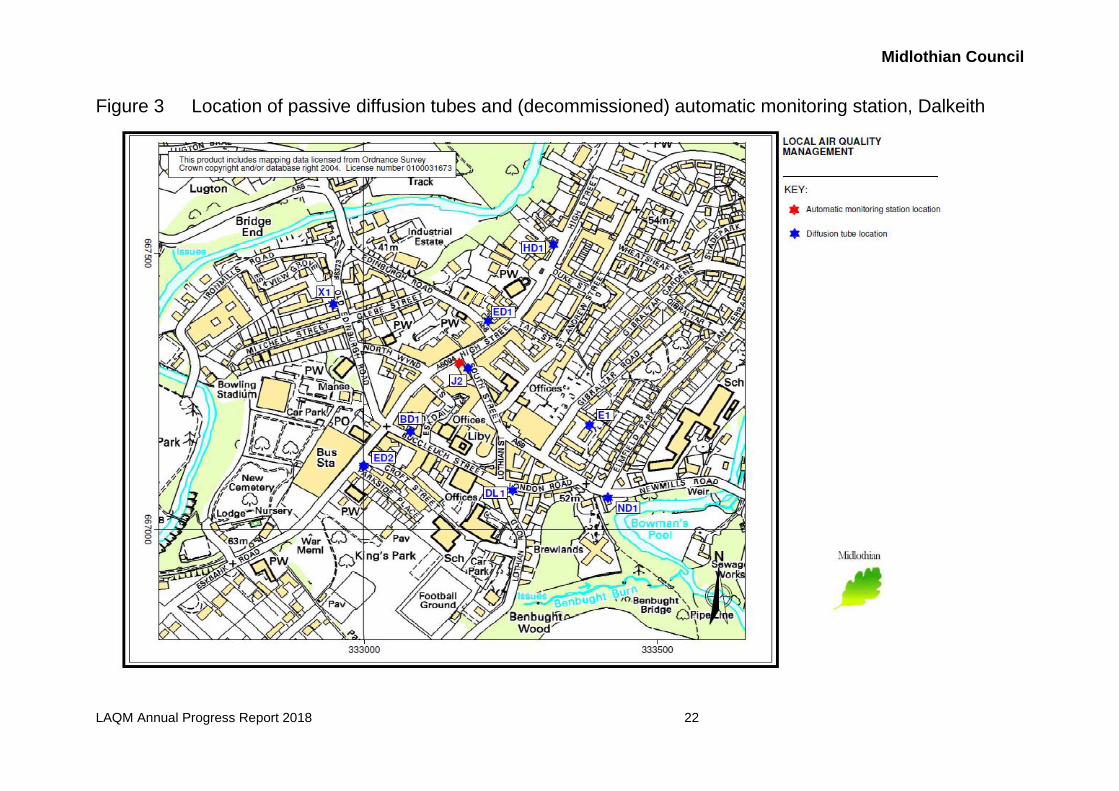
The locations of the historic Dalkeith and the Pathhead monitoring stations are
shown in Figures 3 and 4. Until decommissioned, the stations were included in the
Air Quality in Scotland website http://www.scottishairquality.co.uk/
No continuous monitoring is currently carried out in Midlothian.
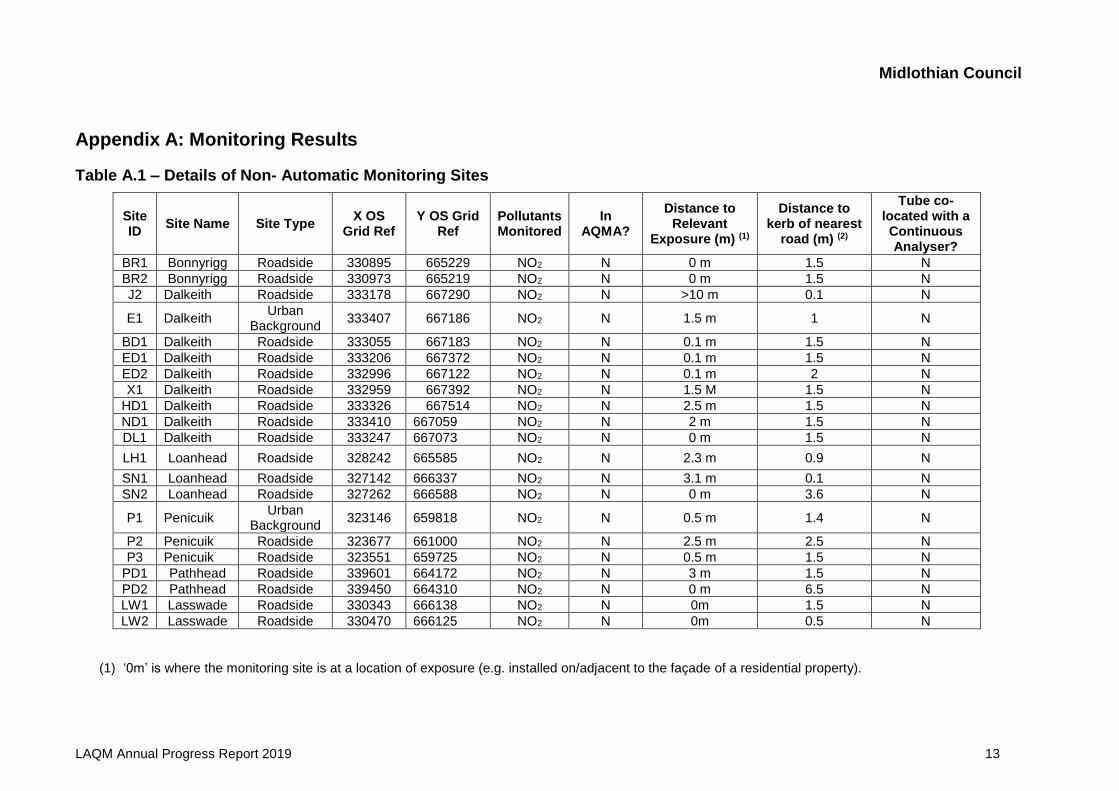
3.1.2 Non-Automatic Monitoring Sites
Midlothian Council undertook non- automatic (passive) monitoring of NO2 at 17 sites
during 2018. Appendix A shows the details of the sites.
Maps showing the location of the monitoring sites are provided in Figures 3 - 8.
Further details on Quality Assurance/Quality Control (QA/QC) and bias adjustment
for the diffusion tubes are included in Appendix C.
3.2 Individual pollutants
The air quality monitoring results presented in this section are, where relevant,
adjusted for annualisation and bias. Further details on adjustments are provided in
Appendix C.
Midlothian Council
LAQM Annual Progress Report 2019 8
3.2.1 Nitrogen Dioxide (NO2)
The results in Appendix B indicate that measured concentrations of nitrogen dioxide
are within the annual mean air quality objective by some margin at all monitoring
locations.
Measured concentrations of nitrogen dioxide within Dalkeith town centre decreased
significantly following the opening of the Dalkeith Bypass in September 2008,
resulting in reduced numbers of vehicles travelling through Dalkeith town centre.
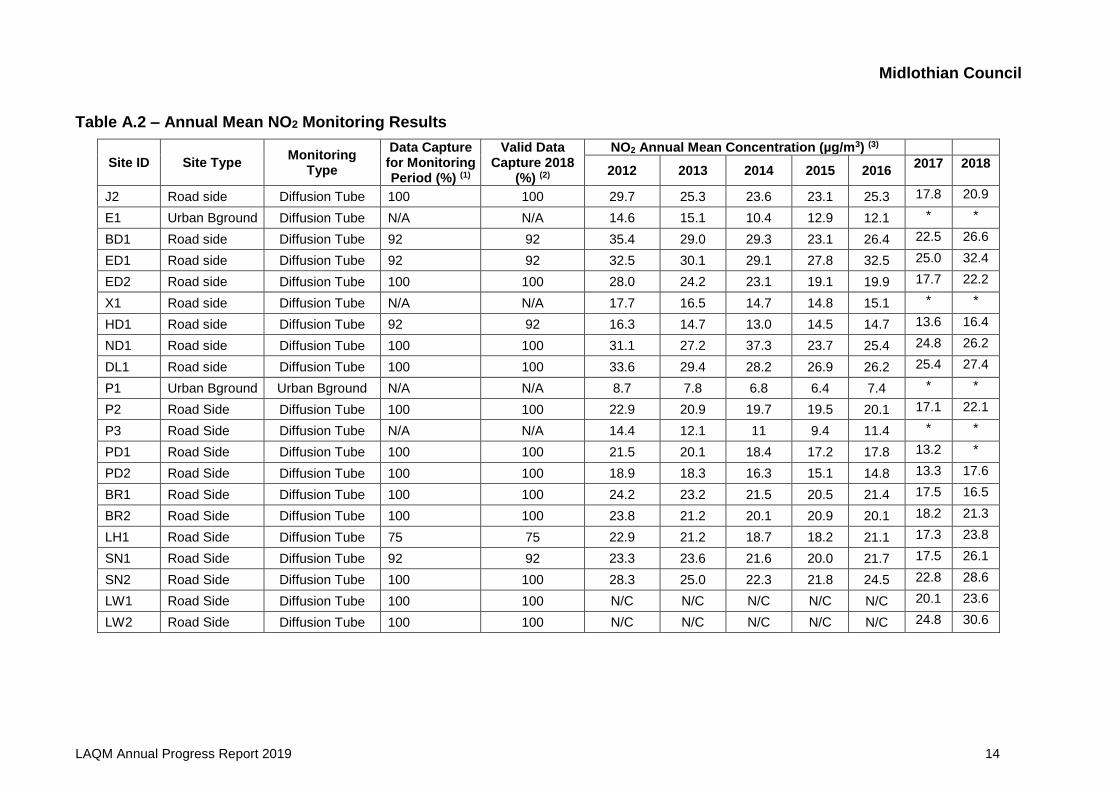
Table 2 in Appendix A compares the ratified and adjusted monitored NO2 annual
mean concentrations for the past 7 years with the air quality objective of 40µg/m3.
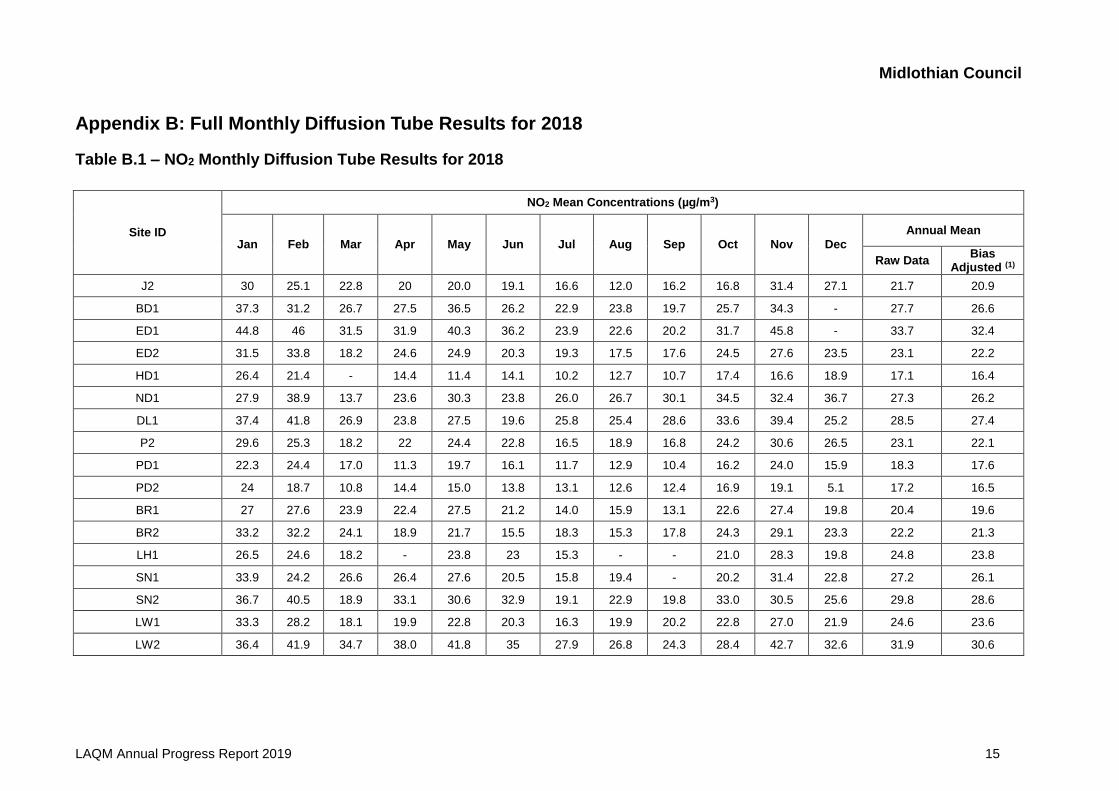
For diffusion tubes, the full 2018 dataset of monthly mean values is provided in
Appendix B. No continuous hourly monitoring of NO2 is carried out.
Measurement of nitrogen dioxide will continue using the diffusion tube method to
monitor the ongoing trends in nitrogen dioxide concentrations in Midlothian.
3.2.2 Particulate Matter (PM10)
Midlothian Council no longer monitors levels of PM10.
3.2.3 Particulate Matter (PM2.5)
Midlothian Council does not monitor levels of PM2.5. There are no plans in the near
future to commence monitoring PM2.5.
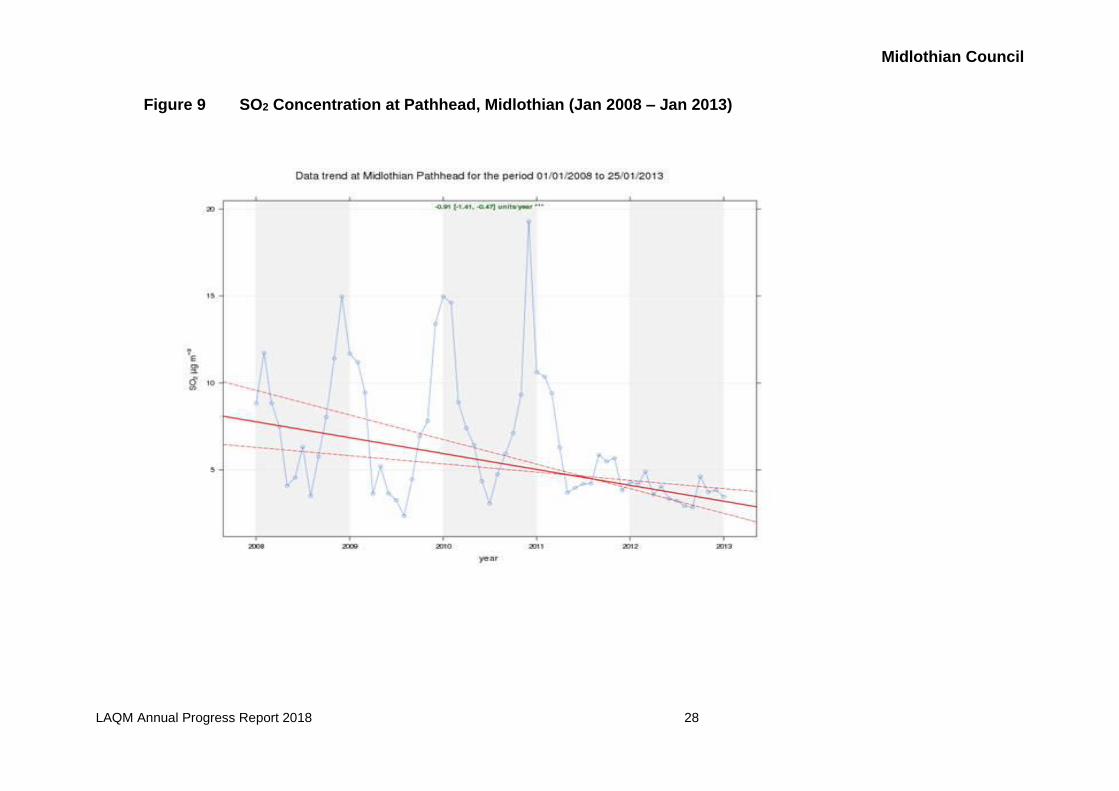
3.2.4 Sulphur Dioxide (SO2)
Midlothian Council no longer monitors levels of SO2.
Following submission of Midlothian Council’s 2010 Progress Report, the Scottish
Environment Protection Agency commented that as the measured levels of SO2 were
so low, exceedance of the air quality objective was unlikely and therefore continued
monitoring of this pollutant was no longer considered necessary. Monitoring of SO2
ceased in Dalkeith at the end of the 2012 monitoring period and in Pathhead at the
end of 2013.
The graph in figure 9 was created using the Open Air Tools on the Scottish Air
Quality website and shows a significant drop in SO2 concentration in Pathhead from
Midlothian Council
LAQM Annual Progress Report 2019 9
2011 and until monitoring ceased in 2013. The marked decrease in SO2 coincides
with the installation and connection of households to the new gas main.
3.2.5 Carbon Monoxide, Lead and 1,3-Butadiene
Midlothian Council does not monitor carbon dioxide, lead or 1, 3 butadiene.
4. New Local Developments
4.1 Road Traffic Sources
The new ‘Millerhill bypass’ road, planning ref 18/00018/MSC opened in 2019. It is
envisaged that this new stretch of road will reduce traffic on the B6415 and through
Millerhill, by diverting all but local traffic away from existing residences on the B6415.
There are no new road traffic sources in Midlothian which bring traffic closer to
relevant exposure.
4.2 Other Transport Sources
Since the opening of the Waverly Line and commencement of the passenger service
in September 2015, there has been no new other traffic sources in Midlothian.
4.3 Industrial Sources
The Zero Waste facility at Millerhill Marshalling Yards, Energy from Waste plant was
commissioned in September 2018. This is located south of the existing anaerobic
digestion facility for food waste. Land for approximately 4,000 new houses is
allocated within the wider Shawfair area. Whilst house building in Shawfair has
commenced, the allocated housing sites closet to the anaerobic digestion plant and
energy from waste facility are not yet developed. Consideration of the potential
impact on Shawfair in terms of air quality was considered in the Environmental
Statement and will be included in future LAQM assessments. Additionally the site
operator is required to demonstrate that appropriate control techniques are being
utilised through application of Best Available Techniques (BAT) in relation to the
appropriate SEPA permit applications, together with a requirement for continuous in-
stack emission monitoring.
Midlothian Council
LAQM Annual Progress Report 2019 10
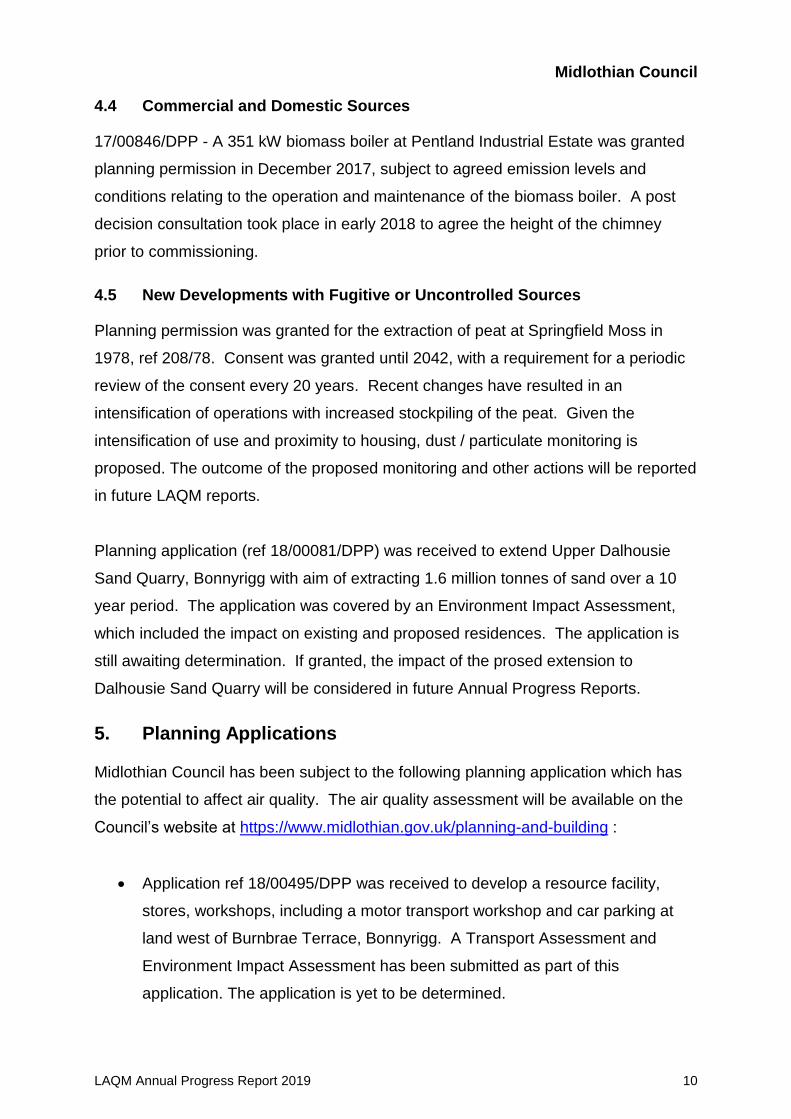
4.4 Commercial and Domestic Sources
17/00846/DPP - A 351 kW biomass boiler at Pentland Industrial Estate was granted
planning permission in December 2017, subject to agreed emission levels and
conditions relating to the operation and maintenance of the biomass boiler. A post
decision consultation took place in early 2018 to agree the height of the chimney
prior to commissioning.
4.5 New Developments with Fugitive or Uncontrolled Sources
Planning permission was granted for the extraction of peat at Springfield Moss in
1978, ref 208/78. Consent was granted until 2042, with a requirement for a periodic
review of the consent every 20 years. Recent changes have resulted in an
intensification of operations with increased stockpiling of the peat. Given the
intensification of use and proximity to housing, dust / particulate monitoring is
proposed. The outcome of the proposed monitoring and other actions will be reported
in future LAQM reports.
Planning application (ref 18/00081/DPP) was received to extend Upper Dalhousie
Sand Quarry, Bonnyrigg with aim of extracting 1.6 million tonnes of sand over a 10
year period. The application was covered by an Environment Impact Assessment,
which included the impact on existing and proposed residences. The application is
still awaiting determination. If granted, the impact of the prosed extension to
Dalhousie Sand Quarry will be considered in future Annual Progress Reports.
5. Planning Applications
Midlothian Council has been subject to the following planning application which has
the potential to affect air quality. The air quality assessment will be available on the
Council’s website at https://www.midlothian.gov.uk/planning-and-building :
Application ref 18/00495/DPP was received to develop a resource facility,
stores, workshops, including a motor transport workshop and car parking at
land west of Burnbrae Terrace, Bonnyrigg. A Transport Assessment and
Environment Impact Assessment has been submitted as part of this
application. The application is yet to be determined.
Midlothian Council
LAQM Annual Progress Report 2019 11
6. Conclusions and Proposed Actions
6.1 Conclusions from New Monitoring Data
Monitoring of nitrogen dioxide was carried out at several locations across Midlothian
using diffusion tubes. The results indicated that concentrations measured at all
locations are well within the annual mean air quality objective.
No other issues have been identified which would warrant a Detailed Assessment at
this time.
6.2 Conclusions relating to New Local Developments
A large number of sites in Midlothian are currently under development for housing,
following allocation in the Midlothian Local Development plan. This includes housing
within the wider Shawfair area, which contains the villages of Millerhill, Danderhall
and Newton and extending to Cauldcoats Farm, close to the boundary with the City
of Edinburgh Council.
The air quality report for the Cauldcoats development, (application for planning
permission in principal, ref 14/00910/PPP) concluded that for all modelled scenarios,
the predicted concentrations of NO2 and PM
10 following completion of the
development are within the annual mean objectives at all modelled receptors. The
predicted impact at most modelled receptors is reported as being negligible however,
at one receptor location, taking into account all proposed and committed
development, a slight adverse impact is predicted. The report noted this can be
mitigated through policies including TRANS5 of the Midlothian Local Development
Plan, requiring electric vehicle charging stations and, through planning condition,
requiring suitable walking and cycle routes linking the new housing with the proposed
new primary school and the rest of Shawfair. The outcome will be reported in future
LAQM reports.
6.3 Proposed Actions
Midlothian Council will continue to monitor the concentration of NO2 throughout the
district, including the new diffusion tubes locations in Lasswade introduced following
the review undertaken at the end of 2016.
Midlothian Council
LAQM Annual Progress Report 2019 12
A wider review of diffusion tube locations is ongoing and advice has been sought
from SEPA in relation to removal of existing sites where levels continue to be very
low. SEPA advised that during their review, the Council should consider relocating
kerbside/roadside diffusion tubes which have recorded concentrations significantly
below the objective concentration for >5 years and are unnecessary for long term
analysis and that diffusion tubes meeting this criteria should be redeployed in areas
of public exposure which have not been previously assessed such as where new
residential developments are planned or have been identified close to busy roads
and junctions.
The review is ongoing as it is in intended to also include schools, which are located in
close proximity to busy roads. This review will be continue to be undertaken in
consultation with SEPA and Scottish Government.
The results of air quality monitoring and other air quality work will be included in the
next Annual Progress Report due to be submitted by June 2020.
Midlothian Council
LAQM Annual Progress Report 2019 13
Appendix A: Monitoring Results
Table A.1 – Details of Non- Automatic Monitoring Sites
Site ID
Site Name Site Type X OS
Grid Ref Y OS Grid
Ref Pollutants Monitored
In AQMA?
Distance to Relevant
Exposure (m) (1)
Distance to kerb of nearest
road (m) (2)
Tube co-located with a Continuous Analyser?
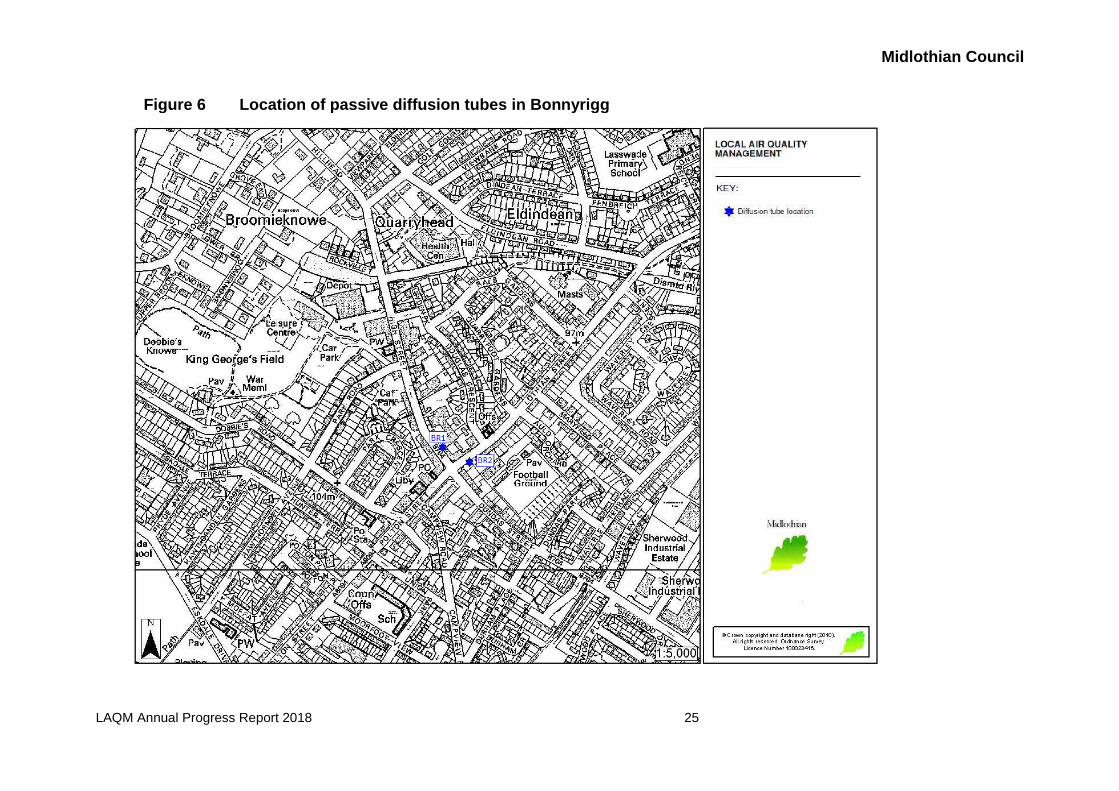
BR1 Bonnyrigg Roadside 330895 665229 NO2 N 0 m 1.5 N
BR2 Bonnyrigg Roadside 330973 665219 NO2 N 0 m 1.5 N
J2 Dalkeith Roadside 333178 667290 NO2 N >10 m 0.1 N
E1 Dalkeith Urban
Background 333407 667186 NO2 N 1.5 m 1 N
BD1 Dalkeith Roadside 333055 667183 NO2 N 0.1 m 1.5 N
ED1 Dalkeith Roadside 333206 667372 NO2 N 0.1 m 1.5 N
ED2 Dalkeith Roadside 332996 667122 NO2 N 0.1 m 2 N
X1 Dalkeith Roadside 332959 667392 NO2 N 1.5 M 1.5 N
HD1 Dalkeith Roadside 333326 667514 NO2 N 2.5 m 1.5 N
ND1 Dalkeith Roadside 333410 667059 NO2 N 2 m 1.5 N
DL1 Dalkeith Roadside 333247 667073 NO2 N 0 m 1.5 N
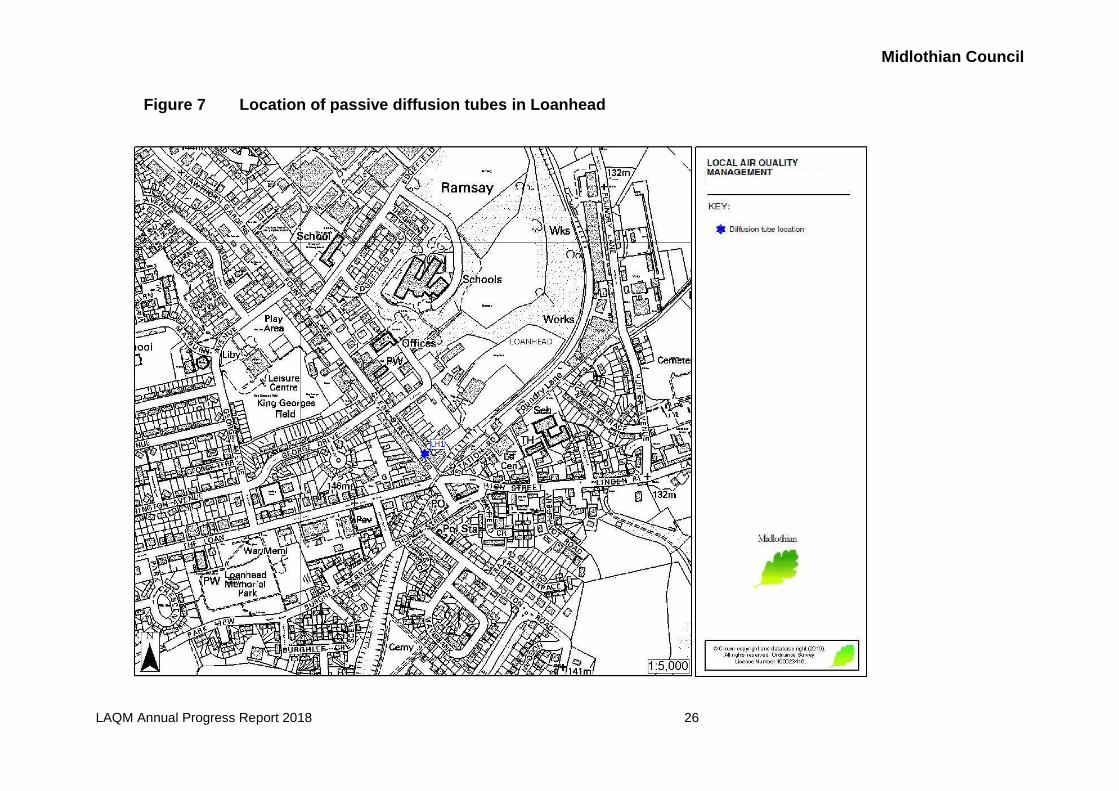
LH1 Loanhead Roadside 328242 665585 NO2 N 2.3 m 0.9 N
SN1 Loanhead Roadside 327142 666337 NO2 N 3.1 m 0.1 N
SN2 Loanhead Roadside 327262 666588 NO2 N 0 m 3.6 N
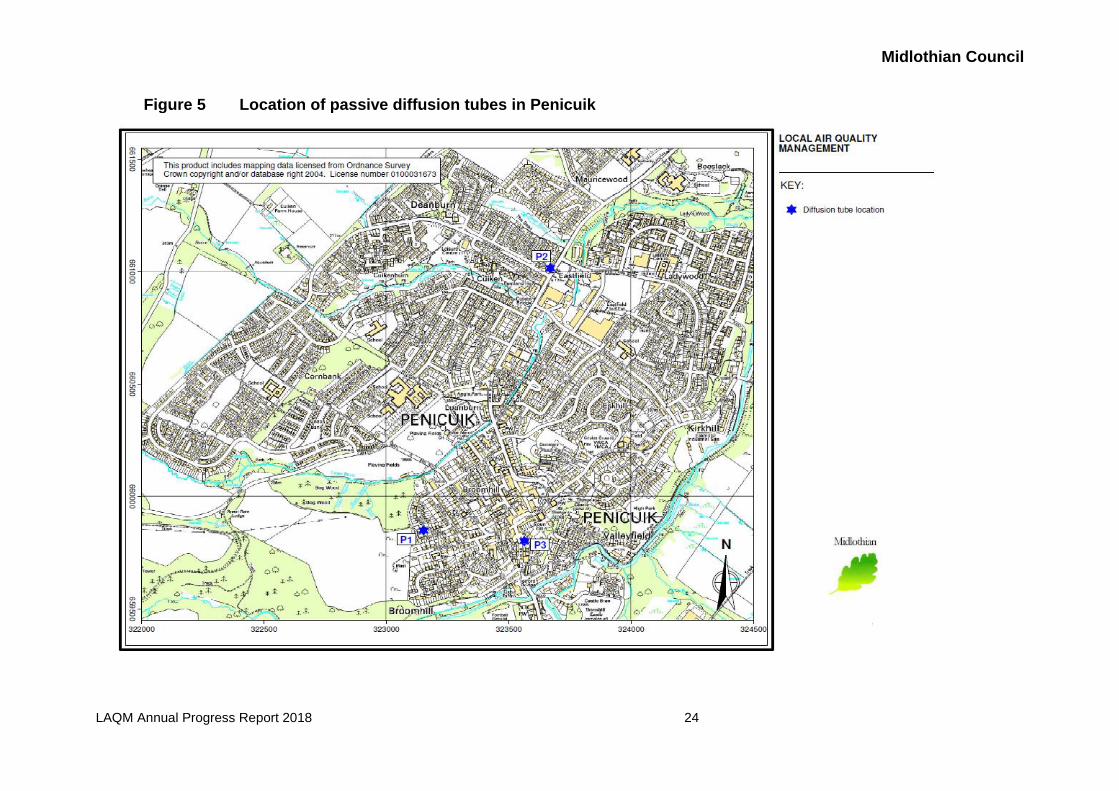
P1 Penicuik Urban
Background 323146 659818 NO2 N 0.5 m 1.4 N
P2 Penicuik Roadside 323677 661000 NO2 N 2.5 m 2.5 N
P3 Penicuik Roadside 323551 659725 NO2 N 0.5 m 1.5 N
PD1 Pathhead Roadside 339601 664172 NO2 N 3 m 1.5 N
PD2 Pathhead Roadside 339450 664310 NO2 N 0 m 6.5 N
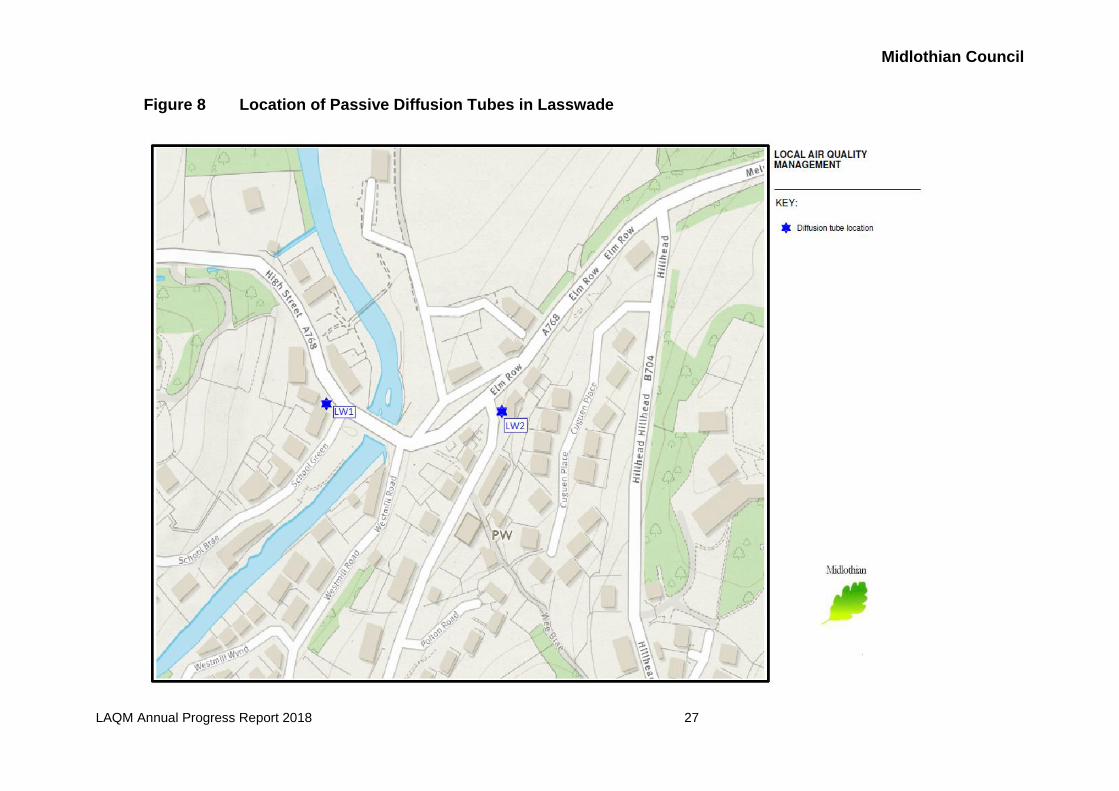
LW1 Lasswade Roadside 330343 666138 NO2 N 0m 1.5 N
LW2 Lasswade Roadside 330470 666125 NO2 N 0m 0.5 N
(1) ‘0m’ is where the monitoring site is at a location of exposure (e.g. installed on/adjacent to the façade of a residential property).
Midlothian Council
LAQM Annual Progress Report 2019 14
Table A.2 – Annual Mean NO2 Monitoring Results
Site ID Site Type Monitoring
Type
Data Capture for Monitoring Period (%) (1)
Valid Data Capture 2018
(%) (2)
NO2 Annual Mean Concentration (µg/m3) (3)
2012 2013 2014 2015 2016 2017 2018
J2 Road side Diffusion Tube 100 100 29.7 25.3 23.6 23.1 25.3 17.8 20.9
E1 Urban Bground Diffusion Tube N/A N/A 14.6 15.1 10.4 12.9 12.1 * *
BD1 Road side Diffusion Tube 92 92 35.4 29.0 29.3 23.1 26.4 22.5 26.6
ED1 Road side Diffusion Tube 92 92 32.5 30.1 29.1 27.8 32.5 25.0 32.4
ED2 Road side Diffusion Tube 100 100 28.0 24.2 23.1 19.1 19.9 17.7 22.2
X1 Road side Diffusion Tube N/A N/A 17.7 16.5 14.7 14.8 15.1 * *
HD1 Road side Diffusion Tube 92 92 16.3 14.7 13.0 14.5 14.7 13.6 16.4
ND1 Road side Diffusion Tube 100 100 31.1 27.2 37.3 23.7 25.4 24.8 26.2
DL1 Road side Diffusion Tube 100 100 33.6 29.4 28.2 26.9 26.2 25.4 27.4
P1 Urban Bground Urban Bground N/A N/A 8.7 7.8 6.8 6.4 7.4 * *
P2 Road Side Diffusion Tube 100 100 22.9 20.9 19.7 19.5 20.1 17.1 22.1
P3 Road Side Diffusion Tube N/A N/A 14.4 12.1 11 9.4 11.4 * *
PD1 Road Side Diffusion Tube 100 100 21.5 20.1 18.4 17.2 17.8 13.2 *
PD2 Road Side Diffusion Tube 100 100 18.9 18.3 16.3 15.1 14.8 13.3 17.6
BR1 Road Side Diffusion Tube 100 100 24.2 23.2 21.5 20.5 21.4 17.5 16.5
BR2 Road Side Diffusion Tube 100 100 23.8 21.2 20.1 20.9 20.1 18.2 21.3
LH1 Road Side Diffusion Tube 75 75 22.9 21.2 18.7 18.2 21.1 17.3 23.8
SN1 Road Side Diffusion Tube 92 92 23.3 23.6 21.6 20.0 21.7 17.5 26.1
SN2 Road Side Diffusion Tube 100 100 28.3 25.0 22.3 21.8 24.5 22.8 28.6
LW1 Road Side Diffusion Tube 100 100 N/C N/C N/C N/C N/C 20.1 23.6
LW2 Road Side Diffusion Tube 100 100 N/C N/C N/C N/C N/C 24.8 30.6
Midlothian Council
LAQM Annual Progress Report 2019 15
Appendix B: Full Monthly Diffusion Tube Results for 2018
Table B.1 – NO2 Monthly Diffusion Tube Results for 2018
Site ID
NO2 Mean Concentrations (µg/m3)
Jan Feb Mar Apr May Jun Jul Aug Sep Oct Nov Dec
Annual Mean
Raw Data Bias
Adjusted (1)
J2 30 25.1 22.8 20 20.0 19.1 16.6 12.0 16.2 16.8 31.4 27.1 21.7 20.9
BD1 37.3 31.2 26.7 27.5 36.5 26.2 22.9 23.8 19.7 25.7 34.3 - 27.7 26.6
ED1 44.8 46 31.5 31.9 40.3 36.2 23.9 22.6 20.2 31.7 45.8 - 33.7 32.4
ED2 31.5 33.8 18.2 24.6 24.9 20.3 19.3 17.5 17.6 24.5 27.6 23.5 23.1 22.2
HD1 26.4 21.4 - 14.4 11.4 14.1 10.2 12.7 10.7 17.4 16.6 18.9 17.1 16.4
ND1 27.9 38.9 13.7 23.6 30.3 23.8 26.0 26.7 30.1 34.5 32.4 36.7 27.3 26.2
DL1 37.4 41.8 26.9 23.8 27.5 19.6 25.8 25.4 28.6 33.6 39.4 25.2 28.5 27.4
P2 29.6 25.3 18.2 22 24.4 22.8 16.5 18.9 16.8 24.2 30.6 26.5 23.1 22.1
PD1 22.3 24.4 17.0 11.3 19.7 16.1 11.7 12.9 10.4 16.2 24.0 15.9 18.3 17.6
PD2 24 18.7 10.8 14.4 15.0 13.8 13.1 12.6 12.4 16.9 19.1 5.1 17.2 16.5
BR1 27 27.6 23.9 22.4 27.5 21.2 14.0 15.9 13.1 22.6 27.4 19.8 20.4 19.6
BR2 33.2 32.2 24.1 18.9 21.7 15.5 18.3 15.3 17.8 24.3 29.1 23.3 22.2 21.3
LH1 26.5 24.6 18.2 - 23.8 23 15.3 - - 21.0 28.3 19.8 24.8 23.8
SN1 33.9 24.2 26.6 26.4 27.6 20.5 15.8 19.4 - 20.2 31.4 22.8 27.2 26.1
SN2 36.7 40.5 18.9 33.1 30.6 32.9 19.1 22.9 19.8 33.0 30.5 25.6 29.8 28.6
LW1 33.3 28.2 18.1 19.9 22.8 20.3 16.3 19.9 20.2 22.8 27.0 21.9 24.6 23.6
LW2 36.4 41.9 34.7 38.0 41.8 35 27.9 26.8 24.3 28.4 42.7 32.6 31.9 30.6
Midlothian Council
LAQM Annual Progress Report 2019 16
(1) See Appendix C for details on bias adjustment.
(2) Dash represents no data due to missing tube.
(3) * means site no longer monitored.
(4) N/C means monitoring at location not commenced.
Midlothian Council
LAQM Annual Progress Report 2019 17
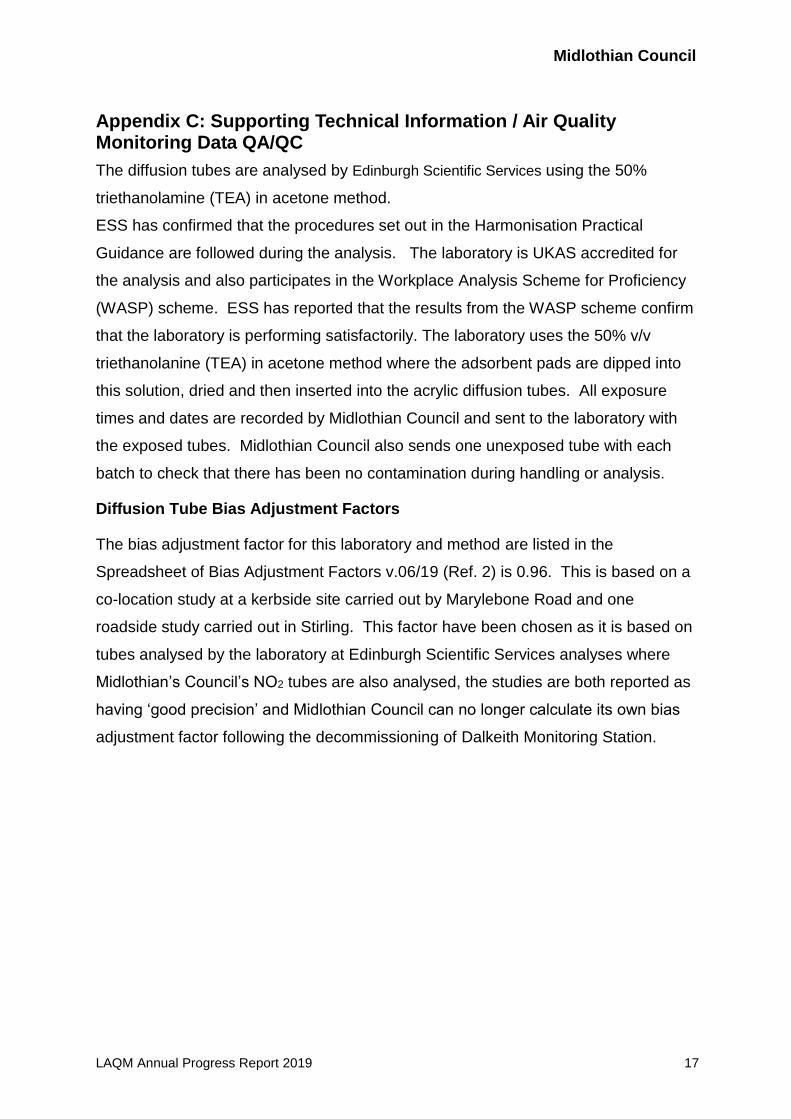
Appendix C: Supporting Technical Information / Air Quality Monitoring Data QA/QC
The diffusion tubes are analysed by Edinburgh Scientific Services using the 50%
triethanolamine (TEA) in acetone method.
ESS has confirmed that the procedures set out in the Harmonisation Practical
Guidance are followed during the analysis. The laboratory is UKAS accredited for
the analysis and also participates in the Workplace Analysis Scheme for Proficiency
(WASP) scheme. ESS has reported that the results from the WASP scheme confirm
that the laboratory is performing satisfactorily. The laboratory uses the 50% v/v
triethanolanine (TEA) in acetone method where the adsorbent pads are dipped into
this solution, dried and then inserted into the acrylic diffusion tubes. All exposure
times and dates are recorded by Midlothian Council and sent to the laboratory with
the exposed tubes. Midlothian Council also sends one unexposed tube with each
batch to check that there has been no contamination during handling or analysis.
Diffusion Tube Bias Adjustment Factors
The bias adjustment factor for this laboratory and method are listed in the
Spreadsheet of Bias Adjustment Factors v.06/19 (Ref. 2) is 0.96. This is based on a
co-location study at a kerbside site carried out by Marylebone Road and one
roadside study carried out in Stirling. This factor have been chosen as it is based on
tubes analysed by the laboratory at Edinburgh Scientific Services analyses where
Midlothian’s Council’s NO2 tubes are also analysed, the studies are both reported as
having ‘good precision’ and Midlothian Council can no longer calculate its own bias
adjustment factor following the decommissioning of Dalkeith Monitoring Station.
Midlothian Council
LAQM Annual Progress Report 2019 18
Glossary of Terms
Abbreviation Description
AQAP Air Quality Action Plan - A detailed description of measures, outcomes, achievement dates and implementation methods, showing how the LA intends to achieve air quality limit values’
AQMA Air Quality Management Area – An area where air pollutant concentrations exceed / are likely to exceed the relevant air quality objectives. AQMAs are declared for specific pollutants and objectives
APR Air quality Annual Progress Report
AURN Automatic Urban and Rural Network (UK air quality monitoring network)
Defra Department for Environment, Food and Rural Affairs
DMRB Design Manual for Roads and Bridges – Air quality screening tool produced by Highways England
FDMS Filter Dynamics Measurement System
LAQM Local Air Quality Management
NO2 Nitrogen Dioxide
NOx Nitrogen Oxides
PM10 Airborne particulate matter with an aerodynamic diameter of 10µm (micrometres or microns) or less
PM2.5 Airborne particulate matter with an aerodynamic diameter of 2.5µm or less
QA/QC Quality Assurance and Quality Control
SO2 Sulphur Dioxide
Midlothian Council
LAQM Annual Progress Report 2018 19
References
1. Defra and the Devolved Administrations, Local Air Quality Management, Technical Guidance (TG17), April 2016.
2. Defra and the Devolved Administrations, National Diffusion Tube Bias Adjustment Spreadsheet, version 06/19, accessed at
http://laqm.defra.gov.uk/bias-adjustment-factors/national-bias.html.
3. Cleaner Air for Scotland: The Road to a Healthier Future, Scottish Government
4. Midlothian Council Transport Plan 2013 to 2017
5. Midlothian Local Development Plan 2017
Midlothian Council
LAQM Annual Progress Report 2018 20
Figure 1 - Schematic showing boundary of Midlothian, including towns, villages and significant roads

Midlothian Council
LAQM Annual Progress Report 2018 21
Figure 2 Extent of Revoked Air Quality Management Area, Pathhead
Midlothian Council
LAQM Annual Progress Report 2018 22
Figure 3 Location of passive diffusion tubes and (decommissioned) automatic monitoring station, Dalkeith

Midlothian Council
LAQM Annual Progress Report 2018 23
Figure 4 Location of passive diffusion tubes and (decommissioned) automatic monitoring station, Pathhead
Midlothian Council
LAQM Annual Progress Report 2018 24
Figure 5 Location of passive diffusion tubes in Penicuik
Midlothian Council
LAQM Annual Progress Report 2018 25
Figure 6 Location of passive diffusion tubes in Bonnyrigg
Midlothian Council
LAQM Annual Progress Report 2018 26
Figure 7 Location of passive diffusion tubes in Loanhead
Midlothian Council
LAQM Annual Progress Report 2018 27
Figure 8 Location of Passive Diffusion Tubes in Lasswade
Midlothian Council
LAQM Annual Progress Report 2018 28
Figure 9 SO2 Concentration at Pathhead, Midlothian (Jan 2008 – Jan 2013)