Annual Program Report 2016Annual Program Report 20164 Canadian Grain Commission Grain Research...
28
GRAIN RESEARCH LABORATORY Annual Program Report 2016 ISSN 2371-0411
Transcript of Annual Program Report 2016Annual Program Report 20164 Canadian Grain Commission Grain Research...

Grain research Laboratory
Annual Program Report
2016
ISSN 2371-0411
Grain Research Laboratory · Canadian Grain Commission · www.grainscanada.gc.ca
Our Mandate The Canadian Grain Commission works in the interests of grain producers. Guided by the Canada Grain Act, the Canadian Grain Commission works to establish and main-tain standards of quality for Canadian grain, regulate grain handling in Canada, and to ensure that grain is a dependable commodity for domestic and export markets.
Our VisiOn To be a world class, science-based quality assurance provider.
3 Director’s Welcome
4 Overview
5 Statistics and Facts
6 Bread and Durum Wheat Research
8 Milling and Malting/Research on Barley and Other Grains
10 Oilseeds
12 Pulse Research
14 Wheat Enzymes, Asian Products and Analytical Services
16 Grain Biotechnology Research18 Microbiology
20 Trace Organics and Trace Elements Analysis
22 VarietyIdentificationResearch and Monitoring
24 2015-2016ScientificPublications
26 Harvest Sample Program Evaluation Summary
COntents
© Her Majesty the Queen in Right of Canada, as represented by the Minister of Agriculture and Agri-Food Canada, 2017
Annual Program Report || 20163 Canadian Grain Commission || Grain Research Laboratory
2016 was another very successful and productive year for the Grain Research Laboratory.
In the spring of 2016 we received Ference and Company Consulting Ltd.’s final report on its evaluation of our Harvest Sample Program. The evaluation reaffirmed the program’s importance and its value to you, our stakeholders in the grain sector. An abbreviated executive summary is included in this report.
One of the Grain Research Laboratory’s key functions is monitoring and evaluating the scientific basis for the Canadian Grain Commission’s grading system. For a second year, we continued our efforts to assess the quality impact of mildew in wheat. Based on our results, immediate changes to mildew grading factors were implemented, bene-fitting producers, exporters and customers.
Two new tests developed by the Grain Research Laboratory were officially approved by the Prairie Grain Development Committee. A modified extensograph pro-tocol allows for a more rapid throughput of
testing, while reducing the amount of wheat material required. In addition, our Lean No Time baking method is faster, more accurate and minimizes ingredients to better assess intrinsic quality.
This year’s report highlights some of the innovative and exciting scientific research projects currently going on. These projects are strategically aligned with the needs of our grain sector stakeholders and are at the forefront of scientific discovery. The quality of our work and the value of the scientific results are recognized worldwide. Many of our scientists and staff are regularly invited to deliver presentations and update reports on their work.
I encourage you to read the report and learn more about our abilities, research areas and the quality of service the dedicated scientists and staff at the Grain Research Laboratory provide on a daily basis to serve you and all members of the Canadian grain value chain. Please share with us your com-ments and thoughts. We greatly appreciate your feedback.
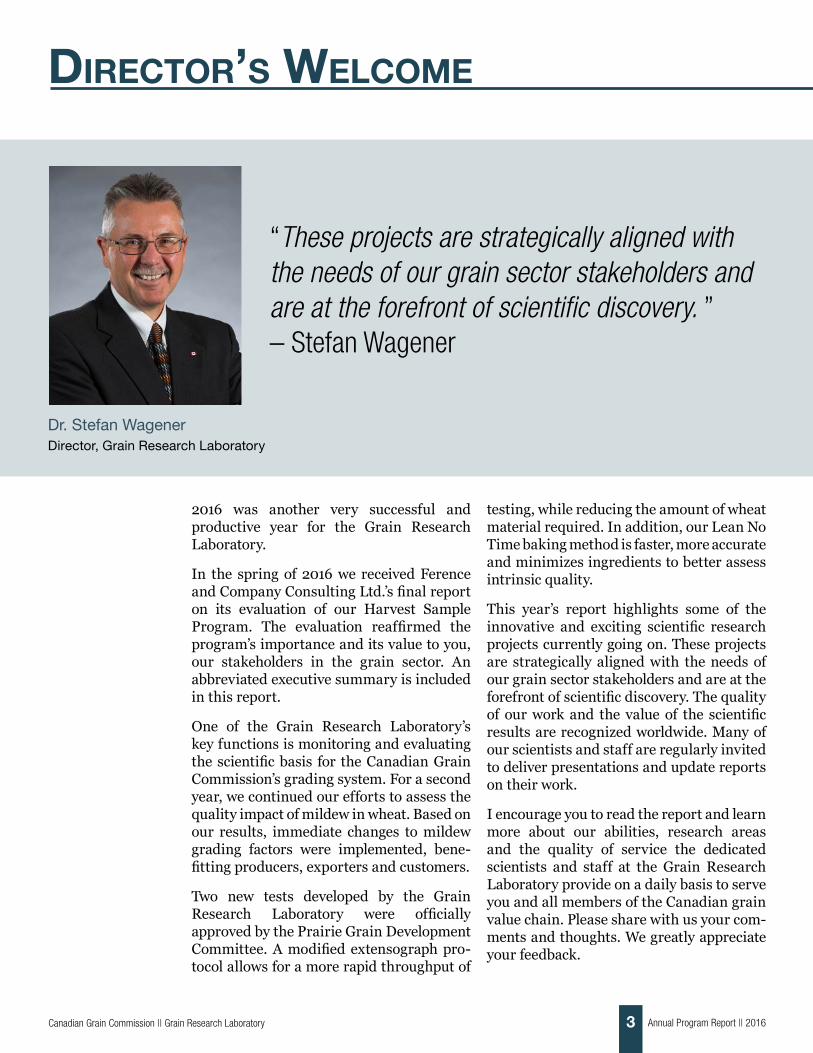
Dr. Stefan WagenerDirector, Grain Research Laboratory
“These projects are strategically aligned with the needs of our grain sector stakeholders and are at the forefront of scientific discovery. ” – Stefan Wagener
direCtOr’s WelCOMe
Annual Program Report || 2016 4 Canadian Grain Commission || Grain Research Laboratory
The research conducted by the Canadian Grain Commission’s Grain Research Laboratory falls under two categories: crop research and technology research.
Research related to crops assesses Canadian grain harvest quality and studies how grading factors affect end-use properties. Crop research also develops new uses for Canadian grain and evaluates new varieties as part of the variety registration process.
Research related to technology evaluates and develops methods used to assess the quality and safety of Canadian grain.
Crop research programs include:
• Bread and Durum Wheat Research
• Milling and Malting/Research on Barley and Other Grains
• Oilseeds
• Pulse Research
• Wheat Enzymes, Asian Products and Analytical Services
Technology research programs include:
• Grain Biotechnology Research
• Microbiology
• Trace Organics and Trace Elements Analysis
• VarietyIdentificationResearch and Monitoring
Beyond each program’s own testing and research, all of the programs support four key activities:
OVerVieW
Cargo quality monitoring
Provides analytical testing of export grain shipments (e.g. mycotoxins, pesticides, variety composition) to ensure they meet Canada’s grading and quality parameters.
Plant breeder line evaluation
Provides testing and recommendations for the advancement of breeder line seed.
Requests for service analysis
Provides analytical services of samples submitted by the industry for testing, at times for a fee.
Harvest Sample Program
A yearly survey of the crop quality for that year’s harvest. Producers send in a voluntary sample of their harvest, and in return receive a free,unofficialCanadianGrainCommission grade. Data from this survey is used to generate a harvest quality report of Canadian grain.

Annual Program Report || 20165 Canadian Grain Commission || Grain Research Laboratory
Grl statistiCs and faCts
In 2016
We publish annual harvest and crop reports, we also publish an annual Fusarium survey report from samples we collect through the Harvest Sample Program.
• State-of-the-art, high-throughput quantitative PCR technology has enabled the Microbiology program to take the annual Fusarium survey to another level. It allows us to analyze more than 1,000 harvest samples every year.
• The Harvest Sample Program received over 13,150 samples for the 2016-2017 crop year.
We continuously develop new methods and explore new technologies to stay innovative and meet grain sector needs. Examples include:
• We developed a high-throughput rapid extensograph method for gluten strength.
• Ourresearchprovidesascientificbasisfortolerancesfor grading factors.
• We developed a “Lean No Time” baking test with improved ability to distinguish among varieties.
• 27 scientific publications were published by our scientists. Refer to page 24.
• WedevelopedDNA-basedvarietyidentificationmethodsfordurumwheatandflax.
• The Pulse Research program is studying the feasibility of using the new technology of combining high-resolution NIR spectroscopy and machine vision to analyze and sort pulses according to their chemical and physical (size, colour and shape) properties.
Current and historical crop quality survey reports are available for the following grains:
Cereals
• Wheat
• Malting barley
Oilseeds
• Canola
• Flaxseed
• Mustard
• Soybeans
(Non-food grade)
Pulses
• Beans
• Chick peas
• Lentils
• Peas
• Soybeans
(Food-grade)
Harvest Sample Program
Innovation
Annual Program Report || 2016 6 CROPS Canadian Grain Commission || Grain Research Laboratory
Bread and duruM Wheat researCh
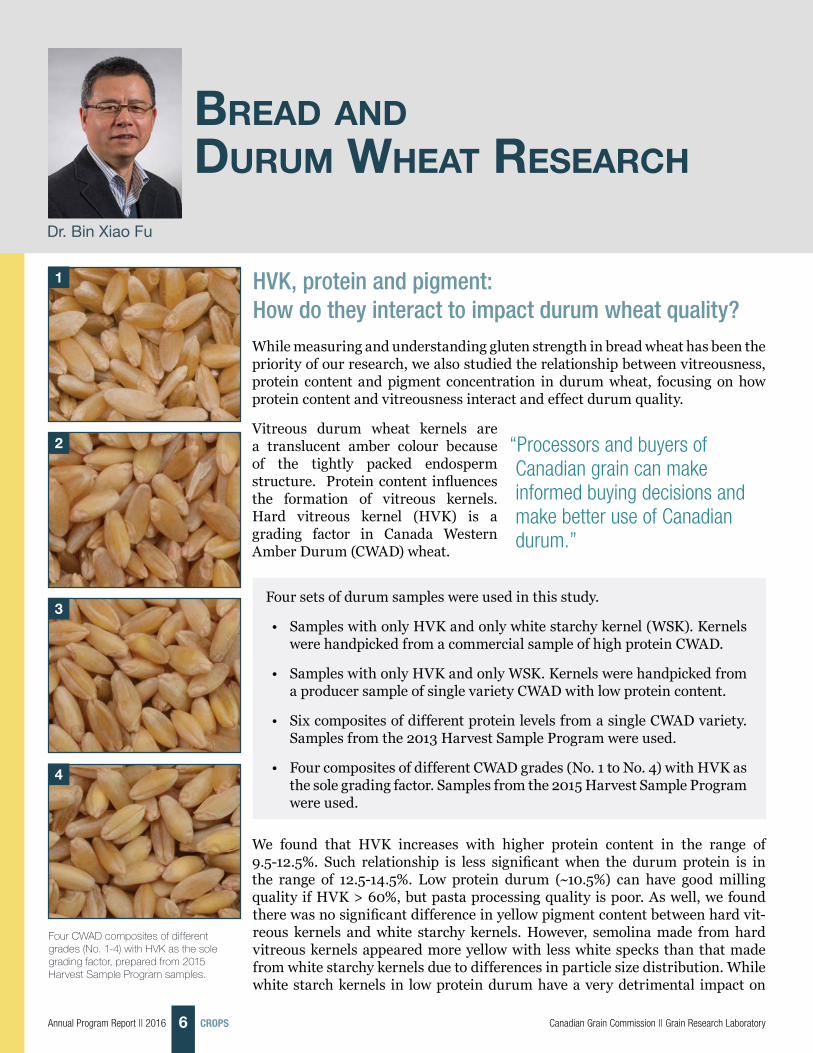
Dr. Bin Xiao Fu
HVK, protein and pigment: How do they interact to impact durum wheat quality?
Four CWAD composites of different grades (No. 1-4) with HVK as the sole grading factor, prepared from 2015 Harvest Sample Program samples.
While measuring and understanding gluten strength in bread wheat has been the priority of our research, we also studied the relationship between vitreousness, protein content and pigment concentration in durum wheat, focusing on how protein content and vitreousness interact and effect durum quality.
Vitreous durum wheat kernels are a translucent amber colour because of the tightly packed endosperm structure. Protein content influences the formation of vitreous kernels. Hard vitreous kernel (HVK) is a grading factor in Canada Western Amber Durum (CWAD) wheat.
We found that HVK increases with higher protein content in the range of 9.5-12.5%. Such relationship is less significant when the durum protein is in the range of 12.5-14.5%. Low protein durum (~10.5%) can have good milling quality if HVK > 60%, but pasta processing quality is poor. As well, we found there was no significant difference in yellow pigment content between hard vit-reous kernels and white starchy kernels. However, semolina made from hard vitreous kernels appeared more yellow with less white specks than that made from white starchy kernels due to differences in particle size distribution. While white starch kernels in low protein durum have a very detrimental impact on
“Processors and buyers of Canadian grain can make informed buying decisions and make better use of Canadian durum.”
1
2
3
4
Four sets of durum samples were used in this study.
• Samples with only HVK and only white starchy kernel (WSK). Kernels were handpicked from a commercial sample of high protein CWAD.
• Samples with only HVK and only WSK. Kernels were handpicked from a producer sample of single variety CWAD with low protein content.
• Six composites of different protein levels from a single CWAD variety. Samples from the 2013 Harvest Sample Program were used.
• Four composites of different CWAD grades (No. 1 to No. 4) with HVK as the sole grading factor. Samples from the 2015 Harvest Sample Program were used.

Annual Program Report || 20167 CROPSCanadian Grain Commission || Grain Research Laboratory
Lab Members • Brigitte Dupuis, Chemist
• Andrea Iverson, Technician
• Altash Yirdaw, Technician
• Dale Taylor, Technician
• Jerry Suchy, Technician
• Kun Wang, Technician
• Ofelia Fransico-Pabalan,
Technician
• Shin Nam, Technician
• Tanya Zirdum, Technician
milling and pasta processing quality, high protein content can mitigate the effect of white starchy kernels on quality. In terms of protein compo-sition, vitreous kernels appeared to have higher ratios of insoluble to total glutenin, and total monomeric to total glutenin proteins.
Research objectiveThe proportion HVK, protein content, and yellow pigment concentration are the top three specifications determining the value of durum wheat. However, there is little information available on how vitreousness, yellow pigment content and semolina and pasta colour relate to each other. As well, the relationship described in the literature between protein content and degree of vitreousness is not always in agreement.
Benefits for Canada’s grain sectorUnderstanding how hard vitreous kernels, protein content and their interaction affect the quality of products made from durum wheat, as well as processing quality, helps us determine if current grade tolerances are appropriate. As well, processors and buyers of Canadian grain can make informed buying decisions and make better use of Canadian durum with the knowledge of how grading factors affect the quality of products made from durum wheat.
Effect of HVK on Durum Wheat Quality
Quality parameter No.1 No.2 No.3 No.4
Wheat
Vitreous Kernels, % 90 68 42 30
Protein Content, % 13.3 12.2 11.8 11.3
Test Weight, kg/hL 81.9 81.9 80.6 80.1
Milling
Total Milling yield, % 76.2 76.0 75.1 74.8
Semolina yield, % 68.0 67.2 65.8 64.3
Semolina
Yellowness, b* 30.5 30.2 29.2 27.8
Yellow Pigment, ppm 8.8 8.8 8.5 8.6
Gluten Index, % 83 81 79 86
White specks (per 100cm²) 39 49 85 94
Spaghetti
Yellowness (dry), b* 60.9 62.1 61.0 60.4
Firmness (cooked), g 591 567 511 485
HVK does not impact yellow pigment content but it does impact colour and white specks in semolina.
Dr. Fu presented part of this research at the 66th Australian Grain Science Conference in his keynote speech “Kernel vitreosity and protein content in relation to durum wheat quality.” Manuscript in preparation.
Micro-extruder used for making spaghetti for quality evaluation.
Annual Program Report || 2016 8 CROPS Canadian Grain Commission || Grain Research Laboratory
MillinG and MaltinG / researCh On Barley and Other Grains
Dr. Marta Izydorczyk
Understanding the role of barley arabinoxylans in malting and brewing processes This year our research continued to focus on factors affecting the content of arabinox-ylans in barley and on the role of arabinoxylans in beer production. Arabinoxylans are non-starch polysaccharides found in cell walls of various tissues in barley. During malting, arabinoxylans are partially solu-bilized and broken down, but they can still be detected in wort, spent grain and even in beer. Because arabinoxylans make solu-tions more viscous, they can cause filtration
problems during beer production. They may also contribute to haze and precipi-tates formation in beer. On the other hand, arabinoxylans may have positive effects and contribute to desirable mouthfeel and foam stability in beers.
We surveyed arabinoxylan content in Canadian barley to determine how genotype and environment affect the concentration of arabinoxylans in grain. We developed an NIR (near infrared) calibration for measuring the level of arabinoxylans in barley. We’ve also studied how the level of arabinoxylan content and composition change during malting, mashing and brewing.
Research objectiveOne of the top research priorities of the malting and brewing industry is under-standing arabinoxylans’ role in beer production. Our project, which addresses this research priority, is partially sponsored by the Brewing and Malting Barley Research Institute (BMBRI) and its members.
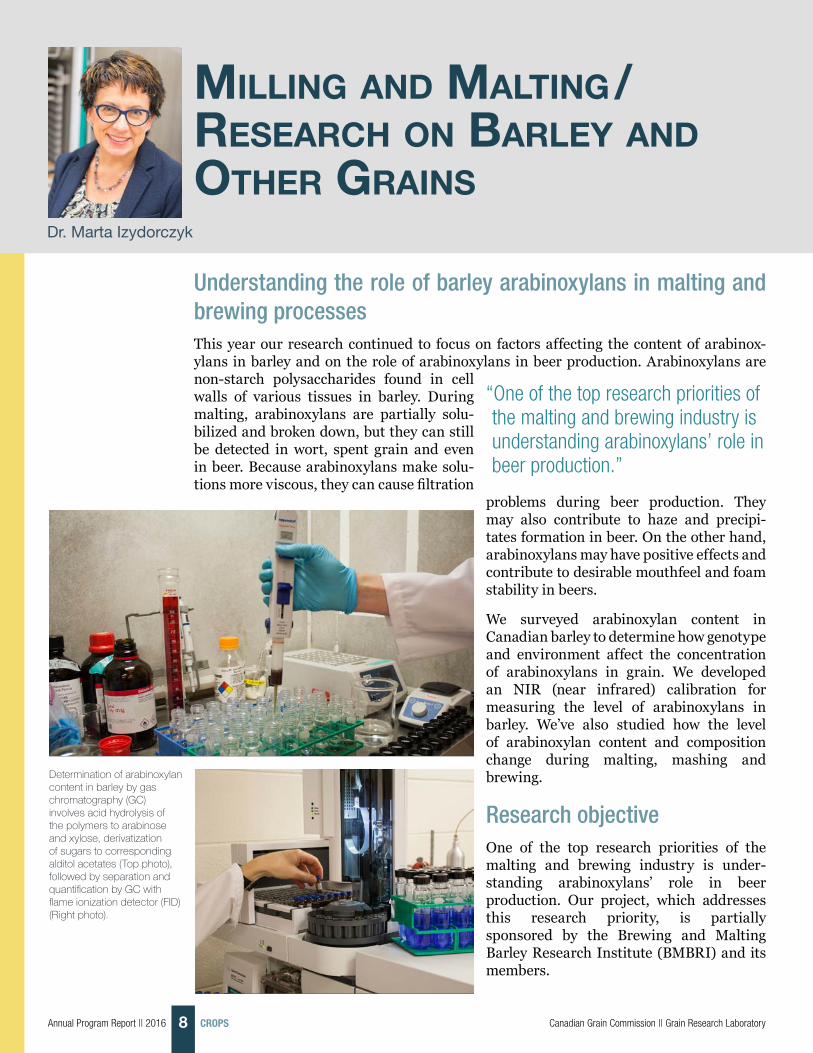
Determination of arabinoxylan content in barley by gas chromatography (GC) involves acid hydrolysis of the polymers to arabinose and xylose, derivatization of sugars to corresponding alditol acetates (Top photo), followed by separation and quantification by GC with flame ionization detector (FID) (Right photo).
“One of the top research priorities of the malting and brewing industry is understanding arabinoxylans’ role in beer production.”

Annual Program Report || 20169 CROPSCanadian Grain Commission || Grain Research Laboratory
Lab Members • Tricia McMillan, Chemist
• Arzoo Sharma, Chemist
• Sharon Bazin, Technician
• Anna Chepurna,
Technician
• Debby Shaluk, Technician
• Shawn Parsons,
Technician
• Jerry Kletke, Technician
• Dave Turnock, Technician
Scientific publications relating to this research 1. Izydorczyk, M.S. (2016). Functional Properties of
Cereal Cell-Wall Polysaccharides. In: Carbohydrates in Food, 3rd Edition, A.-C. Eliasson (ed.) pp.193-256. CRC Press, Oxford.
2. Izydorczyk, M.S., (2014). Barley Arabinoxylans: Molecular, Physicochemical, and Functional Properties In: Barley: Chemistry and Technology, 2nd Edition, P.R. Shewry and S.E. Ullrich (eds.), pp. 97-122. AACC International, St. Pauls.
3. Izydorczyk, M.S., McMillan, T., Bazin, S. (2014). Changes in content and physicochemical properties of arabinoxylans during malting and brewing of two- and six-rowed Canadian malting barley. Results presented at the 11th International Trends in Brewing, Ghent, Belgium.
4. Izydorczyk, M.S., McMillan, T., Bazin, S., Chepurna, A., Dushnicky, L. (2013). Characterization and quantificationofarabinoxylansinCanadianbarley.Results presented at the 22nd BMBRI Triennial Barley Improvement Meeting, Winnipeg, MB
Benefits for Canada’s grain sectorOur work showed that NIR-based analysis can be used as a screening tool for malting barley breeding programs that aim to produce vari-eties with arabinoxylan content best suited for malting.
Knowledge about arabinoxylan content in malting barley could be useful in predicting arabinoxylans’ concentration in beer and spent grain. Only a small portion of arabinoxylans breaks down and dissolves during malting and brewing processes. All remaining arabinoxylans are found in brewers’ spent grain, a nutrient-rich product.
Because arabinoxylans have health benefits, there is interest in increasing arabinoxylan content in food and beverages. As a rapid measurement technology, NIR can be used by breeding programs to develop food barley varieties with high arabinoxylan content to take advantage of their health benefits.
Scatter plot of predicted (NIR) versus reference values (GC-FID) for concentration of arabinoxylans in barley, demonstrating that NIR can be used as a screening tool.
NIR sample cell for whole grain
Light microscopy micrograph of a cross section of barley kernel showing the abundance of arabinoxylans (blue auto fluorescence) in the cell walls of the outer layers: husk (h), pericarp (p), testa (t), and aleurone (a), and in the endosperm (e).
pt
a
h
e
Annual Program Report || 2016 10 CROPS Canadian Grain Commission || Grain Research Laboratory
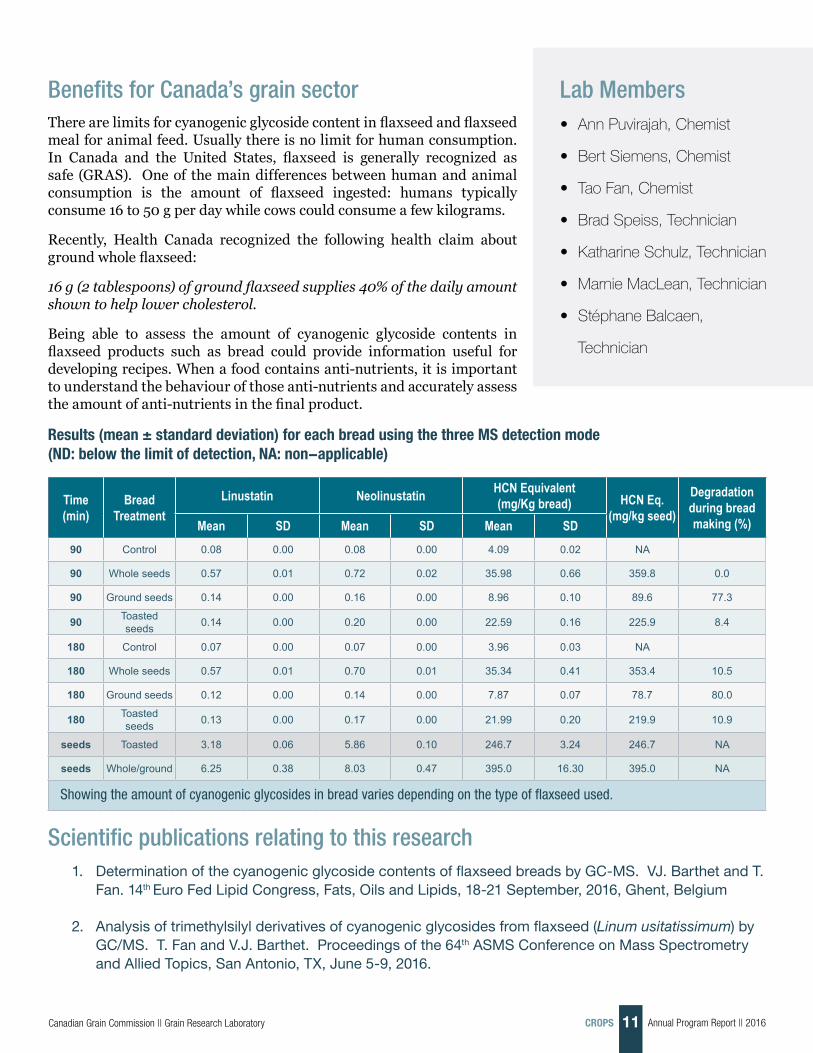
Investigating how bread making affects cyanogenic glycoside compounds in flaxseed We’re developing a method to analyze cyanogenic glycoside compounds in baked products made with flaxseed. Cyanogenic glycosides are anti-nutrients found in many crops other
than flaxseed, such as cassava and bitter almond. Anti-nutrients are compounds that interfere with the absorption of nutrition.
To investigate what happens to cyano-genic glycosides through the bread-making process, bread was made with 10% flaxseed. Bread made with whole, ground or commercially toasted ground flaxseed and using two fermentation times was studied. The resulting loaves of bread were analyzed using gas chromatograph-mass spectrometry (GC-MS).
We found that while the fermentation time had no effect on the amount of cyanogenic glycoside in bread made with flaxseed, how the flaxseed was prepared did have an effect. Bread made with whole flaxseed had 1.6 times more cyanogenic glycosides than bread made with toasted ground flaxseeds and 3.9 times more than bread with ground flaxseeds. All the loaves that were made with various flaxseeds were well within the cyanogenic glycosides limits set for other foods.
Research objectiveFlaxseeds are full of healthy components such as omega-3 fatty acids, fiber and lignans. However, not much is known about how cyanogenic glycosides persist in products made of flaxseed or if processing has an effect on cyanogenic glycoside levels.
GC-MS allows the quantification of each individual cyanogenic compound, removing the interference of the artifact caused by making breads or muffins or any processed products.
Oilseeds
Dr. Véronique Barthet
“Being able to assess the amount of cyanogenic glycoside contents in flaxseed products such as bread could provide information useful for developing recipes.”
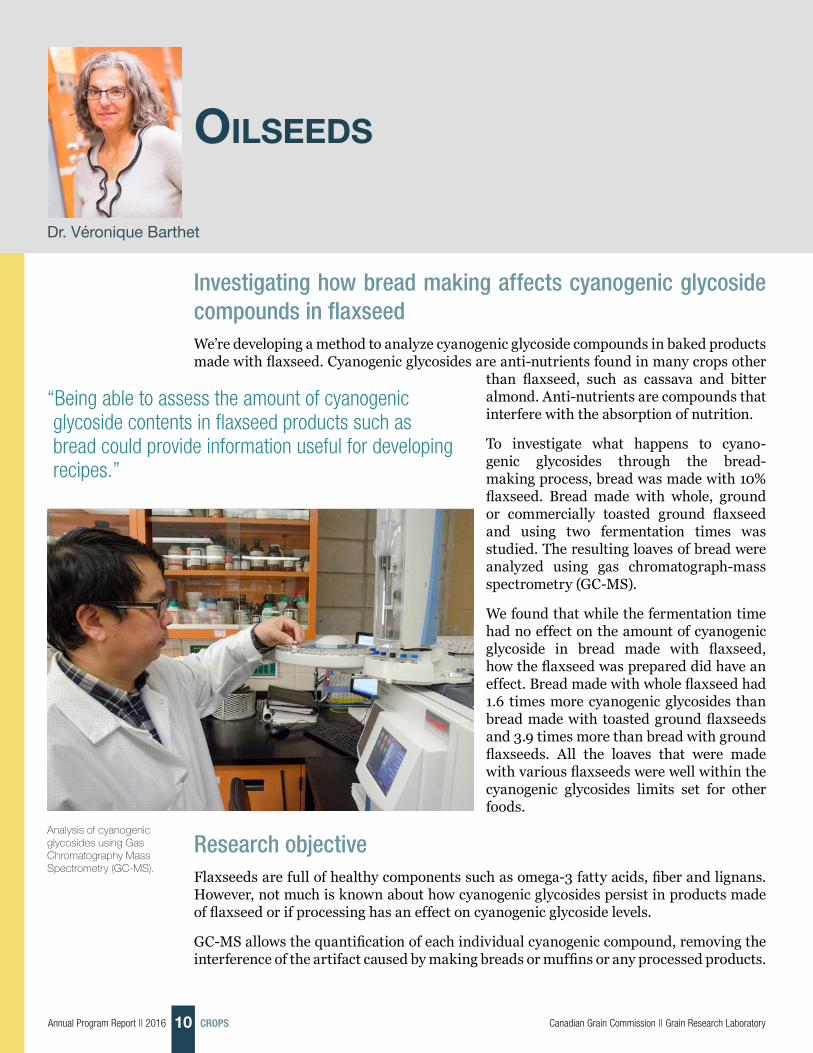
Analysis of cyanogenic glycosides using Gas Chromatography Mass Spectrometry (GC-MS).
Annual Program Report || 201611 CROPSCanadian Grain Commission || Grain Research Laboratory
Lab Members • Ann Puvirajah, Chemist
• Bert Siemens, Chemist
• Tao Fan, Chemist
• Brad Speiss, Technician
• Katharine Schulz, Technician
• Marnie MacLean, Technician
• Stéphane Balcaen,
Technician
Scientific publications relating to this research 1. DeterminationofthecyanogenicglycosidecontentsofflaxseedbreadsbyGC-MS.VJ.BarthetandT.
Fan. 14th Euro Fed Lipid Congress, Fats, Oils and Lipids, 18-21 September, 2016, Ghent, Belgium
2. Analysisoftrimethylsilylderivativesofcyanogenicglycosidesfromflaxseed(Linum usitatissimum) by GC/MS.T.FanandV.J.Barthet.Proceedingsofthe64th ASMS Conference on Mass Spectrometry andAlliedTopics,SanAntonio,TX,June5-9,2016.
Benefits for Canada’s grain sectorThere are limits for cyanogenic glycoside content in flaxseed and flaxseed meal for animal feed. Usually there is no limit for human consumption. In Canada and the United States, flaxseed is generally recognized as safe (GRAS). One of the main differences between human and animal consumption is the amount of flaxseed ingested: humans typically consume 16 to 50 g per day while cows could consume a few kilograms.
Recently, Health Canada recognized the following health claim about ground whole flaxseed:
16 g (2 tablespoons) of ground flaxseed supplies 40% of the daily amount shown to help lower cholesterol.
Being able to assess the amount of cyanogenic glycoside contents in flaxseed products such as bread could provide information useful for developing recipes. When a food contains anti-nutrients, it is important to understand the behaviour of those anti-nutrients and accurately assess the amount of anti-nutrients in the final product.
Results (mean ± standard deviation) for each bread using the three MS detection mode (ND: below the limit of detection, NA: non-applicable)
Time(min)
BreadTreatment
Linustatin Neolinustatin HCN Equivalent(mg/Kg bread) HCN Eq.
(mg/kg seed)
Degradation during bread making (%)Mean SD Mean SD Mean SD
90 Control 0.08 0.00 0.08 0.00 4.09 0.02 NA
90 Whole seeds 0.57 0.01 0.72 0.02 35.98 0.66 359.8 0.0
90 Ground seeds 0.14 0.00 0.16 0.00 8.96 0.10 89.6 77.3
90 Toasted seeds 0.14 0.00 0.20 0.00 22.59 0.16 225.9 8.4
180 Control 0.07 0.00 0.07 0.00 3.96 0.03 NA
180 Whole seeds 0.57 0.01 0.70 0.01 35.34 0.41 353.4 10.5
180 Ground seeds 0.12 0.00 0.14 0.00 7.87 0.07 78.7 80.0
180 Toasted seeds 0.13 0.00 0.17 0.00 21.99 0.20 219.9 10.9
seeds Toasted 3.18 0.06 5.86 0.10 246.7 3.24 246.7 NA
seeds Whole/ground 6.25 0.38 8.03 0.47 395.0 16.30 395.0 NA
Showing the amount of cyanogenic glycosides in bread varies depending on the type of flaxseed used.
Annual Program Report || 2016 12 CROPS Canadian Grain Commission || Grain Research Laboratory
Determining the effect of cultivar and growing environment on dry bean quality We’re collaborating with the bean breeding program at the Morden Research and Development Centre of Agriculture and Agri-Food Canada to investigate how cultivar, growing location and year affect quality factors in beans grown in Manitoba. This project is supported by Manitoba Pulse and Soybean Growers.
Pulse researCh
Dr. Ning Wang
“Information from our research on nutritional value could support and enhance the marketability of Canadian pulses.”
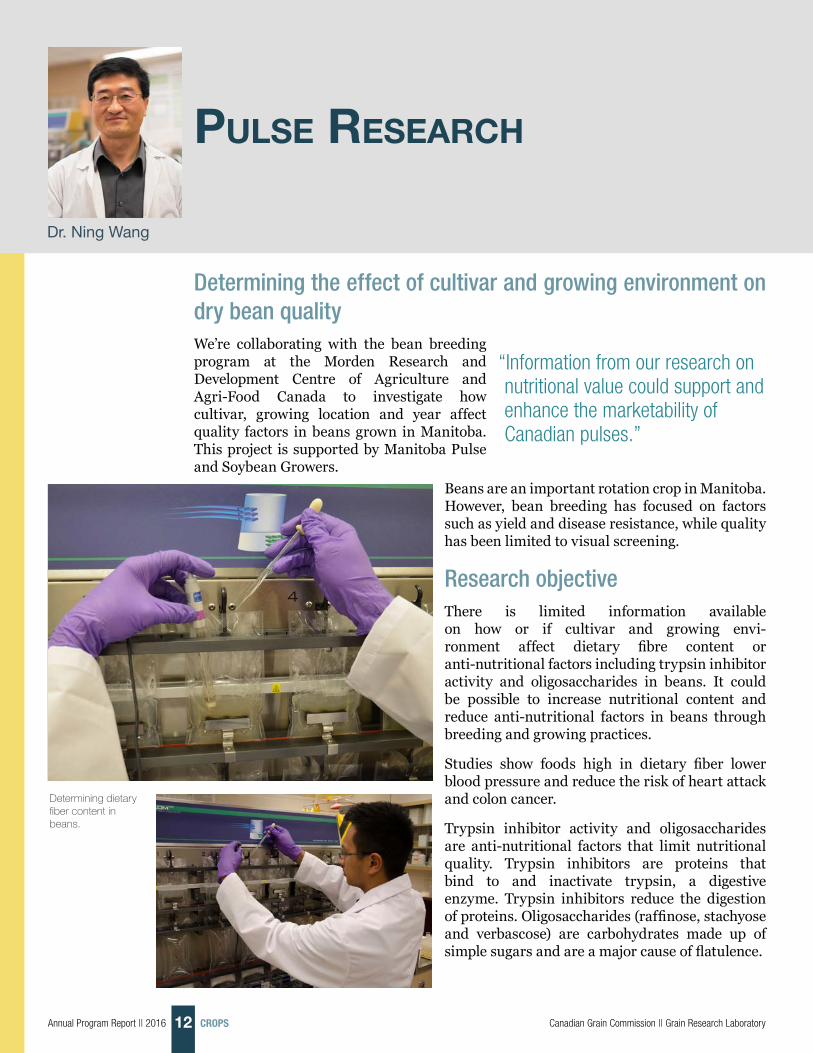
Determining dietary fiber content in beans.
Beans are an important rotation crop in Manitoba. However, bean breeding has focused on factors such as yield and disease resistance, while quality has been limited to visual screening.
Research objectiveThere is limited information available on how or if cultivar and growing envi-ronment affect dietary fibre content or anti-nutritional factors including trypsin inhibitor activity and oligosaccharides in beans. It could be possible to increase nutritional content and reduce anti-nutritional factors in beans through breeding and growing practices.
Studies show foods high in dietary fiber lower blood pressure and reduce the risk of heart attack and colon cancer.
Trypsin inhibitor activity and oligosaccharides are anti-nutritional factors that limit nutritional quality. Trypsin inhibitors are proteins that bind to and inactivate trypsin, a digestive enzyme. Trypsin inhibitors reduce the digestion of proteins. Oligosaccharides (raffinose, stachyose and verbascose) are carbohydrates made up of simple sugars and are a major cause of flatulence.
Annual Program Report || 201613 CROPSCanadian Grain Commission || Grain Research Laboratory
Lab Members • Lisa Maximiuk, Technician
• Joseffus Santos, Technician
• Ashley Hudrick, Technician
Scientific publications relating to this research 1. Wang,N.,Hou,A.,Santos,J.andMaximiuk,L.(2016).
Effects of cultivar, growing location and year on physi-co-chemical and cooking characteristics of dry beans (Phaseolus vulgaris). Focus Issue of Cereal Chemistry (in press).
2. Wang,N.,Hou,A.,Maximiuk,L.andSantos,J.(2016).Variationindietaryfibreandoligosaccharidecontentsofdifferent beans (Phaseolus vulgaris) grown in Manitoba. Presented at 10th Canadian Pulse Research Workshop, October 26-28, 2016, Winnipeg MB.
3. Wang, N. and Maximiuk, L. (2015). Development of an improved electrical resistance method for determining emulsifying capacity of pulse and soy materials. Cereal Chem. 92(3):253-257.
Benefits for Canada’s grain sectorBean breeders could use what we learn from this project to improve quality and nutritional values. In turn, pulse growers and the pulse industry could be more competitive in domestic and international markets. As well, information from our research on nutritional value could support and enhance the marketability of Canadian pulses.
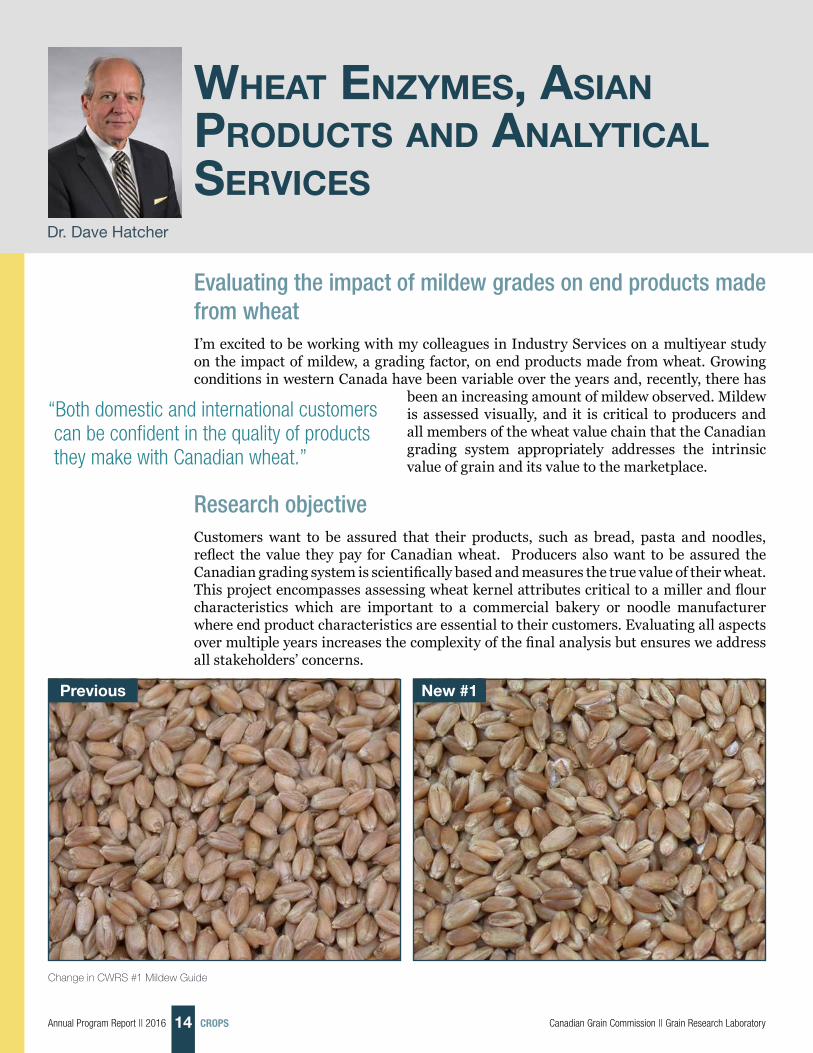
Analysis of sugars in beans with HPLC method
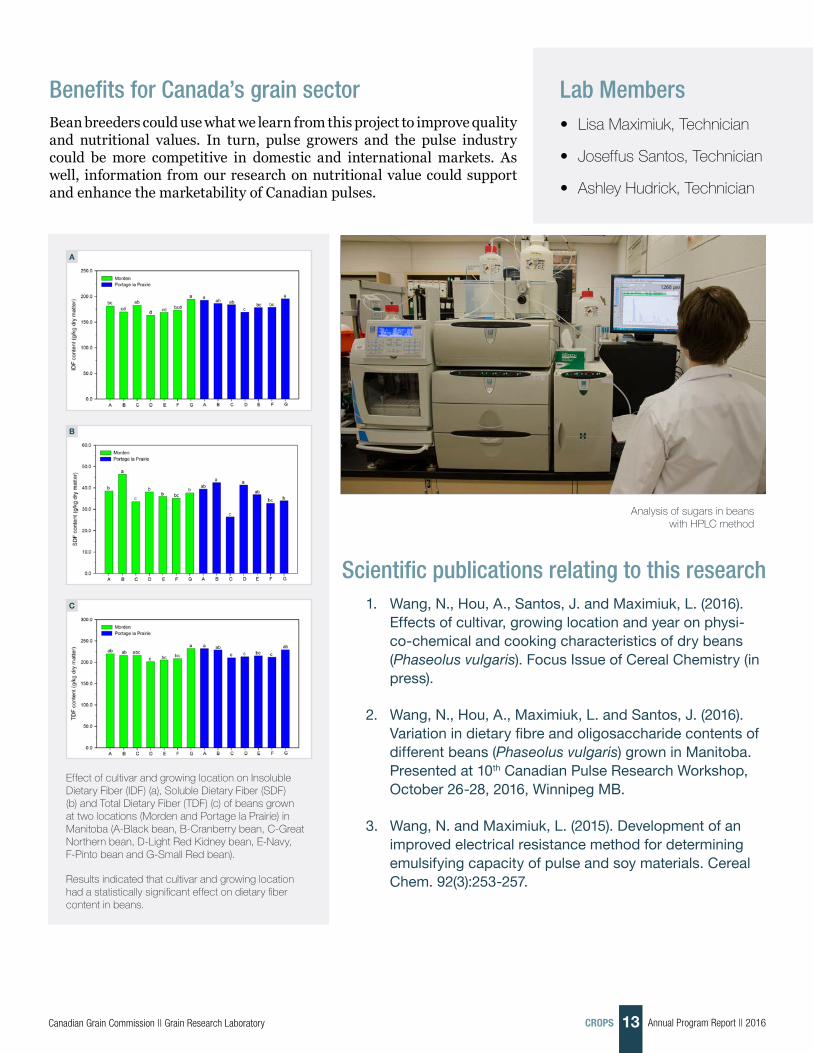
Effect of cultivar and growing location on Insoluble Dietary Fiber (IDF) (a), Soluble Dietary Fiber (SDF) (b) and Total Dietary Fiber (TDF) (c) of beans grown at two locations (Morden and Portage la Prairie) in Manitoba (A-Black bean, B-Cranberry bean, C-Great Northern bean, D-Light Red Kidney bean, E-Navy, F-Pinto bean and G-Small Red bean).
Results indicated that cultivar and growing location had a statistically significant effect on dietary fiber content in beans.
A
B
C
Annual Program Report || 2016 14 CROPS Canadian Grain Commission || Grain Research Laboratory
Evaluating the impact of mildew grades on end products made from wheatI’m excited to be working with my colleagues in Industry Services on a multiyear study on the impact of mildew, a grading factor, on end products made from wheat. Growing conditions in western Canada have been variable over the years and, recently, there has
been an increasing amount of mildew observed. Mildew is assessed visually, and it is critical to producers and all members of the wheat value chain that the Canadian grading system appropriately addresses the intrinsic value of grain and its value to the marketplace.
Research objectiveCustomers want to be assured that their products, such as bread, pasta and noodles, reflect the value they pay for Canadian wheat. Producers also want to be assured the Canadian grading system is scientifically based and measures the true value of their wheat. This project encompasses assessing wheat kernel attributes critical to a miller and flour characteristics which are important to a commercial bakery or noodle manufacturer where end product characteristics are essential to their customers. Evaluating all aspects over multiple years increases the complexity of the final analysis but ensures we address all stakeholders’ concerns.
Wheat enzyMes, asian PrOduCts and analytiCal serViCes
Dr. Dave Hatcher
“Both domestic and international customers can be confident in the quality of products they make with Canadian wheat.”
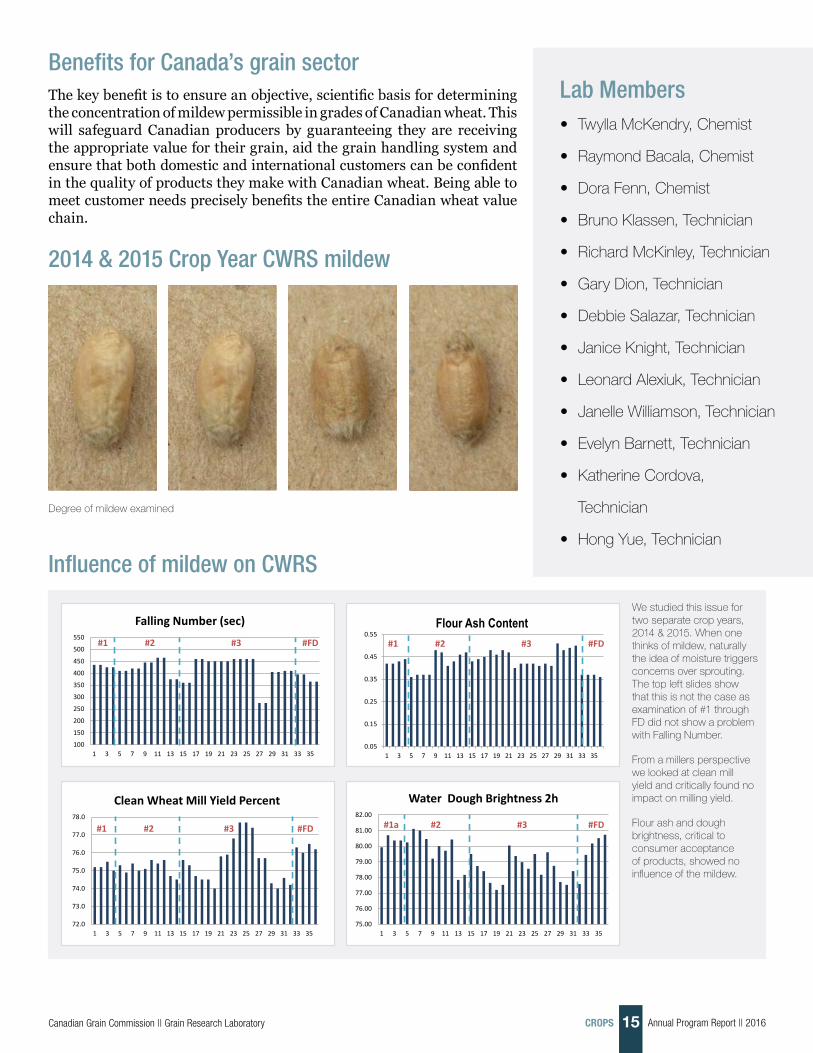
Change in CWRS #1 Mildew Guide
Previous New #1
Annual Program Report || 201615 CROPSCanadian Grain Commission || Grain Research Laboratory
Lab Members • Twylla McKendry, Chemist
• Raymond Bacala, Chemist
• Dora Fenn, Chemist
• Bruno Klassen, Technician
• Richard McKinley, Technician
• Gary Dion, Technician
• Debbie Salazar, Technician
• Janice Knight, Technician
• Leonard Alexiuk, Technician
• Janelle Williamson, Technician
• Evelyn Barnett, Technician
• Katherine Cordova,
Technician
• Hong Yue, Technician
Benefits for Canada’s grain sectorThe key benefit is to ensure an objective, scientific basis for determining the concentration of mildew permissible in grades of Canadian wheat. This will safeguard Canadian producers by guaranteeing they are receiving the appropriate value for their grain, aid the grain handling system and ensure that both domestic and international customers can be confident in the quality of products they make with Canadian wheat. Being able to meet customer needs precisely benefits the entire Canadian wheat value chain.
2014 & 2015 Crop Year CWRS mildew
Influence of mildew on CWRS
Degree of mildew examined
We studied this issue for two separate crop years, 2014 & 2015. When one thinks of mildew, naturally the idea of moisture triggers concerns over sprouting. The top left slides show that this is not the case as examination of #1 through FD did not show a problem with Falling Number.
From a millers perspective we looked at clean mill yield and critically found no impact on milling yield.
Flour ash and dough brightness, critical to consumer acceptance of products, showed no influence of the mildew.
100
150
200
250
300
350
400
450
500
550
1 3 5 7 9 11 13 15 17 19 21 23 25 27 29 31 33 35
Falling Number (sec)
#1 #2 #3 #FD
0.05
0.15
0.25
0.35
0.45
0.55
1 3 5 7 9 11 13 15 17 19 21 23 25 27 29 31 33 35
Flour Ash Content#1 #2 #3 #FD
72.0
73.0
74.0
75.0
76.0
77.0
78.0
1 3 5 7 9 11 13 15 17 19 21 23 25 27 29 31 33 35
Clean Wheat Mill Yield Percent
#1 #2 #3 #FD
75.00
76.00
77.00
78.00
79.00
80.00
81.00
82.00
1 3 5 7 9 11 13 15 17 19 21 23 25 27 29 31 33 35
Water Dough Brightness 2h
#1a #2 #3 #FD
Annual Program Report || 2016 16 TECHNOLOGIES Canadian Grain Commission || Grain Research Laboratory
Grain BiOteChnOlOGy researCh
Dr. Tigst Demeke
Simultaneous detection of multiple biotech eventsOur project focuses on detecting multiple biotech events at the same time using a qualitative PCR-based (polymerase chain reaction) platform. The low-level presence of unapproved or discontinued GMO (genetically modified organism) events in non-biotech grains continues to be a challenge for the grain sector.
GMO events are also called biotech, genetically engineered or transgenic events. A GMO event describes the insertion of a particular gene into a
“PCR is the most commonly used method for the detection of individual GMO events.”
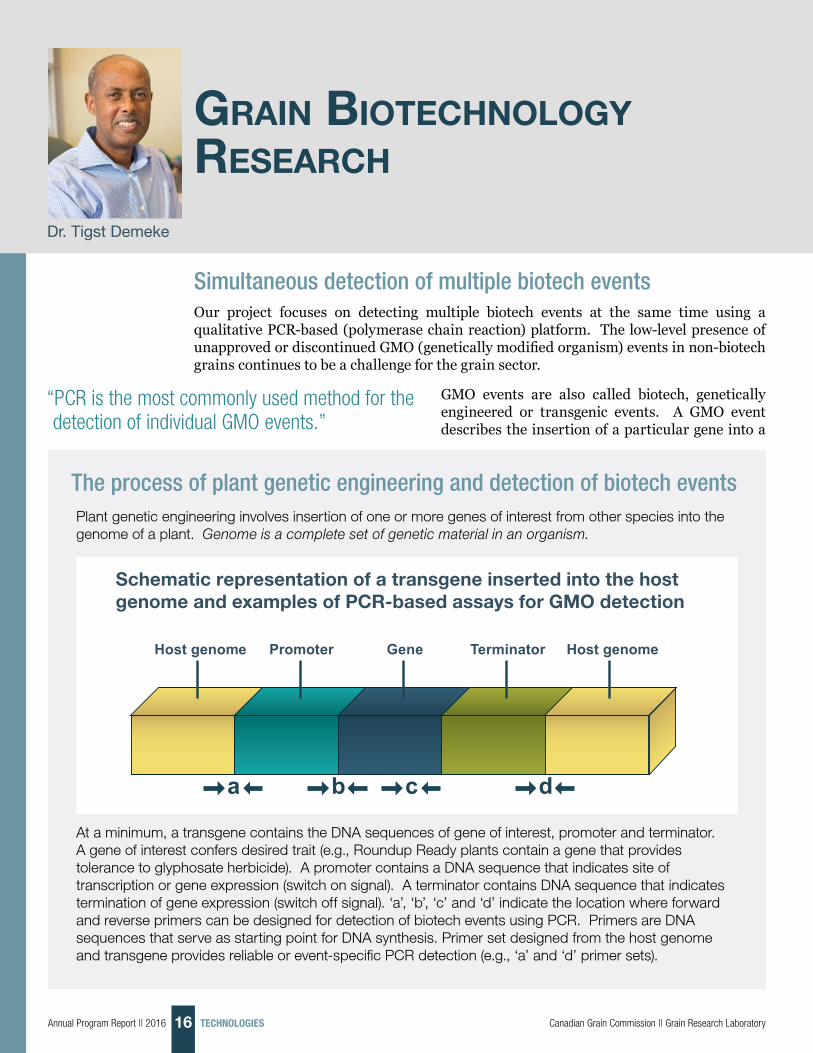
The process of plant genetic engineering and detection of biotech eventsPlant genetic engineering involves insertion of one or more genes of interest from other species into the genome of a plant. Genome is a complete set of genetic material in an organism.
At a minimum, a transgene contains the DNA sequences of gene of interest, promoter and terminator. A gene of interest confers desired trait (e.g., Roundup Ready plants contain a gene that provides tolerance to glyphosate herbicide). A promoter contains a DNA sequence that indicates site of transcription or gene expression (switch on signal). A terminator contains DNA sequence that indicates termination of gene expression (switch off signal). ‘a’, ‘b’, ‘c’ and ‘d’ indicate the location where forward and reverse primers can be designed for detection of biotech events using PCR. Primers are DNA sequences that serve as starting point for DNA synthesis. Primer set designed from the host genome and transgene provides reliable or event-specific PCR detection (e.g., ‘a’ and ‘d’ primer sets).
Host genome Host genomePromoter Gene Terminator
a b c d
Schematic representation of a transgene inserted into the host genome and examples of PCR-based assays for GMO detection
Annual Program Report || 201617 TECHNOLOGIESCanadian Grain Commission || Grain Research Laboratory
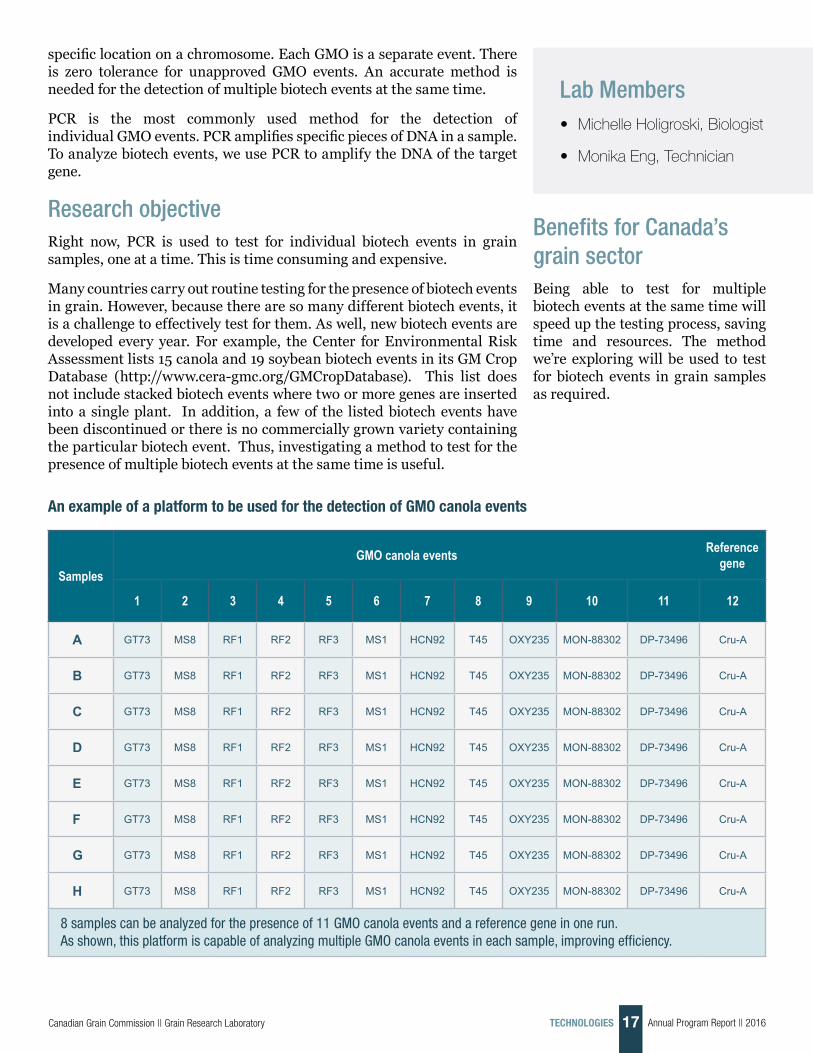
An example of a platform to be used for the detection of GMO canola events
SamplesGMO canola events Reference
gene
1 2 3 4 5 6 7 8 9 10 11 12
A GT73 MS8 RF1 RF2 RF3 MS1 HCN92 T45 OXY235 MON-88302 DP-73496 Cru-A
B GT73 MS8 RF1 RF2 RF3 MS1 HCN92 T45 OXY235 MON-88302 DP-73496 Cru-A
C GT73 MS8 RF1 RF2 RF3 MS1 HCN92 T45 OXY235 MON-88302 DP-73496 Cru-A
D GT73 MS8 RF1 RF2 RF3 MS1 HCN92 T45 OXY235 MON-88302 DP-73496 Cru-A
E GT73 MS8 RF1 RF2 RF3 MS1 HCN92 T45 OXY235 MON-88302 DP-73496 Cru-A
F GT73 MS8 RF1 RF2 RF3 MS1 HCN92 T45 OXY235 MON-88302 DP-73496 Cru-A
G GT73 MS8 RF1 RF2 RF3 MS1 HCN92 T45 OXY235 MON-88302 DP-73496 Cru-A
H GT73 MS8 RF1 RF2 RF3 MS1 HCN92 T45 OXY235 MON-88302 DP-73496 Cru-A
8 samples can be analyzed for the presence of 11 GMO canola events and a reference gene in one run. As shown, this platform is capable of analyzing multiple GMO canola events in each sample, improving efficiency.
specific location on a chromosome. Each GMO is a separate event. There is zero tolerance for unapproved GMO events. An accurate method is needed for the detection of multiple biotech events at the same time.
PCR is the most commonly used method for the detection of individual GMO events. PCR amplifies specific pieces of DNA in a sample. To analyze biotech events, we use PCR to amplify the DNA of the target gene.
Research objectiveRight now, PCR is used to test for individual biotech events in grain samples, one at a time. This is time consuming and expensive.
Many countries carry out routine testing for the presence of biotech events in grain. However, because there are so many different biotech events, it is a challenge to effectively test for them. As well, new biotech events are developed every year. For example, the Center for Environmental Risk Assessment lists 15 canola and 19 soybean biotech events in its GM Crop Database (http://www.cera-gmc.org/GMCropDatabase). This list does not include stacked biotech events where two or more genes are inserted into a single plant. In addition, a few of the listed biotech events have been discontinued or there is no commercially grown variety containing the particular biotech event. Thus, investigating a method to test for the presence of multiple biotech events at the same time is useful.
Benefits for Canada’s grain sectorBeing able to test for multiple biotech events at the same time will speed up the testing process, saving time and resources. The method we’re exploring will be used to test for biotech events in grain samples as required.
Lab Members • Michelle Holigroski, Biologist
• Monika Eng, Technician
Annual Program Report || 2016 18 TECHNOLOGIES Canadian Grain Commission || Grain Research Laboratory
MiCrOBiOlOGy
Dr. Tom Gräfenhan
Understanding microbial communities in barley with DNA sequencingWe are studying the biodiversity and composition of microbial communities that naturally occur in Canadian barley and how they can affect the malting process. To do
this, we’re using high-throughput next generation sequencing. This lets us collect DNA sequence data from the microorganisms found in barley and understand how they change during dif-ferent stages of commercial malting. Using genetic barcodes, we are able to identify hundreds of bacteria, moulds and yeasts by species.
For the past three years, we’ve generated and collected DNA sequence data from microorganisms associated with barley grain and malt. We currently analyze the complete data set in collab-oration with our project partners. This analysis requires large computer clusters with terabytes of working memory and special software for analyzing biological data. As well, we will need to be able to run multiple computer routines at the same time.
Research objectiveRight now, not enough is known about the biodiversity and com-position of microbial communities in Canadian barley or how microorganisms can affect processing. This project will close this knowledge gap.
“The data we generate during this project will help us identify microbes that can have positive or negative effects on the beer brewing process.”
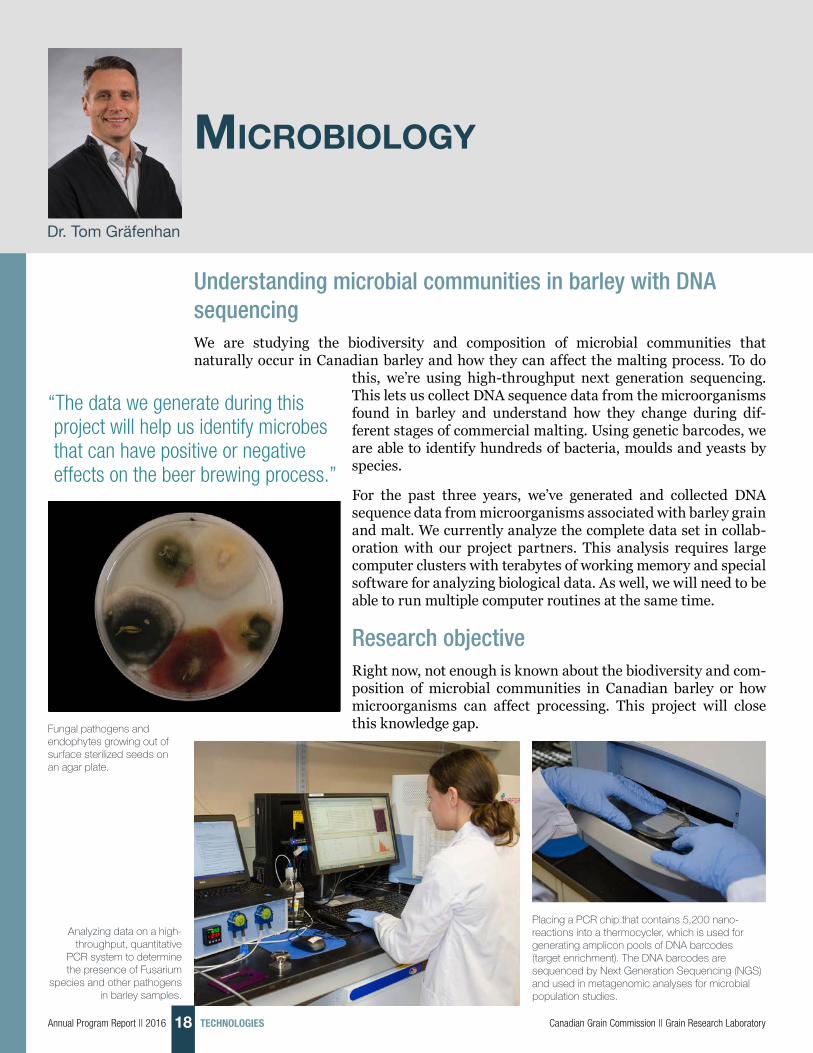
Fungal pathogens and endophytes growing out of surface sterilized seeds on an agar plate.
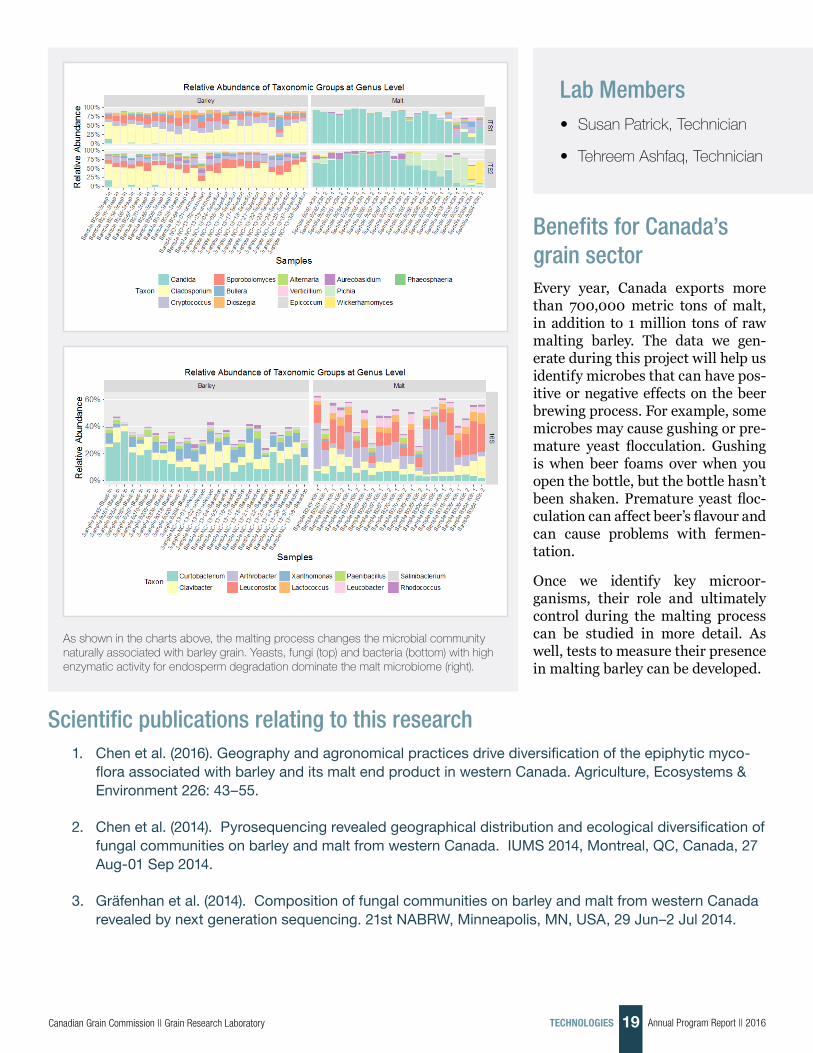
Analyzing data on a high-throughput, quantitative
PCR system to determine the presence of Fusarium
species and other pathogens in barley samples.
Placing a PCR chip that contains 5,200 nano-reactions into a thermocycler, which is used for generating amplicon pools of DNA barcodes (target enrichment). The DNA barcodes are sequenced by Next Generation Sequencing (NGS) and used in metagenomic analyses for microbial population studies.
Annual Program Report || 201619 TECHNOLOGIESCanadian Grain Commission || Grain Research Laboratory
Benefits for Canada’s grain sectorEvery year, Canada exports more than 700,000 metric tons of malt, in addition to 1 million tons of raw malting barley. The data we gen-erate during this project will help us identify microbes that can have pos-itive or negative effects on the beer brewing process. For example, some microbes may cause gushing or pre-mature yeast flocculation. Gushing is when beer foams over when you open the bottle, but the bottle hasn’t been shaken. Premature yeast floc-culation can affect beer’s flavour and can cause problems with fermen-tation.
Once we identify key microor-ganisms, their role and ultimately control during the malting process can be studied in more detail. As well, tests to measure their presence in malting barley can be developed.
Lab Members • Susan Patrick, Technician
• Tehreem Ashfaq, Technician
As shown in the charts above, the malting process changes the microbial community naturally associated with barley grain. Yeasts, fungi (top) and bacteria (bottom) with high enzymatic activity for endosperm degradation dominate the malt microbiome (right).
Scientific publications relating to this research 1. Chenetal.(2016).Geographyandagronomicalpracticesdrivediversificationoftheepiphyticmyco-
floraassociatedwithbarleyanditsmaltendproductinwesternCanada.Agriculture,Ecosystems&Environment 226: 43–55.
2. Chenetal.(2014).Pyrosequencingrevealedgeographicaldistributionandecologicaldiversificationoffungal communities on barley and malt from western Canada. IUMS 2014, Montreal, QC, Canada, 27 Aug-01 Sep 2014.
3. Gräfenhan et al. (2014). Composition of fungal communities on barley and malt from western Canada revealedbynextgenerationsequencing.21stNABRW,Minneapolis,MN,USA,29Jun–2Jul2014.

Annual Program Report || 2016 20 TECHNOLOGIES Canadian Grain Commission || Grain Research Laboratory
traCe OrGaniCs and traCe eleMents analysis
Dr. Sheryl Tittlemier
“Removing hulls would greatly reduce the concentration of these mycotoxins in food made with oats.”
Investigating how processing affects mycotoxins in oats
Groats (left) and oat hulls (right). Initial results show that removing hulls would greatly reduce the concentration of mycotoxins.
This year, we’re investigating what happens to mycotoxins when oats are processed. Along with our colleagues in Milling and Malting/Research on Barley and Other Grains, we’re examining samples of oats through different stages of oats processing, from de-hulling to heat treatment to milling.
As the oat samples are processed, we’re analyzing them for over 20 different mycotoxins.
The Prairie Oat Growers Association has helped us source oat samples from producers to use in our project. The asso-ciation is also funding part of our work, along with Saskatchewan’s Ministry of Agriculture and the Canada-Saskatchewan Growing Forward 2 bi-lateral agreement.
Hulling oats in the Grain Research Laboratory.

Annual Program Report || 201621 TECHNOLOGIESCanadian Grain Commission || Grain Research Laboratory
Lab Members • Anja Richter, Chemist
• Kerri Pleskach, Chemist
• Jules Carlson, Chemist
• Lianna Bestvater,
Technician
• Richard Blagden,
Technician
• Daniel Bockru, Technician
• Jason Chan, Technician
• Dainna Drul, Technician
• Wes Harnden, Technician
• Shannon Neumann,
Technician
• Michael Tran, Technician
• Bobby Trelka, Technician
Research objectiveWe don’t really know what happens to mycotoxins in oats during pro-cessing. For some cereals, we know that processing steps, such as scouring, which removes the bran, help to remove mycotoxins asso-ciated with bran.
Initial results from our work suggest that some mycotoxins exist on hulls. Removing hulls would greatly
reduce the concentration of these mycotoxins in food made with oats and minimize consumer exposure to mycotoxins.
Heat treatment, which is used to extend shelf life and develop good taste and texture, could change the amount of mycotoxins in processed oats.
Benefits for Canada’s grain sectorIf regulators know what happens to mycotoxins during processing, they will be able to set appropriate maximum limits for mycotoxins in oats.
Heating oats in an oven. The effects of heat treatment on mycotoxin concentrations is being studied.
Dividing ground oats for mycotoxin analysis (above
and right). Mycotoxins are not evenly distributed in oat kernels and ground
oats (far right), therefore systematic methods are used
for sample preparation to prevent inaccurate mycotoxin
measurements.Distribution of the mycotoxin ochratoxin A amongst various particle sizes of ground oats.
0.000
0.100
0.200
0.300
0.400
0.500
0.600
>1180
>600
>300
>160
<160
OTA
mas
s fra
ctio
n
Particle size (µm)

Annual Program Report || 2016 22 TECHNOLOGIES Canadian Grain Commission || Grain Research Laboratory
Variety identifiCatiOn researCh and MOnitOrinG
Dr. Daniel Perry
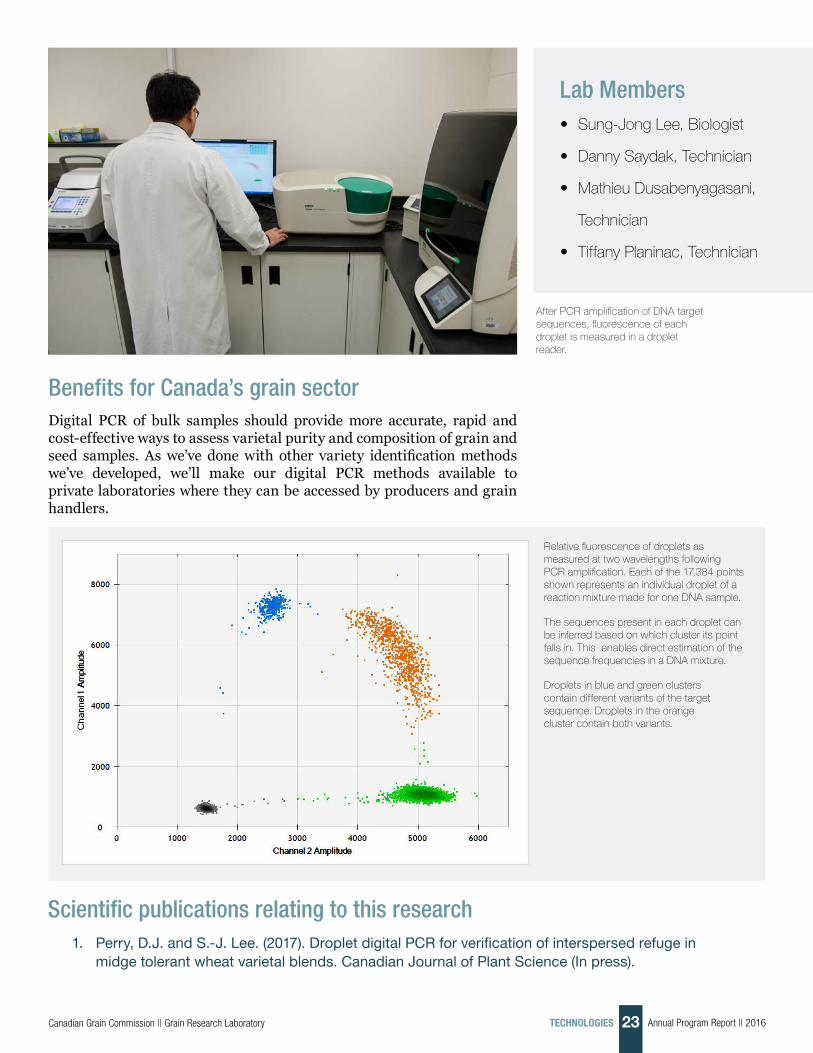
Using digital PCR to identify varieties in bulk grain samplesThis year, we’ve been investigating digital PCR as a means to assess the variety com-position of grain mixtures. PCR is a powerful technology for DNA analysis. It amplifies specific pieces of DNA, or target sequences, present in a DNA sample. Digital PCR is a new variation of this technology. With it, we can count the number of times each of our specific target sequences occurs in a DNA mixture.
“Digital PCR of bulk samples should provide more accurate, rapid and cost-effective ways to assess varietal purity and composition of grain and seed samples.”
Up to 96 PCR reaction mixtures are placed in an automated droplet generator. Here, each mixture is partitioned into an emulsion of tiny droplets. PCR amplification occurs independently in each droplet.
We’re using digital PCR to analyze areas in the DNA of barley or wheat where we know there are differences between varieties, such as the vari-ation of a single nucleotide in the sequence or the insertion or deletion of a small part of the DNA. If we can measure how much of each of these sequences is present in the DNA mixture extracted from a grain sample, we can use an algorithm to figure out the variety composition of that sample.
Research objectiveThe testing methods we use now rely on the analysis of many individual kernels per sample. A few years ago, we demonstrated that bulk-sample analysis was an achievable alternative when we developed
a method for barley using an earlier version of PCR technology, real-time PCR. However, that method required complex calibration procedures to adjust for differences in amplification rates among the various DNA targets. Digital PCR should be less sensitive to such differences. It should give better accuracy without needing calibration.
Annual Program Report || 201623 TECHNOLOGIESCanadian Grain Commission || Grain Research Laboratory
Benefits for Canada’s grain sectorDigital PCR of bulk samples should provide more accurate, rapid and cost-effective ways to assess varietal purity and composition of grain and seed samples. As we’ve done with other variety identification methods we’ve developed, we’ll make our digital PCR methods available to private laboratories where they can be accessed by producers and grain handlers.
Lab Members • Sung-Jong Lee, Biologist
• Danny Saydak, Technician
• Mathieu Dusabenyagasani,
Technician
• Tiffany Planinac, Technician
After PCR amplification of DNA target sequences, fluorescence of each droplet is measured in a droplet reader.
Relative fluorescence of droplets as measured at two wavelengths following PCR amplification. Each of the 17,384 points shown represents an individual droplet of a reaction mixture made for one DNA sample.
The sequences present in each droplet can be inferred based on which cluster its point falls in. This enables direct estimation of the sequence frequencies in a DNA mixture.
Droplets in blue and green clusters contain different variants of the target sequence. Droplets in the orange cluster contain both variants.
Scientific publications relating to this research 1. Perry,D.J.andS.-J.Lee.(2017).DropletdigitalPCRforverificationofinterspersedrefugein
midgetolerantwheatvarietalblends.CanadianJournalofPlantScience(Inpress).

Annual Program Report || 2016 24 Canadian Grain Commission || Grain Research Laboratory
2015 - 2016 sCientifiC PuBliCatiOnsPeer-Reviewed Journal and Book (Published or accepted for publication)
1. Daugelaite D, Strybulevych A, Hatcher DW, Scanlon MG, and Page JH.(2017).FrozenConvenienceNoodles:UseofUltrasoundtostudytheInfluenceofPreparationMethodsontheirRheologicalParameters. Cereal Chemistry (In press).
2. Dupuis B, Fu BX. (2017). A new lean no time test baking method withimproveddiscriminatingpower.JournalofCerealScience(Inpress).
3. Izydorczyk MS, Edney, M. (2017). “Barley: Grain quality charac-teristics and management of quality requirements”. In: Wrigley C, Batey I, Miskelly D (editors). Cereal Grains, Assessing and Managing Quality, 2nd Edition, pp. 195-234.
4. O’DonovanJT,EdneyMJ,IzydorczykMS,TurkingtonTK,JuskiwPE,McKenzieTH,GrantCA,HarkerKN,MayWE,JohnsonEN,Smith EG, Clayton GW. (2017). Effect of seeding date and rate on maltingbarley(HordeumvulgareL.)quality.CanadianJournalofPlant Science. 97:1-4.
5. PerryDJ,LeeSJ.(2017).DurumwheatvarietyidentificationbyOpenArrayanalysis.CanadianJournalofPlantScience(Inpress).
6. PerryDJ,LeeSJ.(2017).DropletdigitalPCRforverificationofinterspersed refuge in midge tolerant wheat varietal blends. CanadianJournalofPlantScience(Inpress).
7. SenthilkumarT,JayasDS,WhiteNDG,FieldsPG,GräfenhanT.(2017). Detection of ochratoxin A contamination in stored wheat usingnear-infraredhyperspectralimaging.InfraredPhysics&Technology 81: 228–235. DOI: 10.1016/j.infrared.2017.01.015
8. SuchyS,DupuisB,SakamotoJ,FuBX.(2017).Alternatedoughpreparation protocol for extensigraph test of dough strength. Cereal Chemistry (In Press).
9. WangN,HouA,SantosJ,MaximiukL.(2017).Effectsofcultivar,growing location and year on physico-chemical and cooking char-acteristics of dry beans (Phaseolus vulgaris). Focus Issue of Cereal Chemistry (In press).
10. Buckley WT, Izydorczyk MS, Legge WG. (2016). Detection of incipient germination in malting barley with starch viscosity methods and a proposed ethanol emission method. Cereal Chemistry. 93:450-455.
11. ChenW,TurkingtonTK,LévesqueCA,BamforthJM,PatrickSK,LewisCT,ChapadosJT,GabaD,TittlemierSA,MacLeodA, Gräfenhan T. (2016). “Geography and agronomical practices drivediversificationoftheepiphyticmycofloraassociatedwithbarley and its malt end product in western Canada”. Agriculture, Ecosystems and Environment. 226: 43–55. DOI: 10.1016/j.agee.2016.03.030
12. DaugelatieD,StrybulevychA,ScanlonMG,PageJH,HatcherDW.(2016) Use of Ultrasound to Investigate Glucose Oxidase Storage Effects on the Rheological Properties of Cooked Asian Noodles. Cereal Chemistry. 93(2):125-129.
13. DemekeT,HoligroskiM,EngM,XingJ.(2016).Absolutequanti-ficationofgeneticallyengineeredtraitswithdropletdigitalPCR:Effect of DNA treatments and spiking with non-target DNA. Food Control. 68: 105-111.
14. FouhseJ,VasanthanT,IzydorczykMS,BeattieA,ZijlstraR.(2016).Cereal grain composition alters nutrient digestibility and growth performanceregardlessofproteinqualityinpigs.JournalofAnimalScience. 94: 279-282.
15. FouhseJ,GaoJ,VasanthanT,IzydorczykMS,BeattieA,ZijlstraR.(2016).Whole-grainbarleyfibercompositioninfluencessiteofnutrient digestion, standardized ileal digestibility of amino acids, andwhole-bodyenergyutilizationingrowerpigs.TheJournalofNutrition. jn238667:1-8.
16. GräfenhanT,JohnstonP,VauthanMM,McCormickSP,ProctorR,BusmanM,WardT,O'DonnellK.(2016).“Fusariumpraegramin-earum sp. nov., a novel nivalenol mycotoxin-producing pathogen fromNewZealandcaninduceheadblightonwheat”.Mycologia.DOI: 10.3852/16-110
17. Herrera MP, Vasanthan T, Hoover R, Izydorczyk MS. (2016). Molecular size distribution and amylase-resistance of maize starch nanoparticles prepared by acid hydrolysis. Cereal Chemistry, "First Look" paper • http://dx.doi.org/10.1094/CCHEM-02-16-0028-R • posted 08/23/2016
18. IzydorczykM,FitzpatrickK.(2016).Barley:AnIncredibleSourceofAntioxidants and Phytochemicals. GoBarley.com. http://gobarley.com/health-nutrition/for-health-professionals/
19. Izydorczyk MS. (2016). Functional Properties of Cereal Cell-Wall Polysaccharides. In: Eliasson, AC (editor). Carbohydrates in Food, 3rd Edition, pp.193-25. CRC Press, Oxford.
20. Izydorczyk MS. (2016). β-Glucans: Measurement and Processing. In:WrigleyC,CorkeH,Seetharaman,K,FaubionJ(editors.)Encyclopedia of Food Grains, 2nd Edition, pp. 287-298. Oxford: Academic Press.
21. IzydorczykMS,DexterJE.(2016).Barley:MillingandProcessing.In:WrigleyC,CorkeH,SeetharamanK,FaubionJ(editors).Encyclopedia of Food Grains, 2nd Edition, pp. 434-445. Oxford: Academic Press.
22. McMillan T, Izydorczyk MS, Li Y. (2016). Quality of Western Canadian Malting Barley. 2016 Annual Harvest Report. http://www.grainscanada.gc.ca/barley-orge/harvest-recolte/2016/qbsm16-qosm16-1-en.htm
23. MacLeod A, Edney M, Izydorczyk MS. (2016). Barley: Grading andMarketing.In:WrigleyC,CorkeH,SeetharamanK,FaubionJ(editors).EncyclopediaofFoodGrains,2ndEdition,pp.16-24.Oxford: Academic Press.
24. Nguyen HD, Lewis CT, Lévesque CA, Gräfenhan T. (2016). “Draft genome sequence of Alternaria alternata ATCC 34957”. Genome Announcements 4: e01554-15. DOI: 10.1128/genomeA.01554-15.
25. PerryDJ,LeeSJ.(2016).MultiplexedSSRmarkersforidentificationandpurityassessmentofCanadianflaxvarieties.SeedScienceand Technology. 44:156-167.
26. TittlemierSA,DrulD,RoscoeM,MenziesJG(2016).Theeffectsofselected factors on measured ergot alkaloid content in Claviceps purpurea-infected hexaploid and durum wheat. World Mycotoxin Journal.9:555-564.

Annual Program Report || 201625 Canadian Grain Commission || Grain Research Laboratory
27. Tittlemier SA, Trelka R, Roscoe M, Tran M, Gaba D, Barthet V, Siemens B (2016). Analysis of quinclorac and quinclorac methyl ester in canola from the 2015 harvest using QuEChERS with liquid chromatography polarity switching tandem mass spectrometry. Food Additives and Contaminants. 33:1003-1009.
28. SenthilkumarT,JayasDS,WhiteNDG,FieldsPG,GräfenhanT.(2016). “Detection of fungal infection and Ochratoxin A contami-nation in stored barley using near-infrared hyperspectral imaging”. Biosystems Engineering 147:162–173. DOI: 10.1016/j.biosyste-mseng.2016.03.010.
29. SenthilkumarT,JayasDS,WhiteNDG,FieldsPG,GräfenhanT.(2016). “Detection of fungal infection and Ochratoxin A contami-nation in stored wheat using near-infrared hyperspectral imaging”. JournalofStoredProductsResearch65:30–39.DOI:10.1016/j.jspr.2015.11.004
30. SenthilkumarT,JayasDS,WhiteNDG,FieldsPG,GräfenhanT.(2016). “Detection of fungal infection and Ochratoxin A contami-nation in stored wheat using near infrared hyperspectral imaging”. JournalofGrainStorageResearch,specialissueofIndianJournalof Entomology 78: 114–120. DOI: 10.5958/0974-8172.2016.00032.8
31. SenthilkumarT,JayasDS,WhiteNDG,FieldsPG,GräfenhanT.(2016). “Near-infrared (NIR) hyperspectral imaging: theory and applications to detect fungal infection and mycotoxin contam-inationinfoodproducts”.JournalofGrainStorageResearch,specialissueofIndianJournalofEntomology78:91–99.DOI:10.5958/0974-8172.2016.00029.8
32. SivagnanamK,KomatsuE,PatrickS,RampitschC,PerreaultH,Gräfenhan T. (2016). “Rapid screening of ergot alkaloids in sclerotia byMALDI-TOFmassspectrometry”.JournalofAOACInternational99: 895–898. DOI: 10.5740/jaoacint.16-0117.
33. SivagnanamK,KomatsuE,RampitschC,PerreaultH,GräfenhanT. (2016). “Rapid screening of Alternaria mycotoxins using MALDI-TOFmassspectrometry”.JournaloftheScienceofFoodand Agriculture 97: 357–361. DOI: 10.1002/jsfa.7703.
34. SultT,BarthetVJ,BennettL,EdwardsA,FastB,GillikinN,LaunisK,NewS,Rogers-SzumaK,SabbatiniJ,SrinivasanJR,TiltonGB, Venkatesh TV. (2016). Report: Release of the International Life SciencesInstituteCropCompositionDatabaseVersion5.J.FoodComposition and Analysis. 51:106-111.
35. BarthetVJ.(2016)Canola:Overview.EncyclopediaofFoodGrains(SecondEdition).In:WrigleyC,CorkeH,SeetharamanK,FaubionJ(editors). Volume 1: The world of food grains. Pages 237–241.
36. ChenW,TurkingtonTK,LévesqueCA,BamforthJ,PatrickSK,LewisCT,ChapadosJT,GabaD,TittlemierSA,MacLeodA,Gräfenhan T. (2016). Geographic condition and farming practice causeecologicaldiversificationoftheepiphyticmycofloraasso-ciated with barley grain and have impact on the quality of malt end-product. Agriculture, Ecosystems and Environment. 226:43-55.
37. BianchiniA,HorsleyR,JackMM,KobielushB,RyuD,TittlemierS,WilsonWW,AbbasHK,AbelS,HarrisonG,MillerJD,ShierWT,Weaver G. (2015). DON Occurrence in Grains: A North American Perspective. Cereal Foods World. 60:45-53.
38. Amarasinghe CC, Tittlemier SA, Fernando WGD. (2015). Nivalenol producing Fusarium cerealis associated with Fusarium head blight in winter wheat in Manitoba, Canada. Plant Pathology. 64:988-995.
39. ChirembaC,PozniakCJ,FuBX.(2015).ChangesinSemolinaYellow Pigment Content and Carotenoid Composition during Pasta Processing. Cereal Chem. 92:551-556.
40. HattoriK,DupuisB,FuBX,Edwards,NM.(2015).Effectsofmonoglycerides of varying fatty acid chain length and mixtures thereof on sponge-and-dough breadmaking quality. Cereal Chem. 92:481-486.
41. O’DonovanJT,AnbessaY,McleodA,EdneyM,IzydorczykMS,TurkingtonTK,JuskiwP,LafondGP,MayWE,GrantCA,HarkerKN,JohnsonEN,BeresBL,McAllisterTA,SmithEG,ChapmanW. (2015). Relative responses of new malting barley cultivars to increasingnitrogenratesinwesternCanada.CanadianJournalofPlant Science. 95: 831-839.
42. McMillan T, Izydorczyk MS, Li Y. (2015). Quality of Western Canadian Malting Barley. 2015 Annual Harvest Report. http://www.grainscanada.gc.ca/barley-orge/harvest-recolte/2015/qbsm15-qosm15-1-en.htm
43. PerryDJ,LeeSJ.(2015).IdentificationofCanadianwheatvari-etiesusingOpenArraygenotypingtechnology.JournalofCerealScience. 65:267-276.
44. TittlemierSA,DrulD,RoscoeM,McKendryT.(2015).Occurrenceof ergot and ergot alkaloids in western Canadian wheat and other cereals.JournalofAgriculturalandFoodChemistry.63:6644-6650.
45. TittlemierSA,SoberingD,BowlerK,ZirdumT,GabaD,ChanJM,Roscoe M, Blagden R, Campbell L. (2015). Byproducts of grain cleaning: an opportunity for rapid sampling and screening of wheat formycotoxins.WorldMycotoxinJournal.8:45-53.
46. Wang N, Maximiuk L. (2015). Development of an improved elec-trical resistance method for determining emulsifying capacity of pulse and soy materials. Cereal Chem. 92(3):253-257.
47. WaszkowiakK,Gliszczyńska- ͆wigłoA,BarthetVJ,SkrętyJ.(2015)Effect of extraction method on the phenolic and cyanogenic glu-cosideprofileofflaxseedextractsandtheirantioxidantcapacity.JournaloftheAmericanOilChemists'Society,92(11-12):1609-1619.
48. WaszkowiakK,Barthet,VJ.(2015)CharacterizationofaPartiallyPurifiedExtractfromFlax(LinumusitatissimumL.)Seed.Journalof the American Oil Chemists' Society, 92 (8):1183-1194.
Annual Program Report || 2016 26 Canadian Grain Commission || Grain Research Laboratory
In 2015, the Canadian Grain Commission hired Ference & Company to conduct an evaluation of the Harvest Sample Program. The evaluation
was completed in 2016 and concluded that stake-holders are overall very satisfied with the Harvest Sample Program.
Each year, producers submit their samples to the Canadian Grain Commission at harvest and, in exchange, they receive a free unofficial grade and quality information about their samples. Producers find the unofficial grade and quality information useful because they can use this information to better market their grain.
The Canadian Grain Commission generates harvest quality reports used by the industry to support marketing Canadian grains. The grain industry finds the quality reports provide very useful information on the Canadian grain crop.
The samples the Canadian Grain Commission gets through this program are essential to its work to establish grain grades and standards. As well, it uses samples in research about grain and grain products.
MethodIn part, the evaluation was based on:
• Interviews with 28 Canadian Grain Commission representatives, 19 industry and producer associations, 21 domestic grain companies and buyers, and 17 international buyers of Canadian grain
• Surveys of 1,207 producers who have taken part in the program by sending in harvest samples
• Surveys of 125 producers who registered, but who have never sent harvest samples
eValuatiOn Of the harVest saMPle PrOGraM
Findings and conclusionsRelevance
The Harvest Sample Program supports the Canadian Grain Commission’s key responsi-bilities, including developing visual grading standards, monitoring and verifying grading factors, researching environmental conditions and conducting other special research projects.
The Harvest Sample Program supports the Canadian Grain Commission’s strategic outcome to ensure that, “Canada’s grain is safe, reliable, and marketable and Canadian grain producers are properly compen-sated for grain deliveries to licensed grain companies.” The program also supports the Canadian Grain Commission’s organizational priority, “investing in stakeholder relations”, as identified in its 2015-16 Report on Plans and Priorities.
Samples from the Harvest Sample Program are essential to grain quality research and quality assurance. The program is the only source of samples best suited for many quality research projects. The program samples are ideal for research because they are pure, non-blended samples with a known geographic location and are obtained directly from producers at the beginning of the supply chain.
Because of changes in grain marketing and a move to an open market, there is more demand for Harvest Sample Program results from orga-nizations that use this data.

Achievement of intended outcomes
The program has successfully:
• Increased producers’ knowledge of their grain quality
• Increased awareness among domestic and international buyers and processors of the quality of Canadian grain
• Supported the activities and objectives of the quality assurance and grain quality research programs
RecommendationsWhile stakeholders are satisfied with the Harvest Sample Program and stated it is essential for the program to continue, they made the following recommendations to further enhance it:
• Recruit new program participants
• Improve harvest quality information for producers
• Redevelop the online interface for producers
• Improve tracking of producer participation
• Improve communication with stakeholders
• Build partnerships to increase participation in eastern Canada
• Work with the Canadian International Grains Institute to produce a comprehensive report
The Canadian Grain Commission is developing action plans based on these recommendations.
A complete summary of the evaluation’s finding is available at www.grainscanada.gc.ca.
Design and delivery
Currently, the program design is efficient, cost-effective and the best option based on the program’s purposes and beneficiaries. Thanks to the Harvest Sample Program, the Canadian Grain Commission is able to use unique, indi-vidual samples to generate quality data and conduct research. At the same time, producers get the information they need to market their grain and negotiate grade and price.
External recipients are very satisfied with the design and delivery of the Canadian Grain Commission’s annual harvest quality reports and information. Stakeholder organizations and individuals reported that the content, format and delivery meet their needs well. International buyers value the ability to communicate directly with Canadian Grain Commission representa-tives to better understand the harvest quality reports and ask questions.
Grain research Laboratory
Annual Program Report
2016
ISSN 2371-0411
Grain Research Laboratory · Canadian Grain Commission · www.grainscanada.gc.ca